2020 Maryland Department of Transportation Greenhouse Gas Reduction Act Plan

Welcome message from author
This document is posted to help you gain knowledge. Please leave a comment to let me know what you think about it! Share it to your friends and learn new things together.
Transcript

2020 Maryland Department of Transportation
Greenhouse Gas Reduction Act Plan
Executive Summary The Greenhouse Gas Reduction Act (GGRA) Plan presents the Maryland Department of Transportation’s (MDOT) approach to meet the requirements of the GGRA. The GGRA requires the Maryland Department of Environment (MDE) to submit a plan that reduces statewide greenhouse gas (GHG) emissions by 40 percent from 2006 levels by 2030 (“40 by 30”). MDOT worked in coordination with MDE, other agencies, and partners to develop and test strategies for the transportation sector to achieve the “40 by 30” goal. The current statewide emissions inventory, developed for 2017, shows that on-road transportation is the single largest GHG emissions generator in Maryland, representing 36 percent of total GHG emissions. Off-road transportation (aviation, marine, and rail) represents another 4 percent. A steady increase in transportation demand indicators including growth in population, vehicle miles traveled (VMT), and congestion combined with limited revenue relative to needs creates a major challenge. Based on MDOT analysis accounting for these challenges and by harnessing new opportunities, it is possible for Maryland’s transportation sector to meet the “40 by 30” goal. The analysis considered two policy scenarios built from the Maryland Transportation Plan (MTP), the Consolidated Transportation Program (CTP), and Maryland’s two major Metropolitan Planning Organizations’ (MPO) plans and programs (Baltimore and Washington D.C. regions). Achieving the goal will not be easy and requires an innovative and cost-effective approach that includes:
An aggressive investment in transportation beyond current levels of projected funding,
Supportive policy and new and additional resources enabling MDOT to fund and advance these needed investments,
A shared commitment and coordinated approach between MDOT and its partners to advance reliable, low-cost, and low-carbon technologies, and
A best-case scenario for the roll-out and adoption of transportation technology, including market penetration of electric vehicles (EVs) into public and private fleets in Maryland.
According to projections by the Maryland Department of Planning (MDP), Maryland may grow to over 6.5 million people by 2030. Coupled with economic expansion and land use change, VMT could increase to over 69 billion by 2030. Reducing emissions from this projected travel activity rests on the four pillars of emission reduction (as shown in Figure ES 1). These pillars rely on behavioral change and innovation among all the stakeholders of the State’s transportation system, as we transition to a low-carbon emissions pathway to achieve the 2030 goal.
Statewide VMT, which is a major indicator of transportation sector GHG emissions, has been steadily increasing in Maryland since 2014, with over 60 billion VMT in 2019. VMT growth has been consistent with population growth as VMT per capita has remained stable. While population increase is expected to create additional demand for the State’s transportation systems, VMT in Maryland dropped dramatically in 2020 due to the COVID-19 pandemic. Based on MDOT’s estimates of VMT trends, 2020 annual VMT is expected to drop to an estimated 51.1 billion VMT statewide. While MDOT anticipates that VMT will rebound back to 2019 levels over the next five years, there is uncertainty regarding the exact timeline and pace of the recovery.

Figure ES 1 The Four Pillars of Emission Reductions in the Transportation Sector
Construct of Scenarios and Strategy Development
While the GGRA goal is “40 by 30” across all economic sectors in Maryland, MDOT’s analysis applies the same goal for the transportation sector as the current and projected largest contributor of GHG emissions in Maryland by 2030. The policy scenarios and results are presented in Figure ES 2. Figure ES 2 MDOT GGRA Plan – Scenario Construct
The 2006 Baseline Inventory established the base conditions for the GHG reduction goals in the GGRA (25 percent by 2020 and 40 percent by 2030). The on-road portion of the emissions inventory represents a “bottom-up” approach to estimating statewide GHG emissions based on roadway congestion levels, traffic volumes, and vehicle fleet data. GHG emission estimates for on-road transportation in 2014 and 2017 baselines reflect an alignment with actual conditions based upon the process for developing the U.S. Environmental Protection Agency’s (EPA) National Emissions Inventory (NEI). Reference Case – This scenario assumes a constant 1.2 percent annual VMT growth rate (the annual average since 1990) through 2030 combined with full implementation of current
federal emission and fuel standards. With the full implementation of final federal vehicle and fuel standards through 2030, total on-road GHG emissions could decrease by 6.35 mmt CO2e1, bringing 2030 emissions 20 percent below 2006 emissions. Maryland meeting the Zero Emissions Vehicle Memorandum of Understanding (ZEV MOU) target of 535,000 ZEVs registered in Maryland by 2030 (9.9 percent of the light-duty vehicle fleet) will result in an additional 1.66 mmt CO2e reductions. This results in a reduction to 22.71 mmt CO2e from on-road mobile sources in 2030, a 26 percent reduction from 2006. Policy Scenario 1 “On-the-Books” – As its name indicates, this scenario evaluates the emission reductions from funded projects and programs. This includes projects and programs in the CTP, land development assumptions consistent with local plans and MDP’s goals, and GHG reducing projects included in fiscally constrained MPO metropolitan transportation plans. This scenario represents a best-case outcome for implementation of all currently funded programs through 2030. The total estimated statewide reduction as a result of implementing Policy Scenario 1 in 2030 is 2.19 mmt CO2e. The result is a reduction to 20.53 mmt CO2e from on-road mobile sources in 2030, a 33 percent reduction from 2006. Policy Scenario 2 “Emerging and Innovative” – This scenario acknowledges that attaining the 2030 goal will require additional investments to expand or accelerate deployment of previously planned strategies. This could include expanding their scope of application, deployment of new best-practice strategies, and capitalizing on the opportunities created by new transportation technologies by enabling policies and providing incentives. All the strategies in Policy Scenario 2 require additional funding and, in some cases, private sector commitment. The 22 strategies in this scenario (16 emerging and 6 innovative) represent a combination of approaches to reduce GHG emissions with varying levels of confidence and MDOT responsibility. The total estimated statewide reduction in 2030 under Policy Scenario 2 is estimated between 4.539 and 6.417 mmt CO2e.The result is a reduction to 15.70 mmt CO2e from on-road mobile sources in 2030, a 49 percent reduction from 2006. This scenario suggests that achieving the 40 percent reduction is possible; however, the transportation sector will need a new infusion of revenues and partnerships to make this a reality. The strategies in both scenarios create opportunities for significant co-benefits beyond reduced fuel consumption and GHG emissions, including improved air and water quality, public health benefits, more equitable transportation options and access to opportunity, and direct and indirect economic impacts for current and future Maryland workers and employers.
Figure ES 3 shows how far the transportation sector in Maryland can get in terms of emission reductions by 2030 as a result of implementing the two policy scenarios.
1 Note: CO2e represents CO2 equivalents, which is a measure of GHG emissions that considers the global warming potential of each GHG, including CO2, methane, and nitrous oxides. More information is available through US EPA here.
The COVID-19 pandemic resulted in a decrease in VMT and congestion on Maryland roadways as many employers switched to telework. This, coupled with advancement in transportation technology, will result in lower GHG emissions in Maryland. Nonetheless, as long-term national trends continue to show an increase in VMT and decrease in transit ridership as an externality resulting from social-distancing measures, it is important that the State continue to develop solutions that address modern preferences, such as mobile applications that offer riders real-time bus tracking, or investment in travel time reduction and facility-wide comfort.

Figure ES 3 MDOT GGRA Plan – Scenarios and Potential Emissions Reductions
Implementation Costs
A majority of the strategies require an influx of capital funding for implementation. These include facility construction costs, the cost of acquiring right-of-way, purchasing rolling stock or vehicles for transit, and technology costs for equipment and infrastructure. Policy Scenario 1 total estimated cost is $14.09 billion. These costs are based on CTP outlays, ongoing investments in current MDOT programs from 2026 to 2030, and funded projects and programs in MPO MTPs planned for implementation by 2030. These programs are included within fiscally constrained plans based on projected revenue sources available to fund the programs for implementation. Policy Scenario 2 total estimated cost, not including potential investments in MAGLEV or Loop, ranges from $11.59 billion up to $15.59 billion (total funding levels of around 80 to 110 percent above current fiscally constrained plans). A balanced investment approach is needed to identify and prioritize strategies for funding based on cost effectiveness, reduction potential, and overall feasibility including readiness of policy adoption, public acceptance, and a supportive regulatory environment for rolling out new technologies. The path to “40 by 30” for the transportation sector is beset with implementation challenges and uncertainties, while also having the potential to capitalize on known and unknown opportunities. MDOT’s approach takes a careful, fact and research-driven approach to gauge what is realistic by 2030. Given the vitality of the transportation sector for maintaining and enhancing the economic prosperity of Maryland’s citizens and its contribution as the largest source of GHG emissions in Maryland, a firm commitment to fulfilling the sector’s resource and implementation challenges will enable the state to meet the GGRA goals.
1. Background and Approach The Greenhouse Gas Reduction Act (GGRA) Plan presents the Maryland Department of Transportation’s (MDOT) blueprint for reducing greenhouse gas (GHG) emissions from the transportation sector through 2030. The Plan includes information on emission reductions, co-benefits, implementation considerations, and costs of a diverse set of strategies and scenarios developed in coordination with the Maryland Department of Environment (MDE), other State agencies, and regional and local partners.
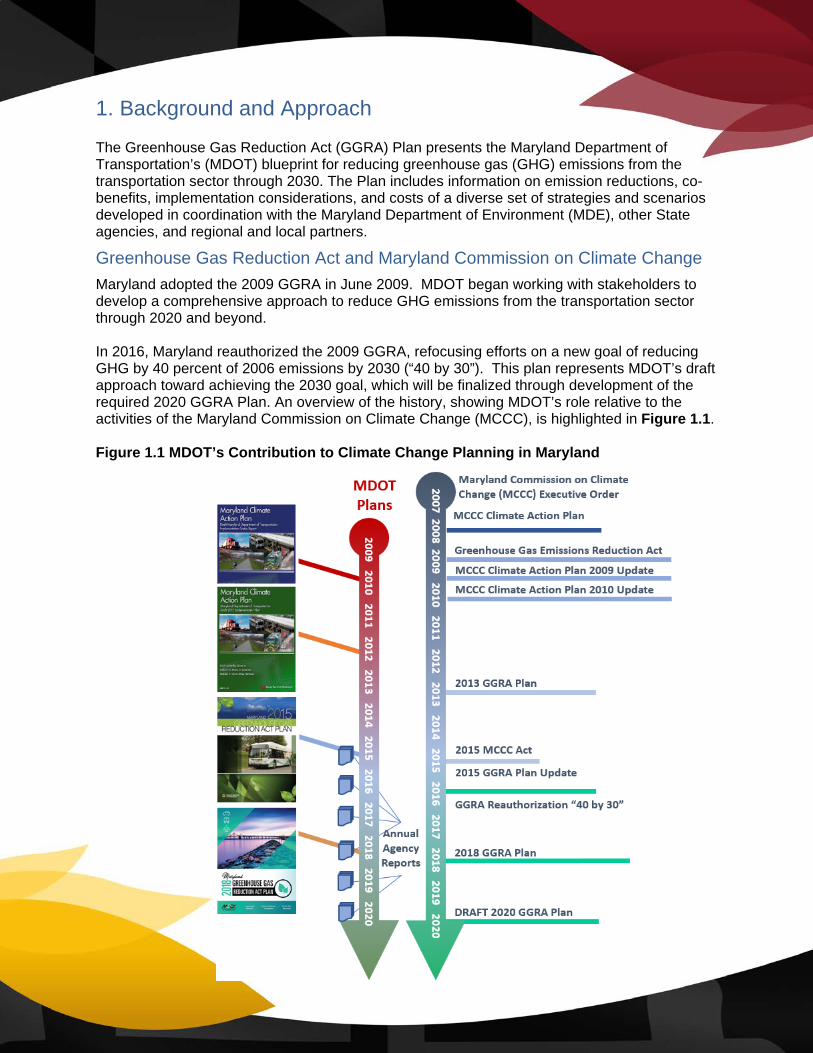
Greenhouse Gas Reduction Act and Maryland Commission on Climate Change Maryland adopted the 2009 GGRA in June 2009. MDOT began working with stakeholders to develop a comprehensive approach to reduce GHG emissions from the transportation sector through 2020 and beyond. In 2016, Maryland reauthorized the 2009 GGRA, refocusing efforts on a new goal of reducing GHG by 40 percent of 2006 emissions by 2030 (“40 by 30”). This plan represents MDOT’s draft approach toward achieving the 2030 goal, which will be finalized through development of the required 2020 GGRA Plan. An overview of the history, showing MDOT’s role relative to the activities of the Maryland Commission on Climate Change (MCCC), is highlighted in Figure 1.1. Figure 1.1 MDOT’s Contribution to Climate Change Planning in Maryland

Purpose of the Plan The Plan presents the progress made by the transportation sector in reducing GHG emissions, the trends affecting GHG emissions through 2030, and the anticipated benefits of planned MDOT strategies to support achieving the “40 by 30” goal. The Plan’s purpose is to:
• Present transportation sector accomplishments since 2009;
• Discuss broad trends impacting vehicle miles traveled (VMT), vehicle technology, and fuel use, as well as the associated emission outcomes of these trends;
• Identify specific actions, including costs and benefits, for implementation through 2030; and
• Assess the transportation sector’s contribution to the overall 2030 emission reduction goal.
Recent and Ongoing MDOT Actions MDOT, through annual status reports to the Governor’s Office and General Assembly, provides a review of recent, ongoing, and planned activities aimed toward meeting the GGRA goals across three different implementation tiers: policy, programs, and data. These plans are available for review here.
Transportation Technology As a leader in implementing emerging transportation technologies, MDOT is leading various initiatives including the Maryland Zero Emission Electric Vehicle Infrastructure Council (ZEEVIC), connected and automated vehicle (CAV) technology, and renewable energy.
• Total registered Electric Vehicles (EVs) in Maryland stands at 29,268 as of December 31, 2020.
• MDOT is completing its Fleet Innovation Plan which will support the conversion of MDOT’s light-duty and bus fleet to Zero Emission Vehicles (ZEVs).
Congestion Mitigation MDOT continues its comprehensive and innovative approach to mitigating congestion and improving travel and freight reliability through various initiatives, including those within Transportation Systems Management and Operations (TSMO).
• In 2019, the Coordinated Highways Action Response Team (CHART) Program cleared 31,750 traffic incidents and assisted 39,500 motorists on Maryland highways. The program saved drivers $1.4 billion in delay and fuel costs through effective traffic incident management, traveler information, and emergency services.
VMT Reduction MDOT invests in low-emissions travel modes (transit, bicycle, and pedestrian) and provides commuting incentives and information under the Commuter Choice Maryland Travel Demand Management Program.
• MDOT Maryland Transit Administration (MTA) continues its railcar replacement program, replacing 78 railcars to improve passenger comfort and travel time reliability, and enhancing safety components on the Metro SubwayLink system.
• MDOT MTA launched real-time tracking for MARC Train service in August 2020 to improve traveler information and system management.

Infrastructure Design MDOT continues to emphasize the importance of reducing emissions through design principles including practical and innovative project implementation.
• MDOT Transportation Secretary’s Office (TSO) published design guidance for projects applying for MDOT Kim Lamphier Bicycle Program funding.
• Maryland Transportation Authority (MDTA) implemented permanent full-time all-electronic (cashless) tolling at all of its facilities across Maryland.
Setting the Context for 2030: Drivers and Trends Maryland continues to witness significant shifts in the factors impacting transportation demand. The Maryland Transportation Plan (MTP) establishes a 20-year vision for multimodal transportation and outlines the State’s transportation policies and priorities to proactively address these shifts. The MTP outlines strategies that support a new framework for transportation investments. Figure 1.2 shows the four broad drivers which shape the State’s transportation emissions pathways through 2030 and beyond. Figure 1.2 Drivers and Trends
Economic shifts and changing demographics are the key drivers of demand for travel in Maryland. MDOT’s balanced transportation system connects system users and customers to life’s opportunities. In areas of the state with high population density, residents tend to rely more on mass transit and non-motorized transportation modes, while those living in rural, ex-urban, and less populated areas rely on motor vehicles for connectivity and access. Emerging mobility and accessibility trends toward a “sharing economy” in transportation and changing logistics and supply chain patterns will influence the use of the transportation system. Given the expansive scope of the origins and drivers of these trends, MDOT has very limited control in how they will play out. Through the MTP and other long-range planning activities, MDOT and its partners will balance demand and available resources to accommodate current needs and create the 2030 and beyond transportation network.

Maryland is a leader in adopting transportation technologies. Through the Clean Cars Program, Maryland adopted more stringent standards for vehicles purchased in the State. Figure 1.3 shows the number of EVs registered by fiscal year since the start of the Clean Cars Program in 2011. MDOT also leads a workgroup dedicated to ensuring that CAV technology is deployed safely and thoughtfully on Maryland’s roads. Through facilitation of enabling policies for innovative and low-emissions transportation technologies, MDOT is positioning Maryland to achieve the full potential GHG emission benefits afforded by new vehicle technologies. Figure 1.3 Registered Electric Vehicles in Maryland by Fiscal Year
* FY 2021 registrations as of Dec 31, 2020 MDOT supports strategies across every mode of transportation – improving the customer experience on the transportation network by improving safety, reducing congestion, providing more convenient travel options, increasing connections between modes, and improving the flow of goods. MDOT’s multimodal transportation investment policy and funding priorities demonstrate commitment to reducing emissions in the transportation sector. MDOT tracks the total share of Consolidated Transportation Program (CTP) funding dedicated to projects that will help Maryland meet its climate change goals. In the FY 2020–2025 CTP, 65 percent (approximately $7.05 billion) of Maryland’s $10.85 billion six-year major capital program are investments that will reduce GHG emissions. These investments range from connecting Maryland with expanded transit options to addressing highway congestion to optimizing waterways and intermodal facilities for trade.
1,421 1,943 2,643 3,745 5,495 10,938
14,930 17,397
1,540 1,757 3,521 4,345
5,624 7,712
9,784
10,812
11,871
609 2,059 3,178
5,464 6,988
9,369
13,207
20,722
25,742
29,268
-
5,000
10,000
15,000
20,000
25,000
30,000
35,000
2012 2013 2014 2015 2016 2017 2018 2019 2020 2021*
BEV PHEV Total
The economic challenges and uncertainty surrounding the COVID-19 global pandemic have impacted virtually all MDOT operations and revenues. In response, MDOT has reduced its revenue projections. Estimated State revenues for the Draft FY2021 – FY2026 CTP are $2.6 billion less than the estimates for the FY2020 – FY2025 CTP (reducing total projected capital spending by almost 18 percent).

2. 2030 Modeling Approach and Considerations Emission reduction strategies and scenarios in this Plan pivot from the 2006 Base Year GHG emissions inventory. MDOT refers to 2006, 2014, and 2017 inventories as “Baseline Scenarios.”
• The 2006 Baseline Inventory established the base conditions for the GHG reduction goals in the GGRA (25 percent by 2020 and 40 percent by 2030). The on-road portion of the emissions inventory represents a “bottom-up” approach to estimating statewide GHG emissions based on travel speeds and traffic volumes. This approach utilizes emission rates from the U.S. Environmental Protection Agency’s (EPA) MOVES (Motor Vehicle Emissions Simulator) model and Maryland reported VMT.
• GHG emission estimates for on-road transportation in 2014 and 2017 baselines reflect an update to actual conditions based on the process for developing EPA’s National Emissions Inventory (NEI). The statewide inventories represent traffic conditions based on roadway segment counts, reported speed data from MDOT State Highway Administration (SHA), and the vehicle technology standards in place for each inventory.
Technical Approach MDOT’s technical approach to analyzing GHG emission outcomes and co-benefits continues to evolve with new and updated tools. In addition, there are new assumptions for consideration with each iteration of inventory development, including economic growth, socioeconomics, vehicle and fuel technology, and transportation funding trends. As in prior analysis, the EPA’s MOVES model remains the primary tool for estimating on-road GHG emissions. This model has improved from previous MDOT analyses, as have the inputs from MPO metropolitan transportation plans and statewide planning forecasts. Figure 2.1 highlights the primary inputs into the MOVES model for each emissions inventory.
Figure 2.1 Emissions Inventory Modeling and Inputs
EPA MOVES Model
(Version 2014b)
Roadway VMT and Speeds by Vehicle Type
(collected by MDOT SHA)
Vehicle Fleet Age Data
(Maryland vehicle registration data)
Temperature, Humidity
(average weather by season)
Fuel Characteristics (unique features of
fuel sold in Maryland)
Vehicle Population
(Maryland vehicle registration data)
Federal Control Programs
(emission control standards for
vehicles)

2030 Reference Case The 2030 Reference Scenario includes the Maryland Clean Cars Program and federal vehicle technology and fuel economy standards, and federal renewable fuels standards in place in 2020 (at the time of emissions modeling). Implementation of these state and federal vehicle and fuel standards yields a substantial GHG emissions reduction for on-road emissions from cars and trucks through 2030. The technology advances are designed to improve vehicle fuel economy and reduce average GHG emissions per mile. The benefits will increase over time as older vehicles are replaced with newer vehicles. A summary of these standards is presented in Table 2.1. Table 2.1 2030 Approach Overview – Standards and Programs
Light-Duty Vehicle (passenger cars and trucks) Standards
• The Maryland Clean Car Program (Model Year 2011) – Implements California’s Low-Emission Vehicle (LEV) standards to vehicles purchased in Maryland. The California LEV program also includes goals for the sale of EVs (adopted 2007).
• Corporate Average Fuel Economy (CAFE) Standards (Model Years 2008-2011) – Vehicle model years through 2011 are covered under CAFE standards. These remain intact under the National Program.
• National Program (Model Years 2012-2016) – The light-duty vehicle fuel economy standards for model years between 2012 and 2016. The fuel economy improvements increase over time until an average 250 gram/mile CO2 standard is met in 2016. This equates to an average fuel economy near 35 mpg (published May 2010).
• National Program Phase 2 (Model Years 2017-2020) – The light-duty vehicle fuel economy standards for model years between 2017 and 2020. These standards were projected through model year 2025 but were replaced by the SAFE Vehicle Rule. (The National Program Phase 2 was originally published October 2012.)
• Safer Affordable Fuel-Efficient (SAFE) Vehicle Rule (Model Years (2021-2026) – The light-duty fuel economy standards for model years 2021-2026. SAFE replaces the Phase 2 National Fuel Economy Program. Under SAFE, the rollback to standards equate to an estimated miles per gallon efficiency of 40.4 mpg compared to the previous rule that would have achieved 54.5 mpg (published April 2020). Note, this rule is currently under review per Executive Order by the Biden Administration on January 20, 2021.
Medium-/Heavy-Duty Vehicle (trucks and buses) Standards
• Phase 1 National Medium and Heavy Vehicle Standards (Model Years 2014-2018) – Fuel efficiency and GHG standards for model years 2014 to 2018 medium- and heavy-duty vehicles. The new rulemaking adopted standards for three main regulatory categories: combination tractors, heavy-duty pickups and vans, and vocational vehicles (published September 2011).
• Phase 2 National Medium and Heavy Vehicle Standards (2018 and Beyond) – The Phase 2 fuel efficiency and GHG standards for medium- and heavy-duty vehicles for model year 2018 and beyond. The standards apply to four categories of medium- and heavy-duty vehicles: combination tractors, heavy-duty pickups and vans, vocational vehicles and trailers to reduce GHG emissions and improve fuel efficiency. The standards phase in between model years 2021 and 2027 for engines and vehicles, and between model years 2018 and 2027 for trailers (published October 2016).
Fuel Standards
• Tier 3 vehicle and fuel standards – The rule establishes more stringent vehicle emissions standards and will reduce the sulfur content of gasoline from current average level of 30 ppm to 10 ppm beginning in 2017. The gasoline sulfur standard will make emission control systems more effective for both existing and new vehicles and will enable more stringent vehicle emission standards. The vehicle standards will reduce both tailpipe and evaporative emissions from gasoline powered vehicles (published April 28, 2014).
• The Federal Renewable Fuel Standard Program (RFS2) – Mandates the use of 36 billion gallons of renewable fuel annually by 2022 (published March 2010). Based on an approach utilized by the Metropolitan Washington Council of Governments (MWCOG), the use of renewable fuels will represent a 2 percent reduction in total on-road gasoline CO2 emissions in 2030.

Electric Vehicles Initiatives to encourage the purchase and use of electric and other low and ZEVs are part of Maryland’s efforts to reduce emissions from mobile sources by providing alternatives to conventional internal combustion engine vehicles. EVs include battery electric vehicles (BEVs) and plug-in hybrid electric vehicles (PHEVs). Achieving the goals as part of Maryland’s participation within the ZEV Memorandum of Understanding (ZEV MOU) reflects a commitment to a low-emissions fleet that goes beyond what the federal standards require. The path from nearly 30,000 PHEVs and BEVs registered in Maryland in December 2020 to between 535,000 vehicles (without Federal action) and 790,000 vehicles (with Federal action) by 2030—as estimated by the Transportation and Climate Initiative (TCI)—will require a combination of opportunities to come together. Maryland is striving to meet this goal through aggressive deployment of EVs and the charging stations necessary to support their adoption.
Figure 2.2 presents the projected ZEV deployment curve through 2030 starting from 2017. Costs to Maryland to facilitate this level of deployment includes up to $1.2 million annually through 2030 for the Electric Vehicle Recharging Equipment Rebate Program and other capital costs associated with matching federal grants to expand public EV charging infrastructure throughout Maryland.
Figure 2.2 ZEV Deployment Projections Through 2030
Multi-State Medium- and Heavy-Duty Zero Emission Vehicle MOU In July 2020, Maryland signed the Multi-State Medium-and Heavy-Duty Zero Emission Vehicle (MHDV) MOU, joining 14 other states and the District of Columbia, to address GHG pollution from medium-and heavy-duty vehicles through the electrification of large pick-up trucks and vans, delivery trucks, box trucks, school and transit buses, and long-haul delivery trucks.
The Multi-State MHDV MOU will identify barriers to the electrification of medium- and heavy-duty vehicles and will develop solutions to support the deployment of zero emission medium-
16,0
93
23,4
33
24,2
51
34,7
20
45,3
09
66,9
42
90,7
28
129,
605
159,
344
212,
692
283,
393
367,
516
471,
198
534,
970
45,1
89
66,3
66
106,
027
148,
110
203,
890
257,
172
337,
957
427,
512
535,
669
695,
033
790,
691
-
100,000
200,000
300,000
400,000
500,000
600,000
700,000
800,000
2017 2018 2019 2020 2021 2022 2023 2024 2025 2026 2027 2028 2029 2030
TCI Projection Without Federal Action TCI Projection With Federal Action
TCI ZEV Projection
535,000 registered ZEVs = 9.9% of passenger and truck fleet790,000 registered ZEVs = 14.6% of passenger and truck fleet
and heavy-duty vehicles. The MHDV MOU identifies a target of 30 percent of all medium- and heavy-duty vehicle sales will by ZEVs by 2030. Maryland has outlined a Maryland Clean Truck Planning Framework that engages stakeholders and communities to collaboratively develop an action plan to reduce air pollution and GHG emissions from the trucking industry, while preserving existing jobs and creating new jobs.
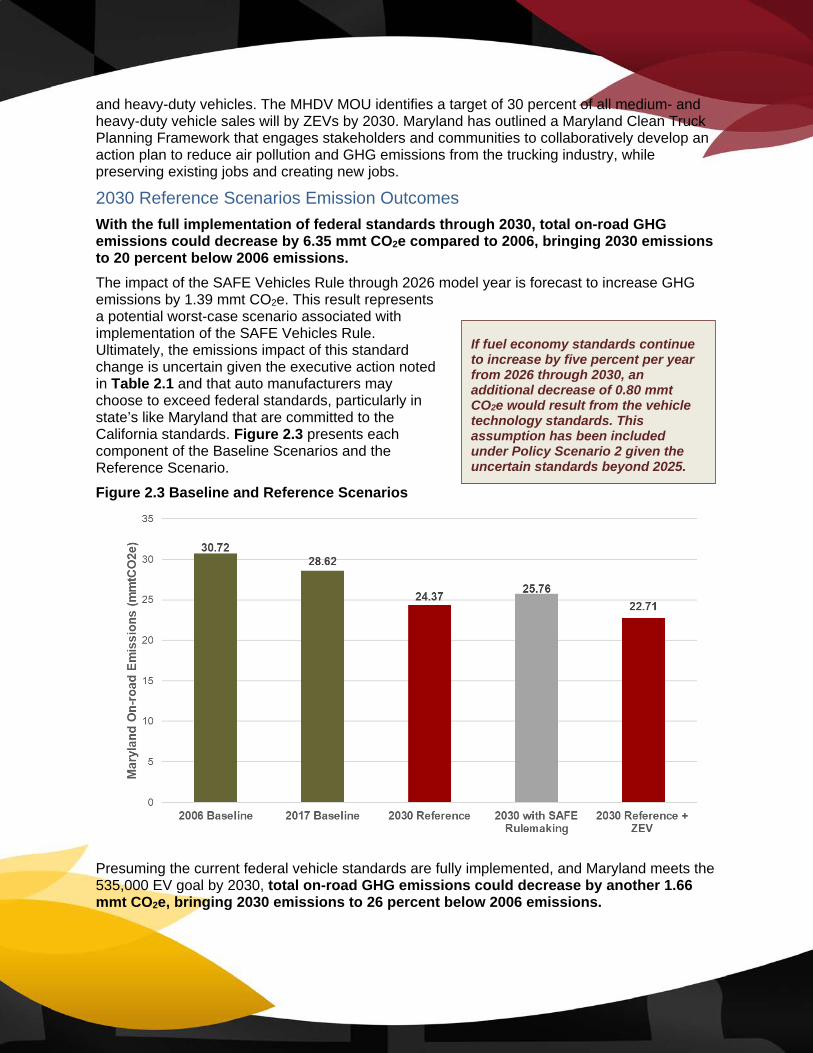
2030 Reference Scenarios Emission Outcomes With the full implementation of federal standards through 2030, total on-road GHG emissions could decrease by 6.35 mmt CO2e compared to 2006, bringing 2030 emissions to 20 percent below 2006 emissions. The impact of the SAFE Vehicles Rule through 2026 model year is forecast to increase GHG emissions by 1.39 mmt CO2e. This result represents a potential worst-case scenario associated with implementation of the SAFE Vehicles Rule. Ultimately, the emissions impact of this standard change is uncertain given the executive action noted in Table 2.1 and that auto manufacturers may choose to exceed federal standards, particularly in state’s like Maryland that are committed to the California standards. Figure 2.3 presents each component of the Baseline Scenarios and the Reference Scenario. Figure 2.3 Baseline and Reference Scenarios
Presuming the current federal vehicle standards are fully implemented, and Maryland meets the 535,000 EV goal by 2030, total on-road GHG emissions could decrease by another 1.66 mmt CO2e, bringing 2030 emissions to 26 percent below 2006 emissions.
If fuel economy standards continue to increase by five percent per year from 2026 through 2030, an additional decrease of 0.80 mmt CO2e would result from the vehicle technology standards. This assumption has been included under Policy Scenario 2 given the uncertain standards beyond 2025.

2030 Strategies and Scenarios Development MDOT has developed scenarios and associated strategies, consistent with the goals, objectives, and strategies in the 2040 MTP, to put Maryland’s transportation sector on a path toward the “40 by 30” goal. While there is some certainty established with transportation funding over the next six years (2020 – 2025) through the CTP, there are significant projects and programs in early planning stages, plus other technological changes such as the shift to an electric fleet, automated and connected vehicles, and the rise of mobility-on-demand services that could greatly change the landscape through 2030. Appendix B lists each GHG mitigation strategy evaluated under the two policy scenarios, with strategy descriptions and underlying contextual and cost assumptions. MDOT coordinated its scenario organization and strategy assumptions with MDE for maintaining consistency with the Mitigation Work Group (MWG): • Policy Scenario 1: Extension of the current policy and program framework within the
Reference Case including funded plans, projects, and programs; and • Policy Scenario 2: New programs and policies beyond Policy Scenario 1 that are not
currently funded. Figure 2.4 depicts the overall strategy and high-level definitions for this scenario approach focused on the on-road transportation sector. Off-road transportation strategies and scenarios (aviation, marine, and rail) are developed and analyzed through a partnership approach between MDOT and MDE and presented separately. Figure 2.4 2030 Scenarios and Strategies Approach

3. Policy Scenario 1 – On-the-Books Policy Scenario 1 includes projects and programs funded within MDOT’s 2020-2025 CTP, expected investments in continuing MDOT GHG emission reduction strategies included in current (2021-2026) and future CTPs through 2030, as well as projects in fiscally constrained MPO metropolitan transportation plans for implementation by 2030.
2030 Plans and Programs MDOT continually takes steps to plan, invest in, and evaluate the transportation system to ensure it connects customers to key destinations–enabling a growing economy. MDOT sets a vision for the transportation system through the MTP, which is then implemented through the six-year budget for transportation, projects produced annually as the CTP. In coordination with MDOT, Maryland’s MPOs develop federally required metropolitan transportation plans. These plans carefully combine locally driven projections of future land use with stakeholder input on transportation needs to develop fiscally constrained list of long-term transportation investments over the next 25 years. The 2030 Plans and Programs use information from the CTP, each MPO plan, and land use, population, and employment projections from the Maryland Department of Planning (MDP) to estimate the emission trendline through 2030. The plans and programs are also referenced in this report as “on-the-books” (or Policy Scenario 1) to reflect that these actions are programmed for implementation by MDOT. The primary benefit of the plans and programs relative to the Reference Scenario is the reduction in VMT and improved operational efficiency of the multimodal transportation system. Figure 3.1 presents Maryland’s VMT trend since 2006 and the alternative VMT projections (Reference Case compared to Policy Scenario 1) for 2030.
Other “On-the-Books” Strategies Along with the traditionally funded transportation programs and investments assumed within the 2030 Plans and Programs, Policy Scenario 1 also assumes other “on-the-books” strategies that have been implemented with funding from Federal agencies (like the Department of Energy, EPA, and others) for improving air quality and reducing GHG emissions. Examples include Diesel Emissions Reduction Act (DERA) funding to replace or repower diesel engines, marine vessels, and cargo handling equipment. One such strategy includes MDOT MPA’s support to replace dray trucks, which results in air quality benefits within the Port of Baltimore area where they operate. Policy Scenario 1 also estimates the emissions impacts of current diesel transit bus replacement policies toward clean diesel and compressed natural gas for MDOT MTA, locally operated transit systems (LOTS), Washington Metropolitan Area Transit Authority (WMATA), and Baltimore/Washington International Thurgood Marshall (BWI) Airport shuttle buses.
Strategy, Emissions, and Cost Summary Table 3.1 lists the Policy Scenario 1 strategies, GHG reduction potential, and estimated costs for implementation. For example, investments in MPO plans and programs yield the highest emission reduction, but also have the highest cost ($10.1 billion).

Figure 3.1 VMT and VMT per Capita Trends, including Policy Scenario 1
Table 3.1 Policy Scenario 1 Strategies Summary Table
Strategies (Funded)
GHG Emission Reduction
(mmt CO2e) Estimated Costs ($M)
2018/2019 MPO Plans & Programs yield lower annual VMT growth (estimated at 0.6% per year growth)
1.712 $10,146.5
On-Road Technology (CHART, Traveler Information) 0.142 $247.0 Freight and Freight Rail Programs (National Gateway, Howard Street Tunnel, MTA rail projects)
0.037 $503.2
Public Transportation (New rail or bus capacity or frequency, improved operations)
0.011 $2,009.8
Public Transportation (50% EV transit bus fleet) 0.074 $625.1
Intercity Transportation Initiatives (Amtrak NE Corridor, Intercity bus) 0.006 $0.0
Transportation Demand Management 0.146 $63.9
Pricing Initiatives (Electronic Tolling) 0.022 $188.5 Bicycle and Pedestrian Strategies (current program continuation and expansion through 2030)
0.024 $263.8
Port of Baltimore Drayage Track Replacements 0.005 $18.0
BWI Airport parking shuttle bus replacements <0.001 $26.1
MDOT Vehicle Fleet (Fleet Innovation Plan) 0.006 n/a
Total Policy Scenario #1 2.19 $14,091.9

Emissions Outcomes Figure 3.2 presents the emission outcomes from Policy Scenario 1, compared to the 2030 Reference and the 2006 and 2017 Baselines.
• The total estimated statewide reduction in 2030 is 2.19 mmt CO2e. This brings the emissions levels to 20.53, resulting in 2030 emissions at 33.2 percent below 2006 emissions (2.10 mmt CO2e short of the 18.43 mmt CO2e goal).
• Strategies that reduce VMT, including the plans and programs and other on-the-books strategies, result in a total reduction of 5.585 billion VMT in Maryland by 2030, equivalent to an 8 percent VMT reduction relative to business-as-usual VMT growth.
Figure 3.2 Policy Scenario 1 Emission Outcomes
Implementation Strategies listed as part of Policy Scenario 1 are funded in the six-year MDOT CTP (FY 2020-FY 2025), MPO metropolitan transportation plans, or through federal grants and funding sources. The total cost of Policy Scenario 1 is $14.09 billion in capital investment through 2030. This does not include additional operating costs for expanded transit or other services implemented by 2030. The objective of constructing Policy Scenario 1 is to group programs and strategies that are completely funded or expected to be funded based on current funding levels and assumptions, and thereby have a high certainty of successful implementation by 2030. The challenges for Policy Scenario 1 strategies include widely acknowledged concerns such as diminishing fuel tax revenue relative to infrastructure costs, which is a primary funding mechanism for the Maryland Transportation Trust Fund (TTF). Another related challenge is continued diminishing returns relative to needs from federal sources, particularly formula funds provided through Federal Highway Administration (FHWA) and Federal Transit Administration (FTA). MDOT and its partners also have to deliver this program, while at the same time prioritizing funds to support maintaining and operating Maryland’s multimodal transportation system.

4. Policy Scenario 2: Emerging and Innovative This scenario envisions implementing two distinct categories of GHG mitigating strategies—emerging and innovative strategies. The key distinction between the Policy Scenario 1 strategies and these strategies is the potential funding available for implementation. Funding sources for emerging and innovative strategies have not been finalized in any planning documents by federal, State, local or private agencies. For a number of these strategies, MDOT has limited control in their execution. Some of these strategies are driven by market forces that require MDOT to play the role of a facilitator enabling supportive policy and regulatory framework for their implementation.
Emerging Strategies Emerging strategies can be defined as logical next steps for strategies that are currently funded in Policy Scenario 1, whose implementation requires one or more of the following:
• Full implementation of a strategy where current fiscally constrained plans have not identified the complete funding approach.
• Expanded application of the strategy by enhancing its geographic scope, accelerated implementation of a strategy that would otherwise not be implemented before 2030, and implementation ramp-up of a strategy involving its intensity of application.
• Strategies that have been implemented in peer states that could work in Maryland.
• Expanded policy impetus and partnerships for a regional scale strategy application. Emerging strategies have a demonstrable record of mitigating emissions based on practice. However, there is still some uncertainty, especially as it relates to the rate of adoption of new technologies by policymakers and the general public. Examples of such strategies include adoption of EVs by the public and transition to an electric bus fleet by transit agencies.
Innovative Strategies Among the strategies grouped under innovative strategies in Policy Scenario 2 are those that are “disruptive” or undergoing breakthroughs in innovation, having impact on a significant user base and broad market reach, and having the potential to alter status quo in the way people make and execute their travel choices. These strategies are also characterized by uncertainty in the technological and policy maturity that is required for widespread adoption. Examples of strategies that require policy and technological maturity are CAV technologies, zero emission truck corridors, and SCMAGLEV or Loop. Some strategies have been implemented on a controlled or limited scale by pioneering jurisdictions—for example, freight consolidation centers and variable speed management corridors. MDOT’s role in implementing some of these strategies is by playing the role of a facilitator and a policy regulator. MDOT can facilitate by providing a safe and conducive environment for Maryland residents and businesses to adopt these new technologies. Challenges to implementing some of these strategies include public funding availability, technological maturity, MDOT’s limited role in strategy facilitation or rolling out an enabling regulatory framework, partnerships with the private sector, transportation safety and data security and privacy, and concerns surrounding public acceptance (for example, speed management on freeways). Strategy, Emissions, and Cost Summary Table 4.1 shows a breakdown of estimated GHG reductions between emerging and innovative solutions as well as the estimated cost presented as ranges. The reason for presenting this

information in ranges has to do with uncertainty due to scope and intensity of implementation and other externalities that determine their effectiveness by the year 2030. Table 4.1 Policy Scenario 2 Strategies Summary Table
Emissions Outcome Figure 4.2 presents the emission outcomes from Policy Scenario 2, compared to the 2030 Reference and the 2006 and 2017 Baselines.
§ Policy change with potential incentive program. Uncertain costs. §§ Policy action with supportive technology/programs offered by private sector.
Strategies (Unfunded) GHG Emission
Reduction (mmt CO2e)
Estimated Costs ($M)
Emerging Strategies TSMO/Integrated Corridor Management (Limited Access System) 0.08 to 0.14 $108 to $152
TSMO//Integrated Corridor Management (Arterial System) 0.10 to 0.18 $453 to $680
Variable Speeds/Speed Management 0.01 to 0.02 $108 to $152
Intermodal Freight Centers Access Improvement 0.02 $2,240 to $3,136 Commercial Vehicle Technologies (Idle Reduction, Low-Carbon Fleet, Dynamic Routing)
0.03 to 0.05 Uncertain §
Regional Clean Fuel Standard 0.895 $148
Eco-Driving (informal implementation underway) 0.042 $3 to $5
EV Market Share Ramp-up of an additional 255,000 vehicles 0.88 $140
Extended CAFE Standards (Model Years 2026-2030) 0.80 $0
Transit capacity/service expansion (fiscally unconstrained) 0.019 to 0.039 $2,307 to $2,659
MARC Growth and Investment Plan / Cornerstone Plan 0.038 to 0.054 $1,078
Transit-Oriented Development (TOD) Build-Out (20 zones) 0.033 $4 to $8
50% to 75% EV Transit Bus Fleet 0.081 to 0.103 $93
Expanded TDM strategies (dynamic) 0.274 to 0.972 $15 to $30
Expanded Telework 0.300 to 0.793 $100 to $200
Expanded bike/pedestrian system development 0.040 to 0.051 $103 Innovative Strategies
Autonomous/Connected Vehicle Technologies 0.68 to 0.73 $43 to $63
Zero-Emission Truck Corridors 0.03 to 0.06 $34 to $128
Freight Villages/Urban Freight Consolidation Centers 0.03 to 0.04 $4,705 to 6,893
Speed Management on Freeways (increased enforcement) 0.04 to 0.20 $7 to $14
High-Speed Rail/SCMAGLEV 0.011 to 0.021 $45,300 to $47,300
Pay-As-You-Drive Insurance 0.123 to 0.292 n/a §§
Total Policy Scenario #2 “Emerging and Innovative” 4.539 to 6.417 $56,893 to $62,886

• The total estimated statewide reduction in 2030 under Policy Scenario 2 is estimated between 4.539 and 6.417 mmt CO2e. This brings emissions levels to 15.70 mmt CO2e (low range) to 13.99 mmt CO2e (high range), demonstrating reduction well beyond the 2030 goal.
• Policy Scenario 2 strategies that reduce VMT result in a total reduction of 4.034 billion VMT (low range) in Maryland by 2030, which is lower compared to the reduction from the Policy Scenario 1. This is due to the majority of Policy Scenario 2 strategies being focused on new technologies and system efficiencies rather than additional transportation capital investments, which are uncertain to be implemented by 2030 given resource realities.
Figure 4.2 Policy Scenario 2 Emissions Outcomes
Implementation Policy Scenario 2 strategies are currently not funded within MDOT’s CTP or the MPO’s metropolitan transportation plans for implementation by 2030. Policy Scenario 2 total estimated costs, not including potential investments in SCMAGLEV or Loop, ranges from $11.59 billion up to $15.59 billion. These strategies require dedicated funding sources outside the current traditional investment sources. It should be noted that some these strategies require significant funding (comparable to the level of the State’s entire CTP), which is indicative of challenges to their implementation. MDOT’s role in implementation of these strategies is lower than that of the emerging strategies as the driving factors for the successful implementation of many of these strategies involve market forces and require significant share of private funding for execution.

5. Implementation Challenges, Opportunities, and Next Steps As highlighted by the results presented in this Plan, the on-road transportation sector in Maryland could achieve the “40 by 30” goal. There are a multitude of approaches MDOT and its partners could take to facilitate achievement of the goal. These include substantial investments in multimodal options and financial and policy support of new technologies to push more people and goods toward cleaner and more efficient modes, and to improve the efficiency of transportation system operations. However, many of the most significant GHG reduction strategies are mostly outside the control of MDOT, including notable examples like EV market penetration, CAV technology, and expanded telework. Maryland’s multimodal transportation network faces a number of challenges including continued need to maintain and modernize infrastructure and ensure the safe and efficient movement of people and goods. MDOT continues to monitor changing transportation needs associated with technological, societal, demographic, land use, climate, and other environmental changes. Opportunities and challenges come hand-in-hand as increasing number of residents and employers in the State will generate additional revenue, but they will also demand services, including transportation services, which could require increased spending. The impact of transportation-related technological changes such as CAVs, EVs, and the shared mobility economy is uncertain, given that the technology maturity and market penetration are yet to play out in the marketplace. MDOT maintains and delivers a transportation system that addresses these challenges to ensure that Maryland remains a great place to live, work, and do business. Across all of these challenges, Maryland faces the overarching uncertainty associated with the transportation-funding picture through 2030:
• Needs continue to far outweigh available resources and revenues;
• The federal funding picture continues to trend toward a competitive grant program, with less reliance on traditional formula-based funding; and
• Traditional revenue sources are producing less relative to growing demand, particularly as trends continue toward more efficient vehicle and lower ownership rates.
Maryland’s transportation needs are comprised of the costs required to operate and maintain the current transportation system, and to expand services and infrastructure as needed. These costs include operation and maintenance (O&M) expenses, capital needs as provided by MDOT’s six transportation business units (TBUs), and Maryland’s share of financial support form the WMATA system. O&M expenses include the costs of service for more than 100 million annual transit trips, maintenance of highways, bridges and tunnels, dredging for the Port of Baltimore, and operations for the BWI and MTN airports.
Transportation Revenue Sources Transportation programs and projects in Maryland are primarily funded from an integrated account called the TTF from sources including motor fuel tax, rental car sales tax, titling tax, corporate income tax, operating revenues, federal aid, motor vehicle taxes and fees, and bond sales. The distribution of revenue is subject to a number of federal and state laws that constrain how and for what system revenues can be assigned. More detail on this process is available within documentation in the CTP. Environmental Co-Benefits Ensuring environmental protection and sensitivity is a goal of the 2040 MTP. The goal focuses on strategies to deliver sustainable transportation infrastructure improvements that protect and reduce impacts to Maryland’s natural, historic, and cultural resources.

The strategies, policies and programs implemented as part of the two policy scenarios, also achieve substantial reductions of the National Ambient Air Quality Standards (NAAQS) criteria pollutants, including ozone producing volatile organic compounds (VOC) and nitrogen oxides (NOx), and fine particulates (PM2.5). Transportation related control measures and improvements to vehicle technologies that reduce ozone and PM2.5 have been included in State Implementation Plans (SIP) and transportation conformity determinations. These measures are major contributors to meeting the State’s air quality goals and have proven to be effective in attaining the NAAQS for ozone and fine particulates. Advanced vehicle and fuel technologies and the draft GGRA Plan scenarios not only reduce criteria pollutant and GHG emissions, but also indirectly will reduce on-road transportation sources impact on Maryland’s water quality and diverse and sensitive ecosystems.
Other Benefits Public Health. Reductions in emissions could help prevent premature deaths and asthma cases in Maryland, translating to reductions in public health costs. Continued investment in bicycle and pedestrian systems can foster healthier lifestyles for Maryland residents. Equity. The MTP goals recognize the importance of Maryland’s transportation system in facilitating access for the aging population and supporting growth and diversification of economic activity in disadvantaged communities. The increase in older and non-working transportation users could change travel patterns and travel times and affect public transportation agencies, non-profit transportation providers, and/or private providers. While Maryland’s largest employment centers are in the Baltimore and Washington regions, other parts of the State require transportation investments to ensure the continued growth of their economies. Striking a balance between congested and growing areas and slower growth areas in need of investment continues to be a key consideration within short- and long-range multimodal planning in Maryland. Many of these communities also lack access to reliable and cost-effective travel choices, which limits access to services, health care, education, and jobs. A number of strategies within this Plan can help address these barriers, especially when they are implemented in a context-sensitive and community supported manner. Consumer Cost Savings. Adoption and implementation of the two policy scenarios would likely lead to cost increases initially in the form of upfront costs as consumers purchase more advanced clean vehicles. These increases would be more than offset in a short term by cost savings from reduced fuel use (because consumers are driving more fuel-efficient vehicles and driving less as a result of more and improved multimodal options), reduced vehicle maintenance costs (also because they are driving less), and incentives and discounts (to promote clean vehicles). Business Cost Savings. Adoption and implementation of the two policy scenarios would likely lead to businesses experiencing initial cost increases due to higher vehicle prices and other policies that may be implemented to increase transportation revenue. Over time, savings from reduced fuel use and vehicle maintenance costs, as well as reductions in labor costs due to relieved congestion and the availability of more cost-effective freight options would quickly offset these increases.

Looking Toward 2050 The transportation sector faces unique challenges when considering potential pathways to an 80 percent reduction in 2006 GHG emissions by 2050. These challenges are associated with current and emerging disruptors in multimodal passenger and freight transportation, including CAVs, EVs, smart and shared mobility, evolving manufacturing and logistics patterns, and emerging modes and ownership models. These disruptors are playing out at the same time as an uncertain transportation revenue future is layered over a system facing increasing system preservation and resilience needs. MDOT’s MTP, MPO metropolitan transportation plans, and other state and regional plans have identified these needs and uncertainties through 2040 and beyond, however, to date, few, if any have attempted to quantify the potential range of impacts, they may create to Maryland’s transportation system, including GHG emissions. While the current 2030 scenario analysis has been able to project the scope and anticipated levels of implementation for current and planned transportation emission reduction strategies and their anticipated benefits over the next decade, MDOT is considering an approach to 2050 scenario analysis, which would allow for a more comprehensive view of the degree of uncertainty that a 30-year period of forecasting entails, with 2050 scenarios built on macro-indicators (such as technology, VMT growth, freight patterns, socioeconomics, location choices, mode choice). Figure 5.1 presents some perspectives on the opportunities, challenges, and uncertainty facing the transportation sector through 2050. As further analysis in 2021 begins to look at 2050, these areas will represent a starting point for evaluating GHG emission reduction opportunities. Figure 5.1 2050 Perspective on Opportunities, Challenges, and Uncertainty
Related Documents


