DRINKING WATER 2020 CONSUMER CONFIDENCE REPORT Este informe contiene informacion muy importante sobre su ague potable. Traduzcalo o hable con alguien que lo entienda bien. www.venturawater.net FEATURING CALENDAR YEAR 2019 WATER QUALITY RESULTS 1

Welcome message from author
This document is posted to help you gain knowledge. Please leave a comment to let me know what you think about it! Share it to your friends and learn new things together.
Transcript
DRINKING WATER
2020 CONSUMERCONFIDENCE REPORT
Este informe contiene informacion muy importante sobre su ague potable. Traduzcalo o hable con alguien que lo entienda bien.www.venturawater.net
FEATURINGCALENDAR YEAR 2019WATER QUALITY RESULTS
1

Ventura Water is pleased to present our 2020 Consumer Confidence Report (CCR) as required by the Safe Drinking Water Act. This annual water quality report provides a snap shot of where your water comes from, what it contains, and how it compares to standards set by regulatory agencies. Every year water quality staff tests water for several hundred chemical compounds at multiple points in the distribution system, as well as in our treatment plants, watersheds and reservoirs. We are committed to delivering a safe and dependable supply of drinking water that meets or exceeds all drinking water quality and health standards 24 hours a day, 7 days a week. On behalf of the entire staff, thank you for partnering with us to protect and preserve our local water resources.
Sincerely,
SUSAN RUNGRENGeneral Manager
COMMUNITY PARTICIPATIONWant to get involved?
Regularly scheduled Water Commission meetings are held on the fourth Tuesday of each month. A public comment period is held during each meeting.
Visit www.venturawater.net and click on the Water Commission Button for agendas and minutes.
OUR WATER SOURCESVentura is one of the largest cities in Southern California that relies exclusively on local water supplies. We manage our water portfolio of three distinct sources based on the availability from each source.
A MESSAGE FROM THE GENERAL MANAGER
VENTURA RIVER Groundwater under the influence of Surface Water
Located near Foster Park, this water primarily services West & Midtown Ventura.
GROUNDWATER BASINS• Mound• Oxnard Plain• Santa Paula
Originating from three groundwater basins.
2
CASITAS Purchased Treated Surface Water
Originating from Lake Casitas, this water primarily services West & Midtown Ventura.

3
COVID-19 (CORONAVIRUS)Ventura’s water supply meets all stringent state and federal drinking water requirements. COVID-19 has not been detected in drinking water and will not affect water supply. In adherence to California Drinking Water Standards Ventura Water’s treatment processes includes membrane filtration and disinfection which remove and kill 99.99% of viruses, including COVID-19, bacteria and other pathogens. Ventura Water owns and operates a full scale, State-certified laboratory and also uses outside State-certified labs to monitor water quality.
For more water quality information on COVID -19 visit:
https://www.epa.gov/coronavirus/coronavirus-and-drinking-water-and-wastewater
The City’s water service area is a complex system of more than 390 miles of pipelines with a total storage capacity of approximately 52 million gallons in 32 tanks and reservoirs providing water to residents and businesses. Water main flushing is a necessary part of operating and maintaining a drinking water distribution system to ensure high quality drinking water.
Routine maintenance is required to:
• Maintain water quality• Clean water mains • Maintain proper distribution operation • Flush dead ends • Maximize pipe lifespan • Conduct fire flow tests
To save water, Ventura Water invested in a state-of-the-art flushing unit called the NO-DES (Neutral Output Discharge Elimination System) truck. The unit filters and recirculates water within the distribution system, saving thousands of gallons of clean drinking water from flushing to residential streets.
WATER QUALITY FLUSHING NO-DES
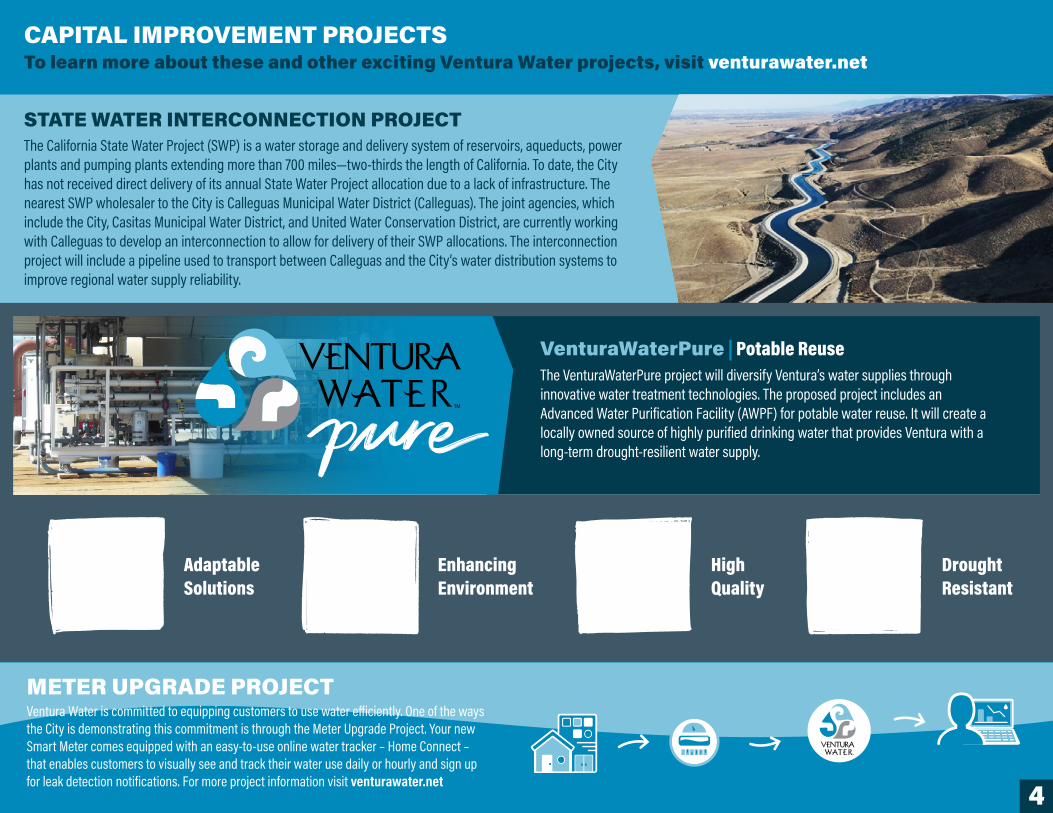
STATE WATER INTERCONNECTION PROJECTThe California State Water Project (SWP) is a water storage and delivery system of reservoirs, aqueducts, power plants and pumping plants extending more than 700 miles—two-thirds the length of California. To date, the City has not received direct delivery of its annual State Water Project allocation due to a lack of infrastructure. The nearest SWP wholesaler to the City is Calleguas Municipal Water District (Calleguas). The joint agencies, which include the City, Casitas Municipal Water District, and United Water Conservation District, are currently working with Calleguas to develop an interconnection to allow for delivery of their SWP allocations. The interconnection project will include a pipeline used to transport between Calleguas and the City’s water distribution systems to improve regional water supply reliability.
METER UPGRADE PROJECTVentura Water is committed to equipping customers to use water efficiently. One of the ways the City is demonstrating this commitment is through the Meter Upgrade Project. Your new Smart Meter comes equipped with an easy-to-use online water tracker – Home Connect – that enables customers to visually see and track their water use daily or hourly and sign up for leak detection notifications. For more project information visit venturawater.net
CAPITAL IMPROVEMENT PROJECTSTo learn more about these and other exciting Ventura Water projects, visit venturawater.net
VenturaWaterPure | Potable ReuseThe VenturaWaterPure project will diversify Ventura’s water supplies through innovative water treatment technologies. The proposed project includes an Advanced Water Purification Facility (AWPF) for potable water reuse. It will create a locally owned source of highly purified drinking water that provides Ventura with a long-term drought-resilient water supply.
4
Drought Resistant
Adaptable Solutions
Enhancing Environment
High Quality
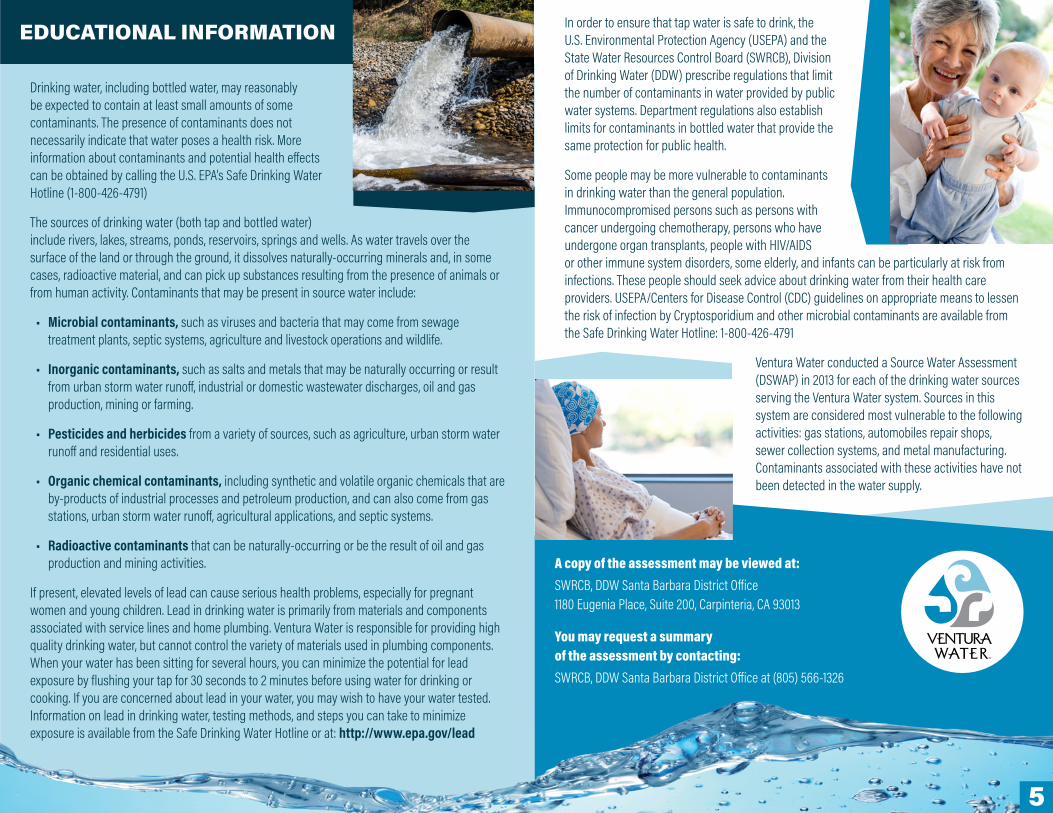
Drinking water, including bottled water, may reasonably be expected to contain at least small amounts of some contaminants. The presence of contaminants does not necessarily indicate that water poses a health risk. More information about contaminants and potential health effects can be obtained by calling the U.S. EPA’s Safe Drinking Water Hotline (1-800-426-4791)
The sources of drinking water (both tap and bottled water) include rivers, lakes, streams, ponds, reservoirs, springs and wells. As water travels over the surface of the land or through the ground, it dissolves naturally-occurring minerals and, in some cases, radioactive material, and can pick up substances resulting from the presence of animals or from human activity. Contaminants that may be present in source water include:
• Microbial contaminants, such as viruses and bacteria that may come from sewage treatment plants, septic systems, agriculture and livestock operations and wildlife.
• Inorganic contaminants, such as salts and metals that may be naturally occurring or result from urban storm water runoff, industrial or domestic wastewater discharges, oil and gas production, mining or farming.
• Pesticides and herbicides from a variety of sources, such as agriculture, urban storm water runoff and residential uses.
• Organic chemical contaminants, including synthetic and volatile organic chemicals that are by-products of industrial processes and petroleum production, and can also come from gas stations, urban storm water runoff, agricultural applications, and septic systems.
• Radioactive contaminants that can be naturally-occurring or be the result of oil and gas production and mining activities.
If present, elevated levels of lead can cause serious health problems, especially for pregnant women and young children. Lead in drinking water is primarily from materials and components associated with service lines and home plumbing. Ventura Water is responsible for providing high quality drinking water, but cannot control the variety of materials used in plumbing components. When your water has been sitting for several hours, you can minimize the potential for lead exposure by flushing your tap for 30 seconds to 2 minutes before using water for drinking or cooking. If you are concerned about lead in your water, you may wish to have your water tested. Information on lead in drinking water, testing methods, and steps you can take to minimize exposure is available from the Safe Drinking Water Hotline or at: http://www.epa.gov/lead
EDUCATIONAL INFORMATION In order to ensure that tap water is safe to drink, the U.S. Environmental Protection Agency (USEPA) and the State Water Resources Control Board (SWRCB), Division of Drinking Water (DDW) prescribe regulations that limit the number of contaminants in water provided by public water systems. Department regulations also establish limits for contaminants in bottled water that provide the same protection for public health.
Some people may be more vulnerable to contaminants in drinking water than the general population. Immunocompromised persons such as persons with cancer undergoing chemotherapy, persons who have undergone organ transplants, people with HIV/AIDS or other immune system disorders, some elderly, and infants can be particularly at risk from infections. These people should seek advice about drinking water from their health care providers. USEPA/Centers for Disease Control (CDC) guidelines on appropriate means to lessen the risk of infection by Cryptosporidium and other microbial contaminants are available from the Safe Drinking Water Hotline: 1-800-426-4791
Ventura Water conducted a Source Water Assessment (DSWAP) in 2013 for each of the drinking water sources serving the Ventura Water system. Sources in this system are considered most vulnerable to the following activities: gas stations, automobiles repair shops, sewer collection systems, and metal manufacturing. Contaminants associated with these activities have not been detected in the water supply.
A copy of the assessment may be viewed at:SWRCB, DDW Santa Barbara District Office1180 Eugenia Place, Suite 200, Carpinteria, CA 93013
You may request a summary of the assessment by contacting: SWRCB, DDW Santa Barbara District Office at (805) 566-1326
5

INORGANIC CONSTITUENTSUNITS MCL PHG
(MCLG)
VENTURA RIVER
AVERAGE
VENTURA RIVER RANGE
GROUND WATER
AVERAGE
GROUND WATER RANGE
CMWD AVERAGE
CMWD RANGE TYPICAL ORIGINS
Arsenic ppb 10 0.004 ND ND 2 ND - 5 ND ND Erosion of natural deposits; Runoff from orchards
Barium ppm 1 2 ND ND ND ND 0.13 0.13 Erosion of natural deposits; Discharges of oil drilling wastes and from metal refineries
Chromium ppm 0.05 N/A ND ND 0.005 ND - 0.014 ND ND Discharge from steel and pulp mills and chrome plating; Erosion of natural deposits
Fluoride ppm 2 1 0.45 0.43 - 0.48 0.46 0.27 - 0.57 0.40 0.40 Erosion of natural deposits
Nitrate (as Nitrogen) ppm 10 10 2.4 2.1 - 2.6 3.0 2.5 - 3.6 ND ND Runoff/leaching from fertilizer use; Leaching from tanks and sewage
Selenium ppb 50 30 < 5.0 ND - 5.0 23 3.0 - 43 ND ND Erosion of natural deposits; Runoff from livestock lots (feed additive)
Gross Alpha Particle Activity pCi/L 15 0 2.9 2.6 - 3.1 9.4 5.3 - 11.5 ND ND Erosion of natural deposits
Uranium pCi/L 20 0.43 2.2 1.8 - 2.7 4.9 1.5 - 8.0 N/A N/A Erosion of natural deposits
Ventura’s Water Quality Summary 2019 Only water quality constituents detected by laboratory testing appear in the chart.USING DATA COLLECTED IN 2019 UNLESS NOTED
6
PRIMARY DRINKING WATER STANDARDS (PDWS)
WATER CLARITY UNITS MCL PHG VENTURA RIVER CMWD TYPICAL ORIGINS
Filtered Effluent Turbidity NTU TT = 1 N/A Highest Value = 0.15 Highest Value = 0.16 Soil runoff
Percentage of measurements below 0.2 NTU 100% 100%
MICROBIOLOGICAL MCL MCLG DISTRIBUTION SYSTEM MONTHLY MAXIMUM TYPICAL ORIGINS
Total Coliform No more than 5% of total samples can be total coliform positive for any given month. 0 0.86% Naturally present in the environment
The result is the highest percentage of positive samples collected in a month during 2019. In October 2019, one sample tested positive for total coliform, which was 0.86% of the total samples collected. All follow-up samples were negative for Total Coliform and Fecal/E. coli bacteria. Total Coliform was not detected in any other month during 2019.
DISINFECTION UNITS MRDL MRDLG DISTRIBUTION SYSTEM AVERAGE DISTRIBUTION SYSTEM RANGE TYPICAL ORIGINS
Chloramine Residual ppm 4 4 2.32 (highest RAA) 0.3 - 5.2 Disinfectant added for treatment
Disinfectant compliance with the MRDL (maximum residual disinfectant level) is based on the calculated running annual average (RAA).
DISINFECTION BY-PRODUCTS UNITS MCL PHG DISTRIBUTION SYSTEM AVERAGE DISTRIBUTION SYSTEM RANGE TYPICAL ORIGINS
Total Trihalomethanes ppb 80 N/A 69 (highest LRAA) 6.0 - 98 Byproduct of drinking water disinfection
Total Haloacetic Acids ppb 60 N/A 48 (highest LRAA) 3.0 - 55 Byproduct of drinking water disinfection
LEAD AND COPPER - RESIDENTIAL UNITS RAL PHG DISTRIBUTION SYSTEM 90TH PERCENTILE DISTRIBUTION SYSTEM RANGE TYPICAL ORIGINS
Lead ppm 0.015 0.0002 0.0051 ND - 0.009 Corrosion of household plumbing
Copper ppm 1.3 0.0003 0.710 ND - 1.1 Corrosion of household plumbing
Every three years, residences are sampled and tested for lead and copper at the tap. The most recent set of samples (54 residences) was collected in 2017. Copper was detected in 52 samples; none exceeded the RAL. Lead was detected in 6 samples; none exceeded the RAL. The next sampling event will be conducted in Summer 2020.
LEAD - SCHOOLS UNITS RAL PHG AVERAGE RANGE TYPICAL ORIGINS
Lead ppm 0.015 0.0002 ND ND - 0.0055 Corrosion of household plumbing
In 2018, Ventura Unified School District requested lead sampling at 22 schools. A total of 108 samples were collected from 22 schools for lead; none exceeded the RAL.
Ventura’s Water Quality Summary 2019 DATA CONTINUED
7
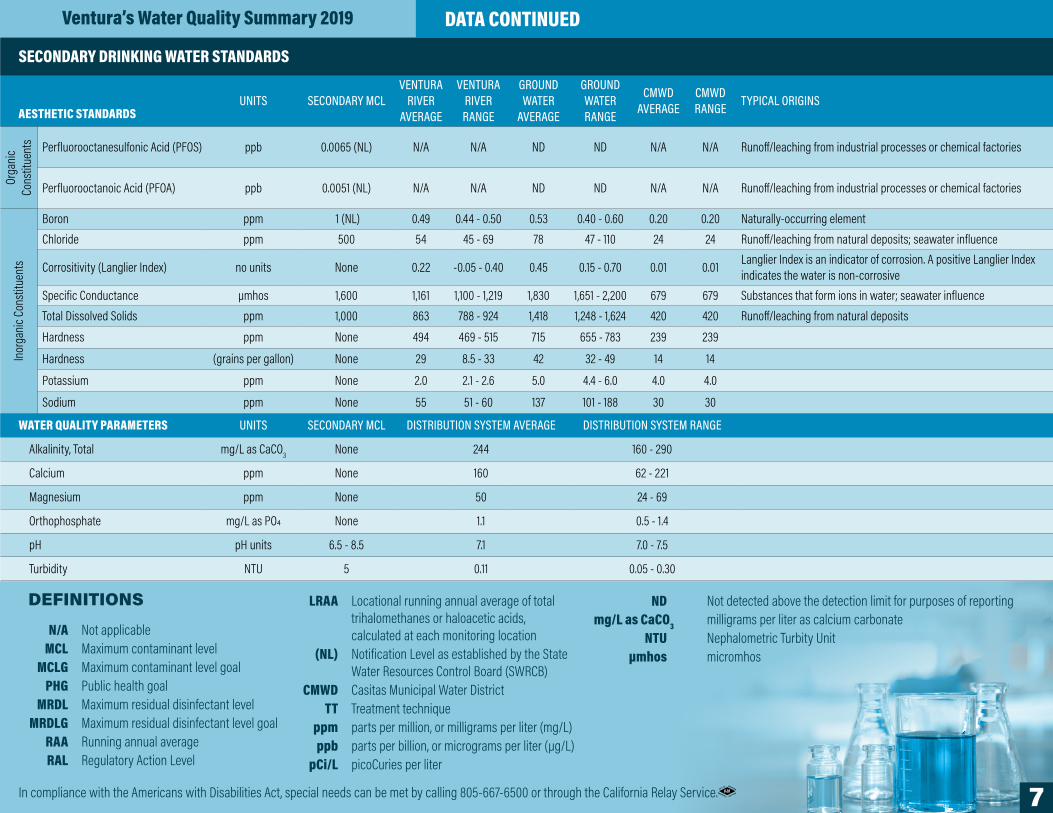
SECONDARY DRINKING WATER STANDARDS
AESTHETIC STANDARDSUNITS SECONDARY MCL
VENTURA RIVER
AVERAGE
VENTURA RIVER RANGE
GROUND WATER
AVERAGE
GROUND WATER RANGE
CMWD AVERAGE
CMWD RANGE TYPICAL ORIGINS
Orga
nic
Cons
titue
nts Perfluorooctanesulfonic Acid (PFOS) ppb 0.0065 (NL) N/A N/A ND ND N/A N/A Runoff/leaching from industrial processes or chemical factories
Perfluorooctanoic Acid (PFOA) ppb 0.0051 (NL) N/A N/A ND ND N/A N/A Runoff/leaching from industrial processes or chemical factories
Inor
ganic
Con
stitu
ents
Boron ppm 1 (NL) 0.49 0.44 - 0.50 0.53 0.40 - 0.60 0.20 0.20 Naturally-occurring elementChloride ppm 500 54 45 - 69 78 47 - 110 24 24 Runoff/leaching from natural deposits; seawater influence
Corrositivity (Langlier Index) no units None 0.22 -0.05 - 0.40 0.45 0.15 - 0.70 0.01 0.01 Langlier Index is an indicator of corrosion. A positive Langlier Index indicates the water is non-corrosive
Specific Conductance µmhos 1,600 1,161 1,100 - 1,219 1,830 1,651 - 2,200 679 679 Substances that form ions in water; seawater influenceTotal Dissolved Solids ppm 1,000 863 788 - 924 1,418 1,248 - 1,624 420 420 Runoff/leaching from natural deposits
Hardness ppm None 494 469 - 515 715 655 - 783 239 239
Hardness (grains per gallon) None 29 8.5 - 33 42 32 - 49 14 14
Potassium ppm None 2.0 2.1 - 2.6 5.0 4.4 - 6.0 4.0 4.0
Sodium ppm None 55 51 - 60 137 101 - 188 30 30
WATER QUALITY PARAMETERS UNITS SECONDARY MCL DISTRIBUTION SYSTEM AVERAGE DISTRIBUTION SYSTEM RANGE
Alkalinity, Total mg/L as CaCO3 None 244 160 - 290
Calcium ppm None 160 62 - 221
Magnesium ppm None 50 24 - 69
Orthophosphate mg/L as PO4 None 1.1 0.5 - 1.4
pH pH units 6.5 - 8.5 7.1 7.0 - 7.5
Turbidity NTU 5 0.11 0.05 - 0.30
In compliance with the Americans with Disabilities Act, special needs can be met by calling 805-667-6500 or through the California Relay Service. 6•20
DEFINITIONS
N/A Not applicable MCL Maximum contaminant level MCLG Maximum contaminant level goal PHG Public health goal MRDL Maximum residual disinfectant level MRDLG Maximum residual disinfectant level goal RAA Running annual average RAL Regulatory Action Level
LRAA Locational running annual average of total trihalomethanes or haloacetic acids, calculated at each monitoring location
(NL) Notification Level as established by the State Water Resources Control Board (SWRCB)
CMWD Casitas Municipal Water District TT Treatment technique ppm parts per million, or milligrams per liter (mg/L) ppb parts per billion, or micrograms per liter (µg/L) pCi/L picoCuries per liter
ND Not detected above the detection limit for purposes of reporting mg/L as CaCO3 milligrams per liter as calcium carbonate NTU Nephalometric Turbity Unit µmhos micromhos
Related Documents