2020 CENSUS LIFE‐CYCLE COST ESTIMATE EXECUTIVE SUMMARY Version 2.0 June 10, 2019

Welcome message from author
This document is posted to help you gain knowledge. Please leave a comment to let me know what you think about it! Share it to your friends and learn new things together.
Transcript

2020CENSUSLIFE‐CYCLECOSTESTIMATEEXECUTIVESUMMARY Version 20
June 10 2019
Life-cycle Cost Estimate Approval
2020CENSUSLIFE‐CYCLECOSTESTIMATE(LCCE)
VERSION20
JUNE 10 2019
Submitted by Electronically Approved June 10 2019
Benjamin K Taylor Date Chief Decennial Budget Office
Approved by Electronically Approved June 10 2019
Albert E Fontenot Jr Date Associate Director for Decennial Census
Programs
Endorsed by Electronically Approved June 10 2019
Everett G Whiteley Date On Behalf Chief Financial Officer Census
Bureau
Version 20 June 10 2019
[Page intentionally left blank]
Version 20 June 10 2019
Table of Contents
1 INTRODUCTION 1
11 EXECUTIVE SUMMARY PURPOSE 1 12 THE ROLE OF THE LCCE 1 13 IMPROVING THE LCCE 1 14 HIGH LEVEL COMPARISON TO PREVIOUS VERSION OF THE 2020 CENSUS LCCE 3
2 BACKGROUND amp SCOPE 4
21 PROGRAM BACKGROUND AND CHARACTERISTICS 4 22 SCOPE OF THE ESTIMATE 11
3 COST ESTIMATION APPROACH 12
31 COST ESTIMATION METHODOLOGY 12 32 RISK ANALYSIS 14 33 ESTIMATION TOOLS 17
4 GROUND RULES amp ASSUMPTIONS 18
41 INFLATION 18 42 MAJOR ASSUMPTIONS 18
5 POINT ESTIMATE amp RISK ADJUSTMENTS 19
51 THE COST ESTIMATION RESULTS 19 52 DETAILED COSTS BY WBS CATEGORY 21 53 IT COSTS 29 54 LEADING ELEMENTS OF COST 31 55 PROGRAM RISK RESERVES AND CONTINGENCY 32 56 INDEPENDENT COST REVIEWS 34
6 CONCLUSION 36
Version 20 June 10 2019
[Page intentionally left blank]
Version 20 June 10 2019
2020 Census Life-cycle Cost Estimate Executive Summary Page 1
1 INTRODUCTION
11 Executive Summary Purpose
This executive summary of the 2020 Decennial Census Life-cycle Cost Estimate (LCCE) provides a high-level overview of the June 2019 version of 2020 Census LCCE and the supporting 2020 Decennial Census LCCE Basis of Estimate (BoE) The executive summary constitutes Version 20 of the 2020 Decennial Census LCCE It incorporates updates to the Version 10 Executive Summary issued December 21 2017 These updates primarily include realigning cost data within the Work Breakdown Structure (WBS) to more accurately reflect how activities are managed and planned updating the estimate to reflect actual costs through FY 2018 integrating FY 2018 End-to-End Census Test results and incorporating final definitive scope details for major contracts and field operations
The executive summary is prepared for public release and does not include details of the technical approach program design assumptions model calculations cost breakouts etc Detailed documentation of the 2020 Census LCCE is contained in the BoE The BoE is the detailed formal documentation of the cost estimate that is not published for the general public but rather is intended for official government use including by auditors and oversight bodies
12 The Role of the LCCE
The LCCE is the estimated cost of developing producing deploying maintaining operating and disposing of a program or system over its entire lifespan The LCCE is prepared in order to support and inform program change decisions major program reviews resource allocation trade-off analyses budget requirements and source selections The LCCE provides the basis for the official projected cost for a program or system that is communicated to the Department of Commerce (DOC) the Office of Management and Budget (OMB) Congress the Government Accountability Office (GAO) and others
As the basis for the official projected cost of the program the LCCE provides Census Bureau and DOC leadership with critical information for making program decisions monitoring resource allocations establishing executable budgets and proactively addressing financial issues
13 Improving the LCCE
The Census Bureau has demonstrably improved the quality of the 2020 Census LCCE The results from the Census Bureaursquos significant efforts have been recognized in GAOrsquos August 2018 assessment of the 2020 Census LCCE as reported in the 2017 Version 10 Executive Summary In this assessment the GAO found that ldquohellipthe Census Bureau has made significant progress in improving its ability to develop a reliable cost estimaterdquo
Figure 1 Comparison of 2015 and 2017 GAO Assessments
Version 20 June 10 2019
2015 Assessment 2017 Assessment
Well-Documented ~ Minimally Met () Partially Met
Accurate () Partially Met 9 Substantially Met
Credible ~ Minimally Met 9 Substantially Met
Comprehensive () Partially Met - Met
bull Met a Substantially Met () Partially Met ~ Minimally Met O Not Met
Source GAO analysis of US Census Bureau data I GA0-1 8-635
2020 Census Life-cycle Cost Estimates Executive Summary Page 2
(shown below) taken from the August 2018 GAO assessment document1 illustrates the extent and scale of improvement between their assessments of the 2015 and 2017 LCCE versions
Figure 1 Comparison of 2015 and 2017 GAO Assessments2
The GAO did not make any new recommendations in their August 2018 assessment (see the 2017 assessment column referenced in Figure 1 above) Accordingly the Census Bureau continues to work on recommendations contained in the June 2016 GAO report3 on their assessment of the 2015 version of the 2020 Census LCCE These recommendations are listed below
1 To help ensure the Bureau produces a reliable cost estimate for the 2020 Census take the following steps to meet the characteristics of a high-quality estimate
a Comprehensivemdashamong other practices ensure the estimate includes all life-cycle costs and documents all cost-influencing assumptions
b Well-documentedmdashamong other practices ensure that its planned documentation plan captures the source data used contains the calculations performed and the
1 2020 CENSUS Census Bureau Improved the Quality of Its Cost Estimation but Additional Steps Are Needed to Ensure Reliability August 2018 GAO-18-635 page 2 2 The dates of the assessments in the figure below refer to the date of the LCCE assessed rather than the release date of the GAO assessment report (which is 2016 and 2018 respectively) 3 2020 Census Census Bureau Needs to Improve Its Life-Cycle Cost Estimating Process June 30 2016 GAO-16-
Version 20 June 10 2019
628
2020 Census Life-cycle Cost Estimates Executive Summary Page 3
estimating methodologies used for each element and describes step by step how the estimate was developed
c Accuratemdashamong other practices ensure the estimating technique for each cost element is used appropriately and that variances between planned and actual cost are documented explained and reviewed
d Crediblemdashamong other practices ensure the estimate includes a sensitivity analysis major cost elements are cross-checked to see whether results are similar and an independent cost estimate is conducted to determine whether other estimating methods produce similar results
2 To further ensure the credibility of data used in cost estimation establish clear guidance on when information for cost assumptions can and should be changed as well as the procedures for documenting such changes and traceable sources for information being used
3 To ensure Bureau and congressional confidence that the Bureaursquos budgeted contingencies are at appropriate levels improve control over how risk and uncertainty are accounted for and communicated with the Bureaursquos decennial cost estimation process such as by implementing and institutionalizing processes or methods for doing so with clear guidance
The Census Bureau has improved across all of these recommendations and intends to continue building upon the success that it has achieved in maturing the 2020 Census LCCE Table 1 Examples of Ongoing LCCE Enhancements below describes examples of ongoing improvement efforts by the Decennial Program
Table 1 Examples of Ongoing LCCE Enhancements
Enhancement Description Increase Understanding of Information Technology and Major Contracts
Developing an application to manage major contract expenses
Deeper involvement of contracts management subject matter experts and decennial leadership
Improve Program Inputs Assumptions
Working with programs to reflect operational refinements and 2018 End‐to‐End Test results
Deeper involvement of operational subject matter experts and decennial leadership
Improve Basis for Cost Management and Integration
Developing Cost Estimation and Analysis Process and related governance artifacts
Using the LCCE as a management tool to inform operational decisions
14 High Level Comparison to Previous Version of the 2020 Census LCCE
The current 2020 Census LCCE as reported in the June 2019 Executive Summary Version 20 is $156 billion This is unchanged from the total LCCE cost reported in the December 2017 Executive Summary Version 10 Table 2 below shows a comparison between October 2017 and May 2019 LCCE There have been changes among different elements of the WBS (see Section
Version 20 June 10 2019
‐
2020 Census Life-cycle Cost Estimates Executive Summary Page 4
22 below) and risk within the same total cost Additionally the confidence level in the total cost has risen since the previous version as illustrated in a greater risk and contingency reserve within the same overall total
Table 2 LCCE Cost Comparison of October 2017 vs June 2019 (in Millions)
Element LCCE Oct 2017 LCCE June 2019 Change
1 ‐ Program Management $625 $681 9
2 CensusSurvey Engineering $1822 $2009 10
3 ‐ Frame $732 $690 ‐6
4 ‐ Response Data $5375 $4988 ‐7
5 ‐ Published Data $219 $220 0
6 ‐ Test Evaluation Special Censuses $791 $777 ‐2
7 ‐ Infrastructure $3454 $3376 ‐2
Point Estimate Subtotal $13018 $12740 ‐2
Risk‐Based Contingency $1056 $1403 33
Point Estimate Subtotal with Risk‐ Based Contingency
Additional Sensitivity Analysis
$14074 $14143 05
$369 $300 ‐19
Secretarial Contingency $1182 $1182 0
Risk‐adjusted Total $15625 $15625 0
2 BACKGROUND amp SCOPE
21 Program Background and Characteristics
The goal of the 2020 Census is to count everyone once only once and in the right place As the cost of completing this goal has significantly increased each decade since 1970 as the population becomes more challenging to count the Census Bureau undertook a challenge this decade to design the 2020 Census to control cost growth while continuing to maintain high quality results The actual cost of the 2010 Census in 2020 inflation-adjusted dollars was $92 per housing unit while Congress appropriated $106 per housing unit4 Comparatively the 2020 Census as
4 In FY 2010-2011 the Census Bureau returned nearly $19 billion in unused appropriations from the 2010 Census
Version 20 June 10 2019
2020 Census Life-cycle Cost Estimates Executive Summary Page 5
currently designed is expected to cost $108 per housing unit in 2020 inflation-adjusted dollars including usage of all estimated contingency and $87 per housing unit without estimated contingency The level of contingency funds ultimately required to conduct a 2020 Census of the highest quality will determine whether the actual inflation-adjusted cost per housing of the 2020 Census is higher or lower than that of the 2010 Census To optimize operational efficiency while maintaining quality the Census Bureau will conduct the most automated modern and dynamic decennial census in history
The goal this decade is to design the 2020 Census for the 21st Century in a way that embraces technology to ensure a high quality 2020 Census that will lay the framework for future censuses for decades to come This will be the first decennial census to update the Census Bureaursquos address frame using geographic information systems and aerial imagery instead of sending census employees to walk and physically check all 11 million census blocks the first to encourage the population to respond to the 2020 Census using the Internet and over the telephone reducing the need for expensive paper data capture the first to use data the public has already provided to the government and data available from commercial sources to enable focusing of additional visits in areas that have traditionally been hard to enumerate and the first to use sophisticated operational control systems to send Census Bureau employees to followup with nonresponding housing units and to track daily progress
The 2020 Census
The purpose of the 2020 Census is to conduct an accurate count of the population and housing to disseminate the results to the President the States and the American people To accomplish this the Census Bureau must count everyone once only once and in the right place The challenge this decade has been to do so at a lower cost per household (adjusted for inflation) than the 2010 Census As the 2020 Census draws near the Census Bureau has designed a 2020 Census that ensures the coverage of the population and housing is as complete as possible The design will serve to minimize the undercounting or overcounting of the population particularly as related to the differential impact on subgroups of the population5 The Census Bureau is fully committed to designing and conducting a 2020 Census that fairly represents every person in America
The primary requirement served by the decennial census is the apportionment of seats allocated to the states for the House of Representatives This requirement is mandated in the US Constitution
Article I Section 2 ldquoThe actual enumeration shall be made within three years after the first meeting of the Congress of the United States and within every subsequent Term of ten Yearsrdquo
5 A detailed discussion of the quality implications of the 2020 Census design can be found in Chapter 7 of the 2020 Census Operational Plan Version 40
Version 20 June 10 2019
2020 Census Life-cycle Cost Estimates Executive Summary Page 6
Fourteenth Amendment Section 2 ldquoRepresentatives shall be apportioned among the several States according to their respective numbers counting the whole number of persons in each Staterdquo
Uses of Decennial Census Data
As discussed above decennial data are used to apportion the number of seats in Congress among the states At the census block level the data informs governmental entities for redistricting (ie defining the representative boundaries for congressional districts state legislative districts school districts and voting precincts) Additionally decennial data help enforce voting rights and civil rights
The Census Bureau also uses the decennial census results to determine the statistical sampling frames for the American Community Survey (ACS) which replaced the long form in the decennial census and the dozens of current surveys conducted by the Census Bureau The results of these surveys are used to support important functions such as appropriating federal funds to local communities (an estimated $675 billion annually6) calculating monthly unemployment crime and poverty rates and publishing health and education data
Finally decennial data play an increasingly important role in United States commerce and the economy As people expand their use of data to make decisions at the local and national levels they increasingly depend on data from the Census Bureau to make these decisions Today local businesses look at data provided by the Census Bureau on topics like population growth and income levels to make decisions about whether or where to locate their restaurants or stores Similarly a real estate investor who is considering investing significant funds to develop a piece of land in the community relies on Census Bureau data to measure the demand for housing predict future need and review aggregate trends Big businesses also rely heavily on Census Bureau data to make critical decisions that impact their success and shape the economy at the national level As noted above the decennial census is the foundation for the Census Bureaursquos demographic survey data
The decennial data must meet high quality standards to ensure good decision-making and to continue building confidence in the government society and the economy Studying the balance between cost and quality is an important focus of the census design
6 Marisa Hotchkiss and Jessica Phelan Uses of Census Bureau Data in Federal Funds Distribution A New Design for the 21st Century Census Working Papers 2017 (Washington DC US Census Bureau September 2017) p 3
Version 20 June 10 2019
2020 Census Life-cycle Cost Estimates Executive Summary Page 7
Challenging Environmental Factors
The 2020 Census challenge is exacerbated by multiple environmental factors that have the potential to impact its success The Census Bureau is committed to proactively addressing the challenges outlined below in Figure 2
2020 Census
Constrained Fiscal
Environment Rapidly Changing Technology
Information Explosion
Distrust in Government
Declining Response Rates
Increasing Diversity
Informal Complex Living
Arrangements
Mobile Population
Figure 2 2020 Census Environment
Constrained fiscal environment Federal budget constraints placed significant pressure on funding available for research testing design and development work for successful innovation7
Rapidly changing use of technology Stakeholders expect the decennial census to use technology innovation yet the rapid pace of change makes it challenging to plan for and adequately test the use of these technologies because they become obsolete
Information explosion Rapid changes in information technology create stakeholder expectations for how the Census Bureau interacts with the public to obtain and disseminate data products
7 A detailed discussion of the major program risks can be found in Chapter 6 of the 2020 Census Operational Plan
Version 40
Version 20 June 10 2019
2020 Census Life-cycle Cost Estimates Executive Summary Page 8
Distrust in government The publicrsquos concerns about information security and privacy the confidentiality of information given to the government and how government programs will use the information they collect continue to grow This impacts response rates and could make it more difficult for government agencies to collect important demographic information
Declining response rates Response rates for Census Bureau surveys and for surveys and censuses in general have declined as citizens are overloaded with requests for information and become increasingly concerned about sharing information
Increasingly diverse population The demographic and cultural make-up of the United States continues to increase in complexity including a growing number of households and individuals with limited English proficiency who may experience language barriers to enumeration and who may have varying levels of comfort with government involvement
Informal complex living arrangements Households are becoming more diverse and dynamic making it a challenge to associate an identified person with a single location For example blended families may include children who have two primary residences Additionally some households include multiple relationships and generations
A mobile population The United States continues to be a highly mobile nation as about 143 percent of the population moves in a given year based on results from the American Community Survey conducted in 2017 Continued growth in cellular telephone technology and an associated reduction in landline telephones tied to physical locations may also complicate enumeration
A New Design for the 21st Century
Several of the societal demographic and technological trends listed above can result in a population that is harder and more expensive to enumerate As it becomes more challenging to locate individuals and solicit their participation through traditional methods the Census Bureau must decade after decade spend more money simply to maintain the same level of accuracy as previous censuses With the innovations described in the 2020 Census Operational Plan Version 4 the Census Bureau estimates that billions of dollars can be saved relative to replicating a design similar to that of the 2010 Census
Field costs associated with Address Canvassing and Nonresponse Followup operations comprise the most expensive aspects of the 2020 Census Four innovation areas are aimed at reducing the costs of fieldwork A reengineered Address Canvassing operation is expected to reduce the field workload for address updating by 60 to 65 percent Self-response innovations which are aimed
Version 20 June 10 2019
The 2020 Census Operational Overview
ESTABLISH WHERETO COUNT
Ccnocia i~llWliNI and~oflfnalianmiddotbull - Minmn n-fidd wiorlr i-~
u~1o-- D idanllfy 41toU Yd --d-Gci1 bcaf ~ ITCJnl lnpL
MOTIVATE PEOPLE TO RESPOND
WOiilt i 8IIOd MUCCIO
klixniilUlilp~ ==1 T9I--_ spodic alDJIXos
Count everyone once only once and in the right place
llakooHGJbpooplo1a _ianyman~
E_19bull poqlo - traquo middot----Ueo lho med ~crffoarwo bull9 -and --shys-n-liltAI CDnIOS~
Knock on doors only __
C
0Dwor 1pplaquoiicMlfflGIOl oUa IDIN~l by Doo 31 2020
FWoGGOU- lo rodolrwtsg by April 1 21121
Mbull ii ouior b Ibo pJlic
degII
2020 Census Life-cycle Cost Estimates Executive Summary Page 9
at generating the largest possible self-response rate coupled with the use of administrative records and third-party data are intended to reduce the field workload associated with Nonresponse Followup Finally the reengineered field operations are intended to increase the efficiency of those operations allowing managers and fieldworkers to be more productive and effective
Figure 3 The 2020 Census - A New Design for the 21st Century describes at a high-level how the 2020 Census will be conducted This design reflects a flexible approach that takes advantage of new technologies and data sources while minimizing risk
Figure 3 The 2020 Census - A New Design for the 21st Century
The first step in conducting the 2020 Census is to identify all of the addresses where people could live or Establish Where to Count An accurate address list helps ensure that everyone is counted For the 2020 Census the Census Bureau began an in-office review of 100 percent of the nationrsquos addresses in September 2015 and is continually updating the address list based on data from multiple sources including the US Postal Service tribal state and local governments satellite imagery and third-party data providers The Census Bureau has completed multiple passes of the entire nation with the in-office address canvassing operation This office work determines which parts of the country require fieldwork to verify address information In-Field Address Canvassing will begin in 2019 and is anticipated to cover approximately 35 to 40 percent of all addresses where in-office address canvassing methods do not work well like
Version 20 June 10 2019
2020 Census Life-cycle Cost Estimates Executive Summary Page 10
where tree cover interferes with the use of imagery or in cities where high rise construction makes address change difficult to detect using aerial imagery
As discussed earlier response rates to surveys and censuses have been declining To Motivate People to Respond the 2020 Census will include a nation-wide communications and partnership campaign This campaign is focused on getting people to respond on their own (self-respond) It costs significantly less to process a response provided via the Internet or through a paper form than it does to send a fieldworker to someonersquos home to collect their response Advertising will make heavy use of digital media tailoring the message to the audience The partnership program will use trusted voices in the community to explain the importance of the Census and encourage wide participation
The Census Bureau Counts the Population by collecting information from all households including those residing in group or unique living arrangements The Census Bureau wants to make it easy for people to respond anytime and anywhere To this end the 2020 Census will offer the opportunity and encourage people to respond via the Internet and will encourage but not require people to enter a unique Census Identification with their response Online responses will be accurate secure and convenient
For those who do not respond the Census Bureau will use the most cost-effective strategy for contacting and counting people The goal for the 2020 Census is to reduce the average number of visits to nonresponding households by using available data from government administrative records and third-party sources These data will be used to identify vacant households to determine the best time of day to visit a particular household and to count the people and fill in the responses with existing high-quality data from trusted sources These uses of government administrative records and third-party sources have shown promise during our testing throughout the decade and were tested again in the 2018 End-to-End Census Test Deploying our resources in the field in the most cost-effective ways allows the Census Bureau to focus time and manpower to maximize response rates across geographic areas and demographic groups
In addition the majority of fieldworkers will use mobile devices for collecting the data Operations such as recruiting training and payroll will be automated reducing the time required for these activities New operational control centers will rely on automation to manage most of the fieldwork enabling more efficient case assignment automatic determination of optimal travel routes and reduction of the number of physical offices In general a streamlined operation and management structure is expected to increase productivity and save costs
The last step in the 2020 Census is to Release the 2020 Census Results The 2020 Census data will be processed and sent to the President (for apportionment) by December 31 2020 to the states for redistricting by April 1 2021 and to the public beginning in December 2021
Version 20 June 10 2019
I I
I
l
2020 Census Life-cycle Cost Estimates Executive Summary Page 11
22 Scope of the Estimate
The time frame covered by the 2020 Census LCCE is a 12-year period from 2012 to 2023 The scope of the 2020 Census includes 35 operations8 The 2020 Census operations are organized into eight major areas that correspond with the Census Bureau standard Work Breakdown Structure (WBS) as shown in Figure 4 2020 Census LCCE WBS Top-level WBS Elements below
2020 Census
Response Data
Published Data
Frame Test and Evaluation
CensusSurvey Engineering
Secretarial Contingency
Program Management
Infrastructure
Figure 4 2020 Census LCCE WBS Top-level WBS Elements
The 35 operations needed to conduct the 2020 Census are shown in Figure 5 2020 Census Operations below The graphic is organized into the major areas that correspond with the 2020 Census Program WBS shown above Program Management CensusSurvey Engineering and Infrastructure are combined into one general group called Support which is shown at the top of the diagram In addition a separate area Other Censuses accounts for the Island Areas Censuses operation which is unique to the Decennial Census Programs
8 The term operation refers to both support and business functions For example Program Management is considered a support function and Address Canvassing is considered a business function
Version 20 June 10 2019
SUPPORT -----------bull-bull-bull-bull-bull- I -----------bull-bull-bull-bull-bull-bull-------------bull-bull-bull-bull-bull-------------bull-bull-bull-bull-bull-bull-------------bull-bull-
PnlgllM Managemenl censJampSurly ~111i i 1 Pngnm llioB1g11Mra 2 Sym Engr-ing a Soc~ Princy and 4Conlllnil nd S langungo Sllrwioas [PM) i and lntiogration (SEIi Corilidonll lily (SPC) Farms DD11Jgn (CFD) (ING)
_____________________ L ___________________________________ __________________________________________________
lrmastrulure
J1 OC1111iol Service Co-rDSC)
FRAME
~~io~-(CIEOP
7 Local Updla of Cnsus Addrouao [LUCA)
a Addro1111 Cllinv Hing (ADC)
OTI-lER CENSUSES
26 hland Cnsaws (JaC)
32 Fiold lnfrulnKtungt FW)
RESPONSE DATA
8 Formbull Prtnili io ond Disribution IRgt
10 P Pf D- Cptu~ (PllCJ
11 flgttogIIIOid P r1no ig and Comumc tions IP I
1 2 tlllDITIIIII SoliRospon8 (ISRJ
TEST AND EVALUAT ION
33_ 0-nial logi51ics Man -t (1111]
t 3 Notgt-10 PTocbulls ing (JC))
14 Updla Enuma- (UE)
15 Group Otllimon (GO)
ff ampiumaatioll at rnmy LocMio (EnI
2amp ea bullbull JO 11-u-11-bing (Clllol)
SgtI IT lnfr-- (ITIN)
17 Consv s o stionrmiro ~g-lCOA)
1 rapotw F (NRFU)
19 RasponN Procsiig (RPO)
20 ~ ly Afiilillampd Coua aa_ (FACO)
35UpdlrtbullLN-(1JL
29 Covaraga Moa11aranmnl FNgtld Oporatia= (Cl[FO)
PUBLISH DATA
21 Ollbi Prod- and oon (DPO)
22 Rodistricting Om Progr m (ROI )
23 Count A~ jCRO)
24 Count Outo1icc Rllwrion ICORJ
2s Ardiving (ARCI
30_ EvalulllKgtlB and Ebullpltlfimants (EApound)
2020 Census Life-cycle Cost Estimates Executive Summary Page 12
Figure 5 2020 Census Operations
3 COST ESTIMATION APPROACH
31 Cost Estimation Methodology
The 2020 Census LCCE has been developed by a team within the Decennial Budget Office (DBO) This team is comprised of certified cost estimators (as administered by the International Cost Estimating and Analysis Association (ICEAA)) experienced subject matter experts from the Census Bureau and supporting contractor resources
The 2020 Census LCCErsquos methodology is primarily based on a bottoms-up cost estimation approach Other methodologies (such as historical data subject matter expertise analogous systems and relevant actual costs) are used when required The 2020 Census Program cost estimation team followed the guidance contained in the GAO Cost Estimating and Assessment Guide Best Practices for Developing and Managing Capital Program Costs (GAO-09-3SP) Specifically the 2020 Census LCCErsquos methodology aligns to the Decennial Directoratersquos Cost Estimation and Analysis Process (CEAP) which is derived from GAOrsquos 12-step Cost Estimating Process The overall process (taken from the August 2018 GAO assessment of the 2020 Census LCCE) is shown below in Figure 6 Decennial Directorate Cost Estimation Process
Version 20 June 10 2019
Department of Commerces Office of Acquisition Management
Participate in progress reviews
Census Bureau Deputy Directors Cost Team
Census Bureau Decennial Directorate Cost Team
1 Determine the estimating structure
7 Document cost estimate and prepare results
Soura GAO enat~rs of US Cerl$US 64lreau da1a I GA0~18--83-5
8 Management reviews and approvesrejects cost estimate
4 Gather and normalize the data
9 Update cost estimate
Develop the independent cost estimate (ICE) and facil itate reconci liation
2020 Census Life-cycle Cost Estimates Executive Summary Page 13
Figure 6 Decennial Directorate Cost Estimation Process
The 2020 Census LCCE utilizes an approach designed to produce a quality cost estimate This calculation flow enables a clear understanding to facilitate a line-of-sight into how the assumptions the inputs and the processescalculations inform the outputsresults By following the cost estimate the process can be effectively replicated and understood An illustration of this approach along with a brief description of each of the four primary process areas is shown in Figure 7 2020 Census LCCE Documentation Approach below
Assumptions
bullProgrammatic source documents from which cost assumptions are derived
Inputs
bullFormats and methods required to ingest the relevant data into cost estimating relationships
Processes Calculations
bullCombining and converting the raw data and business rules into a cohesive LCCE
Output Results
bullThe fully developed LCCE results in terms of reports and displays
Figure 7 2020 Census LCCE Documentation Approach
The 2020 Census Program cost estimators worked with subject matter experts to obtain data and document the variables that influence the cost of the 2020 Census Subject matter experts aided the identification of parameters associated with each variable including historical data collected from the 2010 Census the American Community Survey and the 2020 Census Research and
Version 20 June 10 2019
2020 Census Life-cycle Cost Estimates Executive Summary Page 14
Testing Program The 2020 Census LCCE team used the inputs after reviewing them for relevancy and credibility in consultation with Decennial Programs leadership
The parameters for the variables were entered into a cost model The cost model required three parameters for most variables (minimum median and maximum) derived from historical data test results or expert opinion For example one input parameter used to estimate the nonresponse followup workload included an estimated overall self-response rate after six weeks using the following values minimum of 555 percent median of 605 percent and maximum of 655 percent These values were based on findings from the 2010 Census the American Community Survey and the 2020 Census Research and Testing Program
This step in the overall cost estimation methodology concludes with the development of a point estimate
32 Risk Analysis
After the updated point estimate was compared to the ICE and updated as a result the point estimate cost was then adjusted for risk and uncertainty (to include contingency) A description of the risk and uncertainty is outlined below
The 2020 Decennial LCCE has structured two direct cost reserves to mitigate risks in the estimate ndash Program Risk and Secretarial Contingency (for Unknown Unknown risk)
Program Risk
Program Risk comprises two areas of direct costs to mitigate risk in the estimate ndash Risk-Based Contingency (consisting of Monte Carlo Uncertainty and Discrete Risks) and Additional Sensitivity Analysis ndash and totals $1703 billion spread across the WBS level 2 framework
Risk-Based Contingency
1 To account for uncertainty around the various parameters the cost estimators ran a Monte Carlo simulation This method randomly samples parameters from a probability distribution for each variable (based on the minimum median and maximum) over thousands of simulations and then uses those values to calculate a distribution of cost estimates The additional funding required to move from the point estimate to the estimate at which 80 percent of the simulations fall beneath is the Monte Carlo uncertainty contingency which is then applied to the Program Management WBS element The Program Management WBS covers elements associated with the definition and implementation of program management policies processes and the control functions for planning and implementing the 2020 Census to ensure an efficient and well-managed program This funding is designed to be utilized if actual cost-driving parameters deviate from estimates in a direction and magnitude that would require
Version 20 June 10 2019
2020 Census Life-cycle Cost Estimates Executive Summary Page 15
additional funding to complete an operation The estimated direct cost for Monte Carlo uncertainty was approximately $3055 million
2 Discrete Risks are those identified in the 2020 Life-Cycle Risk Register that were analyzed quantified integrated into the estimate mitigations were also evaluated and incorporated in the estimate when relevant as part of the 2020 LCCE process Examples of the major risk categories in the risk register include cybersecurity incidents issues in system performance and scalability and issues in operational readiness and execution The Census Bureau Enterprise Risk Management (ERM) process was followed to ensure the integrationlinkage of the 2020 Decennial Program risks into the cost estimation process The direct costs for these risks was estimated to be $10975 million This estimate is higher than the analogous estimate in the previous LCCE which captures the effect of fewer risks remaining and some risks reduced in probability following the 2018 End-to-End Census Test but that the remaining risks are more costly if realized This is due to better and more granular information about the costs of late decade mitigation as well as the greater lack of schedule or scope flexibility to resolve problems without sacrificing data quality in any manner other than increasing cost This dynamic is evident in the programmatic point estimate decreasing since the last estimate as the confidence level around operational costs has risen while reflecting that the total potential cost has not changed if this higher confidence level proves false due to the realization of one or more major risks
Additional Sensitivity Analysis
Program risks associated with Additional Sensitivity Analysis were discretely estimated based on impacts of occurrence and program mitigation techniques The following program risks have been reflected in the risk-adjusted cost estimate via additional sensitivity analyses
1 Self-response rates are critical uncertain variables with expected large cost impacts in the Response Data life-cycle costs Response rates have declined decade-over-decade for reasons outlined in ldquoSection 21 Challenging Environmental Factorsrdquo and there are numerous external influences on the program that could cause a dampened self response for the 2020 Census While the Monte Carlo and Risk Register risks include funding designed to address lowered self response rates to acknowledge this uncertainty and cost impact additional sensitivity analysis was performed to account for the possibility that the self-response rate declines below the modeled levels from Census Bureau experts This would cause an increase in the Nonresponse Followup Workload and cost The impact of this risk was estimated by decreasing the self-response rate point estimate from 605 percent to 55 percent The estimated direct cost for this risk was $2514 million
2 The cost of field operations is considered sensitive to the size and cost of recruiting and hiring the necessary workforce in all geographic areas To acknowledge this uncertainty and cost impact additional sensitivity analysis was performed to account for the possibility that additional funds are needed above the modeled recruitment size and wage rate to secure the temporary workforce needed in all given geographic areas This risk
Version 20 June 10 2019
2020 Census Life-cycle Cost Estimates Executive Summary Page 16
was modeled by increasing the nationwide average wage rate of the temporary workforce by about $050 The estimated direct cost for this risk was estimated to be $483 million
3 In LCCE Version 10 the Census Bureau had postulated a significant increase in the efficiency of field operations with a higher Enumerator-to-Supervisor staffing ratio than in the 2010 Census This assumption to generate the point cost estimate in LCCE Version 10 was contingent on the proper implementation and management of resources and the risk was that planned efficiencies from field management staffing are inadequate to support the temporary workforce The impact of this risk was estimated by assuming a decrease in the Enumerator-to-Management staffing ratio from 201 to 161 at a direct cost of $44 million in the previous LCCE Based on highly successful results from the 2018 End-to-End Test proving out the effectiveness of a 201 ratio this risk has been retired and specific funding related to this sensitivity is excluded from LCCE Version 20
Careful research analysis testing and planning throughout the decade has led the Census Bureau to establish a higher self-response rate and operate effectively with a lower wage However even with level of preparation response rates and wages are more difficult to predict with precision as the exact value for each that will be experienced in the 2020 Census lie further from the direct control of the 2020 Census program managers The response rate could be affected unpredictably by both public and private data breaches the publicrsquos overall opinion of the government and the Census Bureaursquos commitment to confidentiality Wage rates for a temporary work force are impacted by the strength of the economy and the competitiveness of the job market As a result of these external factors it is unlikely these risks could be retired and the corresponding estimates included for these discrete risks reduced until very late in the cycle The Census Bureau will continue to manage the 2020 Census Program to the objective assumptions contained within the LCCE that is based on the higher threshold assumptions noted in the self-response and wage risks above and be continuously monitoring external conditions and their impact on these assumptions
Even though the program may carry these risks throughout the entire life-cycle the Bureau is committed to managing this risk and minimizing the use of contingency funding For example the Census Bureau will invest in a robust communications and partnership program designed to promote self-response through accurate and timely information about data security and confidentiality A robust governance process is also in place at the Census Bureau and Department of Commerce to ensure that use of appropriated contingency funds of any type only occurs in valid cases of realizing andor actively mitigating risks or responding to evidence of costly deviations in operational parameters
Finally the Bureau does not expect the cost of the 2020 Census to change following the outcome of litigation regarding the inclusion of a citizenship question on the 2020 Census questionnaire However it is important to note that any reasonably foreseeable impacts to the operational assumptions for the 2020 Census underlying the LCCE are covered by the program risk funding
Version 20 June 10 2019
2020 Census Life-cycle Cost Estimates Executive Summary Page 17
Secretarial Contingency
The Secretarial Contingency represents the unknown-unknown category of risk to account for unforeseen risks such as a natural disaster driving residents of an area away from their residences leading up to Census Day for the 2020 Census This category is a 10 percent addition to the risk-adjusted cost in FY 2019 through FY 2023 and 5 percent in FY 2018 To the extent that such a contingency is appropriated by Congress the Department of Commerce will only approve use of this contingency following a formal governance process involving the Census Bureau and Department of Commerce oversight entities for the 2020 Census program The direct cost assigned to the unknown-unknown risk was $1182 million The Census Bureau would only utilize funding made available under this category in situations where other contingency reserves had been fully exhausted or in situations so unforecastable and unknowable that the Census Bureau and Department of Commerce in addressing them should prudently choose to utilize funding in such a manner as to avoid impacting the future availability of program risk mitigation funds needed for the addressing of known risks that may be realized in the execution of the 2020 Census program
At the end of the risk and uncertainty analyses the risks and uncertainty were added to the point estimate to produce a total risk-adjusted cost estimate for the 2020 Census Program The risk-adjusted life-cycle cost was determined to be approximately $15625 billion (including overhead)
33 Estimation Tools
The 2020 Census is a large and complex operation and therefore the cost estimate that supports it is also large and complex To accommodate the operation the 2020 Census LCCE is built within the Decennial Budget Integration Tool (DBIT) system DBIT is a suite of applications used by the Decennial Programs to support cost estimation budget planning and execution and contracts management functions for the 2020 Census and other programs It consists of a database data collection webapp mathematical model and analysisreporting tools Part of the DBIT application suite comprises the IBM Cognos platform which provides two major capabilities TM1 is an enterprise planning tool that provides advanced Online Analytical Processing (OLAP) and reporting capabilities9 and the Analytics capability enables highly-capable analysis and interactive reporting of cost information
The point estimate is developed and modeled using Cognos TM1 TM1 can accommodate the entire planning cycle and allows for modeling the cost of complex programs such as the 2020
9 TM1 is an IBM tool that enables the generation of cost estimates with higher levels of dimensionality precision accountability and reporting The enterprise planning capabilities of TM1 are well-suited for detailed modeling of the cost of complex programs comprised of multiple products and operations which require hundreds or thousands of variables TM1 Performance Modeler can produce estimates under multiple model scenarios using groups of inputs that conform an internally-consistent regarding the estimate
Version 20 June 10 2019
2020 Census Life-cycle Cost Estimates Executive Summary Page 18
Census Hundreds of variables across the 35 operations were incorporated into the model to generate a total cost estimate for the 2020 Census Within the 2020 Census LCCE there are 1151 data cubes and over 1859 inputs and assumptions There are 73000 summary cost records The use of the IBM Cognos platform provides the 2020 Census LCCE with the ability to use multi-dimensional cubes to bring data sets to bear for calculations analyses and reference
4 Ground Rules amp Assumptions
41 Inflation
All costs are presented in then-year (also called current-year) dollars Then-year dollars are those that have been inflated using an established inflation rate that are expressed in the year when the disbursements or expenditures are expected to occur The 2020 Census uses the Chained Price Index (CPI) from the Office of Management and Budgetrsquos (OMBrsquos) Table 101 entitled Gross Domestic Product and Deflators Used in the Historic Tables 1940-2022
42 Major Assumptions
The major assumptions changed from the October 2017 Version 10 of the LCCE and the relative scale of impact on the overall cost (as denoted by a MajorMinor +-) are shown in Table 3 below
Table 3 Major Assumptions and Impact of Changes
Item Change Driver Impact on
LCCE
Late Self‐Response During Nonresponse Followup (NRFU)
Increased from 625 to 655 Expected increase based on results from earlier field tests including the 2018 End‐to‐End Census Test that leaving a notice at nonresponding housing units which states itrsquos not too late to self‐respond will increase overall self‐response
Major ndash
Shift in Primary Enumeration Method Designation from Update Leave to Mailed‐out Invitations
Increased designation of housing units invited by mail to self‐respond from 1335 million to 1400 million
Decreased designation of Update Leave housing units where an enumerator leaves an invitation to self‐respond while double checking the address list from 119 million to 66 million
Updated analysis by Census Bureau subject matter experts
Updated analysis by Census Bureau subject matter experts
Minor +
Version 20 June 10 2019
2020 Census Life-cycle Cost Estimates Executive Summary Page 19
Nonresponse Followup (NRFU) Workload and Productivity
Added a single NRFU visit to double check nonresponding housing units resolved by using administrative records
Increased NRFU productivity from 125 caseshour to 155 caseshour
Updated operational assumption to align with updated operational plans following 2018 End‐to‐End Census Test experiences
Expected increase based on results from the 2018 End‐to‐End Census Test
Offsetting Net Minor ndash
Major Contracts Overall decrease due to re‐estimation
Updated cost data from contract award system and contract renegotiation reconciliation with the DOC ICE and greater ability to define requirements at low levels Updates led to major decreases in Field IT Deployment (FITd) and the removal of portions of CEDCaP from the program baseline after FY 2018 partially offset by smaller increases in Technical Integration Census Questionnaire Assistance and Decennial Device as a Service (dDaaS)
Offsetting Net Major ndash
Coverage Improvement
Modified Coverage Improvement quality follow‐up cost estimation method
Updated cost estimate to align with updated operational plans that activity will be conducted by phone
Major ndash
Information Technology Maturity
Increased support to ensure systems readiness and security for buildup deployment and closeout
Updated operational assumption to align with updated operational plans
Major +
Strengthening Program Management and Operational Planning
Increased support to continue robust program management
To align with GAO recommendations and industry best practices further strengthened program management IT program management cost schedule and risk management Includes added investments in the planning and management of the partnership and communications program
Major +
5 POINT ESTIMATE amp RISK ADJUSTMENTS
51 The Cost Estimation Results
This section discusses the summary costs of the 2020 Census LCCE
Version 20 June 10 2019
--------
2020 Census Life-cycle Cost Estimates Executive Summary Page 20
Table 4 Cost1 Estimate Summary (In Millions) below presents the estimated life-cycle cost (including overhead) for each of the WBS level-2 elements of the Census Bureau WBS Response Data which includes most costs associated with the actual collection of data by multiple means and other supporting activities such as printing distribution and questionnaire support accounts for almost one third of the total cost of the 2020 Census at $5480 billion Infrastructure with a cost of $3432 billion is the second largest cost component this WBS element includes the required IT and field operations investments as well as the infrastructure required to support logistic management and service centers Census Survey and Engineering which includes systems engineering and integration system security content and forms design and language services is the third largest component with $2055 billion followed by Program Management at $1789 billion
Table 4 Cost1 Estimate Summary (In Millions)
Fiscal Year
1 ‐ Program Manage‐ ment 2
2 ‐ Census Survey
Engineering 3
3 ‐ Frame
4 ‐ Response Data 4
5 ‐ Published
Data
6 ‐ Test Evaluation
and Special Censuses
7 ‐ Infra‐ structure 5
8 ‐ Secretarial Contingency
Grand Total
2012 9 16 3 6 1 17 12 ‐ 63
2013 8 8 4 8 3 26 41 ‐ 99
2014 20 18 27 18 11 48 85 ‐ 227
2015 41 16 26 56 15 94 93 ‐ 340
2016 99 118 82 91 32 83 145 ‐ 650
2017 65 194 55 177 23 39 238 ‐ 791
2018 87 342 67 249 15 40 270 6 1075
2019 369 468 294 1048 24 97 814 359 3473
2020 846 480 66 3662 26 190 1409 669 7348
2021 170 238 37 128 29 107 226 91 1025
2022 51 132 15 19 27 23 61 39 368
2023 25 24 14 18 13 12 39 19 165
Total 1789 2055 690 5480 220 777 3432 1182 15625
1 Actual costs displayed for fiscal years 2012-2018 are sourced from the Commerce Business System (CBS) as of October 2018
2 This framework contains $1108 billion in program risk in addition to $681 million in programmatic costs
3 This framework contains $46 million in program risk in addition to $2009 billion in programmatic costs
4 This framework contains $492 million in program risk in addition to $4988 billion in programmatic costs
5 This framework contains $56 million in program risk in addition to $3376 billion in programmatic costs
Version 20 June 10 2019
bull bull - bull bull bull bull
- bull bull
- =
2020 Census Life-cycle Cost Estimates Executive Summary Page 21
52 Detailed Costs by WBS Category
Additional details are provided for each level-2 WBS element within this section providing specific insights and more granular cost breakdown A visual representation of the overall program cost is displayed in Figure 8 2020 LCCE Costs by Level-2 WBS below
Given the nature of the program the majority of the Census operations occurs between FY 2019 and FY 2020 During this period $1082 billion of the projected $15625 billion 2020 Census costs (nearly 70 percent of the total costs) are expected to be incurred this highlights the significant concentration of expenditure in those years as well as the importance of prior preparation to deploy investments and operations efficiently over this period of intense activity and the potential for significant deviations in cost
$00
$10
$20
$30
$40
$50
$60
$70
$80
2012 2013 2014 2015 2016 2017 2018 2019 2020 2021 2022 2023
Total C
ost (Billions)
Fiscal Year
8 ‐ Secretarial Contingency
7 ‐ Infrastructure
6 ‐ Test Evaluation Special Censuses
5 ‐ Published Data
4 ‐ Response Data
3 ‐ Frame
2 ‐ CensusSurvey Engineering
1 ‐ Program Management
Figure 8 2020 LCCE Costs by Level-2 WBS
Version 20 June 10 2019
-_ - - II I -
2020 Census Life-cycle Cost Estimates Executive Summary Page 22
Program Management Costs
The Program Management element which includes all activities that implement and support policies processes and control functions oriented to improve the efficiency of operations and management of the program accounts for $1789 billion (including bureau overheads) over the lifespan of the 2020 Census Program (representing eleven percent of total program cost) The program management costs are shown in Figure 9 Program Management Costs by WBS Level 3
Program risk direct costs to mitigate risk and uncertainty are the largest contributor to program management costs during the program implementation phase (FY19-FY21) estimated at $1108 billion Program risk contingencies account for inherent uncertainties captured through Monte Carlo simulations as well as certain discrete risks from the risk register that could require additional program oversight scheduling or other supporting efforts
Programmatic costs for Program Management are estimated at $681 million (including bureau overheads)
$0
$100
$200
$300
$400
$500
$600
$700
$800
$900
2012 2013 2014 2015 2016 2017 2018 2019 2020 2021 2022 2023
Total C
ost (Millions)
Fiscal Year
02 ‐ Program Risk
01 ‐ Program Management
Figure 9 Program Management Costs by WBS Level 3
Version 20 June 10 2019
I -
2020 Census Life-cycle Cost Estimates Executive Summary Page 23
CensusSurvey Engineering Costs
CensusSurvey Engineering costs are estimated at $2055 billion (including bureau overheads) over the lifespan of the 2020 Census Program representing 13 percent of the life-cycle cost of the program An overview of the CensusSurvey Engineering costs is displayed below in Figure 10 CensusSurvey Engineering Costs by WBS Level 3 Programmatic costs for CensusSurvey engineering are estimated at $2009 billion (including overheads) Additional direct program risk costs are estimated at $46 million
Systems Design and Integration (SEI) is by far the main driver of program costs associated with CensusSurvey Engineering This is consistent with expectations for a program of this size which is developing an integrated system-of-systems to complete its innovative redesign The concentration of SEI costs around the implementation phase of the program is indicative of potential high technical integration and testing costs and risks to deliver the 2020 Census system of systems The vast majority of the total life-cycle direct cost for the Technical Integration (TI) contract of $134 billion is captured in CensusSurvey Engineering (Note that a small portion ($71 million) of the total TI contract ($14 billion) is aligned with specific operations in the Response Data and Infrastructure WBS Level 3 elements
CensusSurvey Design is the second largest component of costs under this WBS category Though substantially smaller than its SEI counterpart it includes the operational (readiness integration and testing) and demographic (content and forms) design of surveys
$0
$100
$200
$300
$400
$500
$600
2012 2013 2014 2015 2016 2017 2018 2019 2020 2021 2022 2023
Total C
ost (Millions)
Fiscal Year
04 ‐ Program Risk
03 ‐ Policy
02 ‐ Systems Design and Integration
01 ‐ CensusSurvey Design
Figure 10 CensusSurvey Engineering Costs by WBS Level 3
Version 20 June 10 2019
I
2020 Census Life-cycle Cost Estimates Executive Summary Page 24
Frame Costs
Geographic Frame activities costs are estimated at $690 million (including bureau overheads) which represents four percent of the programrsquos total life-cycle cost These are the costs spent by the program with the goal of developing a high-quality address and geospatial frame that serves as the universe for the enumeration activities
Address Frame the delivery of a complete and accurate address list and spatial database for enumeration and includes the type and characteristics of each living quarter is the main driver of the cost associated with frame activities The second highest costs are a result of the Geospatial Frame effort which provides the geographic foundation to support data collection and tabulation activities
As depicted in Figure 11 Frame Costs by WBS Level 3 below the spike in Address Frame costs in FY 2019 is a result of the in-field address canvassing operational cost of $185 million (excluding contingency) which is executed prior to the deployment of 2020 Census field enumeration operations
$0
$50
$100
$150
$200
$250
$300
$350
2012 2013 2014 2015 2016 2017 2018 2019 2020 2021 2022 2023
Total C
ost (Millions)
Fiscal Year
02 ‐ Geospatial Frame
01 ‐ Address Frame
Figure 11 Frame Costs by WBS Level 3
Version 20 June 10 2019
= = l1 LJ =
2020 Census Life-cycle Cost Estimates Executive Summary Page 25
Response Data Costs
The total life-cycle cost for Response Data is $5480 billion (including bureau overheads) representing 35 percent of the total 2020 Census estimate and is the largest cost element for the 2020 Census Program It consists of activities to collect information from 2020 Census respondents by multiple means of communication including all operations associated with the gathering of responses management of cases and initial processing of the data Figure 12 Response Data Costs by WBS Level 3 below provides an overview of the Response Data costs Programmatic costs for Response Data are estimated at $4988 billion (including overheads) Additional direct program risk costs are estimated at $492 million Included in this direct program risk cost is all of the $300 million for Additional Sensitivity Analysis
The concentration of forecasted expenses in FY 2020 reflects the nature of Response Data which involves activities interrelated with deployed field resources to perform the collection of Census data
Nearly half of the Response Data cost in FY 2020 corresponds to Computer Assisted Personal Interview (CAPI) files which includes Nonresponse Followup at a direct cost of $14 billion one of the costliest activities of the 2020 Census The direct costs for Respondent Outreach is at $880 million which includes advertising and partnership This is followed by Advertising and Computer Assisted Telephone Interview (CATI) files which includes the Census Questionnaire Assistance (CQA) contract with an estimated direct cost of $802 million Device DevelopmentProcurement is the next costliest and includes the Decennial Device as a Service Contract (dDaaS) with estimated direct costs of $447 million
$00
$05
$10
$15
$20
$25
$30
$35
$40
2012 2013 2014 2015 2016 2017 2018 2019 2020 2021 2022 2023
Total C
ost (Billions)
Fiscal Year
09 ‐ Program Risk
08 ‐ Device DevelopmentProcurement 07 ‐ Respondent Outreach
06 ‐ Unedited Data
05 ‐ Internet Data Collected Files 04 ‐ Paper Files
03 ‐ CATI Files
02 ‐ Mailout
01 ‐ CAPI Files
Figure 12 Response Data Costs by WBS Level 3
Version 20 June 10 2019
-
2020 Census Life-cycle Cost Estimates Executive Summary Page 26
Published Data Costs
Published Data is the least costly level-2 WBS activity with life-cycle costs of $220 million (including bureau overheads) which represents one percent of the 2020 Census life-cycle cost Even though Published Data accounts for a very small portion of the overall cost it provides high-value activities which include supporting imputation of data and adjustments data review and analysis tabulation and data product dissemination An overview of the Published Data costs is provided in Figure 13 Published Data Costs by WBS Level 3 below
The highest cost within Published Data is Data Products which includes the preparation review approval and dissemination of final data products Data Products costs are most pronounced in FY 2020 and FY 2022 when the most relevant intermediate and final products are completed and released Tabbed data which includes data reviews analysis and tabulation is the second largest cost driver within this category Its cost profile year-over-year however is smoother than Data Products given the more continuous nature of its associated activities
Itrsquos important to note that the Center for Enterprise Dissemination Services and Consumer Innovation (CEDSCI) the system which will be used to disseminate the 2020 Census data is not part of the LCCErsquos scope and therefore is not reflected in these life-cycle costs CEDSCI is an enterprise system and therefore is budgeted and managed outside of the 2020 Census program
$0
$5
$10
$15
$20
$25
$30
$35
2012 2013 2014 2015 2016 2017 2018 2019 2020 2021 2022 2023
Total C
ost (Millions)
Fiscal Year
03 ‐ Data Products
02 ‐ Tabbed Data
01 ‐ Edited Data
Figure 13 Published Data Costs by WBS Level 3
Version 20 June 10 2019
I
I I I - I
= =
2020 Census Life-cycle Cost Estimates Executive Summary Page 27
Test Evaluation and Special Census Costs
Test Evaluation and Special Censuses element is estimated at $777 million (including bureau overheads) or five percent of the 2020 Census life-cycle costs and is illustrated in Figure 14 Test Evaluation and Special Censuses Costs by WBS Level 3 This level-2 WBS element is comprised of two relatively unrelated sets of activities Test and Evaluation and Special Censuses
Test and Evaluation involves conducting tests throughout the decade aimed at investigating specific research questions and objectives needed to make decisions on important aspects of the 2020 Census operational design This included the costs of field andor self-response testing in every fiscal year from 2012 to 2019 It also assesses the quality of the 2020 Census and is the start of preparations for the 2030 Census Decennial Program It includes coverage measurement as well as evaluations and experiments It covers the Post Enumeration Survey and sample the identification of matches between the 2020 Census and the survey (an independent collection of information for the coverage measurement sample) the development of measures of success and the early planning activities to support the transition and design of the 2030 Census Coverage measurement Census tests and research and planning are the activities that require the largest uses of funds within Test Evaluation and Special Census estimated at $583 million (including overheads)
Special Census includes the enumeration of residents of the Islands Areas of American Samoa Northern Mariana Guam and the Virgin Islands The cost of Special Censuses at $80 million (including overheads) is a relatively small portion of the total cost of this level-2 WBS element
$0
$20
$40
$60
$80
$100
$120
$140
$160
$180
$200
2012 2013 2014 2015 2016 2017 2018 2019 2020 2021 2022 2023
Total C
ost (Millions)
Fiscal Year
07 ‐ Census 2020 Tests
06 ‐ 2030 Research and Planning
05 ‐ 2020 Research and Planning
04 ‐ 2020 Evaluations
03 ‐ Puerto Rico
02 ‐ Island Areas Enumeration
01 ‐ Post‐Enumeration Survey
Figure 14 Test Evaluation and Special Censuses Costs by WBS Level 3
Version 20 June 10 2019
2020 Census Life-cycle Cost Estimates Executive Summary Page 28
Infrastructure Costs
Infrastructure is the second-highest level-2 cost element of the WBS totaling $3432 billion (including bureau overheads) or 22 percent of the 2020 Census life-cycle cost Nearly half of Infrastructurersquos life-cycle costs are expected to be incurred in FY 2020 when field office infrastructure10 staff office space and equipment usages peak along with non-Headquarters staffing operations (such as training recruiting and onboarding) Programmatic costs for Infrastructure are estimated at $3376 billion (including overheads) Additional direct program risk costs are estimated at $56 million
The life-cycle direct costs of ACO and RCC office staff are $968 million and the ACO and RCC space direct costs are $265 million The life-cycle cost also includes the Field IT (FITd) infrastructure contract which was awarded late in FY 2018 The life-cycle direct cost for the FITd contract in the LCCE is $122 million (of which $21 million is in Response WBS) See Figure 15 Infrastructure Costs by WBS Level 3 below for the breakdown of Infrastructure costs
Consistent with the peak infrastructure spending in FY 2020 program risk is included in the prior-years to mitigate potential operational risks described previously Program Risk costs are projected in the FY19 and FY 20 to account for the risks with deployment and execution
IT infrastructure though not as costly as other Infrastructure components began peaking earlier than those (starting in FY 2016) as IT needed to be ready for deployment before the additional staff would be hired and the space and other infrastructure would be fielded
This includes Area Census Offices (ACO) and Regional Census Centers (RCC)
Version 20 June 10 2019
10
-
I =
2020 Census Life-cycle Cost Estimates Executive Summary Page 29
$00
$02
$04
$06
$08
$10
$12
$14
$16
2012 2013 2014 2015 2016 2017 2018 2019 2020 2021 2022 2023
Total C
ost (Billions)
Fiscal Year
08 ‐ Program Risk
07 ‐ Administrative Support
06 ‐ IT Infrastructure
05 ‐ Non‐HQ Staffing Operations
04 ‐ Field StaffOffice Support
03 ‐ Field Office InfrastructureLogistics
02 ‐ Field Office Management and Admin Support
01 ‐ Administrative Records Data
Figure 15 Infrastructure Costs by WBS Level 3
53 IT Costs
Since the 2020 Census will be the most automated decennial census in history and includes many technological innovations IT investments have contributed to a large portion of the overall program costs These investments for this decade will lay the foundation for a new decennial census design framework for decades to come Though IT expenses are embedded throughout the 2020 Census WBS structure this section focuses on IT-specific costs
The cost estimators developed a multi-step process to estimate the IT components of each operation and WBS element This process does not apply uniformly to all IT components but includes the integration of past execution data as well as cost estimates produced parametrically andor by analogy with past estimates or similar systems The LCCE team utilized the list of systems developed by Census Bureaursquos Enterprise Architecture Group (EAG) along with other IT elements to achieve a comprehensive estimate of all IT costs in the 2020 Census To describe this two categories were developed by the LCCE team to align the IT costs to the LCCE WBS These categories and their descriptions are shown below
The associated IT Cost Categories are provided in Table 5 2020 Census IT Cost Categories
Version 20 June 10 2019
- - bull bull I r r r T T T I I -T T r
2020 Census Life-cycle Cost Estimates Executive Summary Page 30
Table 5 2020 Census IT Cost Categories
IT Cost Category Description IT (Systems and Services) Systems on the EAGrsquos systems list that support the 2020 census
and the service contracts that support IT development maintenance etc (such as the Technical Integration contract)
Census Enterprise Data Collection and Processing (CEDCaP)
An enterprise system for data collection and processing that is being developed to support data collection and response processing first for the 2020 census and later other Census Bureau surveys and censuses
The graph below in Figure 16 IT Costs by Fiscal Year illustrates the breakout of costs by 2020 IT Services and Systems and 2020 CEDCaP In this graph the 2020 IT Services and Systems costs are the largest element of IT costs in the 2020 Census LCCE
The total cost for IT is estimated at $5035 billion (including overhead)
$00
$02
$04
$06
$08
$10
$12
$14
$16
$18
$20
2012 2013 2014 2015 2016 2017 2018 2019 2020 2021 2022 2023
Total C
ost (Billions)
Fiscal Year
CEDCaP
IT
Figure 16 IT Costs by Fiscal Year
2020 IT Systems and Services Cost Details
The 2020 IT Systems represent system capabilities funded by the 2020 Census These systems include many small and relatively inexpensive systems including Decennial Response Processing System and Integrated Logistics Management System but also includes larger and more expensive systems including Census Schedule A Hiring Recruiting and Payroll System Geographic imagery and matching systems and the Decennial Tabulation System
Version 20 June 10 2019
-~--~--_ _______
2020 Census Life-cycle Cost Estimates Executive Summary Page 31
Supporting the development and integration of these systems are the 2020 enterprise IT Services which largely contain contract costs but also includes infrastructure costs The major contracts in this category include Census Questionnaire Assistance (CQA) Decennial Device as a Service (dDaaS) Field IT Deployment (FITd) and Technical Integration which were all referenced above in the WBS Level 2 elements each is aligned with It also includes the cost of IT infrastructure provided in the Census Bureaursquos data center related to the 2020 Census and the costs related to security assessment and testing prior to the issuance of an authority to operate
CEDCaP Cost Details
CEDCaP is the enterprise system that supports data collection for not only the decennial census but other censuses as well This is a major investment that peaks in FY 2017 and FY 2018 to support the 2018 End-to-End Test and lays the foundation for the ramp up to the 2020 decennial census This was budgeted as an enterprise investment after FY 2018 so only costs of operating and maintaining these systems and scaling them up for the 2020 Census are included in this iteration of the LCCE after FY 2018
54 LCCE Leading Elements of Cost
The life-cycle cost of the 2020 Census is largely driven by a select few categories The primary four cost elements account for over 50 percent of the overall costs of the LCCE Major IT Contracts Field Operations Risk-Based Contingency and Level of Effort and Program Management This is illustrated in Table 6 2020 Census LCCE below that shows the individual and cumulative percent of costs Note that the five bottom cost elements account for a small portion (approximately 20 percent) of the total cost
Table 6 2020 Census LCCE Leading Elements of Cost
Cost Element Cost ($M) of Total Cumulative
Major IT Contracts $3095 20 20
Field Operations $1815 12 31
Program Risk $1703 11 42
Level of Effort and Program Management $1646 11 53
Census Bureau Overheads $1549 10 63
ACORCC Staff Space Supplies Kits $1412 9 72
Secretarial Contingency $1182 7 79
Partnership and Advertising $870 6 85
Other $753 5 90
Systems Engineering and IT Infrastructure $758 5 95
Printing Postage Paper Processing $461 3 98
C‐SHaRPS and Employee Check $382 2 100
Grand Total $15625 100 100
Version 20 June 10 2019
I
I I I I I bull I bull I
2020 Census Life-cycle Cost Estimates Executive Summary Page 32
Costs by Budget Object Class
The federal governmentrsquos standard chart of accounts utilizes a standard set of budget categories called Budget Object Classes (BOC) Funds are allocated using BOC The BOC provide a view of the 2020 Census LCCE costs by resource category Figure 17 Life-cycle Costs by Object Class provides a view of the major cost elements by BOC This graph highlights the cost significance of contracted services within the 2020 Census LCCE
$00 $20 $40 $60
Contracted Services
FTE Salary and Benefits
Program Risk
Overhead
Secretarial Contingency
Other
Printing and Publications
Operation and Maintenance of Equipment
Federal BuildingOther Space Rentals
Travel
Total Cost (Billions)
Object Class for BOE
Figure 17 Life-cycle Costs by Object Class
55 Program Risk Reserves and Contingency
See Figure 8 2020 LCCE Costs by Level-2 WBS in section 52 Detailed Cost by WBS Category for additional details on the risk methodology employed and category definitions
Program Risk and Secretarial Contingency direct cost totals $2885 billion across the life-cycle of the program with the Program Risk costs embedded into the associated WBS level-2 elements discussed in section 52 Risks have been grouped into two main categories based on the level of risk awareness and program control Program Risk ($1703 billion) and Secretarial Contingency ($1182 billion) as shown in Figure 18 Program Risk and Contingency Breakdown below
After completing the risk analyses the calculated risk and uncertainty values were added to the point estimate subtotal to produce a risk-adjusted life-cycle cost estimate for the 2020 Census Program of $15625B
Version 20 June 10 2019
11 _ _ _
1---1---I I I
bull bull
2020 Census Life-cycle Cost Estimates Executive Summary Page 33
$00 $05 $10 $15 $20
Program Risk
Secretarial Contingency
Total Cost (Billions)
Figure 18 Program Risk and Contingency Breakdown
Figure 19 Contingency Costs by Fiscal Year below provides an overview of the scale and fiscal year time frame in which the Program Risk and Secretarial Contingency costs are allotted in the 2020 Census LCCE The majority of the costs 90 percent are in FY 2019 and FY 2020 the main years of the 2020 Census implementation
$00 $05 $10 $15 $20 $25
2023
2022
2021
2020
2019
2018
Total Cost (Billions)
Fiscal Year
Secretarial Contingency
Program Risk
Figure 19 Contingency Costs by Fiscal Year
Version 20 June 10 2019
2020 Census Life-cycle Cost Estimates Executive Summary Page 34
56 Independent Cost Reviews
The 2020 Census LCCE has been compared to three independent cost estimates (ICEs)11 in its developmental history GAO treats an ICE as a useful tool to determine the reasonableness of a cost estimate Specifically the GAO states
An ICE is considered one of the best and most reliable validation methods ICEs are typically performed by organizations higher in the decision-making process than the office performing the baseline estimate They provide an independent view of expected program costs that tests the program officersquos estimate for reasonableness Therefore ICEs can provide decision-makers with additional insight into a programrsquos potential costs ndash in part because they frequently use different methods and are less burdened with organizational bias Moreover ICEs tend to incorporate adequate risk and therefore tend to be more conservative in forecasting higher costs than the program office12
In all instances of comparisons of an ICE and the 2020 Census cost estimate there were differences in individual cost categories but the overall (total) cost was similar between the ICE and the 2020 Census Program Office Estimate (POE)13 The primary reason for the differences were the estimating method and the different application of contingency and uncertainty The results of the ICE to POE comparisons are shown in Table 7 Comparison to Independent Cost Estimates below
Table 7 Comparison to Independent Cost Estimates
May‐16 POE DBO $10989 ‐2 $1323 ‐31 $12312 ‐6
Jun‐16 ICE OCEAA $11229 NA $1931 NA $13160 NA
Apr‐17 POE DBO $10284 ‐10 $3196 106 $13480 ‐4
Aug‐17 ICE DOC OAM $11406 NA $1551 NA $14074 NA
Sep‐17 ICE DOC OAM $11406 NA $4218 NA $15625 NA
Nov‐17 POE DBO $11405 ‐0 $4224 ‐0 $15625 0
Mar‐19 POE DBO $11191 ‐1 $4434 3 $15625 NA
Mar‐19 ICE DOC OAM $11325 NA $4300 NA $15625 0
Date Estimate Estimator Direct Cost
Delta from ICE
Risk Uncertainty amp Overheads
Delta from ICE
Total Cost
Delta from ICE
11 An ICE is conducted by an independent organization using the same technical and procurement information used to develop the POE The ICE provides an unbiased test of a LCCErsquos reasonableness in terms of cost risk etc12 GAO Cost Estimating and Assessment Guide March 2009 GAO-09-3SP page 186 13 A POE is the official projected cost for a system or program that is formally submitted to justify budget requirements to higher headquarters Congress GAO and others
Version 20 June 10 2019
2020 Census Life-cycle Cost Estimates Executive Summary Page 35
The first ICE was conducted by the Census Bureaursquos Office of Cost Estimation and Assessment (OCEAA) beginning in FY 2015 and ending in June 2016 The differences between the point estimate (direct cost) was approximately two percent The OCEAA ICE used more conservative costs for mitigating risks and uncertainty and therefore the difference was just over 30 percent The total delta between the two estimates was 64 percent The differences between the ICE and the POE were reconciled in a series of meetings between the OCEAA ICE team and the 2020 Census LCCE The information from the reconciliation was used to update the POE
A second comparison was conducted between the April 2017 POE and an August 2017 ICE The second ICE was conducted by the DOCrsquos Office of Acquisition Management (OAM) which reports to the Office of the Secretary (OS) This ICE utilized a top-down approach that made use of newly available Census data on IT costs as well as more conservative risk and uncertainty assumptions The difference in direct costs (the point estimate) was just over 10 percent largely due to more direct reliance on 2010 Census historical operational assumptions However the OAM ICE assumed less costs to mitigate risk and uncertainty The overall difference was approximately 42
Following reconciliation between the April 2017 POE and the August 2017 ICE additional reconciliation occurred with the DOC OAM estimate in September 2017 The difference in risk and uncertainty between this latest estimate and the April 2017 POE accounted for the addition of $11 billion for the Secretarial contingency The results of the September 2017 reconciliation between the POE and DOC ICE was under one percent
The latest comparison of the 2020 Census POE to an ICE was completed during March 2019 The ICE was again prepared by the DOC OAM beginning in mid-2018 as one of the key recommendations of the Milestone 3 Review for the 2020 Census The purpose was to continue to refine the ICE reconciliation with updated program office estimates and actuals as well as the results of the 2018 End-to-End Census Test and system performance and scalability testing in FY 2019 The final difference in direct costs (the point estimate) was about one percent while the difference in risk and uncertainty was about three percent The delta between the two estimates (the current version) is zero at an aggregate level The ICE cost estimators increased their confidence level in the sufficiency of the $15625 billion cost estimate for the 2020 Census from 80 percent in FY 2017 to 86 percent in FY 2019 reflected by the increased ICE risk reserve within the same overall cost total
Version 20 June 10 2019
2020 Census Life-cycle Cost Estimates Executive Summary Page 36
6 CONCLUSION
The 2020 Decennial Census is a large and complex program that has a 12-year life-cycle and a projected total cost of $15625 billion The estimate includes the mobilization of technology office space people and infrastructure across the entire US and its territories As demonstrated in this Version 20 of the 2020 Census LCCE and its BoE the cost is of a large scale
The 2020 Census LCCE is a key tool for management to justify budget requirements support resource allocation decisions and to develop an informed understanding of the projected costs and risks of their programs A reliable LCCE will increase the probability of program success The Census Bureau will be using the 2020 Census LCCE to focus on delivering a cost-effective and high-quality census
Despite the challenges of developing improving and maintaining a reliable cost estimate for a program as large and complex as the 2020 Decennial census the Census Bureau is using certified cost estimators advanced tool sets and ongoing enhancements to internal controls to continuously improve the cost estimate This commitment is underscored by the close working relationship that the Decennial Programs Directorate has established with both GAO and the DOC The Census Bureau will continue to build upon and mature the 2020 Census LCCE and will be regularly updating the cost estimate with actual cost data that will assist in strengthening internal controls as the Census transitions into full execution
Version 20 June 10 2019

[Page intentionally left blank]
Version 20 June 10 2019
Table of Contents
1 INTRODUCTION 1
11 EXECUTIVE SUMMARY PURPOSE 1 12 THE ROLE OF THE LCCE 1 13 IMPROVING THE LCCE 1 14 HIGH LEVEL COMPARISON TO PREVIOUS VERSION OF THE 2020 CENSUS LCCE 3
2 BACKGROUND amp SCOPE 4
21 PROGRAM BACKGROUND AND CHARACTERISTICS 4 22 SCOPE OF THE ESTIMATE 11
3 COST ESTIMATION APPROACH 12
31 COST ESTIMATION METHODOLOGY 12 32 RISK ANALYSIS 14 33 ESTIMATION TOOLS 17
4 GROUND RULES amp ASSUMPTIONS 18
41 INFLATION 18 42 MAJOR ASSUMPTIONS 18
5 POINT ESTIMATE amp RISK ADJUSTMENTS 19
51 THE COST ESTIMATION RESULTS 19 52 DETAILED COSTS BY WBS CATEGORY 21 53 IT COSTS 29 54 LEADING ELEMENTS OF COST 31 55 PROGRAM RISK RESERVES AND CONTINGENCY 32 56 INDEPENDENT COST REVIEWS 34
6 CONCLUSION 36
Version 20 June 10 2019
[Page intentionally left blank]
Version 20 June 10 2019
2020 Census Life-cycle Cost Estimate Executive Summary Page 1
1 INTRODUCTION
11 Executive Summary Purpose
This executive summary of the 2020 Decennial Census Life-cycle Cost Estimate (LCCE) provides a high-level overview of the June 2019 version of 2020 Census LCCE and the supporting 2020 Decennial Census LCCE Basis of Estimate (BoE) The executive summary constitutes Version 20 of the 2020 Decennial Census LCCE It incorporates updates to the Version 10 Executive Summary issued December 21 2017 These updates primarily include realigning cost data within the Work Breakdown Structure (WBS) to more accurately reflect how activities are managed and planned updating the estimate to reflect actual costs through FY 2018 integrating FY 2018 End-to-End Census Test results and incorporating final definitive scope details for major contracts and field operations
The executive summary is prepared for public release and does not include details of the technical approach program design assumptions model calculations cost breakouts etc Detailed documentation of the 2020 Census LCCE is contained in the BoE The BoE is the detailed formal documentation of the cost estimate that is not published for the general public but rather is intended for official government use including by auditors and oversight bodies
12 The Role of the LCCE
The LCCE is the estimated cost of developing producing deploying maintaining operating and disposing of a program or system over its entire lifespan The LCCE is prepared in order to support and inform program change decisions major program reviews resource allocation trade-off analyses budget requirements and source selections The LCCE provides the basis for the official projected cost for a program or system that is communicated to the Department of Commerce (DOC) the Office of Management and Budget (OMB) Congress the Government Accountability Office (GAO) and others
As the basis for the official projected cost of the program the LCCE provides Census Bureau and DOC leadership with critical information for making program decisions monitoring resource allocations establishing executable budgets and proactively addressing financial issues
13 Improving the LCCE
The Census Bureau has demonstrably improved the quality of the 2020 Census LCCE The results from the Census Bureaursquos significant efforts have been recognized in GAOrsquos August 2018 assessment of the 2020 Census LCCE as reported in the 2017 Version 10 Executive Summary In this assessment the GAO found that ldquohellipthe Census Bureau has made significant progress in improving its ability to develop a reliable cost estimaterdquo
Figure 1 Comparison of 2015 and 2017 GAO Assessments
Version 20 June 10 2019
2015 Assessment 2017 Assessment
Well-Documented ~ Minimally Met () Partially Met
Accurate () Partially Met 9 Substantially Met
Credible ~ Minimally Met 9 Substantially Met
Comprehensive () Partially Met - Met
bull Met a Substantially Met () Partially Met ~ Minimally Met O Not Met
Source GAO analysis of US Census Bureau data I GA0-1 8-635
2020 Census Life-cycle Cost Estimates Executive Summary Page 2
(shown below) taken from the August 2018 GAO assessment document1 illustrates the extent and scale of improvement between their assessments of the 2015 and 2017 LCCE versions
Figure 1 Comparison of 2015 and 2017 GAO Assessments2
The GAO did not make any new recommendations in their August 2018 assessment (see the 2017 assessment column referenced in Figure 1 above) Accordingly the Census Bureau continues to work on recommendations contained in the June 2016 GAO report3 on their assessment of the 2015 version of the 2020 Census LCCE These recommendations are listed below
1 To help ensure the Bureau produces a reliable cost estimate for the 2020 Census take the following steps to meet the characteristics of a high-quality estimate
a Comprehensivemdashamong other practices ensure the estimate includes all life-cycle costs and documents all cost-influencing assumptions
b Well-documentedmdashamong other practices ensure that its planned documentation plan captures the source data used contains the calculations performed and the
1 2020 CENSUS Census Bureau Improved the Quality of Its Cost Estimation but Additional Steps Are Needed to Ensure Reliability August 2018 GAO-18-635 page 2 2 The dates of the assessments in the figure below refer to the date of the LCCE assessed rather than the release date of the GAO assessment report (which is 2016 and 2018 respectively) 3 2020 Census Census Bureau Needs to Improve Its Life-Cycle Cost Estimating Process June 30 2016 GAO-16-
Version 20 June 10 2019
628
2020 Census Life-cycle Cost Estimates Executive Summary Page 3
estimating methodologies used for each element and describes step by step how the estimate was developed
c Accuratemdashamong other practices ensure the estimating technique for each cost element is used appropriately and that variances between planned and actual cost are documented explained and reviewed
d Crediblemdashamong other practices ensure the estimate includes a sensitivity analysis major cost elements are cross-checked to see whether results are similar and an independent cost estimate is conducted to determine whether other estimating methods produce similar results
2 To further ensure the credibility of data used in cost estimation establish clear guidance on when information for cost assumptions can and should be changed as well as the procedures for documenting such changes and traceable sources for information being used
3 To ensure Bureau and congressional confidence that the Bureaursquos budgeted contingencies are at appropriate levels improve control over how risk and uncertainty are accounted for and communicated with the Bureaursquos decennial cost estimation process such as by implementing and institutionalizing processes or methods for doing so with clear guidance
The Census Bureau has improved across all of these recommendations and intends to continue building upon the success that it has achieved in maturing the 2020 Census LCCE Table 1 Examples of Ongoing LCCE Enhancements below describes examples of ongoing improvement efforts by the Decennial Program
Table 1 Examples of Ongoing LCCE Enhancements
Enhancement Description Increase Understanding of Information Technology and Major Contracts
Developing an application to manage major contract expenses
Deeper involvement of contracts management subject matter experts and decennial leadership
Improve Program Inputs Assumptions
Working with programs to reflect operational refinements and 2018 End‐to‐End Test results
Deeper involvement of operational subject matter experts and decennial leadership
Improve Basis for Cost Management and Integration
Developing Cost Estimation and Analysis Process and related governance artifacts
Using the LCCE as a management tool to inform operational decisions
14 High Level Comparison to Previous Version of the 2020 Census LCCE
The current 2020 Census LCCE as reported in the June 2019 Executive Summary Version 20 is $156 billion This is unchanged from the total LCCE cost reported in the December 2017 Executive Summary Version 10 Table 2 below shows a comparison between October 2017 and May 2019 LCCE There have been changes among different elements of the WBS (see Section
Version 20 June 10 2019
‐
2020 Census Life-cycle Cost Estimates Executive Summary Page 4
22 below) and risk within the same total cost Additionally the confidence level in the total cost has risen since the previous version as illustrated in a greater risk and contingency reserve within the same overall total
Table 2 LCCE Cost Comparison of October 2017 vs June 2019 (in Millions)
Element LCCE Oct 2017 LCCE June 2019 Change
1 ‐ Program Management $625 $681 9
2 CensusSurvey Engineering $1822 $2009 10
3 ‐ Frame $732 $690 ‐6
4 ‐ Response Data $5375 $4988 ‐7
5 ‐ Published Data $219 $220 0
6 ‐ Test Evaluation Special Censuses $791 $777 ‐2
7 ‐ Infrastructure $3454 $3376 ‐2
Point Estimate Subtotal $13018 $12740 ‐2
Risk‐Based Contingency $1056 $1403 33
Point Estimate Subtotal with Risk‐ Based Contingency
Additional Sensitivity Analysis
$14074 $14143 05
$369 $300 ‐19
Secretarial Contingency $1182 $1182 0
Risk‐adjusted Total $15625 $15625 0
2 BACKGROUND amp SCOPE
21 Program Background and Characteristics
The goal of the 2020 Census is to count everyone once only once and in the right place As the cost of completing this goal has significantly increased each decade since 1970 as the population becomes more challenging to count the Census Bureau undertook a challenge this decade to design the 2020 Census to control cost growth while continuing to maintain high quality results The actual cost of the 2010 Census in 2020 inflation-adjusted dollars was $92 per housing unit while Congress appropriated $106 per housing unit4 Comparatively the 2020 Census as
4 In FY 2010-2011 the Census Bureau returned nearly $19 billion in unused appropriations from the 2010 Census
Version 20 June 10 2019
2020 Census Life-cycle Cost Estimates Executive Summary Page 5
currently designed is expected to cost $108 per housing unit in 2020 inflation-adjusted dollars including usage of all estimated contingency and $87 per housing unit without estimated contingency The level of contingency funds ultimately required to conduct a 2020 Census of the highest quality will determine whether the actual inflation-adjusted cost per housing of the 2020 Census is higher or lower than that of the 2010 Census To optimize operational efficiency while maintaining quality the Census Bureau will conduct the most automated modern and dynamic decennial census in history
The goal this decade is to design the 2020 Census for the 21st Century in a way that embraces technology to ensure a high quality 2020 Census that will lay the framework for future censuses for decades to come This will be the first decennial census to update the Census Bureaursquos address frame using geographic information systems and aerial imagery instead of sending census employees to walk and physically check all 11 million census blocks the first to encourage the population to respond to the 2020 Census using the Internet and over the telephone reducing the need for expensive paper data capture the first to use data the public has already provided to the government and data available from commercial sources to enable focusing of additional visits in areas that have traditionally been hard to enumerate and the first to use sophisticated operational control systems to send Census Bureau employees to followup with nonresponding housing units and to track daily progress
The 2020 Census
The purpose of the 2020 Census is to conduct an accurate count of the population and housing to disseminate the results to the President the States and the American people To accomplish this the Census Bureau must count everyone once only once and in the right place The challenge this decade has been to do so at a lower cost per household (adjusted for inflation) than the 2010 Census As the 2020 Census draws near the Census Bureau has designed a 2020 Census that ensures the coverage of the population and housing is as complete as possible The design will serve to minimize the undercounting or overcounting of the population particularly as related to the differential impact on subgroups of the population5 The Census Bureau is fully committed to designing and conducting a 2020 Census that fairly represents every person in America
The primary requirement served by the decennial census is the apportionment of seats allocated to the states for the House of Representatives This requirement is mandated in the US Constitution
Article I Section 2 ldquoThe actual enumeration shall be made within three years after the first meeting of the Congress of the United States and within every subsequent Term of ten Yearsrdquo
5 A detailed discussion of the quality implications of the 2020 Census design can be found in Chapter 7 of the 2020 Census Operational Plan Version 40
Version 20 June 10 2019
2020 Census Life-cycle Cost Estimates Executive Summary Page 6
Fourteenth Amendment Section 2 ldquoRepresentatives shall be apportioned among the several States according to their respective numbers counting the whole number of persons in each Staterdquo
Uses of Decennial Census Data
As discussed above decennial data are used to apportion the number of seats in Congress among the states At the census block level the data informs governmental entities for redistricting (ie defining the representative boundaries for congressional districts state legislative districts school districts and voting precincts) Additionally decennial data help enforce voting rights and civil rights
The Census Bureau also uses the decennial census results to determine the statistical sampling frames for the American Community Survey (ACS) which replaced the long form in the decennial census and the dozens of current surveys conducted by the Census Bureau The results of these surveys are used to support important functions such as appropriating federal funds to local communities (an estimated $675 billion annually6) calculating monthly unemployment crime and poverty rates and publishing health and education data
Finally decennial data play an increasingly important role in United States commerce and the economy As people expand their use of data to make decisions at the local and national levels they increasingly depend on data from the Census Bureau to make these decisions Today local businesses look at data provided by the Census Bureau on topics like population growth and income levels to make decisions about whether or where to locate their restaurants or stores Similarly a real estate investor who is considering investing significant funds to develop a piece of land in the community relies on Census Bureau data to measure the demand for housing predict future need and review aggregate trends Big businesses also rely heavily on Census Bureau data to make critical decisions that impact their success and shape the economy at the national level As noted above the decennial census is the foundation for the Census Bureaursquos demographic survey data
The decennial data must meet high quality standards to ensure good decision-making and to continue building confidence in the government society and the economy Studying the balance between cost and quality is an important focus of the census design
6 Marisa Hotchkiss and Jessica Phelan Uses of Census Bureau Data in Federal Funds Distribution A New Design for the 21st Century Census Working Papers 2017 (Washington DC US Census Bureau September 2017) p 3
Version 20 June 10 2019
2020 Census Life-cycle Cost Estimates Executive Summary Page 7
Challenging Environmental Factors
The 2020 Census challenge is exacerbated by multiple environmental factors that have the potential to impact its success The Census Bureau is committed to proactively addressing the challenges outlined below in Figure 2
2020 Census
Constrained Fiscal
Environment Rapidly Changing Technology
Information Explosion
Distrust in Government
Declining Response Rates
Increasing Diversity
Informal Complex Living
Arrangements
Mobile Population
Figure 2 2020 Census Environment
Constrained fiscal environment Federal budget constraints placed significant pressure on funding available for research testing design and development work for successful innovation7
Rapidly changing use of technology Stakeholders expect the decennial census to use technology innovation yet the rapid pace of change makes it challenging to plan for and adequately test the use of these technologies because they become obsolete
Information explosion Rapid changes in information technology create stakeholder expectations for how the Census Bureau interacts with the public to obtain and disseminate data products
7 A detailed discussion of the major program risks can be found in Chapter 6 of the 2020 Census Operational Plan
Version 40
Version 20 June 10 2019
2020 Census Life-cycle Cost Estimates Executive Summary Page 8
Distrust in government The publicrsquos concerns about information security and privacy the confidentiality of information given to the government and how government programs will use the information they collect continue to grow This impacts response rates and could make it more difficult for government agencies to collect important demographic information
Declining response rates Response rates for Census Bureau surveys and for surveys and censuses in general have declined as citizens are overloaded with requests for information and become increasingly concerned about sharing information
Increasingly diverse population The demographic and cultural make-up of the United States continues to increase in complexity including a growing number of households and individuals with limited English proficiency who may experience language barriers to enumeration and who may have varying levels of comfort with government involvement
Informal complex living arrangements Households are becoming more diverse and dynamic making it a challenge to associate an identified person with a single location For example blended families may include children who have two primary residences Additionally some households include multiple relationships and generations
A mobile population The United States continues to be a highly mobile nation as about 143 percent of the population moves in a given year based on results from the American Community Survey conducted in 2017 Continued growth in cellular telephone technology and an associated reduction in landline telephones tied to physical locations may also complicate enumeration
A New Design for the 21st Century
Several of the societal demographic and technological trends listed above can result in a population that is harder and more expensive to enumerate As it becomes more challenging to locate individuals and solicit their participation through traditional methods the Census Bureau must decade after decade spend more money simply to maintain the same level of accuracy as previous censuses With the innovations described in the 2020 Census Operational Plan Version 4 the Census Bureau estimates that billions of dollars can be saved relative to replicating a design similar to that of the 2010 Census
Field costs associated with Address Canvassing and Nonresponse Followup operations comprise the most expensive aspects of the 2020 Census Four innovation areas are aimed at reducing the costs of fieldwork A reengineered Address Canvassing operation is expected to reduce the field workload for address updating by 60 to 65 percent Self-response innovations which are aimed
Version 20 June 10 2019
The 2020 Census Operational Overview
ESTABLISH WHERETO COUNT
Ccnocia i~llWliNI and~oflfnalianmiddotbull - Minmn n-fidd wiorlr i-~
u~1o-- D idanllfy 41toU Yd --d-Gci1 bcaf ~ ITCJnl lnpL
MOTIVATE PEOPLE TO RESPOND
WOiilt i 8IIOd MUCCIO
klixniilUlilp~ ==1 T9I--_ spodic alDJIXos
Count everyone once only once and in the right place
llakooHGJbpooplo1a _ianyman~
E_19bull poqlo - traquo middot----Ueo lho med ~crffoarwo bull9 -and --shys-n-liltAI CDnIOS~
Knock on doors only __
C
0Dwor 1pplaquoiicMlfflGIOl oUa IDIN~l by Doo 31 2020
FWoGGOU- lo rodolrwtsg by April 1 21121
Mbull ii ouior b Ibo pJlic
degII
2020 Census Life-cycle Cost Estimates Executive Summary Page 9
at generating the largest possible self-response rate coupled with the use of administrative records and third-party data are intended to reduce the field workload associated with Nonresponse Followup Finally the reengineered field operations are intended to increase the efficiency of those operations allowing managers and fieldworkers to be more productive and effective
Figure 3 The 2020 Census - A New Design for the 21st Century describes at a high-level how the 2020 Census will be conducted This design reflects a flexible approach that takes advantage of new technologies and data sources while minimizing risk
Figure 3 The 2020 Census - A New Design for the 21st Century
The first step in conducting the 2020 Census is to identify all of the addresses where people could live or Establish Where to Count An accurate address list helps ensure that everyone is counted For the 2020 Census the Census Bureau began an in-office review of 100 percent of the nationrsquos addresses in September 2015 and is continually updating the address list based on data from multiple sources including the US Postal Service tribal state and local governments satellite imagery and third-party data providers The Census Bureau has completed multiple passes of the entire nation with the in-office address canvassing operation This office work determines which parts of the country require fieldwork to verify address information In-Field Address Canvassing will begin in 2019 and is anticipated to cover approximately 35 to 40 percent of all addresses where in-office address canvassing methods do not work well like
Version 20 June 10 2019
2020 Census Life-cycle Cost Estimates Executive Summary Page 10
where tree cover interferes with the use of imagery or in cities where high rise construction makes address change difficult to detect using aerial imagery
As discussed earlier response rates to surveys and censuses have been declining To Motivate People to Respond the 2020 Census will include a nation-wide communications and partnership campaign This campaign is focused on getting people to respond on their own (self-respond) It costs significantly less to process a response provided via the Internet or through a paper form than it does to send a fieldworker to someonersquos home to collect their response Advertising will make heavy use of digital media tailoring the message to the audience The partnership program will use trusted voices in the community to explain the importance of the Census and encourage wide participation
The Census Bureau Counts the Population by collecting information from all households including those residing in group or unique living arrangements The Census Bureau wants to make it easy for people to respond anytime and anywhere To this end the 2020 Census will offer the opportunity and encourage people to respond via the Internet and will encourage but not require people to enter a unique Census Identification with their response Online responses will be accurate secure and convenient
For those who do not respond the Census Bureau will use the most cost-effective strategy for contacting and counting people The goal for the 2020 Census is to reduce the average number of visits to nonresponding households by using available data from government administrative records and third-party sources These data will be used to identify vacant households to determine the best time of day to visit a particular household and to count the people and fill in the responses with existing high-quality data from trusted sources These uses of government administrative records and third-party sources have shown promise during our testing throughout the decade and were tested again in the 2018 End-to-End Census Test Deploying our resources in the field in the most cost-effective ways allows the Census Bureau to focus time and manpower to maximize response rates across geographic areas and demographic groups
In addition the majority of fieldworkers will use mobile devices for collecting the data Operations such as recruiting training and payroll will be automated reducing the time required for these activities New operational control centers will rely on automation to manage most of the fieldwork enabling more efficient case assignment automatic determination of optimal travel routes and reduction of the number of physical offices In general a streamlined operation and management structure is expected to increase productivity and save costs
The last step in the 2020 Census is to Release the 2020 Census Results The 2020 Census data will be processed and sent to the President (for apportionment) by December 31 2020 to the states for redistricting by April 1 2021 and to the public beginning in December 2021
Version 20 June 10 2019
I I
I
l
2020 Census Life-cycle Cost Estimates Executive Summary Page 11
22 Scope of the Estimate
The time frame covered by the 2020 Census LCCE is a 12-year period from 2012 to 2023 The scope of the 2020 Census includes 35 operations8 The 2020 Census operations are organized into eight major areas that correspond with the Census Bureau standard Work Breakdown Structure (WBS) as shown in Figure 4 2020 Census LCCE WBS Top-level WBS Elements below
2020 Census
Response Data
Published Data
Frame Test and Evaluation
CensusSurvey Engineering
Secretarial Contingency
Program Management
Infrastructure
Figure 4 2020 Census LCCE WBS Top-level WBS Elements
The 35 operations needed to conduct the 2020 Census are shown in Figure 5 2020 Census Operations below The graphic is organized into the major areas that correspond with the 2020 Census Program WBS shown above Program Management CensusSurvey Engineering and Infrastructure are combined into one general group called Support which is shown at the top of the diagram In addition a separate area Other Censuses accounts for the Island Areas Censuses operation which is unique to the Decennial Census Programs
8 The term operation refers to both support and business functions For example Program Management is considered a support function and Address Canvassing is considered a business function
Version 20 June 10 2019
SUPPORT -----------bull-bull-bull-bull-bull- I -----------bull-bull-bull-bull-bull-bull-------------bull-bull-bull-bull-bull-------------bull-bull-bull-bull-bull-bull-------------bull-bull-
PnlgllM Managemenl censJampSurly ~111i i 1 Pngnm llioB1g11Mra 2 Sym Engr-ing a Soc~ Princy and 4Conlllnil nd S langungo Sllrwioas [PM) i and lntiogration (SEIi Corilidonll lily (SPC) Farms DD11Jgn (CFD) (ING)
_____________________ L ___________________________________ __________________________________________________
lrmastrulure
J1 OC1111iol Service Co-rDSC)
FRAME
~~io~-(CIEOP
7 Local Updla of Cnsus Addrouao [LUCA)
a Addro1111 Cllinv Hing (ADC)
OTI-lER CENSUSES
26 hland Cnsaws (JaC)
32 Fiold lnfrulnKtungt FW)
RESPONSE DATA
8 Formbull Prtnili io ond Disribution IRgt
10 P Pf D- Cptu~ (PllCJ
11 flgttogIIIOid P r1no ig and Comumc tions IP I
1 2 tlllDITIIIII SoliRospon8 (ISRJ
TEST AND EVALUAT ION
33_ 0-nial logi51ics Man -t (1111]
t 3 Notgt-10 PTocbulls ing (JC))
14 Updla Enuma- (UE)
15 Group Otllimon (GO)
ff ampiumaatioll at rnmy LocMio (EnI
2amp ea bullbull JO 11-u-11-bing (Clllol)
SgtI IT lnfr-- (ITIN)
17 Consv s o stionrmiro ~g-lCOA)
1 rapotw F (NRFU)
19 RasponN Procsiig (RPO)
20 ~ ly Afiilillampd Coua aa_ (FACO)
35UpdlrtbullLN-(1JL
29 Covaraga Moa11aranmnl FNgtld Oporatia= (Cl[FO)
PUBLISH DATA
21 Ollbi Prod- and oon (DPO)
22 Rodistricting Om Progr m (ROI )
23 Count A~ jCRO)
24 Count Outo1icc Rllwrion ICORJ
2s Ardiving (ARCI
30_ EvalulllKgtlB and Ebullpltlfimants (EApound)
2020 Census Life-cycle Cost Estimates Executive Summary Page 12
Figure 5 2020 Census Operations
3 COST ESTIMATION APPROACH
31 Cost Estimation Methodology
The 2020 Census LCCE has been developed by a team within the Decennial Budget Office (DBO) This team is comprised of certified cost estimators (as administered by the International Cost Estimating and Analysis Association (ICEAA)) experienced subject matter experts from the Census Bureau and supporting contractor resources
The 2020 Census LCCErsquos methodology is primarily based on a bottoms-up cost estimation approach Other methodologies (such as historical data subject matter expertise analogous systems and relevant actual costs) are used when required The 2020 Census Program cost estimation team followed the guidance contained in the GAO Cost Estimating and Assessment Guide Best Practices for Developing and Managing Capital Program Costs (GAO-09-3SP) Specifically the 2020 Census LCCErsquos methodology aligns to the Decennial Directoratersquos Cost Estimation and Analysis Process (CEAP) which is derived from GAOrsquos 12-step Cost Estimating Process The overall process (taken from the August 2018 GAO assessment of the 2020 Census LCCE) is shown below in Figure 6 Decennial Directorate Cost Estimation Process
Version 20 June 10 2019
Department of Commerces Office of Acquisition Management
Participate in progress reviews
Census Bureau Deputy Directors Cost Team
Census Bureau Decennial Directorate Cost Team
1 Determine the estimating structure
7 Document cost estimate and prepare results
Soura GAO enat~rs of US Cerl$US 64lreau da1a I GA0~18--83-5
8 Management reviews and approvesrejects cost estimate
4 Gather and normalize the data
9 Update cost estimate
Develop the independent cost estimate (ICE) and facil itate reconci liation
2020 Census Life-cycle Cost Estimates Executive Summary Page 13
Figure 6 Decennial Directorate Cost Estimation Process
The 2020 Census LCCE utilizes an approach designed to produce a quality cost estimate This calculation flow enables a clear understanding to facilitate a line-of-sight into how the assumptions the inputs and the processescalculations inform the outputsresults By following the cost estimate the process can be effectively replicated and understood An illustration of this approach along with a brief description of each of the four primary process areas is shown in Figure 7 2020 Census LCCE Documentation Approach below
Assumptions
bullProgrammatic source documents from which cost assumptions are derived
Inputs
bullFormats and methods required to ingest the relevant data into cost estimating relationships
Processes Calculations
bullCombining and converting the raw data and business rules into a cohesive LCCE
Output Results
bullThe fully developed LCCE results in terms of reports and displays
Figure 7 2020 Census LCCE Documentation Approach
The 2020 Census Program cost estimators worked with subject matter experts to obtain data and document the variables that influence the cost of the 2020 Census Subject matter experts aided the identification of parameters associated with each variable including historical data collected from the 2010 Census the American Community Survey and the 2020 Census Research and
Version 20 June 10 2019
2020 Census Life-cycle Cost Estimates Executive Summary Page 14
Testing Program The 2020 Census LCCE team used the inputs after reviewing them for relevancy and credibility in consultation with Decennial Programs leadership
The parameters for the variables were entered into a cost model The cost model required three parameters for most variables (minimum median and maximum) derived from historical data test results or expert opinion For example one input parameter used to estimate the nonresponse followup workload included an estimated overall self-response rate after six weeks using the following values minimum of 555 percent median of 605 percent and maximum of 655 percent These values were based on findings from the 2010 Census the American Community Survey and the 2020 Census Research and Testing Program
This step in the overall cost estimation methodology concludes with the development of a point estimate
32 Risk Analysis
After the updated point estimate was compared to the ICE and updated as a result the point estimate cost was then adjusted for risk and uncertainty (to include contingency) A description of the risk and uncertainty is outlined below
The 2020 Decennial LCCE has structured two direct cost reserves to mitigate risks in the estimate ndash Program Risk and Secretarial Contingency (for Unknown Unknown risk)
Program Risk
Program Risk comprises two areas of direct costs to mitigate risk in the estimate ndash Risk-Based Contingency (consisting of Monte Carlo Uncertainty and Discrete Risks) and Additional Sensitivity Analysis ndash and totals $1703 billion spread across the WBS level 2 framework
Risk-Based Contingency
1 To account for uncertainty around the various parameters the cost estimators ran a Monte Carlo simulation This method randomly samples parameters from a probability distribution for each variable (based on the minimum median and maximum) over thousands of simulations and then uses those values to calculate a distribution of cost estimates The additional funding required to move from the point estimate to the estimate at which 80 percent of the simulations fall beneath is the Monte Carlo uncertainty contingency which is then applied to the Program Management WBS element The Program Management WBS covers elements associated with the definition and implementation of program management policies processes and the control functions for planning and implementing the 2020 Census to ensure an efficient and well-managed program This funding is designed to be utilized if actual cost-driving parameters deviate from estimates in a direction and magnitude that would require
Version 20 June 10 2019
2020 Census Life-cycle Cost Estimates Executive Summary Page 15
additional funding to complete an operation The estimated direct cost for Monte Carlo uncertainty was approximately $3055 million
2 Discrete Risks are those identified in the 2020 Life-Cycle Risk Register that were analyzed quantified integrated into the estimate mitigations were also evaluated and incorporated in the estimate when relevant as part of the 2020 LCCE process Examples of the major risk categories in the risk register include cybersecurity incidents issues in system performance and scalability and issues in operational readiness and execution The Census Bureau Enterprise Risk Management (ERM) process was followed to ensure the integrationlinkage of the 2020 Decennial Program risks into the cost estimation process The direct costs for these risks was estimated to be $10975 million This estimate is higher than the analogous estimate in the previous LCCE which captures the effect of fewer risks remaining and some risks reduced in probability following the 2018 End-to-End Census Test but that the remaining risks are more costly if realized This is due to better and more granular information about the costs of late decade mitigation as well as the greater lack of schedule or scope flexibility to resolve problems without sacrificing data quality in any manner other than increasing cost This dynamic is evident in the programmatic point estimate decreasing since the last estimate as the confidence level around operational costs has risen while reflecting that the total potential cost has not changed if this higher confidence level proves false due to the realization of one or more major risks
Additional Sensitivity Analysis
Program risks associated with Additional Sensitivity Analysis were discretely estimated based on impacts of occurrence and program mitigation techniques The following program risks have been reflected in the risk-adjusted cost estimate via additional sensitivity analyses
1 Self-response rates are critical uncertain variables with expected large cost impacts in the Response Data life-cycle costs Response rates have declined decade-over-decade for reasons outlined in ldquoSection 21 Challenging Environmental Factorsrdquo and there are numerous external influences on the program that could cause a dampened self response for the 2020 Census While the Monte Carlo and Risk Register risks include funding designed to address lowered self response rates to acknowledge this uncertainty and cost impact additional sensitivity analysis was performed to account for the possibility that the self-response rate declines below the modeled levels from Census Bureau experts This would cause an increase in the Nonresponse Followup Workload and cost The impact of this risk was estimated by decreasing the self-response rate point estimate from 605 percent to 55 percent The estimated direct cost for this risk was $2514 million
2 The cost of field operations is considered sensitive to the size and cost of recruiting and hiring the necessary workforce in all geographic areas To acknowledge this uncertainty and cost impact additional sensitivity analysis was performed to account for the possibility that additional funds are needed above the modeled recruitment size and wage rate to secure the temporary workforce needed in all given geographic areas This risk
Version 20 June 10 2019
2020 Census Life-cycle Cost Estimates Executive Summary Page 16
was modeled by increasing the nationwide average wage rate of the temporary workforce by about $050 The estimated direct cost for this risk was estimated to be $483 million
3 In LCCE Version 10 the Census Bureau had postulated a significant increase in the efficiency of field operations with a higher Enumerator-to-Supervisor staffing ratio than in the 2010 Census This assumption to generate the point cost estimate in LCCE Version 10 was contingent on the proper implementation and management of resources and the risk was that planned efficiencies from field management staffing are inadequate to support the temporary workforce The impact of this risk was estimated by assuming a decrease in the Enumerator-to-Management staffing ratio from 201 to 161 at a direct cost of $44 million in the previous LCCE Based on highly successful results from the 2018 End-to-End Test proving out the effectiveness of a 201 ratio this risk has been retired and specific funding related to this sensitivity is excluded from LCCE Version 20
Careful research analysis testing and planning throughout the decade has led the Census Bureau to establish a higher self-response rate and operate effectively with a lower wage However even with level of preparation response rates and wages are more difficult to predict with precision as the exact value for each that will be experienced in the 2020 Census lie further from the direct control of the 2020 Census program managers The response rate could be affected unpredictably by both public and private data breaches the publicrsquos overall opinion of the government and the Census Bureaursquos commitment to confidentiality Wage rates for a temporary work force are impacted by the strength of the economy and the competitiveness of the job market As a result of these external factors it is unlikely these risks could be retired and the corresponding estimates included for these discrete risks reduced until very late in the cycle The Census Bureau will continue to manage the 2020 Census Program to the objective assumptions contained within the LCCE that is based on the higher threshold assumptions noted in the self-response and wage risks above and be continuously monitoring external conditions and their impact on these assumptions
Even though the program may carry these risks throughout the entire life-cycle the Bureau is committed to managing this risk and minimizing the use of contingency funding For example the Census Bureau will invest in a robust communications and partnership program designed to promote self-response through accurate and timely information about data security and confidentiality A robust governance process is also in place at the Census Bureau and Department of Commerce to ensure that use of appropriated contingency funds of any type only occurs in valid cases of realizing andor actively mitigating risks or responding to evidence of costly deviations in operational parameters
Finally the Bureau does not expect the cost of the 2020 Census to change following the outcome of litigation regarding the inclusion of a citizenship question on the 2020 Census questionnaire However it is important to note that any reasonably foreseeable impacts to the operational assumptions for the 2020 Census underlying the LCCE are covered by the program risk funding
Version 20 June 10 2019
2020 Census Life-cycle Cost Estimates Executive Summary Page 17
Secretarial Contingency
The Secretarial Contingency represents the unknown-unknown category of risk to account for unforeseen risks such as a natural disaster driving residents of an area away from their residences leading up to Census Day for the 2020 Census This category is a 10 percent addition to the risk-adjusted cost in FY 2019 through FY 2023 and 5 percent in FY 2018 To the extent that such a contingency is appropriated by Congress the Department of Commerce will only approve use of this contingency following a formal governance process involving the Census Bureau and Department of Commerce oversight entities for the 2020 Census program The direct cost assigned to the unknown-unknown risk was $1182 million The Census Bureau would only utilize funding made available under this category in situations where other contingency reserves had been fully exhausted or in situations so unforecastable and unknowable that the Census Bureau and Department of Commerce in addressing them should prudently choose to utilize funding in such a manner as to avoid impacting the future availability of program risk mitigation funds needed for the addressing of known risks that may be realized in the execution of the 2020 Census program
At the end of the risk and uncertainty analyses the risks and uncertainty were added to the point estimate to produce a total risk-adjusted cost estimate for the 2020 Census Program The risk-adjusted life-cycle cost was determined to be approximately $15625 billion (including overhead)
33 Estimation Tools
The 2020 Census is a large and complex operation and therefore the cost estimate that supports it is also large and complex To accommodate the operation the 2020 Census LCCE is built within the Decennial Budget Integration Tool (DBIT) system DBIT is a suite of applications used by the Decennial Programs to support cost estimation budget planning and execution and contracts management functions for the 2020 Census and other programs It consists of a database data collection webapp mathematical model and analysisreporting tools Part of the DBIT application suite comprises the IBM Cognos platform which provides two major capabilities TM1 is an enterprise planning tool that provides advanced Online Analytical Processing (OLAP) and reporting capabilities9 and the Analytics capability enables highly-capable analysis and interactive reporting of cost information
The point estimate is developed and modeled using Cognos TM1 TM1 can accommodate the entire planning cycle and allows for modeling the cost of complex programs such as the 2020
9 TM1 is an IBM tool that enables the generation of cost estimates with higher levels of dimensionality precision accountability and reporting The enterprise planning capabilities of TM1 are well-suited for detailed modeling of the cost of complex programs comprised of multiple products and operations which require hundreds or thousands of variables TM1 Performance Modeler can produce estimates under multiple model scenarios using groups of inputs that conform an internally-consistent regarding the estimate
Version 20 June 10 2019
2020 Census Life-cycle Cost Estimates Executive Summary Page 18
Census Hundreds of variables across the 35 operations were incorporated into the model to generate a total cost estimate for the 2020 Census Within the 2020 Census LCCE there are 1151 data cubes and over 1859 inputs and assumptions There are 73000 summary cost records The use of the IBM Cognos platform provides the 2020 Census LCCE with the ability to use multi-dimensional cubes to bring data sets to bear for calculations analyses and reference
4 Ground Rules amp Assumptions
41 Inflation
All costs are presented in then-year (also called current-year) dollars Then-year dollars are those that have been inflated using an established inflation rate that are expressed in the year when the disbursements or expenditures are expected to occur The 2020 Census uses the Chained Price Index (CPI) from the Office of Management and Budgetrsquos (OMBrsquos) Table 101 entitled Gross Domestic Product and Deflators Used in the Historic Tables 1940-2022
42 Major Assumptions
The major assumptions changed from the October 2017 Version 10 of the LCCE and the relative scale of impact on the overall cost (as denoted by a MajorMinor +-) are shown in Table 3 below
Table 3 Major Assumptions and Impact of Changes
Item Change Driver Impact on
LCCE
Late Self‐Response During Nonresponse Followup (NRFU)
Increased from 625 to 655 Expected increase based on results from earlier field tests including the 2018 End‐to‐End Census Test that leaving a notice at nonresponding housing units which states itrsquos not too late to self‐respond will increase overall self‐response
Major ndash
Shift in Primary Enumeration Method Designation from Update Leave to Mailed‐out Invitations
Increased designation of housing units invited by mail to self‐respond from 1335 million to 1400 million
Decreased designation of Update Leave housing units where an enumerator leaves an invitation to self‐respond while double checking the address list from 119 million to 66 million
Updated analysis by Census Bureau subject matter experts
Updated analysis by Census Bureau subject matter experts
Minor +
Version 20 June 10 2019
2020 Census Life-cycle Cost Estimates Executive Summary Page 19
Nonresponse Followup (NRFU) Workload and Productivity
Added a single NRFU visit to double check nonresponding housing units resolved by using administrative records
Increased NRFU productivity from 125 caseshour to 155 caseshour
Updated operational assumption to align with updated operational plans following 2018 End‐to‐End Census Test experiences
Expected increase based on results from the 2018 End‐to‐End Census Test
Offsetting Net Minor ndash
Major Contracts Overall decrease due to re‐estimation
Updated cost data from contract award system and contract renegotiation reconciliation with the DOC ICE and greater ability to define requirements at low levels Updates led to major decreases in Field IT Deployment (FITd) and the removal of portions of CEDCaP from the program baseline after FY 2018 partially offset by smaller increases in Technical Integration Census Questionnaire Assistance and Decennial Device as a Service (dDaaS)
Offsetting Net Major ndash
Coverage Improvement
Modified Coverage Improvement quality follow‐up cost estimation method
Updated cost estimate to align with updated operational plans that activity will be conducted by phone
Major ndash
Information Technology Maturity
Increased support to ensure systems readiness and security for buildup deployment and closeout
Updated operational assumption to align with updated operational plans
Major +
Strengthening Program Management and Operational Planning
Increased support to continue robust program management
To align with GAO recommendations and industry best practices further strengthened program management IT program management cost schedule and risk management Includes added investments in the planning and management of the partnership and communications program
Major +
5 POINT ESTIMATE amp RISK ADJUSTMENTS
51 The Cost Estimation Results
This section discusses the summary costs of the 2020 Census LCCE
Version 20 June 10 2019
--------
2020 Census Life-cycle Cost Estimates Executive Summary Page 20
Table 4 Cost1 Estimate Summary (In Millions) below presents the estimated life-cycle cost (including overhead) for each of the WBS level-2 elements of the Census Bureau WBS Response Data which includes most costs associated with the actual collection of data by multiple means and other supporting activities such as printing distribution and questionnaire support accounts for almost one third of the total cost of the 2020 Census at $5480 billion Infrastructure with a cost of $3432 billion is the second largest cost component this WBS element includes the required IT and field operations investments as well as the infrastructure required to support logistic management and service centers Census Survey and Engineering which includes systems engineering and integration system security content and forms design and language services is the third largest component with $2055 billion followed by Program Management at $1789 billion
Table 4 Cost1 Estimate Summary (In Millions)
Fiscal Year
1 ‐ Program Manage‐ ment 2
2 ‐ Census Survey
Engineering 3
3 ‐ Frame
4 ‐ Response Data 4
5 ‐ Published
Data
6 ‐ Test Evaluation
and Special Censuses
7 ‐ Infra‐ structure 5
8 ‐ Secretarial Contingency
Grand Total
2012 9 16 3 6 1 17 12 ‐ 63
2013 8 8 4 8 3 26 41 ‐ 99
2014 20 18 27 18 11 48 85 ‐ 227
2015 41 16 26 56 15 94 93 ‐ 340
2016 99 118 82 91 32 83 145 ‐ 650
2017 65 194 55 177 23 39 238 ‐ 791
2018 87 342 67 249 15 40 270 6 1075
2019 369 468 294 1048 24 97 814 359 3473
2020 846 480 66 3662 26 190 1409 669 7348
2021 170 238 37 128 29 107 226 91 1025
2022 51 132 15 19 27 23 61 39 368
2023 25 24 14 18 13 12 39 19 165
Total 1789 2055 690 5480 220 777 3432 1182 15625
1 Actual costs displayed for fiscal years 2012-2018 are sourced from the Commerce Business System (CBS) as of October 2018
2 This framework contains $1108 billion in program risk in addition to $681 million in programmatic costs
3 This framework contains $46 million in program risk in addition to $2009 billion in programmatic costs
4 This framework contains $492 million in program risk in addition to $4988 billion in programmatic costs
5 This framework contains $56 million in program risk in addition to $3376 billion in programmatic costs
Version 20 June 10 2019
bull bull - bull bull bull bull
- bull bull
- =
2020 Census Life-cycle Cost Estimates Executive Summary Page 21
52 Detailed Costs by WBS Category
Additional details are provided for each level-2 WBS element within this section providing specific insights and more granular cost breakdown A visual representation of the overall program cost is displayed in Figure 8 2020 LCCE Costs by Level-2 WBS below
Given the nature of the program the majority of the Census operations occurs between FY 2019 and FY 2020 During this period $1082 billion of the projected $15625 billion 2020 Census costs (nearly 70 percent of the total costs) are expected to be incurred this highlights the significant concentration of expenditure in those years as well as the importance of prior preparation to deploy investments and operations efficiently over this period of intense activity and the potential for significant deviations in cost
$00
$10
$20
$30
$40
$50
$60
$70
$80
2012 2013 2014 2015 2016 2017 2018 2019 2020 2021 2022 2023
Total C
ost (Billions)
Fiscal Year
8 ‐ Secretarial Contingency
7 ‐ Infrastructure
6 ‐ Test Evaluation Special Censuses
5 ‐ Published Data
4 ‐ Response Data
3 ‐ Frame
2 ‐ CensusSurvey Engineering
1 ‐ Program Management
Figure 8 2020 LCCE Costs by Level-2 WBS
Version 20 June 10 2019
-_ - - II I -
2020 Census Life-cycle Cost Estimates Executive Summary Page 22
Program Management Costs
The Program Management element which includes all activities that implement and support policies processes and control functions oriented to improve the efficiency of operations and management of the program accounts for $1789 billion (including bureau overheads) over the lifespan of the 2020 Census Program (representing eleven percent of total program cost) The program management costs are shown in Figure 9 Program Management Costs by WBS Level 3
Program risk direct costs to mitigate risk and uncertainty are the largest contributor to program management costs during the program implementation phase (FY19-FY21) estimated at $1108 billion Program risk contingencies account for inherent uncertainties captured through Monte Carlo simulations as well as certain discrete risks from the risk register that could require additional program oversight scheduling or other supporting efforts
Programmatic costs for Program Management are estimated at $681 million (including bureau overheads)
$0
$100
$200
$300
$400
$500
$600
$700
$800
$900
2012 2013 2014 2015 2016 2017 2018 2019 2020 2021 2022 2023
Total C
ost (Millions)
Fiscal Year
02 ‐ Program Risk
01 ‐ Program Management
Figure 9 Program Management Costs by WBS Level 3
Version 20 June 10 2019
I -
2020 Census Life-cycle Cost Estimates Executive Summary Page 23
CensusSurvey Engineering Costs
CensusSurvey Engineering costs are estimated at $2055 billion (including bureau overheads) over the lifespan of the 2020 Census Program representing 13 percent of the life-cycle cost of the program An overview of the CensusSurvey Engineering costs is displayed below in Figure 10 CensusSurvey Engineering Costs by WBS Level 3 Programmatic costs for CensusSurvey engineering are estimated at $2009 billion (including overheads) Additional direct program risk costs are estimated at $46 million
Systems Design and Integration (SEI) is by far the main driver of program costs associated with CensusSurvey Engineering This is consistent with expectations for a program of this size which is developing an integrated system-of-systems to complete its innovative redesign The concentration of SEI costs around the implementation phase of the program is indicative of potential high technical integration and testing costs and risks to deliver the 2020 Census system of systems The vast majority of the total life-cycle direct cost for the Technical Integration (TI) contract of $134 billion is captured in CensusSurvey Engineering (Note that a small portion ($71 million) of the total TI contract ($14 billion) is aligned with specific operations in the Response Data and Infrastructure WBS Level 3 elements
CensusSurvey Design is the second largest component of costs under this WBS category Though substantially smaller than its SEI counterpart it includes the operational (readiness integration and testing) and demographic (content and forms) design of surveys
$0
$100
$200
$300
$400
$500
$600
2012 2013 2014 2015 2016 2017 2018 2019 2020 2021 2022 2023
Total C
ost (Millions)
Fiscal Year
04 ‐ Program Risk
03 ‐ Policy
02 ‐ Systems Design and Integration
01 ‐ CensusSurvey Design
Figure 10 CensusSurvey Engineering Costs by WBS Level 3
Version 20 June 10 2019
I
2020 Census Life-cycle Cost Estimates Executive Summary Page 24
Frame Costs
Geographic Frame activities costs are estimated at $690 million (including bureau overheads) which represents four percent of the programrsquos total life-cycle cost These are the costs spent by the program with the goal of developing a high-quality address and geospatial frame that serves as the universe for the enumeration activities
Address Frame the delivery of a complete and accurate address list and spatial database for enumeration and includes the type and characteristics of each living quarter is the main driver of the cost associated with frame activities The second highest costs are a result of the Geospatial Frame effort which provides the geographic foundation to support data collection and tabulation activities
As depicted in Figure 11 Frame Costs by WBS Level 3 below the spike in Address Frame costs in FY 2019 is a result of the in-field address canvassing operational cost of $185 million (excluding contingency) which is executed prior to the deployment of 2020 Census field enumeration operations
$0
$50
$100
$150
$200
$250
$300
$350
2012 2013 2014 2015 2016 2017 2018 2019 2020 2021 2022 2023
Total C
ost (Millions)
Fiscal Year
02 ‐ Geospatial Frame
01 ‐ Address Frame
Figure 11 Frame Costs by WBS Level 3
Version 20 June 10 2019
= = l1 LJ =
2020 Census Life-cycle Cost Estimates Executive Summary Page 25
Response Data Costs
The total life-cycle cost for Response Data is $5480 billion (including bureau overheads) representing 35 percent of the total 2020 Census estimate and is the largest cost element for the 2020 Census Program It consists of activities to collect information from 2020 Census respondents by multiple means of communication including all operations associated with the gathering of responses management of cases and initial processing of the data Figure 12 Response Data Costs by WBS Level 3 below provides an overview of the Response Data costs Programmatic costs for Response Data are estimated at $4988 billion (including overheads) Additional direct program risk costs are estimated at $492 million Included in this direct program risk cost is all of the $300 million for Additional Sensitivity Analysis
The concentration of forecasted expenses in FY 2020 reflects the nature of Response Data which involves activities interrelated with deployed field resources to perform the collection of Census data
Nearly half of the Response Data cost in FY 2020 corresponds to Computer Assisted Personal Interview (CAPI) files which includes Nonresponse Followup at a direct cost of $14 billion one of the costliest activities of the 2020 Census The direct costs for Respondent Outreach is at $880 million which includes advertising and partnership This is followed by Advertising and Computer Assisted Telephone Interview (CATI) files which includes the Census Questionnaire Assistance (CQA) contract with an estimated direct cost of $802 million Device DevelopmentProcurement is the next costliest and includes the Decennial Device as a Service Contract (dDaaS) with estimated direct costs of $447 million
$00
$05
$10
$15
$20
$25
$30
$35
$40
2012 2013 2014 2015 2016 2017 2018 2019 2020 2021 2022 2023
Total C
ost (Billions)
Fiscal Year
09 ‐ Program Risk
08 ‐ Device DevelopmentProcurement 07 ‐ Respondent Outreach
06 ‐ Unedited Data
05 ‐ Internet Data Collected Files 04 ‐ Paper Files
03 ‐ CATI Files
02 ‐ Mailout
01 ‐ CAPI Files
Figure 12 Response Data Costs by WBS Level 3
Version 20 June 10 2019
-
2020 Census Life-cycle Cost Estimates Executive Summary Page 26
Published Data Costs
Published Data is the least costly level-2 WBS activity with life-cycle costs of $220 million (including bureau overheads) which represents one percent of the 2020 Census life-cycle cost Even though Published Data accounts for a very small portion of the overall cost it provides high-value activities which include supporting imputation of data and adjustments data review and analysis tabulation and data product dissemination An overview of the Published Data costs is provided in Figure 13 Published Data Costs by WBS Level 3 below
The highest cost within Published Data is Data Products which includes the preparation review approval and dissemination of final data products Data Products costs are most pronounced in FY 2020 and FY 2022 when the most relevant intermediate and final products are completed and released Tabbed data which includes data reviews analysis and tabulation is the second largest cost driver within this category Its cost profile year-over-year however is smoother than Data Products given the more continuous nature of its associated activities
Itrsquos important to note that the Center for Enterprise Dissemination Services and Consumer Innovation (CEDSCI) the system which will be used to disseminate the 2020 Census data is not part of the LCCErsquos scope and therefore is not reflected in these life-cycle costs CEDSCI is an enterprise system and therefore is budgeted and managed outside of the 2020 Census program
$0
$5
$10
$15
$20
$25
$30
$35
2012 2013 2014 2015 2016 2017 2018 2019 2020 2021 2022 2023
Total C
ost (Millions)
Fiscal Year
03 ‐ Data Products
02 ‐ Tabbed Data
01 ‐ Edited Data
Figure 13 Published Data Costs by WBS Level 3
Version 20 June 10 2019
I
I I I - I
= =
2020 Census Life-cycle Cost Estimates Executive Summary Page 27
Test Evaluation and Special Census Costs
Test Evaluation and Special Censuses element is estimated at $777 million (including bureau overheads) or five percent of the 2020 Census life-cycle costs and is illustrated in Figure 14 Test Evaluation and Special Censuses Costs by WBS Level 3 This level-2 WBS element is comprised of two relatively unrelated sets of activities Test and Evaluation and Special Censuses
Test and Evaluation involves conducting tests throughout the decade aimed at investigating specific research questions and objectives needed to make decisions on important aspects of the 2020 Census operational design This included the costs of field andor self-response testing in every fiscal year from 2012 to 2019 It also assesses the quality of the 2020 Census and is the start of preparations for the 2030 Census Decennial Program It includes coverage measurement as well as evaluations and experiments It covers the Post Enumeration Survey and sample the identification of matches between the 2020 Census and the survey (an independent collection of information for the coverage measurement sample) the development of measures of success and the early planning activities to support the transition and design of the 2030 Census Coverage measurement Census tests and research and planning are the activities that require the largest uses of funds within Test Evaluation and Special Census estimated at $583 million (including overheads)
Special Census includes the enumeration of residents of the Islands Areas of American Samoa Northern Mariana Guam and the Virgin Islands The cost of Special Censuses at $80 million (including overheads) is a relatively small portion of the total cost of this level-2 WBS element
$0
$20
$40
$60
$80
$100
$120
$140
$160
$180
$200
2012 2013 2014 2015 2016 2017 2018 2019 2020 2021 2022 2023
Total C
ost (Millions)
Fiscal Year
07 ‐ Census 2020 Tests
06 ‐ 2030 Research and Planning
05 ‐ 2020 Research and Planning
04 ‐ 2020 Evaluations
03 ‐ Puerto Rico
02 ‐ Island Areas Enumeration
01 ‐ Post‐Enumeration Survey
Figure 14 Test Evaluation and Special Censuses Costs by WBS Level 3
Version 20 June 10 2019
2020 Census Life-cycle Cost Estimates Executive Summary Page 28
Infrastructure Costs
Infrastructure is the second-highest level-2 cost element of the WBS totaling $3432 billion (including bureau overheads) or 22 percent of the 2020 Census life-cycle cost Nearly half of Infrastructurersquos life-cycle costs are expected to be incurred in FY 2020 when field office infrastructure10 staff office space and equipment usages peak along with non-Headquarters staffing operations (such as training recruiting and onboarding) Programmatic costs for Infrastructure are estimated at $3376 billion (including overheads) Additional direct program risk costs are estimated at $56 million
The life-cycle direct costs of ACO and RCC office staff are $968 million and the ACO and RCC space direct costs are $265 million The life-cycle cost also includes the Field IT (FITd) infrastructure contract which was awarded late in FY 2018 The life-cycle direct cost for the FITd contract in the LCCE is $122 million (of which $21 million is in Response WBS) See Figure 15 Infrastructure Costs by WBS Level 3 below for the breakdown of Infrastructure costs
Consistent with the peak infrastructure spending in FY 2020 program risk is included in the prior-years to mitigate potential operational risks described previously Program Risk costs are projected in the FY19 and FY 20 to account for the risks with deployment and execution
IT infrastructure though not as costly as other Infrastructure components began peaking earlier than those (starting in FY 2016) as IT needed to be ready for deployment before the additional staff would be hired and the space and other infrastructure would be fielded
This includes Area Census Offices (ACO) and Regional Census Centers (RCC)
Version 20 June 10 2019
10
-
I =
2020 Census Life-cycle Cost Estimates Executive Summary Page 29
$00
$02
$04
$06
$08
$10
$12
$14
$16
2012 2013 2014 2015 2016 2017 2018 2019 2020 2021 2022 2023
Total C
ost (Billions)
Fiscal Year
08 ‐ Program Risk
07 ‐ Administrative Support
06 ‐ IT Infrastructure
05 ‐ Non‐HQ Staffing Operations
04 ‐ Field StaffOffice Support
03 ‐ Field Office InfrastructureLogistics
02 ‐ Field Office Management and Admin Support
01 ‐ Administrative Records Data
Figure 15 Infrastructure Costs by WBS Level 3
53 IT Costs
Since the 2020 Census will be the most automated decennial census in history and includes many technological innovations IT investments have contributed to a large portion of the overall program costs These investments for this decade will lay the foundation for a new decennial census design framework for decades to come Though IT expenses are embedded throughout the 2020 Census WBS structure this section focuses on IT-specific costs
The cost estimators developed a multi-step process to estimate the IT components of each operation and WBS element This process does not apply uniformly to all IT components but includes the integration of past execution data as well as cost estimates produced parametrically andor by analogy with past estimates or similar systems The LCCE team utilized the list of systems developed by Census Bureaursquos Enterprise Architecture Group (EAG) along with other IT elements to achieve a comprehensive estimate of all IT costs in the 2020 Census To describe this two categories were developed by the LCCE team to align the IT costs to the LCCE WBS These categories and their descriptions are shown below
The associated IT Cost Categories are provided in Table 5 2020 Census IT Cost Categories
Version 20 June 10 2019
- - bull bull I r r r T T T I I -T T r
2020 Census Life-cycle Cost Estimates Executive Summary Page 30
Table 5 2020 Census IT Cost Categories
IT Cost Category Description IT (Systems and Services) Systems on the EAGrsquos systems list that support the 2020 census
and the service contracts that support IT development maintenance etc (such as the Technical Integration contract)
Census Enterprise Data Collection and Processing (CEDCaP)
An enterprise system for data collection and processing that is being developed to support data collection and response processing first for the 2020 census and later other Census Bureau surveys and censuses
The graph below in Figure 16 IT Costs by Fiscal Year illustrates the breakout of costs by 2020 IT Services and Systems and 2020 CEDCaP In this graph the 2020 IT Services and Systems costs are the largest element of IT costs in the 2020 Census LCCE
The total cost for IT is estimated at $5035 billion (including overhead)
$00
$02
$04
$06
$08
$10
$12
$14
$16
$18
$20
2012 2013 2014 2015 2016 2017 2018 2019 2020 2021 2022 2023
Total C
ost (Billions)
Fiscal Year
CEDCaP
IT
Figure 16 IT Costs by Fiscal Year
2020 IT Systems and Services Cost Details
The 2020 IT Systems represent system capabilities funded by the 2020 Census These systems include many small and relatively inexpensive systems including Decennial Response Processing System and Integrated Logistics Management System but also includes larger and more expensive systems including Census Schedule A Hiring Recruiting and Payroll System Geographic imagery and matching systems and the Decennial Tabulation System
Version 20 June 10 2019
-~--~--_ _______
2020 Census Life-cycle Cost Estimates Executive Summary Page 31
Supporting the development and integration of these systems are the 2020 enterprise IT Services which largely contain contract costs but also includes infrastructure costs The major contracts in this category include Census Questionnaire Assistance (CQA) Decennial Device as a Service (dDaaS) Field IT Deployment (FITd) and Technical Integration which were all referenced above in the WBS Level 2 elements each is aligned with It also includes the cost of IT infrastructure provided in the Census Bureaursquos data center related to the 2020 Census and the costs related to security assessment and testing prior to the issuance of an authority to operate
CEDCaP Cost Details
CEDCaP is the enterprise system that supports data collection for not only the decennial census but other censuses as well This is a major investment that peaks in FY 2017 and FY 2018 to support the 2018 End-to-End Test and lays the foundation for the ramp up to the 2020 decennial census This was budgeted as an enterprise investment after FY 2018 so only costs of operating and maintaining these systems and scaling them up for the 2020 Census are included in this iteration of the LCCE after FY 2018
54 LCCE Leading Elements of Cost
The life-cycle cost of the 2020 Census is largely driven by a select few categories The primary four cost elements account for over 50 percent of the overall costs of the LCCE Major IT Contracts Field Operations Risk-Based Contingency and Level of Effort and Program Management This is illustrated in Table 6 2020 Census LCCE below that shows the individual and cumulative percent of costs Note that the five bottom cost elements account for a small portion (approximately 20 percent) of the total cost
Table 6 2020 Census LCCE Leading Elements of Cost
Cost Element Cost ($M) of Total Cumulative
Major IT Contracts $3095 20 20
Field Operations $1815 12 31
Program Risk $1703 11 42
Level of Effort and Program Management $1646 11 53
Census Bureau Overheads $1549 10 63
ACORCC Staff Space Supplies Kits $1412 9 72
Secretarial Contingency $1182 7 79
Partnership and Advertising $870 6 85
Other $753 5 90
Systems Engineering and IT Infrastructure $758 5 95
Printing Postage Paper Processing $461 3 98
C‐SHaRPS and Employee Check $382 2 100
Grand Total $15625 100 100
Version 20 June 10 2019
I
I I I I I bull I bull I
2020 Census Life-cycle Cost Estimates Executive Summary Page 32
Costs by Budget Object Class
The federal governmentrsquos standard chart of accounts utilizes a standard set of budget categories called Budget Object Classes (BOC) Funds are allocated using BOC The BOC provide a view of the 2020 Census LCCE costs by resource category Figure 17 Life-cycle Costs by Object Class provides a view of the major cost elements by BOC This graph highlights the cost significance of contracted services within the 2020 Census LCCE
$00 $20 $40 $60
Contracted Services
FTE Salary and Benefits
Program Risk
Overhead
Secretarial Contingency
Other
Printing and Publications
Operation and Maintenance of Equipment
Federal BuildingOther Space Rentals
Travel
Total Cost (Billions)
Object Class for BOE
Figure 17 Life-cycle Costs by Object Class
55 Program Risk Reserves and Contingency
See Figure 8 2020 LCCE Costs by Level-2 WBS in section 52 Detailed Cost by WBS Category for additional details on the risk methodology employed and category definitions
Program Risk and Secretarial Contingency direct cost totals $2885 billion across the life-cycle of the program with the Program Risk costs embedded into the associated WBS level-2 elements discussed in section 52 Risks have been grouped into two main categories based on the level of risk awareness and program control Program Risk ($1703 billion) and Secretarial Contingency ($1182 billion) as shown in Figure 18 Program Risk and Contingency Breakdown below
After completing the risk analyses the calculated risk and uncertainty values were added to the point estimate subtotal to produce a risk-adjusted life-cycle cost estimate for the 2020 Census Program of $15625B
Version 20 June 10 2019
11 _ _ _
1---1---I I I
bull bull
2020 Census Life-cycle Cost Estimates Executive Summary Page 33
$00 $05 $10 $15 $20
Program Risk
Secretarial Contingency
Total Cost (Billions)
Figure 18 Program Risk and Contingency Breakdown
Figure 19 Contingency Costs by Fiscal Year below provides an overview of the scale and fiscal year time frame in which the Program Risk and Secretarial Contingency costs are allotted in the 2020 Census LCCE The majority of the costs 90 percent are in FY 2019 and FY 2020 the main years of the 2020 Census implementation
$00 $05 $10 $15 $20 $25
2023
2022
2021
2020
2019
2018
Total Cost (Billions)
Fiscal Year
Secretarial Contingency
Program Risk
Figure 19 Contingency Costs by Fiscal Year
Version 20 June 10 2019
2020 Census Life-cycle Cost Estimates Executive Summary Page 34
56 Independent Cost Reviews
The 2020 Census LCCE has been compared to three independent cost estimates (ICEs)11 in its developmental history GAO treats an ICE as a useful tool to determine the reasonableness of a cost estimate Specifically the GAO states
An ICE is considered one of the best and most reliable validation methods ICEs are typically performed by organizations higher in the decision-making process than the office performing the baseline estimate They provide an independent view of expected program costs that tests the program officersquos estimate for reasonableness Therefore ICEs can provide decision-makers with additional insight into a programrsquos potential costs ndash in part because they frequently use different methods and are less burdened with organizational bias Moreover ICEs tend to incorporate adequate risk and therefore tend to be more conservative in forecasting higher costs than the program office12
In all instances of comparisons of an ICE and the 2020 Census cost estimate there were differences in individual cost categories but the overall (total) cost was similar between the ICE and the 2020 Census Program Office Estimate (POE)13 The primary reason for the differences were the estimating method and the different application of contingency and uncertainty The results of the ICE to POE comparisons are shown in Table 7 Comparison to Independent Cost Estimates below
Table 7 Comparison to Independent Cost Estimates
May‐16 POE DBO $10989 ‐2 $1323 ‐31 $12312 ‐6
Jun‐16 ICE OCEAA $11229 NA $1931 NA $13160 NA
Apr‐17 POE DBO $10284 ‐10 $3196 106 $13480 ‐4
Aug‐17 ICE DOC OAM $11406 NA $1551 NA $14074 NA
Sep‐17 ICE DOC OAM $11406 NA $4218 NA $15625 NA
Nov‐17 POE DBO $11405 ‐0 $4224 ‐0 $15625 0
Mar‐19 POE DBO $11191 ‐1 $4434 3 $15625 NA
Mar‐19 ICE DOC OAM $11325 NA $4300 NA $15625 0
Date Estimate Estimator Direct Cost
Delta from ICE
Risk Uncertainty amp Overheads
Delta from ICE
Total Cost
Delta from ICE
11 An ICE is conducted by an independent organization using the same technical and procurement information used to develop the POE The ICE provides an unbiased test of a LCCErsquos reasonableness in terms of cost risk etc12 GAO Cost Estimating and Assessment Guide March 2009 GAO-09-3SP page 186 13 A POE is the official projected cost for a system or program that is formally submitted to justify budget requirements to higher headquarters Congress GAO and others
Version 20 June 10 2019
2020 Census Life-cycle Cost Estimates Executive Summary Page 35
The first ICE was conducted by the Census Bureaursquos Office of Cost Estimation and Assessment (OCEAA) beginning in FY 2015 and ending in June 2016 The differences between the point estimate (direct cost) was approximately two percent The OCEAA ICE used more conservative costs for mitigating risks and uncertainty and therefore the difference was just over 30 percent The total delta between the two estimates was 64 percent The differences between the ICE and the POE were reconciled in a series of meetings between the OCEAA ICE team and the 2020 Census LCCE The information from the reconciliation was used to update the POE
A second comparison was conducted between the April 2017 POE and an August 2017 ICE The second ICE was conducted by the DOCrsquos Office of Acquisition Management (OAM) which reports to the Office of the Secretary (OS) This ICE utilized a top-down approach that made use of newly available Census data on IT costs as well as more conservative risk and uncertainty assumptions The difference in direct costs (the point estimate) was just over 10 percent largely due to more direct reliance on 2010 Census historical operational assumptions However the OAM ICE assumed less costs to mitigate risk and uncertainty The overall difference was approximately 42
Following reconciliation between the April 2017 POE and the August 2017 ICE additional reconciliation occurred with the DOC OAM estimate in September 2017 The difference in risk and uncertainty between this latest estimate and the April 2017 POE accounted for the addition of $11 billion for the Secretarial contingency The results of the September 2017 reconciliation between the POE and DOC ICE was under one percent
The latest comparison of the 2020 Census POE to an ICE was completed during March 2019 The ICE was again prepared by the DOC OAM beginning in mid-2018 as one of the key recommendations of the Milestone 3 Review for the 2020 Census The purpose was to continue to refine the ICE reconciliation with updated program office estimates and actuals as well as the results of the 2018 End-to-End Census Test and system performance and scalability testing in FY 2019 The final difference in direct costs (the point estimate) was about one percent while the difference in risk and uncertainty was about three percent The delta between the two estimates (the current version) is zero at an aggregate level The ICE cost estimators increased their confidence level in the sufficiency of the $15625 billion cost estimate for the 2020 Census from 80 percent in FY 2017 to 86 percent in FY 2019 reflected by the increased ICE risk reserve within the same overall cost total
Version 20 June 10 2019
2020 Census Life-cycle Cost Estimates Executive Summary Page 36
6 CONCLUSION
The 2020 Decennial Census is a large and complex program that has a 12-year life-cycle and a projected total cost of $15625 billion The estimate includes the mobilization of technology office space people and infrastructure across the entire US and its territories As demonstrated in this Version 20 of the 2020 Census LCCE and its BoE the cost is of a large scale
The 2020 Census LCCE is a key tool for management to justify budget requirements support resource allocation decisions and to develop an informed understanding of the projected costs and risks of their programs A reliable LCCE will increase the probability of program success The Census Bureau will be using the 2020 Census LCCE to focus on delivering a cost-effective and high-quality census
Despite the challenges of developing improving and maintaining a reliable cost estimate for a program as large and complex as the 2020 Decennial census the Census Bureau is using certified cost estimators advanced tool sets and ongoing enhancements to internal controls to continuously improve the cost estimate This commitment is underscored by the close working relationship that the Decennial Programs Directorate has established with both GAO and the DOC The Census Bureau will continue to build upon and mature the 2020 Census LCCE and will be regularly updating the cost estimate with actual cost data that will assist in strengthening internal controls as the Census transitions into full execution
Version 20 June 10 2019
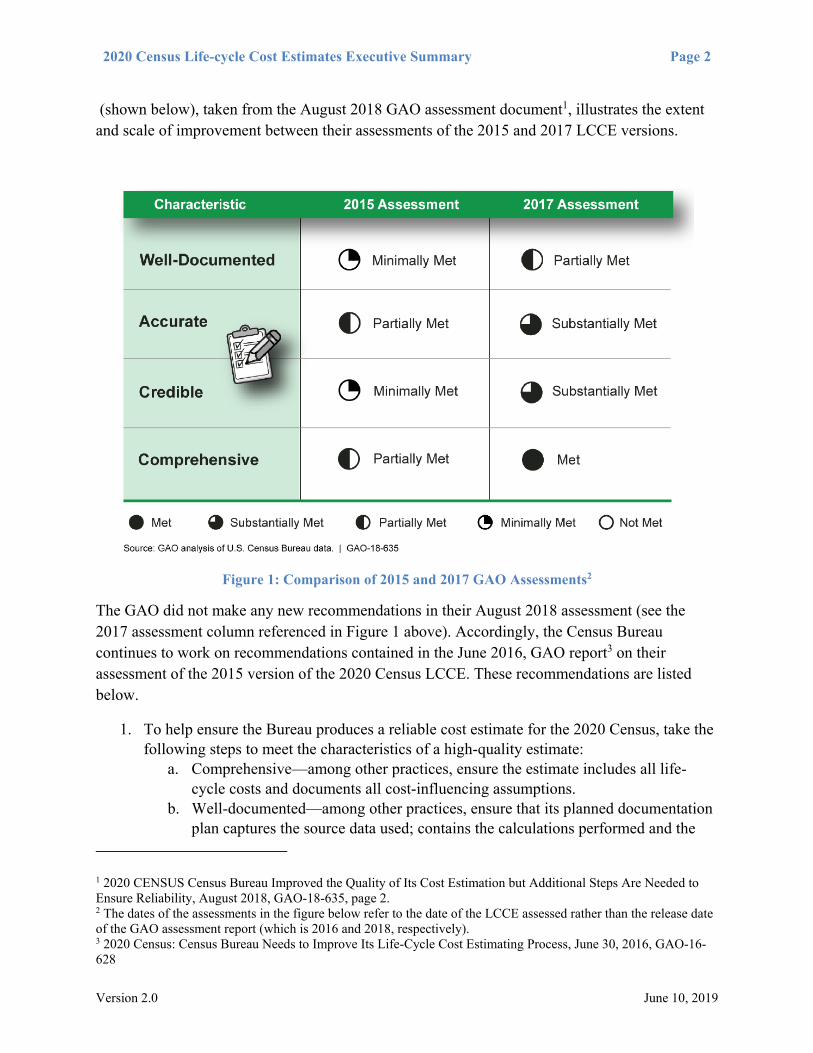
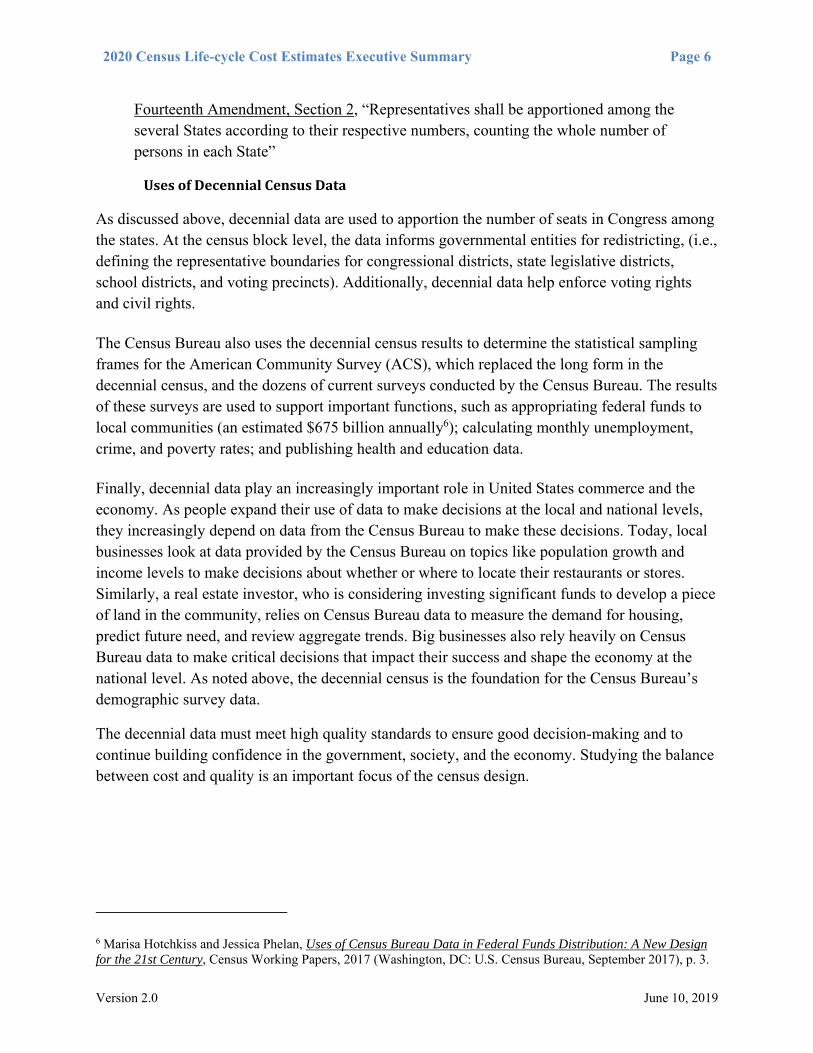
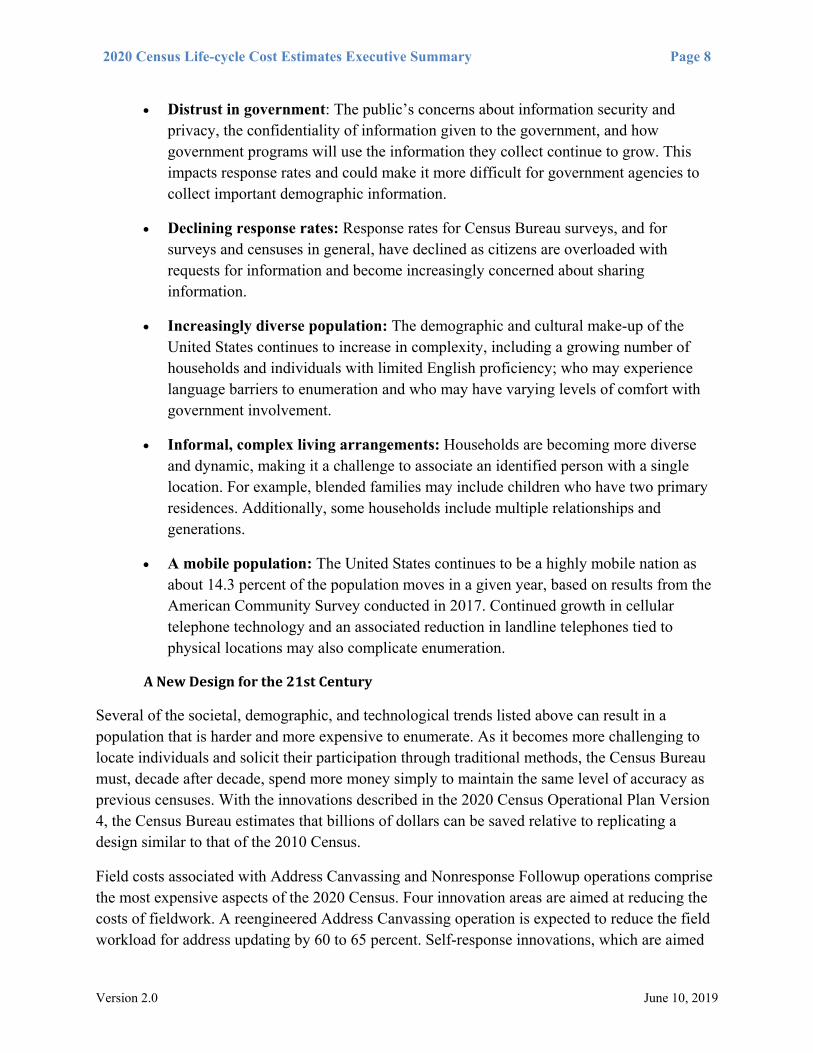
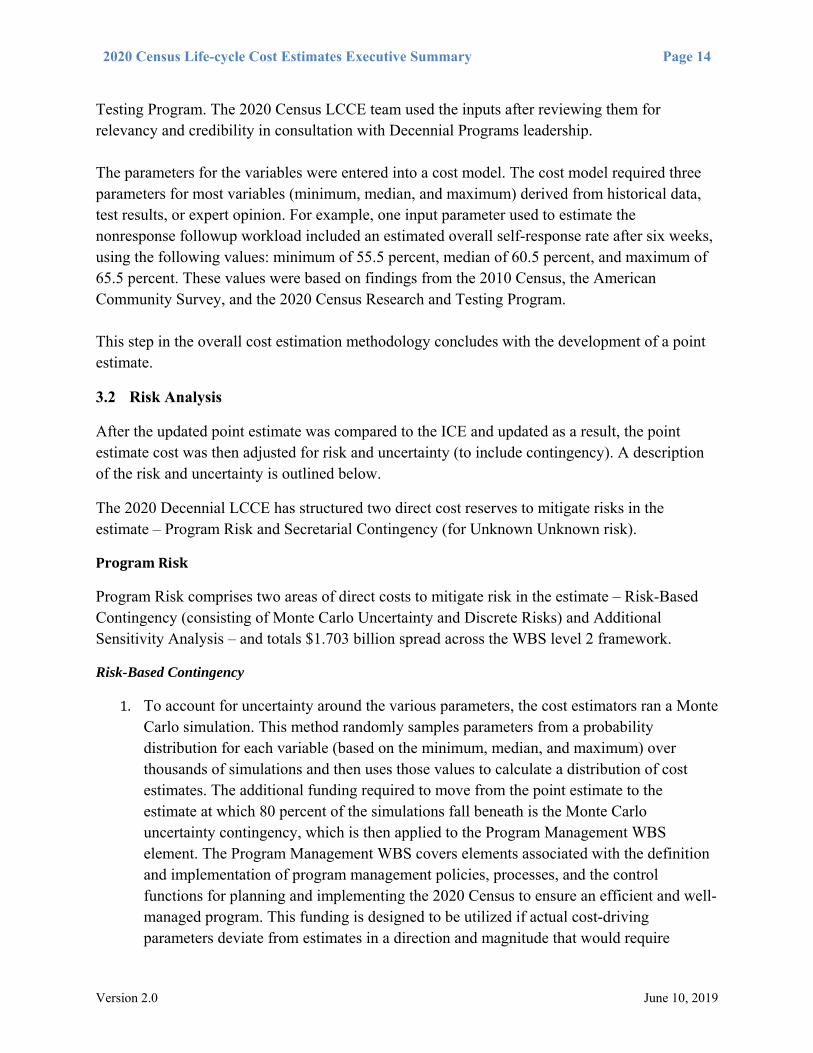
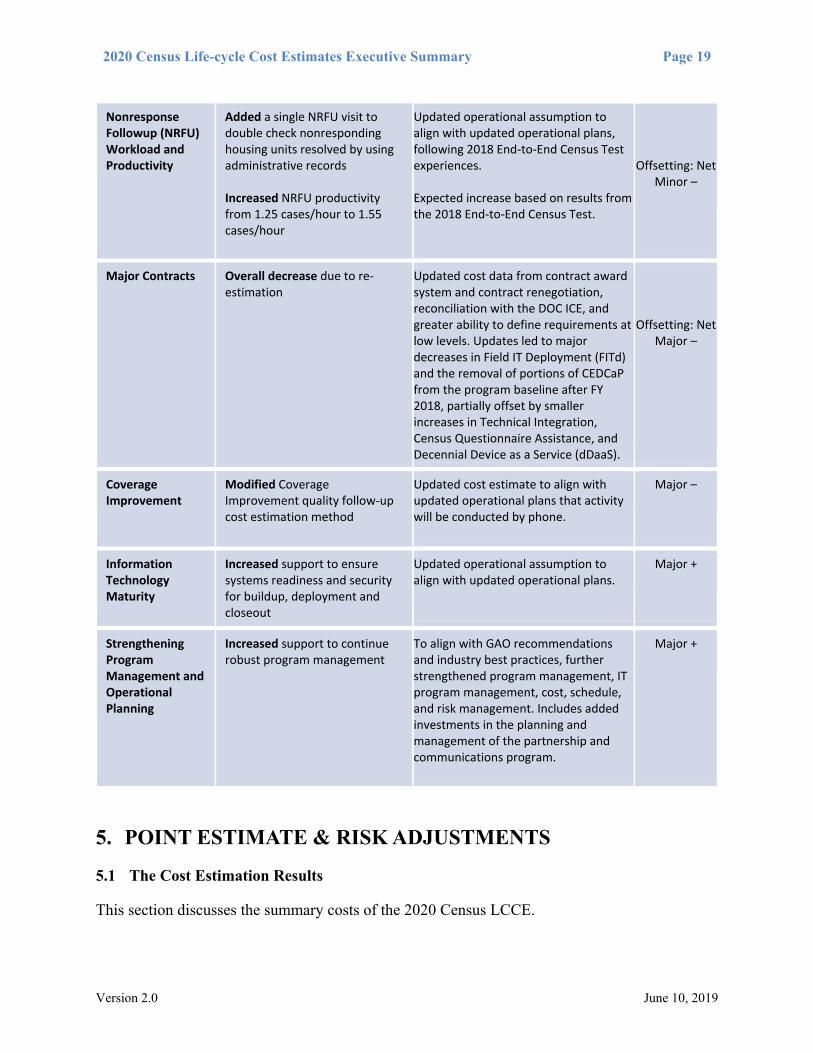

I
2020 Census Life-cycle Cost Estimates Executive Summary Page 24
Frame Costs
Geographic Frame activities costs are estimated at $690 million (including bureau overheads) which represents four percent of the programrsquos total life-cycle cost These are the costs spent by the program with the goal of developing a high-quality address and geospatial frame that serves as the universe for the enumeration activities
Address Frame the delivery of a complete and accurate address list and spatial database for enumeration and includes the type and characteristics of each living quarter is the main driver of the cost associated with frame activities The second highest costs are a result of the Geospatial Frame effort which provides the geographic foundation to support data collection and tabulation activities
As depicted in Figure 11 Frame Costs by WBS Level 3 below the spike in Address Frame costs in FY 2019 is a result of the in-field address canvassing operational cost of $185 million (excluding contingency) which is executed prior to the deployment of 2020 Census field enumeration operations
$0
$50
$100
$150
$200
$250
$300
$350
2012 2013 2014 2015 2016 2017 2018 2019 2020 2021 2022 2023
Total C
ost (Millions)
Fiscal Year
02 ‐ Geospatial Frame
01 ‐ Address Frame
Figure 11 Frame Costs by WBS Level 3
Version 20 June 10 2019
= = l1 LJ =
2020 Census Life-cycle Cost Estimates Executive Summary Page 25
Response Data Costs
The total life-cycle cost for Response Data is $5480 billion (including bureau overheads) representing 35 percent of the total 2020 Census estimate and is the largest cost element for the 2020 Census Program It consists of activities to collect information from 2020 Census respondents by multiple means of communication including all operations associated with the gathering of responses management of cases and initial processing of the data Figure 12 Response Data Costs by WBS Level 3 below provides an overview of the Response Data costs Programmatic costs for Response Data are estimated at $4988 billion (including overheads) Additional direct program risk costs are estimated at $492 million Included in this direct program risk cost is all of the $300 million for Additional Sensitivity Analysis
The concentration of forecasted expenses in FY 2020 reflects the nature of Response Data which involves activities interrelated with deployed field resources to perform the collection of Census data
Nearly half of the Response Data cost in FY 2020 corresponds to Computer Assisted Personal Interview (CAPI) files which includes Nonresponse Followup at a direct cost of $14 billion one of the costliest activities of the 2020 Census The direct costs for Respondent Outreach is at $880 million which includes advertising and partnership This is followed by Advertising and Computer Assisted Telephone Interview (CATI) files which includes the Census Questionnaire Assistance (CQA) contract with an estimated direct cost of $802 million Device DevelopmentProcurement is the next costliest and includes the Decennial Device as a Service Contract (dDaaS) with estimated direct costs of $447 million
$00
$05
$10
$15
$20
$25
$30
$35
$40
2012 2013 2014 2015 2016 2017 2018 2019 2020 2021 2022 2023
Total C
ost (Billions)
Fiscal Year
09 ‐ Program Risk
08 ‐ Device DevelopmentProcurement 07 ‐ Respondent Outreach
06 ‐ Unedited Data
05 ‐ Internet Data Collected Files 04 ‐ Paper Files
03 ‐ CATI Files
02 ‐ Mailout
01 ‐ CAPI Files
Figure 12 Response Data Costs by WBS Level 3
Version 20 June 10 2019
-
2020 Census Life-cycle Cost Estimates Executive Summary Page 26
Published Data Costs
Published Data is the least costly level-2 WBS activity with life-cycle costs of $220 million (including bureau overheads) which represents one percent of the 2020 Census life-cycle cost Even though Published Data accounts for a very small portion of the overall cost it provides high-value activities which include supporting imputation of data and adjustments data review and analysis tabulation and data product dissemination An overview of the Published Data costs is provided in Figure 13 Published Data Costs by WBS Level 3 below
The highest cost within Published Data is Data Products which includes the preparation review approval and dissemination of final data products Data Products costs are most pronounced in FY 2020 and FY 2022 when the most relevant intermediate and final products are completed and released Tabbed data which includes data reviews analysis and tabulation is the second largest cost driver within this category Its cost profile year-over-year however is smoother than Data Products given the more continuous nature of its associated activities
Itrsquos important to note that the Center for Enterprise Dissemination Services and Consumer Innovation (CEDSCI) the system which will be used to disseminate the 2020 Census data is not part of the LCCErsquos scope and therefore is not reflected in these life-cycle costs CEDSCI is an enterprise system and therefore is budgeted and managed outside of the 2020 Census program
$0
$5
$10
$15
$20
$25
$30
$35
2012 2013 2014 2015 2016 2017 2018 2019 2020 2021 2022 2023
Total C
ost (Millions)
Fiscal Year
03 ‐ Data Products
02 ‐ Tabbed Data
01 ‐ Edited Data
Figure 13 Published Data Costs by WBS Level 3
Version 20 June 10 2019
I
I I I - I
= =
2020 Census Life-cycle Cost Estimates Executive Summary Page 27
Test Evaluation and Special Census Costs
Test Evaluation and Special Censuses element is estimated at $777 million (including bureau overheads) or five percent of the 2020 Census life-cycle costs and is illustrated in Figure 14 Test Evaluation and Special Censuses Costs by WBS Level 3 This level-2 WBS element is comprised of two relatively unrelated sets of activities Test and Evaluation and Special Censuses
Test and Evaluation involves conducting tests throughout the decade aimed at investigating specific research questions and objectives needed to make decisions on important aspects of the 2020 Census operational design This included the costs of field andor self-response testing in every fiscal year from 2012 to 2019 It also assesses the quality of the 2020 Census and is the start of preparations for the 2030 Census Decennial Program It includes coverage measurement as well as evaluations and experiments It covers the Post Enumeration Survey and sample the identification of matches between the 2020 Census and the survey (an independent collection of information for the coverage measurement sample) the development of measures of success and the early planning activities to support the transition and design of the 2030 Census Coverage measurement Census tests and research and planning are the activities that require the largest uses of funds within Test Evaluation and Special Census estimated at $583 million (including overheads)
Special Census includes the enumeration of residents of the Islands Areas of American Samoa Northern Mariana Guam and the Virgin Islands The cost of Special Censuses at $80 million (including overheads) is a relatively small portion of the total cost of this level-2 WBS element
$0
$20
$40
$60
$80
$100
$120
$140
$160
$180
$200
2012 2013 2014 2015 2016 2017 2018 2019 2020 2021 2022 2023
Total C
ost (Millions)
Fiscal Year
07 ‐ Census 2020 Tests
06 ‐ 2030 Research and Planning
05 ‐ 2020 Research and Planning
04 ‐ 2020 Evaluations
03 ‐ Puerto Rico
02 ‐ Island Areas Enumeration
01 ‐ Post‐Enumeration Survey
Figure 14 Test Evaluation and Special Censuses Costs by WBS Level 3
Version 20 June 10 2019
2020 Census Life-cycle Cost Estimates Executive Summary Page 28
Infrastructure Costs
Infrastructure is the second-highest level-2 cost element of the WBS totaling $3432 billion (including bureau overheads) or 22 percent of the 2020 Census life-cycle cost Nearly half of Infrastructurersquos life-cycle costs are expected to be incurred in FY 2020 when field office infrastructure10 staff office space and equipment usages peak along with non-Headquarters staffing operations (such as training recruiting and onboarding) Programmatic costs for Infrastructure are estimated at $3376 billion (including overheads) Additional direct program risk costs are estimated at $56 million
The life-cycle direct costs of ACO and RCC office staff are $968 million and the ACO and RCC space direct costs are $265 million The life-cycle cost also includes the Field IT (FITd) infrastructure contract which was awarded late in FY 2018 The life-cycle direct cost for the FITd contract in the LCCE is $122 million (of which $21 million is in Response WBS) See Figure 15 Infrastructure Costs by WBS Level 3 below for the breakdown of Infrastructure costs
Consistent with the peak infrastructure spending in FY 2020 program risk is included in the prior-years to mitigate potential operational risks described previously Program Risk costs are projected in the FY19 and FY 20 to account for the risks with deployment and execution
IT infrastructure though not as costly as other Infrastructure components began peaking earlier than those (starting in FY 2016) as IT needed to be ready for deployment before the additional staff would be hired and the space and other infrastructure would be fielded
This includes Area Census Offices (ACO) and Regional Census Centers (RCC)
Version 20 June 10 2019
10
-
I =
2020 Census Life-cycle Cost Estimates Executive Summary Page 29
$00
$02
$04
$06
$08
$10
$12
$14
$16
2012 2013 2014 2015 2016 2017 2018 2019 2020 2021 2022 2023
Total C
ost (Billions)
Fiscal Year
08 ‐ Program Risk
07 ‐ Administrative Support
06 ‐ IT Infrastructure
05 ‐ Non‐HQ Staffing Operations
04 ‐ Field StaffOffice Support
03 ‐ Field Office InfrastructureLogistics
02 ‐ Field Office Management and Admin Support
01 ‐ Administrative Records Data
Figure 15 Infrastructure Costs by WBS Level 3
53 IT Costs
Since the 2020 Census will be the most automated decennial census in history and includes many technological innovations IT investments have contributed to a large portion of the overall program costs These investments for this decade will lay the foundation for a new decennial census design framework for decades to come Though IT expenses are embedded throughout the 2020 Census WBS structure this section focuses on IT-specific costs
The cost estimators developed a multi-step process to estimate the IT components of each operation and WBS element This process does not apply uniformly to all IT components but includes the integration of past execution data as well as cost estimates produced parametrically andor by analogy with past estimates or similar systems The LCCE team utilized the list of systems developed by Census Bureaursquos Enterprise Architecture Group (EAG) along with other IT elements to achieve a comprehensive estimate of all IT costs in the 2020 Census To describe this two categories were developed by the LCCE team to align the IT costs to the LCCE WBS These categories and their descriptions are shown below
The associated IT Cost Categories are provided in Table 5 2020 Census IT Cost Categories
Version 20 June 10 2019
- - bull bull I r r r T T T I I -T T r
2020 Census Life-cycle Cost Estimates Executive Summary Page 30
Table 5 2020 Census IT Cost Categories
IT Cost Category Description IT (Systems and Services) Systems on the EAGrsquos systems list that support the 2020 census
and the service contracts that support IT development maintenance etc (such as the Technical Integration contract)
Census Enterprise Data Collection and Processing (CEDCaP)
An enterprise system for data collection and processing that is being developed to support data collection and response processing first for the 2020 census and later other Census Bureau surveys and censuses
The graph below in Figure 16 IT Costs by Fiscal Year illustrates the breakout of costs by 2020 IT Services and Systems and 2020 CEDCaP In this graph the 2020 IT Services and Systems costs are the largest element of IT costs in the 2020 Census LCCE
The total cost for IT is estimated at $5035 billion (including overhead)
$00
$02
$04
$06
$08
$10
$12
$14
$16
$18
$20
2012 2013 2014 2015 2016 2017 2018 2019 2020 2021 2022 2023
Total C
ost (Billions)
Fiscal Year
CEDCaP
IT
Figure 16 IT Costs by Fiscal Year
2020 IT Systems and Services Cost Details
The 2020 IT Systems represent system capabilities funded by the 2020 Census These systems include many small and relatively inexpensive systems including Decennial Response Processing System and Integrated Logistics Management System but also includes larger and more expensive systems including Census Schedule A Hiring Recruiting and Payroll System Geographic imagery and matching systems and the Decennial Tabulation System
Version 20 June 10 2019
-~--~--_ _______
2020 Census Life-cycle Cost Estimates Executive Summary Page 31
Supporting the development and integration of these systems are the 2020 enterprise IT Services which largely contain contract costs but also includes infrastructure costs The major contracts in this category include Census Questionnaire Assistance (CQA) Decennial Device as a Service (dDaaS) Field IT Deployment (FITd) and Technical Integration which were all referenced above in the WBS Level 2 elements each is aligned with It also includes the cost of IT infrastructure provided in the Census Bureaursquos data center related to the 2020 Census and the costs related to security assessment and testing prior to the issuance of an authority to operate
CEDCaP Cost Details
CEDCaP is the enterprise system that supports data collection for not only the decennial census but other censuses as well This is a major investment that peaks in FY 2017 and FY 2018 to support the 2018 End-to-End Test and lays the foundation for the ramp up to the 2020 decennial census This was budgeted as an enterprise investment after FY 2018 so only costs of operating and maintaining these systems and scaling them up for the 2020 Census are included in this iteration of the LCCE after FY 2018
54 LCCE Leading Elements of Cost
The life-cycle cost of the 2020 Census is largely driven by a select few categories The primary four cost elements account for over 50 percent of the overall costs of the LCCE Major IT Contracts Field Operations Risk-Based Contingency and Level of Effort and Program Management This is illustrated in Table 6 2020 Census LCCE below that shows the individual and cumulative percent of costs Note that the five bottom cost elements account for a small portion (approximately 20 percent) of the total cost
Table 6 2020 Census LCCE Leading Elements of Cost
Cost Element Cost ($M) of Total Cumulative
Major IT Contracts $3095 20 20
Field Operations $1815 12 31
Program Risk $1703 11 42
Level of Effort and Program Management $1646 11 53
Census Bureau Overheads $1549 10 63
ACORCC Staff Space Supplies Kits $1412 9 72
Secretarial Contingency $1182 7 79
Partnership and Advertising $870 6 85
Other $753 5 90
Systems Engineering and IT Infrastructure $758 5 95
Printing Postage Paper Processing $461 3 98
C‐SHaRPS and Employee Check $382 2 100
Grand Total $15625 100 100
Version 20 June 10 2019
I
I I I I I bull I bull I
2020 Census Life-cycle Cost Estimates Executive Summary Page 32
Costs by Budget Object Class
The federal governmentrsquos standard chart of accounts utilizes a standard set of budget categories called Budget Object Classes (BOC) Funds are allocated using BOC The BOC provide a view of the 2020 Census LCCE costs by resource category Figure 17 Life-cycle Costs by Object Class provides a view of the major cost elements by BOC This graph highlights the cost significance of contracted services within the 2020 Census LCCE
$00 $20 $40 $60
Contracted Services
FTE Salary and Benefits
Program Risk
Overhead
Secretarial Contingency
Other
Printing and Publications
Operation and Maintenance of Equipment
Federal BuildingOther Space Rentals
Travel
Total Cost (Billions)
Object Class for BOE
Figure 17 Life-cycle Costs by Object Class
55 Program Risk Reserves and Contingency
See Figure 8 2020 LCCE Costs by Level-2 WBS in section 52 Detailed Cost by WBS Category for additional details on the risk methodology employed and category definitions
Program Risk and Secretarial Contingency direct cost totals $2885 billion across the life-cycle of the program with the Program Risk costs embedded into the associated WBS level-2 elements discussed in section 52 Risks have been grouped into two main categories based on the level of risk awareness and program control Program Risk ($1703 billion) and Secretarial Contingency ($1182 billion) as shown in Figure 18 Program Risk and Contingency Breakdown below
After completing the risk analyses the calculated risk and uncertainty values were added to the point estimate subtotal to produce a risk-adjusted life-cycle cost estimate for the 2020 Census Program of $15625B
Version 20 June 10 2019
11 _ _ _
1---1---I I I
bull bull
2020 Census Life-cycle Cost Estimates Executive Summary Page 33
$00 $05 $10 $15 $20
Program Risk
Secretarial Contingency
Total Cost (Billions)
Figure 18 Program Risk and Contingency Breakdown
Figure 19 Contingency Costs by Fiscal Year below provides an overview of the scale and fiscal year time frame in which the Program Risk and Secretarial Contingency costs are allotted in the 2020 Census LCCE The majority of the costs 90 percent are in FY 2019 and FY 2020 the main years of the 2020 Census implementation
$00 $05 $10 $15 $20 $25
2023
2022
2021
2020
2019
2018
Total Cost (Billions)
Fiscal Year
Secretarial Contingency
Program Risk
Figure 19 Contingency Costs by Fiscal Year
Version 20 June 10 2019
2020 Census Life-cycle Cost Estimates Executive Summary Page 34
56 Independent Cost Reviews
The 2020 Census LCCE has been compared to three independent cost estimates (ICEs)11 in its developmental history GAO treats an ICE as a useful tool to determine the reasonableness of a cost estimate Specifically the GAO states
An ICE is considered one of the best and most reliable validation methods ICEs are typically performed by organizations higher in the decision-making process than the office performing the baseline estimate They provide an independent view of expected program costs that tests the program officersquos estimate for reasonableness Therefore ICEs can provide decision-makers with additional insight into a programrsquos potential costs ndash in part because they frequently use different methods and are less burdened with organizational bias Moreover ICEs tend to incorporate adequate risk and therefore tend to be more conservative in forecasting higher costs than the program office12
In all instances of comparisons of an ICE and the 2020 Census cost estimate there were differences in individual cost categories but the overall (total) cost was similar between the ICE and the 2020 Census Program Office Estimate (POE)13 The primary reason for the differences were the estimating method and the different application of contingency and uncertainty The results of the ICE to POE comparisons are shown in Table 7 Comparison to Independent Cost Estimates below
Table 7 Comparison to Independent Cost Estimates
May‐16 POE DBO $10989 ‐2 $1323 ‐31 $12312 ‐6
Jun‐16 ICE OCEAA $11229 NA $1931 NA $13160 NA
Apr‐17 POE DBO $10284 ‐10 $3196 106 $13480 ‐4
Aug‐17 ICE DOC OAM $11406 NA $1551 NA $14074 NA
Sep‐17 ICE DOC OAM $11406 NA $4218 NA $15625 NA
Nov‐17 POE DBO $11405 ‐0 $4224 ‐0 $15625 0
Mar‐19 POE DBO $11191 ‐1 $4434 3 $15625 NA
Mar‐19 ICE DOC OAM $11325 NA $4300 NA $15625 0
Date Estimate Estimator Direct Cost
Delta from ICE
Risk Uncertainty amp Overheads
Delta from ICE
Total Cost
Delta from ICE
11 An ICE is conducted by an independent organization using the same technical and procurement information used to develop the POE The ICE provides an unbiased test of a LCCErsquos reasonableness in terms of cost risk etc12 GAO Cost Estimating and Assessment Guide March 2009 GAO-09-3SP page 186 13 A POE is the official projected cost for a system or program that is formally submitted to justify budget requirements to higher headquarters Congress GAO and others
Version 20 June 10 2019
2020 Census Life-cycle Cost Estimates Executive Summary Page 35
The first ICE was conducted by the Census Bureaursquos Office of Cost Estimation and Assessment (OCEAA) beginning in FY 2015 and ending in June 2016 The differences between the point estimate (direct cost) was approximately two percent The OCEAA ICE used more conservative costs for mitigating risks and uncertainty and therefore the difference was just over 30 percent The total delta between the two estimates was 64 percent The differences between the ICE and the POE were reconciled in a series of meetings between the OCEAA ICE team and the 2020 Census LCCE The information from the reconciliation was used to update the POE
A second comparison was conducted between the April 2017 POE and an August 2017 ICE The second ICE was conducted by the DOCrsquos Office of Acquisition Management (OAM) which reports to the Office of the Secretary (OS) This ICE utilized a top-down approach that made use of newly available Census data on IT costs as well as more conservative risk and uncertainty assumptions The difference in direct costs (the point estimate) was just over 10 percent largely due to more direct reliance on 2010 Census historical operational assumptions However the OAM ICE assumed less costs to mitigate risk and uncertainty The overall difference was approximately 42
Following reconciliation between the April 2017 POE and the August 2017 ICE additional reconciliation occurred with the DOC OAM estimate in September 2017 The difference in risk and uncertainty between this latest estimate and the April 2017 POE accounted for the addition of $11 billion for the Secretarial contingency The results of the September 2017 reconciliation between the POE and DOC ICE was under one percent
The latest comparison of the 2020 Census POE to an ICE was completed during March 2019 The ICE was again prepared by the DOC OAM beginning in mid-2018 as one of the key recommendations of the Milestone 3 Review for the 2020 Census The purpose was to continue to refine the ICE reconciliation with updated program office estimates and actuals as well as the results of the 2018 End-to-End Census Test and system performance and scalability testing in FY 2019 The final difference in direct costs (the point estimate) was about one percent while the difference in risk and uncertainty was about three percent The delta between the two estimates (the current version) is zero at an aggregate level The ICE cost estimators increased their confidence level in the sufficiency of the $15625 billion cost estimate for the 2020 Census from 80 percent in FY 2017 to 86 percent in FY 2019 reflected by the increased ICE risk reserve within the same overall cost total
Version 20 June 10 2019
2020 Census Life-cycle Cost Estimates Executive Summary Page 36
6 CONCLUSION
The 2020 Decennial Census is a large and complex program that has a 12-year life-cycle and a projected total cost of $15625 billion The estimate includes the mobilization of technology office space people and infrastructure across the entire US and its territories As demonstrated in this Version 20 of the 2020 Census LCCE and its BoE the cost is of a large scale
The 2020 Census LCCE is a key tool for management to justify budget requirements support resource allocation decisions and to develop an informed understanding of the projected costs and risks of their programs A reliable LCCE will increase the probability of program success The Census Bureau will be using the 2020 Census LCCE to focus on delivering a cost-effective and high-quality census
Despite the challenges of developing improving and maintaining a reliable cost estimate for a program as large and complex as the 2020 Decennial census the Census Bureau is using certified cost estimators advanced tool sets and ongoing enhancements to internal controls to continuously improve the cost estimate This commitment is underscored by the close working relationship that the Decennial Programs Directorate has established with both GAO and the DOC The Census Bureau will continue to build upon and mature the 2020 Census LCCE and will be regularly updating the cost estimate with actual cost data that will assist in strengthening internal controls as the Census transitions into full execution
Version 20 June 10 2019
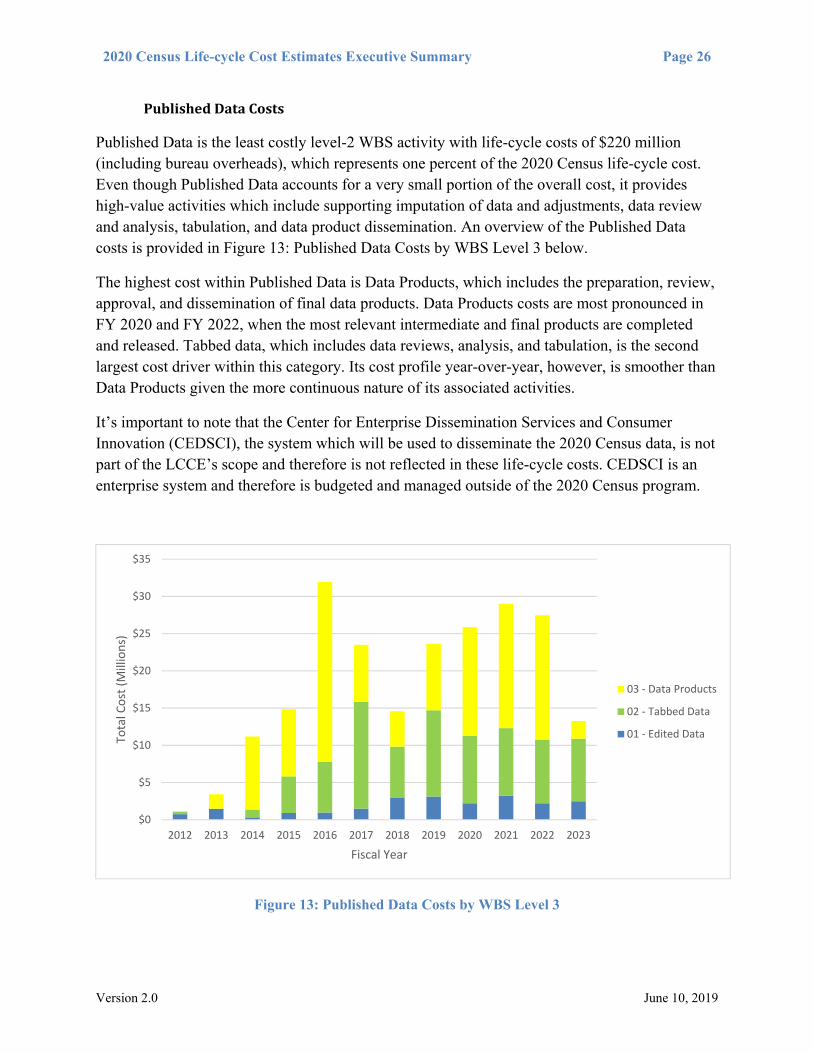
-
2020 Census Life-cycle Cost Estimates Executive Summary Page 26
Published Data Costs
Published Data is the least costly level-2 WBS activity with life-cycle costs of $220 million (including bureau overheads) which represents one percent of the 2020 Census life-cycle cost Even though Published Data accounts for a very small portion of the overall cost it provides high-value activities which include supporting imputation of data and adjustments data review and analysis tabulation and data product dissemination An overview of the Published Data costs is provided in Figure 13 Published Data Costs by WBS Level 3 below
The highest cost within Published Data is Data Products which includes the preparation review approval and dissemination of final data products Data Products costs are most pronounced in FY 2020 and FY 2022 when the most relevant intermediate and final products are completed and released Tabbed data which includes data reviews analysis and tabulation is the second largest cost driver within this category Its cost profile year-over-year however is smoother than Data Products given the more continuous nature of its associated activities
Itrsquos important to note that the Center for Enterprise Dissemination Services and Consumer Innovation (CEDSCI) the system which will be used to disseminate the 2020 Census data is not part of the LCCErsquos scope and therefore is not reflected in these life-cycle costs CEDSCI is an enterprise system and therefore is budgeted and managed outside of the 2020 Census program
$0
$5
$10
$15
$20
$25
$30
$35
2012 2013 2014 2015 2016 2017 2018 2019 2020 2021 2022 2023
Total C
ost (Millions)
Fiscal Year
03 ‐ Data Products
02 ‐ Tabbed Data
01 ‐ Edited Data
Figure 13 Published Data Costs by WBS Level 3
Version 20 June 10 2019
I
I I I - I
= =
2020 Census Life-cycle Cost Estimates Executive Summary Page 27
Test Evaluation and Special Census Costs
Test Evaluation and Special Censuses element is estimated at $777 million (including bureau overheads) or five percent of the 2020 Census life-cycle costs and is illustrated in Figure 14 Test Evaluation and Special Censuses Costs by WBS Level 3 This level-2 WBS element is comprised of two relatively unrelated sets of activities Test and Evaluation and Special Censuses
Test and Evaluation involves conducting tests throughout the decade aimed at investigating specific research questions and objectives needed to make decisions on important aspects of the 2020 Census operational design This included the costs of field andor self-response testing in every fiscal year from 2012 to 2019 It also assesses the quality of the 2020 Census and is the start of preparations for the 2030 Census Decennial Program It includes coverage measurement as well as evaluations and experiments It covers the Post Enumeration Survey and sample the identification of matches between the 2020 Census and the survey (an independent collection of information for the coverage measurement sample) the development of measures of success and the early planning activities to support the transition and design of the 2030 Census Coverage measurement Census tests and research and planning are the activities that require the largest uses of funds within Test Evaluation and Special Census estimated at $583 million (including overheads)
Special Census includes the enumeration of residents of the Islands Areas of American Samoa Northern Mariana Guam and the Virgin Islands The cost of Special Censuses at $80 million (including overheads) is a relatively small portion of the total cost of this level-2 WBS element
$0
$20
$40
$60
$80
$100
$120
$140
$160
$180
$200
2012 2013 2014 2015 2016 2017 2018 2019 2020 2021 2022 2023
Total C
ost (Millions)
Fiscal Year
07 ‐ Census 2020 Tests
06 ‐ 2030 Research and Planning
05 ‐ 2020 Research and Planning
04 ‐ 2020 Evaluations
03 ‐ Puerto Rico
02 ‐ Island Areas Enumeration
01 ‐ Post‐Enumeration Survey
Figure 14 Test Evaluation and Special Censuses Costs by WBS Level 3
Version 20 June 10 2019
2020 Census Life-cycle Cost Estimates Executive Summary Page 28
Infrastructure Costs
Infrastructure is the second-highest level-2 cost element of the WBS totaling $3432 billion (including bureau overheads) or 22 percent of the 2020 Census life-cycle cost Nearly half of Infrastructurersquos life-cycle costs are expected to be incurred in FY 2020 when field office infrastructure10 staff office space and equipment usages peak along with non-Headquarters staffing operations (such as training recruiting and onboarding) Programmatic costs for Infrastructure are estimated at $3376 billion (including overheads) Additional direct program risk costs are estimated at $56 million
The life-cycle direct costs of ACO and RCC office staff are $968 million and the ACO and RCC space direct costs are $265 million The life-cycle cost also includes the Field IT (FITd) infrastructure contract which was awarded late in FY 2018 The life-cycle direct cost for the FITd contract in the LCCE is $122 million (of which $21 million is in Response WBS) See Figure 15 Infrastructure Costs by WBS Level 3 below for the breakdown of Infrastructure costs
Consistent with the peak infrastructure spending in FY 2020 program risk is included in the prior-years to mitigate potential operational risks described previously Program Risk costs are projected in the FY19 and FY 20 to account for the risks with deployment and execution
IT infrastructure though not as costly as other Infrastructure components began peaking earlier than those (starting in FY 2016) as IT needed to be ready for deployment before the additional staff would be hired and the space and other infrastructure would be fielded
This includes Area Census Offices (ACO) and Regional Census Centers (RCC)
Version 20 June 10 2019
10
-
I =
2020 Census Life-cycle Cost Estimates Executive Summary Page 29
$00
$02
$04
$06
$08
$10
$12
$14
$16
2012 2013 2014 2015 2016 2017 2018 2019 2020 2021 2022 2023
Total C
ost (Billions)
Fiscal Year
08 ‐ Program Risk
07 ‐ Administrative Support
06 ‐ IT Infrastructure
05 ‐ Non‐HQ Staffing Operations
04 ‐ Field StaffOffice Support
03 ‐ Field Office InfrastructureLogistics
02 ‐ Field Office Management and Admin Support
01 ‐ Administrative Records Data
Figure 15 Infrastructure Costs by WBS Level 3
53 IT Costs
Since the 2020 Census will be the most automated decennial census in history and includes many technological innovations IT investments have contributed to a large portion of the overall program costs These investments for this decade will lay the foundation for a new decennial census design framework for decades to come Though IT expenses are embedded throughout the 2020 Census WBS structure this section focuses on IT-specific costs
The cost estimators developed a multi-step process to estimate the IT components of each operation and WBS element This process does not apply uniformly to all IT components but includes the integration of past execution data as well as cost estimates produced parametrically andor by analogy with past estimates or similar systems The LCCE team utilized the list of systems developed by Census Bureaursquos Enterprise Architecture Group (EAG) along with other IT elements to achieve a comprehensive estimate of all IT costs in the 2020 Census To describe this two categories were developed by the LCCE team to align the IT costs to the LCCE WBS These categories and their descriptions are shown below
The associated IT Cost Categories are provided in Table 5 2020 Census IT Cost Categories
Version 20 June 10 2019
- - bull bull I r r r T T T I I -T T r
2020 Census Life-cycle Cost Estimates Executive Summary Page 30
Table 5 2020 Census IT Cost Categories
IT Cost Category Description IT (Systems and Services) Systems on the EAGrsquos systems list that support the 2020 census
and the service contracts that support IT development maintenance etc (such as the Technical Integration contract)
Census Enterprise Data Collection and Processing (CEDCaP)
An enterprise system for data collection and processing that is being developed to support data collection and response processing first for the 2020 census and later other Census Bureau surveys and censuses
The graph below in Figure 16 IT Costs by Fiscal Year illustrates the breakout of costs by 2020 IT Services and Systems and 2020 CEDCaP In this graph the 2020 IT Services and Systems costs are the largest element of IT costs in the 2020 Census LCCE
The total cost for IT is estimated at $5035 billion (including overhead)
$00
$02
$04
$06
$08
$10
$12
$14
$16
$18
$20
2012 2013 2014 2015 2016 2017 2018 2019 2020 2021 2022 2023
Total C
ost (Billions)
Fiscal Year
CEDCaP
IT
Figure 16 IT Costs by Fiscal Year
2020 IT Systems and Services Cost Details
The 2020 IT Systems represent system capabilities funded by the 2020 Census These systems include many small and relatively inexpensive systems including Decennial Response Processing System and Integrated Logistics Management System but also includes larger and more expensive systems including Census Schedule A Hiring Recruiting and Payroll System Geographic imagery and matching systems and the Decennial Tabulation System
Version 20 June 10 2019
-~--~--_ _______
2020 Census Life-cycle Cost Estimates Executive Summary Page 31
Supporting the development and integration of these systems are the 2020 enterprise IT Services which largely contain contract costs but also includes infrastructure costs The major contracts in this category include Census Questionnaire Assistance (CQA) Decennial Device as a Service (dDaaS) Field IT Deployment (FITd) and Technical Integration which were all referenced above in the WBS Level 2 elements each is aligned with It also includes the cost of IT infrastructure provided in the Census Bureaursquos data center related to the 2020 Census and the costs related to security assessment and testing prior to the issuance of an authority to operate
CEDCaP Cost Details
CEDCaP is the enterprise system that supports data collection for not only the decennial census but other censuses as well This is a major investment that peaks in FY 2017 and FY 2018 to support the 2018 End-to-End Test and lays the foundation for the ramp up to the 2020 decennial census This was budgeted as an enterprise investment after FY 2018 so only costs of operating and maintaining these systems and scaling them up for the 2020 Census are included in this iteration of the LCCE after FY 2018
54 LCCE Leading Elements of Cost
The life-cycle cost of the 2020 Census is largely driven by a select few categories The primary four cost elements account for over 50 percent of the overall costs of the LCCE Major IT Contracts Field Operations Risk-Based Contingency and Level of Effort and Program Management This is illustrated in Table 6 2020 Census LCCE below that shows the individual and cumulative percent of costs Note that the five bottom cost elements account for a small portion (approximately 20 percent) of the total cost
Table 6 2020 Census LCCE Leading Elements of Cost
Cost Element Cost ($M) of Total Cumulative
Major IT Contracts $3095 20 20
Field Operations $1815 12 31
Program Risk $1703 11 42
Level of Effort and Program Management $1646 11 53
Census Bureau Overheads $1549 10 63
ACORCC Staff Space Supplies Kits $1412 9 72
Secretarial Contingency $1182 7 79
Partnership and Advertising $870 6 85
Other $753 5 90
Systems Engineering and IT Infrastructure $758 5 95
Printing Postage Paper Processing $461 3 98
C‐SHaRPS and Employee Check $382 2 100
Grand Total $15625 100 100
Version 20 June 10 2019
I
I I I I I bull I bull I
2020 Census Life-cycle Cost Estimates Executive Summary Page 32
Costs by Budget Object Class
The federal governmentrsquos standard chart of accounts utilizes a standard set of budget categories called Budget Object Classes (BOC) Funds are allocated using BOC The BOC provide a view of the 2020 Census LCCE costs by resource category Figure 17 Life-cycle Costs by Object Class provides a view of the major cost elements by BOC This graph highlights the cost significance of contracted services within the 2020 Census LCCE
$00 $20 $40 $60
Contracted Services
FTE Salary and Benefits
Program Risk
Overhead
Secretarial Contingency
Other
Printing and Publications
Operation and Maintenance of Equipment
Federal BuildingOther Space Rentals
Travel
Total Cost (Billions)
Object Class for BOE
Figure 17 Life-cycle Costs by Object Class
55 Program Risk Reserves and Contingency
See Figure 8 2020 LCCE Costs by Level-2 WBS in section 52 Detailed Cost by WBS Category for additional details on the risk methodology employed and category definitions
Program Risk and Secretarial Contingency direct cost totals $2885 billion across the life-cycle of the program with the Program Risk costs embedded into the associated WBS level-2 elements discussed in section 52 Risks have been grouped into two main categories based on the level of risk awareness and program control Program Risk ($1703 billion) and Secretarial Contingency ($1182 billion) as shown in Figure 18 Program Risk and Contingency Breakdown below
After completing the risk analyses the calculated risk and uncertainty values were added to the point estimate subtotal to produce a risk-adjusted life-cycle cost estimate for the 2020 Census Program of $15625B
Version 20 June 10 2019
11 _ _ _
1---1---I I I
bull bull
2020 Census Life-cycle Cost Estimates Executive Summary Page 33
$00 $05 $10 $15 $20
Program Risk
Secretarial Contingency
Total Cost (Billions)
Figure 18 Program Risk and Contingency Breakdown
Figure 19 Contingency Costs by Fiscal Year below provides an overview of the scale and fiscal year time frame in which the Program Risk and Secretarial Contingency costs are allotted in the 2020 Census LCCE The majority of the costs 90 percent are in FY 2019 and FY 2020 the main years of the 2020 Census implementation
$00 $05 $10 $15 $20 $25
2023
2022
2021
2020
2019
2018
Total Cost (Billions)
Fiscal Year
Secretarial Contingency
Program Risk
Figure 19 Contingency Costs by Fiscal Year
Version 20 June 10 2019
2020 Census Life-cycle Cost Estimates Executive Summary Page 34
56 Independent Cost Reviews
The 2020 Census LCCE has been compared to three independent cost estimates (ICEs)11 in its developmental history GAO treats an ICE as a useful tool to determine the reasonableness of a cost estimate Specifically the GAO states
An ICE is considered one of the best and most reliable validation methods ICEs are typically performed by organizations higher in the decision-making process than the office performing the baseline estimate They provide an independent view of expected program costs that tests the program officersquos estimate for reasonableness Therefore ICEs can provide decision-makers with additional insight into a programrsquos potential costs ndash in part because they frequently use different methods and are less burdened with organizational bias Moreover ICEs tend to incorporate adequate risk and therefore tend to be more conservative in forecasting higher costs than the program office12
In all instances of comparisons of an ICE and the 2020 Census cost estimate there were differences in individual cost categories but the overall (total) cost was similar between the ICE and the 2020 Census Program Office Estimate (POE)13 The primary reason for the differences were the estimating method and the different application of contingency and uncertainty The results of the ICE to POE comparisons are shown in Table 7 Comparison to Independent Cost Estimates below
Table 7 Comparison to Independent Cost Estimates
May‐16 POE DBO $10989 ‐2 $1323 ‐31 $12312 ‐6
Jun‐16 ICE OCEAA $11229 NA $1931 NA $13160 NA
Apr‐17 POE DBO $10284 ‐10 $3196 106 $13480 ‐4
Aug‐17 ICE DOC OAM $11406 NA $1551 NA $14074 NA
Sep‐17 ICE DOC OAM $11406 NA $4218 NA $15625 NA
Nov‐17 POE DBO $11405 ‐0 $4224 ‐0 $15625 0
Mar‐19 POE DBO $11191 ‐1 $4434 3 $15625 NA
Mar‐19 ICE DOC OAM $11325 NA $4300 NA $15625 0
Date Estimate Estimator Direct Cost
Delta from ICE
Risk Uncertainty amp Overheads
Delta from ICE
Total Cost
Delta from ICE
11 An ICE is conducted by an independent organization using the same technical and procurement information used to develop the POE The ICE provides an unbiased test of a LCCErsquos reasonableness in terms of cost risk etc12 GAO Cost Estimating and Assessment Guide March 2009 GAO-09-3SP page 186 13 A POE is the official projected cost for a system or program that is formally submitted to justify budget requirements to higher headquarters Congress GAO and others
Version 20 June 10 2019
2020 Census Life-cycle Cost Estimates Executive Summary Page 35
The first ICE was conducted by the Census Bureaursquos Office of Cost Estimation and Assessment (OCEAA) beginning in FY 2015 and ending in June 2016 The differences between the point estimate (direct cost) was approximately two percent The OCEAA ICE used more conservative costs for mitigating risks and uncertainty and therefore the difference was just over 30 percent The total delta between the two estimates was 64 percent The differences between the ICE and the POE were reconciled in a series of meetings between the OCEAA ICE team and the 2020 Census LCCE The information from the reconciliation was used to update the POE
A second comparison was conducted between the April 2017 POE and an August 2017 ICE The second ICE was conducted by the DOCrsquos Office of Acquisition Management (OAM) which reports to the Office of the Secretary (OS) This ICE utilized a top-down approach that made use of newly available Census data on IT costs as well as more conservative risk and uncertainty assumptions The difference in direct costs (the point estimate) was just over 10 percent largely due to more direct reliance on 2010 Census historical operational assumptions However the OAM ICE assumed less costs to mitigate risk and uncertainty The overall difference was approximately 42
Following reconciliation between the April 2017 POE and the August 2017 ICE additional reconciliation occurred with the DOC OAM estimate in September 2017 The difference in risk and uncertainty between this latest estimate and the April 2017 POE accounted for the addition of $11 billion for the Secretarial contingency The results of the September 2017 reconciliation between the POE and DOC ICE was under one percent
The latest comparison of the 2020 Census POE to an ICE was completed during March 2019 The ICE was again prepared by the DOC OAM beginning in mid-2018 as one of the key recommendations of the Milestone 3 Review for the 2020 Census The purpose was to continue to refine the ICE reconciliation with updated program office estimates and actuals as well as the results of the 2018 End-to-End Census Test and system performance and scalability testing in FY 2019 The final difference in direct costs (the point estimate) was about one percent while the difference in risk and uncertainty was about three percent The delta between the two estimates (the current version) is zero at an aggregate level The ICE cost estimators increased their confidence level in the sufficiency of the $15625 billion cost estimate for the 2020 Census from 80 percent in FY 2017 to 86 percent in FY 2019 reflected by the increased ICE risk reserve within the same overall cost total
Version 20 June 10 2019
2020 Census Life-cycle Cost Estimates Executive Summary Page 36
6 CONCLUSION
The 2020 Decennial Census is a large and complex program that has a 12-year life-cycle and a projected total cost of $15625 billion The estimate includes the mobilization of technology office space people and infrastructure across the entire US and its territories As demonstrated in this Version 20 of the 2020 Census LCCE and its BoE the cost is of a large scale
The 2020 Census LCCE is a key tool for management to justify budget requirements support resource allocation decisions and to develop an informed understanding of the projected costs and risks of their programs A reliable LCCE will increase the probability of program success The Census Bureau will be using the 2020 Census LCCE to focus on delivering a cost-effective and high-quality census
Despite the challenges of developing improving and maintaining a reliable cost estimate for a program as large and complex as the 2020 Decennial census the Census Bureau is using certified cost estimators advanced tool sets and ongoing enhancements to internal controls to continuously improve the cost estimate This commitment is underscored by the close working relationship that the Decennial Programs Directorate has established with both GAO and the DOC The Census Bureau will continue to build upon and mature the 2020 Census LCCE and will be regularly updating the cost estimate with actual cost data that will assist in strengthening internal controls as the Census transitions into full execution
Version 20 June 10 2019

I
I I I - I
= =
2020 Census Life-cycle Cost Estimates Executive Summary Page 27
Test Evaluation and Special Census Costs
Test Evaluation and Special Censuses element is estimated at $777 million (including bureau overheads) or five percent of the 2020 Census life-cycle costs and is illustrated in Figure 14 Test Evaluation and Special Censuses Costs by WBS Level 3 This level-2 WBS element is comprised of two relatively unrelated sets of activities Test and Evaluation and Special Censuses
Test and Evaluation involves conducting tests throughout the decade aimed at investigating specific research questions and objectives needed to make decisions on important aspects of the 2020 Census operational design This included the costs of field andor self-response testing in every fiscal year from 2012 to 2019 It also assesses the quality of the 2020 Census and is the start of preparations for the 2030 Census Decennial Program It includes coverage measurement as well as evaluations and experiments It covers the Post Enumeration Survey and sample the identification of matches between the 2020 Census and the survey (an independent collection of information for the coverage measurement sample) the development of measures of success and the early planning activities to support the transition and design of the 2030 Census Coverage measurement Census tests and research and planning are the activities that require the largest uses of funds within Test Evaluation and Special Census estimated at $583 million (including overheads)
Special Census includes the enumeration of residents of the Islands Areas of American Samoa Northern Mariana Guam and the Virgin Islands The cost of Special Censuses at $80 million (including overheads) is a relatively small portion of the total cost of this level-2 WBS element
$0
$20
$40
$60
$80
$100
$120
$140
$160
$180
$200
2012 2013 2014 2015 2016 2017 2018 2019 2020 2021 2022 2023
Total C
ost (Millions)
Fiscal Year
07 ‐ Census 2020 Tests
06 ‐ 2030 Research and Planning
05 ‐ 2020 Research and Planning
04 ‐ 2020 Evaluations
03 ‐ Puerto Rico
02 ‐ Island Areas Enumeration
01 ‐ Post‐Enumeration Survey
Figure 14 Test Evaluation and Special Censuses Costs by WBS Level 3
Version 20 June 10 2019
2020 Census Life-cycle Cost Estimates Executive Summary Page 28
Infrastructure Costs
Infrastructure is the second-highest level-2 cost element of the WBS totaling $3432 billion (including bureau overheads) or 22 percent of the 2020 Census life-cycle cost Nearly half of Infrastructurersquos life-cycle costs are expected to be incurred in FY 2020 when field office infrastructure10 staff office space and equipment usages peak along with non-Headquarters staffing operations (such as training recruiting and onboarding) Programmatic costs for Infrastructure are estimated at $3376 billion (including overheads) Additional direct program risk costs are estimated at $56 million
The life-cycle direct costs of ACO and RCC office staff are $968 million and the ACO and RCC space direct costs are $265 million The life-cycle cost also includes the Field IT (FITd) infrastructure contract which was awarded late in FY 2018 The life-cycle direct cost for the FITd contract in the LCCE is $122 million (of which $21 million is in Response WBS) See Figure 15 Infrastructure Costs by WBS Level 3 below for the breakdown of Infrastructure costs
Consistent with the peak infrastructure spending in FY 2020 program risk is included in the prior-years to mitigate potential operational risks described previously Program Risk costs are projected in the FY19 and FY 20 to account for the risks with deployment and execution
IT infrastructure though not as costly as other Infrastructure components began peaking earlier than those (starting in FY 2016) as IT needed to be ready for deployment before the additional staff would be hired and the space and other infrastructure would be fielded
This includes Area Census Offices (ACO) and Regional Census Centers (RCC)
Version 20 June 10 2019
10
-
I =
2020 Census Life-cycle Cost Estimates Executive Summary Page 29
$00
$02
$04
$06
$08
$10
$12
$14
$16
2012 2013 2014 2015 2016 2017 2018 2019 2020 2021 2022 2023
Total C
ost (Billions)
Fiscal Year
08 ‐ Program Risk
07 ‐ Administrative Support
06 ‐ IT Infrastructure
05 ‐ Non‐HQ Staffing Operations
04 ‐ Field StaffOffice Support
03 ‐ Field Office InfrastructureLogistics
02 ‐ Field Office Management and Admin Support
01 ‐ Administrative Records Data
Figure 15 Infrastructure Costs by WBS Level 3
53 IT Costs
Since the 2020 Census will be the most automated decennial census in history and includes many technological innovations IT investments have contributed to a large portion of the overall program costs These investments for this decade will lay the foundation for a new decennial census design framework for decades to come Though IT expenses are embedded throughout the 2020 Census WBS structure this section focuses on IT-specific costs
The cost estimators developed a multi-step process to estimate the IT components of each operation and WBS element This process does not apply uniformly to all IT components but includes the integration of past execution data as well as cost estimates produced parametrically andor by analogy with past estimates or similar systems The LCCE team utilized the list of systems developed by Census Bureaursquos Enterprise Architecture Group (EAG) along with other IT elements to achieve a comprehensive estimate of all IT costs in the 2020 Census To describe this two categories were developed by the LCCE team to align the IT costs to the LCCE WBS These categories and their descriptions are shown below
The associated IT Cost Categories are provided in Table 5 2020 Census IT Cost Categories
Version 20 June 10 2019
- - bull bull I r r r T T T I I -T T r
2020 Census Life-cycle Cost Estimates Executive Summary Page 30
Table 5 2020 Census IT Cost Categories
IT Cost Category Description IT (Systems and Services) Systems on the EAGrsquos systems list that support the 2020 census
and the service contracts that support IT development maintenance etc (such as the Technical Integration contract)
Census Enterprise Data Collection and Processing (CEDCaP)
An enterprise system for data collection and processing that is being developed to support data collection and response processing first for the 2020 census and later other Census Bureau surveys and censuses
The graph below in Figure 16 IT Costs by Fiscal Year illustrates the breakout of costs by 2020 IT Services and Systems and 2020 CEDCaP In this graph the 2020 IT Services and Systems costs are the largest element of IT costs in the 2020 Census LCCE
The total cost for IT is estimated at $5035 billion (including overhead)
$00
$02
$04
$06
$08
$10
$12
$14
$16
$18
$20
2012 2013 2014 2015 2016 2017 2018 2019 2020 2021 2022 2023
Total C
ost (Billions)
Fiscal Year
CEDCaP
IT
Figure 16 IT Costs by Fiscal Year
2020 IT Systems and Services Cost Details
The 2020 IT Systems represent system capabilities funded by the 2020 Census These systems include many small and relatively inexpensive systems including Decennial Response Processing System and Integrated Logistics Management System but also includes larger and more expensive systems including Census Schedule A Hiring Recruiting and Payroll System Geographic imagery and matching systems and the Decennial Tabulation System
Version 20 June 10 2019
-~--~--_ _______
2020 Census Life-cycle Cost Estimates Executive Summary Page 31
Supporting the development and integration of these systems are the 2020 enterprise IT Services which largely contain contract costs but also includes infrastructure costs The major contracts in this category include Census Questionnaire Assistance (CQA) Decennial Device as a Service (dDaaS) Field IT Deployment (FITd) and Technical Integration which were all referenced above in the WBS Level 2 elements each is aligned with It also includes the cost of IT infrastructure provided in the Census Bureaursquos data center related to the 2020 Census and the costs related to security assessment and testing prior to the issuance of an authority to operate
CEDCaP Cost Details
CEDCaP is the enterprise system that supports data collection for not only the decennial census but other censuses as well This is a major investment that peaks in FY 2017 and FY 2018 to support the 2018 End-to-End Test and lays the foundation for the ramp up to the 2020 decennial census This was budgeted as an enterprise investment after FY 2018 so only costs of operating and maintaining these systems and scaling them up for the 2020 Census are included in this iteration of the LCCE after FY 2018
54 LCCE Leading Elements of Cost
The life-cycle cost of the 2020 Census is largely driven by a select few categories The primary four cost elements account for over 50 percent of the overall costs of the LCCE Major IT Contracts Field Operations Risk-Based Contingency and Level of Effort and Program Management This is illustrated in Table 6 2020 Census LCCE below that shows the individual and cumulative percent of costs Note that the five bottom cost elements account for a small portion (approximately 20 percent) of the total cost
Table 6 2020 Census LCCE Leading Elements of Cost
Cost Element Cost ($M) of Total Cumulative
Major IT Contracts $3095 20 20
Field Operations $1815 12 31
Program Risk $1703 11 42
Level of Effort and Program Management $1646 11 53
Census Bureau Overheads $1549 10 63
ACORCC Staff Space Supplies Kits $1412 9 72
Secretarial Contingency $1182 7 79
Partnership and Advertising $870 6 85
Other $753 5 90
Systems Engineering and IT Infrastructure $758 5 95
Printing Postage Paper Processing $461 3 98
C‐SHaRPS and Employee Check $382 2 100
Grand Total $15625 100 100
Version 20 June 10 2019
I
I I I I I bull I bull I
2020 Census Life-cycle Cost Estimates Executive Summary Page 32
Costs by Budget Object Class
The federal governmentrsquos standard chart of accounts utilizes a standard set of budget categories called Budget Object Classes (BOC) Funds are allocated using BOC The BOC provide a view of the 2020 Census LCCE costs by resource category Figure 17 Life-cycle Costs by Object Class provides a view of the major cost elements by BOC This graph highlights the cost significance of contracted services within the 2020 Census LCCE
$00 $20 $40 $60
Contracted Services
FTE Salary and Benefits
Program Risk
Overhead
Secretarial Contingency
Other
Printing and Publications
Operation and Maintenance of Equipment
Federal BuildingOther Space Rentals
Travel
Total Cost (Billions)
Object Class for BOE
Figure 17 Life-cycle Costs by Object Class
55 Program Risk Reserves and Contingency
See Figure 8 2020 LCCE Costs by Level-2 WBS in section 52 Detailed Cost by WBS Category for additional details on the risk methodology employed and category definitions
Program Risk and Secretarial Contingency direct cost totals $2885 billion across the life-cycle of the program with the Program Risk costs embedded into the associated WBS level-2 elements discussed in section 52 Risks have been grouped into two main categories based on the level of risk awareness and program control Program Risk ($1703 billion) and Secretarial Contingency ($1182 billion) as shown in Figure 18 Program Risk and Contingency Breakdown below
After completing the risk analyses the calculated risk and uncertainty values were added to the point estimate subtotal to produce a risk-adjusted life-cycle cost estimate for the 2020 Census Program of $15625B
Version 20 June 10 2019
11 _ _ _
1---1---I I I
bull bull
2020 Census Life-cycle Cost Estimates Executive Summary Page 33
$00 $05 $10 $15 $20
Program Risk
Secretarial Contingency
Total Cost (Billions)
Figure 18 Program Risk and Contingency Breakdown
Figure 19 Contingency Costs by Fiscal Year below provides an overview of the scale and fiscal year time frame in which the Program Risk and Secretarial Contingency costs are allotted in the 2020 Census LCCE The majority of the costs 90 percent are in FY 2019 and FY 2020 the main years of the 2020 Census implementation
$00 $05 $10 $15 $20 $25
2023
2022
2021
2020
2019
2018
Total Cost (Billions)
Fiscal Year
Secretarial Contingency
Program Risk
Figure 19 Contingency Costs by Fiscal Year
Version 20 June 10 2019
2020 Census Life-cycle Cost Estimates Executive Summary Page 34
56 Independent Cost Reviews
The 2020 Census LCCE has been compared to three independent cost estimates (ICEs)11 in its developmental history GAO treats an ICE as a useful tool to determine the reasonableness of a cost estimate Specifically the GAO states
An ICE is considered one of the best and most reliable validation methods ICEs are typically performed by organizations higher in the decision-making process than the office performing the baseline estimate They provide an independent view of expected program costs that tests the program officersquos estimate for reasonableness Therefore ICEs can provide decision-makers with additional insight into a programrsquos potential costs ndash in part because they frequently use different methods and are less burdened with organizational bias Moreover ICEs tend to incorporate adequate risk and therefore tend to be more conservative in forecasting higher costs than the program office12
In all instances of comparisons of an ICE and the 2020 Census cost estimate there were differences in individual cost categories but the overall (total) cost was similar between the ICE and the 2020 Census Program Office Estimate (POE)13 The primary reason for the differences were the estimating method and the different application of contingency and uncertainty The results of the ICE to POE comparisons are shown in Table 7 Comparison to Independent Cost Estimates below
Table 7 Comparison to Independent Cost Estimates
May‐16 POE DBO $10989 ‐2 $1323 ‐31 $12312 ‐6
Jun‐16 ICE OCEAA $11229 NA $1931 NA $13160 NA
Apr‐17 POE DBO $10284 ‐10 $3196 106 $13480 ‐4
Aug‐17 ICE DOC OAM $11406 NA $1551 NA $14074 NA
Sep‐17 ICE DOC OAM $11406 NA $4218 NA $15625 NA
Nov‐17 POE DBO $11405 ‐0 $4224 ‐0 $15625 0
Mar‐19 POE DBO $11191 ‐1 $4434 3 $15625 NA
Mar‐19 ICE DOC OAM $11325 NA $4300 NA $15625 0
Date Estimate Estimator Direct Cost
Delta from ICE
Risk Uncertainty amp Overheads
Delta from ICE
Total Cost
Delta from ICE
11 An ICE is conducted by an independent organization using the same technical and procurement information used to develop the POE The ICE provides an unbiased test of a LCCErsquos reasonableness in terms of cost risk etc12 GAO Cost Estimating and Assessment Guide March 2009 GAO-09-3SP page 186 13 A POE is the official projected cost for a system or program that is formally submitted to justify budget requirements to higher headquarters Congress GAO and others
Version 20 June 10 2019
2020 Census Life-cycle Cost Estimates Executive Summary Page 35
The first ICE was conducted by the Census Bureaursquos Office of Cost Estimation and Assessment (OCEAA) beginning in FY 2015 and ending in June 2016 The differences between the point estimate (direct cost) was approximately two percent The OCEAA ICE used more conservative costs for mitigating risks and uncertainty and therefore the difference was just over 30 percent The total delta between the two estimates was 64 percent The differences between the ICE and the POE were reconciled in a series of meetings between the OCEAA ICE team and the 2020 Census LCCE The information from the reconciliation was used to update the POE
A second comparison was conducted between the April 2017 POE and an August 2017 ICE The second ICE was conducted by the DOCrsquos Office of Acquisition Management (OAM) which reports to the Office of the Secretary (OS) This ICE utilized a top-down approach that made use of newly available Census data on IT costs as well as more conservative risk and uncertainty assumptions The difference in direct costs (the point estimate) was just over 10 percent largely due to more direct reliance on 2010 Census historical operational assumptions However the OAM ICE assumed less costs to mitigate risk and uncertainty The overall difference was approximately 42
Following reconciliation between the April 2017 POE and the August 2017 ICE additional reconciliation occurred with the DOC OAM estimate in September 2017 The difference in risk and uncertainty between this latest estimate and the April 2017 POE accounted for the addition of $11 billion for the Secretarial contingency The results of the September 2017 reconciliation between the POE and DOC ICE was under one percent
The latest comparison of the 2020 Census POE to an ICE was completed during March 2019 The ICE was again prepared by the DOC OAM beginning in mid-2018 as one of the key recommendations of the Milestone 3 Review for the 2020 Census The purpose was to continue to refine the ICE reconciliation with updated program office estimates and actuals as well as the results of the 2018 End-to-End Census Test and system performance and scalability testing in FY 2019 The final difference in direct costs (the point estimate) was about one percent while the difference in risk and uncertainty was about three percent The delta between the two estimates (the current version) is zero at an aggregate level The ICE cost estimators increased their confidence level in the sufficiency of the $15625 billion cost estimate for the 2020 Census from 80 percent in FY 2017 to 86 percent in FY 2019 reflected by the increased ICE risk reserve within the same overall cost total
Version 20 June 10 2019
2020 Census Life-cycle Cost Estimates Executive Summary Page 36
6 CONCLUSION
The 2020 Decennial Census is a large and complex program that has a 12-year life-cycle and a projected total cost of $15625 billion The estimate includes the mobilization of technology office space people and infrastructure across the entire US and its territories As demonstrated in this Version 20 of the 2020 Census LCCE and its BoE the cost is of a large scale
The 2020 Census LCCE is a key tool for management to justify budget requirements support resource allocation decisions and to develop an informed understanding of the projected costs and risks of their programs A reliable LCCE will increase the probability of program success The Census Bureau will be using the 2020 Census LCCE to focus on delivering a cost-effective and high-quality census
Despite the challenges of developing improving and maintaining a reliable cost estimate for a program as large and complex as the 2020 Decennial census the Census Bureau is using certified cost estimators advanced tool sets and ongoing enhancements to internal controls to continuously improve the cost estimate This commitment is underscored by the close working relationship that the Decennial Programs Directorate has established with both GAO and the DOC The Census Bureau will continue to build upon and mature the 2020 Census LCCE and will be regularly updating the cost estimate with actual cost data that will assist in strengthening internal controls as the Census transitions into full execution
Version 20 June 10 2019
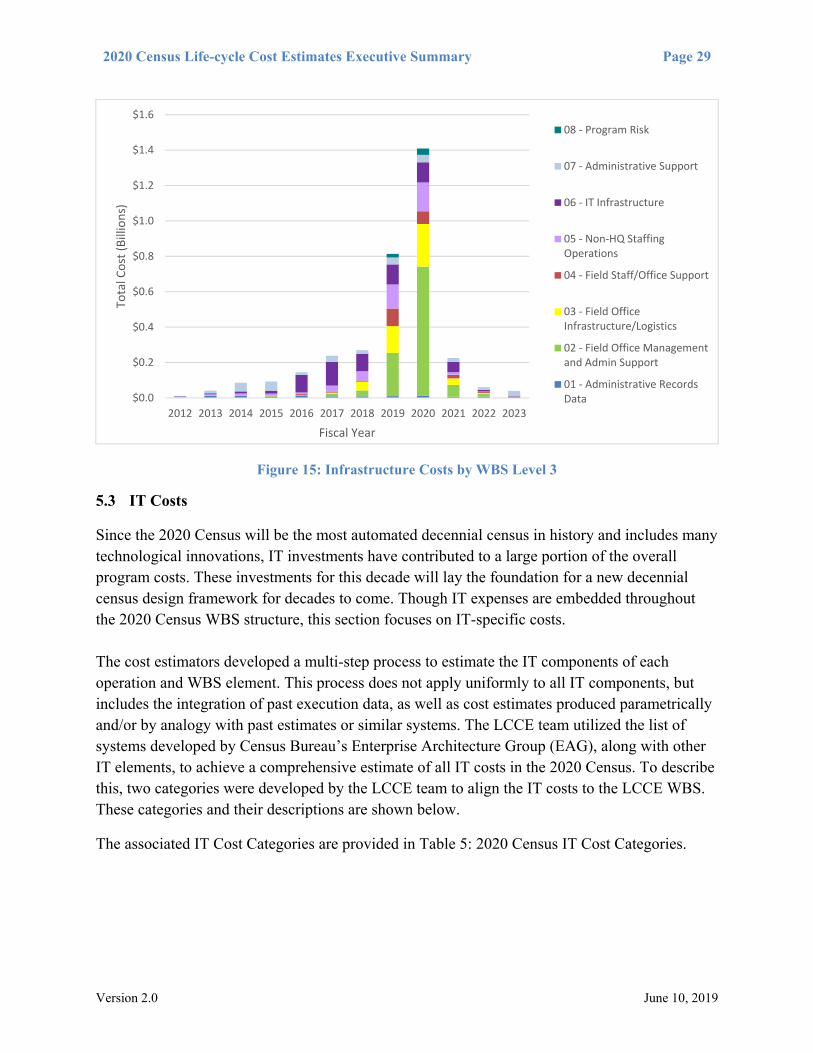
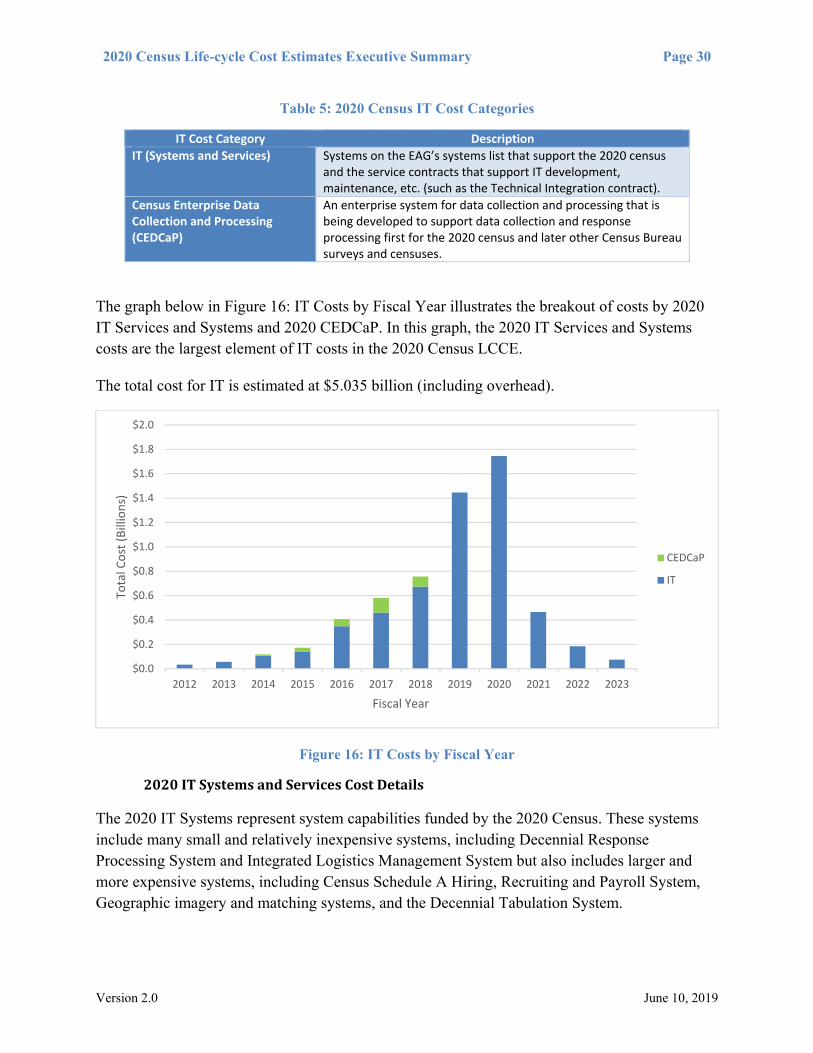
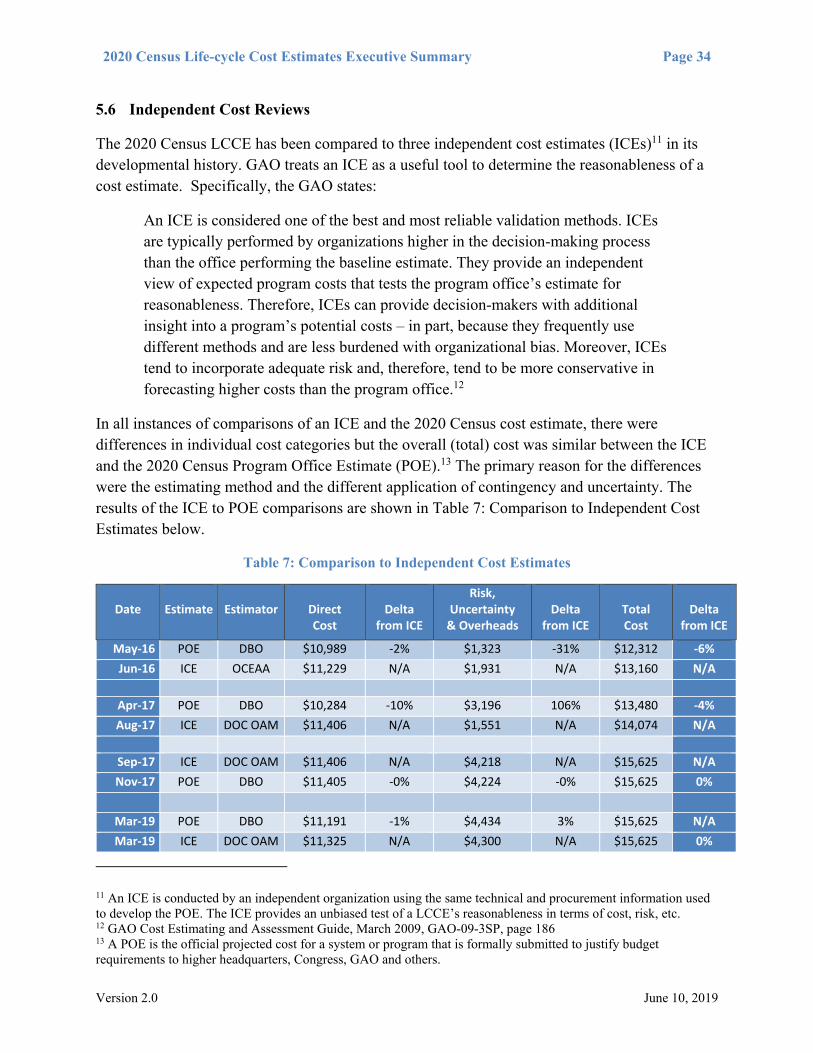
Related Documents