2020 ANNUAL REPORT California Advanced Services Fund PROGRAM YEAR JANUARY 2020 – DECEMBER 2020 PUBLISHED APRIL 2021 \

Welcome message from author
This document is posted to help you gain knowledge. Please leave a comment to let me know what you think about it! Share it to your friends and learn new things together.
Transcript
2020 ANNUAL REPORT California Advanced Services Fund
PROGRAM YEAR JANUARY 2020 – DECEMBER 2020
PUBLISHED APRIL 2021
\

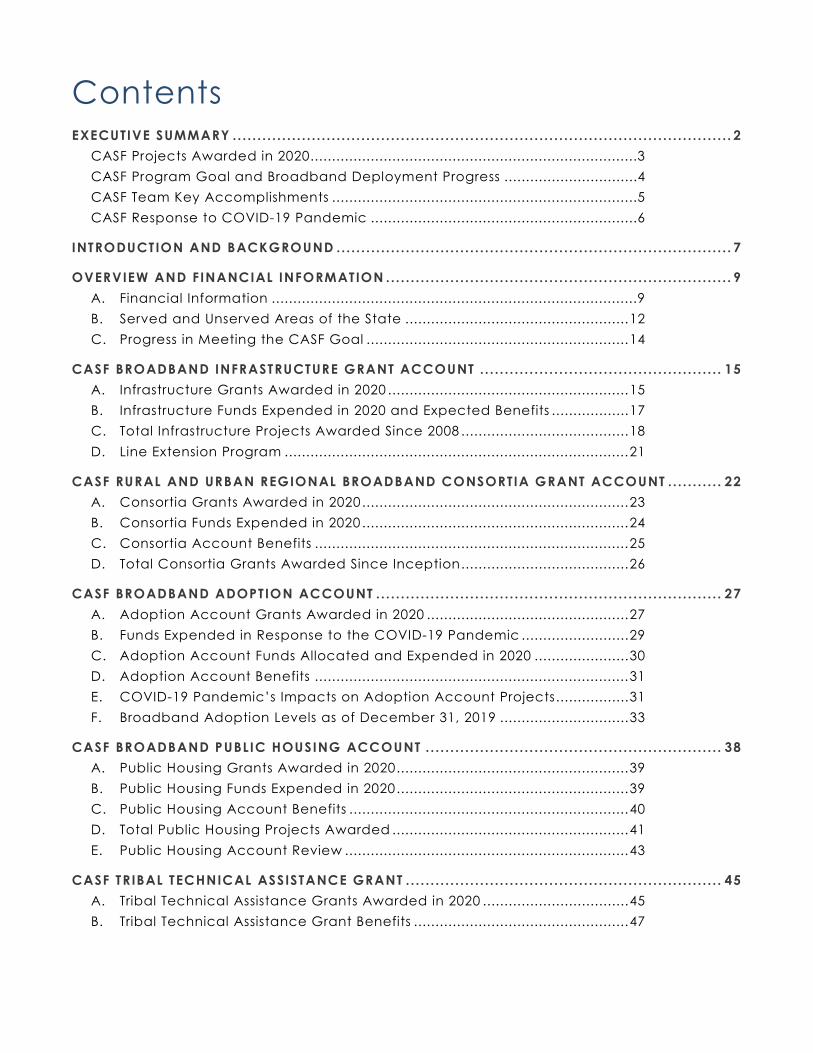
Contents EXECUTIVE SUMMARY .. . . . . . . . . . . . . . . . . . . . . . . . . . . . . . . . . . . . . . . . . . . . . . . . . . . . . . . . . . . . . . . . . . . . . . . . . . . . . . . . . . . . . . . . . . . . . . . . . . . . 2
CASF Projects Awarded in 2020 ............................................................................3 CASF Program Goal and Broadband Deployment Progress ...............................4 CASF Team Key Accomplishments .......................................................................5 CASF Response to COVID-19 Pandemic ..............................................................6
INTRODUCTION AND BACKGROUND .. . . . . . . . . . . . . . . . . . . . . . . . . . . . . . . . . . . . . . . . . . . . . . . . . . . . . . . . . . . . . . . . . . . . . . . . . . . . . . . 7
OVERVIEW AND FINANCIAL INFORMATION .. . . . . . . . . . . . . . . . . . . . . . . . . . . . . . . . . . . . . . . . . . . . . . . . . . . . . . . . . . . . . . . . . . . . . 9 A. Financial Information .....................................................................................9 B. Served and Unserved Areas of the State .................................................... 12 C. Progress in Meeting the CASF Goal ............................................................. 14
CASF BROADBAND INFRASTRUCTURE GRANT ACCOUNT .. . . . . . . . . . . . . . . . . . . . . . . . . . . . . . . . . . . . . . . . . . . . . . . . 15 A. Infrastructure Grants Awarded in 2020 ........................................................ 15 B. Infrastructure Funds Expended in 2020 and Expected Benefits .................. 17 C. Total Infrastructure Projects Awarded Since 2008 ....................................... 18 D. Line Extension Program ................................................................................ 21
CASF RURAL AND URBAN REGIONAL BROADBAND CONSORTIA GRANT ACCOUNT .. . . . . . . . . . 22 A. Consortia Grants Awarded in 2020 .............................................................. 23 B. Consortia Funds Expended in 2020 .............................................................. 24 C. Consortia Account Benefits ......................................................................... 25 D. Total Consortia Grants Awarded Since Inception ....................................... 26
CASF BROADBAND ADOPTION ACCOUNT .. . . . . . . . . . . . . . . . . . . . . . . . . . . . . . . . . . . . . . . . . . . . . . . . . . . . . . . . . . . . . . . . . . . . . 27 A. Adoption Account Grants Awarded in 2020 ............................................... 27 B. Funds Expended in Response to the COVID-19 Pandemic ......................... 29 C. Adoption Account Funds Allocated and Expended in 2020 ...................... 30 D. Adoption Account Benefits ......................................................................... 31 E. COVID-19 Pandemic’s Impacts on Adoption Account Projects ................. 31 F. Broadband Adoption Levels as of December 31, 2019 .............................. 33
CASF BROADBAND PUBLIC HOUSING ACCOUNT .. . . . . . . . . . . . . . . . . . . . . . . . . . . . . . . . . . . . . . . . . . . . . . . . . . . . . . . . . . . 38 A. Public Housing Grants Awarded in 2020 ...................................................... 39 B. Public Housing Funds Expended in 2020 ...................................................... 39 C. Public Housing Account Benefits ................................................................. 40 D. Total Public Housing Projects Awarded ....................................................... 41 E. Public Housing Account Review .................................................................. 43
CASF TRIBAL TECHNICAL ASSISTANCE GRANT .. . . . . . . . . . . . . . . . . . . . . . . . . . . . . . . . . . . . . . . . . . . . . . . . . . . . . . . . . . . . . . . 45 A. Tribal Technical Assistance Grants Awarded in 2020 .................................. 45 B. Tribal Technical Assistance Grant Benefits .................................................. 47
LEVERAGING NON-CASF FUNDS .. . . . . . . . . . . . . . . . . . . . . . . . . . . . . . . . . . . . . . . . . . . . . . . . . . . . . . . . . . . . . . . . . . . . . . . . . . . . . . . . . . . 48
ATTACHMENTS .. . . . . . . . . . . . . . . . . . . . . . . . . . . . . . . . . . . . . . . . . . . . . . . . . . . . . . . . . . . . . . . . . . . . . . . . . . . . . . . . . . . . . . . . . . . . . . . . . . . . . . . . . . . . . 50 Attachment A: Wireline and Fixed Wireless Served Status by County as of December 31, 2019…………………………………………………………………………………………………………….51 Attachment B: Approved CASF Infrastructure Projects as of December 31, 2020 ………...54 Attachment C: Consortia Account Reported Benefits Funded by CASF…………………….57 Attachment D: Consortia Account Projects as of December 31, 2020……………………….66 Attachment E1: Broadband Adoption Account Projects as of December 31, 2020……...69 Attachment E2: Broadband Adoption Project Status as of December 31, 2020…………..73 Attachment F1: Public Housing Adoption Projects as of December 31, 2020………………79 Attachment F2: Public Housing Infrastructure Projects as of December 31, 2020…………82 Attachment G: Public Housing Completed Project Costs and Participation as of December 31, 2020………………………………………………………………………………………..88

2 0 2 0 CA L I F OR N I A A D VA N C E D S ER V IC E S F U N D A N N UA L R E P O R T
C A L I F O R N IA P U B L I C UT I L I T I E S C O M MI S S I O N 1
The California Public Utilities Commission (CPUC) submits this annual report on the California Advanced Services Fund (CASF) 2020 program activities, pursuant to California Public Utilities (Pub. Util.) Code
section 914.7(a).

2 0 2 0 CA L I F OR N I A A D VA N C E D S ER V IC E S F U N D A N N UA L R E P O R T
C A L I F O R N IA P U B L I C UT I L I T I E S C O M MI S S I O N 2
Executive Summary Since 2008, the California Advanced Services Fund (CASF) has helped close the Digital Divide in California by providing subsidies to build and expand broadband facilities to unserved areas of the state. The program has funded fiber-optic, fixed wireless, hybrid fiber-coaxial, and copper facility-based projects with a goal of making broadband available to 98 percent of households in each consortia region by 2022.1
This report presents financial and programmatic highlights, including revenues, expenditures, approved projects, and expected benefits. It also provides updates on unserved/served areas and broadband adoption in the state. The year 2020 posed several major challenges, but despite that the California Public Utilities Commission (CPUC) approved 11 new infrastructure grants totaling approximately $20 million, two consortia grants worth $900,000, 60 adoption grants worth $3.1 million, three public housing grants worth $148,000, and nine Tribal technical assistance grants worth $538,000. Further, some of the top-level policy matters in 2020 included:
• The COVID-19 pandemic required changes in procedures as all staff switched to 100 percent remote work.
• In response to the pandemic, the CPUC leveraged $5 million in CASF Adoption Account funds to help school districts purchase devices for remote learning.
• The prohibition on funding broadband infrastructure costs that are also funded by federal programs sunset on July 1, 2020.2
• Assembly Bill 82 (Committee on Budget, Statutes of 2020) allowed state leveraging of federal funds.3 • The CPUC received a record number of 54 CASF Infrastructure grant applications that, if awarded,
would exceed the remaining funds available. • After the Federal Communications Commission’s announcement on Rural Digital Opportunity
Fund (RDOF) Auction 904 winning bidders, the CPUC created new procedures to account for the possibility of federally funded projects overlapping those contained in CASF applications.
• The CPUC established the Tribal Technical Assistance Grant program to support Tribes in improving broadband access on Tribal lands.4
The main items in this report are summarized on the following pages including the CASF response to the COVID-19 pandemic.
1 The statutory goal is to reach 98 percent of households in each consortia region by 2022. Pub. Util. Code § 281(b)(1)(A). 2 Pub. Util. Code § 281(f)(5)(C)(I). 3 Codified in Pub. Util. Code § 281(b)(1)(b)(ii). The CPUC voted out the final CASF-RDOF Kicker Initiative process in Decision (D.) 21-01-003. 4 D.20-08-005 at pp. 15-17 and Appendix 1.
2 0 2 0 CA L I F OR N I A A D VA N C E D S ER V IC E S F U N D A N N UA L R E P O R T
C A L I F O R N IA P U B L I C UT I L I T I E S C O M MI S S I O N 3
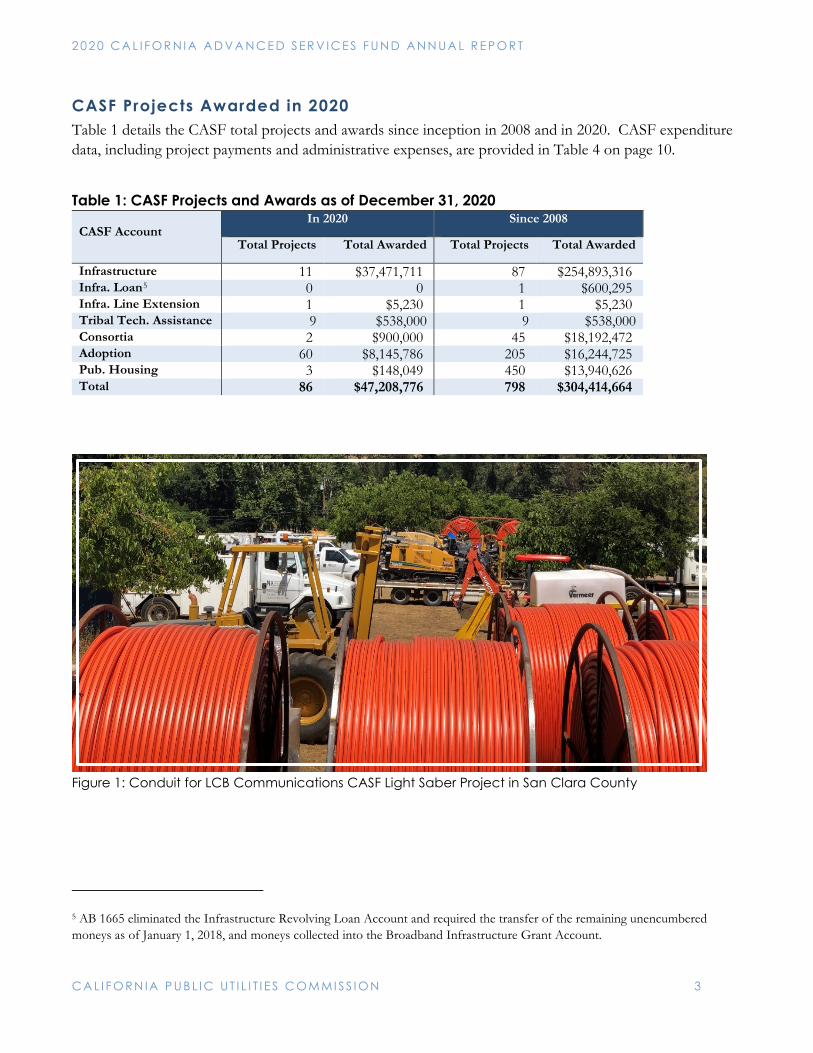
CASF Projects Awarded in 2020 Table 1 details the CASF total projects and awards since inception in 2008 and in 2020. CASF expenditure data, including project payments and administrative expenses, are provided in Table 4 on page 10.
Table 1: CASF Projects and Awards as of December 31, 2020
CASF Account In 2020 Since 2008
Total Projects Total Awarded Total Projects Total Awarded
Infrastructure 11 $37,471,711 87 $254,893,316 Infra. Loan5 0 0 1 $600,295 Infra. Line Extension 1 $5,230 1 $5,230 Tribal Tech. Assistance 9 $538,000 9 $538,000 Consortia 2 $900,000 45 $18,192,472 Adoption 60 $8,145,786 205 $16,244,725 Pub. Housing 3 $148,049 450 $13,940,626 Total 86 $47,208,776 798 $304,414,664
Figure 1: Conduit for LCB Communications CASF Light Saber Project in San Clara County
5 AB 1665 eliminated the Infrastructure Revolving Loan Account and required the transfer of the remaining unencumbered moneys as of January 1, 2018, and moneys collected into the Broadband Infrastructure Grant Account.
2 0 2 0 CA L I F OR N I A A D VA N C E D S ER V IC E S F U N D A N N UA L R E P O R T
C A L I F O R N IA P U B L I C UT I L I T I E S C O M MI S S I O N 4
CASF Program Goal and Broadband Deployment Progress The statutory goal of the CASF program is to provide broadband access to 98 percent of households in each consortia region by December 31, 2022.6 Data for fixed broadband availability reveal the following:7
• Program Goal: The East Bay Broadband Consortium and Los Angeles County Regional Broadband Consortium have met the 98 percent goal. The Bay Area (San Francisco, San Mateo, and Santa Clara counties)8 has also met the 98 percent goal. (See page 12 for additional information)
• Broadband Deployment at 6/1: Approximately 97.2 percent of California households have access to wireline or fixed wireless broadband speeds of at least 6 megabits per second (Mbps) downstream and 1 Mbps upstream (6/1 Mbps).
• Broadband Deployment at 25/3: Approximately 96.5 percent of California households have access to wireline or fixed wireless broadband speeds of at least 25 Mbps downstream and 3 Mbps upstream (25/3 Mbps).
• Broadband Adoption: Approximately 85.4 percent of California households subscribe to broadband speeds at or above 6/1 Mbps.
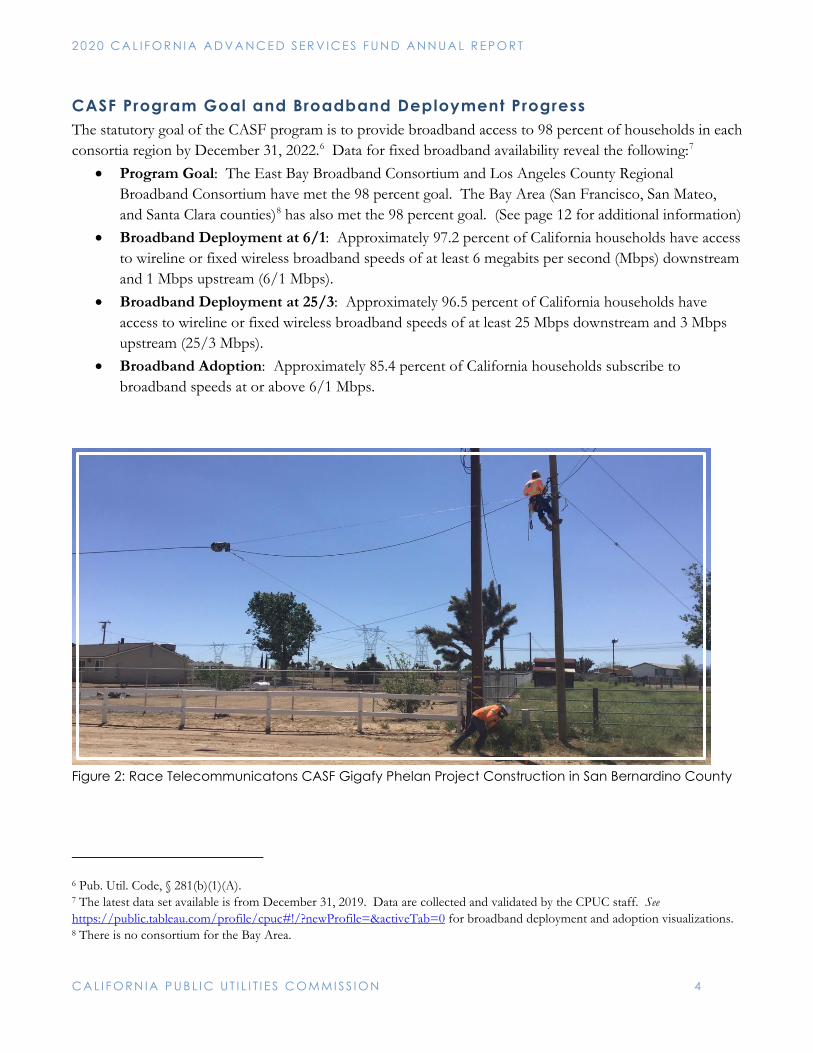
Figure 2: Race Telecommunicatons CASF Gigafy Phelan Project Construction in San Bernardino County
6 Pub. Util. Code, § 281(b)(1)(A). 7 The latest data set available is from December 31, 2019. Data are collected and validated by the CPUC staff. See https://public.tableau.com/profile/cpuc#!/?newProfile=&activeTab=0 for broadband deployment and adoption visualizations. 8 There is no consortium for the Bay Area.
2 0 2 0 CA L I F OR N I A A D VA N C E D S ER V IC E S F U N D A N N UA L R E P O R T
C A L I F O R N IA P U B L I C UT I L I T I E S C O M MI S S I O N 5
CASF Team Key Accomplishments • Broadband Infrastructure Account: Staff reviewed an unprecedented 54 applications received in
the May 4, 2020 application cycle. • Broadband Adoption Account: Staff processed an emergency allocation of $5 million from the
Adoption Account to the California Department of Education to help public schools and school districts impacted by the COVID-19 pandemic.9 Staff conducted a survey to ascertain the pandemic’s impact on projects and determine project status.
• Broadband Public Housing Account: Staff recommended approval of three projects. • Broadband Consortia Account: Staff recommended approval for two consortia groups to assist
infrastructure grant applicants with project development or the grant application process required to deploy broadband infrastructure.
• Broadband Mapping: Staff completed its 2020 annual broadband data collection and updated the Interactive Broadband Map on the CPUC’s website in December 2020. The Team processed data from 154 broadband providers, which is a new record. The Team also restarted CalSPEED testing, completed 4,000 speed tests statewide, and updated the Interactive Broadband Map to include additional helpful layers for broadband mapping analysis.10
• Staff set up the Tribal Technical Assistance grant program within the CASF (state operations)11 to support California Tribes in developing market studies, feasibilities studies, and/or business plans to improve broadband in their communities.
• The CPUC opened a new CASF rulemaking proceeding (R.20-08-021) to implement proposed programmatic changes and adopt rules that will maximize broadband infrastructure deployment and leverage multiple funding sources to better meet the goals of the program.
• The CPUC adopted Resolution T-17709 effective December 1, 2020, which increased the CASF remittance rate to 1.019 percent of reported intrastate revenue, and should collect $66 million during 2021, allaying immediate concerns about funding in the short term.
• Staff worked with the State Controller’s Office on the CASF Performance and Financial Audit, which assesses, among other things, the effectiveness of the program’s implementation and administration and compliance with applicable laws and regulations. The final audit reports can be found at: https://www.cpuc.ca.gov/General.aspx?id=9226.
• Staff conducted the 2020 CASF workshop virtually to consult with regional consortia, stakeholders, local governments, the federal government, existing facility-based broadband providers, and consumers regarding unserved areas of the state and cost-effective strategies for expanding access to broadband. The workshop attracted over 400 attendees from across the state.12
9 Resolution T-17697 issued May 12, 2020. 10 See the California Interactive Broadband Map at https://www.broadbandmap.ca.gov/. 11 D.20-08-005 at pp.15-17 and Appendix 1. This decision authorizes the use CASF state operations funds for the Tribal Technical Assistance program. For more information on state operations, see “Section A. Financial Information.” 12 If participants joined multiple times, they were counted multiple times.
2 0 2 0 CA L I F OR N I A A D VA N C E D S ER V IC E S F U N D A N N UA L R E P O R T
C A L I F O R N IA P U B L I C UT I L I T I E S C O M MI S S I O N 6
CASF Response to COVID-19 Pandemic The COVID-19 pandemic and subsequent Stay-at-Home restrictions disrupted the CASF grantees’ ability to perform project work. For example, many Broadband Adoption Account projects have been delayed since in-person trainings had to be cancelled. The pandemic also exacerbated broadband needs across the state but especially for students. In response to the pandemic’s impacts, the CPUC took the following steps:
• The CPUC’s Executive Director sent a letter on March 20, 2020 postponing the 2020 CASF Infrastructure application deadline from April 1 to May 4, 2020, and revised the Infrastructure Account timeline in response to the pandemic and requests from some stakeholders.
• The CPUC’s Communications Division Director sent a letter on March 30, 2020 to CASF Adoption, Consortia, and Public Housing grantees informing them that project completion dates would likely be extended; allowed grantees to modify curriculum and work plans for classrooms to remote options; payment requests would be prioritized to help reduce potential financial burdens; provided information resources; and requested information on which grantees were operational.
• The CPUC’s Executive Director sent a letter on May 1, 2020 extending the completion deadlines of all CASF projects. Specifically, the letter suspended any project deadlines during the pendency of the Governor’s Executive Order N-33-20.
• The CPUC issued Resolution T-17697 on May 12, 2020 adopting criteria and a process for distributing up to $5 million in grants from the CASF Adoption Account to public schools and school districts in response to the COVID-19 pandemic. The CPUC worked with the California Department of Education to facilitate grant distribution.
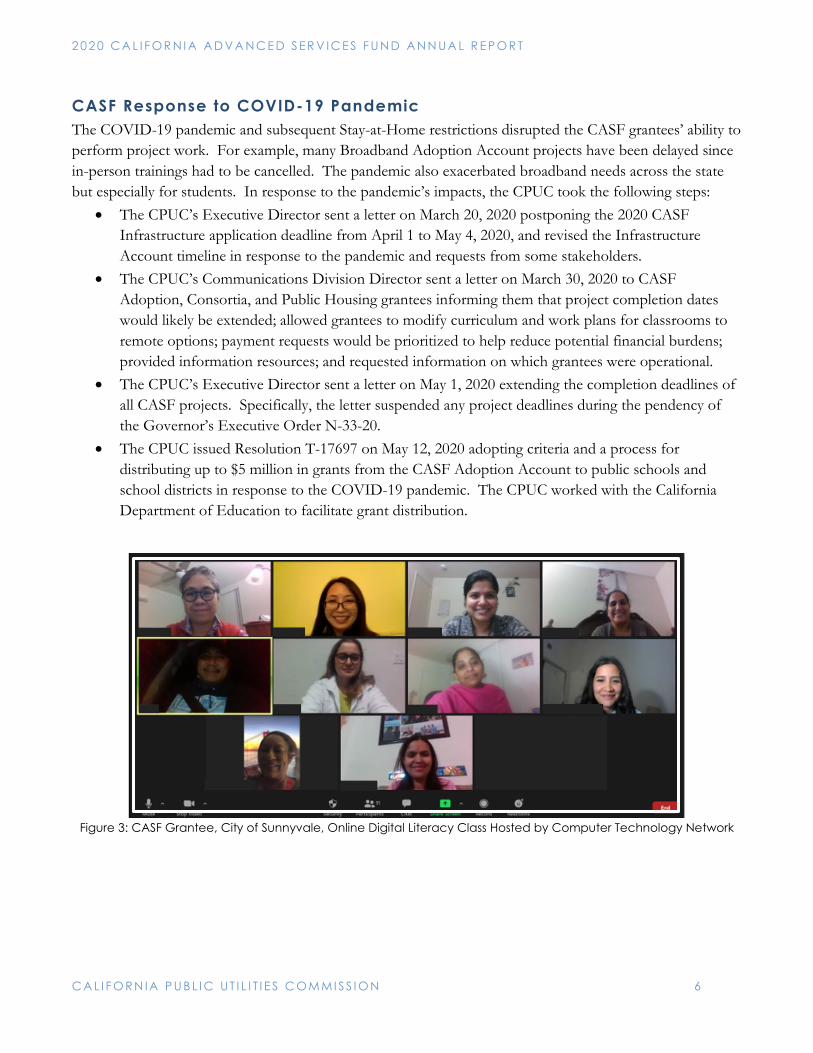
Figure 3: CASF Grantee, City of Sunnyvale, Online Digital Literacy Class Hosted by Computer Technology Network
2 0 2 0 CA L I F OR N I A A D VA N C E D S ER V IC E S F U N D A N N UA L R E P O R T
C A L I F O R N IA P U B L I C UT I L I T I E S C O M MI S S I O N 7
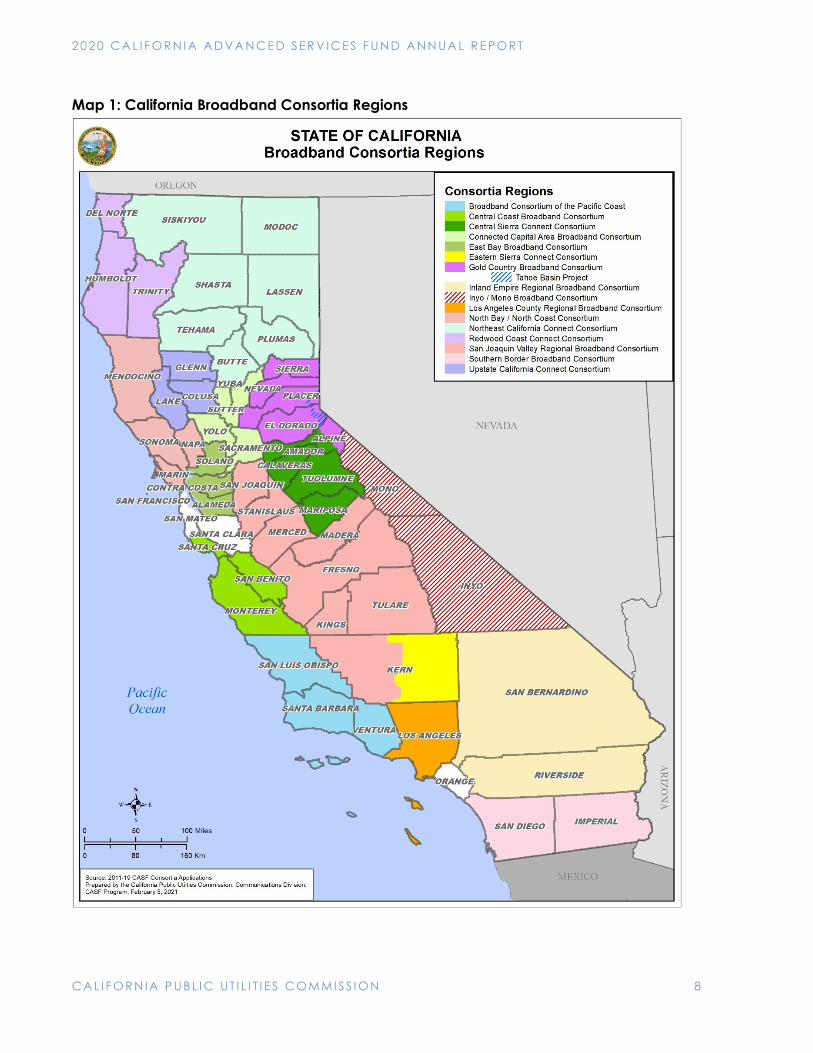
Introduction and Background The statutory goal of the CASF program is to provide broadband access to 98 percent of households in each consortia region by December 31, 2022.13 The program consists of four main accounts contributing to this goal; the accounts are: Broadband Infrastructure Grant Account, which includes the Line Extension program, the Rural and Urban Regional Broadband Consortia Grant Account, the Broadband Public Housing Account, and the Broadband Adoption Account.14 In 2017, Assembly Bill (AB) 166515 revised the CASF program; this included extending the goal of providing broadband access to 98 percent of households in each consortia region by 2022. (See Map 1 on the following page for the locations of the consortia regions.) In 2020, CASF prohibition on funding the costs of broadband infrastructure that are also funded by the federal Connect America Fund program or other similar federal public program sunset by its own terms.16 More background and historical information about each CASF account is available at https://www.cpuc.ca.gov/casf/.
13 Pub. Util. Code, § 281(b)(1)(A). 14 Pub. Util. Code, § 281(c). 15 Ch. 851, Stats. 2017. AB 1665 is codified at Pub. Util. Code, § 281. 16 Pub. Util. Code, § 281(f)(5)(C)(i).
2 0 2 0 CA L I F OR N I A A D VA N C E D S ER V IC E S F U N D A N N UA L R E P O R T
C A L I F O R N IA P U B L I C UT I L I T I E S C O M MI S S I O N 8
Map 1: California Broadband Consortia Regions
2 0 2 0 CA L I F OR N I A A D VA N C E D S ER V IC E S F U N D A N N UA L R E P O R T
C A L I F O R N IA P U B L I C UT I L I T I E S C O M MI S S I O N 9
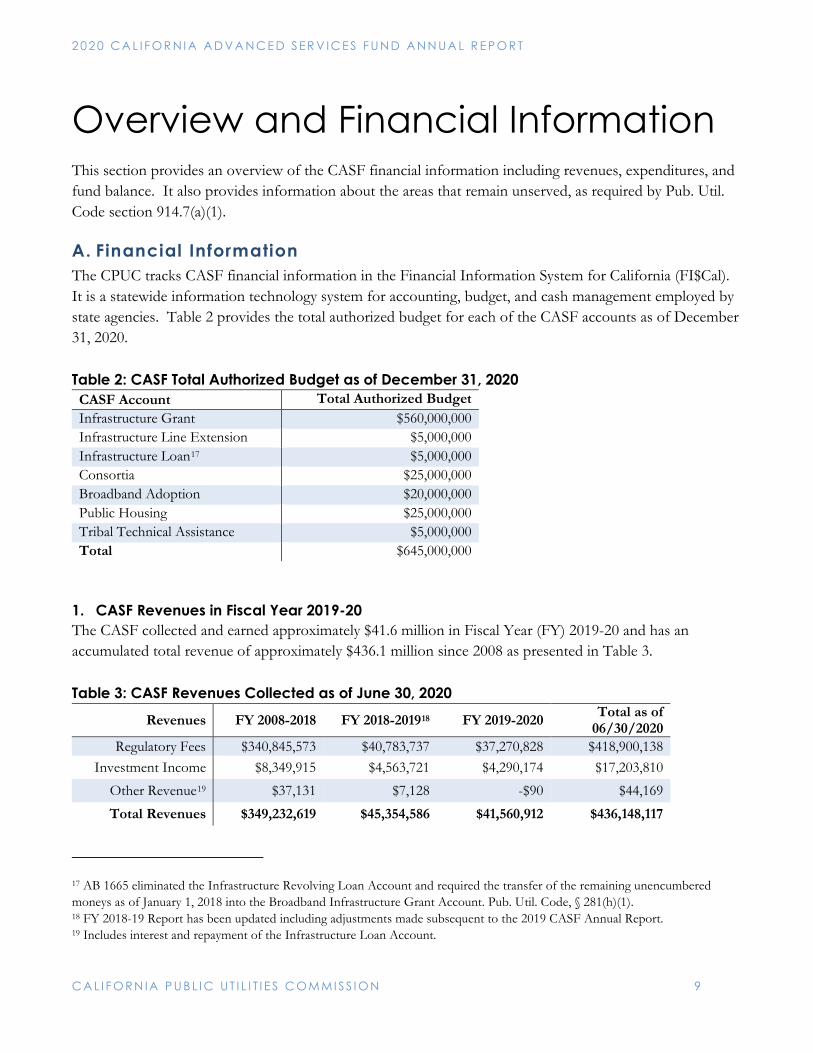
Overview and Financial Information This section provides an overview of the CASF financial information including revenues, expenditures, and fund balance. It also provides information about the areas that remain unserved, as required by Pub. Util. Code section 914.7(a)(1).
A. Financial Information The CPUC tracks CASF financial information in the Financial Information System for California (FI$Cal). It is a statewide information technology system for accounting, budget, and cash management employed by state agencies. Table 2 provides the total authorized budget for each of the CASF accounts as of December 31, 2020. Table 2: CASF Total Authorized Budget as of December 31, 2020 CASF Account Total Authorized Budget Infrastructure Grant $560,000,000 Infrastructure Line Extension $5,000,000 Infrastructure Loan17 $5,000,000 Consortia $25,000,000 Broadband Adoption $20,000,000 Public Housing $25,000,000 Tribal Technical Assistance $5,000,000 Total $645,000,000
1. CASF Revenues in Fiscal Year 2019-20 The CASF collected and earned approximately $41.6 million in Fiscal Year (FY) 2019-20 and has an accumulated total revenue of approximately $436.1 million since 2008 as presented in Table 3. Table 3: CASF Revenues Collected as of June 30, 2020
Revenues FY 2008-2018 FY 2018-201918 FY 2019-2020 Total as of 06/30/2020
Regulatory Fees $340,845,573 $40,783,737 $37,270,828 $418,900,138 Investment Income $8,349,915 $4,563,721 $4,290,174 $17,203,810
Other Revenue19 $37,131 $7,128 -$90 $44,169
Total Revenues $349,232,619 $45,354,586 $41,560,912 $436,148,117
17 AB 1665 eliminated the Infrastructure Revolving Loan Account and required the transfer of the remaining unencumbered moneys as of January 1, 2018 into the Broadband Infrastructure Grant Account. Pub. Util. Code, § 281(h)(1). 18 FY 2018-19 Report has been updated including adjustments made subsequent to the 2019 CASF Annual Report. 19 Includes interest and repayment of the Infrastructure Loan Account.
2 0 2 0 CA L I F OR N I A A D VA N C E D S ER V IC E S F U N D A N N UA L R E P O R T
C A L I F O R N IA P U B L I C UT I L I T I E S C O M MI S S I O N 10
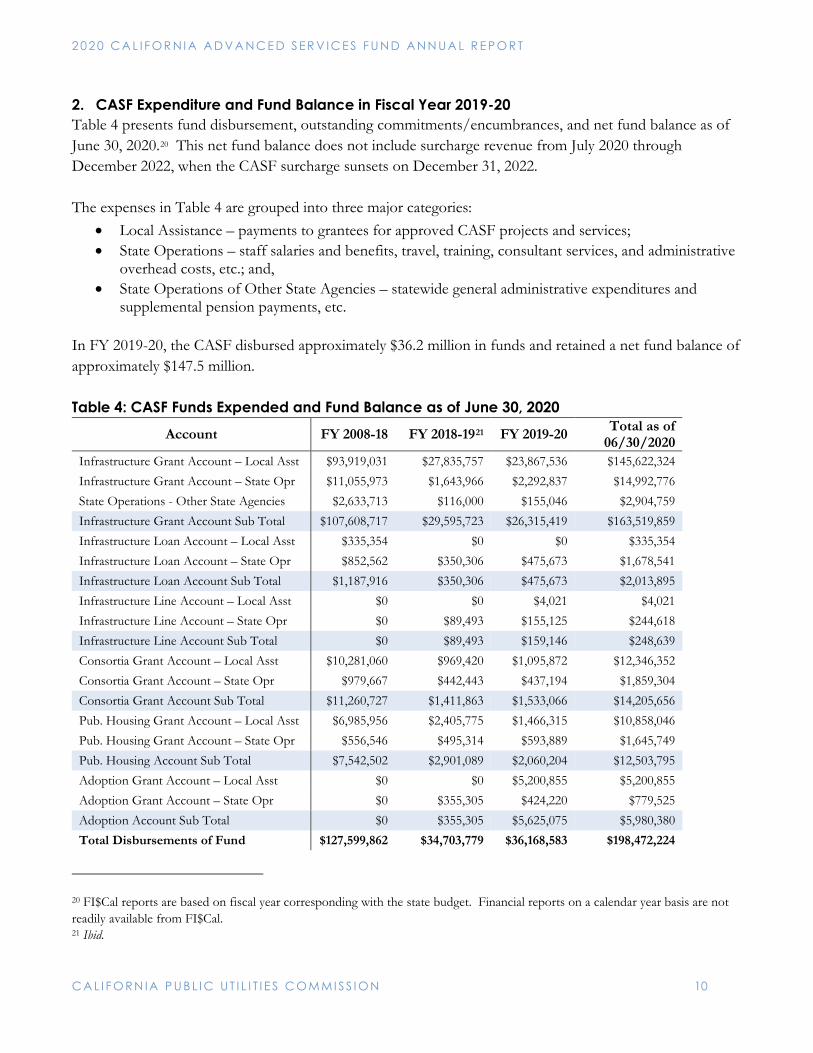
2. CASF Expenditure and Fund Balance in Fiscal Year 2019-20 Table 4 presents fund disbursement, outstanding commitments/encumbrances, and net fund balance as of June 30, 2020.20 This net fund balance does not include surcharge revenue from July 2020 through December 2022, when the CASF surcharge sunsets on December 31, 2022. The expenses in Table 4 are grouped into three major categories:
• Local Assistance – payments to grantees for approved CASF projects and services; • State Operations – staff salaries and benefits, travel, training, consultant services, and administrative
overhead costs, etc.; and, • State Operations of Other State Agencies – statewide general administrative expenditures and
supplemental pension payments, etc. In FY 2019-20, the CASF disbursed approximately $36.2 million in funds and retained a net fund balance of approximately $147.5 million. Table 4: CASF Funds Expended and Fund Balance as of June 30, 2020
Account FY 2008-18 FY 2018-1921 FY 2019-20 Total as of 06/30/2020
Infrastructure Grant Account – Local Asst $93,919,031 $27,835,757 $23,867,536 $145,622,324 Infrastructure Grant Account – State Opr $11,055,973 $1,643,966 $2,292,837 $14,992,776 State Operations - Other State Agencies $2,633,713 $116,000 $155,046 $2,904,759 Infrastructure Grant Account Sub Total $107,608,717 $29,595,723 $26,315,419 $163,519,859 Infrastructure Loan Account – Local Asst $335,354 $0 $0 $335,354 Infrastructure Loan Account – State Opr $852,562 $350,306 $475,673 $1,678,541 Infrastructure Loan Account Sub Total $1,187,916 $350,306 $475,673 $2,013,895 Infrastructure Line Account – Local Asst $0 $0 $4,021 $4,021 Infrastructure Line Account – State Opr $0 $89,493 $155,125 $244,618 Infrastructure Line Account Sub Total $0 $89,493 $159,146 $248,639 Consortia Grant Account – Local Asst $10,281,060 $969,420 $1,095,872 $12,346,352 Consortia Grant Account – State Opr $979,667 $442,443 $437,194 $1,859,304 Consortia Grant Account Sub Total $11,260,727 $1,411,863 $1,533,066 $14,205,656 Pub. Housing Grant Account – Local Asst $6,985,956 $2,405,775 $1,466,315 $10,858,046 Pub. Housing Grant Account – State Opr $556,546 $495,314 $593,889 $1,645,749 Pub. Housing Account Sub Total $7,542,502 $2,901,089 $2,060,204 $12,503,795 Adoption Grant Account – Local Asst $0 $0 $5,200,855 $5,200,855 Adoption Grant Account – State Opr $0 $355,305 $424,220 $779,525 Adoption Account Sub Total $0 $355,305 $5,625,075 $5,980,380 Total Disbursements of Fund $127,599,862 $34,703,779 $36,168,583 $198,472,224
20 FI$Cal reports are based on fiscal year corresponding with the state budget. Financial reports on a calendar year basis are not readily available from FI$Cal. 21 Ibid.
2 0 2 0 CA L I F OR N I A A D VA N C E D S ER V IC E S F U N D A N N UA L R E P O R T
C A L I F O R N IA P U B L I C UT I L I T I E S C O M MI S S I O N 11
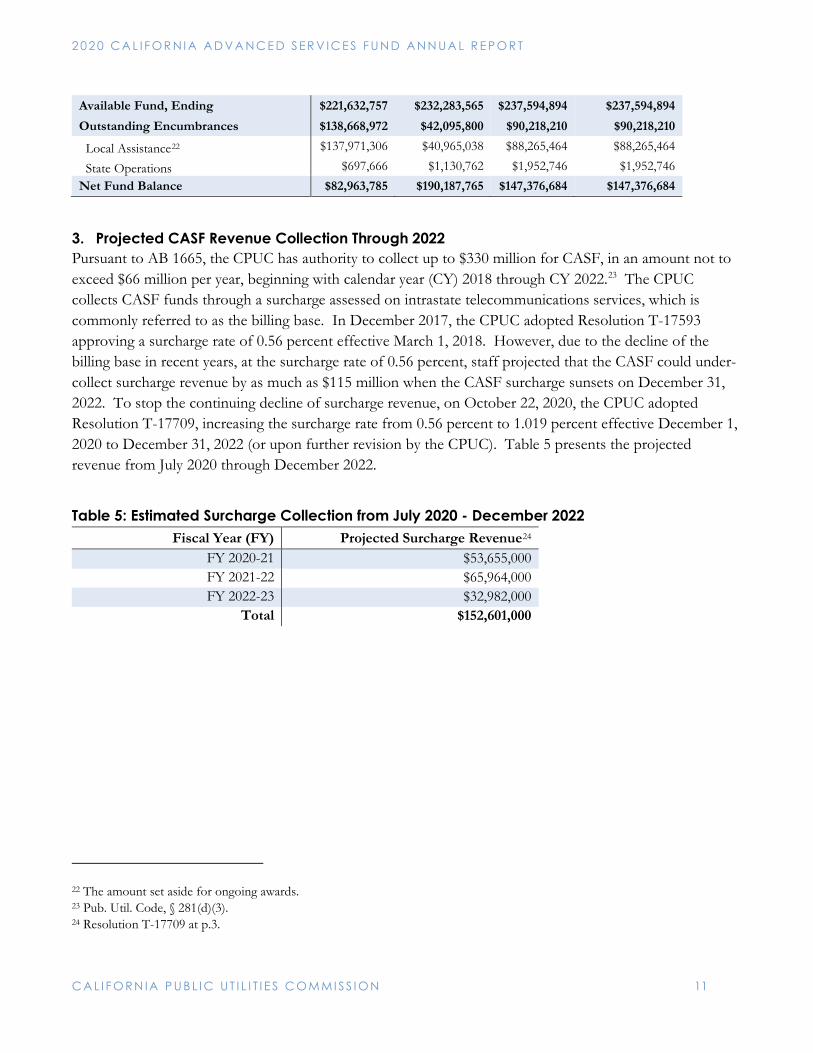
Available Fund, Ending $221,632,757 $232,283,565 $237,594,894 $237,594,894 Outstanding Encumbrances $138,668,972 $42,095,800 $90,218,210 $90,218,210
Local Assistance22 $137,971,306 $40,965,038 $88,265,464 $88,265,464
State Operations $697,666 $1,130,762 $1,952,746 $1,952,746 Net Fund Balance $82,963,785 $190,187,765 $147,376,684 $147,376,684
3. Projected CASF Revenue Collection Through 2022 Pursuant to AB 1665, the CPUC has authority to collect up to $330 million for CASF, in an amount not to exceed $66 million per year, beginning with calendar year (CY) 2018 through CY 2022.23 The CPUC collects CASF funds through a surcharge assessed on intrastate telecommunications services, which is commonly referred to as the billing base. In December 2017, the CPUC adopted Resolution T-17593 approving a surcharge rate of 0.56 percent effective March 1, 2018. However, due to the decline of the billing base in recent years, at the surcharge rate of 0.56 percent, staff projected that the CASF could under-collect surcharge revenue by as much as $115 million when the CASF surcharge sunsets on December 31, 2022. To stop the continuing decline of surcharge revenue, on October 22, 2020, the CPUC adopted Resolution T-17709, increasing the surcharge rate from 0.56 percent to 1.019 percent effective December 1, 2020 to December 31, 2022 (or upon further revision by the CPUC). Table 5 presents the projected revenue from July 2020 through December 2022. Table 5: Estimated Surcharge Collection from July 2020 - December 2022
Fiscal Year (FY) Projected Surcharge Revenue24 FY 2020-21 $53,655,000 FY 2021-22 $65,964,000 FY 2022-23 $32,982,000
Total $152,601,000
22 The amount set aside for ongoing awards. 23 Pub. Util. Code, § 281(d)(3). 24 Resolution T-17709 at p.3.
2 0 2 0 CA L I F OR N I A A D VA N C E D S ER V IC E S F U N D A N N UA L R E P O R T
C A L I F O R N IA P U B L I C UT I L I T I E S C O M MI S S I O N 12
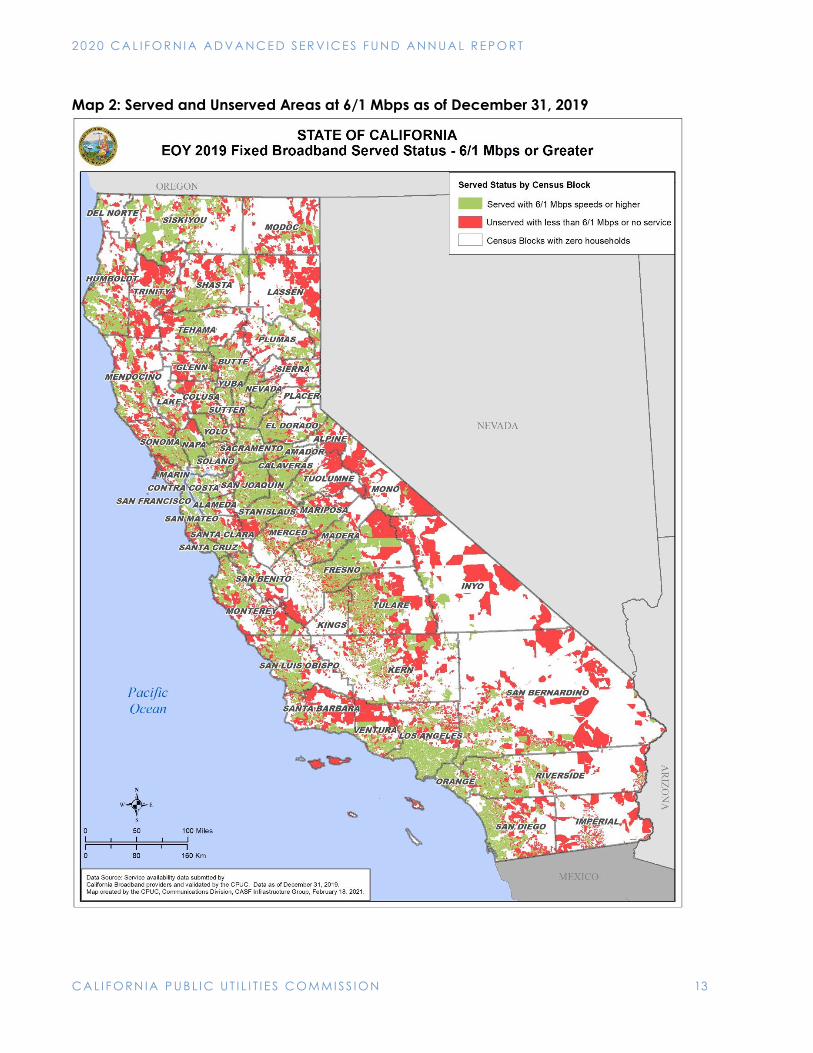
B. Served and Unserved Areas of the State Existing statute defines an unserved household as one for which no facility-based provider offers broadband service at speeds of at least 6/1 Mbps.25 Only areas with unserved households are eligible for CASF Infrastructure grants.26 The latest data available as of December 31, 2019 indicate that 97.2 percent of California households are in census blocks with access to fixed (wireline and fixed wireless) broadband service at served speeds (6/1 Mbps and above).27 Map 2, on the following page, shows the served and unserved areas of the state as of December 31, 2019.
1. Broadband Availability in Rural and Urban Areas of the State Table 6 below provides percentages of served and unserved households in California in census blocks designated as rural or urban by the US Census Bureau.
In rural areas, 82.7 percent of households have access to broadband at or above 6/1 Mbps speeds, whereas 98 percent of households in urban areas have access at or above 6/1 Mbps. Table 6 also provides the percentage of urban and rural households with access to speeds at or above 25/3 Mbps and 100 Mbps downstream. The data show that the Digital Divide between rural and urban areas widens as the speeds increase.
Table 6: Wireline and Fixed Wireless Broadband Availability as of December 31, 2019 Speed
Benchmarks (Mbps)
Percentage of Total Households with Broadband
Availability
Unserved Households Number of Unserved
Households Percentage of
Unserved Households Urban Rural Statewide Urban Rural Statewide Urban Rural >=6/1 98.0% 82.7% 97.2% 252,604 119,143 371,747 2.0% 17.3% >=25/3 97.8% 73.8% 96.5% 281,507 180,922 462,429 2.2% 26.2% >=100 down28 97.5% 48.7% 94.9% 320,504 354,226 674,730 2.5% 51.3%
See Attachment A for additional data on broadband availability at the county level.
25 Pub. Util. Code, § 281(b)(1)(B). 26 Other factors are also considered in determining CASF eligibility, such as a check of areas in the Right of First Refusal filings. 27 The CPUC validates providers’ broadband availability data submitted at the census block level. The CPUC’s analysis considers wireline and fixed-wireless technologies. Examples of “wireline” technologies include Digital Subscriber Line (DSL), cable modem (via coaxial or hybrid fiber-coaxial infrastructure), and fiber-optic network technologies such as Fiber to the Home (FTTH) or Fiber to the Node/Neighborhood (FTTN). These technologies use terrestrial wires or cables as the physical layer of the connection from the provider to the user. “Fixed wireless” solutions rely on radio frequency (RF) waves to make an “over-the-air” connection between the provider and the user at a fixed location. 28 This benchmark measures broadband speeds at 100 Mbps downstream and at any upstream speeds (i.e., no filter was used for upstream speeds, only downstream).
97.2 percent of California households have access to wireline or fixed wireless broadband service at 6/1
Mbps or above as of December 31, 2019.
2 0 2 0 CA L I F OR N I A A D VA N C E D S ER V IC E S F U N D A N N UA L R E P O R T
C A L I F O R N IA P U B L I C UT I L I T I E S C O M MI S S I O N 13
Map 2: Served and Unserved Areas at 6/1 Mbps as of December 31, 2019
2 0 2 0 CA L I F OR N I A A D VA N C E D S ER V IC E S F U N D A N N UA L R E P O R T
C A L I F O R N IA P U B L I C UT I L I T I E S C O M MI S S I O N 14
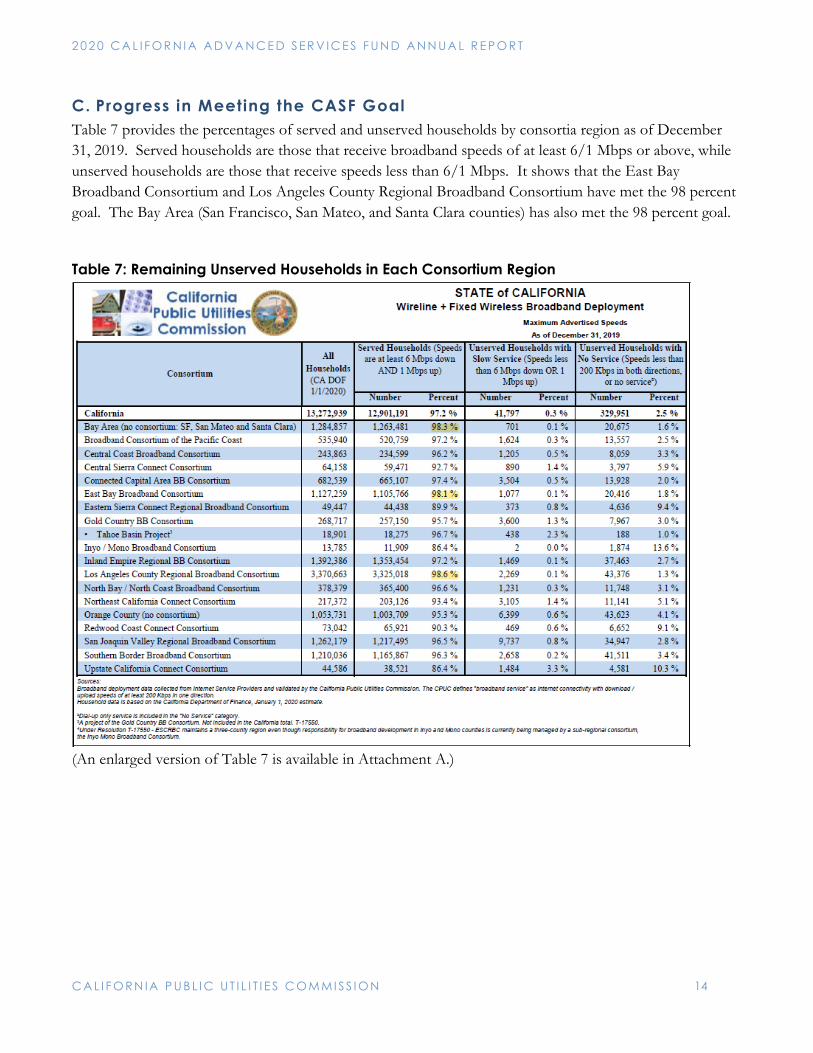
C. Progress in Meeting the CASF Goal Table 7 provides the percentages of served and unserved households by consortia region as of December 31, 2019. Served households are those that receive broadband speeds of at least 6/1 Mbps or above, while unserved households are those that receive speeds less than 6/1 Mbps. It shows that the East Bay Broadband Consortium and Los Angeles County Regional Broadband Consortium have met the 98 percent goal. The Bay Area (San Francisco, San Mateo, and Santa Clara counties) has also met the 98 percent goal.
Table 7: Remaining Unserved Households in Each Consortium Region
(An enlarged version of Table 7 is available in Attachment A.)
2 0 2 0 CA L I F OR N I A A D VA N C E D S ER V IC E S F U N D A N N UA L R E P O R T
C A L I F O R N IA P U B L I C UT I L I T I E S C O M MI S S I O N 15
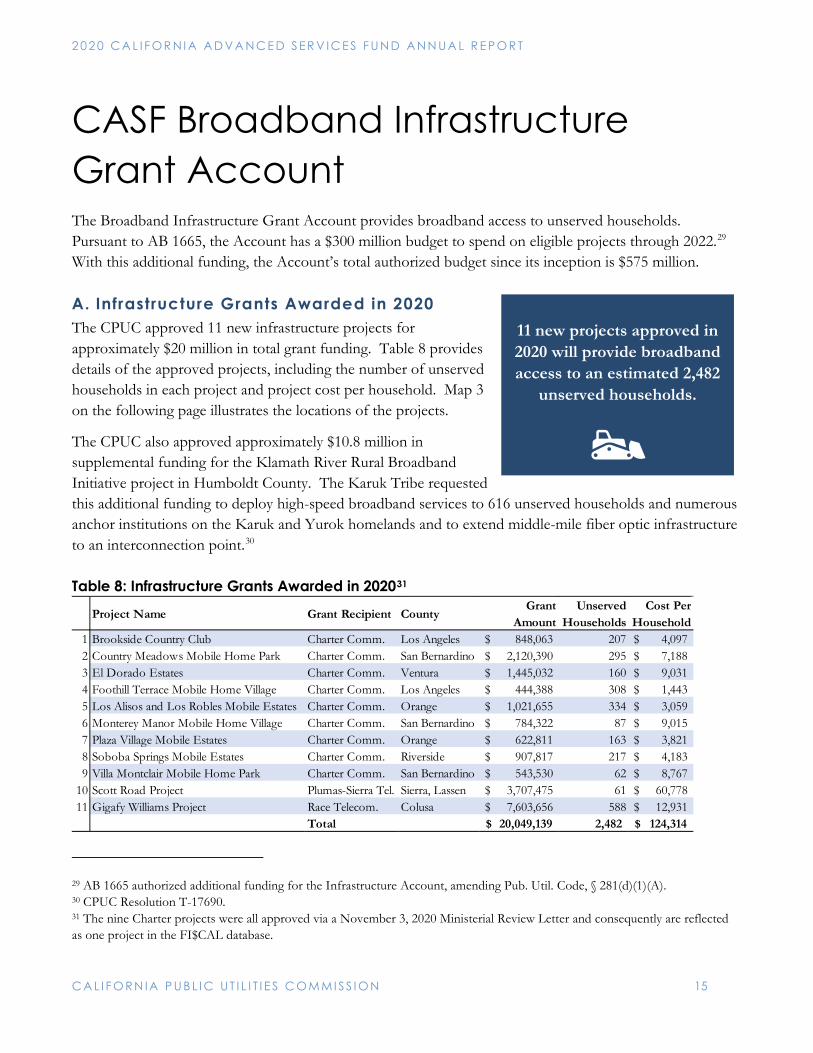
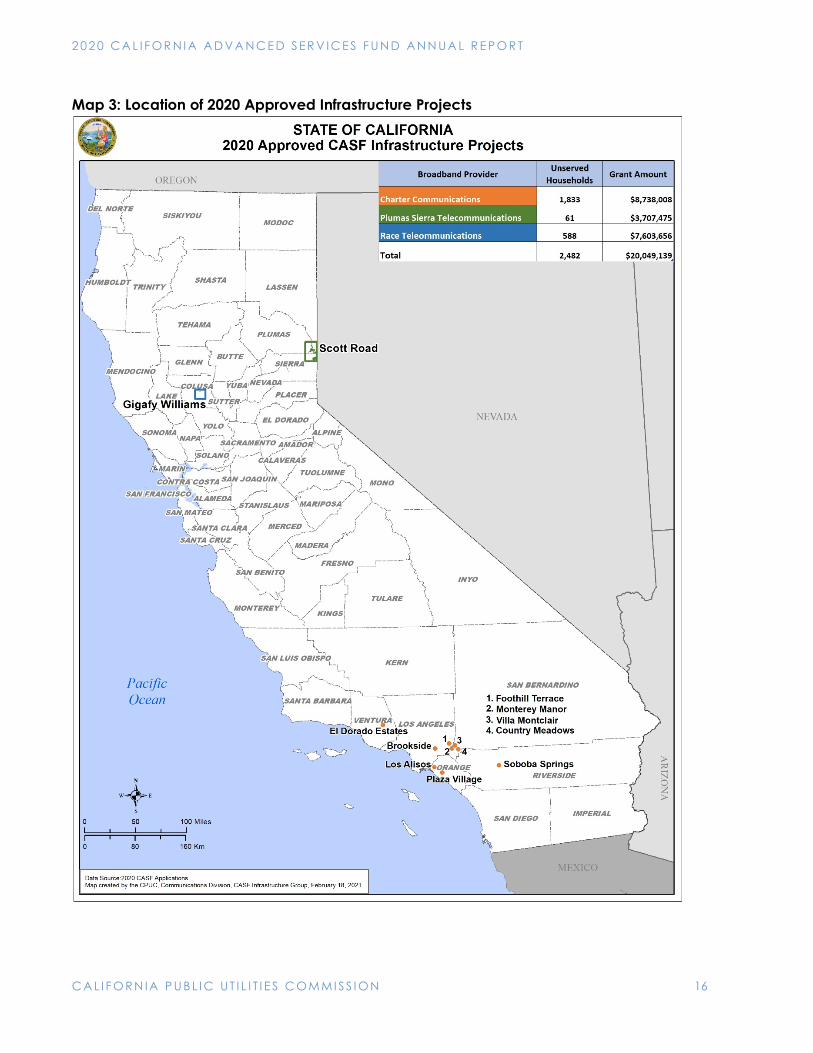
CASF Broadband Infrastructure Grant Account The Broadband Infrastructure Grant Account provides broadband access to unserved households. Pursuant to AB 1665, the Account has a $300 million budget to spend on eligible projects through 2022.29 With this additional funding, the Account’s total authorized budget since its inception is $575 million. A. Infrastructure Grants Awarded in 2020 The CPUC approved 11 new infrastructure projects for approximately $20 million in total grant funding. Table 8 provides details of the approved projects, including the number of unserved households in each project and project cost per household. Map 3 on the following page illustrates the locations of the projects.
The CPUC also approved approximately $10.8 million in supplemental funding for the Klamath River Rural Broadband Initiative project in Humboldt County. The Karuk Tribe requested this additional funding to deploy high-speed broadband services to 616 unserved households and numerous anchor institutions on the Karuk and Yurok homelands and to extend middle-mile fiber optic infrastructure to an interconnection point.30 Table 8: Infrastructure Grants Awarded in 202031
29 AB 1665 authorized additional funding for the Infrastructure Account, amending Pub. Util. Code, § 281(d)(1)(A). 30 CPUC Resolution T-17690. 31 The nine Charter projects were all approved via a November 3, 2020 Ministerial Review Letter and consequently are reflected as one project in the FI$CAL database.
Project Name Grant Recipient CountyGrant
AmountUnserved
HouseholdsCost Per
Household1 Brookside Country Club Charter Comm. Los Angeles 848,063$ 207 4,097$ 2 Country Meadows Mobile Home Park Charter Comm. San Bernardino 2,120,390$ 295 7,188$ 3 El Dorado Estates Charter Comm. Ventura 1,445,032$ 160 9,031$ 4 Foothill Terrace Mobile Home Village Charter Comm. Los Angeles 444,388$ 308 1,443$ 5 Los Alisos and Los Robles Mobile Estates Charter Comm. Orange 1,021,655$ 334 3,059$ 6 Monterey Manor Mobile Home Village Charter Comm. San Bernardino 784,322$ 87 9,015$ 7 Plaza Village Mobile Estates Charter Comm. Orange 622,811$ 163 3,821$ 8 Soboba Springs Mobile Estates Charter Comm. Riverside 907,817$ 217 4,183$ 9 Villa Montclair Mobile Home Park Charter Comm. San Bernardino 543,530$ 62 8,767$
10 Scott Road Project Plumas-Sierra Tel. Sierra, Lassen 3,707,475$ 61 60,778$ 11 Gigafy Williams Project Race Telecom. Colusa 7,603,656$ 588 12,931$
Total 20,049,139$ 2,482 124,314$
11 new projects approved in 2020 will provide broadband access to an estimated 2,482
unserved households.
2 0 2 0 CA L I F OR N I A A D VA N C E D S ER V IC E S F U N D A N N UA L R E P O R T
C A L I F O R N IA P U B L I C UT I L I T I E S C O M MI S S I O N 16
Map 3: Location of 2020 Approved Infrastructure Projects
2 0 2 0 CA L I F OR N I A A D VA N C E D S ER V IC E S F U N D A N N UA L R E P O R T
C A L I F O R N IA P U B L I C UT I L I T I E S C O M MI S S I O N 17
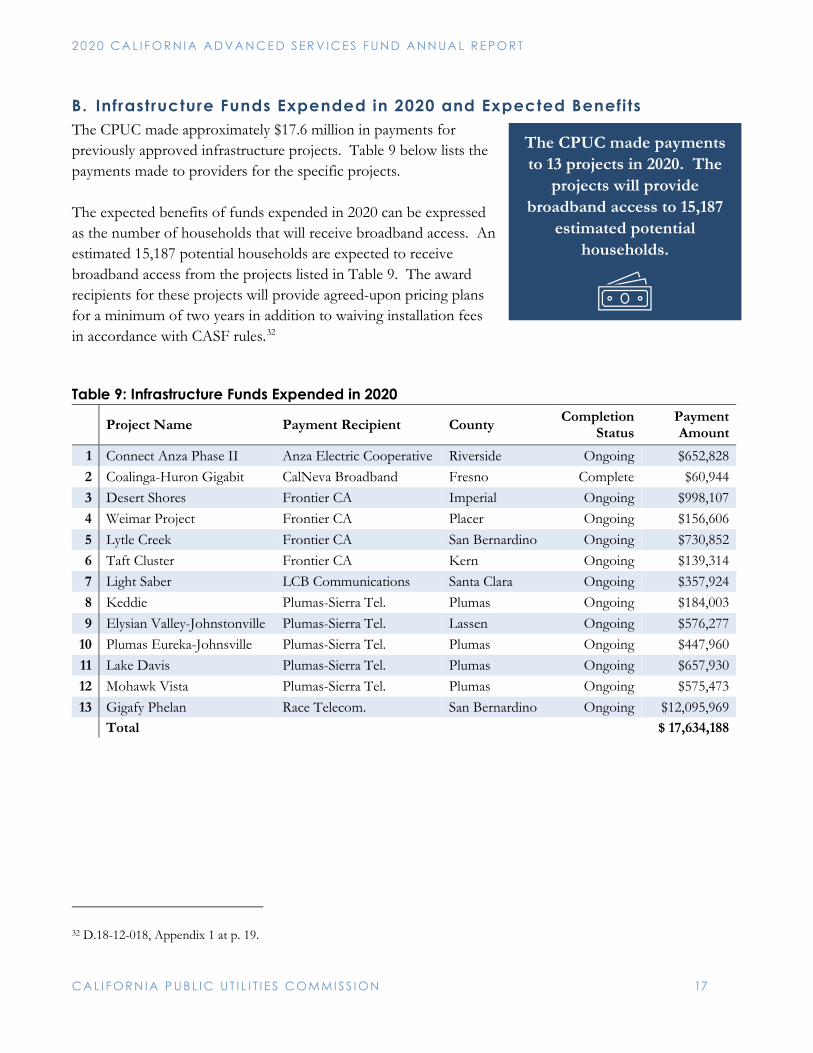
B. Infrastructure Funds Expended in 2020 and Expected Benefits The CPUC made approximately $17.6 million in payments for previously approved infrastructure projects. Table 9 below lists the payments made to providers for the specific projects. The expected benefits of funds expended in 2020 can be expressed as the number of households that will receive broadband access. An estimated 15,187 potential households are expected to receive broadband access from the projects listed in Table 9. The award recipients for these projects will provide agreed-upon pricing plans for a minimum of two years in addition to waiving installation fees in accordance with CASF rules.32
Table 9: Infrastructure Funds Expended in 2020
Project Name Payment Recipient County Completion
Status Payment Amount
1 Connect Anza Phase II Anza Electric Cooperative Riverside Ongoing $652,828 2 Coalinga-Huron Gigabit CalNeva Broadband Fresno Complete $60,944 3 Desert Shores Frontier CA Imperial Ongoing $998,107 4 Weimar Project Frontier CA Placer Ongoing $156,606 5 Lytle Creek Frontier CA San Bernardino Ongoing $730,852 6 Taft Cluster Frontier CA Kern Ongoing $139,314 7 Light Saber LCB Communications Santa Clara Ongoing $357,924 8 Keddie Plumas-Sierra Tel. Plumas Ongoing $184,003 9 Elysian Valley-Johnstonville Plumas-Sierra Tel. Lassen Ongoing $576,277
10 Plumas Eureka-Johnsville Plumas-Sierra Tel. Plumas Ongoing $447,960 11 Lake Davis Plumas-Sierra Tel. Plumas Ongoing $657,930 12 Mohawk Vista Plumas-Sierra Tel. Plumas Ongoing $575,473 13 Gigafy Phelan Race Telecom. San Bernardino Ongoing $12,095,969 Total $ 17,634,188
32 D.18-12-018, Appendix 1 at p. 19.
The CPUC made payments to 13 projects in 2020. The
projects will provide broadband access to 15,187
estimated potential households.
2 0 2 0 CA L I F OR N I A A D VA N C E D S ER V IC E S F U N D A N N UA L R E P O R T
C A L I F O R N IA P U B L I C UT I L I T I E S C O M MI S S I O N 18
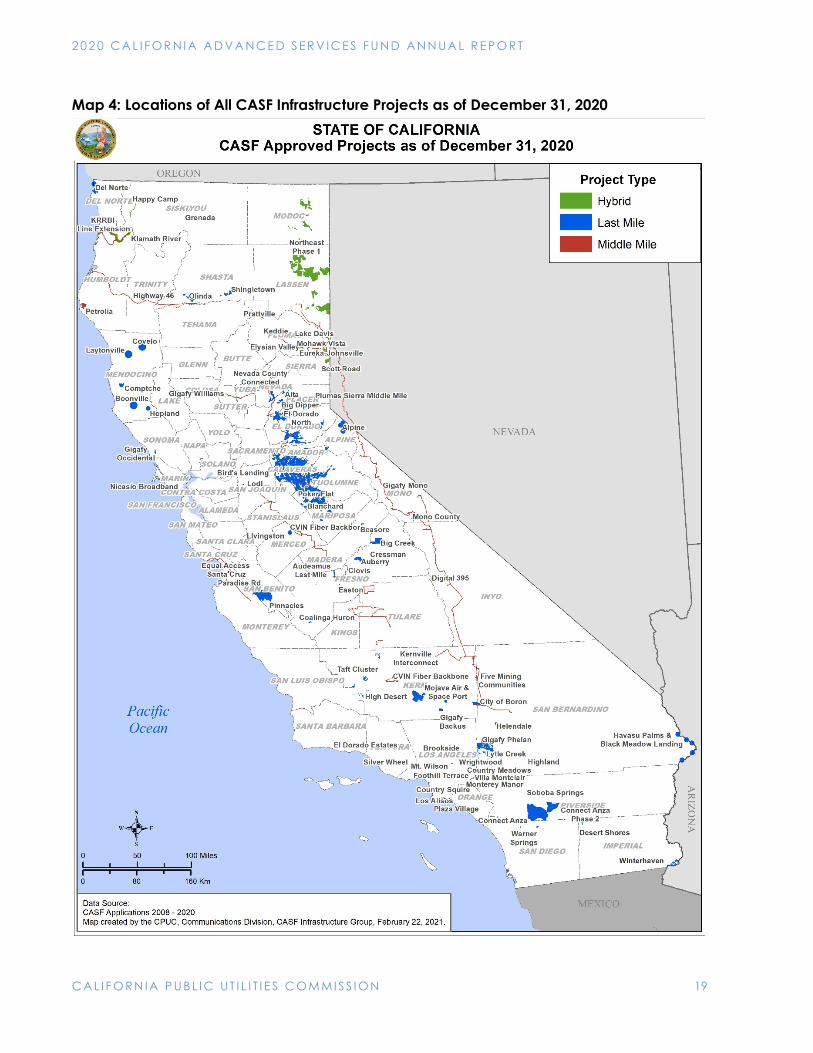
C. Total Infrastructure Projects Awarded Since 2008 The CPUC has awarded approximately $255 million to fund 87 broadband infrastructure projects (not including rescinded projects) since the beginning of the program in 2008 through December 31, 2020. The 87 projects include last-mile, hybrid,33 and middle-mile projects that provide (or will provide) broadband access to 322,909 estimated potential households. Since the 2019 CASF Annual Report, the Digital 299 middle mile project, which was awarded approximately $47 million in 2017, has been terminated. The CPUC received a letter from Inyo Networks on project termination due to funding difficulties.34
Table 10 summarizes the data on the total projects funded since program inception. Attachment B provides a list of all 87 projects including details such as project name, award recipient, project location, completion status, and household subscriptions. Map 4 on the following page illustrates the locations of all approved infrastructure projects.
Table 10: Total CASF Infrastructure Projects Awarded 2008 – 2020 Approved
Projects Completed Ongoing Amount Awarded Estimated Potential Households*
Last-Mile 68 40 28 $144,920,310 64,623
Middle-Mile 7 6 1 $54,486,468 255,859
Hybrid 12 0 12 $55,486,538 2,427
Total 87 46 41 $254,893,316 322,909 * Estimated potential households based on CPUC resolutions approving projects.
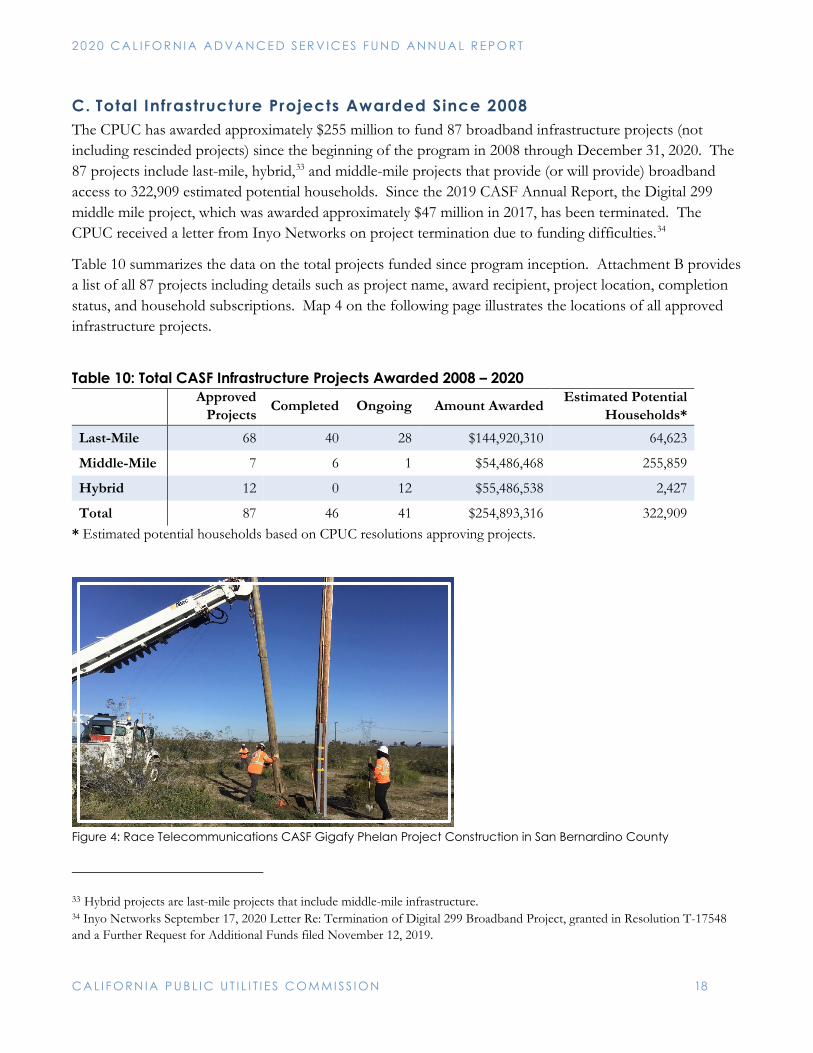
Figure 4: Race Telecommunications CASF Gigafy Phelan Project Construction in San Bernardino County
33 Hybrid projects are last-mile projects that include middle-mile infrastructure. 34 Inyo Networks September 17, 2020 Letter Re: Termination of Digital 299 Broadband Project, granted in Resolution T-17548 and a Further Request for Additional Funds filed November 12, 2019.
2 0 2 0 CA L I F OR N I A A D VA N C E D S ER V IC E S F U N D A N N UA L R E P O R T
C A L I F O R N IA P U B L I C UT I L I T I E S C O M MI S S I O N 19
Map 4: Locations of All CASF Infrastructure Projects as of December 31, 2020
2 0 2 0 CA L I F OR N I A A D VA N C E D S ER V IC E S F U N D A N N UA L R E P O R T
C A L I F O R N IA P U B L I C UT I L I T I E S C O M MI S S I O N 20
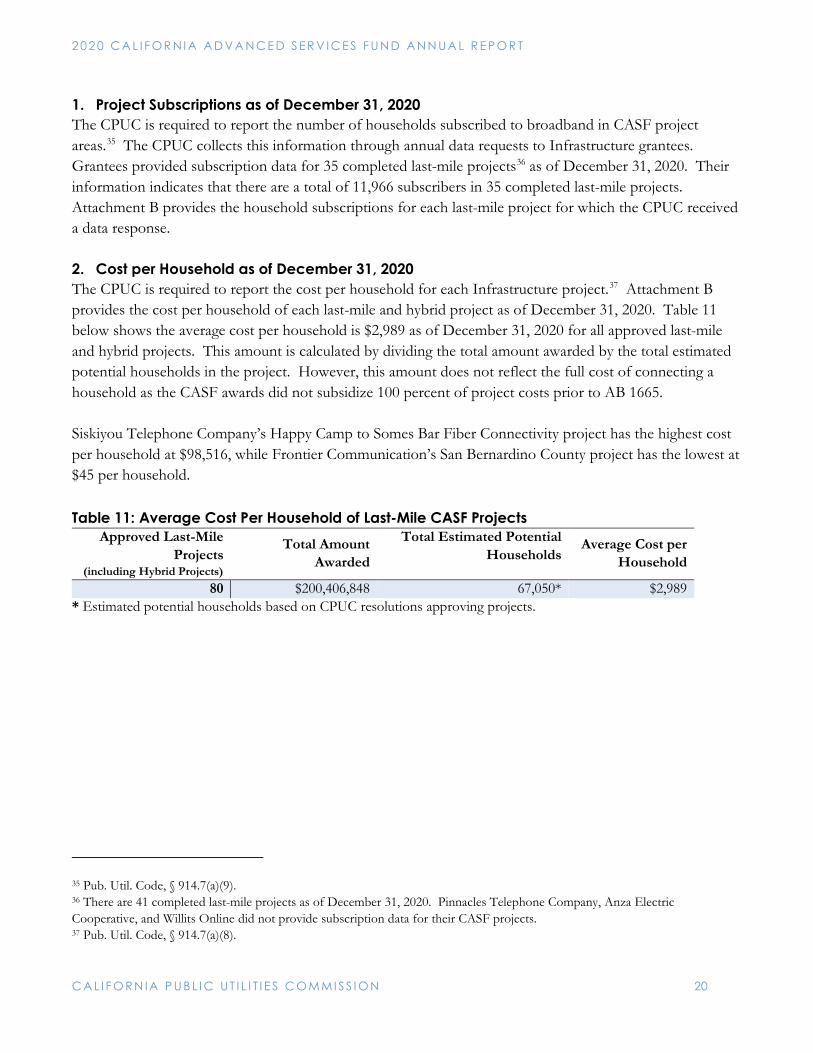
1. Project Subscriptions as of December 31, 2020 The CPUC is required to report the number of households subscribed to broadband in CASF project areas.35 The CPUC collects this information through annual data requests to Infrastructure grantees. Grantees provided subscription data for 35 completed last-mile projects36 as of December 31, 2020. Their information indicates that there are a total of 11,966 subscribers in 35 completed last-mile projects. Attachment B provides the household subscriptions for each last-mile project for which the CPUC received a data response. 2. Cost per Household as of December 31, 2020 The CPUC is required to report the cost per household for each Infrastructure project.37 Attachment B provides the cost per household of each last-mile and hybrid project as of December 31, 2020. Table 11 below shows the average cost per household is $2,989 as of December 31, 2020 for all approved last-mile and hybrid projects. This amount is calculated by dividing the total amount awarded by the total estimated potential households in the project. However, this amount does not reflect the full cost of connecting a household as the CASF awards did not subsidize 100 percent of project costs prior to AB 1665. Siskiyou Telephone Company’s Happy Camp to Somes Bar Fiber Connectivity project has the highest cost per household at $98,516, while Frontier Communication’s San Bernardino County project has the lowest at $45 per household. Table 11: Average Cost Per Household of Last-Mile CASF Projects
Approved Last-Mile Projects
(including Hybrid Projects)
Total Amount Awarded
Total Estimated Potential Households
Average Cost per Household
80 $200,406,848 67,050* $2,989 * Estimated potential households based on CPUC resolutions approving projects.
35 Pub. Util. Code, § 914.7(a)(9). 36 There are 41 completed last-mile projects as of December 31, 2020. Pinnacles Telephone Company, Anza Electric Cooperative, and Willits Online did not provide subscription data for their CASF projects. 37 Pub. Util. Code, § 914.7(a)(8).
2 0 2 0 CA L I F OR N I A A D VA N C E D S ER V IC E S F U N D A N N UA L R E P O R T
C A L I F O R N IA P U B L I C UT I L I T I E S C O M MI S S I O N 21
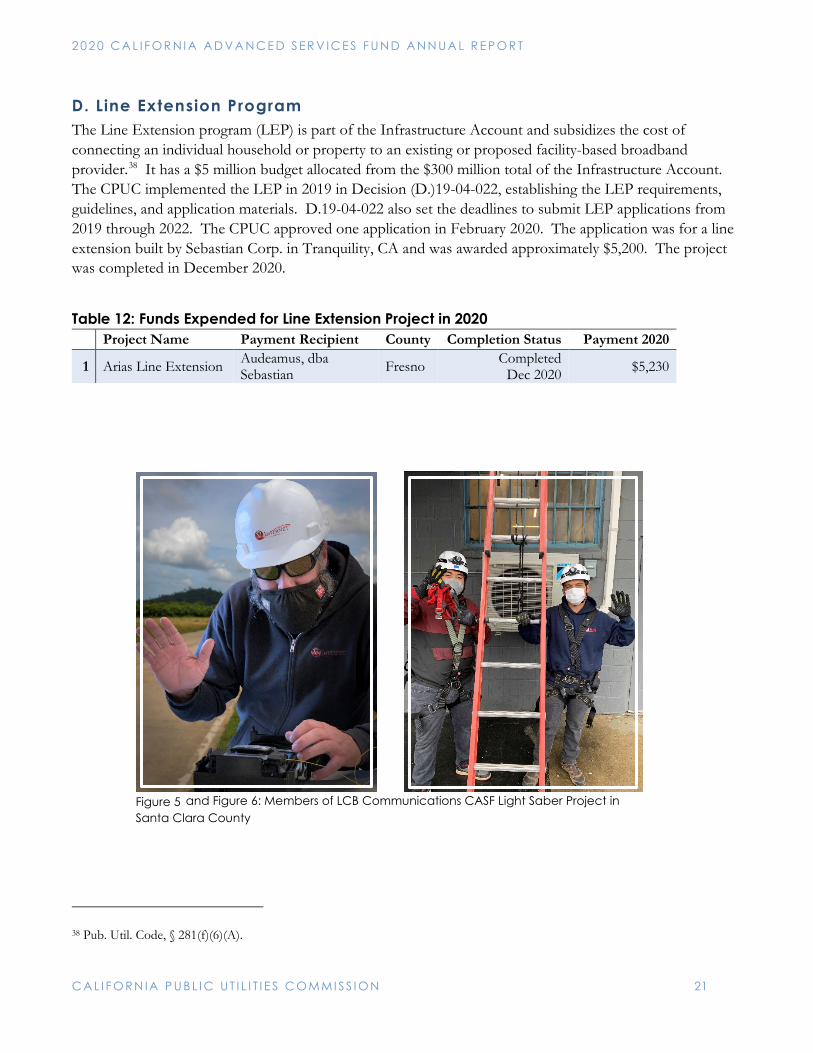
Figure 5 Santa Clara County
and Figure 6: Members of LCB Communications CASF Light Saber Project in
D. Line Extension Program The Line Extension program (LEP) is part of the Infrastructure Account and subsidizes the cost of connecting an individual household or property to an existing or proposed facility-based broadband provider.38 It has a $5 million budget allocated from the $300 million total of the Infrastructure Account. The CPUC implemented the LEP in 2019 in Decision (D.)19-04-022, establishing the LEP requirements, guidelines, and application materials. D.19-04-022 also set the deadlines to submit LEP applications from 2019 through 2022. The CPUC approved one application in February 2020. The application was for a line extension built by Sebastian Corp. in Tranquility, CA and was awarded approximately $5,200. The project was completed in December 2020.
Table 12: Funds Expended for Line Extension Project in 2020 Project Name Payment Recipient County Completion Status Payment 2020
1 Arias Line Extension Audeamus, dba Sebastian Fresno Completed
Dec 2020 $5,230
38 Pub. Util. Code, § 281(f)(6)(A).
2 0 2 0 CA L I F OR N I A A D VA N C E D S ER V IC E S F U N D A N N UA L R E P O R T
C A L I F O R N IA P U B L I C UT I L I T I E S C O M MI S S I O N 22
CASF Rural and Urban Regional Broadband Consortia Grant Account The Rural and Urban Regional Broadband Consortia Grant Account (Consortia Account) provides grants to eligible consortia to facilitate broadband deployment services by assisting CASF infrastructure applicants in the project development or the grant application process.39 Pursuant to AB 1665, the Consortia Account authorized an additional $10 million budget to support eligible consortia activities.40 Consortia grants are distributed in different cycles, and there have been four cycles to date - in 2011, 2016, 2019, and 2020. Further, Map 1 on page 8 of this report illustrates the distribution of the 17 consortia groups by county. Four of 58 counties are not represented by a regional consortium. Those counties are San Francisco, San Mateo, Santa Clara, and Orange counties.41 The CPUC funds grantees for the following activities consistent with Pub. Util. Code section 281:42
• Collaborating with the CPUC to engage regional consortia, local officials, Internet service providers, stakeholders, and consumers regarding priority areas and cost-effective strategies to achieve the broadband access goal.
• Identifying potential CASF infrastructure projects, along with other opportunities, where providers can expand and improve their infrastructure and service offerings to achieve the goal of broadband deployment to 98 percent of households in each consortia region.
• Assisting infrastructure applicants in the project development or grant application process.
• Conducting the following activities provided they lead to infrastructure applications: o Supporting project permitting activities. o Engaging local government officials and communities to better understand and explain regional
broadband needs and solutions. o Conducting an inventory of public assets (e.g., rights-of-ways, publicly owned towers, public
utility poles, equipment housing, publicly owned property) and aggregate demand, including speed tests and the identification and updates of priority areas.
• Assisting the CPUC in publicizing requests for wireline testing volunteers in areas, as needed.
39 Pub. Util. Code, § 281(g)(1). 40 AB 1665 authorized an additional $10 million for the Consortia Account supplementing the previously approved $15 million. 41 On December 18, 2020, the Communications Division sent a letter to the CASF Distribution soliciting Consortia grant applications for regions that are not currently represented or not currently funded by the CASF. Applications were due on February 1, 2021, and subsequently extended to February 12, 2021. 42 The CPUC approved D.18-10-032 adopting revised rules and guidelines for the Consortia Account.
The CPUC awarded two (2) consortia projects with
approximately $900,000 in total funding in 2020.
2 0 2 0 CA L I F OR N I A A D VA N C E D S ER V IC E S F U N D A N N UA L R E P O R T
C A L I F O R N IA P U B L I C UT I L I T I E S C O M MI S S I O N 23
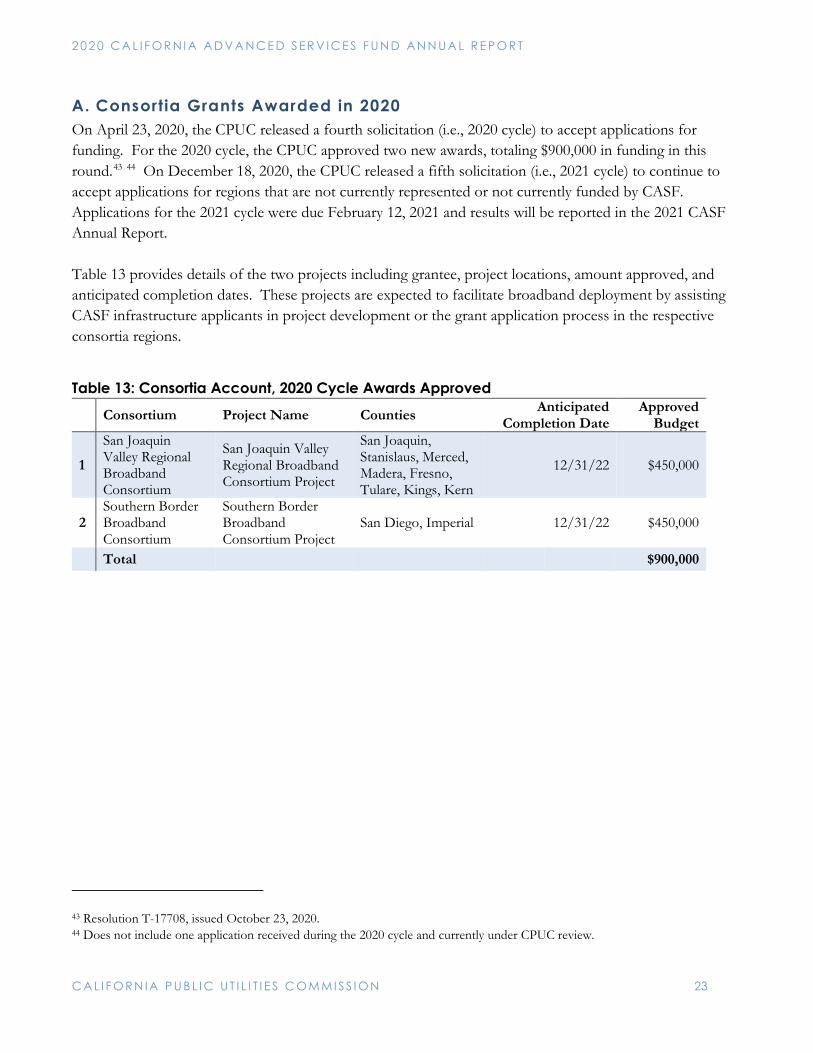
A. Consortia Grants Awarded in 2020 On April 23, 2020, the CPUC released a fourth solicitation (i.e., 2020 cycle) to accept applications for funding. For the 2020 cycle, the CPUC approved two new awards, totaling $900,000 in funding in this round.43 44 On December 18, 2020, the CPUC released a fifth solicitation (i.e., 2021 cycle) to continue to accept applications for regions that are not currently represented or not currently funded by CASF. Applications for the 2021 cycle were due February 12, 2021 and results will be reported in the 2021 CASF Annual Report. Table 13 provides details of the two projects including grantee, project locations, amount approved, and anticipated completion dates. These projects are expected to facilitate broadband deployment by assisting CASF infrastructure applicants in project development or the grant application process in the respective consortia regions.
Table 13: Consortia Account, 2020 Cycle Awards Approved
# Consortium Project Name Counties Anticipated Completion Date
Approved Budget
1
San Joaquin Valley Regional Broadband Consortium
San Joaquin Valley Regional Broadband Consortium Project
San Joaquin, Stanislaus, Merced, Madera, Fresno, Tulare, Kings, Kern
12/31/22 $450,000
2 Southern Border Broadband Consortium
Southern Border Broadband Consortium Project
San Diego, Imperial 12/31/22 $450,000
Total $900,000
43 Resolution T-17708, issued October 23, 2020. 44 Does not include one application received during the 2020 cycle and currently under CPUC review.
2 0 2 0 CA L I F OR N I A A D VA N C E D S ER V IC E S F U N D A N N UA L R E P O R T
C A L I F O R N IA P U B L I C UT I L I T I E S C O M MI S S I O N 24
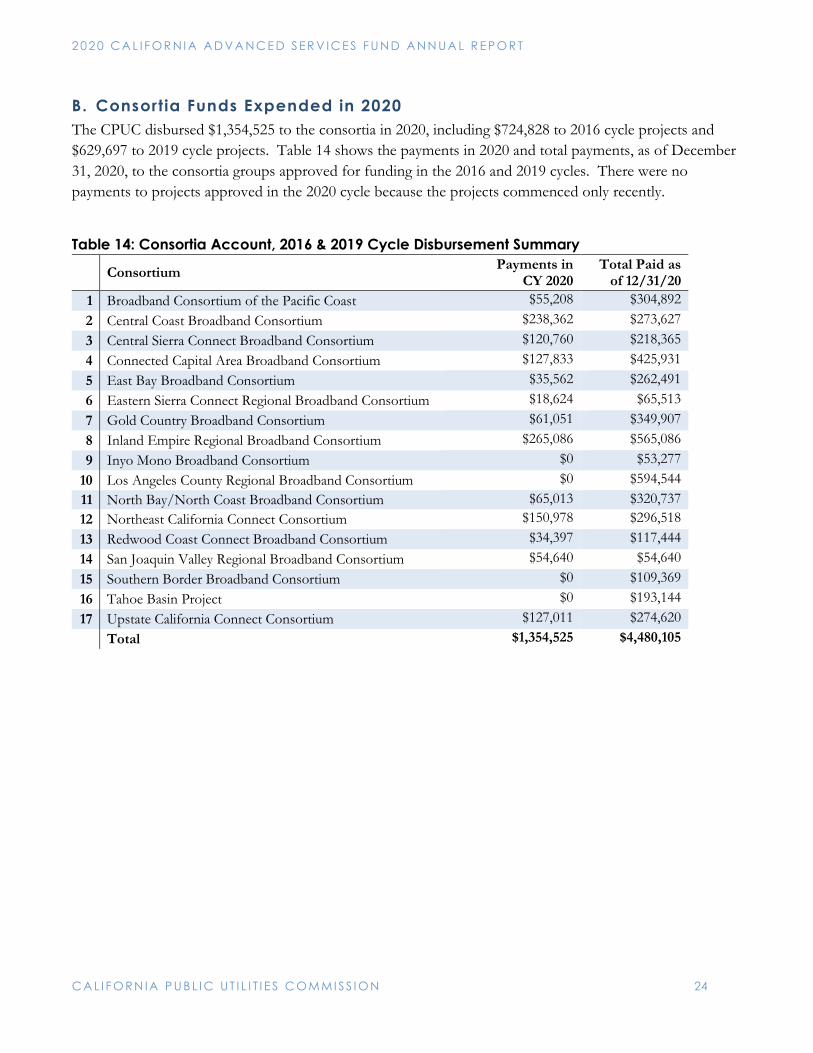
B. Consortia Funds Expended in 2020 The CPUC disbursed $1,354,525 to the consortia in 2020, including $724,828 to 2016 cycle projects and $629,697 to 2019 cycle projects. Table 14 shows the payments in 2020 and total payments, as of December 31, 2020, to the consortia groups approved for funding in the 2016 and 2019 cycles. There were no payments to projects approved in the 2020 cycle because the projects commenced only recently.
Table 14: Consortia Account, 2016 & 2019 Cycle Disbursement Summary
Consortium Payments in CY 2020
Total Paid as of 12/31/20
1 Broadband Consortium of the Pacific Coast $55,208 $304,892 2 Central Coast Broadband Consortium $238,362 $273,627 3 Central Sierra Connect Broadband Consortium $120,760 $218,365 4 Connected Capital Area Broadband Consortium $127,833 $425,931 5 East Bay Broadband Consortium $35,562 $262,491 6 Eastern Sierra Connect Regional Broadband Consortium $18,624 $65,513 7 Gold Country Broadband Consortium $61,051 $349,907 8 Inland Empire Regional Broadband Consortium $265,086 $565,086 9 Inyo Mono Broadband Consortium $0 $53,277
10 Los Angeles County Regional Broadband Consortium $0 $594,544 11 North Bay/North Coast Broadband Consortium $65,013 $320,737 12 Northeast California Connect Consortium $150,978 $296,518 13 Redwood Coast Connect Broadband Consortium $34,397 $117,444 14 San Joaquin Valley Regional Broadband Consortium $54,640 $54,640 15 Southern Border Broadband Consortium $0 $109,369 16 Tahoe Basin Project $0 $193,144 17 Upstate California Connect Consortium $127,011 $274,620 Total $1,354,525 $4,480,105
2 0 2 0 CA L I F OR N I A A D VA N C E D S ER V IC E S F U N D A N N UA L R E P O R T
C A L I F O R N IA P U B L I C UT I L I T I E S C O M MI S S I O N 25
C. Consortia Account Benefits For 2020, the disbursements to consortia groups, representing 49 out of 58 counties in California, were for the following activities:
• Identifying potential CASF infrastructure projects, along with other opportunities, where providers can expand and improve their infrastructure and service offerings to achieve the CASF program goal.
• Providing information and data about broadband availability and demand aggregation to local broadband providers and informing them about the CASF funding opportunity.
• Inventorying regional broadband assets or mapping broadband availability in the area. • Increasing adoption through efforts such as digital literacy training. • Educating and informing policymakers about broadband deployment, access, and adoption and
identifying existing barriers and prospective strategies to bridge the digital divide.45 To assess Consortia Account benefits, staff sent consortia grantees a data request on January 5, 2021, requesting outcomes of consortia access, adoption, and deployment efforts in 2020. The following provides a summary of the responses.
• Ten of the 17 consortia groups responded detailing their efforts in deployment and adoption, as shown in Attachment C on page 55.
• Three of the consortia46 respondents reported their deployment and adoption/access activities, and seven consortia47 reported their deployment activities.
• Seven consortia did not respond and staff followed up with these consortia.48 • All nine consortia receiving the 2019 cycle grants (Pacific Coast, Connected Capital Area, Central
Coast, Gold Country, Inland Empire, North Bay North Coast, Northeastern California Connect, Redwood Coast Connect, and Upstate California Connect) reported that they participated in developing broadband infrastructure applications in 2020 for the 34 of the 54 CASF Infrastructure applications submitted on May 4, 2020.
• One other consortium (Central Sierra Connect) reported that they supported potential infrastructure projects in discussion and development in their region or participated in other deployment related activities in 2020.
45 Prior to AB 1665’s enactment, the objective of consortia activities was to promote “regionally appropriate and cost-effective broadband deployment, access, and adoption.” 46 Central Sierra Connect Broadband, Northeastern California Connect Consortium, and Upstate California Connect Broadband Connect Consortium. 47 Broadband Consortium of the Pacific Coast, Connected Capital Area Broadband Consortium, Central Coast Broadband Consortium, Gold Country Broadband Consortium, Inland Empire Broadband Consortium, North Bay North Coast Broadband Consortium, and Redwood Coast Connect Broadband Consortium. 48 Some consortia may not have activities to report due to their grants ending before 2020 or their new grants were implemented in November 2020. The non-responsive consortia groups are East Bay Broadband Consortium, Eastern Sierra Connect Regional Broadband Consortium, Inyo Mono Broadband Consortium, Los Angeles County Regional Broadband Consortium, San Joaquin Valley Regional Broadband Consortium, Southern Border Broadband Consortium, and Tahoe Basin Project.
2 0 2 0 CA L I F OR N I A A D VA N C E D S ER V IC E S F U N D A N N UA L R E P O R T
C A L I F O R N IA P U B L I C UT I L I T I E S C O M MI S S I O N 26
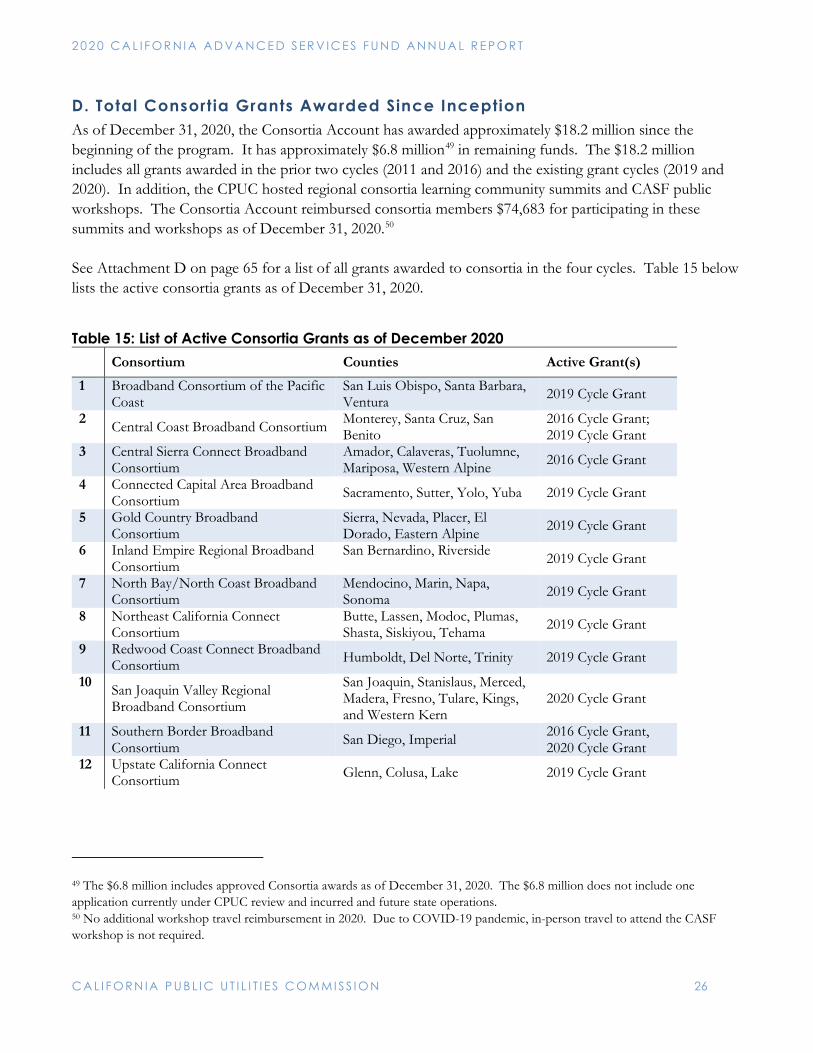
D. Total Consortia Grants Awarded Since Inception As of December 31, 2020, the Consortia Account has awarded approximately $18.2 million since the beginning of the program. It has approximately $6.8 million49 in remaining funds. The $18.2 million includes all grants awarded in the prior two cycles (2011 and 2016) and the existing grant cycles (2019 and 2020). In addition, the CPUC hosted regional consortia learning community summits and CASF public workshops. The Consortia Account reimbursed consortia members $74,683 for participating in these summits and workshops as of December 31, 2020.50 See Attachment D on page 65 for a list of all grants awarded to consortia in the four cycles. Table 15 below lists the active consortia grants as of December 31, 2020.
Table 15: List of Active Consortia Grants as of December 2020
Consortium Counties Active Grant(s)
1 Broadband Consortium of the Pacific Coast
San Luis Obispo, Santa Barbara, Ventura 2019 Cycle Grant
2 Central Coast Broadband Consortium Monterey, Santa Cruz, San Benito
2016 Cycle Grant; 2019 Cycle Grant
3 Central Sierra Connect Broadband Consortium
Amador, Calaveras, Tuolumne, Mariposa, Western Alpine 2016 Cycle Grant
4 Connected Capital Area Broadband Consortium Sacramento, Sutter, Yolo, Yuba 2019 Cycle Grant
5 Gold Country Broadband Consortium
Sierra, Nevada, Placer, El Dorado, Eastern Alpine 2019 Cycle Grant
6 Inland Empire Regional Broadband Consortium
San Bernardino, Riverside 2019 Cycle Grant
7 North Bay/North Coast Broadband Consortium
Mendocino, Marin, Napa, Sonoma 2019 Cycle Grant
8 Northeast California Connect Consortium
Butte, Lassen, Modoc, Plumas, Shasta, Siskiyou, Tehama 2019 Cycle Grant
9 Redwood Coast Connect Broadband Consortium Humboldt, Del Norte, Trinity 2019 Cycle Grant
10 San Joaquin Valley Regional Broadband Consortium
San Joaquin, Stanislaus, Merced, Madera, Fresno, Tulare, Kings, and Western Kern
2020 Cycle Grant
11 Southern Border Broadband Consortium San Diego, Imperial 2016 Cycle Grant,
2020 Cycle Grant 12 Upstate California Connect
Consortium Glenn, Colusa, Lake 2019 Cycle Grant
49 The $6.8 million includes approved Consortia awards as of December 31, 2020. The $6.8 million does not include one application currently under CPUC review and incurred and future state operations. 50 No additional workshop travel reimbursement in 2020. Due to COVID-19 pandemic, in-person travel to attend the CASF workshop is not required.
2 0 2 0 CA L I F OR N I A A D VA N C E D S ER V IC E S F U N D A N N UA L R E P O R T
C A L I F O R N IA P U B L I C UT I L I T I E S C O M MI S S I O N 27
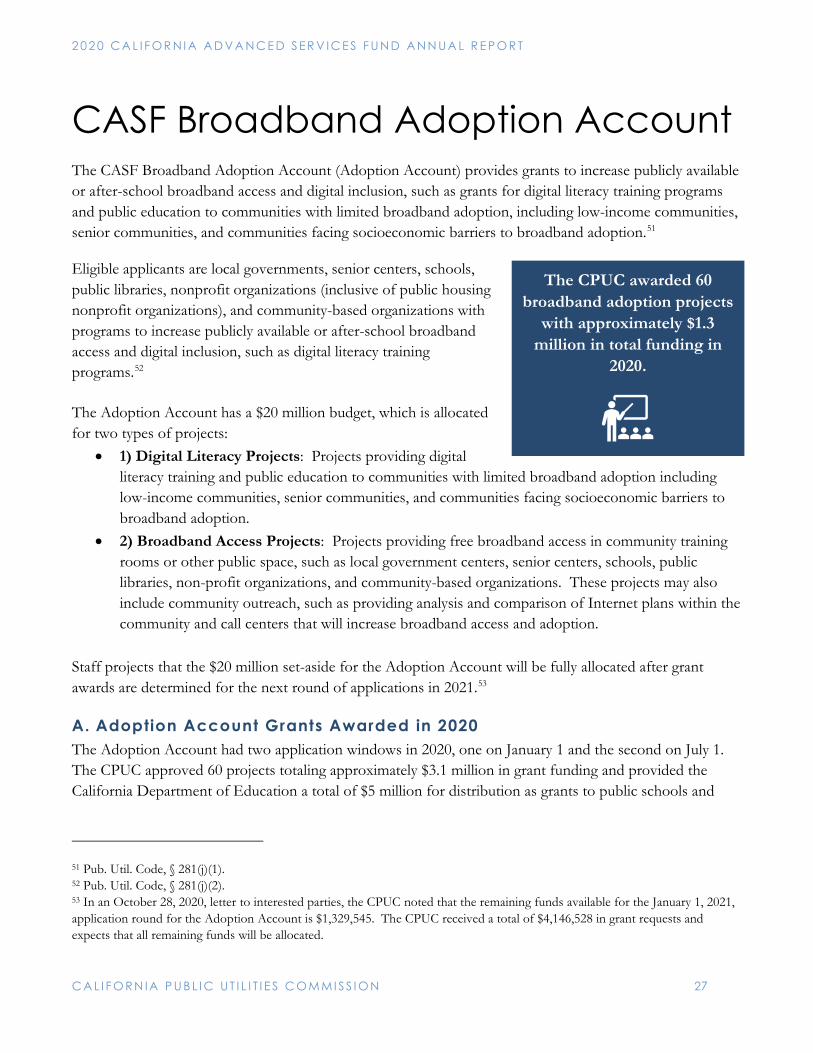
CASF Broadband Adoption Account The CASF Broadband Adoption Account (Adoption Account) provides grants to increase publicly available or after-school broadband access and digital inclusion, such as grants for digital literacy training programs and public education to communities with limited broadband adoption, including low-income communities, senior communities, and communities facing socioeconomic barriers to broadband adoption.51
Eligible applicants are local governments, senior centers, schools, public libraries, nonprofit organizations (inclusive of public housing nonprofit organizations), and community-based organizations with programs to increase publicly available or after-school broadband access and digital inclusion, such as digital literacy training programs.52 The Adoption Account has a $20 million budget, which is allocated for two types of projects:
• 1) Digital Literacy Projects: Projects providing digital literacy training and public education to communities with limited broadband adoption including low-income communities, senior communities, and communities facing socioeconomic barriers to broadband adoption.
• 2) Broadband Access Projects: Projects providing free broadband access in community training rooms or other public space, such as local government centers, senior centers, schools, public libraries, non-profit organizations, and community-based organizations. These projects may also include community outreach, such as providing analysis and comparison of Internet plans within the community and call centers that will increase broadband access and adoption.
Staff projects that the $20 million set-aside for the Adoption Account will be fully allocated after grant awards are determined for the next round of applications in 2021.53
A. Adoption Account Grants Awarded in 2020 The Adoption Account had two application windows in 2020, one on January 1 and the second on July 1. The CPUC approved 60 projects totaling approximately $3.1 million in grant funding and provided the California Department of Education a total of $5 million for distribution as grants to public schools and
51 Pub. Util. Code, § 281(j)(1). 52 Pub. Util. Code, § 281(j)(2). 53 In an October 28, 2020, letter to interested parties, the CPUC noted that the remaining funds available for the January 1, 2021, application round for the Adoption Account is $1,329,545. The CPUC received a total of $4,146,528 in grant requests and expects that all remaining funds will be allocated.
The CPUC awarded 60 broadband adoption projects
with approximately $1.3 million in total funding in
2020.
2 0 2 0 CA L I F OR N I A A D VA N C E D S ER V IC E S F U N D A N N UA L R E P O R T
C A L I F O R N IA P U B L I C UT I L I T I E S C O M MI S S I O N 28
Figure 5: CASF Grantee EAH Housing Digital Literacy Class
school districts in response to the COVID-19 pandemic (see the next section for additional information on this distribution). Table 16 provides a summary of the Adoption Account awards in 2020.
Table 16: Summary of Approved Funding in 2020
Digital Literacy
Broadband Access
CA Department of Education Funding Total Approved
Projects 55 5 12 Schools/Districts
Funding $2,891,327 $254,459 $5,000,000 $8,145,786 Attachment E1 shows the projects approved in 2020 and all projects approved since the program’s inception in 2018. It provides project details including project name, grantee, project location, grant amount, payments made, and completion date (if applicable). Table 17 specifies grants by county. Table 17: Grants by County in 2020
County Grant Amount Alameda $38,148 Contra Costa $99,626 Fresno $54,480 Kern $54,480 Kings $54,480 Los Angeles $718,162 Madera $54,480 Marin $18,850 Mariposa $54,480 Merced $54,480 Monterey $54,480 Multiple $539,247 Orange $11,608 Sacramento $108,772 San Benito $54,480 San Diego $53,584 San Francisco $288,607 San Joaquin $54,480 San Luis Obispo $54,480
San Mateo $41,895 Santa Clara $401,289 Stanislaus $54,480 Tulare $101,239 Tuolumne $54,480 Ventura $70,999 Total: $3,145,786
2 0 2 0 CA L I F OR N I A A D VA N C E D S ER V IC E S F U N D A N N UA L R E P O R T
C A L I F O R N IA P U B L I C UT I L I T I E S C O M MI S S I O N 29
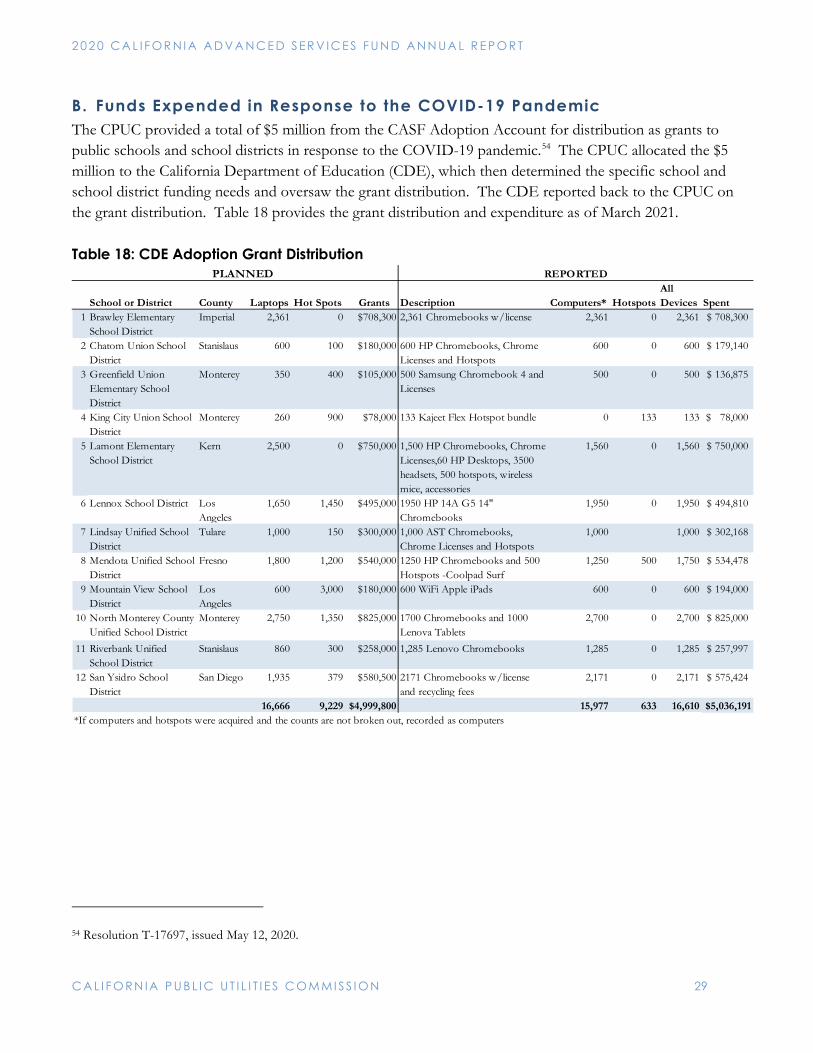
B. Funds Expended in Response to the COVID-19 Pandemic The CPUC provided a total of $5 million from the CASF Adoption Account for distribution as grants to public schools and school districts in response to the COVID-19 pandemic.54 The CPUC allocated the $5 million to the California Department of Education (CDE), which then determined the specific school and school district funding needs and oversaw the grant distribution. The CDE reported back to the CPUC on the grant distribution. Table 18 provides the grant distribution and expenditure as of March 2021. Table 18: CDE Adoption Grant Distribution
54 Resolution T-17697, issued May 12, 2020.
School or District County Laptops Hot Spots Grants Description Computers* HotspotsAll Devices Spent
1 Brawley Elementary School District
Imperial 2,361 0 $708,300 2,361 Chromebooks w/license 2,361 0 2,361 708,300$
2 Chatom Union School District
Stanislaus 600 100 $180,000 600 HP Chromebooks, Chrome Licenses and Hotspots
600 0 600 179,140$
3 Greenfield Union Elementary School District
Monterey 350 400 $105,000 500 Samsung Chromebook 4 and Licenses
500 0 500 136,875$
4 King City Union School District
Monterey 260 900 $78,000 133 Kajeet Flex Hotspot bundle 0 133 133 78,000$
5 Lamont Elementary School District
Kern 2,500 0 $750,000 1,500 HP Chromebooks, Chrome Licenses,60 HP Desktops, 3500 headsets, 500 hotspots, wireless mice, accessories
1,560 0 1,560 750,000$
6 Lennox School District Los Angeles
1,650 1,450 $495,000 1950 HP 14A G5 14" Chromebooks
1,950 0 1,950 494,810$
7 Lindsay Unified School District
Tulare 1,000 150 $300,000 1,000 AST Chromebooks, Chrome Licenses and Hotspots
1,000 1,000 302,168$
8 Mendota Unified School District
Fresno 1,800 1,200 $540,000 1250 HP Chromebooks and 500 Hotspots -Coolpad Surf
1,250 500 1,750 534,478$
9 Mountain View School District
Los Angeles
600 3,000 $180,000 600 WiFi Apple iPads 600 0 600 194,000$
10 North Monterey County Unified School District
Monterey 2,750 1,350 $825,000 1700 Chromebooks and 1000 Lenova Tablets
2,700 0 2,700 825,000$
11 Riverbank Unified School District
Stanislaus 860 300 $258,000 1,285 Lenovo Chromebooks 1,285 0 1,285 257,997$
12 San Ysidro School District
San Diego 1,935 379 $580,500 2171 Chromebooks w/license and recycling fees
2,171 0 2,171 575,424$
16,666 9,229 $4,999,800 15,977 633 16,610 $5,036,191*If computers and hotspots were acquired and the counts are not broken out, recorded as computers
PLANNED REPORTED
2 0 2 0 CA L I F OR N I A A D VA N C E D S ER V IC E S F U N D A N N UA L R E P O R T
C A L I F O R N IA P U B L I C UT I L I T I E S C O M MI S S I O N 30
Figure 6: CASF Grantee, Women's Audio Mission Online Digital Literacy Class
C. Adoption Account Funds Allocated and Expended in 2020 The CPUC continued to reimburse for previously approved Adoption Account projects. Table 19 shows that the CPUC expended $657,903 in funding across 18 counties in 2020.
Table 19: Funds Expended by County in 2020 County Payments Alameda $86,210 Contra Costa $107,785 Fresno $302 Kern $230 Kings $293 Los Angeles $167,162 Madera $329 Merced $266 Nevada $21,446 San Bernardino $19,599 San Diego $10,105 San Francisco $104,227 San Joaquin $295 San Mateo $42,302 Santa Clara $89,778 Santa Cruz $7,017 Stanislaus $293 Tulare $266 Total: $657,905
Figure 7: CASF Grantee First Community Socially Distanced Digital Literacy Class
2 0 2 0 CA L I F OR N I A A D VA N C E D S ER V IC E S F U N D A N N UA L R E P O R T
C A L I F O R N IA P U B L I C UT I L I T I E S C O M MI S S I O N 31
D. Adoption Account Benefits The Adoption Account benefits can be expressed as the number of people receiving training through the digital literacy projects and the number of people provided broadband access through the broadband access projects. Staff sent data requests to grantees to learn the number of people who have benefited from projects. A summary of the data collected is provided in the following bullet points.55 These numbers will continue to increase as most of the projects are ongoing.
• Digital Literacy: 5,948 people completed eight hours or more of digital literacy training and 2,104 new broadband subscriptions from the 172 projects awarded as of December 31, 2020.
• Broadband Access: 48,170 people were provided broadband access and 2,785 new broadband subscriptions from the 28 projects as of December 31, 2020.
• Broadband Call Center: 7,614 new broadband subscriptions resulted from four projects awarded as of December 31, 2020.
Attachment E2 provides Adoption Account project performance and project status given the COVID-19 pandemic.
E. COVID-19 Pandemic’s Impacts on Adoption Account Projects Staff sent a survey to Adoption Account grantees to obtain project status and impacts of the COVID-19 pandemic and Stay-at-Home restrictions on 198 projects. Grantees reported:
• 95 projects as delayed in some way due to the pandemic. See Attachment E2 for further details on each project.
• 47 projects as active having made successful adjustments during the pandemic. • 42 projects as not active but will be reactivated once the Stay-at-Home restrictions are lifted. • No response on 14 projects so project status could not be determined.56
The responses indicated grantees being stressed by the pandemic and encountering difficulties in carrying out the projects. One grantee, Compass Family Services stated, “We have competing priorities and lack of staff capacity, due to needing to reconfigure existing services and providing crisis relief to our client population of families experiencing or at risk of a housing crisis.” The responses also showed that it was impossible for grantees to serve as many people as initially projected given the limitations of remote instruction, social distancing requirements, and increased costs of providing digital inclusion services. For some locations, such as libraries, facilities are closed, and programs are not active or limited to outside access.
55 Staff sent requests to 58 grantees of which 33 responded. 56 To account for project status, staff plan to review all ongoing projects post-survey and take any necessary steps, such as modification of project schedules, workplans, and/or budgets, in response to grantee needs.
2 0 2 0 CA L I F OR N I A A D VA N C E D S ER V IC E S F U N D A N N UA L R E P O R T
C A L I F O R N IA P U B L I C UT I L I T I E S C O M MI S S I O N 32
Further, program participants may not have the requisite skills to access remote instruction or may not have an Internet connection available. Grantees may not be able to enter the participant’s residence to set up equipment due to COVID-19 restrictions. Some grantees reported that the need for these services is greater than ever, possibly due to social isolation, whereas one grantee reported that would-be participants have more pressing needs such as employment.
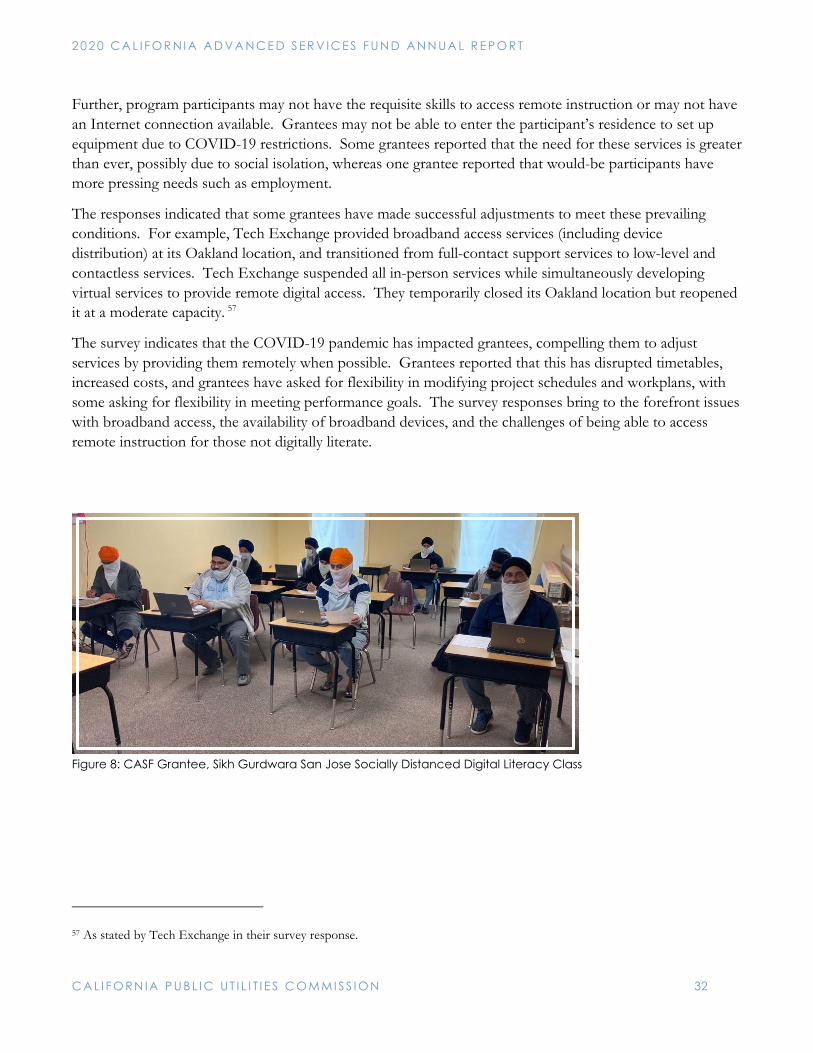
The responses indicated that some grantees have made successful adjustments to meet these prevailing conditions. For example, Tech Exchange provided broadband access services (including device distribution) at its Oakland location, and transitioned from full-contact support services to low-level and contactless services. Tech Exchange suspended all in-person services while simultaneously developing virtual services to provide remote digital access. They temporarily closed its Oakland location but reopened it at a moderate capacity. 57
The survey indicates that the COVID-19 pandemic has impacted grantees, compelling them to adjust services by providing them remotely when possible. Grantees reported that this has disrupted timetables, increased costs, and grantees have asked for flexibility in modifying project schedules and workplans, with some asking for flexibility in meeting performance goals. The survey responses bring to the forefront issues with broadband access, the availability of broadband devices, and the challenges of being able to access remote instruction for those not digitally literate.
Figure 8: CASF Grantee, Sikh Gurdwara San Jose Socially Distanced Digital Literacy Class
57 As stated by Tech Exchange in their survey response.
2 0 2 0 CA L I F OR N I A A D VA N C E D S ER V IC E S F U N D A N N UA L R E P O R T
C A L I F O R N IA P U B L I C UT I L I T I E S C O M MI S S I O N 33
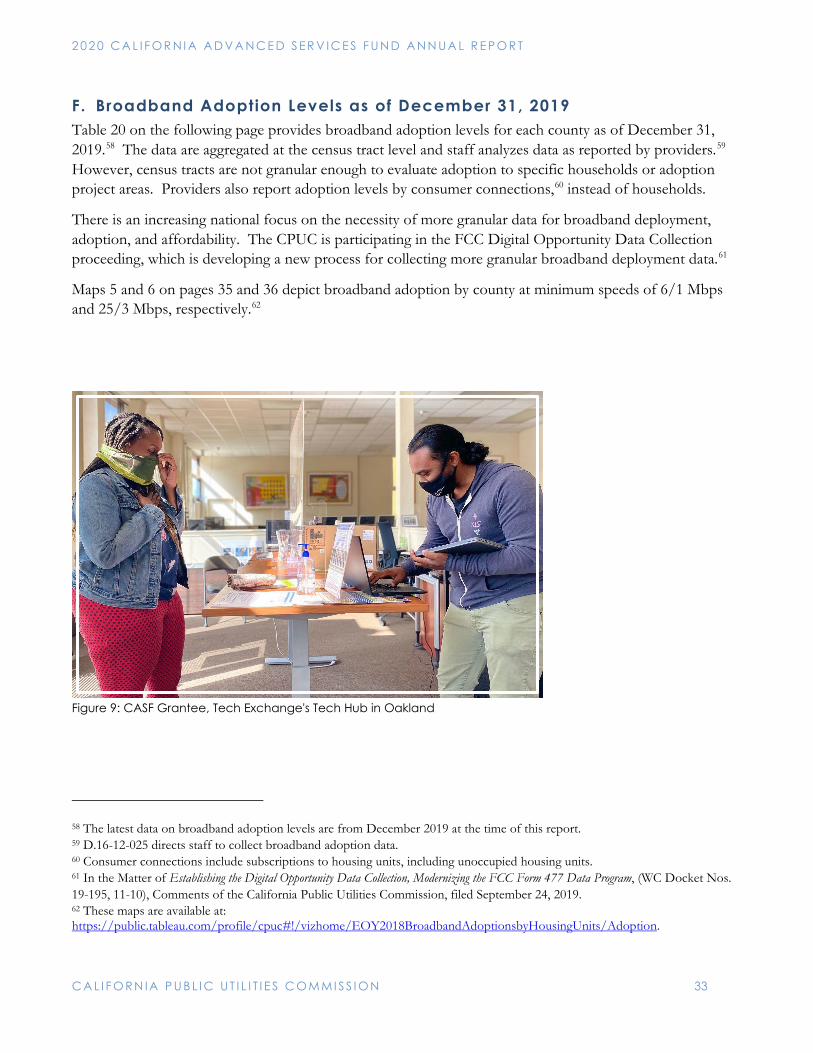
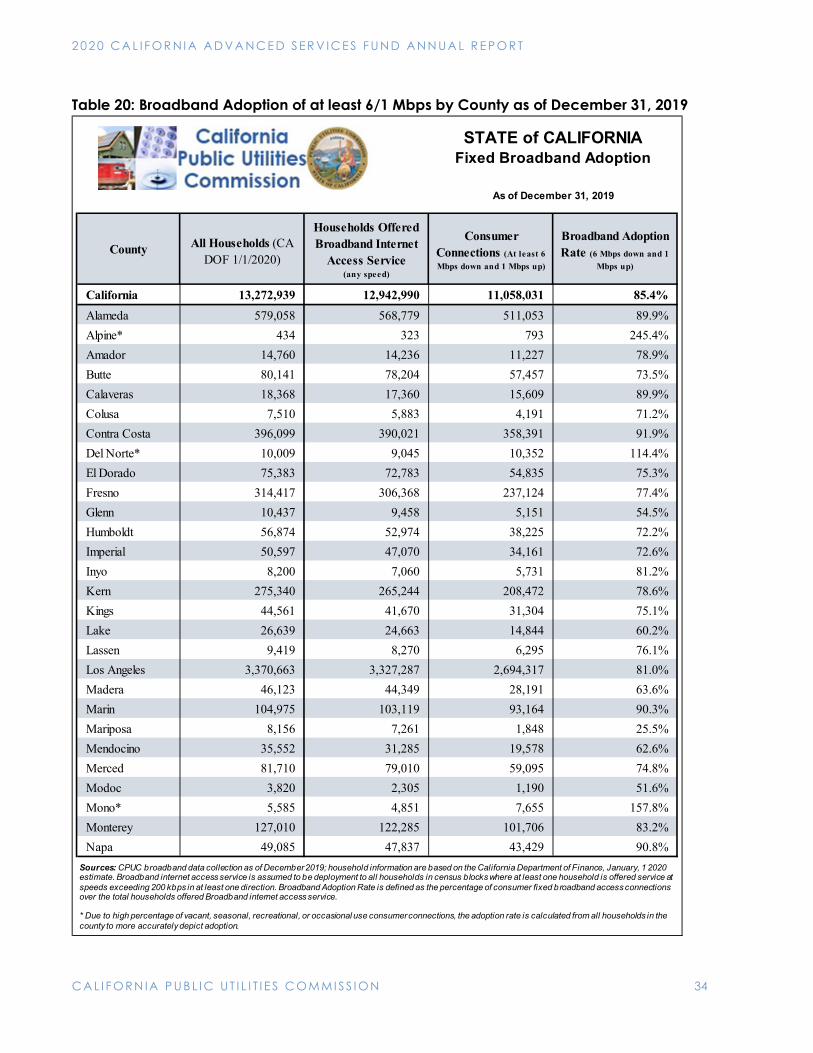
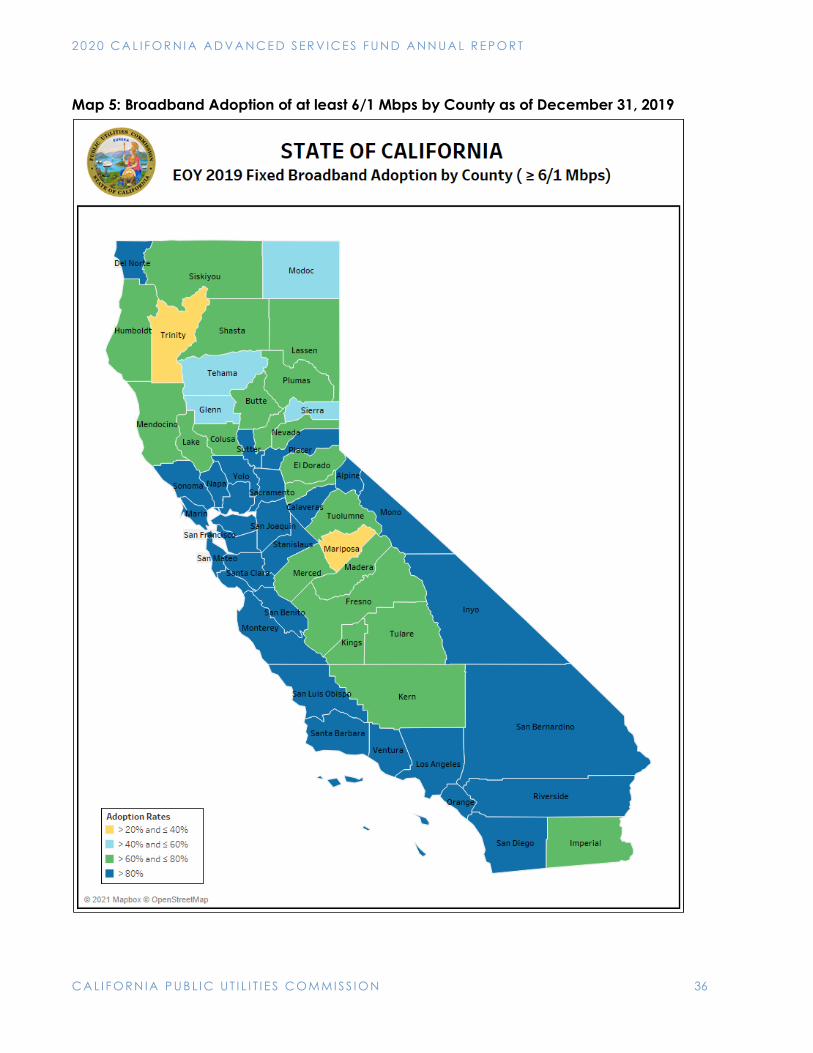
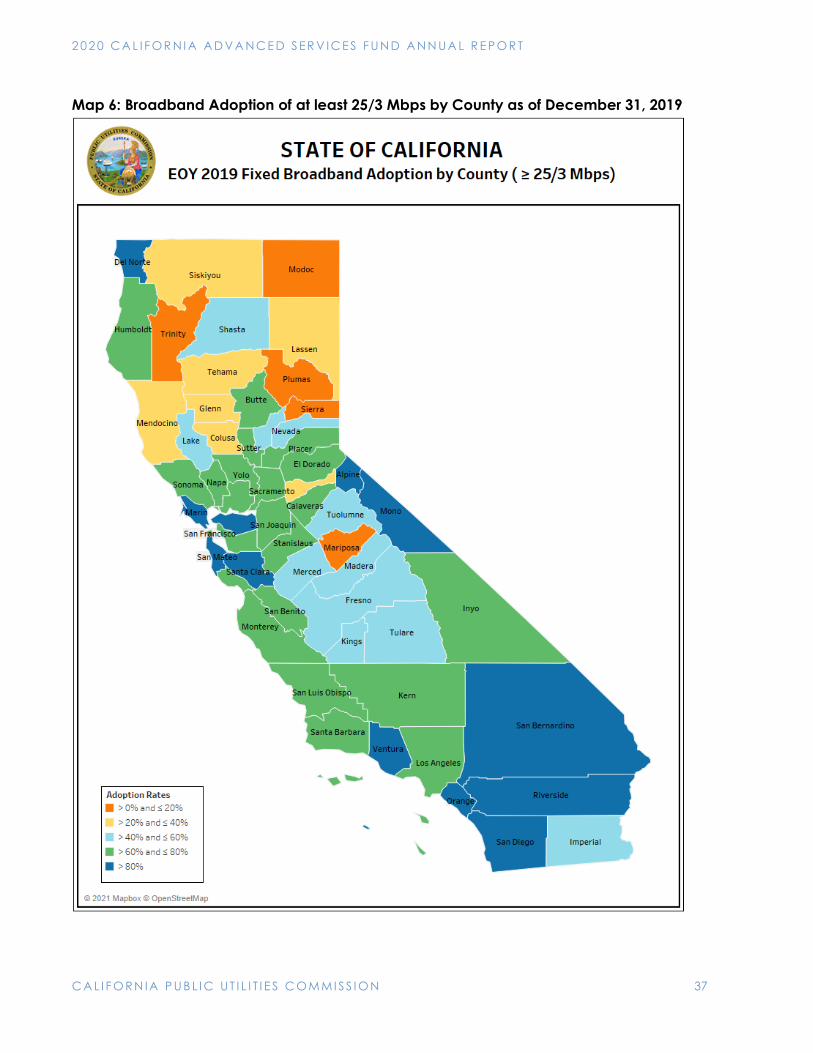
F. Broadband Adoption Levels as of December 31, 2019 Table 20 on the following page provides broadband adoption levels for each county as of December 31, 2019.58 The data are aggregated at the census tract level and staff analyzes data as reported by providers.59 However, census tracts are not granular enough to evaluate adoption to specific households or adoption project areas. Providers also report adoption levels by consumer connections,60 instead of households.
There is an increasing national focus on the necessity of more granular data for broadband deployment, adoption, and affordability. The CPUC is participating in the FCC Digital Opportunity Data Collection proceeding, which is developing a new process for collecting more granular broadband deployment data.61
Maps 5 and 6 on pages 35 and 36 depict broadband adoption by county at minimum speeds of 6/1 Mbps and 25/3 Mbps, respectively.62
Figure 9: CASF Grantee, Tech Exchange's Tech Hub in Oakland
58 The latest data on broadband adoption levels are from December 2019 at the time of this report. 59 D.16-12-025 directs staff to collect broadband adoption data. 60 Consumer connections include subscriptions to housing units, including unoccupied housing units. 61 In the Matter of Establishing the Digital Opportunity Data Collection, Modernizing the FCC Form 477 Data Program, (WC Docket Nos. 19-195, 11-10), Comments of the California Public Utilities Commission, filed September 24, 2019. 62 These maps are available at: https://public.tableau.com/profile/cpuc#!/vizhome/EOY2018BroadbandAdoptionsbyHousingUnits/Adoption.
2 0 2 0 CA L I F OR N I A A D VA N C E D S ER V IC E S F U N D A N N UA L R E P O R T
C A L I F O R N IA P U B L I C UT I L I T I E S C O M MI S S I O N 34
Table 20: Broadband Adoption of at least 6/1 Mbps by County as of December 31, 2019
County All Households (CA DOF 1/1/2020)
Households Offered Broadband Internet
Access Service(any speed)
Consumer Connections (At least 6 Mbps down and 1 Mbps up)
Broadband Adoption Rate (6 Mbps down and 1
Mbps up)
California 13,272,939 12,942,990 11,058,031 85.4%Alameda 579,058 568,779 511,053 89.9%Alpine* 434 323 793 245.4%Amador 14,760 14,236 11,227 78.9%Butte 80,141 78,204 57,457 73.5%Calaveras 18,368 17,360 15,609 89.9%Colusa 7,510 5,883 4,191 71.2%Contra Costa 396,099 390,021 358,391 91.9%Del Norte* 10,009 9,045 10,352 114.4%El Dorado 75,383 72,783 54,835 75.3%Fresno 314,417 306,368 237,124 77.4%Glenn 10,437 9,458 5,151 54.5%Humboldt 56,874 52,974 38,225 72.2%Imperial 50,597 47,070 34,161 72.6%Inyo 8,200 7,060 5,731 81.2%Kern 275,340 265,244 208,472 78.6%Kings 44,561 41,670 31,304 75.1%Lake 26,639 24,663 14,844 60.2%Lassen 9,419 8,270 6,295 76.1%Los Angeles 3,370,663 3,327,287 2,694,317 81.0%Madera 46,123 44,349 28,191 63.6%Marin 104,975 103,119 93,164 90.3%Mariposa 8,156 7,261 1,848 25.5%Mendocino 35,552 31,285 19,578 62.6%Merced 81,710 79,010 59,095 74.8%Modoc 3,820 2,305 1,190 51.6%Mono* 5,585 4,851 7,655 157.8%Monterey 127,010 122,285 101,706 83.2%Napa 49,085 47,837 43,429 90.8%
As of December 31, 2019
STATE of CALIFORNIA Fixed Broadband Adoption
Sources: CPUC broadband data collection as of December 2019; household information are based on the California Department of Finance, January, 1 2020 estimate. Broadband internet access service is assumed to be deployment to all households in census blocks where at least one household is offered service at speeds exceeding 200 kbps in at least one direction. Broadband Adoption Rate is defined as the percentage of consumer fixed broadband access connections over the total households offered Broadband internet access service.
* Due to high percentage of vacant, seasonal, recreational, or occasional use consumer connections, the adoption rate is calculated from all households in the county to more accurately depict adoption.
2 0 2 0 CA L I F OR N I A A D VA N C E D S ER V IC E S F U N D A N N UA L R E P O R T
C A L I F O R N IA P U B L I C UT I L I T I E S C O M MI S S I O N 35
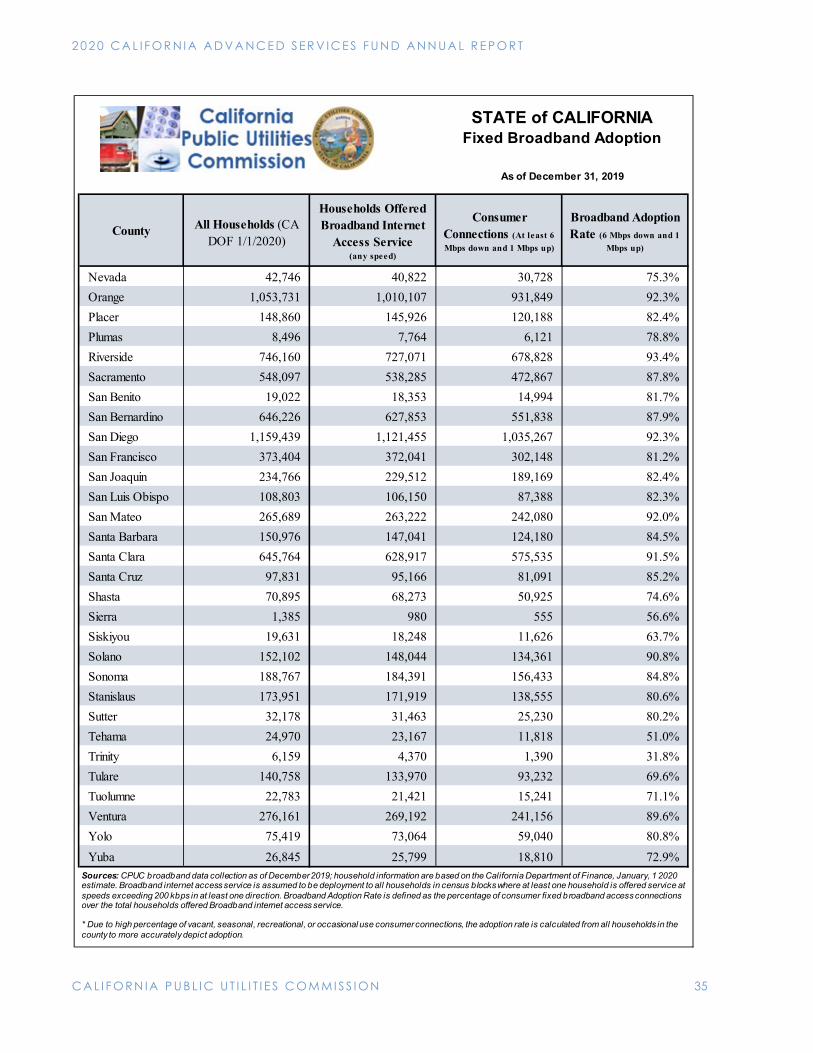
County All Households (CA DOF 1/1/2020)
Households Offered Broadband Internet
Access Service(any speed)
Consumer Connections (At least 6 Mbps down and 1 Mbps up)
Broadband Adoption Rate (6 Mbps down and 1
Mbps up)
Nevada 42,746 40,822 30,728 75.3%Orange 1,053,731 1,010,107 931,849 92.3%Placer 148,860 145,926 120,188 82.4%Plumas 8,496 7,764 6,121 78.8%Riverside 746,160 727,071 678,828 93.4%Sacramento 548,097 538,285 472,867 87.8%San Benito 19,022 18,353 14,994 81.7%San Bernardino 646,226 627,853 551,838 87.9%San Diego 1,159,439 1,121,455 1,035,267 92.3%San Francisco 373,404 372,041 302,148 81.2%San Joaquin 234,766 229,512 189,169 82.4%San Luis Obispo 108,803 106,150 87,388 82.3%San Mateo 265,689 263,222 242,080 92.0%Santa Barbara 150,976 147,041 124,180 84.5%Santa Clara 645,764 628,917 575,535 91.5%Santa Cruz 97,831 95,166 81,091 85.2%Shasta 70,895 68,273 50,925 74.6%Sierra 1,385 980 555 56.6%Siskiyou 19,631 18,248 11,626 63.7%Solano 152,102 148,044 134,361 90.8%Sonoma 188,767 184,391 156,433 84.8%Stanislaus 173,951 171,919 138,555 80.6%Sutter 32,178 31,463 25,230 80.2%Tehama 24,970 23,167 11,818 51.0%Trinity 6,159 4,370 1,390 31.8%Tulare 140,758 133,970 93,232 69.6%Tuolumne 22,783 21,421 15,241 71.1%Ventura 276,161 269,192 241,156 89.6%Yolo 75,419 73,064 59,040 80.8%Yuba 26,845 25,799 18,810 72.9%
As of December 31, 2019
STATE of CALIFORNIA Fixed Broadband Adoption
Sources: CPUC broadband data collection as of December 2019; household information are based on the California Department of Finance, January, 1 2020 estimate. Broadband internet access service is assumed to be deployment to all households in census blocks where at least one household is offered service at speeds exceeding 200 kbps in at least one direction. Broadband Adoption Rate is defined as the percentage of consumer fixed broadband access connections over the total households offered Broadband internet access service.
* Due to high percentage of vacant, seasonal, recreational, or occasional use consumer connections, the adoption rate is calculated from all households in the county to more accurately depict adoption.
2 0 2 0 CA L I F OR N I A A D VA N C E D S ER V IC E S F U N D A N N UA L R E P O R T
C A L I F O R N IA P U B L I C UT I L I T I E S C O M MI S S I O N 36
Map 5: Broadband Adoption of at least 6/1 Mbps by County as of December 31, 2019
2 0 2 0 CA L I F OR N I A A D VA N C E D S ER V IC E S F U N D A N N UA L R E P O R T
C A L I F O R N IA P U B L I C UT I L I T I E S C O M MI S S I O N 37
Map 6: Broadband Adoption of at least 25/3 Mbps by County as of December 31, 2019
2 0 2 0 CA L I F OR N I A A D VA N C E D S ER V IC E S F U N D A N N UA L R E P O R T
C A L I F O R N IA P U B L I C UT I L I T I E S C O M MI S S I O N 38
CASF Broadband Public Housing Account The CASF Broadband Public Housing Account (BPHA) provides grants for broadband connectivity and adoption in publicly supported housing communities.63 An eligible applicant is either a publicly supported community (PSC) that is wholly owned by a public housing agency or an incorporated non-profit organization 501(c)(3) that has received public funding to subsidize housing construction or maintenance costs. The eligible housing is occupied by residents whose annual income qualifies as “low” or “very low” according to federal poverty guidelines.64 The BPHA has a $25 million budget, which is allocated for two types of projects:
• 1) Infrastructure Projects: $20 million in grant funding to finance infrastructure projects connecting PSCs with broadband.
• 2) Adoption Projects: $5 million in grant funding to finance broadband adoption projects for residents in PSCs.
The CPUC has fully allocated the $5 million funding for BPHA adoption projects as of October 17, 2018. The CPUC awarded funding for BPHA infrastructure projects in 2020 (discussed below) but will no longer accept new applications as all remaining unawarded funds as of December 31, 2020 are to be transferred back to the Broadband Infrastructure Grant Account pursuant to Pub. Util. Code section 281.65
63 D.14-12-032 established rules and eligibility criteria for the BPHA. In D.18-06-032 and D.20-08-005, the CPUC made further modifications to the BPHA application requirements and guidelines 64 Pub. Util. Code, § 281(i)(1)(B)(i) and (ii). 65 Pub. Util. Code, § 281(i)(7).
The CPUC awarded three (3) broadband public housing projects with
approximately $148,000 in total funding in 2020.
2 0 2 0 CA L I F OR N I A A D VA N C E D S ER V IC E S F U N D A N N UA L R E P O R T
C A L I F O R N IA P U B L I C UT I L I T I E S C O M MI S S I O N 39
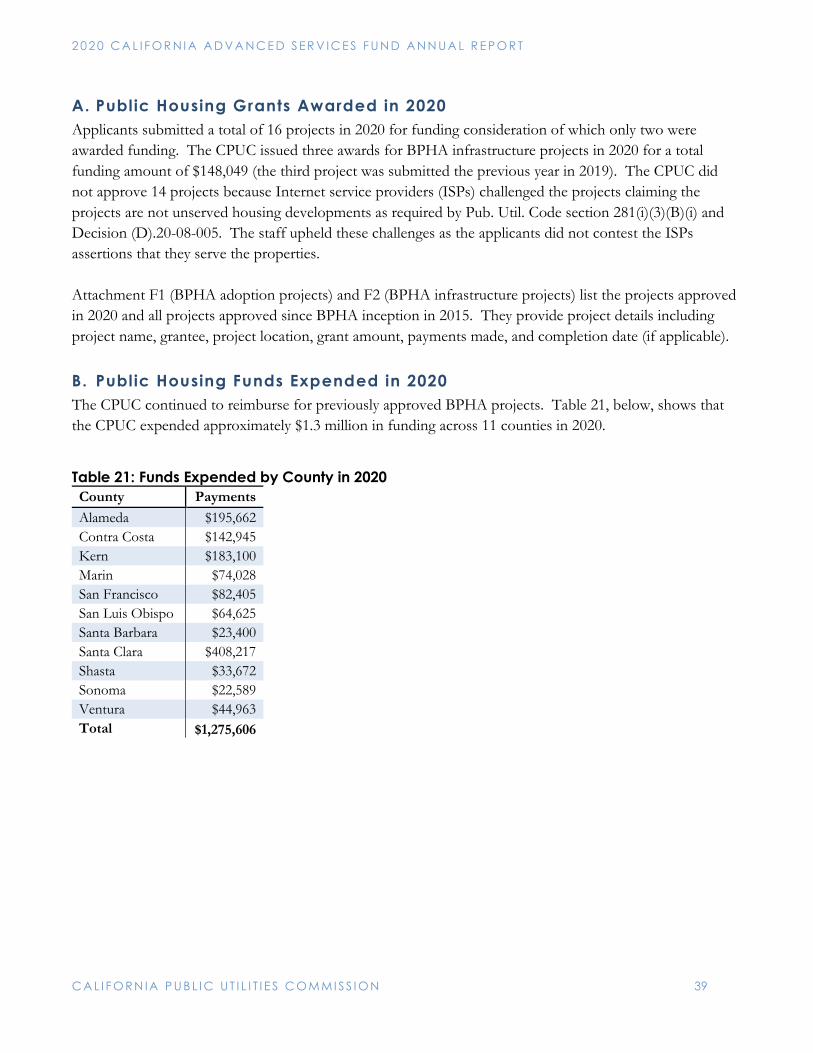
A. Public Housing Grants Awarded in 2020 Applicants submitted a total of 16 projects in 2020 for funding consideration of which only two were awarded funding. The CPUC issued three awards for BPHA infrastructure projects in 2020 for a total funding amount of $148,049 (the third project was submitted the previous year in 2019). The CPUC did not approve 14 projects because Internet service providers (ISPs) challenged the projects claiming the projects are not unserved housing developments as required by Pub. Util. Code section 281(i)(3)(B)(i) and Decision (D).20-08-005. The staff upheld these challenges as the applicants did not contest the ISPs assertions that they serve the properties. Attachment F1 (BPHA adoption projects) and F2 (BPHA infrastructure projects) list the projects approved in 2020 and all projects approved since BPHA inception in 2015. They provide project details including project name, grantee, project location, grant amount, payments made, and completion date (if applicable). B. Public Housing Funds Expended in 2020 The CPUC continued to reimburse for previously approved BPHA projects. Table 21, below, shows that the CPUC expended approximately $1.3 million in funding across 11 counties in 2020.
Table 21: Funds Expended by County in 2020 County Payments Alameda $195,662 Contra Costa $142,945 Kern $183,100 Marin $74,028 San Francisco $82,405 San Luis Obispo $64,625 Santa Barbara $23,400 Santa Clara $408,217 Shasta $33,672 Sonoma $22,589 Ventura $44,963 Total $1,275,606
2 0 2 0 CA L I F OR N I A A D VA N C E D S ER V IC E S F U N D A N N UA L R E P O R T
C A L I F O R N IA P U B L I C UT I L I T I E S C O M MI S S I O N 40
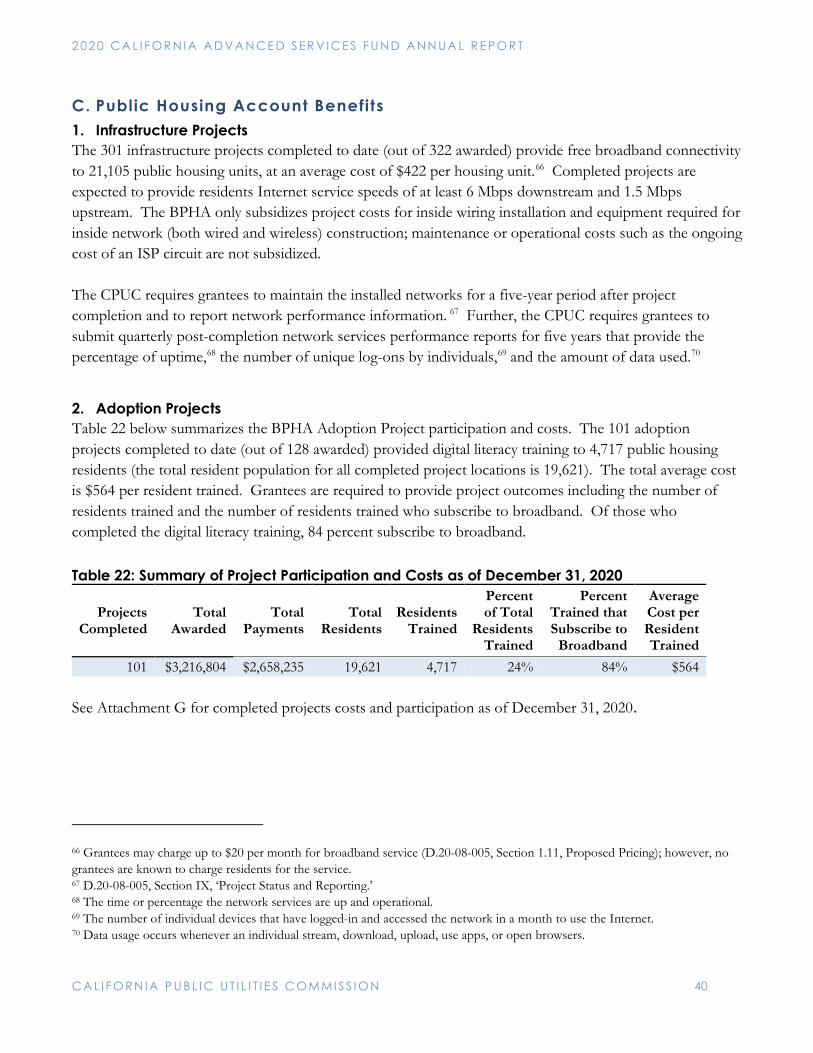
C. Public Housing Account Benefits 1. Infrastructure Projects The 301 infrastructure projects completed to date (out of 322 awarded) provide free broadband connectivity to 21,105 public housing units, at an average cost of $422 per housing unit.66 Completed projects are expected to provide residents Internet service speeds of at least 6 Mbps downstream and 1.5 Mbps upstream. The BPHA only subsidizes project costs for inside wiring installation and equipment required for inside network (both wired and wireless) construction; maintenance or operational costs such as the ongoing cost of an ISP circuit are not subsidized. The CPUC requires grantees to maintain the installed networks for a five-year period after project completion and to report network performance information. 67 Further, the CPUC requires grantees to submit quarterly post-completion network services performance reports for five years that provide the percentage of uptime,68 the number of unique log-ons by individuals,69 and the amount of data used.70
2. Adoption Projects Table 22 below summarizes the BPHA Adoption Project participation and costs. The 101 adoption projects completed to date (out of 128 awarded) provided digital literacy training to 4,717 public housing residents (the total resident population for all completed project locations is 19,621). The total average cost is $564 per resident trained. Grantees are required to provide project outcomes including the number of residents trained and the number of residents trained who subscribe to broadband. Of those who completed the digital literacy training, 84 percent subscribe to broadband. Table 22: Summary of Project Participation and Costs as of December 31, 2020
Projects Completed
Total Awarded
Total Payments
Total Residents
Residents Trained
Percent of Total
Residents Trained
Percent Trained that Subscribe to
Broadband
Average Cost per Resident Trained
101 $3,216,804 $2,658,235 19,621 4,717 24% 84% $564 See Attachment G for completed projects costs and participation as of December 31, 2020.
66 Grantees may charge up to $20 per month for broadband service (D.20-08-005, Section 1.11, Proposed Pricing); however, no grantees are known to charge residents for the service. 67 D.20-08-005, Section IX, ‘Project Status and Reporting.’ 68 The time or percentage the network services are up and operational. 69 The number of individual devices that have logged-in and accessed the network in a month to use the Internet. 70 Data usage occurs whenever an individual stream, download, upload, use apps, or open browsers.
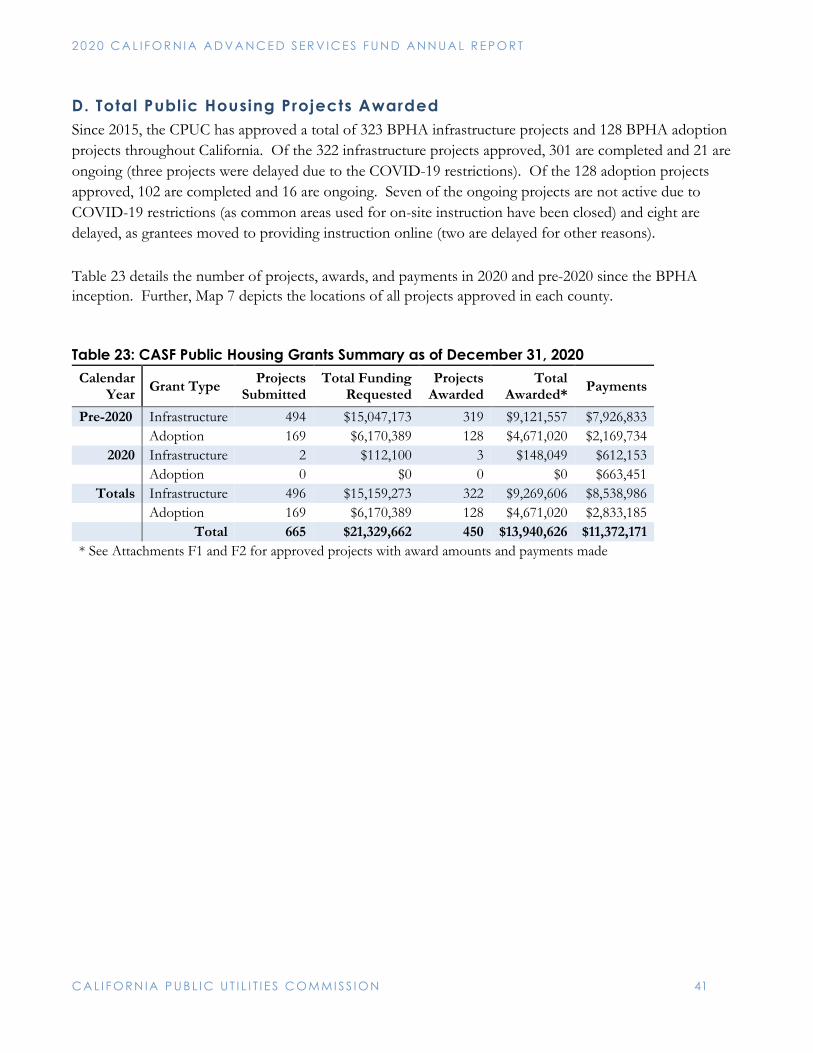
2 0 2 0 CA L I F OR N I A A D VA N C E D S ER V IC E S F U N D A N N UA L R E P O R T
C A L I F O R N IA P U B L I C UT I L I T I E S C O M MI S S I O N 41
D. Total Public Housing Projects Awarded Since 2015, the CPUC has approved a total of 323 BPHA infrastructure projects and 128 BPHA adoption projects throughout California. Of the 322 infrastructure projects approved, 301 are completed and 21 are ongoing (three projects were delayed due to the COVID-19 restrictions). Of the 128 adoption projects approved, 102 are completed and 16 are ongoing. Seven of the ongoing projects are not active due to COVID-19 restrictions (as common areas used for on-site instruction have been closed) and eight are delayed, as grantees moved to providing instruction online (two are delayed for other reasons). Table 23 details the number of projects, awards, and payments in 2020 and pre-2020 since the BPHA inception. Further, Map 7 depicts the locations of all projects approved in each county.
Table 23: CASF Public Housing Grants Summary as of December 31, 2020 Calendar
Year Grant Type Projects Submitted
Total Funding Requested
Projects Awarded
Total Awarded* Payments
Pre-2020 Infrastructure 494 $15,047,173 319 $9,121,557 $7,926,833 Adoption 169 $6,170,389 128 $4,671,020 $2,169,734
2020 Infrastructure 2 $112,100 3 $148,049 $612,153 Adoption 0 $0 0 $0 $663,451
Totals Infrastructure 496 $15,159,273 322 $9,269,606 $8,538,986 Adoption 169 $6,170,389 128 $4,671,020 $2,833,185 Total 665 $21,329,662 450 $13,940,626 $11,372,171 * See Attachments F1 and F2 for approved projects with award amounts and payments made
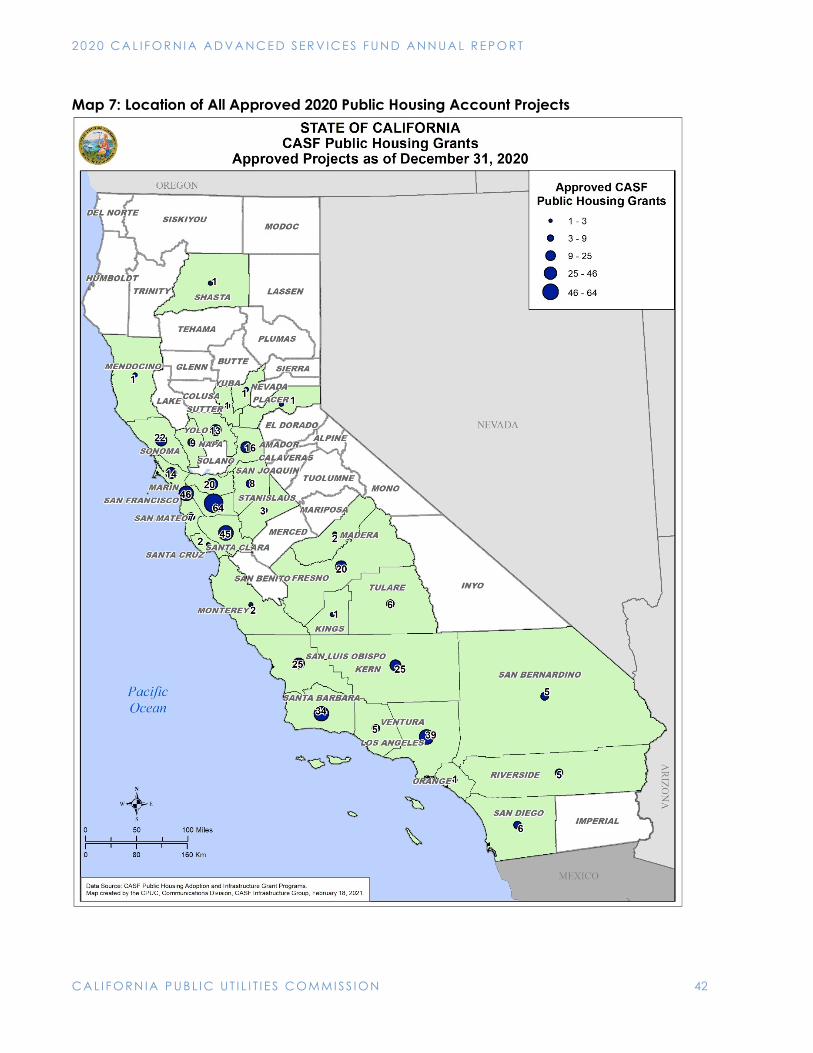
2 0 2 0 CA L I F OR N I A A D VA N C E D S ER V IC E S F U N D A N N UA L R E P O R T
C A L I F O R N IA P U B L I C UT I L I T I E S C O M MI S S I O N 42
Map 7: Location of All Approved 2020 Public Housing Account Projects
2 0 2 0 CA L I F OR N I A A D VA N C E D S ER V IC E S F U N D A N N UA L R E P O R T
C A L I F O R N IA P U B L I C UT I L I T I E S C O M MI S S I O N 43
E. Public Housing Account Review The CPUC is no longer accepting BPHA infrastructure applications, as Pub. Util. Code section 281 requires that all remaining funds not awarded as of December 31, 2020 be transferred back to the Broadband Infrastructure Grant Account. This section provides a review of the BPHA as of December 31, 2020. On December 22, 2014, the CPUC issued Decision (D.) 14-12-039 adopting the BPHA, as defined in AB 1299, to fund infrastructure and adoption projects in publicly supported housing communities.71 Senate Bill (SB) 745 (Hueso, 2016) extended the BPHA until December 31, 202072 and limited grant awards for infrastructure projects to unserved housing developments, with “unserved” defined as a housing development where at least one housing unit within the development is not offered broadband service. 1. Infrastructure Projects Review The BPHA infrastructure projects will connect 21,268 units if grantees complete all ongoing projects funded as of December 31, 2020. The CPUC received significantly less project applications after SB 745 limited eligibility to “unserved” housing developments. The staff found that almost all public housing locations became ineligible for funding except for new construction. As a result, the CPUC received only 17 project proposals since SB 745, of which only three were approved (all new building construction), with the remaining considered not unserved.73 Cable companies have challenged many of the proposed infrastructure projects claiming they already serve the project locations. Further, an affordability issue exists for publicly supported communities that have service but cannot afford it. If the BPHA or a similar program receives funding for future installation of WI-FI or similar networks inside a publicly supported community, then staff recommends it address the affordability issue to support publicly supported communities unable to pay for high cost of service.74 Once infrastructure projects are built, BPHA grantees must maintain the network to ensure good broadband service quality. However, staff found that network maintenance is uneven - some public housing grantees have the necessary professional staff to maintain installed networks, whereas other grantees let the networks decline. To track projects, the CPUC requires grantees to submit quarterly post-project reports for five years. Compliance with this requirement is inconsistent with some grantees submitting reports unprompted while others require efforts to enforce compliance. Since the CPUC does not regulate public housing organizations and public housing organizations are not ISPs, there is the possibility that BPHA
71 AB 1299 (Bradford) Stats. 2013 Ch. 507, amending Pub. Util. Code, § 281. 72 SB 745 (Hueso), Stats. 2016, ch. 710 amending Pub. Util. Code, §§ 281 and 914.7 73 One project awarded by Resolution T-17684, issued February 28, 2020. Two projects awarded by Resolution T-17718, issued December 18, 2020. 74 For example, Fresno Housing was not able to obtain broadband service from Internet Service Providers (ISPs) to complete broadband network installations for its Brierwood Courts, Villa Del Mar, Maldonado Migrant Center, Dayton Square and Yosemite Village projects due to costs/ISP’s company policies. After multiple follow ups and discussions among staff, Fresno Housing, and ISPs, Fresno Housing finally had an agreement with an ISP to move forward to complete broadband network installations for these projects.
2 0 2 0 CA L I F OR N I A A D VA N C E D S ER V IC E S F U N D A N N UA L R E P O R T
C A L I F O R N IA P U B L I C UT I L I T I E S C O M MI S S I O N 44
funded networks will not be maintained optimally, which devalues the benefit of this public purpose program. 2. Adoption Projects Review The BPHA adoption projects are designed to increase adoption rates in publicly supported communities through trainings/classes. Projects are location-based and grantees “‘must sustain the adoption project for 12 months or until 75 percent of residents are trained for that location.” 75 The locations of funded projects vary in size—the smallest location has 21 units and residents, and the largest location has 713 units and 1,750 residents. Certain grantees had higher costs per resident trained due to low training attendance. Grantees can only allow residents of the public housing location to attend. For some projects, situations arose where the grantee’s expectations regarding class attendance were incorrect. Also, attendance may be greater at the beginning of the project and trail off over the course of the project as those interested would have attended early, especially at smaller locations. If the BPHA or a similar program receives funding to support digital inclusion activities in publicly supported communities, staff recommends that grantees need not be restricted to providing services to only one public housing location but be allowed to provide such services to multiple locations. Additionally, given the current need to provide instruction remotely due to the COVID-19 pandemic and that remote instruction may be more frequently used going forward, it could be more effective for public housing organizations to address digital inclusion issues for multiple locations through one project.
75 D.14-12-039.
2 0 2 0 CA L I F OR N I A A D VA N C E D S ER V IC E S F U N D A N N UA L R E P O R T
C A L I F O R N IA P U B L I C UT I L I T I E S C O M MI S S I O N 45
CASF Tribal Technical Assistance Grant The Technical Tribal Assistance Grant was established by Decision (D.) 20-08-00576 to provide technical assistance grants to California Tribes to support Tribal broadband needs and increase access. In (D.) 20-08-005, the CPUC adopted guidelines that established quarterly application windows, eligibility, performance, and payment requirements. The CPUC authorized up to $5,000,000 in CASF state operations funds for technical assistance grants up to $150,000 per fiscal year per Tribe. California Tribes with or without federal recognition, that demonstrate Tribal leadership support are eligible for technical assistance grants.
Eligible applicants77 can request funding for the following types of technical assistance, including but not limited to:
• Feasibility Studies • Market Studies • And/or Business Plans
A. Tribal Technical Assistance Grants Awarded in 2020 The CPUC held its first application window on October 1, 2020. The CPUC awarded grants to five Tribes for nine projects totaling approximately $538,000 for feasibility studies, market studies, and business plans. The Tribes have up to 24 months to complete their projects. Map 8 illustrates the locations of the Tribes that have been awarded Grants.
76 D.20-08-005 at pp. 15-17 and Appendix 1 established rules and eligibility criteria for the Tribal Technical Assistance Grant. 77 Eligible entities are California Tribes with or without federal recognition, that demonstrates Tribal Leadership support, such as a letter from the Tribal Administrator, chair, or council. (D.20-08-005, Appendix 1, ¶ 3.)
The CPUC awarded nine (9) Tribal technical assistance projects with
approximately $538,000 in total funding in 2020.
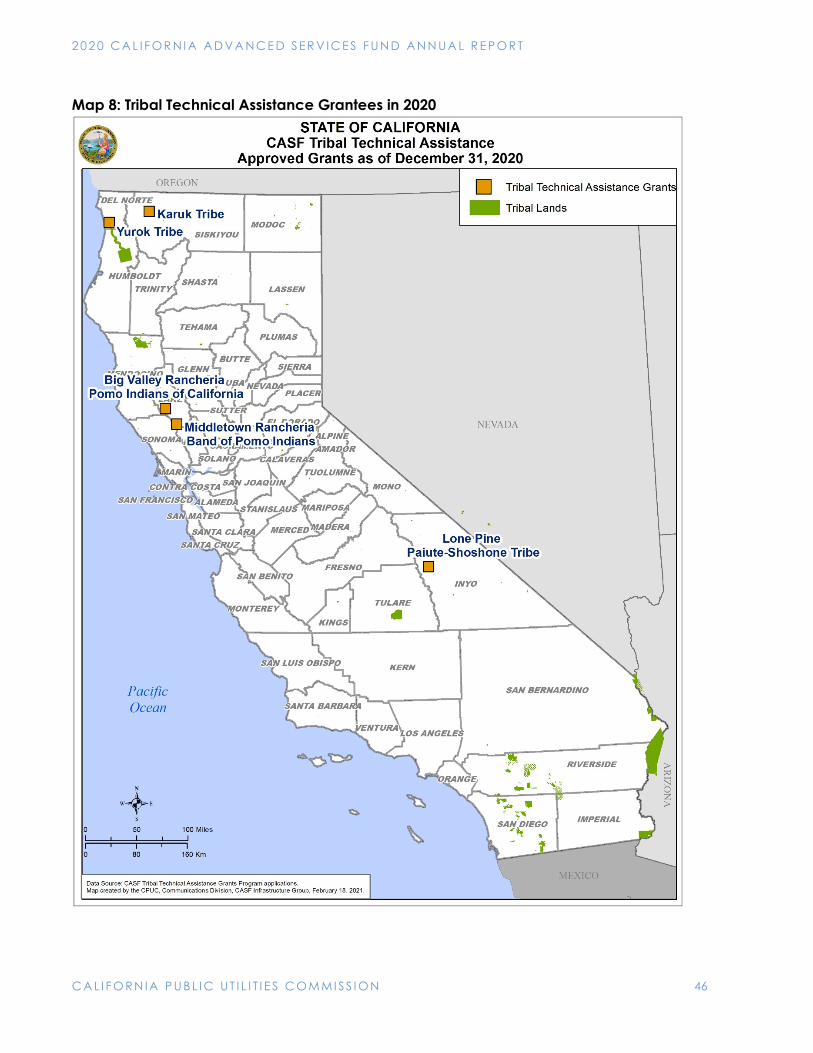
2 0 2 0 CA L I F OR N I A A D VA N C E D S ER V IC E S F U N D A N N UA L R E P O R T
C A L I F O R N IA P U B L I C UT I L I T I E S C O M MI S S I O N 46
Map 8: Tribal Technical Assistance Grantees in 2020
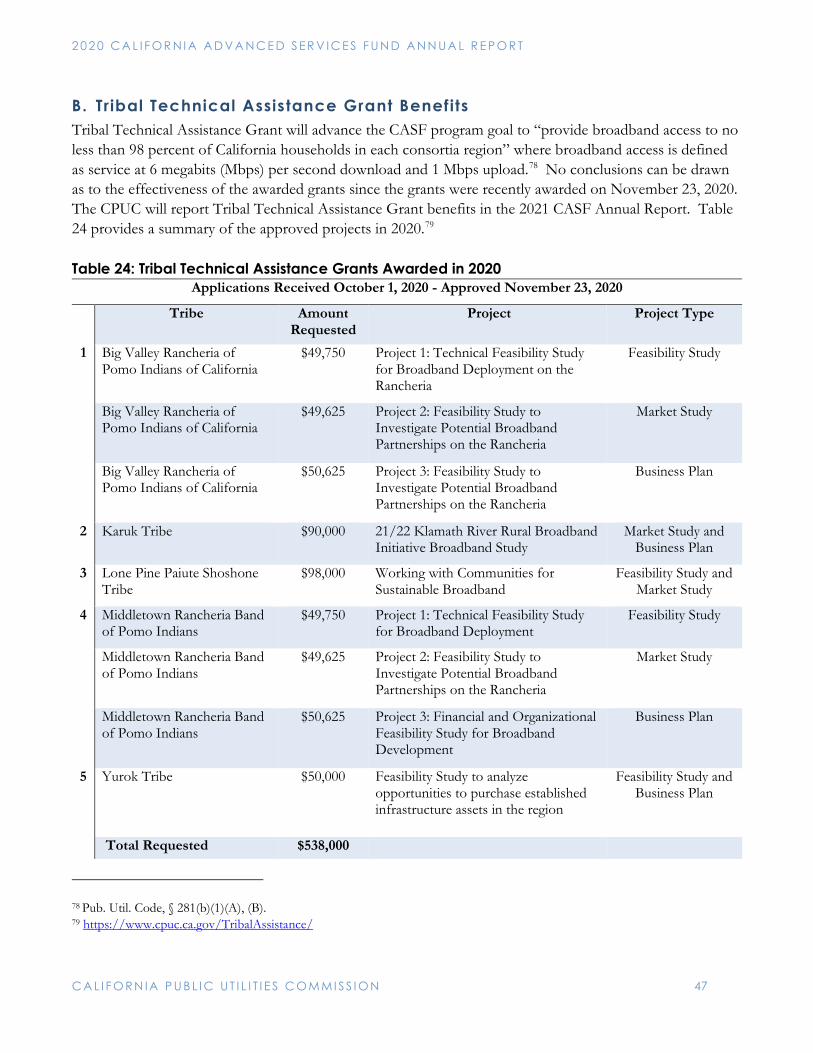
2 0 2 0 CA L I F OR N I A A D VA N C E D S ER V IC E S F U N D A N N UA L R E P O R T
C A L I F O R N IA P U B L I C UT I L I T I E S C O M MI S S I O N 47
B. Tribal Technical Assistance Grant Benefits Tribal Technical Assistance Grant will advance the CASF program goal to “provide broadband access to no less than 98 percent of California households in each consortia region” where broadband access is defined as service at 6 megabits (Mbps) per second download and 1 Mbps upload.78 No conclusions can be drawn as to the effectiveness of the awarded grants since the grants were recently awarded on November 23, 2020. The CPUC will report Tribal Technical Assistance Grant benefits in the 2021 CASF Annual Report. Table 24 provides a summary of the approved projects in 2020.79 Table 24: Tribal Technical Assistance Grants Awarded in 2020
Applications Received October 1, 2020 - Approved November 23, 2020
Tribe Amount Requested
Project Project Type
1 Big Valley Rancheria of Pomo Indians of California
$49,750 Project 1: Technical Feasibility Study for Broadband Deployment on the Rancheria
Feasibility Study
Big Valley Rancheria of Pomo Indians of California
$49,625 Project 2: Feasibility Study to Investigate Potential Broadband Partnerships on the Rancheria
Market Study
Big Valley Rancheria of Pomo Indians of California
$50,625 Project 3: Feasibility Study to Investigate Potential Broadband Partnerships on the Rancheria
Business Plan
2 Karuk Tribe $90,000 21/22 Klamath River Rural Broadband Initiative Broadband Study
Market Study and Business Plan
3 Lone Pine Paiute Shoshone Tribe
$98,000 Working with Communities for Sustainable Broadband
Feasibility Study and Market Study
4 Middletown Rancheria Band of Pomo Indians
$49,750 Project 1: Technical Feasibility Study for Broadband Deployment
Feasibility Study
Middletown Rancheria Band of Pomo Indians
$49,625 Project 2: Feasibility Study to Investigate Potential Broadband Partnerships on the Rancheria
Market Study
Middletown Rancheria Band of Pomo Indians
$50,625 Project 3: Financial and Organizational Feasibility Study for Broadband Development
Business Plan
5 Yurok Tribe $50,000 Feasibility Study to analyze opportunities to purchase established infrastructure assets in the region
Feasibility Study and Business Plan
Total Requested $538,000
78 Pub. Util. Code, § 281(b)(1)(A), (B). 79 https://www.cpuc.ca.gov/TribalAssistance/
2 0 2 0 CA L I F OR N I A A D VA N C E D S ER V IC E S F U N D A N N UA L R E P O R T
C A L I F O R N IA P U B L I C UT I L I T I E S C O M MI S S I O N 48
Leveraging Non-CASF Funds California legislation in 2020 and CPUC engagement in federal universal service fund proceedings at the FCC focused on leveraging federal funds for broadband deployment. In particular, the CPUC participated in the FCC’s Rural Digital Opportunity Fund (RDOF) docket. The RDOF is set to potentially award $20.4 billion or more in funding nationwide over ten years for infrastructure projects offering minimum broadband speeds of 25/3 Mbps.
In 2020, the CPUC filed comments80 and met with FCC staff multiple times81 to encourage the FCC to work with state broadband programs so that states can leverage as much federal funding as possible to further universal service goals. The CPUC noted that federal funding can go further when it is matched with state funding, documenting for FCC staff that recent research identified 30 to 35 states that manage their own broadband infrastructure development programs.82 Throughout this process, CPUC Commissioners and staff encouraged the FCC to incorporate provisions in the RDOF aligning with state broadband programs to leverage federal funds with the significant array of state resources.
The California passed AB 82 (Committee on Budget, Statutes of 2020) to better enable California providers receiving CASF funds to compete for federal RDOF broadband funding.
The FCC opened the RDOF Phase I Auction 904 in October 2020. The CPUC took the following steps to inform and encourage California Internet service providers to participate in the auction and bring federal funding to California:
• Hosted a presentation by FCC staff on the RDOF Phase I Auction that covered how Internet service providers can participate in the auction.83
• Brought on a consultant to help with data analysis to better understand how California can leverage funding.
• Created a webpage to provide information on the auction to interested bidders: https://www.cpuc.ca.gov/broadbandfederalfunding/.
• Created a California RDOF Map that provided reserve price and build-out cost data on RDOF-eligible locations in California: https://www.broadbandmap.ca.gov/federalfunding/.
80 In the Matter of the Rural Digital Opportunity Fund, Connect America Fund, (WC Docket Nos. 19-126, 10-90), Comments of the California Public Utilities Commission, filed March 27, 2020. 81 In the Matter of the Rural Digital Opportunity Fund, Connect America Fund, (WC Docket Nos. 19-126, 10-90), CPUC Ex Parte Notices filed January 13, 2020, January 22, 2020, January 24, 2020, February 26, 2020, and March 2, 2020. See also CPUC Ex Parte Letter filed May 18, 2020. 82 The Pew Charitable Trusts; State Broadband Policy Explorer, (July 31, 2019). 83 The presentation was held on June 10, 2020.
2 0 2 0 CA L I F OR N I A A D VA N C E D S ER V IC E S F U N D A N N UA L R E P O R T
C A L I F O R N IA P U B L I C UT I L I T I E S C O M MI S S I O N 49
• Established the CPUC’s CASF-RDOF ‘Kicker Initiative’ to use CASF funding to leverage RDOF funding. Specifically, the CPUC set aside CASF funding, which winning Auction 904 bidders can obtain if they meet and agree to certain requirements.84
The FCC announced preliminary bid winners on December 7, 2020, and 15 companies won bids for the California RDOF locations. The CPUC has encouraged the FCC to thoroughly review each company’s plans and financial resources before awarding money.
The CPUC continues to work on leveraging federal funding from the RDOF program and tracks other opportunities to leverage non-CASF funding. The CPUC’s federal efforts are important for broadband underserved communities. These efforts are also shown in several action items assigned to the CPUC by the Broadband Action Plan 202085 of the California Broadband Council.
84 D.21-01-003. 85 Broadband for All Action Plan 2020, California Broadband Council, (December 2020).
2 0 2 0 CA L I F OR N I A A D VA N C E D S ER V IC E S F U N D A N N UA L R E P O R T
C A L I F O R N IA P U B L I C UT I L I T I E S C O M MI S S I O N 50
Attachments Attachment A: Wireline and Fixed Wireless Served Status by County as of December 31, 2019….…….51
Attachment B: Approved CASF Infrastructure Projects as of December 31, 2020……………….……..54
Attachment C: Consortia Account Reported Benefits Funded by CASF………………………….….....57
Attachment D: Consortia Account Projects as of December 31, 2020…………………………….……66
Attachment E1: Broadband Adoption Account Projects as of December 31, 2020…………….……….69
Attachment E2: Broadband Adoption Project Status as of December 31, 2020………………………...73
Attachment F1: Public Housing Adoption Projects as of December 31, 2020………………………….79
Attachment F2: Public Housing Infrastructure Projects as of December 31, 2020……………………...82
Attachment G: Public Housing Completed Project Costs and Participation as of December 31, 2020…88
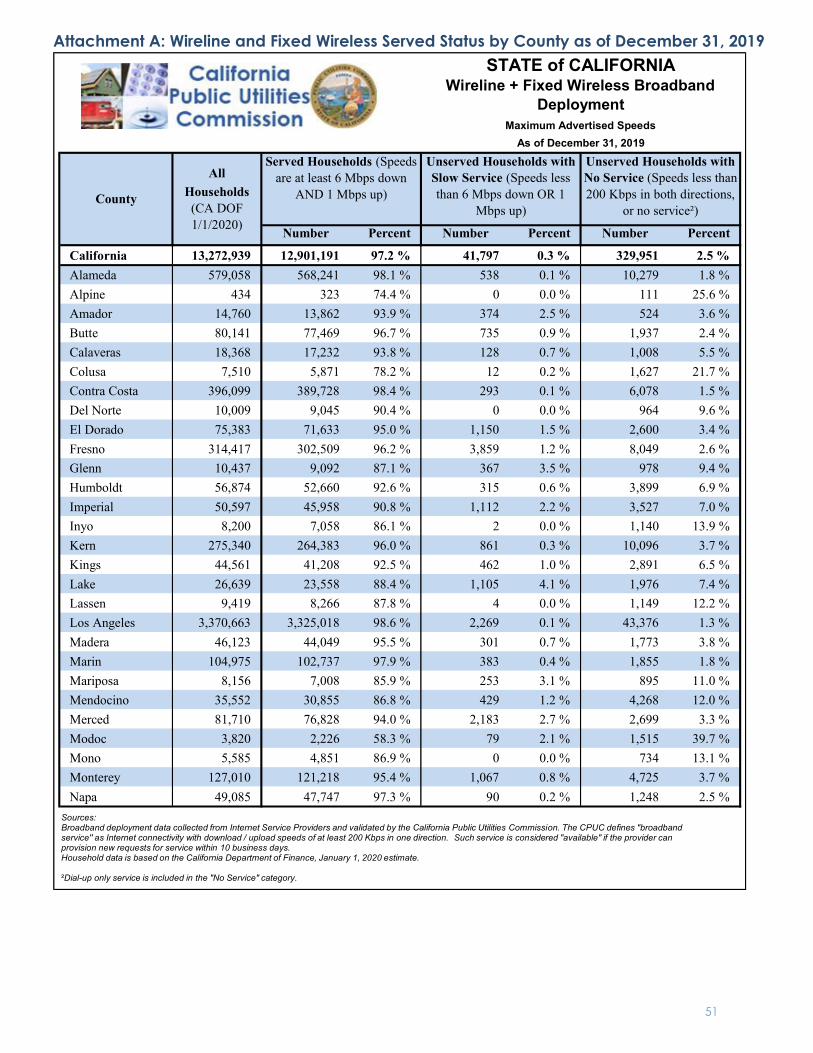
Number Percent Number Percent Number Percent
California 13,272,939 12,901,191 97.2 % 41,797 0.3 % 329,951 2.5 %
Alameda 579,058 568,241 98.1 % 538 0.1 % 10,279 1.8 %
Alpine 434 323 74.4 % 0 0.0 % 111 25.6 %
Amador 14,760 13,862 93.9 % 374 2.5 % 524 3.6 %
Butte 80,141 77,469 96.7 % 735 0.9 % 1,937 2.4 %
Calaveras 18,368 17,232 93.8 % 128 0.7 % 1,008 5.5 %
Colusa 7,510 5,871 78.2 % 12 0.2 % 1,627 21.7 %
Contra Costa 396,099 389,728 98.4 % 293 0.1 % 6,078 1.5 %
Del Norte 10,009 9,045 90.4 % 0 0.0 % 964 9.6 %
El Dorado 75,383 71,633 95.0 % 1,150 1.5 % 2,600 3.4 %
Fresno 314,417 302,509 96.2 % 3,859 1.2 % 8,049 2.6 %
Glenn 10,437 9,092 87.1 % 367 3.5 % 978 9.4 %
Humboldt 56,874 52,660 92.6 % 315 0.6 % 3,899 6.9 %
Imperial 50,597 45,958 90.8 % 1,112 2.2 % 3,527 7.0 %
Inyo 8,200 7,058 86.1 % 2 0.0 % 1,140 13.9 %
Kern 275,340 264,383 96.0 % 861 0.3 % 10,096 3.7 %
Kings 44,561 41,208 92.5 % 462 1.0 % 2,891 6.5 %
Lake 26,639 23,558 88.4 % 1,105 4.1 % 1,976 7.4 %
Lassen 9,419 8,266 87.8 % 4 0.0 % 1,149 12.2 %
Los Angeles 3,370,663 3,325,018 98.6 % 2,269 0.1 % 43,376 1.3 %
Madera 46,123 44,049 95.5 % 301 0.7 % 1,773 3.8 %
Marin 104,975 102,737 97.9 % 383 0.4 % 1,855 1.8 %
Mariposa 8,156 7,008 85.9 % 253 3.1 % 895 11.0 %
Mendocino 35,552 30,855 86.8 % 429 1.2 % 4,268 12.0 %
Merced 81,710 76,828 94.0 % 2,183 2.7 % 2,699 3.3 %
Modoc 3,820 2,226 58.3 % 79 2.1 % 1,515 39.7 %
Mono 5,585 4,851 86.9 % 0 0.0 % 734 13.1 %
Monterey 127,010 121,218 95.4 % 1,067 0.8 % 4,725 3.7 %
Napa 49,085 47,747 97.3 % 90 0.2 % 1,248 2.5 %
STATE of CALIFORNIA Wireline + Fixed Wireless Broadband
DeploymentMaximum Advertised Speeds
County
All
Households (CA DOF 1/1/2020)
Served Households (Speeds are at least 6 Mbps down
AND 1 Mbps up)
Unserved Households with Slow Service (Speeds less than 6 Mbps down OR 1
Mbps up)
Unserved Households with No Service (Speeds less than 200 Kbps in both directions,
or no service²)
As of December 31, 2019
Sources:Broadband deployment data collected from Internet Service Providers and validated by the California Public Utilities Commission. The CPUC defines "broadband service'' as Internet connectivity with download / upload speeds of at least 200 Kbps in one direction. Such service is considered "available" if the provider can provision new requests for service within 10 business days. Household data is based on the California Department of Finance, January 1, 2020 estimate.
²Dial-up only service is included in the "No Service" category.
51
Attachment A: Wireline and Fixed Wireless Served Status by County as of December 31, 2019
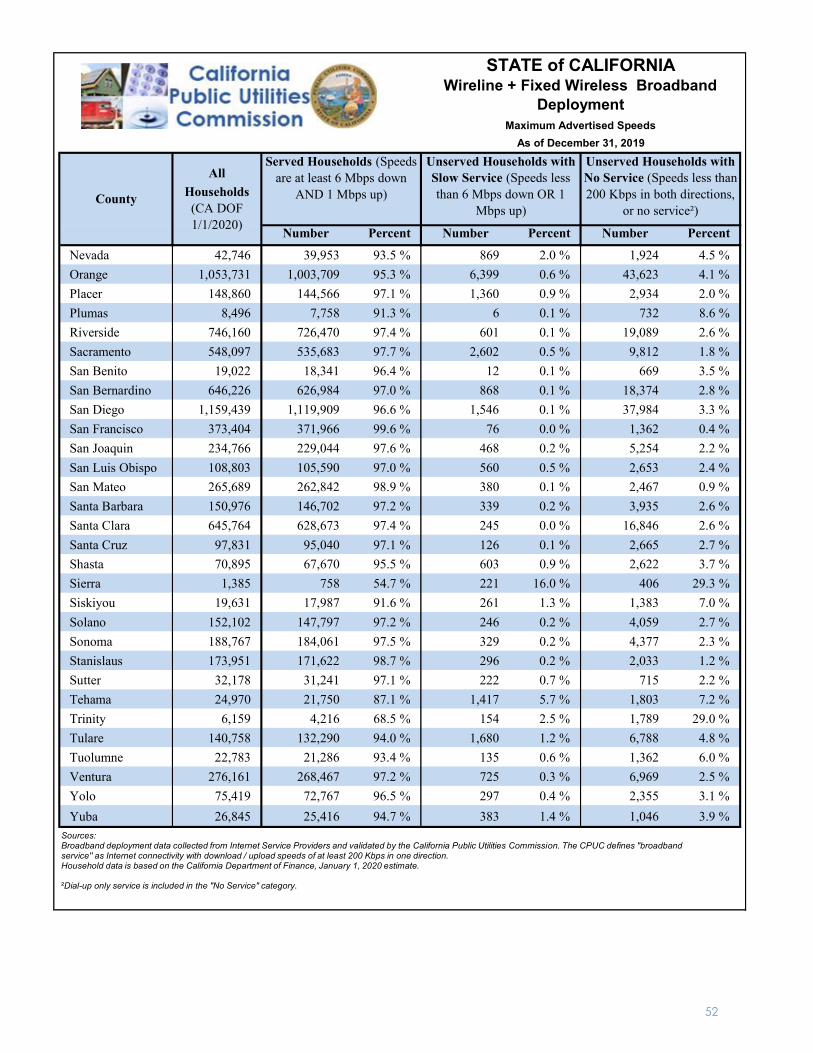
Number Percent Number Percent Number Percent
Nevada 42,746 39,953 93.5 % 869 2.0 % 1,924 4.5 %
Orange 1,053,731 1,003,709 95.3 % 6,399 0.6 % 43,623 4.1 %
Placer 148,860 144,566 97.1 % 1,360 0.9 % 2,934 2.0 %
Plumas 8,496 7,758 91.3 % 6 0.1 % 732 8.6 %
Riverside 746,160 726,470 97.4 % 601 0.1 % 19,089 2.6 %
Sacramento 548,097 535,683 97.7 % 2,602 0.5 % 9,812 1.8 %
San Benito 19,022 18,341 96.4 % 12 0.1 % 669 3.5 %
San Bernardino 646,226 626,984 97.0 % 868 0.1 % 18,374 2.8 %
San Diego 1,159,439 1,119,909 96.6 % 1,546 0.1 % 37,984 3.3 %
San Francisco 373,404 371,966 99.6 % 76 0.0 % 1,362 0.4 %
San Joaquin 234,766 229,044 97.6 % 468 0.2 % 5,254 2.2 %
San Luis Obispo 108,803 105,590 97.0 % 560 0.5 % 2,653 2.4 %
San Mateo 265,689 262,842 98.9 % 380 0.1 % 2,467 0.9 %
Santa Barbara 150,976 146,702 97.2 % 339 0.2 % 3,935 2.6 %
Santa Clara 645,764 628,673 97.4 % 245 0.0 % 16,846 2.6 %
Santa Cruz 97,831 95,040 97.1 % 126 0.1 % 2,665 2.7 %
Shasta 70,895 67,670 95.5 % 603 0.9 % 2,622 3.7 %
Sierra 1,385 758 54.7 % 221 16.0 % 406 29.3 %
Siskiyou 19,631 17,987 91.6 % 261 1.3 % 1,383 7.0 %
Solano 152,102 147,797 97.2 % 246 0.2 % 4,059 2.7 %
Sonoma 188,767 184,061 97.5 % 329 0.2 % 4,377 2.3 %
Stanislaus 173,951 171,622 98.7 % 296 0.2 % 2,033 1.2 %
Sutter 32,178 31,241 97.1 % 222 0.7 % 715 2.2 %
Tehama 24,970 21,750 87.1 % 1,417 5.7 % 1,803 7.2 %
Trinity 6,159 4,216 68.5 % 154 2.5 % 1,789 29.0 %
Tulare 140,758 132,290 94.0 % 1,680 1.2 % 6,788 4.8 %
Tuolumne 22,783 21,286 93.4 % 135 0.6 % 1,362 6.0 %
Ventura 276,161 268,467 97.2 % 725 0.3 % 6,969 2.5 %
Yolo 75,419 72,767 96.5 % 297 0.4 % 2,355 3.1 %
Yuba 26,845 25,416 94.7 % 383 1.4 % 1,046 3.9 %
STATE of CALIFORNIA Wireline + Fixed Wireless Broadband
DeploymentMaximum Advertised Speeds
County
All
Households (CA DOF 1/1/2020)
Served Households (Speeds are at least 6 Mbps down
AND 1 Mbps up)
Unserved Households with Slow Service (Speeds less than 6 Mbps down OR 1
Mbps up)
Unserved Households with No Service (Speeds less than 200 Kbps in both directions,
or no service²)
As of December 31, 2019
Sources:Broadband deployment data collected from Internet Service Providers and validated by the California Public Utilities Commission. The CPUC defines "broadband service'' as Internet connectivity with download / upload speeds of at least 200 Kbps in one direction.Household data is based on the California Department of Finance, January 1, 2020 estimate.
²Dial-up only service is included in the "No Service" category.
52
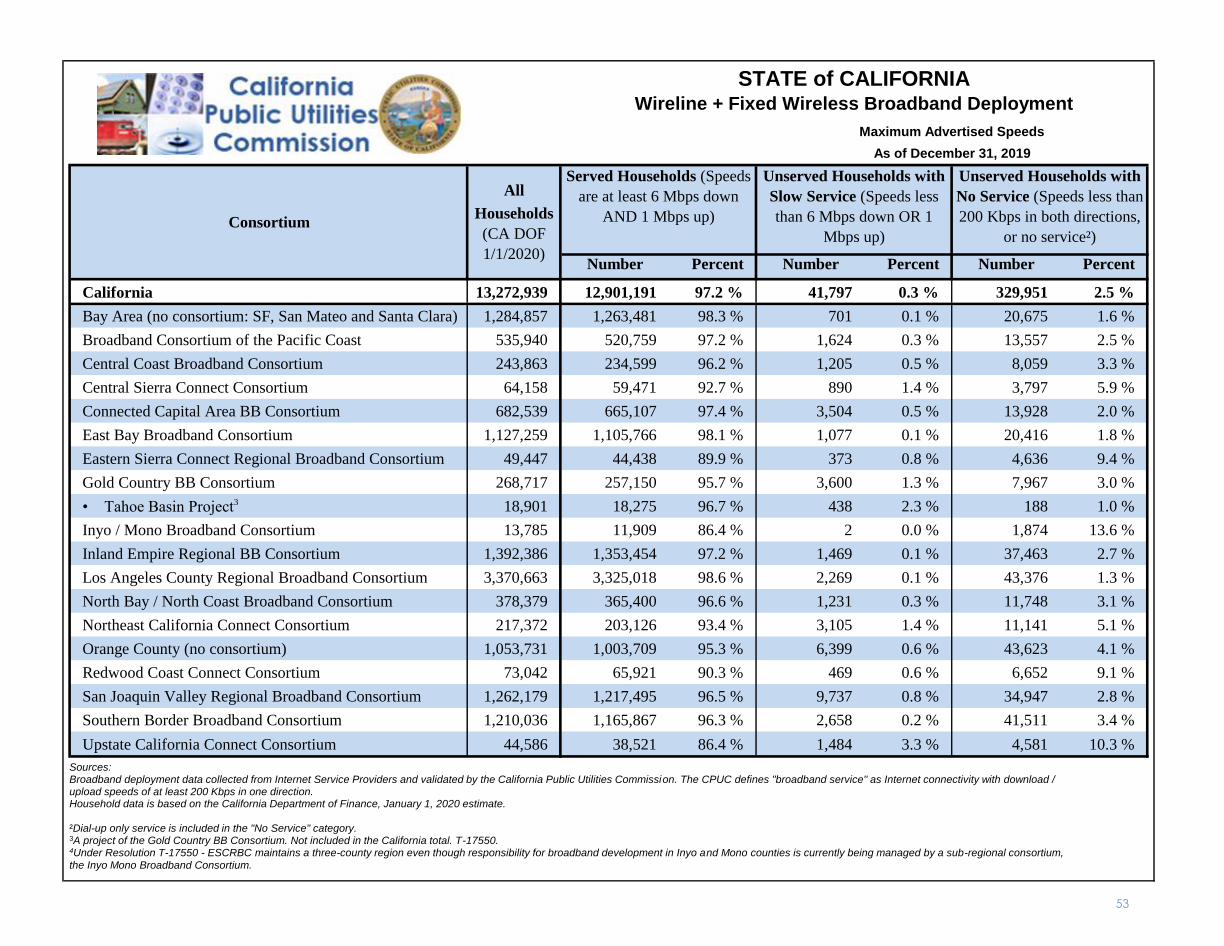
Number Percent Number Percent Number Percent
California 13,272,939 12,901,191 97.2 % 41,797 0.3 % 329,951 2.5 %
Bay Area (no consortium: SF, San Mateo and Santa Clara) 1,284,857 1,263,481 98.3 % 701 0.1 % 20,675 1.6 %
Broadband Consortium of the Pacific Coast 535,940 520,759 97.2 % 1,624 0.3 % 13,557 2.5 %
Central Coast Broadband Consortium 243,863 234,599 96.2 % 1,205 0.5 % 8,059 3.3 %
Central Sierra Connect Consortium 64,158 59,471 92.7 % 890 1.4 % 3,797 5.9 %
Connected Capital Area BB Consortium 682,539 665,107 97.4 % 3,504 0.5 % 13,928 2.0 %
East Bay Broadband Consortium 1,127,259 1,105,766 98.1 % 1,077 0.1 % 20,416 1.8 %
Eastern Sierra Connect Regional Broadband Consortium 49,447 44,438 89.9 % 373 0.8 % 4,636 9.4 %
Gold Country BB Consortium 268,717 257,150 95.7 % 3,600 1.3 % 7,967 3.0 %
• Tahoe Basin Project3 18,901 18,275 96.7 % 438 2.3 % 188 1.0 %
Inyo / Mono Broadband Consortium 13,785 11,909 86.4 % 2 0.0 % 1,874 13.6 %
Inland Empire Regional BB Consortium 1,392,386 1,353,454 97.2 % 1,469 0.1 % 37,463 2.7 %
Los Angeles County Regional Broadband Consortium 3,370,663 3,325,018 98.6 % 2,269 0.1 % 43,376 1.3 %
North Bay / North Coast Broadband Consortium 378,379 365,400 96.6 % 1,231 0.3 % 11,748 3.1 %
Northeast California Connect Consortium 217,372 203,126 93.4 % 3,105 1.4 % 11,141 5.1 %
Orange County (no consortium) 1,053,731 1,003,709 95.3 % 6,399 0.6 % 43,623 4.1 %
Redwood Coast Connect Consortium 73,042 65,921 90.3 % 469 0.6 % 6,652 9.1 %
San Joaquin Valley Regional Broadband Consortium 1,262,179 1,217,495 96.5 % 9,737 0.8 % 34,947 2.8 %
Southern Border Broadband Consortium 1,210,036 1,165,867 96.3 % 2,658 0.2 % 41,511 3.4 %
Upstate California Connect Consortium 44,586 38,521 86.4 % 1,484 3.3 % 4,581 10.3 %
STATE of CALIFORNIAWireline + Fixed Wireless Broadband Deployment
Maximum Advertised Speeds
As of December 31, 2019
Consortium
All
Households
(CA DOF
1/1/2020)
Served Households (Speeds
are at least 6 Mbps down
AND 1 Mbps up)
Unserved Households with
Slow Service (Speeds less
than 6 Mbps down OR 1
Mbps up)
Unserved Households with
No Service (Speeds less than
200 Kbps in both directions,
or no service²)
Sources:Broadband deployment data collected from Internet Service Providers and validated by the California Public Utilities Commission. The CPUC defines "broadband service'' as Internet connectivity with download / upload speeds of at least 200 Kbps in one direction.Household data is based on the California Department of Finance, January 1, 2020 estimate.
²Dial-up only service is included in the "No Service" category.3A project of the Gold Country BB Consortium. Not included in the California total. T-17550.4Under Resolution T-17550 - ESCRBC maintains a three-county region even though responsibility for broadband development in Inyo and Mono counties is currently being managed by a sub-regional consortium,
the Inyo Mono Broadband Consortium.
53
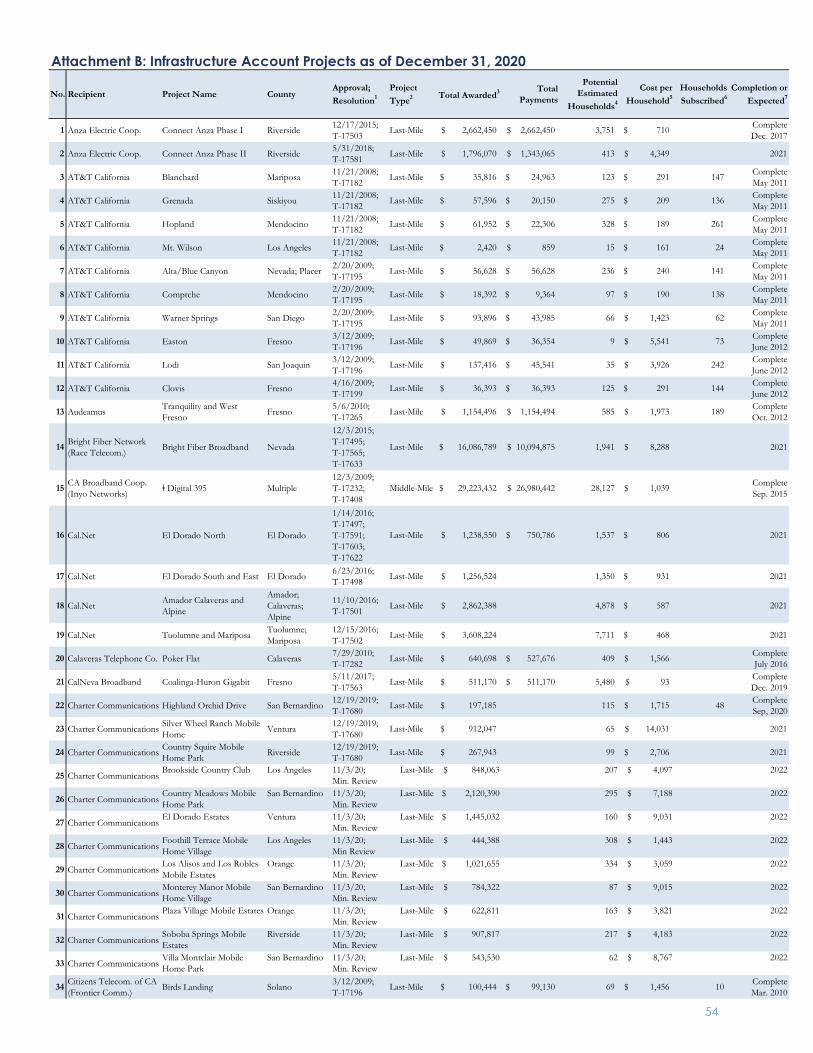
No. Recipient Project Name CountyApproval;Resolution1
Project Type2 Total Awarded3 Total
Payments
Potential Estimated
Households4
Cost per Household5
Households Subscribed6
Completion or Expected7
1 Anza Electric Coop. Connect Anza Phase I Riverside 12/17/2015; T-17503 Last-Mile 2,662,450$ 2,662,450$ 3,751 710$ Complete
Dec. 2017
2 Anza Electric Coop. Connect Anza Phase II Riverside 5/31/2018;T-17581 Last-Mile 1,796,070$ 1,343,065$ 413 4,349$ 2021
3 AT&T California Blanchard Mariposa 11/21/2008; T-17182 Last-Mile 35,816$ 24,963$ 123 291$ 147 Complete
May 2011
4 AT&T California Grenada Siskiyou 11/21/2008; T-17182 Last-Mile 57,596$ 20,150$ 275 209$ 136 Complete
May 2011
5 AT&T California Hopland Mendocino 11/21/2008; T-17182 Last-Mile 61,952$ 22,306$ 328 189$ 261 Complete
May 2011
6 AT&T California Mt. Wilson Los Angeles 11/21/2008; T-17182 Last-Mile 2,420$ 859$ 15 161$ 24 Complete
May 2011
7 AT&T California Alta/Blue Canyon Nevada; Placer 2/20/2009; T-17195 Last-Mile 56,628$ 56,628$ 236 240$ 141 Complete
May 2011
8 AT&T California Comptche Mendocino 2/20/2009;T-17195 Last-Mile 18,392$ 9,364$ 97 190$ 138 Complete
May 2011
9 AT&T California Warner Springs San Diego 2/20/2009; T-17195 Last-Mile 93,896$ 43,985$ 66 1,423$ 62 Complete
May 2011
10 AT&T California Easton Fresno 3/12/2009; T-17196 Last-Mile 49,869$ 36,354$ 9 5,541$ 73 Complete
June 2012
11 AT&T California Lodi San Joaquin 3/12/2009; T-17196 Last-Mile 137,416$ 45,541$ 35 3,926$ 242 Complete
June 2012
12 AT&T California Clovis Fresno 4/16/2009;T-17199 Last-Mile 36,393$ 36,393$ 125 291$ 144 Complete
June 2012
13 Audeamus Tranquility and West Fresno Fresno 5/6/2010;
T-17265 Last-Mile 1,154,496$ 1,154,494$ 585 1,973$ 189 CompleteOct. 2012
14 Bright Fiber Network (Race Telecom.) Bright Fiber Broadband Nevada
12/3/2015; T-17495;T-17565;T-17633
Last-Mile 16,086,789$ 10,094,875$ 1,941 8,288$ 2021
15 CA Broadband Coop. (Inyo Networks) ǂ Digital 395 Multiple
12/3/2009;T-17232;T-17408
Middle-Mile 29,223,432$ 26,980,442$ 28,127 1,039$ CompleteSep. 2015
16 Cal.Net El Dorado North El Dorado
1/14/2016;T-17497;T-17591;T-17603;T-17622
Last-Mile 1,238,550$ 750,786$ 1,537 806$ 2021
17 Cal.Net El Dorado South and East El Dorado 6/23/2016;T-17498 Last-Mile 1,256,524$ 1,350 931$ 2021
18 Cal.Net Amador Calaveras and Alpine
Amador; Calaveras; Alpine
11/10/2016; T-17501 Last-Mile 2,862,388$ 4,878 587$ 2021
19 Cal.Net Tuolumne and Mariposa Tuolumne; Mariposa
12/15/2016; T-17502 Last-Mile 3,608,224$ 7,711 468$ 2021
20 Calaveras Telephone Co. Poker Flat Calaveras 7/29/2010;T-17282 Last-Mile 640,698$ 527,676$ 409 1,566$ Complete
July 2016
21 CalNeva Broadband Coalinga-Huron Gigabit Fresno 5/11/2017;T-17563 Last-Mile 511,170$ 511,170$ 5,480 93$ Complete
Dec. 2019
22 Charter Communications Highland Orchid Drive San Bernardino 12/19/2019;T-17680 Last-Mile 197,185$ 115 1,715$ 48 Complete
Sep, 2020
23 Charter Communications Silver Wheel Ranch Mobile Home Ventura 12/19/2019;
T-17680 Last-Mile 912,047$ 65 14,031$ 2021
24 Charter Communications Country Squire Mobile Home Park Riverside 12/19/2019;
T-17680 Last-Mile 267,943$ 99 2,706$ 2021
25 Charter CommunicationsBrookside Country Club Los Angeles 11/3/20;
Min. Review Last-Mile $ 848,063 207 $ 4,097 2022
26 Charter CommunicationsCountry Meadows Mobile Home Park
San Bernardino 11/3/20;Min. Review
Last-Mile $ 2,120,390 295 $ 7,188 2022
27 Charter CommunicationsEl Dorado Estates Ventura 11/3/20;
Min. ReviewLast-Mile $ 1,445,032 160 $ 9,031 2022
28 Charter CommunicationsFoothill Terrace Mobile Home Village
Los Angeles 11/3/20; Min Review
Last-Mile $ 444,388 308 $ 1,443 2022
29 Charter CommunicationsLos Alisos and Los Robles Mobile Estates
Orange 11/3/20;Min. Review
Last-Mile $ 1,021,655 334 $ 3,059 2022
30 Charter CommunicationsMonterey Manor Mobile Home Village
San Bernardino 11/3/20;Min. Review
Last-Mile $ 784,322 87 $ 9,015 2022
31 Charter CommunicationsPlaza Village Mobile Estates Orange 11/3/20;
Min. ReviewLast-Mile $ 622,811 163 $ 3,821 2022
32 Charter CommunicationsSoboba Springs Mobile Estates
Riverside 11/3/20;Min. Review
Last-Mile $ 907,817 217 $ 4,183 2022
33 Charter CommunicationsVilla Montclair Mobile Home Park
San Bernardino 11/3/20;Min. Review
Last-Mile $ 543,530 62 $ 8,767 2022
34 Citizens Telecom. of CA (Frontier Comm.) Birds Landing Solano 3/12/2009;
T-17196 Last-Mile 100,444$ 99,130$ 69 1,456$ 10 CompleteMar. 2010
Attachment B: Infrastructure Account Projects as of December 31, 2020
54
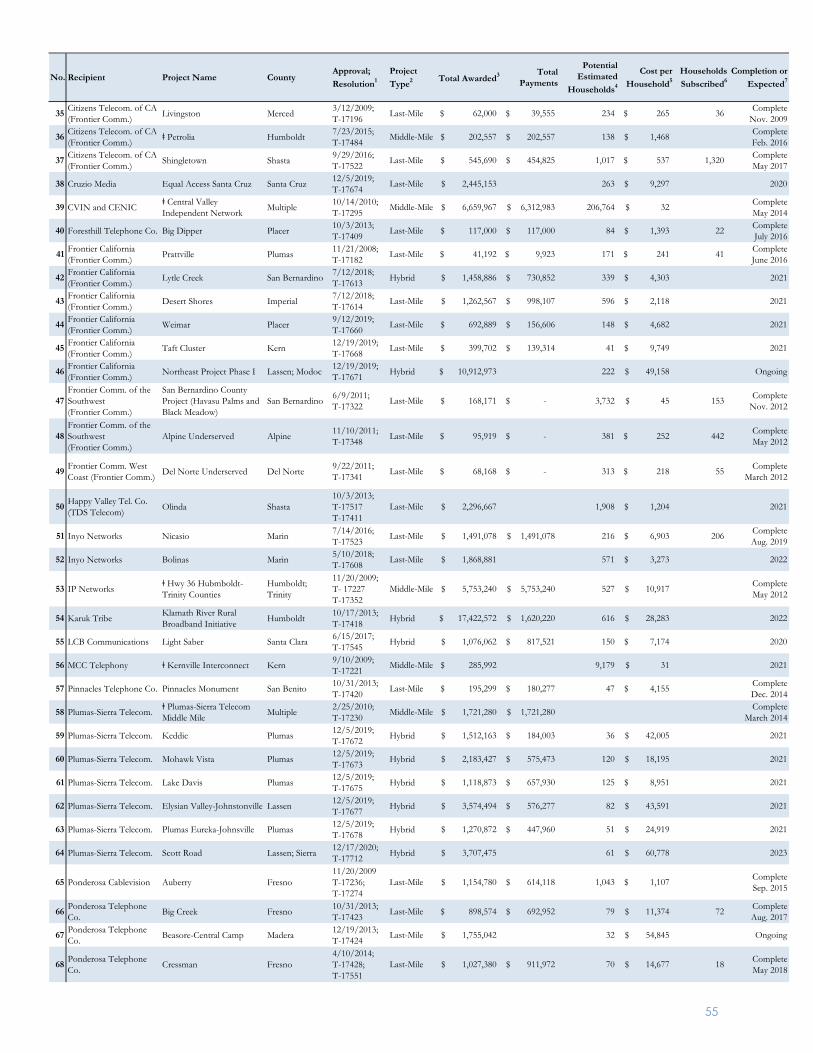
No. Recipient Project Name CountyApproval;Resolution1
Project Type2 Total Awarded3 Total
Payments
Potential Estimated
Households4
Cost per Household5
Households Subscribed6
Completion or Expected7
35 Citizens Telecom. of CA (Frontier Comm.) Livingston Merced 3/12/2009;
T-17196 Last-Mile 62,000$ 39,555$ 234 265$ 36 CompleteNov. 2009
36 Citizens Telecom. of CA (Frontier Comm.) ǂ Petrolia Humboldt 7/23/2015;
T-17484 Middle-Mile 202,557$ 202,557$ 138 1,468$ CompleteFeb. 2016
37 Citizens Telecom. of CA (Frontier Comm.) Shingletown Shasta 9/29/2016;
T-17522 Last-Mile 545,690$ 454,825$ 1,017 537$ 1,320 CompleteMay 2017
38 Cruzio Media Equal Access Santa Cruz Santa Cruz 12/5/2019;T-17674 Last-Mile 2,445,153$ 263 9,297$ 2020
39 CVIN and CENIC ǂ Central Valley Independent Network Multiple 10/14/2010;
T-17295 Middle-Mile 6,659,967$ 6,312,983$ 206,764 32$ CompleteMay 2014
40 Foresthill Telephone Co. Big Dipper Placer 10/3/2013; T-17409 Last-Mile 117,000$ 117,000$ 84 1,393$ 22 Complete
July 2016
41 Frontier California (Frontier Comm.) Prattville Plumas 11/21/2008;
T-17182 Last-Mile 41,192$ 9,923$ 171 241$ 41 CompleteJune 2016
42 Frontier California (Frontier Comm.) Lytle Creek San Bernardino 7/12/2018;
T-17613 Hybrid 1,458,886$ 730,852$ 339 4,303$ 2021
43 Frontier California (Frontier Comm.) Desert Shores Imperial 7/12/2018;
T-17614 Last-Mile 1,262,567$ 998,107$ 596 2,118$ 2021
44 Frontier California(Frontier Comm.) Weimar Placer 9/12/2019;
T-17660 Last-Mile 692,889$ 156,606$ 148 4,682$ 2021
45 Frontier California (Frontier Comm.) Taft Cluster Kern 12/19/2019;
T-17668 Last-Mile 399,702$ 139,314$ 41 9,749$ 2021
46 Frontier California (Frontier Comm.) Northeast Project Phase I Lassen; Modoc 12/19/2019;
T-17671 Hybrid 10,912,973$ 222 49,158$ Ongoing
47Frontier Comm. of the Southwest (Frontier Comm.)
San Bernardino County Project (Havasu Palms and Black Meadow)
San Bernardino 6/9/2011;T-17322 Last-Mile 168,171$ -$ 3,732 45$ 153 Complete
Nov. 2012
48Frontier Comm. of the Southwest (Frontier Comm.)
Alpine Underserved Alpine 11/10/2011;T-17348 Last-Mile 95,919$ -$ 381 252$ 442 Complete
May 2012
49 Frontier Comm. West Coast (Frontier Comm.) Del Norte Underserved Del Norte 9/22/2011;
T-17341 Last-Mile 68,168$ -$ 313 218$ 55 CompleteMarch 2012
50 Happy Valley Tel. Co. (TDS Telecom) Olinda Shasta
10/3/2013;T-17517T-17411
Last-Mile 2,296,667$ 1,908 1,204$ 2021
51 Inyo Networks Nicasio Marin 7/14/2016;T-17523 Last-Mile 1,491,078$ 1,491,078$ 216 6,903$ 206 Complete
Aug. 2019
52 Inyo Networks Bolinas Marin 5/10/2018;T-17608 Last-Mile 1,868,881$ 571 3,273$ 2022
53 IP Networks ǂ Hwy 36 Hubmboldt-Trinity Counties
Humboldt; Trinity
11/20/2009;T- 17227T-17352
Middle-Mile 5,753,240$ 5,753,240$ 527 10,917$ CompleteMay 2012
54 Karuk Tribe Klamath River Rural Broadband Initiative Humboldt 10/17/2013;
T-17418 Hybrid 17,422,572$ 1,620,220$ 616 28,283$ 2022
55 LCB Communications Light Saber Santa Clara 6/15/2017;T-17545 Hybrid 1,076,062$ 817,521$ 150 7,174$ 2020
56 MCC Telephony ǂ Kernville Interconnect Kern 9/10/2009;T-17221 Middle-Mile 285,992$ 9,179 31$ 2021
57 Pinnacles Telephone Co. Pinnacles Monument San Benito 10/31/2013;T-17420 Last-Mile 195,299$ 180,277$ 47 4,155$ Complete
Dec. 2014
58 Plumas-Sierra Telecom. ǂ Plumas-Sierra Telecom Middle Mile Multiple 2/25/2010;
T-17230 Middle-Mile 1,721,280$ 1,721,280$ CompleteMarch 2014
59 Plumas-Sierra Telecom. Keddie Plumas 12/5/2019;T-17672 Hybrid 1,512,163$ 184,003$ 36 42,005$ 2021
60 Plumas-Sierra Telecom. Mohawk Vista Plumas 12/5/2019;T-17673 Hybrid 2,183,427$ 575,473$ 120 18,195$ 2021
61 Plumas-Sierra Telecom. Lake Davis Plumas 12/5/2019;T-17675 Hybrid 1,118,873$ 657,930$ 125 8,951$ 2021
62 Plumas-Sierra Telecom. Elysian Valley-Johnstonville Lassen 12/5/2019;T-17677 Hybrid 3,574,494$ 576,277$ 82 43,591$ 2021
63 Plumas-Sierra Telecom. Plumas Eureka-Johnsville Plumas 12/5/2019;T-17678 Hybrid 1,270,872$ 447,960$ 51 24,919$ 2021
64 Plumas-Sierra Telecom. Scott Road Lassen; Sierra 12/17/2020;T-17712 Hybrid 3,707,475$ 61 60,778$ 2023
65 Ponderosa Cablevision Auberry Fresno11/20/2009T-17236;T-17274
Last-Mile 1,154,780$ 614,118$ 1,043 1,107$ CompleteSep. 2015
66 Ponderosa Telephone Co. Big Creek Fresno 10/31/2013;
T-17423 Last-Mile 898,574$ 692,952$ 79 11,374$ 72 CompleteAug. 2017
67 Ponderosa Telephone Co. Beasore-Central Camp Madera 12/19/2013;
T-17424 Last-Mile 1,755,042$ 32 54,845$ Ongoing
68 Ponderosa Telephone Co. Cressman Fresno
4/10/2014;T-17428;T-17551
Last-Mile 1,027,380$ 911,972$ 70 14,677$ 18 CompleteMay 2018
55
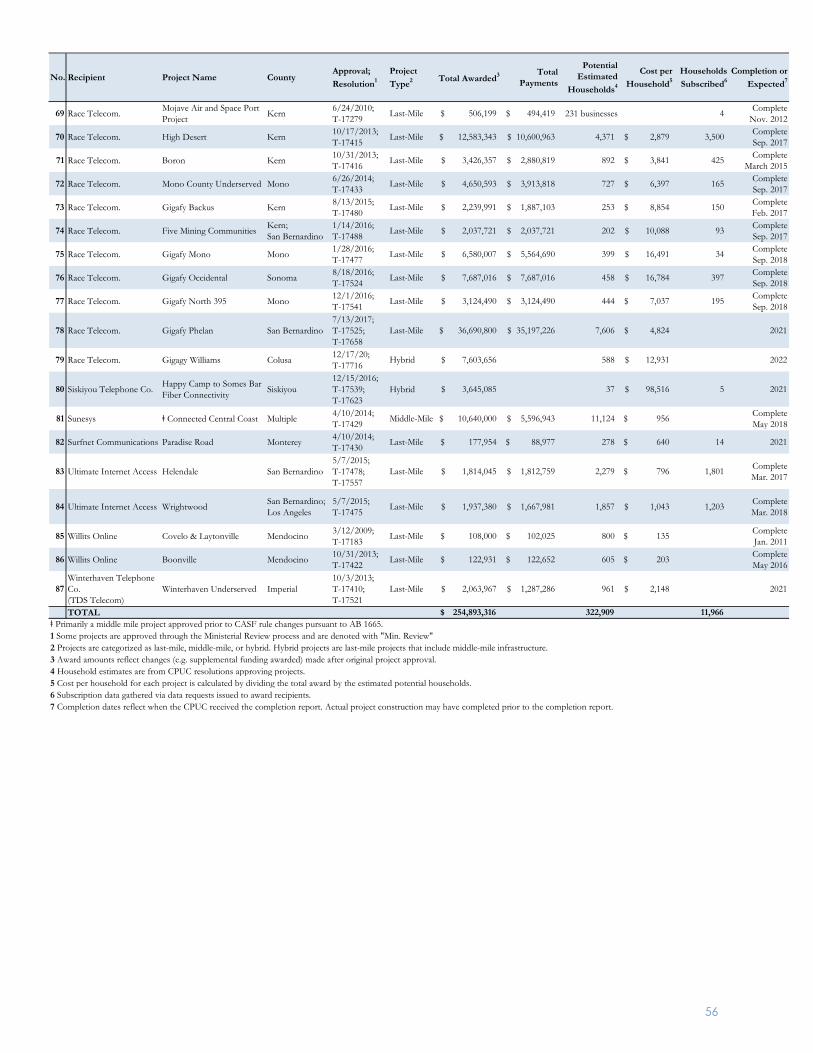
No. Recipient Project Name CountyApproval;Resolution1
Project Type2 Total Awarded3 Total
Payments
Potential Estimated
Households4
Cost per Household5
Households Subscribed6
Completion or Expected7
69 Race Telecom. Mojave Air and Space Port Project Kern 6/24/2010;
T-17279 Last-Mile 506,199$ 494,419$ 231 businesses 4 CompleteNov. 2012
70 Race Telecom. High Desert Kern 10/17/2013;T-17415 Last-Mile 12,583,343$ 10,600,963$ 4,371 2,879$ 3,500 Complete
Sep. 2017
71 Race Telecom. Boron Kern 10/31/2013;T-17416 Last-Mile 3,426,357$ 2,880,819$ 892 3,841$ 425 Complete
March 2015
72 Race Telecom. Mono County Underserved Mono 6/26/2014;T-17433 Last-Mile 4,650,593$ 3,913,818$ 727 6,397$ 165 Complete
Sep. 2017
73 Race Telecom. Gigafy Backus Kern 8/13/2015;T-17480 Last-Mile 2,239,991$ 1,887,103$ 253 8,854$ 150 Complete
Feb. 2017
74 Race Telecom. Five Mining Communities Kern;San Bernardino
1/14/2016;T-17488 Last-Mile 2,037,721$ 2,037,721$ 202 10,088$ 93 Complete
Sep. 2017
75 Race Telecom. Gigafy Mono Mono 1/28/2016;T-17477 Last-Mile 6,580,007$ 5,564,690$ 399 16,491$ 34 Complete
Sep. 2018
76 Race Telecom. Gigafy Occidental Sonoma 8/18/2016;T-17524 Last-Mile 7,687,016$ 7,687,016$ 458 16,784$ 397 Complete
Sep. 2018
77 Race Telecom. Gigafy North 395 Mono 12/1/2016;T-17541 Last-Mile 3,124,490$ 3,124,490$ 444 7,037$ 195 Complete
Sep. 2018
78 Race Telecom. Gigafy Phelan San Bernardino7/13/2017;T-17525;T-17658
Last-Mile 36,690,800$ 35,197,226$ 7,606 4,824$ 2021
79 Race Telecom. Gigagy Williams Colusa 12/17/20;T-17716 Hybrid 7,603,656$ 588 12,931$ 2022
80 Siskiyou Telephone Co. Happy Camp to Somes Bar Fiber Connectivity Siskiyou
12/15/2016;T-17539;T-17623
Hybrid 3,645,085$ 37 98,516$ 5 2021
81 Sunesys ǂ Connected Central Coast Multiple 4/10/2014;T-17429 Middle-Mile 10,640,000$ 5,596,943$ 11,124 956$ Complete
May 2018
82 Surfnet Communications Paradise Road Monterey 4/10/2014;T-17430 Last-Mile 177,954$ 88,977$ 278 640$ 14 2021
83 Ultimate Internet Access Helendale San Bernardino5/7/2015;T-17478;T-17557
Last-Mile 1,814,045$ 1,812,759$ 2,279 796$ 1,801 CompleteMar. 2017
84 Ultimate Internet Access Wrightwood San Bernardino; Los Angeles
5/7/2015;T-17475 Last-Mile 1,937,380$ 1,667,981$ 1,857 1,043$ 1,203 Complete
Mar. 2018
85 Willits Online Covelo & Laytonville Mendocino 3/12/2009;T-17183 Last-Mile 108,000$ 102,025$ 800 135$ Complete
Jan. 2011
86 Willits Online Boonville Mendocino 10/31/2013;T-17422 Last-Mile 122,931$ 122,652$ 605 203$ Complete
May 2016
87Winterhaven Telephone Co. (TDS Telecom)
Winterhaven Underserved Imperial10/3/2013;T-17410;T-17521
Last-Mile 2,063,967$ 1,287,286$ 961 2,148$ 2021
TOTAL 254,893,316$ 322,909 11,966
6 Subscription data gathered via data requests issued to award recipients.7 Completion dates reflect when the CPUC received the completion report. Actual project construction may have completed prior to the completion report.
ǂ Primarily a middle mile project approved prior to CASF rule changes pursuant to AB 1665.
2 Projects are categorized as last-mile, middle-mile, or hybrid. Hybrid projects are last-mile projects that include middle-mile infrastructure. 3 Award amounts reflect changes (e.g. supplemental funding awarded) made after original project approval.4 Household estimates are from CPUC resolutions approving projects.5 Cost per household for each project is calculated by dividing the total award by the estimated potential households.
1 Some projects are approved through the Ministerial Review process and are denoted with "Min. Review"
56
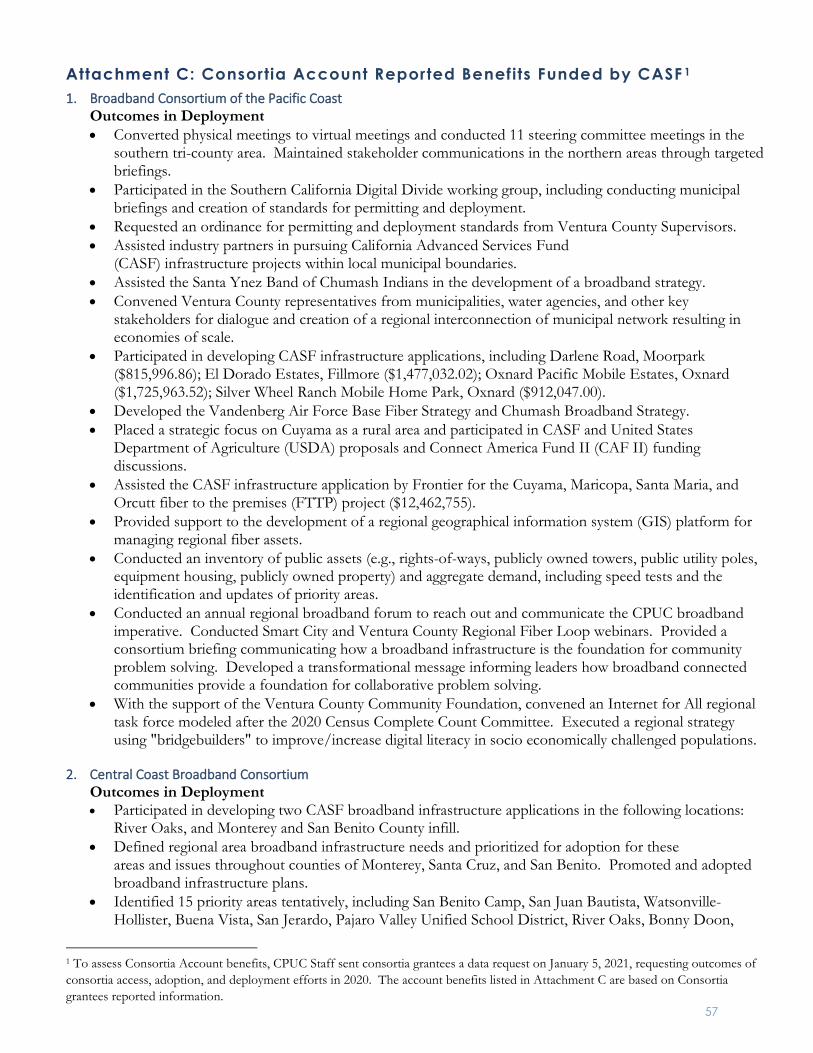
Attachment C: Consortia Account Reported Benefits Funded by CASF 1 1. Broadband Consortium of the Pacific Coast
Outcomes in Deployment• Converted physical meetings to virtual meetings and conducted 11 steering committee meetings in the
southern tri-county area. Maintained stakeholder communications in the northern areas through targetedbriefings.
• Participated in the Southern California Digital Divide working group, including conducting municipalbriefings and creation of standards for permitting and deployment.
• Requested an ordinance for permitting and deployment standards from Ventura County Supervisors.• Assisted industry partners in pursuing California Advanced Services Fund
(CASF) infrastructure projects within local municipal boundaries.• Assisted the Santa Ynez Band of Chumash Indians in the development of a broadband strategy.• Convened Ventura County representatives from municipalities, water agencies, and other key
stakeholders for dialogue and creation of a regional interconnection of municipal network resulting ineconomies of scale.
• Participated in developing CASF infrastructure applications, including Darlene Road, Moorpark($815,996.86); El Dorado Estates, Fillmore ($1,477,032.02); Oxnard Pacific Mobile Estates, Oxnard($1,725,963.52); Silver Wheel Ranch Mobile Home Park, Oxnard ($912,047.00).
• Developed the Vandenberg Air Force Base Fiber Strategy and Chumash Broadband Strategy.• Placed a strategic focus on Cuyama as a rural area and participated in CASF and United States
Department of Agriculture (USDA) proposals and Connect America Fund II (CAF II) fundingdiscussions.
• Assisted the CASF infrastructure application by Frontier for the Cuyama, Maricopa, Santa Maria, andOrcutt fiber to the premises (FTTP) project ($12,462,755).
• Provided support to the development of a regional geographical information system (GIS) platform formanaging regional fiber assets.
• Conducted an inventory of public assets (e.g., rights-of-ways, publicly owned towers, public utility poles,equipment housing, publicly owned property) and aggregate demand, including speed tests and theidentification and updates of priority areas.
• Conducted an annual regional broadband forum to reach out and communicate the CPUC broadbandimperative. Conducted Smart City and Ventura County Regional Fiber Loop webinars. Provided aconsortium briefing communicating how a broadband infrastructure is the foundation for communityproblem solving. Developed a transformational message informing leaders how broadband connectedcommunities provide a foundation for collaborative problem solving.
• With the support of the Ventura County Community Foundation, convened an Internet for All regionaltask force modeled after the 2020 Census Complete Count Committee. Executed a regional strategyusing "bridgebuilders" to improve/increase digital literacy in socio economically challenged populations.
2. Central Coast Broadband ConsortiumOutcomes in Deployment• Participated in developing two CASF broadband infrastructure applications in the following locations:
River Oaks, and Monterey and San Benito County infill.• Defined regional area broadband infrastructure needs and prioritized for adoption for these
areas and issues throughout counties of Monterey, Santa Cruz, and San Benito. Promoted and adoptedbroadband infrastructure plans.
• Identified 15 priority areas tentatively, including San Benito Camp, San Juan Bautista, Watsonville-Hollister, Buena Vista, San Jerardo, Pajaro Valley Unified School District, River Oaks, Bonny Doon,
1 To assess Consortia Account benefits, CPUC Staff sent consortia grantees a data request on January 5, 2021, requesting outcomes of consortia access, adoption, and deployment efforts in 2020. The account benefits listed in Attachment C are based on Consortia grantees reported information.
57
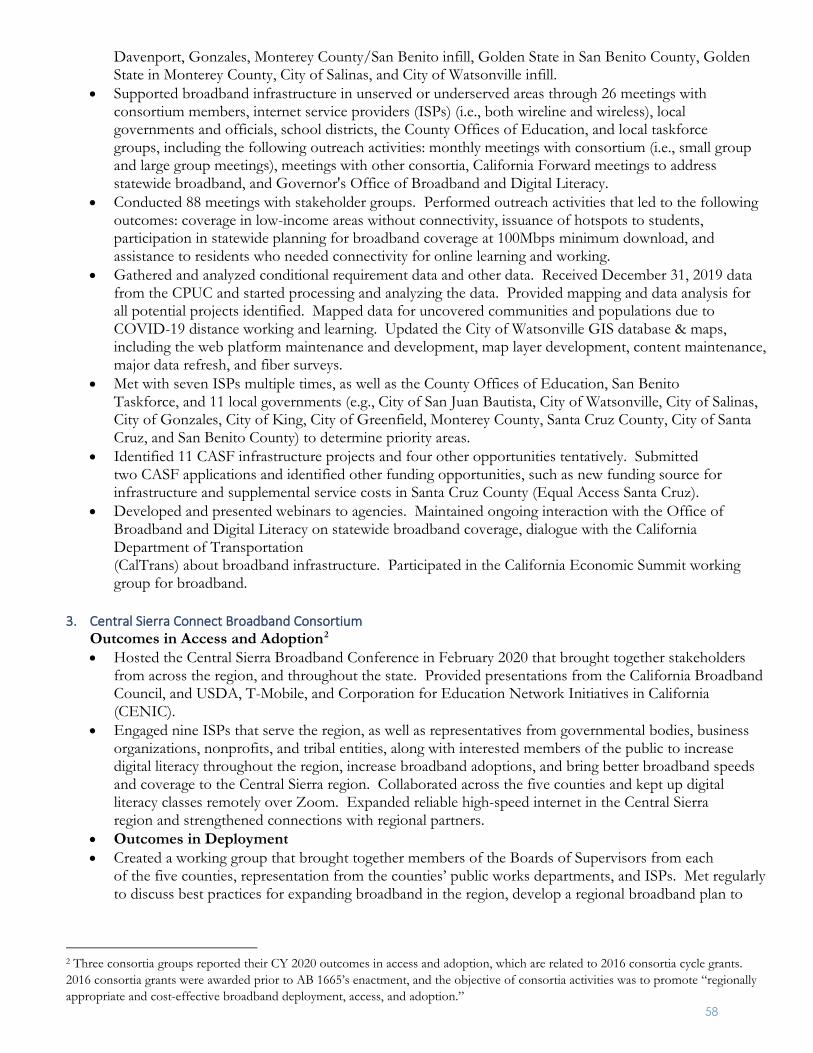
Davenport, Gonzales, Monterey County/San Benito infill, Golden State in San Benito County, Golden State in Monterey County, City of Salinas, and City of Watsonville infill.
• Supported broadband infrastructure in unserved or underserved areas through 26 meetings withconsortium members, internet service providers (ISPs) (i.e., both wireline and wireless), localgovernments and officials, school districts, the County Offices of Education, and local taskforcegroups, including the following outreach activities: monthly meetings with consortium (i.e., small groupand large group meetings), meetings with other consortia, California Forward meetings to addressstatewide broadband, and Governor's Office of Broadband and Digital Literacy.
• Conducted 88 meetings with stakeholder groups. Performed outreach activities that led to the followingoutcomes: coverage in low-income areas without connectivity, issuance of hotspots to students,participation in statewide planning for broadband coverage at 100Mbps minimum download, andassistance to residents who needed connectivity for online learning and working.
• Gathered and analyzed conditional requirement data and other data. Received December 31, 2019 datafrom the CPUC and started processing and analyzing the data. Provided mapping and data analysis forall potential projects identified. Mapped data for uncovered communities and populations due toCOVID-19 distance working and learning. Updated the City of Watsonville GIS database & maps,including the web platform maintenance and development, map layer development, content maintenance,major data refresh, and fiber surveys.
• Met with seven ISPs multiple times, as well as the County Offices of Education, San BenitoTaskforce, and 11 local governments (e.g., City of San Juan Bautista, City of Watsonville, City of Salinas,City of Gonzales, City of King, City of Greenfield, Monterey County, Santa Cruz County, City of SantaCruz, and San Benito County) to determine priority areas.
• Identified 11 CASF infrastructure projects and four other opportunities tentatively. Submittedtwo CASF applications and identified other funding opportunities, such as new funding source forinfrastructure and supplemental service costs in Santa Cruz County (Equal Access Santa Cruz).
• Developed and presented webinars to agencies. Maintained ongoing interaction with the Office ofBroadband and Digital Literacy on statewide broadband coverage, dialogue with the CaliforniaDepartment of Transportation(CalTrans) about broadband infrastructure. Participated in the California Economic Summit workinggroup for broadband.
3. Central Sierra Connect Broadband ConsortiumOutcomes in Access and Adoption2
• Hosted the Central Sierra Broadband Conference in February 2020 that brought together stakeholdersfrom across the region, and throughout the state. Provided presentations from the California BroadbandCouncil, and USDA, T-Mobile, and Corporation for Education Network Initiatives in California(CENIC).
• Engaged nine ISPs that serve the region, as well as representatives from governmental bodies, businessorganizations, nonprofits, and tribal entities, along with interested members of the public to increasedigital literacy throughout the region, increase broadband adoptions, and bring better broadband speedsand coverage to the Central Sierra region. Collaborated across the five counties and kept up digitalliteracy classes remotely over Zoom. Expanded reliable high-speed internet in the Central Sierraregion and strengthened connections with regional partners.
• Outcomes in Deployment• Created a working group that brought together members of the Boards of Supervisors from each
of the five counties, representation from the counties’ public works departments, and ISPs. Met regularlyto discuss best practices for expanding broadband in the region, develop a regional broadband plan to
2 Three consortia groups reported their CY 2020 outcomes in access and adoption, which are related to 2016 consortia cycle grants. 2016 consortia grants were awarded prior to AB 1665’s enactment, and the objective of consortia activities was to promote “regionally appropriate and cost-effective broadband deployment, access, and adoption.”
58
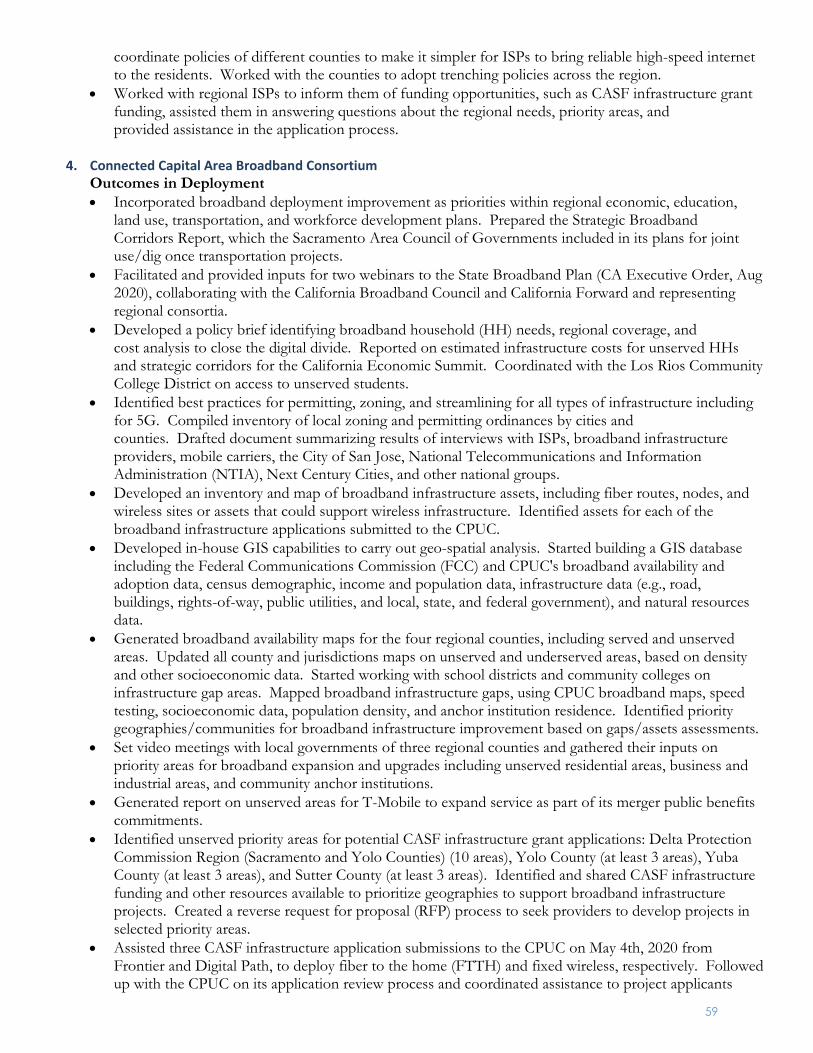
coordinate policies of different counties to make it simpler for ISPs to bring reliable high-speed internet to the residents. Worked with the counties to adopt trenching policies across the region.
• Worked with regional ISPs to inform them of funding opportunities, such as CASF infrastructure grant funding, assisted them in answering questions about the regional needs, priority areas, and provided assistance in the application process.
4. Connected Capital Area Broadband Consortium
Outcomes in Deployment • Incorporated broadband deployment improvement as priorities within regional economic, education,
land use, transportation, and workforce development plans. Prepared the Strategic Broadband Corridors Report, which the Sacramento Area Council of Governments included in its plans for joint use/dig once transportation projects.
• Facilitated and provided inputs for two webinars to the State Broadband Plan (CA Executive Order, Aug 2020), collaborating with the California Broadband Council and California Forward and representing regional consortia.
• Developed a policy brief identifying broadband household (HH) needs, regional coverage, and cost analysis to close the digital divide. Reported on estimated infrastructure costs for unserved HHs and strategic corridors for the California Economic Summit. Coordinated with the Los Rios Community College District on access to unserved students.
• Identified best practices for permitting, zoning, and streamlining for all types of infrastructure including for 5G. Compiled inventory of local zoning and permitting ordinances by cities and counties. Drafted document summarizing results of interviews with ISPs, broadband infrastructure providers, mobile carriers, the City of San Jose, National Telecommunications and Information Administration (NTIA), Next Century Cities, and other national groups.
• Developed an inventory and map of broadband infrastructure assets, including fiber routes, nodes, and wireless sites or assets that could support wireless infrastructure. Identified assets for each of the broadband infrastructure applications submitted to the CPUC.
• Developed in-house GIS capabilities to carry out geo-spatial analysis. Started building a GIS database including the Federal Communications Commission (FCC) and CPUC's broadband availability and adoption data, census demographic, income and population data, infrastructure data (e.g., road, buildings, rights-of-way, public utilities, and local, state, and federal government), and natural resources data.
• Generated broadband availability maps for the four regional counties, including served and unserved areas. Updated all county and jurisdictions maps on unserved and underserved areas, based on density and other socioeconomic data. Started working with school districts and community colleges on infrastructure gap areas. Mapped broadband infrastructure gaps, using CPUC broadband maps, speed testing, socioeconomic data, population density, and anchor institution residence. Identified priority geographies/communities for broadband infrastructure improvement based on gaps/assets assessments.
• Set video meetings with local governments of three regional counties and gathered their inputs on priority areas for broadband expansion and upgrades including unserved residential areas, business and industrial areas, and community anchor institutions.
• Generated report on unserved areas for T-Mobile to expand service as part of its merger public benefits commitments.
• Identified unserved priority areas for potential CASF infrastructure grant applications: Delta Protection Commission Region (Sacramento and Yolo Counties) (10 areas), Yolo County (at least 3 areas), Yuba County (at least 3 areas), and Sutter County (at least 3 areas). Identified and shared CASF infrastructure funding and other resources available to prioritize geographies to support broadband infrastructure projects. Created a reverse request for proposal (RFP) process to seek providers to develop projects in selected priority areas.
• Assisted three CASF infrastructure application submissions to the CPUC on May 4th, 2020 from Frontier and Digital Path, to deploy fiber to the home (FTTH) and fixed wireless, respectively. Followed up with the CPUC on its application review process and coordinated assistance to project applicants
59
(e.g., Frontier and Digital Path). One application approved by the CPUC on its voting meeting on January 14th, 2021 – Digital Path project to deploy fixed wireless to 279 unserved households in Sutter and Placer counties.
• Worked on preparation for the next CASF infrastructure grant cycle, by reaching out to potential eligible applicants and providing information of priority unserved areas.
• Conducted briefings with municipalities, public institutions, ISPs, and other key stakeholders to share findings on broadband deployment needs and recommended solutions, explore mutual interest, and solicit projects.
• Identified and activated venues and mediums for promoting ground truth speed testing opportunities. Generated digital flyers with CalSPEED information emphasizing the importance of broadband coverage validation and proactively promoted CalSPEED tests through an e-newsletter which reaches more than 1,500 readers on a bi-weekly to monthly basis, social media on a bi-weekly, webinars and meetings with broadband stakeholders. Assisted near 300 fixed and 300 mobile CalSPEED testing in the region in 2020.
• Worked with the CPUC on the NTIA pilot to assure ground truth speed testing results are incorporated into the Federal Communications Commission (FCC) mapping.
5. Gold Country Broadband Consortium
Outcomes in Deployment • Assisted three ISPs with CASF infrastructure grant application submissions located in the priority
areas in Sierra County, Nevada County, and Placer County. Worked with Nevada County to expand broadband by leveraging public-private grants to secure two rounds of non-CASF funding to connecting 800 homes in 2020. An additional 116 connections are scheduled for installation January through April of 2021.
• Promoted utilization of one million dollars of CARE Act funding to expedite infrastructure broadband expansion projects.
• Participated in broadband working groups to support continued broadband expansion efforts and prioritize county-wide broadband policies.
• Worked with Nevada County, the California Emerging Technology Fund (CETF), and Nossaman LLP Law Firm, to support a county-wide programmatic environmental impact report (EIR) study to remove California Environmental Quality Act (CEQA) barriers, expedite environmental permitting, and reduce onerous costs for last-mile projects.
• Worked with Placer County to develop a broadband survey and promoted speed tests to identify unserved/underserved priority areas in Placer County for project identification and implementation.
• Worked with Nevada County to review county-wide policy recommendations and steps for implementation of the “Dig Once” policy.
• Promoted CPUC CalSPEED tests through the Sierra Business Council (SBC) website, social media posts, and e-newsletters. Met with four homeowners’ associations (HOAs) to collect public feedback and promote CalSPEED testing.
• Attended ongoing virtual meetings with the County Boards of Supervisors, Town Council, City Council, and county staff as related to broadband deployment. Encouraged revision of economic development plans across agencies to incorporate broadband stand-alone objectives and adoption of policies declaring broadband as essential infrastructure. Provided the SBC authored Nevada County Broadband Plan as example.
• Met with 11 active ISPs across the counties. Reviewed four incumbent ISPs’ business plans and project proposals.
• Partnered with the California Stewardship Network and California Forward to support Governor Newsom's Broadband for All Initiative. Attended the Broadband for All working group meetings.
• Identified initial legislation introduced in December 2020 to prioritize in the 2021-22 California legislative session, including AB 14 (Aguiar-Curry), SB 4 (Gonzalez), and AB 34 (Garcia), and the Broadband for All Bond Act.
60
• Tracked the Sierra CAMP Broadband Data and Vulnerability Assessments addressing county-wide data in Sierra County.
6. Inland Empire Regional Broadband Consortium
Outcomes in Deployment • Developed four mapping data updates and updated the Inland Empire Broadband Plan to add Mojave
Desert region, the Lake Mathews area, and unserved mobile home parks as priority unserved areas. Developed 14 broadband availability maps for distribution to ISPs, including inventories of unserved mobile home parks, aggregate demand for potential CASF grant applications, and fairgrounds in the region that need broadband upgrades as they are used in emergencies, which could help as a public asset and in aggregating demand for broadband.
• Provided two broadband planning consultations with counties of San Bernardino and Riverside and six consultations with cities of Riverside, Beaumont, Cathedral City, Colton, Joshua Tree, Twenty-Nine Palms, Yucca Valley, and Fontana, and three regional agency consultations with the Council of San Benito County Governments (SBCOG), Caltrans, and the Southern California Association of Governments (SCAG). Collaborated with SCAG, CETF, Broadband Consortium of the Pacific Coast, and Southern Border Broadband Consortium to provide data and outreach to help show that broadband deployment should be part of regional and statewide transportation facility planning and transportation demand management as it can lead to reduction in vehicle miles traveled (VMT) and greenhouse gas reduction (GHG).
• Held 12 regional stakeholder meetings to discuss strategies for unserved areas in the region. Obtained and analyzed feedback from planning meetings for the broadband plan update.
• Identified seven priority unserved areas, including Aguanga, Lake Mathews area, Mecca, Ripley, and Thermal in Riverside County; and Morongo Basin Area and Mojave Desert in San Bernardino County. There are 41,697 unserved households in the region.
• Completed the "Preferred Scenario Report for Unserved Households in the Inland Empire", which provides a broadband gap analysis for the region.
• Worked with both Riverside and San Bernardino counties to determine availability of leveraged funding from local sources to potentially deploy broadband in unserved areas. Provided input and information about Covid-19 related broadband usage, demand, and unmet needs, especially in unserved areas. Provided information about federal USDA and FCC broadband grant programs to stakeholders and ISPs.
• Worked with CETF and SCAG in collaboration with two other regional consortiums to address broadband as a “green strategy" and advocate for “dig once” and “dig smart” strategies to integrate broadband deployment into transportation planning, and result in streamlined permitting for cities, counties, Caltrans, and other responsible agencies.
• Assisted an ISP with five CASF broadband infrastructure applications in San Bernardino County and two CASF broadband infrastructure applications in Riverside County. Assisted ten ISPs by providing them with CASF broadband infrastructure grant information and discussing priority unserved areas in the region and reviewing the CPUC Broadband Map to identify additional CASF eligible unserved areas in the region.
• Supported permitting for one CASF broadband infrastructure project approved by the CPUC for Lytle Creek in San Bernardino County. Met with Riverside and San Bernardino counties to discuss a regional effort to close the digital divide by improving regional and local broadband permitting. Reviewed and provided suggestions on the SCAG draft resolution to support a regional broadband permit. Provided information to Caltrans about benefits of streamlined permitting for broadband projects and suggested that the information be part of local Caltrans district professional and technical development and that including ISPs along with professional engineers, city/county engineers, and Caltrans district staff would be beneficial for broadband deployment.
• Participated in an ongoing wireline testing survey project with the Cal State Chico in the region. Provided feedback to the Cal State Chico and CPUC regarding the clarity of outreach materials; the ease of signing up to be a volunteer participant in the study, as well as installing the home wireline
61
testing equipment sent to volunteers, uninstalling, and returning to the Cal State Chico for their review and analysis.
7. North Bay North Coast Broadband Consortium
Outcomes in Deployment Marin County • Worked with the county to engage and maintain involvement and commitment of the Board of
Supervisors and leaders of cities, towns, special districts, schools, libraries, public safety agencies, health facilities, businesses, and other community-based organizations.
• Engaged several existing broadband providers to learn more about their current offerings and future plans to deploy broadband infrastructure and service to communities within the county.
• Worked with the county, cities, towns, special districts, schools, libraries, public safety agencies, health facilities, businesses, and other community-based organizations to obtain data regarding existing assets and map it in GIS whenever possible. As of December 31, 2020, this data-gathering component of the project was 70 percent complete.
Mendocino County • Focused on developing project plans for broadband deployment in communities across the county that
are currently underserved or not served. • Engaged between consumers and service providers in communities of Covelo, Comptche, and
Gualala. Facilitated the community support of Mendocino County’s digital infrastructure project planning, resulted in more than 40 letters of support from the county’s leaders and organizations.
• Identified the county into three geographic project areas to deploy broadband infrastructure and services to provide broadband access to unserved households in several communities throughout the county. Completed project plans for the three project areas. These project areas include: Project 1 – Round Valley/Covelo/Dos Rios, Laytonville, Willits/Brooktrails, Hopland, and parts of Ukiah/Calpella/Redwood Valley; Project 2 – Piercy, Leggett, Branscomb, Westport, Cleone, Fort Bragg, Caspar, Mendocino, Little River, Albion, Elk, Manchester, Point Arena, Anchor Bay, Gualala, Comptche, Philo/Navarro, Boonville, and Yorkville (Whitethorn is being developed as a separate sub-project); and Project 3 – Redwood Valley, Potter Valley, Talmage, Calpella, Ukiah, and outlying areas in Projects 1 and 2.
• Assisted one CASF infrastructure grant application from Hunter Communications to deploy fiber-based “last mile” infrastructure to 3,943 unserved and non-served households and dozens of businesses and community anchor institutions. Worked on the development of two other CASF infrastructure grant applications that are ready for the next round submission.
Napa County • Completed the Napa County Network Infrastructure Assessment – Opportunity Analysis and Recommendation report,
focusing on the broadband infrastructure expansion to underserved/unserved areas and those areas particularly susceptible to service issues during emergencies or disaster recovery.
• Performed outreach to dozens of agencies in the county such as municipalities, schools, and emergency service providers.
• Identified nine specific broadband deployment opportunities on a wide a range of complexity and coverage.
Sonoma County • Worked on the creation of a broadband action plan. Held a series of meetings and discussions
with county stakeholders to better understand opportunities, including a publicly owned fiber network using county owned assets that would save the county millions of dollars in construction costs by utilizing these assets (e.g., empty conduit, fiber, and towers).
• Worked with the Sonoma County Information Systems Department and their GIS department to create an interactive mapping tool that can be utilized to assist internet service providers with deployment projects. The mapping layers include available assets, unserved areas, home and business locations, as well as other useful applications. The mapping tool is under development and will be publicly accessible and updated frequently with new publicly available data.
62
North Bay North Coast Broadband Consortium-Specific • Worked with the Chico GIS team on several maps and data analysis.
8. Northeastern California Connect Consortium and Upstate California Connect Consortium
Outcomes in Access and Adoption • Updated county priority areas based on the most current CPUC CA Broadband Mapping data. Held
consortium conference calls and meetings with local government partners across consortium regional counties, resulting in broadband policy approval by one county and three cities, and coordination information flow/dialogue with local elected officials and agencies.
• Established a relationship with the California Telehealth Resource Center (CTRC)and held a telehealth webinar for the region on June 24, 2020 to share results of the telehealth survey study. Completed outreach to rural healthcare facilities in three consortium counties to conduct the telehealth survey by phone and/or email. Completed analysis of survey results. Completed and published a final report/paper that describes all steps of this effort, results, and findings.
• Reviewed and generated an inventory of existing policies, ordinances, and general plans in all consortium counties to better assess potential needed updates and incorporating new polices, goals, and/or actions that can promote cost-effective broadband infrastructure expansion.
• Made efforts to develop Master Broadband Plans, incorporating: 1) current broadband landscape, 2) recommendations to expand broadband infrastructure in priority areas, 3) recommendations to develop and implement policies to promote broadband expansion, and 4) recommendations to increase broadband adoption. As a result, the plans for counties of Tehama, Glenn, and Lake were completed, with Lake County adopted its county-wide Master Broadband Plan in early 2020 and other plans are under review by county staff and supervisors for potential approval and implementation. Master Broadband Plans for counties of Siskiyou, Modoc, Lassen, Butte, and Colusa are work in progress.
• Developed a model to assess the direct impact of broadband (25/3 mbps) on median household income, poverty, educational attainment, and other indicators. Reached out and held conference calls with community colleges and K-12 education partners to identify projects and potential funding sources such as USDA Distance Learning and Telehealth.
• Provided supporting efforts with all 16 regional consortia, Caltrans, CETF, California Department of Technology, California Forward, and among other partners for the Regional Consortia Strategic Broadband Corridors to be included in the California Transportation Commission’s (CTC's) Comprehensive Multimodal Corridor Plan Guidelines.
• Created an online survey report to assess current levels of broadband service for community anchor institutions and business customers, interest in improved broadband service, and impact to business productivity and profitability in all regional counties.
• As a COVID-19 emergency response, collaborated and participated in meetings with statewide agencies to address potential solutions for computer and broadband connectivity needs in unserved rural areas. Posted low-income plans and other internet service resources in consortium website. Reached out to education partners in consortium region to make sure these resources will reach student families.
Outcomes in Deployment • Conducted ongoing research of best practices for broadband infrastructure permit processes, policy
adoptions, and technical specifications to reduce barriers for broadband deployments, and ongoing gathering of feedback from ISPs regarding barriers for deployments.
• Performed ongoing work with municipalities to generate a public asset inventory and to develop master lease agreements for these assets.
• Conducted a broadband feasibility study for the Town of Paradise to assist with development of technical designs, funding resources, and economic development opportunities during rebuild.
• Participated in developing CASF broadband infrastructure applications. Reached out to ISPs (i.e., incumbent, competitive, and new entrant) in three counties and provided detailed information on CASF infrastructure grant rules and application process along with relevant data/information, which
63
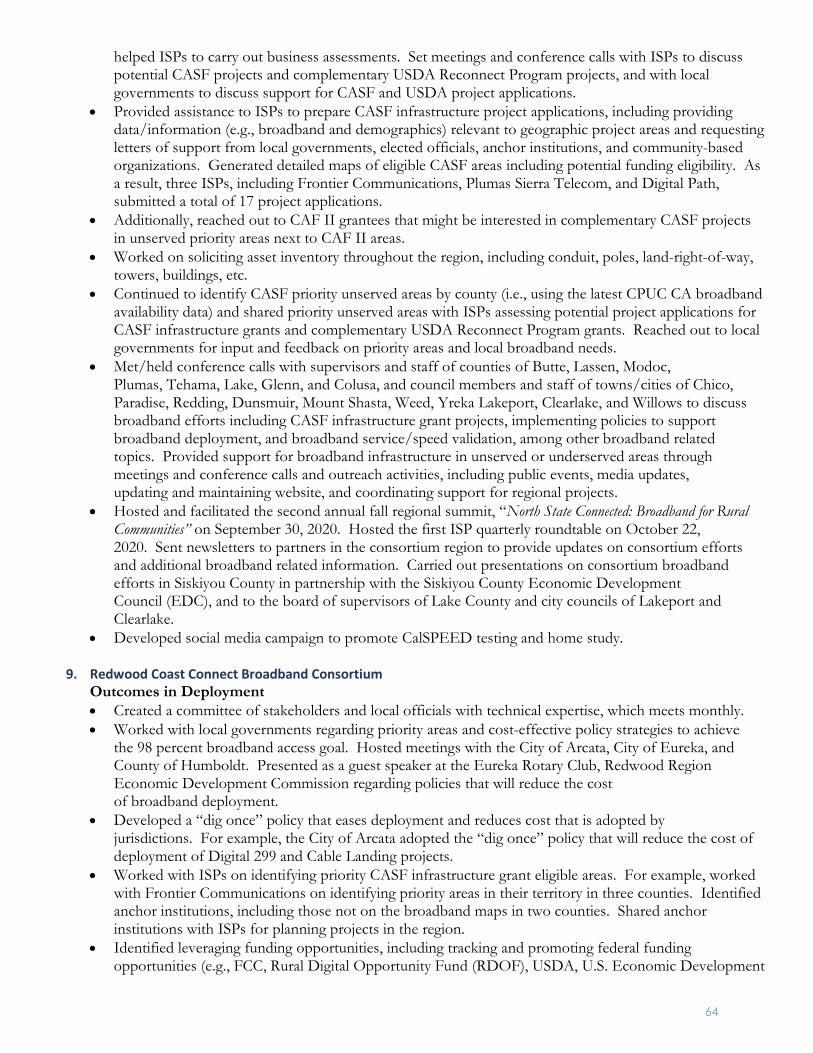
helped ISPs to carry out business assessments. Set meetings and conference calls with ISPs to discuss potential CASF projects and complementary USDA Reconnect Program projects, and with local governments to discuss support for CASF and USDA project applications.
• Provided assistance to ISPs to prepare CASF infrastructure project applications, including providing data/information (e.g., broadband and demographics) relevant to geographic project areas and requesting letters of support from local governments, elected officials, anchor institutions, and community-based organizations. Generated detailed maps of eligible CASF areas including potential funding eligibility. As a result, three ISPs, including Frontier Communications, Plumas Sierra Telecom, and Digital Path, submitted a total of 17 project applications.
• Additionally, reached out to CAF II grantees that might be interested in complementary CASF projects in unserved priority areas next to CAF II areas.
• Worked on soliciting asset inventory throughout the region, including conduit, poles, land-right-of-way, towers, buildings, etc.
• Continued to identify CASF priority unserved areas by county (i.e., using the latest CPUC CA broadband availability data) and shared priority unserved areas with ISPs assessing potential project applications for CASF infrastructure grants and complementary USDA Reconnect Program grants. Reached out to local governments for input and feedback on priority areas and local broadband needs.
• Met/held conference calls with supervisors and staff of counties of Butte, Lassen, Modoc, Plumas, Tehama, Lake, Glenn, and Colusa, and council members and staff of towns/cities of Chico, Paradise, Redding, Dunsmuir, Mount Shasta, Weed, Yreka Lakeport, Clearlake, and Willows to discuss broadband efforts including CASF infrastructure grant projects, implementing policies to support broadband deployment, and broadband service/speed validation, among other broadband related topics. Provided support for broadband infrastructure in unserved or underserved areas through meetings and conference calls and outreach activities, including public events, media updates, updating and maintaining website, and coordinating support for regional projects.
• Hosted and facilitated the second annual fall regional summit, “North State Connected: Broadband for Rural Communities” on September 30, 2020. Hosted the first ISP quarterly roundtable on October 22, 2020. Sent newsletters to partners in the consortium region to provide updates on consortium efforts and additional broadband related information. Carried out presentations on consortium broadband efforts in Siskiyou County in partnership with the Siskiyou County Economic Development Council (EDC), and to the board of supervisors of Lake County and city councils of Lakeport and Clearlake.
• Developed social media campaign to promote CalSPEED testing and home study.
9. Redwood Coast Connect Broadband Consortium Outcomes in Deployment • Created a committee of stakeholders and local officials with technical expertise, which meets monthly. • Worked with local governments regarding priority areas and cost-effective policy strategies to achieve
the 98 percent broadband access goal. Hosted meetings with the City of Arcata, City of Eureka, and County of Humboldt. Presented as a guest speaker at the Eureka Rotary Club, Redwood Region Economic Development Commission regarding policies that will reduce the cost of broadband deployment.
• Developed a “dig once” policy that eases deployment and reduces cost that is adopted by jurisdictions. For example, the City of Arcata adopted the “dig once” policy that will reduce the cost of deployment of Digital 299 and Cable Landing projects.
• Worked with ISPs on identifying priority CASF infrastructure grant eligible areas. For example, worked with Frontier Communications on identifying priority areas in their territory in three counties. Identified anchor institutions, including those not on the broadband maps in two counties. Shared anchor institutions with ISPs for planning projects in the region.
• Identified leveraging funding opportunities, including tracking and promoting federal funding opportunities (e.g., FCC, Rural Digital Opportunity Fund (RDOF), USDA, U.S. Economic Development
64
Administration (EDA), FCC Health). Shared federal funding opportunities with ISPs, health care, tribal, and local government.
• Identified four CASF infrastructure application projects in three counties for the May 4t, 2020 CASF infrastructure grant application cycle. Promoted CASF infrastructure grant funding and worked with ISPs on the applications. Assisted in getting ten letters of support for the applications. Assisted in getting applications submitted by Frontier Communications for Smith River, Crescent City, Mad River, and Garberville. Assisted the ISP in addressing equity in low-income communities throughout the region for the applications. All of these applications would provide broadband to low-income communities and therefore are qualified for additional funding.
• Supported project permitting activities for Digital 299 project (i.e., currently funded with a CASF grant Resolution T-17548). Supported project activities for Klamath River Rural Broadband Initiative (KRRBI) (i.e., currently funded with a CASF grant Resolution T-17418 but seeking more funding). Gathered support for KRRBI's additional funding needs and provided permitting support as needed.
65
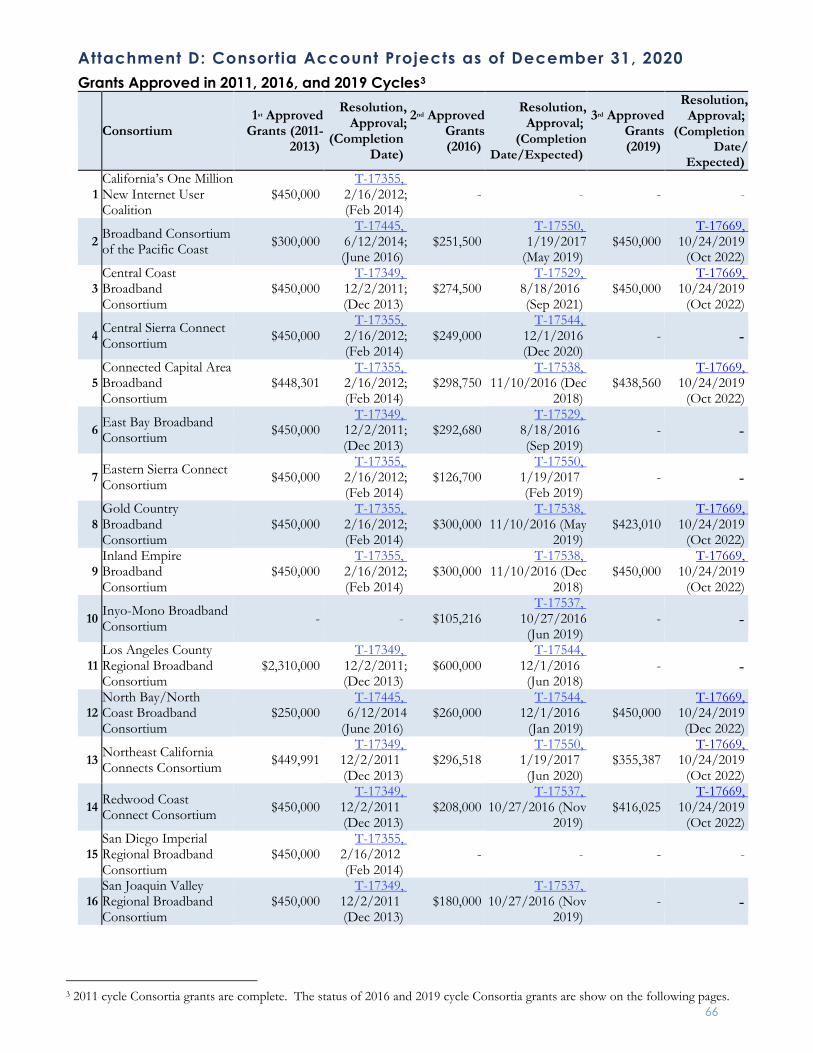
Attachment D: Consortia Account Projects as of December 31, 2020 Grants Approved in 2011, 2016, and 2019 Cycles3
Consortium 1st Approved
Grants (2011-2013)
Resolution, Approval;
(Completion Date)
2nd Approved Grants (2016)
Resolution, Approval;
(Completion Date/Expected)
3rd Approved Grants (2019)
Resolution, Approval;
(Completion Date/
Expected)
1 California’s One Million New Internet User Coalition
$450,000 T-17355,
2/16/2012; (Feb 2014)
- - - -
2 Broadband Consortium of the Pacific Coast $300,000
T-17445, 6/12/2014; (June 2016)
$251,500 T-17550,
1/19/2017 (May 2019)
$450,000 T-17669,
10/24/2019 (Oct 2022)
3 Central Coast Broadband Consortium
$450,000 T-17349,
12/2/2011; (Dec 2013)
$274,500 T-17529,
8/18/2016 (Sep 2021)
$450,000 T-17669,
10/24/2019 (Oct 2022)
4 Central Sierra Connect Consortium $450,000
T-17355, 2/16/2012; (Feb 2014)
$249,000 T-17544,
12/1/2016 (Dec 2020)
- -
5 Connected Capital Area Broadband Consortium
$448,301 T-17355,
2/16/2012; (Feb 2014)
$298,750 T-17538,
11/10/2016 (Dec 2018)
$438,560 T-17669,
10/24/2019 (Oct 2022)
6 East Bay Broadband Consortium $450,000
T-17349, 12/2/2011;
(Dec 2013) $292,680
T-17529, 8/18/2016 (Sep 2019)
- -
7 Eastern Sierra Connect Consortium $450,000
T-17355, 2/16/2012; (Feb 2014)
$126,700 T-17550,
1/19/2017 (Feb 2019)
- -
8 Gold Country Broadband Consortium
$450,000 T-17355,
2/16/2012; (Feb 2014)
$300,000 T-17538,
11/10/2016 (May 2019)
$423,010 T-17669,
10/24/2019 (Oct 2022)
9 Inland Empire Broadband Consortium
$450,000 T-17355,
2/16/2012; (Feb 2014)
$300,000 T-17538,
11/10/2016 (Dec 2018)
$450,000 T-17669,
10/24/2019 (Oct 2022)
10 Inyo-Mono Broadband Consortium - - $105,216
T-17537, 10/27/2016 (Jun 2019)
- -
11 Los Angeles County Regional Broadband Consortium
$2,310,000 T-17349,
12/2/2011; (Dec 2013)
$600,000 T-17544,
12/1/2016 (Jun 2018)
- -
12 North Bay/North Coast Broadband Consortium
$250,000 T-17445,
6/12/2014 (June 2016)
$260,000 T-17544,
12/1/2016 (Jan 2019)
$450,000 T-17669,
10/24/2019 (Dec 2022)
13 Northeast California Connects Consortium $449,991
T-17349, 12/2/2011 (Dec 2013)
$296,518 T-17550,
1/19/2017 (Jun 2020)
$355,387 T-17669,
10/24/2019 (Oct 2022)
14 Redwood Coast Connect Consortium $450,000
T-17349, 12/2/2011 (Dec 2013)
$208,000 T-17537,
10/27/2016 (Nov 2019)
$416,025 T-17669,
10/24/2019 (Oct 2022)
15 San Diego Imperial Regional Broadband Consortium
$450,000 T-17355,
2/16/2012 (Feb 2014)
- - - -
16 San Joaquin Valley Regional Broadband Consortium
$450,000 T-17349,
12/2/2011 (Dec 2013)
$180,000 T-17537,
10/27/2016 (Nov 2019)
- -
3 2011 cycle Consortia grants are complete. The status of 2016 and 2019 cycle Consortia grants are show on the following pages.
66
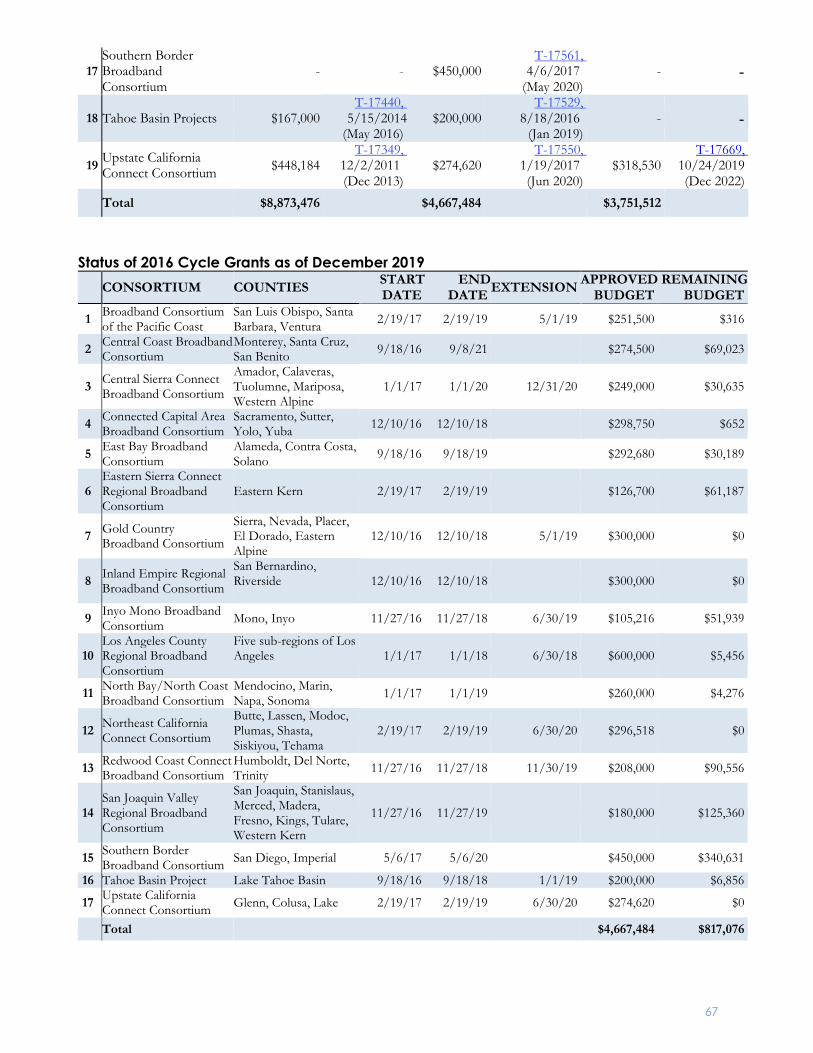
17 Southern Border Broadband Consortium
- - $450,000 T-17561,
4/6/2017 (May 2020)
- -
18 Tahoe Basin Projects $167,000 T-17440,
5/15/2014 (May 2016)
$200,000 T-17529,
8/18/2016 (Jan 2019)
- -
19 Upstate California Connect Consortium $448,184
T-17349, 12/2/2011 (Dec 2013)
$274,620 T-17550,
1/19/2017 (Jun 2020)
$318,530 T-17669,
10/24/2019 (Dec 2022)
Total $8,873,476 $4,667,484 $3,751,512
Status of 2016 Cycle Grants as of December 2019 CONSORTIUM COUNTIES START
DATE END
DATE EXTENSION APPROVED BUDGET
REMAINING BUDGET
1 Broadband Consortium of the Pacific Coast
San Luis Obispo, Santa Barbara, Ventura 2/19/17 2/19/19 5/1/19 $251,500 $316
2 Central Coast Broadband Consortium
Monterey, Santa Cruz, San Benito 9/18/16 9/8/21 $274,500 $69,023
3 Central Sierra Connect Broadband Consortium
Amador, Calaveras, Tuolumne, Mariposa, Western Alpine
1/1/17 1/1/20 12/31/20 $249,000 $30,635
4 Connected Capital Area Broadband Consortium
Sacramento, Sutter, Yolo, Yuba 12/10/16 12/10/18 $298,750 $652
5 East Bay Broadband Consortium
Alameda, Contra Costa, Solano 9/18/16 9/18/19 $292,680 $30,189
6 Eastern Sierra Connect Regional Broadband Consortium
Eastern Kern 2/19/17 2/19/19 $126,700 $61,187
7 Gold Country Broadband Consortium
Sierra, Nevada, Placer, El Dorado, Eastern Alpine
12/10/16 12/10/18 5/1/19 $300,000 $0
8 Inland Empire Regional Broadband Consortium
San Bernardino, Riverside
12/10/16 12/10/18 $300,000 $0
9 Inyo Mono Broadband Consortium Mono, Inyo 11/27/16 11/27/18 6/30/19 $105,216 $51,939
10 Los Angeles County Regional Broadband Consortium
Five sub-regions of Los Angeles
1/1/17 1/1/18 6/30/18 $600,000 $5,456
11 North Bay/North Coast Broadband Consortium
Mendocino, Marin, Napa, Sonoma 1/1/17 1/1/19 $260,000 $4,276
12 Northeast California Connect Consortium
Butte, Lassen, Modoc, Plumas, Shasta, Siskiyou, Tehama
2/19/17 2/19/19 6/30/20 $296,518 $0
13 Redwood Coast Connect Broadband Consortium
Humboldt, Del Norte, Trinity 11/27/16 11/27/18 11/30/19 $208,000 $90,556
14 San Joaquin Valley Regional Broadband Consortium
San Joaquin, Stanislaus, Merced, Madera, Fresno, Kings, Tulare, Western Kern
11/27/16 11/27/19 $180,000 $125,360
15 Southern Border Broadband Consortium San Diego, Imperial 5/6/17 5/6/20 $450,000 $340,631
16 Tahoe Basin Project Lake Tahoe Basin 9/18/16 9/18/18 1/1/19 $200,000 $6,856 17 Upstate California
Connect Consortium Glenn, Colusa, Lake 2/19/17 2/19/19 6/30/20 $274,620 $0
Total $4,667,484 $817,076
67
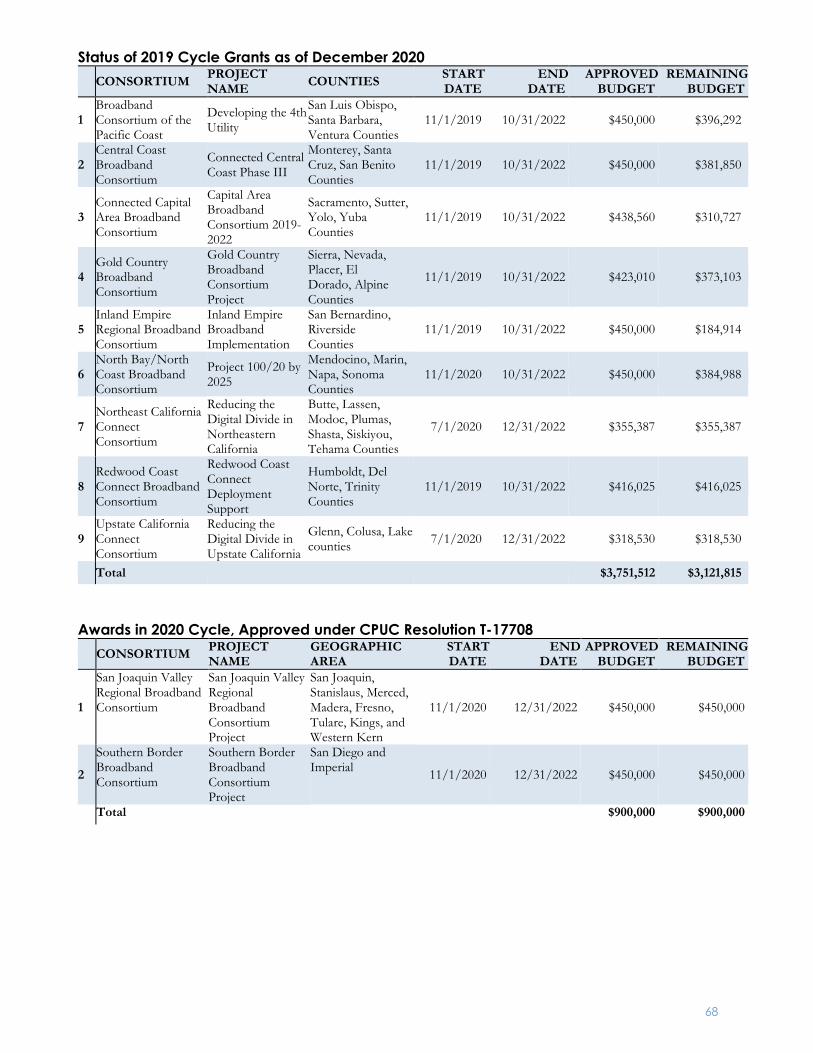
Status of 2019 Cycle Grants as of December 2020 CONSORTIUM PROJECT
NAME COUNTIES START DATE
END DATE
APPROVED BUDGET
REMAINING BUDGET
1 Broadband Consortium of the Pacific Coast
Developing the 4th Utility
San Luis Obispo, Santa Barbara, Ventura Counties
11/1/2019 10/31/2022 $450,000 $396,292
2 Central Coast Broadband Consortium
Connected Central Coast Phase III
Monterey, Santa Cruz, San Benito Counties
11/1/2019 10/31/2022 $450,000 $381,850
3 Connected Capital Area Broadband Consortium
Capital Area Broadband Consortium 2019-2022
Sacramento, Sutter, Yolo, Yuba Counties
11/1/2019 10/31/2022 $438,560 $310,727
4 Gold Country Broadband Consortium
Gold Country Broadband Consortium Project
Sierra, Nevada, Placer, El Dorado, Alpine Counties
11/1/2019 10/31/2022 $423,010 $373,103
5 Inland Empire Regional Broadband Consortium
Inland Empire Broadband Implementation
San Bernardino, Riverside Counties
11/1/2019 10/31/2022 $450,000 $184,914
6 North Bay/North Coast Broadband Consortium
Project 100/20 by 2025
Mendocino, Marin, Napa, Sonoma Counties
11/1/2020 10/31/2022 $450,000 $384,988
7 Northeast California Connect Consortium
Reducing the Digital Divide in Northeastern California
Butte, Lassen, Modoc, Plumas, Shasta, Siskiyou, Tehama Counties
7/1/2020 12/31/2022 $355,387 $355,387
8 Redwood Coast Connect Broadband Consortium
Redwood Coast Connect Deployment Support
Humboldt, Del Norte, Trinity Counties
11/1/2019 10/31/2022 $416,025 $416,025
9 Upstate California Connect Consortium
Reducing the Digital Divide in Upstate California
Glenn, Colusa, Lake counties 7/1/2020 12/31/2022 $318,530 $318,530
Total $3,751,512 $3,121,815
Awards in 2020 Cycle, Approved under CPUC Resolution T-17708 CONSORTIUM PROJECT
NAME GEOGRAPHIC AREA
START DATE
END DATE
APPROVED BUDGET
REMAINING BUDGET
1
San Joaquin Valley Regional Broadband Consortium
San Joaquin Valley Regional Broadband Consortium Project
San Joaquin, Stanislaus, Merced, Madera, Fresno, Tulare, Kings, and Western Kern
11/1/2020 12/31/2022 $450,000 $450,000
2 Southern Border Broadband Consortium
Southern Border Broadband Consortium Project
San Diego and Imperial 11/1/2020 12/31/2022 $450,000 $450,000
Total $900,000 $900,000
68
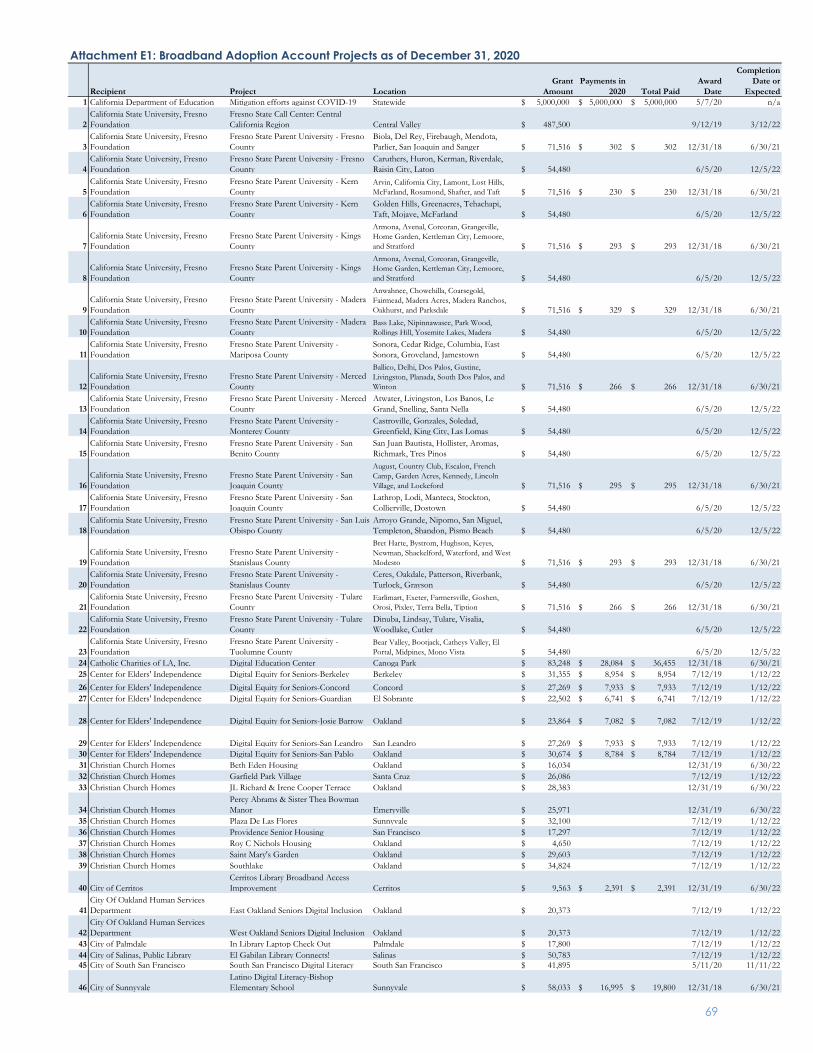
Recipient Project Location Grant
Amount Payments in
2020 Total Paid Award
Date
Completion Date or
Expected1 California Department of Education Mitigation efforts against COVID-19 Statewide $ 5,000,000 $ 5,000,000 $ 5,000,000 5/7/20 n/a
2California State University, Fresno Foundation
Fresno State Call Center: Central California Region Central Valley $ 487,500 9/12/19 3/12/22
3California State University, Fresno Foundation
Fresno State Parent University - Fresno County
Biola, Del Rey, Firebaugh, Mendota, Parlier, San Joaquin and Sanger $ 71,516 $ 302 $ 302 12/31/18 6/30/21
4California State University, Fresno Foundation
Fresno State Parent University - Fresno County
Caruthers, Huron, Kerman, Riverdale, Raisin City, Laton $ 54,480 6/5/20 12/5/22
5California State University, Fresno Foundation
Fresno State Parent University - Kern County
Arvin, California City, Lamont, Lost Hills, McFarland, Rosamond, Shafter, and Taft $ 71,516 $ 230 $ 230 12/31/18 6/30/21
6California State University, Fresno Foundation
Fresno State Parent University - Kern County
Golden Hills, Greenacres, Tehachapi, Taft, Mojave, McFarland $ 54,480 6/5/20 12/5/22
7California State University, Fresno Foundation
Fresno State Parent University - Kings County
Armona, Avenal, Corcoran, Grangeville, Home Garden, Kettleman City, Lemoore, and Stratford $ 71,516 $ 293 $ 293 12/31/18 6/30/21
8California State University, Fresno Foundation
Fresno State Parent University - Kings County
Armona, Avenal, Corcoran, Grangeville, Home Garden, Kettleman City, Lemoore, and Stratford $ 54,480 6/5/20 12/5/22
9California State University, Fresno Foundation
Fresno State Parent University - Madera County
Anwahnee, Chowchilla, Coarsegold, Fairmead, Madera Acres, Madera Ranchos, Oakhurst, and Parksdale $ 71,516 $ 329 $ 329 12/31/18 6/30/21
10California State University, Fresno Foundation
Fresno State Parent University - Madera County
Bass Lake, Nipinnawasee, Park Wood, Rollings Hill, Yosemite Lakes, Madera $ 54,480 6/5/20 12/5/22
11California State University, Fresno Foundation
Fresno State Parent University - Mariposa County
Sonora, Cedar Ridge, Columbia, East Sonora, Groveland, Jamestown $ 54,480 6/5/20 12/5/22
12California State University, Fresno Foundation
Fresno State Parent University - Merced County
Ballico, Delhi, Dos Palos, Gustine, Livingston, Planada, South Dos Palos, and Winton $ 71,516 $ 266 $ 266 12/31/18 6/30/21
13California State University, Fresno Foundation
Fresno State Parent University - Merced County
Atwater, Livingston, Los Banos, Le Grand, Snelling, Santa Nella $ 54,480 6/5/20 12/5/22
14California State University, Fresno Foundation
Fresno State Parent University - Monterey County
Castroville, Gonzales, Soledad, Greenfield, King City, Las Lomas $ 54,480 6/5/20 12/5/22
15California State University, Fresno Foundation
Fresno State Parent University - San Benito County
San Juan Bautista, Hollister, Aromas, Richmark, Tres Pinos $ 54,480 6/5/20 12/5/22
16California State University, Fresno Foundation
Fresno State Parent University - San Joaquin County
August, Country Club, Escalon, French Camp, Garden Acres, Kennedy, Lincoln Village, and Lockeford $ 71,516 $ 295 $ 295 12/31/18 6/30/21
17California State University, Fresno Foundation
Fresno State Parent University - San Joaquin County
Lathrop, Lodi, Manteca, Stockton, Collierville, Dostown $ 54,480 6/5/20 12/5/22
18California State University, Fresno Foundation
Fresno State Parent University - San Luis Obispo County
Arroyo Grande, Nipomo, San Miguel, Templeton, Shandon, Pismo Beach $ 54,480 6/5/20 12/5/22
19California State University, Fresno Foundation
Fresno State Parent University - Stanislaus County
Bret Harte, Bystrom, Hughson, Keyes, Newman, Shackelford, Waterford, and West Modesto $ 71,516 $ 293 $ 293 12/31/18 6/30/21
20California State University, Fresno Foundation
Fresno State Parent University - Stanislaus County
Ceres, Oakdale, Patterson, Riverbank, Turlock, Grayson $ 54,480 6/5/20 12/5/22
21California State University, Fresno Foundation
Fresno State Parent University - Tulare County
Earlimart, Exeter, Farmersville, Goshen, Orosi, Pixley, Terra Bella, Tiption $ 71,516 $ 266 $ 266 12/31/18 6/30/21
22California State University, Fresno Foundation
Fresno State Parent University - Tulare County
Dinuba, Lindsay, Tulare, Visalia, Woodlake, Cutler $ 54,480 6/5/20 12/5/22
23California State University, Fresno Foundation
Fresno State Parent University - Tuolumne County
Bear Valley, Bootjack, Catheys Valley, El Portal, Midpines, Mono Vista $ 54,480 6/5/20 12/5/22
24 Catholic Charities of LA, Inc. Digital Education Center Canoga Park $ 83,248 $ 28,084 $ 36,455 12/31/18 6/30/2125 Center for Elders' Independence Digital Equity for Seniors-Berkeley Berkeley $ 31,355 $ 8,954 $ 8,954 7/12/19 1/12/2226 Center for Elders' Independence Digital Equity for Seniors-Concord Concord $ 27,269 $ 7,933 $ 7,933 7/12/19 1/12/2227 Center for Elders' Independence Digital Equity for Seniors-Guardian El Sobrante $ 22,502 $ 6,741 $ 6,741 7/12/19 1/12/22
28 Center for Elders' Independence Digital Equity for Seniors-Josie Barrow Oakland $ 23,864 $ 7,082 $ 7,082 7/12/19 1/12/22
29 Center for Elders' Independence Digital Equity for Seniors-San Leandro San Leandro $ 27,269 $ 7,933 $ 7,933 7/12/19 1/12/2230 Center for Elders' Independence Digital Equity for Seniors-San Pablo Oakland $ 30,674 $ 8,784 $ 8,784 7/12/19 1/12/2231 Christian Church Homes Beth Eden Housing Oakland $ 16,034 12/31/19 6/30/2232 Christian Church Homes Garfield Park Village Santa Cruz $ 26,086 7/12/19 1/12/2233 Christian Church Homes JL Richard & Irene Cooper Terrace Oakland $ 28,383 12/31/19 6/30/22
34 Christian Church HomesPercy Abrams & Sister Thea Bowman Manor Emeryville $ 25,971 12/31/19 6/30/22
35 Christian Church Homes Plaza De Las Flores Sunnyvale $ 32,100 7/12/19 1/12/2236 Christian Church Homes Providence Senior Housing San Francisco $ 17,297 7/12/19 1/12/2237 Christian Church Homes Roy C Nichols Housing Oakland $ 4,650 7/12/19 1/12/2238 Christian Church Homes Saint Mary's Garden Oakland $ 29,603 7/12/19 1/12/2239 Christian Church Homes Southlake Oakland $ 34,824 7/12/19 1/12/22
40 City of CerritosCerritos Library Broadband Access Improvement Cerritos $ 9,563 $ 2,391 $ 2,391 12/31/19 6/30/22
41City Of Oakland Human Services Department East Oakland Seniors Digital Inclusion Oakland $ 20,373 7/12/19 1/12/22
42City Of Oakland Human Services Department West Oakland Seniors Digital Inclusion Oakland $ 20,373 7/12/19 1/12/22
43 City of Palmdale In Library Laptop Check Out Palmdale $ 17,800 7/12/19 1/12/2244 City of Salinas, Public Library El Gabilan Library Connects! Salinas $ 50,783 7/12/19 1/12/2245 City of South San Francisco South San Francisco Digital Literacy South San Francisco $ 41,895 5/11/20 11/11/22
46 City of SunnyvaleLatino Digital Literacy-Bishop Elementary School Sunnyvale $ 58,033 $ 16,995 $ 19,800 12/31/18 6/30/21
Attachment E1: Broadband Adoption Account Projects as of December 31, 2020
69
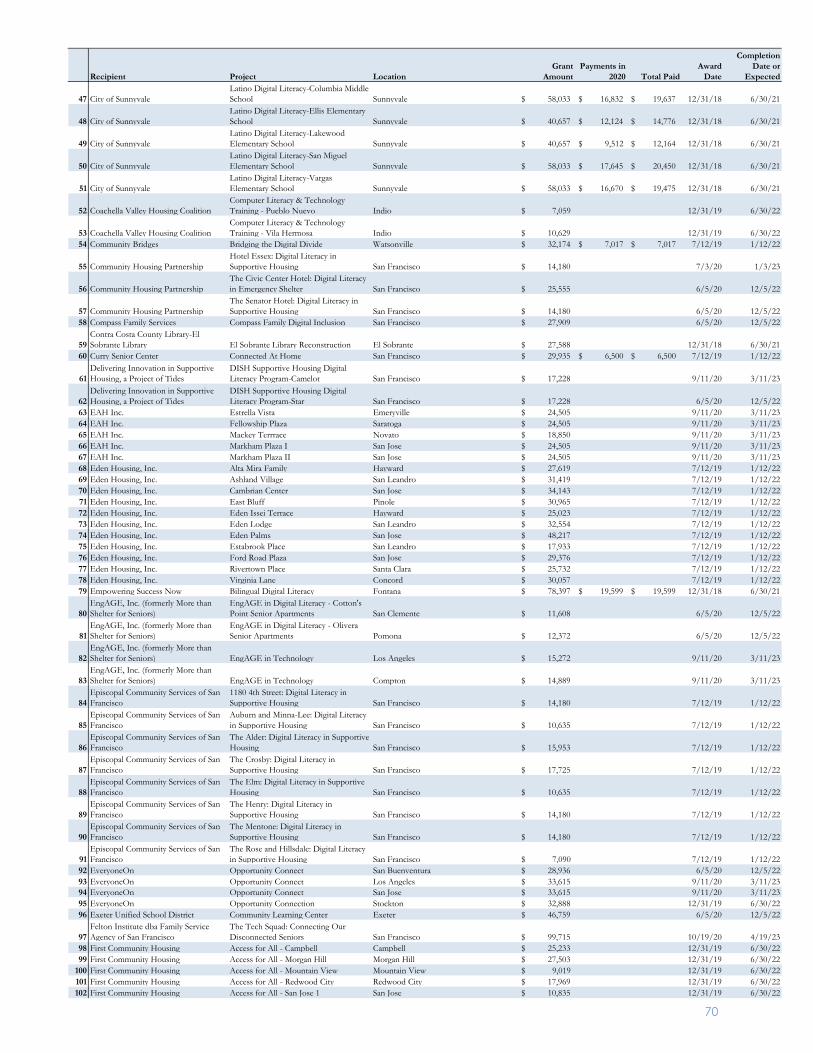
Recipient Project Location Grant
Amount Payments in
2020 Total Paid Award
Date
Completion Date or
Expected
47 City of SunnyvaleLatino Digital Literacy-Columbia Middle School Sunnyvale $ 58,033 $ 16,832 $ 19,637 12/31/18 6/30/21
48 City of SunnyvaleLatino Digital Literacy-Ellis Elementary School Sunnyvale $ 40,657 $ 12,124 $ 14,776 12/31/18 6/30/21
49 City of SunnyvaleLatino Digital Literacy-Lakewood Elementary School Sunnyvale $ 40,657 $ 9,512 $ 12,164 12/31/18 6/30/21
50 City of SunnyvaleLatino Digital Literacy-San Miguel Elementary School Sunnyvale $ 58,033 $ 17,645 $ 20,450 12/31/18 6/30/21
51 City of SunnyvaleLatino Digital Literacy-Vargas Elementary School Sunnyvale $ 58,033 $ 16,670 $ 19,475 12/31/18 6/30/21
52 Coachella Valley Housing CoalitionComputer Literacy & Technology Training - Pueblo Nuevo Indio $ 7,059 12/31/19 6/30/22
53 Coachella Valley Housing CoalitionComputer Literacy & Technology Training - Vila Hermosa Indio $ 10,629 12/31/19 6/30/22
54 Community Bridges Bridging the Digital Divide Watsonville $ 32,174 $ 7,017 $ 7,017 7/12/19 1/12/22
55 Community Housing PartnershipHotel Essex: Digital Literacy in Supportive Housing San Francisco $ 14,180 7/3/20 1/3/23
56 Community Housing PartnershipThe Civic Center Hotel: Digital Literacy in Emergency Shelter San Francisco $ 25,555 6/5/20 12/5/22
57 Community Housing PartnershipThe Senator Hotel: Digital Literacy in Supportive Housing San Francisco $ 14,180 6/5/20 12/5/22
58 Compass Family Services Compass Family Digital Inclusion San Francisco $ 27,909 6/5/20 12/5/22
59Contra Costa County Library-El Sobrante Library El Sobrante Library Reconstruction El Sobrante $ 27,588 12/31/18 6/30/21
60 Curry Senior Center Connected At Home San Francisco $ 29,935 $ 6,500 $ 6,500 7/12/19 1/12/22
61Delivering Innovation in Supportive Housing, a Project of Tides
DISH Supportive Housing Digital Literacy Program-Camelot San Francisco $ 17,228 9/11/20 3/11/23
62Delivering Innovation in Supportive Housing, a Project of Tides
DISH Supportive Housing Digital Literacy Program-Star San Francisco $ 17,228 6/5/20 12/5/22
63 EAH Inc. Estrella Vista Emeryville $ 24,505 9/11/20 3/11/2364 EAH Inc. Fellowship Plaza Saratoga $ 24,505 9/11/20 3/11/2365 EAH Inc. Mackey Terrrace Novato $ 18,850 9/11/20 3/11/2366 EAH Inc. Markham Plaza I San Jose $ 24,505 9/11/20 3/11/2367 EAH Inc. Markham Plaza II San Jose $ 24,505 9/11/20 3/11/2368 Eden Housing, Inc. Alta Mira Family Hayward $ 27,619 7/12/19 1/12/2269 Eden Housing, Inc. Ashland Village San Leandro $ 31,419 7/12/19 1/12/2270 Eden Housing, Inc. Cambrian Center San Jose $ 34,143 7/12/19 1/12/2271 Eden Housing, Inc. East Bluff Pinole $ 30,965 7/12/19 1/12/2272 Eden Housing, Inc. Eden Issei Terrace Hayward $ 25,023 7/12/19 1/12/2273 Eden Housing, Inc. Eden Lodge San Leandro $ 32,554 7/12/19 1/12/2274 Eden Housing, Inc. Eden Palms San Jose $ 48,217 7/12/19 1/12/2275 Eden Housing, Inc. Estabrook Place San Leandro $ 17,933 7/12/19 1/12/2276 Eden Housing, Inc. Ford Road Plaza San Jose $ 29,376 7/12/19 1/12/2277 Eden Housing, Inc. Rivertown Place Santa Clara $ 25,732 7/12/19 1/12/2278 Eden Housing, Inc. Virginia Lane Concord $ 30,057 7/12/19 1/12/2279 Empowering Success Now Bilingual Digital Literacy Fontana $ 78,397 $ 19,599 $ 19,599 12/31/18 6/30/21
80EngAGE, Inc. (formerly More than Shelter for Seniors)
EngAGE in Digital Literacy - Cotton's Point Senior Apartments San Clemente $ 11,608 6/5/20 12/5/22
81EngAGE, Inc. (formerly More than Shelter for Seniors)
EngAGE in Digital Literacy - Olivera Senior Apartments Pomona $ 12,372 6/5/20 12/5/22
82EngAGE, Inc. (formerly More than Shelter for Seniors) EngAGE in Technology Los Angeles $ 15,272 9/11/20 3/11/23
83EngAGE, Inc. (formerly More than Shelter for Seniors) EngAGE in Technology Compton $ 14,889 9/11/20 3/11/23
84Episcopal Community Services of San Francisco
1180 4th Street: Digital Literacy in Supportive Housing San Francisco $ 14,180 7/12/19 1/12/22
85Episcopal Community Services of San Francisco
Auburn and Minna-Lee: Digital Literacy in Supportive Housing San Francisco $ 10,635 7/12/19 1/12/22
86Episcopal Community Services of San Francisco
The Alder: Digital Literacy in Supportive Housing San Francisco $ 15,953 7/12/19 1/12/22
87Episcopal Community Services of San Francisco
The Crosby: Digital Literacy in Supportive Housing San Francisco $ 17,725 7/12/19 1/12/22
88Episcopal Community Services of San Francisco
The Elm: Digital Literacy in Supportive Housing San Francisco $ 10,635 7/12/19 1/12/22
89Episcopal Community Services of San Francisco
The Henry: Digital Literacy in Supportive Housing San Francisco $ 14,180 7/12/19 1/12/22
90Episcopal Community Services of San Francisco
The Mentone: Digital Literacy in Supportive Housing San Francisco $ 14,180 7/12/19 1/12/22
91Episcopal Community Services of San Francisco
The Rose and Hillsdale: Digital Literacy in Supportive Housing San Francisco $ 7,090 7/12/19 1/12/22
92 EveryoneOn Opportunity Connect San Buenventura $ 28,936 6/5/20 12/5/2293 EveryoneOn Opportunity Connect Los Angeles $ 33,615 9/11/20 3/11/2394 EveryoneOn Opportunity Connect San Jose $ 33,615 9/11/20 3/11/2395 EveryoneOn Opportunity Connection Stockton $ 32,888 12/31/19 6/30/2296 Exeter Unified School District Community Learning Center Exeter $ 46,759 6/5/20 12/5/22
97Felton Institute dba Family Service Agency of San Francisco
The Tech Squad: Connecting Our Disconnected Seniors San Francisco $ 99,715 10/19/20 4/19/23
98 First Community Housing Access for All - Campbell Campbell $ 25,233 12/31/19 6/30/2299 First Community Housing Access for All - Morgan Hill Morgan Hill $ 27,503 12/31/19 6/30/22
100 First Community Housing Access for All - Mountain View Mountain View $ 9,019 12/31/19 6/30/22101 First Community Housing Access for All - Redwood City Redwood City $ 17,969 12/31/19 6/30/22102 First Community Housing Access for All - San Jose 1 San Jose $ 10,835 12/31/19 6/30/22
70
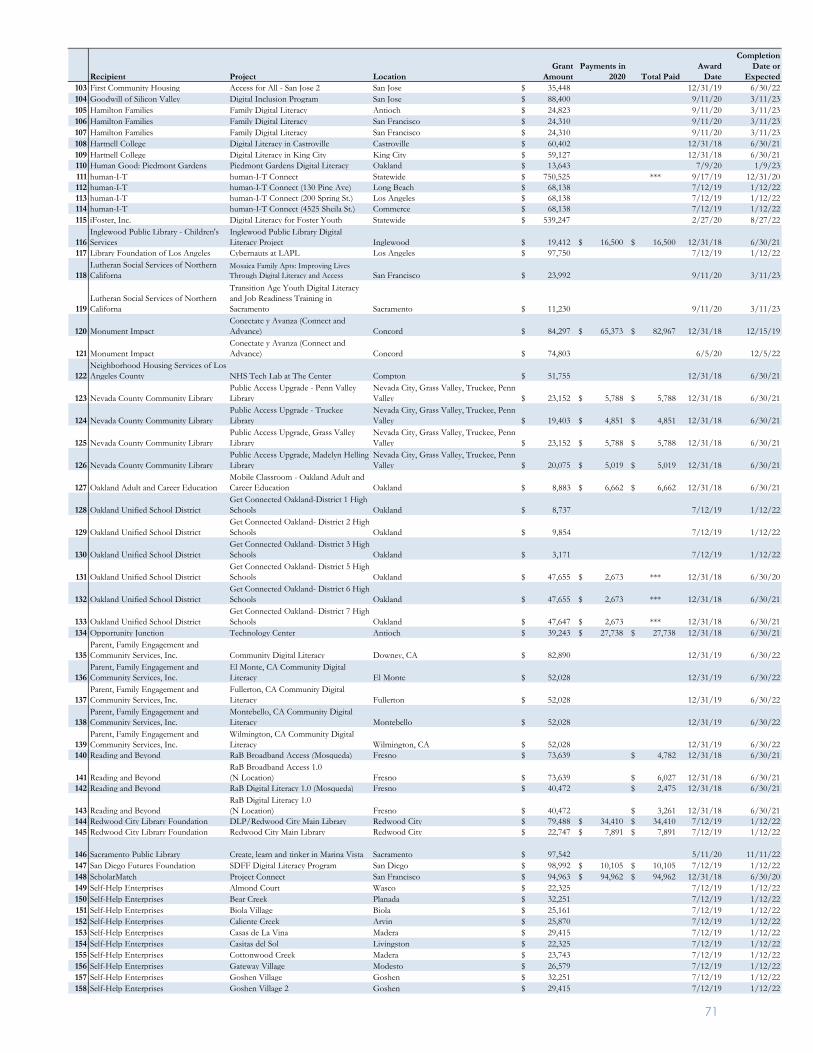
Recipient Project Location Grant
Amount Payments in
2020 Total Paid Award
Date
Completion Date or
Expected103 First Community Housing Access for All - San Jose 2 San Jose $ 35,448 12/31/19 6/30/22104 Goodwill of Silicon Valley Digital Inclusion Program San Jose $ 88,400 9/11/20 3/11/23105 Hamilton Families Family Digital Literacy Antioch $ 24,823 9/11/20 3/11/23106 Hamilton Families Family Digital Literacy San Francisco $ 24,310 9/11/20 3/11/23107 Hamilton Families Family Digital Literacy San Francisco $ 24,310 9/11/20 3/11/23108 Hartnell College Digital Literacy in Castroville Castroville $ 60,402 12/31/18 6/30/21109 Hartnell College Digital Literacy in King City King City $ 59,127 12/31/18 6/30/21110 Human Good: Piedmont Gardens Piedmont Gardens Digital Literacy Oakland $ 13,643 7/9/20 1/9/23111 human-I-T human-I-T Connect Statewide $ 750,525 *** 9/17/19 12/31/20112 human-I-T human-I-T Connect (130 Pine Ave) Long Beach $ 68,138 7/12/19 1/12/22113 human-I-T human-I-T Connect (200 Spring St.) Los Angeles $ 68,138 7/12/19 1/12/22114 human-I-T human-I-T Connect (4525 Sheila St.) Commerce $ 68,138 7/12/19 1/12/22115 iFoster, Inc. Digital Literacy for Foster Youth Statewide $ 539,247 2/27/20 8/27/22
116Inglewood Public Library - Children's Services
Inglewood Public Library Digital Literacy Project Inglewood $ 19,412 $ 16,500 $ 16,500 12/31/18 6/30/21
117 Library Foundation of Los Angeles Cybernauts at LAPL Los Angeles $ 97,750 7/12/19 1/12/22
118Lutheran Social Services of Northern Californa
Mosaica Family Apts: Improving Lives Through Digital Literacy and Access San Francisco $ 23,992 9/11/20 3/11/23
119Lutheran Social Services of Northern Californa
Transition Age Youth Digital Literacy and Job Readiness Training in Sacramento Sacramento $ 11,230 9/11/20 3/11/23
120 Monument ImpactConectate y Avanza (Connect and Advance) Concord $ 84,297 $ 65,373 $ 82,967 12/31/18 12/15/19
121 Monument ImpactConectate y Avanza (Connect and Advance) Concord $ 74,803 6/5/20 12/5/22
122Neighborhood Housing Services of Los Angeles County NHS Tech Lab at The Center Compton $ 51,755 12/31/18 6/30/21
123 Nevada County Community LibraryPublic Access Upgrade - Penn Valley Library
Nevada City, Grass Valley, Truckee, Penn Valley $ 23,152 $ 5,788 $ 5,788 12/31/18 6/30/21
124 Nevada County Community LibraryPublic Access Upgrade - Truckee Library
Nevada City, Grass Valley, Truckee, Penn Valley $ 19,403 $ 4,851 $ 4,851 12/31/18 6/30/21
125 Nevada County Community LibraryPublic Access Upgrade, Grass Valley Library
Nevada City, Grass Valley, Truckee, Penn Valley $ 23,152 $ 5,788 $ 5,788 12/31/18 6/30/21
126 Nevada County Community LibraryPublic Access Upgrade, Madelyn Helling Library
Nevada City, Grass Valley, Truckee, Penn Valley $ 20,075 $ 5,019 $ 5,019 12/31/18 6/30/21
127 Oakland Adult and Career EducationMobile Classroom - Oakland Adult and Career Education Oakland $ 8,883 $ 6,662 $ 6,662 12/31/18 6/30/21
128 Oakland Unified School DistrictGet Connected Oakland-District 1 High Schools Oakland $ 8,737 7/12/19 1/12/22
129 Oakland Unified School DistrictGet Connected Oakland- District 2 High Schools Oakland $ 9,854 7/12/19 1/12/22
130 Oakland Unified School DistrictGet Connected Oakland- District 3 High Schools Oakland $ 3,171 7/12/19 1/12/22
131 Oakland Unified School DistrictGet Connected Oakland- District 5 High Schools Oakland $ 47,655 $ 2,673 *** 12/31/18 6/30/20
132 Oakland Unified School DistrictGet Connected Oakland- District 6 High Schools Oakland $ 47,655 $ 2,673 *** 12/31/18 6/30/21
133 Oakland Unified School DistrictGet Connected Oakland- District 7 High Schools Oakland $ 47,647 $ 2,673 *** 12/31/18 6/30/21
134 Opportunity Junction Technology Center Antioch $ 39,243 $ 27,738 $ 27,738 12/31/18 6/30/21
135Parent, Family Engagement and Community Services, Inc. Community Digital Literacy Downey, CA $ 82,890 12/31/19 6/30/22
136Parent, Family Engagement and Community Services, Inc.
El Monte, CA Community Digital Literacy El Monte $ 52,028 12/31/19 6/30/22
137Parent, Family Engagement and Community Services, Inc.
Fullerton, CA Community Digital Literacy Fullerton $ 52,028 12/31/19 6/30/22
138Parent, Family Engagement and Community Services, Inc.
Montebello, CA Community Digital Literacy Montebello $ 52,028 12/31/19 6/30/22
139Parent, Family Engagement and Community Services, Inc.
Wilmington, CA Community Digital Literacy Wilmington, CA $ 52,028 12/31/19 6/30/22
140 Reading and Beyond RaB Broadband Access (Mosqueda) Fresno $ 73,639 $ 4,782 12/31/18 6/30/21
141 Reading and BeyondRaB Broadband Access 1.0 (N Location) Fresno $ 73,639 $ 6,027 12/31/18 6/30/21
142 Reading and Beyond RaB Digital Literacy 1.0 (Mosqueda) Fresno $ 40,472 $ 2,475 12/31/18 6/30/21
143 Reading and BeyondRaB Digital Literacy 1.0 (N Location) Fresno $ 40,472 $ 3,261 12/31/18 6/30/21
144 Redwood City Library Foundation DLP/Redwood City Main Library Redwood City $ 79,488 $ 34,410 $ 34,410 7/12/19 1/12/22145 Redwood City Library Foundation Redwood City Main Library Redwood City $ 22,747 $ 7,891 $ 7,891 7/12/19 1/12/22
146 Sacramento Public Library Create, learn and tinker in Marina Vista Sacramento $ 97,542 5/11/20 11/11/22147 San Diego Futures Foundation SDFF Digital Literacy Program San Diego $ 98,992 $ 10,105 $ 10,105 7/12/19 1/12/22148 ScholarMatch Project Connect San Francisco $ 94,963 $ 94,962 $ 94,962 12/31/18 6/30/20149 Self-Help Enterprises Almond Court Wasco $ 22,325 7/12/19 1/12/22150 Self-Help Enterprises Bear Creek Planada $ 32,251 7/12/19 1/12/22151 Self-Help Enterprises Biola Village Biola $ 25,161 7/12/19 1/12/22152 Self-Help Enterprises Caliente Creek Arvin $ 25,870 7/12/19 1/12/22153 Self-Help Enterprises Casas de La Vina Madera $ 29,415 7/12/19 1/12/22154 Self-Help Enterprises Casitas del Sol Livingston $ 22,325 7/12/19 1/12/22155 Self-Help Enterprises Cottonwood Creek Madera $ 23,743 7/12/19 1/12/22156 Self-Help Enterprises Gateway Village Modesto $ 26,579 7/12/19 1/12/22157 Self-Help Enterprises Goshen Village Goshen $ 32,251 7/12/19 1/12/22158 Self-Help Enterprises Goshen Village 2 Goshen $ 29,415 7/12/19 1/12/22
71
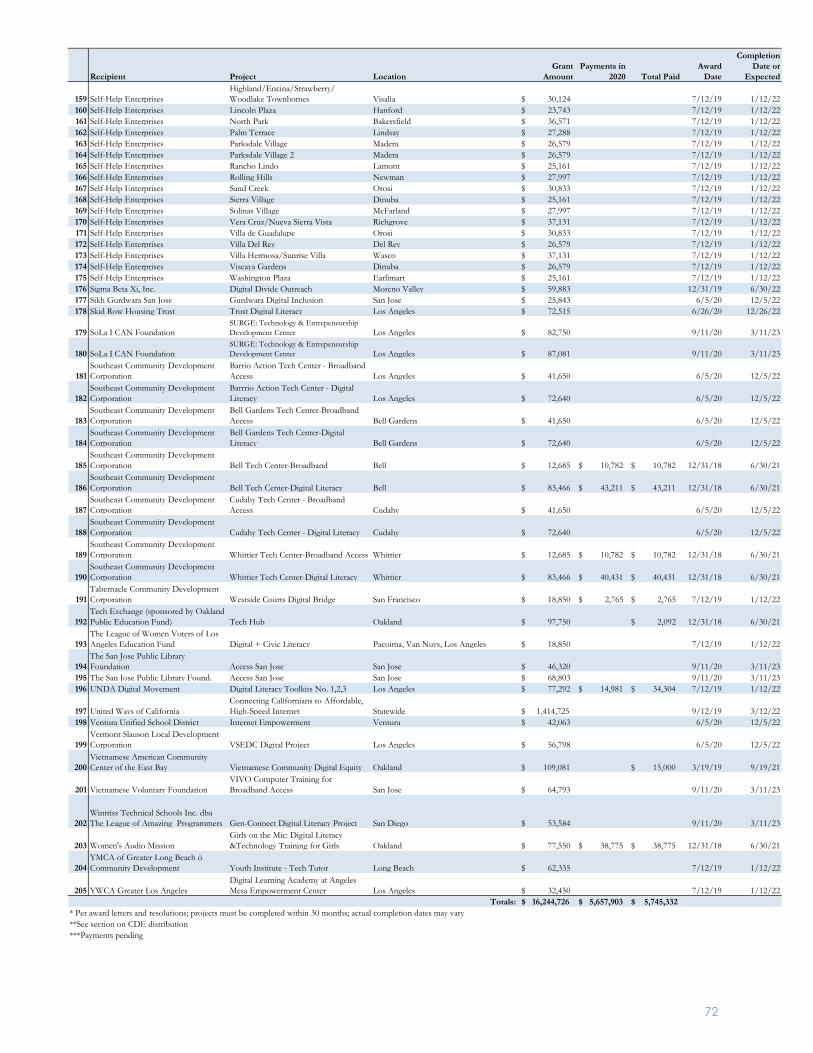
Recipient Project Location Grant
Amount Payments in
2020 Total Paid Award
Date
Completion Date or
Expected
159 Self-Help EnterprisesHighland/Encina/Strawberry/Woodlake Townhomes Visalia $ 30,124 7/12/19 1/12/22
160 Self-Help Enterprises Lincoln Plaza Hanford $ 23,743 7/12/19 1/12/22161 Self-Help Enterprises North Park Bakersfield $ 36,571 7/12/19 1/12/22162 Self-Help Enterprises Palm Terrace Lindsay $ 27,288 7/12/19 1/12/22163 Self-Help Enterprises Parksdale Village Madera $ 26,579 7/12/19 1/12/22164 Self-Help Enterprises Parksdale Village 2 Madera $ 26,579 7/12/19 1/12/22165 Self-Help Enterprises Rancho Lindo Lamont $ 25,161 7/12/19 1/12/22166 Self-Help Enterprises Rolling Hills Newman $ 27,997 7/12/19 1/12/22167 Self-Help Enterprises Sand Creek Orosi $ 30,833 7/12/19 1/12/22168 Self-Help Enterprises Sierra Village Dinuba $ 25,161 7/12/19 1/12/22169 Self-Help Enterprises Solinas Village McFarland $ 27,997 7/12/19 1/12/22170 Self-Help Enterprises Vera Cruz/Nueva Sierra Vista Richgrove $ 37,131 7/12/19 1/12/22171 Self-Help Enterprises Villa de Guadalupe Orosi $ 30,833 7/12/19 1/12/22172 Self-Help Enterprises Villa Del Rey Del Rey $ 26,579 7/12/19 1/12/22173 Self-Help Enterprises Villa Hermosa/Sunrise Villa Wasco $ 37,131 7/12/19 1/12/22174 Self-Help Enterprises Viscaya Gardens Dinuba $ 26,579 7/12/19 1/12/22175 Self-Help Enterprises Washington Plaza Earlimart $ 25,161 7/12/19 1/12/22176 Sigma Beta Xi, Inc. Digital Divide Outreach Moreno Valley $ 59,883 12/31/19 6/30/22177 Sikh Gurdwara San Jose Gurdwara Digital Inclusion San Jose $ 25,843 6/5/20 12/5/22178 Skid Row Housing Trust Trust Digital Literacy Los Angeles $ 72,515 6/26/20 12/26/22
179 SoLa I CAN FoundationSURGE: Technology & Entrepeneurship Development Center Los Angeles $ 82,750 9/11/20 3/11/23
180 SoLa I CAN FoundationSURGE: Technology & Entrepeneurship Development Center Los Angeles $ 87,081 9/11/20 3/11/23
181Southeast Community Development Corporation
Barrio Action Tech Center - Broadband Access Los Angeles $ 41,650 6/5/20 12/5/22
182Southeast Community Development Corporation
Barrrio Action Tech Center - Digital Literacy Los Angeles $ 72,640 6/5/20 12/5/22
183Southeast Community Development Corporation
Bell Gardens Tech Center-Broadband Access Bell Gardens $ 41,650 6/5/20 12/5/22
184Southeast Community Development Corporation
Bell Gardens Tech Center-Digital Literacy Bell Gardens $ 72,640 6/5/20 12/5/22
185Southeast Community Development Corporation Bell Tech Center-Broadband Bell $ 12,685 $ 10,782 $ 10,782 12/31/18 6/30/21
186Southeast Community Development Corporation Bell Tech Center-Digital Literacy Bell $ 83,466 $ 43,211 $ 43,211 12/31/18 6/30/21
187Southeast Community Development Corporation
Cudahy Tech Center - Broadband Access Cudahy $ 41,650 6/5/20 12/5/22
188Southeast Community Development Corporation Cudahy Tech Center - Digital Literacy Cudahy $ 72,640 6/5/20 12/5/22
189Southeast Community Development Corporation Whittier Tech Center-Broadband Access Whittier $ 12,685 $ 10,782 $ 10,782 12/31/18 6/30/21
190Southeast Community Development Corporation Whittier Tech Center-Digital Literacy Whittier $ 83,466 $ 40,431 $ 40,431 12/31/18 6/30/21
191Tabernacle Community Development Corporation Westside Courts Digital Bridge San Francisco $ 18,850 $ 2,765 $ 2,765 7/12/19 1/12/22
192Tech Exchange (sponsored by Oakland Public Education Fund) Tech Hub Oakland $ 97,750 $ 2,092 12/31/18 6/30/21
193The League of Women Voters of Los Angeles Education Fund Digital + Civic Literacy Pacoima, Van Nuys, Los Angeles $ 18,850 7/12/19 1/12/22
194The San Jose Public Library Foundation Access San Jose San Jose $ 46,320 9/11/20 3/11/23
195 The San Jose Public Library Found. Access San Jose San Jose $ 68,803 9/11/20 3/11/23196 UNDA Digital Movement Digital Literacy Toolkits No. 1,2,3 Los Angeles $ 77,292 $ 14,981 $ 34,304 7/12/19 1/12/22
197 United Ways of CaliforniaConnecting Californians to Affordable, High-Speed Internet Statewide $ 1,414,725 9/12/19 3/12/22
198 Ventura Unified School District Internet Empowerment Ventura $ 42,063 6/5/20 12/5/22
199Vermont Slauson Local Development Corporation VSEDC Digital Project Los Angeles $ 56,798 6/5/20 12/5/22
200Vietnamese American Community Center of the East Bay Vietnamese Community Digital Equity Oakland $ 109,081 $ 15,000 3/19/19 9/19/21
201 Vietnamese Voluntary FoundationVIVO Computer Training for Broadband Access San Jose $ 64,793 9/11/20 3/11/23
202Wintriss Technical Schools Inc. dba The League of Amazing Programmers Gen-Connect Digital Literacy Project San Diego $ 53,584 9/11/20 3/11/23
203 Women's Audio MissionGirls on the Mic: Digital Literacy &Technology Training for Girls Oakland $ 77,550 $ 38,775 $ 38,775 12/31/18 6/30/21
204YMCA of Greater Long Beach ò Community Development Youth Institute - Tech Tutor Long Beach $ 62,335 7/12/19 1/12/22
205 YWCA Greater Los AngelesDigital Learning Academy at Angeles Mesa Empowerment Center Los Angeles $ 32,450 7/12/19 1/12/22
Totals: $ 16,244,726 $ 5,657,903 $ 5,745,332 * Per award letters and resolutions; projects must be completed within 30 months; actual completion dates may vary**See section on CDE distribution***Payments pending
72
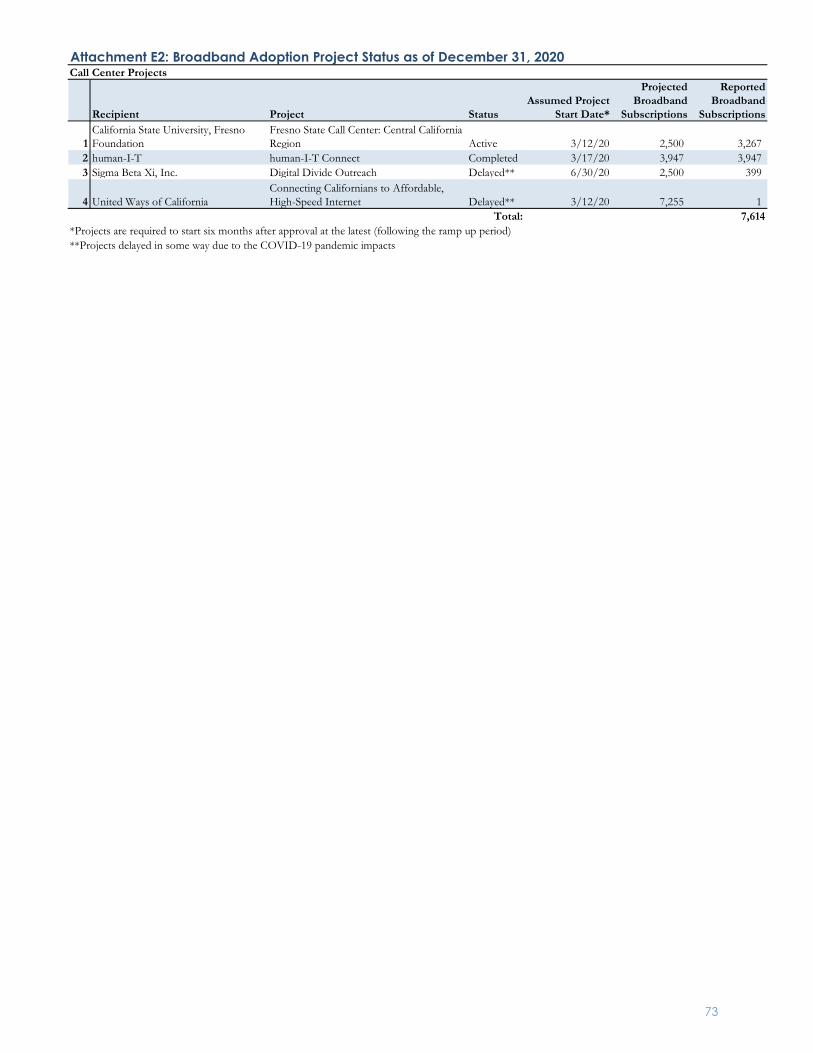
Recipient Project StatusAssumed Project
Start Date*
Projected Broadband
Subscriptions
Reported Broadband
Subscriptions
1California State University, Fresno Foundation
Fresno State Call Center: Central California Region Active 3/12/20 2,500 3,267
2 human-I-T human-I-T Connect Completed 3/17/20 3,947 3,947 3 Sigma Beta Xi, Inc. Digital Divide Outreach Delayed** 6/30/20 2,500 399
4 United Ways of CaliforniaConnecting Californians to Affordable, High-Speed Internet Delayed** 3/12/20 7,255 1
Total: 7,614*Projects are required to start six months after approval at the latest (following the ramp up period)**Projects delayed in some way due to the COVID-19 pandemic impacts
Attachment E2: Broadband Adoption Project Status as of December 31, 2020Call Center Projects
73
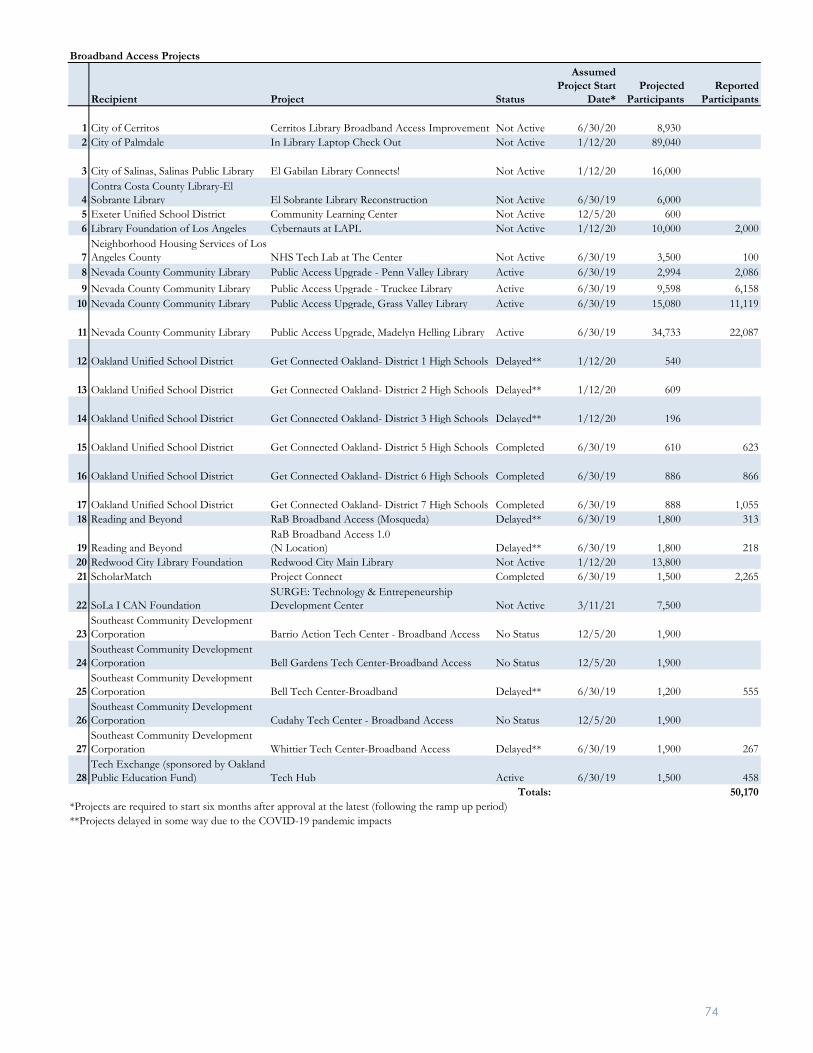
Recipient Project Status
Assumed Project Start
Date* Projected
Participants Reported
Participants
1 City of Cerritos Cerritos Library Broadband Access Improvement Not Active 6/30/20 8,930 2 City of Palmdale In Library Laptop Check Out Not Active 1/12/20 89,040
3 City of Salinas, Salinas Public Library El Gabilan Library Connects! Not Active 1/12/20 16,000
4Contra Costa County Library-El Sobrante Library El Sobrante Library Reconstruction Not Active 6/30/19 6,000
5 Exeter Unified School District Community Learning Center Not Active 12/5/20 600 6 Library Foundation of Los Angeles Cybernauts at LAPL Not Active 1/12/20 10,000 2,000
7Neighborhood Housing Services of Los Angeles County NHS Tech Lab at The Center Not Active 6/30/19 3,500 100
8 Nevada County Community Library Public Access Upgrade - Penn Valley Library Active 6/30/19 2,994 2,0869 Nevada County Community Library Public Access Upgrade - Truckee Library Active 6/30/19 9,598 6,158
10 Nevada County Community Library Public Access Upgrade, Grass Valley Library Active 6/30/19 15,080 11,119
11 Nevada County Community Library Public Access Upgrade, Madelyn Helling Library Active 6/30/19 34,733 22,087
12 Oakland Unified School District Get Connected Oakland- District 1 High Schools Delayed** 1/12/20 540
13 Oakland Unified School District Get Connected Oakland- District 2 High Schools Delayed** 1/12/20 609
14 Oakland Unified School District Get Connected Oakland- District 3 High Schools Delayed** 1/12/20 196
15 Oakland Unified School District Get Connected Oakland- District 5 High Schools Completed 6/30/19 610 623
16 Oakland Unified School District Get Connected Oakland- District 6 High Schools Completed 6/30/19 886 866
17 Oakland Unified School District Get Connected Oakland- District 7 High Schools Completed 6/30/19 888 1,05518 Reading and Beyond RaB Broadband Access (Mosqueda) Delayed** 6/30/19 1,800 313
19 Reading and BeyondRaB Broadband Access 1.0 (N Location) Delayed** 6/30/19 1,800 218
20 Redwood City Library Foundation Redwood City Main Library Not Active 1/12/20 13,800 21 ScholarMatch Project Connect Completed 6/30/19 1,500 2,265
22 SoLa I CAN FoundationSURGE: Technology & Entrepeneurship Development Center Not Active 3/11/21 7,500
23Southeast Community Development Corporation Barrio Action Tech Center - Broadband Access No Status 12/5/20 1,900
24Southeast Community Development Corporation Bell Gardens Tech Center-Broadband Access No Status 12/5/20 1,900
25Southeast Community Development Corporation Bell Tech Center-Broadband Delayed** 6/30/19 1,200 555
26Southeast Community Development Corporation Cudahy Tech Center - Broadband Access No Status 12/5/20 1,900
27Southeast Community Development Corporation Whittier Tech Center-Broadband Access Delayed** 6/30/19 1,900 267
28Tech Exchange (sponsored by Oakland Public Education Fund) Tech Hub Active 6/30/19 1,500 458
Totals: 50,170*Projects are required to start six months after approval at the latest (following the ramp up period)**Projects delayed in some way due to the COVID-19 pandemic impacts
Broadband Access Projects
74
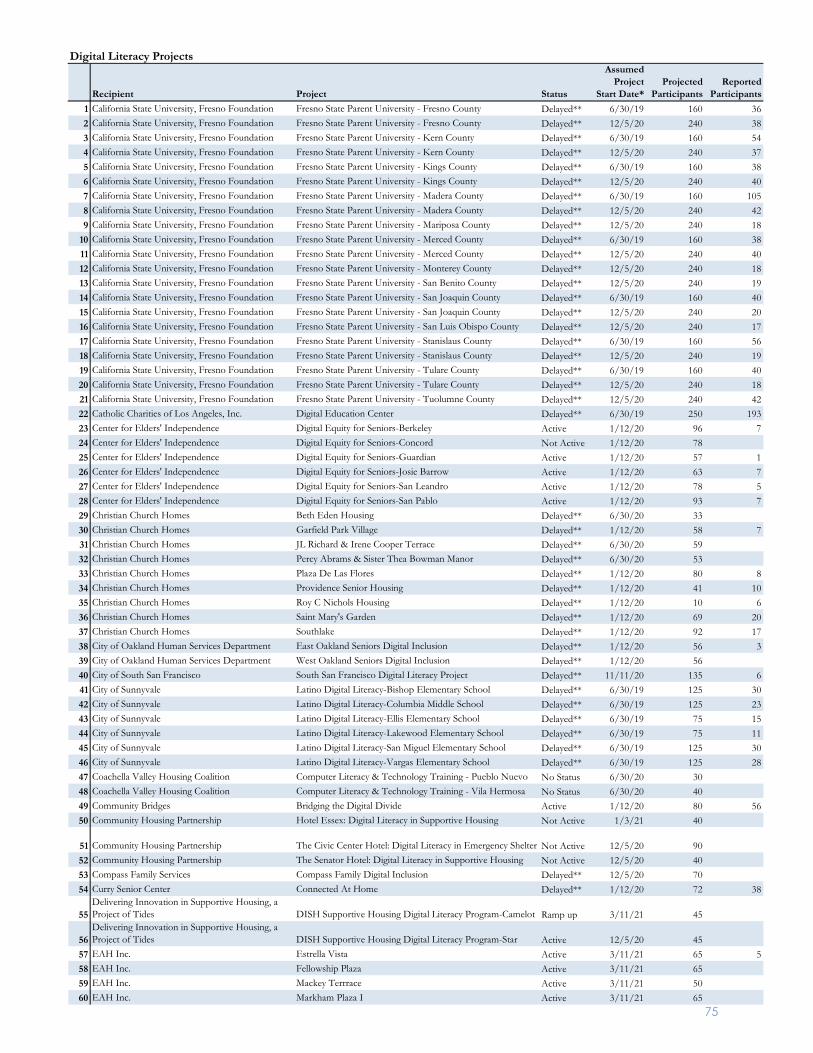
Recipient Project Status
Assumed Project
Start Date*Projected
ParticipantsReported
Participants1 California State University, Fresno Foundation Fresno State Parent University - Fresno County Delayed** 6/30/19 160 362 California State University, Fresno Foundation Fresno State Parent University - Fresno County Delayed** 12/5/20 240 383 California State University, Fresno Foundation Fresno State Parent University - Kern County Delayed** 6/30/19 160 544 California State University, Fresno Foundation Fresno State Parent University - Kern County Delayed** 12/5/20 240 375 California State University, Fresno Foundation Fresno State Parent University - Kings County Delayed** 6/30/19 160 386 California State University, Fresno Foundation Fresno State Parent University - Kings County Delayed** 12/5/20 240 407 California State University, Fresno Foundation Fresno State Parent University - Madera County Delayed** 6/30/19 160 1058 California State University, Fresno Foundation Fresno State Parent University - Madera County Delayed** 12/5/20 240 429 California State University, Fresno Foundation Fresno State Parent University - Mariposa County Delayed** 12/5/20 240 18
10 California State University, Fresno Foundation Fresno State Parent University - Merced County Delayed** 6/30/19 160 3811 California State University, Fresno Foundation Fresno State Parent University - Merced County Delayed** 12/5/20 240 4012 California State University, Fresno Foundation Fresno State Parent University - Monterey County Delayed** 12/5/20 240 1813 California State University, Fresno Foundation Fresno State Parent University - San Benito County Delayed** 12/5/20 240 1914 California State University, Fresno Foundation Fresno State Parent University - San Joaquin County Delayed** 6/30/19 160 4015 California State University, Fresno Foundation Fresno State Parent University - San Joaquin County Delayed** 12/5/20 240 2016 California State University, Fresno Foundation Fresno State Parent University - San Luis Obispo County Delayed** 12/5/20 240 1717 California State University, Fresno Foundation Fresno State Parent University - Stanislaus County Delayed** 6/30/19 160 5618 California State University, Fresno Foundation Fresno State Parent University - Stanislaus County Delayed** 12/5/20 240 1919 California State University, Fresno Foundation Fresno State Parent University - Tulare County Delayed** 6/30/19 160 4020 California State University, Fresno Foundation Fresno State Parent University - Tulare County Delayed** 12/5/20 240 1821 California State University, Fresno Foundation Fresno State Parent University - Tuolumne County Delayed** 12/5/20 240 4222 Catholic Charities of Los Angeles, Inc. Digital Education Center Delayed** 6/30/19 250 19323 Center for Elders' Independence Digital Equity for Seniors-Berkeley Active 1/12/20 96 724 Center for Elders' Independence Digital Equity for Seniors-Concord Not Active 1/12/20 7825 Center for Elders' Independence Digital Equity for Seniors-Guardian Active 1/12/20 57 126 Center for Elders' Independence Digital Equity for Seniors-Josie Barrow Active 1/12/20 63 727 Center for Elders' Independence Digital Equity for Seniors-San Leandro Active 1/12/20 78 528 Center for Elders' Independence Digital Equity for Seniors-San Pablo Active 1/12/20 93 729 Christian Church Homes Beth Eden Housing Delayed** 6/30/20 3330 Christian Church Homes Garfield Park Village Delayed** 1/12/20 58 731 Christian Church Homes JL Richard & Irene Cooper Terrace Delayed** 6/30/20 5932 Christian Church Homes Percy Abrams & Sister Thea Bowman Manor Delayed** 6/30/20 5333 Christian Church Homes Plaza De Las Flores Delayed** 1/12/20 80 834 Christian Church Homes Providence Senior Housing Delayed** 1/12/20 41 1035 Christian Church Homes Roy C Nichols Housing Delayed** 1/12/20 10 636 Christian Church Homes Saint Mary's Garden Delayed** 1/12/20 69 2037 Christian Church Homes Southlake Delayed** 1/12/20 92 1738 City of Oakland Human Services Department East Oakland Seniors Digital Inclusion Delayed** 1/12/20 56 339 City of Oakland Human Services Department West Oakland Seniors Digital Inclusion Delayed** 1/12/20 5640 City of South San Francisco South San Francisco Digital Literacy Project Delayed** 11/11/20 135 641 City of Sunnyvale Latino Digital Literacy-Bishop Elementary School Delayed** 6/30/19 125 3042 City of Sunnyvale Latino Digital Literacy-Columbia Middle School Delayed** 6/30/19 125 2343 City of Sunnyvale Latino Digital Literacy-Ellis Elementary School Delayed** 6/30/19 75 1544 City of Sunnyvale Latino Digital Literacy-Lakewood Elementary School Delayed** 6/30/19 75 1145 City of Sunnyvale Latino Digital Literacy-San Miguel Elementary School Delayed** 6/30/19 125 3046 City of Sunnyvale Latino Digital Literacy-Vargas Elementary School Delayed** 6/30/19 125 2847 Coachella Valley Housing Coalition Computer Literacy & Technology Training - Pueblo Nuevo No Status 6/30/20 3048 Coachella Valley Housing Coalition Computer Literacy & Technology Training - Vila Hermosa No Status 6/30/20 4049 Community Bridges Bridging the Digital Divide Active 1/12/20 80 5650 Community Housing Partnership Hotel Essex: Digital Literacy in Supportive Housing Not Active 1/3/21 40
51 Community Housing Partnership The Civic Center Hotel: Digital Literacy in Emergency Shelter Not Active 12/5/20 9052 Community Housing Partnership The Senator Hotel: Digital Literacy in Supportive Housing Not Active 12/5/20 4053 Compass Family Services Compass Family Digital Inclusion Delayed** 12/5/20 7054 Curry Senior Center Connected At Home Delayed** 1/12/20 72 38
55Delivering Innovation in Supportive Housing, a Project of Tides DISH Supportive Housing Digital Literacy Program-Camelot Ramp up 3/11/21 45
56Delivering Innovation in Supportive Housing, a Project of Tides DISH Supportive Housing Digital Literacy Program-Star Active 12/5/20 45
57 EAH Inc. Estrella Vista Active 3/11/21 65 558 EAH Inc. Fellowship Plaza Active 3/11/21 6559 EAH Inc. Mackey Terrrace Active 3/11/21 5060 EAH Inc. Markham Plaza I Active 3/11/21 65
Digital Literacy Projects
75
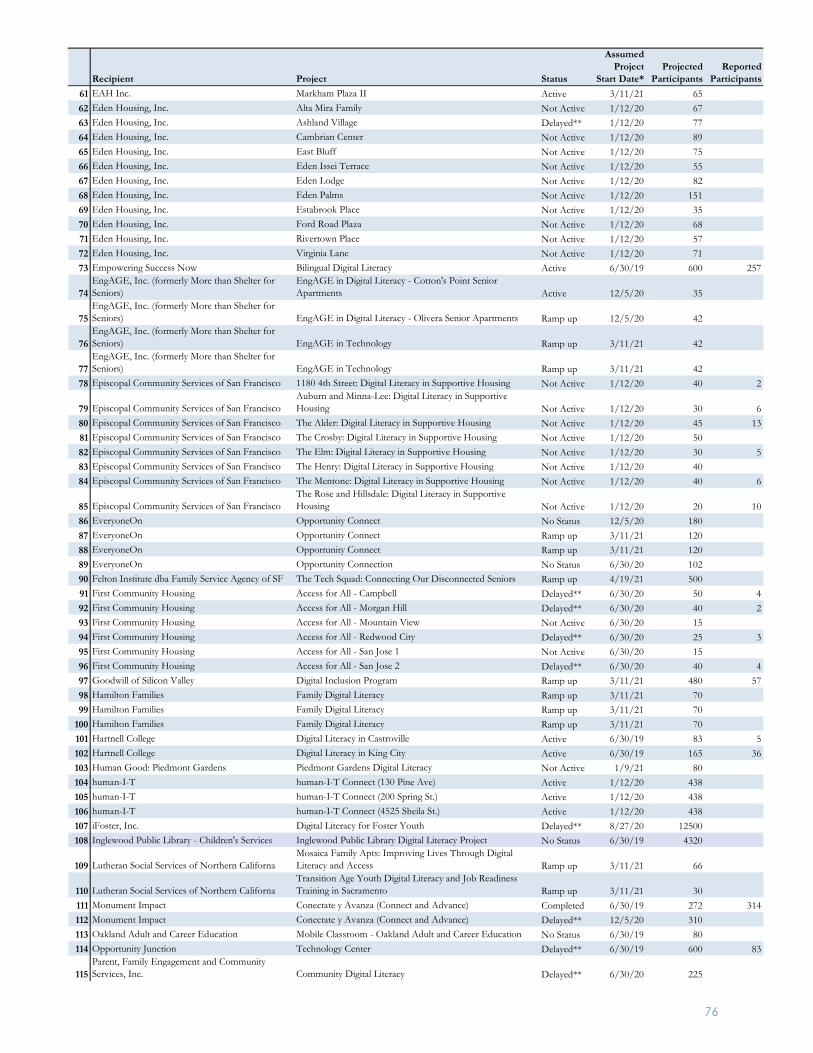
Recipient Project Status
Assumed Project
Start Date*Projected
ParticipantsReported
Participants61 EAH Inc. Markham Plaza II Active 3/11/21 6562 Eden Housing, Inc. Alta Mira Family Not Active 1/12/20 6763 Eden Housing, Inc. Ashland Village Delayed** 1/12/20 7764 Eden Housing, Inc. Cambrian Center Not Active 1/12/20 8965 Eden Housing, Inc. East Bluff Not Active 1/12/20 7566 Eden Housing, Inc. Eden Issei Terrace Not Active 1/12/20 5567 Eden Housing, Inc. Eden Lodge Not Active 1/12/20 8268 Eden Housing, Inc. Eden Palms Not Active 1/12/20 15169 Eden Housing, Inc. Estabrook Place Not Active 1/12/20 3570 Eden Housing, Inc. Ford Road Plaza Not Active 1/12/20 6871 Eden Housing, Inc. Rivertown Place Not Active 1/12/20 5772 Eden Housing, Inc. Virginia Lane Not Active 1/12/20 7173 Empowering Success Now Bilingual Digital Literacy Active 6/30/19 600 257
74EngAGE, Inc. (formerly More than Shelter for Seniors)
EngAGE in Digital Literacy - Cotton's Point Senior Apartments Active 12/5/20 35
75EngAGE, Inc. (formerly More than Shelter for Seniors) EngAGE in Digital Literacy - Olivera Senior Apartments Ramp up 12/5/20 42
76EngAGE, Inc. (formerly More than Shelter for Seniors) EngAGE in Technology Ramp up 3/11/21 42
77EngAGE, Inc. (formerly More than Shelter for Seniors) EngAGE in Technology Ramp up 3/11/21 42
78 Episcopal Community Services of San Francisco 1180 4th Street: Digital Literacy in Supportive Housing Not Active 1/12/20 40 2
79 Episcopal Community Services of San FranciscoAuburn and Minna-Lee: Digital Literacy in Supportive Housing Not Active 1/12/20 30 6
80 Episcopal Community Services of San Francisco The Alder: Digital Literacy in Supportive Housing Not Active 1/12/20 45 1381 Episcopal Community Services of San Francisco The Crosby: Digital Literacy in Supportive Housing Not Active 1/12/20 5082 Episcopal Community Services of San Francisco The Elm: Digital Literacy in Supportive Housing Not Active 1/12/20 30 583 Episcopal Community Services of San Francisco The Henry: Digital Literacy in Supportive Housing Not Active 1/12/20 4084 Episcopal Community Services of San Francisco The Mentone: Digital Literacy in Supportive Housing Not Active 1/12/20 40 6
85 Episcopal Community Services of San FranciscoThe Rose and Hillsdale: Digital Literacy in Supportive Housing Not Active 1/12/20 20 10
86 EveryoneOn Opportunity Connect No Status 12/5/20 18087 EveryoneOn Opportunity Connect Ramp up 3/11/21 12088 EveryoneOn Opportunity Connect Ramp up 3/11/21 12089 EveryoneOn Opportunity Connection No Status 6/30/20 10290 Felton Institute dba Family Service Agency of SF The Tech Squad: Connecting Our Disconnected Seniors Ramp up 4/19/21 50091 First Community Housing Access for All - Campbell Delayed** 6/30/20 50 492 First Community Housing Access for All - Morgan Hill Delayed** 6/30/20 40 293 First Community Housing Access for All - Mountain View Not Active 6/30/20 1594 First Community Housing Access for All - Redwood City Delayed** 6/30/20 25 395 First Community Housing Access for All - San Jose 1 Not Active 6/30/20 1596 First Community Housing Access for All - San Jose 2 Delayed** 6/30/20 40 497 Goodwill of Silicon Valley Digital Inclusion Program Ramp up 3/11/21 480 5798 Hamilton Families Family Digital Literacy Ramp up 3/11/21 7099 Hamilton Families Family Digital Literacy Ramp up 3/11/21 70
100 Hamilton Families Family Digital Literacy Ramp up 3/11/21 70101 Hartnell College Digital Literacy in Castroville Active 6/30/19 83 5102 Hartnell College Digital Literacy in King City Active 6/30/19 165 36103 Human Good: Piedmont Gardens Piedmont Gardens Digital Literacy Not Active 1/9/21 80104 human-I-T human-I-T Connect (130 Pine Ave) Active 1/12/20 438105 human-I-T human-I-T Connect (200 Spring St.) Active 1/12/20 438106 human-I-T human-I-T Connect (4525 Sheila St.) Active 1/12/20 438107 iFoster, Inc. Digital Literacy for Foster Youth Delayed** 8/27/20 12500108 Inglewood Public Library - Children's Services Inglewood Public Library Digital Literacy Project No Status 6/30/19 4320
109 Lutheran Social Services of Northern CalifornaMosaica Family Apts: Improving Lives Through Digital Literacy and Access Ramp up 3/11/21 66
110 Lutheran Social Services of Northern CalifornaTransition Age Youth Digital Literacy and Job Readiness Training in Sacramento Ramp up 3/11/21 30
111 Monument Impact Conectate y Avanza (Connect and Advance) Completed 6/30/19 272 314112 Monument Impact Conectate y Avanza (Connect and Advance) Delayed** 12/5/20 310113 Oakland Adult and Career Education Mobile Classroom - Oakland Adult and Career Education No Status 6/30/19 80114 Opportunity Junction Technology Center Delayed** 6/30/19 600 83
115Parent, Family Engagement and Community Services, Inc. Community Digital Literacy Delayed** 6/30/20 225
76
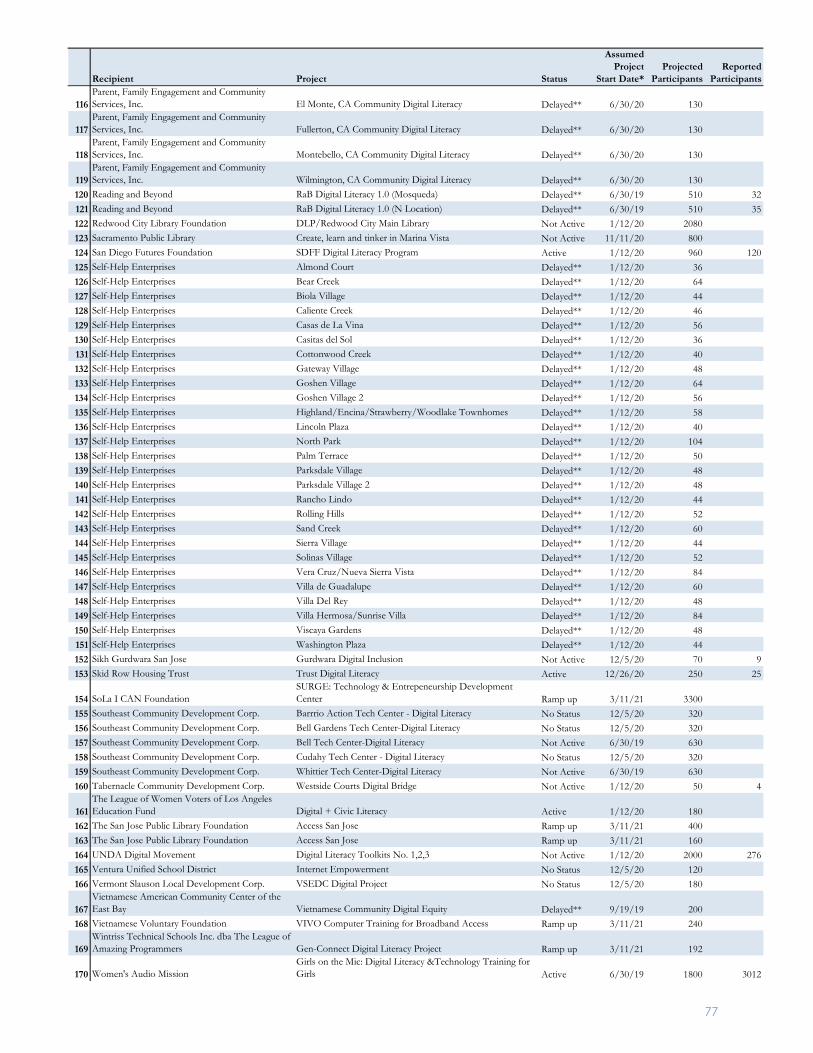
Recipient Project Status
Assumed Project
Start Date*Projected
ParticipantsReported
Participants
116Parent, Family Engagement and Community Services, Inc. El Monte, CA Community Digital Literacy Delayed** 6/30/20 130
117Parent, Family Engagement and Community Services, Inc. Fullerton, CA Community Digital Literacy Delayed** 6/30/20 130
118Parent, Family Engagement and Community Services, Inc. Montebello, CA Community Digital Literacy Delayed** 6/30/20 130
119Parent, Family Engagement and Community Services, Inc. Wilmington, CA Community Digital Literacy Delayed** 6/30/20 130
120 Reading and Beyond RaB Digital Literacy 1.0 (Mosqueda) Delayed** 6/30/19 510 32121 Reading and Beyond RaB Digital Literacy 1.0 (N Location) Delayed** 6/30/19 510 35122 Redwood City Library Foundation DLP/Redwood City Main Library Not Active 1/12/20 2080123 Sacramento Public Library Create, learn and tinker in Marina Vista Not Active 11/11/20 800124 San Diego Futures Foundation SDFF Digital Literacy Program Active 1/12/20 960 120125 Self-Help Enterprises Almond Court Delayed** 1/12/20 36126 Self-Help Enterprises Bear Creek Delayed** 1/12/20 64127 Self-Help Enterprises Biola Village Delayed** 1/12/20 44128 Self-Help Enterprises Caliente Creek Delayed** 1/12/20 46129 Self-Help Enterprises Casas de La Vina Delayed** 1/12/20 56130 Self-Help Enterprises Casitas del Sol Delayed** 1/12/20 36131 Self-Help Enterprises Cottonwood Creek Delayed** 1/12/20 40132 Self-Help Enterprises Gateway Village Delayed** 1/12/20 48133 Self-Help Enterprises Goshen Village Delayed** 1/12/20 64134 Self-Help Enterprises Goshen Village 2 Delayed** 1/12/20 56135 Self-Help Enterprises Highland/Encina/Strawberry/Woodlake Townhomes Delayed** 1/12/20 58136 Self-Help Enterprises Lincoln Plaza Delayed** 1/12/20 40137 Self-Help Enterprises North Park Delayed** 1/12/20 104138 Self-Help Enterprises Palm Terrace Delayed** 1/12/20 50139 Self-Help Enterprises Parksdale Village Delayed** 1/12/20 48140 Self-Help Enterprises Parksdale Village 2 Delayed** 1/12/20 48141 Self-Help Enterprises Rancho Lindo Delayed** 1/12/20 44142 Self-Help Enterprises Rolling Hills Delayed** 1/12/20 52143 Self-Help Enterprises Sand Creek Delayed** 1/12/20 60144 Self-Help Enterprises Sierra Village Delayed** 1/12/20 44145 Self-Help Enterprises Solinas Village Delayed** 1/12/20 52146 Self-Help Enterprises Vera Cruz/Nueva Sierra Vista Delayed** 1/12/20 84147 Self-Help Enterprises Villa de Guadalupe Delayed** 1/12/20 60148 Self-Help Enterprises Villa Del Rey Delayed** 1/12/20 48149 Self-Help Enterprises Villa Hermosa/Sunrise Villa Delayed** 1/12/20 84150 Self-Help Enterprises Viscaya Gardens Delayed** 1/12/20 48151 Self-Help Enterprises Washington Plaza Delayed** 1/12/20 44152 Sikh Gurdwara San Jose Gurdwara Digital Inclusion Not Active 12/5/20 70 9153 Skid Row Housing Trust Trust Digital Literacy Active 12/26/20 250 25
154 SoLa I CAN FoundationSURGE: Technology & Entrepeneurship Development Center Ramp up 3/11/21 3300
155 Southeast Community Development Corp. Barrrio Action Tech Center - Digital Literacy No Status 12/5/20 320156 Southeast Community Development Corp. Bell Gardens Tech Center-Digital Literacy No Status 12/5/20 320157 Southeast Community Development Corp. Bell Tech Center-Digital Literacy Not Active 6/30/19 630158 Southeast Community Development Corp. Cudahy Tech Center - Digital Literacy No Status 12/5/20 320159 Southeast Community Development Corp. Whittier Tech Center-Digital Literacy Not Active 6/30/19 630160 Tabernacle Community Development Corp. Westside Courts Digital Bridge Not Active 1/12/20 50 4
161The League of Women Voters of Los Angeles Education Fund Digital + Civic Literacy Active 1/12/20 180
162 The San Jose Public Library Foundation Access San Jose Ramp up 3/11/21 400163 The San Jose Public Library Foundation Access San Jose Ramp up 3/11/21 160164 UNDA Digital Movement Digital Literacy Toolkits No. 1,2,3 Not Active 1/12/20 2000 276165 Ventura Unified School District Internet Empowerment No Status 12/5/20 120166 Vermont Slauson Local Development Corp. VSEDC Digital Project No Status 12/5/20 180
167Vietnamese American Community Center of the East Bay Vietnamese Community Digital Equity Delayed** 9/19/19 200
168 Vietnamese Voluntary Foundation VIVO Computer Training for Broadband Access Ramp up 3/11/21 240
169Wintriss Technical Schools Inc. dba The League of Amazing Programmers Gen-Connect Digital Literacy Project Ramp up 3/11/21 192
170 Women's Audio MissionGirls on the Mic: Digital Literacy &Technology Training for Girls Active 6/30/19 1800 3012
77

Recipient Project Status
Assumed Project
Start Date*Projected
ParticipantsReported
Participants
171YMCA of Greater Long Beach ò Community Development Youth Institute - Tech Tutor Delayed** 1/12/20 660 320
172 YWCA Greater Los AngelesDigital Learning Academy at Angeles Mesa Empowerment Center Not Active 1/12/20 100
Totals: 5,948
**Projects delayed in some way due to the COVID-19 pandemic impacts
*Projects are required to start six months after approval at the latest (following the ramp up period)
78
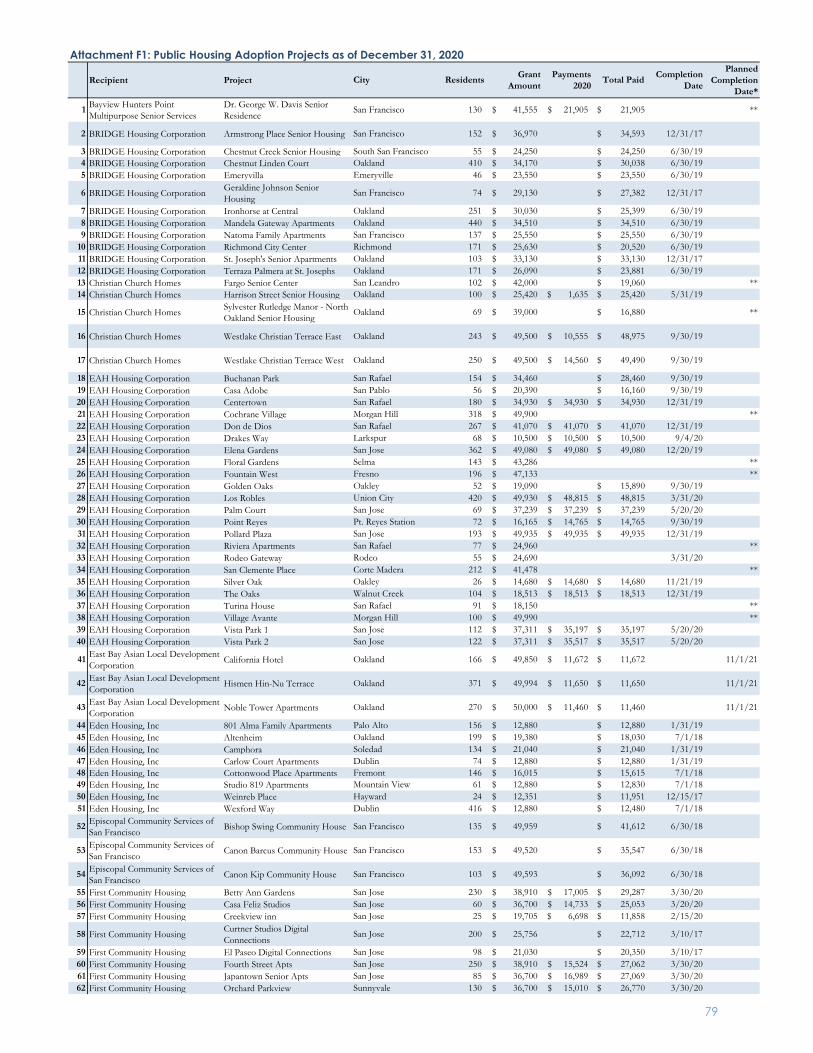
Recipient Project City Residents Grant Amount
Payments 2020 Total Paid Completion
Date
Planned Completion
Date*
1 Bayview Hunters Point Multipurpose Senior Services
Dr. George W. Davis Senior Residence
San Francisco 130 41,555$ 21,905$ 21,905$ **
2 BRIDGE Housing Corporation Armstrong Place Senior Housing San Francisco 152 36,970$ 34,593$ 12/31/17
3 BRIDGE Housing Corporation Chestnut Creek Senior Housing South San Francisco 55 24,250$ 24,250$ 6/30/194 BRIDGE Housing Corporation Chestnut Linden Court Oakland 410 34,170$ 30,038$ 6/30/195 BRIDGE Housing Corporation Emeryvilla Emeryville 46 23,550$ 23,550$ 6/30/19
6 BRIDGE Housing Corporation Geraldine Johnson Senior Housing
San Francisco 74 29,130$ 27,382$ 12/31/17
7 BRIDGE Housing Corporation Ironhorse at Central Oakland 251 30,030$ 25,399$ 6/30/198 BRIDGE Housing Corporation Mandela Gateway Apartments Oakland 440 34,510$ 34,510$ 6/30/199 BRIDGE Housing Corporation Natoma Family Apartments San Francisco 137 25,550$ 25,550$ 6/30/19
10 BRIDGE Housing Corporation Richmond City Center Richmond 171 25,630$ 20,520$ 6/30/1911 BRIDGE Housing Corporation St. Joseph's Senior Apartments Oakland 103 33,130$ 33,130$ 12/31/1712 BRIDGE Housing Corporation Terraza Palmera at St. Josephs Oakland 171 26,090$ 23,881$ 6/30/1913 Christian Church Homes Fargo Senior Center San Leandro 102 42,000$ 19,060$ **14 Christian Church Homes Harrison Street Senior Housing Oakland 100 25,420$ 1,635$ 25,420$ 5/31/19
15 Christian Church Homes Sylvester Rutledge Manor - North Oakland Senior Housing
Oakland 69 39,000$ 16,880$ **
16 Christian Church Homes Westlake Christian Terrace East Oakland 243 49,500$ 10,555$ 48,975$ 9/30/19
17 Christian Church Homes Westlake Christian Terrace West Oakland 250 49,500$ 14,560$ 49,490$ 9/30/19
18 EAH Housing Corporation Buchanan Park San Rafael 154 34,460$ 28,460$ 9/30/1919 EAH Housing Corporation Casa Adobe San Pablo 56 20,390$ 16,160$ 9/30/1920 EAH Housing Corporation Centertown San Rafael 180 34,930$ 34,930$ 34,930$ 12/31/1921 EAH Housing Corporation Cochrane Village Morgan Hill 318 49,900$ **22 EAH Housing Corporation Don de Dios San Rafael 267 41,070$ 41,070$ 41,070$ 12/31/1923 EAH Housing Corporation Drakes Way Larkspur 68 10,500$ 10,500$ 10,500$ 9/4/2024 EAH Housing Corporation Elena Gardens San Jose 362 49,080$ 49,080$ 49,080$ 12/20/1925 EAH Housing Corporation Floral Gardens Selma 143 43,286$ **26 EAH Housing Corporation Fountain West Fresno 196 47,133$ **27 EAH Housing Corporation Golden Oaks Oakley 52 19,090$ 15,890$ 9/30/1928 EAH Housing Corporation Los Robles Union City 420 49,930$ 48,815$ 48,815$ 3/31/2029 EAH Housing Corporation Palm Court San Jose 69 37,239$ 37,239$ 37,239$ 5/20/2030 EAH Housing Corporation Point Reyes Pt. Reyes Station 72 16,165$ 14,765$ 14,765$ 9/30/1931 EAH Housing Corporation Pollard Plaza San Jose 193 49,935$ 49,935$ 49,935$ 12/31/1932 EAH Housing Corporation Riviera Apartments San Rafael 77 24,960$ **33 EAH Housing Corporation Rodeo Gateway Rodeo 55 24,690$ 3/31/2034 EAH Housing Corporation San Clemente Place Corte Madera 212 41,478$ **35 EAH Housing Corporation Silver Oak Oakley 26 14,680$ 14,680$ 14,680$ 11/21/1936 EAH Housing Corporation The Oaks Walnut Creek 104 18,513$ 18,513$ 18,513$ 12/31/1937 EAH Housing Corporation Turina House San Rafael 91 18,150$ **38 EAH Housing Corporation Village Avante Morgan Hill 100 49,990$ **39 EAH Housing Corporation Vista Park 1 San Jose 112 37,311$ 35,197$ 35,197$ 5/20/2040 EAH Housing Corporation Vista Park 2 San Jose 122 37,311$ 35,517$ 35,517$ 5/20/20
41 East Bay Asian Local Development Corporation California Hotel Oakland 166 49,850$ 11,672$ 11,672$ 11/1/21
42 East Bay Asian Local Development Corporation Hismen Hin-Nu Terrace Oakland 371 49,994$ 11,650$ 11,650$ 11/1/21
43 East Bay Asian Local Development Corporation Noble Tower Apartments Oakland 270 50,000$ 11,460$ 11,460$ 11/1/21
44 Eden Housing, Inc 801 Alma Family Apartments Palo Alto 156 12,880$ 12,880$ 1/31/1945 Eden Housing, Inc Altenheim Oakland 199 19,380$ 18,030$ 7/1/1846 Eden Housing, Inc Camphora Soledad 134 21,040$ 21,040$ 1/31/1947 Eden Housing, Inc Carlow Court Apartments Dublin 74 12,880$ 12,880$ 1/31/1948 Eden Housing, Inc Cottonwood Place Apartments Fremont 146 16,015$ 15,615$ 7/1/1849 Eden Housing, Inc Studio 819 Apartments Mountain View 61 12,880$ 12,830$ 7/1/1850 Eden Housing, Inc Weinreb Place Hayward 24 12,351$ 11,951$ 12/15/1751 Eden Housing, Inc Wexford Way Dublin 416 12,880$ 12,480$ 7/1/18
52 Episcopal Community Services of San Francisco Bishop Swing Community House San Francisco 135 49,959$ 41,612$ 6/30/18
53 Episcopal Community Services of San Francisco Canon Barcus Community House San Francisco 153 49,520$ 35,547$ 6/30/18
54 Episcopal Community Services of San Francisco Canon Kip Community House San Francisco 103 49,593$ 36,092$ 6/30/18
55 First Community Housing Betty Ann Gardens San Jose 230 38,910$ 17,005$ 29,287$ 3/30/2056 First Community Housing Casa Feliz Studios San Jose 60 36,700$ 14,733$ 25,053$ 3/20/2057 First Community Housing Creekview inn San Jose 25 19,705$ 6,698$ 11,858$ 2/15/20
58 First Community Housing Curtner Studios Digital Connections
San Jose 200 25,756$ 22,712$ 3/10/17
59 First Community Housing El Paseo Digital Connections San Jose 98 21,030$ 20,350$ 3/10/1760 First Community Housing Fourth Street Apts San Jose 250 38,910$ 15,524$ 27,062$ 3/30/2061 First Community Housing Japantown Senior Apts San Jose 85 36,700$ 16,989$ 27,069$ 3/30/2062 First Community Housing Orchard Parkview Sunnyvale 130 36,700$ 15,010$ 26,770$ 3/30/20
Attachment F1: Public Housing Adoption Projects as of December 31, 2020
79
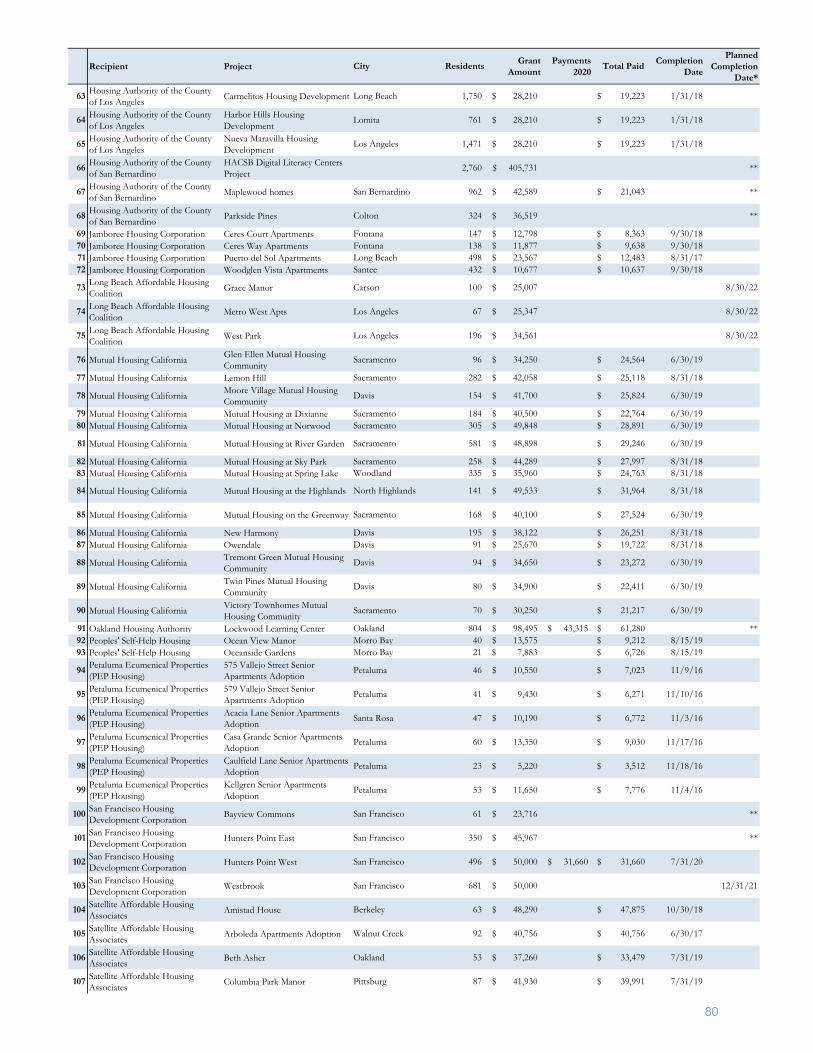
Recipient Project City Residents Grant Amount
Payments 2020 Total Paid Completion
Date
Planned Completion
Date*
63 Housing Authority of the County of Los Angeles Carmelitos Housing Development Long Beach 1,750 28,210$ 19,223$ 1/31/18
64 Housing Authority of the County of Los Angeles
Harbor Hills Housing Development
Lomita 761 28,210$ 19,223$ 1/31/18
65 Housing Authority of the County of Los Angeles
Nueva Maravilla Housing Development
Los Angeles 1,471 28,210$ 19,223$ 1/31/18
66 Housing Authority of the County of San Bernardino
HACSB Digital Literacy Centers Project
2,760 405,731$ **
67 Housing Authority of the County of San Bernardino Maplewood homes San Bernardino 962 42,589$ 21,043$ **
68 Housing Authority of the County of San Bernardino Parkside Pines Colton 324 36,519$ **
69 Jamboree Housing Corporation Ceres Court Apartments Fontana 147 12,798$ 8,363$ 9/30/1870 Jamboree Housing Corporation Ceres Way Apartments Fontana 138 11,877$ 9,638$ 9/30/1871 Jamboree Housing Corporation Puerto del Sol Apartments Long Beach 498 23,567$ 12,483$ 8/31/1772 Jamboree Housing Corporation Woodglen Vista Apartments Santee 432 10,677$ 10,637$ 9/30/18
73 Long Beach Affordable Housing Coalition Grace Manor Carson 100 25,007$ 8/30/22
74 Long Beach Affordable Housing Coalition Metro West Apts Los Angeles 67 25,347$ 8/30/22
75 Long Beach Affordable Housing Coalition West Park Los Angeles 196 34,561$ 8/30/22
76 Mutual Housing California Glen Ellen Mutual Housing Community
Sacramento 96 34,250$ 24,564$ 6/30/19
77 Mutual Housing California Lemon Hill Sacramento 282 42,058$ 25,118$ 8/31/18
78 Mutual Housing California Moore Village Mutual Housing Community
Davis 154 41,700$ 25,824$ 6/30/19
79 Mutual Housing California Mutual Housing at Dixianne Sacramento 184 40,500$ 22,764$ 6/30/1980 Mutual Housing California Mutual Housing at Norwood Sacramento 305 49,848$ 28,891$ 6/30/19
81 Mutual Housing California Mutual Housing at River Garden Sacramento 581 48,898$ 29,246$ 6/30/19
82 Mutual Housing California Mutual Housing at Sky Park Sacramento 258 44,289$ 27,997$ 8/31/1883 Mutual Housing California Mutual Housing at Spring Lake Woodland 335 35,960$ 24,763$ 8/31/18
84 Mutual Housing California Mutual Housing at the Highlands North Highlands 141 49,533$ 31,964$ 8/31/18
85 Mutual Housing California Mutual Housing on the Greenway Sacramento 168 40,100$ 27,524$ 6/30/19
86 Mutual Housing California New Harmony Davis 195 38,122$ 26,251$ 8/31/1887 Mutual Housing California Owendale Davis 91 25,670$ 19,722$ 8/31/18
88 Mutual Housing California Tremont Green Mutual Housing Community
Davis 94 34,650$ 23,272$ 6/30/19
89 Mutual Housing California Twin Pines Mutual Housing Community
Davis 80 34,900$ 22,411$ 6/30/19
90 Mutual Housing California Victory Townhomes Mutual Housing Community
Sacramento 70 30,250$ 21,217$ 6/30/19
91 Oakland Housing Authority Lockwood Learning Center Oakland 804 98,495$ 43,315$ 61,280$ **92 Peoples' Self-Help Housing Ocean View Manor Morro Bay 40 13,575$ 9,212$ 8/15/1993 Peoples' Self-Help Housing Oceanside Gardens Morro Bay 21 7,883$ 6,726$ 8/15/19
94 Petaluma Ecumenical Properties (PEP Housing)
575 Vallejo Street Senior Apartments Adoption
Petaluma 46 10,550$ 7,023$ 11/9/16
95 Petaluma Ecumenical Properties (PEP Housing)
579 Vallejo Street Senior Apartments Adoption
Petaluma 41 9,430$ 6,271$ 11/10/16
96 Petaluma Ecumenical Properties (PEP Housing)
Acacia Lane Senior Apartments Adoption
Santa Rosa 47 10,190$ 6,772$ 11/3/16
97 Petaluma Ecumenical Properties (PEP Housing)
Casa Grande Senior Apartments Adoption
Petaluma 60 13,350$ 9,030$ 11/17/16
98 Petaluma Ecumenical Properties (PEP Housing)
Caulfield Lane Senior Apartments Adoption
Petaluma 23 5,220$ 3,512$ 11/18/16
99 Petaluma Ecumenical Properties (PEP Housing)
Kellgren Senior Apartments Adoption
Petaluma 53 11,650$ 7,776$ 11/4/16
100 San Francisco Housing Development Corporation Bayview Commons San Francisco 61 23,716$ **
101 San Francisco Housing Development Corporation Hunters Point East San Francisco 350 45,967$ **
102 San Francisco Housing Development Corporation Hunters Point West San Francisco 496 50,000$ 31,660$ 31,660$ 7/31/20
103 San Francisco Housing Development Corporation Westbrook San Francisco 681 50,000$ 12/31/21
104 Satellite Affordable Housing Associates Amistad House Berkeley 63 48,290$ 47,875$ 10/30/18
105 Satellite Affordable Housing Associates Arboleda Apartments Adoption Walnut Creek 92 40,756$ 40,756$ 6/30/17
106 Satellite Affordable Housing Associates Beth Asher Oakland 53 37,260$ 33,479$ 7/31/19
107 Satellite Affordable Housing Associates Columbia Park Manor Pittsburg 87 41,930$ 39,991$ 7/31/19
80
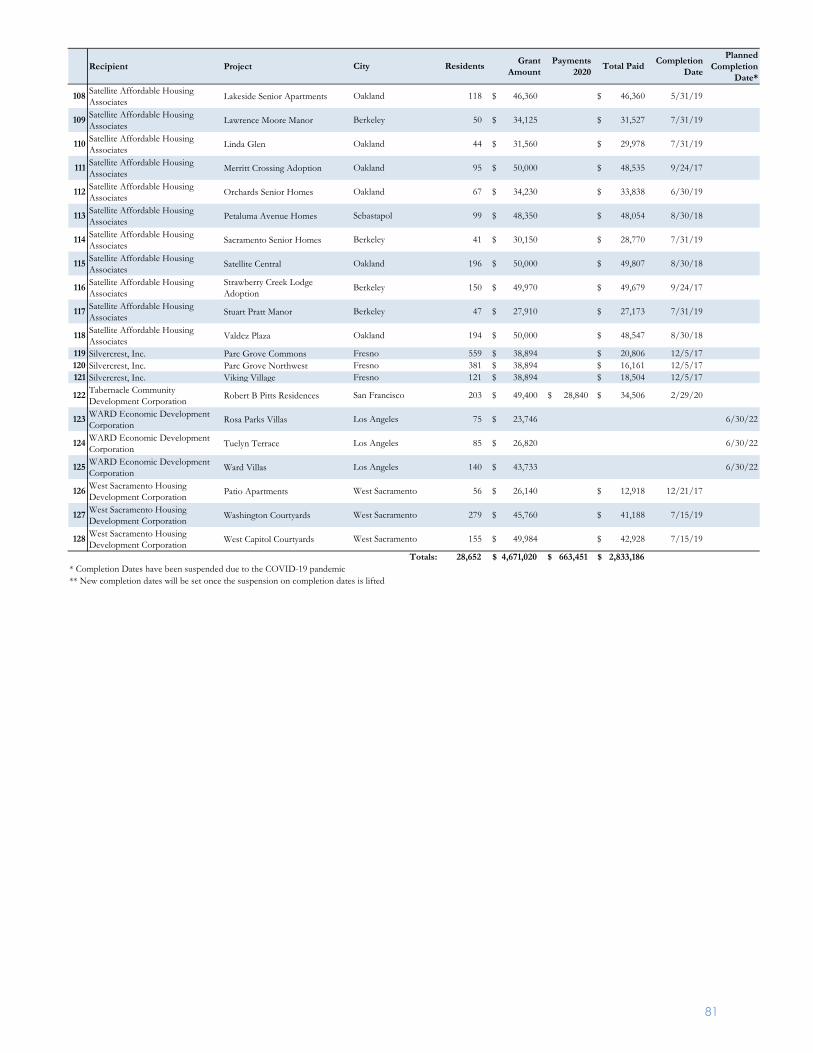
Recipient Project City Residents Grant Amount
Payments 2020 Total Paid Completion
Date
Planned Completion
Date*
108 Satellite Affordable Housing Associates Lakeside Senior Apartments Oakland 118 46,360$ 46,360$ 5/31/19
109 Satellite Affordable Housing Associates Lawrence Moore Manor Berkeley 50 34,125$ 31,527$ 7/31/19
110 Satellite Affordable Housing Associates Linda Glen Oakland 44 31,560$ 29,978$ 7/31/19
111 Satellite Affordable Housing Associates Merritt Crossing Adoption Oakland 95 50,000$ 48,535$ 9/24/17
112 Satellite Affordable Housing Associates Orchards Senior Homes Oakland 67 34,230$ 33,838$ 6/30/19
113 Satellite Affordable Housing Associates Petaluma Avenue Homes Sebastapol 99 48,350$ 48,054$ 8/30/18
114 Satellite Affordable Housing Associates Sacramento Senior Homes Berkeley 41 30,150$ 28,770$ 7/31/19
115 Satellite Affordable Housing Associates Satellite Central Oakland 196 50,000$ 49,807$ 8/30/18
116 Satellite Affordable Housing Associates
Strawberry Creek Lodge Adoption
Berkeley 150 49,970$ 49,679$ 9/24/17
117 Satellite Affordable Housing Associates Stuart Pratt Manor Berkeley 47 27,910$ 27,173$ 7/31/19
118 Satellite Affordable Housing Associates Valdez Plaza Oakland 194 50,000$ 48,547$ 8/30/18
119 Silvercrest, Inc. Parc Grove Commons Fresno 559 38,894$ 20,806$ 12/5/17120 Silvercrest, Inc. Parc Grove Northwest Fresno 381 38,894$ 16,161$ 12/5/17121 Silvercrest, Inc. Viking Village Fresno 121 38,894$ 18,504$ 12/5/17
122 Tabernacle Community Development Corporation Robert B Pitts Residences San Francisco 203 49,400$ 28,840$ 34,506$ 2/29/20
123 WARD Economic Development Corporation Rosa Parks Villas Los Angeles 75 23,746$ 6/30/22
124 WARD Economic Development Corporation Tuelyn Terrace Los Angeles 85 26,820$ 6/30/22
125 WARD Economic Development Corporation Ward Villas Los Angeles 140 43,733$ 6/30/22
126 West Sacramento Housing Development Corporation Patio Apartments West Sacramento 56 26,140$ 12,918$ 12/21/17
127 West Sacramento Housing Development Corporation Washington Courtyards West Sacramento 279 45,760$ 41,188$ 7/15/19
128 West Sacramento Housing Development Corporation West Capitol Courtyards West Sacramento 155 49,984$ 42,928$ 7/15/19
Totals: 28,652 4,671,020$ 663,451$ 2,833,186$ * Completion Dates have been suspended due to the COVID-19 pandemic** New completion dates will be set once the suspension on completion dates is lifted
81
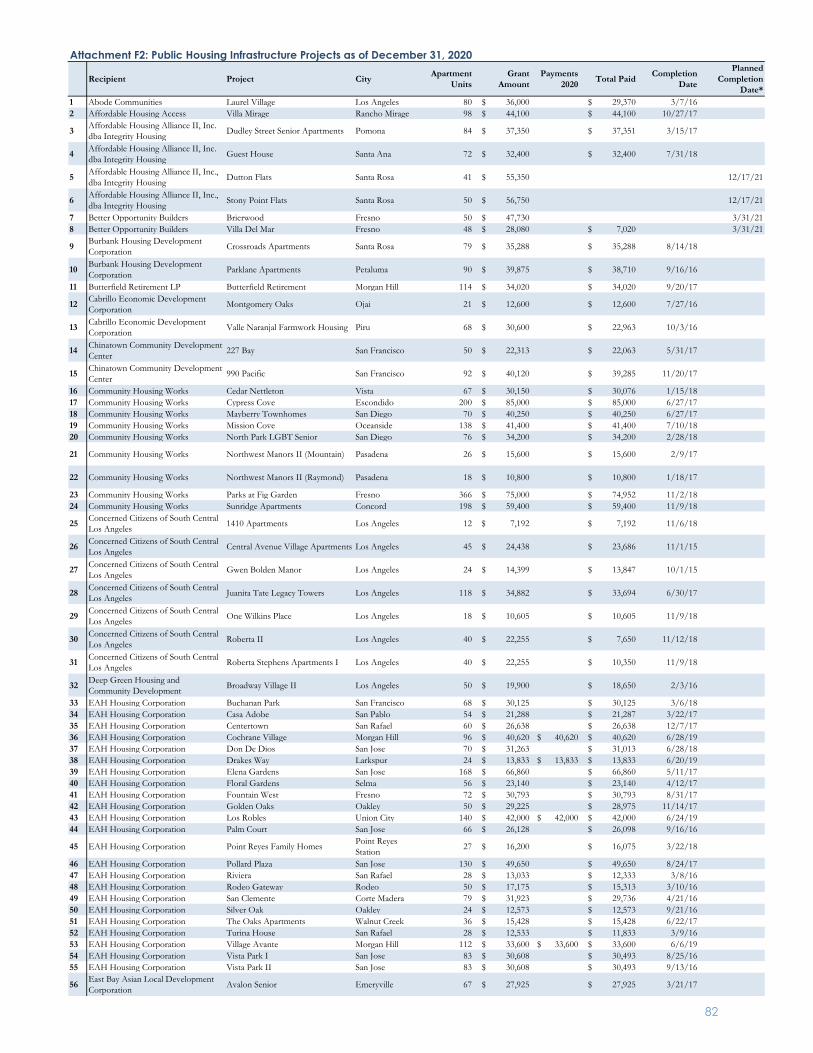
Recipient Project City Apartment Units
Grant Amount
Payments 2020 Total Paid Completion
Date
Planned Completion
Date*1 Abode Communities Laurel Village Los Angeles 80 $ 36,000 $ 29,370 3/7/162 Affordable Housing Access Villa Mirage Rancho Mirage 98 $ 44,100 $ 44,100 10/27/17
3 Affordable Housing Alliance II, Inc. dba Integrity Housing Dudley Street Senior Apartments Pomona 84 $ 37,350 $ 37,351 3/15/17
4 Affordable Housing Alliance II, Inc. dba Integrity Housing Guest House Santa Ana 72 $ 32,400 $ 32,400 7/31/18
5 Affordable Housing Alliance II, Inc., dba Integrity Housing Dutton Flats Santa Rosa 41 $ 55,350 12/17/21
6 Affordable Housing Alliance II, Inc., dba Integrity Housing Stony Point Flats Santa Rosa 50 $ 56,750 12/17/21
7 Better Opportunity Builders Brierwood Fresno 50 $ 47,730 3/31/218 Better Opportunity Builders Villa Del Mar Fresno 48 $ 28,080 $ 7,020 3/31/21
9 Burbank Housing Development Corporation Crossroads Apartments Santa Rosa 79 $ 35,288 $ 35,288 8/14/18
10 Burbank Housing Development Corporation Parklane Apartments Petaluma 90 $ 39,875 $ 38,710 9/16/16
11 Butterfield Retirement LP Butterfield Retirement Morgan Hill 114 $ 34,020 $ 34,020 9/20/17
12 Cabrillo Economic Development Corporation Montgomery Oaks Ojai 21 $ 12,600 $ 12,600 7/27/16
13 Cabrillo Economic Development Corporation Valle Naranjal Farmwork Housing Piru 68 $ 30,600 $ 22,963 10/3/16
14 Chinatown Community Development Center 227 Bay San Francisco 50 $ 22,313 $ 22,063 5/31/17
15 Chinatown Community Development Center 990 Pacific San Francisco 92 $ 40,120 $ 39,285 11/20/17
16 Community Housing Works Cedar Nettleton Vista 67 $ 30,150 $ 30,076 1/15/1817 Community Housing Works Cypress Cove Escondido 200 $ 85,000 $ 85,000 6/27/1718 Community Housing Works Mayberry Townhomes San Diego 70 $ 40,250 $ 40,250 6/27/1719 Community Housing Works Mission Cove Oceanside 138 $ 41,400 $ 41,400 7/10/1820 Community Housing Works North Park LGBT Senior San Diego 76 $ 34,200 $ 34,200 2/28/18
21 Community Housing Works Northwest Manors II (Mountain) Pasadena 26 $ 15,600 $ 15,600 2/9/17
22 Community Housing Works Northwest Manors II (Raymond) Pasadena 18 $ 10,800 $ 10,800 1/18/17
23 Community Housing Works Parks at Fig Garden Fresno 366 $ 75,000 $ 74,952 11/2/1824 Community Housing Works Sunridge Apartments Concord 198 $ 59,400 $ 59,400 11/9/18
25 Concerned Citizens of South Central Los Angeles 1410 Apartments Los Angeles 12 $ 7,192 $ 7,192 11/6/18
26 Concerned Citizens of South Central Los Angeles Central Avenue Village Apartments Los Angeles 45 $ 24,438 $ 23,686 11/1/15
27 Concerned Citizens of South Central Los Angeles Gwen Bolden Manor Los Angeles 24 $ 14,399 $ 13,847 10/1/15
28 Concerned Citizens of South Central Los Angeles Juanita Tate Legacy Towers Los Angeles 118 $ 34,882 $ 33,694 6/30/17
29 Concerned Citizens of South Central Los Angeles One Wilkins Place Los Angeles 18 $ 10,605 $ 10,605 11/9/18
30 Concerned Citizens of South Central Los Angeles Roberta II Los Angeles 40 $ 22,255 $ 7,650 11/12/18
31 Concerned Citizens of South Central Los Angeles Roberta Stephens Apartments I Los Angeles 40 $ 22,255 $ 10,350 11/9/18
32 Deep Green Housing and Community Development Broadway Village II Los Angeles 50 $ 19,900 $ 18,650 2/3/16
33 EAH Housing Corporation Buchanan Park San Francisco 68 $ 30,125 $ 30,125 3/6/1834 EAH Housing Corporation Casa Adobe San Pablo 54 $ 21,288 $ 21,287 3/22/1735 EAH Housing Corporation Centertown San Rafael 60 $ 26,638 $ 26,638 12/7/1736 EAH Housing Corporation Cochrane Village Morgan Hill 96 $ 40,620 $ 40,620 $ 40,620 6/28/1937 EAH Housing Corporation Don De Dios San Jose 70 $ 31,263 $ 31,013 6/28/1838 EAH Housing Corporation Drakes Way Larkspur 24 $ 13,833 $ 13,833 $ 13,833 6/20/1939 EAH Housing Corporation Elena Gardens San Jose 168 $ 66,860 $ 66,860 5/11/1740 EAH Housing Corporation Floral Gardens Selma 56 $ 23,140 $ 23,140 4/12/1741 EAH Housing Corporation Fountain West Fresno 72 $ 30,793 $ 30,793 8/31/1742 EAH Housing Corporation Golden Oaks Oakley 50 $ 29,225 $ 28,975 11/14/1743 EAH Housing Corporation Los Robles Union City 140 $ 42,000 $ 42,000 $ 42,000 6/24/1944 EAH Housing Corporation Palm Court San Jose 66 $ 26,128 $ 26,098 9/16/16
45 EAH Housing Corporation Point Reyes Family Homes Point Reyes Station 27 $ 16,200 $ 16,075 3/22/18
46 EAH Housing Corporation Pollard Plaza San Jose 130 $ 49,650 $ 49,650 8/24/1747 EAH Housing Corporation Riviera San Rafael 28 $ 13,033 $ 12,333 3/8/1648 EAH Housing Corporation Rodeo Gateway Rodeo 50 $ 17,175 $ 15,313 3/10/1649 EAH Housing Corporation San Clemente Corte Madera 79 $ 31,923 $ 29,736 4/21/1650 EAH Housing Corporation Silver Oak Oakley 24 $ 12,573 $ 12,573 9/21/1651 EAH Housing Corporation The Oaks Apartments Walnut Creek 36 $ 15,428 $ 15,428 6/22/1752 EAH Housing Corporation Turina House San Rafael 28 $ 12,533 $ 11,833 3/9/1653 EAH Housing Corporation Village Avante Morgan Hill 112 $ 33,600 $ 33,600 $ 33,600 6/6/1954 EAH Housing Corporation Vista Park I San Jose 83 $ 30,608 $ 30,493 8/25/1655 EAH Housing Corporation Vista Park II San Jose 83 $ 30,608 $ 30,493 9/13/16
56 East Bay Asian Local Development Corporation Avalon Senior Emeryville 67 $ 27,925 $ 27,925 3/21/17
Attachment F2: Public Housing Infrastructure Projects as of December 31, 2020
82
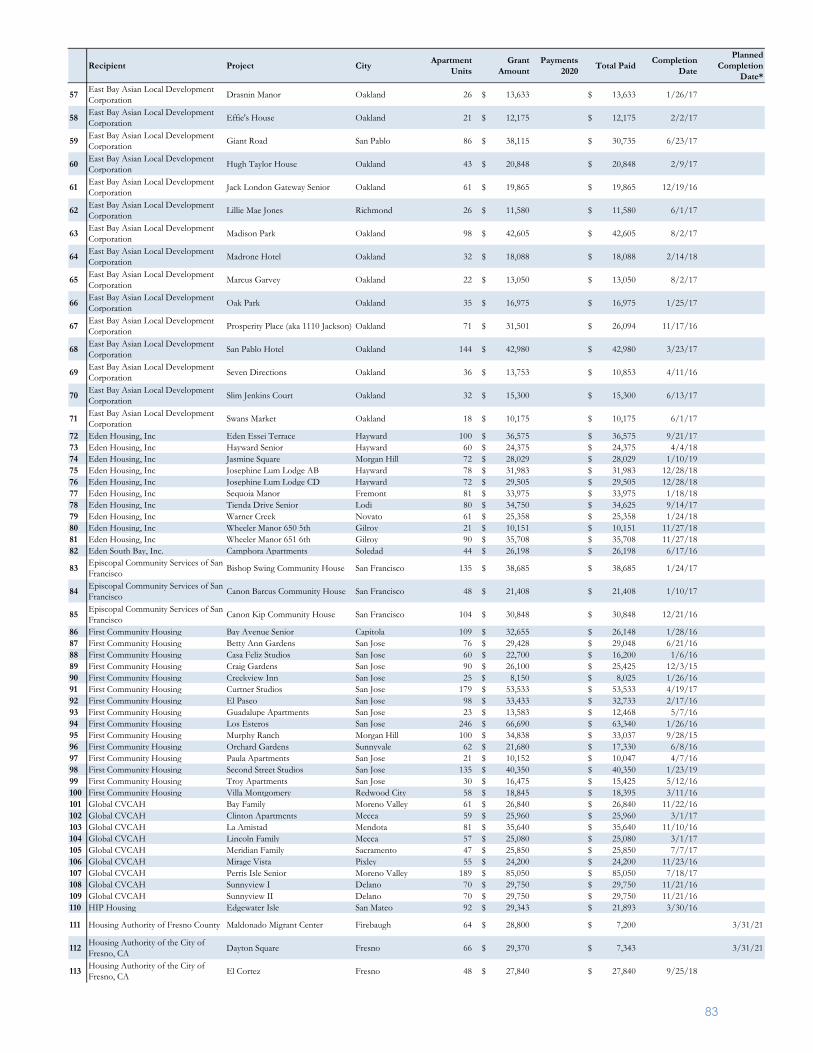
Recipient Project City Apartment Units
Grant Amount
Payments 2020 Total Paid Completion
Date
Planned Completion
Date*
57 East Bay Asian Local Development Corporation Drasnin Manor Oakland 26 $ 13,633 $ 13,633 1/26/17
58 East Bay Asian Local Development Corporation Effie's House Oakland 21 $ 12,175 $ 12,175 2/2/17
59 East Bay Asian Local Development Corporation Giant Road San Pablo 86 $ 38,115 $ 30,735 6/23/17
60 East Bay Asian Local Development Corporation Hugh Taylor House Oakland 43 $ 20,848 $ 20,848 2/9/17
61 East Bay Asian Local Development Corporation Jack London Gateway Senior Oakland 61 $ 19,865 $ 19,865 12/19/16
62 East Bay Asian Local Development Corporation Lillie Mae Jones Richmond 26 $ 11,580 $ 11,580 6/1/17
63 East Bay Asian Local Development Corporation Madison Park Oakland 98 $ 42,605 $ 42,605 8/2/17
64 East Bay Asian Local Development Corporation Madrone Hotel Oakland 32 $ 18,088 $ 18,088 2/14/18
65 East Bay Asian Local Development Corporation Marcus Garvey Oakland 22 $ 13,050 $ 13,050 8/2/17
66 East Bay Asian Local Development Corporation Oak Park Oakland 35 $ 16,975 $ 16,975 1/25/17
67 East Bay Asian Local Development Corporation Prosperity Place (aka 1110 Jackson) Oakland 71 $ 31,501 $ 26,094 11/17/16
68 East Bay Asian Local Development Corporation San Pablo Hotel Oakland 144 $ 42,980 $ 42,980 3/23/17
69 East Bay Asian Local Development Corporation Seven Directions Oakland 36 $ 13,753 $ 10,853 4/11/16
70 East Bay Asian Local Development Corporation Slim Jenkins Court Oakland 32 $ 15,300 $ 15,300 6/13/17
71 East Bay Asian Local Development Corporation Swans Market Oakland 18 $ 10,175 $ 10,175 6/1/17
72 Eden Housing, Inc Eden Essei Terrace Hayward 100 $ 36,575 $ 36,575 9/21/1773 Eden Housing, Inc Hayward Senior Hayward 60 $ 24,375 $ 24,375 4/4/1874 Eden Housing, Inc Jasmine Square Morgan Hill 72 $ 28,029 $ 28,029 1/10/1975 Eden Housing, Inc Josephine Lum Lodge AB Hayward 78 $ 31,983 $ 31,983 12/28/1876 Eden Housing, Inc Josephine Lum Lodge CD Hayward 72 $ 29,505 $ 29,505 12/28/1877 Eden Housing, Inc Sequoia Manor Fremont 81 $ 33,975 $ 33,975 1/18/1878 Eden Housing, Inc Tienda Drive Senior Lodi 80 $ 34,750 $ 34,625 9/14/1779 Eden Housing, Inc Warner Creek Novato 61 $ 25,358 $ 25,358 1/24/1880 Eden Housing, Inc Wheeler Manor 650 5th Gilroy 21 $ 10,151 $ 10,151 11/27/1881 Eden Housing, Inc Wheeler Manor 651 6th Gilroy 90 $ 35,708 $ 35,708 11/27/1882 Eden South Bay, Inc. Camphora Apartments Soledad 44 $ 26,198 $ 26,198 6/17/16
83 Episcopal Community Services of San Francisco Bishop Swing Community House San Francisco 135 $ 38,685 $ 38,685 1/24/17
84 Episcopal Community Services of San Francisco Canon Barcus Community House San Francisco 48 $ 21,408 $ 21,408 1/10/17
85 Episcopal Community Services of San Francisco Canon Kip Community House San Francisco 104 $ 30,848 $ 30,848 12/21/16
86 First Community Housing Bay Avenue Senior Capitola 109 $ 32,655 $ 26,148 1/28/1687 First Community Housing Betty Ann Gardens San Jose 76 $ 29,428 $ 29,048 6/21/1688 First Community Housing Casa Feliz Studios San Jose 60 $ 22,700 $ 16,200 1/6/1689 First Community Housing Craig Gardens San Jose 90 $ 26,100 $ 25,425 12/3/1590 First Community Housing Creekview Inn San Jose 25 $ 8,150 $ 8,025 1/26/1691 First Community Housing Curtner Studios San Jose 179 $ 53,533 $ 53,533 4/19/1792 First Community Housing El Paseo San Jose 98 $ 33,433 $ 32,733 2/17/1693 First Community Housing Guadalupe Apartments San Jose 23 $ 13,583 $ 12,468 5/7/1694 First Community Housing Los Esteros San Jose 246 $ 66,690 $ 63,340 1/26/1695 First Community Housing Murphy Ranch Morgan Hill 100 $ 34,838 $ 33,037 9/28/1596 First Community Housing Orchard Gardens Sunnyvale 62 $ 21,680 $ 17,330 6/8/1697 First Community Housing Paula Apartments San Jose 21 $ 10,152 $ 10,047 4/7/1698 First Community Housing Second Street Studios San Jose 135 $ 40,350 $ 40,350 1/23/1999 First Community Housing Troy Apartments San Jose 30 $ 16,475 $ 15,425 5/12/16100 First Community Housing Villa Montgomery Redwood City 58 $ 18,845 $ 18,395 3/11/16101 Global CVCAH Bay Family Moreno Valley 61 $ 26,840 $ 26,840 11/22/16102 Global CVCAH Clinton Apartments Mecca 59 $ 25,960 $ 25,960 3/1/17103 Global CVCAH La Amistad Mendota 81 $ 35,640 $ 35,640 11/10/16104 Global CVCAH Lincoln Family Mecca 57 $ 25,080 $ 25,080 3/1/17105 Global CVCAH Meridian Family Sacramento 47 $ 25,850 $ 25,850 7/7/17106 Global CVCAH Mirage Vista Pixley 55 $ 24,200 $ 24,200 11/23/16107 Global CVCAH Perris Isle Senior Moreno Valley 189 $ 85,050 $ 85,050 7/18/17108 Global CVCAH Sunnyview I Delano 70 $ 29,750 $ 29,750 11/21/16109 Global CVCAH Sunnyview II Delano 70 $ 29,750 $ 29,750 11/21/16110 HIP Housing Edgewater Isle San Mateo 92 $ 29,343 $ 21,893 3/30/16
111 Housing Authority of Fresno County Maldonado Migrant Center Firebaugh 64 $ 28,800 $ 7,200 3/31/21
112 Housing Authority of the City of Fresno, CA Dayton Square Fresno 66 $ 29,370 $ 7,343 3/31/21
113 Housing Authority of the City of Fresno, CA El Cortez Fresno 48 $ 27,840 $ 27,840 9/25/18
83
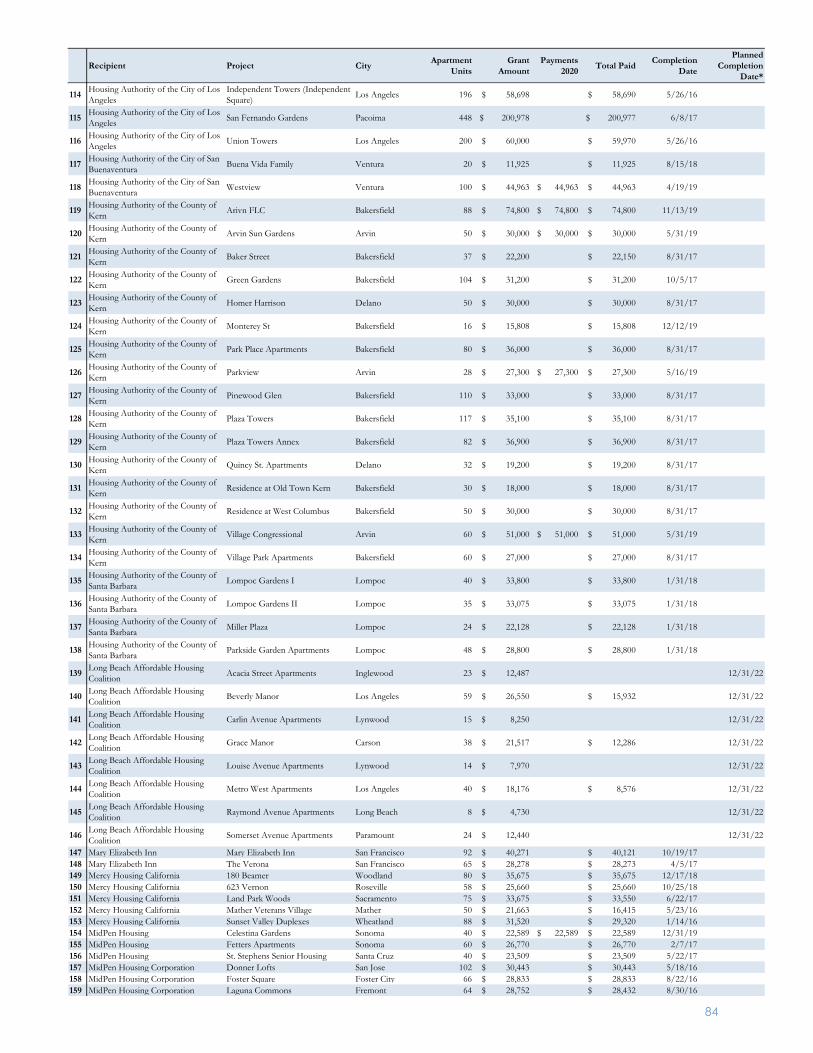
Recipient Project City Apartment Units
Grant Amount
Payments 2020 Total Paid Completion
Date
Planned Completion
Date*
114 Housing Authority of the City of Los Angeles
Independent Towers (Independent Square) Los Angeles 196 $ 58,698 $ 58,690 5/26/16
115 Housing Authority of the City of Los Angeles San Fernando Gardens Pacoima 448 $ 200,978 $ 200,977 6/8/17
116 Housing Authority of the City of Los Angeles Union Towers Los Angeles 200 $ 60,000 $ 59,970 5/26/16
117 Housing Authority of the City of San Buenaventura Buena Vida Family Ventura 20 $ 11,925 $ 11,925 8/15/18
118 Housing Authority of the City of San Buenaventura Westview Ventura 100 $ 44,963 $ 44,963 $ 44,963 4/19/19
119 Housing Authority of the County of Kern Arivn FLC Bakersfield 88 $ 74,800 $ 74,800 $ 74,800 11/13/19
120 Housing Authority of the County of Kern Arvin Sun Gardens Arvin 50 $ 30,000 $ 30,000 $ 30,000 5/31/19
121 Housing Authority of the County of Kern Baker Street Bakersfield 37 $ 22,200 $ 22,150 8/31/17
122 Housing Authority of the County of Kern Green Gardens Bakersfield 104 $ 31,200 $ 31,200 10/5/17
123 Housing Authority of the County of Kern Homer Harrison Delano 50 $ 30,000 $ 30,000 8/31/17
124 Housing Authority of the County of Kern Monterey St Bakersfield 16 $ 15,808 $ 15,808 12/12/19
125 Housing Authority of the County of Kern Park Place Apartments Bakersfield 80 $ 36,000 $ 36,000 8/31/17
126 Housing Authority of the County of Kern Parkview Arvin 28 $ 27,300 $ 27,300 $ 27,300 5/16/19
127 Housing Authority of the County of Kern Pinewood Glen Bakersfield 110 $ 33,000 $ 33,000 8/31/17
128 Housing Authority of the County of Kern Plaza Towers Bakersfield 117 $ 35,100 $ 35,100 8/31/17
129 Housing Authority of the County of Kern Plaza Towers Annex Bakersfield 82 $ 36,900 $ 36,900 8/31/17
130 Housing Authority of the County of Kern Quincy St. Apartments Delano 32 $ 19,200 $ 19,200 8/31/17
131 Housing Authority of the County of Kern Residence at Old Town Kern Bakersfield 30 $ 18,000 $ 18,000 8/31/17
132 Housing Authority of the County of Kern Residence at West Columbus Bakersfield 50 $ 30,000 $ 30,000 8/31/17
133 Housing Authority of the County of Kern Village Congressional Arvin 60 $ 51,000 $ 51,000 $ 51,000 5/31/19
134 Housing Authority of the County of Kern Village Park Apartments Bakersfield 60 $ 27,000 $ 27,000 8/31/17
135 Housing Authority of the County of Santa Barbara Lompoc Gardens I Lompoc 40 $ 33,800 $ 33,800 1/31/18
136 Housing Authority of the County of Santa Barbara Lompoc Gardens II Lompoc 35 $ 33,075 $ 33,075 1/31/18
137 Housing Authority of the County of Santa Barbara Miller Plaza Lompoc 24 $ 22,128 $ 22,128 1/31/18
138 Housing Authority of the County of Santa Barbara Parkside Garden Apartments Lompoc 48 $ 28,800 $ 28,800 1/31/18
139 Long Beach Affordable Housing Coalition Acacia Street Apartments Inglewood 23 $ 12,487 12/31/22
140 Long Beach Affordable Housing Coalition Beverly Manor Los Angeles 59 $ 26,550 $ 15,932 12/31/22
141 Long Beach Affordable Housing Coalition Carlin Avenue Apartments Lynwood 15 $ 8,250 12/31/22
142 Long Beach Affordable Housing Coalition Grace Manor Carson 38 $ 21,517 $ 12,286 12/31/22
143 Long Beach Affordable Housing Coalition Louise Avenue Apartments Lynwood 14 $ 7,970 12/31/22
144 Long Beach Affordable Housing Coalition Metro West Apartments Los Angeles 40 $ 18,176 $ 8,576 12/31/22
145 Long Beach Affordable Housing Coalition Raymond Avenue Apartments Long Beach 8 $ 4,730 12/31/22
146 Long Beach Affordable Housing Coalition Somerset Avenue Apartments Paramount 24 $ 12,440 12/31/22
147 Mary Elizabeth Inn Mary Elizabeth Inn San Francisco 92 $ 40,271 $ 40,121 10/19/17148 Mary Elizabeth Inn The Verona San Francisco 65 $ 28,278 $ 28,273 4/5/17149 Mercy Housing California 180 Beamer Woodland 80 $ 35,675 $ 35,675 12/17/18150 Mercy Housing California 623 Vernon Roseville 58 $ 25,660 $ 25,660 10/25/18151 Mercy Housing California Land Park Woods Sacramento 75 $ 33,675 $ 33,550 6/22/17152 Mercy Housing California Mather Veterans Village Mather 50 $ 21,663 $ 16,415 5/23/16153 Mercy Housing California Sunset Valley Duplexes Wheatland 88 $ 31,520 $ 29,320 1/14/16154 MidPen Housing Celestina Gardens Sonoma 40 $ 22,589 $ 22,589 $ 22,589 12/31/19155 MidPen Housing Fetters Apartments Sonoma 60 $ 26,770 $ 26,770 2/7/17156 MidPen Housing St. Stephens Senior Housing Santa Cruz 40 $ 23,509 $ 23,509 5/22/17157 MidPen Housing Corporation Donner Lofts San Jose 102 $ 30,443 $ 30,443 5/18/16158 MidPen Housing Corporation Foster Square Foster City 66 $ 28,833 $ 28,833 8/22/16159 MidPen Housing Corporation Laguna Commons Fremont 64 $ 28,752 $ 28,432 8/30/16
84
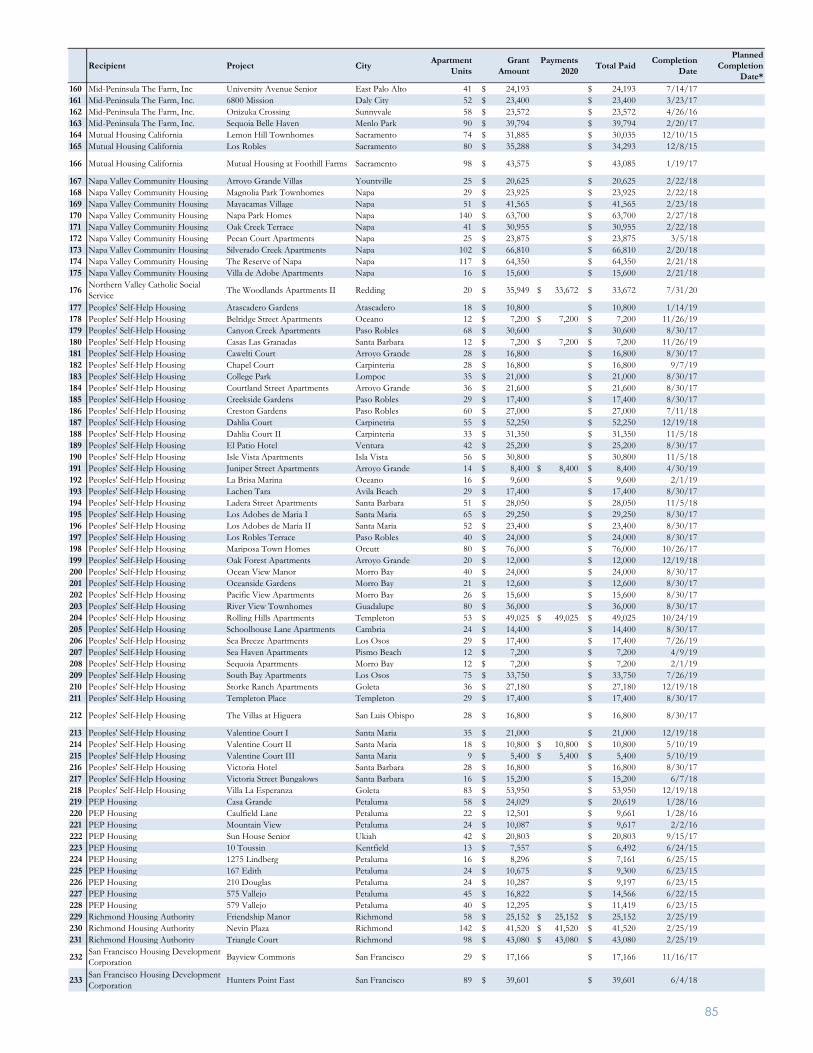
Recipient Project City Apartment Units
Grant Amount
Payments 2020 Total Paid Completion
Date
Planned Completion
Date*160 Mid-Peninsula The Farm, Inc University Avenue Senior East Palo Alto 41 $ 24,193 $ 24,193 7/14/17161 Mid-Peninsula The Farm, Inc. 6800 Mission Daly City 52 $ 23,400 $ 23,400 3/23/17162 Mid-Peninsula The Farm, Inc. Onizuka Crossing Sunnyvale 58 $ 23,572 $ 23,572 4/26/16163 Mid-Peninsula The Farm, Inc. Sequoia Belle Haven Menlo Park 90 $ 39,794 $ 39,794 2/20/17164 Mutual Housing California Lemon Hill Townhomes Sacramento 74 $ 31,885 $ 30,035 12/10/15165 Mutual Housing California Los Robles Sacramento 80 $ 35,288 $ 34,293 12/8/15
166 Mutual Housing California Mutual Housing at Foothill Farms Sacramento 98 $ 43,575 $ 43,085 1/19/17
167 Napa Valley Community Housing Arroyo Grande Villas Yountville 25 $ 20,625 $ 20,625 2/22/18168 Napa Valley Community Housing Magnolia Park Townhomes Napa 29 $ 23,925 $ 23,925 2/22/18169 Napa Valley Community Housing Mayacamas Village Napa 51 $ 41,565 $ 41,565 2/23/18170 Napa Valley Community Housing Napa Park Homes Napa 140 $ 63,700 $ 63,700 2/27/18171 Napa Valley Community Housing Oak Creek Terrace Napa 41 $ 30,955 $ 30,955 2/22/18172 Napa Valley Community Housing Pecan Court Apartments Napa 25 $ 23,875 $ 23,875 3/5/18173 Napa Valley Community Housing Silverado Creek Apartments Napa 102 $ 66,810 $ 66,810 2/20/18174 Napa Valley Community Housing The Reserve of Napa Napa 117 $ 64,350 $ 64,350 2/21/18175 Napa Valley Community Housing Villa de Adobe Apartments Napa 16 $ 15,600 $ 15,600 2/21/18
176 Northern Valley Catholic Social Service The Woodlands Apartments II Redding 20 $ 35,949 $ 33,672 $ 33,672 7/31/20
177 Peoples' Self-Help Housing Atascadero Gardens Atascadero 18 $ 10,800 $ 10,800 1/14/19178 Peoples' Self-Help Housing Belridge Street Apartments Oceano 12 $ 7,200 $ 7,200 $ 7,200 11/26/19179 Peoples' Self-Help Housing Canyon Creek Apartments Paso Robles 68 $ 30,600 $ 30,600 8/30/17180 Peoples' Self-Help Housing Casas Las Granadas Santa Barbara 12 $ 7,200 $ 7,200 $ 7,200 11/26/19181 Peoples' Self-Help Housing Cawelti Court Arroyo Grande 28 $ 16,800 $ 16,800 8/30/17182 Peoples' Self-Help Housing Chapel Court Carpinteria 28 $ 16,800 $ 16,800 9/7/19183 Peoples' Self-Help Housing College Park Lompoc 35 $ 21,000 $ 21,000 8/30/17184 Peoples' Self-Help Housing Courtland Street Apartments Arroyo Grande 36 $ 21,600 $ 21,600 8/30/17185 Peoples' Self-Help Housing Creekside Gardens Paso Robles 29 $ 17,400 $ 17,400 8/30/17186 Peoples' Self-Help Housing Creston Gardens Paso Robles 60 $ 27,000 $ 27,000 7/11/18187 Peoples' Self-Help Housing Dahlia Court Carpinetria 55 $ 52,250 $ 52,250 12/19/18188 Peoples' Self-Help Housing Dahlia Court II Carpinteria 33 $ 31,350 $ 31,350 11/5/18189 Peoples' Self-Help Housing El Patio Hotel Ventura 42 $ 25,200 $ 25,200 8/30/17190 Peoples' Self-Help Housing Isle Vista Apartments Isla Vista 56 $ 30,800 $ 30,800 11/5/18191 Peoples' Self-Help Housing Juniper Street Apartments Arroyo Grande 14 $ 8,400 $ 8,400 $ 8,400 4/30/19192 Peoples' Self-Help Housing La Brisa Marina Oceano 16 $ 9,600 $ 9,600 2/1/19193 Peoples' Self-Help Housing Lachen Tara Avila Beach 29 $ 17,400 $ 17,400 8/30/17194 Peoples' Self-Help Housing Ladera Street Apartments Santa Barbara 51 $ 28,050 $ 28,050 11/5/18195 Peoples' Self-Help Housing Los Adobes de Maria I Santa Maria 65 $ 29,250 $ 29,250 8/30/17196 Peoples' Self-Help Housing Los Adobes de Maria II Santa Maria 52 $ 23,400 $ 23,400 8/30/17197 Peoples' Self-Help Housing Los Robles Terrace Paso Robles 40 $ 24,000 $ 24,000 8/30/17198 Peoples' Self-Help Housing Mariposa Town Homes Orcutt 80 $ 76,000 $ 76,000 10/26/17199 Peoples' Self-Help Housing Oak Forest Apartments Arroyo Grande 20 $ 12,000 $ 12,000 12/19/18200 Peoples' Self-Help Housing Ocean View Manor Morro Bay 40 $ 24,000 $ 24,000 8/30/17201 Peoples' Self-Help Housing Oceanside Gardens Morro Bay 21 $ 12,600 $ 12,600 8/30/17202 Peoples' Self-Help Housing Pacific View Apartments Morro Bay 26 $ 15,600 $ 15,600 8/30/17203 Peoples' Self-Help Housing River View Townhomes Guadalupe 80 $ 36,000 $ 36,000 8/30/17204 Peoples' Self-Help Housing Rolling Hills Apartments Templeton 53 $ 49,025 $ 49,025 $ 49,025 10/24/19205 Peoples' Self-Help Housing Schoolhouse Lane Apartments Cambria 24 $ 14,400 $ 14,400 8/30/17206 Peoples' Self-Help Housing Sea Breeze Apartments Los Osos 29 $ 17,400 $ 17,400 7/26/19207 Peoples' Self-Help Housing Sea Haven Apartments Pismo Beach 12 $ 7,200 $ 7,200 4/9/19208 Peoples' Self-Help Housing Sequoia Apartments Morro Bay 12 $ 7,200 $ 7,200 2/1/19209 Peoples' Self-Help Housing South Bay Apartments Los Osos 75 $ 33,750 $ 33,750 7/26/19210 Peoples' Self-Help Housing Storke Ranch Apartments Goleta 36 $ 27,180 $ 27,180 12/19/18211 Peoples' Self-Help Housing Templeton Place Templeton 29 $ 17,400 $ 17,400 8/30/17
212 Peoples' Self-Help Housing The Villas at Higuera San Luis Obispo 28 $ 16,800 $ 16,800 8/30/17
213 Peoples' Self-Help Housing Valentine Court I Santa Maria 35 $ 21,000 $ 21,000 12/19/18214 Peoples' Self-Help Housing Valentine Court II Santa Maria 18 $ 10,800 $ 10,800 $ 10,800 5/10/19215 Peoples' Self-Help Housing Valentine Court III Santa Maria 9 $ 5,400 $ 5,400 $ 5,400 5/10/19216 Peoples' Self-Help Housing Victoria Hotel Santa Barbara 28 $ 16,800 $ 16,800 8/30/17217 Peoples' Self-Help Housing Victoria Street Bungalows Santa Barbara 16 $ 15,200 $ 15,200 6/7/18218 Peoples' Self-Help Housing Villa La Esperanza Goleta 83 $ 53,950 $ 53,950 12/19/18219 PEP Housing Casa Grande Petaluma 58 $ 24,029 $ 20,619 1/28/16220 PEP Housing Caulfield Lane Petaluma 22 $ 12,501 $ 9,661 1/28/16221 PEP Housing Mountain View Petaluma 24 $ 10,087 $ 9,617 2/2/16222 PEP Housing Sun House Senior Ukiah 42 $ 20,803 $ 20,803 9/15/17223 PEP Housing 10 Toussin Kentfield 13 $ 7,557 $ 6,492 6/24/15224 PEP Housing 1275 Lindberg Petaluma 16 $ 8,296 $ 7,161 6/25/15225 PEP Housing 167 Edith Petaluma 24 $ 10,675 $ 9,300 6/23/15226 PEP Housing 210 Douglas Petaluma 24 $ 10,287 $ 9,197 6/23/15227 PEP Housing 575 Vallejo Petaluma 45 $ 16,822 $ 14,566 6/22/15228 PEP Housing 579 Vallejo Petaluma 40 $ 12,295 $ 11,419 6/23/15229 Richmond Housing Authority Friendship Manor Richmond 58 $ 25,152 $ 25,152 $ 25,152 2/25/19230 Richmond Housing Authority Nevin Plaza Richmond 142 $ 41,520 $ 41,520 $ 41,520 2/25/19231 Richmond Housing Authority Triangle Court Richmond 98 $ 43,080 $ 43,080 $ 43,080 2/25/19
232 San Francisco Housing Development Corporation Bayview Commons San Francisco 29 $ 17,166 $ 17,166 11/16/17
233 San Francisco Housing Development Corporation Hunters Point East San Francisco 89 $ 39,601 $ 39,601 6/4/18
85
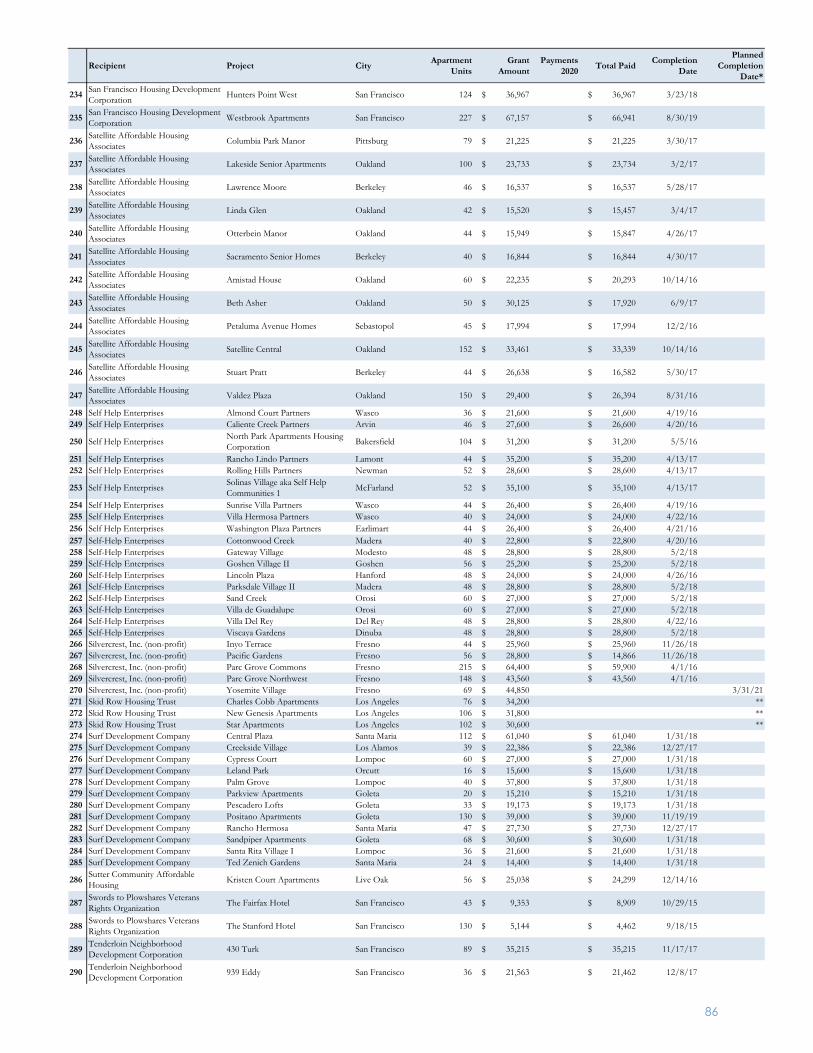
Recipient Project City Apartment Units
Grant Amount
Payments 2020 Total Paid Completion
Date
Planned Completion
Date*
234 San Francisco Housing Development Corporation Hunters Point West San Francisco 124 $ 36,967 $ 36,967 3/23/18
235 San Francisco Housing Development Corporation Westbrook Apartments San Francisco 227 $ 67,157 $ 66,941 8/30/19
236 Satellite Affordable Housing Associates Columbia Park Manor Pittsburg 79 $ 21,225 $ 21,225 3/30/17
237 Satellite Affordable Housing Associates Lakeside Senior Apartments Oakland 100 $ 23,733 $ 23,734 3/2/17
238 Satellite Affordable Housing Associates Lawrence Moore Berkeley 46 $ 16,537 $ 16,537 5/28/17
239 Satellite Affordable Housing Associates Linda Glen Oakland 42 $ 15,520 $ 15,457 3/4/17
240 Satellite Affordable Housing Associates Otterbein Manor Oakland 44 $ 15,949 $ 15,847 4/26/17
241 Satellite Affordable Housing Associates Sacramento Senior Homes Berkeley 40 $ 16,844 $ 16,844 4/30/17
242 Satellite Affordable Housing Associates Amistad House Oakland 60 $ 22,235 $ 20,293 10/14/16
243 Satellite Affordable Housing Associates Beth Asher Oakland 50 $ 30,125 $ 17,920 6/9/17
244 Satellite Affordable Housing Associates Petaluma Avenue Homes Sebastopol 45 $ 17,994 $ 17,994 12/2/16
245 Satellite Affordable Housing Associates Satellite Central Oakland 152 $ 33,461 $ 33,339 10/14/16
246 Satellite Affordable Housing Associates Stuart Pratt Berkeley 44 $ 26,638 $ 16,582 5/30/17
247 Satellite Affordable Housing Associates Valdez Plaza Oakland 150 $ 29,400 $ 26,394 8/31/16
248 Self Help Enterprises Almond Court Partners Wasco 36 $ 21,600 $ 21,600 4/19/16249 Self Help Enterprises Caliente Creek Partners Arvin 46 $ 27,600 $ 26,600 4/20/16
250 Self Help Enterprises North Park Apartments Housing Corporation Bakersfield 104 $ 31,200 $ 31,200 5/5/16
251 Self Help Enterprises Rancho Lindo Partners Lamont 44 $ 35,200 $ 35,200 4/13/17252 Self Help Enterprises Rolling Hills Partners Newman 52 $ 28,600 $ 28,600 4/13/17
253 Self Help Enterprises Solinas Village aka Self Help Communities 1 McFarland 52 $ 35,100 $ 35,100 4/13/17
254 Self Help Enterprises Sunrise Villa Partners Wasco 44 $ 26,400 $ 26,400 4/19/16255 Self Help Enterprises Villa Hermosa Partners Wasco 40 $ 24,000 $ 24,000 4/22/16256 Self Help Enterprises Washington Plaza Partners Earlimart 44 $ 26,400 $ 26,400 4/21/16257 Self-Help Enterprises Cottonwood Creek Madera 40 $ 22,800 $ 22,800 4/20/16258 Self-Help Enterprises Gateway Village Modesto 48 $ 28,800 $ 28,800 5/2/18259 Self-Help Enterprises Goshen Village II Goshen 56 $ 25,200 $ 25,200 5/2/18260 Self-Help Enterprises Lincoln Plaza Hanford 48 $ 24,000 $ 24,000 4/26/16261 Self-Help Enterprises Parksdale Village II Madera 48 $ 28,800 $ 28,800 5/2/18262 Self-Help Enterprises Sand Creek Orosi 60 $ 27,000 $ 27,000 5/2/18263 Self-Help Enterprises Villa de Guadalupe Orosi 60 $ 27,000 $ 27,000 5/2/18264 Self-Help Enterprises Villa Del Rey Del Rey 48 $ 28,800 $ 28,800 4/22/16265 Self-Help Enterprises Viscaya Gardens Dinuba 48 $ 28,800 $ 28,800 5/2/18266 Silvercrest, Inc. (non-profit) Inyo Terrace Fresno 44 $ 25,960 $ 25,960 11/26/18267 Silvercrest, Inc. (non-profit) Pacific Gardens Fresno 56 $ 28,800 $ 14,866 11/26/18268 Silvercrest, Inc. (non-profit) Parc Grove Commons Fresno 215 $ 64,400 $ 59,900 4/1/16269 Silvercrest, Inc. (non-profit) Parc Grove Northwest Fresno 148 $ 43,560 $ 43,560 4/1/16270 Silvercrest, Inc. (non-profit) Yosemite Village Fresno 69 $ 44,850 3/31/21271 Skid Row Housing Trust Charles Cobb Apartments Los Angeles 76 $ 34,200 **272 Skid Row Housing Trust New Genesis Apartments Los Angeles 106 $ 31,800 **273 Skid Row Housing Trust Star Apartments Los Angeles 102 $ 30,600 **274 Surf Development Company Central Plaza Santa Maria 112 $ 61,040 $ 61,040 1/31/18275 Surf Development Company Creekside Village Los Alamos 39 $ 22,386 $ 22,386 12/27/17276 Surf Development Company Cypress Court Lompoc 60 $ 27,000 $ 27,000 1/31/18277 Surf Development Company Leland Park Orcutt 16 $ 15,600 $ 15,600 1/31/18278 Surf Development Company Palm Grove Lompoc 40 $ 37,800 $ 37,800 1/31/18279 Surf Development Company Parkview Apartments Goleta 20 $ 15,210 $ 15,210 1/31/18280 Surf Development Company Pescadero Lofts Goleta 33 $ 19,173 $ 19,173 1/31/18281 Surf Development Company Positano Apartments Goleta 130 $ 39,000 $ 39,000 11/19/19282 Surf Development Company Rancho Hermosa Santa Maria 47 $ 27,730 $ 27,730 12/27/17283 Surf Development Company Sandpiper Apartments Goleta 68 $ 30,600 $ 30,600 1/31/18284 Surf Development Company Santa Rita Village I Lompoc 36 $ 21,600 $ 21,600 1/31/18285 Surf Development Company Ted Zenich Gardens Santa Maria 24 $ 14,400 $ 14,400 1/31/18
286 Sutter Community Affordable Housing Kristen Court Apartments Live Oak 56 $ 25,038 $ 24,299 12/14/16
287 Swords to Plowshares Veterans Rights Organization The Fairfax Hotel San Francisco 43 $ 9,353 $ 8,909 10/29/15
288 Swords to Plowshares Veterans Rights Organization The Stanford Hotel San Francisco 130 $ 5,144 $ 4,462 9/18/15
289 Tenderloin Neighborhood Development Corporation 430 Turk San Francisco 89 $ 35,215 $ 35,215 11/17/17
290 Tenderloin Neighborhood Development Corporation 939 Eddy San Francisco 36 $ 21,563 $ 21,462 12/8/17
86
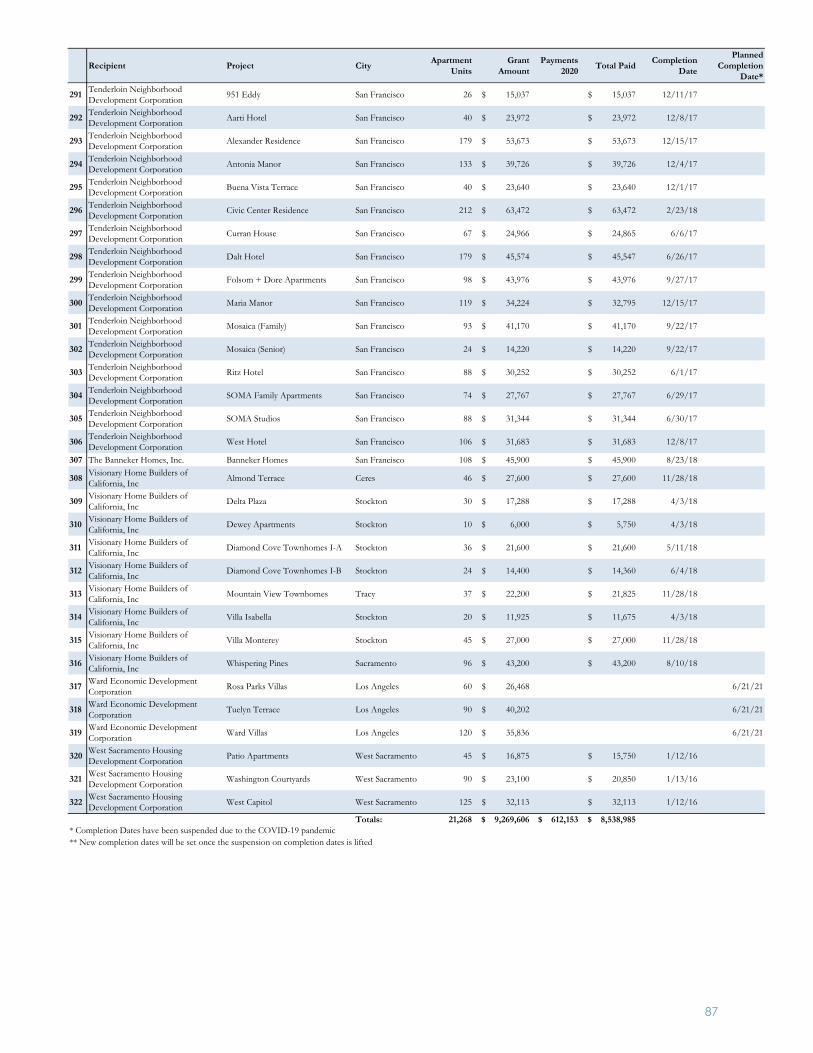
Recipient Project City Apartment Units
Grant Amount
Payments 2020 Total Paid Completion
Date
Planned Completion
Date*
291 Tenderloin Neighborhood Development Corporation 951 Eddy San Francisco 26 $ 15,037 $ 15,037 12/11/17
292 Tenderloin Neighborhood Development Corporation Aarti Hotel San Francisco 40 $ 23,972 $ 23,972 12/8/17
293 Tenderloin Neighborhood Development Corporation Alexander Residence San Francisco 179 $ 53,673 $ 53,673 12/15/17
294 Tenderloin Neighborhood Development Corporation Antonia Manor San Francisco 133 $ 39,726 $ 39,726 12/4/17
295 Tenderloin Neighborhood Development Corporation Buena Vista Terrace San Francisco 40 $ 23,640 $ 23,640 12/1/17
296 Tenderloin Neighborhood Development Corporation Civic Center Residence San Francisco 212 $ 63,472 $ 63,472 2/23/18
297 Tenderloin Neighborhood Development Corporation Curran House San Francisco 67 $ 24,966 $ 24,865 6/6/17
298 Tenderloin Neighborhood Development Corporation Dalt Hotel San Francisco 179 $ 45,574 $ 45,547 6/26/17
299 Tenderloin Neighborhood Development Corporation Folsom + Dore Apartments San Francisco 98 $ 43,976 $ 43,976 9/27/17
300 Tenderloin Neighborhood Development Corporation Maria Manor San Francisco 119 $ 34,224 $ 32,795 12/15/17
301 Tenderloin Neighborhood Development Corporation Mosaica (Family) San Francisco 93 $ 41,170 $ 41,170 9/22/17
302 Tenderloin Neighborhood Development Corporation Mosaica (Senior) San Francisco 24 $ 14,220 $ 14,220 9/22/17
303 Tenderloin Neighborhood Development Corporation Ritz Hotel San Francisco 88 $ 30,252 $ 30,252 6/1/17
304 Tenderloin Neighborhood Development Corporation SOMA Family Apartments San Francisco 74 $ 27,767 $ 27,767 6/29/17
305 Tenderloin Neighborhood Development Corporation SOMA Studios San Francisco 88 $ 31,344 $ 31,344 6/30/17
306 Tenderloin Neighborhood Development Corporation West Hotel San Francisco 106 $ 31,683 $ 31,683 12/8/17
307 The Banneker Homes, Inc. Banneker Homes San Francisco 108 $ 45,900 $ 45,900 8/23/18
308 Visionary Home Builders of California, Inc Almond Terrace Ceres 46 $ 27,600 $ 27,600 11/28/18
309 Visionary Home Builders of California, Inc Delta Plaza Stockton 30 $ 17,288 $ 17,288 4/3/18
310 Visionary Home Builders of California, Inc Dewey Apartments Stockton 10 $ 6,000 $ 5,750 4/3/18
311 Visionary Home Builders of California, Inc Diamond Cove Townhomes I-A Stockton 36 $ 21,600 $ 21,600 5/11/18
312 Visionary Home Builders of California, Inc Diamond Cove Townhomes I-B Stockton 24 $ 14,400 $ 14,360 6/4/18
313 Visionary Home Builders of California, Inc Mountain View Townhomes Tracy 37 $ 22,200 $ 21,825 11/28/18
314 Visionary Home Builders of California, Inc Villa Isabella Stockton 20 $ 11,925 $ 11,675 4/3/18
315 Visionary Home Builders of California, Inc Villa Monterey Stockton 45 $ 27,000 $ 27,000 11/28/18
316 Visionary Home Builders of California, Inc Whispering Pines Sacramento 96 $ 43,200 $ 43,200 8/10/18
317 Ward Economic Development Corporation Rosa Parks Villas Los Angeles 60 $ 26,468 6/21/21
318 Ward Economic Development Corporation Tuelyn Terrace Los Angeles 90 $ 40,202 6/21/21
319 Ward Economic Development Corporation Ward Villas Los Angeles 120 $ 35,836 6/21/21
320 West Sacramento Housing Development Corporation Patio Apartments West Sacramento 45 $ 16,875 $ 15,750 1/12/16
321 West Sacramento Housing Development Corporation Washington Courtyards West Sacramento 90 $ 23,100 $ 20,850 1/13/16
322 West Sacramento Housing Development Corporation West Capitol West Sacramento 125 $ 32,113 $ 32,113 1/12/16
Totals: 21,268 $ 9,269,606 $ 612,153 $ 8,538,985
** New completion dates will be set once the suspension on completion dates is lifted* Completion Dates have been suspended due to the COVID-19 pandemic
87
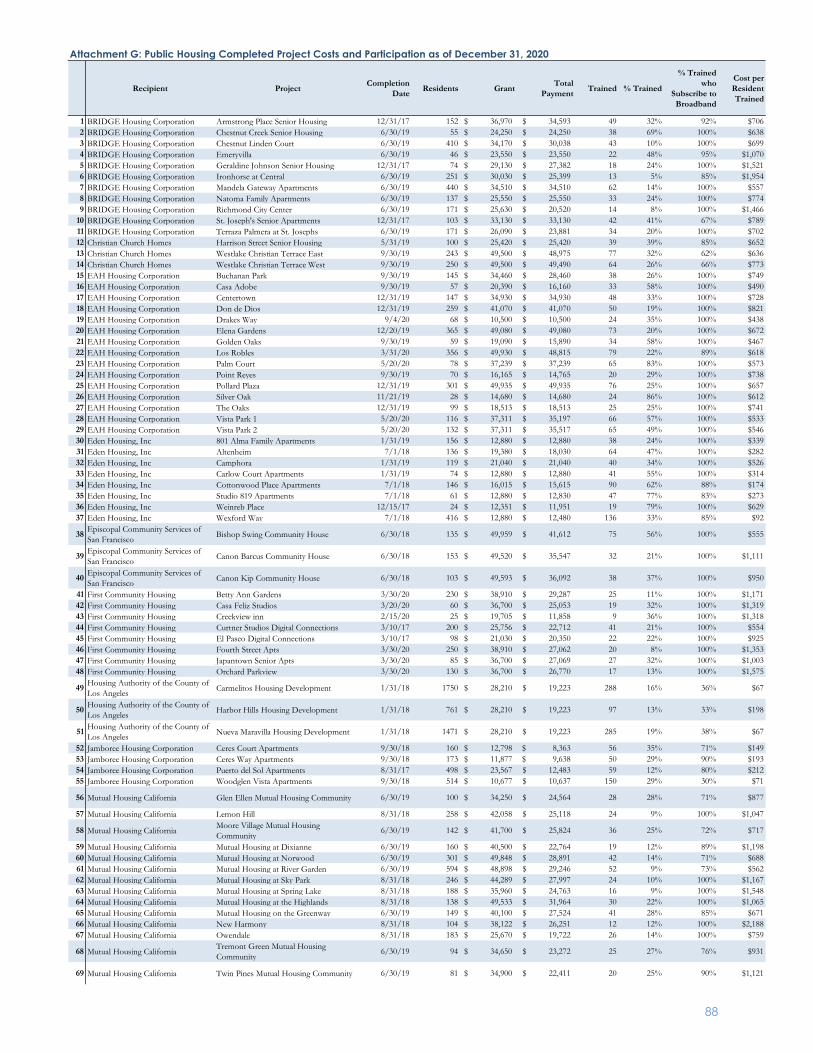
Recipient Project Completion Date Residents Grant Total
Payment Trained % Trained
% Trained who
Subscribe to Broadband
Cost per Resident Trained
1 BRIDGE Housing Corporation Armstrong Place Senior Housing 12/31/17 152 36,970$ 34,593$ 49 32% 92% $7062 BRIDGE Housing Corporation Chestnut Creek Senior Housing 6/30/19 55 24,250$ 24,250$ 38 69% 100% $6383 BRIDGE Housing Corporation Chestnut Linden Court 6/30/19 410 34,170$ 30,038$ 43 10% 100% $6994 BRIDGE Housing Corporation Emeryvilla 6/30/19 46 23,550$ 23,550$ 22 48% 95% $1,0705 BRIDGE Housing Corporation Geraldine Johnson Senior Housing 12/31/17 74 29,130$ 27,382$ 18 24% 100% $1,5216 BRIDGE Housing Corporation Ironhorse at Central 6/30/19 251 30,030$ 25,399$ 13 5% 85% $1,9547 BRIDGE Housing Corporation Mandela Gateway Apartments 6/30/19 440 34,510$ 34,510$ 62 14% 100% $5578 BRIDGE Housing Corporation Natoma Family Apartments 6/30/19 137 25,550$ 25,550$ 33 24% 100% $7749 BRIDGE Housing Corporation Richmond City Center 6/30/19 171 25,630$ 20,520$ 14 8% 100% $1,466
10 BRIDGE Housing Corporation St. Joseph's Senior Apartments 12/31/17 103 33,130$ 33,130$ 42 41% 67% $78911 BRIDGE Housing Corporation Terraza Palmera at St. Josephs 6/30/19 171 26,090$ 23,881$ 34 20% 100% $70212 Christian Church Homes Harrison Street Senior Housing 5/31/19 100 25,420$ 25,420$ 39 39% 85% $65213 Christian Church Homes Westlake Christian Terrace East 9/30/19 243 49,500$ 48,975$ 77 32% 62% $63614 Christian Church Homes Westlake Christian Terrace West 9/30/19 250 49,500$ 49,490$ 64 26% 66% $77315 EAH Housing Corporation Buchanan Park 9/30/19 145 34,460$ 28,460$ 38 26% 100% $74916 EAH Housing Corporation Casa Adobe 9/30/19 57 20,390$ 16,160$ 33 58% 100% $49017 EAH Housing Corporation Centertown 12/31/19 147 34,930$ 34,930$ 48 33% 100% $72818 EAH Housing Corporation Don de Dios 12/31/19 259 41,070$ 41,070$ 50 19% 100% $82119 EAH Housing Corporation Drakes Way 9/4/20 68 10,500$ 10,500$ 24 35% 100% $43820 EAH Housing Corporation Elena Gardens 12/20/19 365 49,080$ 49,080$ 73 20% 100% $67221 EAH Housing Corporation Golden Oaks 9/30/19 59 19,090$ 15,890$ 34 58% 100% $46722 EAH Housing Corporation Los Robles 3/31/20 356 49,930$ 48,815$ 79 22% 89% $61823 EAH Housing Corporation Palm Court 5/20/20 78 37,239$ 37,239$ 65 83% 100% $57324 EAH Housing Corporation Point Reyes 9/30/19 70 16,165$ 14,765$ 20 29% 100% $73825 EAH Housing Corporation Pollard Plaza 12/31/19 301 49,935$ 49,935$ 76 25% 100% $65726 EAH Housing Corporation Silver Oak 11/21/19 28 14,680$ 14,680$ 24 86% 100% $61227 EAH Housing Corporation The Oaks 12/31/19 99 18,513$ 18,513$ 25 25% 100% $74128 EAH Housing Corporation Vista Park 1 5/20/20 116 37,311$ 35,197$ 66 57% 100% $53329 EAH Housing Corporation Vista Park 2 5/20/20 132 37,311$ 35,517$ 65 49% 100% $54630 Eden Housing, Inc 801 Alma Family Apartments 1/31/19 156 12,880$ 12,880$ 38 24% 100% $33931 Eden Housing, Inc Altenheim 7/1/18 136 19,380$ 18,030$ 64 47% 100% $28232 Eden Housing, Inc Camphora 1/31/19 119 21,040$ 21,040$ 40 34% 100% $52633 Eden Housing, Inc Carlow Court Apartments 1/31/19 74 12,880$ 12,880$ 41 55% 100% $31434 Eden Housing, Inc Cottonwood Place Apartments 7/1/18 146 16,015$ 15,615$ 90 62% 88% $17435 Eden Housing, Inc Studio 819 Apartments 7/1/18 61 12,880$ 12,830$ 47 77% 83% $27336 Eden Housing, Inc Weinreb Place 12/15/17 24 12,351$ 11,951$ 19 79% 100% $62937 Eden Housing, Inc Wexford Way 7/1/18 416 12,880$ 12,480$ 136 33% 85% $92
38 Episcopal Community Services of San Francisco Bishop Swing Community House 6/30/18 135 49,959$ 41,612$ 75 56% 100% $555
39 Episcopal Community Services of San Francisco Canon Barcus Community House 6/30/18 153 49,520$ 35,547$ 32 21% 100% $1,111
40 Episcopal Community Services of San Francisco Canon Kip Community House 6/30/18 103 49,593$ 36,092$ 38 37% 100% $950
41 First Community Housing Betty Ann Gardens 3/30/20 230 38,910$ 29,287$ 25 11% 100% $1,17142 First Community Housing Casa Feliz Studios 3/20/20 60 36,700$ 25,053$ 19 32% 100% $1,31943 First Community Housing Creekview inn 2/15/20 25 19,705$ 11,858$ 9 36% 100% $1,31844 First Community Housing Curtner Studios Digital Connections 3/10/17 200 25,756$ 22,712$ 41 21% 100% $55445 First Community Housing El Paseo Digital Connections 3/10/17 98 21,030$ 20,350$ 22 22% 100% $92546 First Community Housing Fourth Street Apts 3/30/20 250 38,910$ 27,062$ 20 8% 100% $1,35347 First Community Housing Japantown Senior Apts 3/30/20 85 36,700$ 27,069$ 27 32% 100% $1,00348 First Community Housing Orchard Parkview 3/30/20 130 36,700$ 26,770$ 17 13% 100% $1,575
49 Housing Authority of the County of Los Angeles Carmelitos Housing Development 1/31/18 1750 28,210$ 19,223$ 288 16% 36% $67
50 Housing Authority of the County of Los Angeles Harbor Hills Housing Development 1/31/18 761 28,210$ 19,223$ 97 13% 33% $198
51 Housing Authority of the County of Los Angeles Nueva Maravilla Housing Development 1/31/18 1471 28,210$ 19,223$ 285 19% 38% $67
52 Jamboree Housing Corporation Ceres Court Apartments 9/30/18 160 12,798$ 8,363$ 56 35% 71% $14953 Jamboree Housing Corporation Ceres Way Apartments 9/30/18 173 11,877$ 9,638$ 50 29% 90% $19354 Jamboree Housing Corporation Puerto del Sol Apartments 8/31/17 498 23,567$ 12,483$ 59 12% 80% $21255 Jamboree Housing Corporation Woodglen Vista Apartments 9/30/18 514 10,677$ 10,637$ 150 29% 30% $71
56 Mutual Housing California Glen Ellen Mutual Housing Community 6/30/19 100 34,250$ 24,564$ 28 28% 71% $877
57 Mutual Housing California Lemon Hill 8/31/18 258 42,058$ 25,118$ 24 9% 100% $1,047
58 Mutual Housing California Moore Village Mutual Housing Community
6/30/19 142 41,700$ 25,824$ 36 25% 72% $717
59 Mutual Housing California Mutual Housing at Dixianne 6/30/19 160 40,500$ 22,764$ 19 12% 89% $1,19860 Mutual Housing California Mutual Housing at Norwood 6/30/19 301 49,848$ 28,891$ 42 14% 71% $68861 Mutual Housing California Mutual Housing at River Garden 6/30/19 594 48,898$ 29,246$ 52 9% 73% $56262 Mutual Housing California Mutual Housing at Sky Park 8/31/18 246 44,289$ 27,997$ 24 10% 100% $1,16763 Mutual Housing California Mutual Housing at Spring Lake 8/31/18 188 35,960$ 24,763$ 16 9% 100% $1,54864 Mutual Housing California Mutual Housing at the Highlands 8/31/18 138 49,533$ 31,964$ 30 22% 100% $1,06565 Mutual Housing California Mutual Housing on the Greenway 6/30/19 149 40,100$ 27,524$ 41 28% 85% $67166 Mutual Housing California New Harmony 8/31/18 104 38,122$ 26,251$ 12 12% 100% $2,18867 Mutual Housing California Owendale 8/31/18 183 25,670$ 19,722$ 26 14% 100% $759
68 Mutual Housing California Tremont Green Mutual Housing Community
6/30/19 94 34,650$ 23,272$ 25 27% 76% $931
69 Mutual Housing California Twin Pines Mutual Housing Community 6/30/19 81 34,900$ 22,411$ 20 25% 90% $1,121
Attachment G: Public Housing Completed Project Costs and Participation as of December 31, 2020
88
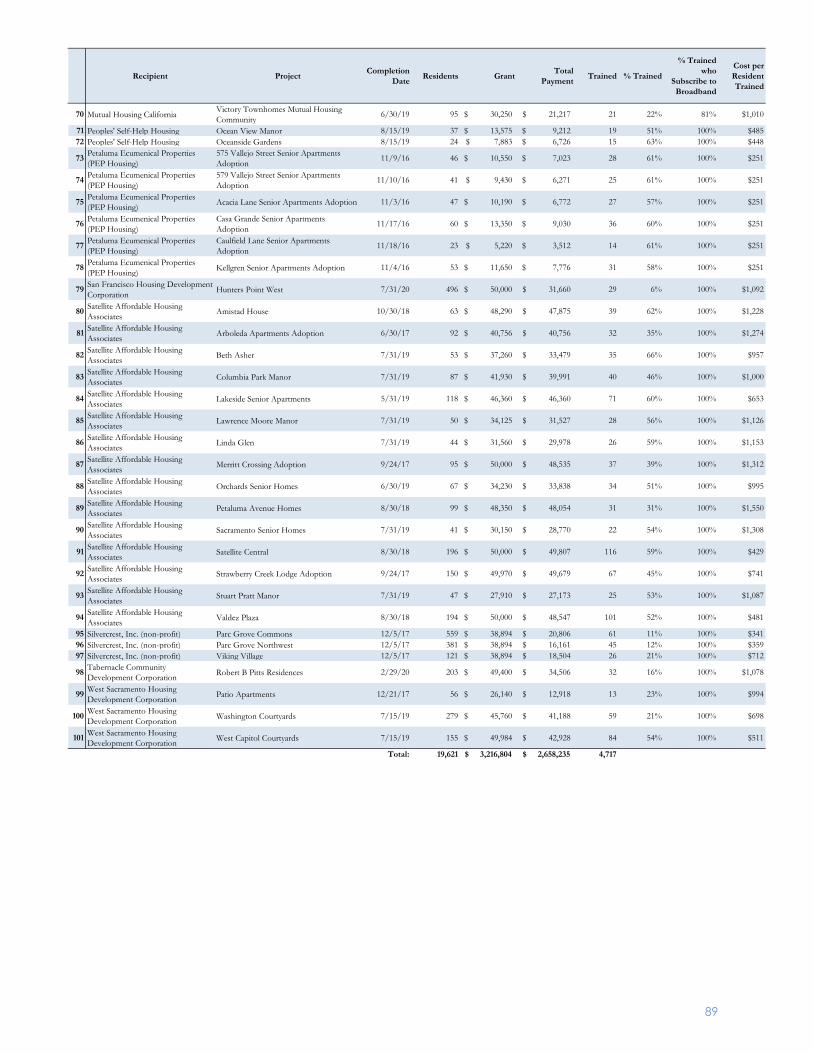
Recipient Project Completion Date Residents Grant Total
Payment Trained % Trained
% Trained who
Subscribe to Broadband
Cost per Resident Trained
70 Mutual Housing California Victory Townhomes Mutual Housing Community
6/30/19 95 30,250$ 21,217$ 21 22% 81% $1,010
71 Peoples' Self-Help Housing Ocean View Manor 8/15/19 37 13,575$ 9,212$ 19 51% 100% $48572 Peoples' Self-Help Housing Oceanside Gardens 8/15/19 24 7,883$ 6,726$ 15 63% 100% $448
73 Petaluma Ecumenical Properties (PEP Housing)
575 Vallejo Street Senior Apartments Adoption
11/9/16 46 10,550$ 7,023$ 28 61% 100% $251
74 Petaluma Ecumenical Properties (PEP Housing)
579 Vallejo Street Senior Apartments Adoption
11/10/16 41 9,430$ 6,271$ 25 61% 100% $251
75 Petaluma Ecumenical Properties (PEP Housing) Acacia Lane Senior Apartments Adoption 11/3/16 47 10,190$ 6,772$ 27 57% 100% $251
76 Petaluma Ecumenical Properties (PEP Housing)
Casa Grande Senior Apartments Adoption
11/17/16 60 13,350$ 9,030$ 36 60% 100% $251
77 Petaluma Ecumenical Properties (PEP Housing)
Caulfield Lane Senior Apartments Adoption
11/18/16 23 5,220$ 3,512$ 14 61% 100% $251
78 Petaluma Ecumenical Properties (PEP Housing) Kellgren Senior Apartments Adoption 11/4/16 53 11,650$ 7,776$ 31 58% 100% $251
79 San Francisco Housing Development Corporation Hunters Point West 7/31/20 496 50,000$ 31,660$ 29 6% 100% $1,092
80 Satellite Affordable Housing Associates Amistad House 10/30/18 63 48,290$ 47,875$ 39 62% 100% $1,228
81 Satellite Affordable Housing Associates Arboleda Apartments Adoption 6/30/17 92 40,756$ 40,756$ 32 35% 100% $1,274
82 Satellite Affordable Housing Associates Beth Asher 7/31/19 53 37,260$ 33,479$ 35 66% 100% $957
83 Satellite Affordable Housing Associates Columbia Park Manor 7/31/19 87 41,930$ 39,991$ 40 46% 100% $1,000
84 Satellite Affordable Housing Associates Lakeside Senior Apartments 5/31/19 118 46,360$ 46,360$ 71 60% 100% $653
85 Satellite Affordable Housing Associates Lawrence Moore Manor 7/31/19 50 34,125$ 31,527$ 28 56% 100% $1,126
86 Satellite Affordable Housing Associates Linda Glen 7/31/19 44 31,560$ 29,978$ 26 59% 100% $1,153
87 Satellite Affordable Housing Associates Merritt Crossing Adoption 9/24/17 95 50,000$ 48,535$ 37 39% 100% $1,312
88 Satellite Affordable Housing Associates Orchards Senior Homes 6/30/19 67 34,230$ 33,838$ 34 51% 100% $995
89 Satellite Affordable Housing Associates Petaluma Avenue Homes 8/30/18 99 48,350$ 48,054$ 31 31% 100% $1,550
90 Satellite Affordable Housing Associates Sacramento Senior Homes 7/31/19 41 30,150$ 28,770$ 22 54% 100% $1,308
91 Satellite Affordable Housing Associates Satellite Central 8/30/18 196 50,000$ 49,807$ 116 59% 100% $429
92 Satellite Affordable Housing Associates Strawberry Creek Lodge Adoption 9/24/17 150 49,970$ 49,679$ 67 45% 100% $741
93 Satellite Affordable Housing Associates Stuart Pratt Manor 7/31/19 47 27,910$ 27,173$ 25 53% 100% $1,087
94 Satellite Affordable Housing Associates Valdez Plaza 8/30/18 194 50,000$ 48,547$ 101 52% 100% $481
95 Silvercrest, Inc. (non-profit) Parc Grove Commons 12/5/17 559 38,894$ 20,806$ 61 11% 100% $34196 Silvercrest, Inc. (non-profit) Parc Grove Northwest 12/5/17 381 38,894$ 16,161$ 45 12% 100% $35997 Silvercrest, Inc. (non-profit) Viking Village 12/5/17 121 38,894$ 18,504$ 26 21% 100% $712
98 Tabernacle Community Development Corporation Robert B Pitts Residences 2/29/20 203 49,400$ 34,506$ 32 16% 100% $1,078
99 West Sacramento Housing Development Corporation Patio Apartments 12/21/17 56 26,140$ 12,918$ 13 23% 100% $994
100 West Sacramento Housing Development Corporation Washington Courtyards 7/15/19 279 45,760$ 41,188$ 59 21% 100% $698
101 West Sacramento Housing Development Corporation West Capitol Courtyards 7/15/19 155 49,984$ 42,928$ 84 54% 100% $511
Total: 19,621 3,216,804$ 2,658,235$ 4,717
89
Related Documents