UNITED STATES SECURITIES AND EXCHANGE COMMISSION Washington, D.C. 20549 FORM 10-K ☒ ANNUALLY REPORT PURSUANT TO SECTION 13 OR 15(d) OF THE SECURITIES EXCHANGE ACT OF 1934 For the fiscal year ended December 31, 2020 or ☐ TRANSITION REPORT PURSUANT TO SECTION 13 OR 15(d) OF THE SECURITIES EXCHANGE ACT OF 1934 For the transition period from to Commission file number 001-37983 TechnipFMC plc (Exact name of registrant as specified in its charter) United Kingdom 98-1283037 (State or other jurisdiction of incorporation or organization) (I.R.S. Employer Identification No.) One St. Paul’s Churchyard London United Kingdom EC4M 8AP (Address of principal executive offices) (Zip Code) +44 203-429-3950 (Registrant’s telephone number, including area code) Securities registered pursuant to Section 12(b) of the Act: Title of Each Class Trading Symbol Name of Each Exchange on Which Registered Ordinary shares, $1.00 par value per share FTI New York Stock Exchange Securities registered pursuant to Section 12(g) of the Act: None. Indicate by check mark if the registrant is a well-known seasoned issuer, as defined in Rule 405 of the Securities Act. Yes ☒ No ☐ Indicate by check mark if the registrant is not required to file reports pursuant to Section 13 or Section 15(d) of the Act. Yes ☐ No ☒ Indicate by check mark whether the registrant (1) has filed all reports required to be filed by Section 13 or 15(d) of the Securities Exchange Act of 1934 during the preceding 12 months (or for such shorter period that the registrant was required to file such reports), and (2) has been subject to such filing requirements for the past 90 days. Yes ☒ No ☐ Indicate by check mark whether the registrant has submitted electronically every Interactive Data File required to be submitted pursuant to Rule 405 of Regulation S-T (§232.405 of this chapter) during the preceding 12 months (or for such shorter period that the registrant was required to submit such files). Yes ☒ No ☐ Indicate by check mark whether the registrant is a large accelerated filer, an accelerated filer, a non-accelerated filer, a smaller reporting company, or an emerging growth company. See the definitions of “large accelerated filer,” “accelerated filer,” “smaller reporting company,” and “emerging growth company” in Rule 12b-2 of the Exchange Act. Large accelerated filer ☒ Accelerated filer ☐ Non-accelerated filer ☐ Smaller reporting company ☐ Emerging growth company ☐ If an emerging growth company, indicate by check mark if the registrant has elected not to use the extended transition period for complying with any new or revised financial accounting standards provided pursuant to Section 13(a) of the Exchange Act. ☐ Indicate by check mark whether the registrant has filed a report on and attestation to its management’s assessment of the effectiveness of its internal control over financial reporting under Section 404(b) of the Sarbanes-Oxley Act (15 U.S.C. 7262(b)) by the registered public accounting firm that prepared or issued its audit report. ☒ Indicate by check mark whether the registrant is a shell company (as defined in Rule 12b-2 of the Act). YES ☐ NO ☒ The aggregate market value of the registrant’s ordinary shares held by non-affiliates of the registrant, determined by multiplying the outstanding shares on June 30, 2020, by the closing price on such day of $6.80 as reported on the New York Stock Exchange, was $2.7 billion. Class Outstanding at February 24, 2021 Ordinary shares, $1.00 par value per share 450,433,770 DOCUMENTS INCORPORATED BY REFERENCE Portions of the registrant’s definitive Proxy Statement relating to its 2021 Annual General Meeting of Shareholders are incorporated by reference into Part III of this Annual Report on Form 10-K where indicated. The 2021 Proxy Statement will be filed with the U.S. Securities and Exchange Commission within 120 days after the end of the fiscal year to which this report relates.

Welcome message from author
This document is posted to help you gain knowledge. Please leave a comment to let me know what you think about it! Share it to your friends and learn new things together.
Transcript

UNITED STATESSECURITIES AND EXCHANGE COMMISSION
Washington, D.C. 20549
FORM 10-K☒ ANNUALLY REPORT PURSUANT TO SECTION 13 OR 15(d) OF THE SECURITIES EXCHANGE ACT OF 1934
For the fiscal year ended December 31, 2020or
☐ TRANSITION REPORT PURSUANT TO SECTION 13 OR 15(d) OF THE SECURITIES EXCHANGE ACT OF 1934For the transition period from to
Commission file number 001-37983
TechnipFMC plc(Exact name of registrant as specified in its charter)
United Kingdom 98-1283037(State or other jurisdiction of incorporation or organization) (I.R.S. Employer Identification No.)
One St. Paul’s ChurchyardLondon
United Kingdom EC4M 8AP(Address of principal executive offices) (Zip Code)
+44 203-429-3950(Registrant’s telephone number, including area code)
Securities registered pursuant to Section 12(b) of the Act:Title of Each Class Trading Symbol Name of Each Exchange on Which Registered
Ordinary shares, $1.00 par value per share FTI New York Stock ExchangeSecurities registered pursuant to Section 12(g) of the Act: None.
Indicate by check mark if the registrant is a well-known seasoned issuer, as defined in Rule 405 of the Securities Act. Yes ☒ No ☐
Indicate by check mark if the registrant is not required to file reports pursuant to Section 13 or Section 15(d) of the Act. Yes ☐ No ☒
Indicate by check mark whether the registrant (1) has filed all reports required to be filed by Section 13 or 15(d) of the Securities Exchange Act of 1934 during the preceding12 months (or for such shorter period that the registrant was required to file such reports), and (2) has been subject to such filing requirements for the past 90 days. Yes ☒ No ☐
Indicate by check mark whether the registrant has submitted electronically every Interactive Data File required to be submitted pursuant to Rule 405 of Regulation S-T(§232.405 of this chapter) during the preceding 12 months (or for such shorter period that the registrant was required to submit such files). Yes ☒ No ☐
Indicate by check mark whether the registrant is a large accelerated filer, an accelerated filer, a non-accelerated filer, a smaller reporting company, or an emerging growthcompany. See the definitions of “large accelerated filer,” “accelerated filer,” “smaller reporting company,” and “emerging growth company” in Rule 12b-2 of the Exchange Act.Large accelerated filer ☒ Accelerated filer ☐
Non-accelerated filer ☐ Smaller reporting company ☐
Emerging growth company ☐
If an emerging growth company, indicate by check mark if the registrant has elected not to use the extended transition period for complying with any new or revised financialaccounting standards provided pursuant to Section 13(a) of the Exchange Act. ☐
Indicate by check mark whether the registrant has filed a report on and attestation to its management’s assessment of the effectiveness of its internal control over financialreporting under Section 404(b) of the Sarbanes-Oxley Act (15 U.S.C. 7262(b)) by the registered public accounting firm that prepared or issued its audit report. ☒
Indicate by check mark whether the registrant is a shell company (as defined in Rule 12b-2 of the Act). YES ☐ NO ☒
The aggregate market value of the registrant’s ordinary shares held by non-affiliates of the registrant, determined by multiplying the outstanding shares on June 30, 2020, by theclosing price on such day of $6.80 as reported on the New York Stock Exchange, was $2.7 billion.
Class Outstanding at February 24, 2021Ordinary shares, $1.00 par value per share 450,433,770
DOCUMENTS INCORPORATED BY REFERENCEPortions of the registrant’s definitive Proxy Statement relating to its 2021 Annual General Meeting of Shareholders are incorporated by reference into Part III of this AnnualReport on Form 10-K where indicated. The 2021 Proxy Statement will be filed with the U.S. Securities and Exchange Commission within 120 days after the end of the fiscal yearto which this report relates.

TABLE OF CONTENTS
PagePART IItem 1. Business 4Executive Officers of the Registrant 29Item 1A. Risk Factors 30Item 1B. Unresolved Staff Comments 46Item 2. Properties 47Item 3. Legal Proceedings 142Item 4. Mine Safety Disclosures 142PART IIItem 5. Market for Registrant’s Common Equity, Related Stockholder Matters and Issuer Purchases of Equity Securities 50Item 6. Selected Financial Data 52Item 7. Management’s Discussion and Analysis of Financial Condition and Results of Operations 53Item 7A. Quantitative and Qualitative Disclosures About Market Risk 76Item 8. Financial Statements and Supplementary Data 78Item 9. Changes in and Disagreements with Accountants on Accounting and Financial Disclosure 141Item 9A. Controls and Procedures 141Item 9B. Other Information 142PART IIIItem 10. Directors, Executive Officers and Corporate Governance 143Item 11. Executive Compensation 143Item 12. Security Ownership of Certain Beneficial Owners and Management and Related Stockholder Matters 143Item 13. Certain Relationships and Related Transactions, and Director Independence 144Item 14. Principal Accountant Fees and Services 144PART IVItem 15. Exhibits and Financial Statement Schedules 145Item 16. Form 10-K Summary 147Signatures 149
2

CAUTIONARY NOTE REGARDING FORWARD-LOOKING STATEMENTS
This Annual Report on Form 10-K contains “forward-looking statements” as defined in Section 27A of the United States Securities Act of1933, as amended, and Section 21E of the United States Securities Act of 1934, as amended (the “Exchange Act”). Forward-lookingstatements usually relate to future events and anticipated revenues, earnings, cash flows or other aspects of our operations or operatingresults. Forward-looking statements are often identified by the words “believe,” “expect,” “anticipate,” “plan,” “intend,” “foresee,” “should,”“would,” “could,” “may,” “estimate,” “outlook” and similar expressions, including the negative thereof. The absence of these words, however,does not mean that the statements are not forward-looking. These forward-looking statements are based on our current expectations, beliefsand assumptions concerning future developments and business conditions and their potential effect on us. While management believes thatthese forward-looking statements are reasonable as and when made, there can be no assurance that future developments affecting us willbe those that we anticipate.
All of our forward-looking statements involve risks and uncertainties (some of which are significant or beyond our control) and assumptionsthat could cause actual results to differ materially from our historical experience and our present expectations or projections. Known materialfactors that could cause actual results to differ materially from those contemplated in the forward-looking statements include unpredictabletrends in the demand for and price of crude oil and natural gas; competition and unanticipated changes relating to competitive factors in ourindustry, including ongoing industry consolidation; the COVID-19 pandemic and its impact on the demand for our products and services; ourinability to develop, implement, and protect new technologies and services; the cumulative loss of major contracts, customers, or alliances;disruptions in the political, regulatory, economic, and social conditions of the countries in which we conduct business; the refusal of DTC andEuroclear to act as depository and clearing agencies for our shares; the United Kingdom’s withdrawal from the European Union; the impactof our existing and future indebtedness and the restrictions on our operations by terms of the agreements governing our existingindebtedness; the risks caused by our acquisition and divestiture activities; the risks caused by fixed-price contracts; any delays and costoverruns of new capital asset construction projects for vessels and manufacturing facilities; our failure to deliver our backlog; our reliance onsubcontractors, suppliers, and our joint venture partners; a failure of our IT infrastructure, including as a result of cyber-attacks; the risks ofpirates endangering our maritime employees and assets; potential liabilities inherent in the industries in which we operate or have operated;our failure to comply with numerous laws and regulations, including those related to environmental protection, health and safety, labor andemployment, import/export controls, currency exchange, bribery and corruption, taxation, privacy, data protection and data security; theadditional restrictions on dividend payouts or share repurchases as an English public limited company; uninsured claims and litigation againstus, including intellectual property litigation; tax laws, treaties and regulations and any unfavorable findings by relevant tax authorities; theuncertainties related to the anticipated benefits or our future liabilities in connection with the spin-off of our Technip Energies businesssegment (the “Spin-off”); any negative changes in Technip Energies’s results of operations, cash flows and financial position, which impactthe value of our remaining investment therein and our obligations under the share purchase agreement, dated January 7, 2021 (the “SharePurchase Agreement”), with Bpifrance Participations SA, a société anonyme incorporated under the laws of the Republic of France (‘‘BPI”);potential departure of our key managers and employees; adverse seasonable and weather conditions and unfavorable currency exchangerate; risk in connection with our defined benefit pension plan commitments, as well as those set forth in Part I, Item 1A, “Risk Factors” andelsewhere of this Annual Report on Form 10-K. We caution you not to place undue reliance on any forward-looking statements, which speakonly as of the date hereof. We undertake no obligation to publicly update or revise any of our forward-looking statements after the date theyare made, whether as a result of new information, future events or otherwise, except to the extent required by law.
3

PART I
ITEM 1. BUSINESS
Company Overview
TechnipFMC plc, a public limited company incorporated and organized under the laws of England and Wales, with registered number09909709, and with its registered office at One St. Paul’s Churchyard, London EC4M 8AP, United Kingdom (“TechnipFMC,” the “Company,”“we,” or “our”) is a global leader in the energy industry; delivering projects, products, technologies, and services. With our proprietarytechnologies and production systems, integrated expertise, and comprehensive solutions, we are transforming our customers’ projecteconomics.
We have operational headquarters in Paris, France, and Houston, Texas, United States, and operate across three business segments:Subsea, Technip Energies, and Surface Technologies. We are uniquely positioned to deliver greater efficiency across project lifecycles fromconcept to project delivery and beyond. Through innovative technologies and improved efficiencies, our offering unlocks new possibilities forour customers in developing their energy resources and in their positioning to meet the energy transition challenge. On February 16, 2021,the Company completed the Spin-off. Subsequent to the Spin-off, the Company will operate under two reporting segments: Subsea andSurface Technologies, for further details see section “The Spin-off” below.
Enhancing our performance and competitiveness is a key component of this strategy, which is achieved throughtechnology and innovation differentiation, seamless execution, and reliance on simplification to drive costs down. We are targeting profitableand sustainable growth by seizing market growth opportunities and expanding our range of services. We are managing our assets efficientlyto ensure we are well-prepared to drive and benefit from the opportunities in many of the segments we serve.
Each of our more than 35,000 employees is driven by a steady commitment to clients and a culture of project execution, purposefulinnovation, challenging industry conventions, and rethinking how the best results are achieved. This leads to fresh thinking, streamlineddecisions, and smarter results, enabling us to achieve our vision of enhancing the performance of the world’s energy industry.
History
In March 2015, FMC Technologies, Inc., a U.S. Delaware corporation (“FMC Technologies”), and Technip S.A., a French société anonyme(“Technip”), signed an agreement to form an exclusive alliance and to launch Forsys Subsea, a 50/50 joint venture, that would unite thesubsea skills and capabilities of two industry leaders. This alliance, which became operational on June 1, 2015, was established to identifynew and innovative approaches to the design, delivery, and maintenance of subsea fields.
Forsys Subsea brought the industry’s most-talented subsea professionals together early in operators’ project concept phase with thetechnical capabilities to design and integrate products, systems, and installation to significantly reduce the cost of subsea field developmentand enhance overall project economics.
Based on the success of the Forsys Subsea joint venture and its innovative approach to integrated solutions, Technip and FMC Technologiesannounced in May 2016 that the companies would combine through a merger of equals to create a global subsea leader, TechnipFMC, thatwould drive change by redefining the production of oil and gas. The business combination was completed on January 16, 2017 (the“Merger”), and on January 17, 2017, TechnipFMC began operating as a unified, combined company trading on the New York StockExchange (“NYSE”) and on the Euronext Paris Stock Exchange (“Euronext Paris”) under the symbol “FTI.”
In 2017, our first year as a merged company, TechnipFMC secured several project awards as many operators moved forward with finalinvestment decisions for major onshore projects and subsea developments. Several of the subsea awards incorporated the use of ourintegrated approach to project delivery, validating our unique business model aimed at lowering project costs and accelerating the delivery ofinitial hydrocarbon production. This was made possible by bringing together the complimentary subsea work scopes of the mergedcompanies.
In 2018, TechnipFMC delivered the industry’s first three full-cycle, integrated projects and realized considerable growth in Subsea orderinbound, driven in part by its unique integrated offering, iEPCI™ (“iEPCI”). For all of 2019, the value of integrated subsea awards toTechnipFMC more than doubled versus the prior year, representing more than 50% of all Subsea project order inbound. The increase wasdriven by a wider adoption of the integrated
4

business model, particularly by those clients where we have unique alliances. With the industry’s most comprehensive and only trulyintegrated subsea market offering, we have continued to expand the deepwater opportunity set for our clients.
TechnipFMC’s expertise does not end with the production of hydrocarbons. Because of its best-in-class Engineering and Construction(“E&C”) project design and execution capabilities, enabled by a portfolio of proprietary technologies, TechnipFMC continues to secure anddeliver projects that further enable our clients to monetize resources – from liquefaction of gas, both onshore and on floating vessels, throughrefining and product facilities and with green chemistry and renewables.
The Spin-off
On August 26, 2019, we announced our intention to separate into two diversified pure-play market leaders – TechnipFMC, focused onsubsea and surface hydrocarbon production, and Technip Energies, focused on downstream engineering, procurement, and construction(”EPC”) project execution. Due to the COVID-19 pandemic, a significant decline in commodity prices, and the heightened volatility in globalequity markets, on March 15, 2020, we announced the postponement of the completion of the transaction until the markets sufficientlyrecover. On January 7, 2021, we announced the resumption of activity toward completion of the transaction based on increased clarity in themarket outlook and our demonstrated ability to successfully execute projects.
On February 16, 2021, we completed the separation of the Technip Energies business segment. The transaction was structured as a spin-off(the “Spin-off”), which occurred by way of a pro rata dividend (the “Distribution”) to our shareholders of 50.1 percent of the outstanding sharesin Technip Energies N.V. Each of our shareholders received one ordinary share of Technip Energies N.V. for every five ordinary shares ofTechnipFMC held at 5:00 p.m., New York City time on the record date, February 17, 2021. Technip Energies N.V. is now an independentpublic company and its shares trade under the ticker symbol “TE” on the Euronext Paris stock exchange.
In connection with the Spin-off, on January 7, 2021, BPI, which has been one of our substantial shareholders since 2009, entered into aShare Purchase Agreement pursuant to which BPI agreed to purchase a portion of our retained stake in Technip Energies N.V. (the “BPIInvestment”) for $200.0 million (the “Purchase Price”). On February 25, 2021, BPI paid $200.0 million in connection with the Share PurchaseAgreement. The Purchase Price is subject to adjustments, and BPI’s ownership stake will be determined based upon a thirty day volume-weighted average price of Technip Energies N.V.’ s shares (with BPI’s ownership collared between an 11.82 percentage floor and a 17.25percentage cap), less a six percent discount. The BPI Investment is subject to customary conditions and regulatory approval. We intend tosignificantly reduce our shareholding in Technip Energies N.V. over the 18 months following the Spin-off, including in connection with the saleof shares to BPI pursuant to the BPI Investment.
Beginning in the first quarter of 2021, Technip Energies’ historical financial results for periods prior to the Distribution will be reflected in ourconsolidated financial statements as discontinued operations.
The Spin-off enables both companies to benefit from distinct and compelling market opportunities across the energy value chain; dedicatedfocus of management, resources, and capital; and unique value propositions with differentiated investment appeal.
• TechnipFMC is a fully-integrated technology and services provider, driving energy development across deepwater, conventional, andunconventional resources. TechnipFMC continues to successfully demonstrate leadership in integrated subsea project delivery andis focused on replicating this success through the development of integrated production models for the surface market. TechnipFMCis also poised to benefit from service opportunities resulting from the world’s largest installed base of subsea production equipment,umbilicals, risers, and flowlines, and in the supply of surface integrated systems in the drilling, frac, production and measurementmarkets.
• Technip Energies is a leading engineering and construction player, with a robust project delivery model, strong technical capabilities,and proven track record as demonstrated by the successful execution of some of the world’s most iconic EPC projects. TechnipEnergies will continue to leverage its industry-leading process technology portfolio, particularly in the areas of ethylene andhydrogen, while pursuing further opportunities to enhance and differentiate this portfolio, and to accelerate the journey to a low-carbon future.
5

BUSINESS SEGMENTS
On February 16, 2021, we completed the Spin-off. Subsequent to the Spin-off, we will operate under two reporting segments: Subsea andSurface Technologies.
Subsea
We are focused on transforming subsea by safely delivering innovative solutions that improve economics, enhance performance and reduceemissions. As a fully-integrated technology and services provider, we continue to drive responsible energy development.
Our Subsea segment provides integrated design, engineering, procurement, manufacturing, fabrication, installation, and life of field servicesfor subsea systems, subsea field infrastructure, and subsea pipe systems used in oil and gas production and transportation.
We are an industry leader in front-end engineering and design (“FEED”), subsea production systems (“SPS”), subsea flexible pipe, andsubsea umbilicals, risers, and flowlines (“SURF”) and subsea robotics. We also have the capability to install these products and relatedsubsea infrastructure with our fleet of highly specialized vessels. By integrating the SPS and SURF work scopes, we are able to drive greatervalue to our clients through more efficient field layout and execution of the installation campaign. This capability, in conjunction with ourstrong commercial focus, has enabled the successful market introduction of an integrated subsea business model, iEPCI, which spans aproject’s early phase design through the life of field.
Our integrated business model is unlocking incremental opportunities and materially expanding the deepwater opportunity set. Since the firstiEPCI project was awarded in 2016, market adoption of the business model has accelerated each year.
Through integrated FEED studies, or iFEED™ (“iFEED”), we are uniquely positioned to influence project concept and design. Usinginnovative solutions for field architecture, including standardized equipment, new technologies, and simplified installation, we can significantlyreduce subsea development costs and accelerate time to first production.
Our first-mover advantage and ability to convert iFEED studies into iEPCI contracts, often as a direct award, creates a unique set ofopportunities for us that are not available to our peers. This allows us to deliver a fully integrated – and technologically differentiated –subsea system, and to better manage the complete work scope through a single contracting mechanism and a single interface, yieldingmeaningful improvements in project economics and time to first oil.
We continue to support our clients following project delivery by offering aftermarket and life of field services. Our wide range of capabilitiesand solutions, including integrated life of field, or iLOF™ (“iLOF”), allows us to help clients increase oil and gas recovery and equipmentuptime while reducing overall cost. Our iLOF offering is designed to unlock the full potential of subsea infrastructures during operations bytransforming the way subsea services are delivered and proactively addressing the challenges operators face over the life of subsea fields.We provide production optimization, asset life extension insight, proactive de-bottlenecking, and condition-based maintenance.
Our Subsea business depends on our ability to maintain a cost-effective and efficient production system, achieve planned equipmentproduction targets, successfully develop new products, and meet or exceed stringent performance and reliability standards.
Subsea segment products and services
Subsea Production Systems. Our systems are used in the offshore production of crude oil and natural gas. Subsea systems are placed onthe seafloor and are used to control the flow of crude oil and natural gas from the reservoir to a host processing facility, such as a floatingproduction facility, a fixed platform, or an onshore facility.
Our subsea production systems and products include subsea trees, chokes and flow modules, manifold pipeline systems, controls andautomation systems, well access systems, multiphase and wet-gas meters, and additional technologies. The design and manufacture of oursubsea systems requires a high degree of technical expertise and innovation. Some of our systems are designed to withstand exposure tothe extreme hydrostatic pressure of deepwater environments, as well as internal pressures of up to 20,000 pounds per square inch ("psi")and
6

temperatures of up to 400º F. The development of our integrated subsea production systems includes initial engineering design studies andfield development planning and considers all relevant aspects and project requirements, including optimization of drilling programs andsubsea architecture.
Subsea Processing Systems. Our subsea processing systems, which include subsea boosting, subsea gas compression, and subseaseparation, are designed to accelerate production, increase recovery, extend field life, and/or lower operators’ production costs for greenfield,subsea tie-back and brownfield applications. To provide these products, systems, and services, we utilize our engineering, projectmanagement, procurement, manufacturing, and assembly and test capabilities.
Rigid Pipe. We design and fabricate rigid pipes for production and service applications at our spoolbases. Rigid pipes are installed from ourfleet of differentiated rigid pipelay vessels. Our pipelines optimize flow assurance through innovative insulation coatings, electric traceheating, plastic liners, and pipe-in-pipe systems.Flexible Pipe and Umbilicals. We design and manufacture flexible pipes as well as steel tube, thermoplastic hose, power, communication,and hybrid (a combination of steel tube, thermoplastic hose, and electrical cables) umbilicals. TechnipFMC vessels will typically perform theinstallation of the flexible pipes and umbilicals, but we also sell these products directly to oil companies or to other vessel operators.
Vessels. We have a fleet of 18 vessels that are used for the installation and servicing of our products. We have sole ownership of tenvessels, ownership of six vessels as part of joint ventures, and two vessels operated under long-term charters.
Subsea Services. We provide a portfolio of well and asset services that improve economics and enhance performance over the life of ourclients' subsea development cycle. Well services include all service offerings: (i) provision of exploration and production wellhead systemsand services; (ii) remotely operated vehicle (“ROV”) drill support services; (iii) well completion installation services; (iv) well access andintervention services, both rig-based and vessel-based (riserless light well intervention or “RLWI”); and (v) well plug and abandonment. AssetServices include all service offerings, such as (i) maintenance services for test, modification, refurbishment, and upgrade of subseaequipment and tooling; (ii) integrity services based on product and field data to optimize the performance of the subsea asset, includingproactive inspection, maintenance, and repair (“IMR”) of subsea infrastructure; and (iii) production metering services to enhance well andfield production, including real time virtual metering services and flow assurance services.
Key drivers of subsea services market activity are the services linked to subsea wells in greenfield development and brownfield subseatiebacks, or infill developments.Additionally, with our extensive experience in subsea equipment, our leading installed base of subsea production equipment, our broad rangeof services, and our historical technical design and manufacturing leadership, we are in a unique position to offer integrated solutions acrossthe “life of field” (“LOF”) services. These combine asset light solutions (e.g. RLWI), digital services (e.g. data driven monitoring, surveillance,and production management suite of applications), and leading edge automated and robotic systems (e.g. Schilling ROVs) to enhance theeconomics of producing fields through maximization of asset uptime, higher production volumes, and lower operating expense.
Robotics, Controls and Automation. We design and manufacture ROVs and manipulator arms that are used in subsea drilling, construction,IMR, and life of field services. Our product offering includes hydraulic work-class ROVs, tether-management systems, launch and recoverysystems, remote manipulator arms, and modular control systems. We also provide support and services such as product training, pilotsimulator training, spare parts, and technical assistance.
We also provide electro-hydraulic and electric production and intervention control systems, allowing accurate control and monitoring ofsubsea installations to ensure the highest production availability that can ensure safe and environmentally friendly field operations. Theseinclude the sensors, multiphase flow meters, digital infrastructure, integrity monitoring, control functionality, and automation features neededfor subsea systems. Robotics capabilities are now being used in the control of manifold valves during production, which demonstrates aconvergence of our technologies in order to provide better systems for our customers.
Subsea Studio™ Digital Platform. Subsea Studio™ is our portfolio of digital solutions to increase performance, transform experience, andenable innovation. Subsea Studio™ FD is our front-end field development tool,
7

transforming conventional concept, FEED and tender phases into ultra-fast digital field development. Subsea Studio™ Ex is our projectexecution digital application that increases the efficiency and speed of project execution with a data-centric approach. Subsea Studio™ LOFuses our digitally enabled operations and advanced data driven services to enhance performance and production targets.
Research, Engineering, Manufacturing and Supply Chain (“REMS”). REMS is an organization formed in September of 2019 to supportaccelerated technology innovation, and product delivery improvements. We accomplish this by reducing the cycle-time of engineering andmanufacturing our products, including working with our suppliers to reduce their costs, and optimizing our processes and how we manageworkflow. Through REMS, we are focused on challenging existing technologies and implementing world-class manufacturing practices,including LEAN and process automation, to improve reliability while reducing total product cost and lead time to delivery. Our REMSorganization primarily supports our Subsea segment but is also integrated across our Surface Technologies segment.
Product Management. In 2019, we established a Product Management function to expand our capabilities to assess, define, and deliver thetechnologies and products of the future. This function enables REMS, and the Subsea and Surface Technologies businesses to drive theunderstanding of customer requirements, competitive landscape, and investment prioritization.
Capital Intensity
Many of the systems and products we supply for subsea applications are highly engineered to meet the unique demands of our customers’field properties and are typically ordered one to two years before installation. We often receive advance payments and progress billings fromour customers to fund initial development and working capital requirements.
Dependence on Key Customers
Generally, our customers in the Subsea segment are major integrated oil companies, national oil companies, and independent explorationand production companies.
We actively pursue alliances with companies that are engaged in the subsea development of oil and natural gas to promote our integratedsystems for subsea production. These alliances are typically related to the procurement of subsea production equipment, although somealliances are related to EPCI services. Development of subsea fields, particularly in deepwater environments, involves substantial capitalinvestments. Operators have also sought the security of alliances with us to ensure timely and cost-effective delivery of subsea and otherenergy-related systems that provide integrated solutions to meet their needs.
Our alliances establish important ongoing relationships with our customers. While these alliances do not contractually commit our customersto purchase our systems and services, they have historically led to, and we expect that they would continue to result in, such purchases.
The commitment to our customers goes beyond project delivery, and we nurture these alliances with transparency and collaboration to betterunderstand their needs to ensure customer success.
No single Subsea customer accounted for 10% or more of our 2020 consolidated revenue.
Competition
We are the only fully integrated company that can provide the complete suite of subsea production equipment, umbilicals, and flowlines withthe complete portfolio of installation and LOF services enabling us to develop a subsea field as a single company. We compete withcompanies that supply some of the components as well as installation companies. Our competitors include Aker Solutions ASA, BakerHughes Company (“Baker Hughes”), Dril-Quip, Inc., McDermott International, Inc. (“McDermott”), National Oilwell Varco, OceaneeringInternational, Inc., Saipem S.p.A. (“Saipem”), Schlumberger, Ltd. (“Schlumberger”), and Subsea 7 S.A.
Seasonality
8

In the North Sea, winter weather generally subdues drilling activity, reducing vessel utilization and demand for subsea services as certainactivities cannot be performed. As a result, the level of offshore activity in our Subsea segment is negatively impacted in the first quarter ofeach year.
Market Environment
The volatile, and generally low, crude oil price environment of the last several years led many of our customers to reduce their capitalspending plans and defer new deepwater projects. Order activity in 2020 was particularly impacted by the sharp decline in commodity pricesin April, driven in part by the reduced economic activity, and the general uncertainty related to the COVID-19 pandemic. The reduction anddeferral of new projects resulted in delayed subsea projects inbound for the industry.
While economic activity continues to be impacted by the pandemic, the short-term outlook for crude oil has improved as the OPEC+countries better manage the oversupplied market. Long-term demand for energy is still forecast to rise, and we believe this outlook willultimately provide our customers with the confidence to increase investments in new sources of oil and natural gas production.
The trajectory and pace of further recovery and expansion in the subsea market is subject to the capital our clients dedicate to developingoffshore oil and gas fields amongst their entire portfolio of projects and drivers of capital expansion or discipline. The risk of projectsanctioning delays is still present in the current environment; however, innovative approaches to subsea projects, like our iEPCI solution,have improved project economics, and many offshore discoveries can be developed economically at today’s crude oil prices. In the long-term, deepwater development is expected to remain a significant part of many of our customers’ portfolios.
As the subsea industry continues to evolve, we have taken actions to further streamline our organization, achieve standardization, andreduce cycle times. The rationalization of our global footprint will also further leverage the benefits of our integrated offering. We aim tocontinuously align our operations with activity levels, while preserving our core capacity in order to deliver current projects in backlog andfuture order activity.
Strategy
With our proprietary technologies and production systems, and integration expertise, we are transforming subsea by safely deliveringinnovative solutions that improve economics, enhance performance, and reduce emissions. We have used these capabilities to develop anew subsea commercial model that is transforming the way we interact with our customers and create value with them.
Our strategy includes the following priorities:
• Engagement in the conceptual design and integrated front-end engineering of subsea development projects to create value throughtechnology and integration of scopes by simplifying field architecture and accelerating both delivery schedules and time to firstproduction.
• Innovative research and development (“R&D”), often in collaboration with clients and partners, to develop leading products andtechnologies that deliver greater efficiency to the client, lower development costs, unlock stranded and/or marginal fields, and enablefrontier developments.
• Focus on selecting the right projects to ensure a strong and healthy backlog.
• Superior project execution capabilities allowing us to mobilize the right teams, assets, and facilities to capture and profitably executecomplex subsea projects and services.
• Capitalize on combined competencies coming from alliances and partnerships with both clients and suppliers.
• Leverage supplier relationships to optimize supply chain market dynamics and implement greater simplification and standardizationin products and processes.
TechnipFMC is a clear leader in the subsea industry. Our success has been built on our technological strength, innovation, focus ondigitalization, and strong partnerships with major oil companies to expand market opportunities.
9

Recent and Future Developments
We continue to focus on performance improvement and optimization strategies that will improve our profitability. Our investments decisionsfully support our business with technologies that will differentiate our portfolio.
Subsea Studio is transforming the conventional concept, FEED and tendering phases of subsea projects. Working with our clients, we arenow able to develop ultra-fast, digital field architectures that bring together decades of engineering knowledge with artificial intelligence andmachine learning to optimize product configurations, accelerate execution, and maximize value.
Subsea Studio has an open architecture that allows integration with other engineering and manufacturing systems, eliminating the needfor multiple hand-offs, and resulting in as much as a 50% reduction in the time required for front-end engineering. We are extending theplatform beyond subsea system design to incorporate the execution and field management phases of a project. Once fully implemented, wewill have a complete digital thread from concept design, all the way through to the life of the field.
To further our commitment to meaningfully contribute to the energy transition, we formed New Energy Ventures to define a detailed businessplan and identify and develop business opportunities and investment cases. We seek to make energy more sustainable throughelectrification of offshore fields through renewable sources. Offshore floating wind, wave energy, and green hydrogen will be maincontributors to our subsea energy transition vision. Our core competencies in systems engineering, safety control and systems, highpressure gas pipelines and risers, connection systems, and subsea tank systems are easily transferable from oil and gas to alternativeenergy solutions.
We have set a target to reduce up to 50 percent of CO emissions from offshore upstream life of field. Subsea is a field development solutionthat is uniquely positioned to minimize carbon footprint and drive simplification in field design, product design and offshore operations toenable a platform-less future.
Subsea all-electric field developments enable longer step-out and tiebacks as well as unmanned platforms and operations. Subseaprocessing and power solutions move technology from topside to seabed. Automation and robotics such as the Gemini ROV represent a stepchange towards autonomous operations.
Our subsea products and infrastructure help our clients' businesses be less carbon intensive across activities by reducing CO emissions.
We expect our iEPCI capabilities to provide a competitive advantage as we deliver comprehensive and differentiated solutions. In addition,we anticipate the following longer-term trends in the subsea market:
• Increased market adoption of integrated subsea projects, leading to further penetration of our integrated business model and higherlevels of iEPCI order activity for our Company.
• Growing service opportunities, driven by (i) higher levels of project activity, (ii) increased asset integrity and production managementactivities focused on improving uptime and production volume and lowering emissions, and (iii) increased maintenance andintervention activity resulting from an expanding and aging installed equipment base.
• Smaller projects (less than $75 million) and direct awards will continue to contribute meaningfully to our order mix. In 2020, theseawards collectively represented more than half of our total subsea inbound orders, with the remainder being publicly announcedprojects and subsea service activities. Subsea tiebacks are often part of this mix, and these shorter cycle brownfield expansionsprovide operators with faster paybacks and higher returns.
• There is a growing trend towards independent operators and new entrants undertaking subsea developments; we are a naturalpartner for this customer group because of our ability to offer fully integrated solutions.
TM
TM
2
2
10

• Natural gas developments are growing in prominence. We believe that more than 20 percent of offshore capital expenditures couldbe directed at natural gas developments by early next decade. We also anticipate that 45 percent of gas production will come fromoffshore, with significant growth in the Middle East (shallow water) followed by Australia (deep water) in the next five years.
We continue to work closely with our customers and believe that, in the context of lower oil prices, with our unique business model we canfurther reduce their project break-even levels by offering cost-effective approaches to their project developments and accelerating time to firstoil and gas.
Product Development
Technology development progressed on our Subsea 2.0™ (“Subsea 2.0”) product platform, the next generation of subsea equipment, usingdesigns that are significantly simpler, leaner, and smarter than current designs. These products incorporate a modular product architectureand component level standardization to enable a flexible configure-to-order approach, reducing hardware delivery time for clients. Theproducts are expected to deliver breakthroughs in the way subsea products are manufactured, assembled, installed, and maintained over thelife of the field. Incorporating our Subsea 2.0 platform can greatly simplify the subsea infrastructure, while reducing greenhouse gasemissions. When combined with iEPCI, it also simplifies vessel installation campaigns by providing an even greater environmental andeconomic benefit and unlocks first oil and gas faster. In 2020, we installed Subsea 2.0 trees on two projects, with production under wayoffshore in Brazil. Additionally, we were awarded our latest iEPCI project with Shell in Malaysia. It incorporates our Subsea 2.0 technology aswell as a diverse set of other projects in some of the most active basins in the world.
Our Joint Industry Program for electrification of the field progressed well this year. This system solution will drive reduced emissions, enablemore digitally enabled intelligent field operations, improve economics for long step-out and subsea tie-back to short field developments, andcontribute to a more sustainable way to develop oil and gas resources.
In a partnership with Halliburton, we introduced Odassea™, the first distributed acoustic sensing solution for subsea wells. This technologyplatform enables operators to execute intervention-less seismic imaging and reservoir diagnostics to reduce total cost of ownership whileimproving reservoir knowledge. This project expands our unique integrated subsea solution and leverages the competencies and know-howto drive a higher level of sustainability. In the field, we are delivering solutions with the technology to multiple subsea projects at all stagesfrom conceptual design to execution and installation.
This year, we have also advanced on our journey towards more autonomous operations with the launch of the Gemini™® (“Gemini”) ROVsystem, featuring advanced automation and precision robotics to increase offshore productivity. Gemini is the next generation of advanced250 horse power work class ROV system providing unprecedented subsea productivity. The integration of ROV, manipulators and toolingenables a transition to highly automated subsea robotics, which reduces task time from hours to minutes, ensuring predictable results everytime. Featuring a significant advancement in manipulator design, the Gemini manipulators provide integrated hydraulics, electric power,communications, and force compliance. Additionally, the ROV has access to more than 30 subsea exchangeable tools and a comprehensivefluid intervention system to support the most demanding deepwater drilling and completion operations. With a depth rating of up to 4,000meters, Gemini can remain subsea for one month, enabling 24/7 operations without recovery for tooling reconfiguration. Its combination ofsystem availability, capability and productivity reduces operational costs and delivers unequaled performance.
In addition to investments to develop lower-cost production solutions, we also invest in the development of technology to expand our serviceportfolio. As an example, we have simultaneously launched a suite of new ROV services for drill rigs alongside Gemini to drive even greaterefficiency.
Acquisitions and Investments
We did not make any material acquisitions or corporate investments in 2020. We have focused on business transformation to mitigate theadverse effects of the rapidly changing market environment and to ensure the long-term viability of our subsea business.Going forward, we will need fewer assets to deliver more comprehensive solutions:
11

• We are optimizing our operations across geographies, and if economic returns don’t make sense, we will look to exit.
• We continue to right-size our assets to better align with and leverage the benefits of our differentiated offering and the advantages ofnew technologies – such as Subsea 2.0 – and integrated project delivery.
• We continue to partner with others, providing us access to unique assets in a more capital efficient manner.
As the subsea industry continues to evolve, we are accelerating actions to further streamline our organization, achieve standardization, andreduce cycle times. We aim to continuously align our operations with activity levels, while preserving our core capacity in order to delivercurrent projects in backlog and future order activity.
Technip Energies
Technip Energies offers a full range of design, project management, and construction services to our customers spanning the entiredownstream value chain, including technical consulting, concept selection, and final acceptance test. With the drive of the energy transition,we are increasingly deploying low-carbon solutions. We have been successful in meeting our clients’ needs given our proven skills inmanaging large engineering, procurement, and construction projects.
Technip Energies’ onshore business combines the study, engineering, procurement, construction, and project management of the entirerange of facilities related to the production, treatment, and transportation of gas, oil and renewables, the transformation of petrochemicalssuch as ethylene, polymers, and fertilizers, as well as other major activities including refining and hydrogen.
Technip Energies conducts large-scale, complex, and challenging projects that involve extreme climatic conditions and non-conventionalresources and are subject to increasing environmental and regulatory performance standards. Technip Energies relies on technologicalknow-how for process design and engineering, either through the integration of technologies from leading alliance partners or through its owntechnologies. Technip Energies seeks to integrate and develop advanced technologies and reinforce its strong project execution capabilitiesin each of its onshore activities.
Technip Energies’ offshore business combines the study, engineering, procurement, construction, and project management within the entirerange of fixed and floating offshore facilities, many of which were the first of their kind, including the development of floating liquefied naturalgas (“FLNG”) facilities.
Principal Products and Services
Onshore Engineering & Construction. Technip Energies designs and builds different types of facilities for the development of onshore gas, oil,and renewables, processing facilities, and product export systems. In addition, Technip Energies renovates existing facilities by modernizingproduction equipment and control systems, in accordance with applicable environmental standards.
Natural Gas Treatment and Liquefaction. Technip Energies offers a complete range of services across the gas value chain to support itsclients’ capital projects from concept to delivery. Technip Energies’ capabilities include the design and construction of facilities for liquefiednatural gas (“LNG”), gas-to-liquids (“GTL”), natural gas liquids (“NGL”) recovery, and gas treatment.
In the field of LNG, Technip Energies pioneered base-load LNG plant construction through the first-ever facility in Arzew, Algeria. Workingwith its partners, Technip Energies has constructed facilities that can deliver more than 105 million metric tonnes per annum (“Mtpa”), whichis a significant portion of the global liquefaction capacity in operation today. Technip Energies brings knowledge and conceptual designcapabilities that are unique among engineering and construction companies involved in LNG. Technip Energies has engineered anddelivered a broad range of LNG plants, including mid-scale and very large-scale plants, both onshore and offshore, and plants in remotelocations. Technip Energies has experience in the complete range of services for LNG, receiving terminals from conceptual design studies toEPC. Reference projects include LNG trains in Qatar (the sixth largest ever constructed), Yemen, and a series of mid-scale LNG plants inChina. Together with its joint venture partners,
12

Technip Energies delivered the first phase of the Yamal LNG plant (“Yamal”) in the Russian Arctic with all three trains put in production beforethe end of 2018. During 2019, the Arctic LNG 2 project for Novatek was sanctioned following award of the EPC contract to Technip Energies,together with its joint venture partners. Technip Energies combines its capabilities with its technology and know-how to develop new solutionsthat supports the energy transition in reducing LNG plant emissions and improving their energy efficiency.
Technip Energies is also well-positioned in the GTL market and are one of the few contractors with experience in large GTL facilities. TechnipEnergies has unique experience in delivering plants using Sasol’s “Slurry Phase Distillate” technology, and it has provided front-endengineering design for the Fischer-Tropsch section of more than 60 percent of commercial liquids conversion capacity worldwide. TechnipEnergies’ clients also benefit from its development of environmental protection measures, including low nitrogen oxide and sulfur oxideemissions, waste-water treatment, and waste management.
Technip Energies specializes in the design and construction of large-scale gas treatment complexes as well as existing facility upgrades. Gastreatment includes the removal of carbon dioxide and sulfur components from natural gas using chemical or physical solvents, sulfurrecovery, and gas sweetening processes based on the use of an amine solvent. Technip Energies ranks among the top contractors in thefield in relation to sulfur recovery units installed in refineries or natural gas processing plants. Given its long-term experience in the field ofsour gas processing, Technip Energies can provide support to clients for the overall evaluation of the gas sweetening/sulfur recovery chainand the selection of optimum technologies.
Refining. Technip Energies is a leader in the design and construction of refineries. Technip Energies manages many aspects of theseprojects, including the preparation of concept and feasibility studies, and the design, construction, and start-up of complex refineries or singlerefinery units. Technip Energies has been involved in the design and construction of more than 30 new refineries or major refineryexpansions and are one of the few contractors in the world to have built seven new refineries since 2000. Technip Energies has extensiveexperience with technologies related to refining and have completed more than 840 individual process units within major expansion orrefurbishment projects, implemented in more than 75 countries. As a result of its cooperation with the most highly renowned technologylicensors and catalyst suppliers, and its strong technological expertise and refinery consulting services, Technip Energies is able to providean independent selection of appropriate technologies to meet specific project and client targets. These technologies result in direct benefitsto the client, such as energy efficiency, emission control and environmental protection, including hydrogen and carbon dioxide management,sulfur recovery units, water treatment, and zero flaring. With a strong record of accomplishment in refinery optimization and performanceimprovement projects, Technip Energies has experience and competence in relevant technological fields in the refining sector. Transition to alow-carbon economy is a strategic trend driving the refining industry today for which Technip Energies offers significant experience,technological skills, solid project development, and delivery references.
Biofuels. Biofuels are a renewable alternative to fossil fuels and an advanced solution to meet stringent, medium-term climate targets. In thisdomain, Technip Energies is one of the global leaders and delivers a wide range of biofuel plants utilizing various technologies. TechnipEnergies has end-to-end project management expertise, delivering projects from feasibility studies to full EPC project execution.Opportunities lie in expansions or revamps of existing refineries, as well as stand-alone projects. As an example, Technip Energies is apartner of choice for Neste’s NEXBTL projects, being involved in its facilities in Singapore and Rotterdam.
Hydrogen. Hydrogen is widely used in the production of cleaner transport fuels and is also the most widely used industrial gas in the refining,chemical, and petrochemical industries. With more than 55 years' experience and expertise in the production of hydrogen, Technip Energiesoffers a single point of responsibility for the design and construction of hydrogen and synthesis gas production units, with tailored solutionsranging from Process Design Packages to full lump-sum turnkey projects. Technip Energies also offers services for maintenance andperformance optimization of running units as well as a wide choice of proprietary technologies, including steam reforming technology usedworldwide. Technip Energies has solutions in place for carbon capture readiness in future hydrogen plants, targeting more than a two-thirds'reduction in carbon dioxide release from hydrogen plants. Driven by its track record in grey and blue hydrogen projects, Technip Energies isalso focused on positioning carbon-free, green, hydrogen in the current and future energy landscape, on the basis of its extensive expertisein hydrogen technology. In October 2020, Technip Energies entered into a strategic alliance with McPhy, a leading manufacturer and supplierof carbon-free hydrogen production and distribution equipment, to develop large-scale and competitive carbon-free hydrogen solutions fromproduction to liquefaction, storage, and distribution.
13

Ethylene. Technip Energies holds proprietary technologies and is a leader in the design, construction, and commissioning of ethyleneproduction plants. Technip Energies designs steam crackers, from concept stage through construction and commissioning, for both newplants (including mega-crackers) and plant expansions. Technip Energies has a portfolio of the latest generation of commercially proventechnologies and is uniquely positioned to be both a licensor and an EPC contractor. Technip Energies’ technological developments haveimproved the energy efficiency in ethylene plants by improving thermal efficiency of the furnaces and reducing the compression powerrequired per ton, thereby reducing carbon dioxide emissions per ton of ethylene by 30 percent over the last 20 years.
Petrochemicals. Technip Energies is one of the world leaders in the process design, licensing, and realization of petrochemical units,including basic chemicals, intermediate, and derivative plants. Technip Energies provides a range of services that includes processtechnology licensing and development and full EPC complexes. Technip Energies is accelerating the energy transition by improvingmonomer and energy efficiencies of its plants and by integrating feedstock shifts to improve production costs and carbon footprints. TechnipEnergies licenses a portfolio of chemical technologies through long-standing alliances and relationships with leading manufacturingcompanies and technology providers. Technip Energies has research centers to develop and test technologies for polymer andpetrochemical applications, where fully automated pilot plants gather design data to scale-up processes for commercialization.
Fertilizers. Technip Energies’ expertise covers the entire value chain from mining and beneficiation to fertilizers, including ammonia, urea,and phosphoric acid plants. Working in more than 40 countries, Technip Energies has engineered and delivered more than 350 large fertilizercomplexes and integrated units. Technip Energies services offerings range from global strategic planning, technical consulting, and feasibilitystudies to complete turnkey facilities and further assistance to production and de-bottlenecking. Through its commitment to continuous end-to-end innovation for higher performance and efficiencies, Technip Energies helps its clients develop optimized and sustainable processschemes for their projects and meet the highest environmental standards.
Sustainable Chemistry. Technip Energies is a key player in sustainable chemistry and offers a variety of technologies, processes andservices in the areas of biofuels, biochemicals, and circular economy applications. With leading engineering and project managementcapabilities originating from expertise in chemicals, petrochemicals, refining, and fermentation, it provides high value for clients – fromprocess development in the very early stage of the project, to the implementation of large and complex sustainable chemicals plants.
Decarbonization. Technip Energies provides solutions that span from energy efficiency to full carbon removal, adapting to a variety of clientchallenges and requirements. Technip Energies makes clients’ businesses less carbon intensive across activities, decarbonizes fossil-basedenergies and manages the resulting CO in a sustainable manner. Technip Energies current portfolio of sustainable technologies includesprocess designs that improve energy efficiency and reduce emissions and provides answers today for its customers.
Carbon-free energy solutions. To offer carbon-free solutions requires overcoming many technical and commercial challenges, as well asintegrating multiple technologies for the management of electrical power from wind or solar intermittency. In this field, Technip Energies isexpanding its portfolio of technologies and processes to carbon-free energy chains such as green hydrogen produced from renewableenergy.
Fixed Platforms. Technip Energies offers a broad range of fixed platform solutions in shallow water, including: (i) large conventional platformswith pile steel jackets whose topsides are installed offshore either by heavy lift vessel or floatover; (ii) small, conventional platforms installedby small crane vessel; (iii) steel gravity-based structure platforms, generally with floatover topsides; and (iv) small to large self-installingplatforms. Technip Energies offers a range of design, construction, and industrial applications that are key to the global transition to a lesscarbon intensive economy.
Floating Production Units. Technip Energies offers a broad range of floating platform solutions for moderate to ultra-deepwater applications,including:
• Spar Platforms: Capable of operating in a wide range of water depths, the Spar is a low motion floater that can support full drillingwith dry trees or with tender assist and flexible or steel catenary risers. The Spar topside is installed offshore either by heavy liftvessel or floatover. Technip Energies has constructed 17 Spar facilities which are currently operating in the world.
2
14

• Semi-Submersible Platforms: These platforms are well-suited for oil field developments where subsea wells drilled by a mobileoffshore drilling unit are appropriate. Semi-Submersibles can operate in a wide range of water depths and may have full drilling andlarge topside capabilities. Technip Energies has its own unique design of low-motion Semi-Submersible platforms that canaccommodate dry trees.
• Tension-Leg Platforms (“TLP”): An appropriate platform for deepwater drilling and production in water depths up to approximately1,500 meters, the TLP can be configured with full drilling or with tender assist and is generally a dry tree unit. The TLP and ourtopside can be integrated on to the substructure in a cost-effective manner at quayside.
Floating Production, Storage and Offloading (“FPSO”). Working with its construction partners, Technip Energies has delivered some of thelargest FPSOs in the world. FPSOs enable offshore production and storage of oil which is then transported by a tanker where pipeline exportis uneconomic or technically challenged (e.g., ultra-deepwater). FPSOs utilize onshore processes adapted to a floating marine environment.They can support large topsides and hence large production capacities. Leveraging its industry-leading capabilities in gas monetization,particularly FLNG, Technip Energies is currently well-positioned to leverage the global offshore gas cycle with gas FPSOs.
Floating Liquefied Natural Gas. FLNG is an innovative alternative to traditional onshore LNG plants and is suitable for remote and strandedgas fields that were previously deemed uneconomical. FLNG is a commercially attractive and carbon conscious approach to the monetizationof offshore stranded gas fields or associated gas from oil production. It avoids the cost of building and operating long-distance pipelines andextensive onshore infrastructure. Technip Energies pioneered the FLNG industry and is the contractor best able to integrate all of the coreactivities required to deliver an FLNG project: LNG process, offshore facilities, loading systems, and subsea infrastructure. Technip Energiesdelivered the industry’s first and largest FLNG facilities and is currently executing ENI’s Coral South FLNG, which will be installed offshoreMozambique in East Africa.
Mining and Metals. Technip Energies offers its clients an integrated approach and expertise across the mineral value chain from mining toprocessing. The Sintoukola potash project in the Congo is a prime example of this integrated approach. Technip Energies covers the entireproject lifecycle, from conceptual studies to engineering, procurement, construction, and project management services or EPC Lump-SumTurn-Key services with references including successful completed projects and ongoing projects dedicated to the treatment of nickel,uranium, phosphate, potash, alumina, and iron ore. Technip Energies brings together the know-how and determination to transform itsclients’ project economics.
Life Sciences. Technip Energies is a leading provider in the design and construction of pharmaceuticals and bio-technologies facilities,bringing together know-how, process engineering expertise, construction management, commissioning, and qualification. Technip Energiesoffers fully integrated technical and regulatory solutions from design to validation. Technip Energies provides its clients a robust experiencewith more than 350 pharmaceuticals and bio-technologies facilities delivered in the past 25 years.
Nuclear. Technip Energies has recognized expertise and dedicated capabilities at several stages of the nuclear industry chain, from mining tochemistry, underground waste storage and reprocessing. Technip Energies provides engineering services from basic to detailed design,project management, control assistance, and construction services for the nuclear market.Loading Systems. Technip Energies is globally recognized for setting technical and performance standards in fluid transfer, delivering liquidand gas loading systems to the most challenging applications, both onshore and offshore. Technip Energies leads the market with 10,000loading arms supplied, including more than 500 arms for LNG. Technip Energies has developed unique offshore LNG transfer systems for allFLNG facilities operating to-date. Technip Energies offers equipment design and fabrication projects, as well as services over the life of itssystems.
Cybernetix robotics and surveillance. Technip Energies offers innovative robotics and surveillance systems for harsh environments andoperational constraints. Technip Energies works with an array of clients in the energy industry. This includes nuclear, where Technip Energiesinvolvement dates back more than 20 years. Technip Energies’ solutions help energy clients increase uptime, reduce costs, and improvesafety and speed of decision-making through augmented monitoring and advanced robotics solutions for inspection and dexterousinterventions.
15

Capital Intensity
Technip Energies executes turnkey contracts on a lump-sum or reimbursable basis through engineering, procurement, construction, andproject management services on both brownfield and greenfield developments and projects. Technip Energies can execute EPC contractsthrough sole responsibility, joint ventures, or consortiums with other companies. Technip Energies often receives advance payments andprogress billings from its customers to fund initial development and working capital requirements. However, its working capital balances canvary significantly through the project lifecycle depending on the payment terms and timing on contracts.
Dependence on Key Customers
Generally, Technip Energies' customers are major integrated oil companies or national oil companies. Technip Energies has developed long-term relationships with its main clients around its portfolio of technologies, expertise in project management, and strong execution, whileaddressing national content development requirements. Technip Energies’ customers have sought the security of partnerships with TechnipEnergies to ensure timely and cost-effective delivery of their projects. One customer, Arctic LNG, represented more than 10 percent of our2020 consolidated revenue.
Competition
In the onshore market, Technip Energies faces a large number of competitors, including U.S. companies (Bechtel Corporation, FluorCorporation, KBR, Inc. (“KBR”), and McDermott), Asian and Australian companies (Chiyoda Corporation, JGC Corporation, HyundaiEngineering & Construction Co., Ltd., Samsung Engineering Co., Ltd, SK Engineering & Construction Co., Ltd, and Worley Limited),European companies (Wood Group plc, Maire Tecnimont Group, Petrofac, Ltd., Saipem, and Tecnicas Reunidas, S.A.). In addition, TechnipEnergies competes against smaller, specialized, and locally based engineering and construction companies in certain countries or for specificunits such as petrochemicals.
Competition in the offshore market is relatively fragmented and includes various players with different core capabilities, including offshoreconstruction contractors, shipyards, leasing contractors, and local yards in Asia Pacific, the Middle East, and Africa. Competitors includeChina Offshore Oil Engineering Co., Ltd., Daewoo Shipbuilding & Marine Engineering Co., Ltd., Hyundai Heavy Industries Co., Ltd., JGCCorporation, KBR, McDermott, MODEC Inc., Saipem, and Samsung Heavy Industries Co., Ltd.
Seasonality
Technip Energies’ onshore business is generally not impacted by seasonality. Technip Energies’ offshore business could be impacted byseasonality in the North Sea and other harsh environment regions during the offshore installation campaign at the end of a project.
Market Environment
In the first quarter of 2020, the COVID-19 pandemic provoked an unprecedented drop in demand for oil and gas, while supply wasmaintained at a high level for some time by some large oil and gas producing countries, resulting in sharp price reductions. Technip Energies’clients reacted rapidly, cutting their investments and delaying project sanctions.
Given the long cycle nature of Technip Energies business and the resilience and maturity of the projects in backlog, Technip Energies hasbeen able to mitigate a significant portion of COVID-19 operational impacts. For its large capital projects, deferrals of new projects wererecorded while on-going projects were maintained. With the introduction of its energy transition framework, Technip Energies is wellpositioned to accompany clients in their shift towards low-carbon societies and pursue commercial opportunities, including in digitalization.
The onshore market activity continues to provide a tangible set of opportunities in LNG due to the critical role that natural gas plays as atransition fuel. By focusing on selectivity, cost competitiveness and an agility to capture new opportunities, Technip Energies continues topursue refining, petrochemical, fertilizer, and renewables project opportunities. Based on a solid track-record, technologies and its energytransition framework, Technip Energies is well positioned for growth in sustainable chemistry and other low-carbon or carbon-free energysolutions.
16

Offshore market activity is expected to benefit in the near-term as macro conditions continue to support the international growth cycle,resulting in increased activity in offshore and deepwater exploration and development. In the long term, new upstream investment will also berequired as gas becomes a bigger portion of the global energy mix. Technip Energies is well positioned to capture these opportunities due toits offering in all offshore markets and leadership position in FLNG or gas FPSO.
Strategy
Technip Energies strategy is based on the following:
• Selectivity of clients, projects, and geographies, which serves to maintain early engagement, leading to influence over technologicalchoices, design considerations, and project specifications that make projects economically viable.
• Technology-driven differentiation with strong project management, which eliminates or significantly reduces technical and projectrisks, leading to both schedule and cost certainty without compromising safety.
• Excellence in project execution, because of our global, multi-center project delivery model complemented by deep partnerships andalliances to ensure the best possible execution for complex projects.
Technip Energies continues to invest in innovation and technology. Technip Energies is at the forefront of digital solutions due in part to itsinvestment in three dimensional models, often referred to as digital twin, and interfaces.
Technip Energies continues to serve its clients in traditional markets, developing more energy-efficient solutions while making their facilitiesless-carbon intensive. Technip Energies’ framework about Energy Transition is organized around four pillars, and will help us accelerate thejourney to a low-carbon society:
• LNG – to deliver the necessary infrastructure as a global leader as we transition to a low-carbon society.
• Sustainable Chemistry – to design and implement processes for products from renewable sources and to provide circular solutionsfor the generation of safe and sustainable substances that are in demand by industry and society.
• Decarbonization – to make Technip Energies’ clients’ businesses less carbon intensive across our activities, decarbonize fossil-based energies and manage the resulting CO in a sustainable manner.
• Carbon-Free Solutions – to expand Technip Energies’ portfolio of technologies and processes that provide non-carbon-based energyalternatives.
Recent and Future Developments
Technip Energies’ active early engagement with its clients through front-end engineering studies serves to optimize project economics whilealso significantly mitigating risks during project execution. Technip Energies direct engagement led to the signing of a major EPC contract inJuly for the construction of a new hydrocracking complex for the Assiut refinery in Egypt. Technip Energies continues to selectively trackrefining, petrochemical, fertilizer, and sustainable chemistry project opportunities – notably in the Middle East, Africa, Asia and North America– as these sectors typically prove to be more resilient through a downturn.
In response to an increase in demand for gas, new offshore investment will be required in the long term. Recent discoveries of offshore fieldswith reserves in regions such as Australia and East Africa are expected to benefit future activity; however, the timing of increased investmentin these regions could be deferred. Offshore continued as a leader in gas projects with the ongoing Karish FPSO project for Energean, TortueFPSO project for BP, and Coral FLNG project for Eni.
2
17

Product Development
Technip Energies is positioned as a premier provider of project execution and technology solutions, which enables its customers to unlockresources at advantaged capital and operating economics. Technip Energies invests in these main onshore R&D areas: (i) the developmentof process technology and equipment for economy of scale; (ii) continuous improvement of its proprietary process technologies and othersolutions to reduce operating and investment cost; and (iii) diversification of its proprietary technology offering, especially in the energytransition domain.
Technip Energies’ offshore R&D efforts are focused on improving the economics of its clients’ diverse fixed and floating platform projects.Additionally, to further reduce operating and investment costs, Technip Energies continues to progress the development of robotic solutionsfor offshore platforms and work towards a standard and adaptable design for Normally Unmanned Installations. Technip Energies is alsoevaluating the various opportunities that will emerge as the industry and societal demands shift as part of the energy transition. TechnipEnergies continues to assess and implement the best digital technologies to support the business.
Acquisitions and Investments
Technip Energies has made an investment in McPhy, a leading manufacturer and supplier of carbon-free hydrogen production anddistribution equipment. Technip Energies also signed a memorandum of understanding with McPhy, pursuant to which the two companies willjointly work on technology development and project implementation. In addition to its leadership position in hydrogen, this collaboration willhelp Technip Energies develop large-scale and competitive Green hydrogen solutions.
Surface Technologies
The Surface Technologies segment designs, manufactures, and services products and systems used by companies involved in land andshallow water exploration and production of crude oil and natural gas. Our Surface Technologies product families include (i) drilling, (ii)stimulation, (iii) production, (iv) measurement, and (v) services. We manufacture most of our products internally in facilities locatedworldwide.
Principal Products and Services
Drilling. We provide a full range of drilling and completion systems for both standard and custom engineered applications. The customer baseof our drilling and completion offerings is oil and gas exploration and production companies.
Surface Wellheads and Production Trees. Our products are used to control and regulate the flow of crude oil and natural gas from the well.The wellhead is a system of spools and sealing devices from which the entire downhole well string hangs and provides the structural supportfor surface production trees. Production trees are comprised of valves, actuators and chokes which can be combined in both vertical andhorizontal configurations, depending on customer-specific requirements.
Surface wellheads and production trees are “per-well” systems which are designed for onshore shale, onshore conventional, and offshoreshallow water platform applications, and are typically sold directly to exploration and production operators during the drilling and completionphases of the well lifecycle. Our surface wellhead and production tree systems are used worldwide, and we are one of the few companiesthat provide global coverage and a full range of system configurations, including (i) conventional wellheads, (ii) Unihead® drill-thru wellheadsdesigned for faster installation and drill-time optimization, and (iii) high-pressure, high-temperature (“HPHT”) systems for extreme productionapplications.
We also provide services associated to our surface wellhead and production tree portfolio, including service personnel and rental tooling forwellhead and production tree installation and life of field repair, refurbishment, and general maintenance. Our wellhead and production treebusiness relies on our ability to successfully provide the necessary field operations coverage, responsiveness, and reliability to preventdowntime and non-productive time during the drilling and completion phases
18

Completion and stimulation. Our iComplete™ offering is the first integrated pressure containment kit for the onshore conventional stimulationmarket. Its CyberFrac™ digital platform reduces manpower in the red zone and enables efficiencies that significantly reduce GHG emissions,lower downtime, and eliminate the integration burden for operators.
We are one of the few oilfield service providers that can offer an integrated solution covering the fracturing through flowback phases.iComplete™ provides our exploration and production customers with an integrated rental and service offering, including fracturing tree andmanifold systems, as well as pressure control flowlines, flowback and well testing equipment, and field services.
Fracturing Tree and Manifold Systems. During the completion of a shale well, the well undergoes hydraulic fracturing. During this phase,durable and wear-resistant wellsite equipment is temporarily deployed. Our equipment is designed to sustain the high pressure and highlyerosive fracturing fluid which is pumped through the well into the formation.
Our equipment (fracturing tree systems, fracturing valve greasing systems, hydraulic control units, fracturing manifold systems, and rigid andflexible flowlines) is temporarily laid out between the wellhead and the fracturing pump truck during hydraulic fracturing. These products aretypically supplied to exploration and production operators who rent this equipment directly from us during the hydraulic fracturing activities.Associated with our fracturing equipment rental is fracturing rig-up / rig-down field service personnel as well as oversight and operation of theequipment during the multiple fracturing stages for a shale well.
TechnipFMC’s manifold solutions help increase operational efficiency for a pad site with multiple wells. Our SuperFrac™ Manifold providestime savings and pumping efficiencies when stimulating multiple wells on a single pad. The manifolds are installed and connected to multipletrees off the critical path, which allows our customers to fracture more stages per day in a compact footprint and efficiently move operationsfrom one well to another, saving time and money. We also offer conventional and articulating arm manifold trailers, which are used as theconnection point between fracturing pump trucks and the fracturing flowline and manifold system.
Our Ground Level Fracturing System is an essential tool for unconventional operators who use simultaneous operations to efficiently runcompletions in multi-well pads. The innovative system design uses various lengths of trunkline to align the SuperFrac™ Manifold andfracturing tree at ground level, which minimizes the number of flowline connections for safer operation. We are a significant supplier offlowline pipework (rigid and flexible) that is used to move the fracturing product from the pump truck, via the manifold and into the fracturingtrees.
Pressure Pumping. We design and manufacture equipment used in well completion and stimulation activities by major oilfield service anddrilling companies, as well as by oil and gas exploration and production operators directly.
Flexibles. We have been a leading supplier of flexible lines since the 1970s and have successfully introduced a portfolio of flexible solutionsfor the onshore stimulation market. Our PumpFlex™ and WellFlex™ products can be incorporated into most shale operations and are anintegral part of our iComplete™ system.
Flowline. We are a leading supplier of flowline products and services to the oilfield industry. From the original Chiksan® and Weco® productsto our revolutionary equipment designs and integrated services, our family of flowline products and services provides our customers withreliable and durable pressure pumping equipment. Our facilities stock flowline products in the specific sizes, pressures, and materialscommon to each region. Our commitment is to help our customers worldwide attain maximum value from their pressure pumping assets byguaranteeing that the right products arrive at the job site in top working condition. Our total solutions approach includes the InteServ trackingand management system, mobile inspection and repair, strategically located service centers, and genuine Chiksan® and Weco® spare parts.
Well Service Pumps. We offer a diverse line of well service pumps for use in high-pressure pumping operations such as hydraulic fracturingand stimulation, including triplex and quintuplex pumps, each with its own industry-leading features, including: (i) heavy-duty power ends,paired with main journal roller bearings and heavy-duty rod journal bearings, (ii) heavy-duty crankshafts, (iii) fluid cylinders, with accessiblepacking and valves, and (iv) made-to-order pumps. Our pumps can withstand some of the harshest operating conditions, with pressureranges up to 20,000 psi and flow rates up to 1,500 gallons per minute.
19

Production. Our upstream production offering includes well control, safety and integrity systems, multiphase meter modules, in-lineseparation and processing systems, and standard pumps. These offerings are differentiated by our comprehensive portfolio of in-housecompact, modular, and digital technologies, and are designed to enhance field project economics and reduce operating expenditures with anintegrated system that spans from wellhead to pipeline.
Our iProduction™ system is the first automated integrated production platform for onshore unconventional. Our digital interface enablesoperators to manage their production operations remotely, leveraging Insitex data-monitoring technology. Our separation portfolio andmeasurement technologies, combined with our expertise in modularization, enable our customers to achieve first production faster with fullyoptimized and environmentally conscious, compact systems.
Flowback and Well Testing Services. After a shale well is hydraulically fractured, the well moves to the flowback phase in which much of thefracturing fluid pumped into the well flows back out through the wellhead and fracturing tree system. This phase lasts until the wellbore flow isadequate for flow through the production facilities downstream of the wellsite. Our flowback and well testing offering includes chokes, de-sanders, and advanced well testing equipment and related services which are provided to exploration and production operators during theflowback phase. Our Automated Well Testing Package (AWT™) is now widely used in North America enabling operators to removepersonnel from processes and its digital package anticipates service. These offerings enable a substantial reduction in downtime andenhanced safety.
Well Control and Integrity Systems. We supply control components and safety systems designed to safely and efficiently run a wellpad,modules on an offshore platform, or a production facility. Our systems are based on standard, field-proven building blocks and designed forminimal maintenance during life of field operations.
Surface Multiphase Meter. Our multiphase meters (“MPMs”) are a collection of technologically advanced innovations that provide adifferentiated approach to multiphase measurement. The patented technology in our MPMs offers many unique features that provide a stepchange in allocation measurement and allows for continuous surveillance of wells across a full range of operating conditions. Our MPMsprovide real-time data to a central facility, or our cloud portal, for production reporting and remote notification and system troubleshooting.
Separation and Processing Systems. TechnipFMC provides industry-leading technology for the separation of oil, gas, sand, and water. Thesesolutions are used in onshore production facilities and on offshore platforms worldwide. Our family of separation products delivers clientsuccess by increasing efficiency and throughput and reducing the footprint of processing facilities. Our separation systems offering includesinternal components for oil and gas multiphase separation, in-line deliquidisers, and solids removal, as well as fully assembled separationmodules and packages designed and fabricated for oil and gas separation, fracturing flowback treatment, solids removal, and primaryproduced water treatment.
Standard Pumps and Skid Systems. We provide complete skid solutions, from design consultation through startup and commissioning. Weoffer a diverse line of reciprocating pumps, customized according to the application with pressure ranges available up to 10,000 psi and flowrates up to 1,500 gallons per minute.
Automation and Digital Systems. We provide hardware and software solutions to automate and provide simple human interfaces for anumber of our critical products. These digital offerings help enable the removal of personnel from critical zones, either offshore or onshore. Inaddition, the digital signatures from our products can then be interpreted and used via condition performance monitoring to eliminateunplanned downtime.
Measurement. We design, manufacture, and service measurement products for the oil and gas industry. Our flow computers and controlsystems manage and monitor liquid and gas measurement for applications such as custody transfer, fiscal measurement, and batch loadingand deliveries. Our FPSO metering systems provide the precision and reliability required for measuring large flow rates of marine loadingoperations. Our gas and liquid measurement systems are utilized in multiple energy-related applications, including crude oil and natural gasproduction and transportation, refined product transportation, petroleum refining, and petroleum marketing and distribution. We combineadvanced measurement technology with state-of-the-art electronics and supervisory control systems to provide the measurement of bothliquids and gases. This ensures processes operate efficiently while reducing operating costs and minimizing the risks associated withcustody transfer.
20

Services. We offer our customers a comprehensive suite of service packages to ensure optimal performance and reliability of our equipment.These service packages include all phases of the asset’s life cycle: from the early planning stages through testing and installation,commissioning, and operations, replacement and upgrade, maintenance, storage, preservation, intervention, integrity, decommissioning, andabandonment.
Capital Intensity
Surface Technologies manufactures most of its products, resulting in a reliance on manufacturing locations throughout the world, includingfully owned manufacturing hubs in Stephenville, Texas, U.S., and Singapore, and a wide global network of third-party suppliers. We alsomaintain a large quantity of rental equipment related to our drilling and completion and pressure control offerings.
Dependence on Key Customers
Generally, Surface Technologies’ customers are major integrated oil companies, national oil companies, independent exploration andproduction companies and oil and gas service companies. No single Surface Technologies customer accounted for 10% or more of our 2020consolidated revenue.
Competition
Surface Technologies is a market leader for many of our products and services. Some of the factors that distinguish us from other companiesin the same sector include our technological innovation, reliability, product quality, and ability to integrate across a broad portfolio scope.Surface Technologies competes with other companies that supply surface production equipment and pressure control products. Some of ourmajor competitors include Baker Hughes, Cactus, Inc., Forum Energy Technologies, Inc., Gardner Denver, Inc., Schlumberger, Haliburton,and The Weir Group plc.
Market Environment
It has been a challenging year for the surface market, driven in part by the COVID-19 pandemic and the decline in hydrocarbon demand.Drilling and completion activity during 2020 decreased by approximately 40 percent compared to 2019 levels.
North American activity remained lower during the year, however, the number of U.S. fracturing crews has started to recover from the troughreached in May, and the weekly U.S. rig count has stabilized. Activity outside of North America remains resilient. We also continue to benefitfrom our exposure to the Middle East and Asia Pacific, both of which are being supported by strength in gas-related activity. The businessmix outside of North America is expected to account for as much as 65% of total segment revenue in 2021.
Strategy
We exist to transform the surface market in order to provide customers with breakthrough reductions in cost and carbon intensity in thedrilling, completion, upstream production, and midstream and downstream transportation sectors. We distinguish our offering by three keystrengths: technology, integration, and automation.
Technology: We are committed to differentiated core products that enable integrated solutions to leverage the benefits of smarter designs.
Integration: Integrated ecosystems that reduce costs and increase uptime through pre-engineered, modular solutions which driveimprovements in greenhouse gas emissions.
Automation: Intelligent products that are remotely managed using actionable data, reducing manpower in the field, maximizing uptime, andenabling enhanced production.
Product Development
In 2020, we capitalized on the launch of our revolutionary integrated ecosystems, iProduction™ and iComplete™, with the successfulinstallation of our first iProduction™ system with Shell in their Permian basin iShale™
21

production site, and the implementation of our iComplete™ integrated system in the U.S. utilizing our digital interface technology,CyberFrac™.
iProduction™ is a modern production approach that includes well pad processing, gathering lines, and central processing facilities under asingle digital interface. iProduction™ uses proprietary process technology, allowing customers to eliminate tanks, decrease GHG emissionsand reduce footprint while maintaining reliability. By integrating and modularizing pre-engineered standard products, we reduced our clients’costs by up to 33 percent, reduce time to first oil by up to 30 percent and, using our digital twin technology, each site is monitored andcontrolled remotely – delivering new levels of insightful data to ensure uptime.
iComplete™ uses standardized equipment that can be set up for any unconventional well in the world. The integrated system removes 80percent of connections and reduces the need for manual intervention during operations thanks to our CyberFrac™ digital interface, whichprovides actionable data remotely. Our customers get to oil faster and reduce operating costs by 30 percent. This revolutionary approach ismaking our customers' frac pads faster, safer, and smarter.
Acquisitions and Investments
In June 2018, we broke ground on a new 52,000 square meter facility in Dhahran, Saudi Arabia, with work continuing throughout 2019.Despite the COVID-19 pandemic, work has progressed through 2020 and we are on track to open the facility by mid-2021. The facility, whichwill be comprised of two stories and a 13, 000 square meter manufacturing space, is part of our continued investment in the Middle East toreinforce our leading position in delivering local solutions that extend asset life and improve project returns. The new facility positions us torespond to the expected increase in activity in the area while strengthening our capabilities, providing a solid platform for us to grow in whatis a strategic market for our surface business. The new facility will offer a broader range of capabilities and greater value-add in-country,supporting our full portfolio with high technology equipment in the drilling, completion, production, and pressure control sectors.
Capitalizing on Energy Transition
TechnipFMC continues to innovate and introduce new technologies across our portfolio of products and services. Leveraging our vastexperience and competencies from decades of working in the transformation of the energy sector, we enable our clients to achieve theirenergy transition targets.
In Subsea, we fundamentally changed the way we design, manage, and execute projects, starting with digital tools such as our SubseaStudio™. Our Subsea 2.0™ platform can greatly simplify subsea infrastructure, while reducing greenhouse gas emissions by nearly 50%.Combined with iEPCI™, our unique integrated model, it simplifies vessel installation campaigns, providing an even greater environmentaland economic benefit. Our vision includes an “all-electric” system powered by renewable energy, with the potential to eliminate emissions.
Technip Energies continues to break boundaries and accelerate the journey to a low-carbon society. With decades of experience in theenergy industry, Technip Energies is using its engineering, process and technology competencies as well as R&D facilities to finddecarbonized solutions for a better environment. Technip Energies has structured its energy transition framework around four pillars: LNG,sustainable chemistry, decarbonization and carbon-free energy solutions. Technip Energies is a leader in gas treatment and liquefaction andhas significant expertise and prospects in sustainable chemistry, such as its partnership with Neste’s for renewable diesel projects. It hasexpanded its footprint in the circular economy, including collaboration with Carbios to demonstrate its recycling technology. Technip Energies’Genesis advisory services have a particular focus on energy transition. Technip Energies is a leader in hydrogen, with proven technology todeliver blue hydrogen and, through its investment in McPhy, it is well positioned for the emerging Green hydrogen market.
Surface Technologies’ high-efficiency solutions enable our clients to reach hydrocarbons faster with fully optimized and environmentallycompact systems. Our integrated service lines, such as iProduction™ and iComplete™, provide additional opportunities and benefits to ourcustomers. For instance, a project utilizing our iProduction™ integrated production system allows the client to capture more than 50 percentof the greenhouse gases that are typically released into the atmosphere during the production phase of an unconventional development.
22

OTHER BUSINESS INFORMATION RELEVANT TO OUR BUSINESS SEGMENTS
Sources and Availability of Raw Materials
Our business segments purchase carbon steel, stainless steel, aluminum, and steel castings and forgings from the global marketplace. Wetypically do not use single source suppliers for the majority of our raw material purchases; however, certain geographic areas of ourbusinesses, or a project or group of projects, may heavily depend on certain suppliers for raw materials or supply of semi-finished goods. Webelieve the available supplies of raw materials are adequate to meet our needs.
Research and Development
We are engaged in R&D activities directed toward the improvement of existing products and services, the design of specialized products tomeet customer needs, and the development of new products, processes, and services. A large part of our product development spendinghas focused on the improved design and standardization of our Subsea and Technip Energies products to meet our customer needs.
Patents, Trademarks, and Other Intellectual Property
We own a number of patents, trademarks, and licenses that are cumulatively important to our businesses. As part of our ongoing R&D focus,we seek patents when appropriate for new products, product improvements, and related service innovations. We have approximately 7,300issued patents and pending patent applications worldwide. Further, we license intellectual property rights to or from third parties. We alsoown numerous trademarks and trade names and have approximately 660 registrations and pending applications worldwide.
We protect and promote our intellectual property portfolio and take actions we deem appropriate to enforce and defend our intellectualproperty rights. We do not believe, however, that the loss of any one patent, trademark, or license, or group of related patents, trademarks, orlicenses would have a material adverse effect on our overall business.
Segment and Geographic Financial Information
The majority of our consolidated revenue and segment operating profits are generated in markets outside of the United States. Eachsegment’s revenue is dependent upon worldwide oil and gas exploration, production and petrochemical activity. Financial information aboutour segments and geographic areas is incorporated herein by reference from Note 7 to our consolidated financial statements in Part II, Item 8of this Annual Report on Form 10-K.
Order Backlog
Information regarding order backlog is incorporated herein by reference from the section entitled “Inbound Orders and Order Backlog” in PartII, Item 7 of this Annual Report on Form 10-K.
Website Access to Reports and Proxy Statement
Our Annual Reports on Form 10-K, Quarterly Reports on Form 10-Q, Current Reports on Form 8-K, Proxy Statements, and Forms 3, 4, and5 filed on behalf of directors and executive officers, and amendments to each of those reports and statements, are available free of chargethrough our website at www.technipfmc.com, under “Investors” as soon as reasonably practicable after such material is electronically filedwith, or furnished to, the U.S. Securities and Exchange Commission (the “SEC”). Alternatively, our reports may be accessed through thewebsite maintained by the SEC at www.sec.gov. Unless expressly noted, the information on our website or any other website is notincorporated by reference in this Annual Report on Form 10-K and should not be considered part of this Annual Report on Form 10-K or anyother filing we make with the SEC.
HUMAN CAPITAL
Diversity
In the first quarter of 2018, we developed a global framework and key performance indicators for 2018 and beyond to promote andaccelerate the development of women in all functions of our global organization.
23

Our Advancing Gender Diversity objectives include the following:
• Ensure gender pay equality everywhere we operate and review all jobs to ensure gender pay equality and monitor them through afull review every three years.
• Improve gender balance in the organization, across all functions and levels.
• Promote women fairly and equally through the career development process.
In 2018, we reviewed 100 percent of job functions to ensure pay equity. We identified areas for improvement and completed all necessarysalary adjustments in 2019 to ensure fair compensation for all of our employees. Continuous monitoring to ensure pay equity was a focus for2020. Additionally, in 2020, we announced a global parental leave policy for 2021 implementation.
In 2019, to foster a diverse and inclusive culture, we launched its “Diversity & Inclusion – It Matters!” e-learning module with an aim to raiseawareness of our differences and help our employees improve as people and professionals. This e-learning module was added to new hireorientation in 2020 to promote our commitment to advancing gender diversity and an inclusive culture where all employees can reach theirfull potential. We also continued to improve gender balance in 2020 with a focus on increasing the representation of women hired as newgraduates. 40 percent of all graduates hired globally in 2020 were women, surpassing our goal of 30 percent.
We continued to foster Employee Resource Groups (“ERGs”) and encourage participation throughout the whole Company. Our CEO madethe pledge to CEO Action for Diversity and Inclusion, committing to create a trusting environment where all ideas are welcomed andemployees feel comfortable and empowered to draw on their unique experiences and backgrounds. Our seven ERGs continue to beinstrumental in engaging employees and creating a platform to have complex, and sometimes difficult conversations about diversity andinclusion.
Continuous discussions around improving representation of women in the organization helps us promote women fairly and equallythroughout their career development process within our Company. In 2020, our People and Culture team reviewed all senior managementsuccession plans to ensure that female candidates were considered and included.
As a result, 76 percent of our senior management succession plans in 2020 include at least one woman versus 70 percent in 2019, whichexceeded our 2020 goal to increase representation of women in succession plans by five percent.
As of December 31, 2020, TechnipFMC had the following number of employees:Male Employees Female Employees Total % of Female Employees
2019 2020 2019 2020 2019 2020 2019 2020Executive officers 7 5 4 3 11 8 36 % 38 %Senior managers 84 92 24 19 108 111 22 % 19 %Employees on payroll (overall) 28,760 26,948 8,407 8,135 37,167 35,086 23 % 23 %
24

We are committed to improving this dimension and took necessary steps in strengthening our succession plans and graduate intake in 2020.We have also developed an inclusive leadership curriculum, which, along with executive leadership team commitment and systemic changesto policy and talent standards, will help improve women representation in senior manager roles in the medium to long term.
In June 2020, we decided to broaden our inclusion focus by reflecting not only gender but also race, ethnicity, religion, sexual orientation anddisability. This committee is renamed to “Inclusion and Diversity” empowering our people to be the difference through inclusion andexercising the value of diversity. This will be accomplished through our people, culture and internal and external partnerships.
Promoting Cultural and Ethnic Diversity
We focus on our broad cultural and ethnic diversity, which we constantly promote and develop throughout the Company and our subsidiaries,through the internationalization of our teams, multicultural programs, and international mobility.
Providing Employment to People with Disabilities
Three of our Foundational Beliefs – integrity, respect, and sustainability – are tangibly embedded in fair employment practices and equalopportunity. Our policy is that our employment decisions related to recruitment, selection, evaluation, compensation, and development,among others, are not influenced by unlawful or unfair discrimination on the basis of race, religion, gender, age, ethnic origin, nationality,sexual orientation, gender or gender reassignment, marital status, or disability.
It is our policy to encourage and give full and fair consideration to applications for employment from disabled people, and to assist with theirtraining and development in light of their aptitudes and abilities. If an existing employee becomes disabled, it is our policy whereverpracticable to provide continuing employment under our usual terms and conditions, and to provide training, career development, andpromotion opportunities to the disabled employee to the fullest extent possible.
Employee and Social Matters
People and culture are at the heart of our development strategy. People are our wealth and strength. We are committed to our employees,our employee guidelines are specified in our Code of Business Conduct, which applies to all employees, regardless of their roles and wherethey work.
We believe that all of our employees are entitled to fair treatment, courtesy, and respect, wherever they work: in the office, on vessels, onindustrial and construction sites, or in client offices. We do not tolerate any form of abuse or harassment, and we will not tolerate any action,conduct, or behavior that is humiliating, intimidating, or hostile.
Furthermore, our hiring and employee development decisions are fair and objective. Employment decisions are based only on relevantqualifications, performance, demonstrated skills, experience, and other job-related factors, with our goal of creating a diverse, tolerant, andinclusive workforce.
25

Workforce Overview
Our workforce consists of the following:December 31
2018 2019 2020Permanent employees 33,528 34,454 31,395Temporary employees (fixed-term) 3,616 2,713 3,691Employees on payroll 37,144 37,167 35,086Contracted workforce 3,458 5,310 2,880Total workforce 40,602 42,477 37,966
Developing and Keeping Talent
We simplified the process of identifying key talents in the organization in 2020 and the new process helped us achieve significant and qualityprogress in a remote working environment. We also strengthened the depth of our succession planning for leadership roles in theorganization.
Following the 2019 enhancement of our processes and practices, in 2020 we continued our journey of offering best-in-class developmentopportunities to our people:
• We introduced a new process called 'Talking Talents' in 2020 to identify and flag talents to develop in the key areas of Leadership,Technology and Project Management. This population represented 6 percent of our global population and will be the primary focusfor development initiatives.
• Our new and improved performance appraisal process kicked off for all TechnipFMC employees in October 2020 and we concludedwith 98 percent completion. A stronger focus was put on employees’ behaviors, as part of our core values framework, and asimplified workflow for employees and managers for an efficient performance appraisal process.
• We continued to support our talent acquisition efforts by reinforcing the TechnipFMC employer brand in 2020, reflecting what ourpeople say about TechnipFMC: we work on breakthrough projects, in a global playground and, as a result, our people live inspiringexperiences. This is the key message we want potential future employees to associate with TechnipFMC. Initiatives, such as#technipfmcproud, launched in 2020 comprised of a series of webinars, inviting employees to share their own inspiring TechnipFMCexperiences. This, along with other initiatives and onboarding of brand ambassadors, helped us put our employer brand intooperation in 2020.
Enabling our people to grow and develop is a significant priority and during 2020 we launched and improved upon a number of learning andknowledge management initiatives to enhance the capabilities of our employees. While our ambition is to create a learning environment andtools and resources for everyone to succeed - some of our content is indeed focused on the following development pathways of Leadership,Technology and Project Management mentioned earlier.
• In October 2020, we launched the global technical expertise program, onboarding more than 650 technical experts and laying thefoundation for identifying and nurturing more technical experts who help us in creating differentiated technologies.
• Engagement in the iLearn learning platform gained significant traction in 2020 as we embraced a digital transformation of learning.This hub is a learning experience platform with a modern and easy-to-use interface. In 2020, there were more than 6,860 pieces ofcreative and innovative learning content available, with ongoing releases of new and meaningful courses, to support skillsdevelopment for our employees and enhance their performance in their job. 50 percent of our training hours and 95 percent of ourcourse completions were done in a digital or virtual environment, which resulted in 5.85 training hours per employee. The top fiveareas of learning in 2020 were Health, Safety, Environment and Security, Engineering, Manufacturing, Quality and Surface.
26

• 2020 also saw significant progress in the knowledge management space with our knowledge repository “The Well” having over646,000 visits with 16,674 employees having utilized it. Our second knowledge-sharing platform, The Bridge, which aligns with TheWell, enables chartered global knowledge-sharing networks. It had a soft launch in May 2020, and now has 17 enterprise-widebusiness and technical communities with the expectation that there will be more than 50 by the end of 2021.
Employee attrition in 2020 was 2.5 percent compared to 6.2 percent in 2019 attributable to a major extent to our continued focus on learningand talent development.
Strengthening Social Dialogue
TechnipFMC has developed a culture that is based on the values of trust, mutual respect, and dialogue. In accordance with local legislation,regular meetings with trade union-appointed and/or works council representatives are organized for information and/or consultation. TheEuropean Works Council (“EWC”) meets at least twice a year and all of our European entities had joined the EWC by the end of 2019 withthe EWC agreement signed by participants' representatives by the end of 2019. In the first quarter of 2020, the EWC elected its new memberand held two meetings in 2020, first in May and the second in December.
We also foster ERGs, which are voluntary, employee-led focus groups dedicated to a diverse and inclusive work environment. We currentlyhave seven active ERGs with approximately 1,800 members in the United States, the United Kingdom, and Brazil, covering Diversity inScience, Technology, Engineering and Mathematics, Mothers Network, Black Organization for Leadership & Development, YoungProfessionals Group, Military Veterans & Friends Network, and Handicap Inclusion. ERGs discuss and promote topics related to diversity andinclusion, develop and organize workshops internally and externally, support local initiatives, and propose actions to improve accessibilityand inclusivity for all at the workplace. TechnipFMC provides executive support to our ERGs to help maintain cordial employee relations andimprove the wellbeing of our people.
Employee Wellbeing
In light of the global challenges faced in 2020 due to COVID-19 pandemic, we ran a global employee wellbeing survey in May to understandhow our employees were coping with social distancing and other related domestic challenges during the pandemic. We received a strongresponse, with 19,954 (55 percent) employees responding globally which helped us develop policies to assist in the challenges our peopleare facing in these unprecedented times. 74 percent of responding employees answered favorably to the question on their overall wellbeing.The survey also gave us insights on other topics that helped in improving overall communication and employee engagement.
Internal Communication
We have a robust internal communications strategy and support communication channels that ensure that all employees are communicatedto within a timely and relevant way. The effectiveness of internal communication is continually monitored and adjusted based on a focusgroup feedback program that reaches multiple levels across the organization. Employees are regularly consulted and provided withinformation on changes and events that may affect them through channels such as regular meetings, employee representatives, and ourintranet site. These consultations and meetings ensure that employees are kept informed of the financial and economic factors affecting ourperformance and matters of concern to them as employees.
Labor Relations and Collective Agreements
We seek to maintain constructive relationships with works councils and trade unions, and to comply with relevant local laws and collectiveagreements in relation to collective or individual labor relations. We also operate through local subsidiaries in many countries, a number ofwhich, including France, Germany, Norway, and Italy, have legal requirements for works councils, which include employee representatives.
We send regular information to all employees to share information about business success, changes to the organizational structure, and anymajor impact to the business or company. The same approach of sharing information and maintaining a regular dialogue with employeesexists at a local level through the action of the local
27

communications teams and the managers. In countries where staff representatives or works councils are in place, we seek to maintain aneffective and regular dialogue. To get the direct feedback of employees, employees surveys are performed in some countries or business,such as Norway, Americas, and the Asia Pacific region. Every quarter, all employees receive a direct communication from the Chairman andCEO about our financial results and main business information. While travelling to a company center, the executive leadership teammembers take this as an opportunity to engage with employees, either through town halls or informal meetings.
28

EXECUTIVE OFFICERS OF THE REGISTRANT
Information regarding our executive officers called for by Item 401(b) of Regulation S-K is hereby included in Part I, Item 1 “Business” of thisAnnual Report on Form 10-K.
The following table indicates the names and ages of our executive officers as of March 5, 2021, including all offices and positions held byeach in the past five years:
Name Age Current Position and Business Experience (Start Date)Douglas J. Pferdehirt 57 Executive Chairman and Chief Executive Officer (2019)
Chief Executive Officer (2017)President and Chief Executive Officer of FMC Technologies (2016)
Alf Melin 51 Executive Vice President and Chief Financial Officer (2021)Senior Vice President, Finance Operations (2017)Senior Vice President, Surface Americas (2017)General Manager, Fluid Control (2015)
Victoria Lazar 55 Executive Vice President, General Counsel and Secretary (2020)Senior Vice President, General Counsel and Corporate Secretary for Bristow Group (2020)Executive Counsel, M&A, General Electric (2019)Associate General Counsel, Baker Hughes, a GE Company (2018)Associate General Counsel, GE Oil & Gas (2017)
Justin Rounce 54 Executive Vice President and Chief Technology Officer (2018)President, Valves & Measurement for Schlumberger Limited (2018)Senior Vice President, Marketing & Technology for Schlumberger Limited (2016)
Agnieszka Kmieciak 47 Executive Vice President, People and Culture (2018)HR Director, Production Group for Schlumberger Limited (2017)Talent Manager and Workforce Planning Manager for Schlumberger Limited (2015)
Barry Glickman 52 President, Surface Technologies (2019)President, Engineering, Manufacturing and Supply Chain (2017)Vice President, Subsea Services of FMC Technologies (2015)
Jonathan Landes 48 President, Subsea (2020)Senior Vice President, Subsea Commercial (2017)President, Subsea Projects North America (2017)General Manager, Western Region Subsea (2015)
Krisztina Doroghazi 49 Senior Vice President, Controller, and Chief Accounting Officer (2018)Senior Vice President, Financing Planning and Reporting of MOL Group (2015)
__________________
(a) Member of the Executive Leadership Team and a Rule 3b-7 executive officer and Section 16 officer under the Exchange Act.(b) Section 16 officer under the Exchange Act.
No family relationships exist among any of the above-listed officers, and there are no arrangements or understandings between any of theabove-listed officers and any other person pursuant to which they serve as an officer. During the past 10 years, none of the above-listedofficers was involved in any legal proceedings as defined in Item 401(f) of Regulation S-K. All officers are appointed by the Board of Directorsto hold office until their successors are appointed.
(a)
(a)
(a)
(a)
(a)
(a)
(a)
(b)
29

ITEM 1A. RISK FACTORS
Important risk factors that could impact our ability to achieve our anticipated operating results and growth plan goals are presented below.The following risk factors should be read in conjunction with discussions of our business and the factors affecting our business locatedelsewhere in this Annual Report on Form 10-K and in our other filings with the SEC.
Summary Risk Factors
The following is a summary of some of the risks and uncertainties that could materially adversely affect our business, financial condition andresults of operations. You should read this summary together with the more detailed description of each risk factor contained below.
Risks Related to Our Business and Industry
• Demand for our products and services depends on oil and gas industry activity and expenditure levels, which are directly affected bytrends in the demand for and price of crude oil and natural gas.
• We operate in a highly competitive environment and unanticipated changes relating to competitive factors in our industry, includingongoing industry consolidation, may impact our results of operations.
• Our success depends on our ability to develop, implement, and protect new technologies and services.
• Cumulative loss of several major contracts, customers, or alliances may have an adverse effect on us.
• The COVID-19 pandemic, the United Kingdom’s withdrawal from the European Union, disruptions in the political, regulatory,economic, and social conditions of the countries in which we conduct business, could adversely affect our business or results ofoperations.
• DTC and Euroclear may cease to act as depository and clearing agencies for our shares.
• Our existing and future debt may limit cash flow available to invest in the ongoing needs of our business and could prevent us fromfulfilling our obligations under our outstanding debt.
• A downgrade in our debt rating could restrict our ability to access the capital markets.
• Our acquisition and divestiture activities involve substantial risks.
Risks Related to Our Operations
• We may lose money on fixed-price contracts.
• New capital asset construction projects for vessels and manufacturing facilities are subject to risks, including delays and costoverruns.
• Our failure to timely deliver our backlog could affect future sales, profitability, and customer relationships.
• We face risks relating to our reliance on subcontractors, suppliers, and our joint venture partners.
• A failure of our IT infrastructure, including as a result of cyber-attacks, could adversely impact our business and results of operations.
• Pirates endanger our maritime employees and assets.
Risks Related to Legal Proceedings, Tax, and Regulatory Matters
30

• The industries in which we operate or have operated expose us to potential liabilities, including the installation or use of our products,which may not be covered by insurance or may be in excess of policy limits, or for which expected recoveries may not be realized.
• Our operations require us to comply with numerous laws and regulations, including those related to environmental protection andclimate change, health and safety, privacy, data protection and data security, labor and employment, import/export controls, currencyexchange, bribery and corruption, and taxation, violations of which could have a material adverse effect on our financial condition,results of operations, or cash flows.
• As an English public limited company, we must meet certain additional financial requirements before we may declare dividends orrepurchase shares and certain capital structure decisions may require stockholder approval which may limit our flexibility to manageour capital structure.
• Uninsured claims and litigation against us, including intellectual property litigation, could adversely impact our financial condition,results of operations, or cash flows.
• The IRS may not agree that we should be treated as a foreign corporation for U.S. federal tax purposes and may seek to impose anexcise tax on gains recognized by certain individuals;
• U.S. tax laws and/or guidance could also affect our ability to engage in certain acquisition strategies and certain internalrestructurings.
• We are subject to the tax laws of numerous jurisdictions; challenges to the interpretation of, or future changes to, such laws couldadversely affect us.
• We intend to be treated exclusively as a resident of the United Kingdom for tax purposes, but French or other tax authorities mayseek to treat us as a tax resident of another jurisdiction, and we may not qualify for benefits under tax treaties entered into betweenthe United Kingdom and other countries.
Risks Related to the Spin-off and the Related Transactions
• The Spin-off may subject us to future liabilities and may not achieve some or all of the anticipated benefits.
• We are a significant shareholder of Technip Energies and the value of our investment in Technip Energies may fluctuate substantiallyand may result in a significant impact to our results of operations.
• We may be required to refund the Purchase Price under the Share Purchase Agreement to BPI in the event that certain conditionsthereunder are not met.
General Risk Factors
• Our businesses are dependent on the continuing services of our key managers and employees.
• Seasonal and weather conditions could adversely affect demand for our services and operations.
• Currency exchange rate fluctuations could adversely affect our financial condition, results of operations, or cash flows.
• We are exposed to risks in connection with our defined benefit pension plan commitments.
Risks Related to Our Business and Industry
Demand for our products and services depends on oil and gas industry activity and expenditure levels, which are directly affectedby trends in the demand for and price of crude oil and natural gas.
31

We are substantially dependent on conditions in the oil and gas industry, including (i) the level of exploration, development and productionactivity and (ii) capital spending. Any substantial or extended decline in these expenditures may result in the reduced pace of discovery anddevelopment of new reserves of oil and gas and the reduced exploration of existing wells, which could adversely affect demand for ourproducts and services and, in certain instances, result in the cancellation, modification, or re-scheduling of existing orders in our backlog.These factors could have an adverse effect on our revenue and profitability. The level of exploration, development, and production activity isdirectly affected by trends in oil and natural gas prices, which historically have been volatile and are likely to continue to be volatile in thefuture.
Factors affecting the prices of oil and natural gas include, but are not limited to, the following:
• demand for hydrocarbons, which is affected by worldwide population growth, economic growth rates, and general economic andbusiness conditions, including reductions in travel and commerce relating to the COVID-19 pandemic;
• costs of exploring for, producing, and delivering oil and natural gas;
• political and economic uncertainty, and socio-political unrest;
• governmental laws, policies, regulations and subsidies related to or affecting the production, use, and exportation/importation of oiland natural gas;
• the ability or willingness of the Organization of Petroleum Exporting Countries and the 10 other oil producing countries, includingRussia, Mexico and Kazakhstan (“OPEC+”) to set and maintain production level for oil;
• oil refining and transportation capacity and shifts in end-customer preferences toward fuel efficiency and the use of natural gas;
• technological advances affecting energy consumption;
• development, exploitation, relative price, and availability of alternative sources of energy and our customers’ shift of capital to thedevelopment of these sources;
• volatility in, and access to, capital and credit markets, which may affect our customers’ activity levels, and spending for our productsand services;
• decrease in investors’ interest in hydrocarbon producers because of environmental and sustainability initiatives; and
• natural disasters.
The oil and gas industry has historically experienced periodic downturns, which have been characterized by diminished demand for oilfieldservices and downward pressure on the prices we charge. The oil and natural gas market remains quite volatile, and price recovery andbusiness activity levels are dependent on variables beyond our control, such as geopolitical stability, increasing attention to global climatechange resulting in pressure upon shareholders, financial institutions and/or financial markets to modify their relationships with oil and gascompanies and to limit investments and/or funding to such companies, increasing likelihood of governmental investigations and privatelitigation due to increasing attention to global climate change, OPEC+’s actions to regulate its production capacity, changes in demandpatterns, and international sanctions and tariffs. Continued volatility or any future reduction in demand for oilfield services could furtheradversely affect our financial condition, results of operations, or cash flows.
We operate in a highly competitive environment and unanticipated changes relating to competitive factors in our industry,including ongoing industry consolidation, may impact our results of operations.
We compete on the basis of a number of different factors, such as product offerings, project execution, customer service, and price. In orderto compete effectively we must develop and implement innovative technologies and
32

processes, and execute our clients’ projects effectively. We can give no assurances that we will continue to be able to compete effectivelywith the products and services or prices offered by our competitors.
Our industry, including our customers and competitors, has experienced unanticipated changes in recent years. Moreover, the industry isundergoing consolidation to create economies of scale and control the value chain, which may affect demand for our products and servicesbecause of price concessions for our competitors or decreased customer capital spending. This consolidation activity could impact our abilityto maintain market share, maintain or increase pricing for our products and services or negotiate favorable contract terms with our customersand suppliers, which could have a significant negative impact on our financial condition, results of operations or cash flows. We are unable topredict what effect consolidations and other competitive factors in the industry may have on prices, capital spending by our customers, ourselling strategies, our competitive position, our ability to retain customers or our ability to negotiate favorable agreements with our customers.
The COVID-19 pandemic has significantly reduced demand for our products and services, and has had, and may continue to have,an adverse impact on our financial condition, results of operations, and cash flows.
The COVID-19 pandemic, including actions taken by governments and businesses, has resulted in a significant reduction in global economicactivity, including increased volatility in global oil and natural gas markets. Measures taken to address and limit the spread of the disease-such as stay-at-home orders, social distancing guidelines, and travel restrictions have adversely affected the economies and financialmarkets of many countries. The resulting disruption to our operations, communications, travel, and supply chain may continue or increase inthe future, and could limit the ability of our employees, partners, or vendors to operate efficiently or at all, and has had, and is reasonablylikely to continue to have, an adverse impact on our financial condition, operating results, and cash flows.
Significant uncertainty remains as to the potential impact of the COVID-19 pandemic on our operations, and we are closely monitoring theeffects of the pandemic on commodity demands and on our customers. These effects may include adverse revenue and net income effects;disruptions to our operations; potential project delays or cancellations; employee impacts from illness, school closures, and other communityresponse measures, which may lead to disruptions and decreased productivity; and temporary closures of our facilities or the facilities of ourcustomers and suppliers. Beginning in the first quarter of 2020, we have experienced operational impacts including supply chain disruptions,productivity declines and logistics constraints. We have also experienced incremental, direct costs as a result of COVID-19.
COVID-19, and the volatile regional and global economic conditions stemming from the pandemic, could also aggravate the other risk factorsdiscussed herein, including but not limited to risks related to the demand for oil and gas, which may not recover immediately. The full extentto which the COVID-19 pandemic will impact our results is unknown and evolving and will depend on various factors and consequencesbeyond our control, such as the severity, duration, and spread of COVID-19; the success of actions taken by governments and healthorganizations to combat the disease and treat its effects, including vaccine acceptance, distribution and effectiveness; decisions by ouralliance partners and customers regarding their business plans and capital expenditures; and the extent to which, and the timing of, generaleconomic and operating conditions recover.
Our success depends on our ability to develop, implement, and protect new technologies and services and the intellectualproperty related thereto.
Our success depends on the ongoing development and implementation of new product designs, including the processes used by us toproduce and market our products, and on our ability to protect and maintain critical intellectual property assets related to thesedevelopments. If we are not able to obtain patents, maintain trade secrets or obtain other protection of our intellectual property rights, if ourpatents are unenforceable or the claims allowed under our patents are not sufficient to protect our technology, or if we are not able toadequately protect our patents or trade secrets, we may not be able to continue to develop our services, products and related technologies.Additionally, our competitors may be able to independently develop technology that is similar to ours without infringing on our patents orgaining access to our trade secrets. If any of these events occurs, we may be unable to meet evolving industry requirements or do so atprices acceptable to our customers, which could adversely affect our financial condition, results of operations, or cash flows.
33

Due to the types of contracts we enter into and the markets in which we operate, the cumulative loss of several major contracts,customers, or alliances may have an adverse effect on our results of operations.
We often enter into large, long-term contracts that, collectively, represent a significant portion of our revenue. These agreements, ifterminated or breached, may have a larger impact on our operating results or our financial condition than shorter-term contracts due to thevalue at risk. Moreover, the global market for the production, transportation, and transformation of hydrocarbons and by-products, as well asthe other industrial markets in which we operate, is dominated by a small number of companies. As a result, our business relies on a limitednumber of customers. If we were to lose several key contracts, customers, or alliances over a relatively short period of time, we couldexperience a significant adverse impact on our financial condition, results of operations, or cash flows.
Disruptions in the political, regulatory, economic, and social conditions of the countries in which we conduct business couldadversely affect our business or results of operations.
We operate in various countries across the world. Instability and unforeseen changes in any of the markets in which we conduct business,including economically and politically volatile areas could have an adverse effect on the demand for our services and products, our financialcondition, or our results of operations. These factors include, but are not limited to, the following:
• nationalization and expropriation;
• potentially burdensome taxation;
• inflationary and recessionary markets, including capital and equity markets;
• civil unrest, labor issues, political instability, disease outbreaks, terrorist attacks, cyber terrorism, military activity, and wars;
• supply disruptions in key oil producing countries;
• the ability of OPEC+ to set and maintain production levels and pricing;
• trade restrictions, trade protection measures, price controls, or trade disputes;
• sanctions, such as prohibitions or restrictions by the United States against countries that are the targets of economic sanctions, orare designated as state sponsors of terrorism;
• foreign ownership restrictions;
• import or export licensing requirements;
• restrictions on operations, trade practices, trade partners, and investment decisions resulting from domestic and foreign laws, andregulations;
• regime changes;
• changes in, and the administration of, treaties, laws, and regulations including in response to public health issues;
• inability to repatriate income or capital;
• reductions in the availability of qualified personnel;
• foreign currency fluctuations or currency restrictions; and
• fluctuations in the interest rate component of forward foreign currency rates.
DTC and Euroclear may cease to act as depository and clearing agencies for our shares.
34

Our shares were issued into the facilities of The Depository Trust Company (“DTC”) with respect to shares listed on the NYSE and Euroclearwith respect to shares listed on Euronext Paris (DTC and Euroclear being referred to as the “Clearance Services”). The Clearance Servicesare widely used mechanisms that allow for rapid electronic transfers of securities between the participants in their respective systems, whichinclude many large banks and brokerage firms. The Clearance Services have general discretion to cease to act as a depository and clearingagencies for our shares. If either of the Clearance Services determine at any time that our shares are not eligible for continued deposit andclearance within its facilities, then we believe that our shares would not be eligible for continued listing on the NYSE or Euronext Paris, asapplicable, and trading in our shares would be disrupted. Any such disruption could have a material adverse effect on the trading price of ourshares.
The United Kingdom’s withdrawal from the European Union may have a negative effect on global economic conditions, financialmarkets, and our business.
We are based in the United Kingdom and have operational headquarters in Paris, France; Houston, Texas, United States; and in London,United Kingdom, with worldwide operations, including material business operations in Europe. The United Kingdom withdrew from theEuropean Union on January 31, 2020 (“Brexit”). In connection with Brexit, the United Kingdom and the European Union agreed on the Tradeand Cooperation Agreement (“TCA”) that governs the future trading relationship between the United Kingdom and the European Union inspecified areas. The TCA took effect on January 1, 2021. The United Kingdom is no longer in the European Union customs union and isoutside of the European Union single market. The TCA addresses trade, economic arrangements, law enforcement, judicial cooperation anda governance framework including procedures for dispute resolution, among other things. Because the agreement merely sets forth aframework in many respects and will require complex additional bilateral negotiations between the United Kingdom and the European Unionas both parties continue to work on the rules for implementation, significant political and economic uncertainty remains about whether theterms of the relationship will differ materially from the terms before withdrawal.
These developments could have a material adverse effect on global economic conditions and the stability of the global financial markets andcould significantly reduce global market liquidity and restrict the ability of key market participants to operate in certain financial markets. Assetvaluations, currency exchange rates, and credit ratings may be especially subject to increased market volatility. In addition, there is a lack ofclarity about the future United Kingdom laws and regulations as the United Kingdom determines which European Union laws to replicate orreplace, including financial laws and regulations, tax and free trade agreements, intellectual property rights, supply chain logistics,environmental, health and safety laws and regulations, immigration laws, employment laws, and other rules that would apply to us and oursubsidiaries, could increase our costs, restrict our access to capital within the United Kingdom and the European Union, depress economicactivity, and further decrease foreign direct investment in the United Kingdom. For example, any divergence in the United Kingdom fromEuropean Union law could eliminate the benefit of certain tax-related European Union directives currently applicable to United Kingdomcompanies such as us, including the Parent-Subsidiary Directive and the Interest and Royalties Directive, which could, subject to any reliefunder an available tax treaty, raise our tax cost.
Any of these factors could have a material adverse effect on our business, financial condition, or results of operations.
Our existing and future debt may limit cash flow available to invest in the ongoing needs of our business and could prevent usfrom fulfilling our obligations under our outstanding debt.
We have substantial existing debt. As of December 31, 2020, our total debt was $4.0 billion. In addition, in connection with Spin-off, weobtained commitments from a syndicate of financial institutions for a senior secured revolving credit facility of up to $1.0 billion. We will alsohave the capacity under our debt agreements to incur substantial additional debt.
Our level of debt could have important consequences. For example, it could:
• make it more difficult for us to make payments on our debt;
• require us to dedicate a substantial portion of our cash flow from operations to the payment of debt service, reducing the availabilityof our cash flow to fund working capital, capital expenditures, acquisitions, distributions, and other general partnership purposes;
35

• increase our vulnerability to adverse economic or industry conditions;
• limit our ability to obtain additional financing to react to changes in our business; or
• place us at a competitive disadvantage compared to businesses in our industry that have less debt.
Additionally, any failure to meet required payments on our debt or to comply with any covenants in the instruments governing our debt, couldresult in an event of default under the terms of those instruments. In the event of such default, the holders of such debt could elect to declareall the amounts outstanding under such instruments to be due and payable. Such default could also trigger a cross default or our other debt.
The London Interbank Offered Rate (“LIBOR”), the Euro Interbank Offered Rate and certain other interest “benchmarks” may be subject tofurther regulatory guidance and/or reform that could cause interest rates under our current or future debt agreements to perform differentlythan in the past or cause other unanticipated consequences. The United Kingdom’s Financial Conduct Authority, which regulates LIBOR, hasannounced that the continuation of LIBOR on the current basis cannot and will not be guaranteed after 2021 and it is unclear if LIBOR willcease to exist or if new methods of calculating LIBOR will evolve. If LIBOR ceases to exist or if the methods of calculating LIBOR changefrom their current form, interest rates on our current or future debt obligations may be adversely affected.
The terms of the agreements governing our existing indebtedness restrict our current and future operations, particularly our abilityto respond to changes or to take certain actions.
The terms of the agreements governing our indebtedness contain a number of restrictive covenants that limit our flexibility in conducting ourbusiness and restrict our ability to take specific actions, including (subject to various exceptions) restrictions on incurring indebtedness,paying dividends, making certain loans and investments, selling assets or incurring liens which may limit our ability to compete effectively, orto take advantage of new business opportunities. In addition, the restrictive covenants in the credit agreement, dated February 16, 2021, thatgoverns our $1,000,000,000 three-year senior secured multicurrency revolving credit facility (the “Revolving Credit Facility”) require us tomaintain specified financial ratios and satisfy other financial condition tests.
A breach of the covenants or restrictions under our existing indebtedness could result in an event of default under the applicableindebtedness. Such default may allow the creditors to accelerate the related debt and may result in the acceleration of any other debt towhich a cross-acceleration or cross-default provision applies. An event of default under our Revolving Credit Facility would also permit thelenders to terminate all commitments to extend further credit under that facility. Furthermore, if we were unable to repay the amounts due andpayable under our Revolving Credit Facility, lenders thereunder could proceed against the collateral granted to them to secure thatindebtedness. In the event our lenders or noteholders accelerate the repayment of our borrowings, we and our subsidiaries may not havesufficient assets to repay that indebtedness.
These restrictions may affect our ability to grow in accordance with our strategy. In addition, our financial results, our substantialindebtedness and our credit ratings could adversely affect the availability and terms of our financing.
Our acquisition and divestiture activities involve substantial risks.
We have made and expect to continue to pursue acquisitions, dispositions, or other investments that may strategically fit our business and/orgrowth objectives. We cannot provide assurances that we will be able to locate suitable acquisitions, dispositions, or investments, or that wewill be able to consummate any such transactions on terms and conditions acceptable to us. Even if we do successfully execute suchtransactions, they may not result in anticipated benefits, which could have a material adverse effect on our financial results. If we are unableto successfully integrate and develop acquired businesses, we could fail to achieve anticipated synergies and cost savings, including anyexpected increases in revenues and operating results. We may not be able to successfully cause a buyer of a divested business to assumethe liabilities of that business or, even if such liabilities are assumed, we may have difficulties enforcing our rights, contractual or otherwise,against the buyer. We may invest in companies or businesses that fail, causing a loss of all or part of our investment. In addition, if wedetermine that an other-than-temporary decline in the fair value exists for a company in which we have invested, we may have to write downthat investment to its fair value and recognize the related write-down as an investment loss.
36

In connection with the Spin-off, we agreed to indemnify Technip Energies for certain liabilities and Technip Energies agreed to indemnify usfor certain liabilities. If we are required to act on these indemnities to Technip Energies, our financial results could be negatively impacted.Additionally, any indemnity from Technip Energies may not be sufficient to insure us against the full amount of liabilities for which we areresponsible and Technip Energies may not be able to satisfy its indemnification obligations in the future.
Risks Related to Our Operations
We may lose money on fixed-price contracts.
As customary for some of our projects, we often agree to provide products and services under fixed-price contracts. We are subject tomaterial risks in connection with such fixed-price contracts. It is not possible to estimate with complete certainty the final cost or margin of aproject at the time of bidding or during the early phases of its execution. Actual expenses incurred in executing these fixed-price contractscan vary substantially from those originally anticipated for several reasons including, but not limited to, the following:
• unforeseen additional costs related to the purchase of substantial equipment necessary for contract fulfillment or labor shortages inthe markets where the contracts are performed;
• mechanical failure of our production equipment and machinery;
• delays caused by local weather conditions and/or natural disasters (including earthquakes, floods and public health crises such asthe COVID-19 pandemic); and
• a failure of suppliers, subcontractors, or joint venture partners to perform their contractual obligations.
The realization of any material risks and unforeseen circumstances could also lead to delays in the execution schedule of a project. We maybe held liable to a customer should we fail to meet project milestones or deadlines or to comply with other contractual provisions. Additionally,delays in certain projects could lead to delays in subsequent projects that were scheduled to use equipment and machinery still being utilizedon a delayed project.
Pursuant to the terms of fixed-price contracts, we are not always able to increase the price of the contract to reflect factors that wereunforeseen at the time our bid was submitted, and this risk may be heightened for projects with longer terms. Depending on the size of aproject, variations from estimated contract performance, or variations in multiple contracts, could have a significant impact on our financialcondition, results of operations or cash flows.
New capital asset construction projects for vessels and manufacturing facilities are subject to risks, including delays and costoverruns, which could have a material adverse effect on our financial condition, or results of operations.
From time to time, we carry out capital asset construction projects to maintain, upgrade, and develop our asset base, and such projects aresubject to risks of delay and cost overruns that are inherent in any large construction project, resulting from numerous factors including, butnot limited to, the following:
• shortages of key equipment, materials or skilled labor;
• delays in the delivery of ordered materials and equipment;
• design and engineering issues; and
• shipyard delays and performance issues.
Failure to complete construction in time, or the inability to complete construction in accordance with design specifications, may result in theloss of revenue. Additionally, capital expenditures for construction projects could materially exceed the initially planned investments, or therecould be delays in putting such assets into operation.
Our failure to timely deliver our backlog could affect future sales, profitability, and relationships with our customers.
37

Many of the contracts we enter into with our customers require long manufacturing lead times due to complex technical and logisticalrequirements. These contracts may contain clauses related to liquidated damages or financial incentives regarding on-time delivery, and afailure by us to deliver in accordance with customer expectations could subject us to liquidated damages or loss of financial incentives,reduce our margins on these contracts, or result in damage to existing customer relationships. The ability to meet customer deliveryschedules for this backlog is dependent upon a number of factors, including, but not limited to, access to the raw materials required forproduction, an adequately trained and capable workforce, subcontractor performance, project engineering expertise and execution, sufficientmanufacturing plant capacity, and appropriate planning and scheduling of manufacturing resources. Failure to deliver backlog in accordancewith expectations could negatively impact our financial performance.
We face risks relating to our reliance on subcontractors, suppliers, and our joint venture partners.
We generally rely on subcontractors, suppliers, and our joint venture partners for the performance of our contracts. Although we are notdependent upon any single supplier, certain geographic areas of our business or a project or group of projects may depend heavily on certainsuppliers for raw materials or semi-finished goods.
Any difficulty in engaging suitable subcontractors or acquiring equipment and materials could compromise our ability to generate a significantmargin on a project or to complete such project within the allocated time frame. If subcontractors, suppliers or joint venture partners refuse toadhere to their contractual obligations with us or are unable to do so due to a deterioration of their financial condition, we may be unable tofind a suitable replacement at a comparable price, or at all. Moreover, the failure of one of our joint venture partners to perform theirobligations in a timely and satisfactory manner could lead to additional obligations and costs being imposed on us as we may be obligated toassume our defaulting partner’s obligations or compensate our customers.
Any delay, failure to meet contractual obligations, or other event beyond our control or not foreseeable by us, that is attributable to asubcontractor, supplier or joint venture partner, could lead to delays in the overall progress of the project and/or generate significant extracosts. Even if we are entitled to make a claim for these extra costs against the defaulting supplier, subcontractor or joint venture partner, wemay be unable to recover the entirety of these costs and this could materially adversely affect our business, financial condition or results ofoperations.
A failure of our IT infrastructure, including as a result of cyber-attacks, could adversely impact our business and results ofoperations.
The efficient operation of our business is dependent on our IT systems. Accordingly, we rely upon the capacity, reliability, and security of ourIT hardware and software infrastructure and our ability to expand and update this infrastructure in response to changing needs. We havebeen subject to cyber-attacks in the past, including phishing, malware, and ransomware. No such attack has had a material adverse effect onour business, however this may not be the case with future attacks. Our systems may be vulnerable to damages from such attacks, as wellas from natural disasters, failures in hardware or software, power fluctuations, unauthorized access to data and systems, loss or destructionof data (including confidential customer information), human error, and other similar disruptions, and we cannot give assurance that anysecurity measures we have implemented or may in the future implement will be sufficient to identify and prevent or mitigate such disruptions.In response to the COVID-19 pandemic, we have transitioned many of our employees to remote working arrangements which presentsincreased cybersecurity risks. If a cyber-attack, power outage, connectivity issue, or other event occurred that impacted our employees’ability to work remotely, it may be difficult or, in certain cases, impossible, for us to continue our business for a substantial period of time.
We rely on third parties to support the operation of our IT hardware, software infrastructure, and cloud services, and in certain instances,utilize web-based and software-as-a-service applications. The security and privacy measures implemented by such third parties, as well asthe measures implemented by any entities we acquire or with whom we do business, may not be sufficient to identify or prevent cyber-attacks, and any such attacks may have a material adverse effect on our business. While our IT vendor agreements typically containprovisions that seek to eliminate or limit our exposure to liability for damages from a cyber attack, we cannot ensure such provisions willwithstand legal challenges or cover all or any such damages.
Threats to our IT systems arise from numerous sources, not all of which are within our control, including fraud or malice on the part of thirdparties, accidental technological failure, electrical or telecommunication outages, failures of computer servers or other damage to ourproperty or assets, outbreaks of hostilities, or terrorist acts. The failure
38

of our IT systems or those of our vendors to perform as anticipated for any reason or any significant breach of security could disrupt ourbusiness and result in numerous adverse consequences, including reduced effectiveness and efficiency of operations, inappropriatedisclosure of confidential and proprietary information, including personal data, regulatory action and fines included for a breach of dataprotection laws, reputational harm, regulatory fines or investigations, increased overhead costs, and loss of important information, whichcould have a material adverse effect on our business and results of operations. In addition, we may be required to incur significant costs toprotect against or to mitigate damage caused by these disruptions or security breaches in the future. Our insurance coverage may not coverall of the costs and liabilities we incur as the result of any disruptions or security breaches, and if our business continuity and/or disasterrecovery plans do not effectively and timely resolve issues resulting from a cyber-attack, we may suffer material adverse effects on ourbusiness.
Pirates endanger our maritime employees and assets.
We face material piracy risks in the Gulf of Guinea, the Somali Basin, and the Gulf of Aden, and, to a lesser extent, in Southeast Asia,Malacca, and the Singapore Straits. Piracy represents a risk for both our projects and our vessels, which operate and transport throughsensitive maritime areas. Such risks have the potential to significantly harm our crews and to negatively impact the execution schedule forour projects. If our maritime employees or assets are endangered, additional time may be required to find an alternative solution, which maydelay project realization and negatively impact our business, financial condition, or results of operations.
Risks Related to Legal Proceedings, Tax, and Regulatory Matters
The industries in which we operate or have operated expose us to potential liabilities, including the installation or use of ourproducts, which may not be covered by insurance or may be in excess of policy limits, or for which expected recoveries may notbe realized.
We are subject to potential liabilities arising from, among other possibilities, equipment malfunctions, equipment misuse, personal injuries,and natural disasters, any of which may result in hazardous situations, including uncontrollable flows of gas or well fluids, fires, andexplosions. Our insurance against these risks may not be adequate to cover our liabilities. Further, the insurance may not generally beavailable in the future or, if available, premiums may not be commercially justifiable. If we incur substantial liability and the damages are notcovered by insurance or are in excess of policy limits, or if we were to incur liability at a time when we were not able to obtain liabilityinsurance, such potential liabilities could have a material adverse effect on our business, results of operations, financial condition or cashflows.
Our operations require us to comply with numerous regulations, violations of which could have a material adverse effect on ourfinancial condition, results of operations, or cash flows.
Our operations and manufacturing activities are governed by international, regional, transnational, and national laws and regulations in everyplace where we operate relating to matters such as environmental protection, health and safety, labor and employment, import/exportcontrols, currency exchange, bribery and corruption, and taxation. These laws and regulations are complex, frequently change, and havetended to become more stringent over time. In the event the scope of these laws and regulations expand in the future, the incremental cost ofcompliance could adversely impact our financial condition, results of operations, or cash flows.
Our international operations are subject to anti-corruption laws and regulations, such as the U.S. Foreign Corrupt Practices Act (“FCPA”), theU.K. Bribery Act of 2010 (the “Bribery Act”), the anti-corruption provisions of French law n° 2016-1691 dated December 9, 2016 relating toTransparency, Anti-corruption and Modernization of the Business Practice (“Sapin II Law”), the Brazilian law nº 12,846/13, or the BrazilianAnti-Bribery Act (also known as the Brazilian Clean Company Act), and economic and trade sanctions, including those administered by theUnited Nations, the European Union, the Office of Foreign Assets Control of the U.S. Department of the Treasury (“U.S. Treasury”), and theU.S. Department of State. The FCPA prohibits corruptly providing anything of value to foreign officials for the purposes of obtaining orretaining business or securing any improper business advantage. We may deal with both governments and state-owned businessenterprises, the employees of which are considered foreign officials for purposes of the FCPA. The provisions of the Bribery Act extendbeyond bribery of foreign public officials and are more onerous than the FCPA in a number of other respects, including jurisdiction, non-exemption of facilitation payments, and penalties. Economic and trade sanctions restrict our transactions or dealings with certain sanctionedcountries, territories, and designated persons.
39

As a result of doing business in countries throughout the world, including through partners and agents, we are exposed to a risk of violatinganti-corruption laws and sanctions regulations. Some of the international locations in which we currently operate or may, in the future,operate, have developing legal systems and may have higher levels of corruption than more developed nations. Our continued expansionand worldwide operations, including in developing countries, our development of joint venture relationships worldwide, and the employmentof local agents in the countries in which we operate increases the risk of violations of anti-corruption laws and economic and trade sanctions.Violations of anti-corruption laws and economic and trade sanctions are punishable by civil penalties, including fines, denial of exportprivileges, injunctions, asset seizures, debarment from government contracts (and termination of existing contracts), and revocations orrestrictions of licenses, as well as criminal fines and imprisonment. In addition, any major violations could have a significant impact on ourreputation and consequently on our ability to win future business.
We have implemented internal controls designed to minimize and detect potential violations of laws and regulations in a timely manner butwe can provide no assurance that such policies and procedures will be followed at all times or will effectively detect and prevent violations ofthe applicable laws by one or more of our employees, consultants, agents, or partners. The occurrence of any such violation could subject usto penalties and material adverse consequences on our business, financial condition, results of operations, or cash flows.
Compliance with environmental and climate change-related laws and regulations may adversely affect our business and results ofoperations.
Environmental laws and regulations in various countries affect the equipment, systems, and services we design, market, and sell, as well asthe facilities where we manufacture our equipment and systems, and any other operations we undertake. We are required to invest financialand managerial resources to comply with environmental laws and regulations, and believe that we will continue to be required to do so in thefuture. Failure to comply with these laws and regulations may result in the assessment of administrative, civil, and criminal penalties, theimposition of remedial obligations, the issuance of orders enjoining our operations, or other claims and complaints. Additionally, ourinsurance and compliance costs may increase as a result of changes in environmental laws and regulations or changes in enforcement.These laws and regulations, as well as any new laws and regulations affecting exploration and development of drilling for crude oil andnatural gas, are becoming increasingly strict and could adversely affect our business and operating results by increasing our costs, limitingthe demand for our products and services, or restricting our operations.
Regulatory requirements related to Environmental, Social and Governance (ESG) (including sustainability) matters have been, and arebeing, implemented in the European Union in particular in relation to financial market participants. Such regulatory requirements are beingimplemented on a phased basis. We expect regulatory requirements related to, and investor focus on, ESG (including sustainability) mattersto continue to expand in the EU, the United States, and more globally. We establish ESG objectives that align with our foundational beliefsand corporate strategy with an aim toward reducing our carbon footprint, raising awareness and making advancements in inclusion anddiversity. If, in relation to ESG (including sustainability) matters, we are not able to meet current and future regulatory requirements, thereporting requirements of regulators, or the current and future expectations of investors, customers or other stakeholders, our business andability to raise capital may be adversely affected.
Existing or future laws and regulations relating to greenhouse gas emissions and climate change may adversely affect ourbusiness.
Climate change continues to attract considerable public and scientific attention. As a result, numerous laws, regulations, and proposals havebeen made and are likely to continue to be made at the international, national, regional, and state levels of government to monitor and limitemissions of carbon dioxide, methane, and other “greenhouse gases” (“GHGs”). These efforts have included cap-and-trade programs,carbon taxes, GHG reporting and tracking programs and regulations that directly limit GHG emissions from certain sources. Such existing orfuture laws, regulations, and proposals concerning the release of GHGs or that concern climate change (including laws, regulations, andproposals that seek to mitigate the effects of climate change) may adversely impact demand for the equipment, systems and services wedesign, market and sell. For example, oil and natural gas exploration and production may decline as a result of such laws, regulations, andproposals, and as a consequence, demand for our equipment, systems and services may also decline. In addition, such laws, regulations,and proposals may also result in more onerous obligations with respect to our operations, including the facilities where we manufacture ourequipment and systems. Such decline in demand for our equipment, systems and services and such onerous
40

obligations in respect of our operations may adversely affect our financial condition, results of operations, or cash flows.
As an English public limited company, we must meet certain additional financial requirements before we may declare dividends orrepurchase shares and certain capital structure decisions may require stockholder approval which may limit our flexibility tomanage our capital structure. We may not be able to pay dividends or repurchase shares of our ordinary shares in accordance withour announced intent, or at all.
Under English law, we will only be able to declare dividends, make distributions, or repurchase shares (other than out of the proceeds of anew issuance of shares for that purpose) out of “distributable profits.” Distributable profits are a company’s accumulated, realized profits, tothe extent that they have not been previously utilized by distribution or capitalization, less its accumulated, realized losses, to the extent thatthey have not been previously written off in a reduction or reorganization of capital duly made. In addition, as a public limited companyincorporated in England and Wales, we may only make a distribution if the amount of our net assets is not less than the aggregate of ourcalled-up share capital and non-distributable reserves and to the extent that the distribution does not reduce the amount of those assets toless than that aggregate.
Our articles of association permit us by ordinary resolution of the stockholders to declare dividends, provided that the directors have made arecommendation as to its amount. The dividend shall not exceed the amount recommended by the Board of Directors. The directors mayalso decide to pay interim dividends if it appears to them that the profits available for distribution justify the payment. When recommending ordeclaring payment of a dividend, the directors are required under English law to comply with their duties, including considering our futurefinancial requirements.
In addition, the Board of Directors’ determinations regarding dividends and share repurchases will depend on a variety of other factors,including our net income, cash flow generated from operations or other sources, liquidity position, and potential alternative uses of cash, suchas acquisitions, as well as economic conditions and expected future financial results. Our ability to declare and pay future dividends andmake future share repurchases will depend on our future financial performance, which in turn depends on the successful implementation ofour strategy and on financial, competitive, regulatory, technical, general economic conditions, demand and selling prices for our products andservices, and other factors specific to our industry or specific projects, many of which are beyond our control. Therefore, our ability togenerate cash depends on the performance of our operations and could be limited by decreases in our profitability or increases in costs,regulatory changes, capital expenditures, or debt servicing requirements.
Any failure to pay dividends or repurchase shares of our ordinary shares could negatively impact our reputation, harm investor confidence inus, and cause the market price of our ordinary shares to decline.
Uninsured claims and litigation against us, including intellectual property litigation, could adversely impact our financial condition,results of operations, or cash flows.
We could be impacted by the outcome of pending litigation, as well as unexpected litigation or proceedings. We have insurance coverageagainst operating hazards, including product liability claims and personal injury claims related to our products or operating environments inwhich our employees operate, to the extent deemed prudent by our management and to the extent insurance is available. However, ourinsurance policies are subject to exclusions, limitations, and other conditions and may not apply in all cases, for example where willfulwrongdoing on our part is alleged. Additionally, the nature and amount of that insurance may not be sufficient to fully indemnify us againstliabilities arising out of pending and future claims and litigation. Additionally, in individual circumstances, certain proceedings or cases mayalso lead to our formal or informal exclusion from tenders or the revocation or loss of business licenses or permits. Our financial condition,results of operations, or cash flows could be adversely affected by unexpected claims not covered by insurance.
In addition, the tools, techniques, methodologies, programs, and components we use to provide our services may infringe upon theintellectual property rights of others. Infringement claims generally result in significant legal and other costs. The resolution of these claimscould require us to pay damages, enter into license agreements or develop alternative technologies. The development of these technologiesor the payment of royalties under licenses from third parties, if available, would increase our costs. If a license were not available, or we arenot able to
41

develop alternative technologies, we might not be able to continue providing a particular service or product, which could adversely affect ourfinancial condition, results of operations, or cash flows.
We are subject to governmental regulation and other legal obligations related to privacy, data protection, and data security. Ouractual or perceived failure to comply with such obligations could harm our business.
We are subject to international data protection laws, such as the General Data Protection Regulation, or GDPR, in the European EconomicArea, or EEA, and the United Kingdom (“UK”) GDPR and Data Protection Act 2018 in the UK. The GDPR and implementing legislation in theEEA and UK impose several stringent requirements for controllers and processors of personal data which have increased our obligations,including, for example, by requiring more robust disclosures to individuals, notifications, in some cases, of data breaches to regulators anddata subjects, and a record of processing and other policies and procedures to be maintained to adhere to the accountability principle. Inaddition, we are subject to the GDPR’s rules on transferring personal data outside of the EEA and UK (including to the United States), andrecent legal developments in Europe have created complexity and uncertainty regarding such transfers. In addition, the UK’s withdrawal fromthe European Union may mean that in future we are required to find alternative solutions for the compliant transfer of personal data into theUK.Failure to comply with the requirements of GDPR and the local laws implementing or supplementing the GDPR could result in fines of up to€20,000,000 or up to 4% of the total worldwide annual turnover of the preceding financial year, whichever is higher, as well as otheradministrative penalties. The UK GDPR mirrors the fines under the GDPR. In addition, a breach of the GDPR or UK GDPR could result inregulatory investigations and enforcement action, reputational damage, and civil claims including representative actions and other classaction type litigation.
We are likely to be required to expend significant capital and other resources to ensure ongoing compliance with the GDPR and UK GDPRand other applicable data protection legislation, and we may be required to put in place additional control mechanisms which could beonerous and adversely affect our business, financial condition, results of operations, or cash flows.
The IRS may not agree that we should be treated as a foreign corporation for U.S. federal tax purposes and may seek to impose anexcise tax on gains recognized by certain individuals.
Although we are incorporated in the United Kingdom, the U.S. Internal Revenue Service (the “IRS”) may assert that we should be treated asa U.S. “domestic” corporation (and, therefore, a U.S. tax resident) for U.S. federal income tax purposes pursuant to Section 7874 of the U.S.Internal Revenue Code of 1986, as amended (the “Code”). For U.S. federal income tax purposes, a corporation (i) is generally considered a“domestic” corporation (or U.S. tax resident) if it is organized in the United States or of any state or political subdivision therein, and (ii) isgenerally considered a “foreign” corporation (or non-U.S. tax resident) if it is not considered a domestic corporation. Because we are a U.K.incorporated entity, we would be considered a foreign corporation (and, therefore, a non-U.S. tax resident) under these rules. Section 7874 ofthe Code (“Section 7874”) provides an exception under which a foreign incorporated entity may, in certain circumstances, be treated as adomestic corporation for U.S. federal income tax purposes.
We do not believe this exception applies. However, the Section 7874 rules are complex and subject to detailed regulations, the application ofwhich is uncertain in various respects. It is possible that the IRS will not agree with our position. Should the IRS successfully challenge ourposition, it is also possible that an excise tax under Section 4985 of the Code (the “Section 4985 Excise Tax”) may be assessed againstcertain “disqualified individuals” (including former officers and directors of FMC Technologies, Inc.) on certain stock-based compensation heldthereby. We may, if we determine that it is appropriate, provide disqualified individuals with a payment with respect to the Section 4985Excise Tax, so that, on a net after-tax basis, they would be in the same position as if no such Section 4985 Excise Tax had been applied.
In addition, there can be no assurance that there will not be a change in law or interpretation, including with retroactive effect, that mightcause us to be treated as a domestic corporation for U.S. federal income tax purposes.
U.S. tax laws and/or guidance could affect our ability to engage in certain acquisition strategies and certain internal restructurings.
Even if we are treated as a foreign corporation for U.S. federal income tax purposes, Section 7874, U.S. Treasury regulations, and otherguidance promulgated thereunder may adversely affect our ability to engage in certain future
42

acquisitions of U.S. businesses or to restructure the non-U.S. members of our group. These limitations, if applicable, may affect the taxefficiencies that otherwise might be achieved in such potential future transactions or restructurings.
In addition, the IRS and the U.S. Treasury have issued final and temporary regulations providing that, even if we are treated as a foreigncorporation for U.S. federal income tax purposes, certain intercompany debt instruments issued on or after April 4, 2016 will be treated asequity for U.S. federal income tax purposes, therefore limiting U.S. tax benefits and resulting in possible U.S. withholding taxes. Althoughrecent guidance from the U.S. Treasury removes certain documentation requirements that would otherwise be imposed with respect tocovered debt instruments, announces an intention to further modify and possibly withdraw certain classification rules relating to covered debtinstruments, and further indicates that these rules generally are the subject of continuing study and may be further materially modified, thecurrent regulations may adversely affect our future effective tax rate and could also impact our ability to engage in future restructurings ifsuch transactions cause an existing intercompany debt instrument to be treated as reissued for U.S. federal income tax purposes.
We are subject to the tax laws of numerous jurisdictions; challenges to the interpretation of, or future changes to, such laws couldadversely affect us.
We and our subsidiaries are subject to tax laws and regulations in the United Kingdom, the United States, France, and numerous otherjurisdictions in which we and our subsidiaries operate. These laws and regulations are inherently complex, and we are, and will continue tobe, obligated to make judgments and interpretations about the application of these laws and regulations to our operations and businesses.The interpretation and application of these laws and regulations could be challenged by the relevant governmental authorities, which couldresult in administrative or judicial procedures, actions, or sanctions, which could be material.
On December 22, 2017, the Tax Cuts and Jobs Act was signed into law in the United States, which made extensive changes to the U.S.taxation of multinational companies, and is subject to continuing regulatory and possible legislative changes, especially given the newAdministration and Congress in the United States. In addition, the U.S. Congress, the U.K. Government, the European Union, theOrganization for Economic Co-operation and Development (the “OECD”), and other government agencies in jurisdictions where we and ouraffiliates do business have had an extended focus on issues related to the taxation of multinational corporations. New tax initiatives,directives, and rules, such as the U.S. Tax Cuts and Jobs Act, the OECD’s Base Erosion and Profit Shifting initiative, and the EuropeanUnion’s Anti-Tax Avoidance Directives, may increase our tax burden and require additional compliance-related expenditures. As a result, ourfinancial condition, results of operations, or cash flows may be adversely affected. Further changes, including with retroactive effect, in thetax laws of the United States, the United Kingdom, the European Union, or other countries in which we and our affiliates do business couldalso adversely affect us.
We may not qualify for benefits under tax treaties entered into between the United Kingdom and other countries.
We operate in a manner such that we believe we are eligible for benefits under tax treaties between the United Kingdom and other countries.However, our ability to qualify for such benefits will depend on whether we are treated as a U.K. tax resident, the requirements contained ineach treaty and applicable domestic laws, on the facts and circumstances surrounding our operations and management, and on the relevantinterpretation of the tax authorities and courts. For example, because of Brexit, we may lose some or all of the benefits of tax treatiesbetween the United States and the remaining members of the European Union, and face higher tax liabilities, which may be significant.Another example is the Multilateral Convention to Implement Tax Treaty Related Measures to Prevent Base Erosion and Profit Shifting (the“MLI”), which entered into force for participating jurisdictions on July 1, 2018. The MLI recommends that countries adopt a “limitation-on-benefit” (“LOB”) rule and/or a “principal purpose test” (“PPT”) rule with regards to their tax treaties. The application of the LOB rule or the PPTrule could deny us treaty benefits (such as a reduced rate of withholding tax) that were previously available and as such there remainsuncertainty as to whether and, if so, to what extent such treaty benefits will continue to be available. The position is likely to remain uncertainfor a number of years.
The failure by us or our subsidiaries to qualify for benefits under tax treaties entered into between the United Kingdom and other countriescould result in adverse tax consequences to us (including an increased tax burden and increased filing obligations) and could result in certaintax consequences of owning and disposing of our shares.
43

We intend to be treated exclusively as a resident of the United Kingdom for tax purposes, but French or other tax authorities mayseek to treat us as a tax resident of another jurisdiction.
We are incorporated in the United Kingdom. English law currently provides that we will be regarded as a U.K. resident for tax purposes fromincorporation and shall remain so unless (i) we are concurrently a resident in another jurisdiction (applying the tax residence rules of thatjurisdiction) that has a double tax treaty with the United Kingdom and (ii) there is a tiebreaker provision in that tax treaty which allocatesexclusive residence to that other jurisdiction.
In this regard, we have a permanent establishment in France to satisfy certain French tax requirements imposed by the French Tax Codewith respect to the Merger. Although it is intended that we will be treated as having our exclusive place of tax residence in the UnitedKingdom, the French tax authorities may claim that we are a tax resident of France if we were to fail to maintain our “place of effectivemanagement” in the United Kingdom. Any such claim would be settled between the French and U.K. tax authorities pursuant to the mutualassistance procedure provided for by the tax treaty concluded between France and the United Kingdom. There is no assurance that theseauthorities would reach an agreement that we will remain exclusively a U.K. tax resident; an adverse determination could materially andadversely affect our business, financial condition, results of operations, or cash flows. A failure to maintain exclusive tax residency in theUnited Kingdom could result in adverse tax consequences to us and our subsidiaries and could result in certain adverse changes in the taxconsequences of owning and disposing of our shares.
Risks Related to the Spin-off and the Other Transactions
The Spin-off may subject us to future liabilities.
On February 16, 2021, we completed the Spin-off, resulting in Technip Energies, which holds our former Technip Energies businesssegment, becoming a stand-alone publicly traded corporation. Pursuant to agreements we entered into with Technip Energies in connectionwith the Spin-off, we and Technip Energies are each generally responsible for the obligations and liabilities related to our respectivebusinesses. Pursuant to those agreements, we and Technip Energies each agreed to cross-indemnities principally designed to allocatefinancial responsibility for the obligations and liabilities of our business to us and those of Technip Energies’ business to it. However, thirdparties, including governmental agencies, could seek to hold us responsible for obligations and liabilities that Technip Energies agreed toretain or assume, and there can be no assurance that the indemnification from Technip Energies will be sufficient to protect us against the fullamount of such obligations and liabilities, or that Technip Energies will be able to fully satisfy its indemnification obligations. Additionally, if acourt were to determine that the Spin-off or related transactions were consummated with the actual intent to hinder, delay or defraud currentor future creditors or resulted in Technip Energies receiving less than reasonably equivalent value when it was insolvent, or that it wasrendered insolvent, inadequately capitalized or unable to pay its debts as they become due, then it is possible that the court could disregardthe allocation of obligations and liabilities agreed to between us and Technip Energies, impose substantial obligations and liabilities on usand void some or all of the transactions related to the Spin-off. Any of the foregoing could adversely affect our results of operations andfinancial position.
The Spin-off may not achieve some or all of the anticipated benefits.
We may not realize some or all of the anticipated strategic, financial, operational or other benefits from the Spin-off. As independent publicly-traded companies, we and Technip Energies are smaller, less diversified companies with a narrower business focus, and may be morevulnerable to changing market conditions, which could materially adversely affect our and its results of operations, cash flows and financialposition.
In addition, other events outside of our control, including, but not limited to, political climate, the severity and duration of the pandemic, andregulatory or legislative changes, could also adversely affect our ability to realize the anticipated benefits from the Spin-off. Any suchdifficulties could have an adverse effect on our business, financial condition, or results of operations, and cause the combined market valueof us and Technip Energies after the Spin-off to fall short of the market value of our shares prior to the Spin-off.
We are a significant shareholder of Technip Energies and the value of our investment in Technip Energies may fluctuatesubstantially.
44

Following completion of the Spin-off, we own approximately 49.9% of the outstanding shares of common stock of Technip Energies. Thevalue of our investment in Technip Energies may be adversely affected by negative changes in its results of operations, cash flows andfinancial position, which may occur as a result of the many risks attendant with operating in the onshore/offshore industry, including the effectof laws and regulations on the operation of Technip Energies’ business and the development of its assets, increased competition, loss ofcontract commitments, delays in the timing of or the failure to complete projects, lack of access to capital and operating risks and hazards.The value of our investment in Technip Energies may fluctuate substantially and may result in a significant impact to our results of operations.
We intend to significantly reduce our shareholding in Technip Energies over the 18 months following the Spin-off, including in connection withthe sale of Technip Energies shares to BPI (as defined herein) pursuant to the Investment (as defined herein). However, we can offer noguarantee that we will be able to complete such disposition or, if completed, the extent to which we will reduce our shareholding or the valuethat we will realize in connection with such disposition. The occurrence of any of these and other risks faced by Technip Energies couldadversely affect the value of our investment in Technip Energies.
We may be required to refund the Purchase Price under the Share Purchase Agreement to BPI in the event that certain conditionsthereunder are not met.
In connection with the Spin-off, we entered into the Share Purchase Agreement with BPI, pursuant to which BPI agreed to purchase from usfor $200.0 million, subject to a purchase price adjustment as described below (the “Purchase Price”), a number of Technip Energies shares(the “Purchased Shares”) determined based upon a thirty day volume-weighted average price of Technip Energies’ shares, less a six percentdiscount (the “Investment”). Pursuant to the Share Purchase Agreement, BPI paid us the Purchase Price on February 25, 2021, however (i) ifthe number of Purchased Shares due from us to BPI is less than 11.82% of the number of Technip Energies shares outstanding immediatelyfollowing completion of the Spin-off, then BPI may, upon written notice to us, terminate the Share Purchase Agreement and we will berequired to refund the Purchase Price to BPI or (ii) if the number of Purchased Shares due from us to BPI exceeds 17.25% of the number ofTechnip Energies shares outstanding immediately following completion of the Spin-off (the “Cap”), then we will transfer to BPI an aggregatenumber of Technip Energies shares equal to the Cap and will pay to BPI, as a reduction of the Purchase Price, an amount equal to (x) thedifference between the number of Technip Energies shares that we would have delivered to BPI but for the Cap and the number of TechnipEnergies shares that we actually delivered to BPI, multiplied by (y) the applicable price per Technip Energy share. Any such refund orreduction of the Purchase Price could have a material adverse effect on our financial condition or cash flows.
General Risk Factors
Our businesses are dependent on the continuing services of our key managers and employees.
We depend on key personnel. The loss of any key personnel could adversely impact our business if we are unable to implement keystrategies or transactions in their absence. The loss of qualified employees or failure to retain and motivate additional highly-skilledemployees required for the operation and expansion of our business could hinder our ability to successfully conduct research activities anddevelop marketable products and services.
Seasonal and weather conditions could adversely affect demand for our services and operations.
Our business may be materially affected by variation from normal weather patterns, such as cooler or warmer summers and winters. Adverseweather conditions, such as hurricanes in the Gulf of Mexico or extreme winter conditions in Canada, Russia, and the North Sea, mayinterrupt or curtail our operations, or our customers’ operations, cause supply disruptions or loss of productivity, and may result in a loss ofrevenue or damage to our equipment and facilities, which may or may not be insured. Increasing concentrations of greenhouse gases in theEarth’s atmosphere may produce climate changes that increase variation from normal weather patterns, such as increased frequency andseverity of storms, floods, droughts, and other climatic events, which could further impact our operations. Significant physical effects ofclimate change could also have a direct effect on our operations and an indirect effect on our business by interrupting the operations of thosewith whom we do business. Any of these events or outcomes could have a material adverse effect on our business, financial condition, cashflows, or results of operations.
45

Currency exchange rate fluctuations could adversely affect our financial condition, results of operations, or cash flows.
We conduct operations around the world in many different currencies. Because a significant portion of our revenue is denominated incurrencies other than our reporting currency, the U.S. dollar, changes in exchange rates will produce fluctuations in our revenue, costs, andearnings, and may also affect the book value of our assets and liabilities and related equity. We hedge transaction impacts on margins andearnings where a transaction is not in the functional currency of the business unit, but we do not hedge translation impacts on earnings. Ourefforts to minimize our currency exposure through such hedging transactions may not be successful depending on market and businessconditions. Moreover, certain currencies in which we conduct operations, specifically currencies in countries such as Angola and Nigeria, donot actively trade in the global foreign exchange markets and may subject us to increased foreign currency exposures. As a result,fluctuations in foreign currency exchange rates may adversely affect our financial condition, results of operations, or cash flows.
We are exposed to risks in connection with our defined benefit pension plan commitments.
We have funded and unfunded defined benefit pension plans, which provide defined benefits based on years of service and salary. We arerequired to recognize the funded status of defined benefit post-retirement plans as an asset or liability in the consolidated balance sheet andrecognize changes in that funded status in comprehensive income in the year in which the changes occur. Further, we are required tomeasure each plan’s assets and its obligations that determine its funded status as of the date of the consolidated balance sheet. Eachdefined benefit pension plan’s assets are invested in different asset classes and their value may fluctuate in accordance with marketconditions. Any deterioration in the value of the defined benefit pension plan assets could therefore increase our obligations. Any suchincreases in our net pension obligations could adversely affect our financial condition due to increased additional outflow of funds to financethe pension obligations.
In addition, applicable law and/or the terms of the relevant defined benefit pension plan may require us to make cash contributions or providefinancial support upon the occurrence of certain events. We cannot predict whether, or to what extent, changing market or economicconditions, regulatory changes or other factors will further increase our pension expense or funding obligations. For further informationregarding our pension liabilities, see Note 22 for further information.
ITEM 1B. UNRESOLVED STAFF COMMENTS
None.
46

ITEM 2. PROPERTIES
Our corporate headquarters is in London, England. We also maintain corporate offices in Houston, Texas and Paris, France, wheresignificant worldwide global support activity occurs. In addition, we own or lease numerous properties throughout the world.
We believe our properties and facilities are suitable for their present and intended purposes and are operating at a level consistent with therequirements of the industry in which we operate. We also believe that our leases are at competitive or market rates and do not anticipateany difficulty in leasing suitable additional space upon expiration of our current lease terms.
The following table shows our principal properties by reporting segment as of December 31, 2020:
Location SegmentAfrica
Dande, Angola SubseaHassi-Messaoud, Algeria SurfaceLagos, Nigeria SubseaLobito, Angola SubseaLuanda, Angola SubseaMalabo, Equatorial Guinea SubseaPort Harcourt, Nigeria SubseaTakoradi, Ghana Subsea
AsiaChennai, India Technip EnergiesDahej, India Technip EnergiesHyderabad, India SurfaceJakarta, Indonesia SurfaceJohor, Malaysia SubseaKuala Lumpur, Malaysia Subsea, Surface, Technip EnergiesMumbai, India Technip EnergiesNew Delhi, India Technip EnergiesNoida, India Subsea, Surface, Technip EnergiesNusajaya, Malaysia Subsea, SurfaceSingapore Subsea, Surface
AustraliaHenderson, Australia SubseaPerth, Australia Subsea, Technip Energies
EuropeAberdeen, United Kingdom Subsea, SurfaceAktau, Kazakhstan SurfaceArnhem, The Netherlands SurfaceAtyrau, Kazakhstan SurfaceBarcelona, Spain Technip EnergiesBergen, Norway SubseaCompiegne, France Technip EnergiesCourbevoie (Paris - La Défense), France Subsea, Technip EnergiesDunfermline, United Kingdom Subsea, SurfaceEllerbek, Germany SurfaceEvanton, United Kingdom SubseaHorten, Norway SubseaKongsberg, Norway Subsea, SurfaceKrakow, Poland SubseaLa Garenne-Colombes, France Technip EnergiesLe Trait, France Subsea, SurfaceLisbon, Portugal Subsea
47

London, United Kingdom Subsea, Technip EnergiesLyon, France Technip EnergiesLysaker, Norway Subsea, Technip EnergiesMoscow, Russia Subsea, Surface, Technip EnergiesNewcastle, United Kingdom SubseaOrkanger, Norway SubseaRome, Italy Technip EnergiesSens, France Surface, Technip EnergiesSt. Petersburg, Russia Technip EnergiesStavanger, Norway Subsea, SurfaceVeenord, Netherlands SurfaceZoetermeer, Netherlands Technip Energies
Middle EastAbu Dhabi, United Arab Emirates Surface, Technip EnergiesAl-Khobar, Saudi Arabia Technip EnergiesDammam, Saudi Arabia SurfaceDoha, Qatar Technip Energies
North AmericaBrighton (Colorado), United States SurfaceCalgary (Alberta), Canada SurfaceDavis (California), United States SubseaErie (Pennsylvania), United States SurfaceHouston (Texas), United States Subsea, Surface, Technip EnergiesOdessa (Texas), United States SurfaceOklahoma City (Oklahoma), United States SurfaceSan Antonio (Texas), United States SurfaceSpeers (Pennsylvania), United States SurfaceSt. John’s (Newfoundland), Canada SubseaStephenville (Texas), United States SurfaceTheodore (Alabama), United States Subsea
South AmericaBogota, Colombia Technip EnergiesMacaé, Brazil SubseaNeuquén, Argentina SurfaceRio de Janeiro, Brazil Subsea, SurfaceSão João da Barra, Brazil SubseaVeracruz, Mexico SurfaceYopal, Colombia Surface
48

The following table shows marine vessels in which we held an interest or operated as of December 31, 2020:
Vessel Name Vessel Type Special EquipmentDeep Blue PLSV Reeled pipelay/flexible pipelay/umbilical systemsDeep Energy PLSV Reeled pipelay/flexible pipelay/umbilical systemsApache II PLSV Reeled pipelay/umbilical systemsGlobal 1200 PLSV/HCV Conventional pipelay/Heavy handling operationsDeep Orient HCV Construction/installation systemsNorth Sea Atlantic HCV Construction/installation systemsSkandi Africa HCV Construction/installation systemsDeep Arctic DSV/HCV Diver support systemsDeep Discoverer DSV/HCV Diver support systemsDeep Explorer DSV/HCV Diver support systemsSkandi Vitória PLSV Flexible pipelay/umbilical systemsSkandi Niterói PLSV Flexible pipelay/umbilical systemsCoral do Atlantico PLSV Flexible pipelay/umbilical systemsDeep Star PLSV Flexible pipelay/umbilical systemsSkandi Açu PLSV Flexible pipelay/umbilical systemsSkandi Búzios PLSV Flexible pipelay/umbilical systemsSkandi Olinda PLSV Flexible pipelay/umbilical systemsSkandi Recife PLSV Flexible pipelay/umbilical systems
(a) At December 31, 2020, this vessel is held for sale.
(b) Vessels under long term charter.
PLSV: Pipelay Support VesselHCV: Heavy Duty Construction VesselDSV: Diving Support Vessel
(a)
(b)
(b)
49
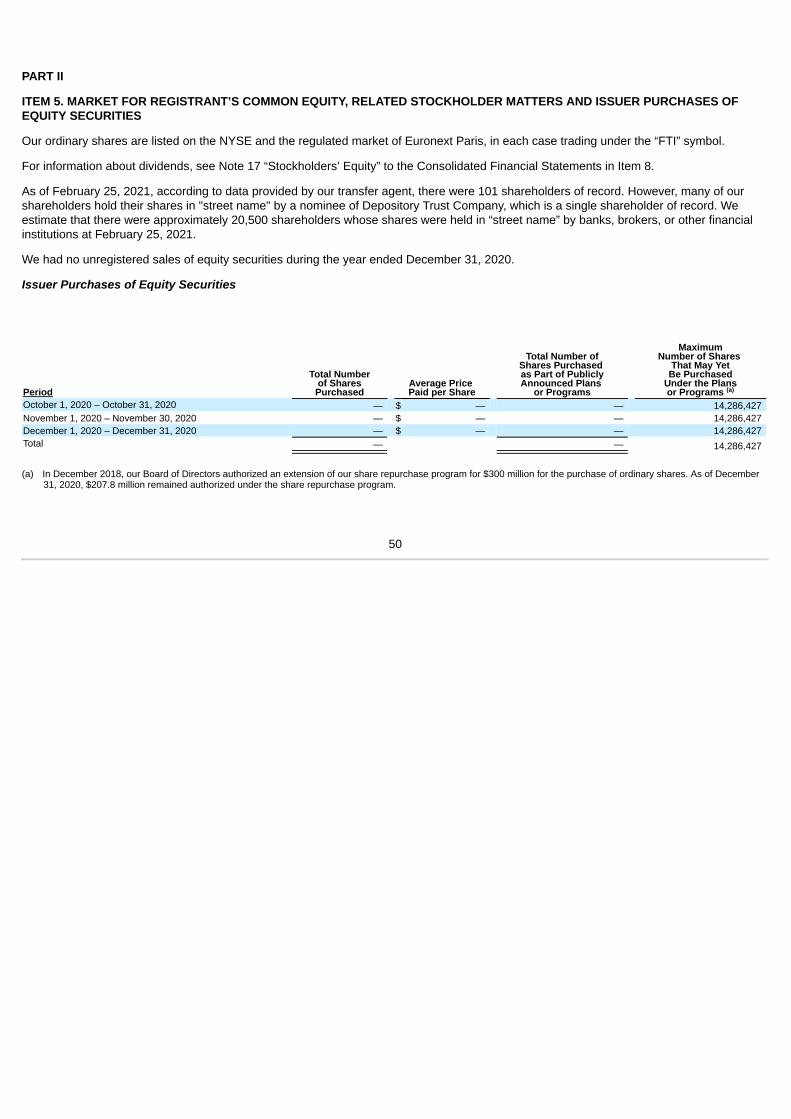
PART II
ITEM 5. MARKET FOR REGISTRANT’S COMMON EQUITY, RELATED STOCKHOLDER MATTERS AND ISSUER PURCHASES OFEQUITY SECURITIES
Our ordinary shares are listed on the NYSE and the regulated market of Euronext Paris, in each case trading under the “FTI” symbol.
For information about dividends, see Note 17 “Stockholders’ Equity” to the Consolidated Financial Statements in Item 8.
As of February 25, 2021, according to data provided by our transfer agent, there were 101 shareholders of record. However, many of ourshareholders hold their shares in "street name" by a nominee of Depository Trust Company, which is a single shareholder of record. Weestimate that there were approximately 20,500 shareholders whose shares were held in “street name” by banks, brokers, or other financialinstitutions at February 25, 2021.
We had no unregistered sales of equity securities during the year ended December 31, 2020.
Issuer Purchases of Equity Securities
Period
Total Numberof Shares
PurchasedAverage Price Paid per Share
Total Number ofShares Purchased as Part of PubliclyAnnounced Plans
or Programs
MaximumNumber of Shares
That May YetBe Purchased
Under the Plansor Programs
October 1, 2020 – October 31, 2020 — $ — — 14,286,427 November 1, 2020 – November 30, 2020 — $ — — 14,286,427 December 1, 2020 – December 31, 2020 — $ — — 14,286,427 Total — — 14,286,427
(a) In December 2018, our Board of Directors authorized an extension of our share repurchase program for $300 million for the purchase of ordinary shares. As of December31, 2020, $207.8 million remained authorized under the share repurchase program.
(a)
50

Performance Graph
The graph below compares the cumulative total shareholder return on our ordinary shares for the period from January 17, 2017 toDecember 31, 2020 with the Standard & Poor’s 500 Index (“S&P 500 Index”) and PHLX Oil Services Index. The comparison assumes $100was invested, including reinvestment of dividends, if any, in our ordinary shares on January 17, 2017 and in both of the indexes on the samedate. The results shown in the graph below are not necessarily indicative of future performance.
December 312017 2018 2019 2020
TechnipFMC plc $ 87.76 $ 55.89 $ 62.63 $ 28.03 S&P 500 Index 119.82 114.56 150.62 178.32 PHLX Oil Services Index 82.00 44.93 44.68 25.88
51

ITEM 6. SELECTED FINANCIAL DATA
The following tables set forth selected financial data for each of the five years in the period ended December 31, 2020. This informationshould be read in conjunction with Part I, Item 1 “Business,” Part II, Item 7 “Management’s Discussion and Analysis of Financial Conditionand Results of Operations” and the audited consolidated financial statements and notes thereto included in Part II, Item 8 of this AnnualReport on Form 10-K.
Year Ended December 31,(In millions, except per share data) 2020 2019 2018 2017 2016Statement of income dataTotal revenue $ 13,050.6 $ 13,409.1 $ 12,552.9 $ 15,056.9 $ 9,199.6 Total costs and expenses $ 15,936.2 $ 14,935.8 $ 13,470.5 $ 14,091.7 $ 8,743.6 Net income (loss) $ (3,237.9) $ (2,412.1) $ (1,910.8) $ 134.2 $ 371.1 Net income (loss) attributable to TechnipFMC plc $ (3,287.6) $ (2,415.2) $ (1,921.6) $ 113.3 $ 393.3
Earnings (loss) per share from continuing operations attributable to TechnipFMC plcBasic earnings (loss) per share $ (7.33) $ (5.39) $ (4.20) $ 0.24 $ 3.29 Diluted earnings (loss) per share $ (7.33) $ (5.39) $ (4.20) $ 0.24 $ 3.16
As of December 31,(In millions) 2020 2019 2018 2017 2016Balance sheet dataTotal assets $ 19,692.6 $ 23,518.8 $ 24,784.5 $ 28,263.7 $ 18,679.3 Long-term debt, less current portion $ 3,317.7 $ 3,980.0 $ 4,124.3 $ 3,777.9 $ 1,869.3 Total TechnipFMC plc stockholders’ equity $ 4,154.2 $ 7,659.3 $ 10,357.6 $ 13,345.9 $ 5,013.8
Year Ended December 31,(In millions) 2020 2019 2018 2017 2016Other financial informationCapital expenditures $ 291.8 $ 454.4 $ 368.1 $ 255.7 $ 312.9 Cash flows provided (required) by operating activities $ 656.9 $ 848.5 $ (185.4) $ 210.7 $ 493.8 Net cash $ 853.9 $ 714.8 $ 1,348.3 $ 2,882.4 $ 3,716.4 Order backlog $ 21,388.2 $ 24,251.1 $ 14,560.0 $ 12,982.8 $ 15,002.0
The results of our operations for the year ended December 31, 2020 include goodwill and long-lived asset impairment charges of $3,083.4million and $204.0 million, respectively. The results of our operations for the year ended December 31, 2019 include goodwill and long-livedasset impairment charges of $1,988.7 million and $495.4 million, respectively. The results of our operations for the year ended December 31,2018 include goodwill and vessels impairment charges of $1,383.0 million and $372.9 million, respectively, and a legal provision of $280.0million. See Notes 19 and 20 to our consolidated financial statements for further details.
The results of our operations for the year ended December 31, 2017 consist of the combined results of operations of Technip and FMCTechnologies. Due to the Merger, FMC Technologies’ results of operations have been included in our financial statements for periodssubsequent to the consummation of the Merger on January 16, 2017 and as a result, data presented for the year December 31, 2017 is notcomparable to actual results presented in prior periods. Technip was the accounting acquirer, therefore results for the years endedDecember 31, 2016 represent Technip only.
Net cash consists of cash and cash equivalents less short-term debt, long-term debt and the current portion of long-term debt. Net cash is anon-GAAP measure that management uses to evaluate our capital structure and financial leverage. See “Liquidity and Capital Resources” inPart II, Item 7 of this Annual Report on Form 10-K for additional discussion and reconciliations of net cash.
Order backlog is calculated as the estimated sales value of unfilled, confirmed customer orders at the reporting date.
52

ITEM 7. MANAGEMENT’S DISCUSSION AND ANALYSIS OF FINANCIAL CONDITION AND RESULTS OF OPERATIONS
EXECUTIVE OVERVIEW
We are a global leader in energy projects, technologies, systems and services. We have manufacturing operations worldwide, strategicallylocated to facilitate efficient delivery of these products, technologies, systems and services to our customers. We report our results ofoperations in the following segments: Subsea, Technip Energies and Surface Technologies. Management’s determination of our reportingsegments was made on the basis of our strategic priorities and corresponds to the manner in which our Chief Executive Officer reviews andevaluates operating performance to make decisions about resource allocations to each segment.
A description of our products and services and annual financial data for each segment can be found in Part I, Item 1, “Business” and Note 7to our consolidated financial statements.
We focus on economic- and industry-specific drivers and key risk factors affecting our business segments as we formulate our strategic plansand make decisions related to allocating capital and human resources. The results of our segments are primarily driven by changes in capitalspending by oil and gas companies, which largely depend upon current and anticipated future crude oil and natural gas demand, productionvolumes, and consequently, commodity prices. We use crude oil and natural gas prices as an indicator of demand. Additionally, we use bothonshore and offshore rig count as an indicator of demand, which consequently influences the level of worldwide production activity andspending decisions. We also focus on key risk factors when determining our overall strategy and making decisions for capital allocation.These factors include risks associated with the global economic outlook, product obsolescence and the competitive environment. Weaddress these risks in our business strategies, which incorporate continuing development of leading edge technologies and cultivating strongcustomer relationships.
Our Subsea segment is affected by changes in commodity prices and trends in deepwater oil and natural gas production. Our TechnipEnergies segment is impacted by change in commodity prices, population growth and demand for natural gas, although the onshore marketis typically more resilient to these changes impacting the segment. Our Subsea and Technip Energies segments both benefit from the currentmarket fundamentals supporting the demand for new liquefied natural gas facilities. Technip Energies also benefits from the construction ofpetrochemical and fertilizer plants.
Our Surface Technologies segment is primarily affected by changes in commodity prices and trends in land-based and shallow water oil andnatural gas production. We have developed close working relationships with our customers. Our results reflect our ability to build long-termalliances with oil and natural gas companies and to provide solutions for their needs in a timely and cost-effective manner. We believe that byclosely working with our customers, we enhance our competitive advantage, improve our operating results and strengthen our marketpositions.
As we evaluate our operating results, we consider business segment performance indicators like segment revenue, operating profit andcapital employed, in addition to the level of inbound orders and order backlog. A significant proportion of our revenue is recognized under thepercentage of completion method of accounting. Cash receipts from such arrangements typically occur at milestones achieved under statedcontract terms. Consequently, the timing of revenue recognition is not always correlated with the timing of customer payments. We aim tostructure our contracts to receive advance payments that we typically use to fund engineering efforts and inventory purchases. Workingcapital (excluding cash) and net cash are therefore key performance indicators of cash flows.
In each of our segments, we serve customers from around the world. During 2020, approximately 84 percent of our total sales wererecognized outside of the United States. We evaluate international markets and pursue opportunities that fit our technological capabilities andstrategies.
The Spin-off
On February 16, 2021, we completed the separation of the Technip Energies business segment. The transaction was structured as a Spin-off, which occurred by way of a Distribution to our shareholders of 50.1 percent of the outstanding shares in Technip Energies N.V. Each ofour shareholders received one ordinary share of Technip Energies N.V. for every five ordinary shares of TechnipFMC held at 5:00 p.m., NewYork City time on the record date, February 17, 2021. Technip Energies N.V. is now an independent public company and its shares tradeunder the ticker symbol “TE” on the Euronext Paris stock exchange.
53

In connection with the Spin-off, on January 7, 2021, BPI, which has been one of our substantial shareholders since 2009, entered into aShare Purchase Agreement with us pursuant to which BPI agreed to purchase a portion of our retained stake in Technip Energies N.V. for$200.0 million. On February 25, 2021, BPI paid $200.0 million in connection with the Share Purchase Agreement. The Purchase Price issubject to adjustment, and BPI’s ownership stake will be determined based upon a thirty day volume-weighted average price of TechnipEnergies N.V.’ shares (with BPI’s ownership collared between an 11.82 percentage floor and a 17.25 percentage cap), less a six percentdiscount. The BPI Investment is subject to customary conditions and regulatory approval. We intend to significantly reduce our shareholdingin Technip Energies N.V. over the 18 months following the Spin-off, including in connection with the sale of shares to BPI pursuant to the BPIInvestment.
Beginning in the first quarter of 2021, Technip Energies’ historical financial results for periods prior to the Distribution will be reflected in ourconsolidated financial statements as discontinued operations.
BUSINESS OUTLOOK
Overall outlook – While economic activity continues to be impacted by the COVID-19 pandemic, the short-term outlook for crude oil hasimproved as the OPEC+ countries better manage the oversupplied market. Long-term demand for energy is still forecast to rise, and webelieve this outlook will ultimately provide our customers with the confidence to increase investments in new sources of oil and natural gasproduction.
Subsequent to the Spin-off, we will operate under two reporting segments: Subsea and Surface Technologies, therefore the discussion belowrelates to these two reporting segments only.
Subsea – The volatile, and generally low crude oil price environment of the last several years led many of our customers to reduce theircapital spending plans and defer new deepwater projects. Order activity in 2020 was particularly impacted by the sharp decline in commodityprices, driven in part by the reduced economic activity, and the general uncertainty related to the pandemic. The reduction and deferral ofnew projects resulted in delayed subsea project inbound for the industry.
The trajectory and pace of further recovery and expansion in the subsea market is subject to more stringent capital discipline and theallocation of capital our clients dedicate to developing offshore oil and gas fields amongst their entire portfolio of projects. The risk of projectsanctioning delays still exists in the current environment; however, innovative approaches to subsea projects, like our iEPCI solution, haveimproved project economics, and many offshore discoveries can be developed economically at today’s crude oil prices. In the long-term,deepwater development is expected to remain a significant part of many of our customers’ portfolios.
As the subsea industry continues to evolve, we have taken actions to further streamline our organization, achieve standardization, andreduce cycle times. The rationalization of our global footprint will also further leverage the benefits of our integrated offering. We aim tocontinuously align our operations with activity levels, while preserving our core capacity in order to deliver current projects in backlog andfuture order activity.
We have experienced renewed operator confidence in advancing subsea activity as a result of the improved economic outlook, lower marketvolatility and higher oil price. With crude now trending back above $50 per barrel, the opportunity set of large subsea projects to besanctioned over the next 24 months has expanded.
FEED activity is also improving, with solid momentum experienced in the second half of 2020. FEED activity in the current year is expectedto return to the more robust levels seen in 2019, which further supports our view of a sustainable recovery for deepwater. We expect at least60% of the projects undergoing studies in 2021 to include an iEPCI solution, many of which could be directly awarded to our Company uponreaching final investment decision.
TechnipFMC is increasingly less dependent on larger, publicly tendered projects.• We anticipate that an increasing share of our inbound orders will result from projects that will be direct awarded to our Company,
many of which come from our alliance partners;
• We anticipate higher activity in subsea services, with the industry’s largest installed base; and
54

• We expect a higher mix of iEPCI project awards, demonstrating strong geographic diversity and new adopters of our unique,integrated approach to subsea development.
For 2021, we believe that Subsea inbound orders will meet or exceed the $4 billion achieved in 2020. We expect Brazil to be the most activeregion of the world for new project orders, driven by continued investment in the pre-salt field discoveries. We see additional market growthpotential coming from the North Sea, Asia Pacific and Africa. The strong front end activity we are experiencing today should further supportproject award momentum into 2022.
Surface Technologies – Surface Technologies’ performance is typically driven by variations in global drilling activity, creating a dynamicenvironment. Operating results can be further impacted by stimulation activity and the completions intensity of shale applications in theAmericas.
The North America shale market is sensitive to oil price fluctuations. The average rig count declined by just over 50 percent in 2020, withdrilling and completion spending estimated to have declined by a similar amount. North America activity improved over the second half of theyear as the rig count increased following the rising oil price. The rig count exited 2020 below prior year-end levels but has experienced furtherimprovement in the current year.
In 2021, we expect our completions-related revenue to outperform the overall market, driven by increased market adoption of iComplete –our fully integrated, digitally-enabled pressure control system. iComplete has already achieved significant market penetration since itsintroduction in the third quarter of 2020, with 10 customers utilizing the new integrated system.
Despite the sequential improvement in market activity, full year revenue for North America is expected to be flat to down modestly versus2020.
Drilling activity in international markets is less cyclical than North America as most activity is driven by national oil companies, which tend tomaintain a longer term view that exhibits less variability in capital spend. Additionally, we continue to benefit from our exposure to the MiddleEast and Asia Pacific, both of which are being supported by strength in gas-related activity. The average rig count in these two regionsdeclined by a more modest 17 percent in 2020 versus the prior year.
International revenue has been gaining significance in our total segment revenue, representing over 60 percent in 2020. We expect a gradualand steady recovery in well count in 2021 to drive modest international market growth, with spending increases led by national oil companies,particularly in the Middle East.
Our unique capabilities in the international markets, which demand higher specification equipment, global services and local content, providea platform for us to extend our leadership positions. We remain levered to these more resilient markets where we expect to sourceapproximately 65% of our full year revenue in 2021.
55

CONSOLIDATED RESULTS OF OPERATIONS
This section of this Form 10-K generally discusses 2020 and 2019 items and year-to-year comparisons between 2020 and 2019. Discussionsof 2018 items and year-to-year comparisons between 2019 and 2018 that are not included in this Form 10-K can be found in “Management’sDiscussion and Analysis of Financial Condition and Results of Operations” in Part II, Item 7 of our Annual Report on Form 10-K for the yearended December 31, 2019.
Year Ended December 31, Change(In millions, except percentages) 2020 2019 2018 2020 vs. 2019 2019 vs. 2018Revenue $ 13,050.6 $ 13,409.1 $ 12,552.9 $ (358.5) (2.7)% $ 856.2 6.8 %
Costs and expensesCost of sales 11,209.4 10,950.7 10,273.0 258.7 2.4 % 677.7 6.6 %Selling, general and administrative expense 1,066.2 1,228.1 1,140.6 (161.9) (13.2)% 87.5 7.7 %Research and development expense 119.8 162.9 189.2 (43.1) (26.5)% (26.3) (13.9)%Impairment, restructuring and other expense 3,501.3 2,490.8 1,831.2 1,010.5 40.6 % 659.6 36.0 %Separation costs 39.5 72.1 — (32.6) (45.2)% 72.1 n/aMerger transaction and integration costs — 31.2 36.5 (31.2) (100.0)% (5.3) (14.5)%
Total costs and expenses 15,936.2 14,935.8 13,470.5 1,000.4 6.7 % 1,465.3 10.9 %
Other income (expense), net 31.1 (220.7) (323.9) 251.8 114.1 % 103.2 31.9 %Income from equity affiliates 63.0 62.9 114.3 0.1 0.2 % (51.4) (45.0)%Net interest expense (293.0) (451.3) (360.9) 158.3 35.1 % (90.4) (25.0)%
Loss before income taxes (3,084.5) (2,135.8) (1,488.1) (948.7) (44.4)% (647.7) (43.5)%Provision for income taxes 153.4 276.3 422.7 (122.9) (44.5)% (146.4) (34.6)%
Net loss (3,237.9) (2,412.1) (1,910.8) (825.8) (34.2)% (501.3) (26.2)%Net profit attributable to non-controlling interests (49.7) (3.1) (10.8) (46.6) (1,503.2)% 7.7 71.3 %
Net loss attributable to TechnipFMC plc $ (3,287.6) $ (2,415.2) $ (1,921.6) $ (872.4) (36.1)% $ (493.6) (25.7)%
Results of Operations in 2020 Compared to 2019
Revenue
Revenue decreased by $358.5 million in 2020 compared to 2019. Subsea revenue decreased year-over-year primarily due to decreasedproject activity in the Gulf of Mexico and the North Sea. Increased revenue in Technip Energies was primarily driven by the continued ramp-up of Arctic LNG 2, increased activity on downstream projects and in the Process Technology business, which more than offset the decline inrevenue from Yamal LNG. Technip Energies revenue was also favorably impacted by the result of a litigation settlement. SurfaceTechnologies revenue decreased, primarily as a result of the significant decline in operator activity in North America, with partial positiveimpact from order intake timing in international markets. In addition, our consolidated revenues were negatively impacted by operationalchallenges associated with the COVID-19 related disruptions.
Gross Profit
Gross profit (revenue less cost of sales) as a percentage of sales decreased to 14.1% in 2020 compared to 18.3% in 2019. Subsea grossprofit decreased due to a more competitively priced backlog and the negative operational impacts related to COVID-19. Gross profit declinedin Technip Energies due in large part to a reduced contribution from Yamal LNG as the project reached physical completion last year and isprogressing through the warranty phase. Surface Technologies gross profit was negatively impacted by the year-over-year decline in NorthAmerican drilling and completions activity, which was partially offset by the lower costs from our accelerated cost reduction initiativeimplemented during 2020.
56

Selling, General and Administrative Expense
Selling, general and administrative expense decreased by $161.9 million year-over-year, primarily as a result of decreased corporateexpenses. During the beginning of 2020, in response to the deteriorated market environment, driven in part by the COVID-19 pandemic, weimplemented a series of cost reduction initiatives that resulted in significant savings and extended to all business segments and supportfunctions.
Impairment, Restructuring and Other Expenses
We incurred $3,501.3 million of restructuring, impairment and other expenses in 2020. These charges primarily included $3,083.4 million ofgoodwill impairment, $204.0 million of long-lived assets impairment, $101.8 million of COVID-19 related expenses, and $112.1 million forrestructuring and severance expenses. COVID-19 related expenses represent unplanned, one-off, incremental and non-recoverable costsincurred solely as a result of the COVID-19 pandemic situation, which would not have been incurred otherwise. COVID-19 related expensesprimarily included (a) employee payroll and travel, operational disruptions associated with quarantining, personnel travel restrictions to jobsites, and shutdown of manufacturing plants and sites; (b) supply chain and related expediting costs of accelerated shipments for previouslyordered and undelivered products; (c) costs associated with implementing additional information technology to support remote workingenvironments; and (d) facilities-related expenses to ensure safe working environments. COVID-19 related expenses exclude costsassociated with project and/or operational inefficiencies, time delays in performance delivery, indirect costs increases and potentiallyreimbursable or recoverable expenses. During 2019, we incurred $2,490.8 million of restructuring, impairment and other expenses, whichincluded $1,988.7 million and $495.4 million of goodwill and long-lived assets impairments, respectively. See Note 19 to our consolidatedfinancial statements for further details.
Separation costs
During the year ended December 31, 2020, we incurred $39.5 million of separation costs associated with the preparation of the separationtransaction. During the first quarter of 2020, we incurred $27.1 million of separation costs associated with the separation transaction, whichwas postponed due to the COVID-19 pandemic, the significant decline in commodity prices, and the heightened volatility in global equitymarkets. During the fourth quarter of 2020, we incurred $12.4 million of separation costs associated with the January 2021 announcement ofthe resumption of activities toward the separation of Technip Energies. During the year ended December 31, 2019, we incurred $72.1 millionof separation costs associated with the separation transaction. See Note 3 to our consolidated financial statements for further details.
Merger Transaction and Integration Costs
Prior to the initial announcement of the planned separation transaction in August 2019, we incurred merger transaction and integration costsof $31.2 million during the first half of 2019 relating to the continuation of the integration activities following the Merger. No such costs wereincurred subsequently in 2019 or in 2020.
Other Income (Expense), Net
Other income (expense), net, primarily reflects foreign currency gains and losses, including gains and losses associated with theremeasurement of net cash positions, gains and losses on sales of property, plant and equipment and other non-operating gains and losses.During 2020, we recognized $31.1 million of other income, which primarily included $23.1 million of gains on sales of property, plant andequipment and other assets. During 2019, we recognized $220.7 million of other expenses, which primarily included $146.9 million of netforeign exchange losses and $54.6 million of legal provision, net of settlements. The change in foreign exchange losses is primarily due to areduction in foreign exchange losses from unhedged currencies, more favorable hedging costs, and the effects of a weakened U.S. dollar onnaturally hedged projects.
Net Interest Expense
Net interest expense decreased $158.3 million in 2020 compared to 2019, primarily due to the change in the fair value of the redeemablefinancial liability. We revalued the mandatorily redeemable financial liability to reflect current expectations about the obligation andrecognized a charge of $202.0 million, as compared to $423.1 million recognized in 2019. See Note 24 to our consolidated financialstatements for further details. Net interest expense, excluding the fair value measurement of the mandatorily redeemable financial liabilityand including interest income decreased by $62.8 million during 2020.
57

Provision for Income Taxes
Our provision for income taxes for 2020 and 2019 reflected effective tax rates of (5.0)% and (12.9)%, respectively. The year-over-yearchange in the effective tax rate was primarily due to the impact of nondeductible goodwill impairments, increase in adjustment on prior yeartaxes, offset in part by the amount of tax expense associated with movements in valuation allowances.
Our effective tax rate can fluctuate depending on our country mix of earnings, which may change based on changes in the jurisdictions inwhich we operate.
OPERATING RESULTS OF BUSINESS SEGMENTS
Segment operating profit is defined as total segment revenue less segment operating expenses. Certain items have been excluded incomputing segment operating profit and are included in corporate items. See Note 7 to our consolidated financial statements for furtherdetails.
We report our results of operations in U.S. dollars; however, our earnings are generated in various currencies worldwide. In order to provideworldwide consolidated results, the earnings of subsidiaries functioning in their local currencies are translated into U.S. dollars based uponthe average exchange rate during the period. While the U.S. dollar results reported reflect the actual economics of the period reported upon,the variances from prior periods include the impact of translating earnings at different rates.
Subsea
Year Ended December 31, Favorable/(Unfavorable)(In millions, except %) 2020 2019 2018 2020 vs. 2019 2019 vs. 2018Revenue $ 5,471.4 $ 5,523.0 $ 4,840.0 $ (51.6) (0.9) % $ 683.0 14.1 %Operating loss $ (2,815.5) $ (1,447.7) $ (1,529.5) $ (1,367.8) (94.5) % $ 81.8 5.3 %
Operating loss as a percentage of revenue (51.5)% (26.2)% (31.6)% (25.3) pts. 5.4 pts.
Subsea revenue decreased $51.6 million, or (0.9)% year-over-year, primarily due to operational challenges driven by the COVID-19pandemic. However, despite these challenges and related disruptions, we continued to demonstrate strong execution of our backlog.
Subsea operating loss is primarily due to significant impairment and other non-recurring charges. The operating loss included $2,957.5million of goodwill and long-lived assets impairments, restructuring and other charges and COVID-19 related expenses compared to $1,752.2million in 2019. Non-recurring charges incurred related to COVID-19 disruptions during 2020 were $50.1 million. See Note 19 to ourconsolidated financial statements for further details.
Refer to ‘Non-GAAP Measures’ for more information regarding our segment operating results.
Technip Energies
Year Ended December 31, Favorable/(Unfavorable)(In millions, except %) 2020 2019 2018 2020 vs. 2019 2019 vs. 2018Revenue $ 6,520.0 $ 6,268.8 $ 6,120.7 $ 251.2 4.0 % $ 148.1 2.4 %Operating profit $ 683.6 $ 959.6 $ 824.0 $ (276.0) (28.8) % $ 135.6 16.5 %
Operating profit as a percentage of revenue 10.5 % 15.3 % 13.5 % (4.8) pts. 1.8 pts.
Technip Energies revenue increased $251.2 million year-over-year. Revenue benefited from the continued ramp-up of Arctic LNG 2 andhigher activity on downstream projects in Africa, North America and India, which more than offset the decline in revenue from Yamal LNG.COVID-19 related operational efficiencies and business disruption also impeded revenue growth during 2020. Revenue during the periodbenefited from a $113.2 million litigation settlement.
58

Operating profit decreased year-over-year, primarily due to a reduced contribution from Yamal LNG and lower margin realization on earlystage projects, including Arctic LNG 2. Project execution remained strong across the portfolio. Non-recurring charges incurred related toCOVID-19 disruptions during the period were $44.0 million.
Refer to ‘Non-GAAP Measures’ for more information regarding our segment operating results. Subsequent to the Spin-off, we operate undertwo reporting segments: Subsea and Surface Technologies, for further details see Note 3 to our consolidated financial statements.
Surface Technologies
Year Ended December 31, Favorable/(Unfavorable)(In millions, except %) 2020 2019 2018 2020 vs. 2019 2019 vs. 2018Revenue $ 1,059.2 $ 1,617.3 $ 1,592.2 $ (558.1) (34.5)% $ 25.1 1.6 %Operating profit (loss) $ (429.3) $ (656.1) $ 172.8 $ 226.8 34.6% $ (828.9) (479.7) %
Operating profit (loss) as a percentage of revenue (40.5)% (40.6)% 10.9 % 0.1 pts. (51.5) pts.
Surface Technologies revenue decreased $558.1 million, or (34.5)% year-over-year, primarily driven by the significant reduction in operatoractivity in North America. Revenue outside of North America displayed resilience, with a more modest decline due to reduced activity levels.Nearly 64% of total segment revenue was generated outside of North America in the period.
Surface Technologies operating loss was primarily due to impairment and other non-recurring charges. The operating loss included $440.2million of goodwill and long-lived assets impairments, restructuring and other charges and COVID-19 related expenses compared to $704.2million incurred in 2019. Operating loss was also negatively impacted by the reduced demand in North America driven by the significantdecline in rig count and completions-related activity, which was partially offset by lower costs from our accelerated cost reduction actionsinitiated in the first quarter of 2020. Non-recurring charges incurred related to COVID-19 disruptions during the period were $7.7 million. SeeNote 19 to our consolidated financial statements for further details.
Refer to ‘Non-GAAP Measures’ for more information regarding our segment operating results.
Corporate Items
Year Ended December 31, Favorable/(Unfavorable)(In millions, except %) 2020 2019 2018 2020 vs. 2019 2019 vs. 2018Corporate expense $ (201.5) $ (393.4) $ (478.0) $ 191.9 49% $ 84.6 18%
Corporate expenses decreased by $191.9 million during 2020. The reduction in corporate expenses is primarily due to $54.6 milliondecrease in legal provision, net of settlements; $38.6 million decrease due to lower activity and the impact of cost reductions implemented in2020; $32.7 million decrease in separation costs; $31.2 million decrease in integration expenses and $16.6 million decrease in restructuringand impairment expenses.
Refer to ‘Non-GAAP Measures’ for more information regarding our segment operating results.
59

NON-GAAP MEASURES
In addition to financial results determined in accordance with U.S. generally accepted accounting principles (“GAAP”), we provide non-GAAPfinancial measures (as defined in Item 10 of Regulation S-K of the Securities Exchange Act of 1934, as amended) below:
– Net income (loss), excluding charges and credits, as well as measures derived from it (excluding charges and credits;
– Income (loss) before net interest expense and income taxes, excluding charges and credits (“Adjusted Operating profit”);
– Adjusted diluted earnings per share attributable to TechnipFMC plc;
– Depreciation and amortization, excluding charges and credits (“Adjusted Depreciation and amortization”);
– Earnings before net interest expense, income taxes, depreciation and amortization, excluding charges and credits (“AdjustedEBITDA”);
– Corporate expenses excluding charges and credits;
– Net cash; and
– Free cash flow.
Management believes that the exclusion of charges and credits from these financial measures enables investors and management to moreeffectively evaluate our operations and consolidated results of operations period-over-period, and to identify operating trends that couldotherwise be masked or misleading to both investors and management by the excluded items. These measures are also used bymanagement as performance measures in determining certain incentive compensation. The foregoing non-GAAP financial measures shouldbe considered in addition to, not as a substitute for or superior to, other measures of financial performance prepared in accordance withGAAP.
The following is a reconciliation of the most comparable financial measures under GAAP to the non-GAAP financial measures.
60

Year EndedDecember 31, 2020
Net income (loss)attributable to
TechnipFMC plc
Net income (loss)attributable to non-
controllinginterests
Provision forincome taxes
Net interestexpense
Income (loss)before net
interest expenseand income taxes(Operating profit)
Depreciation andamortization
Earnings beforenet interest
expense, incometaxes,
depreciation andamortization
(EBITDA)TechnipFMC plc, as reported $ (3,287.6) $ 49.7 $ 153.4 $ 293.0 $ (2,791.5) $ 447.2 $ (2,344.3)
Charges and (credits):Impairment and other charges 3,271.0 — 16.4 — 3,287.4 — 3,287.4 Restructuring and other charges 96.1 — 16.0 — 112.1 — 112.1 Direct COVID-19 expenses 83.7 — 18.1 — 101.8 — 101.8 Litigation settlement (113.2) — — — (113.2) — (113.2)Separation costs 36.3 — 3.2 — 39.5 — 39.5 Purchase price accounting adjustment 6.5 — 2.0 — 8.5 (8.5) — Valuation allowance (3.5) — 3.5 — — — —
Adjusted financial measures $ 89.3 $ 49.7 $ 212.6 $ 293.0 $ 644.6 $ 438.7 $ 1,083.3
Diluted earnings (loss) per share attributable toTechnipFMC plc, as reported $ (7.33)Adjusted diluted earnings per share attributable toTechnipFMC plc $ 0.20
Year EndedDecember 31, 2019
Net income (loss)attributable to
TechnipFMC plc
Net income (loss)attributable to non-
controllinginterests
Provision forincome taxes
Net interestexpense
Income (loss)before net
interest expenseand income taxes(Operating profit)
Depreciation andamortization
Earnings beforenet interest
expense, incometaxes,
depreciation andamortization
(EBITDA)TechnipFMC plc, as reported $ (2,415.2) $ (3.1) $ 276.3 $ (451.3) $ (1,684.5) $ 509.6 $ (1,174.9)
Charges and (credits):Impairment and other charges 2,364.2 — 119.9 — 2,484.1 — 2,484.1 Restructuring and other charges 27.7 — 9.3 — 37.0 — 37.0 Business combination transaction andintegration costs 23.1 — 8.1 — 31.2 — 31.2 Separation costs 54.2 — 17.9 — 72.1 — 72.1 Reorganization 17.2 — 8.1 — 25.3 — 25.3 Legal provision, net 46.3 — 8.3 — 54.6 — 54.6 Purchase price accounting adjustment 26.0 — 8.0 — 34.0 (34.0) — Valuation allowance 187.0 — (187.0) — — — —
Adjusted financial measures $ 330.5 $ 3.1 $ 268.9 $ 451.3 $ 1,053.8 $ 475.6 $ 1,529.4
Diluted earnings per share attributable toTechnipFMC plc, as reported $ (5.39)Adjusted diluted earnings per share attributable toTechnipFMC plc $ 0.74
61

Year EndedDecember 31, 2020
Subsea Technip EnergiesSurface
TechnologiesCorporateExpense
ForeignExchange, net Total
Revenue $ 5,471.4 $ 6,520.0 $ 1,059.2 $ — $ — $ 13,050.6
Operating profit (loss), as reported (pre-tax) $ (2,815.5) $ 683.6 $ (429.3) $ (201.5) $ (28.8) $ (2,791.5)
Charges and (credits):Impairment and other charges 2,854.5 10.3 419.3 3.3 — 3,287.4 Restructuring and other charges* 52.9 39.3 13.2 6.7 — 112.1 Direct COVID-19 expenses 50.1 44.0 7.7 — — 101.8 Litigation settlement — (113.2) — — — (113.2)Separation costs — — — 39.5 — 39.5 Purchase price accounting adjustments 8.5 — — — — 8.5
Subtotal 2,966.0 (19.6) 440.2 49.5 — 3,436.1
Adjusted Operating profit (loss) 150.5 664.0 10.9 (152.0) (28.8) 644.6
Adjusted Depreciation and amortization 316.4 34.2 70.1 18.0 — 438.7
Adjusted EBITDA $ 466.9 $ 698.2 $ 81.0 $ (134.0) $ (28.8) $ 1,083.3
Operating profit margin (51.5)% 10.5 % (40.5)% (21.4)%
Adjusted Operating profit margin 2.8 % 10.2 % 1.0 % 4.9 %
Adjusted EBITDA margin 8.5 % 10.7 % 7.6 % 8.3 %
*On December 30, 2019, we completed the acquisition of the remaining 50% of Technip Odebrecht PLSV CV. A $7.3 million gain was recorded within restructuring and othercharges in the Subsea segment during 2020.
62

Year EndedDecember 31, 2019
Subsea Technip EnergiesSurface
TechnologiesCorporateExpense
ForeignExchange, net Total
Revenue $ 5,523.0 $ 6,268.8 $ 1,617.3 $ — $ — $ 13,409.1
Operating profit (loss), as reported (pre-tax) $ (1,447.7) $ 959.6 $ (656.1) $ (393.4) $ (146.9) $ (1,684.5)
Charges and (credits):Impairment and other charges* 1,798.6 — 685.5 — — 2,484.1 Restructuring and other charges* (46.4) 17.0 39.8 26.6 — 37.0 Business combination transaction and integration costs — — — 31.2 — 31.2 Separation costs — — — 72.1 — 72.1 Reorganization — 25.3 — — — 25.3 Legal provision, net — — — 54.6 — 54.6 Purchase price accounting adjustments 34.0 — — — — 34.0
Subtotal 1,786.2 42.3 725.3 184.5 — 2,738.3
Adjusted Operating profit (loss) 338.5 1,001.9 69.2 (208.9) (146.9) 1,053.8
Adjusted Depreciation and amortization 311.6 38.7 107.9 17.4 — 475.6
Adjusted EBITDA $ 650.1 $ 1,040.6 $ 177.1 $ (191.5) $ (146.9) $ 1,529.4
Operating profit margin (26.2)% 15.3 % (40.6)% (12.6)%
Adjusted Operating profit margin 6.1 % 16.0 % 4.3 % 7.9 %
Adjusted EBITDA margin 11.8 % 16.6 % 11.0 % 11.4 %
*On December 30, 2019, we completed the acquisition of the remaining 50 percent of Technip Odebrecht PLSV CV, which resulted in a net loss of $0.9 million that was recordedin the Subsea segment. The net loss was comprised of an impairment charge of $84.2 million included within impairment and other charges and a gain on bargain purchase of$83.3 million included within restructuring and other charges.
63

INBOUND ORDERS AND ORDER BACKLOG
Inbound orders - Inbound orders represent the estimated sales value of confirmed customer orders received during the reporting period. Thesignificant decline in commodity prices, due in part to the lower demand resulting from COVID-19 contributed to the decrease in the inboundorders during 2020.
Inbound Orders
Year Ended December 31,(In millions) 2020 2019Subsea $ 4,003.0 $ 7,992.6 Technip Energies 5,001.3 13,080.5 Surface Technologies 1,061.2 1,619.9
Total inbound orders $ 10,065.5 $ 22,693.0
Order backlog - Order backlog is calculated as the estimated sales value of unfilled, confirmed customer orders at the reporting date.Backlog reflects the current expectations for the timing of project execution. The scheduling of some future work included in our orderbacklog has been impacted by COVID-19 related disruptions and remains subject to future adjustment. See Note 6 to our consolidatedfinancial statements for further details.
Order BacklogDecember 31,
(In millions) 2020 2019Subsea $ 6,876.0 $ 8,479.8 Technip Energies 14,098.7 15,298.1 Surface Technologies 413.5 473.2
Total order backlog $ 21,388.2 $ 24,251.1
Subsea - Order backlog for Subsea as of December 31, 2020, decreased by $1.6 billion from December 31, 2019. Subsea backlog of $6.9billion as of December 31, 2020, was composed of various subsea projects, including Total Mozambique LNG; Eni Coral and Merakes;Petrobras Mero I and Mero II; Energean Karish; ExxonMobil Payara; Reliance MJ-1; Equinor Johan Sverdrup Phase 2; Husky West WhiteRose; BP Platina; Chevron Gorgon Stage 2; and Woodside Pyxis and Lambert Deep.
Technip Energies - Technip Energies order backlog as of December 31, 2020, decreased by $1.2 billion compared to December 31, 2019.Technip Energies backlog of $14.1 billion as of December 31, 2020 was composed of various projects, including Arctic LNG 2, Yamal LNG;Midor refinery expansion; BP Tortue FPSO; Long Son Petrochemicals; ExxonMobil Beaumont refinery expansion; HURL fertilizer plants;Petronas Kasawari; Energean Karish; Neste bio-diesel expansion; and Motor Oil Hellas New Naphtha Complex. Subsequent to the Spin-off,we will operate under two reporting segments: Subsea and Surface Technologies, for further details see Note 3 to our consolidated financialstatements.
Surface Technologies - Order backlog for Surface Technologies as of December 31, 2020, decreased by $59.7 million compared toDecember 31, 2019, mainly driven by the transfer of the Loading Systems business unit from Surface Technologies to Technip Energies.Given the short-cycle nature of the business, most orders are quickly converted into sales revenue; longer contracts are typically convertedwithin twelve months.
Non-consolidated backlog - Non-consolidated backlog reflects the proportional share of backlog related to joint ventures that is notconsolidated due to our minority ownership position.
Non-consolidatedorder backlog
(In millions)December 31,
2020Subsea $ 640.2 Technip Energies 1,890.3
Total order backlog $ 2,530.5
64

LIQUIDITY AND CAPITAL RESOURCES
Most of our cash is managed centrally and flows through centralized bank accounts controlled and maintained by TechnipFMC globally andin many operating jurisdictions to best meet the liquidity needs of our global operations.Net Cash - Net cash, is a non-GAAP financial measure reflecting cash and cash equivalents, net of debt. Management uses this non-GAAPfinancial measure to evaluate our capital structure and financial leverage. We believe net cash is a meaningful financial measure that mayassist investors in understanding our financial condition and recognizing underlying trends in our capital structure. Net cash should not beconsidered an alternative to, or more meaningful than, cash and cash equivalents as determined in accordance with GAAP or as an indicatorof our operating performance or liquidity.
The following table provides a reconciliation of our cash and cash equivalents to net cash, utilizing details of classifications from ourconsolidated balance sheets.
(In millions) December 31, 2020 December 31, 2019Cash and cash equivalents $ 4,807.8 $ 5,190.2 Short-term debt and current portion of long-term debt (636.2) (495.4)Long-term debt, less current portion (3,317.7) (3,980.0)
Net cash $ 853.9 $ 714.8
Cash Flows
Cash flows for the years ended December 31, 2020, 2019 and 2018 were as follows:
Year Ended December 31,(In millions) 2020 2019 2018Cash provided (required) by operating activities $ 656.9 $ 848.5 $ (185.4)Cash required by investing activities (180.6) (419.8) (460.2)Cash required by financing activities (1,082.2) (784.4) (444.8)Effect of exchange rate changes on cash and cash equivalents 223.5 5.9 (107.0)
Decrease in cash and cash equivalents $ (382.4) $ (349.8) $ (1,197.4)
Working capital $ 54.0 $ (82.2) $ (759.0)
Free cash flow $ 365.1 $ 394.1 $ (553.5)
Operating cash flows - During 2020, we generated $656.9 million in cash flows from operating activities as compared to $848.5 milliongenerated in 2019, resulting in a $191.6 million decrease compared to 2019. The decrease in operating cash flows is primarily driven by thedecrease in cash generated by our operations during the year due to the overall decline in activity.
Investing cash flows - Investing activities used $180.6 million and $419.8 million of cash in 2020 and 2019, respectively. The decrease incash used by investing activities was due primarily to decreased capital expenditures, decreased payments to acquire debt securities andincreased proceeds from sale of assets and debt securities during 2020. In 2019, we purchased a deepwater dive support vessel, DeepDiscoverer for $116.8 million, that was subsequently funded through a sale-leaseback transaction.
Financing cash flows - Financing activities used $1,082.2 million and $784.4 million in 2020 and 2019, respectively. The increase of $297.8million in cash required for financing activities was due primarily to the increased debt pay down activity during 2020 of $883.6 million,partially offset by $338.6 million reduction in settlements of mandatorily redeemable financial liability and our efforts and commitment topreserve cash, which included reduction in cash dividends of $173.6 million and reduction in share repurchases of $92.7 million .
Working capital represents total changes in operating current assets and liabilities.
65

Free cash flow is defined as operating cash flows less capital expenditures. The following table reconciles cash provided by operatingactivities, which is directly comparable financial measure determined in accordance with GAAP, to free cash flow (non-GAAP measure).
Year Ended December 31,(In millions) 2020 2019 2018Cash provided (required) by operating activities $ 656.9 $ 848.5 $ (185.4)Capital expenditures (291.8) (454.4) (368.1)
Free cash flow $ 365.1 $ 394.1 $ (553.5)
Debt and Liquidity
Significant Funding and Liquidity Activities - During 2020, we completed the following transactions in order to enhance our total liquidityposition:
• Repaid $233.9 million of 5.00% 2010 private placement notes;• Repaid the remaining outstanding balance of $190.0 million of the term loan assumed in connection with the acquisition of the
remaining 50% interest in TOP CV.• Issued €200 million aggregate principal amount of 4.500% Private Placement Notes due June 30, 2025. Within three months of the
effective date of the Spin-off of Technip Energies, if there is a downgrade by a nationally recognized rating agency of the corporaterating of TechnipFMC from an investment grade to a non-investment grade rating or a withdrawal of any such rating, the interest rateapplicable to the Private Placement Notes will be increased to 5.75%;
• Entered into a new, six-month €500 million senior unsecured revolving credit facility agreement, which may be extended for twoadditional three-month periods (the “Euro Facility”); and
• Entered into the Bank of England’s COVID Corporate Financing Facility program (the “CCFF Program”), which allows us to issue upto £600 million of unsecured commercial paper notes.
Total borrowings as of December 31, 2020 and 2019 were as follows:
(In millions) December 31,2020 2019
Commercial paper $ 1,525.9 $ 1,967.0 Synthetic bonds due 2021 551.2 492.9 3.45% Senior Notes due 2022 500.0 500.0 5.00% Notes due 2020 — 224.6 3.40% Notes due 2022 184.0 168.5 3.15% Notes due 2023 159.5 146.0 3.15% Notes due 2023 153.4 140.4 4.50% Notes due 2025 245.4 — 4.00% Notes due 2027 92.0 84.2 4.00% Notes due 2032 122.7 112.3 3.75% Notes due 2033 122.7 112.3 Bank borrowings and Other 309.9 536.3 Unamortized debt issuance costs and discounts (12.8) (9.1)
Total borrowings $ 3,953.9 $ 4,475.4
66

Credit Facilities - The following is a summary of our credit facilities as of December 31, 2020:
(In millions)Description Amount
DebtOutstanding
CommercialPaper
Outstanding (a)
Lettersof Credit
UnusedCapacity Maturity
Revolving credit facility $ 2,500.0 $ — $ 708.0 $ — $ 1,792.0 January 2023CCFF Program £ 600.0 £ — £ 600.0 £ — £ — March 2021Euro Facility € 500.0 € — € — € — € 500.0 February 2021Bilateral credit facility € 100.0 € — € — € — € 100.0 May 2021
(a) Under our commercial paper program, we have the ability to access up to $1.5 billion and €1.0 billion of financing through our commercial paper dealers. Our availablecapacity under our revolving credit facility is reduced by any outstanding commercial paper.
Committed credit available under our revolving credit facilities provides the ability to issue our commercial paper obligations on a long-termbasis. We had $708.0 million of commercial paper issued under our facilities as of December 31, 2020. In addition, we had $817.9 million ofNotes outstanding under the CCFF Program. When we have both the ability and intent to refinance certain obligations on a long-term basis,the obligations are classified as long-term, as such, the commercial paper borrowings were classified as long-term debt in our consolidatedbalance sheet as of December 31, 2020.
On June 12, 2020, we entered into Amendment No. 1 to the Facility Agreement and into an Amendment and Restatement Agreement to ourEuro Facility. The amendments, which are effective through the respective expirations of the Facility Agreement and Euro Facility, permit usto include the gross book value of $3.2 billion of goodwill (fully impaired in the quarter ended March 31, 2020) in the calculation ofconsolidated net worth, which is used in the calculation of our quarterly compliance with the total capitalization ratio under the FacilityAgreement and Euro Facility.
The amended and restated Facility Agreement and Euro Facility contain usual and customary covenants, representations and warranties,and events of default for credit facilities of this type, including financial covenants requiring that our total capitalization ratio not exceed 60%at the end of any financial quarter. The Facility Agreement and Euro Facility also contain covenants restricting our ability and our subsidiaries’ability to incur additional liens and indebtedness, enter into asset sales, or make certain investments.
As of December 31, 2020, we were in compliance with all restrictive covenants under our credit facilities.
Refer to Note 24 to our consolidated financial statements included in Part II, Item 8 of this Annual Report on Form 10-K for further informationrelated to credit risk.
Credit Ratings - As of February 25, 2021, our credit ratings with Standard and Poor’s (S&P) are BB+ for our long-term secured debt and B forcommercial paper program. Our credit ratings with Moody’s are Ba1 for our long-term secured debt.
Credit Risk Analysis
For the purposes of mitigating the effect of the changes in exchange rates, we hold derivative financial instruments. Valuations of derivativeassets and liabilities reflect the fair value of the instruments, including the values associated with counterparty risk. These values must alsotake into account our credit standing, thus including the valuation of the derivative instrument and the value of the net credit differentialbetween the counterparties to the derivative contract. Adjustments to our derivative assets and liabilities related to credit risk were notmaterial for any period presented.
The income approach was used as the valuation technique to measure the fair value of foreign currency derivative instruments on a recurringbasis. This approach calculates the present value of the future cash flow by measuring the change from the derivative contract rate and thepublished market indicative currency rate, multiplied by the contract notional values. Credit risk is then incorporated by reducing thederivative’s fair value in asset positions by the result of multiplying the present value of the portfolio by the counterparty’s published creditspread. Portfolios in a liability position are adjusted by the same calculation; however, a spread representing our credit spread is used.Our credit spread, and the credit spread of other counterparties not publicly available, are approximated using the spread of similarcompanies in the same industry, of similar size, and with the same credit rating. See Notes 24 and 25 to our consolidated financialstatements for further details.
67

At this time, we have no credit-risk-related contingent features in our agreements with the financial institutions that would require us to postcollateral for derivative positions in a liability position.
Financial Position Outlook
Overview
We are committed to a strong balance sheet and ample liquidity that that will enable us to avoid distress in cyclical troughs and accesscapital markets throughout the cycle. We believe our liquidity has and continues to exceed the level required to achieve this goal.
Our objective in financing our business is to maintain sufficient liquidity, adequate financial resources and financial flexibility in order to fundthe requirements of our business. Our capital expenditures can be adjusted and managed to match market demand and activity levels.Based on current market conditions and our future expectations, our capital expenditures for 2021 are estimated to be approximately $250.0million. Projected capital expenditures do not include any contingent capital that may be needed to respond to a contract award.
Spin-off
In connection with the Spin-off, we executed a series of refinancing transactions, in order to provide a capital structure with sufficient cashresources to support future operating and investment plans.
Debt Issuance
On February 16, 2021, we entered into Revolving Credit Facility that provides for aggregate revolving capacity of up to $1.0 billion.Availability of borrowings under the Revolving Credit Facility is reduced by any outstanding letters of credit issued against the facility. AtFebruary 25, 2021, there were no outstanding letters of credit and availability of borrowings under the Revolving Credit Facility was $800million.
On January 29, 2021, we issued $1.0 billion of 6.5% senior notes due 2026 (the “2021 Notes”). The interest on the 2021 Notes is paid semi-annually on February 1 and August 1 of each year, beginning on August 1, 2021. The 2021 Notes are senior unsecured obligations and areguaranteed on a senior unsecured basis by substantially all of our wholly-owned U.S. subsidiaries and non-U.S. subsidiaries in Brazil, theNetherlands, Norway, Singapore and the United Kingdom.
Repayment of Debt
The proceeds from the debt issuance described above along with the available cash on hand were used to fund:
• The repayment of all $522.8 million of the outstanding Synthetic Convertible Bonds that matured in January 2021.
• The repayment of all $500.0 million aggregate principal amount of outstanding 3.45% Senior Notes due 2022.
• The termination of the $2.5 billion senior unsecured revolving credit facility we entered into on January 17, 2017; the termination ofthe €500.0 million Euro Facility and the CCFF Program we entered into on May 19, 2020. In connection with the termination of thesecredit facilities, we repaid most of the outstanding commercial paper borrowings, which were $1,525.9 million as of December 31,2020.
We will continue to be strategically focused on cash and liquidity preservation. Subsequent to the completion of the Spin-off, we own 49.9%of the outstanding shares of Technip Energies. The ownership percentage will be further reduced by the sale of shares to BPI pursuant to theShare Purchase Agreement, for further details see section “The Spin-off” in “Item 1. Business.” We intend to conduct an orderly sale of ourstake in Technip Energies over time and will use the proceeds from future sales to further reduce our net leverage.
68

CONTRACTUAL OBLIGATIONS
The following is a summary of our contractual obligations as of December 31, 2020:
Payments Due by Period
(In millions)Total
paymentsLess than
1 year1-3
years3-5
yearsAfter 5years
Debt $ 3,953.9 $ 636.2 $ 2,589.1 $ 294.0 $ 434.6 Interest on debt 242.3 58.1 69.3 42.9 72.0 Operating leases 1,128.0 131.2 328.6 196.8 471.4 Purchase obligations 5,709.4 4,587.5 1,008.9 112.0 1.0 Pension and other post-retirement benefits 19.0 19.0 — — — Unrecognized tax benefits 56.1 4.2 4.2 47.6 0.1 Other contractual obligations 246.6 141.9 104.7 — —
Total contractual obligations $ 11,355.3 $ 5,578.1 $ 4,104.8 $ 693.3 $ 979.1
(a) Our available debt is dependent upon our compliance with covenants, including negative covenants related to liens and our total capitalization ratio. Any violation ofcovenants or other events of default, which are not waived or cured, or changes in our credit rating could have a material impact on our ability to maintain our committedfinancing arrangements.
Due to our intent and ability to refinance commercial paper obligations on a long-term basis under our revolving credit facility and the variable interest rates associated withthese debt instruments, only interest on our Senior Notes is included in the table. During 2020, we paid $107.0 million for interest charges, net of interest capitalized.
Subsequent to the Spin-off, we expect the total future principal payments on debt and total future interest payments to be approximately $2,376.8 million and $556.1million, respectively.
(b) We lease office space, manufacturing facilities and various types of manufacturing and data processing equipment. Leases of real estate generally provide for payment ofproperty taxes, insurance and repairs by us. Substantially all of our leases are classified as operating leases.
(c) In the normal course of business, we enter into agreements with our suppliers to purchase raw materials or services. These agreements include a requirement that oursupplier provide products or services to our specifications and require us to make a firm purchase commitment to our supplier. As substantially all of these commitmentsare associated with purchases made to fulfill our customers’ orders, the costs associated with these agreements will ultimately be reflected in cost of sales in ourconsolidated statements of income. Subsequent to the Spin-off, we expect the total remaining future purchase obligations to be approximately $1,094.1 million.
(d) We expect to contribute approximately $20.7 million to our international pension plans during 2021. Required contributions for future years depend on factors that cannotbe determined at this time. Additionally, we expect to pay directly to beneficiaries approximately $14.3 million for international unfunded pension plan and $4.7 million forU.S. Non-Qualified unfunded pension plan during 2021. Subsequent to the Spin-off, we expect to contribute approximately $18.9 million to our international pension plansduring 2021.
(e) It is reasonably possible that $4.2 million of liabilities for unrecognized tax benefits will be settled during 2021, and this amount is reflected in income taxes payable in ourconsolidated balance sheet as of December 31, 2020. Although unrecognized tax benefits are not contractual obligations, they are presented in this table because theyrepresent demands on our liquidity.
(f) Other contractual obligations represent our share of the mandatorily redeemable financial liability, which is recorded at its fair value. The mandatorily redeemable financialliability relates to our voting control interests in legal Technip Energies contract entities which own and account for the design, engineering and construction of the YamalLNG plant. During the year ended December 31, 2020 we revalued the liability to reflect current expectations about the obligation. See Note 24 to our consolidated financialstatements for further details.
OTHER OFF-BALANCE SHEET ARRANGEMENTS
The following is a summary of other off-balance sheet arrangements for our consolidated subsidiaries as of December 31, 2020:
Amount of Commitment Expiration per Period
(In millions)Total
amountLess than
1 year1-3
years3-5
yearsAfter 5years
Financial guarantees $ 310.1 $ 204.1 $ 38.9 $ 24.7 $ 42.4 Performance guarantees 4,659.6 1,968.0 2,011.4 565.7 114.5 Total other off-balance sheet arrangements $ 4,969.7 $ 2,172.1 $ 2,050.3 $ 590.4 $ 156.9
(a) Financial guarantees represent contracts that contingently require a guarantor to make payments to a guaranteed party based on changes in an underlying agreement thatis related to an asset, a liability or an equity security of the guaranteed party. These tend to be drawn down only if there is a failure to fulfill our financial obligations.
(a)
(a)
(b)
(c)
(d)
(e)
(f)
(a)
(b)
69

(b) Performance guarantees represent contracts that contingently require a guarantor to make payments to a guaranteed party based on another entity's failure to performunder a nonfinancial obligating agreement. Events that trigger payment are performance-related, such as failure to ship a product or provide a service.
CRITICAL ACCOUNTING ESTIMATES
The preparation of financial statements in conformity with GAAP requires management to make certain estimates, judgments andassumptions about future events that affect the reported amounts of assets and liabilities at the date of the financial statements, the reportedamounts of revenue and expenses during the periods presented and the related disclosures in the accompanying notes to the financialstatements. Management has reviewed these critical accounting estimates with the Audit Committee of our Board of Directors. We believethe following critical accounting estimates used in preparing our financial statements address all important accounting areas where the natureof the estimates or assumptions is material due to the levels of subjectivity and judgment necessary to account for highly uncertain matters orthe susceptibility of such matters to change. See Note 1 to our consolidated financial statements for further details.
Revenue Recognition
The majority of our revenue is derived from long-term contracts that can span several years. We account for revenue in accordance withAccounting Standard Codification (“ASC”) Topic 606, Revenues from Contracts with Customers. The unit of account in ASC Topic 606 is aperformance obligation. A contract’s transaction price is allocated to each distinct performance obligation and recognized as revenue when,or as, the performance obligation is satisfied. Our performance obligations are satisfied over time as work progresses or at a point in time.
A significant portion of our total revenue recognized over time relates to our Technip Energies and Subsea segments, primarily for the entirerange of onshore facilities, fixed and floating offshore oil and gas facilities, and subsea exploration and production equipment projects thatinvolve the design, engineering, manufacturing, construction, and assembly of complex, customer-specific systems. Because of controltransferring over time, revenue is recognized based on the extent of progress towards completion of the performance obligation. Theselection of the method to measure progress towards completion requires judgment and is based on the nature of the products or services tobe provided. We generally use the cost-to-cost measure of progress for our contracts because it best depicts the transfer of control to thecustomer that occurs as we incur costs on our contracts. Under the cost-to-cost measure of progress, the extent of progress towardscompletion is measured based on the ratio of costs incurred to date to the total estimated costs at completion of the performanceobligation. Revenues, including estimated fees or profits, are recorded proportionally as costs are incurred.
Due to the nature of the work required to be performed on many of our performance obligations, the estimation of total revenue and cost atcompletion is complex, subject to many variables, and requires significant judgment. It is common for our long-term contracts to containaward fees, incentive fees, or other provisions that can either increase or decrease the transaction price. We include estimated amounts inthe transaction price when we believe we have an enforceable right to the modification, the amount can be estimated reliably, and itsrealization is probable. The estimated amounts are included in the transaction price to the extent it is probable that a significant reversal ofcumulative revenue recognized will not occur when the uncertainty associated with the variable consideration is resolved.
We execute contracts with our customers that clearly describe the equipment, systems, and/or services. After analyzing the drawings andspecifications of the contract requirements, our project engineers estimate total contract costs based on their experience with similar projectsand then adjust these estimates for specific risks associated with each project, such as technical risks associated with a new design. Costsassociated with specific risks are estimated by assessing the probability that conditions arising from these specific risks will affect our totalcost to complete the project. After work on a project begins, assumptions that form the basis for our calculation of total project cost areexamined on a regular basis and our estimates are updated to reflect the most current information and management’s best judgment.
70

Adjustments to estimates of contract revenue, total contract cost, or extent of progress toward completion are often required as workprogresses under the contract and as experience is gained, even though the scope of work required under the contract may not change. Thenature of accounting for long-term contracts is such that refinements of the estimating process for changing conditions and newdevelopments are continuous and characteristic of the process. Consequently, the amount of revenue recognized over time is sensitive tochanges in our estimates of total contract costs. There are many factors, including, but not limited to, the ability to properly execute theengineering and design phases consistent with our customers’ expectations, the availability and costs of labor and material resources,productivity, and weather, all of which can affect the accuracy of our cost estimates, and ultimately, our future profitability.
Our operating loss for the year ended December 31, 2020 was positively impacted by approximately $457.9 million, as a result of changes incontract estimates related to projects that were in progress as of December 31, 2019. During the year ended December 31, 2020, werecognized changes in our estimates that had an impact on our margin in the amounts of $519.5 million, $(56.5) million and $(5.1) million inour Technip Energies, Subsea and Surface Technologies segments, respectively. The changes in contract estimates are attributed to better,than expected performance throughout our execution of our projects.
Our operating loss for the year ended December 31, 2019 was positively impacted by approximately $1,114.3 million, as a result of changesin contract estimates related to projects that were in progress as of December 31, 2018. During the year ended December 31, 2019, werecognized changes in our estimates that had an impact on our margin in the amounts of $797.2 million, $324.7 million and $(7.6) million inour Technip Energies, Subsea and Surface Technologies segments, respectively. The changes in contract estimates are attributed to better,than expected performance throughout our execution of our projects.
Our operating profit for the year ended December 31, 2018 was positively impacted by approximately $553.4 million, as a result of changesin contract estimates related to projects that were in progress as of December 31, 2017. During the year ended December 31, 2018, werecognized changes in our estimates that had an impact on our margin in the amounts of $379.2 million, $169.9 million and $4.3 million in ourTechnip Energies, Subsea and Surface technologies segments, respectively. The changes in contract estimates are attributed to better, thanexpected performance throughout our execution of our projects.
Accounting for Income Taxes
Our income tax expense, deferred tax assets and liabilities, and reserves for uncertain tax positions reflect management’s best assessmentof estimated future taxes to be paid. We are subject to income taxes in the United Kingdom and numerous foreign jurisdictions. Significantjudgments and estimates are required in determining our consolidated income tax expense.
In determining our current income tax provision, we assess temporary differences resulting from differing treatments of items for tax andaccounting purposes. These differences result in deferred tax assets and liabilities, which are recorded in our consolidated balance sheets.When we maintain deferred tax assets, we must assess the likelihood that these assets will be recovered through adjustments to futuretaxable income. To the extent, we believe recovery is not likely, we establish a valuation allowance. We record a valuation allowance toreduce the asset to a value we believe will be recoverable based on our expectation of future taxable income. We believe the accountingestimate related to the valuation allowance is a critical accounting estimate because it is highly susceptible to change from period to period,requires management to make assumptions about our future income over the lives of the deferred tax assets, and finally, the impact ofincreasing or decreasing the valuation allowance is potentially material to our results of operations.
Forecasting future income requires us to use a significant amount of judgment. In estimating future income, we use our internal operatingbudgets and long-range planning projections. We develop our budgets and long-range projections based on recent results, trends, economicand industry forecasts influencing our segments’ performance, our backlog, planned timing of new product launches and customer salescommitments. Significant changes in our judgment related to the expected realizability of a deferred tax asset results in an adjustment to theassociated valuation allowance.
As of December 31, 2020, we have provided a valuation allowance against the related deferred tax assets where we believe it is not morelikely than not that we will generate future taxable income sufficient to realize such assets.
71

The calculation of our income tax expense involves dealing with uncertainties in the application of complex tax laws and regulations innumerous jurisdictions in which we operate. We recognize tax benefits related to uncertain tax positions when, in our judgment, it is morelikely than not that such positions will be sustained on examination, including resolutions of any related appeals or litigation, based on thetechnical merits. We adjust our liabilities for uncertain tax positions when our judgment changes as a result of new information previouslyunavailable. Due to the complexity of some of these uncertainties, their ultimate resolution may result in payments that are materially differentfrom our current estimates. Any such differences will be reflected as adjustments to income tax expense in the periods in which they aredetermined.
Accounting for Pension and Other Post-retirement Benefit Plans
The determination of the projected benefit obligations of our pension and other post-retirement benefit plans are important to the recordedamounts of such obligations in our consolidated balance sheets and to the amount of pension expense in our consolidated statements ofincome. In order to measure the obligations and expense associated with our pension benefits, management must make a variety ofestimates, including discount rates used to value certain liabilities, expected return on plan assets set aside to fund these costs, rate ofcompensation increase, employee turnover rates, retirement rates, mortality rates and other factors. We update these estimates on anannual basis or more frequently upon the occurrence of significant events. These accounting estimates bear the risk of change due to theuncertainty and difficulty in estimating these measures. Different estimates used by management could result in our recognition of differentamounts of expense over different periods of time.
Due to the specialized and statistical nature of these calculations which attempt to anticipate future events, we engage third-party specialiststo assist management in evaluating our assumptions as well as appropriately measuring the costs and obligations associated with thesepension benefits. The discount rate and expected long-term rate of return on plan assets are primarily based on investment yields availableand the historical performance of our plan assets, respectively. The timing and amount of cash outflows related to the bonds included in theindices matches it estimated defined benefits payments. These measures are critical accounting estimates because they are subject tomanagement’s judgment and can materially affect net income.
The actuarial assumptions and estimates made by management in determining our pension benefit obligations may materially differ fromactual results as a result of changing market and economic conditions and changes in plan participant assumptions. While we believe theassumptions and estimates used are appropriate, differences in actual experience or changes in plan participant assumptions may materiallyaffect our financial position or results of operations.
The following table illustrates the sensitivity of changes in the discount rate and expected long-term return on plan assets on pensionexpense and the projected benefit obligation:
(In millions, except basis points)
Increase (Decrease) in2020 Pension
Expense BeforeIncome Taxes
Increase (Decrease) inProjected BenefitObligation as of
December 31, 202025 basis point decrease in discount rate $ 3.2 $ 66.8 25 basis point increase in discount rate $ (3.2) $ (63.5)25 basis point decrease in expected long-term rate of return on plan assets $ 3.7 N/A25 basis point increase in expected long-term rate of return on plan assets $ (1.6) N/A
72

Determination of Fair Value in Business Combinations
Accounting for the acquisition of a business requires the allocation of the purchase price to the various assets acquired and liabilitiesassumed at their respective fair values. The determination of fair value requires the use of significant estimates and assumptions, and inmaking these determinations, management uses all available information. If necessary, we have up to one year after the acquisition closingdate to finalize these fair value determinations. For tangible and identifiable intangible assets acquired in a business combination, thedetermination of fair value utilizes several valuation methodologies including discounted cash flows which has assumptions with respect tothe timing and amount of future revenue and expenses associated with an asset. The assumptions made in performing these valuationsinclude, but are not limited to, discount rates, future revenues and operating costs, projections of capital costs, and other assumptionsbelieved to be consistent with those used by principal market participants. Due to the specialized nature of these calculations, we engagethird-party specialists to assist management in evaluating our assumptions as well as appropriately measuring the fair value of assetsacquired and liabilities assumed. See Note 2 to our consolidated financial statements for further details.
Impairment of Long-Lived and Intangible Assets
Long-lived assets, including vessels, property, plant and equipment, identifiable intangible assets being amortized and capitalized softwarecosts are reviewed for impairment whenever events or changes in circumstances indicate the carrying amount of the long-lived asset maynot be recoverable. The carrying amount of a long-lived asset is not recoverable if it exceeds the sum of the undiscounted cash flowsexpected to result from the use and eventual disposition of the asset. If it is determined that an impairment loss has occurred, the loss ismeasured as the amount by which the carrying amount of the long-lived asset exceeds its fair value. The determination of future cash flowsas well as the estimated fair value of long-lived assets involves significant estimates on the part of management. Because there usually is alack of quoted market prices for long-lived assets, fair value of impaired assets is typically determined based on the present values ofexpected future cash flows using discount rates believed to be consistent with those used by principal market participants, or based on amultiple of operating cash flows validated with historical market transactions of similar assets where possible. The expected future cash flowsused for impairment reviews and related fair value calculations are based on judgmental assessments of revenue, forecasted utilization,operating costs and capital decisions and all available information at the date of review. If future market conditions deteriorate beyond ourcurrent expectations and assumptions, impairments of long-lived assets may be identified if we conclude that the carrying amounts are nolonger recoverable.
Impairment of Goodwill
Goodwill represents the excess of cost over the fair market value of net assets acquired in business combinations. Goodwill is not subject toamortization but is tested for impairment at a reporting unit level on an annual basis, or more frequently if impairment indicators arise. Wehave established October 31 as the date of our annual test for impairment of goodwill. We identify a potential impairment by comparing thefair value of the applicable reporting unit to its net book value, including goodwill. If the net book value exceeds the fair value of the reportingunit, we measure the impairment by comparing the carrying value of the reporting unit to its fair value. Reporting units with goodwill aretested for impairment using a quantitative impairment test.
When using the quantitative impairment test, determining the fair value of a reporting unit is judgmental in nature and involves the use ofsignificant estimates and assumptions. We estimate the fair value of our reporting units using a discounted future cash flow model. Themajority of the estimates and assumptions used in a discounted future cash flow model involve unobservable inputs reflecting management’sown assumptions about the assumptions market participants would use in estimating the fair value of a business. These estimates andassumptions include revenue growth rates and operating margins used to calculate projected future cash flows, discount rates and futureeconomic and market conditions. Our estimates are based upon assumptions believed to be reasonable, but which are inherently uncertainand unpredictable and do not reflect unanticipated events and circumstances that may occur.
73

The income approach estimates fair value by discounting each reporting unit’s estimated future cash flows using a weighted-average cost ofcapital that reflects current market conditions and the risk profile of the reporting unit. To arrive at our future cash flows, we use estimates ofeconomic and market assumptions, including growth rates in revenues, costs, estimates of future expected changes in operating margins,tax rates and cash expenditures. Future revenues are also adjusted to match changes in our business strategy. We believe this approach isan appropriate valuation method. Under the market multiple approach, we determine the estimated fair value of each of our reporting units byapplying transaction multiples to each reporting unit’s projected EBITDA and then averaging that estimate with similar historical calculationsusing either a one, two or three year average. Our reporting unit valuations were determined primarily by utilizing the income approach, witha lesser weighting attributed the market multiple approach.
During the first quarter of 2020 a severe decline in the Company’s market capitalization, significant decline in crude oil prices and the growingpandemic caused by COVID-19 triggered the need for an impairment test at March 31, 2020. We utilized a market approach to measure thefair value of our reporting units as of March 31, 2020. In measuring a fair value of the Company we used the Company’s marketcapitalization. An appropriate control premium was considered for each of the reporting units and applied to the output of the marketapproach. An interim impairment test during the first quarter of 2020 resulted in $2,747.5 million and $335.9 million of goodwill impairmentcharges recorded in our Subsea and Surface Technologies segments, respectively.
During our annual impairment test the following significant estimates were used by management in determining the fair values of ourreporting units in order to test the remaining goodwill at October 31:
2020 2019 2018Year of cash flows before terminal value 4 4 5
Discount rates 0.15 12.5% to 15.0% 12.0% to 13.0%EBITDA multiples N/A 6.0 - 8.5x 7.0 - 8.5x
During the year ended December 31, 2020, the significant estimates used by management in determining the fair value described aboverelate to Technip Energies reporting unit only. Based on the impairment tests performed during the year ended December 31, 2020 werecorded $2,747.5 million and $335.9 million of goodwill impairment charges recorded in our Subsea and Surface Technologies reportingunits, respectively. No goodwill impairment charges were recorded in our Technip Energies reporting unit. The fair value over carryingamount for our Technip Energies segment was in excess of 300% of its carrying amount at our annual impairment test date that is October31, 2020.
During the year ended December 31, 2019, we recorded $1,321.9 million and $666.8 million of goodwill impairment charges in our Subseaand Surface Technologies segments, respectively.
During the year ended December 31, 2018, we recorded $1,383.0 million of goodwill impairment charges in our Subsea segment.
See Notes 15 and 19 to our consolidated financial statements for further details.
OTHER MATTERS
On March 28, 2016, FMC Technologies received an inquiry from the U.S. Department of Justice (“DOJ”) related to the DOJ's investigation ofwhether certain services Unaoil S.A.M. provided to its clients, including FMC Technologies, violated the FCPA. On March 29, 2016, TechnipS.A. also received an inquiry from the DOJ related to Unaoil. We cooperated with the DOJ's investigations and, with regard to FMCTechnologies, a related investigation by the SEC.
In late 2016, Technip S.A. was contacted by the DOJ regarding its investigation of offshore platform projects awarded between 2003 and2007, performed in Brazil by a joint venture company in which Technip S.A. was a minority participant, and we have also raised with DOJcertain other projects performed by Technip S.A. subsidiaries in Brazil between 2002 and 2013. The DOJ has also inquired about projects inGhana and Equatorial Guinea that were awarded to Technip S.A. subsidiaries in 2008 and 2009, respectively. We cooperated with the DOJin its investigation into potential violations of the FCPA in connection with these projects. We contacted and cooperated with the Brazilianauthorities (Federal Prosecution Service (“MPF”), the Comptroller General of Brazil (“CGU”) and the Attorney General of Brazil (“AGU”)) withtheir investigation concerning the projects in Brazil and have also
74

contacted and are cooperating with French authorities (the Parquet National Financier (“PNF”)) about these existing matters.
On June 25, 2019, we announced a global resolution to pay a total of $301.3 million to the DOJ, the SEC, the MPF, and the CGU/AGU toresolve these anti-corruption investigations. We will not be required to have a monitor and will, instead, provide reports on our anti-corruptionprogram to the Brazilian and U.S. authorities for two and three years, respectively.
As part of this resolution, we entered into a three-year Deferred Prosecution Agreement (“DPA”) with the DOJ related to charges ofconspiracy to violate the FCPA related to conduct in Brazil and with Unaoil. In addition, Technip USA, Inc., a U.S. subsidiary, pled guilty toone count of conspiracy to violate the FCPA related to conduct in Brazil. We will also provide the DOJ reports on our anti-corruption programduring the term of the DPA.
In Brazil, our subsidiaries Technip Brasil - Engenharia, Instalações E Apoio Marítimo Ltda. and Flexibrás Tubos Flexíveis Ltda. entered intoleniency agreements with both the MPF and the CGU/AGU. We have committed, as part of those agreements, to make certainenhancements to their compliance programs in Brazil during a two-year self-reporting period, which aligns with our commitment tocooperation and transparency with the compliance community in Brazil and globally.
In September 2019, the SEC approved our previously disclosed agreement in principle with the SEC Staff and issued an AdministrativeOrder, pursuant to which we paid the SEC $5.1 million, which was included in the global resolution of $301.3 million.
To date, the investigation by PNF related to historical projects in Equatorial Guinea and Ghana has not reached resolution. We remaincommitted to finding a resolution with the PNF and will maintain a $70.0 million provision related to this investigation. As we continue toprogress our discussions with PNF towards resolution, the amount of a settlement could exceed this provision.
There is no certainty that a settlement with PNF will be reached or that the settlement will not exceed current accruals. The PNF has a broadrange of potential sanctions under anti-corruption laws and regulations that it may seek to impose in appropriate circumstances including, butnot limited to, fines, penalties, and modifications to business practices and compliance programs. Any of these measures, if applicable to us,as well as potential customer reaction to such measures, could have a material adverse impact on our business, results of operations, andfinancial condition. If we cannot reach a resolution with the PNF, we could be subject to criminal proceedings in France, the outcome of whichcannot be predicted.
RECENTLY ISSUED ACCOUNTING STANDARDS
See Note 4 to our consolidated financial statements included in Part II, Item 8 of this Annual Report on Form 10-K.
75

ITEM 7A. QUANTITATIVE AND QUALITATIVE DISCLOSURES ABOUT MARKET RISK
We are subject to financial market risks, including fluctuations in foreign currency exchange rates and interest rates. In order to manage andmitigate our exposure to these risks, we may use derivative financial instruments in accordance with established policies and procedures. Wedo not use derivative financial instruments where the objective is to generate profits solely from trading activities. As of December 31, 2020and 2019, substantially all of our derivative holdings consisted of foreign currency forward contracts and foreign currency instrumentsembedded in purchase and sale contracts.
These forward-looking disclosures only address potential impacts from market risks as they affect our financial instruments and do notinclude other potential effects that could impact our business as a result of changes in foreign currency exchange rates, interest rates,commodity prices or equity prices.
Foreign Currency Exchange Rate Risk
We conduct operations around the world in a number of different currencies. Many of our significant foreign subsidiaries have designated thelocal currency as their functional currency. Our earnings are therefore subject to change due to fluctuations in foreign currency exchangerates when the earnings in foreign currencies are translated into U.S. dollars. We do not hedge this translation impact on earnings. A 10%increase or decrease in the average exchange rates of all foreign currencies as of December 31, 2020, would have changed our revenueand income before income taxes attributable to TechnipFMC by approximately $813.0 million and $38.0 million, respectively.
When transactions are denominated in currencies other than our subsidiaries’ respective functional currencies, we manage these exposuresthrough the use of derivative instruments. We primarily use foreign currency forward contracts to hedge the foreign currency fluctuationassociated with firmly committed and forecasted foreign currency denominated payments and receipts. The derivative instrumentsassociated with these anticipated transactions are usually designated and qualify as cash flow hedges, and as such the gains and lossesassociated with these instruments are recorded in other comprehensive income until such time that the underlying transactions arerecognized. Unless these cash flow contracts are deemed to be ineffective or are not designated as cash flow hedges at inception, changesin the derivative fair value will not have an immediate impact on our results of operations since the gains and losses associated with theseinstruments are recorded in other comprehensive income. When the anticipated transactions occur, these changes in value of derivativeinstrument positions will be offset against changes in the value of the underlying transaction. When an anticipated transaction in a currencyother than the functional currency of an entity is recognized as an asset or liability on the balance sheet, we also hedge the foreign currencyfluctuation of these assets and liabilities with derivative instruments after netting our exposures worldwide. These derivative instruments donot qualify as cash flow hedges.
Occasionally, we enter into contracts or other arrangements containing terms and conditions that qualify as embedded derivative instrumentsand are subject to fluctuations in foreign exchange rates. In those situations, we enter into derivative foreign exchange contracts that hedgethe price or cost fluctuations due to movements in the foreign exchange rates. These derivative instruments are not designated as cash flowhedges.
For our foreign currency forward contracts hedging anticipated transactions that are accounted for as cash flow hedges, a 10% increase inthe value of the U.S. dollar would have resulted in an additional loss of $68.4 million in the net fair value of cash flow hedges reflected in ourconsolidated balance sheet as of December 31, 2020.
Interest Rate Risk
As of December 31, 2020, we had commercial paper of approximately $1.5 billion with a weighted average interest rate of 0.26%. Usingsensitivity analysis to measure the impact of a 10% adverse movement in the interest rate, or three basis points, would result in an increaseto interest expense of $0.5 million.
76

We assess effectiveness of forward foreign currency contracts designated as cash flow hedges based on changes in fair value attributable tochanges in spot rates. We exclude the impact attributable to changes in the difference between the spot rate and the forward rate for theassessment of hedge effectiveness and recognize the change in fair value of this component immediately in earnings. Considering that thedifference between the spot rate and the forward rate is proportional to the differences in the interest rates of the countries of the currenciesbeing traded, we do not have significant exposure in the unrealized valuation of our forward foreign currency contracts to relative changes ininterest rates between countries in our results of operations. To the extent any one interest rate increases by 10% across all tenors and othercountries’ interest rates remain fixed, and assuming no change in discount rates, we would expect to recognize a decrease of $1.5 million inunrealized earnings in the period of change. Based on our portfolio at December 31, 2020, we have material positions with exposure tointerest rates in the United States, Canada, Australia, Brazil, the United Kingdom, Singapore, the European Community, and Norway.
77

ITEM 8. FINANCIAL STATEMENTS AND SUPPLEMENTARY DATA
Report of Independent Registered Public Accounting Firm
To the Board of Directors and Stockholders of TechnipFMC plc
Opinions on the Financial Statements and Internal Control over Financial Reporting
We have audited the accompanying consolidated balance sheets of TechnipFMC plc and its subsidiaries (the “Company”) as of December31, 2020 and 2019, and the related consolidated statements of income, of comprehensive income, of changes in stockholders’ equity and ofcash flows for each of the three years in the period ended December 31, 2020, including the related notes and schedule of valuation andqualifying accounts for each of the three years in the period ended December 31, 2020 appearing under Item 15(a)(2) (collectively referred toas the “consolidated financial statements”). We also have audited the Company's internal control over financial reporting as of December 31,2020, based on criteria established in Internal Control - Integrated Framework (2013) issued by the Committee of Sponsoring Organizationsof the Treadway Commission (COSO).
In our opinion, the consolidated financial statements referred to above present fairly, in all material respects, the financial position of theCompany as of December 31, 2020 and 2019, and the results of its operations and its cash flows for each of the three years in the periodended December 31, 2020 in conformity with accounting principles generally accepted in the United States of America. Also, in our opinion,the Company maintained, in all material respects, effective internal control over financial reporting as of December 31, 2020, based oncriteria established in Internal Control - Integrated Framework (2013) issued by the COSO.
Change in Accounting Principle
As discussed in Note 1 to the consolidated financial statements, the Company changed the manner in which it accounts for leases in 2019.
Basis for Opinions
The Company's management is responsible for these consolidated financial statements, for maintaining effective internal control overfinancial reporting, and for its assessment of the effectiveness of internal control over financial reporting, included in Management’s AnnualReport on Internal Control over Financial Reporting appearing under Item 9A. Our responsibility is to express opinions on the Company’sconsolidated financial statements and on the Company's internal control over financial reporting based on our audits. We are a publicaccounting firm registered with the Public Company Accounting Oversight Board (United States) (PCAOB) and are required to beindependent with respect to the Company in accordance with the U.S. federal securities laws and the applicable rules and regulations of theSecurities and Exchange Commission and the PCAOB.
We conducted our audits in accordance with the standards of the PCAOB. Those standards require that we plan and perform the audits toobtain reasonable assurance about whether the consolidated financial statements are free of material misstatement, whether due to error orfraud, and whether effective internal control over financial reporting was maintained in all material respects.
Our audits of the consolidated financial statements included performing procedures to assess the risks of material misstatement of theconsolidated financial statements, whether due to error or fraud, and performing procedures that respond to those risks. Such proceduresincluded examining, on a test basis, evidence regarding the amounts and disclosures in the consolidated financial statements. Our auditsalso included evaluating the accounting principles used and significant estimates made by management, as well as evaluating the overallpresentation of the consolidated financial statements. Our audit of internal control over financial reporting included obtaining anunderstanding of internal control over financial reporting, assessing the risk that a material weakness exists, and testing and evaluating thedesign and operating effectiveness of internal control based on the assessed risk. Our audits also included performing such other proceduresas we considered necessary in the circumstances. We believe that our audits provide a reasonable basis for our opinions.
Definition and Limitations of Internal Control over Financial Reporting
A company’s internal control over financial reporting is a process designed to provide reasonable assurance regarding the reliability offinancial reporting and the preparation of financial statements for external purposes in accordance with generally accepted accountingprinciples. A company’s internal control over financial reporting
78

includes those policies and procedures that (i) pertain to the maintenance of records that, in reasonable detail, accurately and fairly reflectthe transactions and dispositions of the assets of the company; (ii) provide reasonable assurance that transactions are recorded asnecessary to permit preparation of financial statements in accordance with generally accepted accounting principles, and that receipts andexpenditures of the company are being made only in accordance with authorizations of management and directors of the company; and (iii)provide reasonable assurance regarding prevention or timely detection of unauthorized acquisition, use, or disposition of the company’sassets that could have a material effect on the financial statements.
Because of its inherent limitations, internal control over financial reporting may not prevent or detect misstatements. Also, projections of anyevaluation of effectiveness to future periods are subject to the risk that controls may become inadequate because of changes in conditions,or that the degree of compliance with the policies or procedures may deteriorate.
Critical Audit Matters
The critical audit matters communicated below are matters arising from the current period audit of the consolidated financial statements thatwere communicated or required to be communicated to the audit committee and that (i) relate to accounts or disclosures that are material tothe consolidated financial statements and (ii) involved our especially challenging, subjective, or complex judgments. The communication ofcritical audit matters does not alter in any way our opinion on the consolidated financial statements, taken as a whole, and we are not, bycommunicating the critical audit matters below, providing separate opinions on the critical audit matters or on the accounts or disclosures towhich they relate.
Revenue Recognition - Determination of Estimated Costs to Complete for Long-Term Contracts
As described in Note 6 to the consolidated financial statements, approximately 86% of the total revenue of $13.1 billion for the year endedDecember 31, 2020 is generated from long-term contracts. As disclosed by management, for the Company’s long-term contracts, because ofcontrol transferring over time, revenue is recognized based on the extent of progress towards completion of the performance obligation. Theselection of the method to measure progress towards completion requires judgment and is based on the nature of the products or services tobe provided. The Company generally uses the cost-to-cost measure of progress for its contracts because it best depicts the transfer ofcontrol to the customer which occurs as the Company incurs costs on the contracts. Under the cost-to-cost measure of progress, the extentof progress towards completion is measured based on the ratio of costs incurred to date to the total estimated costs at completion of theperformance obligation. Revenues, including estimated fees or profits, are recorded proportionally as costs are incurred. Due to the nature ofthe work required to be performed on many of the performance obligations, management’s estimation of total revenue and cost at completionis complex, subject to many variables and requires significant judgment. There are many factors, including, but not limited to, the ability toproperly execute the engineering and design phases consistent with customers’ expectations, the availability and costs of labor and materialsresources, productivity and weather, all of which can affect the accuracy of cost estimates, and ultimately, future profitability.
The principal considerations for our determination that performing procedures relating to revenue recognition - determination of estimatedcosts to complete for long-term contracts is a critical audit matter are the significant judgment by management when determining theestimated costs to complete for long-term contracts, which in turn led to a high degree of auditor judgment, subjectivity and effort inperforming procedures and evaluating management’s significant assumptions related to the estimates of costs to complete.
Addressing the matter involved performing procedures and evaluating audit evidence in connection with forming our overall opinion on theconsolidated financial statements. These procedures included testing the effectiveness of controls relating to the revenue recognitionprocess, including controls over the determination of estimated costs to complete for long-term contracts. These procedures also included,among others, testing management’s process for determining the estimated costs to complete for a selection of long-term contracts by (i)obtaining executed purchase orders and agreements, (ii) evaluating the appropriateness of the method to measure progress towardscompletion, (iii) testing the completeness and accuracy of the underlying data used by management, and (iv) evaluating the reasonablenessof significant assumptions related to the estimates of costs to complete. Evaluating the reasonableness of significant assumptions involvedassessing management’s ability to reasonably estimate costs to complete long-term contracts, as applicable, by (i) performing procedures toassess the reasonableness of estimated costs to complete, (ii) testing management’s process to evaluate the timely identification ofcircumstances which may warrant a modification to a previous cost estimate, (iii) testing management’s process to evaluate contractcontingencies relative to the contractual terms and actual progress of contracts, and (iv) performing procedures to assess thereasonableness of changes in life of project margin.
79
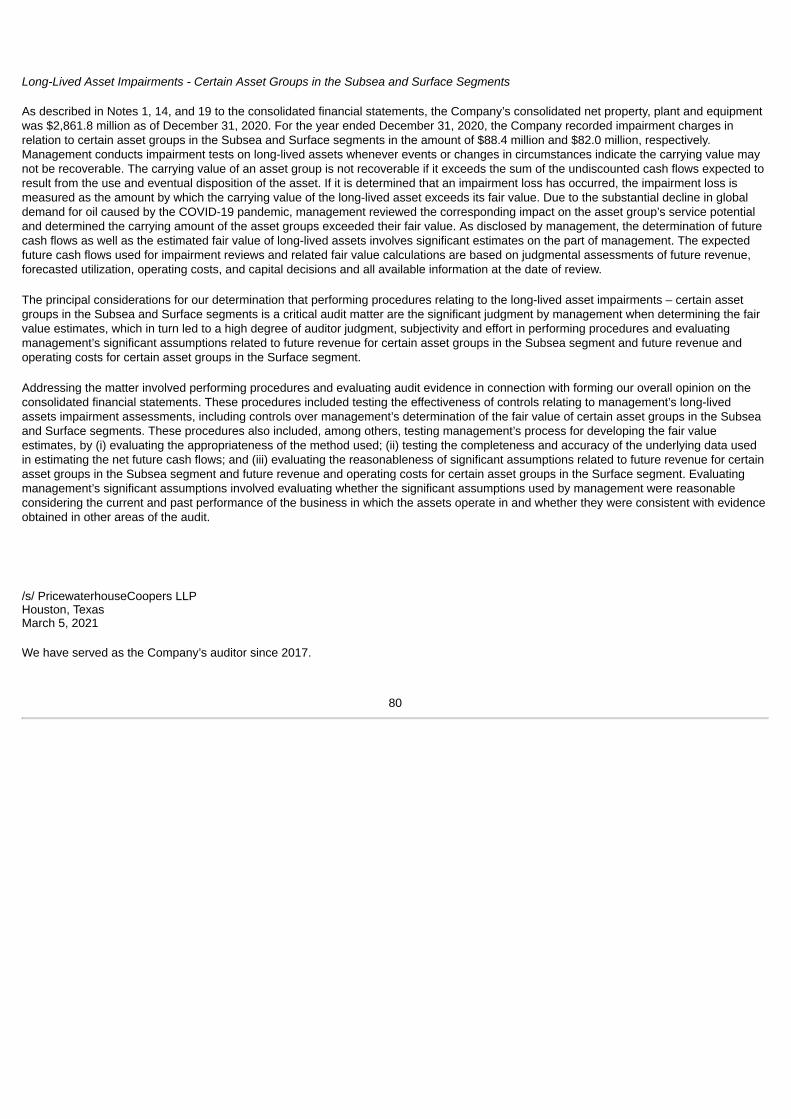
Long-Lived Asset Impairments - Certain Asset Groups in the Subsea and Surface Segments
As described in Notes 1, 14, and 19 to the consolidated financial statements, the Company’s consolidated net property, plant and equipmentwas $2,861.8 million as of December 31, 2020. For the year ended December 31, 2020, the Company recorded impairment charges inrelation to certain asset groups in the Subsea and Surface segments in the amount of $88.4 million and $82.0 million, respectively.Management conducts impairment tests on long-lived assets whenever events or changes in circumstances indicate the carrying value maynot be recoverable. The carrying value of an asset group is not recoverable if it exceeds the sum of the undiscounted cash flows expected toresult from the use and eventual disposition of the asset. If it is determined that an impairment loss has occurred, the impairment loss ismeasured as the amount by which the carrying value of the long-lived asset exceeds its fair value. Due to the substantial decline in globaldemand for oil caused by the COVID-19 pandemic, management reviewed the corresponding impact on the asset group’s service potentialand determined the carrying amount of the asset groups exceeded their fair value. As disclosed by management, the determination of futurecash flows as well as the estimated fair value of long-lived assets involves significant estimates on the part of management. The expectedfuture cash flows used for impairment reviews and related fair value calculations are based on judgmental assessments of future revenue,forecasted utilization, operating costs, and capital decisions and all available information at the date of review.
The principal considerations for our determination that performing procedures relating to the long-lived asset impairments – certain assetgroups in the Subsea and Surface segments is a critical audit matter are the significant judgment by management when determining the fairvalue estimates, which in turn led to a high degree of auditor judgment, subjectivity and effort in performing procedures and evaluatingmanagement’s significant assumptions related to future revenue for certain asset groups in the Subsea segment and future revenue andoperating costs for certain asset groups in the Surface segment.
Addressing the matter involved performing procedures and evaluating audit evidence in connection with forming our overall opinion on theconsolidated financial statements. These procedures included testing the effectiveness of controls relating to management’s long-livedassets impairment assessments, including controls over management’s determination of the fair value of certain asset groups in the Subseaand Surface segments. These procedures also included, among others, testing management’s process for developing the fair valueestimates, by (i) evaluating the appropriateness of the method used; (ii) testing the completeness and accuracy of the underlying data usedin estimating the net future cash flows; and (iii) evaluating the reasonableness of significant assumptions related to future revenue for certainasset groups in the Subsea segment and future revenue and operating costs for certain asset groups in the Surface segment. Evaluatingmanagement’s significant assumptions involved evaluating whether the significant assumptions used by management were reasonableconsidering the current and past performance of the business in which the assets operate in and whether they were consistent with evidenceobtained in other areas of the audit.
/s/ PricewaterhouseCoopers LLPHouston, TexasMarch 5, 2021
We have served as the Company’s auditor since 2017.
80

TECHNIPFMC PLC AND CONSOLIDATED SUBSIDIARIESCONSOLIDATED STATEMENTS OF INCOME
Year Ended(In millions, except per share data) 2020 2019 2018Revenue
Service revenue $ 9,708.2 $ 9,789.7 $ 9,057.6 Product revenue 3,200.4 3,352.9 3,272.6 Lease revenue 142.0 266.5 222.7
Total revenue 13,050.6 13,409.1 12,552.9
Costs and expensesCost of service revenue 8,261.9 7,767.2 7,452.7 Cost of product revenue 2,830.8 3,015.6 2,676.9 Cost of lease revenue 116.7 167.9 143.4 Selling, general and administrative expense 1,066.2 1,228.1 1,140.6 Research and development expense 119.8 162.9 189.2 Impairment, restructuring and other expense (Note 19) 3,501.3 2,490.8 1,831.2 Separation costs (Note 3) 39.5 72.1 — Merger transaction and integration costs — 31.2 36.5
Total costs and expenses 15,936.2 14,935.8 13,470.5
Other income (expense), net 31.1 (220.7) (323.9)Income from equity affiliates (Note 12) 63.0 62.9 114.3
Loss before interest income, interest expense and income taxes (2,791.5) (1,684.5) (1,127.2)Interest income 56.6 116.5 121.4 Interest expense (349.6) (567.8) (482.3)
Loss before income taxes (3,084.5) (2,135.8) (1,488.1)Provision for income taxes (Note 21) 153.4 276.3 422.7
Net loss (3,237.9) (2,412.1) (1,910.8)Net profit attributable to non-controlling interests (49.7) (3.1) (10.8)
Net loss attributable to TechnipFMC plc $ (3,287.6) $ (2,415.2) $ (1,921.6)
Earnings (loss) per share attributable to TechnipFMC plc (Note 8)Basic $ (7.33) $ (5.39) $ (4.20)Diluted $ (7.33) $ (5.39) $ (4.20)
Weighted average shares outstanding (Note 8)Basic 448.7 448.0 458.0 Diluted 448.7 448.0 458.0
The accompanying notes are an integral part of the consolidated financial statements.
81

TECHNIPFMC PLC AND CONSOLIDATED SUBSIDIARIESCONSOLIDATED STATEMENTS OF COMPREHENSIVE INCOME
Year Ended(In millions) 2020 2019 2018Net loss $ (3,237.9) $ (2,412.1) $ (1,910.8)
Foreign currency translation adjustmentsNet gain (losses) arising during the period (169.1) 15.6 (183.3)Reclassification adjustment for net gains included in net income — (12.0) (41.1)
Foreign currency translation adjustments (169.1) 3.6 (224.4)
Net gains (losses) on hedging instrumentsNet gains (losses) arising during the period 25.4 8.9 (58.7)Reclassification adjustment for net losses (gains) included in net income 13.0 18.2 (2.0)
Net gains (losses) on hedging instruments 38.4 27.1 (60.7)
Pension and other post-retirement benefitsNet losses arising during the period (88.3) (81.5) (72.4)Prior service cost arising during the period (4.6) (0.7) (2.1)Reclassification adjustment for settlement losses (gains) included in net income 1.4 0.2 (2.5)Reclassification adjustment for amortization of prior service cost included in net income 0.9 2.0 1.2 Reclassification adjustment for amortization of net actuarial loss included in net income 6.9 0.8 0.3
Net pension and other post-retirement benefits (83.7) (79.2) (75.5)Other comprehensive loss, net of tax (214.4) (48.5) (360.6)
Comprehensive loss (3,452.3) (2,460.6) (2,271.4)Comprehensive income attributable to non-controlling interest (50.4) (2.4) (6.2)
Comprehensive loss attributable to TechnipFMC plc $ (3,502.7) $ (2,463.0) $ (2,277.6)
(a) Net of income tax (expense) benefit of nil, $7.9 and $3.6 for the years ended December 31, 2020, 2019 and 2018, respectively.(b) Net of income tax (expense) benefit of $(9.7), $(6.9) and $16.6 for the years ended December 31, 2020, 2019 and 2018, respectively.(c) Net of income tax (expense) benefit of $25.5, $20.3 and $15.5 for the years ended December 31, 2020, 2019 and 2018, respectively.
The accompanying notes are an integral part of the consolidated financial statements.
(a)
(b)
(c)
82

TECHNIPFMC PLC AND CONSOLIDATED SUBSIDIARIESCONSOLIDATED BALANCE SHEETS
(In millions, except par value data) December 31,Assets 2020 2019
Cash and cash equivalents $ 4,807.8 $ 5,190.2 Trade receivables, net of allowances of $108.9 in 2020 and $95.4 in 2019 2,289.8 2,287.1 Contract assets, net of allowances of $1.0 in 2020 and $2.5 in 2019 1,267.6 1,520.0 Inventories, net (Note 9) 1,268.5 1,416.0 Derivative financial instruments (Note 23) 301.4 101.9 Income taxes receivable 313.4 264.6 Advances paid to suppliers 203.6 242.9 Other current assets (Note 10) 992.6 863.7
Total current assets 11,444.7 11,886.4 Investments in equity affiliates (Note 12) 358.9 300.4 Property, plant and equipment, net (Note 14) 2,861.8 3,162.0 Operating lease right-of-use assets (Note 5) 1,016.7 892.6 Finance lease right-of-use assets (Note 5) 27.5 — Goodwill (Note 15) 2,512.5 5,598.3 Intangible assets, net (Note 15) 981.1 1,086.6 Deferred income taxes (Note 21) 217.9 260.5 Derivative financial instruments (Note 23) 35.9 39.5 Other assets 235.6 292.5
Total assets $ 19,692.6 $ 23,518.8
Liabilities and equityShort-term debt and current portion of long-term debt (Note 16) $ 636.2 $ 495.4 Operating lease liabilities (Note 5) 247.0 275.1 Finance lease liabilities (Note 5) 26.9 — Accounts payable, trade 2,740.3 2,659.8 Contract liabilities 4,736.1 4,585.1 Accrued payroll 418.8 411.5 Derivative financial instruments (Note 23) 167.2 141.3 Income taxes payable 74.1 75.7 Other current liabilities (Note 10) 1,368.6 1,494.5
Total current liabilities 10,415.2 10,138.4 Long-term debt, less current portion (Note 16) 3,317.7 3,980.0 Operating lease liabilities, less current portion (Note 5) 881.0 681.7 Deferred income taxes (Note 21) 79.5 138.2 Accrued pension and other post-retirement benefits, less current portion (Note 22) 420.8 368.6 Derivative financial instruments (Note 23) 23.3 52.7 Other liabilities 297.1 430.0
Total liabilities 15,434.6 15,789.6 Commitments and contingent liabilities (Note 20)
Mezzanine equityRedeemable non-controlling interest 43.7 41.1
Stockholders’ equity (Note 17)Ordinary shares, $1 par value; 618.3 shares authorized in 2020 and 2019; 449.5 shares and 447.1 shares issued and outstanding in 2020 and2019, respectively; nil and 4.0 shares canceled in 2020 and 2019, respectively 449.5 447.1 Capital in excess of par value of ordinary shares 10,242.4 10,182.8 Accumulated deficit (4,915.2) (1,563.1)Accumulated other comprehensive loss (1,622.5) (1,407.5)
Total TechnipFMC plc stockholders’ equity 4,154.2 7,659.3 Non-controlling interests 60.1 28.8
Total equity 4,214.3 7,688.1
Total liabilities and equity $ 19,692.6 $ 23,518.8
The accompanying notes are an integral part of the consolidated financial statements.
83

TECHNIPFMC PLC AND CONSOLIDATED SUBSIDIARIESCONSOLIDATED STATEMENTS OF CASH FLOWS
Year Ended December 31,(In millions) 2020 2019 2018Cash provided (required) by operating activitiesNet loss $ (3,237.9) $ (2,412.1) $ (1,910.8)Adjustments to reconcile net income to cash provided (required) by operating activities
Depreciation 323.5 383.5 367.8 Amortization 123.7 126.1 182.6 Impairments (Note 19) 3,287.4 2,484.1 1,792.6 Employee benefit plan and share-based compensation costs 47.5 63.3 22.4 Deferred income tax provision (benefit), net (6.7) (75.4) 48.8 Unrealized loss (gain) on derivative instruments and foreign exchange (41.2) 32.5 102.7 Income from equity affiliates, net of dividends received (58.1) (58.8) (110.7)Other 195.5 364.4 291.8
Changes in operating assets and liabilities, net of effects of acquisitionsTrade receivables, net and contract assets 348.1 (39.7) (664.1)Inventories, net 82.8 (169.6) (339.4)Accounts payable, trade 18.4 26.1 (1,248.7)Contract liabilities (75.2) 520.1 762.7 Income taxes payable (receivable), net (52.8) 12.7 (190.7)Other current assets and liabilities, net (267.3) (431.8) 921.2 Other noncurrent assets and liabilities, net (30.8) 23.1 (213.6)
Cash provided (required) by operating activities 656.9 848.5 (185.4)
Cash required by investing activitiesCapital expenditures (291.8) (454.4) (368.1)Payment to acquire debt securities (3.9) (71.6) — Proceeds from sale of debt securities 51.5 18.9 — Acquisition of equity securities (17.9) — — Acquisitions, net of cash acquired — 16.0 (104.9)Cash received from (used by) divestitures 8.8 (2.1) (6.7)Proceeds from sale of assets 46.0 7.8 19.5 Proceeds from repayment of advance to joint venture 26.7 62.0 — Other — 3.6 —
Cash required by investing activities (180.6) (419.8) (460.2)
Cash required by financing activitiesNet decrease in short-term debt (24.4) (49.6) (34.9)Net increase (decrease) in commercial paper (554.5) 57.3 496.6 Proceeds from issuance of long-term debt 223.2 96.2 — Repayments of long-term debt (423.9) — — Purchase of ordinary shares — (92.7) (442.6)Dividends paid (59.2) (232.8) (238.1)Payments related to taxes withheld on share-based compensation (7.4) — — Settlements of mandatorily redeemable financial liability (224.2) (562.8) (225.8)Acquisition of non-controlling interest (11.8) — —
Cash required by financing activities (1,082.2) (784.4) (444.8)Effect of changes in foreign exchange rates on cash and cash equivalents 223.5 5.9 (107.0)Decrease in cash and cash equivalents (382.4) (349.8) (1,197.4)
Cash and cash equivalents, beginning of year 5,190.2 5,540.0 6,737.4
Cash and cash equivalents, end of year $ 4,807.8 $ 5,190.2 $ 5,540.0
84

Year Ended December 31,(In millions) 2020 2019 2018Supplemental disclosures of cash flow information
Cash paid for interest (net of interest capitalized) $ 107.0 $ 109.4 $ 99.0 Cash paid for income taxes (net of refunds received) $ 219.7 $ 374.5 $ 410.6
The accompanying notes are an integral part of the consolidated financial statements.
85

TECHNIPFMC PLC AND CONSOLIDATED SUBSIDIARIESCONSOLIDATED STATEMENTS OF CHANGES IN STOCKHOLDERS’ EQUITY
(In millions)OrdinaryShares
OrdinaryShares Held inTreasury and
EmployeeBenefitTrust
Capital inExcess of Par
Value ofOrdinary Shares
RetainedEarnings
(AccumulatedDeficit)
AccumulatedOther
ComprehensiveIncome(Loss)
Non-controlling
Interest
TotalStockholders’
Equity
Balance as of December 31, 2017 $ 465.1 $ (4.8) $ 10,483.3 $ 3,406.0 $ (1,003.7) $ 21.5 $ 13,367.4
Adoption of accounting standards (Note 6) — — — (91.5) — 0.1 (91.4)Net income (loss) — — — (1,921.6) — 10.8 (1,910.8)Other comprehensive loss — — — — (356.0) (4.6) (360.6)Cancellation of treasury shares (Note 17) (14.8) — (333.5) (94.5) — — (442.8)Issuance of ordinary shares 0.2 — — — — — 0.2 Net sales of ordinary shares for employeebenefit trust — 2.4 — — — — 2.4 Cash dividends declared ($0.52 per share)(Note 17) — — — (238.1) — — (238.1)Share-based compensation (Note 18) — — 49.1 — — — 49.1 Other — — (1.9) 11.9 — 3.5 13.5
Balance as of December 31, 2018 $ 450.5 $ (2.4) $ 10,197.0 $ 1,072.2 $ (1,359.7) $ 31.3 $ 10,388.9
Adoption of accounting standards (Note 5) — — — 1.8 — — 1.8 Net income (loss) — — — (2,415.2) — 3.1 (2,412.1)Other comprehensive loss — — — — (47.8) (0.7) (48.5)Cancellation of treasury shares (Note 17) (4.0) — (88.7) — — — (92.7)Issuance of ordinary shares 0.6 — — — — — 0.6 Net sales of ordinary shares for employeebenefit trust — 2.4 — — — — 2.4 Cash dividends declared ($0.52 per share)(Note 17) — — — (232.8) — — (232.8)Share-based compensation (Note 18) — — 74.5 — — — 74.5 Other — — — 10.9 — (4.9) 6.0
Balance as of December 31, 2019 $ 447.1 $ — $ 10,182.8 $ (1,563.1) $ (1,407.5) $ 28.8 $ 7,688.1
Adoption of accounting standards (Note 4) — — — (7.8) — — (7.8)Net income (loss) — — — (3,287.6) — 49.7 (3,237.9)Other comprehensive loss — — — — (215.0) 0.6 (214.4)Issuance of ordinary shares 2.4 — (9.4) — — — (7.0)Cash dividends declared ($0.13 per share)(Note 17) — — — (59.2) — — (59.2)Share-based compensation (Note 18) — — 69.0 — — — 69.0 Acquisition of non-controlling interest — — — (9.4) — (2.1) (11.5)Other — — — 11.9 — (16.9) (5.0)
Balance as of December 31, 2020 $ 449.5 $ — $ 10,242.4 $ (4,915.2) $ (1,622.5) $ 60.1 $ 4,214.3
The accompanying notes are an integral part of the consolidated financial statements.
86

TECHNIPFMC PLC AND CONSOLIDATED SUBSIDIARIESNOTES TO CONSOLIDATED FINANCIAL STATEMENTS
NOTE 1. BASIS OF PRESENTATION AND SUMMARY OF SIGNIFICANT ACCOUNTING POLICIES
Nature of operations - TechnipFMC plc and consolidated subsidiaries (“TechnipFMC,” “we,” “us” or “our”) is a global leader in oil and gasprojects, technologies, systems and services through our business segments: Subsea, Technip Energies and Surface Technologies. Wehave manufacturing operations worldwide, strategically located to facilitate delivery of our products, systems and services to our customers.On February 16, 2021, we completed the separation of Technip Energies segment (the “Spin-off”). Subsequent to the Spin-off, we willoperate under two reporting segments: Subsea and Surface Technologies.
In this Annual Report on Form 10-K, we are reporting the results of our operations for the year ended December 31, 2020. Beginning in thefirst quarter of 2021, Technip Energies’ historical financial results for periods prior to the Spin-off will be reflected in our consolidated financialstatements as discontinued operations.
Basis of presentation - Our consolidated financial statements were prepared in U.S. dollars and in accordance with accounting principlesgenerally accepted in the United States of America (“GAAP”) and rules and regulations of the Securities and Exchange Commission (“SEC”)pertaining to annual financial information. The preparation of financial statements in conformity with these accounting principles requires usto make estimates and assumptions that affect the reported amounts of assets and liabilities at the date of the financial statements and thereported amounts of revenue and expenses during the reporting period. Ultimate results could differ from our estimates.
Principles of consolidation - The consolidated financial statements include the accounts of TechnipFMC and its majority-owned subsidiariesand affiliates. Intercompany accounts and transactions are eliminated in consolidation.
Use of estimates - The preparation of financial statements in conformity with GAAP requires management to make estimates andassumptions that affect the reported amounts of assets and liabilities and disclosures of contingent assets and liabilities at the date of thefinancial statements and the reported amounts of revenue and expenses during the reporting period. Actual results could differ from thoseestimates. Such estimates include, but are not limited to, estimates of total contract profit or loss on long-term construction-type contracts;estimated realizable value on excess and obsolete inventory; estimates related to pension accounting; estimates related to fair value forpurposes of assessing goodwill, long-lived assets and intangible assets for impairment; estimates of fair value in business combinations andestimates related to income taxes.
Investments in the common stock of unconsolidated affiliates - The equity method of accounting is used to account for investments inunconsolidated affiliates where we have the ability to exert significant influence over the affiliates’ operating and financial policies. Wemeasure equity investments not accounted for under the equity method at fair value and recognize any changes in fair value in net income.For certain construction joint ventures, we use the proportionate consolidation method, whereby our proportionate share of each entity’sassets, liabilities, revenues and expenses are included in the appropriate classifications in the consolidated financial statements.Intercompany balances and transactions have been eliminated in preparing the consolidated financial statements.
Investments in unconsolidated affiliates are assessed for impairment whenever events or changes in facts and circumstances indicate thecarrying value of the investments may not be fully recoverable. When such a condition is subjectively determined to be other than temporary,the carrying value of the investment is written down to fair value. Management’s assessment as to whether any decline in value is other thantemporary is based on our ability and intent to hold the investment and whether evidence indicating the carrying value of the investment isrecoverable within a reasonable period of time outweighs evidence to the contrary. Management generally considers our investments inequity method investees to be strategic, long-term investments and completes its assessments for impairment with a long-term viewpoint.
Investments in which ownership is less than 20% or that do not represent significant investments are reported in other assets in theconsolidated balance sheets. Where no active market exists and where no other valuation method can be used, these financial assets aremaintained at cost minus impairment, if any, plus or minus changes resulting from observable price changes in orderly transactions for theidentical or a similar investment of the same issuer.
87

We determine whether investments involve a variable interest entity (“VIE”) based on the characteristics of the subject entity. If the entity isdetermined to be a VIE, then management determines if we are the primary beneficiary of the entity and whether or not consolidation of theVIE is required. The primary beneficiary consolidating the VIE must normally have both (i) the power to direct the activities that mostsignificantly affect the VIE’s economic performance and (ii) the obligation to absorb significant losses of or the right to receive significantbenefits from the VIE. If we are deemed to be the primary beneficiary, the VIE is consolidated and the other party’s equity interest in the VIEis accounted for as a non-controlling interest. Our unconsolidated VIEs are accounted for using the equity method of accounting.
Business combinations - Business combinations are accounted for using the acquisition method of accounting. Under the acquisition method,assets acquired and liabilities assumed are recorded at their respective fair values as of the acquisition date. Determining the fair value ofassets and liabilities involves significant judgment regarding methods and assumptions used to calculate estimated fair values. The purchaseprice is allocated to the acquired assets, assumed liabilities and identifiable intangible assets based on their estimated fair values. Anyexcess of the purchase price over the estimated fair values of the net assets acquired is recorded as goodwill. Transaction related costs areexpensed as incurred.
Leases - The majority of our leases are operating leases. We account for leases in accordance with Accounting Standard Codification(“ASC”)Topic 842, Leases, which we adopted on January 1, 2019 using the modified retrospective method. See Note 5 for further details.
Revenue recognition - The majority of our revenue is derived from long-term contracts that can span several years. We account for revenuein accordance with ASC Topic 606, Revenue from Contracts with Customers, which we adopted on January 1, 2018, using the modifiedretrospective method. See Note 6 for further details.
Contract costs to obtain a contract - Our incremental direct costs of obtaining a contract are deferred and amortized over the period ofcontract performance or a longer period, generally the estimated life of the customer relationship, if renewals are expected and the renewalcommission is not commensurate with the initial commission. We classify deferred commissions as current or noncurrent based on the timingof when we expect to recognize the expense. The current and noncurrent portions of deferred commissions are included in other currentassets and other assets, respectively, in our consolidated balance sheets.
Amortization of deferred commissions is included in selling, general and administrative expenses in our consolidated statements of income.
Cash equivalents - Cash equivalents are highly-liquid, short-term investments with original maturities of three months or less from their dateof purchase.
Trade receivables, net of allowances - An allowance for doubtful accounts is provided on receivables equal to the estimated uncollectibleamounts and is calculated based on loss rates from historical data. We develop loss-rate statistics on the basis of the amount written off overthe life of the receivable and adjust these historical credit loss trends for forward-looking factors specific to the debtors and the economicenvironment to determine lifetime expected losses.
Inventories - Inventories are stated at the lower of cost or net realizable value, except as it relates to inventory measured using the last-in,first-out (“LIFO”) method, for which the inventories are stated at the lower of cost or market. Inventory costs include those costs directlyattributable to products, including all manufacturing overhead, but excluding costs to distribute. Cost for a significant portion of the U.S.domiciled inventories is determined on the LIFO method. The first-in, first-out (“FIFO”) or weighted average methods are used to determinethe cost for the remaining inventories. Write-down of inventories is recorded when the net realizable value of inventories is lower than theirnet book value.
Property, plant and equipment - Property, plant, and equipment is recorded at cost. Depreciation is principally provided on the straight-linebasis over the estimated useful lives of the assets (vessels - 10 to 30 years; buildings - 10 to 50 years; and machinery and equipment - 3 to20 years). Gains and losses are realized upon the sale or retirement of assets and are recorded in other income (expense), net on ourconsolidated statements of income. Maintenance and repair costs are expensed as incurred. Expenditures that extend the useful lives ofproperty, plant and equipment are capitalized and depreciated over the estimated new remaining life of the asset.
88

Impairment of property, plant and equipment - Property, plant and equipment are reviewed for impairment whenever events or changes incircumstances indicate the carrying value of the long-lived asset may not be recoverable. The carrying value of an asset group is notrecoverable if it exceeds the sum of the undiscounted cash flows expected to result from the use and eventual disposition of the asset. If it isdetermined that an impairment loss has occurred, the impairment loss is measured as the amount by which the carrying value of the long-lived asset exceeds its fair value.
Long-lived assets classified as held for sale are reported at the lower of carrying value or fair value less cost to sell.
Goodwill - Goodwill is not subject to amortization but is tested for impairment on an annual basis (or more frequently if impairment indicatorsarise) by comparing the estimated fair value of each reporting unit to its carrying value, including goodwill. A reporting unit is defined as anoperating segment or one level below the operating segment. We have established October 31 as the date of our annual test for impairmentof goodwill. Reporting units with goodwill are tested for impairment using a quantitative impairment test known as the income approach,which estimates fair value by discounting each reporting unit’s estimated future cash flows using a weighted-average cost of capital thatreflects current market conditions and the risk profile of the reporting unit. To arrive at our future cash flows, we use estimates of economicand market assumptions, including growth rates in revenues, costs, estimates of future expected changes in operating margins, tax rates andcash expenditures. Future revenues are also adjusted to match changes in our business strategy. If the fair value of the reporting unit is lessthan its carrying amount as a result of this method, then an impairment loss is recorded.
A lower fair value estimate in the future for any of our reporting units could result in goodwill impairments. Factors that could trigger a lowerfair value estimate include sustained price declines of the reporting unit’s products and services, cost increases, regulatory or politicalenvironment changes, changes in customer demand, and other changes in market conditions, which may affect certain market participantassumptions used in the discounted future cash flow model.
Intangible assets - Our acquired intangible assets are generally amortized on a straight-line basis over their estimated useful lives, whichgenerally range from 2 to 20 years. Our acquired intangible assets do not have indefinite lives. Intangible assets are reviewed for impairmentwhenever events or changes in circumstances indicate the carrying amount of the intangible asset may not be recoverable. The carryingamount of an intangible asset is not recoverable if it exceeds the sum of the undiscounted cash flows expected to result from the use andeventual disposition of the asset. If it is determined that an impairment loss has occurred, the loss is measured as the amount by which thecarrying amount of the intangible asset exceeds its fair value.
Capitalized software costs are recorded at cost. Capitalized software costs include purchases of software and internal and external costsincurred during the application development stage of software projects. These costs are amortized on a straight-line basis over the estimateduseful lives. For internal use software, the useful lives range from 3 to 10 years. For Internet website costs, the estimated useful lives do notexceed 3 years.
Research and development expense is expensed as incurred. Research and development expense includes improvement of existingproducts and services, design and development of new products and services and test of new technologies.
Debt instruments - Debt instruments include synthetic bonds, senior and private placement notes and other borrowings. Issuance fees andredemption premium on debt instruments are included in the cost of debt in the consolidated balance sheets, as an adjustment to thenominal amount of the debt. Loan origination costs for revolving credit facilities are recorded as an asset and amortized over the life of theunderlying debt.
Fair value measurements - Fair value is defined as the price that would be received to sell an asset or paid to transfer a liability (an exit price)in an orderly transaction between market participants at the reporting date. The fair value framework requires the categorization of assetsand liabilities measured at fair value into three levels based upon the assumptions (inputs) used to price the assets or liabilities, with theexception of certain assets and liabilities measured using the net asset value practical expedient, which are not required to be leveled. Level1 provides the most reliable measure of fair value, whereas Level 3 generally requires significant management judgment. The three levelsare defined as follows:
• Level 1: Unadjusted quoted prices in active markets for identical assets and liabilities.
• Level 2: Observable inputs other than quoted prices included in Level 1. For example, quoted prices for similar assets or liabilities inactive markets or quoted prices for identical assets or liabilities in inactive markets.
89

• Level 3: Unobservable inputs reflecting management’s own assumptions about the assumptions market participants would use inpricing the asset or liability.
Income taxes - Current income taxes are provided on income reported for financial statement purposes, adjusted for transactions that do notenter into the computation of income taxes payable in the same year. Deferred tax assets and liabilities are measured using enacted taxrates for the expected future tax consequences of temporary differences between the carrying amounts and the tax basis of assets andliabilities. A valuation allowance is established whenever management believes that it is more likely than not that deferred tax assets may notbe realizable.
Income taxes are not provided on our equity in undistributed earnings of foreign subsidiaries or affiliates to the extent we have determinedthat the earnings are indefinitely reinvested. Income taxes are provided on such earnings in the period in which we can no longer supportthat such earnings are indefinitely reinvested.
Tax benefits related to uncertain tax positions are recognized when it is more likely than not, based on the technical merits, that the positionwill be sustained upon examination.
We classify interest expense and penalties recognized on underpayments of income taxes as income tax expense.
Share-based compensation - The measurement of share-based compensation expense on restricted share awards and performance shareawards is based on the market price at the grant date and the number of shares awarded. We use Black-Scholes options pricing model tomeasure the fair value of stock options granted on or after January 1, 2017. The stock-based compensation expense for each award isrecognized ratably over the applicable service period or the period beginning at the start of the service period and ending when an employeebecomes eligible for retirement, after taking into account estimated forfeitures.
Earnings per ordinary share (“EPS”) - Basic EPS is computed using the weighted-average number of ordinary shares outstanding during theyear. We use the treasury stock method to compute diluted EPS which gives effect to the potential dilution of earnings that could haveoccurred if additional shares were issued for awards granted under our incentive compensation and stock plan. The treasury stock methodassumes proceeds that would be obtained upon exercise of awards granted under our incentive compensation and stock plan are used topurchase outstanding ordinary shares at the average market price during the period.
Foreign currency - Financial statements of operations for which the U.S. dollar is not the functional currency, and which are located in non-highly inflationary countries, are translated into U.S. dollars prior to consolidation. Assets and liabilities are translated at the exchange rate ineffect at the balance sheet date, while income statement accounts are translated at the average exchange rate for each period. For theseoperations, translation gains and losses are recorded as a component of accumulated other comprehensive income (loss) in stockholders’equity until the foreign entity is sold or liquidated. For operations in highly inflationary countries and where the local currency is not thefunctional currency, inventories, property, plant and equipment, and other non-current assets are converted to U.S. dollars at historicalexchange rates, and all gains or losses from conversion are included in net income. Foreign currency effects on cash, cash equivalents anddebt in highly inflationary economies are included in interest income or expense.
For certain committed and anticipated future cash flows and recognized assets and liabilities which are denominated in a foreign currency,we may choose to manage our risk against changes in the exchange rates, when compared against the functional currency, through theeconomic netting of exposures instead of derivative instruments. Cash outflows or liabilities in a foreign currency are matched against cashinflows or assets in the same currency, such that movements in exchange rates will result in offsetting gains or losses. Due to the inherentunpredictability of the timing of cash flows, gains and losses in the current period may be economically offset by gains and losses in a futureperiod. All gains and losses are recorded in our consolidated statements of income in the period in which they are incurred. Gains and lossesfrom the remeasurement of assets and liabilities are recognized in other income (expense), net.
During 2018, Argentina’s three year cumulative inflation rate exceeded 100% based on published inflation data, and effective July 1, 2018,Argentina’s currency was considered highly inflationary. Our local operations in Argentina use U.S. dollars as the functional currency andboth monetary and non-monetary assets and liabilities denominated in Argentina pesos were remeasured into U.S. dollars with gains andlosses resulting from foreign currency transactions included in current results of operations. This event did not have a material impact onTechnipFMC’s consolidated financial statements.
90

Derivative instruments - Derivatives are recognized on the consolidated balance sheets at fair value, with classification as current or non-current based upon the maturity of the derivative instrument. Changes in the fair value of derivative instruments are recorded in currentearnings or deferred in accumulated other comprehensive income (loss), depending on the type of hedging transaction and whether aderivative is designated as, and is effective as, a hedge. Each instrument is accounted for individually and assets and liabilities are not offset.
Hedge accounting is only applied when the derivative is deemed to be highly effective at offsetting changes in anticipated cash flows of thehedged item or transaction. Changes in fair value of derivatives that are designated as cash flow hedges are deferred in accumulated othercomprehensive income (loss) until the underlying transactions are recognized in earnings. At such time, related deferred hedging gains orlosses are recorded in earnings on the same line as the hedged item. Effectiveness is assessed at the inception of the hedge and on aquarterly basis. Effectiveness of forward contract cash flow hedges are assessed based solely on changes in fair value attributable to thechange in the spot rate. The change in the fair value of the contract related to the change in forward rates is excluded from the assessmentof hedge effectiveness. Changes in this excluded component of the derivative instrument, along with any ineffectiveness identified, arerecorded in earnings as incurred. We document our risk management strategy and hedge effectiveness at the inception of, and during theterm of, each hedge.
We also use forward contracts to hedge foreign currency assets and liabilities, for which we do not apply hedge accounting. The changes infair value of these contracts are recognized in other income (expense), net on our consolidated statements of income, as they occur andoffset gains or losses on the remeasurement of the related asset or liability.
Reclassifications - Certain prior-year amounts have been reclassified to conform to the current year’s presentation.
NOTE 2. BUSINESS COMBINATION AND OTHER TRANSACTIONS
On October 7, 2020, we signed a Memorandum of Understanding with McPhy Energy S.A. (“McPhy”), a leading manufacturer and supplier ofcarbon-free hydrogen production and distribution equipment, pursuant to which we will jointly work on technology development and projectimplementation. In October 2020, we subscribed to 638,297 shares for €15 million that represents 2.29% of McPhy’s capital. The investmentwas recorded at the fair value.
On December 30, 2019, we completed the acquisition of the remaining 50% interest in Technip Odebrecht PLSV CV (“TOP CV”). TOP CVwas formed as a joint venture between Technip SA and Ocyan SA to provide pipeline installation ships to Petroleo Brasileiro SA (“Petrobras”)for their work in oil and gas fields offshore Brazil with results reported in our Subsea segment using the equity method of accounting.Subsequent to this transaction the investment became a fully consolidated entity. In connection with the acquisition, we acquired $391.0million in assets, including two vessels valued at $335.2 million. In addition, we assumed $239.9 million of liabilities, including a $203.1million term loan. As a result of the acquisition, we recorded a net loss of $0.9 million. The net loss on acquisition was comprised of theimpairment charge of $84.2 million and a gain on bargain purchase of $83.3 million included within restructuring and other charges in ourconsolidated statement of income.
In February 2018, we signed an agreement with the Island Offshore Group to acquire a 51% stake in Island Offshore’s wholly-ownedsubsidiary, Island Offshore Subsea AS. Island Offshore Subsea AS provides RLWI project management and engineering services for plugand abandonment (“P&A”), riserless coiled tubing, and well completion operations. In connection with the acquisition of the controllinginterest, TechnipFMC and Island Offshore entered into a strategic cooperation agreement to deliver RLWI services on a worldwide basis,which also include TechnipFMC’s RLWI capabilities. Island Offshore Subsea AS has been rebranded to TIOS AS and is now the operatingunit for TechnipFMC’s RLWI activities worldwide. The acquisition was completed on April 18, 2018 for total cash consideration of $42.4million. As a result of the acquisition, we recorded a redeemable financial liability equal to the fair value of a written put option and a goodwillof $85.0 million.
On July 18, 2018, we entered into a share sale and purchase agreement with POC Holding Oy to sell 100% of the outstanding shares ofTechnip Offshore Finland Oy. The total pre-tax gain recognized in 2018 was $27.8 million.
Additional acquisitions, including purchased interests in equity method investments, during 2018 totaled $62.5 million in consideration paid.
91

NOTE 3. SEPARATION TRANSACTION
On August 26, 2019, we announced our intention to separate into two diversified pure-play market leaders – TechnipFMC, focused onsubsea and surface hydrocarbon production, and Technip Energies, focused on downstream engineering, procurement, and constructionproject execution. Due to the COVID-19 pandemic, a significant decline in commodity prices, and the heightened volatility in global equitymarkets, on March 15, 2020, we announced the postponement of the completion of the transaction until the markets sufficiently recover. OnJanuary 7, 2021, we announced the resumption of activity toward completion of the transaction based on increased clarity in the marketoutlook and our demonstrated ability to successfully execute projects.
On February 16, 2021, we completed the separation of the Technip Energies business segment. The transaction was structured as a spin-off(the “Spin-off”), which occurred by way of a pro rata dividend (the “Distribution”) to our shareholders of 50.1 percent of the outstanding sharesin Technip Energies N.V. Each of our shareholders received one ordinary share of Technip Energies N.V. for every five ordinary shares ofTechnipFMC held at 5:00 p.m., New York City time on the record date, February 17, 2021. Technip Energies N.V. is now an independentpublic company and its shares trade under the ticker symbol “TE” on the Euronext Paris stock exchange.
In connection with the Spin-off, on January 7, 2021, Bpifrance Participations SA (“BPI”), which has been one of our substantial shareholderssince 2009, entered into a share purchase agreement with us (the “Share Purchase Agreement”) pursuant to which BPI agreed to purchasea portion of our retained stake in Technip Energies N.V. (the “BPI Investment”) for $200.0 million (the “Purchase Price”). On February 25,2021, BPI paid $200.0 million in connection with the Share Purchase Agreement. The Purchase Price is subject to adjustment, and BPI’sownership stake will be determined based upon a thirty day volume-weighted average price of Technip Energies N.V.’s shares (with BPI’sownership collared between an 11.82 percentage floor and a 17.25 percentage cap), less a six percent discount. The BPI Investment issubject to customary conditions and regulatory approval. We intend to significantly reduce our shareholding in Technip Energies N.V. over the18 months following the Spin-off, including in connection with the sale of shares to BPI pursuant to the BPI Investment.
Beginning in the first quarter of 2021, Technip Energies’ historical financial results for periods prior to the Distribution will be reflected in ourconsolidated financial statements as discontinued operations, as the Spin-off represented a strategic shift that will have a major impact to ouroperations and consolidated financial statements. Following the completion of the Spin-off, we elected to apply a fair value option to accountfor our equity method investment in Technip Energies N.V.
During the years ended December 31, 2020 and 2019, we incurred $39.5 million and $72.1 million of separation costs associated with theSpin-off transaction, respectively.
NOTE 4. NEW ACCOUNTING STANDARDS
Recently Adopted Accounting Standards under GAAP
Effective January 1, 2020, we adopted Accounting Standards Update (“ASU”) No. 2018-13, “Fair Value Measurement (Topic 820): DisclosureFramework—Changes to the Disclosure Requirements for Fair Value Measurement.” This update modifies the disclosure requirement on fairvalue measurements in Topic 820. The amendments on changes in unrealized gains and losses, the range and weighted average ofsignificant unobservable inputs used to develop Level 3 fair value measurements, and the narrative description of measurement uncertaintyshould be applied prospectively. The adoption of this update concerns presentation and disclosure only as it relates to our consolidatedfinancial statements. See Note 24 for our fair value measurements disclosure.
Effective January 1, 2020, we adopted ASU No. 2018-15, “Intangibles—Goodwill and Other—Internal-Use Software (Subtopic 350-40):Customer’s Accounting for Implementation Costs Incurred in a Cloud Computing Arrangement That Is a Service Contract (a consensus ofthe FASB Emerging Issues Task Force).” This update requires that the implementation costs incurred in a cloud computing arrangementunder a service contract are deferred, not capitalized. The adoption of this update did not have a material impact on our consolidatedfinancial statements.
92

Effective January 1, 2020, we adopted ASU No. 2018-18, “Collaborative Arrangements (Topic 808)—Clarifying the Interaction between Topic808 and Topic 606.” This update clarifies the interaction between the guidance for certain collaborative arrangements and the RevenueRecognition financial accounting and reporting standard. The adoption of this update concerns presentation and disclosure only with nomaterial impact to our consolidated financial statements.
Effective January 1, 2020, we adopted ASU No. 2019-04, “Codification Improvements to
• Topic 326, Financial Instruments—Credit Losses;
• Topic 815, Derivatives and Hedging; and
• Topic 825, Financial Instruments.”
The update clarifies and improves areas of guidance related to the recently issued standards including
• ASU No. 2016-01, “Financial Instruments—Overall (Subtopic 825-10): Recognition and Measurement of Financial Assets andLiabilities”;
• ASU No. 2016-13, “Financial Instruments—Credit Losses (Topic 326): Measurement of Credit Losses on Financial Instruments.”;and
• ASU No. 2017-12, “Derivatives and Hedging (Topic 815): Targeted Improvements to Accounting for Hedging Activities.”
The adoption of this update concerns presentation and disclosure only with no material impact to our consolidated financial statements.
Adoption of ASU No. 2016-13 “Financial Instruments—Credit Losses (Topic 326): Measurement of Credit Losses on Financial Instruments
Effective January 1, 2020, we adopted ASU No. 2016-13, “Financial Instruments—Credit Losses (Topic 326): Measurement of Credit Losseson Financial Instruments.” This ASU introduces a new model for recognizing credit losses on financial instruments based on an estimate ofcurrent expected credit losses. The guidance applies to (1) loans, accounts receivable, trade receivables, and other financial assetsmeasured at amortized cost, (2) loan commitments and other off-balance sheet credit exposures, (3) debt securities and other financialassets measured at fair value through other comprehensive income, and (4) beneficial interests in securitized financial assets.
In June 2016, the Financial Accounting Standards Board (“FASB”) issued an update of the ASU to provide a practical expedient for transitionand targeted improvements.We adopted Topic 326 using a modified retrospective transition method through a cumulative-effect adjustment to beginning retainedearnings in the period of adoption. The effect of adopting Topic 326 was an increase in accumulated deficit of $7.8 million, which includes a$2.1 million increase in noncurrent deferred tax assets, with a corresponding decrease in trade receivables, loans, and debt notes receivable.
Financial assets at amortized cost include trade receivables, loans issued to third or related parties, and held to maturity debt securities.These financial assets were presented under other current assets or other assets, as applicable. Contract assets are subject to the creditlosses standard per revenue recognition standard.
Trade receivables and contract assets constitute a homogeneous portfolio, and therefore, to measure the expected credit losses, tradereceivables and contract assets have been grouped together. The contract assets relate to unbilled work in progress and have substantiallythe same risk characteristics as the trade receivables for the same types of contracts. We have therefore concluded that the expected lossrates for trade receivables are a reasonable approximation of the loss rates for the contract assets.
93

The following table summarizes the balances of financial assets and non-financial assets at amortized cost as of January 1, 2020:
(In millions)As reported as of
December 31, 2019 Impact of ASC 326Balance as of
January 1, 2020Trade receivables, net $ 2,287.1 $ (3.8) $ 2,283.3 Loans receivable, net 138.5 (1.5) 137.0 Security deposits and other, net 36.6 (1.0) 35.6
Held-to-maturityDebt securities at amortized cost 71.9 (1.1) 70.8
Total financial assets $ 2,534.1 $ (7.4) $ 2,526.7
Non-financial assetsContract assets, net $ 1,520.0 $ (2.5) $ 1,517.5
We manage our receivables portfolios using published default risk as a key credit quality indicator for our loans and receivables. Our loansreceivable and security deposits were related to sales of long-lived assets or businesses, loans to related parties for capital expenditurepurposes, or security deposits for lease arrangements.
We manage our held-to-maturity debt securities using published credit ratings as a key credit quality indicator as our held-to-maturity debtsecurities consist of government bonds.
The table below summarizes the amortized cost basis of financial assets by years of origination and credit quality. The key credit qualityindicator is updated as of December 31, 2020.
(In millions) Year of originationBalance as of
December 31, 2020Loans receivables, security deposits and other
Moody’s rating Ba2 2019 $ 133.0
Debt securities at amortized costMoody’s rating B3 2019 23.7
Total financial assets $ 156.7
Credit Losses
For contract assets and trade receivables, we have elected to calculate an expected credit loss based on loss rates from historical data. Wedevelop loss-rate statistics on the basis of the amount written off over the life of the financial assets and contract assets and adjust thesehistorical credit loss trends for forward-looking factors specific to the debtors and the economic environment to determine lifetime expectedlosses. For short-term notes receivable an expected credit loss is calculated assuming the maximum possible loss in the event of a default(that is, the loan is fully drawn and no amount is recovered). Management established a probability of default based on the counterparty’scredit risk as determined by external credit rating agencies and the maximum loss given default (average recovery rate of sovereign bondissuers as published by credit rating agencies). Based on these factors we determine the expected credit loss for our short-term loansreceivable.
For held-to-maturity debt securities at amortized cost, we evaluate whether the debt securities are considered to have low credit risk at thereporting date using available, reasonable, and supportable information.
The table below shows the roll-forward of allowance for credit losses for the year ended December 31, 2020.
94

Balance as of December 31, 2020
(In millions)Trade
receivables Contract assetsLoans
receivableSecurity deposit
and otherHeld-to-maturitydebt securities
Beginning balance in allowance for credit losses $99.2 $5.0 $9.5 $1.6 $1.1Current period provision for expected credit losses 54.3 (0.2) (0.1) 0.9 (0.6)Write-offs charged against the allowance (46.9) — — — — Recoveries 2.3 (3.8) (0.9) (1.4) —
Ending balance in the allowance for credit losses $ 108.9 $ 1.0 $ 8.5 $ 1.1 $ 0.5
Other than certain trade receivables due in one year or less, we do not have any financial assets that are past due or are on non-accrualstatus.
Recently Issued Accounting Standards under GAAP
In August 2018, the FASB issued ASU No. 2018-14, “Compensation—Retirement Benefits—Defined Benefit Plans—General (Subtopic 715-20): Disclosure Framework—Changes to the Disclosure Requirements for Defined Benefit Plans.” This update amends ASC 715 to add,remove, and clarify disclosure requirements related to defined benefit pension and other post-retirement plans. The amendments in thisupdate are required to be adopted retrospectively. We adopted this amendment as of January 1, 2021. The adoption of this update did nothave a material impact on our consolidated financial statements.
In December 2019, the FASB issued ASU No. 2019-12, “Income Taxes to Topic 740—Simplifying the Accounting for Income Taxes.” Theamendments simplify the accounting for income taxes by removing certain exceptions to the general principles in Topic 740. This update alsoimproves and simplifies areas of generally accepted accounting principles (GAAP) for which costs and complexity can be reduced whilemaintaining or improving the usefulness of the information provided to users of financial statements. We adopted this amendment as ofJanuary 1, 2021. The adoption of this update did not have a material impact on our consolidated financial statements.
In January 2020, the FASB issued ASU No. 2020-01, "Investments—Equity Securities (Topic 321),” “Investments—Equity Method and JointVentures (Topic 323),” and “Derivatives and Hedging (Topic 815)—Clarifying the Interactions between Topic 321, Topic 323, and Topic815,”and made targeted improvements to address certain aspects of accounting for financial instruments. This update clarifies that acompany should consider observable transactions that require a company to either apply or discontinue the equity method of accountingunder Topic 323, Investments—Equity Method and Joint Ventures, for the purposes of applying the measurement alternative in accordancewith Topic 321 immediately before applying or upon discontinuing the equity method. The new ASU also clarifies that, when determining theaccounting for certain forward contracts and purchased options, a company should not consider whether underlying securities would beaccounted for under the equity method or fair value option upon settlement or exercise. We adopted this amendment as of January 1, 2021.The adoption of this update did not have a material impact on our consolidated financial statements.
In March 2020, the FASB issued ASU No. 2020-04, “Facilitation of the Effects of Reference Rate Reform on Financial Reporting (Topic 848),”The amendments in this update apply only to contracts, hedging relationships, and other transactions that reference LIBOR or anotherreference rate expected to be discontinued because of reference rate reform. The expedients and exceptions provided by the amendmentsdo not apply to contract modifications made and hedging relationships entered into or evaluated after December 31, 2022, except forhedging relationships existing as of December 31, 2022, that an entity has elected certain optional expedients for and that are retainedthrough the end of the hedging relationship. The amendments in this update are effective as of March 12, 2020 through December 31, 2022.The adoption of this update is not expected to have a material impact on our consolidated financial statements.
NOTE 5. LEASES
Lessee Arrangements
We lease real estate, including land, buildings and warehouses, machinery/equipment, vessels, vehicles, and various types of manufacturingand data processing equipment, from a lessee perspective. Leases of real estate generally provide for payment of property taxes, insurance,and repairs by us. Substantially all our leases are classified as operating leases.
95

We determine if an arrangement is a lease at inception by assessing whether an identified asset exists and if we have the right to control theuse of the identified asset. Operating leases are included in Operating lease right-of-use assets, Operating lease liabilities (current), andOperating lease liabilities (non-current) in our consolidated balance sheets. Right-of-use assets represent our right to use an underlying assetfor the lease term and lease liabilities represent our obligation to make lease payments arising from the lease. Operating lease right-of-useassets and liabilities are recognized at the commencement date based on the present value of the remaining lease payments over the leaseterm. With the exception of rare cases in which the implicit rate is readily determinable, we use our incremental borrowing rate based on theinformation available at the commencement date in determining the present value of lease payments. The Operating lease right-of-useassets also includes any lease prepayments made and excludes lease incentives we received from the lessor. Lease cost for leasepayments is recognized on a straight-line basis over the lease term. Several of our leases provide for certain guarantees of residual value.We estimate and include in the determination of lease payments any amount probable of being owed under these residual value guarantees.
Lease terms within our lessee arrangements may include options to extend/renew or terminate the lease and/or purchase the underlyingasset when it is reasonably certain that we will exercise that option. TechnipFMC applies a portfolio approach by asset class to determinelease term renewals. The leases within these portfolios are categorized by asset class and have initial lease terms that vary depending onthe asset class. The renewal terms range from 60 days to 5 years for asset classes such as temporary residential housing, forklifts, vehicles,vessels, office and IT equipment, and tool rentals, and up to 15 years or more for commercial real estate. Short-term leases with an initialterm of 12 months or less that do not include a purchase option are not recorded on the balance sheet. Lease costs for short-term leases arerecognized on a straight-line basis over the lease term and amounts related to short-term leases are disclosed within our financialstatements.
TechnipFMC has variable lease payments, including adjustments to lease payments based on an index or rate (such as the Consumer PriceIndex), fair value adjustments to lease payments, and common area maintenance, real estate taxes, and insurance payments in triple-netreal estate leases. Variable lease payments that depend on an index or a rate (such as the Consumer Price Index or a market interest rate)are included when measuring consideration within our lease arrangements using the payments’ base rate or index. Variable payments thatdo not depend on an index or rate are recognized in the consolidated income statements and are disclosed as “variable lease costs” in theperiod they are incurred.
We adopted the practical expedient to not separate lease and non-lease components for all asset classes except for vessels, which havesignificant non-lease components.
TechnipFMC currently subleases certain of its leased real estate and vessels to third parties.
The following table is a summary of the Company’s components of net lease cost for the years ended December 31, 2020 and 2019:
Year Ended December 31,(In millions) 2020 2019Operating lease costs including variable costs $ 312.1 $ 362.4 Short-term lease costs 13.7 20.8 Less: sublease income 7.3 8.9
Net lease cost $ 318.5 $ 374.3
Supplemental cash flow information related to leases for the years ended December 31, 2020 and 2019 is as follows:
96

Year Ended December 31,(In millions) 2020 2019Cash paid for amounts included in the measurement of lease liabilitiesOperating cash flows from operating leases $ 314.2 $ 384.7
Right-of-use assets obtained in exchange for lease liabilitiesOperating leases $ 535.9 $ 125.4
Supplemental balance sheet information related to leases as of December 31, 2020 and 2019 is as follows:
December 31,(In millions, except lease term and discount rate) 2020 2019Weighted average remaining lease termOperating leases 11.8 years 7.5 yearsFinance leases 0.6 years $ —
Weighted average discount rateOperating leases 5.1 % 4.4 %Finance leases 2.1 % — %
Maturities of operating lease liabilities as of December 31, 2020 are as follows:
(In millions) Operating Leases2021 $ 252.5 2022 191.5 2023 137.1 2024 117.6 2025 79.2 Thereafter 471.4 Total lease payments 1,249.3 Less: Imputed interest 121.3
Total lease liabilities $ 1,128.0
Note: For leases that commenced prior to 2019, minimum lease payments exclude payments to landlords for real estate taxes and common area maintenance.
(a) Calculated using the interest rate for each lease.
(b) Includes the current portion of $247.0 million for operating leases.
In December 2020, TechnipFMC sold its leased office building at Gremp Campus in Houston, Texas on behalf of the existing lessor to OakStreet Real Estate Capital, LLC (“New Lessor”). TechnipFMC also sold the land underneath Gremp Campus which the Company owned tothe New Lessor. TechnipFMC concurrently executed a new lease agreement for both land and the office building (collectively, “GrempCampus Properties”) with New Lessor.
The new lease agreement of Gremp Campus Properties commenced on December 11, 2020 and the initial term ends on December 31,2042. TechnipFMC has 4 renewal periods of 10 years each after the expiration of initial term. At inception of the new lease agreement,TechnipFMC did not consider any renewal period as probable of being exercised.
TechnipFMC paid net cash of $1.8 million in connection with the new lease agreement, and recognized a loss of $3.1 million fromderecognition of the existing lease. There was no gain or loss from the sale of the land at Gremp Campus.
(a)
(b)
97

Lessor Arrangements
We lease real estate including land, buildings and warehouses, machinery/equipment, and vessels from a lessor perspective. We determineif an arrangement is a lease at inception by assessing whether an identified asset exists and if the customer has the right to control the use ofthe identified asset. We use our implicit rate for our lessor arrangements. We have elected the practical expedient available for lessors to notseparate lease and non-lease components for vessels. If the non-lease component is predominant in our contracts, we account for thecontracts under the revenue recognition guidance in ASU 2014-09, “Revenue from Contracts with Customers” (Topic 606). If the leasecomponent is predominant in our contracts, we account for the contracts under the lease guidance in Topic 842. We estimate the amount weexpect to derive from the underlying asset following the end of the lease term based on remaining economic life. Our lessor arrangementsgenerally do not include any residual value guarantees. We recognize lessee payments of lessor costs such as taxes and insurance on a netbasis when the lessee pays those costs directly to a third party or when the amount paid by the lessee is not readily determinable.
The following table is a summary of components of lease revenue for the years ended December 31, 2020 and 2019:
Year Ended December 31,(In millions) 2020 2019Operating lease revenue including variable revenue $ 142.0 $ 266.5
The following table is a summary of the maturity analysis of the undiscounted cash flows to be received on an annual basis for each of thefirst five years, and a total of the amounts for the remaining years:
(In millions) Operating Leases2021 $ 21.4 2022 14.3 2023 1.0 2024 — 2025 — Thereafter —
Total undiscounted cash flows $ 36.7
NOTE 6. REVENUE
The majority of our revenue is from long-term contracts associated with designing and manufacturing products and systems and providingservices to customers involved in exploration and production of crude oil and natural gas. On January 1, 2018, we adopted Topic 606 ofGAAP using the modified retrospective method applied to those contracts that were not completed as of January 1, 2018 resulting in a $91.5million reduction to retained earnings.
Significant Revenue Recognition Criteria Explained
Allocation of transaction price to performance obligations - A contract’s transaction price is allocated to each distinct performance obligationand recognized as revenue, when, or as, the performance obligation is satisfied. To determine the proper revenue recognition method, weevaluate whether two or more contracts should be combined and accounted for as one single contract and whether the combined or singlecontract should be accounted for as more than one performance obligation. This evaluation requires significant judgment; some of ourcontracts have a single performance obligation as the promise to transfer the individual goods or services is not separately identifiable fromother promises in the contracts and, therefore, not distinct.
98

Variable consideration - Due to the nature of the work required to be performed on many of our performance obligations, the estimation oftotal revenue and cost at completion is complex, subject to many variables and requires significant judgment. It is common for our long-termcontracts to contain variable considerations that can either increase or decrease the transaction price. Variability in the transaction pricearises primarily due to liquidated damages. We consider our experience with similar transactions and expectations regarding the contract inestimating the amount of variable consideration to which we will be entitled, and determining whether the estimated variable considerationshould be constrained. We include estimated amounts in the transaction price to the extent it is probable that a significant reversal ofcumulative revenue recognized will not occur when the uncertainty associated with the variable consideration is resolved. Our estimates ofvariable consideration are based largely on an assessment of our anticipated performance and all information (historical, current andforecasted) that is reasonably available to us.
Payment terms - Progress billings are generally issued upon completion of certain phases of the work as stipulated in the contract. Paymentterms may either be fixed, lump-sum or driven by time and materials (e.g., daily or hourly rates, plus materials). Because typically thecustomer retains a small portion of the contract price until completion of the contract, our contracts generally result in revenue recognized inexcess of billings which we present as contract assets on the balance sheet. Amounts billed and due from our customers are classified asreceivables in the consolidated balance sheets. The portion of the payments retained by the customer until final contract settlement is notconsidered a significant financing component because the intent is to protect the customer. For some contracts, we may be entitled toreceive an advance payment. We recognize a liability for these advance payments in excess of revenue recognized and present it ascontract liabilities in the consolidated balance sheets. The advance payment typically is not considered a significant financing componentbecause it is used to meet working capital demands that can be higher in the early stages of a contract and to protect us from the other partyfailing to adequately complete some or all of its obligations under the contract.
Warranty - Certain contracts include an assurance-type warranty clause, typically between 18 to 36 months, to guarantee that the productscomply with agreed specifications. A service-type warranty may also be provided to the customer; in such a case, management allocates aportion of the transaction price to the warranty based on the estimated stand-alone selling price of the service-type warranty.
Revenue recognized over time - Our performance obligations are satisfied over time as work progresses or at a point in time. Revenue fromproducts and services transferred to customers over time accounted for approximately 86.0%, 81.7% and 82.4% of our revenue for the yearsended December 31, 2020, 2019 and 2018, respectively. Typically, revenue is recognized over time using an input measure (e.g., costsincurred to date relative to total estimated costs at completion) to measure progress.
Cost-to-cost method - For our long-term contracts, because of control transferring over time, revenue is recognized based on the extent ofprogress towards completion of the performance obligation. We generally use the cost-to-cost measure of progress for our contracts becauseit best depicts the transfer of control to the customer which occurs as we incur costs on our contracts. Under the cost-to-cost measure ofprogress, the extent of progress towards completion is measured based on the ratio of costs incurred to date to the total estimated costs atcompletion of the performance obligation. Revenues, including estimated fees or profits, are recorded proportionally as costs are incurred.Any expected losses on construction-type contracts in progress are charged to earnings, in total, in the period the losses are identified.
Right to invoice practical expedient - The right-to-invoice practical expedient can be applied to a performance obligation satisfied over time ifwe have a right to invoice the customer for an amount that corresponds directly with the value transferred to the customer for ourperformance completed to date. When this practical expedient is used, we do not estimate variable consideration at the inception of thecontract to determine the transaction price or for disclosure purposes. We have contracts which have payment terms dictated by daily orhourly rates where some contracts may have mixed pricing terms which include a fixed fee portion. For contracts in which we charge thecustomer a fixed rate based on the time or materials spent during the project that correspond to the value transferred to the customer, werecognize revenue in the amount to which we have the right to invoice.
99

Contract modifications - Contracts are often modified to account for changes in contract specifications and requirements. We considercontract modifications to exist when the modification either creates new, or changes the existing, enforceable rights and obligations. Most ofour contract modifications are for goods or services that are not distinct from the existing contract due to the significant integration serviceprovided in the context of the contract and are accounted for as if they were part of that existing contract. The effect of a contract modificationon the transaction price and our measure of progress for the performance obligation to which it relates is recognized as an adjustment torevenue (either as an increase in or a reduction of revenue) on a cumulative catch-up basis.
Revenue Recognition by Segment
The following is a description of principal activities separated by reportable segments from which TechnipFMC generates its revenue. SeeNote 7 for more detailed information about reportable segments.
Subsea
Our Subsea segment manufactures and designs products and systems, performs engineering, procurement and project management andprovides services used by oil and gas companies involved in offshore exploration and production of crude oil and natural gas. Systems andservices may be sold separately or as combined integrated systems and services offered within one contract. Many of the systems andproducts TechnipFMC supplies for subsea applications are highly engineered to meet the unique demands of our customers’ field propertiesand are typically ordered one to two years prior to installation. We often receive advance payments and progress billings from our customersin order to fund initial development and working capital requirements.
Under Subsea engineering, procurement, construction and installation contracts, revenue is principally generated from long-term contractswith customers. We have determined these contracts generally have one performance obligation as the delivered product is highlycustomized to customer and field specifications. We generally recognize revenue over time for such contracts as the customized products donot have an alternative use for TechnipFMC and we have an enforceable right to payment plus a reasonable profit for performancecompleted to date.
Our Subsea segment also performs an array of subsea services including (i) installation services, (ii) asset management services (iii) productoptimization, (iv) inspection, maintenance and repair services, and (v) well access and intervention services, where revenue is generallyearned through the execution of either installation-type or maintenance-type contracts. For either contract-type, management has determinedthat the performance of the service generally represents one single performance obligation. We have determined that revenue from thesecontracts is recognized over time as the customer simultaneously receives and consumes the benefit of the services.
Technip Energies
Our Technip Energies segment designs and builds onshore facilities related to the production, treatment, transformation and transportation ofhydrocarbons and renewable feedstock; and designs, manufactures and installs fixed and floating platforms for the offshore production andprocessing of oil and gas reserves.
Our onshore business combines the design, engineering, procurement, construction and project management of the entire range of onshorefacilities. Our onshore activity covers all types of onshore facilities related to the production, treatment and transportation of oil and gas, aswell as transformation with petrochemicals such as ethylene, polymers and fertilizers. Some of the onshore activities include thedevelopment of onshore fields, refining, natural gas treatment and liquefaction, and design and construction of hydrogen and synthesis gasproduction units.
Many of these contracts provide a combination of engineering, procurement, construction, project management and installation services,which may last several years. We have determined that contracts of this nature have generally one performance obligation. In thesecontracts, the final product is highly customized to the specifications of the field and the customer’s requirements. Therefore, the customerobtains control of the asset over time, and thus revenue is recognized over time.
Our offshore business combines the design, engineering, procurement, construction and project management within the entire range of fixedand floating offshore oil and gas facilities, many of which were the first of their kind, including the development of floating liquefied natural gas(“FLNG”) facilities. Similar to onshore contracts, contracts grouped under this segment provide a combination of services, which may lastseveral years.
100

We have determined that contracts of this nature have one performance obligation. In these contracts, the final product is highly customizedto the specifications of the field and the customer’s requirements. We have determined that the customer obtains control of the asset overtime, and thus revenue is recognized over time as the customized products do not have an alternative use for us and we have anenforceable right to payment plus reasonable profit for performance completed to date. Subsequent to the Spin-off, we operate under tworeporting segments: Subsea and Surface Technologies, for further details see Note 3 for further details.
Surface Technologies
Our Surface Technologies segment designs, manufactures and supplies technologically advanced wellhead systems and high pressurevalves and pumps used in stimulation activities for oilfield service companies and provides installation, flowback and other services forexploration and production companies.
We provide a full range of drilling, completion and production wellhead systems for both standard and custom-engineered applications.Under pressure control product contracts, we design and manufacture flowline products, under the Weco®/Chiksan® trademarks, articulatingfrac arm manifold trailers, well service pumps, compact valves and reciprocating pumps used in well completion and stimulation activities bymajor oilfield service companies. Performance obligations within these systems are satisfied either through delivery of a standardized productor equipment or the delivery of a customized product or equipment.
For contracts with a standardized product or equipment performance obligation, management has determined that because there is limitedcustomization to products sold within such contracts and the asset delivered can be resold to another customer, revenue should berecognized as of a point in time, upon transfer of control to the customer and after the customer acceptance provisions have been met.
For contracts with a customized product or equipment performance obligation, the revenue is recognized over time, as the manufacturing ofour product does not create an asset with an alternative use for us.
This segment also designs, manufactures and services measurement products globally. Contract-types include standard product orequipment and maintenance-type services where we have determined that each contract under this product line represents one performanceobligation.
Revenue from standard measurement equipment contracts is recognized at a point in time, while maintenance-type contracts are typicallypriced at a daily or hourly rate. We have determined that revenue for these contracts is recognized over time because the customersimultaneously receives and consumes the benefit of the services.
Disaggregation of Revenue
We disaggregate revenue by geographic location and contract type. The following table presents products and services revenue bygeography for each reportable segment for the years ended December 31, 2020, 2019 and 2018:
Reportable SegmentsYear Ended December 31,
2020 2019 2018
(In millions) Subsea Technip EnergiesSurface
Technologies Subsea Technip EnergiesSurface
Technologies Subsea Technip EnergiesSurface
TechnologiesEurope, Russia,Central Asia $ 1,641.9 $ 3,111.6 $ 188.2 $ 1,745.2 $ 2,813.1 $ 236.7 $ 1,528.1 $ 3,506.1 $ 227.7 Americas 1,957.7 982.6 373.1 1,770.0 766.2 732.1 1,721.5 365.1 865.5 Asia Pacific 753.2 1,094.3 123.4 659.9 1,152.5 189.3 532.9 1,236.1 123.2 Africa 893.9 884.4 45.8 824.8 526.0 61.1 758.1 252.7 57.9 Middle East 169.8 447.1 241.6 407.1 1,011.0 247.6 181.2 760.7 213.4 Total products andservices revenue $ 5,416.5 $ 6,520.0 $ 972.1 $ 5,407.0 $ 6,268.8 $ 1,466.8 $ 4,721.8 $ 6,120.7 $ 1,487.7
101

The following table represents revenue by contract type for each reportable segment for the years ended December 31, 2020, 2019 and2018:
Reportable SegmentsYear Ended December 31,
2020 2019 2018
(In millions) Subsea Technip EnergiesSurface
Technologies Subsea Technip EnergiesSurface
Technologies Subsea Technip EnergiesSurface
Technologies
Services $ 3,121.1 $ 6,436.9 $ 150.2 $ 3,244.5 $ 6,268.8 $ 276.4 $ 2,687.1 $ 6,120.7 $ 249.8 Products 2,295.4 83.1 821.9 2,162.5 — 1,190.4 2,034.7 — 1,237.9 Total products andservices revenue 5,416.5 6,520.0 972.1 5,407.0 6,268.8 1,466.8 4,721.8 6,120.7 1,487.7 Lease and other 54.9 — 87.1 116.0 — 150.5 118.2 — 104.5
Total revenue $ 5,471.4 $ 6,520.0 $ 1,059.2 $ 5,523.0 $ 6,268.8 $ 1,617.3 $ 4,840.0 $ 6,120.7 $ 1,592.2
(a) Represents revenue not subject to ASC Topic 606.
Contract Balances
The timing of revenue recognition, billings and cash collections results in billed accounts receivable, costs and estimated earnings in excessof billings on uncompleted contracts (contract assets), and billings in excess of costs and estimated earnings on uncompleted contracts(contract liabilities) in the consolidated balance sheets.
Contract Assets - Contract Assets include unbilled amounts typically resulting from sales under long-term contracts when revenue isrecognized over time and revenue recognized exceeds the amount billed to the customer, and right to payment is not just subject to thepassage of time. Amounts may not exceed their net realizable value. Costs and estimated earnings in excess of billings on uncompletedcontracts are generally classified as current.
Contract Liabilities - We sometimes receive advances or deposits from our customers, before revenue is recognized, resulting in contractliabilities.
The following table provides information about net contract assets (liabilities) as of December 31, 2020 and 2019:
December 31,(In millions) 2020 2019 $ change % changeContract assets $ 1,267.6 $ 1,520.0 $ (252.4) (16.6)Contract (liabilities) (4,736.1) (4,585.1) (151.0) (3.3)
Net contract liabilities $ (3,468.5) $ (3,065.1) $ (403.4) (13.2)
The decrease in our contract assets from December 31, 2019 to December 31, 2020 was primarily due to the timing of milestones.
The increase in our contract liabilities was primarily due to additional cash received, excluding amounts recognized as revenue during theperiod.
In order to determine revenue recognized in the period from contract liabilities, we first allocate revenue to the individual contract liabilitybalance outstanding at the beginning of the period until the revenue exceeds that balance. Any subsequent revenue we recognize increasescontract asset balance. Revenue recognized for the years ended December 31, 2020 and 2019 that were included in the contract liabilitiesbalance as of December 31, 2019 and 2018 was $1,267.5 million and $2,414.0 million, respectively.
In addition, net revenue recognized for the years ended December 31, 2020 and 2019 from our performance obligations satisfied in previousperiods had favorable impacts of $470.8 million and $1,176.5 million, respectively. This primarily relates to the changes in the estimate of thestage of completion that impacted revenue.
(a)
102

Transaction Price Allocated to the Remaining Unsatisfied Performance Obligations
Remaining unsatisfied performance obligations (“RUPO” or “order backlog”) represent the transaction price for products and services forwhich we have a material right, but work has not been performed. Transaction price of the order backlog includes the base transaction price,variable consideration and changes in transaction price. The order backlog table does not include contracts for which we recognize revenueat the amount to which we have the right to invoice for services performed. The transaction price of order backlog related to unfilled,confirmed customer orders is estimated at each reporting date. As of December 31, 2020, the aggregate amount of the transaction priceallocated to order backlog was $21,388.2 million. TechnipFMC expects to recognize revenue on approximately 51.2% of the order backlogthrough 2021 and 48.8% thereafter.
The following table details the order backlog for each business segment as of December 31, 2020:
(In millions) 2021 2022 ThereafterSubsea $ 3,585.4 $ 2,217.2 $ 1,073.4 Technip Energies 7,016.2 4,081.7 3,000.8 Surface Technologies 343.6 69.4 0.5
Total remaining unsatisfied performance obligations $ 10,945.2 $ 6,368.3 $ 4,074.7
NOTE 7. BUSINESS SEGMENTS
Management’s determination of our reporting segments was made on the basis of our strategic priorities within each segment and thedifferences in the products and services we provide, which corresponds to the manner in which our Chairman and Chief Executive Officer, asour chief operating decision maker, reviews and evaluates operating performance to make decisions about resources to be allocated to thesegment.
We report the results of operations in the following segments:
• Subsea - designs and manufactures products and systems, performs engineering, procurement and project management, and providesservices used by oil and gas companies involved in offshore exploration and production of crude oil and natural gas.
• Technip Energies - offers extensive experience, knowledge and unique project management capabilities in onshore and offshorehydrocarbon infrastructure businesses; it also combines its leading engineering and construction capabilities with its technological know-how, products and services to develop new solutions that will support the world’s energy transition.
• Surface Technologies - designs and manufactures products and systems and provides services used by oil and gas companies involvedin land and shallow water exploration and production of crude oil and natural gas; designs, manufactures, and supplies technologicallyadvanced high-pressure valves and fittings for oilfield service companies; and also provides flowback and well testing services.
Beginning in the first quarter of 2020, in anticipation of our separation transaction, we renamed our Onshore/Offshore segment to TechnipEnergies, which includes our Loading Systems business that was previously reported in the Surface Technologies segment and our processautomation business, Cybernetix, that was previously reported in the Subsea segment. Prior year information has not been restated due tothese businesses not being material. Subsequent to the Spin-off, we operate under two reporting segments: Subsea and SurfaceTechnologies, for further details see Note 3 for further details.
Segment operating profit (loss) is defined as total segment revenue less segment operating expenses. Income (loss) from equity methodinvestments is included in computing segment operating profit. The following items have been excluded in computing segment operatingprofit (loss): corporate staff expense, net interest income (expense) associated with corporate debt facilities, income taxes, and otherrevenue and other expense, net.
103

Information by business segment
Segment revenue and segment operating profit (loss) were as follows:
Year Ended December 31,(In millions) 2020 2019 2018Segment revenueSubsea $ 5,471.4 $ 5,523.0 $ 4,840.0 Technip Energies 6,520.0 6,268.8 6,120.7 Surface Technologies 1,059.2 1,617.3 1,592.2
Total revenue $ 13,050.6 $ 13,409.1 $ 12,552.9
Segment operating profit (loss)Subsea $ (2,815.5) $ (1,447.7) $ (1,529.5)Technip Energies 683.6 959.6 824.0 Surface Technologies (429.3) (656.1) 172.8
Total segment operating loss (2,561.2) (1,144.2) (532.7)
Corporate itemsImpairment, restructuring and other expenses (10.0) (17.4) (18.9)Separation costs (39.5) (72.1) — Merger transaction and integration costs — (31.2) (36.5)Legal expenses — (54.6) (280.0)Other corporate expenses (152.0) (218.1) (142.6)
Corporate expense (201.5) (393.4) (478.0)Interest income 56.6 116.5 121.4 Interest expense (349.6) (567.8) (482.3)Foreign exchange losses (28.8) (146.9) (116.5)
Total corporate items (523.3) (991.6) (955.4)
Loss before income taxes $ (3,084.5) $ (2,135.8) $ (1,488.1)
(a) Other corporate expenses primarily include corporate staff expenses, share-based compensation expenses, and other employee benefits.
(b) Includes amounts attributable to non-controlling interests.
During the year ended December 31, 2020, revenue from Arctic LNG exceeded 10% of our consolidated revenue. During the years endedDecember 31, 2019 and 2018, revenue from Yamal LNG exceeded 10% of our consolidated revenue.
Segment assets were as follows:
December 31,(In millions) 2020 2019Segment assetsSubsea $ 6,796.6 $ 10,824.2 Technip Energies 5,058.3 4,448.8 Surface Technologies 1,758.3 2,246.4 Total segment assets 13,613.2 17,519.4 Corporate 6,079.4 5,999.4
Total assets $ 19,692.6 $ 23,518.8
(a) Corporate includes cash, LIFO adjustments, deferred income tax balances, property, plant and equipment and intercompany eliminations not associated with a specificsegment, pension assets and the fair value of derivative financial instruments.
(a)
(b)
(a)
104

Other business segment information is as follows:
Capital ExpendituresDepreciation and
AmortizationResearch and
Development Expense Year Ended December 31, Year Ended December 31, Year Ended December 31,(In millions) 2020 2019 2018 2020 2019 2018 2020 2019 2018Subsea $ 213.6 $ 287.7 $ 223.2 $ 324.9 $ 345.6 $ 440.4 $ 66.5 $ 134.4 $ 145.2 Technip Energies 13.0 22.6 7.6 34.2 38.7 38.2 44.5 13.2 29.7 Surface Technologies 38.5 96.6 111.9 70.1 107.9 66.6 8.8 15.3 14.3 Corporate 26.7 47.5 25.4 18.0 17.4 5.2 — — —
Total $ 291.8 $ 454.4 $ 368.1 $ 447.2 $ 509.6 $ 550.4 $ 119.8 $ 162.9 $ 189.2
Information by geography
Sales by geography were identified based on the country where our products and services were delivered, and are as follows:
Year Ended December 31,(In millions) 2020 2019 2018RevenueRussia $ 2,451.5 $ 2,378.0 $ 2,773.3 United States 2,141.4 1,931.2 1,275.8 Norway 1,393.5 1,371.1 1,202.6 Brazil 698.8 1,099.7 1,478.7 United Kingdom 513.8 540.8 442.1 Angola 488.5 447.8 385.7 Egypt 445.9 177.6 13.2 Mozambique 391.4 166.1 116.2 India 386.4 518.0 214.0 Senegal 353.0 176.5 1.2 Vietnam 340.7 72.1 34.7 Israel 333.6 757.0 243.8 Guyana 330.1 7.2 7.6 Australia 320.8 372.8 926.6 Singapore 312.2 64.9 23.4 Indonesia 286.9 237.6 130.7 Malaysia 281.7 283.8 362.3 France 186.9 92.8 138.9 China 151.4 272.9 112.3 United Arab Emirates 147.9 327.2 460.3 All other countries 1,094.2 2,114.0 2,209.5
Total revenue $ 13,050.6 $ 13,409.1 $ 12,552.9
105

Long-lived assets by geography represent property, plant and equipment, net, and are as follows:
December 31,(In millions) 2020 2019Long-lived assetsUnited Kingdom $ 936.2 $ 957.1 United States 467.5 558.1 Netherlands 419.5 493.0 Norway 312.2 333.0 Brazil 260.0 313.2 All other countries 466.4 507.6
Total long-lived assets $ 2,861.8 $ 3,162.0
NOTE 8. EARNINGS (LOSS) PER SHARE
A reconciliation of the number of shares used for the basic and diluted earnings per share calculation was as follows:
Year Ended December 31,(In millions, except per share data) 2020 2019 2018Net loss attributable to TechnipFMC plc $ (3,287.6) $ (2,415.2) $ (1,921.6)
Weighted average number of shares outstanding 448.7 448.0 458.0 Dilutive effect of restricted stock units — — — Dilutive effect of performance shares — — —
Total shares and dilutive securities 448.7 448.0 458.0
Basic loss per share attributable to TechnipFMC plc $ (7.33) $ (5.39) $ (4.20)
Diluted loss per share attributable to TechnipFMC plc $ (7.33) $ (5.39) $ (4.20)
For the years ended December 31, 2020, 2019 and 2018, we incurred net losses; therefore, the impact of any incremental shares from ourshare-based compensation awards would be anti-dilutive. For the years ended December 31, 2020, 2019 and 2018, 3.8 million shares, 4.3million shares and 2.7 million shares, respectively, were anti-dilutive due to a net loss position.
Weighted average shares of the following share-based compensation awards were excluded from the calculation of diluted weighted averagenumber of shares where the assumed proceeds exceed the average market price from the calculation of diluted weighted average number ofshares, because their effect would be anti-dilutive:
Year Ended December 31,(millions of shares) 2020 2019 2018Share option awards 4.6 4.0 3.5 Restricted share units 1.8 — — Performance shares 1.9 1.6 —
Total 8.3 5.6 3.5
106

NOTE 9. INVENTORIES
Inventories consisted of the following:
December 31,(In millions) 2020 2019Raw materials $ 272.4 $ 347.5 Work in process 245.2 290.2 Finished goods 750.9 778.3
Inventories, net $ 1,268.5 $ 1,416.0
All amounts in the table above are reported net of obsolescence reserves of $162.8 million and $135.7 million as of December 31, 2020 and2019, respectively.
Net inventories accounted for under the LIFO method totaled $408.5 million and $386.6 million as of December 31, 2020 and 2019,respectively. The current replacement costs of LIFO inventories exceeded their recorded values by $11.6 million and $10.9 million as ofDecember 31, 2020 and 2019, respectively. There was no reduction to the base LIFO inventory in 2020.
NOTE 10. OTHER CURRENT ASSETS & OTHER CURRENT LIABILITIES
Other current assets consisted of the following:
December 31,(In millions) 2020 2019Value - added tax receivables $ 450.5 $ 395.2 Sundry receivables 179.3 69.6 Prepaid expenses 111.7 66.8 Other taxes receivables 90.1 100.7 Assets held for sale 47.3 25.8 Current financial assets at amortized cost 40.6 42.0 Held-to-maturity investments 24.2 49.7 Other 48.9 113.9
Total other current assets $ 992.6 $ 863.7
Other current liabilities consisted of the following:
December 31,(In millions) 2020 2019Warranty accruals and project contingencies 285.9 310.1 Value - added tax and other taxes payable $ 221.3 $ 240.4 Legal provisions 188.5 183.6 Redeemable financial liability 141.9 129.1 Social security liability 108.9 116.5 Provisions 75.5 86.6 Compensation accrual 54.3 89.6 Current portion of accrued pension and other post-retirement benefits 13.9 14.9 Liabilities classified as held for sale — 9.3 Other accrued liabilities 278.4 314.4
Total other current liabilities $ 1,368.6 $ 1,494.5
107

NOTE 11. WARRANTY OBLIGATIONS
Warranty obligations are included within “Other current liabilities” in our consolidated balance sheets as of December 31, 2020 and 2019. Areconciliation of warranty obligations for the years ended December 31, 2020 and 2019 is as follows:
Year Ended December 31,(In millions) 2020 2019Balance at beginning of period $ 193.5 $ 234.4 Warranty expenses 95.6 78.8 Adjustment to existing accruals (86.2) (57.5)Claims paid (28.1) (62.2)Balance at end of period $ 174.8 $ 193.5
NOTE 12. EQUITY METHOD INVESTMENTS
The equity method of accounting is used to account for investments in unconsolidated affiliates where we can have the ability to exertsignificant influence over the affiliates operating and financial policies.
For certain construction joint ventures, we use the proportionate consolidation method, whereby our proportionate share of each entity’sassets, liabilities, revenues, and expenses are included in the appropriate classifications in the consolidated financial statements. None of ourproportionate consolidation investments, individually or in the aggregate, are significant to our consolidated results for 2020, 2019, or 2018.
Our equity investments were as follows as of December 31, 2020 and 2019:
December 312020 2019
(In millions, except %) Percentage Owned Carrying ValueDofcon Brasil AS 50.0 % 234.7 167.4 Magma Global Limited 25.0 % 51.4 50.2 Serimax Holdings SAS 20.0 % 18.8 21.5 Other 54.0 61.3
Investments in equity affiliates $ 358.9 $ 300.4
Our major equity method investments are as follows:
Dofcon Brasil AS (“Dofcon”) - is an affiliated company in the form of a joint venture between TechnipFMC and DOF Subsea and was foundedin 2006. Dofcon provides Pipe-Laying Support Vessels (PLSVs) for work in oil and gas fields offshore Brazil. Dofcon is considered a VIEbecause it does not have sufficient equity to finance its activities without additional subordinated financial support from other parties. We arenot the primary beneficiary of the VIE. As such, we have accounted for our 50% investment using the equity method of accounting withresults reported in our Subsea segment.
Magma Global Limited (“Magma Global”) - is an affiliated company in the form of a collaborative agreement signed in 2018 between Technip-Coflexip UK Holdings Limited and Magma Global to develop hybrid flexible pipe for use in offshore applications. As part of the collaboration,TechnipFMC holds a minority stake. We have accounted for our 25% investment using the equity method investment of accounting withresults reported in our Subsea segment.
Serimax Holdings SAS (“Serimax”) - is an affiliated company in the form of a joint venture between TechnipFMC and Vallourec SA and wasfounded in 2016. Serimax is headquartered in Paris, France and provides rigid pipes welding services for work in oil and gas fields aroundthe world. We have accounted for our 20% investment using the equity method of accounting with results reported in our Subsea segment.
108

Our income from equity affiliates included in each of our reporting segments was as follows:
Year Ended December 31,(In millions) 2020 2019 2018Subsea $ 64.6 $ 59.8 $ 80.9 Technip Energies (1.6) 3.1 33.4
Income from equity affiliates $ 63.0 $ 62.9 $ 114.3
NOTE 13. RELATED PARTY TRANSACTIONS
Receivables, payables, revenues and expenses which are included in our consolidated financial statements for all transactions with relatedparties, defined as entities related to our directors and main shareholders as well as the partners of our consolidated joint ventures, were asfollows.
Trade receivables consisted of receivables due from following related parties:
December 31,(In millions) 2020 2019TP JGC Coral France SNC $ 38.1 $ 40.1 Equinor ASA 24.1 — TTSJV W.L.L. 14.9 22.4 Novarctic SNC 9.7 — Dofcon Navegacao 4.2 — Techdof Brasil AS 8.0 4.3 Storengy 6.1 3.1 Others 8.4 6.9
Total trade receivables $ 113.5 $ 76.8
TP JGC Coral France SNC, TTSJV W.L.L., Dofcon Navegacao, and Novarctic SNC are equity method affiliates. Techdof Brasil AS is a whollyowned subsidiary of Dofcon Brasil AS, our equity method affiliate. A member of our Board of Directors serves on the Board of Directors forStorengy. In October 2020, we added a new member of our Board of Directors who is an executive of Equinor ASA.
Trade payables consisted of payables due to following related parties:
December 31,(In millions) 2020 2019Chiyoda $ 14.2 $ 24.8 Nipigas 14.2 — Saipem 23.7 — JGC Corporation 1.9 15.1 IFP Energies nouvelles — 2.4 Dofcon Navegacao 1.5 2.1 Others 5.7 6.7
Total trade payables $ 61.2 $ 51.1
Chiyoda and JGC Corporation are joint venture partners on our Yamal project. Saipem and Nipigas are joint venture partners on our ArcticLNG project. A member of our Board of Directors serves as an executive officer of IFP Energies nouvelles until June 2020.
Additionally, we have note receivable balance of $40.3 million and $65.2 million as of December 31, 2020 and 2019, respectively. The notereceivable balance includes $37.6 million and $62.5 million with Dofcon Brasil AS as of December 31, 2020 and 2019, respectively. DofconBrasil AS is a VIE and accounted for as an equity method affiliate. These are included in other assets in our consolidated balance sheets.
Revenue consisted of amount from following related parties:
109

Year Ended December 31,(In millions) 2020 2019 2018TTSJV W.L.L. $ 47.2 $ 127.9 $ — TP JGC Coral France SNC 44.2 110.4 118.2 Equinor ASA 81.1 — — Equinor Brasil 38.5 — — Anadarko Petroleum Company — 67.1 124.8 TOP CV — 11.9 7.2 Storengy 10.7 8.8 — Novarctic SNC 10.7 0.4 — Dofcon Navegacao 3.4 8.4 2.9 Techdof Brasil AS 11.2 8.3 7.0 JGC Corporation — 6.7 — Others 27.2 29.7 33.2
Total revenue $ 274.2 $ 379.6 $ 293.3
A member of our Board of Directors (the “Director”) served on the Board of Directors of Anadarko Petroleum Company (“Anadarko”) untilAugust 2019. In August 2019, Anadarko was acquired by Occidental Petroleum Corporation (“Occidental”). As a result, the Director no longerserves as a member of the Board of Directors of Anadarko. The Director is not an officer or director of Occidental.
TOP CV was previously an equity method affiliate that became a fully consolidated subsidiary on December 30, 2019. See Note 2 for furtherdetails.
Equinor Brasil is a subsidiary of Equinor ASA in Brazil.
Expenses consisted of amounts to following related parties:
Year Ended December 31,(In millions) 2020 2019 2018Chiyoda $ 1.4 $ 25.1 $ 53.0 JGC Corporation 0.4 20.8 81.2 Arkema S.A. 5.3 18.9 2.6 Serimax Holdings SAS 0.4 17.7 0.1 Saipem 26.8 — — Nipigas 36.8 — — Magma Global Limited 14.0 7.3 3.0 TP JGC Coral France SNC — 5.0 — Jumbo Shipping 16.0 4.5 — Dofcon Navegacao 24.0 1.8 — Others 24.6 41.3 14.8
Total expenses $ 149.7 $ 142.4 $ 154.7
Serimax Holdings SAS and Magma Global Limited are equity method affiliates. Members of our Board of Directors serve on the Board ofDirectors for Arkema S.A. and Jumbo Shipping.
110

NOTE 14. PROPERTY, PLANT AND EQUIPMENT
Property, plant and equipment consisted of the following:
December 31,(In millions) 2020 2019Land and land improvements $ 88.4 $ 108.4 Buildings 611.0 626.9 Vessels 1,968.1 2,091.9 Machinery and equipment 1,919.4 1,930.6 Office fixtures and furniture 292.0 285.0 Construction in process 148.1 130.9 Other 243.5 277.1
5,270.5 5,450.8 Accumulated depreciation (2,408.7) (2,288.8)
Property, plant and equipment, net $ 2,861.8 $ 3,162.0
Depreciation expense was $323.5 million, $383.5 million and $367.8 million in 2020, 2019 and 2018, respectively. The amount of interestcost capitalized was not material for the years presented.
During 2020 and 2019, we determined the carrying amount of certain of our long-lived assets exceeded their fair value and recorded animpairment. See Note 19 for further details.
In December 2020, we declared our intent to sell our G1200 vessel as part of our overall strategy to optimize the profile and size of oursubsea fleet and classified it as an asset held for sale in Other Current Assets in our consolidated balance sheet. We also evaluated thevessel’s book value and recorded an impairment charge of $8.3 million within Impairment, Restructuring and Other Expenses in ourconsolidated statement of income for the year ended December 31, 2020.
In December 2019, we completed the sale of our G1201 vessel as part of our overall strategy to optimize the profile and size of our subseafleet. We recorded a net loss of $7.1 million, which is included in other income (expense), net in our consolidated statements of income.
NOTE 15. GOODWILL AND INTANGIBLE ASSETS
Goodwill - We record goodwill as the excess of the purchase price over the fair value of the net assets acquired in acquisitions accounted forunder the purchase method of accounting. We test goodwill for impairment annually as of October 31 of each year, or more frequently ifcircumstances indicate possible impairment. We identify a potential impairment by comparing the fair value of the applicable reporting unit(which is consistent with our business segments) to its net book value, including goodwill. If the net book value exceeds the fair value of thereporting unit, we measure the impairment by comparing the carrying value of the reporting unit to its fair value.
We test our goodwill for impairment by comparing the fair value of each of our reporting units to their net carrying value. Our impairmentanalysis is quantitative; however, it includes subjective estimates based on assumptions regarding future growth rates, interest rates andoperating expenses.
A lower fair value estimate in the future for any of our reporting units could result in goodwill impairments. Factors that could trigger a lowerfair value estimate include sustained price declines of the reporting unit’s products and services, cost increases, regulatory or politicalenvironment changes, changes in customer demand, and other changes in market conditions, which may affect certain market participantassumptions used in the discounted future cash flow model based on internal forecasts of revenues and expenses over a specified periodplus a terminal value (the income approach).
111

The income approach estimates fair value by discounting each reporting unit’s estimated future cash flows using a weighted-average cost ofcapital that reflects current market conditions and the risk profile of the reporting unit. To arrive at our future cash flows, we use estimates ofeconomic and market assumptions, including growth rates in revenues, costs, estimates of future expected changes in operating margins,tax rates and cash expenditures. Future revenues are also adjusted to match changes in our business strategy. We believe this approach isan appropriate valuation method. Under the market multiple approach, we determine the estimated fair value of each of our reporting units byapplying transaction multiples to each reporting unit’s projected EBITDA and then averaging that estimate with similar historical calculationsusing either a one, two or three year average. Our reporting unit valuations were determined primarily by utilizing the income approach andthe market multiple approach.
During the first quarter of 2020, triggering events were identified which led to performing interim goodwill impairment testing in our reportingunits as of March 31, 2020. These events included the COVID-19 pandemic breakout, commodity price declines, and a significant decreasein our market capitalization as well as those of our peers and customers. The fair value for our reporting units for the interim testing wasvalued using a market approach. An appropriate control premium was considered for each of the reporting units and applied to the output ofthe market approach. An interim impairment test during the first quarter of 2020 resulted in $2,747.5 million and $335.9 million of goodwillimpairment charges recorded in our Subsea and Surface Technologies segments, respectively.
During our annual impairment tests the following significant estimates were used by management in determining the fair values of reportingunits in order to test the goodwill at October 31:
2020 2019 2018Year of cash flows before terminal value 4 4 5Discount rates 15.0% 12.5% to 15.0% 12.0% to 13.0%EBITDA multiples N/A 6.0 - 8.5x 7.0 - 8.5x
During the year ended December 31, 2020, the significant estimates used by management in determining the fair value described aboverelate to Technip Energies reporting unit only. The fair value over carrying amount for our Technip Energies segment was in excess of 300%of its carrying amount at October 31, 2020.
Based on the impairment tests performed during the year ended December 31, 2020 we recorded $2,747.5 million and $335.9 million ofgoodwill impairment charges recorded in our Subsea and Surface Technologies reporting units, respectively. No goodwill impairment chargeswere recorded in our Technip Energies reporting unit.
During the year ended December 31, 2019, we recorded $1,321.9 million and $666.8 million of goodwill impairment charges in our Subseaand Surface Technologies reporting units, respectively. See Note 19 for further details.
112

The carrying amount of goodwill by reporting segment was as follows:
(In millions) Subsea Technip EnergiesSurface
Technologies TotalDecember 31, 2018 4,142.4 2,447.7 1,017.5 7,607.6
Impairments (1,321.9) — (666.8) (1,988.7)Purchase accounting adjustment — — 9.9 9.9 Other — (17.7) — (17.7)Translation (6.4) (6.4) — (12.8)
December 31, 2019 2,814.1 2,423.6 360.6 5,598.3 Impairments (2,747.5) — (335.9) (3,083.4)Transfers (21.2) 46.1 (24.9) — Translation (45.4) 42.8 0.2 (2.4)
December 31, 2020 $ — $ 2,512.5 $ — $ 2,512.5
(a) Beginning in the first quarter of 2020, Technip Energies includes our Loading Systems business that was previously reported in the Surface Technologies segment and ourprocess automation business, Cybernetix, that was previously reported in the Subsea segment. See Note 7 for further details.
As of December 31, 2020 and 2019, accumulated goodwill impairment was $6,455.1 million and $3,371.7 million, respectively.
Intangible assets - The components of intangible assets were as follows:
December 31,2020 2019
(In millions)
GrossCarryingAmount
AccumulatedAmortization
GrossCarryingAmount
AccumulatedAmortization
Acquired technology $ 247.1 $ 98.1 $ 246.7 $ 73.6 Backlog — — 175.0 175.0 Customer relationships 285.4 114.4 285.4 85.9 Licenses, patents and trademarks 816.8 264.0 811.1 227.6 Software 232.1 178.9 215.9 151.1 Other 120.2 65.1 115.9 50.2
Total intangible assets $ 1,701.6 $ 720.5 $ 1,850.0 $ 763.4
We recorded $123.7 million, $126.1 million and $182.6 million in amortization expense related to intangible assets during the years endedDecember 31, 2020, 2019 and 2018, respectively. During the years 2021 through 2025, annual amortization expense is expected to be asfollows: $117 million in 2021, $114 million in 2022, $110 million in 2023, $96 million in 2024, $93 million in 2025 and $451 million thereafter.
NOTE 16. DEBT
Overview
Short-term debt and current portion of long-term debt - Short-term debt and current portion of long-term debt consisted of the following:
December 31,(In millions) 2020 2019Bank borrowings and other $ 85.0 $ 270.8 Synthetic bonds due 2021 551.2 — 5.00% 2010 Private placement notes due 2020 — 224.6
Total short-term debt and current portion of long-term debt $ 636.2 $ 495.4
(a)
113

Long-term debt consisted of the following:
December 31,(In millions) 2020 2019Commercial paper $ 1,525.9 $ 1,967.0 Synthetic bonds due 2021 551.2 492.9 3.45% Senior Notes due 2022 500.0 500.0 5.00% 2010 Private placement notes due 2020 — 224.6 3.40% 2012 Private placement notes due 2022 184.0 168.5 3.15% 2013 Private placement notes due 2023 159.5 146.0 3.15% 2013 Private placement notes due 2023 153.4 140.4 4.50% 2020 Private placement notes due 2025 245.4 — 4.00% 2012 Private placement notes due 2027 92.0 84.2 4.00% 2012 Private placement notes due 2032 122.7 112.3 3.75% 2013 Private placement notes due 2033 122.7 112.3 Bank borrowings and other 309.9 536.3 Unamortized debt issuance costs and discounts (12.8) (9.1)Total debt 3,953.9 4,475.4 Less: current borrowings 636.2 495.4
Long-term debt $ 3,317.7 $ 3,980.0
Debt maturities as of December 31, 2020, are as follows:
Payments Due by Period
(In millions)Total
paymentsLess than
1 year1-3
years3-5
yearsAfter 5years
Total debt $ 3,953.9 $ 636.2 $ 2,589.1 $ 294.0 $ 434.6
Subsequent to the Spin-off, we expect the total future principal payments on debt to be approximately $2,376.8 million. Refer to Note 26 forfurther details.
Significant Funding and Liquidity Activities
During 2020, we completed the following transactions in order to enhance our total liquidity position:
• Repaid $233.9 million of 5.00% 2010 private placement notes;
• Repaid the remaining outstanding balance of $190.0 million of the term loan assumed in connection with the acquisition of theremaining 50% interest in TOP CV.
• Issued €200 million aggregate principal amount of 4.500% 2020 Private Placement Notes due June 30, 2025. Within three months ofthe effective date of the Spin-off of Technip Energies, if there is a downgrade by a nationally recognized rating agency of thecorporate rating of TechnipFMC from an investment grade to a non-investment grade rating or a withdrawal of any such rating, theinterest rate applicable to the 2020 Private Placement Notes will be increased to 5.75%;
• Entered into a new, six-month €500 million senior unsecured revolving credit facility agreement, which may be extended for twoadditional three-month periods (the “Euro Facility”); and
• Entered into the Bank of England’s COVID Corporate Financing Facility program (the “CCFF Program”), which allows us to issue upto £600 million of unsecured commercial paper notes.
114

Credit Facilities and Debt
Revolving credit facility - On January 17, 2017, we acceded to a new $2.5 billion senior unsecured revolving credit facility agreement(“Facility Agreement”) between FMC Technologies, Inc., Technip Eurocash SNC (the “Borrowers”), and TechnipFMC plc (the “AdditionalBorrower”) with JPMorgan Chase Bank, National Association (“JPMorgan”), as agent and an arranger, SG Americas Securities LLC as anarranger, and the lenders party thereto.
The Facility Agreement provides for the establishment of a multicurrency, revolving credit facility, which includes a $1.5 billion letter of creditsubfacility. Subject to certain conditions, the Borrowers may request the aggregate commitments under the facility agreement be increasedby an additional $500.0 million. On November 26, 2018, we entered into an extension which extends the expiration date to January 2023.
Borrowings under the facility agreement bear interest at the following rates, plus an applicable margin, depending on currency:
• U.S. dollar-denominated loans bear interest, at the Borrowers’ option, at a base rate or an adjusted rate linked to the London interbankoffered rate (“Adjusted LIBOR”);
• sterling-denominated loans bear interest at Adjusted LIBOR; and
• euro-denominated loans bear interest at the Euro interbank offered rate (“EURIBOR”).
Depending on the credit rating of TechnipFMC, the applicable margin for revolving loans varies (i) in the case of Adjusted LIBOR andEURIBOR loans, from 0.820% to 1.300% and (ii) in the case of base rate loans, from 0.000% to 0.300%. The “base rate” is the highest of (a)the prime rate announced by JPMorgan, (b) the greater of the Federal Funds Rate and the Overnight Bank Funding Rate plus 0.5% or (c)one-month Adjusted LIBOR plus 1.0%. As of December 31, 2020, there were no outstanding borrowings under our revolving credit facility.
Euro Facility – On May 19, 2020, we entered into the Euro Facility with HSBC France, as agent, and the lenders party thereto, whichprovides for the establishment of a six-month revolving credit facility denominated in Euros with total commitments of €500 million, which maybe extended by us for two additional three-month periods. Borrowings under the Euro Facility bear interest at the Euro interbank offered ratefor a period equal in length to the interest period of a given loan (which may be three or six months), plus an applicable margin. As ofDecember 31, 2020, there were no outstanding borrowings under Euro Facility.
On June 12, 2020, we entered into Amendment No. 1 to the Facility Agreement and into an Amendment and Restatement Agreement to ourEuro Facility. The amendments, which are effective through the respective expirations of the Facility Agreement and Euro Facility, permit usto include the gross book value of $3.2 billion of goodwill (fully impaired in the quarter ended March 31, 2020) in the calculation ofconsolidated net worth, which is used in the calculation of our quarterly compliance with the total capitalization ratio under the FacilityAgreement and Euro Facility.
The Facility Agreement and Euro Facility contain usual and customary covenants, representations and warranties, and events of default forcredit facilities of this type, including financial covenants requiring that our total capitalization ratio not exceed 60% at the end of any financialquarter. The Facility Agreement and Euro Facility also contain covenants restricting our ability and our subsidiaries’ ability to incur additionalliens and indebtedness, enter into asset sales, or make certain investments.
As of December 31, 2020, we were in compliance with all restrictive covenants under our credit facilities.
CCFF Program - On May 19, 2020, we entered into a dealer agreement (the “Dealer Agreement”) with Bank of America Merrill LynchInternational DAC (the “Dealer”) and an Issuing and Paying Agency Agreement (the “Agency Agreement”, and together with the DealerAgreement, the “Agreements”) with Bank of America, National Association, London Branch, relating to the European commercial paperprogram established under the CCFF Program as a source of additional liquidity.
The Agreements provide the terms under which we may issue, and the Dealer will arrange for, the sale of short-term, unsecured commercialpaper notes (the “Notes”) to reduce existing debt or decrease overall borrowing costs. The Notes contain customary representations,warranties, covenants, defaults, and indemnification provisions, and will be sold at such discounts from their face amounts as shall be agreedbetween us and the Dealer. The Notes will be fully payable at maturity, and the maturities of the Notes will vary but may not exceed 364days. The principal amount of outstanding Notes may not exceed £600 million. The Agency Agreement provides for the terms of
115

issuance and payment of the Notes. As of December 31, 2020, our commercial paper borrowings under the CCFF Program had a weightedaverage interest rate of 0.43%. As of December 31, 2020, we had $817.9 million of Notes outstanding and recorded as long-term borrowingsunder the CCFF Program. When we have both the ability and intent to refinance certain obligations on a long-term basis, the obligations areclassified as long-term, as such, the outstanding borrowings of the CCFF Program were classified as long-term debt in our consolidatedbalance sheet as of December 31, 2020.
Bilateral credit facility - We have access to a €100.0 million bilateral credit facility expiring in May 2021.
The bilateral credit facility contains usual and customary covenants, representations and warranties and events of default for credit facilitiesof this type.
As of December 31, 2020, there were no outstanding borrowings under our bilateral credit facility.
Commercial paper - Under our commercial paper program, we have the ability to access $1.5 billion and €1.0 billion of short-term financingthrough our commercial paper dealers, subject to the limit of unused capacity of our facility agreement. When we have both the ability andintent to refinance certain obligations on a long-term basis, the obligations are classified as long-term, as such, the commercial paperborrowings were classified as long-term debt in our consolidated balance sheets as of December 31, 2020 and 2019. Commercial paperborrowings are issued at market interest rates. As of December 31, 2020, our commercial paper borrowings had a weighted average interestrate of 0.34% on the U.S. dollar denominated borrowings and (0.06)% on the Euro denominated borrowings. As of December 31, 2020, wehad $708.0 million of outstanding commercial paper borrowings under this program.
Synthetic bonds - On January 25, 2016, we issued €375.0 million principal amount of 0.875% convertible bonds with a maturity date ofJanuary 25, 2021 and a redemption at par of the bonds which have not been converted. On March 3, 2016, we issued additional convertiblebonds for a principal amount of €75.0 million issued on the same terms, fully fungible with and assimilated to the bonds issued onJanuary 25, 2016. The issuance of these non-dilutive cash-settled convertible bonds (“Synthetic Bonds”), which are linked to our ordinaryshares were backed simultaneously by the purchase of cash-settled equity call options in order to hedge our economic exposure to thepotential exercise of the conversion rights embedded in the Synthetic Bonds. As the Synthetic Bonds could only be cash settled, they did notresult in the issuance of new ordinary shares or the delivery of existing ordinary shares upon conversion. Interest on the Synthetic Bonds ispayable semi-annually in arrears on January 25 and July 25 of each year, beginning July 26, 2016. The synthetic bonds were repaid duringthe first quarter of 2021.
Senior Notes - We have outstanding 3.45% $500.0 million senior notes due October 1, 2022 (the “Senior Notes”). The terms of the SeniorNotes are governed by the indenture, dated as of March 29, 2017 between TechnipFMC and U.S. Bank National Association, as trustee (the“Trustee”), as amended and supplemented by the First Supplemental Indenture between TechnipFMC and the Trustee (the “FirstSupplemental Indenture”) relating to the issuance of the 2017 Notes and the Second Supplemental Indenture between TechnipFMC and theTrustee (the “Second Supplemental Indenture”) relating to the issuance of the 2022 Notes.
At any time prior to July 1, 2022, in the case of the 2022 Notes, we may redeem some or all of the Senior Notes at the redemption pricesspecified in the First Supplemental Indenture and Second Supplemental Indenture, respectively. At any time on or after July 1, 2022, we mayredeem the 2022 Notes at the redemption price equal to 100% of the principal amount of the 2022 Notes redeemed. The Senior Notes areour senior unsecured obligations. The Senior Notes will rank equally in right of payment with all of our existing and future unsubordinateddebt, and will rank senior in right of payment to all of our future subordinated debt.
Private Placement Notes
2020 Issuance:
During 2020, we completed the private placement of €200 million aggregate principal amount of the 2020 Private Placement Notes. The2020 Private Placement Notes bear interest of 4.50% and are due June 2025. Interest on the notes is payable annually in arrears on June 30of each year beginning June 30, 2020. The 2020 Private Placement Notes contain usual and customary covenants and events of default fornotes of this type. In addition, within three months of the effective date of the Spin-off of Technip Energies, if there is a downgrade by anationally recognized rating agency of the corporate rating of TechnipFMC from an investment grade to a non-investment grade rating or awithdrawal of any such rating, the interest rate applicable to the 2020 Private Placement Notes will be increased to 5.75%.
116

2013 Issuances:
In October 2013, we completed the private placement of €355.0 million aggregate principal amount of senior notes. The notes were issued inthree tranches with €100.0 million bearing interest at 3.75% and due October 2033 (the “Tranche A 2033 Notes”), €130.0 million bearinginterest of 3.15% and due October 2023 (the “Tranche B 2023 Notes) and €125.0 million bearing interest of 3.15% and due October 2023(the “Tranche C 2023 Notes” and, collectively with the “Tranche A 2033 Notes and the “Tranche B 2023 Notes”, the “2013 Private PlacementNotes”).
Interest on the Tranche A 2033 Notes is payable annually in arrears on October 7 each year, beginning October 7, 2014. Interest on theTranche B 2023 Notes is payable annually in arrears on October 16 of each year beginning October 16, 2014. Interest on the Tranche C2023 Notes is payable annually in arrears on October 18 of each year, beginning October 18, 2014.
2012 Issuances:
In June 2012, we completed the private placement of €325.0 million aggregate principal amount of notes. The notes were issued in threetranches with €150.0 million bearing interest at 3.40% and due June 2022 (the “Tranche A 2022 Notes”), €75.0 million bearing interest of4.0% and due June 2027 (the “Tranche B 2027 Notes”) and €100.0 million bearing interest of 4.0% and due June 2032 (the “Tranche C 2032Notes” and, collectively with the “Tranche A 2022 Notes and the “Tranche B 2027 Notes,” the “2012 Private Placement Notes”). Interest onthe Tranche A 2022 Notes and the Tranche C 2032 Notes is payable annually in arrears on June 14 of each year beginning June 14, 2013.Interest on the Tranche B 2027 Notes is payable annually in arrears on June 15 of each year, beginning June 15, 2013.
The 2013 and 2012 Private Placement Notes contain usual and customary covenants and events of default for notes of this type. In theevent of a change of control resulting in a downgrade in the rating of the notes below BBB-, the 2013 and 2012 Private Placement Notes maybe redeemed early at the request of any bondholder, at its sole discretion. The 2013 and 2012 Private Placement Notes are our unsecuredobligations. The 2013 and 2012 Private Placement Notes will rank equally in right of payment with all of our existing and futureunsubordinated debt.
Term loan - In December 2016, we entered into a £160.0 million term loan agreement to finance the Deep Explorer, a diving support vessel(“DSV”), maturing December 2028. Under the loan agreement, interest accrues at an annual rate of 2.813%. This loan agreement containsusual and customary covenants and events of default for loans of this type.
Bank borrowings - In January 2019, we executed a sale-leaseback transaction to finance the purchase of a deepwater dive support vessel,Deep Discoverer (the “Vessel”) for the full transaction price of $116.8 million. The sale-leaseback agreement (“Charter”) was entered into witha French joint-stock company, owned by Credit Industrial et Commercial (“CIC”) which was formed for the sole purpose to purchase and actas the lessor of the Vessel. It is a variable interest entity, which is fully consolidated in our condensed consolidated financial statements. Thetransaction was funded through debt of $96.2 million which is primarily long-term, expiring on January 8, 2031.
Foreign committed credit - We have committed credit lines at many of our international subsidiaries for immaterial amounts. We utilize thesefacilities for asset financing and to provide a more efficient daily source of liquidity. The effective interest rates depend upon the local nationalmarket.
NOTE 17. STOCKHOLDERS’ EQUITY
Cash dividends paid during the years ended December 31, 2020, 2019 and 2018 were $59.2 million, $232.8 million and $238.1 million,respectively. In April 2020, our Board of Directors announced its decision to lower the annual dividend by 75% to $0.13 per share.
As an English public limited company, we are required under U.K. law to have available “distributable reserves” to conduct sharerepurchases or pay dividends to shareholders. Distributable reserves are a statutory requirement and are not linked to a GAAP reportedamount (e.g. retained earnings). The declaration and payment of dividends require the authorization of our Board of Directors, provided thatsuch dividends on issued share capital may be paid only out of our “distributable reserves” on our statutory balance sheet. Therefore, we arenot permitted to pay
117

dividends out of share capital, which includes share premium. On November 27, 2019, we redeemed 50,000 redeemable shares of £1 eachand cancelled one deferred ordinary share of £1 in the capital of TechnipFMC.
The following is a summary of our capital stock activity for the years ended December 31, 2020, 2019 and 2018:
(Number of shares in millions)Ordinary
Shares Issued
Ordinary SharesHeld in
EmployeeBenefit Trust Treasury Stock
December 31, 2017 465.1 — — Stock awards 0.2 — — Treasury stock purchases — — 14.8 Treasury stock cancellation (14.8) — (14.8)Net stock purchased for employee benefit trust — 0.1 —
December 31, 2018 450.5 0.1 — Stock awards 0.6 — — Treasury stock purchases — — 4.0 Treasury stock cancellation (4.0) — (4.0)Net stock purchased for employee benefit trust — (0.1) —
December 31, 2019 447.1 — — Stock awards 2.4 — —
December 31, 2020 449.5 — —
In 2017, the Board of Directors authorized a share repurchase program of up to $500.0 million in ordinary shares. In December 2018, theBoard of Directors authorized an extension of the share repurchase program of up to $300.0 million of additional shares. During the yearsended December 31, 2020, 2019 and 2018, we repurchased $0.0 million, $92.7 million and $442.8 million of shares, respectively. As ofDecember 31, 2020, we had $207.8 million of shares authorized for repurchase. Repurchased shares are canceled and not held in treasury.Canceled treasury shares are accounted for using the constructive retirement method.
Accumulated other comprehensive income (loss) - Accumulated other comprehensive income (loss) consisted of the following:
(In millions)
ForeignCurrency
Translation Hedging
Defined Pension and Other
Post-RetirementBenefits
Accumulated OtherComprehensive
Loss Attributable to TechnipFMC plc
Accumulated OtherComprehensive Loss Attributable
to Non-ControllingInterest
December 31, 2018 $ (1,234.4) $ (32.9) $ (92.4) $ (1,359.7) $ (4.0)Other comprehensive income (loss) before reclassifications, net oftax 16.3 8.9 (82.2) (57.0) (0.7)Reclassification adjustment for net (gains) losses included in netincome, net of tax (12.0) 18.2 3.0 9.2 — Other comprehensive income (loss), net of tax 4.3 27.1 (79.2) (47.8) (0.7)
December 31, 2019 (1,230.1) (5.8) (171.6) (1,407.5) (4.7)Other comprehensive income (loss) before reclassifications, net oftax (171.1) 26.8 (92.9) (237.2) 0.6 Reclassification adjustment for net (gains) losses included in netincome, net of tax — 13.0 9.2 22.2 — Other comprehensive income (loss), net of tax (171.1) 39.8 (83.7) (215.0) 0.6
December 31, 2020 $ (1,401.2) $ 34.0 $ (255.3) $ (1,622.5) $ (4.1)
118

Reclassifications out of accumulated other comprehensive income (loss) - Reclassifications out of accumulated other comprehensive income(loss) consisted of the following:
Year Ended December 31,(In millions) 2020 2019 2018Details about Accumulated Other ComprehensiveLoss Components
Amount Reclassified out of Accumulated OtherComprehensive Loss
Affected Line Item in the Consolidated Statementof Income
Gains on foreign currency translation $ — $ 12.0 $ 41.1 Other income (expense), net
Gains (losses) on hedging instrumentsForeign exchange contracts $ (83.7) $ (26.6) $ (2.4) Revenue
68.5 12.0 3.4 Costs of sales(0.4) — (0.1) Selling, general and administrative expense(4.4) (9.1) 1.0 Other Income (expense), net
(20.0) (23.7) 1.9 Income (loss) before income taxes(7.0) (5.5) (0.1) Provision (benefit) for income taxes
$ (13.0) $ (18.2) $ 2.0 Net income (loss)
Pension and other post-retirement benefitsSettlements and curtailments (2.2) (0.3) 3.0 (a)Amortization of actuarial gain (loss) (9.0) (2.5) (0.6) (a)Amortization of prior service credit (cost) (1.2) (1.0) (1.3) (a)
(12.4) (3.8) 1.1 Income (loss) before income taxes(3.2) (0.8) 0.1 Provision (benefit) for income taxes
$ (9.2) $ (3.0) $ 1.0 Net income (loss)
(a) These accumulated other comprehensive income components are included in the computation of net periodic pension cost (See Note 22 for further details).
NOTE 18. SHARE-BASED COMPENSATION
Incentive compensation and award plan - On January 11, 2017, we adopted the TechnipFMC plc Incentive Award Plan (the “Plan”). The Planprovides certain incentives and awards to officers, employees, non-employee directors and consultants of TechnipFMC and its subsidiaries.The Plan allows our Board of Directors to make various types of awards to non-employee directors and the Compensation Committee (the“Committee”) of the Board of Directors to make various types of awards to other eligible individuals. Awards may include share options, shareappreciation rights, performance share units, restricted share units, restricted shares or other awards authorized under the Plan. All awardsare subject to the Plan’s provisions, including all share-based grants previously issued prior to consummation of the merger of FMCTechnologies and Technip S.A. (the “Merger”). Under the Plan, 24.1 million ordinary shares were authorized for awards. As of December 31,2020, 8.5 million ordinary shares were available for future grant.
The exercise price for options is determined by the Committee but cannot be less than the fair market value of our ordinary shares at thegrant date. Restricted share and performance share unit grants generally vest after three years of service.
Under the Plan, our Board of Directors has the authority to grant non-employee directors share options, restricted shares, restricted shareunits and performance shares. Unless otherwise determined by our Board of Directors, awards to non-employee directors generally vest oneyear from the date of grant. All restricted share units awarded prior to 2020 will be settled when a non-executive director ceases services onthe Board of Directors. Beginning with the 2020 equity award, non-executive directors now have the opportunity to elect the year in whichthey will take receipt of the equity grants from either (a) a period of 1 to 10 years from the grant date or (b) upon their separation from Boardservice. The elections are made prior to the beginning of the grant year and are irrevocable after December 31 of the year prior to grant.Restricted share units are settled when a director ceases services to the Board of Directors. As of December 31, 2020, outstanding awardsto active and retired non-employee directors included 254.3 thousand of share units.
119

The measurement of share-based compensation expense on restricted share awards is based on the market price and fair value at the grantdate and the number of shares awarded. The fair value of performance shares is estimated using a combination of the closing stock price onthe grant date and the Monte Carlo simulation model. We use Black-Scholes options pricing model to measure the fair value of stock optionsgranted on or after January 1, 2017.
The share-based compensation expense for each award is recognized ratably over the applicable service period or the period beginning atthe start of the service period and ending when an employee becomes eligible for retirement (currently age 62 under the Plan), after takinginto account estimated forfeitures.
We recognize compensation expense and the corresponding tax benefits for awards under the Plan. The compensation expense under thePlan was as follows:
Year Ended December 31,(In millions) 2020 2019 2018Share-based compensation expense $ 69.0 $ 74.5 $ 49.1 Income tax benefits related to share-based compensation expense $ 18.6 $ 20.1 $ 13.2
As of December 31, 2020, the portion of share-based compensation expense related to outstanding awards to be recognized in futureperiods is as follows:
December 31, 2020Share-based compensation expense not yet recognized (in millions) $ 68.1 Weighted-average recognition period (in years) 1.8
Restricted Share Units
A summary of the non-vested restricted share units’ activity is as follows:
(Shares in thousands) Shares
Weighted-Average Grant Date Fair Value
Non-vested as of December 31, 2019 4,525.9 $ 27.44 Granted 3,836.0 $ 9.27 Vested (1,909.1) $ 27.16 Cancelled/forfeited (330.9) $ 15.71
Non-vested as of December 31, 2020 6,121.9 $ 18.43
The total grant date fair value of restricted stock share units vested during the years ended December 31, 2020 and 2019 was $51.8 millionand $10.2 million, respectively.
Performance Share Units
The Board of Directors has granted certain employees, senior executives and directors performance share units that vest subject toachieving satisfactory performances. For performance share units issued on or after January 1, 2017, performance is based on results ofreturn on invested capital and total shareholder return (“TSR”).
For the performance share units which vest based on TSR, the fair value of performance shares is estimated using a combination of theclosing stock price on the grant date and the Monte Carlo simulation model. The weighted-average fair value and the assumptions used tomeasure the fair value of performance share units subject to performance-adjusted vesting conditions in the Monte Carlo simulation modelwere as follows:
Year Ended December 31,2020 2019 2018
Weighted-average fair value $10.02 $29.04 $41.97Expected volatility 38.30 % 34.00 % 34.00 %Risk-free interest rate 0.40 % 2.42 % 2.37 %Expected performance period in years 3.0 3.0 3.0
(a) The weighted-average fair value was based on performance share units granted during the period.
(a)
(b)
(c)
(d)
120

(b) Expected volatility is based on normalized historical volatility of our shares over a preceding period commensurate with the expected term of the performance share units.
(c) The risk-free rate for the expected term of the performance share units is based on the U.S. Treasury yield curve in effect at the time of grant.
(d) For awards subject to service-based vesting, due to the lack of historical exercise and post-vesting termination patterns of the post-Merger employee base, the expectedterm was estimated using a simplified method for all awards granted in 2020, 2019 and 2018.
A summary of the non-vested performance share units’ activity is as follows:
(Shares in thousands) Shares
Weighted-Average Grant Date Fair Value
Non-vested as of December 31, 2019 3,817.7 $ 28.52 Granted 2,828.4 $ 10.02 Vested (1,364.4) $ 31.65 Cancelled/forfeited (441.0) $ 20.62
Non-vested as of December 31, 2020 4,840.7 $ 17.55
The total grant date fair value of performance share units vested during years ended December 31, 2020, 2019 and 2018 was $43.2million, $13.3 million and $7.0 million, respectively.
Share Option Awards
The fair value of each share option award is estimated as of the date of grant using the Black-Scholes options pricing model.
Share options awarded prior to 2017 were granted subject to performance criteria based upon certain targets, such as TSR, return on capitalemployed, and operating income from recurring activities. Subsequent share options granted are time-based awards vesting over threeyears.
The weighted-average fair value and the assumptions used to measure fair value are as follows:
Year Ended December 31,2020 2019 2018
Weighted-average fair value $ — $ 5.64 $ 9.07 Expected volatility — % 32.5 % 32.5 %Risk-free interest rate — % 2.5 % 2.7 %Expected dividend yield — % 2.6 % 2.0 %Expected term in years 0 6.5 6.5
(a) The weighted-average fair value was based on stock options granted during the period.
(b) Expected volatility is based on normalized historical volatility of our shares over a preceding period commensurate with the expected term of the option.
(c) The risk-free rate for the expected term of the option is based on the U.S. Treasury yield curve in effect at the time of grant.
(d) There were no share options awarded in 2020. Share options awarded in 2019 and 2018 were valued using an expected dividend yield of 2.6% and 2.0%, respectively.
(e) For awards subject to service-based vesting, due to the lack of historical exercise and post-vesting termination patterns of the post-Merger employee base, the expectedterm was estimated using a simplified method for all awards granted in 2020, 2019 and 2018.
The following is a summary of share option transactions during the year ended December 31, 2020:
(a)
(b)
(c)
(d)
(e)
121

Number of SharesWeighted average
exercise price
Weighted averageremaining life
(in years)Balance as of December 31, 2019 4,842.4 $ 29.68 5.3
Granted — $ — Exercised — $ — Cancelled (244.0) $ 28.08
Balance as of December 31, 2020 4,598.4 $ 29.77 4.2
Exercisable as of December 31, 2020 3,460.8 $ 31.47 3.0
The aggregate intrinsic value of stock options outstanding and stock options exercisable as of December 31, 2020 was nil and nil,respectively.
Cash received from the share option exercises was nil, during each of the years ended December 31, 2020, 2019 and 2018. The totalintrinsic value of share options exercised during each of the years ended December 31, 2020, 2019 and 2018 was nil. To exercise shareoptions, an employee may choose (1) to pay, either directly or by way of the group savings plan, the share option strike price to obtainshares, or (2) to sell the shares immediately after having exercised the share option (in this case, the employee does not pay the strike pricebut instead receives the intrinsic value of the share options in cash).
The following summarizes significant ranges of outstanding and exercisable share options as of December 31, 2020:
Options Outstanding Options Exercisable
Exercise Price RangeNumber of options
(in thousands)Weighted average remaining
life (in years)Weighted average
exercise priceNumber of options
(in thousands)Weighted average
exercise price$20.00-$33.00 4,087.2 4.6 $ 26.68 2,949.5 $ 26.90 $45.00-$51.00 33.0 1.0 $ 45.49 33.0 $ 45.49 $55.00-$57.00 478.2 0.4 $ 56.93 478.3 $ 56.93
Total 4,598.4 4.2 $ 29.77 3,460.8 $ 31.47
122

NOTE 19. IMPAIRMENT, RESTRUCTURING AND OTHER EXPENSES
Impairment, restructuring and other expenses were as follows:
Year Ended December 31,(In millions) 2020 2019 2018Subsea $ 2,957.5 $ 1,752.2 $ 1,801.9 Technip Energies 93.6 17.0 (3.4)Surface Technologies 440.2 704.2 13.8 Corporate and other 10.0 17.4 18.9
Total impairment, restructuring and other expenses $ 3,501.3 $ 2,490.8 $ 1,831.2
Goodwill and Long-Lived Assets Impairments
Goodwill and long-lived assets impairments were as follows:
Year Ended December 31,(In millions) 2020 2019 2018Subsea $ 2,854.5 $ 1,798.6 $ 1,784.2 Technip Energies 10.3 — — Surface Technologies 419.3 685.5 4.5 Corporate and other 3.3 — 3.9 Total impairments $ 3,287.4 $ 2,484.1 $ 1,792.6
Due to the substantial decline in global demand for oil caused by the COVID-19 pandemic in 2020 we reviewed the future utilization of ourvessels and service potential of our subsea service and surface equipment and determined that the carrying amount of our goodwill andsome of our long-lived assets exceeded their respective fair values. We recorded $3,083.4 million and $204.0 million, respectively, related togoodwill and long-lived assets impairments. The $204.0 million of long-lived asset impairments during the year ended December 31, 2020consisted of $88.4 million attributable to plant, equipment and various machinery infrastructure in our Subsea operating segment;$82.0 million mainly related to building and surface equipment in our Surface reportable segment; and $33.6 million of operating lease right-of-use assets impairments.
The prolonged downturn in the energy market and its corresponding impact on our business outlook in 2019 led us to conclude the carryingamount of certain of our assets in our Subsea and Surface Technologies segments exceeded their fair value as of December 31, 2019.During the 2019 year we recorded $1,988.7 million and $495.4 million, respectively, related to goodwill and long-lived assets impairments.The $495.4 million of long-lived asset impairments during the year ended December 31, 2019 primarily consisted of $153.8 million related tovessels in our Subsea operating segment and $168.9 million related to our flexible pipe and umbilical manufacturing facilities in our Surfacereportable segment due to the prolonged downturn in the energy market and its corresponding impact on our business outlook.
The prolonged downturn in the energy market and its corresponding impact on our business outlook in 2018 led us to conclude the carryingamount of certain of our assets in our Subsea operating segment exceeded their fair value as of December 31, 2018. During the year endedDecember 31, 2018, we recorded $1,383.0 million and $372.9 million, respectively, related to goodwill and vessel impairments in our Subseaoperating segment.
Long-lived assets are reviewed for impairment whenever events or changes in circumstances indicate that carrying amounts of such assetsmay not be recoverable. Assessing the recoverability of assets to be held and used involves significant judgement, when determining thepresent value of expected future cash flows. Significant judgements included expected revenue, operating costs and capital decisions thatwere available at the time of the assessment.
123

Restructuring and Other Expenses
Restructuring and other charges primarily consisted of severance and other employee related costs and COVID-19 related expenses acrossall segments. Restructuring and other expenses were as follows:
Year Ended December 31,2020 2019 2018
(In millions)Restructuring and other
charges COVID-19 expensesRestructuring and other
chargesRestructuring and other
chargesSubsea $ 52.9 $ 50.1 $ (46.4) $ 17.7 Technip Energies 39.3 44.0 17.0 (3.4)Surface Technologies 13.2 7.7 18.7 9.3 Corporate and other 6.7 — 17.4 15.0 Total $ 112.1 $ 101.8 $ 6.7 $ 38.6
COVID-19 related expenses represent unplanned, one-off, incremental and non-recoverable costs incurred solely as a result of the COVID-19 pandemic situation, which would not have been incurred otherwise. COVID-19 related expenses primarily included (a) employee payrolland travel, operational disruptions associated with quarantining, personnel travel restrictions to job sites, and shutdown of manufacturingplants and sites; (b) supply chain and related expediting costs of accelerated shipments for previously ordered and undelivered products; (c)costs associated with implementing additional information technology to support remote working environments; and (d) facilities-relatedexpenses to ensure safe working environments.
Prolonged uncertainty in energy markets could lead to further future reductions in capital spending from our customer base. In turn, this maylead to changes in our strategy. We will continue to take actions designed to mitigate the adverse effects of the rapidly changing marketenvironment and expect to continue to adjust our cost structure to market conditions. If market conditions continue to deteriorate, we mayrecord additional restructuring charges and additional impairments of our long-lived assets, operating lease right-of-use assets and equitymethod investments.
NOTE 20. COMMITMENTS AND CONTINGENT LIABILITIES
Contingent liabilities associated with guarantees - In the ordinary course of business, we enter into standby letters of credit, performancebonds, surety bonds, and other guarantees with financial institutions for the benefit of our customers, vendors, and other parties. The majorityof these financial instruments expire within five years. Management does not expect any of these financial instruments to result in losses that,if incurred, would have a material adverse effect on our consolidated financial position, results of operations, or cash flows.
Guarantees of our consolidated subsidiaries consisted of the following:
(In millions) December 31, 2020Financial guarantees $ 310.1 Performance guarantees 4,659.6
Maximum potential undiscounted payments $ 4,969.7
(a) Financial guarantees represent contracts that contingently require a guarantor to make payments to a guaranteed party based on changes in an underlying agreement thatis related to an asset, a liability or an equity security of the guaranteed party. These tend to be drawn down only if there is a failure to fulfill our financial obligations.
(b) Performance guarantees represent contracts that contingently require a guarantor to make payments to a guaranteed party based on another entity's failure to performunder a nonfinancial obligating agreement. Events that trigger payment are performance-related, such as failure to ship a product or provide a service.
We believe the ultimate resolution of our known contingencies will not materially adversely affect our consolidated financial position, resultsof operations, or cash flows.
Contingent liabilities associated with legal and tax matters - We are involved in various pending or potential legal and tax actions or disputesin the ordinary course of our business. These actions and disputes can involve our agents, suppliers, clients, and venture partners, and caninclude claims related to payment of fees, service quality,
(a)
(b)
124

and ownership arrangements, including certain put or call options. We are unable to predict the ultimate outcome of these actions because oftheir inherent uncertainty. However, we believe that the most probable, ultimate resolution of these matters will not have a material adverseeffect on our consolidated financial position, results of operations or cash flows.
On March 28, 2016, FMC Technologies received an inquiry from the U.S. Department of Justice (“DOJ”) related to the DOJ's investigation ofwhether certain services Unaoil S.A.M. provided to its clients, including FMC Technologies, violated the U.S. Foreign Corrupt Practices Act(“FCPA”). On March 29, 2016, Technip S.A. also received an inquiry from the DOJ related to Unaoil. We cooperated with the DOJ'sinvestigations and, with regard to FMC Technologies, a related investigation by the SEC.
In late 2016, Technip S.A. was contacted by the DOJ regarding its investigation of offshore platform projects awarded between 2003 and2007, performed in Brazil by a joint venture company in which Technip S.A. was a minority participant, and we have also raised with the DOJcertain other projects performed by Technip S.A. subsidiaries in Brazil between 2002 and 2013. The DOJ has also inquired about projects inGhana and Equatorial Guinea that were awarded to Technip S.A. subsidiaries in 2008 and 2009, respectively. We cooperated with the DOJin its investigation into potential violations of the FCPA in connection with these projects. We contacted and cooperated with the Brazilianauthorities (Federal Prosecution Service (“MPF”), the Comptroller General of Brazil (“CGU”) and the Attorney General of Brazil (“AGU”)) withtheir investigation concerning the projects in Brazil and have also contacted and are cooperating with French authorities (the ParquetNational Financier (“PNF”)) with their investigation about these existing matters.
On June 25, 2019, we announced a global resolution to pay a total of $301.3 million to the DOJ, the SEC, the MPF, and the CGU/AGU toresolve these anti-corruption investigations. We will not be required to have a monitor and will, instead, provide reports on our anti-corruptionprogram to the Brazilian and U.S. authorities for two and three years, respectively.
As part of this resolution, we entered into a three-year Deferred Prosecution Agreement (“DPA”) with the DOJ related to charges ofconspiracy to violate the FCPA related to conduct in Brazil and with Unaoil. In addition, Technip USA, Inc., a U.S. subsidiary, pled guilty toone count of conspiracy to violate the FCPA related to conduct in Brazil. We will also provide the DOJ reports on our anti-corruption programduring the term of the DPA.
In Brazil, our subsidiaries Technip Brasil - Engenharia, Instalações E Apoio Marítimo Ltda. and Flexibrás Tubos Flexíveis Ltda. entered intoleniency agreements with both the MPF and the CGU/AGU. We have committed, as part of those agreements, to make certainenhancements to their compliance programs in Brazil during a two-year self-reporting period, which aligns with our commitment tocooperation and transparency with the compliance community in Brazil and globally.
In September 2019, the SEC approved our previously disclosed agreement in principle with the SEC Staff and issued an AdministrativeOrder, pursuant to which we paid the SEC $5.1 million, which was included in the global resolution of $301.3 million.
To date, the investigation by PNF related to historical projects in Equatorial Guinea and Ghana has not reached resolution. We remaincommitted to finding a resolution with the PNF and will maintain a $70.0 million provision related to this investigation. As we continue toprogress our discussions with PNF towards resolution, the amount of a settlement could exceed this provision.
There is no certainty that a settlement with PNF will be reached or that the settlement will not exceed current accruals. The PNF has a broadrange of potential sanctions under anticorruption laws and regulations that it may seek to impose in appropriate circumstances including, butnot limited to, fines, penalties, and modifications to business practices and compliance programs. Any of these measures, if applicable to us,as well as potential customer reaction to such measures, could have a material adverse impact on our business, results of operations, andfinancial condition. If we cannot reach a resolution with the PNF, we could be subject to criminal proceedings in France, the outcome of whichcannot be predicted.
125

Contingent liabilities associated with liquidated damages - Some of our contracts contain provisions that require us to pay liquidateddamages if we are responsible for the failure to meet specified contractual milestone dates and the applicable customer asserts a conformingclaim under these provisions. These contracts define the conditions under which our customers may make claims against us for liquidateddamages. Based upon the evaluation of our performance and other commercial and legal analysis, management believes we haveappropriately recognized probable liquidated damages as of December 31, 2020 and 2019, and that the ultimate resolution of such matterswill not materially affect our consolidated financial position, results of operations, or cash flows.
NOTE 21. INCOME TAXES
Components of income (loss) before income taxes - U.S. and outside U.S. components of income (loss) before income taxes were asfollows:
Year Ended December 31,(In millions) 2020 2019 2018United States $ (3,073.5) $ (1,406.5) $ (197.0)Outside United States $ (11.5) $ (729.3) $ (1,291.1)
Loss before income taxes $ (3,085.0) $ (2,135.8) $ (1,488.1)
Provision for income tax - The provision for income taxes consisted of:
Year Ended December 31,(In millions) 2020 2019 2018Current
United States $ (4.7) $ 34.7 $ 52.1 Outside United States 164.8 317.0 321.8
Total current income taxes 160.1 351.7 373.9 Deferred
United States (3.1) 2.6 19.5 Outside United States (3.6) (78.0) 29.3
Total deferred income taxes (6.7) (75.4) 48.8
Provision for income taxes $ 153.4 $ 276.3 $ 422.7
126

Deferred tax assets and liabilities - Significant components of deferred tax assets and liabilities were as follows:
December 31,(In millions) 2020 2019Deferred tax assets attributable to
Accrued expenses $ 147.8 $ 124.4 Capital loss 21.1 21.1 Non-deductible interest 77.0 84.7 Foreign tax credit carryforwards 145.8 135.3 Other tax credits 166.8 113.2 Net operating loss carryforwards 489.0 430.5 Inventories 16.5 6.3 Research and development credit 3.4 7.6 Foreign exchange — 20.4 Provisions for pensions and other long-term employee benefits 96.1 84.1 Contingencies 43.4 163.3 Margin recognition on construction contracts 113.9 115.9 Leases 254.9 219.8 Revenue in excess of billings on contracts accounted for under the percentage of completion method — 10.9 Other — 6.9
Deferred tax assets 1,575.7 1,544.4 Valuation allowance (935.3) (916.9)Deferred tax assets, net of valuation allowance 640.4 627.5
Deferred tax liabilities attributable toRevenue in excess of billings on contracts accounted for under the percentage of completion method 42.6 — U.S. tax on foreign subsidiaries’ undistributed earnings not indefinitely reinvested 4.2 10.4 Property, plant and equipment, intangibles and other assets 185.8 279.6 Foreign exchange 27.8 — Leases 237.0 215.2 Other 4.7 —
Deferred tax liabilities 502.1 505.2
Net deferred tax assets $ 138.3 $ 122.3
At December 31, 2020 and 2019, the carrying amount of net deferred tax assets and the related valuation allowance included the impact offoreign currency translation adjustments.
Non-deductible interest. At December 31, 2020, deferred tax assets include tax benefits related to certain intercompany interest costs whichare not currently deductible, but which may be deductible in future periods. If not utilized, these costs will become permanently non-deductible beginning in 2025. Management believes that it is more likely than not that we will not be able to deduct these costs beforeexpiration of the carry forward period; therefore, we have established a valuation allowance against the related deferred tax assets.
Foreign tax credit carryforwards. At December 31, 2020, deferred tax assets included U.S. foreign tax credit carryforwards of $145.8 million,which, if not utilized, will begin to expire in 2024. Realization of these deferred tax assets is dependent on the generation of sufficient U.S.taxable income prior to the above date. Based on long-term forecasts of operating results, management believes that it is more likely than notthat our U.S. earnings over the forecast period will not result in sufficient U.S. taxable income to fully realize these deferred tax assets;therefore, we have established a valuation allowance against the related deferred tax assets. In its analysis, management has considered theeffect of deemed dividends and other expected adjustments to U.S. earnings that are required in determining U.S. taxable income. Non-U.S.earnings subject to U.S. tax, including deemed dividends for U.S. tax purposes, were $61 thousand in 2020, $3.8 million in 2019 and $307.6million in 2018.
127

Net operating loss carryforwards. As of December 31, 2020, deferred tax assets include tax benefits relating to net operating losscarryforwards. If not utilized, these net operating loss carryforward will begin to expire in 2021. Except in Norway (net operating losses of$373.7 million), management believes it is more likely than not that we will not be able to utilize these operating loss carryforwards beforeexpiration; thus, we have established a valuation allowance against the related deferred tax assets (inclusive of NOL’s generated in UnitedKingdom, Saudi Arabia, Netherlands, Mexico, Brazil, Canada, United States, Luxembourg, and Germany). Except in Canada, Mexico, andNetherlands, all of these tax loss carryforwards extend indefinitely.
Certain Adjustments to Valuation Allowance. The net increase in valuation allowance from December 31, 2019 to December 31, 2020includes certain adjustments which did not impact net tax expense. These adjustments include $62.0 million of deferred tax assets whichwere recorded in 2020 and are related to certain previously unrecorded tax credits in the Netherlands that are subject to a full valuationallowance. In addition, the Company wrote off $15.3 million and $11.3 million of deferred tax assets in Italy and Mexico, respectively, that hadbeen subject to a full valuation allowance.
Unrecognized tax benefits - The following table presents a summary of changes in our unrecognized tax benefits:
(In millions)
Federal,State andForeign
TaxBalance at December 31, 2018 $ 91.0
Reductions for tax positions related to prior years (62.4)Additions for tax positions related to current year 72.9 Reductions for tax positions due to settlements (20.8)
Balance at December 31, 2019 $ 80.7
Reductions for tax positions related to prior years (7.9)Additions for tax positions related to current year 0.9 Reductions for tax positions due to settlements (2.6)
Balance at December 31, 2020 $ 71.1
The amounts reported above for uncertain tax positions excludes interest and penalties of $3.7 million, $0.1 million, and $2.8 million for theyears ended December 31, 2020, 2019, and 2018, respectively. Interest and penalties relating to these uncertain tax positions were includedin income tax expense in our consolidated statements of income. It is reasonably possible that within twelve months, $4.2 million of liabilitiesfor unrecognized tax benefits will be settled. This amount is reflected in income taxes payable, the remaining balance of the unrecognized taxbenefits is recorded in other long term liabilities.
We operate in numerous jurisdictions around the world and could be subject to multiple tax audits at any given time. Most notably, thefollowing tax years and thereafter remain subject to examination: 2010 for Norway, 2016 for Nigeria, 2016 for Brazil, 2017 for France, and2016 for the United States.
TechnipFMC plc is a public limited company incorporated under the laws of England and Wales. Therefore, our earnings are subject to theU.K. statutory rate which is 19.0% for 2020, 2019, and 2018.
128

Effective income tax rate reconciliation - The effective income tax rate was different from the statutory U.K. income tax rate due to thefollowing:
Year Ended December 31, 2020 2019 2018Statutory income tax rate 19.0 % 19.0 % 19.0 %Net difference resulting from
Foreign earnings subject to different tax rates (1.5)% 0.3 % (9.7)%Adjustments to prior year taxes (1.3)% (0.4)% (0.7)%Changes in valuation allowance — % (8.8)% (14.4)%Deferred tax asset/liability revaluation for tax rate change — % (0.5)% (1.7)%Impairments (22.5)% (21.9)% (16.5)%Non-deductible legal provision — % (0.8)% (3.8)%Other 1.3 % 0.2 % (0.6)%
Effective income tax rate (5.0)% (12.9)% (28.4)%
Income tax holidays. We benefit from income tax holidays in Singapore and Malaysia which will expire after 2023 for Singapore and 2020 forMalaysia. For the year ended December 31, 2020, these tax holidays reduced our provision for income taxes by $5.8 million, or $0.01 pershare on a diluted basis.
NOTE 22. PENSION AND OTHER POST-RETIREMENT BENEFIT PLANS
We have funded and unfunded defined benefit pension plans, which provide defined benefits based on years of service and final averagesalary.
On December 31, 2017, we amended the U.S. retirement plans (the “Plans”) to freeze benefit accruals for all participants of the Plans as ofDecember 31, 2017. After that date, participants in the Plans will no longer accrue any further benefits and participants’ benefits under thePlans will be determined based on credited service and eligible earnings as of December 31, 2017.
Foreign-based employees are eligible to participate in TechnipFMC-sponsored or government-sponsored benefit plans to which wecontribute. Several of the foreign defined benefit pension plans sponsored by us provide for employee contributions; the remaining plans arenoncontributory. The most significant of these plans are in the Netherlands, France, and the United Kingdom.
We have other post-retirement benefit plans covering substantially all of our U.S. unionized employees. The post-retirement health careplans are contributory; the post-retirement life insurance plans are noncontributory.
We are required to recognize the funded status of defined benefit post-retirement plans as an asset or liability in the consolidated balancesheet and recognize changes in that funded status in comprehensive income (loss) in the year in which the changes occur. Further, we arerequired to measure the plan’s assets and its obligations that determine its funded status as of the date of the consolidated balance sheet.We have applied this guidance to our domestic pension and other post-retirement benefit plans as well as for many of our non-U.S. plans,including those in the United Kingdom, Germany, France and Canada. Pension expense measured in compliance with GAAP for the othernon-U.S. pension plans is not materially different from the locally reported pension expense.
The funded status of our U.S. Pension Plans, certain foreign pension plans and U.S. post-retirement health care and life insurance benefitplans, together with the associated balances recognized in our consolidated balance sheets as of December 31, 2020 and 2019, were asfollows:
129

Pensions
OtherPost-retirement
Benefits 2020 2019 2020 2019(In millions) U.S. Int’l U.S. Int’l
Accumulated benefit obligation $ 684.7 $ 873.0 $ 669.6 $ 773.3
Projected benefit obligation at January 1 $ 669.7 $ 881.0 $ 598.1 $ 753.4 $ 10.6 $ 9.5 Service cost — 19.1 — 16.3 — — Interest cost 22.2 14.1 25.6 18.3 0.4 0.5 Actuarial (gain) loss 53.9 35.5 80.7 102.8 (0.2) 1.4 Amendments — 0.1 — 0.9 — — Curtailments — (0.2) — — — — Settlements (25.6) (3.5) — (0.6) — — Foreign currency exchange rate changes — 48.0 — 11.1 (0.5) (0.1)Plan participants’ contributions — 1.1 — 1.1 — — Benefits paid (35.5) (27.2) (34.7) (25.7) (0.5) (0.5)Other — 2.1 — 3.4 — (0.2)
Projected benefit obligation as of December 31 684.7 970.1 669.7 881.0 9.8 10.6 Fair value of plan assets at January 1 520.0 657.8 477.4 570.6 — —
Actual return on plan assets 14.3 45.9 72.0 89.1 — — Company contributions — 28.7 — 6.9 — — Foreign currency exchange rate changes — 33.4 — 13.5 — — Settlements (19.6) (1.9) — — — — Plan participants’ contributions — 1.1 — 1.1 — — Benefits paid (31.0) (20.8) (29.4) (19.6) — — Other — 2.0 — (3.8) — —
Fair value of plan assets as of December 31 483.7 746.2 520.0 657.8 — —
Funded status of the plans (liability) as of December 31 $ (201.0) $ (223.9) $ (149.7) $ (223.2) $ (9.8) $ (10.6)
Pensions
OtherPost-retirement
Benefits 2020 2019 2020 2019(In millions) U.S. Int’l U.S. Int’l Current portion of accrued pension and other post-retirementbenefits (4.6) (8.6) (5.5) (8.8) (0.7) (0.6)Accrued pension and other post-retirement benefits, net ofcurrent portion (196.4) (215.3) (144.2) (214.4) (9.1) (10.0)
Funded status as of December 31 $ (201.0) $ (223.9) $ (149.7) $ (223.2) $ (9.8) $ (10.6)
130

The following table summarizes the pre-tax amounts in accumulated other comprehensive (income) loss as of December 31, 2020 and 2019that have not been recognized as components of net periodic benefit cost:
Pensions
OtherPost-retirement
Benefits 2020 2019 2020 2019(In millions) U.S. Int’l U.S. Int’l Pre-tax amounts recognized in accumulated othercomprehensive (income) loss
Unrecognized actuarial loss $ 198.4 $ 122.3 $ 121.6 $ 90.7 $ 1.3 $ 1.9 Unrecognized prior service cost — 6.2 — 7.0 — —
Accumulated other comprehensive (income) loss as ofDecember 31 $ 198.4 $ 128.5 $ 121.6 $ 97.7 $ 1.3 $ 1.9
The following tables summarize the projected and accumulated benefit obligations and fair values of plan assets where the projected oraccumulated benefit obligation exceeds the fair value of plan assets as of December 31, 2020 and 2019:
Pensions
OtherPost-retirement
Benefits 2020 2019 2020 2019(In millions) U.S. Int’l U.S. Int’l Plans with underfunded or non-funded projected benefitobligation
Aggregate projected benefit obligation $ 684.7 $ 818.7 $ 668.4 $ 741.2 $ 9.8 $ 10.7 Aggregate fair value of plan assets $ 483.7 $ 596.7 $ 518.8 $ 522.8 $ — $ —
Pensions
OtherPost-retirement
Benefits 2020 2019 2020 2019(In millions) U.S. Int’l U.S. Int’l Plans with underfunded or non-funded accumulated benefitobligation
Aggregate accumulated benefit obligation $ 684.7 $ 325.7 $ 668.4 $ 292.1 $ — $ — Aggregate fair value of plan assets $ 483.7 $ 154.0 $ 518.8 $ 140.3 $ — $ —
131

The following table summarizes the components of net periodic benefit cost (income) for the years ended December 31, 2020, 2019 and2018:
PensionsOther Post-retirement
Benefits 2020 2019 2018 2020 2019 2018(In millions) U.S. Int’l U.S. Int’l U.S. Int’l Components of net periodic benefitcost (income)
Service cost $ — $ 19.1 $ — $ 16.3 $ 0.2 $ 21.2 $ — $ — $ — Interest cost 22.2 14.1 25.6 18.3 23.8 20.9 0.4 0.5 0.4 Expected return on plan assets (45.4) (37.9) (41.6) (33.5) (50.1) (41.2) — — — Settlement cost 1.4 0.8 — 0.3 0.4 0.4 — — — Curtailment benefit — — — — — (3.8) — — — Amortization of net actuarial loss(gain) 6.9 2.1 1.8 0.7 — 0.6 0.1 — — Amortization of prior service cost(credit) — 1.2 — 1.0 — 1.3 — — —
Net periodic benefit cost (income) $ (14.9) $ (0.6) $ (14.2) $ 3.1 $ (25.7) $ (0.6) $ 0.5 $ 0.5 $ 0.4
The following table summarizes changes in plan assets and benefit obligations recognized in other comprehensive income (loss) for theyears ended December 31, 2020, 2019 and 2018:
PensionsOther Post-retirement
Benefits 2020 2019 2018 2020 2019 2018(In millions) U.S. Int’l U.S. Int’l U.S. Int’l Changes in plan assets and benefitobligations recognized in othercomprehensive income (loss)
Net actuarial gain (loss) arisingduring period $ (85.1) $ (27.2) $ (50.2) $ (47.3) $ (73.5) $ (15.3) $ — $ — $ — Prior service (cost) credit arisingduring period — (0.1) — (0.9) 0.2 (2.7) — — — Settlements and curtailments 1.4 0.8 — 0.3 0.4 (3.4) — — — Amortization of net actuarial loss(gain) 6.9 2.1 1.8 0.7 — 0.6 (0.1) — — Amortization of prior service cost(credit) — 1.2 — 1.0 — 1.3 — — — Other — (7.5) — (0.8) — 1.4 (0.6) (0.1) (0.1)
Total recognized in othercomprehensive income (loss) $ (76.8) $ (30.7) $ (48.4) $ (47.0) $ (72.9) $ (18.1) $ (0.7) $ (0.1) $ (0.1)
Included in accumulated other comprehensive income (loss) as of December 31, 2020, are noncash, pre-tax charges which have not yetbeen recognized in net periodic benefit cost (income). The estimated amounts expected to be amortized from the portion of each componentof accumulated other comprehensive income (loss) as a component of net period benefit cost (income), during the next fiscal year are asfollows:
Pensions
OtherPost-retirement
Benefits(In millions) U.S. Int’l Net actuarial losses $ 16.8 $ 4.0 $ — Prior service cost $ — $ 1.2 $ —
132
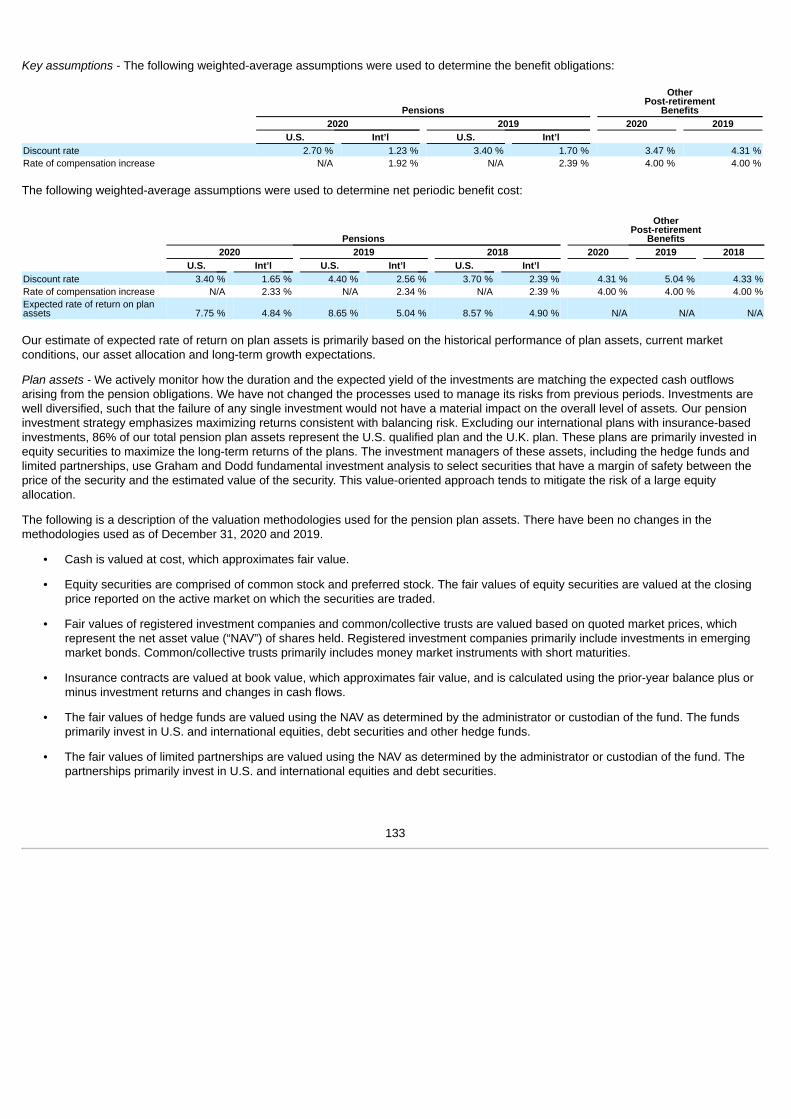
Key assumptions - The following weighted-average assumptions were used to determine the benefit obligations:
Pensions
OtherPost-retirement
Benefits 2020 2019 2020 2019 U.S. Int’l U.S. Int’l Discount rate 2.70 % 1.23 % 3.40 % 1.70 % 3.47 % 4.31 %Rate of compensation increase N/A 1.92 % N/A 2.39 % 4.00 % 4.00 %
The following weighted-average assumptions were used to determine net periodic benefit cost:
Pensions
OtherPost-retirement
Benefits2020 2019 2018 2020 2019 2018
U.S. Int’l U.S. Int’l U.S. Int’l Discount rate 3.40 % 1.65 % 4.40 % 2.56 % 3.70 % 2.39 % 4.31 % 5.04 % 4.33 %Rate of compensation increase N/A 2.33 % N/A 2.34 % N/A 2.39 % 4.00 % 4.00 % 4.00 %Expected rate of return on planassets 7.75 % 4.84 % 8.65 % 5.04 % 8.57 % 4.90 % N/A N/A N/A
Our estimate of expected rate of return on plan assets is primarily based on the historical performance of plan assets, current marketconditions, our asset allocation and long-term growth expectations.
Plan assets - We actively monitor how the duration and the expected yield of the investments are matching the expected cash outflowsarising from the pension obligations. We have not changed the processes used to manage its risks from previous periods. Investments arewell diversified, such that the failure of any single investment would not have a material impact on the overall level of assets. Our pensioninvestment strategy emphasizes maximizing returns consistent with balancing risk. Excluding our international plans with insurance-basedinvestments, 86% of our total pension plan assets represent the U.S. qualified plan and the U.K. plan. These plans are primarily invested inequity securities to maximize the long-term returns of the plans. The investment managers of these assets, including the hedge funds andlimited partnerships, use Graham and Dodd fundamental investment analysis to select securities that have a margin of safety between theprice of the security and the estimated value of the security. This value-oriented approach tends to mitigate the risk of a large equityallocation.
The following is a description of the valuation methodologies used for the pension plan assets. There have been no changes in themethodologies used as of December 31, 2020 and 2019.
• Cash is valued at cost, which approximates fair value.
• Equity securities are comprised of common stock and preferred stock. The fair values of equity securities are valued at the closingprice reported on the active market on which the securities are traded.
• Fair values of registered investment companies and common/collective trusts are valued based on quoted market prices, whichrepresent the net asset value (“NAV”) of shares held. Registered investment companies primarily include investments in emergingmarket bonds. Common/collective trusts primarily includes money market instruments with short maturities.
• Insurance contracts are valued at book value, which approximates fair value, and is calculated using the prior-year balance plus orminus investment returns and changes in cash flows.
• The fair values of hedge funds are valued using the NAV as determined by the administrator or custodian of the fund. The fundsprimarily invest in U.S. and international equities, debt securities and other hedge funds.
• The fair values of limited partnerships are valued using the NAV as determined by the administrator or custodian of the fund. Thepartnerships primarily invest in U.S. and international equities and debt securities.
133

• Real estate and other investments primarily consist of real estate investment trusts and other investments. These investments aremeasured at quoted market prices, which represent the NAV of the securities held in such funds at year end.
Our pension plan assets measured at fair value on a recurring basis are as follows as of December 31, 2020 and 2019. Refer to “Fair valuemeasurements” in Note 1 to these consolidated financial statements for a description of the levels.
(In millions) U.S. International
December 31, 2020 Total Level 1 Level 2 Level 3Net AssetValue Total Level 1 Level 2 Level 3
Net AssetValue
Cash and cash equivalents $ 38.1 $ 38.1 $ — $ — $ — $ 66.3 $ 66.3 $ — $ — $ — Equity securities
U.S. companies 83.3 83.3 — — — 96.3 96.3 — — — International companies 1.1 1.1 — — — 209.1 209.1 — — —
Registered investment companies 38.4 — — — 38.4 68.2 — — — 68.2 Insurance contracts — — — — — 154.0 — 154.0 — — Hedge funds 160.9 — — — 160.9 98.3 — — — 98.3 Limited partnerships 160.9 — — — 160.9 14.5 — — — 14.5 Real estate and otherinvestments 1.0 1.0 — — — 39.5 39.5 — — —
Total assets $ 483.7 $ 123.5 $ — $ — $ 360.2 $ 746.2 $ 411.2 $ 154.0 $ — $ 181.0
December 31, 2019 Cash and cash equivalents $ 50.5 $ 50.5 $ — $ — $ — $ 10.0 $ 10.0 $ — $ — $ — Equity securities
U.S. companies 110.3 110.3 — — — 70.4 70.4 — — — International companies 5.4 5.4 — — — 251.5 251.5 — — —
Registered investment companies 36.3 — — — 36.3 63.4 — — — 63.4 Common/collective trusts 12.5 — — — 12.5 — — — — — Insurance contracts — — — — — 138.5 — 138.5 — — Hedge funds 164.3 — — — 164.3 82.0 — — — 82.0
Limited partnerships 139.4 — — — 139.4 7.9 — — — 7.9 Real estate and otherinvestments 1.3 1.3 — — — 36.0 36.0 — — —
Total assets $ 520.0 $ 167.5 $ — $ — $ 352.5 $ 659.7 $ 367.9 $ 138.5 $ — $ 153.3
(a) Certain investments that are measured at fair value using net asset value per share (or its equivalent) have not been classified in the fair value hierarchy.
Contributions - We expect to contribute approximately $20.7 million to our international pension plans, representing primarily the Netherlandsqualified pension plans and U.K. qualified pension plans. We do not expect to make any contributions to our U.S. Qualified Pension Plan andour U.S. Non-Qualified Defined Benefit Pension Plan in 2021. All of the contributions are expected to be in the form of cash. In 2020 and2019, we contributed $28.7 million and $6.9 million to all pension plans, respectively. Subsequent to the Spin-off, we expect to contributeapproximately $18.9 million to our non-U.S. pension plans.
(a) (a)
134

Estimated future benefit payments - The following table summarizes expected benefit payments from our various pension and post-retirement benefit plans through 2028. Actual benefit payments may differ from expected benefit payments.
Pensions
OtherPost-retirement
Benefits(In millions) U.S. International 2021 $ 47.6 $ 36.6 $ 0.6 2022 32.4 30.6 0.6 2023 31.0 32.8 0.6 2024 31.7 34.8 0.6 2025 31.9 34.8 0.6 2025-2029 $ 164.3 $ 198.3 $ 2.6
Savings plans - The TechnipFMC Retirement Savings Plan (“Qualified Plan”), a qualified salary reduction plan under Section 401(k) of theInternal Revenue Code, is a defined contribution plan. Additionally, we have a non-qualified deferred compensation plan, the Non-QualifiedPlan, which allows certain highly compensated employees the option to defer the receipt of a portion of their salary. We match a portion ofthe participants’ deferrals to both plans. Both plans relate to FMC Technologies, Inc.
Participants in the Non-Qualified Plan earn a return based on hypothetical investments in the same options as our 401(k) plan. Changes inthe market value of these participant investments are reflected as an adjustment to the deferred compensation liability with an offset to otherincome (expense), net. As of December 31, 2020 and 2019, our liability for the Non-Qualified Plan was $22.8 million and $26.3 million,respectively, and was recorded in other liabilities in our consolidated balance sheets. We hedge the financial impact of changes in theparticipants’ hypothetical investments by purchasing the investments that the participants have chosen. Changes in the fair value of theseinvestments are recognized as an offset to other income (expense), net in our consolidated statements of income. As of December 31, 2020and 2019, we had investments for the Non-Qualified Plan totaling $22.8 million and $26.3 million at fair market value, respectively.
During the years ended December 31, 2020, and 2019 we recognized expense of $29.9 million and $34.0 million, respectively for matchingcontributions to these plans in 2020 and 2019, respectively. Additionally, during the years ended December 31, 2020 and 2019, werecognized expense of $12.1 million and $13.2 million, respectively, for non-elective contributions.
NOTE 23. DERIVATIVE FINANCIAL INSTRUMENTS
For purposes of mitigating the effect of changes in exchange rates, we hold derivative financial instruments to hedge the risks of certainidentifiable and anticipated transactions and recorded assets and liabilities in our consolidated balance sheets. The types of risks hedged arethose relating to the variability of future earnings and cash flows caused by movements in foreign currency exchange rates. Our policy is tohold derivatives only for the purpose of hedging risks associated with anticipated foreign currency purchases and sales created in the normalcourse of business, and not for trading purposes where the objective is solely to generate profit.
Generally, we enter into hedging relationships such that changes in the fair values or cash flows of the transactions being hedged areexpected to be offset by corresponding changes in the fair value of the derivatives. For derivative instruments that qualify as a cash flowhedge, the effective portion of the gain or loss of the derivative, which does not include the time value component of a forward currency rate,is reported as a component of other comprehensive income (“OCI”) and reclassified into earnings in the same period or periods during whichthe hedged transaction affects earnings. For derivative instruments not designated as hedging instruments, any change in the fair value ofthose instruments is reflected in earnings in the period such change occurs.
We hold the following types of derivative instruments:
Foreign exchange rate forward contracts – The purpose of these instruments is to hedge the risk of changes in future cash flows ofanticipated purchase or sale commitments denominated in foreign currencies and recorded assets and liabilities in our consolidated balancesheets. As of December 31, 2020, we held the following material net positions:
135

Net Notional Amount
Bought (Sold)(In millions) USD EquivalentEuro 1,794.5 2,201.8 British pound 771.7 1,054.3 Malaysian ringgit 891.0 221.5 Norwegian krone 1,721.6 201.7 Brazilian real 681.4 131.1 Singapore dollar 171.2 129.4 Mexican peso 1,288.0 64.7 Australian dollar 78.2 60.3 Indian rupee 3,172.0 43.4 Japanese yen 1,124.4 10.9 Columbian peso 37,142.2 10.8 Hong Kong dollar (97.6) (12.6)Indonesian rupiah (201,679.7) (14.3)U.S. dollar (2,922.1) (2,922.1)
Foreign exchange rate instruments embedded in purchase and sale contracts – The purpose of these instruments is to match offsettingcurrency payments and receipts for particular projects, or comply with government restrictions on the currency used to purchase goods incertain countries. As of December 31, 2020, our portfolio of these instruments included the following material net positions:
Net Notional Amount
Bought (Sold)(In millions) USD EquivalentBrazilian real 77.9 15.0 Hong Kong dollar 48.3 6.2 Euro (8.7) (10.7)Norwegian krone (142.8) (16.7)U.S. dollar 5.2 5.2
Fair value amounts for all outstanding derivative instruments have been determined using available market information and commonlyaccepted valuation methodologies. See Note 24 for further details. Accordingly, the estimates presented may not be indicative of the amountsthat we would realize in a current market exchange and may not be indicative of the gains or losses we may ultimately incur when thesecontracts are settled.
136

The following table presents the location and fair value amounts of derivative instruments reported in the consolidated balance sheets:
December 31, 2020 December 31, 2019(In millions) Assets Liabilities Assets LiabilitiesDerivatives designated as hedging instruments
Foreign exchange contractsCurrent - Derivative financial instruments $ 215.8 $ 151.6 $ 94.3 $ 125.0 Long-term - Derivative financial instruments 35.6 23.3 34.8 48.0
Total derivatives designated as hedging instruments 251.4 174.9 129.1 173.0 Derivatives not designated as hedging instruments
Foreign exchange contractsCurrent - Derivative financial instruments 85.6 15.6 7.6 16.3 Long-term - Derivative financial instruments 0.3 — 0.4 0.4
Total derivatives not designated as hedging instruments 85.9 15.6 8.0 16.7 Long-term - Derivative financial instruments - Synthetic Bonds - Call OptionPremium — — 4.3 — Long-term - Derivative financial instruments - Synthetic Bonds - EmbeddedDerivatives — — — 4.3
Total derivatives $ 337.3 $ 190.5 $ 141.4 $ 194.0
Cash flow hedges of forecasted transactions, net of tax, which qualify for hedge accounting, resulted in accumulated other comprehensivegains (losses) of $32.5 million and $(5.8) million as of December 31, 2020 and 2019, respectively. We expect to transfer an approximately$107.6 million gain from accumulated OCI to earnings during the next 12 months when the anticipated transactions actually occur. Allanticipated transactions currently being hedged are expected to occur by the second half of 2025.
The following tables present the location of gains (losses) in the consolidated statements of income related to derivative instrumentsdesignated as cash flow hedges.
Gain (Loss) Recognized in OCI Year Ended December 31,(In millions) 2020 2019 2018Foreign exchange contracts $ 28.0 $ 10.3 $ (75.4)
The following represents the effect of cash flow hedge accounting on the consolidated statements of income for the year endedDecember 31, 2020, 2019 and 2018:
Year Ended December 31,(In millions) 2020 2019 2018Total amount of income(expense) presented inthe consolidatedstatements of incomeassociated with hedgesand derivatives Revenue
Cost ofsales
Selling,general
andadministrative
expenseOther income(expense), net Revenue
Cost ofsales
Selling,general
andadministrative
expenseOther income(expense), net Revenue
Cost ofsales
Selling,general
andadministrative
expenseOther income(expense), net
Cash Flow hedge gain(loss) recognized inincome
Foreign ExchangeContracts
Amounts reclassifiedfrom accumulated OCIto income (loss) $ (83.7) $ 68.5 $ (0.4) $ (4.4) $ (26.6) $ 12.0 $ — $ (9.1) $ (2.4) $ 3.4 $ (0.1) $ 1.0 Amounts excluded fromeffectiveness testing 7.7 (9.8) (0.2) 34.2 0.6 (7.6) — (34.9) (2.2) (4.8) — (12.3)
Total cash flow hedgegain (loss) recognized inincome (76.0) 58.7 (0.6) 29.8 (26.0) 4.4 — (44.0) (4.6) (1.4) (0.1) (11.3)
Gain (loss) recognized inincome on derivatives notdesignated as hedginginstruments (0.8) 3.4 — 22.7 (1.6) 0.2 — (10.2) (1.7) 0.2 — (11.4)
Total $ (76.8) $ 62.1 $ (0.6) $ 52.5 $ (27.6) $ 4.6 $ — $ (54.2) $ (6.3) $ (1.2) $ (0.1) $ (22.7)
137

Balance Sheet Offsetting - We execute derivative contracts with counterparties that consent to a master netting agreement which permits netsettlement of the gross derivative assets against gross derivative liabilities. Each instrument is accounted for individually and assets andliabilities are not offset. As of December 31, 2020 and 2019, we had no collateralized derivative contracts. The following tables present bothgross information and net information of recognized derivative instruments:
December 31, 2020 December 31, 2019
(In millions)Gross Amount
Recognized
Gross AmountsNot Offset
Permitted UnderMaster Netting
Agreements Net AmountGross Amount
Recognized
Gross AmountsNot Offset
Permitted UnderMaster Netting
Agreements Net AmountDerivative assets $ 337.3 $ (134.0) $ 203.3 $ 141.4 $ (112.5) $ 28.9 Derivative liabilities $ 190.5 $ (134.0) $ 56.5 $ 194.0 $ (112.5) $ 81.5
NOTE 24. FAIR VALUE MEASUREMENTS
Recurring Fair Value Measurements
Assets and liabilities measured at fair value on a recurring basis were as follows:
December 31, 2020 December 31, 2019(In millions) Total Level 1 Level 2 Level 3 Total Level 1 Level 2 Level 3AssetsInvestments
Equity securities $ 65.6 $ 65.6 $ — $ — $ 54.8 $ 54.8 $ — $ — Money market fund 1.7 — 1.7 — 1.5 — 1.5 — Stable value fund 0.9 — — — 2.1 — — — Held-to-maturity debt securities 24.2 — 24.2 — 71.9 — 71.9 —
Derivative financial instrumentsSynthetic bonds - call option premium — — — — 4.3 — 4.3 — Foreign exchange contracts 337.3 — 337.3 — 137.1 — 137.1 —
Assets held for sale 47.3 — — 47.3 25.8 — — 25.8 Total assets $ 477.0 $ 65.6 $ 363.2 $ 47.3 $ 297.5 $ 54.8 $ 214.8 $ 25.8 Liabilities
Redeemable financial liability $ 246.6 $ — $ — $ 246.6 $ 268.8 $ — $ — $ 268.8 Derivative financial instruments
Synthetic bonds - embedded derivatives — — — — 4.3 — 4.3 — Foreign exchange contracts 190.5 — 190.5 — 189.7 — 189.7 —
Liabilities held for sale — — — — 9.3 — — 9.3 Total liabilities $ 437.1 $ — $ 190.5 $ 246.6 $ 472.1 $ — $ 194.0 $ 278.1
(a) Includes fixed income and other investments measured at fair value.
(b) Certain investments that are measured at fair value using net asset value per share (or its equivalent) have not been classified in the fair value hierarchy.
Equity securities and Available-for-sale Securities - The fair value measurement of our traded securities and Available-for-sale-Securities isbased on quoted prices that we have the ability to access in public markets.
Stable value fund and Money market fund - Stable value fund and money market fund are valued at the net asset value of the shares held atthe end of the quarter, which is based on the fair value of the underlying investments using information reported by our investment advisor atquarter-end.
Held-to-maturity debt securities - Held-to-maturity debt securities consist of government bonds. These investments are stated at amortizedcost, which approximates fair value.
(a)
(b)
138

Assets and liabilities held for sale - The fair value of our assets and liabilities held for sale was determined using a market approach that tookinto consideration the expected sales price.
Mandatorily redeemable financial liability - We have a mandatorily redeemable financial liability which is recorded at its fair value. Themandatorily redeemable financial liability relates to our voting control interests in legal Technip Energies contract entities which own andaccount for the design, engineering and construction of the Yamal LNG plant. The fair value is determined using a discounted cash flowmodel. The key assumptions used in applying the income approach are the selected discount rates and the expected dividends to bedistributed in the future to the non-controlling interest holders. Expected dividends to be distributed are based on the non-controllinginterests’ share of the expected profitability of the underlying contract, a 15.0% discount rate and the overall timing of completion of theproject.
A mandatorily redeemable financial liability of $246.6 million, $268.8 million and $408.5 million was recognized as of December 31, 2020,2019 and 2018, respectively, to account for the fair value of the non-controlling interests. During the years ended December 31, 2020, 2019and 2018, we revalued the liability to reflect current expectations about the obligation, which resulted in the recognition of a loss of $202.0million, $423.1 million and $322.3 million, respectively.
A decrease of one percentage point in the discount rate would have increased the liability by $2.0 million as of December 31, 2020. The fairvalue measurement is based upon significant unobservable inputs not observable in the market and is consequently classified as a Level 3fair value measurement.
Change in the fair value of our Level 3 mandatorily redeemable financial liability is recorded as interest expense on the consolidatedstatements of income and was as follows:
Year Ended December 31,(In millions) 2020 2019 2018Balance at beginning of period $ 268.8 $ 408.5 $ 312.0 Less: Expenses recognized in net interest expense (202.0) (423.1) (322.3)Less: Settlements 224.2 562.8 225.8
Balance at end of period $ 246.6 $ 268.8 $ 408.5
Redeemable non-controlling interest - We own a 51% share in Island Offshore Subsea AS that was subsequently renamed to TIOS AS. Thenon-controlling interest is recorded as mezzanine equity at fair value. The fair value measurement is based upon significant unobservableinputs not observable in the market and is consequently classified as a Level 3 fair value measurement. As of December 31, 2020 and 2019,the fair value of our redeemable non-controlling interest was $43.7 million and $41.1 million, respectively. See Note 2 for further details.
Derivative financial instruments - We use the income approach as the valuation technique to measure the fair value of foreign currencyderivative instruments on a recurring basis. This approach calculates the present value of the future cash flow by measuring the change fromthe derivative contract rate and the published market indicative currency rate, multiplied by the contract notional values. Credit risk is thenincorporated by reducing the derivative’s fair value in asset positions by the result of multiplying the present value of the portfolio by thecounterparty’s published credit spread. Portfolios in a liability position are adjusted by the same calculation; however, a spread representingour credit spread is used. Our credit spread, and the credit spread of other counterparties not publicly available, are approximated by usingthe spread of similar companies in the same industry, of similar size and with the same credit rating. We have no credit-risk-relatedcontingent features in our agreements with the financial institutions that would require us to post collateral for derivative positions in a liabilityposition. See Note 23 for further details.
Nonrecurring Fair Value Measurements
Fair value of long-lived, non-financial assets - Long-lived assets are reviewed for impairment whenever events or changes in circumstancesindicate that carrying amounts of such assets may not be recoverable.
The following summarizes impairments of long-lived assets and related post-impairment fair value for the years ended December 31, 2020and 2019:
139

Year Ended December 31,2020 2019
(In millions) Impairment Fair Value Impairment Fair Value Long-lived assets $ 204.0 $ 464.7 $ 495.4 $ 342.5 (b)
(a) Measured as of the impairment date using the income approach and a 10.8% risk-adjusted rate of interest, resulting in a Level 3 fair value measurement.(b) Includes $104.0 million fair value of vessels determined using the transaction price of a similar vessel, resulting in a Level 2 fair value measurement.
Other fair value disclosures
Fair value of debt - The fair value of our Synthetic Bonds, Senior Notes and private placement notes are as follows:
December 31, 2020 December 31, 2019
(In millions) Carrying Amount Fair Value Carrying Amount Fair Value Synthetic bonds due 2021 $ 551.2 $ 552.0 $ 492.9 $ 513.1 3.45% Senior Notes due 2022 500.0 513.2 500.0 499.2 5.00% Notes due 2020 — — 224.6 230.0 3.40% Notes due 2022 184.0 188.8 168.5 180.6 3.15% Notes due 2023 159.5 163.7 146.0 156.8 3.15% Notes due 2023 153.4 161.8 140.4 150.5 4.50% Notes due 2025 245.4 256.8 — — 4.00% Notes due 2027 92.0 99.7 84.2 96.4 4.00% Notes due 2032 122.7 136.8 112.3 127.8 3.75% Notes due 2033 122.7 126.4 112.3 123.8
(a) Carrying amounts include unamortized debt discounts and premiums and unamortized debt issuance costs of $12.8 million and $9.1 million as of December 31, 2020, and2019, respectively.
(b) Fair values are based on Level 2 quoted market prices.
Other fair value disclosures - The carrying amounts of cash and cash equivalents, trade receivables, accounts payable, short-term debt,commercial paper, debt associated with our bank borrowings, credit facilities, as well as amounts included in other current assets and othercurrent liabilities that meet the definition of financial instruments, approximate fair value.
Credit risk - By their nature, financial instruments involve risk, including credit risk, for non-performance by counterparties. Financialinstruments that potentially subject us to credit risk primarily consist of trade receivables and derivative contracts. We manage the credit riskon financial instruments by transacting only with what management believes are financially secure counterparties, requiring credit approvalsand credit limits, and monitoring counterparties’ financial condition. Our maximum exposure to credit loss in the event of non-performance bythe counterparty is limited to the amount drawn and outstanding on the financial instrument. Allowances for losses on trade receivables areestablished based on collectability assessments. We mitigate credit risk on derivative contracts by executing contracts only withcounterparties that consent to a master netting agreement, which permits the net settlement of gross derivative assets against grossderivative liabilities.
(a) (a)
(a) (b) (a) (b)
140

NOTE 25. QUARTERLY INFORMATION (UNAUDITED)
2020 2019(In millions, except per share data) 4th Qtr. 3rd Qtr. 2nd Qtr. 1st Qtr. 4th Qtr. 3rd Qtr. 2nd Qtr. 1st Qtr.Revenue $ 3,426.1 $ 3,335.7 $ 3,158.5 $ 3,130.3 $ 3,726.8 $ 3,335.1 $ 3,434.2 $ 2,913.0 Cost of sales 2,973.8 2,882.3 2,647.0 2,706.3 3,067.2 2,726.4 2,745.2 2,411.9 Net income (loss) (13.9) 6.4 15.3 (3,245.7) (2,430.3) (115.3) 113.7 19.8 Net income (loss) attributable toTechnipFMC plc $ (39.3) $ (3.9) $ 11.7 $ (3,256.1) $ (2,414.0) $ (119.1) $ 97.0 $ 20.9 Basic earnings (loss) per share $ (0.09) $ (0.01) $ 0.03 $ (7.28) $ (5.40) $ (0.27) $ 0.22 $ 0.05 Diluted earnings (loss) per share $ (0.09) $ (0.01) $ 0.03 $ (7.28) $ (5.40) $ (0.27) $ 0.21 $ 0.05
Basic and diluted earnings (loss) per share are computed independently for each of the quarters presented. Therefore, the sum of quarterly basic and diluted per shareinformation may not equal annual basic and diluted earnings (loss) per share.
NOTE 26. SUBSEQUENT EVENT
On February 16, 2021, we completed the Spin-off, see Note 3 for further details. In connection with the Spin-off, we executed a series ofrefinancing transactions, in order to provide a capital structure with sufficient cash resources to support future operating and investmentplans.
On February 16, 2021, we entered into a new senior secured revolving credit facility (the “Revolving Credit Facility”) that provides foraggregate revolving capacity of up to $1.0 billion. Availability of borrowings under the Revolving Credit Facility is reduced by any outstandingletters of credit issued against the facility. At February 25, 2021, there were no outstanding letters of credit and availability of borrowingsunder the Revolving Credit Facility was $800 million.
On January 29, 2021, we issued $1.0 billion of 6.5% senior notes due 2026 (the “2021 Notes”). The interest on the 2021 Notes is paid semi-annually on February 1 and August 1 of each year, beginning on August 1, 2021. The 2021 Notes are senior unsecured obligations and areguaranteed on a senior unsecured basis by substantially all of our wholly-owned U.S. subsidiaries and non-U.S. subsidiaries in Brazil, theNetherlands, Norway, Singapore and the United Kingdom.
The proceeds from the debt issuance described above along with the available cash on hand were used to fund the repayment of all$522.8 million of the outstanding Synthetic Convertible Bonds that matured in January 2021 and the repayment of all $500.0 millionaggregate principal amount of outstanding 3.45% Senior Notes due 2022.
In addition, we terminated the $2.5 billion senior unsecured revolving credit facility we entered into on January 17, 2017 and terminated the€500.0 million Euro Facility and CCFF Program we entered into on May 19, 2020. In connection with the termination of these credit facilities,we repaid most of the outstanding commercial paper borrowings, which were $1,525.9 million as December 31, 2020.
ITEM 9. CHANGES IN AND DISAGREEMENTS WITH ACCOUNTANTS ON ACCOUNTING AND FINANCIAL DISCLOSURE
None.
ITEM 9A. CONTROLS AND PROCEDURES
Evaluation of Disclosure Controls and Procedures
As of December 31, 2020, and under the direction of our Chief Executive Officer and Chief Financial Officer, we evaluated the effectivenessof our disclosure controls and procedures, as defined in Rule 13a-15(e) under the Exchange Act. Based upon this evaluation, our ChiefExecutive Officer and Chief Financial Officer concluded as of December 31, 2020, that our disclosure controls and procedures were effective.
Management’s Annual Report on Internal Control over Financial Reporting
(1)
(1)
(1)
141

Management is responsible for establishing and maintaining adequate internal control over financial reporting as defined in Rule 13a-15(f)under the Exchange Act.
Management evaluated the effectiveness of our internal control over financial reporting as of December 31, 2020 based on the framework inInternal Control-Integrated Framework (2013) issued by the Committee of Sponsoring Organizations of the Treadway Commission (COSO).As a result of this evaluation, management concluded that our internal control over financial reporting was effective as of December 31,2020.
The effectiveness of our internal control over financial reporting as of December 31, 2020, has been audited by PricewaterhouseCoopersLLP, an independent registered public accounting firm, as stated in their report included herein.
Changes in Internal Control over Financial Reporting
There were no changes in our internal control over financial reporting during the year ended December 31, 2020 that have materiallyaffected, or are reasonably likely to materially affect, our internal control over financial reporting.
ITEM 9B. OTHER INFORMATION
None.
ITEM 3. LEGAL PROCEEDINGS
A purported shareholder class action filed in 2017 and amended in January 2018 and captioned Prause v. TechnipFMC, et al., No. 4:17-cv-02368 (S.D. Texas) is pending in the U.S. District Court for the Southern District of Texas (“District Court”) against TechnipFMC and certaincurrent and former officers and employees of TechnipFMC. The suit alleged violations of the federal securities laws in connection with therestatement of our first quarter 2017 financial results and a material weakness in our internal control over financial reporting announced onJuly 24, 2017. On January 18, 2019, the District Court dismissed claims under Section 10(b) and 20(a) of the Securities Exchange Act of1934, as amended, and Section 15 of the Securities Act of 1933, as amended (“Securities Act”). The shareholder also asserted a claim foralleged violation of Section 11 of the Securities Act in connection with the reporting of certain financial results in our Form S-4 RegistrationStatement filed in 2016. On December 13, 2020, the parties filed a Stipulation and Agreement of Settlement to settle all claims asserted inthe suit with prejudice. The defendants entered into the Stipulation solely to eliminate the burden, expense, uncertainty and risk of furtherlitigation, and denied, and continue to deny, each and all of the claims and contentions alleged by the shareholder plaintiff in this action. OnDecember 16, 2020, the District Court entered an order preliminarily approving the settlement and ordering notice to the settlement class. Asettlement hearing is scheduled in the first quarter 2021.
In addition to the above-referenced matter, we are involved in various other pending or potential legal actions or disputes in the ordinarycourse of our business. These actions and disputes can involve our agents, suppliers, clients, and join venture partners and can includeclaims related to payment of fees, service quality, and ownership arrangements including certain put or call options. Management is unable topredict the ultimate outcome of these actions because of their inherent uncertainty. However, management believes that the most probable,ultimate resolution of these matters will not have a material adverse effect on our consolidated financial position, results of operations, orcash flows.
ITEM 4. MINE SAFETY DISCLOSURES
Not applicable.
142

PART III
ITEM 10. DIRECTORS, EXECUTIVE OFFICERS AND CORPORATE GOVERNANCE
See Part I, Item 1 “Executive Officers of the Registrant” of this Annual Report on Form 10-K for information regarding our executive officers.The information set forth under the sections “Corporate Governance,” “Proposals 1(a) - 1(n) - Election of Directors”, and if applicable,“Delinquent Section 16(a) Reports” in our 2021 Proxy Statement is incorporated herein by reference.
We have adopted a Code of Business Conduct, which is applicable to our directors, officers, and employees, including our principalexecutive officer, financial and accounting officers, and persons performing similar functions. Our Code of Business Conduct may be foundon our website at www.technipfmc.com under “About us-Governance” and is available in print to shareholders without charge by submitting arequest to 11740 Katy Freeway, Energy Tower 3, Houston, Texas 77079, Attention: Corporate Secretary. We intend to satisfy the disclosurerequirements under the Securities and Exchange Act of 1934, as amended, regarding an amendment to or waiver from a provision of ourCode of Business Conduct by posting such information on our website.
Name Principal OccupationDouglas J. Pferdehirt Executive Chairman and Chief Executive Officer of TechnipFMCEleazar de Carvalho Filho Founding Partner of Virtus BR Partners Assessoria Corporativa Ltda. and Founding Partner of Sinfonia Consultoria Financeira e
Participações Ltda., financial advisory and consulting firmsClaire S. Farley Vice Chairman in the Energy & Infrastructure business of KKR & Co. L.P., a global investment firmPeter Mellbye Former Executive Vice President, Development & Production, International, of Statoil ASA, an international oil and gas companyJohn O’Leary Chief Executive Officer of Strand Energy, a Dubai-based company specializing in business development in the oil and gas industryMargareth Øvrum Executive Vice President of Development and Production Brazil of Equinor ASA, an international oil and gas companyKay G. Priestly Former Chief Executive Officer of Turquoise Hill Resources Ltd., an international mining companyJames M. Ringler Former non-executive Chairman of the Board of Teradata Corporation, a provider of database software, data warehousing and
analyticsJohn Yearwood Former Chief Executive Officer, President, and Chief Operating Officer of Smith International, Inc., a supplier of services and
manufactured products to oil and gas exploration and production companies
ITEM 11. EXECUTIVE COMPENSATION
Information required by this item is incorporated herein by reference from the sections entitled “Director Compensation,” “CorporateGovernance - Compensation Committee Interlocks and Insider Participation in Compensation Decisions” and “Executive CompensationDiscussion and Analysis” of our Proxy Statement for the 2021 Annual General Meeting of Shareholders.
ITEM 12. SECURITY OWNERSHIP OF CERTAIN BENEFICIAL OWNERS AND MANAGEMENT AND RELATED SHAREHOLDERMATTERS
Information required by this item is incorporated herein by reference from the section entitled “Security Ownership of Our Management andHolders of More Than 5% of our Outstanding Ordinary Shares” of our Proxy Statement for the 2021 Annual General Meeting ofShareholders.
As of December 31, 2020, our securities authorized for issuance under equity compensation plans were as follows:
(shares in thousands)
Number of Securities to be Issued
Upon Exercise ofOutstanding Options,Warrants and Rights
Weighted Average Exercise Price of
Outstanding Options,Warrants and Rights
Number of SecuritiesRemaining Availablefor Future Issuance
under EquityCompensation Plans
Equity compensation plans approved by security holders 4,598.4 $ 29.77 14,250.2 Equity compensation plans not approved by security holders — — —
Total 4,598.4 $ 29.77 14,250.2
143

ITEM 13. CERTAIN RELATIONSHIPS AND RELATED TRANSACTIONS, AND DIRECTOR INDEPENDENCE
Information required by this item is incorporated herein by reference from the sections entitled “Transactions with Related Persons” and“Corporate Governance - Director Independence” of our Proxy Statement for the 2021 Annual General Meeting of Shareholders.
ITEM 14. PRINCIPAL ACCOUNTANT FEES AND SERVICES
Information required by this item is incorporated herein by reference from the sections entitled “Proposal 5 — Ratification of U.S. Auditor” ofour Proxy Statement for the 2021 Annual General Meeting of Shareholders.
144

PART IV
ITEM 15. EXHIBITS AND FINANCIAL STATEMENT SCHEDULES
(a) The following documents are filed as part of this Annual Report on Form 10-K:
1. The following consolidated financial statements of TechnipFMC plc and subsidiaries are filed as part of this Annual Report onForm 10-K under Part II, Item 8:
Reports of Independent Registered Public Accounting Firm on Consolidated Financial Statements
Consolidated Statements of Income for the Years Ended December 31, 2020, 2019 and 2018
Consolidated Statements of Comprehensive Income for the Years Ended December 31, 2020, 2019, and 2018
Consolidated Balance Sheets as of December 31, 2020 and 2019
Consolidated Statements of Cash Flows for the Years Ended December 31, 2020, 2019 and 2018
Consolidated Statements of Changes in Stockholders’ Equity for the Years Ended December 31, 2020, 2019 and 2018
Notes to Consolidated Financial Statements
2. Financial Statement Schedule:
See “Schedule II - Valuation and Qualifying Accounts” included herein. All other schedules are omitted because of theabsence of conditions under which they are required or because information called for is shown in the consolidated financialstatements and notes thereto in Part II, Item 8 of this Annual Report on Form 10-K.
3. Exhibits:
See “Index of Exhibits” filed as part of this Annual Report on Form 10-K.
145

Schedule II—Valuation and Qualifying Accounts
(In millions) Additions
Description
Balance atBeginning of
Period
Charged to Costs
and ExpensesCharged to
Other Accounts Deductionsand Adjustments
Balance atEnd of Period
Year Ended December 31, 2018Trade receivables allowance for doubtful accounts $ 117.4 $ 54.7 $ 0.3 $ (52.8) $ 119.6 Valuation allowance for deferred tax assets $ 430.0 $ 213.8 $ (21.3) $ 60.9 $ 683.4
Year Ended December 31, 2019Trade receivables allowance for doubtful accounts $ 119.6 $ 22.0 $ (2.9) $ (43.3) $ 95.4 Valuation allowance for deferred tax assets $ 683.4 $ 187.0 $ (2.1) $ 48.6 $ 916.9
Year Ended December 31, 2020Trade receivables allowance for doubtful accounts $ 95.4 $ 66.8 $ 11.9 $ (65.2) $ 108.9 Valuation allowance for deferred tax assets $ 916.9 $ 94.7 $ (7.3) $ (69.0) $ 935.3
(a) "Additions charged to other accounts” includes translation adjustments.
(b) “Deductions and adjustments” includes write-offs, net of recoveries, increases in allowances offset by increases to deferred tax assets, and reductions in the allowancescredited to expense.
(c) On January 1, 2020, we adopted ASU 2016-13, resulting in a $3.8 million increase to our trade receivables allowance for doubtful accounts. See Note 4 for further details.
See accompanying Report of Independent Registered Public Accounting Firm.
(a) (b)
(c)
146

ITEM 16. SUMMARY
None.
147

INDEX OF EXHIBITS
Exhibit Number Exhibit Description2.1 Business Combination Agreement, dated as of June 14, 2016, by and among FMC Technologies, Inc., TechnipFMC plc (f/k/a FMC Technologies SIS
Limited) and Technip S.A. (incorporated by reference from Annex A-1 to the Registration Statement on Form S-4, as amended, filed on October 21, 2016)(File No. 333-213067)
2.1.a Amendment No. 1 to Business Combination Agreement, dated as of December 14, 2016, by and among FMC Technologies, Inc., TechnipFMC plc (f/k/aTechnipFMC Limited) and Technip S.A. (incorporated by reference from Exhibit 2.1 to the Current Report on Form 8-K filed on December 14, 2016) (FileNo. 333-213067)
2.3 Joinder Agreement, dated as of December 14, 2016, by and among FMC Technologies, Inc., TechnipFMC plc (f/k/a TechnipFMC Limited), Technip S.A.,TechnipFMC Holdings Limited, TechnipFMC US Holdings LLC and TechnipFMC US Merger Sub LLC (incorporated by reference from Exhibit 2.2 to theCurrent Report on Form 8-K filed on December 14, 2016) (File No. 333-213067)
3.1 Articles of Association of TechnipFMC plc (incorporated by reference from Exhibit 3.1 to the Current Report on Form 8-K filed on January 17, 2017) (FileNo. 001-37983)
4.1 Indenture, dated March 29, 2017, between TechnipFMC plc and U.S. Bank National Association, as trustee (incorporated by reference from Exhibit 4.1 tothe Current Report on Form 8-K filed on March 30, 2017) (File No. 001-37983)
4.1.a Second Supplemental Indenture, dated March 29, 2017, between TechnipFMC plc and U.S. Bank National Association, as trustee (including the form of3.45% Senior Notes due 2022) (incorporated by reference from Exhibit 4.3 to the Current Report on Form 8-K filed on March 30, 2017) (File No. 001-37983)
4.2 Indenture, dated January 29, 2021, between TechnipFMC plc and U.S. Bank National Association, as trustee (including the form of 6.500% Senior Notedue 2026) (incorporated by reference from Exhibit 4.1 to the Current Report on Form 8-K filed on January 29, 2021 (File No. 001-37983)
4.2.a Supplemental Indenture, dated February 16, 2021, by and among TechnipFMC plc, the guarantors party thereto, and U.S. Bank National Association, astrustee (incorporated by reference from Exhibit 4.1 to the Current Report on Form 8-K filed on February 16, 2021) (File No. 001-37983)
4.3 Description of Registrant’s Securities Registered Pursuant to Section 12 of the Securities Exchange Act of 1934, as amended (incorporated by referencefrom Exhibit 4.2 to the Annual Report on Form 10-K filed on March 3, 2020) (File No. 001-37983)
10.1* Amended and Restated FMC Technologies, Inc. Non-Qualified Savings and Investment Plan, dated July 31, 2008 (incorporated by reference from Exhibit10.9 to the Annual Report on Form 10-K of FMC Technologies, Inc. filed on March 1, 2010) (File No. 001-16489)
10.1.a* First Amendment of FMC Technologies, Inc. Non-Qualified Savings and Investment Plan, dated October 29, 2009 (incorporated by reference from Exhibit10.9 to the Quarterly Report on Form 10-Q of FMC Technologies, Inc. filed on November 3, 2009) (File No. 001-16489)
10.1.b* Second Amendment of FMC Technologies, Inc. Non-Qualified Savings and Investment Plan, dated December 18, 2015 (incorporated by reference fromExhibit 10.14.b to the Annual Report on Form 10-K of FMC Technologies, Inc. filed on February 24, 2016) (File No. 001-16489)
10.2* Amended and Restated TechnipFMC plc Incentive Award Plan (incorporated by reference from Exhibit 10.2 to the Annual Report on Form 10-K filed onMarch 11, 2019) (File No. 001-37983)
10.3* Form of Restricted Stock Unit Agreement pursuant to the TechnipFMC plc Incentive Award Plan (Employee) (incorporated by reference from Exhibit 10.1 tothe Quarterly Report on Form 10-Q filed on August 4, 2017) (File No. 001-37983)
10.3a* Form of Restricted Stock Unit Agreement pursuant to the Amended and Restated TechnipFMC plc Incentive Award Plan (Employee) (incorporated byreference from Exhibit 10.1 to the Quarterly Report on Form 10-Q filed on May 9, 2019) (File No. 001-37983)
10.3b* Form of Restricted Stock Unit Agreement pursuant to the TechnipFMC plc Incentive Award Plan (Employee) (incorporated by reference from Exhibit 10.1 tothe Quarterly Report on Form 10-Q filed on May 4, 2020) (File No. 001-37983)
10.4* Form of Restricted Stock Unit Agreement pursuant to the TechnipFMC plc Incentive Award Plan (Non-Employee Director) (incorporated by reference fromExhibit 10.2 to the Quarterly Report on Form 10-Q filed on August 4, 2017) (File No. 001-37983)
10.5* Form of Performance Stock Unit Agreement pursuant to the TechnipFMC plc Incentive Award Plan (Employee) (incorporated by reference from Exhibit 10.3to the Quarterly Report on Form 10-Q filed on August 4, 2017) (File No. 001-37983)
10.5a* Form of Performance Stock Unit Agreement pursuant to the Amended and Restated TechnipFMC plc Incentive Award Plan (Employee) (incorporated byreference from Exhibit 10.2 to the Quarterly Report on Form 10-Q filed on May 9, 2019) (File No. 001-37983)
10.5b* Form of Performance Stock Unit Agreement pursuant to the TechnipFMC plc Incentive Award Plan (Employee) (incorporated by reference from Exhibit 10.2to the Quarterly Report on Form 10-Q filed on May 4, 2020) (File No. 001-37983)
10.6* Form of Nonqualified Stock Option Agreement pursuant to the TechnipFMC plc Incentive Award Plan (Employee) (incorporated by reference from Exhibit10.4 to the Quarterly Report on Form 10-Q filed on August 4, 2017) (File No. 001-37983)
10.7* Form of Nonqualified Stock Option Agreement pursuant to the Amended and Restated TechnipFMC plc Incentive Award Plan (Employee) (incorporated byreference from Exhibit 10.3 to the Quarterly Report on Form 10-Q filed on May 9, 2019) (File No. 001-37983)
10.8* 2013 Technip Incentive and Reward Plan (Rules of the Performance Shares Plan) June 14, 2013 allocation (incorporated by reference from Exhibit 99.4 tothe Registration Statement on Form S-8 of TechnipFMC plc, filed on February 27, 2017) (File No. 333-216289)
10.9* 2013 Technip Incentive and Reward Plan (Stock Option Plan Rules) June 14, 2013 allocation (incorporated by reference from Exhibit 99.5 to theRegistration Statement on Form S-8 of TechnipFMC plc, filed on February 27, 2017) (File No. 333-216289)
10.10* 2013 Technip Incentive and Reward Plan (Rules of the Performance Shares Plan) January 10, 2014 allocation (incorporated by reference from Exhibit 99.6to the Registration Statement on Form S-8 of TechnipFMC plc, filed on February 27, 2017) (File No. 333-216289)
10.11* 2013 Technip Incentive and Reward Plan (Stock Option Plan Rules) January 10, 2014 allocation (incorporated by reference from Exhibit 99.7 to theRegistration Statement on Form S-8 of TechnipFMC plc, filed on February 27, 2017) (File No. 333-216289)
10.12* 2014 Technip Incentive and Reward Plan (Rules of the Performance Shares Plan) December 10, 2014 allocation (incorporated by reference from Exhibit99.8 to the Registration Statement on Form S-8 of TechnipFMC plc, filed on February 27, 2017) (File No. 333-216289)
10.13* 2015 Technip Incentive and Reward Plan (Stock Option Plan Rules) September 7, 2015 allocation (incorporated by reference from Exhibit 99.9 to theRegistration Statement on Form S-8 of TechnipFMC plc, filed on February 27, 2017) (File No. 333-216289)
10.14* 2016 Technip Incentive and Reward Plan (Rules of the Performance Shares Plan) July 1, 2016 allocation (incorporated by reference from Exhibit 99.10 tothe Registration Statement on Form S-8 of TechnipFMC plc, filed on February 27, 2017) (File No. 333-216289)
10.15* 2016 Technip Incentive and Reward Plan (Stock Option Plan Rules) July 1, 2016 allocation (incorporated by reference from Exhibit 99.11 to theRegistration Statement on Form S-8 of TechnipFMC plc, filed on February 27, 2017) (File No. 333-216289)
10.16* 2016 Technip Incentive and Reward Plan (Rules of the Performance Shares Plan) December 6, 2016 allocation (incorporated by reference from Exhibit99.12 to the Registration Statement on Form S-8 of TechnipFMC plc, filed on February 27, 2017) (File No. 333-216289)
10.17* Form of TechnipFMC plc Executive Severance Agreement (incorporated by reference from Exhibit 10.1 to the Quarterly Report on Form 10-Q filed onNovember 2, 2020) (File No. 001-37983)
10.18* Service Agreement between TechnipFMC plc and Thierry Pilenko dated January 16, 2017 (incorporated by reference from Exhibit 10.21 to the AnnualReport on Form 10-K filed on April 2, 2018) (File No. 001-37983)
10.19* Letter Agreement between TechnipFMC plc and Thierry Pilenko dated September 20, 2017 (incorporated by reference from Exhibit 10.22 to the AnnualReport on Form 10-K filed on April 2, 2018) (File No. 001-37983)
10.20* Form of Executive Director Appointment Letter (incorporated by reference from Exhibit 10.2 to the Current Report on Form 8-K filed on January 17, 2017)(File No. 001-37983)
10.21 Form of Non-Executive Director Appointment Letter (incorporated by reference from Exhibit 10.3 to the Current Report on Form 8-K filed on January 17,2017) (File No. 001-37983)
10.22 Form of Director Deed of Indemnity (Directors) (incorporated by reference from Exhibit 10.2 to the Current Report on Form 8-K filed on January 17, 2017)(File No. 001-37983)
10.23* Form of Deed of Indemnity (Executive Officers) (incorporated by reference from Exhibit 10.3 to the Current Report on Form 8-K filed on January 17, 2017)(File No. 001-37983)
10.24 Form of Director Deed of Indemnity (Executive Directors) (incorporated by reference from Exhibit 10.4 to the Current Report on Form 8-K filed on January17, 2017) (File No. 001-37983)
10.25* TechnipFMC plc Directors Deferred Compensation Plan10.26 US$2,500,000,000 Facility Agreement, dated January 12, 2017, by and among FMC Technologies, Inc., Technip Eurocash SNC and TechnipFMC plc, as
borrowers; JPMorgan Chase Bank, N.A., as agent; SG Americas Securities, LLC as syndication agent; and the other lenders party thereto (incorporated byreference from Exhibit 10.1 to the Current Report on Form 8-K filed on January 17, 2017) (File No. 001-37983)
10.27 Form of Commercial Paper Dealer Agreement, by and among FMC Technologies, Inc., as Issuer, TechnipFMC plc, as Guarantor, and the Dealer partythereto (incorporated by reference from Exhibit 10.1 to the Current Report on Form 8-K filed on September 20, 2017) (File No. 001-37983)
10.28 Separation and Distribution Agreement, dated as of January 7, 2021, by and between the Company and Technip Energies B.V. (incorporated by referencefrom Exhibit 10.1 to the Current Report on Form 8-K filed on January 12, 2021) (File No. 001-37983)
10.29 Share Purchase Agreement, dated as of January 7, 2021, by and between the Company and Bpifrance Participations SA (incorporated by reference fromExhibit 10 2 to the Current Report on Form 8 K filed on January 12 2021) (File No 001 37983)

Exhibit 10.2 to the Current Report on Form 8-K filed on January 12, 2021) (File No. 001-37983)10.30 Relationship Agreement, dated as of January 7, 2021, by and among the Company, Technip Energies B.V. and Bpifrance Participations SA (incorporated by
reference from Exhibit 10.3 to the Current Report on Form 8-K filed on January 12, 2021) (File No. 001-37983)10.31 Commitment Letter, dated as of January 7, 2021, by and among the Company and the financial institutions party thereto (incorporated by reference from
Exhibit 10.4 to the Current Report on Form 8-K filed on January 12, 2021) (File No. 001-37983)10.32 Dealer Agreement, dated as of May 19, 2020 between TechnipFMC plc, as Issuer; FMC Technologies, Inc., as Guarantor; and Bank of America Merrill
Lynch International DAC, as Arranger and Dealer (incorporated by reference from Exhibit 10.1 to the Current Report on Form 8-K filed on May 21, 2020)(File No. 001-37983)
10.33 Issuing and Paying Agency Agreement, dated as of May 19, 2020 between TechnipFMC plc, as Issuer; FMC Technologies, Inc., as Guarantor; and Bank ofAmerica, National Association, London Branch, as Issue and Paying Agent and Calculation Agent (incorporated by reference from Exhibit 10.2 to theCurrent Report on Form 8-K filed on May 21, 2020) (File No. 001-37983)
10.34 €500,000,000 Facility Agreement dated as of May 19, 2020 between TechnipFMC plc and Technip Eurocash SNC, as borrowers; HSBC France, as Agent;and the lenders party thereto (incorporated by reference from Exhibit 10.3 to the Current Report on Form 8-K filed on May 21, 2020) (File No. 001-37983)
10.35 Amendment and Restatement Agreement to €500,000,000 Facility Agreement dated as of June 12, 2020 between TechnipFMC plc and Technip EurocashSNC, as borrowers; HSBC France, as Agent; and the lenders party thereto (incorporated by reference from Exhibit 10.2 to the Current Report on Form 8-Kfiled on June 15, 2020) (File No. 001-37983)
10.36 Amendment No. 1 to $2,500,000,000 Facility Agreement, dated as of June 12, 2020, by and among TechnipFMC plc, FMC Technologies, Inc. and TechnipEurocash SNC, as borrowers; JPMorgan Chase Bank, N.A., as agent and an arranger; SG Americas Securities LLC as an arranger; and the other lendersparty thereto (incorporated by reference from Exhibit 10.1 to the Current Report on Form 8-K filed on June 15, 2020) (File No. 001-37983)
10.37 Tax Matters Agreement, dated as of February 16, 2021 by and between TechnipFMC plc and Technip Energies B.V. (incorporated by reference from Exhibit10.1 to the Current Report on Form 8-K filed on February 16, 2021) (File No. 001-37983)
10.38 Employee Matters Agreement, dated as of February 15, 2021, by and between TechnipFMC plc and Technip Energies B.V. (incorporated by reference fromExhibit 10.2 to the Current Report on Form 8-K filed on February 16, 2021) (File No. 001-37983)
10.39 Transition Services Agreement, dated as of February 15, 2021 by and between TechnipFMC plc and Technip Energies B.V. (incorporated by reference fromExhibit 10.3 to the Current Report on Form 8-K filed on February 16, 2021) (File No. 001-37983)
10.40 Patent License Agreement, dated as of February 15, 2021 by and between TechnipFMC plc and Technip Energies B.V. (incorporated by reference fromExhibit 10.4 to the Current Report on Form 8-K filed on February 16, 2021) (File No. 001-37983)
10.41 Coexistence and Trademark Matters Agreement, dated as of February 15, 2021 by and between TechnipFMC plc and Technip Energies B.V. (incorporatedby reference from Exhibit 10.5 to the Current Report on Form 8-K filed on February 16, 2021) (File No. 001-37983)
10.42 Credit Agreement, dated February 16, 2021, by and among TechnipFMC plc, JPMorgan Chase Bank, N.A., Citigroup Global Markets Inc. or an affiliate,DNB Capital, LLC or an affiliate, Société Générale, Sumitomo Mitsui Banking Corporation, Wells Fargo Securities, LLC and BofA Securities, Inc.,collectively, as lead arrangers, JPMorgan Chase Bank, N.A., as administrative agent, Standard Chartered Bank, as documentation agent, and the lendersparty thereto (incorporated by reference from Exhibit 10.6 to the Current Report on Form 8-K filed on February 16, 2021) (File No. 001-37983)
21.1 List of Significant Subsidiaries23.1 Consent of PricewaterhouseCoopers LLP31.1 Certification of Chief Executive Officer31.2 Certification of Chief Financial Officer32.1** Certification of Chief Executive Officer pursuant to 18 U.S.C.32.2** Certification of Chief Financial Officer pursuant to 18 U.S.C.101.INS XBRL Instance Document – the instance document does not appear in the Interactive Data File because its XBRL tags are embedded within the Inline
XBRL document.101.SCH Inline XBRL Taxonomy Extension Schema Document.101.CAL Inline XBRL Taxonomy Extension Calculation Linkbase Document.101.DEF Inline XBRL Taxonomy Extension Definition Linkbase Document.101.LAB Inline XBRL Taxonomy Extension Label Linkbase Document.101.PRE Inline XBRL Taxonomy Extension Presentation Linkbase Document.104 Cover Page Interactive Data File (formatted as Inline XBRL and contained in Exhibit 101).
* Indicates a management contract or compensatory plan or arrangement.
** Furnished with this Form 10-K.
148

SIGNATURES
Pursuant to the requirements of Section 13 or 15(d) of the Securities Exchange Act of 1934, the Registrant has duly caused this report to besigned on its behalf by the undersigned, thereunto duly authorized.
TechnipFMC plc(Registrant)
By: /S/ KRISZTINA DOROGHAZI
Krisztina DoroghaziSenior Vice President, Controller and Chief Accounting Officer
(Principal Accounting Officer and a Duly Authorized Officer)
Date: March 5, 2021
Pursuant to the requirements of the Securities Exchange Act of 1934, this report has been signed below by the following persons on behalfof the registrant and in the capacities and on the dates indicated.
Date Signature
March 5, 2021 /S/ DOUGLAS J. PFERDEHIRT
Douglas J. PferdehirtChairman and Chief Executive Officer
(Principal Executive Officer)
March 5, 2021 /S/ ALF MELIN
Alf MelinExecutive Vice President and Chief Financial Officer
(Principal Financial Officer)
March 5, 2021 /S/ ELEAZAR DE CARVALHO FILHOEleazar de Carvalho Filho,
Director
March 5, 2021 /S/ CLAIRE S. FARLEY
Claire S. Farley,
Director
March 5, 2021 /S/ PETER MELLBYE
Peter Mellbye,
Director
March 5, 2021 /S/ JOHN O’LEARY
John O’Leary,
Director
March 5, 2021 /S/ MARGARETH ØVRUMMargareth Øvrum,
Director
March 5, 2021 /S/ KAY G. PRIESTLY
Kay G. Priestly,
Director
March 5, 2021 /S/ JAMES M. RINGLERJames M. Ringler,
Director
March 5, 2021 /S/ JOHN YEARWOODJohn Yearwood,
Director
149

TECHNIPFMC PLC
DIRECTORS DEFERRED COMPENSATION PLAN
Section 1. Purpose and Effective Date
The purpose of this Plan is to provide the non-executive members of the Board of Directors (the “Board”) of TechnipFMC plc (the“Company”) with an opportunity to elect the date on which their Annual Equity RSUs will be settled and paid, including any deferral thereon(in addition to any vesting requirements set forth in the RSU Grant Agreement) and to establish the terms for such elections and deferrals.
Section 2. Eligibility
Any member of the Board (a “Director”) who is not an officer or employee of the Company or a subsidiary of the Company is eligible toparticipate in the Plan.
Section 3. Elections to With Respect to an Annual Equity RSUs
(a) Normal Time of Election . Elections under this Plan with respect to any Annual Equity RSUs for a Plan Year shall be made nolater than the date specified by the Plan Administrator, but no later than December 31 of the calendar year prior to the year in which theservices are performed. Any such election shall be effective for Annual Equity RSUs earned in the following calendar year.
(b) Initial Service as a Director. Notwithstanding Section 3(a), a new Director nominee (who is not at the time of nomination asitting Director) may make an initial election prior to or within 30 days following the date the nominee commences service as a Director andsuch election shall be effective for the Annual Equity RSUs earned following the later of the date the nominee commences services as aDirector and the date the election form is provided to the Secretary of the Company.
(c) Manner of Election . Unless otherwise determined by the Plan Administrator, a participant may elect to a Settlement Date forall, but not less than all, of such participant’s Annual Equity RSUs for a Plan Year within the time periods prescribed under this Section 3 bygiving written notice on an election form provided by the Company, which notice shall specify (to the extent applicable) the Settlement Dateelected under Section 4.
(d) Duration and Effect of Election. An election to defer Annual Equity RSUs shall become effective and binding on theparticipant once the Plan Year to which the election applies has commenced and, except as provided by this paragraph, once made, isirrevocable and may not be changed. An election for a Plan Year may be cancelled upon demonstration of an “unforeseeable emergency”(within the meaning of Section 409A) and with the concurrence of the Chairman of the Board. The Plan Administrator may in its discretionprovide that elections may be evergreen and apply to all future Plan Years until revoked according to such procedures established by the PlanAdministrator. However, any revocation will only apply to a future Plan Year.
Section 4. Settlement Date Election
A participant may elect the Settlement Date of his or her Annual Equity RSU for a Plan Year to be paid upon (i) a specified year in the future,between one (1) and ten (10) years following the date of grant,

provided the Settlement Date and payment will be made on the March 15 of the selected year (or the first business day immediatelyfollowing March 15 if March 15 is not a business day) If a participant does not make an election under this Plan with respect to the AnnualEquity RSUs, then that Annual Equity RSU will be paid as provided in the RSU Grant Agreement.
Section 5. Death or Disability Prior to Receipt
In the event of a participant’s death or Disability prior to the date elected by the participant to receive the Shares underlying an Annual RSUGrant deferred hereunder, then such Shares shall be paid to the participant (or the participant’s estate or personal representative, asapplicable) in a lump sum within sixty (60) days following the date of the participant’s death or Disability.
Section 6. Participant's Rights Unsecured
Nothing in this Plan shall require the segregation of any assets of the Company or any type of funding by the Company, it being the intentionof the parties that the Plan be an unfunded arrangement for federal income tax purposes. No participant shall have any rights to or interest inany specific assets or Shares by reason of the Plan, and any participant’s rights to enforce payment of the obligations of the Companyhereunder shall be those of a general creditor of the Company.
Section 7. Assignability
No right to receive payments hereunder shall be transferable or assignable by a participant, except by will or by the laws of descent anddistribution. A participant may not sell, assign, transfer, pledge or otherwise encumber any interest in the participant’s Annual RSU Grantand any attempt to do so shall be void against, and shall not be recognized by, the Company.
Section 8. Administration
The Plan shall be administered by the Plan Administrator, who shall have the authority to adopt rules and regulations for carrying out thePlan and interpret, construe and implement the provisions of the Plan consistent with those applicable under the Equity Plan.
Section 9. Construction
To the extent applicable to a participant, the Plan is intended to comply with Section 409A and any regulations and guidance thereunder andshall be interpreted and administered in accordance with that intent. If any provision of the Plan would otherwise conflict with or frustratethis intent, that provision will be interpreted and deemed amended so as to avoid the conflict. The laws of the State of Delaware shall governall questions of law arising with respect to the Plan, without regard to the choice of law principles of any jurisdiction that would result in theapplication of the laws of another jurisdiction. If any provision of the Plan is held to be illegal or void, such illegality or invalidity shall notaffect the remaining provisions of the Plan, but shall be fully severable, and the Plan shall be construed and enforced as if the illegal orinvalid provision had never been inserted.
Section 10. Amendment
- 2 -

The Plan may at any time or from time to time be amended, modified or terminated by the Company. No amendment, modification ortermination shall, without the consent of the participant, adversely affect any Annual RSU Grants deferred under this Plan , except that thePlan Administrator may terminate the Plan and distribute the Shares underlying any Annual RSU Grants deferred under this Plan toparticipants in accordance with and subject to the rules of Treas. Reg. Section 1.409A-3(j)(4)(ix), or successor provisions, and any generallyapplicable guidance issued by the Internal Revenue Service permitting such termination and distribution. The Plan Administrator maydelegate to a committee consisting of at least three employees of the Company the authority to make technical amendments to the Plan and toestablish procedures regarding elections hereunder.
Section 11. Definitions
(a) “Annual Equity RSUs” means the annual RSUs granted to a Director for serving as a member of the Board.
(b) “Disability” means Participant’s inability to engage in any substantial gainful activity by reason of any medicallydeterminable physical or mental impairment that can be expected to result in death or that can be expected to last for a continuous period ofnot less than twelve (12) months.
(c) “Equity Plan” means the Amended and Restated Company Incentive Award Plan (as it may be amended from time to time)or any successor plan.
(d) “Plan” means this TechnipFMC PLC Directors Deferred Compensation Plan.
(e) “Plan Administrator” means the Administrator of the Equity Plan, including any officer who may be delegated powers of theAdministrator under Section 12.6 of the Equity Plan.
(f) “Plan Year” means a calendar year.
(g) “RSU” means a stock-settled restricted stock unit granted under the Equity Plan.
(h) “RSU Grant Agreement” means the agreement between the Company and a Director which sets forth the terms andconditions of the participant’s Annual Equity RSUs.
(i) “Section 409A” means Section 409A of the Internal Revenue Code of 1986, as amended.
(j) “Shares” means the ordinary shares in the capital of the Company.
(k) “Settlement Date” has the meaning set forth in the RSU Grant Agreement as the date the Shares become payable under theAnnual RSU Grant.
- 3 -

Exhibit 21.1TechnipFMC plc
Significant Subsidiaries of the RegistrantDecember 31, 2020
Name of Company Country of Incorporation
Technip Offshore International FranceTechnipFMC Holdings Limited United KingdomFMC Technologies Inc United StatesTechnip USA Inc United States

Exhibit 23.1
CONSENT OF INDEPENDENT REGISTERED PUBLIC ACCOUNTING FIRM
We hereby consent to the incorporation by reference in the Registration Statements on Form S-8 (333-216284) and on Form S-3 (No. 333-240355) of TechnipFMC plc of our report dated March 5, 2021 relating to the financial statements and financial statement schedule and theeffectiveness of internal control over financial reporting, which appears in this Form 10-K.
/s/PricewaterhouseCoopers
Houston, TexasMarch 5, 2021

Exhibit 31.1
CERTIFICATION OF CHIEF EXECUTIVE OFFICERPURSUANT TO RULE 13A-14(A) AND RULE 15D-14(A)
OF THE SECURITIES EXCHANGE ACT OF 1934, AS AMENDED
I, Douglas J. Pferdehirt, certify that:
1. I have reviewed this annual report on Form 10-K for the period ended December 31, 2020 of TechnipFMC plc (the “registrant”);
2. Based on my knowledge, this report does not contain any untrue statement of a material fact or omit to state a material fact necessary to make thestatements made, in light of the circumstances under which such statements were made, not misleading with respect to the period covered by thisreport;
3. Based on my knowledge, the financial statements, and other financial information included in this report, fairly present in all material respects thefinancial condition, results of operations and cash flows of the registrant as of, and for, the periods presented in this report;
4. The registrant’s other certifying officer and I are responsible for establishing and maintaining disclosure controls and procedures (as defined inExchange Act Rules 13a-15(e) and 15d-15(e)) and internal control over financial reporting (as defined in Exchange Act Rules 13a-15(f) and 15d-15(f)) for the registrant and have:
(a) Designed such disclosure controls and procedures, or caused such disclosure controls and procedures to be designed under oursupervision, to ensure that material information relating to the registrant, including its consolidated subsidiaries, is made known to us byothers within those entities, particularly during the period in which this report is being prepared;
(b) Designed such internal control over financial reporting, or caused such internal control over financial reporting to be designed under oursupervision, to provide reasonable assurance regarding the reliability of financial reporting and the preparation of financial statements forexternal purposes in accordance with generally accepted accounting principles;
(c) Evaluated the effectiveness of the registrant’s disclosure controls and procedures and presented in this report our conclusions about theeffectiveness of the disclosure controls and procedures, as of the end of the period covered by this report based on such evaluation; and
(d) Disclosed in this report any change in the registrant’s internal control over financial reporting that occurred during the registrant’s mostrecent fiscal quarter (the registrant’s fourth fiscal quarter in the case of an annual report) that has materially affected, or is reasonably likelyto materially affect, the registrant’s internal control over financial reporting; and
5. The registrant’s other certifying officer and I have disclosed, based on our most recent evaluation of internal control over financial reporting, to theregistrant’s auditors and the audit committee of the registrant’s board of directors (or persons performing the equivalent functions):
(a) All significant deficiencies and material weaknesses in the design or operation of internal control over financial reporting which arereasonably likely to adversely affect the registrant’s ability to record, process, summarize and report financial information; and
(b) Any fraud, whether or not material, that involves management or other employees who have a significant role in the registrant’s internalcontrol over financial reporting.
Date: March 5, 2021
/s/ DOUGLAS J. PFERDEHIRTDouglas J. Pferdehirt
Executive Chairman and Chief Executive Officer(Principal Executive Officer)

Exhibit 31.2
CERTIFICATION OF CHIEF FINANCIAL OFFICERPURSUANT TO RULE 13A-14(A) AND RULE 15D-14(A)
OF THE SECURITIES EXCHANGE ACT OF 1934, AS AMENDED
I, Alf Melin, certify that:
1. I have reviewed this annual report on Form 10-K for the period ended December 31, 2020 of TechnipFMC plc (the “registrant”);
2. Based on my knowledge, this report does not contain any untrue statement of a material fact or omit to state a material fact necessary to make thestatements made, in light of the circumstances under which such statements were made, not misleading with respect to the period covered by thisreport;
3. Based on my knowledge, the financial statements, and other financial information included in this report, fairly present in all material respects thefinancial condition, results of operations and cash flows of the registrant as of, and for, the periods presented in this report;
4. The registrant’s other certifying officer and I are responsible for establishing and maintaining disclosure controls and procedures (as defined inExchange Act Rules 13a-15(e) and 15d-15(e)) and internal control over financial reporting (as defined in Exchange Act Rules 13a-15(f) and 15d-15(f)) for the registrant and have:
(a) Designed such disclosure controls and procedures, or caused such disclosure controls and procedures to be designed under oursupervision, to ensure that material information relating to the registrant, including its consolidated subsidiaries, is made known to us byothers within those entities, particularly during the period in which this report is being prepared;
(b) Designed such internal control over financial reporting, or caused such internal control over financial reporting to be designed under oursupervision, to provide reasonable assurance regarding the reliability of financial reporting and the preparation of financial statements forexternal purposes in accordance with generally accepted accounting principles;
(c) Evaluated the effectiveness of the registrant’s disclosure controls and procedures and presented in this report our conclusions about theeffectiveness of the disclosure controls and procedures, as of the end of the period covered by this report based on such evaluation; and
(d) Disclosed in this report any change in the registrant’s internal control over financial reporting that occurred during the registrant’s mostrecent fiscal quarter (the registrant’s fourth fiscal quarter in the case of an annual report) that has materially affected, or is reasonably likelyto materially affect, the registrant’s internal control over financial reporting; and
5. The registrant’s other certifying officer and I have disclosed, based on our most recent evaluation of internal control over financial reporting, to theregistrant’s auditors and the audit committee of the registrant’s board of directors (or persons performing the equivalent functions):
(a) All significant deficiencies and material weaknesses in the design or operation of internal control over financial reporting which arereasonably likely to adversely affect the registrant’s ability to record, process, summarize and report financial information; and
(b) Any fraud, whether or not material, that involves management or other employees who have a significant role in the registrant’s internalcontrol over financial reporting.
Date: March 5, 2021
/s/ ALF MELINAlf Melin
Executive Vice President and Chief Financial Officer(Principal Financial Officer)

Exhibit 32.1CERTIFICATION OF CHIEF EXECUTIVE OFFICER
UNDER SECTION 906 OF THE SARBANES-OXLEYACT OF 2002, 18 U.S.C. SECTION 1350
I, Douglas J. Pferdehirt, Executive Chairman and Chief Executive Officer of TechnipFMC plc (the “Company”), do hereby certify, pursuant to 18 U.S.C.Section 1350, as adopted pursuant to Section 906 of the Sarbanes-Oxley Act of 2002, that, to my knowledge:
(a) The Annual Report on Form 10-K of the Company for the period ended December 31, 2020, as filed with the Securities and Exchange Commission (the“Report”), fully complies with the requirements of Section 13(a) or 15(d) of the Securities Exchange Act of 1934, as amended; and
(b) The information contained in the Report fairly presents, in all material respects, the financial condition and results of operations of the Company.
Date: March 5, 2021
/s/ DOUGLAS J. PFERDEHIRTDouglas J. Pferdehirt
Executive Chairman and Chief Executive Officer(Principal Executive Officer)

Exhibit 32.2CERTIFICATION OF CHIEF FINANCIAL OFFICER
UNDER SECTION 906 OF THE SARBANES-OXLEYACT OF 2002, 18 U.S.C. SECTION 1350
I, Alf Melin, Executive Vice President and Chief Financial Officer of TechnipFMC plc (the “Company”), do hereby certify, pursuant to 18 U.S.C. Section 1350,as adopted pursuant to Section 906 of the Sarbanes-Oxley Act of 2002, that, to my knowledge:
(a) The Annual Report on Form 10-K of the Company for the period ended December 31, 2020, as filed with the Securities and Exchange Commission (the“Report”), fully complies with the requirements of Section 13(a) or 15(d) of the Securities Exchange Act of 1934, as amended; and
(b) The information contained in the Report fairly presents, in all material respects, the financial condition and results of operations of the Company.
Date: March 5, 2021
/s/ ALF MELINAlf Melin
Executive Vice President and Chief Financial Officer(Principal Financial Officer)
Related Documents