Constructive Capital 2020 ANNUAL REPORT

Welcome message from author
This document is posted to help you gain knowledge. Please leave a comment to let me know what you think about it! Share it to your friends and learn new things together.
Transcript

Constructive Capital2020 ANNUAL REPORT
2 2020Highlights
4 GrowingQuébec’sEconomyandCompanies
6 Long-termPartnerships
8 StewardshipInvesting
10 OurClients:Quebecers
12 ResultsbyAssetClass
14 OurAchievements
16 MessagefromtheChairmanoftheBoard
17 MessagefromthePresidentandChiefExecutiveOfficer
19 OurClients,theDepositors
27 ManagementReport
63 CDPQinQuébec
89 ReportsoftheBoardofDirectorsandBoardCommittees
119 BoardofDirectorsandExecutiveCommittee
125 SustainableDevelopmentReport
135 FinancialReport
143 ConsolidatedFinancialStatements

This report presents an overview of our 2020 results, our achievements and our progress in Québec and around the world.

CDPQ | 2020 AR2
2020 HIGHLIGHTS
We are a global investment group with assets in all major markets.
35%UNITEDSTATES
Total portfolio geographic exposureASATDECEMBER31,2020
2020
2015
2010
32% 35% 14% 12% 4% 3%
46% 27% 14% 9% 1% 3%
64% 17% 11% 6% 1% 1%
CanadaUnitedStatesEuropeAsiaPacificLatinAmericaOtherregions
14%EUROPE
32%CANADA
12%ASIAPACIFIC
4%LATINAMERICA
overallportfo
liogeo
graphicalexposure
3CDPQ | 2020 AR
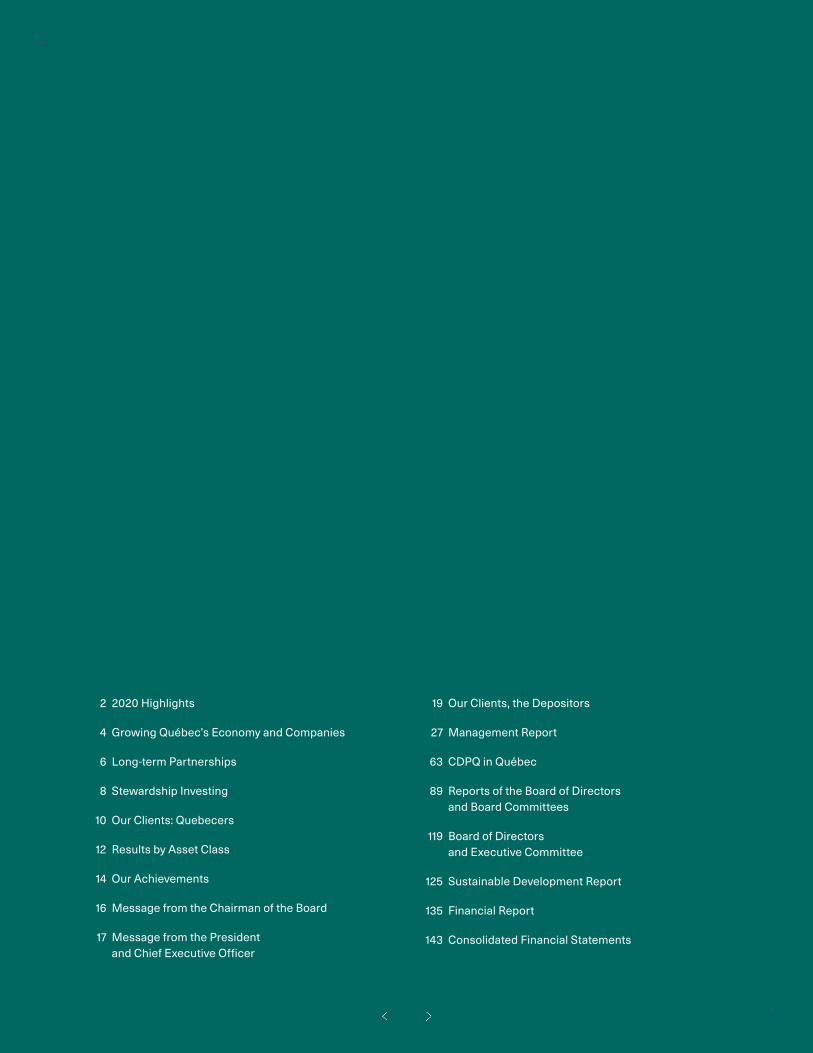
Net assets
$365.5 BASATDECEMBER31,2020
2020 results
7.7%
RETURN
$24.8 BINVESTMENTRESULTS
Results over five years
7.8%
ANNUALIZEDRETURN
$110.7 BINVESTMENTRESULTS
Results over ten years
8.6%
ANNUALIZEDRETURN
$198.0 BINVESTMENTRESULTS
Liquidity
C D P Qhassufficientliquidityto meet itscommitmentsandthoseofitsdepositorsinadditiontomaintainingthedesiredflexibilitytoactduringacrisis,suchasto seize investmentopportunities.
Highest credit ratings reaffirmed
ATheD
A B R S,
AFitch,Moody’sand
S & Pratingagencieshavereaffirmedtheinvestmentgradecreditratingsof C D P QandC D PFinancialwitha stableoutlook.
Growth in net assets since 2010(inbillionsofdollars)
365.5340.1
309.5298.5270.7
248.0225.9
200.1176.2
159.0151.7
2019201820172016201520142013201220112010 2020

CDPQ | 2020 AR4
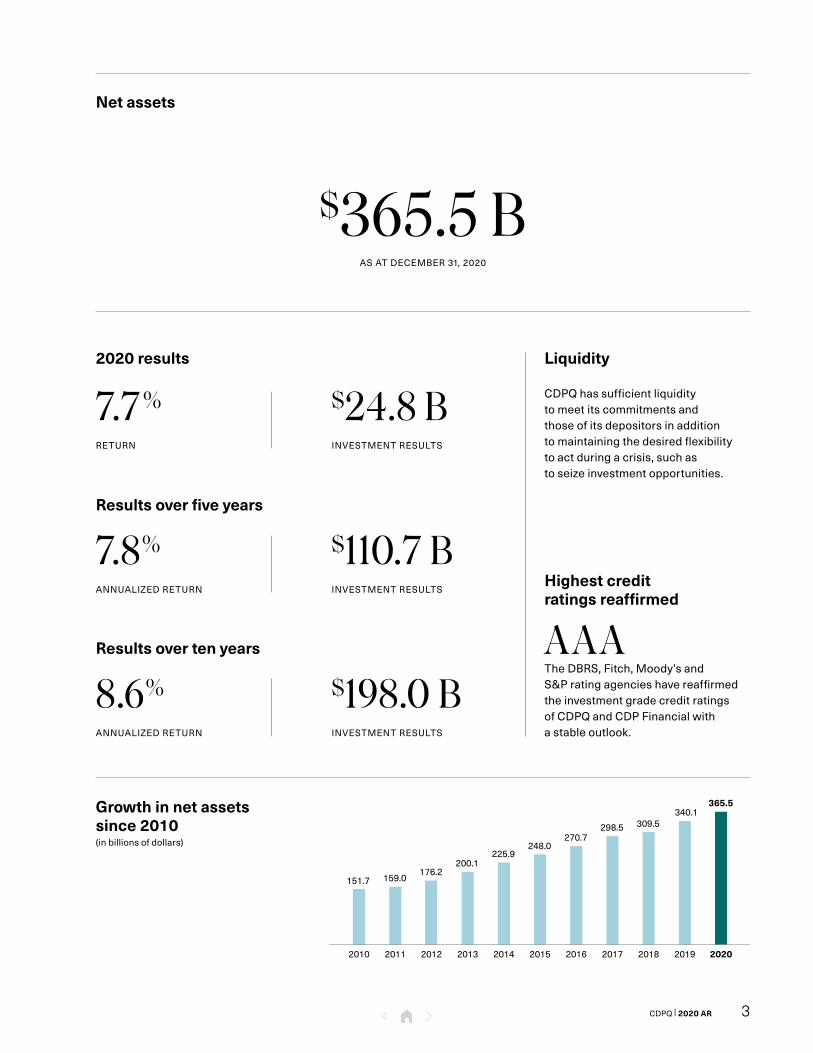
GROWING QUÉBEC’S ECONOMY AND COMPANIES
We are actively participating in the recovery and are building a dynamic, competitive and sustainable economy.Putting Québec at the centre of our priorities. As the leading investment group in Québec, we support our companies and the various stakeholders in our economy, especially in turbulent times.
1 2 3
5CDPQ | 2020 AR
1. Réseau express métropolitain (REM)
• 2,000workersonmorethan20activeconstructionsitesinGreaterMontréal;startofdynamictestsonthefirstsegment
• Aproposed$10-billionproject,theREMdel’Estwillservetheeastandnortheastsectorsofthecity, with32kmoftracksand23stations
2.C A E
• Worldleaderintheaeronauticssector
• Invested$150milliontosupportitsexpansionplans,includingtheacquisitionofFlightSimulationCompany,andthedevelopmentofitstrainingservicesinEurope
3.Equity 253
• CreationofafundtoincreasediversityandinclusioninQuébecandCanadiancompanies,thelargestofitskindinthecountry
• $250milliontobedeployedoverfouryearsthroughinvestmentsof$5to$30millionandsupportforimplementingadiversityplan
4.Medicom
• Akeyplayerinthehealthcareindustrythatmanufacturesand distributesmedical supplies
• Loantoexplorenewavenuesofexpansionand increaseaccessibilityof its products
5.Nuvei
• Globalproviderofpayment software
• Supportforitslistingonthe TorontoStockExchange,thelargestever foratechnologycompanyontheT S X atthetime
Leveraging our advantages in this market that we understand very well. We support private sector companies in their growth plans, international expansion and technological innovation, while helping create an economy and communities that are more sustainable. Our assets: our teams’ know-how and our vast business network.
5
4

CDPQ | 2020 AR6
LONG-TERM PARTNERSHIPS
We partner with the best to expand our reach.
Forging lasting relationships to move forward. Our extensive network of experienced partners around the world is a key distinguishing factor amidst fierce competition for quality assets. We view every partnership as the beginning of a lasting collaboration.
1 2 3

7CDPQ | 2020 AR
1.LOGOS
• Partnerinlogisticsandindustrialrealestatesince 2015
• Launchofa4thdevelopmentvehiclein Asia withU S$800-millionofcapacityandacquisitionofanAustraliansitetocreatea$230-millionlogisticsplatform
2.S2G Ventures
• Newpartnershipwith thisventurecapitalfundtargetingtheagri-food sector
• InvestmentofuptoU S$125millioninclimatechangeopportunities
3.Plenary Group
• Long-standingbusinessrelationshipwiththispublic-privatepartnershipspecialistwithoperationsin Australia,CanadaandtheUnitedStates
• C D P QacquiredPlenaryAmericas,aNorthAmericanleaderinpublic infrastructure
4. Ares Management Corporation
• Partnershipwiththisalternativeinvestmentmanagerthatownsaglobalprivatedebtplatform
• Participatedina£1.875-billioncommit-mentledbyArestoThe Ardonagh Group,a majorU Kinsurancebroker
Partnering with the best. That means creating new opportunities and multiplying the impact of our projects. Our partners share our long-term investment approach and offer strategies that are complementary to ours.
When they do business with us, they gain access to a global team, high-level expertise and quality investment opportunities that span markets and asset classes.
4

STEWARDSHIP INVESTING
We invest constructive capital to support sustainable businesses and projects around the world.
Taking on the great challenges of our time. The health crisis, the effects of climate change and growing inequality have shown that we all have a role to play. In 2020, we also saw just how important it is to generate sustainable value to stimulate economies. More than ever, we are united by our purpose to build companies that drive performance and progress.
$36 BLOW-CARBONASSETSINTHEPORTFOLIO,
UP$18 BSINCE2017,INCLUDING$2BIN2020
-38%
REDUCTIONINOURPORTFOLIO’SCARBONINTENSITYSINCE2017,
COMPAREDTOOUR25%REDUCTIONOBJECTIVEBY2025
CDPQ | 2020 AR8
21

9CDPQ | 2020 AR
Leveraging diversity and inclusion to drive growth
Ourconvictionisthatdiversityandinclusionareessentialtoachieving business objectives—for us and our portfoliocompanies—aswellasbeingessential toouremployees’talentdevelopmentandwell-being.
In2020,we joined inkeyefforts toadvancethese issues,including theBlackNorth Initiative and, togetherwith theResponsible Investment Association (R I A), the CanadianInvestorStatementonDiversityandInclusion.
Integrating our stewardship investing priorities into our proxy voting policy
Weupdatedourproxyvotingpolicytoincludeatargetof30%womenonourportfoliocompanies’Boardsandexecutivecommitteestobeachievedby2022.
Ourclimaterequirementshavealsobeenenhanced,primarilywith respect todisclosureand theadoptionofclearG H Gemissionreductiontargets.
Providing leadership on international tax matters
Ourinternationaltaxcommitmenthasbeenupdatedtorenewouropposition to theabusiveuseof taxstructuresandtoreflectevolvingbestpractices.
Ourpositionandinvestmentprocessesallowusto,amongotherthings,evaluatethestructureofproposedtransactionsandtoworktoinfluenceourpartnerstolimittheuseoflow-taxjurisdictionsasmuchaspossible.
1. Greater Changhua 1
• Offshorewindfarmproject underconstructioninTaiwan
• Willprovidecleanenergytomorethan650,000homes
2.C D P Q Renovables Iberia
• Platformforrenewableassets
• Suppliesmorethan115,000 householdsinSpain
3.AddÉnergie
• Leaderinelectricvehicle chargingsolutionsinCanada
• OperatesanetworkofchargingstationsacrossNorthAmerica
4.Azure Power
• LeaderinthedevelopmentandoperationofsolarenergyprojectsinIndia
• Participatesinthegrowth oftherenewableenergymarket
Formoreinformationonourstewardshipinvestingactivities,seeourStewardshipInvestingReportatw w w.c d p q.com.
3 4

CDPQ | 2020 AR10
OUR CLIENTS: QUEBECERS
We aim to ensure that our depositors’ funds and the pensions of millions of people are sustainable.
Delivering optimal performance. With our global reach and experience across asset classes, we can seize opportunities that benefit all Quebecers.
For our eight principal depositors, we have achieved returns ranging from:
6.5 % to 9.0%
IN2020
7.0% to 8.3%
OVER5YEARS
8.0% to 9.3%
OVER10YEARS
Acknowledging the reality our clients face. Each of our depositors has distinct needs that we take into consideration when establishing our investment strategies.
Collaboration and listening to each other form the foundation of our relationship. This is even more essential in a crisis; with unprecedented markets, we intensified our discussions.
In everything we do, we never lose sight of the fact that we work for the Québec people.

11CDPQ | 2020 AR
C D P Q at a glance
6 million +who contribute
or receive benefits
to to CDPQ’sinvestment experts
who invest the funds
in Québec’seconomy and in
to generatereturns overthe long term
40+ major
retirement and insuranceplans entrust their funds
benefit
Quebecers
countries65+
Our main depositors
RetirementPlansSinkingFund
QuébecPensionPlanFund,baseandadditionalplans
GovernmentandPublicEmployeeRetirementPlan
SupplementalPensionPlanforEmployeesoftheQuébec
ConstructionIndustry
Fondsdelasantéetdelasécuritédutravail
Fondsd’assuranceautomobileduQuébec
GenerationsFund PensionPlanofManagementPersonnel
Forthecompletelistofourdepositors,seepage26.

CDPQ | 2020 AR12
RESULTS BY ASSET CLASS
We support companies to drive their growth.
1. Alstom
• World’ssecond-largestplayerinsustainablemobilityfollowingitsacquisitionofBombardierTransportation
• Ouragreement:$4billionfora17.5%equitystake,withstructuringcommit-mentsforQuébec
2.Colisée
• AretirementhomesectorleaderinEurope
• Ourobjective:takeastakeinthecompanysoitcanconsidernewgrowthopportunitieswhileconsolidatingitscareandserviceoffering
3. Titan Aircraft Investments
• Leadingaircargosolutionsprovider
• Ourvalueadded:leveragingourabilitytodesigninnovativefinancingstructurestosupportnewacquisitions
1
2
3

13CDPQ | 2020 AR
Results by asset class
Equities
12.4% 11.0%
IN2020 OVER5YEARS
FixedIncome
9.0% 5.3%
IN2020 OVER5YEARS
RealAssets
-7.0% 4.3%
IN2020 OVER5YEARS
Net assets ASATDECEMBER31,2020
Equities
$182.3 BNETASSETSBYPORTFOLIOANDMANDATE
GlobalQualityCanadaGrowthMarketsAlternativeBetaGlobalValueOtherPrivateEquity
$24.6 B
$12.0 B
$21.9 B
$42.0 B$64.3 B
$11.8 B
$5.7 B
FixedIncome
$110.2 BNETASSETSBYPORTFOLIO
RatesCreditShortTermInvestmentsLongTermBondsRealReturnBonds
$30.3 B
$0.7 B$3.4 B
$1.6 B
$74.2 B
RealAssets
$67.2 BNETASSETSBYPORTFOLIO
RealEstateInfrastructure
$31.7 B
$35.5 B

CDPQ | 2020 AR14
OUR ACHIEVEMENTS
Our major accomplishments for the year are in line with our strategic orientations, which evolved in 2020.
Optimal performanceBenefit from diversified sources of return, create value through post-investment management and assess risk thoroughly
• Implementationofmeasurestoaddressthepandemic,including:
– Reviewofallassets
– Globalandcoordinatedmanagementofstrategy,portfolioconstructionandrisks
– Crisisteamtoensurebusinesscontinuityandkeeptheorganizationfullyoperational
• ForFixedIncome,rigorousdeploymentwithafocusoninvestment-gradebondsandcreationoftheCapitalSolutionsteam
• ForRealAssets:
– AccelerationoftherepositioningoftheRealEstateportfolio,withover70transactions
– $3.5billioninInfrastructureinvestmentsinvariouscountriesandsectors
• ForEquityMarkets,seizingopportunitiesfollowingthefirstquartercorrectionandevolvingtheportfoliotostronglypositionitforthenextdecade
• ForPrivateEquity,valuecreationthroughoperationalsupportforportfoliocompanies
• Regularmonitoringofliquiditytoensurethelevelissufficienttoaddressanyeventualityandseizeopportunities
Québec economyLeverage our advantages in Québec to generate returns while helping build a dynamic, competitive and sustainable economy
• $4-billionenvelopetohelpQuébeccompaniesweatherthecrisisandpropeltheirrecoveryandgrowthplansoverthelongerterm
Growth:
• SupportthegrowthambitionsofseveralleadersintheirfieldsuchasW S P,A P PGroup,CanamGroupandMedicom
• Supportforentrepreneurshipandthenextgeneration,withspecificattentiontothegrowthofbusinessesownedbywomen
Globalization:
• Investmentstargetingexpansionprojectsinnewmarkets,includingEddyfi/N D T,K D C/ONEandC A E
Technologicalleap:
• InvestmentsincompaniessuchasNuvei,LightspeedandDialoguethatplacetechnologyattheheartoftheirbusinessmodel
• HelpacceleratethedigitalshiftofcompaniessuchasL C IEducation,MonarchandIntactFinancialCorporation
Sustainableeconomyandcommunities:
• ProgressontheREM,withmorethan20activeconstructionsites,andproposalofamobilityprojecttoserveMontréal’seastandnortheastsectors
• Forrenewableenergy,supportforaleaderinelectricvehiclechargingstationsandCanada’slargestagriculturalcooperative

15CDPQ | 2020 AR
Worldwide presenceIncrease our exposure to global markets by adopting an integrated approach across regions and partnering with the best
• CreationofC D P QGlobaltosteerourglobalizationstrategyandtoapproachthevariousmarketswithacross-functionalperspective
• Leadingtransactionsaroundtheworld:
– NorthAmerica,privatedebtinthebankingandairfreightsectors
– Europe,inpromisingrealestatesegments
– AsiaPacific,inrenewableenergyinfrastructure,includingourfirstinvestmentinTaiwan
Stewardship investingInvest in assets that support the transition toward a low-carbon economy while affirming our leadership on E S G matters
• Since2017,a38%decreaseinourcarbonfootprintperdollarinvestedandan$18-billionincreaseinourgreenassets:
– CreationofC D P QRenovablesIberia,aEuropeaninvestmentandmanagementplatforminrenewableenergy
– Co-investmentpartnershipwithS2GVenturestomakeagri-foodmoresustainable
• Clearcommitmentstodiversity:
– SigningoftheBlackNorthInitiative
– CreationoftheEquity253fundtoincreasediversityandinclusionincompaniesinQuébecandCanada
• ActiveparticipationintheInvestorLeadershipNetworkandtheNet-ZeroAlliance,andadherencetotheMaple8declarationforbetterE S Gdisclosure
Technology trendsCreate value by capitalizing on the acceleration of technology trends, including the impact that a digitizing economy has on businesses and our operations
• Launchofanintegratedstrategybasedonthreepillars:seizingtechnologyinvestmentopportunities,takingthisfactorintoaccountinriskmanagementandpursuingthedigitaltransformation
• Continuationofprojects,especiallyinartificialintelligence,topropelustothecuttingedgeofourenvironment

CDPQ | 2020 AR16
MESSAGE FROM THE CHAIRMAN OF THE BOARD
We entered 2020 knowing that our business environment for the next few years would be different from the previous decade and would pose new challenges. However, we had no idea that a pandemic of this magnitude would test not only the global economy and financial markets, but also society as a whole.
Inthiscontext,theBoardofDirectorsworkedcloselywithmanage-menttocarefullymonitortheimpactofCOVID-19ontheportfolio.Inparticular,weexamineddifferentscenariosandtheireffectonthestrategyandreturns,andchangeswerequicklyimplementedwhereneeded.Throughouttheyear,C D P Qhasbeenabletomanagerisksrigorouslywhiletakingadvantageofopportunitiesgeneratedbythecrisis.
TheBoardisfullysatisfiedwiththeperformancedeliveredbothin2020andoverthelongerterm,meetingtheexpectationsofourdepositors.Overthepasttenyears,nearly$200billionininvest-ment resultshavebeengenerated, includingover$9billion invalueadded.Thisisinadditiontoachievementsandinitiativesthathavebeenveryimpactful.
Ourorganizationhasadapteditsstrategicorientationstobetternavigate an uncertain environment. We must pursue andacceleratetheelementsofourapproachthathavebeensuccessfulinrecentyears—globalizationandtheshifttoprivatedebt,infra-structureandprivateequity—whileoptimizingcertainaspectsofthestrategytocontinuemovingforward,suchasinrealestateandequitymarkets.
Morethaneverin2020,C D P Qdemonstratedhowitsconstructivecapitalismakingadifference.HereI’mthinkinginparticularaboutour quick action to support Québec companies during thisturbulentperiod.With their expertise, our teamshelped themprepareforthepost-crisisperiod,withtheobjectiveofpositioningthemforlong-termsuccess.
C D P Q’scommitmenttoQuébecisalsoreflectedininvestmentsfocused on growth, globalization and the technological shift.We launchedstructuringprojectsthatcontributetoasustainablefuturebyinvestingsignificantlyinrenewableenergyandhelpingcompaniestransitiontowardachievinglow-carbonperformance.In addition, despite the challenges caused by the pandemic,constructionoftheREMprojectcontinuedtoprogress,makingthearrivalofthispublictransitnetworkintheGreaterMontréalareaevenmoretangible.
Our teams completed a significant number of transactionsglobally acrossallassetclasses.They’vebeenveryactiveinpost-investmentmanagementofportfoliocompanies,whichhasresultedinvaluecreationagainthisyear.Severalprojectswerealsocarriedouttodeploynewapproachestobetterpositiontheorganizationforthefuture,bothintermsoftechnologyandmanagingitsinter-nationalactivities.
On the climate change front, C D P Q continued to be involvedin globalinvestorinitiativesandaddedgreenassetstoourportfolio,consolidatingour leadership.TheBoardalsoapplaudsC D P Q’seffortsondiversityandinclusion,whichareanadditionalperfor-mance lever for companies, firmly believing in the value andtimelinessoftheEquity253initiative.
Onapersonalnote,IwouldliketoacknowledgetheworkofmyfellowBoardmemberswhohaveplayedakeyroleingovernance.MysincerethankstoFrançoisJolyforhismandate,whichendedin 2020,andawarmwelcometoJean-FrançoisBlais,whojoineduslastMay.
Inclosing,onbehalfoftheBoard,IwouldliketothankC D P Q’steamsforallthatthey’veaccomplishedwhileworkingfromhomeinanunusualcontext.Behindourresults,therearepeople.Mobilizedwomenandmenwhoareproudtocontributetothemissionofthisuniqueinstitution,attheserviceofQuebecers.
IwouldberemissifIdidn’thighlighttheoutstandingleadershipofCharlesEmond,whotookoverasPresidentandChiefExecutiveOfficershortlybeforethepandemic.Hetookswiftactiontoensurethattheorganizationremainedengaged,productiveandinnovative.
Robert TessierChairmanoftheBoard
17CDPQ | 2020 AR
MESSAGE FROM THE PRESIDENT AND CHIEF EXECUTIVE OFFICER
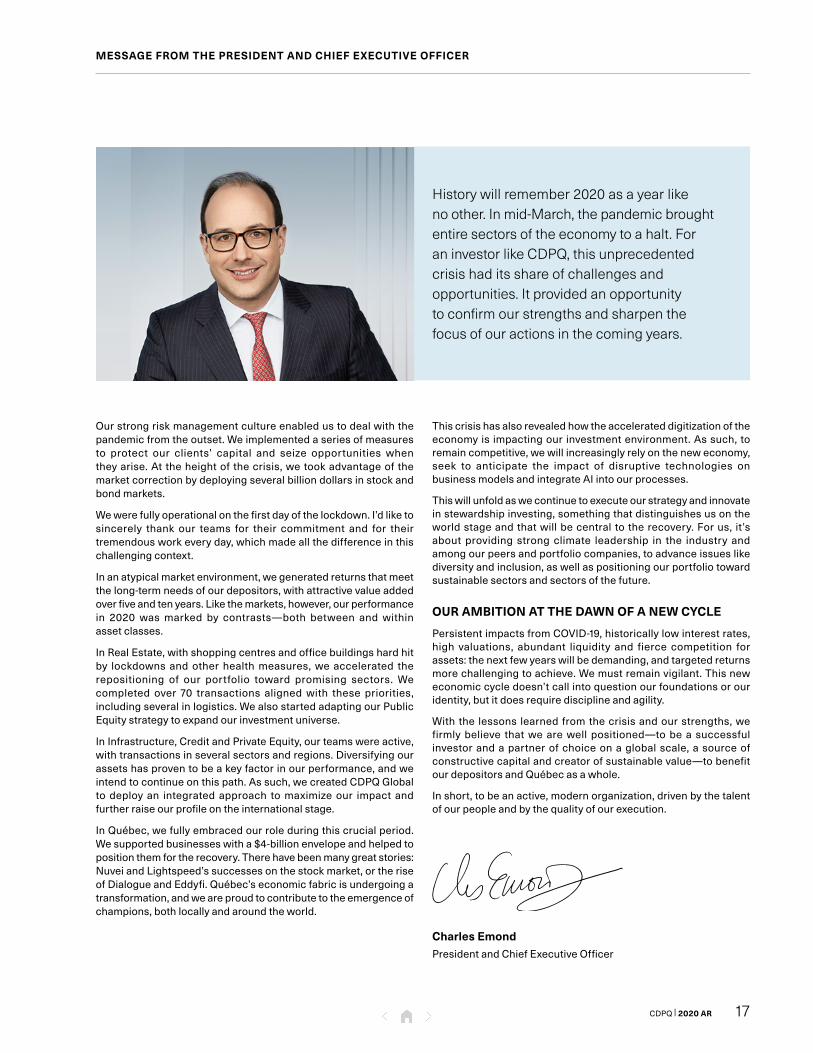
History will remember 2020 as a year like no other. In mid-March, the pandemic brought entire sectors of the economy to a halt. For an investor like C D P Q, this unprecedented crisis had its share of challenges and opportunities. It provided an opportunity to confirm our strengths and sharpen the focus of our actions in the coming years.
Ourstrongriskmanagementcultureenabledustodealwiththepandemicfromtheoutset.Weimplementedaseriesofmeasuresto protect our clients’ capital and seize opportunities whenthey arise.Attheheightofthecrisis,wetookadvantageofthemarketcorrectionbydeployingseveralbilliondollarsinstockandbondmarkets.
Wewerefullyoperationalonthefirstdayofthelockdown.I’dliketosincerely thank our teams for their commitment and for theirtremendousworkeveryday,whichmadeallthedifferenceinthischallengingcontext.
Inanatypicalmarketenvironment,wegeneratedreturnsthatmeetthelong-termneedsofourdepositors,withattractivevalueaddedoverfiveandtenyears.Likethemarkets,however,ourperformancein 2020 wasmarked by contrasts—both between and withinassetclasses.
InRealEstate,withshoppingcentresandofficebuildingshardhitby lockdownsandotherhealthmeasures,weaccelerated therepositioning of our portfolio toward promising sectors. Wecompleted over 70 transactions alignedwith these priorities,includingseveralinlogistics.WealsostartedadaptingourPublicEquitystrategytoexpandourinvestmentuniverse.
InInfrastructure,CreditandPrivateEquity,ourteamswereactive,withtransactionsinseveralsectorsandregions.Diversifyingourassetshasproventobeakeyfactorinourperformance,andweintendtocontinueonthispath.Assuch,wecreatedC D P QGlobaltodeployan integratedapproach tomaximizeour impact andfurtherraiseourprofileontheinternationalstage.
InQuébec,wefullyembracedourroleduringthiscrucialperiod.Wesupportedbusinesseswitha$4-billionenvelopeandhelpedtopositionthemfortherecovery.Therehavebeenmanygreatstories:NuveiandLightspeed’ssuccessesonthestockmarket,ortheriseofDialogueandEddyfi.Québec’seconomicfabricisundergoingatransformation,andweareproudtocontributetotheemergenceofchampions,bothlocallyandaroundtheworld.
Thiscrisishasalsorevealedhowtheaccelerateddigitizationoftheeconomyis impactingourinvestmentenvironment.Assuch,toremaincompetitive,wewillincreasinglyrelyontheneweconomy,seek to anticipate the impact of disruptive technologies onbusinessmodelsandintegrateAIintoourprocesses.
Thiswillunfoldaswecontinuetoexecuteourstrategyandinnovateinstewardshipinvesting,somethingthatdistinguishesusontheworldstageandthatwillbecentral totherecovery.Forus, it’sabout providing strongclimate leadership in the industry andamongourpeersandportfoliocompanies,toadvanceissueslikediversityandinclusion,aswellaspositioningourportfoliotowardsustainablesectorsandsectorsofthefuture.
OUR AMBITION AT THE DAWN OF A NEW CYCLE
PersistentimpactsfromCOVID-19,historicallylowinterestrates,high valuations, abundant liquidity and fierce competition forassets:thenextfewyearswillbedemanding,andtargetedreturnsmorechallengingtoachieve.Wemustremainvigilant.Thisneweconomiccycledoesn’tcallintoquestionourfoundationsorouridentity,butitdoesrequiredisciplineandagility.
Withthe lessons learnedfromthecrisisandourstrengths,wefirmlybelieve thatwearewell positioned—tobea successfulinvestorandapartnerofchoiceonaglobalscale,asourceofconstructivecapitalandcreatorofsustainablevalue—tobenefitourdepositorsandQuébecasawhole.
Inshort,tobeanactive,modernorganization,drivenbythetalentofourpeopleandbythequalityofourexecution.
Charles EmondPresidentandChiefExecutiveOfficer

CDPQ | 2020 AR18
Whitepage

Our Clients, the Depositors

CDPQ | 2020 AR20
Whitepage
21CDPQ | 2020 AR
Our Clients, the Depositors
Theyear2020wascharacterizedbyanextraordinaryeconomicenvironmentduetotheCOVID-19crisis.In particular,stockmarketsfellsharply,thenralliedstronglyinthesecondquarter,whileinterestrates,after fallingsignificantly,maintainedtheirdownwardtrendformostoftheyear.
Thissituationhasaffectedourdepositors’assetsandislikelytohaveanimpactontheirfinancialcommitmentliabilities.OngoingcommunicationbetweenC D P Qandourdepositorsthroughout the year once again played a key role. Thus,despite the restrictions inplace,C D P Q teamsconductedevenmorefollow-upswithdepositors,resultinginadditionalworkandin-depthdiscussions.
ThelevelsofreturnobservedasatDecember31,2020,overtheone-,five-,andten-yearperiodsmeetdepositors’long-termfundingneeds.
However,questionsareemergingaboutfutureperformanceexpectations. High valuations in the public and privatemarkets,uncertaintyaboutinterestratesrisingfromverylowlevels in the futureand thepandemic’seconomic impactcouldherald lowerreturns. In thiscontext,diversification,not onlywithindepositors’portfolios, but also inC D P Q’sinvestmentstrategies,remainsapriorityforeveryone.
CONSTRUCTIVE DISCUSSIONS DURING A CRISIS
TherelationshipbetweenC D P Qandourdepositorsisbasedonabusinessmodelcharacterizedby:
• Collaboration
• Listening
• Transparency
• Cleardivisionofrolesandresponsibilities
In2020,C D P Qteamsanddepositors’representativesheldmorediscussionsonaregularbasiscoveringvarioustopicsrelatedtoportfoliomonitoring,investmentstrategies,productofferingsandtheirinvestmentpolicies.

Our Clients, the Depositors(continued)
CDPQ | 2020 AR22
TheyearwasanopportunityforC D P QtoreviewtheEquityMarketsportfolio.Thisprojecthelpedidentifyitspotentialexposurebiases,whetherinstyle,regionorsector.Severaldiscussionswereheldwiththedepositorstoinformthemofthediagnosis anddesired improvements. This led to theannouncementofchanges to theportfolio’sstructure, itsmanagementanditsabsoluterisklevel,whichwillnowbeequivalent to thatof themarket.Thesechangeswill takeeffectonJuly1,2021.
C D P Q also pursuedwork on the Rates andCredit FixedIncomeportfolios,aswellasontheAssetAllocationportfolio,inordertobetterpresenttheiractivitiesandrisklevel.
Inaddition,asisthecaseeveryyear,thereportingprocess,the investment policy work and the various forums fordiscussion with depositors provided an opportunity toconsider C D P Q’s strategic directions and how they canoptimizetherisk-returnprofileofdepositors’funds.InadditiontothediscussionsregardingtheEquityMarketsportfolio,particularemphasiswasplacedon:
• ProgressonimplementingthestrategicplanfortheRealEstateportfolio
• OptimaldurationtotargetforFixedIncomeportfolios
• Thepossibilityofofferingdepositorsafinancialleverageproduct
CHANGES IN DEPOSITORS’ BUSINESS ENVIRONMENT
Depositors’plansareingoodfinancialshapetoday,despiteayearofpublichealthcrisis.Thisistheresultofseveralyearsofsizableadditionalcontributionstooffsetactuarialdeficits,aswellasthesignificantreturnsgeneratedbyC D P Qforovertenyears.
However, the low interest rateenvironmentaswellas thedecliningreturnoutlooksposechallenges.Intheshortterm,plansmustalsodealwiththeeconomicandfinancialimpactsofthepandemic.
Inaddition,theplans’demographicprofileshavechangedconsiderablyovertheyears.Certaindepositorswillbeinanetdisbursementsituationoverthenextfewyears.Thisrealityrequirestheportfoliostobeconstructedaccordingly.Workontheseissuescontinuedin2020.

23CDPQ | 2020 AR
CUSTOMIZED ADVISORY SERVICES
Throughitsadvisoryservices,C D P Qaimstocontributetothefinancialsolidityofourdepositors’pensionandinsuranceplans.Toaccomplishthis,wesupporttheirdecision-makingcommittees in establishing their investment policies, byleveragingourknowledgeofworldmarketsandexpertiseinportfoliomanagement.Specifically,C D P Qsupportsthemintheir decisions regarding the selection of a long-termbenchmark portfolio (strategic asset allocation). Theseservicesinclude:
• Financialmarketanalysesandeconomicoutlookevaluations
• Long-term risk and return assumptions for theprimaryassetclassesandspecializedportfolios
• Simulationscomparingtheexpectedlong-termeffectofvariousbenchmarkportfoliochoicesonaplan’sreturns,risk,financialpositionanditsfinancing
• Stressteststomeasurethebenchmarkportfolio’sbehaviourinvariousscenarios
During the year, several analysis projects were carriedout withthedepositors.Thisworkpermittedtheevaluationofthestrategicallocationofassets inplaceand, forcertaindepositors,adjustingitbasedontheirfinancialreality,risktolerance,needforliquidityandchangestoC D P Qproducts.Specificattentionwasagainpaidtothemanagementtoolsusedtoadjustthesensitivityoftheirportfoliotointerestratemovements.Workcontinuedtoexaminethepossibilityofusingaleverageproducttooptimizetheplans’risk-returnprofile.
Duringthecrisis,workwascarriedoutwithcertaindepositorstoreviewtheirliquidityneedsinlightoftheneweconomicrealityresultingfromthepandemicanditsimpactontheirfinancialflows.
TABLE 1
SPECIALIZEDPORTFOLIOOFFERING(asatDecember31,2020)
asatDecember31,2020 ACTIVELYMANAGED INDEXED OBJECTIVES
FIXED INCOME RatesCredit
ShortTermInvestmentsLongTermBondsRealReturnBonds
Reducetheportfolio’soverallrisklevelMatchdepositors’assetsandliabilitiesProvideanimportantsourceofliquidityGenerateattractivereturns,notablythroughtheCreditportfolio
REAL ASSETS RealEstateInfrastructure
n.a. HaveexposuretomarketsforwhichinvestmentincomeisindexedtoinflationPartiallyhedgetheinflationriskassociatedwiththeliabilitiesofseveraldepositors
EQUITIES EquityMarketsPrivateEquity
n.a. Increasedepositors’long-termtargetreturns
OTHER INVESTMENTS
AssetAllocation n.a. Achievediversificationandcomplementarityofactivitieswiththoseofotherportfolios

Our Clients, the Depositors(continued)
CDPQ | 2020 AR24
AN ADAPTED PORTFOLIO OFFERING
C D P Q enables its depositors to allocate their funds tospecializedportfolioswiththesametypeofsecurities,withthemajoritymanagedactively(seeTable1,page23).Eachoneismanagedbasedonrulessetoutinaninvestmentpolicy,whichspecifiesthe:
• Managementapproach
• Investmentuniverseandbenchmarkindex
• Targetreturns
• Riskoversight
Inadditiontoitsspecializedportfolios,C D P Qprovidesoverlayoptionstoenableeachdepositortocustomizeitsexposuretointerestrates.
In2020,C D P Qadjustedtheactivitiesofsomeofitsportfolios,including:
• ActiveOverlayStrategies:Thisportfolio,whichcomprisedvariousabsolute-returnorientedoverlayactivities,includinghedgefunds,wasclosedonJanuary1,2020.Inreturn,theuniverseof investmentseligible for theEquityMarketsportfolioandconsolidatedassetallocationactivitieswasbroadenedtoallowtheuseofhedgefundswhentheycancontributetothetargetedstrategy.
• RealReturnBonds:Thisindex-basedportfolioisbeingusedlessandlessbydepositors.Changeshavebeenmadetoreflect theplannedgradualdivestmentof theportfolio.ThesemodificationstookeffectonApril1,2020.
• Infrastructure:Inlinewithdepositors’appetiteforthisassetclass,certainexposurelimitshavebeenmodifiedtoreflectthesignificantdeploymentsanticipatedinthecomingyears.Other adjustments have also beenmade, including tocertaingeographicandsectoraltargets,effectiveJuly1,2020.
Depositors’ returnsOverfiveyears,thevariousdepositors’fundshavedelivered performance that meets their long-termneeds.
Thedecisionsmadeontheallocationofassetsamongthethreemajorassetclassesinthetotalportfolio—FixedIncome,RealAssetsandEquities—are reflected ineachdepositor’s return.Thedepositorsmake thesedecisions,withC D P Q’ssupport,basedoninformationincluding:
• Theirtargetreturns
• Theirrisktolerance
• Theirinvestmenthorizon
Over five years, the eight principal depositorspostedannualizedreturnsrangingfrom7.0%to8.3%.Foroneyear,theirreturnsvariedbetween6.5%and9.0%.
FIGURE 2
THEEIGHTPRINCIPALDEPOSITORS’RETURNS
Lowestreturn
Weightedaveragereturnondepositors’funds
Highestreturn
2
4
6
8
10
05 years 2020
7.0%
7.8%8.3%
6.5%
7.7%
9.0%
25CDPQ | 2020 AR
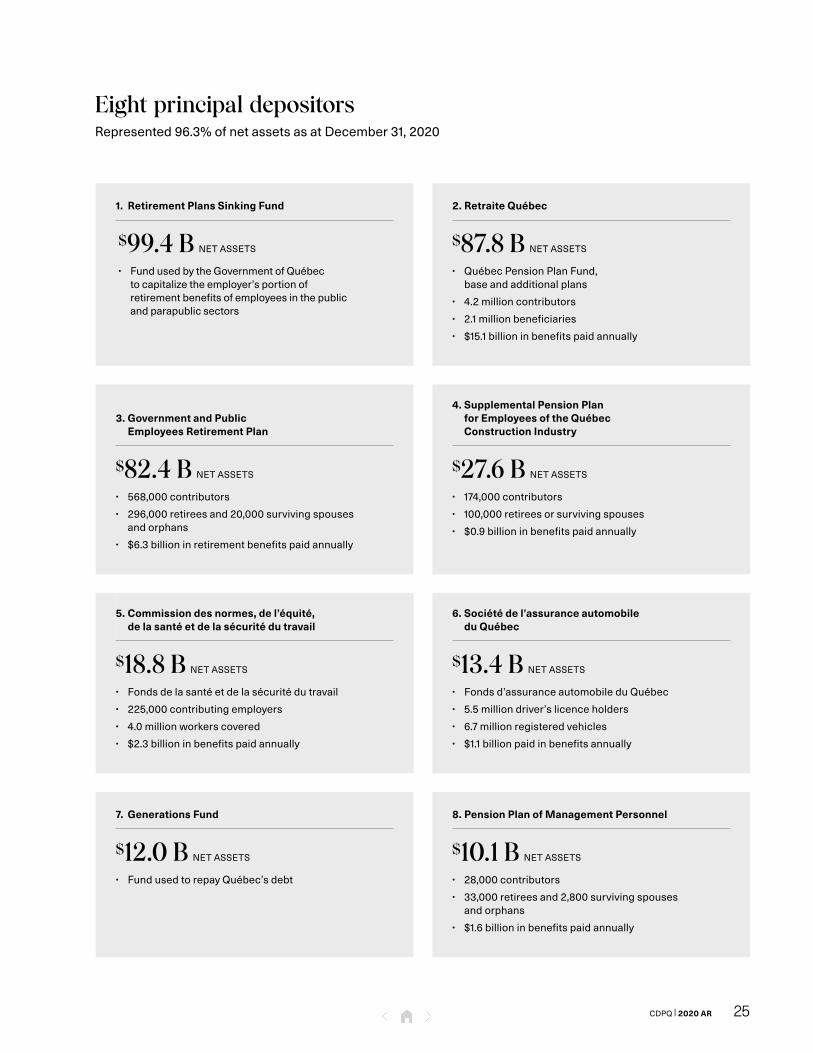
Eight principal depositorsRepresented96.3%ofnetassetsasatDecember31,2020
1. Retirement Plans Sinking Fund
$99.4 B NETASSETS• FundusedbytheGovernmentofQuébectocapitalizetheemployer’sportionofretirementbenefitsofemployeesinthepublicandparapublicsectors
2. Retraite Québec
$87.8 B NETASSETS
• QuébecPensionPlanFund,baseandadditionalplans
• 4.2millioncontributors
• 2.1millionbeneficiaries
• $15.1billioninbenefitspaidannually
3. Government and Public Employees Retirement Plan
$82.4 B NETASSETS
• 568,000contributors
• 296,000retireesand20,000survivingspousesandorphans
• $6.3billioninretirementbenefitspaidannually
4. Supplemental Pension Plan for Employees of the Québec Construction Industry
$27.6 B NETASSETS
• 174,000contributors
• 100,000retireesorsurvivingspouses
• $0.9billioninbenefitspaidannually
5. Commission des normes, de l’équité, de la santé et de la sécurité du travail
$18.8 B NETASSETS
• Fondsdelasantéetdelasécuritédutravail
• 225,000contributingemployers
• 4.0millionworkerscovered
• $2.3billioninbenefitspaidannually
6. Société de l’assurance automobile du Québec
$13.4 B NETASSETS
• Fondsd’assuranceautomobileduQuébec
• 5.5milliondriver’slicenceholders
• 6.7millionregisteredvehicles
• $1.1billionpaidinbenefitsannually
7. Generations Fund
$12.0 B NETASSETS
• FundusedtorepayQuébec’sdebt
8. Pension Plan of Management Personnel
$10.1 B NETASSETS
• 28,000contributors
• 33,000retireesand2,800survivingspousesandorphans
• $1.6billioninbenefitspaidannually

CDPQ | 2020 AR26
TABLE 3
C D P Q’S 42 DEPOSITORSComparison of net assets as at December 31, 2019, and as at December 31, 2020(fair value as at December 31 – in millions of dollars)fair value as at December 31 – in millions of dollars
First deposit
Depositors’ net assets
2020 2019$ % $ %
PENSION PLANSRetraite Québec 1966 87,797 24.0 81,643 24.0Supplemental Pension Plan for Employees of the Québec Construction Industry 1970 27,643 7.6 25,834 7.6Government and Public Employees Retirement Plan 1973 82,408 22.5 76,804 22.6Pension Plan of Management Personnel 1973 10,073 2.8 9,110 2.7Pension Plan for Federal Employees Transferred to Employment with the
Government of Québec 1977 289 0.1 281 0.1Pension Plan of Elected Municipal Officers 1989 316 0.1 296 0.1Retirement Plan for the Mayors and Councillors of Municipalities 2015 1 – 1 –Régime complémentaire de rentes des techniciens ambulanciers/
paramédics et des services préhospitaliers d’urgence 1990 743 0.2 682 0.2Ministère des Finances, Government of Québec1
Retirement Plans Sinking Fund 1994 99,417 27.2 92,961 27.3Superannuation Plan for the Members of the Sûreté du Québec – employers’ fund 2009 979 0.3 938 0.3
Régime de retraite de l’Université du Québec 2004 695 0.2 680 0.2Régime de retraite du personnel des CPE et des garderies privées conventionnées
du Québec 2005 570 0.2 538 0.2Régime de retraite pour certains employés de la Commission scolaire de la Capitale 2006 30 – 31 –Pension Plan of the Non-Teaching Staff of the Commission des écoles
catholiques de Montréal 2007 177 – 183 0.1Superannuation Plan for the Members of the Sûreté du Québec – participants’ fund 2007 684 0.2 608 0.2Régime de retraite des employés de la Ville de Laval 2007 298 0.1 417 0.1Retirement Plan for Active Members of the Centre hospitalier Côte-des-Neiges 2010 98 – 94 –Fonds commun de placement des régimes de retraite de l’Université Laval 2012 217 0.1 340 0.1Fiducie globale Ville de Magog 2012 83 – 78 –Régime de retraite des employées et employés de la Ville de Sherbrooke 2012 53 – 52 –Régime de retraite des agents de la paix en services correctionnels 2013 778 0.2 724 0.2Régime complémentaire de retraite des employés réguliers
de la Société de transport de Sherbrooke 2013 94 – 89 –Régime de retraite de la Corporation de l’École Polytechnique 2014 72 – 73 –Régime de retraite de la Ville de Terrebonne 2015 104 – 95 –Régime de retraite des cadres de la Ville de Québec 2016 303 0.1 286 0.1Régime de retraite des employés manuels de la Ville de Québec 2016 380 0.1 359 0.1Régime de retraite des fonctionnaires de la Ville de Québec 2016 685 0.2 640 0.2Régime de retraite du personnel professionnel de la Ville de Québec 2016 279 0.1 252 0.1Régime de retraite des policiers et policières de la Ville de Québec 2016 587 0.2 530 0.2Régime de retraite des pompiers de la Ville de Québec 2016 222 0.1 199 0.1Régime de retraite des employés du Réseau de transport de la Capitale 2016 138 – 143 0.1Régime de retraite des chauffeurs d’autobus de la Société de transport de Laval 2017 151 – 140 –La Société des casinos du Québec2 2020 22 – – –INSURANCE PLANSRégie des marchés agricoles et alimentaires du Québec 1967 13 – 12 –La Financière agricole du Québec 1968 893 0.2 963 0.3Autorité des marchés financiers 1969 1,069 0.3 962 0.3Commission des normes, de l’équité, de la santé et de la sécurité du travail 1973 18,828 5.2 18,109 5.3Société de l’assurance automobile du Québec 1978 13,447 3.7 12,967 3.8Les Producteurs de bovins du Québec 1989 7 – 6 –Survivor’s Pension Plan 1997 479 0.1 469 0.2Conseil de gestion de l’assurance parentale 2005 362 0.1 402 0.1OTHER DEPOSITORSOffice de la protection du consommateur 1992 161 – 152 0.1Ministère des Finances, Government of Québec1
Generations Fund 2007 11,982 3.3 9,189 2.7Accumulated Sick Leave Fund 2008 1,351 0.4 1,362 0.4Territorial Information Fund 2011 354 0.1 266 0.1
Agence du revenu du Québec 2012 160 – 149 0.1TOTAL 365,492 100.0 340,109 100.0
1. The Ministère des Finances entrusts C D P Q with a total of five funds.
2. New depositor in 2020.

Management Report

CDPQ | 2020 AR28
White page
29CDPQ | 2020 AR
Global Macroeconomic Environment
Followingalongcycleofexpansion,theworldeconomyhasbeenshakenbyahealthcrisisofbothhistoricproportionsandrapidspread.
A LONG ECONOMIC CYCLE WEAKENED BY TRADE TENSIONS
The 2008–2009 financial crisis had persistent negativeeffects on the global economy, particularly in the labourmarket,whereittookseveralyearstoerasethejoblosses.Improvingeconomicconditionsallowedsomecentralbanks,includingtheU SFederalReserve(Fed)tobeginnormalizingmonetarypolicyinlate2015.Thiscreatedupwardpressureonbondyields through theendof2018.TheBankofCanadafollowedsuit in2017,butatamoremoderatepaceduetoheadwindssuchas:
• Prolongedweaknessinoilprices
• Successiveintroductionofstricterrealestateandmortgagerules
• UncertaintyrelatedtothenegotiationoftheCanada–UnitedStates–MexicoAgreement(C U S M A)
In2019,concernsaboutthecontinuityoftheglobalbusinesscyclegrew,inpartduetotighteningfinancialconditionsandrisingprotectionism.Onthatfront,thesharpdeteriorationin
traderelationsbetweenChinaandtheUnitedStates,difficultnegotiationsbetweenCanada,theUnitedStatesandMexico,BrexitandrepeatedU Stariffthreatscreatedagreatdealofuncertainty.
Againstthismorecomplexbackdrop,andinthefaceofdiffi-cultiesinbringinginflationbacktotheirtargets,centralbanksinseveralcountriesmadeamajorshiftin2019bysofteningtheirmonetarypolicyagain.ThishasbeenthecasefortheFedandtheEuropeanCentralBank,buttheBankofCanadahas opted for the status quo to avoid fuelling a rise inhouseholddebtandbecauseinflationwasclosetoitstarget.
InQuébec,theeconomyhadmanagedtoperformsomewhatbetterthanotherprovincespriorto2020,partlybecauseitwasnotexposedtothecontinuingdifficultiesintheoilsector.Asaresult,privatenon-residentialinvestmentexperiencedstrongergrowthfrom2016to2019.Québec’sunemploymentratealsofellsignificantlyfasterthanelsewhereinCanadaduringthisperiod,hittinganall-timelowof4.5%inearly2020.Thelabourshortagewasagrowingissue.

Global Macroeconomic Environment(continued)
CDPQ | 2020 AR30
AND SUDDENLY A PANDEMIC
Theshockthatwouldrattletheglobaleconomyandsocietyin2020wasnotontheradarinlate2019.Indeed,anewcorona-virus suddenly challenged authorities around the world.Particularly contagious and life-threatening for themostvulnerable,COVID-19's fast global spreadput sometimesunsustainablepressureonhealthcaresystems.
Inresponsetothehealthcrisis,theauthoritieshadtoimple-menttravelrestrictionsandoftenseveresocialdistancingrules, which greatly reduced the ability to produce orpurchasecertaingoodsandservices,causingasharpdeclineineconomicactivityinthespring.Althoughnocountrywasspared, there were significant geographic disparities ineconomicgrowthbasedontheseverityanddurationoftherestrictivemeasures(seeFigure4).
Chinawasthefirstcountryhitinthefirstquarter,butmanagedtoquicklycontroltheoutbreaks,helpingittobetheonlymajoreconomytoseepositivegrowthovertheentiretyof2020.InEurope, the first wave of the pandemic was particularlysevere,asitwasinIndia,resultingindeeprecessions.IntheUnitedStates,although thepandemichitsomecitiesandregionshard,thecontractionineconomicactivitywasless
pronounced, in part because of generally less stringentconstraintsthaninotherdevelopedcountries.InCanada,thedropinoilpricesresultingfromlowerdemandamplifiedtheeconomicshock in2020comparedtotheU Sandcreatedinterprovincialdisparities.
The crisis has also had heterogeneous sectoral effects.Restrictions have persistently affected the restaurant,hospitality,entertainment,andairlinesectors.Companiesinothersectorshavebeenforcedtoclosetemporarilyorbeenlimitedtoessentialactivities,ashasbeenthecaseinQuébecformanufacturingandconstruction.Sectorswhereworkingremotelywasmore easily deployed, such as finance andinsurance,havefaredbetter.
AUTHORITIES RESPOND QUICKLY TO SUPPORT THE ECONOMY
Facedwith thehistoricdeterioration ingrowthprospectscausedbythesuddenhaltineconomicactivity,centralbankstookaction.Keyrateswereloweredtotheirfloorsindevelopedeconomies.Inaddition,tosupporttheeconomyandensurethesmoothfunctioningoffinancialmarkets,centralbanksannouncedexceptionalsupportmeasuresinvolvingmassive
FIGURE 4
AVERAGEANNUALGROWTHINREALG D P(asapercentage)
2020
2016to2019
Sources: Haver and Bloomberg
-10 -8 -6 -4 -2 0 2 4 6 8
2.1-5.4
-3.5
-6.8
-9.9
2.3
-6.9
2.3
1.9
1.5
6.6
6.8
Canada
United States
Euro zone
United Kingdom
China
India
31CDPQ | 2020 AR
injectionsofliquidity.Inadditiontopurchasinglargeamountsofgovernmentdebt,theFedandtheBankofCanadahavealso implemented programs to purchase corporate andmortgagedebt.Inseveralgrowthmarkets,monetarypolicywasalsosoftened,but therewas limited flexibilitydue toissuesofpotentialcapital flightandnegativepressureontheir currencies.
Governmentsactedquickly,notably toprovidea financialbridgetohouseholdsandbusinessestohelpthemweatherthecrisis.IncountrieslikeCanadaandtheUnitedStates,thishasresultedinasignificantincreaseintransferstohouseholds,causinganincreaseinpersonaldisposableincomedespitemassivejoblossesandstimulatinggoodsconsumption.
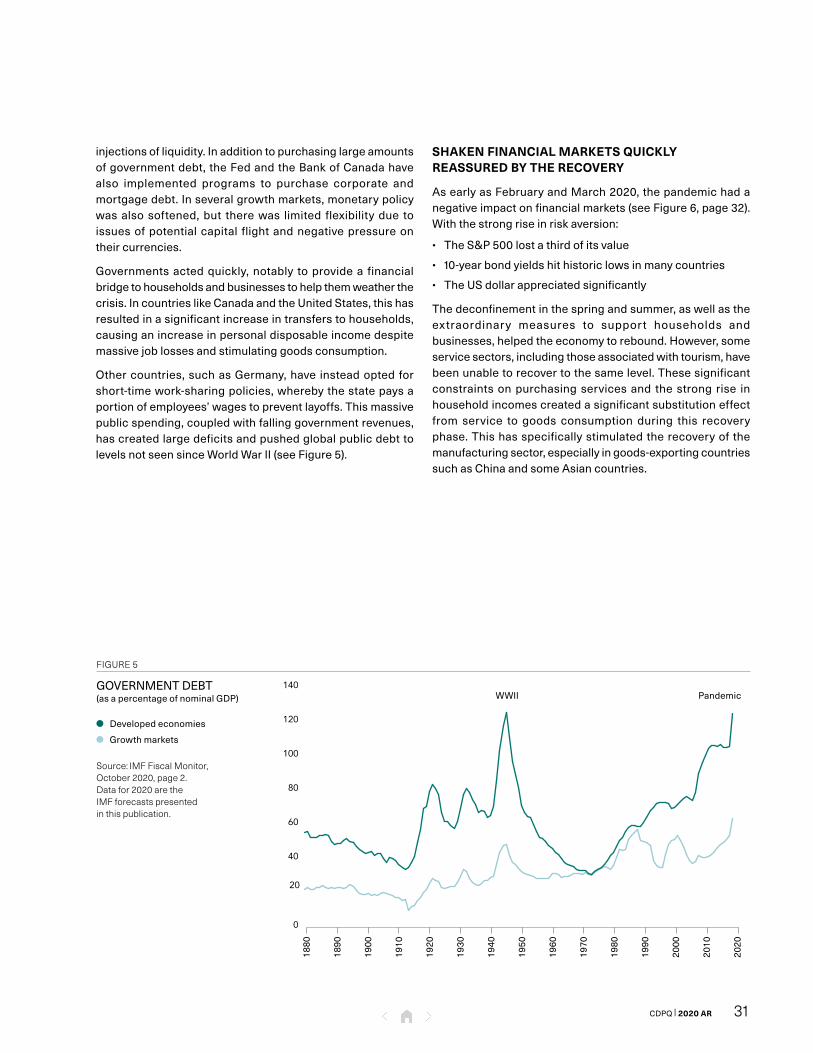
Othercountries,suchasGermany,have insteadoptedforshort-timework-sharingpolicies,wherebythestatepaysaportionofemployees’wagestopreventlayoffs.Thismassivepublicspending,coupledwithfallinggovernmentrevenues,hascreatedlargedeficitsandpushedglobalpublicdebttolevelsnotseensinceWorldWarII(seeFigure5).
SHAKEN FINANCIAL MARKETS QUICKLY REASSURED BY THE RECOVERY
AsearlyasFebruaryandMarch2020,thepandemichadanegativeimpactonfinancialmarkets(seeFigure6,page32).Withthestrongriseinriskaversion:
• TheS & P500lostathirdofitsvalue
• 10-yearbondyieldshithistoriclowsinmanycountries
• TheU Sdollarappreciatedsignificantly
Thedeconfinementinthespringandsummer,aswellastheextraordinary measures to support households andbusinesses,helpedtheeconomytorebound.However,someservicesectors,includingthoseassociatedwithtourism,havebeenunabletorecovertothesamelevel.Thesesignificantconstraintsonpurchasingservicesand thestrong rise inhouseholdincomescreatedasignificantsubstitutioneffectfrom service to goods consumption during this recoveryphase.Thishasspecificallystimulatedtherecoveryofthemanufacturingsector,especiallyingoods-exportingcountriessuchasChinaandsomeAsiancountries.
FIGURE 5
GOVERNMENTDEBT(asapercentageofnominalG D P)
Developedeconomies
Growthmarkets
Source: IMF Fiscal Monitor, October 2020, page 2. Data for 2020 are the IMF forecasts presented in this publication.
WWII Pandemic
0
20
40
60
80
100
120
140
1880
1890
1900
1910
1920
1930
1940
1950
1960
1970
1980
1990
2000
2010
2020

Global Macroeconomic Environment (continued)
CDPQ | 2020 AR32
Residential real estate also contributed positively to the rebound in several regions of the world, including Québec, where strong demand and low supply drove up home sales prices. In fact, the recovery that accompanied the deconfi-nement was somewhat more vigorous in Québec than in other Canadian provinces, more quickly erasing some of the initial job losses.
This recovery, the abundance of liquidity, the prospect of ongoing very low interest rates and dissipating fears on worst-case economic scenarios restored confidence in financial markets. Other important factors supported them later in the year, starting with positive news about vaccine effectiveness and the imminent start of mass vaccination campaigns. In addition, Biden’s victory in the U S presidential election paved the way for a very expansionary fiscal policy.
Thus, despite a particularly severe second wave of the pandemic in late 2020 in several regions, these favourable developments regarding the recovery’s viability have resulted in:
• Several stock indexes concluding the year higher than at the end of 2019
• Long-term interest rates starting to rise again
• Corporate bond credit spreads returning to levels observed before the pandemic
STRUCTURAL TRENDS ACCELERATE
In this difficult and restrictive context, society had to adapt very quickly. The pandemic therefore accelerated trends that were already underway, especially the digitization of the economy. E-commerce, already on the rise, has gained in popularity. Working remotely has been democratized. And, in the process, the stocks of digital and technology companies, such as the GAFAM (Google, Apple, Facebook, Amazon and Microsoft), rose sharply in 2020, driving major stock indexes higher. On the other hand, the commercial real estate sector has been negatively and significantly affected by these phenomena, particularly in the major urban centres.
The pandemic also brought to light supply chain issues. The difficulties encountered in gaining access to certain types of goods gave rise to a desire to regionalize the production of goods deemed strategic, in an environment where protec-tionism had already gained ground.
Lastly, the authorities in many countries are clearly suggesting that they will continue to support the recovery of their economies. For many, this represents an opportunity to make progress on important issues such as fighting climate change, through investments in green infrastructure, and addressing income inequality. Democrats gaining power in the United States is in line with this trend.
Ultimately, the pandemic not only ended a long cycle of expansion, but also set the stage for structural changes that will shape the investment landscape for years to come.
FIGURE 6
CHANGE IN FINANCIAL MARKETS
US 10-year Treasury bond yield (left, as a percentage)
S&P 500 (right, index)
Source: Haver
0.0
0.5
1.0
1.5
2.0
2.5
3.0
1,400
1,800
2,200
2,600
3,000
3,400
3,800
2016 2017 2018 2019 2020

33CDPQ | 2020 AR
Analysis of Overall PerformanceIn an extraordinary year, C D P Q delivered returns that meet the needs of our depositors over one, five and ten years.
$365.5 BNETASSETS
$110.7 BINVESTMENTRESULTS
OVER5YEARS
7.8%
5-YEAR
ANNUALIZEDRETURN
4 asset classes:FixedIncome/RealAssets/Equities/OtherInvestments
FIVE-YEAR RETURN
Total portfolio
Investment results: $110.7 BAnnualized return: 7.8%
As at December 31, 2020, C D P Q’s net assets totalled$365.5billion.Sincetheendof2015,netassetshavegrown$117.5billion,with$110.7billionfrominvestmentresultsand$6.8billionfromnetdeposits.Thisperformancereflectstheimplementationof thepillarsofC D P Q’sstrategy inrecentyears,including:
• Ourinternationalexpansion
• Ourshifttoprivatecredit
• Ourincreasedallocationtoinfrastructure
• Valuecreation inourportfoliocompanies through theiroperations,notablyinprivateequity
Overfiveyears,theannualizedweighted-averagereturnondepositors’ fundswas 7.8%.Over ten years, itwas 8.6%,representingnetinvestmentresultsof$198.0billion.Table7showshowtheselonger-termreturnscomparedwiththosefrom2016to2020.
Overfiveyears,C D P Q’sannualizedreturnwasslightlyaboveits benchmark, at 7.6% (see Table 8, page 34). The 0.2%differencerepresents$1.7billioninvalueadded,derivedfromtheEquitiesandFixedIncomeassetclasses.Overtenyears,thevalueaddedamountsto$9.3billion.
TABLE 7
C D P QRETURNS(forperiodsendedDecember31–asapercentage)
Overallreturn1
5 years 7.810 years 8.62020 7.72019 10.4
2018 4.2
2017 9.32016 7.6
1. Weighted average return on depositors’ funds.

Analysis of Overall Performance(continued)
CDPQ | 2020 AR34
Fixed Income
Investment results: $24.3 BAnnualized return: 5.3%
Thisassetclasshasmadeasignificantcontributiontotheinvestmentresultsofthetotalportfoliooverfiveyears.ThemajorityofitsannualizedreturnwasduetothecurrentyieldoftheactivelymanagedRatesandCreditportfolios.
Theassetclassoutperformeditsbenchmark index,whichdelivereda4.3%return.The$4.5billioninvalueaddedwasprimarilyattributabletoSovereignCredit,RealEstateDebtandCorporateCredit.Thisshowsthatthestrategicreposi-tioningofFixedIncomeactivitiesthatstartedin2017hasbeenasuccess. It shouldbe remembered thatsince that time,C D P Qhasconsiderablyexpandeditsinvestmentsinprivatecredit,asegmentthatperformsbetteroverthelongtermthantraditionalbonds.
Real Assets
Investment results: $8.7 BAnnualized return: 4.3%
Theassetclass’sannualizedreturnfellshortofthatoftheindex,whichwas7.0%.TheRealEstateandInfrastructureportfolios generated annualized 1.1% and 8.9% returns,respectively.
TheRealEstateportfolio’sperformancehasbeenaffectedbytwodifficultyears:2019and2020.TheInfrastructureportfolioperformedwellduetothequalityoftheassetsheldinvarioussectors,butparticularlyinrenewableenergy.
Equities
Investment results: $76.9 BAnnualized return: 11.0%
Thisassetclasscomprisestwoportfolioswithdifferentriskprofiles:EquityMarketsandPrivateEquity.Through theircomplementaryexposures, the twoportfoliosdeliveredastrongperformanceoverfiveyears,outpacingthe9.9%returnof its index.The$6.8billioninvalueaddedcamefromthePrivateEquityportfolio,whichoutperformeditsindexwithanannualizedreturnof14.9%.
EquityMarketsgenerateda9.4%return,slightlylessthanitsindex.Overfiveyears,theEquitiesassetclass,thelargestinthetotalportfoliobysize,contributedmorethantwothirdsofinvestmentresults.
TABLE 8
NETASSETSANDRETURNS(forperiodsendedDecember31,2020)
AssetclassNet assets
$B
5 years 1year
Investment results
$MReturn
%Index
%
Investmentresults
$MReturn
%Index
%
FixedIncome 110.2 24,272 5.3 4.3 8,742 9.0 8.2RealAssets 67.2 8,743 4.3 7.0 (4,951) (7.0) 0.2Equities 182.3 76,889 11.0 9.9 20,049 12.4 12.7
Total1 365.5 110,700 7.8 7.6 24,751 7.7 9.2
1. The total includes consolidated asset allocation activities, customized overlay operations, cash activities of specific funds and terminated activities.

35CDPQ | 2020 AR
2020 RETURN
Total portfolio
Investment results: $24.8 BReturn: 7.7%
Inanunprecedentedmarketenvironment,C D P Q’sreturnfell1.5%shortofitsbenchmark,whichdelivered9.2%(seeTable8, page34). Thedifferencewasmainly due to underperfor-mancebytheRealEstateportfolio,whoseshoppingcentresandofficebuildingswereseverelyaffectedbythepandemic.
Foroneyear,thetotalportfoliodeliveredcontrastingreturnsbetweenandwithinassetclasses.InvestmentresultsstemfromtheEquitiesandFixedIncomeclasses,aswellastheInfrastructureportfolioinRealAssets.
Fixed Income
Investment results: $8.7 BReturn: 9.0%
Theannualperformanceof thisassetclass,whichhad itsthird-bestresultssincethe2008–2009financialcrisis,wasdueinparticularto:
• ThesharpdropinratesinCanadaandtheUnitedStates
• Thehighcurrentyieldsonprivateandrealestatedebt
TheFixedIncomeportfolio’s2020returnoutperformedtheindex,whichdelivered8.2%.Thisresultedin$0.8billioninvalueadded,towhichactivelymanagedportfolioscontributedsignificantlythroughinvestmentsinprivatecredit.
Real Assets
Investment results: -$5.0 BReturn: -7.0%
Thisassetclassrecordedanegativereturn,whileitsindexended 2020 at 0.2%. The year wasmarked by two verydifferentsituationsinrealestateandinfrastructure:
• First,theRealEstateportfoliosufferedseverelyfromthepandemic
• Second,theInfrastructureportfolioperformedwellinthisenvironmentduetobeneficialdiversification
Infact,somerealassets,includingshoppingcentresinCanadaandmoretraditionalofficebuildingsinNorthAmerica,havebeenhardhitbyconfinementmeasuresaroundtheworld.As aresult, theRealEstateportfolio tookasharp tumble,deliveringareturnof-15.6%andfallingshortofitsindexmainlyduetoitsoverweightinginshoppingcentres.TheInfrastructureportfolioand,inparticular,transportationinfrastructure,wasalsoaffectedbythecrisisbutneverthelessreturned5.1%,outperforming its index due to contributions from othersectorssuchastelecommunicationsandrenewableenergy.
Equities
Investment results: $20.0 BReturn: 12.4%
Giventheunprecedentedmarketconditions,thisassetclassperformedwell, in line with its index, which delivered a12.7% return.TheEquityMarketsportfolioproducedan8.3%return.Itneverthelessdidnotmatchtheperformanceofitsindexduetocertainstylebiasesinitsmanagementthathaveexposeditto:
• Moredefensivesecurities
• Fewertechnologyandgrowthstocks
Webeganoptimizingtheportfolioin2020topositionitforthenewdecade.
ThePrivateEquityportfoliohadanexcellentyear,surpassingits index by a wide margin. The technology, health andservices sectorscontributedstrongly to its20.7% return.Post-investmentmanagementalsocreatedmorevalue.Asaresult,thisportfolioprovidedanattractivecomplementtothemoredefensiveriskprofileofthestockmarkets.

Analysis of Overall Performance(continued)
CDPQ | 2020 AR36
GEOGRAPHIC DIVERSIFICATION
Inaddition to investing indifferentassetclasses,C D P Q’sportfolioisdiversifiedgeographically.Thisallowsusto:
• Optimizetherisk-returnprofile
• Seizeattractiveopportunitiesindynamiceconomies
Over five years, the globalization of our operations hasincreasedourexposuretointernationalmarketsby$137billion.Table9showsthesechangesinthemainregionsfrom2015to 2020.Aswecansee,theexposureoutsideCanadagrewfrom54%to68%.
C D P Q’sexposuretotheUnitedStatesgrewthemostduringthisperiod.Itreached35%attheendof2020,surpassingourexposuretoCanadaforthefirsttime.Nevertheless,C D P Qremains very active inCanada—particularly inQuébec—whichstillaccounts forclosetoonethirdof theportfolio.ExposuretoAsiaPacificandLatinAmericaalsogrew,to12%and4%respectivelyattheendof2020.
Andsinceattractiveopportunitieswillcontinuetoarisearoundtheworld, in2020C D P Qadoptedan integratedapproachacrossregions.
CURRENCY EXPOSURE AND FOREIGN EXCHANGE HEDGING
Overthelastfiveyears,C D P Q’sexposuretoforeigncurrenciesgrew from 31% in 2015 to 47% in 2020 aswe globalizedouractivities.
In2020,ourexposuretoforeigncurrenciesfell3%from2019levelsfollowingchangesinourhedgingofcertaincurrencies.
Itisworthnotingthatoverfiveyears,ourexposuretoforeigncurrencieshadaslightlynegativeimpactonoverallperfor-mance.Ontheotherhand,theimpactwasfavourableforoneyearduetotherelativestrengthoftheeuroandthecontribu-tionofdynamichedgingontheU Sdollar.C D P Qbelievesthatcurrenciestendtohaveaneutralimpactoverthelongterm.
TABLE 9
GEOGRAPHICEXPOSUREOFTHETOTALPORTFOLIO1
(asatDecember31–asapercentage)
AsatDecember31–asapercentage 2020 2015
Canada 32 46UnitedStates 35 27Europe 14 14AsiaPacific 12 9LatinAmerica 4 1Otherregions 3 3
Total 100 100
1. The presentation of the portfolio’s geographic exposure was revised and is different from that presented in the Consolidated Financial Statements.

37CDPQ | 2020 AR
BENCHMARK PORTFOLIO
C D P Q’sbenchmarkportfoliocorrespondstotheweightedaverageoftheassetallocationdecisionsmadebyeachofthedepositorswhentheirinvestmentpoliciesareestablished.
ThecompositionofC D P Q’sbenchmarkportfolio reflectsdepositors’adjustmentsduringtheyeartothecompositionoftheir respectiveportfolios.Table10showsthechanges inweightingforoneyear,whichreflectourstrategicorientations.
TOTAL PORTFOLIO
The composition of the total portfolio reflects decisionsmadeby:
• Ourdepositors,withrespecttotheirbenchmarkportfolios
• C D P Q,aspartofconsolidatedassetallocationactivities,withintheupperandlowerlimitssetforeachspecializedportfolio
Thetwocolumnsontheright-handsideofTable10showthetotalportfolio’sallocationsin2019and2020.
TABLE 10
COMPOSITIONOFTHEBENCHMARKPORTFOLIOANDCHANGESINTHETOTALPORTFOLIO(percentageofdepositors’netassets)
percentageofdepositors’netassets Benchmark portfolio Total portfolio
Specialized portfolios
as at December 31, 20201 asatDecember31,20191 as at December 31,
2020
%
asatDecember31,
2019
%
Lower limit
%
Benchmark portfolio
%
Upper limit
%
Benchmarkportfolio
%
Fixed IncomeRates 6.0 11.0 17.4 11.5 8.4 9.2Credit 12.7 18.0 23.6 17.2 20.6 19.5ShortTermInvestments 0.2 1.1 7.8 1.1 0.4 0.3LongTermBonds 0.7 0.9 2.7 0.9 0.9 0.9RealReturnBonds 0.0 0.2 1.9 0.4 0.2 0.4
Total n.a. 31.2 n.a. 31.1 30.5 30.3
Real AssetsRealEstate 7.7 12.5 15.6 12.7 9.8 11.7Infrastructure 4.5 8.5 11.4 7.4 8.8 8.2
Total n.a. 21.0 n.a. 20.1 18.6 19.9
EquitiesEquityMarkets 22.1 33.2 39.4 35.0 32.6 34.4PrivateEquity 9.5 14.6 18.2 13.8 17.8 14.8
Total n.a. 47.8 n.a. 48.8 50.4 49.2
OtherAssetAllocation 0.0 0.0 1.0 0.0 0.5 0.4ActiveOverlayStrategies2 – – – 0.0 – 0.2
Total n.a. 100.0 n.a. 100.0 100.0 100.0
1. The benchmark portfolio and its upper and lower limits are the result of the weighted average of the depositors’ respective benchmark portfolios.
2. The portfolio was closed on January 1, 2020.

CDPQ | 2020 AR38
Fixed IncomeThis asset class leverages its credit strategy to generate strong results and value added.
$110.2 BNETASSETS
30.5%
OFTHETOTALPORTFOLIO
5.3%
5-YEARANNUALIZEDRETURN
5 portfolios:Rates/Credit/ShortTermInvestments/LongTermBonds/RealReturnBondsAllthefiguresinthissectionaredetailedinTable18(page53)
RATES
Since inception
Investment results: $5.2 B
Thisportfolio,createdin2017,isactivelymanaged.Attheendof2020, ithad$30.3billion innetassets. Itsactivitiesareconcentratedintwomainmandates:
• Ratemanagement
• Sovereigncredit
2020 return
Investment results: $2.3 BReturn: 8.6%
Theportfoliodelivereditsbestreturnsinceinception.ItsmainperformancedriverwastheBankofCanada’ssharpratecutinresponsetotheeconomicdownturncausedbythepandemic.Foroneyear,theportfoliobenefitedfromarelativelystablecurrent yield compared to that recorded in recent years,enhancedbyapriceeffect.
Theportfoliooutperformeditsbenchmarkindexby0.4%andgenerated $66million of value added. This results fromover-weightinginprovincialbondswhichwasorchestratedatanopportunemomentduringthecrisis.
RATESPORTFOLIO
COMPOSITION• Moretraditionalgovernmentbondswithexcellentcreditquality:
– GovernmentsofCanadaandotherdevelopedcountries – GovernmentsofCanadianprovinces
ADVANTAGES• Lowrisklevelandprotectionofthetotalportfolio• MainsourceofC D P Q’sliquidity• Diversification• Sourceofcurrentyield• Potentialtomatchassetswiththelong-termfinancialcommitmentsofdepositors

39CDPQ | 2020 AR
CREDIT
Since inception
Investment results: $15.6 B
With$74.2billioninnetassets,thisportfoliorepresentsovertwothirdsof theFixed Incomeassetclass. Its investmentactivitiesaregroupedintofourmainmandates:
• CorporateCredit
• SovereignCredit
• RealEstateDebt
• SpecialtyFinance
– InfrastructureFinancing
– CapitalSolutions
Sinceitslaunchin2017,theportfoliohasadded$3.3billioninvalueinrelationtoitsindexduetogoodperformanceineachofthemandates.
2020 return
Investment results: $6.0 BReturn: 8.9%
Foroneyear,theportfoliobenefitedfromfallinginterestratesacrossthevariousmarkets.Thehighcurrentyieldoncreditactivitiesaccountedforoverhalfoftheportfolio’sreturn.Allthemandatescontributed,particularlyCorporateCreditandRealEstateDebt.Theseactivitiestogetherwithspecialtyfinancingactivitieshaveprovedbeneficial.The1.1%differencewiththebenchmarkindexrepresents$0.8billioninvalueadded.
MARKETCONDITIONS
Fixed income portfolios slightly outperformed theCanadianbondmarket. Table 11 shows theFTSETMXCanadaUniverseBondIndex’sreturnsof8.7%for2020and4.2%overfiveyears.
Allsegmentspostedstrongone-yearreturns,whichwasespecially true of provincial bonds, includingQuébecbonds.Thisissuercategoryhasalsoperformedwelloverfiveyears,closelyfollowedbycorporatebonds.
TABLE 11
FTSETMXCANADABONDINDEXRETURNS(asapercentage)
asapercentage 2020 2019 5years
FTSETMXCanadabondindexes
Short-term
Medium-term
Long-term Total
Short-term
Medium-term
Long-term Total
Short-term
Medium-term
Long-term Total
Federal 4.6 9.3 13.1 7.3 2.1 3.8 8.4 3.7 1.6 2.9 5.2 2.7Provincial 5.3 10.0 11.6 9.9 3.0 5.8 13.5 9.1 2.3 4.0 6.8 5.1Québec 5.3 10.0 11.4 9.9 2.9 5.4 12.9 8.7 2.3 4.0 6.9 5.1Corporate 6.3 11.1 11.1 8.7 4.5 8.4 14.4 8.1 3.2 5.5 8.0 5.0
Universe 5.3 10.1 11.9 8.7 3.1 5.8 12.7 6.9 2.3 4.0 6.8 4.2

Fixed Income (continued)
CDPQ | 2020 AR40
During the year, C D P Q invested in various industries such as financial services and insurance, both in Canada and interna-tionally, including:
• Sollio Cooperative Group: $150 million in preferred shares, in partnership with Rabobank Capital, Fonds de solidarité F T Q and Fondaction, in this largest agricultural cooperative in Canada
• Line 5 Condos: Senior funding of $328 million to finance the construction of two residential towers with 924 condomi-niums in Toronto, in partnership with West Broadway Group and Reserve Midtown Group, renowned real estate owners and developers
• The Ardonagh Group: Commitment of £1.875 billion along-side other investors to support the United Kingdom’s leading independent insurance broker in one of the world’s largest unitranche financing transactions
• Titan Aircraft Investments: U S$300-million financing agreement alongside partners with this leading provider of air freight solutions based in the United States
• Piramal Enterprises: Partnership to create a U S$300-million platform in India targeting private credit financing oppor tu- ni ties in various industries (75% commitment from C D P Q)
CREDIT PORTFOLIO
COMPOSITION• Expanded universe of instruments with features of fixed
income securities according to the mandate: – Corporate Credit: quality or high-yield bonds and direct or
syndicated loans – Sovereign Credit: a focus on sovereign and quasi-sovereign
securities from growth markets – Real Estate Debt: commercial, mortgage and construction
loans, mostly senior, on residential and office buildings, shopping centres and industrial buildings
– Specialty Finance: debt, hybrid or equity securities with certain features of debt instruments, and project financing
– Infrastructure Financing: senior and subordinated debt in industries such as transportation, renewable energy and telecommunications
– Capital Solutions: specialty finance, quasi-equity and opportunistic credit
ADVANTAGES• Market segments featuring better performance and
a return that is superior to the traditional bond market• Diversified sources of value• In real estate debt, lower credit risk due to a prudent
underwriting approach and the quality of the underlying assets

41CDPQ | 2020 AR
SHORT TERM INVESTMENTS
Five-year return
Investment results: $94 MAnnualized return: 1.1%
Thisindexedportfolioincludesliquidshort-terminvestmentson theCanadianmoneymarket. Its five-yearperformancereflectsthelow-rateenvironmentthroughouttheperiod.
2020 return
Investment results: $15 MReturn: 1.0%
Theportfolio’sperformancewasentirelyduetothecurrentyieldoftheportfolio’ssecurities.ItshouldbenotedthattheyielddecreasedasaresultofthesharpdropinCanada’skeyrateduetothecrisis.
LONG TERM BONDS
Five-year return
Investment results: $957 MAnnualized return: 6.7%
This portfolio, managed using an index-style approach,consistsoflong-termprovincialbonds.It’sfive-yearperfor-mancewasduetoboth:
• Thesignificantcurrentyieldofthesecurities
• Afavourablepriceeffectduetolowerlong-termratesinCanadaandQuébecduringtheperiod
2020 return
Investment results: $341 MReturn: 11.6%
Theportfolioonceagaindeliveredastrongreturnin2020,assecurities with long-term maturities benefited from thesustaineddeclineinlong-termratesinthefirsthalfoftheyear.
REAL RETURN BONDS
Five-year return
Investment results: $259 MAnnualized return: 4.8%
This indexed portfolio offers depositors hedging againstinflationusingCanadianrealreturnbonds.Itshouldbenotedthatadivestmentprocessisunderway,anditisexpectedtocontinueuntiltheendof2021.
Overfiveyears,theperformanceismainlyduetothefallingrealratesovertheperiod,whiletheconsumerpriceindex—themeasureonwhichtheinflationfactoriscalculated—hasrisen. The current yield of securities also played a role,althoughtoalesserextent,duetolowinterestrates.
2020 return
Investment results: $122 MReturn: 12.8%
Realratescontinuedtoslidein2020againstabackdropofrisinginflation,whichstimulatedportfolioperformance.

CDPQ | 2020 AR42
Real AssetsThis asset class has delivered positive results over five years, while its two portfolios turned in contrasting performances.
$67.2 BNETASSETS
18.6%
OFTHETOTALPORTFOLIO
4.3%
5-YEARANNUALIZEDRETURN
2 portfolios:RealEstate/InfrastructureAllthefiguresinthissectionaredetailedinTable18(page53)
REAL ESTATE
Five-year return
Investment results: $722 MAnnualized return: 1.1%
This portfolio,managed by Ivanhoé Cambridge, our realestatesubsidiary,postedanannualizedfive-yearreturnof5.3%,whichfellshortofitsbenchmarkindex.Thisunderper-formancewasprimarilydue to its significantexposure toCanadian shopping centres, a sector that has facedchallengesinrecentyears.
Theportfolio’sreturnovertheperiodwasmainlyduetothecurrentyieldonassets,withcontributionsfromallsectors.Withtheexceptionofshoppingcentres,allrecordedpositiveperformance,withthelogisticsandindustrialsectordoingparticularly well. However, some of themore traditionalsectorsexperiencedsignificantassetvaluedepreciationin2019and2020,especially inNorthAmerica.Theequities,fundsandfinancingsectordidwell.
REALESTATEPORTFOLIO
COMPOSITION• High-qualityrealestateproperties,projects,companiesandfundsthatareshapingdynamiccitiesaroundtheworld
• Investmentsinequitiesandfinancingproductsinvarioussectorssuchasofficebuildingsandshoppingcentres,aswellasintheresidential,logisticsandindustrialsectors
ADVANTAGES• Sourcesofcurrentyield• Attractiverisk-returnprofileandsubstantialcashflows• DiversificationoftheriskinC D P Q’stotalportfolioduetoalowercorrelationbetweentheassetsheldandglobalmarkets
• Somelong-termcapitalprotectionagainstinflationduetoleaseindexing
43CDPQ | 2020 AR
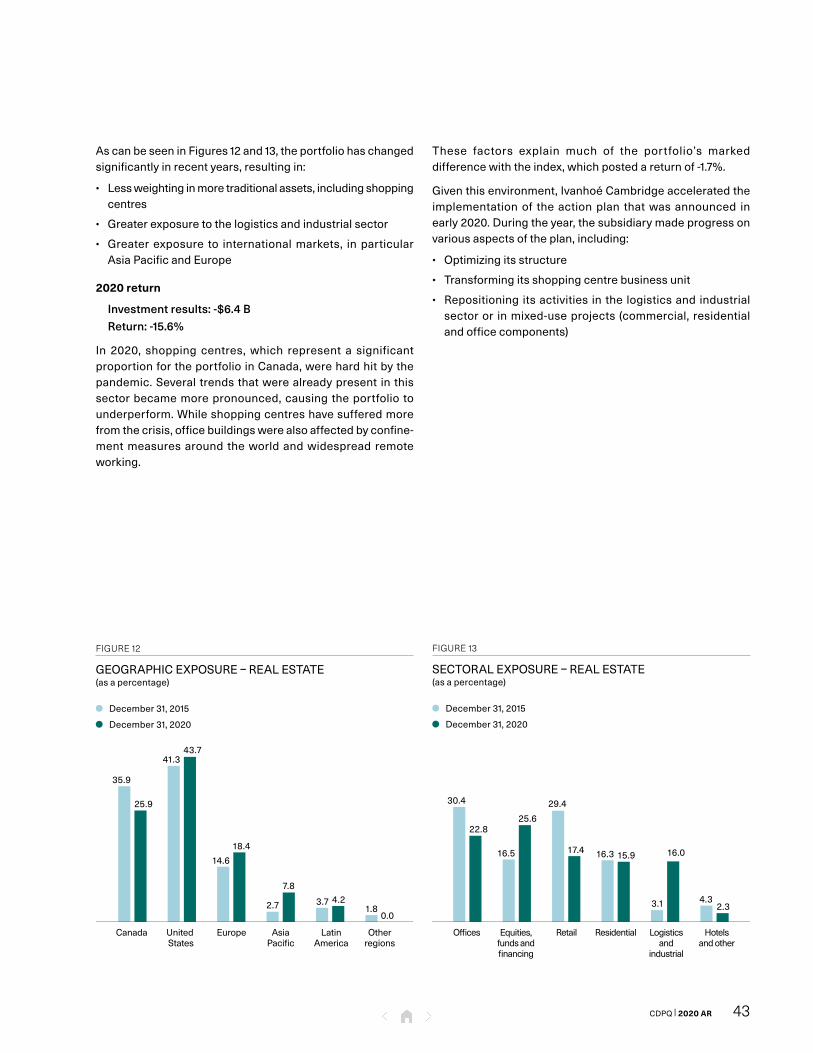
AscanbeseeninFigures12and13,theportfoliohaschangedsignificantlyinrecentyears,resultingin:
• Lessweightinginmoretraditionalassets,includingshoppingcentres
• Greaterexposuretothelogisticsandindustrialsector
• Greaterexposure to internationalmarkets, inparticularAsiaPacificandEurope
2020 return
Investment results: -$6.4 BReturn: -15.6%
In 2020, shopping centres,which represent a significantproportionfortheportfolioinCanada,werehardhitbythepandemic.Severaltrendsthatwerealreadypresent inthissectorbecamemorepronounced,causingtheportfoliotounderperform.Whileshoppingcentreshavesufferedmorefromthecrisis,officebuildingswerealsoaffectedbyconfine-mentmeasuresaroundtheworldandwidespreadremoteworking.
These factors explain much of the portfolio’s markeddifferencewiththeindex,whichpostedareturnof-1.7%.
Giventhisenvironment,IvanhoéCambridgeacceleratedtheimplementationof theactionplan thatwasannounced inearly2020.Duringtheyear,thesubsidiarymadeprogressonvariousaspectsoftheplan,including:
• Optimizingitsstructure
• Transformingitsshoppingcentrebusinessunit
• Repositioningitsactivities inthelogisticsandindustrialsectoror inmixed-useprojects(commercial,residentialandofficecomponents)
FIGURE 12
GEOGRAPHICEXPOSURE–REALESTATE(asapercentage)
December31,2015
December31,2020
Canada United Europe Asia Latin Other States Pacific America regions
35.9
43.7
25.9
41.3
14.6
18.4
2.7
7.8
3.7 4.21.8
0.0
FIGURE 13
SECTORALEXPOSURE–REALESTATE(asapercentage)
December31,2015
December31,2020
Largeur du graphique 262 pts
30.4
25.622.8
16.5
29.4
17.4 16.3 15.9
3.1
16.0
4.32.3
Offices Equities, Retail Residential Logistics Hotels funds and and and other financing industrial

Real Assets(continued)
CDPQ | 2020 AR44
Over 70 transactions aligned with these priorities werecompleted,totalling$8.7billion.Thisincludes$5.9billioninacquisitions and capital investments for developmentpurposesand$2.8billion instrategicsales, including theWoodgrove shopping centre on Vancouver Island.Majortransactionsincluded:
• LOGOS:Inpartnershipwiththisgroupoflogisticsandindus-trialproperties,thelaunchofafourthlogisticsdevelopmentvehicleinAsiawithacapacityofU S$800million,andtheacquisitionofasite inAustraliatocreatea$230-millionlogisticsplatform
• RHP:WithRHPProperties,acquisitionoftheChesapeakeportfolio,consistingofsixmodularhomecommunitiesintheUnitedStates,oneofthemostresilientsegmentsinrealestatesincethecrisisbegan
In France, key investmentswere alsomade in promisingsectors:
• Hub&Flow:Acquisitionofaportfolioof17logisticsassetsinParis andLyon—oneof the largest transactions in thissector inFrance in recentyears—anda36,000square-meterplatforminRoye,betweenParisandLille
• Student housing: Launch by Ivanhoé Cambridge,Bouwinvest andGreystar of aplatform for student andyoung professional accommodation in Paris, with aninvestmentcapacityof€1billion
• Joya:Acquisitionofa50,000square-meterofficecampusdevelopmentinValdeFontenaytoofferoccupantsfit-outflexibility
INFRASTRUCTURE
Five-year return
Investment results: $8.0 BAnnualized return: 8.9%
Theportfoliodeliveredperformancethatcloselymatcheditsindex’s9.1%return.Thiswasduealmostequallyto:
• Assetvalueappreciation,particularlyinrenewableenergyandports
• Ahighcurrentyieldoninvestment
Allregionsandsectorsperformedwell,particularlyutilitiesandenergyassets.Sincetheendof2015,theportfoliohasgrownbyafactorofalmost2.5,reaching$31.7billionattheendof2020.
FIGURE 14
GEOGRAPHICEXPOSURE–INFRASTRUCTURE(asapercentage)
December31,2015
December31,2020
Canada United Europe Asia Latin Other States Pacific America regions
21.7
31.6
0.9
16.3
7.3
15.9
36.8
15.6
1.7 1.9
32.0
18.3
FIGURE 15
SECTORALEXPOSURE–INFRASTRUCTURE1
(asapercentage)
December31,2015
December31,2020
Largeur du graphique 262 pts
Broader Industrials Utilities energy and and transportation other
36.7
56.3
7.0
37.2
49.1
13.7
1. Data for 2015 were adjusted to reflect the portfolio’s new classification.

45CDPQ | 2020 AR
The infrastructure teams have completed major transactions around the world in a wide range of sectors. During the period, $16.2 billion in investments were made, compared to materializations of $1.5 billion.
Figures 14 and 15 on page 44 show the portfolio’s increased geographic and sector diversification over the past five years.
2020 return
Investment results: $1.4 BReturn: 5.1%
The portfolio has demonstrated resilience in the face of the crisis due to its diversification, even though the airport sector—which accounts for almost 10% of its assets—was hard hit by the pandemic, especially in Europe. The portfolio outperformed its index, which delivered 0.5%, creating $0.9 billion in value added. This difference was due in part to:
• Strong performance by energy sector assets, particularly in renewable energy
• Continued good performance of assets in North America, Asia and growth markets
In addition to renewable energy, the portfolio is exposed to some sectors that grew strongly in 2020, such as telecommunications.
In a competitive market, C D P Q was very active, completing $3.5 billion in transactions, including:
• D P World: Expansion to U S$8.2 billion of this global platform, which already includes ten port assets, with this leading port operator
• Plenary Americas: Acquisition of this leading North American public infrastructure investor, developer and operator, which has a portfolio of 36 projects
• Colisée: A stake in this group based in France, a key player in Europe’s retirement home sector
• Invenergy Renewables: An additional U S$1-billion commit-ment in this company, the leading private developer, owner and operator of wind and solar projects in the United States
• Greater Changhua 1: First infrastructure investment in Taiwan for this offshore wind farm currently under construc tion, in partnership with Cathay PE, in a transac tion worth $3.4 billion
During the year, C D P Q Infra continued to build the Réseau express métropolitain (REM) in the Greater Montréal area. Despite the challenges posed by the pandemic, which forced a hiatus of a few months, work has progressed at more than 20 sites with 2,000 workers. In addition, in December the subsidiary presented a proposal for a light rail project for the eastern and northeastern sectors of Montréal, with 32 km of track and 23 new stations.
INFRASTRUCTURE PORTFOLIO
COMPOSITION• Interests in companies that operate various types of
infrastructure: ports, airports, highways, wind and solar farms, energy transmission and distribution networks, passenger transportation systems, and social and telecommunications infrastructure
• Quality companies with lower risk profiles that are less sensitive to changing economic conditions
ADVANTAGES• Stable and predictable revenues over the long term• Steady cash flows and a better risk-return profile than
other asset classes due to the regulatory frameworks governing many sectors
• Distinct risk profile that can be used to diversify risk in the total portfolio
• Some long-term capital protection against inflation
CDPQ | 2020 AR46
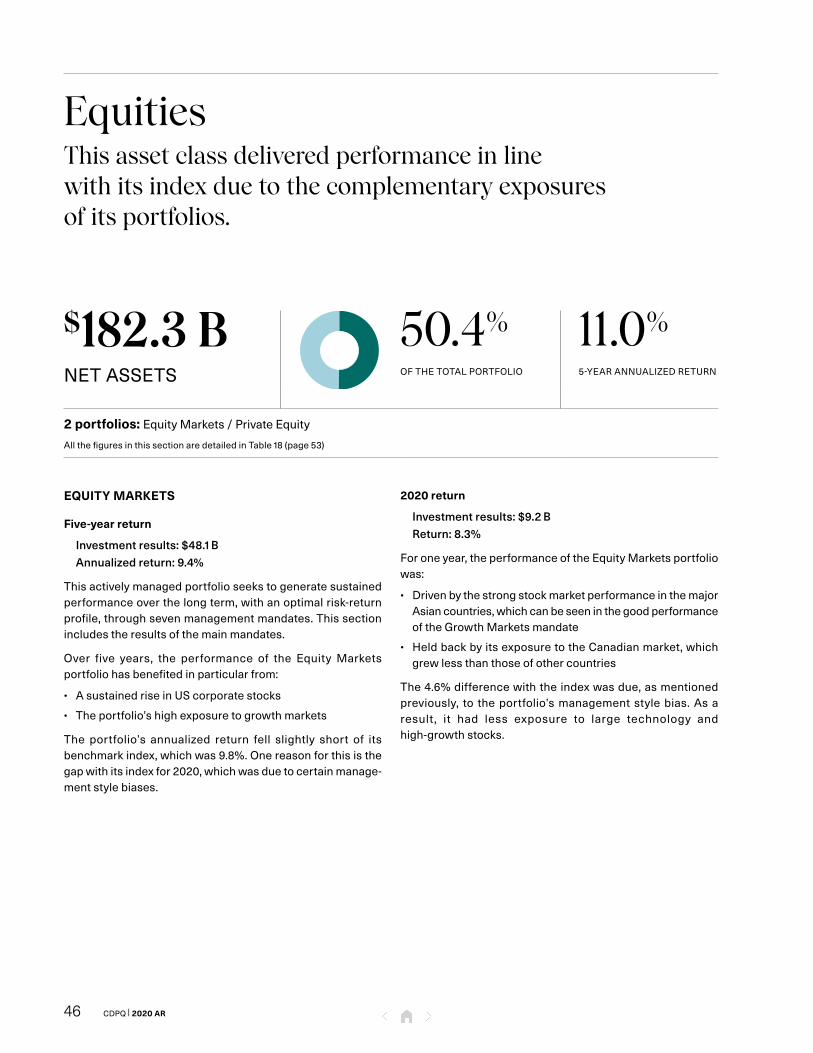
EquitiesThis asset class delivered performance in line with its index due to the complementary exposures of its portfolios.
$182.3 BNETASSETS
50.4%
OFTHETOTALPORTFOLIO
11.0%
5-YEARANNUALIZEDRETURN
2 portfolios: EquityMarkets/PrivateEquity
AllthefiguresinthissectionaredetailedinTable18(page53)
EQUITY MARKETS
Five-year return
Investment results: $48.1 BAnnualized return: 9.4%
Thisactivelymanagedportfolioseekstogeneratesustainedperformanceoverthelongterm,withanoptimalrisk-returnprofile,throughsevenmanagementmandates.Thissectionincludestheresultsofthemainmandates.
Over five years, the performance of the EquityMarketsportfoliohasbenefitedinparticularfrom:
• AsustainedriseinU Scorporatestocks
• Theportfolio’shighexposuretogrowthmarkets
The portfolio’s annualized return fell slightly short of itsbenchmarkindex,whichwas9.8%.Onereasonforthisisthegapwithitsindexfor2020,whichwasduetocertainmanage-mentstylebiases.
2020 return
Investment results: $9.2 BReturn: 8.3%
Foroneyear,theperformanceoftheEquityMarketsportfoliowas:
• DrivenbythestrongstockmarketperformanceinthemajorAsiancountries,whichcanbeseeninthegoodperformanceoftheGrowthMarketsmandate
• HeldbackbyitsexposuretotheCanadianmarket,whichgrewlessthanthoseofothercountries
The4.6%differencewiththeindexwasdue,asmentionedpreviously, to theportfolio’smanagementstylebias.Asaresult, it had less exposure to large technology andhigh-growthstocks.

47CDPQ | 2020 AR
MARKETCONDITIONS
From2016to2020,globalequitymarketsweregenerallybullish(seeFigure16).Allthemajorindexesrecordedpositivereturnsovertheperiod.TheS & P500ledtheway,closelyfollowedbytheM S C IEmergingMarketsIndex, bothofwhicharedrivenby their technologysectors.TheCanadian indexperformedwellacrossall sectors,with theexceptionofenergy,whichhasstruggled.
In2020,despitetheinitialdownturnduetothepandemic,allthemajormarketindexesdeliveredpositivereturns.Afteranunprecedentedandextremelysharpplungeinthefirstquarter,globalstockmarketsralliedquicklyinthesecondquarter,benefitingfromtheextraordinarymeasurestakenbygovernmentsandcentralbankstokeeptheireconomiesafloat.Theyearwasmarkedbythe exceptional surge in the stocks of a handful ofinternet giants, whose performance accounted foralmost70%oftheS & P500Index’sreturn.
GLOBAL QUALITY MANDATE
Five-year return
Investment results: $15.8 BAnnualized return: 8.4%
ThismandateisthelargestintheEquityMarketsportfolio.Itsfive-yearperformancewasdrivenbythegoodperformanceofcompaniesincorporatedintheUnitedStates.
Theindexpostedaslightlyhigherannualizedreturnof9.0%.Thedifferenceismainlyattributabletothemandate’slowerexposureto:
• Thetechnologysector
• Certaingrowthstocks
Notethatsinceitsinception,thismandatehasdemonstratedresilienceduringthemainmarketdownturns.Asaresult,ithasoutperformedthemarketwhileincurringlowerrisk,evenduringtheextremelysharptumbleglobalstockmarketstookinthefirstquarterof2020.
FIGURE 16
EQUITYMARKETSPERFORMANCE2016–2020(December31,2015=100,inlocalcurrencies)
S&P500
MSCIACWI
MSCIEM
MSCIEAFE
S&P/TSX
Source: Rimes
75
100
125
150
175
200
2016 2017 2018 2019 2020

Equities(continued)
CDPQ | 2020 AR48
2020 return
Investment results: $1.8 BReturn: 4.4%
Similarlyforoneyear,stocksofU Scompaniescontributedthe mosttothemandate’sperformance,particularlyinthetechnologyandconsumerdiscretionarysectors.Themandateunderperformeditsindexby7.9%dueto:
• Amoredefensiveapproach
• A less advantageous stock selection in this particularenvironment
Itshouldbenotedthatthemandateperformedasexpectedat the height of the crisis, and during a certain period itgeneratedpositivevalueaddedcomparedtoitsindex.Thisdissipatedduringthemarketrally,whichwascharacterizedbyanemphasisonthehighgrowthpotentialofcompaniesratherthanonstablebalancesheets.
CANADA MANDATE
Five-year return
Investment results: $8.7 BAnnualized return: 7.8%
Thismandatebenefitedfromgoodperformancebystocksinthe financials and technology sectors. The strategy ofcapitalizingonthestrengthoftheU Seconomyalsoprovedsuccessful,withcertainCanadiancompaniesoperating inthe UnitedStates,suchasC NandC G I,contributingsignifi-cantlyto performance.
However,weaknessintheoilsector,whichplaysalargeroleintheCanadianuniverse,temperedthemandate’sreturn.Themandatewas1.5%belowitsindex,mainlyduetoitsperfor-mancein2020.
2020 return
Investment results: -$388 MReturn: -1.7%
Foroneyear,themandatewasstronglyaffectedbydeclinesinenergyandinsurancestocks.Excellentperformancebycompaniestowhichthemandate issignificantlyexposed,suchasC Nin the industrialssectorandDollarama in theconsumerdiscretionarysector,helpedlimitlosses.
The5.6%differencewiththe index ismainlyduetoa lessadvantageous positioning in technology and, to a lesserextent,totheportfolio’s lowerexposuretometals,bothofwhichhaveappreciatedsignificantlyduringthecrisis.
GLOBALQUALITYMANDATE
COMPOSITION• Securitiesinhigh-qualitycompanies,exposedtoglobaleconomicgrowthandtradedonthestockexchangesofthecountriesincludedintheM S C IA C W IIndex(UnitedStates,Canada,Europe,thePacific,Asiaandemergingmarkets)
• Highlyprofitableandstablecompaniesthathavestrongfundamentalsovertimeanddemonstrateaconservativeuseoffinancialleverage
ADVANTAGES• Risk-adjustedreturnexceedingthatofpublicequitiesoveralong-termhorizon
• Geographicdiversification• Protectionagainstinflationoverthelongterm• Investmentsthatarelesssensitivetomarketfluctuationsandprovidehigherliquidityduringperiodsofmarketturmoil
CANADAMANDATE
COMPOSITION• SecuritiesofpubliclylistedCanadiancorporations,withanemphasisontheconstructionofaquality,concentratedportfoliothatreflectsdistinctiveaspectsoftheCanadianuniverse
• Businessesexposedtogrowth,withfundamentalqualitiesandcompetitiveadvantagesthatwillpersistoverthelongterm
• Themandateis36%composedofQuébeccompanies,comparedto16%fortheS & P/T S XIndex
ADVANTAGES• Betterunderstandingofinvestmentsandaroleofinfluenceduetomarketproximity
• Protectionagainstinflationoverthelongterm

49CDPQ | 2020 AR
GROWTH MARKETS MANDATE
Five-year return
Investment results: $11.4 BAnnualized return: 12.6%
ThismandatedeliveredthebestperformanceintheEquityMarketsportfolioforbothfiveyearsandoneyear.Itbenefitedfrom thesustained rise in thestockmarketsof themajorgrowthmarketsovertheperiod,inparticularChina,Taiwan,South Korea and Brazil. Among the various sectors,technologystocksperformedthebest.
Themandatealsobenefitedfromitsexternalmanagementactivities.Withtheirdeepknowledgeofthesemarkets,theselocalspecializedinvestmentfirmsmakestrongcontributionsto the five- and one-year performance. That enabled themandate to outpace its benchmark by 2.6% and create$2.3 billionofvalueaddedovertheperiod.
2020 return
Investment results: $4.8 BReturn: 23.2%
ThemandatebenefitedfrompositionstakeninthestocksofcompaniesinthemajorAsiancountries.In2020,theirstockmarketsrosesharplydueto:
• Thehighweightingoftheirtechnologysector
• Moreeffectivecontrolofthepandemicingeneral
Allmanagementcomponentsofthemandatecontributedtoperformance.Forthisreason,themandateoutperformeditsindexby5.6%, allowing it togenerate$1.1 billion in valueadded.Externalmanagers inChina,Brazil,Europe,SouthAfricaandIndiaallcontributedthroughjudicioussectorandstockselection.
ALTERNATIVE BETA MANDATE
Five-year return
Investment results: $6.7 BAnnualized return: 8.0%
Thestrategyofthismandateistoweightsecuritiesbasedonvariousfundamentalmeasuressuchassales,cashflow,bookvalueanddividends,ratherthanontheirmarketcapitalization.
Overfiveyears,muchofthemandate’sperformancehasbeenduetothestocksofcompaniesincorporatedintheUnitedStates.Hereagain,technologystocksperformedwell,whileother sectors provided more modest returns. However,under-weighting intechnologyandhigh-growthsecuritiesworkedagainst themandate,which fell shortof its indexby 2.3%.
2020 return
Investment results: $697 MReturn: 5.4%
Themandategenerateda5.4%return,comparedtothe14.2%returnofitsbenchmark.Alsoforoneyear,thedifferencewasdueto:
• Lessexposuretotechnology-relatedsecurities
• The highweighting of value stocks, whichweremoreaffectedbythecrisis
Therewerewidedisparities insectoral returnsdueto theparticularnatureofthepandemic.Thetechnology,materialsandconsumerdiscretionarysectorsrosesharply,whiletheenergy,financeandrealestatesectorsfinishedtheyearinnegative territory.Geographically, therewasgrowth inallregionsexcepttheUnitedKingdom.
GROWTHMARKETSMANDATE
COMPOSITION• GrowthmarketsecuritiestradedonthestockexchangesofcountriesmainlyintheM S C IE MIndex(emergingmarkets)
ADVANTAGES• Geographicdiversification
• Significantabsolute-returnmanagementcomponentofthemandateimplementedalongsidewell-establishedlocalpartnersthathavedeepknowledgeofthetargetmarkets
ALTERNATIVEBETAMANDATE
COMPOSITION• SecuritiesindevelopedmarketsincludedintheM S C IWorldIndex,excludingCanada
ADVANTAGES• Reducedexposuretosecuritiesthatthemarketovervalues,regardlessoftheirfundamentalvalues
• Investmentsevenlydistributedamongthesectorstoavoidanoverconcentrationinanyparticularsector

Equities(continued)
CDPQ | 2020 AR50
GLOBAL VALUE MANDATE
Since inception
Investment results: $1.5 B
Launchedin2017,thismandatehasbothinternalandexternalmanagementcomponents.Ittargetsstocksthatappeartobeunderpricedbasedonvariousmeasuresoffundamentalvalue.AsatDecember31,2020,ithad$11.8billioninnetassets.
2020 return
Investment results: $359 MReturn: 0.6%
Themandateunderperformeditsindex,whichposteda14.2%return. Thepreferredmanagement style, basedon valuestocks,put it atadisadvantage inamarket that favouredgrowthstocks.Thisbiasresulted inunderexposuretothetechnologysector,whichposted thebestperformance in2020. However, the mandate was buoyed by the strongperformanceof theconsumerdiscretionarysector,whichplaysakeyroleintheportfolio.
PRIVATE EQUITY
Five-year return
Investment results: $28.7 BAnnualized return: 14.9%
AsatDecember31,2020,theportfoliohad$64.3billioninnetassets due to excellent results. The favourable 5.0%differencewith its index represents $9.0 billion in valueadded.Inparticular,thisperformanceisattributableto:
• Exposure to growth sectors such as technology andservices,whichweretargetedbeforethecrisis
• Post-investmentmanagement,whichplaysakeyroleinthestrategytocreatevaluebyprovidingoperationalsupporttoourportfoliocompanies
Directinvestmentsgeneratedastrongreturnovertheperiod,drivenby thequalityofassetsheld inCanada, theUnitedStatesandEurope.Someof themaincontributors to thisreturnwerePetSmart,Lightspeed,NuveiandW S P.
GLOBALVALUEMANDATE
COMPOSITION• MarketsecuritiesincludedintheM S C IA C W Iindexbasedonthecriteriaspecifictothismanagementstyle
ADVANTAGES• Exposuretosecuritiesthathavebeenoverlookedduetotheirapparentundervaluation,butwhoseintrinsicvalueshowsapotentialfornormalizingoverthelongterm
• BehaviourthatiscomplementarytothatoftheothermandatesintheEquityMarketsportfolio
PRIVATEEQUITYPORTFOLIO
COMPOSITION• Directinterests,primarilyinprivatecompanies,butalsoinlistedcompanies
• Companiesactiveinallsectorsoftheeconomy,includingdefensivesectors
• Growthandqualitycompanieswithstableandpredictablerevenues
• Stakesinhigh-performinginvestmentfunds
ADVANTAGES• Expectedlong-termperformancethatexceedsthatofthestockmarkets
• Focusonqualitypartnershipsandlong-termvaluecreation,particularlythroughorganicgrowth,acquisitionsandoperationalefficiency

51CDPQ | 2020 AR
Overthepastfiveyears,thePrivateEquityteamscompletednumeroustransactions,bothinQuébecandininternationalmarkets,thatcontributedtotheseresults.
Figure17showsthechanges in theportfolio’sgeographicexposureover five years, characterizedbyan increase inassetsinEurope,AsiaPacificandLatinAmerica.
Investment fundsalsocontributedconsiderably toperfor-mance. It shouldbe remembered thatC D P Q’sstrategy isbasedon a rigorous selectionof externalmanagerswithapproachesthatcomplementourowninordertomaximizetheportfolio’srisk-returnprofile.
2020 return
Investment results: $10.8 BReturn: 20.7%
Theportfoliogeneratedareturnwellabovethe9.9%ofitsbenchmarkindex,therebycreating$4.9billioninvalueadded.Muchlikethefive-yearreturn,theone-yearreturnwasduetothestrategicchoiceofsectors,notablytechnology,financeand health care. Direct investmentswere the portfolio’sdrivingforce,benefitingfromfactorssuchas:
• Theriseofe-commerce
• Advantageoussectoralpositioning
• Thestrengthofcertainstocks in the industrialservicessector
We should also mention the excellent performance ofLightspeed,NuveiandPetSmart,whichcontributedsignifi-cantlytothevalueadded.Investmentfundsalsoperformedstrongly over the year, particularly those specialized intechnology.
Duringtheyear,C D P Qmadeinvestmentstotalling$7.2billion,comparedto$6.0billioninmaterializations.Themaininterna-tionaltransactionsincluded:
• AppDirect:$185millionoffundingalongsidepartnerstoacceleratetheglobalexpansionofthisleadingsubscriptioncommerceplatformintheUnitedStates
• Inigo:InvolvementwithpartnersinthelaunchofthisU K insurancegroup,whichenabledittoraiseapproximately$800millionininitialcapital
• IEXGroup:Strategic investment in thisNewYork-basedfinancial technology company, theeighth-largest stockexchangeoperatorgloballyintermsofthevalueofsharestradedeveryday
• Zevia:U S$200milliontosupporttheglobalexpansionofthisU Scompany,whichoffersaportfolioofbeverages
• Alstom:Majoragreementwiththisworldleaderinrailtrans-portationinatransactionworthapproximately$4 billionthatclosedin2021,forastakeof17.5%
InQuébec,theteamswereveryactiveinPrivateEquitywithmanylarge-scaleinvestments,including
• K D C/ONE:ReinvestmentinthisbeautyandpersonalcareproductsprovidertoacquireZobeleGroup,aleadingglobalmanufacturerofhomeandaircareproducts
• CanamGroup:$840millioninpartnershipwithPlacementsC M I(Dutilfamily)andFondsdesolidaritéF T QtoacquiretheCanadianoperationsofthisconstructioncompanyaswellascertainassetsintheUnitedStatesandoverseas
• Eddyfi/N D T:Investmentinthisinnovativeprivatetechno-logygroupoperatinginthefieldoftestingandmeasurement,tosupporttwomajoracquisitionsinEurope
• Dialogue:Participationina$43-millionroundoffinancingled by Sun Life to enable this Canadian telemedicinespecialisttoexpanditsservices
FIGURE 17
GEOGRAPHICEXPOSURE–PRIVATEEQUITY(asapercentage)
December31,2015
December31,2020
Canada United Europe Asia Latin Other States Pacific America regions
26.5
33.8
38.442.6
26.2
17.7
6.44.6
2.20.7 0.30.6

CDPQ | 2020 AR52
Other InvestmentsThis portfolio includes activities that are complementary to those of the other investment activities in order to contribute to the value added of the total portfolio.
$1.6 BNETASSETS
0.5%
OFTHETOTALPORTFOLIO
$26 MRESULTSOFCONSOLIDATED
ACTIVITIESOVER5YEARS
1 portfolio: AssetAllocationAllthefiguresinthissectionaredetailedinTable18(page53)
CONSOLIDATED ASSET ALLOCATION ACTIVITIES
ConsolidatedassetallocationactivitiescontributetoC D P Q’svalueaddedbyimplementingstrategiesthathelpdiversifythetotalportfolio.Theseactivitiesarecarriedoutintwoways:
• ActivestrategieswithintheAssetAllocationspecializedportfolio
• Anallocationofcapitaltothevariousspecializedportfolios,withintheleewaysetbyourdepositors
Results over five years
Results of consolidated activities: $26 M – Asset Allocation portfolio: -$1,005 M – Allocation to other specialized portfolios: $1,031 M
Managing weightings in less-liquid assets contributedpositively toperformance,whilestrategiestoreducetotalportfolioriskreducedvalue.
Results in 2020
Results of consolidated activities: $841 M – Asset Allocation portfolio: -$514 M – Allocation to other specialized portfolios: $1,355 M
CONSOLIDATEDASSETALLOCATIONACTIVITIES
COMPOSITION• AssetAllocationspecializedportfolio:non-capitalizedinvestmentsthattakepositionsinkeyfinancialmarketfactors(equitymarkets,credit,ratesandcurrencies)
• Consolidatedassetallocationactivities:capitalallocationthroughC D P Q’sspecializedportfolios
ADVANTAGES• Enhancementofthetotalportfolio’svalueadded• Exposuretoassetclassestodiversifythetotalportfolio• Contributiontomanagementofthetotalportfolio
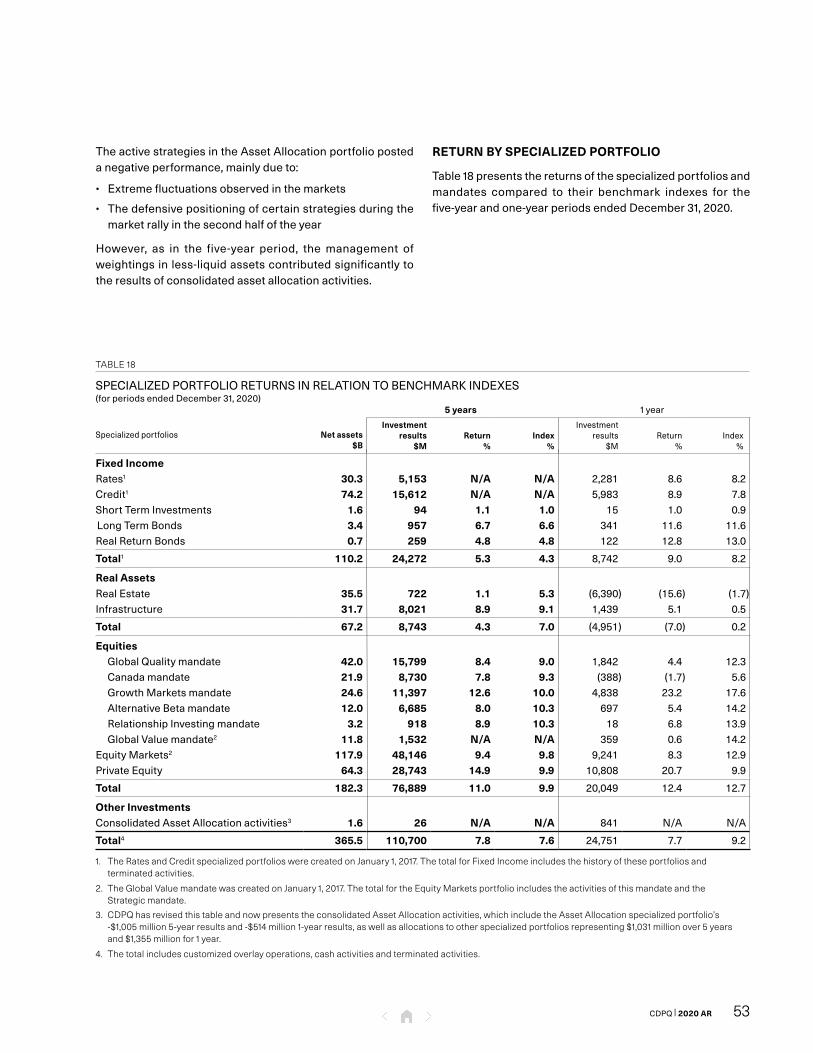
53CDPQ | 2020 AR
TheactivestrategiesintheAssetAllocationportfoliopostedanegativeperformance,mainlydueto:
• Extremefluctuationsobservedinthemarkets
• Thedefensivepositioningofcertainstrategiesduringthemarketrallyinthesecondhalfoftheyear
However, as in the five-year period, themanagement ofweightingsinless-liquidassetscontributedsignificantlytotheresultsofconsolidatedassetallocationactivities.
RETURN BY SPECIALIZED PORTFOLIO
Table18presentsthereturnsofthespecializedportfoliosandmandates compared to their benchmark indexes for thefive-yearandone-yearperiodsendedDecember31,2020.
TABLE 18
SPECIALIZEDPORTFOLIORETURNSINRELATIONTOBENCHMARKINDEXES(forperiodsendedDecember31,2020)
forperiodsendedDecember31,2020
Specializedportfolios Net assets$B
5 years 1year
Investment results
$MReturn
%Index
%
Investmentresults
$MReturn
%Index
%
Fixed IncomeRates1 30.3 5,153 N/A N/A 2,281 8.6 8.2Credit1 74.2 15,612 N/A N/A 5,983 8.9 7.8ShortTermInvestments 1.6 94 1.1 1.0 15 1.0 0.9LongTermBonds 3.4 957 6.7 6.6 341 11.6 11.6RealReturnBonds 0.7 259 4.8 4.8 122 12.8 13.0
Total1 110.2 24,272 5.3 4.3 8,742 9.0 8.2
Real AssetsRealEstate 35.5 722 1.1 5.3 (6,390) (15.6) (1.7)Infrastructure 31.7 8,021 8.9 9.1 1,439 5.1 0.5
Total 67.2 8,743 4.3 7.0 (4,951) (7.0) 0.2
EquitiesGlobalQualitymandate 42.0 15,799 8.4 9.0 1,842 4.4 12.3Canadamandate 21.9 8,730 7.8 9.3 (388) (1.7) 5.6GrowthMarketsmandate 24.6 11,397 12.6 10.0 4,838 23.2 17.6AlternativeBetamandate 12.0 6,685 8.0 10.3 697 5.4 14.2RelationshipInvestingmandate 3.2 918 8.9 10.3 18 6.8 13.9GlobalValuemandate2 11.8 1,532 N/A N/A 359 0.6 14.2
EquityMarkets2 117.9 48,146 9.4 9.8 9,241 8.3 12.9PrivateEquity 64.3 28,743 14.9 9.9 10,808 20.7 9.9
Total 182.3 76,889 11.0 9.9 20,049 12.4 12.7
Other InvestmentsConsolidatedAssetAllocationactivities3 1.6 26 N/A N/A 841 N/A N/A
Total4 365.5 110,700 7.8 7.6 24,751 7.7 9.2
1. The Rates and Credit specialized portfolios were created on January 1, 2017. The total for Fixed Income includes the history of these portfolios and terminated activities.
3. C D P Q has revised this table and now presents the consolidated Asset Allocation activities, which include the Asset Allocation specialized portfolio’s -$1,005 million 5-year results and -$514 million 1-year results, as well as allocations to other specialized portfolios representing $1,031 million over 5 years and $1,355 million for 1 year.
2. The Global Value mandate was created on January 1, 2017. The total for the Equity Markets portfolio includes the activities of this mandate and the Strategic mandate.
4. The total includes customized overlay operations, cash activities and terminated activities.
CDPQ | 2020 AR54
Risk managementC D P Q rigorously managed risk in a complex year marked by the pandemic.
HIGHLIGHTS
1Marketriskincreasedinthepastyearandisslightlyabovethatof thebenchmarkportfolio.
2Thepandemicdemonstratedourteams’highlevelofpreparednessastheymobilizedtomanagethecrisisandmitigateitsimpact.
3Workhasbeencarriedouttobetter managekey issuesandportfoliobiases.
CHANGES IN RISK MEASUREMENT
ForC D P Q,riskisinseparablefromperformance.That’swhyriskmanagementisanintegralpartofeverythingwedo,fromportfoliomanagementtobusinessprocesses.
Eachyear,asignificantnumberofinitiativesaredeployedtoreinforcethis.Thiscommitmenttothehigheststandardsofgovernance,managementandriskmonitoringhasgarneredusrecognitionasaworld-classriskmanager.
Toevaluaterisks,teamsanalyzeelementssuchas:
• Globaleconomicconditions
• Financialmarketschanges
• Concentrations,specificallysectoralandgeographic,ofthetotalportfolio
In2020,manypreviously identified risks continued tobemonitored,andotherswereadded.Thekeyriskstomonitorin2021,underconditionswherecurrentassetclassvaluationsarehigh,include:
Economicrisks
Geopoliticalrisk
• TheCOVID-19pandemic,itsimpactandthepaceofglobaleconomicrecovery
• Adjustmentstocentralbankmonetarypoliciesandcoordi-nationwithfiscalpolicies
• The levelofgovernmentandcorporatedebtaroundtheworld
• Anongoingcompetitiveness issue inCanada,apprecia-tion oftheCanadiandollar,changesintheoilsectorandhouseholddebt
• Thepresenceofgeopoliticaltensionsaroundtheworld
• WorseningtradetensionsbetweentheUnitedStatesand China
• ThechangeofgovernmentinapolarizedUnitedStates
• Tensionsrelatedtosocialinequalitiesaroundtheworldandtheriseofpopulistmovements
• InstabilityinEurope

55CDPQ | 2020 AR
Financialandoperationalrisks
• Protectionist measures, restrictions on foreign directinvestmentandregulatorychanges
• Apossiblecorrection invaluationsshouldmarkets turnrisk-averse
• Impactofdisruptivetechnologiesonthebusinessenvironment
• Consequencesofpossiblecyberattacks
• Impactofclimatechange
Market risk
C D P Q’s objective is to build a high-performance andwell-diversifiedportfolio,whileseekingtoestablishanopti-mumrisk-returnprofile,consistentwithitsriskassessmentandmarketvaluations.
Over the past five years, the total portfolio’smarket riskremainedfairlystableformostoftheperiodbeforeincreasingsignificantlyinthewakeofthepandemic.
As shown in Figure 19, the total portfolio’s absolute riskamountedto14.0%atDecember31,2020,comparedto13.5%atDecember31,2015.
READYTOFACETHECRISIS
TheCOVID-19pandemichasshakentheglobaleconomyandmarkets,testingthetotalportfolio.C D P Qquicklymobilizedallofourteamstomitigateanyimpacts.Wehavedeployedaseriesofmeasurestoprotectdepositors’capital,butalsototakeadvantageofattractiveinvestmentopportunities.Inaddition,weassessedtheimpactofthepandemiconouroverallinvestments.
A crisis unit ensured that business continuity ismaintainedandthatoperationalrisksarereduced(seedetailsoftheactionstakenonpage58).Fromtheoutset,ourorganizationwasfullyoperational.Ourteamsalsoreviewedallassetsintheportfoliotoidentifyareasofopportunityandpotentialrisk.
FIGURE 19
C D P QABSOLUTERISKANDBENCHMARKPORTFOLIORISK1
(asapercentage)
CDPQabsoluterisk
Benchmarkportfoliorisk
Dec.2015
June Dec.2016
June Dec.2017
June Dec.2018
June Dec.2019
June Dec.2020
11
12
13
14
15
16
17
1. The risk figures preceding January 2020 were adjusted to reflect the changes in the risk calculation methodology that occurred in 2020 (see Note 11 to the Consolidated Financial Statements, page 176).

Risk management(continued)
CDPQ | 2020 AR56
Theincreaseinmarketriskismainlydueto:
• TheeffectsoftheMarch2020marketdownturnintheriskcalculation
• AnincreaseintheweightingofPrivateEquitycomparedtothebenchmarkportfolio
• Additionalrisk-takingwithintheEquityMarketsportfolioduringtheyeartotakeadvantageofattractiveopportunities
• AgenerallylessdefensivepositioningintheAssetAllocationportfolio
Asforthebenchmarkportfolio,absoluteriskwas13.6%attheendof2015,closetothelevelofthetotalportfolio.Attheendof2020,however,whilestillat13.6%,thebenchmarkportfoliowaslowerthanthetotalportfolio.
Figure20illustrateshowthisdifferencetranslatesintotheabsoluteriskratioforthetotalportfoliocomparedtothatofthebenchmarkportfolio.Overtheperiod,theratiorosefrom0.99to1.03,reflectinggreaterrisk-takingtogeneratevalueadded.Notethatabsoluteriskremainswellwithinsetlimits.
Table21,onpage57,showsthatfortheone-yearperiod,themarketrisklevelincreasedinallassetclasses.ThegreatestchangewasintheEquitiesclassduetoanincreaseintheweightingofthePrivateEquityportfolio,whichincludesriskierassets.
MARKETRISKMEASUREMENT
Tomeasuremarketrisk,C D P Qcalculatedtheabsoluteriskratioforthetotalportfoliocomparedtotheabsoluteriskforthebenchmarkportfolio.Aratioof1indicatesthatrisk-takingisidentical,whilearatiogreaterthan1 signalsgreaterrisk-takingtogeneratevalueadded.An absoluterisklimit,usingthisratio,governsmarketriskforthetotalportfolio.
FIGURE 20
CHANGEINABSOLUTE1RISKRATIO
Absoluteriskratio
Dec.2020
JuneDec.2019
JuneDec.2018
JuneDec.2017
JuneDec.2016
JuneDec.2015
0.90
0.95
1.00
1.05
1.10
1. The risk figures preceding January 2020 were adjusted to reflect the changes in the risk calculation methodology that occurred in 2020 (see Note 11 to the Consolidated Financial Statements, page 176).

57CDPQ | 2020 AR
Credit risk
Credit risk ended the year at a similar level to the beginning of the year. The level of risk was increased during the crisis to take advantage of business opportunities.
In assessing credit risk, teams consider both:
• The potential capital loss risk: This quantitative measure-ment integrates the probability of an issuer default, correlations and recovery assumptions
• Internal ratings for each investment file: The ratings are assigned by a committee comprising Risk Management and Investment team members based on fundamental analyses
The committee follows the ratings closely, including any differences with credit agency ratings, and may be required to review them periodically. In 2020, it reviewed 230 issuers in the portfolio.
Concentration risk
Concentration risk in the total portfolio has increased as a result of the appreciation of certain less-liquid assets. It should be noted that the contribution to market risk for C D P Q’s 30 largest issuers was 20% in 2020, compared to 15% in 2019.
To mitigate this risk, C D P Q ensures both the geographic and sectoral diversification of its assets. This does not prevent us from taking more concentrated positions in certain promising assets.
Counterparty risk
The counterparty risk posed by the use of over-the-counter derivative financial instruments remained low compared to the previous year. C D P Q uses various means to mitigate this risk, including:
• Negotiation of legal agreements based on International Swaps and Derivatives Association (I S D A) standards
• Daily collateral exchange
• Establishment of exposure limits for each counterparty
• Continuous follow-up of a series of indicators to assess their financial health and detect any change in the quality of their credit
Liquidity risk
C D P Q was able to maintain an adequate level of liquidity throughout the year. At the height of the crisis, commitments were always met and our proactive liquidity management allowed for additional risk-taking to seize market opportunities.
LIQUIDITY RESERVE
This includes two types of liquid assets:
• Primary liquidities: highly liquid assets that can be used immediately without loss of value
• Secondary liquidities: assets that are somewhat less liquid, but can be converted quickly if needed, in addition to being resilient
Each year, C D P Q establishes a minimum liquidity threshold to be maintained in the reserve in order to:
• Meet its potential commitments as well as those of its depositors
• Rebalance the total portfolio
• Maintain the desired flexibility during a crisis, speci-fically to seize investment opportunities
For more information, see note 11 to the Consolidated Financial Statements on page 176.
TABLE 21
MARKET RISK – ABSOLUTE1
(as at December 31 – as a percentage)
Asset class 2020 2019
Fixed Income 6.2 5.8Real Assets 17.5 17.0Equities 23.5 21.5Other Investments 0.8 0.5
Overall 14.0 13.0
1. The risk figures preceding January 2020 were adjusted to reflect the changes in the risk calculation methodology that occurred in 2020 (see Note 11 to the Consolidated Financial Statements, page 176).

Risk management(continued)
CDPQ | 2020 AR58
REVIEW OF OVERSIGHT AND PROCESSES
AtC D P Q,riskmanagementisbasedonguidelines(seenote 11totheConsolidatedFinancialStatements,page176).Italsoreliesonthestrengthofouroversightandprocesses,whicharecontinuouslystrengthened.Infact,theteamshavecompletedseveralinitiativestothatendin2020.
Influence of the Risk Management function on investment
TheRiskManagementgroupcontinuedtoplayaleadingroleinC D P Q’sinvestmentactivities.Inadditiontoensuringsoundgovernanceofriskprocesses,itsinfluencecanbeseenin:
• Anactivepresenceonmanycommittees, including theInvestment-Risk,StrategyandExecution,OperationalRisk,Investment,ResearchandCurrencyCommittees
• Anongoingroleinanalyzingandpreparingthestrategicplanto fullyunderstandthechallengesof theproposedstrategiesanddeterminenewinitiatives’potentialimpactonportfoliorisk
• Oversightensuringsounddiversificationandcompliancewiththestrategicplanforeachportfolio
• The integrationofbusinessunit riskmanagersoneachinvestmentteam
• Anindependentassessmentofportfolioissuespresentedineachportfolio’sreporting
Identification of portfolio issues and biases
In2020,C D P Qreviewedallofitsportfolioassetstoanalyzetheirsolidityandidentifyanyissues.ThisexercisehighlightedsomestylebiasesintheEquityMarketsportfolio.
Inanefforttooptimizetheportfolio,theinvestmentteams,incollaborationwithRiskManagement,proposedsolutionssothattheEquityMarketsportfoliocouldbetterbenefitfromtheperformanceofcertaingrowthstockstowhichitwaslessexposed.Thiswork,whichbegan in2020,will allow it tobroadenitsinvestmentuniverseandprovidemoreexposuretocomplementarystyles.
Relative risk management
Inrecentyears,therehasbeenanemphasisonabsoluteriskmanagement.Theuniquemarketenvironmentduring2020promptedtheteamstoexploreotheraspectstobetterantici-pateadverseperformancevariances from thebenchmarkportfolio.Whilerisksarestillmanagedprimarilyinabsoluteterms, since 2020, particular attention has been paid tomonitoringrelativerisks,whichhasledtothedevelopmentofnewindicators.
Mitigation of operational risks during the crisis
Operationalrisksmayresultfromtransactionalactivities,aswellasfromorganizationaltransformationsrelatedtostrategicobjectives.TheOperationalRiskCommitteeisresponsibleforidentifyingandprioritizingtheserisksanddeterminingtheoptionsandmeanstomitigatethem.A priorityoperationalriskmapisalsoregularlyupdatedtomeasuretheirimpactandprobability.
InthecontextofCOVID-19,acrisisunitwassetup,bringingtogetherteamsfromvarioussectors.Itsgoal:tomanagethecrisis and the transition to working remotely to ensurebusinesscontinuity.Itmaderecommendationsconcerningthe closure of C D P Q offices—and re-openings, whenallowed—bothinQuébecandinternationally.
Keyactionstakentomitigateoperationalriskinclude:
• DevelopingpandemicevolutionscenariosinordertoadaptC D P Q’s response according to various assumptions(severity,duration,vaccination,etc.)
• Reassessing key business processes and controls toensuretheyareeffectiveevenwhenworkingremotely
• CloselymonitoringC D P Q’scriticalsupplierstoverifytheirfinancialandoperationalsoundness,aswellastheirabilitytocopewiththecrisis
• Monitoring2020businessplanstoreviewprioritiesandprevent any overload of non-essential work for teamsalreadyaffectedbythesituation
• Adapting office layouts to meet government healthguidelinestoaccommodateemployeeswhoneedtoreturntotheoffice
• Conductingregularemployeesurveystotakethepulseoftheorganizationandaccountforchangingneeds

59CDPQ | 2020 AR
Technology risk
In2020,C D P Qdeployedanintegratedtechnologystrategy,includingacomponenttoevaluatetheimpactofinnovationsanddisruptivetechnologiesonitsportfoliocompanies.Thetechnologyriskfunctionwasthereforeimplementedtobettertakethisfactorintoaccountinriskmanagement.Acommitteegroupingseveralteamsmonitorsthisrisk.
CYBERSECURITY
C D P Q pays close attention to cybersecurity. It employssignificant security measures by applying recognizedframeworks,theaspectsofwhicharecontinuouslytested,both internallyandby independent thirdparties.Ongoingeffortsaremadetomonitorchangesintechnologyandbeabletocounteremergingthreats.Inaddition,severallinesofdefence,bothinternalandexternal,areestablishedtoensurethatthemeasuresinplaceareeffective.
Overthepastfewyears,throughitscontinuouscybersecurityimprovementprogram,C D P Qhasintegratedstate-of-the-arttechnologiesintoitsenvironmenttorapidlydetectabnormalbehaviours and irregularities, and thus counter variousthreats. This program includes a component that raisesawarenessamongC D P Qemployeesaboutsafebehaviourstoadopt. Cybersecurity risks are regularly reviewed by theOperationalRiskCommittee,aswellaspoliciesandguidelinesrelatedtocybersecurity.
ThemanagementofcybersecurityrisksalsoappliestotheserviceprovidersthathostC D P Q’sdata.Allsuchsuppliersare subject to a verification process to ensure that theirsystemsmeetoursecuritystandards. Inaddition,severalsecurityconditionsmustbemetbeforeasuppliercanbeauthorizedtohostourdata.
IMPROVED RISK MANAGEMENT METHODOLOGIES AND TOOLS
Duringtheyear,C D P Qcontinuedtorefineitsmethodologiesandquantitativeanalysistools,to:
• Proposeriskassessmentmethodologiesadaptedtotheportfoliosandtothemarketenvironment
• Better support investment teams with effective riskmanagementtools
Risk measurement and stress testing
Inadditiontothevalueatrisk(VaR),C D P Qmeasuresmarketriskusingstresstests.Historicalandhypotheticalscenariosare analyzed to assess our portfolios’ behaviour duringfavourableandunfavourablemarketevents.
In 2020, several stress tests focused specifically on thecrisis anditsimpactontheportfolio.Theteamsalsoconductedanin-depthreviewofthelatter,securitybysecurity,sectorby sector.
E S G risk assessment
In2020,C D P Qperformedmorethan200E S Ganalysesinordertopreventassociatedrisks,forbothnewtransactionsandexistingassets.
Inlinewiththestrategytoaddressclimatechange,theteamsmeasured the carbon intensity of nearly 300 files andanalyzedtheirimpactonthetotalportfolio’scarbonfootprint.Aclimateriskmeasurementtoolhasalsobeendevelopedtomakethedataaccessibletotheentireorganization.
Formoreinformation,seeourStewardshipInvestingReportatw w w.c d p q.com.
KEYWORKCOMPLETEDIN2020
• Implementationofnewrisktoolsregardingbiasesandtheirpotentialimpactonportfolios
• Improvementofthetoolsusedtoanalyzeportfolioriskmanagement
• EnhancedriskmeasurestoimprovemonitoringoftheCreditportfolio
• Post-investmentanalysestoidentifyrisksandissuesthatmayariseafterthetransactioniscompleted
• Workoncontextualizingthemeasurementofmarketrisktotakefurtherintoaccountthevaluationlevelindeterminingrisk

CDPQ | 2020 AR60
Compliance
HIGHLIGHTS
1Programswereapplied duringthe year toensurecompliancewithdepositors’investmentpoliciesandC D P Q’sinvestmentpolicies.
2TheCoordinationCommittee,consistingoftheethicsandcomplianceofficersofC D P Qanditssubsidiaries,hasdevelopedharmonizedethics andcompliancepracticesalignedwiththehigheststandards.
3TheEthicsandComplianceteamprovidedinteractiveethicsandcompliancetrainingtoteamsinourinternationalofficesaspartofavirtualtour.
C D P Q’scomplianceactivitiesincludeacomponentonmonitoringtheportfolios’investmentpoliciestoensurecomplianceandanotheronapplyingtheCodeofEthicsandProfessionalConduct.
INVESTMENT POLICIES
C D P Qimplementscomplianceprogramstocertifyadherenceto the investment policies of both our portfolios and ourclients.In2020,certificatesofcompliancewiththesepolicieswere issued to depositors on June 30 andDecember 31.Programs to ensure the compliance of activities in thespecializedportfoliosandmanagementmandateswerealsomaintained.Inaddition,compliancesystemswereimprovedinlinewithC D P Q’sstrategicfocusonstewardshipinvesting.
CODE OF ETHICS AND PROFESSIONAL CONDUCT
CompliancewiththeCodeofEthicsandProfessionalConductforOfficersandEmployeesisessential.Atthebeginningofeachyear, all employeesmustcompleteadeclarationoncompliance with the Code and provide the documentsrequired to confirm information on the holdings in theirpersonalportfolios.Employeesarerequiredtodeclareanyactualorpotentialconflictsofinterest,andreportsituationswherethereisareasonablelikelihoodofabreachofC D P Q’sCode or policies. In 2020, a new online platform wasdevelopedandimplementedforcompletingthesedeclara-tions. When employees wish to carry out personaltransactions,theymustfirstusethepre-authorizationsystemprovidedforthispurpose,whichisaccessibletoeveryoneatalltimes.

61CDPQ | 2020 AR
During the year, C D P Q carried out several activities to heighten employee awareness of various aspects of the Code of Ethics and Professional Conduct. This included:
• Two mandatory training sessions for new employees, one of which was a new session specifically on preventing and detecting corruption
• A one-to-one meeting with every incoming manager to discuss various aspects of the Code
• Publication on the intranet of interactive video clips throughout the year to address specific topics or ethical questions and remind employees of how to handle situations involving ethics and professional conduct
In the fall of 2020, C D P Q conducted a virtual tour of our inter-national offices to provide employees in those offices with interactive ethics and compliance training. The purpose of this training was to introduce the Ethics and Compliance team, to convey ethics rules and best practices, and to clearly express the organization’s expectations regarding the behaviour to be adopted. The topics covered included: conflicts of interest, gifts and entertainment, personal transactions, the confiden-tiality of information, respect in the workplace, as well as the reporting and handling of complaints and penalties.
The Code of Ethics and Professional Conduct for Officers and Employees is available at w w w.c d p q.com, in the Governance section.
HARMONIZATION OF ETHICAL PRACTICES AT C D P Q AND ITS SUBSIDIARIES
The Coordination Committee, which was created in 2019 and consists of the ethics and compliance officers of C D P Q, Otéra Capital, Ivanhoé Cambridge and C D P Q Infra, has developed a harmonized ethics and compliance vision and practices that are aligned with the highest standards.
At the beginning of each year, the Committee adopts a plan that reflects the priorities shared by C D P Q and its subsi-diaries. At their quarterly meetings, Committee members discuss various ethics and compliance issues and report on the progress made toward these priorities and the resulting initiatives they will undertake together. Committee members
also share various best practices on tools and processes and discuss new developments in ethics and compliance. In addition to these quarterly meetings, working groups have been formed to undertake ongoing, collaborative projects.
ACCESS TO INFORMATION
C D P Q processes requests for access to information in accordance with the Act respecting access to documents held by public bodies and the protection of personal information (the Access Act). In 2020, C D P Q processed 64 requests for access to documents, including:
• 50 for C D P Q
• 5 for C D P Q and C D P Q Infra
• 9 for C D P Q Infra
All of the requests were handled within the legally prescribed time limit. Of these 64 requests:
• 19 were accepted
• 15 were accepted in part
• 5 were referred to another entity
• 23 were refused
• 2 were withdrawn
The requests received concerned issues such as expenses incurred by the members of the Board of Directors, the number of employees and the payroll for communications, minutes of meetings, the Réseau express métropolitain (REM) and several other subjects of an administrative or budgetary nature. Three requests were subject to an application for review by the Commission d’accès à l’information (CAI). Responses to requests for access are available on C D P Q’s website.
Lastly, in accordance with the Regulation respecting the distribution of information and the protection of personal information, C D P Q posts on its website the specific information covered by this regulation: leases, training contracts, advertising and promotion contracts, mobile telecommunications contracts, training expenses, total travel expenses, and the C E O’s travel expenses, official expenses and executive vehicle expenses.

Compliance(continued)
CDPQ | 2020 AR62
LANGUAGE POLICY
C D P QcomplieswiththerequirementsoftheCharteroftheFrenchLanguageanditslanguagepolicy,whichstipulatesFrenchastheeverydaylanguageofworkforallemployeesinitsofficesinQuébec.C D P QconsidersthequalityanduseofFrench in itsspokenandwrittencommunicationstobeofparamount importance. To that end, C D P Q provides itsemployees with various tools that foster correct Frenchusage,aswellasanumberofreferenceworks,includingalexiconthatitcompiledtodefinetermsspecifictoitsinvestingactivities.
In2020,severalarticlesontheproperuseofexpressionsandidiomswerepublishedregularlyontheintranet.EmployeesarealsoencouragedtousethetoolsandreferencesprovidedonthewebsiteoftheOffice québécois de la langue française (O Q L F),aswellasotherlanguagetoolsavailabletothem.
Inaddition,thelanguagecommitteemetthreetimesduringtheyear.
COMPLAINT MANAGEMENT
C D P QhasdesignatedMeBrunoDuguay,Vice-President,HeadofEthicsandCompliance,toreceivecomplaintsandanalyze themwith all due attention. Complaintsmay beaddressedtohimbyphone(514673-1630),fax(514281-9334)oremail(gestiondesplaintes@c d p q.com).

C D P Q in Québec

CDPQ | 2020 AR64
CDPQ IN QUÉBEC
Building a dynamic, competitive and sustainable Québec economy
$68.3 BTOTALASSETS INQUÉBEC
$3.1 BNEWINVESTMENTS
ANDCOMMITMENTSIN2020
$50 BTOTALASSETS
INTHEQUÉBECPRIVATESECTOR
$30 BINCREASEINTHEPRIVATE
SECTOROVERTHELAST10YEARS

65CDPQ | 2020 AR
C D P Q’s commitment to Québec businesses and economic stakeholders is based on four pillars:
GrowthPropelling Québec companies
15%
Averageannualrevenuegrowthfor portfolio companiesoverthelastfiveyears
GlobalizationNavigating international markets
285Internationalacquisitionsbyportfoliocompaniesoverthelastfiveyears
Technological leapAccelerating the digital shift
$11.6 BAssetsinQuébecrelatedtothetechnologyandneweconomysectors
Sustainable economy and communitiesFocusing on projects of the future
$10 BTotalinvestmentsinlow-carbonassetsinQuébec

CDPQ | 2020 AR66
CDPQ IN QUÉBEC
Stimulating Québec’s economy
Asaglobalinvestmentgroupmanagingfundsforpublicpensionandinsuranceplans,C D P QaimstogenerateoptimalreturnswhilecontributingtothedevelopmentoftheQuébececonomy,whereweareakeyplayer.By deployingconstructivecapital,wegeneratebenefitsforallQuebecers.
Oursupportforprivatesectorcompaniesseekingtogrowandnavigateinternationalmarketsfosterseconomicactivity.WefinanceandsupportinnovativeprojectsthatacceleratethetechnologicalleapessentialtoQuébec’seconomiccompeti-tiveness.Inaddition,thestructuringprojectsweundertakehelpcreateaneconomyandcommunitiesthataresustainable.
C D P Q’sstrengthliesinourstrategicadvantages:ourteams’know-how,ourmulti-sectorexpertiseacrossassetclasses,andourvastbusinessnetwork inQuébecandaround theworld.Ourimpactextendswellbeyondthesumsweinvest.
Forseveralyears,C D P Qhasconcentratedthemajorityofourinvestmentsintheprivatesector,whereourassetsreached$50billionin2020,up$30billionovertenyears.
OurpublicandprivateinvestmentsinQuébecarestructuredaroundfiveinvestmentactivities:
• PrivateEquity
• Infrastructure
• EquityMarkets
• RealEstateandRealEstateDebt
• FinancingandFixedIncome
Notethatasummaryofeachinvestmentactivityispresentedonpage84.

67CDPQ | 2020 AR
COVID-19: Actions to weather the crisis$4 BILLION TO RECOVER AND BUILD FOR THE LONG TERMC D P Qmobilizedatthebeginningofthepandemic,creatinga$4-billionenvelopetosupportQuébeccompaniestemporarilyaffectedbythecrisis.Thissupport,whichcomplementsthemeasuresannouncedbyotherfinancialandgovernmentalinstitutions,wasaccompaniedbypersonalizedsupportthatdrewonthefinancial,strategicandoperationalexpertiseofourteams.
Withhalfof thefundsallocatedor intheprocessofbeingallocated,thisinitiativehashelpedbusinessesweatherthisturbulentperiodwhilepropellingtheirrecoveryandlonger-termgrowthplans.
• Companyselectioncriteria:
– Wereprofitablebeforetheonsetofthepandemic
– Demonstratepromisinggrowthprospects
– Seekfundingof$5millionormore
• Somecompaniessupportedthroughthisenvelope:
– Hopper,aleaderinonlinetravel,tofuelthegrowthofitstravelappandexpanditsworkinartificialintelligence
– C A E,aworldleaderintheaerospaceindustry,tofundfutureexpansionandacquisitionopportunities
IVANHOÉ CAMBRIDGE AND OTÉRA CAPITAL SUPPORT MEASURES
IvanhoéCambridge,C D P Q’srealestatesubsidiary,workedwiththevariouslevelsofgovernmentandtookintoaccounttheneedsof its tenants toofferexceptional recoveryandsupportsolutions,suchasrentdeferrals.
ItalsopartneredwithLightspeed,a leader incloud-basedsalesservicesforbusinesses.Thegoal:tooffertenantsandrestaurateursinitsCanadianshoppingcentresoneyearoffreeaccesstointegratedsalessoftware,aswellasreal-timeinventory management and delivery service optimi-zationmodules.
Topromotethewell-beingofmerchantsandcustomersandtoprovidethemwithasafeenvironment,IvanhoéCambridgealsoimplementedavirtualqueuemanagementsysteminitsproperties,whichitoffersfreeofchargetoitstenants.
OtéraCapital,C D P Q’srealestatedebtsubsidiary,grantedreliefmeasurestoallowseveralQuébeccompanies,particularlyinthehotelandcommercialsectors,todeferloanpayments.

CDPQ | 2020 AR68
CDPQ IN QUÉBEC
Growth Propelling Québec companies
C D P QpartnerswithQuébeccompaniesandactivelyhelpsthemachievetheirgrowthambitionsbysharingourleading-edgeexpertiseandthestrengthofournetwork.Wedevelopandsupportimpactfulinitiativesforeconomicleaders,aswellaspromoteentrepreneurshipandsupportthenextgeneration.
Investments in 2020
1. W S PPrivateplacementof$64millionwithC P PInvestments,with$44millionfromC D P Q,tosupportthisworld-renownedengineeringandconstructionservicesfirminfinancingacquisitions.
2. Canam GroupParticipationintherepatriationofthisleadingconstructioncompany’sCanadianoperationsandtheacquisitionofassetsintheUnitedStatesandoverseas.Thistransactionofmorethan$840millionenabledthecompanytobecomeentirelyQuébec-ownedagainandtocontinueitsexpansion.
3. MedicomLoanusedbythisleadingmedicalsuppliesmanufactureranddistributortoexplorenew avenuesofexpansionand increaseaccessibilityto itsproducts.
1 2

69CDPQ | 2020 AR
“Thanks to C D P Q’s support, Canam continues to grow with the same standards of quality and reliability that our reputation is built on. C D P Q has partnered with us for more than a quarter of a century, and we are pleased to continue to grow alongside them.”
Marcel DUtilChairmanoftheBoardofCanamGroup
Diversityissues,bothgenderandethno-cultural,arepartofC D P Q’sstrategicpriorities.Itstartswithequity,butitgoesevendeeper,becausediversityis animportantperformancedriverforcompanies.
ThelaunchoftheEquity253fundinOctober2020isoneofthetangibleresultsofthiscommitment.Itsobjective:toencouragegrowing S M Es and successful technology companies inQuébecandCanadatoincreasediversityandinclusionintheirteamsusingameasurableobjective.Theselectedcompaniescommit to achieving,within five years of confirmation offunding,atleast25%diversity(women,visibleminoritiesorIndigenouspeoples)withintheir:
• BoardofDirectors
• Managementteam
• Shareholding
TheEquity253fundoffers$5to$30millionininvestmentsaswell as operational guidance to implement and executea customizeddiversityandinclusionplan.Overfouryears,$250millionwillbedeployed,makingEquity253thelargestfundcreatednationallythatdirectlytargetsdiversityasaleverfordevelopmentandexpansion.
3
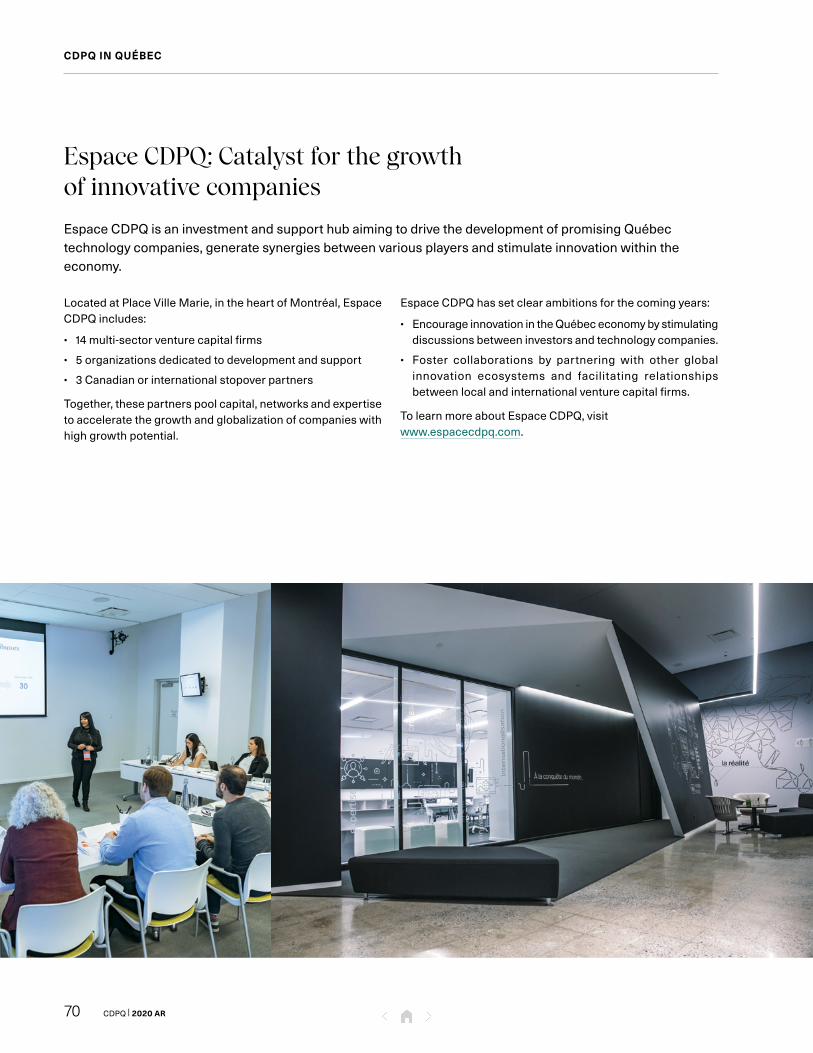
CDPQ | 2020 AR70
CDPQ IN QUÉBEC
Espace C D P Q: Catalyst for the growth of innovative companies
EspaceC D P QisaninvestmentandsupporthubaimingtodrivethedevelopmentofpromisingQuébectechnologycompanies,generatesynergiesbetweenvariousplayersandstimulateinnovationwithintheeconomy.
LocatedatPlaceVilleMarie,intheheartofMontréal,EspaceC D P Qincludes:
• 14multi-sectorventurecapitalfirms
• 5organizationsdedicatedtodevelopmentandsupport
• 3Canadianorinternationalstopoverpartners
Together,thesepartnerspoolcapital,networksandexpertisetoacceleratethegrowthandglobalizationofcompanieswithhighgrowthpotential.
EspaceC D P Qhassetclearambitionsforthecomingyears:
• EncourageinnovationintheQuébececonomybystimulatingdiscussionsbetweeninvestorsandtechnologycompanies.
• Foster collaborations by partnering with other globalinnovation ecosystems and facilitating relationshipsbetweenlocalandinternationalventurecapitalfirms.
TolearnmoreaboutEspaceC D P Q,visitw w w.espace c d p q.com.

71CDPQ | 2020 AR
SUPPORT, NETWORKING AND EXPERTISE: THE KEYS TO FIVE YEARS OF SUCCESS
Sinceitsinception,EspaceC D P Qhasplayedanimportantrole in helping local technology companies access thefinancingsolutionsandresourcestheyneedtogrow.
Over five years, the 14 investor partners—representingmore than800companiesand$6.6billionincapitalundermanagement—havecompletedmorethan480investmentsandreinvestmentsinQuébecand81co-investmenttransactions.
From2016to2020,nearly17,000businessevents,meetingsandactivitieswerealsoorganizedandfacilitated,benefitingover76,000visitors.
2020 HIGHLIGHTS
EspaceC D P QquicklyadaptedtothenewrealityimposedbyCOVID-19byofferingitsactivitiestoentrepreneursvirtually.Twoflagshipinitiativeswerepursued:
Axe IA
AproductofthestrategicpartnershipwithMila,theQuébecArtificial IntelligenceInstitute,this initiativeisdesignedtoacceleratethecommercializationofnewartificialintelligenceproducts.In2020,theprogramsupported18start-ups,offered13eventsandtrainingsessions,andcreated33financialorexpertisenetworkingmatches.
Regional hubs
EntrepreneursfromtwotechnologyacceleratorsassociatedwithEspaceC D P Q,basedinQuébecCityandSherbrooke,participatedvirtuallyinthethirdeditionofBootcamp.Thispersonalized three-dayeventallowed the 14participatingcompanies toobtain financingadviceand talk toexperts,entrepreneursandinvestors,creatingabout20matches.

CDPQ | 2020 AR72
CDPQ IN QUÉBEC
Stimulating entrepreneurship and encouraging the next generation
BecauseQuébec’seconomydependsonthevitalityofitsbusinesses,C D P Qdevotessubstantialeffortto promotingentrepreneurshipandsupportingthenextgenerationofentrepreneurs.Withdiversityasoneofourpriorities,wealsopayparticularattentiontoseeingagreaternumberofwomenjointheranksofmanagementinsuccessfulcompanies.
WOMEN AND ENTREPRENEURSHIP
In2020,C D P Qrenewed its support for several initiativestargetingwomen-ownedbusinesses:
1.Québec women’s business awards
Atthebeginningoftheyear,theorganizationparticipatedintheunveilingofthefirst-everlistofwinners,inpartnershipwithPremières en affairesmagazine.Thiscompilationof75 inspiringexamples,ofwhichnearlytenhavesalesofover$50 million,isintendedtoencouragewomeninbusinesstosharetheirsuccessestoencouragethenextgenerationofwomenentrepreneurs.
2.R F A Q+ platform
Thisdatabaseofwomen-ownedbusinesses,theresultofacollaborationwith theRéseau des Femmes d’affaires duQuébec (R F A Q), aims to increase the visibility ofwomenentrepreneursandallowthemtomoreeasilyreachthesupplychainsoflargecorporations.
3.Femmessor
Activein17regionsofQuébec,Femmessorisanorganizationthatsupportsthecreation,growthandacquisitionofbusinessesrunandownedbywomen.Anewcomponentwasaddedtothispartnershipin2020:FemmessorÉmergencecells,whichweredesignedtomeetthespecificneedsofstart-ups.
PALMARÈS D’ENTREPRISES AU FÉMININ
au cœur de l’économie du Québec
50 H IVER 2020 premieresenaffaires.com
© B
ill O
xfor
d
1re
édition
1 2 3
4 5
73CDPQ | 2020 AR
4.Cheffes de file
Throughouttheyear,theCheffesdefileinitiativecontinueditsmomentumandnowsupportsthegrowthof76womenentre-preneursin11regionsofQuébec,withsalesbetween$5 and$20million. Inauguratedin2018,thisprogramisbasedonthreepillars:
• Creationofacommunityofpractice
• AccesstoC D P Q’snetworkofpartnershereandabroad
• Ateamofexpertstosupporttheparticipants
In2020,eventprogrammingbeganadigitalshift,andabout15 virtual eventswereheld, includingdiscussiongroups,hands-onworkshops,andexpertlectures.Topicsincludedplanning for post-pandemic growth for their company,improving their customer experience, and building theiremployerbrand,amongothers.
5.Devenir entrepreneur
TheDevenirentrepreneurplatformcontinueditsactivities,faithful to itsmissionof raisingawarenessandprovidinginformation on entrepreneurship as a profession. In thisuniqueyear,ithashelpedentrepreneurstobetterweatherthecrisisbyhighlightingontheirplatformthemultipleinitiativestheyhavetakentomeetthechallengesofthesituation.
Inaddition,itcontributedtotheirvisibilitythroughnumerousportraits,articlesandpodcasts,withaspecialfocusonentre-preneursanddiversity.
ENTREPRENEURSHIP INITIATIVES WITH UNIVERSITIES
TheAcadémiedelarelèveentrepreneuriale,inpartnershipwithUniversitéLaval,beganphasetwoofitscoachingpro-gram in2020. Itsmission: to increase theentrepreneurialskillsofstudentsandrecentgraduatesinvolvedinstartinghigh-potentialbusinesses.
Inaddition,theStratégiesd’expansioninitiative,incollabo-rationwithUniversitédeSherbrooke,continuedtosupportthe growth and internationalization of companies inleading-edgetechnologysectorsbymakingC D P Q’snetworkandexpertiseavailabletothem.Overtime,20companieswillbenefitfromthissupport.
AsafoundingpartnerofHECMontréal’sCreativeDestructionLab,C D P QalsocontinuedtofocusonartificialintelligenceanddatasciencetoleverageMontréal’sexpertiseintheseareas.Theprogramincludesintensivesessionswithmentors,theopportunitytoraisecapitalandaccesstoanetworkofworld-classexperts.
Lastly, the Carrefour d’entrepreneuriat et d’innovationprogramatUniversitéduQuébecàTrois-Rivièrescontinuedtoserveasatalentincubator.

CDPQ | 2020 AR74
CDPQ IN QUÉBEC
GlobalizationNavigating international markets
Inadditiontoourroleasaninvestor,C D P Qiscommittedtobeingalong-termpartnertoQuébeccompaniesbysupportingtheirprojectstoexpandintonewmarkets.Ourintegratedapproachisbasedonpersonalizedsupportateverystageoftheirdevelopment,thankstothestrengthofournetworkinQuébecandaroundthe world.
Investments in 2020
1. K D C/ONESupportforthisproviderofmanufacturingandpackag-ing solutionsforbeauty,personalcareandhouseholdproductsfortheacquisitionofZobeleGroup,aleadingglobalmanufacturerofhomeandaircareproducts.
2. Eddyfi/N D TInvestmentinthisleaderinnon-destructiveinspectiontechnologiesintheQuébecCityareatosupporttwomajoracquisitions:N D TGlobal,anIrish-basedcompany,andHalfwave,aNorwegiancompanyactiveworldwide.
3. C A EInvestmentof$150millionto supportthisaviationindustryleader’sexpansionplans,includingtheacquisitionofFlightSimulationCompanytoexpanditstrainingservicesinEurope.
1 2
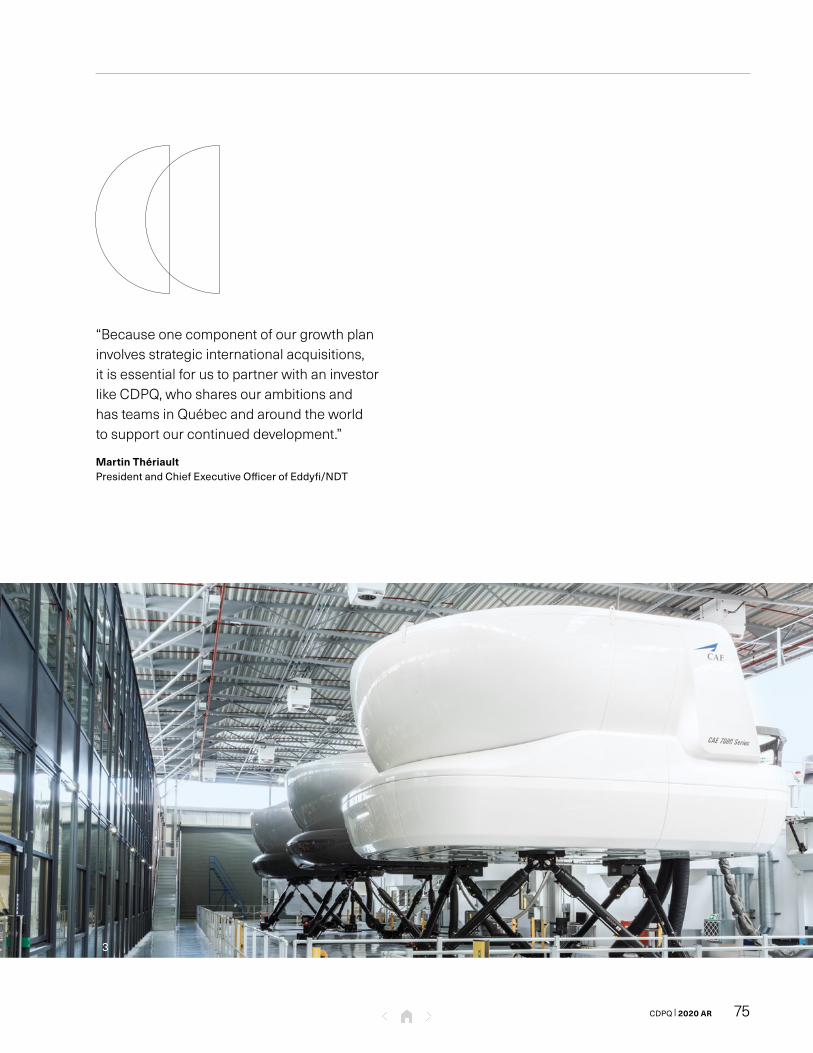
75CDPQ | 2020 AR
“Because one component of our growth plan involves strategic international acquisitions, it is essential for us to partner with an investor like C D P Q, who shares our ambitions and has teams in Québec and around the world to support our continued development.”
Martin ThériaultPresidentandChiefExecutiveOfficerofEddyfi/N D T
3

CDPQ | 2020 AR76
CDPQ IN QUÉBEC
Technological leapAccelerating the digital transition
Awareoftechnology’scrucialcontributiontoeconomicgrowthandthecompetitivenessofQuébeccompaniesbothtodayandtomorrow,C D P Qisactivelyinvolvedinthisarea.Weencouragecompaniestoacceleratetheirdigitalshiftandinvestinthosethatleveragetechnologytodeployinnovativebusinessmodels.
Investments in 2020—Digital shift
1. L C I educationLoantothislargeQuébecnetworkofpost-secondaryinstitutionstostrengthenitsdigitalpresence,accelerateitsinternationalexpansionand supportthesuccessofthefamilybusinesssuccessionprocess.
2. MonarchCommitmentof$5milliontohelprestartgoldproductionattheBeauformineinVal-d’Orandtoenablethecompanytointegrateartificialintelligenceandadvancedanalyticsintoitsoperations.
3. Intact Financial Corporation
InvestmentinthisinsuranceprovidertoassistintheacquisitionoftheCanadian,U K andinternationaloperationsofR S AInsuranceGroup.Thisagreementwillgeneratesignificantbenefitsforthe
Québececonomy,includinga$1.5-billioninvestmentbythecompanyintechnology,growthofitsteamsinthissectorandexpansionofitsassetmanagementactivities.
1 2 3

77CDPQ | 2020 AR
“We are privileged to have an institutional partner of C D P Q’s quality. Their funding and support allow us to further develop our technology and continue to grow in order to offer integrated virtual health care services to a rising number of employers in Canada and around the world.”
Cherif HabibC E O and Co-Founder of Dialogue
Support and investments in 2020—Technology companies
1. Nuvei Support for this global payment software provider in its IPO on the Toronto Stock Exchange, the largest ever for a technology company on the T S X at the time.
2. Logibec Lead lender in the acquisition by Novacap and Investissement Québec of this specialist in health care application software and solutions. This transaction allows the company to become a Québec company again, to consolidate its leadership position in Canada and to support its growth.
3. Lightspeed Support for this leader recognized for its integrated cloud management solution—and first Québec unicorn to go public in Toronto in 2019—in being listed on the New York Stock Exchange.
4. DialogueParticipation in a $43-million financing round to enable this Canadian telemedicine leader to expand its range of services and pursue its international growth.
41 2
3

CDPQ | 2020 AR78
CDPQ IN QUÉBEC
Sustainable economy and communitiesFocusing on projects of the future
C D P QinvestsinprojectsthatsupportthesustainabilityoftheQuébececonomyandpromoteits long-termprosperity.Thankstoourfinancialcapacityandexpertise,wecanexecutestructuringprojects—ininfrastructure,realestateandrenewableenergy—thatimproveQuebecers’dailylivesandcommunities.
Investments in 2020
1.AddÉnergieNewroundofinvestmentinthisQuébec-basedoperatorofelectricvehiclechargingstationstocontinueitsdevelopmentplanandNorthAmericanexpansion.
2.Sollio Cooperative Group
$150millioninprivatecredit,inpartnershipwithRabobankandFondsdesolidaritéF T Q,toenablethisQuébec-basedagriculturalcooperative—thelargestinCanada—tomodernizeitsproductionactivitiesandincreaseitsimpactinQuébec.
3.M K BSupportforthisMontréal-basedprivateequityfirminthelaunchofa$150-millionfundfocusedonacceleratingtheenergytransitionforcompaniesworkingincleanenergyandsustainabletransportation.
1

79CDPQ | 2020 AR
“AddÉnergie has experienced strong expansion in Canada and a successful entry into the U S market, thanks in part to C D P Q’s support. We are well positioned to accelerate our growth in North America as the transition toward electric vehicles speeds up and is increasingly recognized as a key factor in the fight against climate change.”
Louis TremblayPresident and Chief Executive Officer of AddÉnergie
2 3

CDPQ | 2020 AR80
CDPQ IN QUÉBEC
C D P Q Infra: Infrastructure projects for sustainable mobility
C D P QInfra’smissionistobuildsustainabletransportationinfrastructureforcommunities.Itactsasadeveloperformajorprojectsandisresponsibleforallphases,fromplanningtofinancingtoimplementationtooperation.
C D P QInfra iscurrentlyoverseeing theconstructionof theRéseauexpressmétropolitain(REM),a100%automatedelectriclightrailsysteminGreaterMontréal.IthasalsoproposedtheREMdel’Esttoservethecity’seastandnortheastsectors.Thesubsidiary is conducting feasibility studies and pursuingdiscussionsonotherpublictransitprojectshereandaroundtheworld.InQuébec,accordingtoestablishedgovernance,thegovernmentproposestheprojectsforwhichC D P QInfra isaskedtoformulatearecommendation,inadditiontodevelopingtechnicalandfinancialproposals.
REM, THE NEW NETWORK FOR GREATER MONTRÉAL
TheREMis the largestpublic transitproject inQuébec in50years.ItwillconnectseveralareasinGreaterMontréal,includingdowntown,universities,theSouthShore,theNorthShore,theWestIslandandtheMontréal-TrudeauAirport.Withanetworkof67km,26stationsandfrequentservice,itwilltransportusers20hoursaday,7daysaweek.TheywillbeabletotransfertothemainMontréalmetrolinesatBonaventure,McGillandÉdouard-Montpetitstations.
The REM project generates major spinoffs in Québec:
$4 B+ inQuébeccontent,or65%oftheproject’svalue
30,000+ directandindirectjobsduringconstruction
$Nearly 2 B paidinwages
Reductionof680,000 tonnes ofgreenhousegasesover25years
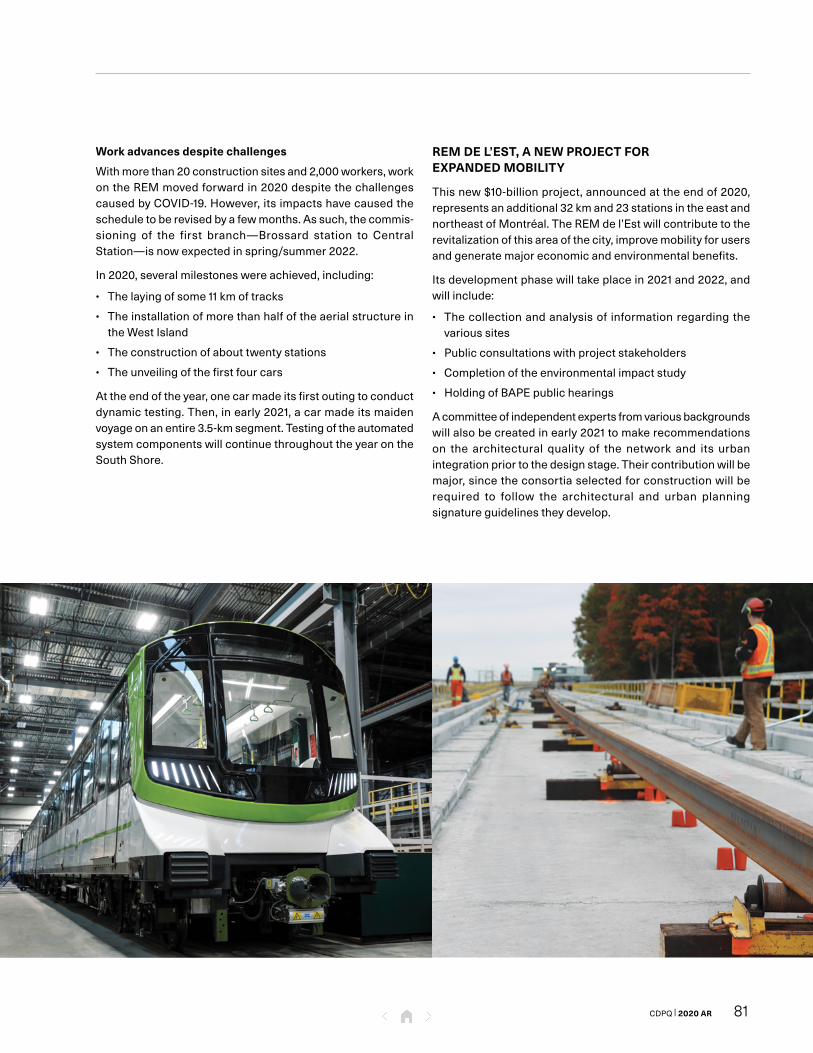
81CDPQ | 2020 AR
Work advances despite challenges
Withmorethan20constructionsitesand2,000workers,workontheREMmovedforwardin2020despitethechallengescausedbyCOVID-19.However,itsimpactshavecausedthescheduletoberevisedbyafewmonths.Assuch,thecommis-sioning of the first branch—Brossard station to CentralStation—isnowexpectedinspring/summer2022.
In2020,severalmilestoneswereachieved,including:
• Thelayingofsome11kmoftracks
• TheinstallationofmorethanhalfoftheaerialstructureintheWestIsland
• Theconstructionofabouttwentystations
• Theunveilingofthefirstfourcars
Attheendoftheyear,onecarmadeitsfirstoutingtoconductdynamictesting.Then,inearly2021,acarmadeitsmaidenvoyageonanentire3.5-kmsegment.TestingoftheautomatedsystemcomponentswillcontinuethroughouttheyearontheSouthShore.
REM DE L’EST, A NEW PROJECT FOR EXPANDED MOBILITY
Thisnew$10-billionproject,announcedattheendof2020,representsanadditional32kmand23stationsintheeastandnortheastofMontréal.TheREMdel’Estwillcontributetotherevitalizationofthisareaofthecity,improvemobilityforusersandgeneratemajoreconomicandenvironmentalbenefits.
Itsdevelopmentphasewilltakeplacein2021and2022,andwillinclude:
• Thecollectionandanalysisof informationregardingthevarioussites
• Publicconsultationswithprojectstakeholders
• Completionoftheenvironmentalimpactstudy
• HoldingofBAPEpublichearings
Acommitteeofindependentexpertsfromvariousbackgroundswillalsobecreatedinearly2021tomakerecommendationson the architectural quality of the network and its urbanintegrationpriortothedesignstage.Theircontributionwillbemajor,sincetheconsortiaselectedforconstructionwillberequired to follow the architectural and urban planningsignatureguidelinestheydevelop.

CDPQ | 2020 AR82
CDPQ IN QUÉBEC
Ivanhoé Cambridge: Shaping sustainable living environments
IvanhoéCambridgeactivelymanagesitsrealestateportfolioinQuébecanddevelopsprojectsthatwillmeet theneedsofusersforyearstocome.Itsambition:toofferurbansolutionsfocusedonpeople’swell-being,aswellasanimprovedexperienceforworkandservicesforeveryone.
Duringthisunusualyear,IvanhoéCambridgeimplementedexceptionalrecoveryandsupportsolutionsforitstenantsandclientswhilecontinuingtomanageitsproperties,particularlythoselocatedindowntownMontréal.Therealestatesubsidiaryhassignedagreementswithseveral tenants for itsofficetowersintheheartofthecity,including:
• BehavoxatMaisonManuvie
• Dentons,Mercer,MarshandOliverWymanat1P V M
• S A Pat5P V M
Theseagreements represent215,000square feet (20,000squaremeters) of world-class office space, designed toenhanceflexibilityofthespacesandencourageinnovativewaysofworkingtogether.
PROJET NOUVEAU CENTRE: EXPERIMENTING TO BETTER INNOVATE
Thisambitious$1-billionrevitalizationplanaimstotransformdowntownMontréalintoavibrantandaccessibleplacethatisfullofexperiences.Tosuccessfullycompletethisimmenseproject,IvanhoéCambridgeisfocusingonavisionofinnovationandsustainabledevelopmentbasedonusers’needsforitsspaces.Thisprojectisasortoflaboratory:afieldofexperi-mentationindesign,constructionandprofessionalservices.Theknow-howacquiredwill thenbenefitotherpropertieselsewhereintheworld.
ProjetNouveauCentreisbuiltaroundfourflagshipprojects,twoofwhichhavebeencompleted:
• ThetransformationoftheFairmontTheQueenElizabethHotel,crownedwithEspaceC2anditsbreathtakingviewofdowntown,aswellastheCoLab3businesscampus,whichoffersmultifunctionalroomstoencouragecreativityandinnovation
• TheconstructionofMaisonManuvie,aLEEDGoldcertifiedbuilding for itssustainableandenvironmentally friendlyarchitecture,whichhasa98%occupancyrate
The other two projects progressed in 2020 despite theupheavalcausedbythecrisis:
• TherevitalizationoftheP V MEsplanade,whichwillregainitsprimarypurposeasanurbanmeetingplace,aswellastheopeningoftheCathcartRestaurantsandBiergarten.This food court provides a unique and varied culinaryoffering—threefull-servicerestaurants,ninecountersandtwocafés—all inaprimelocation:ahugeindoorgardenbathedinnaturallight,undertheEsplanade’sglasspavilion.Asaresultofthepandemic,pick-upanddeliveryserviceshavebeensetup
• ThecompleteredevelopmentoftheMontrealEatonCentre,whichwelcomedmajorbannerssuchasUniqloin2020andDecathlonin2019.TimeOutMarket,thelong-awaitedfoodmarketunveiledin2019,bringsthecity’sbestchefsandrestaurantstogetherunderoneroof.Sincethepandemic,theyalsoofferdeliveryandtake-outservices
83CDPQ | 2020 AR
Leveraging our talent by supporting local research and expertise
C D P QisactivelyinvolvedincreatingapoolofqualifiedexpertsbyestablishingvariouspartnershipswithQuébec universities,includingtwonewagreementsinsustainableinvestmentandinethicsandcompliance.OurresearchandtrainingsupportstrategyextendstoseveralregionsofQuébec.Determinedtodevelopthe nextgeneration,wealsowelcomemanyinternseachyear.
ETHICS AND COMPLIANCE
Launchedin2020incollaborationwithHECMontréal,theEthicsandComplianceprogramprovidesparticipantswithanoverviewofbestpracticesinthisarea.Itoffersthemtoolsandworkshopstoimplementanethicsandcomplianceprogramadaptedtotheirorganization,acquireexpertiseonleading- edgeissuesandactivatetheirbusinessnetwork.
STEWARDSHIP INVESTING
In 2020, the new Sustainability Ecosystem program, inpartnershipwithConcordiaUniversity,createdopportunitiesforstudents,academics,investors,businessesandpoliticalorganizationstomeetandexchangeinformation,experiences,andideasforco-operationonsustainabilitytopics.
Inaddition,C D P Qrenewed its support forPolytechniqueMontréal’sresponsibleinvestmentprogram,whichexplorestheissueofclimatechangeandthedevelopmentofindicatorsandscenarios.
FINANCE AND ECONOMICS
C D P QworkscloselywithtwoChairsfromtheUniversitéduQuébec à Montréal’s École des sciences de la gestion(E S G UQAM).
ThefirstChairisdedicatedtoportfoliomanagementresearchandthetrainingoftalentspecializedinthisfield.Itsobjectivesinclude:
• Developmentofcutting-edgescientificresearch
• Analysisofnewpracticesanddifferentriskandreturnfactors
• Knowledgesharing
ThesecondChairconductsresearchinmacroeconomicsandforecastingwhilepreparingthenextgenerationoftopecono-mists.Ithasestablishedmultiplepartnershipswithpublicandprivate institutions inCanadaaswellaswithnationalandinternationalresearchinstitutes.Itspurposeistopromotethedevelopmentofmethodologiesto:
• Constructavulnerabilityindexofeconomicactivityandclimatechange
• Incorporateclimateforecastsintomacroeconomicforecastingmodels
• Analyzethemacroeconomicimpactofnaturaldisastersandcarbonpricing
INTERNSHIPS
C D P Qoffersinternshipsinfinanceandotherkeyareaseachyear.In2020,wehosted140studentsandinternsforperiodsoffourtoeightmonths.Theseinternshipsrepresentanenrichingexperienceinalargeorganizationandhelptrainacompetentnextgeneration.
A large network of suppliers throughout Québec
C D P Q and our subsidiaries rely on the services ofnumerousQuébeccompaniestocarryoutouractivi-ties,requiringthecontributionofapproximately2,200Québec-based suppliers. In 2020, expenditures inQuébecbyC D P Qanditssubsidiaries,includingC D P QInfra,amountedtomorethan$2billion,alevelcompar-ableto2019,despitethepandemicandtheslowdownincertainexpenditures.
AsstipulatedinourPolicyonContractsfortheAcquisi-tionorLeasingofGoodsandServices,C D P QfavoursQuébecsuppliers,providedtheysatisfycostandqualitycriteria.
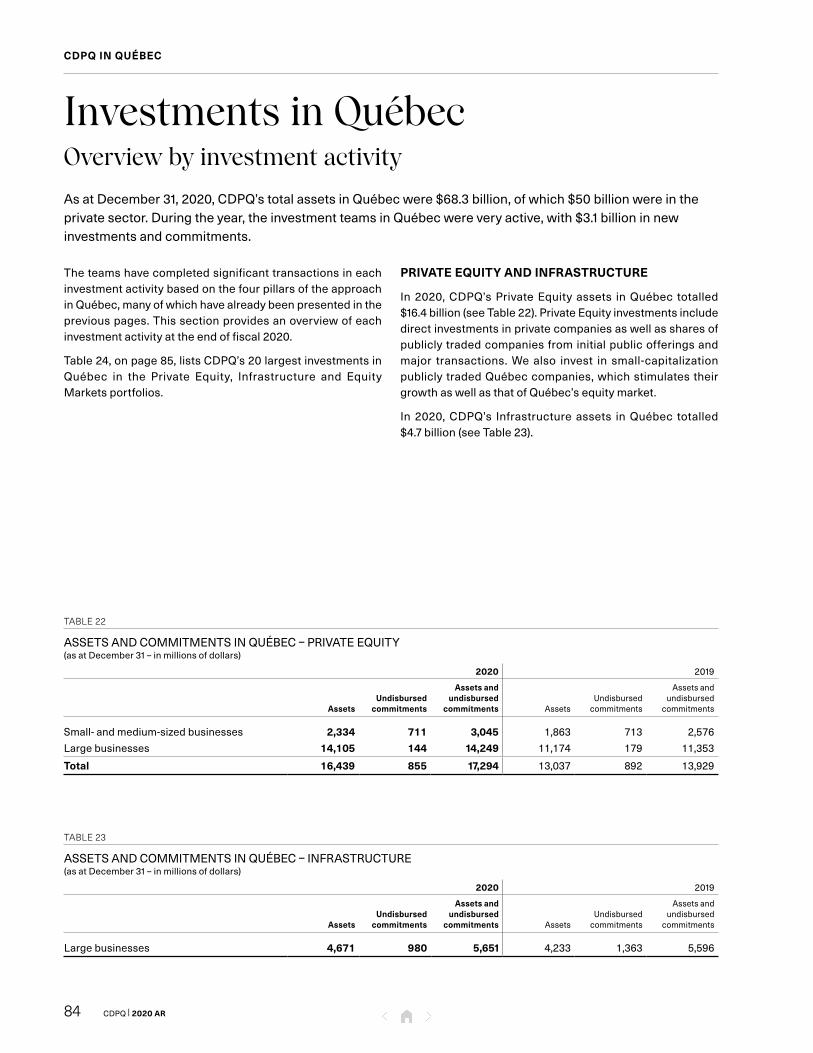
CDPQ | 2020 AR84
CDPQ IN QUÉBEC
Investments in QuébecOverview by investment activity
As at December 31, 2020, C D P Q’s total assets in Québec were $68.3 billion, of which $50 billion were in the private sector. During the year, the investment teams in Québec were very active, with $3.1 billion in new investments and commitments.
The teams have completed significant transactions in each investment activity based on the four pillars of the approach in Québec, many of which have already been presented in the previous pages. This section provides an overview of each investment activity at the end of fiscal 2020.
Table 24, on page 85, lists C D P Q’s 20 largest investments in Québec in the Private Equity, Infrastructure and Equity Markets portfolios.
PRIVATE EQUITY AND INFRASTRUCTURE
In 2020, C D P Q’s Private Equity assets in Québec totalled $16.4 billion (see Table 22). Private Equity investments include direct investments in private companies as well as shares of publicly traded companies from initial public offerings and major transactions. We also invest in small-capitalization publicly traded Québec companies, which stimulates their growth as well as that of Québec’s equity market.
In 2020, C D P Q’s Infrastructure assets in Québec totalled $4.7 billion (see Table 23).
TABLE 22
ASSETS AND COMMITMENTS IN QUÉBEC – PRIVATE EQUITY(as at December 31 – in millions of dollars)
as at December 31 – in millions of dollars 2020 2019
AssetsUndisbursed
commitments
Assets and undisbursed
commitments AssetsUndisbursed
commitments
Assets and undisbursed
commitments
Small- and medium-sized businesses 2,334 711 3,045 1,863 713 2,576Large businesses 14,105 144 14,249 11,174 179 11,353
Total 16,439 855 17,294 13,037 892 13,929
TABLE 23
ASSETS AND COMMITMENTS IN QUÉBEC – INFRASTRUCTURE(as at December 31 – in millions of dollars)
as at December 31 – in millions of dollars 2020 2019
AssetsUndisbursed
commitments
Assets and undisbursed
commitments AssetsUndisbursed
commitments
Assets and undisbursed
commitments
Large businesses 4,671 980 5,651 4,233 1,363 5,596
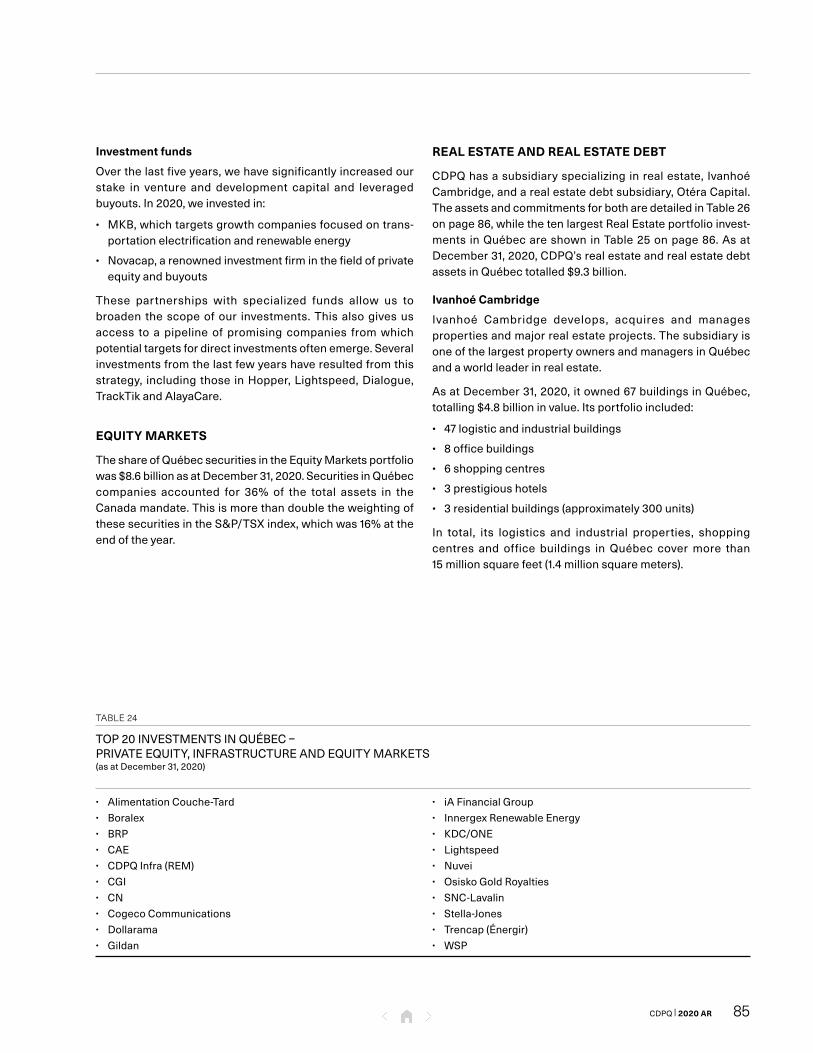
85CDPQ | 2020 AR
Investment funds
Overthelastfiveyears,wehavesignificantlyincreasedourstake in venture and development capital and leveragedbuyouts.In 2020,weinvestedin:
• M K B,whichtargetsgrowthcompaniesfocusedontrans-portationelectrificationandrenewableenergy
• Novacap,arenownedinvestmentfirminthefieldofprivateequityandbuyouts
These partnerships with specialized funds allow us tobroaden thescopeofour investments.Thisalsogivesusaccess to apipelineof promisingcompanies fromwhichpotentialtargetsfordirectinvestmentsoftenemerge.Severalinvestmentsfromthelastfewyearshaveresultedfromthisstrategy, includingthose inHopper,Lightspeed,Dialogue,TrackTikandAlayaCare.
EQUITY MARKETS
TheshareofQuébecsecuritiesintheEquityMarketsportfoliowas$8.6billionasatDecember31,2020.SecuritiesinQuébeccompanies accounted for 36% of the total assets in theCanadamandate.ThisismorethandoubletheweightingofthesesecuritiesintheS & P/T S Xindex,whichwas16%attheendoftheyear.
REAL ESTATE AND REAL ESTATE DEBT
C D P Qhasasubsidiaryspecializinginrealestate, IvanhoéCambridge,andarealestatedebtsubsidiary,OtéraCapital.TheassetsandcommitmentsforbotharedetailedinTable26onpage86,whilethetenlargestRealEstateportfolioinvest-ments inQuébecareshowninTable25onpage86.AsatDecember31,2020,C D P Q’srealestateandrealestatedebtassetsinQuébectotalled$9.3billion.
Ivanhoé Cambridge
Ivanhoé Cambridge develops, acquires and managespropertiesandmajorrealestateprojects.ThesubsidiaryisoneofthelargestpropertyownersandmanagersinQuébecandaworldleaderinrealestate.
AsatDecember31,2020,itowned67buildingsinQuébec,totalling$4.8billioninvalue.Itsportfolioincluded:
• 47logisticandindustrialbuildings
• 8officebuildings
• 6shoppingcentres
• 3prestigioushotels
• 3residentialbuildings(approximately300units)
In total, its logistics and industrial properties, shoppingcentres and office buildings inQuébec covermore than15 millionsquarefeet(1.4millionsquaremeters).
TABLE 24
TOP20INVESTMENTSINQUÉBEC–PRIVATEEQUITY,INFRASTRUCTUREANDEQUITYMARKETS(asatDecember31,2020)
• AlimentationCouche-Tard• Boralex• B R P• C A E• C D P QInfra(REM)• C G I• C N• CogecoCommunications• Dollarama• Gildan
• iAFinancialGroup• InnergexRenewableEnergy• K D C/ONE• Lightspeed• Nuvei• OsiskoGoldRoyalties• S N C-Lavalin• Stella-Jones• Trencap(Énergir)• W S P
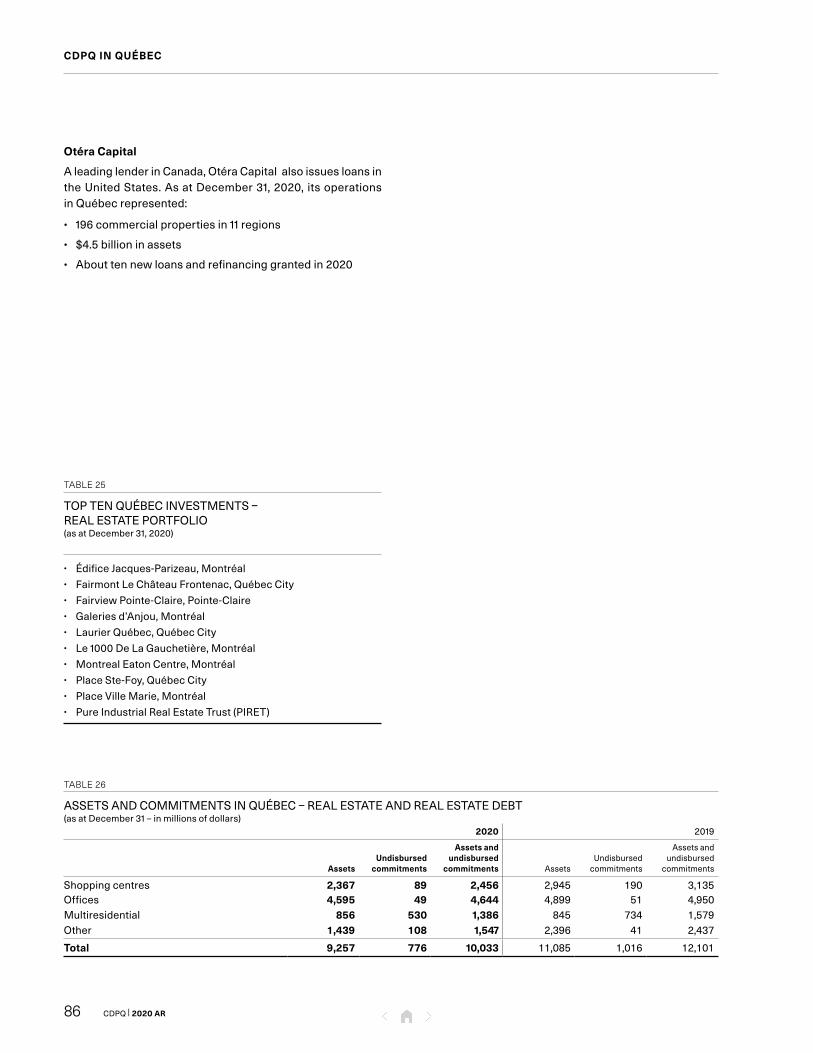
CDPQ | 2020 AR86
CDPQ IN QUÉBEC
Otéra Capital
AleadinglenderinCanada,OtéraCapitalalsoissuesloansintheUnitedStates.AsatDecember31,2020,itsoperationsin Québecrepresented:
• 196commercialpropertiesin11regions
• $4.5billioninassets
• Abouttennewloansandrefinancinggrantedin2020
TABLE 25
TOPTENQUÉBECINVESTMENTS–REALESTATEPORTFOLIO(asatDecember31,2020)
• ÉdificeJacques-Parizeau,Montréal• FairmontLeChâteauFrontenac,QuébecCity• FairviewPointe-Claire,Pointe-Claire• Galeriesd’Anjou,Montréal• LaurierQuébec,QuébecCity• Le1000DeLaGauchetière,Montréal• MontrealEatonCentre,Montréal• PlaceSte-Foy,QuébecCity• PlaceVilleMarie,Montréal• PureIndustrialRealEstateTrust(P I R E T)
TABLE 26
ASSETSANDCOMMITMENTSINQUÉBEC–REALESTATEANDREALESTATEDEBT(asatDecember31–inmillionsofdollars)(asatDecember31–inmillionsofdollars) 2020 2019
AssetsUndisbursed
commitments
Assets and undisbursed
commitments AssetsUndisbursedcommitments
Assetsandundisbursed
commitments
Shoppingcentres 2,367 89 2,456 2,945 190 3,135Offices 4,595 49 4,644 4,899 51 4,950Multiresidential 856 530 1,386 845 734 1,579Other 1,439 108 1,547 2,396 41 2,437
Total 9,257 776 10,033 11,085 1,016 12,101

87CDPQ | 2020 AR
FINANCING AND FIXED INCOME
Sinceitscreation,C D P QhasplayedakeyroleinfinancinginQuébec,inboththeprivateandpublicsectors.
AsatDecember31,2020,C D P Q’sholdingsofprivateandpublic-sectorbondstotalled$29.3billion(seeTable27).
Private sector
Overthepastdecade,ourprivatesectoractivitieshavegrownconsiderably, reaching$10.9billion in2020.Sinceprivatecompaniesstimulategrowth,financingtheirprojectshelpsussupport Québec’s economy while generating attractivelong-termreturnsforourdepositors.
Overtheyears,C D P QhasfinancedmanyQuébeccompanies,bothpubliclytradedandunlisted.Asalong-standingpartner,wesupporttheirplansforgrowthandexpansioninlocalandinternationalmarkets.
TheFixedIncometeamsworkcloselywiththePrivateEquityteamstoprovidefinancingpackagestailoredtothespecificprojectsandneedsofcompanies.Thisteamworkresultedin theintegrationofafinancingcomponentincertainequityinvestments.
Public sector
C D P QhasalwaysbeenamajorholderofQuébecpublicsectorbonds.Thisincludessecuritiesissuedby:
• TheGovernmentofQuébec
• Governmentcorporations
• Municipalities
• Para-governmentalcorporations
In2020,public sectorassetsdecreasedslightly from thepreviousyear, reflectingtheFixedIncomeportfolios’shifttowardprivatedebt.
TABLE 27
ASSETSINQUÉBEC–FINANCINGANDFIXEDINCOME(asatDecember31–inbillionsofdollars)
asatDecember31–inbillionsofdollars 2020 2019
Private sector: corporate securities 10.9 10.4
Québec public sector
GovernmentofQuébec 11.7 12.6
Hydro-Québec 5.7 5.6
Othergovernmentcorporations 0.8 0.8
Municipalitiesandpara-governmentalcorporations 0.2 0.1
Subtotal 18.4 19.1
Total 29.3 29.5

CDPQ | 2020 AR88
White page

Reports of the Board of Directors and Board Committees
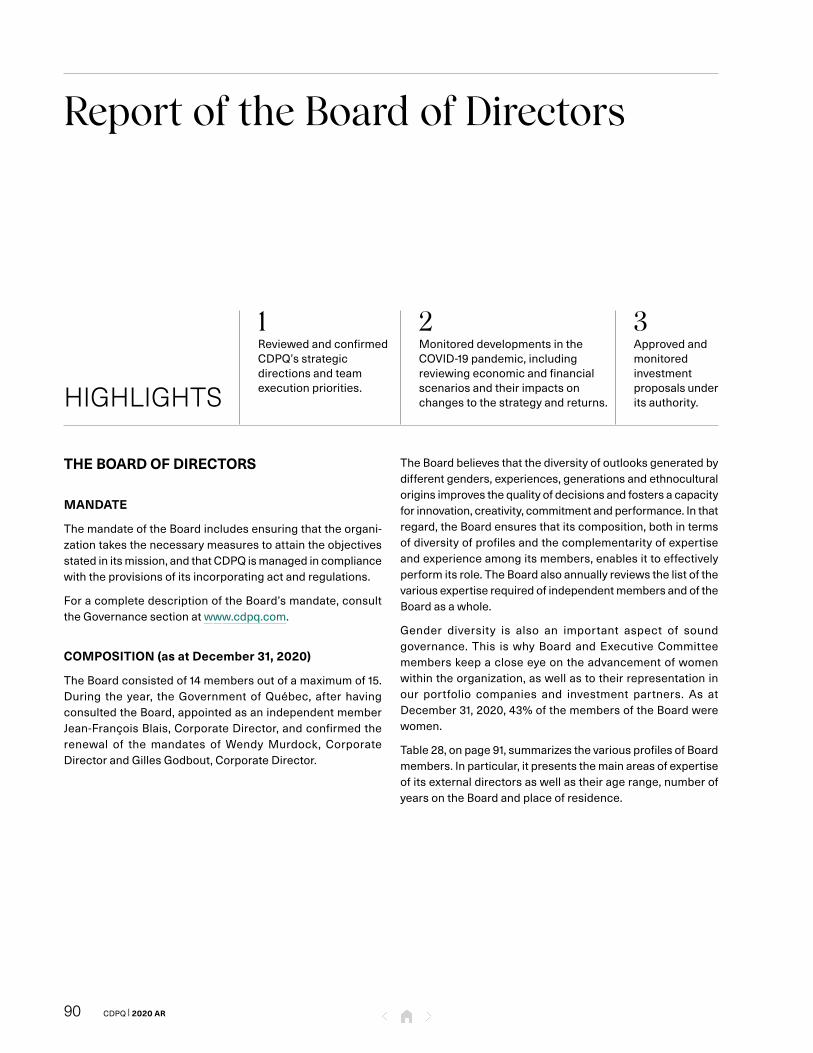
CDPQ | 2020 AR90
Report of the Board of Directors
HIGHLIGHTS
1ReviewedandconfirmedC D P Q’sstrategicdirectionsandteamexecutionpriorities.
2MonitoreddevelopmentsintheCOVID-19pandemic,includingreviewingeconomicandfinancialscenariosandtheirimpactsonchangestothestrategyandreturns.
3Approvedandmonitoredinvestmentproposalsunderitsauthority.
THE BOARD OF DIRECTORS
MANDATE
ThemandateoftheBoardincludesensuringthattheorgani-zationtakesthenecessarymeasurestoattaintheobjectivesstatedinitsmission,andthatC D P Qismanagedincompliancewiththeprovisionsofitsincorporatingactandregulations.
ForacompletedescriptionoftheBoard’smandate,consulttheGovernancesectionatw w w.c d p q.com.
COMPOSITION (as at December 31, 2020)
TheBoardconsistedof14membersoutofamaximumof15.During the year, theGovernmentofQuébec, afterhavingconsultedtheBoard,appointedasanindependentmemberJean-FrançoisBlais,CorporateDirector,andconfirmedtherenewal of themandates ofWendyMurdock, CorporateDirectorandGillesGodbout,CorporateDirector.
TheBoardbelievesthatthediversityofoutlooksgeneratedbydifferentgenders,experiences,generationsandethnoculturaloriginsimprovesthequalityofdecisionsandfostersacapacityforinnovation,creativity,commitmentandperformance.Inthatregard,theBoardensuresthatitscomposition,bothintermsofdiversityofprofilesandthecomplementarityofexpertiseandexperienceamongitsmembers,enablesittoeffectivelyperformitsrole.TheBoardalsoannuallyreviewsthelistofthevariousexpertiserequiredofindependentmembersandoftheBoardasawhole.
Gender diversity is also an important aspect of soundgovernance.This iswhyBoardandExecutiveCommitteememberskeepacloseeyeontheadvancementofwomenwithintheorganization,aswellastotheirrepresentationinour portfolio companies and investment partners. As atDecember31,2020,43%ofthemembersoftheBoardwerewomen.
Table28,onpage91,summarizesthevariousprofilesofBoardmembers.Inparticular,itpresentsthemainareasofexpertiseofitsexternaldirectorsaswellastheiragerange,numberofyearsontheBoardandplaceofresidence.

91CDPQ | 2020 AR
TABLE 28
DIVERSITYONTHEBOARDOFDIRECTORS
Directors1
Age Mandate Placeofresidence Diversity Top5specialtiesorexpertise
<40
40to65
≥65
Yearson
theBoa
rd
Qué
bec
UnitedStates
Europe
Male/female
Other
2
Investmen
t
Dep
osito
rs
Strategicplan
ning
Riskman
agem
ent
Econ
omicand
po
liticalissues
Fina
nce/
acco
untin
g/au
dit
Talentman
agem
ent
andco
mpe
nsation
Governa
nce
Tech
nology
Jean-FrançoisBlais n.a. • n.a. <1 • n.a. n.a. M n.a. • n.a. • • n.a. n.a. • n.a. •
IvanaBonnet-Zivcevic n.a. • n.a. 3 n.a. n.a. • F • n.a. n.a. • • n.a. • • • n.a.
SylvainBrosseau n.a. • n.a. 2 • n.a. n.a. M n.a. • • n.a. • n.a. n.a. • n.a. •
AlainCôté n.a. • n.a. 1 • n.a. n.a. M n.a. • n.a. n.a. • • • • n.a. n.a.
MichelDesprés n.a. • n.a. 4 • n.a. n.a. M n.a. n.a. • • n.a. • • n.a. • n.a.
GillesGodbout n.a. n.a. • 7 • n.a. n.a. M n.a. • • • n.a. • • n.a. n.a. n.a.
LynnJeanniot n.a. • n.a. 1 • n.a. n.a. F n.a. n.a. n.a. • • • n.a. • • n.a.
MariaS.JelescuDreyfus n.a. • n.a. 1 n.a. • n.a. F • • n.a. • • • n.a. n.a. n.a. •
JeanLaCouture n.a. n.a. • 7 • n.a. n.a. M n.a. • n.a. • • n.a. • n.a. • n.a.
DianeLemieux n.a. • n.a. 6 • n.a. n.a. F n.a. n.a. • • • • n.a. n.a. • n.a.
WendyMurdock n.a. n.a. • 4 n.a. • n.a. F • • n.a. • n.a. n.a. • • • n.a.
RavyPor • n.a. n.a. 1 • n.a. n.a. F • n.a. n.a. n.a. • n.a. • • • •
RobertTessier n.a. n.a. • 11 • n.a. n.a. M n.a. n.a. • • n.a. • n.a. • • n.a.
1. Charles Emond, as President and Chief Executive Officer, is a Board member by virtue of office. He has held his position for less than one year and lives in Québec.
2. These directors voluntarily reported to belonging to one of the diversity groups representing the various components of Québec society.
TABLE 29
COMPENSATIONPAIDTOINDEPENDENTDIRECTORSUNDERORDER-IN-COUNCIL1(indollars)
DirectorsAnnual
compensationCompensationasCommitteeChair
Attendancefees
Totalcompensation
Jean-FrançoisBlais2 12,275 − 14,010 26,285IvanaBonnet-Zivcevic3 19,947 6,235 27,086 53,268SylvainBrosseau 19,947 − 37,360 57,307AlainCôté4 19,947 4,762 33,624 58,333GillesGodbout 19,947 − 31,090 51,037LynnJeanniot 20,760 − 26,152 46,912MariaS.JelescuDreyfus 22,602 − 28,954 51,556FrançoisJoly4 4,713 1,473 8,406 14,592JeanLaCouture3 19,947 6,235 29,888 56,070WendyMurdock 19,947 4,762 28,954 53,663RavyPor2 19,947 − 27,086 47,033
Total 199,979 23,467 292,610 516,056
1. In accordance with the terms of the Order-in-Council:
a. The attendance fee for each special Board or Committee meeting of short duration, held by teleconference, is half of the attendance fee allowed for a regular meeting.
b. Up to March 31, 2020, members who are retired from the public sector received total reduced compensation.
2. These directors received attendance fees for attending a committee meeting as an observer.
3. These directors received attendance fees for attending a meeting of C D P Q’s Selection Committee.
4. These directors received attendance fees for attending the Audit Committee meetings of C D P Q’s real estate and real estate debt subsidiaries.

Report of the Board of Directors(continued)
CDPQ | 2020 AR92
DIRECTOR COMPENSATION
ThecompensationofC D P Q’sdirectorsisdeterminedbyanorder-in-counciloftheGovernmentofQuébec.Theircompen-sation for 2020 is provided in Table 29 on page 91. Thedirectorsarealsoentitledtobereimbursedfortheirtravelandlivingexpenses.
COMPENSATION OF THE CHAIRMAN OF THE BOARD
TheannualcompensationoftheChairmanoftheBoardissetat $195,000 by an order-in-council of theGovernment ofQuébec.TheChairmanof theBoard isalsoentitled tobereimbursedforrepresentationexpensesrelatedtothedutiesofhisposition,toamaximumof$15,000peryear.
ACTIVITY REPORT
TheBoardcarriesoutitsresponsibilitiesdirectlyorthroughfourcommittees:
• TheAuditCommittee
• TheGovernanceandEthicsCommittee
• TheInvestmentandRiskManagementCommittee
• TheHumanResourcesCommittee
Theactivityreportofeachofthesecommitteesispresentedonthefollowingpages.Themainresponsibilitiesdischargedby the Board during the year are also presented on thefollowingpages.
TABLE 30
DIRECTORATTENDANCEATBOARDANDCOMMITTEEMEETINGSIN20201
Directors BoardofDirectorsAudit
Committee
InvestmentandRiskManagementCommittee
Governanceand EthicsCommittee
HumanResourcesCommittee
SelectionCommittee
6reg. 12spec. 6reg. 6reg. 5spec. 6reg. 3spec. 7reg. 4spec. 1reg.
Jean-FrançoisBlais 4/4 5/5 3/3 – – – – – – –IvanaBonnet-Zivcevic 5 12 – – – – – 6 4 1SylvainBrosseau 6 12 – 6 5 – – 7 4 –AlainCôté 6 12 6 5/5 5 – – – – –MichelDesprés 6 11 – – – – – – – –GillesGodbout 6 12 6 6 5 – – – – –LynnJeanniot 6 12 – – – – – 6 4 –MariaS.JelescuDreyfus 6 12 – 6 5 – – – – –FrançoisJoly 1/1 3/3 2/2 1/1 – – – – – –JeanLaCouture 6 12 – 6 5 – – – – 1DianeLemieux 6 11 – – – – – – – –WendyMurdock 6 11 4/4 1/1 – 6 3 – – –RavyPor 6 12 – – – 6 3 – – –MichaelSabia – 1/1 – – – – – – – –CharlesEmond 6 11/11 – – – – – – – –RobertTessier 6 12 – – – 6 3 7 4 1
1. Directors justify their absences from regular meetings of a Committee or the Board to C D P Q’s Secretariat. During 2020, directors were not able to attend certain meetings, due to health reasons or to obligations related to family or work commitments, or to our rules governing potential conflicts of interest.

93CDPQ | 2020 AR
Strategic directions
The Board reviewed and approved C D P Q’s strategicdirectionsandtheannualbudget,aswellastheexecutionprioritiesofeachteam.Duringtheyear,theBoardreceivedandreviewedregularmanagementreportsonthemonitoringandadvancementofthesepriorities.
COVID-19 pandemic
Concerningthepandemic,theBoardreviewedwithmanage-ment various economic and financial scenarios and theirimpactsontheevolutionofthestrategyandreturns.
TheBoardalsoapprovedthesupportprogramforQuébecbusinessesandcommunityorganizations,whichwasaddedtootherinitiativesasacontributiontothecollectiveeffort.
In addition, in the context of the transition to having allemployeeswork remotely, theBoard reviewed thedigitalenvironmentandC D P Q’scybersecurityposture,inadditiontopayingparticularattentiontotheoverallhealthofemployeesandtheinitiativesimplementedtosupportthem.TheBoardreviewedscenariosforreturningtoworkingintheofficeanddiscussedwithmanagementtheevolutionofthepost-COVID-19workenvironment,particularlywith respect toschedules,waysofworkingandofficelayout.
Financial results, internal controls and risk management oversight
WithassistancefromtheAuditCommittee,theBoardfulfilleditsresponsibilitieswithrespecttofinancialresults,internalcontrolsandriskmanagement,notablyby:
• Reviewing and approving the consolidated financialstatementsasatJune30andDecember31.
• Evaluatingthe integrityofall thecontrolsappliedtothevarious types of data used to prepare these financialstatementsandrelatednotes.
• Reviewingthereturnsoftheinvestmentunitsandapprovingthenewsreleasesonfinancialresults.
• ReviewingandapprovingC D P Q’sAnnualReport.
• Approvingreviewsofseveralpolicies,including:
– ThePolicy–InternalControls
– TheFinancialInformationDisclosurePolicy
– ThePolicyonContractsfortheAcquisitionorLeasingofGoodsandServices
• Monitoringprogressontechnologicalprojectstoupdatethefinancialreportingsystem.
• Approvingthereviewofdelegationsofauthority.
SeetheReportoftheAuditCommitteeonpage96formoreinformation on the responsibilities discharged by theCommitteeandtheBoard.
Investment and risk management
AssistedbytheInvestmentandRiskManagementCommittee,the Board ensured that an effective and rigorous riskmanagement framework and the relatedprocesseswereappliedthroughouttheyear.Assuch,theBoard:
• Approvedinvestmentproposalsunderitsauthority,takingintoaccount,amongotherthings,theimpactofeachoneonthe levelandconcentrationof risk in thespecializedportfolioinquestionandinthetotalportfolio.
• Monitored progress in the construction of the Réseauexpressmétropolitain(REM).
• Approvedthereviewoftheinvestmentpoliciesofcertainspecializedportfolios.
• ApprovedthereviewoftheIntegratedRiskManagementPolicy.
• ApprovedliquidityriskoversightandensuredthatC D P Q’soverallstrategyformanagingthisriskwasfollowed.
See theReport of the Investment andRiskManagementCommitteeonpage117formoreinformationontheresponsi-bilitiesdischargedbytheCommitteeandtheBoard.
Report of the Board of Directors(continued)
CDPQ | 2020 AR94
Corporate governance
The Board met in the absence of members of seniormanagementandhelddiscussionswiththePresidentandChiefExecutiveOfficerintheabsenceofothermembersofseniormanagement.Italsoreceivedanactivityreportfromeachcommitteeateachmeeting,sothatitcouldreviewandexpressanopinionontheirrecommendations.Inaddition,ontherecommendationoftheGovernanceandEthicsCommittee,theBoard:
• Reviewedthecompositionofitscommittees.
• Approvedtheexpertiseandexperienceprofileofitsindependentmembers.
• ApprovedthePolicy–FraudandCorruptionPreventionandDetection
• ApprovedthereviewofthePolicyonDonationsandSponsorships.
• Approved the review of the Policy on the PrinciplesGoverningtheExerciseofVotingRightsofPublicCompanies.
• ApprovedthereviewoftheCodeofEthicsandProfessionalConductapplicabletoofficersandemployees,aswellastheCodeofEthicsandProfessionalConductforDirectorsofC D P Qanditsrealestateandrealestatedebtsubsidiaries.
Orientation and continuing education program
The Board recognizes the importance of providing itsmemberswiththenecessarytrainingandsupporttoenablethemtocarryouttheirrolesinaccordancewiththeprovisionsoftheActrespectingC D P Q,themandateoftheBoardanditscommittees,andinlinewithbestpractices.C D P Qdeploysanorientationprocessassoonasanewmemberisappointedtofacilitate the director’s integration and to allow them tobecomefamiliarwiththerole,therequirementsoftherelateddutiesandthestrategicorientationsoftheorganization.Thisprocessincludes:
• Electronic access to theDirectors’Manual containinginformation on, among other things, the laws andregulationsapplicabletoC D P Q,themandatesoftheBoardanditscommittees,theCodeofEthicsandProfessionalConduct forDirectors, the governance framework, theexpertise and experience profile of the independentmembers,themeetingscheduleandtheevaluationprocess.
• MeetingswiththeChairmanoftheBoard,thecommitteechairsandmembersofseniormanagement.
• Trainingonriskmanagementandfinancialaspects.
AtBoardandcommitteemeetingsand training sessions,membersattendpresentationsbyrepresentativesofvariousC D P Qteamsand,fromtimetotime,byoutsiderepresenta-tiveson topicsrelevant toC D P Q’sactivitiesandstrategicorientations.C D P Qalsoencouragesparticipationintrainingsessionsofferedbyvariousexternalorganizationsandsharesrecommendedpublicationswithitsmembers.
In 2020,members received training on various subjects,including:
• Riskmanagement
• Theeconomy
• Stewardshipinvesting
• TheimpactoftheCOVID-19pandemiconinternalauditandfinancialreportingactivities
• Strategicpartnerships
• Taxmatters
• Governance
SeetheReportoftheGovernanceandEthicsCommitteeonpage 99 for more information on the responsibilitiesdischarged by the Committee and the Board regardinggovernanceandethics.

95CDPQ | 2020 AR
Human resources management
At the beginning of 2020, with the approval of the government, the Board appointed Charles Emond as President and Chief Executive Officer. Following his appointment and with the support of the Human Resources Committee, the Board adopted his objectives for 2020 and assessed his performance, as well as his total compensation conditions.
In addition, the Board approved changes to the organizational structure, which resulted in several important appointments during the year. Kim Thomassin, who served as Executive Vice-President, Legal Affairs and Secretariat, was appointed Executive Vice-President and Head of Investments in Québec and Stewardship Investing. Helen Beck, who was a member of the Equity Markets team, became Executive Vice-President and Head of Equity Markets, while Ève Giard was appointed Executive Vice-President, Talent and Performance. In addition, Vincent Delisle was appointed Executive Vice-President and Head of Liquid Markets, Marc-André Blanchard was appointed Executive Vice-President and Head of C D P Q Global, and Michel Lalande was appointed Executive Vice-President, Legal Affairs and Secretariat.
Further to these changes to the organizational structure, the Board also reviewed the assignment of additional responsibi-lities to certain members of senior management, including responsibility for global strategy given to Martin Coiteux, who was appointed Head of Economic Analysis and Global Strategy, and the leadership of the new cross-functional approach in technology to Alexandre Synnett, who was appointed Executive Vice-President and Chief Technology Officer.
At the end of 2020, the Board approved the appointment of Jean-Marc Arbaud as President and Chief Executive Officer of C D P Q Infra, as well as Martin Laguerre as Executive Vice-President and Head of Private Equity and Capital Solutions.
The Board also approved the performance evaluations and total compensation conditions for senior executives.
See the Report of the Human Resources Committee on page 101 for more information on the responsibilities discharged by the Committee and the Board.

CDPQ | 2020 AR96
Report of the Audit Committee
HIGHLIGHTS
1Reviewed and monitored preparation of the financial statements.
2Approved the three-year internal audit plan and monitored activities under the plan.
3Monitored and analyzed the effects of all activities implemented to ensure optimal use of resources.
THE AUDIT COMMITTEE
MANDATE
The Audit Committee sees that the financial statements accurately reflect C D P Q’s financial position. It also ensures, among other things, that C D P Q has adequate and effective internal control mechanisms and a risk management process.
For a complete description of the Committee’s mandate, consult the Governance section at w w w.c d p q.com.
COMPOSITION (as at December 31, 2020)
The composition of the Committee was reviewed in 2020. The Committee consisted of four independent members, including the Chair of the Committee:
• Chair: Alain Côté (guest member at meetings of the Invest ment and Risk Management Committee)
• Members: Jean-François Blais, Gilles Godbout and Wendy Murdock
The Chairman of the Board attends the Committee meetings.
It should be noted that the Committee consisted of profes-sionals with accounting or finance expertise as well as the experience and knowledge required to read and understand financial statements and to fulfill their roles properly.
ACTIVITY REPORT
Number of meetings in 2020: 6
The Audit Committee plays an essential role in the sound financial governance of C D P Q, including in oversight of financial reporting, risk management and internal controls, internal auditors and external auditors.
During the year, the Committee discharged the following responsibilities:
Financial reporting
In 2020, the Committee:
• With the Finance group and the co-auditors, being the Auditor General of Québec and EY, reviewed and recom-mended to the Board for approval the consolidated financial statements. As part of this review, the Committee reviewed, among other things, the process used to prepare the financial statements and to value investments as well as treasury items, including liquidity, leverage and financing.
• Reviewed the report on the financial certification process that enables the President and Chief Executive Officer and the Executive Vice-President and Chief Financial and Operations Officer to certify publicly that the disclosure controls and procedures and the internal financial reporting controls are adequate and effective.

97CDPQ | 2020 AR
• Discussedwiththeco-auditorstheirreportsfollowingtheinterimreviewasatJune30andtheauditasatDecember31.
• ReviewedandrecommendedtotheBoardforapprovalthenewsreleasesannouncingC D P Q’sfinancialresults.
• ReviewedpreparatoryworkontheAnnualReport.
• Reviewedthequarterlyresults,operatingexpensesandbudgetmonitoring.
• Discussedwith the co-auditors their plan for auditingC D P Q’s financial statements and their internal qualitycontrolprocedures.
• Monitored application of thePolicy – IndependenceofExternalAuditorsandapprovedEY’sfees.
• Receivedfollow-upreportsonprojectsrelatedtochangesinthefinancialreportingsystems.
• HeldregulardiscussionswiththeExecutiveVice-PresidentandChiefFinancial andOperationsOfficerwithout thepresenceofothermembersofmanagement.
• Discussedwiththeco-auditors,intheabsenceofmembersofmanagement,variousaspectsoftheirmandate.
• ReceivedreportsfromtheChairoftheCommitteefollowinghisattendanceatmeetingsoftheauditcommitteesoftherealestateandrealestatedebtsubsidiaries.
Internal audit
In2020,theCommittee:
• ApprovedtheInternalAuditCharter.
• Approvedthe2020–2022InternalAuditPlanandreviewedtheinternalauditplansoftherealestateandrealestatedebtsubsidiariesandC D P QInfra.
• ReviewedInternalAudit’sprogressreportspreparedundertheInternalAuditPlantoaddresssuchmattersasinternalcontrolmechanisms,riskmanagementprocessesandtheoptimaluseofresources.
• ReviewedimplementationbyseniormanagementofInternalAudit’srecommendations.
• MonitoredactivitiescarriedoutbytheInternalAuditunitsoftherealestateandrealestatedebtsubsidiaries.
• Validated that the Internal Audit teamwas able to actindependentlyfrommanagement.
• HeldregulardiscussionswiththeVice-President,InternalAudit,withoutthepresenceofmanagement.

Report of the Audit Committee(continued)
CDPQ | 2020 AR98
Internal controls and plan for the optimal use of resources
In2020,theCommittee:
• Reviewedtheplantoensureoptimaluseofresourcesandmonitoredandanalyzed theeffectsof all the activitiesimplementedundertheplan.
• Reviewed the resultsofwork toassess thedesignandeffectivenessofinternalfinancialreportingcontrolsanddisclosurecontrolsandprocedures,includingthoseoftherealestateandrealestatedebtsubsidiariesandC D P QInfra.
• ReviewedC D P Q’sinsurancecoverage.
Risk management
In2020,theCommittee:
• Discussed,withmembersofLegalAffairsandSecretariat:
ReportsoncompliancewiththeActrespectingC D P Q,depositors’ investment policies and the specializedportfolios’investmentpolicies.
–
– Reports on legal proceedings involving C D P Q or itssubsidiaries.
• ReceivedcopiesoftheminutesoftheInvestmentandRiskManagementCommittee’smeetings.
• ReviewedthemeasuresimplementedinthecontextoftheCOVID-19pandemicandemployees’transitiontoworkingremotely.
• Monitoredinternationaltaxmanagementactivities.
• Reviewedthedigitaltechnologysecurityprogram.
• RevieweddelegationsofauthorityandrecommendedthemtotheBoardforapproval.
• ReviewedandrecommendedtotheBoardforapprovalthePolicyonContractsfortheAcquisitionorLeasingofGoodsandServices,theInternalControlPolicy,andtheFinancialInformationDisclosurePolicy.
USE OF EXTERNAL EXPERTS
TheAuditCommitteedidnotuse theservicesofexternalexpertsin2020.Itneverthelessendorsedmanagement’suseofexternalfirmsforanindependentreviewofthefairvalueofcertaininvestments.

99CDPQ | 2020 AR
Report of the Governance and Ethics Committee
HIGHLIGHTS
1ReviewedtheCodesofEthicsandProfessionalConductofC D P Qandsomeofitsoperatingsubsidiaries.
2ReviewedthegovernancerulesapplicabletoC D P Qandsomeofitsoperatingsubsidiaries.
3ReviewedthecompositionoftheBoardanditscommittees.
GOVERNANCE AND ETHICS COMMITTEE
MANDATE
TheCommitteeensuresthatC D P Qadherestothehigheststandardsofgovernanceandethics.
For a full description of the Governance and EthicsCommittee’smandate,consult theGovernancesectionatw w w.c d p q.com.
COMPOSITION (as at December 31, 2020)
ThecompositionoftheCommitteewasreviewedin2020.TheCommittee consisted of four independent members,includingtheChairoftheCommittee:
• Chair:WendyMurdock
• Members:GillesGodbout,RavyPorandRobertTessier
ACTIVITY REPORT
Numberofmeetingsin2020:9
TheCommitteeassiststheBoard,andmakesrecommenda-tionsforitsapproval,regardingdeterminingthecompositionoftheBoardanditscommittees, implementingtheannualprocessforassessingthefunctioningoftheBoardanditscommittees,developingcorporategovernanceandethicsrules,andoverseeingtheapplicationofpoliciesonC D P Q’sbusinessconduct.
During the year, theCommitteedischarged the followingresponsibilities:
Composition, performance and operations of the Board and its committees
In2020,theCommittee:
• ReviewedthecompositionoftheBoardanditscommitteestoensurethattheircompositionmeetstherequirementsoftheActrespectingC D P Qandenablesthemtofullyassumetheirresponsibilities.
• Reviewed, in collaborationwith theHumanResourcesCommittee, theexpertiseandexperienceprofile for theselectionofindependentmembers.
• EvaluatedthefunctioningoftheBoardanditscommittees.
• ReviewedthereportingontrainingactivitiesattendedbyBoardmembersanddevelopedthetrainingplan.
• Reviewed theorientationprogram for newdirectors toensure the harmonious and swift integration of newmembers.
• Sawtotheestablishmentandmaintenanceofstructuresand procedures that would enable the Board to actindependentlyofmanagement.
Inparticular,theCommitteeensuredthatdiscussionsessionsareheldateach regularmeetingwithout thepresenceofmembersofmanagement.

Report of the Governance and Ethics Committee(continued)
CDPQ | 2020 AR100
Governance and ethics policies and practices
In2020,theCommittee:
• ReviewedthegovernancerulesforC D P Qandsomeofitsoperatingsubsidiaries.
• StudiedthereviewofthePolicyonDonationsandSpons or-ships and reviewed the report on philanthropic andinstitutionalsponsorshipactivities.
• StudiedthereviewofthePolicyonthePrinciplesGoverningtheExerciseofVotingRightsofPublicCompanies.
• ReviewedthePolicy–FraudandCorruptionPreventionandDetection.
• Reviewedthereportsonstewardshipinvestingactivities.
• ReviewedthereportondesignatingmemberstotheBoardsofDirectorsofcompaniesinwhichC D P Qinvests.
• Reviewedamendmentstotherulesonethicsandprofes-sionalconductapplicabletoBoardmembersandC D P Qofficersandemployees,toitsrealestateandrealestatedebtsubsidiaries,andtoitswhollyownedsubsidiaries.
• ReviewedthereportontheapplicationoftheCodeofEthicsandProfessionalConductforDirectorsandensuredthateachmemberdisclosedtheirinterestsinaccordancewiththeprovisionsoftheCodeandtheActrespectingC D P Q.
• ReviewedreportsontransactionsinvolvingsecuritiesofcompaniesthathavetieswithC D P Qdirectors.
USE OF EXTERNAL EXPERTS
The Governance and Ethics Committee did not use theservicesofexternalexpertsin2020.

101CDPQ | 2020 AR
Report of the Human Resources Committee
HIGHLIGHTS
1Managementduringa crisisandsupportforallC D P Q’steamsinthecontextofapandemicandanextendedperiodofworkingremotely.
2Furtherdevelopedthediversityandinclusionstrategytoprovideaninclusiveexperienceforallemployees.
3PreparedC D P Qandits talenttoseizeo pportunitiesandriseto futurechallengesastheorganizationandthe labourmarketevolve.
HUMAN RESOURCES COMMITTEE
MANDATE
ThemandateoftheCommitteeistoreviewtheorientationsandstrategiesusedbyC D P Qtomanageitshumanresources,includingperformanceevaluation,successionplanningandexecutive compensation, as well as its general humanresourcesmanagementpractices.
ForafulldescriptionoftheHumanResourcesCommittee’smandate, please consult the Governance section atw w w.c d p q.com.
COMPOSITION (as at December 31, 2020)
TheCommitteeiscomposedoffourindependentmembers,includingtheChairoftheCommittee:
• Chair:IvanaBonnet-Zivcevic
• Members:SylvainBrosseau,LynnJeanniotandRobert Tessier
ACTIVITY REPORT
Numberofmeetingsin2020:11
President and Chief Executive Officer
FollowingtheappointmentofCharlesEmondasPresidentandChiefExecutiveOfficer, theCommittee reviewedhisobjectivesfor2020andrecommendedthemtotheBoardofDirectors for approval. Consequently, the CommitteereviewedtheperformanceevaluationandtotalcompensationconditionsforthePresidentandChiefExecutiveOfficerandrecommendedthemtotheBoardofDirectorsforapproval.
Senior executives
TheCommitteereviewedchangestotheorganizationalstruc-tureinthecontextofanewPresidentandChiefExecutiveOfficertakinguphisduties,andrecommendedthechangestotheBoardofDirectorsforapproval.Thesechangesledtoseveralkeyappointmentsduringtheyear.KimThomassin,whoservedasExecutiveVice-President,LegalAffairsandSecretariat,was appointedExecutiveVice-President andHeadofInvestmentsinQuébecandStewardshipInvesting.HelenBeck,whowasamemberoftheEquityMarketsteam,becameExecutiveVice-PresidentandHeadofEquityMarkets,whileÈveGiardwasappointedExecutiveVice-President,Talent andPerformance. In addition,VincentDelislewasappointed Executive Vice-President and Head of LiquidMarkets,Marc-AndréBlanchardwasappointedExecutiveVice-PresidentandHeadofC D P QGlobal,andMichelLalandewas appointed Executive Vice-President, Legal AffairsandSecretariat.

Report of the Human Resources Committee (continued)
CDPQ | 2020 AR102
Further to these changes to the organizational structure, the Board also reviewed the assignment of additional responsibi-lities to certain members of senior management, including responsibility for global strategy given to Martin Coiteux, who was appointed Head of Economic Analysis and Global Strategy, and the leadership of the new cross-functional and integrated approach in technology to Alexandre Synnett, who was appointed Executive Vice-President and Chief Technology Officer.
At the end of 2020, following the departure of Macky Tall, the Committee reviewed the appointment of Jean-Marc Arbaud as President and Chief Executive Officer of C D P Q Infra, as well as Martin Laguerre as Executive Vice-President and Head of Private Equity and Capital Solutions, and recommended them both to the Board for approval.
In addition, the Committee reviewed senior executive performance evaluations and total compensation and recommended both to the Board for approval.
Given the exceptional economic context related to the COVID-19 pandemic, C D P Q decided to freeze the salaries of all the organization’s leaders for 2020.
Key strategies and policies for integrated talent management
In 2020, the Committee focused on several initiatives concerning integrated talent management. The Committee reviewed:
• Measures implemented to support employees in the context of a pandemic and an extended period of working remotely.
• The follow-up on priority talent management targets by reviewing key indicators, including hires, gender and generational diversity, the management ratio and internal mobility.
• The strategy and monitoring of diversity and inclusion initiatives.
• The revamped mentoring program.
• The process for identifying key skills for the future and implementing the related development levers.
• The exercise to maintain pay equity.
• In collaboration with the Governance and Ethics Committee, the expertise and experience profile used to appoint independent members to the Board.
Use of external experts
In implementing the variable compensation program, the Committee and the Board used the services of Hugessen Consulting, an independent consulting firm recognized for its expertise in the compensation of pension fund personnel. The Committee takes Hugessen Consulting’s recommendations into account but makes its own decisions, which may be based on information other than the firm’s recommendations.
COMPENSATION POLICY
Committee’s work on compensation
During 2020, the Committee, with advice from Hugessen Consulting, ensured that the Compensation Policy met its strategic objectives of paying for long-term performance, offering competitive compensation and linking the interests of management and depositors. The Committee reviewed how C D P Q’s Compensation Policy was applied. It analyzed the proposed variable compensation and proposals for the application of the co-investment program and ensured that the proposals were aligned with Compensation Policy and market practices.
Accordingly, the Committee notably analyzed the amount to be awarded under the variable compensation program and recommended it to the Board for approval.
Moreover, the Committee received an update on compen-sation market trends with regard to salary reviews in the context of the COVID-19 pandemic. It also discussed the salary conditions of C D P Q’s employees for 2021 and recommended them to the Board for approval.
Framework
C D P Q’s Compensation Policy was adopted in accordance with Schedule A of the regulation governing the internal management of C D P Q (the Internal Bylaw). This schedule:
• Defines the maximum levels of total employee compen-sation and the reference markets.
• States that the data reflecting the reference-market profile must be compiled by a recognized independent firm through an annual survey and must be administered and analyzed according to a methodology and rules generally accepted in the field.
• Stipulates that C D P Q’s payroll must not exceed 100% of the salary-scale midpoint.

103CDPQ | 2020 AR
Reference markets and compensation levels1
For the position of President and Chief Executive Officer, the reference market consists of a sample of the seven largest Canadian pension funds, as listed in Table 35 on page 110. For this position, total compensation must be between the median and third quartile (75th percentile) of the reference market, depending on whether C D P Q’s performance has been average or superior.
For investment-related positions, the Canadian institutional investment market serves as the reference. A representative sample must include institutions, insurance companies, trust companies, pension funds, investment advisors, brokerage firms and fund managers or their counterparts in similar industries. The current sample comprises the 34 organiza-tions listed in Table 37 on page 111. For these positions, total compensation must fall below the upper decile (90th percentile) of the reference market. For the executive vice-presidents in investment roles, a reduced sample of that described above is used. It groups together 17 firms whose assets under management are greater than $20 billion. The list is provided in Table 36 on page 110.
For non-investment positions, the Québec market serves as the reference, and must notably include public-sector jobs. It therefore contains a representative sample of large public- and private-sector Québec firms and financial-sector companies. The current sample comprises the 54 organizations listed in Table 38 on page 111. For these positions, total compensation must be within the third quartile (75th percentile) of the reference market.
The reference markets for positions located outside Canada were established according to principles similar to those listed previously.
In 2020, C D P Q retained the services of Willis Towers Watson for benchmarking its reference markets and engaged McLagan’s services regarding positions outside Canada.
Strategic objectives of the Compensation Policy
C D P Q must rely on highly skilled employees to fulfill its mission, which is to receive moneys on deposit as provided by the Act respecting C D P Q and manage them with a view to achieving an optimal return on capital within the framework of depositors’ investment policies, while at the same time contri-buting to Québec’s economic development.
The total Compensation Policy therefore has the following three objectives:
1. Pay for performance: variable compensation aligned with the returns delivered to depositors. This goal has four key components:
• Long-term focus, to compensate consistent performance over several years.
• Risk-return balance, to encourage measured risk-taking conducive to sustainable, long-term returns for deposi-tors, while taking into account their risk tolerance.
• Overall evaluation, to strike a balance between employees’ individual and collective contributions to the organiza-tion’s success, both in terms of financial results related to the performance of the asset class portfolios and C D P Q’s total portfolio and attainment of C D P Q’s business objectives.
• A view toward carbon footprint reduction, to support the investment strategy to address climate change and help achieve reduction targets related to carbon footprint intensity in asset class investments and the total portfolio, while capturing the profitable opportunities arising from the energy transition.
2. Offer competitive compensation: to attract, motivate and retain the employees with experience and expertise who will enable C D P Q to achieve its strategic objectives, within the guidelines in the Internal Bylaw, as described above.
3. Link the interests of management and depositors: to ensure that their individual and team efforts are conducive to C D P Q’s long-term success.
1. For compensation purposes, the first quartile ranges from the 1st to the 25th percentile, the second quartile from the 26th to the 50th percentile, the third quartile from the 51st to the 75th percentile and the fourth quartile from the 76th to the 100th percentile.

Report of the Human Resources Committee (continued)
CDPQ | 2020 AR104
C D P Q’s Compensation Policy complies with the Principles for Sound Compensation Practices issued by the Financial Stability Board and endorsed by the G20 nations: effective compensation governance; alignment of compensation with long-term, measured risk-taking; and regular review of compensation practices.
Components of total compensation
C D P Q’s employees receive total compensation based on four components:
1. Base salary
2. Variable compensation
3. Pension plan
4. Benefits
Base salary
Under the Internal Bylaw, the average base salary must not exceed the salary-scale midpoint. Within these parameters, annual base salaries are set according to the salary conditions prevailing on the reference markets.
Each year, the Human Resources Committee submits the payroll budget increase to the Board for approval.
For 2020, the Board of Directors approved the following recommendations made by C D P Q’s senior management:
• Maintain 2020 salary scales close to the median of the reference markets, as measured by recognized external firms; and
• Grant a budget for increases that is at the median of the market increase forecasts.
Given the exceptional economic context related to the COVID-19 pandemic, C D P Q decided to freeze the salaries of all leaders in the organization and its subsidiaries for 2020.
Variable compensation
In the investment industry, variable compensation is an essential part of the total compensation package for employees working in the sector because it aligns financial incentives with clients’ performance objectives.
Variable compensation at C D P Q serves to recognize performance, attainment of objectives and contribution to the achievement of strategic orientations. It is an important part of employee total compensation, as is the case for the entire financial sector. Accordingly, it has a direct influence on the positioning of total compensation in comparison with the reference market.
Variable compensation at C D P Q is determined based on a global evaluation that takes into account individual performance, portfolio or team performance and C D P Q’s return, measured over a five-year period. This period allows placing greater focus on seeking sustained performance aligned with the long-term investment strategy.
This variable compensation program recognizes consistent performance and requires eligible employees to defer a portion of this variable compensation into a co-investment account over a three-year period (see Figure 33 on page 107). This mechanism continues to link the interests of management to those of depositors by having these amounts vary according to the absolute return generated for depositors.
For the relevant employees in the International Private Equity team in international subsidiaries, a part of the variable compensation is awarded as performance units. This supports deployment of the direct International Private Equity strategy. This mechanism aims to recognize the various compensation structures present in the private equity sector and in countries where C D P Q is present internationally. This allows placing increased emphasis on the quality of the transactions completed by internal private equity teams, year after year, in establishing variable compensation. It also provides C D P Q with the opportunity to internalize expertise developed in direct investment rather than pay higher fees to external fund managers. In addition, it fosters attracting, retaining and motivating sought-after talent.

105CDPQ | 2020 AR
Components of variable compensation
Variable compensation is never guaranteed; it always depends on the evaluation of performance criteria as established by the variable compensation program. Accordingly, employees receive variable compensation based on the three components outlined in Figure 31.
Regarding the Return component, namely the return on the specialized portfolios, the objective of all portfolios is to outperform their benchmark indexes. The three less-liquid portfolios, namely Real Estate, Infrastructure and Private Equity, as well as the Equity Markets portfolio, each also have an absolute-return target.
Moreover, since 2018, a component linked to carbon footprint intensity reduction targets has been added to the variable compensation calculation to support C D P Q’s strategy to address climate change.
Results since 2016
Over the past five years, C D P Q has invested constructive capital in numerous projects, businesses and initiatives. The Human Resources Committee highlights some of these achie-vements, including those in 2020, with several of them presented in this report.
• Over five years, C D P Q has generated investment results of $110.7 billion through an annualized return of 7.8%. This performance is 0.2% greater than that of its benchmark index, creating $1.7 billion in value added.
• In 2020, in an extraordinary environment characterized by major contrasts between the asset classes, C D P Q delivered a 7.7% return that, overall, meets the needs of its depositors. This result is 1.5% short of its index, mainly due to under- performance by the Real Estate portfolio, which was hard hit by the pandemic. Total investment results were $24.8 billion.
• In Québec, C D P Q is helping build a dynamic, competitive and sustainable economy. It had $50 billion in assets in the private sector at the end of 2020, representing a $30-billion increase over ten years. To help Québec companies weather the crisis, C D P Q created a $4-billion envelope that will also enable them to drive their recovery and growth plans over the longer term. During the year, $3.1 billion in new invest-ments and commitments were made in alignment with the four pillars of C D P Q’s strategy: the growth of companies, their globalization, the acceleration of the technological shift and the development of a sustainable economy and communities—including by building the REM.
• In recent years, in addition to completing numerous transac-tions across all asset classes, the teams have implemented the organization’s main orientations, with compelling results:
– In Fixed Income, repositioning toward private credit has proven profitable, generating $3.3 billion in added value since 2017.
– The Private Equity portfolio also generated considerable value added ($9.0 billion over five years, including $4.9 billion in 2020) due to the excellent results of portfolio companies and increased post-investment support.
FIGURE 31
VARIABLE COMPENSATION COMPONENTS
BASED ON ACHIEVEMENT OF INDIVIDUAL OBJECTIVES Individual contribution
BASED ON ACHIEVEMENT OF BUSINESS OBJECTIVES OR RETURNS ON THE SPECIALIZED PORTFOLIOS OF EACH UNIT
Portfolio return or business plan achievement
BASED ON ACHIEVEMENT OF CDPQ’S RETURN OBJECTIVES CDPQ overall return

Report of the Human Resources Committee(continued)
CDPQ | 2020 AR106
– TheEquityMarketsportfoliodeliveredagoodreturn,posting $48.1 billion in net investment results overfiveyears.
– TheInfrastructureportfoliototalled$31.7billioninnetassetsduetoconsistentresultsfortheperiodandforhaving weathered the crisis well as a result of itsdiversification.
– InRealEstate,thelasttwoyearshavebeendifficult,buttheportfoliorepositioningacceleratedinthewakeofthepandemic.Over70transactionstotalling$8.7billionwereconcluded inprofitablesectorssuchas logisticsandmixed-useprojects. Inaddition,exposuretoshoppingcentres was significantly diminished and IvanhoéCambridgetookmeasurestooptimizeitsstructureandloweritscosts.
• Overthepastfiveyears,C D P Qhascontinuedtoglobalizeoperations,takingadvantageofattractiveopportunitiesinseveralcountries. Itsexposure to internationalmarketsgrewby$137billion,to68%,withmarkedincreasesintheUnitedStates,AsiaPacificandLatinAmerica.Inordertobettercoordinateitsactivitiesacrossthevariousregionsandourbusinessrelationshipsaroundtheworld,C D P QGlobalwascreatedin2020.
• C D P Qhasbecomeoneoftheworld’slargestinvestorsinsustainableassets.Since2017,itslow-carboninvestmentshavegrown$18billionanditscarbonfootprintperdollarinvested is down 38%. C D P Q has also been activelypromoting diversity, notably with the creation of a$250-millionfundaimedatincreasingdiversityandinclusionincompaniesinQuébecandCanada.
• Inaddition,toimproveitsimpactintechnologyandmakeitarealperformancedriver,C D P Qimplementedanintegratedtechnologystrategyin2020.
• Lastly,over five years,C D P Q’snetassets increasedby$117.5billion,bringingthetotalasatDecember31,2020,to$365.5billion.
2020 variable compensation
Taking intoaccountvariablecompensationbothpaidanddeferred,employees’totalcompensationin2020wasbelowthemedianofthereferencemarketsfora7.8%performanceoverfiveyears.VariablecompensationforC D P QemployeesinQuébecandtheinternationalofficestotalled$158.7millionin2020,comparedwith$156.8millionin2019.Thisrepresentsan average decrease of nearly 8% per employee due tovariationsinthenumberofpersonnel.
Morespecifically,astudybyWillisTowersWatsonshowedthattheemployees’totalcompensationrankedbetweenthe14thand68thpercentilesofthereferencemarkets,andonaverageatthe35thpercentile(wherethe100thpercentilerepresents the highest compensation in the market),dependingontheposition,thespecificperformanceoftheportfoliosandthecompensationawardedforthesepositions(seeTable32).
TheopinionpresentedbyHugessenConsultingtoC D P Q’sBoardofDirectorsstated:
“WereviewedC D P Q’sreturnsandbenchmark indexesfor2020,aswellasthefactorsthatcontributedtoitsreturn,andwe are satisfied with them. We can confirm that thevalue-added calculations, the 2020 returnmultiples, the2016–2020averagereturnmultiplesandthe2020variablecompensationmultiplesareconsistentwithC D P Q’svariablecompensationprogram.Inouropinion,thetotalamountofvariablecompensationdeterminedundertheprogramin2020isreasonableintheprevailingmarketconditionsandgivenC D P Q’sperformancein2016,2017,2018,2019and2020.”
TABLE 32
POSITIONINGOFTOTALCOMPENSATIONBYPOSITIONTYPE
PositiontypeMaximumtotalcompensationundertheBylaw1
Averagepositioningofthetotalcompensationawardedin2020relativetothereferencemarketsundertheBylaw
Investmentpositions 90thpercentile Betweenthe14thto68thpercentileand,onaverage,atthe35thpercentileNon-investmentpositions 75thpercentile
1. Maximum total compensation refers to percentile positions found in Schedule A of the Internal Bylaw.
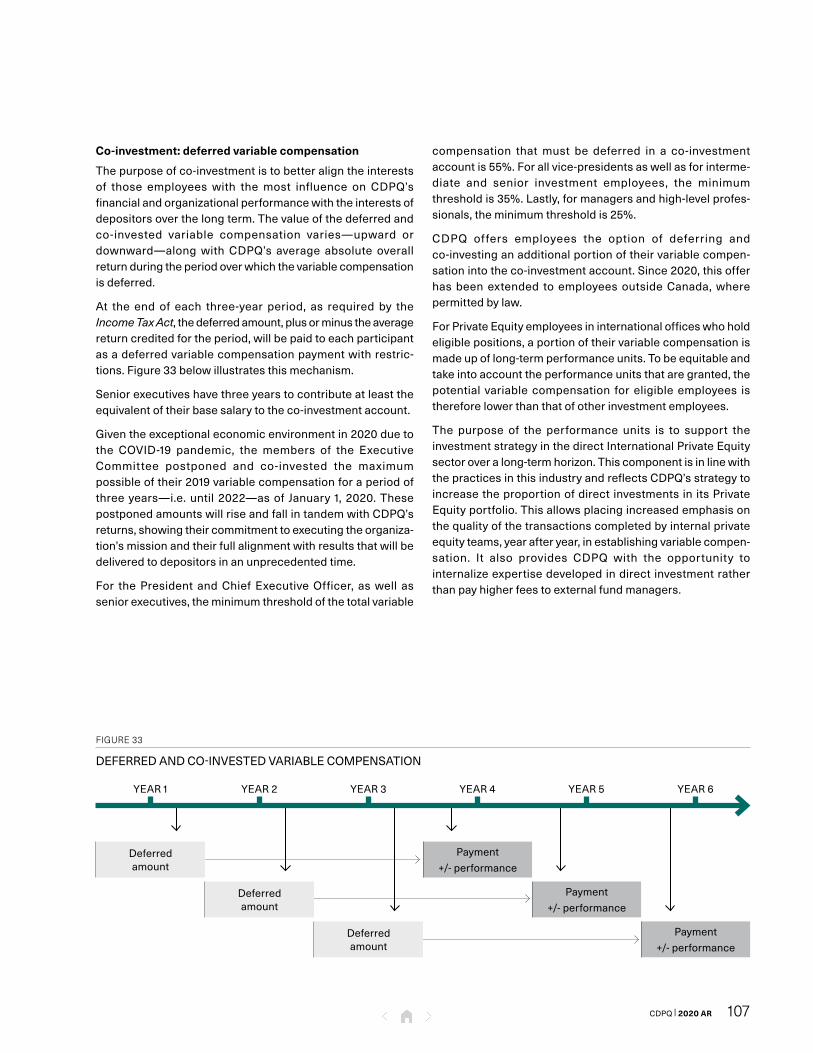
107CDPQ | 2020 AR
Co-investment: deferred variable compensation
Thepurposeofco-investmentistobetteraligntheinterestsof those employees with themost influence on C D P Q’sfinancialandorganizationalperformancewiththeinterestsofdepositorsoverthelongterm.Thevalueofthedeferredandco-invested variable compensation varies—upward ordownward—alongwith C D P Q’s average absolute overallreturnduringtheperiodoverwhichthevariablecompensationisdeferred.
At the end of each three-year period, as required by theIncome Tax Act,thedeferredamount,plusorminustheaveragereturncreditedfortheperiod,willbepaidtoeachparticipantasadeferredvariablecompensationpaymentwithrestric-tions.Figure33belowillustratesthismechanism.
Seniorexecutiveshavethreeyearstocontributeatleasttheequivalentoftheirbasesalarytotheco-investmentaccount.
Giventheexceptionaleconomicenvironmentin2020duetothe COVID-19 pandemic, the members of the ExecutiveCommittee postponed and co-invested the maximumpossibleoftheir2019variablecompensationforaperiodofthreeyears—i.e.until2022—asof January 1,2020.ThesepostponedamountswillriseandfallintandemwithC D P Q’sreturns,showingtheircommitmenttoexecutingtheorganiza-tion’smissionandtheirfullalignmentwithresultsthatwillbedeliveredtodepositorsinanunprecedentedtime.
For thePresident andChiefExecutiveOfficer, aswell asseniorexecutives,theminimumthresholdofthetotalvariable
compensation thatmust be deferred in a co-investmentaccountis55%.Forallvice-presidentsaswellasforinterme-diate and senior investment employees, the minimumthresholdis35%.Lastly,formanagersandhigh-levelprofes-sionals,theminimumthresholdis25%.
C D P Q offers employees the option of deferring andco-investinganadditionalportionoftheirvariablecompen-sationintotheco-investmentaccount.Since2020,thisofferhasbeenextended toemployeesoutsideCanada,wherepermittedbylaw.
ForPrivateEquityemployeesininternationalofficeswhoholdeligiblepositions,aportionoftheirvariablecompensationismadeupoflong-termperformanceunits.Tobeequitableandtakeintoaccounttheperformanceunitsthataregranted,thepotential variablecompensation foreligibleemployees isthereforelowerthanthatofotherinvestmentemployees.
The purpose of the performance units is to support theinvestmentstrategyinthedirectInternationalPrivateEquitysectoroveralong-termhorizon.ThiscomponentisinlinewiththepracticesinthisindustryandreflectsC D P Q’sstrategytoincreasetheproportionofdirectinvestmentsinitsPrivateEquityportfolio.Thisallowsplacingincreasedemphasisonthequalityofthetransactionscompletedbyinternalprivateequityteams,yearafteryear,inestablishingvariablecompen-sation. It also provides C D P Q with the opportunity tointernalizeexpertisedevelopedindirectinvestmentratherthanpayhigherfeestoexternalfundmanagers.
FIGURE 33
DEFERREDANDCO-INVESTEDVARIABLECOMPENSATION
YEAR1 YEAR2 YEAR3 YEAR4 YEAR5 YEAR6
Deferred amount
Payment+/-performance
Deferred amount
Payment+/-performance
Deferred amount
Payment+/-performance

Report of the Human Resources Committee (continued)
CDPQ | 2020 AR108
The value of the performance units awarded will rise and fall according to the absolute return of the designated portfolio during a five-year performance period.
At the end of this period, the units acquired will be settled based on the achievement of performance objectives established at the time they were granted and converted into performance factors that have a threshold and a maximum. When the performance over five years is less than the threshold, no amounts are payable.
Pension plan
Depending on their positions, all employees based in Canada are members and contribute to one of two defined-benefit pension plans: the Government and Public Employees Retirement Plan or the Pension Plan of Management Personnel. In addition, managers and professionals in strategic positions participate in the Régime additionnel de retraite (R A R) and senior executives participate in the Supplemental Pension Plan for Designated Officers (S P P D O). Under these two plans, they are entitled, as of the normal age of retirement, to receive a total annual pension equal to 2% of their eligible earnings for each year or fractional year of plan membership, taking into account the annual tax limits imposed by the Canada Revenue Agency for each year they were not R A R or S P P D O members.
Some senior executives will have additional years of service recognized under the S P P D O, depending on the circums-tances of their promotion or hiring.
Benefits
Employees enjoy a range of competitive benefits, including group insurance (such as medical, dental and life insurance). Moreover, senior executives benefit from specific benefits paid as an allowance. Note that C D P Q requests that senior executives undergo annual health assessments.
Review of the President and Chief Executive Officer’s performance and total compensation
Performance review
At the beginning of his mandate, the Committee recommended to the Board a series of individual objectives proposed by the President and Chief Executive Officer. The context of the pandemic, declared one month after Mr. Emond took office, required that his main objectives be adapted to reflect the priorities that such an environment demands.
• A first objective was to minimize the risks to the physical and psychological health of our employees and to maintain the commitment of our teams in this extraordinary context and keep them mobilized.
• A second objective was to see to the overall management of the portfolio in a pandemic market environment and, more specifically, to: tightly manage liquidity, rebalance portfolios, monitor portfolio assets and maintain an ongoing dialogue with C D P Q’s key stakeholders to provide support as needed, and position C D P Q for the recovery.
• A third objective was to establish the new organizational structure to support the execution of C D P Q’s strategy over the next few years, particularly internationally and with respect to technology.
• A fourth objective was to ensure a specific presence to support Québec companies that are well positioned for the future, despite the challenges posed by the pandemic.
Review of total compensation
The Board decided to appoint Charles Emond as President and Chief Executive Officer, effective February 1, 2020. The compensation and other employment conditions of the President and Chief Executive Officer are based on parameters set by the government after consultation with the Board of Directors. Mr. Emond’s annual base salary was set at $550,000.
The President and Chief Executive Officer’s annual variable compensation was determined on the basis of the same three components as in 2019, presented in Figure 34 on page 109.

109CDPQ | 2020 AR
Likeallothermembersofseniormanagementcoveredbythevariable compensation program, thePresident andChiefExecutiveOfficerisrequiredtodeferaminimumof55%ofhisvariablecompensationinaco-investmentaccount.
This year, thecomponent linked toC D P Q’soverall returncorrespondstothereturnoverthefive-yearperiodfrom2016to2020.Theannualizedreturnforthisperiodis7.8%,with$110.7billionof valueadded in relation to thebenchmarkportfolio. This return represents solid performance overfive years.
Asforthecomponentbasedontheorganization’sobjectives,underMr.Emond’sleadershipsinceFebruary1,2020,C D P Q:
• Ensured strict management of the risks posed by theexceptionalmarketenvironment,includingbymaintainingagoodlevelofliquidity,prudentlyadjustingthevaluesofthe less-liquid assetsmost affected by the pandemic,providingstrongsupporttoourportfoliocompanies,andbeginningtorepositionsomeofC D P Q’sactivitiestoreflectthenewenvironment.
• ContinuedtoplayaleadingrolewithQuébeccompanies,includingbycreatinganenvelopetohelpthemgetthroughthepandemicandbepositionedfortherecovery,aswellasthroughsustainedinvestmentsinQuébec’sprivatesector,includinginneweconomycompanies.
• Providedrigorous follow-upof theREMprojectand therelatedandongoingworkonextensionprojects,includingtheREMdel’Est,announcedattheendoftheyear.
• Strengthenedthemanagementandvalueofpost-investmentactivitiestoenhanceC D P Q’simpactonportfoliocompaniesandcreatemorevalueforourdepositors.
• Reviewed thegovernancemodel forC D P Q’soperatingsubsidiaries.
• Continuedtodeploythe investmentstrategytoaddressclimatechange,withmajortransactions, inparticular inrenewableenergy,andbyactivelyparticipatinginmajorglobal initiatives topromote transitioning theeconomy,suchastheNet-ZeroAssetOwnerAllianceandtheInvestorLeadershipNetwork(I L N).
Toconclude,Mr.Emondexercisedunifying leadership tomobilizeteamsandmaintaintheirlevelofcommitmentandperformance inanextraordinaryenvironment.C D P Qwastherefore able to continue implementing its strategy togeneratesolidlong-termresultsforthebenefitofdepositors,inadditiontohavingcarriedouttheworkrequiredtostronglypositionitsportfolioforthefuture.TheCommitteeandtheBoard believe that Mr. Emond delivered remarkableperformancethathasgreatlysurpassedtheobjectivessetforhim.
TheBoard ofDirectors has awardedMr. Emond variablecompensation of $2,750,000 and, of this amount, he haselectedtodeferanamountof$1,512,500intotheco-investmentaccount. In 2023,Mr. Emondwill be eligible to receive adeferredamountrelatedtothissum,increasedordecreasedbyC D P Q’saverageabsolutereturnoverthethree-yearperiodfrom2021to2023.
FIGURE 34
VARIABLECOMPENSATIONCOMPONENTSOFTHEPRESIDENTANDCHIEFEXECUTIVEOFFICER
CDPQOVERALLRETURNBasedonthelevelofattainmentofCDPQ’sreturnobjectives
ACHIEVEMENTOFTHEORGANIZATION’SOBJECTIVESBasedonthelevelofattainmentoftheorganization’sobjectives
INDIVIDUALCONTRIBUTIONBasedonthelevelofattainmentofindividualobjectives

Report of the Human Resources Committee(continued)
CDPQ | 2020 AR110
TheotheremploymentconditionstowhichMr.EmondwasentitledarealignedwithC D P Q’spoliciesandcomplywiththeparameterssetoutintheInternalBylaw.Hereceived$40,000inannualperquisitesandwasamemberofC D P Q’sEmployeeGroupInsurancePlan.
Mr.EmondisamemberofthebasicpensionplanunderthePensionPlanofManagementPersonnel (PPMP). In2020,contributionsto themandatorybasicplanrepresentedanannualcosttoC D P Qof$19,002.Likethemembersofseniormanagement,Mr.EmondhasparticipatedintheSupplementalPension Plan for Designated Officers (S P P D O) sincebeinghired.
In the event that his employment contract is terminatedwithoutjustandsufficientcause,Mr.Emondwillbeentitledtoseverancepayrepresenting18monthsofsalaryandtargetvariablecompensation,aswellasaproratedamountofhisvariable compensation for the current year and for thepreviousyear, ifsuchvariablecompensationhasnotbeenpaid.ThisprovisiondoesnotapplyifMr.Emondresigns.
Noseverancewillbepaidupontheexpirationofthecontractorifthecontractisterminatedwithcause.
Compensation of the President and Chief Executive Officer and the five most highly compensated executives for 2018–2020
C D P Q’sBoardofDirectors recognizes the importanceofqualifiedleadershipandfirmlybelievesthatthepoliciesandprogramsithasendorsedmakeitpossibleto:
• Offer competitive compensation in a market wherecompetition for talent is intenseandwhereC D P Qmustcompetegloballytogeneratetheexpectedreturns.
• AchievethestrategicobjectivesthatenableC D P Qtofulfillitsmission.
PursuanttotheActrespectingC D P Q,itdiscloses,foritselfanditswhollyownedsubsidiaries,thecompensationofthePresidentandChiefExecutiveOfficeraswellasthatofthefivemosthighlycompensatedexecutivesreportingdirectlytohim(seeTable39,page112).
TABLE 35
REFERENCEMARKET–PRESIDENTANDCHIEFEXECUTIVEOFFICER
• AlbertaInvestmentManagementCorporation(A I M Co)
• BritishColumbiaInvestmentManagementCorporation(B C I)
• C P PInvestments
• HealthcareofOntarioPensionPlan(H O O P P)
• OntarioMunicipalEmployeesRetirementSystem(O M E R S)
• OntarioTeachers’PensionPlan(O T P P)
• PublicSectorPensionInvestmentBoard(P S P Investments)
TABLE 36
REFERENCEMARKET–INVESTMENTEXECUTIVEVICE-PRESIDENTPOSITIONS
• AddendaCapital• AlbertaInvestmentManagementCorporation(A I MCo)
• BritishColumbiaInvestmentManagementCorporation(B C I)
• CanadaPostPensionPlan• Connor,Clark&LunnFinancialGroup• C P PInvestments
• DesjardinsGlobalAssetManagement• HealthcareofOntarioPensionPlan(H O O P P)
• Hydro-QuébecPensionPlan• iAFinancialGroup• InvestmentManagementCorporationof Ontario(I M C O)
• MawerInvestmentManagement
• OntarioMunicipalEmployeesRetirementSystem(O M E R S)
• OntarioTeachers’PensionPlan(O T P P)• PublicSectorPensionInvestmentBoard(P S P Investments)
• SunLifeFinancial• WorkplaceSafetyandInsuranceBoard(Ontario)
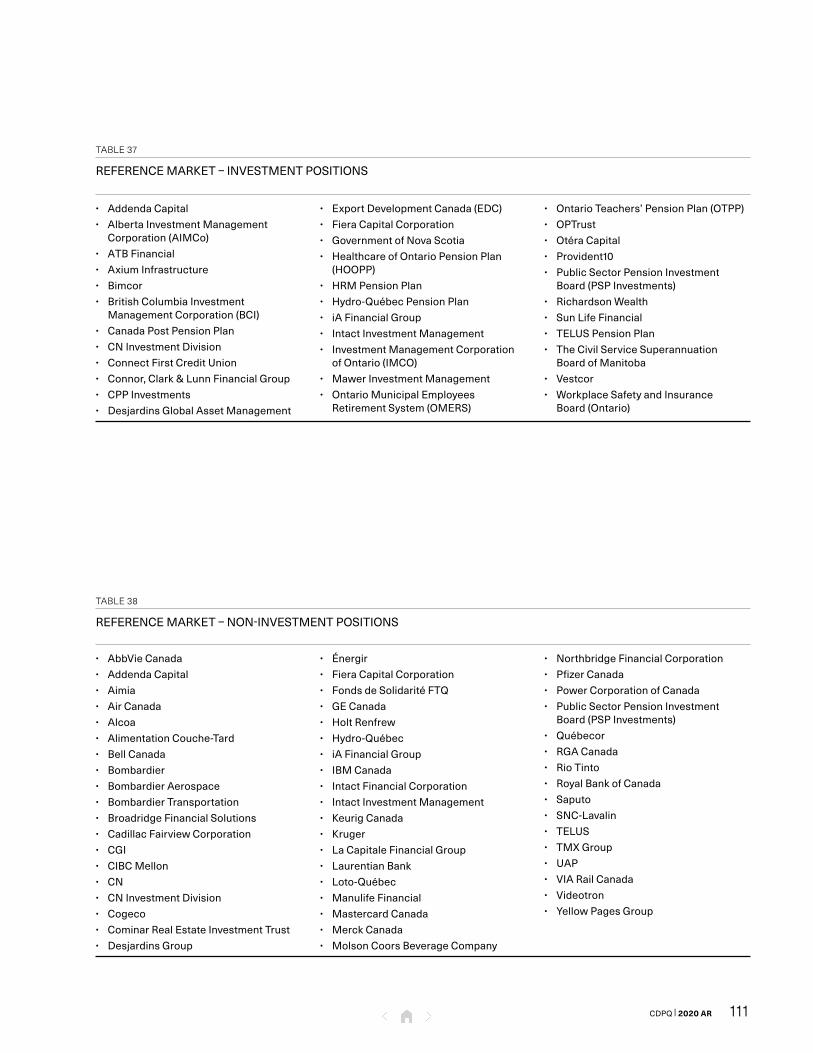
111CDPQ | 2020 AR
TABLE 37
REFERENCEMARKET–INVESTMENTPOSITIONS
• AddendaCapital• AlbertaInvestmentManagementCorporation(A I M Co)
• A T BFinancial• AxiumInfrastructure• Bimcor• BritishColumbiaInvestmentManagementCorporation(B C I)
• CanadaPostPensionPlan• C NInvestmentDivision• ConnectFirstCreditUnion• Connor,Clark&LunnFinancialGroup• C P PInvestments• DesjardinsGlobalAssetManagement
• ExportDevelopmentCanada(E D C)• FieraCapitalCorporation• GovernmentofNovaScotia• HealthcareofOntarioPensionPlan(H O O P P)
• HRMPensionPlan• Hydro-QuébecPensionPlan• iAFinancialGroup• IntactInvestmentManagement• InvestmentManagementCorporationofOntario(I M C O)
• MawerInvestmentManagement• OntarioMunicipalEmployeesRetirementSystem(O M E R S)
• OntarioTeachers’PensionPlan(O T P P)• O P Trust• OtéraCapital• Provident10• PublicSectorPensionInvestmentBoard(P S P Investments)
• RichardsonWealth• SunLifeFinancial• TELUSPensionPlan• TheCivilServiceSuperannuationBoardofManitoba
• Vestcor• WorkplaceSafetyandInsuranceBoard(Ontario)
TABLE 38
REFERENCEMARKET–NON-INVESTMENTPOSITIONS
• AbbVieCanada• AddendaCapital• Aimia• AirCanada• Alcoa• AlimentationCouche-Tard• BellCanada• Bombardier• BombardierAerospace• BombardierTransportation• BroadridgeFinancialSolutions• CadillacFairviewCorporation• C G I• CIBCMellon• C N• C NInvestmentDivision• Cogeco• CominarRealEstateInvestmentTrust• DesjardinsGroup
• Énergir• FieraCapitalCorporation• FondsdeSolidaritéF T Q• GECanada• HoltRenfrew• Hydro-Québec• iAFinancialGroup• I B MCanada• IntactFinancialCorporation• IntactInvestmentManagement• KeurigCanada• Kruger• LaCapitaleFinancialGroup• LaurentianBank• Loto-Québec• ManulifeFinancial• MastercardCanada• MerckCanada• MolsonCoorsBeverageCompany
• NorthbridgeFinancialCorporation• PfizerCanada• PowerCorporationofCanada• PublicSectorPensionInvestmentBoard(P S P Investments)
• Québecor• R G ACanada• RioTinto• RoyalBankofCanada• Saputo• S N C-Lavalin• TELUS• TMXGroup• U A P• VIARailCanada• Videotron• YellowPagesGroup

Report of the Human Resources Committee(continued)
CDPQ | 2020 AR112
TABLE 39
SUMMARYOFTHECOMPENSATIONOFTHEPRESIDENTANDC E O ANDTHEFIVEMOSTHIGHLYCOMPENSATEDEXECUTIVESFOR2018–2020
Thistablesummarizestotalcompensationasawarded.Specifically,itsetsoutthevariablecompensationawardedfortheyear,dividedbetweentheproportionpaidfortheyearandtheamountco-invested(deferred),aswellasthevalueofpensionplanparticipation, if applicable. Total compensation awarded provides a better understanding of the alignment withC D P Q’sperformance.
NameandmainpositionYear
Basesalary
A
Variablecompensation
paidfortheyear
B
Co-investmentamountfor
theyear1
C
Variablecompensationawardedfor
theyearD=B+C
Pensionvalue2
E
Othercompensation3
F
Totalcompensationawardedfor
theyearG=A+D+E+F
CharlesEmond4 PresidentandChiefExecutiveOfficer
2020 $ 546,000 $1,237,500 $1,512,500 $2,750,000 $ 103,700 $ 50,400 $3,450,100
2019 $ 458,000 $ 0 $2,200,000 $2,200,000 $ 87,100 $ 36,300 $2,781,400
2018 N/A N/A N/A N/A N/A N/A N/A
MackyTall5 HeadofRealAssetsand PrivateEquity,C D P Q PresidentandChiefExecutiveOfficer,C D P Q Infra
2020 $ 500,000 $1,755,000 N/A $1,755,000 $ 90,000 $ 41,900 $2,386,900
2019 $ 500,000 $ 593,900 $1,854,100 $2,448,000 $ 90,000 $ 42,100 $3,080,100
2018 $ 485,000 $1,113,700 $ 811,300 $1,925,000 $ 92,200 $ 42,000 $2,544,200
EmmanuelJaclot6 ExecutiveVice-PresidentandHeadofInfrastructure
2020 € 425,000 € 431,100 € 526,900 € 958,000 € 76,500 € 6,800 €1,466,3002019 € 425,000 € 22,700 €1,114,300 €1,137,000 € 38,300 € 6,800 €1,607,100
2018 € 248,000 € 504,900 € 617,100 €1,122,000 € 10,000 € 5,600 €1,385,600
ClaudeBergeron ChiefRiskOfficerand HeadofDepositor Relationships
2020 $ 440,000 $ 447,300 $ 546,700 $ 994,000 $ 136,400 $ 40,100 $1,610,500
2019 $ 440,000 $ 0 $1,244,000 $1,244,000 $ 136,400 $ 40,600 $1,861,000
2018 $ 431,000 $ 400,000 $ 600,000 $1,000,000 $ 137,900 $ 41,900 $1,610,800
KimThomassin7 ExecutiveVice-President andHeadofInvestments in Québecand StewardshipInvesting
2020 $ 400,000 $ 242,000 $ 726,000 $ 968,000 $ 120,000 $ 37,500 $1,525,500
2019 $ 400,000 $ 0 $ 965,000 $ 965,000 $ 116,000 $ 37,200 $1,518,200
2018 $ 400,000 $ 154,000 $ 616,000 $ 770,000 $ 128,000 $ 38,800 $1,336,800
MaarikaPaul ExecutiveVice-PresidentandChiefFinancialandOperationsOfficer
2020 $ 440,000 $ 0 $ 795,000 $ 795,000 $ 237,600 $ 41,400 $1,514,000
2019 $ 440,000 $ 0 $ 806,000 $ 806,000 $ 237,600 $ 41,200 $1,524,800
2018 $ 415,000 $ 202,500 $ 607,500 $ 810,000 $ 240,700 $ 42,500 $1,508,200
6. For Mr. Jaclot, in addition to total compensation awarded, he receives a temporary allowance of €280,000 in annual instalments until May 2023 and a compensatory amount of €300,000 in 2020. His compensation is presented in euros.
5. Mr. Tall stepped down on December 31, 2020.
4. For Mr. Emond, total compensation reflects what he was awarded in his role as Executive Vice-President up to February 2020. In addition to his total compensation, he receives compensatory amounts related to his hiring as Executive Vice-President ($1,482,000 in 2020 and $1,769,000 in 2021).
3. Amounts indicated include employer contributions to group insurance premiums, perquisites and health assessments. This category may also include other allocated amounts, depending on the executive.
2. The pension value is based on a calculation that allocates the total pension value over the period corresponding to the executive’s career. This value is calculated by Willis Towers Watson.
1. As mentioned on page 107 of this Annual Report, under the variable compensation program, senior executives must defer a minimum of 55% of their annual awarded variable compensation into a co-investment account.
7. Ms. Thomassin’s compensation reflects what she was awarded in her role as Executive Vice-President, Legal Affairs and Secretariat up to April 2020.

113CDPQ | 2020 AR
TABLE 40
SUMMARYOFTHEDEFERREDANDCO-INVESTEDCOMPENSATIONOFTHEPRESIDENTANDC E OANDOFTHEFIVEMOSTHIGHLYCOMPENSATEDEXECUTIVESFOR2017–2020
NameandmainpositionFiscalyear
Deferredandco-investedcompensation1
Cumulativereturnatthetimeofpayment
Previouslyco-investedcompensationdisbursed
in20202
CharlesEmond PresidentandChiefExecutiveOfficer
2020 $1,512,500
N/A N/A
2019 $2,200,000
2018 N/A
2017 N/A N/A N/A
MackyTall HeadofRealAssetsandPrivateEquity,C D P Q PresidentandChiefExecutiveOfficer,C D P Q Infra
2020 N/A
N/A N/A
2019 $1,854,100
2018 $ 811,300
2017 $ 646,300 $ 80,083 $ 726,383
EmmanuelJaclot ExecutiveVice-PresidentandHeadofInfrastructure
2020 € 526,900
N/A N/A
2019 €1,114,300
2018 € 617,100
2017 N/A N/A N/A
ClaudeBergeron ChiefRiskOfficerandHeadofDepositorRelationships
2020 $ 546,700
N/A N/A
2019 $1,244,000
2018 $ 600,000
2017 $ 528,000 $ 65,424 $ 593,424
KimThomassin ExecutiveVice-PresidentandHeadofInvestmentsinQuébecandStewardshipInvesting
2020 $ 726,000
N/A N/A
2019 $ 965,000
2018 $ 616,000
2017 $ 560,000 $ 69,389 $ 629,389
MaarikaPaul ExecutiveVice-PresidentandChiefFinancialandOperationsOfficer
2020 $ 795,000
N/A N/A
2019 $ 806,000
2018 $ 607,500
2017 $ 600,000 $ 74,346 $ 674,346
1. The amounts appearing in the table refer to the portion of the variable compensation awarded from previous years and the current year, which is deferred over a three-year period. As required by the Income Tax Act, these amounts must be disbursed after three years.
2. Disbursed co-investments correspond to the sum of the deferred compensation and the return earned during the three-year period. The returns earned correspond to the weighted average return on C D P Q’s depositors’ funds expressed as a percentage, as published by C D P Q for each of its fiscal years and each of its six-month periods, compounded over a three-year period.
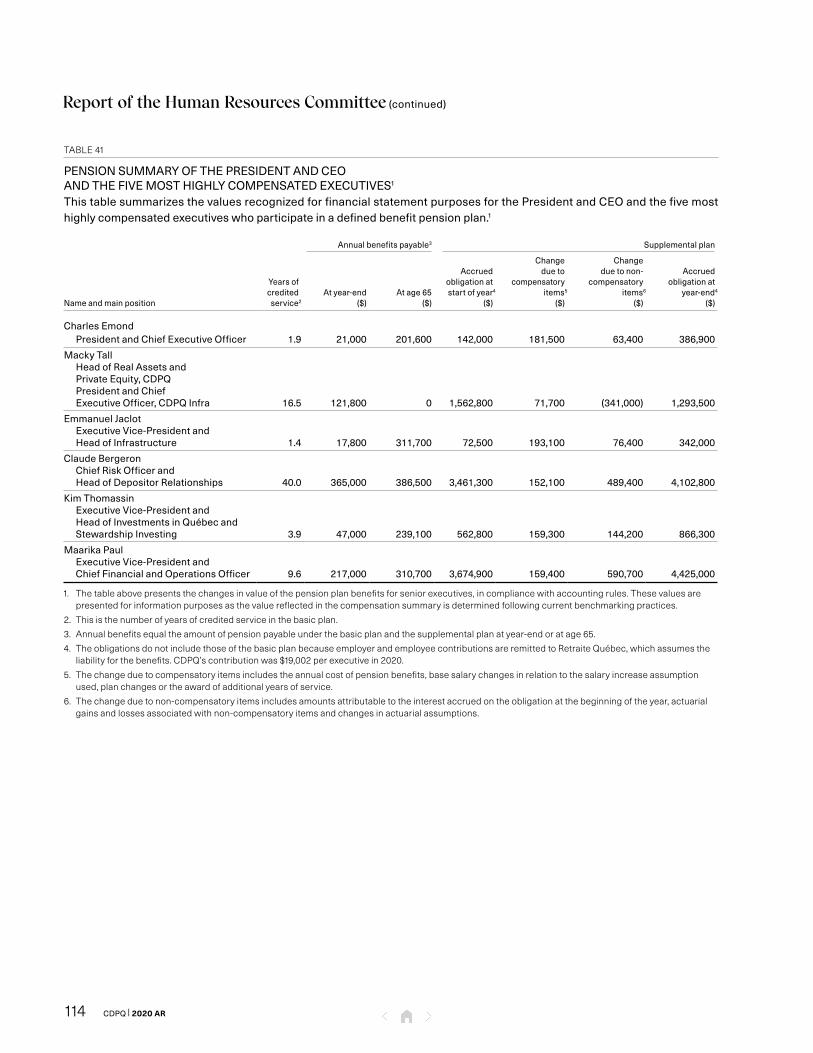
Report of the Human Resources Committee (continued)
CDPQ | 2020 AR114
TABLE 41
PENSION SUMMARY OF THE PRESIDENT AND C E O AND THE FIVE MOST HIGHLY COMPENSATED EXECUTIVES1
This table summarizes the values recognized for financial statement purposes for the President and C E O and the five most highly compensated executives who participate in a defined benefit pension plan.1
Name and main position
Years of credited service2
Annual benefits payable3 Supplemental plan
At year-end($)
At age 65($)
Accrued obligation at start of year4
($)
Change due to
compensatory items5
($)
Change due to non-
compensatory items6
($)
Accrued obligation at
year-end4
($)
Charles Emond President and Chief Executive Officer 1.9 21,000 201,600 142,000 181,500 63,400 386,900
Macky Tall Head of Real Assets and Private Equity, C D P Q President and Chief Executive Officer, C D P Q Infra 16.5 121,800 0 1,562,800 71,700 (341,000) 1,293,500
Emmanuel Jaclot Executive Vice-President and Head of Infrastructure 1.4 17,800 311,700 72,500 193,100 76,400 342,000
Claude Bergeron Chief Risk Officer and Head of Depositor Relationships 40.0 365,000 386,500 3,461,300 152,100 489,400 4,102,800
Kim Thomassin Executive Vice-President and Head of Investments in Québec and Stewardship Investing 3.9 47,000 239,100 562,800 159,300 144,200 866,300
Maarika Paul Executive Vice-President and Chief Financial and Operations Officer 9.6 217,000 310,700 3,674,900 159,400 590,700 4,425,000
1. The table above presents the changes in value of the pension plan benefits for senior executives, in compliance with accounting rules. These values are presented for information purposes as the value reflected in the compensation summary is determined following current benchmarking practices.
2. This is the number of years of credited service in the basic plan.
3. Annual benefits equal the amount of pension payable under the basic plan and the supplemental plan at year-end or at age 65.
4. The obligations do not include those of the basic plan because employer and employee contributions are remitted to Retraite Québec, which assumes the liability for the benefits. C D P Q’s contribution was $19,002 per executive in 2020.
5. The change due to compensatory items includes the annual cost of pension benefits, base salary changes in relation to the salary increase assumption used, plan changes or the award of additional years of service.
6. The change due to non-compensatory items includes amounts attributable to the interest accrued on the obligation at the beginning of the year, actuarial gains and losses associated with non-compensatory items and changes in actuarial assumptions.

115CDPQ | 2020 AR
TABLE 42
SUMMARYOFSEVERANCEPAYFORTHEPRESIDENTANDC E OANDTHEFIVEMOSTHIGHLYCOMPENSATEDEXECUTIVES
Nameandmainposition Precipitatingevent Theoreticalamountpayable
CharlesEmond1 PresidentandChiefExecutiveOfficer Non-voluntarytermination $2,681,000
MackyTall2 HeadofRealAssetsandPrivateEquity,C D P QPresidentandChiefExecutiveOfficer,C D P QInfra Non-voluntarytermination $1,250,000
EmmanuelJaclot3 ExecutiveVice-PresidentandHeadofInfrastructure Non-voluntarytermination € 638,000
ClaudeBergeron4 ChiefRiskOfficerandHeadofDepositorRelationships Non-voluntarytermination $1,097,000
KimThomassin5 ExecutiveVice-PresidentandHeadofInvestmentsinQuébecandStewardshipInvesting Non-voluntarytermination $ 830,000
MaarikaPaul6 ExecutiveVice-PresidentandChiefFinancialandOperationsOfficer Non-voluntarytermination $ 995,000
1. In the event of dismissal without just and sufficient cause, this executive’s employment contract provides for severance equal to 18 months of his annual base salary, increased by an amount equal to 18 months of his annual target variable compensation and, if applicable, to his annual target variable compensation prorated to the months worked during the months preceding the termination of his employment, as well as annual variable compensation for the full year worked preceding the termination of his employment.
2. In the event of dismissal without just and sufficient cause, this executive’s employment contract provides for severance equal to his annual base salary, increased by an amount equal to his annual target variable compensation and, if applicable for the current year, the amount of his annual target variable compensation and the average of the annual target variable compensation for the last three years corresponding to his responsibilities as President and Chief Executive Officer of C D P Q Infra, prorated to the months worked during the months preceding the termination of his employment.
3. In the event of dismissal without just and sufficient cause, this executive’s employment contract provides for severance equal to 18 months of his annual base salary and, if applicable, the annual variable compensation corresponding to the average of the annual variable compensation of the last four years, prorated to the months worked during the months preceding the termination of his employment as well as annual variable compensation for the full year worked preceding the termination of his employment.
4. In the event of dismissal without just and sufficient cause, this executive’s employment contract provides for severance pay equal to his annual base salary, increased by an amount equivalent to his annual target variable compensation and the annual amount related to perquisites.
5. In the event of dismissal without just and sufficient cause, this executive’s employment contract provides for severance pay equal to 24 months of her annual base salary.
6. In the event of dismissal without just and sufficient cause, this executive’s employment contract provides for severance pay equal to 15 months of her annual base salary, increased by an amount equivalent to 15 months of her annual target variable compensation, up to a maximum of $995,000.
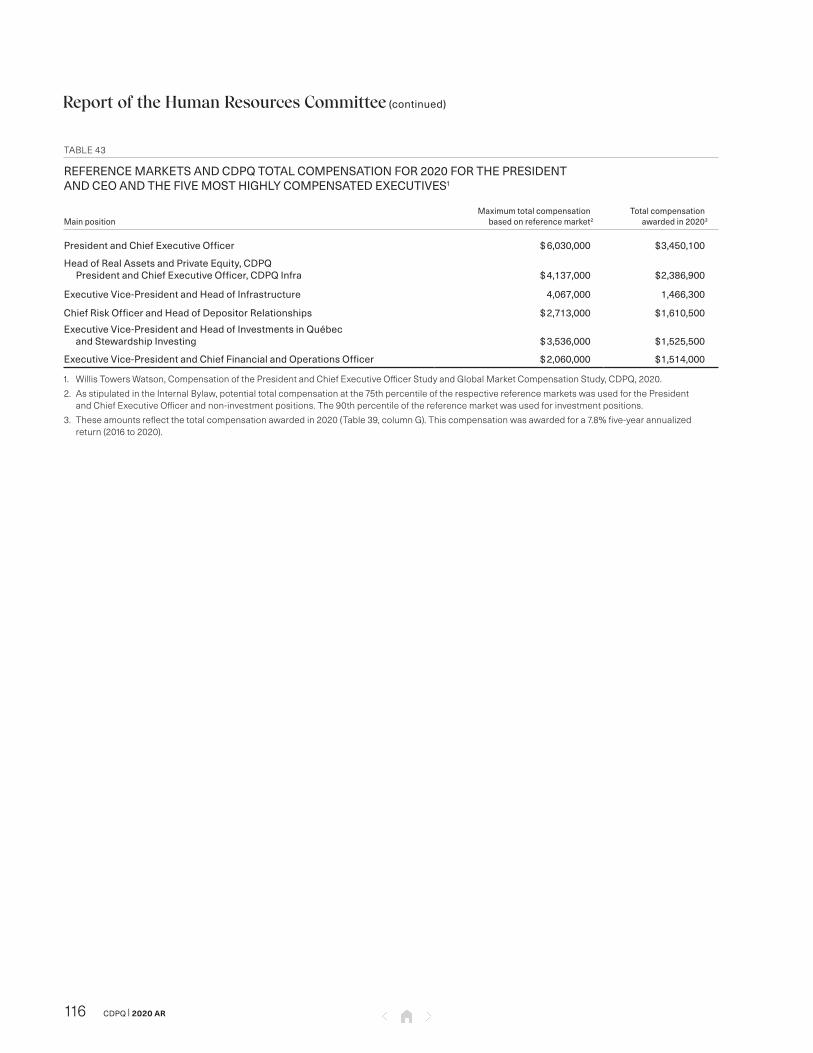
Report of the Human Resources Committee (continued)
CDPQ | 2020 AR116
TABLE 43
REFERENCE MARKETS AND C D P Q TOTAL COMPENSATION FOR 2020 FOR THE PRESIDENT AND C E O AND THE FIVE MOST HIGHLY COMPENSATED EXECUTIVES1
Main positionMaximum total compensation
based on reference market2
Total compensation awarded in 20203
President and Chief Executive Officer $ 6,030,000 $3,450,100
Head of Real Assets and Private Equity, C D P Q President and Chief Executive Officer, C D P Q Infra $ 4,137,000 $2,386,900
Executive Vice-President and Head of Infrastructure € 4,067,000 €1,466,300
Chief Risk Officer and Head of Depositor Relationships $ 2,713,000 $1,610,500
Executive Vice-President and Head of Investments in Québec and Stewardship Investing $ 3,536,000 $1,525,500
Executive Vice-President and Chief Financial and Operations Officer $ 2,060,000 $1,514,000
1. Willis Towers Watson, Compensation of the President and Chief Executive Officer Study and Global Market Compensation Study, C D P Q, 2020.
3. These amounts reflect the total compensation awarded in 2020 (Table 39, column G). This compensation was awarded for a 7.8% five-year annualized return (2016 to 2020).
2. As stipulated in the Internal Bylaw, potential total compensation at the 75th percentile of the respective reference markets was used for the President and Chief Executive Officer and non-investment positions. The 90th percentile of the reference market was used for investment positions.

117CDPQ | 2020 AR
Report of the Investment and Risk Management Committee
HIGHLIGHTS
1Reviewedr isk-returnreports.
2Reviewedreportsonspecializedportfolioreporting.
3ReviewedinvestmentproposalsundertheBoard’sauthority.
THE INVESTMENT AND RISK MANAGEMENT COMMITTEE
TheBoardestablishedtheInvestmentandRiskManagementCommittee to help theAuditCommittee fulfill its duty toimplementariskmanagementprocess.
MANDATE
TheCommittee’smandateistoensurethatriskmanagementpoliciesareinplacewiththeobjectiveofachievinganoptimalrisk-returnrelationship.
ForafulldescriptionoftheInvestmentandRiskManagementCommittee’smandate,consult theGovernancesectionatw w w.c d p q.com.
COMPOSITION (as at December 31, 2020)
ThecompositionoftheCommitteewasreviewedin2020.TheCommittee consisted of four independent members,includingtheChairoftheCommittee:
• Chair:JeanLaCouture
• Members:Jean-FrançoisBlais,SylvainBrosseauandMariaS.JelescuDreyfus
• Guestmember:AlainCôté,ChairoftheAuditCommittee
TheChairmanoftheBoardattendstheCommitteemeetings.
ACTIVITY REPORT
Numberofmeetingsin2020:11
In addition to supporting theAudit Committee in its riskmanagement oversight role, the Committee reviews andrecommendstotheBoardforapprovalkeypoliciesrelatedtoitsactivitiesandinvestmentproposalsrequiringtheBoard’sauthorization.
During the year, theCommitteedischarged the followingresponsibilities:
Risk management guidelines and policies
In2020,theCommittee:
• UsedvariousmechanismstoprovidetheAuditCommitteeandtheBoardwiththenecessaryassuranceregardingtheimplementation of a risk management process. ThisincludedreportingonitsactivitiestotheBoardaftereachmeeting,makingitsmeetingminutesavailabletotheAuditCommitteeand theBoard,and inviting theChairof theAuditCommitteetoeachmeeting.
• ReviewedtheIntegratedRiskManagementPolicy.
• Reviewedthemarketrisklimitsforspecializedportfoliosandthetotalportfolio,aswellastheproposedchangestothebenchmarkindexesandperformanceobjectivesforthespecializedportfoliosandmajormandates.

Report of the Investment and Risk Management Committee(continued)
CDPQ | 2020 AR118
• Reviewedtheinvestmentpolicyandstrategicorientationsofsomespecializedportfolios.
• Reviewedtheminimumliquidityreserves.
• Reviewed the report on the use of derivative financialinstruments.
• Reviewed,ateachCommitteemeeting,therisk-returnreportforthetotalportfolio.
• ReviewedtheRiskManagementandDepositorRelationshipsgroup’sbusinessplan.
Investment
In2020,theCommittee:
• Studied the investment files under the authority of theBoard,takingintoaccount:
– Theanalysispresentedbytheteamresponsibleforthetransaction.
– Theanalysisoftheprojectrisksand,morespecifically,itsimpactonthedegreeandconcentrationofrisk intherelevantspecializedportfolioandthetotalportfolio.
– Complianceof the investmentwith riskmanagementpoliciesandguidelines.
• Received follow-up reports on investment proposalsauthorizedbytheBoardaswellasinvestmentsthatwereauthorizedbyC D P Q’sseniormanagementbutthatdidnotcomeundertheBoard’spurview.
• Reviewedreportsonspecializedportfolioreporting.
Depositors
In2020,theCommitteeanalyzedthecertificatesofcompliancewiththedepositors’investmentpoliciesandthespecializedportfolios’investmentpolicies.
USE OF EXTERNAL EXPERTS
TheInvestmentandRiskManagementCommitteedidnotusetheservicesofexternalexpertsin2020.
Board of Directors and Executive Committee
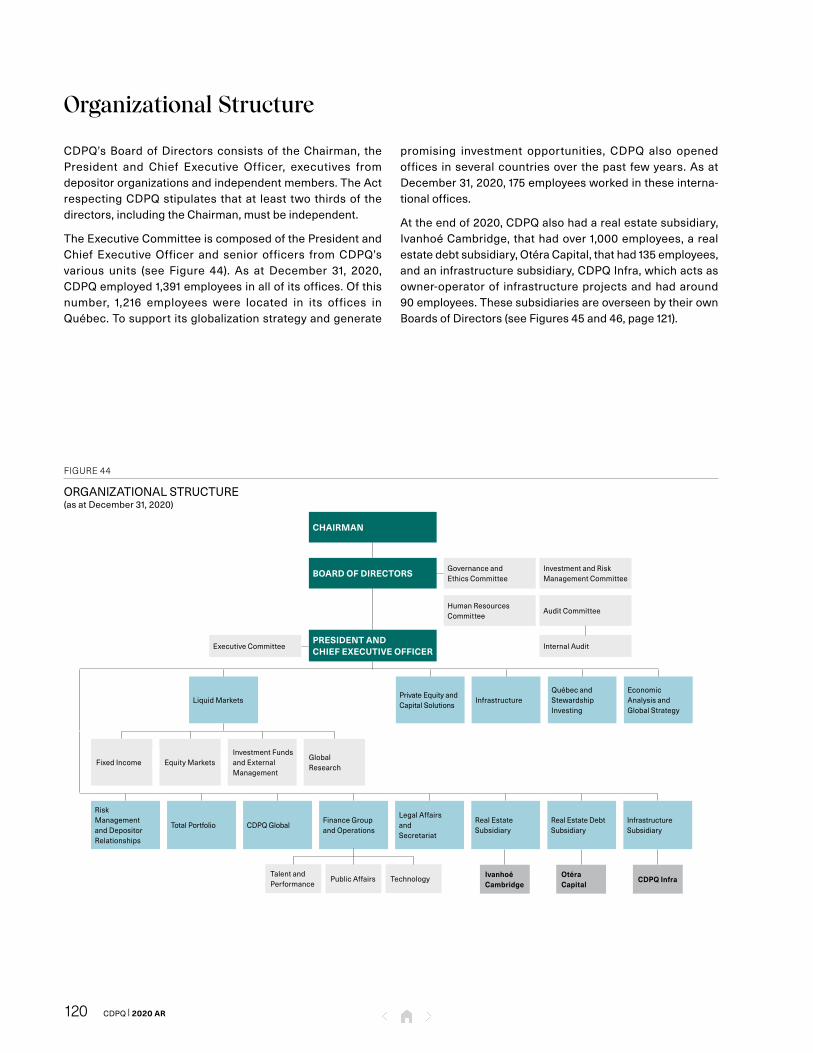
CDPQ | 2020 AR120
Organizational Structure
C D P Q’sBoardofDirectorsconsistsof theChairman, thePresident and Chief Executive Officer, executives fromdepositororganizationsandindependentmembers.TheActrespectingC D P Qstipulates thatat least two thirdsof thedirectors,includingtheChairman,mustbeindependent.
TheExecutiveCommitteeiscomposedofthePresidentandChief ExecutiveOfficer and senior officers fromC D P Q’svarious units (see Figure 44). As at December 31, 2020,C D P Q employed1,391employeesinallofitsoffices.Ofthisnumber, 1,216 employees were located in its offices inQuébec. Tosupportitsglobalizationstrategyandgenerate
promising investment opportunities, C D P Q also openedoffices inseveralcountriesover thepast fewyears.AsatDecember31,2020,175employeesworkedintheseinterna-tionaloffices.
Attheendof2020,C D P Qalsohadarealestatesubsidiary,IvanhoéCambridge, thathadover1,000employees,arealestatedebtsubsidiary,OtéraCapital,thathad135employees,andaninfrastructuresubsidiary,C D P QInfra,whichactsasowner-operatorof infrastructureprojectsandhadaround90employees.ThesesubsidiariesareoverseenbytheirownBoardsofDirectors(seeFigures45and46,page121).
FIGURE 44
ORGANIZATIONALSTRUCTURE(asatDecember31,2020)
FIGURE 44
ORGANIZATIONALSTRUCTURE(asatDecember31,2020)
CHAIRMAN
BOARD OF DIRECTORSGovernanceandEthicsCommittee
InvestmentandRiskManagementCommittee
HumanResourcesCommittee
AuditCommittee
PRESIDENT AND CHIEF EXECUTIVE OFFICER
ExecutiveCommittee InternalAudit
RiskManagementandDepositorRelationships
TotalPortfolio CDPQGlobalFinanceGroupandOperations
LegalAffairsandSecretariat
RealEstateSubsidiary
RealEstateDebtSubsidiary
InfrastructureSubsidiary
TalentandPerformance
PublicAffairs Technology
LiquidMarketsPrivateEquityandCapitalSolutions
InfrastructureQuébecandStewardshipInvesting
EconomicAnalysisandGlobalStrategy
FixedIncome EquityMarketsInvestmentFundsandExternalManagement
GlobalResearch
Ivanhoé Cambridge
Otéra Capital
CDPQ Infra
44_organizationalstru
cture

121CDPQ | 2020 AR
REAL ESTATE AND REAL ESTATE DEBT SUBSIDIARIES
Realestateinvestments,whichtaketheformofequitiesanddebt,involveprimarilyofficebuildings,shoppingcentresandresidential, logisticsand industrialproperties inkeycitiesworldwide. Real estate activities are divided into twocategories:realestateandrealestatedebt.TheRealEstateportfolio consists of the assets of IvanhoéCambridge, aglobalrealestateindustryleader.RealEstateDebt,whichislinked with fixed income activities, is comprised of theactivitiesofOtéraCapital,aleadinglenderinCanadathatalsoissuesloansintheUnitedStates.
Figure45presentstheorganizationalstructureoftherealestateandrealestatedebtoperations.Moreinformationonthesesubsidiariescanbefoundatw w w.ivanhoecambridge.com andw w w.oteracapital.com.
INFRASTRUCTURE SUBSIDIARY
Theinfrastructuresubsidiaryestablishedin2015,C D P QInfra,aims to effectively and efficiently carry outmajor publicinfrastructureprojects.
Figure 46 presents its organizational structure. Moreinformation on C D P Q Infra’s operations can be found atw w w.c d p qinfra.com.
FIGURE 45
ORGANIZATIONALSTRUCTURE–REALESTATEANDREALESTATE DEBTSUBSIDIARIES(asatDecember31,2020) REAL ESTATE REAL ESTATE DEBT
BOARD OF DIRECTORS BOARD OF DIRECTORS Ivanhoé Cambridge Otéra Capital
IVANHOÉ CAMBRIDGE OTÉRA CAPITAL(CDPQ subsidiary – 95.5%) (CDPQ subsidiary – 97.5%)
MCAP(OtéraCapitalsubsidiary–78.5%)
FIGURE 46
ORGANIZATIONALSTRUCTURE–INFRASTRUCTURESUBSIDIARY(asatDecember31,2020)
INFRASTRUCTURE
BOARD OF DIRECTORSCDPQ Infra
CDPQ INFRA

CDPQ | 2020 AR122
Board of Directors
ROBERT TESSIERChairmanoftheBoard C D P Q
Committees:GovernanceandEthics, HumanResources MembersinceMarch2009 Endofterm:October2021
JEAN-FRANÇOIS BLAISCorporateDirector
Committees:Audit, InvestmentandRiskManagement MembersinceMay2020 Endofterm:May2024
IVANA BONNET-ZIVCEVICPresidentandChiefExecutiveOfficer CréditAgricoleCIBinItaly
Committee:HumanResources(Chair) MembersinceDecember2017 Endofterm:December2021
SYLVAIN BROSSEAUPresidentandChiefExecutiveOfficer WalterGlobalAssetManagement
Committees:InvestmentandRiskManagement, HumanResources MembersinceJuly2018 Endofterm:July2022
ALAIN CÔTÉCorporateDirector
Committee:Audit(Chair) MembersinceAugust2019 Endofterm:August2023
MICHEL DESPRÉSPresidentandChiefExecutiveOfficer RetraiteQuébec
MembersinceMarch2016 Endofterm:March2020
GILLES GODBOUTCorporateDirector
Committees:Audit, GovernanceandEthics MembersinceJanuary2013 Endofterm:January2023
LYNN JEANNIOTCorporateDirector
Committee:HumanResources MembersinceDecember2019 Endofterm:December2023
MARIA S. JELESCU DREYFUSChiefExecutiveOfficer ArdinallInvestmentManagement
Committee:InvestmentandRiskManagement MembersinceNovember2019 Endofterm:November2023
JEAN LA COUTUREPresident HuisClosLtée,ConflictandLitigationAdvisors
Committee:InvestmentandRisk Management(Chair) MembersinceJanuary2013 Endofterm:April2022

123CDPQ | 2020 AR
DIANE LEMIEUXPresidentandChiefExecutiveOfficer CommissiondelaconstructionduQuébec
MembersinceDecember2014 Endofterm:April2022
WENDY MURDOCKCorporateDirector
Committees:GovernanceandEthics(Chair), Audit MembersinceMarch2016 Endofterm:March2023
RAVY PORExecutiveDirector,ArtificialIntelligence andEmergingTechnologies KPMG
Committee:GovernanceandEthics MembersinceAugust2019 Endofterm:August2022
CHARLES EMONDPresidentandChiefExecutiveOfficer C D P Q
MembersinceFebruary2020 Endofterm:January2025
ThebiographiesofthemembersoftheBoardofDirectorscanbefoundonC D P Q’swebsiteatw w w.c d p q.com.

CDPQ | 2020 AR124
Executive Committee1, 2, 3
MAXIME AUCOINExecutiveVice-President andHeadofTotalPortfolio
HELEN BECKExecutiveVice-President andHeadofEquityMarkets
CLAUDE BERGERONChiefRiskOfficer andHeadofDepositorRelationships
MARC-ANDRÉ BLANCHARDExecutiveVice-President andHeadofC D P QGlobal
ANI CASTONGUAYExecutiveVice-President PublicAffairs
MARTIN COITEUXHeadofEconomicAnalysis andGlobalStrategy
MARC CORMIERExecutiveVice-President andHeadofFixedIncome
VINCENT DELISLEExecutiveVice-President andHeadofLiquidMarkets
CHARLES EMONDPresidentandChiefExecutiveOfficer
ÈVE GIARDExecutiveVice-President TalentandPerformance
EMMANUEL JACLOTExecutiveVice-President andHeadofInfrastructure
MARTIN LAGUERRE2
ExecutiveVice-President andHeadofPrivateEquity andCapitalSolutions C D P QU S(NewYork)
MICHEL LALANDE3
ExecutiveVice-President LegalAffairsandSecretariat
MAARIKA PAULExecutiveVice-President andChiefFinancialandOperationsOfficer
ALEXANDRE SYNNETTExecutiveVice-President ChiefTechnologyOfficer
KIM THOMASSINExecutiveVice-President andHeadofInvestmentsinQuébec andStewardshipInvesting
ThebiographiesofthemembersoftheExecutiveCommitteecanbefoundonC D P Q’swebsiteatw w w.c d p q.com.
1. Macky Tall left his position in December 2020.
2. Martin Laguerre started in his role in January 2021.
3. Michel Lalande started in his role in January 2021.

Sustainable Development Report
CDPQ | 2020 AR126
Sustainable Development Report
2019–2020 ACTION PLAN
In2019,C D P QpublisheditsSustainableDevelopmentActionPlan,comprising27actionstobecompletedoveratwo-yearperiod.
Theseactionsaddressfiveofthegovernment’seightmajorsustainabledevelopmentpriorities.Our2019–2020SustainableDevelopmentActionPlancanbeconsultedathttps://www.c d p q.com.
In2020,C D P Qaccomplishednumerousactivitiesthatresultedinpositiveandsustainablesocialandenvironmentalchanges.Thisreportpresentsasummaryoftheseactions.Detailedinformationonmeasurescompletedbefore2020canbefoundinpreviousC D P Qreports.
Direction: Strengthen sustainable development governance
OBJECTIVE:Strengtheneco-responsiblepractices
ACTION 1: Carry out eco-responsible actions related to current material resource management operations
Measure/Fosterconcludingagreementswithsocialeconomycompanies
Indicator / Take stock of the number of social economyenterpriseswithwhichC D P Qhasagreements
Thisactionwascompletedin2019aspartofthefirstyearofthe2019–2020ActionPlan.
ACTION 2: Apply best practices in material resource and waste management (Ivanhoé Cambridge)
Measure/SetobjectivesforincreasingthewastediversionrateatCanadianmanagedproperties
Indicator/Achieveareclamationrateofatleast60%by2020
TheoverallwastereclamationrateatIvanhoéCambridgereached61%in2019andremainedat thesamelevelin 2020.
Indicator/ObtainawastediversionrateatÉdificeJacques-ParizeauthatishigherthantheaverageforpropertiesmanagedbyIvanhoéCambridge
In2020,theÉdificeJacques-Parizeau’sreclamationratewas59.7%,higherthanthepropertyaverageof51.5%.

127CDPQ | 2020 AR
ACTION 3: Encourage the adoption of eco-responsible practices in document management
Measure/Continuereducingthemassofpaperdocuments
Indicator/Destroyat least600boxesofpaperdocumentsperyear
In2020,604boxesofpaperdocumentsweredestroyedand84newboxesweresent to thewarehouse.Thenumberofboxesstoredwasthereforereducedby520.
Measure/Raiseemployeeawarenessonadoptingdocumentmanagementbestpractices
Indicator /Execute a communications plan regardingdocumentmanagementbestpractices
Acommunicationsplanaddressingdocumentmanage-mentbestpracticeswasdevelopedandimplementedin 2019. In 2020, the Document and SubscriptionsManagement section of the intranetwas revised tostrengthen the adoption of best practices. Severalarticleswerealsopublishedon the intranet to raiseawareness.Inaddition,trainingworkshopswereofferedtoallemployees.
Measure/Trainnewemployeesondocumentmanagementbestpractices
Indicator /At leastsix trainingsessionsper year fornewemployees
In2020, 25orientation sessions (5 face-to-faceand20virtual)wereheldfornewemployees.Theyspecifi-cally providedinformationregardingdocumentmanage-ment bestpracticesandthebesttoolstousefortheirdocuments.
ACTION 4: Encourage employees to adopt sustainable mobility
Measure /Develop a communications plan targetingemployees’work-relatedandpersonaltravelhabits
Indicator /Complete a communications plan targetingemployees’work-relatedandpersonaltravelhabits
Thisactionwascompletedin2019aspartofthefirstyearofthe2019–2020ActionPlan.
Measure/Createanactionplanonemployeebusinesstravel,including sections related toG H G emissions in calls fortender for travel agencies andoffsettingG H GemissionsrelatedtoC D P Qemployeeairtravel
Indicator/IncludeG H Gemission-relatedclausesincallsfortender
Thisactionwascompletedin2019aspartofthefirstyearofthe2019–2020ActionPlan.
ACTION 5: Carry out construction, renovation and leasehold improvement work in an eco-responsible manner (Ivanhoé Cambridge)
Measure/Fostereco-responsiblepracticeswhendevelopingandredevelopingcommercialbuildings
Indicator/Percentageofenvironmentalcertificationrenewals
In2020, 100%of thebuildingsmanagedby IvanhoéCambridgerenewedtheirenvironmentalcertification.
Indicator/MaximizethepercentageofpropertiesmanagedbyIvanhoéCambridgethathaveatleastoneenvironmentalcertification
In 2020, 94% of properties managed by IvanhoéCambridgeheldenvironmentalcertifications.
Completed
Ongoing
LEGEND
Sustainable Development Report(continued)
CDPQ | 2020 AR128
ACTION 6: Improve eco-responsible management of C D P Q’s I T infrastructure
Measure/ReduceinternalkWhconsumptionforI Tservices
Indicator/Reductionofthenumberofcabinetsindatacentres
Thenumberofcabinetsremainsstabledespitegrowth.Increased data volume has led to increased powerconsumption.
Action/Ensurethataneco-responsibleprocessisusedfordealingwithI Tequipmentthathasreacheditsendoflife
Indicator/Percentageofoutdatedcomputerequipmentthatissenttonon-profitorganizations
In2020,all I Tequipment identifiedasoutdatedwasgiventonon-profitorganizations.
ACTION 7: Adopt best practices for organizing eco-responsible events at C D P Q
Measure/Createanactionplantoimplementbestpractices,includingremovingwaterbottles,raisingawarenessamongadministrativepersonnelandhandingoutachecklistregard-ingorganizingevents
Indicator / Removal ofwater bottles frommeetings heldatC D P Q
Thisactionwascompletedin2019aspartofthefirstyearofthe2019–2020ActionPlan.
OBJECTIVE:Strengthenconsiderationofsustainabledevelopmentprinciples
ACTION 8: Improve how sustainable development principles are taken into account in C D P Q activities
Measure/IntegratesustainabledevelopmentelementsintoC D P Q’sintranet
Indicator/Atleasttwoarticlespublishedeachyearontheintranet
In2020,severalarticlespromotingC D P Q’ssustainabledevelopment initiatives and commitments werepublished on the intranet. These items cover threecategories:
1. Overall employee health
• HealthmeasuresduringCOVID-19
• Tipsandtechniquestobreakisolation
• Ergonomicswhileworkingremotely
• Measurestopromoteemployeewell-beingandwork-lifebalance
• Mentalhealth
• Stressmanagement
2. Equity, diversity and inclusion and stewardship investing
• Women’sbusinessawards
• UpdateontheActionPlanforPersonswithDisabilities
• Impactofwomeninfinance
• Diversitywithininvestmentcommittees
• DiversityatC D P Q
• InvestorLeadershipNetwork
• Energytransition
• PayequityatC D P Q
• BlackNorthInitiative
• Equity253fund,afunddedicatedtoS M Estoincreasediversityandinclusion
• Diversityasagrowthdriverforourcompanies
3. Supporting the community
• TheCanadianRedCross’sEmergencySupportWhenYouNeedItMostfundraisingcampaign
• HookedonSchoolDayscampaign
• Centraidecampaign
• Foodsecurityforvulnerableworkers
• Localorganicvegetablebaskets
129CDPQ | 2020 AR
ACTION 9: Develop a new generation of business leaders by facilitating access to knowledge
Measure/Developtheprogramfornewfinancegraduatesfora12-monthperiod(varioussectors)
Indicator/Launchofarotationprogram
In2020,12peopleparticipatedintherotationprogram.
Measure / Continue enhancing the internship program,offeringqualityjobsatC D P Q
Indicator /Numberof internshiredandcombiningof theinternshipprogramandsummerjobs
In2020,140internswerehired.
ACTION 10: Develop the diversity and representation of women in all C D P Q activities
Measure / Provide development and networking oppor-tunities for women at C D P Q, notably by pursuing ourparticipationintheEffetAprogram
Indicator/NumberofwomenparticipatingintheEffetA’sDéfi100joursprogramorasimilarprogram
Twenty-fourwomenparticipated intheDéfi 100 joursprogram and threewomen completed Effet A’sDéfiLeadershipinMontréal.TwoactivitiesbringingtogethertheDéfi100jourscohortof24participantsandtheirtwoambassadors,aC D P QseniorexecutiveandawomanmemberoftheC D P QBoardofDirectors,wereorganizedtoshareexperiencesandconsolidatetheirachievements.
In addition, C D P Q led a mentorship program withexperiencedmanagersfor13womenfromtheinvest-ment sector, which ended mid-2020. C D P Q alsodesignedamentoringprogramforallitsemployeesthatwillstartin2021.
C D P Q has also implemented two co-developmentcohortsforwomeninassistantpositions.
Measure/DevelopastrategyondiversityandinclusionandaconcreteactionplantosupportgenderdiversityatC D P Q
Indicator/Launchingastrategyondiversityandinclusionandupdatingoftheannualactionplan
Deployment of amulti-year strategy and the annualactionplancontinuedin2020,withafocusonwomenininvestmentandseniorleadershippositions.Progresshasalsobeenmadeintheareaofethnoculturaldiversity.
In line with the three-part strategy set out in the2019SustainableDevelopmentReport,tangiblecommit-mentshavebeenmadeaspartoftheactionplanupdate:
• In 2020, C D P Q joined several key initiatives toadvancediversityandinclusioninbothcompaniesandsociety.TheseincludetheBlackNorthInitiative,signedbymorethan300businessesinQuébecandCanada,and theCanadian InvestorStatementonDiversity and Inclusion, coordinated by theResponsibleInvestmentAssociation(R I A).
• For its Québec workforce, C D P Q conducted arepresentationanalysisforfivegroupsdesignatedbytheAct respecting equal access to employment in public bodies. Subsequently, we set quantitativegoalstoreducetherepresentationgap.
OBJECTIVE:Continuedevelopingknowledgeandskillsregardingsustainabledevelopment
ACTION 11: Engage employees’ interest and enhance their knowledge on sustainable development
Measure/Organize internalactivitiesonvarioussubjectsrelatedtosustainabledevelopment
Indicator/Organizeat leastonesustainabledevelopmentrelatedactivityeachyearforemployees
Two tree planting activities were held in 2019 incollaborationwithSoverdi, andalmostonehundredemployeesparticipated.DuetotheCOVID-19pandemic,noactivitieswereheldin2020.

Sustainable Development Report(continued)
CDPQ | 2020 AR130
OBJECTIVE:Strengthenaccesstoandparticipationinculturallifeasaleverofsocial,economicandterritorialdevelopment
ACTION 12: Give pride of place to Québec arts and culture by promoting C D P Q’s art collection and providing greater access to it
Measure/Organizeguidedvisitsforemployeesandmembersofthegreatercommunity
Indicator/Organizeatleasttenguidedvisitseachyear
In2019,21tourswereconductedforemployeesandtheoutside community. In 2020, due to the COVID-19pandemic, several virtual activitieswere proposed,including:
• FourpodcastsaboutC D P Q’sartcollectionontheintranet
• WebconferencepresentingthecollectiontoMcGillarthistorystudents
• GuidedtouroftheIvanhoéCambridgecollectionattheFairmontTheQueenElizabethHotel
• InternalguidedtourfortheCentraideorganization
Measure/Holdluncheonsonvisualarts-relatedtopics
Indicator/Organizeatleastoneluncheoneachyear
One visit to the exhibition ofworks from the PierreBourgiecollectionwasorganized.
ACTION 13: Raise awareness of Québec’s cultural heritage among national and international partners
Completedaspartofthe2016–2018ActionPlan.
ACTION 14: Recognize the role played by art and culture as a driver of democracy
Completedaspartofthe2016–2018ActionPlan.
ACTION 15: Improve the cultural quality of the environ-ments we live in by appropriately presenting and protecting Québec’s cultural heritage and by showcasing public art, architecture, design and distinctive landscapes (Ivanhoé Cambridge)
Measure/Integrateculturalconsiderationsintodecisionsonleaseholdimprovementsandpropertymodernizationsandrestorations
Indicator/At leastone initiative implemented topromoteculturalconsiderationsamongthegeneralpublic
In2020,duetotheCOVID-19pandemic, initiativestopromotetheculturaldimensiontothegeneralpublichavebeenmorelimited.However,IvanhoéCambridgecollaboratedwithArtSouterraintoimplementafriendlyandfunvirtualandin-personprojectatitsPlaceVilleMarie,MontrealEatonCentreandFairmontTheQueenElizabethproperties.
Measure/Developpartnershipswithvariousorganizationsinordertoprotectandshowcaseourculturalheritage
Indicator/Atleastonecollaborativeprojectimplemented
In2020,IvanhoéCambridgemaintaineditspartnershipwithHeritageMontrealtoadaptsomeoftheiractivitiesto therealityof theCOVID-19pandemic,suchas theArchitecTours.Theorganizationwasthusabletoofferhalf-in-person,half-virtualprogramming.

131CDPQ | 2020 AR
OBJECTIVE:Co-operateonsustainabledevelopmentnationallyandinternationally,inparticularwithintheFrancophonie
ACTION 16: Participate in collective responsible invest-ment initiatives with other investors or groups in the financial community
Measure/IdentifyrelevantinitiativesforC D P Qandpartic-ipateinthem
Indicator/TakestockofinitiativesandbecomeamemberofthosethatarethemostrelevantforC D P Q
C D P Qisamemberof:
• The Québec Colloquium on Responsible Invest-ment’sorganizingcommittee.
• ThePrinciplesforResponsibleInvestment’s(P R I)–QuébecNetworkAdvisoryCommittee.
• ThePrinciplesforResponsibleInvestment’s(P R I)–FrancophonieNetworkAdvisoryCommittee.
• TheInvestorLeadershipNetwork(I L N),asafoundingmember.Thisinvestorcoalitionsupportsthreekeyinitiatives:developmentofsustainableinfrastructureskills,investmentdiversityandclimatedisclosure.
• TheCanadianCoalitionforGoodGovernance,wherewehavecontributedtocollaborativecommitmentsdealingwithenvironmental,socialandgovernance(E S G)matters,andthepublicationofanarticleonexecutive compensation and the integration ofE S Gcriteria.
• Aninvestorgroupthatpromotestheadoptionofanadvisoryvoteonexecutivecompensation.ThisgroupcontactsCanadiancompaniestoencouragethemtoadoptthevoteonavoluntarybasis.
• TheNet-ZeroAlliance,whosemembersaimtobecarbonneutralby2050,inadditiontoencouragingtheir portfolio companies to reduce their carbonfootprintoverthesameperiod.
• The Canadian Chapter of the Accounting forSustainability(A4S)C F OLeadershipNetwork,whichworks to integrate economic, environmental andsocialissuesintobusinessstrategies,processesanddecision-making.
ACTION 17: Participate in collective initiatives with other actors in the industry and take part in various sustainable development associations
Completedaspartofthe2016–2018ActionPlan.
Direction: Sustainably develop a prosperous economy that is green and responsible
OBJECTIVE:Supportthedevelopmentofgreenandresponsiblebusinesspracticesandmodels
ACTION 18: Encourage Québec companies to develop or continue a sustainable development process
Measure/Support thedevelopmentofanecosystemthatsupportsbusinessesinthesocialeconomy
Indicator/Supportatleastfiveorganizationsintheirsocialeconomyorsustainabledevelopmentinitiatives.
C D P QsupportsovertensocialeconomyorsustainabledevelopmentorganizationssuchasSoverdi and theAppalachianCorridor.WearecontinuingourpartnershipwiththeFondsd’actionquébécoispourledéveloppementdurable(F A Q D D),therebyprovidingguidanceforN P Osintheirsustainabledevelopmentinitiatives.
ACTION 19: Help increase the number of businesses that embark on a sustainable development process
Completedaspartofthe2016–2018ActionPlan.

Sustainable Development Report(continued)
CDPQ | 2020 AR132
OBJECTIVE:Fosterinvestmentandfinancialsupporttoeasethetransitiontoagreenandresponsibleeconomy
ACTION 20: Promote stewardship investing
Measure/ContinueimplementingtheactionsoftheInvestorLeadershipNetwork(I L N)
Indicator/ConsolidationofI L Nactivities
C D P QteamscontinuetobeactivelyinvolvedintheI L N,whichpromotessustainableand inclusiveeconomicgrowth.Theyhaveparticipated inworkingmeetingswith their peers as well as meetings with externalpartners to ensure expansion of this internationalcollaborativeinitiative,tostructureitandtoconsolidateitsactivityoutreach. In2020, a secretariatwasalsoestablishedtosupportI L N’soperations.
Direction: Manage natural resources responsibly while respecting biodiversity
OBJECTIVE:Efficientlymanagenaturalresourcesinaconcertedmannertosupporteconomicvitalityandmaintainbiodiversity
ACTION 21: Adopt responsible practices and approaches to natural resource management (Ivanhoé Cambridge)
Measure /Improve how water is managed in buildingsmanagedbyIvanhoéCambridge
Indicator/Establishreductiontargetsforeachproperty
New reduction targetswere established for 47% ofbuildingsmanagedbyIvanhoéCambridgeinconjunc-tionwithenvironmentalcertificationrenewals.
Measure/Sharewater,energyandairmanagementpolicieswithbusinesspartners
Thismeasurewascompletedaspartofthe2016–2018ActionPlan.
OBJECTIVE:Conserveandpromotebiodiversity,ecosystemsandecologicalservicesbyimprovingsociety’sinterventionsandpractices
ACTION 22: Sustainably restore, build and promote ecosystems and favour their diversity (Ivanhoé Cambridge)
Measure/InpartnershipwithC D P Q,participateingreeningand biodiversity initiatives (e.g. volunteer tree-plantingactivities,greeningaschoolyardorlot)
Indicator/Completeatleasttwogreeningprojects
In2020, IvanhoéCambridgehostedbeehiveson theroofsofabout20ofitsproperties.Inadditiontooptimiz-ingunusedspace insomebuildingsandhighlightingenvironmental issues, these projects support bio-diversityinurbanareas.Thisyear,jarsofhoneyweredonatedtofoodbanks.
Ivanhoé Cambridge has also par tnered withMicroHabitat to renovate the roofs of theMontrealEatonCentreintobiodiversity-richvegetablegardens.In addition to contributing to the greening of thedowntownarea,thisinitiativesupportedyoungpeopleinneedbydonatingalloftheharvesttotheDanslarueorganization.
133CDPQ | 2020 AR
Direction: Promote social inclusion and reduce social and economic inequalities
OBJECTIVE:Helprecognize,developandmaintainskills,particularlyamongthemostvulnerable
ACTION 23: Foster access to work for the most vulnerable members of society (Ivanhoé Cambridge)
Measure/Continuesocialreintegrationinitiatives
Indicator/Supportatleasttwoorganizationswithmissionstofostersocialreintegration
In 2020, Ivanhoé Cambridge partnered with aboutforty organizations that help homeless people. Itscontributionofover$300,000in2020providedmorethan 20,000 people with clothes, food and a placetosleep.
OBJECTIVE:Supportandpromotetheactivitiesofcommunityorganizationsandsocialeconomyenterprisesthatmakeacontributiontosocialinclusionandreduceinequalities
ACTION 24: Raise the profile of Collectivité, an initiative to encourage and recognize employee engagement in the community
Measure /Recognize employees’ involvement throughvisibilityontheintranetorthroughadonationofupto$1,000directlytotheorganization
Indicator /At least 40donationsbyC D P Qwere linked toemployeeinvolvement
In2020,C D P Qmade39donations,fortotalcontributionsofalmost$35,000tovariousorganizationsasaresultof the donation program to causes supported byemployeesthroughtheirinvolvement(BoD,fundraisingcampaign,etc.).Asaresult,C D P Qmade88donationsrelatedtoemployeeinvolvementovertheentiredurationofthe2019–2020ActionPlan.
Measure/EncourageemployeestosharetheirexpertisewithorganizationsthroughtheBénévolesd’affairesplatform
Indicator/Atleast100employeeswhoaremembersofN P OBoardsofDirectors
Almost150employeesaremembersofN P OBoardsofDirectors.
Measure/Createopportunitiesforcollectivecommitmentinsupportofcausesbyencouragingemployeeswhoorganizeteamvolunteeringactivities
Indicator/Organizeatleastonevolunteeractivityperyear
Six expertise volunteer missions with N P Os wereorganizedbyImpact20-35,aninitiativeofyoungC D P Q professionalsaged20to35.
ACTION 25: Strengthen support for and promotion of community and social economy organizations that help achieve social inclusion and reduce inequalities by encouraging employee engagement (Ivanhoé Cambridge)
Measure/ImplementavolunteerprograminpartnershipwithN P Os
Indicator/Proposeavolunteerprogramthroughdonationandsponsorshippartnerships
The concept of employee volunteers is included inour agreementswithcommunityorganizations.Giventhe health restrictions related to the pandemic, novolunteer activities were undertaken in 2020 forIvanhoé Cambridgeemployees,withtheexceptionofoneinitiativeinJanuary.
Ivanhoé Cambridge employees participated in theconstructionofanInnovHausproject,oneofHabitatforHumanityQuébec’smostrecentprojects, incollabo-rationwithUniversitydeSherbrooke.
Inaddition,theemployeesdecidedtoconvertaportionofthebudgetforyear-endactivitiesintodonationstofoodbanks.Asaresult,justover$100,000wasdonatedtotheseorganizationsonbehalfof IvanhoéCambridgeemployees.

Sustainable Development Report(continued)
CDPQ | 2020 AR134
Direction: Support sustainable mobility
OBJECTIVE:Supporttheelectrificationofvariousmeansoftransportationandimproveenergyefficiencyinthissectortodeveloptheeconomyandreducegreenhousegasemissions
ACTION 26: Expand the application of the Sustainable Development Plan to all C D P Q subsidiaries
Measure/DevelopanactionplanspecifictoC D P QInfra’sactivitiesanditsRéseauExpressMétropolitain(REM)project
Indicator/Plant250,000treestooffsetthegreenhousegasesemittedduringconstructionoftheREM
Todate, themandatedorganization (EarthDay) hasplanted140,000treesintheCommunautémétropolitainedeMontréal’sGreenbelt.Noplantingoccurredin2020duetoCOVID-19.
Direction: Encourage the production and use of renewable forms of energy as well as energy efficiency to reduce greenhouse gas emissions
OBJECTIVE:OptimizetheproductionofrenewableformsofenergyforthebenefitofallQuebecers
ACTION 27: Carry out projects that optimize the production of renewable forms of energy (Ivanhoé Cambridge)
Measure/Proposeastrategyonrenewableenergy
Indicator/Completeafeasibilitystudy
Astudyexploringthepotential forrenewableenergyprojectsintheU Sindustrialportfolioisstillunderwayandistargetingthestateswiththegreatestpotential.IvanhoéCambridgewillcontinuetheprocessin2021.

Financial Report

CDPQ | 2020 AR136
Change in Assets
NET ASSETS ATTRIBUTABLE TO DEPOSITORS
Net assets attributable to depositors grew from $248.0 billion as at December 31, 2015, to $365.5 billion as at December 31, 2020, an increase of $117.5 billion over five years. This growth was primarily due to investment results of $110.7 billion, in addition to depositors’ net contributions of $6.8 billion (see Table 50, page 137).
During 2020, net assets attributable to depositors increased by $25.4 billion to $365.5 billion, compared to $340.1 billion as at December 31, 2019. This increase was due to $24.8 billion of investment results and $0.6 billion in depositors’ net contributions.
TOTAL ASSETS
As at December 31, 2020, total assets reached $412.1 billion, compared to $392.6 billion at the end of 2019 (see Table 47). The $19.5-billion increase was due to the reinvestment of investment income and net gains realized on financial instruments at fair value. The liabilities to total assets ratio fell to 11% as at December 31, 2020, compared to 13% as at December 31, 2019. C D P Q’s liabilities consist primarily of
amounts payable on transactions being settled, securities sold under repurchase agreements, securities sold short and the financing programs issued by our subsidiary C D P Financial, which are used to finance investments.
ASSETS UNDER MANAGEMENT AND ASSETS UNDER ADMINISTRATION
C D P Q and its subsidiaries administer and manage assets entrusted to them by clients and on their behalf. These assets are not included in C D P Q’s Consolidated Statements of Financial Position. C D P Q and its subsidiaries receive fees in return for such portfolio management services and adminis-trative services, which include the administration of real estate properties and transferred mortgages.
As at December 31, 2020, C D P Q’s assets under management and administered assets totalled $127.1 billion, up $3.2 billion from one year earlier (see Table 48).
This growth came primarily from the portfolio administered by MCAP, a subsidiary of Otéra Capital. This company administers $106.0 billion of Canadian residential, commercial and construction mortgages.
TABLE 47
FINANCIAL INFORMATION – FINANCIAL POSITION(as at December 31 – in millions of dollars)
(as at December 31 – in millions of dollars) 2020 2019
ASSETSInvestments 405,978 382,467Other assets 6,115 10,152
Total assets 412,093 392,619
LIABILITIESInvestment liabilities 42,106 49,830Other liabilities 4,495 2,680
Total liabilities 46,601 52,510
Net assets 365,492 340,109
TABLE 48
FINANCIAL INFORMATION – TOTAL ASSETS UNDER MANAGEMENT(as at December 31 – in millions of dollars)
(as at December 31 – in millions of dollars) 2020 2019
Total assets 412,093 392,619Assets under management 19,603 20,581Assets under administration 107,493 103,303
Assets under management and assets under administration 127,096 123,884
Total assets under management 539,189 516,503

137CDPQ | 2020 AR
INVESTMENT RESULTS
Overfiveyears,investmentresultsamountedto$110.7billion.TheEquitiesassetclasscontributedthemost,generatingresultsof$76.9billion,including$48.1billionfromtheEquityMarketsportfolioand$28.7billion fromthePrivateEquityportfolio. In addition, the Fixed Income and Real Assetsasset classes contributed $24.3 billion and $8.7 billion,respectively.
The contribution by asset class to the $24.8 billion ininvestment results (see Table 49) for 2020 is as follows:Equitiesat$20.0billion;FixedIncomeat$8.7billionandRealAssetsat-$5.0billion.
NET CONTRIBUTIONS BY DEPOSITORS
As at December 31, 2020, depositors’ net contributionstotalled$0.6billion,mainlydueto$2.2billioninnetcontribu-tionsfromtheGovernmentofQuébec’sGenerationsFund,whichwasoffsetbynetwithdrawalsof $1.1 billionby theGovernment and Public Employees Retirement Plan and$0.4billionbytheFondsdelasantéetdelasécuritédutravail.
TABLE 49
FINANCIALINFORMATION–INVESTMENTRESULTS(fortheperiodendedDecember31–inmillionsofdollars)
fortheperiodendedDecember31–inmillionsofdollars 2020 2019
Netinvestmentincome 8,895 9,893Operatingexpenses (609) (630)
Net income 8,286 9,263
Net gains on financial instruments at fair value 16,465 21,883
Investment results 24,751 31,146
TABLE 50
FINANCIALINFORMATION–SUMMARYOFCHANGESINNETASSETS(fortheperiodfrom2016to2020–inbillionsofdollars)
fortheperiodfrom2016to2020–inbillionsofdollars 2020 2019 2018 2017 2016 5years
Net assets, beginning of year 340.1 309.5 298.5 270.7 248.0 248.0Investmentresults 24.8 31.1 11.8 24.6 18.4 110.7Netcontributions(netwithdrawals)bydepositors 0.6 (0.5) (0.8) 3.2 4.3 6.8
Net assets, end of year 365.5 340.1 309.5 298.5 270.7 365.5

CDPQ | 2020 AR138
Analysis of Operating Expenses and External Management Fees
Operatingexpenses representportfoliomanagementandadministrationcosts.Externalmanagementfeesareamountspaidtoinstitutionalfundmanagers,activeinthestockmarkets,tomanagesecuritiesbelongingtoC D P Q.For2020,operatingexpensestotalled$609million,comparedto$630millionin2019.ThedecreasewasduetoexpensereductioneffortsandaslowdowninspendingcausedbytheCOVID-19pandemic.
Externalmanagementfeestotalled$148million,up$21millionfrom 2019,mainly due to an increase in the value of theinvestmentsmanagedexternallyincertainmarkets.Operatingexpenses and external management fees amounted to$757millionin2020,thesameamountasin2019.Thisamountrepresents 23 cents per $100 of average net assets (seeFigure51).
Operating expenses and external management fees, at23centsper$100ofaveragenetassets,comparefavourablywith the industry. Operating expenses and externalmanagementfees incentsper$100ofaveragenetassets
increasedslightlyoverthelastfiveyears.Thisincreasewasduetoanincreaseinthevalueofexternallymanagedsecuritiesandtheimplementationofaninvestmentstrategyfocusedonglobalization,less-liquidassetsandcreditactivities.In2020,operatingexpensesandexternalmanagementfeesremainedstablecomparedtothepriorperiod.
OPERATIONAL EFFICIENCY
C D P Qperiodicallyreviewsourprocessestomaintaintightcontroloverouroperatingexpenses.Weaimtomaintainsuchexpensesatalevelcomparabletothatofinstitutionalfundmanagersofthesamesizewithsimilaroperations.C D P Qhasbeenbenchmarkingcostsbyassetclassformanyyears.Inaddition, an annual benchmarking conducted with C E MBenchmarking, an independent provider of cost andperformancebenchmarkinginformationforpensionfundsandotherinstitutionalassetownersaroundtheworld,ranksusfavourablyamongourpeers.
FIGURE 51
OPERATINGEXPENSESANDEXTERNALMANAGEMENTFEESEXPRESSEDPER$100OFDEPOSITORS’AVERAGENETASSETS(forperiodsendedDecember31–incents)
2016 2017 2018 2019 2020
20
2223
2223
20
2223
2223
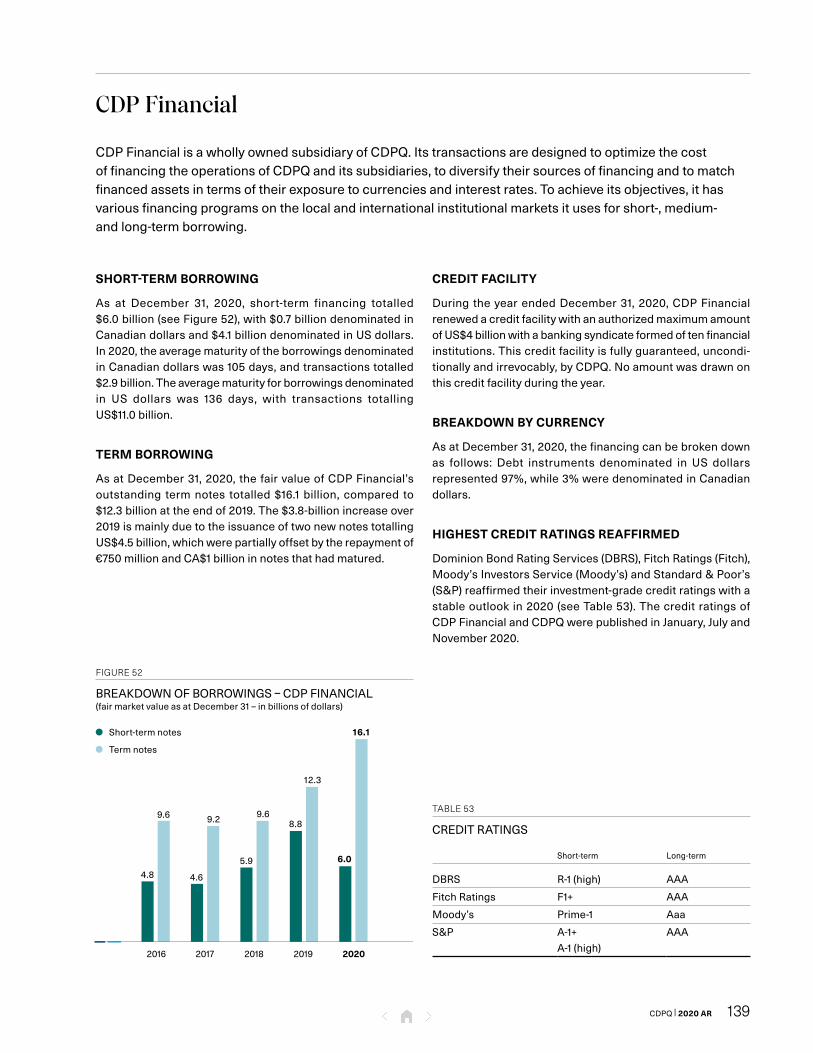
139CDPQ | 2020 AR
C D P Financial
C D P Financial is a wholly owned subsidiary of C D P Q. Its transactions are designed to optimize the cost of financing the operations of C D P Q and its subsidiaries, to diversify their sources of financing and to match financed assets in terms of their exposure to currencies and interest rates. To achieve its objectives, it has various financing programs on the local and international institutional markets it uses for short-, medium- and long-term borrowing.
SHORT-TERM BORROWING
As at December 31, 2020, short-term financing totalled $6.0 billion (see Figure 52), with $0.7 billion denominated in Canadian dollars and $4.1 billion denominated in U S dollars. In 2020, the average maturity of the borrowings denominated in Canadian dollars was 105 days, and transactions totalled $2.9 billion. The average maturity for borrowings denominated in U S dollars was 136 days, with transactions totalling U S$11.0 billion.
TERM BORROWING
As at December 31, 2020, the fair value of C D P Financial’s outstanding term notes totalled $16.1 billion, compared to $12.3 billion at the end of 2019. The $3.8-billion increase over 2019 is mainly due to the issuance of two new notes totalling U S$4.5 billion, which were partially offset by the repayment of €750 million and CA$1 billion in notes that had matured.
CREDIT FACILITY
During the year ended December 31, 2020, C D P Financial renewed a credit facility with an authorized maximum amount of U S$4 billion with a banking syndicate formed of ten financial institutions. This credit facility is fully guaranteed, uncondi-tion ally and irrevocably, by C D P Q. No amount was drawn on this credit facility during the year.
BREAKDOWN BY CURRENCY
As at December 31, 2020, the financing can be broken down as follows: Debt instruments denominated in U S dollars represented 97%, while 3% were denominated in Canadian dollars.
HIGHEST CREDIT RATINGS REAFFIRMED
Dominion Bond Rating Services (D B R S), Fitch Ratings (Fitch), Moody’s Investors Service (Moody’s) and Standard & Poor’s (S & P) reaffirmed their investment-grade credit ratings with a stable outlook in 2020 (see Table 53). The credit ratings of C D P Financial and C D P Q were published in January, July and November 2020.
FIGURE 52
BREAKDOWN OF BORROWINGS – C D P FINANCIAL(fair market value as at December 31 – in billions of dollars)
Short-term notes
Term notes
Largeur du graphique 262 pts
2016 2017 2018 2019 2020
5.9
9.69.6
4.8
9.2
4.6
16.1
6.0
8.8
12.3
TABLE 53
CREDIT RATINGS
n.a. Short-term Long-term
D B R S R-1 (high) A A A
Fitch Ratings F1+ A A A
Moody’s Prime-1 Aaa
S & P A-1+A-1 (high)
A A A

CDPQ | 2020 AR140
Significant Accounting Policies
C D P Q’s consolidated financial statements include theaccountsoftheGeneralFund,oftheindividualfunds,andofthe specialized portfolios aswell as the accounts of oursubsidiariesthatexclusivelyofferservicesrelatedtofinancing,administrative and management activities. Net assetsattributable to depositors presented in theConsolidatedStatementsofFinancialPositionreflect thecombinednetvalueof theaccountsofeachof thedepositorsofC D P Q.Note 2totheAuditedConsolidatedFinancialStatementsasat December31,2020describesthesignificantaccountingpoliciesusedbyC D P Q.
FINANCIAL REPORTING
C D P Q’sconsolidatedfinancialstatementsarepreparedinaccordancewiththeprevailingaccountingstandards,namelyInternational Financial Reporting Standards (I F R S), asstipulatedintheActrespectingC D P Q.
EXTERNAL AUDIT
InaccordancewiththeActrespectingC D P Q,theco-auditorsaudited all of C D P Q’s accounting records and issued anunqualified auditors’ report for each of the 71 financialstatements.
Significant I F R S accounting standards applicable to the consolidated financial statements of C D P Q
Investmententities
UnderI F R S10–Consolidated Financial Statements,thesub-sidiaries that constitute an investment for an investmententitymustbepresentedandmeasuredatfairvalue.C D P Q,whichisqualifiedasaninvestmententity,doesnotconsolidateitssubsidiaries,particularlyitsrealestate,realestatedebt,privateequity,infrastructure,fixedincome,hedgefundandequitymarketssubsidiaries.Valuationoftheseinvestmentsisbasedon a corporate valuation technique in accordancewith I F R S.
Fairvaluemeasurement
I F R S13–Fair Value Measurementprovidesasinglesourceofguidelinesforallfairvaluemeasurements.Fairvalueisdefinedasthepricethatwouldbereceivedonthesaleofanassetorpaidtotransferaliabilityinanorderlytransactionbetweenmarket participants at themeasurement date. Themaintechniquesformeasuringinvestments,includingmeasuringC D P Q’snon-consolidatedsubsidiaries,aredescribedinNote6 totheConsolidatedFinancialStatementsonpage163.
Impact of COVID-19 on judgments, estimates and assumptions
TheCOVID-19pandemicgeneratedhighlevelsofuncertaintyandvolatilityinequityandfinancialmarketsin2020.Althoughthetechniquesusedtomeasure the fairvalueof financialinstrumentshaveremainedthesame,C D P Qhasadjustedtheunobservable inputsusedbasedon informationanddataavailableatthedateoftheconsolidatedfinancialstatements.Thisallowsustoprovideourbestestimateoftheimpactofthepandemiconthefairvalueofthesefinancialinstruments.Uncertaintiesaroundthepandemiccouldresultinsignificantadjustments to fair value and net assets attributable todepositorsoverthecomingyear.
Financial measures
AspartofissuingcertaininformationincludedintheAnnualReport, C D P Q uses and presents both measures inaccordancewithI F R Sandothernon-I F R Sfinancialmeasures.C D P Qisoftheopinionthatthesemeasuresproviderelevantinformation,complementarytotheanalysisof itsfinancialreporting(seeGeneralNotes3and6onpage199).
Adoption of new I F R S
No issued or amended standard not yet effective on thereportingdateisexpectedtohaveanimpactontheconsoli-datedfinancialstatements.
141CDPQ | 2020 AR
Fair Value Measurement
FAIR VALUE MEASUREMENT POLICY
Investment valuation is aprocesswherebya fair value isassigned to each of C D P Q’s investments with a view topreparingtheconsolidatedfinancialstatements.Measure-mentofinvestmentsatfairvalueisperformedperiodicallyinaccordancewithC D P Q’sInvestmentValuationPolicy,whichisapprovedbytheBoardofDirectors.Thisgeneralpolicyisfurthersupportedby thevaluationdirectiveapplicable toprivate investments and the protocols that stipulate thevaluation process and methodology for each type ofinvestment.Thepolicyanddirectivealsoestablishgovernanceforthevaluationandreportingprocess.ApplicationofthepolicyistheresponsibilityoftheValuationCommittee,whichreportstotheExecutiveCommitteeandissupportedbyavaluation team. The Valuation Committee approvescompliancewiththepolicyandthefairvalueofC D P Q’sinvest-mentssemiannually.Accordingly,theValuationCommitteerecommendsthesefairvaluestotheAuditCommittee.ThepolicycomplieswiththestandardsandpracticesofCanadianand international valuation bodies and demonstrates arigorous governance framework for financial instrumentvaluationprocesses.
Underthepolicy,whenfairvalueisdeterminedbyexternalvaluatorsorthirdparties,theValuationCommittee,withthesupport of theValuation team, verifies thequalifications,experienceandindependenceoftheseparties.Italsoreviewsthe valuation techniques, the significant inputs used incalculating fair value, and the results andconclusions toensurethattheyareincompliancewithrecognizedvaluationstandards.
Inaddition, toensurethereasonablenessof thefairvaluedetermined,C D P Qconductsbacktesting,andcomparestheestablishedfairvaluewithvaluesofcomparabletransactions,including the values of comparable public companies, inadditiontousingtheservicesofexternalvaluators.
Theco-auditorshaveaccesstoallvaluationfilesaspartoftheauditoftheyear-endconsolidatedfinancialstatements.
CONCEPTUAL FRAMEWORK
I F R Sdefinefairvalueandprovideguidelinesonmeasurementanddisclosuresrelatedtofairvalue.Entitiesarerequiredtomaximizetheuseofrelevantobservableinputsandminimizetheuseofunobservableinputswhenmeasuringfairvalue.Fairvaluemustbeestablishedbyassumingthattheinvestmentsareavailableforsale,thatis,thatthefairvalueofinvestmentscorresponds to an exit price at the date of the financialstatements.Thepurposeoftheaccountingstandardsistodefineasingleconceptualframeworkthatcanbeusedinallsituationsrequiringfairvaluemeasurement.
C D P QconsidersthatI F R Sconstituteacoherentframeworkforfairvaluemeasurement.Nevertheless,thesestandardsdonottakeintoaccountthefactthat,inaccordancewiththeverylong-terminvestmenthorizonadoptedbyourmaindepositors,C D P Qhasthemeansandintendstoholdcertaininvestmentsuntiltheiroptimalvalueisattained.
Assuch,thefairvalueestablishedasatDecember31,2020,forinvestmentsinliquidandless-liquidmarketsreflectsthegeneralvolatilityofthefinancialmarkets,andthismaydifferfromtheeconomicvalueoflong-terminvestments.
Note6totheConsolidatedFinancialStatements,onpage163,describesthefairvaluemeasurementtechniques.

CDPQ | 2020 AR142
White page

Consolidated Financial Statements

CDPQ | 2020 AR144
Management’s Responsibility for Consolidated Financial Reporting
ThepreparationandpresentationoftheconsolidatedfinancialstatementsoflaCaissededépôtetplacementduQuébec(“C D P Q”)aretheresponsibilityofmanagement.TheconsolidatedfinancialstatementswerepreparedinaccordancewithInternationalFinancialReportingStandards(I F R S),asissuedbytheInternationalAccountingStandardsBoard(I A S B)andincorporatedintotheC P ACanadaHandbook.We ensure that the financial information in theAnnual Report is consistentwith the information in the consolidatedfinancialstatements.
Theconsolidatedfinancialstatementsincludeamountsthatarebasedonmanagement’sbestestimatesandjudgment,withdueregardfortheirrelativeimportance.Moreover,whenpreparingthefinancialinformation,managementhasmadedecisionsregardingtheinformationtobepresentedaswellasestimatesandassumptionsthataffecttheinformationpresented.Futureresultsmaydifferconsiderablyfromourcurrentestimates,aschangestofinancialmarketsorothereventscouldhaveanimpactonthefairvalueoftheinvestments.
Inourresponsibilityforthereliabilityoffinancialinformation,werelyondisclosurecontrolsandproceduresandinternalcontrolsoverfinancialreporting.Inparticular,thesecontrolsincludeacleardefinitionofresponsibilities,delegationofpowers,allocationofduties,ethicalstandards,employeehiringandtrainingcriteriaaswellaspolicies,guidelinesandproceduresdesignedtoensurethattransactionsaredulyauthorized,assetsareproperlymeasuredandsafeguarded,andproperrecordsaremaintained.
Moreover,C D P Q’sinternalauditgroupauditstheinternalcontrolsonaregularbasis.Thesecontrolsandauditsaredesignedtoprovidereasonableassuranceregardingthereliabilityoftheaccountingrecordsusedtopreparetheconsolidatedfinancialstatementsandtoensurethatassetsarenotusedordisposedofinanyunauthorizedmanner,thatliabilitiesarerecorded,andthatwemeetallthelegalrequirementstowhichC D P Qissubject,includingtheAct respecting the Caisse de dépôt et placement du Québec.
Eachyear,wecertifythatthedesignoftheinternalcontroloverfinancialinformationissufficientandthatthedesignandoperationofthefinancialinformationdisclosurecontrolsandproceduresareeffective.WereportanysignificantirregularitytotheAuditCommitteeoftheBoardofDirectorsofC D P Q,asnecessary.
TheAuditorGeneralofQuébecandErnst&YoungL L P(the“co-auditors”)haveauditedtheconsolidatedfinancialstatementsofC D P QfortheyearsendedDecember31,2020and2019andtheirreportcoversthenatureandscopeoftheauditandexpressestheiropinion.Theco-auditorshaveunrestrictedaccesstotheAuditCommitteetodiscussanymatterrelatedtotheiraudit.
TheBoardofDirectorsanditscommitteessupervisethemannerinwhichmanagementfulfillsitsresponsibilityfortheestablishmentandpresentationof financial information,maintenanceofappropriate internalcontrols,compliancewith therequirementsof lawsandregulations,managementofandcontroloverthemainrisks,andevaluationofmajortransactions.Moreover,itapprovestheconsolidatedfinancialstatementsandtheAnnualReport.
TheBoardofDirectorsapprovedtheconsolidatedfinancialstatementsfortheyearsendedDecember31,2020and2019.ItisassistedinitsresponsibilitiesbytheAuditCommittee,ofwhichallmembersareindependentdirectors.ThisCommitteemeetswithmanagementandtheco-auditors,examinestheconsolidatedfinancialstatements,andrecommendstheapprovalthereoftotheBoardofDirectors.
CHARLES EMOND
PresidentandChiefExecutiveOfficer
MAARIKA PAUL, F C P A, F C A, C B V, I C D.D
ExecutiveVice-PresidentandChiefFinancialandOperationsOfficer
Montréal, February 23, 2021

145CDPQ | 2020 AR
Independent Auditors’ Report
TotheNationalAssembly
Report on the Audit of the Consolidated Financial Statements
OpinionWehaveauditedtheconsolidatedfinancialstatementsoflaCaissededépôtetplacementduQuébecanditssubsidiaries(theGroup),whichcomprisetheConsolidatedStatementsofFinancialPositionasatDecember31,2020and2019andtheConsolidatedStatementsofComprehensiveIncome,theConsolidatedStatementsofChangesinNetAssetsAttributabletoDepositorsandtheConsolidatedStatementsofCashFlowsfortheyearsthenended,andnotestotheconsolidatedfinancialstatements,includingasummaryofsignificantaccountingpolicies.
Inouropinion,theaccompanyingconsolidatedfinancialstatementspresentfairly,inallmaterialrespects,theconsolidatedfinancialpositionoftheGroupasatDecember31,2020and2019anditsconsolidatedfinancialperformanceanditsconsolidatedcashflowsfortheyearsthenended,inaccordancewithInternationalFinancialReportingStandards(I F R S).
Basis for OpinionWeconductedourauditinaccordancewithCanadiangenerallyacceptedauditingstandards.OurresponsibilitiesunderthosestandardsarefurtherdescribedintheAuditors’ResponsibilitiesfortheAuditoftheConsolidatedFinancialStatementssectionofourreport.WeareindependentoftheGroupinaccordancewiththeethicalrequirementsthatarerelevanttoourauditoftheconsolidatedfinancialstatementsinCanada,andwehavefulfilledourotherethicalresponsibilitiesinaccordancewiththeserequirements.Webelievethattheauditevidencewehaveobtainedissufficientandappropriatetoprovideabasisforouropinion.
Other InformationManagementisresponsiblefortheotherinformation.Theotherinformationcomprisestheinformation,otherthantheconsolidatedfinancialstatementsandourauditors’reportthereon,intheAnnualReport.
Ouropinionontheconsolidatedfinancialstatementsdoesnotcovertheotherinformationandwewillnotexpressanyformofassuranceconclusionthereon.
Inconnectionwithourauditoftheconsolidatedfinancialstatements,ourresponsibilityistoreadtheotherinformationidentifiedaboveand,indoingso,considerwhethertheotherinformationismateriallyinconsistentwiththeconsolidatedfinancialstatementsorourknowledgeobtainedintheaudit,orotherwiseappearstobemateriallymisstated.
The2020AnnualReportisexpectedtobemadeavailabletousafterthedateofthisauditors’report.If,basedontheworkwewillperformonthe2020AnnualReport,weconcludethatthereisamaterialmisstatementofthisotherinformation,wearerequiredtoreportthatfacttothosechargedwithgovernance.
Responsibilities of Management and Those Charged with Governance for the Consolidated Financial StatementsManagementisresponsibleforthepreparationandfairpresentationoftheconsolidatedfinancialstatementsinaccordancewithI F R S,andforsuchinternalcontrolasmanagementdeterminesisnecessarytoenablethepreparationofconsolidatedfinancialstatementsthatarefreefrommaterialmisstatement,whetherduetofraudorerror.
Inpreparingtheconsolidatedfinancialstatements,managementisresponsibleforassessingtheGroup’sabilitytocontinueasagoingconcern,disclosing,asapplicable,mattersrelatedtogoingconcernandusingthegoingconcernbasisofaccountingunlessmanagementeitherintendstoliquidatetheGrouportoceaseoperations,orhasnorealisticalternativebuttodoso.
ThosechargedwithgovernanceareresponsibleforoverseeingtheGroup’sfinancialreportingprocess.

CDPQ | 2020 AR146
Independent Auditors’ Report
Auditors’ Responsibilities for the Audit of the Consolidated Financial StatementsOurobjectivesaretoobtainreasonableassuranceaboutwhethertheconsolidatedfinancialstatementsasawholearefreefrommaterialmisstatement,whetherduetofraudorerror,andtoissueanauditors’reportthatincludesouropinion.Reasonableassuranceisahighlevelofassurance,butisnotaguaranteethatanauditconductedinaccordancewithCanadiangenerallyacceptedauditingstandardswillalwaysdetectamaterialmisstatementwhenitexists.Misstatementscanarisefromfraudorerrorandareconsideredmaterialif,individuallyorintheaggregate,theycouldreasonablybeexpectedtoinfluencetheeconomicdecisionsofuserstakenonthebasisoftheseconsolidatedfinancialstatements.
AspartofanauditinaccordancewithCanadiangenerallyacceptedauditingstandards,weexerciseprofessionaljudgmentandmaintainprofessionalskepticismthroughouttheaudit.Wealso:
• Identifyandassesstherisksofmaterialmisstatementoftheconsolidatedfinancialstatements,whetherduetofraudorerror,designandperformauditproceduresresponsivetothoserisks,andobtainauditevidencethatissufficientandappropriatetoprovideabasisforouropinion.Theriskofnotdetectingamaterialmisstatementresultingfromfraudishigherthanforoneresultingfromerror,asfraudmayinvolvecollusion,forgery,intentionalomissions,misrepresentations,ortheoverrideofinternalcontrol.
• Obtainanunderstandingofinternalcontrolrelevanttotheauditinordertodesignauditproceduresthatareappropriateinthecircumstances,butnotforthepurposeofexpressinganopinionontheeffectivenessoftheGroup’sinternalcontrol.
• Evaluatetheappropriatenessofaccountingpoliciesusedandthereasonablenessofaccountingestimatesandrelateddisclosuresmadebymanagement.
• Concludeontheappropriatenessofmanagement’suseofthegoingconcernbasisofaccountingand,basedontheauditevidenceobtained,whetheramaterialuncertaintyexistsrelatedtoeventsorconditionsthatmaycastsignificantdoubtontheGroup’sabilitytocontinueasagoingconcern.Ifweconcludethatamaterialuncertaintyexists,wearerequiredtodrawattentioninourauditors’reporttotherelateddisclosuresintheconsolidatedfinancialstatementsor,ifsuchdisclosuresareinadequate,tomodifyouropinion.Ourconclusionsarebasedontheauditevidenceobtaineduptothedateofourauditors’report.However,futureeventsorconditionsmaycausetheGrouptoceasetocontinueasagoingconcern.
• Evaluatetheoverallpresentation,structureandcontentoftheconsolidatedfinancialstatements,includingthedisclosures,andwhetherthe consolidated financial statements represent the underlying transactions and events in a manner that achievesfairpresentation.
• ObtainsufficientappropriateauditevidenceregardingtheconsolidatedfinancialinformationoftheentitiesorbusinessactivitieswithintheGrouptoexpressanopinionontheconsolidatedfinancialstatements.Weareresponsibleforthedirection,supervisionandperformanceoftheauditofthegroupaudit.Weremainsolelyresponsibleforourauditopinion.
Wecommunicatewiththosechargedwithgovernanceregarding,amongothermatters, theplannedscopeandtimingof theauditandsignificantauditfindings,includinganysignificantdeficienciesininternalcontrolthatweidentifyduringouraudit.
Wealsoprovidethosechargedwithgovernancewithastatementthatwehavecompliedwithrelevantethicalrequirementsregardingindependence,andtocommunicatewiththemallrelationshipsandothermattersthatmayreasonablybethoughttobearonourindependence,andwhereapplicable,relatedsafeguards.
Report on Other Legal and Regulatory RequirementsAsrequiredbytheAuditor General Act (C Q L R,chapterV-5.01),wereportthat,inouropinion,theseaccountingstandardshavebeenappliedonabasisconsistentwiththatoftheprecedingyear.
TheengagementpartnerfromErnst&YoungL L Pontheauditresultinginthisindependentauditors’reportisMichelBergeron.
AuditorGeneralofQuébec,
GuylaineLeclerc,F C P Aauditor,F C A
Canada, Montréal, February 23, 2021
Ernst&YoungL L P1
1F C P Aauditor,F C A,publicaccountancypermitno.A114960
Canada, Montréal, February 23, 2021
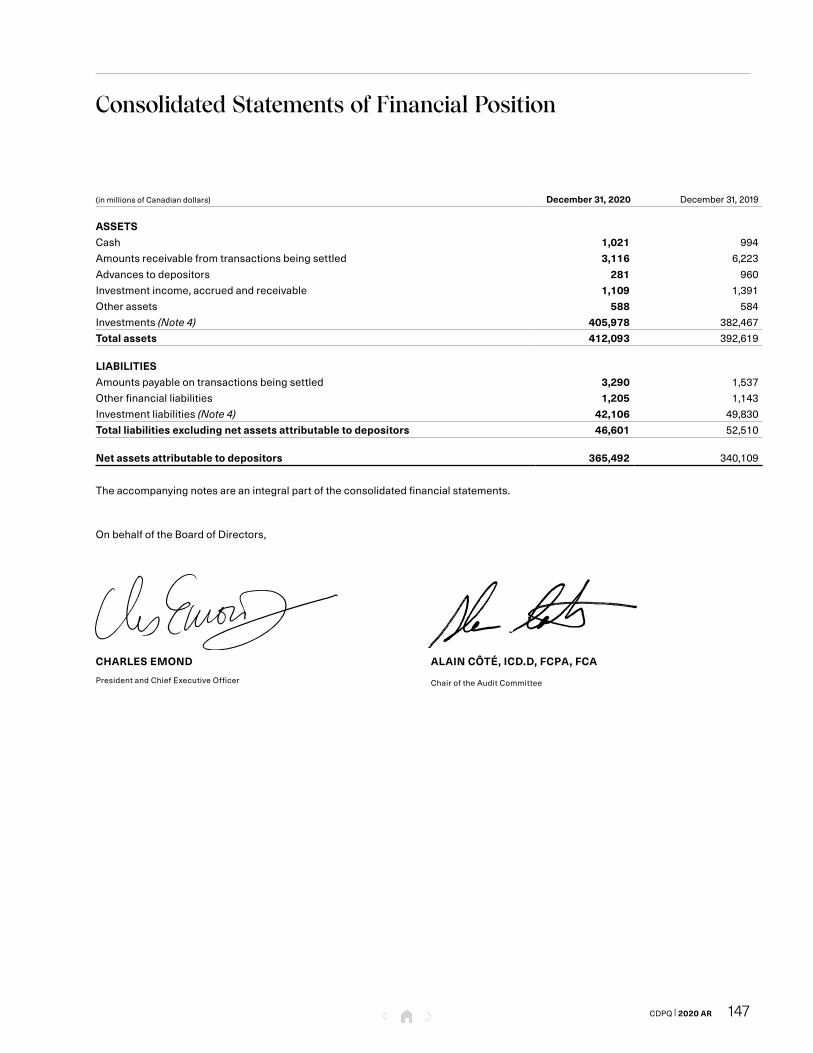
147CDPQ | 2020 AR
Consolidated Statements of Financial Position
(inmillionsofCanadiandollars) December 31, 2020 December31,2019
ASSETSCash 1,021 994Amountsreceivablefromtransactionsbeingsettled 3,116 6,223Advancestodepositors 281 960Investmentincome,accruedandreceivable 1,109 1,391Otherassets 588 584Investments(Note 4) 405,978 382,467Total assets 412,093 392,619
LIABILITIESAmountspayableontransactionsbeingsettled 3,290 1,537Otherfinancialliabilities 1,205 1,143Investmentliabilities(Note 4) 42,106 49,830Total liabilities excluding net assets attributable to depositors 46,601 52,510
Net assets attributable to depositors 365,492 340,109
Theaccompanyingnotesareanintegralpartoftheconsolidatedfinancialstatements.
OnbehalfoftheBoardofDirectors,
CHARLES EMOND
PresidentandChiefExecutiveOfficer
ALAIN CÔTÉ, I C D.D, F C P A, F C A
ChairoftheAuditCommittee
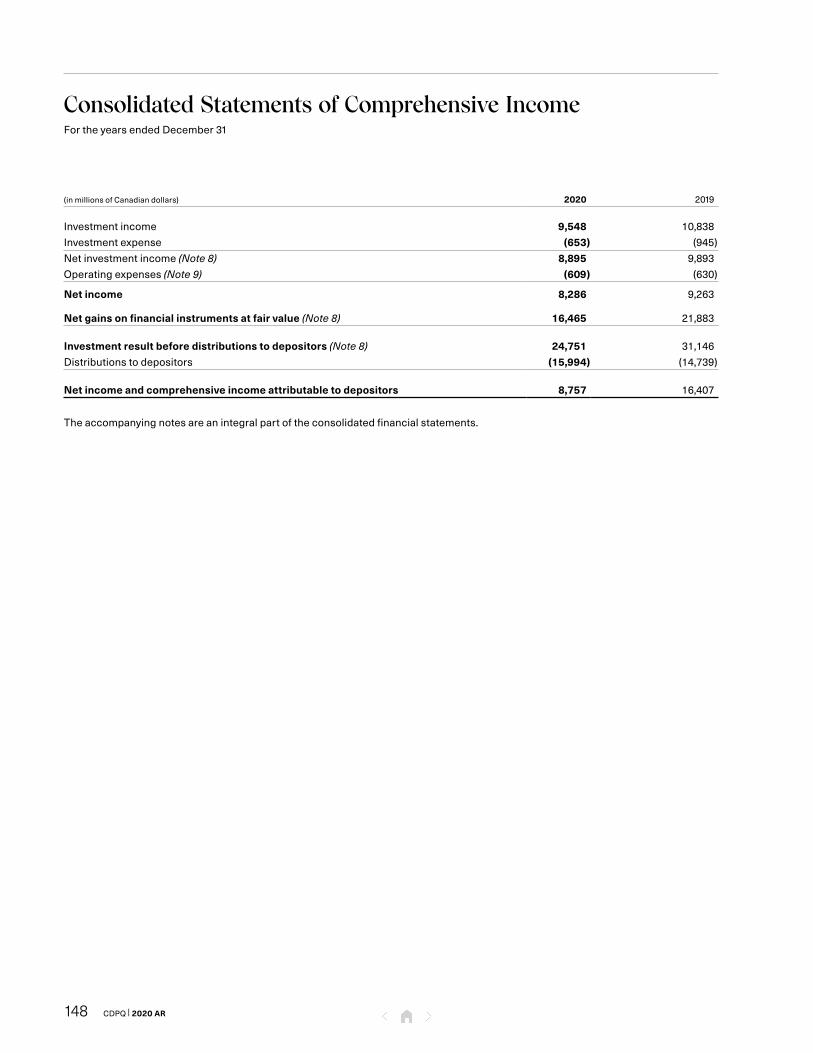
CDPQ | 2020 AR148
Consolidated Statements of Comprehensive IncomeFortheyearsendedDecember31
(inmillionsofCanadiandollars) 2020 2019
Investmentincome 9,548 10,838Investmentexpense (653) (945)Netinvestmentincome (Note 8) 8,895 9,893Operatingexpenses (Note 9) (609) (630)
Net income 8,286 9,263
Net gains on financial instruments at fair value (Note 8) 16,465 21,883
Investment result before distributions to depositors (Note 8) 24,751 31,146Distributionstodepositors (15,994) (14,739)
Net income and comprehensive income attributable to depositors 8,757 16,407
Theaccompanyingnotesareanintegralpartoftheconsolidatedfinancialstatements.

149CDPQ | 2020 AR
Consolidated Statements of Changes in Net Assets Attributable to DepositorsFortheyearsendedDecember31
(inmillionsofCanadiandollars)Demanddeposits
Termdeposits
Distributionspayable to
depositorsParticipation
deposits
Net assetsattributable
to depositors
BalanceasatDecember31,2018 712 6 2,506 306,287 309,511
Attributions and distributionsNetincomeandcomprehensiveincomeattributabletodepositors – – – 16,407 16,407Distributionstodepositors 14,284 – 455 – 14,739
Participation depositsIssuanceofparticipationdepositunits (18,515) – – 18,515 –Cancellationofparticipationdepositunits 4,473 – – (4,473) –
Net depositsNetwithdrawals (548) – – – (548)BALANCE AS AT DECEMBER 31, 2019 406 6 2,961 336,736 340,109
Attributions and distributionsNetincomeandcomprehensiveincomeattributabletodepositors – – – 8,757 8,757Distributionstodepositors 16,302 – (308) – 15,994
Participation depositsIssuanceofparticipationdepositunits (14,969) – – 14,969 –Cancellationofparticipationdepositunits 1,672 – – (1,672) –
Net depositsNetchangeintermdeposits (1) 1 – – –Netcontributions 632 – – – 632BALANCE AS AT DECEMBER 31, 2020 4,042 7 2,653 358,790 365,492
Theaccompanyingnotesareanintegralpartoftheconsolidatedfinancialstatements.

CDPQ | 2020 AR150
Consolidated Statements of Cash FlowsFortheyearsendedDecember31
(inmillionsofCanadiandollars) 2020 2019
Cash flows from operating activitiesNetincomeandcomprehensiveincomeattributabletodepositors 8,757 16,407
Adjustments for:Unrealizednetlossesonshort-termpromissorynotes,termnotesandloanspayable 291 258Foreignexchangegainsonshort-termpromissorynotes,termnotesandloanspayable (642) (772)Distributionstodepositors 15,994 14,739
Net changes in operating assets and liabilitiesAmountsreceivablefromtransactionsbeingsettled 3,107 (1,636)Advancestodepositors 679 (57)Investmentincome,accruedandreceivable 282 (39)Otherassets (4) (102)Investments (22,250) (40,695)Amountspayableontransactionsbeingsettled 1,753 424Otherfinancialliabilities 62 (29)Investmentliabilities (9,268) 5,938TOTAL (1,239) (5,564)
Cash flows from financing activitiesNetchangeinshort-termpromissorynotespayable (2,697) 365Issuanceofshort-termpromissorynotespayable 9,739 9,844Repaymentofshort-termpromissorynotespayable (9,738) (7,078)Netchangeinloanspayable 573 85Issuanceoftermnotespayable 6,166 5,313Repaymentoftermnotespayable (2,148) (2,330)Netcontributions(netwithdrawals) 632 (548)TOTAL 2,527 5,651
Net increase in cash and cash equivalents 1,288 87Cashandcashequivalentsatthebeginningoftheyear 1,122 1,035Cash and cash equivalents at the end of the year 2,410 1,122
Cash and cash equivalents comprise:Cash 1,021 994Cashequivalents (Note 4) 1,389 128TOTAL 2,410 1,122
Supplemental information on cash flows from operating activitiesInterestanddividendsreceived 9,589 10,433Interestpaid (622) (855)
Theaccompanyingnotesareanintegralpartoftheconsolidatedfinancialstatements.

151CDPQ | 2020 AR
Notes to the Consolidated Financial Statements(TabularamountsareshowninmillionsofCanadiandollars,unlessotherwiseindicated.)
01CONSTITUTION AND NATURE OF OPERATIONS
LaCaissededépôtetplacementduQuébec(“C D P Q”),alegalpersonestablishedinthepublicinterestwithinthemeaningoftheCivilCodeofQuébec,isgovernedbytheAct respecting the Caisse de dépôt et placement du Québec (C Q L R,chapterC-2)(the“Act”).
C D P QisdomiciledinQuébec,Canada.Itsheadofficeislocatedat65Sainte-AnneSt.,QuébecCity,Canadaanditsmainofficeislocatedat1000PlaceJean-Paul-Riopelle,Montréal,Canada.
C D P Q’smissionistoreceivemoneysondepositasprovidedbytheActandtomanagethemwithaviewtoachievinganoptimalreturnondepositors’capitalwithintheframeworkofthedepositorinvestmentpolicieswhilealsocontributingtoQuébec’seconomicdevelopment.
CONSOLIDATED FINANCIAL STATEMENTS
TheseconsolidatedfinancialstatementshavebeenpreparedforthepurposesofpresentingC D P Q’sfinancialposition,financialperformanceandcashflows.C D P Q’sconsolidatedfinancialstatementsincludetheaccountsoftheGeneralFund,oftheindividualfunds,andofthespecializedportfoliosaswellastheaccountsofitssubsidiariesthatexclusivelyofferservicesrelatedtofinancing,administrativeandmanagementactivities.Inpreparingtheconsolidatedfinancialstatements,allintercompanytransactionsandbalanceshavebeeneliminated.
TheinvestingactivitiesofthedepositorsinC D P Q’svariousspecializedportfoliosareconcludedthroughtheparticipationdepositunitsofindividualfunds.
GENERAL FUND
TheGeneralFundcomprisescashandcashequivalentactivitiesforC D P Q’soperationalpurposesandmanagementofdemanddeposits,termdeposits,andthefinancingactivities.
INDIVIDUAL FUNDS
Theindividualfundsconsistmainlyofdiversifiedinvestmentsinspecializedportfolios.Eachindividualfundisdedicatedtoasingledepositorwhoinvestsintheparticipationdepositsofindividualfunds.
Theindividualfundsofdepositorsareasfollows:
Fund 300: BaseQuébecPensionPlan,administeredbyRetraiteQuébec
Fund 301: GovernmentandPublicEmployeesRetirementPlan,administeredbyRetraiteQuébec
Fund 302: PensionPlanofManagementPersonnel,administeredbyRetraiteQuébec
Fund 303: PensionPlanforFederalEmployeesTransferredtoEmploymentwiththeGouvernementduQuébec,administeredbyRetraiteQuébec
Fund 305: PensionPlanofElectedMunicipalOfficers(PPEMO),administeredbyRetraiteQuébec
Fund 306: Régimecomplémentairederentesdestechniciensambulanciers/paramédicsetdesservicespréhospitaliersd’urgence–Voletàprestationsdéterminées,administeredbytheComitéderetraite
Fund 307: Fondsd’assuranceautomobileduQuébec,administeredbytheSociétédel’assuranceautomobileduQuébec
Fund 310: Régimederetraitedeschauffeursd’autobusdelaSociétédetransportdeLaval,administeredbytheComitéderetraite
Fund 311: SupplementalPensionPlanforEmployeesoftheQuébecConstructionIndustry–GeneralAccount,administeredbytheCommissiondelaconstructionduQuébec
Fund 312: SupplementalPensionPlanforEmployeesoftheQuébecConstructionIndustry–RetireesAccount,administeredbytheCommissiondelaconstructionduQuébec
Fund 313: SupplementalPensionPlanforEmployeesoftheQuébecConstructionIndustry–SupplementaryAccount,administeredbytheCommissiondelaconstructionduQuébec
Fund 314: DepositInsuranceFund,administeredbytheAutoritédesmarchésfinanciers
Fund 315: Dedicatedaccount,administeredbyLaFinancièreagricoleduQuébec
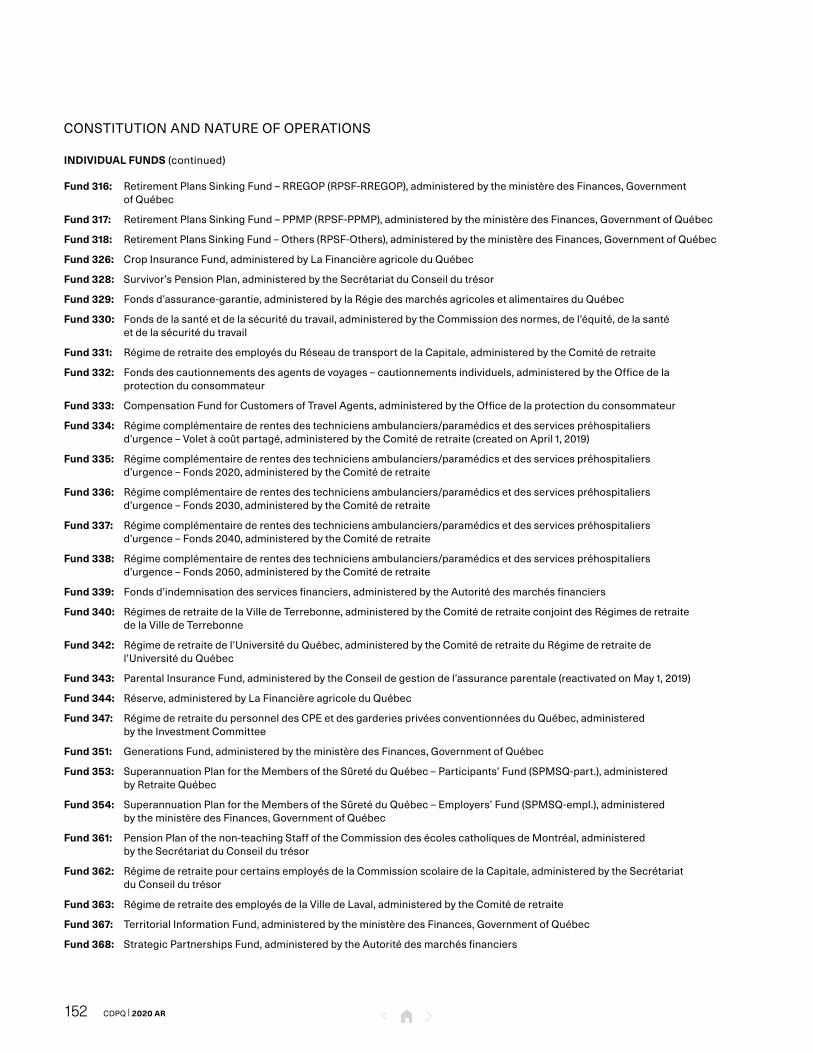
CDPQ | 2020 AR152
CONSTITUTIONANDNATUREOFOPERATIONS
INDIVIDUAL FUNDS(continued)
Fund 316: RetirementPlansSinkingFund–RREGOP(RPSF-RREGOP),administeredbytheministèredesFinances,GovernmentofQuébec
Fund 317: RetirementPlansSinkingFund–PPMP(RPSF-PPMP),administeredbytheministèredesFinances,GovernmentofQuébec
Fund 318: RetirementPlansSinkingFund–Others(RPSF-Others),administeredbytheministèredesFinances,GovernmentofQuébec
Fund 326: CropInsuranceFund,administeredbyLaFinancièreagricoleduQuébec
Fund 328: Survivor’sPensionPlan,administeredbytheSecrétariatduConseildutrésor
Fund 329: Fondsd’assurance-garantie,administeredbylaRégiedesmarchésagricolesetalimentairesduQuébec
Fund 330: Fondsdelasantéetdelasécuritédutravail,administeredbytheCommissiondesnormes,del’équité,delasantéetdelasécuritédutravail
Fund 331: RégimederetraitedesemployésduRéseaudetransportdelaCapitale,administeredbytheComitéderetraite
Fund 332: Fondsdescautionnementsdesagentsdevoyages–cautionnementsindividuels,administeredbytheOfficedelaprotectionduconsommateur
Fund 333: CompensationFundforCustomersofTravelAgents,administeredbytheOfficedelaprotectionduconsommateur
Fund 334: Régimecomplémentairederentesdestechniciensambulanciers/paramédicsetdesservicespréhospitaliersd’urgence–Voletàcoûtpartagé,administeredbytheComitéderetraite(createdonApril1,2019)
Fund 335: Régimecomplémentairederentesdestechniciensambulanciers/paramédicsetdesservicespréhospitaliersd’urgence–Fonds2020,administeredbytheComitéderetraite
Fund 336: Régimecomplémentairederentesdestechniciensambulanciers/paramédicsetdesservicespréhospitaliersd’urgence–Fonds2030,administeredbytheComitéderetraite
Fund 337: Régimecomplémentairederentesdestechniciensambulanciers/paramédicsetdesservicespréhospitaliersd’urgence–Fonds2040,administeredbytheComitéderetraite
Fund 338: Régimecomplémentairederentesdestechniciensambulanciers/paramédicsetdesservicespréhospitaliersd’urgence–Fonds2050,administeredbytheComitéderetraite
Fund 339: Fondsd’indemnisationdesservicesfinanciers,administeredbytheAutoritédesmarchésfinanciers
Fund 340: RégimesderetraitedelaVilledeTerrebonne,administeredbytheComitéderetraiteconjointdesRégimesderetraitedelaVilledeTerrebonne
Fund 342: Régimederetraitedel’UniversitéduQuébec,administeredbytheComitéderetraiteduRégimederetraitedel’UniversitéduQuébec
Fund 343: ParentalInsuranceFund,administeredbytheConseildegestiondel’assuranceparentale(reactivatedonMay1,2019)
Fund 344: Réserve,administeredbyLaFinancièreagricoleduQuébec
Fund 347: RégimederetraitedupersonneldesCPEetdesgarderiesprivéesconventionnéesduQuébec,administeredbytheInvestmentCommittee
Fund 351: GenerationsFund,administeredbytheministèredesFinances,GovernmentofQuébec
Fund 353: SuperannuationPlanfortheMembersoftheSûretéduQuébec–Participants’Fund(S P M S Q-part.),administeredbyRetraiteQuébec
Fund 354: SuperannuationPlanfortheMembersoftheSûretéduQuébec–Employers’Fund(S P M S Q-empl.),administeredbytheministèredesFinances,GovernmentofQuébec
Fund 361: PensionPlanofthenon-teachingStaffoftheCommissiondesécolescatholiquesdeMontréal,administeredbytheSecrétariatduConseildutrésor
Fund 362: RégimederetraitepourcertainsemployésdelaCommissionscolairedelaCapitale,administeredbytheSecrétariatduConseildutrésor
Fund 363: RégimederetraitedesemployésdelaVilledeLaval,administeredbytheComitéderetraite
Fund 367: TerritorialInformationFund,administeredbytheministèredesFinances,GovernmentofQuébec
Fund 368: StrategicPartnershipsFund,administeredbytheAutoritédesmarchésfinanciers
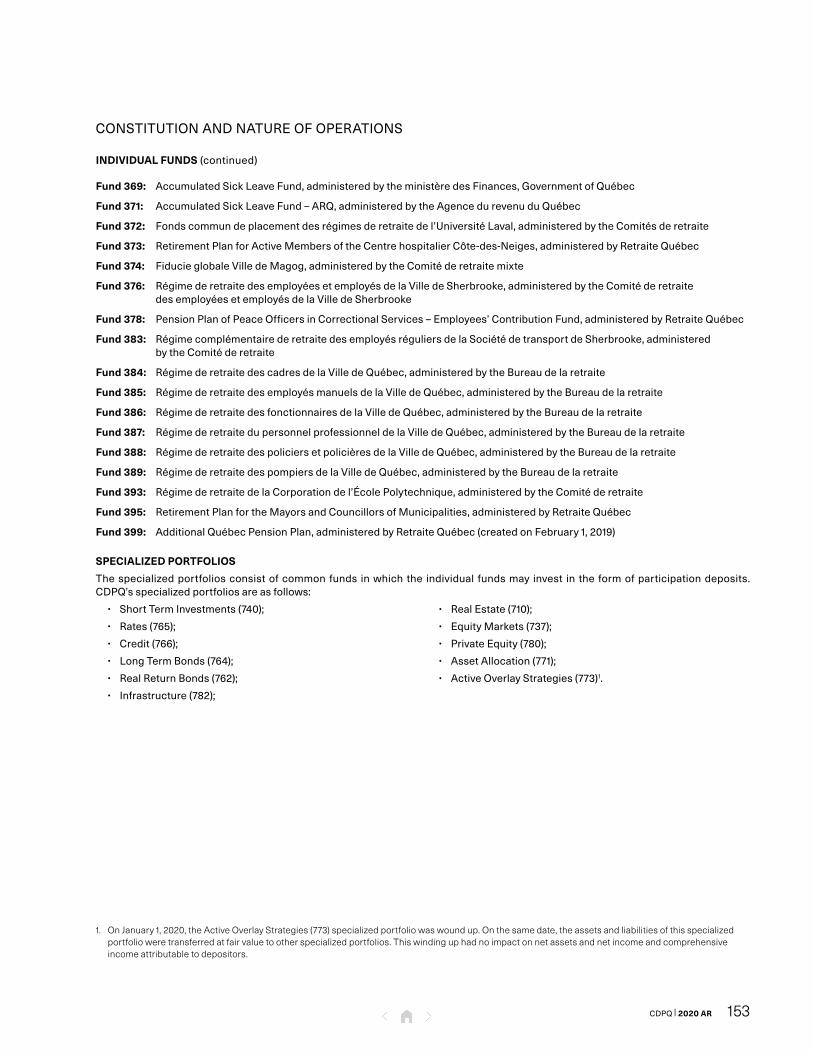
153CDPQ | 2020 AR
CONSTITUTIONANDNATUREOFOPERATIONS
INDIVIDUAL FUNDS(continued)
Fund 369: AccumulatedSickLeaveFund,administeredbytheministèredesFinances,GovernmentofQuébec
Fund 371: AccumulatedSickLeaveFund–ARQ,administeredbytheAgencedurevenuduQuébec
Fund 372: Fondscommundeplacementdesrégimesderetraitedel’UniversitéLaval,administeredbytheComitésderetraite
Fund 373: RetirementPlanforActiveMembersoftheCentrehospitalierCôte-des-Neiges,administeredbyRetraiteQuébec
Fund 374: FiducieglobaleVilledeMagog,administeredbytheComitéderetraitemixte
Fund 376: RégimederetraitedesemployéesetemployésdelaVilledeSherbrooke,administeredbytheComitéderetraitedesemployéesetemployésdelaVilledeSherbrooke
Fund 378: PensionPlanofPeaceOfficersinCorrectionalServices–Employees’ContributionFund,administeredbyRetraiteQuébec
Fund 383: RégimecomplémentairederetraitedesemployésréguliersdelaSociétédetransportdeSherbrooke,administeredbytheComitéderetraite
Fund 384: RégimederetraitedescadresdelaVilledeQuébec,administeredbytheBureaudelaretraite
Fund 385: RégimederetraitedesemployésmanuelsdelaVilledeQuébec,administeredbytheBureaudelaretraite
Fund 386: RégimederetraitedesfonctionnairesdelaVilledeQuébec,administeredbytheBureaudelaretraite
Fund 387: RégimederetraitedupersonnelprofessionneldelaVilledeQuébec,administeredbytheBureaudelaretraite
Fund 388: RégimederetraitedespoliciersetpolicièresdelaVilledeQuébec,administeredbytheBureaudelaretraite
Fund 389: RégimederetraitedespompiersdelaVilledeQuébec,administeredbytheBureaudelaretraite
Fund 393: RégimederetraitedelaCorporationdel’ÉcolePolytechnique,administeredbytheComitéderetraite
Fund 395: RetirementPlanfortheMayorsandCouncillorsofMunicipalities,administeredbyRetraiteQuébec
Fund 399: AdditionalQuébecPensionPlan,administeredbyRetraiteQuébec(createdonFebruary1,2019)
SPECIALIZED PORTFOLIOS
Thespecializedportfoliosconsistofcommonfunds inwhichthe individual fundsmay invest in the formofparticipationdeposits.C D P Q’sspecializedportfoliosareasfollows:
• ShortTermInvestments(740);
• Rates(765);
• Credit(766);
• LongTermBonds(764);
• RealReturnBonds(762);
• Infrastructure(782);
• RealEstate(710);
• EquityMarkets(737);
• PrivateEquity(780);
• AssetAllocation(771);
• ActiveOverlayStrategies(773)1.
1. On January 1, 2020, the Active Overlay Strategies (773) specialized portfolio was wound up. On the same date, the assets and liabilities of this specialized portfolio were transferred at fair value to other specialized portfolios. This winding up had no impact on net assets and net income and comprehensive income attributable to depositors.
CDPQ | 2020 AR154
02SIGNIFICANT ACCOUNTING PRINCIPLES
STATEMENT OF COMPLIANCE
TheseconsolidatedfinancialstatementshavebeenpreparedinaccordancewithInternationalFinancialReportingStandards(I F R S),asissuedbytheInternationalAccountingStandardsBoard(I A S B).Theaccountingpoliciesdescribedbelowhavebeenappliedconsistentlytoallreportingperiodspresented.
PRESENTATION AND MEASUREMENT BASIS
C D P Qmeasuresallofitsfinancialinstruments,includinginvestmentsinunconsolidatedsubsidiaries,jointventures,associatesandstructuredentities,atfairvaluethroughprofitorloss(F V T P L).Subsidiariesthatsolelyprovideservicesrelatedtofinancing,administrative,andmanagementactivitiesareconsolidatedinaccordancewiththeguidancesetoutinI F R S10–Consolidated Financial Statements.
TheConsolidatedStatementsofFinancialPositionarepresentedbasedonliquidity.
APPROVAL OF THE CONSOLIDATED FINANCIAL STATEMENTS
TheBoardofDirectorsapprovedC D P Q’sconsolidatedfinancialstatementsandthepublicationthereofonFebruary23,2021.
FUNCTIONAL AND PRESENTATION CURRENCY
C D P Q’sconsolidatedfinancialstatementsarepresentedinCanadiandollars,whichisthefunctionalcurrency.
FOREIGN CURRENCY TRANSLATION
FinancialassetsandliabilitiesdenominatedinaforeigncurrencyaretranslatedintoCanadiandollarsattheexchangerateineffectatthereportingdate.ForeigncurrencytransactionsaretranslatedintoCanadiandollarsattheexchangerateineffectatthetransactiondate.
Translationdifferencesoninvestmentsandinvestmentliabilitiesatfairvalueandonothermonetaryfinancialassetsandliabilitiesarepresentedunder“Netgainsonfinancialinstrumentsatfairvalue”intheConsolidatedStatementsofComprehensiveIncome.
USE OF JUDGMENTS AND ESTIMATES
InpreparingC D P Q’sconsolidatedfinancialstatementsinaccordancewithI F R S,managementmustmakejudgments,estimatesandassumptionsthataffecttheapplicationofthesignificantaccountingpoliciesdescribedbelowandtheamountsreportedintheConsolidatedStatementsofFinancialPositionandtheConsolidatedStatementsofComprehensiveIncome.
155CDPQ | 2020 AR
SIGNIFICANTACCOUNTINGPRINCIPLES
USE OF JUDGMENTS AND ESTIMATES(continued)
JUDGMENT
Qualification as an investment entityJudgmentisrequiredwhenqualifyingC D P Qasaninvestmententity.C D P QmeetsthethreemandatorycriteriaoftheI F R S10definition:1)Obtainfundsfromoneormoredepositors;2)Committoitsdepositorsthatitsbusinesspurposeistoinvestfundssolelyforreturnsfromcapitalappreciation,investmentincome,orboth;and3)Measureandevaluatetheperformanceofitsinvestmentsonafairvaluebasis.
I F R S10alsosuggestsfourtypicalcharacteristicsbeconsideredinassessingwhetheranentityqualifiesasaninvestmententity:1)Havemorethanoneinvestment;2)Havemorethanonedepositor;3)Haveinvestorsthatarenotrelatedparties;and4)Haveownershipinterestsintheformofequityorsimilarinterests.C D P QdoesnotsatisfythethirdtypicalcharacteristicofaninvestmententitybecauseC D P Qandthedepositorsarerelated.However,C D P Qnonethelessqualifiesasaninvestmententity,asmanagementbelievesthathavingdepositorsrelatedtotheinvestmententitydoesnotcompromiseC D P Q’smissionofinvestingforreturnsfromcapitalappreciation,investmentincome,orboth,foritsdepositors.
Fair value hierarchy of financial instrumentsManagementmustusejudgmentindeterminingthesignificanceofeachinputusedwhenestablishingtheclassificationintothefairvaluehierarchy,asexplainedinNote6.
Interests in entitiesManagementmustusejudgmentindeterminingwhetherC D P Qhascontrol,jointcontrolorsignificantinfluenceovercertainentities,andovertheholdingofinterestsinstructuredentities,asdescribedinNote16.JudgmentontherelationshipbetweenC D P QandanyentityinwhichC D P Qholdsaninterestisexerciseduponinitialinvestmentandmustbereassessedwhenfactsandcircumstancesindicatethatthereareoneormorechangestotheelementsofcontrol.
C D P Qholdsinterestsinastructuredentitywhenvotingorsimilarrightsarenotthedominantfactorindecidingwhocontrolstheentity.
C D P Qcontrolsasubsidiary,includingastructuredentity,onlyiftheI F R S10criteriaaremet:1)Ithasdecision-makingauthorityregardingtheentity’srelevantactivities;2)Ithasexposureorrightstovariablereturnsfromitsinvolvementwiththeentity;and3)Ithastheabilitytouseitspowertoaffecttheamountofthereturns.Whenmanagementdeterminesdecision-makingauthority,severalfactorsaretakenintoaccount,includingtheexistenceandeffectofactualandpotentialvotingrightsheldbyC D P Qthatareexercisable,theholdingofinstrumentsthatareconvertibleintovotingshares,theexistenceofcontractualagreementsthroughwhichtherelevantactivitiesoftheentitycanbedirected,aswellasothercircumstancesthataffectdecision-making.
C D P Qhasjointcontroloverajointventurewhenthereisacontractualorimplicitarrangementwherebydecisionsaboutrelevantactivitiesrequiretheunanimousconsentofthepartiessharingcontrolandwhenthesepartieshaverightstothenetassetsofthearrangement.
C D P Qhassignificantinfluenceoveranassociatewhenithasthepowertoparticipateinthefinancialandoperatingpolicydecisionsoftheentity.C D P Qisdeemedtohavesignificantinfluencewhenitholds20%ormoreofthevotingrightsofanentitybutdoesnothavecontrolorjointcontrol.
ESTIMATES AND ASSUMPTIONS
Themainestimatesandassumptions,whicharedisclosedinNote6,involvethefairvaluemeasurementofinvestmentsandinvestmentliabilitiesclassifiedinLevel3ofthefairvaluehierarchy.Actualvaluesmaydifferfromtheestimatedvalues.
IMPACT OF COVID-19 ON JUDGMENTS, ESTIMATES AND ASSUMPTIONS
TheCOVID-19pandemicdeclaredbytheWorldHealthOrganizationonMarch11,2020disruptedglobaleconomicactivityandcreatedhighlevelsofuncertaintyandvolatilityinfinancialandstockmarketsduring2020,resultinginaneconomicslowdown.Governmentsandcentralbanksreactedwithsubstantialmonetaryandfiscalinterventionsinanattempttostabilizeeconomicconditions.
Whilethefairvaluevaluationtechniquesoffinancialinstrumentsthatarenottradedinanactivemarkethaveremainedthesame,C D P QhasadjustedtheunobservableinputsusedbasedoninformationanddataavailableatthedateoftheseconsolidatedfinancialstatementsinordertoprovideitsbestestimateoftheimpactoftheCOVID-19pandemiconthefairvalueofthesefinancialinstruments.Uncertaintyregardingtheduration,severityandmagnitudeofthepandemic,theeffectivenessofgovernmentmeasuresaswellasalloftheresultingeconomicconsequencescouldresultinasignificantadjustmentbeingmadetothefairvalueofthesefinancialinstrumentsandtothenetassetsattributabletodepositorsinthecomingyear.ThefairvaluevaluationtechniquesandunobservableinputsusedarepresentedinNote6ewhileasensitivityanalysisispresentedinNote6f.ManagementcontinuestomonitortheevolutionoftheCOVID-19pandemicanditsimpactonC D P Q.

CDPQ | 2020 AR156
SIGNIFICANTACCOUNTINGPRINCIPLES
FINANCIAL INSTRUMENTS
C D P Q’sfinancialinstrumentsincludecash,amountsreceivablefromtransactionsbeingsettled,advancestodepositors,accruedandreceivableinvestmentincome,investments,amountspayableontransactionsbeingsettled,otherfinancialliabilities,investmentliabilitiesandnetassetsattributabletodepositors.
CLASSIFICATION AND MEASUREMENT
Financialinstrumentsarecategorizedbasedontheirnatureandcharacteristics.Classificationisdetermineduponinitialrecognition,whichisthedateonwhichC D P Qissubjecttothecontractualprovisionsoftheinstrument.C D P Q’sfinancialassetsandliabilitiesaremanagedandtheirperformanceisevaluatedonafairvaluebasis.Consequently,allofC D P Q’sfinancialassetsmustbeclassifiedatF V T P LwhileitsfinancialliabilitiesaredesignatedatF V T P L.DerivativefinancialinstrumentsandsecuritiessoldshortmustbeclassifiedatF V T P L.
CorporatedebtcommitmentsareclassifiedatF V T P Lwhenoneofthefollowingcriteriaismet:1)ThecommitmentsaredesignatedasfinancialliabilitiesatF V T P LorC D P Qhasapracticeofsellingtheloansresultingfromitscommitments;or2)Thecorporatedebtcommitmentscanbesettlednetincash.
Financialinstrumentsareinitiallyandsubsequentlyrecognizedatfairvalue.Changesinthefairvalueoffinancialinstrumentsarepresentedunder“Netgainsonfinancialinstrumentsatfairvalue”intheConsolidatedStatementsofComprehensiveIncome.WhenthechangeinthefairvalueoffinancialliabilitiesdesignatedatF V T P LisattributabletochangesinC D P Q’sowncreditrisk,itispresentedseparatelyintheConsolidatedStatementsofComprehensiveIncomeunlessdoingsocreatesorenlargesanaccountingmismatch,whenappropriate.Incomeandexpensearepresentedunder“Netinvestmentincome”intheConsolidatedStatementsofComprehensiveIncome.
FAIR VALUE MEASUREMENT
Fairvalueisdefinedasthepricethatwouldbereceivedonthesaleofanassetorpaidtotransferaliabilityinanorderlytransactionbetweenmarketparticipantsatthemeasurementdate.Fairvalueisdeterminedforeachfinancialinstrument,whichcouldbeastand-aloneassetorliability(e.g.,ashareorbond)oragroupofassetsandliabilities(e.g.,anownershipinterestinasubsidiaryorassociate).Uponinitialrecognition,thebestevidenceofthefairvalueofafinancialinstrumentisthetransactionprice,whichisthefairvalueoftheconsiderationreceivedorgiven.Subsequently,thefairvalueofafinancialinstrumentisclassifiedusingthefairvaluehierarchydescribedinNote6.
C D P Qappliesappropriatevaluationtechniquesbasedonafinancial instrument’scharacteristics, theavailabilityof inputs,andtheassumptionsthatwouldbeusedbymarketparticipants,focusingonmaximizingtheuseofrelevantobservableinputswhileminimizingtheuseofunobservableinputs.Thevaluationtechniquesareappliedconsistently.FairvalueinformationisprovidedinNote6.
CashCashisthecashdepositedwithrecognizedfinancialinstitutionsandbearsinterestatmarketrates.
InvestmentsInvestmentsincludecashequivalents,fixed-incomesecurities,variable-incomesecurities,interestsinunconsolidatedsubsidiariesandderivativefinancialinstruments.
Cashequivalentsincludeshort-terminvestmentsandsecuritiespurchasedunderreverserepurchaseagreements.Thesesecuritiesmeetthedefinitionofcashequivalentsbecausetheyareusedforcashmanagementpurposes,arereadilyconvertibleintoaknownamountofcash,havenegligibleriskoffairvaluechangesandhaveinitialmaturitiesofthreemonthsorless.Thesefinancialinstrumentsbearinterestatmarketrates.
Fixed-incomesecuritiesincludeshort-terminvestments,securitiespurchasedunderreverserepurchaseagreements,corporatedebtandbonds,whichincludebondfunds.Purchasesandsalesoffixed-incomesecuritiesarerecordedatthetransactiondate,exceptforpurchasesandsalesofcorporatedebt,whicharerecordedatthesettlementdate.
Variable-incomesecuritiescompriseequitiesofpubliccompaniesincludingexchangetradedfunds,privatecompaniesincludinginvestmentfunds,privateinvestmentfundsandinfrastructurefunds,aswellashedgefunds.Purchasesandsalesofequities,hedgefundsandinvestmentfundsarerecordedatthetransactiondate,whereaspurchasesandsalesofinvestmentfunds,privateinvestmentfundsandinfrastructurefundsarerecordedatthesettlementdate.
InterestsinunconsolidatedsubsidiariesrepresentC D P Q’sinvestmentincontrolledentitiesthatarenotconsolidatedunderI F R S10.C D P Q’sinvestmentintheseentitiesmaybeintheformofequityinstrumentsordebtinstruments.

157CDPQ | 2020 AR
SIGNIFICANTACCOUNTINGPRINCIPLES
FINANCIAL INSTRUMENTS(continued)
Investment liabilitiesInvestmentliabilitiesincludesecuritiessoldunderrepurchaseagreements,securitiessoldshort,short-termpromissorynotespayable,loanspayable,termnotespayableandderivativefinancialinstruments.
SecuritiessoldshortarecommitmentsmadebyC D P Qtopurchasesecuritiesfromthirdpartiestocoveritspositions.C D P Qmayshort-sellequitiesandbonds.
Derivative financial instrumentsInmanagingitsinvestments,C D P Qconductstransactionsinvolvingvariousderivativefinancialinstrumentsfordiscretionarypurposesortomanagetherisksassociatedwithexchangerate,interestrateandmarketfluctuations.Derivativefinancialinstrumentswhosefairvalueisfavourablearepresentedunder“Investments”intheConsolidatedStatementsofFinancialPosition,whilethosewhosefairvalueisunfavourablearepresentedunder“Investmentliabilities”intheConsolidatedStatementsofFinancialPosition.
Transactions being settledTransactionswithcounterpartiesforthesaleorpurchaseofsecuritiesthathavenotyetbeensettledatthereportingdatearepresentedrespectivelyunder“Amountsreceivablefromtransactionsbeingsettled”and“Amountspayableontransactionsbeingsettled”intheConsolidatedStatementsofFinancialPosition.
DERECOGNITION OF FINANCIAL ASSETS AND LIABILITIES
C D P QderecognizesfinancialassetswhenallofthecontractualrightstotheassetshaveexpiredorwhenthecontractualrightstoreceivethecashflowsfromthefinancialassetshavebeentransferredandwhenC D P Qhastransferredsubstantiallyalloftherisksandrewardsofthefinancialassetsuchthatitnolongerretainscontrolovertheasset.IfC D P Qconsidersthatitretainssubstantiallyalloftherisksandrewardsofatransferredfinancialasset,thatassetisnotderecognizedfromtheConsolidatedStatementsofFinancialPositionand,ifappropriate,acorrespondingfinancialliabilityisrecorded.FinancialassetsthathavebeentransferredbutnotderecognizedaredisclosedinNote13.Financialliabilitiesarederecognizedwhentherelatedobligationisdischarged,cancelledorexpired.
Securities purchased under reverse repurchase agreements and sold under repurchase agreementsC D P Qentersintotransactionstopurchaseandsellsecurities,i.e.,short-terminvestmentsandbonds,thatitagreestoreselltoorrepurchasefromthecounterpartyatafuturedate.
ThepurchasedsecuritiesarenotrecognizedintheConsolidatedStatementsofFinancialPositionbecausethecounterpartyretainstherisksandrewardsofthesecurities.Thecashamountsdisbursedarederecognized,andacorrespondingassetisrecordedininvestmentsunder“Securitiespurchasedunderreverserepurchaseagreements”.
ThesoldsecuritiesarenotderecognizedfromtheConsolidatedStatementsofFinancialPositionbecauseC D P Qretainstherisksandrewardsofthesecurities.Thecashamountsreceivedarerecognized,andacorrespondingliabilityisrecordedininvestmentliabilitiesunder“Securitiessoldunderrepurchaseagreements”.
Lending and borrowing of securitiesC D P Qconductssecuritieslendingandborrowingtransactionsinvolvingequitiesandbonds.ThesetransactionsaregenerallyguaranteedbythesecuritiesreceivedfromthecounterpartiesorpledgedbyC D P Q,respectively.Loanedsecuritiesarenotderecognizedfrom,andborrowedsecuritiesarenotrecognizedin,theConsolidatedStatementsofFinancialPositionbecauseC D P Qorthecounterparty,respectively,retainstherisksandrewardsofthesecurities.Incomeandexpensesresultingfromsecuritieslendingandborrowingtransactionsarepresentedunder“Investmentincome”and“Investmentexpense”,respectively,intheConsolidatedStatementsofComprehensiveIncome.

CDPQ | 2020 AR158
SIGNIFICANTACCOUNTINGPRINCIPLES
FINANCIAL INSTRUMENTS(continued)
NET ASSETS ATTRIBUTABLE TO DEPOSITORS
Netassetsattributabletodepositorsconsistofdemanddeposits,termdeposits,distributionspayabletodepositorsandparticipationdeposits.
Demand deposits and term depositsDemanddepositsbearinterestatavariablerateandarerepayableondemand.Termdepositsbearinterestatafixedorvariablerateandarerepayableatmaturity.DemanddepositsandtermdepositsrepresentC D P Q’sindebtednesstowardsthedepositorsinaccordancewiththeRegulation respecting the terms and conditions of deposits, funds and portfolios of the Caisse de dépôt et placement du Québec (Regulation).
Distributions payable to depositorsUndertheRegulation,distributionspayabletodepositorsrepresentthenetincomeornetlossarisingfromthespecializedportfoliosaswellasthenetrealizedgainsorlossesuponcancellationoftheparticipationunitsofspecializedportfoliosheldbytheindividualfundsthatarerecordedattheendofthemonthandarepaidintothedemanddepositaccountsofdepositorsatthebeginningofthefollowingmonth.Distributionsmayalsobemadethroughtheissuanceofparticipationdepositunitsofindividualfunds.
Participation depositsParticipationdepositsareexpressedinparticipationunitsforeachindividualfund.Eachparticipationunitgivestheholderaninterestintheindividualfund’snetassets.Theper-unitvalueofthenetassetsisdeterminedbydividingtheindividualfund’snetassetsbythenumberofoutstandingunits.Depositorscanpurchaseorcancelparticipationdepositunitsatthatvalueatthebeginningofeachmonth.Thedifferencebetweentheproceedsofcancellationandthecarryingvalueatissuanceisrecoveredinthedepositor’sdemanddepositaccount.Inaddition,holdersofparticipationdepositunitsareentitledtoreceivedistributions.Participationdepositunitsarefinancialinstrumentsdefinedasdepositor’sequityintheRegulationandaresubordinatetoallothercategoriesoffinancialliabilities.
NET INCOME
DIVIDEND AND INTEREST INCOME AND EXPENSE
DividendincomeisrecognizedwhenC D P Qobtainstherighttothedividend,generallyontheex-dividenddate.Distributionsfromfundsarerecognizedasincomeonthesettlementdate.Dividendexpensefromequitiessoldshortisrecordedwhentheshareholdersobtaintherighttothedividend.Dividendincomeandexpensearepresentedunder“Investmentincome”and“Investmentexpense”,respectively,intheConsolidatedStatementsofComprehensiveIncome.
Interestincomeandexpensearerecognizedasamountsareearnedorincurredusingtheprescribedcouponratemethod.Interestincomeandexpensearepresentedunder“Investment income”and“Investmentexpense”,respectively, intheConsolidatedStatementsofComprehensiveIncome.
EXTERNAL MANAGEMENT FEES
Externalmanagementfeesareamountspaidtoexternalfinancialinstitutions,mainlyinstitutionalfundmanagersactiveininternationalstockmarkets,forthemanagementofsecuritiesownedbyC D P Q.Thebasefeesandperformance-relatedfeesofexternalmanagersarepresentedunder“Investmentexpense”and“Netgainsonfinancialinstrumentsatfairvalue”,respectively,intheConsolidatedStatementsofComprehensiveIncome.
INCOME TAX
Underfederalandprovincialincometaxlegislation,C D P QisexemptfromincometaxinCanada.Incertainforeignjurisdictions,investmentincomeandcapitalgainsmaybesubjecttotax.Withholdingtaxesandincometaxexpensearepresentedunder“Netinvestmentincome”and“Netgainsonfinancialinstrumentsatfairvalue”,respectively,intheConsolidatedStatementsofComprehensiveIncome.
OPERATING EXPENSES
OperatingexpensesconsistofalltheexpensesincurredtomanageandadministerC D P Q’sinvestmentsandarepresentedseparatelyintheConsolidatedStatementsofComprehensiveIncome.

159CDPQ | 2020 AR
NET GAINS ON FINANCIAL INSTRUMENTS AT FAIR VALUE
Gainsandlossesrealizedoninvestmentsandinvestmentliabilitiesrepresentthedifferencebetweensettlementvalueandvalueatinitialrecognition.Gainsandlossesrealizedonderivativefinancialinstrumentsrepresentpaymentsandreceipts.Unrealizedgainsandlossesonfinancialinstrumentsincludenetchangesinfairvaluefortheyearaswellasthereversalofprior-yearunrealizedgainsandlossesthatwererealizedduringtheyear.Realizedandunrealizedgainsandlossesarepresentedunder“Netgainsonfinancialinstrumentsatfairvalue”intheConsolidatedStatementsofComprehensiveIncome.
Transactioncostsdirectlyattributabletotheacquisition,saleandissuanceofafinancialinstrumentarepresentedunder“Netgainsonfinancialinstrumentsatfairvalue”intheConsolidatedStatementsofComprehensiveIncome.Transactioncostsincludecommissions,stockexchangefeesaswellasprofessionalandlegalfeesrelatedtoinvestingandfinancingactivities.
DISTRIBUTIONS TO DEPOSITORS
UndertheRegulation,distributionstodepositorsconsistoftheannualnetincomeorlossfromthespecializedportfoliosaswellasthenetgainsorlossesrealizedonthecancellationofparticipationunitsofthespecializedportfoliosheldbytheindividualfunds.DistributionstodepositorsarerecordedasfinancecostsandpresentedseparatelyintheConsolidatedStatementsofComprehensiveIncome.
03NEW I F R S STANDARDS
Noissuedoramendedstandardnotyeteffectiveasofthedateofthesefinancialstatementsisexpectedtohaveanimpactontheconsolidatedfinancialstatements.
SIGNIFICANTACCOUNTINGPRINCIPLES

CDPQ | 2020 AR160
04INVESTMENTS AND INVESTMENT LIABILITIES
A) INVESTMENTS
Thefollowingtableshowsthefairvaluesoftheinvestments.Thegeographicallocationisdeterminedaccordingtothecountryoftheissuer’sprincipalplaceofbusiness.Thegeographicallocationofinterestsinunconsolidatedsubsidiariesisdeterminedaccordingtothecountryoftheunderlyinginvestments,whiletheallocationofderivativefinancialinstrumentsisdeterminedaccordingtothecurrencyinwhichtheinstrumentwillbesettled.Fair values of the Investments December 31, 2020 December31,2019
n.a. Canada Foreign Fair value Canada Foreign Fairvalue
InvestmentsCash equivalentsShort-terminvestments 200 – 200 27 – 27Securitiespurchasedunderreverserepurchaseagreements 1,189 – 1,189 101 – 101
Total cash equivalents 1,389 – 1,389 128 – 128
Fixed-income securities
Short-terminvestments 395 39 434 64 74 138Securitiespurchasedunderreverserepurchaseagreements 4,557 1,026 5,583 12 3,524 3,536
Corporatedebt 979 1,380 2,359 742 1,273 2,015BondsGovernments 41,917 19,411 61,328 41,969 22,042 64,011Governmentcorporationsandotherpublicadministrations 6,604 591 7,195 6,425 574 6,999
Corporatesector 11,826 7,104 18,930 11,970 6,094 18,064Bondfunds – 1,401 1,401 – 1,603 1,603
Total fixed-income securities 66,278 30,952 97,230 61,182 35,184 96,366
Variable-income securitiesEquitiesPubliccompanies 30,746 88,623 119,369 30,322 86,863 117,185Privatecompanies 3,305 20,127 23,432 3,317 16,001 19,318Hedgefunds – 428 428 – 1,321 1,321
Total variable-income securities 34,051 109,178 143,229 33,639 104,185 137,824
Interests in unconsolidated subsidiariesInvestmentsinrealestateholdings 13,380 31,780 45,160 17,975 31,019 48,994Investmentsinrealestatedebt 15,261 2,232 17,493 14,290 1,197 15,487Privateequityinvestments1 7,680 32,819 40,499 4,872 27,045 31,917Infrastructureinvestments1 5,417 20,164 25,581 3,737 19,167 22,904Investmentsinfixed-incomesecurities 4,902 19,234 24,136 4,809 14,592 19,401Investmentsinhedgefunds – 3,886 3,886 77 4,345 4,422Stockmarketinvestments 2,869 1,614 4,483 1,039 2,230 3,269
Total interests in unconsolidated subsidiaries 49,509 111,729 161,238 46,799 99,595 146,394
Derivative financial instruments (Note 5) 1 2,891 2,892 10 1,745 1,755Total investments 151,228 254,750 405,978 141,758 240,709 382,467
1. Due to a change in the geographic allocation methodology for underlying investments, amounts of $927 million and $63 million were reclassified from “Foreign” to “Canada” in respect of private equity and infrastructure investments, respectively, under interests in unconsolidated subsidiaries as at December 31, 2019.
EQUITIES IN GROWTH MARKETS
C D P QhasQualifiedForeignInstitutionalInvestorstatusandobtainedaninvestmentquotatoaccesstheChinesecapitalmarkets.AlthoughC D P Qhasalong-terminvestmentstrategy,itmustmeettheconditionssetbytheregulatoryauthoritiesintheeventofarepatriationofinvestedcapital.AsatDecember31,2020,thefairvalueofsecuritiesinvestedinChinaamountedto$3,425million($2,187millionasatDecember31,2019).

161CDPQ | 2020 AR
INVESTMENTSANDINVESTMENTLIABILITIES
B) INVESTMENT LIABILITIES
Thefollowingtableshowsthefairvaluesofinvestmentliabilities.Thegeographicallocationofnon-derivativefinancialliabilitiesisdeterminedusingthecountryoftheissuer’sprincipalplaceofbusiness,whiletheallocationofderivativefinancialinstrumentsisdeterminedaccordingtothecurrencyinwhichtheinstrumentwillbesettled.
fair values of investment liabilities December 31, 2020 December31,2019
n.a. Canada Foreign Fair value Canada Foreign Fairvalue
Investment liabilitiesNon-derivative financial liabilities
Securitiessoldunderrepurchaseagreements 11,261 3,455 14,716 15,131 8,396 23,527SecuritiessoldshortEquities 103 26 129 104 15 119Bonds 1,610 1,022 2,632 172 3,496 3,668
Short-termpromissorynotespayable 5,983 – 5,983 8,794 – 8,794Loanspayable 514 428 942 149 219 368Termnotespayable 16,113 – 16,113 12,332 – 12,332Total non-derivative financial liabilities 35,584 4,931 40,515 36,682 12,126 48,808
Derivative financial instruments (Note 5) 3 1,588 1,591 27 995 1,022Total investment liabilities 35,587 6,519 42,106 36,709 13,121 49,830
05DERIVATIVE FINANCIAL INSTRUMENTS
Derivativefinancialinstrumentsarefinancialcontractswhosevaluefluctuatesaccordingtoanunderlyingitem,whichrequireverylittleornoinitialinvestmentandaresettledatafuturedate.Theunderlyingitemmaybeofafinancialnature(interestrate,foreigncurrencyorstockmarketsecurityorindex)ormaybeacommodity(preciousmetal,produceoroil).Certainderivativefinancialinstrumentsaresettledthroughclearinghouses.C D P Quses,amongothers,thederivativefinancialinstrumentsdescribedbelow.
Forwardcontractsarecommitmentsforthepurchaseorsaleofanunderlyingitem,thequantityandpriceofwhicharedeterminedinthecontractandaccordingtothematuritystatedtherein.Forwardcontractshavecustomizedtermsandconditionsnegotiateddirectlybetweenthepartiesontheover-the-countermarket.Futurescontractshavetermsandconditionsdeterminedbyanexchangemarket.
Optionsarecontractstradedonover-the-counterorexchangemarketsandthatgivethepurchasertheright,butnottheobligation,tobuyorsellagivenamountofanunderlyingsecurity,indexorcommodityatastrikepricestipulatedinadvance,eitheratadeterminedfuturedateoratanytimebeforeaspecifiedmaturitydate.
Swapsarederivativestradedonover-the-countermarketswherebytwopartiesagreetoexchangeaseriesofcashflowsaccordingtopredeterminedconditionsthatincludeanotionalamount,paymentdatesandatermtomaturity.
Warrantsarecontractstradedonover-the-counterorexchangemarketsthatenablethepurchaseofanunderlyingitem,thepriceofwhichisdeterminedinthecontract,whichincludesapredeterminedmaturitydate.
Thenotionalamountistheamounttowhicharateorpriceisappliedtodeterminetheamountsofcashflowstobeexchangedperiodically.

CDPQ | 2020 AR162
ThefollowingtableshowsthefairvaluesandthenotionalamountsofthederivativefinancialinstrumentsheldbyC D P Q:
fair values and the notional amounts of the derivative financial instruments held by CDPQ December 31, 2020 December31,2019
n.a.
Fair valueNotional
amount n.a.
FairvalueNotionalamountAssets Liabilities Assets Liabilities
Exchange marketsInterest rate derivativesFuturescontracts – – 56,619 – – 69,325Equity derivativesFuturescontracts – – 23,823 – – 19,204Warrants 1 – 53 6 – 51Commodity derivativesFuturescontracts – – 844 2 3 777
Total exchange markets 1 – 81,339 8 3 89,357
Over-the-counter marketsInterest rate derivativesSwaps 250 – 2,128 177 – 5,974Swapssettledthroughaclearinghouse – – 46,698 – – 80,525Forwardcontracts – – – 10 10 1,459Options 31 32 18,191 174 214 41,329Currency derivativesSwaps 141 130 8,768 62 53 5,492Forwardcontracts 1,868 879 97,149 894 413 80,848Options 48 151 25,707 151 36 24,191Credit default derivativesSwapssettledthroughaclearinghouse – – 45,485 – – 31,043Options 12 – 6,406 3 – 4,742Equity derivativesSwaps 156 166 8,127 112 144 9,697Forwardcontracts 160 – 1,091 – – –Options 225 212 21,333 164 149 22,918Commodity derivativesOptions – 21 1,867 – – –
Total over-the-counter markets 2,891 1,591 282,950 1,747 1,019 308,218Total derivative financial instruments 2,892 1,591 364,289 1,755 1,022 397,575
DERIVATIVEFINANCIALINSTRUMENTS
163CDPQ | 2020 AR
06FAIR VALUE MEASUREMENT
A) POLICY, DIRECTIVE, PROTOCOLS AND PROCEDURES RELATED TO FAIR VALUE MEASUREMENT
C D P Q’svaluationproceduresaregovernedbytheInvestmentValuationPolicy,whichisapprovedbytheBoardofDirectors.ThisgeneralpolicyisfurthersupportedbythevaluationdirectiveapplicabletoprivateinvestmentsandthevaluationprotocolsthatstipulatethevaluationprocessandmethodologyforeachtypeofinvestmentheldbyC D P Q.Thegeneralpolicyandthedirectivealsoestablishthegovernanceframeworkforthevaluationandreportingprocess.ApplicationofthepolicyistheresponsibilityoftheValuationCommittee,whichreportstotheExecutiveCommittee,supportedbyavaluationteam.TheValuationCommitteeapprovescompliancewiththepolicyandthefairvaluesonasemi-annualbasis.Subsequently,theValuationCommitteerecommendsthefairvaluestotheAuditCommittee.Forvaluationsofprivateinvestments,consistingofprivateequityandinfrastructureinvestmentsaswellasspecializedfinancing,thepolicyprovidesforanexternalreview,overaperiodofthreeyears,ofsubstantiallyallthefairvalueoftheseinvestments.Externalreviewsincludevaluationsbyindependentvaluators,observationsofcomparabletransactionsinthemarket,orvaluationsbyapartner.
Thepolicyalsoincludesdirectivestobefollowedwhenusingpricesfromexternalsourcessuchasbrokerquotesandnetassetvaluesprovidedbyexternaladministratorsofthefundsorgeneralpartners.
Whenfairvalueisdeterminedbyexternalvaluatorsorthirdparties,theValuationCommittee,supportedbythevaluationteam,verifiesthequalifications,experienceandindependenceoftheseparties.Italsoreviewsthevaluationtechniques,thesignificantinputsusedincalculatingfairvalue,andtheresultsandconclusionstoensurethattheyareincompliancewithrecognizedvaluationstandards.
Inaddition,toensurethereasonablenessofthefairvaluedetermined,C D P Qconductsbacktesting,comparestheestablishedfairvaluewithvaluesofcomparabletransactions,includingthevaluesofcomparablepubliccompanies,andusestheservicesofexternalvaluators.
B) FAIR VALUE VALUATION TECHNIQUES
ThefollowingparagraphsdescribethemainvaluationtechniquesusedtomeasureC D P Q’sfinancialinstruments.
SHORT-TERM INVESTMENTS, SECURITIES PURCHASED UNDER REVERSE REPURCHASE AGREEMENTS, SECURITIES SOLD UNDER REPURCHASE AGREEMENTS, SHORT-TERM PROMISSORY NOTES PAYABLE, LOANS PAYABLE AND TERM NOTES PAYABLE
Thefairvalueofthesefinancialassetsandliabilitiesisdeterminedusingadiscountedcashflowtechniquethatprimarilyusesobservableinputssuchastheinterestratecurvesandcreditspreadsthatmakeupthediscountrates.
CORPORATE DEBT
Thefairvalueofthecorporatedebtisdeterminedusingadiscountedcashflowtechniquethatusesobservableandunobservableinputssuchastheinterestratecurvesandcreditspreads.DuringtheyearendedDecember31,2020,C D P Qrefineditsmethodologyforcalculatingcreditspreadsbyreducingtheimpactofcertainobservableinputstobetterreflectvaluationsintheprivatedebtmarket.C D P Qmayalsousepricespublishedbybrokersinactivemarketsforidenticalorsimilarinstruments.
BONDS
Thefairvalueofbondsisdeterminedusingpricespublishedinactivemarketsforidenticalorsimilarinstruments.Thefairvalueofbondsthathavenopublishedpricesisdeterminedusingeitheradiscountedcashflowtechniqueorbrokerquotes.Discountedcashflowvaluationsuseobservableandunobservableinputssuchastheinterestratecurvesandcreditspreadsthatmakeupthediscountrates.
EQUITIES
Public companiesThefairvalueofequitiesofpubliccompaniesincludingexchangetradedfundsisdeterminedbasedonclosingpricesobservedonmajorstockexchanges,whichrepresenttheactivemarket.
Thefairvalueofanownershipinterestinasubsidiaryorassociatewhosesecuritiesarelistedisdeterminedusingabusinessvaluationtechniquebasedonobservableandunobservableinputs.
CDPQ | 2020 AR164
FAIR VALUE VALUATION TECHNIQUES(continued)
Private companiesThefairvalueofequitiesofprivateequityinvestmentcompaniesisprimarilydeterminedaccordingtothemarketapproach,whichincludestechniquesbasedoncomparablecompanymultiplesandcomparabletransactionmultiples.C D P Qidentifiescomparablecompaniesbasedontheirindustry,size,financialpositionandstrategyandselectsanappropriatemultipleforeachcomparablecompanyidentified.Thistechniqueusesobservableandunobservableinputssuchasearningsbeforeinterest,taxes,depreciationandamortization(E B I T D A)multiplesandothermultiples.
Thefairvalueofequitiesofprivateinfrastructureinvestmentcompaniesisprimarilydeterminedusingadiscountedcashflowtechniqueandcorroboratedbythemarketapproach.Thistechniqueusesobservableandunobservableinputssuchasdiscountratesthattakeintoaccounttheriskassociatedwiththeinvestmentaswellasfuturecashflows.
C D P Qmayalsouseinformationaboutrecentcomparabletransactionscarriedoutinthemarketforvaluationsofprivateequityandinfrastructureinvestments.
FUNDS
Thefairvalueofbondfunds,hedgefunds,investmentfundsandprivateinvestmentandinfrastructurefundsisdeterminedusingthenetassetsprovidedbytheadministratororbythegeneralpartner,unlessthereisanindicationthatthefairvaluediffersfromthenetassetvalueprovided.C D P Qensuresthatthevaluationtechniquesusedbythefund’sadministratororgeneralpartnertodeterminenetassetvaluesareincompliancewithI F R S.Furthermore,thenetassetvalueisadjustedtoreflectcertainfactorssuchaspurchasesandsalesoffundunitsbetweenthedateofthemostrecentfinancialstatementsprovidedbythefundandthevaluationdate,thequotedpriceoftheunderlyingswhentherearesecuritiesofpubliclylistedcorporations,orwhenthereareotherindicationsrequiringjudgmenttobemade.
INTERESTS IN UNCONSOLIDATED SUBSIDIARIES
ThefairvalueofC D P Q’sinterestsinvariousunconsolidatedsubsidiariesisdeterminedusinganenterprisevaluationtechnique.
Investments in real estate holdingsThefairvalueresultingfromtheenterprisevaluetechniqueisdeterminedusingacommonlyusedmethod,i.e.,thecomparablecompanymultiplesmethod,whichissupportedbyobservableandunobservableinputssuchastheprice-to-bookvalueratio.Thisvalueisdeterminedannuallybyanindependentexternalfirm.Enterprisevaluereflects,amongotherthings,thefairvalueoftheassetsandliabilitieshelddirectlybythesesubsidiaries,whichincludeinvestmentproperty,otherrealestateinvestments,whichmainlyincluderealestatefundsandownershipinterestsheldincompanies,liabilitiesassociatedwithinvestmentproperty,aswellasthefairvalueresultingfromthequalityoftheportfolioandtheintegratedmanagementoftheplatformofthesesubsidiaries.
Thefairvalueofinvestmentproperty,whichismeasuredaccordingtothehighestandbestuse,isdeterminedandcertifiedsemi-annuallybyexternal,recognizedandindependentcharteredrealestateappraisers.Valuationsarecarriedoutincompliancewiththevaluationstandardsineffectineachmarket.C D P Qselectsthefairvalueitdeemsmostrepresentativewithintherangesprovidedbytheexternalvaluators.Thevaluationtechniquesusedarebasedprimarilyontworecognizedmethodologies,namely,thediscountedcashflowtechniqueandthecapitalizationofrevenuetechnique.Thesetechniquesuseobservableandunobservableinputssuchasleasetermsandconditions,operatingexpenses,residualvalueandratesofreturn,discountratesandcapitalizationrates.Valuesobservedforcomparabletransactionsareusedtodeterminetherepresentativefairvaluerangeandsupportthefairvaluedetermined.CertainexternalvaluationreportsasatDecember31,2020includeamaterialmeasurementuncertaintyclauseinaccordancewithinternationalvaluationstandardsduetothemarketdisruptionscausedbytheCOVID-19pandemic,whichresultedinareductionintransactionalevidenceandmarketreturns.Whilethisclausedoesnotinvalidatethevaluations,itdoesimplythatthereismuchmoreuncertaintythaninnormalmarketconditions.
Thefairvalueofotherrealestateinvestmentsisdeterminedbasedoncharacteristicsspecifictotheseassets,whosevalueisbasedonnetassetswhichmaybeprovidedbyanadministratororavailableinapublishedfinancialstatement.Thenetassetvalueisadjustedtoreflectexternalfactorsorwhenthereareotherindicationsrequiringjudgmenttobeexercised.
Thefairvalueoffinancialliabilitiesassociatedwithinvestmentpropertyisdeterminedbasedonthediscountedcashflowtechnique.Thistechniqueusesobservableandunobservableinputssuchastheinterestratesandcreditspreadsthatmakeupthediscountrates.
Investments in real estate debtThefairvalueofC D P Q’sinterestsinrealestatedebtsubsidiariesisdeterminedusinganenterprisevaluationtechnique.Enterprisevaluereflectsthefairvalueoftheassetshelddirectlybythesesubsidiaries,whichprimarilyincludecommercialmortgages.
Thefairvalueofcommercialmortgagesisdeterminedusingthediscountedcashflowtechniqueandaredividedintoriskcategories,accordingtotheloan-to-valueratio,andforwhichanappropriatediscountrateisdetermined.Commercialmortgagevaluationsarereviewedannuallybyanindependentexternalfirm.
FAIRVALUEMEASUREMENT

165CDPQ | 2020 AR
FAIR VALUE VALUATION TECHNIQUES(continued)
Private equity, infrastructure, fixed-income securities, hedge funds, and stock marketsEnterprisevaluereflectsthefairvalueofassetshelddirectlybythesesubsidiaries,whichincludebonds,corporatedebt,equitiesofprivatecompanies,equitiesofpubliccompaniesaswellasfundswhosevaluationtechniquesaredescribedabove.
C D P Qmayalsouseinformationaboutrecenttransactionscarriedoutinthemarketforvaluationsofthesefinancialassets.
SECURITIES SOLD SHORT
Thefairvalueofbondsandequitiesthataresoldshortisdeterminedusingthefairvalueofthesecuritythatissoldshort.Thetechniquesforvaluingthesesecuritieshavebeendescribedabove.
DERIVATIVE FINANCIAL INSTRUMENTS
Thefairvalueofderivativefinancialinstrumentsisdeterminedaccordingtothetypeofinstrument.Thefairvalueofderivativefinancialinstrumentstradedonexchangemarketsandonover-the-countermarketsthataresettledthroughaclearinghouseisdetermined,respectively,usingthepricesonthemajorstockexchangesrepresentingtheactivemarketandclearinghouseprices.Thefairvalueoftheotherderivativefinancialinstrumentstradedonover-the-countermarketsisdeterminedusingrecognizedandcommonlyusedvaluationtechniquessuchasthediscountedcashflowtechniqueorotherfinancialmodels.Thesetechniquesrequirethedevelopmentanduseofassumptionsthattakeintoaccountobservableandunobservableinputssuchastheinterestratecurvesandcreditspreadsthatmakeupthediscountratesaswellasforeignexchangeratecurves,pricesoftheunderlying,andvolatility.
NET ASSETS ATTRIBUTABLE TO DEPOSITORS
Demand depositsThefairvalueofdemanddepositsisdeterminedbasedontheirnominalvalue,astheyarerepayableatanytimeattheoptionoftheissuerwithoutpenalty.
Term deposits and distributions payable to depositorsThefairvalueoftermdepositsanddistributionspayabletodepositorsisdeterminedusingthediscountedcashflowtechnique.Thisvaluationtechniquemainlyusesobservableinputssuchastheinterestratecurvesandcreditspreadsthatmakeupthediscountrates.
Participation depositsThefairvalueofdepositorparticipationdepositsstemsfromavaluationofallthefinancialassetsandliabilitiesheldbyC D P Q.
C) FAIR VALUE HIERARCHY
C D P Q’sfinancialinstrumentsatF V T P Lareclassifiedaccordingtothebelow-describedfairvaluehierarchy,basedonthelowestlevelofsignificantinputusedinmeasuringfairvalue.
Level 1: Thefairvaluecalculationofthefinancialinstrumentisbasedonobservableprices(unadjusted)inactivemarketsthattheentitycanaccessatthemeasurementdateforidenticalassetsorliabilities.
Level 2: Thefairvalueofthefinancialinstrumentiscalculatedusingvaluationtechniquesforwhichthesignificantinputsareobservable,eitherdirectlyorindirectly.
Level 3: Thefairvalueofthefinancialinstrumentiscalculatedusingvaluationtechniquesforwhichthesignificantinputsareunobservable.Thislevelincludesfinancialinstrumentswhosevaluationisbasedonpricesobservedforsimilarfinancialinstruments,substantiallyadjustedtoreflectthecharacteristicsspecifictothefinancialinstrumentbeingmeasuredandavailablemarketdata.
Classificationintothefairvaluehierarchylevelsisdetermineduponinitialmeasurementofthefinancialinstrumentandisreviewedoneachsubsequentmeasurementdate.Transfersbetweenlevelsofthefairvaluehierarchyaremeasuredatfairvalueatthebeginningofeachfiscalyear.
Thefairvaluehierarchylevelsoffinancialinstrumentsaredeterminedatthereportingdateandareinfluencedbythemarketfactorsprevailingonthatdate.Consequently,theclassificationsbylevelcanvarysignificantlyfromoneyeartothenext.
FAIRVALUEMEASUREMENT

CDPQ | 2020 AR166
FAIRVALUEMEASUREMENT
FAIR VALUE HIERARCHY(continued)
Thefollowingtablesshowanallocationofthefairvalueoffinancialinstrumentsintothethreelevelsofthefairvaluehierarchy:
December 31, 2020
December31,2020 Level 1 Level 2 Level 3 Total
Financial assetsAmountsreceivablefromtransactionsbeingsettled – 3,116 – 3,116Advancestodepositors – 281 – 281Investmentincome,accruedandreceivable – 1,109 – 1,109InvestmentsCashequivalents – 1,389 – 1,389Short-terminvestments – 434 – 434Securitiespurchasedunderreverserepurchaseagreements – 5,583 – 5,583Corporatedebt – – 2,359 2,359Bonds 63,825 24,804 225 88,854EquitiesPubliccompanies 118,759 610 – 119,369Privatecompanies – 6,715 16,717 23,432Hedgefunds – 395 33 428
InterestsinunconsolidatedsubsidiariesInvestmentsinrealestateholdings – 9,755 35,405 45,160Investmentsinrealestatedebt – 13,768 3,725 17,493Privateequityinvestments – – 40,499 40,499Infrastructureinvestments – – 25,581 25,581Investmentsinfixed-incomesecurities – 5,122 19,014 24,136Investmentsinhedgefunds – 3,886 – 3,886Stockmarketinvestments – 2,869 1,614 4,483
Derivativefinancialinstruments 1 2,891 – 2,892TOTAL 182,585 82,727 145,172 410,484
Financial liabilities excluding net assets attributable to depositorsAmountspayableontransactionsbeingsettled – 3,290 – 3,290Otherfinancialliabilities – 1,205 – 1,205InvestmentliabilitiesSecuritiessoldunderrepurchaseagreements – 14,716 – 14,716Securitiessoldshort 2,761 – – 2,761Short-termpromissorynotespayable – 5,983 – 5,983Loanspayable – 942 – 942Termnotespayable – 16,113 – 16,113Derivativefinancialinstruments – 1,591 – 1,591
TOTAL 2,761 43,840 – 46,601
Net assets attributable to depositorsDemanddeposits – 4,042 – 4,042Termdeposits – 7 – 7Distributionspayabletodepositors – 2,653 – 2,653Participationdeposits – 358,790 – 358,790TOTAL – 365,492 – 365,492
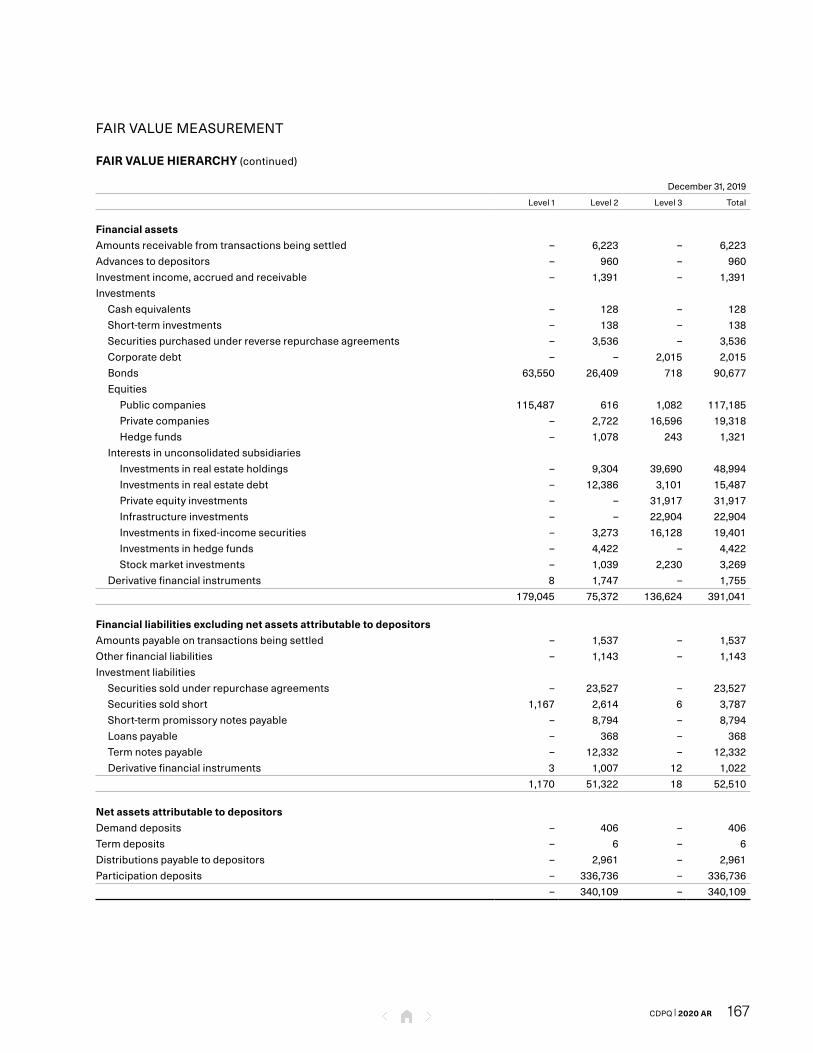
167CDPQ | 2020 AR
FAIRVALUEMEASUREMENT
FAIR VALUE HIERARCHY(continued)
December31,2019
December 31, 2019 Level1 Level2 Level3 Total
Financial assetsAmountsreceivablefromtransactionsbeingsettled – 6,223 – 6,223Advancestodepositors – 960 – 960Investmentincome,accruedandreceivable – 1,391 – 1,391InvestmentsCashequivalents – 128 – 128Short-terminvestments – 138 – 138Securitiespurchasedunderreverserepurchaseagreements – 3,536 – 3,536Corporatedebt – – 2,015 2,015Bonds 63,550 26,409 718 90,677EquitiesPubliccompanies 115,487 616 1,082 117,185Privatecompanies – 2,722 16,596 19,318Hedgefunds – 1,078 243 1,321
InterestsinunconsolidatedsubsidiariesInvestmentsinrealestateholdings – 9,304 39,690 48,994Investmentsinrealestatedebt – 12,386 3,101 15,487Privateequityinvestments – – 31,917 31,917Infrastructureinvestments – – 22,904 22,904Investmentsinfixed-incomesecurities – 3,273 16,128 19,401Investmentsinhedgefunds – 4,422 – 4,422Stockmarketinvestments – 1,039 2,230 3,269
Derivativefinancialinstruments 8 1,747 – 1,755TOTAL 179,045 75,372 136,624 391,041
Financial liabilities excluding net assets attributable to depositorsAmountspayableontransactionsbeingsettled – 1,537 – 1,537Otherfinancialliabilities – 1,143 – 1,143InvestmentliabilitiesSecuritiessoldunderrepurchaseagreements – 23,527 – 23,527Securitiessoldshort 1,167 2,614 6 3,787Short-termpromissorynotespayable – 8,794 – 8,794Loanspayable – 368 – 368Termnotespayable – 12,332 – 12,332Derivativefinancialinstruments 3 1,007 12 1,022
TOTAL 1,170 51,322 18 52,510
Net assets attributable to depositorsDemanddeposits – 406 – 406Termdeposits – 6 – 6Distributionspayabletodepositors – 2,961 – 2,961Participationdeposits – 336,736 – 336,736TOTAL – 340,109 – 340,109

CDPQ | 2020 AR168
FAIRVALUEMEASUREMENT
FAIR VALUE HIERARCHY(continued)
TRANSFERS BETWEEN LEVELS OF THE FAIR VALUE HIERARCHY
AsatDecember31,2020,duetochangesintheavailabilityofobservableinputsgivenchangingmarketconditions,financialinstrumentswithavalueof$989millionweretransferredfromLevel1toLevel2,andof$771millionfromLevel2toLevel1.Moreover,duetoalossofsignificantinfluenceinanassociatewhosesecuritiesarequoted,financialinstrumentsvaluedat$916millionweretransferredfromLevel3toLevel1.
AsatDecember31,2019,duetochangesintheavailabilityofobservableinputsgivenchangingmarketconditions,financialinstrumentswithavalueof$1,398millionweretransferredfromLevel1toLevel2,of$949millionfromLevel2toLevel1,of$4,747millionfromLevel2toLevel3,andof$528millionfromLevel3toLevel2.
D) LEVEL 3: RECONCILIATION BETWEEN OPENING AND CLOSING BALANCES
For financial instruments classified in Level 3 of the hierarchy, reconciliations between the opening and closing balances as atDecember31,2020and2019areasfollows:
2020
2020
Openingbalance
(assets /(liabilities))
Gains (losses)
recognized incompre-
hensive income2 Purchases Sales Settlements Transfers
Closingbalance
(assets /(liabilities))
Unrealized gains
(losses) on financial
instruments held at
year-end2,3
Corporatedebt 2,015 174 284 – (114) – 2,359 73Bonds 718 (8) 479 (957) (7) – 225 (1)Equities 17,921 (72) 1,338 (1,521) – (916) 16,750 74
Interestsinunconsolidatedsubsidiaries 115,970 (1,511) 14,279 (2,900) – – 125,838 (1,205)Derivativefinancialinstruments1 (12) (1) – – 13 – – –Securitiessoldshort (6) 6 – – – – – –
2. Presented under “Net gains on financial instruments at fair value” in the Consolidated Statements of Comprehensive Income.
1. The assets and liabilities related to derivative financial instruments are presented on a net basis.
3. Includes the change in fair value resulting from measuring financial instruments denominated in their original currency and excludes the amounts of gains (losses) resulting from translating financial instruments denominated in foreign currencies. Due to a change in presentation, an unrealized foreign exchange loss of $1,513 million was removed from “Unrealized gains (losses) on financial instruments held at year-end” for the year ended December 31, 2019, given that this amount was already included in “Gains (losses) recognized in comprehensive income”. This change in presentation did not have an impact on net income and comprehensive income attributable to depositors.

169CDPQ | 2020 AR
LEVEL 3: RECONCILIATION BETWEEN OPENING AND CLOSING BALANCES(continued)
2019
2019
Openingbalance(assets/
(liabilities))
Gains(losses)
recognizedincompre-
hensiveincome2 Purchases Sales Settlements Transfers
Closingbalance(assets/
(liabilities))
Unrealizedgains
(losses)onfinancial
instrumentsheldat
year-end2,3
Corporatedebt 2,073 13 454 (227) (298) – 2,015 24Bonds 722 37 113 (106) (11) (37) 718 48Equities 16,260 656 3,043 (1,711) – (327) 17,921 1,117
Interestsinunconsolidatedsubsidiaries 97,473 (649) 18,976 (4,413) – 4,583 115,970 342Derivativefinancialinstruments1 (20) (2) – – 10 – (12) (2)Securitiessoldshort (8) 2 – – – – (6) –
2. Presented under “Net gains on financial instruments at fair value” in the Consolidated Statements of Comprehensive Income.
1. The assets and liabilities related to derivative financial instruments are presented on a net basis.
FAIRVALUEMEASUREMENT
3. Includes the change in fair value resulting from measuring financial instruments denominated in their original currency and excludes the amounts of gains (losses) resulting from translating financial instruments denominated in foreign currencies. Due to a change in presentation, an unrealized foreign exchange loss of $1,513 million was removed from “Unrealized gains (losses) on financial instruments held at year-end” for the year ended December 31, 2019, given that this amount was already included in “Gains (losses) recognized in comprehensive income”. This change in presentation did not have an impact on net income and comprehensive income attributable to depositors.
E) LEVEL 3: FAIR VALUE MEASUREMENT BASED ON REASONABLY POSSIBLE ALTERNATIVE ASSUMPTIONS
Incertaincases,theassumptionsusedinthevaluationtechniquesarebasedonunobservableinputsorobservableinputsadjustedsignificantly toreflect thecharacteristicsspecific to thefinancial instrumentbeingmeasured.WhileC D P Qconsiders its fairvaluemeasurementstobeappropriate,theuseofreasonablypossiblealternativeassumptionscouldresultindifferentfairvalues.Foragivenmeasurementdate,itispossiblethatothermarketparticipantscouldmeasureasamefinancialinstrumentatadifferentfairvalue,withthevaluationtechniquesandinputsusedbythesemarketparticipantsstillmeetingthedefinitionoffairvalue.Thefactthatdifferentfairvaluemeasurementsexistreflectsthejudgment,estimatesandassumptionsappliedaswellastheuncertaintyinvolvedindeterminingthefairvalueofthesefinancialinstruments.

CDPQ | 2020 AR170
FAIRVALUEMEASUREMENT
LEVEL 3: FAIR VALUE MEASUREMENT BASED ON REASONABLY POSSIBLE ALTERNATIVE ASSUMPTIONS(continued)
ThefollowingtablesshowquantitativeinformationontheprimaryvaluationtechniquesandunobservableinputsforthefinancialinstrumentsclassifiedinLevel3ofthefairvaluehierarchythataresubjecttothesensitivityanalysisinNote6faswellasthosethatareexcludedfromtheanalysis:
December 31, 2020
DECEMBER31,2020Fair
valueValuation techniques
Unobservable inputs
Range (weighted average)
Included in the sensitivity analysis
Corporatedebt 2,303 Discounted cash flows Credit spreads 0.6% to 3.4%(1.9%)
n.a. n.a. n.a. Discount rates 5.5% to 11.0%(8.1%)
EquitiesPrivateequityinvestments 4,953 Comparable
company multiplesE B I T D A multiples 7.8 to 16.0
(11.8)Infrastructureinvestments 5,145 Discounted cash flows Discount rates 6.5% to 13.3%
(9.9%)Interestsinunconsolidated subsidiariesInvestmentsinrealestateholdings 35,405 Discounted cash flows Discount rates 4.1% to 13.8%
(6.5%)Credit spreads 0.0% to 6.8%
(2.0%)Capitalization of revenue Capitalization rate 2.1% to 10.7%
(5.3%)Net real estate assets Discounts to net asset value 0.0% to 14.4%
(4.0%)Privateequityinvestments 12,471 Comparable
company multiplesE B I T D A multiples 6.3 to 15.6
(11.9)Infrastructureinvestments 19,027 Discounted cash flows Discount rates 6.0% to 14.0%
(9.1%)Investmentsinfixed-incomesecurities 14,066 Discounted cash flows Discount rates 7.0%
Credit spreads 1.1% to 8.8%(4.5%)
TOTAL 93,370 n.a. n.a.
Excluded from the sensitivity analysis
Financialinstruments1 51,802 Recent transactions2 n.a. n.a.Broker quotes3 n.a. n.a.Net assets3 n.a. n.a.
Net financial instruments classified in Level 3 145,172
n.a.
2. When fair value is determined based on recent transaction information, this value is the most representative indication of fair value. Consequently, C D P Q did not conduct a sensitivity analysis.
1. The fair value of financial instruments presented in this item includes corporate debt, bonds, equities and interests in unconsolidated subsidiaries.
n.a.: not applicable
3. When fair value is determined using broker quotes or net asset value, this value is the only reasonable indication of fair value. Consequently, C D P Q is unable to conduct a sensitivity analysis.

171CDPQ | 2020 AR
FAIRVALUEMEASUREMENT
LEVEL 3: FAIR VALUE MEASUREMENT BASED ON REASONABLY POSSIBLE ALTERNATIVE ASSUMPTIONS(continued)
December31,2019
DECEMBER31,2019Fair
valueValuationtechniques
Unobservableinputs
Range(weightedaverage)
Included in the sensitivity analysis
Corporatedebt 1,713 Discountedcashflows Creditspreads 0.4%to2.4%(1.5%)
Discountrates 6.0%to9.3%(6.9%)
Equities Equities
Privateequityinvestments 6,833 Comparablecompanymultiples
E B I T D Amultiples 8.7to16.0(11.7)
Infrastructureinvestments 5,311 Discountedcashflows Discountrates 6.0%to9.8%(8.7%)
Interestsinunconsolidated subsidiariesInvestmentsinrealestateholdings 39,690 Comparable
companymultiplesPrice-to-bookvalueratios 1.05
Discountedcashflows Discountrates 4.0%to13.5%(6.4%)
Creditspreads 0.0%to9.8%(1.6%)
Capitalizationofrevenue Capitalizationrate 2.7%to10.5%(5.3%)
Netrealestateassets Discountstonetassetvalue 0.0%to8.0%(2.3%)
Privateequityinvestments 12,001 Comparablecompanymultiples
E B I T D Amultiples 9.0to17.0(12.4)
Infrastructureinvestments 16,983 Discountedcashflows Discountrates 6.0%to13.8%(9.2%)
Investmentsinfixed-incomesecurities 9,894 Discountedcashflows Discountrates 6.9%
Creditspreads 1.1%to8.5%(3.6%)
TOTAL 92,425 n.a.
Excluded from the sensitivity analysis
Financialinstruments1 44,181 Recenttransactions2 n.a. n.a.Brokerquotes3 n.a. n.a.Netassets3 n.a. n.a.
Net financial instruments classified in Level 3 136,606 n.a.
n.a.: not applicable
2. When fair value is determined based on recent transaction information, this value is the most representative indication of fair value. Consequently, C D P Q did not conduct a sensitivity analysis.
1. The fair value of financial instruments presented in this item includes corporate debt, bonds, equities and interests in unconsolidated subsidiaries, derivative financial instruments and securities sold short.
3. When fair value is determined using broker quotes or net asset value, this value is the only reasonable indication of fair value. Consequently, C D P Q is unable to conduct a sensitivity analysis.

CDPQ | 2020 AR172
FAIRVALUEMEASUREMENT
F) SENSITIVITY ANALYSIS OF FAIR VALUE
ThefollowinganalysisshowsthesensitivityoffairvaluemeasurementstoreasonablypossiblealternativeassumptionsforthesignificantunobservableinputsshownintheprecedingtablesofNote6e.C D P Qidentifiedreasonablypossiblealternativeassumptionsusingitsjudgmentandknowledgeofthemarkets.AlthoughC D P QtookallavailableinformationintoaccounttoprovideitsbestestimateofthemagnitudeofthepotentialimpactoftheCOVID-19pandemiconthesefinancialinstruments,thefollowingrangesarebasedonalternativeassumptions,whichmaychangesignificantlyandcouldthereforebegreaterthanthoseindicatedbelow.
ThefollowingtableshowstheincreasesanddecreasesinfairvaluethatwouldresultfromthesealternativeassumptionsforthefinancialinstrumentsclassifiedinLevel3ofthefairvaluehierarchythataresubjecttoasensitivityanalysis:
increases and decreases in fair value December 31, 2020 December31,2019
n.a. Increase Decrease Increase Decrease
Sensitivityoffairvalue 6,324 (6,099) 6,263 (5,609)
AsatDecember31,2020,thefairvaluesensitivityanalysisaboveshowsanincreaseinfairvalueof$2,551million($2,754millionasatDecember31,2019)andadecreaseinfairvalueof$2,325million($2,392millionasatDecember31,2019)attributabletoinvestmentsinrealestateholdings.
Thereisacorrelationbetweenunobservableinputsandthedeterminationoffairvalue.Therefore,anincrease(decrease)indiscountrates,creditspreads,capitalizationratesanddiscountstonetassetvaluewouldresultinadecrease(increase)infairvalue.Furthermore,anincrease(decrease)inE B I T D Amultiplesandprice-to-bookvalueratioswouldresultinanincrease(decrease)infairvalue.Thereisnopredictablecorrelationbetweenunobservableinputs.
07OFFSETTING FINANCIAL ASSETS AND FINANCIAL LIABILITIES
AfinancialassetandafinancialliabilitymustbeoffsetintheConsolidatedStatementsofFinancialPositionwhenC D P Qhasalegallyenforceablerightofset-offandintendseithertosettleonanetbasisortorealizethefinancialassetandsettlethefinancialliabilitysimultaneouslywiththecounterparty.C D P Qhasalegallyenforceablerightofset-offwhenthisrightisexercisableinthenormalcourseofbusinessandintheeventofdefault,insolvencyorbankruptcy.
Amountsreceivablefromandamountspayableontransactionsbeingsettled,securitiespurchasedunderreverserepurchaseagreements,securitiessoldunderrepurchaseagreementsandderivativefinancialinstrumentstradedonover-the-countermarketsinaccordancewithagreementsoftheInternationalSwapsandDerivativesAssociation(I S D A)aresubjecttomasternettingagreementsthatdonotmeetthecriteriaforoffsettingintheConsolidatedStatementsofFinancialPositionastheygivearightofset-offthatisenforceableonlyintheeventofdefault,insolvencyorbankruptcy.
Securitiespurchasedunderreverserepurchaseagreementsandsecuritiessoldunderrepurchaseagreementssettledthroughaclearinghousesatisfytheoffsettingcriteria.Derivativefinancialinstrumentstradedonexchangemarketsaswellasthosesettledbyclearinghousesthroughbrokersalsosatisfyoffsettingcriteria.

173CDPQ | 2020 AR
OFFSETTINGFINANCIALASSETSANDFINANCIALLIABILITIES
ThefollowingtablesshowinformationaboutfinancialassetsandliabilitiesthatareoffsetandnotoffsetintheConsolidatedStatementsofFinancialPositionandthataresubjecttomasternettingagreementsorsimilararrangements:
December 31, 2020
DECEMBER31,2020
Gross amounts
recognizedAmounts
offset
Net amounts presented
in the Consolidated
Statements of Financial
Position1
Amounts subject
to master netting
agreements
Collateral received/
pledged2
Net amounts
Financial assetsAmountsreceivablefromtransactionsbeingsettled 3,116 – 3,116 (1,164) – 1,952Securitiespurchasedunderreverserepurchaseagreements3 16,119 (9,346) 6,773 (5,471) (1,302) –
Derivativefinancialinstruments3 2,903 – 2,903 (1,308) (1,003) 592TOTAL 22,138 (9,346) 12,792 (7,943) (2,305) 2,544
Financial liabilitiesAmountspayableontransactionsbeingsettled 3,290 – 3,290 (1,164) – 2,126Securitiessoldunderrepurchaseagreements3 24,072 (9,346) 14,726 (5,471) (9,255) –Derivativefinancialinstruments3 1,596 – 1,596 (1,308) (176) 112TOTAL 28,958 (9,346) 19,612 (7,943) (9,431) 2,238
December31,2019
DECEMBER31,2019
Grossamounts
recognizedAmounts
offset
Netamountspresented
intheConsolidatedStatementsofFinancial
Position1
Amountssubject
tomasternetting
agreements
Collateralreceived/pledged2
Net amounts
Financial assetsAmountsreceivablefromtransactionsbeingsettled 6,223 – 6,223 (602) – 5,621Securitiespurchasedunderreverserepurchaseagreements3 8,502 (4,865) 3,637 (3,622) (13) 2
Derivativefinancialinstruments3 1,777 (5) 1,772 (930) (475) 367TOTAL 16,502 (4,870) 11,632 (5,154) (488) 5,990
Financial liabilitiesAmountspayableontransactionsbeingsettled 1,537 – 1,537 (602) – 935Securitiessoldunderrepurchaseagreements3 28,414 (4,865) 23,549 (3,622) (19,866) 61Derivativefinancialinstruments3 1,062 (5) 1,057 (930) (108) 19TOTAL 31,013 (4,870) 26,143 (5,154) (19,974) 1,015
2. The financial collateral received or pledged cannot include a net amount per counterparty less than zero. The total amounts of financial collateral received or pledged are disclosed in Notes 13 and 14.
1. Net amounts presented in the Consolidated Statements of Financial Position or in Notes 4a and 4b.
3. The amounts presented in this item include amounts receivable and payable presented, respectively, under “Investment income, accrued and receivable” and “Other financial liabilities”.
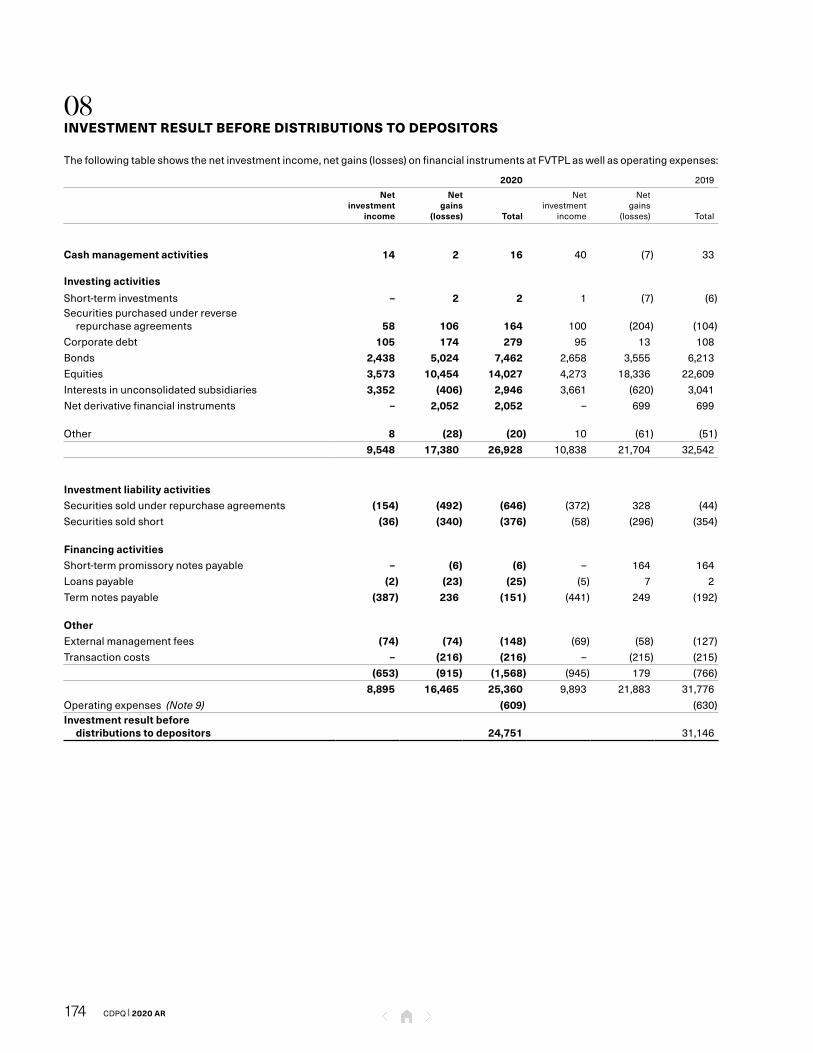
CDPQ | 2020 AR174
08INVESTMENT RESULT BEFORE DISTRIBUTIONS TO DEPOSITORS
Thefollowingtableshowsthenetinvestmentincome,netgains(losses)onfinancialinstrumentsatF V T P Laswellasoperatingexpenses:
n.a. 2020 2019
n.a.
Net investment
income
Net gains
(losses) Total
Netinvestment
income
Netgains
(losses) Total
Cash management activities 14 2 16 40 (7) 33
Investing activities
Short-terminvestments – 2 2 1 (7) (6)Securitiespurchasedunderreverserepurchaseagreements 58 106 164 100 (204) (104)
Corporatedebt 105 174 279 95 13 108Bonds 2,438 5,024 7,462 2,658 3,555 6,213Equities 3,573 10,454 14,027 4,273 18,336 22,609Interestsinunconsolidatedsubsidiaries 3,352 (406) 2,946 3,661 (620) 3,041Netderivativefinancialinstruments – 2,052 2,052 – 699 699
Other 8 (28) (20) 10 (61) (51)TOTAL 9,548 17,380 26,928 10,838 21,704 32,542
Investment liability activitiesSecuritiessoldunderrepurchaseagreements (154) (492) (646) (372) 328 (44)Securitiessoldshort (36) (340) (376) (58) (296) (354)
Financing activitiesShort-termpromissorynotespayable – (6) (6) – 164 164Loanspayable (2) (23) (25) (5) 7 2Termnotespayable (387) 236 (151) (441) 249 (192)
OtherExternalmanagementfees (74) (74) (148) (69) (58) (127)Transactioncosts – (216) (216) – (215) (215)TOTAL (653) (915) (1,568) (945) 179 (766)TOTAL 8,895 16,465 25,360 9,893 21,883 31,776Operatingexpenses(Note 9) (609) (630)Investment result before
distributions to depositors 24,751 31,146

175CDPQ | 2020 AR
09OPERATING EXPENSES
The following table shows the operating expenses:
operating expenses 2020 2019
Salaries and employee benefits 391 405Information technology and professional services 68 68Maintenance, equipment and amortization 64 57Data services and subscriptions 29 24Rent 19 19Other expenses 19 38TOTAL 590 611Safekeeping of securities 19 19TOTAL 609 630
10SEGMENT INFORMATION
C D P Q enables its depositors to allocate their funds to specialized portfolios that hold securities of the same type. These portfolios represent operating segments that have been grouped into three separate segments according to management approach, economic characteristics, and performance targets:
• Fixed Income: This segment’s objective is to reduce the overall risk level of C D P Q’s portfolio and match its depositors’ assets and liabilities while providing a significant source of liquidity. This segment consists of the Rates, Credit, Short Term Investments, Long Term Bonds, and Real Return Bonds specialized portfolios.
• Real Assets: This segment’s objective is to expose C D P Q to markets for which investment income is indexed to inflation and to partially hedge the inflation risk associated with the liabilities of several depositors. This segment consists of the Real Estate and Infrastructure specialized portfolios.
• Equities: This segment’s objective is to increase the depositors’ long-term target returns. This segment consists of the Equity Markets and Private Equity specialized portfolios.
The following table shows the allocation of net assets attributable to depositors according to each of C D P Q’s segment:
allocation of net assets attributable to depositors December 31, 2020 December 31, 2019
Fixed Income 110,237 102,890Real Assets 67,176 67,481Equities 182,257 167,117Other1 5,822 2,621Net assets attributable to depositors 365,492 340,109
The following table shows the allocation of the investment result before distributions to depositors for each of C D P Q’s segment:
allocation of the investment result before distributions to depositors 2020 2019
Fixed Income 8,742 8,165Real Assets (4,951) 560Equities 20,049 22,169Other1 911 252Investment result before distributions to depositors 24,751 31,146
1. TheOtheritemincludestheActiveOverlayStrategies(wounduponJanuary1,2020)andAssetAllocationspecializedportfolios,cashactivities,andthecustomizedoperationsofindividualfunds,whichconsistofdirectholdingsofderivativefinancialinstrumentsbytheindividualfundsforthecustomizedmanagementofthedesiredexposurebyeachdepositor.exposurebyeachdepositor.

CDPQ | 2020 AR176
11RISK IDENTIFICATION AND MANAGEMENT
RISK MANAGEMENT POLICIES, DIRECTIVES AND PROCEDURES RELATED TO INVESTMENT ACTIVITIES
C D P Qisresponsibleformanagingdepositsinaccordancewithserviceagreementsanddepositorinvestmentpolicies,theinvestmentpoliciesforspecializedportfoliosandtheintegratedriskmanagementpolicy.Todoso,ithasimplementedvariouspolicies,directivesandprocedurestooverseethemanagementoftherisksrelatingtoitsoperations.
TheintegratedriskmanagementpolicyisadoptedbyC D P Q’sBoardofDirectors.ThepurposeofthispolicyistopromotearigorousriskmanagementcultureandpracticesthathelpC D P Qcarryoutitsmissiononbehalfofitsdepositors.Theintegratedriskmanagementpolicydefinesmarketrisk,concentrationrisk,creditrisk,counterpartyriskassociatedwithderivativefinancialinstruments,andfinancing-liquidityrisk.
Specifically,thispolicyaimsto:
• EstablishtheguidingprinciplesthatsupportC D P Q’sintegratedriskmanagementframeworkandpromoteasoundriskmanagementcultureatalllevelsoftheorganization
• Setouttheriskmanagementmodelandgovernancestructure
• Definetherolesandresponsibilitiesofstakeholders
• EstablishoversightofthemainriskstowhichC D P Qisexposed
C D P Q’sgovernanceandriskmanagementarebasedonthefollowingtwelveguidingprinciples:
• Arisktoleranceframework
• TherolesoftheBoardofDirectorsandseniorexecutives
• Aclient-centricapproachthatfocusesontheneedsofdepositors
• Along-terminvestmentstrategy
• Liquidityandfinancingmanagement
• In-depthknowledgeofassetsandmarkets
• Independentfunctionsandstakeholderaccountability
• Collaborationforcomprehensiveriskmanagement
• Operationalexcellence
• Useofderivativefinancialinstrumentsandcounterpartyriskmanagement
• Oversightofnewinvestmentactivitiesandnewfinancialinstruments
• Aresponsibleinvestmentframework
Thelevelsofcontrolandpartiesresponsibleforriskmanagementgovernanceareasfollows:
1. Investmentgroupshavetheprimaryresponsibilityformanagingtherisksrelatedtotheiroperations.
2. Independentteamsandinternalcommitteesareresponsibleforsupportinginvestmentgroupemployeesandsettingappropriatecontrolmechanisms.
3.TheBoardofDirectorsanditscommitteesensureamanagementframeworkisadopted,andtheInternalAuditgroupensuresexecutionandcompliancewiththeestablishedriskmanagementframework.
TheintegratedriskmanagementpolicysetsoutrisklimitsandauthorizationlevelsforC D P Qasawholeaswellaslimitsapplicabletocross-functionalactivities.Inaddition,C D P Qdevelopsandperiodicallyreviewsthespecializedportfolioinvestmentpoliciesthataredesignedtooverseetheworkofthespecializedportfoliomanagers.Aseparateinvestmentpolicysetsoutinvestmentstrategy,managementstyle,eligibleinvestments,targetreturns,benchmarkindex,andconcentrationandrisklimits.
Furthermore,eachinvestmentgroupmustadoptaninvestmentstrategy.Strategicinvestmentplanning(S I P)seekstostrengthenthedecision-makingprocessbyachievingabettermatchingofreturntoriskwhenchoosinginvestments.S I Psetsfuturedirections,strengthensthecollaborationandinformationsharingprocessesrequiredtomakestrategicinvestmentdecisionsandensuresabetteralignmentbetweenthedirectionsandstrategies.TheS I Pprocessisconductedcontinuouslyandincludesthefollowingsteps:1)Diagnosticandstrategicdirections;2)Strategicplans;3)Reviewandapprovaland4)Executionandaccountability.InvestmentplansarecommunicatedtotheExecutiveCommitteeandpresentedtotheInvestment-RiskCommittee(I R C)andBoardofDirectorsforapproval.
C D P Qisexposedtovariousfinancialrisks.Detailedinformationregardingtheserisksisdisclosedinthefollowingsections.

177CDPQ | 2020 AR
MARKET RISK
Marketriskistheriskoffinanciallossarisingfromfluctuationsinthefairvalueoffinancialinstruments.Volatilityinfinancialinstrumentpricesstemsfromchangesinmarketriskfactors,inparticularinterestrates,creditspreads,exchangerates,sharepricesandcommodityprices.C D P Qusesderivativefinancialinstrumentstomanagemarketrisks.
C D P Qmanagesallmarketrisksaccordingtoanintegratedapproachforallspecializedportfolios.Themainfactorscontributingtorisks,suchasindustrysector,geographicregionandissuer,aretakenintoaccount.C D P Q’smarketrisksaremanagedandcalculatedaccordingtofactorsthatcaninfluencethefairvalueofinvestmentsandinvestmentliabilities.
C D P QmeasuresitsmarketriskusingValue-at-Risk(VaR),whichisbasedonastatisticalestimateofthevolatilityofthefairvalueofeachpositionandofcorrelationsbetweenmarketriskfactors.VaRisastatisticalestimateofthepotentialfinanciallossthatcouldbeincurredbyC D P Q’sactualportfolio,basedonapredeterminedconfidencelevelandagivenexposureperiod.ThemarketVaRisestimatedwitha95%confidenceleveloveranexposureperiodofoneyear.Moreover,duetothemethodology,theeffectsontheportfoliooftheunfavourableeventsseenoveraone-monthhorizonarerepeatedseveraltimesduringtheyear.Tosummarize,VaRindicatestheleveloflossthattheactualportfolioofC D P Qcouldexceedinonly5%ofcasesovertheforthcomingyear.C D P QestimatesVaRforeachinstrumentheldinitsspecializedportfoliosandaggregatestheinformationforC D P Q’sactualportfolio.
Thehistorical-simulationmethodisusedtomeasureVaR.Thismethodisbasedmainlyontheassumptionthatthefuturewillbesimilartothepast.Itrequiresthathistoricaldataseriesonalltheriskfactorsneededtoestimatethereturnsonfinancialinstrumentsbeavailable.Intheabsenceofhistoricaldata,alternativemethodsareused.
Thecalculationresultsobtainedbyapplyingthismethodologydonotmakeitpossibletoestimatetheamountofloss,basedonaspecificevent,thatwouldbeincurredbyC D P Q’sportfolioifthiseventre-occurred.Forexample,iffutureconditionsandmarketriskfactorsweresubstantiallydifferentfrompasteconomicconditions,actuallossescoulddiffersubstantiallyfromestimatedlosses.Moreover,theseestimatesatagivendatedonottakeintoaccountallpossiblelossesresultingfromexceptionalmarketeventsorlossesthatcouldariseoverandabove the95%confidence level.Consequently, in lightof these limitations,C D P Q’sactualportfolio lossescouldexceedtheestimates.
EffectiveJanuary1,2020,C D P QreviseditsobservationhistoryoftheriskfactorsusedtocalculatetheVaR.Ariskfactorobservationhistoryoveraperiodfrom2006tothereportingdateisnowbeingusedtoassessthevolatilityofreturnsandthecorrelationbetweentheperformanceoffinancialinstrumentsratherthanafixednumberof3,000days.Moreover,theinformationusedtocalculatetheVaRofprivateequityinvestmentswasrefinedtobetterreflectthedebtlevelofsomecompanies.ThecomparativeVaRasatDecember31,2019wasrecalculatedtoreflectthesechanges.
Tworiskmeasuresarecalculatedandanalyzed:
• TheabsoluteriskoftheactualportfoliorepresentsthetotalriskassociatedwiththecategoriesoffinancialinstrumentsthatmakeupC D P Q’sactualportfolio.
• TheabsoluteriskofthebenchmarkportfoliotargetedbydepositorsrepresentsthetotalriskofthebenchmarkindexesassociatedwiththecategoriesoffinancialinstrumentsthatmakeupC D P Q’sbenchmarkportfolio.
TheabsoluterisksofC D P Q’sactualandbenchmarkportfoliosaremeasuredregularlyandusedtocalculatetheabsoluteriskratio,whichissubjecttocertainlimitations.Theabsoluteriskratioisobtainedbydividingtheabsoluteriskoftheactualportfoliobytheabsoluteriskofthebenchmarkportfolio.
TheabsoluteriskofC D P Q’sactualandbenchmarkportfolio,includingtheriskassociatedwiththeunderlyinginvestmentsofunconsolidatedsubsidiarieswhoseriskismanagedbyC D P Q,asapercentageofnetassets,accordingtoa95%confidencelevelandahistoryofobservationoveraperiodfrom2006tothereportingdate,aswellastheabsoluteriskratio,areasfollows:
n.a. December 31, 2020 December31,2019
n.a.
Absolute risk of the actual portfolio
%
Absolute risk of the benchmark
portfolio%
Absolute risk ratio
Absoluteriskofthe actualportfolio
%
Absoluteriskofthebenchmark
portfolio%
Absoluteriskratio
Valueatrisk 14.0 13.6 1.03 13.0 13.1 0.99
RISKIDENTIFICATIONANDMANAGEMENT

CDPQ | 2020 AR178
RISKIDENTIFICATIONANDMANAGEMENT
MARKET RISK(continued)
Moreover,whenmanagingmarketrisk,C D P QusesstressteststhatallowittoevaluatetheconsequencesofspecificcircumstancesonthereturnsofC D P Q’sactualportfoliobasedonhistorical,hypotheticalorriskfactorsensitivityscenarios.Usingvarioustypesofscenarios,stresstestsmeasurethegainsorlossesinvalueofafinancialinstrumentfollowingachangeinoneormoreoften-relatedriskfactors,suchasshareprices,interestrates,ratespreads,exchangerates,commoditypricesandmarketvolatility.Thehypotheticalscenariosarealsocontinuouslyenrichedtointegratenewissues,suchastheimpactoftheCOVID-19pandemicontheglobaleconomy.
CURRENCY RISK
Currencyriskistheriskthatthefairvalueorfuturecashflowsofafinancialinstrumentwillfluctuatebecauseofchangesinforeignexchangerates.ThisriskisintegratedintotheVaRmeasurement.
C D P Qusesadynamicmanagementapproachforthemaincurrenciesofdevelopedcountries.DynamicmanagementisusedtoprotectcertainspecializedportfolioswhentheCanadiandollarappearstobesignificantlyundervaluedorovervaluedcomparedtoitsequilibriumvalueaccordingtothevaluationmodels.Dynamichedgingshouldthereforebe lessfrequent,but thedurationof thehedge,beingunforeseeable,mayvarywidelyandlastforafewweekstoseveralmonths.Certainspecializedportfoliosmaythereforebepartiallyhedgedagainstforeignexchangerisk.
Tostrategicallymanagecurrencyrisk,C D P Qusescurrencyderivativestomanageitsexposuretothemaincurrenciesofdevelopedcountriesaccordingtohedgingtargets.Forothercurrencies,adiscretionaryhedgemaybeimplementedtomanagetheforeigncurrencyexposuresofthespecializedportfoliosorofcertaininvestments.Moreover,currencyriskcanbemanagedbywayofnaturalhedgingactivities,includingthefinancingofinvestmentsinthesamecurrency.
Thenetexposuretoforeigncurrenciestakesintoaccounttheeffectsofcurrencyderivatives,naturalhedgingandtheunderlyinginvestmentsincurrenciesofunconsolidatedsubsidiarieswhosecurrencyriskismanagedbyC D P Q.C D P Q’snetexposuretoforeigncurrencies,asapercentageofnetassetsincludingpurchasesandcancellationsofparticipationunitsofthespecializedportfolioscompletedatthebeginningofeachmonth,isasfollows:
n.a.December 31, 2020
%December31,2019
%
Canadiandollar 53 50U.S.dollar 23 21Euro 4 7Poundsterling 4 4Brazilianreal 2 2Chineseyuan 2 2Indianrupee 2 2Mexicanpeso 2 2Other 8 10TOTAL 100 100
INTEREST RATE RISK
Interestrateriskistheriskthatthefairvalueorfuturecashflowsofafinancialinstrumentwillfluctuatebecauseofchangesinmarketinterestrates.ThisriskisintegratedintotheVaRmeasurement.
PRICE RISK
Priceriskistheriskthatthefairvalueorfuturecashflowsofafinancialinstrumentwillfluctuatebecauseofchangesinmarketprices(otherthanchangesarisingfrominterestrateriskorcurrencyrisk),whetherthosechangesarecausedbyfactorsspecifictotheindividualfinancialinstrumentoritsissuerorbyfactorsthataffectallsimilarfinancialinstrumentstradedonthemarket.ThisriskisintegratedintotheVaRmeasurement.

179CDPQ | 2020 AR
RISKIDENTIFICATIONANDMANAGEMENT
CONCENTRATION RISK
C D P Qanalyzesoverallconcentrationriskfortheentiregroupofspecializedportfoliositmanages.Theintegratedriskmanagementpolicysetsoutexposurelimitsaccordingtocategoryoffinancialinstrumentandaccordingtoissuerforgrowthmarketsandforcertaincountries.Moreover,theinvestmentpoliciesofthespecializedportfoliossetoutspecificlimitsforeachissuer,industrysector,andgeographicregion.
Theconcentrationlimitbyissueris3%ofC D P Q’stotalassets,withtheexceptionofsecuritiesissuedbytheCanadianorU.S.governmentsorbytheiragenciesandthatfeatureanexplicitguaranteeorthoseissuedbyaCanadianprovinceorterritoryofCanadaoraministryoragencythereoforbysovereignissuersratedA A A,whicharenotincludedintheconcentrationlimit.ConcentrationbyissuerismonitoredmonthlyoruponinitiationofatransactionrequiringapprovaloftheI R CortheBoardofDirectors,asappropriate.
Thefollowingtableshowsthemaingeographicconcentrationsasapercentageoftotalnetexposure,establishedaccordingtothecountryof the issuers’principalplaceofbusiness,aftertheeffectsofcertainderivativefinancial instrumentsandincludingtheunderlyinginvestmentsinunconsolidatedsubsidiarieswhoseconcentrationriskismanagedbyC D P Q:
n.a.December 31, 2020
%December31,2019
%
UnitedStates 35 33Canada 32 34Europe 14 14Growthmarkets 14 14Other 5 5TOTAL 100 100
Thefollowingtableshowstheprincipalindustrysectorconcentrationsasapercentageoftotalnetexposure,establishedaccordingtotheindustrysectorinwhichtheissuersoperate,aftertheeffectsofcertainderivativefinancialinstrumentsandincludingtheunderlyinginvestmentsinunconsolidatedsubsidiarieswhoseconcentrationriskismanagedbyC D P Q:
n.a.December 31, 2020
%December31,2019
%
Industry sectorRealestate 14 17Industrials 11 11Financials 10 10Informationtechnology 7 6Consumerdiscretionary 6 5Utilities 5 5Healthcare 5 5Consumerstaples 4 4Realestatedebt 4 4Communicationservices 4 4Energy 3 4Materials 2 2Other 2 3
Government sectorGovernmentoftheUnitedStates 9 7
GovernmentofCanada 7 6GovernmentofQuébec 3 3GovernmentcorporationsandotherpublicadministrationsinQuébec 2 2Other 2 2TOTAL 100 100

CDPQ | 2020 AR180
RISK IDENTIFICATION AND MANAGEMENT
CREDIT RISK
Credit risk is the possibility of incurring a loss in value should a borrower, endorser, or guarantor experience a deterioration in financial position, fail to meet an obligation to repay a loan or fail to meet any other financial commitment.
Maximum credit risk exposure is measured based on the fair value of financial instruments without taking into account guarantees or other credit enhancements. For the other items, the maximum exposure to credit risk is the total amount guaranteed or committed.
The following table shows the maximum exposure to credit risk:
maximum exposure to credit risk December 31, 2020 December 31, 2019
Cash 1,021 994Amounts receivable from transactions being settled 3,116 6,223Advances to depositors 281 960Investment income, accrued and receivable 1,109 1,391Investments
Cash equivalents 1,389 128Fixed-income securities 97,230 96,366Interests in unconsolidated subsidiaries in the form of debt instruments 30,525 28,189Derivative financial instruments 2,892 1,755
TOTAL 137,563 136,006
Other itemsFinancial guarantees (Note 18) 1,976 616
TOTAL 139,539 136,622
C D P Q enters into master netting agreements (Note 7), receives guarantees (Note 14) and may also use derivative financial instruments such as credit default swaps to reduce its total credit risk exposure.
In addition, to manage credit risk, C D P Q closely monitors changes in the credit cycle of issuers and uses a credit VaR to calculate the potential financial loss related to possible changes in the credit quality of issuers of fixed-income securities.

181CDPQ | 2020 AR
RISKIDENTIFICATIONANDMANAGEMENT
CREDIT RISK(continued)
CONCENTRATION OF CREDIT RISK
Acreditriskconcentrationanalysismeasuresthefairvalueofallfinancialinstrumentsrelatedtoasameissuer.Theinvestmentpolicyofthespecializedportfoliossetsoutconcentrationlimitsaccordingtocreditrating.ThecreditriskanalysisconsiderstheprobabilityofdefaultandtherecoveryrateondebtsecuritiesheldbyC D P Qandmonitorschangesinthecreditqualityofissuers.
Thefollowingtableshowsthecreditriskconcentrationaccordingtothecreditratingsofissuersoffixed-incomesecuritiesandcertainderivativefinancialinstrumentsusedtomanagecreditrisk,asapercentageofthetotalexposuretocreditconcentrationrisk:
n.a.December 31, 2020
%December31,2019
%
Credit ratingA A A–A A 61 64A 5 5B B B 13 11B Borlower 17 16Nocreditrating 4 4TOTAL 100 100
Thecreditratingsofsecuritiesissuedorguaranteedbygovernmentsareobtainedfromrecognizedcreditratingagencies.Forcorporatesectorsecurities,creditratingsaredeterminedusinganinternalratingprocessthatmonitorschangesinthecreditcycleannuallywhenthenecessaryinformationisavailable.Otherwise,C D P Qusesrecognizedcreditratingagencies.
COUNTERPARTY RISK RELATED TO DERIVATIVE FINANCIAL INSTRUMENTS
Certainover-the-counterfinancialinstrumentsgiverisetocounterpartyriskbecausetheyarenegotiatedbycontractwithoutbeingtradedorsettledthroughaclearinghouse.Counterpartyriskrelatedtoderivativefinancialinstrumentsisthecreditriskcreatedbycurrentorpotentialexposuresarisingfromderivativefinancialinstrumenttransactionswherethecounterpartybecomesunabletohonourthetermsofthecontracts.
Tolimititsexposuretothecounterpartyriskarisingfromtransactionsinvolvingover-the-counterderivativefinancialinstruments,C D P Qcarriesouttransactionswithfinancialinstitutionsinaccordancewithmanagement’scriteriaregardingthequalityoftheissuer.Moreover,C D P QentersintolegalagreementsbasedonI S D Astandardsunderwhichitbenefitsfromthecompensatingeffectsbetweenat-riskamountsandthecollateralexchangedinordertolimititsnetexposuretothisrisk.
Thisriskismeasuredbycounterparty,pursuanttotheapplicablelegalagreement,fromwhichitispossibletocalculatethenetexposurecreatedbyalloftheover-the-counterderivativefinancialinstrumentsandcollateralexchanged.Actualexposuretocounterpartyriskismeasuredonadailybasis,whereaspotentialexposuretocounterpartyriskismeasuredonamonthlybasis.
AsatDecember31,2020and2019,thelegalagreementsandthecollateralreceivedhelpedreduceexposuretothecounterpartyriskofover-the-counterderivativefinancialinstruments.Themaximumexposuretothisriskwas$385million($317millionasatDecember31,2019).

CDPQ | 2020 AR182
RISKIDENTIFICATIONANDMANAGEMENT
LIQUIDITY RISK
LiquidityriskisthepossibilityofC D P Qnotalwaysbeingabletohonouritsfinancialliabilitycommitmentswithouthavingtoobtainfundsatabnormallyhighpricesorhavingtosellassetsthroughforcedliquidation.ItisalsotheriskofC D P Qnotbeingabletoquicklysellinvestmentswithouthavingasignificantunfavourableeffectonthepriceoftheinvestmentinquestion.
LiquidityismanagedacrossallofC D P Q’scashactivities.Compliancewiththeestablishedrulesisanalyzedonamonthlybasis,andtheliquiditystatusisdetermineddaily.ManagersareresponsibleforevaluatingtheliquidityofthemarketsinwhichC D P Qobtainsfinancingforitsoperations.
Toensurethatsourcesofliquidityandpotentialliquidityrequirementsareproperlyaligned,C D P Qhasanumberofsourcesofliquidityinadditiontoitscashandcashequivalents,includingreceiptofinvestmentincome,thesaleofbonds,salesunderrepurchaseagreements,andliquidmoneymarketsecurities.Inaddition,C D P Qmayissueshort-termpromissorynotesandtermnotespayableaswellasacommittedcreditfacilitytotallingU S$4billiontomeetitscontractualcommitmentsandfinancialobligations.AsatDecember31,2020,C D P Qhadcloseto$50billioninliquidityintheformofgovernmentbondsandmoneymarketsecurities($46billionasatDecember31,2019).
Furthermore,tomanageliquidityrisk,C D P Qconductssimulationsofscenariosoverdifferenthorizonsandexamineseventsthatcouldleadtoaliquiditycrisis.C D P Qrigorouslyandfrequentlymonitorsitspotentialliquidityneedsandproactivelyensurespermanentaccesstostableandresilientsourcesofliquidity.C D P QhasasufficientliquidityreservetomeettheneedsanduncertaintiescausedbytheCOVID-19pandemic.
Ananalysisofundiscountedcontractualcashflowsoffinancialliabilities,showninthetablebelow,isacomponentofliquidityandfinancingmanagement.However,thisby-maturityallocationisnotnecessarilyrepresentativeofthemannerinwhichC D P Qmanagesitsliquidityriskandfinancingrequirements.
Thefollowingtablesshowthematuritiesoftheundiscountedcontractualcashflowsofnon-derivativefinancialliabilities,derivativefinancialinstrumentsandotheritems:
December 31, 2020
DECEMBER31,2020 On demandLess than
1 year1 year to 5 years
More than 5 years Total
Non-derivative financial liabilitiesAmountspayableontransactionsbeingsettled – (3,290) – – (3,290)Otherfinancialliabilities – (749) (84) (451) (1,284)InvestmentliabilitiesSecuritiessoldunderrepurchaseagreements – (14,721) – – (14,721)Securitiessoldshort – (2,761) – – (2,761)Short-termpromissorynotespayable – (5,985) – – (5,985)Loanspayable – (942) – – (942)Termnotespayable – (2,867) (11,633) (2,549) (17,049)
Net assets attributable to depositorsDemandandtermdeposits (4,042) (7) – – (4,049)Distributionspayabletodepositors – (2,653) – – (2,653)TOTAL (4,042) (33,975) (11,717) (3,000) (52,734)Derivative financial instrumentsDerivativeinstrumentswithnetsettlement – (18) 107 147 236DerivativeinstrumentswithgrosssettlementContractualcashflowsreceivable – 120,747 5,625 771 127,143Contractualcashflowspayable – (119,727) (5,649) (807) (126,183)
TOTAL – 1,002 83 111 1,196Other itemsCommitments (Note 18) – (21,021) (75) (426) (21,522)Financialguarantees(Note 18) – (1,446) (440) (90) (1,976)TOTAL – (22,467) (515) (516) (23,498)TOTAL (4,042) (55,440) (12,149) (3,405) (75,036)

183CDPQ | 2020 AR
RISKIDENTIFICATIONANDMANAGEMENT
LIQUIDITY RISK(continued)
December31,2019
DECEMBER31,2019 OndemandLessthan
1year1yearto5years
Morethan5years Total
Non-derivative financial liabilitiesAmountspayableontransactionsbeingsettled – (1,537) – – (1,537)Otherfinancialliabilities – (677) (59) (465) (1,201)InvestmentliabilitiesSecuritiessoldunderrepurchaseagreements – (23,577) – – (23,577)Securitiessoldshort – (3,787) – – (3,787)Short-termpromissorynotespayable – (8,822) – – (8,822)Loanspayable – (368) – – (368)Termnotespayable – (2,487) (8,648) (2,955) (14,090)
Net assets attributable to depositorsDemandandtermdeposits (406) (6) – – (412)Distributionspayabletodepositors – (2,961) – – (2,961)TOTAL (406) (44,222) (8,707) (3,420) (56,755)Derivative financial instrumentsDerivativeinstrumentswithnetsettlement – (57) 62 109 114DerivativeinstrumentswithgrosssettlementContractualcashflowsreceivable – 102,277 4,143 1,342 107,762Contractualcashflowspayable – (101,694) (4,102) (1,491) (107,287)
TOTAL – 526 103 (40) 589Other itemsCommitments (Note 18) (9) (19,713) (74) (411) (20,207)Financialguarantees(Note 18) – (106) (305) (205) (616)TOTAL (9) (19,819) (379) (616) (20,823)TOTAL (415) (63,515) (8,983) (4,076) (76,989)
Moreover,concerningnetassetsattributable todepositors, theRegulationstatesthatC D P Qmaysetmonthly limits forcancellingparticipationunits,i.e.,adepositorislimitedtoamaximumreimbursementofalltheirparticipationunitsinallofC D P Q’sspecializedportfoliosof$50million.Anyparticipationunitsthatarenotcancelledgiventhemaximumamountpermittediscarriedforwardtothefirstdayofthesubsequentmonthandarecancelledassoonasthelimitpermits.ThepurposeofthelimitsistoensureoptimalmanagementofC D P Q’soverallliquidity.Moreover,substantiallyalldepositorsarerequiredtoinvestwithC D P QinaccordancewiththeActortherespectiveapplicablelegislation.

CDPQ | 2020 AR184
RISK IDENTIFICATION AND MANAGEMENT
LIQUIDITY RISK (continued)
FINANCING-LIQUIDITY RISK
The following tables show the main terms and conditions and interest rates of the investment liabilities related to C D P Q’s financing activities:
December 31, 2020
DECEMBER 31, 2020Currency
Nominal value1 Maturity
Interestrate
%
Loans payable U S D 428 Less than one year 0.54C A D 514 Less than one year 0.56
TOTAL n.a. 942 n.a. n.a.
Short-term promissory notes payable C A D 707 Less than one year 0.20U S D 5,279 Less than one year 0.30
TOTAL n.a. 5,986 n.a. n.a.
Term notes payable U S D 2,548 June 2021 2.13U S D 2,548 March 2022 2.75U S D 2,548 April 2023 1.00U S D 2,548 July 2024 3.15U S D 3,185 June 2025 0.88U S D 1,593 November 2039 5.60
TOTAL n.a. 14,970 n.a. n.a.
December 31, 2019
DECEMBER 31, 2019Currency
Nominal value1 Maturity
Interestrate
%
Loans payable U S D 368 Less than one year 2.28TOTAL n.a. 368 n.a. n.a.
Short-term promissory notes payable C A D 1,000 Less than one year 1.77U S D 7,823 Less than one year 1.90
TOTAL n.a. 8,823 n.a. n.a.
Term notes payable E U R 1,092 June 2020 3.50C A D 1,000 July 2020 4.60U S D 2,594 June 2021 2.13U S D 2,594 March 2022 2.75U S D 2,594 July 2024 3.15U S D 1,621 November 2039 5.60
TOTAL n.a. 11,495 n.a. n.a.
1. TheamountsshownaretranslatedintoCanadiandollarsandrepresentamountstoberepaidatmaturity.

185CDPQ | 2020 AR
LIQUIDITY RISK(continued)
FINANCING-LIQUIDITY RISK (continued)
Short-termpromissorynotespayableareissuedatfixedrates,withmaturitiesnotexceeding12months,guaranteedbyC D P Q’sassets.Thenominalvalueforalloutstandingshort-termpromissorynotesmayneverexceedCA$3billionandU S$10billioninaccordancewiththelimitprescribedintheshort-termpromissorynotesissuanceinformationdocument.
TermnotespayablearerepayableatmaturityandguaranteedbyC D P Q’sassets.Certaininterest-bearingfixed-ratetermnoteshaveanoptionalprepaymentclauseattheoptionoftheissuer.
Furthermore,duringtheyearendedDecember31,2020,C D P QreneweditscreditfacilityarrangedwithabankingsyndicateforatotalamountofapproximatelyCA$5billion,whichisrenewableannuallyforatermoftwoyears.Thecreditfacilitybearsinterestatavariablerateandisentirelysecured,unconditionallyandirrevocably,byC D P Q.AsatDecember31,2020and2019,noamounthadbeendrawnonthiscreditfacility.
12CAPITAL MANAGEMENT
C D P Qdefinesitscapitalasnetassetsattributabletodepositors.C D P Q’scapitalmayfluctuateaccordingtodepositordemandsforcancellationsandissuancesofparticipationdepositunitsandfordepositsandwithdrawalsofdemandandtermdeposits.C D P Q’scapitalmanagementobjectiveistoinvestcontributionsanddepositsinthebestinterestsofthedepositorsinaccordancewiththeActinordertoachieveanoptimalreturnwhilerespectingthedepositorinvestmentpolicies.
C D P Qisnotsubjecttoexternalcapitalrequirements.
Furthermore,C D P Q’sobjective istomaintain itsA A AcreditratingtoensureaccesstocapitalmarketsatthebestcostthroughitsC D P FinancialInc.subsidiary.Consequently,theBoardofDirectorshaslimitedtheamountofnotesthatC D P Qmayissueoncapitalmarketsto10%ofitsnetassetsattributabletodepositors,towhichisaddedthefairvalueofoutstandingnotes(adjustednetassets).
13FINANCIAL ASSETS TRANSFERRED BUT NOT DERECOGNIZED
C D P Qentersintosecuritieslendingandborrowingtransactionsaswellassecuritiesrepurchaseagreementswherebyittransfersfinancialassetstocounterparties.ThetransferredsecuritiesdonotmeetderecognitioncriteriasinceC D P Qretainsmostoftheriskssuchascreditrisk,interestraterisk,currencyrisk,andpricerisk,aswellasmostoftherelatedrewardssuchascashflows.
ThefollowingtableshowsthefairvaluesofthefinancialassetstransferredbutnotderecognizedfromtheConsolidatedStatementsofFinancialPositionaswellasthefairvaluesoftheassociatedliabilities:
n.a. December 31, 2020 December31,2019
Financial assets transferred but not derecognizedBonds 36,388 33,897Equities 7,476 10,359TOTAL 43,864 44,256
Associated financial liabilitiesLoanspayable1 942 368Securitiessoldunderrepurchaseagreements2 24,072 28,414TOTAL 25,014 28,782
1. The amount presented corresponds to cash received as collateral on securities lending transactions and derivative financial instruments transactions.
2. The net amount is disclosed in Notes 4 and 7.
RISKIDENTIFICATIONANDMANAGEMENT

CDPQ | 2020 AR186
14GUARANTEES
FINANCIAL ASSETS PLEDGED AS COLLATERAL
Inthenormalcourseofbusiness,C D P Qpledgesfinancialassetsascollateralfortransactionsinvolvingsecuritiesborrowings,securitiessoldunderrepurchaseagreementsandderivativefinancialinstruments.Thecounterpartiesareauthorized,bywayoflegalcontractormarketpractices,toeithersellorrepledgethesesecuritiesascollateral.Oncertainconditions,C D P Qmayhavetopledgeadditionalcollateralifthepledgedsecuritieslosevalue.
ThefollowingtableshowsthefairvalueofcollateralpledgedbyC D P Qaccordingtotransactiontype:
n.a. December 31, 2020 December31,2019
Securitiesborrowing 98 99Securitiessoldunderrepurchaseagreements 24,539 28,535Exchange-tradedderivativefinancialinstruments 1,384 1,037Over-the-counterderivativefinancialinstruments 1,112 994TOTAL 27,133 30,665
FINANCIAL ASSETS RECEIVED AS COLLATERAL
C D P Qreceivesfinancialassetsascollateralfortransactionsinvolvingsecuritieslending,securitiespurchasedunderreverserepurchaseagreementsandderivativefinancialinstruments.Ifthefairvalueofthecollateralreceiveddecreases,C D P Qmay,incertaincases,requestadditionalcollateral.C D P Qisauthorizedtosellorrepledgeascollateralcertainsecuritiesintheabsenceofdefaultbythecounterparty.However,nosecurityreceivedascollateralwassoldorrepledgedascollateralfortheyearsendedDecember31,2020and2019.
ThefollowingtableshowsthefairvalueofcollateralreceivedbyC D P Qaccordingtotransactiontype:
n.a. December 31, 2020 December31,2019
Securitieslending 20,091 16,312Securitiespurchasedunderreverserepurchaseagreements 16,217 8,483Over-the-counterderivativefinancialinstruments 1,050 487TOTAL 37,358 25,282
15RELATED PARTY DISCLOSURES
RELATED PARTY TRANSACTIONS
C D P Q’sprimaryrelatedpartiesincludeunconsolidatedsubsidiaries,jointventures,associates,andC D P Q’skeymanagementpersonnel.
C D P Qentersintovarioustransactionswithrelatedparties.Thesetransactionsareconcludedunderthesameconditionsasthoseprevailinginthemarketwithunrelatedpartiesandaremeasuredatfairvalue.GiventheverynatureofC D P Q’sactivitiesasaninvestmententity,itmaymakeinvestmentsinseveralinvestmentcategories,includinginvestmentsinunconsolidatedsubsidiaries,jointventuresandassociates.

187CDPQ | 2020 AR
COMPENSATION OF KEY MANAGEMENT PERSONNEL
C D P Q’s key management personnel are those persons having authority and responsibility for planning, directing and controlling the activities of the entity, either directly or indirectly. These persons are the members of the Board of Directors, the President and Chief Executive Officer, and key members of the Executive Committee.
The following table shows the compensation of C D P Q’s key management personnel:
compensation of C D P Q’s key management personnel 2020 2019
Salaries and other short-term employee benefits 10 14Post-employment benefits 1 1Other long-term employee benefits 4 5TOTAL 15 20
OTHER RELATED PARTIES
C D P Q is governed by the Act, and the Government of Québec appoints the Board of Director members, at least two-thirds of whom must be independent. The Government of Québec also approves the appointment of the President and Chief Executive Officer. Consequently, C D P Q has availed itself of the exemption set out in I A S 24 – Related Party Disclosures regarding the disclosure of transactions with a related government and with any entities related to the related government. The transactions carried out with the Government of Québec and its related entities are investment activities involving bonds issued by or guaranteed by the government and are carried out under normal market conditions through external brokers. These bonds are included in the “Governments” and “Government corporations and other public administrations” bond categories of Note 4a. In addition, C D P Q discloses information on the Government sector category in the “Government of Québec” and “Government corporations and other public administrations in Québec” items of Note 11. Furthermore, the Government of Québec and its related entities have entered into agreements related to a public infrastructure project in Québec being carried out through C D P Q Infra Inc, a subsidiary of C D P Q. These agreements were signed in the subsidiary’s normal course of business.
16INTERESTS IN OTHER ENTITIES
SUBSIDIARIES
CONSOLIDATED SUBSIDIARY
C D P Financial Inc is a wholly owned subsidiary that issues debt securities in order to finance C D P Q’s investments at an optimal financing cost.
UNCONSOLIDATED SUBSIDIARIES
The subsidiaries presented in this category are entities controlled by C D P Q either directly or indirectly through subsidiaries in accordance with the criteria in I F R S 10.
INTERMEDIATE SUBSIDIARIES
As part of certain investment activities, C D P Q may use intermediate subsidiaries whose sole purpose is to hold investments for C D P Q. They are therefore not included in the information shown in the following tables, while the main underlying ownership interests in subsidiaries, joint ventures, associates and non-controlled structured entities are shown.
RELATED PARTY DISCLOSURES

CDPQ | 2020 AR188
SUBSIDIARIES(continued)
ThefollowingtableshowstheownershipinterestsheldinthemainconsolidatedandunconsolidatedsubsidiariesasatDecember31,2020aswellasthecomparativeownershipinterestsasatDecember31,2019:
n.a. December 31, 2020 December31,2019
n.a.Principalplaceofbusiness Ownership interest
%Ownershipinterest
%
Consolidated subsidiaryC D PFinancialInc Canada 100.0 100.0
Unconsolidated subsidiariesReal estate debtOtéraCapitalInc1 Canada 97.5 97.5EnergyAzurePowerGlobalLtd2 India7 50.5 49.7C D P QRenovablesIberia,S.L. Spain 100.0 –SouthernStarAcquisitionCorporation UnitedStates 79.9 79.9TenedoradeEnergíaRenovableSolyVientoS.A.P.I.deC.V.3 Mexico 67.1 67.1TrencapL P(Énergir)4 Canada 64.7 64.7Hedge fundsC T AA L PFund,L P UnitedStates – 100.0C T AW L HFund,L P UnitedKingdom8 100.0 100.0E M NA N FFund,L P UnitedStates – 100.0E M NC D MFund,L P UnitedStates 100.0 100.0E M NC N MFund,L P UnitedStates 100.0 100.0E M NE N PFund,L P UnitedStates – 100.0G M A CA S OFundInc Singapore9 100.0 100.0IonicPamliGlobalCreditStrategiesFund UnitedStates9 – 100.0M SL P RFundL P UnitedStates 100.0 –
Debt fundsFranklinTempletonEmergingMarketDebtOpportunitiesFund Canada 100.0 –GlobalCreditOpportunities(Canada)L P Canada 100.0 100.0Private investment fundsApolloHerculesPartnersL P UnitedStates9 97.6 97.6ECPartnersL P Singapore 100.0 100.0G S OChurchillPartnersL P UnitedStates9 98.0 98.0K K R-C D PPartnersL P UnitedStates9 90.1 90.1Real estate – Ivanhoé Cambridge GroupCareitCanadaD C RG P Canada 95.5 94.7CareitCanadaG P Canada 95.5 94.7I CAustraliaTrust Australia 95.5 94.7I CInvestmentsU SG P Canada 95.5 94.7I CMultiEquitiesL P Canada 95.5 94.7IvanhoéCambridgeInc Canada 95.5 94.7S I T QE.U.L P UnitedStates 95.4 94.6IndustrialsC D P QInfraInc Canada 100.0 100.0EinnVolantAircraftLeasingHoldingsLtd Ireland10 90.5 90.5PatinaRailL L P5 UnitedKingdom 75.0 75.0SpinnerU SAcquireCoInc(StudentTransportationofAmerica) UnitedStates 79.9 79.9ServicesDatamarsS A6 Switzerland 64.8 64.8
UtilitiesPlenaryAmericasHoldingsLtd(PlenaryGroupCanada) Canada 100.0 –
INTERESTSINOTHERENTITIES
1. Otéra Capital Inc held 78.5% of MCAP Commercial L P as at December 31, 2020 (78.4% as at December 31, 2019).
4. Trencap L P holds 61.1% of Noverco Inc, which holds 100.0% of Énergir Inc and 100.0% of Valener Inc, which together hold 100.0% of Énergir L P.
2. Presented in the ’Associates’ category as at December 31, 2019.
3. Voting rights amount to 60.0%.
5. Patina Rail L L P holds 40.0% of Eurostar International Limited.
6. Voting rights amount to 55.0%.
7. Constituted in Mauritius.
8. Constituted in the United States.
9. Constituted in the Cayman Islands in accordance with the structure of the limited partner.
10. Constituted in Bermuda.

189CDPQ | 2020 AR
JOINT VENTURES
ThefollowingtableshowstheownershipinterestsheldinthemainjointventuresasatDecember31,2020aswellasthecomparativeownershipinterestsasatDecember31,2019:
n.a. December 31, 2020 December31,2019
n.a.Principalplaceofbusiness Ownership interest
%Ownershipinterest
%
EnergyInvenergyRenewablesHoldingsL L C1,2 UnitedStates 64.4 65.0TransportadoraAssociadadeGasS A1,2 Brazil 35.0 31.5
FinancialsU S IAdvantageCorp2 UnitedStates 26.4 26.0
IndustrialsDelachauxS A2 France 43.0 43.0D PWorldAustralieB.V.2 Australia3 45.0 45.0D PWorldCanadaInvestmentInc2 Canada 45.0 45.0D PWorldCaucedo(CaucedoInvestmentsInc,
CaucedoServicesInc)2 DominicanRepublic4 45.0 45.0D PWorldHoldingU KLimited(U K)2 Chile5 44.6 45.0
MaterialsCanamGroupInc Canada 33.3 –
Information technology
KiwiHoldcoCayco,Ltd(F N Z)2 UnitedKingdom6 72.0 72.0
INTERESTSINOTHERENTITIES
1. Presented in the “Associates” category as at December 31, 2019.
2. Voting rights amount to 50.0%.
3. Constituted in the Netherlands.
4. Constituted in the British Virgin Islands.
5. Constituted in the United Kingdom.
6. Constituted in the Cayman Islands.

CDPQ | 2020 AR190
INTERESTSINOTHERENTITIES
ASSOCIATES
ThefollowingtableshowstheownershipinterestsheldinthemainassociatesasatDecember31,2020aswellasthecomparativeownershipinterestsasatDecember31,2019:
n.a. December 31, 2020 December31,2019
n.a.Principalplaceofbusiness Ownership interest
%Ownershipinterest
%
Consumer discretionaryCogecoCommunicationsU S AInc UnitedStates 21.0 21.0SGUHoldingsL P UnitedStates9 46.7 46.7Consumer non-cyclicalsMoranFoodsL L C1 UnitedStates 28.8 –EnergyCorexResourcesLtd Canada 49.5 49.5FluxysS A Belgium 20.0 20.0IPALCOEnterprises,Inc UnitedStates 30.0 30.0LondonArrayLtd,LondonArrayUnincorporatedJV UnitedKingdom 25.0 25.0N S WElectricityNetworksAssetsHoldingTrust,
N S WElectricityNetworksOperationsHoldingTrust(TransGrid) Australia 22.5 22.5SUEZWaterTechnologiesandSolutionsS.A. France 30.0 30.0TechemGmbH Germany 24.5 24.5FinancialsAvisonYoung(Canada)Inc Canada 33.3 33.3FirstLionHoldingsInc Canada 25.7 22.3GreenstoneLtd Australia 30.0 30.0HilcoTradingL L C UnitedStates 27.3 27.3HowdenGroupHoldingLimited
(formerlyHyperionInsuranceGroupLtd) UnitedKingdom 29.1 29.6InigoLimited2 UnitedKingdom 24.0 –IndustrialsAirportHoldingKft Hungary 21.2 21.2AlixPartnersL L P UnitedStates 21.0 21.0AlliedUniversalHoldcoL L C UnitedStates 35.3 41.5AlvestInternationalEquityS A S3 France 39.9 39.9BarretteOutdoorLiving3 UnitedStates 34.0 –ClariosPowerSolutionsHoldingsL P UnitedStates9 30.0 30.0EddyfiN D TInc3 Canada 34.7 –FivesGroup4 France 30.4 30.4GroupeKeolisS A S France 30.0 30.0GroupeSolmaxInc Canada 30.0 30.0KnowltonDevelopmentCorporationInc5 Canada 24.7 35.8LightspeedP O SInc6 Canada 20.4 20.4N R TGroupHoldingsUnitTrust,N R TGroupHoldingsPtyLtd
(SydneyMetro) Australia 24.9 24.9OrganizacióndeProyectosdeInfraestructura,S.A.P.IdeC.V.(O P I),
O P C E M,S.A.P.I.deC.V.(O P C E M) Mexico 45.5 45.5PlusGradeParentL P7 Canada 39.9 39.9Q P HHoldTrust,Q P HHoldCoP T YLimited(PortofBrisbane) Australia 26.7 26.7ZeviaL L C2 UnitedStates 36.4 –Health careA N ZHospitalTopco Australia 21.3 21.3Invekra,S.A.P.I.deC.V. Mexico 22.7 22.7UtilitiesC L PIndiaPvtLtd India 40.0 40.0Real estate servicesGroupeFoncia France 29.1 29.1Information technologyNuveiCorporation8 Canada 16.3 28.0TelecommunicationsVerticalBridgeReitL L C UnitedStates 34.7 30.0Rail transportBombardierTransportation(Investment)U KLimited Germany10 34.1 30.0
1. Voting rights amount to 40.0%.
3. Voting rights amount to 28.6%.
2. Voting rights amount to 25.0%.
4. Voting rights amount to 20.3%.
5. Voting rights amount to 27.8%.
6. As at December 31, 2020, C D P Q no longer exercises a significant influence and voting rights amount to 12.5% (22.9% as at December 31, 2019).
8. Voting rights amount to 22.1% as at December 31, 2020 (22.9% as at December 31, 2019).
7. Voting rights amount to 37.5%.
9. Constituted in Canada.
10. Constituted in the United Kingdom.

191CDPQ | 2020 AR
INTERESTSINOTHERENTITIES
NON-CONTROLLED STRUCTURED ENTITIES
C D P Qholdsinterestsinnon-controlledstructuredentities,themajorityofwhichrepresentprivateinvestmentfundsorlimitedpartnerships.TheinterestsheldbyC D P Qdonotgiveitpowerovertherelevantactivitiesoftheseentities,ascontrolisestablishedbycontractualagreementinfavour,generally,ofageneralpartneroradministrator.Themaximumexposuretolossattributabletothevariousinterestsheld in themainnon-controlledstructuredentities is limited to the fairvalueof the investmentheldbyC D P Q, i.e.,$34,003millionin240companiesasatDecember31,2020($28,181millionin216companiesasatDecember31,2019).
17RECONCILIATION OF LIABILITIES ARISING FROM FINANCING ACTIVITIES
Thefollowingtablesshowchangesinliabilitiesarisingfromfinancingactivities,includingnon-cashchanges:
n.a. Non-cash changes
December 31, 2020n.a. December 31, 2019
Cash flows from financing
activities
Changes in foreign exchange
Changes infair value
Short-termpromissorynotespayable 8,794 (2,696) (93) (22) 5,983
Loanspayable 368 573 1 – 942Termnotespayable 12,332 4,018 (550) 313 16,113TOTAL 21,494 1,895 (642) 291 23,038
n.a. Non-cashchanges
December31,2019n.a. December31,2018
Cashflowsfromfinancing
activities
Changesinforeignexchange
Changesinfairvalue
Short-termpromissorynotespayable 5,921 3,131 (272) 14 8,794
Loanspayable 290 85 (7) – 368Termnotespayable 9,598 2,983 (493) 244 12,332TOTAL 15,809 6,199 (772) 258 21,494

CDPQ | 2020 AR192
18COMMITMENTS AND FINANCIAL GUARANTEES
Giventhenatureofitsactivities,C D P Qentersintovariousinvestmentpurchasecommitmentsthatwillbesettledinthecomingfiscalyearsinaccordancewiththetermsandconditionsintherelatedagreements.
ForC D P Q,financialguaranteesconsistofprovidingguarantees,tofinancialinstitutionsandcorporations,onderivativefinancialinstrumenttransactions,repaymentofloanstakenbycompaniesinwhichithasaneconomicinterest,andcertainlettersofcreditofitssubsidiaries.Aspartofcertaininvestmenttransactions,C D P Qmayalsoprovidefinancialguaranteesorissuelettersofcredittothirdparties.ThematuritiesofthecommitmentsandfinancialguaranteesaredisclosedinNote11.
Commitmentsandfinancialguaranteesaredetailedasfollows:
n.a. December 31, 2020 December31,2019
Investmentpurchasecommitments 21,002 19,702Commitmentsunderleases 520 505Financialguarantees 1,976 616TOTAL 23,498 20,823
LITIGATION
Inthenormalcourseofbusiness,C D P Qmaybesubjecttolegalactions.AlthoughC D P QcannotpredicttheoutcomesofanyongoinglegalproceedingsasatDecember31,2020,ithasnoreasontobelievethatthesettlementofanyoneoftheseproceedingscouldhaveamaterialimpactonitsfinancialposition.

193CDPQ | 2020 AR
19SUPPLEMENTARY INFORMATION
The following statements present the financial information of the specialized portfolios:
financial information of the specialized portfoliosSHORT TERM
INVESTMENTS (740)RATES
(765)CREDIT
(766)LONG TERM BONDS
(764)
Statement of financial position2020 2019 2020 2019 2020 2019 2020 2019
Total assets 1,580 1,566 49,135 61,244 103,172 96,714 4,104 3,572
Total liabilities excluding net assets attributable to holders of participation units 1 685 18,856 30,053 29,418 30,784 760 508
Net assets attributable to holders of participation units 1,579 881 30,279 31,191 73,754 65,930 3,344 3,064
Statement of comprehensive income 2020 2019 2020 2019 2020 2019 2020 2019
Net income 15 15 530 666 2,711 2,355 87 96
Net gains (losses) on financial instruments at fair value – – 1,751 790 3,272 3,879 254 266
Investment result before recoveries from (distributions to) holders of participation units 15 15 2,281 1,456 5,983 6,234 341 362
Recoveries (distributions) (15) (15) (530) (666) (2,711) (2,355) (87) (96)
Net income and comprehensive income attributable to holders of participation units – – 1,751 790 3,272 3,879 254 266
Statement of changes in net assets attributable to holders of participation units 2020 2019 2020 2019 2020 2019 2020 2019
Balance at beginning of the year 881 866 31,191 32,784 65,930 55,675 3,064 2,845
Net change in participation units for the year 698 15 (2,663) (2,383) 4,552 6,376 26 (47)
Net income and comprehensive income attributable to holders of participation units – – 1,751 790 3,272 3,879 254 266
Balance at end of the year 1,579 881 30,279 31,191 73,754 65,930 3,344 3,064
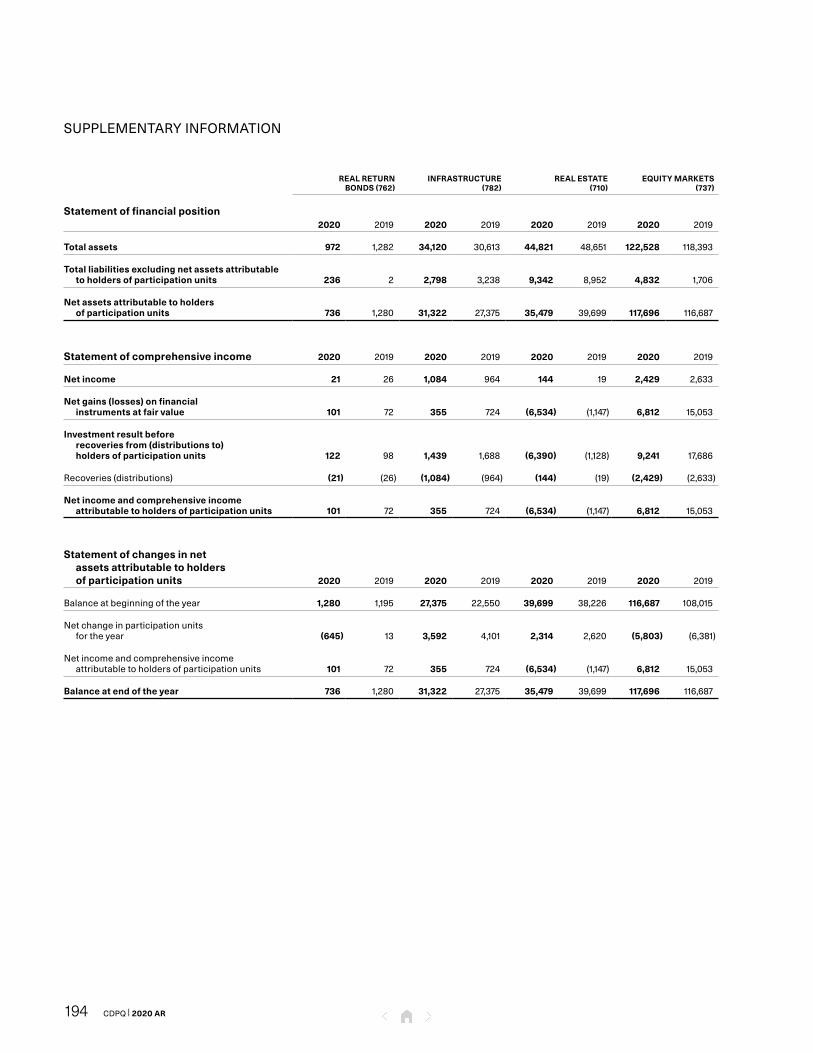
CDPQ | 2020 AR194
financial information of the specialized portfoliosREAL RETURN
BONDS (762)INFRASTRUCTURE
(782)REAL ESTATE
(710)EQUITY MARKETS
(737)
Statement of financial position2020 2019 2020 2019 2020 2019 2020 2019
Total assets 972 1,282 34,120 30,613 44,821 48,651 122,528 118,393
Total liabilities excluding net assets attributable to holders of participation units 236 2 2,798 3,238 9,342 8,952 4,832 1,706
Net assets attributable to holders of participation units 736 1,280 31,322 27,375 35,479 39,699 117,696 116,687
Statement of comprehensive income 2020 2019 2020 2019 2020 2019 2020 2019
Net income 21 26 1,084 964 144 19 2,429 2,633
Net gains (losses) on financial instruments at fair value 101 72 355 724 (6,534) (1,147) 6,812 15,053
Investment result before recoveries from (distributions to) holders of participation units 122 98 1,439 1,688 (6,390) (1,128) 9,241 17,686
Recoveries (distributions) (21) (26) (1,084) (964) (144) (19) (2,429) (2,633)
Net income and comprehensive income attributable to holders of participation units 101 72 355 724 (6,534) (1,147) 6,812 15,053
Statement of changes in net assets attributable to holders of participation units 2020 2019 2020 2019 2020 2019 2020 2019
Balance at beginning of the year 1,280 1,195 27,375 22,550 39,699 38,226 116,687 108,015
Net change in participation units for the year (645) 13 3,592 4,101 2,314 2,620 (5,803) (6,381)
Net income and comprehensive income attributable to holders of participation units 101 72 355 724 (6,534) (1,147) 6,812 15,053
Balance at end of the year 736 1,280 31,322 27,375 35,479 39,699 117,696 116,687
SUPPLEMENTARY INFORMATION

195CDPQ | 2020 AR
financial information of the specialized portfoliosPRIVATE EQUITY
(780)ASSET ALLOCATION
(771)ACTIVE OVERLAY
STRATEGIES (773)1
Statement of financial position2020 2019 2020 2019 2020 2019
Total assets 64,569 52,018 5,094 2,725 – 6,058
Total liabilities excluding net assets attributable to holders of participation units 485 2,885 3,482 1,087 – 5,381
Net assets attributable to holders of participation units 64,084 49,133 1,612 1,638 – 677
Statement of comprehensive income 2020 2019 2020 2019 2020 2019
Net income 1,169 2,297 (1) 5 – (33)
Net gains (losses) on financial instruments at fair value 9,639 2,186 (476) (255) – 239
Investment result before recoveries from (distributions to) holders of participation units 10,808 4,483 (477) (250) – 206
Recoveries (distributions) (1,169) (2,297) 1 (5) – 33
Net income and comprehensive income attributable to holders of participation units 9,639 2,186 (476) (255) – 239
Statement of changes in net assets attributable to holders of participation units 2020 2019 2020 2019 2020 2019
Balance at beginning of the year 49,133 42,142 1,638 1,624 677 529
Net change in participation units for the year 5,312 4,805 450 269 (677) (91)
Net income and comprehensive income attributable to holders of participation units 9,639 2,186 (476) (255) – 239
Balance at end of the year 64,084 49,133 1,612 1,638 – 677
SUPPLEMENTARY INFORMATION
1. OnJanuary1,2020,theActiveOverlayStrategies(773)specializedportfoliowaswoundup.Onthesamedate,theassetsandliabilitiesofthisspecializedportfolioweretransferredatfairvaluetootherspecializedportfolios.Thiswindinguphadnoimpactonnetassetsandnetincomeandcomprehensiveincomeattributabletodepositors.
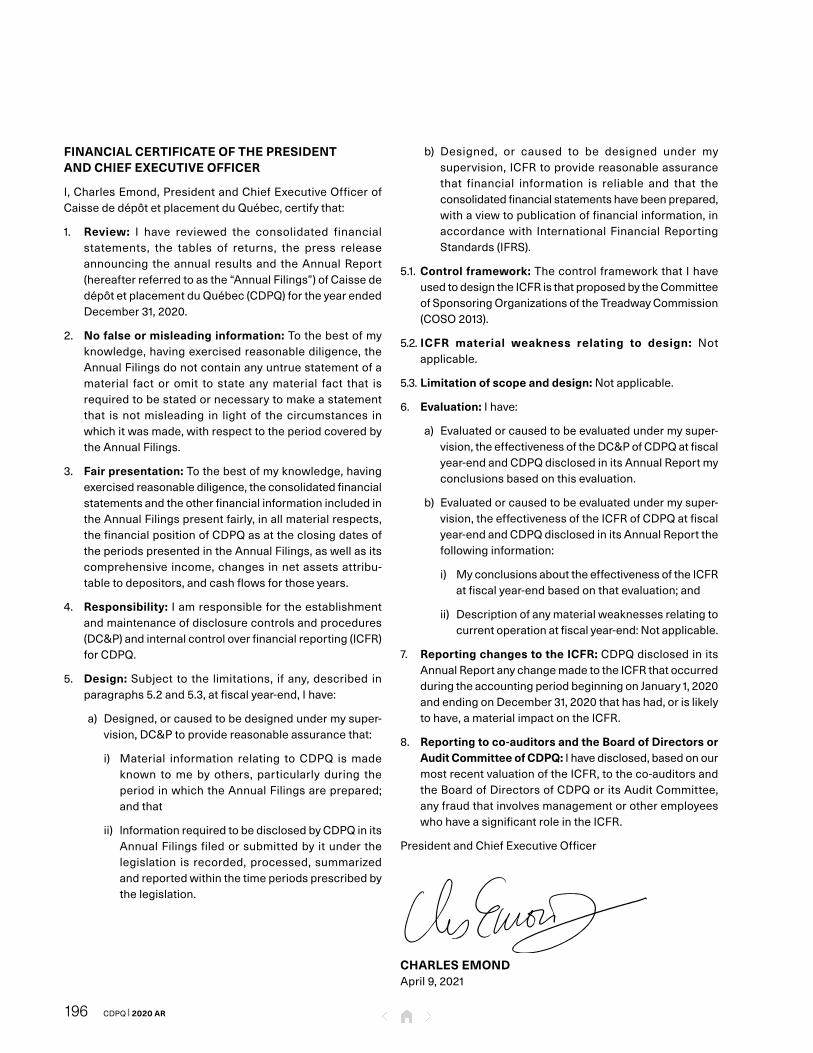
CDPQ | 2020 AR196
FINANCIAL CERTIFICATE OF THE PRESIDENT AND CHIEF EXECUTIVE OFFICER
I, Charles Emond, President and Chief Executive Officer of Caisse de dépôt et placement du Québec, certify that:
1. Review: I have reviewed the consolidated financial statements, the tables of returns, the press release announcing the annual results and the Annual Report (hereafter referred to as the “Annual Filings”) of Caisse de dépôt et placement du Québec (C D P Q) for the year ended December31,2020.
2. No false or misleading information: To the best of my knowledge, having exercised reasonable diligence, the Annual Filings do not contain any untrue statement of a material fact or omit to state any material fact that is required to be stated or necessary to make a statement that is not misleading in light of the circumstances in which it was made, with respect to the period covered by theAnnualFilings.
3. Fair presentation: To the best of my knowledge, having exercised reasonable diligence, the consolidated financial statements and the other financial information included in the Annual Filings present fairly, in all material respects, the financial position of C D P Q as at the closing dates of the periods presented in the Annual Filings, as well as its comprehensive income, changes in net assets attributabletodepositors,andcashflowsforthoseyears.
4. Responsibility: I am responsible for the establishment and maintenance of disclosure controls and procedures (D C & P) and internal control over financial reporting (I C F R) for C D P Q.
5. Design: Subject to the limitations, if any, described in paragraphs5.2and5.3,atfiscalyear-end,Ihave:
a) Designed, or caused to be designed under my supervision, D C & P to provide reasonable assurance that:
i) Material information relating to C D P Q is made known to me by others, particularly during the period in which the Annual Filings are prepared; and that
ii) lnformation required to be disclosed by C D P Q in its Annual Filings filed or submitted by it under the legislation is recorded, processed, summarized and reported within the time periods prescribed by thelegislation.
b) Designed, or caused to be designed under my supervision, I C F R to provide reasonable assurance that financial information is reliable and that the consolidated financial statements have been prepared, with a view to publication of financial information, in accordance with International Financial Reporting Standards (I F R S).
5.1.Control framework: The control framework that I have used to design the I C F R is that proposed by the Committee of Sponsoring Organizations of the Treadway Com mis sion (C O S O2013).
5.2.I C F R material weakness relating to design: Not applicable.
5.3.Limitation of scope and design:Notapplicable.
6. Evaluation: I have:
a) Evaluated or caused to be evaluated under my supervi sion, the effectiveness of the D C & P of C D P Q at fiscal yearend and C D P Q disclosed in its Annual Report my conclusionsbasedonthisevaluation.
b) Evaluated or caused to be evaluated under my supervision, the effectiveness of the I C F R of C D P Q at fiscal yearend and C D P Q disclosed in its Annual Report the following information:
i) My conclusions about the effectiveness of the I C F R at fiscal yearend based on that evaluation; and
ii) Description of any material weaknesses relating to currentoperationatfiscalyear-end:Notapplicable.
7. Reporting changes to the I C F R: C D P Q disclosed in its Annual Report any change made to the I C F R that occurred duringtheaccountingperiodbeginningonJanuary1,2020andendingonDecember31,2020thathashad,orislikelyto have, a material impact on the I C F R.
8. Reporting to co-auditors and the Board of Directors or Audit Committee of C D P Q: I have disclosed, based on our most recent valuation of the I C F R, to the coauditors and the Board of Directors of C D P Q or its Audit Committee, any fraud that involves management or other employees who have a significant role in the I C F R.
President and Chief Executive Officer
CHARLES EMONDApril9,2021

197CDPQ | 2020 AR
FINANCIAL CERTIFICATE OF THE EXECUTIVE VICE-PRESIDENT AND CHIEF FINANCIAL AND OPERATIONS OFFICER
I, Maarika Paul, Executive VicePresident and Chief Financial and Operations Officer of Caisse de dépôt et placement du Québec, certify that:
1. Review: I have reviewed the consolidated financial statements, the tables of returns, the press release announcing the annual results and the Annual Report (hereafter referred to as the “Annual Filings”) of Caisse de dépôt et placement du Québec (C D P Q) for the year ended December31,2020.
2. No false or misleading information: To the best of my knowledge, having exercised reasonable diligence, the Annual Filings do not contain any untrue statement of a material fact or omit to state any material fact that is required to be stated or necessary to make a statement that is not misleading in light of the circumstances in which it was made, with respect to the period covered by theAnnualFilings.
3. Fair presentation: To the best of my knowledge, having exercised reasonable diligence, the consolidated financial statements and the other financial information included in the Annual Filings present fairly, in all material respects, the financial position of C D P Q as at the closing dates of the periods presented in the Annual Filings, as well as its comprehensive income, changes in net assets attributabletodepositors,andcashflowsforthoseyears.
4. Responsibility: I am responsible for the establishment and maintenance of disclosure controls and procedures (D C & P) and internal control over financial reporting (I C F R) for C D P Q.
5. Design: Subject to the limitations, if any, described in paragraphs5.2and5.3,atfiscalyear-end,Ihave:
a) Designed, or caused to be designed under my supervision, D C & P to provide reasonable assurance that:
i) Material information relating to C D P Q is made known to me by others, particularly during the period in which the Annual Filings are prepared; and that
ii) lnformation required to be disclosed by C D P Q in its Annual Filings filed or submitted by it under the legislation is recorded, processed, summarized and reported within the time periods prescribed by thelegislation.
b) Designed, or caused to be designed under my supervision, I C F R to provide reasonable assurance that financial information is reliable and that the consolidated financial statements have been prepared, with a view to publication of financial information, in accordance with International Financial Reporting Standards (I F R S).
5.1.Control framework: The control framework that I have used to design the I C F R is that proposed by the Committee of Sponsoring Organizations of the Treadway Commission (C O S O2013).
5.2.I C F R material weakness relating to design: Not applicable.
5.3.Limitation of scope and design:Notapplicable.
6. Evaluation: I have:
a) Evaluated or caused to be evaluated under my supervision, the effectiveness of the D C & P of C D P Q at fiscal yearend and C D P Q disclosed in its Annual Reportmyconclusionsbasedonthisevaluation.
b) Evaluated or caused to be evaluated under my supervision, the effectiveness of the I C F R of C D P Q at fiscal yearend and C D P Q disclosed in its Annual Report the following information:
i) My conclusions about the effectiveness of the I C F R at fiscal yearend based on that evaluation; and
ii) Description of any material weaknesses relating to currentoperationatfiscalyear-end:Notapplicable.
7. Reporting changes to the I C F R: C D P Q disclosed in its Annual Report any change made to the I C F R that occurred duringtheaccountingperiodbeginningonJanuary1,2020andendingonDecember31,2020thathashad,orislikelyto have, a material impact on the I C F R.
8. Reporting to co-auditors and the Board of Directors or Audit Committee of C D P Q: I have disclosed, based on our most recent valuation of the I C F R, to the coauditors and the Board of Directors of C D P Q or its Audit Com mit tee, any fraud that involves management or other employees who have a significant role in the I C F R.
Executive VicePresident and Chief Financial and Operations Officer
MAARIKA PAUL, F C P A, F C A, C B V, I C D.DApril9,2021

CDPQ | 2020 AR198
CONCLUSIONS ABOUT THE DESIGN AND EFFECTIVENESS OF INTERNAL CONTROL OVER FINANCIAL REPORTING
In2020,theChiefFinancialandOperationsOfficeroversawworktoupdateexistingdocumentationandtoevaluatethedesignandeffectivenessof internalcontrolover financialreporting, and the Executive Committee approved themethodologyforevaluatingkeycontrols.ThepurposeofthisevaluationofinternalcontroloverthemainfinancialprocesseswastoensurethatC D P Qcouldmeetitsqualityobjectivesrelatedtofinancialreporting,inallmaterialrespects.
Theevaluationof thedesignandeffectivenessof internalcontrol over financial reportingwas carried outwith theframeworkusuallyadoptedbyNorthAmericancompanies,namelythatoftheCommitteeofSponsoringOrganizationsoftheTreadwayCommission(C O S O2013).Thisworkenabledthe ExecutiveCommittee to conclude that the design ofcontroloverfinancialreportingisadequateandeffective,andthat it provides reasonable assurance that the financialinformationpresented intheAnnualFilings,asdefinedbyC D P Q’sFinancialCertificationPolicy, is reliable,and thatC D P Q’sconsolidatedfinancialstatementswerepreparedinaccordancewithInternationalFinancialReportingStandards(I F R S).
CONCLUSIONS ABOUT THE DESIGN AND EFFECTIVENESS OF FINANCIAL REPORTING CONTROLS AND PROCEDURES
UnderC D P Q’sFinancialCertificationPolicy,thedesignandeffectivenessofdisclosurecontrolsandprocedurespertainingto the Annual Filings, namely the consolidated financialstatements,thetablesofreturns,thepressreleaseannouncingtheannualresultsandtheAnnualReport,mustbeevaluated.
As with the evaluation of internal control over financialreporting, theChiefFinancialandOperationsOfficeralsooversawefforts toupdateexistingdocumentationand toevaluatethedesignandeffectivenessofdisclosurecontrolsandprocedures,andtheExecutiveCommitteealsoapprovedthemethodologyforevaluatingkeycontrols.
AsatDecember31,2020,theevaluationconfirmedthatthedisclosure controls and procedures are adequate andeffective,andprovidereasonableassurancethatallrelevantinformationisgatheredandsubmittedinatimelyfashiontoseniormanagement,inparticulartothePresidentandChiefExecutiveOfficerandtotheChiefFinancialandOperationsOfficer,soastoensurethatappropriatedecisionsconcerningdisclosurecanbemade.
TheBoardofDirectorsalsoapprovedthe2020AnnualFilingsbeforetheirpublicdisclosure.

199CDPQ | 2020 AR
General Notes
1. C D P Q’soperationscomplywiththerequirementsoftheAct respecting the Caisse de dépôt et placement du Québec1 andinvestmentindustrypractices.ItsfinancialstatementsarepreparedinaccordancewithInternationalFinancialReportingStandards(I F R S).Eachyear,C D P Q’sco-auditors,theAuditorGeneralofQuébecandErnst&YoungL L P,auditthefinancialstatements,thecomplianceofoperationswith laws, regulations, policies andguidelines, to theextenttheydeemappropriate.
2. The 2020Annual ReportAdditional Information is anintegralpartofthe2020AnnualReportandpresents,inthefirstsection,theTablesofReturnsasatDecember31,2020,forcompositesofC D P Q’sdepositors’accounts.Thesetables and calculations have been audited as atDecember 31,2020byDeloitteL L PforcompliancewiththeGlobalInvestmentPerformanceStandards(G I P S®).
3. InthisAnnualReport,netassetsandinvestmentresultsare defined as being, in the consolidated financialstatements, net assets attributable to depositors andinvestmentresultsbeforedistributionstodepositors.
4. Thereturnsof thespecializedportfoliosuse the time-weightedrateofreturnformula.
5. Thebenchmarkindexesfortheassetclassesandtotalportfolio are based on the weighted average of thebenchmark indexes for the specializedportfolios thatcomprisethem.
6. Unlessotherwisestated,returns,whichareexpressedasa percentage, are presented net of transaction fees,externalmanagementfeesrelatedtoinvestmentfunds,andunconsolidated real estate subsidiaries fees, butbefore operating expenses and other fees. They areannualizedforperiodsofmorethanoneyear.Theyincludethereturnoncashandcashequivalentsandtheytakeintoaccount any foreign exchange hedging. The ratio ofoperatingexpenses to theaveragenetassetsofeachspecializedportfolioispresentedinthenotesinthe2020AnnualReportAdditionalInformation.
7. Unless otherwise stated, investment results and netassetsattributable todepositorsarepresentednetofoperatingexpensesandotherfees.
8. Somereturnsareexpressed inbasispoints (bps).Onehundredbasispointsequal 1.00%andonebasispointequals0.01%.
9. Unlessotherwisestated,allfiguresareinCanadiandollars.ThelettersMandBusedwithdollaramountsdesignatemillionsandbillions,respectively.
10. Totals (figures or percentages)may vary because ofroundingoffigures.
11. Unlessotherwisestated,alldatainthetablesandfiguresarefromstudiescarriedoutbyC D P Q.
12. Thetables listingtheprincipal investmentspresent, inalphabetical order, themain cashpositionsbasedoninformationshown in tables7,8,9and 10of the2020AnnualReportAdditionalInformation.
13. TodeterminewhetheranassetisclassifiedasaQuébecinvestment,C D P Qusesthelocationoftheheadofficeofthecompanyoroftheissueror,inthecaseofrealestate,thelocationoftheproperty.Thisclassificationsystemiswidelyusedinthefundmanagementindustrybutinvolvesbiases.SomecompaniesareincludedeventhoughtheircoreoperationsareoutsideQuébec.Similarly,companieswithextensiveoperationsinQuébecareexcludediftheirheadofficeisoutsidetheprovince.
1. The Act respecting the Caisse de dépôt et placement du Québec is available on C D P Q’s website at w w w.c d p q.com.

Whitepage

INTERNATIONALOFFICES
AUSTRALIAC D P Q SYDNEY
DeutscheBankPlace,Suite2201 126PhillipStreet SydneyNSW2000 Australia
Telephone:+61283163800
BRAZILC D P Q BRASIL
Av.BrigadeiroFariaLima3477 5thFloor,Suite51,NorthTower ItaimBibi,SãoPaulo,SP Brazil04538-133
Telephone:+551146320190
INDIAC D P Q INDIA
5thFloor,Worldmark3 SuiteNo.507 Aerocity,NewDelhi Delhi110037 India
Telephone:+911149577802
MEXICOC D P Q MÉXICO
TorreVirreyes Pedregal24,9thFloor,Suite902 ColoniaMolinodelRey DelegaciónMiguelHidalgo 11040Mexico,CDMX Mexico
Telephone:+525541709625
NEW YORKC D P Q US (NEW YORK)
1211AvenueoftheAmericas Suite3001 NewYork,NY10036 USA
Telephone:+1212596-6300
PARISC D P Q PARIS
28-32,avenueVictor-Hugo 6thFloor 75116Paris France
Telephone:+33156692530
SHANGHAIC D P Q SHANGHAI
OneCorporateAvenue Unit1504,15thFloor 222HubinRoad,HuangPuDistrict Shanghai,200021 China
Telephone:+862163900100
SINGAPOREC D P Q SINGAPORE
OneRafflesQuay #21-01NorthTower Singapore048583 Singapore
Telephone:+6568004870
UNITED KINGDOMC D P Q LONDON
11CharlesIIStreet 2ndFloor London,SW1Y4QU UnitedKingdom
Telephone:+442070248186
WASHINGTON, DCC D P Q US (WASHINGTON, DC)
1775PennsylvaniaAvenueNW Suite200 Washington,DC20006 USA
Telephone:+1202730-8010
The2020AnnualReportandthe2020AnnualReportAdditionalInformationareavailableatw w w.c d p q.com.Forinformation:514842-3261,info@c d p q.comLe Rapport annuel 2020 et le document Renseignements additionnels au Rapport annuel 2020 sont aussi accessibles en français au w w w.c d p q.com.LegalDeposit–BibliothèqueetArchivesnationalesduQuébec,2021ISSN1705-6462ISSNonline1705-6470

BUSINESS OFFICE1000,placeJean-Paul-Riopelle Montréal,QuébecH2Z2B3 Telephone:+1514842-3261 Tollfree:+1866330-3936 Fax:+1514842-4833
HEAD OFFICE65,rueSainte-Anne,14thfloor Québec,QuébecG1R3X5 Telephone:+1418684-2334 Fax:+1418684-2335
w w w.c d p q.com
Related Documents