Key points Past & future SME performance 1 : In Poland’s ‘non-financial business economy’, SMEs accounted for slightly more than half of overall value added in 2018, a share of 52.9%. In 2014-2018, overall SME value added increased by 26.3%, while in large firms the rise was 23.2%. Overall SME value added is expected to rise in 2018-2020, exceeding the growth projected for large firms. By the end of 2020, it is predicted that SMEs will generate 98,700 jobs. Implementing the Small Business Act for Europe (SBA): Poland’s SBA profile remains below the EU average in skills & innovation, the single market and internationalisation, directly affecting the competitiveness of Polish SMEs. Poland scores in line with the EU average in second chance, responsive administration and entrepreneurship. It has above average scores for the environment, State aid & public procurement and access to finance. Nevertheless, since 2008 most progress has been observed in the single market, access to finance, State aid & public procurement, and in particular in responsive administration. SME policy priorities: Poland correctly identifies its pressing development gaps in areas such as skills & innovation and internationalisation and addresses them with new and existing policy measures, although the scale and effectiveness of these measures are not always sufficient. Such policies are especially important, as they help to ensure the long-term competitiveness of Polish SMEs. There is a significant focus on improving the legislative framework (covered by the areas of responsive administration and entrepreneurship) through deregulation, more favourable administration and the digitalisation of services. Still, SMEs would welcome a more coherent interpretation of laws by public administration and more predictable changes in the regulatory framework, with a better implementation of the ‘SME test’. Other areas such as second chance or the environment are less prominent in Poland’s SME agenda. Shortening the time it takes to resolve insolvency and reducing its cost and providing support for previously bankrupt but honest entrepreneurs or recognising the role of SMEs in green transformation could help to address those areas. 2019 SBA Fact Sheet Poland About the SBA fact sheets: The Small Business Act for Europe (SBA) is the EU’s flagship policy initiative to support small and medium-sized enterprises (SMEs). It comprises a set of policy measures organised around 10 principles ranging from entrepreneurship and ‘responsive administration’ to internationalisation. To improve the governance of the SBA, the 2011 review of it called for better monitoring. The SBA fact sheets, published annually, aim to improve the understanding of recent trends and national policies affecting SMEs. Since 2011, each EU Member State has appointed a high-ranking government official as its national SME envoy. SME envoys spearhead the implementation of the SBA agenda in their countries. Internal market, industry, entrepreneurship and SMEs Ref. Ares(2019)7616591 - 11/12/2019

Welcome message from author
This document is posted to help you gain knowledge. Please leave a comment to let me know what you think about it! Share it to your friends and learn new things together.
Transcript
Key points
Past & future SME performance1:
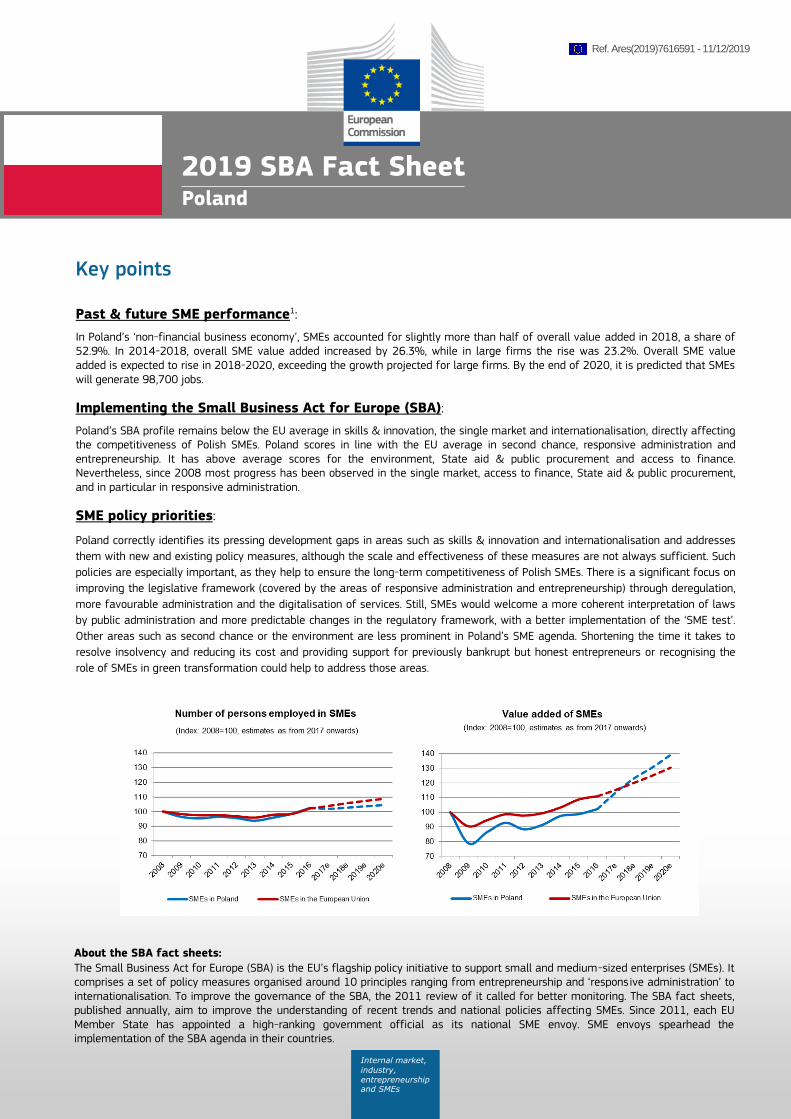
In Poland’s ‘non-financial business economy’, SMEs accounted for slightly more than half of overall value added in 2018, a share of 52.9%. In 2014-2018, overall SME value added increased by 26.3%, while in large firms the rise was 23.2%. Overall SME value added is expected to rise in 2018-2020, exceeding the growth projected for large firms. By the end of 2020, it is predicted that SMEs will generate 98,700 jobs.
Implementing the Small Business Act for Europe (SBA):
Poland’s SBA profile remains below the EU average in skills & innovation, the single market and internationalisation, directly affecting the competitiveness of Polish SMEs. Poland scores in line with the EU average in second chance, responsive administration and entrepreneurship. It has above average scores for the environment, State aid & public procurement and access to finance. Nevertheless, since 2008 most progress has been observed in the single market, access to finance, State aid & public procurement, and in particular in responsive administration.
SME policy priorities:
Poland correctly identifies its pressing development gaps in areas such as skills & innovation and internationalisation and addresses
them with new and existing policy measures, although the scale and effectiveness of these measures are not always sufficient. Such
policies are especially important, as they help to ensure the long-term competitiveness of Polish SMEs. There is a significant focus on
improving the legislative framework (covered by the areas of responsive administration and entrepreneurship) through deregulation,
more favourable administration and the digitalisation of services. Still, SMEs would welcome a more coherent interpretation of laws
by public administration and more predictable changes in the regulatory framework, with a better implementation of the ‘SME test’.
Other areas such as second chance or the environment are less prominent in Poland’s SME agenda. Shortening the time it takes to
resolve insolvency and reducing its cost and providing support for previously bankrupt but honest entrepreneurs or recognising the
role of SMEs in green transformation could help to address those areas.
2019 SBA Fact Sheet Poland
About the SBA fact sheets:
The Small Business Act for Europe (SBA) is the EU’s flagship policy initiative to support small and medium-sized enterprises (SMEs). It comprises a set of policy measures organised around 10 principles ranging from entrepreneurship and ‘responsive administration’ to internationalisation. To improve the governance of the SBA, the 2011 review of it called for better monitoring. The SBA fact sheets, published annually, aim to improve the understanding of recent trends and national policies affecting SMEs. Since 2011, each EU Member State has appointed a high-ranking government official as its national SME envoy. SME envoys spearhead the implementation of the SBA agenda in their countries.
Internal market,
industry, entrepreneurship and SMEs
Ref. Ares(2019)7616591 - 11/12/2019

2019 SBA Fact Sheet — Poland 2
Table of Contents Key points ..................................................................................................................................................................................................................................................................... 1
1. SMEs — basic figures ....................................................................................................................................................................................................................................... 2 2. SBA profile ............................................................................................................................................................................................................................................................. 4 3. SBA principles ....................................................................................................................................................................................................................................................... 6
3.0 ‘Think Small First’ ............................................................................................................................................................................................................................................. 6 3.1 Entrepreneurship............................................................................................................................................................................................................................................... 7 3.2 ‘Second chance’ ................................................................................................................................................................................................................................................. 8 3.3 ‘Responsive administration’ ........................................................................................................................................................................................................................ 9 3.4 State aid & public procurement ............................................................................................................................................................................................................ 10 3.5 Access to finance........................................................................................................................................................................................................................................... 11 3.6 Single market .................................................................................................................................................................................................................................................. 12 3.7 Skills & innovation ........................................................................................................................................................................................................................................ 13 3.8 Environment ..................................................................................................................................................................................................................................................... 14 3.9 Internationalisation ...................................................................................................................................................................................................................................... 15
4. Interesting initiative ....................................................................................................................................................................................................................................... 16
1. SMEs — basic figures
Class size
Number of enterprises Number of persons employed Value added
Poland EU-28 Poland EU-28 Poland EU-28
Number Share Share Number Share Share Billion € Share Share
Micro 1,664,944 96.1% 93.0% 3,510,745 38.4% 29.7% 44.2 19.6% 20.8%
Small 49,890 2.9% 5.9% 1,072,123 11.7% 20.1% 29.4 13.0% 17.6%
Medium-sized
14,389 0.8% 0.9% 1,542,957 16.9% 16.8% 45.8 20.3% 18.0%
SMEs 1,729,223 99.8% 99.8% 6,125,825 67.1% 66.6% 119.5 52.9% 56.4%
Large 3,400 0.2% 0.2% 3,005,796 32.9% 33.4% 106.4 47.1% 43.6%
Total 1,732,623 100.0% 100.0% 9,131,621 100.0% 100.0% 225.9 100.0% 100.0%
These are estimates for 2018 produced by DIW Econ, based on 2008-2016 figures from the Structural Business Statistics Database (Eurostat). The data cover the 'non-financial business economy', which includes industry, construction, trade, and services (NACE Rev. 2 sections B to J, L, M and N), but not enterprises in agriculture, forestry and fisheries and the largely non-market service sectors such as education and health. The following size-class definitions are applied: micro firms (0-9 persons employed), small firms (10-49 persons employed), medium-sized firms (50-249 persons employed), and large firms (250+ persons employed). The advantage of using Eurostat data is that the statistics are harmonised and comparable across countries. The disadvantage is that for some countries the data may be different from those published by national authorities.
In Poland’s ‘non-financial business economy’, SMEs accounted
for slightly more than half of overall value added in 2018, a
share of 52.9%. Although this share is lower than the EU
average of 56.4%, they have gradually been converging over
recent years. SMEs generated 67.1% of total employment in the
Polish ‘non-financial business economy’ in 2018, similar to the
EU average. Polish SMEs employ approximately 3.5 people,
compared with the EU average of 3.9.
In 2014-2018, overall SME value added increased by 26.3%,
while in large firms the rise was 23.2%. Micro firms grew fastest
in 2014-2018, by 37.6%, clearly outperforming small and
medium-sized firms in which value added rose by 20.4%. In
terms of employment, the difference was even more significant:
whereas employment in micro firms grew by 15.8% in 2014-
2018, in small and medium-sized firms, it fell by 2.9%. Overall,
SME employment stabilised at a total of 6,100,000 jobs for the
three consecutive years of 2016-2018.
Between 2014 and 2018, SME value added and employment in
the construction sector increased and surpassed the
performance of large firms. Micro firms generated the fastest

2019 SBA Fact Sheet — Poland 3
growth in value added. They were the sole growth driver for
overall SME employment growth in the sector. Firms in the
construction sector have been affected both positively and
negatively by recent economic developments in Poland. On the
one hand, economic growth and an increase in household
incomes have led to higher household spending, which has
particularly benefited micro firms involved in house building and
renovation. On the other hand, the rising cost of materials and
wages have increased overall costs and lowered profit margins
in the sector. This is especially the case for large firms, which
are bound by long-term contracts whose fixed prices are
determined by highly competitive public tenders.
The wholesale and retail trade sector generated significant value
added growth in 2014-2018, both for SMEs and even more so
for the large firms. Such developments reflect the generally
good performance of the economy. For example, household
disposable income increased by one fifth between 2014 and
2017 as a result of falling unemployment, an increase in the
minimum wage and the new child benefit system introduced in
2016. The higher growth of large firms reflects long-term trends
in the Polish trade sector, which used to be dominated by small
shops but is now transitioning into a model similar to Western
European countries, with networks of supermarkets and
‘franchises’ playing a larger role.
In 2018, 383,000 new firms were registered in Poland, the
largest total since 2010, and 332,000 firms deregistered, the
highest total since 2011. Both registrations and deregistrations
increased considerably in 2017-2018, rising by 8.7% for new
registrations and by 15.6% for deregistrations. However, the net
increase of 61,000 firms remains in line with the data from
2014-2017, when on average 62,300 firms joined the register
per year.
As per the data collected by the European Startup Monitor 2019
project2, 65% of the Polish startups that responded to the online
questionnaire were set up by one male founder or an all-male
team of founders. 0% were set up by one female founder or an
all-female team of founders. The remaining 35% were set up by
at least one man and one woman. In terms of their stage of
development, 15% are in the pre-seed or seed stage, 46% in the
start-up stage, 4% in the steady stage and 35% in the growth
stage. Regarding financial aspects, 62% are operating at a loss,
15% currently break-even and 23% are profitable. Of those
start-ups that are operating at a loss, 94% expect to break-even
in less than 2 years, while 6% expect that it will take them over
2 years to break-even. 65% have a turnover between €1 and
€500,000; 19% report having no turnover yet and the remaining
15% have a turnover of over €500,000. They have 11
employees on average, of which around 35% work on a part-
time basis. On average they plan to hire 4 people within a year.
Many firms have successfully scaled up their operations in
recent years. In 2016, 11,774 firms (11.7% of all firms in the
‘business economy’ with at least 10 employees) were high-
growth firms. This share is higher than the EU average of 10.7%.
In 2018, Polish SMEs in the specialised knowledge-intensive
services and high-tech manufacturing sectors, both of which are
usually R&D-intensive, accounted for 25.6% of SME value added
in the manufacturing and services sectors. This is significantly
lower than the EU average of 33%.
Overall, SME value added is expected to rise by 13% between
2018 and 2020, exceeding the 11.7% growth projected for large
firms. By the end of 2020, it is predicted that SMEs will generate
98,700 jobs.

2019 SBA Fact Sheet — Poland 4
2. SBA profile3
Poland has a mixed SBA profile. The country performs in line
with the EU average for the following SBA principles:
entrepreneurship, second chance and responsive administration.
The country scores above the EU average for the SBA principles
of State aid & public procurement, access to finance and the
environment, while, on the other hand, the country performs
below the EU average for the SBA principles of skills &
innovation, the single market and internationalisation.
Since 2008, the development of Polish SMEs has been an
important part of the agenda of successive governments. It is
also prominently included in the ‘Strategy for Responsible
Development’, the Polish government’s current key strategic
document.
In general, since 2008, small and medium-sized businesses have
been especially wary of the unclear legislative framework, the
inconsistent interpretations of the law by public administration,
the frequent changes in legislation and an insufficient level of
communication. This is why the SBA area of responsive
administration was among the most visible in public discourse
and became a target of multiple policy measures over the years
– the development of e-administration can be considered the
single greatest achievement of the previous decade. This
approach was continued in 2018 and the first quarter of 2019,
which saw preparation and/or implementation of many
legislative acts aimed at improving the institutional conditions
for Polish enterprises. This goal is also supported by the newly
established office of the SME Ombudsperson, which supports the
‘Think first policy’ in both the legislative process and the day-to-
day operations of public administration. Deregulation was
supplemented by lowering the corporate income tax and social
security dues for some segments of SMEs.
An important goal of Polish policy in the case of SMEs is to
ensure development in the areas of internationalisation, the
single market and skills & innovation, where there is a
considerable gap with many European countries. While new
measures mostly focusing on skills & innovation were
implemented, all the measure were part of a continuation and
expansion of various programmes, many run by the Polish
Development Fund group of institutions and agencies, and were
part of the comprehensive “Start in Poland” approach.
Second chance is an SBA area where progress is limited,
especially when it comes to support for previously bankrupt
entrepreneurs. Another area where more active policy would be
welcome is the environment, as the role of SMEs in the green
transformation is currently not fully recognised.

2019 SBA Fact Sheet — Poland 5
SBA performance of Poland: state of play and development from 2008 to 20194
Low Performance, Deterioration

2019 SBA Fact Sheet — Poland 6
3. SBA principles5
3.0 ‘Think Small First’ The ‘think small first’ principle is meant to be a guiding principle
for all policy- and law-making activities. It requires policymakers
to take SMEs’ interests into account at the early stages of the
policy-making process. This principle also calls for newly
designed legislation, administrative rules and procedures to be
made simple and easy to apply.
This principle has been highly valued by Polish governments
since 2008 and stakeholders point out many improvements,
such as the gradual introduction of SME-friendly e-
administration and the general level of service in administrative
offices. On the other hand, in general, an incoherent
interpretation of laws by the public administration and frequent
changes in the regulatory framework are continually noted as
especially problematic to SMEs, given their limited access to
legal assistance. Previous reforms sometimes lacked proper
implementation, and especially in the area of taxation there is
enduring tension between making regulations more favourable
to SMEs and the public administration’s goal of tackling various
forms of tax evasion.
2018 was the year of continued implementation of ambitious
policy measures focused on improving the regulatory framework
for SMEs.
- The newly organized independent office of the SME
Ombudsperson (Rzecznik MŚP) is actively lobbying for
the practical implementation of the ‘Think Small First’
principle in both new legislation and in the day-to-day
operation of public administration. The SME
Ombudsperson may also ask administrative bodies to
interpret legislation or regulations.
- In 2019, the corporate income tax (CIT) for many small
enterprises was further lowered to 9% (Niższa stawka
CIT dla małych podatników).
The government introduced consecutive packages of laws
to reduce the excessive administrative burden and improve
the regulatory framework for SMEs (‘Constitution of
Business’ - Konstytucja biznesu, ‘Easy law’ package - Pakiet
przyjazne prawo, ‘SME package’ - Pakiet MŚP).
While those changes are mostly welcomed by stakeholders,
some point to a mixed record of implementation of the
‘SME test’ principle and regulatory impact assessments in
some legislative proceedings. There is also the notion that
more active economic and innovation policy should
supplement deregulatory efforts to ensure the further
development of Polish SMEs.

2019 SBA Fact Sheet — Poland 7
3.1 Entrepreneurship
Poland performs in line with the EU average in entrepreneurship,
although in the previous reference period, it even exceeded the
EU average. Progress since 2008 has been modest, but positive
overall. Entrepreneurship education performs below the EU
average in both primary school and secondary levels. A similar
score is observed for media attention given to entrepreneurship.
Early stage entrepreneurial activity has deteriorated compared
to last year, including for women. Poland scores far below
average for the new indicator in this year’s SBA fact sheet – high
job creation expectation rate (nascent entrepreneur or owner-
manager of a new business expecting to create six or more jobs
in 5 years). On the other hand, the established business
ownership rate has improved, increasing to 13% in 2018 – the
top performance among the Member States. Poland also has the
highest score in the EU for entrepreneurship as a desirable
career choice.
Promoting entrepreneurship was part of public discourse and
policy in Poland long before 2008 – since 2003,
entrepreneurship is taught as a subject in public schools, and
there are a number of incentives in place, such as funding for
the unemployed to start a business. On the other hand, the
quality of entrepreneurship education is still not considered high,
and little, if anything is being done to accommodate for
entrepreneurship education or promote it, taking into account the
diverse needs of minority groups. Moreover, the improved
situation on the job market makes individual entrepreneurship
somehow less desirable when compared with a less risky career
in an established company.
In the reference period (2018 and the first quarter of 2019) the
government introduced many measures to address those issues.
- One important issue is succession in a family business
– a new law on succession in sole proprietorship
enterprises came into force in 2018, with further
amendments planned (Ustawa o zarządzie
sukcesyjnym przedsiębiorstwem osoby fizycznej).
- The Polish Agency for Enterprise Development (PARP)
is providing strategic support for succession in such
enterprises (Sukcesja w firmach rodzinnych).
- Entrepreneurs who are new or have small businesses
can make use of the unregistered activity exception
(Konstytucja biznesu – Prawo przedsiębiorców).
- Individual entrepreneurs also benefit from lower social
insurance fees (Mały ZUS dla małych firm).
- More established and innovative SMEs can invest in
their growth by using the new territorial investment
support framework (Ustawa o wspieraniu nowych
inwestycji).
- Another development in this area is the simple joint-
stock company (Prosta spółka akcyjna), which is
intended to provide start-ups with an effective
framework for growth and for attracting investment.
The Polish Development Fund group provides numerous
programmes for SMEs at different stages of their
development (“Start in Poland”). However, all these
measures affect only a minority of SMEs, and there are still
important macroeconomic and social capital constraints
that limit entrepreneurship in Poland.

2019 SBA Fact Sheet — Poland 8
3.2 ‘Second chance’
‘Second chance’ refers to ensuring that honest entrepreneurs
who have gone bankrupt get a second chance quickly. Poland
performs in line with the EU average, having made positive
progress since 2008. Two of the indicators rank below the
average, namely the time and the cost to resolve insolvency.
Both have remained unchanged since the previous reference
period, while the strength of the insolvency framework index has
also retained its position, performing well above the EU average.
Since 2008, Poland has introduced a number of measures to
support struggling and bankrupt entrepreneurs. However, the
focus of this policy was mostly to avoid unnecessary
bankruptcies altogether, with the support of acts such as the
Restructuring Law of 2015. The measures to help previously
insolvent business owners to run their business once again were
not as prominent.
This tendency is still present during the current reference period,
as no new important measures were introduced. One noteworthy
ongoing programme is ‘Early Warning Poland’ by the Polish
Agency for Enterprise Development and the Family Businesses
Foundation, which provide advisory support for struggling SMEs.
There is also a plan to support such enterprises financially, but
the mechanism is still not in place.
This area is also indirectly affected by other measures meant to
prevent insolvency crises in SMEs. During the current reference
period, the implemented or proposed changes include shortening
the periods for larger enterprises and public administration to
pay SMEs and introducing favourable tax regulations.
In general, ‘second chance’ policy is currently less prominent due
to the still positive economic situation in Poland. However, it
might require more attention in the event of an economic
slowdown.

2019 SBA Fact Sheet — Poland 9
3.3 ‘Responsive administration’
‘Responsive administration’ refers to public administration being
responsive to the needs of SMEs. Poland continues to perform in
line with the EU average. The country has made substantial
progress since 2008. While most indicators perform within the
EU average, there are also some exceptions. The cost required to
transfer property is much lower than the EU average, but the
time to transfer property remained longer than the average.
Poland has the second worst performance in terms of the time it
takes to pay taxes, amounting to 334 hours per year. This is an
increase from 260 hours in 2018. A less dramatic increase was
represented in the burden of government regulations, remaining
below the average.
More effective, consistent administration has been seen as the
key issue since 2008, with successive Polish governments
tackling it through legislative actions and softer administrative
measures. Business stakeholders have for a long time pointed to
issues such as lengthy administrative procedures, the e-
administration gap, a complicated licencing framework and an
inconsistent interpretation of the frequently changing law by
public administration. Those problems were especially
problematic for SMEs, with their limited liquidity and legal
capacities. However, this past decade has seen significant,
gradual developments, especially in areas such as access to
information, e-administration, and a general professionalisation
of public administration. Lingering problems affect areas where
the interests of a particular SME and the public administration
might be contradictory, such as the interpretation of tax laws.
This reference period was marked by the practical
implementation of previously introduced laws (‘Constitution of
Business’ supported by the SME Ombudsperson) but also by the
preparation of draft legislation.
- New sets of regulatory improvements were grouped
into an ‘SME Package’ (Pakiet MŚP), covering the
reduction of administrative and organisational burden,
formal and material improvements in taxation and
more.
- Work is currently under way on the ‘Friendly Law
Package’ (Pakiet Przyjazne Prawo) which will broaden
legal forms for conducting business for craftspeople
and introduce the ‘tolerance for beginners mistake’
rule for new entrepreneurs whose formal violations
were unintentional.
Accommodating the fast pace of changes can be in itself a
challenge for SMEs, but in general those acts were favourably
received by the business community. Stakeholders note,
however, that the practical impact of many of those measures
can only be assessed in the long term, and the interpretation of
tax laws remains a contentious issue with the Polish
government’s active policy on fighting tax avoidance.

2019 SBA Fact Sheet — Poland 10
3.4 State aid & public procurement
Important methodological changes have been introduced for this
principle in this year’s fact sheet. Three new indicators from the
Tenders Electronic Daily (TED) database have been added and
refer to procurement above EU thresholds:
percentage of awards for which the winner was an
SME;
proportion of bids by SMEs;
percentage of calls for tenders which were split into
lots.
In addition, the indicator on e-procurement has been removed.
Therefore, the overall performance in this area cannot be
compared to last year’s.
Poland’s profile in State aid & public procurement is performing
above the EU average. This is in line with steady progress since
2008.
There are no indicators, performing significantly below the
average for this SBA principle. Almost half of the calls for
tenders were split into lots, the second highest score in the EU.
SMEs account for two thirds of the total value of public
contracts awarded in 2017, a significant improvement compared
to 25% in 2013. SMEs in Poland also appear to be quite
successful in bids. Although the proportion of applications is
lower than the EU average, the percentage of awards for which
the winner was an SME is higher than the EU average.
As for policy developments, the continuous introduction of e-
procurement is generally considered a success. On the other
hand, the public procurement law from 2004 is, after many
amendments, considered by stakeholders and government alike
to be unclear and dated.
To address the latter issue, a new public procurement law
(Projekt ustawy – Prawo zamówień publicznych,) is at an
advanced stage of the government legislative procedure. Its aim
is to improve regulation of the entire public procurement process
(including preparation and preparatory consultations), exclude
abusive clauses from public contracts, increase the number of
offers to improve competitiveness and potentially to facilitate
higher participation of SMEs in proceedings. Finalising the
legislative process and successful implementation will be a
challenge in the next few quarters. In the meantime, other
relevant changes are also proceeding, such as a shorter period
for public sector entities to pay SMEs from 60 to 30 days as part
of the act on the prevention of late payment.

2019 SBA Fact Sheet — Poland 11
3.5 Access to finance
Access to finance for SMEs in Poland continues to be above the
EU average in general, with substantial progress since 2008.
In 2018, the cost of borrowing for small loans in Poland was
lower than for large loans, and was the only such favourable
situation in the EU. On the other hand, the situation in equity is
not clear. Although the country performs well for the indicator on
equity funding for new and growing firms, venture capital
investments are below the average.
Since 2008, Polish SMEs’ access to capital has been recognised
as an important issue affecting their development. The matter is
as diverse as small and medium enterprises themselves. The
stable banking sector provides viable borrowing possibilities for
enterprises, while the public Bank Gospodarstwa Krajowego
supports more risky undertakings such as international
expansion. A business environment for start-ups and scale-ups is
developing, based also on programmes by the Polish
Development Fund. However, the prevalence of venture capital
funds and business angels remains lower than in more
innovative economies. Public administration is continuing its
active policy of supporting prospective enterprises, mainly
through the programmes of the Polish Development Fund (PFR)
group (established in 2016). This includes PFR Ventures, fund
that invests in other funds (the fund of funds formula) and
provides funding in cooperation with venture capital funds or
business angels. Funding programmes by PFR form an important
part of the ‘Start in Poland’ approach to support the
development of a start-up ecosystem in Poland.
For the majority of small businesses, payment delays, often
from larger companies, have been an important risk factor for
financial liquidity that could escalate in the event of an
economic slowdown. During the current reference period, a
comprehensive law to prevent late payments was in the making
(Projekt ustawy o zmianie ustaw w celu ograniczenia zatorów
płatniczych). It includes measures regulating payment periods
between SMEs and larger companies, harsher sanctions for
delays in payment and changes to the tax code to lessen the
harm this problem can cause to businesses.

2019 SBA Fact Sheet — Poland 12
3.6 Single market
Poland continues to perform below the EU average for the single
market. The country’s profile shows mixed developments, with
some indicators improving, while others have deteriorated. For
instance, the easy market access for new and growing firms
scored below the EU average, down from the previous fact
sheet. Furthermore, Poland was among the bottom performers
for market access for new and growing firms without being
unfairly blocked by established firms, with its position
deteriorating compared to the previous reference period. On the
other hand, there were positive developments between 2017
and 2018 for decreases in the number of single market
directives not yet transposed and in the average delay for
transposing them.
EU Member States are a major destination for Polish exports.
However, the development of Polish SMEs on the single market
is behind compared to the other EU countries. To a large extent,
this is rooted in deeper socio-economic factors such as a less
diverse offer of innovative goods and services, a less established
brand of Polish industry or developing internal market. Still, the
area has been a major target of public policy measures, such as
financial or consulting support schemes.
In the reference period, no new significant measures were
introduced. It was generally a year of continuation and further
development of previously introduced measures, such as support
programmes by the Polish Agency for Enterprise Development or
export credits by Bank Gospodarstwa Krajowego. The Polish
Investment & Trade Agency is continuing its sectoral export
promotion and economic marketing programmes, with a notable
effort to develop Foreign Trade Offices. Those programmes
support the export to EU countries, as well as non-EU countries.

2019 SBA Fact Sheet — Poland 13
3.7 Skills & innovation
Since 2008, Poland has struggled with its performance in skills
& innovation, continuously performing far below the EU average
and currently having the third worst score among the Member
States in this SBA area. Some indicators, however, show
improvements, while remaining below the EU average, e.g. the
share of SMEs selling and purchasing online, the percentage of
SMEs innovating in-house and the ones introducing product and
process innovations. Regarding skills, despite a slight
improvement from 2017, the percentage of enterprises (SMEs
with more than 10 employees) employing ICT specialists is the
second lowest in the EU. This situation corresponds to the share
of SMEs, which is far below average, providing ICT skills training
to their employees.
Poland’s gross domestic spending on R&D as a percentage of
GDP has risen from 0.6% in 2008 to 1% in 2017, but still
remains well below the EU average of 2% (source: OECD).
Cooperation between institutions of science and higher
education and industry has been considered insufficient for a
long time, and the start-up ecosystem is still not well developed.
Numerous public policy measures were employed in the past
decade to support the transformation into a more technically
advanced economy, but their impact was constrained by the
unwillingness to substantially increase spending in this area.
In the reference period, a number of changes were introduced or
implemented, mainly to give financial incentives for developing
innovative SMEs and other companies.
- Since the beginning of 2019, the ‘Innovation box’
(Ustawa o zmianie ustaw podatkowych tzw. Innovation
box) solution lowers the corporate (CIT) and the
personal income tax (PIT) on profit derived from the
commercialisation of intellectual property rights.
- Furthermore, since the law came into force at the
beginning of 2016 (Ustawa o zmianie niektórych ustaw
w celu poprawy otoczenia prawnego działalności
innowacyjnej), R&D costs can be deducted from
taxable income. In 2018, the deduction was increased
to 100%, and the list of eligible costs was expanded.
- There is also tax relief for industrial automation, which
affect mainly the smallest enterprises (Ulga na
robotyzację).
- The Polish Agency for Enterprise Development as an
SME Development Centre (Centrum Rozwoju MŚP) has
continued its numerous programmes to provide
financial and advisory support for innovative
enterprises at different stages of development (part of
“Start in Poland”).

2019 SBA Fact Sheet — Poland 14
The National Centre for Research and Development
supports the development of science and innovative
solutions in enterprises as well. Moreover, the recent reform
of higher education aims to facilitate the development of
practical solutions for industry, improve research standards
and support cooperation between research institutions and
enterprises, although there has not been a substantial
increase in science spending to match this. Furthermore, the
investment support system was reformed in 2018, one of
the aims being to enable tax credits for new investments by
innovative SMEs.
3.8 Environment
Based on the 2017 results, Poland performs in general above
the EU average in this SBA area.
Since 2008, the issue of green development in Poland has
generally been complex, and the role of small and medium
enterprises in this respect has not been considered that much.
One notable measure was substantial funding for improving the
energy efficiency and thermo-modernisation of buildings (mainly
by The National Fund for Environmental Protection and Water
Management), although air pollution problems warrant the need
to also ensure both financial incentives and more effective
supervision of emissions by businesses (such as small industry
or workshops). There are also softer measures on various levels
to improve the environmental awareness of entrepreneurs. Until
2015, green technologies in Poland were supported under
GreenEvo, an accelerator programme for innovative SMEs. In
2018, a new edition was organised after the hiatus.

2019 SBA Fact Sheet — Poland 15
3.9 Internationalisation
Based mostly on 2017 results, Poland performs below the EU
average in internationalisation.
The international development of Polish SMEs has for a long
time been seen as an important factor in the country’s overall
economic progress. Since 2008, both central and regional public
administration has carried out multiple programmes to facilitate
such an expansion, providing both financial and advisory support.
With the growing experience of both the public and private
sectors, the quality of those efforts has been improving. These
last couple of years have seen a renewed focus on developing
markets outside the EU due to the growing potential and
comparative advantages of Polish industry. It must be noted,
however, that small enterprises lag behind medium and large
companies in economic cooperation outside the EU.
In the reference period, no new measures of greater importance
were noted. However, the ones initiated before have been
continued and expanded. That includes multiple programmes by
member entities of the Polish Development Fund Group: the
Polish Agency for Enterprise Development (financial and
consulting support), the Polish Investment & Trade Agency
(including sectoral economic marketing programmes on markets
mostly outside the EU) and Bank Gospodarstwa Krajowego
(preferential financial instruments), but also initiatives by
regional governments. 2018 saw a significant expansion of the
Foreign Trade Offices network, which addressed gaps in Polish
foreign economic policy, as assessed by some of the
stakeholders. Moreover, the measures to facilitate innovation
and technical development in Polish enterprises are also
considered to improve the competitiveness of Polish SMEs on
international markets.

2019 SBA Fact Sheet — Poland 16
4. Interesting initiative
Below is an example of an initiative from Poland to show what governments can do to support SMEs.
SME Ombudsperson
The SME Ombudsperson is a new independent institution created in 2018 as part of the ‘Constitution of Business’
initiative. It is responsible for championing the rights of SMEs, including freedom of enterprise, trust between
public administration and entrepreneurs, and fair competition. In close cooperation with SME organisations, the
SME Ombudsperson can take part in the consultation of proposed laws and support individual enterprises, in
particular disputes with the public administration. The Ombudsperson can also influence the conditions for SMEs
by introducing educational initiatives and suggesting improvements to public administration and even state-
owned companies.
While the issues concerning the development of SMEs are still actively managed by the respective ministries and
institutions, the relatively independent status of the SME Ombudsperson outside the government and its
collaboration with SME stakeholders enable this office to serve as the unique voice of the SME environment on
both general (legislative) and specific matters. Stakeholders see this as a chance to further implement a ‘Think
small policy’ in the legislative process and facilitate the development of SME-friendly public administration,
although it will take more time to assess the extent to which these ambitious goals will be achieved.
Sources:
Jornal of Laws, http://www.dziennikustaw.gov.pl/du/2018/648/1
Website of SME Ombudsperson Bureau https://rzecznikmsp.gov.pl/

2019 SBA Fact Sheet — Poland 17
Important remarks
The European Commission Directorate-General for Internal Market, Industry, Entrepreneurship and SMEs (DG GROW) produces the
SBA fact sheets as part of the SME Performance Review (SPR), its main vehicle for economic analysis of SME issues. They
combine the latest available statistical and policy information. Produced annually, they help to organise the available information
to facilitate SME policy assessments and monitor SBA implementation. They take stock and record progress. They are not an
assessment of Member State policies. Rather, they should be regarded as an additional source of information to improve
evidence-based policy-making. For example, they cite only policy measures national SME policy experts consider relevant. They do
not and cannot reflect all measures the government has taken over the reference period. There is more policy information on a
database accessible from the SPR website.
SME Performance Review:
http://ec.europa.eu/growth/smes/business-friendly-environment/performance-review/
Small Business Act:
http://ec.europa.eu/growth/smes/business-friendly-environment/small-business-act/index_en.htm
Entrepreneurship and SMEs:
https://ec.europa.eu/growth/smes
Endnotes
1 The two graphs below present the trend over time for the variables. They consist of index values for the years since 2008, with the base year 2008 set at a value of 100. As from 2017, the graphs show estimates of the development over time, produced by DIW Econ on the basis of 2008-2016 figures from Eurostat’s Structural Business Statistics Database. The data cover the ‘non-financial business economy’, which includes industry, construction, trade and services (NACE Rev. 2 sections B to J, L, M and N). They do not cover enterprises in agriculture, forestry and fisheries or largely non-market service sectors such as education and health. A detailed methodology can be consulted at: http://ec.europa.eu/growth/smes/business-friendly-environment/performance-review/
2 www.europeanstartupmonitor2019.eu
3 The 2019 SBA fact sheets benefited substantially from input from the European Commission’s Joint Research Centre (JRC) in Ispra, Italy. The JRC made major improvements to the methodological approach, statistical work on the dataset and the visual presentation of the data.
4 The quadrant chart combines two sets of information. Firstly, it shows current performance based on data for the latest available years. This information is plotted along the X-axis measured in standard deviations of the simple, non-weighted arithmetical average for the EU. Secondly, it shows progress over time, i.e. the average annual growth rates from 2008 to 2019. These are measured against the individual indicators which make up the SBA area averages. Hence, the location of a particular SBA area average in any of the four quadrants provides information not only about where the country is located in this SBA area relative to the EU average at a given point in time, but also about the extent of progress made between 2008 and 2019. All SBA principles, with the exception of the ‘think small first’ principle for which there is not enough statistical data available, are calculated as composite indicators following the OECD/JRC Handbook guide. A detailed methodology can be consulted at: http://ec.europa.eu/growth/smes/business-friendly-environment/performance-review/
5 The policy measures presented in this SBA fact sheet are only a selection of the measures the government took in 2018 and the first quarter of 2019. The national SME policy expert that PwC (DG GROW’s lead contractor for the 2019 SBA fact sheets) contracted made the selection. The experts were asked to select only the measures they considered the most important, i.e. the ones expected to have the highest impact in the SBA area in question. The complete range of measures the experts compiled in
2019 SBA Fact Sheet — Poland 18
producing this year’s fact sheets will be published alongside the fact sheets in the form of a policy database on the DG GROW website.
Related Documents