2019 Proxy Statement and Annual Report

Welcome message from author
This document is posted to help you gain knowledge. Please leave a comment to let me know what you think about it! Share it to your friends and learn new things together.
Transcript
2019Proxy Statement
and Annual Report
October 18, 2019
Dear fellow stockholders,
The General Finance Corporation team continues to deliver great results in executing our long-term growth strategy. Wecontinue to execute our growth strategy with our specialty rental services business model.
Our business model has several key features: an attractive asset class of long-lived assets that offer rapid paybackperiods and low maintenance costs, a diversified customer base and storage products adoptable to a wide variety of uses. Wecontinue to manage our business model to deliver organic growth, recurring leasing revenue, superior customer service,product innovation, operational excellence and disciplined acquisitions.
GROWTH MILESTONES
Through our team’s dedication and commitment to our long-term growth strategies, we reached important growthmilestones in fiscal year ended June 30, 2019, or fiscal year 2019:
Branch Network and Lease Fleet Growth. Our branch network has grown from 15 branches at June 2007 to101 branches at June 30, 2019, and from June 2008 to June 2019 our lease fleet grew at a compound annualgrowth rate of 12%.
Revenue, Leasing Revenue and EBITDA Growth. Fiscal year 2019 revenues, leasing revenue and AdjustedEBITDA increased by 8.9%, 12% and 21.9%, respectively, over the prior fiscal year.
EBITDA Margin Growth. Our EBITDA margins have increased from 17% in June 2007 to 28% at June 30,2019.
Large and Loyal Customer Base. Outstanding customer service, as evidenced by Pac-Van’s fiscal year2019 net promoter score of 84, has fueled the growth of our customer base from 12,000 customers at June2007 to over 50,000 customers at June 30, 2019.
Disciplined and Accretive Acquisitions. In fiscal year 2019 we continued our long-term strategy ofcompleting disciplined acquisitions, entering five new markets in North America and the Asia-Pacific regionvia six acquisitions in fiscal year 2019, and from July 1, 2007 to June 30, 2019 we completed 57 accretiveacquisitions.
Product Innovation. Customers have embraced the safety and convenience of the locking system featured inour U.S. PV3 Safety Containers, Canadian CK3 Safety Containers and Asia-Pacific Wolf Lock PremiumContainers, and as of June 30, 2019 U.S customers had leased nearly 4,000 PV3 Safety Containers.
LEASE FLEET
During fiscal year 2019 our combined North America and Asia-Pacific lease fleet units increased 16.2% as wecontinued to carefully allocate capital to organic growth via capital expenditures and to accretive acquisitions. In fiscal year2019 we invested $38.5 million in net lease fleet purchases to drive organic growth and $22.3 million to acquire NorthAmerica and Asia-Pacific container businesses.
The charts below show the long-term growth of our lease fleet, unit utilization and the value of our lease fleet.
85%
80%80%
77%76%
80%
120,000
FY 2019
Total Units in Fleet Average Fleet Utilization
FY 2015 FY 2016 FY 2018FY 2017
100,000
80,000
60,000
40,000
20,000
-
80%
75%
70%
65%
60%
55%
50%
Lease Fleet Units
99,743
85,81280,71278,605
72,856
$600
$500
Lease Fleet, net($ in millions)
$400
$300
$200
$100
$-FY 2015
$457
$38$22
$429
$21
$87
$427
$22$5
$419
$21$23
$411
$55
$38
FY 2016 FY 2017 FY 2018 FY 2019Lease Fleet, net Organic Growth Acquisitions
OUR PEOPLE AND CUSTOMERS
Our team continues to deliver outstanding customer service, earning Pac-Van a “net promoter score” of 84 in fiscal year2019, which we believe leads our industry. This high level of customer satisfaction has helped General Finance Corporationbuild the diverse and loyal customer base shown below.
Fiscal Year 2017
Education2%
Commercial25%
Oil & Gas10%
Construction23%
Industrial11%
Consumer7%
Moving &Transportation
6%
Retail6%
Government3%
Mining3%
Other4%
Fiscal Year 2019Other5%
Oil & Gas15%
Commercial23%
Construction22%
Moving &Transportation
6%
Retail5%
Industrial11%
Consumer5%
Government2%
Mining3%
Education3%
Fiscal Year 2018
Education1%
Oil & Gas14%
Commercial27%
Construction22%
Moving &Transportation
6%
Other6%
Industrial9%
Consumer5%
Government2%Mining
3%Retail
5%
LEADERSHIP
Our executive team, lead by Jody Miller, Chuck Barrantes, Jeff Kluckman and Chris Wilson, continues to successfullyexecute our long-term growth strategy with critical contributions in North America from Ted Mourouzis, Eric Weber, BobbyKeenom and Brian Bottelberghe, and in Asia Pacific from Neil Littlewood and Greg Baker.
OUR ANNUAL STOCKHOLDER MEETING
We look forward to seeing you at our 2019 annual stockholder meeting of General Finance Corporation on Thursday,December 5, 2019 at 10:00 a.m. at 39 East Union Street, Pasadena, California 91103, and we appreciate your interest inGeneral Finance Corporation.
Sincerely,
Ronald F. Valenta Jody E. MillerExecutive Chairman of the Board Chief Executive Officer and President

PROXYSTATEMENT
NOTICE OF 2019 ANNUAL MEETING OF STOCKHOLDERSTo be held on December 5, 2019
ANDNOTICE OF INTERNET AVAILABILITY OF PROXY MATERIALS
Notice of Date, Time and Location of Meeting
Notice is hereby given to the holders of common stock of General Finance Corporation (the “Company”) that the 2019Annual Meeting of Stockholders (“Annual Meeting”) will be held on Thursday, December 5, 2019 at 10:00 a.m. PacificStandard Time at the offices of the Company located at 39 East Union Street, Pasadena, California. At the Annual Meetingwe will ask you to:
Items of Business
1. Election of Directors. Elect two Class A directors, Manuel Marrero and Douglas Trussler, to serve for terms of threeyears each and until their respective successors are elected and qualified. The qualifications and experience of the twoClass A directors are described in the accompanying Proxy Statement;
2. Ratification of Appointment of the Independent Registered Public Accounting Firm. Ratify the selection of CroweLLP as our independent auditors for the fiscal year ending June 30, 2020;
3. Advisory Vote Regarding Executive Compensation. Vote on an advisory and non-binding basis resolution regardingexecutive compensation;
4. Frequency of Advisory Votes on Executive Compensation. Vote on an advisory and non-binding basis regarding thefrequency of future advisory votes on executive compensation; and
5. Other Business. Transact any other business that may properly be presented at the Annual Meeting.
Record Date
If you owned Company common stock on October 8, 2019, the record date, you are entitled to notice of, to attend and tovote at the Annual Meeting and any adjournments or postponements thereof. In addition to submitting a proxy and voting inperson, you may vote by mail, telephone or the Internet. A complete list of stockholders entitled to vote at the AnnualMeeting will be available at the principal executive offices of General Finance Corporation located at 39 East Union Street,Pasadena, California beginning November 25, 2019 and at the Annual Meeting.
Materials to Review
The Proxy Statement, form of proxy card and Annual Report on Form 10-K for the fiscal year ended June 30, 2019 (the“2019 Annual Report”) that accompany this Notice (all of the foregoing collectively, the “Proxy Materials”) containadditional information regarding the proposals to be considered at the Annual Meeting, and stockholders are encouraged toread the Proxy Materials in their entirety. Under rules adopted by the U.S. Securities and Exchange Commission (“SEC”), wehave elected to provide access to our Proxy Materials both by sending you the Proxy Materials by mail and by notifying youof the availability of our Proxy Materials at the website www.cstproxy.com/generalfinance/2019. Internet access to our ProxyMaterials does not identify visitors to the website.
Proxy Voting
If you submit a proxy, you are entitled to revoke your proxy at any time before it is exercised by attending the AnnualMeeting and voting in person, duly executing and delivering a proxy bearing a later date or sending written notice ofrevocation to our Secretary at 39 East Union Street, Pasadena, California 91103. Whether or not you plan to be present at theAnnual Meeting, we encourage you to vote your proxy by following the instructions provided in the Proxy Materials. Anystockholder attending the Annual Meeting may vote in person even if the stockholder previously returned a proxy.
Respectfully Submitted
Christopher A. WilsonGeneral Counsel, Vice President & Secretary
October 18, 2019
Important Notice Regarding the Availability of Proxy Materials for the Annual Meeting of Stockholders to be Heldon December 5, 2019. Our Proxy Statement and our 2019 Annual Report to stockholders are available at
http://www.cstproxy.com/generalfinance/2019.
PROXY STATEMENT—TABLE OF CONTENTS
PROXY STATEMENT SUMMARYINFORMATION ABOUT THE ANNUAL MEETING AND VOTING 1CORPORATE GOVERNANCE 5
Overview 5GOVERNANCE INFORMATION 6
Board of Directors 6General Oversight 6Leadership Structure 6Risk Oversight 6
Corporate Governance 7Director Independence 7Executive Sessions of Independent Directors 8Lead Independent Director 8Board and Committee Meetings 8Board Committees 8
Audit Committee 8Compensation Committee 9Nominating and Governance Committee 9
Composition of the Board and Review of Director Nominees 9Compensation Committee Interlocks and Insider Participation 10Review and Approval of Transactions with Related Persons 11Communication with the Board of Directors 11Code of Ethics 11Compensation of Non-Employee Directors 11
Cash Compensation 11Annual Award of Restricted Stock 12
Stock Ownership Guidelines 12Director Attendance at Annual Meetings 12
PROPOSALS REQUIRING YOUR VOTEProposal 1: Election of Directors 13Proposal 2: Ratification of Selection of Independent Auditors 16Proposal 3: Advisory (Non-Binding) Vote Regarding Executive Compensation (Say-On-Pay) 17Proposal 4: Advisory (Non-Binding) Vote on the Frequency of Future Advisory Votes on
Executive Compensation (Say-When-On-Pay) 19REPORT OF THE AUDIT COMMITTEE 21SECURITY OWNERSHIP OF CERTAIN BENEFICIAL OWNERS AND MANAGEMENT 22COMPLIANCE WITH SECTION 16(A) BENEFICIAL OWNERSHIP REPORTING 24EXECUTIVE COMPENSATION 25
COMPENSATION COMMITTEE REPORT 25COMPENSATION DISCUSSION AND ANALYSIS 25
Overview of Compensation Philosophy and Objectives 25Say-on-Pay and Frequency of Say-on-Pay Advisory Votes 25Executive Compensation Program 26Elements of Compensation 27
Base Salaries 27Bonuses 27Equity-Based Compensation 27
Stock Option and Restricted Stock Grant Practices 27Role of Executive Officers 28Compensation Surveys 28Compensation of Executives 28Severance 29
Clawback Policy 30Perquisites and Other Personal Benefits 30Tax & Accounting Considerations 30
Deductibility of Executive Compensation—Code Section 162(m) 30Accounting for Stock-Based Compensation 30
Report of the Compensation Committee 31Summary Compensation Table 31Plan-Based Awards 32
Employment Agreements 33Potential Payments Upon Termination of Employment of Change in Control 35
2019 CEO TO MEDIAN EMPLOYEE PAY RATIO 36TRANSACTIONS WITH RELATED PERSONS 37STOCKHOLDER COMMUNICATIONS WITH DIRECTORS 38STOCKHOLDER RECOMMENDATIONS FOR BOARD NOMINEES 38OTHER MATTERS 39AVAILABILITY OF ANNUAL REPORT ON FORM 10-K 39
PROXY STATEMENT SUMMARY
2019 ANNUAL MEETING OF STOCKHOLDERS
Date and Time: Thursday, December 5, 201910:00 a.m. Pacific Standard Time
Place: General Finance Corporation39 East Union StreetPasadena, California 91103
Record Date: October 8, 2019
This summary sets forth certain performance highlights, as well as information contained elsewhere in this proxystatement. You should read the entire proxy statement before casting your vote.
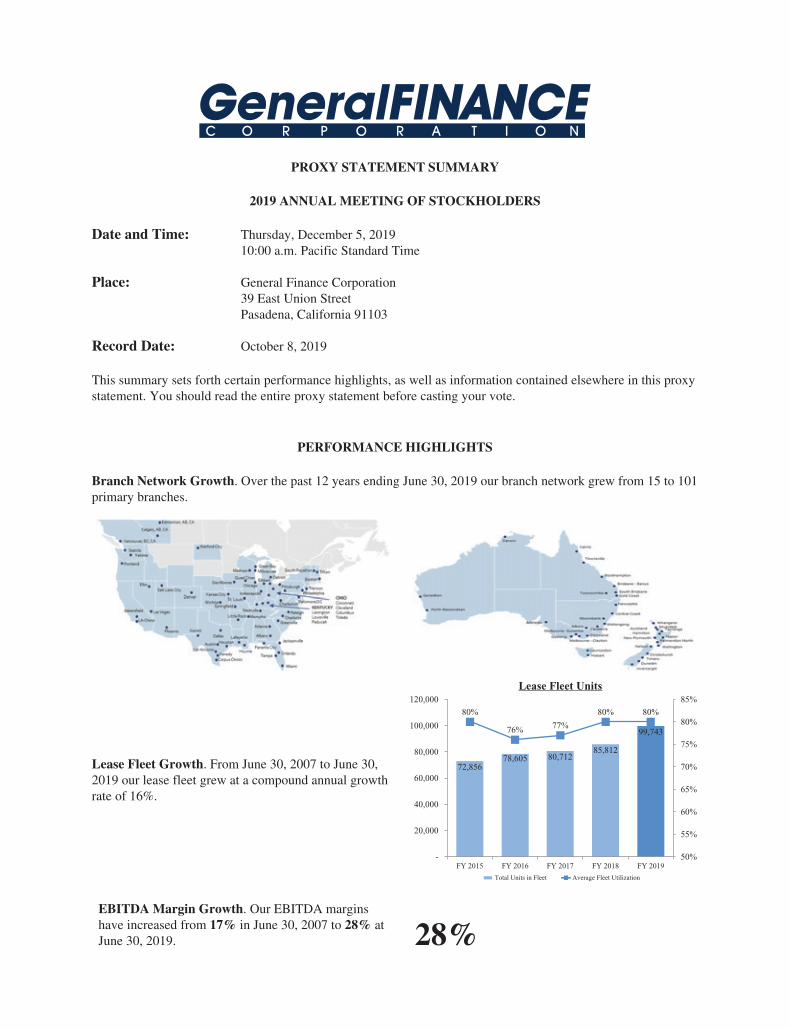
PERFORMANCE HIGHLIGHTS
Branch Network Growth. Over the past 12 years ending June 30, 2019 our branch network grew from 15 to 101primary branches.
Lease Fleet Growth. From June 30, 2007 to June 30,2019 our lease fleet grew at a compound annual growthrate of 16%.
85%
80%80%
77%76%
80%
120,000
FY 2019
Total Units in Fleet Average Fleet Utilization
FY 2015 FY 2016 FY 2018FY 2017
100,000
80,000
60,000
40,000
20,000
-
80%
75%
70%
65%
60%
55%
50%
Lease Fleet Units
99,743
85,81280,71278,605
72,856
EBITDA Margin Growth. Our EBITDA marginshave increased from 17% in June 30, 2007 to 28% atJune 30, 2019. 28%
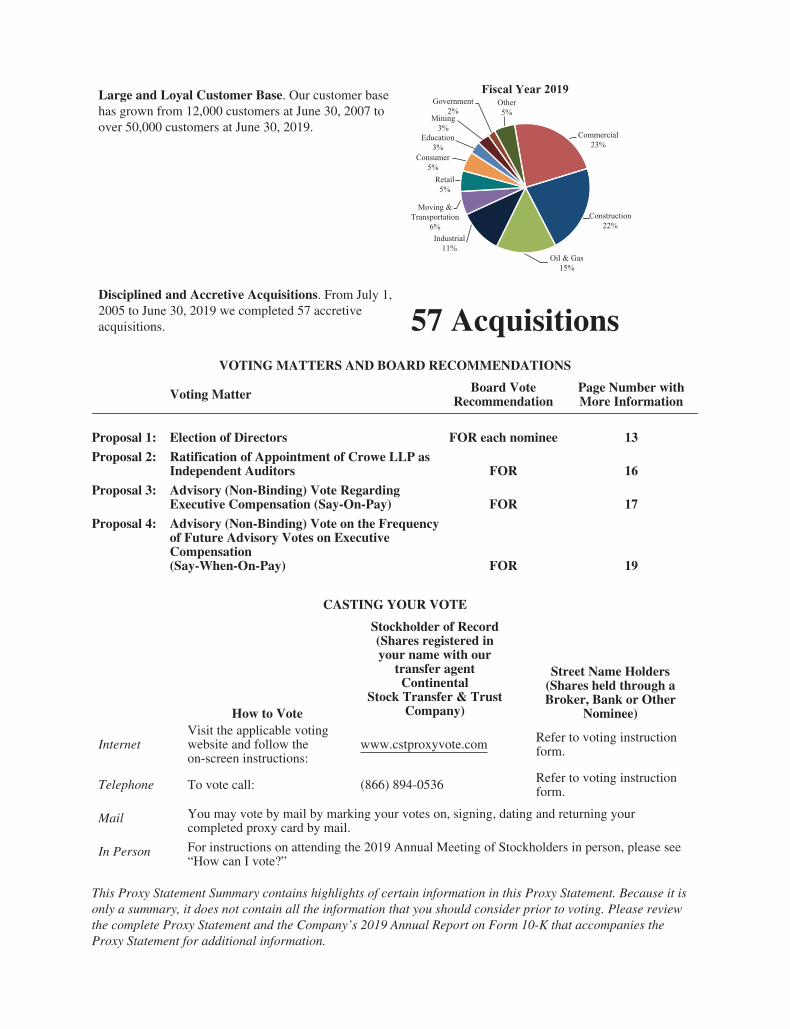
Large and Loyal Customer Base. Our customer basehas grown from 12,000 customers at June 30, 2007 toover 50,000 customers at June 30, 2019.
Fiscal Year 2019Other5%
Oil & Gas15%
Commercial23%
Construction22%
Moving &Transportation
6%
Retail5%
Industrial11%
Consumer5%
Government2%
Mining3%
Education3%
Disciplined and Accretive Acquisitions. From July 1,2005 to June 30, 2019 we completed 57 accretiveacquisitions. 57 Acquisitions
VOTING MATTERS AND BOARD RECOMMENDATIONS
Voting Matter Board VoteRecommendation
Page Number withMore Information
Proposal 1: Election of Directors FOR each nominee 13
Proposal 2: Ratification of Appointment of Crowe LLP asIndependent Auditors FOR 16
Proposal 3: Advisory (Non-Binding) Vote RegardingExecutive Compensation (Say-On-Pay) FOR 17
Proposal 4: Advisory (Non-Binding) Vote on the Frequencyof Future Advisory Votes on ExecutiveCompensation(Say-When-On-Pay) FOR 19
CASTING YOUR VOTE
How to Vote
Stockholder of Record(Shares registered inyour name with our
transfer agentContinental
Stock Transfer & TrustCompany)
Street Name Holders(Shares held through aBroker, Bank or Other
Nominee)
InternetVisit the applicable votingwebsite and follow theon-screen instructions:
www.cstproxyvote.com Refer to voting instructionform.
Telephone To vote call: (866) 894-0536 Refer to voting instructionform.
Mail You may vote by mail by marking your votes on, signing, dating and returning yourcompleted proxy card by mail.
In Person For instructions on attending the 2019 Annual Meeting of Stockholders in person, please see“How can I vote?”
This Proxy Statement Summary contains highlights of certain information in this Proxy Statement. Because it isonly a summary, it does not contain all the information that you should consider prior to voting. Please reviewthe complete Proxy Statement and the Company’s 2019 Annual Report on Form 10-K that accompanies theProxy Statement for additional information.
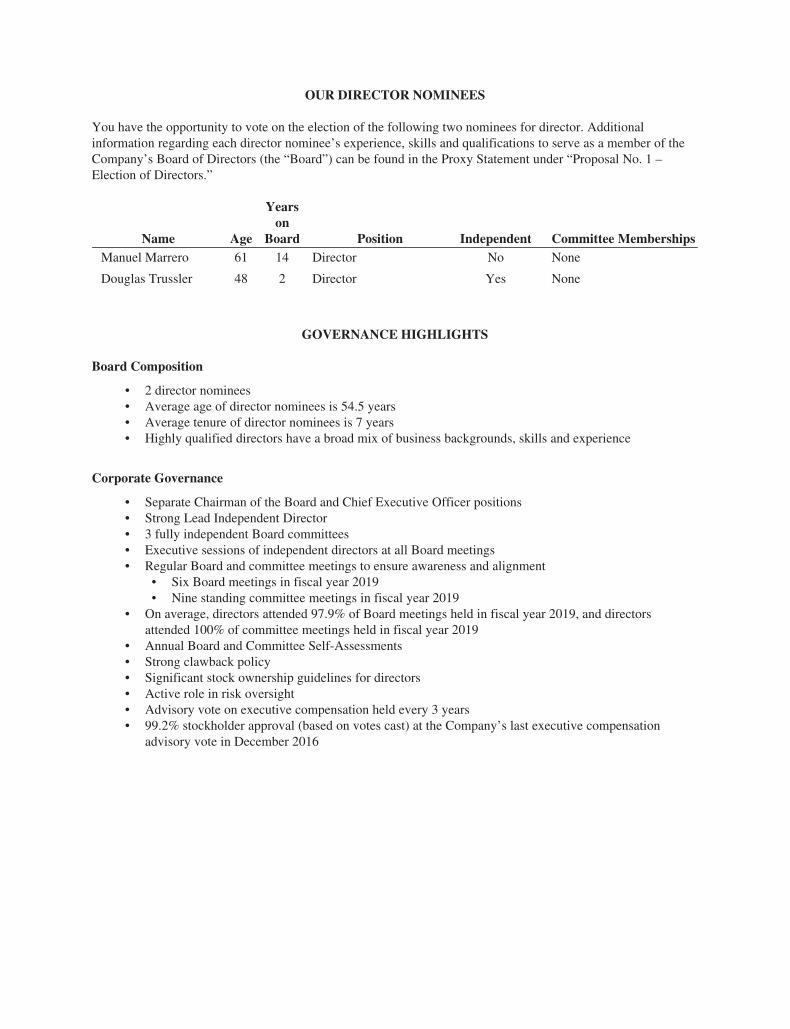
OUR DIRECTOR NOMINEES
You have the opportunity to vote on the election of the following two nominees for director. Additionalinformation regarding each director nominee’s experience, skills and qualifications to serve as a member of theCompany’s Board of Directors (the “Board”) can be found in the Proxy Statement under “Proposal No. 1 –Election of Directors.”
Name Age
Yearson
Board Position Independent Committee MembershipsManuel Marrero 61 14 Director No None
Douglas Trussler 48 2 Director Yes None
GOVERNANCE HIGHLIGHTS
Board Composition
• 2 director nominees• Average age of director nominees is 54.5 years• Average tenure of director nominees is 7 years• Highly qualified directors have a broad mix of business backgrounds, skills and experience
Corporate Governance
• Separate Chairman of the Board and Chief Executive Officer positions• Strong Lead Independent Director• 3 fully independent Board committees• Executive sessions of independent directors at all Board meetings• Regular Board and committee meetings to ensure awareness and alignment
• Six Board meetings in fiscal year 2019• Nine standing committee meetings in fiscal year 2019
• On average, directors attended 97.9% of Board meetings held in fiscal year 2019, and directorsattended 100% of committee meetings held in fiscal year 2019
• Annual Board and Committee Self-Assessments• Strong clawback policy• Significant stock ownership guidelines for directors• Active role in risk oversight• Advisory vote on executive compensation held every 3 years• 99.2% stockholder approval (based on votes cast) at the Company’s last executive compensation
advisory vote in December 2016
PROXY STATEMENT
ANNUAL MEETING OF STOCKHOLDERSTo be held on Tuesday, December 5, 2019
INFORMATION ABOUT THE ANNUAL MEETING AND VOTING
Why did you send me the Proxy Materials?
We sent you the Proxy Materials because you owned shares of common stock (“Common Stock”) ofGeneral Finance Corporation (“we” or the “Company”) at the close of business on October 8, 2019, the recorddate for the Annual Meeting. The Proxy Materials furnished by the Board provide you with information that willhelp you cast your vote at the Annual Meeting and at any adjournment or postponement thereof. You do not needto attend the Annual Meeting to vote your shares. Instead, you may simply complete, sign, date and return theenclosed proxy card.
You are invited to attend the Annual Meeting, which will take place on December 5, 2019 at 10:00 a.m.Pacific Standard Time, at 39 East Union Street, Pasadena, California 91103.
When you return the completed, signed and dated proxy card, you appoint the proxy holders named therein(your proxies), as your representatives at the Annual Meeting. The proxy holders will vote your shares at theAnnual Meeting as you have instructed them on your proxy card(s). If an issue not set forth on the proxy cardcomes up for vote at the Annual Meeting, the proxy holders will vote your shares, under your proxy, inaccordance with their best judgment.
We began sending the Proxy Materials on or about October 21, 2019 to all stockholders entitled to vote.
We have enclosed with this Proxy Statement, proxy card and Notice of the 2019 Annual Meeting ofStockholders our Annual Report to stockholders, which includes our 2019 Annual Report as filed with the SEC.
Who is entitled to vote at the Annual Meeting?
Only stockholders who owned Common Stock at the close of business on October 8, 2019, the record date,are entitled to vote on matters properly presented at the Annual Meeting. On the record date, there were30,573,863 shares of Common Stock outstanding. The Common Stock is our only class of voting stockoutstanding.
What am I voting on?
We ask you to vote on the election of two Class A directors, ratification of the selection of Crowe LLP asour independent auditors for the fiscal year ending June 30, 2020, an advisory (non-binding) vote regardingexecutive compensation, an advisory (non-binding) vote regarding the frequency of future advisory votesregarding executive compensation and any other matter properly presented at the Annual Meeting. The sectionsentitled “Election of Directors,” “Ratification of Selection of Independent Auditors,” “Advisory (Non-Binding)Vote Regarding Executive Compensation (Say-On-Pay)” and “Advisory (Non-Binding) Vote on the Frequencyof Future Advisory Votes on Executive Compensation (Say-When-On-Pay)” provide more information on theseproposals.
1
Could other matters be decided at the Annual Meeting?
On the date this Proxy Statement was printed, we did not know of any matters to be raised at the AnnualMeeting other than those mentioned in this Proxy Statement. If you vote your proxy by following the instructionsin this Proxy Statement and other matters are properly presented at the Annual Meeting for a vote ofstockholders, the persons appointed as proxies by the Board will have discretion to vote your shares for you.
How many votes do I have, and who will count the votes?
You have one vote for each share of our Common Stock you own. Charles E. Barrantes, our Executive VicePresident and Chief Financial Officer, and Christopher A. Wilson, our General Counsel, Vice President andSecretary, will act as inspectors of the election and will tabulate the votes.
How are abstentions and broker non-votes treated?
Abstentions and broker non-votes will be included in the number of shares present at the Annual Meetingfor purposes of determining the presence of a quorum. (A “broker non-vote” occurs when a beneficial owner failsto provide the broker with instructions on how the vote the shares, and the broker lacks discretionary authority tovote the shares.) Abstentions and broker non-votes will not be counted either as a vote cast for or against theelection of the two Class A directors, the ratification of selection of independent auditors, the advisory(non-binding) vote regarding executive compensation or the advisory (non-binding) vote regarding the frequencyof future advisory votes regarding executive compensation.
How can I vote?
For Company stockholders of record, the Company has established the telephone and Internet votingdescribed below. If your shares of common stock are held in a brokerage account, by a bank or other holder ofrecord, you are considered a “beneficial owner” of those shares, and the availability of telephone and Internetvoting will depend on the voting processes of your broker, bank or other holder of record. We thereforerecommend that you follow the voting instructions in the materials you receive.
You may vote by telephone or via the Internet. You can vote by telephone or via the Internet by followingthe instructions in your enclosed proxy card, notice and/or voting instruction form. Votes submittedelectronically over the Internet or by telephone must be received by 7:00 p.m. Eastern Standard Time onDecember 4, 2019. You can vote by calling the toll-free telephone number on your proxy card. Please have yourproxy card available when you call. The website for Internet voting is www.proxyvote.com.
You may vote by mail. You can vote by mail by completing, signing and dating the enclosed proxy card andreturning it promptly in the prepaid envelope provided. If you are a stockholder of record and you did not receivea prepaid envelope, please mail your signed proxy card to Continental Stock Transfer & Trust Company, 1 StateStreet, Floor 30, New York, New York 10275-0741, Attention: Proxy Department. If you mark your votinginstructions on the proxy card, your shares will be voted as you instruct. If you return a signed proxy card butdo not provide voting instructions, your shares will be voted FOR the election of the nominees for director,FOR the ratification of the selection of independent auditors, FOR the advisory (non-binding) vote onexecutive compensation and FOR future advisory (non-binding) votes on executive compensation to beheld every three years.
You may vote in person at the Annual Meeting. You may attend the Annual Meeting and vote in person. Ifyou hold your shares as a beneficial owner (“in street name”), you must request a legal proxy from yourstockbroker in order to vote at the Annual Meeting. Otherwise, we cannot count your votes. Please see the noticeor voting instruction form from your bank, broker or other holder of record for more information on theseoptions.
2
What is the difference between holding shares of Common Stock as a stockholder of record and as abeneficial owner?
If your shares of Common Stock are registered in your name with Continental Stock Transfer & TrustCompany, the Company’s transfer agent, you are a “stockholder of record” of those shares, and the ProxyMaterials were sent to you by Continental Stock Transfer & Trust Company. If your shares of common stock areheld in a brokerage account or by a bank or other holder of record, you are considered a “beneficial owner” ofthose shares, and Proxy Materials were sent to you by your broker, bank or other holder of record. As thebeneficial owner you have the right to direct your broker, bank or other holder of record how to vote your sharesby using the voting instruction card or by following their instructions for voting by telephone, Internet, by mail orother means.
May I revoke my proxy?
If you are a stockholder of record, you can change or revoke your proxy before it is exercised by givingwritten notice to our Secretary or in person at our corporate headquarters before the Annual Meeting that youhave revoked your proxy, by delivering in a timely manner a valid proxy by mail, telephone or Internet with adate later than the prior proxy or by attending the Annual Meeting and voting in person. If you are a beneficialowner of shares, you may submit new voting instructions by contacting your broker, bank or other holder ofrecord. All shares for which proxies have been properly submitted and not revoked will be voted at the AnnualMeeting.
How will shares I hold in street name be voted?
If your shares of Common Stock are held in street name, your broker, bank or other holder of record, undercertain circumstances, may not vote your shares without specific voting instructions under rules of TheNASDAQ Stock Market LLC (“NASDAQ”). This is called a “broker non-vote.” We encourage you to provideinstructions to your brokerage firm by voting your proxy. This ensures your shares will be voted at the AnnualMeeting.
What does it mean if I receive more than one proxy card?
If you have more than one account at the transfer agent and/or with stockbrokers, you will receive separateproxy cards for each account. Please sign and return all proxy cards to ensure that all your shares are voted.
How many votes may be cast at the Annual Meeting?
Based on the number of shares of Common Stock outstanding on the record date, up to 30,573,863 votesmay be cast on any matter.
How many shares of Common Stock do you need to hold the Annual Meeting (what are the quorumrequirements)?
Shares representing a majority of our outstanding votes on the record date of October 8, 2019 must bepresent in person or by proxy to constitute a quorum for the transaction of business at the Annual Meeting.Accordingly, a quorum will be present at the Annual Meeting if 15,286,932 shares of Common Stock arerepresented at the Annual Meeting in person or by proxy. Your shares will be counted towards the quorum onlyif you submit a valid proxy (or one is submitted on your behalf by your broker) or if you vote in person at theAnnual Meeting. Abstentions and broker non-votes will be counted as present for purposes of determining aquorum.
Who nominates individuals for election to the Board?
Nominations for the election of individuals to the Board may be made by the Board or by any holder of ourCommon Stock.
3
How many votes must the director nominee receive to be elected?
The nominees receiving the highest number of “FOR” votes of the shares present in person or representedby proxy at the meeting and entitled to vote on the election of the two Class A directors will be elected as the twoClass A directors. This number is called a plurality. If you withhold authority to vote for the nominee on yourproxy card, your vote will not count either “for” or “against” the nominee.
How many votes are required to ratify the selection of auditors?
The selection of Crowe LLP will be ratified if a majority of the votes cast are voted in favor of ratification.
How many votes are required to approve the advisory (non-binding) vote on executive compensation?
The votes cast “FOR” the advisory vote on executive compensation must exceed the votes cast “AGAINST”to approve, on a non-binding basis, the fiscal year 2019 compensation of our Chief Executive Officer, ChiefFinancial Officer and each of the three most highly compensated executive officers, other than each ChiefExecutive Officer and Chief Financial Officer serving as executive officers at the end of fiscal year 2019 whosetotal salary and bonus exceeds $150,000 as well as any additional individuals for whom disclosure would havebeen provided except that the individual was not serving as an officer of the Company at the end of fiscal year2019 (such persons, the “Named Executive Officers”). Abstentions and, if applicable, broker non-votes are notcounted as votes “FOR” or “AGAINST” this proposal.
How many votes are required to select the frequency of future advisory (non-binding) votes on executivecompensation?
The alternative for the frequency of future advisory (non-binding) votes on executive compensation,whether every year, every two years or every three years, receiving the highest number of votes, or plurality, willbe selected for the frequency of future advisory votes on executive compensation.
Is there a list of stockholders entitled to vote at the Annual Meeting?
A list of stockholders entitled to vote at the Annual Meeting will be available at the Annual Meeting and forten days prior to the Annual Meeting by contacting the Company Secretary for any purpose appropriate to theAnnual Meeting at our offices located at 39 East Union Street, Pasadena, California between the hours of9:00 a.m. and 5:00 p.m.
Who pays the costs of soliciting these proxies?
The Company pays to distribute and solicit proxies and reimburses the reasonable fees and expensesincurred by brokers, nominees, fiduciaries and other custodians in forwarding proxy materials to stockholders.The directors, officers and employees of the Company may solicit proxies in person, through mail, telephone, theInternet, electronic transmission or other means. We do not pay those individuals additional compensation forsoliciting proxies.
When will the voting results be announced?
We will announce the final voting results at the Annual Meeting. We will also report final voting resultsfrom the Annual Meeting in a Current Report on Form 8-K filed with the SEC within four business days of theAnnual Meeting.
4
CORPORATE GOVERNANCE
Overview
This section of the Proxy Statement provides an overview of the corporate governance of General FinanceCorporation. The Board of General Finance Corporation is committed to effective corporate governance. TheBoard regularly reviews the key governance documents of General Finance Corporation, including its CorporateGovernance Guidelines, and these governance documents and policies are updated to reflect changes inapplicable laws and corporate governance the Board determines to be in the best interests of the Company and itsstockholders.
The Corporate Governance Guidelines of General Finance Corporation include the following key features:
• A majority of our directors are independent.
• A Lead Independent Director leads the independent directors.
• The Audit, Compensation and Nominating and Governance Committees are comprised solely ofindependent directors.
• The Company does not have a stockholder rights plan, or “poison pill.”
• The Board has adopted a whistleblower policy which encourages employees to report any instances offraud, dishonesty and violations of Company policies and procedures without fear of any retaliation orbreach of confidentiality.
• The Board has approved stock incentive plans and bonus plans for executives that enable the Companyto “clawback” previously awarded compensation if the compensation was predicated on financialresults which were the subject of a material financial restatement, the recipient was deemed to haveengaged in fraud or misconduct that caused the material financial restatement and a lower granting,vesting or payment would have resulted based upon the restated financial results.
• The Board and each of its committees have the authority to retain outside advisors.
• The Audit Committee monitors and restricts the hiring of current and former Company employees byour independent auditor.
• The Compensation Committee may only select or receive advice from any compensation consultant,legal counsel or other advisor to the Committee, other than in-house legal counsel, after taking intoconsideration the factors identified by NASDAQ as necessary to evaluate independence andaffirmatively determine whether the consultant, legal counsel or advisor is independent in the judgmentof the Compensation Committee.
• There are no interlocks among Compensation Committee members.
• The responsibilities of the committees of our Board set forth in each committee’s charter are regularlyreviewed, updated as necessary and posted to the Company’s website.
• The Company’s Code of Ethics is regularly reviewed and posted to the Company’s website.
• The Board and each of its committees perform self-assessments.
• The Board has adopted an “overboarding policy” which prohibits directors from serving on more thansix public company boards.
• The Board has adopted stock ownership guidelines for directors.
• Each director attended at least 75% of the Board and committee meetings of which he or she was amember, and the Board has adopted an attendance policy requiring board members to attend 75% ofthe Board meetings and committee meetings of which each director is a member in each fiscal yearwith attendance excused in the case of medical issues or illness.
5
The Corporate Governance Guidelines and the following additional corporate governance materials arepublished at the General Finance Corporation website www.generalfinance.com under the “Governance” section:
• Audit Committee Charter
• Charter of the Lead Independent Director
• Compensation Committee Charter
• Code of Ethics
• Corporate Governance Guidelines
• Nominating and Governance Committee Charter
We will provide without charge copies of any the documents listed above upon written request to theGeneral Finance Corporation Secretary, 39 East Union Street, Pasadena, California 91103. The information onour website is not part of this Proxy Statement.
GOVERNANCE INFORMATION
Board of Directors
General Oversight
The business of the Company is managed under the direction of the Company’s Board. The Board’s generaloversight responsibility is conferred by the Delaware General Corporation Law, the Company’s Amended andRestated Certificate of Incorporation and the Company’s Second Amended and Restated Bylaws (“Bylaws”).The leadership structure of the Board and its committees assist the Board in exercising its fiduciary duties as itoversees the Company’s business affairs, Chief Executive Officer performance and succession, internal controlsover financial reporting and long-term strategy.
Leadership Structure
The Company does not have a formal policy concerning whether the same individual may serve as theChief Executive Officer and Chairman of the Board. In June 2014, the Board approved a Charter for the LeadIndependent Director, elected Ronald F. Valenta as the Chairman of the Board and elected James B. Roszak asthe Lead Independent Director. The Charter of Lead Independent Director provides that the Lead IndependentDirector must be independent and delineates the powers of the Lead Independent Director, including the power tocall meetings, to develop agendas for executive sessions of the Board’s independent members and to preside atexecutive sessions of the Board’s independent directors. Ronald F. Valenta retired as the Chief Executive Officereffective December 31, 2017 and continues to serve as the Board’s Executive Chairman. Jody Miller has servedas our Chief Executive Officer and President since January 1, 2018.
Risk Oversight
The identification, evaluation and mitigation of risks arising in connection with the Company’s businessesare the responsibility of the Company’s senior management. The Board’s responsibility is to understand the risksrelated to the Company’s businesses and to oversee senior management’s mitigation of those risks.
The Board and the Audit Committee receive regular reports from senior management concerning the risksrelated to the Company’s businesses.
The Audit Committee and the Nominating and Governance Committee have certain risk managementoversight responsibilities and regularly report to the Board concerning risk management. These reports include
6
the risks considered by each committee and the direction given to management to mitigate these risks. The AuditCommittee oversees compliance by the Company with legal requirements and regularly receives reportsconcerning the Company’s significant internal controls, steps taken by management to maintain a strong internalcontrols environment and enterprise risk management. In addition, representatives of the Company’s independentauditors attend Audit Committee meetings, deliver presentations to the Audit Committee and meet with the AuditCommittee in private session. The Company’s Chief Financial Officer and General Counsel also meet in privatesession with the Audit Committee. The Nominating and Governance Committee develops corporate governanceprinciples and oversees management’s evaluation and mitigation of risk relating to the Company’s Code ofEthics and business practices.
Corporate Governance
Our corporate governance reflects the principles that guide the Company. Our corporate governanceframework specifies the duties, responsibilities and rights of our stockholders, Board and management. Ourcorporate governance principles are found in the Company’s charter documents, the Company’s CorporateGovernance Guidelines, Company’s Code of Ethics, committee charters and other policies approved by theBoard.
The Corporate Governance Guidelines were adopted by the Board in December 2010. The CorporateGovernance Guidelines are reviewed at least annually to guide our corporate governance to address changingregulatory requirements and as circumstances warrant.
Our Corporate Governance Guidelines, Code of Ethics and committee charters are available for review onour website https://generalfinance.com/corporate-charters or may be requested without charge by written requestto our Secretary, General Finance Corporation, 39 East Union Street, Pasadena, California 91103. Theinformation on our website is not part of this Proxy Statement.
Director Independence
NASDAQ Stock Market Rules require that a majority of the members of the Board be “independentdirectors,” which is defined generally as a person, other than an officer or employee of the Company or itssubsidiaries, having no relationship, which, in the opinion of the Company’s Board, would interfere with thedirector’s exercise of independent judgment in carrying out the responsibilities of a director. All members of theBoard’s Audit, Compensation and Nominating and Governance Committees are “independent” within themeaning of NASDAQ Stock Market Rules and Rule 10A-3(b)(i) under the Securities Exchange Act of 1934, asamended (the “Exchange Act”).
In making these determinations, the Board was presented with a report from the Company’s GeneralCounsel and discussed information provided by the directors and the Company to determine whether eachdirector’s business and personal activities and relationships would interfere with the exercise of each director’sindependent judgment. To assist with this evaluation each director and executive officer is required to complete adirector and officer questionnaire each year which requires disclosure of transactions with the Company in whichthe director or officer, or any members of his or her family, have a direct or indirect material interest and whichrequires disclosure of any relationships or transactions which could interfere with the director’s exercise ofindependent judgment.
The Board has determined that Ms. Harris and Messrs. Baribault, Roszak, Tashjian and Trussler areindependent under NASDAQ Stock Market rules and Rule 10A-3(b)(i) of the Exchange Act and have norelationship with the Company except as a director and stockholder. The Board determined that Mr. Valenta isnot independent because he served as the Chief Executive Officer of the Company until December 31, 2017. TheBoard determined that Mr. Marrero is not independent because he serves as the President of Main St. PersonalFinance, Inc., a specialty finance company controlled by Mr. Valenta. The Board determined that Mr. Miller is
7
not independent because he serves as the President and, since December 31, 2017, as the Chief Executive Officerof the Company.
Executive Sessions of Independent Directors
The Company’s corporate governance guidelines require independent directors to meet, withoutmanagement, at regularly scheduled executive sessions which generally may take place after regularly scheduledmeetings of the entire Board. The Chairman of the Board, the Lead Independent Director or any two independentdirectors may call a special executive session of the independent directors at any time. Such special executivesessions may take place after a regular or special meeting of the entire Board or at such other time deemedappropriate.
Lead Independent Director
The Charter of the Lead Independent Director was adopted and authorized by the Board. James B. Roszakhas served as the Lead Independent Director since June 2014.
Board and Committee Meetings
The Board held six meetings during the fiscal year ended June 30, 2019, or fiscal year 2019, and acted bywritten consent four times. Five of the six meetings were regular meetings. The Board holds meetings each fiscalyear according to a pre-arranged schedule, but the Board also holds special meetings and acts by written consentfrom time to time as needed.
Each director attended more than 97.9% of all meetings of the Board and 100% of the committee meetingsof the committees on which he or she served during fiscal year 2019.
Board Committees
The Board has an Audit Committee, a Compensation Committee and a Nominating and GovernanceCommittee. Each committee regularly delivers reports to the full Board concerning its meetings and actions. Infiscal year 2019 the independent directors met in executive session five times, and the Audit Committee met inexecutive session in each of its four regularly scheduled meetings.
Audit Committee. The Audit Committee consists of Mr. Roszak, as Chair, Mr. Baribault, Ms. Harris andMr. Tashjian. The Board has determined that each member of the Audit Committee qualifies as “independent”within the meaning of NASDAQ Stock Market Rules and Section 10A of the Exchange Act. Our Board hasdetermined that Mr. Roszak, Mr. Baribault and Mr. Tashjian each qualify as an “audit committee financialexpert,” as defined in the rules and regulations of the SEC and NASDAQ. In addition, Mr. Roszak,Mr. Baribault, Ms. Harris and Mr. Tashjian have the past employment experience in finance or accounting,requisite professional certification in accounting or other comparable experience or background that results intheir financial sophistication.
The functions of the Audit Committee and its activities during fiscal year 2019 are described below underthe heading “Report of the Audit Committee.”
The Board established the Audit Committee in May 2006 and adopted a written charter for the AuditCommittee in June 2006. The Audit Committee reviewed and assessed the adequacy of the charter in September2019. The Audit Committee charter was most recently amended in September 2019 to add cybersecurity to theAudit Committee’s oversight responsibilities. A copy of the Audit Committee Charter is available free of chargeon the “Governance” section in our website at www.generalfinance.com or by written request addressed to ourSecretary.
8
The Audit Committee met five times in fiscal year 2019.
Compensation Committee. The Compensation Committee consists of Ms. Harris, as Chair, Mr. Baribault,Mr. Roszak and Mr. Tashjian, each of whom is an independent director under NASDAQ Stock Market Rules andSection 10A of the Exchange Act. The purposes of the Compensation Committee are to determine and approvethe goals, objectives and compensation structure for our executive officers and to review the performance of ourexecutive officers and the Company’s management resources, succession planning and development activities.
The Board established the Compensation Committee in May 2006. The Compensation Committee adoptedits charter in February 2007. The Compensation Committee reviews its charter annually and recommends to theBoard any changes to the charter it believes are warranted. The Compensation Committee amended its charter inJune 2011 and October 2013. The October 2013 amendments provided that each member of the CompensationCommittee must be “independent” with the meaning of SEC and NASDAQ Stock Market Rules, that committeemember independence must be evaluated from a variety of factors, including committee member compensationsources and affiliation with the Company and that the Company’s chief executive officer may not be presentduring voting or deliberations concerning his compensation. The June 2011 amendments to the charter providedthat each member of the Compensation Committee must be independent within the meaning of NASDAQ StockMarket Rules and Rule 10A-3(b)(i) under the Exchange Act, and that prior to selection of an executivecompensation advisor, the Compensation Committee must evaluate the independence of the executivecompensation advisor by considering the factors identified by the SEC necessary to determine the executivecompensation advisors are independent. A copy of the Compensation Committee Charter is available free ofcharge on the “Governance” section in our website at www.generalfinance.com or by written request addressedto our Secretary.
The Compensation Committee met three times in fiscal year 2019.
Nominating and Governance Committee. The Nominating and Governance Committee consists ofMr. Tashjian, as Chair, Ms. Harris and Mr. Roszak. The Board has determined that each member of theNominating and Governance Committee qualifies as “independent” within the meaning of NASDAQ StockMarket Rules and Section 10A of the Exchange Act. The Nominating and Governance Committee is responsiblefor certain matters, which include reviewing the size and composition of the Board, overseeing the selection ofpersons to be nominated to serve on our Board, maintaining and overseeing the corporate governance of theCompany, assuring that the Board conducts an annual self-evaluation and periodically reviewing the Company’ssuccession plans.
The Board established and adopted a written charter for the Nominating and Governance Committee inJanuary 2006 and amended its charter in September 2009. A copy of the Nominating and Governance CommitteeCharter is available free of charge on the “Governance” section in our website at www.generalfinance.com or bywritten request addressed to our Secretary.
The Nominating and Governance Committee met one time in fiscal year 2019.
Composition of the Board and Review of Director Nominees
The Nominating and Governance Committee periodically assesses and makes recommendations to theBoard concerning the size and composition of the Board. The Nominating and Governance Committee seeks toachieve a balance of diverse knowledge, experience and capabilities on the Board. The committee is responsiblefor identifying and assessing potential director candidates from directors, management and stockholders. TheNominating and Governance Committee recommends qualified candidates to the Board.
Stockholders’ nominees for director must be delivered to the Company in writing and include the writtenconsent of and background information concerning the nominee sufficient for the Nominating and Governance
9
Committee to evaluate the candidate’s qualifications. Stockholder nominees for director must be deliveredpursuant to all of the requirements described in the paragraphs below and the section of this Proxy Statemententitled “Stockholder Recommendations for Board Nominees.” When considering candidates for director, theNominating and Governance Committee takes into account a number of factors, including the following:
• Ethics and integrity;
• Ability to attend regular and special board and committee meetings and willingness to perform theduties of a director;
• Excellent moral character and reputation;
• Industry knowledge, contacts and network of potential clients in industries served by the Company;
• Ability to be responsible and fair-minded;
• Prior experience, including service on boards of directors;
• Senior-level management experience;
• Whether the candidate has a background that would provide diversity to the Board; and
• Possession of specific skills in auditing, accounting, personnel and finance.
Candidates need not possess all of these characteristics, nor are all of these factors weighed equally.
The Nominating and Governance Committee periodically determines whether any vacancies on the Boardare expected. If vacancies are anticipated or arise, or the size of the Board expands, the Nominating andGovernance Committee will consider potential candidates for director. Candidates may come to the attention ofthe Board through current Board members or management, stockholders or other persons. These candidates willbe evaluated at regular or special meetings of the Nominating and Governance Committee and may beconsidered at any point during the year.
The Nominating and Governance Committee will consider candidates for directors proposed bystockholders who follow the proper procedures in submitting the recommendation. The Board will considercandidates recommended by stockholders using the same criteria it applies to candidates recommended bydirectors. To be considered for election at an annual meeting, the recommendation must be submitted not laterthan the close of business on the 10th day following the day on which such notice of the date of the annualmeeting was mailed or such public disclosure was made. The recommendation must be in writing and addressedto the Secretary and must include the following: (i) a statement that the writer is a stockholder and is proposing acandidate for consideration by the Nominating and Governance Committee; (ii) the name and contactinformation for the candidate; (iii) a statement of the candidate’s business and educational experience;(iv) information regarding each of the factors listed above (other than the factor regarding board size andcomposition) sufficient to enable the Nominating and Governance Committee to evaluate the candidate; (v) astatement detailing any relationship between the candidate and any competitor of the Company; (vi) detailedinformation about any relationship or understanding between the writer and the candidate; and (vii) a statementthat the candidate is willing to be considered and is willing to serve as a director if nominated and elected.
Compensation Committee Interlocks and Insider Participation
No person who served on the Compensation Committee in fiscal year 2019 was, during the year orpreviously, an officer or employee of the Company or had a relationship with the Company requiring disclosureunder Item 404 of Regulation S-K. Since July 2011 Mr. Marrero has served as the President of Main St. PersonalFinance, Inc., a company controlled by Ronald F. Valenta. Mr. Valenta has the power to set Mr. Marrero’sincentive compensation. No other interlocking relationship exists between any member of the Board and anymember of any other Company’s Board or compensation committee.
10
Review and Approval of Transactions with Related Persons
The Company has not adopted a formal written policy regarding transactions with related persons. TheCompany’s Code of Ethics for Directors, Officers and Employees (“Code of Ethics”) requires the disclosure ofall potential conflicts of interest. Delaware law in turn requires that each director or officer disclose to the Boardall material facts relating to such director’s or officer’s relationship or interest in a proposed contract ortransaction and that a majority of the Board, with any interested director abstaining, approve the contract ortransaction in good faith.
The Board is responsible for reviewing any proposed transaction with related persons. The Board considersall relevant information in deciding whether to approve or reject a transaction with a related person. Informationrelating to transactions between the Company and related persons is set forth in “Transactions with RelatedParties.”
Communication with the Board Directors
Stockholders may communicate with the Board in writing by mail delivered to the following address:General Finance Corporation, 39 East Union Street, Pasadena, California 91103, Attention: Secretary. All noticesand communications received in writing will be distributed to the Chairman of the Board, the Lead IndependentDirector and, if applicable, the chairman or chair of the appropriate Board committee.
Code of Ethics
The Company’s Code of Ethics applies to all our directors, officers and employees, including our principalexecutive officer, principal financial officer and principal accounting officer. The Code of Ethics sets forth theguiding principles by which the Board, officers and employees operate the Company’s businesses. The Code ofEthics is posted on our Internet website at www.generalfinance.com under the “Governance” section.
We will provide a copy of the Code of Ethics upon written request delivered to General FinanceCorporation, 39 East Union Street, Pasadena, California 91103, Attention: Secretary.
Compensation of Non-Employee Directors
We currently have five non-employee directors who qualify for compensation. In fiscal year 2019 thefive non-employee directors received the cash compensation and annual award of restricted stock shown below inthe table below entitled “Fiscal Year 2019 Non-Employee Director Compensation.”
Cash Compensation
In June 2018, the Compensation Committee approved a schedule of cash compensation of ournon-employee directors effective July 1, 2018. The following table summarizes the schedule of compensation ofour non-employee directors (directors who also serve as officers receive no additional compensation for theirservices as directors). In addition to the compensation set forth below, each director is also eligible forreimbursement of reasonable expenses incurred in connection with the director’s services.
Annual Retainer—Non-Employee Directors $60,000Lead Independent Director 20,000Additional Annual Retainer—Audit Committee Chair 12,000Additional Annual Retainer—Compensation Committee Chair 10,000Additional Annual Retainer—Nominating and Governance Committee Chair 6,000Special Meeting Attendance Fee 1,500
The annual retainers are payable in advance in quarterly installments. Fees to directors are paid for specialmeetings other than regular meetings of the Board and committees.
11
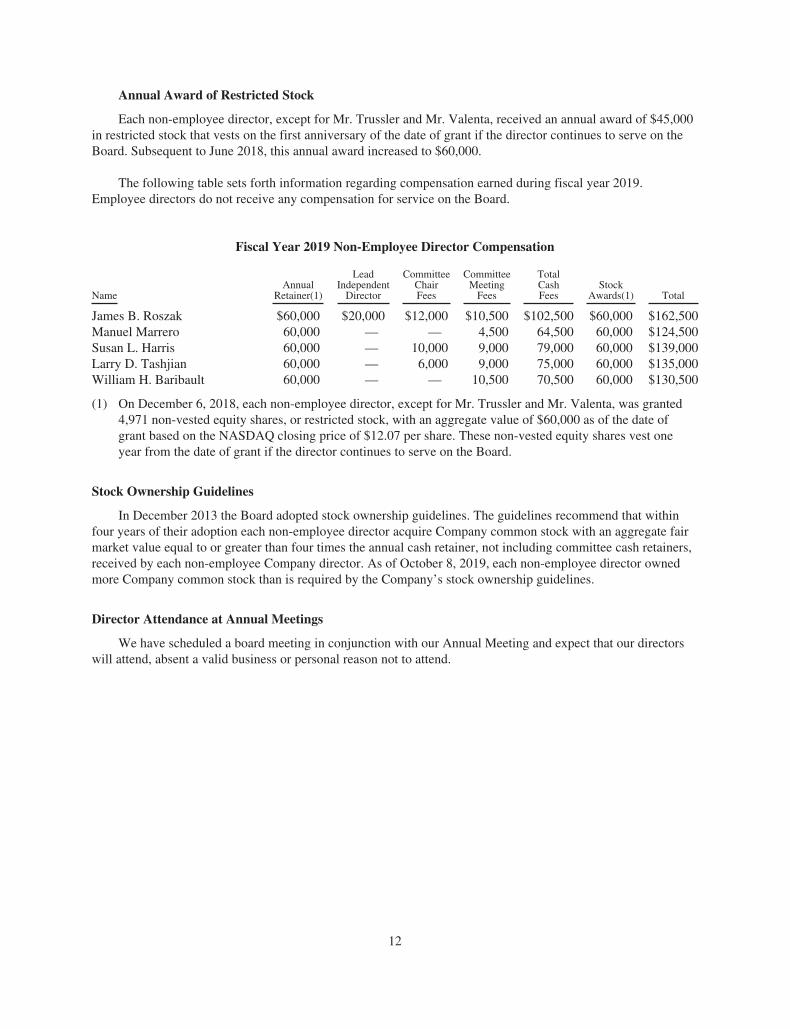
Annual Award of Restricted Stock
Each non-employee director, except for Mr. Trussler and Mr. Valenta, received an annual award of $45,000in restricted stock that vests on the first anniversary of the date of grant if the director continues to serve on theBoard. Subsequent to June 2018, this annual award increased to $60,000.
The following table sets forth information regarding compensation earned during fiscal year 2019.Employee directors do not receive any compensation for service on the Board.
Fiscal Year 2019 Non-Employee Director Compensation
NameAnnual
Retainer(1)
LeadIndependent
Director
CommitteeChairFees
CommitteeMeeting
Fees
TotalCashFees
StockAwards(1) Total
James B. Roszak $60,000 $20,000 $12,000 $10,500 $102,500 $60,000 $162,500Manuel Marrero 60,000 — — 4,500 64,500 60,000 $124,500Susan L. Harris 60,000 — 10,000 9,000 79,000 60,000 $139,000Larry D. Tashjian 60,000 — 6,000 9,000 75,000 60,000 $135,000William H. Baribault 60,000 — — 10,500 70,500 60,000 $130,500
(1) On December 6, 2018, each non-employee director, except for Mr. Trussler and Mr. Valenta, was granted4,971 non-vested equity shares, or restricted stock, with an aggregate value of $60,000 as of the date ofgrant based on the NASDAQ closing price of $12.07 per share. These non-vested equity shares vest oneyear from the date of grant if the director continues to serve on the Board.
Stock Ownership Guidelines
In December 2013 the Board adopted stock ownership guidelines. The guidelines recommend that withinfour years of their adoption each non-employee director acquire Company common stock with an aggregate fairmarket value equal to or greater than four times the annual cash retainer, not including committee cash retainers,received by each non-employee Company director. As of October 8, 2019, each non-employee director ownedmore Company common stock than is required by the Company’s stock ownership guidelines.
Director Attendance at Annual Meetings
We have scheduled a board meeting in conjunction with our Annual Meeting and expect that our directorswill attend, absent a valid business or personal reason not to attend.
12
PROPOSAL 1:
ELECTION OF DIRECTORS(Item Number 1 on the Proxy Card)
Background
Pursuant to our Amended and Restated Certificate of Incorporation, the Board must consist of no less thanthree members, the exact number of which is determined from time to time by the Board, divided into threeclasses designated Class A, Class B and Class C, respectively. As of the Annual Meeting, the number of directorswill be fixed at eight.
The terms of the Class A directors will expire as of the annual meeting of stockholders in 2019, the terms ofthe Class B directors will expire as of the annual meeting of stockholders in 2020 and the terms of the Class Cdirectors will expire as of the annual meeting of stockholders in 2021. Upon expiration of the terms of thedirectors of each class as set forth above, the terms of their successors in that class will continue until the end oftheir terms and until their successors are duly elected and qualified.
The Board has nominated two Class A directors, Manuel Marrero and Douglas Trussler, for re-election bythe stockholders. If a nominee is unable to serve or for good cause will not serve, your proxy holders may votefor another nominee proposed by the Board. If any director resigns, dies or is otherwise unable to serve out his orher term, the Board may fill the vacancy until the next Annual Meeting.
Information Concerning the Nominees and Continuing Director
The following information is provided regarding the nominees and the continuing directors:
Name Age Director SinceTerm toExpire
Nominees—Class A Directors:Manuel Marrero 61 2005 2019Douglas B. Trussler 48 2017 2019
Class B Directors:James B. Roszak (Lead Independent Director) 78 2005 2020Susan L. Harris 62 2008 2020Jody E. Miller 52 2017 2020
Class C Directors:Ronald F. Valenta (Chairman) 60 2005 2021William H. Baribault 74 2015 2021Larry D. Tashjian 66 2014 2021
Nominees
Each nominee is a current director has consented to serve as a director. The Board has no reason to believethat the nominees will be unable to serve as directors. If any nominee is unable to serve or should a vacancyoccur before the Annual Meeting, the Board may designate a substitute nominee. If a substitute nominee isnamed, your shares will be voted in favor of the election of the substitute nominee designated by the Board.
Douglas B. Trussler was elected as a director in December 2017. Mr. Trussler has served as a foundingpartner and investment committee member of Bison Capital Partners since 2001. From 1995 to 2000 Mr. Trusslerserved as a principal of Windward Capital Partners. Mr. Trussler graduated from the Richard Ivey School ofBusiness Administration in 1993. Mr. Trussler’s experience includes capital markets fund raising, deal sourcing,mergers and acquisition due diligence and structuring and exit strategy execution.
13
Manuel Marrero has been a director since November 2005, and Mr. Marrero served as a director of RoyalWolf Holdings Limited from October 2014 to October 2017. Since March 2009 Mr. Marrero has served as theChief Executive Officer of the specialty finance companies of General Finance Group, Inc. and since August2009 as the President of Main St. Personal Finance, Inc., companies controlled by Ronald F. Valenta. FromJanuary 2004 to March 2009, Mr. Marrero worked as a financial and operations management consultant withseveral companies, principally focused in consumer products brand management. From May 2002 until January2004, Mr. Marrero served as the Chief Financial Officer of Mossimo, Inc., a designer and licensor of apparel andrelated products. From 1999 to 2001, Mr. Marrero was the Chief Operating Officer and Chief Financial Officerof Interplay Entertainment Corp., a developer, publisher and distributor of interactive entertainment software,and from 1996 to 1999 Mr. Marrero served as the Chief Financial Officer of Precision Specialty Metals, Inc., alight gauge conversion mill for flat rolled stainless steel and high performance alloy. Mr. Marrero has served onthe boards of directors of Interplay OEM, Inc., Shiney Entertainment, Inc., Seed Internet Ventures, Inc., L.A. TopProducers, LLC, Friends of Rancho San Pedro and Tree People. Mr. Marrero’s business experiences andentrepreneurial accomplishments assist the Board in shaping the Company’s strategy and growth.
Continuing Directors
William H. Baribault has been a director since December 2015. Mr. Baribault has served on the AuditCommittee and Compensation Committee since December 2016. Mr. Baribault has served as the chief operatingofficer and president of the Richard Nixon Foundation from 2014 to the present. Mr. Baribault has also served asan independent trustee of the American Funds from 2009 to the present and as a principal of OakwoodEnterprises, a private investment and consulting firm, from 1998 to the present. Mr. Baribault’s broad range ofexperience, including manufacturing, retail sales, expansion of product portfolios and acquisition strategiesprovide the Board with important perspectives in those areas.
Larry D. Tashjian has served as a director since February 2014 and the chair of the Nominating andGovernance Committee since February 2016. He is the founder, President and CEO of CAM Capital Advisors, anopportunistic, valued-based manager in all asset classes. Prior to starting CAM Capital Advisors, he wasChief Executive Officer of Provident Investment Counsel (“PIC”), a Pasadena-based investment company thatspecializes in growth stocks. During his time with PIC (1981—2005), Mr. Tashjian was an integral part of thecompany’s growth. In 1995, he was intimately involved in the sale of PIC to United Asset Management, aNew York Stock Exchange-listed company. He would go on to serve on its board of directors. Near the end of 2000,United Asset Management was acquired by Old Mutual PLC. Prior to joining PIC, Mr. Tashjian worked for theBank of America, both in retail banking and corporate finance, and his professional career in investmentmanagement spans over 30 years. Mr. Tashjian’s other professional activities have included directorships atBavarian Specialty Food Products, Southland Title Corporation, Lineage Capital Partners, S & S Portable Servicesand PGP Capital Advisors. He also currently serves as Chairman of Investment Managers Series Trust II, a multipleseries trust investment company. In 2001, Mr. Tashjian helped found Professional Business Bank in Pasadena,California, which was initially sold to Belvedere Capital Management in 2005 and maintained his involvement withProfessional Business Bank through continued board participation until the bank was ultimately sold again in late2010. During this period of time, he served on the audit committee and chaired both the compensation and loancommittees. Mr. Tashjian’s business and capital markets knowledge provide the Board with unique insights.
Ronald F. Valenta has served as a director since our inception and was appointed Executive Chairman of theBoard on January 1, 2018. Mr. Valenta served as the Chairman of the Board since June 2014 and as the ChiefExecutive Officer from inception to December 31, 2017. Mr. Valenta has served as the chairman of GeneralFinance Group, Inc. since 2008. From 1988 to 2003 Mr. Valenta served as the President and Chief ExecutiveOfficer of Mobile Services Group, Inc., a portable storage company he founded. From 2003 to 2006 Mr. Valentawas a founding director of the National Portable Storage Association, a storage industry non-profit organization.From 1985 to 1989, Mr. Valenta was a Senior Vice President of Public Storage, Inc. From 1980 to 1985,Mr. Valenta was employed by the accounting firm of Arthur Andersen & Co. in Los Angeles. Mr. Valenta’sexperience in the portable storage industry, his financial and accounting background and the knowledge heacquired in managing diverse businesses provide the Board with key insights.
14
Susan L. Harris has been a director since 2008 and the Chair of the Compensation Committee sinceFebruary 2016. Ms. Harris served as a director of portable storage companies Mobile Services Group, Inc. andMobile Storage Group, Inc. from May 2004 to August 2006 and from May 2002 to August 2006, respectively.Ms. Harris retired from SunAmerica Inc., a NYSE-listed financial services company, where she served in avariety of positions between 1985 and 2000, including her most recent position as Senior Vice President, GeneralCounsel and Corporate Secretary. Prior to joining SunAmerica Inc., Ms. Harris worked for the law firm ofLillick, McHose and Charles, specializing in corporate and securities law. Ms. Harris brings to our Board broadlegal experience and knowledge of the portable storage industry that provide the Board with key perspectives incorporate governance, legal matters and portable storage.
Jody E. Miller was elected as a member of the Board in December 2017 and was appointed as the ChiefExecutive Officer in January 2018. Mr. Miller has served as our President since January 2017 and GeneralFinance Corporation Executive Vice President from June 2015 to January 2017. Since July 2017, Mr. Miller hasalso served as the President of Southern Frac LLC, the Chief Executive Officer of GFN ManufacturingCorporation and GFN North America Corp. and the Chief Executive Officer of Lone Star Tank Rental Inc.Mr. Miller has also served as the Chief Executive Officer of GFN North America Leasing Corporation since June2016. Mr. Miller has served as director of GFN Manufacturing Corporation, Lone Star Tank Rental Inc., GFNNorth America Leasing Corporation, GFN U.S. Australasia Holdings, Inc. and Royal Wolf Holdings Limitedsince June 2014, September 2014, June 2016, June 2016 and July 2016, respectively. Mr. Miller served as aconsultant to GFN Manufacturing Corporation from May 2013 to June 2015. Mr. Miller has over 25 years ofexperience in the equipment rental industry, including five years at Mobile Mini, Inc. as Executive VicePresident and Chief Operations Officer, five years at Mobile Storage Group, Inc. as Senior Vice President andfifteen years at RSC Holdings, Inc. where he held many positions including Regional Vice President forseven years. Mr. Miller is a 1990 graduate of Central Missouri State University.
James B. Roszak has been a director since November 2005 and our Lead Independent Director sinceJune 2014. Mr. Roszak was employed by the Life Insurance Division of Transamerica Corporation, a financialservices organization engaged in life insurance, commercial lending, equipment leasing and real estate services,from 1962 until his retirement in 1997. From 1978 to 1988 Mr. Roszak was based in Toronto, Canada and duringthat time served as the President and Chief Executive Officer of Transamerica’s life insurance operations inCanada. In 1988 Mr. Roszak returned to the U. S. Life insurance operations as the Chief Marketing Officer andwas subsequently named President, the capacity in which he served until his retirement. Mr. Roszak also servedon the board of directors of buy.com, an Internet retailer and NASDAQ-listed company and also served as itsinterim Chief Executive Officer from February 2001 to August 2001 when it was taken private. He was also adirector of National RV Holdings from June 2003 until July 2008. He is currently a member of the Board ofTrustees of Chapman University where he is the Chairman of the Finance Committee. Our board benefits fromMr. Roszak’s management and board experience and deep knowledge of finance, accounting, internationalbusiness, operations and risk management.
Vote Required
The two nominees for Class A director receiving the highest number of “FOR” votes, or a plurality, of theshares present in person or represented by proxy at the meeting and entitled to vote on the election of the twoClass A directors will be elected as the two Class A directors. If you do not vote for a nominee, or you withholdauthority to vote for the nominee on your proxy card, your vote will not count either “for” or “against” the nominee.
The persons appointed by the Board as proxies intend to vote for the election of the Director nominees,unless you indicate otherwise on the proxy or voting instruction card.
Recommendation
THE BOARD OF DIRECTORS RECOMMENDS A VOTE “FOR” THE ELECTION OF EACH OF THEBOARD NOMINEES.
15
PROPOSAL 2:
RATIFICATION OF SELECTION OF INDEPENDENT AUDITORS(Item Number 2 on the Proxy Card)
Background
The Audit Committee selected Crowe LLP as our independent auditors for fiscal year ending June 30, 2020,or fiscal year 2020. We are asking the stockholders to ratify this selection. We expect a representative fromCrowe LLP to participate in the Annual Meeting and the Crowe LLP representative will have the opportunity tomake a statement if desired and to respond to appropriate questions by stockholders.
Aggregate fees billed to us by Crowe LLP for professional services rendered with respect to our fiscal yearended June 30, 2019, or fiscal year 2019, and our fiscal year ended June 30, 2018, or fiscal year 2018, were asfollows:
2019 2018
Audit Fees $621,044 $683,522Audit-Related Fees 201,193 209,250Tax Fees — —All Other Fees — —
In the above table, in accordance with the SEC’s definitions and rules, “audit fees” are fees we paid forprofessional services for the audit of our consolidated financial statements, including those in our Annual Reporton Form 10-K and local statutory audit requirements and reviews of our Quarterly Reports on Form 10-Q.“Audit-related fees” are fees for assurance and related services that are reasonably related to the performance ofthe audit or review of our financial statements. “Tax fees” are fees for tax compliance, tax advice and taxplanning.
The policy of the Audit Committee is that it must approve in advance all services (audit and non-audit) to berendered by the Company’s independent auditors. The Audit Committee approved in advance the engagement ofCrowe LLP for services in fiscal year 2018 and fiscal year 2019.
Vote Required
The ratification of the selection of Crowe LLP requires the affirmative vote of the holders of a majority ofthe number of shares present or represented by proxy and entitled to vote on this proposal. Abstentions will becounted as if voted “against” this proposal. If the stockholders do not ratify the selection, the adverse vote will bedeemed to be an indication to the Audit Committee that it should consider selecting other independent auditorsfor fiscal year 2020. Because of the difficulty and expense of substituting accounting firms, it is the intention ofthe Audit Committee that the appointment of Crowe LLP for fiscal year 2020 will stand unless, for a reason otherthan the adverse vote of the stockholders, the Audit Committee deems it necessary or appropriate to make achange. The Audit Committee also retains the power to appoint another independent auditor at any time or fromtime to time if it determines it is in our best interests.
Recommendation
THE BOARD OF DIRECTORS RECOMMENDS THAT YOU VOTE “FOR” THE RATIFICATION OFTHE SELECTION OF CROWE LLP AS OUR INDEPENDENT AUDITORS FOR FISCAL YEAR 2020.
16
PROPOSAL 3:
ADVISORY (NON-BINDING) VOTE REGARDING EXECUTIVE COMPENSATION(SAY-ON-PAY)
(Item Number 3 on the Proxy Card)
Background
Our 2019 Annual Meeting is the third annual meeting of stockholders at which the Company, as anaccelerated filer, is required to hold an advisory, or non-binding, vote on its executive compensation policies.The Dodd-Frank Wall Street Reform and Consumer Protection Act (the “Dodd-Frank Act”) requires thatCompany stockholders have the opportunity to cast an advisory, non-binding, vote on executive compensation,commonly known as a “Say-on-Pay” vote. The Dodd-Frank Act requires that we hold an advisory vote onexecutive compensation no less frequently than once every three years.
This advisory vote on executive compensation is a non-binding vote on the compensation of our NamedExecutive Officers. The vote solicited by this proposal will not bind the Company, the Board or ourCompensation Committee. The Company nevertheless values the opinions of our stockholders and, if ProposalNo. 3 concerning executive officer compensation was not approved, the Company would seriously evaluatestockholder concerns and consider what action, if any, to take in response.
The compensation program for our Named Executive Officers is described in the Compensation Discussionand Analysis section (“CD&A”) and in the disclosure relating to executive compensation set forth in this ProxyStatement. Please read the CD&A section starting on page 23 of this Proxy Statement for a detailed discussionabout our executive compensation programs.
The CD&A section of this Proxy Statement describes the Company’s executive compensation program andcompensation philosophy. The Compensation Committee has structured the Company’s compensation programsto align executive officers’ and stockholders’ interests. The Compensation Committee achieves this alignment byestablishing long-term strategic goals intended to increase stockholder value and by rewarding executive’sachievement of those goals.
The CD&A section of this Proxy Statement also discusses how the design of the executive compensationprogram achieves key goals. The key goals served by the design of the executive compensation program are thereinforcement of the business strategy, the balancing of rewards for short-term and long-term strategic objectives,the motivation of executives to achieve a high degree of business performance without taking undue risk, thealignment of executives’ and stockholders’ interests and the attraction and retention of skilled executives whowill increase stockholder value.
Stockholders will be asked at the Annual Meeting to approve the following resolution pursuant to thisProposal No. 3:
“RESOLVED, that the stockholders of General Finance Corporation approve, on an advisory basis, thecompensation of the Company’s Named Executive Officers, as disclosed pursuant to Item 402 of Securities andExchange Commission Regulation S-K, including the Compensation Discussion and Analysis, the compensationtables and narrative disclosures in the Company’s definitive Proxy Statement for the 2019 Annual Meeting ofStockholders.”
Vote Required
The votes cast “for” must exceed the votes cast “against” to approve, on an advisory basis, the compensationof our Named Executive Officers. Abstentions and, if applicable, broker non-votes are not counted as votes “for”or “against” this proposal.
17

Recommendation
OUR BOARD OF DIRECTORS UNANIMOUSLY RECOMMENDS A VOTE “FOR” THE APPROVAL,ON AN ADVISORY BASIS, OF THE COMPENSATION OF THE COMPANY’S NAMED EXECUTIVE
OFFICERS, AS STATED IN THE FOREGOING RESOLUTION. PROXIES WILL BE SO VOTEDUNLESS STOCKHOLDERS SPECIFY OTHERWISE IN THEIR PROXIES.
18
PROPOSAL 4:
ADVISORY (NON-BINDING) VOTE ON THE FREQUENCY OF FUTURE ADVISORY VOTESON EXECUTIVE COMPENSATION
(SAY-WHEN-ON-PAY)(Item Number 4 on the Proxy Card)
Background
Our 2019 Annual Meeting is the third annual meeting of stockholders at which the Company, as anaccelerated filer, is required to hold an advisory, or non-binding, stockholder vote concerning whether a futureSay-on-Pay vote should occur every one, two or three years, commonly referred to as “Say-When-On-Pay” vote.At our December 2013 and December 2016 Annual Meetings the Company stockholders voted to hold anadvisory, or non-binding, vote on the frequency of future advisory votes on the compensation of executiveofficers every three years.
You may vote to hold the vote every year, every two years, every three years or to abstain on the matter. Forthe reasons described below, our Board recommends that our stockholders select a “Say-When-On-Pay” voteevery three years. We are required to solicit stockholder approval on the frequency of future Say-on-Payproposals at least once every six years, although we may seek stockholder input more frequently.
Our Board believes that our current executive compensation programs directly link executive compensationto our financial performance and align the interests of our executive officers with those of our stockholders. OurBoard has determined that an advisory vote on executive compensation every three years is the best approach forthe Company based on a number of considerations, including the following:
• Our compensation program does not change significantly from year to year and is designed toincentivize performance over a multi-year period. A Say-on-Pay vote held every three years would bemore consistent with, and provide better input on, our long-term compensation, which constitutes asignificant portion of the compensation of our Named Executive Officers;
• Holding a “Say-When-On-Pay” vote every three years gives the Board and the CompensationCommittee sufficient time to thoughtfully consider the results of the advisory vote, to engage withstockholders to understand and respond to the vote results and effectively implement any appropriatechanges to our executive compensation policies and procedures;
• A three-year vote cycle will provide stockholders with a more complete view of the amount and mix ofcomponents of the compensation paid to our Named Executive Officers, as the amount and mix ofcomponents may differ from year to year;
• A three-year period between votes will encourages stockholders to take a long-term view of executivecompensation and gives stockholders sufficient time to evaluate the effectiveness of our short- andlong-term compensation strategies and the related business outcomes of the Company, and whether thecomponents of the compensation paid to our Named Executive Officers have achieved positive resultsfor the Company; and
• Many large stockholders rely on proxy advisory firms for vote recommendations. We believe that atriennial vote on executive compensation, rather than an annual or biennial vote, will help proxyadvisory firms provide more detailed and thorough analyses and recommendations. Less frequentSay-on-Pay votes will improve the ability of institutional stockholders to exercise their voting rights ina more deliberate, thoughtful and informed way that is in the best interests of stockholders.
Our stockholders also have the opportunity to provide additional feedback on important matters involvingexecutive compensation even in the years when Say-on-Pay votes do not occur.
19
We understand that our stockholders may have different views as to what is the best approach for theCompany, and we look forward to hearing from our stockholders on this Proposal No. 4.
You may cast your vote on your preferred voting frequency by choosing the option of one year, two years,three years or abstain from voting when you vote in response to the resolution set forth below.
Vote Required
The selection for the frequency of future advisory votes that receives the highest number of votes cast bystockholders will constitute the frequency of future advisory votes selected by our stockholders. The Board maydetermine, however, that a difference frequency of future advisory votes on executive compensation is in the bestinterests of the Company and its stockholders since the stockholder vote is advisory, or non-binding.
Recommendation
OUR BOARD OF DIRECTORS UNANIMOUSLY RECOMMENDS A VOTE “SAY-WHEN-ON-PAY”VOTE EVERY THREE YEARS. PROXIES WILL BE SO VOTED UNLESS STOCKHOLDERS
SPECIFY OTHERWISE IN THEIR PROXIES.
20
REPORT OF THE AUDIT COMMITTEE
The following Report of the Audit Committee does not constitute soliciting material and should not be deemedfiled or incorporated by reference into any other filing under the Securities Act of 1933, as amended, or theSecurities Exchange Act of 1934, as amended, except to the extent the Company specifically incorporates thisReport by reference therein.
The Audit Committee oversees the financial reporting process on behalf of the Board of Directors. Infulfilling its oversight responsibilities, the Audit Committee reviewed and discussed the audited financialstatements included in the Annual Report on Form 10-K filed with the SEC and the unaudited financialstatements included with Quarterly Reports on Form 10-Q filed with the SEC.
The Audit Committee met and discussed with management and the independent auditors the mattersrequired to be discussed under the rules and standards of the Public Company Accounting Oversight Board(“PCAOB”). These discussions included the clarity of the disclosures made therein, the underlying estimates andassumptions used in the financial reporting, the reasonableness of the significant judgments and managementdecisions made in developing the financial statements and the testing and evaluation of the system of internalcontrol over financial reporting. In addition, the Audit Committee has discussed with the independent auditorstheir independence from the Company and has received the written letter required by the PCAOB from theindependent auditors.
The Audit Committee also met and discussed with the independent auditors the overall scope and objectivesof the audit, the Company’s critical accounting policies and the specific results of the audit. Management waspresent at all or some part of each of these meetings.
Pursuant to the reviews and discussions described above, the Audit Committee recommended to the Boardof Directors that the audited financial statements be included in the Company’s Annual Report on Form 10-K forthe fiscal year ended June 30, 2019.
Management is responsible for the Company’s financial reporting process, including its system of internalcontrols, and for the preparation of consolidated financial statements in accordance with generally acceptedaccounting principles. The Company’s independent auditors are responsible for auditing those financialstatements. The Audit Committee’s responsibility is to monitor and review these processes. It is neither theCommittee’s duty nor responsibility to conduct auditing or accounting reviews or procedures. Members of theAudit Committee are not employees of the Company and may not be, and do not represent themselves to be or toserve as, accountants or auditors by profession or experts in the fields of accounting or auditing. Therefore,members have relied, without independent verification, on management’s representation that the financialstatements have been prepared with integrity and objectivity and in conformity with accounting principlesgenerally accepted in the United States of America and on the representations of the independent auditorsincluded in their report on the Company’s financial statements. The Audit Committee’s oversight does notprovide it with an independent basis to determine that management has maintained appropriate accounting andfinancial reporting principles or policies, or appropriate internal controls and procedures designed to assurecompliance with accounting standards and applicable laws and regulations. Furthermore, consultations anddiscussions with management and the independent auditors do not assure that the Company’s financialstatements are presented in accordance with generally accepted accounting principles, that the audit of theCompany’s financial statements has been carried out in accordance with generally accepted auditing standards orthat the Company’s independent accountants are in fact “independent.”
Respectfully Submitted,
James B. Roszak, ChairmanSusan L. HarrisWilliam H. BaribaultLarry D. Tashjian
21
SECURITY OWNERSHIP OF CERTAIN BENEFICIAL OWNERS AND MANAGEMENT
The following table sets forth information regarding the beneficial ownership of our common stock as ofOctober 17, 2019, by (i) each person known by us to be the beneficial owner of more than 5% of our outstandingshares of common stock; (ii) each of our executive officers and directors; and (iii) all of our executive officersand directors as a group. Unless otherwise noted, we believe that each beneficial owner named in the table hassole voting and investment power with respect to the shares shown, subject to community property laws whereapplicable. An asterisk (*) denotes beneficial ownership of less than one percent.
Beneficial Ownership
NameNumber ofShares(1)
Percent ofClass(1)
Directors and Executive OfficersRonald F. Valenta(2)(3) 4,763,741 15.5%James B. Roszak(2)(4) 129,104 (*)Larry D. Tashjian(2)(5) 237,713 (*)Manuel Marrero(2)(6) 159,509 (*)Susan L. Harris(2)(7) 64,884 (*)William H. Baribault(2)(8) 34,251 (*)Douglas B. Trussler(9)(10) 1,235,294 4.0%Charles E. Barrantes(2)(11) 386,250 1.3%Christopher Wilson(2)(12) 371,852 1.2%Jeffrey Kluckman(2)(13) 298,788 (*)Neil Littlewood(14)(15) 71,362 (*)Theodore M. Mourouzis(16)(17) 511,497 1.7%Jody M. Miller(2)(18) 397,241 1.3%
All executive officers and directors as a group (twelve persons) 8,661,486 27.4%5% Stockholders
Olowalu Holdings, LLC(19) 2,438,224 8.0%2863 S. Western AvenuePalos Verdes, California 90275
Neil Gagnon(20) 3,616,429 11.8%1370 Avenue of the Americas, Suite 2400New York, New York 10019
Ronald L. Havner, Jr.and Lee Ann R. Havner(21) 5,482,100 17.9%
c/o Karl SwaidanHahn & Hahn LLP301 East Colorado Boulevard, Suite 900Pasadena, California 91101
(1) Based on 30,573,863 shares of common stock outstanding as of October 17, 2019. In accordance with therules of the SEC, person is deemed to be the beneficial owner of shares that the person may acquire withinthe following 60 days (such as upon exercise of options or warrants or conversion of convertible securities).These shares are deemed to be outstanding for purposes of computing the percentage ownership of theperson beneficially owning such shares but not for purposes of computing the percentage of any otherholder.
(2) Business address is General Finance Corporation, 39 East Union Street, Pasadena, California 91103.(3) Includes 4,527,741 (including 16,667 restricted shares) shares owned and 236,000 shares that may be
acquired upon exercise of options owned by GF Group Holdings, Inc., a corporation over which Mr. Valentaexercises voting and investment control. 2,995,573 of these shares are pledged to secure the repayment ofthree loans and a charitable gift.
(4) Includes 120,104 shares owned (including 4,971 restricted shares) and 9,000 shares that may be acquiredupon exercise of options.
22
(5) Includes 188,068 shares owned (including 4,971 restricted shares), 13,500 shares owned by Mr. Tashjian’schildren over which Mr. Tashjian exercises investment power, 30,000 shares owned by a family limitedpartnership and 6,145 shares owned by a family trust.
(6) Includes 150,509 shares owned (including 4,971 restricted shares) and 9,000 shares that may be acquiredupon exercise of options.
(7) Includes 55,884 shares owned (including 4,971 restricted shares) and 9,000 shares that may be acquiredupon exercise of options.
(8) Consists of 34,251 shares owned (including 4,971 restricted shares).(9) Business address is Bison Capital, 233 Wilshire Boulevard, Suite 425, Santa Monica, California 90401.(10) Consists of 1,235,294 shares owned by Bison Capital Partners V, L.P. and Bison Capital Partners V-A, L.P.
(with 1,130,566 shares owned by Bison Capital Partners V, L.P. and 104,728 shares owned by Bison CapitalPartners V-A, L.P.). Mr. Trussler is a managing member of the general partner of Bison Capital Partners V,L.P. and Bison Capital Partners V-A, L.P.
(11) Includes 127,750 shares (including 18,333 restricted shares) owned and 258,500 shares that may be acquiredupon exercise of stock options.
(12) Includes 113,352 shares (including 16,667 restricted shares) owned and 258,500 shares that may be acquiredupon exercise of stock options
(13) Includes 123,788 shares (including 26,666 restricted shares) owned and 175 shares owned byMr. Kluckman’s child living in his residence and 175,000 shares that may be acquired upon exercise ofstock options.
(14) Business address is Level 3, 1-3 Merriwa Street, Gordon, New South Wales, Australia 2072(15) Consists of 71,362 restricted shares.(16) Business address is 9155 Harrison Park Court, Indianapolis, Indiana 46216.(17) Includes 471,272 shares owned (including 10,000 restricted shares), 2,819 shares owned by Mr. Mourouzis’
minor children and 87,406 shares that may be acquired upon exercise of stock options.(18) Includes 397,241 shares owned (including 89,388 restricted shares).(19) Information is based upon Amendment No. 4 to Schedule 13G filed on January 19, 2018. Olowalu
Holdings, LLC (“Olowalu”), is a Hawaiian limited liability company, of which Rick Pielago and MarcPerez are the managers. Olowalu shares voting and investment power as to all of the shares shown with U.S.Commonwealth Life A.I., a Puerto Rican company, and the Ronald Valenta Irrevocable Life InsuranceTrust No. 1, a California trust, of which Mr. Pielago is trustee. The Ronald Valenta Irrevocable LifeInsurance Trust No. 1 is an irrevocable family trust established by Ronald F. Valenta in December 1999 forthe benefit of his wife at the time, any future wife, and their descendants. Mr. Valenta, himself, is not abeneficiary of the Trust, and neither he nor his wife or their descendants has voting or investment power, orany other legal authority, with respect to the shares shown. Mr. Valenta disclaims beneficial ownership ofthe shares held by the Trust. Mr. Pielago and Mr. Perez may be deemed to be the control persons ofOlowalu, and Mr. Pielago may be deemed to be the control person of the Ronald Valenta Irrevocable LifeInsurance Trust No. 1.
(20) Information is based upon Amendment No. 3 to Schedule 13G filed on December 31, 2018.(21) Information is based upon Amendment No. 10 to Schedule 13D filed on April 4, 2018 and a Form 4 filed on
September 6, 2018 filed by the Havner Family Trust. The shares shown consist of 3,970,600 shares ownedby the Havner Family Trust, 2,000 shares held by Ronald L. Havner, Jr., 9,500 shares owned by Lee AnnHavner and 1,500,000 shares owned by JCS Ventures II, LLC, a limited liability company of whichMr. Havner and Mrs. Havner act as managers.
23
COMPLIANCE WITH SECTION 16(A) BENEFICIAL OWNERSHIP REPORTING
Section 16(a) of the Securities Exchange Act of 1934, as amended, requires our directors, executive officersand 10% stockholders to file reports with the SEC on changes in their beneficial ownership of common stock andto provide us with copies of the reports. Based solely upon our review of the forms furnished to us and writtenrepresentations from certain reporting persons, we believe that in fiscal year 2019 our directors and officers whoare subject to Section 16(a) of the Securities Exchange Act of 1934, as amended, met all applicable filingrequirements.
24
EXECUTIVE COMPENSATION
COMPENSATION COMMITTEE REPORT
The following report of the Compensation Committee shall not be deemed to be incorporated by referenceinto any previous filing by the Company under either the Securities Act of 1933, as amended (“Securities Act”),or the Securities Exchange Act of 1934, as amended (“Exchange Act”), that incorporates future Securities Act orExchange Act filings in whole or in part by reference.
The Compensation Committee has reviewed and discussed with management the following CompensationDiscussion and Analysis section of the Company’s 2019 Proxy Statement. Based on our review and discussion,we have recommended to the Board that the following Compensation Discussion and Analysis be included in theCompany’s 2019 Proxy Statement.
Compensation Committee
Susan L. Harris (Chair)William BaribaultJames B. RoszakLarry D. Tashjian
COMPENSATION DISCUSSION AND ANALYSIS
Overview of Compensation Philosophy and Objectives
This Compensation Discussion and Analysis reviews the Company’s executive compensation program forfiscal year 2019.
The Company’s executive compensation program aligns the interests of our executive officers with theinterests of our stockholders. The Company’s executive compensation program does so by establishing short-term and long-term and strategic goals to increase stockholder value and by rewarding the achievement byexecutive officers of those goals. The Compensation Committee periodically reviews and makesrecommendations with respect to the adoption and implementation of equity-based and non-equity basedcompensation plans for executive officers. We therefore structure the compensation of our executive officers toreward the achievement of the strategic goals that drive stockholder value.
Say-on-Pay and Frequency of Say-on Pay Advisory Votes
The Company held its initial advisory vote on executive compensation at its December 2013 annualstockholder meeting at which time a non-binding, advisory vote on executive compensation was approved withapproximately 98.6% of the stockholders who voted on the proposal approving the compensation of our NamedExecutive Officers. At the same December 2013 annual meeting of stockholders, we held our first advisory voteon the frequency of future advisory votes on executive compensation. The Company’s stockholders voted to holdtriennial votes on executive compensation.
At our December 2016 annual meeting of stockholders we held our second advisory vote on executivecompensation and our second advisory vote on the frequency of future advisory votes on executivecompensation. The December 2016 non-binding, advisory vote on executive compensation was approved withapproximately 99.2% of the stockholders who voted on the proposal approving the compensation of our NamedExecutive Officers. The Company’s stockholders also voted in December 2016 to hold a triennial vote onexecutive compensation.
25
Executive Compensation Program
The Compensation Committee of the Board is responsible for the establishment and development of theCompany’s compensation philosophy. The Compensation Committee establishes, implements and monitors thestructure of the Company’s executive compensation program.
The Compensation Committee designs the executive compensation program to achieve the following keygoals:
• Reinforce the business strategy;
• Balance rewards that address both short-term and long-term strategic objectives;
• Motivate executives to deliver a high degree of business performance without encouraging unnecessaryrisk taking;
• Align executives’ interests with the stockholders’ interests; and
• Attract and retain talented executives whose skills and achievements will increase stockholder value.
The Compensation Committee determines the structure and amount of all executive officer compensation,including grants of equity and non-equity compensation, after receiving recommendations from management andinput from its independent compensation consultant, Semler Brossy Consulting Group, LLC.
The Compensation Committee believes the structure and implementation of the executive compensationprogram in fiscal year 2019 implemented its compensation philosophies. Each executive’s fiscal year planconsists of financial incentives based upon the achievement of earnings before interest, taxes, depreciation andamortization (“EBITDA”) targets and individualized key performance indicators. In fiscal year 2019 EBITDA-based targets constituted a meaningful portion of each executive’s incentive plan: 50% of the potential annualbonus for our chief executive officer, 48.3% of the potential bonus for our chief financial officer, 40% of thepotential annual bonus of our executive vice president of global business development and 60% of the potentialannual bonus of our chief executive officer of GFN Asia Pacific Holdings Limited (“Royal Wolf”). Theremaining non-equity, performance-based incentive compensation for these executives was based on theattainment of key performance indicators created for each executive. The Compensation Committee believes thiscompensation program structure focuses the executive team on increasing revenues and profitability, a keyelement of the Company’s business strategy.
The Compensation established key performance indicators in fiscal year 2019 for our chief executive officerthat reinforced our business strategy. Other non-financial objectives of performance-based incentivecompensation of our chief executive officer and president included de-levering the Company’s balance sheet,mentoring and training members of the senior management team, attending investor conferences and earningsconference calls, overseeing the information technology consolidation plan, reducing stale inventory andimplementing an enterprise financial management system.
The Compensation Committee believes that the compensation plans of Lone Star Tank Rental Inc. (“LoneStar”), Pac-Van, Inc. (“Pac-Van”), Royal Wolf and Southern Frac, LLC (“Southern Frac”), and the risks taken bytheir respective management teams to meet compensation plan goals, do not vary significantly between the fourbusinesses.
The Compensation Committee also believes that compensation plans and practices of the Company, LoneStar, Pac-Van, Royal Wolf and Southern Frac do not create risks that are reasonably likely to have a materialadverse effect on the Company. For fiscal year 2019, non-equity, performance-based compensation goalsestablished by the Compensation Committee were based upon a variety of metrics, which include EBITDA, andkey performance indicators. These objectives and metrics require executives to consider a variety of operatingresults in pursuing their compensation goals. The Compensation Committee believes that the structure of the
26
non-equity, performance-based compensation emphasizes long-term results, thereby reducing the risk thatexecutives would take undue risk to achieve short-term goals. The Compensation Committee therefore believesthe structure of the compensation plans for annual bonuses and the vesting of equity awards stock do not createrisks that are reasonably likely to have a material adverse effect on the Company.
Elements of Compensation.
For the fiscal year 2019, the principal components of compensation for the President and Chief ExecutiveOfficer (principal executive officer), Chief Financial Officer (the principal financial officer) and the other threemost highly compensated executive officers, or collectively the Named Executive Officers, were:
1. Annual base salary;
2. Non-equity performance-based annual incentive compensation; and
3. Long-term equity incentive compensation.
Base Salaries. Annual base salaries provide executive officers with a minimum level of cash compensation.We establish base salaries at levels so that a significant portion of the total cash compensation such executivescan earn is performance-based (through annual incentive compensation). Base salaries are set based on factors, asapplicable, that include whether a salary level is competitive with comparable companies, the recommendationsof Mr. Miller for the other Named Executive Officers and the business judgment of the members of theCompensation Committee, as discussed further below.
Bonuses. Annual cash bonuses are designed to reward our executive officers, including each of the NamedExecutive Officers and certain employees, for achievement of financial and operational goals and individualperformance objectives to enable us to meet long and short-term goals. In fiscal year 2019 the objectives relatedto financial metrics, such as EBITDA goals, and the achievement of other corporate, operational and financialgoals. These goals and bonuses are determined annually at the discretion of the Compensation Committee inconsultation with Mr. Miller.
Equity-Based Compensation. Equity awards of stock options and restricted stock are long-term incentivesdesigned to reward long-term growth in the stockholder value. Stock option and restricted stock awards assist inthe retention of executives because they are not exercisable at the time of grant and achieve their maximum valueonly if vesting conditions, which include performance goals and continued employment, are met. Stock optionshave value solely to the extent that the price of our common stock increases over the exercise price set as of thedate of grant. The Compensation Committee believes that our executive officers should have an incentive toimprove the Company’s performance by having an ongoing stake in the success of our business. TheCompensation Committee seeks to create this incentive by granting executive officers stock options andrestricted stock.
Stock Option and Restricted Stock Grant Practices
Grants of stock options and restricted stock to all of our executive officers and other employees, includingthe Named Executive Officers, must be approved by the Compensation Committee, which consists entirely ofindependent directors. Grants occur only at meetings of the Compensation Committee and such grants are madeeffective as of the date of the meeting or a future date, as in the case of the hiring of a new employee. Awards ofstock options and restricted stock are not timed in coordination with the release of material non-publicinformation. The exercise price of all stock options and restricted stock granted is equal to the closing marketprice of our common shares on the date of grant so that the executive officer may not profit from the optionunless the price of the Company’s common shares increases.
The Compensation Committee determines stock option and restricted stock award levels using theirjudgment and the recommendations of Mr. Miller, consideration of the importance of an individual’sresponsibilities and performance within the Company and equity awards at comparable companies.
27
Stock options and restricted stock granted by the Compensation Committee also are designed to help usretain executive officers in that stock options and restricted stock are not exercisable at the time of grant andachieve their maximum value only if performance criteria are met or if the executive remains in the Company’semploy for a period of years. All stock options and restricted stock granted to U.S. executive officers andemployees in fiscal year 2019 vest ratably over three years based on continued employment while all equityincentives granted to Royal Wolf employees vested 50% ratably over three years based on continuedemployment and 50% ratably over three years based upon attaining EBITDA goals of Royal Wolf. TheCompensation Committee believes that these vesting arrangements align the interests of option holders withstockholders by emphasizing a long-term view of building stockholder value. The Compensation Committee alsobelieves that multi-year vesting reduces the risks that could arise from undertaking initiatives to realize annualEBITDA goals, such as through acquisitions or capital expenditures that could attain short-term goals whileadversely effecting long-term stockholder value.
Grants of stock options and restricted stock under the 2009 Plan and the 2014 Plan are subject to therecoupment provisions included in each plan which require each option holder to forfeit all or any portion of anoption grant and to reimburse the Company for all proceeds received from exercising stock options and restrictedstock if (i) payment, grant or vesting was predicated on the achievement of financial results that weresubsequently the subject of a material financial misstatement, (ii) the Board determines the award recipientsengaged in fraud or misconduct that caused or partially caused the material financial restatement of the Companyor any affiliate and (iii) a lower payment, award or vesting would have occurred based on the financial results.
Role of Executive Officers.
In general, Mr. Miller attends all meetings of the Compensation Committee at which compensation of theother Named Executive Officers or compensation policy is reviewed other than when his compensation is beingdiscussed. Mr. Miller does not vote on items before the Compensation Committee. The CompensationCommittee and the Board solicit Mr. Miller’s views on the performance of the executive officers who report tohim.
Compensation Surveys.
Each component of compensation we pay to our Named Executive Officers—salary, cash bonuses, stockoptions and restricted stock—is based generally on the Committee’s assessment of each individual’s role andresponsibilities. Consideration of market rates is an additional factor reviewed by the Committee in determiningcompensation levels. The Compensation Committee engaged Semler Brossy in fiscal year 2015 as itscompensation consultants to analyze the Company’s compensation program, to provide a benchmarking analysiswhich compared the Company’s compensation program to industry peers and comparable companies and toassist with the design and implementation of the Company’s compensation program.
The Compensation Committee also bases its payment of base salary and annual bonuses for NamedExecutive Officers, other than the chief executive officer, on the attainment of objectives established by theCompensation Committee and based upon recommendations from Mr. Valenta. In establishing individualbonuses for senior executives, the Compensation Committee considers growth in the enterprise value, commonstock price, EBITDA and other financial and corporate objectives, together with the executive officer’scontribution to the Company’s growth and profitability.
Compensation of Executives
The Compensation Committee sets the base salaries, bonus and equity compensation for the NamedExecutive Officers after consideration of benchmarking and other analyses from Semler Brossy, its independentcompensation consultant, and recommendations prepared by Mr. Miller. Mr. Miller used information relating toeach executive officer’s responsibilities and achievements in accomplishing the corporate objectives set by the
28
Compensation Committee for the previous year, his assessment of the individual performance of each namedexecutive officer and to recommend to the Compensation Committee the annual incentive bonuses for each of theother Named Executive Officers.
The implementation of the executive compensation program underlined our commitment to pay forperformance. Executives who achieved annual, long-term and strategic goals received compensation inaccordance with their compensation plans, while executives who failed to achieve their goals receivedcompensation corresponding to their performance.
In June 2019, the Compensation Committee considered the Company’s fiscal year 2019 revenues andEBITDA and the recommendations of Mr. Miller with respect to the individual performance of the other NamedExecutive Officers and the payment of bonuses for fiscal year 2019. The Company exceeded its EBITDA goalfor fiscal year 2019 by a considerable margin. The Compensation Committee considered the completion by theNamed Executive Officers of certain strategic and operational initiatives during fiscal year 2019 in awardingbonuses for fiscal year 2019.
Based on the review of the Compensation Committee and the consideration of Mr. Miller’srecommendations, the Compensation Committee awarded the following bonuses to the Named ExecutiveOfficers for fiscal year 2019.
The Compensation Committee determined that Mr. Miller exceeded his EBITDA goals and achieved all ofhis fiscal year 2019 key performance indicators, and the Compensation Committee therefore determined to payMr. Miller $279,500 for attaining his EBITDA targets, $25,000 for reaching his target for reducing seniorindebtedness and 100% of his key performance indicators, or $125,000. The Compensation Committeedetermined that Mr. Barrantes exceeded his EBITDA goals and achieved virtually all of his fiscal year 2019 keyperformance indicators, and the Compensation Committee therefore determined to pay Mr. Barrantes 194.1% ofhis EBITDA target, or $123,200, and 96% of his key performance indicators, or $72,500. The CompensationCommittee determined that Mr. Kluckman exceeded his EBITDA goals and achieved all of his fiscal year 2019key performance indicators, and the Compensation Committee therefore determined to pay Mr. Kluckman$103,200 for exceeding his EBITDA target and 100% of his key performance indicators, or $75,000. TheCompensation Committee determined that Mr. Littlewood exceeded his EBITDA goals and achieved all of hisfiscal year 2019 key performance indicators, and the Compensation Committee therefore determined to payMr. Littlewood 109% of his EBITDA target, or $89,112, and 100% of his key performance indicators, or$54,378.
The executive compensation program therefore reflected the Company’s compensation philosophies bypaying executive compensation only when the Company’s business goals are met.
Effective July 1, 2018 the annual base salaries of Mr. Miller and Mr. Barrantes were increased by 19.4%and 7.1%, respectively.
Neither the Committee nor Mr. Miller believe that the fiscal year 2019 goals will require the NamedExecutive Officers to take risks to achieve their EBITDA goals that are reasonably likely to have a materialadverse effect on the Company.
Severance
Pursuant to separate employment agreements with Mr. Valenta, Mr. Miller, Mr. Barrantes andMr. Kluckman, we will make severance payments equal to one year’s salary if such person’s employment isterminated by the Company without cause or by the employee for good cause, each as defined in their respectiveemployment agreements. Pursuant to employment agreements with Mr. Littlewood, we will make a severancepayment equal to six months’ salary, respectively, if his employment is terminated by Royal Wolf without causeor by the employee for good cause, each as defined in their respective employment agreements.
29
Each of these five employment agreements provide that each executive may be terminated for cause, and theCompany or Royal Wolf, as applicable, would therefore not be required to pay severance equal to six months’salary or one year’s salary, as applicable, if such executive breaches his employment agreement, commits any actof personal dishonesty, fraud or breach of fiduciary duty or trust, is convicted of or pleads guilty or no contest toany theft, fraud, breach of fiduciary duty or crime involving moral turpitude or felony, committed acts whichgive rise to liability for discrimination or harassment, violates directions from the Board or chief executiveofficer, acts in a manner that harms the reputation of the Company, is found liable of violating securities or otherlaws, fails to advance or cooperate with any investigation by the Company or misrepresents his experience oremployment history.
Each of Mr. Valenta, Mr. Barrantes, Miller and Kluckman may terminate their employment for good reasonand receive severance equal to one year’s salary if the Company reduces their base salary, permanently relocatestheir place of employment more than 40 miles from their current residence, hires a person to perform the jobfunctions currently performed by such executive or assigns such executive duties beneath the duties theyordinarily perform.
We may also elect to pay six months’ compensation to Mr. Littlewood in lieu of providing six months’ priornotice of termination of his employment.
Clawback Policy
In accordance with the Dodd-Frank, the Compensation Committee has adopted recoupment provisions inthe Company’s 2009 Plan, 2014 Stock Incentive Plan, the 2014 Restated Plan and in equity award agreements.The Compensation Committee will adopt an amended clawback policy once the SEC has adopted final rules toimplement the Dodd-Frank Wall Street Reform and Consumer Protection Act of 2010.
Perquisites and Other Personal Benefits
Except for an expense allowance of $30,000 per year for Mr. Valenta, a car allowance of $650 per monthfor Mr. Miller and a monthly stipend of $450 for Mr. Kluckman, we do not have programs in place to providepersonal perquisites for our executive officers. Mr. Valenta, Mr. Miller, Mr. Barrantes and Mr. Kluckmanparticipate in the medical and dental insurance of Lone Star or Pac-Van at the expense of the Company.Messrs. Valenta, Mr. Barrantes, Miller and Kluckman are also eligible to participate in the 401(k) retirement planof Pac-Van, Inc. Mr. Littlewood participates in the medical and dental insurance of Royal Wolf, and Royal Wolfcontributes to Mr. Littlewood’s retirement plan as required by Australian law. We do not have any otherretirement plans under which our executive officers may participate.
Tax & Accounting Considerations
Deductibility of Executive Compensation—Code Section 162(m). Section 162(m) of the Internal RevenueCode imposes a $1,000,000 limit on the annual deduction that may be claimed for compensation paid to each ofthe chief executive officer and the three other highest paid employees of a publicly held corporation (other thanthe chief financial officer). However, while the Compensation Committee considers the tax deductibility ofcompensation, the Committee has and may approve compensation that does not qualify for deductibility incircumstances it deems appropriate to promote varying corporate goals.
Accounting for Stock-Based Compensation. For the issuances of stock options, the Company follows thefair value provisions of Financial Accounting Standards Board (“FASB”) Accounting Standards Codification(“ASC”) Topic 718, Stock Compensation. FASB ASC Topic 718 requires recognition of employee share-basedcompensation expense in the statements of income over the vesting period based on the fair value of the stockoption at the grant date. For a discussion of valuation assumptions used in the calculation of these amounts forfiscal year 2019, see Note 2, “Summary of Significant Accounting Policies,” and Note 9, “Equity Plans,” of theNotes to Consolidated Financial Statements included in our 2019 Annual Report filed with the SEC onSeptember 12, 2019.
30
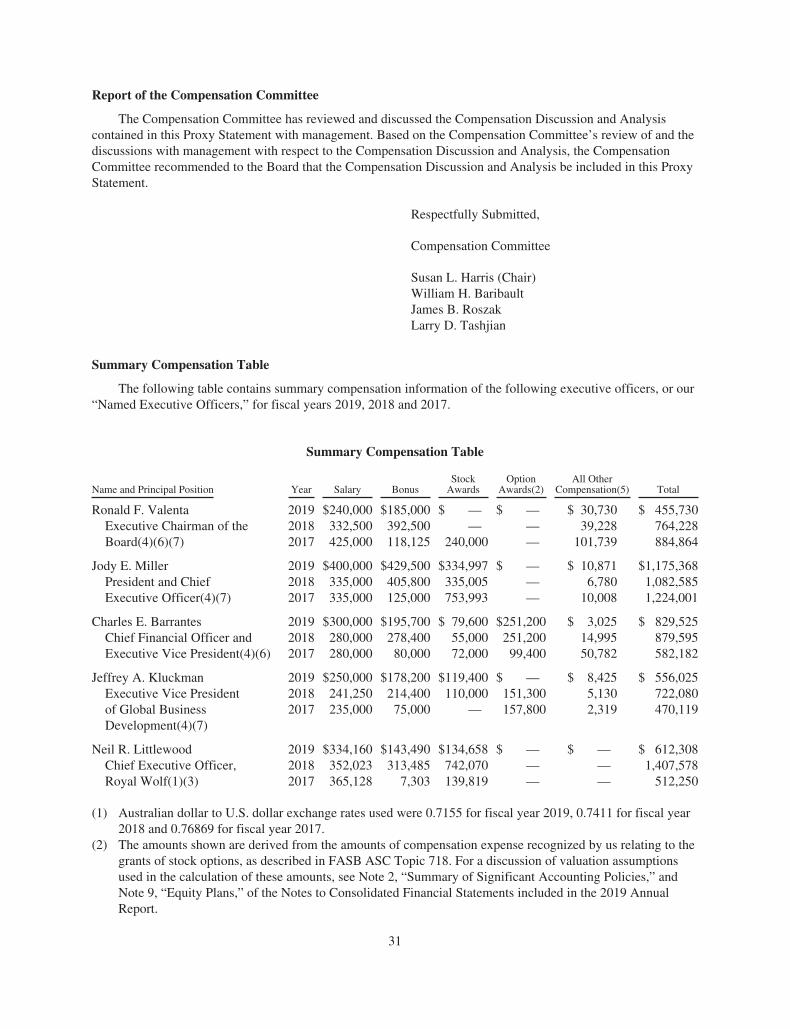
Report of the Compensation Committee
The Compensation Committee has reviewed and discussed the Compensation Discussion and Analysiscontained in this Proxy Statement with management. Based on the Compensation Committee’s review of and thediscussions with management with respect to the Compensation Discussion and Analysis, the CompensationCommittee recommended to the Board that the Compensation Discussion and Analysis be included in this ProxyStatement.
Respectfully Submitted,
Compensation Committee
Susan L. Harris (Chair)William H. BaribaultJames B. RoszakLarry D. Tashjian
Summary Compensation Table
The following table contains summary compensation information of the following executive officers, or our“Named Executive Officers,” for fiscal years 2019, 2018 and 2017.
Summary Compensation Table
Name and Principal Position Year Salary BonusStock
AwardsOption
Awards(2)All Other
Compensation(5) Total
Ronald F. Valenta 2019 $240,000 $185,000 $ — $ — $ 30,730 $ 455,730Executive Chairman of theBoard(4)(6)(7)
2018 332,500 392,500 — — 39,228 764,2282017 425,000 118,125 240,000 — 101,739 884,864
Jody E. Miller 2019 $400,000 $429,500 $334,997 $ — $ 10,871 $1,175,368President and Chief 2018 335,000 405,800 335,005 — 6,780 1,082,585Executive Officer(4)(7) 2017 335,000 125,000 753,993 — 10,008 1,224,001
Charles E. Barrantes 2019 $300,000 $195,700 $ 79,600 $251,200 $ 3,025 $ 829,525Chief Financial Officer and 2018 280,000 278,400 55,000 251,200 14,995 879,595Executive Vice President(4)(6) 2017 280,000 80,000 72,000 99,400 50,782 582,182
Jeffrey A. Kluckman 2019 $250,000 $178,200 $119,400 $ — $ 8,425 $ 556,025Executive Vice President 2018 241,250 214,400 110,000 151,300 5,130 722,080of Global BusinessDevelopment(4)(7)
2017 235,000 75,000 — 157,800 2,319 470,119
Neil R. Littlewood 2019 $334,160 $143,490 $134,658 $ — $ — $ 612,308Chief Executive Officer, 2018 352,023 313,485 742,070 — — 1,407,578Royal Wolf(1)(3) 2017 365,128 7,303 139,819 — — 512,250
(1) Australian dollar to U.S. dollar exchange rates used were 0.7155 for fiscal year 2019, 0.7411 for fiscal year2018 and 0.76869 for fiscal year 2017.
(2) The amounts shown are derived from the amounts of compensation expense recognized by us relating to thegrants of stock options, as described in FASB ASC Topic 718. For a discussion of valuation assumptionsused in the calculation of these amounts, see Note 2, “Summary of Significant Accounting Policies,” andNote 9, “Equity Plans,” of the Notes to Consolidated Financial Statements included in the 2019 AnnualReport.
31
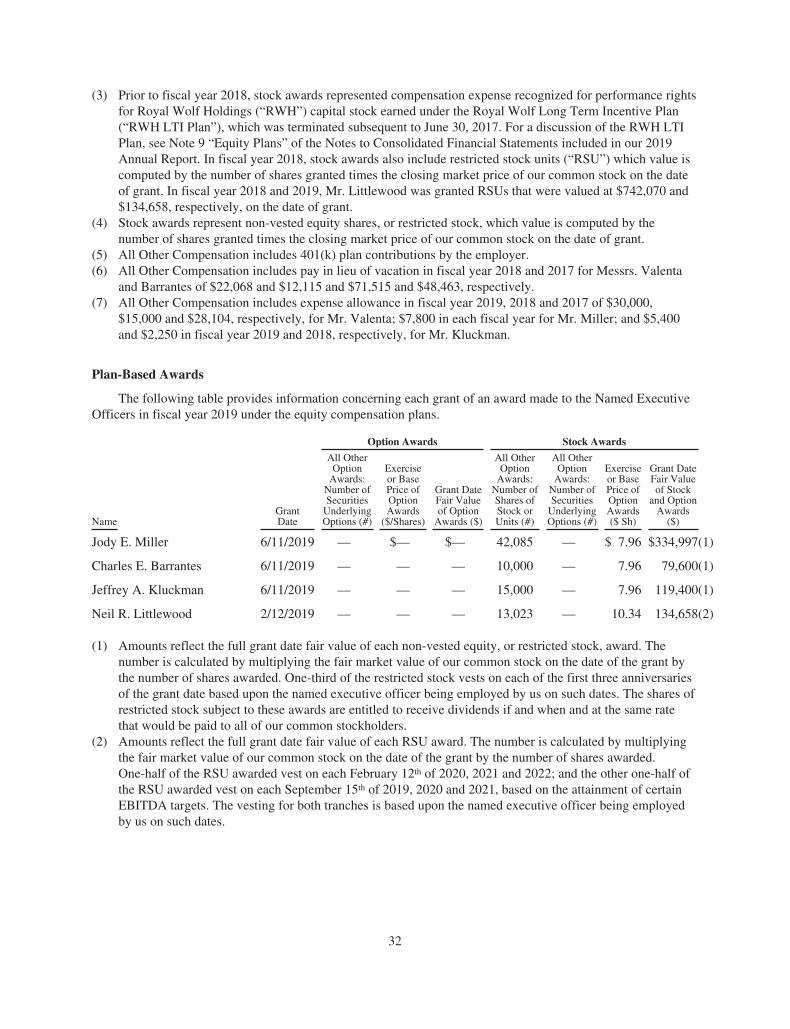
(3) Prior to fiscal year 2018, stock awards represented compensation expense recognized for performance rightsfor Royal Wolf Holdings (“RWH”) capital stock earned under the Royal Wolf Long Term Incentive Plan(“RWH LTI Plan”), which was terminated subsequent to June 30, 2017. For a discussion of the RWH LTIPlan, see Note 9 “Equity Plans” of the Notes to Consolidated Financial Statements included in our 2019Annual Report. In fiscal year 2018, stock awards also include restricted stock units (“RSU”) which value iscomputed by the number of shares granted times the closing market price of our common stock on the dateof grant. In fiscal year 2018 and 2019, Mr. Littlewood was granted RSUs that were valued at $742,070 and$134,658, respectively, on the date of grant.
(4) Stock awards represent non-vested equity shares, or restricted stock, which value is computed by thenumber of shares granted times the closing market price of our common stock on the date of grant.
(5) All Other Compensation includes 401(k) plan contributions by the employer.(6) All Other Compensation includes pay in lieu of vacation in fiscal year 2018 and 2017 for Messrs. Valenta
and Barrantes of $22,068 and $12,115 and $71,515 and $48,463, respectively.(7) All Other Compensation includes expense allowance in fiscal year 2019, 2018 and 2017 of $30,000,
$15,000 and $28,104, respectively, for Mr. Valenta; $7,800 in each fiscal year for Mr. Miller; and $5,400and $2,250 in fiscal year 2019 and 2018, respectively, for Mr. Kluckman.
Plan-Based Awards
The following table provides information concerning each grant of an award made to the Named ExecutiveOfficers in fiscal year 2019 under the equity compensation plans.
Option Awards Stock Awards
NameGrantDate
All OtherOption
Awards:Number ofSecurities
UnderlyingOptions (#)
Exerciseor BasePrice ofOptionAwards
($/Shares)
Grant DateFair Valueof Option
Awards ($)
All OtherOption
Awards:Number ofShares ofStock orUnits (#)
All OtherOption
Awards:Number ofSecurities
UnderlyingOptions (#)
Exerciseor BasePrice ofOptionAwards($ Sh)
Grant DateFair Valueof Stock
and OptionAwards
($)
Jody E. Miller 6/11/2019 — $— $— 42,085 — $ 7.96 $334,997(1)
Charles E. Barrantes 6/11/2019 — — — 10,000 — 7.96 79,600(1)
Jeffrey A. Kluckman 6/11/2019 — — — 15,000 — 7.96 119,400(1)
Neil R. Littlewood 2/12/2019 — — — 13,023 — 10.34 134,658(2)
(1) Amounts reflect the full grant date fair value of each non-vested equity, or restricted stock, award. Thenumber is calculated by multiplying the fair market value of our common stock on the date of the grant bythe number of shares awarded. One-third of the restricted stock vests on each of the first three anniversariesof the grant date based upon the named executive officer being employed by us on such dates. The shares ofrestricted stock subject to these awards are entitled to receive dividends if and when and at the same ratethat would be paid to all of our common stockholders.
(2) Amounts reflect the full grant date fair value of each RSU award. The number is calculated by multiplyingthe fair market value of our common stock on the date of the grant by the number of shares awarded.One-half of the RSU awarded vest on each February 12th of 2020, 2021 and 2022; and the other one-half ofthe RSU awarded vest on each September 15th of 2019, 2020 and 2021, based on the attainment of certainEBITDA targets. The vesting for both tranches is based upon the named executive officer being employedby us on such dates.
32
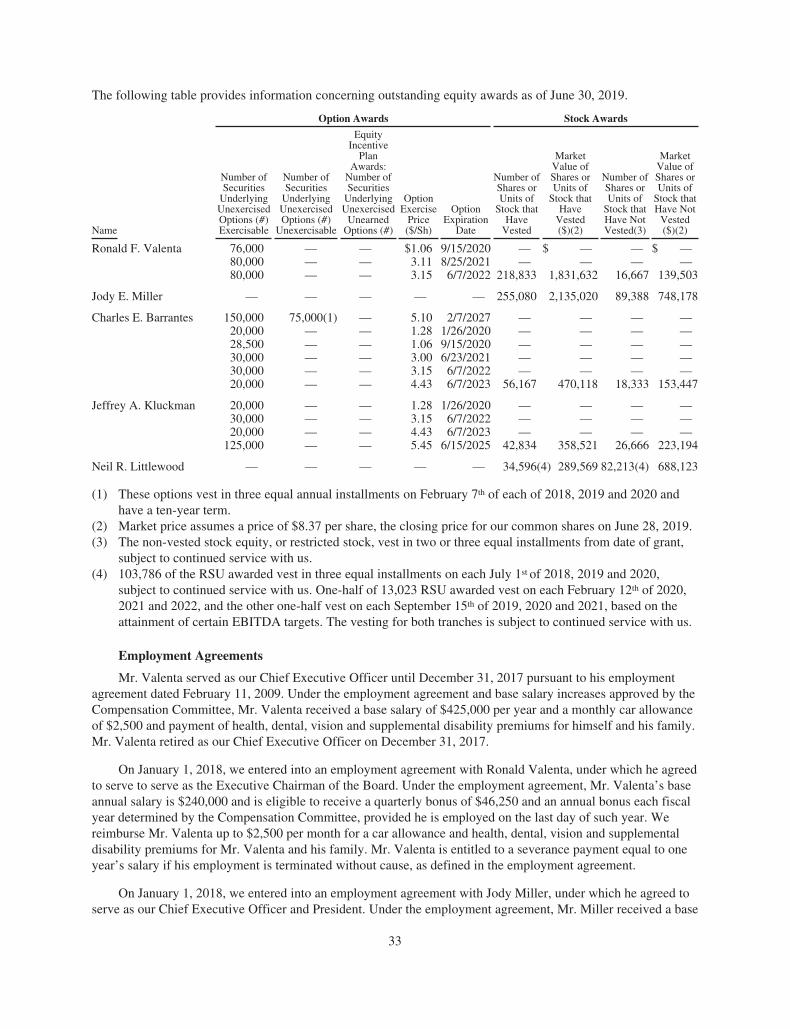
The following table provides information concerning outstanding equity awards as of June 30, 2019.
Option Awards Stock Awards
Name
Number ofSecurities
UnderlyingUnexercisedOptions (#)Exercisable
Number ofSecurities
UnderlyingUnexercisedOptions (#)
Unexercisable
EquityIncentive
PlanAwards:
Number ofSecurities
UnderlyingUnexercised
UnearnedOptions (#)
OptionExercise
Price($/Sh)
OptionExpiration
Date
Number ofShares orUnits of
Stock thatHave
Vested
MarketValue ofShares orUnits of
Stock thatHave
Vested($)(2)
Number ofShares orUnits of
Stock thatHave NotVested(3)
MarketValue ofShares orUnits of
Stock thatHave Not
Vested($)(2)
Ronald F. Valenta 76,000 — — $1.06 9/15/2020 — $ — — $ —80,000 — — 3.11 8/25/2021 — — — —80,000 — — 3.15 6/7/2022 218,833 1,831,632 16,667 139,503
Jody E. Miller — — — — — 255,080 2,135,020 89,388 748,178
Charles E. Barrantes 150,000 75,000(1) — 5.10 2/7/2027 — — — —20,000 — — 1.28 1/26/2020 — — — —28,500 — — 1.06 9/15/2020 — — — —30,000 — — 3.00 6/23/2021 — — — —30,000 — — 3.15 6/7/2022 — — — —20,000 — — 4.43 6/7/2023 56,167 470,118 18,333 153,447
Jeffrey A. Kluckman 20,000 — — 1.28 1/26/2020 — — — —30,000 — — 3.15 6/7/2022 — — — —20,000 — — 4.43 6/7/2023 — — — —
125,000 — — 5.45 6/15/2025 42,834 358,521 26,666 223,194
Neil R. Littlewood — — — — — 34,596(4) 289,569 82,213(4) 688,123
(1) These options vest in three equal annual installments on February 7th of each of 2018, 2019 and 2020 andhave a ten-year term.
(2) Market price assumes a price of $8.37 per share, the closing price for our common shares on June 28, 2019.(3) The non-vested stock equity, or restricted stock, vest in two or three equal installments from date of grant,
subject to continued service with us.(4) 103,786 of the RSU awarded vest in three equal installments on each July 1st of 2018, 2019 and 2020,
subject to continued service with us. One-half of 13,023 RSU awarded vest on each February 12th of 2020,2021 and 2022, and the other one-half vest on each September 15th of 2019, 2020 and 2021, based on theattainment of certain EBITDA targets. The vesting for both tranches is subject to continued service with us.
Employment Agreements
Mr. Valenta served as our Chief Executive Officer until December 31, 2017 pursuant to his employmentagreement dated February 11, 2009. Under the employment agreement and base salary increases approved by theCompensation Committee, Mr. Valenta received a base salary of $425,000 per year and a monthly car allowanceof $2,500 and payment of health, dental, vision and supplemental disability premiums for himself and his family.Mr. Valenta retired as our Chief Executive Officer on December 31, 2017.
On January 1, 2018, we entered into an employment agreement with Ronald Valenta, under which he agreedto serve to serve as the Executive Chairman of the Board. Under the employment agreement, Mr. Valenta’s baseannual salary is $240,000 and is eligible to receive a quarterly bonus of $46,250 and an annual bonus each fiscalyear determined by the Compensation Committee, provided he is employed on the last day of such year. Wereimburse Mr. Valenta up to $2,500 per month for a car allowance and health, dental, vision and supplementaldisability premiums for Mr. Valenta and his family. Mr. Valenta is entitled to a severance payment equal to oneyear’s salary if his employment is terminated without cause, as defined in the employment agreement.
On January 1, 2018, we entered into an employment agreement with Jody Miller, under which he agreed toserve as our Chief Executive Officer and President. Under the employment agreement, Mr. Miller received a base
33
annual salary of $335,000 until June 30, 2018, $400,000 in during fiscal year 2019 and $425,000 in fiscal year2020 and is eligible to receive an annual bonus each fiscal year of $250,000, $300,000 and $350,000 in fiscalyears 2018, 2019 and 2020, respectively, provided he is employed on the last day of such year. Mr. Miller isentitled to a severance payment equal to one year’s salary if his employment is terminated without cause, asdefined in the employment agreement. We pay Mr. Miller an automobile allowance of $650 per month, and wereimburse Mr. Miller for health, dental, vision and supplemental disability premiums for himself and his family.Mr. Miller is entitled to participate on the same basis in all offered benefits or programs as any other employee.
On September 11, 2006, we entered into an employment agreement with Charles E. Barrantes, under whichhe agreed to serve as our Executive Vice President and Chief Financial Officer. Under the employmentagreement and base salary increases approved by the Compensation Committee, Mr. Barrantes received a baseannual salary of $280,000 during fiscal year 2018 and is eligible to receive an annual bonus each fiscal yeardetermined by the Compensation Committee, provided he is employed on the last day of such year. EffectiveJuly 1, 2018 Mr. Barrantes’ base salary was increased to $300,000 per year, and effective July 1, 2019Mr. Barrantes’ base salary was increased to $309,000 per year. We reimburse Mr. Barrantes for health, dental,vision and supplemental disability premiums for himself and his family. Mr. Barrantes is entitled to participateon the same basis in all offered benefits or programs as any other employee. On June 30, 2009, we entered intoan amended and restated employment agreement with Mr. Barrantes that provides that Mr. Barrantes is entitledto a severance payment equal to one year’s salary if his employment is terminated without cause, as defined inthe employment agreement.
On September 15, 2011, we entered into an employment agreement with Jeffrey Kluckman, under which heagreed to serve as our Executive Vice President of Business Development. Under the employment agreement,Mr. Kluckman received a base annual salary of $225,000, and is eligible to receive an annual bonus each fiscalyear, provided he is employed on the last day of such year. Mr. Kluckman is entitled to a severance paymentequal to one year’s salary if his employment is terminated without cause, as defined in the employmentagreement. Effective in February 2018, with his new title of Executive Vice President of Global BusinessDevelopment, Mr. Kluckman’s annual base salary was increased to $250,000, and Mr. Kluckman beganreceiving a monthly allowance of $450 per month. Effective July 1, 2019 Mr. Kluckman’s annual base salarywas increased to $275,000. We reimburse Mr. Kluckman for health, dental, vision and supplemental disabilitypremiums for himself and his family. Mr. Kluckman is entitled to participate on the same basis in all offeredbenefits or programs as any other employee.
Royal Wolf entered into an employment agreement with Neil Littlewood dated February 7, 2016. Under hisemployment agreement Mr. Littlewood agreed to serve as the chief executive officer of Royal Wolf Holdingscommencing on July 1, 2016 until the agreement was terminated. The employment agreement provides thatMr. Littlewood would be paid an annual base salary of A$475,000 (including superannuation contributions), anannual discretionary bonus targeted at 40% of the annual base salary and long-term incentives in each fiscal yeartargeted at 40% of the annual base salary. Mr. Littlewood’s employment agreement requires either six months’notice prior to termination or the payment of six months’ salary in lieu of such notice.
The employment agreements of Mr. Valenta, Mr. Miller, Mr. Barrantes and Mr. Kluckman will terminateupon the date of their death or in the event of a physical or mental disability that renders either of them unable toperform his duties for 60 consecutive days or 120 days in any twelve-month period. Mr. Valenta, Mr. Barrantes,Mr. Miller and Mr. Kluckman may terminate their respective employment agreements at any time upon 30 days’notice to us, and we may terminate these agreements at any time upon notice to Mr. Valenta, Mr. Miller,Mr. Barrantes and Mr. Kluckman.
In approving the compensation of Mr. Valenta, Mr. Miller, Mr. Barrantes, Mr. Littlewood andMr. Kluckman, the Board reviewed information provided by management regarding the compensation ofcomparable level officers of public companies, including companies in the equipment leasing business. TheBoard also considered the size of the Company, the experience and prior compensation of Mr. Valenta,
34
Mr. Miller, Mr. Barrantes, Mr. Littlewood and Mr. Kluckman, and the scope of the services that each would berequired to render (particularly given the lack of support staff and the need to implement policies andprocedures).
Potential Payments Upon Termination of Employment or Change in Control
The employment agreements of Mr. Valenta, Mr. Miller, Mr. Barrantes and Mr. Kluckman provide that eachis entitled to a lump sum severance payment of twelve months base salary if we terminate their employmentwithout “cause” or he terminates his employment for “good reason.” Mr. Littlewood’s employment agreementrequires either six months’ notice prior to termination or the payment of six months’ salary in lieu of such notice.
None of the employment agreements of Mr. Valenta, Mr. Miller, Mr. Barrantes, Mr. Kluckman orMr. Littlewood includes a provision that would require a payment upon a change of control.
35
2019 CEO TO MEDIAN EMPLOYEE PAY RATIO
The Dodd-Frank Act requires the Company to determine the ratio of the annual total compensation (underthe Summary Compensation Table definition) of Company’s Chief Executive Officer to that of the Company’smedian employee. In the identification of our median employee we used June 30, 2019, or the last day of yourfiscal year 2019, as our determination date. As of the determination date, the Company had 1,291 employees,excluding the Chief Executive Officer. For purposes of identifying the median employee we included in thecalculation of compensation: base salary, stock-based compensation (based on the grant date fair value of awardsgranted in 2019), target bonus amounts, estimated annual commissions and estimated overtime. We ranked ourfull employee population from the highest paid to the lowest paid, and the employee at the midpoint is ourmedian employee.
The total compensation for the median employee was then calculated in accordance with Item 402(c)(2)(x)of SEC Regulation S-K. Annual total compensation for Mr. Miller, the Company’s Chief Executive Officer was$1,175,368, which was approximately 25 times the median employee compensation of $47,043.18.
This pay ratio is a reasonable estimate calculated in a manner consistent with SEC rules based on ourpayroll and employment records and the methodology described above. The SEC rules for identifying the mediancompensated employee and calculating the pay ratio based on that employee’s annual total compensation allowcompanies to adopt a variety of methodologies, to apply certain exclusions, and to make reasonable estimates andassumptions that reflect their compensation practices. As such, the pay ratio reported by other companies maynot be comparable to the pay ratio reported above, as other companies may have different employment andcompensation practices and may use different methodologies, exclusions, estimates and assumptions incalculating their pay ratios.
36
TRANSACTIONS WITH RELATED PERSONS
Effective January 31, 2008, we entered into a lease with an affiliate of Ronald F. Valenta, who served at thattime as the Company’s Chief Executive Officer and who now serves as the Company’s Executive Chairman ofthe Board, for our corporate headquarters in Pasadena, California. The lease provides for rent of $7,393 permonth, effective March 1, 2009, plus allocated charges for common area maintenance, real property taxes andinsurance, for approximately 3,000 square feet of office space. The term of the lease is five years, with two five-year renewal options, and the rent is adjusted yearly based on the consumer price index. On October 11, 2012, weexercised the first option to renew the lease for an additional five-year term commencing February 1, 2013 andon August 7, 2017, exercised the second option for an additional five-year term commencing on February 1,2018. Rental payments were $113,000 in fiscal year 2017, $112,000 in fiscal year 2018 and $111,000 in fiscalyear 2019.
The premises of Pac-Van’s Las Vegas branch are owned by and were leased from the then acting Pac-Vanbranch manager through December 31, 2016. From January 1, 2017 through May 12, 2017, Pac-Van leased thepremises on a month-to-month basis. Effective May 12, 2017, we entered into a lease agreement throughDecember 31, 2020 for rental of $10,876 per month and the right to extend the term of the lease for threetwo-year options, with the monthly rental increasing at each option period from $11,420 to $12,590 per month.Rental payments on these premises totaled $124,000 in fiscal year 2017, $131,000 in fiscal year 2018 and$176,000 in fiscal year 2019.
We have not adopted a formal written policy regarding transactions with related persons. However, ingeneral, any such related party transaction would require approval of the Board, with any interested directorabstaining.
37
STOCKHOLDER COMMUNICATIONS WITH DIRECTORS
Stockholders who want to communicate with the Board or any individual director should write to: Secretary,General Finance Corporation, 39 East Union Street, Pasadena, California 91103. The letter should indicate thatyou are a stockholder of General Finance Corporation and set forth the number of shares you hold and how theshares are held if they are not registered in your name. Depending upon the subject matter, the Secretary will:
• Forward the communication to the director or directors to whom it is addressed;
• Delegate the inquiry to management where it is a request for information about the Company or astock-related matter; or
• Not forward the communication, if it is primarily commercial in nature, or if it relates to an improper orirrelevant topic, or is repetitive or redundant.
STOCKHOLDER RECOMMENDATIONS FOR BOARD NOMINEES
The Company’s Bylaws require that a stockholder’s notice of a person or persons the stockholder wishes tonominate as director or submit a proposal for vote at the Annual Meeting of Stockholders must be delivered inwriting to the Company’s Secretary at 39 East Union Street, Pasadena, California 91103 not less than 60 days normore than 90 days prior to the date of the 2019 Annual Meeting of Stockholders. If the Company does notpublicly disclose the date of the 2019 Annual Meeting of Stockholders at least 70 days prior to the date of themeeting, a stockholder’s notice must be received by the Company’s Secretary not later than the close of businesson the 10th day following the day on which such notice of the date of meeting was mailed or such publicdisclosure of such meeting was made.
We intend to hold our 2020 Annual Meeting of Stockholders in December 2020. As a result, if, for example,we hold our 2020 Annual Meeting of Stockholders on December 3, 2020 and publicly disclose or notifystockholders by mail of the date of the 2020 Annual Meeting of Stockholders at least 100 days prior toDecember 3, 2020, any notice given by a stockholder pursuant to these provisions of our Bylaws must bereceived no earlier than September 4, 2020 and no later than October 4, 2020.
To be in proper form, a stockholder’s notice must include the specified information concerning the proposalor nominee as described in our Bylaws. A stockholder who wishes to submit a proposal or nomination isencouraged to seek independent counsel about our Bylaws and legal requirements. The Company will notconsider any proposal or nomination that does not meet the requirements of the Company’s Bylaw and SECrequirements for submitting a nomination.
Stockholders who pursuant to Rule 14a-8 under the Exchange Act wish to present proposals for inclusion inthe proxy materials to be distributed in connection with our proxy statement for the 2020 annual meeting mustsubmit their proposals and proof of ownership of our common stock, in accordance with Rule 14a-8 under theExchange Act, to our corporate secretary at our principal executive offices no later than the close of business onJune 23, 2020 (120 days prior to the anniversary of this year’s mailing date). To be in proper form astockholder’s notice must include the specified information concerning the nominee or proposal required by ourBylaws. Any nomination or proposal which is not in the proper form or which is not submitted on a timely basis,as described above, will not be considered by the Company to be included in our proxy statement. The Companyreserves the right to exclude any proposal that does not comply with these or other applicable requirements.
38
OTHER MATTERS
Management does not know of any matters to be presented to the Annual Meeting other than those set forthabove. However, if other matters properly come before the Annual Meeting, it is the intention of the personsnamed in the accompanying proxy to vote said proxy in accordance with the recommendation of the Board andauthority to do so is included in the proxy.
AVAILABILITY OF ANNUAL REPORT ON FORM 10-K
We will furnish without charge a copy of our 2019 Annual Report, as filed with the Securities andExchange Commission, including the financial statements and financial statement schedule thereto, to anystockholder who so requests by writing to: Secretary, General Finance Corporation, 39 East Union Street,Pasadena, California 91103.
The 2019 Annual Report is not incorporated into this proxy statement and is not to be considered to be apart of our proxy solicitation materials.
By Order of the Board of Directors
Christopher A. WilsonGeneral Counsel, Vice President and Secretary
Dated: October 18, 2019
39
10-KUNITED STATES
SECURITIES AND EXCHANGE COMMISSIONWashington, D.C. 20549
FORM 10-K
È ANNUAL REPORT PURSUANT TO SECTION 13 OR 15(d) OF THE SECURITIES EXCHANGEACT OF 1934
For the Fiscal Year Ended June 30, 2019
OR
‘ TRANSITION REPORT PURSUANT TO SECTION 13 OR 15(d) OF THE SECURITIES EXCHANGEACT OF 1934
Commission file number 001-32845
(Exact name of registrant as specified in its charter)
Delaware 32-0163571(State or other Jurisdiction ofIncorporation or Organization)
(I.R.S. EmployerIdentification No.)
39 East Union StreetPasadena, California 91103 (626) 584-9722
(Address of Principal Executive Offices) (Registrant’s telephone number, including area code)
Securities registered pursuant to Section 12(b) of the Act:
Title of Each ClassTradingSymbol(s)
Name of Each Exchange On WhichRegistered
Common Stock, $0.0001 par value GFN NASDAQ Global Market
9.00% Series C Cumulative RedeemablePerpetual Preferred Stock (Liquidation
Preference $100 per share) GFNCP NASDAQ Global Market
8.125% Senior Notes due 2021 GFNSL NASDAQ Global Market
Securities registered pursuant to Section 12(g) of the Act:None
Indicate by check mark if the registrant is a well-known seasoned issuer, as defined in Rule 405 the Securities Act. Yes ‘ No È
Indicate by check mark if the registrant is not required to file reports pursuant to Section 13 or Section 15(d) of the Act. Yes ‘ No È
Indicate by check mark whether the registrant: (1) has filed all reports required to be filed by Section 13 or 15(d) of the Securities Exchange Act of 1934 during thepreceding 12 months (or for such shorter period that the registrant was required to file such reports) and (2) has been subject to such filing requirements for the last90 days. Yes È No ‘
Indicate by check mark whether the registrant has submitted electronically every Interactive Data File required to be submitted pursuant to Rule 405 of Regulation S-T(§232.405 of this chapter) during the preceding 12 months (or for such shorter period that the registrant was required to submit such files).
Yes È No ‘
Indicate by check mark whether the registrant is a large accelerated filer, an accelerated filer, a non-accelerated filer, a smaller reporting company, or an emerging growthcompany. See definition of “large accelerated filer,” “accelerated filer,” non-accelerated filer,” “smaller reporting company” and “emerging growth company” inRule 12b-2 of the Exchange Act.
Large accelerated filer ‘ Accelerated filer È
Non-accelerated filer ‘ (Do not check if a smaller reporting company) Smaller reporting company ‘
Emerging growth company ‘
If an emerging growth company, indicate by check mark if the registrant has elected not to use the extended transition period for complying with any new or revisedfinancial accounting standards provided pursuant to Section 13(a) of the Exchange Act. ‘
Indicate by check mark whether the registrant is a shell company (as defined in Rule 12b-2 of the Exchange Act). Yes ‘ No È
The aggregate market value of Common Stock held by non-affiliates of the Registrant on December 31, 2018 was approximately $122,778,000 based on a closing price of$10.11 for the Common Stock on such date. For purposes of this computation, all executive officers and directors have been deemed to be affiliates. Such determinationshould not be deemed to be an admission that such executive officers and directors are, in fact, affiliates of the Registrant.
There were 30,528,431 shares of the Registrant’s Common Stock outstanding as of September 5, 2019.
DOCUMENTS INCORPORATED BY REFERENCE
Portions of the Registrant’s Proxy Statement for its 2019 Annual Meeting of Stockholders are incorporated by reference into Part III of this Annual Report on Form 10-K.In addition, certain exhibits are incorporated into Part IV, Item 15. of this Annual Report on Form 10-K by reference to other reports and registration statements of theRegistrant, which have been filed with the Securities and Exchange Commission.
GENERAL FINANCE CORPORATION2019 ANNUAL REPORT ON FORM 10-K
TABLE OF CONTENTS
Page
SAFE HARBOR STATEMENT . . . . . . . . . . . . . . . . . . . . . . . . . . . . . . . . . . . . . . . . . . . . . . . . . . . . . . . . . ii
PART I
Item 1. Business . . . . . . . . . . . . . . . . . . . . . . . . . . . . . . . . . . . . . . . . . . . . . . . . . . . . . . . . . . . . . . . . . . . I-1
Item 1A. Risk Factors . . . . . . . . . . . . . . . . . . . . . . . . . . . . . . . . . . . . . . . . . . . . . . . . . . . . . . . . . . . . . . . I-24
Item 1B. Unresolved Staff Comments . . . . . . . . . . . . . . . . . . . . . . . . . . . . . . . . . . . . . . . . . . . . . . . . . . I-46
Item 2. Properties . . . . . . . . . . . . . . . . . . . . . . . . . . . . . . . . . . . . . . . . . . . . . . . . . . . . . . . . . . . . . . . . . . I-47
Item 3. Legal Proceedings . . . . . . . . . . . . . . . . . . . . . . . . . . . . . . . . . . . . . . . . . . . . . . . . . . . . . . . . . . . . I-50
Item 4. Mine Safety Disclosures . . . . . . . . . . . . . . . . . . . . . . . . . . . . . . . . . . . . . . . . . . . . . . . . . . . . . . . I-50
PART II
Item 5. Market for Registrant’s Common Equity, Related Stockholder Matters and Issuer Purchasesof Equity Securities . . . . . . . . . . . . . . . . . . . . . . . . . . . . . . . . . . . . . . . . . . . . . . . . . . . . . . . . . . . . . . . II-1
Item 6. Selected Financial Data . . . . . . . . . . . . . . . . . . . . . . . . . . . . . . . . . . . . . . . . . . . . . . . . . . . . . . . II-3
Item 7. Management’s Discussion and Analysis of Financial Condition and Results of Operations . . . II-5
Item 7A. Quantitative and Qualitative Disclosures About Market Risk . . . . . . . . . . . . . . . . . . . . . . . . . II-24
Item 8. Financial Statements and Supplementary Data . . . . . . . . . . . . . . . . . . . . . . . . . . . . . . . . . . . . . II-24
Item 9. Changes in and Disagreements with Accountants on Accounting and Financial Disclosure . . II-24
Item 9A. Controls and Procedures . . . . . . . . . . . . . . . . . . . . . . . . . . . . . . . . . . . . . . . . . . . . . . . . . . . . . II-24
Item 9B. Other Information . . . . . . . . . . . . . . . . . . . . . . . . . . . . . . . . . . . . . . . . . . . . . . . . . . . . . . . . . . . II-26
PART III
Item 10. Directors, Executive Officers and Corporate Governance . . . . . . . . . . . . . . . . . . . . . . . . . . . . III-1
Item 11. Executive Compensation . . . . . . . . . . . . . . . . . . . . . . . . . . . . . . . . . . . . . . . . . . . . . . . . . . . . . III-1
Item 12. Security Ownership of Certain Beneficial Owners and Management and RelatedStockholder Matters . . . . . . . . . . . . . . . . . . . . . . . . . . . . . . . . . . . . . . . . . . . . . . . . . . . . . . . . . . . . . . III-1
Item 13. Certain Relationships and Related Transactions, and Director Independence . . . . . . . . . . . . . III-1
Item 14. Principal Accountant Fees and Services . . . . . . . . . . . . . . . . . . . . . . . . . . . . . . . . . . . . . . . . . . III-1
PART IV
Item 15. Exhibits, Financial Statement Schedules . . . . . . . . . . . . . . . . . . . . . . . . . . . . . . . . . . . . . . . . . IV-1
Item 16. Form 10-K Summary . . . . . . . . . . . . . . . . . . . . . . . . . . . . . . . . . . . . . . . . . . . . . . . . . . . . . . . . IV-6
SIGNATURES . . . . . . . . . . . . . . . . . . . . . . . . . . . . . . . . . . . . . . . . . . . . . . . . . . . . . . . . . . . . . . . . . . . . . . . . SIG
i
SAFE HARBOR STATEMENT
This Annual Report on Form 10-K, including the documents incorporated by reference into this AnnualReport on Form 10-K, contains forward-looking statements within the meaning of Section 27A of the SecuritiesAct of 1933, as amended, referred to in this Annual Report on Form 10-K as the Securities Act, and Section 21Eof the Securities Exchange Act of 1934, as amended, referred to in this Annual Report on Form 10-K as theExchange Act. Forward-looking statements involve risks and uncertainties that could cause results or outcomesto differ materially from those expressed in the forward-looking statements. Forward-looking statements mayinclude, without limitation, statements relating to our plans, strategies, objectives, expectations and intentionsand are intended to be made pursuant to the safe harbor provisions of the Private Securities Litigation ReformAct of 1995. Some of the forward-looking statements can be identified by the use of forward-looking terms suchas “believes,” “expects,” “may,” “will,” “should,” “could,” “seek,” “intends,” “plans,” “estimates,” “anticipates”or other comparable terms. A number of important factors could cause actual results to differ materially fromthose in the forward-looking statements. The risks and uncertainties discussed in “Risk Factors” should beconsidered in evaluating our forward-looking statements. You should not place undue reliance on our forward-looking statements. Further, any forward-looking statement speaks only as of the date on which it is made, andwe undertake no obligation to update or revise any forward-looking statements.
ii
PART I
Item 1. Business
References to “we,” “us,” “our” or the “Company” refer to General Finance Corporation, a Delawarecorporation (“GFN”), and its consolidated subsidiaries. These subsidiaries include GFN U.S. AustralasiaHoldings, Inc., a Delaware corporation (“GFN U.S.”); GFN Insurance Corporation, an Arizona corporation(“GFNI”); GFN North America Leasing Corporation, a Delaware corporation (“GFNNA Leasing”); GFN NorthAmerica Corp., a Delaware corporation (“GFNNA”); GFN Realty Company, LLC, a Delaware limited liabilitycompany (“GFNRC”); GFN Manufacturing Corporation, a Delaware corporation (“GFNMC”), and itssubsidiary, Southern Frac, LLC, a Texas limited liability company (collectively “Southern Frac”); Pac-Van, Inc.,an Indiana corporation, and its Canadian subsidiary, PV Acquisition Corp., an Alberta corporation (collectively“Pac-Van”); and Lone Star Tank Rental Inc., a Delaware corporation (“Lone Star”); GFN Asia Pacific HoldingsPty Ltd, an Australian corporation (“GFNAPH”), and its subsidiaries, Royal Wolf Trading Australia Pty Limitedand Royalwolf Trading New Zealand Limited, a New Zealand Corporation (collectively, “Royal Wolf”).
Overview
Founded in 2005, we are a leading specialty rental services company offering portable storage, modularspace and liquid containment solutions, with a diverse and expanding lease fleet of 99,743 units as of June 30,2019. Our primary 101 branch locations across North America and the Asia-Pacific offer a wide range ofportable storage units, including our core 20-feet and 40-feet steel containers, office container, mobile office andmodular space products and steel tanks that provide our customers a flexible, cost-effective and convenient wayto meet their temporary storage and space needs. Our units are easily customized to satisfy our customers’specific application needs and include numerous value-added components. We provide our storage solutions to adiverse base of over 50,000 customers across a broad range of industries, including the commercial, construction,transportation, industrial, energy, manufacturing, mining, retail, consumer, education and government sectors.Our customers utilize our storage and space units for a wide variety of applications, including the temporarystorage of materials, supplies, equipment, retail merchandise inventories, documents and liquid storage and foroffice use.
We focus on leasing rather than selling our units. Approximately 65% of our total non-manufacturingrevenues for the year ended June 30, 2019 (“FY 2019”) were derived from leasing activities. We believe ourbusiness model is compelling because it is driven by lease fleet assets that:
• generate a recurring revenue stream with average lease durations of over 12 months;
• possess long useful lives of 20 to 30 years with high residual values;
• return the original equipment cost through revenue within four years on average;
• operate at high lease fleet utilization levels, historically between 70% and 85%;
• require low maintenance expenditures; and
• earn attractive margins.
Our lease fleet is comprised of three distinct specialty rental equipment categories that possess attractiveasset characteristics and serve our customers’ on-site temporary needs and applications. These categories matchthe sectors we serve and which we collectively refer to as the “portable services industry” - portable (or mobile)storage, modular space and liquid containment.
Our portable storage category is segmented into two products: (1) storage containers, which primarilyconsist of new and used steel shipping containers under International Organization for Standardization (“ISO”)standards, that provide a flexible, low cost alternative to warehousing, while offering greater security,
I-1
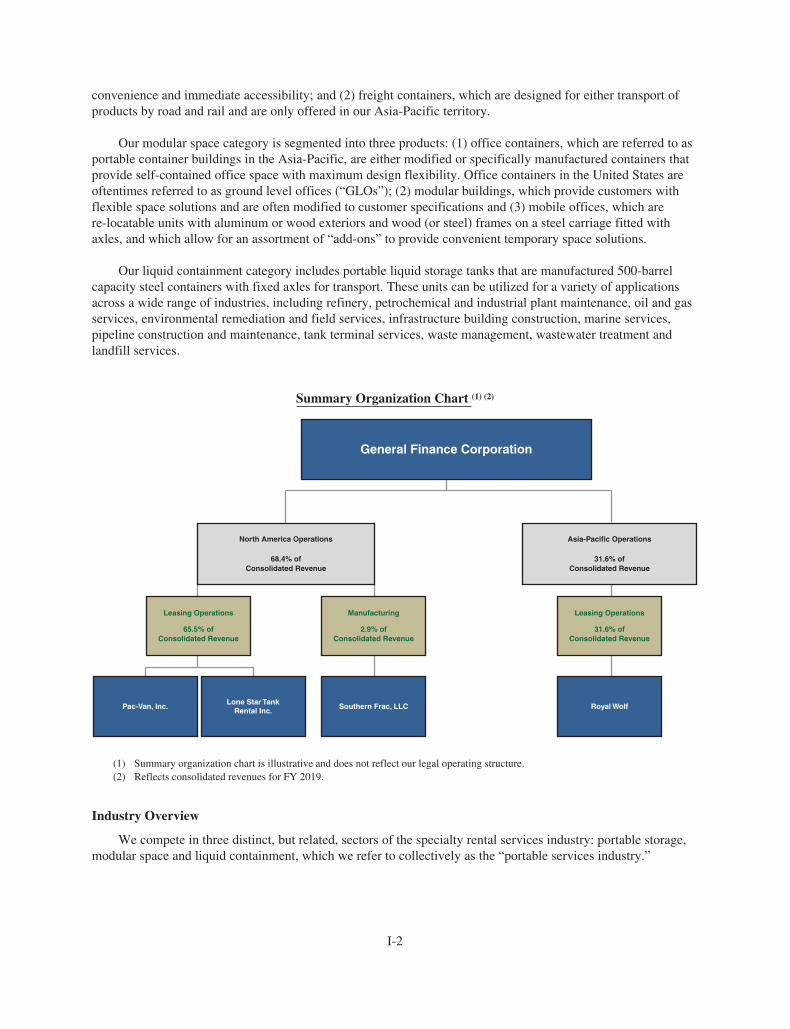
convenience and immediate accessibility; and (2) freight containers, which are designed for either transport ofproducts by road and rail and are only offered in our Asia-Pacific territory.
Our modular space category is segmented into three products: (1) office containers, which are referred to asportable container buildings in the Asia-Pacific, are either modified or specifically manufactured containers thatprovide self-contained office space with maximum design flexibility. Office containers in the United States areoftentimes referred to as ground level offices (“GLOs”); (2) modular buildings, which provide customers withflexible space solutions and are often modified to customer specifications and (3) mobile offices, which arere-locatable units with aluminum or wood exteriors and wood (or steel) frames on a steel carriage fitted withaxles, and which allow for an assortment of “add-ons” to provide convenient temporary space solutions.
Our liquid containment category includes portable liquid storage tanks that are manufactured 500-barrelcapacity steel containers with fixed axles for transport. These units can be utilized for a variety of applicationsacross a wide range of industries, including refinery, petrochemical and industrial plant maintenance, oil and gasservices, environmental remediation and field services, infrastructure building construction, marine services,pipeline construction and maintenance, tank terminal services, waste management, wastewater treatment andlandfill services.
Summary Organization Chart (1) (2)
General Finance Corporation
Asia-Pacific Operations
31.6% ofConsolidated Revenue
North America Operations
68.4% ofConsolidated Revenue
Leasing Operations
65.5% ofConsolidated Revenue
Pac-Van, Inc.Lone Star Tank
Rental Inc.Southern Frac, LLC Royal Wolf
Manufacturing
2.9% ofConsolidated Revenue
Leasing Operations
31.6% ofConsolidated Revenue
(1) Summary organization chart is illustrative and does not reflect our legal operating structure.(2) Reflects consolidated revenues for FY 2019.
Industry Overview
We compete in three distinct, but related, sectors of the specialty rental services industry: portable storage,modular space and liquid containment, which we refer to collectively as the “portable services industry.”
I-2
Portable Storage
The storage industry includes two principal markets, fixed self-storage and portable storage. The fixed self-storage market consists of permanent structures located away from customer locations used primarily byconsumers to temporarily store excess household goods. We do not participate in the fixed self-storage marketwith permanent structures. The portable storage market, in which we primarily operate, differs from the fixedself-storage market in that it brings the storage solution to the customer’s location and addresses the need forsecure, temporary storage with immediate access to the storage unit. The advantages of portable storage includeconvenience, immediate accessibility, improved security and lower costs. In contrast to fixed self-storage, theportable storage market is primarily used by businesses and offers a flexible, secure, cost-effective andconvenient alternative to constructing permanent warehouse space or storing items at an offsite facility. A broadrange of industries, including the construction, industrial, commercial, retail and government sectors, utilizeportable storage equipment to meet both their short-term and permanent storage needs.
The portable storage industry is fragmented in each of our geographic markets, with numerous participantsin local markets leasing and selling portable storage units. While we are not aware of any published third-partyanalysis of either the Asia-Pacific or North American portable storage markets, we believe the portable storagesector has experienced steady growth since the 1990s and is achieving increased market share compared to otherstorage alternatives because of an increasing awareness of the benefits that portable storage units offer, includingthe availability, convenience, security and cost benefits of portable storage, as well as an increasing number ofnew applications for portable storage units.
Modular Space
Modular space solutions, including modular buildings, mobile offices and portable container buildings, areused primarily by businesses to address either temporary or permanent space needs. We believe modular spacedelivers four core benefits compared to permanent buildings or structures: reusability, timely solutions, lowercosts and flexibility. Modular buildings may offer customers significant cost savings over permanentconstruction and can generally be installed more quickly because site work and fabrication can take placeconcurrently. In addition, modular solutions are not site specific and can be configured in a number of ways tomeet multiple needs. Finally, modular buildings are reusable and will generally serve a wide variety of usesduring their life span. A variety of industries utilize modular space solutions, including construction, resources,government, education, retail and special events, among others.
The Modular Building Institute, in its 2019 Relocatable Buildings Annual Data Report, stated that the NorthAmerican modular space (or relocatable) sector, as reported by its members only, generated approximately$2.0 billion in annual revenues and management believes that the total sector to be approximately $4.0 billion.The sector has evolved in recent years as the number of applications for modular space has expanded andrecognition of the product’s positive attributes has grown. By outsourcing their space needs, customers are ableto achieve flexibility, preserve capital for core operations, and convert fixed costs into variable costs. The IBISWorld Industry Report published in October 2018 estimated that the portable container buildings market inAustralia generated revenue of AUS$1.8 billion ($1.3 billion), of which approximately AUS$1.1 billion ($0.8billion) related to the markets in which we offer a competing product. We believe that we are well positioned tobenefit from any growth in the North American and Asia-Pacific modular space markets.
We expect that the modular space market will grow over the long-term, driven in part by increasingawareness of the advantages of modular space. Additionally, we believe that the advantages of modular spaceover permanent buildings and structures of reusability, timely solutions, lower costs, and flexibility are highlyvalued in many of the end markets we serve. We further believe the increased penetration of modular spacesolutions in additional end markets will also continue to drive market growth.
I-3
Liquid Containment
Portable liquid storage tank containers are used in environmental and industrial applications to temporarilystore hazardous and nonhazardous liquids and semi-solids. The tanks are used by customers across a wide varietyof end markets, including chemical, refinery and industrial plant maintenance, environmental remediation,infrastructure building construction, marine services, oil and gas exploration and field services, pipelineconstruction and maintenance, tank terminal services, wastewater treatment and waste management and landfillservices. Liquid containment end market demand is recurring and is driven by the non-discretionary nature ofrequired customer maintenance cycles, an increasing enforcement of existing environmental regulations, agrowing outsourcing of liquid containment solutions and an increasing level of vendor consolidation. We believethat the rental industry in the U.S. for liquid containment equipment is fragmented and generated approximately$1.4 billion of annual rental revenues in 2013 – 2014. As a result of the decline in oil and gas prices during thelatter part of our year ended June 30, 2015, the size of the liquid containment sector has contracted. However, oiland gas drilling and production activity increased in the year ended June 30, 2018 (“FY 2018”) and stabilized inFY 2019, particularly in the Permian Basin of Texas. We believe that we can leverage our branch network,existing relationships and operating philosophies to successfully compete in this sector. Our research indicatesthat many of the companies that used containment solutions also used portable storage and mobile officeproducts.
Competitive Strengths
Leading Provider with Strong Presence in Served Markets
We believe we are a leading provider of portable storage, modular space and liquid containment solutions inall of the territories we serve. In North America, Pac-Van is a recognized national provider of portable storage,modular buildings and mobile offices. Lone Star is a market leader in portable liquid storage tank rental andrelated services in the Permian Basin in West Texas and the Eagle Ford Shale in South Texas. In the Asia-Pacificarea, we believe Royal Wolf is the leading provider in Australia and New Zealand of portable storage containers,portable container buildings and freight containers. Royal Wolf is represented in all major metropolitan areas,and we believe it maintains the largest branch network and container fleet, with an estimated 35% market sharein Australia and 50% market share in New Zealand, and is estimated to be at least twice the size of the nextclosest competitor in Australia and New Zealand.
Superior Service Focus
Our operating infrastructure in each of our markets is designed to ensure that we consistently meet orexceed customer expectations. Our scalable management information systems and administrative supportservices enhance our customer service capabilities by enabling our operating management teams to access realtime information on product availability, customer reservations, customer usage history and rates on a national,regional and local level. We believe these capabilities enable us to provide superior customer service, allowing usto attract new and retain existing customers. With the goal of delivering “best in class” customer service, webegan collecting customer responses on net promoter scores (“NPS”) in North America at Pac-Van, which trackcustomer willingness to recommend our products and services, and for FY 2019 our customers gave us an NPSof 84. In the Asia Pacific at Royal Wolf our customers there gave us an NPS of 69 in FY 2019. In addition, over85% of our consolidated total leasing revenues in FY 2019 were derived from repeat customers, which webelieve is a result of our superior customer service.
Extensive Reach and Capabilities
Through our expansive primary branch network of 101 locations, we maintain national service capabilitiesin our markets. In North America, our branches serve 51 of the top 100 U.S. Metropolitan Statistical Areas, orMSAs. With our expansion into Alberta and British Columbia, we are now also able to serve the westernprovinces in Canada. Our Lone Star branches are strategically positioned to be able to respond quickly and
I-4
maximize service opportunities with customers in the Permian Basin and Eagle Ford Shale. We also have branchoffices located in every state in Australia and on both the North and South Islands of New Zealand. We are theonly portable storage container company in these Asia-Pacific markets with a national infrastructure andworkforce.
Geographic, Product and End Market Diversification
Our specialty rental units are used in a wide variety of applications, and we have established strongrelationships with a diversified customer base in both our North American and Asia-Pacific venues. Ourcustomers range from large companies with a national presence to small local businesses. On a consolidatedbasis, during FY 2019 we served over 50,000 customers across a broad range of industries. In FY 2019, ourlargest customer in each venue accounted for less than 5% of the respective venue’s revenues and our 20 largestcustomers in each venue accounted for less than 25% of the respective venue’s revenues. We believe that thebreadth of our products and services limits the impact of changes within any given customer or industry.
High Quality Fleet with Attractive Asset Characteristics
Our branch offices maintain our lease fleet to consistent quality standards. Maintenance costs are expensedas incurred and branch managers and operations staff are responsible for managing a maintenance programaimed at providing equipment to customers that meets or exceeds customer expectations and industry standards.All of our lease fleet carries signage reflecting its respective brands, which is important to ongoing namerecognition in our markets. Our lease fleet possesses attractive asset characteristics, including long economicuseful lives with high residual values, predictable and recurring revenue streams, low maintenance expense, rapidpayback periods, high incremental leasing margins and favorable tax attributes. We believe these characteristicsallow us to generate high returns on invested capital relative to other rental services sectors and a level ofdiscretion in investing this capital.
Experienced Management Team
We believe our management team’s experience and long tenure with our company and within the industrygive us a strong competitive advantage. Our current senior executive management team in FY 2019, led by ourExecutive Chairman of the Board, Ronald F. Valenta, who has been with us since our inception, has successfullyentered new markets, expanded our customer base and integrated a number of meaningful acquisitions. Hestepped down as Chief Executive Officer and assumed the title of Executive Chairman of the Board in January2018. Jody Miller, who became President in January 2017, became our Chief Executive Officer in January 2018and has been Chief Executive Officer of GFNNA Leasing since June 2015. He has spent over 25 years in theequipment rental industry.
Neil Littlewood, who became Chief Executive Officer of Royal Wolf in July 2016, has over 18 years ofsenior experience in the rental/hire industry and Pac-Van’s Chief Executive Officer and President, Theodore M.Mourouzis, joined Pac-Van in 1997 and has been integral to our successful growth in North America.
Lone Star’s management team has extensive experience in the oil and gas industry and emphasizes safetytraining and monitoring for all employees.
Our senior management, as well as corporate, regional and branch managers across all of our operatingcompanies, has been integral in developing and maintaining our high level of customer service, deployingtechnology to improve operational efficiencies and successfully integrating acquisitions.
I-5
Business Strategy
Our business strategy consists of the following:
Focus on High Margin Core Leasing Business
We focus on growing our core leasing business because it provides recurring revenues from specialty rentalassets that (1) have long useful lives of over 20 years; (2) generate rapid payback of unit investment throughrevenue in less than four years on average; and (3) have high residual values of up to 70% of original equipmentcost. We have successfully increased leasing revenues as a percentage of our consolidated non-manufacturingrevenues from 29% in fiscal year 2007 to 65% for FY 2019. We believe that we can continue to generatesubstantial demand for our leasing products as the industry is still relatively underdeveloped in our markets. Withnew uses for our products continually emerging, we believe many more applications for our specialty rentalsolutions are still yet to be developed.
Generate Organic Growth
We define organic growth as an increase in lease revenues on a year-over-year basis at our branches inoperation for at least one year, excluding leasing revenue attributed to same-market acquisitions. We continue tofocus on increasing the number of our lease fleet units. We believe that our high quality lease fleet and superiorcustomer service enable us to increase our lease rates and utilization rates over time. We generate organic growthwithin our existing markets through sales and marketing programs designed to increase brand recognition,expand market awareness of the uses of our specialty rental units and differentiate our products from ourcompetitors.
Leverage Our Infrastructure
Our branch network infrastructure covers a broad geographic area and is capable of serving significantadditional customer volume while incurring a minimal amount of incremental fixed costs. With our establishedbranch network and infrastructure we generate significant adjusted earnings before interest, income taxes,impairment, depreciation and amortization and other non-operating costs and income (“Adjusted EBITDA”)margins on incremental units deployed. Our objective is to add volume by organically growing the lease fleetacross our locations and through strategic acquisitions. Asset purchases of “tuck-in” competitors and adding newunits to our fleet allow us to more effectively leverage our infrastructure. Between June 30, 2007 and June 30,2019, our lease fleet grew from approximately 16,000 units to over 99,700 units, representing an over 16%compound annual growth rate, and our Adjusted EBITDA margin expanded from 17% in the fiscal year endedJune 30, 2008 to 28% in FY 2019.
Opportunistically Enter New Geographic Markets
We believe a long-term opportunity exists for us to significantly expand the size of our branch network inNorth America by opening up to 30 new locations in attractive markets. Additionally, we expect to open selectsatellite branch locations in our Asia-Pacific territory to expand our service reach to attractive but more remoteareas of Australia and New Zealand.
Pursue Select Strategic Acquisitions
Acquisitions represent an attractive means for us to further leverage our infrastructure, add complementaryproduct lines, enter new geographic regions and accelerate our growth and margin expansion opportunities. Weoperate in fragmented industries, and we seek to identify acquisition candidates that we believe would beearnings accretive. We have a proven integration model that we have effectively used to integrate 57 acquisitionssince June 30, 2005.
I-6
Continue New Product Innovation
We have a history of developing innovative new product concepts to better service our customers’ needs.Our in-house capabilities and third party modification capabilities allow us to customize units to meet customerspecifications. We have introduced many new product innovations, including temporary prison holding cells,hoarding units, blast-resistant units, workforce living accommodations, temporary retail frontage units andobservatory units customized from storage containers. In the Asia-Pacific area we offer over 100 container-baseddesigns for the portable services industry. We believe these innovative new product offerings differentiate us inthe market.
Products and Services
Portable Storage
Our portable storage products primarily consist of steel storage containers and freight containers. Storagecontainers are steel structures, which are generally eight feet wide and eight and one-half feet high; and are builtto ISO standards for carrying ocean cargo. They typically vary in size from 10 feet to 48 feet in length, with20-foot and 40-foot length containers being the most common. Storage containers consist of new and usedshipping containers that provide a flexible, low cost alternative to warehousing, while offering greater security,convenience and immediate accessibility. Storage containers include general purpose dry storage, refrigeratedand specialty containers in a range of standard and modified sizes, designs and capacities. Specialty containersinclude solar lit, blast-resistant, hoarding and hazardous waste units. In FY2018 we introduced our patent-pending safety containers, marketed as PV3 Safety Containers in the United States, CK3 Safety Containers inCanada and the Wolf Lock Premium Container in the Asia/Pacific region. Our freight containers are specificallydesigned for transport of products by road and rail, and include curtain-side, refrigerated and bulk cargocontainers, together with a range of standard and industry-specific dry freight containers. Freight containerproducts are only offered in our Asia-Pacific territory. These products are designed for long useful lives. Aportion of our fleet consists of used storage containers of eight to thirteen years in age, a time at which theiruseful life as ocean-going shipping containers is over according to the standards promulgated by the ISO.Because we do not have the same stacking and strength requirements that apply in the ocean-going shippingindustry, we have no need for these containers to meet ISO standards. We purchase these containers in largequantities, refurbish them by removing any rust and paint them with a rust inhibiting paint, further customizethem, and add our decals and branding.
Modular Space
Our modular space products include office container products, modular buildings and mobile offices. Ouroffice container products (portable building containers and ground level office containers, or GLOs) are eithermodified or specifically-manufactured containers that provide secure and convenient office space with maximumdesign flexibility. Floor plans can either be all office space, with features similar to those found in mobile offices,or a combination of office and storage space. Due to their construction, office containers provide greater securitythan traditional field offices, and since they sit at ground level they do not require stairs for entry and exit.Modular buildings are factory-built, highly customizable portable structures constructed for diverse applications,ranging from schools to restaurants to medical offices and ranging in size from 1,000 to over 50,000 square feet.Mobile offices are factory built, single-unit structures that are re-locatable and used primarily for temporaryoffice space. Mobile offices are generally built on frames that are connected to axles and wheels and have eithera fixed or removable hitch for easy transportation. Mobile offices can be equipped with HVAC systems, lighting,electrical wiring, phone jacks, desk tops, shelving and other features normally associated with basic office space.Mobile sales offices generally have wood siding, carpeting, high ceilings, custom windows and glass storefrontdoors, which provide a professional, customer-friendly building in which to conduct business. In addition tooffering modular buildings for rent, in the Asia-Pacific area, we also provide customers with the ability tocustomize buildings using our in-house engineering team.
I-7
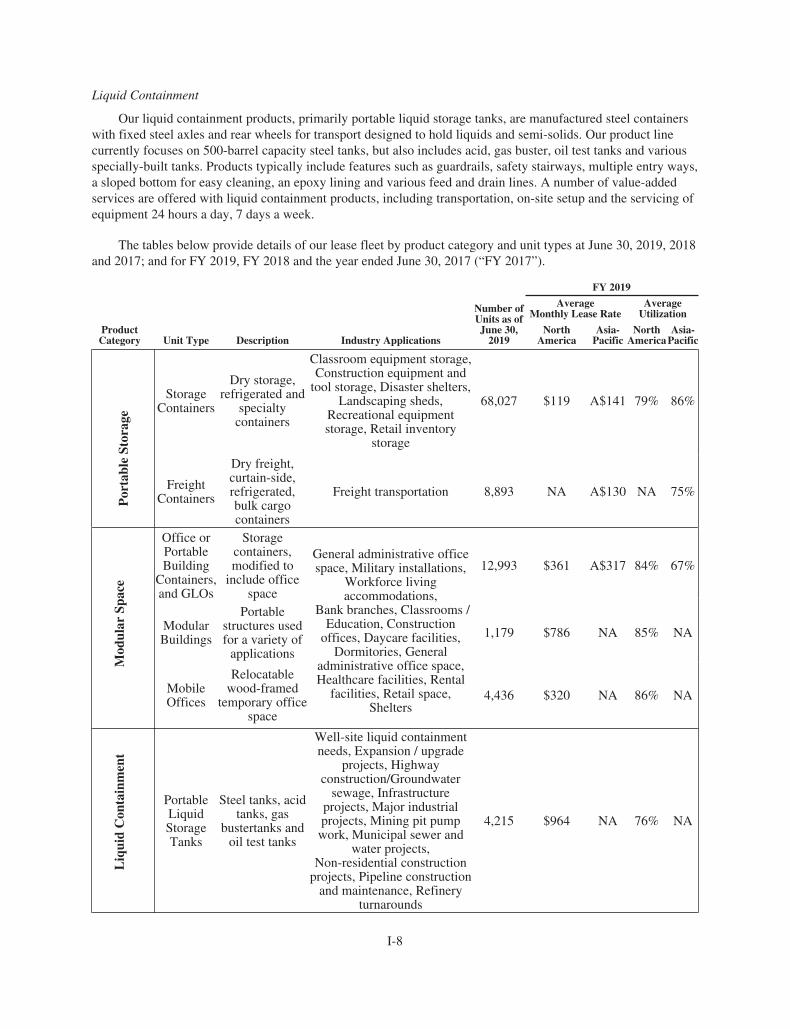
Liquid Containment
Our liquid containment products, primarily portable liquid storage tanks, are manufactured steel containerswith fixed steel axles and rear wheels for transport designed to hold liquids and semi-solids. Our product linecurrently focuses on 500-barrel capacity steel tanks, but also includes acid, gas buster, oil test tanks and variousspecially-built tanks. Products typically include features such as guardrails, safety stairways, multiple entry ways,a sloped bottom for easy cleaning, an epoxy lining and various feed and drain lines. A number of value-addedservices are offered with liquid containment products, including transportation, on-site setup and the servicing ofequipment 24 hours a day, 7 days a week.
The tables below provide details of our lease fleet by product category and unit types at June 30, 2019, 2018and 2017; and for FY 2019, FY 2018 and the year ended June 30, 2017 (“FY 2017”).
FY 2019
ProductCategory Unit Type Description Industry Applications
Number ofUnits as ofJune 30,
2019
AverageMonthly Lease Rate
AverageUtilization
NorthAmerica
Asia-Pacific
NorthAmerica
Asia-Pacific
Por
tabl
eSt
orag
e
StorageContainers
Dry storage,refrigerated and
specialtycontainers
Classroom equipment storage,Construction equipment and
tool storage, Disaster shelters,Landscaping sheds,
Recreational equipmentstorage, Retail inventory
storage
68,027 $119 A$141 79% 86%
FreightContainers
Dry freight,curtain-side,refrigerated,bulk cargocontainers
Freight transportation 8,893 NA A$130 NA 75%
Mod
ular
Spac
e
Office orPortableBuilding
Containers,and GLOs
Storagecontainers,modified to
include officespace
General administrative officespace, Military installations,
Workforce livingaccommodations,
Bank branches, Classrooms /Education, Construction
offices, Daycare facilities,Dormitories, General
administrative office space,Healthcare facilities, Rental
facilities, Retail space,Shelters
12,993 $361 A$317 84% 67%
ModularBuildings
Portablestructures usedfor a variety of
applications
1,179 $786 NA 85% NA
MobileOffices
Relocatablewood-framed
temporary officespace
4,436 $320 NA 86% NA
Liq
uid
Con
tain
men
t
PortableLiquidStorageTanks
Steel tanks, acidtanks, gas
bustertanks andoil test tanks
Well-site liquid containmentneeds, Expansion / upgrade
projects, Highwayconstruction/Groundwater
sewage, Infrastructureprojects, Major industrialprojects, Mining pit pumpwork, Municipal sewer and
water projects,Non-residential construction
projects, Pipeline constructionand maintenance, Refinery
turnarounds
4,215 $964 NA 76% NA
I-8
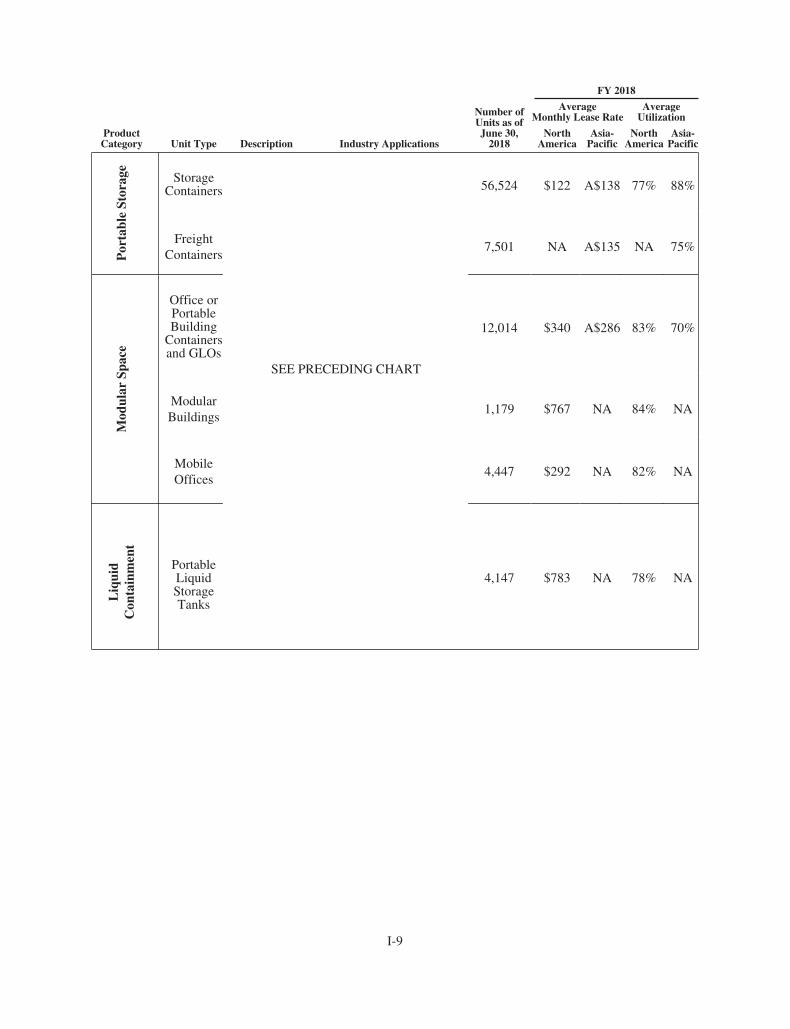
FY 2018
ProductCategory Unit Type Description Industry Applications
Number ofUnits as ofJune 30,
2018
AverageMonthly Lease Rate
AverageUtilization
NorthAmerica
Asia-Pacific
NorthAmerica
Asia-Pacific
Por
tabl
eSt
orag
e
StorageContainers 56,524 $122 A$138 77% 88%
FreightContainers
7,501 NA A$135 NA 75%
Mod
ular
Spac
e
Office orPortableBuilding
Containersand GLOs
SEE PRECEDING CHART
12,014 $340 A$286 83% 70%
ModularBuildings
1,179 $767 NA 84% NA
MobileOffices
4,447 $292 NA 82% NA
Liq
uid
Con
tain
men
t
PortableLiquidStorageTanks
4,147 $783 NA 78% NA
I-9
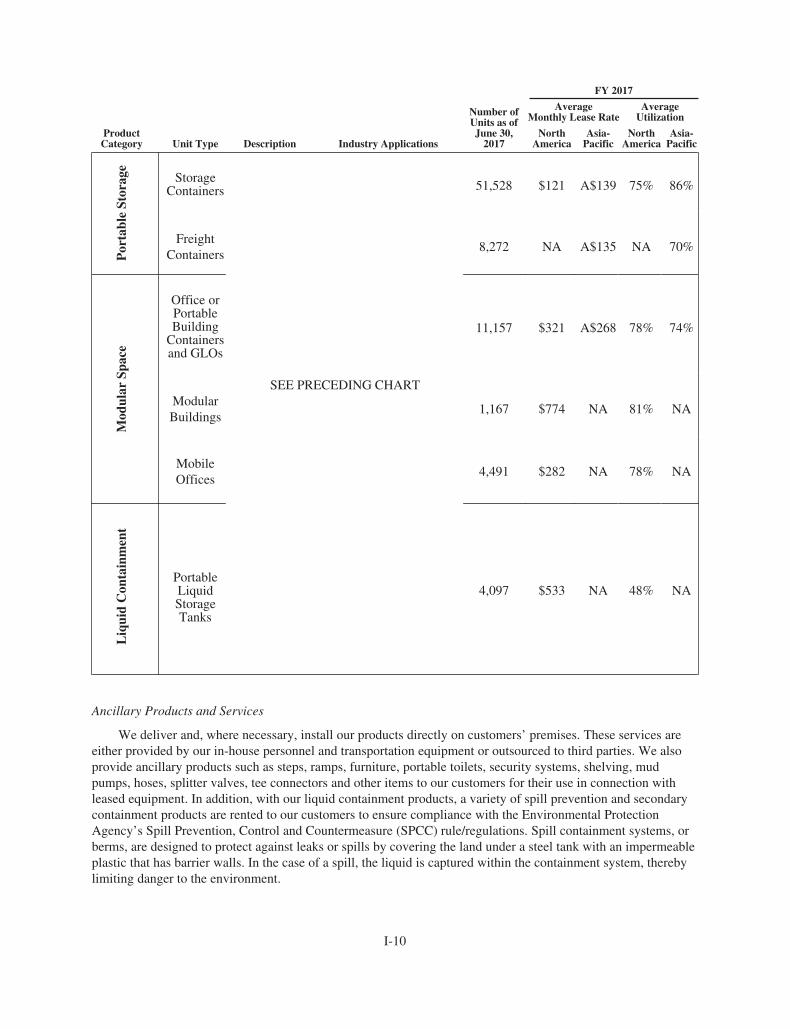
FY 2017
ProductCategory Unit Type Description Industry Applications
Number ofUnits as ofJune 30,
2017
AverageMonthly Lease Rate
AverageUtilization
NorthAmerica
Asia-Pacific
NorthAmerica
Asia-Pacific
Por
tabl
eSt
orag
e
StorageContainers 51,528 $121 A$139 75% 86%
FreightContainers
8,272 NA A$135 NA 70%
Mod
ular
Spac
e
Office orPortableBuilding
Containersand GLOs
11,157 $321 A$268 78% 74%
ModularBuildings
SEE PRECEDING CHART
1,167 $774 NA 81% NA
MobileOffices
4,491 $282 NA 78% NA
Liq
uid
Con
tain
men
t
PortableLiquidStorageTanks
4,097 $533 NA 48% NA
Ancillary Products and Services
We deliver and, where necessary, install our products directly on customers’ premises. These services areeither provided by our in-house personnel and transportation equipment or outsourced to third parties. We alsoprovide ancillary products such as steps, ramps, furniture, portable toilets, security systems, shelving, mudpumps, hoses, splitter valves, tee connectors and other items to our customers for their use in connection withleased equipment. In addition, with our liquid containment products, a variety of spill prevention and secondarycontainment products are rented to our customers to ensure compliance with the Environmental ProtectionAgency’s Spill Prevention, Control and Countermeasure (SPCC) rule/regulations. Spill containment systems, orberms, are designed to protect against leaks or spills by covering the land under a steel tank with an impermeableplastic that has barrier walls. In the case of a spill, the liquid is captured within the containment system, therebylimiting danger to the environment.
I-10
In response to the reduced demand of its portable liquid storage tanks, our North American manufacturingoperations began manufacturing a variety of other steel-based products, including:
• Shipping Container Modifications
• Specialty Trailers
• Specialty Tanks
• Chassis
• Storm Shelters
• Trash Hoppers
Shipping Container Modifications consist primarily of GLO’s produced for Pac-Van’s rental fleet and othermodifications designed to meet customer specifications.
Specialty Trailers are designed to meet customer specifications and have primarily focused on the defensesector to date.
Specialty tanks consist primarily of portable fuel tanks and tanks used in the agriculture industry to storechemicals. In particular, portable fuel tanks allow the end user to work more efficiently and can reduce costs byaccessing fleet fuel on the job site. Specialty tanks are manufactured similar to liquid containment tanks for theoil and gas industry using a structural steel understructure.
Designed for transporting containers safely on the road, the chassis are made with high quality components,are fully customizable and all chassis sales are backed with both a five year limited warranty on axles as well as afive-year warranty on workmanship.
Storm shelters are designed for above ground installation, thereby protecting homeowners from a naturaldisaster. The shelters come in two different wall designs (corrugated or smooth) and in two different standardsizes. Custom sizes are also available to accommodate specific needs. All storm shelters are Texas Tech WindInstitute Certified and compliant with ICC 500 2014 and FEMA 361.
Ideal for any industry needing to process, dispose or relocate materials, trash hoppers work well in multi-story building construction applications, as they can be attached to a telehandler and elevated to accept discardedmaterials or trash. These trash hoppers are constructed of 3/16” corrugated plate steel, making them stronger andmore durable than our competitors.
Sales
We complement our core leasing business by selling existing lease fleet assets or assets purchasedspecifically for resale. The sale of lease fleet units has historically been a cost effective method of replenishingand upgrading the lease fleet. We also provide additional services when selling units. These services range fromdelivery to full scale turnkey solutions. In a turnkey solution, we provide not only the underlying equipment butalso a full range of project related services, which may include foundation, specialty interior finishes, subleasinggenerators and landscaping, as may be necessary to make the equipment fully operational for the customer.
Product Lives and Durability
Our portable storage, modular space and liquid containment units have long estimated useful lives of20-30 years. The age of our rental equipment, which can be a key price factor in some rental businesses, has onlya modest impact on rental rates. This high value retention is due to the fact that our lease fleet units have virtually
I-11
no technology obsolescence risk, do not possess engines, have few moving parts, have low maintenancerequirements and are used in non-destructive applications, all differentiating characteristics from many otherclasses of rental equipment.
Ongoing maintenance to our fleet is performed on an as-needed basis and is intended to maintain the valueand rental-ready condition of our units. Maintenance requirements on portable storage units can includeremoving rust and dents, patching small holes, repairing floors, painting and replacing seals around the doors.Maintenance requirements for modular space units can include repairs of floors, doors, air conditioning units,windows, roofs and electric wiring. Maintenance requirements for liquid containment units include cleaning theunit to eliminate any residual material and inspecting and repairing the lining, if needed. Maintenance isperformed by in-house fleet technicians and third-party vendors, depending on the branch and complexity of thework. Maintenance and repair costs of our lease fleet are included as direct costs of leasing operations andexpensed as incurred whether performed by in house technicians or by third party vendors. We believe ourmaintenance program ensures a high quality fleet that supports both leasing and sales operations.
Our lease fleet units are recorded at cost and depreciated on the straight-line basis, in accordance withaccounting principles generally accepted in the United States, up to 20 years after the date they are put in service,down to their estimated residual values. Because we have a history of selling units for gains, we believe our leasefleet’s estimated residual value is at or below net realizable value.
Geographic Network
Our service locations are segmented into two operating areas: North America and Asia-Pacific. In NorthAmerica, these service locations are called branches and in our Asia-Pacific area they are referred to as CustomerService Centers, or “CSCs.” Our primary North American branch network consists of 61 branch locations in theUnited States and three in Canada, and our primary Asia-Pacific network consists of 23 CSCs in Australia and 14in New Zealand.
Our network enables us to maintain product availability and provide customer service within regional andlocal markets. Customers benefit because they are provided with improved service availability, reduced time tooccupancy, better access to sales representatives, and the ability to inspect units prior to rental and lower freightcosts. We, in turn, benefit because we are able to spread regional overhead and marketing costs over a large leasebase, redeploy units within our network to optimize utilization, discourage potential competitors by providingample local supply and service local customers in a more cost efficient manner. Through our network, wedevelop local market knowledge and strong customer relationships while our corporate-based marketing groupmanages our brand image, web presence and lead generation programs.
I-12
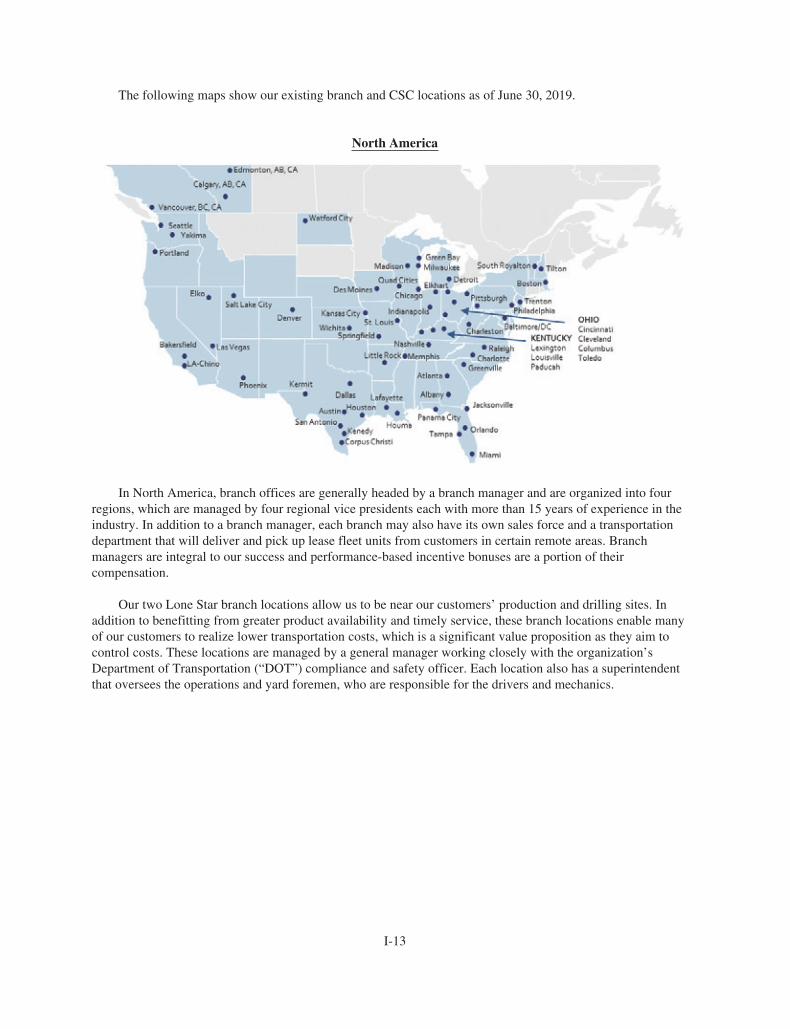
The following maps show our existing branch and CSC locations as of June 30, 2019.
North America
In North America, branch offices are generally headed by a branch manager and are organized into fourregions, which are managed by four regional vice presidents each with more than 15 years of experience in theindustry. In addition to a branch manager, each branch may also have its own sales force and a transportationdepartment that will deliver and pick up lease fleet units from customers in certain remote areas. Branchmanagers are integral to our success and performance-based incentive bonuses are a portion of theircompensation.
Our two Lone Star branch locations allow us to be near our customers’ production and drilling sites. Inaddition to benefitting from greater product availability and timely service, these branch locations enable manyof our customers to realize lower transportation costs, which is a significant value proposition as they aim tocontrol costs. These locations are managed by a general manager working closely with the organization’sDepartment of Transportation (“DOT”) compliance and safety officer. Each location also has a superintendentthat oversees the operations and yard foremen, who are responsible for the drivers and mechanics.
I-13
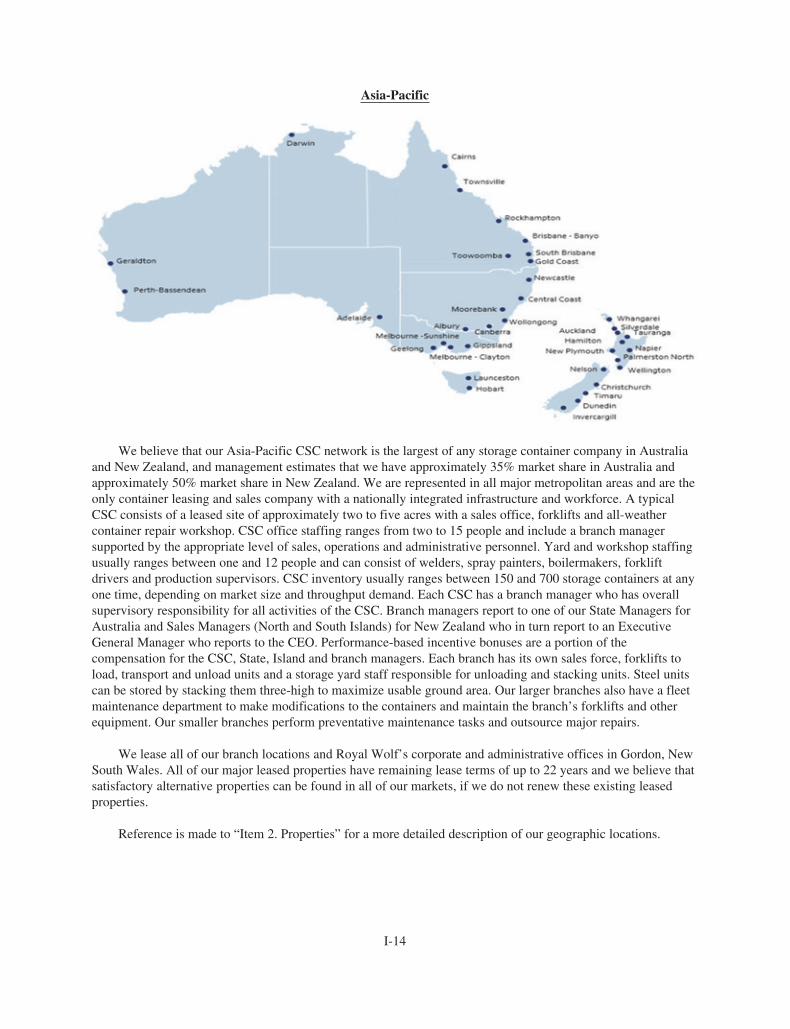
Asia-Pacific
We believe that our Asia-Pacific CSC network is the largest of any storage container company in Australiaand New Zealand, and management estimates that we have approximately 35% market share in Australia andapproximately 50% market share in New Zealand. We are represented in all major metropolitan areas and are theonly container leasing and sales company with a nationally integrated infrastructure and workforce. A typicalCSC consists of a leased site of approximately two to five acres with a sales office, forklifts and all-weathercontainer repair workshop. CSC office staffing ranges from two to 15 people and include a branch managersupported by the appropriate level of sales, operations and administrative personnel. Yard and workshop staffingusually ranges between one and 12 people and can consist of welders, spray painters, boilermakers, forkliftdrivers and production supervisors. CSC inventory usually ranges between 150 and 700 storage containers at anyone time, depending on market size and throughput demand. Each CSC has a branch manager who has overallsupervisory responsibility for all activities of the CSC. Branch managers report to one of our State Managers forAustralia and Sales Managers (North and South Islands) for New Zealand who in turn report to an ExecutiveGeneral Manager who reports to the CEO. Performance-based incentive bonuses are a portion of thecompensation for the CSC, State, Island and branch managers. Each branch has its own sales force, forklifts toload, transport and unload units and a storage yard staff responsible for unloading and stacking units. Steel unitscan be stored by stacking them three-high to maximize usable ground area. Our larger branches also have a fleetmaintenance department to make modifications to the containers and maintain the branch’s forklifts and otherequipment. Our smaller branches perform preventative maintenance tasks and outsource major repairs.
We lease all of our branch locations and Royal Wolf’s corporate and administrative offices in Gordon, NewSouth Wales. All of our major leased properties have remaining lease terms of up to 22 years and we believe thatsatisfactory alternative properties can be found in all of our markets, if we do not renew these existing leasedproperties.
Reference is made to “Item 2. Properties” for a more detailed description of our geographic locations.
I-14
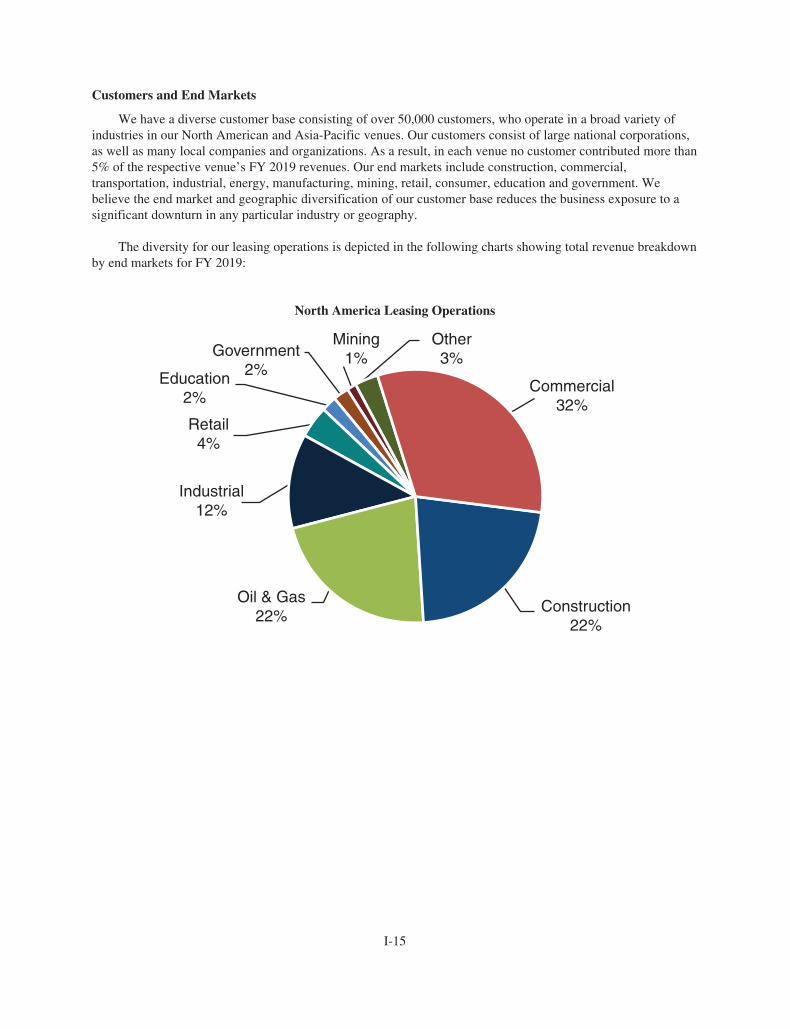
Customers and End Markets
We have a diverse customer base consisting of over 50,000 customers, who operate in a broad variety ofindustries in our North American and Asia-Pacific venues. Our customers consist of large national corporations,as well as many local companies and organizations. As a result, in each venue no customer contributed more than5% of the respective venue’s FY 2019 revenues. Our end markets include construction, commercial,transportation, industrial, energy, manufacturing, mining, retail, consumer, education and government. Webelieve the end market and geographic diversification of our customer base reduces the business exposure to asignificant downturn in any particular industry or geography.
The diversity for our leasing operations is depicted in the following charts showing total revenue breakdownby end markets for FY 2019:
North America Leasing Operations
Other3%
Commercial32%
Construction22%
Oil & Gas22%
Industrial12%
Retail4%
Education2%
Government2%
Mining1%
I-15
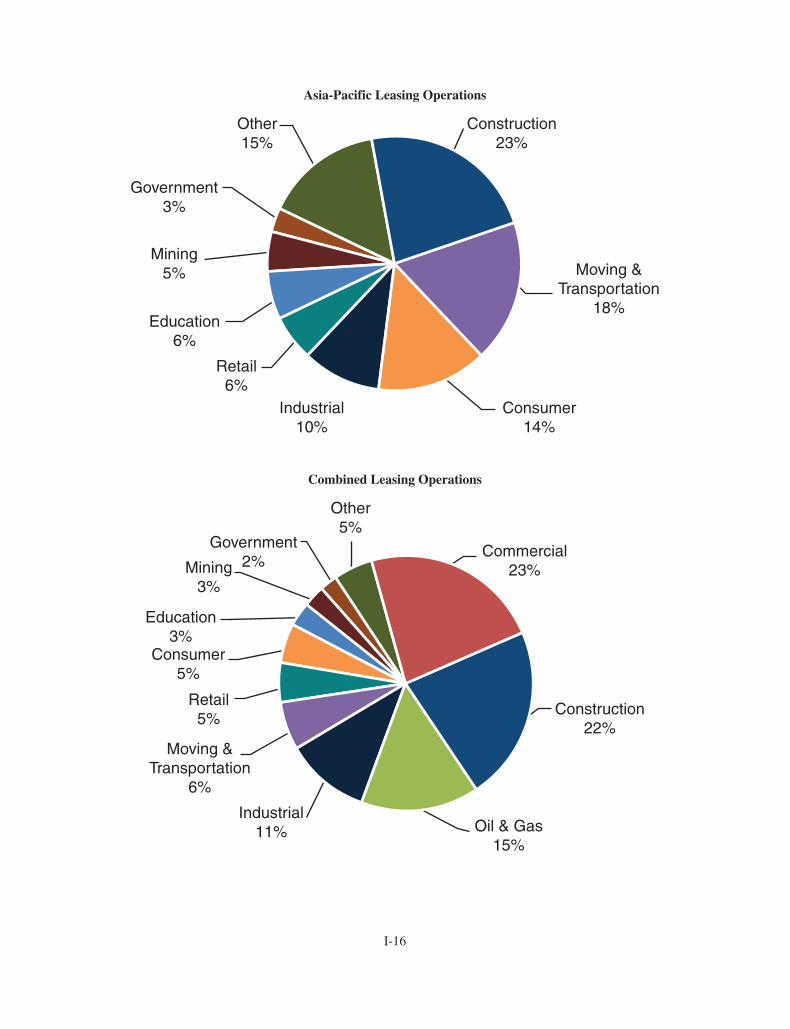
Asia-Pacific Leasing Operations
Construction23%
Moving &Transportation
18%
Consumer14%
Industrial10%
Retail6%
Education6%
Mining5%
Government3%
Other15%
Combined Leasing Operations
Construction22%
Commercial23%
Oil & Gas15%
Industrial11%
Moving &Transportation
6%
Retail5%
Consumer5%
Education3%
Mining3%
Government2%
Other5%
I-16
The following provides an overview of the end markets served by our leasing operations:
• Construction - general contractors, residential homebuilders and subcontractors
• Industrial - industrial and manufacturing customers including a broad array of manufacturers,telecommunications, distribution, utilities, refuse, recycling and bottling companies
• Commercial - businesses that provide service to both commercial businesses and individualconsumers, including wholesalers, health care facilities, veterinary offices, entertainmentcompanies, religious institutions and lodging facilities
• Oil and Gas and Mining - Customers in specific sectors of the extractive industries
• Government - federal agencies, state and local governments, fire departments, correctionalinstitutions, and the U.S. military
• Retail - large national chains, small local stores, shopping centers and restaurants
• Education - public schools, private schools and day care facilities
• Consumer - mass market of individuals or groups, not businesses, such as families, sporting teamsand community groups in the Asia-Pacific area
• Moving and Transportation - freight providers for primarily road and rail transport in the Asia-Pacific area
• Other - all other customers
We differentiate ourselves from competitors in several ways. In our portable storage and modular spacebusinesses, we provide a diverse set of competitively priced products and, in our Asia-Pacific market, weleverage our engineering team to provide customized units upon customer request. In our liquid containmentbusiness, we leverage long-standing customer relationships and not only provide liquid containment units, butalso bundle units with transportation, on-site set-up, and the servicing of equipment 24 hours a day, 7 days aweek. Our customer-centric approach is designed to ensure that our businesses consistently meet or exceedcustomer expectations. We believe this focus on customer service attracts new and retains existing customers.With the goal of delivering “best in class” customer service, we began collecting customer responses on netpromoter scores (“NPS”) in North America at Pac-Van during the year ended June 30, 2015, which trackcustomer willingness to recommend our products and services. In both FY 2017 and FY 2018, our customersgave us an NPS of 85. In FY 2019, our customers at Pac-Van gave us an NPS of 84. In FY 2017, we begancollecting customer responses on NPS in the Asia Pacific at Royal Wolf and in both FY 2017 and FY 2018 ourcustomers there gave us an NPS of 61. In FY 2019, our customers at Royal Wolf gave us an NPS of 69. Inaddition, over 85% of our consolidated total leasing revenues in FY 2019 were derived from repeat customers,which we believe is a result of our superior customer service.
Sales and Marketing
In North America, members of our sales teams act as primary customer service representatives and areresponsible for prospecting new customers, fielding calls, obtaining credit applications, quoting prices, followingup on quotes and handling orders. Our sales teams are responsible for developing and managing localrelationships, as well as handling both inbound and outbound calls. They also assist customers in defining theirspace needs, assess potential opportunities, quote deals, close transactions and obtain the necessarydocumentation. Upon completing a lease or a sale, the sales team works closely with the local branch operationsteam to ensure that customer expectations are met or exceeded, relative to equipment quality and delivery timing.Our marketing group is primarily responsible for lead generation, digital marketing, advertising campaigns,producing company literature, creating promotional sales tools and oversight of customer relationshipmanagement systems. We market services through a number of promotional vehicles, including website, searchengine optimization (SEO), search engine marketing (SEM), signage on our equipment, outbound sales efforts,
I-17
targeted mailings, trade shows, live chat and new online ordering portal, which rolled out in FY 2019. Webelieve this targeted approach to marketing is consistent with the local nature of our business and allows eachbranch to employ a customized marketing plan that fosters growth within its particular market. As a result of ournational footprint and strong service levels, we continue to seek and secure national account agreements withlarge retailers, industrial organizations, hospitality entities, construction companies and other large businesses.We provide ongoing training to our sales teams, monitor call quality and survey our customers to ensure thatcustomer interactions meet our quality and service standards. Our lease fleet carries signage reflecting ourbrands, which is important to ongoing name recognition.
Our sales and marketing strategy in the Asia-Pacific is designed to reach thousands of potential customers.Communication with potential customers is predominantly generated through a combination of internaladvertising SEO and SEM, print media advertising, telemarketing, website, customer referrals, signage and decalawareness, direct mail, video, television, radio, social media and live chat. The customer hiring or buying processis being driven by customer awareness of the products combined with price shopping. We believe that while atypical customer may shop a limited number of suppliers, the customer does not spend much time doing sobecause the potential cost savings is relatively low compared to the value of their time. Our goals are to be one ofthe suppliers that potential customers call and to make the experience as easy as possible for that customer.
Fleet Management and Information Systems
Fleet Management
Fleet information is updated daily at the branch level, which provides management with the ability tomonitor branch operations on a daily, weekly, monthly and ad hoc basis with on-line access to utilization, leasingand sale fleet unit levels and revenues by branch or geographic region. In managing our fleet, we regularlyrelocate containers between branches to meet changes in regional demand and optimize inventory levels. Wehave close relationships with the national road and rail hauling companies that enable us to transport the majorityof containers interstate at attractive rates.
Ongoing maintenance to our North American leasing fleet is performed on an as-needed basis and isintended to maintain the value and rental-ready condition of our units. We use both in-house fleet technicians andthird-party vendors to perform maintenance, depending on the branch and complexity of the work. Maintenancerequirements on containers are generally minor and include removing rust and dents, patching small holes,repairing floors, painting and replacing seals around the doors. Maintenance requirements for container offices,mobile offices and modular buildings tend to be more significant than for storage equipment and may involverepairs of floors, doors, air conditioning units, windows, roofs and electric wiring. Portable liquid storage tanksrequire simple maintenance, including cleaning the unit to eliminate any residual material and inspecting andrepairing the lining, if needed. Whether performed by us or a third party, the cost of maintenance and repair ofour lease fleet is included as direct costs of leasing operations and is expensed as incurred. We believe ourmaintenance program ensures a high quality fleet that supports both leasing and sales operations.
In the Asia-Pacific, most of our fleet is comprised of new and refurbished and customized storagecontainers, manufactured steel containers and record storage units, along with our freight and accommodationunits. These products are designed for long useful lives. A portion of our fleet consists of used storage containersof eight to thirteen years in age, a time at which their useful life as ocean-going shipping containers is overaccording to the standards promulgated by ISO. Because we do not have the same stacking and strengthrequirements that apply in the ocean-going shipping industry, we have no need for these containers to meet ISOstandards. We purchase these containers in large quantities, refurbish them by removing any rust and paint themwith a rust inhibiting paint, further customize them and add our decals and branding. We maintain our steelcontainers on a regular basis by painting them on average once every three to five years, removing rust, spotwelding and occasionally replacing the wooden floor or other parts. This periodic maintenance keeps thecontainer in good condition and is designed to maintain the unit’s value and rental rates comparable to new units.
I-18
Information Systems
We utilize management information systems across each of our businesses to support fleet management andtargeted marketing efforts, and we believe they are tailored to satisfactorily meet each of our businesses’ specificneeds for efficient operation.
In our North American portable storage and modular space business, we utilize Microsoft DynamicsNavision and a rental module Armada at all of our branches to monitor operations at branches on a daily, weekly,monthly and ad hoc basis. Lease fleet information is updated daily at the branch level and verified throughroutine physical inventories by branch personnel, providing management with online access to utilization, leasefleet unit detail and rental revenues by branch and geographic region. In addition, an electronic file for each unitshowing its lease history and current location and status is maintained in the information system. Branchsalespeople utilize the system to obtain information regarding unit condition and availability. The database tracksindividual units by serial number and provides comprehensive information including cost, condition and otherfinancial and unit specific information. In FY 2018 we added a business intelligence corporate performancemanagement software package, Microsoft SQL Server Reporting Services, or SSRS, to our information systemplatform.
In our Asia-Pacific portable storage and modular space businesses, our management information systems,including Microsoft Dynamics Navision and CRM, Armada, TCM and Power BI, are scalable and provide uswith critical information to manage our business. Utilizing our systems, we track a number of key operating andfinancial metrics including utilization, lease rates, profitability, customer trends and fleet data. All our branchesuse the CRM Platform for surveying and enhanced customer relationship management and “cradle to grave”quoting, and Navision and Armada for day to day processing. TCM, Power BI and Navision provide branchmanagers with vital data for financial, inventory and customer reports. In the year ending June 30, 2020, weintend to further develop our Navision and Armada capabilities, refine and further automate reporting, roll-out aCustomer Portal for self-management and business interaction, and continue to provide efficiency throughsystem improvements and mobility solutions.
Our North American manufacturing business utilizes the enterprise resource planning (ERP) businesssystem, SyteLine, which provides comprehensive functionality, including order processing, inventory,purchasing, planning and scheduling, production, cost management, project tracking, accounting and customerservice.
Product Procurement
North America
Our North American leasing operations closely monitor fleet capital expenditures, which include fleetpurchases and any capitalized improvements to existing units. Pac-Van’s top four suppliers of units for FY 2019represented approximately 40% of all fleet purchases and the top ten suppliers represented approximately 68% ofall fleet purchases. We purchase our Pac-Van lease fleet from a network of third-party suppliers. All of ourmobile offices are built by an established network of manufacturing partners to standard specifications, whichmay vary depending on regional preferences. In addition, we build these units to meet state building coderequirements and generally obtain multi-state certificates enabling us to move equipment among our branchnetwork to meet changing demand and supply conditions. Like mobile offices, we procure modular buildingsfrom an established network of manufacturing partners to meet state building requirements and generally obtainmultiple state certificates for each unit.
On October 1, 2012, we acquired 90% of the membership interests of Southern Frac. Southern Fracmanufactures primarily portable liquid storage containers in Waxahachie, Texas for oil and gas exploration andproduction, but it can also manufacture for, among others, the chemical and industrial, environmental
I-19
remediation, waste water treatment and waste management sectors. In addition, prior to FY 2017, Southern Fracintroduced other high-quality steel-based products, including container chassis, under the name “SouthernFabrication Specialties.”
Our North American leasing operations has historically purchased its tank fleet from several manufacturersbut expects Southern Frac to be its primary supplier of steel tanks going forward. However, if needed, we havean established network of steel tank manufacturing partners located throughout the United States. Lone Starpurchases its other containment solutions, pumps and hoses from a network of other manufacturing providers.
We believe that Southern Frac will continue to provide a substantial portion of the portable liquid storagecontainers requirements to our North American leasing operations, including a portion of their GLOrequirements, as well as generate leasing referrals.
Capital investments are adjusted to match business needs and to respond to changing economic conditions.We do not generally enter into long-term purchase contracts with manufacturers, and we can modify our capitalinvestment activities in response to market conditions. Our North American leasing operations supplement fleetspending with acquisitions. Although the timing and amount of acquisitions are difficult to predict, managementconsiders its acquisition strategy to be opportunistic and attempts to adjust its fleet spending patterns as favorableacquisition opportunities become available.
Asia-Pacific
In the Asia-Pacific area, we purchase marine cargo containers from a wide variety of international shippinglines and container leasing companies and new container products directly from storage container manufacturersin China. We believe we are the largest buyer of both new and used storage container products for the Australiaand New Zealand markets. The majority of used storage containers purchased is standard 20-foot and 40-footunits which we convert, refurbish or customize. We purchase new storage container products in the Asia-Pacificarea under purchase orders issued to container manufacturers, which the manufacturers may or may not accept orbe able to fill. There are several alternative sources of supply for storage containers. Though we are notdependent upon any one manufacturer in purchasing storage container products, if one or more suppliers did nottimely fill our purchase orders or did not properly manufacture the ordered products, our reputation and financialcondition also could be harmed. The top ten suppliers represented approximately 37% and 48% of all fleetpurchases in Australia and New Zealand, respectively, during FY 2019.
Competition
Portable Storage
The portable storage markets in North America, Australia and New Zealand are highly fragmented. In mostlocations within its markets, Pac-Van and Royal Wolf compete with several national and regional competitors.Our largest competitors in the portable storage sector in North America are Mobile Mini, Williams Scotsman(WillScot Corporation), McGrath RentCorp, Haulaway Storage Containers, Eagle Leasing, PODS,1-800-PACK-RAT and other national, regional and local companies. We believe we are the market share leaderin Australia and New Zealand. Our primary competitors in these markets include CGM-CMA Group, and theSCF Group (Simply Containers) as well as smaller, full and part-time operators. Local competitors are regionallyfocused, and are usually more capital-constrained. Therefore, in general, they are heavily reliant on monthly salesperformance, have slow growing rental fleets and have limited ability to handle larger volume contracts orcustomer accounts. We believe that participants in this sector compete on the basis of customer relationships,price, service, as well as breadth and quality of equipment offered.
I-20
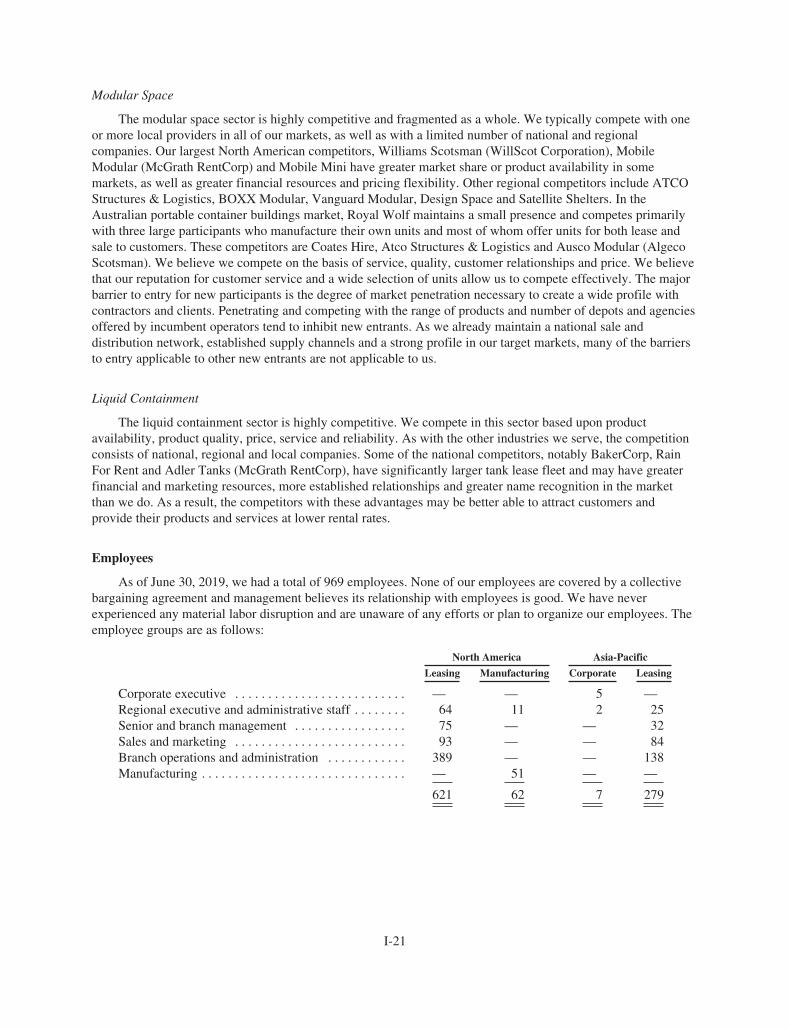
Modular Space
The modular space sector is highly competitive and fragmented as a whole. We typically compete with oneor more local providers in all of our markets, as well as with a limited number of national and regionalcompanies. Our largest North American competitors, Williams Scotsman (WillScot Corporation), MobileModular (McGrath RentCorp) and Mobile Mini have greater market share or product availability in somemarkets, as well as greater financial resources and pricing flexibility. Other regional competitors include ATCOStructures & Logistics, BOXX Modular, Vanguard Modular, Design Space and Satellite Shelters. In theAustralian portable container buildings market, Royal Wolf maintains a small presence and competes primarilywith three large participants who manufacture their own units and most of whom offer units for both lease andsale to customers. These competitors are Coates Hire, Atco Structures & Logistics and Ausco Modular (AlgecoScotsman). We believe we compete on the basis of service, quality, customer relationships and price. We believethat our reputation for customer service and a wide selection of units allow us to compete effectively. The majorbarrier to entry for new participants is the degree of market penetration necessary to create a wide profile withcontractors and clients. Penetrating and competing with the range of products and number of depots and agenciesoffered by incumbent operators tend to inhibit new entrants. As we already maintain a national sale anddistribution network, established supply channels and a strong profile in our target markets, many of the barriersto entry applicable to other new entrants are not applicable to us.
Liquid Containment
The liquid containment sector is highly competitive. We compete in this sector based upon productavailability, product quality, price, service and reliability. As with the other industries we serve, the competitionconsists of national, regional and local companies. Some of the national competitors, notably BakerCorp, RainFor Rent and Adler Tanks (McGrath RentCorp), have significantly larger tank lease fleet and may have greaterfinancial and marketing resources, more established relationships and greater name recognition in the marketthan we do. As a result, the competitors with these advantages may be better able to attract customers andprovide their products and services at lower rental rates.
Employees
As of June 30, 2019, we had a total of 969 employees. None of our employees are covered by a collectivebargaining agreement and management believes its relationship with employees is good. We have neverexperienced any material labor disruption and are unaware of any efforts or plan to organize our employees. Theemployee groups are as follows:
North America Asia-Pacific
Leasing Manufacturing Corporate Leasing
Corporate executive . . . . . . . . . . . . . . . . . . . . . . . . . . — — 5 —Regional executive and administrative staff . . . . . . . . 64 11 2 25Senior and branch management . . . . . . . . . . . . . . . . . 75 — — 32Sales and marketing . . . . . . . . . . . . . . . . . . . . . . . . . . 93 — — 84Branch operations and administration . . . . . . . . . . . . 389 — — 138Manufacturing . . . . . . . . . . . . . . . . . . . . . . . . . . . . . . . — 51 — —
621 62 7 279
I-21
Executive Officers of the Registrant
The following information is provided as of June 30, 2019 regarding our executive officers. No familyrelationship exists between any executive officer.
Name Age Position
Ronald F. Valenta 60 Executive Chairman of the BoardJody Miller 52 President and Chief Executive OfficerCharles E. Barrantes 67 Executive Vice President and Chief Financial OfficerChristopher A. Wilson 52 General Counsel, Vice President and SecretaryJeffrey A. Kluckman 58 Executive Vice President of Global Business DevelopmentNeil Littlewood 58 Chief Executive Officer of Royal Wolf Trading Australia Pty LimitedTheodore M.Mourouzis 56 Chief Executive Officer and President of Pac-Van, Inc.
Ronald F. Valenta assumed the title of Executive Chairman of the Board in January 2018. Mr. Valenta hasserved as a director since our inception and our Chairman of the Board since June 2014. He was our Presidentfrom inception until January 2017 and Chief Executive Officer from inception until January 2018. From May2011 to October 2017, Mr. Valenta served as a director of Royal Wolf Holdings Limited when it was anAustralian public reporting company. From 1988 to 2003, Mr. Valenta served as the President and ChiefExecutive Officer of Mobile Services Group, Inc., a portable storage company he founded, and from 2003 to2006, Mr. Valenta was a director of the National Portable Storage Association, a storage industry non-profitorganization that he co-founded. From 1985 to 1989, Mr. Valenta was a Senior Vice President of Public Storage,Inc., and from 1980 to 1985, Mr. Valenta was employed by the accounting firm of Arthur Andersen & Co. inLos Angeles.
Jody Miller became our Chief Executive Officer in January 2018 and has served as our President sinceJanuary 2017. Mr. Miller was our Executive Vice President from June 2015 to January 2017and has been theChief Executive Officer of GFN North America Leasing Corporation since June 2015 and has served on theboard of Royal Wolf Holdings Limited and subsequently Royal Wolf since 2016. Prior to joining us, Mr. Millerspent over 25 years in the equipment rental industry, including at Mobile Mini, Inc. as Executive Vice Presidentand Chief Operations Officer for five years, Mobile Services Group, Inc. as Senior Vice President for five years,and RSC Holdings, Inc. for fifteen years; where he held many positions, including Regional Vice President forseven years. Mr. Miller is a 1990 graduate of Central Missouri State University.
Charles E. Barrantes has served as our Executive Vice President and Chief Financial Officer sinceSeptember 2006. Prior to joining us, Mr. Barrantes was Vice President and Chief Financial Officer for RoyceMedical Company from early 2005 to its sale in late 2005. From 1999 to early 2005, he was Chief FinancialOfficer of Earl Scheib, Inc., a public company that operated over 100 retail paint and body shops. Mr. Barranteshas over 40 years of experience in accounting and finance, starting with more than a decade with ArthurAndersen & Co.
Christopher A. Wilson has served as our General Counsel, Vice President and Secretary sinceDecember 2007. Prior to joining us, Mr. Wilson was the general counsel and assistant secretary of MobileServices Group, Inc. from February 2002 to December 2007. Mr. Wilson practiced corporate law as an associateat Paul, Hastings, Janofsky & Walker LLP from 1998 to February 2002. Mr. Wilson graduated with a B.A. fromDuke University in 1989 and a J.D. from Loyola Law School of Los Angeles in 1993.
Jeffrey A. Kluckman is our Executive Vice President of Global Business Development. Jeff started with usin September 2011. Prior to joining us, among other things, he held the role of vice president of mergers andacquisitions for portable storage solutions provider Mobile Mini, Inc. and, earlier, similar positions with MobileServices Group, Inc., which was acquired by Mobile Mini in 2008, and RSC Equipment Rental, Inc. In his over20-year background in the rental services sector, including the mobile storage, modular space and equipment
I-22
rental industries, Mr. Kluckman successfully completed almost 160 transactions. Mr. Kluckman received anaccounting degree from Northern Illinois University.
Neil Littlewood became Chief Executive Officer of Royal Wolf in July 2016. He joined Royal Wolf inMarch 2013 in the role of Executive General Manager, North East. Neil has over 18 years of senior experience inthe rental/hire industry including executive roles at Coates Hire and Australian Temporary Fencing. Prior to this,Neil spent 20 years as an Army Officer including being in charge of recruiting for the Australian Army andretiring as Lieutenant Colonel. He is a graduate of the Royal Military College Duntroon and holds a Bachelor ofArts and Masters in Management from the University of New South Wales.
Theodore M. Mourouzis became Chief Executive Officer of Pac-Van, Inc. in April 2017 and has served asits President since August 2006. He previously served as its Chief Operating Officer since 1999 and as its VicePresident of Finance from 1997 until 1999. Prior to his employment with Pac-Van, Mr. Mourouzis was acontroller for a 3M joint venture, served four years in management consulting with Deloitte & Touche, and waspresident of a picture framing distributor. He received his undergraduate degree from Stanford University in1985 and a Masters of Business Administration from The Wharton School of the University of Pennsylvania in1991.
Trademarks
North America
We own trademarks important to our North American leasing operations, including Pac-Van®, “We’ve PutThousands of U.S. Businesses In Space®,” “Expect More. We’ll Deliver®” and the “Container King” logo inCanada. Material trademarks are registered in the U.S. Patent and Trademark Office (“USPTO”). On March 27,2018, we filed an application for the “PV 3 Safety Container,” and, on May 29, 2018, filed an amendment toallege use of the trademark, which was accepted by the USPTO on July 12, 2018. We are currently preparing aresponse to the USPTO office action to proceed with registration of the trademark. Registrations for suchtrademarks in the U.S. will last indefinitely as long as we continue to use and maintain the trademarks and renewfilings with the applicable governmental offices.
Asia-Pacific
We entered into a licensing agreement with Triton Corporation in May 2008 for the use of the “Royal Wolf”name and trademark in connection with its retail sales and leasing of intermodal cargo containers and othercontainer applications in the domestic storage market within Australia and New Zealand and surrounding islandsin the Pacific Islands region. We paid Triton Corporation $740,000 to license the trademark. The license willcontinue in perpetuity as long as Royal Wolf continues to use the “Royal Wolf” name and trademark as theexclusive name for its business and mark for its products, subject to the termination provisions of the license. Thelicense may be terminated by the licensor upon 30 days notice in the event Royal Wolf breaches its obligationsunder the license and will terminate automatically if Royal Wolf becomes insolvent or ceases to sell productsunder the trademark for a continuous period of 30 months. We sold the “Royal Wolf” name and trademark toRoyal Wolf in May 2011 in connection with the Australian initial public offering of Royal Wolf. There are noclaims pending against Royal Wolf challenging its right to use the “Royal Wolf” name and trade mark withinRoyal Wolf’s region of business. In September 2017, we reacquired the Royal Wolf shares that were issued inthe initial public offering and not previously owned.
Cybersecurity
We believe that we have implemented appropriate preventative measures to avert and mitigate the effects ofcyber attacks; however, like other companies, the measures that we employ to protect our systems may not detector prevent cybersecurity breaches. We have, from time to time, experienced threats to our data and systems,
I-23
including malware, computer virus attacks and phishing attempts. Costs and consequences of a cybersecurityincident could include, among other things, remediation expenses, lost revenues, litigation, reputational damageand erosion of shareholder value. Our Board regularly reviews our cybersecurity risks and controls with seniormanagement. We have not experienced a material cybersecurity breach.
Available information
Our Internet website address is www.generalfinance.com. This reference to our Internet website does notincorporate by reference the information contained on or hyperlinked from our Internet website into this AnnualReport on Form 10-K. Such information should not be considered part of this Annual Report on Form 10-K. TheInternet websites for our operating units are Royal Wolf (www.royalwolf.com.au and www.royalwolf.co.nz),Pac-Van (www.pacvan.com), Lone Star (www.lonestartank.com) and Southern Frac (www.southernfrac.com andwww.southernfabricationspecialties.com). We are required to file Annual Reports on Form 10-K and QuarterlyReports on Form 10-Q with the Securities and Exchange Commission (“SEC”) on a regular basis and arerequired to disclose certain material events in a current report on Form 8-K. The public may read and obtain acopy of any materials we file with the SEC through our Internet website noted above, which is hyperlinked to theSEC’s Internet website that contains reports, proxy and information statements and other information regardingissuers that file electronically with the SEC. The SEC’s Internet website is located at http://www.sec.gov.
Item 1A. Risk Factors
In addition to the other information in our Annual Report on Form 10-K, you should consider the risksdescribed below that we believe may be material to investors in evaluating us. This section contains forward-looking statements, and in considering these statements, you should refer to the qualifications and limitations onour forward-looking statements that are described in SAFE HARBOR STATEMENT before the beginning ofItem 1.
Economic conditions and global market disruptions may adversely affect our business, financial conditionand results of operations.
An economic slowdown in the United States and/or globally, including reduced oil and gas andnon-residential construction activity, would adversely affect our business. Furthermore, increased global tradedisputes, particularly between the U.S. and China, could negatively impact the economies of our businesses inNorth America and the Asia-Pacific area. Worsening conditions could adversely affect, among other things, thecollection of our trade receivables on a timely basis, resulting in additional reserves for uncollectible accounts;and, in the event of continued contraction in product sales and leasing, could lead to a build-up of inventory andlease fleet levels and a decline in revenues. In addition, we engage in borrowing and repayment activities underour revolving credit facilities on an almost daily basis and have not had any disruption in our ability to access ourrevolving credit facilities as needed. However, disruptions in the global capital and credit markets, such as thosethat occurred in the global financial crisis during the latter part of the past decade, could increase the likelihoodthat one or more of our lenders may be unable to honor its commitments under our revolving credit facilities,which could have an adverse effect on our business, financial condition and results of operations.
We operate with a significant amount of indebtedness, borrowed primarily under senior secured creditfacilities, which include various restrictions, including liens on all or substantially all of our assets, variableinterest rates and contains restrictive covenants.
Our substantial indebtedness could have adverse consequences, such as:
• require us to dedicate a substantial portion of our cash flow from operations to payments on ourindebtedness, which could reduce the availability of our cash flow to fund future operating capital,capital expenditures, acquisitions and other general corporate purposes;
I-24
• expose us to the risk of increases in interest rates, as a substantial portion of our borrowings on oursecured senior credit facilities are at variable rates of interest;
• require us to sell assets to reduce indebtedness or influence our decisions about whether to do so;
• increase our vulnerability to general adverse economic and industry conditions;
• limit our flexibility in planning for, or reacting to, changes in our business and industry;
• prohibit us from making strategic acquisitions or pursuing business opportunities; and
• limit, along with the financial and other restrictive covenants in our indebtedness, among other things,our ability to borrow additional funds.
Violating covenants in these agreements could have a material adverse effect on our business, financialcondition and results of operations; including substantially increasing our cost of borrowing and restricting ourfuture operations, if not cured or waived. In addition, the lenders may be able to terminate any commitments theyhad made to supply us with further funds. Accordingly, we may not be able to fully repay our debt obligations, ifsome or all of our debt obligations are accelerated upon an event of default.
Our senior credit agreements also contain various restrictive covenants that limit the operations of ourbusiness. Among other things, these agreements include covenants and restrictions relating to:
• payments and distributions to GFN;
• liens, loans and investments;
• debt and hedging arrangements;
• mergers, acquisitions and asset sales;
• transactions with affiliates; and
• changes in business activities.
In addition, we may incur substantial debt to complete business combinations. The incurrence of debt couldresult in:
• default and foreclosure on our assets if our operating revenues after a business combination areinsufficient to repay our debt obligations;
• our immediate payment of all principal and accrued interest, if any, if the debt security is payable ondemand; and
• our inability to obtain necessary additional financing if the agreements governing such indebtednessrestrict our ability to obtain such financing while the debt instrument is outstanding.
The amount our North American leasing operations can borrow under its senior credit agreement depends inpart on the value of its lease fleet. If the value of the lease fleet declines under appraisals our lenders receive, theamount we can borrow will decline by a similar amount. Several covenants with our lenders are affected bychanges in the value of the lease fleet. We would be in breach of certain of these covenants if the value of theNorth American lease fleet drops below specified levels. If this happens, we may not be able to borrow theamounts we need to expand our business both organically and through acquisitions, make payments anddistributions to GFN, and we may be forced to liquidate a portion of our existing fleet.
While we believe we will remain in compliance with the covenants in agreements governing suchindebtedness in the foreseeable future and that our relationships with our senior lenders are good, there is noassurance our lenders would consent to an amendment or waiver in the event of noncompliance; or that suchconsent would not be conditioned upon the receipt of a cash payment, revised principal payout terms, increased
I-25
interest rates or restrictions in the expansion of the credit facilities for the foreseeable future; or that our seniorlenders would not exercise rights that would be available to them, including, among other things, demandingpayment of outstanding borrowings. In addition, our ability to obtain additional capital or alternative borrowingarrangements at reasonable rates may be adversely affected. All or any of these adverse events would furtherlimit our flexibility in planning for or reacting to downturns in our business.
See also the significant risks related primarily to our 9.00% Series C Cumulative Redeemable PerpetualPreferred Stock (the “Series C Preferred Shares” or “Series C Preferred Stock”) and our 8.125% Senior Notes(the “Senior Notes”), that are due in July 2021. In addition, reference is made to Notes 3 and 5 of Notes toConsolidated Financial Statements for more information regarding our Series C Preferred Stock andindebtedness.
We may need additional capital which we may be unable to obtain.
Our business is capital intensive and any inability to obtain capital in the amounts and at the times whenneeded, may have a material adverse effect on our business, financial condition and results of operations,including substantially increasing our cost of borrowing and restricting our future operations and impairing ourability to grow, improve and maintain our leased assets. We have a significant amount of our outstanding seniorindebtedness maturing in the foreseeable future. We may not have sufficient cash flow from our operations torepay amounts coming due and, if we are unable to refinance this indebtedness, it could have a material adverseeffect on our business.
Declines in demand for our products and services could also lead to increased borrowings and reducedcollateral values which could lower the amounts we can borrow under our senior credit facilities; which could, inturn, restrict our ability to grow our business.
If we are unable to collect on contracts with customers, our operating results could be materially adverselyaffected.
Some of our customers may have liquidity issues and may not be able to fulfill the terms of their rentalagreements with us. Historically, accounts receivable write-offs have not been significant. However, if we areunable to manage credit risk issues, or if a large number of customers have financial difficulties at the same time,our credit losses could increase above historical levels and our operating results would be adversely affected.Delinquencies and credit losses generally can be expected to increase during economic slowdowns or recessions.
Demand for a portion of our lease fleet and manufacturing products in North America is, to a significantdegree, dependent on the levels of expenditures and drilling activity by the oil and gas industry and canfluctuate significantly in a short period of time. A substantial or an extended decline in oil and gas pricescould result in lower expenditures and reduced drilling by the oil and gas industry, which could have amaterial adverse effect on our financial condition, results of operations and cash flows.
Demand for a portion of our lease fleet and manufacturing products in North America depends, to asignificant degree, on the level of expenditures by the oil and gas industry for the exploration, development andproduction of oil and natural gas reserves and can fluctuate significantly in a short period of time. Theseexpenditures are generally dependent on numerous factors and events over which we have no control, includingthe industry’s view of current and future oil and natural gas prices, future economic growth and the resultingimpact on demand for oil and natural gas. Declines, as well as anticipated declines, in oil and gas prices couldresult in the reduction of drilling activity, project modifications, delays or cancellations, general businessdisruptions and delays in payment of, or nonpayment of, amounts that are owed to us. The oil and gas industryhas historically experienced volatile prices for oil and gas and periodic downturns, which have beencharacterized by diminished demand for oilfield services and downward pressure on vendor prices charged. Asignificant and/or extended downturn in the oil and gas industry could result in a reduction in demand for our
I-26
products, specifically our portable liquid containment products and services in North America, reduce theamounts we are able to borrow under our senior secured credit facilities and could adversely affect our financialcondition, results of operations and cash flows.
Changes in regulatory, or governmental, oversight of hydraulic fracturing could materially adversely affectthe demand for our portable liquid containment products.
Oil and gas exploration and extraction (including the use of tanks for hydraulic fracturing of gas and oilshale) are subject to numerous local, state and federal regulations. The hydraulic fracturing method of extractionhas come under scrutiny in several states and by the federal government due to the potential adverse effects thathydraulic fracturing, and the liquids and chemicals used, may have on water quality and public health. Inaddition, the disposal of wastewater from the hydraulic fracturing process into injection wells may be proven toincrease the rate of seismic activity near drill sites and could result in regulatory changes, delays or interruptionof future activity. Changes in these regulations could limit, interrupt or stop exploration and extraction activities,which would negatively impact the demand for our portable liquid containment products and services in NorthAmerica.
We are subject to fluctuations in the rates of exchanges in the translation of our foreign operations into theU.S dollar for financial reporting purposes.
Fluctuations in the rates of exchange for the U.S. dollar against the Australian, New Zealand and Canadiandollars could significantly affect our results of operations through lower than anticipated reported revenues andprofitability as a result of the translation of our foreign operations’ financial results into U.S. dollars.
A write-off of all or a part of our goodwill and intangibles would hurt our operating results and reduce ourstockholders’ equity.
As a result of our acquisitions, we have recorded significant amounts of goodwill and intangible assets.Goodwill represents the excess of the total purchase price of these acquisitions over the fair value of the netassets acquired. We are not permitted to amortize goodwill under U.S. accounting standards and, instead, wereview goodwill (as well as intangible assets) for impairment. Impairment may result from, among other things,deterioration in the performance of acquired businesses, adverse market conditions and adverse changes inapplicable laws or regulations, including changes that restrict the activities of the acquired business. In the eventimpairment is identified, a charge to earnings would be recorded. Although it does not affect our cash flow, awrite-off of all or a part of our goodwill or intangibles would adversely affect our operating results and equity.
Reference is made to Note 2 of Notes to Consolidated Financial Statements for more information regardinggoodwill and intangible assets.
Future acquisitions of businesses and greenfield expansions could subject us to additional business, operatingand industry risks, the impact of which cannot presently be evaluated, and which could adversely impact ourcapital structure.
We intend to pursue acquisition opportunities and greenfield expansions in an effort to diversify ourinvestments and grow our business. Any business we acquire may cause us to be affected by numerous risksinherent in the target’s business operations. If we acquire a business in an industry characterized by a high levelof risk, we may be affected by the currently unascertainable risks of that industry. Although we will endeavor toevaluate the risks inherent in a particular industry or target business, we cannot assure that we will be able toproperly ascertain or assess all of the significant risk factors. In addition, integrating acquired businesses,greenfield expansions and assets into our business can be difficult and risky, especially if the acquired businessor assets involve an industry segment with which our management has limited experience or where there arelimited synergies with our current businesses. Our integration of acquired businesses and realization of all
I-27

synergies or efficiencies that we believe may result from such acquisitions or expansions may not come tofruition, which could negatively impact our business.
The financing of any acquisition we complete could adversely impact our capital structure as any suchfinancing would likely include the borrowing of additional funds and/or the issuance of additional equitysecurities. Increasing our indebtedness could increase the risk of a default that would entitle the holder to declareall of such indebtedness due and payable and/or to seize any collateral securing the indebtedness. In addition,default under one debt instrument could in turn permit lenders under other debt instruments to declareborrowings outstanding under those other instruments to be due and payable pursuant to cross default clauses.The issuance of additional equity securities may significantly reduce the equity interest of our stockholders and/or adversely affect prevailing market prices for our common stock.
Reference is made to Note 4 of Notes to Consolidated Financial Statements for more information regardingacquisitions.
While part of our long-term business strategy is to acquire additional businesses, there is no assurance that wewill be able to identify businesses that we can acquire upon terms we believe acceptable, or if such acquisitionsrequire additional financing, that we could obtain such additional financing.
We cannot ascertain the availability of businesses to acquire, nor the capital requirements for futuretransactions. We cannot assure that, if required, additional financing will be available on acceptable terms, if atall. To the extent that additional financing proves to be unavailable when needed to consummate a particularacquisition, we would be compelled to either restructure the transaction or abandon that particular acquisition. Inaddition, if we consummate a future acquisition, we may require additional financing to fund the operations orgrowth of the target business. The failure to secure additional financing may impact the continued developmentor growth of the target business and could adversely impact our operating results.
Our long-term growth plan involves an element of risk and could strain our management resources. Failure toretain key executives could adversely affect our operations and could impede our ability to execute ourbusiness plan and growth strategy.
We intend to pursue a growth strategy involving organic and non-organic growth. There is a no guaranteethat such growth will occur or be successful. We may incur significant capital expenditures in connection withexpansion plans that may not be realized or may not deliver the earnings that are expected. In addition, ourexpansion plans may, in the future, give rise to unforeseen risks or problems, and our future performance willdepend in large part on our ability to manage our long-term planned growth that could strain our existingmanagement, human and other resources. To successfully manage this growth, we must continue to addcompetent managers and employees and improve our operating, financial and other internal procedures andcontrols. We also must effectively motivate, train and manage employees. If we do not manage our growtheffectively, it would adversely affect our future operating results.
Our growth strategies, operational guidance, capital allocation and capital markets support are managedlargely by our existing corporate officers; as well as the senior management teams at our operating units in theAsia-Pacific area and North America. The continued success of our businesses will depend largely on the effortsand abilities of our corporate executives and the operational senior management teams. These key personnel havean understanding of our businesses that cannot be readily duplicated. However, we do not have key-maninsurance on any of these key personnel. The loss of any of these key personnel could impair our ability toexecute our business plan and growth strategy and could have a material adverse effect on our operating results.
I-28
Our long-term growth plan may include the expansion of operations into markets outside of North Americaand the Asia-Pacific area. Such international expansion may not prove successful, and may divert significantcapital, resources and management’s time and attention and adversely affect our on-going operations.
To date, we have conducted all of our business within North America and the Asia-Pacific area. However,we may in the future enter international markets, which would require substantial amounts of management timeand attention. Our products and overall business approach may not be accepted in other markets to the extentneeded to make our international expansion profitable. In addition, the additional demands on management fromthese activities may detract from our efforts in our current markets and adversely affect our operating resultstherein. Any international expansion will expose us to the risks normally associated with conducting internationalbusiness operations, including unexpected changes in regulatory requirements, changes in foreign legislation,possible foreign currency controls, currency exchange rate fluctuations or devaluations, tariffs, difficulties instaffing and managing foreign operations, difficulties in obtaining and managing vendors and distributors,potential negative tax consequences and asset management difficulties.
We may issue shares of our capital stock that would reduce the equity interest of our stockholders and couldcause a change in control of our ownership.
We may seek to finance future transactions, including business combinations, or improve our financialposition by issuing additional shares of our common stock and/or preferred stock. The issuance of any number ofshares of our common stock or of our preferred stock:
• may significantly reduce the equity interest of investors;
• may subordinate the rights of holders of common stock if preferred stock is issued with rights senior tothose afforded to our common stock;
• may cause a change in control if a substantial number of our shares of common stock are issued, whichmay affect, among other things, our ability to use our net operating loss carry forwards, if any, andcould result in the resignation or removal of our present officers and directors; and
• may adversely affect prevailing market prices for our common stock.
Because we have depended to a large extent on the success of our leasing operations, the failure to effectivelyand quickly remarket lease units that are returned could materially and adversely affect our results ofoperations.
Historically, our average monthly lease fleet utilization has averaged between 70% and 85% and the typicallease term has averaged over twelve months. These factors have provided us with a fairly predictable revenuestream. However, if utilization rates decline or should a significant number of our lease units be returned duringany short period of time, we would have to re-lease a large supply of units at similar rates to maintain historicrevenues from these operations. Our failure to effectively maintain historical utilization rates or remarket a largeinflux of units returning from leases could have a material adverse effect on our results of operations and cashflows.
The supply and cost of used ISO containers fluctuates, which can affect our pricing.
We purchase, remanufacture and modify used ISO containers in order to expand our rental fleet. If used ISOcontainer prices increase substantially, these price increases could increase our expenses, particularly if we arenot able (due to competitive reasons or otherwise) to raise our rental rates to absorb this increased cost.Conversely, an oversupply of used ISO containers may cause container prices to fall. In such event, competitorsmay then lower the rental rates on their storage units. As a result, we may need to lower our rental rates to remaincompetitive. Therefore, fluctuations in the used ISO container market could cause our revenues and our earningsto decline.
I-29
Our lease fleet is subject to residual value risk upon disposition, and may not sell at the prices or in thequantities we expect.
A significant portion of our revenues are from unit sales out of our lease fleet. The market value of anygiven unit of our lease fleet could be less than its depreciated value at the time it is sold. The market value ofused rental equipment depends on several factors, including:
• the market price for new equipment of a like kind;
• the age of the equipment at the time it is sold, as well as wear and tear on the equipment relative to itsage;
• the supply of used equipment on the market;
• technological advances relating to the equipment;
• worldwide and domestic demand for used equipment; and
• general economic conditions.
We include in operating income the difference between the sales price and the depreciated value of an itemof equipment sold. Changes in our assumptions regarding depreciation could change our depreciation expense, aswell as the gain or loss realized upon disposal of lease fleet. Sales of units from our lease fleet at prices that fallsignificantly below its carrying value will have an adverse impact on our results of operations.
New tariffs on steel imports could result in increased container prices.
During 2018, the U.S. government announced an ad valorem tariff that will be applied to Chinese exports tothe U.S. The rollout of the tariff has been in the form of tranches or lists of items to be subject to the tariff. Thelists of proposed products and commodities that would be subject to this 25% tariff have included ISOcontainers, but they have been removed up to this point. However, there cannot be any guarantee that they willnot later be subject to future tariffs. Containers involved in typical import/export shipping activities areconsidered instruments of international trade and not typically subject to tariffs, but it is possible that the U.S.government could view containers as being subject to the proposed tariff once they are sold into the UnitedStates. Since a significant portion of portable storage containers currently in the United States are originallymanufactured in China to transport goods before eventually being sold for domestic use, any proposed tariffwould immediately increase the cost of new and used containers being sold into the United States. Such an actionwould result in increased steel container prices, which could adversely affect our results of operations andfinancial condition.
Unionization by some or all of our employees could cause increases in operating costs.
Our employees are not presently covered by collective bargaining agreements. Unions may attempt toorganize our employees in the future. We are unable to predict the outcome of any continuing or future efforts toorganize our employees, the terms of any future labor agreements, or the effect, if any, those agreements mighthave on our operations or financial performance.
We are subject to laws and governmental regulations and actions that affect our operating results andfinancial condition.
Our business is subject to regulation and taxation under a wide variety of foreign and U.S. federal, state andlocal laws, regulations and policies including those imposed by the SEC, the Internal Revenue Service, the Dodd-Frank Wall Street Reform and Consumer Protection Act and NASDAQ, as well as applicable labor laws.Although we have policies and procedures designed to comply with applicable laws and regulations, failure tocomply with the various laws and regulations may result in civil and criminal liability, fines and penalties,increased costs of compliance, additional taxation and restatement of our financial statements.
I-30
There can also be no assurance that, in response to current economic conditions or the current politicalenvironment or otherwise, laws and regulations will not be implemented or changed in ways that adversely affectour operating results and financial condition, such as recently adopted legislation that expands health carecoverage costs or facilitates union activity or federal legislative proposals to increase taxation and operatingcosts.
Our effective tax rate may change and become less predictable as our business expands, making our futureafter-tax results less predictable.
We continue to consider expansion opportunities domestically and internationally for our leasingbusinesses. Since the our effective tax rate depends on business levels, personnel and assets located in variousjurisdictions, further expansion into new markets or acquisitions may change the effective tax rate in the futureand may make it, and consequently our after-tax results, less predictable going forward. In addition, theenactment of future tax law changes by federal, state and international taxing authorities may impact our incometax provision and deferred tax liabilities.
Failure to comply with internal control attestation requirements could lead to loss of public confidence in ourfinancial statements and negatively impact our stock price.
As a public reporting company, we are required to comply with the Sarbanes-Oxley Act of 2002, includingSection 404, and the related rules and regulations of the SEC, including expanded disclosures and acceleratedreporting requirements. Compliance with Section 404 and other related requirements has increased our costs andwill continue to require additional management resources. We may need to continue to implement additionalfinance and accounting systems, procedures and controls to satisfy new reporting requirements, and there is noassurance that future assessments of the adequacy of our internal controls over financial reporting will befavorable. If we are unable to obtain future unqualified reports as to the effectiveness of our internal control overfinancial reporting, investors could lose confidence in the reliability of our internal control over financialreporting, which could, among other things, adversely affect our stock price.
Our self-insured loss reserves through our captive insurance company may be inadequate to cover ourultimate liability.
We have insurance policies with coverage that we believe are adequate, including auto liability, generalliability, directors and officers liability and workers compensation. Effective on February 1, 2017, we becameself-insured for auto liability and general liability through GFNI, our wholly-owned captive insurance company.Claims and expenses are reported when it is probable that a loss has occurred and the amount of the loss can bereasonably estimated. These losses include an estimate of claims that have been incurred but not reported. Werecord reserves (included in “Trade payables and accrued liabilities” in our consolidated balance sheets) to coverestimated losses for our self-insured general liability and auto liability. The determination of these loss reservesis based upon a number of factors, including current and historical claims activity, claims payment patterns anddevelopments in any existing claims. Accordingly, reserves do not represent an exact calculation of liability andcan be affected by both internal and external events, such as adverse developments on existing claims or changesin claims handling procedures, administrative costs and legal fees, inflation, and legal trends and legislativechanges. Loss reserves are adjusted from time to time to reflect new claims, claim developments, or systemicchanges, and such adjustments are reflected in the results of the periods in which the loss reserves are changed.Though we believe the loss reserves recorded at our consolidated balance sheet dates are adequate, because of theuncertainties that surround estimating losses we cannot be certain that such reserves will cover the ultimateliability. If our loss reserves are insufficient to cover our actual losses, we would incur additional charges thatcould be material to our consolidated results of operations and financial condition.
I-31
We are exposed to various possible claims relating to our business and our insurance may not fully protect us.
We are exposed to various possible claims relating to our business. These possible claims include thoserelating to: (i) personal injury or death caused by container products, mobile offices or modular units leased orsold by us; (ii) accidents involving our vehicles and our employees; (iii) employment-related claims;(iv) property damage; (v) commercial claims and (vi) environmental contamination. We believe that we haveadequate insurance coverage for the protection of our assets and operations. However, our insurance may notfully protect us for certain types of claims, such as claims for punitive damages or for damages arising fromintentional misconduct, which are often alleged in third-party lawsuits.
In addition, we may be exposed to uninsured liability at levels in excess of our policy limits. If we are foundliable for any significant claims that are not covered by insurance, our liquidity and operating results could bematerially adversely affected. It is possible that our insurance carriers may disclaim coverage for any class actionand derivative lawsuits against us. It is also possible that some or all of the insurance that is currently available tous will not be available in the future on economically reasonable terms or not available at all. In addition,whether we are covered by insurance or not, certain claims may have the potential for negative publicitysurrounding such claims, which may adversely impact our operating results, value of our public securities, orgive rise to additional similar claims being filed.
Disruptions in our information technology systems could limit our ability to effectively monitor and controlour operations and adversely affect our operations.
Our information technology systems facilitate our ability to monitor and control our operations and adjust tochanging market conditions. Any disruption in our information technology systems or the failure of thesesystems to operate as expected could, depending on the magnitude of the problem, adversely affect our operatingresults by limiting our capacity to effectively transact business, monitor and control our operations and adjust tochanging market conditions in a timely manner. Like other companies, our information technology systems maybe vulnerable to a variety of interruptions due to our own error or events beyond our control, including, but notlimited to, cybersecurity (see “Cybersecurity” in Item 1. Business) breaches, natural disasters, terrorist attacks,telecommunications failures, computer viruses, hackers and other security issues. The failure of these systems tooperate effectively could result in substantial harm or inconvenience to us or our customers. This could includethe improper use of personal information or other “identity theft.” Each of these situations or data privacybreaches may cause delays in customer service, reduce efficiency in our operations, require significant capitalinvestments to remediate the problem, or result in negative publicity that could harm our reputation and results.
In addition, the delay or failure to implement information system upgrades and new systems effectivelycould disrupt our business, distract management’s focus and attention from our business operations and growthinitiatives and increase our implementation and operating costs, any of which could negatively impact ouroperations and operating results.
The price of our common stock may fluctuate significantly, which may make it difficult for stockholders toresell common stock when they want or at a price they find attractive.
We expect that the market price of our common stock will fluctuate. Our common stock price can fluctuateas a result of a variety of factors, many of which are beyond our control. These factors include:
• actual or anticipated variations in our quarterly operating results;
• changes in interest rates and other general economic conditions;
• significant acquisitions or business combinations, strategic partnerships, joint ventures or capitalcommitments by or involving us or our competitors;
• operating and stock price performance of other companies that investors deem comparable to us;
I-32
• news reports relating to trends, concerns, litigation, regulatory changes and other issues in our industry;
• geopolitical conditions such as acts or threats of terrorism or military conflicts;
• relatively low trading volume; and
• significant concentration of ownership in our common stock.
If equity research analysts do not publish research or reports about our business or if they issue unfavorablecommentary or downgrade our common stock, the price of our common stock could decline.
The trading market for our common stock will rely in part on the research and reports that equity researchanalysts publish about us and our business. We do not control these analysts. The price of our stock could declineif one or more equity analysts downgrade our stock or if those analysts issue other unfavorable commentary orcease publishing reports about us or our business.
We do not currently intend to pay dividends on our common stock, which may limit the return on yourinvestment in us.
Except for payment of dividends on our preferred stock, we intend to retain all available funds and anyfuture earnings for use in the operation and expansion of our business and do not anticipate paying any cashdividends on our common stock in the foreseeable future.
Significant Risks Related Primarily to Our Leasing Operations in North America
General or localized economic downturns or weakness may adversely affect our customers, in particular thosein the oil and gas and construction industries, which may reduce demand for our products and services andnegatively impact our future revenues and results of operations.
A significant portion of our revenues in our North American leasing operations is derived from customerswho are in industries and businesses that are cyclical in nature and subject to changes in general economicconditions, including the oil and gas and the construction industries. Although the variety of our products, thebreadth of our customer base and the number of markets we serve throughout North America limit our exposureto economic downturns, general economic downturns or localized downturns in markets where we operate couldreduce demand for our products, especially in the construction or oil and gas industries, and negatively impactour future revenues, results of operations and cash flows.
In the oil and gas industry, lower or the perception of lower or unstable domestic oil or gas prices have anadverse effect on our portable liquid containment business. Such market conditions cause customers to limit orstop exploration and extraction activities, resulting in lower rental demand and rates for our portable liquidcontainment products. Also, a weak U.S. economy may negatively impact infrastructure construction andindustrial activity. Any of these factors would adversely affect our cash flows and financial performance andcould result in excess lease fleet or impairment charges.
We may be brought into tort or environmental litigation or held responsible for cleanup of spills if thecustomer fails to perform, or an accident occurs in the use of our tank container products, which couldmaterially adversely affect our business, future operating results or financial position.
Our portable liquid tank containers and containment products are used by customers to store non-hazardousand certain hazardous liquids on customer sites. Customers are responsible for proper operation of our fleetequipment while on lease and returning a cleaned and undamaged container upon completion of use, but wecannot always assure that these responsibilities are fully met in all cases. Our operations are subject tooperational hazards, including accidents or equipment issues that can cause pollution and other damage to the
I-33
environment. Hazards inherent in the oil and natural gas industry, such as, but not limited to, accidents, blowouts,explosions, pollution and other damage to the environment, fires and hydrocarbon spills, may delay or haltoperations at extraction sites which we service. These conditions can cause:
• personal injury or loss of life;
• liabilities from accidents by our fleet of trucks and other equipment;
• damage to or destruction of property, equipment and the environment; and
• the suspension of operations.
In the event of a spill or accident, we may be brought into a lawsuit or enforcement action by either ourcustomer or a third party on numerous potential grounds, including that an inherent flaw in a container tankcontributed to the accident or that the container tank had suffered some undiscovered harm from a previouscustomer’s use. In the event of a spill caused by our customers, we may be held responsible for cleanup underenvironmental laws and regulations concerning obligations of suppliers of rental products to effect remediation.In addition, applicable environmental laws and regulations may impose liability on us for conduct of thirdparties, or for actions that complied with applicable regulations when taken, regardless of negligence or fault.Substantial damage awards have also been made in certain jurisdictions against lessors of industrial equipmentbased upon claims of personal injury, property damage, and resource damage caused by the use of variousproducts. While we try to take reasonable precautions that our lease equipment is in good and safe conditionprior to lease and carry insurance to protect against certain risks of loss or accidents, liability could adverselyimpact our profitability.
We maintain insurance coverage that we believe to be customary in the industry against these hazards. Wemay not be able to maintain adequate insurance in the future at rates we consider reasonable. In addition,insurance may not be available to cover any or all of the risks to which we are subject, or, even if available, thecoverage provided by such insurance may be inadequate, or insurance premiums or other costs could make suchinsurance prohibitively expensive. It is likely that, in our insurance renewals, our premiums and deductibles willbe higher, and certain insurance coverage either will be unavailable or considerably more expensive than it hasbeen in the recent past. In addition, our insurance is subject to coverage limits, and some policies excludecoverage for damages resulting from environmental contamination.
The portable storage industry in North America is highly competitive and fragmented, and we face significantcompetition that may lead to our inability to increase or maintain our prices, which could have a materialadverse impact on our results of operations.
The portable storage industry in North America is highly competitive and fragmented. Many of the marketsin which we operate are served by numerous competitors, ranging from national companies to smaller multi-regional companies and small, independent businesses with a limited number of locations. Some of thesecompetitors currently offer products outside of our offerings or may have better brand recognition in somemarket sectors. If these competitors use their brand awareness to promote products that compete with our productofferings, customers may choose these competitors’ products over ours, and we could lose business. A number ofour competitors are competing aggressively on the basis of pricing and may drive down prices. Additionally,general economic factors could drive down market prices. To the extent that we choose to match ourcompetitors’ declining prices, it could harm our results of operations as we would have lower margins. To theextent that we choose not to match or remain within a reasonable competitive distance from our competitors’pricing, it could also harm our results of operations, as we may lose rental volume.
I-34
The portable liquid containment rental industry is highly competitive, and competitive pressures could impairour ability to increase market share and to rent or sell, equipment at favorable prices.
The portable liquid containment rental industry is highly competitive. We compete against national, regionaland local companies, some of which are significantly larger than we are and have greater financial and marketingresources than we have. Some of our competitors also have longer operating histories, lower cost rentalequipment and lower cost structures and more established relationships with equipment manufacturers than wehave. In addition, certain of our competitors are more geographically diverse than we are and have greater namerecognition among customers than we do. As a result, our competitors that have these advantages may be betterable to attract customers.
We believe that local relationships, equipment quality, service levels and fleet size are key competitivefactors in the portable liquid containment industry. From time to time, we or our competitors may attempt tocompete aggressively by lowering rental rates or prices. Competitive pressures could adversely affect our futurerevenues and operating results by depressing the rental rates. To the extent we lower lease rates or increase ourfleet size in order to retain or increase market share, our operating margins would be adversely impacted. Inaddition, we may not be able to match a larger competitor’s price reductions or fleet investment because of itsgreater financial resources, all of which could adversely impact our future operating results.
Seasonality of the portable liquid containment industry may impact future quarterly results.
Activity may decline in our second quarter months of November and December and our third quartermonths of January and February. These months may have lower rental activity in parts of the country whereinclement weather may delay, or suspend, customer projects. The impact of these delays may be to decrease thenumber of frac tank containers on lease until companies are able to resume their projects when weather improves.These seasonal factors may impact our future quarterly results in each year’s second and third quarters.
A key for success in the oil and gas industry in North America is our ability to continue to employ and retainskilled and unskilled personnel. Any difficulty we experience replacing or adding personnel could adverselyaffect our business.
We may not be able to find enough skilled and unskilled labor to meet our needs, which could limit ourgrowth. Oil and gas business activity historically decreases or increases with the prices of oil and natural gas. Wemay have problems retaining and finding enough laborers in the future, particularly if the demand for ourportable liquid containment products and fluid management services increases significantly in a relatively shortperiod of time. Other factors may also inhibit our ability to find enough workers to meet our employment needs.We believe that a key to our success in the oil and gas industry in North America is our ability to continue toemploy and retain skilled and unskilled personnel. Our inability to employ or retain personnel generally couldhave a significant adverse effect on our operations.
A substantial portion of the revenues of Lone Star are earned from a limited number of major customers, andthe loss of any one or more of these customers could adversely affect our results of operations.
Lone Star earns a substantial portion of its revenue from a limited number of major customers. One or moreof these customers could cancel their leases and cease doing business with Lone Star for a variety of reasonsbeyond our control. The loss of one or more of these major customers could adversely affect our results ofoperations.
I-35
We face significant competition in the modular space industry, especially from several national competitors inthe United States who have greater financial resources and pricing flexibility than we do. If we are unable tocompete successfully, we could lose customers and our future revenues could decline.
Although our competition varies significantly by market, the modular space markets in which we competeare dominated primarily by three participants and are highly competitive. In addition, we compete with a numberof large to mid-sized regional competitors, as well as many smaller, full and part-time operators in many localregions. The modular space industry is highly competitive, subject to stiff pricing competition and almost all ofthe competitors have portable storage product offerings. The primary modular national competitors with portablestorage product offerings have greater financial resources and pricing flexibility. If they focus on portable storageand are unable to compete successfully, we could lose customers and our future revenues and results ofoperations could decline.
Failure to comply with applicable regulations could harm our business and financial condition, resulting inlower operating results and cash flows.
Similar to conventionally constructed buildings, companies in the modular building industry are subject toregulations by multiple governmental agencies at the federal, state and local level relating to environmental,zoning, health and safety, labor and transportation, among other matters. New governmental regulations in theseor other areas may increase our acquisition cost of new rental equipment, limit the use of or make obsolete someof our existing fleet, or increase our costs of rental operations. Failure to comply with these laws or regulationscould impact our business or harm our reputation and result in higher capital or operating expenditures or theimposition of penalties or restrictions on our operations. Compliance with building codes and regulations entailsa certain amount of risk as state and local government authorities do not necessarily interpret building codes andregulations in a consistent manner, particularly where applicable regulations may be unclear and subject tointerpretation. These regulations often provide broad discretion to governmental authorities that oversee thesematters, which can result in unanticipated delays or increases in the cost of compliance in particular markets. Theconstruction and modular industries have developed many “best practices” which are constantly evolving. Someof our peers and competitors may adopt practices that are more or less stringent than ours. When, and if,regulatory standards are clarified, the effect of the clarification may be to impose rules on our business andpractices retroactively, at which time, we may not be in compliance with such regulations and we may berequired to incur costly remediation. If we are unable to pass these increased costs on to our customers, ourprofitability, operating cash flows and financial condition could be negatively impacted.
Significant increases in raw material costs could increase our operating costs significantly and harm ourfuture results of operations.
We purchase raw materials, including metals, lumber, siding and roofing and other products, to constructand modify modular buildings and to modify containers to its customers’ requirements. We also maintain a truckfleet to deliver units to and return units from customers. During periods of rising prices for raw materials,especially oil and fuel for delivery vehicles, and in particular when the prices increase rapidly or to levelssignificantly higher than normal, we may incur significant increases in operating costs and may not be able topass price increases through to customers in a timely manner, which could harm our future results of operations.
Failure by our manufacturers to sell and deliver products in a timely fashion may harm our reputation andfinancial condition.
We currently purchase new modular buildings and components, mobile offices and container productsdirectly from manufacturers. Although we are not dependent on any one manufacturer and are able to purchaseproducts from a variety of suppliers, the failure of one or more of our suppliers to timely manufacture and deliverstorage containers to us could adversely affect our operations. We purchase new modular buildings andcomponents, mobile offices and storage containers under purchase orders issued to various manufacturers, which
I-36
the manufacturers may or may not accept or be able to fill. We have no contracts with any supplier. If thesesuppliers do not timely fill our purchase orders, or do not properly manufacture the ordered products, ourreputation and financial condition could be harmed.
Some zoning laws restrict the use of our storage units and therefore limit our ability to offer products in allmarkets.
Many of our customers use our storage units to store goods on their own properties. Local zoning laws insome of our markets prohibit customers from maintaining mobile offices or storage containers on their propertiesor require that mobile offices or storage containers be located out of sight from the street. If local zoning laws inone or more of our geographic markets were to ban or restrict our products from being stored on customers’ sites,our business in that market could suffer.
As Department of Transportation regulations increase, our operations could be negatively impacted andcompetition for qualified drivers could increase.
We operate in the United States pursuant to operating authority granted by the U.S. Department ofTransportation (“DOT”). Our company drivers must comply with the safety and fitness regulations of the DOT,including those relating to drug and alcohol testing and hours-of-service. Such matters as equipment weight anddimensions also are subject to government regulations. Our safety record could be ranked poorly compared to ourpeer firms. A poor fleet ranking may result in the loss of customers or difficulty attracting and retaining qualifieddrivers which could affect our results of operations. Should additional rules be enacted in the future, compliancewith such rules could result in additional costs.
A tightening transportation-related labor market could adversely affect Lone Star
Lone Star’s ability to remain productive and competitive depends on its ability to attract and retaintransportation personnel in particular skilled truck drivers. The national tightening of the transportation relatedlabor market due to a shortage of skilled truck drivers may inhibit Lone Star’s ability to hire and retain thissegment of our employee base. Additionally, rising wages paid to skilled truck drivers may pose a risk to LoneStar’s margins if it is unable to pass on such higher costs through rate increases. These labor factors could have amaterial adverse effect on our results of operations.
Significant Risks Related Primarily to Our Leasing Operations in the Asia-Pacific
The future performance of Royal Wolf depends on customer demand for portable container solutions as wellas the expansion of the portable container solutions products market in Australia.
Any reduction in customer demand, failure of customer demand to grow, or failure of Royal Wolf to meetchanges in customer demand or preferences may adversely affect Royal Wolf’s businesses, operationalperformance, growth prospects and financial position. For example, if expected growth in the portable containerbuildings market fails to come to fruition, or if businesses and individuals no longer demand portable containerbuildings at current levels, Royal Wolf’s return on its portable container building investments could benegatively impacted. The demand for Royal Wolf’s assets is dependent on the key industry segments into whichRoyal Wolf sells and lease assets, such as oil and gas, mining, construction, industrial and retail. A significantreduction in the business climate in these industry segments, could negatively impact Royal Wolf’s results ofoperations.
The success and ability to drive future growth is dependent to a large extent on brand reputation.
Royal Wolf believes its brand reputation is a key driver in its success and its ability to drive future growth.Any adverse change to the reputation of Royal Wolf may adversely affect the Company’s businesses, operational
I-37
performance and financial condition. Royal Wolf licenses the “Royal Wolf” trademark in Australia, NewZealand and surrounding islands in the Asia-Pacific region. There is a risk that use of the “Royal Wolf” brand bythird parties in jurisdictions in which Royal Wolf does not own the trademark may adversely impact the RoyalWolf brand and consequently its business.
Royal Wolf’s ability to achieve its long-term business strategy is dependent to a certain extent on its supplychain and purchasing.
Royal Wolf’s long-term business strategy assumes a certain level of growth in Australian and New Zealanddemand for container based solutions. Royal Wolf’s ability to meet this demand is dependent, to a certain extent,on the ability of Royal Wolf to purchase storage containers economically and on a timely basis. Historically,Royal Wolf has successfully worked with shipping lines and international container leasing companies topurchase used containers, and with manufacturers and brokers, including in China, to purchase new containers,but there can be no guarantee of this in the future. Changes to shipping line practices with respect to usedcontainers, and adverse changes in trade practices, regulations and relations between Australia and its tradingpartners, including China, could adversely impact Royal Wolf’s ability to purchase containers or impact the priceat which Royal Wolf is able to purchase containers.
Historically, Royal Wolf has relied on internal supply chain and sourcing arrangements, internationalsuppliers and the logistics industry to relocate containers. Changes to these arrangements, constraints on thesupply chain, failure of suppliers to deliver or deliver in a timely manner or material increases in the price of newor used containers could have an adverse impact on Royal Wolf’s business, operational performance, profitmargins and financial results. Royal Wolf purchases new storage container products under purchase orders issuedto container manufacturers, which the manufacturers may or may not accept or be able to fill. There are severalalternative sources of supply for storage containers. Though Royal Wolf is not dependent upon any onemanufacturer in purchasing storage container products, the failure of one or more of its suppliers to timelydeliver containers to Royal Wolf could adversely affect its operations. If these suppliers do not timely fill RoyalWolf’s purchase orders or do not properly manufacture the ordered products, Royal Wolf’s reputation andfinancial condition also could be harmed.
Royal Wolf conducts its business in a highly competitive sector.
Royal Wolf’s faces competition in the portable buildings, freight and portable storage markets. Royal Wolfalso faces potentially significant competition from modular industry companies who have non-container portablebuilding offerings, especially several national competitors in Australia who have greater financial resources andpricing flexibility than Royal Wolf. As a result, Royal Wolf is subject to potential competition from newdomestic and foreign competitors and the provision of new products or services, aggressive pricing and leaserates offered by existing competitors. Competition varies by region and Royal Wolf may not always be able tomatch its competitors in service levels, functionality and price in each or all regions. The emergence of a newcompetitor with international reach, or increased focus on the rental model by existing competitors, particularlywith an extensive distribution network, could have an adverse effect on Royal Wolf’s business, financialcondition, results of operations and growth prospects. Also, continued service improvement by competitors mayresult in Royal Wolf’s customers using substitutes in place of some of Royal Wolf’s products. Royal Wolf maynot always be able to match its competitors in both functionality and price, which could negatively impact RoyalWolf’s revenues. In addition, some of Royal Wolf’s unique products are the subject of patent applications onlyand there is no guarantee that those applications will become effective. If the patent applications do not becomeeffective, there is a risk that Royal Wolf’s competitors could produce similar rival products, which may have anadverse effect on Royal Wolf.
Royal Wolf is subject to foreign exchange rate fluctuations.
Royal Wolf is subject to exchange rate fluctuations, particularly as it sources a substantial portion of itsportable container solutions fleet from China in purchases, which are U.S. dollar-denominated. While Royal
I-38
Wolf has a hedging policy to mitigate this risk, unhedged exchange rate fluctuations in the Australian dollarrelative to the U.S. dollar and, to a lesser extent, the New Zealand dollar, may adversely affect the financialperformance of Royal Wolf, including its financial position, cash flows, distributions and growth prospects.
Royal Wolf is subject to Australian and New Zealand taxation and tariff regulation.
Significant recent reforms and current proposals for further reforms to tax laws in the jurisdictions withinwhich Royal Wolf operates may give rise to uncertainty. The precise scope and impact of future changes to taxlaws may not be known. Royal Wolf is also subject to import tariffs with respect to the portable containerproducts it sources from overseas. Any changes to such tax or tariff laws (including the imposition of, orincreases to, such taxes or tariffs), their interpretation or the manner in which they are administered by therelevant government agency or the current rate of company income tax or import tariff may impact theoperational or financial performance of Royal Wolf (or customers in its key end markets).
Royal Wolf may face a tightening labor force and is subject to Workplace Health and Safety regulations.
Royal Wolf’s ability to remain productive, profitable and competitive and to effect its planned growthinitiatives depends on its ability to attract and retain workers. Tightening of the labor market in key regions dueto a shortage of suitably skilled workers may inhibit Royal Wolf’s ability to hire and retain employees.Additionally, rising wages paid to employees may pose a risk to Royal Wolf’s margins if it is unable to pass onsuch higher costs through price increases. Royal Wolf is also subject to Workplace Health and Safety regulations.If Royal Wolf is not able to maintain its working conditions to meet Workplace Health and Safety regulations itmay impact Royal Wolf’s operations and ability to attract and retain workers and also result in contravention ofthose regulations, which may give rise to potential criminal and civil liability and also damage Royal Wolf’sbrand and reputation.
Significant Risks Related Primarily to Our Manufacturing Operations in North America
Demand for our manufacturing products in North America is to a significant degree dependent on the levelsof expenditures and drilling activity by the oil and gas industry, primarily in Texas, and can fluctuatesignificantly in a short period of time. The viability of our manufacturing operations during times ofreductions in domestic drilling activity and demand for our portable liquid containment products may besignificantly reliant on the commercial success of other steel-based products to industry sectors outside of theoil and gas market.
A substantial downturn in the domestic oil and gas industry can result in lower expenditures and reduceddrilling, which in turn would have a material adverse effect on the results of operations and cash flows of ourmanufacturing operations in North America. In order to remain commercially viable and diversify outside of theportable liquid containment business, our manufacturing operations have focused on introducing steel-basedproducts for non-oil and gas markets, which include, among other things, a chassis product line targeted to theNorth American transportation market, the production of GLOs for the portable storage market, the production ofstorm shelters for the consumer market and the production of specialty portable fuel tanks for the agriculturalmarket. While we have been relatively successful in achieving commercial viability in these non-oil and gassteel-based products and closely monitor the situation, there is no assurance that such commercial success orviability will be sustained.
Significant competition in the oil and gas industry in which Southern Frac produces its portable liquidcontainment products may result in its competitors offering new or better products and services or lowerprices, which could result in a loss of customers and a decrease in revenues.
The portable liquid storage tank container manufacturing industry is highly competitive. Southern Fraccompetes with other manufacturers of varying sizes, some of which have substantial financial resources.
I-39

Manufacturers compete primarily on the quality of their products, customer relationships, service availability andcost. Barriers to entry are low. As a result, it is possible that additional competitors could enter the market at anytime. If Southern Frac is unable to successfully compete with other portable liquid storage tank containermanufacturers it could lose customers and our revenues may decline.
Seasonality of the portable liquid containment industry may impact future quarterly results.
While the oil and gas industry is extremely volatile, historically, activity may typically decline in our secondquarter months of November and December and our third quarter months of January and February. These monthsmay have lower rental activity in parts of the country where inclement weather may delay, or suspend, customerprojects. The impact of these delays may be to decrease the number of frac tank containers sold until companiesare able to resume their projects when weather improves. These seasonal factors may impact Southern Frac’sfuture operating results in each fiscal year’s second and third quarters.
Difficulties Associated with Fixed Capacity Levels
Southern Frac’s ability to increase manufacturing capacity may require significant investments in equipmentand personnel. To the extent that we make investments to increase manufacturing capacity and demand for ourproducts is not sustained, our results of operations and financial condition may be adversely affected.Conversely, if we choose not to make investments to increase manufacturing capacity, our ability to meetcustomer demand for our products and increase revenues may be adversely affected. Additionally, operating ourfacilities at near full capacity levels may cause us to incur labor costs at premium rates in order to meet customerrequirements, experience increased maintenance expenses or require us to replace our machinery and equipmenton an accelerated basis, each of which could cause our results of operations and financial condition to beadversely affected.
Implementation of Operational Improvements
As part of our ongoing focus on being a low-cost provider of high quality products, we periodically analyzeour business to further improve our operations. Our continued analysis may include identifying andimplementing opportunities for: (i) further rationalization of manufacturing capacity; (ii) streamlining of selling,general and administrative overhead; or (iii) efficient investment in new equipment and the upgrading of existingequipment. We may be unable to successfully identify or implement plans targeting these initiatives, or fail torealize the benefits of the plans we have already implemented, as a result of operational difficulties, a weakeningof the economy or other factors. Cost reductions may not fully offset decreases in the prices of our products dueto the time required to develop and implement cost reduction initiatives. Additional factors, such as inconsistentcustomer ordering patterns, increasing product complexity and heightened quality standards, may also make itmore difficult to reduce our costs. It is also possible that as we incur costs to implement improvement strategies,the initial impact on our financial position, results of operations and cash flow may be adverse and we may notbe able to successfully realize sufficient cost savings to mitigate this adverse impact.
Southern Frac’s business could be harmed if we fail to maintain proper inventory levels.
Southern Frac is required to maintain sufficient inventories to accommodate the needs of its customersincluding, in many cases, short lead times on delivery requirements. We purchase raw materials on a regularbasis in an effort to maintain our inventory at levels that we believe are sufficient to satisfy the anticipated needsof our customers based upon orders, customer volume expectations, historic buying practices and marketconditions. Inventory levels in excess of customer demand may result in the use of higher-priced inventory to fillorders reflecting lower selling prices, if steel prices have significantly decreased. These events could adverselyaffect our financial results. Conversely, if we underestimate demand for our products or if our suppliers fail tosupply quality products in a timely manner, we may experience inventory shortages. Inventory shortages couldresult in unfilled orders, negatively impacting our customer relationships and resulting in lost revenues, whichcould harm our business and adversely affect our financial results.
I-40
Southern Frac’s future operating results may be affected by fluctuations in raw material prices, and it may beunable to pass on any increases in raw material costs to its customers.
Southern Frac’s principal raw material is steel. The steel industry as a whole has been cyclical, and at timesavailability and steel prices can be volatile due to a number of factors beyond our control. These factors includegeneral economic conditions, domestic and worldwide demand, the influence of hedge funds and otherinvestment funds participating in commodity markets, curtailed production from major suppliers due to factorssuch as the closing or idling of facilities, accidents or equipment breakdowns, repairs or catastrophic events,labor costs or problems, competition, new laws and regulations, import duties, tariffs, energy costs, availabilityand cost of steel inputs (e.g., ore, scrap, coke and energy), currency exchange rates and other factors. Thisvolatility, as well as any increases in raw material costs, could significantly affect our steel costs and adverselyimpact our financial results. If our suppliers increase the prices of our critical raw materials, we may not havealternative sources of supply. In addition, in an environment of increasing prices for steel and other rawmaterials, competitive conditions may impact how much of the price increases we can pass on to our customers.To the extent we are unable to pass on future price increases in our raw materials to customers, our financialresults could be adversely affected. Also, if steel prices decrease, competitive conditions may impact howquickly we must reduce our prices to our customers, and we could be forced to use higher-priced raw materials tocomplete orders for which the selling prices have decreased. Decreasing steel prices could also require us towrite-down the value of our inventory to reflect current market pricing.
The loss of key supplier relationships could adversely affect Southern Frac.
Southern Frac has developed relationships with certain steel and other suppliers which have been beneficialto us by providing more assured delivery and a more favorable all-in cost, which includes price and shippingcosts. If any of those relationships were disrupted, it could have an adverse effect on delivery times and theoverall cost and quality of our raw materials, which could have a negative impact on our business. In addition,we do not have long-term contracts with any of our suppliers. If, in the future, we are unable to obtain sufficientamounts of steel and other products at competitive prices and on a timely basis from our traditional suppliers, wemay be unable to obtain these products from alternative sources at competitive prices to meet our deliveryschedule, which could have a material adverse effect on our results of operations.
The costs of manufacturing Southern Frac’s products and its ability to supply customers could be negativelyimpacted if we experience interruptions in deliveries of needed raw materials or supplies.
If, for any reason, Southern Frac’s supply of steel is curtailed or it otherwise is unable to obtain thequantities it needs at competitive prices, our business could suffer and our financial results could be adverselyaffected. Such interruptions could result from a number of factors, including a shortage of capacity in thesupplier base of raw materials, energy or the inputs needed to make steel or other supplies, a failure of suppliersto fulfill their supply or delivery obligations, financial difficulties of suppliers resulting in the closing or idling ofsupplier facilities, other significant events affecting supplier facilities, significant weather events and otherfactors, all of which are beyond our control.
A tightening Texas labor force could adversely affect Southern Frac
Southern Frac’s ability to remain productive and competitive depends on its ability to attract and retainworkers. Tightening of the labor market in Texas due to a shortage of suitably semi-skilled workers may inhibitSouthern Frac’s ability to hire and retain employees. Additionally, rising wages paid to employees may pose arisk to Southern Frac’s margins if it is unable to pass on such higher costs through price increases. These laborfactors could have a material adverse effect on our results of operations.
I-41
Significant Risks Related Primarily to Our Series C Preferred Stock
We cannot assure that quarterly dividends on, or any other payments in respect of, the Series C PreferredShares will be made timely or at all.
We cannot assure that we will be able to pay quarterly dividends on the Series C Preferred Shares or toredeem the Series C Preferred Shares, if we wanted to do so. Quarterly dividends on our Series C PreferredShares will be paid from funds legally available for such purpose when, as and if declared by our board ofdirectors. Certain factors may influence our decision, or adversely affect our ability, to pay dividends on, or makeother payments in respect of, our Series C Preferred Shares, including, among other things:
• the amount of our available cash or other liquid assets, including the impact of any liquidity shortfallscaused by the below-described restrictions on the ability of our subsidiaries to generate and transfercash to us;
• our ability to service and refinance our current and future indebtedness;
• changes in our cash requirements to fund capital expenditures, acquisitions or other operational orstrategic initiatives;
• our ability to borrow or raise additional capital to satisfy our capital needs;
• restrictions imposed by our existing, or any future, credit facilities, debt securities or leases, includingrestricted payment and leverage covenants that could limit our ability to make payments to holders ofthe Series C Preferred Shares;
• limitations on our subsidiaries’ ability to distribute cash to us due to third parties holding equityinterests in those subsidiaries; and
• limitations on cash payments to shareholders under Delaware law, including limitations that requiredividend payments be made out of surplus or, subject to certain limitations, out of net profits for thethen-current or preceding year in the event there is no surplus.
• our ability to maintain a Fixed Charge Ratio, as defined, of no less than 2.00.
Based on its evaluation of these and other relevant factors, our board of directors may, in its sole discretion,decide not to declare a dividend on the Series C Preferred Shares for any quarterly period for any reason,regardless of whether we have funds legally available for such purpose. In such event, a holder’s sole recoursewill be its rights as a holder of Series C Preferred Shares, which includes the right to cumulative dividends and,under certain specified circumstances, to additional interest and limited conditional voting rights.
GFN’s ability, as a holding company, to make payments in respect of the Series C Preferred Shares dependson the ability of our subsidiaries to transfer funds to us.
GFN is a holding company and, accordingly, substantially all of our operations are conducted through oursubsidiaries. As a result, GFN’s cash flow and ability to make dividend payments to our stockholders depend onthe earnings of our subsidiaries, the distribution from our subsidiaries and compliance with the covenantsgoverning the indebtedness of our subsidiaries, including, without limitation, covenants of the senior creditfacilities of our subsidiaries that permit dividends and other payments from such subsidiaries to GFN. Paymentsby our subsidiaries to GFN are also contingent upon those subsidiaries’ earnings and business considerations.Furthermore, GFN’s right to receive any assets of any of our subsidiaries upon their liquidation, reorganization orotherwise, and thus the ability of a holder of Series C Preferred Stock to benefit indirectly from such distribution,will be subject to the prior claims of the subsidiaries’ creditors.
The terms of the revolving senior secured credit facility with a syndicate led by Wells Fargo Bank, NationalAssociation (“Wells Fargo”) limit the ability of our North American Leasing operations to upstream funds toGFN that would be used to pay dividends on the Series C Preferred Stock. If the amount of the dividends payableon the Series C Preferred Stock exceeds the amount of the funds our North American Leasing operations are
I-42
permitted to pay GFN, and GFN is unable to generate sufficient cash from its other subsidiaries for a dividendpayment, GFN may not be able to make the required dividend payment on the Series C Preferred Stock. Ourability to pay dividends or make other payments to the holders of our Series C Preferred Shares will be adverselyaffected if the senior credit facility prohibits the transfer of funds to GFN.
The Series C Preferred Shares represent perpetual equity interests.
The Series C Preferred Shares represent perpetual equity interests in us and, unlike our indebtedness, willnot entitle the holders thereof to receive payment of a principal amount at a particular date. As a result, holders ofthe Series C Preferred Shares may be required to bear the financial risks of an investment in the Series CPreferred Shares for an indefinite period of time. In addition, the Series C Preferred Shares will rank junior to allour indebtedness and other liabilities, and to any other senior securities we may issue in the future with respect toassets available to satisfy claims against us. In addition, the lack of a fixed mandatory redemption date for theSeries C Preferred Shares will increase your reliance on the secondary market for liquidity purposes.
Investors should not expect us to redeem the Series C Preferred Shares on the date the Series C PreferredShares become redeemable by the Company or on any particular date afterwards.
The shares of Series C Preferred Shares have no maturity or mandatory redemption date and are notredeemable at the option of investors under any circumstances. By their terms, the Series C Preferred Shares maybe redeemed by us at our option either in whole or in part at any time on or after May 17, 2018. Any decision wemay make at any time regarding whether to redeem the Series C Preferred Shares will depend upon a widevariety of factors, including our evaluation of our capital position, our capital requirements and general marketconditions at that time. However, investors should not assume that we will redeem the Series C Preferred Sharesat any particular time, or at all.
Increases in market interest rates may adversely affect the trading price of our Series C Preferred Shares.
One of the factors that will influence the trading price of our Series C Preferred Shares will be the dividendyield on the Series C Preferred Shares relative to market interest rates. An increase in market interest rates mayreduce demand for our Series C Preferred Shares and would likely increase our borrowing costs and potentiallydecrease funds available for distribution. Accordingly, higher market interest rates could cause the market priceof our Series C Preferred Shares to decrease.
The Series C Preferred Shares have not been rated and the lack of a rating may adversely affect the tradingprice of the Series C Preferred Shares.
We have not sought to obtain a rating for the Series C Preferred Shares, and the shares may never be rated.It is possible, however, that one or more rating agencies might independently determine to assign a rating to theSeries C Preferred Shares or that we may elect to obtain a rating of our Series C Preferred Shares in the future. Inaddition, we may elect to issue other securities for which we may seek to obtain a rating. The market value of theSeries C Preferred Shares could be adversely affected if:
• any ratings assigned to the Series C Preferred Shares in the future or to other securities we issue inthe future are lower than market expectations or are subsequently lowered or withdrawn;
• or ratings for such other securities would imply a lower relative value for the Series C PreferredShares.
I-43
The interests of holders in the Series C Preferred Shares could be diluted by our issuance of additional sharesof preferred stock, including additional Series C Preferred Shares, and by other transactions.
Our charter currently authorizes the issuance of up to one million shares of preferred stock in one or moreclasses or series, and we will be permitted, without notice to or consent of the holders of Series C PreferredShares, to issue additional Series C Preferred Shares or other securities that have rights junior to such shares, upto the maximum aggregate number of authorized shares of our preferred stock. The issuance of additionalpreferred stock on a parity with or senior to our Series C Preferred Shares would dilute the interests of theholders of our Series C Preferred Shares, and any issuance of preferred stock senior to or on a parity with ourSeries C Preferred Shares or of additional indebtedness could adversely affect our ability to pay dividends on,redeem or pay the liquidation preference on our Series C Preferred Shares. We cannot assure that quarterlydividends on, or any other payments in respect of, the Series C Preferred Shares will be made timely or at all andthere are effectively no provisions relating to our Series C Preferred Shares that protect the holders of our SeriesC Preferred Shares in the event of a highly leveraged or other transaction, including a merger or the sale, lease orconveyance of all or substantially all our assets or business; any of which might adversely affect the holders ofour Series C Preferred Shares.
A holder of Series C Preferred Shares has extremely limited voting rights.
Voting rights as a holder of Series C Preferred Shares will be extremely limited. However, in the event thatsix quarterly dividends, whether consecutive or not, payable on Series C Preferred Shares are in arrears or alisting failure has occurred and is continuing, the holders of Series C Preferred Shares will have the right, votingtogether as a class with all other classes or series of parity securities upon which like voting rights have beenconferred and are exercisable, to elect two additional directors to serve on our board of directors.
The Series C Preferred Shares are not convertible, and purchasers may not realize a corresponding benefit ifthe trading price of our common stock rises.
The Series C Preferred Shares are not convertible into our common shares and do not have exchange rightsor entitled or subject to any preemptive or similar rights. Accordingly, the market value of the Series C PreferredShares may depend to some degree on, among other things, dividend and interest rates for other securities andother investment alternatives and our actual and perceived ability to make dividend or other payments in respectof our Series C Preferred Shares rather than the trading price of our common stock. In addition, our right toredeem the Series C Preferred Shares on or after May 17, 2018 or in the event of a change in control couldimpose a ceiling on their value.
Significant Risks Related Primarily to Our Senior Notes
The Senior Notes are not rated, and the issuance of a credit rating could adversely affect the market price ofthe Senior Notes.
At their issuance, the Senior Notes were not rated by any credit rating agency. However, the Senior Notesmay subsequently be rated by one or more of the credit rating agencies. If the Senior Notes are rated, the ratingcould be lower than expected, and such a rating could have an adverse effect on the market price of the SeniorNotes. Furthermore, credit rating agencies revise their ratings from time to time and could lower or withdraw anyrating issued with respect to the Senior Notes. Any real or anticipated downgrade or withdrawal of any ratings ofthe Senior Notes could have an adverse effect on the market price or liquidity of the Senior Notes.
Ratings reflect only the views of the issuing credit rating agency or agencies and are not recommendationsto purchase, sell or hold any particular security, including the Senior Notes. In addition, ratings do not reflectmarket prices or suitability of a security for a particular investor, and any future rating of the Senior Notes maynot reflect all risks related to us and our business or the structure or market value of the Senior Notes.
I-44
We are the sole obligor of the Senior Notes, and our direct and indirect subsidiaries do not guarantee ourobligations under the Senior Notes and do not have any obligation with respect to the Senior Notes.Furthermore, your right to receive payment on the Senior Notes will be structurally subordinated to theliabilities of our subsidiaries.
GFN is a holding company with no business operations or assets other than the capital stock of its direct andindirect subsidiaries. Consequently, we will be dependent on loans, dividends and other payments from thesesubsidiaries to make payments of principal and interest on the Senior Notes. However, our subsidiaries areseparate and distinct legal entities, and they will have no obligation, contingent or otherwise, to pay the amountsdue under the Senior Notes or to make any funds available to pay those amounts, whether by dividend,distribution, loan or other payments. Holders of the Senior Notes will not have any direct claim on the cash flowsor assets of our direct and indirect subsidiaries.
The ability of our subsidiaries to pay dividends and make other payments to us will depend on their cashflows and earnings, which, in turn, will be affected by all of the factors discussed in our Annual Report onForm 10-K. The ability of our direct and indirect subsidiaries to pay dividends and make distributions to us maybe restricted by, among other things, applicable laws and regulations and by the terms of the agreements intowhich they enter. If we are unable to obtain funds from our direct and indirect subsidiaries as a result ofrestrictions under their debt or other agreements, applicable laws and regulations or otherwise, we may not beable to pay cash interest or principal on the Senior Notes when due.
The Senior Notes are structurally subordinated to all indebtedness of our subsidiaries. While the indenturegoverning the Senior Notes will limit the indebtedness and activities of these subsidiaries, holders ofindebtedness of, and trade creditors of, our subsidiaries, are entitled to payments of their claims from the assetsof such subsidiaries before those assets are made available for distribution to us, as direct or indirect shareholder.Accordingly, in the event that any of our subsidiaries becomes insolvent, liquidates or otherwise reorganizes:
• the creditors of such subsidiary (including the holders of the Senior Notes) will have no right toproceed against such subsidiary’s assets; and
• the creditors of such subsidiary, including trade creditors, will generally be entitled to payment in fullfrom the sale or other disposal of assets of such subsidiary before we, as direct or indirect stockholder,will be entitled to receive any distributions from such subsidiary.
GFN’s ability, as a holding company, to make payments in respect of the Senior Notes depends on the abilityof our subsidiaries to transfer funds to us.
GFN’s cash flow and ability to make payments in respect of the Senior Notes depends on the earnings of oursubsidiaries, the distribution from our subsidiaries and compliance with the covenants governing theindebtedness of our subsidiaries, including, without limitation, covenants of the senior credit facilities of oursubsidiaries that permit dividends and other payments from such subsidiaries to GFN. Payments by oursubsidiaries to GFN are also contingent upon those subsidiaries’ earnings and business considerations.Furthermore, GFN’s right to receive any assets of any of our subsidiaries upon their liquidation, reorganization orotherwise, and thus the ability of a holder of Senior Notes to benefit indirectly from such distribution, will besubject to the prior claims of the subsidiaries’ creditors.
The terms of the revolving senior credit facility with a syndicate led by Wells Fargo limit the ability of ourNorth American Leasing operations to upstream funds to GFN that would be used to pay interest on the SeniorNotes. If the amount of the interest payable on the Senior Notes exceeds the amount of the funds our NorthAmerican Leasing operations are permitted to pay GFN, and GFN is unable to generate sufficient cash from itsother subsidiaries for an interest payment, GFN may not be able to make the required interest payment on theSenior Notes. Our ability to pay interest or principal to the holders of our Senior Notes will be adversely affectedif the senior credit facility prohibits the transfer of funds to GFN.
I-45
We may be unable to repurchase the Senior Notes upon a change of control.
In the event of a “change of control,” as defined in the indenture governing our Senior Notes, we must offerto purchase the Senior Notes at a purchase price equal to 101% of the principal amount, plus accrued and unpaidinterest to the date of repurchase. In the event that we are required to make such offer with respect to the SeniorNotes, there can be no assurance that we would have sufficient funds available to purchase any Senior Notes, andwe may be required to refinance the Senior Notes. There can be no assurance that we would be able toaccomplish a refinancing or, if a refinancing were to occur, that it would be accomplished on commerciallyreasonable terms. The revolving credit facilities of our subsidiaries prohibit us from repurchasing any of theSenior Notes, except under limited circumstances. The revolving credit facilities of our subsidiaries also providethat certain change of control events would constitute a default. In the event a change of control occurs at a timewhen we are prohibited from purchasing the Senior Notes, we could seek the consent of the lenders under therevolving credit facilities of our U.S. subsidiaries to purchase the Senior Notes. If we did not obtain such consent,we would remain prohibited from purchasing the Senior Notes. In this case, our failure to purchase wouldconstitute an event of default under the indenture governing the Senior Notes.
Changes in the credit markets could adversely affect the market price of the Senior Notes.
The market price for the Senior Notes will be based on a number of factors, including:
• the prevailing interest rates being paid by other companies similar to us; and
• and the overall condition of the financial markets.
The conditions of the credit markets and prevailing interest rates have fluctuated in the past and can beexpected to fluctuate in the future. Fluctuations in these factors could have an adverse effect on the price andliquidity of the Senior Notes.
An increase in market interest rates could result in a decrease in the relative value of the Senior Notes.
In general, as market interest rates rise, Senior Notes bearing interest at a fixed rate generally decline invalue. Consequently, if you purchase these Senior Notes and market interest rates increase, the market values ofyour Senior Notes may decline. We cannot predict the future level of market interest rates.
We could enter into various transactions that could increase the amount of our outstanding debt, or adverselyaffect our capital structure or credit rating, or otherwise adversely affect holders of the Senior Notes.
Subject to certain exceptions relating to incurring certain liens or entering into certain sale and leasebacktransactions, the terms of the Senior Notes do not prevent us from entering into a variety of acquisition,divestiture, refinancing, recapitalization or other highly leveraged transactions. As a result, we could enter intoany such transaction even though the transaction could increase the total amount of our outstanding indebtedness,adversely affect our capital structure or credit rating or otherwise adversely affect the holders of the SeniorNotes.
Redemption may adversely affect your return on the Senior Notes.
We have the right to redeem some or all of the Senior Notes prior to maturity. We may redeem the SeniorNotes at times when prevailing interest rates may be relatively low compared to rates at the time of issuance ofthe Senior Notes. Accordingly, you may not be able to reinvest the redemption proceeds in a comparable securityat an effective interest rate as high as that of the Senior Notes.
Item 1B. Unresolved Staff Comments
None.
I-46
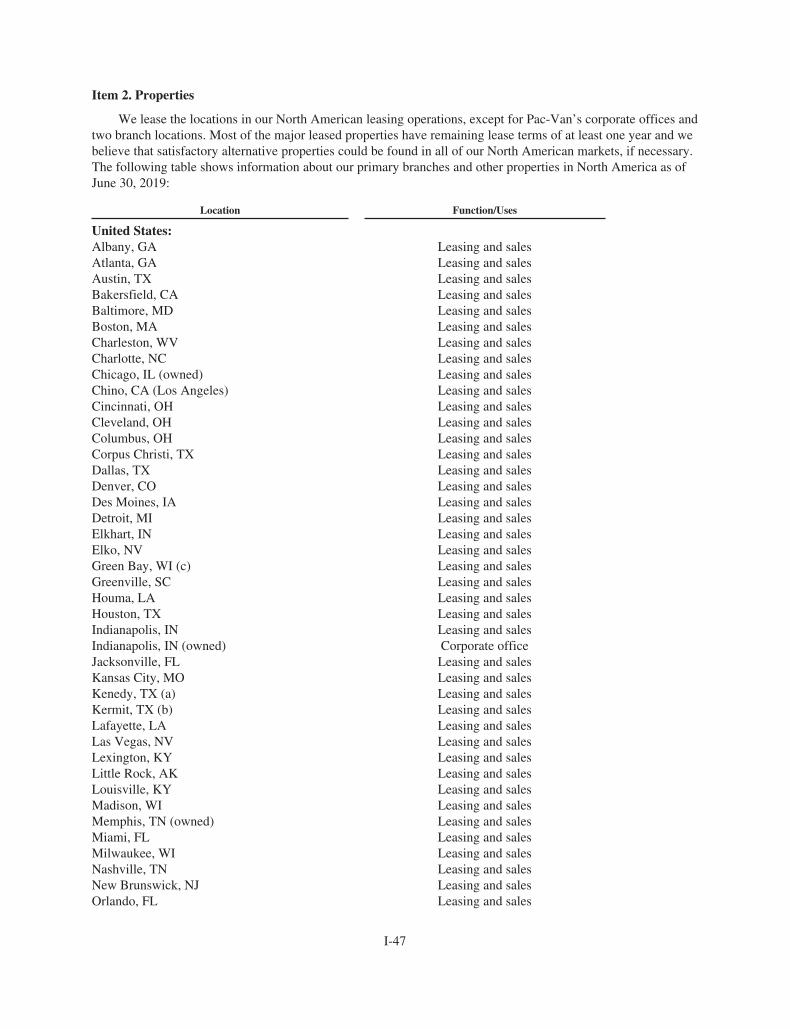
Item 2. Properties
We lease the locations in our North American leasing operations, except for Pac-Van’s corporate offices andtwo branch locations. Most of the major leased properties have remaining lease terms of at least one year and webelieve that satisfactory alternative properties could be found in all of our North American markets, if necessary.The following table shows information about our primary branches and other properties in North America as ofJune 30, 2019:
Location Function/Uses
United States:Albany, GA Leasing and salesAtlanta, GA Leasing and salesAustin, TX Leasing and salesBakersfield, CA Leasing and salesBaltimore, MD Leasing and salesBoston, MA Leasing and salesCharleston, WV Leasing and salesCharlotte, NC Leasing and salesChicago, IL (owned) Leasing and salesChino, CA (Los Angeles) Leasing and salesCincinnati, OH Leasing and salesCleveland, OH Leasing and salesColumbus, OH Leasing and salesCorpus Christi, TX Leasing and salesDallas, TX Leasing and salesDenver, CO Leasing and salesDes Moines, IA Leasing and salesDetroit, MI Leasing and salesElkhart, IN Leasing and salesElko, NV Leasing and salesGreen Bay, WI (c) Leasing and salesGreenville, SC Leasing and salesHouma, LA Leasing and salesHouston, TX Leasing and salesIndianapolis, IN Leasing and salesIndianapolis, IN (owned) Corporate officeJacksonville, FL Leasing and salesKansas City, MO Leasing and salesKenedy, TX (a) Leasing and salesKermit, TX (b) Leasing and salesLafayette, LA Leasing and salesLas Vegas, NV Leasing and salesLexington, KY Leasing and salesLittle Rock, AK Leasing and salesLouisville, KY Leasing and salesMadison, WI Leasing and salesMemphis, TN (owned) Leasing and salesMiami, FL Leasing and salesMilwaukee, WI Leasing and salesNashville, TN Leasing and salesNew Brunswick, NJ Leasing and salesOrlando, FL Leasing and sales
I-47
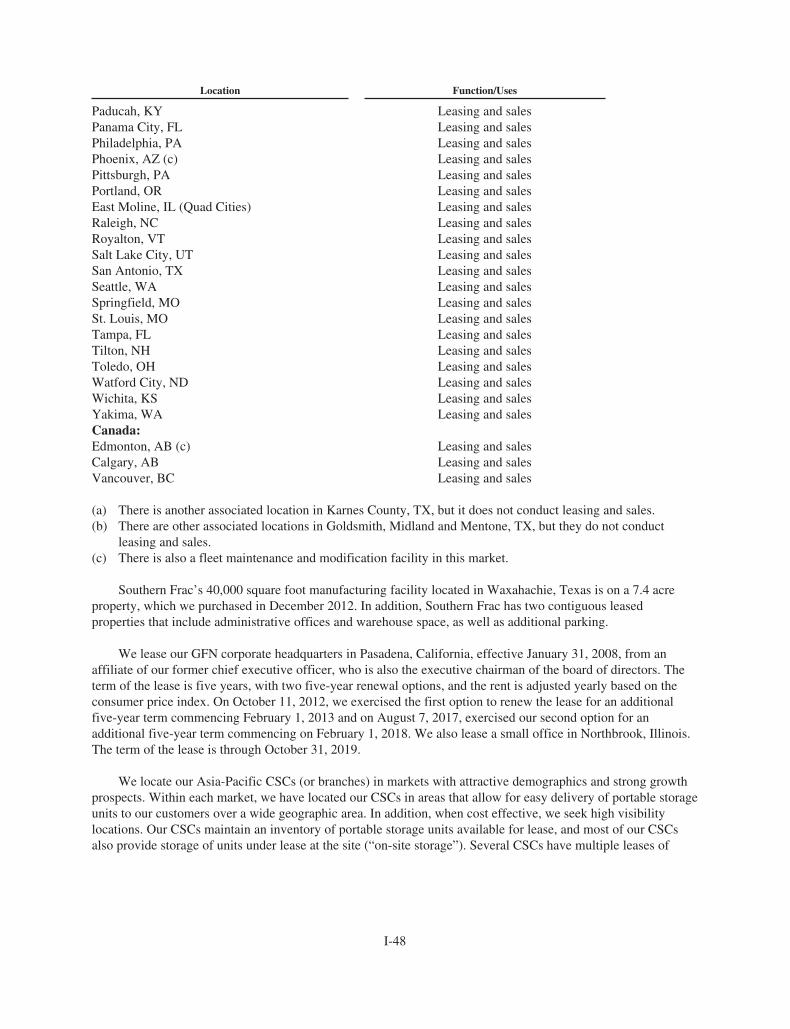
Location Function/Uses
Paducah, KY Leasing and salesPanama City, FL Leasing and salesPhiladelphia, PA Leasing and salesPhoenix, AZ (c) Leasing and salesPittsburgh, PA Leasing and salesPortland, OR Leasing and salesEast Moline, IL (Quad Cities) Leasing and salesRaleigh, NC Leasing and salesRoyalton, VT Leasing and salesSalt Lake City, UT Leasing and salesSan Antonio, TX Leasing and salesSeattle, WA Leasing and salesSpringfield, MO Leasing and salesSt. Louis, MO Leasing and salesTampa, FL Leasing and salesTilton, NH Leasing and salesToledo, OH Leasing and salesWatford City, ND Leasing and salesWichita, KS Leasing and salesYakima, WA Leasing and salesCanada:Edmonton, AB (c) Leasing and salesCalgary, AB Leasing and salesVancouver, BC Leasing and sales
(a) There is another associated location in Karnes County, TX, but it does not conduct leasing and sales.(b) There are other associated locations in Goldsmith, Midland and Mentone, TX, but they do not conduct
leasing and sales.(c) There is also a fleet maintenance and modification facility in this market.
Southern Frac’s 40,000 square foot manufacturing facility located in Waxahachie, Texas is on a 7.4 acreproperty, which we purchased in December 2012. In addition, Southern Frac has two contiguous leasedproperties that include administrative offices and warehouse space, as well as additional parking.
We lease our GFN corporate headquarters in Pasadena, California, effective January 31, 2008, from anaffiliate of our former chief executive officer, who is also the executive chairman of the board of directors. Theterm of the lease is five years, with two five-year renewal options, and the rent is adjusted yearly based on theconsumer price index. On October 11, 2012, we exercised the first option to renew the lease for an additionalfive-year term commencing February 1, 2013 and on August 7, 2017, exercised our second option for anadditional five-year term commencing on February 1, 2018. We also lease a small office in Northbrook, Illinois.The term of the lease is through October 31, 2019.
We locate our Asia-Pacific CSCs (or branches) in markets with attractive demographics and strong growthprospects. Within each market, we have located our CSCs in areas that allow for easy delivery of portable storageunits to our customers over a wide geographic area. In addition, when cost effective, we seek high visibilitylocations. Our CSCs maintain an inventory of portable storage units available for lease, and most of our CSCsalso provide storage of units under lease at the site (“on-site storage”). Several CSCs have multiple leases of
I-48
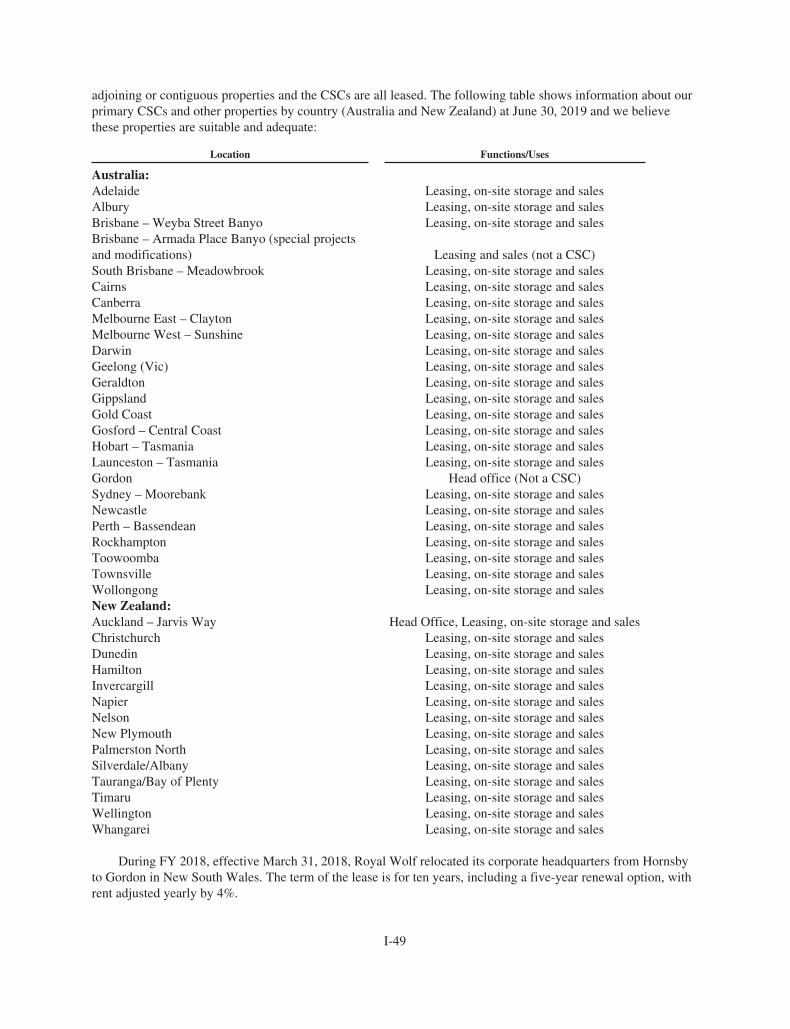
adjoining or contiguous properties and the CSCs are all leased. The following table shows information about ourprimary CSCs and other properties by country (Australia and New Zealand) at June 30, 2019 and we believethese properties are suitable and adequate:
Location Functions/Uses
Australia:Adelaide Leasing, on-site storage and salesAlbury Leasing, on-site storage and salesBrisbane – Weyba Street Banyo Leasing, on-site storage and salesBrisbane – Armada Place Banyo (special projectsand modifications) Leasing and sales (not a CSC)South Brisbane – Meadowbrook Leasing, on-site storage and salesCairns Leasing, on-site storage and salesCanberra Leasing, on-site storage and salesMelbourne East – Clayton Leasing, on-site storage and salesMelbourne West – Sunshine Leasing, on-site storage and salesDarwin Leasing, on-site storage and salesGeelong (Vic) Leasing, on-site storage and salesGeraldton Leasing, on-site storage and salesGippsland Leasing, on-site storage and salesGold Coast Leasing, on-site storage and salesGosford – Central Coast Leasing, on-site storage and salesHobart – Tasmania Leasing, on-site storage and salesLaunceston – Tasmania Leasing, on-site storage and salesGordon Head office (Not a CSC)Sydney – Moorebank Leasing, on-site storage and salesNewcastle Leasing, on-site storage and salesPerth – Bassendean Leasing, on-site storage and salesRockhampton Leasing, on-site storage and salesToowoomba Leasing, on-site storage and salesTownsville Leasing, on-site storage and salesWollongong Leasing, on-site storage and salesNew Zealand:Auckland – Jarvis Way Head Office, Leasing, on-site storage and salesChristchurch Leasing, on-site storage and salesDunedin Leasing, on-site storage and salesHamilton Leasing, on-site storage and salesInvercargill Leasing, on-site storage and salesNapier Leasing, on-site storage and salesNelson Leasing, on-site storage and salesNew Plymouth Leasing, on-site storage and salesPalmerston North Leasing, on-site storage and salesSilverdale/Albany Leasing, on-site storage and salesTauranga/Bay of Plenty Leasing, on-site storage and salesTimaru Leasing, on-site storage and salesWellington Leasing, on-site storage and salesWhangarei Leasing, on-site storage and sales
During FY 2018, effective March 31, 2018, Royal Wolf relocated its corporate headquarters from Hornsbyto Gordon in New South Wales. The term of the lease is for ten years, including a five-year renewal option, withrent adjusted yearly by 4%.
I-49
Item 3. Legal Proceedings
We are not involved in any material lawsuits or claims arising out of the normal course of our business. Wehave insurance policies to cover general liability and workers compensation related claims. In our opinion, theultimate amount of liability not covered by insurance under pending litigation and claims, if any, will not have amaterial adverse effect on our financial position, operating results or cash flows.
Reference is made to Note 10 of Notes to Consolidated Financial Statements for further discussion ofcommitments and contingencies, including any legal proceedings.
Item 4. Mine Safety Disclosures
Not applicable.
I-50
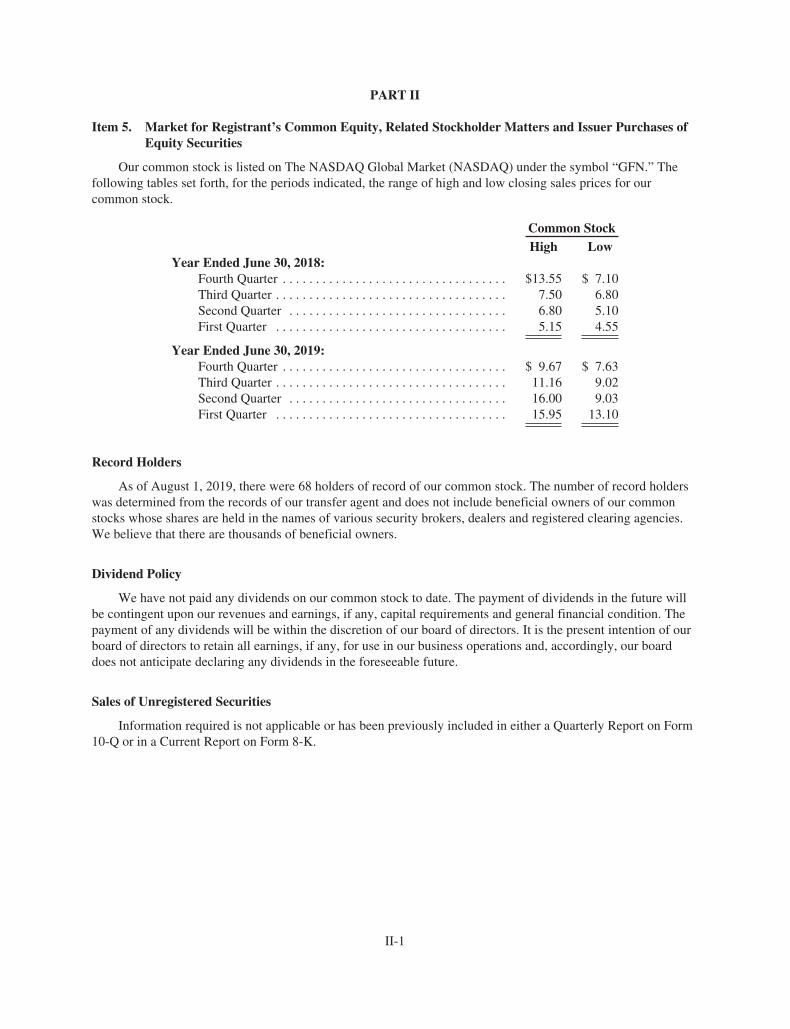
PART II
Item 5. Market for Registrant’s Common Equity, Related Stockholder Matters and Issuer Purchases ofEquity Securities
Our common stock is listed on The NASDAQ Global Market (NASDAQ) under the symbol “GFN.” Thefollowing tables set forth, for the periods indicated, the range of high and low closing sales prices for ourcommon stock.
Common StockHigh Low
Year Ended June 30, 2018:Fourth Quarter . . . . . . . . . . . . . . . . . . . . . . . . . . . . . . . . . . $13.55 $ 7.10Third Quarter . . . . . . . . . . . . . . . . . . . . . . . . . . . . . . . . . . . 7.50 6.80Second Quarter . . . . . . . . . . . . . . . . . . . . . . . . . . . . . . . . . 6.80 5.10First Quarter . . . . . . . . . . . . . . . . . . . . . . . . . . . . . . . . . . . 5.15 4.55
Year Ended June 30, 2019:Fourth Quarter . . . . . . . . . . . . . . . . . . . . . . . . . . . . . . . . . . $ 9.67 $ 7.63Third Quarter . . . . . . . . . . . . . . . . . . . . . . . . . . . . . . . . . . . 11.16 9.02Second Quarter . . . . . . . . . . . . . . . . . . . . . . . . . . . . . . . . . 16.00 9.03First Quarter . . . . . . . . . . . . . . . . . . . . . . . . . . . . . . . . . . . 15.95 13.10
Record Holders
As of August 1, 2019, there were 68 holders of record of our common stock. The number of record holderswas determined from the records of our transfer agent and does not include beneficial owners of our commonstocks whose shares are held in the names of various security brokers, dealers and registered clearing agencies.We believe that there are thousands of beneficial owners.
Dividend Policy
We have not paid any dividends on our common stock to date. The payment of dividends in the future willbe contingent upon our revenues and earnings, if any, capital requirements and general financial condition. Thepayment of any dividends will be within the discretion of our board of directors. It is the present intention of ourboard of directors to retain all earnings, if any, for use in our business operations and, accordingly, our boarddoes not anticipate declaring any dividends in the foreseeable future.
Sales of Unregistered Securities
Information required is not applicable or has been previously included in either a Quarterly Report on Form10-Q or in a Current Report on Form 8-K.
II-1
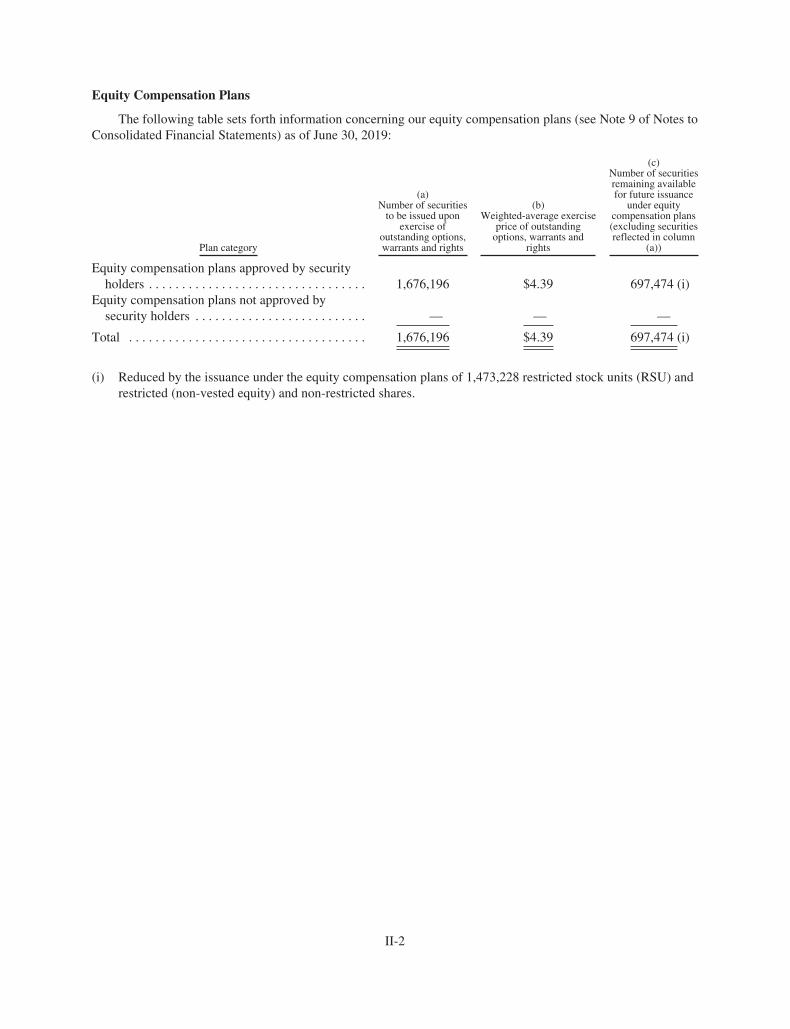
Equity Compensation Plans
The following table sets forth information concerning our equity compensation plans (see Note 9 of Notes toConsolidated Financial Statements) as of June 30, 2019:
Plan category
(a)Number of securities
to be issued uponexercise of
outstanding options,warrants and rights
(b)Weighted-average exercise
price of outstandingoptions, warrants and
rights
(c)Number of securitiesremaining availablefor future issuance
under equitycompensation plans(excluding securitiesreflected in column
(a))
Equity compensation plans approved by securityholders . . . . . . . . . . . . . . . . . . . . . . . . . . . . . . . . . 1,676,196 $4.39 697,474 (i)
Equity compensation plans not approved bysecurity holders . . . . . . . . . . . . . . . . . . . . . . . . . . — — —
Total . . . . . . . . . . . . . . . . . . . . . . . . . . . . . . . . . . . . 1,676,196 $4.39 697,474 (i)
(i) Reduced by the issuance under the equity compensation plans of 1,473,228 restricted stock units (RSU) andrestricted (non-vested equity) and non-restricted shares.
II-2
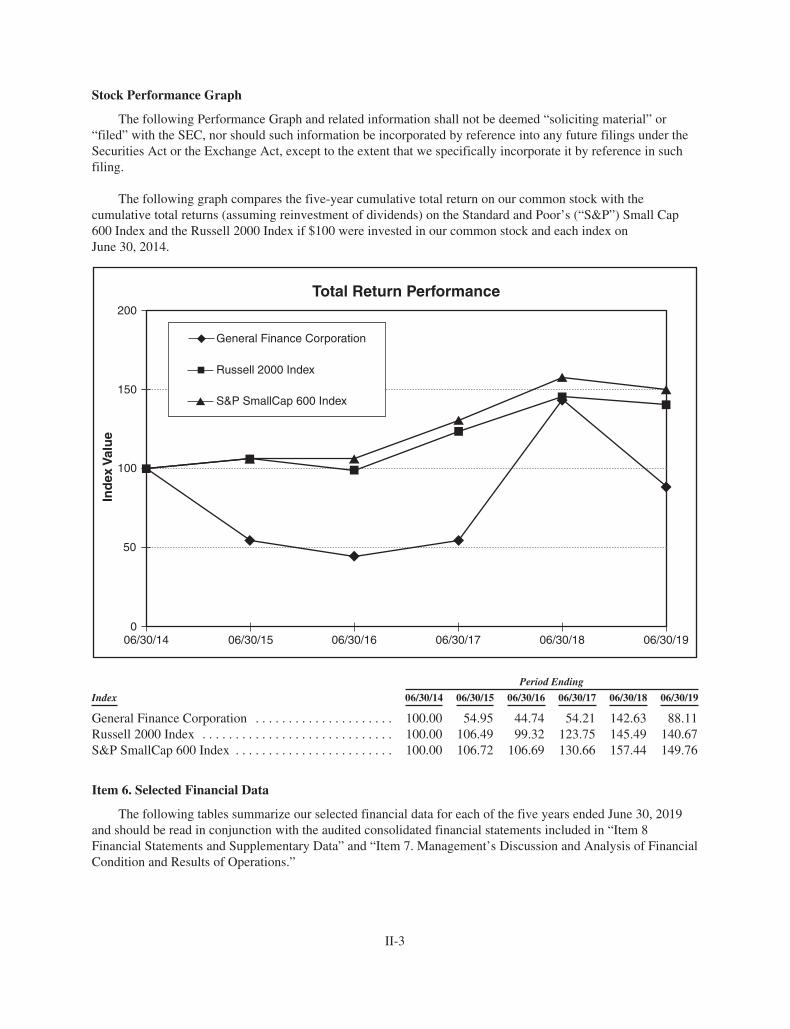
Stock Performance Graph
The following Performance Graph and related information shall not be deemed “soliciting material” or“filed” with the SEC, nor should such information be incorporated by reference into any future filings under theSecurities Act or the Exchange Act, except to the extent that we specifically incorporate it by reference in suchfiling.
The following graph compares the five-year cumulative total return on our common stock with thecumulative total returns (assuming reinvestment of dividends) on the Standard and Poor’s (“S&P”) Small Cap600 Index and the Russell 2000 Index if $100 were invested in our common stock and each index onJune 30, 2014.
Total Return Performance
General Finance Corporation
200
150
100
Ind
ex V
alu
e
50
006/30/14 06/30/15 06/30/16 06/30/17 06/30/18 06/30/19
Russell 2000 Index
S&P SmallCap 600 Index
Period Ending
Index 06/30/14 06/30/15 06/30/16 06/30/17 06/30/18 06/30/19
General Finance Corporation . . . . . . . . . . . . . . . . . . . . . 100.00 54.95 44.74 54.21 142.63 88.11Russell 2000 Index . . . . . . . . . . . . . . . . . . . . . . . . . . . . . 100.00 106.49 99.32 123.75 145.49 140.67S&P SmallCap 600 Index . . . . . . . . . . . . . . . . . . . . . . . . 100.00 106.72 106.69 130.66 157.44 149.76
Item 6. Selected Financial Data
The following tables summarize our selected financial data for each of the five years ended June 30, 2019and should be read in conjunction with the audited consolidated financial statements included in “Item 8Financial Statements and Supplementary Data” and “Item 7. Management’s Discussion and Analysis of FinancialCondition and Results of Operations.”
II-3
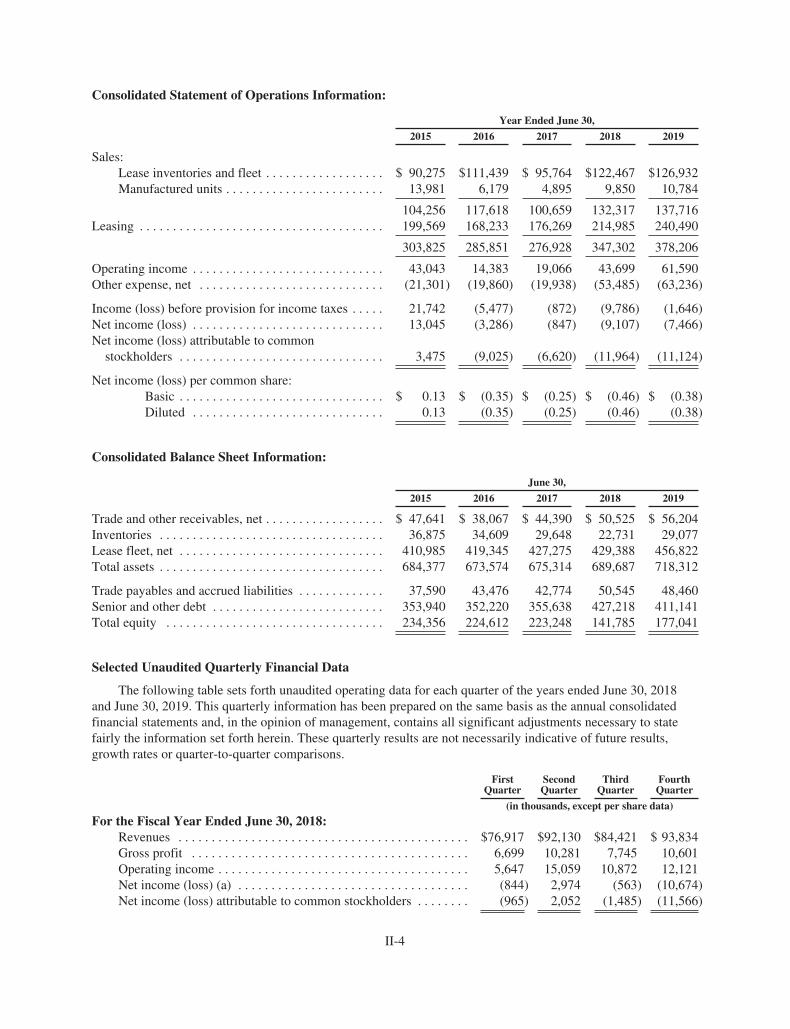
Consolidated Statement of Operations Information:
Year Ended June 30,
2015 2016 2017 2018 2019
Sales:Lease inventories and fleet . . . . . . . . . . . . . . . . . . $ 90,275 $111,439 $ 95,764 $122,467 $126,932Manufactured units . . . . . . . . . . . . . . . . . . . . . . . . 13,981 6,179 4,895 9,850 10,784
104,256 117,618 100,659 132,317 137,716Leasing . . . . . . . . . . . . . . . . . . . . . . . . . . . . . . . . . . . . . 199,569 168,233 176,269 214,985 240,490
303,825 285,851 276,928 347,302 378,206
Operating income . . . . . . . . . . . . . . . . . . . . . . . . . . . . . 43,043 14,383 19,066 43,699 61,590Other expense, net . . . . . . . . . . . . . . . . . . . . . . . . . . . . (21,301) (19,860) (19,938) (53,485) (63,236)
Income (loss) before provision for income taxes . . . . . 21,742 (5,477) (872) (9,786) (1,646)Net income (loss) . . . . . . . . . . . . . . . . . . . . . . . . . . . . . 13,045 (3,286) (847) (9,107) (7,466)Net income (loss) attributable to common
stockholders . . . . . . . . . . . . . . . . . . . . . . . . . . . . . . . 3,475 (9,025) (6,620) (11,964) (11,124)
Net income (loss) per common share:Basic . . . . . . . . . . . . . . . . . . . . . . . . . . . . . . . $ 0.13 $ (0.35) $ (0.25) $ (0.46) $ (0.38)Diluted . . . . . . . . . . . . . . . . . . . . . . . . . . . . . 0.13 (0.35) (0.25) (0.46) (0.38)
Consolidated Balance Sheet Information:
June 30,
2015 2016 2017 2018 2019
Trade and other receivables, net . . . . . . . . . . . . . . . . . . $ 47,641 $ 38,067 $ 44,390 $ 50,525 $ 56,204Inventories . . . . . . . . . . . . . . . . . . . . . . . . . . . . . . . . . . 36,875 34,609 29,648 22,731 29,077Lease fleet, net . . . . . . . . . . . . . . . . . . . . . . . . . . . . . . . 410,985 419,345 427,275 429,388 456,822Total assets . . . . . . . . . . . . . . . . . . . . . . . . . . . . . . . . . . 684,377 673,574 675,314 689,687 718,312
Trade payables and accrued liabilities . . . . . . . . . . . . . 37,590 43,476 42,774 50,545 48,460Senior and other debt . . . . . . . . . . . . . . . . . . . . . . . . . . 353,940 352,220 355,638 427,218 411,141Total equity . . . . . . . . . . . . . . . . . . . . . . . . . . . . . . . . . 234,356 224,612 223,248 141,785 177,041
Selected Unaudited Quarterly Financial Data
The following table sets forth unaudited operating data for each quarter of the years ended June 30, 2018and June 30, 2019. This quarterly information has been prepared on the same basis as the annual consolidatedfinancial statements and, in the opinion of management, contains all significant adjustments necessary to statefairly the information set forth herein. These quarterly results are not necessarily indicative of future results,growth rates or quarter-to-quarter comparisons.
FirstQuarter
SecondQuarter
ThirdQuarter
FourthQuarter
(in thousands, except per share data)
For the Fiscal Year Ended June 30, 2018:Revenues . . . . . . . . . . . . . . . . . . . . . . . . . . . . . . . . . . . . . . . . . . . . $76,917 $92,130 $84,421 $ 93,834Gross profit . . . . . . . . . . . . . . . . . . . . . . . . . . . . . . . . . . . . . . . . . . 6,699 10,281 7,745 10,601Operating income . . . . . . . . . . . . . . . . . . . . . . . . . . . . . . . . . . . . . . 5,647 15,059 10,872 12,121Net income (loss) (a) . . . . . . . . . . . . . . . . . . . . . . . . . . . . . . . . . . . (844) 2,974 (563) (10,674)Net income (loss) attributable to common stockholders . . . . . . . . (965) 2,052 (1,485) (11,566)
II-4
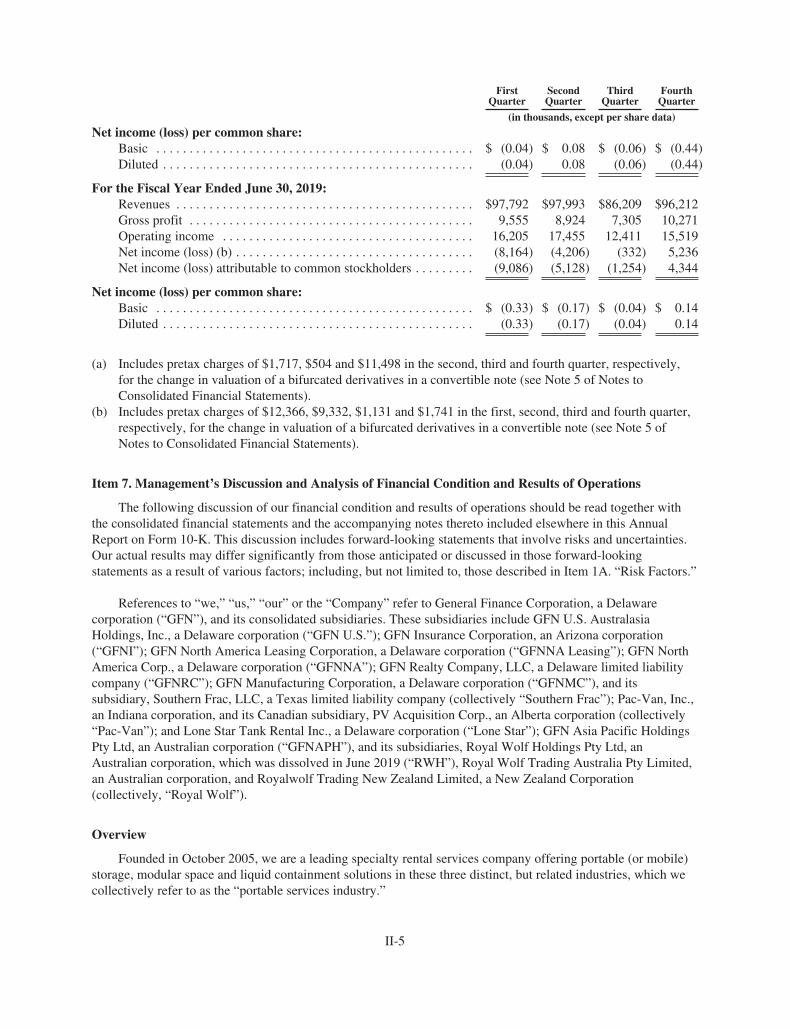
FirstQuarter
SecondQuarter
ThirdQuarter
FourthQuarter
(in thousands, except per share data)
Net income (loss) per common share:Basic . . . . . . . . . . . . . . . . . . . . . . . . . . . . . . . . . . . . . . . . . . . . . . . . $ (0.04) $ 0.08 $ (0.06) $ (0.44)Diluted . . . . . . . . . . . . . . . . . . . . . . . . . . . . . . . . . . . . . . . . . . . . . . . (0.04) 0.08 (0.06) (0.44)
For the Fiscal Year Ended June 30, 2019:Revenues . . . . . . . . . . . . . . . . . . . . . . . . . . . . . . . . . . . . . . . . . . . . . $97,792 $97,993 $86,209 $96,212Gross profit . . . . . . . . . . . . . . . . . . . . . . . . . . . . . . . . . . . . . . . . . . . 9,555 8,924 7,305 10,271Operating income . . . . . . . . . . . . . . . . . . . . . . . . . . . . . . . . . . . . . . 16,205 17,455 12,411 15,519Net income (loss) (b) . . . . . . . . . . . . . . . . . . . . . . . . . . . . . . . . . . . . (8,164) (4,206) (332) 5,236Net income (loss) attributable to common stockholders . . . . . . . . . (9,086) (5,128) (1,254) 4,344
Net income (loss) per common share:Basic . . . . . . . . . . . . . . . . . . . . . . . . . . . . . . . . . . . . . . . . . . . . . . . . $ (0.33) $ (0.17) $ (0.04) $ 0.14Diluted . . . . . . . . . . . . . . . . . . . . . . . . . . . . . . . . . . . . . . . . . . . . . . . (0.33) (0.17) (0.04) 0.14
(a) Includes pretax charges of $1,717, $504 and $11,498 in the second, third and fourth quarter, respectively,for the change in valuation of a bifurcated derivatives in a convertible note (see Note 5 of Notes toConsolidated Financial Statements).
(b) Includes pretax charges of $12,366, $9,332, $1,131 and $1,741 in the first, second, third and fourth quarter,respectively, for the change in valuation of a bifurcated derivatives in a convertible note (see Note 5 ofNotes to Consolidated Financial Statements).
Item 7. Management’s Discussion and Analysis of Financial Condition and Results of Operations
The following discussion of our financial condition and results of operations should be read together withthe consolidated financial statements and the accompanying notes thereto included elsewhere in this AnnualReport on Form 10-K. This discussion includes forward-looking statements that involve risks and uncertainties.Our actual results may differ significantly from those anticipated or discussed in those forward-lookingstatements as a result of various factors; including, but not limited to, those described in Item 1A. “Risk Factors.”
References to “we,” “us,” “our” or the “Company” refer to General Finance Corporation, a Delawarecorporation (“GFN”), and its consolidated subsidiaries. These subsidiaries include GFN U.S. AustralasiaHoldings, Inc., a Delaware corporation (“GFN U.S.”); GFN Insurance Corporation, an Arizona corporation(“GFNI”); GFN North America Leasing Corporation, a Delaware corporation (“GFNNA Leasing”); GFN NorthAmerica Corp., a Delaware corporation (“GFNNA”); GFN Realty Company, LLC, a Delaware limited liabilitycompany (“GFNRC”); GFN Manufacturing Corporation, a Delaware corporation (“GFNMC”), and itssubsidiary, Southern Frac, LLC, a Texas limited liability company (collectively “Southern Frac”); Pac-Van, Inc.,an Indiana corporation, and its Canadian subsidiary, PV Acquisition Corp., an Alberta corporation (collectively“Pac-Van”); and Lone Star Tank Rental Inc., a Delaware corporation (“Lone Star”); GFN Asia Pacific HoldingsPty Ltd, an Australian corporation (“GFNAPH”), and its subsidiaries, Royal Wolf Holdings Pty Ltd, anAustralian corporation, which was dissolved in June 2019 (“RWH”), Royal Wolf Trading Australia Pty Limited,an Australian corporation, and Royalwolf Trading New Zealand Limited, a New Zealand Corporation(collectively, “Royal Wolf”).
Overview
Founded in October 2005, we are a leading specialty rental services company offering portable (or mobile)storage, modular space and liquid containment solutions in these three distinct, but related industries, which wecollectively refer to as the “portable services industry.”
II-5
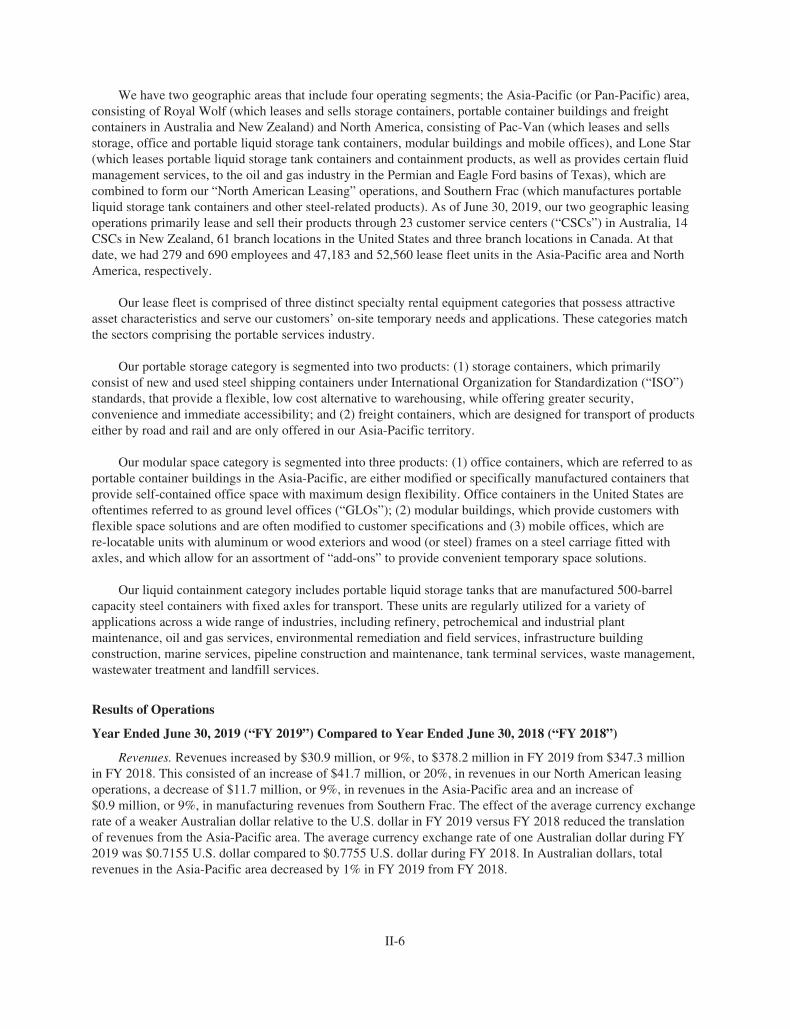
We have two geographic areas that include four operating segments; the Asia-Pacific (or Pan-Pacific) area,consisting of Royal Wolf (which leases and sells storage containers, portable container buildings and freightcontainers in Australia and New Zealand) and North America, consisting of Pac-Van (which leases and sellsstorage, office and portable liquid storage tank containers, modular buildings and mobile offices), and Lone Star(which leases portable liquid storage tank containers and containment products, as well as provides certain fluidmanagement services, to the oil and gas industry in the Permian and Eagle Ford basins of Texas), which arecombined to form our “North American Leasing” operations, and Southern Frac (which manufactures portableliquid storage tank containers and other steel-related products). As of June 30, 2019, our two geographic leasingoperations primarily lease and sell their products through 23 customer service centers (“CSCs”) in Australia, 14CSCs in New Zealand, 61 branch locations in the United States and three branch locations in Canada. At thatdate, we had 279 and 690 employees and 47,183 and 52,560 lease fleet units in the Asia-Pacific area and NorthAmerica, respectively.
Our lease fleet is comprised of three distinct specialty rental equipment categories that possess attractiveasset characteristics and serve our customers’ on-site temporary needs and applications. These categories matchthe sectors comprising the portable services industry.
Our portable storage category is segmented into two products: (1) storage containers, which primarilyconsist of new and used steel shipping containers under International Organization for Standardization (“ISO”)standards, that provide a flexible, low cost alternative to warehousing, while offering greater security,convenience and immediate accessibility; and (2) freight containers, which are designed for transport of productseither by road and rail and are only offered in our Asia-Pacific territory.
Our modular space category is segmented into three products: (1) office containers, which are referred to asportable container buildings in the Asia-Pacific, are either modified or specifically manufactured containers thatprovide self-contained office space with maximum design flexibility. Office containers in the United States areoftentimes referred to as ground level offices (“GLOs”); (2) modular buildings, which provide customers withflexible space solutions and are often modified to customer specifications and (3) mobile offices, which arere-locatable units with aluminum or wood exteriors and wood (or steel) frames on a steel carriage fitted withaxles, and which allow for an assortment of “add-ons” to provide convenient temporary space solutions.
Our liquid containment category includes portable liquid storage tanks that are manufactured 500-barrelcapacity steel containers with fixed axles for transport. These units are regularly utilized for a variety ofapplications across a wide range of industries, including refinery, petrochemical and industrial plantmaintenance, oil and gas services, environmental remediation and field services, infrastructure buildingconstruction, marine services, pipeline construction and maintenance, tank terminal services, waste management,wastewater treatment and landfill services.
Results of Operations
Year Ended June 30, 2019 (“FY 2019”) Compared to Year Ended June 30, 2018 (“FY 2018”)
Revenues. Revenues increased by $30.9 million, or 9%, to $378.2 million in FY 2019 from $347.3 millionin FY 2018. This consisted of an increase of $41.7 million, or 20%, in revenues in our North American leasingoperations, a decrease of $11.7 million, or 9%, in revenues in the Asia-Pacific area and an increase of$0.9 million, or 9%, in manufacturing revenues from Southern Frac. The effect of the average currency exchangerate of a weaker Australian dollar relative to the U.S. dollar in FY 2019 versus FY 2018 reduced the translationof revenues from the Asia-Pacific area. The average currency exchange rate of one Australian dollar during FY2019 was $0.7155 U.S. dollar compared to $0.7755 U.S. dollar during FY 2018. In Australian dollars, totalrevenues in the Asia-Pacific area decreased by 1% in FY 2019 from FY 2018.
II-6
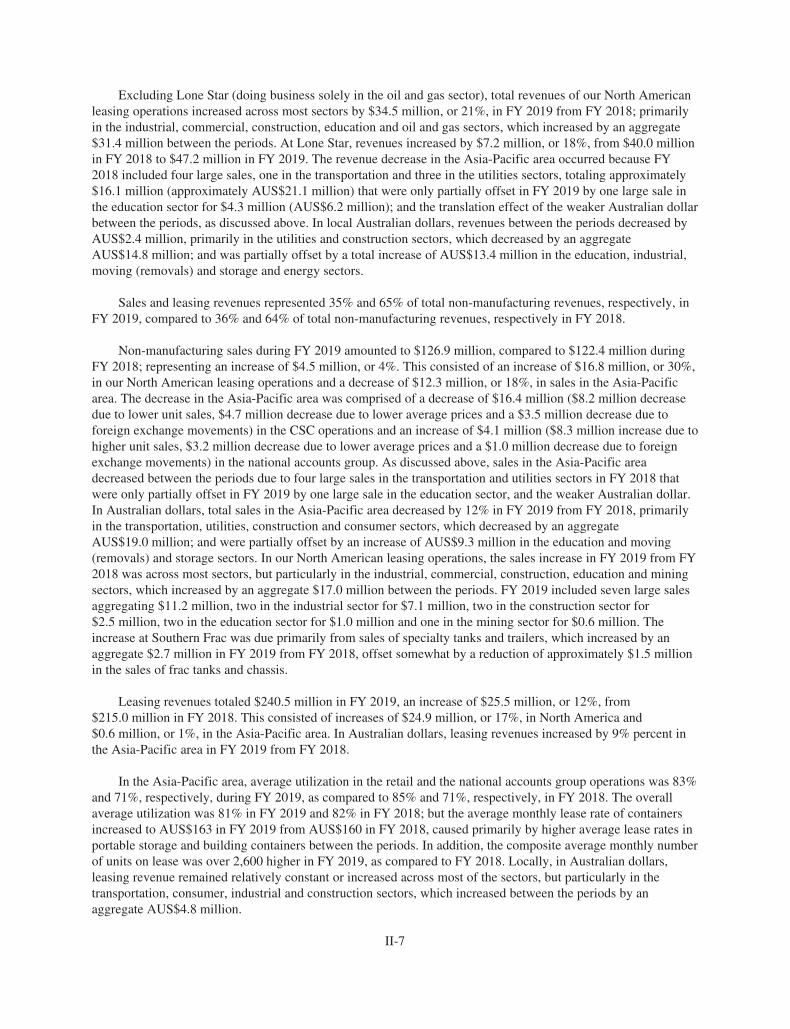
Excluding Lone Star (doing business solely in the oil and gas sector), total revenues of our North Americanleasing operations increased across most sectors by $34.5 million, or 21%, in FY 2019 from FY 2018; primarilyin the industrial, commercial, construction, education and oil and gas sectors, which increased by an aggregate$31.4 million between the periods. At Lone Star, revenues increased by $7.2 million, or 18%, from $40.0 millionin FY 2018 to $47.2 million in FY 2019. The revenue decrease in the Asia-Pacific area occurred because FY2018 included four large sales, one in the transportation and three in the utilities sectors, totaling approximately$16.1 million (approximately AUS$21.1 million) that were only partially offset in FY 2019 by one large sale inthe education sector for $4.3 million (AUS$6.2 million); and the translation effect of the weaker Australian dollarbetween the periods, as discussed above. In local Australian dollars, revenues between the periods decreased byAUS$2.4 million, primarily in the utilities and construction sectors, which decreased by an aggregateAUS$14.8 million; and was partially offset by a total increase of AUS$13.4 million in the education, industrial,moving (removals) and storage and energy sectors.
Sales and leasing revenues represented 35% and 65% of total non-manufacturing revenues, respectively, inFY 2019, compared to 36% and 64% of total non-manufacturing revenues, respectively in FY 2018.
Non-manufacturing sales during FY 2019 amounted to $126.9 million, compared to $122.4 million duringFY 2018; representing an increase of $4.5 million, or 4%. This consisted of an increase of $16.8 million, or 30%,in our North American leasing operations and a decrease of $12.3 million, or 18%, in sales in the Asia-Pacificarea. The decrease in the Asia-Pacific area was comprised of a decrease of $16.4 million ($8.2 million decreasedue to lower unit sales, $4.7 million decrease due to lower average prices and a $3.5 million decrease due toforeign exchange movements) in the CSC operations and an increase of $4.1 million ($8.3 million increase due tohigher unit sales, $3.2 million decrease due to lower average prices and a $1.0 million decrease due to foreignexchange movements) in the national accounts group. As discussed above, sales in the Asia-Pacific areadecreased between the periods due to four large sales in the transportation and utilities sectors in FY 2018 thatwere only partially offset in FY 2019 by one large sale in the education sector, and the weaker Australian dollar.In Australian dollars, total sales in the Asia-Pacific area decreased by 12% in FY 2019 from FY 2018, primarilyin the transportation, utilities, construction and consumer sectors, which decreased by an aggregateAUS$19.0 million; and were partially offset by an increase of AUS$9.3 million in the education and moving(removals) and storage sectors. In our North American leasing operations, the sales increase in FY 2019 from FY2018 was across most sectors, but particularly in the industrial, commercial, construction, education and miningsectors, which increased by an aggregate $17.0 million between the periods. FY 2019 included seven large salesaggregating $11.2 million, two in the industrial sector for $7.1 million, two in the construction sector for$2.5 million, two in the education sector for $1.0 million and one in the mining sector for $0.6 million. Theincrease at Southern Frac was due primarily from sales of specialty tanks and trailers, which increased by anaggregate $2.7 million in FY 2019 from FY 2018, offset somewhat by a reduction of approximately $1.5 millionin the sales of frac tanks and chassis.
Leasing revenues totaled $240.5 million in FY 2019, an increase of $25.5 million, or 12%, from$215.0 million in FY 2018. This consisted of increases of $24.9 million, or 17%, in North America and$0.6 million, or 1%, in the Asia-Pacific area. In Australian dollars, leasing revenues increased by 9% percent inthe Asia-Pacific area in FY 2019 from FY 2018.
In the Asia-Pacific area, average utilization in the retail and the national accounts group operations was 83%and 71%, respectively, during FY 2019, as compared to 85% and 71%, respectively, in FY 2018. The overallaverage utilization was 81% in FY 2019 and 82% in FY 2018; but the average monthly lease rate of containersincreased to AUS$163 in FY 2019 from AUS$160 in FY 2018, caused primarily by higher average lease rates inportable storage and building containers between the periods. In addition, the composite average monthly numberof units on lease was over 2,600 higher in FY 2019, as compared to FY 2018. Locally, in Australian dollars,leasing revenue remained relatively constant or increased across most of the sectors, but particularly in thetransportation, consumer, industrial and construction sectors, which increased between the periods by anaggregate AUS$4.8 million.
II-7
In our North American leasing operations, average utilization rates were 79%, 84%, 76%, 86% and 85% andaverage monthly lease rates were $119, $361, $964, $320 and $786 for storage containers, office containers, fractank containers, mobile offices and modular units, respectively, during FY 2019; as compared to 77%, 83%,78%, 82% and 84% and average monthly lease rates of $122, $340, $783, $292 and $767 for storage containers,office containers, frac tank containers, mobile offices and modular units in FY 2018, respectively. The averagecomposite utilization rate was 80% FY 2019 and 78% in FY 2018, and the composite average monthly number ofunits on lease was over 7,900 higher in FY 2019 as compared to FY 2018. The increase in leasing revenuesbetween the periods was across most sectors, but particularly in the oil and gas, commercial, construction,industrial and retail sectors, which increased by an aggregate $25.4 million in FY 2019 from FY 2018, and waspartially offset by a decrease of $1.5 million in the mining sector. Excluding Lone Star, total leasing revenues ofour North American leasing operations increased by approximately $17.7 million, or 16%, in FY 2019 from FY2018.
Cost of Sales. Cost of sales from our lease inventories and fleet (which is the cost related to our salesrevenues only and exclusive of the line items discussed below) increased by $5.4 million from $87.8 millionduring FY 2018 to $93.2 million during FY 2019, and our gross profit percentage from these non-manufacturingsales deteriorated slightly to 27% in FY 2019 from 28% in FY 2018. Fluctuations in gross profit percentagebetween periods is not unusual as a significant amount of our non-manufacturing sales are out of the lease fleetwhich, among other things, would have varying sales prices and carrying values. Cost of sales from ourmanufactured products totaled $8.5 million in FY 2019, as compared to $9.2 million in FY 2018, resulting in agross profit of approximately $2.3 million and gross profit percentage of 21% in FY 2019 versus a slight grossprofit in FY 2018 of $0.7 million and 7% gross profit percentage. Increased manufacturing sales (including afavorable mix of higher margin specialty tanks and trailers) and production levels, as well as improvedefficiency, between the periods were the primary factors in the improvement in the gross margin.
Direct Costs of Leasing Operations and Selling and General Expenses. Direct costs of leasing operationsand selling and general expenses increased by $6.4 million from $166.9 million during FY 2018 to$173.3 million during FY 2019. As a percentage of revenues, however, these costs decreased to 46% during FY2019 from 48% in FY 2018 due primarily to increases in revenues in North America and higher average units onlease and lease rates between the periods in both geographic venues without a proportionate cost increase in theinfrastructure.
Depreciation and Amortization. Depreciation and amortization increased by $1.9 million to $41.7 million inFY 2019 from $39.8 million in FY 2018. The increase between the periods was in both geographic venues, withthe Asia-Pacific area increasing by $0.9 million and North America increasing by $1.0 million, as a result of ourincreased investment in the lease fleet and business acquisitions.
Interest Expense. Interest expense of $35.3 million in FY 2019 increased by $1.3 million from $34.0 millionin FY 2018. In the Asia-Pacific area, FY 2019 interest expense was $0.5 million higher than FY 2018 due tohigher average borrowings between the periods, which more than offset the slightly lower weighted-averageinterest rate and translation effect of a weaker Australian dollar between the periods. The weighted-averageinterest rate was 10.0% (which does not include the effect of translation, interest rate swap contracts and optionsand the amortization of deferred financing costs) in FY 2019 versus 10.1% in FY 2018. In North America, FY2019 interest expense increased by $0.8 million from FY 2018 due primarily to the weighted-average interestrate of 6.6% (which does not include the effect of the accretion of interest and amortization of deferred financingcosts) in FY 2019 being higher than the 6.2% in FY 2018, offset somewhat by slightly lower average borrowingsbetween the periods.
Change in Valuation of Bifurcated Derivatives. FY 2019 and FY 2018 include non-cash charges of$24.6 million and $13.7 million, respectively, for the loss on the change in the valuation of the stand-alonebifurcated derivatives in the Bison Capital Convertible Note.
II-8
Foreign Exchange and Other. The currency exchange rate of one Australian dollar to one U.S. dollar was0.7687 at June 30, 2017, 0.7411 at June 30, 2018 and 0.7029 at June 30, 2019. In FY 2018 and FY 2019, netunrealized and realized foreign exchange gains (losses) totaled $(6,138,000) and $(451,000) and $5,163,000 and$(10,159,000), respectively. FY 2019 includes a non-cash realized foreign exchange loss of $3,554,000 related tothe Bison Capital Convertible Note prior to its conversion to equity. In addition, in FY 2018 and FY 2019, netunrealized exchange gains on forward exchange contracts totaled $697,000 and $(311,000), respectively.
Income Taxes. Our income tax provision for FY 2019, which derived a very high effective tax rate on arelatively small pretax loss, was significantly greater than the benefit that would have been derived from the U.S.federal statutory rate of 21% primarily as a result of nondeductible expenses for (i) the loss on the change in thevaluation of the bifurcated derivatives in the Bison Capital Convertible Note and (ii) the non-cash realizedforeign exchange loss prior its conversion to equity (see Note 5 of Notes to Consolidated Financial statements).Our effective income tax rate was 6.9% in FY 2018 and was comprised of:
(i) A charge of $0.8 million, primarily as a result of the nondeductible expense of the change in valuation ofthe bifurcated derivatives in the Bison Capital Convertible Note (see Note 5 of Notes to Consolidated FinancialStatements);
(ii) As a result of the enactment on December 22, 2017 of the Act, a tax benefit of $1.6 million for, amongother things, the re-measurement of approximately $7.0 million for our estimated deferred tax assets andliabilities for temporary differences and NOL and FTC carryforwards reasonably estimated to be existing atDecember 22, 2017, and from the current statutory rate of 35% to the new corporate rate of either 28% (if thetemporary timing differences are expected to roll off in FY 2018) or 21 percent (if the temporary timingdifferences and NOL carryforwards are expected to remain as of June 30, 2018). This estimated tax benefit wasoffset by approximately $4.8 million for the estimated transition tax on the mandatory repatriation ofaccumulated foreign earnings and a $0.3 million valuation allowance that was established to offset previouslyrecognized FTC carryforward deferred tax assets that we believe will not be realized, and other adjustmentstotaling approximately $0.3 million (see Note 2 of Notes to Consolidated Financial Statements); and
(iii) A net tax charge of $0.1 million for the net of excess tax benefits and forfeitures on equitycompensation awards (see Note 2 of Notes to Consolidated Financial Statements).
In both periods, the effective tax rate also differs from the U.S. federal tax rate (28% in FY 2018) because ofstate income taxes from the filing of tax returns in multiple U.S. states and the effect of doing business and filingincome tax returns in foreign jurisdictions, as well as large nondeductible permanent differences in the AsiaPacific area, primarily the valuation of the embedded derivatives, as previously discussed above. FY 2019included a tax benefit of $311,000 for equity plan activity that is currently recognized in the consolidatedstatements of operations.
Preferred Stock Dividends. In both FY 2019 and FY 2018, we paid dividends of $3.7 million primarily onour 9.00% Series C Cumulative Redeemable Perpetual Preferred Stock.
Noncontrolling Interest. In FY 2018, prior to acquiring all the shares of Royal Wolf that we did not own,noncontrolling interest in the Royal Wolf operations were a decrease of $0.8 million to the net loss.
Net Loss Attributable to Common Stockholders. Net loss attributable to common stockholders was$11.1 million in FY 2019 versus $12.0 million in FY 2018, an improvement between the periods of $0.9 million.This was primarily due to higher operating profit in both North America and the Asia-Pacific area, substantiallyoffset by the non-cash charge for the change in the valuation of the stand-alone bifurcated derivatives in theBison Capital Convertible Note, higher interest expense and income taxes.
II-9
FY 2018 Compared to Year Ended June 30, 2017 (“FY 2017”)
The following compares our FY 2018 results of operations with our FY 2017 results of operations.
Revenues. Revenues increased by $70.4 million, or 25%, to $347.3 million in FY 2018 from $276.9 millionin FY 2017. This consisted of increases of $42.5 million, or 26%, in revenues in our North American leasingoperations, $22.9 million increase, or 21%, in revenues in the Asia-Pacific area and $5.0 million, or 102%, inmanufacturing revenues from Southern Frac. The effect of the average currency exchange rate of the strongerAustralian dollar relative to the U.S. dollar in FY 2018 versus FY 2017 enhanced the translation of revenuesfrom the Asia-Pacific area. The average currency exchange rate of one Australian dollar during FY 2018 was$0.7755 U.S. dollar compared to $0.7541 U.S. dollar during FY 2017. In Australian dollars, total revenues in theAsia-Pacific area increased by 18% in FY 2018 from FY 2017.
Excluding Lone Star (doing business solely in the oil and gas sector), total revenues of our North Americanleasing operations increased by $21.6 million, or 15%, in FY 2018 from FY 2017, primarily in the commercial,construction, industrial, oil and gas, services, mining and government sectors, which increased by an aggregate$19.8 million between the periods, offset somewhat by reductions in primarily the education and retail sectors of$1.6 million. At Lone Star, revenues significantly increased by $20.9 million, or 109%, from $19.1 million in FY2017 to $40.0 million in FY 2018. The revenue increase in the Asia-Pacific area occurred primarily in theutilities, transportation, construction, mining, retail, wholesale and special events sectors, which increasedbetween the periods by an aggregate $26.6 million, and were partially offset by a total decrease of $5.1 million inthe oil and gas and industrials sectors.
Sales and leasing revenues represented 36% and 64% of total non-manufacturing revenues, respectively, inFY 2018, compared to 35% and 65% of total non-manufacturing revenues, respectively in FY 2017.
Non-manufacturing sales during FY 2018 amounted to $122.4 million, compared to $95.7 million duringFY 2017; representing an increase of $26.7 million, or 28%. This consisted of increases of $18.9 million, or 39%,in sales in the Asia-Pacific area and $7.8 million, or 16%, in our North American leasing operations. Theincrease in the Asia-Pacific area was comprised of increases of $17.0 million ($4.4 million decrease due to lowerunit sales, $19.9 million increase due to higher average prices and a $1.5 million increase due to foreignexchange movements) in the CSC operations and $1.9 million ($0.5 million increase due to higher unit sales,$1.2 million increase due to higher average prices and a $0.2 million increase due to foreign exchangemovements) in the national accounts group, and occurred primarily in the utilities, transportation, construction,mining and retail sectors, which increased between the periods by $21.0 million and was partially offset by adecrease of $2.9 million in the oil and gas and industrial sectors. FY 2018 included four large sales, one in thetransportation sector and three in the utilities sector, totaling approximately $16.1 million (approximatelyAUS$21.1 million); whereas FY 2017 had two large sales, one each in the energy and transportation sectors,totaling $2.7 million (AUS$3.5 million). In Australian dollars, total sales in the Asia-Pacific area increased by36% in FY 2018 from FY 2017. In our North American leasing operations, the sales increase in FY 2018 fromFY 2017 was primarily in the commercial, construction, oil and gas, services and government sectors, whichincreased by a total of $7.6 million between the periods; offset somewhat by a decrease of $1.8 million in theeducation and mining sectors. The increase at Southern Frac was due primarily from sales of portable liquidcontainment tanks, which increased by 354% in FY 2018 from FY 2017, as sales on all other steel-basedproducts decreased by 16% in FY 2018 from FY 2017.
Leasing revenues totaled $215.0 million in FY 2018, an increase of $38.7 million, or 22%, from$176.3 million in FY 2017. This consisted of increases of $34.7 million, or 30%, in North America and$4.0 million, or 7%, in the Asia-Pacific area. In Australian dollars, leasing revenues increased by 4% percent inthe Asia-Pacific area in FY 2018 from FY 2017.
II-10
In the Asia-Pacific area, average utilization in the retail and the national accounts group operations was 85%and 71%, respectively, during FY 2018, as compared to 84% and 67%, respectively, in FY 2017. The overallaverage utilization increased to 82% in FY 2018 from 80% in FY 2017; and the average monthly lease rate ofcontainers was AUS$160 in FY 2018 and AUS$158 in FY 2017. The composite average monthly number ofunits on lease was over 800 higher in FY 2018, as compared to FY 2017. The leasing revenue increase in theAsia-Pacific area occurred primarily in the construction, mining, industrial, transportation, special events andretail sectors, which increased between the periods by $5.8 million, and was partially offset by a decrease of$2.9 million in the oil and gas sector. FY 2017 included a recovery of $2.2 million (AUS$2.8) million from alease settlement payment made by a former oil and gas customer.
In our North American leasing operations, average utilization rates were 77%, 83%, 78%, 82% and 84% andaverage monthly lease rates were $122, $340, $783, $292 and $767 for storage containers, office containers, fractank containers, mobile offices and modular units, respectively, during FY 2018; as compared to 75%, 78%,48%, 78% and 81% and average monthly lease rates were $121, $321, $533, $282 and $774 for storagecontainers, office containers, frac tank containers, mobile offices and modular units in FY 2017, respectively.The average composite utilization rate was 78% FY 2018 and 73% in FY 2017, and the composite averagemonthly number of units on lease was over 4,400 higher in FY 2018 as compared to FY 2017. The increase inleasing revenues between the periods was across the board, but primarily in the oil and gas, commercial,construction, industrial and mining sectors, which increased by $33.3 in FY 2018 from FY 2017. Excluding LoneStar, total leasing revenues of our North American leasing operations increased by $13.8 million, or 14%, in FY2018 from FY 2017.
Cost of Sales. Cost of sales from our lease inventories and fleet (which is the cost related to our salesrevenues only and exclusive of the line items discussed below) increased by $19.6 million from $68.2 millionduring FY 2017 to $87.8 million during FY 2018, and our gross profit percentage from these non-manufacturingsales deteriorated slightly to 28% in FY 2018 from 29% in FY 2017. Cost of sales from our manufacturedproducts totaled $9.2 million in FY 2018, as compared to $6.3 million in FY 2017, resulting in a slight grossprofit of $0.7 million in FY 2018 and a gross loss of $1.4 million during FY 2017. The low profitability or lossduring both periods was due primarily to the lack of production from our portable liquid containment tanks andother steel-based products. A greater amount of portable liquid containment tanks were sold out of inventory inFY 2018, as compared to FY 2017, and because these units had been written down to net realizable value, thegross profit effect was minimal despite the increase in sales between the periods. In addition, production levelson all other steel-based products decreased by 43% in FY 2018 from FY 2017.
Direct Costs of Leasing Operations and Selling and General Expenses. Direct costs of leasing operationsand selling and general expenses increased in the aggregate by $22.9 million from $144.0 million during FY2017 to $166.9 million during FY 2018. As a percentage of revenues, however, these costs decreased to 48%during FY 2018 from 52% in FY 2017 due to the higher revenues being primarily driven by increases in averageunits on lease and average lease rates between the periods in both North America and the Asia-Pacific area,without a proportionate increase in infrastructure costs.
Depreciation and Amortization. Depreciation and amortization increased slightly by $0.5 million to$39.8 million in FY 2018 from $39.3 million in FY 2017, substantially all in the Asia-Pacific, which increasedby $0.4 million and included the translation effect of a stronger Australian dollar to the U.S. dollar in FY 2018versus FY 2017. Depreciation and amortization in our North American operations increased by only $0.1 millionin FY 2018 from FY 2017.
Interest Expense. Interest expense of $34.0 million in FY 2018 increased by $14.3 million from$19.7 million in FY 2017. In the Asia-Pacific area, the significantly higher interest expense between the periodsof $12.1 million was due primarily to a higher weighted-average interest rate of 10.1% (which does not includethe effect of translation, interest rate swap contracts and options, the accretion of interest and the amortization ofdeferred financing costs) in FY 2018 from the 5.0% in FY 2017, higher average borrowings and by a stronger
II-11
Australian dollar between the periods. In North America, the higher interest expense of $2.2 million between theperiods was due primarily to the weighted-average interest rate of 6.2% (which does not include the effect of theaccretion of interest and amortization of deferred financing costs) in FY 2018 being higher than the 5.3% in FY2017.
Change in Valuation of Bifurcated Derivatives. FY 2018 includes a non-cash charge of $13.7 million for theloss on the change in the valuation of the stand-alone bifurcated derivatives in the Bison Capital ConvertibleNote (see Note 5 of Notes to Consolidated Financial Statements).
Foreign Exchange and Other. The currency exchange rate of one Australian dollar to one U.S. dollar was$0.74425 at June 30, 2016, $0.76869 at June 30, 2017 and $0.7411 at June 30, 2018. In FY 2017 and FY 2018,net unrealized and realized foreign exchange gains (losses) totaled $(375,000) and $(39,000), and $(6,138,000)and $(451,000), respectively. In addition, in FY 2017 and FY 2018, net unrealized exchange gains (losses) onforward exchange contracts totaled $(12,000) and $697,000, respectively.
Income Taxes. Our income tax provision for FY 2018, which derived an effective tax rate of 6.9%, wascomprised of:
(i) A charge of $0.8 million, primarily as a result of the nondeductible expense of the change in valuation ofthe bifurcated derivatives in the Bison Capital Convertible Note (see Note 5 of Notes to Consolidated FinancialStatements);
(ii) As a result of the enactment on December 22, 2017 of the Act, a tax benefit of $1.6 million for, amongother things, the re-measurement of approximately $7.0 million for our estimated deferred tax assets andliabilities for temporary differences and NOL and FTC carryforwards reasonably estimated to be existing atDecember 22, 2017, and from the current statutory rate of 35% to the new corporate rate of either 28% (if thetemporary timing differences are expected to roll off in FY 2018) or 21 percent (if the temporary timingdifferences and NOL carryforwards are expected to remain as of June 30, 2018). This estimated tax benefit wasoffset by approximately $4.8 million for the estimated transition tax on the mandatory repatriation ofaccumulated foreign earnings and a $0.3 million valuation allowance that was established to offset previouslyrecognized FTC carryforward deferred tax assets that we believe will not be realized, and other adjustmentstotaling approximately $0.3 million (see Note 2 of Notes to Consolidated Financial Statements); and
(iii) A net tax charge of $0.1 million for the net of excess tax benefits and forfeitures on equitycompensation awards (see Note 2 of Notes to Consolidated Financial Statements).
The effective income tax rate in FY 2017 was 40.0% and in both periods, the effective tax rate differs fromthe U.S. federal tax rate of 28% in FY 2018 and 35% in FY 2017 primarily because of state income taxes fromthe filing of tax returns in multiple U.S. states and the effect of doing business and filing income tax returns inforeign jurisdictions; including some large nondeductible permanent differences in the Asia Pacific area,primarily the valuation of the embedded derivative.
Preferred Stock Dividends. In both FY 2018 and FY 2017, we paid $3.7 million primarily on our 9.00%Series C Cumulative Redeemable Perpetual Preferred Stock.
Noncontrolling Interest. Noncontrolling interests in the Royal Wolf and, in FY 2017, Southern Frac resultsof operations were a decrease of $0.8 million to the net loss in FY 2018 and an increase to the net loss of$2.1 million in FY 2017.
Net Loss Attributable to Common Stockholders. Net loss attributable to common stockholders was$12.0 million in FY 2018 versus a net loss of $6.6 million in FY 2017, an increase of approximately $5.4 million,primarily as a result of the non-cash charge of $13.7 million for the change in the valuation of the stand-alone
II-12
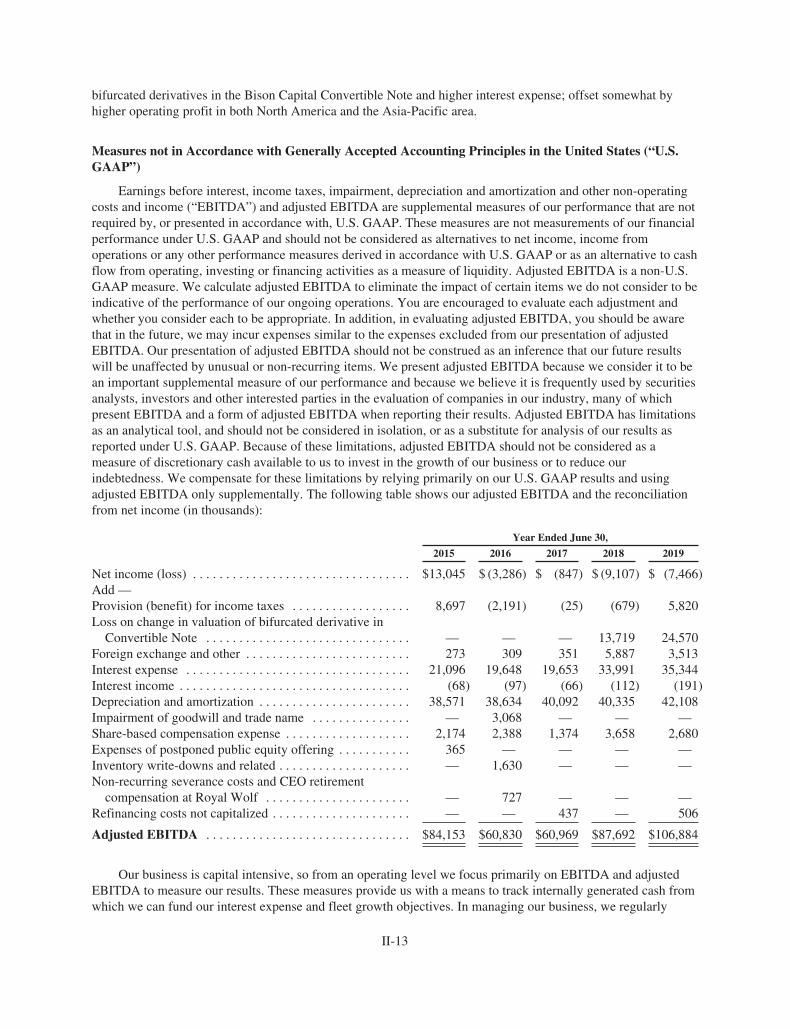
bifurcated derivatives in the Bison Capital Convertible Note and higher interest expense; offset somewhat byhigher operating profit in both North America and the Asia-Pacific area.
Measures not in Accordance with Generally Accepted Accounting Principles in the United States (“U.S.GAAP”)
Earnings before interest, income taxes, impairment, depreciation and amortization and other non-operatingcosts and income (“EBITDA”) and adjusted EBITDA are supplemental measures of our performance that are notrequired by, or presented in accordance with, U.S. GAAP. These measures are not measurements of our financialperformance under U.S. GAAP and should not be considered as alternatives to net income, income fromoperations or any other performance measures derived in accordance with U.S. GAAP or as an alternative to cashflow from operating, investing or financing activities as a measure of liquidity. Adjusted EBITDA is a non-U.S.GAAP measure. We calculate adjusted EBITDA to eliminate the impact of certain items we do not consider to beindicative of the performance of our ongoing operations. You are encouraged to evaluate each adjustment andwhether you consider each to be appropriate. In addition, in evaluating adjusted EBITDA, you should be awarethat in the future, we may incur expenses similar to the expenses excluded from our presentation of adjustedEBITDA. Our presentation of adjusted EBITDA should not be construed as an inference that our future resultswill be unaffected by unusual or non-recurring items. We present adjusted EBITDA because we consider it to bean important supplemental measure of our performance and because we believe it is frequently used by securitiesanalysts, investors and other interested parties in the evaluation of companies in our industry, many of whichpresent EBITDA and a form of adjusted EBITDA when reporting their results. Adjusted EBITDA has limitationsas an analytical tool, and should not be considered in isolation, or as a substitute for analysis of our results asreported under U.S. GAAP. Because of these limitations, adjusted EBITDA should not be considered as ameasure of discretionary cash available to us to invest in the growth of our business or to reduce ourindebtedness. We compensate for these limitations by relying primarily on our U.S. GAAP results and usingadjusted EBITDA only supplementally. The following table shows our adjusted EBITDA and the reconciliationfrom net income (in thousands):
Year Ended June 30,
2015 2016 2017 2018 2019
Net income (loss) . . . . . . . . . . . . . . . . . . . . . . . . . . . . . . . . . $13,045 $ (3,286) $ (847) $ (9,107) $ (7,466)Add —Provision (benefit) for income taxes . . . . . . . . . . . . . . . . . . 8,697 (2,191) (25) (679) 5,820Loss on change in valuation of bifurcated derivative in
Convertible Note . . . . . . . . . . . . . . . . . . . . . . . . . . . . . . . — — — 13,719 24,570Foreign exchange and other . . . . . . . . . . . . . . . . . . . . . . . . . 273 309 351 5,887 3,513Interest expense . . . . . . . . . . . . . . . . . . . . . . . . . . . . . . . . . . 21,096 19,648 19,653 33,991 35,344Interest income . . . . . . . . . . . . . . . . . . . . . . . . . . . . . . . . . . . (68) (97) (66) (112) (191)Depreciation and amortization . . . . . . . . . . . . . . . . . . . . . . . 38,571 38,634 40,092 40,335 42,108Impairment of goodwill and trade name . . . . . . . . . . . . . . . — 3,068 — — —Share-based compensation expense . . . . . . . . . . . . . . . . . . . 2,174 2,388 1,374 3,658 2,680Expenses of postponed public equity offering . . . . . . . . . . . 365 — — — —Inventory write-downs and related . . . . . . . . . . . . . . . . . . . . — 1,630 — — —Non-recurring severance costs and CEO retirement
compensation at Royal Wolf . . . . . . . . . . . . . . . . . . . . . . — 727 — — —Refinancing costs not capitalized . . . . . . . . . . . . . . . . . . . . . — — 437 — 506
Adjusted EBITDA . . . . . . . . . . . . . . . . . . . . . . . . . . . . . . . $84,153 $60,830 $60,969 $87,692 $106,884
Our business is capital intensive, so from an operating level we focus primarily on EBITDA and adjustedEBITDA to measure our results. These measures provide us with a means to track internally generated cash fromwhich we can fund our interest expense and fleet growth objectives. In managing our business, we regularly
II-13
compare our adjusted EBITDA margins on a monthly basis. As capital is invested in our established branch (orCSC) locations, we achieve higher adjusted EBITDA margins on that capital than we achieve on capital investedto establish a new branch, because our fixed costs are already in place in connection with the establishedbranches. The fixed costs are those associated with yard and delivery equipment, as well as advertising, sales,marketing and office expenses. With a new market or branch, we must first fund and absorb the start-up costs forsetting up the new branch facility, hiring and developing the management and sales team and developing ourmarketing and advertising programs. A new branch will have low adjusted EBITDA margins in its early yearsuntil the number of units on rent increases. Because of our higher operating margins on incremental leaserevenue, which we realize on a branch-by-branch basis, when the branch achieves leasing revenues sufficient tocover the branch’s fixed costs, leasing revenues in excess of the break-even amount produce large increases inprofitability and adjusted EBITDA margins. Conversely, absent significant growth in leasing revenues, theadjusted EBITDA margin at a branch will remain relatively flat on a period by period comparative basis.
Liquidity and Financial Condition
Though we have raised capital at the corporate level to primarily assist in the funding of acquisitions andlease fleet expenditures, as well as for general purposes, our operating units substantially fund their operationsthrough secured bank credit facilities that require compliance with various covenants. These covenants requireour operating units to, among other things; maintain certain levels of interest or fixed charge coverage, EBITDA(as defined), utilization rate and overall leverage.
Asia-Pacific Leasing Senior Credit Facility
Our operations in the Asia-Pacific area had an AUS$150,000,000 secured senior credit facility, as amended,under a common terms deed arrangement with the Australia and New Zealand Banking Group Limited (“ANZ”)and Commonwealth Bank of Australia (“CBA”) (the “ANZ/CBA Credit Facility”). On October 26, 2017, RWH(subsequently replaced by GFNAPH) and its subsidiaries and a syndicate led by Deutsche Bank AG, SydneyBranch (“Deutsche Bank”), entered into a Syndicated Facility Agreement (the “Syndicated Facility Agreement”).Pursuant to the Syndicated Facility Agreement, the parties entered into a senior secured credit facility and repaidthe ANZ/CBA Credit Facility on November 3, 2017. The senior secured credit facility, as amended on June 25,2018 and March 22, 2019 (the “Deutsche Bank Credit Facility”), consists of a $30,223,000 (AUS$43,000,000)Facility A that will amortize semi-annually; a $81,884,000 (AUS$116,500,000) Facility B that has no scheduledamortization; a $14,057,000 (AUS$20,000,000) revolving Facility C that is used for working capital, capitalexpenditures and general corporate purposes; and a $26,358,000 (AUS$37,500,000) revolving Term LoanFacility D. Borrowings bear interest at the three-month bank bill swap interest rate in Australia (“BBSY”), plus amargin of 4.25% to 5.50% per annum, as determined by net leverage, as defined. The Deutsche Bank CreditFacility is secured by substantially all of the assets of Royal Wolf and by the pledge of all the capital stock ofGFNAPH and its subsidiaries and matures on November 2, 2023
Bison Capital Notes
On September 19, 2017, Bison Capital Equity Partners V, L.P and its affiliates (“Bison Capital”), GFN,GFN U.S., GFNAPH and GFNAPF, entered into that certain Amended and Restated Securities PurchaseAgreement dated September 19, 2017 (the “Amended Securities Purchase Agreement”). On September 25, 2017,pursuant to the Amended Securities Purchase Agreement, GFNAPH and GFNAPF issued and sold to Bison an11.9% secured senior convertible promissory note dated September 25, 2017 in the original principal amount of$26,000,000 (the “Convertible Note”) and an 11.9% secured senior promissory note dated September 25, 2017 inthe original principal amount of $54,000,000 (the “Senior Term Note” and collectively with the ConvertibleNote, the “Bison Capital Notes”). Net proceeds from the sale of the Bison Capital Notes were used to repay infull all principal, interest and other amounts due under the term loan to Credit Suisse (see Note 5 of Notes toConsolidated Financial Statements), to acquire the 49,188,526 publicly-traded shares of RWH not owned by usand to pay all related fees and expenses.
II-14
On September 6, 2018, we elected to force the conversion of the Convertible Note under its terms thereinand delivered a notice to the holders requiring the conversion of the Convertible Note into 3,058,824 shares ofthe Company’s common stock effective September 10, 2018. GFNAPF was dissolved in September 2018.
On March 25, 2019, the Senior Term Note was repaid in full by proceeds borrowed under the DeutscheBank Credit Facility, which included interest we elected to defer.
North America Senior Credit Facility
Our North America leasing (Pac-Van and Lone Star) and manufacturing operations (Southern Frac) have acombined $260,000,000 senior secured revolving credit facility, as amended, with a syndicate led by Wells FargoBank, National Association (“Wells Fargo”) that also includes East West Bank, CIT Bank, N.A., the CanadianImperial Bank of Commerce (“CIBC”), KeyBank, National Association, Bank Hapoalim B.M. and AssociatedBank, N.A. (the “Wells Fargo Credit Facility”). In addition, the Wells Fargo Credit Facility provides anaccordion feature that may be exercised by the syndicate, subject to the terms in the credit agreement, to increasethe maximum amount that may be borrowed by an additional $25,000,000. The Wells Fargo Credit Facilitymatures on March 24, 2022, assuming our publicly-traded senior notes due July 31, 2021(see below) areextended at least 90 days past this scheduled maturity date; otherwise the Wells Fargo Credit Facility wouldmature on March 24, 2021. There was also a separate loan agreement with Great American Capital Partners(“GACP”), where GACP provided a First-In, Last-Out Term Loan (“FILO Term Loan”) within the Wells FargoCredit Facility in the amount of $20,000,000 that had the same maturity date and commenced principalamortization on October 1, 2018 at $500,000 per quarter. On December 24, 2018, the FILO Term Loan, with aprincipal balance of $19,500,000, including accrued interest and prepayment fee of one percent, was repaid infull and all terms and provisions relating to the FILO Term Loan were terminated within the credit agreement.
Borrowings under the Wells Fargo Credit Facility accrue interest, at the our option, either at the base rate,plus 0.5% and a range of 1.00% to 1.50%, or the LIBOR rate, plus 1.0% and a range of 2.50% to 3.00%. TheFILO Term Loan bore interest at 11.00% above the LIBOR rate, with a LIBOR rate floor of 1.00%. The WellsFargo Credit Facility is secured by substantially all of the rental fleet, inventory and other assets of our NorthAmerican leasing and manufacturing operations. The FILO Term Loan also contains a first priority lien on thesame collateral, but on a “last out basis,” after all of the outstanding obligations to the primary lenders in theWells Fargo Credit Facility have been satisfied. The Wells Fargo Credit Facility effectively not only finances ourNorth American operations, but also the funding requirements for the Series C Preferred Stock and the publicly-traded unsecured senior notes (see below). The maximum amount of intercompany dividends that Pac-Van andLone Star are allowed to pay in each fiscal year to GFN for the funding requirements of GFN’s senior and otherdebt and the Series C Preferred Stock are (a) the lesser of $5,000,000 for the Series C Preferred Stock or theamount equal to the dividend rate of the Series C Preferred Stock and its aggregate liquidation preference and theactual amount of dividends required to be paid to the Series C Preferred Stock; and (b) $6,300,000 for the publicoffering of unsecured senior notes or the actual amount of annual interest required to be paid; provided that(i) the payment of such dividends does not cause a default or event of default; (ii) each of Pac-Van and Lone Staris solvent; (iii) excess availability, as defined, is $5,000,000 or more under the Wells Fargo Credit Facility;(iv) the fixed charge coverage ratio, as defined, will be greater than 1.25 to 1.00; and (v) the dividends are paidno earlier than ten business days prior to the date they are due.
Corporate Senior Notes
On June 18, 2014, we completed the sale of unsecured senior notes (the “Senior Notes”) in a public offeringfor an aggregate principal amount of $72,000,000. On April 24, 2017, we completed the sale of a “tack-on”offering of our publicly-traded Senior Notes for an aggregate principal amount of $5,390,000 that was priced at$24.95 per denomination. Net proceeds were $5,190,947, after deducting an aggregate original issue discount(“OID”) of $10,780 and underwriting discount of $188,273. In both offerings, we used at least 80% of the grossproceeds to reduce indebtedness at Pac-Van and Lone Star under the Wells Fargo Credit Facility in order to
II-15
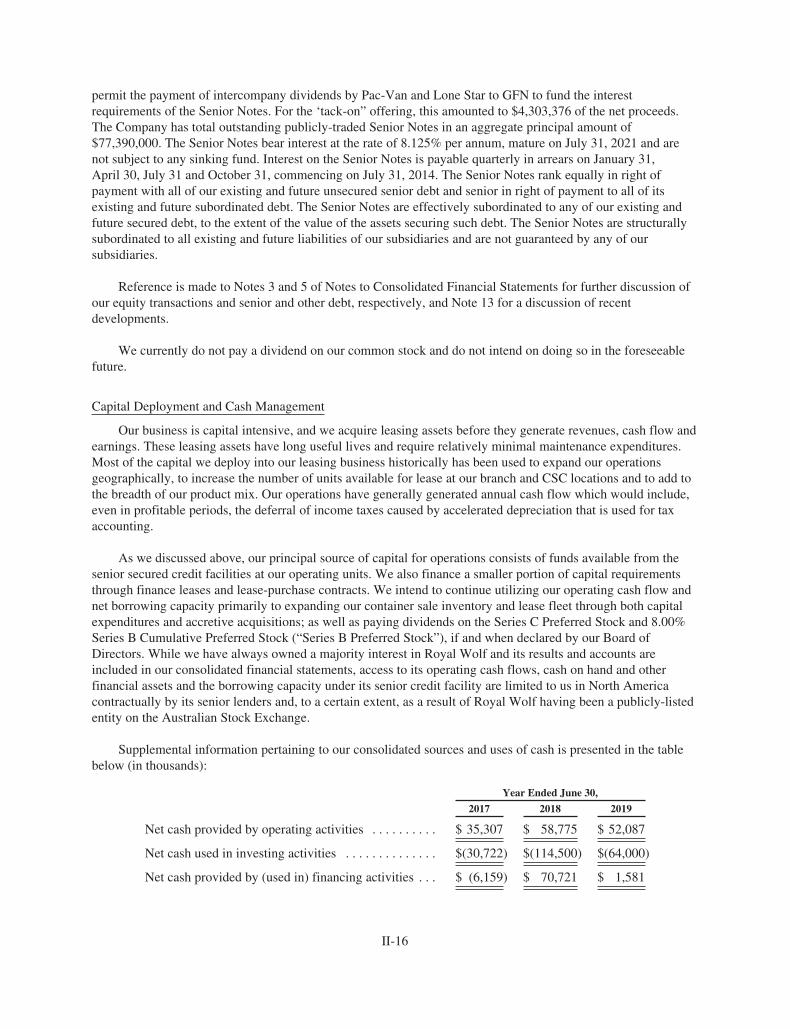
permit the payment of intercompany dividends by Pac-Van and Lone Star to GFN to fund the interestrequirements of the Senior Notes. For the ‘tack-on” offering, this amounted to $4,303,376 of the net proceeds.The Company has total outstanding publicly-traded Senior Notes in an aggregate principal amount of$77,390,000. The Senior Notes bear interest at the rate of 8.125% per annum, mature on July 31, 2021 and arenot subject to any sinking fund. Interest on the Senior Notes is payable quarterly in arrears on January 31,April 30, July 31 and October 31, commencing on July 31, 2014. The Senior Notes rank equally in right ofpayment with all of our existing and future unsecured senior debt and senior in right of payment to all of itsexisting and future subordinated debt. The Senior Notes are effectively subordinated to any of our existing andfuture secured debt, to the extent of the value of the assets securing such debt. The Senior Notes are structurallysubordinated to all existing and future liabilities of our subsidiaries and are not guaranteed by any of oursubsidiaries.
Reference is made to Notes 3 and 5 of Notes to Consolidated Financial Statements for further discussion ofour equity transactions and senior and other debt, respectively, and Note 13 for a discussion of recentdevelopments.
We currently do not pay a dividend on our common stock and do not intend on doing so in the foreseeablefuture.
Capital Deployment and Cash Management
Our business is capital intensive, and we acquire leasing assets before they generate revenues, cash flow andearnings. These leasing assets have long useful lives and require relatively minimal maintenance expenditures.Most of the capital we deploy into our leasing business historically has been used to expand our operationsgeographically, to increase the number of units available for lease at our branch and CSC locations and to add tothe breadth of our product mix. Our operations have generally generated annual cash flow which would include,even in profitable periods, the deferral of income taxes caused by accelerated depreciation that is used for taxaccounting.
As we discussed above, our principal source of capital for operations consists of funds available from thesenior secured credit facilities at our operating units. We also finance a smaller portion of capital requirementsthrough finance leases and lease-purchase contracts. We intend to continue utilizing our operating cash flow andnet borrowing capacity primarily to expanding our container sale inventory and lease fleet through both capitalexpenditures and accretive acquisitions; as well as paying dividends on the Series C Preferred Stock and 8.00%Series B Cumulative Preferred Stock (“Series B Preferred Stock”), if and when declared by our Board ofDirectors. While we have always owned a majority interest in Royal Wolf and its results and accounts areincluded in our consolidated financial statements, access to its operating cash flows, cash on hand and otherfinancial assets and the borrowing capacity under its senior credit facility are limited to us in North Americacontractually by its senior lenders and, to a certain extent, as a result of Royal Wolf having been a publicly-listedentity on the Australian Stock Exchange.
Supplemental information pertaining to our consolidated sources and uses of cash is presented in the tablebelow (in thousands):
Year Ended June 30,
2017 2018 2019
Net cash provided by operating activities . . . . . . . . . . $ 35,307 $ 58,775 $ 52,087
Net cash used in investing activities . . . . . . . . . . . . . . $(30,722) $(114,500) $(64,000)
Net cash provided by (used in) financing activities . . . $ (6,159) $ 70,721 $ 1,581
II-16
Cash Flow for FY 2019 Compared to FY 2018
Operating activities. Our operations provided cash of $52.1 million during FY 2019 versus $58.8 millionduring FY 2018, a decrease of $6.7 million between the periods. The net loss in FY 2019 of $7.5 million was$1.6 million better than the net loss in FY 2018 of $9.1 million, but our management of operating assets andliabilities in FY 2019, when compared to FY 2018, reduced cash by $17.6 million. Historically we haveexperienced significant variations in operating assets and liabilities between periods when conducting ourbusiness in due course. In FY 2019, we invested more in our fleet inventory than in the prior year to anticipatethe demands of our expanding business. In addition, the non-cash gains on the bargain purchases of twobusinesses, one in each geographic venue (see Note 4 of Notes to Consolidated Financial Statements), reducedour cash from operating activities by $1.8 million in FY 2019; and non-cash share-based compensation alsodecreased operating cash flows by $1.0 million between the periods. Share-based compensation was $2.7 millionin FY 2019 versus $3.7 million in FY 2018. Also, net unrealized gains and losses from foreign exchange andforeign exchange contracts (see Note 6 of Notes to Consolidated Financial Statements), which affect operatingresults but are non-cash addbacks for cash flow purposes, further decreased operating cash flow byapproximately $10.3 million between the periods, from a net cash increase of $5.4 million in FY 2018 to a netcash decrease of $4.9 million in FY 2019. However, cash from operating activities between the periods increasedby $10.9 million as a result of non-cash adjustments of $24.6 million in FY 2019 relating to the change in thevaluation of the stand-alone bifurcated derivatives in the Convertible Note, versus $13.7 million in FY 2018, andthe non-cash realized foreign exchange loss of $3.6 million prior to its conversion to equity in FY 2019 (see Note5 of Notes to Consolidated Financial Statements). In addition, non-cash depreciation and amortization, includingthe amortization of deferred financing costs, accretion of interest and interest deferred on the Senior Term Note,increased cash between the periods by $2.6 million, from an aggregate $46.7 million in FY 2018 to $49.3 millionin FY 2019; and operating cash flows were further enhanced by $7.0 million between the periods for deferredincome taxes. Deferred income taxes increased cash in FY 2019 by $4.0 million versus reducing cash by$3.0 million in FY 2018. During FY 2019 and FY 2018, the net gain on the sales of lease fleet reduced operatingcash flows by $10.0 million and $8.5 million, respectively.
Investing Activities. Net cash used in investing activities was $64.0 million during FY 2019, as compared to$114.5 million used during FY 2018, resulting in a net reduction in cash used between the periods of$50.5 million. In FY 2018, we used $73.3 million and $15.1 million of cash to acquire the noncontrolling interestof Royal Wolf and make four business acquisitions in North America, respectively; whereas in FY 2019 wemade six business acquisitions, five in North America and one in the Asia-Pacific area, for $18.6 million (seeNote 4 of Notes to Consolidated Financial Statements). Purchases of property, plant and equipment, or rollingstock (maintenance capital expenditures), were $7.2 million in FY 2019 and $4.8 million in FY 2018, an increaseof $2.4 million. In both periods, proceeds from sales of property, plant and equipment were not significant. Netcapital expenditures of lease fleet (purchases, net of proceeds from sales of lease fleet) were $38.5 million in FY2019 as compared to $21.1 million in FY 2018, an increase of $17.4 million. In FY 2019, net capitalexpenditures of lease fleet were approximately $32.1 million in North America, as compared to $19.0 million inFY 2018, an increase of $13.1 million; and net capital expenditures of lease fleet in the Asia Pacific totaled$6.4 million in FY 2019, versus $2.1 million in FY 2018, an increase of $4.3 million. The amount of cash that weuse during any period in investing activities is almost entirely within management’s discretion and we have nosignificant long-term contracts or other arrangements pursuant to which we may be required to purchase at acertain price or a minimum amount of goods or services.
Financing Activities. Net cash provided from financing activities was $1.6 million during FY 2019, ascompared to $70.7 million provided during FY 2018, a decrease to cash between the periods of $69.1 million. InFY 2018, we issued the Bison Capital Notes for proceeds totaling $80.0 million to, among other things, acquirethe noncontrolling interest of Royal Wolf (see above) and repay the principal of $10.0 million due under the termloan to Credit Suisse (see Note 5 of Notes to Consolidated Financial Statements). In FY 2019 and FY 2018,financing activities also included net borrowings of $68.1 million and $89.4 million, respectively, on existingcredit facilities. These financing activities on our existing credit facilities were primarily to fund our investmentin the container lease fleet, make business acquisitions, pay dividends and manage our operating assets and
II-17
liabilities. In addition, in FY 2019, $63.3 million was borrowed under the Deutsche Bank Credit Facility to repaythe Senior Term Note; and, in FY 2018, $81.5 million was borrowed from the Deutsche Bank Credit Facility torepay the ANZ/CBA Credit Facility (see Note 5 of Notes to Consolidated Financial Statements). Deferredfinancing costs related to the Bison Capital Notes and Deutsche Bank Credit Facility totaled $4.0 million in FY2018 versus $0.4 million in FY 2019, which primarily related to the Senior Notes consent solicitation and anamendment to Wells Fargo Credit Facility. Cash of $3.7 million was used during both periods to pay dividendson primarily our Series C Preferred Stock; and, in FY 2018, Royal Wolf paid a capital stock dividend of$1.0 million to noncontrolling interests (see Note 3 of Notes to Consolidated Financial Statements). In FY 2019,we received proceeds of $0.9 million from issuances of common stock on the exercises of stock options versus$1.2 million in FY 2018.
Cash Flow for FY 2018 Compared to FY 2017
Operating activities. Our operations provided cash of $58.8 million during FY 2018 versus $35.3 millionduring FY 2017, an increase in cash of $23.5 million between the periods. Net loss in FY 2018 of $9.1 millionwas $8.3 million higher than the net loss in FY 2017 of $0.8 million. However, our management of operatingassets and liabilities in FY 2018, when compared to FY 2017, increased cash by $11.2 million. Historically wehave experienced significant variations in operating assets and liabilities between periods when conducting ourbusiness in due course. Non-cash adjustments relating to depreciation and amortization, including amortizationof deferred financing costs, accretion of interest and interest deferred on the Senior Term Note also increasedcash between the periods by $4.8 million, from $41.9 million in FY 2017 to $46.7 million in FY 2018; andnon-cash share-based compensation of $3.7 million in FY 2018 further increased operating cash flows by$2.3 million, when compared to $1.4 million in FY 2017. In the first quarter of FY 2017 a benefit of $0.7 millionwas recorded at Royal Wolf, primarily for the reversal of expenses recognized for unvested performance grantsto key employees under its Long Term Incentive Plan (see Note 8 of Notes to Consolidated FinancialStatements). The non-cash charge of $13.7 million for the change in the valuation of the stand-alone bifurcatedderivative in the Convertible Note (see Note 5 of Notes to Consolidated Financial Statements) increasedoperating cash flow in FY 2018 and, additionally, net unrealized gains and losses from foreign exchange andderivative instruments (see Note 6 of Notes to Consolidated Financial Statements), which affect operating resultsbut are non-cash addbacks for cash flow purposes, increased cash by $6.1 million between the periods, from acash reduction of $0.7 million in FY 2017 to a cash increase of $5.4 million in FY 2018. Somewhat offsettingthese increases were the net gain on the sales of lease fleet, which reduced operating cash flows by $8.5 millionin FY 2018 and by $3.7 million in FY 2017, a reduction of $4.8 million between the periods; and, additionally,operating cash flows were reduced by non-cash adjustments for deferred income taxes in FY 2018 and FY 2017of $3.0 million and $1.2 million, respectively.
Investing Activities. Net cash used in investing activities was $114.5 million during FY 2018, as comparedto $30.7 million used during FY 2017, resulting in a net increase in the use of cash between the periods of$83.8 million. In FY 2018, we used $73.3 million and $15.1 million of cash to acquire the noncontrolling interestof Royal Wolf and make four business acquisitions in North America, respectively (see Note 4 of Notes toConsolidated Financial Statements). In FY 2017, we made three business acquisitions (two in North America andone in the Asia-Pacific area) for cash of $5.0 million. Purchases of property, plant and equipment, or rollingstock (maintenance capital expenditures), were $4.8 million in FY 2018 and $3.7 million in FY 2017, an increaseof $1.1 million. In both periods, proceeds from sales of property, plant and equipment were not significant. Netcapital expenditures of lease fleet (purchases, net of proceeds from sales of lease fleet) were $21.1 million in FY2018 as compared to $21.8 million in FY 2017, a slight decrease of $0.7 million. In FY 2018, net capitalexpenditures of lease fleet were approximately $19.0 million in North America, as compared to $10.7 million inFY 2017, an increase of $8.3 million; and net capital expenditures of lease fleet in the Asia Pacific totaled$2.1 million in FY 2018, versus $11.1 million in FY 2017, a decrease of $9.0 million. The amount of cash thatwe use during any period in investing activities is almost entirely within management’s discretion and we haveno significant long-term contracts or other arrangements pursuant to which we may be required to purchase at acertain price or a minimum amount of goods or services.
II-18
Financing Activities. Net cash provided from financing activities was $70.7 million during FY 2018, ascompared to $6.2 million cash used during FY 2017, an increase to cash between the periods of $76.9 million. InFY 2018, we issued the Bison Capital Notes for proceeds totaling $80.0 million to, among other things, acquirethe noncontrolling interest of Royal Wolf (see above) and repay the principal of $10.0 million due under the termloan to Credit Suisse (see Note 5 of Notes to Consolidated Financial Statements). Cash of $3.7 million was usedduring both periods to pay dividends on primarily our Series C Preferred Stock and, in FY 2018 and FY 2017,Royal Wolf paid a capital stock dividend of $1.0 million and $1.9 million, respectively, to the noncontrollinginterests (see Note 3 of Notes to Consolidated Financial Statements). In FY 2018 and FY 2017, financingactivities also included net borrowings and repayments of $89.4 million and $3.3 million, respectively, onexisting credit facilities and, in FY 2017, we completed the sale of a “tack-on” offering of our publicly-tradedSenior Notes for an aggregate principal amount of $5.4 million. These financing activities on our existing creditfacilities and Senior Notes were primarily to fund our investment in the container lease fleet, make businessacquisitions, pay dividends, manage our operating assets and liabilities and, in FY 2018, $81.5 million wasborrowed from the Deutsche Bank Credit Facility to repay the ANZ/CBA Credit Facility (see Note 5 of Notes toConsolidated Financial Statements). In addition, deferred financing costs related to the Bison Capital Notes andDeutsche Bank Credit Facility totaled $4.0 million in FY 2018 and, in FY 2017, we paid deferred financing costsof $2.8 million primarily for the amendment and extension of our senior secured credit facilities in both NorthAmerica and the Asia-Pacific area, as well as for the “tack-on” offering of our publicly-traded Senior Notes. InFY 2018, we received proceeds of $1.2 million from issuances of common stock on the exercises of stockoptions versus $0.1 million in FY 2017.
Asset Management
Receivables and inventories were $56.2 million and $29.1 million at June 30, 2019 and $50.5 million and$22.7 million at June 30, 2018, respectively. At June 30, 2019, DSO in trade receivables were 34 days and 46days in the Asia-Pacific area and our North American leasing operations, as compared to 35 days and 47 days atJune 30, 2018, respectively. The $6.4 million increase in inventories was primarily due to the timing of receiptsof sale and fleet units to fulfill known increased demand. Effective asset management is always a significantfocus as we strive to apply appropriate credit and collection controls and maintain proper inventory levels toenhance cash flow and profitability.
The net book value of our total lease fleet was $456.8 million at June 30, 2019, as compared to$429.4 million at June 30, 2018. At June 30, 2019, we had 99,743 units (25,355 units in retail operations inAustralia, 9,254 units in national account group operations in Australia, 12,574 units in New Zealand, which areconsidered retail; and 52,560 units in North America) in our lease fleet, as compared to 85,812 units (24,037units in retail operations in Australia, 8,046 units in national account group operations in Australia, 10,222 unitsin New Zealand, which are considered retail; and 43,507 units in North America) at June 30, 2018. At thosedates, 77,214 units (20,376 units in retail operations in Australia, 5,931 units in national account groupoperations in Australia, 10,196 units in New Zealand, which are considered retail; and 40,711 units in NorthAmerica); and 68,712 units (20,102 units in retail operations in Australia, 5,038 units in national account groupoperations in Australia, 8,705 units in New Zealand, which are considered retail; and 34,867 units in NorthAmerica) were on lease, respectively.
In the Asia-Pacific area, the lease fleet was comprised of 39,616 storage and freight containers and 7,567portable building containers at June 30, 2019; and 34,507 storage and freight containers and 7,798 portablebuilding containers at June 30, 2018. At those dates, units on lease were comprised of 31,610 storage and freightcontainers and 4,893 portable building containers; and 28,301 storage and freight containers and 5,544 portablebuilding containers, respectively.
In North America, the lease fleet was comprised of 37,304 storage containers, 5,426 office containers(GLOs), 4,215 portable liquid storage tank containers, 4,436 mobile offices and 1,179 modular units at June 30,2019; and 29,518 storage containers, 4,216 office containers (GLOs), 4,147 portable liquid storage tank
II-19
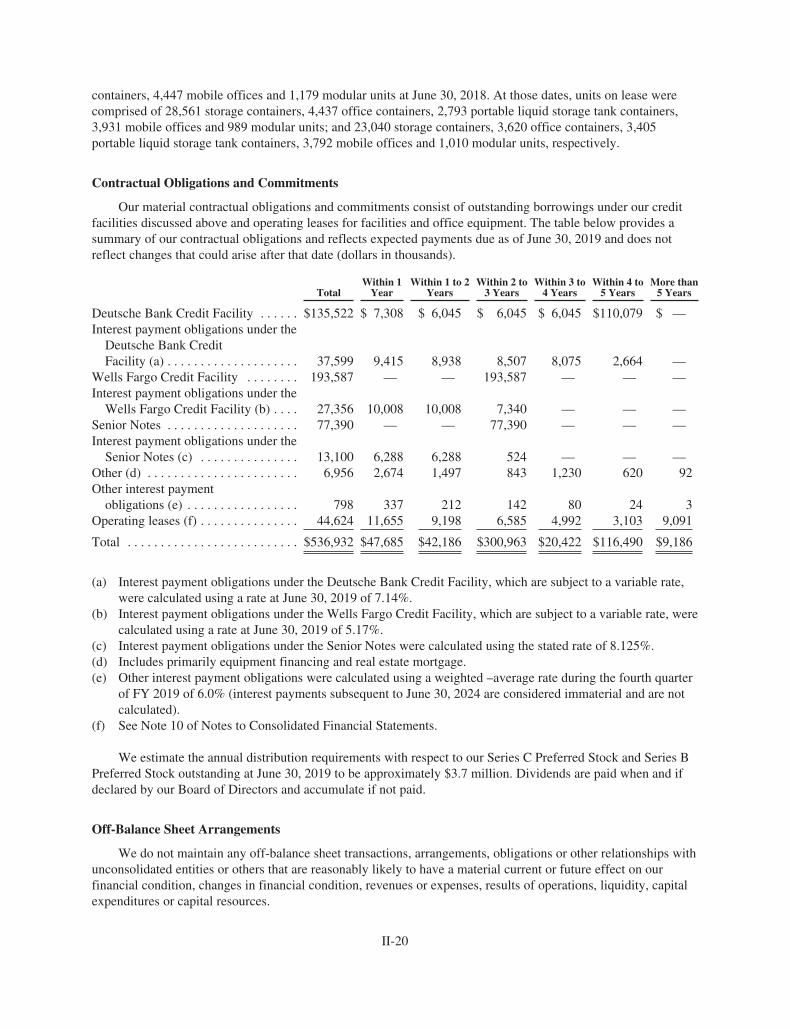
containers, 4,447 mobile offices and 1,179 modular units at June 30, 2018. At those dates, units on lease werecomprised of 28,561 storage containers, 4,437 office containers, 2,793 portable liquid storage tank containers,3,931 mobile offices and 989 modular units; and 23,040 storage containers, 3,620 office containers, 3,405portable liquid storage tank containers, 3,792 mobile offices and 1,010 modular units, respectively.
Contractual Obligations and Commitments
Our material contractual obligations and commitments consist of outstanding borrowings under our creditfacilities discussed above and operating leases for facilities and office equipment. The table below provides asummary of our contractual obligations and reflects expected payments due as of June 30, 2019 and does notreflect changes that could arise after that date (dollars in thousands).
TotalWithin 1
YearWithin 1 to 2
YearsWithin 2 to
3 YearsWithin 3 to
4 YearsWithin 4 to
5 YearsMore than
5 Years
Deutsche Bank Credit Facility . . . . . . $135,522 $ 7,308 $ 6,045 $ 6,045 $ 6,045 $110,079 $ —Interest payment obligations under the
Deutsche Bank CreditFacility (a) . . . . . . . . . . . . . . . . . . . . 37,599 9,415 8,938 8,507 8,075 2,664 —
Wells Fargo Credit Facility . . . . . . . . 193,587 — — 193,587 — — —Interest payment obligations under the
Wells Fargo Credit Facility (b) . . . . 27,356 10,008 10,008 7,340 — — —Senior Notes . . . . . . . . . . . . . . . . . . . . 77,390 — — 77,390 — — —Interest payment obligations under the
Senior Notes (c) . . . . . . . . . . . . . . . 13,100 6,288 6,288 524 — — —Other (d) . . . . . . . . . . . . . . . . . . . . . . . 6,956 2,674 1,497 843 1,230 620 92Other interest payment
obligations (e) . . . . . . . . . . . . . . . . . 798 337 212 142 80 24 3Operating leases (f) . . . . . . . . . . . . . . . 44,624 11,655 9,198 6,585 4,992 3,103 9,091
Total . . . . . . . . . . . . . . . . . . . . . . . . . . $536,932 $47,685 $42,186 $300,963 $20,422 $116,490 $9,186
(a) Interest payment obligations under the Deutsche Bank Credit Facility, which are subject to a variable rate,were calculated using a rate at June 30, 2019 of 7.14%.
(b) Interest payment obligations under the Wells Fargo Credit Facility, which are subject to a variable rate, werecalculated using a rate at June 30, 2019 of 5.17%.
(c) Interest payment obligations under the Senior Notes were calculated using the stated rate of 8.125%.(d) Includes primarily equipment financing and real estate mortgage.(e) Other interest payment obligations were calculated using a weighted –average rate during the fourth quarter
of FY 2019 of 6.0% (interest payments subsequent to June 30, 2024 are considered immaterial and are notcalculated).
(f) See Note 10 of Notes to Consolidated Financial Statements.
We estimate the annual distribution requirements with respect to our Series C Preferred Stock and Series BPreferred Stock outstanding at June 30, 2019 to be approximately $3.7 million. Dividends are paid when and ifdeclared by our Board of Directors and accumulate if not paid.
Off-Balance Sheet Arrangements
We do not maintain any off-balance sheet transactions, arrangements, obligations or other relationships withunconsolidated entities or others that are reasonably likely to have a material current or future effect on ourfinancial condition, changes in financial condition, revenues or expenses, results of operations, liquidity, capitalexpenditures or capital resources.
II-20
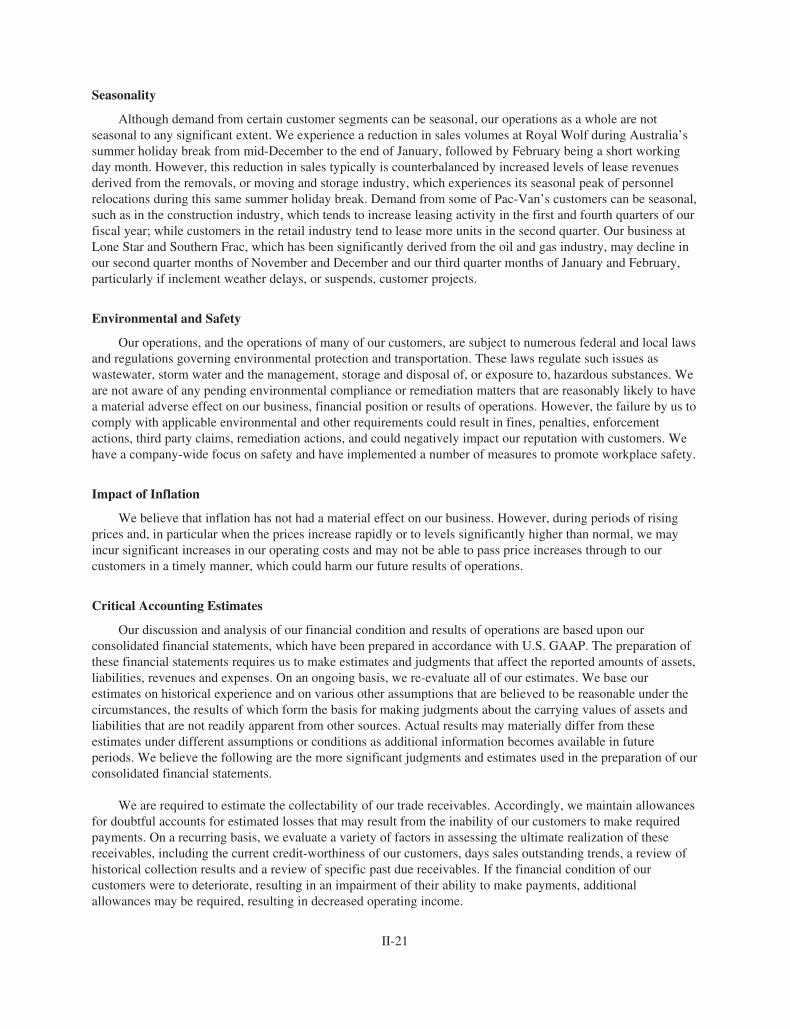
Seasonality
Although demand from certain customer segments can be seasonal, our operations as a whole are notseasonal to any significant extent. We experience a reduction in sales volumes at Royal Wolf during Australia’ssummer holiday break from mid-December to the end of January, followed by February being a short workingday month. However, this reduction in sales typically is counterbalanced by increased levels of lease revenuesderived from the removals, or moving and storage industry, which experiences its seasonal peak of personnelrelocations during this same summer holiday break. Demand from some of Pac-Van’s customers can be seasonal,such as in the construction industry, which tends to increase leasing activity in the first and fourth quarters of ourfiscal year; while customers in the retail industry tend to lease more units in the second quarter. Our business atLone Star and Southern Frac, which has been significantly derived from the oil and gas industry, may decline inour second quarter months of November and December and our third quarter months of January and February,particularly if inclement weather delays, or suspends, customer projects.
Environmental and Safety
Our operations, and the operations of many of our customers, are subject to numerous federal and local lawsand regulations governing environmental protection and transportation. These laws regulate such issues aswastewater, storm water and the management, storage and disposal of, or exposure to, hazardous substances. Weare not aware of any pending environmental compliance or remediation matters that are reasonably likely to havea material adverse effect on our business, financial position or results of operations. However, the failure by us tocomply with applicable environmental and other requirements could result in fines, penalties, enforcementactions, third party claims, remediation actions, and could negatively impact our reputation with customers. Wehave a company-wide focus on safety and have implemented a number of measures to promote workplace safety.
Impact of Inflation
We believe that inflation has not had a material effect on our business. However, during periods of risingprices and, in particular when the prices increase rapidly or to levels significantly higher than normal, we mayincur significant increases in our operating costs and may not be able to pass price increases through to ourcustomers in a timely manner, which could harm our future results of operations.
Critical Accounting Estimates
Our discussion and analysis of our financial condition and results of operations are based upon ourconsolidated financial statements, which have been prepared in accordance with U.S. GAAP. The preparation ofthese financial statements requires us to make estimates and judgments that affect the reported amounts of assets,liabilities, revenues and expenses. On an ongoing basis, we re-evaluate all of our estimates. We base ourestimates on historical experience and on various other assumptions that are believed to be reasonable under thecircumstances, the results of which form the basis for making judgments about the carrying values of assets andliabilities that are not readily apparent from other sources. Actual results may materially differ from theseestimates under different assumptions or conditions as additional information becomes available in futureperiods. We believe the following are the more significant judgments and estimates used in the preparation of ourconsolidated financial statements.
We are required to estimate the collectability of our trade receivables. Accordingly, we maintain allowancesfor doubtful accounts for estimated losses that may result from the inability of our customers to make requiredpayments. On a recurring basis, we evaluate a variety of factors in assessing the ultimate realization of thesereceivables, including the current credit-worthiness of our customers, days sales outstanding trends, a review ofhistorical collection results and a review of specific past due receivables. If the financial condition of ourcustomers were to deteriorate, resulting in an impairment of their ability to make payments, additionalallowances may be required, resulting in decreased operating income.
II-21
We lease and sell a fleet of storage, portable building, office and portable liquid storage tank containers,modular buildings and mobile offices to our customers. Leases to customers, which have varying terms,generally qualify as operating leases unless there is a bargain purchase option at the end of the lease term.Revenue is recognized as earned in accordance with the lease terms established by the lease agreements andwhen collectability is reasonably assured. Revenue from sales of equipment is recognized upon delivery andwhen collectability is reasonably assured, while revenue from the sales of manufactured units are recognizedwhen title and risk of loss transfers to the purchaser, generally upon shipment. Certain arrangements to sell unitsunder long-term construction-type sales contracts are accounted for under the percentage of completion method.Under this method, income is recognized in proportion to the incurred costs to date under the contract toestimated total costs. There were no such significant arrangements in FY 2017, FY 2018 and FY 2019. The leasefleet (or lease or rental equipment) is recorded at cost and depreciated on the straight-line basis over theestimated useful life (5 — 20 years), after the date the units are put in service, down to their estimated residualvalues (up to 70% of cost). In our opinion, estimated residual values are at or below net realizable values. Weperiodically review these depreciation policies in light of various factors, including the practices of the largercompetitors in the industry, and our own historical experience.
For the issuances of stock options, we follow the fair value provisions of Financial Accounting StandardsBoard (“FASB”) Accounting Standards Codification (“ASC”) Topic 718, Compensation — Stock Compensation.FASB ASC Topic 718 requires recognition of employee share-based compensation expense in the statements ofincome over the vesting period based on the fair value of the stock option at the grant date. The pricing model weuse for determining fair values of the purchase option is the Black-Scholes Pricing Model. Valuations derivedfrom this model are subject to ongoing internal and external verification and review. The model uses market-sourced inputs such as interest rates, market prices and volatilities. Selection of these inputs involvesmanagement’s judgment and may impact operating income. In particular, we use a volatility rate based on theperformance of our common stock, which yields a higher rate. In addition we use a risk-free interest rate, whichis the rate on U.S. Treasury instruments, for a security with a maturity that approximates the estimated remainingexpected term of the stock option.
The purchase consideration of acquired businesses have been allocated to the assets and liabilities acquiredbased on the estimated fair values on the respective acquisition dates. Based on these values, the excess purchaseconsideration over the fair value of the net assets acquired was allocated to goodwill. We account for goodwill inaccordance with FASB ASC Topic 350, Intangibles — Goodwill and Other. FASB ASC Topic 350 prohibits theamortization of goodwill and intangible assets with indefinite lives and requires these assets be reviewed forimpairment. We operate two reportable geographic areas and the vast majority of goodwill recorded was in theacquisitions of Royal Wolf, Pac-Van, Southern Frac and Lone Star.
We assesses the potential impairment of goodwill on an annual basis or if a determination is made based ona qualitative assessment that it is more likely than not (i.e., greater than 50%) that the fair value of the reportingunit is less than its carrying amount. Qualitative factors which could cause an impairment include (1) significantunderperformance relative to historical, expected or projected future operating results; (2) significant changes inthe manner of use of the acquired businesses or the strategy for our overall business; (3) significant changesduring the period in our market capitalization relative to net book value; and (4) significant negative industry orgeneral economic trends. If we did determine that fair value is more likely than not less than the carrying amount,a quantitative process for potential impairment is performed where the fair value of the reporting unit iscompared to its carrying value to determine if the goodwill is impaired. If the carrying value of the net assetsassigned to the reporting unit were to exceed its fair value, then in accordance with FASB Accounting StandardsUpdate (“ASU”) No. 2017-04, a goodwill impairment write-down would be recorded for the amount by which areporting unit’s carrying value exceeds its fair value, but the loss recognized should not exceed the total amountof goodwill allocated to that reporting unit. Our annual impairment assessment at June 30, 2018 and 2019concluded that the fair value of the goodwill of each of its reporting units was greater than their respectivecarrying amounts. Determining the fair value of a reporting unit requires judgment and involves the use of
II-22
significant estimates and assumptions. We based our fair value estimates on assumptions that we believe arereasonable, but are uncertain and subject to changes in market conditions.
Intangible assets include those with indefinite (trademark and trade name) and finite (primarily customerbase and lists, non-compete agreements and deferred financing costs) useful lives. Customer base and lists andnon-compete agreements are amortized on the straight-line basis over the expected period of benefit which rangefrom one to fourteen years. Costs to obtaining long-term financing are deferred and amortized over the term ofthe related revolving line of credit senior debt using the straight-line method. Amortizing the deferred financingcosts using the straight-line method does not produce significantly different results than that of the effectiveinterest method. We review intangible assets (those assets resulting from acquisitions) for impairment if wedetermine, based on a qualitative assessment, that it is more likely than not (i.e., greater than 50%) that fair valuemight be less than the carrying amount. If we determine that fair value is more likely than not less than thecarrying amount, then impairment would be quantitatively tested, using historical cash flows and other relevantfacts and circumstances as the primary basis for estimates of future cash flows. If we determine that fair value isnot likely to be less than the carrying amount, then no further testing would be required. We conducted ourreview at each fiscal yearend, which did not result in an impairment adjustment at June 30, 2018 and 2019.Determining the fair value of intangible assets involves the use of significant estimates and assumptions, whichwe believe are reasonable, but are uncertain and subject to changes in market conditions.
We had a convertible note which conversion rights and minimum return provision were embeddedderivatives that required bifurcation and separate accounting of fair value. We determine the fair value of thesebifurcated derivatives using a valuation model and market prices and reassess fair value at the end of eachreporting period, or more frequently as deemed necessary, with any changes in value reported in the consolidatedstatements of operations.
In preparing our consolidated financial statements, we recognize income taxes in each of the jurisdictions inwhich we operate. For each jurisdiction, we estimate the actual amount of taxes currently payable or receivableas well as deferred tax assets and liabilities attributable to temporary differences between the financial statementcarrying amounts of existing assets and liabilities and their respective tax bases. Deferred income tax assets andliabilities are measured using enacted tax rates expected to apply to taxable income in the years in which thesetemporary differences are expected to be recovered or settled. The effect on deferred tax assets and liabilities of achange in tax rates is recognized in income in the period that includes the enactment date. A valuation allowancewould be provided for those deferred tax assets for which it is more likely than not that the related benefits willnot be realized. In determining the amount of the valuation allowance, we consider estimated future taxableincome as well as feasible tax planning strategies in each jurisdiction. If we determine that we will not realize allor a portion of our deferred tax assets, we would increase our valuation allowance with a charge to income taxexpense or offset goodwill if the deferred tax asset was acquired in a business combination. Conversely, if wedetermine that we will ultimately be able to realize all or a portion of the related benefits for which a valuationallowance has been provided, all or a portion of the related valuation allowance would be reduced with a credit toincome tax expense except if the valuation allowance was created in conjunction with a tax asset in a businesscombination.
Reference is made to Note 2 of Notes to Consolidated Financial Statements for a further discussion of oursignificant accounting policies.
Impact of Recently Issued Accounting Pronouncements
Reference is made to Note 2 of Notes to Consolidated Financial Statements for a discussion of recentlyissued accounting pronouncements that could potentially impact us.
II-23
Item 7A. Quantitative and Qualitative Disclosures about Market Risk
Market risk is the sensitivity of income to changes in interest rates, foreign exchanges and other market-driven rates or prices. Exposure to interest rates and currency risks arises in the normal course of our businessand we may use derivative financial instruments to hedge exposure to fluctuations in foreign exchange rates andinterest rates. We believe we have no material market risks to our operations, financial position or liquidity as aresult of derivative activities, including forward-exchange contracts.
Reference is made to Notes 5 and 6 of Notes to Consolidated Financial Statements for a discussion of oursenior and other debt and financial instruments.
Item 8. Financial Statements and Supplementary Data
Index to Consolidated Financial Statements:
Report of Independent Registered Public Accounting Firm . . . . . . . . . . . . . . . . . . . . . . . . . . . . . . . . . . . . . . . F-1
Consolidated Balance Sheets as of June 30, 2018 and 2019 . . . . . . . . . . . . . . . . . . . . . . . . . . . . . . . . . . . . . . . F-3
Consolidated Statements of Operations for the years ended June 30, 2017, 2018 and 2019 . . . . . . . . . . . . . . F-4
Consolidated Statements of Comprehensive Income/Loss for the years ended June 30, 2017, 2018and 2019 . . . . . . . . . . . . . . . . . . . . . . . . . . . . . . . . . . . . . . . . . . . . . . . . . . . . . . . . . . . . . . . . . . . . . . . . . . . . . F-5
Consolidated Statements of Equity for the years ended June 30, 2017, 2018 and 2019 . . . . . . . . . . . . . . . . . . F-6
Consolidated Statements of Cash Flows for the years ended June 30, 2017, 2018 and 2019 . . . . . . . . . . . . . . F-8
Notes to Consolidated Financial Statements . . . . . . . . . . . . . . . . . . . . . . . . . . . . . . . . . . . . . . . . . . . . . . . . . . . F-9
Item 9. Changes in and Disagreements with Accountants on Accounting and Financial Disclosure
None.
Item 9A. Controls and Procedures
Conclusion Regarding the Effectiveness of Disclosure Controls and Procedures
We maintain disclosure controls and procedures that are designed to ensure that information required to bedisclosed in reports we file and submit under the Securities Exchange Act of 1934, as amended (“ExchangeAct”), is recorded, processed, summarized and reported within the time periods specified in accordance with SECguidelines and that such information is communicated to management, including our Chief Executive Officer andChief Financial Officer, to allow timely decisions regarding required disclosure based on the definition of“disclosure controls and procedures” in the Exchange Act. In designing and evaluating our disclosure controlsand procedures, we recognized that any controls and procedures, no matter how well designed and operated, canprovide only reasonable assurance of achieving the desired control objectives and that our managementnecessarily was required to apply its judgment in evaluating the cost-benefit relationship of possible controls andprocedures in reaching that level of reasonable assurance. Under the supervision and with the participation of ourmanagement, including our Chief Executive Officer and Chief Financial Officer, we evaluated the effectivenessof our disclosure controls and procedures, as required by Exchange Act, as of the end of the period covered bythis report. Based on that evaluation, our Chief Executive Officer and Chief Financial Officer concluded that ourdisclosure controls and procedures, after the remediation of the material weakness in our internal control overfinancial reporting described below, were effective at the reasonable assurance level.
II-24
Management’s Report on Internal Control over Financial Reporting
Management is responsible for establishing and maintaining adequate internal control over financialreporting, as such term is defined in Exchange Act. Internal control over financial reporting is a process designedto provide reasonable assurance regarding the reliability of financial reporting and the preparation of financialstatements for external purposes in accordance with generally accepted accounting principles. Internal controlover financial reporting includes those policies and procedures that (1) pertain to the maintenance of records that,in reasonable detail, accurately and fairly reflect the transactions and dispositions of assets; (2) providereasonable assurance that transactions are recorded as necessary to permit preparation of financial statements inconformity with U.S. generally accepted accounting principles, and that receipts and expenditures are being madeonly in accordance with authorizations of management and directors; and (3) provide reasonable assuranceregarding prevention or timely detection of unauthorized acquisition, use, or disposition of assets that could havea material effect on the financial statements.
A control system, no matter how well conceived and operated, can provide only reasonable, not absolute,assurance that the objectives of the controls system are met. Because of the inherent limitations in all controlssystems, no evaluation of controls can provide absolute assurance that all control issues and instances of fraud, ifany, have been detected. Under the supervision and with the participation of management, we assessed theeffectiveness of our internal control over financial reporting based on the criteria in Internal Control —Integrated Framework issued by the Committee of Sponsoring Organizations of the Treadway Commission.Based on our evaluation under the criteria in Internal Control — Integrated Framework (2013), we concludedthat our internal control over financial reporting, after the remediation of the material weakness described below,was effective as of June 30, 2019. The effectiveness of our internal control over financial reporting as of June 30,2019 has been audited by Crowe LLP, our independent registered public accounting firm, as stated and attestedto in their report that is included herein.
During the third quarter of FY 2019, we identified an error in the accounting for the valuation of theminimum return provision in the Convertible Note (see Note 5 of Notes to Consolidated Financial Statements).Specifically, the accounting for the valuation of the minimum return provision in the Convertible Note during thequarter ended September 30, 2018 should have been a charge through the condensed consolidated statements ofoperations instead of directly to equity. We restated our previously issued condensed consolidated financialstatements for the quarters ended September 30, 2018 and December 31, 2018 for this error and the respectiveQuarterly Reports on Form 10-Q/A filed reflected the proper accounting for this bifurcated derivative. In light ofour determination that there were material inaccuracies in the financial information for the quarter endedSeptember 30, 2018 and six months ended December 31, 2018, which were included in the original QuarterlyReport for the quarters ended September 30, 2018 and December 31, 2018, our Chief Executive Officer andChief Financial Officer concluded that a control deficiency with respect to the identification, interpretation andapplication of accounting for highly technical or non-routine and complex accounting transactions constituted amaterial weakness in internal control over financial reporting.
We have enhanced our controls and procedures to properly identify, interpret and apply the accounting forderivatives. As part of this process, we have designated key finance personnel to participate in derivativeaccounting training and will also implement a formal continuing education program to ensure our key financepersonnel are adequately trained and that they maintain competencies with not only current accounting andreporting requirements, but to monitor new FASB and SEC accounting and reporting rules to ensure timelyreview, education, assessment, and adoption. On highly technical or non-routine and complex accountingtransactions, we will engage third-party advisors with the requisite skills and technical expertise to assist us inassessing, performing and reviewing such transactions. Based on these changes to our internal control overfinancial reporting, we believe the material weakness described above has been remediated as of June 30, 2019.
II-25

Changes in Internal Control over Financial Reporting
Other than the changes made to address the material deficiency described above, there were no changes inour internal control over financial reporting during the quarter ended June 30, 2019 that have materially affected,or are reasonably likely to materially affect, our internal control over financial reporting.
Item 9B. Other Information
None.
II-26
PART III
Certain information required by Part III is omitted from this Annual Report on Form 10-K because we willfile a definitive Proxy Statement for the 2019 Annual Meeting of Stockholders, pursuant to Regulation 14A ofthe Securities Exchange Act of 1934 (the “Proxy Statement”), not later than 120 days after the end of the fiscalyear covered by this Annual Report on Form 10-K and the applicable information included in the ProxyStatement is incorporated herein by reference.
Item 10. Directors, Executive Officers and Corporate Governance
Information concerning our executive officers is set forth in Item 1. of this Annual Report on Form 10-Kunder the caption “Executive Officers of the Registrant.”
We have adopted a code of ethics that applies to our directors, officers (including our principal executiveand principal financial and accounting officers) and employees. A copy of these code of ethics is available free ofcharge on the “Corporate Governance” section of our website at www.generalfinance.com or by a written requestaddressed to the Corporate Secretary, General Finance Corporation, 39 East Union Street, Pasadena, California91103. We intend to satisfy any disclosure requirement under Item 5.05 of Form 8-K regarding an amendment to,or waiver from, a provision of the code of ethics by posting such information on our web site at the address andlocation specified above.
Other information required by this Item is incorporated herein by reference to information included in theProxy Statement.
Item 11. Executive Compensation
Information required by this Item is incorporated herein by reference to information included in the ProxyStatement.
Item 12. Security Ownership of Certain Beneficial Owners and Management and Related StockholderMatters
Information required by this Item is incorporated herein by reference to information included in the ProxyStatement
Item 13. Certain Relationships and Related Transactions, and Director Independence
Information required by this Item is incorporated herein by reference to information included in the ProxyStatement
Item 14. Principal Accountant Fees and Services
Information required by this Item is incorporated herein by reference to information included in the ProxyStatement.
III-1
PART IV
Item 15. Exhibits, Financial Statement Schedules
(a) Financial Statements
(1) The financial statements required in this Annual Report on Form 10-K are included in Item 8.Financial Statements and Supplementary Data.
(2) Financial statement schedule:
Schedule I — Condensed Financial Information of Registrant (Parent Company Information)
All other supplemental schedules have been omitted since the required information is not present in amountssufficient to require submission of the schedule, or because the required information is included in theconsolidated financial statements or notes thereto.
(b) Exhibits
Exhibit No. Exhibit Description
2.1 Agreement and Plan of Merger dated July 28, 2008 among General Finance Corporation, GFNNorth America Corp., Mobile Office Acquisition Corp., Pac-Van, Inc., Ronald F. Valenta, RonaldL. Havner, Jr., D. E. Shaw Laminar Portfolios, L.L.C. and Kaiser Investments Limited(incorporated by reference to Exhibit 2.1 of Registrant’s Form 8-K filed July 28, 2008).
2.2 Asset Purchase Agreement dated February 28, 2014 among KHM Rentals, LLC, Lone Star TankRental LP, certain other parties thereto and Lone Star Tank Rental Inc. (incorporated by referenceto Registrant’s Form 8-K filed March 3, 2014).
3.1 Amended and Restated Certificate of Incorporation filed April 4, 2006 (incorporated by referenceto Exhibit 3.1 of Registrant’s Form S-1, File No. 333-129830).
3.2 Amended and Restated Bylaws as of October 30, 2007 (incorporated by reference to Exhibit 3.2 ofRegistrant’s Form 10-Q for the quarter ended September 30, 2007).
3.3 Certificate of Designation for the Series A Preferred Stock filed with the Delaware Secretary ofState on December 3, 2008 (incorporated by reference to Registrant’s Form 8-K filed December 9,2008).
3.4 Certificate of Designation for the Series B Preferred Stock filed with the Delaware Secretary ofState on December 3, 2008 (incorporated by reference to Registrant’s Form 8-K filed December 9,2008).
3.5 Corrected Amended and Restated Certificate of Designation for Series A 12.5% CumulativePreferred Stock filed with the Delaware Secretary of State on May 10, 2013 (incorporated byreference to Registrant’s Form 8-K filed May 16, 2013).
3.6 Certificate of Designation for the Series C Convertible Cumulative Preferred Stock filed with theDelaware Secretary of State on September 28, 2012 (incorporated by reference to Registrant’sForm 8-K filed October 4, 2012).
3.7 Certificate of Elimination of Certificate of Designation, Preferences and Rights of Series CConvertible Cumulative Preferred Stock filed with the Delaware Secretary of State on April 2,2013 (incorporated by reference to Registrant’s Form 8-K filed April 5, 2013).
IV-1
Exhibit No. Exhibit Description
3.8 Certificate of Designations, Preferences and Rights of 9.00% Series C Cumulative RedeemablePerpetual Preferred Stock (incorporated by reference to Exhibit 3.7 of Registrant’s Form S-1, FileNo. 333-187687).
3.9 Certificate of Elimination of Certificate of Designation, Preferences and Rights of Series A 12.5%Cumulative Preferred Stock (incorporated by reference to Registrant’s Form 8-K filed June 14,2013).
3.10 Amended and Restated Certificate of Designations, Preferences and Rights of 9.00% Series CCumulative Redeemable Perpetual Preferred Stock Association (incorporated by reference toExhibit 3.1 of Registrant’s Quarterly Report on Form 10-Q for the quarter endedDecember 31, 2018).
4.1 Form of Common Stock Certificate (incorporated by reference to Exhibit 4.2 of Registrant’sForm S-1, File No. 333-129830).
4.2 Specimen 9.00% Series C Cumulative Redeemable Perpetual Preferred Stock Certificate(incorporated by reference to Exhibit 4.2 of Registrant’s Form S-1, File No. 333-187687).
4.3 Senior Indenture dated as of June 18, 2014, between General Finance Corporation and Wells FargoBank, National Association, as trustee (incorporated by reference to Registrant’s Form 8-K filedJune 18, 2014).
4.4 First Supplemental Indenture dated as of June 18, 2014, between General Finance Corporation andWells Fargo Bank, National Association, as trustee (incorporated by reference to Registrant’sForm 8-K filed June 18, 2014).
4.5 Form of 8.125% Senior Note due 2021 (incorporated by reference to Registrant’s Form 8-K filedJune 18, 2014).
4.6 Second Supplemental Indenture dated as of October 31, 2018, between General FinanceCorporation and Wells Fargo Bank, National Association, as trustee (incorporated by reference toRegistrant’s Form 8-K filed November 1, 2018).
10.1 General Finance Corporation 2009 Stock Incentive Plan (incorporated by reference to Appendix Aof Registrant’s Definitive Proxy Statement filed October 19, 2009).
10.2 General Finance Corporation 2014 Stock Incentive Plan (incorporated by reference to Appendix Aof Registrant’s Definitive Proxy Statement filed October 17, 2014).
10.3 Amendment to General Finance Corporation 2014 Stock Incentive Plan Association (incorporatedby reference to Exhibit 10.2 of Registrant’s Quarterly Report on Form 10-Q for the quarter endedDecember 31, 2014).
10.4 Amended and Restated 2014 Stock Incentive Plan (incorporated by reference to Registrant’sForm 8-K filed December 9, 2015).
10.5 Omnibus Amendment and Reaffirmation Agreement is dated as of March 24, 2017 among WellsFargo Bank, National Association (“Wells Fargo”), East West Bank (“East West”), CIT Bank,N.A. (“CIT”), the Private Bank and Trust Company (the “Private Bank”), Key Bank, NationalAssociation (“Key Bank”), Bank Hapoalim, N.A. (“BHI”) and GACP I, L.P. (“Great American”and collectively with Wells Fargo, East West, CIT, Private Bank, Key Bank and BHI, the“Lenders”), GFN Realty Company, LLC, (“GFNRC”), Lone Star Tank Rental Inc. (“Lone Star”),Pac-Van, Inc. (“Pac-Van”), Southern Frac, LLC (“Southern Frac”), PV Acquisition Corp.,(“PV Acquisition”), GFN Manufacturing Corporation (“GFN Manufacturing”), and GFN NorthAmerica Corp. (“GFNNA” and collectively with GFNRC, Southern Frac, Lone Star, Pac-Van, PVAcquisition and GFN Manufacturing, the “Credit Parties”) (incorporated by reference toRegistrant’s Form 8-K/A filed March 31, 2017).
IV-2
Exhibit No. Exhibit Description
10.6 Pledge Agreement dated March 24, 2017 by GFN Realty Company, LLC (“GFN Realty”), for thebenefit of Wells Fargo, as agent for the Lenders (incorporated by reference to Registrant’sForm 8-K/A filed March 31, 2017).
10.7 Master Assignment and Assumption Agreement dated March 24, 2017 among Pac-Van, theLenders, Capital One Business Corp. and HSBC Bank U.S.A. (incorporated by reference toRegistrant’s Form 8-K/A filed March 31, 2017).
10.8 Intercreditor Provisions dated March 24, 2017 among the Lenders and the Credit Parties(incorporated by reference to Registrant’s Form 8-K/A filed March 31, 2017).
10.9 Omnibus Amendment and Reaffirmation Agreement is dated as of March 24, 2017 among WellsFargo, East West, CIT, the Private Bank, Key Bank, BHI and Great American (collectively withWells Fargo, East West, CIT, Private Bank, Key Bank and BHI, the “Lenders”), and the CreditParties (incorporated by reference to Registrant’s Form 8-K filed May 3, 2017).
10.10 Amendment No. 6 to Amended and Restated Credit Agreement dated March 24, 2017 amongWells Fargo Bank, East West, CIT, Private Bank, Key Bank, BHI, Great American, GFNRC, LoneStar, Pac-Van and Southern Frac. (Certain portions have been omitted pursuant to a confidentialtreatment request. Omitted information has been filed separately with the Securities and ExchangeCommission) (incorporated by reference to Registrant’s Form 8-K filed May 3, 2017).
10.11 Increase and Joinder Agreement dated as of June 30, 2017 among Wells Fargo Bank, NationalAssociation, Associated Bank, N.A., East West Bank, CIT Bank, N.A., the Private Bank and TrustCompany, Key Bank, National Association, Bank Hapoalim, N.A., GACP I, L.P., GFN RealtyCompany, LLC, Lone Star Tank Rental Inc., Pac-Van, Inc. and Southern Frac, LLC (incorporatedby reference to Registrant’s Form 8-K filed July 6, 2017).
10.12 Commitment Letter dated July 11, 2017 from Bison Capital Partners V., L.P. to GFN Asia PacificHoldings Pty Ltd. and GFN Asia Pacific Finance Pty Ltd. (incorporated by reference toRegistrant’s Form 8-K filed July 14, 2017).
10.13 Commitment Letter dated 11 July 2017 from Deutsche Bank AG, Sydney Branch to GFN AsiaPacific Holdings Pty Ltd. and General Finance Corporation (incorporated by reference toRegistrant’s Form 8-K filed July 14, 2017).
10.14 Buy-Out Letter dated 11 July 2017 from Deutsche Bank AG, Sydney Branch to Bison CapitalPartners V., L.P. (incorporated by reference to Registrant’s Form 8-K filed July 14, 2017).
10.15 Takeover Bid Implementation Agreement dated 12 July 10217 between GFN Asia PacificHoldings Pty Ltd. and Royal Wolf Holdings Limited (incorporated by reference to Registrant’sForm 8-K filed July 14, 2017).
10.16 Amendment No. 7 to Amended and Restated Credit Agreement is dated as of July 31, 2017 amongWells Fargo Bank, National Association, East West Bank, CIT Bank, N.A., the Private Bank andTrust Company, Key Bank, National Association, Bank Hapoalim, N.A., Associated Bank, N.A.,GACP I, L.P., GFN Realty Company, LLC, Lone Star Tank Rental Inc., Pac-Van, Inc. andSouthern Frac, LLC and Guarantor Acknowledgement (incorporated by reference to Registrant’sForm 8-K filed August 1, 2017).
10.17 Waiver of Certain Closing Conditions dated August 17, 2017 by and among Bison CapitalPartners V, LP, General Finance Corporation, GFN U.S. Australasia Holdings, Inc., GFN AsiaPacific Holdings Pty Ltd. and GFN Asia Pacific Finance Pty Ltd. (incorporated by reference toRegistrant’s Form 8-K filed August 21, 2017).
IV-3
Exhibit No. Exhibit Description
10.18 Amended and Restated Securities Purchase Agreement dated September 19, 2017 by and amongBison Capital Partners V., L.P., General Finance Corporation, GFN Asia Pacific Holdings Pty Ltd.,GFN Asia Pacific Finance Pty Ltd. and GFN U.S. Australasia Holdings, Inc. (incorporated byreference to Registrant’s Form 8-K filed September 22, 2017).
10.19 11.9% Secured Senior Convertible Promissory Note dated September 25, 2017 by GFN AsiaPacific Holdings Pty Ltd. and GFN Asia Pacific Finance Pty Ltd. (incorporated by reference toRegistrant’s Form 8-K filed September 28, 2017).
10.20 11.9% Secured Senior Promissory Note dated September 25, 2017 by GFN Asia Pacific HoldingsPty Ltd. and GFN Asia Pacific Finance Pty Ltd. (incorporated by reference to Registrant’sForm 8-K filed September 28, 2017).
10.21 Pledge and Security Agreement dated September 25, 2017 by GFN Asia Pacific Holdings Pty Ltd.in favor of Bison Capital Partners V, L.P. (incorporated by reference to Registrant’s Form 8-Kfiled September 28, 2017).
10.22 Pledge and Security Agreement dated September 25, 2017 by GFN Asia Pacific Holdings Pty Ltd.and GFN U.S. Australasia Holdings, Inc. in favor of Bison Capital Partners V, L.P. (incorporatedby reference to Registrant’s Form 8-K filed September 28, 2017).
10.23 Pledge and Security Agreement dated September 25, 2017 by GFN Asia Pacific Finance Pty Ltd.and GFN U.S. Australasia Holdings, Inc. in favor of Bison Capital Partners V, L.P. (incorporatedby reference to Registrant’s Form 8-K filed September 28, 2017).
10.24 Pledged Account Agreement dated September 25, 2017 among D.A. Davidson & Co., BisonCapital Partners V, L.P. and GFN Asia Pacific Holdings Pty Ltd. (incorporated by reference toRegistrant’s Form 8-K filed September 28, 2017).
10.25 CHESS Sponsorship Deed dated September 25, 2017 by GFN Asia Pacific Holdings Pty Ltd.,Credit Suisse Equities (Australia) Limited and Bison Capital Partners V., L.P. (incorporated byreference to Registrant’s Form 8-K filed September 28, 2017).
10.26 General Security Deed dated September 25, 2017 between Bison Capital Partners V, L.P. and GFNAsia Pacific Finance Pty Ltd. (incorporated by reference to Registrant’s Form 8-K filedSeptember 28, 2017).
10.27 General Security Deed dated September 25, 2017 between Bison Capital Partners V, L.P. and GFNU.S. Australasia Holdings, Inc. (incorporated by reference to Registrant’s Form 8-K filedSeptember 28, 2017).
10.28 General Security Deed dated September 25, 2017 between Bison Capital Partners V, L.P. and GFNAsia Pacific Holdings Pty Ltd. (incorporated by reference to Registrant’s Form 8-K filedSeptember 28, 2017).
10.29 Side Letter Deed dated September 25, 2017 among Bison Capital Partners V, L.P., GeneralFinance Corporation, GFN U.S. Australasia Holdings, Inc., GFN Asia Pacific Holdings Pty Ltd.and GFN Asia Pacific Holdings Pty Ltd. (incorporated by reference to Registrant’s Form 8-K filedSeptember 28, 2017).
10.30 Board Observer Agreement dated September 25, 2017 between General Finance Corporation andBison Capital Partners V, L.P. (incorporated by reference to Registrant’s Form 8-K filedSeptember 28, 2017).
10.31 Registration Rights Agreement dated September 25, 2017 between General Finance Corporationand Bison Capital Partners V, L.P. (incorporated by reference to Registrant’s Form 8-K filedSeptember 28, 2017).
IV-4
Exhibit No. Exhibit Description
10.32 Guaranty dated September 25, 2017 by GFN U.S. Australasia Holdings, Inc. (incorporated byreference to Registrant’s Form 8-K filed September 28, 2017).
10.33 Syndicated Facility Agreement dated October 26, 2017 among Royal Wolf Holdings Limited,Royal Wolf Trading Australia Pty Limited, Royalwolf Trading New Zealand Limited, KookaburraContainers Pty Limited, Royalwolf NZ Acquisition Co. Limited, Deutsche Bank AG, SydneyBranch, CSL Fund (PB) Lux Sarl II, Aiguilles Rouges Lux Sarl II, Perpetual Corporate TrustLimited and P.T. Limited (incorporated by reference to Registrant’s Form 8-K filed October 27,2017).
10.34 Commitment Letter dated July 11, 2017 from Bison Capital Partners V., L.P. to GFN Asia PacificHoldings Pty Ltd. and GFN Asia Pacific Finance Pty Ltd. (incorporated by reference toRegistrant’s Form 8-K/A filed November 3, 2017).
10.35 Commitment Letter dated 11 July 2017 from Deutsche Bank AG, Sydney Branch to GFN AsiaPacific Holdings Pty Ltd. and General Finance Corporation (incorporated by reference toRegistrant’s Form 8-K/A filed November 3, 2017).
10.36 Buy-Out Letter dated 11 July 2017 from Deutsche Bank AG, Sydney Branch to Bison CapitalPartners V., L.P. (incorporated by reference to Registrant’s Form 8-K/A filed November 3, 2017).
10.37 Securities Purchase Agreement dated July 12, 2017 by and among Bison Capital Partners V., L.P.,General Finance Corporation, GFN Asia Pacific Holdings Pty Ltd., GFN Asia Pacific Finance PtyLtd. and GFN U.S. Australasia Holdings, Inc. (incorporated by reference to Registrant’sForm 8-K/A filed November 3, 2017).
10.38 Takeover Bid Implementation Agreement dated 12 July 10217 between GFN Asia PacificHoldings Pty Ltd. and Royal Wolf Holdings Limited (incorporated by reference to Registrant’sForm 8-K/A filed November 3, 2017).
10.39 Valenta Employment Agreement dated January 1, 2018 (incorporated by reference to Registrant’sForm 8-K filed January 3, 2018).
10.40 Miller Employment Agreement dated January 1, 2018 (incorporated by reference to Registrant’sForm 8-K filed January 3, 2018).
10.41 First Amendment and Restatement Deed dated June 25, 2018 among RWH, Royal Wolf TradingAustralia Pty Ltd., Royalwolf Trading New Zealand Limited, Kookaburra Containers Pty Limited,Royalwolf NZ Acquisition Co. Limited, Deutsche Bank AG, Sydney Branch, CSL Fund (PB) LuxSarl II, CSL Fund (PB) Holdings Lux Sarl II, Aiguilles Rouges Lux Sarl II, Core Senior LendingFund (A-A) Lux SARL II and Core Senior Lending Fund Lux SARL II (incorporated by referenceto Registrant’s Form 8-K/A filed June 29, 2018).
10.42 First Amendment to Amended and Restated Purchase Agreement dated June 26, 2018 by andamong Bison, GFN, GFNAPH, GFNAPF and GFN U.S. (incorporated by reference to Registrant’sForm 8-K/A filed June 29, 2018).
10.43 Amendment No. 8 to Amended and Restated Credit Agreement dated as of December 24,2018 among Wells Fargo Bank, National Association (“Wells Fargo”), East West Bank (“EastWest”), CIT Bank, N.A. (“CIT”), CIBC Bank USA (“CIBC”), Key Bank, National Association(“Key Bank”), Bank Hapoalim, B.M. (“BHI”), Associated Bank (“Associated” and collectivelywith Wells Fargo, East West, CIT, CIBC, Key Bank and BHI, the “Lenders”), Pac-Van, Inc., LoneStar Tank Rental Inc., GFN Realty Company, LLC and Southern Frac, LLC and the GuarantorAcknowledgement dated December 24, 2018 by PV Acquisition Corp. and GFN ManufacturingCorporation (incorporated by reference to Registrant’s Form 8-K filed December 26, 2018).
IV-5
Exhibit No. Exhibit Description
10.44 Second Amendment and Restatement Deed dated March 22, 2019 among GFN Asia PacificHoldings Pty Ltd., Royal Wolf Holdings Pty Limited, Royal Wolf Trading Australia Pty Limited,Royalwolf Trading New Zealand Limited, Deutsche Bank AG, Sydney Branch, CSL Fund (PB)Lux Sarl II, CSL Fund (PB) Holdings Lux Sarl II, CSL Fund (PB) Holdings B Lux Sarl II, CSLFund (PB) Holdings C Lux Sarl II, Aiguilles Rouges Lux Sarl II, Core Senior Lending Fund (A-A)Lux SARL II, Core Senior Lending Fund Lux SARL II, Kitty Hawk Credit Lux SARL II, GIM,L.P., Perpetual Corporate Trust Limited and P.T. Limited (incorporated by reference toRegistrant’s Form 8-K filed March 27, 2019).
10.45 Combined Security Agreement dated March 22, 2019 between GFN Asia Pacific Holdings Pty Ltdand P.T. Limited 2018 (incorporated by reference to Registrant’s Form 8-K filed March 27, 2019).
21.1 Subsidiaries of General Finance Corporation (a)
23.1 Consent of Independent Registered Public Accounting Firm (a)
31.1 Certification of Chief Executive Officer Pursuant to SEC Rule 13a-14(a)/15d-14 (a)
31.2 Certification of Chief Financial Officer Pursuant to SEC Rule 13a-14(a)/15d-14 (a)
32.1 Certification of Chief Executive Officer Pursuant to 18 U.S.C. §1350 (a)
32.2 Certification of Chief Financial Officer Pursuant to 18 U.S.C. §1350(a)
101 The following materials from the Registrant’s Annual Report on Form 10-K for the year endedJune 30, 2019, formatted in XBRL (eXtensible Business Reporting Language): (i) theConsolidated Balance Sheets, (ii) the Consolidated Statements of Operations, (iii) the ConsolidatedStatements of Comprehensive Income/Loss, (iv) the Consolidated Statements of Equity, (v) theConsolidated Statements of Cash Flows, (vi) Notes to Consolidated Financial Statements and(vii) Financial Statement Schedule I.
(a) Filed herewith.
Item 16. Form 10-K Summary
Not applicable.
IV-6
SIGNATURES
Pursuant to the requirements of Section 13 or 15(d) of the Securities Exchange Act of 1934, the registranthas duly caused this report to be signed on its behalf by the undersigned, thereunto duly authorized.
General Finance Corporation
By: /s/ Jody E. Miller September 12, 2019Name: Jody E. MillerTitle: Chief Executive Officer
Pursuant to the requirements of the Securities Exchange Act of 1934, this report has been signed below bythe following persons on behalf of the registrant and in the capacities and on the dates indicated:
Signature Title Date
/s/ Jody E. Miller
Jody E. MillerChief Executive Officer (PrincipalExecutive Officer) September 12, 2019
/s/ Charles E. Barrantes
Charles E. Barrantes
Executive Vice President and ChiefFinancial Officer (PrincipalAccounting and Financial Officer)
September 12, 2019
/s/ Ronald F. Valenta
Ronald F. ValentaExecutive Chairman of the Board
September 12, 2019
/s/ James B. Roszak
James B. RoszakLead Independent Director
September 12, 2019
/s/ Manuel Marrero
Manuel MarreroDirector
September 12, 2019
/s/ Susan L. Harris
Susan L. HarrisDirector
September 12, 2019
/s/ Larry D. Tashjian
Larry D. TashjianDirector
September 12, 2019
/s/ William H. Baribault
William H. BaribaultDirector
September 12, 2019
/s/ Douglas B. Trussler
Douglas B. TrusslerDirector
September 12, 2019
SIG

REPORT OF INDEPENDENT REGISTERED PUBLIC ACCOUNTING FIRM
Shareholders and the Board of Directors of General Finance CorporationPasadena, California
Opinions on the Financial Statements and Internal Control over Financial Reporting
We have audited the accompanying consolidated balance sheets of General Finance Corporation (the“Company”) as of June 30, 2019 and 2018, the related consolidated statements of operations, comprehensiveincome/loss, equity, and cash flows for each of the years in the three-year period ended June 30, 2019, and therelated notes and schedules (collectively referred to as the “financial statements”). We also have audited theCompany’s internal control over financial reporting as of June 30, 2019, based on criteria established in InternalControl – Integrated Framework: (2013) issued by the Committee of Sponsoring Organizations of the TreadwayCommission (COSO).
In our opinion, the financial statements referred to above present fairly, in all material respects, the financialposition of the Company as of June 30, 2019 and 2018, and the results of its operations and its cash flows foreach of the years in the three-year period ended June 30, 2019 in conformity with accounting principles generallyaccepted in the United States of America. Also in our opinion, the Company maintained, in all material respects,effective internal control over financial reporting as of June 30, 2019, based on criteria established in InternalControl – Integrated Framework: (2013) issued by COSO.
Basis for Opinions
The Company’s management is responsible for these financial statements, for maintaining effective internalcontrol over financial reporting, and for its assessment of the effectiveness of internal control over financialreporting, included in the accompanying Management’s Report on Internal Control over Financial Reporting.Our responsibility is to express an opinion on the Company’s financial statements and an opinion on theCompany’s internal control over financial reporting based on our audits. We are a public accounting firmregistered with the Public Company Accounting Oversight Board (United States) (“PCAOB”) and are required tobe independent with respect to the Company in accordance with the U.S. federal securities laws and theapplicable rules and regulations of the Securities and Exchange Commission and the PCAOB.
We conducted our audits in accordance with the standards of the PCAOB. Those standards require that we planand perform the audits to obtain reasonable assurance about whether the financial statements are free of materialmisstatement, whether due to error or fraud, and whether effective internal control over financial reporting wasmaintained in all material respects.
Our audits of the financial statements included performing procedures to assess the risks of materialmisstatement of the financial statements, whether due to error or fraud, and performing procedures that respondto those risks. Such procedures included examining, on a test basis, evidence regarding the amounts anddisclosures in the financial statements. Our audits also included evaluating the accounting principles used andsignificant estimates made by management, as well as evaluating the overall presentation of the financialstatements. Our audit of internal control over financial reporting included obtaining an understanding of internalcontrol over financial reporting, assessing the risk that a material weakness exists, and testing and evaluating thedesign and operating effectiveness of internal control based on the assessed risk. Our audits also includedperforming such other procedures as we considered necessary in the circumstances. We believe that our auditsprovide a reasonable basis for our opinions.
F-1

REPORT OF INDEPENDENT REGISTERED PUBLIC ACCOUNTING FIRM
Definition and Limitations of Internal Control Over Financial Reporting
A company’s internal control over financial reporting is a process designed to provide reasonable assuranceregarding the reliability of financial reporting and the preparation of financial statements for external purposes inaccordance with generally accepted accounting principles. A company’s internal control over financial reportingincludes those policies and procedures that (1) pertain to the maintenance of records that, in reasonable detail,accurately and fairly reflect the transactions and dispositions of the assets of the company; (2) provide reasonableassurance that transactions are recorded as necessary to permit preparation of financial statements in accordancewith generally accepted accounting principles, and that receipts and expenditures of the company are being madeonly in accordance with authorizations of management and directors of the company; and (3) provide reasonableassurance regarding prevention or timely detection of unauthorized acquisition, use, or disposition of thecompany’s assets that could have a material effect on the financial statements.
Because of its inherent limitations, internal control over financial reporting may not prevent or detectmisstatements. Also, projections of any evaluation of effectiveness to future periods are subject to the risk thatcontrols may become inadequate because of changes in conditions, or that the degree of compliance with thepolicies or procedures may deteriorate.
/s/ Crowe LLP
We have served as the Company’s auditor since 2009.
Sherman Oaks, CaliforniaSeptember 12, 2019
F-2
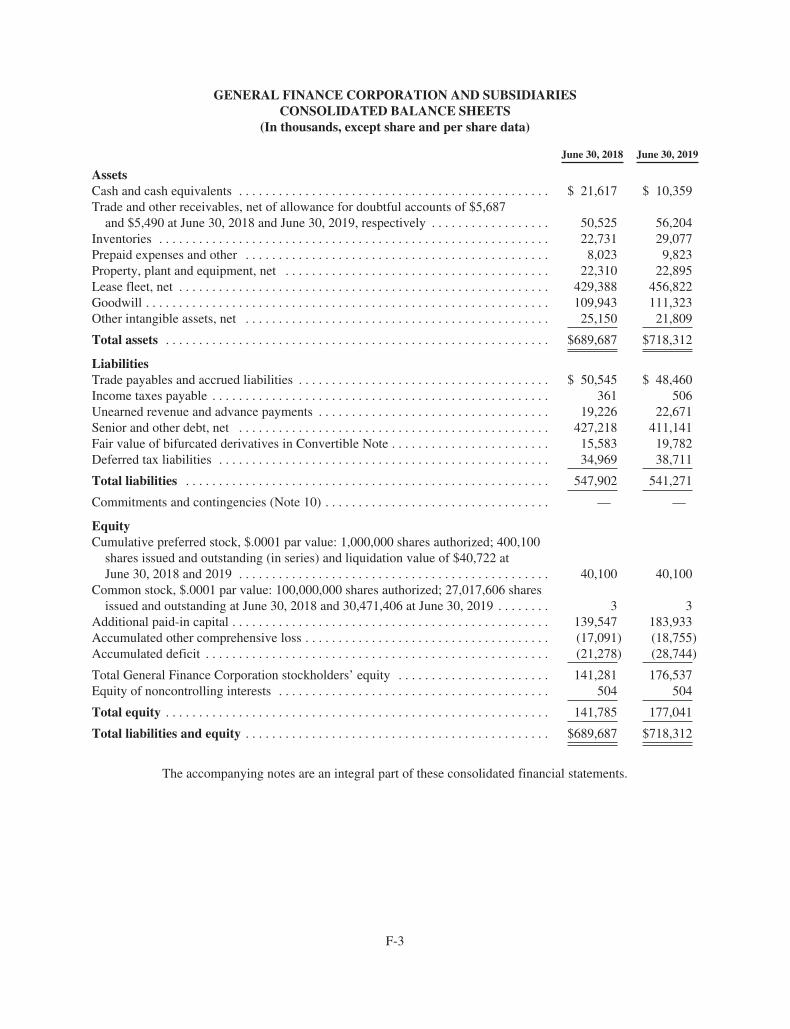
GENERAL FINANCE CORPORATION AND SUBSIDIARIESCONSOLIDATED BALANCE SHEETS
(In thousands, except share and per share data)
June 30, 2018 June 30, 2019
AssetsCash and cash equivalents . . . . . . . . . . . . . . . . . . . . . . . . . . . . . . . . . . . . . . . . . . . . . . . $ 21,617 $ 10,359Trade and other receivables, net of allowance for doubtful accounts of $5,687
and $5,490 at June 30, 2018 and June 30, 2019, respectively . . . . . . . . . . . . . . . . . . 50,525 56,204Inventories . . . . . . . . . . . . . . . . . . . . . . . . . . . . . . . . . . . . . . . . . . . . . . . . . . . . . . . . . . . 22,731 29,077Prepaid expenses and other . . . . . . . . . . . . . . . . . . . . . . . . . . . . . . . . . . . . . . . . . . . . . . 8,023 9,823Property, plant and equipment, net . . . . . . . . . . . . . . . . . . . . . . . . . . . . . . . . . . . . . . . . 22,310 22,895Lease fleet, net . . . . . . . . . . . . . . . . . . . . . . . . . . . . . . . . . . . . . . . . . . . . . . . . . . . . . . . . 429,388 456,822Goodwill . . . . . . . . . . . . . . . . . . . . . . . . . . . . . . . . . . . . . . . . . . . . . . . . . . . . . . . . . . . . . 109,943 111,323Other intangible assets, net . . . . . . . . . . . . . . . . . . . . . . . . . . . . . . . . . . . . . . . . . . . . . . 25,150 21,809
Total assets . . . . . . . . . . . . . . . . . . . . . . . . . . . . . . . . . . . . . . . . . . . . . . . . . . . . . . . . . . $689,687 $718,312
LiabilitiesTrade payables and accrued liabilities . . . . . . . . . . . . . . . . . . . . . . . . . . . . . . . . . . . . . . $ 50,545 $ 48,460Income taxes payable . . . . . . . . . . . . . . . . . . . . . . . . . . . . . . . . . . . . . . . . . . . . . . . . . . . 361 506Unearned revenue and advance payments . . . . . . . . . . . . . . . . . . . . . . . . . . . . . . . . . . . 19,226 22,671Senior and other debt, net . . . . . . . . . . . . . . . . . . . . . . . . . . . . . . . . . . . . . . . . . . . . . . . 427,218 411,141Fair value of bifurcated derivatives in Convertible Note . . . . . . . . . . . . . . . . . . . . . . . . 15,583 19,782Deferred tax liabilities . . . . . . . . . . . . . . . . . . . . . . . . . . . . . . . . . . . . . . . . . . . . . . . . . . 34,969 38,711
Total liabilities . . . . . . . . . . . . . . . . . . . . . . . . . . . . . . . . . . . . . . . . . . . . . . . . . . . . . . . 547,902 541,271
Commitments and contingencies (Note 10) . . . . . . . . . . . . . . . . . . . . . . . . . . . . . . . . . . — —
EquityCumulative preferred stock, $.0001 par value: 1,000,000 shares authorized; 400,100
shares issued and outstanding (in series) and liquidation value of $40,722 atJune 30, 2018 and 2019 . . . . . . . . . . . . . . . . . . . . . . . . . . . . . . . . . . . . . . . . . . . . . . . 40,100 40,100
Common stock, $.0001 par value: 100,000,000 shares authorized; 27,017,606 sharesissued and outstanding at June 30, 2018 and 30,471,406 at June 30, 2019 . . . . . . . . 3 3
Additional paid-in capital . . . . . . . . . . . . . . . . . . . . . . . . . . . . . . . . . . . . . . . . . . . . . . . . 139,547 183,933Accumulated other comprehensive loss . . . . . . . . . . . . . . . . . . . . . . . . . . . . . . . . . . . . . (17,091) (18,755)Accumulated deficit . . . . . . . . . . . . . . . . . . . . . . . . . . . . . . . . . . . . . . . . . . . . . . . . . . . . (21,278) (28,744)
Total General Finance Corporation stockholders’ equity . . . . . . . . . . . . . . . . . . . . . . . 141,281 176,537Equity of noncontrolling interests . . . . . . . . . . . . . . . . . . . . . . . . . . . . . . . . . . . . . . . . . 504 504
Total equity . . . . . . . . . . . . . . . . . . . . . . . . . . . . . . . . . . . . . . . . . . . . . . . . . . . . . . . . . . 141,785 177,041
Total liabilities and equity . . . . . . . . . . . . . . . . . . . . . . . . . . . . . . . . . . . . . . . . . . . . . . $689,687 $718,312
The accompanying notes are an integral part of these consolidated financial statements.
F-3

GENERAL FINANCE CORPORATION AND SUBSIDIARIESCONSOLIDATED STATEMENTS OF OPERATIONS
(In thousands, except share and per share data)
Year Ended June 30,
2017 2018 2019
RevenuesSales:
Lease inventories and fleet . . . . . . . . . . . . . . . . . . . . . . . . . . . . . $ 95,764 $ 122,467 $ 126,932Manufactured units . . . . . . . . . . . . . . . . . . . . . . . . . . . . . . . . . . . 4,895 9,850 10,784
100,659 132,317 137,716Leasing . . . . . . . . . . . . . . . . . . . . . . . . . . . . . . . . . . . . . . . . . . . . . . . . 176,269 214,985 240,490
276,928 347,302 378,206
Costs and expensesCost of Sales:
Lease inventories and fleet (exclusive of the items shownseparately below) . . . . . . . . . . . . . . . . . . . . . . . . . . . . . . . . . . . 68,215 87,779 93,183
Manufactured units . . . . . . . . . . . . . . . . . . . . . . . . . . . . . . . . . . . 6,336 9,212 8,478Direct costs of leasing operations . . . . . . . . . . . . . . . . . . . . . . . . . . . . 76,306 89,201 91,286Selling and general expenses . . . . . . . . . . . . . . . . . . . . . . . . . . . . . . . . 67,705 77,650 81,965Depreciation and amortization . . . . . . . . . . . . . . . . . . . . . . . . . . . . . . 39,300 39,761 41,704
Operating income . . . . . . . . . . . . . . . . . . . . . . . . . . . . . . . . . . . . . . . 19,066 43,699 61,590
Interest income . . . . . . . . . . . . . . . . . . . . . . . . . . . . . . . . . . . . . . . . . . 66 112 191Interest expense (includes cash flow hedge reclassifications from
AOCI of an unrealized gain of $1,073 in 2017 and $12 in2018) . . . . . . . . . . . . . . . . . . . . . . . . . . . . . . . . . . . . . . . . . . . . . . . . (19,653) (33,991) (35,344)
Change in valuation of bifurcated derivatives in Convertible Note(Note 5) . . . . . . . . . . . . . . . . . . . . . . . . . . . . . . . . . . . . . . . . . . . . . . — (13,719) (24,570)
Foreign exchange and other . . . . . . . . . . . . . . . . . . . . . . . . . . . . . . . . (351) (5,887) (3,513)
(19,938) (53,485) (63,236)
Loss before benefit for income taxes . . . . . . . . . . . . . . . . . . . . . . . . (872) (9,786) (1,646)Provision (benefit) for income taxes . . . . . . . . . . . . . . . . . . . . . . . . . . (25) (679) 5,820
Net loss . . . . . . . . . . . . . . . . . . . . . . . . . . . . . . . . . . . . . . . . . . . . . . . . (847) (9,107) (7,466)
Preferred stock dividends . . . . . . . . . . . . . . . . . . . . . . . . . . . . . . . . . . (3,658) (3,658) (3,658)Noncontrolling interest . . . . . . . . . . . . . . . . . . . . . . . . . . . . . . . . . . . . (2,115) 801 —
Net loss attributable to common stockholders . . . . . . . . . . . . . . . . $ (6,620) $ (11,964) $ (11,124)
Net loss per common share:Basic . . . . . . . . . . . . . . . . . . . . . . . . . . . . . . . . . . . . . . . . . . $ (0.25) $ (0.46) $ (0.38)Diluted . . . . . . . . . . . . . . . . . . . . . . . . . . . . . . . . . . . . . . . . . (0.25) (0.46) (0.38)
Weighted average shares outstanding:Basic . . . . . . . . . . . . . . . . . . . . . . . . . . . . . . . . . . . . . . . . . . 26,348,344 26,269,931 29,318,511Diluted . . . . . . . . . . . . . . . . . . . . . . . . . . . . . . . . . . . . . . . . . 26,348,344 26,269,931 29,318,511
The accompanying notes are an integral part of these consolidated financial statements.
F-4
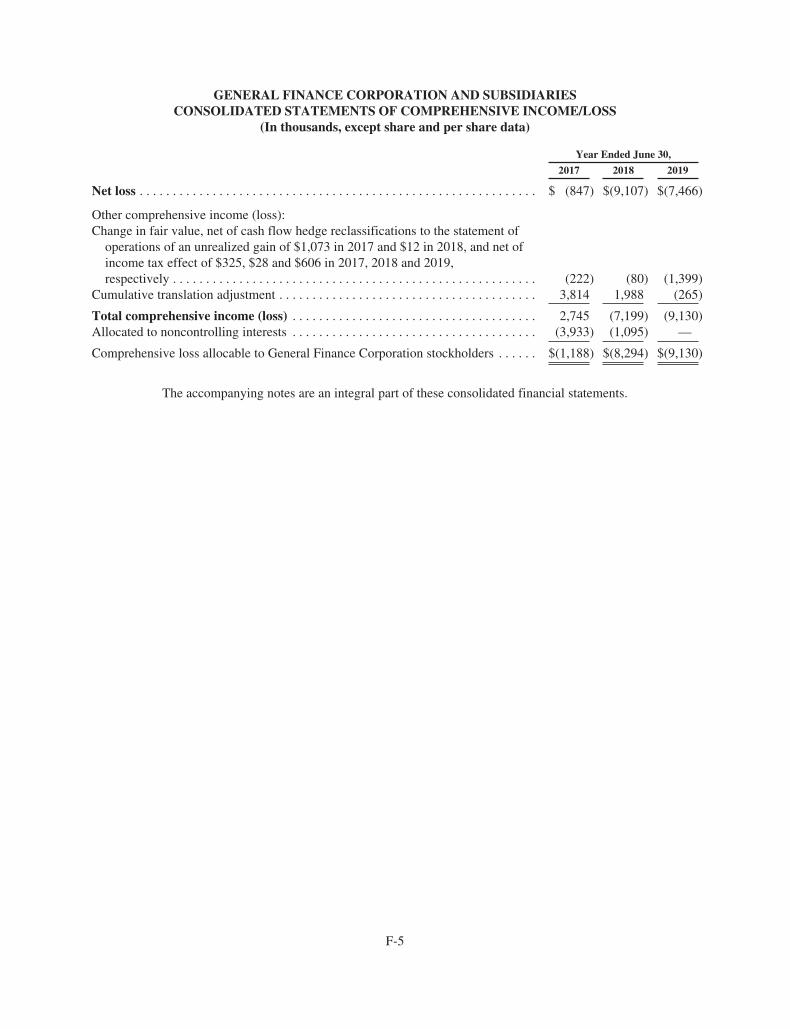
GENERAL FINANCE CORPORATION AND SUBSIDIARIESCONSOLIDATED STATEMENTS OF COMPREHENSIVE INCOME/LOSS
(In thousands, except share and per share data)
Year Ended June 30,
2017 2018 2019
Net loss . . . . . . . . . . . . . . . . . . . . . . . . . . . . . . . . . . . . . . . . . . . . . . . . . . . . . . . . . . . . $ (847) $(9,107) $(7,466)
Other comprehensive income (loss):Change in fair value, net of cash flow hedge reclassifications to the statement of
operations of an unrealized gain of $1,073 in 2017 and $12 in 2018, and net ofincome tax effect of $325, $28 and $606 in 2017, 2018 and 2019,respectively . . . . . . . . . . . . . . . . . . . . . . . . . . . . . . . . . . . . . . . . . . . . . . . . . . . . . . . (222) (80) (1,399)
Cumulative translation adjustment . . . . . . . . . . . . . . . . . . . . . . . . . . . . . . . . . . . . . . . 3,814 1,988 (265)
Total comprehensive income (loss) . . . . . . . . . . . . . . . . . . . . . . . . . . . . . . . . . . . . . 2,745 (7,199) (9,130)Allocated to noncontrolling interests . . . . . . . . . . . . . . . . . . . . . . . . . . . . . . . . . . . . . (3,933) (1,095) —
Comprehensive loss allocable to General Finance Corporation stockholders . . . . . . $(1,188) $(8,294) $(9,130)
The accompanying notes are an integral part of these consolidated financial statements.
F-5
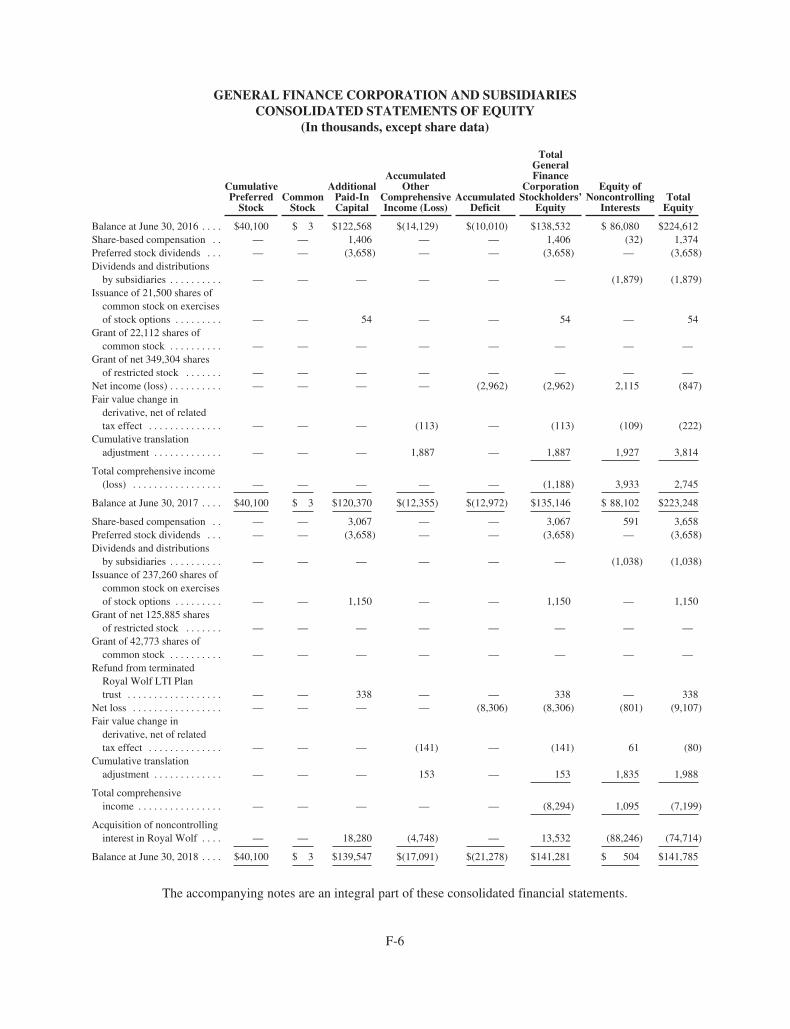
GENERAL FINANCE CORPORATION AND SUBSIDIARIESCONSOLIDATED STATEMENTS OF EQUITY
(In thousands, except share data)
CumulativePreferred
StockCommon
Stock
AdditionalPaid-InCapital
AccumulatedOther
ComprehensiveIncome (Loss)
AccumulatedDeficit
TotalGeneralFinance
CorporationStockholders’
Equity
Equity ofNoncontrolling
InterestsTotal
Equity
Balance at June 30, 2016 . . . . $40,100 $ 3 $122,568 $(14,129) $(10,010) $138,532 $ 86,080 $224,612Share-based compensation . . — — 1,406 — — 1,406 (32) 1,374Preferred stock dividends . . . — — (3,658) — — (3,658) — (3,658)Dividends and distributions
by subsidiaries . . . . . . . . . . — — — — — — (1,879) (1,879)Issuance of 21,500 shares of
common stock on exercisesof stock options . . . . . . . . . — — 54 — — 54 — 54
Grant of 22,112 shares ofcommon stock . . . . . . . . . . — — — — — — — —
Grant of net 349,304 sharesof restricted stock . . . . . . . — — — — — — — —
Net income (loss) . . . . . . . . . . — — — — (2,962) (2,962) 2,115 (847)Fair value change in
derivative, net of relatedtax effect . . . . . . . . . . . . . . — — — (113) — (113) (109) (222)
Cumulative translationadjustment . . . . . . . . . . . . . — — — 1,887 — 1,887 1,927 3,814
Total comprehensive income(loss) . . . . . . . . . . . . . . . . . — — — — — (1,188) 3,933 2,745
Balance at June 30, 2017 . . . . $40,100 $ 3 $120,370 $(12,355) $(12,972) $135,146 $ 88,102 $223,248
Share-based compensation . . — — 3,067 — — 3,067 591 3,658Preferred stock dividends . . . — — (3,658) — — (3,658) — (3,658)Dividends and distributions
by subsidiaries . . . . . . . . . . — — — — — — (1,038) (1,038)Issuance of 237,260 shares of
common stock on exercisesof stock options . . . . . . . . . — — 1,150 — — 1,150 — 1,150
Grant of net 125,885 sharesof restricted stock . . . . . . . — — — — — — — —
Grant of 42,773 shares ofcommon stock . . . . . . . . . . — — — — — — — —
Refund from terminatedRoyal Wolf LTI Plantrust . . . . . . . . . . . . . . . . . . — — 338 — — 338 — 338
Net loss . . . . . . . . . . . . . . . . . — — — — (8,306) (8,306) (801) (9,107)Fair value change in
derivative, net of relatedtax effect . . . . . . . . . . . . . . — — — (141) — (141) 61 (80)
Cumulative translationadjustment . . . . . . . . . . . . . — — — 153 — 153 1,835 1,988
Total comprehensiveincome . . . . . . . . . . . . . . . . — — — — — (8,294) 1,095 (7,199)
Acquisition of noncontrollinginterest in Royal Wolf . . . . — — 18,280 (4,748) — 13,532 (88,246) (74,714)
Balance at June 30, 2018 . . . . $40,100 $ 3 $139,547 $(17,091) $(21,278) $141,281 $ 504 $141,785
The accompanying notes are an integral part of these consolidated financial statements.
F-6
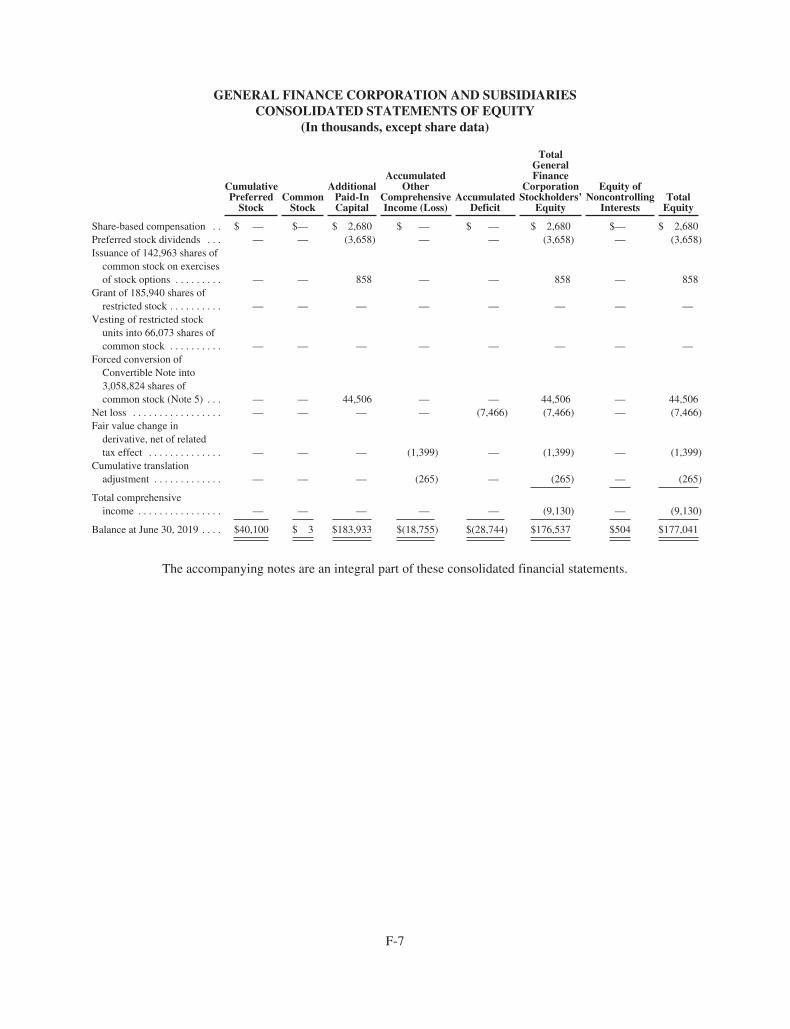
GENERAL FINANCE CORPORATION AND SUBSIDIARIESCONSOLIDATED STATEMENTS OF EQUITY
(In thousands, except share data)
CumulativePreferred
StockCommon
Stock
AdditionalPaid-InCapital
AccumulatedOther
ComprehensiveIncome (Loss)
AccumulatedDeficit
TotalGeneralFinance
CorporationStockholders’
Equity
Equity ofNoncontrolling
InterestsTotal
Equity
Share-based compensation . . $ — $— $ 2,680 $ — $ — $ 2,680 $— $ 2,680Preferred stock dividends . . . — — (3,658) — — (3,658) — (3,658)Issuance of 142,963 shares of
common stock on exercisesof stock options . . . . . . . . . — — 858 — — 858 — 858
Grant of 185,940 shares ofrestricted stock . . . . . . . . . . — — — — — — — —
Vesting of restricted stockunits into 66,073 shares ofcommon stock . . . . . . . . . . — — — — — — — —
Forced conversion ofConvertible Note into3,058,824 shares ofcommon stock (Note 5) . . . — — 44,506 — — 44,506 — 44,506
Net loss . . . . . . . . . . . . . . . . . — — — — (7,466) (7,466) — (7,466)Fair value change in
derivative, net of relatedtax effect . . . . . . . . . . . . . . — — — (1,399) — (1,399) — (1,399)
Cumulative translationadjustment . . . . . . . . . . . . . — — — (265) — (265) — (265)
Total comprehensiveincome . . . . . . . . . . . . . . . . — — — — — (9,130) — (9,130)
Balance at June 30, 2019 . . . . $40,100 $ 3 $183,933 $(18,755) $(28,744) $176,537 $504 $177,041
The accompanying notes are an integral part of these consolidated financial statements.
F-7
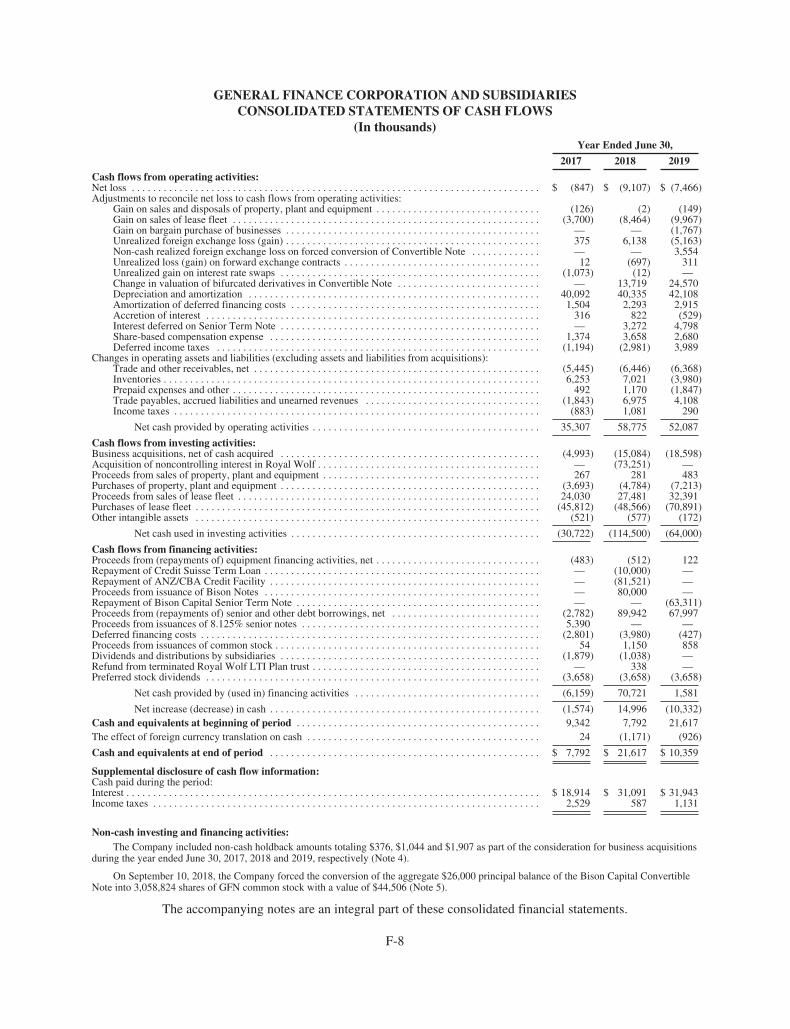
GENERAL FINANCE CORPORATION AND SUBSIDIARIESCONSOLIDATED STATEMENTS OF CASH FLOWS
(In thousands)Year Ended June 30,
2017 2018 2019
Cash flows from operating activities:Net loss . . . . . . . . . . . . . . . . . . . . . . . . . . . . . . . . . . . . . . . . . . . . . . . . . . . . . . . . . . . . . . . . . . . . . . . . . . . . . $ (847) $ (9,107) $ (7,466)Adjustments to reconcile net loss to cash flows from operating activities:
Gain on sales and disposals of property, plant and equipment . . . . . . . . . . . . . . . . . . . . . . . . . . . . . . . (126) (2) (149)Gain on sales of lease fleet . . . . . . . . . . . . . . . . . . . . . . . . . . . . . . . . . . . . . . . . . . . . . . . . . . . . . . . . . . (3,700) (8,464) (9,967)Gain on bargain purchase of businesses . . . . . . . . . . . . . . . . . . . . . . . . . . . . . . . . . . . . . . . . . . . . . . . . — — (1,767)Unrealized foreign exchange loss (gain) . . . . . . . . . . . . . . . . . . . . . . . . . . . . . . . . . . . . . . . . . . . . . . . . 375 6,138 (5,163)Non-cash realized foreign exchange loss on forced conversion of Convertible Note . . . . . . . . . . . . . — — 3,554Unrealized loss (gain) on forward exchange contracts . . . . . . . . . . . . . . . . . . . . . . . . . . . . . . . . . . . . . 12 (697) 311Unrealized gain on interest rate swaps . . . . . . . . . . . . . . . . . . . . . . . . . . . . . . . . . . . . . . . . . . . . . . . . . (1,073) (12) —Change in valuation of bifurcated derivatives in Convertible Note . . . . . . . . . . . . . . . . . . . . . . . . . . . — 13,719 24,570Depreciation and amortization . . . . . . . . . . . . . . . . . . . . . . . . . . . . . . . . . . . . . . . . . . . . . . . . . . . . . . . 40,092 40,335 42,108Amortization of deferred financing costs . . . . . . . . . . . . . . . . . . . . . . . . . . . . . . . . . . . . . . . . . . . . . . . 1,504 2,293 2,915Accretion of interest . . . . . . . . . . . . . . . . . . . . . . . . . . . . . . . . . . . . . . . . . . . . . . . . . . . . . . . . . . . . . . . 316 822 (529)Interest deferred on Senior Term Note . . . . . . . . . . . . . . . . . . . . . . . . . . . . . . . . . . . . . . . . . . . . . . . . . — 3,272 4,798Share-based compensation expense . . . . . . . . . . . . . . . . . . . . . . . . . . . . . . . . . . . . . . . . . . . . . . . . . . . 1,374 3,658 2,680Deferred income taxes . . . . . . . . . . . . . . . . . . . . . . . . . . . . . . . . . . . . . . . . . . . . . . . . . . . . . . . . . . . . . (1,194) (2,981) 3,989
Changes in operating assets and liabilities (excluding assets and liabilities from acquisitions):Trade and other receivables, net . . . . . . . . . . . . . . . . . . . . . . . . . . . . . . . . . . . . . . . . . . . . . . . . . . . . . . (5,445) (6,446) (6,368)Inventories . . . . . . . . . . . . . . . . . . . . . . . . . . . . . . . . . . . . . . . . . . . . . . . . . . . . . . . . . . . . . . . . . . . . . . . 6,253 7,021 (3,980)Prepaid expenses and other . . . . . . . . . . . . . . . . . . . . . . . . . . . . . . . . . . . . . . . . . . . . . . . . . . . . . . . . . . 492 1,170 (1,847)Trade payables, accrued liabilities and unearned revenues . . . . . . . . . . . . . . . . . . . . . . . . . . . . . . . . . (1,843) 6,975 4,108Income taxes . . . . . . . . . . . . . . . . . . . . . . . . . . . . . . . . . . . . . . . . . . . . . . . . . . . . . . . . . . . . . . . . . . . . . (883) 1,081 290
Net cash provided by operating activities . . . . . . . . . . . . . . . . . . . . . . . . . . . . . . . . . . . . . . . . . . . 35,307 58,775 52,087
Cash flows from investing activities:Business acquisitions, net of cash acquired . . . . . . . . . . . . . . . . . . . . . . . . . . . . . . . . . . . . . . . . . . . . . . . . . (4,993) (15,084) (18,598)Acquisition of noncontrolling interest in Royal Wolf . . . . . . . . . . . . . . . . . . . . . . . . . . . . . . . . . . . . . . . . . . — (73,251) —Proceeds from sales of property, plant and equipment . . . . . . . . . . . . . . . . . . . . . . . . . . . . . . . . . . . . . . . . . 267 281 483Purchases of property, plant and equipment . . . . . . . . . . . . . . . . . . . . . . . . . . . . . . . . . . . . . . . . . . . . . . . . . (3,693) (4,784) (7,213)Proceeds from sales of lease fleet . . . . . . . . . . . . . . . . . . . . . . . . . . . . . . . . . . . . . . . . . . . . . . . . . . . . . . . . . 24,030 27,481 32,391Purchases of lease fleet . . . . . . . . . . . . . . . . . . . . . . . . . . . . . . . . . . . . . . . . . . . . . . . . . . . . . . . . . . . . . . . . . (45,812) (48,566) (70,891)Other intangible assets . . . . . . . . . . . . . . . . . . . . . . . . . . . . . . . . . . . . . . . . . . . . . . . . . . . . . . . . . . . . . . . . . (521) (577) (172)
Net cash used in investing activities . . . . . . . . . . . . . . . . . . . . . . . . . . . . . . . . . . . . . . . . . . . . . . . (30,722) (114,500) (64,000)
Cash flows from financing activities:Proceeds from (repayments of) equipment financing activities, net . . . . . . . . . . . . . . . . . . . . . . . . . . . . . . . (483) (512) 122Repayment of Credit Suisse Term Loan . . . . . . . . . . . . . . . . . . . . . . . . . . . . . . . . . . . . . . . . . . . . . . . . . . . . — (10,000) —Repayment of ANZ/CBA Credit Facility . . . . . . . . . . . . . . . . . . . . . . . . . . . . . . . . . . . . . . . . . . . . . . . . . . . — (81,521) —Proceeds from issuance of Bison Notes . . . . . . . . . . . . . . . . . . . . . . . . . . . . . . . . . . . . . . . . . . . . . . . . . . . . — 80,000 —Repayment of Bison Capital Senior Term Note . . . . . . . . . . . . . . . . . . . . . . . . . . . . . . . . . . . . . . . . . . . . . . — — (63,311)Proceeds from (repayments of) senior and other debt borrowings, net . . . . . . . . . . . . . . . . . . . . . . . . . . . . (2,782) 89,942 67,997Proceeds from issuances of 8.125% senior notes . . . . . . . . . . . . . . . . . . . . . . . . . . . . . . . . . . . . . . . . . . . . . 5,390 — —Deferred financing costs . . . . . . . . . . . . . . . . . . . . . . . . . . . . . . . . . . . . . . . . . . . . . . . . . . . . . . . . . . . . . . . . (2,801) (3,980) (427)Proceeds from issuances of common stock . . . . . . . . . . . . . . . . . . . . . . . . . . . . . . . . . . . . . . . . . . . . . . . . . . 54 1,150 858Dividends and distributions by subsidiaries . . . . . . . . . . . . . . . . . . . . . . . . . . . . . . . . . . . . . . . . . . . . . . . . . (1,879) (1,038) —Refund from terminated Royal Wolf LTI Plan trust . . . . . . . . . . . . . . . . . . . . . . . . . . . . . . . . . . . . . . . . . . . — 338 —Preferred stock dividends . . . . . . . . . . . . . . . . . . . . . . . . . . . . . . . . . . . . . . . . . . . . . . . . . . . . . . . . . . . . . . . (3,658) (3,658) (3,658)
Net cash provided by (used in) financing activities . . . . . . . . . . . . . . . . . . . . . . . . . . . . . . . . . . . (6,159) 70,721 1,581
Net increase (decrease) in cash . . . . . . . . . . . . . . . . . . . . . . . . . . . . . . . . . . . . . . . . . . . . . . . . . . . (1,574) 14,996 (10,332)Cash and equivalents at beginning of period . . . . . . . . . . . . . . . . . . . . . . . . . . . . . . . . . . . . . . . . . . . . . . 9,342 7,792 21,617The effect of foreign currency translation on cash . . . . . . . . . . . . . . . . . . . . . . . . . . . . . . . . . . . . . . . . . . . . 24 (1,171) (926)
Cash and equivalents at end of period . . . . . . . . . . . . . . . . . . . . . . . . . . . . . . . . . . . . . . . . . . . . . . . . . . . $ 7,792 $ 21,617 $ 10,359
Supplemental disclosure of cash flow information:Cash paid during the period:Interest . . . . . . . . . . . . . . . . . . . . . . . . . . . . . . . . . . . . . . . . . . . . . . . . . . . . . . . . . . . . . . . . . . . . . . . . . . . . . . $ 18,914 $ 31,091 $ 31,943Income taxes . . . . . . . . . . . . . . . . . . . . . . . . . . . . . . . . . . . . . . . . . . . . . . . . . . . . . . . . . . . . . . . . . . . . . . . . . 2,529 587 1,131
Non-cash investing and financing activities:The Company included non-cash holdback amounts totaling $376, $1,044 and $1,907 as part of the consideration for business acquisitions
during the year ended June 30, 2017, 2018 and 2019, respectively (Note 4).
On September 10, 2018, the Company forced the conversion of the aggregate $26,000 principal balance of the Bison Capital ConvertibleNote into 3,058,824 shares of GFN common stock with a value of $44,506 (Note 5).
The accompanying notes are an integral part of these consolidated financial statements.
F-8
GENERAL FINANCE CORPORATION AND SUBSIDIARIESNOTES TO CONSOLIDATED FINANCIAL STATEMENTS
Note 1. Organization and Business Operations
General Finance Corporation (“GFN”) was incorporated in Delaware in October 2005. References to the“Company” in these Notes are to GFN and its consolidated subsidiaries. These subsidiaries include GFN U.S.Australasia Holdings, Inc., a Delaware corporation (“GFN U.S.”); GFN Insurance Corporation, an Arizonacorporation (“GFNI”); GFN North America Leasing Corporation, a Delaware corporation (“GFNNA Leasing”);GFN North America Corp., a Delaware corporation (“GFNNA”); GFN Realty Company, LLC, a Delawarelimited liability company (“GFNRC”); GFN Manufacturing Corporation, a Delaware corporation (“GFNMC”),and its subsidiary, Southern Frac, LLC, a Texas limited liability company (collectively “Southern Frac”);Pac-Van, Inc., an Indiana corporation, and its Canadian subsidiary, PV Acquisition Corp., an Alberta corporation(collectively “Pac-Van”); and Lone Star Tank Rental Inc., a Delaware corporation (“Lone Star”); GFN AsiaPacific Holdings Pty Ltd, an Australian corporation (“GFNAPH”), and its subsidiaries, Royal Wolf Holdings PtyLtd, an Australian corporation, which was dissolved in June 2019 (“RWH”), Royal Wolf Trading Australia PtyLimited, an Australian corporation, and Royalwolf Trading New Zealand Limited, a New Zealand Corporation(collectively, “Royal Wolf”).
The Company does business in three distinct, but related industries, mobile storage, modular space andliquid containment (which are collectively referred to as the “portable services industry”), in two geographicareas; the Asia-Pacific (or Pan-Pacific) area, consisting of Royal Wolf (which leases and sells storage containers,portable container buildings and freight containers in Australia and New Zealand) and North America, consistingof Pac-Van (which leases and sells storage, office and portable liquid storage tank containers, modular buildingsand mobile offices) and Lone Star (which leases portable liquid storage tank containers and containmentproducts, as well as provides certain fluid management services, to the oil and gas industry in the Permian andEagle Ford basins of Texas), which are combined to form our North American leasing operations, and SouthernFrac (which manufactures portable liquid storage tank containers and other steel-related products).
Note 2. Summary of Significant Accounting Policies
Basis of Presentation
The consolidated financial statements have been prepared on the accrual basis of accounting in accordancewith accounting principles generally accepted in the United States (“U.S. GAAP”).
Unless otherwise indicated, references to “FY 2017,” “FY 2018” and “FY 2019” are to the fiscal yearsended June 30, 2017, 2018 and 2019, respectively.
Certain amounts have been reclassified or revised to conform with the current year presentation. The mostsignificant are the income taxes paid for FY 2017 and FY 2018, which are disclosed supplementally in theconsolidated statements of cash flows.
Principles of Consolidation
The consolidated financial statements include the accounts of the Company and its wholly-owned andmajority-owned subsidiaries. All significant intercompany accounts and transactions have been eliminated.
Foreign Currency Translation
The Company’s functional currencies for its foreign operations are the respective local currencies, theAustralian (“AUS”) and New Zealand (“NZ”) dollars in the Asia-Pacific area and the Canadian (“C”) dollar inNorth America. All adjustments resulting from the translation of the accompanying consolidated financial
F-9
GENERAL FINANCE CORPORATION AND SUBSIDIARIESNOTES TO CONSOLIDATED FINANCIAL STATEMENTS
statements from the functional currency into reporting currency are recorded as a component of stockholders’equity in accordance with Financial Accounting Standards Board (“FASB”) Accounting Standards Codification(“ASC”) Topic 830, Foreign Currency Matters. All assets and liabilities are translated at the rates in effect at thebalance sheet dates; and revenues, expenses, gains and losses are translated using the average exchange ratesduring the periods. Transactions in foreign currencies are translated at the foreign exchange rate prevailing at thedate of the transaction. Monetary assets and liabilities denominated in foreign currencies at the balance sheet dateare translated to the functional currency at the foreign exchange rate prevailing at that date. Foreign exchangedifferences arising on translation are recognized in the statement of operations. Non-monetary assets andliabilities that are measured in terms of historical cost in a foreign currency are translated using the exchange rateat the date of the transaction. Non-monetary assets and liabilities denominated in foreign currencies that arestated at fair value are translated to the functional currency at foreign exchange rates prevailing at the dates thefair value was determined.
Segment Information
FASB ASC Topic 280, Segment Reporting, establishes standards for the way companies report informationabout operating segments in annual financial statements. It also establishes standards for related disclosuresabout products and services, geographic areas and major customers. Based on the provisions of FASB ASCTopic 280 and the manner in which the chief operating decision maker analyzes the business, the Company hasdetermined it has two separately reportable geographic areas that include four operating segments, NorthAmerica (the leasing operations of Pac-Van and Lone Star and manufacturing, including corporate headquarters)and the Asia-Pacific area (the leasing operations of Royal Wolf).
Use of Estimates
The preparation of consolidated financial statements in conformity with accounting principles generallyaccepted in the United States requires management to make estimates and assumptions that affect the reportedamounts of assets and liabilities and disclosure of contingent assets and liabilities at the date of the consolidatedfinancial statements, and the reported amounts of revenues and expenses during the reporting period. Actualresults could differ from those estimates. Material estimates that are particularly susceptible to significantchanges include assumptions used in assigning value to identifiable intangible assets at the acquisition date, theassessment for impairment of goodwill, the assessment for impairment of other intangible assets, the allowancefor doubtful accounts, share-based compensation expense, residual value of the lease fleet, derivative liabilityvaluation and deferred tax assets and liabilities. Assumptions and factors used in the estimates are evaluated onan annual basis or whenever events or changes in circumstances indicate that the previous assumptions andfactors have changed. The results of the analysis could result in adjustments to estimates.
Cash Equivalents
The Company considers highly liquid investments with maturities of three months or less, when purchased,to be cash equivalents. The Company maintains its cash in bank deposit accounts that, at times, may exceedfederally insured limits. The Company has not experienced any losses in such accounts. The Company believes itis not exposed to any significant credit risk on its cash balances.
Inventories
Inventories are stated at the lower of cost or net realizable value and consist of primarily finished goods forcontainers, modular buildings and mobile offices held for sale or lease; as well as raw materials, work in-processand finished goods of manufactured portable liquid storage tank containers. Costs for leasing operations are
F-10
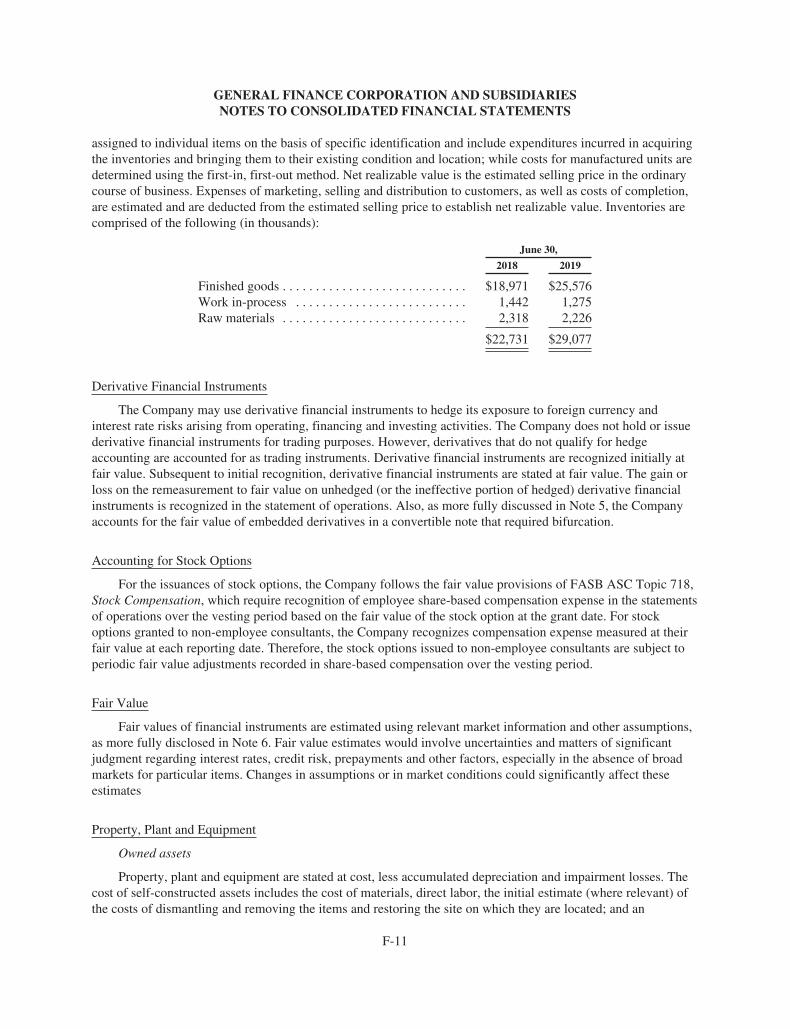
GENERAL FINANCE CORPORATION AND SUBSIDIARIESNOTES TO CONSOLIDATED FINANCIAL STATEMENTS
assigned to individual items on the basis of specific identification and include expenditures incurred in acquiringthe inventories and bringing them to their existing condition and location; while costs for manufactured units aredetermined using the first-in, first-out method. Net realizable value is the estimated selling price in the ordinarycourse of business. Expenses of marketing, selling and distribution to customers, as well as costs of completion,are estimated and are deducted from the estimated selling price to establish net realizable value. Inventories arecomprised of the following (in thousands):
June 30,
2018 2019
Finished goods . . . . . . . . . . . . . . . . . . . . . . . . . . . . $18,971 $25,576Work in-process . . . . . . . . . . . . . . . . . . . . . . . . . . 1,442 1,275Raw materials . . . . . . . . . . . . . . . . . . . . . . . . . . . . 2,318 2,226
$22,731 $29,077
Derivative Financial Instruments
The Company may use derivative financial instruments to hedge its exposure to foreign currency andinterest rate risks arising from operating, financing and investing activities. The Company does not hold or issuederivative financial instruments for trading purposes. However, derivatives that do not qualify for hedgeaccounting are accounted for as trading instruments. Derivative financial instruments are recognized initially atfair value. Subsequent to initial recognition, derivative financial instruments are stated at fair value. The gain orloss on the remeasurement to fair value on unhedged (or the ineffective portion of hedged) derivative financialinstruments is recognized in the statement of operations. Also, as more fully discussed in Note 5, the Companyaccounts for the fair value of embedded derivatives in a convertible note that required bifurcation.
Accounting for Stock Options
For the issuances of stock options, the Company follows the fair value provisions of FASB ASC Topic 718,Stock Compensation, which require recognition of employee share-based compensation expense in the statementsof operations over the vesting period based on the fair value of the stock option at the grant date. For stockoptions granted to non-employee consultants, the Company recognizes compensation expense measured at theirfair value at each reporting date. Therefore, the stock options issued to non-employee consultants are subject toperiodic fair value adjustments recorded in share-based compensation over the vesting period.
Fair Value
Fair values of financial instruments are estimated using relevant market information and other assumptions,as more fully disclosed in Note 6. Fair value estimates would involve uncertainties and matters of significantjudgment regarding interest rates, credit risk, prepayments and other factors, especially in the absence of broadmarkets for particular items. Changes in assumptions or in market conditions could significantly affect theseestimates
Property, Plant and Equipment
Owned assets
Property, plant and equipment are stated at cost, less accumulated depreciation and impairment losses. Thecost of self-constructed assets includes the cost of materials, direct labor, the initial estimate (where relevant) ofthe costs of dismantling and removing the items and restoring the site on which they are located; and an
F-11
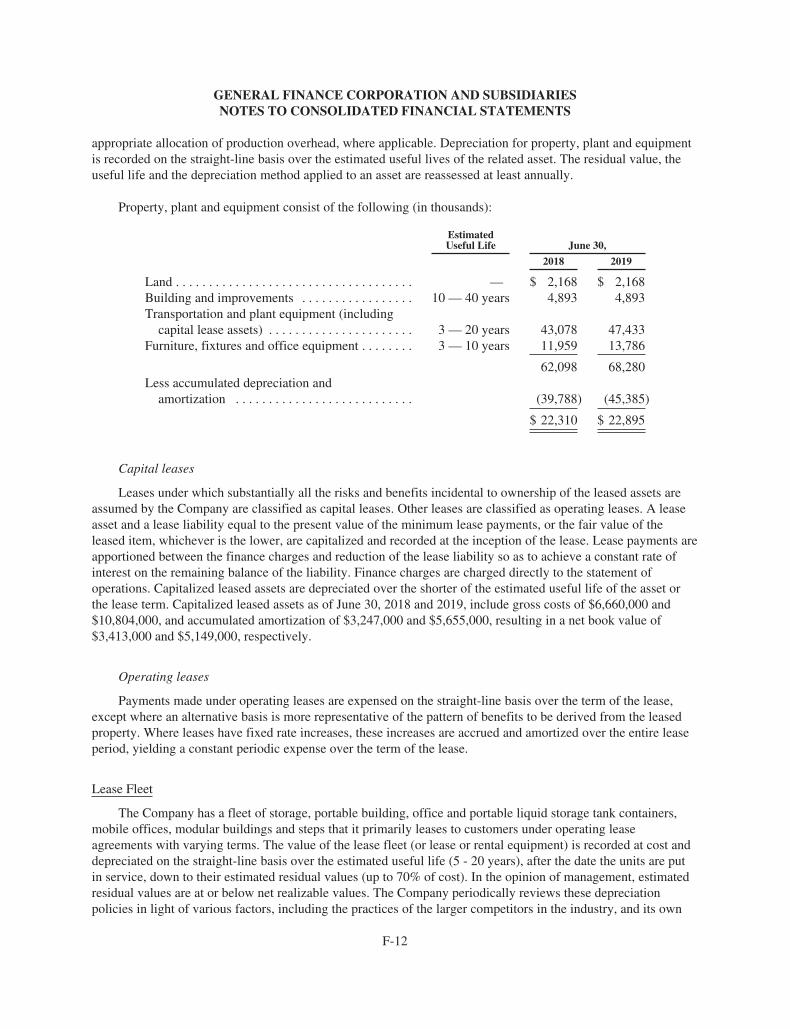
GENERAL FINANCE CORPORATION AND SUBSIDIARIESNOTES TO CONSOLIDATED FINANCIAL STATEMENTS
appropriate allocation of production overhead, where applicable. Depreciation for property, plant and equipmentis recorded on the straight-line basis over the estimated useful lives of the related asset. The residual value, theuseful life and the depreciation method applied to an asset are reassessed at least annually.
Property, plant and equipment consist of the following (in thousands):
EstimatedUseful Life June 30,
2018 2019
Land . . . . . . . . . . . . . . . . . . . . . . . . . . . . . . . . . . . . — $ 2,168 $ 2,168Building and improvements . . . . . . . . . . . . . . . . . 10 — 40 years 4,893 4,893Transportation and plant equipment (including
capital lease assets) . . . . . . . . . . . . . . . . . . . . . . 3 — 20 years 43,078 47,433Furniture, fixtures and office equipment . . . . . . . . 3 — 10 years 11,959 13,786
62,098 68,280Less accumulated depreciation and
amortization . . . . . . . . . . . . . . . . . . . . . . . . . . . (39,788) (45,385)
$ 22,310 $ 22,895
Capital leases
Leases under which substantially all the risks and benefits incidental to ownership of the leased assets areassumed by the Company are classified as capital leases. Other leases are classified as operating leases. A leaseasset and a lease liability equal to the present value of the minimum lease payments, or the fair value of theleased item, whichever is the lower, are capitalized and recorded at the inception of the lease. Lease payments areapportioned between the finance charges and reduction of the lease liability so as to achieve a constant rate ofinterest on the remaining balance of the liability. Finance charges are charged directly to the statement ofoperations. Capitalized leased assets are depreciated over the shorter of the estimated useful life of the asset orthe lease term. Capitalized leased assets as of June 30, 2018 and 2019, include gross costs of $6,660,000 and$10,804,000, and accumulated amortization of $3,247,000 and $5,655,000, resulting in a net book value of$3,413,000 and $5,149,000, respectively.
Operating leases
Payments made under operating leases are expensed on the straight-line basis over the term of the lease,except where an alternative basis is more representative of the pattern of benefits to be derived from the leasedproperty. Where leases have fixed rate increases, these increases are accrued and amortized over the entire leaseperiod, yielding a constant periodic expense over the term of the lease.
Lease Fleet
The Company has a fleet of storage, portable building, office and portable liquid storage tank containers,mobile offices, modular buildings and steps that it primarily leases to customers under operating leaseagreements with varying terms. The value of the lease fleet (or lease or rental equipment) is recorded at cost anddepreciated on the straight-line basis over the estimated useful life (5 - 20 years), after the date the units are putin service, down to their estimated residual values (up to 70% of cost). In the opinion of management, estimatedresidual values are at or below net realizable values. The Company periodically reviews these depreciationpolicies in light of various factors, including the practices of the larger competitors in the industry, and its own
F-12
GENERAL FINANCE CORPORATION AND SUBSIDIARIESNOTES TO CONSOLIDATED FINANCIAL STATEMENTS
historical experience. Costs incurred on lease fleet units subsequent to initial acquisition are capitalized when it isprobable that future economic benefits in excess of the originally assessed performance will result; otherwise,they are expensed as incurred. At June 30, 2018 and 2019, the gross costs of the lease fleet were $555,263,000and $598,757,000, respectively. Units in the lease fleet are also available for sale. The cost of sales of a unit inthe lease fleet is recognized at the carrying amount at the date of sale.
Impairment of Long-Lived Assets
The Company periodically reviews for the impairment of long-lived assets and assesses when an event orchange in circumstances indicates the carrying value of an asset may not be recoverable. An impairment losswould be recognized when estimated future cash flows expected to result from the use of the asset and theeventual disposition is less than its carrying amount. The Company has determined that no impairment provisionrelated to long-lived assets was required to be recorded as of June 30, 2018 and 2019.
Goodwill
The purchase consideration of acquired businesses have been allocated to the assets and liabilities acquiredbased on the estimated fair values on the respective acquisition dates (see Note 4). Based on these values, theexcess purchase consideration over the fair value of the net assets acquired was allocated to goodwill. TheCompany accounts for goodwill in accordance with FASB ASC Topic 350, Intangibles — Goodwill and Other.FASB ASC Topic 350 prohibits the amortization of goodwill and intangible assets with indefinite lives andrequires these assets be reviewed for impairment. The Company operates two reportable geographic areas and thevast majority of goodwill recorded was in the acquisitions of Royal Wolf, Pac-Van, Southern Frac and Lone Star.
The Company assesses the potential impairment of goodwill on an annual basis or if a determination ismade based on a qualitative assessment that it is more likely than not (i.e., greater than 50%) that the fair value ofthe reporting unit is less than its carrying amount. Qualitative factors which could cause an impairment include(1) significant underperformance relative to historical, expected or projected future operating results;(2) significant changes in the manner of use of the acquired businesses or the strategy for the Company’s overallbusiness; (3) significant changes during the period in the Company’s market capitalization relative to net bookvalue; and (4) significant negative industry or general economic trends. If the Company did determine that fairvalue is more likely than not less than the carrying amount, a quantitative process for potential impairment isperformed where the fair value of the reporting unit is compared to its carrying value to determine if the goodwillis impaired. If the carrying value of the net assets assigned to the reporting unit were to exceed its fair value, thenin accordance with FASB Accounting Standards Update (“ASU”) No. 2017-04, a goodwill impairment write-down would be recorded for the amount by which a reporting unit’s carrying value exceeds its fair value, but theloss recognized should not exceed the total amount of goodwill allocated to that reporting unit.
The Company’s annual impairment assessment at June 30, 2018 and 2019 concluded that the fair value ofthe goodwill of each of its reporting units was greater than their respective carrying amounts. Determining thefair value of a reporting unit requires judgment and involves the use of significant estimates and assumptions.The Company based its fair value estimates on assumptions that it believes are reasonable, but are uncertain andsubject to changes in market conditions.
F-13
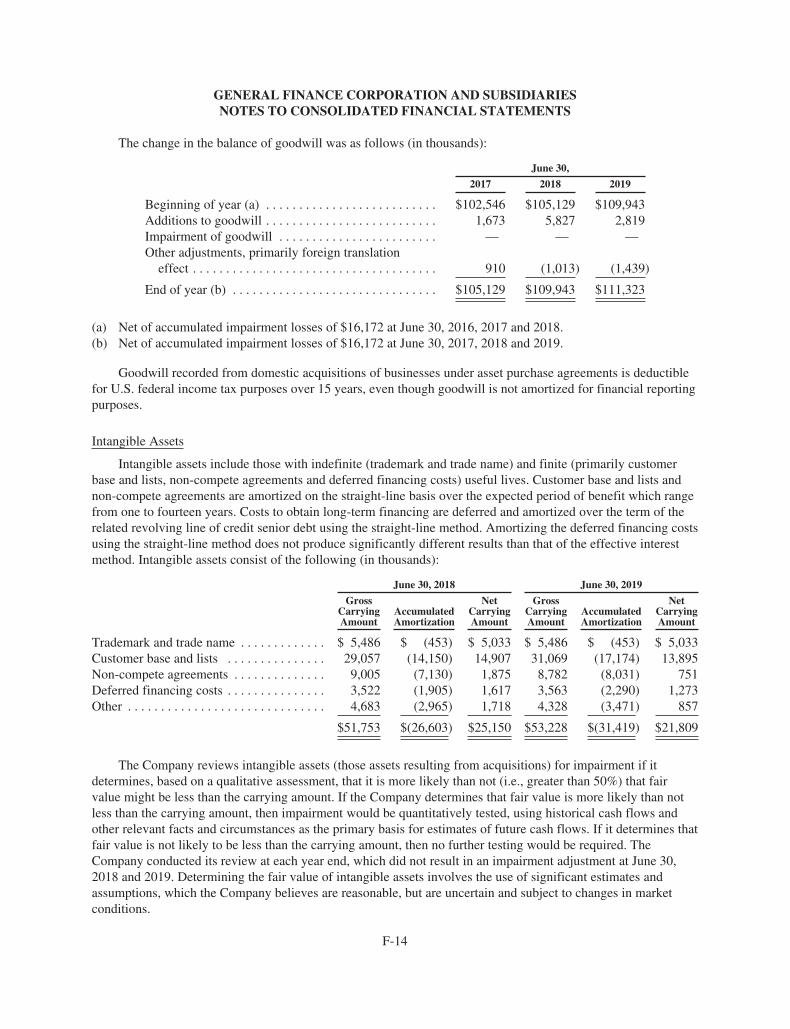
GENERAL FINANCE CORPORATION AND SUBSIDIARIESNOTES TO CONSOLIDATED FINANCIAL STATEMENTS
The change in the balance of goodwill was as follows (in thousands):
June 30,
2017 2018 2019
Beginning of year (a) . . . . . . . . . . . . . . . . . . . . . . . . . . $102,546 $105,129 $109,943Additions to goodwill . . . . . . . . . . . . . . . . . . . . . . . . . . 1,673 5,827 2,819Impairment of goodwill . . . . . . . . . . . . . . . . . . . . . . . . — — —Other adjustments, primarily foreign translation
effect . . . . . . . . . . . . . . . . . . . . . . . . . . . . . . . . . . . . . 910 (1,013) (1,439)
End of year (b) . . . . . . . . . . . . . . . . . . . . . . . . . . . . . . . $105,129 $109,943 $111,323
(a) Net of accumulated impairment losses of $16,172 at June 30, 2016, 2017 and 2018.(b) Net of accumulated impairment losses of $16,172 at June 30, 2017, 2018 and 2019.
Goodwill recorded from domestic acquisitions of businesses under asset purchase agreements is deductiblefor U.S. federal income tax purposes over 15 years, even though goodwill is not amortized for financial reportingpurposes.
Intangible Assets
Intangible assets include those with indefinite (trademark and trade name) and finite (primarily customerbase and lists, non-compete agreements and deferred financing costs) useful lives. Customer base and lists andnon-compete agreements are amortized on the straight-line basis over the expected period of benefit which rangefrom one to fourteen years. Costs to obtain long-term financing are deferred and amortized over the term of therelated revolving line of credit senior debt using the straight-line method. Amortizing the deferred financing costsusing the straight-line method does not produce significantly different results than that of the effective interestmethod. Intangible assets consist of the following (in thousands):
June 30, 2018 June 30, 2019
GrossCarryingAmount
AccumulatedAmortization
NetCarryingAmount
GrossCarryingAmount
AccumulatedAmortization
NetCarryingAmount
Trademark and trade name . . . . . . . . . . . . . $ 5,486 $ (453) $ 5,033 $ 5,486 $ (453) $ 5,033Customer base and lists . . . . . . . . . . . . . . . 29,057 (14,150) 14,907 31,069 (17,174) 13,895Non-compete agreements . . . . . . . . . . . . . . 9,005 (7,130) 1,875 8,782 (8,031) 751Deferred financing costs . . . . . . . . . . . . . . . 3,522 (1,905) 1,617 3,563 (2,290) 1,273Other . . . . . . . . . . . . . . . . . . . . . . . . . . . . . . 4,683 (2,965) 1,718 4,328 (3,471) 857
$51,753 $(26,603) $25,150 $53,228 $(31,419) $21,809
The Company reviews intangible assets (those assets resulting from acquisitions) for impairment if itdetermines, based on a qualitative assessment, that it is more likely than not (i.e., greater than 50%) that fairvalue might be less than the carrying amount. If the Company determines that fair value is more likely than notless than the carrying amount, then impairment would be quantitatively tested, using historical cash flows andother relevant facts and circumstances as the primary basis for estimates of future cash flows. If it determines thatfair value is not likely to be less than the carrying amount, then no further testing would be required. TheCompany conducted its review at each year end, which did not result in an impairment adjustment at June 30,2018 and 2019. Determining the fair value of intangible assets involves the use of significant estimates andassumptions, which the Company believes are reasonable, but are uncertain and subject to changes in marketconditions.
F-14
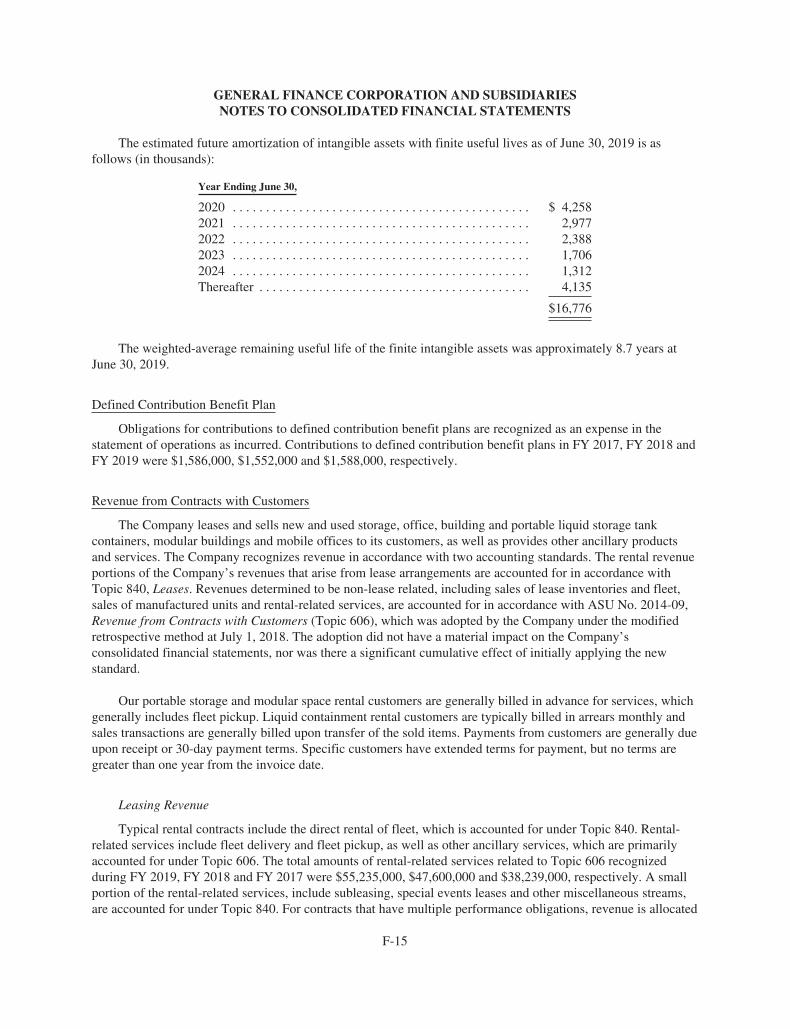
GENERAL FINANCE CORPORATION AND SUBSIDIARIESNOTES TO CONSOLIDATED FINANCIAL STATEMENTS
The estimated future amortization of intangible assets with finite useful lives as of June 30, 2019 is asfollows (in thousands):
Year Ending June 30,
2020 . . . . . . . . . . . . . . . . . . . . . . . . . . . . . . . . . . . . . . . . . . . . . $ 4,2582021 . . . . . . . . . . . . . . . . . . . . . . . . . . . . . . . . . . . . . . . . . . . . . 2,9772022 . . . . . . . . . . . . . . . . . . . . . . . . . . . . . . . . . . . . . . . . . . . . . 2,3882023 . . . . . . . . . . . . . . . . . . . . . . . . . . . . . . . . . . . . . . . . . . . . . 1,7062024 . . . . . . . . . . . . . . . . . . . . . . . . . . . . . . . . . . . . . . . . . . . . . 1,312Thereafter . . . . . . . . . . . . . . . . . . . . . . . . . . . . . . . . . . . . . . . . . 4,135
$16,776
The weighted-average remaining useful life of the finite intangible assets was approximately 8.7 years atJune 30, 2019.
Defined Contribution Benefit Plan
Obligations for contributions to defined contribution benefit plans are recognized as an expense in thestatement of operations as incurred. Contributions to defined contribution benefit plans in FY 2017, FY 2018 andFY 2019 were $1,586,000, $1,552,000 and $1,588,000, respectively.
Revenue from Contracts with Customers
The Company leases and sells new and used storage, office, building and portable liquid storage tankcontainers, modular buildings and mobile offices to its customers, as well as provides other ancillary productsand services. The Company recognizes revenue in accordance with two accounting standards. The rental revenueportions of the Company’s revenues that arise from lease arrangements are accounted for in accordance withTopic 840, Leases. Revenues determined to be non-lease related, including sales of lease inventories and fleet,sales of manufactured units and rental-related services, are accounted for in accordance with ASU No. 2014-09,Revenue from Contracts with Customers (Topic 606), which was adopted by the Company under the modifiedretrospective method at July 1, 2018. The adoption did not have a material impact on the Company’sconsolidated financial statements, nor was there a significant cumulative effect of initially applying the newstandard.
Our portable storage and modular space rental customers are generally billed in advance for services, whichgenerally includes fleet pickup. Liquid containment rental customers are typically billed in arrears monthly andsales transactions are generally billed upon transfer of the sold items. Payments from customers are generally dueupon receipt or 30-day payment terms. Specific customers have extended terms for payment, but no terms aregreater than one year from the invoice date.
Leasing Revenue
Typical rental contracts include the direct rental of fleet, which is accounted for under Topic 840. Rental-related services include fleet delivery and fleet pickup, as well as other ancillary services, which are primarilyaccounted for under Topic 606. The total amounts of rental-related services related to Topic 606 recognizedduring FY 2019, FY 2018 and FY 2017 were $55,235,000, $47,600,000 and $38,239,000, respectively. A smallportion of the rental-related services, include subleasing, special events leases and other miscellaneous streams,are accounted for under Topic 840. For contracts that have multiple performance obligations, revenue is allocated
F-15
GENERAL FINANCE CORPORATION AND SUBSIDIARIESNOTES TO CONSOLIDATED FINANCIAL STATEMENTS
to each performance obligation in the contract based on the Company’s best estimate of the standalone sellingprices of each distinct performance obligation. The standalone selling price is determined using methods andassumptions developed consistently across similar customers and markets generally applying an expected costplus an estimated margin to each performance obligation.
Rental contracts are based on a monthly rate for our portable storage and modular space fleet and a dailyrate for our liquid containment fleet. Rental revenue is recognized ratably over the rental period. The rentalcontinues until the end of the initial term of the lease or when cancelled by the customer or the Company. Ifequipment is returned prior to the end of the contractual lease period, customers are typically billed a cancellationfee, which is recorded as rental revenue upon the return of the equipment. Customers may utilize our equipmenttransportation services and other on-site services in conjunction with the rental of equipment, but are not requiredto do so. Given the short duration of these services, equipment transportation services and other on-site servicesrevenue of a rented unit is recognized in leasing revenue upon completion of the service.
Non-Lease Revenue
Non-lease revenues consist primarily of the sale of new and used units, and to a lesser extent, sales ofmanufactured units are all accounted for under Topic 606. Sales contracts generally have a single performanceobligation that is satisfied at the time of delivery, which is the point in time control over the unit transfers and theCompany is entitled to consideration due under the contract with its customer.
Contract Costs and Liabilities
The Company incurs commission costs to obtain rental contracts and for sales of new and used units. Weexpect the period benefitted by each commission to be less than one year. Therefore, we have applied thepractical expedient for incremental costs of obtaining a contract and expense commissions as incurred.
When customers are billed in advance for rentals, end of lease services, and deposit payments, we deferrevenue and reflect unearned rental revenue at the end of the period. As of June 30, 2019 and June 30, 2018, wehad approximately $22,671,000 and $19,226,000, respectively, of unearned rental revenue included in unearnedrevenue and advance payments in the accompanying consolidated balance sheets. Revenues of $12,538,000,which were included in the unearned rental revenue balance at June 30, 2018, were recognized during FY 2019.The Company’s uncompleted contracts with customers have unsatisfied (or partially satisfied) performanceobligations. For the future service revenues that are expected to be recognized within twelve months, theCompany has elected to utilize the optional disclosure exemption made available regarding transaction priceallocated to unsatisfied (or partially unsatisfied) performance obligations. The transaction price for performanceobligations that will be completed in greater than twelve months is generally variable based on the costsultimately incurred to provide those services and therefore we are applying the optional exemption to omitdisclosure of such amounts.
Sales taxes charged to customers are excluded from revenues and expenses.
Sales of new modular buildings not manufactured by the Company are typically covered by warrantiesprovided by the manufacturer of the products sold. Certain sales of manufactured units are covered by assurance-type warranties and as of June 30, 2019 and June 30, 2018, the Company had $219,331 and $238,956,respectively, of warranty reserve included in trade payables and accrued liabilities in the accompanyingconsolidated balance sheets.
F-16
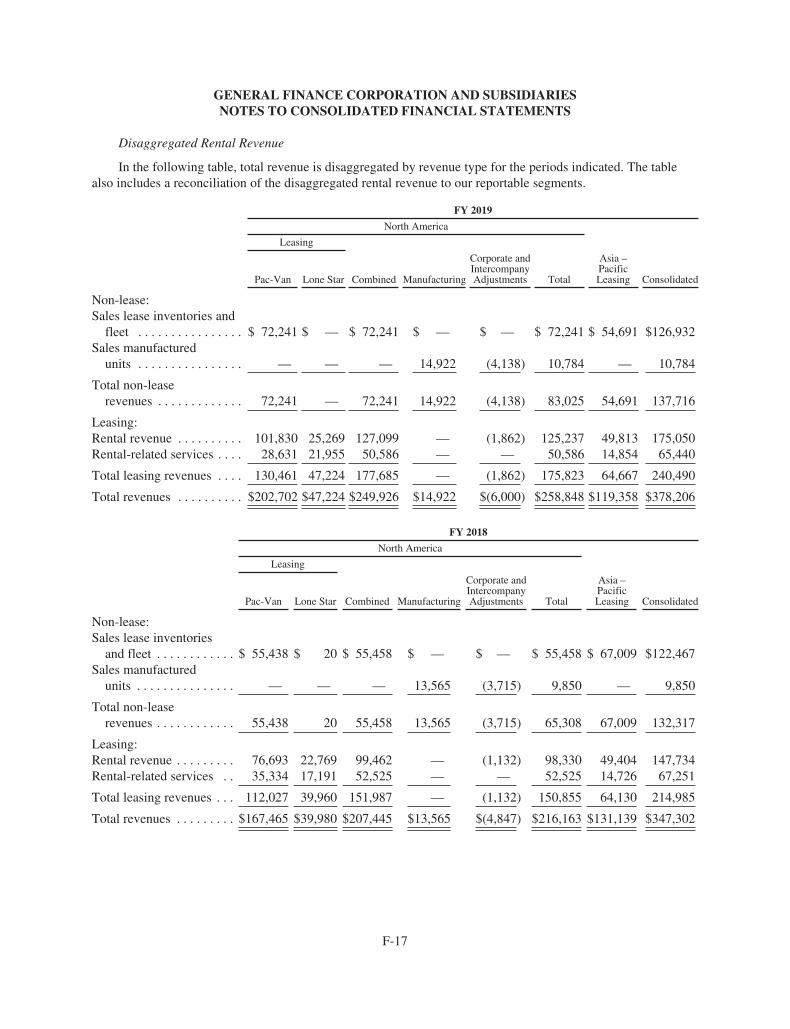
GENERAL FINANCE CORPORATION AND SUBSIDIARIESNOTES TO CONSOLIDATED FINANCIAL STATEMENTS
Disaggregated Rental Revenue
In the following table, total revenue is disaggregated by revenue type for the periods indicated. The tablealso includes a reconciliation of the disaggregated rental revenue to our reportable segments.
FY 2019
North America
Leasing
Pac-Van Lone Star Combined Manufacturing
Corporate andIntercompanyAdjustments Total
Asia –PacificLeasing Consolidated
Non-lease:Sales lease inventories and
fleet . . . . . . . . . . . . . . . . $ 72,241 $ — $ 72,241 $ — $ — $ 72,241 $ 54,691 $126,932Sales manufactured
units . . . . . . . . . . . . . . . . — — — 14,922 (4,138) 10,784 — 10,784
Total non-leaserevenues . . . . . . . . . . . . . 72,241 — 72,241 14,922 (4,138) 83,025 54,691 137,716
Leasing:Rental revenue . . . . . . . . . . 101,830 25,269 127,099 — (1,862) 125,237 49,813 175,050Rental-related services . . . . 28,631 21,955 50,586 — — 50,586 14,854 65,440
Total leasing revenues . . . . 130,461 47,224 177,685 — (1,862) 175,823 64,667 240,490
Total revenues . . . . . . . . . . $202,702 $47,224 $249,926 $14,922 $(6,000) $258,848 $119,358 $378,206
FY 2018
North America
Leasing
Pac-Van Lone Star Combined Manufacturing
Corporate andIntercompanyAdjustments Total
Asia –PacificLeasing Consolidated
Non-lease:Sales lease inventories
and fleet . . . . . . . . . . . . $ 55,438 $ 20 $ 55,458 $ — $ — $ 55,458 $ 67,009 $122,467Sales manufactured
units . . . . . . . . . . . . . . . — — — 13,565 (3,715) 9,850 — 9,850
Total non-leaserevenues . . . . . . . . . . . . 55,438 20 55,458 13,565 (3,715) 65,308 67,009 132,317
Leasing:Rental revenue . . . . . . . . . 76,693 22,769 99,462 — (1,132) 98,330 49,404 147,734Rental-related services . . 35,334 17,191 52,525 — — 52,525 14,726 67,251
Total leasing revenues . . . 112,027 39,960 151,987 — (1,132) 150,855 64,130 214,985
Total revenues . . . . . . . . . $167,465 $39,980 $207,445 $13,565 $(4,847) $216,163 $131,139 $347,302
F-17
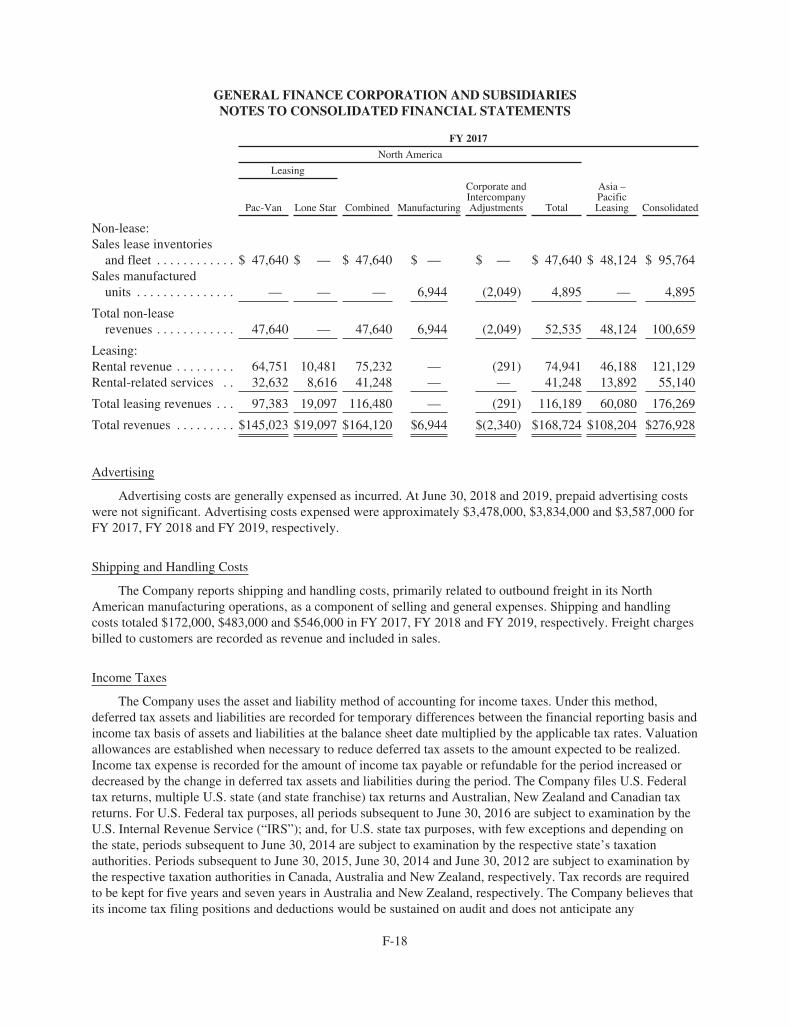
GENERAL FINANCE CORPORATION AND SUBSIDIARIESNOTES TO CONSOLIDATED FINANCIAL STATEMENTS
FY 2017
North America
Leasing
Pac-Van Lone Star Combined Manufacturing
Corporate andIntercompanyAdjustments Total
Asia –PacificLeasing Consolidated
Non-lease:Sales lease inventories
and fleet . . . . . . . . . . . . $ 47,640 $ — $ 47,640 $ — $ — $ 47,640 $ 48,124 $ 95,764Sales manufactured
units . . . . . . . . . . . . . . . — — — 6,944 (2,049) 4,895 — 4,895
Total non-leaserevenues . . . . . . . . . . . . 47,640 — 47,640 6,944 (2,049) 52,535 48,124 100,659
Leasing:Rental revenue . . . . . . . . . 64,751 10,481 75,232 — (291) 74,941 46,188 121,129Rental-related services . . 32,632 8,616 41,248 — — 41,248 13,892 55,140
Total leasing revenues . . . 97,383 19,097 116,480 — (291) 116,189 60,080 176,269
Total revenues . . . . . . . . . $145,023 $19,097 $164,120 $6,944 $(2,340) $168,724 $108,204 $276,928
Advertising
Advertising costs are generally expensed as incurred. At June 30, 2018 and 2019, prepaid advertising costswere not significant. Advertising costs expensed were approximately $3,478,000, $3,834,000 and $3,587,000 forFY 2017, FY 2018 and FY 2019, respectively.
Shipping and Handling Costs
The Company reports shipping and handling costs, primarily related to outbound freight in its NorthAmerican manufacturing operations, as a component of selling and general expenses. Shipping and handlingcosts totaled $172,000, $483,000 and $546,000 in FY 2017, FY 2018 and FY 2019, respectively. Freight chargesbilled to customers are recorded as revenue and included in sales.
Income Taxes
The Company uses the asset and liability method of accounting for income taxes. Under this method,deferred tax assets and liabilities are recorded for temporary differences between the financial reporting basis andincome tax basis of assets and liabilities at the balance sheet date multiplied by the applicable tax rates. Valuationallowances are established when necessary to reduce deferred tax assets to the amount expected to be realized.Income tax expense is recorded for the amount of income tax payable or refundable for the period increased ordecreased by the change in deferred tax assets and liabilities during the period. The Company files U.S. Federaltax returns, multiple U.S. state (and state franchise) tax returns and Australian, New Zealand and Canadian taxreturns. For U.S. Federal tax purposes, all periods subsequent to June 30, 2016 are subject to examination by theU.S. Internal Revenue Service (“IRS”); and, for U.S. state tax purposes, with few exceptions and depending onthe state, periods subsequent to June 30, 2014 are subject to examination by the respective state’s taxationauthorities. Periods subsequent to June 30, 2015, June 30, 2014 and June 30, 2012 are subject to examination bythe respective taxation authorities in Canada, Australia and New Zealand, respectively. Tax records are requiredto be kept for five years and seven years in Australia and New Zealand, respectively. The Company believes thatits income tax filing positions and deductions would be sustained on audit and does not anticipate any
F-18
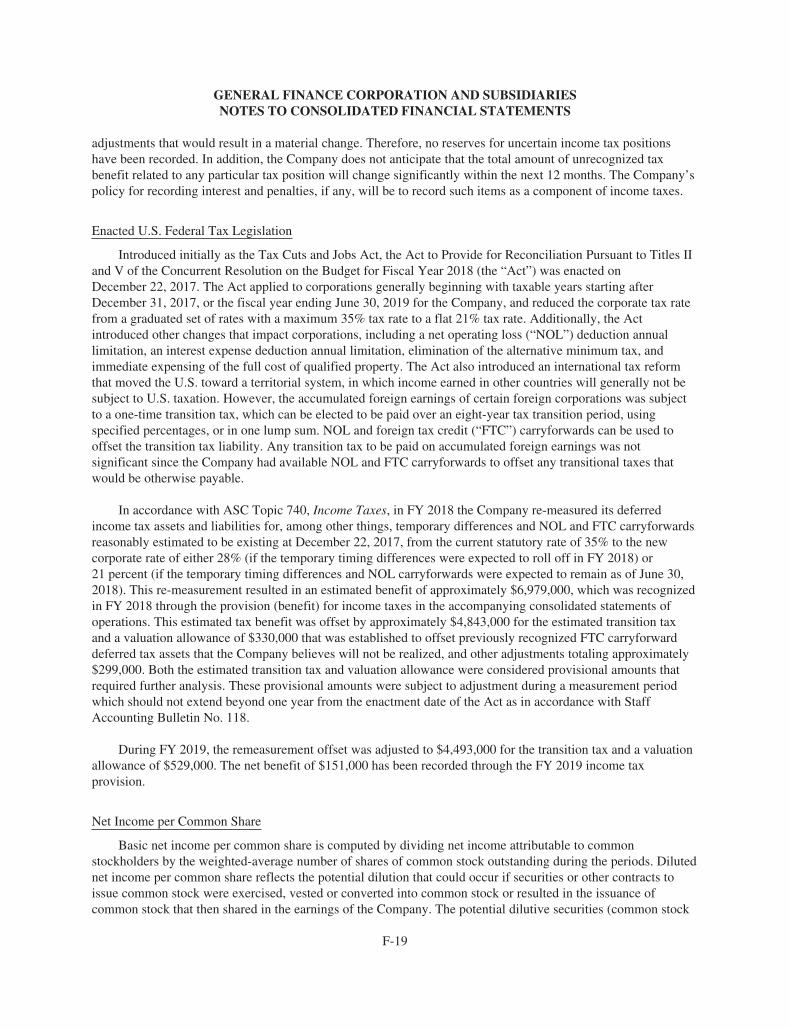
GENERAL FINANCE CORPORATION AND SUBSIDIARIESNOTES TO CONSOLIDATED FINANCIAL STATEMENTS
adjustments that would result in a material change. Therefore, no reserves for uncertain income tax positionshave been recorded. In addition, the Company does not anticipate that the total amount of unrecognized taxbenefit related to any particular tax position will change significantly within the next 12 months. The Company’spolicy for recording interest and penalties, if any, will be to record such items as a component of income taxes.
Enacted U.S. Federal Tax Legislation
Introduced initially as the Tax Cuts and Jobs Act, the Act to Provide for Reconciliation Pursuant to Titles IIand V of the Concurrent Resolution on the Budget for Fiscal Year 2018 (the “Act”) was enacted onDecember 22, 2017. The Act applied to corporations generally beginning with taxable years starting afterDecember 31, 2017, or the fiscal year ending June 30, 2019 for the Company, and reduced the corporate tax ratefrom a graduated set of rates with a maximum 35% tax rate to a flat 21% tax rate. Additionally, the Actintroduced other changes that impact corporations, including a net operating loss (“NOL”) deduction annuallimitation, an interest expense deduction annual limitation, elimination of the alternative minimum tax, andimmediate expensing of the full cost of qualified property. The Act also introduced an international tax reformthat moved the U.S. toward a territorial system, in which income earned in other countries will generally not besubject to U.S. taxation. However, the accumulated foreign earnings of certain foreign corporations was subjectto a one-time transition tax, which can be elected to be paid over an eight-year tax transition period, usingspecified percentages, or in one lump sum. NOL and foreign tax credit (“FTC”) carryforwards can be used tooffset the transition tax liability. Any transition tax to be paid on accumulated foreign earnings was notsignificant since the Company had available NOL and FTC carryforwards to offset any transitional taxes thatwould be otherwise payable.
In accordance with ASC Topic 740, Income Taxes, in FY 2018 the Company re-measured its deferredincome tax assets and liabilities for, among other things, temporary differences and NOL and FTC carryforwardsreasonably estimated to be existing at December 22, 2017, from the current statutory rate of 35% to the newcorporate rate of either 28% (if the temporary timing differences were expected to roll off in FY 2018) or21 percent (if the temporary timing differences and NOL carryforwards were expected to remain as of June 30,2018). This re-measurement resulted in an estimated benefit of approximately $6,979,000, which was recognizedin FY 2018 through the provision (benefit) for income taxes in the accompanying consolidated statements ofoperations. This estimated tax benefit was offset by approximately $4,843,000 for the estimated transition taxand a valuation allowance of $330,000 that was established to offset previously recognized FTC carryforwarddeferred tax assets that the Company believes will not be realized, and other adjustments totaling approximately$299,000. Both the estimated transition tax and valuation allowance were considered provisional amounts thatrequired further analysis. These provisional amounts were subject to adjustment during a measurement periodwhich should not extend beyond one year from the enactment date of the Act as in accordance with StaffAccounting Bulletin No. 118.
During FY 2019, the remeasurement offset was adjusted to $4,493,000 for the transition tax and a valuationallowance of $529,000. The net benefit of $151,000 has been recorded through the FY 2019 income taxprovision.
Net Income per Common Share
Basic net income per common share is computed by dividing net income attributable to commonstockholders by the weighted-average number of shares of common stock outstanding during the periods. Dilutednet income per common share reflects the potential dilution that could occur if securities or other contracts toissue common stock were exercised, vested or converted into common stock or resulted in the issuance ofcommon stock that then shared in the earnings of the Company. The potential dilutive securities (common stock
F-19
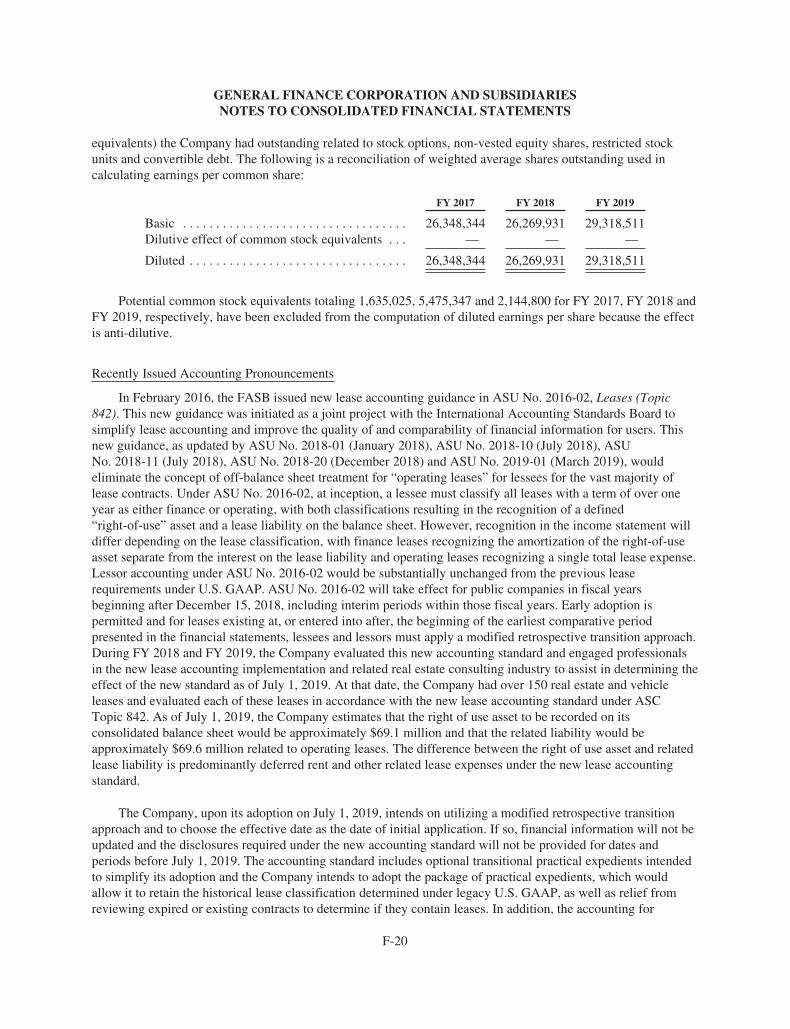
GENERAL FINANCE CORPORATION AND SUBSIDIARIESNOTES TO CONSOLIDATED FINANCIAL STATEMENTS
equivalents) the Company had outstanding related to stock options, non-vested equity shares, restricted stockunits and convertible debt. The following is a reconciliation of weighted average shares outstanding used incalculating earnings per common share:
FY 2017 FY 2018 FY 2019
Basic . . . . . . . . . . . . . . . . . . . . . . . . . . . . . . . . . . 26,348,344 26,269,931 29,318,511Dilutive effect of common stock equivalents . . . — — —
Diluted . . . . . . . . . . . . . . . . . . . . . . . . . . . . . . . . . 26,348,344 26,269,931 29,318,511
Potential common stock equivalents totaling 1,635,025, 5,475,347 and 2,144,800 for FY 2017, FY 2018 andFY 2019, respectively, have been excluded from the computation of diluted earnings per share because the effectis anti-dilutive.
Recently Issued Accounting Pronouncements
In February 2016, the FASB issued new lease accounting guidance in ASU No. 2016-02, Leases (Topic842). This new guidance was initiated as a joint project with the International Accounting Standards Board tosimplify lease accounting and improve the quality of and comparability of financial information for users. Thisnew guidance, as updated by ASU No. 2018-01 (January 2018), ASU No. 2018-10 (July 2018), ASUNo. 2018-11 (July 2018), ASU No. 2018-20 (December 2018) and ASU No. 2019-01 (March 2019), wouldeliminate the concept of off-balance sheet treatment for “operating leases” for lessees for the vast majority oflease contracts. Under ASU No. 2016-02, at inception, a lessee must classify all leases with a term of over oneyear as either finance or operating, with both classifications resulting in the recognition of a defined“right-of-use” asset and a lease liability on the balance sheet. However, recognition in the income statement willdiffer depending on the lease classification, with finance leases recognizing the amortization of the right-of-useasset separate from the interest on the lease liability and operating leases recognizing a single total lease expense.Lessor accounting under ASU No. 2016-02 would be substantially unchanged from the previous leaserequirements under U.S. GAAP. ASU No. 2016-02 will take effect for public companies in fiscal yearsbeginning after December 15, 2018, including interim periods within those fiscal years. Early adoption ispermitted and for leases existing at, or entered into after, the beginning of the earliest comparative periodpresented in the financial statements, lessees and lessors must apply a modified retrospective transition approach.During FY 2018 and FY 2019, the Company evaluated this new accounting standard and engaged professionalsin the new lease accounting implementation and related real estate consulting industry to assist in determining theeffect of the new standard as of July 1, 2019. At that date, the Company had over 150 real estate and vehicleleases and evaluated each of these leases in accordance with the new lease accounting standard under ASCTopic 842. As of July 1, 2019, the Company estimates that the right of use asset to be recorded on itsconsolidated balance sheet would be approximately $69.1 million and that the related liability would beapproximately $69.6 million related to operating leases. The difference between the right of use asset and relatedlease liability is predominantly deferred rent and other related lease expenses under the new lease accountingstandard.
The Company, upon its adoption on July 1, 2019, intends on utilizing a modified retrospective transitionapproach and to choose the effective date as the date of initial application. If so, financial information will not beupdated and the disclosures required under the new accounting standard will not be provided for dates andperiods before July 1, 2019. The accounting standard includes optional transitional practical expedients intendedto simplify its adoption and the Company intends to adopt the package of practical expedients, which wouldallow it to retain the historical lease classification determined under legacy U.S. GAAP, as well as relief fromreviewing expired or existing contracts to determine if they contain leases. In addition, the accounting for
F-20
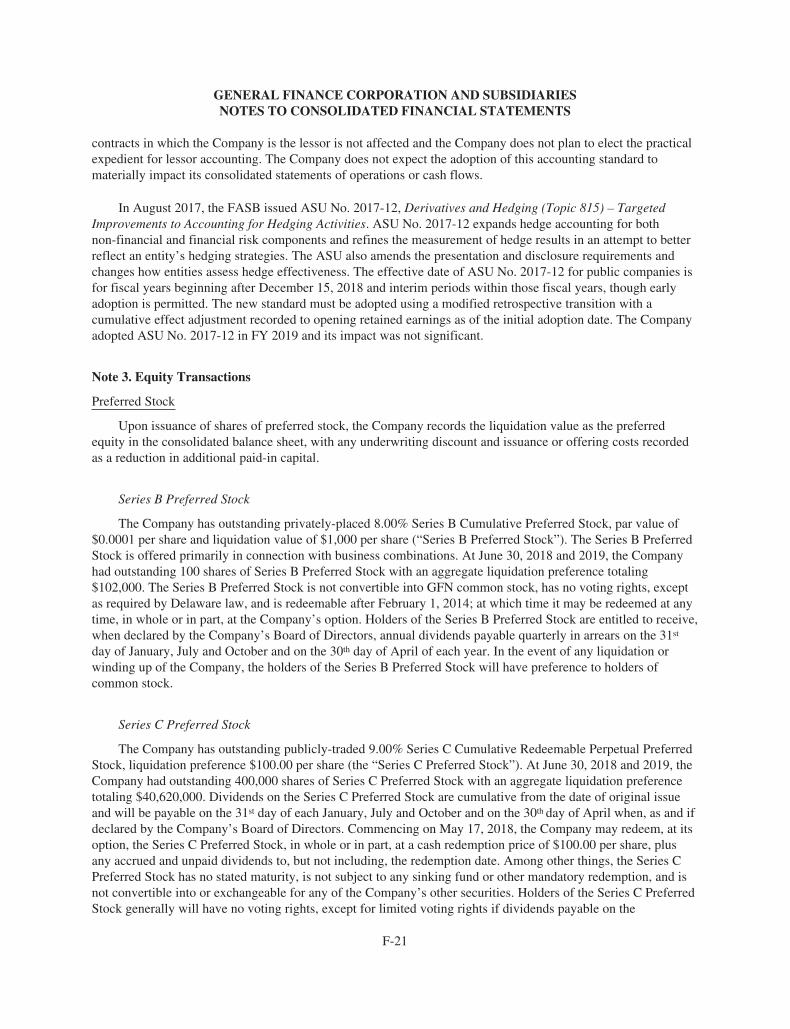
GENERAL FINANCE CORPORATION AND SUBSIDIARIESNOTES TO CONSOLIDATED FINANCIAL STATEMENTS
contracts in which the Company is the lessor is not affected and the Company does not plan to elect the practicalexpedient for lessor accounting. The Company does not expect the adoption of this accounting standard tomaterially impact its consolidated statements of operations or cash flows.
In August 2017, the FASB issued ASU No. 2017-12, Derivatives and Hedging (Topic 815) – TargetedImprovements to Accounting for Hedging Activities. ASU No. 2017-12 expands hedge accounting for bothnon-financial and financial risk components and refines the measurement of hedge results in an attempt to betterreflect an entity’s hedging strategies. The ASU also amends the presentation and disclosure requirements andchanges how entities assess hedge effectiveness. The effective date of ASU No. 2017-12 for public companies isfor fiscal years beginning after December 15, 2018 and interim periods within those fiscal years, though earlyadoption is permitted. The new standard must be adopted using a modified retrospective transition with acumulative effect adjustment recorded to opening retained earnings as of the initial adoption date. The Companyadopted ASU No. 2017-12 in FY 2019 and its impact was not significant.
Note 3. Equity Transactions
Preferred Stock
Upon issuance of shares of preferred stock, the Company records the liquidation value as the preferredequity in the consolidated balance sheet, with any underwriting discount and issuance or offering costs recordedas a reduction in additional paid-in capital.
Series B Preferred Stock
The Company has outstanding privately-placed 8.00% Series B Cumulative Preferred Stock, par value of$0.0001 per share and liquidation value of $1,000 per share (“Series B Preferred Stock”). The Series B PreferredStock is offered primarily in connection with business combinations. At June 30, 2018 and 2019, the Companyhad outstanding 100 shares of Series B Preferred Stock with an aggregate liquidation preference totaling$102,000. The Series B Preferred Stock is not convertible into GFN common stock, has no voting rights, exceptas required by Delaware law, and is redeemable after February 1, 2014; at which time it may be redeemed at anytime, in whole or in part, at the Company’s option. Holders of the Series B Preferred Stock are entitled to receive,when declared by the Company’s Board of Directors, annual dividends payable quarterly in arrears on the 31st
day of January, July and October and on the 30th day of April of each year. In the event of any liquidation orwinding up of the Company, the holders of the Series B Preferred Stock will have preference to holders ofcommon stock.
Series C Preferred Stock
The Company has outstanding publicly-traded 9.00% Series C Cumulative Redeemable Perpetual PreferredStock, liquidation preference $100.00 per share (the “Series C Preferred Stock”). At June 30, 2018 and 2019, theCompany had outstanding 400,000 shares of Series C Preferred Stock with an aggregate liquidation preferencetotaling $40,620,000. Dividends on the Series C Preferred Stock are cumulative from the date of original issueand will be payable on the 31st day of each January, July and October and on the 30th day of April when, as and ifdeclared by the Company’s Board of Directors. Commencing on May 17, 2018, the Company may redeem, at itsoption, the Series C Preferred Stock, in whole or in part, at a cash redemption price of $100.00 per share, plusany accrued and unpaid dividends to, but not including, the redemption date. Among other things, the Series CPreferred Stock has no stated maturity, is not subject to any sinking fund or other mandatory redemption, and isnot convertible into or exchangeable for any of the Company’s other securities. Holders of the Series C PreferredStock generally will have no voting rights, except for limited voting rights if dividends payable on the
F-21
GENERAL FINANCE CORPORATION AND SUBSIDIARIESNOTES TO CONSOLIDATED FINANCIAL STATEMENTS
outstanding Series C Preferred Stock are in arrears for six or more consecutive or non-consecutive quarters, andunder certain other circumstances. If the Company fails to maintain the listing of the Series C Preferred Stock onthe NASDAQ Stock Market (“NASDAQ”) for 30 days or more, the per annum dividend rate will increase by anadditional 2.00% per $100.00 stated liquidation value ($2.00 per annum per share) so long as the listing failurecontinues. In addition, in the event of any liquidation or winding up of the Company, the holders of the Series CPreferred Stock will have preference to holders of common stock and are pari passu with the Series B PreferredStock. The Series C Preferred Stock is listed on NASDAQ under the symbol “GFNCP.”
Dividends
As of June 30, 2019, since issuance, dividends paid or payable totaled $101,000 for the Series B PreferredStock and dividends paid totaled $21,740,000 for the Series C Preferred Stock. The characterization of dividendsto the recipients for Federal income tax purposes is made based upon the earnings and profits of the Company, asdefined by the Internal Revenue Code.
Royal Wolf Dividends
On August 10, 2016, the Board of Directors of Royal Wolf declared a dividend of AUS$0.025 per RWHshare payable on October 4, 2016 to shareholders of record on September 16, 2016 and on February 7, 2017, theBoard of Directors of Royal Wolf declared a dividend of AUS$0.025 per RWH share payable on April 4, 2017 toshareholders of record on March 16, 2017.
On August 2, 2017, Royal Wolf paid a special dividend of AUS$0.0265 per RWH share to shareholders ofrecord on July 18, 2017 (see Note 4).
The consolidated financial statements reflect the amount of the dividends pertaining to the noncontrollinginterest.
Note 4. Acquisitions
The Company can enhance its business and market share by entering into new markets in various ways,including starting up a new location or acquiring a business consisting of container, modular unit or mobile officeassets of another entity. An acquisition generally provides the Company with operations that enables it to at leastcover existing overhead costs and is preferable to a start-up or greenfield location. The acquisition(s) discussedbelow were completed primarily to expand the Company’s container lease fleet. The accompanying consolidatedfinancial statements include the operations of the acquired businesses from the dates of acquisition.
FY 2017 Acquisitions
On July 22, 2016, the Company, through Pac-Van, purchased the container business of The Great ContainerCompany, Ltd. (“GCC”), for $662,000 (C$869,000), which included holdback and other adjustment amountstotaling $102,000 (C$133,000). GCC is located in Vancouver, British Columbia.
On July 27, 2016, the Company, through Pac-Van, purchased the business of Container Systems Storage,Inc. (“CSS”), for $1,667,000, which included holdback and other adjustment amounts totaling approximately$120,000. CSS, which is located in Yakima, Washington, leases and sells storage containers in the state ofWashington and in northern Oregon.
On December 1, 2016, the Company, through Royal Wolf, purchased the container businesses of All DirectContainer Sales Pty Limited and ADC Storage Pty Limited as Trustee for the ADC Storage Unit Trust
F-22
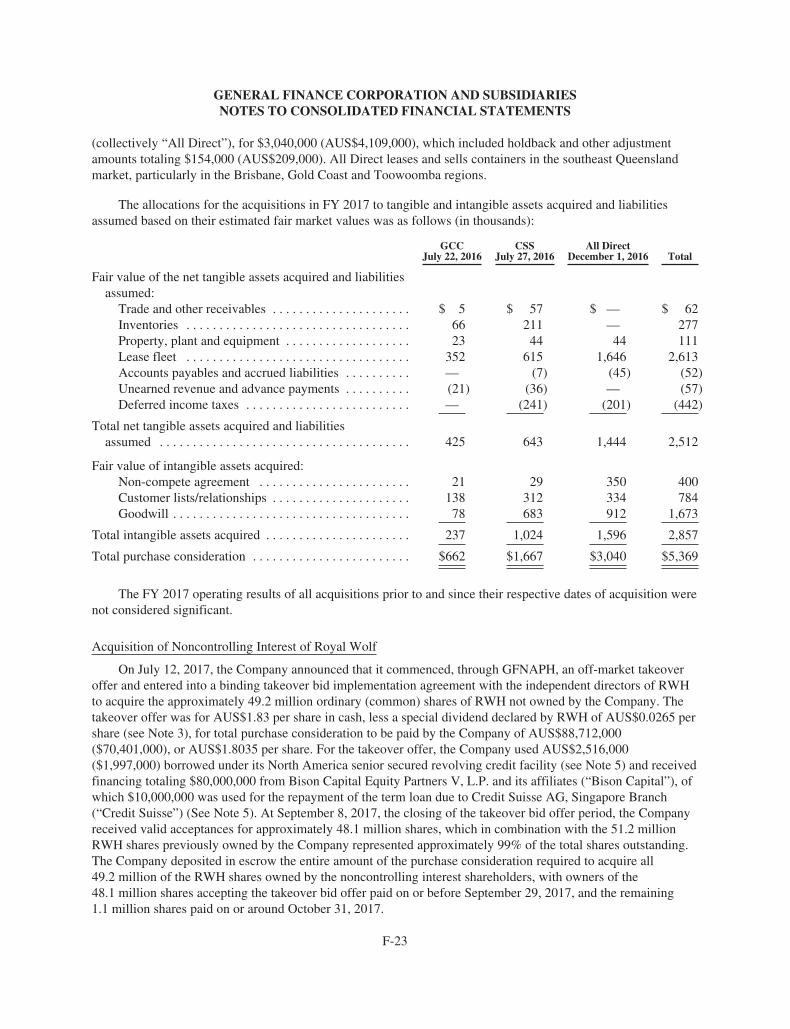
GENERAL FINANCE CORPORATION AND SUBSIDIARIESNOTES TO CONSOLIDATED FINANCIAL STATEMENTS
(collectively “All Direct”), for $3,040,000 (AUS$4,109,000), which included holdback and other adjustmentamounts totaling $154,000 (AUS$209,000). All Direct leases and sells containers in the southeast Queenslandmarket, particularly in the Brisbane, Gold Coast and Toowoomba regions.
The allocations for the acquisitions in FY 2017 to tangible and intangible assets acquired and liabilitiesassumed based on their estimated fair market values was as follows (in thousands):
GCCJuly 22, 2016
CSSJuly 27, 2016
All DirectDecember 1, 2016 Total
Fair value of the net tangible assets acquired and liabilitiesassumed:
Trade and other receivables . . . . . . . . . . . . . . . . . . . . . $ 5 $ 57 $ — $ 62Inventories . . . . . . . . . . . . . . . . . . . . . . . . . . . . . . . . . . 66 211 — 277Property, plant and equipment . . . . . . . . . . . . . . . . . . . 23 44 44 111Lease fleet . . . . . . . . . . . . . . . . . . . . . . . . . . . . . . . . . . 352 615 1,646 2,613Accounts payables and accrued liabilities . . . . . . . . . . — (7) (45) (52)Unearned revenue and advance payments . . . . . . . . . . (21) (36) — (57)Deferred income taxes . . . . . . . . . . . . . . . . . . . . . . . . . — (241) (201) (442)
Total net tangible assets acquired and liabilitiesassumed . . . . . . . . . . . . . . . . . . . . . . . . . . . . . . . . . . . . . . 425 643 1,444 2,512
Fair value of intangible assets acquired:Non-compete agreement . . . . . . . . . . . . . . . . . . . . . . . 21 29 350 400Customer lists/relationships . . . . . . . . . . . . . . . . . . . . . 138 312 334 784Goodwill . . . . . . . . . . . . . . . . . . . . . . . . . . . . . . . . . . . . 78 683 912 1,673
Total intangible assets acquired . . . . . . . . . . . . . . . . . . . . . . 237 1,024 1,596 2,857
Total purchase consideration . . . . . . . . . . . . . . . . . . . . . . . . $662 $1,667 $3,040 $5,369
The FY 2017 operating results of all acquisitions prior to and since their respective dates of acquisition werenot considered significant.
Acquisition of Noncontrolling Interest of Royal Wolf
On July 12, 2017, the Company announced that it commenced, through GFNAPH, an off-market takeoveroffer and entered into a binding takeover bid implementation agreement with the independent directors of RWHto acquire the approximately 49.2 million ordinary (common) shares of RWH not owned by the Company. Thetakeover offer was for AUS$1.83 per share in cash, less a special dividend declared by RWH of AUS$0.0265 pershare (see Note 3), for total purchase consideration to be paid by the Company of AUS$88,712,000($70,401,000), or AUS$1.8035 per share. For the takeover offer, the Company used AUS$2,516,000($1,997,000) borrowed under its North America senior secured revolving credit facility (see Note 5) and receivedfinancing totaling $80,000,000 from Bison Capital Equity Partners V, L.P. and its affiliates (“Bison Capital”), ofwhich $10,000,000 was used for the repayment of the term loan due to Credit Suisse AG, Singapore Branch(“Credit Suisse”) (See Note 5). At September 8, 2017, the closing of the takeover bid offer period, the Companyreceived valid acceptances for approximately 48.1 million shares, which in combination with the 51.2 millionRWH shares previously owned by the Company represented approximately 99% of the total shares outstanding.The Company deposited in escrow the entire amount of the purchase consideration required to acquire all49.2 million of the RWH shares owned by the noncontrolling interest shareholders, with owners of the48.1 million shares accepting the takeover bid offer paid on or before September 29, 2017, and the remaining1.1 million shares paid on or around October 31, 2017.
F-23
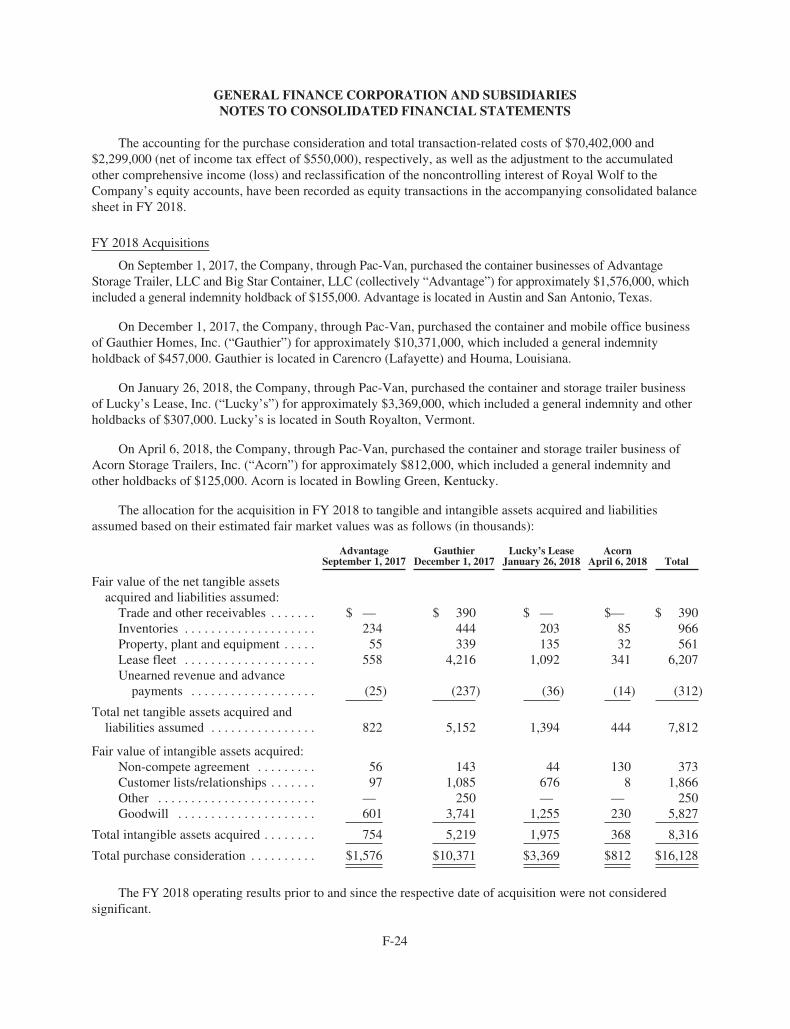
GENERAL FINANCE CORPORATION AND SUBSIDIARIESNOTES TO CONSOLIDATED FINANCIAL STATEMENTS
The accounting for the purchase consideration and total transaction-related costs of $70,402,000 and$2,299,000 (net of income tax effect of $550,000), respectively, as well as the adjustment to the accumulatedother comprehensive income (loss) and reclassification of the noncontrolling interest of Royal Wolf to theCompany’s equity accounts, have been recorded as equity transactions in the accompanying consolidated balancesheet in FY 2018.
FY 2018 Acquisitions
On September 1, 2017, the Company, through Pac-Van, purchased the container businesses of AdvantageStorage Trailer, LLC and Big Star Container, LLC (collectively “Advantage”) for approximately $1,576,000, whichincluded a general indemnity holdback of $155,000. Advantage is located in Austin and San Antonio, Texas.
On December 1, 2017, the Company, through Pac-Van, purchased the container and mobile office businessof Gauthier Homes, Inc. (“Gauthier”) for approximately $10,371,000, which included a general indemnityholdback of $457,000. Gauthier is located in Carencro (Lafayette) and Houma, Louisiana.
On January 26, 2018, the Company, through Pac-Van, purchased the container and storage trailer businessof Lucky’s Lease, Inc. (“Lucky’s”) for approximately $3,369,000, which included a general indemnity and otherholdbacks of $307,000. Lucky’s is located in South Royalton, Vermont.
On April 6, 2018, the Company, through Pac-Van, purchased the container and storage trailer business ofAcorn Storage Trailers, Inc. (“Acorn”) for approximately $812,000, which included a general indemnity andother holdbacks of $125,000. Acorn is located in Bowling Green, Kentucky.
The allocation for the acquisition in FY 2018 to tangible and intangible assets acquired and liabilitiesassumed based on their estimated fair market values was as follows (in thousands):
AdvantageSeptember 1, 2017
GauthierDecember 1, 2017
Lucky’s LeaseJanuary 26, 2018
AcornApril 6, 2018 Total
Fair value of the net tangible assetsacquired and liabilities assumed:
Trade and other receivables . . . . . . . $ — $ 390 $ — $— $ 390Inventories . . . . . . . . . . . . . . . . . . . . 234 444 203 85 966Property, plant and equipment . . . . . 55 339 135 32 561Lease fleet . . . . . . . . . . . . . . . . . . . . 558 4,216 1,092 341 6,207Unearned revenue and advance
payments . . . . . . . . . . . . . . . . . . . (25) (237) (36) (14) (312)
Total net tangible assets acquired andliabilities assumed . . . . . . . . . . . . . . . . 822 5,152 1,394 444 7,812
Fair value of intangible assets acquired:Non-compete agreement . . . . . . . . . 56 143 44 130 373Customer lists/relationships . . . . . . . 97 1,085 676 8 1,866Other . . . . . . . . . . . . . . . . . . . . . . . . — 250 — — 250Goodwill . . . . . . . . . . . . . . . . . . . . . 601 3,741 1,255 230 5,827
Total intangible assets acquired . . . . . . . . 754 5,219 1,975 368 8,316
Total purchase consideration . . . . . . . . . . $1,576 $10,371 $3,369 $812 $16,128
The FY 2018 operating results prior to and since the respective date of acquisition were not consideredsignificant.
F-24

GENERAL FINANCE CORPORATION AND SUBSIDIARIESNOTES TO CONSOLIDATED FINANCIAL STATEMENTS
FY 2019 Acquisitions
On July 2, 2018, the Company, through Royal Wolf, purchased the container business of Spacewise (N.Z.)Limited (“Spacewise NZ”), for approximately $7,337,000 (NZ$10,901,000) which included holdback and otheradjustment amounts totaling approximately $615,000 (NZ$914,000). Spacewise operates from eight majorlocations in New Zealand.
On August 9, 2018, the Company, through Pac-Van, purchased the container and trailer business ofDelmarva Trailer Sales and Rentals, Inc. (“Delmarva”) for approximately $358,000, which included a generalindemnity and other adjustment amounts of $50,000. Delmarva is located in Elkridge (Baltimore/D.C. area),Maryland.
On September 21, 2018, the Company, through Pac-Van, purchased the container and trailer business ofInstant Storage and Instant Storage of Florida, Inc. (“Instant Storage”) for approximately $4,568,000, whichincluded a general indemnity and other adjustment amounts of $464,000. Instant Storage is located inBakersfield, California and Opa-Locka (Miami area), Florida.
On October 5, 2018, the Company, through Pac-Van, purchased the container and trailer business of TiltonTrailer Rental Corp. (“Tilton”) for approximately $5,431,000, which included a general indemnity and otheradjustment amounts of $505,000. Tilton is located in Tilton, New Hampshire.
On March 27, 2019, the Company, through Pac-Van, purchased the container and trailer business of BBSLeasing, LLP (“BBS Leasing”) for approximately $1,117,000, which included a general indemnity and otheradjustment amounts of $100,000. BBS Leasing is located in Fort Worth, Texas.
On May 7, 2019, the Company, through Pac-Van, purchased the container and trailer business of PierMobile Storage, Inc. (“Pier Mobile”) for approximately $1,694,000, which included a general indemnity andother adjustment amounts of $173,000. Pier Mobile operates from three locations in Kentucky.
The allocation for the acquisition in FY 2019 to tangible and intangible assets acquired and liabilitiesassumed based on their estimated fair market values was as follows (in thousands):
Spacewise NZJuly 2,2018
DelmarvaAugust 9,
2018
InstantStorage
September 21,2018
TiltonOctober 5,
2018
BBS LeasingMarch 27,
2019
PierMobileMay 7,2019 Total
Fair value of the net tangible assetsacquired and liabilities assumed:
Trade and other receivables . . $ — $ — $ — $ — $ — $ — $ —Inventories . . . . . . . . . . . . . . . 995 157 555 318 355 682 3,062Property, plant and
equipment . . . . . . . . . . . . . . 79 38 465 329 — 195 1,106Lease fleet . . . . . . . . . . . . . . . . 6,834 893 3,013 2,775 234 504 14,253Unearned revenue and
advance payments . . . . . . . . (5) (112) (289) (260) (35) (30) (731)Deferred income taxes . . . . . . (225) — — — — — (225)
Total net tangible assets acquiredand liabilities assumed . . . . . . . . 7,678 976 3,744 3,162 554 1,351 17,465
F-25
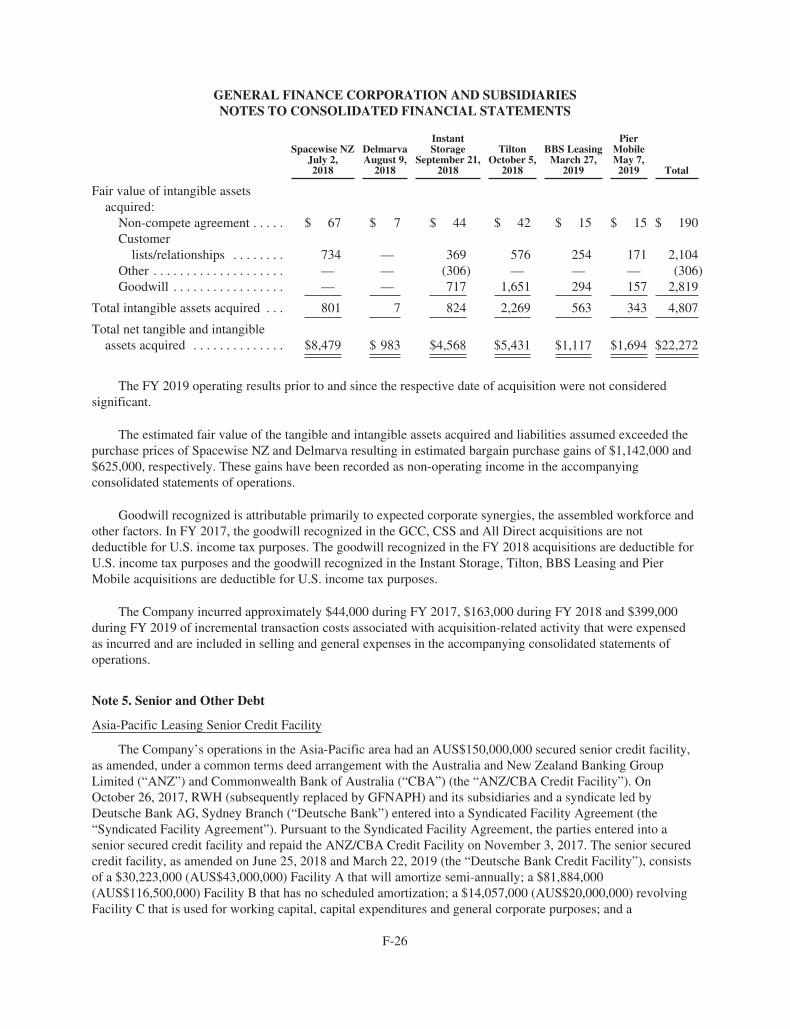
GENERAL FINANCE CORPORATION AND SUBSIDIARIESNOTES TO CONSOLIDATED FINANCIAL STATEMENTS
Spacewise NZJuly 2,2018
DelmarvaAugust 9,
2018
InstantStorage
September 21,2018
TiltonOctober 5,
2018
BBS LeasingMarch 27,
2019
PierMobileMay 7,2019 Total
Fair value of intangible assetsacquired:
Non-compete agreement . . . . . $ 67 $ 7 $ 44 $ 42 $ 15 $ 15 $ 190Customer
lists/relationships . . . . . . . . 734 — 369 576 254 171 2,104Other . . . . . . . . . . . . . . . . . . . . — — (306) — — — (306)Goodwill . . . . . . . . . . . . . . . . . — — 717 1,651 294 157 2,819
Total intangible assets acquired . . . 801 7 824 2,269 563 343 4,807
Total net tangible and intangibleassets acquired . . . . . . . . . . . . . . $8,479 $ 983 $4,568 $5,431 $1,117 $1,694 $22,272
The FY 2019 operating results prior to and since the respective date of acquisition were not consideredsignificant.
The estimated fair value of the tangible and intangible assets acquired and liabilities assumed exceeded thepurchase prices of Spacewise NZ and Delmarva resulting in estimated bargain purchase gains of $1,142,000 and$625,000, respectively. These gains have been recorded as non-operating income in the accompanyingconsolidated statements of operations.
Goodwill recognized is attributable primarily to expected corporate synergies, the assembled workforce andother factors. In FY 2017, the goodwill recognized in the GCC, CSS and All Direct acquisitions are notdeductible for U.S. income tax purposes. The goodwill recognized in the FY 2018 acquisitions are deductible forU.S. income tax purposes and the goodwill recognized in the Instant Storage, Tilton, BBS Leasing and PierMobile acquisitions are deductible for U.S. income tax purposes.
The Company incurred approximately $44,000 during FY 2017, $163,000 during FY 2018 and $399,000during FY 2019 of incremental transaction costs associated with acquisition-related activity that were expensedas incurred and are included in selling and general expenses in the accompanying consolidated statements ofoperations.
Note 5. Senior and Other Debt
Asia-Pacific Leasing Senior Credit Facility
The Company’s operations in the Asia-Pacific area had an AUS$150,000,000 secured senior credit facility,as amended, under a common terms deed arrangement with the Australia and New Zealand Banking GroupLimited (“ANZ”) and Commonwealth Bank of Australia (“CBA”) (the “ANZ/CBA Credit Facility”). OnOctober 26, 2017, RWH (subsequently replaced by GFNAPH) and its subsidiaries and a syndicate led byDeutsche Bank AG, Sydney Branch (“Deutsche Bank”) entered into a Syndicated Facility Agreement (the“Syndicated Facility Agreement”). Pursuant to the Syndicated Facility Agreement, the parties entered into asenior secured credit facility and repaid the ANZ/CBA Credit Facility on November 3, 2017. The senior securedcredit facility, as amended on June 25, 2018 and March 22, 2019 (the “Deutsche Bank Credit Facility”), consistsof a $30,223,000 (AUS$43,000,000) Facility A that will amortize semi-annually; a $81,884,000(AUS$116,500,000) Facility B that has no scheduled amortization; a $14,057,000 (AUS$20,000,000) revolvingFacility C that is used for working capital, capital expenditures and general corporate purposes; and a
F-26
GENERAL FINANCE CORPORATION AND SUBSIDIARIESNOTES TO CONSOLIDATED FINANCIAL STATEMENTS
$26,358,000 (AUS$37,500,000) revolving Term Loan Facility D. Borrowings bear interest at the three-monthbank bill swap interest rate in Australia (“BBSY”), plus a margin of 4.25% to 5.50% per annum, as determinedby net leverage, as defined. In addition, financing fees totaling $2,018,200 (AUS$2,871,400) are payablequarterly in advance through maturity. The Deutsche Bank Credit Facility is secured by substantially all of theassets of Royal Wolf and by the pledge of all the capital stock of GFNAPH and its subsidiaries and matures onNovember 2, 2023. However, an exit fee of $739,100 (AUS$1,051,600) is due on November 3, 2020 from theoriginal November 3, 2017 financing. Prepayment penalties equal to 3.0% and 1.0% of any amount prepaidunder the Deutsche Bank Credit Facility will expire on March 22, 2020 and 2021, with no prepayment penaltydue after March 22, 2021.
The Deutsche Bank Credit Facility is subject to certain financial and other customary covenants, including,among other things, compliance with specified net leverage and debt requirement or fixed charge ratios based onearnings before interest, income taxes, impairment, depreciation and amortization and other non-operating costsand income (“EBITDA”), as defined. The Deutsche Bank Credit Facility Agreement also requires Royal Wolf toprepay amounts borrowed by a percentage of excess cash flow, as defined, as of the end of each fiscal year,depending on the net leverage ratio as of such date.
At June 30, 2019, the Deutsche Bank Credit Facility totaled $134,414,000 (AUS$191,236,000), net ofdeferred financing costs of $1,108,000 (AUS$1,577,000), and availability, including cash at the bank, totaled$20,080,000 (AUS$28,568,000).
The above amounts were translated based upon the exchange rate of one Australian dollar to 0.702871 U.S.dollar and one New Zealand dollar to 0.672146 U.S. dollar at June 30, 2019.
Bison Capital Notes
General
On September 19, 2017, Bison Capital Equity Partners V, L.P and its affiliates (“Bison Capital”), GFN,GFN U.S., GFNAPH and GFN Asia Pacific Finance Pty Ltd, an Australian corporation (“GFNAPF”), enteredinto that certain Amended and Restated Securities Purchase Agreement dated September 19, 2017 (the“Amended Securities Purchase Agreement”). On September 25, 2017, pursuant to the Amended SecuritiesPurchase Agreement, GFNAPH and GFNAPF issued and sold to Bison an 11.9% secured senior convertiblepromissory note dated September 25, 2017 in the original principal amount of $26,000,000 (the “ConvertibleNote”) and an 11.9% secured senior promissory note dated September 25, 2017 in the original principal amountof $54,000,000 (the “Senior Term Note” and collectively with the Convertible Note, the “Bison Capital Notes”).Net proceeds from the sale of the Bison Capital Notes were used to repay in full all principal, interest and otheramounts due under the term loan to Credit Suisse, to acquire the 49,188,526 publicly-traded shares of RWH notowned by the Company and to pay all related fees and expenses.
The Bison Capital Notes had a maturity of five years and bore interest from the date of issuance, payablequarterly in arrears beginning on January 2, 2018. The Bison Capital Notes may have been prepaid at 102% ofthe original principal amount, plus accrued interest, after the first anniversary and prior to the second anniversaryof issuance, at 101% of the original principal amount, plus accrued interest, after the second anniversary andprior to the third anniversary of issuance and with no prepayment premium after the third anniversary ofissuance. The Company may have elected to defer interest under the Bison Capital Notes until the secondanniversary of issuance. Interest on the Bison Capital Notes were payable in Australian dollars, but the principalwas to be repaid in U.S. dollars. The Bison Capital Notes were secured by a first priority security interest over allof the assets of GFN U.S., GFNAPH and GFNAPF, by the pledge by GFN U.S. of the capital stock of GFNAPH
F-27
GENERAL FINANCE CORPORATION AND SUBSIDIARIESNOTES TO CONSOLIDATED FINANCIAL STATEMENTS
and GFNAPF and by of all of the capital stock of RWH. The Bison Capital Notes were subject to all terms,conditions and covenants set forth in the Amended Securities Purchase Agreement. The Amended SecuritiesPurchase Agreement contained certain financial and other customary and restrictive covenants, including, amongother things, a minimum EBITDA requirement to equal or exceed AUS$30,000,000 per trailing 12-month period.In addition, the Bison Capital Notes must have been repaid upon a change of control, as defined. GFNAPF wasdissolved in September 2018.
On March 25, 2019, the Senior Term Note was repaid in full by proceeds totaling $63,311,000(AUS$89,804,000) borrowed under the Deutsche Bank Credit Facility, which included interest the Companyelected to defer and a prepayment fee of two percent.
Convertible Note
At any time prior to maturity, Bison Capital may have converted unpaid principal and interest under theConvertible Note into shares of GFN common stock based upon a price of $8.50 per share (3,058,824 sharesbased on the original $26,000,000 principal amount), subject to adjustment as described in the Convertible Note.If GFN common stock trades above 150% of the conversion price over 30 consecutive trading days and theaggregate dollar value of all GFN common stock traded on NASDAQ exceeds $600,000 over the last 20consecutive days of the same 30-day period, GFN may force Bison Capital to convert all or a portion of theConvertible Note. Such a conversion threshold occurred on September 5, 2018, and on September 6, 2018 theCompany elected to force the conversion and delivered a notice to the holders requiring the conversion of theConvertible Note into 3,058,824 shares of the Company’s common stock effective September 10, 2018. TheConvertible Note included a provision which required GFNAPH to pay Bison Capital, via the payment ofprincipal, interest and the realized value of GFN common stock received after conversion of the ConvertibleNote, a minimum return of 1.75 times the original principal amount. Although the conversion feature of thisminimum return provision was included in the conversion rights derivative discussed below, as a result of theforced conversion, this embedded derivative with a fair value of $8,918,000 at September 10, 2018 remainsbifurcated and separately accounted for on a standalone basis. The Company determined the fair value using avaluation model and market prices and will reassess its value at each reporting period, with any changes in valuereported in the accompanying consolidated statements of operations. At June 30, 2019, the fair value of thisbifurcated derivative was $19,782,000. In the event that Bison Capital or holders of the Convertible Note receiveaggregate proceeds in excess of $48,900,000 from the sale of GFN common stock received after the conversionof the Convertible Note, then 50% of the interest actually paid to Bison Capital (such amount, the “PriceIncrease”) shall be repaid by Bison Capital or holders of the Convertible Note by either (i) paying such PriceIncrease to GFNAPH in the form of cash, (ii) returning to GFN shares of GFN Common Stock with a value equalto the Price Increase or (iii) any combination of (i) or (ii) above that if the aggregate equals the Price Increase.The value of the GFN common stock for purposes of the return of shares to GFN shall be deemed to be theaverage price per share of GFN common stock realized by the Convertible Note holder in the sale of such shares.The Convertible Note holders may satisfy such obligations by returning to GFN shares of GFN common stockwith an aggregate value equivalent to the Price Increase.
The Company evaluated the Convertible Note at its issuance and determined that certain conversion rightswere an embedded derivative that required bifurcation because they were not deemed to be clearly and closelyrelated to the Convertible Note, met the definition of a derivative and none of the exceptions applied. As a result,the Company separately accounted for these conversion rights as a standalone derivative. As of the date ofissuance on September 25, 2017, the fair value of this bifurcated derivative was determined to be $1,864,000,resulting in a principal balance of $24,136,000 for the Convertible Note. The Company determined the fair valueof the bifurcated derivative using a valuation model and market prices and reassessed its fair value at the end ofeach reporting period, with any changes in value reported in the accompanying consolidated statements of
F-28
GENERAL FINANCE CORPORATION AND SUBSIDIARIESNOTES TO CONSOLIDATED FINANCIAL STATEMENTS
operations. At September 10, 2018, prior to conversion, the fair value of this bifurcated derivative was$29,288,000, of which $20,370,000 was extinguished upon the conversion of the Convertible Note into shares ofthe Company’s common stock. The value of the shares received was recorded as a benefit to equity of$44,506,000 in FY 2019.
North America Senior Credit Facility
The North America leasing (Pac-Van and Lone Star) and manufacturing operations (Southern Frac) have acombined $260,000,000 senior secured revolving credit facility, as amended, with a syndicate led by Wells FargoBank, National Association (“Wells Fargo”) that also includes East West Bank, CIT Bank, N.A., the CanadianImperial Bank of Commerce (“CIBC”), KeyBank, National Association, Bank Hapoalim B.M. and AssociatedBank, N.A. (the “Wells Fargo Credit Facility”). In addition, the Wells Fargo Credit Facility provides anaccordion feature that may be exercised by the syndicate, subject to the terms in the credit agreement, to increasethe maximum amount that may be borrowed by an additional $25,000,000. The Wells Fargo Credit Facilitymatures on March 24, 2022, assuming the Company’s publicly-traded senior notes due July 31, 2021(see below)are extended at least 90 days past this scheduled maturity date; otherwise the Wells Fargo Credit Facility wouldmature on March 24, 2021. There was also a separate loan agreement with Great American Capital Partners(“GACP”), where GACP provided a First-In, Last-Out Term Loan (“FILO Term Loan”) within the Wells FargoCredit Facility in the amount of $20,000,000 that had the same maturity date and commenced principalamortization on October 1, 2018 at $500,000 per quarter. On December 24, 2018, the FILO Term Loan, with aprincipal balance of $19,500,000, including accrued interest and prepayment fee of one percent, was repaid infull through borrowings from the Wells Fargo Credit Facility and all terms and provisions relating to the FILOTerm Loan were terminated within the credit agreement.
The Wells Fargo Credit Facility is secured by substantially all of the rental fleet, inventory and other assetsof the Company’s North American leasing and manufacturing operations. The Wells Fargo Credit Facilityeffectively not only finances the North American operations, but also the funding requirements for the Series CPreferred Stock (see Note 3) and the publicly-traded unsecured senior notes. The maximum amount ofintercompany dividends that Pac-Van and Lone Star are allowed to pay in each fiscal year to GFN for thefunding requirements of GFN’s senior and other debt and the Series C Preferred Stock are (a) the lesser of$5,000,000 for the Series C Preferred Stock or the amount equal to the dividend rate of the Series C PreferredStock and its aggregate liquidation preference and the actual amount of dividends required to be paid to theSeries C Preferred Stock; and (b) $6,300,000 for the public offering of unsecured senior notes or the actualamount of annual interest required to be paid; provided that (i) the payment of such dividends does not cause adefault or event of default; (ii) each of Pac-Van and Lone Star is solvent; (iii) excess availability, as defined, is$5,000,000 or more under the Wells Fargo Credit Facility; (iv) the fixed charge coverage ratio, as defined, willbe greater than 1.25 to 1.00; and (v) the dividends are paid no earlier than ten business days prior to the date theyare due.
Borrowings under the Wells Fargo Credit Facility accrue interest, at the Company’s option, either at thebase rate, plus 0.5% and a range of 1.00% to 1.50%, or the LIBOR rate, plus 1.0% and a range of 2.50% to3.00%. The FILO Term Loan that was within the Wells Fargo Credit Facility bore interest at 11.00% above theLIBOR rate, with a LIBOR rate floor of 1.00%. The Wells Fargo Credit Facility contains, among other things,certain financial covenants, including fixed charge coverage ratios, and other covenants, representations,warranties, indemnification provisions, and events of default that are customary for senior secured creditfacilities; including a covenant that would require repayment upon a change in control, as defined.
At June 30, 2019, borrowings and availability under the Wells Fargo Credit Facility totaled $193,587,000and $60,150,000, respectively.
F-29
GENERAL FINANCE CORPORATION AND SUBSIDIARIESNOTES TO CONSOLIDATED FINANCIAL STATEMENTS
Credit Suisse Term Loan
On March 31, 2014, the Company entered into a $25,000,000 facility agreement, as amended, with CreditSuisse (“Credit Suisse Term Loan”) as part of the financing for the acquisition of Lone Star and, on April 3,2014, the Company borrowed the $25,000,000 available to it. The Credit Suisse Term Loan provided that theamount borrowed would bear interest at LIBOR plus 7.50% per year, would be payable quarterly and that allprincipal and interest would mature on July 1, 2018. In addition, the Credit Suisse Term Loan was secured by afirst ranking pledge over substantially all shares of RWH owned by GFN U.S., required a certain coveragemaintenance ratio in U.S. dollars based on the value of the RWH shares and, among other things, that an amountequal to six-months interest be deposited in an interest reserve account pledged to secure repayment of allamounts borrowed. The Company had repaid, prior to maturity, $15,000,000 of the outstanding borrowings ofthe Credit Suisse Term Loan and, as of June 30, 2017, $9,920,000 remained outstanding, net of unamortized debtissuance costs of $80,000. On September 25, 2017, in connection with the acquisition of the noncontrollinginterest of Royal Wolf (see Note 4), the Credit Suisse Term Loan was fully repaid.
Senior Notes
On June 18, 2014, the Company completed the sale of unsecured senior notes (the “Senior Notes”) in apublic offering for an aggregate principal amount of $72,000,000. On April 24, 2017, the Company completedthe sale of a “tack-on” offering of its publicly-traded Senior Notes for an aggregate principal amount of$5,390,000 that was priced at $24.95 per denomination. Net proceeds were $5,190,947, after deducting anaggregate original issue discount (“OID”) of $10,780 and underwriting discount of $188,273. In both offerings,the Company used at least 80% of the gross proceeds to reduce indebtedness at Pac-Van and Lone Star under theWells Fargo Credit Facility in order to permit the payment of intercompany dividends by Pac-Van and Lone Starto GFN to fund the interest requirements of the Senior Notes. For the ‘tack-on” offering, this amounted to$4,303,376 of the net proceeds. The Company has total outstanding publicly-traded Senior Notes in an aggregateprincipal amount of $77,390,000 ($75,824,000 and $76,184,000, net of unamortized debt issuance costs of$1,566,000 and $1,206,000, at June 30, 2018 and 2019, respectively).
The Senior Notes were issued in minimum denominations of $25 and integral multiples of $25 in excessthereof and pursuant to the first supplemental indenture (the “First Supplemental Indenture”) dated as of June 18,2014 by and between the Company and Wells Fargo, as trustee (the “Trustee”). The First Supplemental Indenturesupplements the indenture entered into by and between the Company and the Trustee dated as of June 18, 2014(the “Base Indenture”). The Senior Notes bear interest at the rate of 8.125% per annum, mature on July 31, 2021and are not subject to any sinking fund. Interest on the Senior Notes is payable quarterly in arrears on January 31,April 30, July 31 and October 31, commencing on July 31, 2014. The Senior Notes rank equally in right ofpayment with all of the Company’s existing and future unsecured senior debt and senior in right of payment to allof its existing and future subordinated debt. The Senior Notes are effectively subordinated to any of theCompany’s existing and future secured debt, to the extent of the value of the assets securing such debt. TheSenior Notes are structurally subordinated to all existing and future liabilities of the Company’s subsidiaries andare not guaranteed by any of the Company’s subsidiaries.
On October 31, 2018, the Company successfully completed a consent solicitation to amend the BaseIndenture and First Supplemental Indenture to permit the Company to incur additional indebtedness from time totime, including pursuant to its existing Wells Fargo Credit Facility and existing master capital lease agreement,or such new capital lease obligations as the Company may enter into from time to time. The consent of at least amajority in the aggregate principal amount outstanding of the Senior Notes as of the record date (as defined inthe consent solicitation statement dated October 16, 2018) was required to approve the proposed amendmentsand the Company received consents from approximately 63.3% of the holders of the Senior Notes. Upon the
F-30
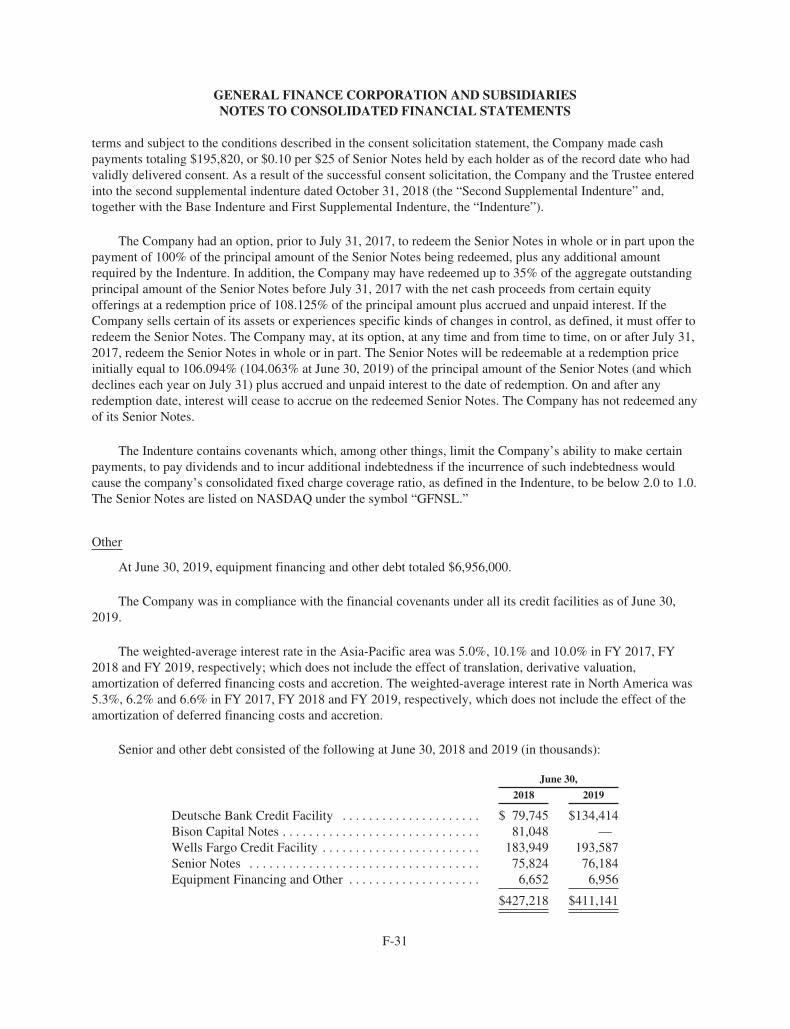
GENERAL FINANCE CORPORATION AND SUBSIDIARIESNOTES TO CONSOLIDATED FINANCIAL STATEMENTS
terms and subject to the conditions described in the consent solicitation statement, the Company made cashpayments totaling $195,820, or $0.10 per $25 of Senior Notes held by each holder as of the record date who hadvalidly delivered consent. As a result of the successful consent solicitation, the Company and the Trustee enteredinto the second supplemental indenture dated October 31, 2018 (the “Second Supplemental Indenture” and,together with the Base Indenture and First Supplemental Indenture, the “Indenture”).
The Company had an option, prior to July 31, 2017, to redeem the Senior Notes in whole or in part upon thepayment of 100% of the principal amount of the Senior Notes being redeemed, plus any additional amountrequired by the Indenture. In addition, the Company may have redeemed up to 35% of the aggregate outstandingprincipal amount of the Senior Notes before July 31, 2017 with the net cash proceeds from certain equityofferings at a redemption price of 108.125% of the principal amount plus accrued and unpaid interest. If theCompany sells certain of its assets or experiences specific kinds of changes in control, as defined, it must offer toredeem the Senior Notes. The Company may, at its option, at any time and from time to time, on or after July 31,2017, redeem the Senior Notes in whole or in part. The Senior Notes will be redeemable at a redemption priceinitially equal to 106.094% (104.063% at June 30, 2019) of the principal amount of the Senior Notes (and whichdeclines each year on July 31) plus accrued and unpaid interest to the date of redemption. On and after anyredemption date, interest will cease to accrue on the redeemed Senior Notes. The Company has not redeemed anyof its Senior Notes.
The Indenture contains covenants which, among other things, limit the Company’s ability to make certainpayments, to pay dividends and to incur additional indebtedness if the incurrence of such indebtedness wouldcause the company’s consolidated fixed charge coverage ratio, as defined in the Indenture, to be below 2.0 to 1.0.The Senior Notes are listed on NASDAQ under the symbol “GFNSL.”
Other
At June 30, 2019, equipment financing and other debt totaled $6,956,000.
The Company was in compliance with the financial covenants under all its credit facilities as of June 30,2019.
The weighted-average interest rate in the Asia-Pacific area was 5.0%, 10.1% and 10.0% in FY 2017, FY2018 and FY 2019, respectively; which does not include the effect of translation, derivative valuation,amortization of deferred financing costs and accretion. The weighted-average interest rate in North America was5.3%, 6.2% and 6.6% in FY 2017, FY 2018 and FY 2019, respectively, which does not include the effect of theamortization of deferred financing costs and accretion.
Senior and other debt consisted of the following at June 30, 2018 and 2019 (in thousands):
June 30,
2018 2019
Deutsche Bank Credit Facility . . . . . . . . . . . . . . . . . . . . . $ 79,745 $134,414Bison Capital Notes . . . . . . . . . . . . . . . . . . . . . . . . . . . . . . 81,048 —Wells Fargo Credit Facility . . . . . . . . . . . . . . . . . . . . . . . . 183,949 193,587Senior Notes . . . . . . . . . . . . . . . . . . . . . . . . . . . . . . . . . . . 75,824 76,184Equipment Financing and Other . . . . . . . . . . . . . . . . . . . . 6,652 6,956
$427,218 $411,141
F-31
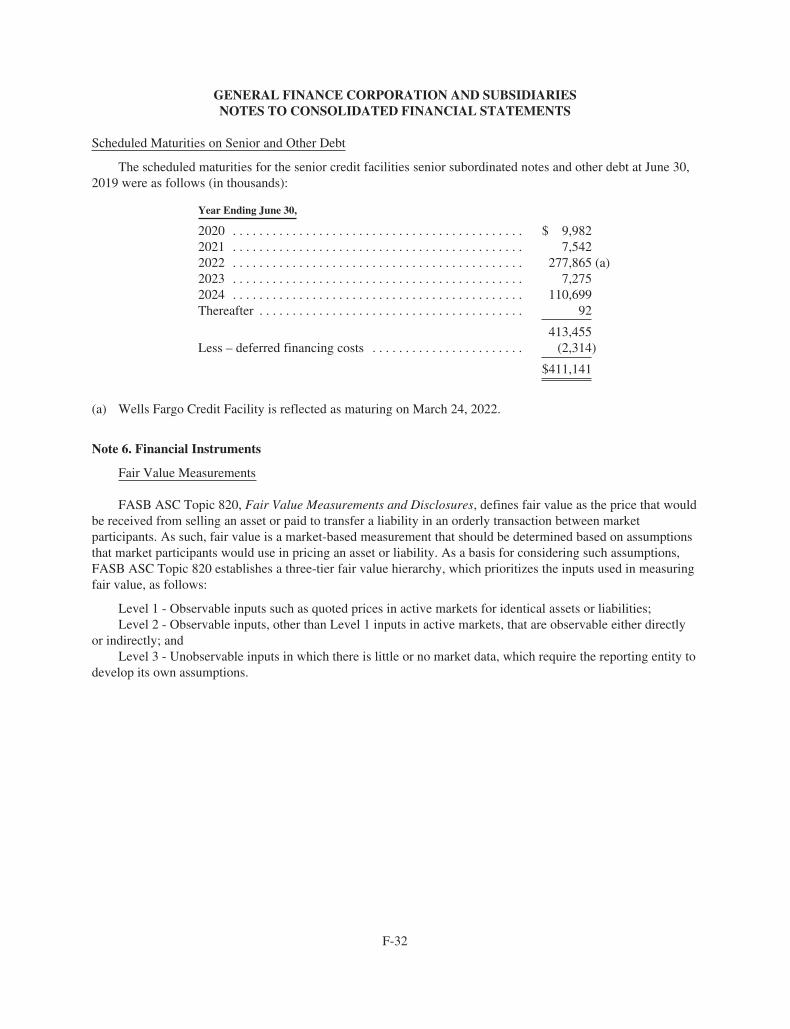
GENERAL FINANCE CORPORATION AND SUBSIDIARIESNOTES TO CONSOLIDATED FINANCIAL STATEMENTS
Scheduled Maturities on Senior and Other Debt
The scheduled maturities for the senior credit facilities senior subordinated notes and other debt at June 30,2019 were as follows (in thousands):
Year Ending June 30,
2020 . . . . . . . . . . . . . . . . . . . . . . . . . . . . . . . . . . . . . . . . . . . . $ 9,9822021 . . . . . . . . . . . . . . . . . . . . . . . . . . . . . . . . . . . . . . . . . . . . 7,5422022 . . . . . . . . . . . . . . . . . . . . . . . . . . . . . . . . . . . . . . . . . . . . 277,865 (a)2023 . . . . . . . . . . . . . . . . . . . . . . . . . . . . . . . . . . . . . . . . . . . . 7,2752024 . . . . . . . . . . . . . . . . . . . . . . . . . . . . . . . . . . . . . . . . . . . . 110,699Thereafter . . . . . . . . . . . . . . . . . . . . . . . . . . . . . . . . . . . . . . . . 92
413,455Less – deferred financing costs . . . . . . . . . . . . . . . . . . . . . . . (2,314)
$411,141
(a) Wells Fargo Credit Facility is reflected as maturing on March 24, 2022.
Note 6. Financial Instruments
Fair Value Measurements
FASB ASC Topic 820, Fair Value Measurements and Disclosures, defines fair value as the price that wouldbe received from selling an asset or paid to transfer a liability in an orderly transaction between marketparticipants. As such, fair value is a market-based measurement that should be determined based on assumptionsthat market participants would use in pricing an asset or liability. As a basis for considering such assumptions,FASB ASC Topic 820 establishes a three-tier fair value hierarchy, which prioritizes the inputs used in measuringfair value, as follows:
Level 1 - Observable inputs such as quoted prices in active markets for identical assets or liabilities;Level 2 - Observable inputs, other than Level 1 inputs in active markets, that are observable either directly
or indirectly; andLevel 3 - Unobservable inputs in which there is little or no market data, which require the reporting entity to
develop its own assumptions.
F-32
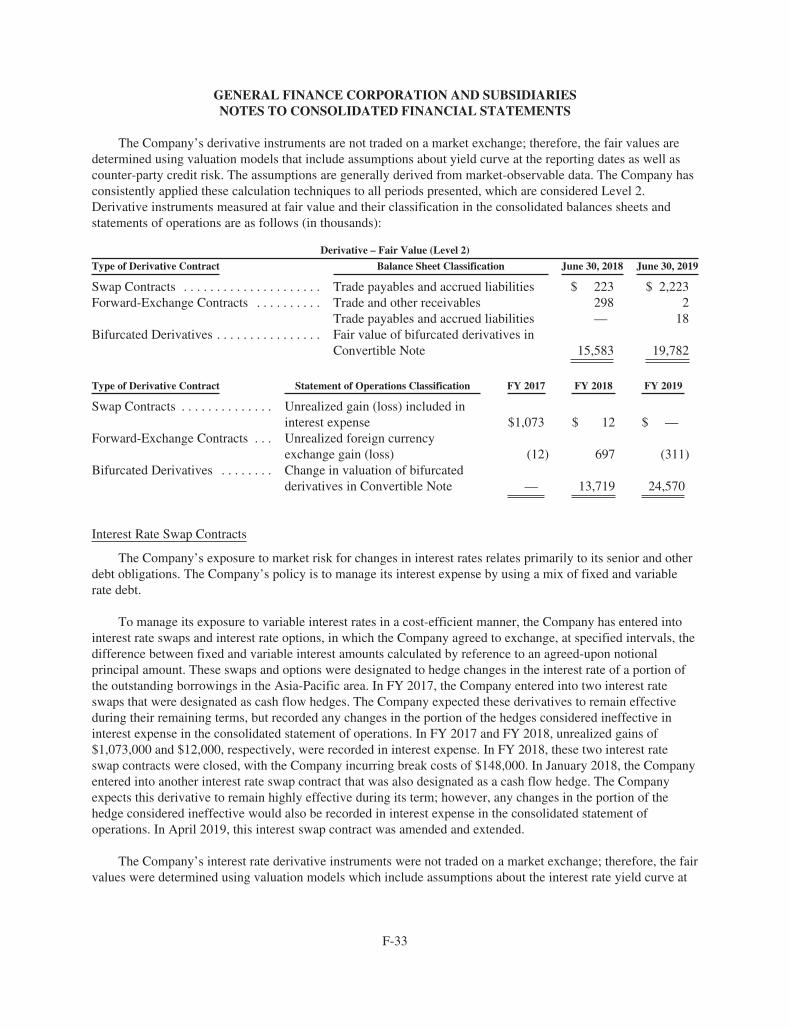
GENERAL FINANCE CORPORATION AND SUBSIDIARIESNOTES TO CONSOLIDATED FINANCIAL STATEMENTS
The Company’s derivative instruments are not traded on a market exchange; therefore, the fair values aredetermined using valuation models that include assumptions about yield curve at the reporting dates as well ascounter-party credit risk. The assumptions are generally derived from market-observable data. The Company hasconsistently applied these calculation techniques to all periods presented, which are considered Level 2.Derivative instruments measured at fair value and their classification in the consolidated balances sheets andstatements of operations are as follows (in thousands):
Derivative – Fair Value (Level 2)
Type of Derivative Contract Balance Sheet Classification June 30, 2018 June 30, 2019
Swap Contracts . . . . . . . . . . . . . . . . . . . . . Trade payables and accrued liabilities $ 223 $ 2,223Forward-Exchange Contracts . . . . . . . . . . Trade and other receivables 298 2
Trade payables and accrued liabilities — 18Bifurcated Derivatives . . . . . . . . . . . . . . . . Fair value of bifurcated derivatives in
Convertible Note 15,583 19,782
Type of Derivative Contract Statement of Operations Classification FY 2017 FY 2018 FY 2019
Swap Contracts . . . . . . . . . . . . . . Unrealized gain (loss) included ininterest expense $1,073 $ 12 $ —
Forward-Exchange Contracts . . . Unrealized foreign currencyexchange gain (loss) (12) 697 (311)
Bifurcated Derivatives . . . . . . . . Change in valuation of bifurcatedderivatives in Convertible Note — 13,719 24,570
Interest Rate Swap Contracts
The Company’s exposure to market risk for changes in interest rates relates primarily to its senior and otherdebt obligations. The Company’s policy is to manage its interest expense by using a mix of fixed and variablerate debt.
To manage its exposure to variable interest rates in a cost-efficient manner, the Company has entered intointerest rate swaps and interest rate options, in which the Company agreed to exchange, at specified intervals, thedifference between fixed and variable interest amounts calculated by reference to an agreed-upon notionalprincipal amount. These swaps and options were designated to hedge changes in the interest rate of a portion ofthe outstanding borrowings in the Asia-Pacific area. In FY 2017, the Company entered into two interest rateswaps that were designated as cash flow hedges. The Company expected these derivatives to remain effectiveduring their remaining terms, but recorded any changes in the portion of the hedges considered ineffective ininterest expense in the consolidated statement of operations. In FY 2017 and FY 2018, unrealized gains of$1,073,000 and $12,000, respectively, were recorded in interest expense. In FY 2018, these two interest rateswap contracts were closed, with the Company incurring break costs of $148,000. In January 2018, the Companyentered into another interest rate swap contract that was also designated as a cash flow hedge. The Companyexpects this derivative to remain highly effective during its term; however, any changes in the portion of thehedge considered ineffective would also be recorded in interest expense in the consolidated statement ofoperations. In April 2019, this interest swap contract was amended and extended.
The Company’s interest rate derivative instruments were not traded on a market exchange; therefore, the fairvalues were determined using valuation models which include assumptions about the interest rate yield curve at
F-33
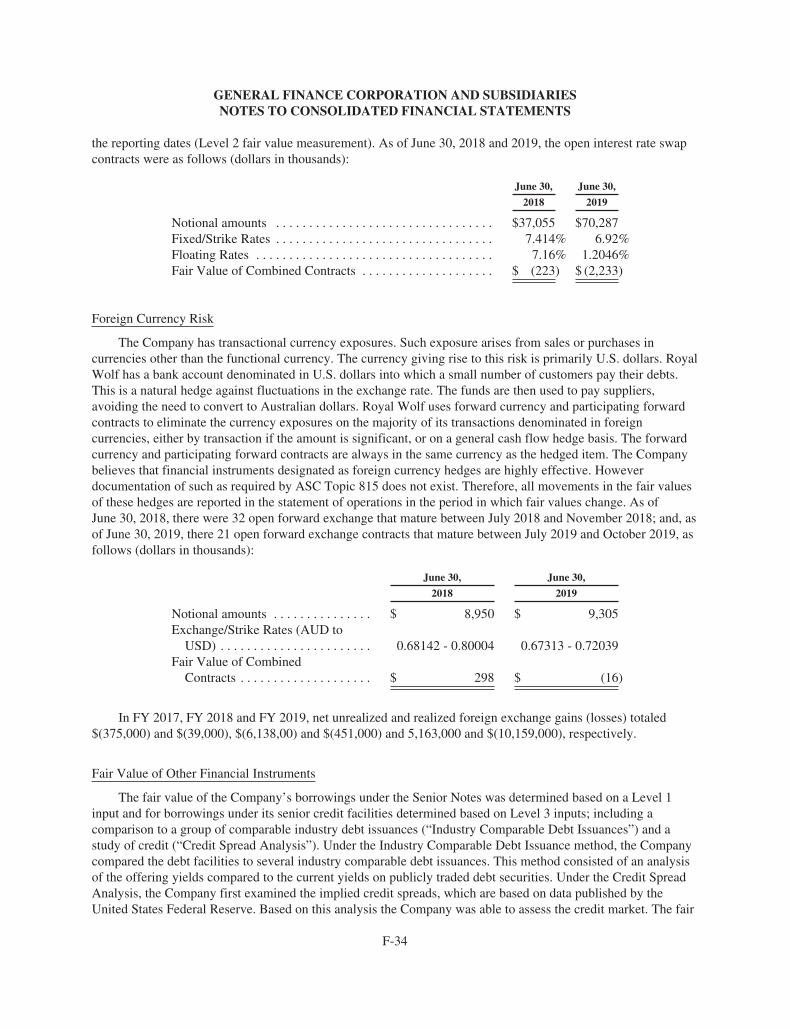
GENERAL FINANCE CORPORATION AND SUBSIDIARIESNOTES TO CONSOLIDATED FINANCIAL STATEMENTS
the reporting dates (Level 2 fair value measurement). As of June 30, 2018 and 2019, the open interest rate swapcontracts were as follows (dollars in thousands):
June 30, June 30,
2018 2019
Notional amounts . . . . . . . . . . . . . . . . . . . . . . . . . . . . . . . . . $37,055 $70,287Fixed/Strike Rates . . . . . . . . . . . . . . . . . . . . . . . . . . . . . . . . . 7.414% 6.92%Floating Rates . . . . . . . . . . . . . . . . . . . . . . . . . . . . . . . . . . . . 7.16% 1.2046%Fair Value of Combined Contracts . . . . . . . . . . . . . . . . . . . . $ (223) $ (2,233)
Foreign Currency Risk
The Company has transactional currency exposures. Such exposure arises from sales or purchases incurrencies other than the functional currency. The currency giving rise to this risk is primarily U.S. dollars. RoyalWolf has a bank account denominated in U.S. dollars into which a small number of customers pay their debts.This is a natural hedge against fluctuations in the exchange rate. The funds are then used to pay suppliers,avoiding the need to convert to Australian dollars. Royal Wolf uses forward currency and participating forwardcontracts to eliminate the currency exposures on the majority of its transactions denominated in foreigncurrencies, either by transaction if the amount is significant, or on a general cash flow hedge basis. The forwardcurrency and participating forward contracts are always in the same currency as the hedged item. The Companybelieves that financial instruments designated as foreign currency hedges are highly effective. Howeverdocumentation of such as required by ASC Topic 815 does not exist. Therefore, all movements in the fair valuesof these hedges are reported in the statement of operations in the period in which fair values change. As ofJune 30, 2018, there were 32 open forward exchange that mature between July 2018 and November 2018; and, asof June 30, 2019, there 21 open forward exchange contracts that mature between July 2019 and October 2019, asfollows (dollars in thousands):
June 30, June 30,
2018 2019
Notional amounts . . . . . . . . . . . . . . . $ 8,950 $ 9,305Exchange/Strike Rates (AUD to
USD) . . . . . . . . . . . . . . . . . . . . . . . 0.68142 - 0.80004 0.67313 - 0.72039Fair Value of Combined
Contracts . . . . . . . . . . . . . . . . . . . . $ 298 $ (16)
In FY 2017, FY 2018 and FY 2019, net unrealized and realized foreign exchange gains (losses) totaled$(375,000) and $(39,000), $(6,138,00) and $(451,000) and 5,163,000 and $(10,159,000), respectively.
Fair Value of Other Financial Instruments
The fair value of the Company’s borrowings under the Senior Notes was determined based on a Level 1input and for borrowings under its senior credit facilities determined based on Level 3 inputs; including acomparison to a group of comparable industry debt issuances (“Industry Comparable Debt Issuances”) and astudy of credit (“Credit Spread Analysis”). Under the Industry Comparable Debt Issuance method, the Companycompared the debt facilities to several industry comparable debt issuances. This method consisted of an analysisof the offering yields compared to the current yields on publicly traded debt securities. Under the Credit SpreadAnalysis, the Company first examined the implied credit spreads, which are based on data published by theUnited States Federal Reserve. Based on this analysis the Company was able to assess the credit market. The fair
F-34
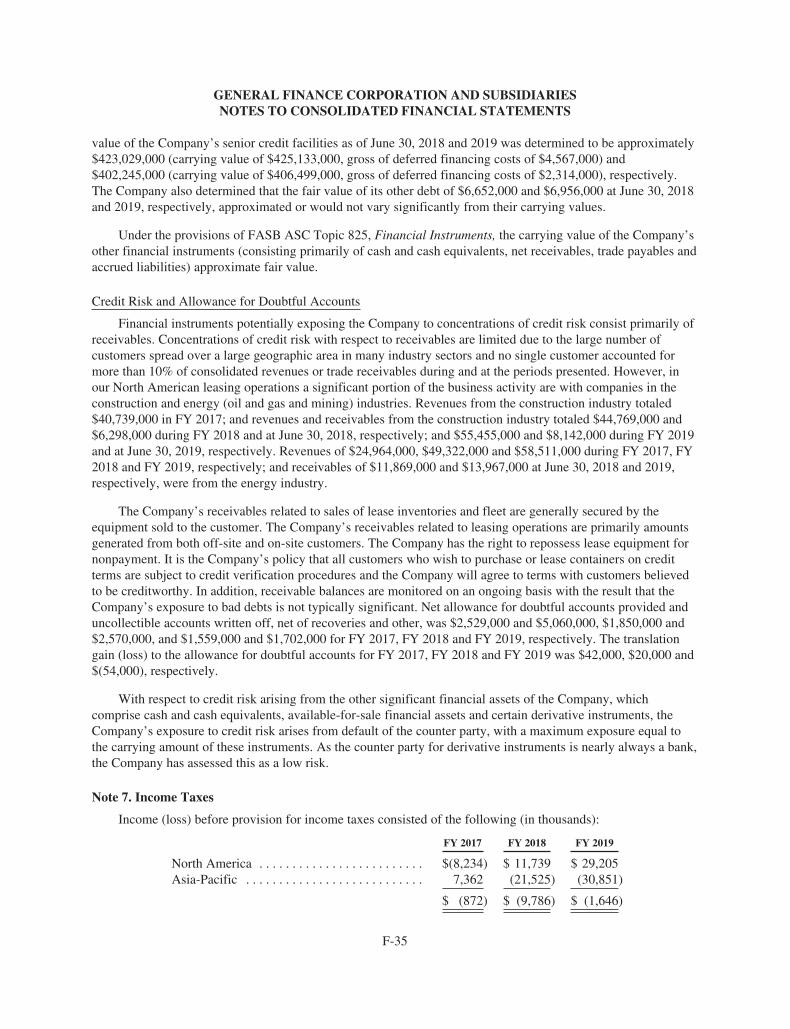
GENERAL FINANCE CORPORATION AND SUBSIDIARIESNOTES TO CONSOLIDATED FINANCIAL STATEMENTS
value of the Company’s senior credit facilities as of June 30, 2018 and 2019 was determined to be approximately$423,029,000 (carrying value of $425,133,000, gross of deferred financing costs of $4,567,000) and$402,245,000 (carrying value of $406,499,000, gross of deferred financing costs of $2,314,000), respectively.The Company also determined that the fair value of its other debt of $6,652,000 and $6,956,000 at June 30, 2018and 2019, respectively, approximated or would not vary significantly from their carrying values.
Under the provisions of FASB ASC Topic 825, Financial Instruments, the carrying value of the Company’sother financial instruments (consisting primarily of cash and cash equivalents, net receivables, trade payables andaccrued liabilities) approximate fair value.
Credit Risk and Allowance for Doubtful Accounts
Financial instruments potentially exposing the Company to concentrations of credit risk consist primarily ofreceivables. Concentrations of credit risk with respect to receivables are limited due to the large number ofcustomers spread over a large geographic area in many industry sectors and no single customer accounted formore than 10% of consolidated revenues or trade receivables during and at the periods presented. However, inour North American leasing operations a significant portion of the business activity are with companies in theconstruction and energy (oil and gas and mining) industries. Revenues from the construction industry totaled$40,739,000 in FY 2017; and revenues and receivables from the construction industry totaled $44,769,000 and$6,298,000 during FY 2018 and at June 30, 2018, respectively; and $55,455,000 and $8,142,000 during FY 2019and at June 30, 2019, respectively. Revenues of $24,964,000, $49,322,000 and $58,511,000 during FY 2017, FY2018 and FY 2019, respectively; and receivables of $11,869,000 and $13,967,000 at June 30, 2018 and 2019,respectively, were from the energy industry.
The Company’s receivables related to sales of lease inventories and fleet are generally secured by theequipment sold to the customer. The Company’s receivables related to leasing operations are primarily amountsgenerated from both off-site and on-site customers. The Company has the right to repossess lease equipment fornonpayment. It is the Company’s policy that all customers who wish to purchase or lease containers on creditterms are subject to credit verification procedures and the Company will agree to terms with customers believedto be creditworthy. In addition, receivable balances are monitored on an ongoing basis with the result that theCompany’s exposure to bad debts is not typically significant. Net allowance for doubtful accounts provided anduncollectible accounts written off, net of recoveries and other, was $2,529,000 and $5,060,000, $1,850,000 and$2,570,000, and $1,559,000 and $1,702,000 for FY 2017, FY 2018 and FY 2019, respectively. The translationgain (loss) to the allowance for doubtful accounts for FY 2017, FY 2018 and FY 2019 was $42,000, $20,000 and$(54,000), respectively.
With respect to credit risk arising from the other significant financial assets of the Company, whichcomprise cash and cash equivalents, available-for-sale financial assets and certain derivative instruments, theCompany’s exposure to credit risk arises from default of the counter party, with a maximum exposure equal tothe carrying amount of these instruments. As the counter party for derivative instruments is nearly always a bank,the Company has assessed this as a low risk.
Note 7. Income Taxes
Income (loss) before provision for income taxes consisted of the following (in thousands):
FY 2017 FY 2018 FY 2019
North America . . . . . . . . . . . . . . . . . . . . . . . . . $(8,234) $ 11,739 $ 29,205Asia-Pacific . . . . . . . . . . . . . . . . . . . . . . . . . . . 7,362 (21,525) (30,851)
$ (872) $ (9,786) $ (1,646)
F-35
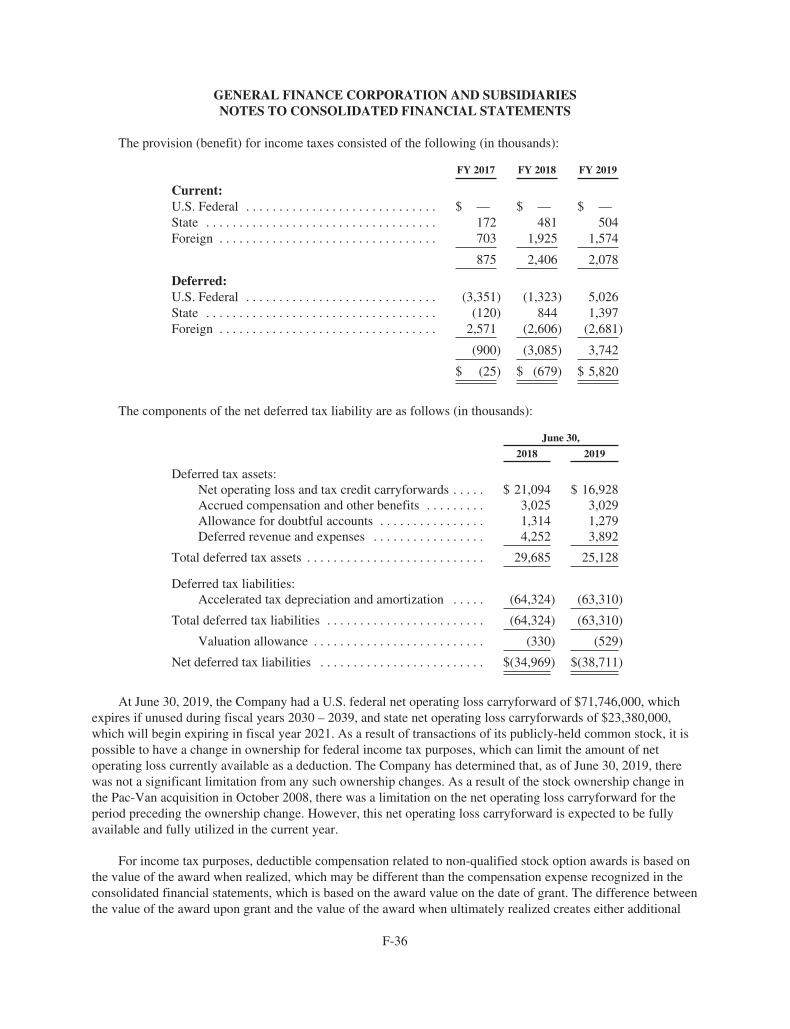
GENERAL FINANCE CORPORATION AND SUBSIDIARIESNOTES TO CONSOLIDATED FINANCIAL STATEMENTS
The provision (benefit) for income taxes consisted of the following (in thousands):
FY 2017 FY 2018 FY 2019
Current:U.S. Federal . . . . . . . . . . . . . . . . . . . . . . . . . . . . . $ — $ — $ —State . . . . . . . . . . . . . . . . . . . . . . . . . . . . . . . . . . . 172 481 504Foreign . . . . . . . . . . . . . . . . . . . . . . . . . . . . . . . . . 703 1,925 1,574
875 2,406 2,078
Deferred:U.S. Federal . . . . . . . . . . . . . . . . . . . . . . . . . . . . . (3,351) (1,323) 5,026State . . . . . . . . . . . . . . . . . . . . . . . . . . . . . . . . . . . (120) 844 1,397Foreign . . . . . . . . . . . . . . . . . . . . . . . . . . . . . . . . . 2,571 (2,606) (2,681)
(900) (3,085) 3,742
$ (25) $ (679) $ 5,820
The components of the net deferred tax liability are as follows (in thousands):
June 30,
2018 2019
Deferred tax assets:Net operating loss and tax credit carryforwards . . . . . $ 21,094 $ 16,928Accrued compensation and other benefits . . . . . . . . . 3,025 3,029Allowance for doubtful accounts . . . . . . . . . . . . . . . . 1,314 1,279Deferred revenue and expenses . . . . . . . . . . . . . . . . . 4,252 3,892
Total deferred tax assets . . . . . . . . . . . . . . . . . . . . . . . . . . . 29,685 25,128
Deferred tax liabilities:Accelerated tax depreciation and amortization . . . . . (64,324) (63,310)
Total deferred tax liabilities . . . . . . . . . . . . . . . . . . . . . . . . (64,324) (63,310)
Valuation allowance . . . . . . . . . . . . . . . . . . . . . . . . . . (330) (529)
Net deferred tax liabilities . . . . . . . . . . . . . . . . . . . . . . . . . $(34,969) $(38,711)
At June 30, 2019, the Company had a U.S. federal net operating loss carryforward of $71,746,000, whichexpires if unused during fiscal years 2030 – 2039, and state net operating loss carryforwards of $23,380,000,which will begin expiring in fiscal year 2021. As a result of transactions of its publicly-held common stock, it ispossible to have a change in ownership for federal income tax purposes, which can limit the amount of netoperating loss currently available as a deduction. The Company has determined that, as of June 30, 2019, therewas not a significant limitation from any such ownership changes. As a result of the stock ownership change inthe Pac-Van acquisition in October 2008, there was a limitation on the net operating loss carryforward for theperiod preceding the ownership change. However, this net operating loss carryforward is expected to be fullyavailable and fully utilized in the current year.
For income tax purposes, deductible compensation related to non-qualified stock option awards is based onthe value of the award when realized, which may be different than the compensation expense recognized in theconsolidated financial statements, which is based on the award value on the date of grant. The difference betweenthe value of the award upon grant and the value of the award when ultimately realized creates either additional
F-36
GENERAL FINANCE CORPORATION AND SUBSIDIARIESNOTES TO CONSOLIDATED FINANCIAL STATEMENTS
tax benefits or a tax shortfall. Prior to July 1, 2017, tax benefits resulting from tax deductions in excess of thecompensation cost recognized for share-based awards would have been recognized as increases to additional paidin capital only if an incremental income tax benefit would be realized after considering all other tax attributespresently available. Tax shortfalls, which would occur when the tax deduction for share-based awards is less thanthe compensation cost recognized, would have been recorded as a reduction to additional paid in capital to theextent that, cumulatively, the shortfalls do not exceed the cumulative excess tax benefits recognized (includingexcess tax benefits not yet recognized in additional paid in capital). Should cumulative tax shortfalls haveexceeded cumulative excess tax benefits, the difference would have been reflected as additional tax expense inthe consolidated financial statements. The Company did not recognize excess tax benefits in FY 2017 because ithas not paid U.S. federal income taxes in those years. Effective July 1, 2017, the difference between thedeductible compensation related to share-based awards based on the value of the award when realized and thecompensation expense recognized in the consolidated financial statements based on the award value on the dateof grant is recognized upon realization as an additional tax expense or benefit in the consolidated statements ofoperations.
Management evaluates the ability to realize its deferred tax assets on a quarterly basis and adjusts theamount of its valuation allowance if necessary. As of June 30, 2018 and 2019, the Company recorded a valuationallowance of $330,000 and $529,000, respectively, for foreign tax credit carryforwards that it believes will not berealized.
A reconciliation of the U.S. federal statutory rate to the Company’s effective tax rate is as follows:
FY 2017 FY 2018 FY 2019
Federal statutory rate . . . . . . . . . . . . . . . . . . . . . . . . . . . . . . . 35.0% 28.0% 21.0%Adjustment to estimated state deferred tax liability, net of
U.S. federal tax benefit (a) . . . . . . . . . . . . . . . . . . . . . . . . . (34.1) — —Change in valuation of bifurcated derivative in Convertible
Note . . . . . . . . . . . . . . . . . . . . . . . . . . . . . . . . . . . . . . . . . . . — (42.7) (521.3)State and Asia-Pacific taxes, net of U.S. federal tax
benefit . . . . . . . . . . . . . . . . . . . . . . . . . . . . . . . . . . . . . . . . . (2.1) 6.0 117.2Adjustment of net deferred tax liability for enacted tax rate
change by the Act . . . . . . . . . . . . . . . . . . . . . . . . . . . . . . . . — 18.8 21.2Adjustment for previously unrecognized net tax deficiency
related to equity compensation activity prior to July 1,2017 . . . . . . . . . . . . . . . . . . . . . . . . . . . . . . . . . . . . . . . . . . — (1.1) —
Net tax benefit related to equity compensation activity . . . . . — 0.4 15.4Valuation allowance . . . . . . . . . . . . . . . . . . . . . . . . . . . . . . . . — (3.4) (12.1)Other . . . . . . . . . . . . . . . . . . . . . . . . . . . . . . . . . . . . . . . . . . . . 4.1 0.9 5.0
Effective tax rate . . . . . . . . . . . . . . . . . . . . . . . . . . . . . . . . . . . 2.9% 6.9% (353.6%)
(a) Adjustment for estimated state taxes of $297,000.
Note 8. Related-Party Transactions
Effective January 31, 2008, the Company entered into a lease with an affiliate of the Company’s then ChiefExecutive Officer (now Executive Chairman of the Board of Directors) for its corporate headquarters inPasadena, California. The rent is $7,393 per month, effective March 1, 2009, plus allocated charges for commonarea maintenance, real property taxes and insurance, for approximately 3,000 square feet of office space. The
F-37
GENERAL FINANCE CORPORATION AND SUBSIDIARIESNOTES TO CONSOLIDATED FINANCIAL STATEMENTS
term of the lease is five years, with two five-year renewal options, and the rent is adjusted yearly based on theconsumer price index. On October 11, 2012, the Company exercised the first option to renew the lease for anadditional five-year term commencing February 1, 2013 and, on August 7, 2017, it exercised its second optionfor an additional five-year term commencing on February 1, 2018. Rental payments were $113,000 in FY 2017,$112,000 in FY 2018 and $111,000 in FY 2019.
The premises of Pac-Van’s Las Vegas branch are owned by and were leased from the then acting branchmanager through December 31, 2016. From January 1, 2017 through May 12, 2017, the use of the premises wasrented on a month-to-month basis. Effective May 12, 2017, the Company entered into a lease agreement throughDecember 31, 2020 for rental of $10,876 per month and the right to extend the term of the lease for threetwo-year options, with the monthly rental increasing at each option period from $11,420 to $12,590 per month.Rental payments on these premises totaled $124,000 in FY 2017, $131,000 in FY 2018 and $176,000 in FY2019.
Note 9. Equity Plans
On September 11, 2014, the Board of Directors of the Company adopted the 2014 Stock Incentive Plan (the“2014 Plan”), which was approved by the stockholders at the Company’s annual meeting on December 4, 2014and amended and restated by the stockholders at the annual meeting on December 3, 2015. The 2014 Plan is an“omnibus” incentive plan permitting a variety of equity programs designed to provide flexibility in implementingequity and cash awards, including incentive stock options, nonqualified stock options, restricted stock grants(“non-vested equity shares”), restricted stock units, stock appreciation rights, performance stock, performanceunits and other stock-based awards. Participants in the 2014 Plan may be granted any one of the equity awards orany combination of them, as determined by the Board of Directors or the Compensation Committee. Upon theapproval of the 2014 Plan by the stockholders, the Company suspended further grants under its previous equityplans, the General Finance Corporation 2006 Stock Option Plan (the “2006 Plan”) and the 2009 Stock IncentivePlan (the “2009 Plan”) (collectively the “Predecessor Plans”), which had a total of 2,500,000 shares reserved forgrant. Any stock options which are forfeited under the Predecessor Plans will become available for grant underthe 2014 Plan, but the total number of shares available under the 2014 Plan will not exceed the 1,500,000 sharesreserved for grant under the 2014 Plan, plus any options which were forfeited or are available for grant under thePredecessor Plans. If not sooner terminated by the Board of Directors, the 2014 Plan will expire on December 4,2024, which is the tenth anniversary of the date it was approved by the Company’s stockholders. The 2006 Planexpired on June 30, 2016 and the 2009 Plan will expire on December 10, 2019. On December 7, 2017, thestockholders approved an amendment unanimously approved by the Board of Directors of the Company thatincreased the number of shares reserved for issuance under the 2014 Plan by 1,000,000 shares, from 1,500,000 to2,500,000 shares of common stock, plus any options which were forfeited or are available for grant under the2009 Plan. The Predecessor Plans and the 2014 Plan are referred to collectively as the “Stock Incentive Plan.”
All grants to-date consist of incentive and non-qualified stock options that vest over a period of up to fiveyears (“time-based”), non-qualified stock options that vest over varying periods that are dependent on theattainment of certain defined EBITDA and other targets (“performance-based”), non-vested equity shares(“restricted stock”) and restricted stock units (“RSU”). At June 30, 2019, 697,474 shares remained available forgrant.
On February 7, 2017 (the “February 2017 Grant”), the Company granted time-based options to an officer ofGFN to purchase 225,000 shares of common stock at an exercise price equal to the closing market price of theCompany’s common stock as of that date, or $5.10 per share. The options under the February 2017 Grant vestover 36 months from the date of grant. The weighted-average fair value of the stock options in the February 2017Grant was $3.35, determined using the Black-Scholes option-pricing model using the following assumptions: a
F-38
GENERAL FINANCE CORPORATION AND SUBSIDIARIESNOTES TO CONSOLIDATED FINANCIAL STATEMENTS
risk-free interest rate of 2.13%, an expected life of 7.5 years, an expected volatility of 65.1% and no expecteddividend.
On December 15, 2017 (the “December 2017 Grant”), the Company granted time-based options to an officerof GFN to purchase 225,000 shares of common stock at an exercise price equal to the closing market price of theCompany’s common stock as of that date, or $6.25 per share. The options under the December 2017 Grant vest over36 months from the date of grant. The fair value of the stock options in the December 2017 Grant was $3.45,determined using the Black-Scholes option-pricing model using the following assumptions: a risk-free interest rateof 2.26%, an expected life of 7.5 years, an expected volatility of 50.5% and no expected dividend.
On February 6, 2018 (the “February 2018 Grant”), the Company granted time-based options to a keyemployee of Royal Wolf to purchase 81,280 shares of common stock at an exercise price equal to the closingmarket price of the Company’s common stock as of that date, or $7.15 per share. The options under the February2018 Grant vest over 28.8 months from the date of grant. The fair value of the stock options in the February 2018Grant was $4.00, determined using the Black-Scholes option-pricing model using the following assumptions: arisk-free interest rate of 2.66%, an expected life of 7.5 years, an expected volatility of 50.5% and no expecteddividend.
In FY 2018, the weighted-average fair value of the stock options granted to officers and key employees was$3.60.
On February 12, 2019 (the “February 2019 Grant”), the Company granted 1,625 time-based and 1,624performance-based options to a key employee of Royal Wolf to purchase a total of 3,249 shares of common stockat an exercise price equal to the closing market price of the Company’s common stock as of that date, or $10.34per share. The options under the February 2019 Grant vest over 36 months from the date of grant, with thevesting of the performance-based options subject to the attainment of the targets. The fair value of the stockoptions in the February 2019 Grant was $5.05, determined using the Black-Scholes option-pricing model usingthe following assumptions: a risk-free interest rate of 2.584%, an expected life of 7.5 years, an expected volatilityof 41.88% and no expected dividend.
Since inception, the range of the fair value of the stock options granted (other than to non-employeeconsultants) and the assumptions used are as follows:
Fair value of stock options . . . . . . . . . . . . . . . . . . . . . $0.81 - $6.35
Assumptions used:Risk-free interest rate . . . . . . . . . . . . . . . . . . . . . . . . . . 1.19% - 4.8%Expected life (in years) . . . . . . . . . . . . . . . . . . . . . . . . . 7.5Expected volatility . . . . . . . . . . . . . . . . . . . . . . . . . . . . 26.5% - 84.6%Expected dividends . . . . . . . . . . . . . . . . . . . . . . . . . . . . —
F-39
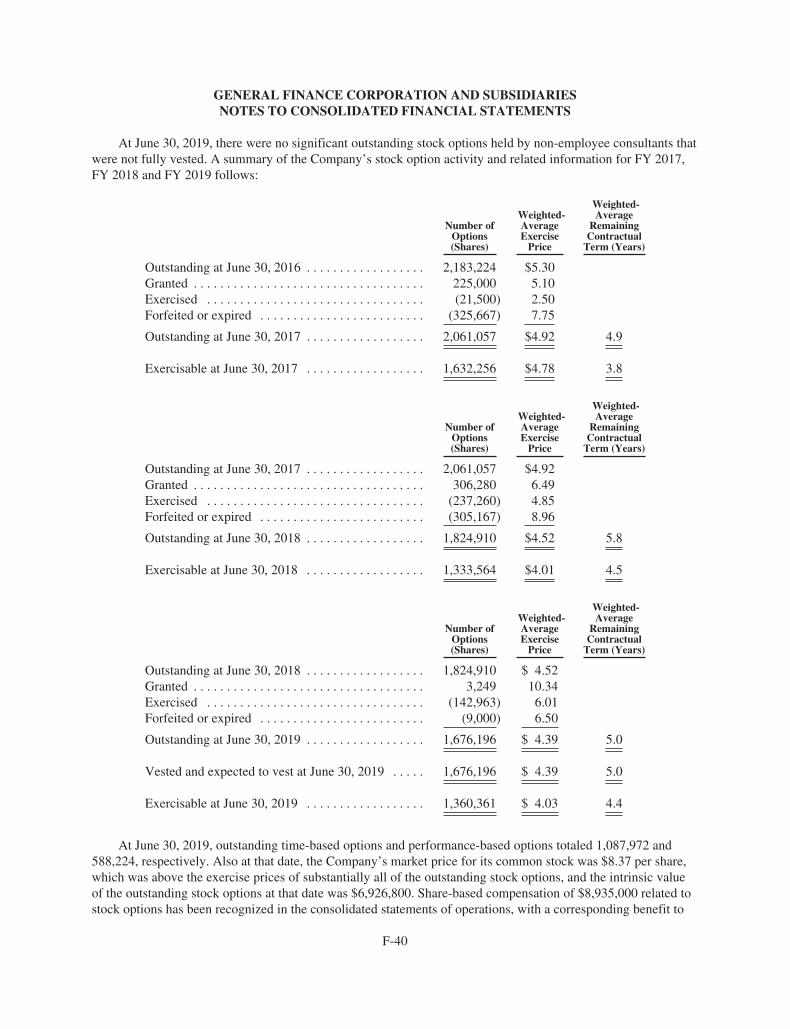
GENERAL FINANCE CORPORATION AND SUBSIDIARIESNOTES TO CONSOLIDATED FINANCIAL STATEMENTS
At June 30, 2019, there were no significant outstanding stock options held by non-employee consultants thatwere not fully vested. A summary of the Company’s stock option activity and related information for FY 2017,FY 2018 and FY 2019 follows:
Number ofOptions(Shares)
Weighted-AverageExercise
Price
Weighted-Average
RemainingContractual
Term (Years)
Outstanding at June 30, 2016 . . . . . . . . . . . . . . . . . . 2,183,224 $5.30Granted . . . . . . . . . . . . . . . . . . . . . . . . . . . . . . . . . . . 225,000 5.10Exercised . . . . . . . . . . . . . . . . . . . . . . . . . . . . . . . . . (21,500) 2.50Forfeited or expired . . . . . . . . . . . . . . . . . . . . . . . . . (325,667) 7.75
Outstanding at June 30, 2017 . . . . . . . . . . . . . . . . . . 2,061,057 $4.92 4.9
Exercisable at June 30, 2017 . . . . . . . . . . . . . . . . . . 1,632,256 $4.78 3.8
Number ofOptions(Shares)
Weighted-AverageExercise
Price
Weighted-Average
RemainingContractual
Term (Years)
Outstanding at June 30, 2017 . . . . . . . . . . . . . . . . . . 2,061,057 $4.92Granted . . . . . . . . . . . . . . . . . . . . . . . . . . . . . . . . . . . 306,280 6.49Exercised . . . . . . . . . . . . . . . . . . . . . . . . . . . . . . . . . (237,260) 4.85Forfeited or expired . . . . . . . . . . . . . . . . . . . . . . . . . (305,167) 8.96
Outstanding at June 30, 2018 . . . . . . . . . . . . . . . . . . 1,824,910 $4.52 5.8
Exercisable at June 30, 2018 . . . . . . . . . . . . . . . . . . 1,333,564 $4.01 4.5
Number ofOptions(Shares)
Weighted-AverageExercise
Price
Weighted-Average
RemainingContractual
Term (Years)
Outstanding at June 30, 2018 . . . . . . . . . . . . . . . . . . 1,824,910 $ 4.52Granted . . . . . . . . . . . . . . . . . . . . . . . . . . . . . . . . . . . 3,249 10.34Exercised . . . . . . . . . . . . . . . . . . . . . . . . . . . . . . . . . (142,963) 6.01Forfeited or expired . . . . . . . . . . . . . . . . . . . . . . . . . (9,000) 6.50
Outstanding at June 30, 2019 . . . . . . . . . . . . . . . . . . 1,676,196 $ 4.39 5.0
Vested and expected to vest at June 30, 2019 . . . . . 1,676,196 $ 4.39 5.0
Exercisable at June 30, 2019 . . . . . . . . . . . . . . . . . . 1,360,361 $ 4.03 4.4
At June 30, 2019, outstanding time-based options and performance-based options totaled 1,087,972 and588,224, respectively. Also at that date, the Company’s market price for its common stock was $8.37 per share,which was above the exercise prices of substantially all of the outstanding stock options, and the intrinsic valueof the outstanding stock options at that date was $6,926,800. Share-based compensation of $8,935,000 related tostock options has been recognized in the consolidated statements of operations, with a corresponding benefit to
F-40
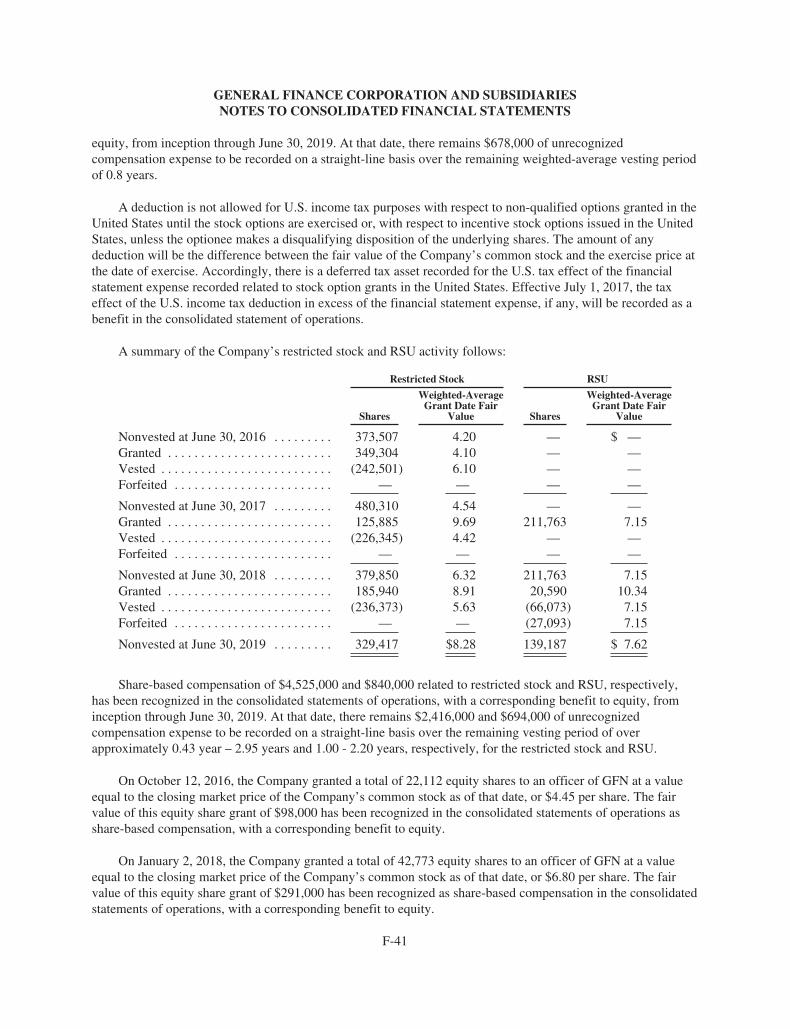
GENERAL FINANCE CORPORATION AND SUBSIDIARIESNOTES TO CONSOLIDATED FINANCIAL STATEMENTS
equity, from inception through June 30, 2019. At that date, there remains $678,000 of unrecognizedcompensation expense to be recorded on a straight-line basis over the remaining weighted-average vesting periodof 0.8 years.
A deduction is not allowed for U.S. income tax purposes with respect to non-qualified options granted in theUnited States until the stock options are exercised or, with respect to incentive stock options issued in the UnitedStates, unless the optionee makes a disqualifying disposition of the underlying shares. The amount of anydeduction will be the difference between the fair value of the Company’s common stock and the exercise price atthe date of exercise. Accordingly, there is a deferred tax asset recorded for the U.S. tax effect of the financialstatement expense recorded related to stock option grants in the United States. Effective July 1, 2017, the taxeffect of the U.S. income tax deduction in excess of the financial statement expense, if any, will be recorded as abenefit in the consolidated statement of operations.
A summary of the Company’s restricted stock and RSU activity follows:
Restricted Stock RSU
Shares
Weighted-AverageGrant Date Fair
Value Shares
Weighted-AverageGrant Date Fair
Value
Nonvested at June 30, 2016 . . . . . . . . . 373,507 4.20 — $ —Granted . . . . . . . . . . . . . . . . . . . . . . . . . 349,304 4.10 — —Vested . . . . . . . . . . . . . . . . . . . . . . . . . . (242,501) 6.10 — —Forfeited . . . . . . . . . . . . . . . . . . . . . . . . — — — —
Nonvested at June 30, 2017 . . . . . . . . . 480,310 4.54 — —Granted . . . . . . . . . . . . . . . . . . . . . . . . . 125,885 9.69 211,763 7.15Vested . . . . . . . . . . . . . . . . . . . . . . . . . . (226,345) 4.42 — —Forfeited . . . . . . . . . . . . . . . . . . . . . . . . — — — —
Nonvested at June 30, 2018 . . . . . . . . . 379,850 6.32 211,763 7.15Granted . . . . . . . . . . . . . . . . . . . . . . . . . 185,940 8.91 20,590 10.34Vested . . . . . . . . . . . . . . . . . . . . . . . . . . (236,373) 5.63 (66,073) 7.15Forfeited . . . . . . . . . . . . . . . . . . . . . . . . — — (27,093) 7.15
Nonvested at June 30, 2019 . . . . . . . . . 329,417 $8.28 139,187 $ 7.62
Share-based compensation of $4,525,000 and $840,000 related to restricted stock and RSU, respectively,has been recognized in the consolidated statements of operations, with a corresponding benefit to equity, frominception through June 30, 2019. At that date, there remains $2,416,000 and $694,000 of unrecognizedcompensation expense to be recorded on a straight-line basis over the remaining vesting period of overapproximately 0.43 year – 2.95 years and 1.00 - 2.20 years, respectively, for the restricted stock and RSU.
On October 12, 2016, the Company granted a total of 22,112 equity shares to an officer of GFN at a valueequal to the closing market price of the Company’s common stock as of that date, or $4.45 per share. The fairvalue of this equity share grant of $98,000 has been recognized in the consolidated statements of operations asshare-based compensation, with a corresponding benefit to equity.
On January 2, 2018, the Company granted a total of 42,773 equity shares to an officer of GFN at a valueequal to the closing market price of the Company’s common stock as of that date, or $6.80 per share. The fairvalue of this equity share grant of $291,000 has been recognized as share-based compensation in the consolidatedstatements of operations, with a corresponding benefit to equity.
F-41
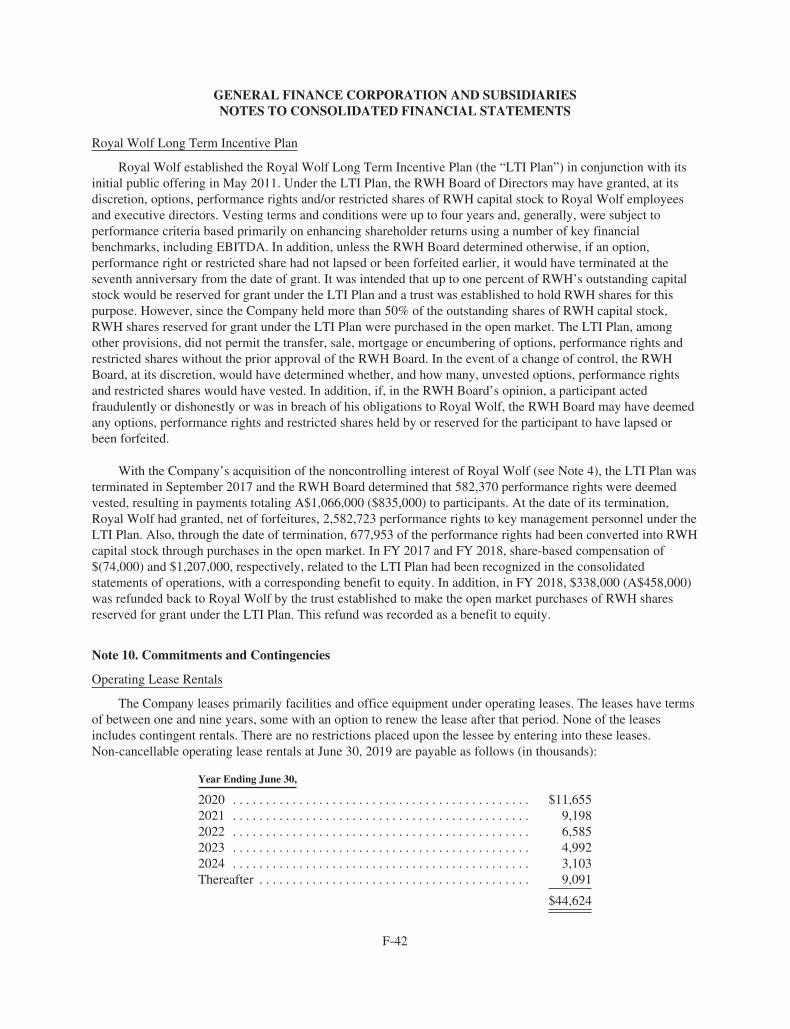
GENERAL FINANCE CORPORATION AND SUBSIDIARIESNOTES TO CONSOLIDATED FINANCIAL STATEMENTS
Royal Wolf Long Term Incentive Plan
Royal Wolf established the Royal Wolf Long Term Incentive Plan (the “LTI Plan”) in conjunction with itsinitial public offering in May 2011. Under the LTI Plan, the RWH Board of Directors may have granted, at itsdiscretion, options, performance rights and/or restricted shares of RWH capital stock to Royal Wolf employeesand executive directors. Vesting terms and conditions were up to four years and, generally, were subject toperformance criteria based primarily on enhancing shareholder returns using a number of key financialbenchmarks, including EBITDA. In addition, unless the RWH Board determined otherwise, if an option,performance right or restricted share had not lapsed or been forfeited earlier, it would have terminated at theseventh anniversary from the date of grant. It was intended that up to one percent of RWH’s outstanding capitalstock would be reserved for grant under the LTI Plan and a trust was established to hold RWH shares for thispurpose. However, since the Company held more than 50% of the outstanding shares of RWH capital stock,RWH shares reserved for grant under the LTI Plan were purchased in the open market. The LTI Plan, amongother provisions, did not permit the transfer, sale, mortgage or encumbering of options, performance rights andrestricted shares without the prior approval of the RWH Board. In the event of a change of control, the RWHBoard, at its discretion, would have determined whether, and how many, unvested options, performance rightsand restricted shares would have vested. In addition, if, in the RWH Board’s opinion, a participant actedfraudulently or dishonestly or was in breach of his obligations to Royal Wolf, the RWH Board may have deemedany options, performance rights and restricted shares held by or reserved for the participant to have lapsed orbeen forfeited.
With the Company’s acquisition of the noncontrolling interest of Royal Wolf (see Note 4), the LTI Plan wasterminated in September 2017 and the RWH Board determined that 582,370 performance rights were deemedvested, resulting in payments totaling A$1,066,000 ($835,000) to participants. At the date of its termination,Royal Wolf had granted, net of forfeitures, 2,582,723 performance rights to key management personnel under theLTI Plan. Also, through the date of termination, 677,953 of the performance rights had been converted into RWHcapital stock through purchases in the open market. In FY 2017 and FY 2018, share-based compensation of$(74,000) and $1,207,000, respectively, related to the LTI Plan had been recognized in the consolidatedstatements of operations, with a corresponding benefit to equity. In addition, in FY 2018, $338,000 (A$458,000)was refunded back to Royal Wolf by the trust established to make the open market purchases of RWH sharesreserved for grant under the LTI Plan. This refund was recorded as a benefit to equity.
Note 10. Commitments and Contingencies
Operating Lease Rentals
The Company leases primarily facilities and office equipment under operating leases. The leases have termsof between one and nine years, some with an option to renew the lease after that period. None of the leasesincludes contingent rentals. There are no restrictions placed upon the lessee by entering into these leases.Non-cancellable operating lease rentals at June 30, 2019 are payable as follows (in thousands):
Year Ending June 30,
2020 . . . . . . . . . . . . . . . . . . . . . . . . . . . . . . . . . . . . . . . . . . . . . $11,6552021 . . . . . . . . . . . . . . . . . . . . . . . . . . . . . . . . . . . . . . . . . . . . . 9,1982022 . . . . . . . . . . . . . . . . . . . . . . . . . . . . . . . . . . . . . . . . . . . . . 6,5852023 . . . . . . . . . . . . . . . . . . . . . . . . . . . . . . . . . . . . . . . . . . . . . 4,9922024 . . . . . . . . . . . . . . . . . . . . . . . . . . . . . . . . . . . . . . . . . . . . . 3,103Thereafter . . . . . . . . . . . . . . . . . . . . . . . . . . . . . . . . . . . . . . . . . 9,091
$44,624
F-42
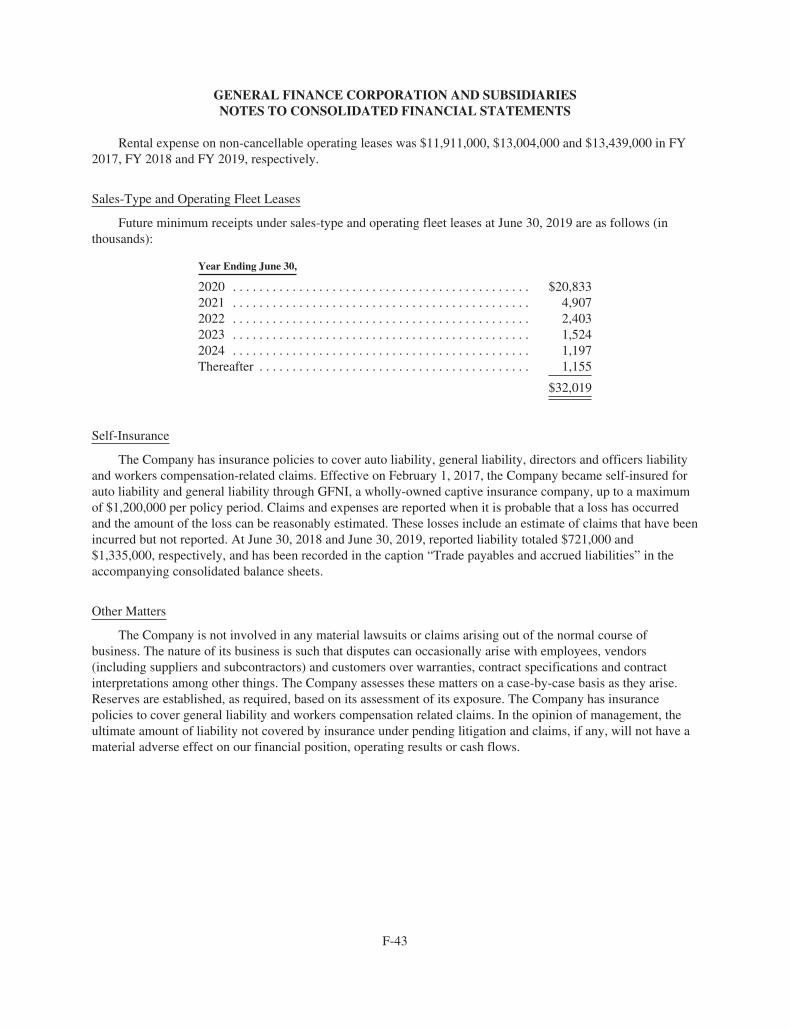
GENERAL FINANCE CORPORATION AND SUBSIDIARIESNOTES TO CONSOLIDATED FINANCIAL STATEMENTS
Rental expense on non-cancellable operating leases was $11,911,000, $13,004,000 and $13,439,000 in FY2017, FY 2018 and FY 2019, respectively.
Sales-Type and Operating Fleet Leases
Future minimum receipts under sales-type and operating fleet leases at June 30, 2019 are as follows (inthousands):
Year Ending June 30,
2020 . . . . . . . . . . . . . . . . . . . . . . . . . . . . . . . . . . . . . . . . . . . . . $20,8332021 . . . . . . . . . . . . . . . . . . . . . . . . . . . . . . . . . . . . . . . . . . . . . 4,9072022 . . . . . . . . . . . . . . . . . . . . . . . . . . . . . . . . . . . . . . . . . . . . . 2,4032023 . . . . . . . . . . . . . . . . . . . . . . . . . . . . . . . . . . . . . . . . . . . . . 1,5242024 . . . . . . . . . . . . . . . . . . . . . . . . . . . . . . . . . . . . . . . . . . . . . 1,197Thereafter . . . . . . . . . . . . . . . . . . . . . . . . . . . . . . . . . . . . . . . . . 1,155
$32,019
Self-Insurance
The Company has insurance policies to cover auto liability, general liability, directors and officers liabilityand workers compensation-related claims. Effective on February 1, 2017, the Company became self-insured forauto liability and general liability through GFNI, a wholly-owned captive insurance company, up to a maximumof $1,200,000 per policy period. Claims and expenses are reported when it is probable that a loss has occurredand the amount of the loss can be reasonably estimated. These losses include an estimate of claims that have beenincurred but not reported. At June 30, 2018 and June 30, 2019, reported liability totaled $721,000 and$1,335,000, respectively, and has been recorded in the caption “Trade payables and accrued liabilities” in theaccompanying consolidated balance sheets.
Other Matters
The Company is not involved in any material lawsuits or claims arising out of the normal course ofbusiness. The nature of its business is such that disputes can occasionally arise with employees, vendors(including suppliers and subcontractors) and customers over warranties, contract specifications and contractinterpretations among other things. The Company assesses these matters on a case-by-case basis as they arise.Reserves are established, as required, based on its assessment of its exposure. The Company has insurancepolicies to cover general liability and workers compensation related claims. In the opinion of management, theultimate amount of liability not covered by insurance under pending litigation and claims, if any, will not have amaterial adverse effect on our financial position, operating results or cash flows.
F-43
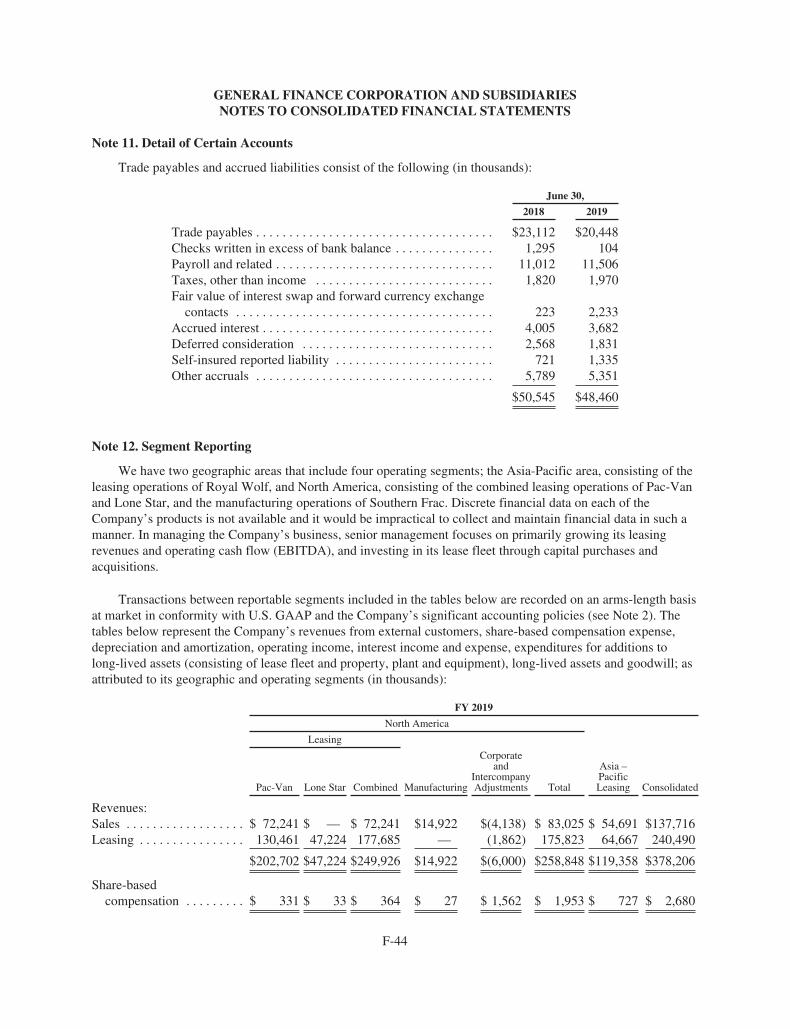
GENERAL FINANCE CORPORATION AND SUBSIDIARIESNOTES TO CONSOLIDATED FINANCIAL STATEMENTS
Note 11. Detail of Certain Accounts
Trade payables and accrued liabilities consist of the following (in thousands):
June 30,
2018 2019
Trade payables . . . . . . . . . . . . . . . . . . . . . . . . . . . . . . . . . . . . $23,112 $20,448Checks written in excess of bank balance . . . . . . . . . . . . . . . 1,295 104Payroll and related . . . . . . . . . . . . . . . . . . . . . . . . . . . . . . . . . 11,012 11,506Taxes, other than income . . . . . . . . . . . . . . . . . . . . . . . . . . . 1,820 1,970Fair value of interest swap and forward currency exchange
contacts . . . . . . . . . . . . . . . . . . . . . . . . . . . . . . . . . . . . . . . 223 2,233Accrued interest . . . . . . . . . . . . . . . . . . . . . . . . . . . . . . . . . . . 4,005 3,682Deferred consideration . . . . . . . . . . . . . . . . . . . . . . . . . . . . . 2,568 1,831Self-insured reported liability . . . . . . . . . . . . . . . . . . . . . . . . 721 1,335Other accruals . . . . . . . . . . . . . . . . . . . . . . . . . . . . . . . . . . . . 5,789 5,351
$50,545 $48,460
Note 12. Segment Reporting
We have two geographic areas that include four operating segments; the Asia-Pacific area, consisting of theleasing operations of Royal Wolf, and North America, consisting of the combined leasing operations of Pac-Vanand Lone Star, and the manufacturing operations of Southern Frac. Discrete financial data on each of theCompany’s products is not available and it would be impractical to collect and maintain financial data in such amanner. In managing the Company’s business, senior management focuses on primarily growing its leasingrevenues and operating cash flow (EBITDA), and investing in its lease fleet through capital purchases andacquisitions.
Transactions between reportable segments included in the tables below are recorded on an arms-length basisat market in conformity with U.S. GAAP and the Company’s significant accounting policies (see Note 2). Thetables below represent the Company’s revenues from external customers, share-based compensation expense,depreciation and amortization, operating income, interest income and expense, expenditures for additions tolong-lived assets (consisting of lease fleet and property, plant and equipment), long-lived assets and goodwill; asattributed to its geographic and operating segments (in thousands):
FY 2019
North America
Leasing
Pac-Van Lone Star Combined Manufacturing
Corporateand
IntercompanyAdjustments Total
Asia –PacificLeasing Consolidated
Revenues:Sales . . . . . . . . . . . . . . . . . . $ 72,241 $ — $ 72,241 $14,922 $(4,138) $ 83,025 $ 54,691 $137,716Leasing . . . . . . . . . . . . . . . . 130,461 47,224 177,685 — (1,862) 175,823 64,667 240,490
$202,702 $47,224 $249,926 $14,922 $(6,000) $258,848 $119,358 $378,206
Share-basedcompensation . . . . . . . . . $ 331 $ 33 $ 364 $ 27 $ 1,562 $ 1,953 $ 727 $ 2,680
F-44
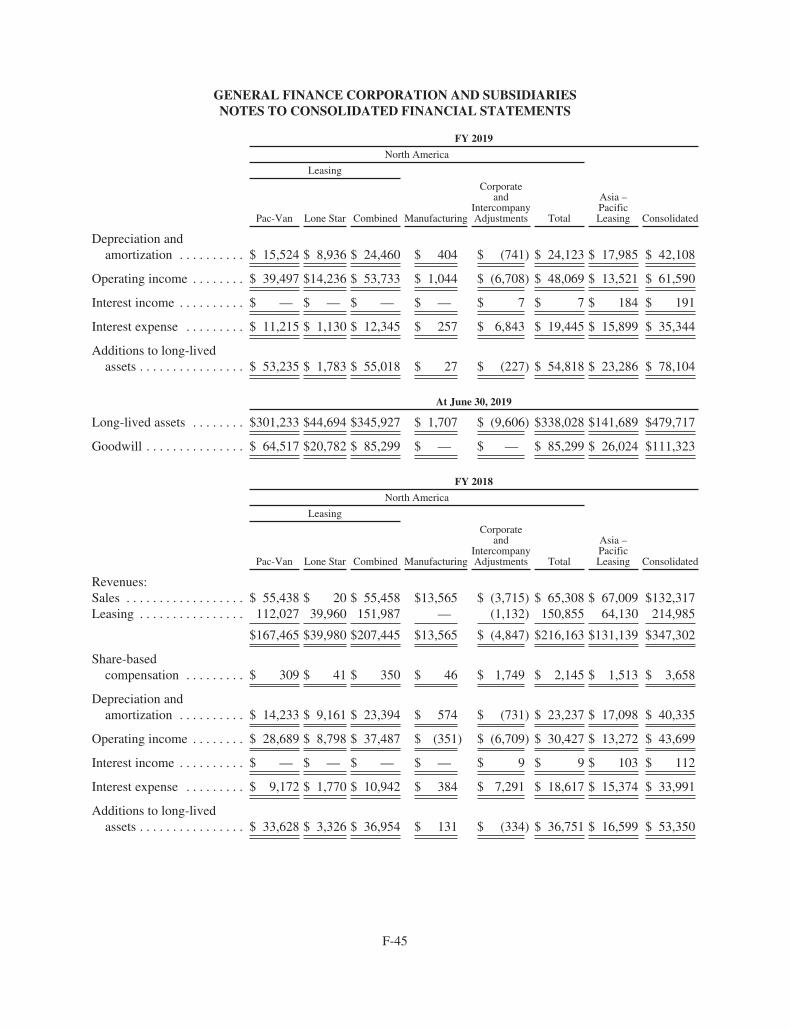
GENERAL FINANCE CORPORATION AND SUBSIDIARIESNOTES TO CONSOLIDATED FINANCIAL STATEMENTS
FY 2019
North America
Leasing
Pac-Van Lone Star Combined Manufacturing
Corporateand
IntercompanyAdjustments Total
Asia –PacificLeasing Consolidated
Depreciation andamortization . . . . . . . . . . $ 15,524 $ 8,936 $ 24,460 $ 404 $ (741) $ 24,123 $ 17,985 $ 42,108
Operating income . . . . . . . . $ 39,497 $14,236 $ 53,733 $ 1,044 $ (6,708) $ 48,069 $ 13,521 $ 61,590
Interest income . . . . . . . . . . $ — $ — $ — $ — $ 7 $ 7 $ 184 $ 191
Interest expense . . . . . . . . . $ 11,215 $ 1,130 $ 12,345 $ 257 $ 6,843 $ 19,445 $ 15,899 $ 35,344
Additions to long-livedassets . . . . . . . . . . . . . . . . $ 53,235 $ 1,783 $ 55,018 $ 27 $ (227) $ 54,818 $ 23,286 $ 78,104
At June 30, 2019
Long-lived assets . . . . . . . . $301,233 $44,694 $345,927 $ 1,707 $ (9,606) $338,028 $141,689 $479,717
Goodwill . . . . . . . . . . . . . . . $ 64,517 $20,782 $ 85,299 $ — $ — $ 85,299 $ 26,024 $111,323
FY 2018
North America
Leasing
Pac-Van Lone Star Combined Manufacturing
Corporateand
IntercompanyAdjustments Total
Asia –PacificLeasing Consolidated
Revenues:Sales . . . . . . . . . . . . . . . . . . $ 55,438 $ 20 $ 55,458 $13,565 $ (3,715) $ 65,308 $ 67,009 $132,317Leasing . . . . . . . . . . . . . . . . 112,027 39,960 151,987 — (1,132) 150,855 64,130 214,985
$167,465 $39,980 $207,445 $13,565 $ (4,847) $216,163 $131,139 $347,302
Share-basedcompensation . . . . . . . . . $ 309 $ 41 $ 350 $ 46 $ 1,749 $ 2,145 $ 1,513 $ 3,658
Depreciation andamortization . . . . . . . . . . $ 14,233 $ 9,161 $ 23,394 $ 574 $ (731) $ 23,237 $ 17,098 $ 40,335
Operating income . . . . . . . . $ 28,689 $ 8,798 $ 37,487 $ (351) $ (6,709) $ 30,427 $ 13,272 $ 43,699
Interest income . . . . . . . . . . $ — $ — $ — $ — $ 9 $ 9 $ 103 $ 112
Interest expense . . . . . . . . . $ 9,172 $ 1,770 $ 10,942 $ 384 $ 7,291 $ 18,617 $ 15,374 $ 33,991
Additions to long-livedassets . . . . . . . . . . . . . . . . $ 33,628 $ 3,326 $ 36,954 $ 131 $ (334) $ 36,751 $ 16,599 $ 53,350
F-45
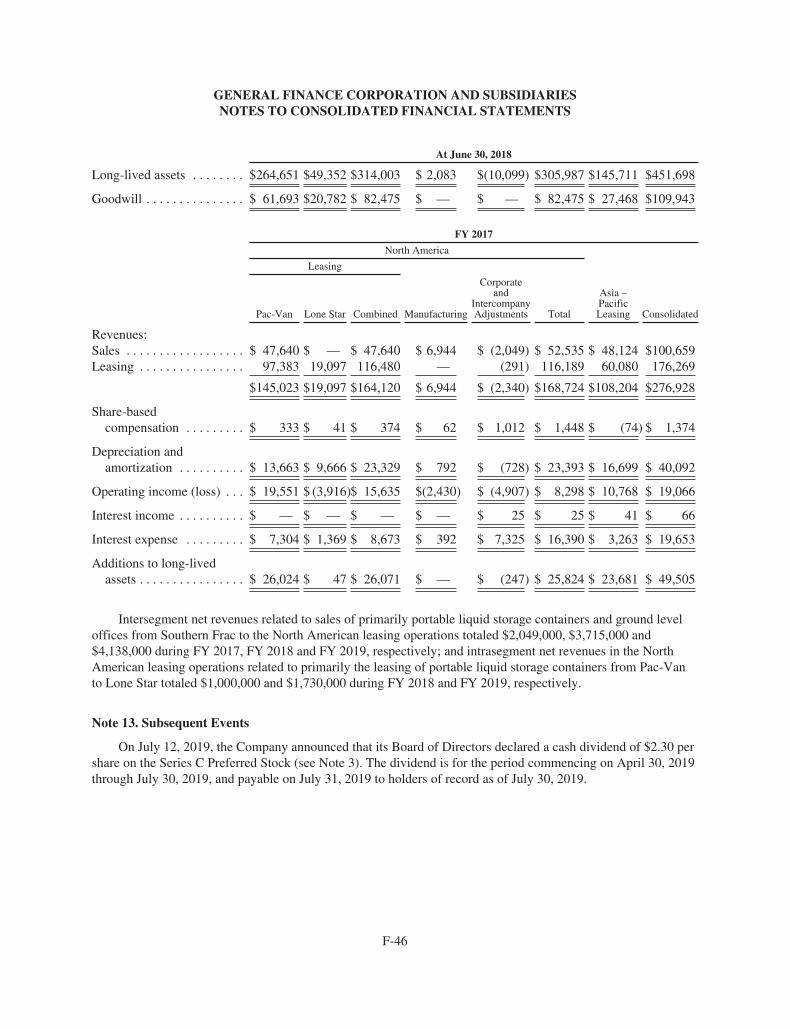
GENERAL FINANCE CORPORATION AND SUBSIDIARIESNOTES TO CONSOLIDATED FINANCIAL STATEMENTS
At June 30, 2018
Long-lived assets . . . . . . . . $264,651 $49,352 $314,003 $ 2,083 $(10,099) $305,987 $145,711 $451,698
Goodwill . . . . . . . . . . . . . . . $ 61,693 $20,782 $ 82,475 $ — $ — $ 82,475 $ 27,468 $109,943
FY 2017
North America
Leasing
Pac-Van Lone Star Combined Manufacturing
Corporateand
IntercompanyAdjustments Total
Asia –PacificLeasing Consolidated
Revenues:Sales . . . . . . . . . . . . . . . . . . $ 47,640 $ — $ 47,640 $ 6,944 $ (2,049) $ 52,535 $ 48,124 $100,659Leasing . . . . . . . . . . . . . . . . 97,383 19,097 116,480 — (291) 116,189 60,080 176,269
$145,023 $19,097 $164,120 $ 6,944 $ (2,340) $168,724 $108,204 $276,928
Share-basedcompensation . . . . . . . . . $ 333 $ 41 $ 374 $ 62 $ 1,012 $ 1,448 $ (74) $ 1,374
Depreciation andamortization . . . . . . . . . . $ 13,663 $ 9,666 $ 23,329 $ 792 $ (728) $ 23,393 $ 16,699 $ 40,092
Operating income (loss) . . . $ 19,551 $ (3,916)$ 15,635 $(2,430) $ (4,907) $ 8,298 $ 10,768 $ 19,066
Interest income . . . . . . . . . . $ — $ — $ — $ — $ 25 $ 25 $ 41 $ 66
Interest expense . . . . . . . . . $ 7,304 $ 1,369 $ 8,673 $ 392 $ 7,325 $ 16,390 $ 3,263 $ 19,653
Additions to long-livedassets . . . . . . . . . . . . . . . . $ 26,024 $ 47 $ 26,071 $ — $ (247) $ 25,824 $ 23,681 $ 49,505
Intersegment net revenues related to sales of primarily portable liquid storage containers and ground leveloffices from Southern Frac to the North American leasing operations totaled $2,049,000, $3,715,000 and$4,138,000 during FY 2017, FY 2018 and FY 2019, respectively; and intrasegment net revenues in the NorthAmerican leasing operations related to primarily the leasing of portable liquid storage containers from Pac-Vanto Lone Star totaled $1,000,000 and $1,730,000 during FY 2018 and FY 2019, respectively.
Note 13. Subsequent Events
On July 12, 2019, the Company announced that its Board of Directors declared a cash dividend of $2.30 pershare on the Series C Preferred Stock (see Note 3). The dividend is for the period commencing on April 30, 2019through July 30, 2019, and payable on July 31, 2019 to holders of record as of July 30, 2019.
F-46
CO
RP
OR
AT
EIN
FO
RM
AT
ION
DIRECTORS
Ronald F. ValentaExecutive Chairman of the Board
Jody E. MillerChief Executive Officer and President
James B. RoszakLead Independent Director andChairman of the Audit Committee
Susan L. HarrisChairman of the CompensationCommittee
Larry D. TashjianChairman of the Nominating andGovernance Committee
Manuel MarreroDirector
William H. BaribaultDirector
Douglas B. TrusslerDirector
INVESTOR RELATIONS
Financial Profiles, Inc.11601 Wilshire Boulevard, Suite 1920Los Angeles, CA 90025Tel: (310) 622-8223
LEGAL COUNSEL
Morrison & Foerster LLP707 Wilshire BoulevardLos Angeles, CA 90017
Recent press releases, filings with theSecurities and Exchange Commissionand additional information aboutGeneral Finance Corporation can beobtained by visiting our website atwww.generalfinance.com
EXECUTIVE OFFICERS
Jody E. MillerChief Executive Officer and President
Charles E. BarrantesExecutive Vice President and ChiefFinancial Officer
Christopher A. WilsonGeneral Counsel, Vice President andSecretary
Jeffrey A. KluckmanExecutive Vice President of GlobalBusiness Development
Neil LittlewoodChief Executive Officer, Royal WolfTrading Australia Pty Limited
Theodore M. MourouzisChief Executive Officer and President,Pac-Van, Inc.
TRANSFER AGENT
Continental Stock Transfer & TrustCompany1 State Street, 30th FloorNew York, NY 10004Tel: (212) 509-4000
INDEPENDENT AUDITORS
Crowe LLP15233 Ventura Blvd., 9th FloorSherman Oaks, CA 91403
Related Documents