2019 PRIME Benchmarking report KPI & Benchmarking Subgroup PRIME LEGAL NOTICE This report has been financed by the European Commission however it reflects the views only of the authors, and the Commission cannot be held responsible for any use which may be made of the information contained therein.

Welcome message from author
This document is posted to help you gain knowledge. Please leave a comment to let me know what you think about it! Share it to your friends and learn new things together.
Transcript

2019 PRIME Benchmarking report
KPI & Benchmarking Subgroup PRIME
LEGAL NOTICE
This report has been financed by the European Commission however it reflects
the views only of the authors, and the Commission cannot be held responsible
for any use which may be made of the information contained therein.

Page: 2
Contents
Foreword by PRIME co-chairs 3
Introduction 5
1 PRIME KPI & benchmarking 8
2 Trends and developments 13
2.1 Overview of main rail industry characteristics and trends 13
Summary of industry characteristics 13
Development and benchmark of industry characteristics 14
2.2 Financial 27
Summary of finance 27
Development and benchmark of finance 28
Costs 29
Revenues 35
2.3 Safety 41
Summary of safety 41
Development and benchmark of safety 42
2.4 Environment 48
Summary of environment 48
Development and benchmark of environment 49
2.5 Performance and delivery 56
Summary of performance and delivery 56
Development and benchmark of performance and delivery 57
Punctuality 57
Reliability 68
Availability 73
2.6 ERTMS deployment 76
Summary of ERTMS deployment 76
Development and benchmark of ERTMS 76
3 Outlook 80
4 Annex 82
4.1 Key influencing factors of participating infrastructure managers 82
4.2 Fact sheets of the infrastructure managers 86
4.3 Comments on deviations 95
4.4 PRIME KPI-definitions 97
4.5 Individual thresholds of punctuality for national measures 105
4.6 Financial data 106
5 Glossary 107
Page: 3
Foreword by PRIME co-chairs
The European Green Deal sets out how to
make Europe the first climate-neutral conti-
nent by 2050. The European Year of Rail
2021 highlights the important role of rail in
reaching this goal. Rail will have to take up a
bigger share of the transport system. Rail in-
frastructure managers work to provide safe,
reliable and efficient railway infrastructure for
the transport of people and goods. Their con-
tribution will be key in meeting additional ca-
pacity needs and creating optimal operating
conditions for the provision of attractive rail
services. The recent COVID pandemic has
had a very heavy economic impact on the
sector, which will only become fully visible in
the data in next year’s report. But the ongoing
recovery also offers an opportunity to trans-
form our transport systems and it is good to
see that many Member States are making use
of funding from the EU Recovery and Resili-
ence Facility to invest in rail.
The KPI subgroup was set up in 2014 with two
main objectives: to monitor common trends at
the EU level; and to benchmark performance
and by so doing to strive for better results. We
are pleased that we can share with you the
fourth benchmarking report prepared by the
PRIME KPI subgroup, covering the years
2012-2019. For the infrastructure managers,
benchmarking helps to understand where
each organisation stands and where there is
potential for improvement. For the European
Commission, there is an invaluable opportuni-
ty to identify best practice and to monitor the
progress with respect to EU policy priorities.
For all stakeholders, it is an opportunity to
observe trends as they evolve, and to identify
strengths and weaknesses of the system.
Compared to the first three reports, this edi-
tion includes a more complete dataset and
one new participant (in total 18). Six infra-
structure managers are in the transitional
phase to join. Similar to last year’s report, this
report offers more detailed explanations and
contextual information to make the wealth of
data more accessible.
We would like to thank the PRIME KPI sub-
group chair Rui Coutinho from IP Portugal, as
well as the members of this group from 24
organisations, the Commission and the Euro-
pean Union Agency for Railways, for this out-
standing achievement.
PRIME members have jointly agreed on the
key performance indicators that are relevant
for their business. The progress on common
data definitions and KPIs is documented in the
catalogue, which is continuously refined and
publicly available on the PRIME website. We
will continue to work on making PRIME KPIs
more robust, comparable for benchmarking
purposes and more complete by covering ad-
ditional aspects.
We believe that PRIME data and definitions
can serve the needs of a large range of rail
experts and policy makers. By measuring and
sharing the results, we aim to demonstrate to
the wider public that the rail sector is commit-
ted to improving its service provision.
PRIME co-chairs
Kristian Schmidt European Commission, DG MOVE Director of Land Transport Alain Quinet SNCF Réseau Deputy Director General

Page: 4
Page: 5
Introduction
Rail is the backbone of European transportation. It is the safest, greenest mode
of land transport and has also proven efficiency in the current COVID-19 pan-
demic, as rail freight continued to run reliably throughout the pandemic, ensur-
ing supply chains and being more resilient than other modes.
Today, transport accounts for a quarter of the EU's total greenhouse gas emis-
sions, which have increased over recent years. One of the main objectives of
the European Green Deal is to reach a 90% reduction in transport emissions by
2050. Rail has an essential role in this transformation, which is why the Com-
mission has set a number of ambitious rail related milestones in the new Sus-
tainable and Smart Mobility Strategy, to be reached by 2050, such as to:
• Double rail freight traffic
• Triple high-speed rail traffic
• Complete the multimodal Trans-European Transport Network (TEN-T)
equipped for sustainable and smart transport
In order to fulfil its role in the European Green Deal and meet the objectives of
the Sustainable and Smart Mobility Strategy, rail has to be safe, reliable, green,
smart, affordable and able to adapt to the changing needs of passengers and
industries. This depends on the performance of both rail operators and infra-
structure managers. The latter are responsible for developing, maintaining and
managing the rail infrastructure. The PRIME KPI & Benchmarking Subgroup
collects data to monitor their performances in these categories.
• Safety is a top priority. Although safety risks cannot be completely eliminat-
ed, safety levels can be significantly improved by good asset condition and
the adoption of safety policies. Investing in state-of-the-art technology (e.g.
ERTMS), rethinking networks, stations, level-crossings, training of track
workers and awareness-raising campaigns for the public are available tools
for infrastructure managers.
• Ensuring the optimal use of rail infrastructure based on the needs of
customers is essential and can be promoted through adequate instruments
such as economic incentives and/or charging and performance schemes, in
line with EU law1. As capacity is limited, and new construction is very costly
1 Directive 2012/34/EU of the European Parliament and of the Council of 21 November 2012
establishing a single European railway area http://data.europa.eu/eli/dir/2012/34/oj

Page: 6
and time intensive, getting maximum capacity out of the existing infrastruc-
ture network is paramount. This depends on efficient capacity allocation and
traffic management, as well as on systems like the European Rail Traffic
Management System (ERTMS), which allows for shorter head times be-
tween trains.
• Strong cooperation between all actors across borders is vital to enabling
smooth operation between countries, overcoming fragmented national struc-
tures and creating a truly open and interoperable railway market. It paves
the way for major international projects and services linking European cities
and citizens with each other. The Platform for Rail Infrastructure Managers
in Europe (PRIME) is a central element of this cooperation.
• Efficient and foresighted maintenance and construction increases reliability
and availability. Reducing the number of asset failures through proactive
maintenance reduces delays and cancellations, thereby making rail more at-
tractive to users. Conversely, tracks in bad condition, and therefore subject
to permanent or temporary speed limitations or even closure, lead to longer
travel times and in some cases lower utilisation, as the route becomes unat-
tractive.
• Rail is already one of the most environmentally friendly and energy-efficient
transport modes. But environmental sustainability is not only about more
people using rail, but also about rail itself becoming greener. Rail is mostly
electrified, with 4 out of 5 trains running on electricity, and represents only
0,4% of CO2 emissions from all transport modes2. Rail has the potential to
become completely carbon neutral well before the rest of the economy by
2050.
• Providing good value for money is important, as infrastructure managers
are largely funded by the public and State budgets are constrained. This is
done, for example, by developing high asset management standards and
balancing costs, risk and performance as a tool for investment decisions.
Governments have a part to play here too. In accordance with EU law3,
Member States have to ensure that the accounts of infrastructure managers
are balanced. Low levels of investment over an extended period of time can
negatively impact operational costs, safety and overall performance.
2 Statistical Pocketbook 2020. https://ec.europa.eu/transport/facts-fundings/statistics/pocketbook-
2020_en. and CER launches the Future is Rail campaign - UIC Communications 3 Directive 2012/34/EU of the European Parliament and of the Council of 21 November 2012
establishing a single European railway area. http://data.europa.eu/eli/dir/2012/34/oj

Page: 7
2020 and most likely also 2021 are going to be difficult years for the rail sector.
Transport is one of the sectors most severely affected by the COVID-19 pan-
demic. While freight transport has shown a certain resilience in the crisis, there
has been a huge drop in passenger mobility. During the peak of the crisis, rid-
ership went down by more than 90% in several countries and many internation-
al connections were stopped. Rail infrastructure managers are impacted due to
the reduction in traffic and the revenues it generates4.
As this report covers data up to 2019, it does not yet show the impacts of the
pandemic, but is to be considered the last "regular" report in the sense that it
shows the industry development before the various distortions of the COVID-19
pandemic. In this respect, this report can be a good data reference to compare
developments before and after the pandemic.
More time will be needed to gather and analyse data in order to grasp the full
impact of the current pandemic on the behaviour of passengers and transport
users. But there are certainly lessons to be learnt, such as the resilience and
increased punctuality of rail during the crisis and the growing appetite of cus-
tomers for sustainability.
4 Opinion of the European Economic and Social Committee (TEN/716-EESC-2020) for the Proposal for a Regulation of the European Parliament and of the Council establishing measures for a sustainable rail market in view of the COVID-19 pandemic [COM(2020) 260 final - 2020/0127 (COD)], Rapporteur-general: Alberto MAZZOLA, Plenary session: 553 - Jul 16, 2020 https://www.eesc.europa.eu/fr/our-work/opinions-information-reports/opinions/proposal-regulation-european-parliament-and-council-establishing-measures-sustainable-rail-market-view-covid-19-pandemic

Page: 8
1 PRIME KPI & benchmarking
Platform of Rail Infrastructure Managers in Europe (PRIME)
The Platform of Rail Infrastructure Managers in Europe (PRIME) was estab-
lished between the European Commission’s transport and mobility directorate
general (DG MOVE), and rail infrastructure managers in 2013. Its main objec-
tive is to improve the cooperation between rail infrastructure managers across
Europe. Furthermore, the platform supports and facilitates the implementation
of European rail policy and develops performance benchmarking for the ex-
change of best practices.
Alongside the European Commission and the European Union Agency for
Railways (ERA), PRIME now has 37 industry members including all main infra-
structure managers of EU Member States and of the EFTA members Switzer-
land and Norway. Four industry associations of European rail infrastructure
managers participate as observers5.
KPI & Benchmarking Subgroup
A central idea behind PRIME is to give infrastructure managers, who are natu-
ral monopolies, an opportunity to learn from each other. The performance
benchmarking currently covers several dimensions of rail infrastructure man-
agement: costs, safety, sustainable development, punctuality, resilience, and
digitalisation. The core of the benchmarking is the catalogue, which contains a
clear and concise documentation of the PRIME key performance indicators
(KPIs).
The number of infrastructure managers participating in the subgroup has
steadily increased. The first pilot benchmarking started in 2015 with 9 infra-
structure managers collecting data predating to 2012. In this year’s benchmark-
ing, based on 2019 data, 23 infrastructure managers have contributed to the
report, of which 18 are involved in the external report presented in the table
below.
5 PRIME members: https://webgate.ec.europa.eu/multisite/primeinfrastructure/about-
prime/members_en

Page: 9
Infrastructure managers participating in the report
Infrastructure manager Logo & abbreviation Country
Adif Adif
Spain
Bane NOR Bane NOR
Norway
Banedanmark BDK
Denmark
DB Netz AG DB
Germany
Finnish Transport Infrastructure
Agency
FTIA
Finland
HŽ Infrastruktura d.o.o. HŽI
Croatia
Iarnród Éireann – Irish Rail IÉ Ireland
Infraestruturas de Portugal S.A. IP
Portugal
Latvijas dzelzceļš LDZ
Latvia
AB LTG Infra6 LTGI
Lithuania
LISEA LISEA
France
PKP PLK PKP PLK
Poland
ProRail ProRail
Netherlands
RFI RFI
Italy
SBB SBB
Switzerland
SNCF Réseau SNCF R.
France
Správa železnic, s.o. SŽCZ
Czechia
Trafikverket
TRV
Sweden
Table 1: Infrastructure managers participating in the report
6 Former Lietuvos geležinkeliai

Page: 10
Purpose and empirical methodological approach of the report
The purpose of this report is to illustrate the current performance of infrastruc-
ture managers, to identify areas for further analysis and to provide relevant data
to the railway industry and related sectors, politicians, researchers, economists
and other interested stakeholders. Above all, the general objective for the re-
port is to deliver insight and inspiration for better decisions on developing a
sustainable and competitive infrastructure management which provides high
quality services.
In this report the key indicators will each be shown in a benchmark graph and a
time series graph, presenting a cross-comparison of infrastructure managers
and the key trends. Compared to last year's report, which showed data for
2012-2018, in this year’s report the time series covers 2015-2019. This allows
more companies to be presented in the graphs and makes it in perspec-
tive easier for new members to reach the threshold for historical data. To
ensure clarity and comparability only complete time series are shown. The time
series chart is complemented with the compound annual growth rate (CAGR) to
increase the visibility of the overall development. The CAGR also shows only
complete time series.
The benchmarking charts show the latest available annual data and the aver-
age of the available years in 2012-2019 for every individual infrastructure man-
ager, plus the peer group’s average weighted by denominator. For example, if
the KPI reflects cost per main track kilometre (denominator), organisations with
large networks will have a correspondingly higher impact on the weighted aver-
age. Thus, the weighted average reflects the average of the combined total
network of all participating infrastructure managers. The accuracy level of the
data is indicated in each case and highlighted in a lighter colour in the charts for
values that deviate from the standard. The reason for showing deviating figures
even if they are less comparable is to show a more complete dataset and ena-
ble more infrastructure managers to provide data. Deviating figures will pro-
spectively become less with every report.
The quantitative results can only be interpreted meaningfully if the main
influencing factors are taken into account. Without considering the differ-
ent characteristics of the infrastructure managers and their structural pe-
culiarities, meaningful comparisons cannot be achieved. In order to facili-
tate the interpretation of the figures and the quantitative results, background
information on the specific contexts of the infrastructure managers and rail in-
frastructure is provided for each indicator. Additionally to this, more general

Page: 11
information on influencing factors can be found in the Annex 4.1 as well as
some macro level data of the infrastructure managers and the countries they
are operating in, in Annex 4.2.
Selected indicators and report structure
The indicators presented in this report are selected from the data pool of the
PRIME KPI & Benchmarking Subgroup. They aim to display a status quo
alongside the European objectives, covering the fields of finance, safety, envi-
ronment, performance, and delivery. Figure 1 shows these groups as well as
the selected indicators that are analysed in the report. The numbers beside the
KPI point to the chapter in which they are treated.

Page: 12
Co
nte
xt
PR
IME
Safe
ty
Accid
en
ts
Fa
talitie
s
En
viro
nm
en
t
Die
sel tra
ins
Ele
ctric
train
s
Co
nd
ition
Asse
t failu
res
Sig
nallin
g
Tele
co
m
Po
wer s
up
ply
Tra
ck
Stru
ctu
res
Oth
er
Perm
an
en
t sp
eed
re
stric
tion
s
Tem
po
rary
sp
eed
re
stric
tion
s
Co
sts
OP
EX
Main
ten
an
ce
Tra
ffic m
an
ag
em
en
t
CA
PE
X
Ren
ew
als
Reve
nu
es
Utilis
atio
n
Tra
in-k
m
Pass
en
ger tra
ins
Fre
igh
t train
s
Asse
t Cap
ab
ility &
E
RT
MS
Dep
loym
en
t tod
ay
Dep
loym
en
t 203
0
Safe
ty &
En
viro
nm
en
t D
eliv
ery
F
ina
ncia
l G
row
th
Pu
nctu
ality
Pass
en
ger tra
ins
Fre
igh
t train
s
Dela
ys c
au
sed
by IM
Tra
in c
an
cella
tion
ca
use
d b
y IM
Relia
bility
Dela
ys
Sig
nallin
g
Tele
co
m
Po
wer s
up
ply
Tra
ck
Stru
ctu
res
Oth
er
Perfo
rma
nc
e
No
n a
cce
ss c
harg
es
Tra
ck a
cc
es
s c
harg
es
Pro
po
rtion
2.5
2.5
2.5
2.5
2.5
2.5
2.5
2.5
2.5
2.2
2.2
2.2
2.2
2.2
2.2
2.2
2.2
2.5
2.5
2.5
2.5
2.5
2.5
2.5
2.5
2.5
2.5
2.5
2.4
2.4
2.3
2.3
2.1
2.1
2.1
2.6
2.6
2.6
Pre
cu
rso
rs
2.3
= a
ggre
ga
ted
indic
ato
r
Co
nte
xt
Ele
ctrific
atio
n
Mo
da
l sh
are
p
asse
ng
er tra
nsp
ort
Mo
da
l sh
are
freig
ht
tran
sp
ort
2.4
2.1
2.1
Figure 1: Selected indicators for the report and their chapters in the report

Page: 13
2 Trends and developments
In this core chapter of the report selected indicators regarding finance, safety,
environment, performance and delivery, and ERTMS deployment are shown. It
aims to give an overview of the development and status quo of the performance
of the infrastructure managers.
Before analysing the more specific indicators, however, it is important to under-
stand the major characteristics and trends of the rail industry in the participating
Member States. For this reason, we will briefly outline the development of the
modal share, network and utilisation in Chapter 2.1 and work through the differ-
ent categories from Chapter 2.2 onwards.
2.1 Overview of main rail industry characteristics and trends
Summary of industry characteristics
EU-wide objectives
• Increasing the passenger volume in rail and shifting more freight transport
from road to rail are key objectives of the European Green Deal and the
Sustainable and Smart Mobility Strategy.
• Rail needs to be an attractive alternative to more polluting modes of
transport, both for passengers and freight.
• The EU’s Sustainable and Smart Mobility Strategy lays the foundation for
making the EU transport system greener and supporting digital transfor-
mation. It sets out ambitious rail related targets by 2050, such as to7:
– Double freight traffic
– Triple high-speed traffic
– Complete the TEN-T network
7 COM/2020/789 final: Sustainable and Smart Mobility Strategy – putting European transport on
track for the future. https://eur-lex.europa.eu/legal-content/EN/TXT/HTML/?uri=CELEX:52020DC0789&from

Page: 14
Peer group’s performance
• The network size ranges between 670 and 55.000 main track-kilometres.
• The average density of the peer group’s network is 55 main track-
kilometres per 1.000 km2.
• Eight infrastructure managers operate high-speed lines.
• The individual modal share of rail of the peer group has a range between
1% and 19% in passengers and 0,8% and 76% in freight transport.
• In passenger transport the modal share of rail showed a positive devel-
opment in more than half of the countries.
• In freight transport the modal share of rail decreased 0,2% on average in
the peer group.
• The degree of utilisation ranges between 8 and 75 passenger trains and
0,2 and 10 freight trains per main track-kilometre per day.
Development and benchmark of industry characteristics
Rail infrastructure is developed over decades and determines the shape and
the management of the network for a very long time. This chapter aims to give
an overview of the status quo on the rail sector of the operating country and
shows the infrastructure manager’s main network characteristics on a macro
level.
Rail characteristics indicators:
PRIME members are reporting nine indicators on rail characteristics:
• National modal share of rail in passenger transport
• National modal share of rail in freight transport
• Total track-kilometres
• Total main track-kilometres
• Total passenger high-speed main line-kilometres
• Total main line-kilometres
• Degree of network utilisation of passenger trains
• Degree of network utilisation of freight trains

Page: 15
• Degree of network utilisation of all trains
In order to increase comparability of these values across infrastructure manag-
ers, utilisation is measured in train-kilometres per main track-kilometre.
Modal share of rail transport
Modal share is an important indicator for the European Union in developing
sustainable transport. For passenger inland transport the modal share com-
pares the share of passenger cars, buses/coaches and railways. The modal
share of rail in freight inland transport shows the national rail tonne-kilometres
compared to total tonne-kilometres carried on road, inland waterways and rail
freight. Figures 2 and 5 present the benchmark of the modal share of rail in
inland passenger and freight transport in the Member States, based on data of
the European Commission. Figures 3 and 6 show the national trends of rail in
inland passenger and freight modal share development.
Figure 2: National modal share of rail in inland passenger transport (% of passenger-km)8
8 Source: European Commission, Eurostat/Statistical Pocketbook. Estimated data for 2019
according to 2018 data
ES
FI
K
E
HR
PT
IE
L
SE
FR
LT
PL
L
IT
CH
CZ
IM accuracy
Latest available year
verage of each IMs latest available year weighted by denominator
ata accuracy o entry ormal E Estimate eviating from definition P Preliminary
verage of available years

Page: 16
Figure 2 shows the cross-comparison of the participating Member States. The
range of modal share of rail in inland passenger transport varies widely across
the peer group. The highest modal share can be found in Switzerland (19%),
while it varies between 1% and 11% in the other countries.
Figure 3: National modal share of rail in inland passenger transport (% of passenger-km) and CAGR (%) in 2015-20199
Between 2015 and 2019 the peer group’s modal share of passenger rail
transport remained relatively stable, showing only a slight average increase of
0,6%. In two third of the countries the development was stagnating or positive.
The highest annual increase in this period was in Lithuania, which however still
has the lowest share of passenger rail in the peer group. Other countries with a
growth above 2% were Poland, Czechia, and Germany. Frontrunner Switzer-
land showed a slight reduction of 0,6%.
The modal share in passenger transport in a country highly depends on a num-
ber of geographic and socio-demographic factors as well as the network size,
density, and utilisation. The main parameters affecting the mobility choice are
travel time, availability and reliability, supply of alternative transportation
means, comfort and price factors. Switzerland is a good example for having
relatively good conditions in most of these parameters. As the country has a
relatively small territory, the travel distances are comparatively low. Due to the
high rail network density and utilisation, most of the cities can be reached in a
relatively short time. Additionally, its performance in punctuality and reliability is
9 Source: European Commission, Eurostat/Statistical Pocketbook. Estimated data for 2019
according to 2018 data
PL
FR
CZ E
L
HR
SE
PT
L
ES IT
FI
CH
LT
IE
K
Page: 17
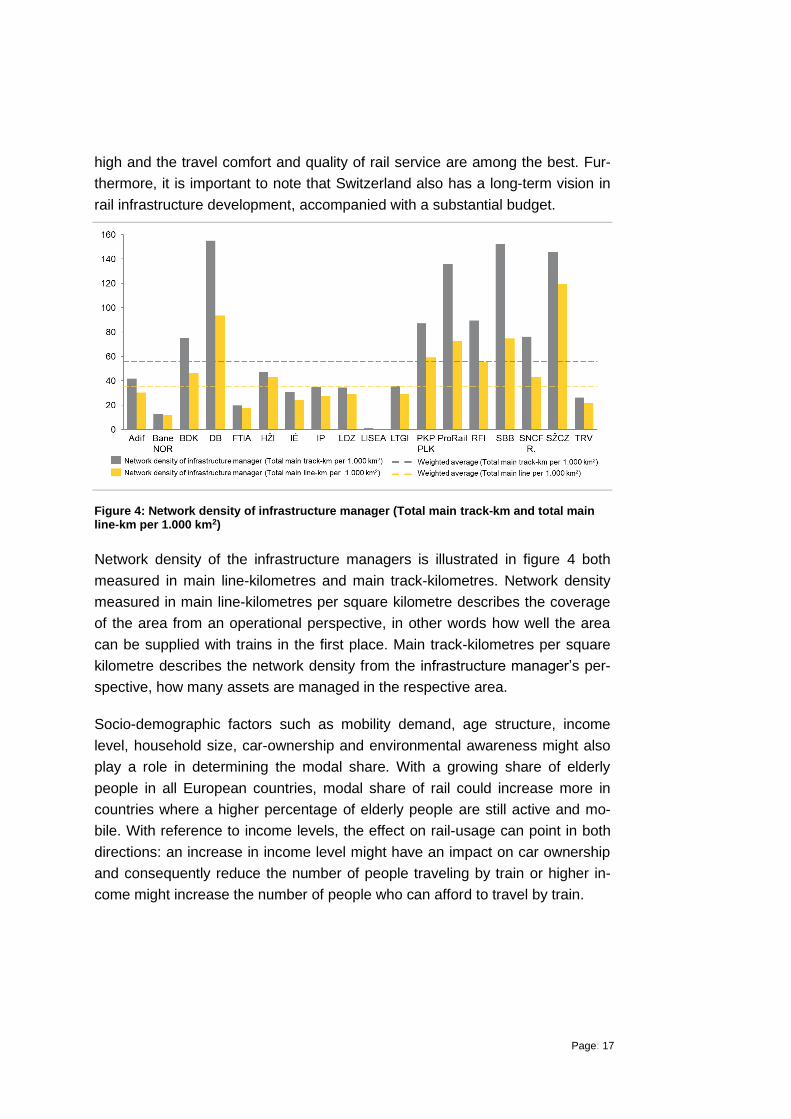
high and the travel comfort and quality of rail service are among the best. Fur-
thermore, it is important to note that Switzerland also has a long-term vision in
rail infrastructure development, accompanied with a substantial budget.
Figure 4: Network density of infrastructure manager (Total main track-km and total main line-km per 1.000 km2)
Network density of the infrastructure managers is illustrated in figure 4 both
measured in main line-kilometres and main track-kilometres. Network density
measured in main line-kilometres per square kilometre describes the coverage
of the area from an operational perspective, in other words how well the area
can be supplied with trains in the first place. Main track-kilometres per square
kilometre describes the network density from the infrastructure manager’s per-
spective, how many assets are managed in the respective area.
Socio-demographic factors such as mobility demand, age structure, income
level, household size, car-ownership and environmental awareness might also
play a role in determining the modal share. With a growing share of elderly
people in all European countries, modal share of rail could increase more in
countries where a higher percentage of elderly people are still active and mo-
bile. With reference to income levels, the effect on rail-usage can point in both
directions: an increase in income level might have an impact on car ownership
and consequently reduce the number of people traveling by train or higher in-
come might increase the number of people who can afford to travel by train.
Page: 18
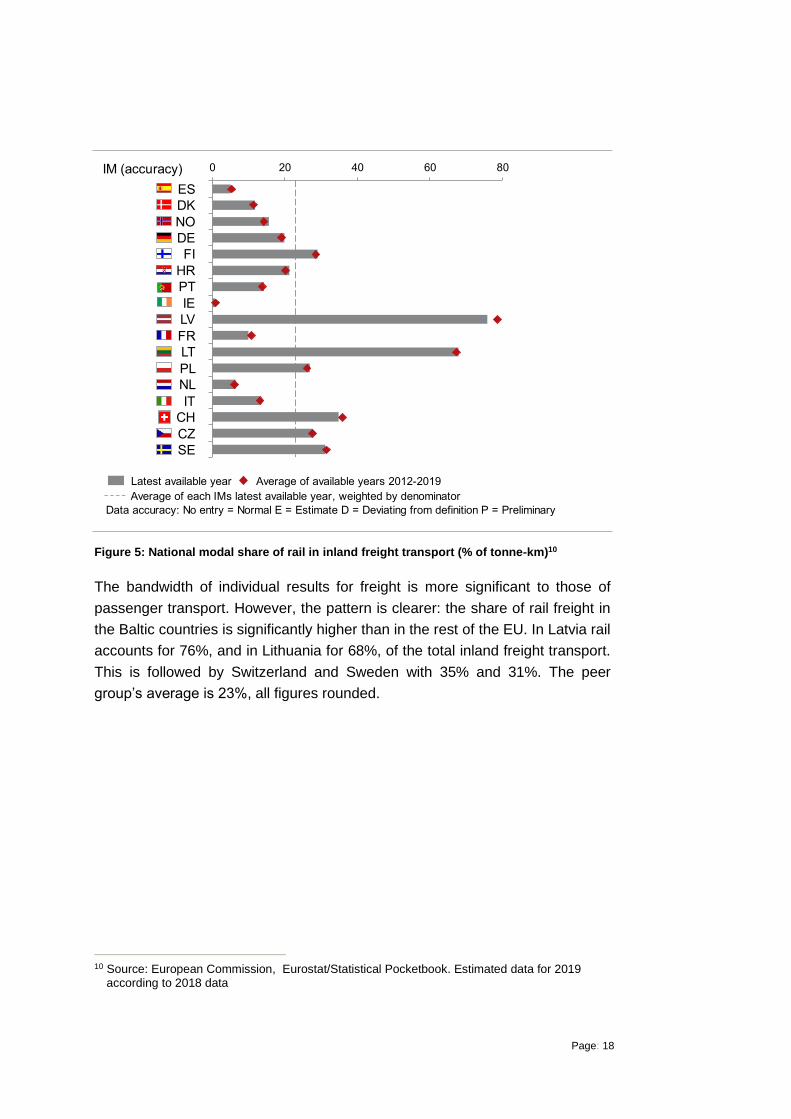
Figure 5: National modal share of rail in inland freight transport (% of tonne-km)10
The bandwidth of individual results for freight is more significant to those of
passenger transport. However, the pattern is clearer: the share of rail freight in
the Baltic countries is significantly higher than in the rest of the EU. In Latvia rail
accounts for 76%, and in Lithuania for 68%, of the total inland freight transport.
This is followed by Switzerland and Sweden with 35% and 31%. The peer
group’s average is %, all figures rounded.
10 Source: European Commission, Eurostat/Statistical Pocketbook. Estimated data for 2019
according to 2018 data
IE
ES
K
FI
E
PT
HR
L
FR
LT
PL
L
IT
CH
CZ
SE
IM accuracy
Latest available year
verage of each IMs latest available year weighted by denominator
ata accuracy o entry ormal E Estimate eviating from definition P Preliminary
verage of available years

Page: 19
Figure 6: National modal share of rail in inland freight transport (% of tonne-km) and CAGR (%) in 2015-201911
Figure 6 shows the national modal share development in rail freight transport.
Compared to the slight increase in the modal share of passenger rail, freight
transportation shows a slight reduction of 0,2% on average, with losses in-
curred in 7 countries. Considering the objective of doubling rail freight by 2050
set in the Sustainable and Smart Mobility Strategy, these trends are rather dis-
appointing.
As already highlighted, the Baltic countries show the highest share of rail in
freight. These can be linked partly to the transit transport of Russian energy
products but might also have its roots in the history of these countries12. In the
post-war period the extension of freight rail transport became an important pillar
of the industrialisation of Eastern European countries. Czechia and Poland are
also among the countries with higher levels of freight activity. Switzerland,
however, has almost no heavy industry but shows a relatively high rail freight
share. One explanation could be the Swiss ban on night-time trucking, its gen-
eral rail-friendly transport policy and its strategic position in Europe.
Macro-economic aspects, such as trade relations and the organisation of the
logistics sector of a country, have an impact on the freight sector and therefore
also on rail freight traffic. Network density and transport corridors between eco-
nomic centres, as well as transhipment points such as ports and airports, are
equally important. The growth of e-commerce and the associated change in the
11 Source: European Commission, Eurostat/Statistical Pocketbook. Estimated data for 2019
according to 2018 data 12 DG MOVE (2015): Study on the Cost and Contribution of the Rail Sector.
L
PT
L LTCHSE
FR
FICZPL
HR E
IT K
ES IE

Page: 20
logistics sector is not reflected in the data of rail freight development. An in-
crease in interconnected multimodal transport solutions can support a shift to
rail. However, this development must be initiated by the rail freight operators.
Given the EU's policy objectives, it is important to continue to monitor this de-
velopment. Rail freight needs serious boosting through increased capacity,
strengthened cross-border coordination and cooperation between rail infra-
structure managers, better overall management of the rail network, and the
deployment of new technologies such as digital coupling and automation13.
Network size
This subchapter aims to give a better overview of the network size operated by
the infrastructure managers and presents its network measured in total track-
kilometres, in total main track-kilometres, and total main line-kilometres. It fur-
thermore illustrates the high-speed network of relevant infrastructure managers.
Figure 7 and 9 show the benchmark and figure 8 and 10 the development of
the network in main track-km and high-speed main line for selected infrastruc-
ture managers.
Figure 7: Total track-km, Total main track-km, Total main line-km and Total high-speed main line-km14
13 COM/2020/789 final: Sustainable and Smart Mobility Strategy – putting European transport on
track for the future. https://eur-lex.europa.eu/legal-content/EN/TXT/HTML/?uri=CELEX:52020DC0789&from
14 LISEA has no countrywide network but operating the South Europe Atlantic high-speed rail line.
.
.
.
.
.
.
.
.
.
.
.
.
IP S CF
R.
Bane
R
FTI HŽI BLT IL ZI PKP
PLK
SŽCZ TR dif LISE ProRail RFI SBBB K
Infrastructure managers with high speed lines
Total main track km Total main line km High speed main line kmTotal track kmLeft axis Right axis
Page: 21
Figure 7 shows the benchmark of the network in the different units of meas-
urement. Infrastructure managers with high-speed lines are circled on the right.
While total track-kilometres show the cumulative length of all tracks maintained
by the infrastructure manager, total main track-kilometres exclude tracks at
service facilities15 which are not used for running trains. Total main line-
kilometres indicate the cumulative length of railway lines operated and used for
running trains by the end of reporting year. Regarding total track-kilometres
SNCF R. and DB are managing the largest networks with more than 60.000
kilometres of track. The smallest networks considering track size are operated
by LISEA, IÉ and LDZ, however LISEA is not managing a countrywide network
but operating a high-speed line alone (South Europe Atlantic High-Speed Rail
Line). Furthermore, it is important to note that these figures do not represent
the entire national railway network but only the part that is managed by the peer
group’s infrastructure manager.
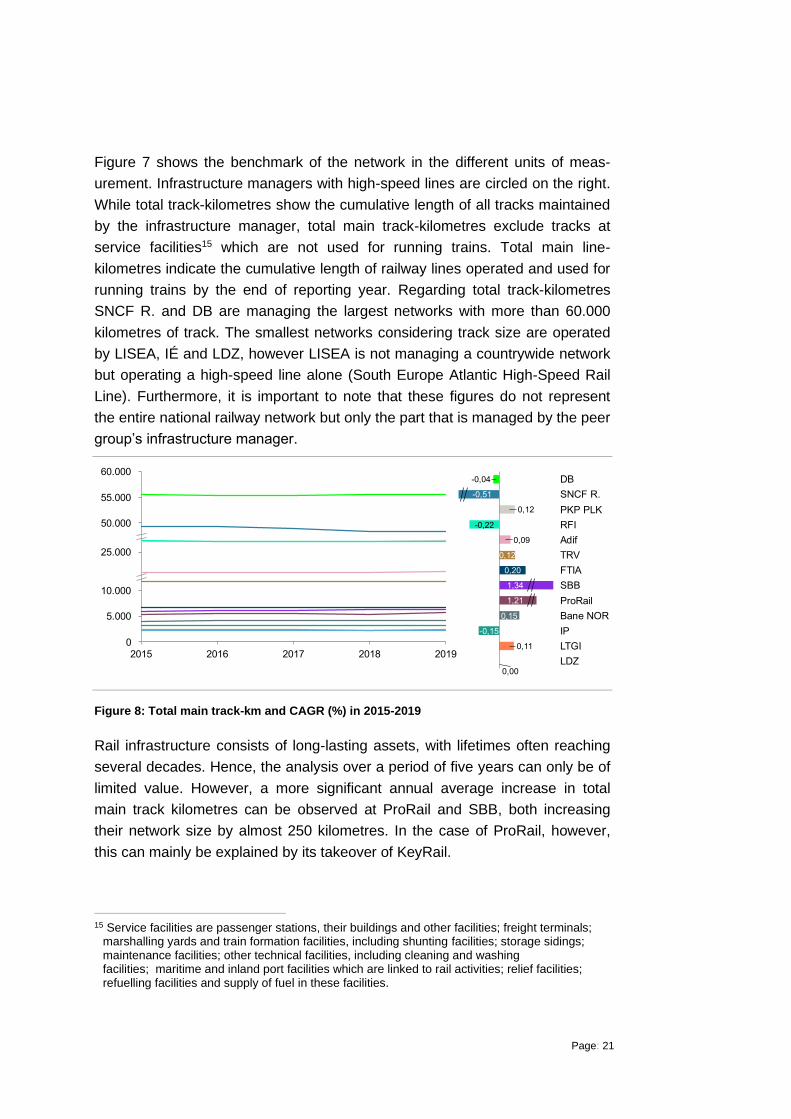
Figure 8: Total main track-km and CAGR (%) in 2015-2019
Rail infrastructure consists of long-lasting assets, with lifetimes often reaching
several decades. Hence, the analysis over a period of five years can only be of
limited value. However, a more significant annual average increase in total
main track kilometres can be observed at ProRail and SBB, both increasing
their network size by almost 250 kilometres. In the case of ProRail, however,
this can mainly be explained by its takeover of KeyRail.
15 Service facilities are passenger stations, their buildings and other facilities; freight terminals;
marshalling yards and train formation facilities, including shunting facilities; storage sidings; maintenance facilities; other technical facilities, including cleaning and washing facilities; maritime and inland port facilities which are linked to rail activities; relief facilities; refuelling facilities and supply of fuel in these facilities.
.
.
.
.
.
.
dif
B
L Z
S CF R.
PKP PLK
RFI
TR
FTI
SBB
ProRail
Bane R
IP
LT I

Page: 22
Figure 9: Share of total high-speed main line-kilometres (in % of total main line-km)
Figure 9 shows selected infrastructure managers which also operate a high-
speed line and their share of the total main line. High-speed lines are defined
as a whole or part of lines, approved for 250 km/h or more, which are:
• specially built high-speed lines equipped for speeds generally equal to or
greater than 250 km/h,
• specially upgraded high-speed lines equipped for speeds of the order of 200
km/h,
• specially upgraded high-speed lines which have special features as a result
of topographical, relief or town-planning constraints, on which the speed
must be adapted to each case.
The last category also includes interconnecting lines between the high-speed
and conventional networks, lines through stations, accesses to terminals, de-
pots etc. travelled at conventional speed by ‘high-speed’ rolling stock.16
Eight infrastructure managers have high-speed main lines ranging between
2760 kilometres for Adif and 57 kilometres for BDK. There is large variation in
the proportion of high-speed tracks. While LISEA is a 100% high-speed line,
only 2% of ProRail’s network is high-speed.
16 Source: Glossary for Transport Statistics, A.I-04. Directive (EU) 2016/798 on the rail
interoperability, Annex I, Article 1

Page: 23
Figure 10: Total high-speed main line-kilometre and CAGR (%) in 2015-2019
Figure 10 shows the development of high-speed network of the relevant infra-
structure managers. Five infrastructure managers increased the length of their
high-speed lines between 2015 and 2019. SBB more than doubled its high-
speed network compared to 2015 mainly with the opening of the Gotthard Base
Tunnel in December 2016 through the Alps.
It is not surprising that the size of a network is strongly correlated with the size
of the country and its population. However, the distribution of the population is
an important aspect too, as it might lead to a concentration of significant parts
of the network in a few urban areas or along corridors.
As illustrated, rail networks mostly remained unchanged over the years, how-
ever more infrastructure managers focus now on extending their high-speed
infrastructure. Increasing high speed traffic is among the transport priorities of
the European Commission. Improving the offer of high-speed rail services
would provide passengers with a true alternative to short-haul flights and cars.
In particular where high-speed rail services can be linked to form an attractive
alternative to long distance flights (e.g. Paris, Frankfurt, Amsterdam), this could
not only reduce CO2 emissions compared to short-haul feeder flights, but also
free up scarce airport capacity and avoid maintaining unprofitable air routes.
Current network extension programs are highly dependent on the status of rail
within the country, funding agreements and budgets available. These factors in
turn are closely linked to a country’s economic power. Eligibility for EU-funds is
another important factor, especially with regards to the extension of high-speed
lines, as EU cohesion policy-related financing is one of the major sources of rail
funding. Most of the network extensions in Eastern and Central European coun-
tries, in Portugal and Spain were co-financed to a significant extent by the EU.
.
.
.
RFI
dif
S CF R.
SBB
ProRail
B

Page: 24
Network utilisation
Utilisation is an essential measure of the performance of an infrastructure man-
ager. One of the most important objectives is to use its infrastructure as effec-
tively as possible. Figure 10 presents the aggregated benchmark of the degree
of network utilisation by passenger and freight trains. Figures 12 and 13 show
the development chart of these indicators.
Figure 11: Degree of network utilisation –all trains (Daily train-km per main track-km)
Figure 11 illustrates the network utilisation of both passenger and freight trains.
Marked with red colour the intensity of network use of passenger trains ranges
from 7 to 75 trains per day. ProRail’s and SBB’s networks are utilised more
than twice the average. LTGI and LDZ are showing the lowest degrees of utili-
sation regarding passenger trains.
Utilisation of freight trains is marked with yellow colour and reflects the results
seen in the modal share for freight transport in the Baltic countries. With more
than 11 freight trains per day running on each kilometre of main track of L Z’s
and LT I’s network the intensity of use in the two Baltic networks is among the
highest in the peer group. Only SBB and DB show higher utilisation, with 12
freight trains per day. With reference to non-freight train activity LISEA is a spe-
cial case, as its network is 100% high-speed which does not allow freight trains.

Page: 25
Figure 12: Degree of network utilisation – passenger trains (Daily passenger train-km per main track-km) and CAGR (%) in 2015-2019
As it can be seen in the figure above passenger train utilisation increased
slightly over the years. The individual growth rates range between -2,1% and
+5,4% per year, with IP showing the highest increase in passenger train activity
on its network. Three infrastructure managers show a decrease in passenger
train utilisation.
Figure 13: Degree of network utilisation – freight trains (Daily freight train-km per main track-km) and CAGR (%) in 2015-2019
The volatility of the degree of network utilisation with reference to freight trains
is slightly higher than for passenger trains. Freight train activity decreased in
five infrastructure managers, increased in three and remained stable in two
infrastructure managers. Similarly, the highest annual growth of passenger train
activity can be seen at IP, which increased the degree of utilisation by an annu-
al average of 5,6%. LDZ shows a significant decline in freight train activity. The
main reasons for these reduced cargo volumes can be related to the current
political relationship with Russia and a limited cargo transportation through Lat-
RFI
TR
IP
ProRail
B
PKP PLK
Bane R
dif
S CF R.
L Z

Page: 26
via, improved Russian port infrastructure, and a lack of demand for coal in Eu-
rope. However, besides train kilometres, load factor is also a key to under-
standing reduced freight train activity, as more trains are not necessarily need-
ed to carry more goods, and slot optimization can also have a huge impact.
It is visible that – with the exception of DB – passenger train utilisation is higher
in smaller countries with high population density and a wider rail network, e.g.
The Netherlands, Switzerland, and Denmark. Similar to the parameters influ-
encing the share of passenger rail in a country’s modal share utilisation is driv
en by the prosperity of a country and its citizens, and the status of the rail sec-
tor in that country. It furthermore depends on public service obligations in rural
areas with low population density and the existence of bottlenecks and con-
gested nodes where all traffic has to pass. Utilisation is particularly important
for infrastructure managers when it comes to finance. It is decisive both for rev-
enues and expenditures as public funding decisions are largely based on train
activity, while on the other hand wear and tear is accelerated by more intensive
use.
Similar to the modal share in freight transport, the degree of utilisation by freight
trains highly depends on logistical circumstances, such as availability of suita-
ble transhipments centres and smooth interconnections. The European Com-
mission has set out in the Sustainable and Smart Mobility Strategy its intention
to promote intermodal transport. Ultimately all transport modes for freight must
come together via multimodal terminals and the European Commission will take
initiatives so that EU funding and other policies, including R&I support, be
geared better towards addressing these issues17. Punctuality and plannability
are decisive factors for freight clients. Improving performance in freight train
punctuality might also increase the willingness of companies to shift their goods
to rail.
17 COM/2020/789 final: Sustainable and Smart Mobility Strategy – putting European transport on
track for the future. https://eur-lex.europa.eu/legal-content/EN/TXT/HTML/?uri=CELEX:52020DC0789&from

Page: 27
2.2 Financial
Summary of finance
EU-wide objectives
• Railway infrastructure requires substantial amounts of funding to cover
capital and operating expenditures. Providing value for money is
paramount as funding is constrained, and infrastructure managers are
constantly improving their asset management activities to achieve this
objective.
• The European infrastructure managers apply different financing and
funding structures and rely on combinations of public funding, access
charges and commercial revenues.
• EU legislation aims at increasing the transparency of funding
arrangements and developing appropriate incentives to ensure the best
available use of existing assets and capacity.
• Directive 2012/34/EU, establishing a single European railway area18,
requires
– rail undertakings and infrastructure managers to maintain separate
accounts
– the expenditure (under normal business conditions and over a period
not exceeding five years) and the infrastructure managers’ income
from different sources (including access charges and state funding) to
be balanced.
• It also sets out a framework for determining charges, establishing the
principle that the charges paid to operate a train service must cover the
direct cost incurred as a result of such operation while allowing for
additional mark-ups and charges to recover fixed costs and address
externalities.
18 Directive 2012/34/EU of the European Parliament and of the Council of 21 November 2012
establishing a single European railway area Text with EEA relevance. http://data.europa.eu/eli/dir/2012/34/oj

Page: 28
Peer group’s performance
• The level of operational expenditures varies between € 40.000 – 221.000
per main track-kilometre per year and remained relatively stable in 2015-
2019.
• The range of capital expenditures varies between € 0 – 255.000 per main
track-kilometre per year and show a higher fluctuation in 2015-2019.
• TAC revenues vary between € – € showing an average of € per
train-kilometre.
Development and benchmark of finance
Rail infrastructure requires a significant amount of funding which is dedicated to
building new infrastructure, replacing existing assets as well as maintaining and
operating the asset base. The financial chapter covers important elements re-
lated to expenditure and revenues of infrastructure managers.
Rail financing indicators
PRIME members report four indicators measuring costs and three indicators
measuring revenues:
• Costs:
– Operational expenditures
– Capital expenditures
– Maintenance expenditures
– Renewal expenditures
• Revenues:
– Proportion of TAC in total revenue
– Track access charges
– Non-access charges
In order to increase comparability of these values among infrastructure manag-
ers, the expenditure-figures are related to main track-kilometres. The revenues
from track access charges are related to main track-kilometres, train-kilometres
and the monetary value. Non-access charges are related to main track-
kilometres.

Page: 29
Costs
The costs category includes relevant costs incurred by the infrastructure
manager, broken down into useful and comparable sub-categories. It includes
all operating, capital and investment costs. For purposes of comparison, costs
are adjusted to reflect local costs using purchasing power parities (PPPs). The
costs incurred by an infrastructure manager are dependent on a number of fac-
tors: some lie within and some outside the responsibility of an infrastructure
manager.
Figures 14 to 18 show the operational and capital expenditures of the PRIME
members in a latest benchmark and over the time period 2015-2019.
Operational expenditure
Figure 14: Composition of operational expenditure in relation to network size (1.000 Euro per main track-km)19
19 Results are normalised for purchasing power parity.
Lighter colours indicate accuracy level deviating from normal. Comments concerning the deviations can be found in the Annex 4.3.
dif
B
Bane R
IP
B K
FTI
I HŽI
L ZLISE
LT IPKP PLK
ProRailRFI
TR
SBBS CF R.
SŽCZ
Maintenance Traffic Management Residual PE
verage of each IMs latest available year weighted by denominator
ata accuracy o entry ormal E Estimate eviating from definition P Preliminary
Traffic Management not available therefore included in residual PE
isaggregation not available
IM accuracy

Page: 30
Figure 14 shows the composition and the level of operational expenditures in
2019. The level of operational expenditures varies between €40.000 –
€ 21.000 per main track-kilometre per year and shows an overall dispersion of
values of € . . SBB spent more than twice the amount compared to the
peer group average, but this is due to the high residual OPEX which is gener-
ated by activities related to other income, i.e. shunting yard operations and trac-
tion power supply, and by project-related, non-depreciable activities. (See fig-
ure 25 as counterpart: total revenues from non-access charges). On average,
infrastructure managers’ annual operational expenditures amount to €103.000
per main track-kilometre. The lighter colour of DB indicates deviating data for
maintenance, which is explained in the Annex 4.3.
Figure 15: Operational expenditures in relation to network size (1.000 Euro per main track-km) and CAGR (%) in 2015-201920
As can be seen in figure 15, the expenditure across the peer group remained
relatively stable over the period. However, some infrastructure managers like
SNCF R., Bane NOR, PKP PLK experienced more or less constant annual in-
creases. In contrast, LDZ’s and ProRail’s operational expenditures decreased
over the period.
Operational costs are driven by a range of different factors. The size and com-
plexity of the networks are just as relevant as train utilisation. For example, a
network with a relatively large number of switches and a high degree of electri-
fication and level crossings is more prone to failures and requires more inter-
ventions. Tunnels and bridges must not only be checked more regularly, but
also entail more costly and sophisticated replacements and repairs. Busy tracks
20 Results are normalised for purchasing power parity.
Bane R
ProRail
S CF R.
B
PKP PLK
SBB
L Z
RFI
IP
TR

Page: 31
are subject to higher wear and tear. Condition and age of the assets are also
relevant: investments that have been made in the past pay off and reduce op-
erational costs later. Besides maintenance, operational expenditures also in-
clude functions of traffic management. The services provided by the infrastruc-
ture manager vary significantly, too. Different technologies and the amount of
human resources needed determine the level of expenditures.
Capital expenditures
ccording to the PRIME KPI & Benchmarking subgroup’s definition, capital
expenditures are funds used by a company to acquire or upgrade physical as-
sets such as property, industrial buildings or equipment. An expense is consid-
ered a capital expenditure when the asset is a newly purchased capital asset or
an investment that improves the useful life of an existing capital asset. Hence, it
comprises investments in new infrastructure as well as renewals and en-
hancements. As capital expenditures are often linked to major (re-)investment
programs it is not surprising that expenditure levels fluctuate over time.
Figure 16: Composition of capital expenditures in relation to network size (1.000 Euro per main track-km)21
21 Results are normalised for purchasing power parity.
ata accuracy o entry ormal E Estimate eviating from definition P Preliminary
Renewal not available therefore included in residual C PE
dif
I
Bane R
HŽI
B K B
IP
ProRail
FTI
L ZLISE
S CF R.
PKP PLKLT I
RFI
SŽCZ
SBB
TR
Enhancements Investments & ther C PE Renewal
IM accuracy
verage of each IMs latest available year weighted by denominator

Page: 32
As shown in figure 16 the range of annual capital expenditures varies between
€0 – 255.000 per main track-kilometre. It also shows the composition of renew-
als and enhancements, investments & other capital expenditures. On average
€121.000 per main track-kilometre and year are spent on capital expenditures.
The standard deviation in the peer group is € . , expectedly higher than for
OPEX. The highest value for renewals at SBB is mainly due to forced mainte-
nance22 as well as the intensive development of the railway by the federal gov-
ernment. LISE ’s capital expenditure is zero as its infrastructure is fairly new.
The lighter colour of DB indicates deviating data for renewals, which is ex-
plained in the Annex 4.3.
Figure 17: Capital expenditures in relation to network size (1.000 Euro per main track-km) and CAGR (%) in 2015-201923
As capital expenditures are often linked to major (re-)investment programs it is
not surprising that expenditure levels fluctuate over time. The individual annual
growth rates of the infrastructure managers range from -43,7% to 43,6%. The
highest increase in investment-related expenditure has been recorded at IP
spending almost five times as much in 2019 as in 2015. IP is undertaking a
relevant investment in Portuguese railway network, building, enhancing and
renewing infrastructure which will last until 2023.
Similar to operational costs, capital expenditures also increase with higher net-
work complexity. High numbers of switches, signalling and telecommunication
Lighter colours indicate accuracy level deviating from normal. Comments concerning the
deviations can be found in the Annex 4.3. 22 "Forced maintanance” refers to maintenance acting on regulations. 23 Results are normalised for purchasing power parity.
Bane R
SBB
RFI
ProRail
S CF R.
B
TR
L Z
IP

Page: 33
assets increase the cost of renewals. Network complexity, in turn, might partly
be owed to geographic conditions.
The level of capital expenditures is highly dependent on the budget and funding
agreements between infrastructure managers and national governments. In
particular renewals of rail infrastructure require long term planning, reflecting
the long-lived nature of the assets and the need for a whole-life approach to
asset management. Longer funding settlements provide more stability regard-
ing finance issues and enable larger investments projects. In terms of public
funding the eligibility for the EU Cohesion Fund is particularly important for
Central and Eastern European countries, as EU cohesion policy-related financ-
ing is one of the major sources of funding, especially modernisation projects
such as ERTMS, railway electrification etc. The condition and age of the asset
also influences the need for renewals and asset improvement. The supplier
market, prices and resources determine the level of activities achievable with
the budgets provided.

Page: 34
Maintenance and renewals
Figure 18: Maintenance (component of OPEX) and renewal expenditures (component of CAPEX) in relation to network size (1.000 Euro per main track-km)24
Figure 18 aims to provide a snapshot of current maintenance and renewal ex-
penditures. Maintenance expenditures are dedicated to the infrastructure man-
ager’s activities needed to maintain the condition and capability of the existing
infrastructure or to optimise asset lifetimes. Renewals represent capital expend-
itures needed to replace existing infrastructure with new assets of the same or
similar type. On average infrastructure managers spend €88.000 per main
track-kilometre per year on maintenance and renewal. Only three infrastructure
managers are significantly spending more than average, namely SBB, ProRail
and DB. The different spread of OPEX and CAPEX can also be seen here:
while maintenance shows a standard deviation of € . renewals have a
spread in data distribution of € . .
24 Results are normalised for purchasing power parity.
Lighter colours indicate accuracy level deviating from normal. Comments concerning the deviations can be found in the Annex 4.3.
B K
difBane R
B FTI HŽI
I IP
L ZLISE
LT IPKP PLK
ProRailRFI
SŽCZ
SBBS CF R.
TR
RenewalsMaintenance
IM accuracy
verage of each IMs latest available year weighted by denominator
ata accuracy o entry ormal E Estimate eviating from definition P Preliminary
Renewal not available
Page: 35
Similar to operational and capital expenditures, maintenance and renewal costs
are driven by the following factors: network complexity/asset densities (e.g.
switches bridges tunnels… network utilisation and the condition of assets.
Revenues
This category provides an overview of track access charges which are paid by
railway undertakings using the railway network and its service facilities. TAC
revenues are shown both in relation to network and to traffic volume, as
operators are charged based on the usage of the network which is indicated by
the traffic volume. The TAC relation to the network illustrates the TAC revenue
in relation to a major cost driver. Furthermore, it measures and compares non-
track access related revenues ‘earned’ by an infrastructure manager, excluding
subsidies and property development.
To achieve meaningful comparability, the indicators for charging have been
simplified, and PRIME is using fundamental KPIs that all infrastructure
managers find common and easy to collect. Together with cost related
indicators, they provide an indication to what extent infrastructure managers are
capable of covering their costs, respective to what extent they rely on subsides.
Figures 19, 21 and 22 show the latest benchmark of the revenue indicators of
between the infrastructure managers. The development over the time period
2015-2019 is presented in figures 20, 23 and 24.

Page: 36
TAC - Track access charges
Figure 19: Proportion of TAC in revenue (% of monetary value)
For five infrastructure managers the share of track access charges of total rev-
enues is above 80%. LISEA generates all its revenues from track access
charges. The peer group’s average is 4%, however for Bane NOR, HŽI and
SŽCZ the relevant share is only 20%, 29% and 35%.
Figure 20: Proportion of TAC in revenue (% of monetary value) and CAGR (%) in 2015-2019

Page: 37
The proportion of revenues from track access charges remained relatively sta-
ble across the peer group. Only Bane NOR faced a more significant decline,
where the proportion of TAC revenues decreased from 27% in 2015 to 20% in
2012.
Figure 21 and 22 illustrate the revenues per track-kilometre generated by
infrastructure managers to cover the cost of the network in relation to its
network and its traffic volume.
Figure 21: TAC revenue in relation to network size (1.000 Euro per main track-km) 25
25 Results are normalised for purchasing power parity.

Page: 38
Figure 22: TAC revenue in relation to traffic volume (Euro per total train-km) 26
Figure 22 illustrates the revenues per track-kilometre and figure 23 the reve-
nues per train-kilometre as a benchmark. The comparison shows the differ-
ences in the extent to which infrastructure managers can generate TAC reve-
nues per train-kilometre on the one hand, and how many TAC revenues per
track they have available in relation to their network costs on the other. DB's
TAC revenues for example, are above average in relation to network size, but
remain below average when related to traffic volumes. The range of TAC reve-
nues in relation to network size varies between € .000 – € 38.000 per main
track-kilometre per year and has a peer group average of € . and a stand-
ard deviation of € . . In relation to traffic volume TAC revenues varies be-
tween €0,3 – € , showing an average of € . LISEA's level of income is sig-
nificantly higher than that of other infrastructure managers because it comes
exclusively from the LGV line (high-speed line) while remaining comparable to
the charges levels of other LGVs on the French national network.
26 Results are normalised for purchasing power parity.
Lighter colours indicate accuracy level deviating from normal. Comments concerning the deviations can be found in the Annex 4.3.

Page: 39
Figure 23: TAC revenue in relation to network size (1.000 Euro per main track-km) and CAGR (%) in 2015-201927
Figure 24: TAC revenue in relation to traffic volume (Euro total train-km) and CAGR (%) in 2015-201928
Figure 23 and 24 illustrates the development of revenues per track-kilometre
and train-kilometre generated by infrastructure managers to cover the cost of
the network. Between 2015 and 2019 the majority of the peer group members
increased their TAC revenues. The highest increase can be seen at Adif
(18,9%), however this development is partly the result of a change of the TAC
system in 201729.
27 Results are normalised for purchasing power parity. 28 Results are normalised for purchasing power parity. 29 Data estimated from the official P&L and balance sheet of Adif and Adif AV (two different infra
managers and legal entities).
SBB
B
S CF R.
TR
dif
ProRail
RFI
PKP PLK
IP
Bane R
FTI

Page: 40
Non-access charges
Revenues from non-access charges may include revenues from service facili-
ties and other services for operators, commercial letting, advertising, and tele-
communication services, but exclude grants and subsidies. The growing im-
portance of third-party financing in the transportation sector is also reflected by
the development of the PRIME members.
Figure 25: Total revenues from non-access charges in relation to network size (1.000 Euro per main track-km) 30
The annual peer group’s average is €20.000 per main track-kilometre. Six in-
frastructure managers have revenues from non-access charges of less than
€ . per main track kilometre among which LISE has zero non-access
charges revenues. The € .000 generated by SBB are far above the average
and stem from providing goods (e.g. traction current, switches) and services
(e.g. use of IT tools, project management) to other infrastructure managers in
Switzerland (See fig. 14 for the comparatively high financial importance of activ-
ities related to residual OPEX.).
30 Results are normalised for purchasing power parity.
xis is shortened due for readability. ProRails high value for the available years’ average is due to a definition change in 2015.
FTI
dif
HŽI
S CF R.
B K
ProRail
I
Bane R
B
IP
L ZLISE LT I
SŽCZ
PKP PLK
RFISBB
TR
IM accuracy
Latest available year
verage of each IMs latest available year weighted by denominator
ata of year
ata accuracy o entry ormal E Estimate eviating from definition P Preliminary
verage of available years
Shortened

Page: 41
Figure 26: Total revenues from non-access charges in relation to network size (1.000 Euro per main track-km) and CAGR (%) in 2015-2019 31
Except for SBB all infrastructure managers exhibit an upwards trend: TRV,
Bane NOR and SNCF R. realised annual growth rates of over 10%.
The figures above demonstrate the different levels of revenues generated by
infrastructure managers based on track access-related and non-track access-
related sources. One of the main reasons is the difference in combining public
funding, access charging and commercial funding. The precise combination in
a given country typically reflects historical precedent, the intensity with which
the rail network is used, the legacy of asset management (which determines
the extent to which maintenance and renewal costs can be forecast with confi-
dence), the need for new capacity (which can prompt a search for alternative
forms of funding) and the willingness of users to pay.
2.3 Safety
Summary of safety
EU-wide objectives
• All infrastructure managers aim at providing safe railway transport.
• In order to maintain and continuously improve railway safety EU-wide, the
European Union has developed a legal framework for a harmonized
approach to rail safety.
31 Results are normalised for purchasing power parity.
S CF R.
SBB
PKP PLK
RFI
Bane R
IP
B
TR

Page: 42
EU-wide objectives
• The objective of the EU is to maintain and further develop the high
standards of rail safety.
• In accordance with the Sustainable and smart mobiltiy strategy, by 2050
the number of fatalities should be close to zero for all modes.
Peer group’s performance
• On average there have been 0,3 significant accidents and 0,3 people
seriously injured and killed per million train-kilometres each year.
• Safety performance increased in two third of the companies.
• Infrastructure manager related precursors also show a declining trend.
Development and benchmark of safety
For infrastructure managers safety is of outstanding importance and is manda-
tory in any framework of key performance indicators. It is the most important
element in the performance of an infrastructure manager, and affects custom-
ers, stakeholders, the reputation of the infrastructure manager, the railway and
society at large. Infrastructure managers constantly invest in their assets and
new technology to provide good safety levels, and they develop their safety
policies to achieve maximum awareness. This chapter presents the safety per-
formance of the infrastructure managers.
Rail safety indicators
PRIME members are reporting three indicators measuring railway safety per-
formance:
• Significant accidents
• Persons seriously injured and killed
• Infrastructure manager related precursors to accidents
In order to increase comparability of these values among infrastructure manag-
ers, these values are related to million train-kilometres.
Development and benchmark
Figures 27 to 32 show the safety performance of the PRIME members as a
benchmark and over the time-period 2015-2019.

Page: 43
Figure 27: Significant accidents (Number per million train-km)32
The KPI values vary notably between the infrastructure managers, however
they all remain below 1,5 significant accidents per million train-kilometres.
LISE and SŽCZ show the lowest values LISE counting zero accidents in
2019. A relative increase can be seen at IP. However, IP is aware of global
safety KPI results and several perspectives that contribute to the current trend.
On the one hand, IP's network has a relatively low traffic density which
influences KPIs negatively, on the other hand, 90% of significant accidents and
its consequences result from infringement of rules by people external to railway
system, intrusion into the rail premises and failure to comply signalling at level
crossings. The lighter grey of BDK and DB indicates deviating data, which is
explained in the Annex 4.3.
32 Lighter colours indicate accuracy level deviating from normal. Comments concerning the
deviations can be found in the Annex 4.3.
SBB: No average of available years as some types of accidents were excluded before 2017.
IPHŽI
difB K
B
PKP PLK
Bane R
FTI
I
LISE L Z
LT I
ProRailRFI
SBBS CF R.
SŽCZTR
IM accuracy
Latest available year
verage of each IMs latest available year weighted by denominator
ata accuracy o entry ormal E Estimate eviating from definition P Preliminary
verage of available years

Page: 44
Figure 28: Significant accidents on infrastructure manager’s network (Number per million train-km) and CAGR (%) in 2015-2019
The overall trend in safety performance is positive. Eight infrastructure manag-
ers improved their safety level from 2015 to 2019 with reducing their relative
accident numbers. The highest decrease in the number of significant accidents
related to train activity can be seen at LTGI and PKP PLK with a reduction of
27% and 14%. This is also the result of direct safety measures and modernisa-
tion, and replacement of traffic control equipment. PKP PLK for example is run-
ning a social campaign called “Bezpieczny przejazd” (safe crossing), to raise
awareness of risks resulting from failures to observe special precautions on
railway grade crossings and railway areas, and offers targeted trainings for rail
traffic controllers and people responsible for safety. SBB’s increase is mainly
due to different counting method according to the PRIME definition from 2017;
its accidents rate is still among the lowest in the peer group.

Page: 45
Figure 29: Persons seriously injured or killed (Number per million train-km) 33
The number of persons seriously injured and killed strongly correlates to the
lower number of significant accidents and has an average of 0,3 per million
train-kilometres. However, while the majority of infrastructure managers have
below average casualty rates, some networks are well above the weighted av-
erage. The standard deviation for this indicator is 0,4.
33 Lighter colours indicate accuracy level deviating from normal. Comments concerning the
deviations can be found in the Annex 4.3.
HŽI
SŽCZ
dif
B
B K Bane R
L Z
FTI
I IP
LISE LT I
PKP PLKProRail
RFISBB
S CF R.
TR
IM accuracy
Latest available year
verage of each IMs latest available year weighted by denominator
ata accuracy o entry ormal E Estimate eviating from definition P Preliminary
verage of available years

Page: 46
Figure 30: Persons seriously injured and killed (Number per million train-km) and CAGR (%) in 2015-2019
The number of persons seriously injured and killed corresponds to the number
of significant accidents. Two thirds of the infrastructure managers have reduced
the number of people seriously injured and killed relative to million train-km.
Figure 31: Infrastructure manager related precursors (Number per million train-km)34
34 Lighter colours indicate accuracy level deviating from normal. Comments concerning the
deviations can be found in the Annex 4.3.
PKP PLK
IP
L Z
dif
B
SBB
RFI
FTI
Bane R
ProRail
TR
S CF R.
S CF R.
FTI
Bane R
difB K
RFI
I
HŽI
B
IP
L ZLISE LT I
PKP PLKProRail
SBB
SŽCZTR
IM accuracy
Latest available year
verage of each IMs latest available year weighted by denominator
ata of year
ata accuracy o entry ormal E Estimate eviating from definition P Preliminary
verage of available years

Page: 47
Precursors are a good indicator to understand and mitigate root causes for sig-
nificant accidents and include broken rails, track buckle and track misalignment,
as well as wrong-side signalling failures.
The number of precursors of the peer group varies widely, some showing levels
well below the peer group’s weighted average of ,2, while others have signifi-
cantly higher values. However, it is interesting to see that the two infrastructure
managers of the Baltic countries show a relatively high number of accidents,
while the infrastructure related precursors to accidents are among the lowest in
the peer group.
Figure 32: Infrastructure manager related precursors (Number per million train-km) and CAGR (%) in 2015-2019
Figure 32 depicts a higher fluctuation in infrastructure manager related precur-
sors to accidents. However, there is also here a parallel to the positive devel-
opment of the other indicators. Similarly to the other two indicators illustrated
above (in figures 28 and 30), the most significant improvement can be seen at
PKP PLK. On the other side LTGI and FTIA show an increase in infrastructure
related precursors.
Rail safety is influenced by a wide array of factors. Safety policies should be
preventive and reactive at the same time. Providing assets in good condition by
ensuring appropriate activity levels of maintenance and renewal is a precondi-
tion for reliable and safe operations. Safety figures are also influenced by unau-
thorised persons entering the rails, whereby these incidents can only be influ-
enced by the infrastructure manager to a limited extent. Many infrastructure
managers have launched campaigns to reduce the number of level crossings
and to introduce modern signalling and communication systems. Increased
awareness among employees and track workers, as well as the public, is an-
IP
TR
dif
FTI
PKP PLK
Bane R
ProRail
LT I
SBB
L Z
B

Page: 48
other main pillar of rail safety. n organisation’s safety culture is therefore es-
sential, playing a major role by employing direct preventive measures, and
through raising awareness of safety, which reduces the influence of the human
factor. Regarding casualties, response time in emergency services and differ-
ent reporting and hospital procedures in the Member States might also have an
impact on the statistics.
As infrastructure managers in the EU are working under different circumstances
it is very important to put the data in context. The infrastructure managers from
newer EU countries in Eastern Europe are still in a phase of modernizing and
upgrading their railway networks. The initial conditions were different not only
regarding asset conditions and technical safety equipment, but also safety poli-
cies. In addition, it is important to note that in order to identify infrastructure
manager related precursors to accidents, an organisation must have sufficient
capacity and implemented systems to capture them.
2.4 Environment
Summary of environment
EU-wide objectives
• The European Green Deal aims to make Europe climate-neutral by 2050.
• In accordance with the EU’s Sustainable and Smart Mobility Strategy:
– All transport modes need to become more sustainable
– Sustainable transport alternatives should be widely available
– Scheduled collective travel of under 500 km should be carbon-neutral
by 2030 within the EU
• Rail needs to continue with further electrification of the track or using
greener alternatives to diesel where electrification is not possible. The
TEN-T core network is to be electrified by 2030, the comprehensive
network by 2050.

Page: 49
Peer group’s performance
• The network of the peer group is mostly electrified with an average of
74%, and remained relatively stable in 2015-2019.
• The share of electricity-powered trains in relation to train-kilometres
across the peer groups is around 81%.
• While the degree of electrification strongly correlates with the share of
electricity-powered trains, the electrified networks are not 100% exploited
by all infrastructure managers.
• The share of diesel-powered trains in relation to train-kilometres across
the peer group is around 18%.
Development and benchmark of environment
While rail is the most environmentally friendly transport mode it is still important
that it continues to become greener. The biggest overall impact will come from
electrification and the use of greener alternatives to diesel where electrification
is not possible. The indicators related to the electrification process are present-
ed in this chapter.
Rail environment indicators
PRIME members are reporting three indicators measuring railway environmen-
tal performance:
• Degree of electrification
• Share of electricity-powered trains
• Share of diesel-powered trains
In order to increase comparability of these values among infrastructure manag-
ers, these values are related to main track-kilometres and to train-kilometres.
Development and benchmark
Figures 33 to 36 show the relevant environmental indicators as a latest bench-
mark between the infrastructure managers and their development over the
time-period 2015-2019.

Page: 50
Figure 33: Degree of electrification of total main track (% of main track-km)
In the EU railway networks are mostly electrified. The peer group’s average is
74%, however, the degree of electrification varies widely from 5% to 100%.
While SBB, LISEA, and ProRail have the highest degree of electrification,
reaching over 90%, IÉ, LTGI and LDZ have electrified below 25% of their net-
work.
Figure 34: Degree of electrification of total main track (% of main track-km) and CAGR (%) in 2015-2019
dif
PKP PLK
IP
FTI B
B KBane R
I
HŽI
L ZLISE
RFI
LT I
ProRail
SBBS CF R.
SŽCZTR
IM accuracy
Latest available year
verage of each IMs latest available year weighted by denominator
ata accuracy o entry ormal E Estimate eviating from definition P Preliminary
verage of available years
IP
SBB
PKP PLK
FTI
TR
ProRail
RFI
B
dif
S CF R.
Bane R
L Z
LT I

Page: 51
The degree of electrification remained relatively constant over the period. Out-
standing annual growth can be seen at LTGI, almost tripling its degree of elec-
trified network between 2015 and 2019. In absolute terms this growth corre-
sponds to an additional 195 kilometres of electrified main tracks in 2019 com-
pared to 2015. The rest of the peer group increased its network by below 1%,
with the exception of TRV, which showed a slight decrease in the share.
Network utilisation and density appear to be a driver for electrification in several
cases. As the transfer to electrified lines requires high investments, electrifica-
tion makes economically most sense on busy lines. On low-density lines the
cost-efficiency is not proven, which is one reason why some infrastructure
managers as IÉ, LDZ and LTGI are showing rather low degrees of electrifica-
tion. Economic conditions can also impact the ability of a rail member to invest.
Infrastructure managers and operators managing and running on low-density
networks are discussing other approaches to develop greener railways. Battery
powered trains and hybrid-diesel electric locomotives are two possible ap-
proaches. Making rail transport more sustainable cannot only be achieved by a
fully electrified network, but also by incentivising and investing in other alterna-
tive energy sources.

Page: 52
Figure 35: Share of electricity-powered trains (% of total train-km) 35
The share of electricity-powered trains corresponds to the electrification of the
network. Over 80% of the peer group's traffic is powered by electricity. On
LISE ’s network all trains run with electricity-power, also SBB, TRV and RFI
have above 90% of electricity-powered trains running on their network. The
lighter grey of ProRail indicates an estimated figure.
35 Lighter colours indicate accuracy level deviating from normal.
difB K
I
Bane R
IP
FTI B
HŽI
L ZLISE LT I
PKP PLKProRail E
RFI
SŽCZ
SBB
TR
S CF R.
IM accuracy
Latest available year
verage of each IMs latest available year weighted by denominator
ata of year
ata accuracy o entry ormal E Estimate eviating from definition P Preliminary
verage of available years

Page: 53
Figure 36: Share of electricity-powered trains (% of total train-km) and CAGR (%) in 2015-2019
Figure 36 shows the development of electricity-powered trains between 2015
and 2019. Parallel to the development of the electrification of the main tracks
the trend is relatively stable, showing only a slight increase. Only LDZ shows an
annual growth of above 5%, and increased its share of electricity-powered
trains from 18% in 2015 to 22% in 2019.
PKP PLK
dif
RFI
SBB
TR
FTI
IP
Bane R
S CF R.
L Z

Page: 54
Figure 37: Share of diesel-powered trains (% of total train-km) 36
Figure 37 is the counterpart to figure 35, and shows the share of diesel-
powered trains in relation to traffic volume of the infrastructure managers. Cor-
responding to the low electrification level of their network, the Baltic countries
and Ireland show higher rates of diesel-powered trains than the rest of the
group. % of LT I’s, 87% of I ’s and % of L Z’s traffic volume is pro-
duced by diesel-powered trains, however the peer group’s average stays below
20%.
36 Lighter colours indicate accuracy level deviating from normal.
Bane R
difB K
TR
FTI B
LISE
HŽI
SBB
IPI
L Z
LT IPKP PLK
ProRail E RFI
S CF R.SŽCZ
IM accuracy
Latest available year
verage of each IMs latest available year weighted by denominator
ata of year
ata accuracy o entry ormal E Estimate eviating from definition P Preliminary
verage of available years

Page: 55
Figure 38: Share of diesel-powered trains (% of total train-km) and CAGR (%) in 2015-2019
Figure 38 shows the development of the share of diesel-powered trains be-
tween 2015 and 2019. Considering the European Commission’s objective of
reducing the share of diesel-powered trains, the declining trend across the peer
group is promising. The highest annual growth can be seen at SBB, however it
still remains far below the average with a share of diesel-powered trains of
0,3% in 2015 and 1% in 2019.
Figure 39: Share of electricity-powered trains (% of train-km) / Degree of electrification (% of main track-km)
Figure 39 shows an unsurprising correlation between the degree of electrifica-
tion of the network and the share of electric trains. However, it is noticeable that
similar degrees of electrification do not automatically lead to similar shares of
electrically produced train services. The decision to operate electricity-powered
2015 2016 2017 2018 2019
5
20
0
15
10
80
85-1,3
-1,3
3,3
-1,8
-1,4
-2,6
-3,5
-1,3
RFI
IP
LDZ
SNCF R.
0,0 Adif
PKP PLK
Bane NOR
FTIA
TRV
35,0 SBB

Page: 56
trains lies mainly with the operator, which may decide to run diesel-powered
trains or alternative engines on electrified lines. Historic trains or trains that also
run on non-electrified lines are two examples.
2.5 Performance and delivery
Summary of performance and delivery
EU-wide objectives
• Improving performance and increasing punctuality of passenger and
freight rail services is an objective of every infrastructure manager.
• Infrastructure managers establish targets and monitor them closely to
develop appropriate activities and measure their effectiveness.
• EU legislation has established basic principles to minimise disruptions.
Infrastructure charging schemes should encourage railway undertakings
and the infrastructure manager to minimise disruption and improve the
performance of the railway network through a performance scheme.
Peer group’s performance
• PRIME has developed common definitions to increase the comparability
of performance measures:
– Passenger trains punctuality is measured with a threshold of 5:29
minutes
– Freight trains punctuality is measured with a threshold of 15:29
minutes
• Passenger train punctuality has remained relatively stable between 2015
and 2019.
• Freight train punctuality shows a slight decline between 2015 and 2019.
• On average infrastructure managers caused 5 delay minutes per
thousand train-kilometres.
• On average 909 asset failures per thousand main track-kilometres per
year causing an average delay of 51 minutes per failure.
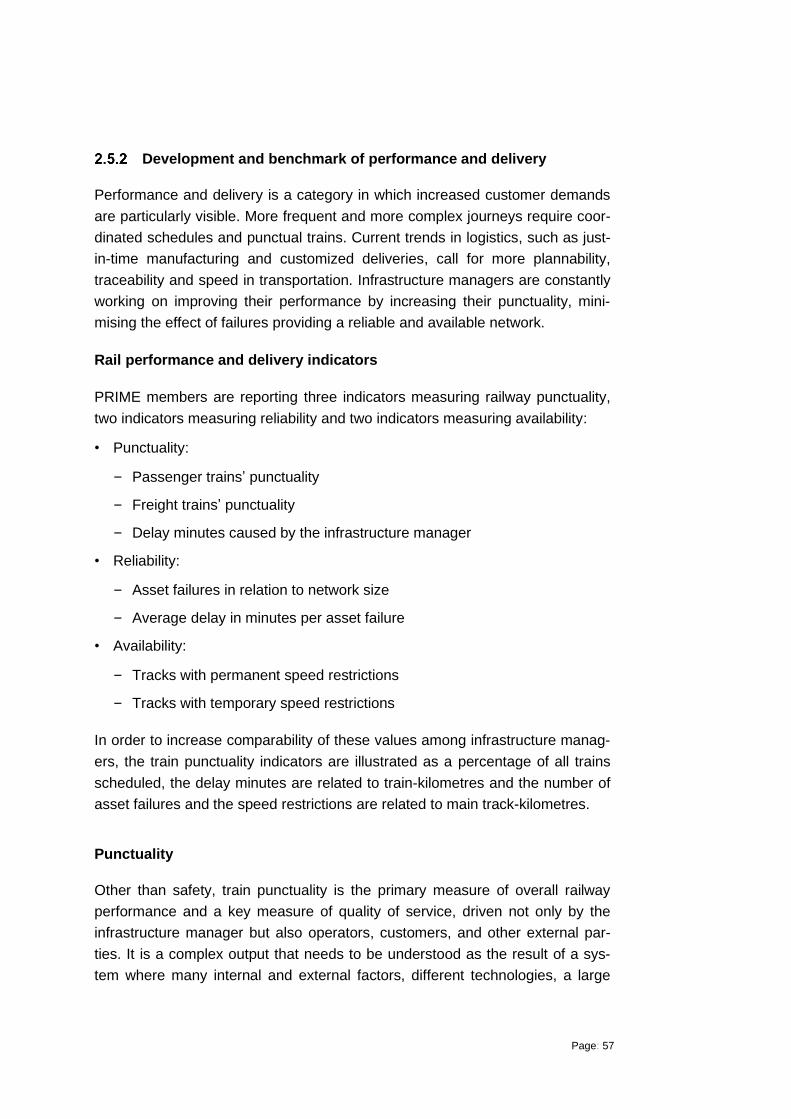
Page: 57
Development and benchmark of performance and delivery
Performance and delivery is a category in which increased customer demands
are particularly visible. More frequent and more complex journeys require coor-
dinated schedules and punctual trains. Current trends in logistics, such as just-
in-time manufacturing and customized deliveries, call for more plannability,
traceability and speed in transportation. Infrastructure managers are constantly
working on improving their performance by increasing their punctuality, mini-
mising the effect of failures providing a reliable and available network.
Rail performance and delivery indicators
PRIME members are reporting three indicators measuring railway punctuality,
two indicators measuring reliability and two indicators measuring availability:
• Punctuality:
– Passenger trains’ punctuality
– Freight trains’ punctuality
– Delay minutes caused by the infrastructure manager
• Reliability:
– Asset failures in relation to network size
– Average delay in minutes per asset failure
• Availability:
– Tracks with permanent speed restrictions
– Tracks with temporary speed restrictions
In order to increase comparability of these values among infrastructure manag-
ers, the train punctuality indicators are illustrated as a percentage of all trains
scheduled, the delay minutes are related to train-kilometres and the number of
asset failures and the speed restrictions are related to main track-kilometres.
Punctuality
Other than safety, train punctuality is the primary measure of overall railway
performance and a key measure of quality of service, driven not only by the
infrastructure manager but also operators, customers, and other external par-
ties. It is a complex output that needs to be understood as the result of a sys-
tem where many internal and external factors, different technologies, a large

Page: 58
number of actors and stakeholders come together and interact to produce a
good service for passenger and freight customers.
Reaching good punctuality rates is a priority of all countries, although it is
measured and managed in very different ways. In particular, measurement
concepts are quite diverse, as performance schemes are not yet sufficiently
coordinated between infrastructure managers. The different concepts concern
mainly the thresholds of punctuality and approaches regarding measurement
points. Within the peer group the individual span of thresholds set to classify a
train as delayed may differ by more than 10 minutes for passenger trains and
more than 50 minutes for freight trains. The collection of the individual compa-
ny standards that are used for national and company internal monitoring can be
found in the Annex 4.5.
In order to promote good quality benchmarking, PRIME has established a
common definition including an agreed threshold for each passenger and
freight services. For passenger trains, punctuality indicators represent the per-
centage of actually operating national and international passenger trains which
arrive at each strategic measuring point with a delay of less than or equal to
5:29 minutes. For freight trains the threshold has been set to 15:29 minutes.
Several but not all infrastructure managers report their punctuality figures ac-
cording to this definition. However, for some infrastructure managers this
threshold is less favourable and difficult to align with internal company targets.
As already indicated, the other important component of measurement concepts
is the approach regarding measuring points. The density of measurement
points in networks can be as low as measuring at the final destination only, or
as high as measuring at arrivals, destinations and additional points. The follow-
ing table shows the different concepts with regards to measurement points in
each infrastructure manager’s network. The counting method and definition of
strategic measuring points lays in the responsibility of the infrastructure man-
agers and is not further harmonised by PRIME.
Infrastructure
manager Measurement points in the network
Adif For statistical purposes at final destination only. For traffic
regulation and management also at every station, in blocks
and at some other strategic points like switches.
BDK Passenger trains (commuter): 85 strategic measurement

Page: 59
Infrastructure
manager Measurement points in the network
points
Passenger trains (regional and long distance): 47 strategic
measurement points
Freight trains: 16 strategic measurement points
Bane NOR PRIME punctuality performance measures are measured
at final destination and Oslo Central Station for both pas-
senger and freight trains
DB For statistical purposes:
Punctuality of passenger trains is measured taking into
account all stations.
Punctuality of freight trains is measured at the final station
(arrival) within Germany.
FTIA For local trains the measurement is done both at the first
and at last station; for all other trains only at arrival. Delays
are measured at block signals on line (but not used to cal-
culate punctuality).
HŽI For all trains, time is measured only at the destination (fi-
nal relation station, or transfer to neighbouring infrastruc-
ture managers)
IÉ Measured at final destination
IP Exclusively at the destination (all systems are prepared for
the measurement to be performed on more stations. To
this end, the stations to be selected will be all those that
enhance commercial service or have technical characteris-
tics for services requested by the operator).
LDZ Strategic measurement points.
LISEA Stations and strategic measurement points across the
network.
LTGI Measured at strategic points.
PKP PLK For statistical purposes, time measured at the destination
(final relation station, or transfer to neighbouring infrastruc-
ture manager). The possibility of measurement exists at

Page: 60
Infrastructure
manager Measurement points in the network
any point where the arrival / departure time of the train is
described.
ProRail Strategic measurement points.
RFI Final destination for punctuality purpose.
SBB Passenger trains: 53 strategic measurement points.
Freight trains: 52 strategic measurement points.
SNCF R. Measurements of punctuality are drawn from strategic and
near-stations points.
SŽCZ For statistical purposes:
• Origin point of a train or arriving border station in case
of cross-border train (transfer from other infrastructure
manager)
• Final destination point or departing border station in
case of cross-border train (transfer to other infrastruc-
ture manager)
TRV Official performance measures measured at final destina-
tion only.
Many more measuring points exist, but are not calculated
in the performance measures.
Table 2: Infrastructure manager’s measurement points in the network
Passenger total train punctuality (5:29 minutes)
Figures 40 to 41 show the punctuality of passenger trains for operators using
the network of PRIME members as a benchmark and over the time-period
2015-2019. It is important to note that punctuality figures presented here are
not solely the result of the infrastructure manager’s performance but also in-
clude delays caused by operators and other parties as well as external causes,
hence representing full system-punctuality.

Page: 61
Figure 40: Passenger trains total punctuality (5:29 minutes) (% of trains) 37
Figure 40 shows the passenger train punctuality data of the latest available
year. The figures vary between 80% and 99%, which is again partly a result of
different measuring methodologies. Passenger trains punctuality has a
weighted average of 93% and a standard deviation of 4,3%. The lighter grey
colour highlights the infrastructure managers which deviate from the PRIME
definition. In total, nine infrastructure managers are deviating from definition.
Comments explaining in what sense the individual data points are deviating are
collected in the Annex 4.3.
37 Lighter colours indicate accuracy level deviating from normal. Comments concerning the
deviations can be found in the Annex 4.3.

Page: 62
Figure 41: Passenger trains total punctuality (5:29 minutes) (% of trains) and CAGR (%) in 2015-2019
Overall, passenger train punctuality has remained relatively stable since 2015
in the peer group. Only two IMs show a decrease in punctuailty of over 1%
during the period. Compared to 2015, 8 infrastructure managers improved their
punctuality.
Besides different measuring concepts, there are other factors impacting punc-
tuality. Some of them are outside the infrastructure manager’s control. The
complexity of a network and its utilisation are among the most important fac-
tors. The risk of delays due to failures increases with higher complexity. For
example, a network with a high density of assets such as switches and level
crossings, or a high degree of electrification, is more prone to failures and re-
quires more interventions, such as maintenance and renewal activities. Con-
struction works can have a relevant impact on punctuality as they can reduce
the performance of the lines in the short term during the construction phase.
The same principle applies with respect to the degree of utilisation. A network
with a high degree of utilisation (expressed as train-kilometres per track-
kilometre) experiences more wear and tear, operational conflicts, and train-
affecting perturbations. Knock-on effects on punctuality increase with the level
of utilisation. On the other side, higher utilisation implies that less error is ac-
cepted, and a higher punctuality is needed. This means that the quality of the
timetabling and of the infrastructure needs to be better. As shown in figure 14
this implies higher operational costs for infrastructure managers like SBB and
ProRail. The need for more CAPEX is less clear as there are many other needs
with high priority (e.g. renewal and safety requirements).
Poor asset condition might also lead to a higher number of failures and in-
creased repair time. Response times to failures and time needed to repair de-
dif
FTI
L Z
SBB
ProRail
B
PKP PLK
TR
Bane R
S CF R.
IP
RFI

Page: 63
termine the infrastructure managers’ capability to recover the assets availability
and return to normal traffic operation. Condition of the rolling stock, which is a
responsibility of the operator, as well as weather conditions, are factors that are
perfectly independent from the infrastructure manager, but still do influence
punctuality to a significant degree.
Freight total train punctuality (15:29 minutes)
Figures 42 and 43 show the punctuality of freight trains of PRIME members in a
latest benchmark and over the time period 2015-2019.
Figure 42: Freight trains total punctuality (15:29 minutes) (% of trains)38
In total five infrastructure managers deviate from the definition: these are
marked in a lighter grey in the graph and the deviation are explained in the An-
nex 4.3. Compared to passenger train services, the percentage of freight trains
on time is lower and ranges between 31% and 93%. The average punctuality
for freight trains is 63% with a standard deviation of 25%. Especially, with re-
gard to the European Union’s objective to boost freight transportation these
38 Lighter colours indicate accuracy level deviating from normal. Comments concerning the
deviations can be found in the Annex 4.3.
Bane R B
HŽI
difB K
I
FTI
IP
L ZLISE LT I
PKP PLK
TR
ProRailRFI
SBBS CF R.
SŽCZ
IM accuracy
Latest available year
verage of each IMs latest available year weighted by denominator
ata accuracy o entry ormal E Estimate eviating from definition P Preliminary
verage of available years

Page: 64
numbers are rather sobering. In order to become a true alternative for logistic
companies, rail has to improve punctuality, reliability and flexibility.
Figure 43: Freight trains total punctuality (15:29 minutes) (% of trains) and CAGR (%) in 2015-2019
As with the results for passenger train punctuality, the development of punctual-
ity of freight trains in 2015 and 2019 is diverse. Four infrastructure managers
improved their punctuality of freight trains up to 2,8% on an annual average. Six
infrastructure managers on the other hand have faced punctuality losses in this
period.
Factors influencing punctuality of freight trains are similar to the ones described
for passenger train services. In addition, freight train services run for a large
part on international routes and over long distances, which makes them more
vulnerable to disturbances. Another impact on punctuality in freight transport is
caused by the fact that freight trains run mainly at night. Maintenance and mi-
nor renewal works are mainly carried out at night so as to not, or only slightly,
effect passenger traffic, which is often prioritized. Due to this, freight trains may
be effected more frequently, especially by short-term repair and maintenance
work, with a negative impact on punctuality.
Delays caused by infrastructure managers
As illustrated before, punctuality depends on a wide array of different factors
and has to be interpreted as a systemic result. Hence, the number of delay
minutes accrued should be distinguished between those caused by the infra-
structure managers and others.
L Z
FTI
SBB
Bane R
TR
S CF R.
ProRail
IP
RFI
PKP PLK

Page: 65
Delay minutes caused by infrastructure manager
According to the PRIME KPI & Benchmarking subgroup delays caused by in-
frastructure managers can be allocated to one of these four categories: opera-
tional planning, infrastructure installations, civil engineering causes, causes of
other infrastructure managers.
Figure 44: Delay minutes per train-km caused by the infrastructure manager (Minutes per thousand train-km) 39
On average infrastructure managers caused 5 delay minutes per thousand
train-kilometres, and their results vary between 1 and 18 minutes per thousand
train-kilometres. Corresponding to their overall high passenger train punctuality
shown in figure 40, LISEA, ProRail and DB have a significantly lower level of
delay minutes caused by the infrastructure managers. IP’s relatively high value
can partly be explained by the restrictive cancellation policy of the Portuguese
Rail system, and the way cancellations are treated in performance statistics
according to which it is more acceptable to continue to delay a train rather than
to cancel it. Furthermore the current investment program in the Portuguese
39 Lighter colours indicate accuracy level deviating from normal. Comments concerning the
deviations can be found in the Annex 4.3.
FTI
B K dif
HŽI
B Bane R
SŽCZ
IPI
L Z
LT ILISE
PKP PLKProRailRFI E
SBBS CF R.
TR
IM accuracy
Latest available year
verage of each IMs latest available year weighted by denominator
ata of year
ata accuracy o entry ormal E Estimate eviating from definition P Preliminary
verage of available years
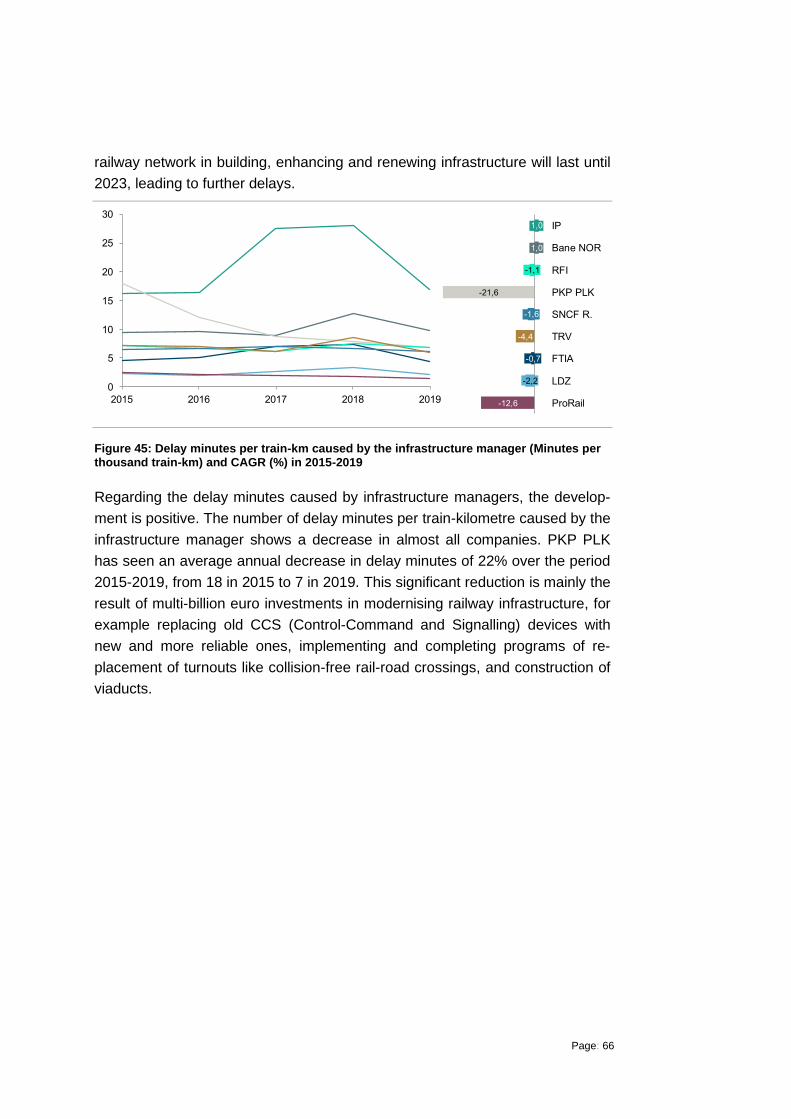
Page: 66
railway network in building, enhancing and renewing infrastructure will last until
2023, leading to further delays.
Figure 45: Delay minutes per train-km caused by the infrastructure manager (Minutes per thousand train-km) and CAGR (%) in 2015-2019
Regarding the delay minutes caused by infrastructure managers, the develop-
ment is positive. The number of delay minutes per train-kilometre caused by the
infrastructure manager shows a decrease in almost all companies. PKP PLK
has seen an average annual decrease in delay minutes of 22% over the period
2015-2019, from 18 in 2015 to 7 in 2019. This significant reduction is mainly the
result of multi-billion euro investments in modernising railway infrastructure, for
example replacing old CCS (Control-Command and Signalling) devices with
new and more reliable ones, implementing and completing programs of re-
placement of turnouts like collision-free rail-road crossings, and construction of
viaducts.
IP
PKP PLK
ProRail
Bane R
RFI
S CF R.
TR
FTI
L Z

Page: 67
Figure 46: Passenger train cancellations caused by the infrastructure manager (% of scheduled and cancelled passenger trains) 40
As illustrated in figure 46 the percentage of train cancellations caused by infra-
structure managers varies widely, some showing levels well below the weighted
average while others have significantly higher values. On average 27% of train
cancellations were the infrastructure managers’ responsibility; the standard
deviation is 21%.
Besides different measuring concepts, cancellation policies vary between the
infrastructure managers. Infrastructure managers apply different practices with
regards to the number of trains cancelled and the way they are treated in per-
formance statistics. Some infrastructure managers consider long delays above
a fixed threshold as a cancellation while others do not have a fixed threshold
and cancel trains according to the timetable reprogramming. Following a re-
strictive cancellation policy could make it more difficult to achieve punctuality
goals.
40 Lighter colours indicate accuracy level deviating from normal.
FTI
dif
B
HŽI
I
Bane R
PKP PLK
B K
IP
L ZLISE LT I
ProRailRFI E
SBBS CF R.
SŽCZTR
IM accuracy
Latest available year
verage of each IMs latest available year weighted by denominator
ata accuracy o entry ormal E Estimate eviating from definition P Preliminary
verage of available years

Page: 68
Reliability
Reliability reflects the probability that railway systems or components will per-
form a required function for a given time when used under stated operating
conditions. It is measured by counting failures which are actually affecting train
operations. Many elements of the infrastructure manager’s asset management
system are geared to improve asset reliability, including regular condition moni-
toring of assets, renewal programmes, as well as predictive and preventive
maintenance concepts.
Development and benchmark
Figures 47 to 50 show the latest benchmark of the number of train-affecting
asset failures between the infrastructure managers and its development over
the time period of 2015-2019.
Figure 47: Asset failures in relation to network size (Number per thousand main track km)41
41 Lighter colours indicate accuracy level deviating from normal. Comments concerning the
deviations can be found in the Annex 4.3.
. .
RFI E
dif
B KBane R
HŽI
B
I
FTI
SBB
IPL Z
LISE LT I
PKP PLKProRail
S CF R.SŽCZTR
Signalling
Telecommunication
Power supply
Track
Structures
ther failures
ot assigned
IM accuracy
verage of each IMs latest available year weighted by denominator
ata accuracy o entry ormal E Estimate eviating from definition P Preliminary

Page: 69
Figure 47 shows the level and the composition of asset failures that caused
delays. On average 909 assets fail per thousand main track-kilometres per
year. The failure frequency in the peer group varies between 55 and 1.400 fail-
ures per thousand main track-kilometres. Signalling accounts for the majority of
all asset failures. SBB's high level of signalling errors stems at least partially
from a high block and therefore signal density and the pioneering use of ETCS.
The track system is the second highest failing asset group. Failures of power
supply and telecommunication assets are less common and, considering the
overall number, the frequency of structural failures is negligible in most of the
countries. The lighter grey colour of DB and LDZ indicates deviating figures for
signalling failures, the lighter yellow of DB for telecommunication failures, the
lighter orange of FTIA and LDZ for track failures and the lighter green colour
and red colour of LDZ indicates deviating data for power supply failures and
other failures. In what sense these data is deviating is explained in Annex 4.3.
Figure 48: Asset failures in relation to network size (Number per thousand main track-km) and CAGR (%) in 2015-2019
The development of the number of failures per main track-kilometre is rather
different in the peer group. Some infrastructure managers show a stable per-
formance, while others are facing a higher fluctuation. In Bane NOR the relative
number of asset failures increased from 460 in 2015 to 790 in 2019. This is
mainly due to an increase registering of the number of signalling failures in
2017. However, as shown in figure 51, the impact of signalling failures on de-
lays is comparatively low, which can party be the reason for the declining trend
of Bane R’s average delay minutes caused by asset failures shown in the
next two figures. The declining trend of SBB is partly a success of the imple-
mentation of a so-called network status report (Netzzustandsberichte) of the
Federal Office of Transport in 2015, which aims to provide comprehensive
.
.
dif
RFI
PKP PLK
SBB
Bane R
TR
IP
ProRail
S CF R.

Page: 70
overview of the condition of the railway infrastructure in Switzerland and to
monitor its development42.
While asset failures have an impact on almost all performance indicators, such
as finance, safety, punctuality and reliability, there are several factors which
determine the frequency and dimension of asset failures. Complexity (electrifi-
cation, switch density and signalling) naturally increases the chances of fail-
ures, and high utilisation accelerates wear and tear. The condition, age and
renewal rate of assets is also decisive. However, asset failure also depends on
a number of factors such as stage of development, historic elements and the
budget of the infrastructure manager and the Member State concerned. Pre-
vention policies, good maintenance/renewal management, as well as failure
recording technologies, might help to identify failing assets at an early stage
and allow effective measures to be taken before consequences grow.
Geographical risks such as earthquakes, floods and landslides might cause
severe damage, and extreme weather conditions such as extreme heat can
cause rail buckling and broken rails. Infrastructure managers have to be pre-
pared as extreme weather events, such as storms, rainfall and extreme tem-
perature fluctuations becoming increasingly common.
The magnitude of the impact of asset failures on delays and their development
over the period is shown in figures 49 and 50.
42 Bundesamt für Verkehr BAV Netzzustandsberichte (admin.ch)

Page: 71
Figure 49: Average delay minutes per asset failure (Minutes per failure)43
On average asset failures cause a delay of 51 minutes and vary widely be-
tween 16 and 135 minutes per asset failure. The lowest level of delay minutes
caused by asset failures are found at PKP PLK, LDZ and FTIA, where one as-
set failure causes on average a delay of below 25 minutes.
43 Lighter colours indicate accuracy level deviating from normal. Comments concerning the
deviations can be found in the Annex.
I
B
L Z
Bane R
difB K
FTI
IPHŽI
LISE LT I
PKP PLKProRail
RFI E SBB
S CF R.SŽCZTR
IM accuracy
Latest available year
verage of each IMs latest available year weighted by denominator
ata of year
ata accuracy o entry ormal E Estimate eviating from definition P Preliminary
verage of available years

Page: 72
Figure 50: Average delay minutes per asset failure (Minutes per failure) and CAGR (%) in 2015-2019
Similar to the development of asset failures, the average train delay minutes
per asset failure shows a high fluctuation in the peer group. While Bane NOR
and PKP PLK show a decreasing trend of above 11%, the values for the rest of
the group remained stable.
The magnitude of delays caused by asset failures highly depends on the type
of asset involved. By relating the frequency of individual asset failures to the
delay minutes caused, the impact on punctuality becomes visible. Figure 51
shows this relationship.
Figure 51: Delay per asset failure (Minutes per failure) / Asset failures (Number per thou-sand main track-km)
Bane R
TR
IP
S CF R.
RFI
PKP PLK

Page: 73
In 2019 power supply assets caused the highest number of delay minutes with
145 minutes per failure. Structural assets such as bridges and tunnels were
responsible for an average delay of 76 minutes per failure. Track failures and
telecommunication failures caused on average 72 and 55 delay minutes re-
spectively. The most frequent type of asset failures was related to signalling,
with an average of almost 600 failures per thousand main track-kilometre, how-
ever they had a comparably low impact of 63 delay minutes per failure on aver-
age.
However, the type of asset failures is not the only driving factor. High utilisation
increases knock-on effects. Particularly on very busy routes, one single disrup-
tion can cause several knock-on delays. The knock-on might affect the traffic
on the route where the disruption happened, plus on any connecting tracks,
resulting in secondary delays.
Having well-organised maintenance planning and good response times are
important when it comes to managing failures. Efficient contingency plans,
good communication with operators, and the ability to quickly alter timetables
are essential for minimizing delays.
Availability
Availability of the infrastructure reflects the state of an asset and its usability for
its intended purpose. As well as managing its assets in such a way as to mini-
mise the effect of failures on the railway, availability indicators also measure the
effectiveness and timeliness of the infrastructure manager in responding to
these failures, and returning the network to normal function.
Temporary and permanent speed restrictions have an overall impact on the
availability of railway infrastructure, and can lead to delays, breakdowns and
longer travel times. Speed restrictions are imposed on the railway to ensure
safe use of the infrastructure and are applied when track renewals or regular
maintenance work are carried out. However, it is often important to relieve the
infrastructure by reducing speed limits even before maintenance work is start-
ed.
Development and benchmark
Figures 52 to 53 show to what degree a network was affected by permanent or
temporary speed restrictions. Due to incomplete time series, no trend line can
be shown for these two indicators.

Page: 74
Figure 52: Tracks with permanent speed restrictions (% of main track-km)44
Based on the definition, restrictions are defined as permanent if they are incor-
porated within the yearly timetable. The majority of infrastructure managers
show a share of track with permanent speed restrictions below 1%, while others
have 9%, 15% and 50% of their network under permanent speed restriction. On
average 4,5% of the peer groups network faces a permanent speed restriction
with a spread of 14%. For HŽI permanent speed restrictions are a consequence
of the poor condition of local and regional lines. Some infrastructure managers
do not count permanent speed restrictions at all, as they are included in the
working timetable.
44 Axis for HŽI shortened for better readability. Lastest available year: 50,5%; average of
available years: 50,6%
Lighter colours indicate accuracy level deviating from normal. Comments concerning the deviations can be found in the Annex 4.3.

Page: 75
Figure 53: Tracks with temporary speed restrictions (% of main track-km)45
Other than permanent speed restrictions, restrictions that occur during the year
and are not included in the annual timetable are considered temporary. On av-
erage, 2,2% of the main track is unavailable due to temporary speed re-
strictions, which are typically caused by deteriorating conditions or necessary
track works. While some infrastructure managers have hardly any temporary
speed restrictions, HŽI restricts speed on 21% of its network. IP’s increase in
temporary speed restrictions in 2019 is mainly due to an investment program in
the Portuguese railway network, building, enhancing and renewing infrastruc-
ture, which will last until 2023. The standard deviation of the peer group is
5,5%.
Speed restrictions are usually set by the infrastructure manager in consultation
with train operators. For how long speed restrictions last and whether the tem-
porary ones become permanent depends on the funding agreements and
budget of the infrastructure managers for maintenance and investments. It is
also relevant how utilised the effected routes are, and whether there are branch
45 Lighter colours indicate accuracy level deviating from normal. Comments concerning the
deviations can be found in the Annex 4.3.

Page: 76
lines that can be used during the maintenance works. Reducing speed in order
to extend service life is sometimes the better option than interrupting a very
active route for a longer period of time.
2.6 ERTMS deployment
Summary of ERTMS deployment
EU-wide objectives
• igitalisation is one of the key pillars of the European Commission’s
Sustainable and Smart Mobility Strategy. It is an indispensable driver for
the modernisation of the entire system, making it seamless and more
efficient. In the rail sector ERTMS deployment plays a major role in this
digital transformation.
• The main objectives of ERTMS are to increase safety, capacity and
interoperability, harmonise automatic train control and communication
systems throughout the European rail network, and act as the building
block for digitalisation of the rail network.
• Technical details of ERTMS are laid down in the CCS TSI (Control-
Command and Signalling Technical Specification for Interoperability). The
European Union Agency for Railways (ERA) is the ERTMS System
Authority responsible for ensuring interoperable deployment as defined in
the Fourth Railway Package.
• According to the TEN-T Guidelines, the Core Network shall be equipped
by 2030.
Peer group’s performance
• ERTMS deployment is highly heterogonous in the peer group.
• ERTMS is deployed on about 7% of all tracks of the peer group's railway
network
• Across the peer group ERTMS is expected to be implemented in about
35% of the railway network by 2030.
Development and benchmark of ERTMS
In the rail sector ERTMS deployment plays a major role in this digital
transformation. ERTMS deployment is a significant investment but is crucial for

Page: 77
infrastructure managers, as expected benefits of ERTMS deployment are
significant, including increased safety, capacity, availability, and interoperability.
ERTMS indicators
PRIME members are reporting two indicators measuring ERTMS deployment:
• ERTMS track-side deployment
• Planned extent of ERTMS deployment by 2030
In order to increase comparability of these values among infrastructure manag-
ers, these values are related to main track-kilometres.
Development and benchmark
Figures 54 and 55 show the level of ERTMS track-side deployment and the
planned extent of ERTMS deployment by 2030.
Figure 54: ERTMS track-side deployment (% of main track-km)46
ERTMS is deployed on about 7% of all tracks of the peer group's railway net-
work. The infrastructure managers’ implementation strategies are heterogene-
46 Axis shortened for better readability. LISEA: Lastest available year: 98%; average of available
years: 98%. SBB: : Lastest available year: 100%; average of available years: 99%.
FTI
Bane R E
dif
IP
SŽCZ
B K
SBB
B
HŽI
I
PKP PLK
L ZLISE LT I
ProRailRFI
S CF R.
TR
IM accuracy
Latest available year
verage of each IMs latest available year weighted by denominator
ata accuracy o entry ormal E Estimate eviating from definition P Preliminary
verage of available years
Shortened %
Shortened %

Page: 78
ous, which is reflected by there being no ERTMS deployment in some countries
vs. a high share in others of more than 90%. Some infrastructure managers
have different traffic management systems, for example LTGI’s isolated net-
work which does not require ERTMS deployment. Ireland, too, does not have to
implement ERTMS as it does not have a border with another EU-country, how-
ever it has started to deploy a new management control system which is a
combination of other systems.
Figure 55: Planned extent of ERTMS deployment by 2030 (% of current main track-km)47
By 2030, ERTMS is expected to cover about 35% of the peer group's railway
network. For SBB the value is higher than 100%, as the future network will be
larger than the current network and both are or will be entirely equipped with
ERTMS. For BDK the value is not quite 100% since the Copenhagen S-bane
will be equipped with a similar system called CBTC instead of ERTMS. It is
important to note that considering the EU objective on ERTMS deployment, this
indicator does not show the full picture, as it refers to the ERTMS deployment
of the total main network and not only the TEN-T lines.
47 The label “latest availabel year” indictates in this figure the latest approval of planned ERTMS
deplyement. For ProRail the last available data is 2017.
RFI
HŽI
dif
Bane RB K
S CF R.
I
BFTI
IP
L ZLISE LT I
PKP PLKProRail
SBB
SŽCZTR
IM accuracy
Latest available year
verage of each IMs latest available year weighted by denominator
ata of year
ata accuracy o entry ormal E Estimate eviating from definition P Preliminary

Page: 79
Despite the fact that the European vision of the deployment of ERTMS is clear-
ly formulated, the speed and commitment of uptake depend on a variety of fac-
tors. The stage of a railway’s development, past and present priorities, funding
agreements and the level of the budget for investment are some of them. Net-
work size and complexity (number of stations and hubs), adaptability to the
existing infrastructure, technical equipment and asset condition are other as-
pects that might influence the timeline for deployment of ERTMS. Difficulties in
coordinating with operators, who have to equip their fleet with ERTMS on-board
systems, increase the burden of deployment.

Page: 80
3 Outlook
This benchmarking report provides a status overview of the European rail
industry at the end of 2019. Against the background of the policy objectives set
at European level – through the European Green Deal and the Sustainable and
Smart Mobility Strategy, it describes a successful development of the
infrastructure managers cooperating in PRIME and their constant efforts to
improve their network’s performance. Important successes are visible, including
positive developments in safety, a decreasing proportion of diesel-powered
trains, growing passenger train activity, and a positive development in the
modal share of passenger rail. On the other hand the conditions for freight
trains need to be further developed as freight train activity and the modal share
in rail freight both show a decreasing trend.
The PRIME KPI and benchmarking subgroup is still growing. ÖBB and CFL
joined the working group in 2020 and are currently in transition. IE completed
the transition phase and joined the public report for the first time this year. We
hope that further members will complete the transition phase and become
regular members to take part in this public benchmarking report next year.
This report is based on data up to 2019 and does not yet reflect the effects of
the Covid-19 pandemic. As yet, the full extent and duration of the
consequences for the infrastructure managers cannot be estimated.
It is to be expected however that significant effects will be seen in most of the
PRIME dimensions measured, such as adverse effects on the financial
situations and distorted favourable effects on punctuality.
The next benchmarking report 2020 will show the immediate first effects that
the pandemic has left on the rail business and it will clearly not show a
continuation of past development trends.
Which of these pandemic consequent effects will be of a temporary nature and
which of the consequences may lead to permanent changes in transport
behaviour in the rail sector is a crucial question for the next few years.
Against this background, the work of PRIME benchmarking seems more
valuable than ever. Regular data collection and continuous improvement of the
data base is important to make changes transparent and allow for meaningful
comparisons on national and international level. The existing PRIME database

Page: 81
will serve as a reference and a yardstick for targeted corporate and rail policy
measures in response to the COVID-19 crisis.

Page: 82
4 Annex
4.1 Key influencing factors of participating infrastructure managers
Operating context
Infrastructure managers are operating in different countries under different ge-
ographic and political circumstances. Understanding the influencing factors and
contextualising the indicators with them is essential for the correct interpretation
of the values.
Influencing factors can be grouped in the following seven categories, which are
illustrated below. The impacts of these factors on the performance of infrastruc-
ture managers are very different: some lead to increasing costs, some have an
impact on punctuality or safety.
Figure 56: Factors influencing the outcome of rail infrastructure
Geographic
The geography and topography of a country determines its rail network from
the moment of its construction, to its maintenance and renewals. The size of
the country, its population density and distribution, and the locations of its eco-
nomic and cultural centres are all influencing factors, above all for the length of

Page: 83
the network. The range of sizes of the countries included in this report lies be-
tween 41,000 and 633,000 km² for Switzerland and France respectively (over-
seas territories included). The topography determines the shape and complexi-
ty of the network: mountainous regions hinder long, straight lines and generally
require more sophisticated rail structures such as bridges and tunnels. The
expansion of the network is technically more complex and therefore entails
higher investment costs. Furthermore, maintenance costs are higher in moun-
tainous regions as wear and tear is more frequent and repairs are carried out
under more difficult conditions. Rail infrastructure in regions of seismic activity
is highly exposed to damage caused by earthquakes and seismic waves. Coun-
tries with highly complex topographical conditions include Switzerland, Spain,
Norway, and Italy.
Climatic
Conditions of climate are also important and have an impact on asset failures,
reliability and punctuality that can increase maintenance and renewal costs. In
countries with very hard winters as in Scandinavia and the Baltic, very low tem-
peratures might cause broken rails, switch malfunction, and snowdrifts. Besides
normal latitude-related climate conditions, the increasing number of extreme
weather events due to climate change has additional impacts. Heavy storms
damage tall infrastructure (mileposts, signals), and overturned trees cause de-
lays, failures and speed restrictions48. Increased global temperature is leading
to hotter and drier summers, which favour buckling in railway tracks and in-
crease the risk of forest fires.
Socio-demographic
Population size, population density and population distribution within a country
shape rail infrastructure. In small countries with a high population density, rail
utilisation is higher, allowing for higher economies of scale than in sparsely
populated areas. This is visible in the Netherlands with its highly utilised and
polycentric urban network. In other countries, for example in Spain and the
Scandinavian states, population density varies between densely populated met-
ropolitan areas and the sparsely populated countryside. Age distribution, mobili-
ty patterns and environmental awareness of citizens are additional parameters
that are influencing the share of rail in the modal split – with possible conse-
48 UIC, 2017: Rail Adapt - Adapting the railway for the future.

Page: 84
quences on funding and extension plans. Beyond national circumstances, in-
ternational links are also a decisive driver: In transit countries such as Belgium,
the Netherlands, Germany and Switzerland, transit also accounts for a consid-
erable proportion of network usage. Six of the eleven Rail Freight Corridors run
through Germany. In Switzerland, transit traffic has been a major support factor
for a railway-friendly policy among the population and politicians.
Political and historical
Even though infrastructure managers are independent entities, output parame-
ters of rail infrastructure, like rail transport volumes, are partly politically influ-
enced and investment decisions heavily depend on the availability and regulari-
ty of state funding. The status of rail in a country and the commitment of politi-
cians is therefore very relevant, and also historically shaped.
Traditional heavy industry, with heavy and bulky transport goods such as coal,
sand steel and wood partly explain the high share of rail freight in today’s
Eastern European EU Member States.
Services
The main services offered by railway undertakings on the infrastructure man-
ager’s networks are conventional passenger trains over different distances
freight trains and high-speed connections. The different rail services also have
an impact on the infrastructure: a high share of freight transport causes higher
wear and tear due to the weight of the freight and requires higher maintenance
costs. The nature of high-speed train services is not uniform among infrastruc-
ture managers. In Germany, for example, high speed connections mostly run
on the same routes as lower speed passenger transport and even freight traffic.
If a manager’s network consists exclusively of high-speed lines between metro-
politan areas, it naturally has other OPEX and CAPEX values and other punc-
tuality and reliability values than a mixed transport network.
Technological
The technical and technological level and state of development of railway net-
work infrastructures varies considerably throughout the EU. When comparing
modernisation and roll-out of technological innovations, different starting points
and investment cycles have to be considered. The new EU member states
mainly started with technological modernisation from the 1990s, getting a big-

Page: 85
ger boost with the entitlement to EU-funding after their accession. Modern
technology helps railways to achieve higher safety performance, minimize their
impact on the environment and also become more cost efficient. It is therefore
in the interest of every infrastructure manager to be equipped with state-of-the-
art rail technologies. EU rail policy promotes the incorporation of such technol-
ogies to contribute to the achievement of EU rail policy objectives, including
facilitating cross-border transport. The introduction of ERTMS is a prominent
example.
Economic
Economic circumstances within a country influence the operation of infrastruc-
ture managers both directly and indirectly. country’s P its economic pow
er and connectivity all have a positive impact on passenger and freight
transport demand49. Market structure and the combination of public funding,
track access charges and commercial infrastructure funding determines the
financing pool available to infrastructure managers.
The amount and continuity of available revenues determines the infrastructure
manager’s investment possibilities and maintenance performance. In Switzer
land for example rail projects are decided for several decades and are inde-
pendent of politically influenced budgets of a current government. Furthermore,
growing state funds and eligibility of European funds (e. g. cohesion fund) are
important factors. Czechia for example receives an investment of over €
million euros for from the EU’s Cohesion Fund to modernise its rail
transport.50
49 Passenger and freight transport demand in the EU: https://www.eea.europa.eu/data-and-
maps/indicators/passenger-and-freight-transport-demand/assessment-1 50 EC: EU Cohesion policy € million to modernise the rail transport in Czechia.
https://ec.europa.eu/regional_policy/en/newsroom/news/2021/01/01-11-2021-eu-cohesion-policy-eur160-million-to-modernise-the-rail-transport-in-czechia

Page: 86
4.2 Fact sheets of the infrastructure managers
Figure 57: Fact sheet Adif
Figure 58: Fact sheet: Bane NOR51
51 Grants total are normalised for purchasing power parity

Page: 87
Figure 59: Fact sheet: Banedanmark52
Figure 60: Fact sheet: DB Netz AG53
52 Grants total are normalised for purchasing power parity 53 Grants total are normalised for purchasing power parity

Page: 88
Figure 61: Fact sheet: Finnish Transport Infrastructure Agency54
Figure 62: Fact sheet: HŽ Infrastruktura d.o.o. 55
54 Grants total are normalised for purchasing power parity 55 Grants total are normalised for purchasing power parity

Page: 89
Figure 63: Fact sheet: Iarnród Éireann – Irish Rail56
Figure 64: Fact sheet: Infraestruturas de Portugal S.A. 57
56 Grants total are normalised for purchasing power parity 57 Grants total are normalised for purchasing power parity

Page: 90
Figure 65: Fact sheet: Latvijas dzelzceļš58
Figure 66: Fact sheet: AB LTG Infra59
58 Grants total are normalised for purchasing power parity 59 Former Lietuvos geležinkeliai and grants are normalised for purchasing power parity

Page: 91
Figure 67: Fact sheet: LISEA60
Figure 68: Fact sheet: PKP PLK 61
60 Grants total are normalised for purchasing power parity 61 Grants total are normalised for purchasing power parity

Page: 92
Figure 69: Fact sheet: ProRail62
Figure 70: Fact sheet: RFI63
62 Grants total are normalised for purchasing power parity 63 Grants total are normalised for purchasing power parity

Page: 93
Figure 71: Fact sheet: SBB64
Figure 72: Fact sheet: SNCF Réseau65
64 Grants total are normalised for purchasing power parity 65 Grants total are normalised for purchasing power parity

Page: 94
Figure 73: Správa železnic, státní organizace66
Figure 74: Fact sheet: Trafikverket67
66 Grants total are normalised for purchasing power parity 67 Grants total are normalised for purchasing power parity

Page: 95
4.3 Comments on deviations
Page Indicator name Input data name68 IM69 Comment by the IM for 2019 or the latest available year
30
OPEX – operational expenditures in relation to network size
Total OPEX - operating expenditures (N)
DB According to the definition until data 2018: Total IMs annual operational ex-penditures
30
OPEX – operational expenditures in relation to network size
Total OPEX - operating expenditures (N)
FTIA 2015: Deviation from definition
32
CAPEX – capital expenditures in relation to network size
Total CAPEX - capital expenditures (N)
DB According to the definition until data 2018: Total IMs annual operational ex-penditures
34 Maintenance ex-penditures in relation to network size
Total maintenance expendi-tures (N)
DB According to the definition until data 2018: Total IMs annual operational ex-penditures
34 Renewal expendi-tures in relation to network size
Total renewal expenditures (N)
DB According to the definition until data 2018: Total IMs annual operational ex-penditures
38 TAC revenue in relation to traffic volume
Total train-km (D) BDK The value does not include work traffic
43 Significant accidents Total train-km (D) BDK The value does not include work traffic
43 Significant accidents Number of significant acci-dents (N)
DB The number refers to all IMs in Germany
45 Persons seriously injured or killed
Total train-km (D) BDK The value does not include work traffic
45 Persons seriously injured or killed
Number of persons serious-ly injured and killed (N)
DB The number refers to all IMs in Germany
47 Infrastructure man-ager related precur-sors to accidents
Total train-km (D) BDK The value does not include work traffic
47 Infrastructure man-ager related precur-sors to accidents
Number of precursors to accidents (N)
DB The number refers to all IMs in Germany
62 Passenger trains punctuality
Passenger trains arrived at strategic measuring points with a delay of less than or equal to 5:29 minutes (N)
Adif Only High Speed trains are included because only HS delays suit the defini-tion
62 Passenger trains punctuality
Passenger trains arrived at strategic measuring points with a delay of less than or equal to 5:29 minutes (N)
DB Definition: Passenger trains: 0,00 to max. 5,59 minutes Strategic points are "stops" (Germ. "Halte")
62 Passenger trains punctuality
Passenger trains arrived at strategic measuring points with a delay of less than or equal to 5:29 minutes (N)
HŽI Delays are rounded to 5 minutes for passenger trains
62 Passenger trains punctuality
Passenger trains arrived at strategic measuring points with a delay of less than or equal to 5:29 minutes (N)
LISEA Measuring to less than 5mins 59sec.
62 Passenger trains punctuality
Passenger trains arrived at strategic measuring points with a delay of less than or equal to 5:29 minutes (N)
RFI The measuring point is the arrival time of the train
68 The letters “D” and “N” mark the denominator (D) and nominator (N) of the indicator. 69 IM = Infrastructure manager

Page: 96
Page Indicator name Input data name68 IM69 Comment by the IM for 2019 or the latest available year
62 Passenger trains punctuality
Passenger trains arrived at strategic measuring points with a delay of less than or equal to 5:29 minutes (N)
SBB Limit used is 4'59
62 Passenger trains punctuality
Passenger trains arrived at strategic measuring points with a delay of less than or equal to 5:29 minutes (N)
SNCF R.
First, SNCF R. measures punctuality at the last observation point (which can be some kilometres away from the last stop of the train). Second, SNCF R. does not use UIC’s rounding rule # . Their system only allows the use of the following rule: ’ for passengers transport ’ for freight transport
62 Passenger trains punctuality
Passenger trains arrived at strategic measuring points with a delay of less than or equal to 5:29 minutes (N)
SŽCZ UIC threshold for delay of less or equal to 5:00 minutes
64 Freight trains punc-tuality
Freight trains arrived at strategic measuring points with a delay of less than or equal to 15:29 minutes (N)
DB Definition: Freight trains: 0,00 to max. 15,59 minutes
64 Freight trains punc-tuality
Freight trains arrived at strategic measuring points with a delay of less than or equal to 15:29 minutes (N)
HŽI Delays are rounded to 60 minutes for freight trains.
64 Freight trains punc-tuality
Freight trains arrived at strategic measuring points with a delay of less than or equal to 15:29 minutes (N)
RFI The measuring point is the arrival time of the train
64 Freight trains punc-tuality
Freight trains arrived at strategic measuring points with a delay of less than or equal to 15:29 minutes (N)
SNCF R.
First, SNCF R. measures punctuality at the last observation point (which can be some kilometres away from the last stop of the train). Second, SNCF R. does not use UIC’s rounding rule # . Their system only allows the use of the following rule: ’ for passengers transport ’ for freight transport
64 Freight trains punc-tuality
Freight trains arrived at strategic measuring points with a delay of less than or equal to 15:29 minutes (N)
SŽCZ UIC threshold for delay of less or equal to 5:00 minutes
66
Delay minutes per train-km caused by the infrastructure manager
Total train-km (D) BDK The value does not include work traffic
66
Delay minutes per train-km caused by the infrastructure manager
Delay minutes – infrastruc-ture manager's responsibil-ity (N)
LDZ Threshold 1:00 minute
69 Signalling failures in relation to network size
Total number of signalling failures (N)
DB KPI according to internal measurement system
69 Telecommunication failures in relation to network size
Total number of telecom-munication failures (N)
DB KPI according to internal measurement system
69 Track failures in relation to network size
Total number of track failures (N)
FTIA Signalling related failures in switch func-tions are considered to be "track failures" as well
69 Assets failures in relation to network size
Total number of asset failures (N)
LDZ Threshold 1:00 minute
69 Signalling failures in relation to network size
Total number of signalling failures (N)
LDZ Threshold 1:00 minute
69 Telecommunication failures in relation to network size
Total number of telecom-munication failures (N)
LDZ Threshold 1:00 minute
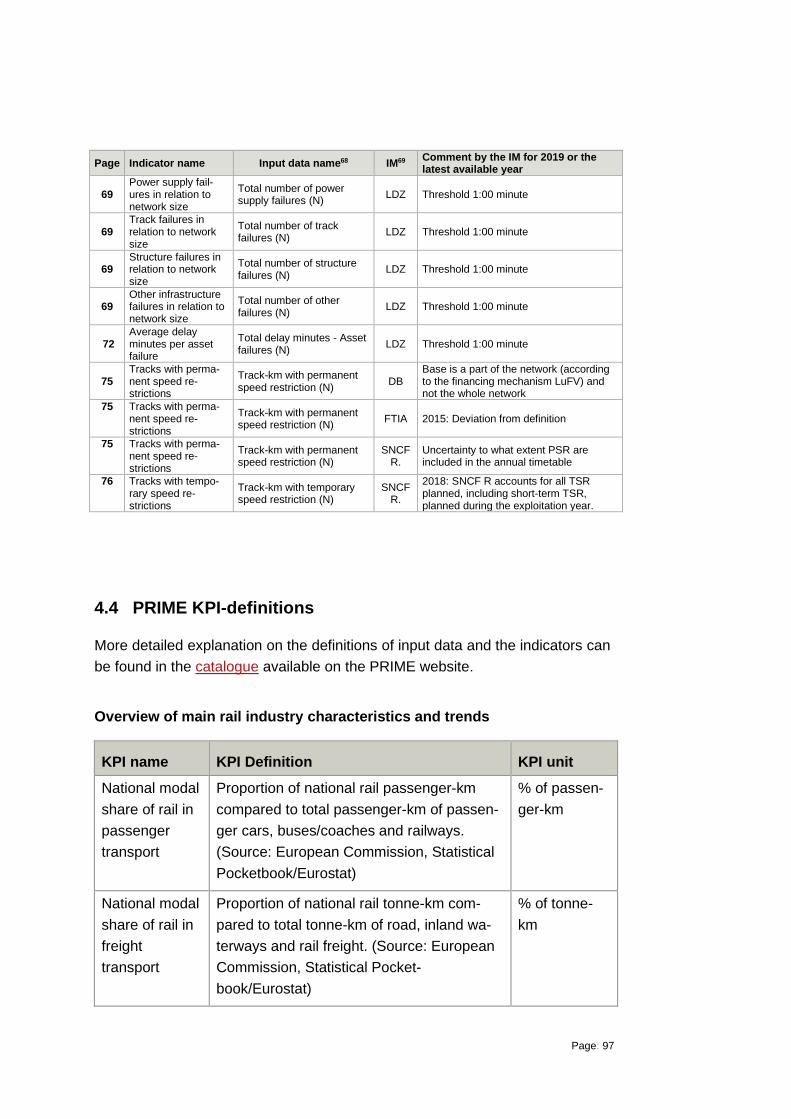
Page: 97
Page Indicator name Input data name68 IM69 Comment by the IM for 2019 or the latest available year
69 Power supply fail-ures in relation to network size
Total number of power supply failures (N)
LDZ Threshold 1:00 minute
69 Track failures in relation to network size
Total number of track failures (N)
LDZ Threshold 1:00 minute
69 Structure failures in relation to network size
Total number of structure failures (N)
LDZ Threshold 1:00 minute
69 Other infrastructure failures in relation to network size
Total number of other failures (N)
LDZ Threshold 1:00 minute
72 Average delay minutes per asset failure
Total delay minutes - Asset failures (N)
LDZ Threshold 1:00 minute
75 Tracks with perma-nent speed re-strictions
Track-km with permanent speed restriction (N)
DB Base is a part of the network (according to the financing mechanism LuFV) and not the whole network
75 Tracks with perma-nent speed re-strictions
Track-km with permanent speed restriction (N)
FTIA 2015: Deviation from definition
75 Tracks with perma-nent speed re-strictions
Track-km with permanent speed restriction (N)
SNCF R.
Uncertainty to what extent PSR are included in the annual timetable
76 Tracks with tempo-rary speed re-strictions
Track-km with temporary speed restriction (N)
SNCF R.
2018: SNCF R accounts for all TSR planned, including short-term TSR, planned during the exploitation year.
4.4 PRIME KPI-definitions
More detailed explanation on the definitions of input data and the indicators can
be found in the catalogue available on the PRIME website.
Overview of main rail industry characteristics and trends
KPI name KPI Definition KPI unit
National modal
share of rail in
passenger
transport
Proportion of national rail passenger-km
compared to total passenger-km of passen-
ger cars, buses/coaches and railways.
(Source: European Commission, Statistical
Pocketbook/Eurostat)
% of passen-
ger-km
National modal
share of rail in
freight
transport
Proportion of national rail tonne-km com-
pared to total tonne-km of road, inland wa-
terways and rail freight. (Source: European
Commission, Statistical Pocket-
book/Eurostat)
% of tonne-
km

Page: 98
KPI name KPI Definition KPI unit
Total track-km Total track-km km
Total main
track-km
A track providing end-to-end line continuity
designed for trains between stations or
places indicated in tariffs as independent
points of departure or arrival for the convey-
ance of passengers or goods, maintained
and operated by the infrastructure manager.
Tracks at service facilities not used for run-
ning trains are excluded. The boundary of
the service facility is the point at which the
railway vehicle leaving the service facility
cannot pass without having an authorization
to access the mainline or other similar line.
This point is usually identified by a signal.
Service facilities are passenger stations,
their buildings and other facilities; freight
terminals; marshalling yards and train for-
mation facilities, including shunting facilities;
storage sidings; maintenance facilities; oth-
er technical facilities, including cleaning and
washing facilities; maritime and inland port
facilities which are linked to rail activities;
relief facilities; refuelling facilities and supply
of fuel in these facilities.
km
Total main line-
km
Cumulative length of railway lines operated
and used for running trains by the end of
reporting year.
Lines solely used for operating touristic
trains and heritage trains are excluded, as
are railways constructed solely to serve
mines, forests or other industrial or agricul-
tural installations and which are not open to
public traffic.
Metro, Tram and Light rail urban lines (with
non-standard – narrow - gauge) should be
km
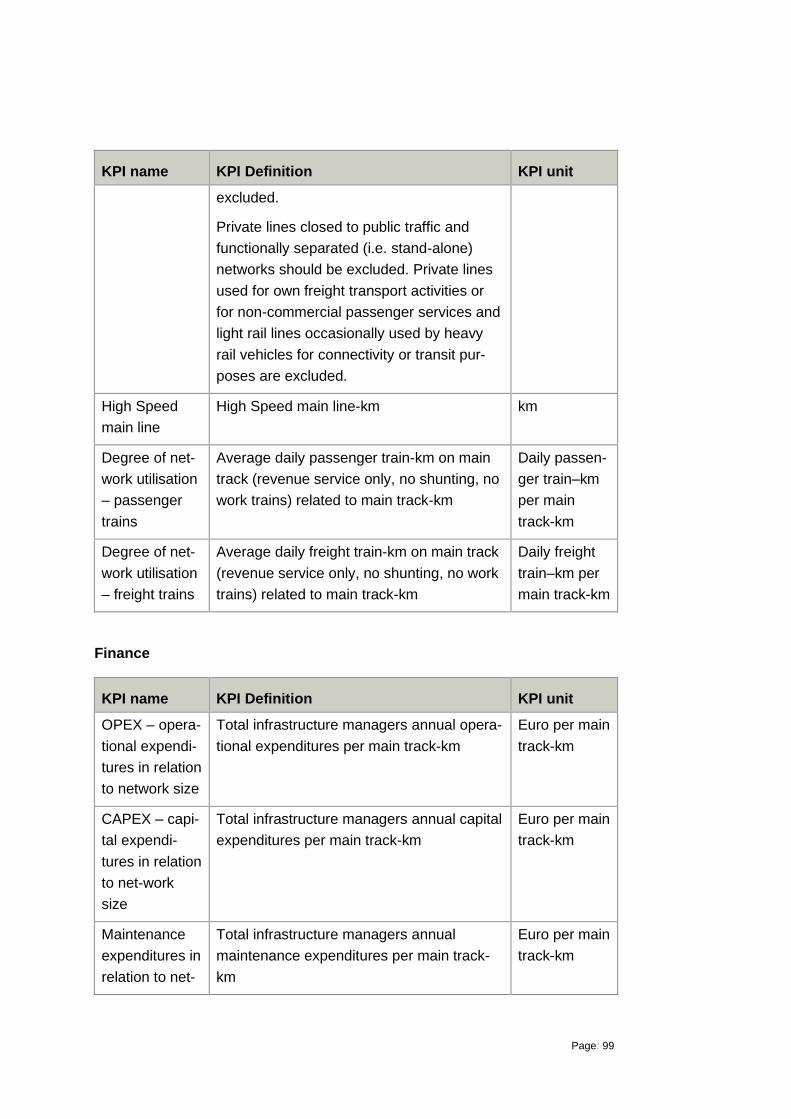
Page: 99
KPI name KPI Definition KPI unit
excluded.
Private lines closed to public traffic and
functionally separated (i.e. stand-alone)
networks should be excluded. Private lines
used for own freight transport activities or
for non-commercial passenger services and
light rail lines occasionally used by heavy
rail vehicles for connectivity or transit pur-
poses are excluded.
High Speed
main line
High Speed main line-km km
Degree of net-
work utilisation
– passenger
trains
Average daily passenger train-km on main
track (revenue service only, no shunting, no
work trains) related to main track-km
Daily passen-
ger train–km
per main
track-km
Degree of net-
work utilisation
– freight trains
Average daily freight train-km on main track
(revenue service only, no shunting, no work
trains) related to main track-km
Daily freight
train–km per
main track-km
Finance
KPI name KPI Definition KPI unit
OPEX – opera-
tional expendi-
tures in relation
to network size
Total infrastructure managers annual opera-
tional expenditures per main track-km
Euro per main
track-km
CAPEX – capi-
tal expendi-
tures in relation
to net-work
size
Total infrastructure managers annual capital
expenditures per main track-km
Euro per main
track-km
Maintenance
expenditures in
relation to net-
Total infrastructure managers annual
maintenance expenditures per main track-
km
Euro per main
track-km

Page: 100
KPI name KPI Definition KPI unit
work size
Renewal ex-
penditures in
relation to net-
work size
Total infrastructure managers annual re-
newal expenditures per main track-km
Euro per main
track-km
TAC revenue
in relation to
network size
Total infrastructure manager’s annual TAC
revenues (including freight, passenger and
touristic trains) per total main track-km
Euro per main
track-km
TAC revenue
in relation to
traffic volume
Total infrastructure manager’s annual TAC
revenues (including freight, passenger and
touristic trains) per train-km
Euro per total
train-km
Total revenues
from non-
access charg-
es in relation to
network size
Total infrastructure managers annual reve-
nues from non-access charges (e.g. com-
mercial letting, advertising, telecoms, but
excluding grants or subsidies) related to
total main track-km
Euro per main
track-km
Proportion of
TAC in total
revenue
Percentage of infrastructure managers an-
nual TAC revenues (including freight, pas-
senger and touristic trains) compared to
total revenues
% of mone-
tary value
Safety
KPI name KPI Definition KPI unit
Significant ac-
cidents
Relative number of significant accidents
including sidings, excluding accidents in
workshops, warehouses and depots, based
on the following types of accidents (primary
accidents):
• Collision of train with rail vehicle,
• Collision of train with obstacle within the
clearance gauge,
• Derailment of train,
Number per
mil-lion train-
km

Page: 101
KPI name KPI Definition KPI unit
• Level crossing accident, including acci-
dent involving pedestrians at level cross-
ing,
• Accident to persons involving rolling
stock in motion, with the exception of su-
icides and attempted suicides,
• Fire on rolling stock,
• Other accidents
The boundary is the point at which the rail-
way vehicle leaving the workshop / ware-
house / depot / sidings cannot pass without
having an authorization to access the main-
line or other similar line. This point is usually
identified by a signal. For further guidance,
please see ERA Implementation Guidance
on CSIs.
Persons seri-
ously injured
and killed
Relative number of persons seriously in-
jured (i.e. hospitalised for more than 24
hours, excluding any attempted suicide) and
killed (i.e. killed immediately or dying within
30 days, excluding any suicide) by acci-
dents based upon following categories:
• Passenger,
• Employee or contractor,
• Level crossing user,
• Trespasser,
• Other person at a platform,
• Other person not at a platform
In number per
million train-
km
Infrastructure
manager relat-
ed precursor to
accidents
Relative number of the following types of
precursors:
• broken rail,
• track buckle and track misalignment,
In number per
million train-
km

Page: 102
KPI name KPI Definition KPI unit
• wrong-side signalling failure
Environment
KPI name KPI Definition KPI unit
Degree of elec-
trification of
total main track
Percentage of main track-km which are
electrified
% of main
track-km
Share of elec-
tricity-powered
trains
Train-kilometres of electricity-powered trains
compared to total train-kilometres (both for
passenger and freight trains)
% of train-km
Share of die-
sel-powered
trains
Train-kilometres of diesel-powered trains
compared to total train-kilometres (both for
passenger and freight trains)
% of train-km
Performance and delivery
KPI name KPI Definition KPI unit
Passenger
trains punctual-
ity
Percentage of actually operating (i.e. not
cancelled) national and international pas-
senger trains (excluding work trains) which
arrive at each strategic measuring point with
a delay of less than or equal to 5:29 minutes
% of trains
Freight trains
punctuality
Percentage of actually operating (i.e. not
cancelled) national and international freight
trains (excluding work trains) which arrive at
each strategic measuring point with a delay
of less than or equal to 15:29 minutes
% of trains
Delay minutes
per train-km
caused by the
infrastructure
manager
Delay minutes caused by incidents that are
regarded as infrastructure managers re-
sponsibility divided by total train-km operat-
ed (revenue service + shunting operations
to and from depots + infrastructure manag-
er’s work traffic ; elay minutes according
Minutes per
train-km

Page: 103
KPI name KPI Definition KPI unit
to UIC leaflet 450-2. Delay minutes will be
measured at all available measuring points.
Of those measured delay minutes that ex-
ceed a threshold of 5:29 minutes for pas-
senger services and 15:29 minutes for
freight services the maximum number is
counted. No delay minutes are counted if
these thresholds are not exceeded at any
measuring point
Assets failures
in relation to
network size
Average number of all asset failures on
main track according to UIC leaflet 450-2.
An asset failure is counted one time and
one time only if any train is affected by it. A
train is affected if the asset failure causes
the train to exceed a delay minutes thresh-
old of 5:29 minutes for passenger services
or 15:29 minutes for freight services at any
available measuring point. An asset failure
is not counted if these thresholds are not
exceeded for any train at any available
measuring point (i.e. if no train is affected)
Number per
thousand
main track-km
Average delay
minutes per
asset failure
Average delay minutes per asset failure
caused by all asset failures on main track
according to UIC leaflet 450-2. An asset
failure is counted one time and one time
only if any train is affected by it. A train is
affected if the asset failure causes the train
to exceed a delay minutes threshold of 5:29
minutes for passenger services or 15:29
minutes for freight services at any available
measuring point. Delay minutes will be
measured at all available measuring points.
Of those measured delay minutes the max-
imum number is counted. No delay minutes
are counted if these thresholds are not ex-
ceeded at any measuring point. An asset
failure is not counted if these thresholds are
Minutes per
failure

Page: 104
KPI name KPI Definition KPI unit
not exceeded for any train at any available
measuring point (i.e. if no train is affected)
Availability
KPI name KPI Definition KPI unit
Tracks with
permanent
speed re-
strictions
Percentage of tracks with permanent speed
restriction due to deteriorating asset condi-
tion weighted by the time the restrictions are
in place (included in the yearly timetable)
related to total main track-km; restrictions
are counted whenever criterion is met re-
gardless of whether infrastructure manager
reports permanent speed restrictions as
such or if they are included in the timetable
% of main
track-km
Tracks with
temporary
speed re-
strictions
Percentage of tracks with temporary speed
restriction due to deteriorating asset condi-
tion weighted by the time the restrictions are
in place (not included in the yearly timeta-
ble) related to total main track-km
% of main
track-km
ERMTS deployment
KPI name KPI Definition KPI unit
ERTMS track-
side deploy-
ment
Main tracks with ERTMS in operation in
proportion to total main tracks (measured in
track-km)
% of main
track-km
Planned extent
of ERTMS de-
ployment by
2030
In 2030, the percentage of main track-km
planned to have been deployed with
ERTMS, i.e. main tracks equipped with both
- ETCS (European train control system; any
baseline or level) and GSM-R (Global Sys-
tem for Mobile Communications); and where
ETCS and GSM-R are used in service
% of current
main track-km

Page: 105
4.5 Individual thresholds of punctuality for national measures
Figure 75: National delay measurement thresholds (in minutes:seconds)70
Figure 76: National delay measurement thresholds (in minutes:seconds)
70 RFI: Some Long distance trains have a threshold of 10:29
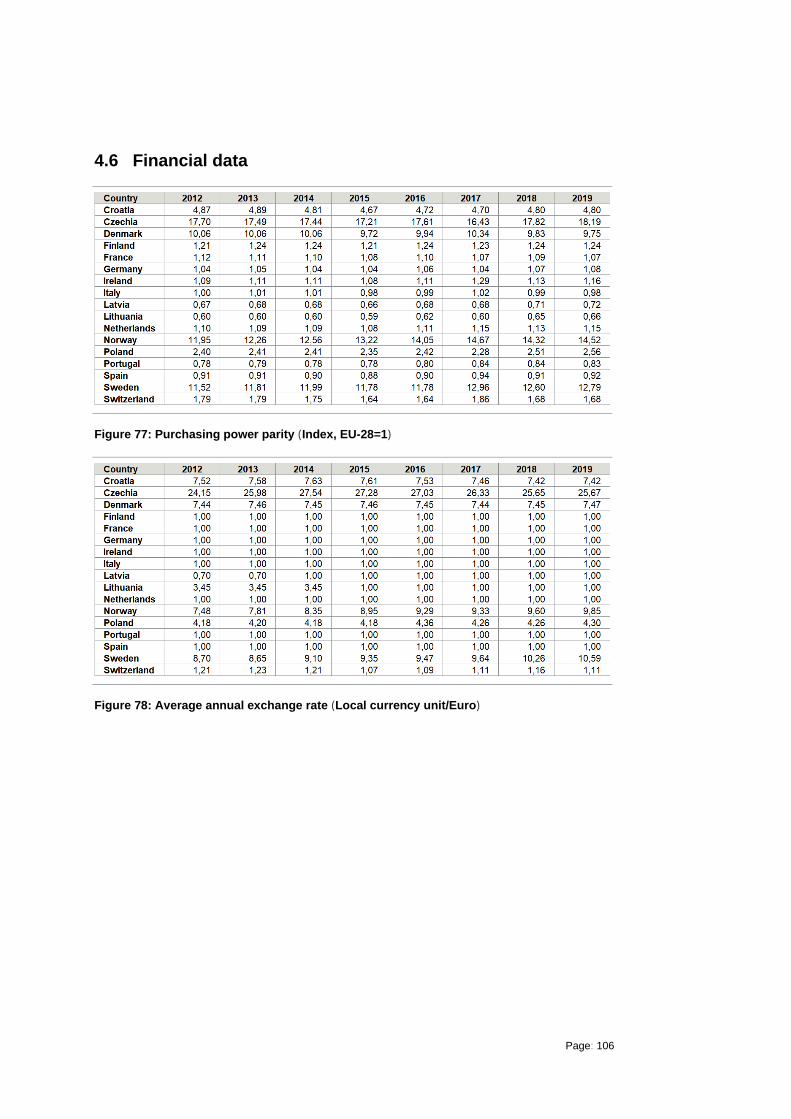
Page: 106
4.6 Financial data
Figure 77: Purchasing power parity (Index, EU-28=1)
Figure 78: Average annual exchange rate (Local currency unit/Euro)

Page: 107
5 Glossary
Name Description Source
Affected train
(by an asset
failure)
A train is affected if the asset failure causes the train to exceed a delay minutes threshold of 5:29 minutes
for passenger services or 15:29 minutes for freight services at any available measuring point.
Asset Capabil-
ity
Asset capability is a quality or function as a property or natural part of an asset. A capability is a charac-
teristic of an asset enabling achievement of its desired function.
Asset failure An asset failure is counted one time and one time only if any train is affected by it. A train is affected if the
asset failure causes the train to exceed a delay minutes threshold of 5:29 minutes for passenger services
or 15:29 minutes for freight services at any available measuring point. An asset failure is not counted if
these thresholds are not exceeded for any train at any available measuring point (i.e. if no train is affect-
ed).
Asset Man-
agement
Coordinated activity of an organisation to realise value from assets. ISO 55000:2014
Assets LICB defines the Railway Infrastructures as consisting of the following items, assuming they form part the
permanent way, including sidings, but excluding lines situated within railway repair workshops, depots or
locomotive sheds and private branch lines or sidings:
- Ground area
- Track and track bed etc.
- Engineering structures: Bridges culverts and other overpasses, tunnels etc.
- Level crossings, including appliances to ensure safety of road traffic;
- Superstructure, in particular: rails, grooved rails; sleepers, small fittings for the permanent way, ballast,
points, crossings.
- Access way for passengers and goods, including access by road;
- Safety, signalling and telecommunications installations on the open track, in stations and in marshalling
yards etc.
- Lightning installations for traffic and safety purposes
- Plant for transforming and carrying electric power for train haulage: substations, Supply cables between
sub-stations and contact wires, catenaries.
EC Directives,
European Com-
mission 5th
Framework Pro-
gramme Improve
rail, Deliverable
“Benchmark
ing exercise in
railway infrastruc-
ture management”
as referred in the
UIC Lasting Infra-
structure Cost
Benchmarking
(LICB) project.
ATP (Auto-
matic train
protection)
A system that enforces obedience to signals and speed restrictions by speed supervision, including au-
tomatic stop at signals.
Recommendations
to revise Annex 1
to Directive
2004/49
Bottleneck A physical, technical or functional barrier which leads to a system break affecting the continuity of long-
distance or cross-border flows and which can be surmounted by creating new infrastructure or substan-
tially upgrading existing infrastructure that could bring significant improvements which will solve the bot-
tleneck constraints.
Regulation (EU)
No 1315/2013
(TEN-T), Article
(3)(q)
Broken rail Any rail which is separated in two or more pieces, or any rail from which a piece of metal becomes de-
tached, causing a gap of more than 50 mm in length and more than 10 mm in depth on the running sur-
face.
Directive (EU)
2016/798 on
railway safety,
Annex I, Appendix
4.1
Cancelled
train
If a planned service is not running (i.e. train cancelled in the operations phase). The codes described in
UIC CODE, 450 – 2, OR, 5th edition, June 2009, Appendix A page 9 should be used to describe the
cause of cancellation on the whole or just a part of the route.
Cancelled trains can be split into four types. These are:
•full cancellation cancelled at origin
•part cancellation en route
•part cancellation changed origin
•part cancellation diverted any train that diverts and does not stop at all of its scheduled locations will be
classed as a part cancellation even if it reaches its end destination).
UIC CODE, 450 –
2, OR, 5th edition,
June 2009, 6 –
Cancelled ser-
vices, combined
with adopting the
types of cancella-
tions described by
Network Rail.
Capacity
(infrastructure)
Capacity means the potential to schedule train paths requested for an element of infrastructure for a
certain period.
2012/34/EU (SE-
RA), Article 3 (24)

Page: 108
Name Description Source
CAPEX,
Capital ex-
penditures
Capital expenditure are funds used by a company to acquire or upgrade physical assets such as proper-
ty, industrial buildings or equipment. An expense is considered to be a capital expenditure when the asset
is a newly purchased capital asset or an investment that improves the useful life of an existing capital
asset. Hence, it comprises investments in new infrastructure as well as renewals and enhancements.
PRIME KPI sub-
group
Charges for
service facili-
ties
Revenues generated by providing access to service facilities. Services facilities include:
(a) passenger stations, their buildings and other facilities, including travel information display and suitable
location for ticketing services;
(b) freight terminals;
(c) marshalling yards and train formation facilities, including shunting facilities;
(d) storage sidings;
(e) maintenance facilities, with the exception of heavy maintenance facilities dedicated to high-speed
trains or to other types of rolling stock requiring specific facilities;
(f) other technical facilities, including cleaning and washing facilities;
(g) maritime and inland port facilities which are linked to rail activities;
(h) relief facilities;
(i) refuelling facilities and supply of fuel in these facilities, charges for which shall be shown on the invoic-
es separately
Directive
2012/32/EU,
Annex II
Conventional
train
Train, composed of vehicles designed to operate at speeds below 250 km/h. Decision No.
1692/96/EC (TEN-
T), Art.10(1)
Delay The time difference between the time the train was scheduled to arrive in accordance with the published
timetable and the time of its actual arrival.
Adapted from
ERA, Glossary of
railway terminolo-
gy
Delay minutes Delay minutes will be measured at all available measuring points. Of those measured delay minutes that
exceed a threshold of 5:29 minutes for passenger services and 15:29 minutes for freight services the
maximum number is counted. No delay minutes are counted if these thresholds are not exceeded at any
measuring point.
Deployment The deployment of a mechanical device, electrical system, computer program, etc., is its assembly or
transformation from a packaged form to an operational working state. Deployment implies moving a
product from a temporary or development state to a permanent or desired state.
Derailment of
train
Any case in which at least one wheel of a train leaves the rails. Glossary for
Transport Statis-
tics, A.VI-14
Directive (EU)
2016/798 on
railway safety,
Annex I, Appendix
1.7
Direct Cost in
the meaning
of Regulation
(EU)2015/909
irect cost in this context means “the cost that is directly incurred as a result of operating the train ser
vice” and which is used for setting charges for the minimum access package and for access to infrastruc-
ture connecting service facilities. The modalities for the calculation of the cost that is directly incurred as a
result of operating the train are set out in Commission Implementing Regulation (EU) 2015/909 and can in
principle be established on the basis of:
(a) a network-wide approach as the difference between, on the one hand, the costs for providing the
services of the minimum access package and for the access to the infrastructure connecting service
facilities and, on the other hand, the non-eligible costs referred to in Article 4 of this regulation, or
(b) econometric or engineering cost modelling.
PRIME KPI sub-
group on the basis
of Implementing
Regulation (EU)
2015/909

Page: 109
Name Description Source
Expenditure
on enhance-
ments of
existing infra-
structure
Enhancements or 'upgrades’ means capital expenditure on a major modification work of the existing
infrastructure which improves its overall performance. Enhancements can be triggered by changed func-
tional requirements (and not triggered by lifetime) or "forced" investments when acting on regulations.
The purpose of enhancements is to change the functional requirements such as electrification of a non-
electrified line, building a second track parallel to a single tracked line, increase of line speed or capacity.
Enhancements include planning (incl. portfolio prioritization, i.e. which enhancements projects are real-
ized when and where), tendering dismantling (disposal of old equipment), construction, testing and com-
missioning (when track is opened to full-speed operation). Enhancements are generally looked on at the
level of annual spending from a cash-flow perspective, i.e. no depreciation or other imputed costs are
taken into account. It includes its proportion of overhead (such as financials, controlling, IT, human re-
sources, purchasing, legal and planning), labour (operative, personnel), material, (used/consumed
goods), internal services (machinery, tools, equipment including transport and logistics) and contractors
(entrepreneurial production) as well as investment subsidies.
PRIME KPI sub-
group on the basis
of Regulation (EU)
2015/1100
(RMMS), Article 2
ERA European Union Agency for Railways Regulation (EU)
2016/796 (ERA)
ERTMS 'European Rail Traffic Management System' (ERTMS) means the system defined in Commission Deci-
sion 2006/679/EC and Commission Decision 2006/860/EC
European Rail Traffic Management System (ERTMS) is the European signalling system consisting the
European Train Control System (ETCS), a standard for in-cab train control, and GSM-R, the GSM mobile
communications standard for railway operations.
ERTMS in operations refers to main tracks equipped with both - ETCS (European train control system;
any baseline or level) and GSM-R (Global System for Mobile Communications); and where ETCS and
GSM-R are used in service.
Commission
Decision
2006/679/EC
Commission
Decision
2006/860/EC
Failure Termination of an item to perform a given service.
Also see -> Asset failure
SIS-EN
13306:2010
Financial
expenditures
Financial expenditures are the ones accounted for in the annual profit and loss statement. It includes
interests and similar charges which correspond to the remuneration of certain financial assets (deposits,
bills, bonds and credits).
PRIME KPI sub-
group on the basis
of Eurostat con-
cepts and defini-
tions on financial
surplus
Freight train Freight (good) train: train for the carriage of goods composed of one or more wagons and, possibly, vans
moving either empty or under load.
Glossary for
Transport Statis-
tics, A.IV-06
Freight train-
km
Unit of measurement representing the movement of all freight trains over one kilometre. From an infra-
structure manager’s point of view it is important to include all freight train movements as they all influence
the deterioration of the rail infrastructure assets. Empty freight train movements are therefore included in
the number of freight train movements.
Glossary for Transport Statis-tics, A.IV-07 LICB Web Glossa-
ry, p.19
Funding An amount of money used for a specific purpose, in our case to finance the infrastructure manager ex-
penditures.
Longman, Dic-
tionary of contem-
porary English
Grant A direct financial contribution given by the federal, state or local government or provided from EU funds to
an eligible grantee. Grants are not expected to be repaid and do not include financial assistance, such as
a loan or loan guarantee, an interest rate subsidy, direct appropriation, or revenue sharing.
PRIME KPI sub-
group
Gross tonne
km
Unit of measure representing the movement over a distance of one kilometre of one tonne of rail vehicle
including the weight of tractive vehicle.
Glossary for
Transport Statis-
tics, A.IV-14
High speed
train
Train, composed of vehicles designed to operate:
- either at speeds of at least 250 km/h on lines specially built for high speeds, while enabling operation at
speeds exceeding 300 km/h in appropriate circumstances,
- or at speeds of the order of 200 km/h on the lines, where compatible with the performance levels of
these lines.
Glossary for
Transport Statis-
tics, A.I-02
Directive (EU)
2016/797 on the
rail interoperabil-
ity, Annex I, Article
1

Page: 110
Name Description Source
High speed
track
Track (line) whole or part of line, approved for Vmax ≥ km/h
— specially built high-speed lines equipped for speeds generally equal to or greater than 250 km/h,
— specially upgraded high-speed lines equipped for speeds of the order of 200 km/h,
— specially upgraded high-speed lines which have special features as a result of topographical, relief or
town-planning constraints, on which the speed must be adapted to each case
The last category also includes interconnecting lines between the high-speed and conventional networks,
lines through stations, accesses to terminals, depots, etc. travelled at conventional speed by ‘high-speed’
rolling stock.
Glossary for
Transport Statis-
tics, A.I-04
Directive (EU)
2016/797 on the
rail interoperabil-
ity, Annex I, Article
1
Infrastructure
Manager (IM)
Any firm or body responsible, in particular, for establishing, managing and maintaining railway infrastruc-
ture, including traffic management and control-command and signalling.
An infrastructure manager can delegate to another enterprise the following tasks: maintaining railway
infrastructure and operating the control and safety system.
'Infrastructure manager' means any body or firm responsible in particular for establishing, managing and
maintaining railway infrastructure, including traffic management and control-command and signalling; the
functions of the infrastructure manager on a network or part of a network may be allocated to different
bodies or firms.
Glossary for
Transport Statis-
tics. A.III-03
Directive
2012/34/EU (SE-
RA), Article 3(2)
Infrastructure
Manager’s
responsibility
for delay
minutes
Table, column 1-, 2-, 3- (Operational and planning management, Infrastructure installations, Civil Engi-
neering causes). Plus: Delay minutes caused by weather incidents that have affected the railway infra-
structure.
The relevant causes are described in Appendix 2.
UIC CODE, 450 –
2, OR, 5th edition,
June 2009, Ap-
pendix A
Interoperability The ability of a rail system to allow the safe and uninterrupted movement of trains which accomplish the
required levels of performance.
Directive (EU)
2016/797 on the
rail interoperabil-
ity, Article 2(2)
Investments in
new infrastruc-
ture
Investment in new infrastructure means capital expenditure on the projects for construction of new infra-
structure installations for new lines.
It includes planning (incl. portfolio prioritization, i.e. which investment projects are realized when and
where), tendering dismantling (disposal of old equipment), construction, testing and commissioning (when
track is opened to full-speed operation). Investments are generally looked on at the level of annual spend-
ing from a cash-flow perspective, i.e. no depreciation or other imputed costs are taken into account. It
also includes its proportion of overheads (such as financials, controlling, IT, human resources, purchas-
ing, legal and planning), labour (operative, personnel), material, (used/consumed goods), internal ser-
vices (machinery, tools, equipment including transport and logistics) and contractors (entrepreneurial
production) as well as investment subsidies.
PRIME KPI sub-
group on the basis
of Regulation (EU)
2015/1100
(RMMS), Article 2
Killed (Death
(killed per-
son))
Any person killed immediately or dying within 30 days as a result of an accident, excluding any suicide. Glossary for
Transport Statis-
tics, A.VI-09
Directive (EU)
2016/798 on
railway safety,
Annex I, Appendix
1.18
Level crossing Any level intersection between a road or passage and a railway, as recognised by the infrastructure
manager and open to public or private users. Passages between platforms within stations are excluded,
as well as passages over tracks for the sole use of employees.
Glossary for
Transport Statis-
tics, A. I-14
Directive (EU)
2016/798 on
railway safety,
Annex I, Appendix
6.3

Page: 111
Name Description Source
Level crossing
accident
Any accident at level crossings involving at least one railway vehicle and one or more crossing vehicles,
other crossing users such as pedestrians or other objects temporarily present on or near the track if lost
by a crossing vehicle or user.
Glossary for
Transport Statis-
tics, A. I-15
Directive (EU)
2016/798 on
railway safety,
Annex I, Appendix
1.8
Line km A cumulative length of all lines maintained by infrastructure managers. PRIME KPI sub-
group based on
Glossary for
transport statistics
Main Lines
(Principle
railway lines)
Railway lines maintained and operated for running trains. Glossary for
transport statistics,
A.I-02.1
Main lines
(Principle
railway lines),
length of
Cumulative length of railway lines operated and used for running trains by the end of reporting year.
Excluded are:
- Lines solely used for operating touristic trains and heritage trains;
- Lines constructed solely to serve mines, forests or other industrial or agricultural installations and
which are not open to public traffic;
- Private lines closed to public traffic and functionally separated (i.e. stand-alone) networks;
- Private lines used for own freight transport activities or for non-commercial passenger services and
light rail tracks occasionally used by heavy rail vehicles for connectivity or transit purposes.
Glossary for
transport statistics,
A.I-02.1 and A.I-
01
Maintenance
cost
Costs of function: Maintenance means non-capital expenditure that the infrastructure manager carries out
in order to maintain the condition and capability of the existing infrastructure or to optimise asset lifetimes.
Preventive maintenance activities cover inspections, measuring or failure prevention. Corrective mainte-
nance activities are repairs (but not replacement), routine over-hauls or small-scale replacement work
excluded from the definitions of renewals. It forms part of annual operating costs. Maintenance expendi-
ture relates to activities that counter the wear, degradation or ageing of the existing infrastructure so that
the required standard of performance is achieved.
Types of costs: Maintenance cost include planning, its proportion of overhead (such as financials, control-
ling, IT, human resources, purchasing, legal and planning), labour (operative, personnel), material,
(used/consumed goods), internal services (machinery, tools, equipment including transport and logistics)
and contractors (entrepreneurial production).
PRIME KPI sub-
group on the basis
of LICB and Regu-
lation (EU)
2015/1100
(RMMS), Article 2
Main track A track providing end-to-end line continuity designed for running trains between stations or places indi-
cated in timetables, network statements, rosters or other indications/publications as independent points of
departure or arrival for the conveyance of passengers or goods.
Glossary for
Transport Statis-
tics, A.I-01.1
Main track
(main track
km), length of
A cumulative length of all running/main tracks
Excluded are:
- Lines solely used for operating touristic trains and heritage trains;
- Lines constructed solely to serve mines, forests or other industrial or agricultural installations and
which are not open to public traffic;
- Private lines closed to public traffic and functionally separated (i.e. stand-alone) networks;
- Private lines used for own freight transport activities or for non-commercial passenger services and light
rail tracks occasionally used by heavy rail vehicles for connectivity or transit purposes
Glossary for
Transport Statis-
tics, A.I-02.1 and
A.I.01
Main track,
electrified
Main running tracks provided with an overhead catenary or with conductor rail (3rd rail) to permit electric
traction.
Glossary for
transport statistics,
A.I-01.1 and
A.I.15
LICB Web Glossa-
ry, p.16

Page: 112
Name Description Source
Minimum
access pack-
age charges
Revenues generated by charging railway undertakings for enabling them to provide their services.
The minimum access package comprises:
(a) handling of requests for railway infrastructure capacity;
(b) the right to utilise capacity which is granted;
(c) use of the railway infrastructure, including track points and junctions;
(d) train control including signalling, regulation, dispatching and the communication and provision of
information on train movement;
(e) use of electrical supply equipment for traction current, where available;
(f) all other information required to implement or operate the service for which capacity has been granted.
Directive
2012/32/EU,
Annex II
Multimodal rail
freight termi-
nals
Multimodal Freight Terminals (IFT) or transfer points are places equipped for the transhipment and stor-
age of Intermodal Transport Units (ITU). They connect at least two transport modes, where at least one of
the modes of transport is rail. The other is usually road, although waterborne (sea and inland waterways)
and air transport can also be integrated.
PRIME KPI sub-
group on the basis
of Regulation (EU)
2015/1100
(RMMS), Article 2
Multimodal
transport
The carriage of passengers or freight, or both, using two or more modes of transport. Regulation (EU)
No 1315/2013
(TEN-T), Art.3(n)
Network Principal railway lines managed by the infrastructure manager. Glossary for
Transport Statis-
tics, A.I-02.1
Operations Operations excluding maintenance. SS-EN 13306:2010 defines operation as: Combination of all tech-
nical, administrative and managerial actions, other than maintenance actions that results in the item being
in use.
Total annual expenditures for the infrastructure manager on operations includes operations proportion of
the infrastructure manager overhead (such as financials, controlling, IT, human resources, purchasing,
legal and planning), labour (operative, personnel), material (used/consumed goods), internal services
(machinery, tools, equipment including transport and logistics) and if some parts are handled by contrac-
tors, this is also included. (Central or holding overheads are to be allocated proportionally.)
OPEX, operat-
ing expendi-
tures
An operating expense is an expense a business incurs through its normal business operations. Operating
expenses include inter alia maintenance cost, rent, equipment, inventory costs, payroll, insurance and
funds allocated toward research and development.
PRIME KPI sub-
group
Other accident Any accident other than a collision of train with rail vehicle, collision of train with obstacle within the clear-
ance gauge, derailment of train, level crossing accident, an accident to person involving rolling stock in
motion or a fire in rolling stock.
Example: Accidents caused by rocks, landslides, trees, lost parts of railway vehicles, lost or displaced
loads, vehicles and machines or equipment for track maintenance
Directive (EU)
2016/798 on
railway safety,
Annex I, Appendix
1.11
Other track All other tracks than main/running ones:
- tracks maintained, but not operated by the infrastructure manager;
- tracks at service facilities not used for running trains.
Tracks at service facilities not used for running trains are excluded. The boundary of the service facility is
the point at which the railway vehicle leaving the service facility cannot pass without having an authoriza-
tion to access the mainline or other similar line. This point is usually identified by a signal.
Service facilities are passenger stations, their buildings and other facilities; freight terminals; marshalling
yards and train formation facilities, including shunting facilities; storage sidings; maintenance facilities;
other technical facilities, including cleaning and washing facilities; maritime and inland port facilities which
are linked to rail activities; relief facilities; refuelling facilities and supply of fuel in these facilities.
Glossary for
Transport Statis-
tics A.I-01.2
Passenger Any person, excluding a member of the train crew, who makes a trip by rail, including a passenger trying
to embark onto or disembark from a moving train for accident statistics only
Glossary for
Transport Statis-
tics, A.VI-18
Directive (EU)
2016/798 on
railway safety,
Annex I, Appendix
1.12

Page: 113
Name Description Source
Passenger-km Unit of measurement representing the transport of one passenger by rail over a distance of one kilometre.
The distance to be taken into consideration should be the distance actually travelled by the passenger on
the network. To avoid double counting each country should count only the pkm performed on its territory.
If this is not available, then the distance charged or estimated should be used.
Glossary for
Transport Statis-
tics, A.V-06
Passenger
train-km
Unit of measurement representing the movement of all passenger trains over a distance of one kilometre.
From an infrastructure manager’s point of view it is important to include all passenger train movements as
they all influence the deterioration of the rail infrastructure assets. Empty passenger train movements are
therefore included in the number of passenger train movements.
Glossary for
Transport Statis-
tics, A.IV-07
LICB Web Glossa-
ry, p.18
Passenger
trains
Train for the carriage of passengers composed of one or more passenger railway vehicles and, possibly,
vans moving either empty or under load.
Glossary for
Transport Statis-
tics, A.IV-06 and
A.IV-05
Permanent
restrictions
Restrictions are defined as permanent if they are incorporated within the yearly timetable. PRIME KPI sub-
group
Punctuality “Punctuality of a train is measured on the basis of comparisons between the time planned in the timetable
of a train identified by its train number and the actual running time at certain measuring point. A measur-
ing point is a specific location on route where the trains running data are captured. One can choose to
measure the departure arrival or run through time”.
“Punctuality is measured by setting up a threshold up to which trains are considered as punctual and
building a percentage.”
When measuring punctuality the following are to be included all in service trains: freight and passenger,
but excluding Empty Coaching Stock movements and engineering trains.
UIC CODE, 450 –
2, OR, 5th edition,
June 2009, 4,
Measurement of
punctuality
Railway line Line of transportation made up by rail exclusively for the use of railway vehicles and maintained for run-
ning trains. A line is made up of one or more tracks and the corresponding exclusion criteria.
Glossary for
Transport Statis-
tics, A.I-02
Recycling Reprocessing by means of a manufacturing process, of a used product material into a product, a compo-
nent incorporated into a product, or a secondary (recycled) raw material; excluding energy recovery and
the use of the product as a fuel.
Recycling of waste is any activity that includes the collection and processing of used or unused items that
would otherwise be considered waste. Recycling involves sorting and processing the recyclable products
into raw material and then using the recycled raw materials to make new products.
ISO 18604:2013,
3.3
Renewal
expenditure
Renewals mean capital expenditure on a major substitution work on the existing infrastructure which does
not change its overall original performance. Renewals are projects where existing infrastructure is re-
placed with new assets of the same or similar type. Usually it is a replacement of complete systems or a
systematic replacement of components at the end of their lifetimes. The borderline to maintenance differs
among the railways. Usually it depends on minimum cost levels or minimum scope (e.g. km). It is capital-
ised at the time it is carried out, and then depreciated. Renewals include planning (incl. portfolio prioritisa-
tion, i.e. which renewal projects are realised when and where), tendering, dismantling/disposal of old
equipment, construction, testing and commissioning (when track is opened to full-speed operation). Re-
newals are generally looked at on the level of annual spending from a cash-flow perspective, i.e. no
depreciation or other imputed costs are taken into account.
Excluded from the definition are construction of new lines (new systems) or measures to raise the stand-
ard of existing infrastructure triggered by changed functional requirements (and not triggered by lifetime!)
or "forced" investments when acting on regulations.
It includes its proportion of overheads (such as financials, controlling, IT, human resources, purchasing,
legal and planning), labour (operative, personnel), material, (used/consumed goods), internal services
(machinery, tools, equipment including transport and logistics) and contractors (entrepreneurial produc-
tion) as well as investment subsidies.
PRIME KPI sub-
group on the basis
of Regulation (EU)
2015/1100
(RMMS), Article 2

Page: 114
Name Description Source
Serious injury
(seriously
injured per-
son)
Any person injured who was hospitalised for more than 24 hours as a result of an accident, excluding any
attempted suicide.
Glossary for
Transport Statis-
tics, A. VII-10
Directive (EU)
2016/798 on
railway safety,
Annex I, Appendix
1.19
Significant
accident
Any accident involving at least one rail vehicle in motion, resulting in at least one killed or seriously injured
person, or in significant damage to stock, track, other installations or environment, or extensive disrup-
tions to traffic, excluding accidents in workshops, warehouses and depots.
Glossary for
Transport Statis-
tics, A.VII-04
Directive (EU)
2016/798 on
railway safety,
Annex I, Appendix
1.1
Significant
damage
Damage that is equivalent to EUR 150 000 or more. Glossary for
Transport Statis-
tics, A.VI-04
Directive (EU)
2016/798 on
railway safety,
Annex I, Appendix
1.2
TAC Total Includes charges for minimum Track Access Charges for the passenger, freight and service train path.
Mark-ups. No other charging components are included.
Temporary
restrictions
Restrictions that occur during the year that are not included in the yearly timetable.
TEN-T re-
quirements
Infrastructure requirements as set in Article 39 of the Regulation (EU) No 1315/2013 on Union guidelines
for the development of the trans-European transport network.
http://publications.europa.eu/resource/cellar/f277232a-699e-11e3-8e4e-01aa75ed71a1.0006.01/DOC_1
Regulation (EU)
No 1315/2013
(TEN-T)
Track A pair of rails over which rail-borne vehicles can run maintained by an infrastructure manager. Metro,
Tram and Light rail urban lines are excluded.
Excluded are:
- Lines solely used for operating touristic trains and heritage trains;
- Lines constructed solely to serve mines, forests or other industrial or agricultural installations and
which are not open to public traffic;
- Private lines closed to public traffic and functionally separated (i.e. stand-alone) networks;
- Private lines used for own freight transport activities or for non-commercial passenger services and
light rail tracks occasionally used by heavy rail vehicles for connectivity or transit purposes.
Glossary for
Transport Statis-
tics, A.I-01
Track buckle
or other track
misalignment
Any fault related to the continuum and the geometry of track, requiring track to be placed out of service or
have immediate restriction of permitted speed imposed.
Directive (EU)
2016/798 on
railway safety,
Annex I, Appendix
4.2
Track km A cumulative length of all tracks maintained by the infrastructure manager; each track of a multiple-track
railway line is to be counted.
PRIME subgroup,
based on Glossa-
ry for Transport
Statistics
Trackside Area adjacent to a railway track such as embankments, level crossings, platforms, shunting yards.
Workshops, warehouses and depots are excluded.
PRIME KPI sub-
group
Train One or more railway vehicles hauled by one or more locomotives or railcars, or one railcar travelling
alone, running under a given number or specific designation from an initial fixed point to a terminal fixed
point, including a light engine, i.e. a locomotive travelling on its own.
In this document we define trains as the sum of passenger trains and freight trains.
Glossary for
Transport Statis-
tics, A.IV-05 and
A.IV-06

Page: 115
Name Description Source
Train-km The unit of measurement representing the movement of a train over one kilometre.
The distance used is the distance actually run, if available, otherwise the standard network distance
between the origin and destination shall be used. Only the distance on the national territory of the report-
ing country shall be taken into account.
Glossary for
Transport Statis-
tics, A.IV-05
Directive (EU)
2016/798 on
railway safety,
Annex I, Appendix
7.1
Traffic Man-
agement Cost
Costs of functions: Traffic management comprises the control of signal installations and traffic, planning
as well as path allocation.
Types of costs: Traffic management includes planning, its proportion of overheads (such as financials,
controlling, IT, human resources, purchasing, legal and planning), labour (operative, personnel), material,
(used/consumed goods), internal services (machinery, tools, equipment including transport and logistics)
and contractors (entrepreneurial production).
PRIME KPI sub-
group on the basis
of UIC studies
(CENOS and
OMC)
Working
timetable
The data defining all planned train and rolling-stock movements which will take place on the relevant infrastructure during the period for which it is in force
Directive
2012/34/EU (SE-
RA), Article .3(28)
Related Documents