2019 POINT IN TIME SUMMARY July 2019 16

Welcome message from author
This document is posted to help you gain knowledge. Please leave a comment to let me know what you think about it! Share it to your friends and learn new things together.
Transcript

2019 POINT IN TIME SUMMARY
July 2019
16

2019 POINT IN TIME COUNT TOTALS
2019 POINT IN TIME COUNT BY THE NUMBERS
SUBPOPULATIONS
TRANSITIONAL AGED YOUTH
Individuals ages 18 to 24
SENIORSIndividuals ages 62 and
older
612VETERANS
Individuals who served in the U.S. Armed Forces, National Guard or
Reserves
North: 2,765Central: 3,332
South: 763
METHODOLOGYThe U.S. Department of Housing and Urban Development (HUD) requires that
all Continuum of Care jurisdictions across the nation complete a biennial unsheltered count and an annual sheltered count of all individuals experiencing homelessness in the community on a single point in time during the last ten days of January.
Orange County’s 2019 Sheltered Point In Time Count took place the night of Tuesday, January 22, 2019. Emergency Shelters and Transitional Housing Programs collected client-level demographic information from individuals and families staying the night in each program. The 2019 Unsheltered Count process took place over two days, Wednesday, January 23 and Thursday, January 24, to ensure the 800 square mile County jurisdiction was canvassed effectively. The change in methodology allowed the count teams to collect unique ID data points that were used to deduplicate records for the two day street count process. The survey data was collected with ArcGIS Survey 123, a phone application that captures GIS locations and provides vital information that guides the way the County responds to homelessness in Orange County. The results for the 2019 Everyone Counts process provide the most accurate data on the scope of homelessness in the County. Because of this improved process, methodology and data quality from the use of GIS technology, Orange County’s 2019 Point In Time Count results ensure that Everyone Counts.
6,860 Individuals
Individuals
IndividualsIndividuals
311 275
17

• Hub for Urban Initiatives – HUD methodology and survey tool design• City Net – lead agency for unsheltered count• 2-1-1 Orange County – lead agency for sheltered count• County of Orange – including Health Care Agency, Social Services Agency,
OC Community Resources, OC Parks, OC Public Works and OC Information& Technology
• Continuum of Care Agencies• Nonprofit and faith-based service providers• 34 Cities and law enforcement agencies• Community volunteers from every part of our county
SHELTERED COUNT
THANK YOU TO ALL THOSE INVOLVED
2,899SHELTERED TOTAL
99VETERANS
Individuals who served in the U.S. Armed Forces, National
Guard or Reserves
TRANSITIONAL AGED YOUTH
Individuals ages 18 to 24
255SENIORS
Individuals ages 62 and older
1,505225
1,169
117
18

UNSHELTERED COUNT
MAPS & VOLUNTEERS
3,961UNSHELTERED TOTAL
VETERANSIndividuals who served in the U.S. Armed Forces, National
Guard or Reserves
TRANSITIONAL AGED YOUTH
Individuals ages 18 to 24
357SENIORS Individuals
ages 62 and older
Community volunteers, nonprofit and faith-based service providers including representatives from law enforcement, all 34 cities and County government.
Field teams of volunteers deployed into the community to canvas maps and survey people experiencing homelessness.244Maps were canvassed at least twice during the 2019 Point In Time Count effort. 239
1,596
1,827538
212
158
1,167
19

UNSHELTERED Subpopulations &
Disabling Conditions
3,714 ADULTS
*Some individuals may identify with more than one subpopulation*
CHRONIC HOMELESSNESS 52.02%1,932 Individuals
SUBSTANCE USE ISSUES 32.93%1,223 Individuals
PHYSICAL DISABIL IT Y 30.83%1,145 Individuals
MENTAL HEALTH ISSUES 26.49%984 Individuals
DEVELOPMENTAL DISABIL IT Y510 Individuals
DOMESTIC VIOLENCE 9.59%356 Individuals
HIV/AIDS 1.80%67 Individuals
13.73%
20

SHELTERED Subpopulations &
Disabling Conditions
2,166 ADULTS
*Some individuals may identify with more than one subpopulation*
CHRONIC HOMELESSNESS 25.81%559 Individuals
SUBSTANCE USE ISSUES 26.69%578 Individuals
PHYSICAL DISABIL IT Y 15.05%326 Individuals
MENTAL HEALTH ISSUES 30.93%670 Individuals
DEVELOPMENTAL DISABIL IT Y112 Individuals
DOMESTIC VIOLENCE 8.54%185 ndividuals
HIV/AIDS 1.80%39 Individuals
5.17%
21

DEMOGRAPHICS
AGE
ETHNICITY
18-24 3.99%158 Individuals
4.04%117 Individuals
Under 18 6.24% 25.28%738 Individuals
Hispanic or Latino
34.18%1,354 Individuals
38.84%1,126 Individuals
25-39 28.98%1,148 Individuals
22.70%658 Individuals
40-49 23.28%922 Individuals
14.69%426 Individuals
Non-Hispanic or Non-Latino
65.82%2,607 Individuals
*One Domestic Violence Provider provided the ages of clientsin ranges: under 18, 18 to 24 and 25 and older. There were20 clients in the 25 and older range.
61.16%1,773 Individuals
50-54 13.83%548 Individuals
9.73%282 Individuals
55-61 14.67%581 Individuals
13.38%388 Individuals
62+ 9.01%357 Individuals
8.80%255 Individuals
Unknown* 1.38%40 Individuals
UNSHELTERED SHELTERED
RACEAmerican Indian or Alaska Native 1.87%
74 Individuals3.86%112 Individuals
Asian 3.11%123 Individuals
3.28%95 Individuals
Black or African American
8.41%333 Individuals
15.01%435 Individuals
Native Hawaiian or other Pacific Islander 1.67%
66 Individuals1.21%35 Individuals
White 72.71%2,880 Individuals
72.54%2,103Individuals
Multiple Races or Other
12.24%485 Individuals
4.10%119 Individuals
UNSHELTERED SHELTERED
GENDER
Female 28.73%1,138Individuals
48.22%1,398 Individuals
Male 71.04%2,814 Individuals
51.61%1,496 Individuals
Transgender 0.10%4 Individuals
0.10%3 Individuals
Gender Non-Conforming
0.13%5 Individuals
0.07%2 Individuals
UNSHELTERED SHELTERED UNSHELTERED SHELTERED
247 Individuals
22
ceozlundy
Sticky Note
Marked set by ceozlundy
Adults Surveyed OTHER UNSHELTERED
QUESTIONS
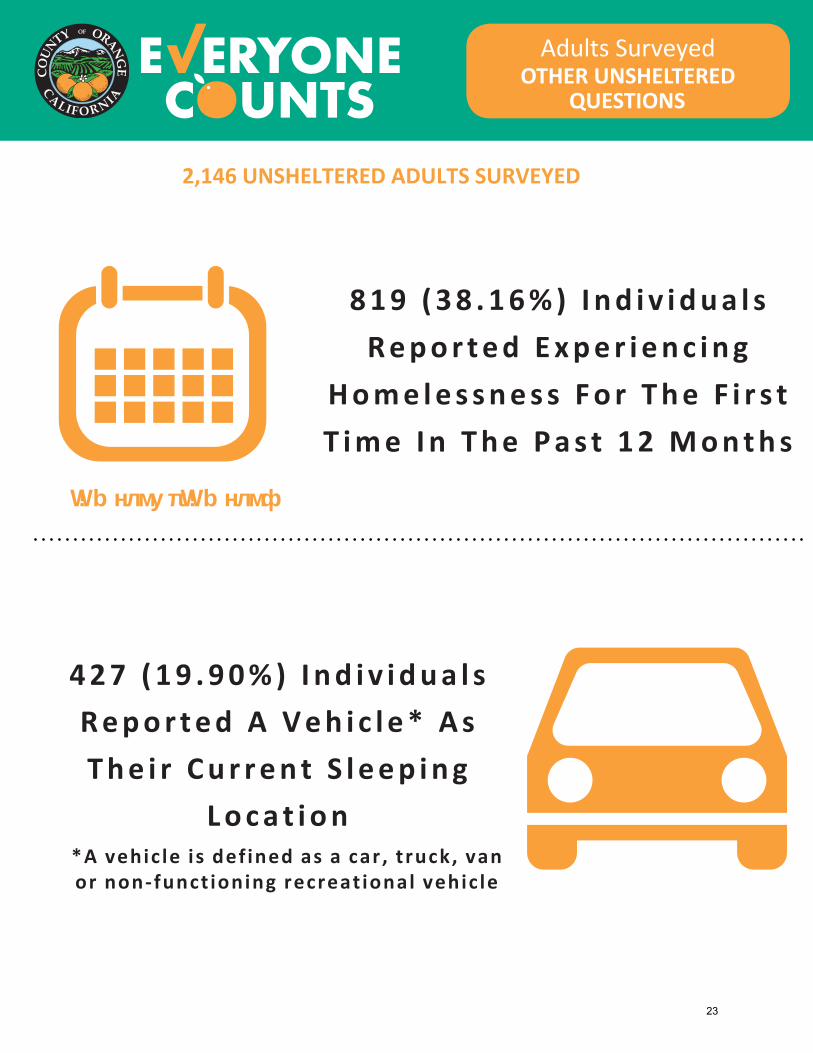
8 1 9 ( 3 8 . 1 6 % ) I n d i v i d u a l s R e p o r t e d E x p e r i e n c i n g
H o m e l e s s n e s s F o r T h e F i r s t T i m e I n T h e P a s t 1 2 M o n t h s
4 2 7 ( 1 9 . 9 0 % ) I n d i v i d u a l sR e p o r t e d A V e h i c l e * A s T h e i r C u r r e n t S l e e p i n g
L o c a t i o n
2,146 UNSHELTERED ADULTS SURVEYED
W!b нлму π W!b нлмф
*A vehic le is def ined as a car , t ruck, vanor non-funct ioning recreat ional vehic le
23

SHELTER INVENTORY & HOUSEHOLD STATUS
EMERGENCY SHELTERS INVENTORY
# OF BEDS IN 2017 - 1,149# OF BEDS IN 2019 - 2,539
% CHANGE: +120.97%
79.2% 78.2%
# OF BEDS IN 2017 - 1,166# OF BEDS IN 2019 - 1,135
% CHANGE: -2.65%
TRANSITIONAL HOUSING INVENTORY
average occupancy in 2019 average occupancy in 2019
HOUSEHOLD STATUS
Population DescriptionUnsheltered
(3,961)Sheltered
(2,899)TOTAL
(6,860)
Individuals Individuals ages 18+ 3,562 1,734 5,296
FamiliesHouseholds with at least one adult
and one child
110 FAMILIES 396 persons in
households: 152 Adults
244 Children
356 FAMILIES 1,154 persons in households: 432 Adults 722
Children
466 Families 1,550 persons in households: 584
Adults 966 Children
Unaccompanied Youth
Minors (17 and younger without parent/guardian)
3 11 14
24

COMMUNITY TIES: UNSHELTERED ADULTS
REPORTED CITY WHERE MOST TIME SPENT WHILE HOMELESS
City in North Service Planning Area 828 Individuals (38.58%)
City in Central Service Planning Area 900 Individuals (41.94%)
City in South Service Planning Area 244 Individuals (11.37%)
County Unincorporated 5 Individuals (0.23%)
Outside Orange County 45 Individuals (2.10%)
Outside California 12 Individuals (0.56%)
Did Not Answer 112 Individuals (5.22%)
City in North Service Planning Area 663 Individuals (30.89%)
City in Central Service Planning Area 682 Individuals (31.78%)
City in South Service Planning Area 202 Individuals (9.41%)
County Unincorporated 12 Individuals (0.56%)
Outside Orange County 267 Individuals
(12.44%)Outside California
186 Individuals (8.67%)
Did Not Answer 134 Individuals (6.24%)
REPORTED CITY OF LAST PERMANENT ADDRESS
0
100
200
300
400
500
600
700
800
0
100
200
300
400
500
600
700
800
900
1000
North Service Planning Area
Central Service Planning Area
South Service Planning Area
CountyUnicorporated
OutsideOrange County
OutsideCalifornia
Did NotAnswer
North Service Planning Area
Central Service Planning Area
South Service Planning Area
CountyUnicorporated
OutsideOrange County
OutsideCalifornia
Did NotAnswer
92%In Orange County
73%In Orange County
25

COMMUNITY TIES: UNSHELTERED ADULTS
Unemployed1,180 Individuals (54.99%)
Full-Time, Part-Time, Seasonally Employed 480 Individuals (22.37%)
Retired, Disabled 380 Individuals (17.71%)
Did Not Answer 106 Individuals (4.94%)
CURRENT EMPLOYMENT
STATUS
72.09% 1,547 Individuals
CURRENTLY WORKING OR HAVE EVER WORKED IN ORANGE COUNTY
51.63%1,108 Individuals
HAVE FAMILY IN ORANGE COUNTY
51.72%1,110 Individuals
ATTENDING OR HAVE ATTENDED SCHOOL IN ORANGE COUNTY
2,146 UNSHELTERED INDIVIDUALS SURVEYED
26
HOW ORANGE COUNTY IS ADDRESSING HOMELESSNESS
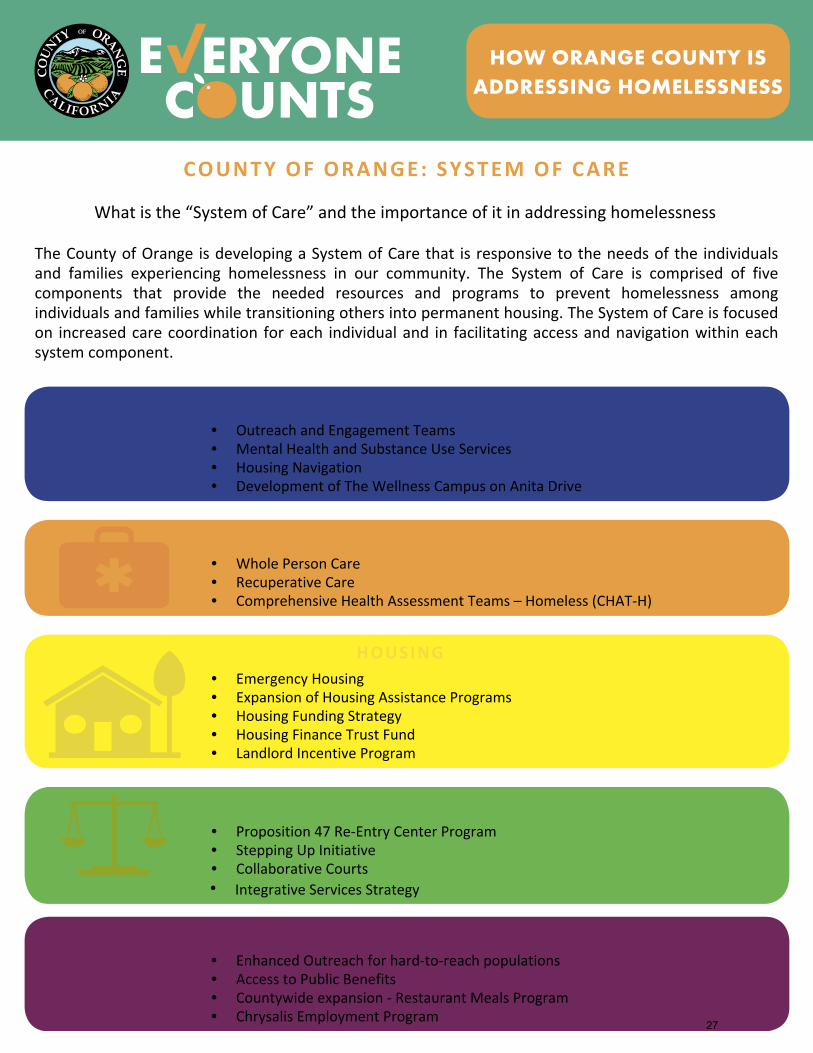
COUNTY OF ORANGE: SYSTEM OF CARE
What is the “System of Care” and the importance of it in addressing homelessness
The County of Orange is developing a System of Care that is responsive to the needs of the individuals and families experiencing homelessness in our community. The System of Care is comprised of five components that provide the needed resources and programs to prevent homelessness among individuals and families while transitioning others into permanent housing. The System of Care is focused on increased care coordination for each individual and in facilitating access and navigation within each system component.
COMMUNITY CORRECTIONS• Proposition 47 Re-Entry Center Program• Stepping Up Initiative• Collaborative Courts
HOUSING• Emergency Housing• Expansion of Housing Assistance Programs• Housing Funding Strategy• Housing Finance Trust Fund• Landlord Incentive Program
HEALTHCARE• Whole Person Care• Recuperative Care• Comprehensive Health Assessment Teams – Homeless (CHAT-H)
BEHAVIORAL HEALTH• Outreach and Engagement Teams• Mental Health and Substance Use Services• Housing Navigation• Development of The Wellness Campus on Anita Drive
PUBLIC SOCIAL SERVICES• Enhanced Outreach for hard-to-reach populations• Access to Public Benefits• Countywide expansion - Restaurant Meals Program• Chrysalis Employment Program
27
• Integrative Services Strategy

Unsheltered Count 2019 POINT IN TIME COUNT
28

2019 POINT IN TIME COUNT:
CITY BY CITY
CITY UNSHELTERED SHELTERED TOTALAnaheim 694 508 1,202
Brea 30 0 30Buena Park 142 145 287
Cypress 39 0 39Fullerton 308 165 473La Habra 45 0 45La Palma 9 0 9
Los Alamitos 1 21 22Orange 193 148 341
Placentia 55 108 163Stanton 71 45 116
Villa Park 0 0 0Yorba Linda 1 0 1
County Unincorporated 8 0 8Domestic Violence Programs N/A 29 29
NORTH SERVICE PLANNING AREA 1,596 2,765
CITY UNSHELTERED SHELTERED TOTALCosta Mesa 187 6 193
Fountain Valley 28 14 42Garden Grove 163 62 225
Huntington Beach 289 60 349Newport Beach 64 0 64
Santa Ana 830 939 1,769Seal Beach 8 0 8
Tustin 95 264 359Westminster 159 25 184
County Unincorporated 4 31 35Domestic Violence Programs N/A 104 104
CENTRAL SERVICE PLANNING AREA 1,827 1,505 3,332
CITY UNSHELTERED SHELTERED TOTALAliso Viejo 1 0 1Dana Point 32 0 32
Irvine 127 3 130Laguna Beach 71 76 147Laguna Hills 24 0 24
Laguna Niguel 7 3 10Laguna Woods 5 0 5
Lake Forest 76 36 112Mission Viejo 22 9 31
Rancho Santa Margarita 15 0 15San Clemente 96 49 145
San Juan Capistrano 62 0 62County Unincorporated 0 0 0
Domestic Violence Programs N/A 49 49SOUTH SERVICE PLANNING AREA 538 225 763
29
1,169
Related Documents


