2019

Welcome message from author
This document is posted to help you gain knowledge. Please leave a comment to let me know what you think about it! Share it to your friends and learn new things together.
Transcript
2019
© Copyright Infopro Digital Services Limited 2018. All Rights Reserved2 | RiskTech100® 2019
Chartis Research is the leading provider of research and analysis on the global market for risk technology. It is part of Infopro Digital, which owns market-leading brands such as Risk and WatersTechnology. Chartis’ goal is to support enterprises as they drive business performance through improved risk management, corporate governance and compliance, and to help clients make informed technology and business decisions by providing in-depth analysis and actionable advice on virtually all aspects of risk technology. Areas of expertise include:
• Credit risk.• Operational risk and governance, risk and
compliance (GRC).• Market risk.• Asset and liability management (ALM) and
liquidity risk.• Energy and commodity trading risk.• Financial crime including trader surveillance, anti-
fraud and anti-money laundering.• Cyber risk management.• Insurance risk.• Regulatory requirements including Basel 2 and
3, Dodd-Frank, MiFID II and Solvency II. Chartis is solely focused on risk and compliance technology, which gives it a significant advantage over generic market analysts.
The firm has brought together a leading team of analysts and advisors from the risk management and financial services industries. This team has hands-on experience of implementing and developing risk management systems and programs for Fortune 500 companies and leading consulting houses.
Visit www.chartis-research.com for more information.
Join our global online community at www.risktech-forum.com.
© Copyright Infopro Digital Services Limited 2018. All Rights Reserved.
No part of this publication may be reproduced, adapted, stored in a retrieval system or transmitted in any form by any means, electronic, mechanical, photocopying, recording or otherwise, without the prior permission of Infopro Digital Services Limited. The facts contained within this report are believed to be correct at the time of publication but cannot be guaranteed.
Please note that the findings, conclusions and recommendations Chartis Research delivers will be based on information gathered in good faith, whose accuracy we cannot guarantee. Chartis Research accepts no liability whatever for actions taken based on any information that may subsequently prove to be incorrect or errors in our analysis. See ‘Terms and conditions’ on www.chartis-research.com.
RiskTech100®, RiskTech Quadrant®, FinTech Quadrant™ and The Risk Enabled Enterprise® are Registered Trade Marks of Infopro Digital Services Limited.
Unauthorized use of Chartis’ name and trademarks is strictly prohibited and subject to legal penalties.
© Copyright Infopro Digital Services Limited 2018. All Rights Reserved3 | RiskTech100® 2019
2019
Table of contents
1. Foreword 5
2. Overview 6
3. Key highlights 8
4. Weathering the STORM 13
5. RiskTech100® 2019 rankings 17
6. Category winners 21
7. Appendix A: Research methodology 24
8. Appendix B: How to read the RiskTech100® rankings 25
9. How to use research and services from Chartis 27
10. Further reading 28
© Copyright Infopro Digital Services Limited 2018. All Rights Reserved4 | RiskTech100® 2019
2019
List of figures and tables
Figure 1: RiskTech100® taxonomy 6
Figure 2: Advanced statistical techniques can be used to solve a range of risk and compliance problems 13
Figure 3: Weathering an accelerating STORM 16
Table 1: RiskTech100® research methodology 24
Table 2: RiskTech100® assessment criteria 25
© Copyright Infopro Digital Services Limited 2018. All Rights Reserved5 | RiskTech100® 2019
2019
1. Foreword
Welcome to RiskTech100® 2019 – the most comprehensive independent study of the world’s major players in risk and compliance technology. Now in its thirteenth year, RiskTech100® is globally
acknowledged as the go-to place for clear, accurate analysis of the risk technology marketplace and the companies doing great things within it.
Risk technology is a diverse, fast-moving space, and to keep pace with the latest trends in the market we are recognizing a record number of firms this year across a wide range of categories. Besides an updated ranking of the top 100 players in the sector for 2019, and our analysis of the major trends that have shaped the market in the past year, this year’s report also recognizes excellence in more than 40 award categories.
I’m also pleased to confirm that we continue our commitment to recognizing innovation from outside the RiskTech100®, with our latest roll-call of RiskTech ‘Rising Stars’. These firms are making their presence felt with innovative technologies and novel approaches to traditional risk methods, and by carving out profitable niches in a highly competitive market.
This is also a market in flux. Innovation abounds, and financial institutions around the world are continuing to transform their patterns of risk technology expenditure and usage. This shift is characterized by a number of key trends – the rapid rise of lighter, cloud-based solutions; the emergence of new and novel approaches; the exploitation and control of data to unlock greater efficiency and performance; and the measured approach we see toward more ‘magical’ technologies, like Artificial Intelligence (AI), which continue to set the tone for RiskTech innovation.
Indeed, the fevered dash for compliance that characterized the post-crisis era has given way to a more cautious enthusiasm, tempered by experience. Firms have a new realism about what technology can achieve, paying more attention to using the right tools for the right use cases on the right platforms. The impact of this ‘post-post-crisis’ wave of transformation is core to much of the work we are doing at Chartis – across our published reports and strategic engagements – to help our clients position themselves for success.
An important area of unrealized value remains AI, which continues to exert a powerful, transformative influence on the industry. Together with the broader set of statistical techniques it belongs to, AI has been a cornerstone of our 2018 research program, cutting across the risk technology landscape and its immediate adjacencies. It’s worth remembering, though, that AI itself – supposedly a novel technology – has many miles on the clock, originating in academic research from the mid-1950s. The AI revolution we are witnessing today is being driven by the confluence of two major factors – the emergence of more powerful computational technologies on affordable platforms, and the willingness of decision makers to invest in AI projects.
On this latter point, it seems to us that too often such decisions are made from a position of relative weakness when it comes to understanding what AI can truly achieve in a business context. The lack of real understanding here is important too, since continuing to invest large sums of money in transformative technologies that are not well understood simply cannot end well.
To address this risk, we have developed a unique taxonomy for Statistical Techniques and Open Risk Management – STORM – to help firms in all areas of financial services assess and make sense of the vast array of statistical methods now on offer. An article later in this report offers a taster of what STORM will bring. I hope you find it thought-provoking, and look forward to the continuing debate with our clients and network on what the AI revolution really means for our industry.
Transformation continues to be a strong theme for our business too, and Chartis has had much to celebrate in 2018. We continue to expand, welcoming Mark Feeley as our new US-based Research Director earlier this year. This key hire was further supported by the addition of several talented new analysts and the appointment of our new Research Principal, Stefan Wagner, to help us deliver a range of projects for our clients. You will also have noticed that Chartis has a new look, another aspect of the ongoing investment we are continuing to make in our business.
We hope you like these changes, and look forward to working with new and existing clients in the year ahead. Enjoy the report!
Rob Stubbs, Head of Research
© Copyright Infopro Digital Services Limited 2018. All Rights Reserved6 | RiskTech100® 2019
2019
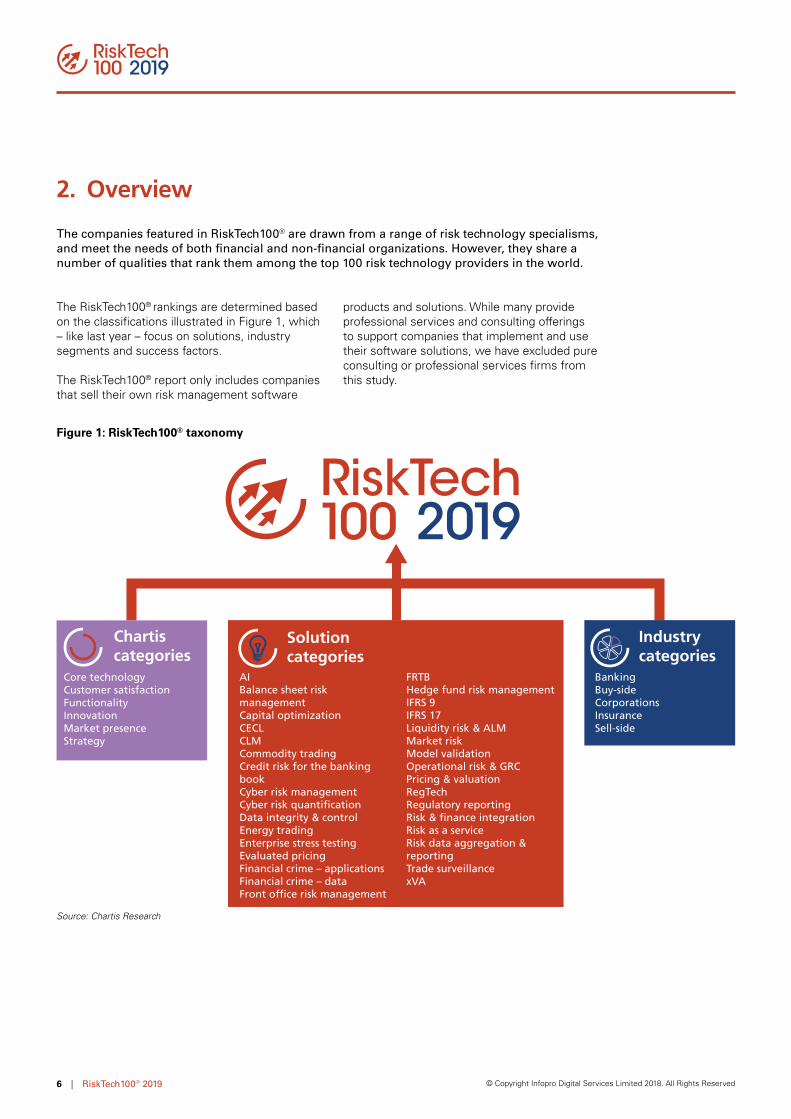
The RiskTech100® rankings are determined based on the classifications illustrated in Figure 1, which – like last year – focus on solutions, industry segments and success factors.
The RiskTech100® report only includes companies that sell their own risk management software
products and solutions. While many provide professional services and consulting offerings to support companies that implement and use their software solutions, we have excluded pure consulting or professional services firms from this study.
Figure 1: RiskTech100® taxonomy
2019
AIBalance sheet risk managementCapital optimizationCECLCLMCommodity tradingCredit risk for the banking bookCyber risk managementCyber risk quantificationData integrity & controlEnergy trading Enterprise stress testingEvaluated pricingFinancial crime – applicationsFinancial crime – dataFront office risk management
FRTBHedge fund risk managementIFRS 9IFRS 17Liquidity risk & ALMMarket riskModel validationOperational risk & GRCPricing & valuationRegTechRegulatory reportingRisk & finance integrationRisk as a serviceRisk data aggregation & reportingTrade surveillancexVA
Solution categories
Core technologyCustomer satisfactionFunctionalityInnovationMarket presenceStrategy
Chartis categories
BankingBuy-sideCorporationsInsuranceSell-side
Industry categories
Source: Chartis Research
2. Overview
The companies featured in RiskTech100® are drawn from a range of risk technology specialisms, and meet the needs of both financial and non-financial organizations. However, they share a number of qualities that rank them among the top 100 risk technology providers in the world.
© Copyright Infopro Digital Services Limited 2018. All Rights Reserved7 | RiskTech100® 2019
2019
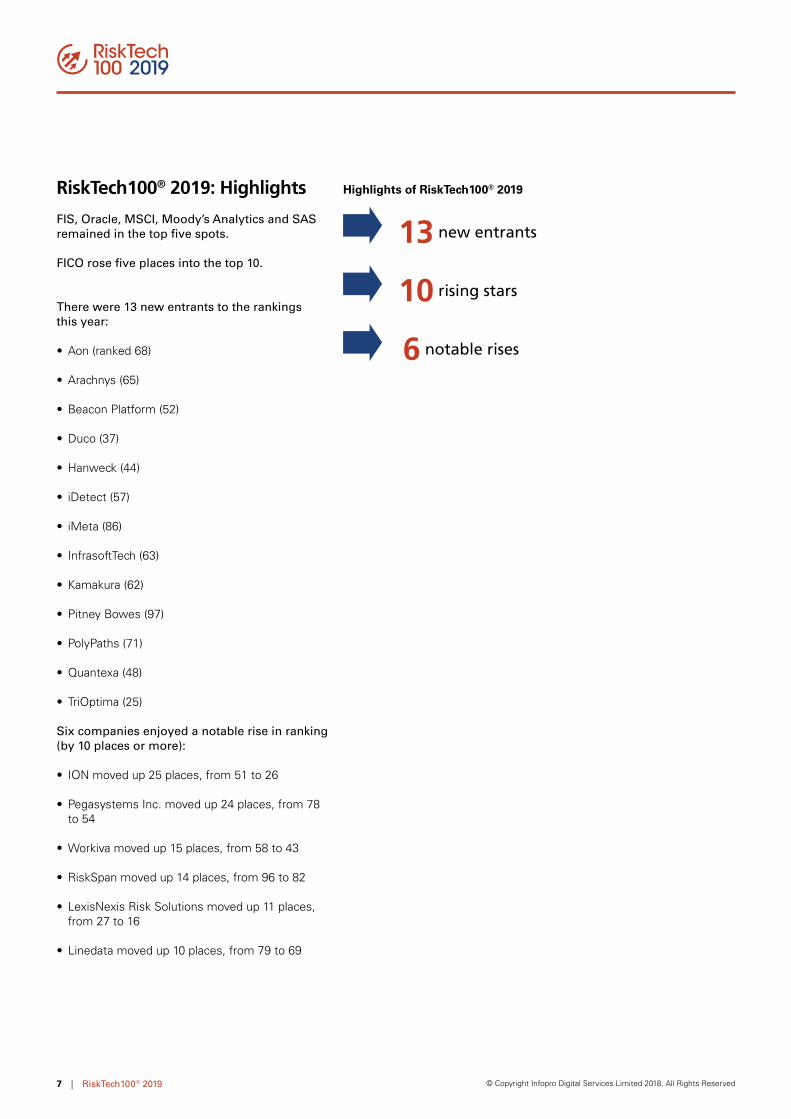
There were 13 new entrants to the rankings this year:
• Aon (ranked 68)
• Arachnys (65)
• Beacon Platform (52)
• Duco (37)
• Hanweck (44)
• iDetect (57)
• iMeta (86)
• InfrasoftTech (63)
• Kamakura (62)
• Pitney Bowes (97)
• PolyPaths (71)
• Quantexa (48)
• TriOptima (25)
Six companies enjoyed a notable rise in ranking (by 10 places or more):
• ION moved up 25 places, from 51 to 26
• Pegasystems Inc. moved up 24 places, from 78 to 54
• Workiva moved up 15 places, from 58 to 43
• RiskSpan moved up 14 places, from 96 to 82
• LexisNexis Risk Solutions moved up 11 places, from 27 to 16
• Linedata moved up 10 places, from 79 to 69
RiskTech100® 2019: Highlights
FIS, Oracle, MSCI, Moody’s Analytics and SAS remained in the top five spots.
FICO rose five places into the top 10.
Highlights of RiskTech100® 2019
➡ 13 new entrants
➡ 10 rising stars
➡ 6 notable rises
© Copyright Infopro Digital Services Limited 2018. All Rights Reserved8 | RiskTech100® 2019
2019
This section contains highlights of our 2018 research program, grouped according to four broad categories: technology (AI to xVA); financial crime (enterprise fraud, Know Your Customer); financial risk (balance sheet management to risk as a service); and market structure and regulation (derivatives market structure, GDPR).
For details of the full Chartis research scope and agenda, visit www.chartis-research.com.
AI in financial services
One ‘cog’ among many
The way that most people think of AI is wrong. While AI is certainly powerful, it is not an ‘overseer’– a method for solving complex multi-factor problems – but a ‘servant’: a cog in an often much larger analytical machine. So far, the most successful financial use cases for AI have been in retail banking, although compelling applications are now established in the areas of so-called ‘alternative’ data and data quality.
We believe that Financial Institutions (FIs) must consider five crucial elements when developing an effective AI process from end to end: data quality, transparency, clear responsibility, adequate hardware and software and AI specialists. Many FIs will use AI to add value across many small, predictive processes, rather than as an overarching decision-making machine. And while AI will continue to expand the assortment of possible ‘cogs’ FIs can use, it will not necessarily outperform the cogs they already have in their decision-making processes.
Longer term, the use of AI will be focused on data analytics, data cleansing, and data transformation and modification. And because the most effective use of AI is currently in transforming data from an unstructured to a structured form, plenty of development opportunities can still be explored.
Cryptocurrencies
Risks and opportunities in a fog of confusion
Cryptocurrencies have become a ubiquitous part of the debate happening between investors, regulators and FIs, not least because they introduce a host of new challenges. Their rapid
surge in popularity, together with the shifting technical landscape on which they operate, is creating confusion on multiple levels.
Within the fog of confusion swirling around these basic issues, however, Chartis sees solid risks and opportunities emerging. The risks fall across a broad spectrum, bounded on one side by inherent risks, and on the other by universal risks.
The opportunities on offer vary in importance for vendors and FIs. For vendors, there could be a strong upside to adapting existing solutions and expertise to the new market opportunities cryptocurrencies create. The opportunities facing FIs are less clear-cut. The technology offers them a more intangible benefit: a new decentralized paradigm through which to view their existing systems, and a vibrant testbed for broader distributed ledger implementations.
Against this backdrop one thing is absolutely certain: the cryptocurrency landscape is changing with extraordinary speed. As it changes, vendors and FIs must remain aware of its certainties to exploit its opportunities, while resisting the urge to succumb to the hype.
Data integrity and control
Searching for meaning in a fragmented market
Focusing on Data Integrity and Control (DI&C) solutions is now essential for FIs. As the DI&C environment continues to evolve rapidly, those FIs exhibiting best practice will adopt a holistic approach to DI&C. Meanwhile, ontology tools have emerged as a central feature of successful DI&C, to give data its all-important meaning.
FIs must also invest in the latest, most effective technologies for automation – specifically AI and Machine Learning (ML). But very few FIs are operating at this level of DI&C today, and a fragmented solutions market has grown up around them. Some vendors adopt a ‘mix and match’ approach to their solutions, while others focus on a specific aspect of the DI&C cycle.
Nevertheless, vendors have started to merge their DI&C criteria and chase opportunities in a common solutions space. The result is that many vendors rely on the varied and fragmented nature of the
3. Key highlights
© Copyright Infopro Digital Services Limited 2018. All Rights Reserved9 | RiskTech100® 2019
2019
market – and FIs’ patchwork approach – to provide full solutions. But to tap the growing opportunity in this evolving market, both types of firms (FIs and vendors) will have to start thinking more holistically.
Open source in capital markets
Understand and engage to succeed
The cost savings, flexibility and scalability offered by open-source technologies make them attractive to FIs looking for powerful, customizable risk solutions. In some areas of financial services, open source is already proving disruptive. This is especially true in the capital markets space. There, open source’s accessibility and flexibility enable FIs to ensure consistent platform standards across the organization, while at the same time enabling them to customize solutions to their very specific needs.
But many capital markets FIs – and vendors – still struggle to get it right. Suitably skilled staff are hard to find, while open source vendors themselves may also present a very different, and potentially unsetlling, proposition for FIs. There is also a danger that open-source solutions themselves may be applied in the wrong way or used to address unsuitable problems.
For any FI serious about using open-source systems, understanding and engagement are crucial. FIs should consider several factors when implementing open-source projects: culture, skills, licensing and integration, and avoid jumping on any bandwagons. Vendors, with their own challenges to address, should continue to focus on scalable databases and analytics engines to provide a strong alternative to commercial providers.
xVA
Powerful, multifaceted … and continuously evolving
xVA – the term used to describe the family of value adjustments now vital in derivatives pricing – enables FIs to allocate specific costs to trades and positions with considerable accuracy. It has proved so successful that xVA desks are now a necessity in almost all trading institutions.
But to handle the volume of calculations and data xVA requires, FIs need computational muscle that meets specific technology and system requirements. Consequently, xVA-related technology has shifted toward more powerful
hardware and software and, increasingly, innovative analytical methods.
xVA continues to develop: a fluid evolution that includes changes in the structure of the xVA/sales desk, the divergence between accounting and regulatory standards, and standardization – all of which will affect how FIs and vendors approach xVA.
Financial crime risk management systems
Enterprise fraud
Diversity the watchword as the vendor market splits
Several key trends have shaped this market. FIs have struggled to integrate their various Financial Crime Risk Management (FCRM) systems, and while other areas of fraud have remained fairly static, the payments landscape is evolving quickly, creating new challenges. Meanwhile, banks are becoming more ‘open’, using APIs and hosted services to reach and manage their customers in new ways, and creating specific ‘technological niches’ and new potential hiding places for fraudsters. Finally, new financial providers are emerging, adding another layer of complexity.
As the anti-fraud market expands it is becoming more diverse, leading to a split in the vendor landscape. Incumbent vendors remain difficult to dislodge, while the faster-moving, more flexible payments market is attracting new entrants in areas such as payment fraud, advanced analytics and infrastructure.
Whatever section of the market they cater to, vendors must increasingly be able to integrate their solutions quickly and efficiently with FIs’ systems, and/or provide their own advanced technologies to process risks in real time. Success will be at least partially dictated by geography, with rapidly growing banking and (and therefore FCRM) markets – such as India – offering fertile ground for all vendor types to make their mark.
Know Your Customer
Coping with complexity, with technology and services
For FIs, the Know Your Customer (KYC) process is increasingly complicated, involving a vast, and
© Copyright Infopro Digital Services Limited 2018. All Rights Reserved10 | RiskTech100® 2019
2019
growing, array of data sources. With massive datasets to sift through, the numbers of KYC staff FIs employ have risen rapidly. FIs are now re-examining how vendors can help them cut costs and improve their operational efficiency. Vendors are responding primarily with technical solutions augmented by large service components. With this technology/services blend, vendors have focused less on replacing staff outright than on assisting FIs’ KYC employees by reducing menial tasks.
Vendor innovation is being driven by four key technologies and service models that can apply in different areas of the KYC process: workflow automation, profile enrichment, consortia and data sharing, and entity resolution and graph analytics. In a highly differentiated landscape, vendors generally fall into one of several categories, including data providers, entity resolution specialists and packaged KYC providers.
Faced with a complex market, FIs must carefully consider the nuances of their KYC requirements and the offerings available. KYC vendors, meanwhile, should aim to develop services partnerships, improve systems integration and deepen their services offerings.
Balance sheet management solutions
Understanding the threats
Following a rapid evolution, Balance Sheet Management (BSM) is now a much more complex, holistic set of processes. For the last decade, the focus of FIs – especially banks – has been on improving how they manage risk, and on establishing stress-testing regimes that embrace the regulators’ scenarios and take into account the idiosyncratic nature of banks’ balance sheets and business profiles.
This challenge is amplified by two interconnected and embedded risks in banks’ balance sheets: the behavior of those holding assets and liabilities, and the optionality given to customers in ‘business as usual’ conditions and various situations of market stress.
For many banks, however, the threats these risks pose may not be completely clear. Technology vendors are well placed to influence how banks respond to these challenges, if they can identify a clear underlying set of capabilities in BSM –
the ‘BSM value chain’ – and the mathematical processes underpinning it.
By understanding the intricacies of the value chain, banks and vendors can communicate clearly with each other, aiding the successful development of new BSM solutions. Pressure will mount for new solutions to tackle the vagaries of the balance sheet, and this will become a vital area of differentiation for vendors in future.
CECL technology solutions
A shifting and challenging marketplace
Much like other regulations and standards, the Current Expected Credit Loss (CECL) standard is a catalyst for revolutionary change in the methodologies, business processes and IT/data infrastructure FIs employ to handle market and credit risk. Dealing with its impacts will require a strong database structure, the right modeling methodology, and an approach that incorporates elements of the systems FIs will have to use for other industry regulations and requirements.
FIs’ progress toward implementation has been patchy, but in some important respects CECL is a vendor issue shaped by the preference for outsourcing in the US, where CECL comes into force. How far providers differentiate themselves in future will depend to a large extent on how closely they match the ‘ideal’ CECL offering. This flexible solution combines support for core business operations with process improvements in the key areas of hedge accounting, classification and measurement and impairment.
Meanwhile, vendors without a Software as a Service (SaaS) or data focus will struggle. This is a shifting market landscape, however, with a great many challenges, and monitoring its development in the coming years will be vital.
Technology solutions for Credit Risk 2.0
Coping with a new revolution
A new digital revolution – ‘Credit Risk 2.0’ – is reshaping the credit landscape, defined by three dynamics:
• The emergence of new ‘risk-aware’ accounting standards.
© Copyright Infopro Digital Services Limited 2018. All Rights Reserved11 | RiskTech100® 2019
2019
• A new focus from regulators on market-linked contingent credit in the trading book.
• New computational approaches to assessing credit and credit risk.
Credit Risk 2.0 can be seen most dramatically in the banking book, where the methodologies and technology underpinning models are undergoing a profound structural revolution.
Credit risk exists within an operational and analytical ‘value chain’, and credit analytics exist as part of a broader process. To cope in the new revolution, FIs need a new methodological and technical structure for their credit risk processes, one that can account systematically for the many idiosyncratic properties of banking book products.
Front office risk management technology
Emerging from a tangle of systems
Over the years, Front Office Risk Management (FORM) has evolved into a tangle of risk components and systems embedded within trading systems and transaction processing platforms. But the nature of FORM since the global financial crisis of 2008 has fundamentally changed, and banks’ inefficient operating models are no longer sustainable. Banks can no longer put off upgrades to systems that were built for a different era, and consensus around the need for a flexible, cross-asset, externalized front-office risk system has developed.
FORM systems are emerging as a fully fledged risk solution category, but many leading vendors have been slow to adapt to the competitive challenges from new market entrants and even banks. Vendors have many different strategies in evidence, but the evolution required for them to survive and flourish has only just begun.
Hedge fund risk management technology
An ecosystem of opportunity
Hedge funds make attractive clients for tech vendors: Chartis estimates their annual spend on risk, analytics and trading technology to be around $9bn. But this is a diverse and changing landscape,
and selling to hedge funds – especially large ones that prefer in-house solutions – is hard. Thanks in part to a predilection for outsourcing, a thriving ecosystem of technology, software and service providers has grown up around hedge funds.
For newer vendors, targeting this ecosystem offers a sizeable opportunity. Ecosystem organizations are likely to be more receptive to software than most hedge funds, and offer a wider group of potential clients that may be a better match for vendors’ business. Indeed, collaborations and partnerships are increasingly common as providers of all types work to create new openings and opportunities in this singular market.
Risk as a service
History and heritage are the keys
Risk as a Service (RaaS) has become a relatively established and routine way to deliver risk management solutions to buy-side firms. The RaaS market is now very complex, with a plethora of entities and multifaceted relationships based on the supply and use of software and connectivity rather than on purely commercial connections.
RaaS is all about history – the key ingredient to success is making better use of what already exists. For vendors this dynamic is important, and for some it is a source of great advantage.
Successful RaaS providers tend to have firm roots in specific market segments, with existing pipes, infrastructure and strategies. The key for newer and/or smaller vendors is to focus on crucial niches where their capabilities and functionality are market-leading, and/or where they have very strong intellectual property.
Chartis believes that buy-side firms prefer to acquire tools from vendors with one or all of the following: pre-existing pipes/connections/networks, a strong intellectual and cultural heritage, and packaged data and analytics. Ultimately, these could be crucial deciding factors in who succeeds with RaaS, and who does not.
Derivatives market structure
Technology – part of the problem, and the solution
Derivatives have a unique relationship to risk. Since the financial crash of 2008 regulators have focused
© Copyright Infopro Digital Services Limited 2018. All Rights Reserved12 | RiskTech100® 2019
2019
on restructuring the derivatives market to make it less risky, but the fundamental nature and function of derivatives hasn’t changed – instead the regulators have made derivatives more expensive and harder to use. Meanwhile, FIs still want to make money, and will always seek to develop new ways of doing so.
While the latest technology innovations are proving a boon to FIs, they have also helped to preserve the underlying structure of the derivatives market itself, distracting attention away from the need to address long-standing systemic risks. To mitigate the risks and avoid a repeat of past crashes, the key will be to match technology with technology: in an ideal world, technology could be used to realign the derivatives market’s relationship with risk, so that the system remains stable while allowing institutions to make money.
Vendors have an important role to play, developing compatible systems and tools for institutions and regulators that could help to stabilize the market. For their part, regulators also need to rethink their role in the scenario, and address this challenge head on. In short, by collaborating, vendors, regulators and other interested parties can use technology to drive much needed stability back into the global derivatives market.
GDPR
Illuminating hidden relationships
The European Union’s General Data Protection Regulation (GDPR) signals a new wave of data protection and the end of an era of unfettered data sharing. Wide-ranging and powerful, it requires firms to know where their customers’ data is at all times, and mandates hefty fines (up to 4% of annual revenue) for breaches. Financial services is a diverse ecosystem, and institutions managing large amounts of consumer data are very exposed.
GDPR also throws light on previously unexplored relationships, such as those between retail banks and credit card outsourcing companies, and it involves several challenging governance requirements. How FIs address these will depend on the complexity and size of their organizations, and the responsibilities and workload of their existing compliance teams.
Ultimately, although complying with GDPR requirements is likely to be fraught with cost and complexity, it represents a ‘new normal’. For FIs, GDPR compliance – while onerous – can prove
valuable, helping them prepare for other data legislation that will inevitably follow.
RiskTech vendors
Mergers, acquisitions and partnerships continue apace among vendors in the risk and compliance technology market. These deals range from large to small; some focus on filling product and technology gaps, while others are driven by the need to defend market share and acquire new clients. Below is a representative list (selected by Chartis) of deals announced in the past 12 months:
• Accuity acquired Safe Banking Systems, a provider of KYC and Anti-Money Laundering (AML) solutions.
• Blackstone acquired Thomson Reuters’ Financial and Risk business, renaming it Refinitiv.
• Broadridge acquired FundAssist, a provider of capabilities including portfolio composition and management and regulatory and disclosure documentation.
• Broadridge acquired MackayWilliams, a specialist European fund market analysis and research firm.
• IBM acquired Armanta, an analytics and aggregation software provider.
• ION Investment Group acquired Openlink, a supplier of trading and risk management solutions.
• LexisNexis Risk Solutions’ parent company, RELX Group, acquired ThreatMetrix, a supplier of fraud and identity risk management solutions.
• Oracle acquired DataScience.com, a provider of data science tools and workspaces.
• SS&C acquired Modestspark, a provider of digital services for financial advisors and wealth management firms.
• Vermeg acquired Lombard Risk, a provider of regulatory reporting and collateral management solutions.
Chartis Research’s Quarterly Market Intelligence updates provide more detail on the main RiskTech market and vendor trends throughout the year.
© Copyright Infopro Digital Services Limited 2018. All Rights Reserved13 | RiskTech100® 2019
2019
A torrent of technologies
Statistical techniques1 and models are well established in the finance sector today, cutting across every process and category in the industry. Even the simple act of reading a balance sheet can now be driven by a statistical process. Thanks to developments in AI technology, a whole range of new and evolving statistical techniques are also being introduced to the sector.
The tools and processes described as Artificial Intelligence (AI), in fact, make up only a small fraction of the broad statistical sweep engulfing the finance industry. These advanced statistical frameworks are enabled by new technologies such as domain-specific languages, highly scalable databases, cloud-native applications and hardware-driven analytics, and encompass a vast array of possible tools and techniques, including graph analytics, statistical segmentation and Machine Learning (ML).
The growth in new statistical techniques in the last few years has increased the complexity in FIs’ systems and processes, and made it harder for them to fully appreciate or even understand what tool should go where. Battered by hype and in fear of being left behind, many FIs may have adopted these tools without a clear idea of what they do. They may even have adopted some techniques without even realizing it.
Exacerbating the issue, risk management is increasingly becoming a core part of processes across the finance organization, enabled in part by this new technology revolution. Having escaped its natural home within the confines of enterprise risk, risk management is now embedding itself in areas as diverse as trading, market data, AML 1 By ‘statistical techniques’ we mean quantitative, mathematically driven computational tools and processes.
and compliance systems (see Figure 2). As risk management – and in particular risk analytics – become more distributed, FIs now have to know exactly where everything should go to get the best results from their risk management systems.
Together, these trends are creating what Chartis has identified as STORM: Statistical Techniques and Open Risk Management – a growing disturbance that affects FIs and the tech vendors that supply them.
4. Weathering the STORM
Coping with the deluge of AI in financial risk management
Statistical techniques – like Artificial Intelligence – are everywhere in the finance industry, helping to free up risk management across financial organizations. But the sheer volume, diversity and complexity of these techniques make costly misunderstandings and misapplications more likely for technology users and vendors. Chartis identifies this problem as the growing ‘STORM’ that threatens to engulf many organizations that aren’t properly prepared. By diagnosing, defining and demystifying the problem – as Statistical Techniques and Open Risk Management – Chartis also offers practical advice for firms everywhere, helping them make sense of statistical methods and their implications.
This article is a precursor to a full report on STORM, which will be published in 2019.
Figure 2: Advanced statistical techniques can be used to solve a range of risk and compliance problems
Problem category EP GA ML NLP RPA RCA SDA
Regulatory compliance ✓ ✓ ✓ ✓ ✓
Fraud analytics ✓ ✓ ✓ ✓
Credit analytics ✓ ✓
Cybersecurity ✓ ✓
Data quality ✓ ✓
T&Cs extraction ✓ ✓
Equity strategy analysis ✓ ✓ ✓
Customer engagement/conduct risk ✓ ✓
KYC ✓ ✓ ✓ ✓ ✓
AML/Patriot Act ✓ ✓ ✓ ✓ ✓
Trade surveillance ✓ ✓ ✓ ✓ ✓
EP Evolutionary Programming NLP Natural Language ProcessingRCA Rules Compression Analytics GA Graph AlgorithmsRE Rules Extraction SDA Statistical Data AggregationML Machine Learning RPA Robotic Process AutomationSource: Chartis Research
© Copyright Infopro Digital Services Limited 2018. All Rights Reserved14 | RiskTech100® 2019
2019
The wider implications of STORM: a change in climate
Given the ubiquity of statistical tools, FIs and technology vendors might have less to fear from STORM than firms in other, less quantitatively focused industries. After all, mathematical models are FIs’ lifeblood; many have already developed elaborate frameworks for model risk management, back-testing and other ‘quant checks’; while detailed mechanisms for analytical explanations are heavily used in banks and other FIs (for performance attribution, for example, and P&L explain).
But Chartis believes that the misuse and misapplication of statistical techniques can create considerable collateral damage. This could include a glut of false positives, breaches of regulations because data has been misused, or misaligned and maladjusted trading strategies based on opaque statistical mechanisms. Different statistical techniques can have very different underlying mechanics, and each presents its own risks and challenges. What’s more, there is no standard back-testing for new analytics, and a host of myths and miscommunication around AI itself threaten to confuse things further.
Terminological inexactitude
In areas where statistical techniques have been used heavily in the past – such as asset management, trading and wholesale markets – techniques have started to converge in complicated ways. As this happens, FIs and vendors must understand exactly how they overlap. Derivatives pricing models, for example, are generally built on Partial Differential Equation (PDE)-based techniques, but are hugely different from traditional models used in portfolio management, which in turn differ greatly from models used in low-latency algorithmic trading.
Unfortunately, the terminology used to define and describe statistical techniques can differ across the financial sector: different terms may mean different things to different institutions. The term ‘performance analytics’, for example, may mean something different to sell-side firms than it does to those on the buy-side, or to low-latency traders. These differences can have practical consequences. The data infrastructure for performance analytics for traditional asset managers, for example, is considerably different from that used by sell-side firms or low-latency traders.
Ensuring consistency and accuracy of description and understanding – knowing exactly what these techniques are, and where and how they can be used – is fundamental to a successful ‘statistical strategy’. Banks are hugely dependent on analytics; however, the issue is not the complexity of their analytical models, but the sheer diversity. Switching from one framework to another is not a trivial exercise. But with a well-defined taxonomy of the analytical landscape, FIs should find it easier to control their analytics environment.
A lack of standards
Testing and validating statistical models, and ensuring that they are appropriate for a particular task, is a challenge. While the processes themselves become more complex, however, standards are few and far between, and FIs have to make important decisions about what to test. And in the new hyper-statistical environment, considerations about the statistical models FIs employ, and the consequences of doing so, take on a great deal more resonance, with a host of new considerations – none of which is trivial. Model validation, for example, is a relatively mature field only in specific vertical sectors such as Over the Counter (OTC) derivatives. For AI or new techniques in ‘alternative data’, by contrast, model validation is far from standard or mature.
Stepping outside the comfort zone
The increasing convergence of statistical techniques is also forcing users to address techniques that sit squarely outside their comfort zone. Derivatives models, for example, are mature and well understood, but there is no comparable understanding in many other areas where statistical processes are rapidly encroaching.
Even for experienced firms – both FIs and vendors – this can present a challenge. The growing number and diversity of statistical domains means that expertise in one will not necessarily translate into expertise in another. And the newest statistical techniques tend to be relatively opaque, further confusing matters, particularly in decision-making processes.
Implications for FIs: optimizing technology and people
In attempting to weather STORM, FIs will have to confront two big issues:
© Copyright Infopro Digital Services Limited 2018. All Rights Reserved15 | RiskTech100® 2019
2019
Ensuring they optimize their technology. Making decisions around statistical techniques is a challenge, with huge consequences for an FI’s technology infrastructure. Our research shows that FIs have a tendency to ‘mash up’ statistical techniques and environments that are very different from one another. With an unclear view of the taxonomy of their processes, and a hazy idea of how to control them, FIs could risk making the wrong decisions at a crucial time in their technological development. Not fully appreciating the diversity and complexity of these techniques could also leave FIs considerably out of pocket, if they select a misaligned technology process or supporting infrastructure.
Ensuring they make best use of their employees. Data scientists and developers that are familiar with one particular modeling approach may struggle to move to a new one, with a knock-on effect in terms of the efficiency of the process and the time taken to rectify the problem. Employees may even refuse to switch unless the techniques have been appropriately mapped beforehand.
Implications for vendors: strategies and frameworks
Technology vendors have some serious considerations too. To weather STORM they will have to develop strategies that address broad and complex variables. Migrating from their current environment to a new one with different statistical nuances is a big and potentially costly step, with important questions to be answered. How far into another area is it wise to go? And are there any challenges to face on the journey?
So far there is also very little in the way of a robust theoretical framework around these new techniques and models that vendors can rely on. Regulation can’t force their hand, either: there has been very little AI-related regulation to date – nor, we believe, is there likely to be any for some time. As more techniques and models interact, vendors may have to ask themselves what the right approach is for them, with the possibility of serious structural change to their organizations.
How can Chartis help?
To begin with, we have identified the problem. And in doing so we have been able to categorize it and break it down, and then develop a series of best
practices for weathering STORM. We have created a taxonomy that pulls together the different statistical techniques currently available, to help FIs make the right choices from among the systems, services and tools they have available to them, and to help them avoid potentially costly mistakes.
We can also help FIs understand why they might need different tools, databases or fundamental calculation mechanisms. Our method is designed to tease out these crucial differences and provide FIs with a map for their statistical methods. This could show how new techniques coming into the organization differ from those that are already there, as well as how they are best applied and where applying them will only create more problems.
As more options become available, the more they converge, and the more complex the situation becomes. The ‘optimal’ environment in which to run statistical processes is changing. The underlying technology options have increased, throwing up new and different choices in statistical environments. With Chartis’ help FIs can decide
A technical aside: similar on the surface, different underneath
On the face of it, Interest-Rate Derivatives (IRDs) and Residential Mortgage-Backed Securities (RMBSs) seem very similar. Both appear to deal with similar behavioral and financial factors, and both are exposed to much interest-rate sensitivity. Start looking at their detailed modeling requirements, however, and we start to find some interesting and important differences.
IRDs are modeled principally using PDEs to forecast into the future. IRDs also experience no impact from human behavior – all the players involved in the transaction are assumed to be rational actors, and prices are set entirely by market dynamics. The derivatives framework is driven strongly by PDE-related solutions, and the technology underpinning it depends heavily on efficient techniques for solving PDEs, with operations that involve a large number of individual steps.
RMBSs are dealt with differently. The modeling process is complex and less structured, and cashflow-generation models tend to be more deal-specific. This is because RMBSs tend to have detailed legal and structural definitions that make a big difference to the nature and behavior of these securities, and which define how they will be processed. Each RMBS security is often modeled and validated separately. RMBSs also depend to a large extent on the way that individuals behave – whether or not they take out a second mortgage, for example – which is not easy to model, with many complex variables (someone may choose to sell their house for a variety of reasons). This requires a great deal of statistical modeling that works well only within particular frameworks.
© Copyright Infopro Digital Services Limited 2018. All Rights Reserved16 | RiskTech100® 2019
2019
the right approach for each statistical framework: which should be distributed, for example, and which centralized.
Because Chartis has a neutral view of technologies and vendors across the landscape, we can help market participants get a clearer, more objective view of what’s out there, helping them map out their requirements and optimize their technology choices. We can help with high-level statistical strategies: is merging an industry derivatives framework with an RMBS framework a good idea, for example? Which vendors can help make the right choices? Which are the safest choices, and the riskiest?
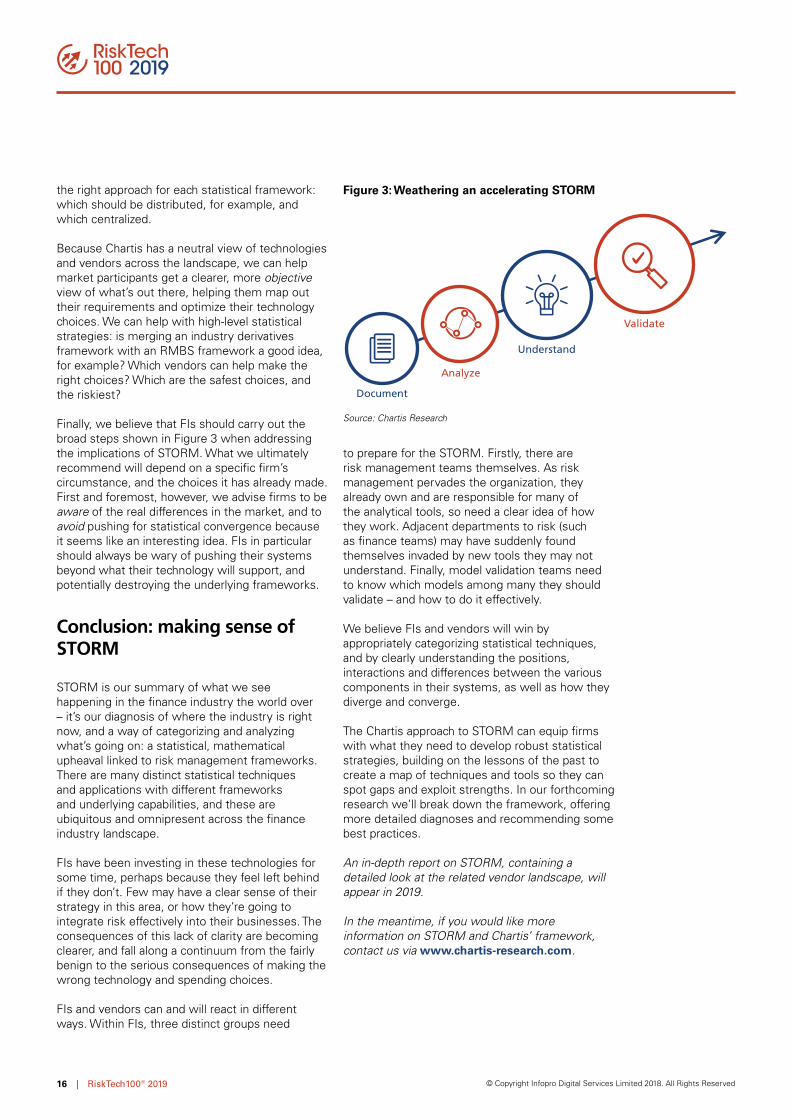
Finally, we believe that FIs should carry out the broad steps shown in Figure 3 when addressing the implications of STORM. What we ultimately recommend will depend on a specific firm’s circumstance, and the choices it has already made. First and foremost, however, we advise firms to be aware of the real differences in the market, and to avoid pushing for statistical convergence because it seems like an interesting idea. FIs in particular should always be wary of pushing their systems beyond what their technology will support, and potentially destroying the underlying frameworks.
Conclusion: making sense of STORM
STORM is our summary of what we see happening in the finance industry the world over – it’s our diagnosis of where the industry is right now, and a way of categorizing and analyzing what’s going on: a statistical, mathematical upheaval linked to risk management frameworks. There are many distinct statistical techniques and applications with different frameworks and underlying capabilities, and these are ubiquitous and omnipresent across the finance industry landscape.
FIs have been investing in these technologies for some time, perhaps because they feel left behind if they don’t. Few may have a clear sense of their strategy in this area, or how they’re going to integrate risk effectively into their businesses. The consequences of this lack of clarity are becoming clearer, and fall along a continuum from the fairly benign to the serious consequences of making the wrong technology and spending choices.
FIs and vendors can and will react in different ways. Within FIs, three distinct groups need
to prepare for the STORM. Firstly, there are risk management teams themselves. As risk management pervades the organization, they already own and are responsible for many of the analytical tools, so need a clear idea of how they work. Adjacent departments to risk (such as finance teams) may have suddenly found themselves invaded by new tools they may not understand. Finally, model validation teams need to know which models among many they should validate – and how to do it effectively.
We believe FIs and vendors will win by appropriately categorizing statistical techniques, and by clearly understanding the positions, interactions and differences between the various components in their systems, as well as how they diverge and converge.
The Chartis approach to STORM can equip firms with what they need to develop robust statistical strategies, building on the lessons of the past to create a map of techniques and tools so they can spot gaps and exploit strengths. In our forthcoming research we’ll break down the framework, offering more detailed diagnoses and recommending some best practices.
An in-depth report on STORM, containing a detailed look at the related vendor landscape, will appear in 2019.
In the meantime, if you would like more information on STORM and Chartis’ framework, contact us via www.chartis-research.com.
Figure 3: Weathering an accelerating STORM
Document
Analyze
Validate
Understand
Source: Chartis Research
© Copyright Infopro Digital Services Limited 2018. All Rights Reserved17 | RiskTech100® 2019
2019
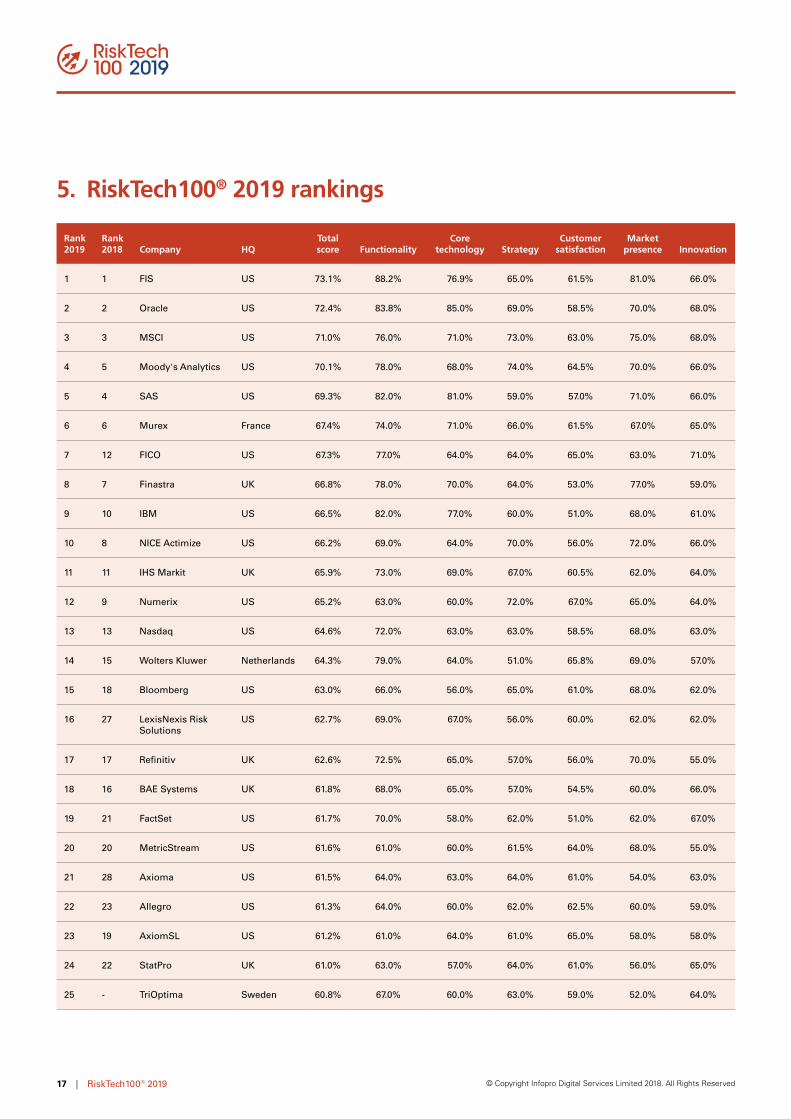
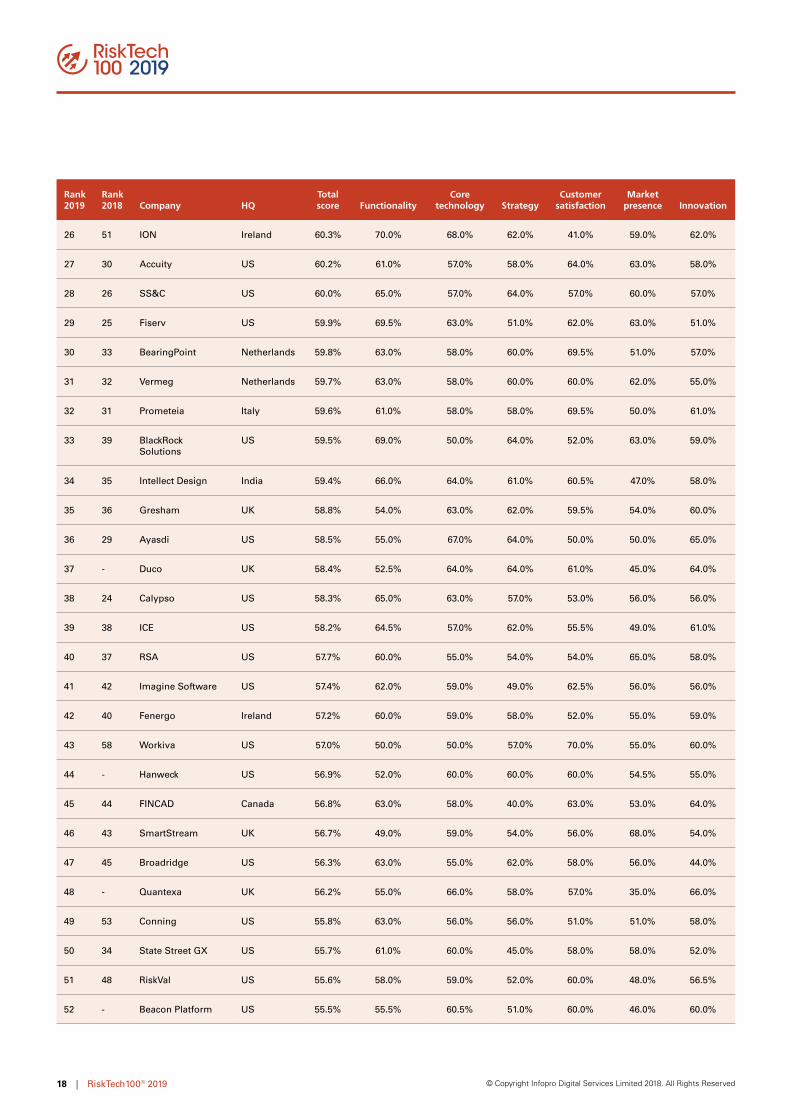
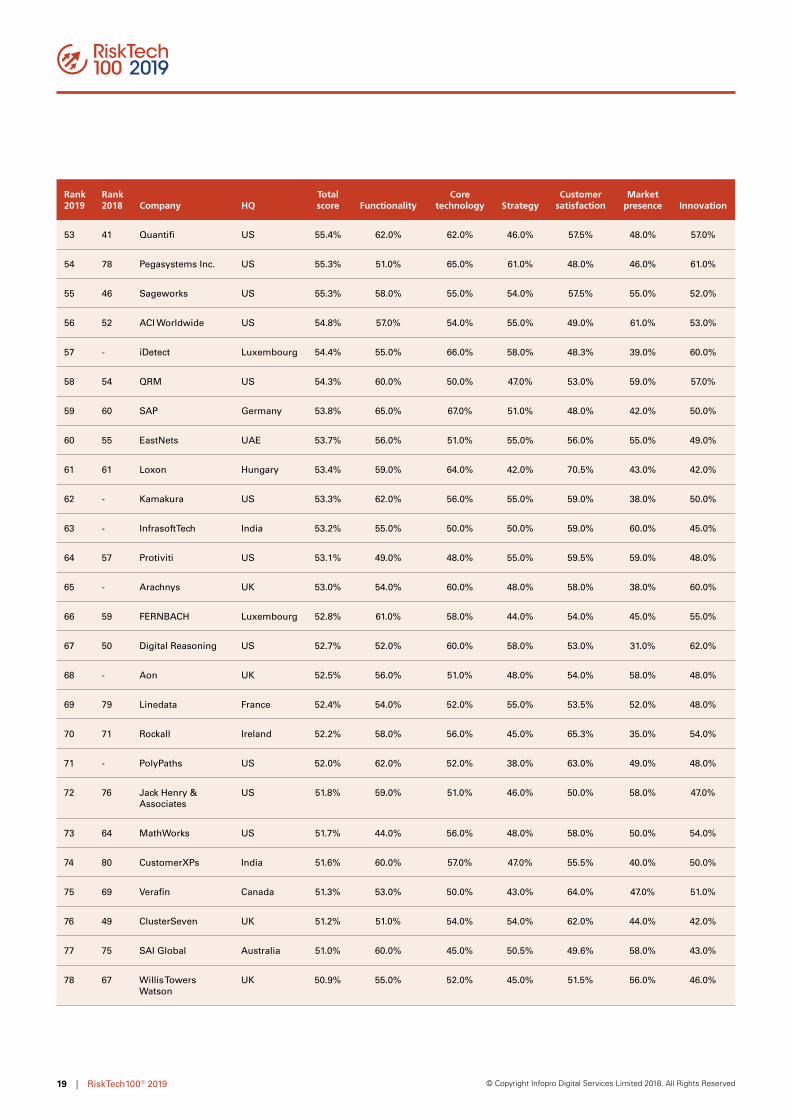
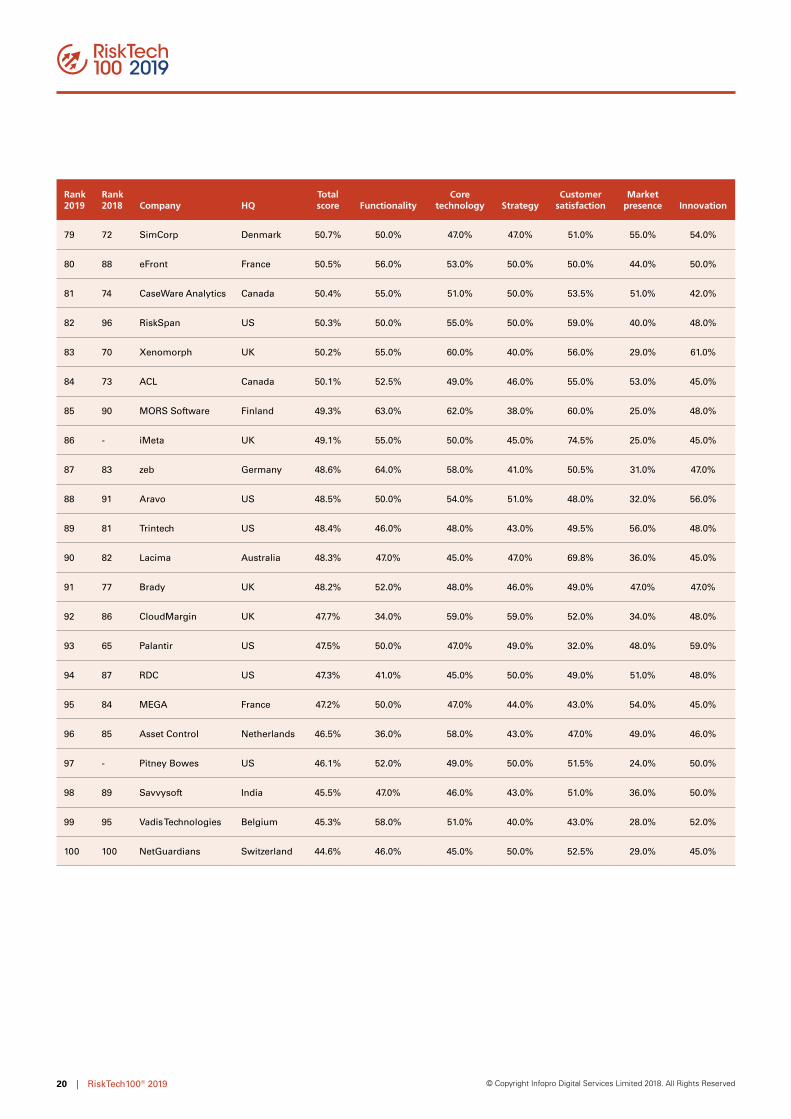
5. RiskTech100® 2019 rankings
Rank 2019
Rank 2018 Company HQ
Total score Functionality
Core technology Strategy
Customer satisfaction
Market presence Innovation
1 1 FIS US 73.1% 88.2% 76.9% 65.0% 61.5% 81.0% 66.0%
2 2 Oracle US 72.4% 83.8% 85.0% 69.0% 58.5% 70.0% 68.0%
3 3 MSCI US 71.0% 76.0% 71.0% 73.0% 63.0% 75.0% 68.0%
4 5 Moody's Analytics US 70.1% 78.0% 68.0% 74.0% 64.5% 70.0% 66.0%
5 4 SAS US 69.3% 82.0% 81.0% 59.0% 57.0% 71.0% 66.0%
6 6 Murex France 67.4% 74.0% 71.0% 66.0% 61.5% 67.0% 65.0%
7 12 FICO US 67.3% 77.0% 64.0% 64.0% 65.0% 63.0% 71.0%
8 7 Finastra UK 66.8% 78.0% 70.0% 64.0% 53.0% 77.0% 59.0%
9 10 IBM US 66.5% 82.0% 77.0% 60.0% 51.0% 68.0% 61.0%
10 8 NICE Actimize US 66.2% 69.0% 64.0% 70.0% 56.0% 72.0% 66.0%
11 11 IHS Markit UK 65.9% 73.0% 69.0% 67.0% 60.5% 62.0% 64.0%
12 9 Numerix US 65.2% 63.0% 60.0% 72.0% 67.0% 65.0% 64.0%
13 13 Nasdaq US 64.6% 72.0% 63.0% 63.0% 58.5% 68.0% 63.0%
14 15 Wolters Kluwer Netherlands 64.3% 79.0% 64.0% 51.0% 65.8% 69.0% 57.0%
15 18 Bloomberg US 63.0% 66.0% 56.0% 65.0% 61.0% 68.0% 62.0%
16 27 LexisNexis Risk Solutions
US 62.7% 69.0% 67.0% 56.0% 60.0% 62.0% 62.0%
17 17 Refinitiv UK 62.6% 72.5% 65.0% 57.0% 56.0% 70.0% 55.0%
18 16 BAE Systems UK 61.8% 68.0% 65.0% 57.0% 54.5% 60.0% 66.0%
19 21 FactSet US 61.7% 70.0% 58.0% 62.0% 51.0% 62.0% 67.0%
20 20 MetricStream US 61.6% 61.0% 60.0% 61.5% 64.0% 68.0% 55.0%
21 28 Axioma US 61.5% 64.0% 63.0% 64.0% 61.0% 54.0% 63.0%
22 23 Allegro US 61.3% 64.0% 60.0% 62.0% 62.5% 60.0% 59.0%
23 19 AxiomSL US 61.2% 61.0% 64.0% 61.0% 65.0% 58.0% 58.0%
24 22 StatPro UK 61.0% 63.0% 57.0% 64.0% 61.0% 56.0% 65.0%
25 - TriOptima Sweden 60.8% 67.0% 60.0% 63.0% 59.0% 52.0% 64.0%
© Copyright Infopro Digital Services Limited 2018. All Rights Reserved18 | RiskTech100® 2019
2019
Rank 2019
Rank 2018 Company HQ
Total score Functionality
Core technology Strategy
Customer satisfaction
Market presence Innovation
26 51 ION Ireland 60.3% 70.0% 68.0% 62.0% 41.0% 59.0% 62.0%
27 30 Accuity US 60.2% 61.0% 57.0% 58.0% 64.0% 63.0% 58.0%
28 26 SS&C US 60.0% 65.0% 57.0% 64.0% 57.0% 60.0% 57.0%
29 25 Fiserv US 59.9% 69.5% 63.0% 51.0% 62.0% 63.0% 51.0%
30 33 BearingPoint Netherlands 59.8% 63.0% 58.0% 60.0% 69.5% 51.0% 57.0%
31 32 Vermeg Netherlands 59.7% 63.0% 58.0% 60.0% 60.0% 62.0% 55.0%
32 31 Prometeia Italy 59.6% 61.0% 58.0% 58.0% 69.5% 50.0% 61.0%
33 39 BlackRock Solutions
US 59.5% 69.0% 50.0% 64.0% 52.0% 63.0% 59.0%
34 35 Intellect Design India 59.4% 66.0% 64.0% 61.0% 60.5% 47.0% 58.0%
35 36 Gresham UK 58.8% 54.0% 63.0% 62.0% 59.5% 54.0% 60.0%
36 29 Ayasdi US 58.5% 55.0% 67.0% 64.0% 50.0% 50.0% 65.0%
37 - Duco UK 58.4% 52.5% 64.0% 64.0% 61.0% 45.0% 64.0%
38 24 Calypso US 58.3% 65.0% 63.0% 57.0% 53.0% 56.0% 56.0%
39 38 ICE US 58.2% 64.5% 57.0% 62.0% 55.5% 49.0% 61.0%
40 37 RSA US 57.7% 60.0% 55.0% 54.0% 54.0% 65.0% 58.0%
41 42 Imagine Software US 57.4% 62.0% 59.0% 49.0% 62.5% 56.0% 56.0%
42 40 Fenergo Ireland 57.2% 60.0% 59.0% 58.0% 52.0% 55.0% 59.0%
43 58 Workiva US 57.0% 50.0% 50.0% 57.0% 70.0% 55.0% 60.0%
44 - Hanweck US 56.9% 52.0% 60.0% 60.0% 60.0% 54.5% 55.0%
45 44 FINCAD Canada 56.8% 63.0% 58.0% 40.0% 63.0% 53.0% 64.0%
46 43 SmartStream UK 56.7% 49.0% 59.0% 54.0% 56.0% 68.0% 54.0%
47 45 Broadridge US 56.3% 63.0% 55.0% 62.0% 58.0% 56.0% 44.0%
48 - Quantexa UK 56.2% 55.0% 66.0% 58.0% 57.0% 35.0% 66.0%
49 53 Conning US 55.8% 63.0% 56.0% 56.0% 51.0% 51.0% 58.0%
50 34 State Street GX US 55.7% 61.0% 60.0% 45.0% 58.0% 58.0% 52.0%
51 48 RiskVal US 55.6% 58.0% 59.0% 52.0% 60.0% 48.0% 56.5%
52 - Beacon Platform US 55.5% 55.5% 60.5% 51.0% 60.0% 46.0% 60.0%
© Copyright Infopro Digital Services Limited 2018. All Rights Reserved19 | RiskTech100® 2019
2019
Rank 2019
Rank 2018 Company HQ
Total score Functionality
Core technology Strategy
Customer satisfaction
Market presence Innovation
53 41 Quantifi US 55.4% 62.0% 62.0% 46.0% 57.5% 48.0% 57.0%
54 78 Pegasystems Inc. US 55.3% 51.0% 65.0% 61.0% 48.0% 46.0% 61.0%
55 46 Sageworks US 55.3% 58.0% 55.0% 54.0% 57.5% 55.0% 52.0%
56 52 ACI Worldwide US 54.8% 57.0% 54.0% 55.0% 49.0% 61.0% 53.0%
57 - iDetect Luxembourg 54.4% 55.0% 66.0% 58.0% 48.3% 39.0% 60.0%
58 54 QRM US 54.3% 60.0% 50.0% 47.0% 53.0% 59.0% 57.0%
59 60 SAP Germany 53.8% 65.0% 67.0% 51.0% 48.0% 42.0% 50.0%
60 55 EastNets UAE 53.7% 56.0% 51.0% 55.0% 56.0% 55.0% 49.0%
61 61 Loxon Hungary 53.4% 59.0% 64.0% 42.0% 70.5% 43.0% 42.0%
62 - Kamakura US 53.3% 62.0% 56.0% 55.0% 59.0% 38.0% 50.0%
63 - InfrasoftTech India 53.2% 55.0% 50.0% 50.0% 59.0% 60.0% 45.0%
64 57 Protiviti US 53.1% 49.0% 48.0% 55.0% 59.5% 59.0% 48.0%
65 - Arachnys UK 53.0% 54.0% 60.0% 48.0% 58.0% 38.0% 60.0%
66 59 FERNBACH Luxembourg 52.8% 61.0% 58.0% 44.0% 54.0% 45.0% 55.0%
67 50 Digital Reasoning US 52.7% 52.0% 60.0% 58.0% 53.0% 31.0% 62.0%
68 - Aon UK 52.5% 56.0% 51.0% 48.0% 54.0% 58.0% 48.0%
69 79 Linedata France 52.4% 54.0% 52.0% 55.0% 53.5% 52.0% 48.0%
70 71 Rockall Ireland 52.2% 58.0% 56.0% 45.0% 65.3% 35.0% 54.0%
71 - PolyPaths US 52.0% 62.0% 52.0% 38.0% 63.0% 49.0% 48.0%
72 76 Jack Henry & Associates
US 51.8% 59.0% 51.0% 46.0% 50.0% 58.0% 47.0%
73 64 MathWorks US 51.7% 44.0% 56.0% 48.0% 58.0% 50.0% 54.0%
74 80 CustomerXPs India 51.6% 60.0% 57.0% 47.0% 55.5% 40.0% 50.0%
75 69 Verafin Canada 51.3% 53.0% 50.0% 43.0% 64.0% 47.0% 51.0%
76 49 ClusterSeven UK 51.2% 51.0% 54.0% 54.0% 62.0% 44.0% 42.0%
77 75 SAI Global Australia 51.0% 60.0% 45.0% 50.5% 49.6% 58.0% 43.0%
78 67 Willis Towers Watson
UK 50.9% 55.0% 52.0% 45.0% 51.5% 56.0% 46.0%
© Copyright Infopro Digital Services Limited 2018. All Rights Reserved20 | RiskTech100® 2019
2019
Rank 2019
Rank 2018 Company HQ
Total score Functionality
Core technology Strategy
Customer satisfaction
Market presence Innovation
79 72 SimCorp Denmark 50.7% 50.0% 47.0% 47.0% 51.0% 55.0% 54.0%
80 88 eFront France 50.5% 56.0% 53.0% 50.0% 50.0% 44.0% 50.0%
81 74 CaseWare Analytics Canada 50.4% 55.0% 51.0% 50.0% 53.5% 51.0% 42.0%
82 96 RiskSpan US 50.3% 50.0% 55.0% 50.0% 59.0% 40.0% 48.0%
83 70 Xenomorph UK 50.2% 55.0% 60.0% 40.0% 56.0% 29.0% 61.0%
84 73 ACL Canada 50.1% 52.5% 49.0% 46.0% 55.0% 53.0% 45.0%
85 90 MORS Software Finland 49.3% 63.0% 62.0% 38.0% 60.0% 25.0% 48.0%
86 - iMeta UK 49.1% 55.0% 50.0% 45.0% 74.5% 25.0% 45.0%
87 83 zeb Germany 48.6% 64.0% 58.0% 41.0% 50.5% 31.0% 47.0%
88 91 Aravo US 48.5% 50.0% 54.0% 51.0% 48.0% 32.0% 56.0%
89 81 Trintech US 48.4% 46.0% 48.0% 43.0% 49.5% 56.0% 48.0%
90 82 Lacima Australia 48.3% 47.0% 45.0% 47.0% 69.8% 36.0% 45.0%
91 77 Brady UK 48.2% 52.0% 48.0% 46.0% 49.0% 47.0% 47.0%
92 86 CloudMargin UK 47.7% 34.0% 59.0% 59.0% 52.0% 34.0% 48.0%
93 65 Palantir US 47.5% 50.0% 47.0% 49.0% 32.0% 48.0% 59.0%
94 87 RDC US 47.3% 41.0% 45.0% 50.0% 49.0% 51.0% 48.0%
95 84 MEGA France 47.2% 50.0% 47.0% 44.0% 43.0% 54.0% 45.0%
96 85 Asset Control Netherlands 46.5% 36.0% 58.0% 43.0% 47.0% 49.0% 46.0%
97 - Pitney Bowes US 46.1% 52.0% 49.0% 50.0% 51.5% 24.0% 50.0%
98 89 Savvysoft India 45.5% 47.0% 46.0% 43.0% 51.0% 36.0% 50.0%
99 95 Vadis Technologies Belgium 45.3% 58.0% 51.0% 40.0% 43.0% 28.0% 52.0%
100 100 NetGuardians Switzerland 44.6% 46.0% 45.0% 50.0% 52.5% 29.0% 45.0%
© Copyright Infopro Digital Services Limited 2018. All Rights Reserved21 | RiskTech100® 2019
2019
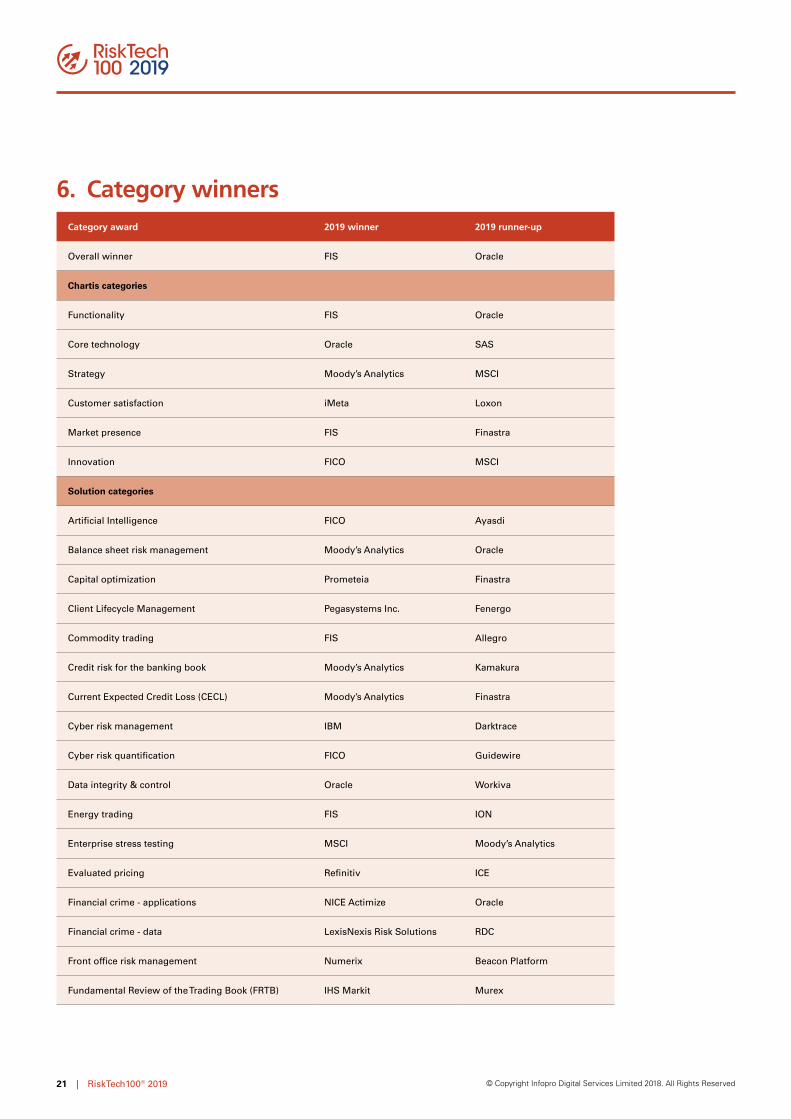
6. Category winnersCategory award 2019 winner 2019 runner-up
Overall winner FIS Oracle
Chartis categories
Functionality FIS Oracle
Core technology Oracle SAS
Strategy Moody’s Analytics MSCI
Customer satisfaction iMeta Loxon
Market presence FIS Finastra
Innovation FICO MSCI
Solution categories
Artificial Intelligence FICO Ayasdi
Balance sheet risk management Moody’s Analytics Oracle
Capital optimization Prometeia Finastra
Client Lifecycle Management Pegasystems Inc. Fenergo
Commodity trading FIS Allegro
Credit risk for the banking book Moody’s Analytics Kamakura
Current Expected Credit Loss (CECL) Moody’s Analytics Finastra
Cyber risk management IBM Darktrace
Cyber risk quantification FICO Guidewire
Data integrity & control Oracle Workiva
Energy trading FIS ION
Enterprise stress testing MSCI Moody’s Analytics
Evaluated pricing Refinitiv ICE
Financial crime - applications NICE Actimize Oracle
Financial crime - data LexisNexis Risk Solutions RDC
Front office risk management Numerix Beacon Platform
Fundamental Review of the Trading Book (FRTB) IHS Markit Murex
© Copyright Infopro Digital Services Limited 2018. All Rights Reserved22 | RiskTech100® 2019
2019
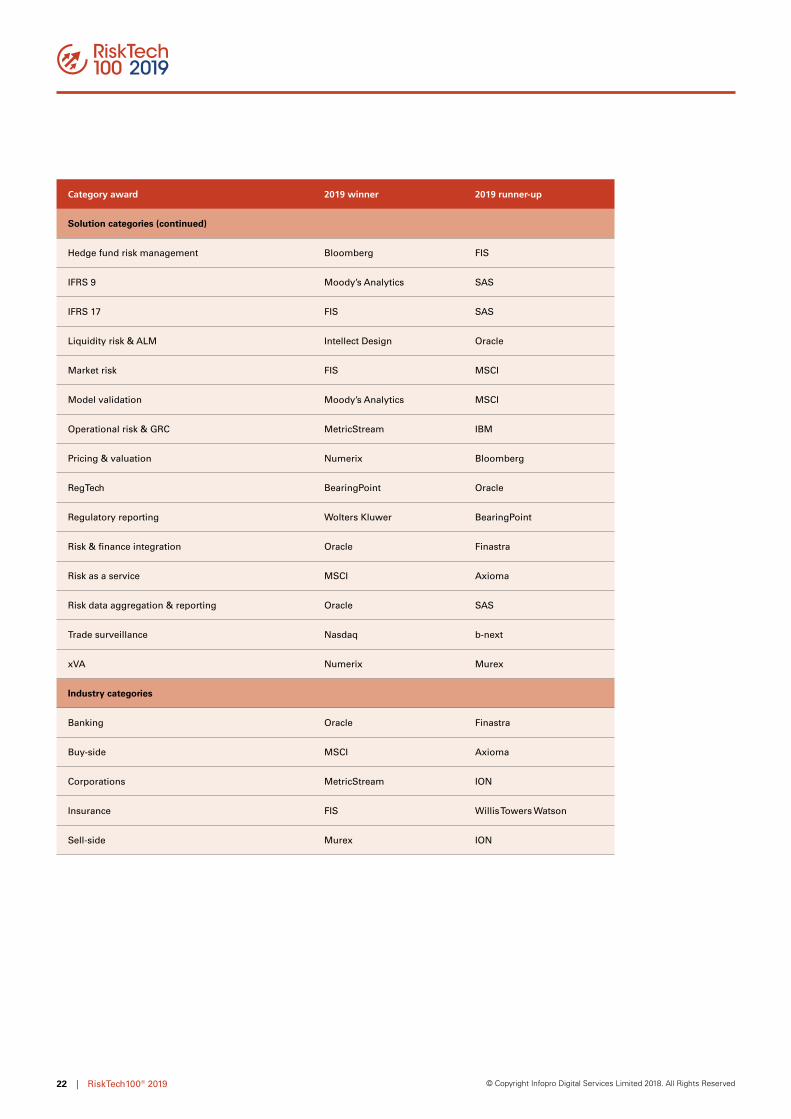
Category award 2019 winner 2019 runner-up
Solution categories (continued)
Hedge fund risk management Bloomberg FIS
IFRS 9 Moody’s Analytics SAS
IFRS 17 FIS SAS
Liquidity risk & ALM Intellect Design Oracle
Market risk FIS MSCI
Model validation Moody’s Analytics MSCI
Operational risk & GRC MetricStream IBM
Pricing & valuation Numerix Bloomberg
RegTech BearingPoint Oracle
Regulatory reporting Wolters Kluwer BearingPoint
Risk & finance integration Oracle Finastra
Risk as a service MSCI Axioma
Risk data aggregation & reporting Oracle SAS
Trade surveillance Nasdaq b-next
xVA Numerix Murex
Industry categories
Banking Oracle Finastra
Buy-side MSCI Axioma
Corporations MetricStream ION
Insurance FIS Willis Towers Watson
Sell-side Murex ION
© Copyright Infopro Digital Services Limited 2018. All Rights Reserved23 | RiskTech100® 2019
2019
RiskTech100® 2019 Rising Stars
This category recognizes a selection of emerging vendors that didn’t make it into the top 100 but, in the opinion of our analysts, are companies to watch.
Many of this year’s winners are using AI and related technologies to push the boundaries of what is possible in risk, creating innovative solutions – especially in the areas of monitoring and defense in FCRM – that take a different approach to traditional and established problems.
★ b-next
b-next’s solution features an innovative blockchain-based monitoring capability. Along with its parent, CME Group, b-next has broad coverage of a range of different trade surveillance styles, an asset that we believe will be integral to trade surveillance solutions in the future.
★ BioCatch
BioCatch’s biometric-based approach to fraud prevention combines continuous monitoring capability, ‘invisible’ checks and entity resolution that departs from traditional password-based systems. That it is already being used in the market highlights how cutting-edge technology can move beyond the merely theoretical to actual deployments.
★ BlackSwan Technologies
A leading company in ‘cognitive technology’, BlackSwan Technologies uses AI in its solution to augment human decision-making. This aligns closely with a trend we are seeing in the risk space, as more and more firms aim to put the right tools in the hands of experts to enhance their insight.
★ Darktrace
In a world where AI-driven attacks are becoming increasingly prevalent, Darktrace is responding with an AI-driven rapid-response solution. It uses ML to enable a ‘self-learning’ approach to cyber defense, with visualization capabilities that allow responders to assess the level of threat in a crisis.
★ ExtraHop
ExtraHop takes a different approach to cyber defense from many other firms, focusing not only on data but also on how and where that data
originated. Deploying ML to examine linkages and patterns across networks and identify threats, it can also decrypt and analyze traffic at speed, and offers tracking and monitoring capabilities.
★ Featurespace
Featurespace’s scalable platform offers an innovative AI-enabled payment fraud management system with a strong focus on ‘adaptive’ behavioural analytics that respond continuously to new customer data.
★ Guidewire
Guidewire’s transaction and processing platform is making headway in the relatively new field of cyber risk and quantification in insurance. Using ML to identify patterns in behavioral data, Guidewire then applies analytics to drive risk-based economic valuations.
★ Julia Computing
Julia Computing was founded by the creators of Julia, an open-source language for Big Data and analytics development. A Rising Star in last year’s RickTech100® report, Julia Computing has continued to develop products to help organizations use and deploy the language.
★ Kinetica
Kinetica’s intriguing approach exploits the massively parallel capabilities of Graphics Processing Units (GPUs) to enable more processing in the database itself. Kinetica is well placed to be a significant player as data continues to expand in every area of risk (such as market risk, credit risk and FCRM).
★ Thesys Technologies
A provider of trading technologies and Big Data solutions to financial organizations, Thesys has transferred its lightweight, high-performance platforms from low-latency areas to general-purpose finance (including trading, market data and risk management).
© Copyright Infopro Digital Services Limited 2018. All Rights Reserved24 | RiskTech100® 2019
2019
7. Appendix A: Research methodology
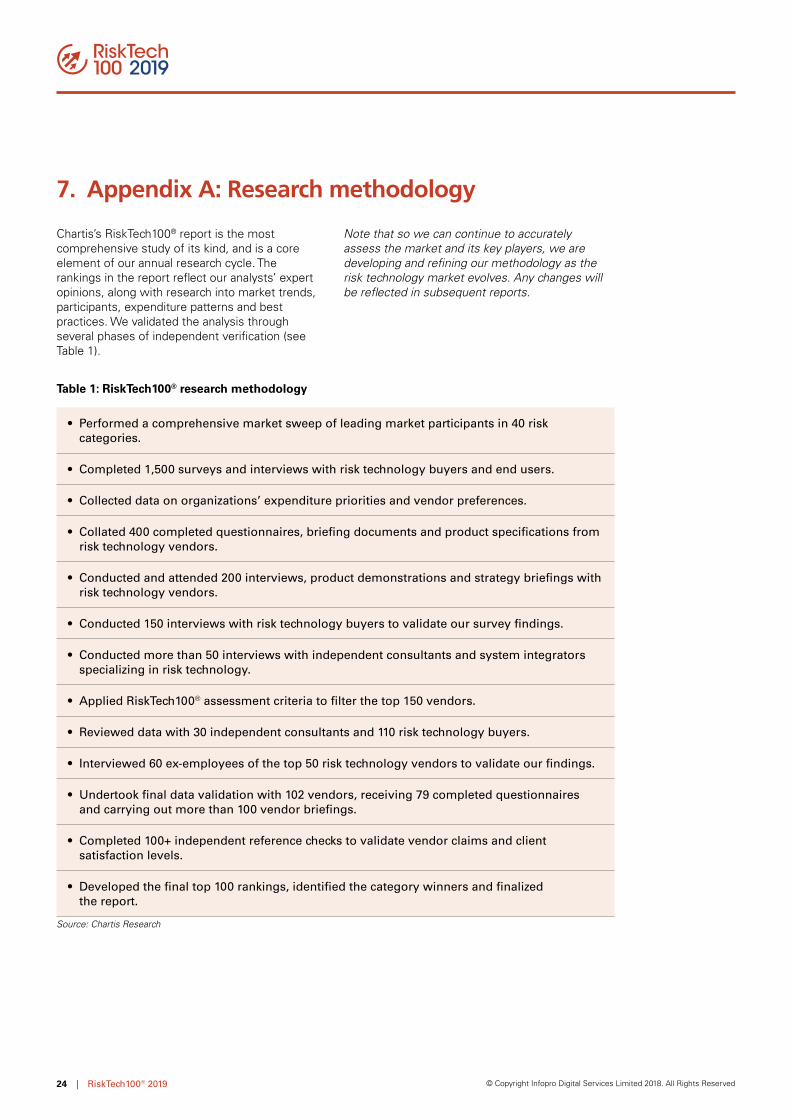
Chartis’s RiskTech100® report is the most comprehensive study of its kind, and is a core element of our annual research cycle. The rankings in the report reflect our analysts’ expert opinions, along with research into market trends, participants, expenditure patterns and best practices. We validated the analysis through several phases of independent verification (see Table 1).
Note that so we can continue to accurately assess the market and its key players, we are developing and refining our methodology as the risk technology market evolves. Any changes will be reflected in subsequent reports.
Table 1: RiskTech100® research methodology
• Performed a comprehensive market sweep of leading market participants in 40 risk categories.
• Completed 1,500 surveys and interviews with risk technology buyers and end users.
• Collected data on organizations’ expenditure priorities and vendor preferences.
• Collated 400 completed questionnaires, briefing documents and product specifications from risk technology vendors.
• Conducted and attended 200 interviews, product demonstrations and strategy briefings with risk technology vendors.
• Conducted 150 interviews with risk technology buyers to validate our survey findings.
• Conducted more than 50 interviews with independent consultants and system integrators specializing in risk technology.
• Applied RiskTech100® assessment criteria to filter the top 150 vendors.
• Reviewed data with 30 independent consultants and 110 risk technology buyers.
• Interviewed 60 ex-employees of the top 50 risk technology vendors to validate our findings.
• Undertook final data validation with 102 vendors, receiving 79 completed questionnaires and carrying out more than 100 vendor briefings.
• Completed 100+ independent reference checks to validate vendor claims and client satisfaction levels.
• Developed the final top 100 rankings, identified the category winners and finalized the report.
Source: Chartis Research
© Copyright Infopro Digital Services Limited 2018. All Rights Reserved25 | RiskTech100® 2019
2019
The RiskTech100® assessment criteria comprise six categories:
• Functionality.
• Core technology.
• Strategy.
• Customer satisfaction.
• Market presence.
• Innovation.
Within each category we have included a number of sub-categories to encompass the range and scope of current risk technology solutions (see Table 2).
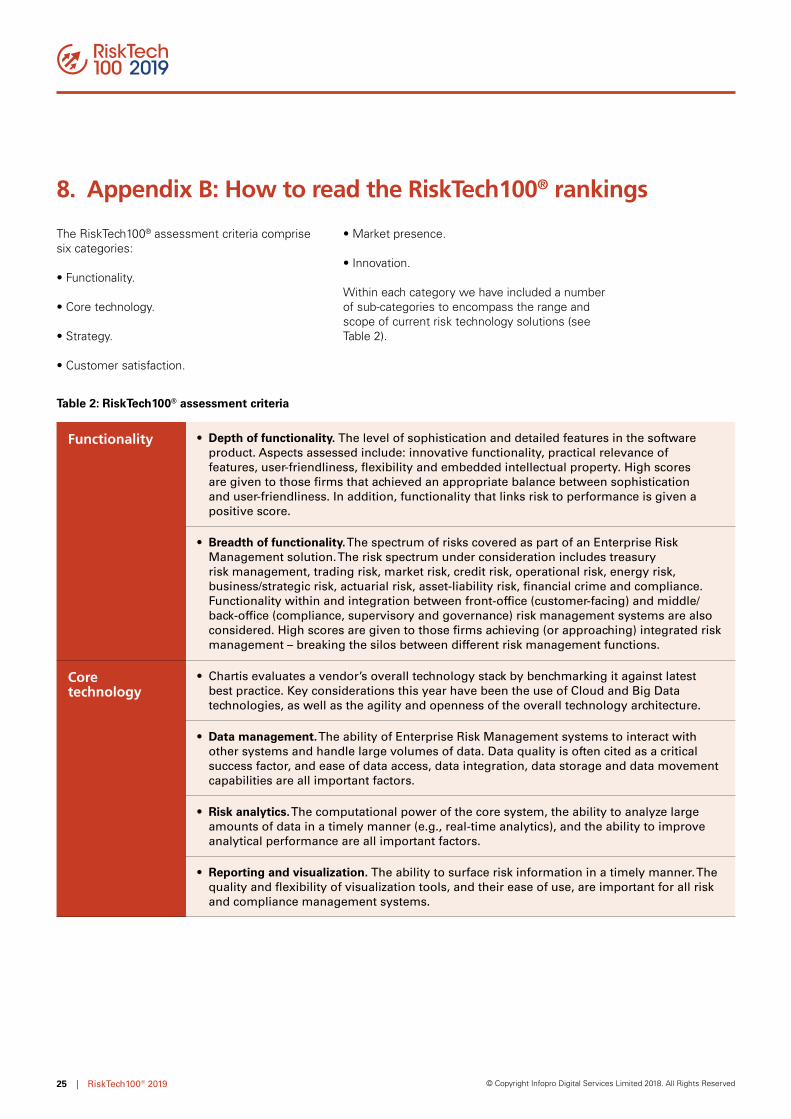
8. Appendix B: How to read the RiskTech100® rankings
Table 2: RiskTech100® assessment criteria
Functionality • Depth of functionality. The level of sophistication and detailed features in the software product. Aspects assessed include: innovative functionality, practical relevance of features, user-friendliness, flexibility and embedded intellectual property. High scores are given to those firms that achieved an appropriate balance between sophistication and user-friendliness. In addition, functionality that links risk to performance is given a positive score.
• Breadth of functionality. The spectrum of risks covered as part of an Enterprise Risk Management solution. The risk spectrum under consideration includes treasury risk management, trading risk, market risk, credit risk, operational risk, energy risk, business/strategic risk, actuarial risk, asset-liability risk, financial crime and compliance. Functionality within and integration between front-office (customer-facing) and middle/back-office (compliance, supervisory and governance) risk management systems are also considered. High scores are given to those firms achieving (or approaching) integrated risk management – breaking the silos between different risk management functions.
Core technology
• Chartis evaluates a vendor’s overall technology stack by benchmarking it against latest best practice. Key considerations this year have been the use of Cloud and Big Data technologies, as well as the agility and openness of the overall technology architecture.
• Data management. The ability of Enterprise Risk Management systems to interact with other systems and handle large volumes of data. Data quality is often cited as a critical success factor, and ease of data access, data integration, data storage and data movement capabilities are all important factors.
• Risk analytics. The computational power of the core system, the ability to analyze large amounts of data in a timely manner (e.g., real-time analytics), and the ability to improve analytical performance are all important factors.
• Reporting and visualization. The ability to surface risk information in a timely manner. The quality and flexibility of visualization tools, and their ease of use, are important for all risk and compliance management systems.
© Copyright Infopro Digital Services Limited 2018. All Rights Reserved26 | RiskTech100® 2019
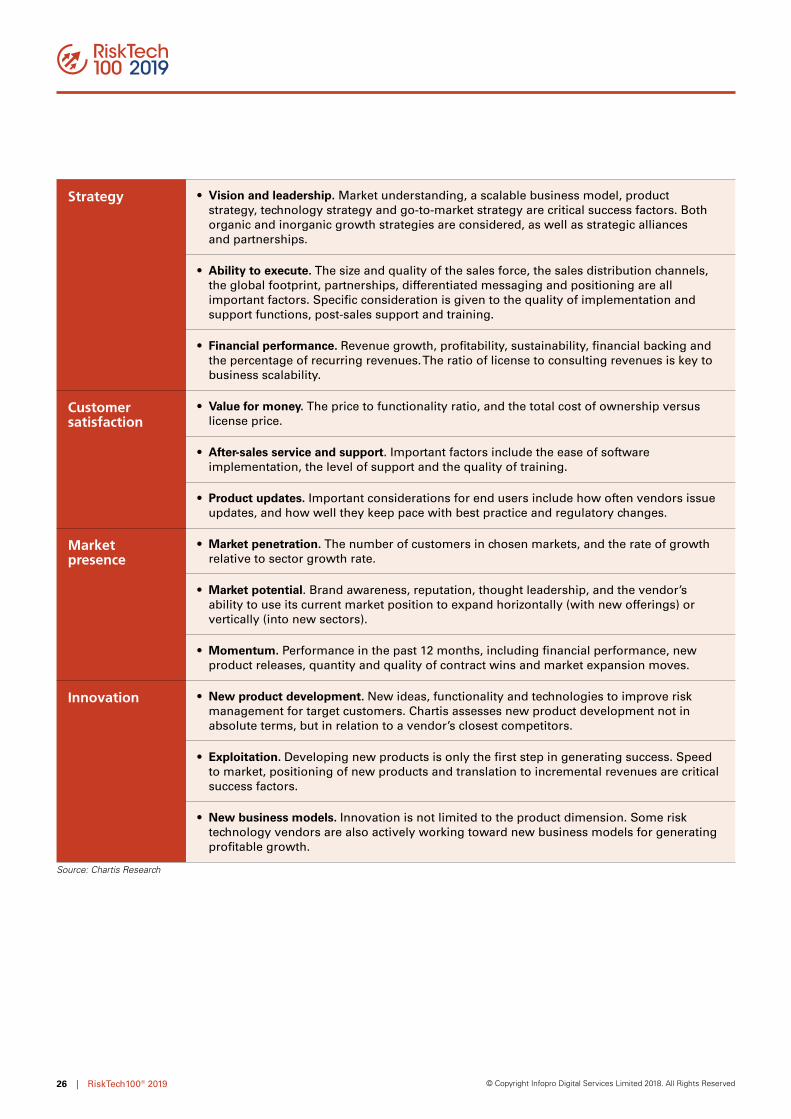
2019
Strategy • Vision and leadership. Market understanding, a scalable business model, product strategy, technology strategy and go-to-market strategy are critical success factors. Both organic and inorganic growth strategies are considered, as well as strategic alliances and partnerships.
• Ability to execute. The size and quality of the sales force, the sales distribution channels, the global footprint, partnerships, differentiated messaging and positioning are all important factors. Specific consideration is given to the quality of implementation and support functions, post-sales support and training.
• Financial performance. Revenue growth, profitability, sustainability, financial backing and the percentage of recurring revenues. The ratio of license to consulting revenues is key to business scalability.
Customer satisfaction
• Value for money. The price to functionality ratio, and the total cost of ownership versus license price.
• After-sales service and support. Important factors include the ease of software implementation, the level of support and the quality of training.
• Product updates. Important considerations for end users include how often vendors issue updates, and how well they keep pace with best practice and regulatory changes.
Market presence
• Market penetration. The number of customers in chosen markets, and the rate of growth relative to sector growth rate.
• Market potential. Brand awareness, reputation, thought leadership, and the vendor’s ability to use its current market position to expand horizontally (with new offerings) or vertically (into new sectors).
• Momentum. Performance in the past 12 months, including financial performance, new product releases, quantity and quality of contract wins and market expansion moves.
Innovation • New product development. New ideas, functionality and technologies to improve risk management for target customers. Chartis assesses new product development not in absolute terms, but in relation to a vendor’s closest competitors.
• Exploitation. Developing new products is only the first step in generating success. Speed to market, positioning of new products and translation to incremental revenues are critical success factors.
• New business models. Innovation is not limited to the product dimension. Some risk technology vendors are also actively working toward new business models for generating profitable growth.
Source: Chartis Research
© Copyright Infopro Digital Services Limited 2018. All Rights Reserved27 | RiskTech100® 2019
For risk technology buyers
If you are purchasing risk management software, Chartis’s vendor selection service is designed to help you find the most appropriate risk technology solution for your needs.
We monitor the market to identify the strengths and weaknesses of the different risk technology solutions, and track the post-sales performance of companies selling and implementing these systems. Our market intelligence includes key decision criteria such as TCO (total cost of ownership) comparisons and customer satisfaction ratings.
Our research and advisory services cover a range of risk and compliance management topics such as credit risk, market risk, operational risk, GRC, financial crime, liquidity risk, asset and liability management, collateral management, regulatory compliance, risk data aggregation, risk analytics and risk BI.
Our vendor selection services include:
• Buy vs. build decision support.
• Business and functional requirements gathering.
• Identification of suitable risk and compliance implementation partners.
• Review of vendor proposals.
• Assessment of vendor presentations and demonstrations.
• Definition and execution of Proof-of-Concept (PoC) projects.
• Due diligence activities.
For risk technology vendors
Strategy
Chartis can provide specific strategy advice for risk technology vendors and innovators, with a special focus on growth strategy, product direction, go-to-market plans, and more. Some of our specific offerings include:
• Market analysis, including market segmentation, market demands, buyer needs, and competitive forces
• Strategy sessions focused on aligning product and company direction based upon analyst data, research, and market intelligence
• Advice on go-to-market positioning, messaging, and lead generation
• Advice on pricing strategy, alliance strategy, and licensing/pricing models
Thought leadership
Risk technology vendors can also engage Chartis to provide thought leadership on industry trends in the form of in-person speeches and webinars, as well as custom research and thought-leadership reports. Target audiences and objectives range from internal teams to customer and user conferences. Some recent examples include:
• Participation on a ‘Panel of Experts’ at a global user conference for a leading Global Enterprise Risk Management software vendor.
• Custom research and thought-leadership paper on Basel 3 and implications for risk technology.
• Webinar on Financial Crime Risk Management.
• Internal education of sales team on key regulatory and business trends and engaging C-level decision makers.
9. How to use research and services from Chartis
In addition to our flagship industry reports, Chartis also offers customized information and consulting services. Our in-depth knowledge of the risk technology market and best practice allows us to provide high-quality and cost-effective advice to our clients. If you found this report informative and useful, you may be interested in the following services from Chartis.
© Copyright Infopro Digital Services Limited 2018. All Rights Reserved28 | RiskTech100® 2019
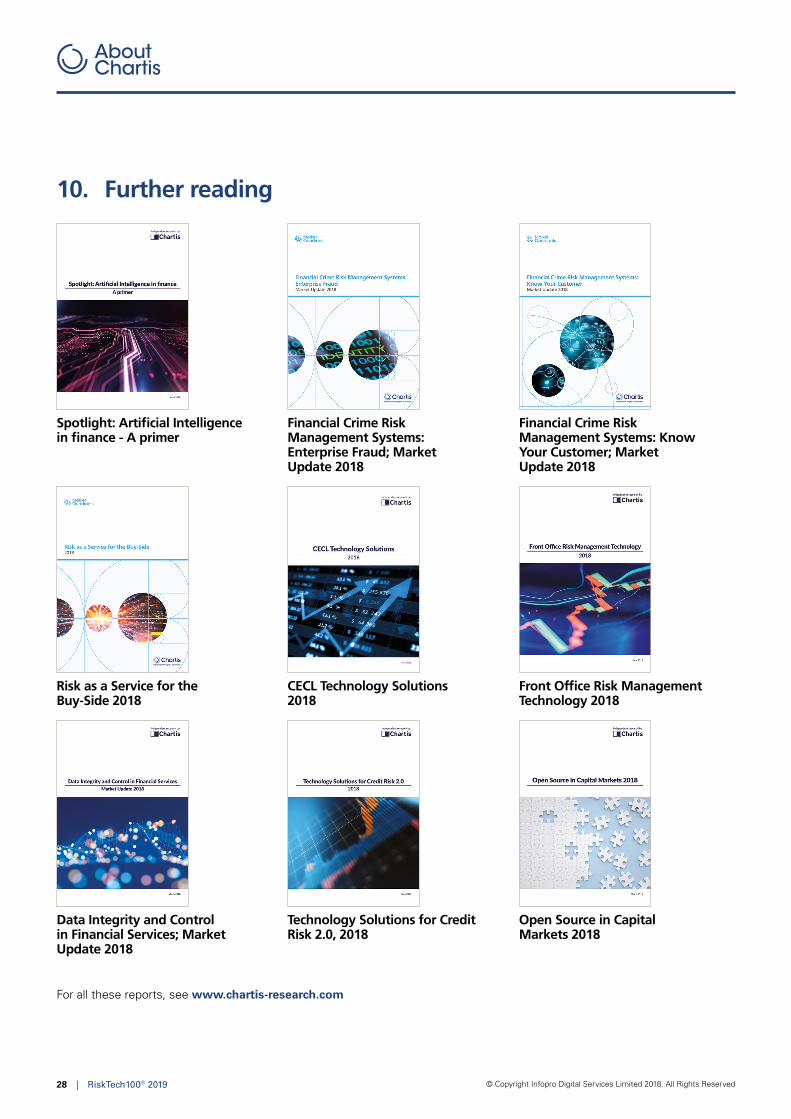
Spotlight: Artificial Intelligence in finance - A primer
Financial Crime Risk Management Systems: Enterprise Fraud; Market Update 2018
Financial Crime Risk Management Systems: Know Your Customer; Market Update 2018
Risk as a Service for the Buy-Side 2018
CECL Technology Solutions 2018
Front Office Risk Management Technology 2018
Data Integrity and Control in Financial Services; Market Update 2018
Technology Solutions for Credit Risk 2.0, 2018
Open Source in Capital Markets 2018
For all these reports, see www.chartis-research.com
10. Further reading
Related Documents