Uncontrolled when printed 2019 Annual Environmental Review

Welcome message from author
This document is posted to help you gain knowledge. Please leave a comment to let me know what you think about it! Share it to your friends and learn new things together.
Transcript

Uncontrolled when printed
[Effective Date]
2019 Annual Environmental Review

2019 Annual Environmental Review Hunter Valley Operations
Report
Number: HVOOC-748212775-6 Status: [Document Status (Office)] Effective: [Effective Date] Page 2 of
238 Owner: [Owner] Version: [Document Version (Office)] Review:
[Planned Review Date]
Uncontrolled when printed
Name of Operations Hunter Valley Operations Name of Operator HV Operations Pty Ltd Development consent /project approval DA 450-10-2003 / PA 06_0261 Name of holder of development consent/project approval HV Operations Pty Ltd Mining Lease Number Contained within Table 6 of this report Name of Mining Lease Holder Contained within Table 6 of this report Water Licence Number Contained within Table 8 of this report Name of Water Licence Holder Contained within Table 8 of this report MOP/RMP Start Date HVO North – 26 February 2019
HVO South – 25 July 2018 MOP/RMP End Date HVO North – 30 July 2020
HVO South – 30 July 2023 Annual Review Start Date 01/01/2019 Annual Review End Date 31/12/2019 I, Tony Galvin, certify that this audit report is a true and accurate record of the compliance status of Hunter
Valley Operations for the period 1st January 2019 to 31st December 2019 and that I am authorised to make this
statement on behalf of Hunter Valley Operations.
Note. a) The Annual Review is an ‘environmental audit’ for the purposes of section 122B(2) of the Environmental
Planning and Assessment Act 1979. Section 122E provides that a person must not include false or misleading information (or provide information for inclusion in) an audit report produced to the Minister in connection with an environmental audit if the person knows the information is false or misleading in a material respect. The maximum penalty is, in the case of a corporation, $1 million and for an individual, $250,000.
b) The Crimes Act 1900 contains other offences relating to the false and misleading information: section 192G (Intention to defraud by false or misleading statement- maximum penalty 5 years imprisonment); sections 307A, 307B and 307C (False or misleading applications/information/documents – maximum penalty 2 years imprisonment or $22,000, or both).
Name of Authorised Reporting Officer Tony Galvin Title of Authorised Reporting Officer General Manager – Hunter Valley Operations Signature of Authorised Reporting Officer
Date 31 March 2020

2019 Annual Environmental Review Hunter Valley Operations
Report
Number: HVOOC-748212775-6 Status: [Document Status (Office)] Effective: [Effective Date] Page 3 of
238 Owner: [Owner] Version: [Document Version (Office)] Review:
[Planned Review Date]
Uncontrolled when printed
Executive Summary This Annual Environmental Review (Annual Review) reports on the environmental performance of Hunter Valley Operations (HVO) during the 2019 calendar year and satisfies the requirements of HVO’s Development Consents and Mining Leases. The structure of the 2019 Annual Review intends to align with the NSW Government Post-approval requirements for State significant mining developments – Annual Review GUIDELINE (October 2015). HVO extracted 19.19 million tonnes of run-of-mine (ROM) coal during 2019 against an approval ROM extraction rate of 42 million tonnes per annum (mtpa). The Coal Handling Preparation Plants (CHPPs) produced 13.59 million tonnes of saleable coal during 2019. Noise There were no noise related non-compliances recorded against HVO’s development consent limits. One exceedance of noise criteria was measured at Maison Dieu during May 2019, this exceedance was found to be compliant in accordance with the Noise Management Plan as follow up measurements resulted in noise levels below the relevant criteria. HVO implemented the revised Noise Management Plan which was approved in February 2019. HVO received and responded to 1456 noise alarms, recording a total of 639 hours of equipment stoppage due to noise management. To reduce noise output from mobile equipment HVO continued to retrofit sound attenuation packages to the existing haul truck fleet. A further 8 haul trucks were retrofitted, resulting in 94% of the haul truck fleet now being sound attenuated. Blasting A total of 221 blast events were initiated at HVO, 140 from HVO South and 81 from HVO North. HVO complied with all blasting related consent and licence criteria with the exception of one blast on 28 May 2019 in the HVO South area which exceeded the Airblast Overpressure criteria at Maison Dieu. This result was independently reviewed by two separate blasting experts which deemed the results to be an anomaly due to a potential influence of a local source and/or wind. The Department of Planning, Infrastructure and Environment (DPIE) issued HVO with a Warning Letter. HVO reviewed the monitoring location and will relocate this monitor to remove any potential influence on the results during 2020. HVO employs a blast fume management protocol to mitigate generation of post blast fume emissions. Four blasts were ranked as producing Category 3 fume emissions but remained on site, there were not Category 4 or 5 fume events. An additional non-compliance from 2017 was identified and reported to DPIE. A review of historic blasting data found that HVO had undertaken blasting on a gazetted public holiday (Easter Saturday) without written regulatory approval. HVO has since implemented additional controls to prevent a reoccurrence. Air Quality An unprecedented number of days in 2019 were deemed to have been effected by extraordinary events. Air Quality was influenced by a combination of ongoing drought conditions, State wide dust storms, regional dust events and smoke from bushfires which significantly affected the Hunter Valley between October 2019 and December 2019. During this period 58 exceedances of the short term (24 hour) PM10 criteria were measured across the HVO monitoring network. Each of these exceedances were reported to DPIE and were noted to have been affected by an extraordinary event and therefore, as per the consent conditions, the criteria was not deemed to be applicable. These events also contributed to exceedances of the long term (annual average) criteria in some instances, however annual averages have been adjusted to exclude these events as per consent conditions. Despite these events, HVO continued to implement operational controls to manage dust emissions in accordance with its Air Quality Management Plan. HVO recorded 7,206 hrs of operational downtime to manage dust in response to real time monitoring alerts and visual inspections. HVO also implemented additional dust management measures including the use of haul road dust suppressant product in HVO West Pit, the use of on bench irrigator to assist with managing dust of blasted material, installation of an additional four monitoring cameras dedicated to dust monitoring and continued upgrade of the CHPP dust suppression system.

2019 Annual Environmental Review Hunter Valley Operations
Report
Number: HVOOC-748212775-6 Status: [Document Status (Office)] Effective: [Effective Date] Page 4 of
238 Owner: [Owner] Version: [Document Version (Office)] Review:
[Planned Review Date]
Uncontrolled when printed
Additional exceedances were recorded when extraordinary events were not declared. These include: - Exceedance of the Total Suspended Particulate (TSP) long term (annual average) impact assessment
criteria were recorded at Kilburnie South, Knodlers Lane and Maison Dieu monitoring locations. - Exceedance of the Long Term (annual average) PM10 criteria.at Maison Dieu, Kilburnie South and the
Hunter Valley Gliding Club monitoring locations - Exceedance of the short term (24 hour average) PM10 criteria, one at Kilburnie South on 11 September
2019 and one at Jerrys Plains on 13 September 2019. - Exceedance of the long term (annual average) dust deposition rate at D118, DL30 and Warkworth
monitoring locations (however they did not exceed the incremental deposition rate criteria). Each of these exceedances were investigated by an Air Quality Specialist to determine the level of contribution from HVO activities in accordance with the compliance protocol outlined in the HVO Air Quality Management Plan. The investigation determined that the contributions from HVO (either North, South or Both) in all cases was not the significant cause of the exceedance and therefore considered compliant. A revised Air Quality and Greenhouse Gas Management Plan was implemented in 2019 which saw a change in monitoring methods used for determining compliance. This change saw the replacement of PM10 High Volume Air Samplers (operating every 6 days) with PM10 real time TEOM monitors (operating continuously) at Maison Dieu, Knodlers Lane, Warkworth and Wandewoi. HVO also introduced the Jerrys Plains Monitoring location. The change in monitoring methodology significantly increased the number of samples being collected and assessed for compliance compared to previous years. Following approval of the Air Quality and Greenhouse Gas Management Plan on 6 September 2019, HVO installed PM2.5 monitoring at Kilburnie South and Maison Dieu. Heritage Under the provisions of both the HVO South and HVO North Aboriginal Cultural Heritage Management Plans (ACHMP), three field based due diligence assessments where undertaken at various locations across HVO and the Mitchelhill Biodiversity Area. Three Aboriginal sites/areas were identified during the assessment at the Mitchelhill Biodiversity Area which were surveyed and pegged, no artefacts or sites were identified during the other assessments. Stage 2 of the Mitchell Pit salvage program commenced. The salvage program involved teams from Registered Aboriginal Parties (RAPs) resulting in the salvage and mitigation of 284 AHIMS registered Aboriginal heritage sites. Two compliance inspections were conducted under the provision of the HVO South ACHMP and one inspection was conducted under the HVO North HMP. The inspections found that all sites have been managed in conformance with the ACHMP/HMP requirements. Additional sites were recorded and sites requiring maintenance and upgrades to site barricading and fencing were identified, with upgrade and maintenance work to be implemented in 2020. Two non-indigenous historic sites, the ‘dog leg fence’ and a remnant ‘timber bridge’ adjacent to the Golden Highway were the subject of a Significance Assessment during 2019. The assessment found that the fence has local historical significance and is of potential State significance for its representativeness and degree of rarity. A program of works will be developed during 2020 for the ongoing management of these sites. Water HVO impounded minimal water from surface runoff due to ongoing dry conditions. As a result HVO continued to increase its abstraction of water from the Hunter River (under licence) to supplement its raw water requirements for coal washing and dust suppression. A total of 4,654 ML water was pumped from the River during 2019. Two water related non-compliances were recorded, both relating to discharge of turbid water to Farrells Creek following rain events on 18 and 30 March 2019. Both incidents were investigated by regulatory authorities. For the incident on 18 March, HVO has entered into an Enforceable Undertaking with the EPA and has also received a Penalty Notice and an Official Caution from the Resource Regulator. For the incident on 30 March HVO received a Warning Letter from DPIE.

2019 Annual Environmental Review Hunter Valley Operations
Report
Number: HVOOC-748212775-6 Status: [Document Status (Office)] Effective: [Effective Date] Page 5 of
238 Owner: [Owner] Version: [Document Version (Office)] Review:
[Planned Review Date]
Uncontrolled when printed
HVO undertook a review of the water management network and developed a proposed program to upgrade water containment. The review forms part of a Pollution Reduction Program (PRP) identified in the HVO Environment Protection Licence (EPL) to address the improvements required. Implementation of this program will commence in 2020. HVO undertook studies during 2019 in accordance with its Pollution Reduction Program relating to Seepage from the North Void Tailings Storage Facility. This included development of a detailed groundwater model and an assessment of potential remedial options. Analysis of groundwater monitoring results has indicated that current management practices are effective in minimising seepage from the Facility. Rehabilitation and Land Management Rehabilitation at HVO is undertaken in accordance with commitments made in the various Mining Operations Plans (MOPs) covering the site: Hunter Valley Operations North MOP (includes Newdell CHPP and Hunter Valley Load Point) and Hunter Valley Operations South MOP. A total of 88.3 ha rehabilitation was undertaken during 2019. HVO has committed to a detailed work plan in response to rehabilitation monitoring and subsequent engagement with Resources Regulator arising from Section 240 Notices received during 2018 and 2019. The plan is particularly focussed upon native vegetation establishment on historic cover crop areas, and protection of these and existing areas from existing and emergent week threats while vegetation establishes. On 5 June 2019 Resources Regulator undertook an audit to assess operational performance of HVO South in relation to the management of topsoil and the implementation of management systems and controls to provide for the sustainable management of the mine’s topsoil resources. The audit assessed compliance for the previous 12 months commencing 5 June 2018 with reference to approved Mining Operations Plan, associated management plans and site procedures. The audit included desktop document review, site inspections and interviews with site personnel and identified one non-conformance and made five observations. HVO will finalise a Topsoil Management Plan during 2020 which will formalise revised and updated operational controls to be used to manage the topsoil resources at site. As part of HVO’s Vertebrate Pest Action Plan a number of baiting programmes are carried out on a seasonal basis. These programmes are conducted at a level of frequency designed to disrupt pest species breeding/colonisation cycles and employ a variety of methodologies including baiting, trapping and ground based shooting. A total of 107 days of weed control work was undertaken on site at HVO during 2019, with approximately 211 ha of land treated, including River Red Gum areas and maintenance of 90 environmental monitoring points. Biodiversity Management. Various management activities were undertaken at the Goulburn River Biodiversity area throughout 2019 in accordance with the approved management plan. Activities in weed control, infrastructure inspections, and vertebrate pest management programs. Independent Environmental Audit An Independent Environmental Audit (IEA) was undertaken in December 2019. This audit was undertaken against the conditions of both Project Approval PA06-0261 and DA 450-10-2003. The audit identified 28 non-compliances, one was identified as a moderate risk, 15 were administrative in nature and 12 findings were considered to be low risk. The audit report and HVO’s response to the auditors’ recommendations were submitted to the Department for their consideration on 24 February 2020. At the time of publishing this Annual Review the findings of the audit are still to be finalised with DPIE.

2019 Annual Environmental Review Hunter Valley Operations
Report
Number: HVOOC-748212775-6 Status: [Document Status (Office)] Effective: [Effective Date] Page 6 of
238 Owner: [Owner] Version: [Document Version (Office)] Review:
[Planned Review Date]
Uncontrolled when printed
Table of Contents Statement of Compliance ............................................................................................... 15
Introduction ..................................................................................................................... 17 2.1 Document Purpose ............................................................................................................................... 17 2.2 Background ........................................................................................................................................... 17 2.3 Mine Contacts ....................................................................................................................................... 17
Approvals ........................................................................................................................ 20 3.1 Approvals, Leases and Licences .......................................................................................................... 20
3.1.1 Current Approvals ................................................................................................................. 20 3.1.2 Management Plans, Programs and Strategies ...................................................................... 32
Operations Summary ...................................................................................................... 35 4.1 Mining 35
4.1.1 Mineral Processing ................................................................................................................ 36 4.1.2 Production Statistics .............................................................................................................. 37 4.1.3 Summary of Changes ........................................................................................................... 37
4.2 Other Operations .................................................................................................................................. 37 4.3 Forecast Operations for Next Reporting Period ................................................................................... 38
Actions Required From Previous Annual Review ........................................................ 39
Environmental Performance .......................................................................................... 42 6.1 Meteorological Data .............................................................................................................................. 42 6.2 Noise 42
6.2.1 Noise Management ............................................................................................................... 42 6.2.2 Sound Attenuation of Heavy Equipment ............................................................................... 42 6.2.3 Real Time Noise Management .............................................................................................. 42 6.2.4 Operational Noise Performance ............................................................................................ 44
6.3 Blasting 46 6.3.1 Blasting Management ........................................................................................................... 46 6.3.2 Blasting Performance ............................................................................................................ 48 6.3.3 Blast Fume Management ...................................................................................................... 51
6.4 Air Quality ............................................................................................................................................. 52 6.4.1 Air Quality Management ........................................................................................................ 52 6.4.2 Air Quality Performance ........................................................................................................ 53 6.4.3 Comparison against EA Predictions ...................................................................................... 99
6.5 Greenhouse Gas and Energy Management ....................................................................................... 103 6.6 Waste and Hazardous Materials ........................................................................................................ 103
6.6.1 Recycling ............................................................................................................................ 103 6.6.2 Sewage Treatment/Disposal ............................................................................................... 104 6.6.3 Hydrocarbons ...................................................................................................................... 104 6.6.4 Contaminated Soil ............................................................................................................... 104 6.6.5 Acid Rock Drainage ............................................................................................................ 104 6.6.6 Waste/Hazardous Materials Non Compliances ................................................................... 104

2019 Annual Environmental Review Hunter Valley Operations
Report
Number: HVOOC-748212775-6 Status: [Document Status (Office)] Effective: [Effective Date] Page 7 of
238 Owner: [Owner] Version: [Document Version (Office)] Review:
[Planned Review Date]
Uncontrolled when printed
6.6.7 Building Demolition ............................................................................................................. 104 6.7 Heritage 104
6.7.1 Management and Community Consultation ........................................................................ 104 6.7.2 Aboriginal Archaeological and Cultural Heritage Investigations .......................................... 105 6.7.3 Heritage Audits and Incidents ............................................................................................. 106 6.7.4 Historic Heritage – Management and Community Consultation .......................................... 106
Water Management ....................................................................................................... 108 7.1 Water Balance .................................................................................................................................... 112
7.1.1 Water Inputs ........................................................................................................................ 112 7.1.2 Water Outputs ..................................................................................................................... 113
7.2 Surface Water ..................................................................................................................................... 113 7.2.1 Surface Water Monitoring ................................................................................................... 115
7.3 Comparison with EIS Predictions ....................................................................................................... 126 7.3.1 South Pit EIS Predictions .................................................................................................... 126 7.3.2 Carrington Pit EIS Predictions ............................................................................................. 126 7.3.3 West Pit EIS Predictions ..................................................................................................... 126
7.4 Performance relating to HRSTS Discharges ...................................................................................... 126 7.5 Groundwater ....................................................................................................................................... 127
7.5.1 Groundwater Management ................................................................................................. 127 7.5.2 Groundwater Performance .................................................................................................. 127 7.5.3 Groundwater Monitoring Summary ..................................................................................... 130
7.6 Compensatory Water Supply .............................................................................................................. 167
Rehabilitation and Land Management ......................................................................... 168 8.1 Summary of Rehabilitation ................................................................................................................. 168 8.2 Rehabilitation Overview ...................................................................................................................... 169
8.2.1 HVON Load Point Rehabilitation ......................................................................................... 169 8.3 Rehabilitation Performance ................................................................................................................ 170 8.4 Rehabilitation Programme Variations ................................................................................................. 174 8.5 Rehabilitation Trials ............................................................................................................................ 174 8.6 Key Issues that may affect Rehabilitation ........................................................................................... 174 8.7 Rehabilitation Monitoring .................................................................................................................... 176 8.8 Overview of Rehabilitation Trajectory ................................................................................................. 185 8.9 Rehabilitation Maintenance ................................................................................................................ 185 8.10 Vertebrate Pest Management ............................................................................................................. 188 8.11 Supplementary Weed Treatment ........................................................................................................ 195 8.12 Renovations ........................................................................................................................................ 199
8.12.1 Newdell Coal Handling Preparation Plant (CHPP) .............................................................. 199 8.12.2 Derelict Rural Buildings ....................................................................................................... 199
8.13 Topsoil Management .......................................................................................................................... 199 8.14 Tailings Management ......................................................................................................................... 202 8.15 River Red Gum Restoration and Rehabilitation ................................................................................. 203

2019 Annual Environmental Review Hunter Valley Operations
Report
Number: HVOOC-748212775-6 Status: [Document Status (Office)] Effective: [Effective Date] Page 8 of
238 Owner: [Owner] Version: [Document Version (Office)] Review:
[Planned Review Date]
Uncontrolled when printed
8.15.1 River Red Gum Overview ................................................................................................... 203 8.16 Biodiversity Offsets ............................................................................................................................. 209
8.16.1 Goulburn River Biodiversity Area Overview ........................................................................ 209 8.16.2 Weather Records ................................................................................................................ 211 8.16.3 Biodiversity Area Management Activities ............................................................................ 211
Community .................................................................................................................... 216 9.1 Complaints .......................................................................................................................................... 216 9.2 Review of Community Engagement ................................................................................................... 218
9.2.1 Communication ................................................................................................................... 218 9.2.2 Consultation and Engagement Activities ............................................................................. 219 9.2.3 Community Consultative Committee ................................................................................... 219 9.2.4 Community Grants .............................................................................................................. 220
Independent Audit ......................................................................................................... 221
Incidents and Non-Compliances .................................................................................. 229 11.1 Blasting ............................................................................................................................................... 229
11.1.1 Air Blast Overpressure Exceedance - 28 May 2019 ........................................................... 229 11.1.2 Easter Saturday Blast - 15 April 2017 (reported 1 July 2019) ............................................. 229
11.2 Water 230 11.2.1 Turbid water discharge - 18 March 2019 ............................................................................ 230 11.2.2 Turbid water discharge - 30 March 2019 ............................................................................ 230
11.3 Noise 231 11.3.1 IEA Finding – Tonal Noise Assessments ............................................................................ 231
11.4 Air Quality ........................................................................................................................................... 231 11.4.1 Missed HVAS Sample - 25 April 2019................................................................................. 231 11.4.2 Dust Management Penalty Notice - 21 August 2019 .......................................................... 231
11.5 IEA Finding - Visual Amenity .............................................................................................................. 232
Activities to be completed in 2020 ............................................................................... 233 12.1 Noise 233 12.2 Blasting ............................................................................................................................................... 233 12.3 Air Quality ........................................................................................................................................... 233 12.4 Historic Heritage ................................................................................................................................. 233 12.5 Water 233 12.6 Rehabilitation ...................................................................................................................................... 233 12.7 Tailing Storage Facility Capping ......................................................................................................... 234 12.8 Stakeholder Engagement ................................................................................................................... 234 12.9 Timeline for Implementation of Improvement Projects ....................................................................... 234

2019 Annual Environmental Review Hunter Valley Operations
Report
Number: HVOOC-748212775-6 Status: [Document Status (Office)] Effective: [Effective Date] Page 9 of
238 Owner: [Owner] Version: [Document Version (Office)] Review:
[Planned Review Date]
Uncontrolled when printed
Figures Figure 1 Regional Context .......................................................................................................................................... 18 Figure 2 Hunter Valley Operations – Site Layout ....................................................................................................... 19 Figure 3 Open Cut Mining Schematic ......................................................................................................................... 35 Figure 4 HVO Attended and Real-time Noise Monitoring Locations .......................................................................... 43 Figure 5 HVO Blast Monitoring Network ..................................................................................................................... 47 Figure 6: Jerrys Plains Blast Monitoring Results 2019 ............................................................................................... 49 Figure 7: Knodlers Lane Blast Monitoring Results 2019 ............................................................................................ 49 Figure 8: Maison Dieu Blast Monitoring Results 2019................................................................................................ 50 Figure 9: Moses Crossing Blast Monitoring Results 2019 .......................................................................................... 50 Figure 10: Warkworth Blast Monitoring Results 2019 ................................................................................................ 51 Figure 11: Equipment Downtime Hours for Air Quality Management 2019 ............................................................... 53 Figure 12: Areas Aerial Seeded in 2019 – HVO North ............................................................................................... 54 Figure 13: Areas Aerial Seeded in 2019 – HVO South .............................................................................................. 54 Figure 14: Air Quality Monitoring Locations (as approved 6 September 2019) ......................................................... 55 Figure 15: Annual average insoluble matter deposition rates 2016-2019 .................................................................. 57 Figure 16: Maximum allowable increase in deposited dust level 2019 ...................................................................... 57 Figure 17: Annual average TSP concentrations 2016 to 2019 ................................................................................... 58 Figure 18: 24 hour average total PM10 results- 2019 .................................................................................................. 61 Figure 19: Annual average HVAS PM10 results 2015 to 2019 .................................................................................. 97 Figure 20: West Pit water management infrastructure ............................................................................................. 109 Figure 21: North Pit water management infrastructure............................................................................................. 110 Figure 22: South Pit water management infrastructure ............................................................................................ 111 Figure 23: Surface Monitoring Locations .................................................................................................................. 114 Figure 24: Hunter River pH Trends 2016 - 2019 ...................................................................................................... 117 Figure 25: Hunter River EC Trends 2016- 2019 ....................................................................................................... 117 Figure 26: Hunter River TSS Trends 2016 - 2019 .................................................................................................... 118 Figure 27: Wollombi Brook pH Trends 2016 – 2019 ................................................................................................ 120 Figure 28: Wollombi Brook EC Trends 2016 – 2019 ................................................................................................ 120 Figure 29: Wollombi Brook TSS Trends 2016 - 2019 ............................................................................................... 121 Figure 30: Other Tributaries pH Trends 2016 – 2019............................................................................................... 122 Figure 31: Other Tributaries EC Trends 2016 – 2019 .............................................................................................. 123 Figure 32: Other Tributaries TSS Trends 2016 – 2019 ............................................................................................ 123 Figure 33: HVO Site Dams pH Trends 2016 – 2019 ................................................................................................ 124 Figure 34: HVO Site Dams EC Trends 2016 – 2019 ................................................................................................ 125 Figure 35: HVO Site Dams TSS Trends 2016 – 2019 .............................................................................................. 125 Figure 36: Groundwater Monitoring Network at HVO – 2019 ................................................................................... 129 Figure 37: Carrington Broonie Groundwater pH Trends 2016 – 2019 ..................................................................... 130 Figure 38: Carrington Broonie Groundwater EC Trends 2016 – 2019 ..................................................................... 131 Figure 39: Carrington Broonie Groundwater SWL Trends 2016 – 2019 .................................................................. 131 Figure 40: Carrington Alluvium Groundwater pH Trends 2016 – 2019 .................................................................... 132 Figure 41: Carrington Alluvium Groundwater EC Trends 2016 – 2019 .................................................................... 133 Figure 42: Carrington Alluvium Groundwater SWL Trends 2016 – 2019 ................................................................. 133 Figure 43: Carrington Interburden Groundwater pH Trends 2016 – 2019 ............................................................... 134 Figure 44: Carrington Interburden Groundwater EC Trends 2016 – 2019 ............................................................... 135 Figure 45: Carrington Interburden Groundwater SWL Trends 2016 – 2019 ............................................................ 135 Figure 46: Carrington West Wing Alluvium Groundwater pH Trends 2016 – 2019 .................................................. 136 Figure 47: Carrington West Wing Alluvium Groundwater EC Trends 2016 – 2019 ................................................. 137 Figure 48: Carrington West Wing Alluvium Groundwater SWL Trends 2016 – 2019 .............................................. 137 Figure 49: Carrington West Wing Flood Plain Groundwater pH Trends 2016 – 2019 ............................................. 138 Figure 50: Carrington West Wing Flood Plain Groundwater EC Trends 2016 – 2019 ............................................. 139 Figure 51: Carrington West Wing Flood Plain Groundwater SWL Trends 2016 – 2019 .......................................... 139 Figure 52: Cheshunt/North Pit Alluvium Groundwater pH Trends 2016 – 2019 ...................................................... 140 Figure 53: Cheshunt/North Pit Alluvium Groundwater EC Trends 2016 – 2019 ...................................................... 141 Figure 54: Cheshunt/North Pit Alluvium Groundwater SWL Trends 2016 – 2019 ................................................... 141 Figure 55: Cheshunt Interburden Groundwater pH Trends 2016 – 2019 ................................................................. 142 Figure 56: Cheshunt Interburden Groundwater EC Trends 2016 – 2019 ................................................................ 143

2019 Annual Environmental Review Hunter Valley Operations
Report
Number: HVOOC-748212775-6 Status: [Document Status (Office)] Effective: [Effective Date] Page 10 of
238 Owner: [Owner] Version: [Document Version (Office)] Review:
[Planned Review Date]
Uncontrolled when printed
Figure 57: Cheshunt Interburden Groundwater SWL Trends 2016 – 2019 ............................................................. 143 Figure 58: Cheshunt Mt Arthur Groundwater pH Trends 2016 – 2019 .................................................................... 144 Figure 59: Cheshunt Mt Arthur Groundwater EC Trends 2016 – 2019 .................................................................... 145 Figure 60: Cheshunt Mt Arthur Groundwater SWL Trends 2016 – 2019 ................................................................. 145 Figure 61: Cheshunt Piercefield Groundwater pH Trends 2016 – 2019 .................................................................. 146 Figure 62: Cheshunt Piercefield Groundwater EC Trends 2016 – 2019 .................................................................. 147 Figure 63: Cheshunt Piercefield Groundwater SWL Trends 2016 – 2019 ............................................................... 147 Figure 64: Lemington South Alluvium Groundwater pH Trends 2016 – 2019 .......................................................... 148 Figure 65: Lemington South Alluvium Groundwater EC Trends 2016 – 2019 ......................................................... 149 Figure 66: Lemington South Alluvium Groundwater SWL Trends 2016 – 2019 ...................................................... 149 Figure 67: Lemington South Arrowfield Groundwater pH Trends 2016 – 2019 ....................................................... 150 Figure 68: Lemington South Arrowfield Groundwater EC Trends 2016 – 2019 ....................................................... 151 Figure 69: Lemington South Arrowfield Groundwater SWL Trends 2016 – 2019 .................................................... 151 Figure 70: Lemington South Bowfield Groundwater pH Trends 2016 – 2019 .......................................................... 152 Figure 71: Lemington South Bowfield Groundwater EC Trends 2016 – 2019 ......................................................... 153 Figure 72: Lemington South Bowfield Groundwater SWL Trends 2016 – 2019 ...................................................... 153 Figure 73: Lemington South Interburden Groundwater pH Trends 2016 – 2019 ..................................................... 154 Figure 74: Lemington South Interburden Groundwater EC Trends 2016 – 2019 .................................................... 155 Figure 75: Lemington South Interburden Groundwater SWL Trends 2016 – 2019 .................................................. 155 Figure 76: Lemington South Woodlands Hill Groundwater pH Trends 2016 – 2019 ............................................... 156 Figure 77: Lemington South Woodlands Hill Groundwater EC Trends 2016 – 2019 ............................................... 157 Figure 78: Lemington South Woodlands Hill Groundwater SWL Trends 2016 – 2019 ............................................ 157 Figure 79: Lemington South Glen Munro Groundwater pH Trends 2016 – 2019 .................................................... 158 Figure 80: Lemington South Glen Munro Groundwater EC Trends 2016 – 2019 .................................................... 159 Figure 81: Lemington South Glen Munro Groundwater SWL Trends 2016 – 2019 ................................................. 159 Figure 82: North Pit Spoil Groundwater pH Trends 2016 – 2019 ............................................................................. 160 Figure 83: North Pit Spoil Groundwater EC Trends 2016 – 2019 ............................................................................ 161 Figure 84: North Pit Spoil Groundwater SWL Trends 2016 – 2019 ......................................................................... 161 Figure 85: West Pit Alluvium Groundwater pH Trends 2016 – 2019 ........................................................................ 162 Figure 86: West Pit Alluvium Groundwater EC Trends 2016 – 2019 ....................................................................... 163 Figure 87: West Pit Alluvium Groundwater SWL Trends 2016 – 2019 .................................................................... 163 Figure 88: West Pit Sandstone/Siltstone Groundwater pH Trends 2016 – 2019 ..................................................... 164 Figure 89: West Pit Sandstone/Siltstone Groundwater EC Trends 2016 – 2019 ..................................................... 165 Figure 90: West Pit Sandstone/Siltstone Groundwater SWL Trends 2016 – 2019 .................................................. 165 Figure 91 – Carrington West Wing Bayswater Groundwater pH Trends 2016 to 2019 ........................................... 166 Figure 92 – Carrington West Wing Bayswater Groundwater EC Trends 2016 to 2019 ........................................... 166 Figure 93 – Carrington West Wing Bayswater Groundwater SWL Trends 2016 to 2019 ........................................ 167 Figure 94: HVO Rehabilitation Areas as at 2019 ...................................................................................................... 171 Figure 95: Overview of 2019 and 2018 rehabilitation monitoring inspections .......................................................... 184 Figure 96: Rehabilitation Maintenance – post-rehabilitation weed control ............................................................... 187 Figure 97: Australian Raven at Ejector Bait Site 44 ................................................................................................. 190 Figure 98: Fox at Ejector Bait Site 44 ....................................................................................................................... 190 Figure 99: HVO Vertebrate Pest Management Bait Locations – Summer 2019 ...................................................... 191 Figure 100: HVO North Vertebrate Pest Management Bait Locations – Autumn 2019 ........................................... 192 Figure 101: HVO Vertebrate Pest Management Bait Locations – Autumn 2019 ..................................................... 193 Figure 102: HVO Vertebrate Pest Management Bait Locations – Spring 2019 ....................................................... 194 Figure 103: Weed Control Overview for West Pit – 2019 ......................................................................................... 196 Figure 104: Weed Control Overview for Carrington Pit – 2019 ................................................................................ 197 Figure 105: Weed Control Overview for Riverview, Cheshunt and Lemington – 2019 ............................................ 198 Figure 106: Native tube stock planting at Carrington Billabong (photo taken in 2017) ............................................ 204 Figure 107: Native tubestock plantings at Carrington Billabong in 2019 .................................................................. 204 Figure 108: Native tubestock plantings at site 51 ..................................................................................................... 205 Figure 109: River red gum plantings at site 51 ......................................................................................................... 205 Figure 110: HVO 2019 weed survey results – Carrington ........................................................................................ 207 Figure 111: HVO 2019 weed survey results – Lemington ........................................................................................ 208 Figure 112: HVO’s Goulburn River Offset and adjoining Warkworth Mine offset ..................................................... 210 Figure 113: Rainfall records recorded at the Merriwa (Roscommon) gauge - 2019. ............................................... 211 Figure 114: Vertebrate pest baiting results undertaken within the Goulburn River BA - Autumn 2019 ................... 212

2019 Annual Environmental Review Hunter Valley Operations
Report
Number: HVOOC-748212775-6 Status: [Document Status (Office)] Effective: [Effective Date] Page 11 of
238 Owner: [Owner] Version: [Document Version (Office)] Review:
[Planned Review Date]
Uncontrolled when printed
Figure 115: Vertebrate pest baiting results undertaken within the Goulburn River BA - Spring 2019 ..................... 213 Figure 116: Baits taken from sites established at Goulburn River BA (Sites G1 to G41) - Spring 2019 .................. 215 Figure 117 Summary of Community Complaints in 2019 ......................................................................................... 216 Figure 118 Community Complaints 2016 – 2019 ..................................................................................................... 216 Figure 119: Proposed Timeline for Implementation of 2020 Improvement Project .................................................. 235

2019 Annual Environmental Review Hunter Valley Operations
Report
Number: HVOOC-748212775-6 Status: [Document Status (Office)] Effective: [Effective Date] Page 12 of
238 Owner: [Owner] Version: [Document Version (Office)] Review:
[Planned Review Date]
Uncontrolled when printed
Tables Table 1 Statement of Compliance .............................................................................................................................. 15 Table 2 Non-compliances ........................................................................................................................................... 15 Table 3 Compliance Status Key for Table 2 ............................................................................................................... 15 Table 4 Mine Contacts ................................................................................................................................................ 17 Table 5 HVO Major Approvals .................................................................................................................................... 20 Table 6 Summary of Mining Tenements ..................................................................................................................... 21 Table 7 HVO Leases and Permits .............................................................................................................................. 24 Table 8 Water Related Approvals ............................................................................................................................... 25 Table 9 Water Access Licences ................................................................................................................................. 29 Table 10 Management Plans and Mining Operations Plans (MOPs) Required for HVO North ................................. 32 Table 11 Management Plans and MOPs Required for HVO South ........................................................................... 34 Table 12 HVO Equipment Used 2018-2019 ............................................................................................................... 35 Table 13 Stockpile Capacities .................................................................................................................................... 36 Table 14 Methods of Coal Transportation .................................................................................................................. 36 Table 15 Production Statistics and Correlating Project Approval Limits .................................................................... 37 Table 16 Production Operations Forecast .................................................................................................................. 38 Table 17 Actions required following review of the 2018 Annual Review .................................................................... 39 Table 18 Comparison of Attended and Real Time Noise Monitoring 2019 ................................................................ 44 Table 19 Noise measurements which exceeded noise criteria during 2019 .............................................................. 45 Table 20 Comparison of 2019 noise monitoring results against previous years ........................................................ 45 Table 21 Comparison of 2019 monitoring against HVO North (Year 14, West Pit EIS, 2003) - Night Period ........... 45 Table 22 Comparison of 2019 monitoring against HVO South (Stage 1 HVO South Modification 5 EA- 2017) ........ 46 Table 23 HVO airblast overpressure allowable exceedance summary ...................................................................... 48 Table 24 Visible blast fume rankings according to the AEISG colour scale ............................................................... 51 Table 25 Real Time PM10 Air Quality Monitoring Data Availability 2019 .................................................................... 53 Table 26: Dust Deposition Annual Average Assessment ........................................................................................... 56 Table 27 Annual TSP investigation - 2019 ................................................................................................................. 58 Table 28 - 24 Hour Elevated TEOMPM10 Investigations ........................................................................................... 62 Table 29 Assessment of Annual Average PM10 - 2019 .............................................................................................. 98 Table 30: Short Term Impact Assessment Criteria – PM2.5 Results 2019 .................................................................. 98 Table 31: HVO South PM10 annual average results compared against cumulative predictions^ ............................. 101 Table 32 HVO South TSP annual average results compared against cumulative predictions^ ............................... 101 Table 33: HVO South Depositional Dust annual average results compared against cumulative predictions^ ........ 102 Table 34 HVO North 2019 PM10 annual average results compared against cumulative predictions^ ..................... 102 Table 35 2019 TSP Annual Average results compared against cumulative predictions^ ........................................ 103 Table 36: Greenhouse Gas Emission summary ....................................................................................................... 103 Table 37 2019 HVO Water Balance ......................................................................................................................... 112 Table 38 HVO Water Monitoring Data Recovery for 2019 (by exception) ................................................................ 115 Table 39 Hunter River Internal Trigger Tracking Results ......................................................................................... 116 Table 40 Wollombi Brook Internal Trigger Exceedance Results .............................................................................. 118 Table 41 Other Tributaries Internal Trigger Exceedance Results ............................................................................ 122 Table 42 Representative Water Quality for West Pit ................................................................................................ 126 Table 43 HVO Groundwater Monitoring Data Recovery for 2019 (by exception) .................................................... 127 Table 44 HVO Carrington Broonie Groundwater 2019 Monitoring Internal Trigger Tracking .................................. 130 Table 45 HVO Carrington Alluvium Groundwater 2019 Monitoring Internal Trigger Tracking ................................. 132 Table 46 HVO Carrington West Wing Alluvium Groundwater 2019 Monitoring Internal Trigger Tracking ............... 136 Table 47 HVO Carrington West Wing Flood Plain Groundwater 2019 Monitoring Internal Trigger Tracking .......... 138 Table 48 HVO Cheshunt/North Pit Alluvium Groundwater 2019 Monitoring Internal Trigger Exceedances ............ 140 Table 49 Cheshunt Interburden Groundwater 2019 Monitoring Internal Trigger Tracking....................................... 142 Table 50 Cheshunt Mt Arthur Groundwater 2019 Monitoring Internal Trigger Tracking .......................................... 144 Table 51 Lemington South Alluvium Groundwater 2019 Monitoring Internal Trigger Tracking ............................... 148 Table 52 Lemington South Arrowfield Groundwater 2019 Monitoring Internal Trigger Tracking ............................. 150 Table 53 Lemington South Bowfield Groundwater 2019 Monitoring Internal Trigger Tracking ............................... 152 Table 54 Lemington South Interburden Groundwater 2019 Monitoring Internal Trigger Tracking ........................... 154 Table 55 Lemington South Woodlands Hill Groundwater 2019 Monitoring Internal Trigger Tracking ..................... 156 Table 56 Lemington South Glen Munro Groundwater 2019 Monitoring Internal Trigger Tracking .......................... 158

2019 Annual Environmental Review Hunter Valley Operations
Report
Number: HVOOC-748212775-6 Status: [Document Status (Office)] Effective: [Effective Date] Page 13 of
238 Owner: [Owner] Version: [Document Version (Office)] Review:
[Planned Review Date]
Uncontrolled when printed
Table 57 North Pit Spoil Groundwater 2019 Monitoring Internal Trigger Tracking .................................................. 160 Table 58 West Pit Sandstone/Siltstone Groundwater 2019 Monitoring Internal Trigger Tracking ........................... 164 Table 59 Key Rehabilitation Performance Indicators ............................................................................................... 168 Table 60 Summary of new rehabilitation completed in 2019 .................................................................................... 169 Table 61 Summary of rehabilitation and disturbance completed in 2019^ ............................................................... 172 Table 62 Variations to the Rehabilitation Programme in 2019 ................................................................................. 174 Table 63 Summary of 2019 and 2018 rehabilitation monitoring inspections ............................................................ 178 Table 64 Summary of Vertebrate Pest Management 2019 ...................................................................................... 188 Table 65 Comparison of results between baiting programmes at HVO ................................................................... 189 Table 66 Soil Management ....................................................................................................................................... 200 Table 67 HVO Topsoil Audit – findings, recommendations and actions .................................................................. 201 Table 68 HVO Tailings Storage Facilities ................................................................................................................. 203 Table 69 Biodiversity Area Management Activities 2019 ......................................................................................... 211 Table 70 Comparison of results - Goulburn River Biodiversity Area. ....................................................................... 214 Table 71 Details of Complaints Received in 2019 .................................................................................................... 217 Table 72: Independent Environmental Audit Findings and Recommendations – 2019 ........................................... 222

2019 Annual Environmental Review Hunter Valley Operations
Report
Number: HVOOC-748212775-6 Status: [Document Status (Office)] Effective: [Effective Date] Page 14 of
238 Owner: [Owner] Version: [Document Version (Office)] Review:
[Planned Review Date]
Uncontrolled when printed
Appendices
Appendix A – 2019 Annual Groundwater Report
Appendix B – HVO S240 Rehabilitation Maintenance Schedule
Appendix C – 2019 Heritage Complaince Inspection Audits

2019 Annual Environmental Review Hunter Valley Operations
Report
Number: HVOOC-748212775-6 Status: [Document Status (Office)] Effective: [Effective Date] Page 15 of
238 Owner: [Owner] Version: [Document Version (Office)] Review:
[Planned Review Date]
Uncontrolled when printed
Statement of Compliance Table 1 is a Statement of compliance against the relevant approvals. Table 2 provides a brief summary of the non-compliances against development consents and a reference to where these are addressed within this Annual Review. Table 3 shows the compliance status descriptions relating to Table 2.
Table 1 Statement of Compliance
Were all conditions of the relevant approvals complied with?
PA 06_02161 (HVO South) No
DA 450-10-2003 (HVO North) No
Table 2 Non-compliances
Relevant Approval
Condition Number
Condition Description Compliance Status
Where addressed in Annual Review
DA450-10-2003
SOC Ref. 22 Annual Visual Assessments 2016-2019
Non-compliant (Administrative)
Section 11.5
PA06_0261 Schedule 3 Condition 23
Missed HVAS sample 25/4/2019
Non-Compliant (low)
Section 11.4.1
PA06_0261 Schedule 3 Condition 7
Overpressure exceedance 28/05/2019
Non-Compliant (low)
Section 11.1.1
PA06_0261 Schedule 3 Condition 10
Blasting Hours 15/04/2017 (Reported 1/07/2019)
Non-Compliant (low)
Section 11.1.2
PA06_0261 Append 4 Condition A4
Tonal Noise Assessments 2016-2019
Non-Compliant (low)
Section 11.3.2
DA450-10-2003
Append 4 Condition A4
Tonal Noise Assessments 2016-2019
Non-Compliant (low)
Section 11.3.2
DA450-10-2003
Schedule 3 Condition 20
Offsite water discharge 18/03/2019
Non-Compliant (medium)
Section 11.2.1
DA450-10-2003
Schedule 3 Condition 20
Offsite water discharge 30/03/2019
Non-Compliant (medium)
Section 11.2.2
PA06_0261 Schedule 3 Condition 22
Dust management 21/08/2019
Non-Compliant (medium)
Section 11.4.2
Table 3 Compliance Status Key for Table 2
Risk Level Colour Code Description
High Non-compliant Non-compliance with potential for significant environmental consequences, regardless of the likelihood of occurrence
Medium Non-compliant Non-compliance with: Potential for serious environmental consequences, but is unlikely to occur; or Potential for moderate environmental consequences, but is unlikely to occur
Low Non-compliant Non-compliance with: Potential for moderate environmental consequences, but is unlikely to occur; or Potential for low environmental consequences, but is unlikely to occur
Administrative Non-compliance
Non-compliant Only to be applied where the non-compliance does not result in any risk of environmental harm (e.g. submitting a report to government later than required under approval conditions)

2019 Annual Environmental Review Hunter Valley Operations
Report
Number: HVOOC-748212775-6 Status: [Document Status (Office)] Effective: [Effective Date] Page 16 of
238 Owner: [Owner] Version: [Document Version (Office)] Review:
[Planned Review Date]
Uncontrolled when printed

2019 Annual Environmental Review Hunter Valley Operations
Report
Number: HVOOC-748212775-6 Status: [Document Status (Office)] Effective: [Effective Date] Page 17 of
238 Owner: [Owner] Version: [Document Version (Office)] Review:
[Planned Review Date]
Uncontrolled when printed
Introduction 2.1 Document Purpose
This Annual Review is written to satisfy the requirements of the Hunter Valley Operations (HVO) Development Consents and conditions of mining leases for events which occurred during the 2019 calendar year. The Annual Review has been written in accordance with the NSW Government Post-approval requirements for State significant mining developments – Annual Review Guideline (October 2015).
This report is distributed to:
NSW Department of Planning, Industry and Environment (DPI&E);
NSW Resource Regulator;
Natural Resource Access Regulator (NRAR);
Singleton Council;
Muswellbrook Shire Council; and
HVO Community Consultative Committee (CCC).
2.2 Background HVO is situated in the Upper Hunter Valley between Singleton and Muswellbrook, approximately 24 km northwest of Singleton, and approximately 100 km northwest of Newcastle. The Hunter River geographically divides HVO into HVO North and HVO South; however they are integrated operationally with personnel, equipment and materials utilised as required. This improves operational efficiency, rationalisation of infrastructure and resource utilisation.
HVO is a jointly controlled operation through a Joint Venture between Glencore (49%) and Yancoal (51%).
The regional context and layout of the HVO pits and facilities are shown in Figure 1 and Figure 2 respectively.
.
2.3 Mine Contacts Key mine contacts are listed in Table 4.
Table 4 Mine Contacts
Contact Role Phone Email
Tony Galvin General Manager 02 6570 0228 [email protected]
Phillip Price Operations Manager 02 6570 0086 [email protected]
Andrew Speechly Environment & Community Manager 02 6570 0497 [email protected]

2019 Annual Environmental Review Hunter Valley Operations
Report
Number: HVOOC-748212775-6 Status: [Document Status (Office)] Effective: [Effective Date] Page 18 of
238 Owner: [Owner] Version: [Document Version (Office)] Review:
[Planned Review Date]
Uncontrolled when printed
Figure 1 Regional Context

2019 Annual Environmental Review Hunter Valley Operations
Report
Number: HVOOC-748212775-6 Status: [Document Status (Office)] Effective: [Effective Date] Page 19 of
238 Owner: [Owner] Version: [Document Version (Office)] Review:
[Planned Review Date]
Uncontrolled when printed
Figure 2 Hunter Valley Operations – Site Layout

2019 Annual Environmental Review Hunter Valley Operations
Report
Number: HVOOC-748212775-6 Status: [Document Status (Office)] Effective: [Effective Date] Page 20 of
238 Owner: [Owner] Version: [Document Version (Office)] Review:
[Planned Review Date]
Uncontrolled when printed
Approvals 3.1 Approvals, Leases and Licences 3.1.1 Current Approvals
The status of HVO development consents, licenses and relevant approvals are listed in the following tables:
Table 5: HVO Major Approvals;
Table 6: Summary of Mining Tenements;
Table 7: HVO Leases and Permits;
Table 8: Water Related Approvals; and
Table 9: Water Access Licence.
Table 5 HVO Major Approvals
Approval Number
Description Issue Date Expiry Date
HVO North DA 450-10-2003 MOD 7
HVO West Pit Extension & Minor Modifications (2003); and associated modifications. MOD 7 approved July 2017. Covers West Pit (approved production limit of 12mtpa), Carrington Pit (approved production limit of 10mtpa), HVCHPP (approved processing limit of 20mtpa) and WCHPP (approved processing limit of 6mtpa).
28/07/2017 12/06/2025
HVO South PA 06_0261 MOD 5
Hunter Valley Operations – South Coal Project & associated modifications MOD 5 approved February 2018 The modification covered: - the progression of mining to the base of the Bayswater seam from Cheshunt Pit into Riverview Pit, and to the base of the Vaux seam in South Lemington Pit 2. - increased overburden emplacement height in some areas to 240m AHD and incorporation of micro-relief - extraction rate increase from 16Mpta to 20Mtpa of ROM coal at peak production and increased processing rate from 16Mpta to 20Mtpa of ROM coal across HVO coal preparation plants. The modification also involved changes to the Statement of Commitments.
28/02/2018 24/03/2030
EPBC 2016/7640
Hunter Valley Operations – State approved mining Hunter Valley NSW
10/10/2016 31/12/2030

2019 Annual Environmental Review Hunter Valley Operations
Report
Number: HVOOC-748212775-6 Status: [Document Status (Office)] Effective: [Effective Date] Page 21 of
238 Owner: [Owner] Version: [Document Version (Office)] Review:
[Planned Review Date]
Uncontrolled when printed
Table 6 Summary of Mining Tenements
Title Mining Tenement
Titleholder Purpose Grant Date Expiry Date
Status
AUTH 72
Authorisation Coal & Allied Pty Ltd and Anotero Pty Ltd
Prospecting 08/03/1977 24/03/2018 Renewal Pending
EL 5291
Exploration Licence
Coal & Allied Pty Ltd and Anotero Pty Ltd
Prospecting 28/04/1997 28/04/2018 Renewal Pending
EL 5292
Exploration Licence
Coal & Allied Pty Ltd and Anotero Pty Ltd
Prospecting 28/04/1997 28/04/2020 Granted
EL 5417
Exploration Licence
Coal & Allied Pty Ltd and Anotero Pty Ltd
Prospecting 23/12/1997 08/05/2018 Renewal Pending
EL 5418
Exploration Licence
Coal & Allied Pty Ltd and Anotero Pty Ltd
Prospecting 23/12/1997 08/05/2017 Renewal Pending
EL 5606
Exploration Licence
Coal & Allied Pty Ltd and Anotero Pty Ltd
Prospecting 11/08/1999 10/08/2019 Renewal Pending
EL 8175
Exploration Licence
Coal & Allied Pty Ltd and Anotero Pty Ltd
Prospecting 23/09/2013 22/09/2018 Renewal Pending
EL 8821
Exploration Licence
Coal & Allied Pty Ltd and Anotero Pty Ltd
Prospecting 13/02/2019 13/02/2025 Granted
(Part) CCL 708
Sub lease Liddell Tenements Pty Ltd
Prospecting and Mining Coal
17/05/1990 29/12/2023 Granted
CCL 714
Consolidated Coal Lease
Coal & Allied Pty Ltd and Anotero Pty Ltd
Prospecting and Mining Coal
23/05/1990 30/08/2030 Granted
CCL 755
Consolidated Coal Lease
Coal & Allied Pty Ltd and Anotero Pty Ltd
Prospecting and Mining Coal
24/01/1990 05/03/2030 Granted
CL 327
Coal Lease Coal & Allied Pty Ltd and Anotero Pty Ltd
Prospecting and Mining Coal
06/03/1989 05/03/2031 Granted
CL 359
Coal Lease Coal & Allied Pty Ltd and Anotero Pty Ltd
Prospecting and Mining Coal
21/05/1990 20/05/2032 Granted
CL 360
Coal Lease Coal & Allied Pty Ltd and Anotero Pty Ltd
Prospecting and Mining Coal
29/05/1990 28/05/2032 Granted
CL 398
Coal Lease Coal & Allied Pty Ltd and Anotero Pty Ltd
Prospecting and Mining Coal
04/06/1992 03/06/2034 Granted
CL 584
Coal Lease Coal & Allied Pty Ltd and Anotero Pty Ltd
Prospecting and Mining Coal
01/01/1982 31/12/2023 Granted
CML 4 Consolidated Mining Lease
Coal & Allied Pty Ltd and Anotero Pty Ltd
Prospecting and Mining Coal
02/03/1993 03/06/2033 Granted

2019 Annual Environmental Review Hunter Valley Operations
Report
Number: HVOOC-748212775-6 Status: [Document Status (Office)] Effective: [Effective Date] Page 22 of
238 Owner: [Owner] Version: [Document Version (Office)] Review:
[Planned Review Date]
Uncontrolled when printed
Title Mining Tenement
Titleholder Purpose Grant Date Expiry Date
Status
ML 1324
Mining Lease Coal & Allied Pty Ltd and Anotero Pty Ltd
Prospecting and Mining Coal
19/08/1993 19/08/2035 Granted
ML 1337
Mining Lease Coal & Allied Pty Ltd and Anotero Pty Ltd
Prospecting and Mining Coal
01/02/1994 01/02/2034 Granted
ML 1359
Mining Lease Coal & Allied Pty Ltd and Anotero Pty Ltd
Prospecting and Mining Coal
01/11/1994 31/10/2015 Renewal Pending
ML 1406
Mining Lease Coal & Allied Pty Ltd and Anotero Pty Ltd
Prospecting and Mining Coal
27/02/1997 10/02/2027 Granted
ML 1428
Mining Lease Coal & Allied Pty Ltd and Anotero Pty Ltd
Prospecting and Mining Coal
15/04/1998 14/04/2019 Renewal Pending
ML 1465
Mining Lease Coal & Allied Pty Ltd and Anotero Pty Ltd
Prospecting and Mining Coal
21/02/2000 20/02/2021 Granted
ML 1474
Mining Lease Coal & Allied Pty Ltd and Anotero Pty Ltd
Prospecting and Mining Coal
24/11/2000 23/11/2021 Granted
ML 1482
Mining Lease Coal & Allied Pty Ltd and Anotero Pty Ltd
Prospecting and Mining Coal
19/03/2001 14/04/2019 Renewal Pending
ML 1500
Mining Lease Coal & Allied Pty Ltd and Anotero Pty Ltd
Prospecting and Mining Coal
21/12/2001 20/12/2022 Granted
ML 1526
Mining Lease Coal & Allied Pty Ltd and Anotero Pty Ltd
Prospecting and Mining Coal
03/12/2002 02/12/2023 Granted
ML 1560
Mining Lease Coal & Allied Pty Ltd and Anotero Pty Ltd
Prospecting and Mining Coal
28/01/2005 27/01/2026 Granted
ML 1589
Mining Lease Coal & Allied Pty Ltd and Anotero Pty Ltd
Prospecting and Mining Coal
02/11/2006 01/11/2027 Granted
ML 1622
Mining Lease Coal & Allied Pty Ltd and Anotero Pty Ltd
Prospecting and Mining Coal
22/10/2010 10/03/2027 Granted
ML 1634
Mining Lease Coal & Allied Pty Ltd and Anotero Pty Ltd
Prospecting and Mining Coal
31/07/2009 30/07/2030 Granted
ML 1682
Mining Lease Coal & Allied Pty Ltd and Anotero Pty Ltd
Prospecting and Mining Coal
16/12/2012 15/12/2033 Granted
ML 1704
Mining Lease Coal & Allied Pty Ltd and Anotero Pty Ltd
Mining Purposes
05/12/2014 04/12/2035 Granted
ML 1705
Mining Lease Coal & Allied Pty Ltd and Anotero Pty Ltd
Prospecting and Mining Coal
17/12/2014 16/12/2035 Granted

2019 Annual Environmental Review Hunter Valley Operations
Report
Number: HVOOC-748212775-6 Status: [Document Status (Office)] Effective: [Effective Date] Page 23 of
238 Owner: [Owner] Version: [Document Version (Office)] Review:
[Planned Review Date]
Uncontrolled when printed
Title Mining Tenement
Titleholder Purpose Grant Date Expiry Date
Status
ML 1706
Mining Lease Coal & Allied Pty Ltd and Anotero Pty Ltd
Mining Purposes
09/12/2014 08/12/2035 Granted
ML 1707
Mining Lease Coal & Allied Pty Ltd and Anotero Pty Ltd
Prospecting and Mining Coal
09/12/2014 08/12/2035 Granted
ML 1710
Mining Lease Coal & Allied Pty Ltd and Anotero Pty Ltd
Prospecting and Mining Coal
22/12/2016 10/03/2027 Granted
ML 1732
Mining Lease Coal & Allied Pty Ltd and Anotero Pty Ltd
Mining Purposes
06/04/2016 05/04/2037 Granted
ML 1734
Mining Lease Coal & Allied Pty Ltd and Anotero Pty Ltd
Mining Purposes
06/04/2016 05/04/2037 Granted
ML 1748
Mining Lease Coal & Allied Pty Ltd and Anotero Pty Ltd
Mining Purposes
05/12/2016 04/12/2037 Granted
ML 1753
Mining Lease Coal & Allied Pty Ltd and Anotero Pty Ltd
Mining Purposes
19/04/2017 18/04/2038 Granted
ALA 52
Assessment Lease Application
Coal & Allied Pty Ltd and Anotero Pty Ltd
Prospecting Mining Lease Application lodged 10th September 2012
Offer of Grant – Pending Determination
ALA 58
Assessment Lease Application
Coal & Allied Pty Ltd and Anotero Pty Ltd
Prospecting Mining Lease Application lodged 1st December 2016
Offer of Grant – Pending Determination
ALA 59
Assessment Lease Application
Coal & Allied Pty Ltd and Anotero Pty Ltd
Prospecting Mining Lease Application lodged 1st December 2016
Offer of Grant – Pending Determination
ELA 5525
Exploration Licence Application
Coal & Allied Pty Ltd and Anotero Pty Ltd
Prospecting Exploration Licence Application lodged 3rd July 2017
GRANTED EL 8821 (above)
ELA 5526
Exploration Licence Application
Coal & Allied Pty Ltd and Anotero Pty Ltd
Prospecting Exploration Licence Application lodged 3rd July 2017
ELA 5527
Exploration Licence Application
Coal & Allied Pty Ltd and Anotero Pty Ltd
Prospecting Exploration Licence Application lodged 3rd July 2017
MLA 489
Mining Lease Application
Coal & Allied Pty Ltd and Anotero Pty Ltd
Mining Purposes
Mining Lease Application lodged 10th March 2015
Application Pending
MLA 495
Mining Lease Application
Coal & Allied Pty Ltd and Anotero Pty Ltd
Mining Purposes
Mining Lease Application lodged 12th May 2015
Application Pending
MLA 496
Mining Lease Application
Coal & Allied Pty Ltd and Anotero Pty Ltd
Mining Purposes
Mining Lease Application lodged 12th May 2015
Application Pending
MLA 520
Mining Lease Application
Coal & Allied Pty Ltd and Anotero Pty Ltd
Mining Purposes
Mining Lease Application lodged 23rd December 2015
Application Pending

2019 Annual Environmental Review Hunter Valley Operations
Report
Number: HVOOC-748212775-6 Status: [Document Status (Office)] Effective: [Effective Date] Page 24 of
238 Owner: [Owner] Version: [Document Version (Office)] Review:
[Planned Review Date]
Uncontrolled when printed
Title Mining Tenement
Titleholder Purpose Grant Date Expiry Date
Status
MLA 534
Mining Lease Application
Coal & Allied Pty Ltd and Anotero Pty Ltd
Mining Purposes
Mining Lease Application lodged 28th October 2016
Application Pending
MLA 535
Mining Lease Application
Coal & Allied Pty Ltd and Anotero Pty Ltd
Mining Purposes
Mining Lease Application lodged 28th October 2016
Application Pending
MLA 542
Mining Lease Application
Coal & Allied Pty Ltd and Anotero Pty Ltd
Ancillary Mining Activities (Mining Purposes)
Mining Lease Application lodged 27th July 2017
Application Pending
MLA 543
Mining Lease Application
Coal & Allied Pty Ltd and Anotero Pty Ltd
Ancillary Mining Activities (Mining Purposes)
Mining Lease Application lodged 27th July 2017
Application Pending
MLA 562
Mining Lease Application
Coal & Allied Pty Ltd and Anotero Pty Ltd
Ancillary Mining Activities (Mining Purposes)
Mining Lease Application lodged 21st December 2018
Application Pending
Table 7 HVO Leases and Permits
Type Licence Number
Description Authority Expiry Date
Environment Protection Licence
EPL640 Environment Protection Licence EPA N/A
Dangerous Goods/ Explosives
RR12709 Licence to Store WorkCover 06/07/2022
Radiation Licence
RML5085293 Radiation Management Licence EPA 14/11/2020
Aboriginal Heritage Permit
C0001890 Care Agreement OEH 03/06/2036
C0002193 Aboriginal Heritage impact Permit OEH 06/12/2026
Road Closure Permit
538338 Road Occupancy Licences– Golden Highway RMS 30/06/2020
N/A Road Closure Approval - Lemington Road Singleton Council
30/06/2020

2019 Annual Environmental Review Hunter Valley Operations
Report
Number: HVOOC-748212775-6 Status: [Document Status (Office)] Effective: [Effective Date] Page 25 of
238 Owner: [Owner] Version: [Document Version (Office)] Review:
[Planned Review Date]
Uncontrolled when printed
Table 8 Water Related Approvals
Licence Number
Type of Licence
Purpose Legislation Description Expiry Date
20BL030566 Bore Well Part 5 Water Act 1912
East Open Cut Perpetuity
20BL141584 Bore Monitoring Bore
Part 5 Water Act 1912
HVO North – Carrington Work Licence
Perpetuity
20BL166637 Bore Monitoring Bore
Part 5 Water Act 1912
No Current Bores Perpetuity
WAL41527 Bore Excavation - Mining
Water Management Act 2000
HVO North – Carrington Pit
Continuing
20BL168820 Bore Monitoring Bore
Part 5 Water Act 1912
HVO North – Bores: CGW39, CGW45a, CGW46,CGW47, CGW47a, CGW48, CGW49, P50/38.5, ,CGW56, 4036C, 4035P, 4032P, 4034P, 4033P, 4053P, 4052P, 4051C, 4040P, 4038C, 4037P Destroyed:CGW7,CGW50, CGW57, CGW58, CGW59, CGW60, CGW61, CGW62, CGW63
Perpetuity
20BL169241 Bore Monitoring Bore
Part 5 Water Act 1912
HVO North – Bores: DM1, HF3, HF7 Destroyed: DM2
Perpetuity
20BL169641 Bore Monitoring Bore
Part 5 Water Act 1912
HVO North – Bores: CGW5, CGW51A, CGW52, CGW53, CGW54, CGW55A, CGW53A, CGW52A, CGW54A, CGW6, CFW55, CFW57, CFW57A, CFW59, and CFW55R. Destroyed: CGW1, CGW2, CGW3, CGW5, CGW8,CGW9, CGW10, CGW12, CGW13, CGW14, CGW30, CGW33, CGW34, CGW35, CGW36, CGW37, CGW38, CGW40, CGW41, CGW42, CGW43, CGW44, CFW56, CFW56A, CFW58
Perpetuity
20BL170496 Bore Monitoring Bore
Part 5 Water Act 1912
HVO South – Bores: BZ10 (CHPZ 2A), BZ11 (CHPZ 3A), BZ18 (CHPZ 10A), BZ20 (CHPZ 12A), BZ21 (CHPZ 13D) , BZ21A (CHPZ 13A), BZ20A
Perpetuity

2019 Annual Environmental Review Hunter Valley Operations
Report
Number: HVOOC-748212775-6 Status: [Document Status (Office)] Effective: [Effective Date] Page 26 of
238 Owner: [Owner] Version: [Document Version (Office)] Review:
[Planned Review Date]
Uncontrolled when printed
Licence Number
Type of Licence
Purpose Legislation Description Expiry Date
(CHPZ 12D), BZ11A (CHPZ 3D) Destroyed: AP50/47.5, AQ52, AV50/56.5, AS50/62.5, AR55, Bunc 3, BZ25 (Bunc 12) , BZ23 (Bunc 14), BZ24 (Bunc 13),
20BL170497 Bore Monitoring Bore
Part 5 Water Act 1912
HVO South – Bores: BZ15 (CHPZ 7A), BZ16 (CHPZ 8D), BZ17 (CHPZ 9A), BZ19 (CHPZ 11A), BZ16A (CHPZ 8A), Bunc 46D Destroyed: Bunc 39 (Shallow & Deep), Bunc 44D
Perpetuity
20BL170498 Bore Monitoring Bore
Part 5 Water Act 1912
HVO South – Bores: BZ12 (CHPZ 4A), BZ13 (CHPZ 5A), BZ14, BZ9 (CHPZ 1A), BC1, BC1a, BZ8-1, BZ8-2, BZ8-3, HG1, HG2, HG2a, HG3, S4, S6, BZ22 (CHPZ14D), BZ22A (CHPZ 14A), BZ5-1, BZ5-2 Destroyed: S2, S3, S9, S11
Perpetuity
20BL171423 Bore Monitoring Bore
Part 5 Water Act 1912
E1.5 Perpetuity
20BL171424 Bore Monitoring Bore
Part 5 Water Act 1912
Destroyed: GW9711 Perpetuity
20BL171425 Bore Monitoring Bore
Part 5 Water Act 1912
Bores: GW9701, GW9710 Perpetuity
20BL171426 Bore Monitoring Bore
Part 5 Water Act 1912
Bores: GW9702 Destroyed: D2(WH236)
Perpetuity
20BL171427 Bore Monitoring Bore
Part 5 Water Act 1912
Bores: C335, C630 (BFS) Perpetuity
20BL171428 Bore Monitoring Bore
Part 5 Water Act 1912
D807 Perpetuity
20BL171429 Bore Monitoring Bore
Part 5 Water Act 1912
HVO South – Bores: B925 (BFS), C122 (BFS), C122 (WDH)
Perpetuity
20BL171430 Bore Monitoring Bore
Part 5 Water Act 1912
HVO South – Bores: C613 (BFS), C809 (GM/WDH)
Perpetuity
20BL171431 Bore Monitoring Bore
Part 5 Water Act 1912
HVO South – Bores: B631 (BFS), B631 (WDH)
Perpetuity
20BL171432 Bore Monitoring Bore
Part 5 Water Act 1912
HVO South – Bores: C130 (AFSH1), C130 (ALL), C130(BFS), C130 (WDH)
Perpetuity
20BL171433 Bore Monitoring Bore
Part 5 Water Act 1912
HVO South – Bore B334 (BFS)
Perpetuity

2019 Annual Environmental Review Hunter Valley Operations
Report
Number: HVOOC-748212775-6 Status: [Document Status (Office)] Effective: [Effective Date] Page 27 of
238 Owner: [Owner] Version: [Document Version (Office)] Review:
[Planned Review Date]
Uncontrolled when printed
Licence Number
Type of Licence
Purpose Legislation Description Expiry Date
20BL171434 Bore Monitoring Bore
Part 5 Water Act 1912
HVO South – Bores: C317 (BFS), C317 (WDH)
Perpetuity
20BL171435 Bore Monitoring Bore
Part 5 Water Act 1912
HVO South – Bores: BZ3-1, BZ3-2, BZ3-3
Perpetuity
20BL171436 Bore Monitoring Bore
Part 5 Water Act 1912
HVO South – Bores: BZ4A(1), BZ4A(2), BZ4B
Perpetuity
20BL171437 Bore Monitoring Bore
Part 5 Water Act 1912
Bores: WG1, WG2, WG3 Perpetuity
20BL171439 Bore Monitoring Bore
Part 5 Water Act 1912
Bores: BRN, E012 Perpetuity
20BL171492 Bore Monitoring Bore
Part 5 Water Act 1912
Bores: C1(WJ039), GW9704, North, GWAR981
Perpetuity
20BL171681 Bore Monitoring Bore
Part 5 Water Act 1912
HVO South – Bores: Bunc 45A, Bunc 45D
Perpetuity
20BL171725 Bore Monitoring Bore
Part 5 Water Act 1912
HVO South – Bores: B425 (WDH), BRS, C621 (BFS), C919 (ALL), D317 (BFS), D317(ALL), D317(WDH) Destroyed: D420, D425, D621, PB02
Perpetuity
20BL171726 Bore Monitoring Bore
Part 5 Water Act 1912
Bores: SR002, SR003, SR004, SR005, SR006, SR007
Perpetuity
20BL171727 Bore Monitoring Bore
Part 5 Water Act 1912
SR001 Perpetuity
20BL171728 Bore Monitoring Bore
Part 5 Water Act 1912
HVO South – Bores: BZ2B, BZ1-1, BZ1-2, BZ1-3, BZ2-1, BZ2-2
Perpetuity
20BL171762 Bore Monitoring Bore
Part 5 Water Act 1912
HVO South – Bores: C817, D010 (BFS), D214 (BFS), D406 (BFS) (AFS), D510 (BFS), PB01 (ALL), D510 (AFS), D010 (GM), D010 (WDH), D406 (BFS) (AFS), D612 (AFS), D612 (BFS)
Perpetuity
20BL171851 Bore Monitoring Bore
Part 5 Water Act 1912
HVO North/South – Bores: HV2, PZ1CH200, PZ2CH400, PZ3CH800, 4118P, 4119P
Perpetuity
20BL171852 Bore Monitoring Bore
Part 5 Water Act 1912
HVO North – PZ4CH1380 Perpetuity
20BL171853 Bore Monitoring Bore
Part 5 Water Act 1912
HVO North – DM3 Perpetuity
20BL171854 Bore Monitoring Bore
Part 5 Water Act 1912
HVO North – Bores: DM5, PZ6CH2450
Perpetuity
20BL171855 Bore Monitoring Bore
Part 5 Water Act 1912
HVO North – PZ5CH1800 Perpetuity
20BL171856 Bore Monitoring Bore
Part 5 Water Act 1912
HVO North – Bores: HV6, HV3, DM6, HV2 (2),
Perpetuity

2019 Annual Environmental Review Hunter Valley Operations
Report
Number: HVOOC-748212775-6 Status: [Document Status (Office)] Effective: [Effective Date] Page 28 of
238 Owner: [Owner] Version: [Document Version (Office)] Review:
[Planned Review Date]
Uncontrolled when printed
Licence Number
Type of Licence
Purpose Legislation Description Expiry Date
4113P, 4114P. 4116P, 4117P
20BL171857 Bore Monitoring Bore
Part 5 Water Act 1912
Bores: HV4, HV4 (2) (GA3), GA3,
Perpetuity
20BL171858 Bore Monitoring Bore
Part 5 Water Act 1912
HVO North – DM4 Perpetuity
20BL171895 Bore Monitoring Bore
Part 5 Water Act 1912
HVO West – NPZ4 Perpetuity
20BL171896 Bore Monitoring Bore
Part 5 Water Act 1912
HVO West – NPZ2 Perpetuity
20BL171897 Bore Monitoring Bore
Part 5 Water Act 1912
HVO West – Bores: NPZ5, NPZ1
Perpetuity
20BL171898 Bore Monitoring Bore
Part 5 Water Act 1912
HVO West – NPZ3 Perpetuity
20BL173062 Bore Monitoring Bore
Part 5 Water Act 1912
RC14 Perpetuity
20BL173065 Bore Monitoring Bore
Part 5 Water Act 1912
HQ11 Perpetuity
20BL173063 Bore Monitoring Bore
Part 5 Water Act 1912
RC07, RC08 Perpetuity
20BL173064 Bore Monitoring Bore
Part 5 Water Act 1912
RC06 Perpetuity
20BL173069 Bore Monitoring Bore
Part 5 Water Act 1912
RC11 Perpetuity
20CA201247 Works Approval
Pumping Plant
Water Management Act 2000
Associated with WAL965 Perpetuity
20CA212713 Works Approval
Pumping Plant
Water Management Act 2000
Associated with WAL36190
30/05/2025
20FW213280 Flood Work Approval
Levee Water Management Act 2000
HVO North Carrington Levee 5
21/09/2021
20FW213281 Formerly 20CW802613
Flood Work Approval
Levee Water Management Act 2000
HVO South – Barry Levee 21/09/2027
20FW213277 Formerly 20CW802603
Flood Work Approval
Block Dam Water Management Act 2000
HVO South – Hobden Gully Levee
21/09/2027
20FW213278 Formerly 20CW802604
Flood Work Approval
Levee Water Management Act 2000
HVO North – North Pit Levee 3
21/09/2021
20WA210991 (see WAL 18307) Formerly 20SL050903
Stream Diversion
Stream Diversion
Water Management Act 2000
HVO West – Parnells Creek Dam
09/01/2023

2019 Annual Environmental Review Hunter Valley Operations
Report
Number: HVOOC-748212775-6 Status: [Document Status (Office)] Effective: [Effective Date] Page 29 of
238 Owner: [Owner] Version: [Document Version (Office)] Review:
[Planned Review Date]
Uncontrolled when printed
Licence Number
Type of Licence
Purpose Legislation Description Expiry Date
20WA211427 Formerly 20SL061290
Stream Diversion
Cutting (Diversion Drain)
Section 10 Water Act 1912
Pikes Gully Creek Stream Diversion
07/09/2023
20WA210985 (see WAL 18327) 20SL042746
Diversion Works
Industrial Water Management Act 2000
HV Loading Point Pump Bayswater Creek
08/09/2022
20WA211428 20SL061594
Stream Diversion
Cutting (Diversion Drain)
Water Management Act 2000
HVO North – Carrington Stream Diversion
31/07/2022
20WA201238 (see WAL 962)
Diversion Works
Pumping Plant
Water Management Act 2000
HVCPP River Pump 16/03/2018- Application for renewal
pending
20WA201257 (see WAL 970)
Diversion Works
Pumping Plant
Water Management Act 2000
HVO South – LCPP River Pump
Perpetuity
20WA201338 (see WAL 1006)
Diversion Works
Pumping Plant
Water Management Act 2000
HVO South – LCPP River Pump
Perpetuity
20WA201501 (see WAL 1070)
Diversion Works
Pumping Plant
Water Management Act 2000
HVO South – LCPP River Pump
Perpetuity
20WA201685 (see WAL 13387)
Diversion Works
Pumping Plant
Water Management Act 2000
HVO West – "Lake Liddell" Licence
Perpetuity
20FW213274 Flood Work Approval
Levee Water Management Act 2000
Riverview 26/10/2028
Table 9 Water Access Licences
Licence Number
Description Water Source
Water Sharing
Plan
Water Source –
Management Zone
Approved Extraction
(ML)
Extraction 2018/19 Water
Year (ML)
WAL718A Wambo United Operations
Hunter River
Hunter Regulated River WSP
Zone 2a (Hunter River From Glennies Creek Junction To Wollombi Brook Junction)
300 (HVO take allocation
only)
300
WAL867 Comleroi, farming & irrigation
Hunter River
Hunter Regulated River WSP
Zone 2a (Hunter River From Glennies Creek Junction To Wollombi Brook Junction)
486 120B
WAL962 HVO North – HVCPP River Pump – Water
Hunter River
Hunter Regulated River WSP
Zone 1b (Hunter River From Goulburn
3,165 (2585 after
transfer) 891C

2019 Annual Environmental Review Hunter Valley Operations
Report
Number: HVOOC-748212775-6 Status: [Document Status (Office)] Effective: [Effective Date] Page 30 of
238 Owner: [Owner] Version: [Document Version (Office)] Review:
[Planned Review Date]
Uncontrolled when printed
Licence Number
Description Water Source
Water Sharing
Plan
Water Source –
Management Zone
Approved Extraction
(ML)
Extraction 2018/19 Water
Year (ML)
Access Licence
River Junction To Glennies Creek Junction)
WAL969
HVO South – Former Riverview pump
Hunter River
Hunter Regulated River WSP
Zone 1b (Hunter River From Goulburn River Junction To Glennies Creek Junction)
39 0
WAL970
HVO South – LCPP River Pump – Water Access Licence
Hunter River
Hunter Regulated River WSP
Zone 2a (Hunter River From Glennies Creek Junction To Wollombi Brook Junction)
500 (690 after transfer)
498.5
WAL1006
HVO South – LCPP River Pump – Water Access Licence
Hunter River
Hunter Regulated River WSP
Zone 2a (Hunter River From Glennies Creek Junction To Wollombi Brook Junction)
500 (650 after transfers)
576
WAL1070
HVO South - LCPP River Pump – Water Access Licence
Hunter River
Hunter Regulated River WSP
Zone 2a (Hunter River From Glennies Creek Junction To Wollombi Brook Junction)
500 0
WAL13387
Macquarie Generation Hunter River Pump Station
Hunter River
Hunter Regulated River WSP
Zone 1b (Hunter River From Goulburn River Junction To Glennies Creek Junction)
20 0
WAL 13391
HVO North – Alluvial Rehabilitation Irrigation.
Hunter River
Hunter Regulated River WSP
Zone 1b (Hunter River From Goulburn River Junction To Glennies Creek Junction
420 (1642 after transfers)
1397
WAL18127 Carrington BB1
Hunter River Alluvium
Hunter Unregulated and Alluvial Water Sources WSP
Hunter Regulated River Alluvial Water Source – Upstream Glennies Creek management zone
383 350D, E

2019 Annual Environmental Review Hunter Valley Operations
Report
Number: HVOOC-748212775-6 Status: [Document Status (Office)] Effective: [Effective Date] Page 31 of
238 Owner: [Owner] Version: [Document Version (Office)] Review:
[Planned Review Date]
Uncontrolled when printed
Licence Number
Description Water Source
Water Sharing
Plan
Water Source –
Management Zone
Approved Extraction
(ML)
Extraction 2018/19 Water
Year (ML)
WAL18158 Ollenberry Hunter River Alluvium
Hunter Unregulated and Alluvial Water Sources WSP
Hunter Regulated River Alluvial Water Source – Upstream Glennies Creek management zone
65
WAL18307
HVO West – Parnells Creek Dam (Diversion Works Bywash)
Unregulated River
Hunter Unregulated and Alluvial Water Sources WSP
Jerrys Water Source; Jerrys Management Zone
500 0
WAL18327
HV Loading Point Pump Bayswater Creek (Diversion Works)
Unregulated River
Hunter Unregulated and Alluvial Water Sources WSP
Jerrys Water Source; Jerrys Management Zone
150 0
WAL23889 Greenleek Wollombi Brook
Hunter Unregulated and Alluvial Water Sources WSP
Lower Wollombi Brook Water Source
144 0
WAL36190 HVO North, old farm bore
Hunter River Alluvium
Hunter Unregulated and Alluvial Water Sources WSP
Hunter Regulated River Alluvial Water Source – Jerrys Management Zone
120 0
WAL39798 Lemington Underground (LUG) Bore
Permian Coal Seams
North Coast Fractured and Porous Rock Groundwater Sources WSP (commenced 1/7/16)
Permian Coal Seams
1,800 1315
WAL40462
HVO Pit Excavations / Alluvial Lands Bores (x4)
Permian Coal Seams
North Coast Fractured and Porous Rock Groundwater Sources WSP (commenced 1/7/16)
Permian Coal Seams
2,400
879D
WAL40463 180
WAL40466 460
TBA (20BL167860)
HVO North (Carrington Pit)
Permian Coal Seams
North Coast Fractured and Porous Rock
Permian Coal Seams 220 0

2019 Annual Environmental Review Hunter Valley Operations
Report
Number: HVOOC-748212775-6 Status: [Document Status (Office)] Effective: [Effective Date] Page 32 of
238 Owner: [Owner] Version: [Document Version (Office)] Review:
[Planned Review Date]
Uncontrolled when printed
Licence Number
Description Water Source
Water Sharing
Plan
Water Source –
Management Zone
Approved Extraction
(ML)
Extraction 2018/19 Water
Year (ML)
Groundwater Sources WSP (commenced 1/7/16)
TBA (20BL170000)
HVO North – Pit Excavation
Permian Coal Seams
North Coast Fractured and Porous Rock Groundwater Sources WSP (commenced 1/7/16)
Permian Coal Seams 20 0
Notes: A WAL718 held by Wambo United Operations. HVO transferred allocation to WAL718 and water was extracted by WAL718 works prior to import to HVO via offtake from Wambo pipeline. Reporting considers only extraction by HVO utilising WAL718 and associated works. Extraction by Wambo United Operations not detailed. B Imports to HVO only. Does not include rural use by property licensee. C Comprising 758ML pumping and 133ML passive take/inflow. D Passive take / inflows E Take for 2016/17 water year was 288ML and 2017/18 water year was 350ML (reporting as required by licence). Trades during reporting period:
Date Reference Seller Buyer Allocation (ML) 26/9/18 SWC765542 WAL9054 WAL13391 541 26/9/18 SWC765546 WAL946 WAL13391 681 11/10/18 SWC763564 WAL962 WAL718 300 13/11/18 SWC764885 WAL894 WAL970 190 28/5/19 SWC775415 WAL962 WAL13391 130 28/5/19 SWC775416 WAL962 WAL1006 150
3.1.2 Management Plans, Programs and Strategies Under the development consent approvals, HVO is required to develop and submit a range of environmental management plans for approval prior to implementation. Issued in 2009, and last modified in 2018, the HVO South Coal Project Approval (PA06_0261) required the submission of a number of monitoring programs, strategies and management plans, and similarly or the 2017 modification to the HVO North Consent (DA 450-10-2003)
Numerous updated plans were submitted to DPI&E in 2019. Some plans remain under review and will be submitted to DPI&E in 2020. Approved management plans are made publically available on the HVO website (https://insite.hvo.com.au/).
The status of management plans is shown in Table 10 and Table 11.
Table 10 Management Plans and Mining Operations Plans (MOPs) Required for HVO North
Management Plan Date Approved
HVO Water Management Plan 16/10/2018
HVO Bushfire Management Plan 23/06/2015
HVO Noise Management Plan 19/02/2019
HVO Blast Management Plan 30/04/2019
HVO Air Quality and Greenhouse Gas Management Plan 06/09/2019
Hunter Valley Operations Environmental Management Strategy 08/01/2019

2019 Annual Environmental Review Hunter Valley Operations
Report
Number: HVOOC-748212775-6 Status: [Document Status (Office)] Effective: [Effective Date] Page 33 of
238 Owner: [Owner] Version: [Document Version (Office)] Review:
[Planned Review Date]
Uncontrolled when printed
Management Plan Date Approved
Rehabilitation Management Plan (addressed in MOP) 26/02/2019
Agricultural Lands Reinstatement Management Plan (addressed in MOP)* 19/02/2016
MOP - HVO North 2019-2021 26/02/2019
HVO River Red Gum Rehabilitation & Restoration Strategy 24/03/2010
HVO North Heritage Management Plan 19/12/2019
HVO Greenhouse and Energy Efficiency Plan (Addressed in HVO Air Quality and Greenhouse Gas Management Plan)
06/09/2019
Fine Reject Management Strategy 07/12/2018
*The Agricultural Lands Reinstatement Management Plan states that the agricultural reinstatement activities and monitoring results will be reported in the HVO Annual Environment Review. However work has not yet commenced hence no monitoring or reporting against the Management Plan specific to the Carrington West Wing project is provided in this report.

2019 Annual Environmental Review Hunter Valley Operations
Report
Number: HVOOC-748212775-6 Status: [Document Status (Office)] Effective: [Effective Date] Page 34 of
238 Owner: [Owner] Version: [Document Version (Office)] Review:
[Planned Review Date]
Uncontrolled when printed
Table 11 Management Plans and MOPs Required for HVO South
Management Plan Date Approved
HVO River Red Gum Rehabilitation & Restoration Strategy 24/03/2010
HVO South Aboriginal Cultural Heritage Management Plan 19/12/2019
HVGC Amenity Management Plan 22/01/2013
HVO Water Management Plan 16/10/2018
HVO South Aboriginal Cultural Heritage Management Plan 19/12/2019
HVO Bushfire Management Plan 23/06/2015
HVO Noise Management Plan 19/02/2019
HVO Blast Management Plan 30/04/2019
HVO Air Quality and Greenhouse Gas Management Plan 06/09/2019
Hunter Valley Operations Environmental Management Strategy 08/01/2019
MOP - HVO South 2019-2021 Incorporates:
‐ Landscape Management Plan ‐ Rehabilitation and Biodiversity Management Plan ‐ Mine Closure Plan ‐ Final Voids Management Plan
26/02/2019
Rehabilitation and Biodiversity Management Plan (Offsets component) 26/06/2017- Goulburn River Biodiversity Area Management Plan
HVO Integrated Biodiversity Management Plan 02/08/2018
HVO Biodiversity Offset Strategy 23/10/2017

2019 Annual Environmental Review Hunter Valley Operations
Report
Number: HVOOC-748212775-6 Status: [Document Status (Office)] Effective: [Effective Date] Page 35 of
238 Owner: [Owner] Version: [Document Version (Office)] Review:
[Planned Review Date]
Uncontrolled when printed
Operations Summary 4.1 Mining
Areas to be mined are geologically modelled, a mine plan is formed and the relevant mining locations are surveyed prior to mining. Figure 3 illustrates the mining process. HVO have no active underground workings.
Figure 3 Open Cut Mining Schematic
No changes were made to the mining method during the reporting period. Mining progress deviated slightly from the schedule of the MOPs as a result of normal variations in productivity and utilisation.
The mining equipment fleet employed to carry out mining operations at HVO in 2018 and 2019 is detailed in Table 12 along with the fleet forecast for 2020.
Table 12 HVO Equipment Used 2018-2019
Equipment Type Number Used in 2018 Number Used in 2019 Forecast Numbers in
2020
Scrapers 2 2 2
Drills 8 8 7
Draglines 2 2 2
Shovels 3 3 3
Excavators 8 8 7
Trucks 81 81 81
Loaders 6 5 5

2019 Annual Environmental Review Hunter Valley Operations
Report
Number: HVOOC-748212775-6 Status: [Document Status (Office)] Effective: [Effective Date] Page 36 of
238 Owner: [Owner] Version: [Document Version (Office)] Review:
[Planned Review Date]
Uncontrolled when printed
Equipment Type Number Used in 2018 Number Used in 2019 Forecast Numbers in
2020
Service Trucks 5 5 6
Track Dozers 29 29 29
Rubber Tyre Dozers 5 5 5
Graders 11 11 10
Water Trucks 10 10 10
Floats 1 1 1
Cable Reeler 1 1 1
Cable Tractors 5 5 5
Total 177 176 174
4.1.1 Mineral Processing Coal is transported to one of two CHPPs, where it is crushed to size and processed to remove impurities. Processing produces saleable coal, along with coarse and fine reject materials. Coarse rejects are disposed of in pit, and fine rejects are placed in a tailings dam, according to commitments outlined in the MOP. Each CHPP site has storage facilities for processed (saleable) and raw (unprocessed) coal. The capacity of each site is listed in Table 13.
No changes or additions were made to process or facilities during the reporting period.
Table 13 Stockpile Capacities
Location Raw Stockpile (t) Saleable Stockpile (t)
Hunter Valley CHPP 176,000 330,000
Howick CHPP 15,000 30,000
Newdell CHPP 0 450,000
Processed, or product coal is transported to one of the two loading points via conveyor belt or road, detailed in Table 14. The coal from HVCHPP is transported to the Hunter Valley Load Point (HVLP) by means of overland conveyor whereas coal from Howick CHPP is typically trucked to Newdell Load Point (NLP) but can receive coal from HVLP via overland conveyor if required. After the coal has reached either HVLP or the NLP, it is transported to the Port of Newcastle by rail.
Table 14 Methods of Coal Transportation
Category of Transport Quantity (Mt)
Coal transported from the site via trains 13.50
Amount of coal received from Hunter Valley Operations South of the Hunter River
11.00
Amount of coal hauled by road to the Hunter Valley Loading Point Nil
Coal hauled by road to the Newdell Load Point 2.084
Amount of coal hauled by road from the Newdell Loading Point to the Ravensworth Coal Terminal
Nil
Amount of coal hauled by road from the Hunter Valley Loading Point to the Ravensworth Coal Terminal
Nil

2019 Annual Environmental Review Hunter Valley Operations
Report
Number: HVOOC-748212775-6 Status: [Document Status (Office)] Effective: [Effective Date] Page 37 of
238 Owner: [Owner] Version: [Document Version (Office)] Review:
[Planned Review Date]
Uncontrolled when printed
Category of Transport Quantity (Mt)
Number of coal haulage truck movements generated by the development. (includes -coal hauled to stockpile, coal hauled to bins, coal hauled from stockpile to bins)
247,297 (truck movements)
4.1.2 Production Statistics Project approvals allow for the extraction of up to 22 million ROM tonnes from operations north of the Hunter River and 20 million ROM tonnes from operations south of the Hunter River. A summary of production and waste at HVO during 2019 in comparison to previous years and approval limits is provided in Table 15.
Product coal includes low-ash, semi-soft and steaming coals.
Table 15 Production Statistics and Correlating Project Approval Limits
Approved Limit (PA 06_0261 and DA 450-10-2003)
Reporting Period 2018
Reporting Period 2019
Forecast for 2020
Prime Waste (Mbcm) - 100.4 102.3 102.6
ROM Coal (Mtpa) (mined) 42 18.99 19.19 18.6
- HVO South 20 11.9 10.8 11.5
- West Pit 12 5.4 8.4 7.07
- Carrington Pit 10 1.7 0 0
Coarse Reject (Mt) - 3.0 2.76 2.98
Fine Reject- Tailings (Mt) - 1.8 1.7 1.54
Product (Mtpa) - 13.3 13.59 14.1
ROM Coal Processed 26 17.99 18.05 18.6
- Hunter Valley CHPP 20 15.6 14.9 15.3
- Howick CHPP 6 2.4 3.13 3.3
4.1.3 Summary of Changes Similar levels of production and equipment were used throughout 2018 to 2019.
Tailings emplacement commenced in the Carrington mining void in 2019.
Mining in the Carrington West Wing location has not yet commenced; at this time mining in this area is not planned to commence during 2020.
4.2 Other Operations The main sealed entrance road at HVO North that intersects with Lemington Road was not diverted in 2019 as anticipated.

2019 Annual Environmental Review Hunter Valley Operations
Report
Number: HVOOC-748212775-6 Status: [Document Status (Office)] Effective: [Effective Date] Page 38 of
238 Owner: [Owner] Version: [Document Version (Office)] Review:
[Planned Review Date]
Uncontrolled when printed
4.3 Forecast Operations for Next Reporting Period Table 16 outlines the forecast operations for the next reporting period.
Table 16 Production Operations Forecast
Material Unit 2019 2019 (Actual) 2020
Forecast 2021
Forecast
Stripped Topsoil M3 46,435 33,936 520,000 155,800
Rock / Overburden Mbcm 119.4 116 115.3 124.9
ROM Coal Mt 19.5 19.1Mt 18.6 18.5
Reject Material Mt 4.8 4.5 4.5 4.0
Product Mt 14.1 13.5 14.1 14.3

2019 Annual Environmental Review Hunter Valley Operations
Report
Number: HVOOC-748212775-6 Status: [Document Status (Office)] Effective: [Effective Date] Page 39 of
238 Owner: [Owner] Version: [Document Version (Office)] Review:
[Planned Review Date]
Uncontrolled when printed
Actions Required From Previous Annual Review
The NSW Resource Regulator (formerly Department of Resources and Geoscience (DRG)) provided feedback on the 2018 Annual Review on 27 September 2019. No further amendment to the 2018 Annual Review was requested.
Following the Department of Planning Industry & Environment’s initial feedback on the 2018 Annual Review received by HVO on 14 June 2019, HVO revised the report to provide the additional detail requested. The 2018 Annual Review was resubmitted on 26 July 2019 addressing the Departments feedback. The Department provided final acceptance of the 2019 Annual Review of 16 August 2019 with no further feedback.
Table 17 Actions required following review of the 2018 Annual Review
Action required from previous Annual Review
Requested by
Action taken by HVO Where discussed in 2019 Annual
Review
Please include high resolution maps that adequately show the operations in a regional context, as required by Section 2 of the Department’s Annual Review Guidelines (for future Annual Environmental Reviews).
DPIE Figure 1 was added into the 2018 Annual Review. Resolution improved to figure for 2019 Annual Review.
Figure 1
Provide details of the titleholders for each of the Mining Titles. The 2018 Report does not clearly identify the relevant titleholders (for future Annual Environmental Reviews).
RR No requirement for input into 2018 Annual Review. Addressed in 2019 Annual Review – titleholder column added to Table 6.
Table 6
a. Maps of Operation: i. Figure 1 of the Annual Review
includes a map of the operation showing the regional context, and addresses the requirements of Section 2 of the Department’s Annual Review Guideline. Please amend the figure to improve the resolution of the map so the boundaries can be seen and the labels are legible.
ii. Please amend Figure 2 (or provide a further figure) in the Annual Review to show Mining Lease boundaries, as required by Section 2 of the Department’s Annual Review Guideline.
DPIE Figures 1 and 2 amended in the 2018 Annual Review. Resolution improved for Figure 1 and 2 for 2019 Annual Review.
Figure 1 and
Figure 2
b. Approvals Section 3 of the Annual Review lists HVO major approvals. Please amend this section to include the Mod 5 to PA 06_0261 granted in February 2018, to meet the requirements of the Annual Review Guidelines to list all approvals currently and any changes to those approvals that occurred during the reporting period.
DPIE Amended Table 3 of the 2018 Annual Review. Now Table 5 in 2019 Annual Review.
Table 5
c. Actions required from the previous Annual Review
Please amend Section 5 of the Annual Review to include a table that identifies
DPIE Table 14 was included in the revised 2018 Annual Review. Now Table 17 in 2019 Annual Review.
This table (Table 17)

2019 Annual Environmental Review Hunter Valley Operations
Report
Number: HVOOC-748212775-6 Status: [Document Status (Office)] Effective: [Effective Date] Page 40 of
238 Owner: [Owner] Version: [Document Version (Office)] Review:
[Planned Review Date]
Uncontrolled when printed
Action required from previous Annual Review
Requested by
Action taken by HVO Where discussed in 2019 Annual
Review
any actions required as an outcome of the previous Annual Review, including any actions that have been undertaken and when those guides were completed, as required by Section 5 of the Department’s Annual Review Guidelines.
d. Environmental Performance Section 6.2 of the Annual Review compares noise data to predictions made in the Environmental Impact Assessment. Please amend Section 6.2 to include “the location of actual mining operations in relation to locations predicted in the EIS” in accordance with the footnote to Table 9 in Schedule 3, Condition 7 of DA 450-10-2003.
DPIE Amendment to Section 6.2 of the 2018 Annual Review.
Section 6.2
e. Water Management i. Table 7 in Section 3 of the Annual
Review describes “actual extraction 2018” for HVO Water Access Licences. Please amend Table 7 to report on the water taken in the previous ‘water year’ (1 July to 30 June) as required by Section 7 of the Department’s Annual Review Guidelines.
ii. Please amend Section 7 of the Annual Review to include the provision of any “compensatory water’ to other users in accordance with Schedule 3 Condition 20B of DA 450-10-2003 and Schedule 3 Condition 26B PA 06_0261, as required by Section 7 of the Department’s Annual Review Guidelines.
DPIE Amended Table 7 in the 2018 Annual Review to include actual extraction. Now Table 9 of 2019 Annual Review. Section 7 amended in the 2018 Annual Review. Now Section 7.6 of 2019 Annual Review.
Table 9
Section 7.6
f) Blasting Please amend Section 6.3 of the Annual Review to include a description of performance in relation to blasting hours, operating conditions and frequency in accordance with Schedule 3 Conditions 10, 11 and 12 of PA 06_0261, and Schedule 3 conditions 14 and 14a of DA 450-10-2003.
DPIE Section 6.3 of the 2018 Annual Review amended.
Section 6.3
g) Rehabilitation i. Figure 92 in Section 8.3 of the Annual Review shows a map of HVO North rehabilitation areas as at 2018. Please amend Section 8.3 of the Annual Review to include an appropriate plan of rehabilitation, as required in section 8 of the Departments Annual Review Guideline.
DPIE Figure 92 amended in the 2018 Annual Review. Now Figure 94 of 2019 Annual Review.
Section 8.3
Rehabilitation Performance

2019 Annual Environmental Review Hunter Valley Operations
Report
Number: HVOOC-748212775-6 Status: [Document Status (Office)] Effective: [Effective Date] Page 41 of
238 Owner: [Owner] Version: [Document Version (Office)] Review:
[Planned Review Date]
Uncontrolled when printed
Action required from previous Annual Review
Requested by
Action taken by HVO Where discussed in 2019 Annual
Review
ii. Please amend the Annual review to include an outline of the outcomes of trials, research projects, and other initiatives undertaken during the reporting period to enhance or assure rehabilitation outcomes, as required by section 8 of the Departments Annual Review Guideline.
iii. Section 8.3 and Section 8.4 of the Annual Review describe rehabilitation programme variations. These sections state that the area of rehabilitation sown in HVO North during the reporting period was 73.5 hectares below the MOP commitment but HVO North net rehabilitation is ahead of the MOP target due to reduced rehabilitation disturbance compared to MOP projections. Please amend the Annual Review to include the reasons for those variations, whether or not DRE was notified, and any actions agreed with DRE to address the variations, as required by Section 8 of the Departments Annual Review Guideline.
Section 8.5 added to the 2018 Annual Review. Sections amended in the 2018 Annual Review.
No rehabilitation trials undertaken
during 2019
Section 8.4
h) Community complaints register i. A community complaints register in accordance with Schedule 5, Condition 12 of DA 450-10-2003, and Schedule 5, Condition 9 of PA 06_0261 was not able to be found in the community section of HVO’s website as required by the Department’s Web-based Reporting Guideline. Please amend the HVO website to include a community complaint register. ii. Please amend the second last line in Table 12 of the Annual Review which appears to be a typographical error.
DPIE Cover letter response to DPIE (2018 Annual Review), website updated to include copy of community complaints register Amended in the 2018 Annual Review.
Website
N/A

2019 Annual Environmental Review Hunter Valley Operations
Report
Number: HVOOC-748212775-6 Status: [Document Status (Office)] Effective: [Effective Date] Page 42 of
238 Owner: [Owner] Version: [Document Version (Office)] Review:
[Planned Review Date]
Uncontrolled when printed
Environmental Performance 6.1 Meteorological Data
The collection of meteorological data is carried out to assist in day to day operational decisions, planning, environmental management and to maintain a historic record. The meteorological (weather) stations record wind speed, wind direction, temperature, humidity, solar radiation and rainfall. HVO operates two real time weather stations; the HVO Corporate Meteorological Station and the Cheshunt Meteorological Station. Daily average data is publically available via the Monthly Environmental Reports published on the HVO Website (insite.hvo.com.au).
6.2 Noise 6.2.1 Noise Management
Mining activities undertaken at HVO are managed to ensure adverse noise impacts are minimised, and to ensure compliance with permissible noise limits at nearby private residences. A combination of both proactive and reactive control mechanisms are employed to ensure effective management of noise as described in the HVO Noise Management Plan.
6.2.2 Sound Attenuation of Heavy Equipment During 2019, 8 haul trucks were retrofitted with sound attenuation kits to achieve an in service sound power level of 115dB(A). This is in addition to 28 trucks that have previously received Stage 1 noise attenuation, achieving a sound power level of 118 dB(A), 22 trucks attenuated in 2018 and 18 trucks attenuated in 2017 to a level of 115 dB(A), making a total of 76 out of 81 trucks (94%) now sound attenuated.
During 2019, two haul trucks were sound power level tested as part of a research and development project refining the sound attenuation packages being utilised at HVO. HVO also developed a routine sound power level testing schedule which will be implemented during 2020.
In 2020, HVO is scheduled to complete fitment of the final 5 sound attenuation kits haul trucks.
6.2.3 Real Time Noise Management HVO operates a network of directional real-time noise monitors as a tool to manage noise emissions within compliance limits and to minimise community impact.
During 2019, HVO received and responded to 14561 noise alarms, recording a total of 639 hours of equipment stoppage due to noise management.
The real-time system generates alarms when elevated noise is measured, triggering the implementation of reactive controls to reduce noise levels. The location of real time and attended noise monitoring locations as per the approved Noise Management Plan are shown in Figure 4.
1 Noise alarm triggers are based on internally set noise criteria. Alarms received include noise exceedances from non-mine sources.

2019 Annual Environmental Review Hunter Valley Operations
Report
Number: HVOOC-748212775-6 Status: [Document Status (Office)] Effective: [Effective Date] Page 43 of 238
Owner: [Owner] Version: [Document Version (Office)] Review: [Planned Review Date]
Uncontrolled when printed
Figure 4 HVO Attended and Real-time Noise Monitoring Locations

2019 Annual Environmental Review
OC-748212775-6
er] Review: [Pld Review Date]
Uncontrolled when printed
An assessment of 2019 real time monitoring compared against attended compliance measurements taken at the same location indicated that the real time monitoring system generally aligned with values recorded during attended noise measurements. Where they didn’t align, the majority of real time measurements were higher than attended noise measurements.
Details of this assessment is provided in Table 18.
Table 18 Comparison of Attended and Real Time Noise Monitoring 2019
Monitoring Location
Number of attended noise measurements1
Real Time measurements that
aligned2 with attended
measurements
Real Time measurements with positive
variance > 3dB(A) of attended
measurements
Real Time measurements with a negative
variance > 3dB(A) of attended
measurements
South North South North South North South North
Maison Dieu3 14 N/A 7 N/A 3 N/A 0 N/A
Knodlers Lane 12 N/A 11 N/A 1 N/A 0 N/A
Long Point3 12 N/A 5 N/A 0 N/A 0 N/A
Kilburnie South3 13 16 3 3 9 13 0 0
Jerrys Plains3 13 16 0 6 13 9 0 0
Notes:
1. Includes measurements under all meteorological conditions
2. Aligned indicates measurements were within 3dB (A) of each other or measurement results <25dB indicated that sourcecontribution was in audible or not measureable.
3. One or more data points not available for attended and / or real time monitoring events.
6.2.4 Operational Noise Performance To assess compliance with the relevant Project Approval noise criteria, HVO engages a suitably qualified and experience acoustic consultant to undertake routine compliance monitoring at nearby private residences, in accordance with the HVO Noise Management Plan. Monitoring is undertaken at a frequency of one night per month and an additional one night per quarter as required by the HVO North Approval. The monitoring is undertaken to evaluate and assess noise impacts under a range of meteorological conditions throughout the year.
A total of 101 measurements were taken during 2019. Each measurement involves an assessment of HVO mine noise against the various LAeq, 15minute and LA1,1min noise criteria in place under the HVO North and South Approvals. Full details for all noise assessments completed can be found in the Hunter Valley Operations Monthly Environmental Monitoring Report, published on the HVO website (https://insite.hvo.com.au).
One measurement exceeded the relevant criteria at Maison Dieu on 7 May 2019. As per the compliance protocol detailed in the Noise Management Plan, a follow up measurement was conducted within 75 minutes and again within 7 days. Both follow up measurements resulted in measurements below the criteria and subsequently do not constitute a non-compliance. The results were reported to DPIE during May 2019. Details of the exceedance are presented in Table 19

2019 Annual Environmental Review
OC-748212775-6 Status: [Document Status (Office)] Effective: [Effective Date]
er] Version: [Document Version (Office)] Review: [Planned Review Date]
Uncontrolled when printed
Table 19 Noise measurements which exceeded noise criteria during 2019
Date/Time Monitoring Location
Criteria Criteria (dB) Measured Noise (dB)
Criteria Exceeded by
(dB)
7/05/2019 22:33 Maison Dieu HVO South LAeq, 15min
39 42 3
Table 20 shows comparisons between the 2019 LAeq attended noise monitoring results (maximum HVO contribution levels measured under applicable meteorological conditions) and previous years.
Table 20 Comparison of 2019 noise monitoring results against previous years
Year Number of Measurements
Number of measurements which exceeded allowable noise (under applicable
meteorological conditions)
Number of non-compliances
2019 101 1 0
2018 105 3 0
2017 100 1* 0
2016 109 2* 0
2015 107 3* 2
* The now superseded NSW Industrial Noise Policy (INP) allowed for the measured result to be less than or equal to 2 dB above theapplicable noise limit without constituting a non-compliance. Note: Where the measured result is greater than 2dB above theapplicable noise limit, the site has 75 minutes to reduce noise levels below applicable noise limits before constituting a non-compliance. As of late October 2017, the NSW INP was superseded by the Noise Policy for Industry (NPfI), with the requirements ofthis policy implemented in late 2017.
Comparisons against the predicted noise levels in the HVO West Pit Extension and Minor Modifications EIS (2003) have been made against the modelled scenario for Year 14 (indicative of activities carried out during 2019) of the development (Table 5.2 of Part J – Hunter Valley Operations West Pit Extension and Minor Modifications Technical Reports Part 3) are shown in Table 21.
Comparison of measured results against the modelled predictions for Year 14 in the HVO West Pit EIS (2003) demonstrates noise levels equal to or lower than predicted at all monitoring locations, with the exception of the Kilburnie South monitoring location which recorded was higher than predicted results by 1dB(A).
Comparisons against the predicted noise levels in the HVO Carrington West Wing EA (2010) have not been made in this years’ Annual Review, as this project has not commenced. Mining activity in the Carrington Pit area was limited to a short term mining campaign prior to the proposed deposition of tailings material.
Table 21 Comparison of 2019 monitoring against HVO North (Year 14, West Pit EIS, 2003) - Night Period
Location Units EIS Prediction (INP) 2019 (max. measured LAeq 15min under applicable met. conditions)
Knodlers Lane (5) dB(A) 27 IA
Maison Dieu (6) dB(A) 26 IA
Shearers Lane (5) dB(A) 27 IA
Kilburnie South (4) dB(A) 34 35
Jerrys Plains (13) dB(A) N/A 36
Jerrys Plains East (1) dB(A) 38 35
Comparisons against the predicted noise levels in the HVO South Modification 5 Environmental Assessment have been made against Stage 1 modelling scenario ( indicative of activities carried out during

2019 Annual Environmental Review
OC-748212775-6 Status: [Document Status (Office)] Effective: [Effective Date]
er] Version: [Document Version (Office)] Review: [Planned Review Date]
Uncontrolled when printed
2019), (Table 6.10 of Appendix E– Hunter Valley Operations South Modification 5 Approval Environmental Assessment Report Volume 2).
The comparison (Table 22) indicates that during 2019, noise was lower than predicted levels for all receptors with the exception of Maison Dieu that recorded one exceedance 2dB(A) greater than the EIS Prediction levels. This result was a one off exceedance that did not constitute a non-compliance. .
Table 22 Comparison of 2019 monitoring against HVO South (Stage 1 HVO South Modification 5 EA- 2017)
Location Units EIS Prediction (INP) 2019 (max. measured LAeq 15min under applicable met. conditions)
Knodlers Lane (120) dB(A) 39 39
Maison Dieu (258) dB(A) 40 42
Shearers Lane (160) dB(A) 41 35
Kilburnie South (307) dB(A) 39 37
Jerrys Plains (399) dB(A) 34 <35
Jerrys Plains East (321) dB(A) 35 <35
6.3 Blasting 6.3.1 Blasting Management
During 2019, HVO operated a blast monitoring network to assess and evaluate blast vibration and overpressure impacts against the HVO North and HVO South Approval limits. HVO achieved 100% blast data capture for all blast monitors.
Monitors are located at or in close proximity to nearby privately owned residences and function as regulatory compliance monitors as shown in Figure 5 from the Blast Management Plan. These monitors are located at:
Jerrys Plains Village;
Warkworth;
Maison Dieu;
Moses Crossing; and
Knodlers Lane

2019 Annual Environmental Review
OC-748212775-6 Status: [Document Status (Office)] Effective: [Effective Date]
er] Version: [Document Version (Office)] Review: [Planned Review Date]
Uncontrolled when printed
Figure 5 HVO Blast Monitoring Network

2019 Annual Environmental Review
OC-748212775-6 Status: [Document Status (Office)] Effective: [Effective Date]
er] Version: [Document Version (Office)] Review: [Planned Review Date]
Uncontrolled when printed
6.3.2 Blasting Performance During the reporting period 221 blast events were initiated at HVO. 140 blasts were fired at HVO South, and 81 at HVO North. HVO complied with all blasting related consent and licence conditions with the exception of one blast on 28 May 2019 in the HVO South area which exceeded the Airblast Overpressure criteria at Maison Dieu. Details on the incident are provided in Section 0. Airblast Overpressure and Ground Vibration results for all blasts fired during the reporting period are displayed in Figure 6 to Figure 10.
There were a total of eight blasts that recorded an overpressure reading greater than 115 dB(L) during the reporting period.
The resulting readings over 115 dB(L) limit have been assessed for comparison against the 5% of the total number of blasts over a 12 month period these results are shown in Table 23.
Table 23 HVO airblast overpressure allowable exceedance summary
Monitoring Location
HVO South Blasts HVO West / North Blasts
Allowable Exceedance over 115 dB(L) of time
over 12 months (%)
Percentage of blasts over 115dB(L)
Allowable Exceedance over 115 dB(L) of time
over 12 months (%)
Percentage of blasts over 115dB(L)
Moses Crossing
5 0.7 5 0
Jerrys Plains 5 1.4 5 0
Warkworth 5 1.4 5 0
Maison Dieu 5 0.7 5 1.2
Knodlers Lane
5 1.4 5 1.2
There were no exceedances of the 5 mm/s or 10 mm/s ground vibration criteria at any residence on privately-owned land.
During 2019, blasting occurred only between the hours of 7am and 6pm Monday to Saturday. No blasting was carried out on Sundays or Public Holidays. In addition, no more than 3 blasts were fired per day and the maximum number of blasts fired during any week was nine, less than the maximum weekly blasting frequencies as specified in DA 450-10-2003 and PA 06_0261.
No fume events were recorded leaving the site in accordance with protocols detailed in the HVO Blast Management Plan.
During the reporting period, HVO closed Lemington Road on 14 occasions and Golden Highway on 17 occasions with 14 minutes and 15 minutes being the average time that these respective roads were closed.
Coordination of blasting times with neighbouring mines, Ravensworth and Wambo, continued to occur by email notifications.

2019 Annual Environmental Review
OC-748212775-6 Status: [Document Status (Office)] Effective: [Effective Date]
er] Version: [Document Version (Office)] Review: [Planned Review Date]
Uncontrolled when printed
Figure 6: Jerrys Plains Blast Monitoring Results 2019
Figure 7: Knodlers Lane Blast Monitoring Results 2019
0
2
4
6
8
10
12
14
0
20
40
60
80
100
120
1/01
/201
98/
01/2
019
15/0
1/20
1922
/01/
2019
29/0
1/20
195/
02/2
019
12/0
2/20
1919
/02/
2019
26/0
2/20
195/
03/2
019
12/0
3/20
1919
/03/
2019
26/0
3/20
192/
04/2
019
9/04
/201
916
/04/
2019
23/0
4/20
1930
/04/
2019
7/05
/201
914
/05/
2019
21/0
5/20
1928
/05/
2019
4/06
/201
911
/06/
2019
18/0
6/20
1925
/06/
2019
2/07
/201
99/
07/2
019
16/0
7/20
1923
/07/
2019
30/0
7/20
196/
08/2
019
13/0
8/20
1920
/08/
2019
27/0
8/20
193/
09/2
019
10/0
9/20
1917
/09/
2019
24/0
9/20
191/
10/2
019
8/10
/201
915
/10/
2019
22/1
0/20
1929
/10/
2019
5/11
/201
912
/11/
2019
19/1
1/20
1926
/11/
2019
3/12
/201
910
/12/
2019
17/1
2/20
1924
/12/
2019
31/1
2/20
19
Airblast Overpressure Limit Airblast Overpressure Limit for Max 5%
Ground Vibration Limit Ground Vibration Limit for Max 5%
Jerrys Plains (dB(L)) Jerrys Plains (mm/s)
0
2
4
6
8
10
12
14
0
20
40
60
80
100
120
1/01
/201
98/
01/2
019
15/0
1/20
1922
/01/
2019
29/0
1/20
195/
02/2
019
12/0
2/20
1919
/02/
2019
26/0
2/20
195/
03/2
019
12/0
3/20
1919
/03/
2019
26/0
3/20
192/
04/2
019
9/04
/201
916
/04/
2019
23/0
4/20
1930
/04/
2019
7/05
/201
914
/05/
2019
21/0
5/20
1928
/05/
2019
4/06
/201
911
/06/
2019
18/0
6/20
1925
/06/
2019
2/07
/201
99/
07/2
019
16/0
7/20
1923
/07/
2019
30/0
7/20
196/
08/2
019
13/0
8/20
1920
/08/
2019
27/0
8/20
193/
09/2
019
10/0
9/20
1917
/09/
2019
24/0
9/20
191/
10/2
019
8/10
/201
915
/10/
2019
22/1
0/20
1929
/10/
2019
5/11
/201
912
/11/
2019
19/1
1/20
1926
/11/
2019
3/12
/201
910
/12/
2019
17/1
2/20
1924
/12/
2019
31/1
2/20
19
Airblast Overpressure Limit Airblast Overpressure Limit for Max 5%
Ground Vibration Limit Ground Vibration Limit for Max 5%
Knodlers Lane (dB(L)) Knodlers Lane (mm/s)

2019 Annual Environmental Review
OC-748212775-6 Status: [Document Status (Office)] Effective: [Effective Date]
er] Version: [Document Version (Office)] Review: [Planned Review Date]
Uncontrolled when printed
Figure 8: Maison Dieu Blast Monitoring Results 2019
Figure 9: Moses Crossing Blast Monitoring Results 2019
0
2
4
6
8
10
12
14
0
20
40
60
80
100
120
1/01
/201
98/
01/2
019
15/0
1/20
1922
/01/
2019
29/0
1/20
195/
02/2
019
12/0
2/20
1919
/02/
2019
26/0
2/20
195/
03/2
019
12/0
3/20
1919
/03/
2019
26/0
3/20
192/
04/2
019
9/04
/201
916
/04/
2019
23/0
4/20
1930
/04/
2019
7/05
/201
914
/05/
2019
21/0
5/20
1928
/05/
2019
4/06
/201
911
/06/
2019
18/0
6/20
1925
/06/
2019
2/07
/201
99/
07/2
019
16/0
7/20
1923
/07/
2019
30/0
7/20
196/
08/2
019
13/0
8/20
1920
/08/
2019
27/0
8/20
193/
09/2
019
10/0
9/20
1917
/09/
2019
24/0
9/20
191/
10/2
019
8/10
/201
915
/10/
2019
22/1
0/20
1929
/10/
2019
5/11
/201
912
/11/
2019
19/1
1/20
1926
/11/
2019
3/12
/201
910
/12/
2019
17/1
2/20
1924
/12/
2019
31/1
2/20
19
Airblast Overpressure Limit Airblast Overpressure Limit for Max 5%
Ground Vibration Limit Ground Vibration Limit for Max 5%
Maison Dieu (dB(L)) Maison Dieu (mm/s)
28 May 2019 - Result investigated and estimated to be <120dB(L). Refer to incident section for detail.
0
2
4
6
8
10
12
14
0
20
40
60
80
100
120
1/01
/201
98/
01/2
019
15/0
1/20
1922
/01/
2019
29/0
1/20
195/
02/2
019
12/0
2/20
1919
/02/
2019
26/0
2/20
195/
03/2
019
12/0
3/20
1919
/03/
2019
26/0
3/20
192/
04/2
019
9/04
/201
916
/04/
2019
23/0
4/20
1930
/04/
2019
7/05
/201
914
/05/
2019
21/0
5/20
1928
/05/
2019
4/06
/201
911
/06/
2019
18/0
6/20
1925
/06/
2019
2/07
/201
99/
07/2
019
16/0
7/20
1923
/07/
2019
30/0
7/20
196/
08/2
019
13/0
8/20
1920
/08/
2019
27/0
8/20
193/
09/2
019
10/0
9/20
1917
/09/
2019
24/0
9/20
191/
10/2
019
8/10
/201
915
/10/
2019
22/1
0/20
1929
/10/
2019
5/11
/201
912
/11/
2019
19/1
1/20
1926
/11/
2019
3/12
/201
910
/12/
2019
17/1
2/20
1924
/12/
2019
31/1
2/20
19
Airblast Overpressure Limit Airblast Overpressure Limit for Max 5%
Ground Vibration Limit Ground Vibration Limit for Max 5%
Moses Crossing (dB(L) Moses Crossing (mm/s)

2019 Annual Environmental Review
OC-748212775-6 Status: [Document Status (Office)] Effective: [Effective Date]
er] Version: [Document Version (Office)] Review: [Planned Review Date]
Uncontrolled when printed
Figure 10: Warkworth Blast Monitoring Results 2019
6.3.3 Blast Fume Management HVO operates a Post Blast Fume Generation Mitigation and Management Plan. This document outlines the practices to be utilised to reduce the risk of generation of post blast fume, and reduce potential offsite impact from any fume which may be produced. This includes specialised blasting design, appropriate product selection, on-bench water management, implementation of fume management zones and use existing blasting permissions to identify likely path of any fume which may be produced.
All blasts are observed for fume and any fume produced is ranked according to the Australian Explosive Industry & Safety Group (AEISG) Scale.
Fume rankings for shots fired during 2019 and comparison to previous years is provided in Table 24. Four blasts produced fume ranked as category 3 (AEISG scale) but did not leave the mine boundary. No fume ranked as category 4 or 5 occurred during 2019.
Table 24 Visible blast fume rankings according to the AEISG colour scale
AEISG Ranking 2019 2018 2017 2016
0 202 214 272 275
1 39 19 39 49
2 15 16 11 13
3 4 4 2 1
4 0 0 0 0
0
2
4
6
8
10
12
14
0
20
40
60
80
100
1201/
01/2
019
8/01
/201
915
/01/
2019
22/0
1/20
1929
/01/
2019
5/02
/201
912
/02/
2019
19/0
2/20
1926
/02/
2019
5/03
/201
912
/03/
2019
19/0
3/20
1926
/03/
2019
2/04
/201
99/
04/2
019
16/0
4/20
1923
/04/
2019
30/0
4/20
197/
05/2
019
14/0
5/20
1921
/05/
2019
28/0
5/20
194/
06/2
019
11/0
6/20
1918
/06/
2019
25/0
6/20
192/
07/2
019
9/07
/201
916
/07/
2019
23/0
7/20
1930
/07/
2019
6/08
/201
913
/08/
2019
20/0
8/20
1927
/08/
2019
3/09
/201
910
/09/
2019
17/0
9/20
1924
/09/
2019
1/10
/201
98/
10/2
019
15/1
0/20
1922
/10/
2019
29/1
0/20
195/
11/2
019
12/1
1/20
1919
/11/
2019
26/1
1/20
193/
12/2
019
10/1
2/20
1917
/12/
2019
24/1
2/20
1931
/12/
2019
Airblast Overpressure Limit Airblast Overpressure Limit for Max 5%
Ground Vibration Limit Ground Vibration Limit for Max 5%
Warkworth (dB(L)) Warkworth (mm/s)

2019 Annual Environmental Review
OC-748212775-6 Status: [Document Status (Office)] Effective: [Effective Date]
er] Version: [Document Version (Office)] Review: [Planned Review Date]
Uncontrolled when printed
AEISG Ranking 2019 2018 2017 2016
5 0 0 0 0
Total* 260 253 324 338
* Where a number of individual blasts were fired as a blast event, fume was assessed for each individual blast pattern rather than for the event as a whole.
6.4 Air Quality 6.4.1 Air Quality Management
Air quality management initiatives are implemented at HVO to ensure that:
Air quality impacts on surrounding residents are minimised;
All statutory requirements are adhered to; and
Local community and regulators are kept informed through prompt and effective response to issues and complaints.
Air quality control mechanisms employed at HVO are described in detail in the Hunter Valley Operations Air Quality and Greenhouse Gas Management Plan, publically available via the Hunter Valley Operations Website (https://insite.hvo.com.au).
During 2019, an unprecedented number of days were deemed to have been effected by extraordinary events caused by a combination of continued drought conditions, State wide dust storms, regional dust events and smoke from bushfires which significantly affected the Hunter Valley primarily between October 2019 and January 2020. During this period 58 exceedances of the short term (24 hour) criteria were measured across the HVO monitoring network. Each of these exceedances were reported to DPIE and were noted to have been affected by an extraordinary event and therefore, as per the consent conditions, the criteria was not deemed to be applicable. These events also contributed to exceedances of the long term (annual average) criteria in some instances, however annual averages reported herein have been adjusted to exclude these events. A list of these dates during 2019 that are considered to have been affected by an extraordinary event are provided below:
January 2019 – 16, 17
February – 13, 19
March – 6, 31
April – 26
August – 8, 9
September – 6
October – 7, 8, 18, 19, 24, 25, 26, 27, 28, 29, 30, 31
November – 1, 2, 7, 8, 12, 16, 17, 19, 20, 21, 22, 23, 26, 27, 28, 29, 30
December – 1 to 23, 27 to 31.
Despite difficult conditions, HVO continued to implement operational controls to manage dust emissions in accordance with its Air Quality Management Plan. During 2019, HVO also implemented additional dust management measures including the use of haul road dust suppressant product in HVO West Pit, the use of on bench irrigator to assist with managing dust of blasted material, installation of an additional four monitoring cameras dedicated to dust monitoring and continued upgrade of the CHPP dust suppression system.

2019 Annual Environmental Review
OC-748212775-6 Status: [Document Status (Office)] Effective: [Effective Date]
er] Version: [Document Version (Office)] Review: [Planned Review Date]
Uncontrolled when printed
6.4.2 Air Quality Performance 6.4.2.1 Real Time Air Quality Management
HVO’s real time air quality monitoring stations continuously log information and transmit data to a central database, generating alarms when particulate matter levels exceed internal trigger limits to guide the operational management.
A total of 2527 real time alarms for air quality and meteorological conditions were received and acknowledged during 2019 which is an increase of 1056 alarms from those recorded during 2018. This increase is likely due to the ongoing drought across New South Wales as well as a large number of ‘extraordinary event’ days, attributed to bushfire smoke from October through to December 2019.
In response, 7206 hours of equipment downtime was recorded due to air quality management. A detailed breakdown of air quality related equipment stoppages (per month, per equipment type) presented in Figure 11.
Figure 11: Equipment Downtime Hours for Air Quality Management 2019
Data availability from HVO’s real time air quality monitoring stations is presented in Table 25.
Table 25 Real Time PM10 Air Quality Monitoring Data Availability 2019
Monitoring Location 2019 Data Availability
Warkworth 99.7%
Knodlers Lane 98.4%
Maison Dieu 99.7%
Howick 99.2%
HC1 Conveyor 98.1%
Wandewoi 96.2%
Golden Highway 98.9%
Jerrys Plains 99.2
Note: Data availability calculated across 2019 is based on availability of a 24 hour average result.
0
200
400
600
800
1000
1200
Jan Feb Mar Apr May Jun Jul Aug Sep Oct Nov Dec
EQUIPMEN
T DOWNTIME FO
R AIR QUALITY
(HOURS)
Dozer
Dragline
Drill
Float
Fuel/Lube Cart
Grader
RT Dozer
Scraper
Shovel
Truck
Water Cart

2019 Annual Environmental Review
OC-748212775-6 Status: [Document Status (Office)] Effective: [Effective Date]
er] Version: [Document Version (Office)] Review: [Planned Review Date]
Uncontrolled when printed
6.4.2.2 Temporary Stabilisation Aerial Seeding was undertaken in July 2019 by a fixed wing aircraft to provide temporary cover to areas exposed to wind generated dust and erosion at HVO. Waste dumps and exposed areas were selected for seeding if they were not planned to be disturbed within six months. A total area of 405 ha was seeded which included waste dumps ahead of mining disturbance (Figure 12 and Figure 13). All areas were seeded using an exotic pasture and legume mix suitable for autumn sowing. A starter fertiliser was mixed with the seed prior to loading to provide sufficient nutrients for plant growth.
Figure 12: Areas Aerial Seeded in 2019 – HVO North
Figure 13: Areas Aerial Seeded in 2019 – HVO South
6.4.2.3 Air Quality Monitoring Air quality monitoring at HVO is undertaken in accordance with the HVO Air Quality Monitoring Program. An extensive network of monitoring equipment is utilised to assess performance against the relevant conditions of HVO’s approvals. Air quality monitoring locations are shown in Figure 14.

2019 Annual Environmental Review
OC-748212775-6 Status: [Document Status (Office)] Effective: [Effective Date]
er] Version: [Document Version (Office)] Review: [Planned Review Date]
Uncontrolled when printed
Following approval of the HVO Air Quality and Greenhouse Gas Management Plan on 6 September 2019, HVO installed PM2.5 monitoring at Kilburnie South and Maison Dieu within 16 weeks (27 December 2019) of approval of the Plan.
Air quality monitoring data is made publically available through the HVO Monthly Environmental Monitoring Report, which can be viewed on the Hunter Valley Operations Website (https://insite.hvo.com.au).
Figure 14: Air Quality Monitoring Locations (as approved 6 September 2019)

2019 Annual Environmental Review
OC-748212775-6 Status: [Document Status (Office)] Effective: [Effective Date]
er] Version: [Document Version (Office)] Review: [Planned Review Date]
Uncontrolled when printed
6.4.2.4 Deposited Dust Deposited dust is monitored at nine locations on privately-owned land, in accordance with the HVO Air Quality Monitoring Program. The annual average insoluble matter deposition rates in 2019 compared with the depositional dust impact assessment criterion and previous years’ data are shown in Figure 15.
During 2019 monthly dust deposition rates equal to or greater than the long-term impact assessment criteria of 4 g/m2/month were recorded at number of sites. Where field observations denote a sample as contaminated (typically with insects, bird droppings or vegetation), the results are excluded from Annual Average compliance assessment. It should be noted that samples collected between October and December 2019 were affected to some extent by the extraordinary bushfire events however it’s not possible to determine the level of impact these events would have had on the samples. It is also consider that depositional dust gauges are less sensitive to smoke particulates than other monitoring methods.
During 2019, three monitoring locations (D118, DL30 and Warkworth) exceeded the annual average insoluble matter deposition rate criteria. All monitoring locations demonstrated compliance with the maximum allowable insoluble solids incremental increase criteria of 2 g/m2/month (Figure 16).
Meteorological conditions and the results of nearby monitors for the sampling period are also considered when determining HVO’s level of contribution to any elevated result. Details of excluded results are presented in the relevant HVO Monthly Environmental Monitoring Report.
The three exceedances were assessed to estimate HVO North’s maximum contribution to the results. Results of this assessment are provided in Table 26.
Table 26: Dust Deposition Annual Average Assessment
Date Site Measured Annual
Average Dust
Deposition (g/m2/month)
Annual Average
Dust Deposition
Criteria
(g/m2/month)
HVO’s contribution
to Dust Deposition
(g/m2/month)
Discussion
2019 D118 4.8 4 0.4 An external consultant was engaged to investigate the exceedance, which
determined that the elevated result was not solely attributable to HVO North.
HVO North were not considered to be significant contributor to these exceedances and is therefore
compliant.
2019 DL30 4.3 4 1.4
2019 Warkworth 5.3 4 1.7

2019 Annual Environmental Review
OC-748212775-6 Status: [Document Status (Office)] Effective: [Effective Date]
er] Version: [Document Version (Office)] Review: [Planned Review Date]
Uncontrolled when printed
Figure 15: Annual average insoluble matter deposition rates 2016-2019
Figure 16: Maximum allowable increase in deposited dust level 2019
6.4.2.5 Total Suspended Particulates (TSP) Total Suspended Particulates (TSP) are monitored at five locations on privately owned land in accordance with the HVO Air Quality Monitoring Program. In addition, Cheshunt East is located on mine-owned land, however is representative of privately owned property. Historical trends for this location has previously not been reported in annual assessments as it was not previously included formally in the monitoring program until the latest version approved in September 2019.
Annual average TSP concentrations recorded in 2019 compared with the long term impact assessment criterion and previous years’ data, are shown in Figure 17. The annual average TSP concentrations recorded in 2019 are reported excluding days deemed to have been affected by extraordinary events (Section 6.4.1). TSP results are consider to be generally consistent with those recorded in previous years.
0.0
1.0
2.0
3.0
4.0
5.0
Inso
lubl
e so
lids
(g/m
2/m
onth
)
2019 2018 2017 2016 Impact Assessment Criteria
0.0
0.5
1.0
1.5
2.0
2.5
Dep
osited Dust (g/m2/m
onth)
Estimated maximum contribution from HVO North
Maximum increase in deposited dust level Criteria (g/m2/month)

2019 Annual Environmental Review
OC-748212775-6 Status: [Document Status (Office)] Effective: [Effective Date]
er] Version: [Document Version (Office)] Review: [Planned Review Date]
Uncontrolled when printed
Figure 17: Annual average TSP concentrations 2016 to 2019
During 2019 three monitoring locations exceeded the impact assessment criteria at Kilburnie South, Knodlers Lane and Maison Dieu.
The exceedances were investigated to determine the level of contribution from HVO activities in accordance with the compliance protocol outlined in the HVO Air Quality Management Plan. The estimated contribution was determined following review of results by an air quality consultant which determined that the contributions from HVO (either North, South or Both) in all cases was not deemed to be the significant cause of the exceedances and therefore considered compliant.
A summary of the investigation undertaken for the annual TSP exceedances are provided in Table 27.
Table 27 Annual TSP investigation - 2019
Date Site Measured Annual Average TSP level (µg/m3)
Annual Average TSP
Criteria
(µg/m3)
HVO’s contribution to TSP level
(μg/m3)
Discussion
2019 Kilburnie South TSP
122 90 40.9 - HVO North
12.9 - HVO South
An air quality specialist was engaged to investigate the exceedance, which determined that the elevated result was not solely attributable to either
HVO North or HVO South. HVO North or South were not
considered to be significant contributors to this exceedance as
they contributed 33% and 11% respectively to the total. With
consideration to the HVO being operated as a complex the combined contribution of 44% the contribution is
still not considered a significant contributor to the exceedance.
2019 Maison Dieu TSP
91.3 90 18.2 – HVO South Only
An air quality specialist was engaged to investigate the exceedance, which determined that the elevated result
was not solely attributable HVO South. HVO South was not considered to be significant
0
20
40
60
80
100
120
140
Kilburnie South Warkworth Maison Dieu Knodlers Lane Long Point Cheshunt East
Average TSP (µg/m3)
LocationAnnual Average 2015 Annual Average 2016
Annual Average 2017 Annual Average 2018
Annual Average 2019 (excluding extraordinary event days) Long Term Impact Assessment Criteria

2019 Annual Environmental Review
OC-748212775-6 Status: [Document Status (Office)] Effective: [Effective Date]
er] Version: [Document Version (Office)] Review: [Planned Review Date]
Uncontrolled when printed
Date Site Measured Annual Average TSP level (µg/m3)
Annual Average TSP
Criteria
(µg/m3)
HVO’s contribution to TSP level
(μg/m3)
Discussion
contributors to this exceedance as it contributed only approximately 20%
to the exceedance
2019 Knodlers Lane HVAS TSP
97.8 90 22.8 – HVO South Only
An air quality specialist was engaged to investigate the exceedance, which determined that the elevated result
was not solely attributable HVO South. HVO South was not considered to be significant
contributors to this exceedance as it contributed only approximately 23%
to the exceedance
During the reporting period, 3 out of 423 TSP measurements were not able to be collected on the scheduled sampling date (based on a sampling frequency of every six days) due to power failures and technical issues with the monitors.
6.4.2.6 Particulate Matter <10µm (PM10) During 2019, compliance assessment for Particulate Matter <10 µm (PM10) was monitored using HVAS and Real Time TEOM monitors. Prior to the revised Air Quality Management Plan being approved in September 2019, HVAS monitors were utilised as the sole measure of PM10 compliance. Post September 2019, TEOM monitors replaced HVAS monitors at Maison Dieu, Knodlers Lane, Warkworth and Wandewoi as the measure of compliance. It should be noted that this increased the number of samples being collected and assessed for compliance compared to previous years.
The Jerrys Plains (DPIE operated) TEOM monitor was also introduced to the monitoring program from September 2019 as such historical trend for this location is not included.
Assessment of annual averages is presented against the full year results recorded against the current approved monitoring program and compliance protocol detailed in the Air Quality and Greenhouse Gas Management Plan.
Cheshunt East is located on mine-owned land, however is representative of privately owned property. Historical trends for this locations have previously not been reported in annual assessments as it was not previously included formally in the monitoring program until the latest version approved in September 2019.
6.4.2.7 Particulate Matter <10µm (PM10) - Short Term (24 hour average) Impact Assessment Criteria
Short Term (24 hour average) PM10 concentrations were calculated for both HVAS and TEOM monitors and assessed against the relevant criteria as per the Air Quality and Greenhouse Gas Management Plan. For TEOM monitors, this was undertaken using hourly average data and for HVAS units this was calculated using the 24 hour average concentrations on each of the run days.
Short term (24 hour average) results recorded by HVO’s compliance monitoring network during 2019 is presented in Figure 18. Data presented in Figure 18 includes total measured results including contribution from all particulate sources and extraordinary events. Each exceedance was investigated to determine the level of contribution from either HVO North, HVO South or where relevant both. Outcomes of these assessments is provided in Table 28

2019 Annual Environmental Review Hunter Valley Operations
Report
Number: HVOOC-748212775-6 Status: [Document Status (Office)] Effective: [Effective Date] Page 61 of 238
Owner: [Owner] Version: [Document Version (Office)] Review: [Planned Review Date]
Uncontrolled when printed
Figure 18: 24 hour average total PM10 results- 2019
0
50
100
150
200
250
300
350
400
450
2/01/2019 2/02/2019 2/03/2019 2/04/2019 2/05/2019 2/06/2019 2/07/2019 2/08/2019 2/09/2019 2/10/2019 2/11/2019 2/12/2019
Total M
easured 24 Hour Average PM10 (ug/m3)
Extraordinary Event 24 Hour Average Criteria Hunter Valley Gliding Club (HVAS) Maison Dieu (HVAS)
Knodlers Lane (HVAS) Long Point (HVAS) Warkworth (HVAS) Kilburnie South (HVAS)
Maison Dieu (TEOM) Knodlers Lane (TEOM) Warkworth (TEOM) Jerrys Plains (TEOM)

2019 Annual Environmental Review Hunter Valley Operations
Report
Number: HVOOC-748212775-6 Status: [Document Status (Office)] Effective: [Effective Date] Page 62 of 238
Owner: [Owner] Version: [Document Version (Office)] Review: [Planned Review Date]
Uncontrolled when printed
Table 28 - 24 Hour Elevated TEOMPM10 Investigations
Date Site 24hr result
(µg/m3)
Estimated max.
contribution from HVO (µg/m3)
Estimated max. Concentration
(%)
Discussion
2/1/2019 Warkworth HVAS 68.0 NA NA An investigation found HVO not to be a significant contributor based on prevailing wind conditions.
2/1/2019 Kilburnie South
HVAS 80.0 41.0 53.0
An investigation determined that the HVO maximum potential contribution to be in the order of 41.0ug/m3 or 53.0% of the total measured based on prevailing wind conditions and upwind monitoring results. The wind direction was inside the arc of influence for 23% of the 24 hour period.
2/1/2019 Glider Club HVAS 51.0 NA NA An investigation found HVO not to be a significant contributor based on prevailing wind conditions.
8/1/2019 Knodlers Lane HVAS 59.0 23.5 39.8
An investigation determined HVO maximum potential contribution to be in the order of 23.5ug/m3 or 39.8% of the total measured based on prevailing wind conditions and upwind monitoring results. The wind direction was inside the arc of influence for 13% of the 24 hour period.
26/1/2019 Kilburnie South
HVAS 57.0 14.5 25.4
An investigation determined HVO maximum potential contribution to be in the order of 14.5ug/m3 or 25.4% of the total measured based on prevailing wind conditions and upwind monitoring results. The wind direction was inside the arc of influence for 7% of the 24 hour period.
26/1/2019 Knodlers Lane HVAS 56.0 20.6 43.3 An investigation determined HVO maximum potential contribution to be in the order of 20.6ug/m3 or 43.3% of the total measured based on prevailing wind conditions and upwind monitoring results.
13/02/2019 Cheshunt East HVAS 77.0 49.6 69.7
An investigation determined HVO maximum potential contribution to be in the order of 49.6ug/m3 or 69.7% of the total measured based on prevailing wind conditions and upwind monitoring results. The wind direction was inside the arc of influence for 14% of the 24 hour period. Note that this day is deemed to be affected by an ‘extraordinary’ event.
13/2/2019 Glider Club HVAS 98.0 23.0 19.5
An investigation determined HVO maximum potential contribution to be in the order of 23.0ug/m3 or 19.5% of the total measured based on prevailing wind conditions and upwind monitoring results. The wind direction was inside the arc of influence for 15% of the 24 hour period. Note that this day is deemed to be affected by an ‘extraordinary’ event.

2019 Annual Environmental Review Hunter Valley Operations
Report
Number: HVOOC-748212775-6 Status: [Document Status (Office)] Effective: [Effective Date] Page 63 of 238
Owner: [Owner] Version: [Document Version (Office)] Review: [Planned Review Date]
Uncontrolled when printed
Date Site 24hr result
(µg/m3)
Estimated max.
contribution from HVO (µg/m3)
Estimated max. Concentration
(%)
Discussion
13/2/2019 Kilburnie South
HVAS 73.0 2.5 3.7
An investigation determined HVO maximum potential contribution to be in the order of 2.5ug/m3 or 3.7% of the total measured based on prevailing wind conditions and upwind monitoring results. Note that this day is deemed to be affected by an ‘extraordinary’ event.
13/2/2019 Maison Dieu HVAS 71.0 NA NA An investigation found HVO not to be a significant contributor based on prevailing wind conditions. Note that this day is deemed to be affected by an ‘extraordinary’ event.
13/2/2019 Knodlers Lane HVAS 118.0 43.0 36.4
An investigation determined HVO maximum potential contribution to be in the order of 43.0ug/m3 or 36.4% of the total measured based on prevailing wind conditions and upwind monitoring results. The wind direction was inside the arc of influence for 11.8% of the 24 hour period. Note that this day is deemed to be affected by an ‘extraordinary’ event.
13/2/2019 Long Point HVAS 67.0 NA NA An investigation found HVO not to be a significant contributor based on prevailing wind conditions. Note that this day is deemed to be affected by an ‘extraordinary’ event.
13/2/2019 Warkworth HVAS 62.0 NA NA An investigation found HVO not to be a significant contributor based on prevailing wind conditions. Note that this day is deemed to be affected by an ‘extraordinary’ event.
19/02/2019 Cheshunt East HVAS 80.0 24.0 32.9
An investigation determined HVO maximum potential contribution to be in the order of 24.0ug/m3 or 32.9% of the total measured based on prevailing wind conditions and upwind monitoring results. The wind direction was inside the arc of influence for 24% of the 24 hour period. Note that this day is deemed to be affected by an ‘extraordinary’ event.
19/2/2019 Glider Club HVAS 58.0 2.0 1.8
An investigation determined HVO maximum potential contribution to be in the order of 2ug/m3 or 1.8% of the total measured based on prevailing wind conditions and upwind monitoring results. Note that this day is deemed to be affected by an ‘extraordinary’ event.
19/2/2019 Kilburnie South
HVAS 64.0 NA NA An investigation found HVO not to be a significant contributor based on prevailing wind conditions. Note that this day is deemed to be affected by an ‘extraordinary’ event.

2019 Annual Environmental Review Hunter Valley Operations
Report
Number: HVOOC-748212775-6 Status: [Document Status (Office)] Effective: [Effective Date] Page 64 of 238
Owner: [Owner] Version: [Document Version (Office)] Review: [Planned Review Date]
Uncontrolled when printed
Date Site 24hr result
(µg/m3)
Estimated max.
contribution from HVO (µg/m3)
Estimated max. Concentration
(%)
Discussion
19/2/2019 Knodlers Lane HVAS 113.0 57.0 50.4 An investigation determined HVO maximum potential contribution to be in the order of 57ug/m3 or 50.4% of the total measured based on prevailing wind conditions. Note that this day is deemed to be affected by an ‘extraordinary’ event.
19/2/2019 Long Point HVAS 56.0 NA NA An investigation found HVO not to be a significant contributor based on prevailing wind conditions. Note that this day is deemed to be affected by an ‘extraordinary’ event.
19/2/2019 Maison Dieu HVAS 73.0 17.0 23.3
An investigation determined HVO maximum potential contribution to be in the order of 17ug/m3 or 23.3% of the total measured based on prevailing wind conditions and upwind monitoring results. The wind direction was inside the arc of influence for 23.3% of the 24 hour period. Note that this day is deemed to be affected by an ‘extraordinary’ event.
25/2/2019 Kilburnie South
HVAS 79.0 NA NA An investigation found HVO not to be a significant contributor based on prevailing wind conditions.
8/4/2019 Knodlers Lane HVAS 76.0 53.5 70.4
An internal investigation determined HVO maximum potential contribution to be in the order of 53.5ug/m3 or 70.4% of the total measured based on prevailing wind conditions and upwind monitoring results. Results considered compliant based on approved management plan (v1.1) at the time.
26/4/2019 Knodlers Lane HVAS 54.0 22.0 70.4
An investigation determined HVO maximum potential contribution to be in the order of 22ug/m3 or 40.7% of the total measured based on prevailing wind conditions and upwind monitoring results. Note that this day is deemed to be affected by an ‘extraordinary’ event.
26/5/2019 Knodlers Lane HVAS 61.0 34.5 57.0 An investigation determined that the HVO maximum potential contribution was estimated to be 34.5ug/m3 or 57.0% of the total measured based on prevailing wind conditions.
26/5/2019 Glider Club HVAS 56.0 41.6 74.0 An investigation determined that the HVO maximum potential contribution was estimated to be 41.6ug/m3 or 74.0% of the total measured based on prevailing wind conditions.
01/06/2019 Gliding Club HVAS 72.0 45.3 63.0 An investigation determined HVO maximum potential contribution to be in the order of 45.3ug/m3 or 63% of the total measured based on prevailing wind conditions and upwind monitoring results.

2019 Annual Environmental Review Hunter Valley Operations
Report
Number: HVOOC-748212775-6 Status: [Document Status (Office)] Effective: [Effective Date] Page 65 of 238
Owner: [Owner] Version: [Document Version (Office)] Review: [Planned Review Date]
Uncontrolled when printed
Date Site 24hr result
(µg/m3)
Estimated max.
contribution from HVO (µg/m3)
Estimated max. Concentration
(%)
Discussion
6/8/2019 Knodlers Lane HVAS 59.0 41.9 71 An investigation determined HVO maximum potential contribution to be in the order of 41.9.0ug/m3 or 71% of the total measured based on prevailing wind conditions.
6/8/2019 Maison Dieu HVAS 56.0 38.9 69 An investigation determined HVO maximum potential contribution to be in the order of 38.9ug/m3 or 69% of the total measured based on prevailing wind conditions.
24/8/2019 Cheshunt East HVAS 71.0 46.0 42.2 An investigation determined HVO maximum potential contribution to be in the order of 46ug/m3 or 42.2% of the total measured based on prevailing wind conditions.
24/8/2019 Long Point HVAS 54.0 29.0 53.7 An investigation determined HVO maximum potential contribution to be in the order of 29ug/m3 or 53.7% of the total measured based on prevailing wind conditions and upwind monitoring results.
24/8/2019 Gliding Club HVAS 59.0 18.7 31.6 An investigation determined HVO maximum potential contribution to be in the order of 18.7ug/m3 or 31.6% of the total measured based on prevailing wind conditions and upwind monitoring results.
24/8/2019 Maison Dieu HVAS 109.0 <46 <42 An investigation determined HVO maximum potential contribution to be in the order of <46ug/m3 or <42% of the total measured based on prevailing wind conditions.
24/8/2019 Knodlers Lane HVAS 83.0 58.0 69.9 An investigation determined HVO maximum potential contribution to be in the order of 58.0ug/m3 or 69.9% of the total measured based on prevailing wind conditions.
6/9/2019 Jerrys Plains TEOM 93.1 NA – HVO North NA
An investigation determined HVO North could not have been a significant contributor as wind direction was from HVO for only 9% of the time during the 24 hour period. Note that this day is deemed to be affected by an ‘extraordinary’ event.
6/9/2019 Jerrys Plains TEOM 93.1 NA – HVO South NA
An investigation determined HVO South could not have been a significant contributor as wind direction was from HVO for only 2% of the time during the 24 hour period. Note that this day is deemed to be affected by an ‘extraordinary’ event.
6/9/2019 Knodlers Lane
TEOM 113.6 33.8 – HVO South 29
An investigation determined HVO South maximum potential contribution to be in the order of 33.8ug/m3 or 29% of the total measured based on prevailing wind conditions. Note that this day is deemed to be affected by an ‘extraordinary’ event.
6/9/2019 Maison Dieu TEOM 109.5 29.7 _ HVO South 27
An investigation determined HVO South maximum potential contribution to be in the order of 29.7ug/m3 or 27% of the total measured based on prevailing wind conditions. Note that this day is deemed to be affected by an ‘extraordinary’ event.
6/9/2019 Warkworth TEOM 86.8 7.0 – HVO South 8 An investigation determined HVO South maximum potential contribution to be in the
order of 7.0ug/m3 or 8% of the total measured based on prevailing wind conditions.

2019 Annual Environmental Review Hunter Valley Operations
Report
Number: HVOOC-748212775-6 Status: [Document Status (Office)] Effective: [Effective Date] Page 66 of 238
Owner: [Owner] Version: [Document Version (Office)] Review: [Planned Review Date]
Uncontrolled when printed
Date Site 24hr result
(µg/m3)
Estimated max.
contribution from HVO (µg/m3)
Estimated max. Concentration
(%)
Discussion
Note that this day is deemed to be affected by an ‘extraordinary’ event.
11/9/2019 Kilburnie South
HVAS 59.0 4.1 – HVO North 2.3
Confirmed results and assessed against compliance protocol to determine if the exceedance was notifiable to the Department.
Preliminary notification made internally and to the Department.
Engaged air quality consultant to investigate HVO's potential contribution to the exceedance.
Investigation determined HVO North Contributed 4.1ug/m3. Department determined that no further action was required, exceedance details to be recorded in the annual review and should be included in the annual average assessment.
11/9/2019 Kilburnie South HVAS 59.0 1.3 – HVO
South 7.0 An investigation determined HVO South maximum potential contribution to be in the order of 1.3ug/m3 or 7.0% of the total measured based on prevailing wind conditions.
12/9/2019 Knodlers Lane
TEOM 57.7 38.0 – HVO South 65 An investigation determined HVO South maximum potential contribution to be in the
order of 19.7ug/m3 or 35% of the total measured based on prevailing wind conditions.
13/9/2019 Jerrys Plains TEOM 64.2 4.3 – HVO North 6
Confirmed results and assessed against compliance protocol to determine if the exceedance was notifiable to the Department.
Preliminary notification made internally and to the Department.
Commenced investigation into HVO contribution to the exceedance.
Investigation determined that HVO North contributed less than 9ug/m3 to the total measured result. Department determined that no further action required with exceedance details to be recorded in the annual review and should be included in the annual average assessment.
13/9/2019 Jerrys Plains TEOM 64.2 NA – HVO South NA An investigation determined HVO South could not have been a significant contributor
as wind direction was from HVO for 12% of the time during the day.

2019 Annual Environmental Review Hunter Valley Operations
Report
Number: HVOOC-748212775-6 Status: [Document Status (Office)] Effective: [Effective Date] Page 67 of 238
Owner: [Owner] Version: [Document Version (Office)] Review: [Planned Review Date]
Uncontrolled when printed
Date Site 24hr result
(µg/m3)
Estimated max.
contribution from HVO (µg/m3)
Estimated max. Concentration
(%)
Discussion
16/9/2019 Knodlers Lane 58.1 33.6 – HVO South 57 An investigation determined HVO South maximum potential contribution to be in the
order of 33.6ug/m3 or 57% of the total measured based on prevailing wind conditions.
16/9/2019 Maison Dieu TEOM 74.6 7.4 – HVO South 9 An investigation determined HVO South maximum potential contribution to be in the
order of 7.4ug/m3 or 9% of the total measured based on prevailing wind conditions.
27/9/2019 Knodlers Lane
TEOM 59.5 44.4 – HVO South 74 An investigation determined HVO South maximum potential contribution to be in the
order of 44.4ug/m3 or 74% of the total measured based on prevailing wind conditions.
3/10/2019 Maison Dieu TEOM 57.0 0.5 – HVO South 0.0 An investigation determined HVO South maximum potential contribution to be in the
order of 0.5ug/m3 based on prevailing wind conditions.
3/10/2019 Knodlers Lane
TEOM 51.1 36 – HVO South 70.1 An investigation determined HVO South maximum potential contribution to be in the order of 36.0ug/m3 based on prevailing wind conditions.
4/10/2019 Maison Dieu TEOM 61.1 14.5 – HVO South 23.7 An investigation determined HVO South maximum potential contribution to be in the
order of 14.5ug/m3 based on prevailing wind conditions.
4/10/2019 Knodlers Lane
TEOM 75.5 30.4 – HVO South 40.2 An investigation determined HVO South maximum potential contribution to be in the
order of 30.4ug/m3 based on prevailing wind conditions.
7/10/2019 Jerrys Plains TEOM 64.2 8.4 – HVO South 13.1
An investigation determined HVO South maximum potential contribution to be in the order of 8.4ug/m3 based on prevailing wind conditions. Note that this day is deemed to be affected by an ‘extraordinary’ event.
7/10/2019 Jerrys Plain TEOM 54.7 0 – HVO North 0.0 HVO North could not have been a contributor as wind direction was from HVO North for 0% of the day. Note that this day is deemed to be affected by an ‘extraordinary’ event.
7/10/2019 Maison Dieu TEOM 67.6 21.5 – HVO South 31.8
An investigation determined HVO South maximum potential contribution to be in the order of 21.5ug/m3 based on prevailing wind conditions. Note that this day is deemed to be affected by an ‘extraordinary’ event.
7/10/2019 Knodlers Lane
TEOM 66.7 43.5 – HVO South 65.2
An investigation determined HVO South maximum potential contribution to be in the order of 43.5ug/m3 based on prevailing wind conditions. Note that this day is deemed to be affected by an ‘extraordinary’ event.
7/10/2019 Warkworth TEOM 52.4 39.6 – HVO South 75.6
An investigation determined HVO South maximum potential contribution to be in the order of 39.6ug/m3 based on prevailing wind conditions. Note that this day is deemed to be affected by an ‘extraordinary’ event.

2019 Annual Environmental Review Hunter Valley Operations
Report
Number: HVOOC-748212775-6 Status: [Document Status (Office)] Effective: [Effective Date] Page 68 of 238
Owner: [Owner] Version: [Document Version (Office)] Review: [Planned Review Date]
Uncontrolled when printed
Date Site 24hr result
(µg/m3)
Estimated max.
contribution from HVO (µg/m3)
Estimated max. Concentration
(%)
Discussion
8/10/2019 Maison Dieu TEOM 53.7 24.8 – HVO South 46.2
An investigation determined HVO South maximum potential contribution to be in the order of 24.8ug/m3 based on prevailing wind conditions. Note that this day is deemed to be affected by an ‘extraordinary’ event.
8/10/2019 Knodlers Lane
TEOM 50.6 32.5 – HVO South 64.2
An investigation determined HVO South maximum potential contribution to be in the order of 32.5ug/m3 based on prevailing wind conditions. Note that this day is deemed to be affected by an ‘extraordinary’ event.
16/10/2019 Maison Dieu TEOM 41.0 24.8 – HVO South 60.5 An investigation determined HVO South maximum potential contribution to be in the
order of 24.8ug/m3 based on prevailing wind conditions.
17/10/2019 Gliding Club HVAS 77.0 37.0 – HVO South 48.0
An investigation determined HVO South maximum potential contribution to be in the order of 37.0ug/m3 or 48.0% of the total measured based on prevailing wind conditions and upwind monitoring results.
17/10/2019 Knodlers Lane
TEOM 70.0 38.3 – HVO South 54.7 An investigation determined HVO South maximum potential contribution to be in the
order of 38.3ug/m3 based on prevailing wind conditions.
17/10/2019 Maison Dieu TEOM 88.4 42.5 – HVO South 48.1 An investigation determined HVO South maximum potential contribution to be in the
order of 42.5ug/m3 based on prevailing wind conditions.
18/10/2019 Maison Dieu TEOM 60.8 28.8 – HVO South 47.4
An investigation determined HVO South maximum potential contribution to be in the order of 28.8ug/m3 based on prevailing wind conditions. Note that this day is deemed to be affected by an ‘extraordinary’ event.
19/10/2019 Knodlers Lane
TEOM 60.8 29.4 – HVO South 48.3
An investigation determined HVO South maximum potential contribution to be in the order of 29.4ug/m3 based on prevailing wind conditions. Note that this day is deemed to be affected by an ‘extraordinary’ event.
19/10/2019 Maison Dieu TEOM 64.2 16.1 – HVO South 25.1
An investigation determined HVO South maximum potential contribution to be in the order of 16.1ug/m3 based on prevailing wind conditions. Note that this day is deemed to be affected by an ‘extraordinary’ event.
24/10/2019 Maison Dieu TEOM 58.5 16.3 – HVO South 27.9
An investigation determined HVO South maximum potential contribution to be in the order of 16.3ug/m3 based on prevailing wind conditions. Note that this day is deemed to be affected by an ‘extraordinary’ event.
24/10/2019 Knodlers Lane
TEOM 56.2 16.5 – HVO South 29.4 An investigation determined HVO South maximum potential contribution to be in the
order of 16.5ug/m3 based on prevailing wind conditions.

2019 Annual Environmental Review Hunter Valley Operations
Report
Number: HVOOC-748212775-6 Status: [Document Status (Office)] Effective: [Effective Date] Page 69 of 238
Owner: [Owner] Version: [Document Version (Office)] Review: [Planned Review Date]
Uncontrolled when printed
Date Site 24hr result
(µg/m3)
Estimated max.
contribution from HVO (µg/m3)
Estimated max. Concentration
(%)
Discussion
Note that this day is deemed to be affected by an ‘extraordinary’ event.
25/10/2019 Maison Dieu TEOM 74.1 32.1 – HVO South 43.3
An investigation determined HVO South maximum potential contribution to be in the order of 32.1ug/m3 based on prevailing wind conditions. Note that this day is deemed to be affected by an ‘extraordinary’ event.
25/10/2019 Knodlers Lane
TEOM 64.0 32.4 – HVO South 50.6
An investigation determined HVO South maximum potential contribution to be in the order of 32.4ug/m3 based on prevailing wind conditions. Note that this day is deemed to be affected by an ‘extraordinary’ event.
26/10/2019 Knodlers Lane
TEOM 169 33.4 – HVO South 20
An investigation determined HVO South maximum potential contribution to be in the order of 33.4ug/m3 based on prevailing wind conditions. Note that this day is deemed to be affected by an ‘extraordinary’ event.
26/10/2019 Maison Dieu TEOM 195 33.7 – HVO South 17
An investigation determined HVO South maximum potential contribution to be in the order of 33.7ug/m3 based on prevailing wind conditions. Note that this day is deemed to be affected by an ‘extraordinary’ event.
26/10/2019 Warkworth TEOM 97.7 40.4 – HVO South 41.4
An investigation determined HVO South maximum potential contribution to be in the order of 40.4ug/m3 based on prevailing wind conditions. Note that this day is deemed to be affected by an ‘extraordinary’ event.
27/10/2019 Knodlers Lane
TEOM 58.0 5.5 – HVO South 9.5
An investigation determined HVO South maximum potential contribution to be in the order of 5.5ug/m3 based on prevailing wind conditions. Note that this day is deemed to be affected by an ‘extraordinary’ event.
27/10/2019 Maison Dieu TEOM 62.5 12.2 – HVO South 19.5
An investigation determined HVO South maximum potential contribution to be in the order of 12.2ug/m3 based on prevailing wind conditions. Note that this day is deemed to be affected by an ‘extraordinary’ event.
27/10/2019 Warkworth TEOM 62.4 11.4 – HVO South 18.3
An investigation determined HVO South maximum potential contribution to be in the order of 11.4ug/m3 based on prevailing wind conditions. Note that this day is deemed to be affected by an ‘extraordinary’ event.
28/10/2019 Knodlers Lane
TEOM 59.7 2.3 – HVO South 3.9
An investigation determined HVO South maximum potential contribution to be in the order of 2.3ug/m3 based on prevailing wind conditions. Note that this day is deemed to be affected by an ‘extraordinary’ event.

2019 Annual Environmental Review Hunter Valley Operations
Report
Number: HVOOC-748212775-6 Status: [Document Status (Office)] Effective: [Effective Date] Page 70 of 238
Owner: [Owner] Version: [Document Version (Office)] Review: [Planned Review Date]
Uncontrolled when printed
Date Site 24hr result
(µg/m3)
Estimated max.
contribution from HVO (µg/m3)
Estimated max. Concentration
(%)
Discussion
28/10/2019 Maison Dieu TEOM 57.1 0.6 – HVO South 1.1
An investigation determined HVO South maximum potential contribution to be in the order of 0.6ug/m3 based on prevailing wind conditions. Note that this day is deemed to be affected by an ‘extraordinary’ event.
28/10/2019 Warkworth TEOM 56.2 4.8 – HVO South 8.5
An investigation determined HVO South maximum potential contribution to be in the order of 4.8ug/m3 based on prevailing wind conditions. Note that this day is deemed to be affected by an ‘extraordinary’ event.
29/10/2019 Glider Club HVAS 82.0 NA – HVO South NA
An investigation found HVO South not to be a significant contributor based on prevailing wind conditions. Note that this day is deemed to be affected by an ‘extraordinary’ event.
29/10/2019 Cheshunt East HVAS 54.0 NA – HVO North NA
An investigation found HVO North not to be a significant contributor based on prevailing wind conditions. Note that this day is deemed to be affected by an ‘extraordinary’ event.
29/10/2019 Kilburnie South
HVAS 95.0 NA – HVO North NA
An investigation determined HVO North not be a significant contributor based on prevailing wind conditions. Note that this day is deemed to be affected by an ‘extraordinary’ event.
29/10/2019 Kilburnie South
HVAS 95.0 24.0 – HVO South 25.3
An investigation determined HVO South maximum potential contribution to be in the order of 24.0ug/m3 of the total measured based on prevailing wind conditions. Note that this day is deemed to be affected by an ‘extraordinary’ event.
29/10/2019 Maison Dieu TEOM 50.3 1.6 – HVO South 3.2
An investigation determined HVO South maximum potential contribution to be in the order of 1.6ug/m3 based on prevailing wind conditions. Note that this day is deemed to be affected by an ‘extraordinary’ event.
29/10/2019 Warkworth TEOM 64.0 10.1 – HVO South 15.7
An investigation determined HVO South maximum potential contribution to be in the order of 10.0ug/m3 based on prevailing wind conditions. Note that this day is deemed to be affected by an ‘extraordinary’ event.
29/10/2019 Jerrys Plains TEOM 52.8 10.2 – HVO South 19.3
An investigation determined HVO South maximum potential contribution to be in the order of 10.2ug/m3 based on prevailing wind conditions. Note that this day is deemed to be affected by an ‘extraordinary’ event.
29/10/2019 Jerrys Plains TEOM 52.8 5.6 – HVO North 10.6 An investigation determined HVO North maximum potential contribution to be in the
order of 5.6ug/m3 based on prevailing wind conditions.

2019 Annual Environmental Review Hunter Valley Operations
Report
Number: HVOOC-748212775-6 Status: [Document Status (Office)] Effective: [Effective Date] Page 71 of 238
Owner: [Owner] Version: [Document Version (Office)] Review: [Planned Review Date]
Uncontrolled when printed
Date Site 24hr result
(µg/m3)
Estimated max.
contribution from HVO (µg/m3)
Estimated max. Concentration
(%)
Discussion
Note that this day is deemed to be affected by an ‘extraordinary’ event.
30/10/2019 Knodlers Lane
TEOM 86.8 34.3 – HVO South 39.5
An investigation determined HVO South maximum potential contribution to be in the order of 34.3ug/m3 based on prevailing wind conditions. Note that this day is deemed to be affected by an ‘extraordinary’ event.
30/10/2019 Maison Dieu TEOM 93.2 23.5 – HVO South 25.2
An investigation determined HVO South maximum potential contribution to be in the order of 23.5ug/m3 based on prevailing wind conditions. Note that this day is deemed to be affected by an ‘extraordinary’ event.
30/10/2019 Warkworth TEOM 91.1 24.7 – HVO South 27.1
An investigation determined HVO South maximum potential contribution to be in the order of 24.7ug/m3 based on prevailing wind conditions. Note that this day is deemed to be affected by an ‘extraordinary’ event.
30/10/2019 Jerrys Plains TEOM 75.3 5.5– HVO South 7.3 An investigation determined HVO South maximum potential contribution to be in the order of 5.5ug/m3 based on prevailing wind conditions. Note that this day is deemed to be affected by an ‘extraordinary’ event.
30/10/2019 Jerrys Plains TEOM 75.3 6.3 – HVO North 8.4
An investigation determined HVO North maximum potential contribution to be in the order of 6.3ug/m3 based on prevailing wind conditions. Note that this day is deemed to be affected by an ‘extraordinary’ event.
31/10/2019 Knodlers Lane
TEOM 106.1 34.2 – HVO South 32.2
An investigation determined HVO South maximum potential contribution to be in the order of 34.2ug/m3 based on prevailing wind conditions. Note that this day is deemed to be affected by an ‘extraordinary’ event.
31/10/2019 Maison Dieu TEOM 103.9 12.9 – HVO South 12.4
An investigation determined HVO South maximum potential contribution to be in the order of 12.9ug/m3 based on prevailing wind conditions. Note that this day is deemed to be affected by an ‘extraordinary’ event.
31/10/2019 Warkworth TEOM 104.3 33.5 – HVO South 32.2
An investigation determined HVO South maximum potential contribution to be in the order of 33.5ug/m3 based on prevailing wind conditions. Note that this day is deemed to be affected by an ‘extraordinary’ event.
31/10/2019 Jerrys Plains TEOM 85.3 20.2 – HVO South 23.4
An investigation determined HVO South maximum potential contribution to be in the order of 20.2ug/m3 based on prevailing wind conditions. Note that this day is deemed to be affected by an ‘extraordinary’ event.

2019 Annual Environmental Review Hunter Valley Operations
Report
Number: HVOOC-748212775-6 Status: [Document Status (Office)] Effective: [Effective Date] Page 72 of 238
Owner: [Owner] Version: [Document Version (Office)] Review: [Planned Review Date]
Uncontrolled when printed
Date Site 24hr result
(µg/m3)
Estimated max.
contribution from HVO (µg/m3)
Estimated max. Concentration
(%)
Discussion
31/10/2019 Jerrys Plains TEOM 85.3 7.5 – HVO North 8.8
An investigation determined HVO North maximum potential contribution to be in the order of 7.5ug/m3 based on prevailing wind conditions. Note that this day is deemed to be affected by an ‘extraordinary’ event.
1/11/2019 Warkworth TEOM 84.0 8.1 – HVO South 9.6
An investigation determined HVO South maximum potential contribution to be in the order of 8.1ug/m3 based on prevailing wind conditions. Note that this day is deemed to be affected by an ‘extraordinary’ event.
1/11/2019 Maison Dieu TEOM 74.8 4.4 – HVO South 5.6
An investigation determined HVO South maximum potential contribution to be in the order of 4.4ug/m3 based on prevailing wind conditions. Note that this day is deemed to be affected by an ‘extraordinary’ event.
1/11/2019 Knodlers Lane
TEOM 73.5 6.5 – HVO South 8.8
An investigation determined HVO South maximum potential contribution to be in the order of 6.5ug/m3 based on prevailing wind conditions. Note that this day is deemed to be affected by an ‘extraordinary’ event.
1/11/2019 Jerrys Plains TEOM 86.0 30.0 – HVO South 34.9
An investigation determined HVO South maximum potential contribution to be in the order of 30.0ug/m3 based on prevailing wind conditions. Note that this day is deemed to be affected by an ‘extraordinary’ event.
1/11/2019 Jerrys Plain TEOM 86.0 27.4 – HVO North 21.8
An investigation determined HVO North maximum potential contribution to be in the order of 27.4ug/m3 based on prevailing wind conditions. Note that this day is deemed to be affected by an ‘extraordinary’ event.
2/11/2019 Warkworth TEOM 54.0 14.6 – HVO South 27.0
An investigation determined HVO South maximum potential contribution to be in the order of 14.6ug/m3 based on prevailing wind conditions. Note that this day is deemed to be affected by an ‘extraordinary’ event.
2/11/2019 Maison Dieu TEOM 51.6 10.1 – HVO South 19.6
An investigation determined HVO South maximum potential contribution to be in the order of 10.1ug/m3 based on prevailing wind conditions. Note that this day is deemed to be affected by an ‘extraordinary’ event.
2/11/2019 Jerrys Plains TEOM 52.6 3.5 – HVO South 6.7
An investigation determined HVO South maximum potential contribution to be in the order of 3.5ug/m3 based on prevailing wind conditions. Note that this day is deemed to be affected by an ‘extraordinary’ event.
2/11/2019 Jerrys Plains TEOM 52.6 4.6 – HVO North 8.7 An investigation determined HVO North maximum potential contribution to be in the
order of 4.6ug/m3 based on prevailing wind conditions.

2019 Annual Environmental Review Hunter Valley Operations
Report
Number: HVOOC-748212775-6 Status: [Document Status (Office)] Effective: [Effective Date] Page 73 of 238
Owner: [Owner] Version: [Document Version (Office)] Review: [Planned Review Date]
Uncontrolled when printed
Date Site 24hr result
(µg/m3)
Estimated max.
contribution from HVO (µg/m3)
Estimated max. Concentration
(%)
Discussion
Note that this day is deemed to be affected by an ‘extraordinary’ event.
3/11/2019 Maison Dieu TEOM 57.0 32.0 – HVO South 56.1 An investigation determined HVO South maximum potential contribution to be in the
order of 32.0ug/m3 based on prevailing wind conditions.
7/11/2019 Warkworth TEOM 75.1 3.9 – HVO South 5.2
An investigation determined HVO South maximum potential contribution to be in the order of 3.9ug/m3 based on prevailing wind conditions. Note that this day is deemed to be affected by an ‘extraordinary’ event.
7/11/2019 Maison Dieu TEOM 96.7 20.2 – HVO South 20.9
An investigation determined HVO South maximum potential contribution to be in the order of 20.2ug/m3 based on prevailing wind conditions. Note that this day is deemed to be affected by an ‘extraordinary’ event.
7/11/2019 Knodlers Lane
TEOM 117.0 42.2 – HVO South 36.1
An investigation determined HVO South maximum potential contribution to be in the order of 42.2ug/m3 based on prevailing wind conditions. Note that this day is deemed to be affected by an ‘extraordinary’ event.
7/11/2019 Jerrys Plains TEOM 67.8 NA – HVO South NA
An investigation determined HVO South was not a significant contributor given that wind direction during the 24 hour period was not within the arc of influence. Note that this day is deemed to be affected by an ‘extraordinary’ event.
7/11/2019 Jerrys Plains TEOM 67.8 NA – HVO North NA
An investigation determined HVO North was not a significant contributor given that wind direction during the 24 hour period was not within the arc of influence. Note that this day is deemed to be affected by an ‘extraordinary’ event.
8/11/2019 Warkworth TEOM 72.0 14.3 – HVO South 19.9
An investigation determined HVO South maximum potential contribution to be in the order of 14.3ug/m3 based on prevailing wind conditions. Note that this day is deemed to be affected by an ‘extraordinary’ event.
8/11/2019 Maison Dieu TEOM 81.1 8.4 – HVO South 10.4
An investigation determined HVO South maximum potential contribution to be in the order of 8.4ug/m3 based on prevailing wind conditions. Note that this day is deemed to be affected by an ‘extraordinary’ event.
8/11/2019 Knodlers Lane
TEOM 102.6 29.8 – HVO South 29.0
An investigation determined HVO maximum potential contribution to be in the order of 29.8ug/m3 based on prevailing wind conditions. Note that this day is deemed to be affected by an ‘extraordinary’ event.
8/11/2019 Jerrys Plains TEOM 72.8 NA – HVO South NA An investigation determined HVO South was not a significant contributor given that
wind direction during the 24 hour period was not within the arc of influence.

2019 Annual Environmental Review Hunter Valley Operations
Report
Number: HVOOC-748212775-6 Status: [Document Status (Office)] Effective: [Effective Date] Page 74 of 238
Owner: [Owner] Version: [Document Version (Office)] Review: [Planned Review Date]
Uncontrolled when printed
Date Site 24hr result
(µg/m3)
Estimated max.
contribution from HVO (µg/m3)
Estimated max. Concentration
(%)
Discussion
Note that this day is deemed to be affected by an ‘extraordinary’ event.
8/11/2019 Jerrys Plains TEOM 72.8 NA – HVO North NA
An investigation determined HVO North was not a significant contributor given that wind direction during the 24 hour period was not within the arc of influence. Note that this day is deemed to be affected by an ‘extraordinary’ event.
10/11/2019 Gliding Club HVAS 57 34.0 – HVO South 59.6
An investigation determined HVO South maximum potential contribution to be in the order of 34.0ug/m3 or 59.6% of the total measured based on prevailing wind conditions.
12/11/2019 Warkworth TEOM 108.1 14.6 – HVO South 13.5
An investigation determined HVO maximum potential contribution to be in the order of 14.6ug/m3 based on prevailing wind conditions. Note that this day is deemed to be affected by an ‘extraordinary’ event.
12/11/2019 Maison Dieu TEOM 162.2 49.4– HVO South 30.5
An investigation determined HVO maximum potential contribution to be in the order of 49.4ug/m3 based on prevailing wind conditions. Note that this day is deemed to be affected by an ‘extraordinary’ event.
12/11/2019 Knodlers Lane
TEOM 146.3 33.5– HVO South 22.9
An investigation determined HVO maximum potential contribution to be in the order of 33.5ug/m3 based on prevailing wind conditions. Note that this day is deemed to be affected by an ‘extraordinary’ event.
12/11/2019 Jerrys Plains TEOM 102.8 0.3– HVO South 2.9 An investigation determined HVO maximum potential contribution to be in the order of 0.3ug/m3 based on prevailing wind conditions. Note that this day is deemed to be affected by an ‘extraordinary’ event.
12/11/2019 Jerrys Plains TEOM 102.8 0.1 – HVO North 0.1
An investigation determined HVO maximum potential contribution to be in the order of 0.1ug/m3 based on prevailing wind conditions. Note that this day is deemed to be affected by an ‘extraordinary’ event.
15/11/2019 Maison Dieu TEOM 55.5 32.6– HVO South 58.7 An investigation determined HVO maximum potential contribution to be in the order of
32.6ug/m3 based on prevailing wind conditions.
16/11/2019 Cheshunt East HVAS 52.0 NA – HVO North NA
An investigation found HVO not to be a significant contributor based on prevailing wind conditions. Note that this day is deemed to be affected by an ‘extraordinary’ event.

2019 Annual Environmental Review Hunter Valley Operations
Report
Number: HVOOC-748212775-6 Status: [Document Status (Office)] Effective: [Effective Date] Page 75 of 238
Owner: [Owner] Version: [Document Version (Office)] Review: [Planned Review Date]
Uncontrolled when printed
Date Site 24hr result
(µg/m3)
Estimated max.
contribution from HVO (µg/m3)
Estimated max. Concentration
(%)
Discussion
16/11/2019 Kilburnie South
HVAS 74.0 NA – HVO South NA
An investigation determined HVO South was not a significant contributor given that wind direction during the 24 hour period was within the arc of influence for 3.5% of the day. Note that this day is deemed to be affected by an ‘extraordinary’ event.
16/11/2019 Kilburnie South
HVAS 74.0 NA – HVO North NA
An investigation determined HVO North was not a significant contributor given that wind direction during the 24 hour period was within the arc of influence for 5% of the day. Note that this day is deemed to be affected by an ‘extraordinary’ event.
16/11/2019 Gliding Club HVAS 87.0 34.0 – HVO South 64.2
An investigation determined HVO South maximum potential contribution to be in the order of 34.0ug/m3 or 64.2% of the total measured based on prevailing wind conditions and upwind monitoring results. The wind direction was inside the arc of influence for 19% of the 24 hour period. Note that this day is deemed to be affected by an ‘extraordinary’ event.
16/11/2019 Long Point HVAS 53.0 NA – HVO South NA
An investigation found HVO South not to be a significant contributor based on prevailing wind conditions within the arc of influence for 9% of the day. Note that this day is deemed to be affected by an ‘extraordinary’ event.
16/11/2019 Warkworth TEOM 60.1 8.2 – HVO South 13.6
An investigation determined HVO South maximum potential contribution to be in the order of 8.2ug/m3 based on prevailing wind conditions. Note that this day is deemed to be affected by an ‘extraordinary’ event.
16/11/2019 Maison Dieu TEOM 59.7 2.8 – HVO South 4.7
An investigation determined HVO South maximum potential contribution to be in the order of 2.8ug/m3 based on prevailing wind conditions. Note that this day is deemed to be affected by an ‘extraordinary’ event.
16/11/2019 Knodlers Lane
TEOM 65.2 11.7 – HVO South 17.9
An investigation determined HVO maximum potential contribution to be in the order of 11.7ug/m3 based on prevailing wind conditions. Note that this day is deemed to be affected by an ‘extraordinary’ event.
16/11/2019 Jerrys Plains TEOM 67.5 21.0 – HVO South 31.1
An investigation determined HVO South maximum potential contribution to be in the order of 21.0ug/m3 based on prevailing wind conditions. Note that this day is deemed to be affected by an ‘extraordinary’ event.
16/11/2019 Jerrys Plains TEOM 67.5 8.9 – HVO North 13.2 An investigation determined HVO North maximum potential contribution to be in the
order of 8.9ug/m3 based on prevailing wind conditions.

2019 Annual Environmental Review Hunter Valley Operations
Report
Number: HVOOC-748212775-6 Status: [Document Status (Office)] Effective: [Effective Date] Page 76 of 238
Owner: [Owner] Version: [Document Version (Office)] Review: [Planned Review Date]
Uncontrolled when printed
Date Site 24hr result
(µg/m3)
Estimated max.
contribution from HVO (µg/m3)
Estimated max. Concentration
(%)
Discussion
Note that this day is deemed to be affected by an ‘extraordinary’ event.
17/11/2019 Warkworth TEOM 72.6 24.8 – HVO South 34.1
An investigation determined HVO South maximum potential contribution to be in the order of 24.8ug/m3 based on prevailing wind conditions. Note that this day is deemed to be affected by an ‘extraordinary’ event.
17/11/2019 Maison Dieu TEOM 77.7 23.1 – HVO South 29.7
An investigation determined HVO South maximum potential contribution to be in the order of 23.1ug/m3 based on prevailing wind conditions. Note that this day is deemed to be affected by an ‘extraordinary’ event.
17/11/2019 Knodlers Lane
TEOM 76.5 31.2 – HVO South 40.8
An investigation determined HVO South maximum potential contribution to be in the order of 31.2ug/m3 based on prevailing wind conditions. Note that this day is deemed to be affected by an ‘extraordinary’ event.
17/11/2019 Jerrys Plains TEOM 76.5 4.0 – HVO South 5.2
An investigation determined HVO South maximum potential contribution to be in the order of 4.0ug/m3 based on prevailing wind conditions. Note that this day is deemed to be affected by an ‘extraordinary’ event.
17/11/2019 Jerrys Plains TEOM 76.5 2.2 – HVO North 2.9
An investigation determined HVO North maximum potential contribution to be in the order of 2.2ug/m3 based on prevailing wind conditions. Note that this day is deemed to be affected by an ‘extraordinary’ event.
18/11/2019 Maison Dieu TEOM 51.9 14.9 – HVO South 28.7 An investigation determined HVO South maximum potential contribution to be in the
order of 14.9ug/m3 based on prevailing wind conditions.
19/11/2019 Maison Dieu TEOM 63.2 2.8– HVO South 4.4 An investigation determined HVO South maximum potential contribution to be in the order of 2.8ug/m3 based on prevailing wind conditions. Note that this day is deemed to be affected by an ‘extraordinary’ event.
19/11/2019 Knodlers Lane
TEOM 52.0 21.6– HVO South 41.5
An investigation determined HVO South maximum potential contribution to be in the order of 21.6ug/m3 based on prevailing wind conditions. Note that this day is deemed to be affected by an ‘extraordinary’ event.
20/11/2019 Warkworth TEOM 56.6 0 – HVO South 0.0 An investigation determined HVO South was not a significant contributor given that wind direction during the 24 hour period was not within the arc of influence. Note that this day is deemed to be affected by an ‘extraordinary’ event.
20/11/2019 Maison Dieu TEOM 50.5 0 – HVO South 0.0 An investigation determined HVO South was not a significant contributor given that wind direction during the 24 hour period was not within the arc of influence.

2019 Annual Environmental Review Hunter Valley Operations
Report
Number: HVOOC-748212775-6 Status: [Document Status (Office)] Effective: [Effective Date] Page 77 of 238
Owner: [Owner] Version: [Document Version (Office)] Review: [Planned Review Date]
Uncontrolled when printed
Date Site 24hr result
(µg/m3)
Estimated max.
contribution from HVO (µg/m3)
Estimated max. Concentration
(%)
Discussion
Note that this day is deemed to be affected by an ‘extraordinary’ event.
20/11/2019 Knodlers Lane
TEOM 51.9 0 – HVO South 0.0 An investigation determined HVO South was not a significant contributor given that wind direction during the 24 hour period was not within the arc of influence. Note that this day is deemed to be affected by an ‘extraordinary’ event.
20/11/2019 Jerrys Plains TEOM 88.4 24.2 – HVO South 27.1
An investigation determined HVO South maximum potential contribution to be in the order of 24.2ug/m3 based on prevailing wind conditions. Note that this day is deemed to be affected by an ‘extraordinary’ event.
20/11/2019 Jerrys Plains TEOM 88.4 10.0 – HVO North 11.3
An investigation determined HVO North maximum potential contribution to be in the order of 10.0ug/m3 based on prevailing wind conditions. Note that this day is deemed to be affected by an ‘extraordinary’ event.
21/11/2019 Warkworth TEOM 113.4 41.0 – HVO South 36.1
An investigation determined HVO South maximum potential contribution to be in the order of 41.0ug/m3 based on prevailing wind conditions. Note that this day is deemed to be affected by an ‘extraordinary’ event.
21/11/2019 Maison Dieu TEOM 173.5 12.7 – HVO South 7.3
An investigation determined HVO South maximum potential contribution to be in the order of 12.7ug/m3 based on prevailing wind conditions. Note that this day is deemed to be affected by an ‘extraordinary’ event.
21/11/2019 Knodlers Lane
TEOM 102.3 31.6 – HVO South 30.9
An investigation determined HVO South maximum potential contribution to be in the order of 31.6ug/m3 based on prevailing wind conditions. Note that this day is deemed to be affected by an ‘extraordinary’ event.
21/11/2019 Jerrys Plains TEOM 115.4 5.3 – HVO South 4.6
An investigation determined HVO South maximum potential contribution to be in the order of 5.3ug/m3 based on prevailing wind conditions. Note that this day is deemed to be affected by an ‘extraordinary’ event.
21/11/2019 Jerrys Plains TEOM 115.4 7.3 – HVO North 6.3
An investigation determined HVO North maximum potential contribution to be in the order of 7.3ug/m3 based on prevailing wind conditions. Note that this day is deemed to be affected by an ‘extraordinary’ event.
22/11/2019 Gliding Club HVAS 150.0 22.0 – HVO South 20.0
An investigation determined HVO South maximum potential contribution to be in the order of 22.0ug/m3 or 20.0% of the total measured based on prevailing wind conditions and upwind monitoring results. The wind direction was inside the arc of influence for 19.9% of the 24 hour period. Note that this day is deemed to be affected by an ‘extraordinary’ event.

2019 Annual Environmental Review Hunter Valley Operations
Report
Number: HVOOC-748212775-6 Status: [Document Status (Office)] Effective: [Effective Date] Page 78 of 238
Owner: [Owner] Version: [Document Version (Office)] Review: [Planned Review Date]
Uncontrolled when printed
Date Site 24hr result
(µg/m3)
Estimated max.
contribution from HVO (µg/m3)
Estimated max. Concentration
(%)
Discussion
22/11/2019 Kilburnie South
HVAS 128 14.2 – HVO North 11.1
An investigation determined HVO North maximum potential contribution to be in the order of 14.2ug/m3 or 11.1% of the total measured based on prevailing wind conditions. The wind direction was inside the arc of influence for 0.7% of the 24 hour period. Note that this day is deemed to be affected by an ‘extraordinary’ event.
22/11/2019 Kilburnie South
HVAS 128.0 16.0 – HVO South 12.5
An investigation determined HVO maximum potential contribution to be in the order of 16.0ug/m3 or 12.5% of the total measured based on prevailing wind conditions. The wind direction was inside the arc of influence for 4.2% of the 24 hour period.
Note that this day is deemed to be affected by an ‘extraordinary’ event.
22/11/2019 Cheshunt East HVAS 112.0 NA – HVO North NA
An investigation found HVO North not to be a significant contributor based on prevailing wind conditions. Note that this day is deemed to be affected by an ‘extraordinary’ event.
22/11/2019 Long Point HVAS 110.0 NA – HVO South NA
An investigation found HVO South not to be a significant contributor based on prevailing wind conditions. Note that this day is deemed to be affected by an ‘extraordinary’ event.
22/11/2019 Warkworth TEOM 98.4 41.7 – HVO South 42.4
An investigation determined HVO SOuth maximum potential contribution to be in the order of 41.7ug/m3 based on prevailing wind conditions. Note that this day is deemed to be affected by an ‘extraordinary’ event.
22/11/2019 Maison Dieu TEOM 121.9 41.8 – HVO South 34.3
An investigation determined HVO South maximum potential contribution to be in the order of 41.8ug/m3 based on prevailing wind conditions. Note that this day is deemed to be affected by an ‘extraordinary’ event.
22/11/2019 Knodlers Lane
TEOM 119.1 7.2– HVO South 6.0 An investigation determined HVO South maximum potential contribution to be in the order of 7.2ug/m3 based on prevailing wind conditions. Note that this day is deemed to be affected by an ‘extraordinary’ event.
22/11/2019 Jerrys Plains TEOM 115.7 3.3– HVO South 2.6 An investigation determined HVO South maximum potential contribution to be in the order of 3.3ug/m3 based on prevailing wind conditions. Note that this day is deemed to be affected by an ‘extraordinary’ event.
22/11/2019 Jerrys Plains TEOM 115.7 11.1 – HVO North 9.6
An investigation determined HVO North maximum potential contribution to be in the order of 11.1ug/m3 based on prevailing wind conditions. Note that this day is deemed to be affected by an ‘extraordinary’ event.

2019 Annual Environmental Review Hunter Valley Operations
Report
Number: HVOOC-748212775-6 Status: [Document Status (Office)] Effective: [Effective Date] Page 79 of 238
Owner: [Owner] Version: [Document Version (Office)] Review: [Planned Review Date]
Uncontrolled when printed
Date Site 24hr result
(µg/m3)
Estimated max.
contribution from HVO (µg/m3)
Estimated max. Concentration
(%)
Discussion
23/11/2019 Warkworth TEOM 55.0 0.3 – HVO South 0.5
An investigation determined HVO South maximum potential contribution to be in the order of 0.3ug/m3 based on prevailing wind conditions. Note that this day is deemed to be affected by an ‘extraordinary’ event.
23/11/2019 Jerrys Plains TEOM 61.9 28.7 – HVO South 46.4
An investigation determined HVO South maximum potential contribution to be in the order of 28.7ug/m3 based on prevailing wind conditions. Note that this day is deemed to be affected by an ‘extraordinary’ event.
23/11/2019 Jerrys Plains TEOM 61.9 18.9 – HVO North 30.5
An investigation determined HVO North maximum potential contribution to be in the order of 18.9ug/m3 based on prevailing wind conditions. Note that DPIE declared this day to be an ‘extraordinary’ event.
26/11/2019 Warkworth TEOM 164.9 27.9 – HVO South 16.9
An investigation determined HVO South maximum potential contribution to be in the order of 27.9ug/m3 based on prevailing wind conditions. Note that this day is deemed to be affected by an ‘extraordinary’ event.
26/11/2019 Maison Dieu TEOM 424.8 25.3 – HVO South 5.9
An investigation determined HVO South maximum potential contribution to be in the order of 25.3ug/m3 based on prevailing wind conditions. Note that this day is deemed to be affected by an ‘extraordinary’ event.
26/11/2019 Knodlers Lane
TEOM 317.7 48.7 – HVO South 14.9
An investigation determined HVO South maximum potential contribution to be in the order of 48.7ug/m3 based on prevailing wind conditions. Note that this day is deemed to be affected by an ‘extraordinary’ event.
26/11/2019 Jerrys Plains TEOM 197.7 0.1 – HVO South 0.0
An investigation determined HVO South maximum potential contribution to be in the order of 0.1ug/m3 based on prevailing wind conditions. Note that this day is deemed to be affected by an ‘extraordinary’ event.
26/11/2019 Jerrys Plains TEOM 197.7 NA – HVO North NA
An investigation determined HVO North was not a significant contributor given that wind direction during the 24 hour period was not within the arc of influence. Note that this day is deemed to be affected by an ‘extraordinary’ event.
27/11/2019 Maison Dieu TEOM 62.1 16.1 – HVO South 25.9
An investigation determined HVO South maximum potential contribution to be in the order of 16.1ug/m3 based on prevailing wind conditions. Note that this day is deemed to be affected by an ‘extraordinary’ event.
27/11/2019 Knodlers Lane
TEOM 53.8 6.6 – HVO South 12.3 An investigation determined HVO maximum potential contribution to be in the order of
6.6ug/m3 based on prevailing wind conditions.

2019 Annual Environmental Review Hunter Valley Operations
Report
Number: HVOOC-748212775-6 Status: [Document Status (Office)] Effective: [Effective Date] Page 80 of 238
Owner: [Owner] Version: [Document Version (Office)] Review: [Planned Review Date]
Uncontrolled when printed
Date Site 24hr result
(µg/m3)
Estimated max.
contribution from HVO (µg/m3)
Estimated max. Concentration
(%)
Discussion
Note that this day is deemed to be affected by an ‘extraordinary’ event.
27/11/2019 Jerrys Plains TEOM 64.1 8.4 – HVO South 13.1
An investigation determined HVO South maximum potential contribution to be in the order of 8.4ug/m3 based on prevailing wind conditions. Note that this day is deemed to be affected by an ‘extraordinary’ event.
27/11/2019 Jerrys Plains TEOM 64.1 5.6 – HVO North 8.7
An investigation determined HVO maximum potential contribution to be in the order of 5.6ug/m3 based on prevailing wind conditions. Note that this day is deemed to be affected by an ‘extraordinary’ event.
28/11/2019 Gliding Club HVAS 152.0 68.0 – HVO South 81.0
An investigation determined HVO South maximum potential contribution to be in the order of 68.0ug/m3 or 81.0% of the total measured based on prevailing wind conditions and upwind monitoring results. The wind direction was inside the arc of influence for 15.6% of the 24 hour period. Note that this day is deemed to be affected by an ‘extraordinary’ event.
28/11/2019 Kilburnie South
HVAS 146.0 21.0 – HVO North 14.4
An investigation determined HVO North maximum potential contribution to be in the order of 21.0ug/m3 or 14.4% of the total measured based on prevailing wind conditions. The wind direction was inside the arc of influence for 18.1% of the 24 hour period. Note that this day is deemed to be affected by an ‘extraordinary’ event.
28/11/2019 Kilburnie South
HVAS 146.0 61.0 – HVO South 41.8
An investigation determined HVO South maximum potential contribution to be in the order of 61.0ug/m3 or 41.8% of the total measured based on prevailing wind conditions. The wind direction was inside the arc of influence for 10.4% of the 24 hour period.
Note that this day is deemed to be affected by an ‘extraordinary’ event.
28/11/2019 Cheshunt East HVAS 85.0 1.0 – HVO North 1.2
An investigation determined HVO North maximum potential contribution to be in the order of 1.0ug/m3 or 1.2% of the total measured based on prevailing wind conditions and upwind monitoring results. The wind direction was inside the arc of influence for 6.3% of the 24 hour period. Note that this day is deemed to be affected by an ‘extraordinary’ event.
28/11/2019 Long Point HVAS 84.0 NA – HVO South NA
An investigation determined HVO South was not a significant contributor given that wind direction during the 24 hour period was not within the arc of influence. Note that this day is deemed to be affected by an ‘extraordinary’ event.

2019 Annual Environmental Review Hunter Valley Operations
Report
Number: HVOOC-748212775-6 Status: [Document Status (Office)] Effective: [Effective Date] Page 81 of 238
Owner: [Owner] Version: [Document Version (Office)] Review: [Planned Review Date]
Uncontrolled when printed
Date Site 24hr result
(µg/m3)
Estimated max.
contribution from HVO (µg/m3)
Estimated max. Concentration
(%)
Discussion
28/11/2019 Warkworth TEOM 133.8 11.3 – HVO South 8.4
An investigation determined HVO South maximum potential contribution to be in the order of 11.3ug/m3 based on prevailing wind conditions. Note that this day is deemed to be affected by an ‘extraordinary’ event.
28/11/2019 Maison Dieu TEOM 90.5 11.2 – HVO South 12.4
An investigation determined HVO South maximum potential contribution to be in the order of 11.2ug/m3 based on prevailing wind conditions. Note that this day is deemed to be affected by an ‘extraordinary’ event.
28/11/2019 Knodlers Lane
TEOM 95.3 17.5 – HVO South 18.4
An investigation determined HVO South maximum potential contribution to be in the order of 17.5ug/m3 based on prevailing wind conditions. Note that this day is deemed to be affected by an ‘extraordinary’ event.
28/11/2019 Jerrys Plains TEOM 104.2 6.1- HVO South 5.9 An investigation determined HVO South maximum potential contribution to be in the order of 6.1ug/m3 based on prevailing wind conditions. Note that this day is deemed to be affected by an ‘extraordinary’ event.
28/11/2019 Jerrys Plains TEOM 104.2 11.3 – HVO North 10.8
An investigation determined HVO North maximum potential contribution to be in the order of 11.3ug/m3 based on prevailing wind conditions. Note that this day is deemed to be affected by an ‘extraordinary’ event.
29/11/2019 Warkworth TEOM 113.3 32.8 – HVO South 28.9
An investigation determined HVO South maximum potential contribution to be in the order of 32.8ug/m3 based on prevailing wind conditions. Note that this day is deemed to be affected by an ‘extraordinary’ event.
29/11/2019 Maison Dieu TEOM 128.7 19.9 – HVO South 15.5
An investigation determined HVO South maximum potential contribution to be in the order of 19.9ug/m3 based on prevailing wind conditions. Note that this day is deemed to be affected by an ‘extraordinary’ event.
29/11/2019 Knodlers Lane
TEOM 128.3 19.4 – HVO South 15.1
An investigation determined HVO South maximum potential contribution to be in the order of 19.4ug/m3 based on prevailing wind conditions. Note that this day is deemed to be affected by an ‘extraordinary’ event.
29/11/2019 Jerrys Plains TEOM 109.1 NA – HVO South NA
An investigation determined HVO South was not a significant contributor given that wind direction during the 24 hour period was not within the arc of influence. Note that this day is deemed to be affected by an ‘extraordinary’ event.
29/11/2019 Jerrys Plains TEOM 109.1 13.1 – HVO North 12.0 An investigation determined HVO North maximum potential contribution to be in the
order of 13.1ug/m3 based on prevailing wind conditions.

2019 Annual Environmental Review Hunter Valley Operations
Report
Number: HVOOC-748212775-6 Status: [Document Status (Office)] Effective: [Effective Date] Page 82 of 238
Owner: [Owner] Version: [Document Version (Office)] Review: [Planned Review Date]
Uncontrolled when printed
Date Site 24hr result
(µg/m3)
Estimated max.
contribution from HVO (µg/m3)
Estimated max. Concentration
(%)
Discussion
Note that this day is deemed to be affected by an ‘extraordinary’ event.
30/11/2019 Warkworth TEOM 82.9 33.5 – HVO South 40.4
An investigation determined HVO South maximum potential contribution to be in the order of 33.5ug/m3 based on prevailing wind conditions. Note that this day is deemed to be affected by an ‘extraordinary’ event.
30/11/2019 Maison Dieu TEOM 107.9 34.8 – HVO South 32.3
An investigation determined HVO South maximum potential contribution to be in the order of 34.8ug/m3 based on prevailing wind conditions. Note that this day is deemed to be affected by an ‘extraordinary’ event.
30/11/2019 Knodlers Lane
TEOM 125.9 30.4 – HVO South 24.1
An investigation determined HVO South maximum potential contribution to be in the order of 30.4 ug/m3 based on prevailing wind conditions. Note that this day is deemed to be affected by an ‘extraordinary’ event.
30/11/2019 Jerrys Plains TEOM 84.6 11.4 – HVO South 13.4
An investigation determined HVO South maximum potential contribution to be in the order of 11.4ug/m3 based on prevailing wind conditions. Note that this day is deemed to be affected by an ‘extraordinary’ event.
30/11/2019 Jerrys Plains TEOM 84.6 8.1 – HVO North 9.6
An investigation determined HVO North maximum potential contribution to be in the order of 8.1ug/m3 based on prevailing wind conditions. Note that this day is deemed to be affected by an ‘extraordinary’ event.
1/12/2019 Knodlers Lane
TEOM 112.2 41.3 – HVO South 36.8
An investigation determined HVO maximum potential contribution to be in the order of 41.3 ug/m3 based on prevailing wind conditions. Note that this day is deemed to be affected by an ‘extraordinary’ event.
1/12/2019 Maison Dieu TEOM 101.0 30.6 – HVO South 30.3
An investigation determined HVO maximum potential contribution to be in the order of 30.6ug/m3 based on prevailing wind conditions. Note that this day is deemed to be affected by an ‘extraordinary’ event.
1/12/2019 Warkworth TEOM 62.9 2.9 – HVO South 4.6
An investigation determined HVO South maximum potential contribution to be in the order of 2.9ug/m3 based on prevailing wind conditions. Note that this day is deemed to be affected by an ‘extraordinary’ event.
1/12/2019 Jerrys Plains TEOM 70.8 11.1 – HVO South 15.7
An investigation determined HVO South maximum potential contribution to be in the order of 11.1ug/m3 based on prevailing wind conditions. Note that this day is deemed to be affected by an ‘extraordinary’ event.

2019 Annual Environmental Review Hunter Valley Operations
Report
Number: HVOOC-748212775-6 Status: [Document Status (Office)] Effective: [Effective Date] Page 83 of 238
Owner: [Owner] Version: [Document Version (Office)] Review: [Planned Review Date]
Uncontrolled when printed
Date Site 24hr result
(µg/m3)
Estimated max.
contribution from HVO (µg/m3)
Estimated max. Concentration
(%)
Discussion
1/12/2019 Jerrys Plains TEOM 70.8 4.2 – HVO North 5.9
An investigation determined HVO North maximum potential contribution to be in the order of 4.2ug/m3 based on prevailing wind conditions Note that this day is deemed to be affected by an ‘extraordinary’ event.
2/12/2019 Knodlers Lane
TEOM 206 117 – HVO South 57.6
An investigation determined HVO maximum potential contribution to be in the order of 117ug/m3 based on prevailing wind conditions. Note that this day is deemed to be affected by an ‘extraordinary’ event.
2/12/2019 Maison Dieu TEOM 216 63 – HVO South 29.2 An investigation determined HVO maximum potential contribution to be in the order of 63ug/m3 based on prevailing wind conditions. Note that this day is deemed to be affected by an ‘extraordinary’ event.
2/12/2019 Warkworth TEOM 98.7 3.1 – HVO South 3.1
An investigation determined HVO South maximum potential contribution to be in the order of 3.1ug/m3 based on prevailing wind conditions. Note that this day is deemed to be affected by an ‘extraordinary’ event.
2/12/2019 Jerrys Plains TEOM 101.2 NA – HVO South NA
An investigation determined HVO South was not a significant contributor to the exceedance based on prevailing wind conditions. Note that this day is deemed to be affected by an ‘extraordinary’ event.
2/12/2019 Jerrys Plains TEOM 101.2 NA – HVO North NA
An investigation determined HVO North was not a significant contributor to the exceedance based on prevailing wind conditions. Note that this day is deemed to be affected by an ‘extraordinary’ event.
3/12/2019 Knodlers Lane
TEOM 90.3 46.3 – HVO South 51.2
An investigation determined HVO South maximum potential contribution to be in the order of 46.3ug/m3 based on prevailing wind conditions. Note that this day is deemed to be affected by an ‘extraordinary’ event.
3/12/2019 Maison Dieu TEOM 69.0 22.9 – HVO South 33.1
An investigation determined HVO South maximum potential contribution to be in the order of 22.9ug/m3 based on prevailing wind conditions. Note that this day is deemed to be affected by an ‘extraordinary’ event.
4/12/2019 Gliding Club HVAS 64.0 29.0 – HVO South 45.3
An investigation determined HVO South maximum potential contribution to be in the order of 29.0ug/m3 or 45.3% of the total measured based on prevailing wind conditions and upwind monitoring results. Note that this day is deemed to be affected by an ‘extraordinary’ event.

2019 Annual Environmental Review Hunter Valley Operations
Report
Number: HVOOC-748212775-6 Status: [Document Status (Office)] Effective: [Effective Date] Page 84 of 238
Owner: [Owner] Version: [Document Version (Office)] Review: [Planned Review Date]
Uncontrolled when printed
Date Site 24hr result
(µg/m3)
Estimated max.
contribution from HVO (µg/m3)
Estimated max. Concentration
(%)
Discussion
4/12/2019 Long Point HVAS 60 18.0 – HVO South 30.0
An investigation determined HVO South maximum potential contribution to be in the order of 18.0ug/m3 or 30.0% of the total measured based on prevailing wind conditions and upwind monitoring results. Note that this day is deemed to be affected by an ‘extraordinary’ event.
4/12/2019 Knodlers Lane
TEOM 91.5 43.5 – HVO South 48
An investigation determined HVO maximum potential contribution to be in the order of 43.5 ug/m3 based on prevailing wind conditions. Note that this day is deemed to be affected by an ‘extraordinary’ event.
4/12/2019 Maison Dieu TEOM 62.6 4.2 – HVO South 7
An investigation determined HVO South maximum potential contribution to be in the order of 4.2ug/m3 based on prevailing wind conditions. Note that this day is deemed to be affected by an ‘extraordinary’ event.
5/12/2019 Knodlers Lane
TEOM 119.3 47.1 – HVO South 40
An investigation determined HVO South maximum potential contribution to be in the order of 47.1 ug/m3 based on prevailing wind conditions. Note that this day is deemed to be affected by an ‘extraordinary’ event.
5/12/2019 Maison Dieu TEOM 103.6 22.5 – HVO South 22
An investigation determined HVO South maximum potential contribution to be in the order of 22.5ug/m3 based on prevailing wind conditions. Note that this day is deemed to be affected by an ‘extraordinary’ event.
6/12/2019 Knodlers Lane
TEOM 186.8 45.5 – HVO South 24
An investigation determined HVO South maximum potential contribution to be in the order of 45.5ug/m3 based on prevailing wind conditions. Note that this day is deemed to be affected by an ‘extraordinary’ event.
6/12/2019 Maison Dieu TEOM 119.8 13.3 – HVO South 11
An investigation determined HVO South maximum potential contribution to be in the order of 13.3ug/m3 based on prevailing wind conditions. Note that this day is deemed to be affected by an ‘extraordinary’ event.
6/12/2019 Warkworth TEOM 102.0 46.6 – HVO South 45.7
An investigation determined HVO South maximum potential contribution to be in the order of 46.6ug/m3 based on prevailing wind conditions. Note that this day is deemed to be affected by an ‘extraordinary’ event.
6/12/2019 Jerrys Plains TEOM 75.6 0.9 – HVO South 1.2
An investigation determined HVO South maximum potential contribution to be in the order of 0.9ug/m3 based on prevailing wind conditions. Note that this day is deemed to be affected by an ‘extraordinary’ event.

2019 Annual Environmental Review Hunter Valley Operations
Report
Number: HVOOC-748212775-6 Status: [Document Status (Office)] Effective: [Effective Date] Page 85 of 238
Owner: [Owner] Version: [Document Version (Office)] Review: [Planned Review Date]
Uncontrolled when printed
Date Site 24hr result
(µg/m3)
Estimated max.
contribution from HVO (µg/m3)
Estimated max. Concentration
(%)
Discussion
6/12/2019 Jerrys Plains TEOM 75.6 NA – HVO North NA
An investigation determined HVO North was not a significant contributor to the exceedance based on prevailing wind conditions. Note that this day is deemed to be affected by an ‘extraordinary’ event.
7/12/2019 Knodlers Lane
TEOM 146.0 21.7 – HVO South 14.9
An investigation determined HVO South maximum potential contribution to be in the order of 21.7ug/m3 based on prevailing wind conditions. Note that this day is deemed to be affected by an ‘extraordinary’ event.
7/12/2019 Maison Dieu TEOM 130.5 18.1 – HVO South 13.9
An investigation determined HVO South maximum potential contribution to be in the order of 18.1ug/m3 based on prevailing wind conditions. Note that this day is deemed to be affected by an ‘extraordinary’ event.
7/12/2019 Warkworth TEOM 243.5 15.7 – HVO South 6.4
An investigation determined HVO South maximum potential contribution to be in the order of 15.7ug/m3 based on prevailing wind conditions. Note that this day is deemed to be affected by an ‘extraordinary’ event.
7/12/2019 Jerrys Plains TEOM 207.2 38.8 – HVO South 18.7
An investigation determined HVO South maximum potential contribution to be in the order of 38.8ug/m3 based on prevailing wind conditions. Note that this day is deemed to be affected by an ‘extraordinary’ event.
7/12/2019 Jerrys Plains TEOM 216.4 49.3 – HVO North 22.8
An investigation determined HVO North maximum potential contribution to be in the order of 49.3ug/m3 based on prevailing wind conditions. Note that this day is deemed to be affected by an ‘extraordinary’ event.
8/12/2019 Knodlers Lane
TEOM 72.3 NA – HVO South NA
An investigation determined HVO South maximum potential contribution to be in the order of 0.0ug/m3 based on prevailing wind conditions. Note that this day is deemed to be affected by an ‘extraordinary’ event.
8/12/2019 Warkworth TEOM 75.1 NA – HVO South NA
An investigation determined HVO South was not a significant contributor to the exceedance based on prevailing wind conditions. Note that this day is deemed to be affected by an ‘extraordinary’ event.
8/12/2019 Jerrys Plains TEOM 58.2 14.0 – HVO South 24.1
An investigation determined HVO South maximum potential contribution to be in the order of 14.0ug/m3 based on prevailing wind conditions. Note that this day is deemed to be affected by an ‘extraordinary’ event.
8/12/2019 Jerrys Plains TEOM 58.2 48.1 – HVO North 82.6 An investigation determined HVO maximum potential contribution to be in the order of
48.1ug/m3 based on prevailing wind conditions.

2019 Annual Environmental Review Hunter Valley Operations
Report
Number: HVOOC-748212775-6 Status: [Document Status (Office)] Effective: [Effective Date] Page 86 of 238
Owner: [Owner] Version: [Document Version (Office)] Review: [Planned Review Date]
Uncontrolled when printed
Date Site 24hr result
(µg/m3)
Estimated max.
contribution from HVO (µg/m3)
Estimated max. Concentration
(%)
Discussion
Note that this day is deemed to be affected by an ‘extraordinary’ event.
9/12/2019 Knodlers Lane
TEOM 78.6 11.8 – HVO South 15.0
An investigation determined HVO South maximum potential contribution to be in the order of 11.8ug/m3 based on prevailing wind conditions. Note that this day is deemed to be affected by an ‘extraordinary’ event.
9/12/2019 Maison Dieu TEOM 79.3 5.8 – HVO South 7.3
An investigation determined HVO South maximum potential contribution to be in the order of 5.8ug/m3 based on prevailing wind conditions. Note that this day is deemed to be affected by an ‘extraordinary’ event.
9/12/2019 Warkworth TEOM 101.7 3.5 – HVO South 3.4
An investigation determined HVO South maximum potential contribution to be in the order of 3.5ug/m3 based on prevailing wind conditions. Note that this day is deemed to be affected by an ‘extraordinary’ event.
9/12/2019 Jerrys Plains TEOM 94.4 12.9 – HVO South 13.7
An investigation determined HVO South maximum potential contribution to be in the order of 12.9ug/m3 based on prevailing wind conditions. Note that this day is deemed to be affected by an ‘extraordinary’ event.
9/12/2019 Jerrys Plains TEOM 94.4 1.2 – HVO North 1.3
An investigation determined HVO North maximum potential contribution to be in the order of 1.2ug/m3 based on prevailing wind conditions. Note that this day is deemed to be affected by an ‘extraordinary’ event.
10/12/2019 Cheshunt East HVAS 117.0 NA – HVO North NA
An investigation found HVO North not to be a significant contributor based on prevailing wind conditions. Note that this day is deemed to be affected by an ‘extraordinary’ event.
10/12/2019 Gliding Club HVAS 208.0 8.0 – HVO South 0.04
An investigation determined HVO South maximum potential contribution to be in the order of 8.0ug/m3 or 0.04% of the total measured based on prevailing wind conditions and upwind monitoring results. Note that this day is deemed to be affected by an ‘extraordinary’ event.
10/12/2019 Kilburnie South
HVAS 190 NA – HVO North NA
An investigation found HVO North not to be a significant contributor based on prevailing wind conditions. Note that this day is deemed to be affected by an ‘extraordinary’ event.
10/12/2019 Kilburnie South
HVAS 190 NA – HVO South NA
An investigation found HVO South not to be a significant contributor based on prevailing wind conditions. Note that this day is deemed to be affected by an ‘extraordinary’ event.

2019 Annual Environmental Review Hunter Valley Operations
Report
Number: HVOOC-748212775-6 Status: [Document Status (Office)] Effective: [Effective Date] Page 87 of 238
Owner: [Owner] Version: [Document Version (Office)] Review: [Planned Review Date]
Uncontrolled when printed
Date Site 24hr result
(µg/m3)
Estimated max.
contribution from HVO (µg/m3)
Estimated max. Concentration
(%)
Discussion
10/12/2019 Long Point HVAS 134 17.0 – HVO South 12.7
An investigation determined HVO South maximum potential contribution to be in the order of 17.0ug/m3 or 12.7% of the total measured based on prevailing wind conditions and upwind monitoring results. Note that this day is deemed to be affected by an ‘extraordinary’ event.
10/12/2019 Knodlers Lane
TEOM 134.6 41.1 – HVO South 30.5
An investigation determined HVO South maximum potential contribution to be in the order of 41.1ug/m3 based on prevailing wind conditions. Note that this day is deemed to be affected by an ‘extraordinary’ event.
10/12/2019 Maison Dieu TEOM 119.7 35.0 – HVO South 29.2
An investigation determined HVO South maximum potential contribution to be in the order of 35.0ug/m3 based on prevailing wind conditions. Note that this day is deemed to be affected by an ‘extraordinary’ event.
10/12/2019 Warkworth TEOM 145.7 44.7 – HVO South 30.1
An investigation determined HVO South maximum potential contribution to be in the order of 44.7ug/m3 based on prevailing wind conditions. Note that this day is deemed to be affected by an ‘extraordinary’ event.
10/12/2019 Jerrys Plains TEOM 146.6 20.6 – HVO South 14.1
An investigation determined HVO South maximum potential contribution to be in the order of 20.6ug/m3 based on prevailing wind conditions. Note that this day is deemed to be affected by an ‘extraordinary’ event.
10/12/2019 Jerrys Plains TEOM 146.6 16.5 – HVO North 11.3
An investigation determined HVO North maximum potential contribution to be in the order of 16.5ug/m3 based on prevailing wind conditions. Note that this day is deemed to be affected by an ‘extraordinary’ event.
11/12/2019 Knodlers Lane
TEOM 154.5 NA – HVO South NA
An investigation found HVO South not to be a significant contributor based on prevailing wind conditions. Note that this day is deemed to be affected by an ‘extraordinary’ event.
11/12/2019 Maison Dieu TEOM 129.9 NA – HVO South NA
An investigation found HVO South not to be a significant contributor based on prevailing wind conditions. Note that this day is deemed to be affected by an ‘extraordinary’ event.
11/12/2019 Warkworth TEOM 152.0 NA – HVO South NA
An investigation found HVO South not to be a significant contributor based on prevailing wind conditions. Note that this day is deemed to be affected by an ‘extraordinary’ event.

2019 Annual Environmental Review Hunter Valley Operations
Report
Number: HVOOC-748212775-6 Status: [Document Status (Office)] Effective: [Effective Date] Page 88 of 238
Owner: [Owner] Version: [Document Version (Office)] Review: [Planned Review Date]
Uncontrolled when printed
Date Site 24hr result
(µg/m3)
Estimated max.
contribution from HVO (µg/m3)
Estimated max. Concentration
(%)
Discussion
11/12/2019 Jerrys Plains TEOM 184.8 39.4 – HVO South 21.3
An investigation determined HVO South maximum potential contribution to be in the order of 39.4ug/m3 based on prevailing wind conditions. Note that this day is deemed to be affected by an ‘extraordinary’ event.
11/12/2019 Jerrys Plains TEOM 184.8 25.6 – HVO North 14.3
An investigation determined HVO maximum potential contribution to be in the order of 25.6ug/m3 based on prevailing wind conditions. Note that this day is deemed to be affected by an ‘extraordinary’ event.
12/12/2019 Knodlers Lane
TEOM 62.8 NA – HVO South NA
An investigation found HVO South not to be a significant contributor based on prevailing wind conditions. Note that this day is deemed to be affected by an ‘extraordinary’ event.
12/12/2019 Maison Dieu TEOM 50.7 NA – HVO South NA
An investigation found HVO South not to be a significant contributor based on prevailing wind conditions. Note that this day is deemed to be affected by an ‘extraordinary’ event.
12/12/2019 Warkworth TEOM 93.7 NA – HVO South NA
An investigation found HVO South not to be a significant contributor based on prevailing wind conditions. Note that this day is deemed to be affected by an ‘extraordinary’ event.
12/12/2019 Jerrys Plains TEOM 105.7 44.0 – HVO South 41.6
An investigation determined HVO South maximum potential contribution to be in the order of 44.0ug/m3 based on prevailing wind conditions. Note that this day is deemed to be affected by an ‘extraordinary’ event.
12/12/2019 Jerrys Plains TEOM 105.7 24.8 – HVO North 23.5
An investigation determined HVO North maximum potential contribution to be in the order of 24.8ug/m3 based on prevailing wind conditions. Note that this day is deemed to be affected by an ‘extraordinary’ event.
13/12/2019 Warkworth TEOM 51.1 NA – HVO South NA
An investigation found HVO South not to be a significant contributor based on prevailing wind conditions. Note that this day is deemed to be affected by an ‘extraordinary’ event.
14/12/2019 Knodlers Lane
TEOM 76.2 20.9 – HVO South 27.4
An investigation determined HVO South maximum potential contribution to be in the order of 20.9ug/m3 based on prevailing wind conditions. Note that this day is deemed to be affected by an ‘extraordinary’ event.
14/12/2019 Maison Dieu TEOM 73.5 20.8 – HVO South 28.2 An investigation determined HVO South maximum potential contribution to be in the
order of 20.8ug/m3 based on prevailing wind conditions.

2019 Annual Environmental Review Hunter Valley Operations
Report
Number: HVOOC-748212775-6 Status: [Document Status (Office)] Effective: [Effective Date] Page 89 of 238
Owner: [Owner] Version: [Document Version (Office)] Review: [Planned Review Date]
Uncontrolled when printed
Date Site 24hr result
(µg/m3)
Estimated max.
contribution from HVO (µg/m3)
Estimated max. Concentration
(%)
Discussion
Note that this day is deemed to be affected by an ‘extraordinary’ event.
14/12/2019 Warkworth TEOM 90.5 24.0 – HVO South 26.5
An investigation determined HVO South maximum potential contribution to be in the order of 24.0ug/m3 based on prevailing wind conditions. Note that this day is deemed to be affected by an ‘extraordinary’ event.
14/12/2019 Jerrys Plains TEOM 79.0 NA – HVO South NA
An investigation found HVO South not to be a significant contributor based on prevailing wind conditions. Note that this day is deemed to be affected by an ‘extraordinary’ event.
14/12/2019 Jerrys Plains TEOM 81.4 3.6- HVO North 4.4 An investigation determined HVO North maximum potential contribution to be in the order of 3.6ug/m3 based on prevailing wind conditions. Note that this day is deemed to be affected by an ‘extraordinary’ event.
15/12/2019 Knodlers Lane
TEOM 74.9 24.2 – HVO South 32.3
An investigation determined HVO South maximum potential contribution to be in the order of 24.2ug/m3 based on prevailing wind conditions. Note that this day is deemed to be affected by an ‘extraordinary’ event.
15/12/2019 Maison Dieu TEOM 64.3 13.0 – HVO South 20.2
An investigation determined HVO South maximum potential contribution to be in the order of 13.0ug/m3 based on prevailing wind conditions. Note that this day is deemed to be affected by an ‘extraordinary’ event.
15/12/2019 Warkworth TEOM 72.4 17.6 – HVO South 24.3
An investigation determined HVO South maximum potential contribution to be in the order of 17.6ug/m3 based on prevailing wind conditions. Note that this day is deemed to be affected by an ‘extraordinary’ event.
15/12/2019 Jerrys Plains TEOM 60.0 4.3 – HVO South 7.2
An investigation determined HVO South maximum potential contribution to be in the order of 4.3ug/m3 based on prevailing wind conditions. Note that this day is deemed to be affected by an ‘extraordinary’ event.
15/12/2019 Jerrys Plains TEOM 59.8 4.4 – HVO North 7.4
An investigation determined HVO North maximum potential contribution to be in the order of 4.4ug/m3 based on prevailing wind conditions. Note that this day is deemed to be affected by an ‘extraordinary’ event.
16/12/2019 Cheshunt East HVAS
North 95.0 NA – HVO North NA
An investigation found HVO North not to be a significant contributor based on prevailing wind conditions. Note that this day is deemed to be affected by an ‘extraordinary’ event.

2019 Annual Environmental Review Hunter Valley Operations
Report
Number: HVOOC-748212775-6 Status: [Document Status (Office)] Effective: [Effective Date] Page 90 of 238
Owner: [Owner] Version: [Document Version (Office)] Review: [Planned Review Date]
Uncontrolled when printed
Date Site 24hr result
(µg/m3)
Estimated max.
contribution from HVO (µg/m3)
Estimated max. Concentration
(%)
Discussion
16/12/2019 Kilburnie South
HVAS 104.0 NA – HVO North NA
An investigation found HVO North not to be a significant contributor based on prevailing wind conditions. Note that this day is deemed to be affected by an ‘extraordinary’ event.
16/12/2019 Kilburnie South
HVAS 104.0 NA – HVO South NA
An investigation found HVO South not to be a significant contributor based on prevailing wind conditions. Note that this day is deemed to be affected by an ‘extraordinary’ event.
16/12/2019 Gliding Club HVAS 89.0 9.0 – HVO South 10.1
An investigation determined HVO South maximum potential contribution to be in the order of 89.0ug/m3 or 9.0% of the total measured based on prevailing wind conditions. The wind direction was inside the arc of influence for 24% of the 24 hour period. Note that this day is deemed to be affected by an ‘extraordinary’ event.
16/12/2019 Knodlers Lane
TEOM 95.8 5.0 – HVO South 5.2
An investigation determined HVO South maximum potential contribution to be in the order of 5.0ug/m3 based on prevailing wind conditions. Note that this day is deemed to be affected by an ‘extraordinary’ event.
16/12/2019 Maison Dieu TEOM 64.3 4.2 – HVO South 6.5
An investigation determined HVO South maximum potential contribution to be in the order of 4.2ug/m3 based on prevailing wind conditions. Note that this day is deemed to be affected by an ‘extraordinary’ event.
16/12/2019 Warkworth TEOM 78.6 9.1 – HVO South 11.6
An investigation determined HVO South maximum potential contribution to be in the order of 9.1ug/m3 based on prevailing wind conditions. Note that this day is deemed to be affected by an ‘extraordinary’ event.
16/12/2019 Jerrys Plains TEOM 96.3 45.5 – HVO South 47.2
An investigation determined HVO South maximum potential contribution to be in the order of 45.5ug/m3 based on prevailing wind conditions. Note that this day is deemed to be affected by an ‘extraordinary’ event.
16/12/2019 Jerrys Plains TEOM 96.4 41.1 – HVO North 42.6
An investigation determined HVO North maximum potential contribution to be in the order of 41.1ug/m3 based on prevailing wind conditions. Note that this day is deemed to be affected by an ‘extraordinary’ event.
17/12/2019 Jerrys Plains TEOM 55.8 34.8 – HVO South 62.3
An investigation determined HVO South maximum potential contribution to be in the order of 34.8ug/m3 based on prevailing wind conditions. Note that this day is deemed to be affected by an ‘extraordinary’ event.

2019 Annual Environmental Review Hunter Valley Operations
Report
Number: HVOOC-748212775-6 Status: [Document Status (Office)] Effective: [Effective Date] Page 91 of 238
Owner: [Owner] Version: [Document Version (Office)] Review: [Planned Review Date]
Uncontrolled when printed
Date Site 24hr result
(µg/m3)
Estimated max.
contribution from HVO (µg/m3)
Estimated max. Concentration
(%)
Discussion
17/12/2019 Jerrys Plains TEOM 56.1 10.3 – HVO North 18.4
An investigation determined HVO North maximum potential contribution to be in the order of 10.3ug/m3 based on prevailing wind conditions. Note that this day is deemed to be affected by an ‘extraordinary’ event.
18/12/2019 Warkworth TEOM 80.6 NA – HVO South NA
An investigation found HVO South not to be a significant contributor based on prevailing wind conditions. Note that this day is deemed to be affected by an ‘extraordinary’ event.
18/12/2019 Jerrys Plains TEOM 71.9 17.0 – HVO South 23.6
An investigation determined HVO South maximum potential contribution to be in the order of 17.0ug/m3 based on prevailing wind conditions. Note that this day is deemed to be affected by an ‘extraordinary’ event.
18/12/2019 Jerrys Plains TEOM 73.0 13.0 – HVO North 17.8
An investigation determined HVO North maximum potential contribution to be in the order of 13.0ug/m3 based on prevailing wind conditions. Note that this day is deemed to be affected by an ‘extraordinary’ event..
19/12/2019 Warkworth TEOM 129.0 18.7 – HVO South 25.6
An investigation determined HVO South maximum potential contribution to be in the order of 18.7ug/m3 based on prevailing wind conditions. Note that this day is deemed to be affected by an ‘extraordinary’ event.
19/12/2019 Jerrys Plains TEOM 85.8 NA – HVO South NA
An investigation found HVO South not to be a significant contributor based on prevailing wind conditions. Note that this day is deemed to be affected by an ‘extraordinary’ event.
19/12/2019 Jerrys Plains TEOM 85.8 22.5 – HVO North 26.2
An investigation determined HVO North maximum potential contribution to be in the order of 22.5ug/m3 based on prevailing wind conditions. Note that this day is deemed to be affected by an ‘extraordinary’ event.
20/12/2019 Knodlers Lane
TEOM 59.0 NA – HVO South NA
An investigation found HVO South not to be a significant contributor based on prevailing wind conditions. Note that this day is deemed to be affected by an ‘extraordinary’ event.
20/12/2019 Warkworth TEOM 83.8 NA – HVO South NA
An investigation found HVO South not to be a significant contributor based on prevailing wind conditions. Note that this day is deemed to be affected by an ‘extraordinary’ event.
20/12/2019 Jerrys Plains TEOM 75.5 43.5 – HVO South 57.2 An investigation determined HVO South maximum potential contribution to be in the
order of 43.5ug/m3 based on prevailing wind conditions.

2019 Annual Environmental Review Hunter Valley Operations
Report
Number: HVOOC-748212775-6 Status: [Document Status (Office)] Effective: [Effective Date] Page 92 of 238
Owner: [Owner] Version: [Document Version (Office)] Review: [Planned Review Date]
Uncontrolled when printed
Date Site 24hr result
(µg/m3)
Estimated max.
contribution from HVO (µg/m3)
Estimated max. Concentration
(%)
Discussion
Note that this day is deemed to be affected by an ‘extraordinary’ event.
20/12/2019 Jerrys Plains TEOM 75.5 13.6 – HVO North 18.0
An investigation determined HVO North maximum potential contribution to be in the order of 13.6ug/m3 based on prevailing wind conditions. Note that this day is deemed to be affected by an ‘extraordinary’ event.
21/12/2019 Knodlers Lane
TEOM 140.2 31.1 – HVO South 22.1
An investigation determined HVO South maximum potential contribution to be in the order of 31.1ug/m3 based on prevailing wind conditions. Note that this day is deemed to be affected by an ‘extraordinary’ event.
21/12/2019 Maison Dieu TEOM 135.0 34.9 – HVO South 25.6
An investigation determined HVO South maximum potential contribution to be in the order of 34.9ug/m3 based on prevailing wind conditions. Note that this day is deemed to be affected by an ‘extraordinary’ event.
21/12/2019 Warkworth TEOM 157.4 32.9 – HVO South 20.9
An investigation determined HVO South maximum potential contribution to be in the order of 32.9ug/m3 based on prevailing wind conditions. Note that this day is deemed to be affected by an ‘extraordinary’ event.
21/12/2019 Jerrys Plains TEOM 124.3 1.9 – HVO South 1.5
An investigation determined HVO South maximum potential contribution to be in the order of 1.9ug/m3 based on prevailing wind conditions. Note that this day is deemed to be affected by an ‘extraordinary’ event.
21/12/2019 Jerrys Plains TEOM 124.3 3.4 – HVO North 2.7
An investigation determined HVO Northmaximum potential contribution to be in the order of 3.4ug/m3 based on prevailing wind conditions. Note that this day is deemed to be affected by an ‘extraordinary’ event.
22/12/2019 Kilburnie South
HVAS 91.0 20.0 – HVO North 22.0
An investigation determined HVO North maximum potential contribution to be in the order of 20.0/m3 or 22.0% of the total measured based on prevailing wind conditions. The wind direction was inside the arc of influence for 0% of the 24 hour period. Note that this day is deemed to be affected by an ‘extraordinary’ event.
22/12/2019 Kilburnie South
HVAS 91.0 42.0 – HVO South 49.0
An investigation determined HVO South maximum potential contribution to be in the order of 42.0/m3 or 49.0% of the total measured based on prevailing wind conditions. The wind direction was inside the arc of influence for 1.4% of the 24 hour period. Note that this day is deemed to be affected by an ‘extraordinary’ event.
22/12/2019 Gliding Club HVAS 71.0 NA – HVO South NA
An investigation found HVO South not to be a significant contributor based on prevailing wind conditions. Note that this day is deemed to be affected by an ‘extraordinary’ event.

2019 Annual Environmental Review Hunter Valley Operations
Report
Number: HVOOC-748212775-6 Status: [Document Status (Office)] Effective: [Effective Date] Page 93 of 238
Owner: [Owner] Version: [Document Version (Office)] Review: [Planned Review Date]
Uncontrolled when printed
Date Site 24hr result
(µg/m3)
Estimated max.
contribution from HVO (µg/m3)
Estimated max. Concentration
(%)
Discussion
22/12/2019 Knodlers Lane
TEOM 51.3 NA – HVO South NA
An investigation found HVO South not to be a significant contributor based on prevailing wind conditions. Note that this day is deemed to be affected by an ‘extraordinary’ event.
22/12/2019 Maison Dieu TEOM 50.3 NA – HVO South NA
An investigation found HVO South not to be a significant contributor based on prevailing wind conditions. Note that this day is deemed to be affected by an ‘extraordinary’ event.
22/12/2019 Warkworth TEOM 60.0 NA – HVO South NA
An investigation found HVO South not to be a significant contributor based on prevailing wind conditions. Note that this day is deemed to be affected by an ‘extraordinary’ event.
22/12/2019 Jerrys Plains TEOM 69.8 29.0 – HVO South 41.5
An investigation determined HVO South maximum potential contribution to be in the order of 29.0ug/m3 based on prevailing wind conditions. Note that this day is deemed to be affected by an ‘extraordinary’ event.
22/12/2019 Jerrys Plains TEOM 69.8 17.0 – HVO North 24.4
An investigation determined HVO North maximum potential contribution to be in the order of 17.0ug/m3 based on prevailing wind conditions. Note that this day is deemed to be affected by an ‘extraordinary’ event.
23/12/2019 Jerrys Plains TEOM 51.6 6.0 – HVO South 11.6
An investigation determined HVO South maximum potential contribution to be in the order of 6.0ug/m3 based on prevailing wind conditions. Note that this day is deemed to be affected by an ‘extraordinary’ event.
23/12/2019 Jerrys Plains TEOM 69.8 2.3 – HVO North 3.3
An investigation determined HVO North maximum potential contribution to be in the order of 2.3ug/m3 based on prevailing wind conditions. Note that this day is deemed to be affected by an ‘extraordinary’ event.
27/12/2019 Jerrys Plains TEOM 69.4 40.4 – HVO South 58.2 An investigation determined HVO South maximum potential contribution to be in the
order of 40.4ug/m3 based on prevailing wind conditions.
27/12/2019 Jerrys Plains TEOM 69.4 14.8 – HVO North 21.3
An investigation determined HVO North maximum potential contribution to be in the order of 14.8ug/m3 based on prevailing wind conditions. Note that this day is deemed to be affected by an ‘extraordinary’ event.
28/12/2019 Cheshunt East HVAS 61.0 NA – HVO North NA
An investigation found HVO North not to be a significant contributor based on prevailing wind conditions. Note that this day is deemed to be affected by an ‘extraordinary’ event.

2019 Annual Environmental Review Hunter Valley Operations
Report
Number: HVOOC-748212775-6 Status: [Document Status (Office)] Effective: [Effective Date] Page 94 of 238
Owner: [Owner] Version: [Document Version (Office)] Review: [Planned Review Date]
Uncontrolled when printed
Date Site 24hr result
(µg/m3)
Estimated max.
contribution from HVO (µg/m3)
Estimated max. Concentration
(%)
Discussion
28/12/2019 Kilburnie South
HVAS North 105.0 NA – HVO North NA
An investigation found HVO North not to be a significant contributor based on prevailing wind conditions. Note that this day is deemed to be affected by an ‘extraordinary’ event.
28/12/2019 Kilburnie South
HVAS South 105.0 NA – HVO South NA
An investigation found HVO South not to be a significant contributor based on prevailing wind conditions. Note that this day is deemed to be affected by an ‘extraordinary’ event.
28/12/2019 Gliding Club HVAS 86.0 25.0 – HVO South 29.1
An investigation determined HVO South maximum potential contribution to be in the order of 25.0/m3 or 29.1% of the total measured based on prevailing wind conditions. The wind direction was inside the arc of influence for 20% of the 24 hour period. Note that this day is deemed to be affected by an ‘extraordinary’ event.
28/12/2019 Long Point HVAS 61.0 NA – HVO South NA
An investigation found HVO South not to be a significant contributor based on prevailing wind conditions. Note that this day is deemed to be affected by an ‘extraordinary’ event.
28/12/2019 Maison Dieu TEOM 56.0 3.7 – HVO South 6.6
An investigation determined HVO South maximum potential contribution to be in the order of 3.7ug/m3 based on prevailing wind conditions. Note that this day is deemed to be affected by an ‘extraordinary’ event.
28/12/2019 Warkworth TEOM 98.6 41.2- HVO South 41.8
An investigation determined HVO South maximum potential contribution to be in the order of 41.2ug/m3 based on prevailing wind conditions. Note that this day is deemed to be affected by an ‘extraordinary’ event.
28/12/2019 Jerrys Plains TEOM 62.1 10.1 – HVO South 16.3
An investigation determined HVO South maximum potential contribution to be in the order of 10.1ug/m3 based on prevailing wind conditions. Note that this day is deemed to be affected by an ‘extraordinary’ event.
28/12/2019 Jerrys Plains TEOM 62.1 26.5 – HVO North 42.7
An investigation determined HVO North maximum potential contribution to be in the order of 26.5ug/m3 based on prevailing wind conditions. Note that this day is deemed to be affected by an ‘extraordinary’ event.
29/12/2019 Knodlers Lane
TEOM 54.5 2.0 – HVO South 7.3
An investigation determined HVO South maximum potential contribution to be in the order of 2.0ug/m3 based on prevailing wind conditions. Note that this day is deemed to be affected by an ‘extraordinary’ event.

2019 Annual Environmental Review Hunter Valley Operations
Report
Number: HVOOC-748212775-6 Status: [Document Status (Office)] Effective: [Effective Date] Page 95 of 238
Owner: [Owner] Version: [Document Version (Office)] Review: [Planned Review Date]
Uncontrolled when printed
Date Site 24hr result
(µg/m3)
Estimated max.
contribution from HVO (µg/m3)
Estimated max. Concentration
(%)
Discussion
29/12/2019 Maison Dieu TEOM 57.4 3.4 – HVO South 5.9
An investigation determined HVO South maximum potential contribution to be in the order of 3.4ug/m3 based on prevailing wind conditions. Note that this day is deemed to be affected by an ‘extraordinary’ event.
29/12/2019 Warkworth TEOM 64.1 18.8 – HVO South 29.3
An investigation determined HVO South maximum potential contribution to be in the order of 18.8ug/m3 based on prevailing wind conditions. Note that this day is deemed to be affected by an ‘extraordinary’ event.
29/12/2019 Jerrys Plains TEOM 70.6 23.4 – HVO South 33.1
An investigation determined HVO South maximum potential contribution to be in the order of 23.4ug/m3 based on prevailing wind conditions. Note that this day is deemed to be affected by an ‘extraordinary’ event.
29/12/2019 Jerrys Plains TEOM 70.6 7.1 – HVO North 10.13
An investigation determined HVO North maximum potential contribution to be in the order of 7.1ug/m3 based on prevailing wind conditions. Note that this day is deemed to be affected by an ‘extraordinary’ event.
30/12/2019 Knodlers Lane
TEOM 66.7 17.6 – HVO South 26.4
An investigation determined HVO South maximum potential contribution to be in the order of 17.6ug/m3 based on prevailing wind conditions. Note that this day is deemed to be affected by an ‘extraordinary’ event.
30/12/2019 Maison Dieu TEOM 87.4 27.7 – HVO South 31.7
An investigation determined HVO South maximum potential contribution to be in the order of 27.7ug/m3 based on prevailing wind conditions. Note that this day is deemed to be affected by an ‘extraordinary’ event.
30/12/2019 Warkworth TEOM 81.9 13.4 – HVO South 16.4
An investigation determined HVO South maximum potential contribution to be in the order of 13.4ug/m3 based on prevailing wind conditions. Note that this day is deemed to be affected by an ‘extraordinary’ event.
30/12/2019 Jerrys Plains TEOM 94.0 11.7 – HVO South 12.4
An investigation determined HVO South maximum potential contribution to be in the order of 11.7ug/m3 based on prevailing wind conditions. Note that this day is deemed to be affected by an ‘extraordinary’ event.
30/12/2019 Jerrys Plains TEOM 94.0 15.1 – HVO North 16.1
An investigation determined HVO North maximum potential contribution to be in the order of 15.1ug/m3 based on prevailing wind conditions. Note that this day is deemed to be affected by an ‘extraordinary’ event.
31/12/2019 Knodlers Lane
TEOM 125.7 30.0 – HVO South 23.9 An investigation determined HVO South maximum potential contribution to be in the
order of 30.0ug/m3 based on prevailing wind conditions.

2019 Annual Environmental Review Hunter Valley Operations
Report
Number: HVOOC-748212775-6 Status: [Document Status (Office)] Effective: [Effective Date] Page 96 of 238
Owner: [Owner] Version: [Document Version (Office)] Review: [Planned Review Date]
Uncontrolled when printed
Date Site 24hr result
(µg/m3)
Estimated max.
contribution from HVO (µg/m3)
Estimated max. Concentration
(%)
Discussion
Note that this day is deemed to be affected by an ‘extraordinary’ event.
31/12/2019 Maison Dieu TEOM 119.1 42.2 – HVO South 35.4
An investigation determined HVO South maximum potential contribution to be in the order of 42.2ug/m3 based on prevailing wind conditions. Note that this day is deemed to be affected by an ‘extraordinary’ event.
31/12/2019 Warkworth TEOM 98.6 41.2– HVO South 41.8
An investigation determined HVO South maximum potential contribution to be in the order of 41.2ug/m3 based on prevailing wind conditions. Note that this day is deemed to be affected by an ‘extraordinary’ event.
31/12/2019 Jerrys Plains TEOM 103.6 3.4– HVO South 3.3 An investigation determined HVO South maximum potential contribution to be in the order of 3.4ug/m3 based on prevailing wind conditions. Note that this day is deemed to be affected by an ‘extraordinary’ event.
31/12/2019 Jerrys Plains TEOM 103.6 NA – HVO North NA
An investigation found HVO North not to be a significant contributor based on prevailing wind conditions. Note that this day is deemed to be affected by an ‘extraordinary’ event.

2019 Annual Environmental Review
OC-748212775-6 Status: [Document Status (Office)] Effective: [Effective Date]
er] Version: [Document Version (Office)] Review: [Planned Review Date]
Uncontrolled when printed
6.4.2.8 Long term PM10 impact assessment criteria Annual average PM10 concentrations were calculated for both HVAS and TEOM monitors and assessed against the relevant criteria as per the Air Quality and Greenhouse Gas Management Plan. For TEOM monitors, this was undertaken using hourly average data and for HVAS units this was calculated using the 24 hour average concentrations on each of the run days. Where results were deemed to have been effected by an extraordinary event these results have been excluded from the calculation of the annual average. A comparison of the long term PM10 impact assessment criterion and previous years’ data, are shown on Figure 19.
Figure 19: Annual average HVAS PM10 results 2015 to 2019
During 2019, three of the eight monitoring locations exceeded the annual average PM10 impact assessment criteria. The results were investigated to determine the level of contribution from HVO activities in accordance with the compliance protocol outlined in the HVO Air Quality Management Plan.
The exceedances were investigated to determine the level of contribution from HVO activities in accordance with the compliance protocol outlined in the HVO Air Quality Management Plan. The estimated contribution was determined following review of results by an air quality consultant which determined that the contributions from HVO (either North, South or Both) in all cases was not deemed to be the significant cause of the exceedance and is therefore considered compliant.
A summary of the investigations undertaken for the annual PM10 exceedances are provided in Table 29 .
0
5
10
15
20
25
30
35
40
Kilburnie South(HVAS)
Knodlers Lane(TEOM)
Maison Dieu(TEOM)
Warkworth(TEOM)
Long Point (HVAS) HVGC (HVAS) Cheshunt East(HVAS)
Jerrys Plains(TEOM)
Particulate M
atter <10µg/m3
LocationAnnual Average 2015 Annual Average 2016
Annual Average 2017 Annual Average 2018
Annual Average 2019 (excluding extraordinary events) HVO North Annual Assessment Criteria
HVO South Annual Assessment Criteria

2019 Annual Environmental Review
OC-748212775-6 Status: [Document Status (Office)] Effective: [Effective Date]
er] Version: [Document Version (Office)] Review: [Planned Review Date]
Uncontrolled when printed
Table 29 Assessment of Annual Average PM10 - 2019
Monitoring Location
Measured PM10
Annual Average
µg/m3
Annual Average PM10 Criteria
µg/m3
Maximum Estimated PM10 Solely due to HVO µg/m3
Discussion
Kilburnie South
(HVAS)
30.5 30 – HVO North 25 – HVO South
2.2 – HVO North 6.7 – HVO South
An air quality specialist was engaged to investigate these
exceedances, which determined that the elevated results were not solely attributable to either
HVO North or HVO South. HVO North or South were not
considered to be significant contributors to this exceedance
and HVO considers these exceedances to be compliant.
Maison Dieu
(TEOM)t
29.4 25 – HVO South Only
1.4 – HVO South
Hunter Valley Gliding Club
(HVAS)
30.7 25 – HVO South Only
8.8 – HVO South
6.4.2.9 Particulate Matter <2.5µm (PM2.5) – Short Term (24 hour average) Impact Assessment Criteria
Following approval of the HVO Air Quality and Greenhouse Gas Management Plan on 6 September 2019, HVO installed PM2.5 monitoring at Kilburnie South and Maison Dieu within 16 weeks (27 December 2019) of approval of the Plan. This resulted in two PM2.5 samples being collected at each location during 2019 as such long term (annual average) assessment is not provided. These results are provided in Table 30.
Table 30: Short Term Impact Assessment Criteria – PM2.5 Results 2019
Date Site Measured 24 hour average
PM2.5 level (µg/m3)
HVO South
24 hour average
PM2.5 Incremental
Criteria
(µg/m3)
Estimated HVO South Incremental contribution to PM2.5level
(μg/m3)
Discussion
22/12/2019 Kilburnie
South 55 25 0
This day was deemed to have been effected by an extraordinary event caused by the influence of Bushfire Smoke. Investigation determined that HVO South was unlikely to have contributed to the exceedance as wind direction on this day was from outside the arc of HVO South’s influence for the majority of the day with only short periods of time (approximately 20 minutes) being from within the arc of influence.
22/12/2019 Maison
Dieu 30 25 0
This day was deemed to have been effected by an extraordinary event caused by the influence of Bushfire Smoke. Investigation determined that HVO South could not have contributed to the exceedance as wind direction on this day was not within the arc of HVO South’s influence for any period of the day.

2019 Annual Environmental Review
OC-748212775-6 Status: [Document Status (Office)] Effective: [Effective Date]
er] Version: [Document Version (Office)] Review: [Planned Review Date]
Uncontrolled when printed
Date Site Measured 24 hour average
PM2.5 level (µg/m3)
HVO South
24 hour average
PM2.5 Incremental
Criteria
(µg/m3)
Estimated HVO South Incremental contribution to PM2.5level
(μg/m3)
Discussion
28/12/2019 Kilburnie
South 81 25 8.9
This day was deemed to have been effected by an extraordinary event caused by the influence of Bushfire Smoke. Investigation determined the monitor was downwind from HVO South for a portion of the day. Data from real time monitors for the Upper Hunter Air Quality Monitoring Network was used to estimate the percentage of time when monitors were not impacted by bushfire smoke and subsequently estimate a potential contribution.
28/12/2019 Maison
Dieu 50 25 0
This day was deemed to have been effected by an extraordinary event caused by the influence of Bushfire Smoke. Investigation determined that HVO South could not have contributed to the exceedance as the monitor was not downwind of HVO South for any significant portion of the day.
Comparison against EA Predictions

2019 Annual Environmental Review
OC-748212775-6 Status: [Document Status (Office)] Effective: [Effective Date]
er] Version: [Document Version (Office)] Review: [Planned Review Date]
Uncontrolled when printed
Table 31 to Table 33 show a comparison between 2019 air quality data and the Stage 2 predictions made in the HVO South Modification 5 Environmental Assessment 2017 (EA). Comparisons have been made against the predictions listed in the EA for the nearest private residence to each monitoring location.
Annual average PM10 measurements in 2019 are generally consistent or slightly above predicted levels for all monitoring locations. Comparison of 2019 maximum 24 hour PM10 values against the predicted maximum values returned results generally above the predicted Stage 2 for all monitoring locations. Refer to Table 31 estimates of HVO South contribution to measured exceedances of 24 hour PM10 criteria during 2019.
TSP Annual Averages typically exceeded modelled predictions in 2019 at all monitoring locations except Warkworth, it’s considered that this is a result of dry conditions that persisted through 2019 and reflects regional air quality trends and ongoing drought conditions not considered in EA predictions.

2019 Annual Environmental Review
OC-748212775-6 Status: [Document Status (Office)] Effective: [Effective Date]
er] Version: [Document Version (Office)] Review: [Planned Review Date]
Uncontrolled when printed
Table 31: HVO South PM10 annual average results compared against cumulative predictions^
Site (EA receptor) Short Term (24hr) criteria Long Term (annual average) criteria
Predicted maximum 24hr PM10 due to HVO South alone (µg/m3)
2019 maximum 24hr PM10
HVO contribution
(µg/m3)
Predicted PM10 annual averages
(µg/m3)
2019 PM10 annual average (µg/m3)*
Stage 2 Stage 2
Maison Dieu (256) 36 42.5 21 29
Warkworth (90) 95 16.7 46 24
Kilburnie South (307)
31 53** 27 31
Knodlers Lane (117)
59 46.3 28 24
Long Point (137) 36 26 20 22
Hunter Valley Gliding Club*** >50 45 >30 31
^ Cumulative predictions for Stage 2 of the HVO South Mod 5 Environmental Assessment.
* Includes all sources
** Result from February 2019. Result is compliant based on percentage contribution under Management Plan Version 1.1 at the time.
*** The HVGC has entered into an Amenity Management Plan with Hunter Valley Operations.
Table 32 HVO South TSP annual average results compared against cumulative predictions^
Site (EA receptor) Long Term (annual average) TSP criteria
Stage 2 prediction (µg/m3) 2019 PM10 annual average (µg/m3)*
Maison Dieu (256) 60 91
Warkworth (90) 106 76
Kilburnie South (307) 76 122
Knodlers Lane (117) 75 98
Long Point (137) 61 69
^ Cumulative predictions for Stage 2 of the HVO South Mod 5 Environmental Assessment.
* Includes all sources.

2019 Annual Environmental Review
OC-748212775-6 Status: [Document Status (Office)] Effective: [Effective Date]
er] Version: [Document Version (Office)] Review: [Planned Review Date]
Uncontrolled when printed
Table 33: HVO South Depositional Dust annual average results compared against cumulative predictions^
Site (representative receptor ID)
Units (Insoluble
Solids)
Assessment Criteria
Stage 2 EA Predictions
Annual Averages
2019 Actual Annual Average*
D118 (Kilburnie Sth) (307)
g/m2/month 4
2.9 4.8
D119 (Jerry’s Plains) (421) 2.0 3.2
DL14 (Maison Dieu) (256) 2.0 2.3
DL21 (261) 2.2 3.9
DL22 (118) 2.9 3.0
Knodlers Lane (120) 2.4 2.2
Warkworth (90) 3.4 5.3
^ Cumulative predictions for Stage 2 of the HVO South Mod 5 Environmental Assessment.
* includes all sources
Table 34 and Table 35 detail comparisons between 2019 air quality monitoring results and the modelled predictions from the 2010 HVO North Carrington West Wing Air Quality Impact Assessment. Predictions have been sourced from modelled scenarios of Year One of the Carrington West Wing development. It should be noted that while Approval has been granted for the commencement of that project, works have not yet commenced.
Table 34 HVO North 2019 PM10 annual average results compared against cumulative predictions^
Site (EA receptor)* Long Term (annual average) criteria
Predicted PM10 annual average (µg/m3)
2019 PM10 annual average (µg/m3)**
Maison Dieu (6) 19.1 29
Warkworth (39) 20.8 24
Kilburnie South (4) 19.7 31
Jerrys Plains (13) 16.6 21.8
Cheshunt East (7) 20.8 23.8
^ Cumulative predictions for Year One (CWW) of the HVO North Environmental Assessment.
*no modelled predictions for the Long Point area
** includes all sources

2019 Annual Environmental Review
OC-748212775-6 Status: [Document Status (Office)] Effective: [Effective Date]
er] Version: [Document Version (Office)] Review: [Planned Review Date]
Uncontrolled when printed
Table 35 2019 TSP Annual Average results compared against cumulative predictions^
Site (EA receptor)* Long Term (annual average) criteria
Predicted TSP annual average (µg/m3)
2019 TSP annual average (µg/m3)**
Maison Dieu (6) 44.7 91
Warkworth (39) 46.6 76
Kilburnie South (4) 45.2 122
Cheshunt East (7) 46.5 69
^ Cumulative predictions for Year One (CWW) of the HVO North Environmental Assessment.
*no modelled predictions for the Long Point area
** includes all sources
Comparison of measured PM10 and TSP with modelled predictions demonstrates above average values for all monitoring locations. Given that the TSP fraction settles out of suspension faster than PM10 (and thus much closer to the operation), it is not reasonable to suggest that nearby private residences are being impacted by mine-generated TSP to a greater degree than by PM10, on the basis of measured data exceeding the predictions. Rather, the data suggests the assumptions in the model relating to extraneous dust sources are under predicting total TSP levels which are experienced at receptors. It is considered that above average results are also attributable to ongoing drought conditions that persisted through 2019 and reflects regional air quality trends.
6.5 Greenhouse Gas and Energy Management During 2019, HVO continued to comply with Emissions Reporting (EERs) under the National Greenhouse and Energy Reporting (NGERs) Act 2007. As such HVO is required to report its annual greenhouse gas emissions, energy use and energy production. Results of greenhouse gas and energy information from corporations is publically available online at www.cleanenergyregulator.gov.au. A summary of greenhouse gas emissions for HVO compared to the previous reporting year are provided in Table 36. Total emissions in 2018/2019 reporting year decreased from the previous reporting year. This is largely reflected by reduction in fuel usage emissions
Table 36: Greenhouse Gas Emission summary
HVO Emissions 2017/2018 Reporting Year
2018/2019 Reporting Year
Fuel Usage (Kt CO2e) 354.21 312.24
Fugitive Emissions (Kt CO2e) 261.66 262.67
Industrial Processes (Kt CO2e) 0.03 0.2
Waste emissions by waste disposal (Kt CO2e) 0.05 -
Electricity consumption (Scope 2) (Kt CO2e) 11.49 112.66
Total 727 688
6.6 Waste and Hazardous Materials 6.6.1 Recycling
HVO has continued to have a focus on training and reinforcing the principles of a good waste management across the site including recycling.

2019 Annual Environmental Review
OC-748212775-6 Status: [Document Status (Office)] Effective: [Effective Date]
er] Version: [Document Version (Office)] Review: [Planned Review Date]
Uncontrolled when printed
In 2019 the percentage of non-mineral waste material generated at HVO and disposed to licensed offsite landfill facilities was 23%. The overall recycling percentage was 77%. These figures are consistent with 2018.
HVO will explore further opportunities to continue to improve recycling rates in 2020.
Details of waste and recyclables removed from demolition activities undertaken during the reporting period are included in Section 8.12.
6.6.2 Sewage Treatment/Disposal The sewage treatment and disposal facilities at HVO consist of sewage treatment plants which treat, disinfect and re-use the treated effluent on-site. The remaining effluent from some septic systems that can’t be treated on site is sent to approved facilities for disposal.
HVO currently has 3 main grouped on-site sewage management systems, these are interconnected from multiple systems forming the 3 main systems. These facilities are located at Howick, HVO North and HVO South.
6.6.3 Hydrocarbons During 2019, 1085 kL of waste oil was taken offsite to be refined into a base oil for reuse in new oil products. Other hydrocarbons recycled via a licensed waste hydrocarbon disposal company include approximately 36 tonnes of waste grease.
6.6.4 Contaminated Soil Management of hydrocarbon contaminated soil employs the use of three bioremediation areas that are maintained and operated in accordance with HVO procedures.
Contaminated soil is taken to one of the bioremediation areas and placed in cells based on the time of contamination. To maximise air circulation, contaminated soil is spread out in beds of no more than approximately 300 mm in height and approximately a grader width at the base. The beds are turned by a grader or equivalent on regular intervals in order to provide aeration for beneficial microbial activity.
Soil in the treatment area is sampled and tested as required until total hydrocarbon levels are below relevant guidelines. Soil meeting these criteria is then removed and disposed of in the spoil dump.
6.6.5 Acid Rock Drainage During 2019, there were no observed issues relating to Acid Rock Drainage. During the reporting period HVO reviewed the acid rock drainage management process and will continue this during 2020.
6.6.6 Waste/Hazardous Materials Non Compliances There were no externally reportable incidents related to waste or hazard management during the reporting period.
6.6.7 Building Demolition During 2019, the following waste volumes were removed and disposed of at appropriate facilities during the demolition of rural buildings across HVO:
13.0 tonnes of bricks
42.4 tonnes of mixed waste
3.2 tonnes of asbestos.
6.7 Heritage 6.7.1 Management and Community Consultation
Aboriginal cultural heritage is managed under the provisions of separate Aboriginal Cultural Heritage Management Plans (ACHMP) approved for these development consents. At HVO North, where mining or

2019 Annual Environmental Review
OC-748212775-6 Status: [Document Status (Office)] Effective: [Effective Date]
er] Version: [Document Version (Office)] Review: [Planned Review Date]
Uncontrolled when printed
associated development activities may impact Aboriginal cultural heritage sites, an Aboriginal Heritage Impact Permit (AHIP) must also be sought from the OEH under Part 6 of the National Parks and Wildlife Act 1974 (NPW Act), on the basis of the management requirements established through the ACHMP process. The HVO South ACHMP area was approved as a State Significant Development which excludes the requirement for obtaining AHIPs prior to implementing cultural heritage management measures authorised under the provisions of the ACHMP.
Hunter Valley Operations consults jointly with the Upper Hunter Valley Aboriginal Cultural Heritage Working Group (CHWG) and the Plains Clan of the Wonnarua Peoples (PCWP). The CHWG is comprised of representatives from HVO and Registered Aboriginal Parties (RAPs) from Upper Hunter Valley aboriginal community groups, corporations and individuals. The CHWG met and discussed cultural heritage management matters associated with HVO on the 12 September 2019.
Separate to the ACHMP, the HVO JV is party to an Ancillary Agreement with the Plains Clan of the Wonnarua People (PCWP). This is an Ancillary Agreement to a Deed under section 31(1)(b) of the Native Title Act 1993 (Cth) regarding the grant of Assessment Lease Application 59 and also an agreement for the grant of Mining Lease Application 534. The agreement commenced on the 3rd May 2018.
Aboriginal cultural heritage at HVO is managed; in consultation with the RAPs associated with the CHWG and the PCWP, in accordance with the ACHMPs, development consent conditions, and the Ancillary Agreement to protect, manage and mitigate cultural heritage at HVO. Management measures include:
Ongoing consultation and involvement of the local Aboriginal community in all matters pertaining to Aboriginal cultural heritage management;
Compliance with existing ACHMP’s and Development Consent conditions;
A cultural heritage Geographic Information System (GIS) and Cultural Heritage Zone Plan (CHZP) incorporating cultural heritage spatial and spatial data (site location, description, assessments, date recorded, associated reports, management provisions and various other details to assist with the management of sites);
A Ground Disturbance Permit (GDP) system for the assessment and approval of ground disturbing activities to ensure these activities do not disturb cultural heritage places;
Limit of Disturbance Boundary (LODB) procedures to demarcate approved disturbance areas and delineate areas not to be disturbed;
Ongoing cultural heritage site inspections, monitoring and auditing along with regular compliance inspections of development works;
Protective management measures such as fencing/barricading sites to avoid disturbance, protective buffer zones, cultural heritage off-set areas; and
Communicating cultural heritage issues and site awareness to personnel via internal electronic and face to face processes.
In consultation with the CHWG and Office of Environment and Heritage (OEH), a Cultural Heritage Storage Facility (CHSF) was established at Hunter Valley Services. The CHSF is a storage shed, with an adjacent sea container, fitted out to allow safe and secure storage of cultural materials, such as stone artefacts. It is a central repository for all materials collected during community collection and salvage activities on all lands related to HVO (including offset properties).
6.7.2 Aboriginal Archaeological and Cultural Heritage Investigations
On the 21st February 2019, a field based due diligence assessment and survey was conducted over the Mitchel Hill Biodiversity Area proposed planting footprint. Three Aboriginal sites/areas were identified and pegged during the assessment and survey.
A second due diligence assessment was conducted along Pikes Gully Road on the 5th September 2019 prior to the installation of road safety signage. No artefacts were identified during the course of this survey.
A third due diligence assessment was conducted at the Wambo Pumps site adjacent to the Hunter River on the 1st October 2019, prior to the proposed installation of a generator and concrete pad. No ACH sites or cultural material objects were found during the archaeological inspection.

2019 Annual Environmental Review
OC-748212775-6 Status: [Document Status (Office)] Effective: [Effective Date]
er] Version: [Document Version (Office)] Review: [Planned Review Date]
Uncontrolled when printed
On the 17th June 2019 the Stage 2 Mitchell Pit Salvage Program commenced, this included the salvage and mitigation of two hundred and eighty-four (284) AHIMS-registered Aboriginal heritage sites (incorporating 747 discrete locations) which were the subject of a surface collection, with sub-surface investigations conducted at three locations within two of these sites. The work was conducted over a three week period and due to the extent of the works involved three teams of RAP’s representing members of the PCWP and the CHWG. This program was authorised and conducted in accordance with the conditions prescribed by Aboriginal Heritage Impact Permit (AHIP) #C0002193 and progresses the salvage work undertaken on the Stage 1 Mitchell Pit Salvage Program that was completed during March/April 2017.
These works were conducted in accordance with the relevant AHIP, the HVO North HMP and the OEH Code of Practice for Archaeological Investigation of Aboriginal Objects in New South Wales (2010).
6.7.3 Heritage Audits and Incidents Under the provisions of the HVO South ACHMP, two Compliance Inspections were conducted in 2019 and under the provisions of the HVO North HMP a single Compliance Inspection was conducted during 2019. The purpose of the compliance inspections is to provide the RAPs with:
The opportunity to visit mine operations and mine areas to inspect operational compliance with ACHMP/HMP provisions and GDP procedures;
To inspect and monitor the condition and management of sites; and
To review the effectiveness and performance of the ACHMP/HMP provisions in the management of cultural heritage at the mine.
These compliance inspections were conducted by RAP representatives of the CHWG and RAP representatives of the PCWP with the assistance of a qualified archaeologist and HVO personnel.
The biannual 2019 HVO South compliance inspection was conducted on 3 September 2019 by RAP representatives of the PCWP. A total of 45 aboriginal heritage sites were inspected focusing on areas west of ‘South Lemington Pit 1’.The findings and recommendations of these inspections are documented in the Hunter Valley Operations South Aboriginal Heritage Management Plan Compliance Audit Inspection report dated September 2019.
The annual 2019 HVO South and HVO North compliance inspection was conducted over several days between the 29 and 31 of October 2019 by six RAP representatives of the CHWG and a suitably qualified and experienced archaeologist. During the HVO South portion of the compliance inspection a total of 44 aboriginal heritage sites were inspected in the Barellan, Nicholls, Lemington South and Southern areas. During the HVO North portion of the compliance inspection, a total of 15 heritage sites were assessed including the key sites at the Carrington West Wing, Mitchell Pit surrounds and sites in proximity to coal stockpiles Lemington Road and CM CD1. The findings and recommendations of these inspections are documented in the Hunter Valley Operations Aboriginal Heritage Management Plans October 2019 Compliance Audit Inspections report.
The inspections found that all sites have been managed in conformance with the ACHMP/HMP requirements. Additional sites were recorded and sites requiring maintenance and upgrades to site barricading and fencing were identified, with upgrade and maintenance work to be implemented in 2020.
During the reporting period there were 57 GDPs assessed for cultural heritage management considerations at HVO. There were no incidents nor any unauthorised disturbance caused to cultural heritage sites at HVO during 2019.
6.7.4 Historic Heritage – Management and Community Consultation
In 2019, community consultation was conducted at the Hunter Valley Operations Community Consultative Meetings held on the 20th February, 29th May, 21st August and 20th November 2019, no matters were raised pertaining to management of historic (non-Indigenous) heritage located on HVO property at these meetings.
Two non-indigenous historic sites, the ‘dog leg fence’ and a remnant ‘timber bridge’ adjacent to the Golden Highway were the subject of a Significance Assessment by an external consultant on 31 October 2019. The assessment found that the fence has local historical significance and is of potential State significance for its

2019 Annual Environmental Review
OC-748212775-6 Status: [Document Status (Office)] Effective: [Effective Date]
er] Version: [Document Version (Office)] Review: [Planned Review Date]
Uncontrolled when printed
representativeness and degree of rarity. The timber bridge was assessed as being of twentieth century construction and not significant at a State or local level. The assessment recommends clearing of vegetation and debris from around the ‘dog leg fence’, archival recording of its features and documentation of its location in Hunter Valley Operations GIS database. Completion of these works will occur in the forthcoming 24 months

2019 Annual Environmental Review
OC-748212775-6 Status: [Document Status (Office)] Effective: [Effective Date]
er] Version: [Document Version (Office)] Review: [Planned Review Date]
Uncontrolled when printed
Water Management HVO manages surface and ground water according to three main objectives:
Fresh water usage is minimised;
Impacts on the environment and HVO neighbours are minimised; and
Interference to mining production is minimal.
This is achieved by:
Minimising freshwater use from the Hunter River;
Preferentially using mine water for coal preparation and dust suppression;
An emphasis on control of water quality and quantity at the source;
Segregating waters of different quality where practical;
Recycling on-site water;
Ongoing maintenance and review of the system; and
Disposing of water to the environment in accordance with statutes and regulations.
Plans showing the layout of all water management structures and key pipelines are shown in Figure 20 to Figure 22. The HVO Water Management Plan contains further detail on management practices and is available on HVO website.

2019 Annual Environmental Review
OC-748212775-6 Status: [Document Status (Office)] Effective: [Effective Date]
er] Version: [Document Version (Office)] Review: [Planned Review Date]
Uncontrolled when printed
Figure 20: West Pit water management infrastructure

2019 Annual Environmental Review
OC-748212775-6 Status: [Document Status (Office)] Effective: [Effective Date]
er] Version: [Document Version (Office)] Review: [Planned Review Date]
Uncontrolled when printed
Figure 21: North Pit water management infrastructure

2019 Annual Environmental Review
OC-748212775-6 Status: [Document Status (Office)] Effective: [Effective Date]
er] Version: [Document Version (Office)] Review: [Planned Review Date]
Uncontrolled when printed
Figure 22: South Pit water management infrastructure

2019 Annual Environmental Review
OC-748212775-6 Status: [Document Status (Office)] Effective: [Effective Date]
er] Version: [Document Version (Office)] Review: [Planned Review Date]
Uncontrolled when printed
7.1 Water Balance The 2019 static water balance for HVO is presented in Table 37.
Table 37 2019 HVO Water Balance
Water Stream Volume (ML)
Inputs
Fresh Water (potable) 41 (0.4%)
Fresh Water (Hunter River extraction)
4654 (39%)
Groundwater 3348 (28%)
Rainfall Runoff 2996 (25%)
Recycled to CHPP from Tails & Storage (not included in total)
3707
Imported (Liddell/Ravensworth (via Cumnock))
0 (0%)
Water from ROM Coal 910 (7.6%)
Total Inputs 11948
Outputs
Dust Suppression 2656 (25%)
Evaporation - Mine Water & Tailings Dams
2152 (21%)
Entrained in Process Waste 1996 (19%)
Discharged (HRSTS) 0 (0%)
Vehicle Wash-down 310 (3%)
Sent to Third Party 1367(13%)
Miscellaneous Industrial Use 350 (3%)
Water in Coarse Reject 328 (3%)
Water in Product Coal 1327 (13%)
Total Outputs 10486
Change in Pit Storage 1462 (increase)
7.1.1 Water Inputs A total of 337 mm of rainfall was recorded at HVO in 2019 producing an estimated 2,996 ML of runoff. Water falling on undisturbed clean water catchments is diverted off site into natural systems where possible.
Groundwater inflows to the pits are calculated via numerical groundwater modelling methods. These are given in Table 37.
Groundwater inflows were estimated to have contributed 3348 ML to the site during 2019. 4654 ML of fresh water was pumped from the Hunter River during the reporting period.

2019 Annual Environmental Review
OC-748212775-6 Status: [Document Status (Office)] Effective: [Effective Date]
er] Version: [Document Version (Office)] Review: [Planned Review Date]
Uncontrolled when printed
7.1.2 Water Outputs The main outputs were water use for dust suppression (2,656 ML), evaporation from dams (2,152 ML), water entrained in process waste (1,996 ML) and water in product coal (1,327 ML).
HVO participates in the Hunter River Salinity Trading Scheme (HRSTS) allowing it to discharge from licensed discharge points during declared discharge events, associated with increased flow in the Hunter River. HVO maintains three licensed discharge monitoring locations:
Dam 11N, located at HVO North, which discharges to Farrell’s Creek
Lake James, located at HVO South, which discharges to the Hunter River; and
Parnell’s Dam, located at HVO West, which discharges to Parnell’s Creek.
During 2019 Hunter Valley Operations discharged no water under the Hunter River Salinity Trading Scheme and Environment Protection Licence 640.
7.2 Surface Water Surface water monitoring activities continued in 2019 in accordance with the HVO Water Management Plan and HVO Surface Water Monitoring Program. HVO maintains a network of surface water monitoring sites located on mine site dams, discharge points and surrounding natural watercourses (Figure 23). Water quality monitoring is undertaken to verify the effectiveness of the water management system onsite, and to identify the emergence of potentially adverse effects on surrounding watercourses. A number of mine water dams are monitored routinely to verify the quality of mine water, used in coal processing, dust suppression, and other day to day activities around the mine.
Surface water monitoring data is reviewed on a quarterly basis. The review involves a comparison of measured pH, Electrical Conductivity (EC) and Total Suspended Solids (TSS) results against internal trigger values which have been derived from the historical data set. The response to measured excursions outside the trigger limits is detailed in the HVO Water Management Plan.

2019 Annual Environmental Review
OC-748212775-6 Status: [Document Status (Office)] Effective: [Effective Date]
er] Version: [Document Version (Office)] Review: [Planned Review Date]
Uncontrolled when printed
Figure 23: Surface Monitoring Locations

2019 Annual Environmental Review
OC-748212775-6 Status: [Document Status (Office)] Effective: [Effective Date]
er] Version: [Document Version (Office)] Review: [Planned Review Date]
Uncontrolled when printed
7.2.1 Surface Water Monitoring Routine surface water monitoring was undertaken in 2019 in accordance with the Surface Water Monitoring Program. All analysis of surface water was carried out in accordance with approved methods by a NATA accredited laboratory.
Water quality is evaluated through the parameters of pH, EC and TSS. Pertinent surface water sites were also sampled for comprehensive analysis annually. Long term water quality trends for the Hunter River, Wollombi Brook, other surrounding tributaries and site dams are presented in this section. The sampling frequency for ephemeral water sites was modified in 2016, from quarterly to a rain-event trigger system, in an effort to ensure samples taken were more representative of typical water quality for those streams (up to eight sampling events per annum can now be taken under the revised sampling protocol).
Dry conditions during the reporting period resulted in fewer rain event sampling events being completed in 2019. All required sampling and analysis was undertaken, except as detailed in Table 38. ANZECC criteria are shown in the figures for comparative purposes.
Table 38 HVO Water Monitoring Data Recovery for 2019 (by exception)
Location Data Recovery (%)
Comments
Barellan 0% Site recorded as dry during all 2019 monitoring events.
Bayswater Creek Downstream
50% Site recorded as dry during 2019 February monitoring event
Bayswater Creek Mid 50% Site recorded as dry during 2019 February monitoring event
Carrington Billabong 0% Site recorded as dry during all 2019 monitoring events.
Carrington Upstream 0% Site recorded as dry during all 2019 monitoring events.
Dam 16W 78% Site recorded as unsafe access during November monitoring event and dry during December monitoring
event
Dam 18W Parnells Ck 89% Site recorded as having insufficient water during December monitoring event
DM6 North Void Tailings 59% Site recorded as having insufficient water during July, August, September, October, November and December
monitoring events
NSW1 (Parnell’s Ck) 0% Site was dry during 2019 monitoring events
NSW2 Emu Ck 0% Site was dry during 2019 monitoring events
NSW3 Davis Ck 50% Site recorded as dry during February monitoring event
Pikes Creek Downstream 50% Site recorded as dry during March monitoring event
Pikes Creek Upstream 0% Site recorded as dry during all 2019 monitoring events.
Redbank Creek Catchment
0% Site recorded as dry 2019 monitoring events
W11 (Farrells Ck Lemington Rd)
50% Site recorded as dry during February monitoring event

2019 Annual Environmental Review
OC-748212775-6 Status: [Document Status (Office)] Effective: [Effective Date]
er] Version: [Document Version (Office)] Review: [Planned Review Date]
Uncontrolled when printed
7.2.1.1 Hunter River The Hunter River was sampled on 47 occasions from eight monitoring locations during 2019. Long term trends for pH, EC and TSS are shown in Figure 24 to Figure 26. Results for water quality were generally consistent with historical trends; EC was seasonally variable and controlled by flow volumes through the catchment. The spike in TSS at multiple locations during the September monitoring event followed rainfall on 18-19 September. Trigger exceedance results are detailed in Table 39.
Table 39 Hunter River Internal Trigger Tracking Results
Location Date Trigger Limit Action Taken In Response
H1 7/03/2019 pH 5th Percentile First breach of pH 5th Percentile trigger. Watching Brief*
W4 24/06/2019 pH 5th Percentile First breach of pH 5th Percentile trigger. Watching Brief*.
W109 19/09/2019 TSS First breach of TSS trigger. Monitoring indicates improved water quality at locations downstream of HVO’s potential
influence. Results are generally consistent with observations and water quality expected in the Hunter River following rainfall on 18-19 September 2019. No
evidence to suggested elevated TSS is associated with mining influence. Maintain watching Brief*.
W1 19/09/2019 TSS First breach of TSS trigger. Monitoring indicates improved water quality at locations downstream of HVO’s potential
influence. Results are generally consistent with observations and water quality expected in the Hunter River following rainfall on 18-19 September 2019. No
evidence to suggested elevated TSS is associated with mining influence. Maintain watching Brief*
W4 19/09/2019 TSS First breach of TSS trigger. Monitoring indicates improved water quality at locations downstream of HVO’s potential
influence. Results are generally consistent with observations and water quality expected in the Hunter River following rainfall on 18-19 September 2019. No
evidence to suggested elevated TSS is associated with mining influence. Maintain watching Brief*
W3 19/09/2019 TSS First breach of TSS trigger. Monitoring indicates improved water quality at locations downstream of HVO’s potential
influence. Results are generally consistent with observations and water quality expected in the Hunter River following rainfall on 18-19 September 2019. No
evidence to suggested elevated TSS is associated with mining influence. Maintain watching Brief*
W4 17/12/2019 pH – 5th percentile First exceedance. Watching Brief*
W4 17/12/2019 EC – 95th percentile First exceedance. Watching Brief*
H1 17/12/2019 pH – 5th percentile First exceedance. Watching Brief*
* = Watching brief established pending outcomes of subsequent monitoring events. No specific actions required.

2019 Annual Environmental Review
OC-748212775-6 Status: [Document Status (Office)] Effective: [Effective Date]
er] Version: [Document Version (Office)] Review: [Planned Review Date]
Uncontrolled when printed
Figure 24: Hunter River pH Trends 2016 - 2019
Figure 25: Hunter River EC Trends 2016- 2019
6
6.5
7
7.5
8
8.5
9
Jan‐16 Jul‐16 Feb‐17 Aug‐17 Mar‐18 Sep‐18 Apr‐19 Nov‐19
Field pH (pH unit)
Hunter RiverField pH (pH unit)
H1 ‐ Hunter River H2 ‐ Hunter River
H3 ‐ Hunter River W1 ‐ Hunter River
W109 ‐ Hunter River W3 ‐ Hunter River
W4 ‐ Hunter River WLP3
ANZECC pH Upper Limit Upper ANZECC pH Lower Limit Lower
0
500
1000
1500
2000
2500
Jan‐16 Jul‐16 Feb‐17 Aug‐17 Mar‐18 Sep‐18 Apr‐19 Nov‐19
Field Electrical Conductivity (µS/cm
)
Hunter RiverField Electrical Conductivity (µS/cm)
H1 ‐ Hunter River H2 ‐ Hunter River
H3 ‐ Hunter River W1 ‐ Hunter River
W109 ‐ Hunter River W3 ‐ Hunter River
W4 ‐ Hunter River WLP3
ANZECC EC Upper Limit Upper ANZECC EC Lower Limit Lower

2019 Annual Environmental Review
OC-748212775-6 Status: [Document Status (Office)] Effective: [Effective Date]
er] Version: [Document Version (Office)] Review: [Planned Review Date]
Uncontrolled when printed
Figure 26: Hunter River TSS Trends 2016 - 2019
7.2.1.2 Wollombi Brook Wollombi Brook was sampled on 12 occasions from three monitoring locations during 2019. Long term trends for pH, EC and TSS from Wollombi Brook are shown in Figure 27 to Figure 29. Results were generally consistent with historical trends and acceptable ranges. EC was variable and recorded an increasing trend at the W2 location due to drying conditions in the Wollombi Brook. Trigger exceedance investigation results are detailed in Table 40.
Table 40 Wollombi Brook Internal Trigger Exceedance Results
Location Date Trigger Limit
Action Taken In Response
W2 - Wollombi Brook
7/03/2019 EC 95th Percentile
Fifth exceedance of EC 95th percentile trigger (2610us/cm). Field observations indicate that sample was taken from a pool of water as there was no flow in the Brook. Downstream monitoring (WL1) indicated a slow flow and lower EC level (515us/cm). Based on
this it can be assumed that the sample taken is not representative of flows in the Brook and that there is no impact to suggest mining
influence. Maintain watching Brief*.
Warkworth Bridge
7/03/2019 EC 95th Percentile
Sixth exceedance of EC 95th Percentile trigger (1390us/cm). Field observations indicate that sample was taken from a pool of water as there was no flow in the Brook. Downstream monitoring (WL1) indicated a slow flow and lower EC level (515us/cm). Based on
this it can be assumed that the sample taken is not representative of flows in the Brook and that there is no impact to suggest mining
influence. Maintain watching Brief*.
W2 - Wollombi Brook
24/06/2019 EC 95th Percentile
Sixth exceedance of EC 95th Percentile trigger (2200us/cm). Field observations indicate that sample was taken from a pool of water as there was no flow in the Brook. Downstream monitoring (WL1) indicated a moderate flow and lower EC level (621us/cm). Based
on this it can be assumed that the sample taken is not
0
10
20
30
40
50
60
70
80
90
Jan‐16 Jul‐16 Feb‐17 Aug‐17 Mar‐18 Sep‐18 Apr‐19 Nov‐19
Total Suspen
ded
Solids (m
g/L)
Hunter RiverTotal Suspended Solids (mg/L)
H1 ‐ Hunter River H2 ‐ Hunter River
H3 ‐ Hunter River W1 ‐ Hunter River
W109 ‐ Hunter River W3 ‐ Hunter River
W4 ‐ Hunter River WLP3
ANZECC TSS Upper Limit Upper

2019 Annual Environmental Review
OC-748212775-6 Status: [Document Status (Office)] Effective: [Effective Date]
er] Version: [Document Version (Office)] Review: [Planned Review Date]
Uncontrolled when printed
Location Date Trigger Limit
Action Taken In Response
representative of flows in the Brook and that there is no impact to suggest mining influence. Maintain watching Brief*.
Warkworth Bridge
24/06/2019 EC 95th Percentile
Seventh exceedance of EC 95th Percentile trigger (1515us/cm). Field observations indicate that sample was taken from a pool of water as there was no flow in the Brook. Downstream monitoring (WL1) indicated a moderate flow and lower EC level (621us/cm).
Based on this it can be assumed that the sample taken is not representative of flows in the Brook and that there is no impact to
suggest mining influence. Maintain watching Brief*.
WL1 – Wollombi Brook
24/06/2019 TSS First Breach of TSS trigger. Downstream results at monitoring location H3 in the Hunter indicate better water quality than that
measured at WL1 indicating that the TSS results may be isolated to a local source to the sampling location and not from a broader
impact. Watching Brief*
Warkworth Bridge
19/09/2019 EC 95th Percentile
Continued exceedance of EC 95th Percentile trigger (1581us/cm). Field observations indicate that sample was taken from a pool of water as there was no flow in the Brook. Downstream monitoring
(WL1) indicated a slow flow and lower EC level (521us/cm). Based on this it can be assumed that the sample taken is not
representative of flows in the Brook and that there is no impact to suggest mining influence. Maintain watching Brief*.
W2 – Wollombi Brook
19/09/2019 EC 95th Percentile
Continued exceedance of EC 95th Percentile trigger (2030us/cm). Field observations indicate that sample was taken from a pool of water as there was no flow in the Brook. Downstream monitoring
(WL1) indicated a slow flow and lower EC level (521us/cm). Based on this it can be assumed that the sample taken is not
representative of flows in the Brook and that there is no impact to suggest mining influence. Maintain watching Brief*
Warkworth Bridge
17/12/2019 EC 95th Percentile
Ninth exceedance of EC 95th Percentile trigger (1935us/cm). Field observations indicate that sample was taken from a pool of water as there was no flow in the Brook. Downstream monitoring (WL1) indicated still water and lower EC level (442us/cm). Based on this it can be assumed that the sample taken is not representative of flows in the Brook and that there is no impact to suggest mining
influence. Maintain watching Brief*
W2 – Wollombi Brook
17/12/2019 EC 95th Percentile
Eighth exceedance of EC 95th Percentile trigger (2500us/cm). Field observations indicate that sample was taken from a pool of water as there was no flow in the Brook. Downstream monitoring (WL1) indicated still water and lower EC level (442us/cm). Based
on this it can be assumed that the sample taken is not representative of flows in the Brook and that there is no impact to
suggest mining influence. Maintain watching Brief*
WL1 – Wollombi Brook
17/12/2019 TSS Second Breach of TSS Trigger. Field observations indicate that the water at the sampling site was still and slightly turbid when the
sample was taken. Observation at the downstream monitoring location (H3 in the Hunter) indicate the water was flowing slowly and was slightly turbid. Downstream results (29mg/L) showed
better water quality than that measured at WL1 indicating that the TSS results may be isolated to a local source to the sampling
location and not from a broader impact. Maintain Watching Brief*
* = Watching brief established pending outcomes of subsequent monitoring events. No specific actions required.

2019 Annual Environmental Review
OC-748212775-6 Status: [Document Status (Office)] Effective: [Effective Date]
er] Version: [Document Version (Office)] Review: [Planned Review Date]
Uncontrolled when printed
Figure 27: Wollombi Brook pH Trends 2016 – 2019
Figure 28: Wollombi Brook EC Trends 2016 – 2019
6
6.5
7
7.5
8
8.5
9
Mar‐16 Sep‐16 Mar‐17 Sep‐17 Mar‐18 Sep‐18 Mar‐19 Sep‐19
Field pH (pH unit)
Wollombi BrookField pH (pH unit)
ANZECC pH Lower limit ANZECC pH Upper Limit W2 ‐ Wollombi Brook
Warkworth Bridge WL1 WL1 Wollombi Brook
0
500
1000
1500
2000
2500
3000
Jan‐16 Jul‐16 Feb‐17 Aug‐17 Mar‐18 Sep‐18 Apr‐19 Nov‐19
Field Electrical Conductivity (µS/cm
)
Wollombi BrookField Electrical Conductivity (µS/cm)
W2 ‐ Wollombi Brook Warkworth Bridge WL1
WL1 Wollombi Brook ANZECC EC Upper Limit Upper ANZECC EC Lower Limit Lower

2019 Annual Environmental Review
OC-748212775-6 Status: [Document Status (Office)] Effective: [Effective Date]
er] Version: [Document Version (Office)] Review: [Planned Review Date]
Uncontrolled when printed
Figure 29: Wollombi Brook TSS Trends 2016 - 2019
7.2.1.3 Other Surrounding Tributaries Rain event-based monitoring of natural tributaries surrounding HVO continued during 2019.
In accordance with the HVO Water Management Plan, two rain event sampling rounds were triggered during 2019. These occurred following rainfall greater 30mm in a 24 hour period on the days of 11 February and 18 March 2019. Monitoring during these rain event’s occurred on the following water courses:
Comleroi Creek;
Emu Creek (dry during February rain event);
Farrells Creek (dry during February rain event);
Pikes Creek (dry during February and March rain events);
Redbank Creek (dry during February and March rain events);
Davis Creek (dry during February rain event);
Bayswater Creek; and
Parnells Creek (dry during February and March rain events).
Long term trends for pH, EC and TSS are shown Figure 30 to Figure 32. On occasion, some sampling sites recorded results outside of the internal trigger levels however, results for water quality remained generally within historical trends and acceptable ranges. The surface water monitoring programme will be reviewed in 2020. The ephemeral nature of these monitoring locations is the primary reason for the considerable variation in physical water quality. Trigger tracking results are detailed in Table 41.
0
100
200
300
400
500
600
700
800
Jan‐16 Jul‐16 Feb‐17 Aug‐17 Mar‐18 Sep‐18 Apr‐19 Nov‐19
Total Suspen
ded
Solids (m
g/L)
Wollombi BrookTotal Suspended Solids (mg/L)
W2 ‐ Wollombi Brook Warkworth Bridge
WL1 WL1 Wollombi Brook
ANZECC TSS Upper Limit Upper

2019 Annual Environmental Review
OC-748212775-6 Status: [Document Status (Office)] Effective: [Effective Date]
er] Version: [Document Version (Office)] Review: [Planned Review Date]
Uncontrolled when printed
Table 41 Other Tributaries Internal Trigger Exceedance Results
Location Date Trigger Limit Action Taken In Response
Bayswater Creek
Midstream
18/03/2019 pH -5th Percentile
First exceedance of pH 5th Percentile trigger. Watching Brief
Bayswater Creek
Downstream
18/03/2019 pH 5th Percentile
First exceedance of pH 5th Percentile trigger. Watching Brief*
Pikes Creek Downstream
18/03/2019 pH 5th Percentile.
First exceedance of pH 5th Percentile trigger. Watching Brief*
NSW3 Davis Creek
18/03/2019 TSS 50mg/L (ANZECC Guideline)
First exceedance of TSS trigger (67mg/L). Field observations indicate that sample was taken from a pool of water as there
was no flow in the creek line. EC (266us/cm) and pH (7.3) results also indicate water quality is not affected by mine
water. Maintain watching Brief*.
W11 (Farrells Creek
Lemington Road)
18/03/2019 pH 5th Percentile
First exceedance of pH 5th Percentile trigger. Watching Brief*
W5 (Farrells Creek
Upstream)
18/03/2019 TSS 50mg/L (ANZECC Guideline)
First exceedance of TSS trigger (450 mg/L). Field observations indicated that there was flow in the creek. Refer to incident
section for details.
W5 (Farrells Creek
Downstream)
18/03/2019 TSS 50mg/L (ANZECC Guideline)
First exceedance of TSS trigger (177 mg/L). Field Observations indicated that there was flow in the creek. Refer
to incident section for details
* = Watching brief established pending outcomes of subsequent monitoring events. No specific actions required.
Figure 30: Other Tributaries pH Trends 2016 – 2019

2019 Annual Environmental Review
OC-748212775-6 Status: [Document Status (Office)] Effective: [Effective Date]
er] Version: [Document Version (Office)] Review: [Planned Review Date]
Uncontrolled when printed
Figure 31: Other Tributaries EC Trends 2016 – 2019
Figure 32: Other Tributaries TSS Trends 2016 – 2019

2019 Annual Environmental Review
OC-748212775-6 Status: [Document Status (Office)] Effective: [Effective Date]
er] Version: [Document Version (Office)] Review: [Planned Review Date]
Uncontrolled when printed
7.2.1.4 HVO Site Dams During 2019, 116 samples were collected across 10 onsite dams. Long term trends for pH, EC and TSS are shown in Figure 33 to Figure 35. EC results show a varying trend during the reporting period, as a result of drier weather conditions reducing rainfall runoff inflows to the mine water management system.
Figure 33: HVO Site Dams pH Trends 2016 – 2019

2019 Annual Environmental Review
OC-748212775-6 Status: [Document Status (Office)] Effective: [Effective Date]
er] Version: [Document Version (Office)] Review: [Planned Review Date]
Uncontrolled when printed
Figure 34: HVO Site Dams EC Trends 2016 – 2019
Figure 35: HVO Site Dams TSS Trends 2016 – 2019

2019 Annual Environmental Review
OC-748212775-6 Status: [Document Status (Office)] Effective: [Effective Date]
er] Version: [Document Version (Office)] Review: [Planned Review Date]
Uncontrolled when printed
7.3 Comparison with EIS Predictions 7.3.1 South Pit EIS Predictions
The South Pit EIS estimated an ‘instantaneous’ water quality for Electrical Conductivity of 5,700 µS/cm as an upper limit. Instantaneous water quality is a simple estimate obtained by dividing the total salt available by the maximum amount of possible void water. Electrical Conductivity measurements at Lake James averaged 2,187 µS/cm during 2019, in line with predicted EC levels.
The South Pit EIS estimated average runoff water quality from undisturbed catchments to be 400 mg/L for TSS and 615 µS/cm for EC. Comleroi Creek, South of Cheshunt Pit was sampled twice during rain events in 2019 resulting in a TSS of 17 mg/L and EC of 129 µS/cm, demonstrating that runoff water from undisturbed catchments in the HVO South area is of better quality than that which was predicted in the EIS.
7.3.2 Carrington Pit EIS Predictions The long term mine water quality for Carrington is discussed in the Carrington Mine Environmental Impact Statement (ERM 1999). The EIS estimated an “instantaneous” water quality for Electrical Conductivity of 7,050 µS/cm.
Dewatering from Carrington is a mixture of surface runoff from overburden emplacements, coal mining areas and seepage from the coal seams and alluvium. Water is directed to Dam 9N and into Dam 11N. The average EC and TSS in Dam 11N during 2019 was 2,551 µS/cm and 6 mg/L respectively, and is considered broadly representative of mine water quality for Carrington.
The Carrington EIS states that runoff from undisturbed catchments within the Carrington Pit will be directed around the mine via contour banks or surface drains to discharge where possible into natural creeks. The salinity of the runoff water was predicted to be approximately 615 µS/cm. Runoff from rehabilitated lands was initially predicted to have higher TSS, with levels approaching pre-mining conditions after several years. Carrington Billabong (where such water quality would be measured for this comparison) was reported as dry during the rain event monitoring rounds in 2019 with no samples collected.
7.3.3 West Pit EIS Predictions The West Pit EIS included the data in Table 42 as representative of water quality in the local catchment area. Emu Creek (NSW2) was sampled once during 2019 as the creek was dry during other sampling rounds. The pH was reported to be 7 pH units during the review period, which is slightly lower than EIS predictions and the Electrical conductivity was 120 µS/cm, indicating fresher than predicted EC results. The pH and EC at Farrells Creek (combined upstream and downstream monitoring sites) averaged 6.9 and 191 µS/cm respectively during the review period, were also slightly lower than EIS predictions. The pH and EC for the sample taken at Davis Creek 7.3 and 266 µS/cm respectively during the review period, slightly lower than EIS predictions. Parnell’s Dam (W3) measured an average EC of 4,227 µS/cm in 2019, within the prediction.
Table 42 Representative Water Quality for West Pit
Watercourse pH (pH Units) EC (μS/cm)
Davis Creek 7.7 to 8.4 767 to +8,000
Emu Creek 7.5 to 8.8 365 to +1,000
Farrells Creek 7.0 to 9.2 195 to +12,000
Mine Water (Parnell’s Dam) - 2,400 to 6,300
7.4 Performance relating to HRSTS Discharges HVO participates in the Hunter River Salinity Trading Scheme (HRSTS), allowing it to discharge to the Hunter River via three licensed discharge points, including Dam 11N, Dam 15S (Lake James) and Dam 9W (Parnells Dam). Discharges can only take place subject to the schemes regulations.

2019 Annual Environmental Review
OC-748212775-6 Status: [Document Status (Office)] Effective: [Effective Date]
er] Version: [Document Version (Office)] Review: [Planned Review Date]
Uncontrolled when printed
As required by the EPL, HVO submitted a discharge report for the 2018/19 financial year. No water was discharged off site during 2019 via the Hunter River Salinity Trading Scheme (HRSTS).
7.5 Groundwater 7.5.1 Groundwater Management
Groundwater monitoring activities were undertaken in 2019 in accordance with the HVO Water Management Plan and Groundwater Monitoring Programme. The monitoring results are used to establish and monitor trends in physical and geochemical parameters of surrounding groundwater potentially influenced by mining.
The groundwater monitoring programme at HVO measures the quality of groundwater against background data, EIS predictions and historical trends. Ground water quality is evaluated through the parameters of pH, EC, and Standing Water Level (SWL) (measured as elevation in metres with respect to the Australian Height Datum, mAHD). On a periodic basis (nominally once per annum) a comprehensive suite of analytes are measured, including major anions, cations and metals. Prior to sampling for comprehensive analysis, bore purging is undertaken to ensure a representative sample is collected.
Groundwater monitoring data is reviewed on a quarterly basis. The review involves a comparison of measured pH and EC results against internal trigger values which have been derived from the historical data set. Trigger limits are calculated as the 95th percentile maximum value (EC and pH) and the 5th percentile minimum value (pH only) from data collected since 2011. Trigger levels have been set on the basis of geographical proximity and target stratigraphy. Bores that record as dry and bores of unknown seam have not been included in calculation of the trigger limits. The response to measured data outside the trigger limits is detailed in the HVO Water Management Plan. Where investigations and subsequent actions have been undertaken following review of monitoring data, these are detailed in this section. Monitoring locations are shown in Figure 36.
The Annual Groundwater Impacts Review and the Triennial Groundwater Model Review conducted during 2019 is provided in Appendix A.
7.5.2 Groundwater Performance Sampling of ground waters was carried out in accordance with the HVO Groundwater Monitoring Programme. Where laboratory analysis was undertaken, this was performed by a NATA accredited laboratory. Sites with a data capture rate of less than 100 per cent are outlined in Table 43.
Table 43 HVO Groundwater Monitoring Data Recovery for 2019 (by exception)
Location Data Recovery
(%)
Comments
4036C 0% Insufficient water during 2019 monitoring events.
B425(WDH) 0% Insufficient water to sample during 2019 monitoring events
BZ1-1 25% Bore unable to be sampled during February monitoring event due to
obstruction, May monitoring event due to insufficient water, and August monitoring event due to obstruction
BZ4A(2) 25% Insufficient water during May, August and November monitoring events
C919(ALL) 0% Insufficient water during 2019 monitoring events
CGW45 0% Bore unable to be sampled during 2019 sampling event due to obstruction
CGW47A 0% Insufficient water during 2019 monitoring events
CGW51A 92% Bores unsafe to access during February monitoring events
CHPZ2A 75% Bore unable to be sampled during May monitoring event due to presence of snake in bore

2019 Annual Environmental Review
OC-748212775-6 Status: [Document Status (Office)] Effective: [Effective Date]
er] Version: [Document Version (Office)] Review: [Planned Review Date]
Uncontrolled when printed
Location Data Recovery
(%)
Comments
CHPZ8A 0% Insufficient water during 2019 monitoring events

2019 Annual Environmental Review
OC-748212775-6 Status: [Document Status (Office)] Effective: [Effective Date]
er] Version: [Document Version (Office)] Review: [Planned Review Date]
Uncontrolled when printed
Figure 36: Groundwater Monitoring Network at HVO – 2019

2019 Annual Environmental Review
OC-748212775-6 Status: [Document Status (Office)] Effective: [Effective Date]
er] Version: [Document Version (Office)] Review: [Planned Review Date]
Uncontrolled when printed
7.5.3 Groundwater Monitoring Summary The following section presents groundwater monitoring data in relation to the geographic locations and target stratigraphy for groundwater monitoring bores.
Each location is discussed below, and a summary of monitoring data presented. Where monitoring results required further investigation following the recording of three consecutive measurements outside the internal statistical limits, these results are summarised in tables for each location.
7.5.3.1 Carrington Broonie Carrington Groundwater was sampled on 4 occasions during 2019 from two monitoring locations. The EC, pH and SWL trends for 2016 to 2019 for Carrington Broonie Seam groundwater bores are shown in Figure 37 to Figure 39 respectively. Data was generally consistent with historical ranges with some minor variation noted with pH results. Trigger tracking results are listed in Table 44.
Table 44 HVO Carrington Broonie Groundwater 2019 Monitoring Internal Trigger Tracking
Location Date Trigger Limit Action Taken In Response
CGW53 13/3/2019 pH - 5th percentile First exceedance. Returned to normal range on next monitoring round.
CGW52 4/12/2019 pH - 5th percentile First exceedance. Watching Brief established*
CGW53 4/12/2019 pH - 5th percentile First exceedance. Watching Brief established*
* = Watching brief established pending outcomes of subsequent monitoring events. No specific actions required.
Figure 37: Carrington Broonie Groundwater pH Trends 2016 – 2019

2019 Annual Environmental Review
OC-748212775-6 Status: [Document Status (Office)] Effective: [Effective Date]
er] Version: [Document Version (Office)] Review: [Planned Review Date]
Uncontrolled when printed
Figure 38: Carrington Broonie Groundwater EC Trends 2016 – 2019
Figure 39: Carrington Broonie Groundwater SWL Trends 2016 – 2019

2019 Annual Environmental Review
OC-748212775-6 Status: [Document Status (Office)] Effective: [Effective Date]
er] Version: [Document Version (Office)] Review: [Planned Review Date]
Uncontrolled when printed
7.5.3.2 Carrington Alluvium Groundwater monitoring in the Carrington Alluvium area was undertaken at five sites during 2019, with 91 samples collected during the reporting period. The EC, pH and SWL trends for 2016 to 2019 for Carrington Alluvium groundwater bores are shown in Figure 40 to Figure 42. Trigger exceedance results are listed in
Table 45.
During 2019, HVO continued to work with the NSW Environment Protection Authority (EPA) to address potential impacts of seepage from the North Void Tailings Storage Facility (TSF). This included ceasing deposition of tailings to the TSF and decanting of surface water to allow the tailings to dry and consolidate. Monitoring of the area continues at an increased frequency including data collection from continuous groundwater loggers measuring water level and quality. Electrical conductivity and pH have stabilised and standing water level has declined, this is an indication that current controls are being effective. HVO will continue to work with the EPA during 2020 as part of a Pollution Reduction Programme (PRP) to address the seepage.
Table 45 HVO Carrington Alluvium Groundwater 2019 Monitoring Internal Trigger Tracking
Location Date Trigger Limit Action Taken In Response
CFW55R 3/1/2019 to 12/2/2019 pH - 5th percentile Investigation in progress as part of North Void Seepage Investigation
which is ongoing. Refer to Appendix A. CFW55R 3/1/2019 to 18/12/2019 EC – 95th percentile
CGW53A 20/09/2019 Standing Water Level – 5th percentile
First exceedance. Watching brief established*. Returned to normal range on next monitoring round.
CGW55A 4/12/2019 Standing Water Level – 5th percentile
First exceedance. Watching brief established*.
CGW55A 4/12/2019 pH – 95th percentile First exceedance. Watching brief established*.
* = Watching brief established pending outcomes of subsequent monitoring events. No specific actions required.
Figure 40: Carrington Alluvium Groundwater pH Trends 2016 – 2019

2019 Annual Environmental Review
OC-748212775-6 Status: [Document Status (Office)] Effective: [Effective Date]
er] Version: [Document Version (Office)] Review: [Planned Review Date]
Uncontrolled when printed
Figure 41: Carrington Alluvium Groundwater EC Trends 2016 – 2019
Figure 42: Carrington Alluvium Groundwater SWL Trends 2016 – 2019

2019 Annual Environmental Review
OC-748212775-6 Status: [Document Status (Office)] Effective: [Effective Date]
er] Version: [Document Version (Office)] Review: [Planned Review Date]
Uncontrolled when printed
7.5.3.3 Carrington Interburden Groundwater monitoring in the Carrington Interburden was undertaken at two sites during 2019, with 19 samples collected for field analysis during the reporting period.
The EC, pH and SWL trends for 2016 to 2019 for groundwater bores in the Carrington Interburden are shown in Figure 43 to Figure 45 respectively. Results were generally consistent with historical trends.
Bore 4036C contained insufficient water for accurate pH and EC analysis throughout 2019. Bore 4051C was unblocked in late 2018 and sampling recommenced in March 2019 in this bore. Sampling frequency for CGW51A had been increased during early 2019 in response to an ongoing groundwater investigation initiated by exceedances of the pH 95th percentile trigger limit. The pH levels in this bore were below the pH 95th percentile trigger limit during 2019.
There were no exceedances for these monitoring bores during 2019.
Figure 43: Carrington Interburden Groundwater pH Trends 2016 – 2019

2019 Annual Environmental Review
OC-748212775-6 Status: [Document Status (Office)] Effective: [Effective Date]
er] Version: [Document Version (Office)] Review: [Planned Review Date]
Uncontrolled when printed
Figure 44: Carrington Interburden Groundwater EC Trends 2016 – 2019
Figure 45: Carrington Interburden Groundwater SWL Trends 2016 – 2019

2019 Annual Environmental Review
OC-748212775-6 Status: [Document Status (Office)] Effective: [Effective Date]
er] Version: [Document Version (Office)] Review: [Planned Review Date]
Uncontrolled when printed
7.5.3.4 Carrington West Wing Alluvium Groundwater monitoring in the Carrington West Wing Alluvium was undertaken at five sites in 2019 with 20 samples collected for field analysis during the reporting period. Results are shown in Figure 46 to Figure 48. Results during 2019 were generally consistent with historical trends.
Trigger tracking results are listed in Table 46.
Table 46 HVO Carrington West Wing Alluvium Groundwater 2019 Monitoring Internal Trigger Tracking
Location Date Trigger Limit Action Taken In Response
CGW49 13/3/2019 EC – 95th Percentile Second exceedance. Maintain watching brief. (Returned to normal range on next sample).
CGW49 20/9/2019 EC – 95th Percentile First exceedance. Watching brief established*
CGW49 4/12/2019 EC – 95th Percentile Second exceedance – Maintain watching brief.
4032P 4/12/2019 EC – 95th Percentile First exceedance - Watching brief established*
* = Watching brief established pending outcomes of subsequent monitoring events. No specific actions required.
Figure 46: Carrington West Wing Alluvium Groundwater pH Trends 2016 – 2019

2019 Annual Environmental Review
OC-748212775-6 Status: [Document Status (Office)] Effective: [Effective Date]
er] Version: [Document Version (Office)] Review: [Planned Review Date]
Uncontrolled when printed
Figure 47: Carrington West Wing Alluvium Groundwater EC Trends 2016 – 2019
Figure 48: Carrington West Wing Alluvium Groundwater SWL Trends 2016 – 2019

2019 Annual Environmental Review
OC-748212775-6 Status: [Document Status (Office)] Effective: [Effective Date]
er] Version: [Document Version (Office)] Review: [Planned Review Date]
Uncontrolled when printed
7.5.3.5 Carrington West Wing Flood Plain Groundwater monitoring in the Carrington West Wing Flood Plain was undertaken at four sites in 2019 with 16 samples collected for field analysis during the reporting period. Results are shown in Figure 49 to Figure 51. Groundwater levels in 2019 were consistent with 2018 levels in all bores. CGW47a was reported as dry during 2019.
There was one trigger exceedance in 2019. Trigger tracking results are listed in Table 47.
Table 47 HVO Carrington West Wing Flood Plain Groundwater 2019 Monitoring Internal Trigger Tracking
Location Date Trigger Limit Action Taken In Response
GW-106 21/06/2019 pH – 5th percentile First exceedance. Watching brief established*
* = Watching brief established pending outcomes of subsequent monitoring events. No specific actions required.
Figure 49: Carrington West Wing Flood Plain Groundwater pH Trends 2016 – 2019

2019 Annual Environmental Review
OC-748212775-6 Status: [Document Status (Office)] Effective: [Effective Date]
er] Version: [Document Version (Office)] Review: [Planned Review Date]
Uncontrolled when printed
Figure 50: Carrington West Wing Flood Plain Groundwater EC Trends 2016 – 2019
Figure 51: Carrington West Wing Flood Plain Groundwater SWL Trends 2016 – 2019

2019 Annual Environmental Review
OC-748212775-6 Status: [Document Status (Office)] Effective: [Effective Date]
er] Version: [Document Version (Office)] Review: [Planned Review Date]
Uncontrolled when printed
7.5.3.6 Cheshunt/North Pit Alluvium Groundwater monitoring in the Cheshunt / North Pit area was undertaken at 17 sites during 2019, with 67 samples collected during routine monitoring. Samples could not be obtained from a number of bores during the reporting period, due to blockages (BZ1-1 and CHP2A) and insufficient water (BZ1-1, CHPZ2A and PZ2CH400). Electrical Conductivity, pH and SWL trends for 2016 to 2019 are shown in Figure 52 to Figure 54. Trigger tracking results are listed in Table 48.
The water level in piezometer PZ2CH400 returned to levels consistent with historical levels during 2019 following a noted increase at the end of 2018.
Table 48 HVO Cheshunt/North Pit Alluvium Groundwater 2019 Monitoring Internal Trigger Exceedances
Location Date Trigger Limit Action Taken In Response
Hobdens Well 22/08/2019 pH - 95th Percentile First exceedance - Watching brief established*
BZ1-1 14/11/2019 pH - 95th Percentile First exceedance - Watching brief established*
Hobdens Well 14/11/2019 pH - 95th Percentile Second exceedance – Maintain watching brief
* Watching Brief established pending outcomes of subsequent monitoring events. No specific actions required.
Figure 52: Cheshunt/North Pit Alluvium Groundwater pH Trends 2016 – 2019

2019 Annual Environmental Review
OC-748212775-6 Status: [Document Status (Office)] Effective: [Effective Date]
er] Version: [Document Version (Office)] Review: [Planned Review Date]
Uncontrolled when printed
Figure 53: Cheshunt/North Pit Alluvium Groundwater EC Trends 2016 – 2019
Figure 54: Cheshunt/North Pit Alluvium Groundwater SWL Trends 2016 – 2019

2019 Annual Environmental Review
OC-748212775-6 Status: [Document Status (Office)] Effective: [Effective Date]
er] Version: [Document Version (Office)] Review: [Planned Review Date]
Uncontrolled when printed
7.5.3.7 Cheshunt Interburden Groundwater monitoring in the Cheshunt Interburden area was undertaken at three sites during 2019, with 12 samples collected during the reporting period. The EC, pH and SWL trends for 2016 to 2019 are shown in Figure 55 to Figure 57. Trigger tracking results are listed in Table 49.
Table 49 Cheshunt Interburden Groundwater 2019 Monitoring Internal Trigger Tracking
Location Date Trigger Limit Action Taken In Response
BZ3-1 14/11/2019 pH - 95th Percentile First exceedance - Watching brief established*
* Watching Brief established pending outcomes of subsequent monitoring events. No specific actions required.
Figure 55: Cheshunt Interburden Groundwater pH Trends 2016 – 2019

2019 Annual Environmental Review
OC-748212775-6 Status: [Document Status (Office)] Effective: [Effective Date]
er] Version: [Document Version (Office)] Review: [Planned Review Date]
Uncontrolled when printed
Figure 56: Cheshunt Interburden Groundwater EC Trends 2016 – 2019
Figure 57: Cheshunt Interburden Groundwater SWL Trends 2016 – 2019

2019 Annual Environmental Review
OC-748212775-6 Status: [Document Status (Office)] Effective: [Effective Date]
er] Version: [Document Version (Office)] Review: [Planned Review Date]
Uncontrolled when printed
7.5.3.8 Cheshunt Mt Arthur Groundwater monitoring in the Cheshunt Mt Arthur area was undertaken at nine sites during 2019. A total of 36 samples were collected during the reporting period. The pH, EC and SWL trends for 2016 to 2019 are shown in Figure 58 to Figure 60. Monitoring results were generally consistent with historical trends. Trigger tracking results are listed in Table 50.
Table 50 Cheshunt Mt Arthur Groundwater 2019 Monitoring Internal Trigger Tracking
Location Date Trigger Limit Action Taken In Response
BZ3-3 25/02/2019 pH – 5th Percentile Second exceedance. Watching brief*
BZ4A(2) 25/02/2019 pH – 5th Percentile First exceedance - Watching brief established*
CHPZ3D 26/08/2019 pH – 5th Percentile First exceedance - Watching brief established*
BZ2A(1) 14/11/2019 pH - 5th Percentile First exceedance - Watching brief established*
BZ3-3 14/11/2019 pH - 5th Percentile First exceedance - Watching brief established*
* Watching Brief established pending outcomes of subsequent monitoring events. No specific actions required.
Figure 58: Cheshunt Mt Arthur Groundwater pH Trends 2016 – 2019

2019 Annual Environmental Review
OC-748212775-6 Status: [Document Status (Office)] Effective: [Effective Date]
er] Version: [Document Version (Office)] Review: [Planned Review Date]
Uncontrolled when printed
Figure 59: Cheshunt Mt Arthur Groundwater EC Trends 2016 – 2019
Figure 60: Cheshunt Mt Arthur Groundwater SWL Trends 2016 – 2019

2019 Annual Environmental Review
OC-748212775-6 Status: [Document Status (Office)] Effective: [Effective Date]
er] Version: [Document Version (Office)] Review: [Planned Review Date]
Uncontrolled when printed
7.5.3.9 Cheshunt Piercefield Groundwater monitoring in the Cheshunt Piercefield area was undertaken from one site during 2019; a total of four samples were collected. The pH, EC and SWL trends for 2016 to 2019 are shown in Figure 61 to Figure 63.
Water quality results were generally consistent with historical trends. There were no trigger exceedances recorded in 2019.
Figure 61: Cheshunt Piercefield Groundwater pH Trends 2016 – 2019

2019 Annual Environmental Review
OC-748212775-6 Status: [Document Status (Office)] Effective: [Effective Date]
er] Version: [Document Version (Office)] Review: [Planned Review Date]
Uncontrolled when printed
Figure 62: Cheshunt Piercefield Groundwater EC Trends 2016 – 2019
Figure 63: Cheshunt Piercefield Groundwater SWL Trends 2016 – 2019

2019 Annual Environmental Review
OC-748212775-6 Status: [Document Status (Office)] Effective: [Effective Date]
er] Version: [Document Version (Office)] Review: [Planned Review Date]
Uncontrolled when printed
7.5.3.10 Lemington South Alluvium Groundwater monitoring in the Lemington South Alluvium area was undertaken at three sites during 2019. A total of 8 samples were collected during the reporting period with water level measured on a monthly basis. Bore C919 (ALL) had insufficient water for sampling during 2019.
The pH, EC and SWL trends for 2016 to 2019 are shown in Figure 64 to Figure 66. Trigger limits are listed in Table 51.
Table 51 Lemington South Alluvium Groundwater 2019 Monitoring Internal Trigger Tracking
Location Date Trigger Limit Action Taken In Response
Appleyard Farm 12/08/2019 pH – 5th percentile First exceedance. Watching brief established*
PB01(ALL) 26/02/2019 EC – 95th Percentile Second exceedance. Watching brief*
PB01(ALL) 27/05/2019 EC – 95th Percentile Third exceedance – investigation commenced. Refer to Appendix A.
PB01(ALL) 12/08/2019 EC – 95th Percentile Investigation in progress Refer to Appendix A.
PB01(ALL) 8/11/2019 EC – 95th Percentile Investigation in progress. Refer to Appendix A.
* Watching Brief established pending outcomes of subsequent monitoring events. No specific actions required.
Figure 64: Lemington South Alluvium Groundwater pH Trends 2016 – 2019

2019 Annual Environmental Review
OC-748212775-6 Status: [Document Status (Office)] Effective: [Effective Date]
er] Version: [Document Version (Office)] Review: [Planned Review Date]
Uncontrolled when printed
Figure 65: Lemington South Alluvium Groundwater EC Trends 2016 – 2019
Figure 66: Lemington South Alluvium Groundwater SWL Trends 2016 – 2019

2019 Annual Environmental Review
OC-748212775-6 Status: [Document Status (Office)] Effective: [Effective Date]
er] Version: [Document Version (Office)] Review: [Planned Review Date]
Uncontrolled when printed
7.5.3.11 Lemington South Arrowfield Groundwater monitoring in the Lemington South Arrowfield area was undertaken at four sites during 2019. A total of 8 samples were collected during the reporting period. The pH, EC and SWL trends for 2016 to 2019 are shown in Figure 67 to Figure 69. Results were generally consistent with historical trends with the exception of an exceedance of internal EC trigger for D612(AFS) as listed in Table 52.
Table 52 Lemington South Arrowfield Groundwater 2019 Monitoring Internal Trigger Tracking
Location Date Trigger Limit Action Taken In Response
D612(AFS) 8/11/2019 EC – 95th Percentile First exceedance - Watching brief established*
* Watching Brief established pending outcomes of subsequent monitoring events. No specific actions required.
Figure 67: Lemington South Arrowfield Groundwater pH Trends 2016 – 2019

2019 Annual Environmental Review
OC-748212775-6 Status: [Document Status (Office)] Effective: [Effective Date]
er] Version: [Document Version (Office)] Review: [Planned Review Date]
Uncontrolled when printed
Figure 68: Lemington South Arrowfield Groundwater EC Trends 2016 – 2019
Figure 69: Lemington South Arrowfield Groundwater SWL Trends 2016 – 2019

2019 Annual Environmental Review
OC-748212775-6 Status: [Document Status (Office)] Effective: [Effective Date]
er] Version: [Document Version (Office)] Review: [Planned Review Date]
Uncontrolled when printed
7.5.3.12 Lemington South Bowfield Groundwater monitoring in the Lemington South Bowfield area was undertaken at 16 sites during 2019. A total of 52 samples were collected during the reporting period. The pH, EC and SWL trends for 2016 to 2019 are shown in Figure 70 to Figure 72. Results were generally considered to be consistent with historical trends with the exception of B631(BFS) and C630(BFS) which exceeded internal triggers as listed in Table 53. Note that C122 (BFS) has been excluded from the graphs as there was insufficient water for sampling during the reporting period.
Table 53 Lemington South Bowfield Groundwater 2019 Monitoring Internal Trigger Tracking
Location Date Trigger Limit Action Taken In Response
B631(BFS) 27/05/2019 pH – 5th Percentile Second exceedance. Watching brief *
C630(BFS) 28/05/2019 pH – 95th Percentile First exceedance. Watching brief established*
B631(BFS) 6/11/2019 pH - 5th Percentile Third exceedance – investigation commenced. Refer to Appendix A.
B631(BFS) 6/11/2019 EC – 95th Percentile First exceedance - Watching brief established*
C630(BFS) 8/11/2019 pH - 95th Percentile First exceedance - Watching brief established*
* Watching Brief established pending outcomes of subsequent monitoring events. No specific actions required.
Figure 70: Lemington South Bowfield Groundwater pH Trends 2016 – 2019
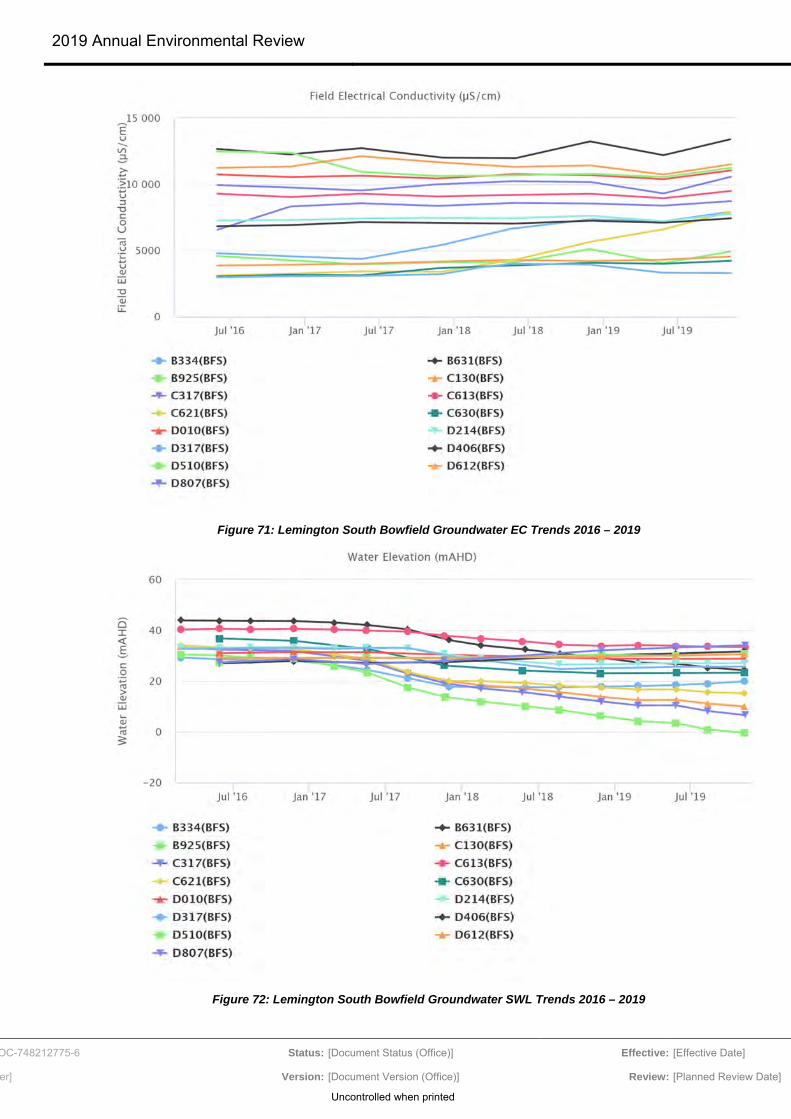
2019 Annual Environmental Review
OC-748212775-6 Status: [Document Status (Office)] Effective: [Effective Date]
er] Version: [Document Version (Office)] Review: [Planned Review Date]
Uncontrolled when printed
Figure 71: Lemington South Bowfield Groundwater EC Trends 2016 – 2019
Figure 72: Lemington South Bowfield Groundwater SWL Trends 2016 – 2019

2019 Annual Environmental Review
OC-748212775-6 Status: [Document Status (Office)] Effective: [Effective Date]
er] Version: [Document Version (Office)] Review: [Planned Review Date]
Uncontrolled when printed
7.5.3.13 Lemington South Interburden Groundwater monitoring in the Lemington South Interburden area was undertaken at one site during 2019; a total of 12 samples were collected. The pH, EC and SWL trends for 2016 to 2019 are shown in Figure 73 to Figure 75. EC has generally been trending upwards during since 2016. The groundwater level has been gradually declining since 2016. Internal triggers are listed in Table 54.
Table 54 Lemington South Interburden Groundwater 2019 Monitoring Internal Trigger Tracking
Location Date Trigger Limit Action Taken In Response
C130(ALL) 26/02/2019 EC – 95th Percentile Second exceedance. Watching brief*
C130(ALL) 28/05/2019 EC – 95th Percentile Third exceedance – investigation commenced. Refer to Appendix A.
C130(ALL) 12/08/2019 EC – 95th Percentile Investigation in progress. Refer to Appendix A.
C130(ALL) 8/11/2019 EC – 95th Percentile Investigation in progress. Refer to Appendix A.
* Watching Brief established pending outcomes of subsequent monitoring events. No specific actions required.
Figure 73: Lemington South Interburden Groundwater pH Trends 2016 – 2019

2019 Annual Environmental Review
OC-748212775-6 Status: [Document Status (Office)] Effective: [Effective Date]
er] Version: [Document Version (Office)] Review: [Planned Review Date]
Uncontrolled when printed
Figure 74: Lemington South Interburden Groundwater EC Trends 2016 – 2019
Figure 75: Lemington South Interburden Groundwater SWL Trends 2016 – 2019

2019 Annual Environmental Review
OC-748212775-6 Status: [Document Status (Office)] Effective: [Effective Date]
er] Version: [Document Version (Office)] Review: [Planned Review Date]
Uncontrolled when printed
7.5.3.14 Lemington South Woodlands Hill Groundwater monitoring in the Lemington South Interburden area was undertaken at seven sites during 2019; a total of 18 samples were collected. The pH, EC and SWL trends for 2016 to 2019 are shown in Figure 76 to Figure 78. Internal triggers are listed in Table 55.
Table 55 Lemington South Woodlands Hill Groundwater 2019 Monitoring Internal Trigger Tracking
Location Date Trigger Limit Action Taken In Response
C130(WDH) 6/11/2019 EC – 95th Percentile First exceedance - Watching brief established*
* Watching Brief established pending outcomes of subsequent monitoring events. No specific actions required.
Figure 76: Lemington South Woodlands Hill Groundwater pH Trends 2016 – 2019

2019 Annual Environmental Review
OC-748212775-6 Status: [Document Status (Office)] Effective: [Effective Date]
er] Version: [Document Version (Office)] Review: [Planned Review Date]
Uncontrolled when printed
Figure 77: Lemington South Woodlands Hill Groundwater EC Trends 2016 – 2019
Figure 78: Lemington South Woodlands Hill Groundwater SWL Trends 2016 – 2019

2019 Annual Environmental Review
OC-748212775-6 Status: [Document Status (Office)] Effective: [Effective Date]
er] Version: [Document Version (Office)] Review: [Planned Review Date]
Uncontrolled when printed
7.5.3.15 Lemington South Glen Munro Groundwater monitoring in the Lemington South Glen Munro seam was undertaken at one site during 2019; two samples were collected. The pH, EC and SWL trends for 2016 to 2019 are shown in Figure 79 to Figure 81. Internal triggers are listed in Table 56. The groundwater level continued to fall during 2019.
Table 56 Lemington South Glen Munro Groundwater 2019 Monitoring Internal Trigger Tracking
Location Date Trigger Limit Action Taken In Response
D010(GM) 8/11/2019 EC – 95th Percentile First exceedance. Watching brief.*
* Watching Brief established pending outcomes of subsequent monitoring events. No specific actions required.
Figure 79: Lemington South Glen Munro Groundwater pH Trends 2016 – 2019

2019 Annual Environmental Review
OC-748212775-6 Status: [Document Status (Office)] Effective: [Effective Date]
er] Version: [Document Version (Office)] Review: [Planned Review Date]
Uncontrolled when printed
Figure 80: Lemington South Glen Munro Groundwater EC Trends 2016 – 2019
Figure 81: Lemington South Glen Munro Groundwater SWL Trends 2016 – 2019

2019 Annual Environmental Review
OC-748212775-6 Status: [Document Status (Office)] Effective: [Effective Date]
er] Version: [Document Version (Office)] Review: [Planned Review Date]
Uncontrolled when printed
7.5.3.16 North Pit Spoil Groundwater monitoring in the North Pit Spoil area was undertaken at 13 sites during 2019. A total of 52 samples were collected during the reporting period. The pH, EC and SWL trends for 2016 to 2019 are shown in Figure 82 to Figure 84. Water quality and levels were generally stable and consistent with historical trends with the exception of exceedances of internal triggers as listed in Table 57. Bore DM7 was dry for the entire reporting period.
Table 57 North Pit Spoil Groundwater 2019 Monitoring Internal Trigger Tracking
Location Date Trigger Limit Action Taken In Response
MB14HVO05 15/03/2019 EC – 95th Percentile First exceedance. Watching brief established*
MB14HVO05 15/03/2019 pH – 5th Percentile First exceedance. Watching brief established*
DM3 20/06/2019 pH – 5th Percentile First exceedance. Watching brief established*
4116P 20/06/2019 EC – 95th Percentile First exceedance. Watching brief established*
4116P 6/09/2019 EC – 95th Percentile Second exceedance. Watching Brief*
MB14HVO05 6/09/2019 EC – 95th Percentile Second exceedance. Watching Brief*
4116P 4/12/2019 EC – 95th Percentile Third exceedance. Investigation commenced. Refer to Appendix A.
* Watching Brief established pending outcomes of subsequent monitoring events. No specific actions required.
Figure 82: North Pit Spoil Groundwater pH Trends 2016 – 2019

2019 Annual Environmental Review
OC-748212775-6 Status: [Document Status (Office)] Effective: [Effective Date]
er] Version: [Document Version (Office)] Review: [Planned Review Date]
Uncontrolled when printed
Figure 83: North Pit Spoil Groundwater EC Trends 2016 – 2019
Figure 84: North Pit Spoil Groundwater SWL Trends 2016 – 2019

2019 Annual Environmental Review
OC-748212775-6 Status: [Document Status (Office)] Effective: [Effective Date]
er] Version: [Document Version (Office)] Review: [Planned Review Date]
Uncontrolled when printed
7.5.3.17 West Pit Alluvium Groundwater monitoring in the West Pit Alluvium area was undertaken at 5 sites during 2019. A total of 44 samples were collected during the reporting period. Bores G1, G2 and G3 continued to be monitored on a monthly basis during the reporting period. Monitoring frequency of these bores will be reviewed in the next reporting period. Monitoring in bores GW-100 and GW-101 was undertaken quarterly in accordance with the HVO Groundwater Monitoring Programme. GW-101 had insufficient water for sampling in March and June and was dry during the September and December monitoring rounds.
The pH, EC and SWL trends for 2016 to 2019 are shown in Figure 85 to Figure 87. Results were consistent with historical trends. There were no trigger exceedances recorded during the reporting period.
Figure 85: West Pit Alluvium Groundwater pH Trends 2016 – 2019

2019 Annual Environmental Review
OC-748212775-6 Status: [Document Status (Office)] Effective: [Effective Date]
er] Version: [Document Version (Office)] Review: [Planned Review Date]
Uncontrolled when printed
Figure 86: West Pit Alluvium Groundwater EC Trends 2016 – 2019
Figure 87: West Pit Alluvium Groundwater SWL Trends 2016 – 2019

2019 Annual Environmental Review
OC-748212775-6 Status: [Document Status (Office)] Effective: [Effective Date]
er] Version: [Document Version (Office)] Review: [Planned Review Date]
Uncontrolled when printed
7.5.3.18 West Pit Sandstone/Siltstone Groundwater monitoring in the West Pit Sandstone/ Siltstone area was undertaken at three sites during 2019. A total of 12 samples were collected during the reporting period. The pH, EC and SWL trends for 2016 to 2019 are shown in Figure 88 to Figure 90. Results were generally consistent with historical trends with the exception of internal trigger exceedances listed in Table 58.
Table 58 West Pit Sandstone/Siltstone Groundwater 2019 Monitoring Internal Trigger Tracking
Location Date Trigger Limit Action Taken In Response
NPZ2 27/03/2019 EC – 95th Percentile First exceedance. Watching brief established. Returned to normal level on next monitoring round.
NPZ2 16/09/2019 EC – 95th Percentile First exceedance. Watching brief established*
NPZ2 5/12/2019 EC – 95th Percentile Second exceedance. Watching brief*
NPZ5 5/12/2019 pH - 5th Percentile First exceedance. Watching brief established*
* Watching Brief established pending outcomes of subsequent monitoring events. No specific actions required.
Figure 88: West Pit Sandstone/Siltstone Groundwater pH Trends 2016 – 2019

2019 Annual Environmental Review
OC-748212775-6 Status: [Document Status (Office)] Effective: [Effective Date]
er] Version: [Document Version (Office)] Review: [Planned Review Date]
Uncontrolled when printed
Figure 89: West Pit Sandstone/Siltstone Groundwater EC Trends 2016 – 2019
Figure 90: West Pit Sandstone/Siltstone Groundwater SWL Trends 2016 – 2019

2019 Annual Environmental Review
OC-748212775-6 Status: [Document Status (Office)] Effective: [Effective Date]
er] Version: [Document Version (Office)] Review: [Planned Review Date]
Uncontrolled when printed
7.5.3.19 Carrington West Wing Bayswater Groundwater monitoring in the Carrington West Wing Bayswater area was undertaken at one site during 2019. A total of 4 samples were collected during the reporting period. The pH, EC and SWL trends for 2016 to 2019 are shown in Figure 91 to Figure 93. There were no trigger exceedances recorded during the reporting period.
Figure 91 – Carrington West Wing Bayswater Groundwater pH Trends 2016 to 2019
Figure 92 – Carrington West Wing Bayswater Groundwater EC Trends 2016 to 2019

2019 Annual Environmental Review
OC-748212775-6 Status: [Document Status (Office)] Effective: [Effective Date]
er] Version: [Document Version (Office)] Review: [Planned Review Date]
Uncontrolled when printed
Figure 93 – Carrington West Wing Bayswater Groundwater SWL Trends 2016 to 2019
7.6 Compensatory Water Supply During 2019 HVO did not provide compensatory water supply or alternate compensation in lieu of compensatory water supply under any new or existing agreements, and circumstances which may trigger a requirement to provide a compensatory water supply were not identified.

2019 Annual Environmental Review
OC-748212775-6 Status: [Document Status (Office)] Effective: [Effective Date]
er] Version: [Document Version (Office)] Review: [Planned Review Date]
Uncontrolled when printed
Rehabilitation and Land Management 8.1 Summary of Rehabilitation
Rehabilitation at HVO is undertaken in accordance with commitments made in the various Mining Operations Plans (MOPs) covering the site: Hunter Valley Operations North MOP (includes Newdell CHPP and Hunter Valley Load Point) and Hunter Valley Operations South MOP.
A summary of the key rehabilitation performance indicators is shown in Table 59.
Table 59 Key Rehabilitation Performance Indicators
Mine Area Type Previous Reporting Period
(Actual) Year 2018 (ha)
This Reporting Period (Actual) Year 2019 (ha)
Next Reporting Period (Forecast)
Year 2020 (ha)
A. Total mine footprint2 6539 6567.8 6617.2
B. Total Active Disturbance3 3599.2 3639.1 3687.0
C. Land being prepared for rehabilitation4 212.3* 529.7* 443.7
D. Land under active rehabilitation5 2727.5* 2392.5 2486.5
E. Completed rehabilitation6 0 0 0 *Increase in land being prepared for rehabilitation is due to reclassification of areas previously reported as under active rehabilitation which require remedial actions prior to being re-sown to final vegetation (i.e. reclassified to Growth Medium Development phase).
2 Total mine footprint includes all areas within a mining lease that either have at some point in time or continue to pose a rehabilitation liability due to mining and associated activities. As such it is the sum of total active disturbance, decommissioning, landform establishment, growth medium development, ecosystem establishment, ecosystem development and relinquished lands (as defined in DRE MOP/RMP Guidelines). Please note that subsidence remediation areas are excluded 3 Total active disturbance includes all areas ultimately requiring rehabilitation such as: on-lease exploration areas, stripped areas ahead of mining, infrastructure areas, water management infrastructure, sewage treatment facilities, topsoil stockpiles areas, access tracks and haul road, active mining areas, waste emplacements (active/unshaped/in or out-of-pit), and tailings dams (active/unshaped/uncapped). 4 Land being prepared for rehabilitation – includes the sum of mine disturbed land that is under the following rehabilitation phases – decommissioning, landform establishment and growth medium development (as defined in DRE MOP/RMP Guidelines). 5 Land under active rehabilitation – includes areas under rehabilitation and being managed to achieve relinquishment – includes the following rehabilitation phases as described in the DRE MOP/RMP Guidelines – “ecosystem and land use sustainability” (revegetation assessed as showing signs of trending towards relinquishment OR infrastructure development). 6 Completed rehabilitation – requires formal sign off by DRE that the area has successfully met the rehabilitation land use objectives and completion criteria.

2019 Annual Environmental Review
OC-748212775-6 Status: [Document Status (Office)] Effective: [Effective Date]
er] Version: [Document Version (Office)] Review: [Planned Review Date]
Uncontrolled when printed
8.2 Rehabilitation Overview A summary of rehabilitation completed in 2019 is shown in Table 60.
Table 60 Summary of new rehabilitation completed in 2019
Rehabilitation Site Name
Seed Mix Area (ha) Summary
Glider Woodland HVO Woodland Mix 31.0 Interim landform sown with native seed.
Glider Pasture HVO Pasture Light Woody Mix
28.7 Final landform sown with final cover.
Riverview North HVO Woodland Mix 12.6 Interim landform sown with native seed.
West Wilton 210 HVO Pasture Light Woody Mix
8.0 Final landform sown with final cover.
West South 230 HVO Pasture Light Woody Mix
6.0 Final landform sown with final cover.
West Centre 230 HVO Pasture Light Woody Mix
2.0 Final landform sown with final cover.
TOTAL REHABILITATION 88.3
8.2.1 HVON Load Point Rehabilitation
In accordance with HVO North Development Consent approval (DA 450-10-2003) Schedule 3, Condition 31A, 0.14ha has been rehabilitated through the planting of trees and vegetation representative of the Swamp Oak Floodplain Forest community on land that adjoins the existing riparian vegetation along Bayswater Creek.
The area was prepared for planting on 16 August 2019 and planted mid-September 2019. The species planted included Casuarina glauca, Syzygium smithii, Callistemon salignus and Lomandra longifolia. These species were planted with tree guards, weed matting, ‘Seasol’ gel and fertiliser tablets. Ongoing watering and monitoring are occurring.

2019 Annual Environmental Review
OC-748212775-6 Status: [Document Status (Office)] Effective: [Effective Date]
er] Version: [Document Version (Office)] Review: [Planned Review Date]
Uncontrolled when printed
8.3 Rehabilitation Performance A total of 88.3 ha rehabilitation was undertaken during 2019. Details of the rehabilitation areas including areas completed during 2019, the extent of mining, surface contours and rehabilitation vegetation types are provided in Figure 94.

2019 Annual Environmental Review
OC-748212775-6 Status: [Document Status (Office)] Effective: [Effective Date]
er] Version: [Document Version (Office)] Review: [Planned Review Date]
Uncontrolled when printed
Figure 94: HVO Rehabilitation Areas as at 2019

2019 Annual Environmental Review
OC-748212775-6 Status: [Document Status (Office)] Effective: [Effective Date]
er] Version: [Document Version (Office)] Review: [Planned Review Date]
Uncontrolled when printed
Table 61 details the amount of rehabilitation and disturbance completed during the reporting period compared with proposed area in the respective MOP’s.
Table 61 Summary of rehabilitation and disturbance completed in 2019^
MOP 2019 Totals (ha) Cumulative Totals During Current MOP Period (ha)*
Actual Proposed MOP Actual Proposed MOP
Rehabilitation
HVO North 16.0 21.4 16.0 21.4
HVO South 72.4 66.4 167.9 151.8
HVO Total 88.3 87.8 183.9 173.2
Rehabilitation Disturbance
HVO North 0 16.6 0 16.6
HVO South 30.1 98.4 30.1 209.1
HVO Total 30.1 115.0 30.1 225.7
New Disturbance
HVO North 4.7 44.6 4.7 44.6
HVO South 0.3 17.4 0.3 41.5
HVO Total 5.0 62.0 5.0 86.1
Net Rehabilitation (Rehabilitation minus Rehabilitation Disturbance)
HVO North 16.0 4.8 16.0 4.8
HVO South 42.3 -32.0 137.8 -57.3
HVO Total 58.2 -27.2 153.8 -52.5
Comparison with HVO North MOP 2019 to 2021 (approved 26 February 2019) and HVO South MOP Amendment A 2018 to 2022 (approved 26 February 2018);
*Cumulative North MOP figures for period 2019 only. Cumulative South MOP figures for period 2018-2019.

2019 Annual Environmental Review
OC-748212775-6 Status: [Document Status (Office)] Effective: [Effective Date]
er] Version: [Document Version (Office)] Review: [Planned Review Date]
Uncontrolled when printed
Following commencement of a new MOP for HVO South in July 2018 the rehabilitation to end of 2019 exceeded the MOP projection for the reporting period by 6 hectares and the projection since MOP commencement by 16.1 hectares. As rehabilitation disturbance projected during the initial period of the MOP has been delayed net rehabilitation since MOP commencement is 195.1 hectares in advance of predictions however this gap will narrow over coming years as planned rehabilitation disturbance occurs.
The area of rehabilitation sown in HVO North during the reporting period was 5.4 hectares below the MOP commitment. As 2019 was the initial year of the MOP the cumulative rehabilitation total across the MOP period was similarly 5.4 hectares below the MOP projection. The reduced rehabilitation at HVO North was offset by the absence of rehabilitation disturbance during the period. In terms of net rehabilitation HVO North is therefore in 11.2 hectares ahead of the MOP projection with net rehabilitation of 16 hectares completed compared with MOP projection of 4.8 hectares.
During 2019 HVO reclassified areas of existing rehabilitation at both HVO North and HVO South from under active rehabilitation to within the growth medium development phase. This was because these areas are under cover-crop vegetation management regimes and remain to be sown to final vegetation covers. Reclassification corrects an historic reporting practice which does not align with contemporary guidelines. These areas are substantively advanced along the establishment continuum however are unable to be reported as active rehabilitation, however exclusion of these areas from reporting tallies would significantly under-represent progress against rehabilitation commitments. Given this, and for completeness, these reclassified areas are and included in progression assessments. Seeding of these areas to final covers is ongoing and the quantum of areas will reduce with time.
A comparison of rehabilitation progression against predictions in the HVO West Pit Extension and Minor Modifications Environmental Impact Statement (EIS) (October 2003) and subsequent modifications to the HVO North approval (DA 450-10-2003) indicates that rehabilitation progression is generally consistent with EIS predictions. Planning approval modifications that changed the rate of rehabilitation progression at HVO North include: Carrington East Extension (Modification 2 - 2006); Carrington Out-of-Pit TSF (modification 4 - 2014); and Carrington In-Pit TSF (Modification 6 - 2014). When the modifications listed above are taken into account the EIS projection for rehabilitation area at the end of 2018 was 1766.9 hectares. The EIS projection for average annual rehabilitation between 2018 (Year 14) and 2024 (Year 20) is 26.2 hectares hence projected rehabilitation at the end of 2019 was 1793.1 hectares. Land under active rehabilitation at HVO North at the end of 2019 totalled 1651.6 hectares. A further 168.3 hectares are classified as within growth medium development phase representing a total rehabilitation management footprint at end of 2019 of 1819.9 hectares which is consistent with EIS projections.
As at the end of 2019, rehabilitation progress for HVO South is consistent with the predictions in the HVO South Coal Project Environmental Assessment Report (January 2008), although with similar considerations to HVO North with respect to current rehabilitation phase classifications. EIS rehabilitation progression at the end of 2019 (Stage 1) shows 1047.6 ha of rehabilitation completed. Land under active rehabilitation at the end of 2019 was 740.8 hectares in association with 305.4 hectares in growth medium development phase. Total rehabilitation management footprint at end 2019 is therefore 1046.2 hectares and consistent with progression to the end of Stage 1.
Of further note, during 2019 topsoil stockpiles totalling 72.2 ha located within rehabilitation areas were reclassified from active rehabilitation to active disturbance and these areas removed from rehabilitation tallies. Management of these areas remains as for the surrounding rehabilitation blocks in which they are located and consideration of the 29.0 hectares at HVO North and 43.2 hectares at HVO South further demonstrates rehabilitation progression generally consistent with respective EIS projections.

2019 Annual Environmental Review
OC-748212775-6 Status: [Document Status (Office)] Effective: [Effective Date]
er] Version: [Document Version (Office)] Review: [Planned Review Date]
Uncontrolled when printed
8.4 Rehabilitation Programme Variations The 2019 variations to the rehabilitation programme are summarised in Table 62.
Table 62 Variations to the Rehabilitation Programme in 2019
MOP Has rehabilitation work proceeded
generally in accordance with the conditions of
an accepted Mining Operations
Plan?
Comment
HVO South No New rehab & disturbance
HVO South net rehabilitation (net rehabilitation = rehabilitation minus – rehabilitation disturbance) completed during period 2018 to 2019: Actual = +42.3 ha vs MOP target = -32.0 ha.
HVO South net rehabilitation progress 195.1 ha ahead of MOP projection for period 2018 to 2019.
HVO South net rehabilitation progress advanced due to HVO delaying disturbing rehabilitation areas at Cheshunt and Riverview. Rehabilitation completion has progressed generally in accordance with MOP.
Historic rehabilitation
Following receipt of Section 240 notice issued 18/7/19 from Resources Regulator HVO reviewed rehabilitation phase classification of all rehabilitation areas. Reclassification approach was supported by Resources Regulator at meeting held 21/8/19.
rehabilitation areas sown to final cover are classified as Ecosystem Establishment phase,
rehabilitation areas awaiting sowing to final cover are classified as Growth Medium Development phase;
topsoil stockpiles located within rehabilitation areas are classified as Active Disturbance.
HVO North: 168.3 ha reclassified from active rehabilitation to land being prepared for rehabilitation; 29.0 ha reclassified from active rehabilitation to active disturbance. HVO South: 305.4 ha reclassified from active rehabilitation to land being prepared for rehabilitation; 43.2ha reclassified from active rehabilitation to active disturbance
HVO North No
8.5 Rehabilitation Trials No rehabilitation trials were conducted during 2019.
8.6 Key Issues that may affect Rehabilitation The key issues that may affect rehabilitation are:
Vegetation Establishment impacts due to competition from problematic weed species, uncontrolled or inappropriate vehicle or livestock impacts, or resulting in low resilience to bushfire impact; and atypical species diversities, structural densities, growth rates, productivity and recruitment levels when compared with analogue sites.

2019 Annual Environmental Review
OC-748212775-6 Status: [Document Status (Office)] Effective: [Effective Date]
er] Version: [Document Version (Office)] Review: [Planned Review Date]
Uncontrolled when printed
Growth Medium Suitability issues due to soil nutrient and chemical properties impacting vegetation establishment; or establishment of inadequate soil depth during the Growth Medium Establishment phase.
Landform Stability including the stability of water management structures, internal and external batter slopes and final void batters, and settlement and ponding on final landform surfaces of tailings storage facilities;
Spontaneous Combustion occurring from placement of high risk materials on or near the final surface, or from exposed coal seams;
Fauna Recolonisation impacts due to competition and predation by vertebrate pest species; and
Ecosystem Function issues such that key Landscape Function Analysis (LFA) values for stability, infiltration, nutrient cycling or landscape organisation are trending away from analogue site values.
A Trigger Action Response Plan (TARP) is included in the MOPs and identifies the proposed contingency strategies in the event of variations or impacts to rehabilitation outcomes. Weed management continues to be a key issue to manage in order to meet rehabilitation objectives. Management activities to improve rehabilitation performance are described below.
Vegetation Establishment
Over the past decade HVO has utilised cover crops for initial stabilisation of rehabilitation areas and as a tool to combat heavy weed seed loads in site topsoils. Delays in progressing these areas to final cover have led to a backlog of areas requiring ongoing maintenance within the Growth Medium Development phase of rehabilitation. A key current focus of rehabilitation maintenance activities is sowing of these areas to final vegetation covers to allow progression to the Ecosystem Establishment phase. Stand-alone initial cover cropping will no longer be utilised except in case specific circumstances. Following this change HVO will prioritise prompt seeding and establishment of final vegetation covers with inclusion of cover crop components as appropriate to assist with initial stabilisation.
Weed competition
Historic weed infestation of former grazing areas and subsequent weed establishment upon many historic topsoil stockpiles has resulted in a significant weed seed burden in many establishing rehabilitation areas. HVOs response to TARP triggers for weed competition (in association with native stem density i.e. vegetation establishment) are a key element of the current rehabilitation maintenance focus. In addition to improvements in topsoil management practices (see below) there is a strong focus upon managing weed competition during the initial post-sowing establishment window, in addition to prioritised interventions based on routine inspections. Review of rehabilitation processes
In association with changes in ownership and site management in 2018 HVO has adopted the Glencore Coal Assets Australia rehabilitation process framework. Key additional process elements which are being progressively integrated to site include:
Development of a comprehensive Annual Rehabilitation and Closure Plan which provides an integrated overview of all rehabilitation and closure related works to be undertaken during the forward period;
Implementation of an annual walkover inspection of all rehabilitation areas to identify landform stability and vegetation establishment issues, maintenance planning, and budgeting;
Annual review and inspection of site conformance with annual plans and GCAA rehabilitation processes; and
Adoption of GCAA spatial data management protocols for rehabilitation.
Topsoil management
Topsoil management processes have been identified as an area for improvement at HVO. During 2018 and in association with the s240 rehabilitation improvement program HVO commenced revision of site topsoil management procedures including characterisation based source separation and discrete stockpiling, topsoil stockpile inspection

2019 Annual Environmental Review
OC-748212775-6 Status: [Document Status (Office)] Effective: [Effective Date]
er] Version: [Document Version (Office)] Review: [Planned Review Date]
Uncontrolled when printed
and maintenance protocols, and topsoil tracking and reconciliation processes. Finalisation of an integrated Topsoil Management Plan to support improvements in site practice and rehabilitation outcomes will be completed during 2020.
Native Vegetation Rehabilitation
Over the previous decade HVO has focussed on re-establishing a diverse native understorey within native vegetation rehabilitation. Experience over this period has shown that weed competition, which includes exotic grasses in the context of native vegetation establishment, is the main limiting factor to the successful establishment of a native understorey. The weed seed source is coming from both historically disturbed areas that are being stripped ahead of mining; and from the cover species on topsoil stockpiles.
HVO continues to refine the approach to minimise the impact of weeds in rehabilitation, including:
Prioritising the use of topsoils from good quality native vegetation areas on rehabilitation that is being returned to native vegetation;
Managing new and old topsoil stockpiles to clean up exotic grass/weed cover and establish a cover of native vegetation (see topsoil management, above);
Development of techniques to use spoils ameliorated with composts (or similar ameliorants) and gypsum as the growth medium for areas being returned to native vegetation. This method avoids the use of “weedy” topsoils and allows native vegetation to become established in the absence of competitive weed species;
Chemical application techniques to target exotic grasses and weeds in areas that have already been sown with native seed mixes. This includes weed wiping of exotic grasses, post-sowing pre-emergent spraying of areas with high risk weed seed loads; and targeted spot spraying across key development windows.
Development of native seed production areas to supply local provenance native grasses for use in rehabilitation and topsoil stockpile maintenance.
HVO has committed to a detailed work plan in response to initial TARP triggers arising from rehabilitation monitoring and subsequent engagement with Resources Regulator arising from Section 240 Notices received during 2018 and 2019. The plan is particularly focussed upon native vegetation establishment on historic cover crop areas, and protection of these and existing areas from existing and emergent week threats while vegetation establishes.
8.7 Rehabilitation Monitoring Performance criteria for each rehabilitation phase have been detailed in the Mining Operations Plan (MOP) for both HVO North and HVO South. These criteria have been developed so that the rehabilitation success can be quantitatively tracked as it progresses through the phases outlined below:
Stage 1 – Decommissioning
Stage 2 – Landform Establishment
Stage 3 – Growing Media Development
Stage 4 – Ecosystem and Land use Establishment
Stage 5 – Ecosystem and Land use Sustainability
Stage 6 – Rehabilitation Complete
The performance criteria are objective target levels or values that can be measured to quantitatively demonstrate the progress and ultimate success of a biophysical process. A monitoring methodology has been developed to measure the performance criteria utilising a combination of tool to assess changes occurring over time.

2019 Annual Environmental Review
OC-748212775-6 Status: [Document Status (Office)] Effective: [Effective Date]
er] Version: [Document Version (Office)] Review: [Planned Review Date]
Uncontrolled when printed
The target levels or values have been based on monitoring results from reference sites. Continued refinement of the criteria in association with key regulatory stakeholders remains ongoing in association with an adaptive management approach.
The monitoring programme for rehabilitated land returned to native vegetation was commenced during 2015. Further monitoring was conducted in early and mid-2017. A number of results from the 2017 monitoring event initiated TARP triggers in relation to native weed presence and the trajectory of native vegetation establishment. This was reported in the 2017 Annual Environmental Review.
In October 2018 in response to TARP triggers and observations during annual inspections, the DP&E – Resources Regulator issued HVO with notice under Section 240(1)(c) of the Mining Act (1992) (Section 240 Improvement Notice).
As detailed by the TARP triggers, and in accordance with this Section 240 notice, HVO initiated review of 12 areas of concern by suitably qualified specialists using an abridged monitoring methodology so as to understand in more detail current site conditions and trajectory, and support intervention decision making. Details of this monitoring program were presented in the 2018 Annual Environment Review.
Following submission of the review in January 2019, Resources Regulator directed the abridged monitoring methodology be applied to an extended area of rehabilitation undertaken since c.2009 when HVO commenced using widespread sacrificial cover crops during initial rehabilitation establishment. This extended monitoring was undertaken across 25 sites during Autumn 2019. Details of all monitoring undertaken utilising this technique over late 2018 and in 2019 are presented in Table 63 and Figure 95. Maintenance interventions and prioritisations since this time have been informed by this monitoring.

2019 Annual Environmental Review Hunter Valley Operations
Report
Number: HVOOC-748212775-6 Status: [Document Status (Office)] Effective: [Effective Date] Page 178 of 238
Owner: [Owner] Version: [Document Version (Office)] Review: [Planned Review Date]
Uncontrolled when printed
Table 63 Summary of 2019 and 2018 rehabilitation monitoring inspections
Site Name Trajectory Ranking Key Issues Recommendations
HVOWES201101 Stable but needs work to improve
Disturbance through the centre of this site has resulted in weed invasion, particularly exotic grasses but natives in this disturbed area are recruiting from the soil seedbank and/or root stock. In undisturbed areas the canopy layer is too dense and competition is excluding mid and ground layer species.
Control weed threats, open up canopy layer in undisturbed sections and sow test areas with shade tolerant species.
HVOWES201301 Stable but needs work to improve
Exotic grasses are the main threat here. One large patch appears to have lost topsoil and/or have subsoil issues and has a low density of trees and shrubs but a good native ground layer.
Manage exotic grass threat and possibly over-sow natives to increase shrub layer. Investigate soil issues in areas of low shrub density and ameliorate as required.
HVOWES201401 Stable but needs work to improve
The majority of the area is tracking well with excellent shrub layer density and good native ground cover. Canopy species stem density is low and the ground layer has a higher density of Galenia, although this does not appear to be seriously threatening natives. One large zone in this area appears to have soil issues preventing tree and shrub establishment. Rhodes grass and Green panic are present in low density.
Control Galenia and exotic grasses. Investigate soil issues in areas of low shrub density and ameliorate as required.
HVOWES201501 Failing There is little native cover across this site apart from Saltbush species. Soil issues appear to be limiting native establishment, although it is possible that natives have not germinated due to harsh drought conditions.
Investigate soil issues in areas of low shrub density and ameliorate as required. Reassess site following substantial rain. Re-sowing may be required following further investigation.
HVOWES201502 Stable but needs work to improve
One large zone in this area appears to have soil issues preventing tree and shrub establishment. Native grasses are present in good diversity and density although proper assessment was difficult following drought conditions. The southern third of the site has better shrub establishment and some trees.
Investigate soil issues in areas of low shrub density and ameliorate as required. Reassess site following substantial rain. Over-sowing trees and shrubs may be warranted following further investigation.
HVOWES201602 Tracking towards success
Good diversity and cover in ground and canopy layers. Good canopy species establishment
Control exotic species through this zone but concentrate efforts on neighbouring blocks to reduce threat form invasive weeds.
HVOWES201605 Stable but needs work to improve Failing
This site currently has low weed density but native establishment has been so far limited, probably due to drought conditions. Further assessment is necessary to properly assess but significant rainfall could either stimulate native establishment or result in a serious weed infestation.
Continue monitoring and control exotic grasses and Galenia.
HVOWES201703 Tracking towards success
Good native establishment though low cover, probably due to drought. Galenia is present in significant density, though control efforts have reduced its impact.
Continue weed control and re-assess following rain

2019 Annual Environmental Review Hunter Valley Operations
Report
Number: HVOOC-748212775-6 Status: [Document Status (Office)] Effective: [Effective Date] Page 179 of 238
Owner: [Owner] Version: [Document Version (Office)] Review: [Planned Review Date]
Uncontrolled when printed
Site Name Trajectory Ranking Key Issues Recommendations
HVOWES201704 Failing / Failed
This site was divided into three zones, based on native and weed densities. The Northern and Southern zones have low native diversity and cover and significant weed invasion. The southern zone in particular is invaded with Rhodes grass and Galenia while the northern section is mostly affected by Galenia. The central zone has good native cover, especially grasses, though trees and shrubs are limited.
Control Rhodes Grass across the site and consider resetting northern and southern zones (spray out and re-sow).
HVOCHE201501B Failed This site is dominated by Green panic and native establishment has been very poor.
Investigate and ameliorate soil issues. Spray out and re-sow.
HVOCHE201601A Failed This site is dominated by Green panic and native establishment has been very poor.
Investigate and ameliorate soil issues. Spray out and re-sow.
HVOCHE201702 Failed / Tracking towards success
This is a varied site, comprised of disturbed remnant woodland with some zones having been completely cleared and rehabbed with imported topsoil. The rehab on imported topsoil has failed, being infested with Galenia and green panic. The remnant woodland has weed issues but natives are re-establishing and with some management the quality of this block will continue to improve overall. Significant weed control and possible over sowing will probably be necessary in the worst-affected zones.
Investigate underlying soil issues. Possible issues could include a combination of subsoil and/or topsoil compaction or contamination or mineral imbalance or nutrient deficiencies. Slash green panic in cleared areas, spot spray Galenia and over-sow cleared areas with colonizing native grasses. Allow natural regeneration from neighbouring zones. Control weeds in remnant woodland zones and encourage natural recruitment.
HVOCHE201801 Failed / Tracking towards success
The southern part of this site is performing extremely well, with excellent native establishment. However, the Northern part (the majority) is completely dominated by green panic and native cover and diversity are extremely low.
Investigate soil issues in areas of low native density and ameliorate as required. Re-sowing of these areas will probably be required following weed control and amelioration.
HVOCHE201802 Stable but needs work to improve
This area has good native grass establishment and some shrubs and canopy species. Native recruitment may continue but native cover is still low. Exotic grasses are present in low densities and should be promptly controlled
Control Rhodes Grass and continue to monitor native establishment.
HVORIV201406 Failing This site has been almost completely dominated by the native annual saltbush Salsola australis. Establishment of other native species has been very limited. Salsola is currently mostly senescent but is probably preventing germination of natives by preventing light from reaching the soil surface.
Slash salsola stands and re-assess following rainfall.

2019 Annual Environmental Review Hunter Valley Operations
Report
Number: HVOOC-748212775-6 Status: [Document Status (Office)] Effective: [Effective Date] Page 180 of 238
Owner: [Owner] Version: [Document Version (Office)] Review: [Planned Review Date]
Uncontrolled when printed
Site Name Trajectory Ranking Key Issues Recommendations
HVORIV201407 Failing / Failed / Stable
This area has been divided into three zones: South of the power line track has failed due to poor native establishment and a dense infestation of Rhodes and Couch grasses. The flat north of the power line and up to the break in slope has good native grass cover, a low density of native shrubs and a low but significant density of Rhodes grass and green panic. The northern slope has good grass and herb establishment, along with good density of shrubs and canopy species. However, exotic grasses are dominating this area and if not controlled will completely invade the Zone.
Control weed patches in central zone with spot a combination of slashing and spot spraying. Spray out weeds in southern section and resow with native grasses. Slashing program on sloping areas to control high-growing exotic grasses and favour low-growing natives, avoiding Shrubs and trees. Spot spraying as required. Continue to monitor native and weed responses.
HVORIV201601A Stable but needs work to improve
This site has been almost completely dominated by the native annual saltbush Salsola australis. Establishment of other native species has been limited, although cover of other native saltbushes is quite good. Salsola is currently mostly senescent but is probably preventing germination of natives by preventing light from reaching the soil surface.
Slash salsola stands and re-assess following rainfall. Investigate underlying soil issues and ameliorate as required.
HVORIV201701 Stable but needs work to improve
This site has been almost completely dominated by the native annual saltbush Salsola australis. Establishment of other native species has been very limited. Salsola is currently mostly senescent but is probably preventing germination of natives by preventing light from reaching the soil surface.
Slash salsola stands and re-assess following rainfall. Investigate underlying soil issues and ameliorate as required.
HVORIV201702 Stable but needs work to improve
This site has been almost completely dominated by the native annual saltbush Salsola australis. Establishment of other native species has been very limited. Salsola is currently mostly senescent but is probably preventing germination of natives by preventing light from reaching the soil surface.
Slash salsola stands and re-assess following rainfall. Investigate underlying soil issues and ameliorate as required.
HVORIV201703 Stable but needs work to improve
This site has been almost completely dominated by the native annual saltbush Salsola australis. Establishment of other native species has been very limited. Salsola is currently mostly senescent but is probably preventing germination of natives by preventing light from reaching the soil surface.
Slash salsola stands and re-assess following rainfall. Investigate underlying soil issues and ameliorate as required.
HVORIV201801 Stable but needs work to improve
This site has been almost completely dominated by the native annual saltbush Salsola australis. Establishment of other native species has been very limited. Salsola is currently mostly senescent but is probably preventing germination of natives by preventing light from reaching the soil surface.
Slash salsola stands and re-assess following rainfall. Investigate underlying soil issues and ameliorate as required.
HVORIV201802 Stable / Tracking towards success
Natives are establishing well on the north western part of this site, and there are initial signs of good native germination on the south eastern part. Exotic grasses and Galenia are present in low densities and should be controlled before they invade bare ground.
Control weeds and continue to monitor native establishment.

2019 Annual Environmental Review Hunter Valley Operations
Report
Number: HVOOC-748212775-6 Status: [Document Status (Office)] Effective: [Effective Date] Page 181 of 238
Owner: [Owner] Version: [Document Version (Office)] Review: [Planned Review Date]
Uncontrolled when printed
Site Name Trajectory Ranking Key Issues Recommendations
HVORIV201803 Stable / Tracking towards success
Natives are establishing well on the northern (lower) part of this site, and there are initial signs of native germination on the southern (higher) part. Exotic grasses and Galenia are present in low densities and should be controlled before they invade bare ground.
Control weeds and continue to monitor native establishment.
HVOCAR200901 Failing Well established canopy but stem density too high for continued success. Under storey and ground layer have low diversity dominated by threatening weeds (Green Panic) Contour banks and swales without significant native cover and infested with exotic grasses.
Thin Eucalypts using mechanical means or fire. Control Weed threats. Increase shrub layer diversity (fire would stimulate acacia germination) Increase shrub and ground layer diversity with soil disturbance and sowing
HVOLEM201501 Failed / Failing/ Tracking towards success
This is a varied site, comprised of disturbed remnant woodland with some zones having been completely cleared and rehabbed with possibly imported topsoil. The rehab on imported topsoil is variable, some having failed, being infested with couch and green panic. Other areas have good native shrub establishment but with a ground layer dominated by exotic grasses. The remnant woodland has weed issues but natives are re-establishing and with some management the quality of this block will continue to improve overall. Significant weed control and possible over sowing will probably be necessary in the worst-affected zones.
Investigate underlying soil issues. Possible issues could include a combination of subsoil and/or topsoil compaction or contamination or mineral imbalance or nutrient deficiencies. Slash green panic in cleared areas, over-sow cleared areas with colonizing native grasses. Allow natural regeneration from neighbouring zones. Control weeds in remnant woodland zones and encourage natural recruitment.
HVOWES201601 (2018)
Failing Soil issues. Poor plant health and growth. Threatening weeds present in significant density.
Repeat monitoring and assessment. Investigate soil issues and ameliorate as necessary. Control Galenia (spot spraying). Aerate to prepare a seed bed
and stimulate germination of natives. Seeding options include: If significant germination/reshooting of natives, consider: Oversow with native seed mix. Sow only chenopods, trees and shrubs to enable treatment of
grass weeds with selective herbicide, then following 1-2 seasons of weed control sow grasses.
If there is no evidence of improvement in native cover: Spray out entire block, prepare seedbed and resow either
entire suite of natives or staged native sowing such as grasses and herbs only, followed by trees and shrubs as required.

2019 Annual Environmental Review Hunter Valley Operations
Report
Number: HVOOC-748212775-6 Status: [Document Status (Office)] Effective: [Effective Date] Page 182 of 238
Owner: [Owner] Version: [Document Version (Office)] Review: [Planned Review Date]
Uncontrolled when printed
Site Name Trajectory Ranking Key Issues Recommendations
HVOWES201604 (2018)
Stable but needs work to improve
Stable native vegetation with good grass cover, low shrub and tree diversity and low stem density.
Some threat from weeds.
Following soil analysis, build on existing native vegetation to increase diversity and cover.
Control weed threats. Selective seeding, if required.
HVOCAR200902 (2018)
Failing Well established canopy but stem density too high for continued success.
Under storey and ground layer have low diversity dominated by threatening weeds (Green Panic).
Contour banks and swales without significant native cover.
Thin Eucalypts using mechanical means or fire. Control weed threats. Increase shrub layer diversity (fire would stimulate Acacia
germination). Increase shrub and ground layer diversity with soil disturbance
and sowing.
HVOCHE201201 (2018)
Failing Very poor native cover or diversity apart from some saltbushes.
Significant densities of threatening weeds. Evidence of ongoing soil or subsoil problems – poor plant
growth and health. Even normally vigorous weeds show signs of drought stress and nutrition problems when compared to other HVO sites.
Investigate soil issues and ameliorate as necessary. Develop and implement a re-establishment plan.
HVOLEM201601 (2018)
Stable but needs work to improve
Good shrub diversity and density. Ground layer dominated by Couch. Threat from Acacia saligna colonising from adjacent vegetation.
Contour banks and swales have low native cover and diversity. Soil appears to be Warkworth Sands Woodland type so
species sown may not have been appropriate to this soil type.
Manage weed threats. Investigate initially sown species mix. Sow ground layer species appropriate for this soil type, if
required.
HVORIV201401 (2018)
Stable but needs work to improve
Good native species diversity but relatively low native groundcover layer (higher percentage of bare ground).
Heavily infested with threatening weeds, especially Rhodes Grass.
Evidence of soil issues in some areas.
Manage exotic grasses threat to avoid contamination of adjacent areas. This should involve a combination of targeted slashing/brush cutting, blanket spraying of larger areas of exotic grasses and spot spraying of isolated plants.
Following control of exotic grasses increase native ground cover by re-sowing native grasses and Saltbushes.
HVORIV201402 (2018)
Stable but needs work to improve
Generally good native grass diversity and cover, apart from one area which appears to have a different topsoil type.
Good shrub layer cover and some Eucalypts, although stem density is low.
Threat of invasion and spread of Rhodes Grass and Green Panic.
Treat threatening weeds. Augment native ground and shrub layer in areas with lower
stem density, if required.

2019 Annual Environmental Review Hunter Valley Operations
Report
Number: HVOOC-748212775-6 Status: [Document Status (Office)] Effective: [Effective Date] Page 183 of 238
Owner: [Owner] Version: [Document Version (Office)] Review: [Planned Review Date]
Uncontrolled when printed
Site Name Trajectory Ranking Key Issues Recommendations
HVORIV201403 (2018)
Stable but needs work to improve
Good but patchy native diversity and cover in ground layer. Evidence of soil issues. Significant weed threats (in particular Rhodes Grass).
Investigate soil issues and ameliorate as necessary. Manage weed threats. Re-sow restricted suite of natives (only sow proven successful
species), if required.
HVORIV201404 (2018)
Failing Patchy native vegetation cover. Majority of the site is dominated by threatening weeds. Soil issues appear to be causing poor native establishment.
Investigate soil issues and ameliorate as necessary. Manage any weeds which pose a threat to adjacent rehab
areas (Rhodes Grass and Green Panic pose highest risk of quickly invading areas dues to windblown seed).
Consider re-sowing with limited native seed mix (only sow proven successful species).
HVORIV201405 (2018)
Failed Evidence of serious soil problems. Site is almost entirely dominated by annual plants (both native
and exotic) suggesting a serious issue with subsoil and/or topsoil.
Investigate soil issues and ameliorate as necessary. Spray out and resow with limited native seed mix (only sow
proven successful species).
HVORIV201501 (2018)
Tracking towards success but needs work
Good native cover and diversity in ground layer. Shrub and canopy layer has low stem density (particularly
Eucalypts).
Manage weed threats. Selective seeding, if required.
HVORIV201503 (2018)
Tracking towards success but needs work
Good native cover and diversity across the majority of the site. Two small zones within the site have lower tree and shrub
stem density.
Manage weed threats. Selective seeding, if required.

2019 Annual Environmental Review
OC-748212775-6 Status: [Document Status (Office)] Effective: [Effective Date]
er] Version: [Document Version (Office)] Review: [Planned Review Date]
Uncontrolled when printed
Figure 95: Overview of 2019 and 2018 rehabilitation monitoring inspections

2019 Annual Environmental Review
OC-748212775-6 Status: [Document Status (Office)] Effective: [Effective Date]
er] Version: [Document Version (Office)] Review: [Planned Review Date]
Uncontrolled when printed
8.8 Overview of Rehabilitation Trajectory Due to the abridged monitoring methodology used during 2018 and 2019, direct assessment of these results against existing completion criteria is not valid. To assess performance and trajectory inspected sites were placed on a four point scale using quantitative data and qualitative professional judgement and ranked as either:
Tracking towards success but needs work;
Stable but needs work to improve
Failing; or
Failed.
Where areas of differing qualities occurred across a site the most representative classification for the area was adopted, although with a conservative bias (i.e. generally default to the less favourable classification). Additionally, a number of sites which were classified as failed have been reclassified from the Ecosystem Establishment phase to Growth Medium Development (GMD) phase. Details of these GMD phase areas are included below however as they are now not ‘in active rehabilitation’ they are excluded from trajectory assessments.
Of the 37 sites inspected during 2019 and 2018, two sites were classified as ‘failed’ (8.1ha), 10 to be ‘failing’ (100ha), 21 to be ‘stable but needing work’ (183.1 ha), and four to be ‘tracking towards success’ (25.7ha). Notably, the two classified as ‘failed’ also included sub-areas identified to be ‘tracking towards success’ (HVOCHE201702, HVOCHE201801) indicating favourable areas which can be built upon during ongoing maintenance.
A further four sites were identified to have ‘failed’ (49.7ha) and reclassified to GMD phase as described above. Although nominally failed these reclassified sites remain a focus for targeted maintenance in association with the s240 maintenance program and hence are expected to demonstrate improvement when future monitoring occurs following corrective action and resowing.
Based on the monitoring classifications across the period it can be seen that 65-70 percent of the monitored sample are establishing favourably (25 of 37 sites, or 209ha of 317ha) and are on a trajectory for success provided appropriate and timely management interventions continue to occur. As further targeted maintenance interventions are undertaken in association with the s240 maintenance plan this success trajectory may be expected to be more obviously demonstrated across the rehabilitation sites.
Development of SMART (Specific, Measurable, Achievable, Realistic, and Timely) Completion Criteria and identification of suitable representative ecosystems has been occurring during 2019 in association with preparation of a revised and consolidated whole of site Mining Operations Plan. It is expected that a monitoring event utilising these criteria and reference sites will be undertaken during Spring 2020 to provide an up to date understanding of current rehabilitation area trajectories and further inform ongoing adaptive management responses.
8.9 Rehabilitation Maintenance Management of rehabilitated areas is undertaken proactively to assist in initial establishment and when issues are identified through monitoring, auditing or inspections.
An overview of key rehabilitation maintenance activities is shown in Figure 96 and detailed below.
Section 240 Maintenance Program
In July 2019 the DP&E – Resources Regulator issued HVO with Notice 3259 under Section 240(1)(c) of the Mining Act (1992) (Section 240 Improvement Notice) requiring HVO to outline measures or actions to improve progressive rehabilitation performance across the site. This follows and earlier similar notice received during 2018 which was limited to 12 initial sites of concern. In response to these notices HVO has developed and committed to a rehabilitation maintenance and improvement program across the site as detailed in Appendix B (the s240 Maintenance Plan). This plan integrates and prioritises rehabilitation maintenance activities across the site to progress areas of rehabilitation initially sown to cover crop, manage weed competition, and encourage vegetation establishment. An overview of work from the plan undertaken during 2019 is presented in association with the plan in Appendix B, in addition to being detailed further below.

2019 Annual Environmental Review
OC-748212775-6 Status: [Document Status (Office)] Effective: [Effective Date]
er] Version: [Document Version (Office)] Review: [Planned Review Date]
Uncontrolled when printed
Broadacre maintenance
Broadacre weed treatment within rehabilitation areas is undertaken using agricultural methods comprising boom sprays, wick wipers and slasher/mulchers. In existing rehabilitation areas boom spraying is primarily used to manage cover crop and fallow areas prior to sowing to final native seed mixes. Pre-emergent application of herbicide is used when appropriate necessary to control emerging weeds in the period between sowing and germination of the desired species. Wick wiping targets rapidly growing exotic grasses and other erect growing weeds in the period following native germination but while desirable species remain below the wiper target zone. Slashing and mulching is used to remove rank pasture grasses and stimulate fresh growth as herbicide target and to truncate seed cycles. During 2019 areas totalling 227 ha were boom sprayed, 76 ha received wick wipe treatment, and 62 ha was slashed or mulched.
Native seed mixes are sown as part of the maintenance program where areas have been sown to an initial cover crop or where areas previously sown to native have not established successfully. During 2019 27 ha of maintenance native seeding was completed, in addition to re-establishment of 131 he of cover crop on areas to provide stabilisation prior to progression to final natives.
Ground based interventions
Hand spraying and manual removal of weeds is undertaken in rehabilitation areas with early stage and establishing native vegetation that would be likely to be damaged or destroyed should broadacre methods be used. During 2019 148 ha of rehabilitation areas at various stages of establishment were treated by ground crews in this manner.
Grazing of Rehabilitation Areas
Grazing of rehabilitation areas is utilised to encourage and maintain pasture diversity, encourage nutrient cycling, and assist in fuel load management. A licence agreement is in place for grazing 666 ha of HVO North rehabilitation area, with temporary fuel load licences across a further 394 ha of rehabilitated land around HVO North and 210 ha around HVO South. Opportunities to integrate grazing to assist rehabilitation progression continue to be assessed.

2019 Annual Environmental Review
OC-748212775-6 Status: [Document Status (Office)] Effective: [Effective Date]
er] Version: [Document Version (Office)] Review: [Planned Review Date]
Uncontrolled when printed
Figure 96: Rehabilitation Maintenance – post-rehabilitation weed control

2019 Annual Environmental Review
OC-748212775-6 Status: [Document Status (Office)] Effective: [Effective Date]
er] Version: [Document Version (Office)] Review: [Planned Review Date]
Uncontrolled when printed
8.10 Vertebrate Pest Management As part of HVO’s Vertebrate Pest Action Plan a number of baiting programmes are carried out on a seasonal basis. These programmes are conducted at a level of frequency designed to disrupt pest species breeding/colonisation cycles and employ a variety of methodologies including baiting, trapping and ground based shooting
Wild Dog and Fox Baiting Programmes
Three 1080 ground baiting program targeting wild dogs and foxes were implemented across operational and biodiversity areas. These were undertaken during summer, winter and spring. Each program consisted of approximately 35 - 60 bait sites utilising meat baits and ejector baits. Baits were checked over a three week period and replaced each week when taken.
Pig Trapping
Two synchronised 1080 pig trapping programs were conducted by HVO in conjunction with the Singleton Local Land Services (branch) and adjoining corporate landholders in April and September 2019. The programs consisted of 4 trap stations equipped with ‘Hog eye cameras’. The trap station at the Wandewoi Biodiversity Area and the Archerfield properties accounted for 20 pigs across the two programs. Pig sightings and numbers are declining and this is attributed partly to the numbers of pigs successfully controlled in previous programs and the benefits of synchronising control activities with neighbours.
In addition there are two pig traps permanently located and maintained at Archerfield Farm. The pigs caught and euthanised in these traps are captured within the shooting summary numbers in Table 64.
Ground Based Shooting
HVO has two shooters attending the site on a regular basis opportunistically controlling feral pest species. Feral species controlled include pigs, wild dogs, foxes, hares /rabbits and cats.
Table 64 summarises the results from the programmes carried out at HVO during 2019 with baiting locations and results for the programmes illustrated in Figure 99 to Figure 102.
Table 64 Summary of Vertebrate Pest Management 2019
Season
1080 Baiting Trapping Shooting
Total Lethal
Baits Laid
Takes by Wild Dog
Takes by Fox
Takes by Feral Pig
Wild Dog
Feral Pig
Feral Pig
Wild Dog
Feral Cat
Hares & Rabbits
Summer 75 39 5 1 1
Autumn-Winter 124 61 10 1 10 6
Spring 120 66 4 19 7 19
Total 319 166 19 20 17 1 1 25
Table 65 provides a comparison of results from the last 13 baiting programmes undertaken at HVO. In 2019, as for previous programmes undertaken at HVO, the vast majority of baits showed evidence of being consumed by wild dogs at 93% with foxes taking 6% and 1% being consumed by non-target species.
Results reported indicate the majority of takes by dogs or foxes and photographic evidence taken in previous programs indicate a high populations of wild dogs in the area. It is, however, becoming increasingly apparent as motion sensor camera photographic data is processed, that the non-target species, Australian ravens, are becoming extremely brazen and adept at digging up and extracting meat baits as well as stripping ejector lures, and even on occasions disassembling ejector mechanisms (Figure 97).

2019 Annual Environmental Review Hunter Valley Operations
Report
Number: HVOOC-748212775-6 Status: [Document Status (Office)] Effective: [Effective Date] Page 189 of 238
Owner: [Owner] Version: [Document Version (Office)] Review: [Planned Review Date]
Uncontrolled when printed
Table 65 Comparison of results between baiting programmes at HVO
Baiting Program
No. of Baiting Sites
Baiting Opportuniti
es
Baits taken by
Dogs
Dog (%)
Baits taken by
Foxes
Fox (%)
Baits taken by other
(non- target)
species
Other (%)
Total No. of Baits Taken
No. Sites where baits taken
at least once
Represented as
Percentage (%)
No. sites with baits taken on
all occasions
No. sites with no
baits taken
No. baits
Disturbed Not
Taken
No. baits taken
alternatively
by Dog or Fox
Baiting
Efficiency
%
Baiting efficiency excluding ‘other’ %
1506 HVO 40 120 55 98 0 0 1 2 56 31 76 5 9 1 0 47 46
1510 HVO 60 180 71 89 8 10 1 1 80 43 72 10 17 4 5 44 44
1602 HVO 60 120 49 92 3 6 1 2 53 42 70 13 18 0 2 44 43
1606 HVO 60 180 94 96 4 4 0 0 98 54 90 10 6 6 4 54 54
1609 HVO 60 180 83 94 5 6 0 0 88 49 82 11 11 12 3 49 49
1702 HVO 59 117 58 84 10 14.5 1 1.5 69 49 87 20 11 7 5 59 58
1705 HVO 60 120 70 95 4 5 0 0 74 51 85 23 9 3 0 62 62
1709 HVO 60 120 67 96 3 4 0 0 70 48 80 22 12 5 2 58 58
1803 HVO 60 120 69 90 6 8 2 2 77 49 82 31 11 7 0 64 63
1806 HVO 60 120 77 94 5 6 0 0 82 50 83 32 10 8 4 68 68
1809 HVO 61 122 73 87 10 12 1 1 84 50 82 34 11 2 6 69 68
1905 HVO 64 124 61 85 10 14 1 1 72 50 78 22 17 8 8 64 63
1910 HVO 60 120 66 4 1 71 48 80 23 14 8 2 59 58
Average Baiting Efficiency 59 58

2019 Annual Environmental Review
OC-748212775-6 Status: [Document Status (Office)] Effective: [Effective Date]
er] Version: [Document Version (Office)] Review: [Planned Review Date]
Uncontrolled when printed
Figure 97: Australian Raven at Ejector Bait Site 44
When assessing bait sites in the field, it is often difficult to ascertain if wild dogs or ravens have taken the meat baits as dogs have been photographed sniffing and investigating bait sites (Figure 98) after an Australian raven has taken the bait; the dog leaving paw prints, digging at and even urinating on the site.
Figure 98: Fox at Ejector Bait Site 44
It is estimated that the number of takes by Australian ravens is increasing, and it is likely they account for at least 10 - 20% or more of meat bait takes. Research shows that Australian native fauna are naturally resistant to 1080 and concentrations in the meat bait need to be substantially higher to adversely affect the animals.
Increasing the number of motion sensor cameras in the field during the baiting process will produce more accurate and realistic bait take results. If future monitoring of program continually reveals increasing take rates of meat baits by ravens, HVO will consider alternatives in baiting techniques to reduce takes by the non-target species.
Vertebrate pest management programmes will continue to be carried out during 2020 to limit feral pest impacts on landholdings and surrounding neighbours.

2019 Annual Environmental Review
OC-748212775-6 Status: [Document Status (Office)] Effective: [Effective Date]
er] Version: [Document Version (Office)] Review: [Planned Review Date]
Uncontrolled when printed
Figure 99: HVO Vertebrate Pest Management Bait Locations – Summer 2019

2019 Annual Environmental Review
OC-748212775-6 Status: [Document Status (Office)] Effective: [Effective Date]
er] Version: [Document Version (Office)] Review: [Planned Review Date]
Uncontrolled when printed
Figure 100: HVO North Vertebrate Pest Management Bait Locations – Autumn 2019

2019 Annual Environmental Review
OC-748212775-6 Status: [Document Status (Office)] Effective: [Effective Date]
er] Version: [Document Version (Office)] Review: [Planned Review Date]
Uncontrolled when printed
Figure 101: HVO Vertebrate Pest Management Bait Locations – Autumn 2019

2019 Annual Environmental Review
OC-748212775-6 Status: [Document Status (Office)] Effective: [Effective Date]
er] Version: [Document Version (Office)] Review: [Planned Review Date]
Uncontrolled when printed
Figure 102: HVO Vertebrate Pest Management Bait Locations – Spring 2019

2019 Annual Environmental Review
OC-748212775-6 Status: [Document Status (Office)] Effective: [Effective Date]
er] Version: [Document Version (Office)] Review: [Planned Review Date]
Uncontrolled when printed
8.11 Supplementary Weed Treatment In addition to weed occurrence in rehabilitation areas, weeds identified at HVO occur primarily in areas that have been disturbed such as previous civil works areas, soil stockpiles, water management structure surrounds, and general areas of minor ground disturbance. A total of 107 days of weed control work was undertaken on site at HVO during 2019, with approximately 211 ha of land treated, including River Red Gum areas and maintenance of 90 environmental monitoring points. The weeds targeted during the 2019 weed management programme were based on the results of the 2018 weed survey. Figure 103 to Figure 105 illustrate the target species and weed treatment areas across HVO. The dominant weed species that were targeted during 2019 included:
African boxthorn (Lycium ferocissimum) African olive (Olea europea) Balloon vine (Cardiospermum grandiflorum) Bathurst burr (Xanthium spinosum) Galenia (Galenia pubescens) Grasses (Various spp) Green cestrum (Cestrum parqui) Mallow (Malva parviflora) Mustard weed (Sisymbrium officinale) Narrow leaf cotton bush (Gomphocarpus fructicosis) Opuntia (Pear) species (Tiger, Prickly and Creeping pear) Saligna / Golden wreath wattle (Acacia saligna) Various thistles: Scotch thistle (Onopordum acanthium), saffron thistle(Carthamus lanatus) and
variegated thistle (Silybum marianum)

2019 Annual Environmental Review
OC-748212775-6 Status: [Document Status (Office)] Effective: [Effective Date]
er] Version: [Document Version (Office)] Review: [Planned Review Date]
Uncontrolled when printed
Figure 103: Weed Control Overview for West Pit – 2019

2019 Annual Environmental Review
OC-748212775-6 Status: [Document Status (Office)] Effective: [Effective Date]
er] Version: [Document Version (Office)] Review: [Planned Review Date]
Uncontrolled when printed
Figure 104: Weed Control Overview for Carrington Pit – 2019

2019 Annual Environmental Review
OC-748212775-6 Status: [Document Status (Office)] Effective: [Effective Date]
er] Version: [Document Version (Office)] Review: [Planned Review Date]
Uncontrolled when printed
Figure 105: Weed Control Overview for Riverview, Cheshunt and Lemington – 2019

2019 Annual Environmental Review
OC-748212775-6 Status: [Document Status (Office)] Effective: [Effective Date]
er] Version: [Document Version (Office)] Review: [Planned Review Date]
Uncontrolled when printed
8.12 Renovations 8.12.1 Newdell Coal Handling Preparation Plant (CHPP)
In 2019 HVO completed demolition works at the Newdell CHPP. DPIE were notified of the proposed activities on 18 June 2019. The works involved the demolition and removal of infrastructure (conveyor belts, wash plant, tanks, buildings etc.) as well as the removal of several concrete base slabs and paved/bitumen areas. Works were undertaken in compliance with Australian Standards and Legislation and included the removal of the following infrastructure:
Newdell Bathhouse;
Thickener Tank;
Newdell Office;
Old laydown area and several tanks;
Breaker, Reject Line and Bins;
Plant Feed and Clean Coal Conveyors; and
Control Room
Asbestos Containing Material (ACM) was found in some sheeting in the eaves and ceiling of the Newdell bathhouse. The following measures were taken in removing the asbestos :
Hazardous Substances Management Plan prepared by external contractor;
Demolition contractor held Class A Asbestos Removal License;
Ongoing air monitoring for airborne asbestos fibre undertaken as required;
Water down methods undertaken to control risk; and
ACM bagged and removed appropriately offsite in a timely manner.
No other contamination issues were identified during and subsequent to removal of buildings/waste.
8.12.2 Derelict Rural Buildings HVO also completed the demolition of two derelict rural buildings located within its rural property portfolio. Works included the decommissioning of septic systems, asbestos removal, the salvage/ recycling of building materials (where feasible) and restoration of vegetation cover. Works were undertaken in compliance with Australian Standards and Legislation.
8.13 Topsoil Management Topsoil is managed according to the HVO Ground Disturbance Permit system and land management procedures. Table 66 outlines the topsoil used and stockpiled during 2019. There were 88.3 ha of rehabilitation completed during 2019, using soil resources from ahead of mining pre-strip and rehabilitation disturbance activities.

2019 Annual Environmental Review
OC-748212775-6 Status: [Document Status (Office)] Effective: [Effective Date]
er] Version: [Document Version (Office)] Review: [Planned Review Date]
Uncontrolled when printed
Table 66 Soil Management
Soil Used This Period (m3)
Soil Prestripped This Period (m3)
Soil Stockpiled to Date (m3)
Soil Stockpiled Last Report (m3)
85,854* 33,936 1,879,745 1,931,663
*excludes rock chutes and rehabilitation water management infrastructures.
Topsoil Audit
On 5 June 2019 Resources Regulator undertook an audit to assess operational performance of HVO South in relation to the management of topsoil and the implementation of management systems and controls to provide for the sustainable management of the mine’s topsoil resources.
The audit assessed compliance for the previous 12 months commencing 5 June 2018 with reference to approved Mining Operations Plan, associated management plans and site procedures. The audit included desktop document review, site inspections and interviews with site personnel and identified one non-conformance and made five observations as detailed in Table 67. HVO will finalise a Topsoil Management Plan during 2020 which will formalise revised and updated operational controls to be used to manage the topsoil resources at site.
Full details of the audit are contained in Compliance Audit Report, Hunter Valley Operations South – Topsoil Management (COC19/704213) available on the Resources Regulator and HVO Insite websites.

2019 Annual Environmental Review
OC-748212775-6 Status: [Document Status (Office)] Effective: [Effective Date]
er] Version: [Document Version (Office)] Review: [Planned Review Date]
Uncontrolled when printed
Table 67 HVO Topsoil Audit – findings, recommendations and actions
Ref No. Finding/Description of Issue
Regulator Recommendation
HVO Action
NC1 The key observation from the audit relating to topsoil
stockpiling was that topsoil did not appear to be separately stockpiled based on topsoil
quality as indicated in section 2.4.2.4 of the MOP. It is
possible for topsoil stripped from a pasture area to be
stockpiled with topsoil stripped from a native
woodland area that may have implications for vegetation
establishment when topsoil is reused. Similarly, there does
not appear to be any distinction between stockpiling alluvial topsoil and stockpiling gravelly soils or acid topsoils.
This should be addressed during the development of the
topsoil management plan being prepared in response to
the Section 240 direction issued in October 2018.
Develop site procedures that support differential stockpiling of site soil resources based upon key soil characteristics, for example, soil source, management history, physical and chemical characterisation, soil classification.
[in process]
OB1 Generally, the descriptions in the MOP relating to topsoil management are very brief
and quite generic using language such as ‘where
possible’ or ‘if required’. Using a risk-based approach to
topsoil management, it would be expected that some form
of trigger action response plan (TARP) would be available to provide the triggers for ‘when’ a particular control might be
required.
This should be addressed during the development of the
topsoil management plan being prepared in response to
the Section 240 direction issued in October 2018.
Identify key risks associated with topsoil management and document in Topsoil Management Plan in association with key controls. Where historic commitments are no longer relevant as controls, explicitly identify, and describe any contemporary replacement controls. Develop a TARP to support implementation.
[in process]
OB2 One older stockpile (possibly 15+ years old) was observed
to be located next to a laydown area for high density
polyethylene pipe (HDPE pipe). Although the stockpile
was well vegetated and signposted, there was a risk
that vehicles could inadvertently impact the
stockpile during placement or retrieval of the pipe sections. The location of the laydown
area for the HDPE pipe would not appear to be consistent
with the location principles for topsoil stockpiles specified in
the MOP.
HVO should review the risks associated with the pipe
laydown area adjacent to the topsoil stockpile and
implement controls as required.
Review poly pipe storage area located opposite Michelle’s Fill Point (Dam 17S). Remove/recycle all waste pipe, fittings and miscellaneous items.
[complete]
OB3 It was noted that Table 10 of the MOP does identify the
erosion potential of each soil type but does not provide any
guidance on when erosion and sediment controls are
required for topsoil stockpiles.
This should be addressed during the development of the
topsoil management plan being prepared in response to
the Section 240 direction issued in October 2018.
Develop TARP (or other guidance) to support implementation of erosion and sediment controls around topsoil stockpiles.
[in process]
OB4 Although HVO staff advised that topsoil stockpiles were
inspected, this process appears to be informal and
not documented. Issues with stockpiling identified by the
This should be addressed during the development of the
topsoil management plan being prepared in response to
the Section 240 direction issued in October 2018.
Develop and implement a topsoil stockpile inspection regime, including supporting documentation.

2019 Annual Environmental Review
OC-748212775-6 Status: [Document Status (Office)] Effective: [Effective Date]
er] Version: [Document Version (Office)] Review: [Planned Review Date]
Uncontrolled when printed
Ref No. Finding/Description of Issue
Regulator Recommendation
HVO Action
auditors may have been identified earlier if a more robust and documented inspection regime was in
place.
[complete]
OB5 A maintenance program for the topsoil stockpiles was
reported to be implemented. There were no records
provided to verify that this program is documented and is
consistently implemented. Given that there was no
formal inspection program, it was difficult to see how the maintenance program was
triggered. If issues are identified during the informal inspections, there does not appear to be a system in
place to record those issues, assign actions and verify completion of corrective
actions.
Development of a robust inspection and maintenance
program for topsoil stockpiles would be beneficial to
achieving more successful rehabilitation outcomes.
Develop process for recording maintenance planned and undertaken on topsoil stockpiles.
[in process]
8.14 Tailings Management A Fine Rejects Management Strategy for HVO has been developed in accordance with the planning approval for HVO North (Clause 28A of DA 450-10-2003 Mod 4). A revised strategy was submitted on 28 September 2018 to reflect approval to deposit tailings in Carrington Pit. The strategy outlines tailings management for the time horizon spanned by current approvals.
Key Tailings Management Activities in 2019, include:
Capping of the Southeast TSF remained ongoing.
Cessation of tailings deposition into the North Void TSF;
Construction of the Carrington secondary flocculation plant and commencement of pipe-head flocculation of tailings into the North Void TSF;
Commencement of tailings deposition to Carrington In-Pit TSF in January 2019 association with pipe-head flocculation;
Ongoing implementation of the North Void TSF Management Plan to manage and mitigate any potential impacts from an identified seepage pathway.
Table 68 below outlines the current state of Tailings Storage Facilities across HVO that are still active or pending decommissioning.

2019 Annual Environmental Review
OC-748212775-6 Status: [Document Status (Office)] Effective: [Effective Date]
er] Version: [Document Version (Office)] Review: [Planned Review Date]
Uncontrolled when printed
Table 68 HVO Tailings Storage Facilities
Facility Status Decant System
North Void Inactive Decant pumps in place, regular pumping.
Dam 6W Active Decant pumps in place, regular pumping.
Cumnock Void Active (not currently depositing) Decant pump in place, regular pumping when deposition occurring.
Bob’s Dump Inactive Solar pump in place, pumping as required.
Southeast TSF Inactive - capping commenced Solar pump in place, pumping as required.
Central TSF Inactive No pumps required due to drying after rainfall (small catchment reporting to TSF).
8.15 River Red Gum Restoration and Rehabilitation 8.15.1 River Red Gum Overview
There are a number of River Red Gum sites (endangered population) across HVO South and North. These are managed under the HVO River Red Gum Restoration and Rehabilitation Strategy (Strategy) which has an implementation plan. In April 2008, the Department of Planning granted HVO conditional approval of the current HVO River Red Gum Strategy subject to preparation of an updated document following its 10 year review.
The sites have been categorised into a high level of management at the Carrington Billabong, intermediate level at the priority sites and low level at the low priority sites. Each has varying levels of monitoring and maintenance requirements as outlined in the Strategy.
In 2019, Umwelt was engaged to update the rehabilitation and restoration strategy. This is being finalised in Q1 2020.
Management activities undertaken within the HVO River Red Gum areas include weed control, vertebrate pest management and ongoing watering and management of the planted tubestock within the Carrington Billabong and high priority areas. Weed and pest management is discussed below. Figures demonstrating the development of the planted areas are presented below (Figure 106 to Figure 109). Additional works are planned for 2020 in these areas which will be reported in the 2020 Annual Review.

2019 Annual Environmental Review
OC-748212775-6 Status: [Document Status (Office)] Effective: [Effective Date]
er] Version: [Document Version (Office)] Review: [Planned Review Date]
Uncontrolled when printed
Figure 106: Native tube stock planting at Carrington Billabong (photo taken in 2017)
Figure 107: Native tubestock plantings at Carrington Billabong in 2019

2019 Annual Environmental Review
OC-748212775-6 Status: [Document Status (Office)] Effective: [Effective Date]
er] Version: [Document Version (Office)] Review: [Planned Review Date]
Uncontrolled when printed
Figure 108: Native tubestock plantings at site 51
Figure 109: River red gum plantings at site 51

2019 Annual Environmental Review
OC-748212775-6 Status: [Document Status (Office)] Effective: [Effective Date]
er] Version: [Document Version (Office)] Review: [Planned Review Date]
Uncontrolled when printed
8.15.1.1 Weeds Weed management occurred throughout HVO in 2019 and included the Carrington Billabong and areas of lesser priority where the River Red Gums are being protected. While the control efforts concentrated on chemical control methods, manual control of small areas was also undertaken.
In 2019, Rural Environmental Management (REM) were engaged to undertake a weed survey in areas across HVO. The areas surveyed included the River Red Gum areas identified in the Strategy. The findings of the survey were compared to a similar survey undertaken in 2018 and determined that there were 27 weed species identified across HVO in 2019 compared to 38 species in 2018. The significant reduction in weed species numbers can largely be attributed to an extended drought period as well as targeted control of priority weeds and follow up treatment of regrowth.
There were no new weed species observed in this year’s survey however it is anticipated that several species which have been drought affected will re-emerge after significant rain events. Vigilant monitoring and follow up treatment is being undertaken to ensure new infestations of priority weeds are kept at bay.
A significant decrease in density and distribution of weed species is evident where concentrated treatment has been carried out, examples include African boxthorn in the Lemington South RRG area. Weed control programs, climatic conditions and general mining operations have been successful in eradicating or preventing heavy reinfestation of several high priority weeds from HVO during 2018 and 2019 that were present in previous surveys but not evident in this year’s survey results. This includes Bathurst burr, bitou bush, fireweed, lantana, Noogoora burr, St John’s Wort and tree of heaven.
In the 2019 survey, Galenia remains the dominant weed species in the Carrington area with the weed sparsely scattered over a large portion of the site The large infestation in Carrington North now contains sparsely scattered African boxthorn growing amongst it, which has emerged during 2019 (Figure 110). Weed control in this area will continue during 2020.
The Carrington Billabong was treated prior to the 2018 weed survey being carried out and therefore weeds were at a minimum during that survey. Being a low lying area on alluvial soils, weed management is an ongoing issue for the Billabong. Various juvenile weeds have sprouted during 2019 and are scattered throughout the area. The billabong is scheduled for re-treatment during early 2020.
Various weeds were present in the southern Lemington South River Red Gum (RRG) area during the 2018 survey, but have since been treated and the area was reported to be largely clear of weeds for the 2019 survey (Figure 111). Monitoring and treatment of regrowth in this area will be scheduled for early to mid-2020.
Similarly, the African boxthorn infestation in the northern Lemington South RRG has also been treated during 2018 and weeds in the area were negligible for the 2019 survey (Figure 111). Monitoring and follow up treatment of weed regrowth will also be scheduled for early to mid-2020. The new infestation of African boxthorn along the entrance road to South Lemington that has emerged this year is testament to the weed’s highly invasive and aggressive nature.

2019 Annual Environmental Review
OC-748212775-6 Status: [Document Status (Office)] Effective: [Effective Date]
er] Version: [Document Version (Office)] Review: [Planned Review Date]
Uncontrolled when printed
Figure 110: HVO 2019 weed survey results – Carrington

2019 Annual Environmental Review Hunter Valley Operations
Report
Number: HVOOC-748212775-6 Status: [Document Status (Office)] Effective: [Effective Date] Page 208 of 238
Owner: [Owner] Version: [Document Version (Office)] Review: [Planned Review Date]
Uncontrolled when printed
Figure 111: HVO 2019 weed survey results – Lemington

2019 Annual Environmental Review
OC-748212775-6 Status: [Document Status (Office)] Effective: [Effective Date]
er] Version: [Document Version (Office)] Review: [Planned Review Date]
Uncontrolled when printed
8.15.1.2 Vertebrate Pest Control Fencing around the Carrington billabong has remained intact and is regularly checked to ensure grazing animals are excluded, or actively discouraged, from the area. Additional areas are scheduled to be assessed and, if required, fenced during 2020. This review of HVO fencing requirements will be reported in the 2020 Annual Review.
As part of HVO’s Vertebrate Pest Action Plan, baiting programmes are carried out on a seasonal basis. These programmes are conducted at a level of frequency designed to disrupt pest species breeding/colonisation cycles and employ a variety of methodologies including baiting, trapping and ground based shooting. Further detail on vertebrate pest control undertaken in 2019 is included in Section 8.10.
8.15.1.3 River Red Gum Monitoring During 2019, monitoring of River Red Gum Management areas included annual weed surveys within the Carrington Billabong and other River Red Gum priority sites. Groundwater monitoring continued in the Carrington Billabong area, these results are presented in the groundwater section of this report.
The River Red Gum Rehabilitation and Restoration Strategy is currently being updated and additional ecological monitoring is scheduled to commence in 2020.
8.16 Biodiversity Offsets 8.16.1 Goulburn River Biodiversity Area Overview
The Hunter Valley Operation Mine’s impacts on biodiversity values are offset through the protection and management of Biodiversity Areas (BAs). The BA that relate to HVO PA 06_0261 is the Goulburn River which has an offset area of 140 hectares.
HVO manage a number of other offsets including Wandewoi, Condon View and Mitchelhill, however, these are managed under EPBC approval 2016/7640, are subject to compliance reporting under that approval and are not subject to further discussion in this document.
The Goulburn River BA is located near the town of Merriwa and, when considered in combination with the adjoining offset for the Warkworth Mine, forms an area of protected vegetation extending from the Goulburn River National Park (Figure 112). The Goulburn River BA is managed according to the Goulburn River Management Plan version 2 that is available on the HVO public website (https://insite.hvo.com.au).
Given that the offsets for the Warkworth Mine and HVO are adjacent to each other and that both parties have a common managing partner in Yancoal, HVO and the Warkworth Mine have an agreement that the HVO BA will be managed by the Warkworth Mine on its behalf under a cost recovery agreement. The benefit of this agreement is a reduction in duplication related to the management and monitoring activities that are undertaken by consultants and contractors. As such, while many of the figures presented below will include information relating to the Warkworth Mine, the text will focus on the data and activities originating from the HVO BA.

2019 Annual Environmental Review Hunter Valley Operations
Report
Number: HVOOC-748212775-6 Status: [Document Status (Office)] Effective: [Effective Date] Page 210 of 238
Owner: [Owner] Version: [Document Version (Office)] Review: [Planned Review Date]
Uncontrolled when printed
Figure 112: HVO’s Goulburn River Offset and adjoining Warkworth Mine offset

2019 Annual Environmental Review
OC-748212775-6 Status: [Document Status (Office)] Effective: [Effective Date]
er] Version: [Document Version (Office)] Review: [Planned Review Date]
Uncontrolled when printed
8.16.2 Weather Records Overall, the rainfall recorded at the closest weather station to the Goulburn River BA was significantly down on the average total rainfall (Figure 113). During 2019, the Merriwa region received 237mm which is 40% of the mean average rainfall for the area that has been recorded since 1969. These results were typical of rainfall records across the Hunter Valley during 2019.
As can be seen in Figure 113, the area received a significant rainfall event in March 2019 where the monthly rainfall received was double the monthly mean. The 40% reduction in the annual rainfall received would have been even less if the March average reflected the decline in rainfall received across the rest of the year.
Figure 113: Rainfall records recorded at the Merriwa (Roscommon) gauge - 2019.
8.16.3 Biodiversity Area Management Activities Various management activities were undertaken at the Goulburn River BA throughout 2019 in accordance with the approved management plan. These activities included weed control, vertebrate pest control and monitoring activities. A summary of the key actions in the BA throughout 2019 is outlined in Table 69 below and discussed further in the text.
Table 69 Biodiversity Area Management Activities 2019
Activity Description
Weed Control Weed control activities were conducted at the Goulburn River Biodiversity Area.
Infrastructure Management and
Improvement
Monthly property infrastructure inspections were undertaken at the Goulburn River Biodiversity Area in 2019.
Fire Management Bushfire management consultants LRM were appointed to review the Goulburn River Biodiversity Area, Bushfire Management plan and prepare an updated individual biodiversity Area Bushfire Management Plan in 2019.
Strategic Grazing Strategic grazing activities did not take place during the 2019 reporting period.

2019 Annual Environmental Review
OC-748212775-6 Status: [Document Status (Office)] Effective: [Effective Date]
er] Version: [Document Version (Office)] Review: [Planned Review Date]
Uncontrolled when printed
Activity Description
Vertebrate Pest Management
The 1080 ground baiting programmes were undertaken in autumn and spring at Goulburn River BA targeting wild dogs and foxes. Baits were checked over a two week period and replaced each week when taken.
Vertebrate pest management programmes will continue to be implemented during 2020 to limit feral pest impacts on landholdings and surrounding neighbours.
8.16.3.1 Wild Dog and Fox Baiting Programmes In 2019, vertebrate pest management programmes were undertaken during autumn and spring 2019. Figure 114 and Figure 115 illustrate the baiting location across the HVO and MTW Goulburn River offsets that were covered by the programmes.
The programme targeted wild dogs (Canis lupus familiaris) and foxes (Vulpes vulpes) and some opportunistic shooting of feral pigs occurred within the MTW section of the BA. As the pig shooting did not occur within the HVO BA, this activity is not discussed further in this report.
The vertebrate pest management programme involved 1080 baiting including ejector baiting stations. The program was run in conjunction with the Local Land Services (LLS) and surrounding landholders.
Figure 114: Vertebrate pest baiting results undertaken within the Goulburn River BA - Autumn 2019

2019 Annual Environmental Review
OC-748212775-6 Status: [Document Status (Office)] Effective: [Effective Date]
er] Version: [Document Version (Office)] Review: [Planned Review Date]
Uncontrolled when printed
Figure 115: Vertebrate pest baiting results undertaken within the Goulburn River BA - Spring 2019
Table 70 provides a comparison of results for all vertebrate pest management programs for the Goulburn River Biodiversity Area from 2015 to 2019. The discussion below relates to the data in Table 70.
For the 41 bait sites established at Goulburn River BA, baits were taken at least once from 33 (79%) of the bait sites with 44 baits taken overall. Eleven sites had baits taken on both checks and eight sites had no baits taken throughout the program. No sites had baits ‘disturbed but not taken (DNT)’. Baits taken at each site are shown in Figure 116.
Track, scat and foraging evidence indicated that 11 (25%) of baits were consumed by dogs of various sizes; nine (20%) were consumed by foxes (12%) and 24 were consumed by non-target species. Results indicate lace monitors (Varanus various) took 20 baits and wild pigs (Sus scrofa) took four.
Two ejector baits were set up at Ejector Bait Sites 15 and 35. Neither of the ejectors were activated during the program, however the motion sensor camera established at Ejector Bait Site 15 captured images of several vertebrate pest species including a wild dog, hares (Lepus europaeus), a feral cat (Felis catus) and a wild boar. Native species photographed included several kangaroos (Macropus spp), an echidna (Tachyglossus aculeatus) and an emu (Dromaius novaehollandiae).
The Baiting efficiency calculated in 2019 for Goulburn River BA shows a baiting efficiency of 54% which is consistent with previous programs. The Baiting Efficiency (excluding non-target species) was calculated at 45% for the current programme which is relatively consistent with previous programmes. Evidence of takes by non-target species increased from 12% in the last program to 55% in this program. Takes by foxes at 20% remained consistent with previous programs and takes by wild dogs decreased by over 40% from the last program.

2019 Annual Environmental Review Hunter Valley Operations
Report
Number: HVOOC-748212775-6 Status: [Document Status (Office)] Effective: [Effective Date] Page 214 of 238
Owner: [Owner] Version: [Document Version (Office)] Review: [Planned Review Date]
Uncontrolled when printed
Table 70 Comparison of results - Goulburn River Biodiversity Area.
Baiting Program
No. of Baiting Sites
Baiting Opportuniti
es
Baits taken by
Dogs
Dog (%)
Baits taken by
Foxes
Fox (%)
Baits taken by other
(non- target)
species
Other (%)
Total No. of Baits Taken
No. Sites where baits taken
at least once
Represented as
Percentage (%)
No. sites with baits taken on
all occasions
No. sites with no
baits taken
No. baits
Disturbed Not
Taken
No. baits taken
alternatively
by Dog or Fox
Baiting
Efficiency
%
Baiting efficiency excluding ‘other’ %
Jun 2015 GOU 28 84 27 54 17 34 6 12 50 26 96 8 2 2 10 60 52
Oct 2015 GOU 40 120 30 38 31 40 17 22 78 37 92 13 3 0 9 65 51
May 2016 GOU
44 132 36 44 30 37 15 18 81 41 93 11 3 8 5 61 50
Sep 2016 GOU
32 65 15 68 5 23 2 9 22 19 86 0 13 6 1 34 31
Sep 2017 GOU
42 84 19 38 11 22 20 40 50 34 81 16 8 3 3 60 36
Jun 2018 GOU 42 84 39 76 8 16 4 8 51 32 76 19 10 2 3 61 56
Sep 2018 GOU
43 86 21 40 12 23 19 37 52 36 84 18 8 3 1 60 38
May 2019 GOU
41 78 27 64 10 24 5 12 42 30 73 12 11 6 4 54 47
Oct 2019 GOU 41 82 11 25 9 20 24 55 44 33 79 11 8 0 3 54 45

2019 Annual Environmental Review Hunter Valley Operations
Report
Number: HVOOC-748212775-6 Status: [Document Status (Office)] Effective: [Effective Date] Page 215 of 238
Owner: [Owner] Version: [Document Version (Office)] Review: [Planned Review Date]
Uncontrolled when printed
Figure 116: Baits taken from sites established at Goulburn River BA (Sites G1 to G41) - Spring 2019
Note that the sites applicable to the HVO BA are bait sites H16, H19 – H23.

2019 Annual Environmental Review
OC-748212775-6 Status: [Document Status (Office)] Effective: [Effective Date]
er] Version: [Document Version (Office)] Review: [Planned Review Date]
Uncontrolled when printed
Community 9.1 Complaints
HVO provides a 24 hour Community Complaints Hotline (via freecall number 1800 888 733) for community members to comment on concerns relating to its operations. All complaint details are recorded in a database in accordance with Condition M4.2 of Environmental Protection Licence 640 and made available on HVO’s website (https://insite.hvo.com.au).
A total of 9 complaints were received by HVO during 2019 (Figure 117). This represents a decrease of 17 community complaints from the previous year (Figure 118). Complaints were received in relation to blasting, air quality and a property accessibility issue. Details of complaints received in 2019 are included in Table 71
Figure 117 Summary of Community Complaints in 2019
Figure 118 Community Complaints 2016 – 2019
0123456789
10
2019 HVO Community Complaints
Monthly total Cumulative Complaints
26
39
26
9
0
5
10
15
20
25
30
35
40
45
2016 2017 2018 2019
HVO Community Complaints 2016‐2019

2019 Annual Environmental Review
OC-748212775-6 Status: [Document Status (Office)] Effective: [Effective Date]
er] Version: [Document Version (Office)] Review: [Planned Review Date]
Uncontrolled when printed
Table 71 Details of Complaints Received in 2019
Date Type Description Follow Up Action
06/03/2019 Air Quality
Complaint reported anonymously to EPA Duty Officer about HVO in relation to dust.
A number of actions were taken by HVO to mitigate dust including working lower in the pit, shutting down various earthmoving equipment and postponing a scheduled blast. Note: 6th of March was affected by regional dust.
29/04/2019 Air Quality
Complainant called HVO in regards to the level of dust recorded on the Upper Hunter Air Quality Monitoring Network (UHAQMN) at the time in Maison Dieu, and was querying what HVO was doing to manage this increased level of dust.
Complainant was called to receive more details of the complaint. Meteorological data was checked to determine the wind direction and found that there was an easterly/ south-easterly wind, blowing dust towards HVO, not in the direction to Maison Dieu. Operational data was then checked and confirmed that there were seven water trucks running and that three dust alarms had activated prior to the complaint. This information was then passed on to the complainant.
27/05/2019 Air Quality
Complainant telephoned neighbouring mine - Mount Thorley Warkworth to complain about high levels of dust on Lemington Road within the vicinity of HVO’s West Pit. Complaint was then passed on to the HVO Environment and Community Officer
Complainant was called to obtain further details regarding where the dust was observed. Following this, West Pit was inspected for dust. It was noted that conditions were very windy. There was no visible equipment running and no wind-blown dust visible from the Western side of Pit. A further dust inspection was undertaken on Lemington Road not long after receiving the complaint where no dust was observed coming from West Pit over Lemington Road during this inspection.
27/05/2019 Air Quality
Complaint was received by EPA public complaint hotline regarding dust coming from South Pit, affecting a resident in Long Point Road. Complainant noted extremely dusty conditions on the 26 and 27 of May 2019.
A Environmental alert was received from Knodlers Lane in Maison Dieu at 9.16am, resulting in the OCE being alerted and all load units (except excavator 316 and three trucks deep in the pit) being shut down. In addition, five water trucks were in circulation.
06/06/2019 Blast Complaint reported anonymously to Department of Planning, Infrastructure and Environment (DPIE) regarding blast odour and fume at HVO.
HVO provided details of blast to DPIE that included time of blast, observations of blast fume, category of blast fume (3B) and photos of blast. No further action was taken (or requested to be taken by DPIE).
26/06/2019 Air Quality
Complainant called the HVO complaints line to complain about the dust being emitted from the mine following a blast in the Riverview Pit. The complainant noted that they reside on a property off the Golden Highway (Jerrys Plains).
Video footage (and met conditions) of the blast indicated a visible dust plume crossed the mine boundary however it was dispersing as it tracked westwards. The video footage was insufficient to track the dust plumes path offsite however, based on wind direction at the time, it is possible the dust plume would have travelled in the general direction of the resident located about 4km from the blast. Based on this, no further action was taken.
12/08/2019 Other Complaint made by licensee regarding a gate being left unlocked into a Traveling Stock Route (TSR), adjacent to HVO’s Riverview pit. The licensee grazes cattle inside the area and was concerned about cattle escaping via the unlocked gate.
HVO Environment and Community Manager contacted the complainant to understand concerns and made assurances that HVO would rectify the situation. HVO fitted a new security lock to the gate (type that requires lock to be closed in order to remove key). In addition a photograph of the closed locked is taken and send to the Environment and Community Manager post

2019 Annual Environmental Review
OC-748212775-6 Status: [Document Status (Office)] Effective: [Effective Date]
er] Version: [Document Version (Office)] Review: [Planned Review Date]
Uncontrolled when printed
Date Type Description Follow Up Action
blasting as evidence that the gate has been locked following each blast.
04/10/2019 Air Quality
Complainant called regarding their concern about dust coming from HVO onto their property in Maison Dieu.
The complainant was advised that the Mining Supervisor had conducted a field inspection and reported that four water carts were in circulation. Additionally, two shovels and an excavator at Cheshunt has stopped running and the proposed blast at Riverview had been postponed.
30/10/2019 Blast Complainant called to advise they could smell a blast fume and observed a dust plume passing across the Maison Dieu river flats
Meteorological conditions were verified to be in line with HVO’s blasting permission process. A minor fume was noted following the blast which was ranked as 1A. Dust monitors were checked which identified an isolated spike in dust at time noted by complainant. The complainant was called and was advised that HVO had waited for the most favourable wind conditions and the shot was fired within blasting permissions. The complainant was satisfied with the response and therefore no further action was required.
9.2 Review of Community Engagement 9.2.1 Communication
Three newsletters were sent to HVO’s near neighbours during 2019 providing an overview of:
Operational updates;
Environmental activities such as aerial seeding activities, feral pest management programme;
Community initiatives such as near neighbour first aid training, donation and sponsorship programme; and
Communication tools – InSite website, environmental monitoring public reporting website and the blast notification SMS alert system.
In May and November, HVO hosted community information session’s for near neighbours at Maison Dieu and Jerrys Plains aimed at providing community members with an opportunity to speak with HVO representatives about current operations and future plans, The sessions were attended by residents from Maison Dieu and Jerrys Plains as well as members from HVO’s Senior Leadership Team.

2019 Annual Environmental Review
OC-748212775-6 Status: [Document Status (Office)] Effective: [Effective Date]
er] Version: [Document Version (Office)] Review: [Planned Review Date]
Uncontrolled when printed
9.2.2 Consultation and Engagement Activities A range of consultation and engagement activities were also completed, including:
Engagement with a number of Maison Dieu residents to discuss the proposed exploration drilling on EL5291;
HVO hosted site tours from a number of high schools in the Hunter Valley; and
School engagement - including Singleton High School roundtable interviews and support of Jerrys Plains Primary School pre-school programme.
HVO continued to encourage the community to contact the company in a way that suits the individual community members.
9.2.3 Community Consultative Committee The HVO CCC meetings were held in February, May, August and November 2019. The HVO CCC meet to discuss operations, projects and mine activities. The Committee is comprised of HVO representatives, community members and other key external stakeholders, including Council. The HVO CCC minutes are available on the HVO website (https://insite.hvo.com.au/document-library/ccc). The community is invited to visit the website(s) to learn more about the HVO CCC.
In 2019 CCC members included:
Dr Colin Gellatly (Independent chairperson);
Cr Hollee Jenkins;
Dr Neville Hodkinson;
Mrs Janelle Wenham
Mr David Love;
Mr Brian Atfield;
Mrs Di Gee;
Mr Todd Mills;
Mr Michael Wellard;
Mrs Jeanie Hayes;
Mrs Sarah Purser (minute taker);
HVO General Manager – Mr Tony Galvin
HVO Operations Manager – Philip Price
HVO Environment & Community Manager – Mr Andrew Speechly

2019 Annual Environmental Review
OC-748212775-6 Status: [Document Status (Office)] Effective: [Effective Date]
er] Version: [Document Version (Office)] Review: [Planned Review Date]
Uncontrolled when printed
9.2.4 Community Grants HVO supports applications for local donations and sponsorships that have a clear community benefit. In 2019, HVO provided $67,300 to 22 local projects and initiatives, including:
1. Camp Quality – Camp Quality 1000ks 4 kids
2. Singleton Theatrical Society – 2019 Production of Les Miserables
3. Singleton PCYC – Singleton PCYC Open Day
4. Singleton Heights Pre-School Inc – Outdoor Classroom Project
5. Singleton Council- Singleton Community Vehicle Messaging Sign
6. Westpac Rescue Helicopter Service- 2019 Hunter Valley Mining Charity Rugby League Day
7. Singleton Bowling Club Co-operative Limited- Graded Triples Tournament
8. Singleton Pony Club – Portable Horse Yards
9. Singleton Council - Blast
10. Singleton Tri Club – Equipment Upgrade
11. Singleton Council - International Day for People with Disability IDPWD - Bush Dinner Dance
12. Singleton Rugby Club - Field Maintenance Equipment Upgrade
13. Jerrys Plains School of Arts Hall Inc. – New BBQ
14. CWA – Kitchen Upgrade
15. Singleton Australian Football Club – Medical and sports training supplies
16. Australian Stock Horse Society Eastern Branch – Eastern Branch ASHS Championship and Performance Weekend
17. St Catherine’s Catholic College – Chill Out Space
18. Early Links Inclusion Support Service – Little Yogi’s
19. Singleton Girl Guides – Kitchen Improvement/Upgrade
20. Australian Christian College Singleton – Share the Love of Reading
21. Hunter Valley Camp Draft Club – 2019 Hunter Valley Camp Draft
22. Singleton Fire Brigade Social Club – Singleton Lolly Run
HVO also continued its partnership with Jerrys Plains Public School providing funding for their pre-school programme.

2019 Annual Environmental Review
OC-748212775-6 Status: [Document Status (Office)] Effective: [Effective Date]
er] Version: [Document Version (Office)] Review: [Planned Review Date]
Uncontrolled when printed
Independent Audit An Independent Environmental Audit (IEA) was undertaken in December 2019. This audit was undertaken against the conditions of both Project Approval PA06-0261 (as modified) and DA 450-10-2003 (as modified). The audit also assessed compliance with other licences and approvals including:
HVO North - EPL 640 and associated Water Access Licences; and
HVO South – EPL 640 and relevant mining/coal leases including ML1634, ML1465, ML1734, ML1753, ML1682, CL398 and CCL714.
Environmental consultant’s Hansen Bailey were engaged and endorsed by DPIE as suitably qualified, independent experts to undertake the audit. The timeframe for the audit was from 1 November 2016 to 1 December 2019. The site inspection component of the audit was undertaken over four days between 2 and 5 December 2019.
The audit report and HVO’s response to the auditors’ recommendations were submitted to the Department for their consideration on 24 February 2020. At the time of publishing this Annual Review the findings of the audit are still to be finalised with DPIE. The audit identified 28 non-compliances, one was identified as a moderate risk, 15 were administrative in nature and 12 findings were considered to be low risk. These findings along with the auditor’s recommendation and HVO’s response to recommendation are summarised in Table 72. Where non-compliances have been identified as relevant to activities that occurred during 2019, these have been identified in the Statement of Compliance in Table 2. The next Independent Environmental Audit is due in 2022.

2019 Annual Environmental Review Hunter Valley Operations
Report
Number: HVOOC-748212775-6 Status: [Document Status (Office)] Effective: [Effective Date] Page 222 of 238
Owner: [Owner] Version: [Document Version (Office)] Review: [Planned Review Date]
Uncontrolled when printed
Table 72: Independent Environmental Audit Findings and Recommendations – 2019
Reference Audit Finding Risk Rating Auditors Recommendation HVO Response Timing
HVO South – PA 06_0261 Non-Compliance Recommendations
Sch 2
Cond 2a
Some non-compliances were identified with the conditions of this approval Administrative
Work with DPIE to comply with conditions in Error! Reference source not found. of the IEA Report where practical.
Actions to address non compliances are committed to via HVO’s response to recommendations.
-
Sch 2
Cond 15
Sch 3 Cond 60 no evidence of correspondence with Singleton Council or NSW RFS in relation to consultation on the Bush Fire Management Plan has been provided.
Administrative Ensure consultation with Singleton Council and RFS over the Bushfire Management Plan as per Schedule 3 Condition 30.
Council and RFS have been consulted on the revised version since the audit and this will be included in the plan once finalised.
30/06/2020
Sch 3
Cond 7
Measured overpressure levels exceeded the 120dbL criterion at two locations (Moses Crossing, Jerrys Plains) on 17 January 2018.
Low
Bridges Acoustic recommends to avoid possible overpressure reflection from the control building and resultant uncertainty regarding overpressure levels, the second Maison Dieu monitor should be considered the primary monitor in this area.
HVO has since received confirmation from DPIE that its relocation approved. HVO is currently seeking approval from the EPA for the relocation as part of the five yearly licence review and will permanently relocate the monitor once approval is received.
TBA – pending EPA response.
Sch 3
Cond 10
One blast on Easter Saturday 2017 (which was officially considered a public holiday in 2017).
Administrative No recommendation provided
Sch 3 Cond 19
The measurement on 29/07/17 at the Gliding Club was determined to be non-compliant at 58 μg/m3 (with HVO contribution being 85% against the maximum contribution limit of 75% in accordance with the approved AQMP at the time). Incident was reported to the HVGC and DPIE.
Low
Dust deposition gauges at DL30 and Warkworth; and PM10 monitors at Knodlers Lane and Long Point be reconsidered as to their appropriateness as representative of private receivers (occur outside EA predictions of exceedance of criteria) as they are exceeding annual average results during the IEA period (however stated not due to HVO activities and not reported consistent with approved AQMP). As Knodlers Lane and Long Point monitoring sites occur within exceedance predictions for PM10 in the MOD5 assessment, it is likely that they will exceed on a continuous basis. HVO advises that DG will remain as internal management sites, not compliance as per Table 5 of the AQMP.
The current approved AQMP identifies which DDG are utilised as a measure of compliance, HVO considers this issue to now be addressed in the current AQMP.
Complete

2019 Annual Environmental Review Hunter Valley Operations
Report
Number: HVOOC-748212775-6 Status: [Document Status (Office)] Effective: [Effective Date] Page 223 of 238
Owner: [Owner] Version: [Document Version (Office)] Review: [Planned Review Date]
Uncontrolled when printed
Reference Audit Finding Risk Rating Auditors Recommendation HVO Response Timing
Internal procedures and relevant training be updated for change to AQMP which changes reportable circumstances for PM10 24 hr consistent with the updated AQMP Section 9. HVO advises this is proposed.
Sch 3 Cond 28
No confirmation that CLWD (now DoI Water) received the 2017 Annual Review.
Administrative No recommendation provided
Sch 3 Cond 30 31
No evidence to confirm all River Red Gum sites (as shown in Appendix 8) have addressed management practices listed in the River Red Gum Strategy (2010).
Low
River Red Gum Strategy: Add confirmation in the Annual Review
over what areas of the Goulburn River Biodiversity areas have been addressed (in order to confirm HVO’s 140 ha is compliant).
Recommend any revision to the Strategy include consultation with DoI Water and OEH.
Recommend holistic review of actions in light of future mining in the immediate area and likely impacts, flooding potential, climate, groundwater and surface water monitoring, and ecological monitoring to determine a realistic way forward in relation to the management of the area which has been inconclusive to date. DPIE should be consulted in relation to findings and way forward to ensure satisfaction secured.
Dot point one – HVO will address this in future Annual Reviews Dot Point two and three – The strategy is currently under review and HVO will include evidence of relevant consultation in next revision.
2020 AEMR – 31/03/2021
30/06/2020
Sch 3 Cond 40
One compliance inspection per year has been completed rather than two as required within the approved ACHMP (2009) for 2018 and 2017.
Administrative No recommendation provided
Sch 3 Cond 48
Overburden emplacement area (OEA) in the Glider Pit was approximately 10 m above the Obstacle Limitation Surface without obtaining prior approval from the HVGC. This was reported and OEA reshaped to remediate issue.
Low No recommendation provided

2019 Annual Environmental Review Hunter Valley Operations
Report
Number: HVOOC-748212775-6 Status: [Document Status (Office)] Effective: [Effective Date] Page 224 of 238
Owner: [Owner] Version: [Document Version (Office)] Review: [Planned Review Date]
Uncontrolled when printed
Reference Audit Finding Risk Rating Auditors Recommendation HVO Response Timing
Sch 3 Cond 53
Northstar advises that whilst a number of the actions undertaken by HVO may have some impact on the annualised GHG emission budget, these have not been presented in context of assessing all reasonable and feasible options.
Low
Northstar recommends that the AQMP Section 7 is updated to identify opportunities for emission reductions (in the reasonable and feasible areas of electricity use, diesel and other fuels, and Land Management. The Annual Review should include a summary of greenhouse gas emissions against commitments in AQMP.
The current AQMP discuss’ Greenhouse Gas Management and as such no further modification to the AQMP is considered necessary
HVO will recommence reporting in the Annual Review greenhouse gas emission summary information against the AQMP.
2020 AEMR - 31/03/2021
Sch 3 Cond 60
No evidence available of consultation with Singleton Council or the RFS. Administrative
Obtain correspondence from Council and Rural Fire Service confirming consultation and add to appendix at next review of the Bushfire Management Plan.
Council and RFS have been consulted on the revised version since the audit and this will be included in the plan once finalised.
30/06/2020
Sch 4 Cond 2
Notification of relevant landholders regarding the blasting exceedance - measured overpressure levels exceeded the 120 dBL criterion at two locations (Moses Crossing, Jerrys Plains) on 17 January 2018 (refer to Sch 3 Cond 7) was sent on 27/11/19, however was outside the required 2-week notification timeframe.
Administrative Update process to notify affected landholders for exceedances of air and blasting.
HVO has developed a post incident (exceedance) checklist which is to ensure that landowners and/or tenants are notified as required.
Complete
Sch 5 Cond 1a
Management plans do not contain all required sections. Refer to Sch 5 Cond 1a for further detail.
Administrative At the next required revision to relevant management plans (none urgent) ensure all items within Sch 5 Cond 1a are addressed.
HVO does not consider this to be non-compliant in accordance with the footnote of the condition that the Secretary may waive some of the requirements required by the condition if they are unnecessary or unwarranted for particular management plans. HVO considers the Secretary’s approval of the plans is Approval of these Waivers. Nonetheless, HVO will review this for adequacy in the next revision of each relevant management plan.
30/06/2020
Sch 5 Cond 4a
No evidence available to confirm reviews of strategies, plans and programs conducted on each occasion listed in this condition. However, all plans have been
Administrative No recommendation provided

2019 Annual Environmental Review Hunter Valley Operations
Report
Number: HVOOC-748212775-6 Status: [Document Status (Office)] Effective: [Effective Date] Page 225 of 238
Owner: [Owner] Version: [Document Version (Office)] Review: [Planned Review Date]
Uncontrolled when printed
Reference Audit Finding Risk Rating Auditors Recommendation HVO Response Timing
updated in the audit period except for the following:
HVO South Aboriginal Cultural Heritage Management Plan (May 2009);
Amenity Management Plan-Hunter Valley Gliding Club (October 2012); and
River Red Gum Rehabilitation and Restoration Strategy (March 2010).
App4 A.4
Bridges Acoustics notes the NMP and noise monitoring reports do not assess and correct for (or do not report) tonal noise as required by the NSW Industrial Noise Policy and later Noise Policy for Industry.
Low Tonal noise should be included in the noise monitoring reports and the NMP on its next revision.
HVO’s noise monitoring consultant’s monitoring reports indicate that intermittent or tonal features are not typically present in mining operational noise and the assessment is not undertaken on this basis. However, HVO will request this inclusion to noise monitoring reports developed by the noise monitoring consultant.
30/04/2020
SOC Ref 11 No evidence exists that collection and storage of River Red Gum seed from existing stands is occurring.
Low Collect seed from River Red Gum area or justify why not possible/required in revised BMP.
Seed collection will occur during 2020 if available. 20/12/2020
HVO North - DA 450-10-2003 Non-Compliance Recommendations
Sch 2 Cond 2a
Some non-compliances were identified with the conditions of this approval. Administrative
Work with DPIE to comply with non-compliances in Error! Reference source not found. of the IEA Report, where practical.
Actions to address non compliances are committed to via HVO’s response to recommendations.
-
Sch 2 Cond 15
Sch 3 Cond 61 no evidence of correspondence with Singleton Council or NSW RFS in relation to consultation on the Bushfire Management Plan was available.
Administrative Ensure consultation with relevant regulators occurs for all management plans, or justify why not required in plan (e.g. administrative changes).
Noted -
Sch 3 Cond 4
As per PA 06_0261 Sch 3 Cond 53. Low As per PA 06_0261 Sch 3 Cond 53. The current AQMP discuss’ Greenhouse Gas Management and as such no further
AEMR 2020 – 31/03/2021

2019 Annual Environmental Review Hunter Valley Operations
Report
Number: HVOOC-748212775-6 Status: [Document Status (Office)] Effective: [Effective Date] Page 226 of 238
Owner: [Owner] Version: [Document Version (Office)] Review: [Planned Review Date]
Uncontrolled when printed
Reference Audit Finding Risk Rating Auditors Recommendation HVO Response Timing
modification to the AQMP is considered necessary
HVO will recommence reporting in the Annual Review greenhouse gas emission summary information against the AQMP.
Sch 3 Cond 7
Exceedance of noise level criteria listed in Table 9. Refer to Appendix E DA 450-10-2003 Sch 3 Cond 7.
Administrative No recommendation provided
Sch 3
Cond 20
The following incidents relating to pollution of waters include: Discharge from leaking
pipework on Parnell's Dam to Parnell's Creek on 4 November 2016; and
Discharge from the Hunter Valley Load Point Sump to Bayswater Creek on 30 March 2017.
Medium No recommendation provided
Sch 5 Cond 4
No evidence available to confirm reviews of strategies, plans and programs conducted on each occasion listed in this condition. However, all plans have been updated in the audit period. Action has since been added to CMO with reminders.
Administrative No recommendation provided
App4 A.4
The NMP and noise monitoring reports do not assess and correct for (or do not report) tonal noise as required by the NSW Industrial Noise Policy and later Noise Policy for Industry.
Low Tonal noise should be included in the noise monitoring reports and the NMP on its next revision.
HVO’s noise monitoring consultant’s monitoring reports indicate that intermittent or tonal features are not typically present in mining operational noise and the assessment is not undertaken on this basis. However, HVO will request this inclusion to noise monitoring reports developed by the noise monitoring consultant.
30/04/2020

2019 Annual Environmental Review Hunter Valley Operations
Report
Number: HVOOC-748212775-6 Status: [Document Status (Office)] Effective: [Effective Date] Page 227 of 238
Owner: [Owner] Version: [Document Version (Office)] Review: [Planned Review Date]
Uncontrolled when printed
Reference Audit Finding Risk Rating Auditors Recommendation HVO Response Timing
SOC Ref 22
Annual visual assessments have not been completed. HVO has since purchased all properties that would have been considered to have been visually impacted by HVO North (particularly the Wandewoi Property on Lemington Road).
Administrative A written justification should be provided to DPIE for approval that annual visual assessments are no longer required.
As per previous IEA, HVO’s response to the recommendations was to review current relevance of completing the assessments in respect to recent property purchases to determine if private receptors would still be impacted visually by HVO north since the 2010 SOC. HVO has since purchased all properties that would have been considered to have been visually impacted by HVO north particularly the Wandewoi Property on Lemington Road. Annual visual assessments are therefore no longer considered relevant. Agree with recommendation to have confirmation from DPIE that these are no longer required.
30/09/2020
EPL 640
L1.1
The following incidents occurred relating to the pollution of waters:
Turbid water entered Farrells Creek from sediment dam overtop on 4-5/10/18 (See response to DA 450-10-2003 Sch 5 Cond 2);
Turbid water entered Farrells Creek from a rehabilitation area on the 18/3/19 (See response to DA 450-10-2003 Sch 5 Cond 2)
Turbid water entered Farrells Creek from two sediment dams on 30/3/19
Low No recommendation provided

2019 Annual Environmental Review Hunter Valley Operations
Report
Number: HVOOC-748212775-6 Status: [Document Status (Office)] Effective: [Effective Date] Page 228 of 238
Owner: [Owner] Version: [Document Version (Office)] Review: [Planned Review Date]
Uncontrolled when printed
Reference Audit Finding Risk Rating Auditors Recommendation HVO Response Timing
(See response to DA 450-10-2003 Sch 5 Cond 2); and
Discharge of mine water to Bayswater Creek 11/5/18 (See response to (PA 06_0261 Sch 3 Cond 20).
L4.1
One blast on Easter Saturday 2017 (which was officially considered a public holiday in 2017) as per PA 06_0261 Sch 3 Cond 10
Administrative No recommendation provided
L4.3
Two blasting exceedances on one occasion in 2018 at point 9 &18:
Measured overpressure levels exceeded the 120 dBL criterion at two locations (Moses Crossing, Jerrys Plains) on 17 January 2018. (See response to PA 06_0261 Sch 3 Cond 7)
Low Refer to PA 06_0261 Sch 3 Cond 7.
HVO has since received confirmation from DPIE that its relocation approved. HVO is currently seeking approval from the EPA for the relocation as part of the five yearly licence review and will permanently relocate the monitor once approval is received.
TBA – pending EPA response.
O2.1
Minor discharge of saline water to Parnells Creek due to pinhole leak on 4/11/16. See response to DA 450-10-2003 Sch 3 Cond 20.
Low No recommendation provided

2019 Annual Environmental Review
OC-748212775-6 Status: [Document Status (Office)] Effective: [Effective Date]
er] Version: [Document Version (Office)] Review: [Planned Review Date]
Uncontrolled when printed
Incidents and Non-Compliances There were a total of 7 incidents and non-compliances recorded at HVO, including:
18 March – Water
30 March – Water
25 April – Air Quality
28 May– Blasting
21 August – Air Quality
Independent Environmental Audit – Noise and Visual
Details of these incidents and non-compliances are provided below.
In addition, on 1 July 2019 HVO also notified DPIE of an incident that occurred on Easter Saturday 2017, (which was not reported at the time). This non-compliance has not been counted in the 2019 statistics. Details of this incident is included in Section 11.1.2 below.
11.1 Blasting During 2019 there was one non-compliance related to blasting. A second non-compliance was reported to DPIE on 1 July 2019, relating to a blast that occurred on Easter Saturday 2017.
11.1.1 Air Blast Overpressure Exceedance - 28 May 2019 A blast fired in the HVO South exceeded the air-blast overpressure criteria of 120.0 dB(L). Maximum overpressure recorded at Maison Dieu was 125.69 dB(L). Blasting was undertaken in accordance with internal blasting permissions and the HVO Blast Management Plan. Two independent investigations were undertaken by technical experts, and both assessments identified that an anomaly with the monitor, compared to other monitors within the network, were the cause of the elevated reading.
In response to this investigation, HVO installed an additional blast monitor in the Maison Dieu location, with the addition of a high resolution anemometer, allowing for better assessment of meteorological impacts.
HVO received a Warning Letter on 19 September 2019 from DPIE regarding this incident. DPIE requested that a report comparing the two monitors be provided. A report detailing this comparison was submitted to DPIE on 31 October 2019, which confirmed that there was potential for a local influence near the monitor to be causing elevated overpressure. As such HVO plans to permanently relocate the monitor during 2020 to reduce this influence.
DPIE further requested that the 125.7 dB(L) recording is to be considered in calculating the annual average over 115 dB(L), noting that the likely overpressure was calculated to be more than 115 dB(L) but less than 120 dB(L).
11.1.2 Easter Saturday Blast - 15 April 2017 (reported 1 July 2019)
An incident was reported to DPIE on 1 July 2019 relating to the firing of a blast in HVO’s Cheshunt Pit at 9.33am on 15 April 2017 (Easter Saturday), a gazetted public holiday. The incident was identified in 2019 as part of a review of historic blasting data. No complaints were received relating to the blast and the blast monitoring results were below the criteria.
Due to the time elapsed and change in personnel it could not be confirmed why the decision was made to blast on a public holiday. Preventative actions implemented as a result of this non-compliance include:
HVO blasting permissions page alerts the blast engineer when there is a public holiday;
Weekly blasting schedules are prepared and issued to an internal and external audience including the E&C team, providing an opportunity to peer review the schedule; and

2019 Annual Environmental Review
OC-748212775-6 Status: [Document Status (Office)] Effective: [Effective Date]
er] Version: [Document Version (Office)] Review: [Planned Review Date]
Uncontrolled when printed
The daily blasting checklist has been updated to check for public holidays.
A monthly review and reconciliation of blasting records against monitoring records is also undertaken to ensure compliance with blasting conditions.
11.2 Water During 2019 there were two incidents related to water as summarised below.
11.2.1 Turbid water discharge - 18 March 2019 HVO received 47.2mm of rainfall over 16, 17 and 18 March 2019. At approximately 14:00 on the 18 March, it was reported to the Environment and Community Coordinator by a sampling contractor that turbid water was identified in Farrell’s Creek downstream from HVO. HVO conducted inspections and determined that a source of turbid water from HVO was due to rainfall runoff entraining sediment from an old rehabilitation slope.
HVO undertook the following actions immediately:
Initial works undertaken 18 March 2019:
A silt curtain was deployed at confluence of Farrells Creek to Hunter River (~ 6pm).
Undertook water sampling of source and receiving waters (between 6 and 7 pm).
A containment bund was pushed up at the toe of the rehabilitation slope to reduce further runoff if further rainfall was to occur (prior to 9 pm).
Notifications were made to relevant authorities in accordance with HVO’s Pollution Incident Response Management Plan, EPL and Development Consent on 18 March 2019.
Further works undertaken (commencing 19 March 2019) included:
Construction of new contour lower on slope to help direct water to Dam 1n (19-3-19)
Rollover bunds installed in vicinity of rehabilitation slope to divert water to Dam 15n (19-3-19)
Installed coconut fibre logs at the exit of the road culvert and toe of rehabilitation slope for sediment control. (19-3-19)
Repaired section of bund at toe of rehabilitation slope (19-3-2019)
Follow up water sampling of source and receiving waters (19-3-2019)
Re-gravelled roadway (commenced 19 and 20-3-19)
Re-instated lower contour with new material (19 and 20-3-19)
Repaired erosion scour on lower slope, re-topsoiled and mulched (20 to 22-3-19)
Investigations into the incident were conducted by the EPA, DPIE and the Resource Regulator. HVO has entered into an Enforceable Undertaking with the EPA and has also received a Penalty Notice and an Official Caution from the Resource Regulator. The Enforceable Undertaking with the EPA includes the following:
Implement a remediation plan of the failed rehabilitation area;
Conduct annual inspections of the area;
Provide $100,000 of funding to the Hunter Local Land Services to undertake a project to improve Travelling Stock Reserves (TSR’s) within the Singleton LGA.
Publically reporting the incident; and
Payment of EPA’s costs.
11.2.2 Turbid water discharge - 30 March 2019 Following 66 mm of rainfall on 30 March 2019, two dams (known as Farm Dam1 and Dam 2n) at HVO North had their capacity exceeded. This resulted in overflow of the dams and flow of turbid water to Farrells Creek. The volume of rainfall had exceeded the designed rainfall event used to construct sediment dams to

2019 Annual Environmental Review
OC-748212775-6 Status: [Document Status (Office)] Effective: [Effective Date]
er] Version: [Document Version (Office)] Review: [Planned Review Date]
Uncontrolled when printed
Blue Book standard. Runoff water captured from these dams is not mine affected, therefore salinity of the water was low.
Immediate actions undertaken include:
Pumps were installed prior to the event and these were operated to lower the dam levels
Sampling undertaken
Internal and external notifications made
Results from sampling indicated that discharged water had negligible impact on the water quality of the receiving waters.
Investigations into the incident conducted by DPIE resulted in HVO being issued with a Warning Letter for failure to fully implement the Water Management Plan at the time of the incident. HVO has since reviewed inspection process of sediment dams and has implemented additional processes to ensure sufficient dam capacity were required.
11.3 Noise During 2019 there was one non-compliance relating to noise identified during the Independent Environmental Audit. These are summarised below.
11.3.1 IEA Finding – Tonal Noise Assessments During the Independent Environmental Audit, it was identified that under HVO North and South Consents (Appendix 4, Condition A4) that HVO was not assessing and reporting on tonal noise as required by the NSW Noise Policy for Industry. HVO’s noise monitoring consultant’s monitoring reports indicate that intermittent or tonal features are not typically present in mining operational noise and the assessment is not undertaken on this basis. However, HVO has requested this inclusion to noise monitoring reports developed by the noise monitoring consultant.
11.4 Air Quality During 2019 there were two non-compliances related to air quality. These non-compliances are summarised below.
11.4.1 Missed HVAS Sample - 25 April 2019 On 25 April 2019 HVO was notified by the Hunter Valley Gliding Club that the PM10 High Volume Air Sampler (HVAS) at the site had been damaged by activities occurring at the club, subsequently resulting in the sample not being captured on 26 April 2019 in accordance with the Air Quality Monitoring Program.
Notification of the missed sample was provided to DPIE on 29 April 2019.
HVO consulted with the Gliding Club on possible solutions to prevent future incidents with the HVAS and it was agreed by both parties that improving the visibility of the unit would assist in preventing future issues. As a result high visibility reflective tape was affixed to the unit. No further issues have been reported.
11.4.2 Dust Management Penalty Notice - 21 August 2019 On 21 August 2019 at approximately 14:45, an Authorised Officer from DPIE undertook unannounced surveillance of HVO’s activities and allegedly observed operations in HVO South generating visible, off-site air pollution. In the Department’s view, at this time, the operations that were taking place in the south-western corner of the Riverview Pit were not being adequately managed to minimise dust generation which travelled off-site, visibly crossing the Golden Highway. This constituted a failure to comply with Schedule 3, Condition 22 of PA06_0261.
DPIE requested information and records relating to HVO’s operations and dust management practices at the time of the alleged breach, which HVO subsequently supplied.
On 18 October 2019 HVO received correspondence from DPIE advising that, following an investigation, the Department determined that HVO committed an offence against Section 4.2 of the EP&A Act by carrying out development not in accordance with the conditions of PA 06_0261 by failing to take all reasonable

2019 Annual Environmental Review
OC-748212775-6 Status: [Document Status (Office)] Effective: [Effective Date]
er] Version: [Document Version (Office)] Review: [Planned Review Date]
Uncontrolled when printed
steps to minimise dust emissions and visible off-site air pollution. HVO received a Penalty Infringement Notice (PIN) in the amount of $15,000 for the non-compliance. It should be noted that HVO considers that operations were being managed in accordance with the HVO Air Quality Management Plan at the time of the allegation.
11.5 IEA Finding - Visual Amenity One non-compliance relating to visual amenity requirements identified during the Independent Environmental Audit. During the Independent Environmental Audit, it was identified that under HVO North Statement of Commitments (SOC Ref. 22) that HVO had not completed the commitment to undertake annual visual assessments during the audit period (2016 to 2019). As per the previous IEA, HVO’s response to the recommendations was to review current relevance of completing the assessments in respect to recent property purchases to determine if private receptors would still be impacted visually by HVO north since the 2010 SOC. HVO has since purchased all properties that would have been considered to have been visually impacted by HVO north particularly the Wandewoi Property on Lemington Road. Annual visual assessments are therefore no longer considered relevant. During 202, HVO will seek confirmation on the continuing need to undertake these assessments from DPIE.

2019 Annual Environmental Review
OC-748212775-6 Status: [Document Status (Office)] Effective: [Effective Date]
er] Version: [Document Version (Office)] Review: [Planned Review Date]
Uncontrolled when printed
Activities to be completed in 2020 12.1 Noise
Noise management improvements identified for implementation in 2020 include:
Sound Power Level testing of various heavy mining equipment ; and
Review of the HVO Noise Management Plan.
12.2 Blasting Blasting management improvements identified for implementation in 2020 include:
Review blast monitoring locations, including relocation of the Maison Dieu Monitor to exclude localised influences on the monitor;
Review of the HVO Blast Management Plan.
12.3 Air Quality Air Quality management improvements identified for implementation in 2020 include:
Review of the HVO Air Quality & Greenhouse Gas Management Plan;
Aerial seeding of overburden that is temporarily unavailable for rehabilitation; and
Continue to implement dust management improvements such as dust monitoring camera system and dust management TARP.
12.4 Historic Heritage Continue to consult with the neighbouring Liddell Coal Operations on any future mining plans that may interact with the Chain of Ponds Inn complex to ensure appropriate protective management measures are implemented where required.
12.5 Water Improvements to mine water management in 2020 include:
Implement pipeline and water infrastructure management projects to reduce potential for unauthorised water discharges (EPL 640 Pollution Reduction Program);
Upgrade of river pumping infrastructure to improve pumping capability and improve pumping system controls;
Ongoing upgrade of internal water transfer pipelines, pumping infrastructure, and system controls and monitoring; and
12.6 Rehabilitation During the next reporting period key focus areas for HVO will be:
Completion of 94ha of new rehabilitation;
Development of new combined HVO North and South Mine Operations Plan including revised rehabilitation completion criteria and monitoring methodology;
Continuation of Section 240 rehabilitation maintenance plan including continued progression of historic cover crop / weed management areas to final cover;
Commence remediation of degraded rehabilitation at the former Eastern TSF at HVO North;
Further develop opportunities for grazing access to suitable rehabilitation areas.

2019 Annual Environmental Review
OC-748212775-6 Status: [Document Status (Office)] Effective: [Effective Date]
er] Version: [Document Version (Office)] Review: [Planned Review Date]
Uncontrolled when printed
12.7 Tailing Storage Facility Capping Capping activities on Southeast TSF will continue during 2020 to progress rehabilitation of the
remaining surface.
Implementation of management activities for the North Void TSF, focusing on dewatering and capping strategy development;
Optimisation of pipe-head flocculation systems at Dam 6W and Carrington In-Pit TSF.
Review the Life of Mine Fine Rejects Management Strategy.
12.8 Stakeholder Engagement The following stakeholder engagement activities are planned for 2020:
Implementing two rounds of the HVO Community Fund;
Developing and distributing two community newsletters;
Conducting two Community Information sessions (at Jerrys Plains and Maison Dieu) (subject to COVID-19 restrictions); and
Hosting a UHMD School Site Tour (subject to COVID-19 restrictions)
12.9 Timeline for Implementation of Improvement Projects
A proposed timeline for the improvement projects mentioned in Section 12 is shown below in Figure 119.

2019 Annual Environmental Review Hunter Valley Operations
Report
Number: HVOOC-748212775-6 Status: [Document Status (Office)] Effective: [Effective Date] Page 235 of 238
Owner: [Owner] Version: [Document Version (Office)] Review: [Planned Review Date]
Uncontrolled when printed
Figure 119: Proposed Timeline for Implementation of 2020 Improvement Project
1/01
/20
20/0
2/20
10/0
4/20
30/0
5/20
19/0
7/20
7/09
/20
27/1
0/20
16/1
2/20
NOISE - Continued noise attenuation of dump trucks
CULTURAL HERITAGE - Upgrading aboriginal heritage site barricading
WATER - Implement pipeline and water infrastructure management projects to reduce potential for unauthorised water discharges(EPL 640 Pollution Reduction Program)
WATER - Upgrade of river pumping infrastructure to mitigate high water impacts, improve pumping capability during high flowevents, and improve pumping system controls
WATER - Ongoing upgrade of internal water transfer pipelines, pumping infrastructure, and system controls and monitoring
REHAB - Completion of 94ha of new rehabilitation
REHAB - Development of revised rehabilitation completion criteria and representative analogue monitoring sites
REHAB - Continuation of Section 240 rehabilitation maintenance plan including continued progression of historic cover crop /weed management areas to final cover;
COMMUNITY DEVELOPMENT - Ongoing Activites
REHAB - Remediation of degraded rehabilitation at the former Eastern TSF at HVO North
TAILINGS - Capping activities on Southeast TSF will continue during 2020 to progress rehabilitation of the remaining surface
TAILINGS - Implementation of the Management Plan for North Void TSF, focusing on dewatering and capping strategydevelopment
TAILINGS - Optimisation of pipe-head flocculation systems at Dam 6W and Carrington In-Pit TSF
REHAB - Further develop opportunities for grazing access to suitable rehabilitation areas
AIR QUALITY - Continue to implement dust management improvements such as dust monitoring camera system and revised dustmanagement TARP
NOISE - Review of Noise Management Plan
NOISE – Sound Power Level testing of various heavy mining equipment
BLASTING - Review of Blast Management Plan
BLASTING - Review blast monitoring locations, including relocation of the Maison Dieu Monitor to exclude localised influences onthe monitor
AIR QUALITY - Review of Air Quality & Greenhouse Gas Management Plan
AIR QUALITY - Aerial seeding of overburden that is temporarily unavailable for rehabilitation

2019 Annual Environmental Review
OC-748212775-6 Status: [Document Status (Office)] Effective: [Effective Date]
er] Version: [Document Version (Office)] Review: [Planned Review Date]
Uncontrolled when printed
Appendix A - Annual Groundwater Review 2019

2019 Annual Environmental Review
OC-748212775-6 Status: [Document Status (Office)] Effective: [Effective Date]
er] Version: [Document Version (Office)] Review: [Planned Review Date]
Uncontrolled when printed
Appendix B - Rehabilitation Maintenance Schedule

2019 Annual Environmental Review
OC-748212775-6 Status: [Document Status (Office)] Effective: [Effective Date]
er] Version: [Document Version (Office)] Review: [Planned Review Date]
Uncontrolled when printed
Appendix C - Aboriginal Heritage Management Plan Compliance Audit Inspections

SLR Ref: 620.12182.00000-R13Version No: v2.0March 2020
HUNTER VALLEY OPERATIONS2019 Annual Groundwater Review
Prepared for:
HV Operations Pty Ltd1011 Lemington Road,Lemington NSW 2330

HV Operations Pty LtdHunter Valley Operations2019 Annual Groundwater Review
SLR Ref No: 620.12182.00000-R13-v3.0.docxMarch 2020
Page 2
PREPARED BY
SLR Consulting Australia Pty LtdABN 29 001 584 612Level 1, The Central Building, UoW Innovation CampusNorth Wollongong NSW 2500 Australia
T: +61 404 939 922 F:E: [email protected] www.slrconsulting.com
BASIS OF REPORT
This report has been prepared by SLR Consulting Australia Pty Ltd with all reasonable skill,care and diligence, and taking account of the timescale and resources allocated to it byagreement with HV Operations Pty Ltd (the Client). Information reported herein is basedon the interpretation of data collected, which has been accepted in good faith as beingaccurate and valid.
This report is for the exclusive use of the Client. No warranties or guarantees areexpressed or should be inferred by any third parties. This report may not be relied uponby other parties without written consent from SLR
SLR disclaims any responsibility to the Client and others in respect of any matters outsidethe agreed scope of the work.
DOCUMENT CONTROL
Reference Date Prepared Checked Authorised
620.12182.00000-R13-v3.0 31 March 2020 Kirsty Cooksey Claire Stephenson Claire Stephenson
620.12182.00000-R13-v2.0 26 March 2020 Kirsty Cooksey Claire Stephenson Claire Stephenson

HV Operations Pty LtdHunter Valley Operations2019 Annual Groundwater Review
SLR Ref No: 620.12182.00000-R13Filename: 620.12182.00000-R13-v3.0.docx
March 2020
CONTENTS
Page 3
1 INTRODUCTION ........................................................................................................... 7
1.1 Overview ..................................................................................................................... 7
1.2 Scope ........................................................................................................................... 7
2 HVO COMPLEX............................................................................................................. 8
2.1 Mine operations........................................................................................................... 8
2.2 Groundwater Impacts ................................................................................................ 11
2.3 Groundwater Licensing .............................................................................................. 12
2.4 Groundwater Conditions ............................................................................................ 13
3 HYDROGEOLOGICAL SETTING .................................................................................... 16
3.1 Climate, Terrain and Drainage .................................................................................... 163.1.1 Climate .................................................................................................................................................. 16
3.1.2 Terrain and Drainage ............................................................................................................................. 17
3.2 Geology ..................................................................................................................... 18
3.2.1 Groundwater Units ................................................................................................................................ 21
3.2.2 Alluvium ................................................................................................................................................ 21
3.2.3 Permian Coal Measures ......................................................................................................................... 21
4 GROUNDWATER MONITORING ................................................................................. 23
4.1 Groundwater Monitoring Program ............................................................................. 23
4.2 Groundwater Monitoring Methodology ..................................................................... 28
4.3 Groundwater Triggers ................................................................................................ 28
4.4 Trigger Investigations ................................................................................................. 30
5 MONITORING RESULTS .............................................................................................. 32
5.1 Data Recovery ............................................................................................................ 32
5.2 Water Levels .............................................................................................................. 325.2.1 Alluvium ................................................................................................................................................ 32
5.2.1.1 West Pit................................................................................................................................................. 33
5.2.1.2 Carrington West Wing and Carrington .................................................................................................... 33
5.2.1.3 Cheshunt Pit/North Pit ........................................................................................................................... 39
5.2.1.4 Lemington South ................................................................................................................................... 40
5.2.2 Permian Coal Measures ......................................................................................................................... 40
5.2.2.1 West Pit................................................................................................................................................. 41
5.2.2.2 Carrington and Carrington West Wing .................................................................................................... 43
5.2.2.3 Cheshunt Pit .......................................................................................................................................... 44

HV Operations Pty LtdHunter Valley Operations2019 Annual Groundwater Review
SLR Ref No: 620.12182.00000-R13Filename: 620.12182.00000-R13-v3.0.docx
March 2020
CONTENTS
Page 4
5.2.2.4 Lemington South ................................................................................................................................... 45
5.2.3 Spoil ...................................................................................................................................................... 50
5.2.3.1 North Pit................................................................................................................................................ 50
5.2.3.2 Carrington ............................................................................................................................................. 50
5.3 Water Quality ............................................................................................................ 51
5.3.1 Alluvium ................................................................................................................................................ 51
5.3.1.1 West Pit................................................................................................................................................. 52
5.3.1.2 Carrington and Carrington West Wing .................................................................................................... 52
5.3.1.3 Cheshunt Pit .......................................................................................................................................... 54
5.3.1.4 Lemington South ................................................................................................................................... 55
5.3.2 Permian Coal Measures ......................................................................................................................... 56
5.3.2.1 West Pit................................................................................................................................................. 56
5.3.2.2 Carrington and Carrington West Wing .................................................................................................... 57
5.3.2.3 Cheshunt Pit .......................................................................................................................................... 57
5.3.2.4 Lemington South ................................................................................................................................... 58
5.3.3 Spoil ...................................................................................................................................................... 60
5.4 Groundwater Take ..................................................................................................... 615.4.1 Groundwater Inflows to Mine Operations .............................................................................................. 61
5.4.2 Bore Abstraction .................................................................................................................................... 61
5.4.3 Summary of Groundwater Take For 2019 ............................................................................................... 61
5.5 Verification of Model Predictions ............................................................................... 62
6 CONCLUSIONS AND RECOMMENDATIONS ................................................................ 64
6.1 Conclusions ................................................................................................................ 64
6.2 Recommendations ..................................................................................................... 65
7 REFERENCES .............................................................................................................. 67
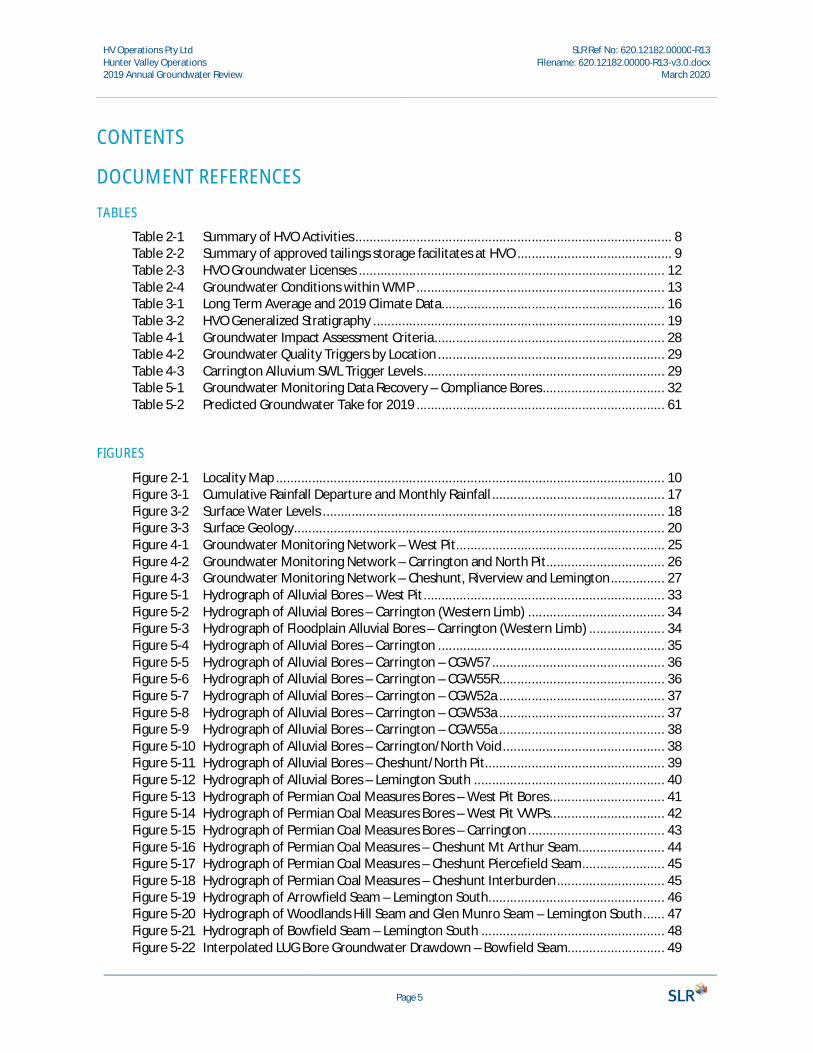
HV Operations Pty LtdHunter Valley Operations2019 Annual Groundwater Review
SLR Ref No: 620.12182.00000-R13Filename: 620.12182.00000-R13-v3.0.docx
March 2020
CONTENTS
Page 5
DOCUMENT REFERENCES
TABLES
Table 2-1 Summary of HVO Activities ........................................................................................ 8Table 2-2 Summary of approved tailings storage facilitates at HVO ........................................... 9Table 2-3 HVO Groundwater Licenses ..................................................................................... 12Table 2-4 Groundwater Conditions within WMP ..................................................................... 13Table 3-1 Long Term Average and 2019 Climate Data .............................................................. 16Table 3-2 HVO Generalized Stratigraphy ................................................................................. 19Table 4-1 Groundwater Impact Assessment Criteria ................................................................ 28Table 4-2 Groundwater Quality Triggers by Location ............................................................... 29Table 4-3 Carrington Alluvium SWL Trigger Levels ................................................................... 29Table 5-1 Groundwater Monitoring Data Recovery – Compliance Bores .................................. 32Table 5-2 Predicted Groundwater Take for 2019 ..................................................................... 61
FIGURES
Figure 2-1 Locality Map ............................................................................................................ 10Figure 3-1 Cumulative Rainfall Departure and Monthly Rainfall ................................................ 17Figure 3-2 Surface Water Levels ............................................................................................... 18Figure 3-3 Surface Geology ....................................................................................................... 20Figure 4-1 Groundwater Monitoring Network – West Pit .......................................................... 25Figure 4-2 Groundwater Monitoring Network – Carrington and North Pit................................. 26Figure 4-3 Groundwater Monitoring Network – Cheshunt, Riverview and Lemington ............... 27Figure 5-1 Hydrograph of Alluvial Bores – West Pit ................................................................... 33Figure 5-2 Hydrograph of Alluvial Bores – Carrington (Western Limb) ...................................... 34Figure 5-3 Hydrograph of Floodplain Alluvial Bores – Carrington (Western Limb) ..................... 34Figure 5-4 Hydrograph of Alluvial Bores – Carrington ............................................................... 35Figure 5-5 Hydrograph of Alluvial Bores – Carrington – CGW57 ................................................ 36Figure 5-6 Hydrograph of Alluvial Bores – Carrington – CGW55R .............................................. 36Figure 5-7 Hydrograph of Alluvial Bores – Carrington – CGW52a .............................................. 37Figure 5-8 Hydrograph of Alluvial Bores – Carrington – CGW53a .............................................. 37Figure 5-9 Hydrograph of Alluvial Bores – Carrington – CGW55a .............................................. 38Figure 5-10 Hydrograph of Alluvial Bores – Carrington/North Void ............................................. 38Figure 5-11 Hydrograph of Alluvial Bores – Cheshunt/North Pit.................................................. 39Figure 5-12 Hydrograph of Alluvial Bores – Lemington South ..................................................... 40Figure 5-13 Hydrograph of Permian Coal Measures Bores – West Pit Bores ................................ 41Figure 5-14 Hydrograph of Permian Coal Measures Bores – West Pit VWPs................................ 42Figure 5-15 Hydrograph of Permian Coal Measures Bores – Carrington ...................................... 43Figure 5-16 Hydrograph of Permian Coal Measures – Cheshunt Mt Arthur Seam........................ 44Figure 5-17 Hydrograph of Permian Coal Measures – Cheshunt Piercefield Seam ....................... 45Figure 5-18 Hydrograph of Permian Coal Measures – Cheshunt Interburden .............................. 45Figure 5-19 Hydrograph of Arrowfield Seam – Lemington South................................................. 46Figure 5-20 Hydrograph of Woodlands Hill Seam and Glen Munro Seam – Lemington South ...... 47Figure 5-21 Hydrograph of Bowfield Seam – Lemington South ................................................... 48Figure 5-22 Interpolated LUG Bore Groundwater Drawdown – Bowfield Seam ........................... 49

HV Operations Pty LtdHunter Valley Operations2019 Annual Groundwater Review
SLR Ref No: 620.12182.00000-R13Filename: 620.12182.00000-R13-v3.0.docx
March 2020
CONTENTS
Page 6
Figure 5-23 Hydrograph of Spoil Bores – North Pit...................................................................... 50Figure 5-24 Hydrograph of Spoil Bores – Carrington ................................................................... 51Figure 5-25 EC vs Sulphate ......................................................................................................... 54Figure 5-26 Sulphate/Chloride Ratio ........................................................................................... 54Figure 5-27 Water Level and EC Trends for PB01(ALL) and Wollombi Brook ................................ 55Figure 5-28 C130(ALL) EC vs Sulphate ......................................................................................... 59
APPENDICES
Appendix A Groundwater Monitoring ProgrammeAppendix B Groundwater Level Readings 2019Appendix C Groundwater Quality Data 2019Appendix D Groundwater Quality Graphs – By Location and GeologyAppendix E Full Water Quality Data 2019Appendix F HVO Triennial Groundwater Model Review

HV Operations Pty LtdHunter Valley Operations2019 Annual Groundwater Review
SLR Ref No: 620.12182.00000-R13Filename: 620.12182.00000-R13-v3.0.docx
March 2020
Page 7
1 Introduction
1.1 Overview
The Hunter Valley Operations (HVO) mining complex is located approximately 24 km north-west of Singleton,NSW. As part of compliance with mine approval conditions, routine groundwater monitoring is conducted acrossHVO, and the data reviewed and analysed on an annual basis. The annual groundwater review is required for:
· HVO North in accordance with Condition 27 of Development Consent (DA 450 10 2003) and individualbore license conditions (20BL173587-89 and 20BL173847).
· HVO South in accordance with Condition 28 of the Project Approval (PA 06 0261 24) and licenceconditions for Lemington Underground (LUG) Bore (20BL173392).
· Individual bore license conditions (20BL173587-89, 20BL173847 and 20BL173392).
This report presents the annual groundwater review for HVO, developed in accordance with the approvalconditions and requirements outlined within the Water Management Plan (WMP).
1.2 Scope
The scope of work for this review included analysis of monitoring data and reporting. This report presents:
· Site background:
· Legislative requirements and conditions relevant to groundwater;
· Mine activities over reporting period;
· Hydrogeological regime; and
· Groundwater monitoring network and programme.
· Data review:
· Review and illustration (i.e. hydrographs) of groundwater level trends;
· Review and illustration (i.e. hydrographs) of groundwater quality trends;
· Comparison of water level and quality trends to relevant trigger levels and natural trends (i.e.surface water levels and rainfall); and
· Assess compliance with mine approval conditions and present a checklist summarising findings.
· Discussion of groundwater impacts and compliance over the reporting period and provision ofrecommendations (where required).

HV Operations Pty LtdHunter Valley Operations2019 Annual Groundwater Review
SLR Ref No: 620.12182.00000-R13Filename: 620.12182.00000-R13-v3.0.docx
March 2020
Page 8
2 HVO ComplexThe following section provides a description of the HVO Complex of relevance to this annual groundwaterreview. The general site layout is presented in Figure 2-1.
2.1 Mine operations
Table 2-1 presents a summary of mine areas across HVO, approved mining timeframes and activities conductedover 2019. Overall, mining was active at West Pit, Cheshunt Pit, and Riverview Pit over 2019.
Table 2-1 Summary of HVO Activities
Mine Area Seam Mined ToApproved Life of
Mining 2019 Activities
West PitBayswater to Hebdenseams 1949 to 2025 Mining active
North Pit Vaux Seam 1979 to 2003 Inactive – fully rehabilitated
Alluvial Lands Vaux Seam 1993 to 2003 Inactive – fully rehabilitated
Carrington Pit Bayswater Seam 2000 to 2021 Inactive – commenced receiving tailingsin January 2019
Carrington West Wing Bayswater Seam Not commenced Not commenced
Cheshunt Pit Vaux & Bayswater seams 2002 to 2030 Mining active – down to the BayswaterSeam
Riverview Pit Vaux & Bayswater seams 1997 to 2030 Mining active – down to the Vaux Seam
Glider Pit Vaux Seam 2016 – 2017 Inactive – fully rehabilitated
Lemington SouthPit 1
Bowfield SeamWarkworth Seam
1998 to 20062019 to 2030
Inactive – rehabilitated with finalvoid/pit lake present. Used for waterstorage from LUG Bore abstraction
As of the 28th February 2018 the Planning Assessment Commission granted consent for the HVO SouthModification 5. These approved operations are reflected in Table 2-1, which includes mining of the RiverviewPit down to the Bayswater seam.
A range of tailings storage facilities (TSF) are present across HVO, as summarised in Table 2-2. The TSF’s aremanaged in accordance with the site Fine Rejects Management Strategy, which includes decant requirementsto enable better consolidation of the material.

HV Operations Pty LtdHunter Valley Operations2019 Annual Groundwater Review
SLR Ref No: 620.12182.00000-R13Filename: 620.12182.00000-R13-v3.0.docx
March 2020
Page 9
Table 2-2 Summary of approved tailings storage facilitates at HVO
Mine Area Location Status
Dam 6W West Pit Active over 2019
Bob’s Dump (20W) West Pit Inactive over 2019
North Void (DM6) North Pit Ceased receiving tailings in January2019, planning for decommissioning andrehabilitation has commenced
Southeast TSF (27N) North Pit Inactive – capping commenced 2016
Central TSF (28N) North Pit Inactive over 2019
Carrington Out of Pit Fine RejectEmplacement (COOP FRE)
Carrington area – out of pitemplacement.
Approved, not constructed
Carrington In Pit Fine RejectEmplacement (FRE)
Carrington area – in pitemplacement
Void area over 2018, receiving tailingssince January 2019
Over 2019 only two areas were actively used for tailings storage, Dam 6W at West Pit and Carrington In Pit FineReject Emplacement. North Void ceased receiving tailings in January 2019, planning for decommissioning andrehabilitation has commenced.
Groundwater was also abstracted from the Lemington Underground Bore (LUG) during 2019. LUG Bore is aproduction bore constructed into the historical Lemington Underground beneath HVO that mined the Mt ArthurSeam of the Whittingham Coal Measures, with this mine having been inactive since 1999. Abstraction from LUGBore is managed by Yancoal for the Mt Thorley Warkworth (MTW) operations.

West Pit Ravensworth
Narama
CarringtonPit
North Pit
Riverview Pit
LemingtonSouth Pit
United
Wambo
NorthVoid DM6
Glider Pit
CarringtonWest Wing
Area
AlluvialLands
Central TSF
Parnell'sCreekDam
Bob's Dump
Cheshunt Pit
PARNE LLSCREEK
WOLLOMBI BROOK
HUNTER RIVER
FOYBRO
OKFOY
BROOK
HUNTER RIVER
GOLDEN HIGHWAY
NEW ENGLAND HIGHWAYH:
\Proj
ects-
SLR\
620-B
NE\62
0-BNE
\620.1
2182
HVO
Grou
ndwa
ter C
ompli
ance
\06 S
LR D
ata\01
GIS
\01 Ar
cGIS
\SLR
6201
2182
_F02
_Loc
ality_
001.m
xd
0 1 2 3 4Kilometres
Barrier WallsMain roadMajor watercourses
IHunter Valley Operations2019 Groundwater Level and Quality ReviewLocality Map
www.slrconsulting.com.au
Sheet Size : A4
22-Feb-2019
Figure 2.1
GDA 1994 MGA Zone 56Scale: 1:75,000

HV Operations Pty LtdHunter Valley Operations2019 Annual Groundwater Review
SLR Ref No: 620.12182.00000-R13Filename: 620.12182.00000-R13-v3.0.docx
March 2020
Page 11
2.2 Groundwater Impacts
Groundwater impacts associated with the approved operations at HVO have been progressively assessed foreach mining area, including:
· Alluvial Lands Project Groundwater Assessment (MMA 1992);
· Carrington Pit Groundwater Assessment (MER 1998);
· West Pit Extension Groundwater Assessment (MER 2003);
· Carrington Pit Extended Groundwater Assessment (MER 2005);
· Carrington West Wing Groundwater Assessment (MER 2010);
· HVO South Groundwater Assessment (ERM 2008);
· HVO North Modification 4 Groundwater Assessment – Carrington Out of Pit Fine Reject Emplacement(AGE 2013b);
· HVO North Modification 6 Groundwater Assessment – Carrington In Pit Fine Reject Emplacement (AGE2016); and
· HVO South Modification 5 Groundwater Assessment (AGE 2017).
The most recent groundwater assessment that captures operations across HVO North and HVO South was theHVO South Modification 5, which was granted consent by the Planning Assessment Commission on 28thFebruary 2018. The groundwater assessment for Modification 5 was completed by AGE (2017) and includeddevelopment of a numerical groundwater model to represent groundwater response to approved mine activitiesand the proposed modification.
AGE (2017) reported on predicted impacts associated with approved operations over 2019 (model Year 4). Theapproved operations included mining at Cheshunt Pit, Riverview Pit, Glider Pit and West Pit, as well assurrounding non-HVO mining operations (i.e. Ravensworth, Mt Thorley Warkworth etc) and abstraction fromthe LUG Bore. The model also included approved mining at Carrington West Wing until 2021; however no mininghas occurred at Carrington West Wing to date.
The model was calibrated to the end of 2015 and groundwater conditions and groundwater response toapproved mining to the end of 2015, as reported by AGE (2017), indicated:
· Groundwater within the hard rock units (i.e. Whittingham Coal Measures) is directly intercepted byapproved operations at HVO;
· Groundwater within the confined to semi-confined Permian coal measures became depressurisedaround the area of active mining. Groundwater drawdown responses were observed around 2 km to6 km from active mine areas within the Permian coal measures;
· There is no direct interception of groundwater within alluvium for active mine operations at HVO.However, historically the South Lemington Pit 1 footprint did directly intercept alluvium and barrierwalls were established at Alluvial Lands and Carrington Pit to separate mine areas from alluvium; and
· With depressurisation of the coal measures, the model predicted a reduction in upward seepage tothe alluvium that was referred to as ‘indirect take’.

HV Operations Pty LtdHunter Valley Operations2019 Annual Groundwater Review
SLR Ref No: 620.12182.00000-R13Filename: 620.12182.00000-R13-v3.0.docx
March 2020
Page 12
· These findings largely aligned with historical groundwater assessments conducted for the approvedoperations across HVO. Groundwater licenses have been obtained for the approved operations, asdiscussed in Section 2.3. Management and monitoring requirements of potential groundwater relatedimpacts from approved operations are captured within the development consent conditions. Schedule3, Condition 27 of Development Consent (DA 450 10 2003) for HVO North, last updated January 2017for Modification 6 and again in July 2017 (no changes to groundwater conditions in July); and
· Schedule 3, Condition 28 of the Project Approval (PA 06 0261 24) for HVO South, last updated October2012.
These conditions are addressed within the site Water Management Plan (WMP). Further discussion on themonitoring and management requirements is included within Section 2.4.
2.3 Groundwater Licensing
Under the Water Act 1912 and Water Management Act 2000, adequate water licences are required for approvalof the mine developments. Groundwater licenses held for HVO are outlined in Table 2-3.
Table 2-3 HVO Groundwater Licenses
License Number Description WSP Water Source -Management Zone
ApprovedExtraction
(ML)WAL 40462 HVO Pit Excavations – Alluvial
Lands BoresNorth Coast Fracturedand Porous Rock
Permian Coal Seams 2,400
WAL 40463 180
WAL 40466 460
WAL41527 HVO North – Carrington Pit 700
WAL41533 HVO North Pit Excavation 20
WAL39798 Lemington Underground(LUG) Bore
1,800
WAL18127 CarringtonBB1
Hunter Unregulatedand Alluvial WaterSources
Hunter RegulatedRiver Alluvial WaterSource – UpstreamGlennies CreekManagement zone
383
WAL18158 Ollenberry 65
WAL18307 HVO West – ParnellsCreek Dam (DiversionWorks Bywash)
Jerrys ManagementZone JerrysManagement Zone
500
WAL18327 HV Loading Point PumpBayswater Creek(Diversion Works)
150
WAL36190 HVO North, old farm bore 120
WAL23889 Greenleek Lower Wollombi BrookWater Source
144

HV Operations Pty LtdHunter Valley Operations2019 Annual Groundwater Review
SLR Ref No: 620.12182.00000-R13Filename: 620.12182.00000-R13-v3.0.docx
March 2020
Page 13
License Number Description WSP Water Source -Management Zone
ApprovedExtraction
(ML)WAL962(20AL201237)
Surface water access – WestPit area
Hunter RegulatedRiver Water Source
Hunter River (Zone 1b)between GoulburnRiver junction andGlennies Creekjunction.
3,165
WAL970, WAL1006& WAL1070(20AL201256,20AL201337 &20AL201500)
Surface water access – HVONorth and HVO South areas
Hunter River (Zone 2a)between GlenniesCreek junction andWollombi Brookjunction.
1,500(500 each)
2.4 Groundwater Conditions
In accordance with the development consent approval conditions, HVO are required to prepare and implementa Water Management Plan (WMP) to the satisfaction of the Secretary. Table 2-4 presents a summary of therelevant groundwater conditions from the development consent and WMP. The table identifies where theconditions relating to routine groundwater monitoring for 2019 have been addressed.
Table 2-4 Groundwater Conditions within WMP
Approval Condition Condition Where Addressed
Sch. 3, Cond. 27(c)(PA 06_0261)
A groundwater monitoring programme thatincludes:
· Additional baseline data of groundwaterlevels yield and quality in the region, andprivately-owned groundwater bores, whichcould be affected by the project;
See WMPNo private bores predicted to be
impacted for current approvedoperations and no monitoring of
private bores.
· Groundwater impact assessment criteria,including trigger levels for investigating anypotentially adverse groundwater impacts ofthe project; and
See Section 4.3 for criteria Section 5comparison to triggers
· A programme to monitor:o Groundwater inflows to the open cut
mining operations; and
See WMP
o Impacts of the project on the region’saquifers, any groundwater bores, andsurrounding watercourses, and inparticular, the Hunter River andWollombi Brook and adjacent alluvium;and
See Section 5
Sch. 3, Cond. 27(c) A Groundwater Management Plan, whichincludes:

HV Operations Pty LtdHunter Valley Operations2019 Annual Groundwater Review
SLR Ref No: 620.12182.00000-R13Filename: 620.12182.00000-R13-v3.0.docx
March 2020
Page 14
Approval Condition Condition Where Addressed
(DA450-10-2003) · Detailed baseline data on groundwaterlevels, yield and quality in the region, andprivately- owned groundwater bores, thatcould be affected by the development;
See WMP
· Groundwater assessment criteria, includingtrigger levels for investigating anypotentially adverse groundwater impacts;
See Section 4.3 for criteria andSection 5 for comparison to
triggers
· A programme to monitor:o Groundwater inflows to the open cut
mining operations;See WMP
o the impacts of the development on:§ The alluvial aquifers, including
additional groundwater monitoringbores as required by NOW;
See Section 5.2.1
§ The effectiveness of the lowpermeability barrier;
See Section 5.2.3
o Base flows to the Hunter River; Groundwater trends reviewed inSection 5.2
o Any groundwater bores on privately-owned land that could be affected bythe development;
No private bores predicted to beimpacted for current approved
operations and no monitoring ofprivate bores.
o Groundwater dependent ecosystems,including the River Red Gum FloodplainWoodland EEC located in the HunterRiver alluvium;
See WMP
o The seepage/leachate from waterstorages, backfilled voids and the finalvoid;
See Section 5.2.3 – includingdiscussion on groundwater
trends within North Pit spoil.
o The development, including anindependent review of the model, everythree years and comparison ofmonitoring results with modelledpredictions; and
See Section 5.5
o A plan to respond to any exceedancesof the groundwater assessmentcriteria.
See Section 6.2
Sch. 3, Cond. 27(c)(DA450-10-2003)
· A programme to validate and recalibrate (ifnecessary) the groundwater model for thedevelopment, including an independentreview of the model every 3 years, andcomparison of monitoring results withmodelled predictions;
See Section 5.5
HVO South Statement ofCommitments
In addition to the mitigation measures undertakenat HVO for groundwater management, thefollowing controls specific to the proposalwill be implemented:
See Surface Water Review

HV Operations Pty LtdHunter Valley Operations2019 Annual Groundwater Review
SLR Ref No: 620.12182.00000-R13Filename: 620.12182.00000-R13-v3.0.docx
March 2020
Page 15
Approval Condition Condition Where Addressed
· Groundwater Flow To and From Rivers:o development of protocols for monitoring
and reporting of NOW stream gaugeresults to clearly record any reductions inflows that are attributed to mining. Thiswill include monitoring Hunter Riverflows immediately up gradient anddown gradient of the site. In addition,consideration will be given to tying inspecific CNA water level recordings withcurrent NOW gauging locations;
o monitoring of groundwater elevationswithin alluvium between the HunterRiver and the Cheshunt Pit; and
See Section 5.2.1.3
o measured groundwater elevations andriver flow will be assessed againstpredictions to determine whetherapplication of additional managementmeasures is required; and
See Section 5.5
o offset seepage to pits in accordance withregulatory requirements.
See WMP
Additional conditions are in place for the approved Carrington West Wing; however, mining has not commencedhere and there are no current plans to commence these operations in the near future.
Groundwater monitoring is conducted in accordance with the Groundwater Monitoring Programme outlinedwithin Appendix A of the WMP. The programme outlines groundwater monitoring frequency, parameters to betested and groundwater triggers for electrical conductivity (EC) and pH. The WMP was updated in October 2018,including updates to the monitoring network and trigger levels. This annual review is based upon the monitoringand reporting requirements documented within the October 2018 version of the WMP. Further discussion onthe groundwater monitoring programme and triggers is included in Section 4.

HV Operations Pty LtdHunter Valley Operations2019 Annual Groundwater Review
SLR Ref No: 620.12182.00000-R13Filename: 620.12182.00000-R13-v3.0.docx
March 2020
Page 16
3 Hydrogeological SettingThis section presents a brief summary of the hydrogeological setting for HVO. This includes discussion onclimate, terrain, drainage, geology and groundwater bearing units.
3.1 Climate, Terrain and Drainage
3.1.1 Climate
The climate of the HVO region can be classed as temperate and is characterised by hot summers and mild drywinters. Rainfall data is available from the Scientific Information for Land Owners (SILO) database of historicalclimate records for Australia (DSITI, 2015). This service interpolates rainfall and evaporation records fromavailable stations for an area within 100 km of the search coordinates, which was Latitude -32.50/Longitude151.00. Climatic data was obtained between 01/01/1900 to 01/01/2020. Table 3-1 provides the averagemonthly rainfall data, as well as the 2019 monthly data from SILO.
A cumulative deviation from mean (CDM) rainfall plot is provided as Figure 3-1 to illustrate long term climatetrends in the HVO area. The CRD graphically shows trends in recorded rainfall compared to long-term averagesand provides a historical record of relatively wet and dry periods. A rising trend in slope in the CRD graphindicates periods of above average rainfall, whilst a declining slope indicates periods when rainfall is belowaverage. A level slope indicates average rainfall conditions. As shown in Figure 3-1 below, the region hasgenerally experienced below average rainfall from 2016.
Table 3-1 Long Term Average and 2019 Climate Data
Rainfall (mm) Jan Feb Mar Apr May Jun Jul Aug Sep Oct Nov Dec Total
AverageHistorical 73.0 71.1 60.3 46.4 38.9 46.1 39.3 34.5 38.5 50.1 60.1 67.0 625.3
2019Rainfall 58.1 23.0 143.6 1.9 17.6 9.9 10.3 20.8 28.6 5.6 23.5 0.7 343.6

HV Operations Pty LtdHunter Valley Operations2019 Annual Groundwater Review
SLR Ref No: 620.12182.00000-R13Filename: 620.12182.00000-R13-v3.0.docx
March 2020
Page 17
Figure 3-1 Cumulative Rainfall Departure and Monthly Rainfall
3.1.2 Terrain and Drainage
The HVO site terrain and surface drainage is dominated by the easterly flowing Hunter River, which dissects thecomplex in a general east-west direction. Ground elevations range between 60 m Australian Height Datum(mAHD) along the Hunter River alluvial plains to 180 mAHD in the northern parts of HVO North and in thewestern parts of HVO South. Minor ephemeral drainage features are also present around HVO North (i.e.Parnells Creek, Farrells Creek and Bayswater Creek) and HVO South (Wollombi Brook), draining into the HunterRiver.
Real time stream flow data is monitored along the Hunter River and Wollombi Brook at DPI water gaugingstations via the Hunter Integrated Telemetry System (HITS). Time series river water elevations (mean level abovezero gauge elevation) is presented in Figure 3-2 for three HITS stations (Hunter River @ Liddell, Hunter River @U/S Foy Brook and Wollombi Brook @ Warkworth) as well as four locations monitored monthly at HVO alongthe Hunter River (WL03, WL05, WL10 and WL14).

HV Operations Pty LtdHunter Valley Operations2019 Annual Groundwater Review
SLR Ref No: 620.12182.00000-R13Filename: 620.12182.00000-R13-v3.0.docx
March 2020
Page 18
Figure 3-2 Surface Water Levels
As shown in Figure 3-2, over 2019 stream elevations within the Hunter River ranged from 66 mAHD upstreamat Liddell, down to 49 mAHD at Foy Brook. Review of stream discharge for the Hunter River at Foybrook (210126)indicates discharge rates peaked during the period March to April 2019 with the highest flow of 12,041 ML/day(1/4/2019) recorded. For the remainder of the year stream discharge remained below 200 ML/day. Over 2019,stream elevations within Wollombi Brook remained fairly static, ranging between 48.52 mAHD and 48.54 mAHD,review of stream discharge shows the Wollombi Brook has not flowed since 2017
3.2 Geology
HVO lies within the Hunter Coalfields, which are dominated by the Permian aged Whittingham Coal Measuresof the Sydney Basin. The Whittingham Coal Measures are made up of the Jerrys Plains Sub-group and Van Sub-group. These units comprise economic coal seams along with overburden and interburden consisting ofsandstone, siltstone, tuffaceous mudstone and conglomerate. The Whittingham Coal Measures are truncatedto the east by the Hunter-Mooki Thrust Fault and occur at HVO as stratified (layered) sequences that dip at ashallow angle (2° to 5°) to the south-west. The coal seams subcrop to the north and east of HVO.
At HVO North the Whittingham Coal Measures are incised by a paleochannel of the Hunter River (Figure 3-3).The properties and extent of the paleochannel were assessed and mapped by MER (2008). The paleochannelcomprises heterogeneous distribution of silts, sands and gravels.
Along the Hunter River and Wollombi Brook thin Quaternary alluvial deposits unconformably overlie thePermian strata. The alluvial deposits comprise surficial fine grained sediments (i.e. silts and clays). Along majorwatercourses (i.e. Hunter River and Wollombi Brook) the surficial sediments overly basal sands and gravels thatare between 7 m to 20 m thick.

HV Operations Pty LtdHunter Valley Operations2019 Annual Groundwater Review
SLR Ref No: 620.12182.00000-R13Filename: 620.12182.00000-R13-v3.0.docx
March 2020
Page 19
Table 3-2 presents a summary of site geology and Figure 3-3 presents a map of the geology of the HVO site andsurrounds.
Table 3-2 HVO Generalized Stratigraphy
Age Stratigraphic Unit Description
Cainozoic Quaternarysediments -alluvium (Qa)
Surficial alluvium (Qhb) Shallow sequences of clay, silty sand and sand.
Productive basal sands/gravel(Qha)
Basal sands and gravels along majorwatercourses (i.e. Hunter River).
Silicified weathering profile (Czas) Silcrete
Alluvial terraces (Cza) Silt, sand and gravel
Jurassic Volcanics (Jv) Flows, sills and dykes
Permian Whittingham CoalMeasures
Jerrys Plains Sub-group (Pswj) Coal bearing sequences interbedded withsandstone and siltstone.Coal seams (youngest to oldest) includeWhybrow Seam, Redbank Creek Seam, WamboSeam, Whynot Seam, Blakefield Seam, GlenMunro Seam, Woodlands Hill Seam, ArrowfieldSeam, Bowfield Seam, Warkworth Seam, MtArthur Seam, Piercefield Seam, Vaux Seam,Broonie Seam and Bayswater Seam.
Archerfield Sandstone Lithic sandstone marker bed.
Vane Sub-group (Pswv) Coal bearing sequences interbedded withsandstone and siltstone.Coal seams (youngest to oldest) includeLemington Seam, Pikes Gully Seam, Arties Seam,Liddell Seam, Barrett Seam and Hebden Seam.

Qa
Qa
Qa
Qa
Qa
Qa
Qa
Qa
Psl
Psl
Psl
Psl
Psl
Psl
Psl
Psl
Psl
Pms
Pms
Pms
Pms
Pms
Tv
Jv
Jv
Jv
Jv
Jv
Jv
Jv
Jv
Jv
Jv
Jv
Jv
Cz
Cz
Pswj
Pswj
Pswj
Pswj
Pswj
Pswj
Pswj
Pswj
Pswj
Pswj
Pswj
Pswj
Pswj
Pswj
Pswj
Pswj
Pswj
Pswj
Pswj
Pswj
Pswj
PmbPmb
Pmb
Pmb
Pmb
Pmb
Pswv
Pswv
Pswv
PswvPswv
Pswv
Pswv
Pswv
Pswv
Pswv
Pswv
Pswv
Pswv
Pswv
Pswv
Pswv
Pswv
Pswv
Pswv
Pswv
PmmPmm
Pmm
Pmm
Pmm
Pmm
Pmm
Pmm
Pmm
Pmm
Pmm
Pmm
Pmm
RnRn
Rn
Rn
Pswc
Pswc
Pswc
Pswc
Pswc
West Pit Ravensworth
Narama
CarringtonPit
North Pit
Riverview Pit
LemingtonSouth Pit
Mt ThorleyWarkworth
United
Wambo
NorthVoid DM6
Glider Pit
CarringtonWest Wing
Area
Alluvial Lands
Central TSF
Parnell'sCreek Dam
Bob's Dump
Cheshunt Pit
Dam 1N
NEWENGLAND HIGHWAY
GOLDEN HIGHWAY
MITCHELLS FLAT ROAD
PUTTY ROA
D
300000 305000 310000 315000 320000 325000 330000
639000
0639
5000
640000
0640
5000
641000
0
H:\P
rojec
ts-SL
R\62
0-BNE
\620-B
NE\62
0.121
82 H
VO G
round
water
Com
plian
ce\06
SLR
Data
\01 G
IS\01
ArcG
IS\SL
R620
1218
2_F0
2_Ge
ology
_002
.mxd
Mine AreasPalaeochannel (MER)
Hunter Coalfields 100k GeologyQa - Quaternary Alluvium
Tv - Tertiary BasaltJv - Jurassic VolcanicsRn - Narrabean GroupPsl - Newcastle Coal Measures
Pswj - Jerrys Plains SubgroupPms - Muree SandstonePgr _ Rowan FormationPswv - Archerfield Ss. Vane Subgroup
Pswc - Saltwater Creek FormationPmm - Mulbring SiltstonePmb - Branxton FormationCz - Carboniferous tuff and ignimbrite
0 1 2 3 4Kilometres
Hunter Valley Operations2019 Annual Groundwater ReviewSurface Geology
I
www.slrconsultingaustralia.com.au
Sheet Size : A3
14-Feb-2019GDA 1994 MGA Zone 56
Scale:1:100,000
Figure 3-3

HV Operations Pty LtdHunter Valley Operations2019 Annual Groundwater Review
SLR Ref No: 620.12182.00000-R13Filename: 620.12182.00000-R13-v3.0.docx
March 2020
Page 21
3.2.1 Groundwater Units
The principal groundwater units at HVO and its immediate surrounds are the productive alluvium associatedwith the Hunter River and Wollombi Brook, and the Permian coal seams of the Whittingham Coal Measures.Description of the groundwater units was derived from historical groundwater assessment reports, discussed inSection 2.2.
3.2.2 Alluvium
The Quaternary alluvium is an unconfined groundwater system that is recharged by rainfall infiltration,streamflow and upward leakage from the underlying stratigraphy, particularly in undisturbed areas (i.e. awayfrom active mining). The potentiometric surface and flow direction within the alluvium is a subdued reflectionof topography. Groundwater within the Hunter River alluvium flows in an easterly direction, while water withinthe Wollombi Brook alluvium flows in a north to north-easterly direction towards the Hunter River.
Regionally, the Hunter River and Wollombi Brook are predominantly gaining water from the surroundingalluvium, as well as from rainfall and regulated flow (i.e. dam releases). However, there are also areas where therivers recharge the underlying alluvium. These losing conditions can occur around areas of active mining, wherethe hydraulic gradient is increased due to depressurisation of the underlying coal measures. Losing conditionsalso occur within the more topographically elevated tributaries of the main water courses, where the watertable is deeper and not connected directly to the streams.
While “less productive” groundwater within the surficial alluvium does not meet the ANZECC (2000) waterquality guidelines for stock water supply, the “highly productive” alluvium (basal sands and gravels) is consideredsuitable for stock water supply from a water quality perspective. However, most agricultural producers (cropand cattle) utilise surface water resources (Hunter River and Wollombi Brook) in preference to alluvialgroundwater.
The alluvial aquifer of the Hunter River supports Carrington Billabong, an ephemeral freshwater wetland locatedsouth of Carrington Pit that is considered a Groundwater Dependant Ecosystem (GDE). Alluvial groundwaterlevels around Carrington Billabong have remained relatively stable during active mining at Carrington Pit. This isdue to installation of a barrier wall through the unconsolidated alluvial sediments, which separates the Billabongfrom Carrington Pit. The stable alluvial groundwater levels in this area are also taken to indicate limited hydraulicconnection between the nearby paleochannel alluvium and the underlying depressurised coal measures.
3.2.3 Permian Coal Measures
The Whittingham Coal Measures outcrop across the north to east of HVO. The coal measures form unconfinedgroundwater systems at outcrop, becoming semi-confined to confined as they dip towards the south-west.
Recharge occurs from direct rainfall to the ground surface, infiltrating into the formations through the thin soilcover and weathered profile. The coal measures also occur at subcrop in localised zones beneath alluviumassociated with the Hunter River and Wollombi Brook, where the unit is recharged by downward seepage wheregradients promote this flow.
The coal seams are typically moderately to slightly permeable, whilst the hydraulic conductivity of theinterburden material is generally less than coal seams but is more variable, depending on the predominance offractures in the rock mass. The hydraulic conductivity of the coal seams generally decreases with depth due tothe closure of the cleats with increasing stratigraphic pressure.

HV Operations Pty LtdHunter Valley Operations2019 Annual Groundwater Review
SLR Ref No: 620.12182.00000-R13Filename: 620.12182.00000-R13-v3.0.docx
March 2020
Page 22
The direction of groundwater flow for the Whittingham Coal Measures is influenced by the local geomorphologyand structural geology, as well as the long history of mining within the region which has significantly alteredgroundwater flow paths within the Permian units. Groundwater flow in the Permian aquifers on a regional scalefollows the regional topography, flowing in a north-easterly direction. However, on a local scale groundwaterlevels show drawdown impacts associated with the extensive active mining areas. Groundwater discharge fromthe Whittingham Coal Measures currently occurs as discharge to active mining and abstraction bores, as well asupward seepage to the Quaternary alluvium where hydraulic gradients promote this flow.
There is no significant usage of groundwater from the Permian coal measures, likely due to the poor quality thatgenerally exceeds ANZECC (2000) water quality guidelines for stock supply, and presence of perennial surfacewater flows (Hunter River and Wollombi Brook) and the more productive alluvial aquifer.

HV Operations Pty LtdHunter Valley Operations2019 Annual Groundwater Review
SLR Ref No: 620.12182.00000-R13Filename: 620.12182.00000-R13-v3.0.docx
March 2020
Page 23
4 Groundwater Monitoring
4.1 Groundwater Monitoring Program
Groundwater monitoring is conducted at HVO in accordance with the HVO WMP, specifically the GroundwaterManagement Plan and Groundwater Monitoring Programme. The monitoring results are used to establish andmonitor trends in physical and geochemical parameters of surrounding groundwater potentially influenced bymining.
The monitoring programme at HVO measures the Standing Water Level (SWL) in monitoring bores, reported aselevation (mAHD). The data is compared against background data, EIS predictions and historical trends as ameans of assessing any HVO related impacts to the quantity of groundwater in the various aquifers.
The monitoring programme at HVO also assesses the quality of groundwater against background data andhistorical trends. Groundwater quality is evaluated through the parameters of pH and electrical conductivity(EC). On a periodic basis (nominally once per annum) a comprehensive suite of analytes is measured, includingmajor anions, cations and metals. Prior to sampling for comprehensive analysis, bore purging is undertaken toensure a representative sample is collected.
Groundwater quality monitoring data is reviewed on a quarterly basis. The review involves a comparison ofmeasured pH and EC results against internal trigger values which have been derived from the historical data set.Trigger limits are calculated as the 95th percentile maximum value (EC and pH) and the 5th percentile minimumvalue (pH only) from data collected since 2011. Trigger levels have been set based on geographical proximityand target stratigraphy.
The groundwater monitoring network at HVO has evolved over time and includes 127 groundwater monitoringpoints that require routine monitoring in accordance with the 2018 WMP, as well as other historical monitoringlocations. The bores are installed into a number of geologic units. As outlined within the WMP, bores aregrouped into one of eight Locations, as summarised below:
· West Pit (HVO North)
· North Pit (HVO North – historical mine area fully rehabilitated)
· Carrington (HVO North – historical mine area)
· Carrington West Wing - CWW (HVO North – approved mine area but not yet commenced)
· Cheshunt/North Pit (HVO North and HVO South - bores located between North Pit and Cheshunt Pit)
· Cheshunt (HVO South – south of Hunter River)
· Lemington South – Lemington (HVO South – near Wollombi Brook)
· Southern (HVO South – unmined area east of Lemington South Pit 1)
The details of each of the HVO monitoring bores as well as each bores respective monitoring programme areprovided in Appendix A and the location of the bores are presented in Figure 4-1 to Figure 4-3.

HV Operations Pty LtdHunter Valley Operations2019 Annual Groundwater Review
SLR Ref No: 620.12182.00000-R13Filename: 620.12182.00000-R13-v3.0.docx
March 2020
Page 24
The 103 compliance bores have trigger levels set for water quality (EC and pH) and five for water quality andwater levels (CFW55R, CFW57, CGW52a, CGW53a and CGW55a). It is noted there are 104 bores listed in thetrigger table of the WMP, but no triggers are assigned for one bore (CGW46). It is recommended that triggersbe assigned during the next revision of the WMP. An additional ten bores were installed in 2018 to monitor thearea to the south of the Carrington Pit/North Void. These bores (GW-120 to GW-129) are yet to be included inthe WMP, however, they have been routinely monitored since installation.
As outlined in Appendix A, full laboratory water quality analysis is required to be conducted for 65 bores, either6-monthly (27 bores) or annually (38 bores). There are also two different laboratory analytical suites used, asfollows:
Comprehensive analysis 1
· TDS;
· Major Ions (Ca, Cl, K, Na, SO4 (or S), CO3);
· Total Alkalinity, Bicarbonate Alkalinity, Carbonate Alkalinity, Hydroxide Alkalinity; and
· Metals (Al, As, B, Cd, Cu, Hg, Mg, Ni, Pb, Se, and Zn).
Comprehensive analysis 2
· TDS;
· Major ions (Ca, Cl, K, Na, SO4 (or S), CO3);
· SiO2;
· Total Alkalinity, Bicarbonate Alkalinity, Carbonate Alkalinity, Hydroxide Alkalinity;
· Metals (Al, As, B, Be, Cd, Co, Cu, F, Fe, Hg, Mg, Mn, Pb, Rb, Sb, Se, Sr, Zn); and
· Nutrients (Ni, NH3, NO2, NO3 and P).

!(
!(
!(
!(
!(
!(!(
!(!(!(
!(!(
!(
!(
!(
!(!(
!(!(
!(
!(
!(
!(
!(
CGW32
DM1
G1G2G3
GW_100GW_100a
GW_101GW_101a GW_102
GW_103 GW_104
GW_105GW_106
GW_110
GW_111
GW_112
NPz1
NPz2
NPz3
NPz4
NPz5
West Pit
Ravensworth
NaramaHVO North
Cumnock
302500 305000 307500 310000 312500
640500
0640
7500
641000
0641
2500
\\au.s
lr.loc
al\Co
rporat
e\Proj
ects-
SLR\
620-B
NE\62
0-BNE
\620.1
2182
HVO
Grou
ndwa
ter C
ompli
ance
\06 SL
R Da
ta\01
GIS
\01 Ar
cGIS
\mxd
\SLR
6201
2182
_F01
_Grou
ndwa
ter_0
02.m
xd
!( Monitoring point
0 200 400 600 800m
Hunter Valley Operations2019 Groundwater Level and Quality ReviewGroundwater Monitoring Network – Carrington and North Pit
I
www.slrconsultingaustralia.com.au
Sheet Size : A3
24-Mar-2020GDA 1994 MGA Zone 56
Scale:1:35,000
1
2
3 Figure 4-2

!( !(!(
!(
!(!(
!(
!(!(!(!(
!( !(
!(
!(!(
!(
!(
!(
!(
!(!(
!(
!(!(
!(!(
!(!(!(
!(!(
!(!(!(!(
!(
!(
!(
!(
!(
!(
!(
!(
!(!(
!(!(
!(
!(
!(!(
!(!(
!(
!(
!(
!(
!(
!(!(
!(!(
!(!(!(
!(
!(!(
!(
!(
!(
!(!(
!(
!(
!(
!( !(
!(
!(
!(
!(!(
!(
!(
!(
!(
!(
!(!(
!(
!(
!(
!(
!(
!(
!(
!(
!(
!( !(!(!(
!(
!(
!(!(!(
!(
!(
!(
!(
!(
!(
!(
!(
!(!(
!(
!(
!(
!(
!(
!(
!(
!(
4032P 4033P4034P4035P
4036C4037P
4038C
4039C_14040P4051C4052P
4053P
4113P
4116P4117P
4119P
BC1
BC1a
BUNC14
BUNC39A(Deep)BUNC44D
BUNC45A
BUNC46D
BZ1-1BZ2A(1)
BZ3-1BZ4A(1)
BZ8-2
C1(WJ039)
CFW55R
CFW57
CFW59
GW_119
CGW39
CGW45 CGW46CGW46a
CGW47
CGW49
CGW51a
CGW52CGW52aCGW53
CGW54a
CGW55a
CGW6
CHPZ10ACHPZ11A
CHPZ12ACHPZ12DCHPZ13ACHPZ13D
CHPZ14ACHPZ1A
CHPZ2ACHPZ3A
CHPZ4A
CHPZ5A
CHPZ7A
CHPZ8A
CHPZ9A
DM3
DM4
DM6 Dewatering BoreDM7
E5038/5
F1.5(WF533)
GA3
GS1 GS2
GS5
GS8
GW_107
GW_108
GW_109
GW_113
GW_114
GW_115
GW_117
GW9701
GW9702
GW9710
H5032/5
H5038/5
HG2HG3
Hobden's Well
HV3
MB14HVO01MB14HVO02 MB14HVO03
MB14HVO04
MB14HVO05
PZ1CH200PZ2CH400
PZ3CH800
PZ4CH1380
PZ5CH1800
Trench
GW_116
HG1
BUNC46D-barrys
CHPZ8DBUNC45DGW-129
GW-120
GW-121GW-123
GW-124
GW-125
GW-126 GW-127
GW-128
GW-122
307500 310000 312500 315000 317500
639750
0640
0000
640250
0
\\au.s
lr.loc
al\Co
rporat
e\Proj
ects-
SLR\
620-B
NE\62
0-BNE
\620.1
2182
HVO
Grou
ndwa
ter C
ompli
ance
\06 SL
R Da
ta\01
GIS
\01 Ar
cGIS
\mxd
\SLR
6201
2182
_F01
_Grou
ndwa
ter_0
02.m
xd
!( Monitoring point
0 200 400 600 800m
Hunter Valley Operations2019 Groundwater Level and Quality ReviewGroundwater Monitoring Network – Carrington and North Pit
I
www.slrconsultingaustralia.com.au
Sheet Size : A3
24-Mar-2020GDA 1994 MGA Zone 56
Scale:1:30,000
1
2
3 Figure 4-2

!(
!(
!(
!(!(
!(
!(!(
!(!(!(!(
!(!(
!(
!( !(
!(
!(!(!(!(
!(
!(!(!(!(
!(!(
!(!(
!(
!(
!(
!(
!(
!(
!(
!(
!(
!(
!(
!(
!(
!(
Appleyard Farm
B334(BFS)
B425(WDH)
B631(BFS)
B925(BFS)
C122(BHS)C122(WDH)
C130(AFS1)C130(ALL)
C317(BFS)
C613(BFS) C621(BFS) C630(BFS)
C809 (GM/WDH)C919(ALL)D010(BFS)
D214(BFS)
D317(ALL)D317(BFS)
D406(AFS)D406(BFS)
D510(AFS)D612(AFS)
D807(BFS)
PB01(ALL)
SR001
SR002
SR003
SR004
SR005
SR006
SR007
SR008
SR009
SR010
SR011
SR012
312500 315000 317500 320000
639250
0639
5000
639750
0
\\au.s
lr.loc
al\Co
rporat
e\Proj
ects-
SLR\
620-B
NE\62
0-BNE
\620.1
2182
HVO
Grou
ndwa
ter C
ompli
ance
\06 SL
R Da
ta\01
GIS
\01 Ar
cGIS
\mxd
\SLR
6201
2182
_F01
_Grou
ndwa
ter_0
02.m
xd
!( Monitoring point
0 200 400 600 800m
Hunter Valley Operations2019 Groundwater Level and Quality ReviewGroundwater Monitoring Network – Carrington and North Pit
I
www.slrconsultingaustralia.com.au
Sheet Size : A3
24-Mar-2020GDA 1994 MGA Zone 56
Scale:1:25,000
1
2
3 Figure 4-2

HV Operations Pty LtdHunter Valley Operations2019 Annual Groundwater Review
SLR Ref No: 620.12182.00000-R13Filename: 620.12182.00000-R13-v3.0.docx
March 2020
Page 28
4.2 Groundwater Monitoring Methodology
HVO engages external contractors AECOM to carry out sampling and analysis. SLR understands that annualsampling is undertaken in accordance with relevant Australian Standards and other regulatory guidelines withrepresentative groundwater quality samples collected. Samples are analysed by laboratories that are NationalAssociation of Testing Authorities (NATA) accredited or equivalent for the parameters being analysed.
It was previously identified by SLR (2018) that monthly to quarterly sampling methodology undertaken by theexternal contractors was not providing representative samples. This resulted in trigger exceedances. Thissampling methodology was reviewed by HVO and improvements in sampling technique made to ensurerepresentative samples are collected.
4.3 Groundwater Triggers
The WMP includes groundwater assessment criteria, including trigger levels for investigating any potentiallyadverse groundwater impacts. These criteria are summarised in Table 4-1.
Table 4-1 Groundwater Impact Assessment Criteria
Criteria Description
1The groundwater level does not decline more than 2 m at any privately owned bores and wellsidentified in the HVO complex EA’s (with the exception of a single bore on land owned by theRavensworth mine (10011459) which is predicted to decline by a maximum of 2.7 m.)
2Water quality does not lower the beneficial use category of the groundwater source beyond 40 mfrom the mining pit. This will be identified using groundwater triggers (EC) for individualmonitoring bores specified in the Groundwater Monitoring Programme.
3The alluvial groundwater source within 40 m of the recognised GDE communities does notexperience more than a 10% reduction in piezometric levels predicted in the EA’s for HVO Northand HVO South (allowing for typical climatic variation).
For Criteria 1, assessment of groundwater level trends over 2019 is discussed in Section 5.2. There are no privatebores identified within the WMP and no routine monitoring of private landholder bores. However, to ensure noadditional impacts are observed than were predicted for current approved operations (including potential forimpacts on landholder bores), verification of the model predictions is undertaken in accordance with Condition27(c) of the Development Consent conditions. Discussion on the model verification is included in Section5.5.Criteria 2 relates to the trigger levels established for electrical conductivity (EC) based on the 95th percentileof baseline data, and the trigger levels for pH based on the 5th and 95th percentiles, as presented in the WMPand summarized Table 4-2. Groundwater quality readings from the site monitoring bores have been comparedto the relevant trigger levels in Section 5.3.
For Criteria 3, it is assumed that direct pumping from surface water is assessed as part of the surface waterannual review. Predicted ‘indirect’ take of water from alluvium and subsequent reductions in baseflowcontributions are discussed in Section 5.4. These predictions are derived from the existing regional-scalenumerical groundwater model developed by AGE (2017) as part of the HVO South Modification 5.

HV Operations Pty LtdHunter Valley Operations2019 Annual Groundwater Review
SLR Ref No: 620.12182.00000-R13Filename: 620.12182.00000-R13-v3.0.docx
March 2020
Page 29
Table 4-2 Groundwater Quality Triggers by Location
Location Target Seam/Stratigraphy
EC (95th)µS/cm
pH (5th) pH (95th)
Carrington Alluvium 6,154 7.0 8.0
Carrington Interburden 10,824 6.7 7.4
Carrington Broonie 8,628 6.8 7.1
Carrington West Wing Alluvium 2,775 7.0 7.5
Carrington West Wing LBL 3,531 7.3 7.6
Cheshunt Mt Arthur 3,350 6.5 7.6
Cheshunt Interburden 6,213 6.9 7.7
Cheshunt Piercefield 2,596 6.4 6.8
Cheshunt / North Pit Alluvium 4,462 6.6 7.5
Lemington South Bowfield 12,440 6.7 7.9
Lemington South Woodlands Hill 20,240 6.6 7.6
Lemington South Arrowfield 15,324 6.8 7.5
Lemington South Alluvium22,7003,938
6.86.6
7.07.7
Lemington South Glen Munro 1,894 6.5 7.2
Lemington South Interburden 11,408 6.7 7.1
North Pit Spoil 12,460 6.5 7.8
West Pit Sandstone / Siltstone 13,428 6.9 8.0
The WMP also includes individual groundwater trigger levels for five bores in the Carrington alluvium. Eachindividual trigger level and corresponding groundwater level are shown in Table 4-3.
Table 4-3 Carrington Alluvium SWL Trigger Levels
Bore SWL Trigger (mAHD) (5th Percentile) SWL Trigger (mAHD) (95th Percentile)
CFW55R 57.06 59.41CFW57 58.24 59.24CGW52a 58.23 60.52CGW53a 58.33 59.19CGW55a 57.49 58.43

HV Operations Pty LtdHunter Valley Operations2019 Annual Groundwater Review
SLR Ref No: 620.12182.00000-R13Filename: 620.12182.00000-R13-v3.0.docx
March 2020
Page 30
4.4 Trigger Investigations
The 2018 annual groundwater review conducted by SLR (2019) reviewed exceedances for groundwater quality.A range of investigations were conducted at HVO over 2019 to address recommendations for bores with triggerthreshold exceedances. A summary of the trigger exceedances are included below, with discussion on findingsfrom investigations where relevant:
· 4116P – bore within spoil at Alluvial Lands constructed to 25.8 m depth. The bore recorded unique ECtrends compared to surrounding bores and the trigger exceedances may relate to bore condition. Thenetwork review recommended further review of the condition of the bore and removal of the borefrom the network. Monitoring was recommended for adjacent bore 4117P that intersects the spoil atthe base of Alluvial Lands Pit. However, following investigation during 2019, it was determined thatboth 4116P and 4117P are blocked. It is recommended that the bores be purged, and if unsuccessful,a replacement bore installed and included in the monitoring network.
· HG2 – bore within weathered overburden overlying the Mt Arthur Seam to the north of Cheshunt Pit.The bore recorded unique pH trends compared to surrounding bores and the trigger exceedances mayrelate to bore condition but requires further review and monitoring. It was recommended that thecondition, construction and geology of bore HG2 be confirmed. It was also recommended that watersampling for HG2 should include analysis of dissolved metals and major ions and data reviewed tobetter understand the potential cause and for early indication of potential adverse changes in waterquality. This was included in the network review and will be captured with revision of the WMP;
· Bores D612(AFS) and C130(WDH) – located near Lemington South Pit intersect the Arrowfield Seam(AFS) and Woodland Hill Seam (WDH). The bores recorded a trend of rising EC with declininggroundwater levels. The decline in groundwater levels was found by SLR (2019) to be potentially dueto abstraction from the LUG Bore or associated with Lemington Pit final void. Modelling was conductedto predict the influence of various abstraction rates on water availability and impacts to the overlyingstratigraphy. These results are discussed in Section 5.2.2.4;
· Bore PB01(ALL) – bore located near Lemington South Pit that intersects the alluvium along WollombiBrook to 10.2 m depth. The bore recorded a slight decline in groundwater levels and rise in EC;however, SLR (2019) indicated this may relate to there being no reported streamflow along WollombiBrook since 2017. As discussed in Section 3.1.2 no flows have been recorded along Wollombi Brooksince 2017, which results in reduced recharge to the alluvium and subsequently reduced groundwaterlevels over time;
· D010 (GM) – bore located near Lemington South Pit and intersects the Glen Munro Seam. The borerecorded a groundwater quality trigger exceedance for EC. The trigger exceedance was found to bedue to incorrect trigger level of 1,894 µS/cm specified in the WMP that was not representative ofhistorical data. It was recommended that the groundwater trigger level for D010(GM) be updated toreflect historical data and the WMP updated to reflect this. This will be captured with revision of theWMP;
· NPz2 – bore located north-west of West Pit beyond the outcrop of coal seams mined at West Pit andextends to 62.5 m depth into interburden sequences that underlie the coal seams mined at West Pit.The bore recorded a slight rise in EC over time. Review by SLR (2019) found that the trend wasconsistent with historical levels for the bore. The purpose of the bore was checked as part of a networkreview by SLR (2019) and it was recommended that NPz2 be removed from the compliance networkwithin the WMP as the location and construction of the bore precludes it from providing an indicationof potential impacts. Bore NPz2 has now been removed from the compliance monitoring network;

HV Operations Pty LtdHunter Valley Operations2019 Annual Groundwater Review
SLR Ref No: 620.12182.00000-R13Filename: 620.12182.00000-R13-v3.0.docx
March 2020
Page 31
· BZ1-1 – located north of Cheshunt Pit and is 21.39 m deep. The bore is included in the WMP as beingwithin the alluvium; however as identified in prior annual reviews (AGE, 2013a) the bore likelyintersects interburden material. It has been recommended that this bore be updated in the WMP asintersecting interburden. This was included in the network review and will be captured in revision ofthe WMP;
· CGW46 - intersects the shallow Bayswater Seam (approximately 13 m deep) underlying alluvium onthe western limb of the paleochannel near Carrington Pit. The bore has been identified as dry, withfield readings showing sustained groundwater levels close to the base of the bore since 2012. However,it is noted that water quality samples have been collected from CGW46 during 2019. A review of thebore construction and condition has been recommended, to confirm whether the water qualitysamples are representative of the surrounding groundwater; and
· Bore C130(ALL) - located between Lemington South Pit and LUG Bore and intersects interburden.C130(ALL) recorded an EC above 11,480 µS/cm in Q1, Q2, Q3, and Q4 of 2018. The annual reviewidentified that historical readings since 2008 regularly fluctuate between 19,500 µS/cm and24,200 µS/cm for EC and 6.4 to 7.9 for pH. The trigger levels were therefore not consideredrepresentative of historical data and should be revised within the WMP. Irrespective of this, a generaltrend of rising EC with a decline in water levels has been observed for C130(ALL). This trend is furtherexplored and discussed in Section 5.3.2.4.
In 2017, trigger level exceedances for EC were also identified in Carrington bore CFW55R. Investigations wereconducted and identified potential seepage in a localised area from the North Void Tailings Storage Facility(NV TSF) to the paleochannel near the bore. This was reported to the regulatory authority, and ongoingmonitoring, management and assessment activities are being undertaken in consultation with the regulatoryauthority. This is further discussed in Section 5.2.1.2 and Section 5.3.1.2.
Also, during 2017, trigger level exceedances were recorded for pH in bore G2, near West Pit. During the triggerinvestigation the water level, pH and EC of bores G1, G2 and G3 were also reviewed. Recommendations in the2018 Annual Review included review of the condition of the bores, installation of loggers, extension of the casingheight for bore G3, measure the volume of water pumped from Parnell’s Creek Dam and review the constructionof the dam. Over 2019, the dam construction was reviewed with nothing new identified. A downhole camerainvestigation was conducted in bores G1 to G3. The screen interval was confirmed in G1 and G3. Bore G2appeared to be blocked. Bore repairs, installation of loggers, casing height extension, and dam level monitoringis still to be completed during 2020.
A review of the bore condition and construction was also recommended for PZ2CH400, BC1a, BZ1-3, BZ2A(1),BZ3-3, BZ4A(2) and B425(WDH) in the 2018 Annual Review. These investigations are planned to be undertakenduring 2020.
Other works to be completed during 2020, based on recommendations in the 2018 Annual Review, is the reviewof land use activities around D807(BFS) to understand trends and to purge bore DM4 to remove sedimentpresent.

HV Operations Pty LtdHunter Valley Operations2019 Annual Groundwater Review
SLR Ref No: 620.12182.00000-R13Filename: 620.12182.00000-R13-v3.0.docx
March 2020
Page 32
5 Monitoring Results
5.1 Data RecoveryAs per the WMP, groundwater level monitoring and sampling was carried out at 127 monitoring bores. Anadditional 15 monitoring bores not specified in the WMP were also sampled and measured as part of the sitemonitoring programme. Sites with a data capture rate of less than 100 per cent are outlined in Table 5-1.
Table 5-1 Groundwater Monitoring Data Recovery – Compliance Bores
Location Type Data Recovery Comments
4036C SWL, WQ 0% Bore dry
4037P WQ 75% Blocked in Q1
B425(WDH) WQ 0% Insufficient water to sample
BZ1-1SWL 75% Bore dry in Q2
WQ 50% Bore dry in Q2 and blocked in Q3
BZ4A(2) WQ 25% Insufficient water to sample in Q2, Q3 and Q4
C122(BFS) SWL, WQ 0% Bore dry
C919(ALL) WQ 0% Bore dry
CGW45 SWL, WQ 0% Blocked
CGW47a WQ 0% Bore dry
CHPZ2ASWL 75% Snake in bore in Q2
WQ 25% Bore blocked Q2, Q3 and Q4
CHPZ8A WQ 0% Insufficient water to sample
DM7 SWL, WQ 0% Bore dry
GW-101SWL 50% Bore dry Q3 and Q4
WQ 0% Insufficient water to sample
GW-107 WQ 0% Bore dry
GW-108 WQ 0% Insufficient water to sample
5.2 Water Levels
A summary of the water level results is provided for each of the main water bearing units (alluvium, Permiancoal measures and spoil) below. Routine water level readings for 2019 are presented in Appendix B.
5.2.1 Alluvium
Three bores were recorded as dry part way through the year (C919(ALL) in Q2, Q3 and Q4; GW-101 in Q3 andQ4; BZ1-1 in Q2). One bore was recorded as blocked in Q2 (CHPZ2A).
Most alluvial bores recorded a slight decline in groundwater levels over 2019, which corresponds with a decliningtrend in the CRD (below average rainfall). Where saturated, groundwater within the alluvium occurred between0.46 m (bore G3) and 23.3 m (bore GW-106) below surface over 2019. Discussion of water level trends is includedfor each of the mine locations from Section 5.2.1.1 to Section 5.2.1.4.

HV Operations Pty LtdHunter Valley Operations2019 Annual Groundwater Review
SLR Ref No: 620.12182.00000-R13Filename: 620.12182.00000-R13-v3.0.docx
March 2020
Page 33
5.2.1.1 West Pit
Time series groundwater levels for the five alluvial/regolith bores north and north-west of West Pit arepresented in Figure 5-1. Over 2019 groundwater elevations within the three bores (G1, G2 and G3) on the south-western side of Parnell’s Creek Dam (18W) ranged between 107.12 mAHD and 109.52 mAHD (2.42 m and 0.46 mdepth). Groundwater levels decreased slightly over 2019, consistent with rainfall trends.
Bores GW-100 and GW-101 are located along Parnell’s Creek, downslope of the dam (18W). Comparisonbetween groundwater levels and screened depths indicates the bores are likely dry and readings may relate towater within the sump at the base of the bore. Review of the bore construction log indicates GW-100 extendsto 6 m depth and has screen from 4 m to 6 m within gravels (colluvial deposit). Bore GW-101 extends to 12 mdepth and has a screen from 9 m to 12 m depth within clay. Groundwater levels within bore GW-100 show ageneral decline since 2017 from 4.2 m below top of casing (TOC) to 6.2 mTOC near the base of the bore. Thisdecline in groundwater levels appears to correspond with a general declining trend in CRD since 2017 and islikely related to reduced rainfall recharge. Bore GW-101 has recorded groundwater levels over 12 mTOC andnoted as dry or having insufficient water to sample since 2013. This may relate to the construction of the borescreen across low permeability clay.
Figure 5-1 Hydrograph of Alluvial Bores – West Pit
5.2.1.2 Carrington West Wing and Carrington
Time series groundwater levels for bores within the alluvium on the western limb of the paleochannel nearCarrington and Carrington West Wing are shown in Figure 5-2. Over 2019 groundwater elevations within thefour bores (4032P, 4034P, 4037P and 4040P) in this area ranged between 58.79 mAHD and 59.77 mAHD(10.36 m and 12.67 m depth). Groundwater levels declined in three of the bores by 0.02 m up to 0.05 m over2019, which appears to correlate with climate and stream flow trends. The groundwater level of 4032P increasedby 0.28 m over 2019. The cause for this trend is unclear as no other bores recorded this rise and there are noknown changes in land use near the bore. The bore is located outside of the mine area on land used for cattlegrazing and is located near a small stand of trees. It is recommended that the condition of the bore and localland use be reviewed to determine the cause of the increase.

HV Operations Pty LtdHunter Valley Operations2019 Annual Groundwater Review
SLR Ref No: 620.12182.00000-R13Filename: 620.12182.00000-R13-v3.0.docx
March 2020
Page 34
Figure 5-2 Hydrograph of Alluvial Bores – Carrington (Western Limb)
Time series groundwater levels for bores within the floodplain alluvium on the northern end of the paleochannel(CGW32 and GW-106) and the two bores on the western limb of the paleochannel (CGW39 and CGW47a) nearCarrington and Carrington West Wing are shown in Figure 5-3. Over 2019 groundwater elevations within thefour bores in this area ranged between 54.55 mAHD and 59.88 mAHD (12.18 m and 23.30 m depth). However,bore CGW47a was recorded as dry throughout 2019. Groundwater levels declined by 0.05 m within the boresover 2019, which appears to correlate with climate and stream flow trends and may also relate to localiseddrawdown towards the Carrington Pit final void.
Figure 5-3 Hydrograph of Floodplain Alluvial Bores – Carrington (Western Limb)

HV Operations Pty LtdHunter Valley Operations2019 Annual Groundwater Review
SLR Ref No: 620.12182.00000-R13Filename: 620.12182.00000-R13-v3.0.docx
March 2020
Page 35
Time series groundwater levels for bores within the alluvium on the five bores on the eastern limb of thepaleochannel near Carrington and Carrington West Wing are shown in Figure 5-4. The groundwater levels in allfive bores, CFW55R, CGW53a, CFW57, CGW55a, and CGW52a, remained relatively stable throughout 2019.Groundwater levels ranged between 57.44 mAHD (13.60 m depth – CGW55a) and 58.63 mAHD (11.65 m depth– CFW55R).
Figure 5-4 Hydrograph of Alluvial Bores – Carrington
Ten additional groundwater monitoring bores (GW-120 to GW-129) were installed in 2018 to the west of theNV TSF; eight bores within the alluvium, one within spoil and one with the Permian coal measures. The boreswere installed to delineate the extent of impacts and monitor response to management practices. Groundwaterlevel triggers were assigned to the existing five alluvial bores at Carrington, CFW55R, CFW57, CGW52a, CGW53aand CGW55a. Hydrographs for each of the bores and Hunter River elevations are compared to CRD in Figure 5-5to Figure 5-9. The graphs show that the five bores stayed within the trigger levels until late 2018. Following thisgroundwater levels started to decline below the 5th percentile trigger level and have continued to decline in2019. The decline in groundwater levels indicates a decline in seepage from NV TSF.

HV Operations Pty LtdHunter Valley Operations2019 Annual Groundwater Review
SLR Ref No: 620.12182.00000-R13Filename: 620.12182.00000-R13-v3.0.docx
March 2020
Page 36
Figure 5-5 Hydrograph of Alluvial Bores – Carrington – CGW57
Figure 5-6 Hydrograph of Alluvial Bores – Carrington – CGW55R

HV Operations Pty LtdHunter Valley Operations2019 Annual Groundwater Review
SLR Ref No: 620.12182.00000-R13Filename: 620.12182.00000-R13-v3.0.docx
March 2020
Page 37
Figure 5-7 Hydrograph of Alluvial Bores – Carrington – CGW52a
Figure 5-8 Hydrograph of Alluvial Bores – Carrington – CGW53a

HV Operations Pty LtdHunter Valley Operations2019 Annual Groundwater Review
SLR Ref No: 620.12182.00000-R13Filename: 620.12182.00000-R13-v3.0.docx
March 2020
Page 38
Figure 5-9 Hydrograph of Alluvial Bores – Carrington – CGW55a
Time series groundwater levels for the newly installed bores within the alluvium along the western edge of theNorth Void and south of Carrington Pit are shown in Figure 5-10. Monitoring began in the eight bores in October2018. Over 2019 groundwater elevations within the eight alluvium bores in this area ranged between58.44 mAHD and 58.91 mAHD (10.21 m and 12.30 m depth). Bore GW-121 was recorded as dry throughout2019. Groundwater levels declined by 0.04 m to 0.12 within the bores over 2019. The purpose of the monitoringis to ensure no additional seepage into the alluvium at this location. The observed decline in groundwater levelsover 2019 indicates a decline in seepage and corresponds with a general trend of below average rainfall.
Figure 5-10 Hydrograph of Alluvial Bores – Carrington/North Void

HV Operations Pty LtdHunter Valley Operations2019 Annual Groundwater Review
SLR Ref No: 620.12182.00000-R13Filename: 620.12182.00000-R13-v3.0.docx
March 2020
Page 39
5.2.1.3 Cheshunt Pit/North Pit
Time series groundwater levels for bores within the alluvium north and south of the Hunter River, betweenNorth Pit and Cheshunt Pit are shown in Figure 5-11. Two bores (CHPZ8A and BUNC45A) recorded groundwaterlevels at or below the base of the screen and are believed to be dry. Bore BZ1-1 was recorded as dry in Q2 andbore CHPZ2A was recorded as blocked in Q2. Where the alluvium is saturated, groundwater levels rangedbetween 53.94 mAHD and 60.27 mAHD (2.36 m and 17.68 m depth). With the exception of PZ2CH400,groundwater levels generally stable and increased slightly by up to 0.24 m within the alluvial bores over 2019.
Bore PZ2CH400 recorded fluctuations of up to 6.87 m between 2018 and 2019, and from March 2019 the borehas recorded a slight rise in groundwater levels of 0.28 m. Groundwater elevations indicate groundwater flowin the Hunter River alluvium follows stream flow, with higher elevations to the west at PZ3CH800 and lowestelevations at bores PZ2CH400 and PZ1CH200.
Over 2019 groundwater levels in PZ2CH400 ranged from 2.36 m (60.27 mAHD) in Q1 to 8.02 m (54.61 mAHD) inQ4, but remained higher than upstream bore PZ3CH800, by 5.24 m by the end of the year. Bore PZ2CH400 islocated immediately east of the North Pit barrier wall and around 180 m east of spoil bore 4119P. Bore 4119Precorded spoil water elevations between 53.56 mAHD and 53.85 mAHD over 2019, lower than alluvial levels atbore PZ2CH400. It was recommended that the bore construction and condition be reviewed in the 2018 AnnualReview. It is noted that this is planned to be undertaken during 2020.
It is also noted that bore BZ1-1 is included in the WMP as being within the alluvium, however as identified inprior annual reviews (AGE, 2013a) the bore likely intersects interburden material. It is recommended that thisbore be updated in the WMP as intersecting interburden.
Figure 5-11 Hydrograph of Alluvial Bores – Cheshunt/North Pit

HV Operations Pty LtdHunter Valley Operations2019 Annual Groundwater Review
SLR Ref No: 620.12182.00000-R13Filename: 620.12182.00000-R13-v3.0.docx
March 2020
Page 40
5.2.1.4 Lemington South
Time series groundwater levels for four bores within the alluvium at Lemington South, along the WollombiBrook, are shown in Figure 5-12. As shown in Figure 5-12, groundwater levels fairly stable throughout 2019 withthe a decline in groundwater levels of 0.36 m recorded within Appleyard Farm bore, which is located over 1.2 kmupstream of Lemington South Pit and within 50 m of Wollombi Brook. Stream gauge Wollombi Brook atWarkworth is located approximately 350 m upstream of the bore. The groundwater level trends show a closecorrelation with declining stream flow levels and discharge for Wollombi Brook, with no discharge recordedsince 2017.
Bore PB01(ALL) is located approximately 150 m from Wollombi Brook and shows a more muted response tostream flow with a decline in groundwater levels of 0.26 m. Bore C919(ALL) was recorded as dry in Q2, Q3 andQ4 of 2019. Bore D317(ALL) is located adjacent to the Lemington South Pit, approximately 190 m from WollombiBrook.
Over 2019 groundwater elevations within the alluvial bores Appleyard Farm and PB01(ALL) ranged between36.48 mAHD and 45.35 mAHD. Groundwater levels remained fairly stable over 2019, but showed a decline of upto 0.36 m in line with stream flow and rainfall.
Figure 5-12 Hydrograph of Alluvial Bores – Lemington South
5.2.2 Permian Coal Measures
Over 2019, two bores in the Permian coal measures were recorded as dry (4036C and C122(BFS)), and one borewas reported as blocked (CGW45). There are eight vibrating wire piezometers (VWPs) that monitor the coalseam and interburden sequences of the Permian coal measures in the Carrington mine area (GW-100a,GW-101a, GW-102, GW-103, GW-104, GW-105, GW-109 and GW-110).
Discussion in water level trends within the Permian coal measures is included for each of the mine locationsfrom Section 5.2.2.1 to Section 5.2.2.4.

HV Operations Pty LtdHunter Valley Operations2019 Annual Groundwater Review
SLR Ref No: 620.12182.00000-R13Filename: 620.12182.00000-R13-v3.0.docx
March 2020
Page 41
5.2.2.1 West Pit
Three of the four bores targeting the Permian coal measures at West Pit were monitored over 2019, bores NPz2,NPz3 and NPz5. Bores NPZ4 and NZP5 intersect the Jerrys Plains Subgroup between West Pit and Carrington Pit.NPz4 was monitored up to December 2016 before being decommissioned due to advancement of mining, andNPZ5 is planned to be decommissioned with advancement of mining in 2020. Review of the geology mapped atbore NPZ2 identified that it intersects the Saltwater Creek Formation (Pswc), and bore NPz3 intersects MulbringSiltstone. The Saltwater Creek Formation underlies the Vane Subgroup mined at West Pit. The Saltwater CreekFormation comprises laminated sequences of siltstone and sandstone, and the underlying Mulbring Siltstonecomprises low permeability siltstone and claystone units and is considered to act as a confining unit. Bore NPz3intersects Mulbring Siltstone (Pmm).
Groundwater elevations for the bores at West Pit are presented in Figure 5-13. Over 2019 groundwater levelswithin bore NPz2 declined by 0.48 m over 2019, while bore NPz3 groundwater levels declined 0.91 m over 2019.These two bores are located upslope, on the northwest side of West Pit. The cause for the groundwater trendsat NPz2 and NPz3 is unclear and would require further information regarding historical land use activities in theregion. However, based on available information, the cause for the changes in groundwater levels do not appearto correlate to mine activities conducted at West Pit. As part of a network review it was recommended that NPz2and NPz3 be removed from the compliance network within the WMP, as the location and construction of thebores precludes them from providing an indication of potential impacts. However, it is recommended thesebores remain in the monitoring program to assist with future assessments and assessment of post closuregroundwater conditions.
Bore NPz5 is located down-slope (south) of the West Pit highwall and recorded a 3.28 m decline in groundwaterlevels over 2019. This decline is likely a response to mining at West Pit, and consistent with groundwaterdrawdown predictions for the approved operations (see Section 2.2). With the removal of bores NPZ4 and NPZ5,ongoing monitoring of groundwater trends in the coal measures can be captured at VWP GW-103 to GW-105.
Figure 5-13 Hydrograph of Permian Coal Measures Bores – West Pit Bores

HV Operations Pty LtdHunter Valley Operations2019 Annual Groundwater Review
SLR Ref No: 620.12182.00000-R13Filename: 620.12182.00000-R13-v3.0.docx
March 2020
Page 42
Eight vibrating wire piezometers (VWPs) were installed in the West Pit area (GW-100a, GW-101a, GW-102,GW-103, GW-104, GW-105, GW-109, and GW-110) in 2012, intersecting the Permian coal measures. BoresGW-103, GW-104 and GW-105 are located to the south of West Pit. Bore GW-109 is located to the west ofCarrington Pit, and bore GW-110 is located north of Carrington Pit. Groundwater level trends for the VWPs arepresented in Figure 5-14. Review of the data identified that some sensors have previously failed, including VWP1(interburden) in GW-101a and VWP3 (coal seam) in GW-109. The units these sensors monitor are also monitoredby nearby bores/VWPs. It is recommended that these sensors be removed from the revised WMP. In addition,calibration details for GW-110 were not available at the time of reporting, therefore data could not be convertedand graphed. However, VWP GW-110 is located near the highwall within Carrington Pit void and may bedecommissioned. Ongoing monitoring of groundwater level recovery in spoil material near Carrington Pit voidcan continue to be conducted at bores GW-107 and GW-108.
VWP GW-100a (Barrett Seam and interburden) and VWP GW-102 (interburden) are located to the west of WestPit. GW-100a recorded relatively stable levels, while GW-102 declined over time.
VWP GW-103, VWP GW-104 and VWP GW-105 are located south of West Pit. GW-103 recorded relatively stablelevels, while GW-105 shows a gradual decline in levels over time. GW-104 VWP1 (Lower Pikes Gully Seam), VWP2(interburden material) and VWP3 (in sandstone above the Barrett Seam) all declined over time due todepressurisation from coal mining at West Pit.
VWP GW-109 is located within the west of the Carrington Pit and the sensor within weathered coal (GW-109VWP1) recorded a slight rise in water levels over 2019, while the deeper sensor within tuffaceous coal (GW-109VWP2) recorded a relatively stable groundwater levels at a lower elevation. The difference in the two sensorsmay relate to instrument drift or an additional source of recharge to the shallow stratigraphy. The area generallyexperienced below average rainfall and no water storage is known of at the site or upgradient of the VWP.Groundwater levels within the spoil in Carrington Pit 1.3 km to the north are also lower at around 24 mAHD(GW-109) and predicted to remain low due to the presence of the Carrington Pit void (AGE, 2016). It isrecommended that local site conditions and the condition of the VWP GW-109 be reviewed, and groundwaterconditions within the spoil in Carrington Pit continue to be monitored.
Figure 5-14 Hydrograph of Permian Coal Measures Bores – West Pit VWPs

HV Operations Pty LtdHunter Valley Operations2019 Annual Groundwater Review
SLR Ref No: 620.12182.00000-R13Filename: 620.12182.00000-R13-v3.0.docx
March 2020
Page 43
5.2.2.2 Carrington and Carrington West Wing
The WMP includes seven monitoring bores with screens that intersect the Permian coal measures at Carringtonand Carrington West Wing. This includes two bores within the Bayswater Seam (CGW45 and CGW46), two withinthe Broonie Seam (CGW52, CGW53) and three within the interburden material (4036C, 4051C and CGW51a).One of the bores (CGW45) were reported as blocked in 2019, and one was recorded as dry (4036C). Time seriesgroundwater elevations for the seven bores are presented in Figure 5-15.
Bore CGW46 intersects the shallow Bayswater Seam (approximately 13 m deep) underlying alluvium on thewestern limb of the paleochannel. Over 2019, groundwater within the bore remained relatively stable, recordedat depths of between 12.19 m and 12.94 m. Groundwater levels within the bore are close to the base of thebore and have remained relatively stable since 2012, which may indicate the bore is dry. Further review of thecondition of the bore is recommended. Bore CGW53 recorded fluctuations in groundwater levels throughoutthe year with an overall 0.29 m decline in groundwater levels. Bores CGW52 and CGW53 both intersect theBroonie Seam and recorded a slight rise in water levels over 2019, which appears to relate to recovery ingroundwater conditions with cessation of mining at Carrington Pit.
Review of available bore details indicates bore CGW51a is actually screened within alluvium comprising fine tomedium grained gravel and sand immediately overlying coal. As a result, groundwater within the bore isrepresentative of alluvial groundwater and groundwater within the weathered coal measures. Over 2019 thebore recorded a general decline in groundwater levels following climate trends. Due to the construction of thebore, it is recommended that it be decommissioned to minimise potential mixing and groundwater levels withinthe backfilled Carrington Pit be monitored to ensure the void continues to act as a groundwater sink. It isrecommended that a new bore be installed within the spoil material to replace CGW51a.
Bore 4051C is located in the western limb of the paleochannel, screened within interburden. Groundwater levelsin bore 4051C increased by 1.42 m over 2019. Nearby, bore 4040P, screened in alluvium, remained stable over2019. Previous records indicated an obstruction within bore 4051C, it is recommended that the total depth ofthe bore be checked and a downhole camera survey conducted to verify if 4051C is providing representativegroundwater data.
Figure 5-15 Hydrograph of Permian Coal Measures Bores – Carrington

HV Operations Pty LtdHunter Valley Operations2019 Annual Groundwater Review
SLR Ref No: 620.12182.00000-R13Filename: 620.12182.00000-R13-v3.0.docx
March 2020
Page 44
5.2.2.3 Cheshunt Pit
The WMP includes 13 monitoring bores with screen that intersects the Permian coal measures at Cheshunt Pit.This includes nine bores within the Mt Arthur Seam (BC1a, BZ1-3, BZ2A(1), BZ3-3, BZ4A(2), CHPZ3D, CHPZ8D,CHPZ12D, HG2a), one within the Piercefield Seam ( BUNC45D) and three within the interburden material (BZ3-1,BZ8-2 and HG2).
Time series groundwater elevations for the bores are presented in Figure 5-16 to Figure 5-18. Sustainedgroundwater level drawdown in response to the approved mining is visible within two of the bores intersectingthe Mt Arthur seam (BZ1-3 and BZ4A(2)). Bores BZ2A(1), BZ3-3, which also intersect the Mt Arthur seam, hadstable groundwater level trends over 2019. Bore BC1a also intersects the Mt Arthur Seam and showeddrawdown from 2011 to 2014 (48.78 mAHD), followed by a gradual recovery in groundwater levels(49.08 mAHD) in 2017. A decline was recorded in November 2018 of 0.3m (48.78 mAHD). Over 2019groundwater levels in BC1a remained fairly stable with a groundwater elevation of 48.75 mAHD in Q4. Theadjacent Mt Arthur Seam bore HG2a shows relatively stable groundwater elevations of around 41.15 mAHDsince 2012. Due to the proximity of BC1a and HG2a it is recommended that the bore construction and conditionis reviewed to understand the difference in groundwater elevations between the two bores.
Groundwater levels in bore BZ3-1, which intersects the Cheshunt Interburden, declined 0.83 m over 2019. Theremaining Mt Arthur seam bores (CHPZ3D, CHPZ8D and CHPZ12D) and Piercefield seam bore (BUNC45D) arelocated over 1 km north-east of Cheshunt Pit, north of the rehabilitated Barry’s Pit. All four bores show relativelystable groundwater levels over 2019.
Figure 5-16 Hydrograph of Permian Coal Measures – Cheshunt Mt Arthur Seam

HV Operations Pty LtdHunter Valley Operations2019 Annual Groundwater Review
SLR Ref No: 620.12182.00000-R13Filename: 620.12182.00000-R13-v3.0.docx
March 2020
Page 45
Figure 5-17 Hydrograph of Permian Coal Measures – Cheshunt Piercefield Seam
Figure 5-18 Hydrograph of Permian Coal Measures – Cheshunt Interburden
5.2.2.4 Lemington South
The WMP includes 29 monitoring bores with screen that intersects the Permian coal measures at LemingtonSouth. This includes:
· Four bores within the Arrowfield Seam - C130(AFS1), D406(AFS), D510(AFS) and D612(AFS);
· One bore within the shallow interburden material (siltstone/sandstone) - C130(ALL);
· Eight bores within the Glen Munro Seam and/or Woodlands Hill Seam - B425(WDH), B631(WDH),C122(WDH), C130(WDH), C317(WDH), C809(GM/WDH), D010(WDH) and D010(GM); and

HV Operations Pty LtdHunter Valley Operations2019 Annual Groundwater Review
SLR Ref No: 620.12182.00000-R13Filename: 620.12182.00000-R13-v3.0.docx
March 2020
Page 46
· 16 bores within the Bowfield Seam - B334(BFS), B631(BFS), B925(BFS), C122(BFS), C130(BFS),C317(BFS), C613(BFS), C621(BFS), C630(BFS), D010(BFS), D214(BFS), D317(BFS), D406(BFS), D510(BFS),D612(BFS) and D807(BFS).
Time series data for bores targeting the Arrowfield Seam are presented in Figure 5-19. As shown in Figure 5-19,two of the Arrowfield Seam bores recorded declining groundwater levels over 2019, consistent with climatetrends. Bores D406(AFS) and D510(AFS) declined by up to 0.58 m during 2019. Bores D612(AFS) and C130(AFS1)remained stable over 2019. Groundwater levels in bores C130(AFS1) and D406(AFS) both remained stable over2019.
Figure 5-19 Hydrograph of Arrowfield Seam – Lemington South
Time series data for bores targeting the shallow interburden, Woodlands Hill Seam and Glen Munro Seam arepresented in Figure 5-20. As shown in Figure 5-20 groundwater elevations for all bores except B425(WDH)ranged between 45.51 mAHD and 47.60 mAHD (8.73 m and 26.21 m depth). Over 2019 the groundwater levelsdeclined between 0.02 m (C130(WDH)) and 0.46 m (D010(GM)). Following the decline of groundwater levels inbore B425(WDH) during 2017, the bore was recorded as dry throughout 2018 and 2019. These elevations andtrends correspond more closely with trends observed for the Bowfield Seam bores. Further review of theconstruction and target lithology of bore B425(WDH) is required. From the network review it was suggested thebore be removed from the monitoring network in favour of ongoing monitoring at nearby bore C130(WDH).

HV Operations Pty LtdHunter Valley Operations2019 Annual Groundwater Review
SLR Ref No: 620.12182.00000-R13Filename: 620.12182.00000-R13-v3.0.docx
March 2020
Page 47
Figure 5-20 Hydrograph of Woodlands Hill Seam and Glen Munro Seam – Lemington South
Time series data for bores targeting the Bowfield Seam are presented in Figure 5-21. As shown in Figure 5-21,groundwater elevations ranged between 6.58 mAHD and 34.22 mAHD (24.66 m and 55.66 m depth).Interpolated groundwater elevation contours for the Bowfield Seam are presented in Figure 5-22, based onDecember 2019 readings. Groundwater levels in bores C630(BFS), D317(BFS), D214(BFS), D010(BFS) andC613(BFS) have remained relatively stable over 2019. All of the bores are located west of Lemington South pit.In comparison, bore D807(BFS) rose by 0.88 m, D612(BFS) rose by 0.42 m, D406(BFS) rose by 0.79 m andB334(BFS) rose by 1.88 m over 2019. With the exception of B334(BFS), all of the bores are north-west of theLemington South pit, close to Wollombi Brook. B334(BFS) is located south of Lemington South pit. Increasingwater level trend likely relates to water level recovery following the cessation of mining in the nearby Glider Pit.
Bore C631(BFS) declined by 3.02 m, C621(BFS) declined by 1.48 m, C130(BFS) declined by 2.50 m, C317(BFS)declined by 3.82 m and B925(BFS) declined by 4.57 m. The bores are located between 300 m (B925(BFS)) and1.3 km (C621(BFS)) of the LUG bore. The LUG bore intersects the historical Lemington Underground workings,which mined through the Bowfield Seam. Over the 2019 (calendar year) 1,732.5 ML of water was abstractedfrom the bore, at an average rate of 4,800 m3/day. The groundwater level drawdown is therefore likely relatedto abstraction from the bore. This is shown in Figure 5-22, which illustrates groundwater flow towards LUG Boreto the southwest. This trend is visible in a range of bores intersecting the Permian coal measures in the area.
The observed drawdown is consistent with predicted drawdown in the coal measures with abstraction from LUGBore, as modelled by SLR (2019b). SLR (2019b) utilised the existing numerical groundwater model developed forHVO Modification 5 to predict the change in groundwater levels and sustainable yield from LUG Bore. The modelpredicted groundwater level drawdown within the Mt Arthur Seam in response to abstraction from the historicalLemington Underground workings by LUG Bore. The abstraction was predicted to induce depressurisation in thecoal measures correlating to the observed decline in groundwater levels for bores intersecting the coal measuresnear Lemington Underground.

HV Operations Pty LtdHunter Valley Operations2019 Annual Groundwater Review
SLR Ref No: 620.12182.00000-R13Filename: 620.12182.00000-R13-v3.0.docx
March 2020
Page 48
Alluvial bore Appleyard Farm is the closest alluvial bore to the LUG Bore. As discussed in Section 5.2.1.4,groundwater trends within the bore reflect rainfall and stream flow trends. The bore shows no clear impactsrelated to groundwater abstraction from the historical underground mine beyond climate and streamflowchanges. However, the abstraction rate from the LUG bore is higher than previously assessed. It is recommendedthat numerical modelling be undertaken to assess the impacts of the higher abstraction rate from the LUG bore.
Figure 5-21 Hydrograph of Bowfield Seam – Lemington South

!(!(
!(
!(
!(
!(
!(
!(
!(
!(
!(
!(
!(
!(
!(
!(
LUG Bore
WOLLOMBI BROOK
REDBANK CREEK
2015
10
5
25
0
30
25
15
10
20
B631(BFS)(23.96mAHD)
B925(BFS)(-0.72mAHD)
C130(BFS)(9.64 mAHD)
C317(BFS)(6.22 mAHD)
C613(BFS)(33.11mAHD)
C621(BFS)(14.87mAHD)
B334(BFS)(19.59mAHD)
C630(BFS)(22.98mAHD)
D010(BFS)(28.44mAHD)
D214(BFS)(26.8 mAHD)
D317(BFS)(25.33mAHD)
D406(BFS)(31.42mAHD)
D510(BFS)(30.32mAHD)
D612(BFS)(30.25mAHD)
D807(BFS)(33.76mAHD)
\\au.slr.local\Corporate\Projects-SLR\620-BNE\620-BNE\620.12182 HVO Groundwater Compliance\06 SLR Data\01 GIS\01 ArcGIS\mxd\62012182_Interpolated LUG Bore Groundwater Drawdown - Bowfield Seam - 2019 Review_2.mxd
I
Sheet Size : A4
0 100 200 300 400m
www.slrconsulting.com
620.1218204-Mar-2020
Hunter Valley Operations 2019 ReviewInterpolated LUG Bore Groundwater Drawdown - Bowfield Seam
FIGURE 5-22
GDA 1994 MGA Zone 56GDA 1994 MGA Zone 561:20,000Scale:
Legend!( Monitoring bore – Bowfield Seam
!( Bowfield Seam Drawdown
!( LUG bore
Inferred Direction of Flow
Interpolated Groundwater (mAHD)
Major Watercourses

HV Operations Pty LtdHunter Valley Operations2019 Annual Groundwater Review
SLR Ref No: 620.12182.00000-R13Filename: 620.12182.00000-R13-v3.0.docx
March 2020
Page 50
5.2.3 Spoil
The WMP includes 15 monitoring bores that intersect spoil material within North Pit. Bore DM7 which is locatedwithin North Pit, was recorded as dry through 2019. A comparison was made in bores GW-114, 4116P, GW-107and GW-108, which intersect the spoil, between groundwater levels and screened depths and indicates that thebores are likely dry and readings may relate to water within the sump at the base of the bore.
5.2.3.1 North Pit
Time series groundwater levels for the spoil are presented in Figure 5-23. Over 2019 groundwater elevationswithin the bores ranged between 32.74 mAHD and 77.86 mAHD (10.89 m and 36.68 m depth). Groundwaterwithin the spoil flows from northern-most bore DM1 (77.86 mAHD) in a southerly direction towards thesouthern-most bore MB14HVO03 (32.74 mAHD). Over the course of 2019 groundwater levels declined bybetween 0.01 m and 0.82 m, consistent with rainfall trends.
Figure 5-23 Hydrograph of Spoil Bores – North Pit
5.2.3.2 Carrington
Time series groundwater levels for the spoil are presented in Figure 5-24. Over 2019 groundwater elevationswithin the bores ranged between 23.50 mAHD and 61.54 mAHD (11.49 m and 60.9 m depth). Groundwaterwithin the spoil flows from northern-most bore DM1 (77.86 mAHD) in a southerly direction towardssouthern-most bore MB14HVO03 (32.74 mAHD). Over the course of 2019 groundwater levels declined by 3.49 min bore GW-129, while bores GW-107 and GW-108 were essentially dry throughout 2019. It is likely the reductionin groundwater levels in these bores is a result of decanting of water from the North Pit/North Void and influenceof the Carrington Pit final void.

HV Operations Pty LtdHunter Valley Operations2019 Annual Groundwater Review
SLR Ref No: 620.12182.00000-R13Filename: 620.12182.00000-R13-v3.0.docx
March 2020
Page 51
Figure 5-24 Hydrograph of Spoil Bores – Carrington
5.3 Water Quality
A summary of the water quality results is provided for each of the main water bearing units (alluvium, Permiancoal measures and spoil) below. Routine EC and pH readings and historical trends are presented in Appendix Cand Appendix D, respectively.
5.3.1 Alluvium
Routine monitoring of EC and pH was conducted for all alluvial monitoring bores over 2019 on a quarterly basis.An exception to this were bores GW-101, CGW47a, C919(ALL), GW-121 and CHPZ8A, which were recorded asdry over 2019. Bore BZ1-1 was recorded as dry in Q2. In addition, water quality samples were unable to becollected from bores 4037P (Q1), BZ1-1 (Q3) and CHPZ2A (Q1, Q2 and Q3) due to blockages.
Alluvial groundwater quality over 2019 ranges between locations, as discussed below:
· West Pit: EC ranges between 1,830 µS/cm and 10,610 µS/cm and pH ranges between 7.2 and 7.7;
· Carrington and Carrington West Wing area: EC ranges between 901 µS/cm and 9,990 µS/cm and pHranges between 6.7 and 8.4;
· Between Cheshunt Pit and North Pit: EC ranges between 285 µS/cm and 2,700 µS/cm and pH rangesbetween 6.7 and 7.7; and
· Lemington South Pit: EC ranges between 568 µS/cm and 5,260 µS/cm and pH ranges between 6.7 and7.2.
Discussion in water quality trends and triggers is included for each of the mine locations from Section 5.3.1.1 toSection 5.3.1.4.

HV Operations Pty LtdHunter Valley Operations2019 Annual Groundwater Review
SLR Ref No: 620.12182.00000-R13Filename: 620.12182.00000-R13-v3.0.docx
March 2020
Page 52
Full water quality analysis was conducted for the site alluvial bores in accordance with the WMP. Exceptions tothis include bores C919(ALL), CGW47a, CHPZ8A, GW-121 and GW-101, which had insufficient water available tosample. Full water quality data is presented in Appendix E and summarised below:
· Total aluminium: variable readings from below laboratory limit of reporting up to 27.2 mg/L (CGW39and GW-100) over 2019;
· Total arsenic: concentrations generally below the limit of reporting or less than 0.014 mg/L;
· Total cadmium: concentrations generally below the limit of reporting or less than 0.0013 mg/L; and
· Total zinc: concentrations generally below the limit of reporting or less than 0.2 mg/L. Exceptions tothis were a reading of 0.414 mg/L for bore GW-128, 0.262 mg/L for bore 4037P and 0.213 mg/L forbore GW-100.
As discussed in Section 5.2.1, groundwater level readings for bores GW-100 and GW-101 indicates they are dryand water quality sampled is likely influenced by sediment in the base of the bore and not consideredrepresentative. It is recommended that the total depth of the bore be checked, and the monitoring programmereviewed to ensure only representative groundwater samples are collected.
5.3.1.1 West Pit
Over the 2019 monitoring period, the following triggers for EC and pH were exceeded at the following bores:
· Bore NPz2 exceeded the trigger level for EC of 13,428 µS/cm in Q1, Q3 and Q4, but is within thehistorical reading range of 12,590 µS/cm to 19,400 µS/cm with no adverse impacts identified; and
· Bore NPz5 recorded pH of under the trigger level of 6.9 in Q4, but is within the historical reading rangeof 6.8 to 7.9 with no adverse impacts identified.
5.3.1.2 Carrington and Carrington West Wing
Over the 2019 monitoring period, the following triggers for EC and pH were exceeded at the Carrington andCarrington West Wing bores:
· Bore CGW49 recorded EC above 2,775 µS/cm in Q1, Q3 and Q4;
· Bore CFW55R recorded EC above 6,154 µS/cm in Q1, Q2, Q3 and Q4;
· Bore 4032P recorded EC above 2,775 µS/cm in Q4;
· Bore CGW55a recorded pH above 8 in Q4;
· Bore GW-106 recorded pH below 6.8 in Q2; and
· Bore CFW55R recorded pH below 7 in Q1.
Bore CGW49 intersects alluvium within the western limb of the paleochannel. Historical readings show that boreCGW49 has recorded an average EC of 4,692 µS/cm and ranging between 2,060 µS/cm and 8,180 µS/cm. Reviewof EC readings at CGW49 shows levels fluctuated slightly over 2019 but remained consistent with historicalconcentrations. The results show no adverse impacts due to mining and highlight that the established triggerlevels do not reflect historical trends.
Bore CGW55a is located approximately 875 m west of the North Void Tailings. Historical readings show thatbore CGW55a has recorded an average pH of 7.5 and ranging between 6.8 and 8. The pH reading in Q4 of 8.4 isabove historical readings and may correlate with the decrease in the groundwater level and bore condition.

HV Operations Pty LtdHunter Valley Operations2019 Annual Groundwater Review
SLR Ref No: 620.12182.00000-R13Filename: 620.12182.00000-R13-v3.0.docx
March 2020
Page 53
Bore 4032P is located west of Carrington Pit and intersects alluvium within the western limb of the paleochannel.Historical readings show that bore 4032P has recorded an average EC of 1,903 µS/cm and ranging between 1,571µS/cm and 2,325 µS/cm. Review of EC readings at 4032P shows that there is a sudden increase to 3,320 µS/cmin Q4, which coincides with a slight (0.28 m) rise in groundwater levels. The cause for this trend in water leveland water quality is unclear as no other bores recorded this rise and there are no known changes in land usenear the bore. The comment in the sample notes state the presence of suspended solids, which may haveimpacted water quality results that may indicate a blockage at the base of the bore or surface inundation (i.e.loose casing) The bore is located outside of the mine area on land used for cattle grazing and is located near asmall stand of trees. It is recommended that the construction and condition bore and local land use be reviewedto determine the cause of the increase.
Bore GW-106 intersects a remnant patch of paleochannel alluvium between West Pit and Carrington Pit. Sincemonitoring commenced at the bore in September 2013, bore GW-106 has recorded an average pH of 6.8 andranging between 6.6 and 6.9. Review of pH readings are within historical concentrations. The results show noadverse impacts due to mining.
Bore CFW55R recorded EC above the trigger threshold over 2019, and a pH reading below 7 in Q1, but above 7over the remainder of the year. Bore CFW55R is an alluvial bore located approximately 50 m north of CarringtonBillabong, 80 m west of the North Void Tailings. Following on from the 2017 annual groundwater review, workhas been conducted to investigate trigger exceedances at the bore. In 2018 this investigation includedinstallation of additional groundwater monitoring bores, hydraulic testing and increased groundwatermonitoring. This is in addition to changes in North Void management undertaken from 2018, includinginstallation of a flocculation plant to discharge flocculated tailings to enhance consolidation, cessation of tailingsdischarge and water management.
Over 2019 EC readings for CFW55R fluctuated and were recorded above the trigger level of 6,154 µS/cm, butremained below historical reading of 10,840 µS/cm (2008) as shown in Figure 5-25. Figure 5-25 shows that boreswithin the paleochannel alluvium (CFW57, CFW55R and CGW54A) were historically saline but became fresherwith progression of mining at Carrington Pit. This is due to direct interception of groundwater within thepaleochannel, as well as depressurisation of the coal measures reducing natural upward seepage from the coalmeasures where they are incised by the paleochannel. Sulphate was also identified as a key analyte to track theextent and movement of impacted water. Over 2019 sulphate concentrations fluctuated between 1,300 mg/Land 2,480 mg/L at CFW55R, with a slight rising trend. In contrast bores CGW54a and CFW57 recorded a generaldecline in sulphate over 2019, from around 890 mg/L in January down to 623 mg/L at CGW54a and 397 mg/L atCFW57 by December 2019. The sulphate to chloride molar ratio helps to indicate presence sulphate oxidation.Figure 5-26 shows a general reduction in the SO4/Cl ratio for bores CFW57 and CGW54A and fluctuations forbore CFW55R. These trends correspond with a change in groundwater level and gradients as discussed in Section5.2.1.2. With the management practices undertaken to minimise seepage from NV TSF, groundwater levels havereduced around CFW55R. This has resulted in a change in alluvial flow directions, with recharge from the HunterRiver now creating a gradient of flow from CFW57 towards CFW55R. This has resulted in fluctuations inconcentrations of EC and sulphate at CFW55R, but reduction in the extent and degree of impacted water atsurrounding bores like CFW57 and CGW54a. A fluctuation at the end of February 2019 is visible in CFW57,CFW55R and CGW54A, that occurred prior to a peak rainfall period and was highest for CFW57. The cause forthis fluctuation is unclear, but was not observed in upgradient bores like GW-126, and quickly dissipated with arapid decline in the following month.
Assessment of trigger exceedances and impacts is ongoing and has been conducted in consultation with theregulatory authority.

HV Operations Pty LtdHunter Valley Operations2019 Annual Groundwater Review
SLR Ref No: 620.12182.00000-R13Filename: 620.12182.00000-R13-v3.0.docx
March 2020
Page 54
Figure 5-25 EC vs Sulphate
Figure 5-26 Sulphate/Chloride Ratio
5.3.1.3 Cheshunt Pit
During 2019, bore CHPZ8A was essentially dry as groundwater levels were close to bore depth. There wasinsufficient water to sample. Bore BZ1-1 was recorded as dry in Q2 and blocked in Q3. Bore CHPZ2A wasrecorded as blocked in Q1, Q2 and Q3.
Over the 2019 monitoring period, the following triggers were exceeded at the Cheshunt Pit bores:
· No bores exceeded triggers for EC;

HV Operations Pty LtdHunter Valley Operations2019 Annual Groundwater Review
SLR Ref No: 620.12182.00000-R13Filename: 620.12182.00000-R13-v3.0.docx
March 2020
Page 55
· Hobden’s Well recorded pH of over 7.5 in Q3 and Q4, but is within the historical reading range of 7.2to 7.8 with no adverse impacts identified; and
· Bore BZ1-1 recorded a pH over 7.5 in Q4, but pH remained within the trigger limits for the remainderof the monitoring period with no adverse impacts identified. As noted earlier, bore BZ1-1 intersectsinterburden rather than alluvium (AGE, 2013a), therefore this should be updated in the WMP.
5.3.1.4 Lemington South
Over the 2019 monitoring period, the following triggers for EC and pH were exceeded at the Lemington Southbores:
· Bore PB01(ALL) recorded EC above 3,938 µS/cm throughout 2019.
Since monitoring commenced at the bore in January 2000, PB01(ALL) has recorded an average EC of 2,758 µS/cmand ranging between 840 µS/cm and 5,260 µS/cm. Review of EC readings at PB01(ALL) show EC levels havehistorically fluctuated. PB01(ALL) records large fluctuations in EC, however, there appears to be a slight trendof rising EC over time up to 5,260 µS/cm in 2019. This coincides with a slight decline in groundwater levels.Groundwater elevations range between 44.99 mAHD and 47.81 mAHD and trends generally correlate to changesin stream flow along Wollombi Brook. Water level and EC trends for PB01(ALL) are presented in Figure 5-27. Thedata is compared to trends for Wollombi Brook as recorded at HITS station Wollombi Brook @ Warkworth(Station 210004). Figure 5-27 shows that water levels within bore PB01(ALL) roughly mimic water level trendswithin the Wollombi Brook. With the cessation of flow along Wollombi Brook since 2017 there has been a declinein groundwater levels in PB01(ALL), to over 9 m below surface.
Bore PB01(ALL) is located on the northern banks of the Wollombi Brook, in an area with no active mining or landclearance. The results indicate the spikes in EC likely relate to the natural decline in recharge to the alluvium. Itis also understood that sampling methodology was revised over 2019, therefore the change in results may relateto increased purging of the bore and collection of more representative samples. No adverse impacts due tomining have been identified. It is recommended that the duplicate trigger level for the Lemington South alluviumbe removed from the WMP, and one trigger level be applied based on representative data.
Figure 5-27 Water Level and EC Trends for PB01(ALL) and Wollombi Brook

HV Operations Pty LtdHunter Valley Operations2019 Annual Groundwater Review
SLR Ref No: 620.12182.00000-R13Filename: 620.12182.00000-R13-v3.0.docx
March 2020
Page 56
5.3.2 Permian Coal Measures
Routine monitoring of EC and pH was conducted for all monitoring bores intersecting the Permian coal measureson a quarterly or six-monthly basis over 2019. Exceptions to this were bores 4036C, B425(WDH), C122(BFS) thatwere dry all year and bore CGW45 that was blocked. Bore BZ4A(2) was dry in Q2, Q3 and Q4.
Over 2019 groundwater quality within the Permian coal measures varied within and between locations, asdiscussed below:
· West Pit: EC ranges between 6,030 µS/cm and 14,080 µS/cm and pH ranges between 6.8 and 7.8;
· Carrington and Carrington West Wing area: EC ranges between 1,584 µS/cm and 8,960 µS/cm and pHranges between 6.7 and 7.5;
· Between Cheshunt Pit and North Pit: EC ranges between 868 µS/cm and 8,410 µS/cm and pH rangesbetween 6. and 8.1; and
· Lemington South Pit: EC ranges between 3,290 µS/cm and 27,400 µS/cm and pH ranges between 6.6and 8.1.
Discussion in water quality trends and triggers is included for each of the mine locations from Section 5.3.2.1 toSection 5.3.2.4.
In accordance with the WMP full water quality analysis was conducted for the bores targeting the Permian coalmeasures. Analysis was also conducted for bores not specified within the WMP. Full water quality data ispresented in Appendix E and summarised below:
· Total aluminium: variable readings from below laboratory limit of reporting to 8.4 mg/L (CGW46) over2019;
· Total arsenic: concentrations generally below the limit of reporting or less than 0.051 mg/L;
· Total cadmium: concentrations generally below the limit of reporting or less than 0.0029 mg/L;
· Total lead: concentrations below the limit of reporting or less than 0.131 mg/L;
· Total selenium: concentrations below the limit of reporting or less than 0.028 mg/L; and
· Total zinc: concentrations generally below the limit of reporting or less than 0.31 mg/L.
5.3.2.1 West Pit
Over the 2019 monitoring period, the following triggers were exceeded for the West Pit bores:
· Bore NPz2 recorded EC over the trigger level of 13,428 µS/cm in Q1, Q3 and Q4; and
· Bore NPz5 recorded pH under the trigger level of 6.9 in Q4.

HV Operations Pty LtdHunter Valley Operations2019 Annual Groundwater Review
SLR Ref No: 620.12182.00000-R13Filename: 620.12182.00000-R13-v3.0.docx
March 2020
Page 57
Bore NPz2 is located approximately 4.5 km north-east of Plashett Reservoir and 1 km north-west of the West Pitmine area. The bore intersects interburden material (siltstone/sandstone) of the deeper Permian coal measures;with a screened interval between 57-60 mbgl. Historical EC readings for NPz2 since 2008 show regularfluctuations of between 12,590 µS/cm and 19,400 µS/cm at the site. The 2019 readings of 13,640 µS/cm,13,650 µS/cm and 14,080 µS/cm are therefore considered consistent with historical concentrations. Based onavailable information, the cause for the changes in EC at NPz2 do not appear to correlate to mine activitiesconducted at West Pit. As discussed in Section 5.2.2, it has been recommended that NPz2 be removed from thecompliance network as the bore location and construction does not provide information on potential impactsrelated to site activities. However, this bore should continue to be monitored to assist with other assessmentsand post closure monitoring.
Bore NPz5 is located approximately 1.4 km east of the West Pit mine area. The bore intersects interburdenmaterial (siltstone/sandstone) of the Permian coal measures; with a screened interval between 40-43 mbgl.Historical pH readings for NPz5 since 2008 show regular fluctuations between 6.8 and 7.9 at the site. The 2018reading of 6.8 and 6.9 is therefore considered consistent with historical concentrations.
5.3.2.2 Carrington and Carrington West Wing
Over the 2019 monitoring period, the following triggers were exceeded for the Carrington and Carrington WestWing bores:
· No bores exceeded triggers for EC;
· Bore CGW52 both recorded a pH under the trigger level of 6.8 in Q4; and
· Bore CGW53 both recorded a pH under the trigger level of 6.8 in Q1 and Q4.
Bore CGW52 and CGW53 are located along the Hunter River. Available bore information indicates CGW52 isconstructed with screen from 39.6 m to 42.6 m below surface with 25 mm diameter casing and screened acrosssiltstone and coal (Broonie Seam). Bore CGW53 is constructed with screen from 38.5 m to 41.5 m below surfacewith 25 mm diameter casing and screened across coal (Broonie Seam). Historical pH readings for the bores since2005 show regular fluctuations of between 6.4 and 8.6. The 2019 readings ranging from 6.7 to 6.9 are consideredconsistent with historical concentrations, with no adverse impacts identified.
5.3.2.3 Cheshunt Pit
Over the 2019 monitoring period, the following triggers were exceeded at the Cheshunt Pit bores:
· No bores exceeded triggers for EC;
· Bore BZ2A(1) recorded a pH under the trigger level of 6.5 in Q4 (6.4);
· Bore BZ3-1 recorded pH over the trigger level of 7.7 in Q4 (8.1); interburden
· Bore BZ3-3 recorded pH under the trigger level of 6.5 in Q1 and Q4 (6.4); and
· Bore CHPZ3D recorded pH under the trigger level of 6.5 in Q3 (6.2).
Bores BZ2A(1), BZ3-3 and CHPZ3D intersect the Mt Arthur Seam and are positioned between Cheshunt Pit andthe Hunter River. The trigger range for the bores is 6.5 to 7.6, while the range in historical data for the bores is6 to 8.2. The 2019 readings for the three bores are considered consistent with historical recordedconcentrations, with no adverse impacts identified.

HV Operations Pty LtdHunter Valley Operations2019 Annual Groundwater Review
SLR Ref No: 620.12182.00000-R13Filename: 620.12182.00000-R13-v3.0.docx
March 2020
Page 58
Bore BZ3-1 intersects interburden and is positioned between Cheshunt Pit and the Hunter River. The triggerrange for the bore is 6.9 to 7.7 and readings of pH above 7.7 have been recorded historically. However, a slighttrend of rising pH is visible for the bore, similar to trends for bore BZ1-1 within the overburden, but not observedfor the Mt Arthur Seam (BZ3-3). This trend may relate to the condition of the bores and weathering of theoverburden material. The rise in pH is not considered to be of concern as it will not result in adverse impacts likemobilisation of metals due to low pH, but the condition of the bore should be reviewed to ensure the quality ofdata collected.
5.3.2.4 Lemington South
Over the 2019 monitoring period, the following triggers were exceeded at the Lemington South bores:
· Bore B631(BFS) recorded an EC above the trigger level of 12,440 µS/cm in Q4 and a pH below 6.7 inQ2 and Q4;
· Bore C130(ALL) recorded an EC above the trigger level of 11,408 µS/cm in Q1, Q2, Q3, and Q4;
· Bore C130(WDH) recorded an EC above the trigger level of 20,240 µS/cm in Q4;
· Bore C630(BFS) recorded a pH above the trigger level of 7.9 in Q2 and Q4;
· Bore D010(GM) recorded an EC above the trigger level of 1,894 µS/cm in Q2 and Q4; and
· Bore D612(AFS) recorded an EC above the trigger level of 15,324 µS/cm in Q4.
Bore B631(BFS) is located approximately 560 m south-west of Lemington South pit and around 660 m east ofthe LUG Bore. The bore intersects the Bowfield Seam (BFS). Historical readings for bore B631(BFS) since 2000show regular fluctuations of EC between 9,250 µS/cm and 15,780 µS/cm and pH of 5.7 to 7.3 for pH. The 2019readings are therefore considered consistent with historical concentrations. However, it is noted that the slightdecline in pH for B631(BFS) may correspond with the decline in groundwater levels within the Bowfield Seam.
Bore C130(ALL) is located between Lemington South pit and the LUG Bore and intersects shallow weatheredoverburden to 17 m depth. Historical readings since 2000 show regular fluctuations of between 19,500 µS/cmand 24,200 µS/cm for EC and 6.4 to 7.9 for pH. The 2019 readings for pH are considered consistent with historicalconcentrations; however, three of the 2019 readings for EC are above historical concentrations. The rise in ECcorresponds with a general decline in groundwater levels. Review of water quality data also indicates a slightrise in sulphate concentrations over time with the rise in EC Figure 5-28. However, a low SO4/Cl molar ratio of0.07 meq was recorded, indicating the trend is likely not a result of sulphide oxidation. The groundwater typefor C130(ALL) is Na-Mg-Cl and this has remained the same over the last four years of water quality sampling. Itis unclear as to the cause for the EC exceedances and it is recommended that ongoing analysis of major ions beconducted for C130(ALL), and water quality sampling and analysis from the LUG bore and Lemington South Pitbe undertaken for comparison to bore water quality data to enable further analysis.
It is also recommended that the water level of Lemington South Pit be monitored to understand the influenceof in-pit water storage on the local groundwater regime. It is also noted that the trigger level for the LemingtonSouth interburden was 22,780 µS/cm prior to a change in 2018 to 11,408 µS/cm. It is recommended that thetrigger level for the interburden, and therefore C130(ALL), be reviewed.

HV Operations Pty LtdHunter Valley Operations2019 Annual Groundwater Review
SLR Ref No: 620.12182.00000-R13Filename: 620.12182.00000-R13-v3.0.docx
March 2020
Page 59
Figure 5-28 C130(ALL) EC vs Sulphate
Bore C130(WDH) is located between Lemington South Pit and LUG Bore and intersects the Woodlands Hill Seam(WDH). Historical readings since 2000 show regular fluctuations of EC between 18,210 µS/cm and 21,000 µS/cmand pH of 6.4 to 7.5 for pH. The 2019 readings for pH are therefore considered consistent with historicalconcentrations. The 2019 reading for EC of 21,300 µS/cm recorded in Q4 is slightly above historicalconcentrations.
Bore C630(BFS) is located between Lemington South Pit and LUG Bore and intersects the Bowfield Seam (BFS).Historical readings show regular fluctuations of between 2,660 µS/cm and 4,190 µS/cm for EC and 7.1 to 8.3 forpH. The 2019 readings are therefore considered consistent with historical concentrations.
Bore D612(AFS) is located between Lemington South Pit and LUG Bore and intersects the Arrowfield Seam (AFS).Historical readings show regular fluctuations of between 11,000 µS/cm and 15,890 µS/cm for EC and 6.7 to 7.6for pH. The EC reading in Q4 of 15,920 µS/cm is slightly above historical concentrations. The rise in EC appearsto correlate with a decline in groundwater levels, to over 22 m below surface. No information is available on theconstruction of D612(AFS), it is recommended that the total depth be measured to see if levels are near the baseof the bore and water quality may reflect sediment within the bore.
Bore D010(GM) is located between Lemington South Pit and LUG Bore and intersects the Glen Munro Seam(GM). Historical readings show regular fluctuations of between 9,050 µS/cm and 12,310 µS/cm for EC and 6.5 to8.1 for pH. The 2019 readings are therefore considered consistent with historical concentrations.
At Lemington there is a continued general trend of rising EC within the bores intersecting the Permian coalmeasures. The rise in EC for some bores is within the range of historical readings, but a trend is visible. Thereare no known changes in local land use in the area that could result in introduction of more saline groundwater.The trend of rising EC appears to correlate to the decline in groundwater levels around the LUG Bore that is usedto abstract water stored within the Lemington Underground. EC is a measure of the ability of water to conductan electrical current and relates to the concentration of dissolved ions in the water, which can comprisedissolved salts, alkalis, chlorides, sulphides and carbonate compounds. The change in EC around the LUG Borelikely relates to changes in local recharge processes and geochemistry in response to abstraction. There are noprivate groundwater users near Lemington that could be impacted by the change in water quality.

HV Operations Pty LtdHunter Valley Operations2019 Annual Groundwater Review
SLR Ref No: 620.12182.00000-R13Filename: 620.12182.00000-R13-v3.0.docx
March 2020
Page 60
5.3.3 Spoil
Routine monitoring of EC and pH was conducted for the spoil monitoring bores over 2019 on a quarterly basis.Exceptions to this were bore DM7, GW-107 and GW-108 which were recorded as dry throughout the year. Over2019, water within the spoil material at North Pit recorded an EC of between 2,300 µS/cm and 14,540 µS/cm,and a pH of between 5.4 and 7.3. Exceedances for EC was recorded for bores 4116P and MB14HVO05.
Bore 4116P is located at the southern end of North Pit and recorded EC of 13,820, 13,950 and 14,420 µS/cm inQ2, Q3 and Q4, respectively. Historical readings show regular fluctuations of between 10,890 µS/cm and13,560 µS/cm for EC. The 2019 readings are slightly above the range of historical readings. Review of waterquality and water level data for nearby bores indicates this trend is unique to bore 4116P. The groundwaterlevel trends indicate the bore is almost dry and there is potential that historical readings may not have beenbased on representative groundwater samples. Numerous blockages have been recorded in 4116P since 2015.On review of the bore construction details it appears the groundwater level is below the screened interval andwater quality samples are not representative of the groundwater in this area. Monitoring was recommendedfor adjacent bore 4117P that intersects the spoil at the base of Alluvial Lands Pit in the network review (SLR,2019). However, bore 4117P has also become blocked, or possibly collapsed. It is also noted that nearby bore4113P also collapsed in 2018. This coincides with a general reduction in water levels in the spoil over time, andsettling of the waste rock material. Ongoing monitoring of the spoil can be maintained at the more recentlyinstalled bores MB14HVO01 and MB14HVO02.
Bore MB14HVO05 recorded EC more than the trigger level of 12,460 µS/cm; 12,920 µS/cm in Q1 and14,540 µS/cm in Q3. In Q1 and Q3 pH was recorded below the trigger level of 6.5; with readings of 5.7 and 5.4respectively. Bore MB14VHO05 has been monitored since March 2015. EC and pH concentrations havefluctuated significantly over a short period of time. The timing of fluctuations appears to correspond with resultsfor MB14HVO01 and MB14HVO02; however, the degree of the fluctuations is unique to MB14VHO05. This mayrelate to localised geochemical processes within the spoil material.
In accordance with the WMP full water quality analysis was conducted for the site bores targeting the spoilmaterial, with the exception of dry bores GW-107, GW-108 and DM7. Additional analysis was also conductedfor bores not specified within the WMP. Full water quality data is presented in Appendix E and summarisedbelow:
· Total aluminium: variable readings from below laboratory limit of reporting to 14.8 mg/L(MB14HVO05) over 2019;
· Total arsenic: concentrations generally below the limit of reporting or less than 0.269 mg/L;
· Total cadmium: concentrations generally below the limit of reporting or less than 0.0159 mg/L;
· Total lead: concentrations below the limit of reporting or less than 0.034 mg/L;
· Total selenium: concentrations below the limit of reporting or less than 0.005 mg/L, with the exceptionof MB14HVO05 (0.07 mg/L in Q1 and 0.14 mg/L in Q3); and
· Total zinc: concentrations generally below the limit of reporting or less than 0.365 mg/L, with theexception of MB14HVO05 that recorded zinc concentration of 13 mg/L (Q1) and 14.8 mg/L (Q3) 2019.

HV Operations Pty LtdHunter Valley Operations2019 Annual Groundwater Review
SLR Ref No: 620.12182.00000-R13Filename: 620.12182.00000-R13-v3.0.docx
March 2020
Page 61
5.4 Groundwater Take
Interception of groundwater occurs at site due to a range of activities, including direct interception ofgroundwater with mining activities and abstraction from water supply bores, and indirect interception viainduced inter-formation flows due to depressurisation of the Permian coal measures. Each activity is discussedbelow, and the estimated groundwater take for the various water sources summarised in Section 5.4.3.
5.4.1 Groundwater Inflows to Mine Operations
A numerical groundwater model was developed for the HVO South Modification 5. The model was calibrated upto December 2015 and replicates mine progression on a quarterly basis to the year 2039. Year 3 model results(predictive model) represent predicted groundwater conditions and take for the 2018 reporting period forinclusion in this report. The AGE (2015) report does not report predicted take for West Pit and includes inflowsfor Carrington West Wing that did not commence operations in 2018. To account for this, the predicted inflowsto West Pit for model Year 3 were extracted from the model and added to the total take from the North CoastFractured and Porous Rock water source. In addition, the volume of water taken as part of the modelledCarrington West Wing was subtracted from the total take.
5.4.2 Bore Abstraction
Lemington Underground (LUG) bore is an abstraction bore constructed into the abandoned LUG mine voidunderlying HVO. The bore is licensed to take up to 1,800 ML of water from the North Coast Fractured and PorousRock aquifer (20BL173392) per water year. The bore is equipped with a flow meter, with total monthlyabstraction is documented. Based on the flow volumes recorded, from July 2018 to June 2019 (water year)1,315 ML of water was abstracted from the LUG bore, which is within the licensed allocation of 1,800 ML/year.From June 2019 to December 2019 990 ML of water was abstracted.
As the bore intersects LUG that mined the Permian coal measures, groundwater levels within bores intersectingthe coal measures around the bore have been reviewed to identify the extent of groundwater drawdown. Asdiscussed in Section 5.2.2.4, groundwater levels within the Bowfield Seam of the Permian coal measures aroundLemington South have declined by up to 4.57 m (B925(BFS)) to a distance of 1.8 km from LUG Bore. However,only limited drawdown (maximum 0.58 m decline) was recorded for bores within the shallower coal measuressurrounding LUG Bore. In addition, no clear impacts related to groundwater abstraction from the historicalunderground mine were observed for nearby alluvial bore Appleyard Farm.
However, the abstraction rate from the LUG bore is higher than previously assessed. It is recommended thatnumerical modelling be undertaken to assess the impacts of the higher abstraction rate from the LUG bore onsurrounding groundwater levels.
5.4.3 Summary of Groundwater Take For 2019
The predicted take of groundwater from the various groundwater sources associated with HVO is presented inTable 5-2.
Table 5-2 Predicted Groundwater Take for 2019
Hunter Regulated(ML)
Hunter Unregulated(ML)
North Coast Fractured and Porous Rock(ML)
HVO Mine Operations† 159 358 853

HV Operations Pty LtdHunter Valley Operations2019 Annual Groundwater Review
SLR Ref No: 620.12182.00000-R13Filename: 620.12182.00000-R13-v3.0.docx
March 2020
Page 62
Hunter Regulated(ML)
Hunter Unregulated(ML)
North Coast Fractured and Porous Rock(ML)
LUG Bore Abstraction - - 1,315*
Total 159 358 2,168
Note: † HVO Mine Operation predictions from HVO South Modification 5 include Carrington West Wing that has notcommenced, and excludes West Pit
* take over water year (July 2018 to end of June 2019)
As shown in Table 5-2, over the 2019 reporting year the total take under the Hunter Regulated water sourcewas estimated at 159 ML, total take from Hunter Unregulated water source was estimated at 358 ML and around2,158 ML from the North Coast Fractured and Porous Rock water source.
5.5 Verification of Model Predictions
In accordance with Schedule 4 Condition 27 (c) under DA 450-10-2003 (HVO North) and Schedule 3 Condition27 (c) under PA 06_0261 (HVO South), the WMP includes requirements to validate and recalibrate (if necessary)the groundwater model for the development. This includes an independent review of the model every 3 years,and comparison of monitoring results with modelled predictions. The latest numerical groundwater model thatreplicates all approved operations across HVO (north and south) was developed by AGE Consultants as part ofHVO South Modification 5 (2017).
The three yearly independent review of the HVO South Modification 5 numerical groundwater model to verifymodel predictions was undertaken by SLR at the end of 2019 and included in Appendix F. The hydrogeologicaldescription, conceptualisation and model design of AGE’s 2016 groundwater model were revisited andreviewed. As a part of the review process, the modelled recharge, stream stage heights and mine progressionwere compared against the actual data for January 2016 to December 2019.
The review of the model files showed minor discrepancies between modelled rainfall and river stage heightsbetween 2016 and present day. The review showed differences between mine progression and the actualmeasurements in different areas of the model domain. The modelled mined area between January 2016 toDecember 2019 covers a larger than the actual mine area, which has likely resulted in overpredicted ofgroundwater drawdowns.
The calibration data base was updated to include latest measurements up to December 2019. The calibrationhydrographs were regenerated. The updated calibrated hydrographs indicated that despite the discrepancies,the model calibration is still satisfactory.
The overall match between observed and measured levels in the transient calibration is reasonable. However,in some areas of the model domain (i.e., Carrington West Wing area and Lemington Pit) the match betweenobserved and simulated heads is some of the bores is poor with the model predicting more impact than capturedby observed water levels. This is likely due to the discrepancies between the actual mine progression andmodelled progression and the model not being able to represent these mining activities adequately.

HV Operations Pty LtdHunter Valley Operations2019 Annual Groundwater Review
SLR Ref No: 620.12182.00000-R13Filename: 620.12182.00000-R13-v3.0.docx
March 2020
Page 63
As an overall conclusion, this reviewer considered the hydrogeological description, the conceptualisation of thegroundwater system and the numerical model design and the numerical model calibration are still fit for purposeand additional impacts to what was previously predicted, such as impacts on landholder bores, is consideredunlikely. Given the scale of the discrepancies comparing to the regional scale of the model, the reviewer believedupdates to the model to remove the discrepancies will result in insignificant changes to the model predictions.However, groundwater models should periodically be evolved, updated and assessed when new data isavailable. The reviewer believed updating the mine progression in the model to match the actual mineprogression is likely to improve the calibration statistics and hydrographs. Therefore, the reviewerrecommended the following updates to the groundwater model:
· Update to Recharge Package (RCH): Update to include to the latest rainfall measurement at site;
· Update to River Package (RIV): Update to include to the latest river stage height measurements atgauging stations 210083 and 210004;
· Update to Drain Package (DRN) and Time-Variant Materials (TVM): Update to ensure modelled andactual mine progressions match; and
· Re-calculate transient calibration statistics and assess the calibration performance.

HV Operations Pty LtdHunter Valley Operations2019 Annual Groundwater Review
SLR Ref No: 620.12182.00000-R13Filename: 620.12182.00000-R13-v3.0.docx
March 2020
Page 64
6 Conclusions and Recommendations
6.1 Conclusions
This annual groundwater review covers data collected over 2019 and was completed in compliance with:
· Condition 27 of Development Consent DA 450 10 2003 for HVO North;
· Condition 28 of the Project Approval PA 06 0261 24 for HVO South; and
· Individual bore license conditions (20BL173587-89, 20BL173847 and 20BL173392).
Over 2019 operations across HVO included active mining at West Pit, Cheshunt Pit, and Riverview Pit. Twotailings facilities were used over the year (Dam 6W and North Void DM6) and groundwater was abstracted fromLUG Bore.
Review of climate data indicates the region generally experienced below average rainfall over 2019 (343.6 mm).Similar trends are reflected in stream levels for the Hunter River and Wollombi Brook from the HITS stations andsite monitoring locations (WL03, WL05, WL10 and WL14).
The groundwater bore network at HVO is extensive, with 137 bores that were installed progressively over thelife of the operations, with 104 of these bores within the WMP. Annual sampling is undertaken in accordancewith relevant Australian Standards. It was previously identified by SLR (2018) that monthly to quarterly samplingmethodology undertaken by the external contractors was not providing representative samples. This resultedin trigger exceedances. This sampling methodology was reviewed by HVO and improvements in samplingtechnique made to ensure representative samples are collected. Over 2019 monitoring of the groundwater borenetwork was largely conducted in accordance with the Groundwater Monitoring Programme outlined within theWMP. However, water level and water quality readings were not taken in every quarter for 16 bores due to arange of factors such as dry or blocked bore conditions and access restrictions.
Review of groundwater level trends indicates that where saturated, water within the alluvium were relativelystable to slightly declining over 2019, generally in line with climate and stream flow trends. Groundwater withinthe Permian coal measures remained relatively stable to slightly declining over 2019.
Review of water quality results and comparison to trigger levels for EC and pH identified several triggerexceedances over 2019. It was identified that several bores exceeded triggers for EC and pH; however, 2019readings were generally in line with historical trends for these bores. Groundwater quality trends that mayindicate potential impacts from mine operations were observed for bore CFW55R, which is located within thealluvium near Carrington Pit and North Void DM6. Investigation into the cause and impact of the change ingroundwater quality was conducted and the regulatory authority notified. Management controls wereimplemented to mitigate further seepage in consultation with the NSW Environmental Protection Authority.Subsequently, a Pollution Reduction Program was developed under Condition 8, U1 of Environmental ProtectionLicence 640. Monitoring and mitigation are currently ongoing, with the latest monitoring results indicating thatthe impacts of seepage are being mitigated.
Quantification of groundwater take was undertaken based on reported volumes estimated for approvedoperations as part of Modification 5 (AGE 2017) and metered abstraction volumes from LUG Bore. Based on this,over the 2019 reporting year the total take under the Hunter Regulated water source was estimated at 159 ML,total take from Hunter Unregulated water source was estimated at 358 ML and around 2,168 ML from the NorthCoast Fractured and Porous Rock water source. These volumes are within the licensed take for eachgroundwater source.

HV Operations Pty LtdHunter Valley Operations2019 Annual Groundwater Review
SLR Ref No: 620.12182.00000-R13Filename: 620.12182.00000-R13-v3.0.docx
March 2020
Page 65
6.2 Recommendations
Based on review of the available data for 2019, the following recommendations have been made:
· Bore CGW46 is included in the current WMP, however, there are no trigger levels specified. It isrecommended that trigger levels be added in the revised version of the WMP, and the purpose ofbores be reviewed and outlined within the WMP.
· Bore BZ1-1 is included in the WMP as being within the alluvium; however, as identified in prior annualreviews the bore likely intersects interburden material. It is recommended that this bore be updatedin the WMP as intersecting interburden.
· It is recommended that NPz2 and NPz3 be removed from the compliance network within the WMP, asthe location and construction of the bores precludes them from providing an indication of potentialimpacts. However, these bores should continue to be monitored to assist with other assessments andpost closure monitoring.
· Bores NPZ4 and NPZ5 should be removed from the WMP as they have been/will be decommissionedwith progression of mining at West Pit. Ongoing monitoring should be conducted at VWP’s GW-103 toGW-105.
· Sensor 1 within VWP GW-101a and sensor 3 within VWP GW-109 have failed. It is recommended thatthese sensors be removed from the WMP as monitoring can be continued by surrounding, close bybores.
· VWP GW-110 is located close to the highwall of Carrington Pit final void and may be decommissioned.It is recommended that this be removed from the WMP and ongoing monitoring be conducted at spoilbores GW-107 and GW-108. Review of spoil water levels around the backfilled southern edge ofCarrington Pit is also recommended.
· Review condition of CGW46 and 4051C, including checking the total depth of the bores and downholecamera survey to understand cause for uncharacteristic water trends that may relate to blockages inthe bore or the condition of the bore.
· Decommission bore CGW51a as available bore construction and water quality results indicates thebore was drilled through alluvium and into a shallow coal seam and does not provide representativegroundwater results from one groundwater unit.
· Check the total depth of bore 4051C.
· Groundwater levels in bores GW-100 and GW-101 indicate they are dry and water quality sampled islikely influenced by sediment in the base of the bore and not considered representative. It isrecommended that the total depth of the bore be checked, and the monitoring programme reviewedto ensure only representative groundwater samples are collected.
· No information is available on the construction of D612(AFS), it is recommended that the total depthbe measured to see if levels are near the base of the bore and water quality may reflect sedimentwithin the bore.
· Assign one trigger level for EC for bore PB01(ALL) and C130(ALL) in WMP, based on historical data.
· Ongoing water quality analysis for C130(ALL), as well as water quality analysis (i.e. major ions) andwater level monitoring for LUG Bore and water stored within Lemington South Pit is recommended.This would also assist in verifying model predictions relating to abstraction from LUG Bore.

HV Operations Pty LtdHunter Valley Operations2019 Annual Groundwater Review
SLR Ref No: 620.12182.00000-R13Filename: 620.12182.00000-R13-v3.0.docx
March 2020
Page 66
· Spoil bores 4116P and 4117P should be removed from the compliance network and ongoingmonitoring be conducted at nearby bores MB14HVO01 and MB14HVO02.
· Review condition of bore 4032P and local land use practices to understand cause for recent rise inwater levels.
· Further works in relation to bores G1 to G3, including:
o Based on findings from the downhole camera survey, conduct bore repairs for site monitoringbores and abandon adjacent bores;
o Install dataloggers into bores G1 to G3 to collect more robust timeseries data;
o Extend casing height for bore G3 and install a cap that enables pressure release;
· Review the bore condition and construction to investigate the elevated groundwater levels at borePZ2CH400.
· Review the condition and construction of bores HG2a, BC1a, BZ1-3, BZ2A(1), BZ3-3,BZ4A(2) andB425(WDH) in order to understand the cause for the variability in trends.
· Review local land use activities around D807(BFS) to understand trends.
· Clear out/purge bore DM4 to remove sediment.
· The abstraction rate from the LUG bore is higher than previously assessed. It is recommended thatnumerical modelling be undertaken to assess the impacts of the higher abstraction rate from the LUGbore on surrounding groundwater levels.

HV Operations Pty LtdHunter Valley Operations2019 Annual Groundwater Review
SLR Ref No: 620.12182.00000-R13Filename: 620.12182.00000-R13-v3.0.docx
March 2020
Page 67
7 ReferencesAustralasian Groundwater and Environmental Consultants 2013a, 2012 HVO South Groundwater ImpactsReport, prepared for Coal & Allied Operations Pty Ltd, March 2013.
Australasian Groundwater and Environmental Consultants 2013b, HVO North Modification Fine RejectEmplacement Groundwater Assessment, prepared for Coal & Allied Operations Pty Ltd, June 2013.
Australasian Groundwater and Environmental Consultants 2016, HVO North Modification 6 Groundwater Study,prepared for EMM Consulting for Coal & Allied Operations Pty Ltd, November 2016.
Australasian Groundwater and Environmental Consultants 2017, HVO South Modification 5 Groundwater Study,prepared for EMM Consulting for Coal & Allied Operations Pty Ltd, January 2017.
Environmental Resources Management Mitchell McCotter Pty Ltd 1997, Extension of Mining Operations atRavensworth Mine: Environmental Impact Statement, Volume 1, prepared for Peabody Resources Limited,August 1997.
Environmental Resources Management 2008, Groundwater Assessment, Hunter Valley Operations South CoalProject, Annex J, prepared for Coal & Allied Operations Pty Ltd, January 2008.
Mackie Environmental Research 1998, Hunter Valley South Mining Extension: Groundwater and Surface WaterManagement Studies, prepared for Rio Tinto Coal, July 1998.
Mackie Environmental Research 2003, West Pit Extension Groundwater Assessment, prepared for Coal & Allied,2003.
Mackie Environmental Research 2005, Assessment of River Leakage Within the Cheshunt Pit Buffer Zone,prepared for Coal & Allied, April 2005.
Mackie Environmental Research 2010, Carrington West Wing Modification – Groundwater Assessment,prepared for Coal & Allied, in Carrington West Wing Environmental Assessment (EA), Volume 2, Appendix E –Groundwater Study, March 2010.
Mackie Martin & Associates 1992, Hunter Valley Mine Alluvial Floodplain Groundwater Studies, prepared forCoal & Allied, Appendix D – Groundwater Study, August 1992.
SLR Consulting Australia, 2019. 2018 Annual Groundwater Review, prepared for Hunter Valley Operations PtyLtd, March 2019.

620.12182.00000-R13-v3.0.docx Page 1 of 1
APPENDIX AGroundwater Monitoring Programme

620.12182.00000-R13-v3.0.docx Page 1 of 6
ID Location Easting NorthingGround
Level(mAHD)
ScreenedInterval (mbgl)
GeologyGroundwater Monitoring Programme
WaterLevel
EC pH FullWQ
Alk/Acidity
4032P CWW 308609 6402945 69.35 7.4-13.4 Paleochannel alluvium Q Q Q 6M
4034P CWW 308239 6402959 71.15 5.6-14.6 Paleochannel alluvium Q Q Q 6M
4036C Carrington 308272 6402688 70.7 33.1-34.1 Interburden(Siltstone/Sandstone) Q Q Q
4037P CWW 308277 6402702 70.74 8.3-14.3 Paleochannel alluvium Q Q Q 6M
4040P CWW 308675 6402724 69.16 5.9-11.9 Paleochannel alluvium Q Q Q
4051C Carrington 308664 6402721 68.92 31.8-32.8Interburden
(Siltstone/Sandstone) Q Q Q
4116P North Pit 310681 6400978 70.17 20.9-23.5 Spoil Q Q Q 6M
4119P North Pit 312501 6402048 63.51 14.9-17.5 Spoil Q Q Q 6M
Appleyard Farm Lemington 315491 6394639 43.4 7-10 Alluvium M Q Q A
B334(BFS) Lemington 316684 6394088 73.37 58.5-64.5 Bowfield Seam Q 6M 6M
B425(WDH) Lemington 316010 6395024 57.88 31.5-35.5 Woodlands Hill Seam Q 6M 6M A
B631(BFS) Lemington 316425 6394319 72.11 78-84 Bowfield Seam Q 6M 6M
B631(WDH) Lemington 316424 6394319 71.98 29.8-32.3 Woodlands Hill Seam 6M 6M 6M
B925(BFS) Lemington 315921 6394604 62.45 81-87 Bowfield Seam Q 6M 6M A
BC1a Cheshunt 312421 6400872 66.08 21.98 Mt Arthur Seam Q Q Q
BUNC45A Cheshunt/North Pit 313667 6402055 72.9 17.3-20.3 Regolith Q Q Q 6M
BUNC45D Cheshunt Pit 313677 6402060 73.36 25.9-28.9 Mt Arthur Seam Q Q Q 6M
BZ1-1 Cheshunt/North Pit 311472 6400483 71.39 21-24 Interburden Q Q Q 6M
BZ1-3 Cheshunt 311472 6400483 71.39 53-56 Mt Arthur Seam Q Q Q 6M
BZ2A(1) Cheshunt 311671 6400561 71.17 49.1-52.1 Mt Arthur Seam Q Q Q
BZ3-1 Cheshunt 311840 6400640 69.97 TD 26.5 Interburden Q Q Q
BZ3-3 Cheshunt 311840 6400640 69.97 41.5-44.5 Mt Arthur Seam Q Q Q
BZ4A(2) Cheshunt 312029 6400705 74.4 38-41 Mt Arthur Seam Q Q Q
BZ8-2 Cheshunt 312685 6401010 67.8 18-21 Interburden Q Q Q 6M
C122(WDH) Lemington 315501 6395007 58.44 19.6-22.6 Woodlands Hill Seam 6M 6M 6M
C122(BFS) Lemington 315501 6395007 58.2 - Bowfield Seam Q Q Q
C130(AFS1) Lemington 316400 6394916 63.17 42-44 Arrowfield Seam 6M 6M 6M A
C130(ALL) Lemington 316400 6394916 63.04 15-17 Interburden Q Q Q A

620.12182.00000-R13-v3.0.docx Page 2 of 6
ID Location Easting NorthingGround
Level(mAHD)
ScreenedInterval (mbgl)
GeologyGroundwater Monitoring Programme
WaterLevel
EC pH FullWQ
Alk/Acidity
C130(BFS) Lemington 316400 6394916 62.98 55.5-64.5 Bowfield Seam 6M 6M 6M
C130(WDH) Lemington 316400 6394916 63.14 19-21.5 Woodlands Hill Seam 6M 6M 6M
C317(BFS) Lemington 315054 6395007 60.38 70-76.5 Bowfield Seam Q 6M 6M
C317(WDH) Lemington 315054 6395007 60.12 31-33.5 Woodlands Hill Seam Q 6M 6M
C613(BFS) Lemington 314688 6395243 63.64 77-85 Bowfield Seam Q 6M 6M
C621(BFS) Lemington 315421 6395321 58.37 47-56 Bowfield Seam Q 6M 6M
C630(BFS) Lemington 316378 6395306 68.81 40.3-48.3 Bowfield Seam 6M 6M 6M
C809 (GM/WDH) Lemington 314207 6395493 59.13 28-38 Woodlands Hill Seam 6M 6M 6M
C919(ALL) Lemington 315192 6395655 57.94 7.5-13.5 Alluvium M Q Q A
CFW55R Carrington 310439 6402180 69.78 9.4-16.4 Paleochannel alluvium Q Q Q 6M
CFW57 Carrington 310084 6402053 70.05 8.4-15.4 Paleochannel alluvium Q Q Q 6M
CGW32 CWW 308598 6404872 78.48 14-23 Paleochannel alluvium Q Q Q
CGW39 CWW 308566 6403694 70.31 5-14 Alluvium Q Q Q 6M
CGW45 CWW 308042 6403349 71.83 28.6 Bayswater Seam Q Q Q
CGW46 CWW 308413 6403276 71.95 13.6 Bayswater Seam Q Q Q 6M
CGW47a CWW 308731 6403405 70.39 16.47 Broonie Seam Q Q Q 6M
CGW49 CWW 308778 6403098 69.05 13.3 Bayswater Seam Q Q Q
CGW51a Carrington 310149 6402419 70.04 13 - 16 Interburden(Siltstone/Sandstone)
Q Q Q
CGW52 Carrington 309906 6402255 70.7 39.6-42.6 Broonie Seam Q Q Q
CGW52a Carrington 309902 6402249 70.61 15 - 18 Alluvium Q Q Q
CGW53 Carrington 309606 6402333 69.87 38.5-41.5 Broonie Seam Q Q Q
CGW53a Carrington 309606 6402333 69.83 11.7 – 14.7 Alluvium Q Q Q
CGW55a Carrington 309840 6402457 70.56 12.8 – 15.8 Alluvium Q Q Q
CHPZ10A Cheshunt/North Pit 313334 6402297 62.57 9.5-12.6 Alluvium Q Q Q 6M
CHPZ12A Cheshunt/North Pit 313238 6402013 63.13 9.5-11.5 Alluvium Q Q Q 6M
CHPZ12D Cheshunt 313236 6402019 63.26 12-15 Mt Arthur Seam Q Q Q 6M
CHPZ1A Cheshunt/North Pit
312820 6401697 65.9 15-18.7 Alluvium Q Q Q 6M2
CHPZ2A Cheshunt/North Pit 312941 6401539 65.14 13.7-16.9 Alluvium Q Q Q 6M

620.12182.00000-R13-v3.0.docx Page 3 of 6
ID Location Easting NorthingGround
Level(mAHD)
ScreenedInterval (mbgl)
GeologyGroundwater Monitoring Programme
WaterLevel
EC pH FullWQ
Alk/Acidity
CHPZ3A Cheshunt/North Pit 313086 6401756 63.18 14.5-11.5 Alluvium Q Q Q 6M
CHPZ3D Cheshunt 313094 6401756 62.96 20.5-23.6 Mt Arthur Seam Q Q Q 6M
CHPZ4A Cheshunt/North Pit 312904 6402123 65.45 10.9-14.2 Alluvium Q Q Q 6M
CHPZ8ACheshunt/North Pit 313503 6402051 60.05 4-6 Alluvium Q Q Q 6M
CHPZ8D Cheshunt 313508 6402047 59.89 6-9.5 Mt Arthur Seam Q Q Q 6M
D010(BFS) Lemington 314355 6395687 55.94 60-66.5 Bowfield Seam 6M 6M 6M
D010(GM) Lemington 314355 6395687 55.95 12.5-17 Glen Munro Seam 6M 6M 6M A
D010(WDH) Lemington 314355 6395687 56 19.5-22.5 Woodlands Hill Seam 6M 6M 6M
D214(BFS) Lemington 314768 6395831 56.67 43-52.5 Bowfield Seam Q 6*M 6*M
D317(BFS) Lemington 315043 6396019 59.64 39-44.2 Bowfield Seam Q 6M 6M
D406(AFS) Lemington 313931 6396074 57.41 24-27.5 Arrowfield Seam 6M 6M 6M
D406(BFS) Lemington 313931 6396074 57.36 51-57 Bowfield Seam 6M 6M 6M
D510(AFS) Lemington 314380 6396141 54.99 25.5-30.5 Arrowfield Seam 6M 6M 6M
D510(BFS) Lemington 314380 6396141 54.98 34-38 Bowfield Seam 6M 6M 6M
D612(AFS) Lemington 314524 6396314 62.16 24.01 Arrowfield Seam 6M 6M 6M
D612(BFS) Lemington 314524 6396314 62.1 29.15 Bowfield Seam 6M 6M 6M
D807(BFS) Lemington 314002 6396484 59.94 36-41 Bowfield Seam 6M 6M 6M
DM1 North Pit 311778 6405164 102.73 29.15 Spoil (Base) Q Q Q A Q
DM3 North Pit 311971 6403310 94.14 41.5 Spoil (Base) Q Q Q A Q
DM4 North Pit 312222 6401418 64.85 55- Spoil (Base) Q Q Q A Q
DM7 North Pit 311136 6400961 69.26 32- Spoil Q Q Q A Q
G1 West Pit 305694 6407301 110 <10 Alluvium Q Q Q A
G2 West Pit 305660 6407451 110.6 3.04 Alluvium Q Q Q A
G3 West Pit 305636 6407556 108.6 <10 Alluvium Q Q Q A
GA3 Cheshunt/North Pit 310159 6400876 67.02 12 Coal Q Q Q
GW-100 West Pit 303729 6406436 89.6 4.4-5 Alluvium Q Q Q A
GW_100a (VWP) Carrington 303722 6406445 89.4 51 Barrett Seam and Interburden Q*
GW-101 West Pit 304374 6406728 100.5 9-12 Alluvium Q Q Q A

620.12182.00000-R13-v3.0.docx Page 4 of 6
ID Location Easting NorthingGround
Level(mAHD)
ScreenedInterval (mbgl)
GeologyGroundwater Monitoring Programme
WaterLevel
EC pH FullWQ
Alk/Acidity
GW-101a (VWP) Carrington 304362 6406721 100.5 51 Interburden(Siltstone/Sandstone) Q*
GW-102 (VWP) Carrington 305280 6406668 114.6 60.5 Interburden (Sandstone withminor coal) Q*
GW-103 (VWP) Carrington 306769 6404610 103.2
25.5 Coal - undifferentiated andweathered
Q*64.5 Siltstone and coal
119.5 Sandstone - mg, fresh
GW-104 (VWP) Carrington 307549 6404657 86.7
59 Lower Pikes Gully Seam
Q*107Sandstone IB (near Upper
Liddell Seam)
135 Sandstone (above Barret)
GW-105 (VWP) Carrington 308597 6405442 93.1
33 Coal - undifferentiated
Q*103.5 Coal - tuffaceous
154 Coal
GW-106 CWW 309092 6405224 82.3 24-27 Paleochannel alluvium Q Q Q A
GW-107 Carrington 308738 6404103 73.5 24.2-27.2 Carrington Spoil Q Q Q A
GW-108 Carrington 309695 6403971 84.4 52.5-58.5 Carrington Spoil Q Q Q A
GW-109 (VWP) Carrington 309232 6402706 85.2
31.5 Coal - slightly weathered
Q*65 Coal - tuffaceous
89.5 Bayswater Seam
GW-110 (VWP) Carrington 310503 6404598 124.6
38 Sandstone - fresh
Q*63 Sandstone
93 Bayswater Seam
GW-114 North Pit 312272 6403981 98.2 27-30 Spoil Q Q Q A
GW-115 North Pit 312227 6402216 68.3 22.2-28.2 Spoil Q Q Q A
GW-120 Carrington 310463 6402239 69.97 12-15 Alluvium TBC TBC TBC TBC
GW-121 Carrington 310332 6401877 68 5-8 Alluvium TBC TBC TBC TBC
GW-122 Carrington 310225 6401781 69.06 12-15 Interburden TBC TBC TBC TBC
GW-123 Carrington 310259 6402014 68.99 9.9-12.9 Alluvium TBC TBC TBC TBC
GW-124 Carrington 310170 6401924 68.9 11.7-14.7 Alluvium TBC TBC TBC TBC

620.12182.00000-R13-v3.0.docx Page 5 of 6
ID Location Easting NorthingGround
Level(mAHD)
ScreenedInterval (mbgl)
GeologyGroundwater Monitoring Programme
WaterLevel
EC pH FullWQ
Alk/Acidity
GW-125 Carrington 310118 6402315 68.46 10.4-13.4 Alluvium TBC TBC TBC TBC
GW-126 Carrington 310055 6402214 70.29 11.8-14.8 Alluvium TBC TBC TBC TBC
GW-127 Carrington 309973 6402109 68.92 11.1-14.1 Alluvium TBC TBC TBC TBC
GW-128 Carrington 310314 6402307 69.77 8.7 - 11.7 Alluvium TBC TBC TBC TBC
GW-129 Carrington 310553 6402211 72.3 12.3 - 21.3 Spoil TBC TBC TBC TBC
HG2 Cheshunt 312469 6400886 67.4 11-17 Interburden Q Q Q
HG2a Cheshunt 312469 6400886 66.82 25.8-27.8 Mt Arthur Seam Q Q Q
Hobdens Well Cheshunt/North Pit
312540 6401093 71 13.9 Alluvium Q Q Q A
HV3(2)Cheshunt/North Pit 310776 6400546 68.06 - Hunter River Alluvium Q Q Q
LUG Bore Lemington 315874 6394295 - M Q Q A
NPz2 West Pit 307800 6411340 190.475 57-60 Sandstone/Siltstone Q Q Q A
NPz3 West Pit 306305 6409131 148.4 93.3-96.6 Siltstone Q Q Q A
NPz5 West Pit 310730 6406550 113.76 40-43 Sandstone/Siltstone Q Q Q A
PBO1(ALL) Lemington 314754 6396026 54.37 9.5-12.5 Alluvium M Q Q A
PZ1CH200 Cheshunt/North Pit
312646 6402256 62.06 >8.9-11.1 Alluvium Q Q Q
PZ2CH400 Cheshunt/North Pit 312635 6402051 62.53 >9.9-11.2 Hunter River Alluvium Q Q Q 6M2
PZ3CH800 Cheshunt/North Pit
312522 6401674 64.16 10.47 Hunter River Alluvium Q Q Q 6M2
PZ4CH1380 Cheshunt/North Pit 312196 6401176 64.93 14.58 Hunter River Alluvium Q Q Q
PZ5CH1800Cheshunt/North Pit 311852 6400928 66.1 15 Hunter River Alluvium Q Q Q
SR001 Southern 319146 6394094 58.44 60 Coal 6M 6M 6M
SR002 Southern 319079 6394620 56.99 38-41 Bayswater Seam 6M 6M 6M
SR003 Southern 318863 6394864 61.33 64.44 Bayswater Seam 6M 6M 6M
SR004 Southern 318994 6395506 78.15 40.64 Bayswater Seam 6M 6M 6M
SR005 Southern 318831 6396128 65.36 27.08 Bayswater Seam 6M 6M 6M
SR006 Southern 318555 6395732 83.31 92.25 Bayswater Seam 6M 6M 6M
SR007 (RC_11) Southern 318772 6394373 60.9 31.5-37.5Overburden and Vaux Seam
coal 6M 6M 6M A

620.12182.00000-R13-v3.0.docx Page 6 of 6
ID Location Easting NorthingGround
Level(mAHD)
ScreenedInterval (mbgl)
GeologyGroundwater Monitoring Programme
WaterLevel
EC pH FullWQ
Alk/Acidity
SR008 (RC_7) Southern 319290 6395111 56.8 24.4-30.4 Siltstone/sandstone belowLemington Seam 6M 6M 6M A
SR009 (RC_8) Southern 319338 6394746 56.1 30.4-36.4 Lemington Seam 6M 6M 6M A
SR010 (RC_6) Southern 317319 6395338 57.5 24.6-30.6 Conglomerate and WarkworthSeam 6M 6M 6M A
SR011 (RC_14) Southern 317699 6394412 88.2 41.4-47.4 Mt Arthur Seam andunderburden 6M 6M 6M A
SR012(HQ_11) Southern 316354 6393926 76.2 23.4-29.4 Overburden - conglomerateand sandstone 6M 6M 6M A
MB14HVO01 North Pit 310587 6401003 71.3 90 Spoil Q Q Q A
MB14HVO02 North Pit 310469 6401001 70.9 90 Spoil Q Q Q A
MB14HVO03 North Pit 311387 6400950 67.1 80 Spoil Q Q Q A
MB14HVO04 North Pit 311491 6401392 67.1 55 Spoil Q Q Q A
MB14HVO05 North Pit 310675 6401127 71.7 85 Spoil Q Q Q A
Notes:(VWP) indicates that the hole is fitted with a grouted vibrating wire piezometer.Q* - Data downloaded quarterlyRE – Rain Event sampling (≥30mm rainfall in 24hrs, max 2 sampling events per quarter),M – Monthly,Q – Quarterly,6M – Six MonthlyA – Annual2 Comprehensive analysis 2

620.12182.00000-R13-v3.0.docx Page 1 of 1
APPENDIX BGroundwater Level Readings 2019

620.12182.00000-R13-v3.0.docx Page 1 of 5
Alluvium
ID Location Easting Northing Ground Level(mAHD)
Screened Interval(mbgl) WMP Geology
SWL (mAHD)Q1 Q2 Q3 Q4
4032P CWW 308609 6402945 69.35 7.4-13.4 Carrington West Wing_Alluvium 58.51 58.51 58.59 58.79
4034P CWW 308239 6402959 71.15 5.6-14.6 Carrington West Wing_Alluvium 58.5 58.49 58.49 58.48
4037P CWW 308277 6402702 70.74 8.3-14.3 Carrington West Wing_Alluvium 58.58 58.56 58.56 58.54
4040P CWW 308675 6402724 69.16 5.9-11.9 Carrington West Wing_Alluvium 58.56 58.8 58.57 58.51
Appleyard Farm Lemington 315491 6394639 43.4 7-10 Lemington South_Alluvium 36.04 36.06 35.92 35.8
BUNC45A Cheshunt/ NorthPit 313667 6402055 72.9 17.3-20.3 Cheshunt / North Pit_Alluvium 51.71 51.78 51.93 50.93
BZ1-1 Cheshunt/ NorthPit
311472 6400483 71.39 21-24 Cheshunt / North Pit_Alluvium 53.88 Bore Dry 53.71 53.93
C919(ALL) Lemington 315192 6395655 57.94 ? Lemington South_Alluvium 45.98 Bore Dry Bore Dry Bore Dry
CFW55R Carrington 310439 6402180 69.78 9.4-16.4 Carrington_Alluvium 58.12 57.97 57.88 57.75
CFW57 Carrington 310084 6402053 70.05 8.4-15.4 Carrington_Alluvium 57.94 57.94 57.81 57.7
CGW32 CWW 308598 6404872 78.48 ?Carrington West Wing_Flood
Plain 59.14 59.11 59.13 59.09
CGW39 CWW 308566 6403694 70.31 5-14 Carrington West Wing_FloodPlain 58.12 58.13 58.12 58.07
CGW47a CWW 308731 6403405 70.39 ? Carrington West Wing_FloodPlain 54.15 54.11 54.15 54.15
CGW49 CWW 308778 6403098 69.05 ? Carrington West Wing_Alluvium 58.97 58.98 58.96 58.95
CGW52a Carrington 309902 6402249 70.61 ? Carrington_Alluvium 58.03 57.93 57.91 57.83
CGW53a Carrington 309606 6402333 69.83 ? Carrington_Alluvium 58.08 58.03 57.49 57.94
CGW55a Carrington 309840 6402457 70.56 ? Carrington_Alluvium 57.34 57.26 57.23 56.96
CHPZ10A Cheshunt/ NorthPit 313334 6402297 62.57 9.5-12.6 Cheshunt / North Pit_Alluvium 53.14 53.25 53.16 53.14
CHPZ12A Cheshunt/ NorthPit
313238 6402013 63.13 9.5-11.5 Cheshunt / North Pit_Alluvium 53.76 53.86 53.77 53.74
CHPZ1A Cheshunt/ NorthPit 312820 6401697 65.9 15-18.7 Cheshunt / North Pit_Alluvium 54.2 54.32 54.15 54.19
CHPZ2A Cheshunt/ NorthPit
312941 6401539 65.14 13.7-16.9 Cheshunt / North Pit_Alluvium 53.62 Blocked 53.62 53.61
CHPZ3A Cheshunt/ NorthPit 313086 6401756 63.18 14.5-11.5 Cheshunt / North Pit_Alluvium 53.48 53.59 53.48 53.46
CHPZ4ACheshunt/ North
Pit 312904 6402123 65.45 10.9-14.2 Cheshunt / North Pit_Alluvium 53.41 53.51 53.39 53.41
CHPZ8A Cheshunt/ NorthPit 313503 6402051 60.05 4-6 Cheshunt / North Pit_Alluvium 53.18 53.32 53.2 53.16
G1 West Pit 305694 6407301 110 ? West Pit_Alluvium 108.37 108.22 108.35 107.99
G2 West Pit 305660 6407451 110.6 ? West Pit_Alluvium 109.26 109.28 109.52 109.06

620.12182.00000-R13-v3.0.docx Page 2 of 5
ID Location Easting Northing Ground Level(mAHD)
Screened Interval(mbgl) WMP Geology
SWL (mAHD)Q1 Q2 Q3 Q4
G3 West Pit 305636 6407556 108.6 ? West Pit_Alluvium 107.76 107.83 108.14 107.69
GA3 Cheshunt/ NorthPit
310159 6400876 67.02 ? Cheshunt / North Pit_Alluvium 56.46 56.52 56.43 56.49
GW-100 West Pit 303729 6406436 89.6 4.4-5 West Pit_Alluvium 83.74 83.68 83.56 83.39
GW-101 West Pit 304374 6406728 100.5 9-12 West Pit_Alluvium 87.68 87.63 Bore Dry Bore Dry
GW-106 CWW 309092 6405224 82.3 24-27 Carrington West Wing_Alluvium 59.06 59 59.08 59.01
GW-120 North Void 310463 6402239 69.97 12-15 North Void_Alluvium 58.19 58.02 57.93 57.78
GW-121 North Void 310332 6401877 68 5-8 North Void_Alluvium Bore Dry Bore Dry Bore Dry Bore Dry
GW-123 North Void 310259 6402014 68.99 10-12.9 North Void_Alluvium 57.91 57.9 57.8 57.67
GW-124 North Void 310170 6401924 68.9 11.7-14.7 North Void_Alluvium 58.18 58.22 58.05 57.94
GW-125 North Void 310118 6402315 68.46 10.4-13.4 North Void_Alluvium 58.24 58.22 58.16 58.04
GW-126 North Void 310055 6402214 70.29 11.8-14.8 North Void_Alluvium 57.92 57.84 57.84 57.72
GW-127 North Void 309973 6402109 68.92 11.1-14.1 North Void_Alluvium 58.19 58.2 58.09 57.98
GW-128 North Void 310314 6402307 69.77 8.7-11.7 North Void_Alluvium 57.83 57.73 57.66 57.52
Hobdens Well Cheshunt/ NorthPit
312540 6401093 71 ? Cheshunt / North Pit_Alluvium 58.5 58.67 58.44 58.5
HV3(2) Cheshunt/ NorthPit 310776 6400546 68.06 ?-16.7 Cheshunt / North Pit_Alluvium 56.95 56.9 57 57.02
PB01(ALL) Lemington 314754 6396026 54.37 9.5-12.5 Lemington South_Alluvium 45.01 45.11 45.04 44.86
PZ1CH200 Cheshunt/ NorthPit 312646 6402256 62.06 >8.9-11.1 Cheshunt / North Pit_Alluvium 54.5 54.55 54.42 54.65
PZ2CH400 Cheshunt/ NorthPit
312635 6402051 62.53 >9.9-11.2 Cheshunt / North Pit_Alluvium 60.17 54.58 54.41 54.51
PZ3CH800 Cheshunt/ NorthPit 312522 6401674 64.16 ? Cheshunt / North Pit_Alluvium 54.74 54.74 54.67 54.86
PZ4CH1380 Cheshunt/ NorthPit
312196 6401176 64.93 ? Cheshunt / North Pit_Alluvium 54.89 54.89 54.86 55.06
PZ5CH1800 Cheshunt/ NorthPit 311852 6400928 66.1 ? Cheshunt / North Pit_Alluvium 55.21 55.2 55.14 55.45

620.12182.00000-R13-v3.0.docx Page 3 of 5
Permian Coal Measures
ID Location Easting NorthingGround
Level(mAHD)
ScreenedInterval(mbgl)
WMP GeologySWL (mAHD)
Q1 Q2 Q3 Q4
4036C Carrington 308272 6402688 70.7 33.1-34.1 Carrington_Interburden Bore Dry Bore Dry Bore Dry Bore Dry
4051C Carrington 308664 6402721 68.92 31.8-32.8 Carrington_Interburden 50.96 51.56 52.1 52.38
B334(BFS) Lemington 316684 6394088 73.37 58.5-? Lemington South_Bowfield 17.71 18.16 18.73 19.59
B425(WDH) Lemington 316010 6395024 57.88 ? Lemington South_Woodlands Hill 22.14 22.28 21.98 22.06
B631(BFS) Lemington 316425 6394319 72.11 78-? Lemington South_Bowfield 26.98 26.53 25.02 23.96
B631(WDH) Lemington 316424 6394319 71.98 ? Lemington South_Woodlands Hill - 45.8 - 45.77
B925(BFS) Lemington 315921 6394604 62.45 81-? Lemington South_Bowfield 3.85 3.06 0.52 -0.72
BC1a Cheshunt 312421 6400872 66.08 ? Cheshunt_Mt Arthur 48.49 48.5 48.42 48.47
BUNC45D Cheshunt Pit 313677 6402060 73.36 25.9-28.9 Cheshunt_Piercefield 48.01 48.1 48.1 48.12
BZ1-3 Cheshunt 311472 6400483 71.39 ? Cheshunt_Mt Arthur 24.34 24.52 24.57 24.63
BZ2A(1) Cheshunt 311671 6400561 71.17 ? Cheshunt_Mt Arthur 25 25.04 25 25.04
BZ3-1 Cheshunt 311840 6400640 69.97 ? Cheshunt_Interburden 53.18 53.07 52.97 52.35
BZ3-3 Cheshunt 311840 6400640 69.97 ? Cheshunt_Mt Arthur 26.84 26.82 26.8 26.86
BZ4A(2) Cheshunt 312029 6400705 74.4 ? Cheshunt_Mt Arthur 33.44 33.06 33.06 33.09
BZ8-2 Cheshunt 312685 6401010 67.8 ? Cheshunt_Interburden 47.58 47.6 49.04 47.09
C122(WDH) Lemington 315501 6395007 58.44 ? Lemington South_Woodlands Hill - 45.86 - 45.71
C122(BFS) Lemington 315501 6395007 58.2 ? Lemington South_Bowfield Bore Dry Bore Dry Bore Dry Bore Dry
C130(AFS1) Lemington 316400 6394916 63.17 42-44 Lemington South_Arrowfield - 44.56 - 44.74
C130(ALL) Lemington 316400 6394916 63.04 15-17 Lemington South_Interburden 47.05 47.07 47.09 46.97
C130(BFS) Lemington 316400 6394916 62.98 55.5-64.5 Lemington South_Bowfield 12.14 12.22 10.77 9.64
C130(WDH) Lemington 316400 6394916 63.14 19-21.5 Lemington South_Woodlands Hill - 47.01 - 46.99
C317(BFS) Lemington 315054 6395007 60.38 ? Lemington South_Bowfield 10.04 10.06 7.82 6.22
C317(WDH) Lemington 315054 6395007 60.12 ? Lemington South_Woodlands Hill 45.55 45.51 45.4 45.3
C613(BFS) Lemington 314688 6395243 63.64 ? Lemington South_Bowfield 33.91 33.57 33.22 33.11
C621(BFS) Lemington 315421 6395321 58.37 ? Lemington South_Bowfield 16.35 16.37 15.3 14.87
C630(BFS) Lemington 316378 6395306 68.81 ? Lemington South_Bowfield - 22.86 - 22.98
C809 (GM/WDH) Lemington 314207 6395493 59.13 28-38 Lemington South_Woodlands Hill - 46.62 - 46.25
CGW45 CWW 308042 6403349 71.83 ? Carrington West Wing_LBL Blocked Blocked Blocked Blocked
CGW46 CWW 308413 6403276 71.95 ? Carrington West Wing_Bayswater 59.01 59.76 59.01 59.05
CGW51a Carrington 310149 6402419 70.04 ? Carrington_Interburden 55.89 55.7 55.63 55.57

620.12182.00000-R13-v3.0.docx Page 4 of 5
ID Location Easting NorthingGround
Level(mAHD)
ScreenedInterval(mbgl)
WMP GeologySWL (mAHD)
Q1 Q2 Q3 Q4
CGW52 Carrington 309906 6402255 70.7 ? Carrington_Broonie 34.06 33.98 34.16 34.28
CGW53 Carrington 309606 6402333 69.87 ? Carrington_Broonie 35.44 35.47 35.59 35.73
CHPZ12D Cheshunt 313236 6402019 63.26 12-15 Cheshunt_Mt Arthur 53.68 53.75 53.66 53.66
CHPZ3D Cheshunt 313094 6401756 62.96 20.5-23.6 Cheshunt_Mt Arthur 52.39 52.56 52.39 52.45
CHPZ8D Cheshunt 313508 6402047 59.89 6-9.5 Cheshunt_Mt Arthur 52.81 53.31 52.82 52.76
D010(BFS) Lemington 314355 6395687 55.94 60-66.5 Lemington South_Bowfield - 28.39 - 28.44
D010(GM) Lemington 314355 6395687 55.95 12.5-17 Lemington South_Glen Munro - 47.22 - 46.76
D010(WDH) Lemington 314355 6395687 56 19.5-22.5 Lemington South_Woodlands Hill - 46.22 - 45.84
D214(BFS) Lemington 314768 6395831 56.67 43-52.5 Lemington South_Bowfield 26.47 26.86 26.64 26.8
D317(BFS) Lemington 315043 6396019 59.64 39-44.2 Lemington South_Bowfield 24.94 25.3 25.3 25.33
D406(AFS) Lemington 313931 6396074 57.41 ? Lemington South_Arrowfield - 40.95 - 40.37
D406(BFS) Lemington 313931 6396074 57.36 ? Lemington South_Bowfield - 30.63 - 31.42
D510(AFS) Lemington 314380 6396141 54.99 25.5-30.5 Lemington South_Arrowfield - 29.88 - 29.58
D510(BFS) Lemington 314380 6396141 54.98 34-38 Lemington South_Bowfield - 29.62 - 30.32
D612(AFS) Lemington 314524 6396314 62.16 ? Lemington South_Arrowfield - 39.46 - 39.38
D612(BFS) Lemington 314524 6396314 62.1 ? Lemington South_Bowfield - 29.83 - 30.25
D807(BFS) Lemington 314002 6396484 59.94 36-41 Lemington South_Bowfield - 32.88 - 33.76
GW-122 North Void 310225 6401781 69.06 12-15 North Void_Permian 58.28 58.13 57.82 57.82
HG2 Cheshunt 312469 6400886 67.4 11-17 Cheshunt_Interburden 54.39 54.54 54.38 54.38
HG2a Cheshunt 312469 6400886 66.82 25.8-27.8 Cheshunt_Mt Arthur 41.06 41.06 41.03 41.08
NPz2 West Pit 307800 6411340 190.475 57-60 West Pit_Sandstone/Siltstone 161.055 160.955 160.955 160.575
NPz3 West Pit 306305 6409131 148.4 ? West Pit_Sandstone/Siltstone 125.81 125.96 125.51 124.9
NPz5 West Pit 310730 6406550 113.76 40-43 West Pit_Sandstone/Siltstone 95.21 95.71 93.57 91.93
SR001 Southern 319146 6394094 58.44 ? Southern_Coal - 47.04 - 46.93
SR002 Southern 319079 6394620 56.99 38-41 Southern_Bayswater Seam - 42.84 - 42.54
SR003 Southern 318863 6394864 61.33 ? Southern_Bayswater Seam - 43.16 - 42.8
SR004 Southern 318994 6395506 78.15 ? Southern_Bayswater Seam - 42.7 - 42.55
SR005 Southern 318831 6396128 65.36 ? Southern_Bayswater Seam - 42.67 - 42.67
SR006 Southern 318555 6395732 83.31 ? Southern_Bayswater Seam - 42.57 - 42.46
SR007 Southern 318772 6394373 60.9 31.5-37.5 Southern_Overburden and Vaux Seam coal 25.83 25.75 25.81 25.84
SR008 Southern 319290 6395111 56.8 24.4-30.4 Southern_Siltstone/sandstone belowLemington Seam 47.22 47.19 47.13 47.04

620.12182.00000-R13-v3.0.docx Page 5 of 5
ID Location Easting NorthingGround
Level(mAHD)
ScreenedInterval(mbgl)
WMP GeologySWL (mAHD)
Q1 Q2 Q3 Q4
SR009 Southern 319338 6394746 56.1 30.4-36.4 Southern_Lemington Seam 49.16 49.16 49.1 49
SR010 Southern 317319 6395338 57.5 24.6-30.6Southern_Conglomerate and Warkworth
Seam 46.61 46.98 47.17 46.92
SR011 Southern 317699 6394412 88.2 41.4-47.4 Southern_Mt Arthur Seam andunderburden
53.6 53.47 53.45 53.36
SR012 Southern 316354 6393926 76.2 23.4-29.4 Southern_Overburden - conglomerate andsandstone 49.49 49.25 49.11 49
Spoil
ID Location Easting Northing Ground Level (mAHD) Screened Interval (mbgl) WMP GeologySWL (mAHD)
Q1 Q2 Q3 Q4
4116P North Pit 310681 6400978 70.17 20.9-23.5 North Pit_Spoil 46.54 47 46.46 46.52
4119P North Pit 312501 6402048 63.51 14.9-17.5 North Pit_Spoil 52.45 52.62 52.4 52.33
DM1 North Pit 311778 6405164 102.73 ? North Pit_Spoil 77.52 77.19 77.53 77.54
DM3 North Pit 311971 6403310 94.14 50-? North Pit_Spoil 63.76 63.68 63.66 63.7
DM4 North Pit 312222 6401418 64.85 55-? North Pit_Spoil 46.86 46.81 46.7 46.61
DM7 North Pit 311136 6400961 69.26 32-? North Pit_Spoil Bore Dry Bore Dry Bore Dry Bore Dry
GW-107 Carrington 308738 6404103 73.5 24.2-27.2 Carrington_Spoil 44.29 44.18 44.28 44.3
GW-108 Carrington 309695 6403971 84.4 52.5-58.5 Carrington_Spoil 23.51 23.5 23.52 23.54
GW-114 North Pit 312272 6403981 98.2 27-30 North Pit_Spoil 66.47 66.39 66.36 66.32
GW-115 North Pit 312227 6402216 68.3 22.2-28.2 North Pit_Spoil 53.51 53.68 53.44 53.36
GW-129 Carrington 310553 6402211 72.3 12.3-21.3 Carrington_Spoil 60.47 58.6 57.95 57.36
MB14HVO01 North Pit 310587 6401003 71.3 ? North Pit_Spoil 35.56 35.42 35.14 35
MB14HVO02 North Pit 310469 6401001 70.9 ? North Pit_Spoil 35.48 35.41 35.14 35
MB14HVO03 North Pit 311387 6400950 67.1 ? North Pit_Spoil 32.9 32.85 32.74 32.74
MB14HVO04 North Pit 311491 6401392 67.1 ? North Pit_Spoil 37.35 37.3 37.12 37.04
MB14HVO05 North Pit 310675 6401127 71.7 ? North Pit_Spoil 35.56 35.43 35.32 35.02

620.12182.00000-R13-v3.0.docx Page 1 of 1
APPENDIX CGroundwater Quality Data 2019

620.12182.00000-R13-v3.0.docx Page 1 of 5
Alluvium
ID LocationQ1 Q2 Q3 Q4
EC TriggerpH Trigger pH Trigger
EC pH EC pH EC pH EC pH (5th Percentile) (95thPercentile)
4032P CWW 1582 7.2 1551 7.3 1596 7.3 3320 7.1 2775 7 7.5
4034P CWW 1492 7.4 1514 7.4 1620 7.4 1579 7.5 2775 7 7.5
4037P CWW Blocked Blocked 1236 7.3 1327 7.2 1314 7.2 2775 7 7.5
4040P CWW 963 7.1 901 7.3 954 7.2 907 7.1 2775 7 7.5
Appleyard Farm Lemington 568 6.8 608 7 585 6.7 613 6.8 227003938
6.86.6
7.07.7
BUNC45ACheshunt/ North
Pit 2130 6.7 2100 6.8 2210 6.8 2140 6.7 4462 6.6 7.5
BZ1-1 Cheshunt/ NorthPit
2700 7.5 Bore Dry Bore Dry Blocked Blocked 2530 7.6 4462 6.6 7.5
C919(ALL) Lemington Bore Dry Bore Dry Bore Dry Bore Dry Bore Dry Bore Dry Bore Dry Bore Dry 227003938
6.86.6
7.07.7
CFW55R Carrington 8250 6.8 9720 7.2 9140 7.1 9150 7.2 6154 7 8
CFW57 Carrington 5940 7.2 5600 7.3 4890 7.4 4120 7.5 6154 7 8
CGW32 CWW 8460 7.2 9050 7.2 7860 7.3 9190 7.2 9280 6.8 7.8
CGW39 CWW 6410 7.4 6130 7.4 5610 7.3 6480 7.3 9280 6.8 7.8
CGW47a CWW Bore Dry Bore Dry Bore Dry Bore Dry Bore Dry Bore Dry Bore Dry Bore Dry 9280 6.8 7.8
CGW49 CWW 2890 7.4 2700 7.4 2940 7.4 2830 7.4 2775 7 7.5
CGW52a Carrington 2290 7.6 1920 7.8 1930 7.8 1925 7.7 6154 7 8
CGW53a Carrington 1408 7.2 1323 7.3 1382 7.3 1428 7.4 6154 7 8
CGW55a Carrington 1672 7.7 1733 7.8 1820 7.8 1810 8.4 6154 7 8
CHPZ10A Cheshunt/ NorthPit 779 6.7 604 7.3 777 6.8 712 7 4462 6.6 7.5
CHPZ12A Cheshunt/ NorthPit 841 6.8 795 6.9 901 6.8 898 7 4462 6.6 7.5
CHPZ1ACheshunt/ North
Pit 738 7 683 7.2 774 7.3 688 7.2 4462 6.6 7.5
CHPZ2A Cheshunt/ NorthPit Blocked Blocked Blocked Blocked Blocked Blocked 888 7.2 4462 6.6 7.5
CHPZ3ACheshunt/ North
Pit 715 6.8 732 7.1 713 6.8 702 6.9 4462 6.6 7.5
CHPZ4A Cheshunt/ NorthPit
707 7 733 7.2 734 7.1 763 7.1 4462 6.6 7.5
CHPZ8ACheshunt/ North
Pit Bore Dry Bore Dry Bore Dry Bore Dry Bore Dry Bore Dry Bore Dry Bore Dry 4462 6.6 7.5

620.12182.00000-R13-v3.0.docx Page 2 of 5
ID LocationQ1 Q2 Q3 Q4
EC TriggerpH Trigger pH Trigger
EC pH EC pH EC pH EC pH (5th Percentile) (95thPercentile)
G1 West Pit 8400 7.4 8950 7.3 6190 7.5 6250 7.4 10751 7.1 8.6
G2 West Pit 4580 7.5 4490 7.6 4540 7.5 4840 7.6 10751 7.1 8.6
G3 West Pit 4900 7.5 4900 7.5 1830 7.5 5090 7.6 10751 7.1 8.6
GA3 Cheshunt/ NorthPit 811 7 868 7.1 836 7 860 7.1 4462 6.6 7.5
GW-100 West Pit 10610 7.4 10220 7.4 9570 7.5 10460 7.4 10751 7.1 8.6
GW-101 West Pit Bore Dry Bore Dry Bore Dry Bore Dry Bore Dry Bore Dry Bore Dry Bore Dry 10751 7.1 8.6
GW-106 CWW 8130 7 9160 6.7 7820 6.8 9180 6.8 9280 6.8 7.8
GW-120 North Void 8850 7.2 9530 7.2 8890 7.1 8800 7.3 - - -
GW-121 North Void Bore Dry Bore Dry Bore Dry Bore Dry Bore Dry Bore Dry Bore Dry Bore Dry - - -
GW-123 North Void 7470 7.2 7270 7.3 7270 7.3 7200 7.3 - - -
GW-124 North Void 5170 7.4 5200 7.5 5260 7.4 5260 7.5 - - -
GW-125 North Void 4880 7.9 4620 7.8 4880 7.8 4340 7.8 - - -
GW-126 North Void 2830 7.5 3200 7.5 2850 7.6 2580 7.6 - - -
GW-127 North Void 2310 7.4 2500 7.3 2420 7.3 2270 7.4 - - -
GW-128 North Void 4500 7.6 5900 7.5 6310 7.4 7050 7.6 - - -
Hobdens WellCheshunt/ North
Pit 980 7.5 945 7.2 916 7.7 943 7.6 4462 6.6 7.5
HV3(2) Cheshunt/ NorthPit
899 6.8 937 7 888 6.8 922 6.9 4462 6.6 7.5
PB01(ALL) Lemington 4,540 7.1 4,340 7.1 4,150 6.9 5260 7.2 227003938
6.86.6
7.07.7
PZ1CH200 Cheshunt/ NorthPit
653 7.1 643 7.1 660 7.1 859 7.1 4462 6.6 7.5
PZ2CH400 Cheshunt/ NorthPit 1160 6.7 1133 6.7 990 6.9 1001 6.9 4462 6.6 7.5
PZ3CH800Cheshunt/ North
Pit 900 7 822 6.9 946 7.1 867 7 4462 6.6 7.5
PZ4CH1380 Cheshunt/ NorthPit 1112 6.9 936 6.9 1112 7 846 7 4462 6.6 7.5
PZ5CH1800Cheshunt/ North
Pit 380 7.2 382 7.3 374 7.3 285 7.1 4462 6.6 7.5

620.12182.00000-R13-v3.0.docx Page 3 of 5
Permian Coal Measures
ID LocationQ1 Q2 Q3 Q4
EC TriggerpH Trigger pH Trigger
EC pH EC pH EC pH EC pH (5th Percentile) (95thPercentile)
4036C Carrington Bore Dry Bore Dry Bore Dry Bore Dry Bore Dry Bore Dry Bore Dry Bore Dry 10824 6.7 7.4
4051C Carrington 1584 6.9 2140 7.3 2350 7.1 2470 7.2 10824 6.7 7.4
B334(BFS) Lemington - - 7200 7.2 - - 7920 7.2 12440 6.7 7.9
B425(WDH) Lemington - - Bore Dry Bore Dry - - Bore Dry Bore Dry 20240 6.6 7.6
B631(BFS) Lemington - - 12200 6.6 - - 13400 6.6 12440 6.7 7.9
B631(WDH) Lemington - - 11750 6.7 - - 12840 6.6 20240 6.6 7.6
B925(BFS) Lemington - - 4050 7 - - 4920 6.9 12440 6.7 7.9
BC1a Cheshunt 916 7.4 868 7 1081 7.3 895 7.2 3350 6.5 7.6
BUNC45D Cheshunt 2450 6.7 2540 6.8 2440 6.8 2510 6.7 2596 6.4 6.8
BZ1-3 Cheshunt 1243 7.5 1169 7.5 1219 7.6 1204 7.6 3350 6.5 7.6
BZ2A(1) Cheshunt 1640 6.6 1479 6.5 1426 6.5 1366 6.4 3350 6.5 7.6
BZ3-1 Cheshunt 1298 7.3 1266 7.6 1265 7.5 1317 8.1 6213 6.9 7.7
BZ3-3 Cheshunt 1115 6.4 1025 6.6 1260 6.5 1374 6.4 3350 6.5 7.6
BZ4A(2) Cheshunt 888 6.2 Bore Dry Bore Dry Bore Dry Bore Dry Bore Dry Bore Dry 3350 6.5 7.6
BZ8-2 Cheshunt 1212 7 1207 6.9 1217 7 1207 7.1 6213 6.9 7.7
C122(WDH) Lemington - - 13200 7.2 - - 14470 7.1 20240 6.6 7.6
C122(BFS) Lemington Bore Dry Bore Dry Bore Dry Bore Dry Bore Dry Bore Dry Bore Dry Bore Dry 12440 6.7 7.9
C130(AFS1) Lemington - - 12890 7.5 - - 14250 7.4 15324 6.8 7.5
C130(ALL) Lemington 27400 7 23700 7 26200 7 25100 6.9 11408 6.7 7.1
C130(BFS) Lemington - - 4310 7.4 - - 4540 7.5 12440 6.7 7.9
C130(WDH) Lemington - - 19800 6.6 - - 21300 6.6 20240 6.6 7.6
C317(BFS) Lemington - - 8390 7.3 - - 8730 7.3 12440 6.7 7.9
C317(WDH) Lemington - - 7590 7.5 - - 7900 7.5 20240 6.6 7.6
C613(BFS) Lemington - - 8950 7.1 - - 9500 7 12440 6.7 7.9
C621(BFS) Lemington - - 6610 7.3 - - 7930 7.3 12440 6.7 7.9
C630(BFS) Lemington - - 4000 8 - - 4220 8.1 12440 6.7 7.9
C809 (GM/WDH) Lemington - - 9380 7.1 - - 10110 7.1 20240 6.6 7.6

620.12182.00000-R13-v3.0.docx Page 4 of 5
Permian Coal Measures
ID LocationQ1 Q2 Q3 Q4
EC TriggerpH Trigger pH Trigger
EC pH EC pH EC pH EC pH (5th Percentile) (95thPercentile)
CGW45 CWW Blocked Blocked Blocked Blocked Blocked Blocked Blocked Blocked 3531 7.3 7.6
CGW46 CWW 2810 7.4 2580 7.5 2700 7.5 2700 7.4 TriggerRemoved Trigger Removed Trigger
RemovedCGW51a Carrington 8430 7.4 8070 7.4 8240 7.3 8290 7.4 10824 6.7 7.4
CGW52 Carrington 8430 6.8 8260 6.9 8340 6.9 8330 6.7 8628 6.8 7.1
CGW53 Carrington 7770 6.7 7300 6.8 7660 6.8 7760 6.7 8628 6.8 7.1
CHPZ12D Cheshunt 1437 6.7 1294 7.2 1335 6.8 1335 7.3 3350 6.5 7.6
CHPZ3D Cheshunt 1037 6.5 1093 6.8 1024 6.3 1073 6.6 3350 6.5 7.6
CHPZ8D Cheshunt 1345 7 1330 7 1389 7.1 1373 7.2 3350 6.5 7.6
D010(BFS) Lemington - - 10390 7.2 - - 11050 7.2 12440 6.7 7.9
D010(GM) Lemington - - 10460 7 - - 11920 6.9 1894 6.5 7.2
D010(WDH) Lemington - - 9030 7 - - 9490 7.1 20240 6.6 7.6
D214(BFS) Lemington - - 7210 7.8 - - 7770 7.7 12440 6.7 7.9
D317(BFS) Lemington - - 3320 6.8 - - 3290 6.8 12440 6.7 7.9
D406(AFS) Lemington - - 11430 6.9 - - 12300 7 15324 6.8 7.5
D406(BFS) Lemington - - 7100 7.3 - - 7430 7.4 12440 6.7 7.9
D510(AFS) Lemington - - 12250 7 - - 13380 6.9 15324 6.8 7.5
D510(BFS) Lemington - - 10550 7.4 - - 11240 7.5 12440 6.7 7.9
D612(AFS) Lemington - - 14750 7 - - 15920 6.9 15324 6.8 7.5
D612(BFS) Lemington - - 10740 7 - - 11510 6.9 12440 6.7 7.9
D807(BFS) Lemington - - 9310 6.9 - - 10570 6.9 12440 6.7 7.9
GW-122 North Void - - 7400 7 - - 5300 7.3 - - -
HG2 Cheshunt 4090 6.9 3880 6.9 3680 7 3820 6.9 6213 6.9 7.7
HG2a Cheshunt 1785 7 1534 7 1420 7.1 1673 7.1 3350 6.5 7.6
LUG Bore Lemington 8710 7.1 7940 7.1 8460 7.1 8540 7 - - -
NPz2 West Pit 13640 7.2 13240 7.2 13650 7.5 14080 7.2 13428 6.9 8
NPz3 West Pit 12690 7.5 12380 7.5 12190 7.8 13220 7.4 13428 6.9 8
NPz5 West Pit 6700 6.9 6690 6.9 6030 6.9 6700 6.8 13428 6.9 8
SR001 Southern - - 16500 6.7 - - 17440 6.7 - - -
SR002 Southern - - 14840 6.8 - - 15990 6.9 - - -
SR003 Southern - - 9830 7 - - 10180 7 - - -

620.12182.00000-R13-v3.0.docx Page 5 of 5
ID LocationQ1 Q2 Q3 Q4
EC TriggerpH Trigger pH Trigger
EC pH EC pH EC pH EC pH (5th Percentile) (95thPercentile)
SR004 Southern - - 12140 6.8 - - 13840 6.8 - - -
SR005 Southern - - 3270 6.5 - - 3490 6.5 - - -
SR006 Southern - - 11120 6.8 - - 11720 6.9 - - -
SR007 Southern 5030 6.6 6350 6.6 5670 6.7 6000 6.6 - - -
SR008 Southern 4250 7.4 12390 6.8 5020 7.2 14270 6.8 - - -
SR009 Southern 4340 7.8 5790 7.3 5100 7.6 6090 7.3 - - -
SR010 Southern 1990 7.6 5760 7 2180 7.5 5940 7 - - -
SR011 Southern 13280 6.6 16800 6.6 15030 6.6 16750 6.5 - - -
SR012 Southern 12700 6.8 14750 6.8 14450 6.8 14950 6.7 - - -
Spoil
ID LocationQ1 Q2 Q3 Q4
EC TriggerpH Trigger pH Trigger
EC pH EC pH EC pH EC pH (5th Percentile) (95thPercentile)
4116P North Pit 12320 7 13820 7.1 13950 7 14420 7.1 12460 6.5 7.8
4119P North Pit 2530 7 3910 7 2300 7 4580 7.1 12460 6.5 7.8
DM1 North Pit 10140 6.6 10190 6.5 9420 6.5 10630 6.5 12460 6.5 7.8
DM3 North Pit 8980 6.5 8600 6.4 9860 6.5 9880 6.5 12460 6.5 7.8
DM4 North Pit 6210 6.9 6130 7 6230 7 6300 7 12460 6.5 7.8
DM7 North Pit Bore Dry Bore Dry Bore Dry Bore Dry Bore Dry Bore Dry Bore Dry Bore Dry 12460 6.5 7.8
GW-107 Carrington Bore Dry Bore Dry Bore Dry Bore Dry Bore Dry Bore Dry Bore Dry Bore Dry - - -
GW-108 Carrington Bore Dry Bore Dry Bore Dry Bore Dry Bore Dry Bore Dry Bore Dry Bore Dry - - -
GW-114 North Pit 8600 6.6 8660 6.6 7480 6.5 8840 6.6 12460 6.5 7.8
GW-115 North Pit 7540 6.8 7240 7 6990 6.8 7740 7.1 12460 6.5 7.8
GW-129 Carrington 8580 7.2 8920 7.2 8360 7.1 8000 7.3 - - -
MB14HVO01 North Pit 7530 6.7 5500 7 7580 6.8 6510 7 12460 6.5 7.8
MB14HVO02 North Pit 7450 6.8 6510 7.2 7720 6.9 7200 7.3 12460 6.5 7.8
MB14HVO03 North Pit 6190 6.9 5070 7 6260 6.9 5860 7 12460 6.5 7.8
MB14HVO04 North Pit 6040 6.8 5840 6.9 6010 6.9 6000 7 12460 6.5 7.8
MB14HVO05 North Pit 12920 5.7 8040 6.8 14540 5.4 8200 6.8 12460 6.5 7.8

620.12182.00000-R13-v3.0.docx Page 1 of 23
APPENDIX DGroundwater Quality Graphs – By Location and Geology

620.12182.00000-R13-v3.0.docx Page 2 of 23
West Pit – Alluvium: pH
West Pit – Alluvium: EC

620.12182.00000-R13-v3.0.docx Page 3 of 23
West Pit - Sandstone/Siltstone (Interburden): pH
West Pit - Sandstone/Siltstone (Interburden): EC

620.12182.00000-R13-v3.0.docx Page 4 of 23
Carrington Pit – Alluvium: pH
Carrington Pit – Alluvium: EC

620.12182.00000-R13-v3.0.docx Page 5 of 23
Carrington Pit – Interburden: pH
Carrington Pit – Interburden: EC

620.12182.00000-R13-v3.0.docx Page 6 of 23
Carrington Pit – Broonie Seam: pH
Carrington Pit – Broonie Seam: EC

620.12182.00000-R13-v3.0.docx Page 7 of 23
Carrington Pit – North Void: pH
Carrington Pit – North Void: EC

620.12182.00000-R13-v3.0.docx Page 8 of 23
CWW Area - Flood Plain Alluvium: pH
CWW Area - Flood Plain Alluvium: EC

620.12182.00000-R13-v3.0.docx Page 9 of 23
CWW Area – Alluvium: pH
CWW Area – Alluvium: EC

620.12182.00000-R13-v3.0.docx Page 10 of 23
CWW Area - Bayswater Seam: pH
CWW Area - Bayswater Seam: EC

620.12182.00000-R13-v3.0.docx Page 11 of 23
North Pit – Spoil: pH
North Pit – Spoil: EC

620.12182.00000-R13-v3.0.docx Page 12 of 23
North Void – Alluvium: pH
North Void – Alluvium: EC

620.12182.00000-R13-v3.0.docx Page 13 of 23
North Void – Permian: pH
North Void – Permian: EC

620.12182.00000-R13-v3.0.docx Page 14 of 23
Cheshunt Pit/ North Pit – Alluvium: pH
Cheshunt Pit/ North Pit – Alluvium: EC

620.12182.00000-R13-v3.0.docx Page 15 of 23
Cheshunt Pit - Mt Arthur Seam: pH
Cheshunt Pit - Mt Arthur Seam: EC

620.12182.00000-R13-v3.0.docx Page 16 of 23
Cheshunt Pit – Piercefield: pH
Cheshunt Pit – Piercefield: EC

620.12182.00000-R13-v3.0.docx Page 17 of 23
Cheshunt Pit – Interburden: pH
Cheshunt Pit – Interburden: EC

620.12182.00000-R13-v3.0.docx Page 18 of 23
Lemington South Pit – Alluvium: pH
Lemington South Pit – Alluvium: EC

620.12182.00000-R13-v3.0.docx Page 19 of 23
Lemington South Pit – Bowfield Seam: pH
Lemington South Pit – Bowfield Seam: EC

620.12182.00000-R13-v3.0.docx Page 20 of 23
Lemington South Pit - Woodlands Hill Seam: pH
Lemington South Pit - Woodlands Hill Seam: EC

620.12182.00000-R13-v3.0.docx Page 21 of 23
Lemington South Pit – Arrowfield Seam: pH
Lemington South Pit – Arrowfield Seam: EC

620.12182.00000-R13-v3.0.docx Page 22 of 23
Lemington South Pit - Glen Munro Seam: pH
Lemington South Pit - Glen Munro Seam: EC

620.12182.00000-R13-v3.0.docx Page 23 of 23
Lemington South Pit – Interburden: pH
Lemington South Pit – Interburden: EC

620.12182.00000-R13-v3.0.docx Page 1 of 4
APPENDIX EFull Water Quality Data 2019

Stat
ion
Date
Geol
ogy
Com
preh
ensiv
eAn
lysis
Even
t
pH F
ield
EC F
ield
(uS/
cm (2
5TRe
f))
TDS
- Tot
al (m
g/l)
Dept
h to
Sta
nd P
ipe
(m)
SWL
(mAH
D)
Al -
Tota
l (m
g/l)
Alk -
Tot
al (m
g/l)
As -
Tota
l (m
g/l)
B (m
g/l)
Bica
rbon
ate A
lkalin
ity as
CaC
O3
Ca -
Tota
l (m
g/l)
Carb
onat
e Alka
linity
as C
aCO3
Cd -
Tota
l (m
g/l)
Cl-
(mg/
l)
Co -
Tota
l (m
g/l)
Cu -
Tota
l (m
g/l)
F (m
g/l)
Fe -
Filte
red
(mg/
L)
Hg -
Tota
l (m
g/l)
Hydr
oxid
e Alk
(mg/
l)
K - T
otal
(mg/
l)
Mg -
Tota
l (m
g/l)
Mn -
Tota
l (m
g/l)
Na -
Tota
l (m
g/l)
Ni -
Tota
l (m
g/l)
Pb -
Tota
l (m
g/l)
Se (
mg/
l)
SO4 -
Tot
al (m
g/l)
Zn -
Tota
l (m
g/l)
4032P 04-12-2019 Alluvium 6M 7.1 3320 - 58.794032P 15-03-2019 Alluvium 6M 7.2 1,582 1080 10.84 58.51 4.1 500 0.00 0.10 500 54 0 0 202 0.02 <0.00 0 5.0 57 190 0.02 0.00 0.009 61 0.084034P 04-12-2019 Alluvium 6M 7.5 1579 12.67 58.484034P 15-03-2019 Alluvium 6M 7.4 1,492 912 12.65 58.50 2.2 447 0.007 0.086 447 49 0 <0.0001 222 0.029 <0.0001 0 2.9 68 170 0.012 0.002 0.006 59 0.044037P 04-12-2019 Alluvium 6M 7.2 1314 12.2 58.544037P 15-03-2019 Alluvium 6M 12.16 58.58
Appleyard Farm 12-12-2019 Alluvium A 7.6 35.8 0Appleyard Farm 06-11-2019 Alluvium A 6.8 613 250 7.6 35.8 0.47 63 <0.001 <0.05 63 17 <1 <0.0001 141 0.19 0.0001 <1 4 14 65 0.012 0.003 <0.01 12 0.013Appleyard Farm 16-10-2019 Alluvium A 7.6 35.8Appleyard Farm 16-10-2019 Alluvium A 7.6 35.8Appleyard Farm 22-03-2019 Alluvium A 7.36 36.04Appleyard Farm 26-02-2019 Alluvium A 6.8 568 7.36 36.04Appleyard Farm 15-01-2019 Alluvium A 7.36 36.04
BUNC45A 14-11-2019 Alluvium 6M 6.7 2140 21.97 50.93BUNC45A 26-02-2019 Alluvium 6M 6.7 2,130 1090 21.19 51.71 2.4 489 <0.001 0.1 489 52 0 <0.0001 352 0.01 <0.0001 0 6.3 36 310 0.005 0.005 <0.001 72 0.043
BZ1-1 14-11-2019 Alluvium 6M 7.6 2530 17.46 53.93BZ1-1 25-02-2019 Alluvium 6M 7.50 2,700 17.51 53.88
C919(ALL) 12-12-2019 Alluvium AC919(ALL) 06-11-2019 Alluvium AC919(ALL) 11-10-2019 Alluvium AC919(ALL) 11-10-2019 Alluvium AC919(ALL) 22-03-2019 Alluvium A 11.96 45.98C919(ALL) 26-02-2019 Alluvium A 11.96 45.98CFW55R 18-12-2019 Alluvium 6M 7.0 9830 6600 12.03 57.75 706 706 129 <1 1840 <1 30 280 1830 1990CFW55R 04-12-2019 Alluvium 6M 7.0 9920 6340 12.03 57.75 0.73 773 <0.001 0.08 773 123 <1 <0.0001 1940 <0.001 <0.0001 <1 30 259 1660 0.024 <0.001 <0.01 2120 <0.005CFW55R 20-11-2019 Alluvium 6M 7.0 9810 6230 12.03 57.75 782 782 136 <1 1890 <1 32 294 1950 1950CFW55R 06-11-2019 Alluvium 6M 7.1 9960 6540 12.03 57.75 0.32 827 <0.001 0.09 827 121 <1 <0.0001 1910 0.002 <0.0001 <1 30 259 1690 0.020 <0.001 <0.01 2250 <0.005CFW55R 24-10-2019 Alluvium 6M 7.1 8,520 6180 12.03 57.75 773 773 125 <1 1860 <1 30.0 260 1720 1680CFW55R 24-10-2019 Alluvium 6M 7.1 8520 6180 12.03 57.75 773 773 125 <1 1860 <1 30 260 1720 1680CFW55R 9-10-2019 Alluvium 6M 7.2 9,150 6460 12.03 57.75 0.36 694 <0.001 0.08 694 125 <1 <0.0001 1860 0.006 <0.0001 <1 30.0 263 1720 0.023 <0.001 <0.01 1970 0.007CFW55R 09-10-2019 Alluvium 6M 7.2 9150 6460 12.03 57.75 0.36 694 <0.001 0.08 694 125 <1 <0.0001 1860 0.006 <0.0001 <1 30 263 1720 0.023 <0.001 <0.01 1970 0.007CFW55R 26-03-2019 Alluvium 6M 7.00 9,360 6620 11.66 58.12 0.39 745 <0.00 0.09 745 130 0 <0.00 2169 0.00 <0.00 0 50.0 250 1500 0.01 <0.00 0.005 1900 <0.00CFW55R 14-03-2019 Alluvium 6M 7.20 9,780 6680 11.66 58.12 742 742 110 0 1980 0 47.0 240 1700 1900CFW55R 27-02-2019 Alluvium 6M 7.10 9,990 6450 11.66 58.12 0.29 740 <0.00 0.09 740 120 0 <0.00 1712 0.00 <0.00 0 54.0 240 1700 0.02 <0.00 0.006 1900 <0.00CFW55R 12-02-2019 Alluvium 6M 6.80 8,340 5760 11.66 58.12 741 741 99 0 1761 0 43.0 210 1600 1600CFW55R 5-02-2019 Alluvium 6M 6.80 8,310 5780 11.66 58.12 748 748 96 0 1908 0 41.0 210 1900 1700
C919(ALL) 15-01-2019 Alluvium A 11.96 45.98CFW55R 30-01-2019 Alluvium 6M 6.70 8,130 5620 11.66 58.12 742 742 96 0 1614 0 41.0 220 1500 1400CFW55R 23-01-2019 Alluvium 6M 6.80 8,690 5510 11.66 58.12 747 747 100 0 1614 0 42.0 210 1500 1300CFW55R 16-01-2019 Alluvium 6M 6.80 8,060 4340 11.66 58.12 0.68 770 <0.00 0.11 770 100 0 <0.00 1712 0.00 <0.00 0 43.0 220 1500 0.06 <0.00 <0.001 1500 <0.00CFW55R 10-01-2019 Alluvium 6M 6.70 8,630 5600 11.66 58.12 762 762 97 0 1663 0 40.0 220 1500 1400CFW57 19-12-2019 Alluvium 6M 7.3 4190 2400 12.35 57.7 534 534 76 <1 783 <1 5 103 692 397CFW57 04-12-2019 Alluvium 6M 7.2 4940 2730 12.35 57.7 0.16 663 <0.001 0.09 663 94 <1 <0.0001 1070 <0.001 <0.0001 <1 5 137 746 0.032 <0.001 <0.01 573 <0.005CFW57 20-11-2019 Alluvium 6M 7.4 4990 2470 12.35 57.7 687 687 103 <1 1080 <1 6 156 855 540
\\AU127L\H:\Projects-SLR\620-BNE\620-BNE\620.12182 HVO Groundwater Compliance\04 Reports\16_HVO 2019 AEMR\Appendices\Appendix E.xlsx
Sheet1 Printed 04-03-2020 2:23 PM SLR Consulting Australia Pty Ltd

CFW57 06-11-2019 Alluvium 6M 7.4 4900 2750 12.35 57.7 0.52 696 <0.001 0.10 696 86 <1 <0.0001 1020 <0.001 <0.0001 <1 5 124 734 0.007 <0.001 <0.01 488 <0.005CFW57 24-10-2019 Alluvium 6M 7.5 4,060 2560 12.35 57.7 604 604 73 <1 913 <1 5.0 111 738 348CFW57 24-10-2019 Alluvium 6M 7.5 4060 2560 12.35 57.7 604 604 73 <1 913 <1 5 111 738 348CFW57 10-10-2019 Alluvium 6M 7.5 4,120 2430 12.35 57.7 0.08 578 <0.001 0.1 578 63 <1 <0.0001 799 <0.001 <0.0001 <1 4.0 97 678 0.009 <0.001 <0.01 404 <0.005CFW57 10-10-2019 Alluvium 6M 7.5 4120 2430 12.35 57.7 0.08 578 <0.001 0.10 578 63 <1 <0.0001 799 <0.001 <0.0001 <1 4 97 678 0.009 <0.001 <0.01 404 <0.005CFW57 27-03-2019 Alluvium 6M 7.50 4,770 3410 12.11 57.94 0.07 641 <0.00 0.12 641 110 0 <0.00 1061 <0.00 <0.00 0 7.5 160 810 0.01 <0.00 0.007 760 <0.00CFW57 14-03-2019 Alluvium 6M 7.40 5,520 3290 12.11 57.94 635 635 93 0 1040 0 6.7 150 870 730CFW57 28-02-2019 Alluvium 6M 7.40 5,230 3300 12.11 57.94 0.41 631 <0.00 0.13 631 100 0 <0.00 612 0.00 <0.00 0 8.3 160 850 0.02 <0.00 0.007 770 0.01CFW57 13-02-2019 Alluvium 6M 7.20 5,720 3440 12.11 57.94 640 640 100 0 1125 0 7.8 160 850 820CFW57 6-02-2019 Alluvium 6M 7.20 5,820 3680 12.11 57.94 642 642 100 0 1174 0 7.4 160 1100 870
CFW55R 3-01-2019 Alluvium 6M 6.80 8,250 5460 11.66 58.12 771 771 88 0 1663 0 29.0 200 1600 1600CFW57 30-01-2019 Alluvium 6M 7.30 5,960 3520 12.11 57.94 646 646 110 0 1076 0 7.9 170 910 820CFW57 24-01-2019 Alluvium 6M 7.30 5,450 3570 12.11 57.94 642 642 110 0 930 0 7.9 170 820 840CFW57 17-01-2019 Alluvium 6M 7.30 5,860 3720 12.11 57.94 0.43 656 <0.00 0.11 656 120 0 <0.00 1027 0.00 <0.00 0 8.0 180 910 0.01 <0.00 0.006 870 <0.00CFW57 11-01-2019 Alluvium 6M 7.20 2,890 3630 12.11 57.94 648 648 110 0 1027 0 7.6 180 900 880CGW39 04-12-2019 Alluvium 6M 7.3 6480 12.24 58.07CGW39 27-03-2019 Alluvium 6M 7.4 6,410 3880 12.19 58.12 3.7 880 0.003 0.1 880 130 0 <0.0001 1567 0.007 <0.0001 0 10.0 200 920 0.007 0.002 0.024 250 0.03
CGW47A 04-12-2019 Alluvium 6M 16.24 54.15CGW47A 13-03-2019 Alluvium 6M 16.24 54.15CHPZ10A 14-11-2019 Alluvium 6M 7.0 712 9.43 53.14CHPZ10A 26-02-2019 Alluvium 6M 6.7 779 452 9.43 53.14 0.43 215 <0.001 0.053 215 52 0 <0.0001 93 0.002 <0.0001 0 1.0 32 40 0.003 <0.001 <0.001 23 0.007CHPZ12A 14-11-2019 Alluvium 6M 7.0 898 9.39 53.74CHPZ12A 25-02-2019 Alluvium 6M 6.8 841 524 9.37 53.76 0.031 214 <0.001 0.046 214 58 0 <0.0001 98 <0.001 <0.0001 0 0.9 36 43 0.001 <0.001 0.002 37 <0.005CHPZ1A 14-11-2019 Alluvium 6M* 7.2 688 11.71 54.19CHPZ1A 25-02-2019 Alluvium 6M* 7 738 416 11.7 54.20 0.032 233 <0.001 0.034 233 45 0 <0.0001 73 <0.001 0.2 <0.005 <0.0001 0 2.4 30 0.003 51 0.001 <0.001 <0.001 18 <0.005CHPZ2A 15-11-2019 Alluvium 6M 7.2 888 463 11.53 53.61 0.02 240 <0.001 <0.05 240 44 <1 <0.0001 132 <0.001 <0.0001 <1 <1 39 81 0.006 <0.001 <0.01 34 <0.005CHPZ2A 25-02-2019 Alluvium 6M 11.52 53.62CHPZ3A 14-11-2019 Alluvium 6M 6.9 702 9.72 53.46CHPZ3A 25-02-2019 Alluvium 6M 6.8 715 394 9.7 53.48 0.76 188 <0.001 0.041 188 38 0 <0.0001 78 0.013 <0.0001 0 1.0 29 48 0.004 <0.001 <0.001 28 0.013CHPZ4A 14-11-2019 Alluvium 6M 7.1 763 12.04 53.41CHPZ4A 25-02-2019 Alluvium 6M 7 707 398 12.04 53.41 0.29 209 <0.001 0.032 209 45 0 <0.0001 78 0.001 <0.0001 0 2.0 28 45 0.007 <0.001 <0.001 25 <0.005CHPZ8A 14-11-2019 Alluvium 6M 6.89 53.16CHPZ8A 26-02-2019 Alluvium 6M 6.87 53.18
G1 12-12-2019 Alluvium A 7.4 5110 3280 2.01 107.99 2.77 631 0.002 0.27 631 88 <1 <0.0001 988 0.008 <0.0001 <1 2 125 952 0.008 0.008 <0.01 664 0.055G1 13-11-2019 Alluvium A 7.4 5580 3140 2.01 107.99 0.36 570 0.001 0.26 570 93 <1 <0.0001 964 <0.001 <0.0001 <1 4 115 931 0.006 0.002 <0.01 812 0.037G1 11-10-2019 Alluvium A 7.4 6,250 3930 2.01 107.99 0.07 516 <0.001 0.19 516 123 <1 <0.0001 1260 <0.001 <0.0001 <1 3.0 148 1170 0.002 <0.001 <0.01 790 0.018G1 11-10-2019 Alluvium A 7.4 6250 3930 2.01 107.99 0.07 516 <0.001 0.19 516 123 <1 <0.0001 1260 <0.001 <0.0001 <1 3 148 1170 0.002 <0.001 <0.01 790 0.018G1 22-03-2019 Alluvium A 7.4 7,590 4840 1.63 108.37 0.067 537 0.001 0.25 537 160 0 <0.0001 1591 0.001 <0.0001 0 6.2 160 1300 0.007 <0.001 <0.001 1100 0.031G1 20-02-2019 Alluvium A 7.4 8,470 5270 1.63 108.37 0.027 515 0.001 0.23 515 180 0 <0.0001 2006 0.002 <0.0001 0 4.2 170 1500 0.007 <0.001 <0.001 1400 0.043
CFW57 3-01-2019 Alluvium 6M 7.20 5,940 3650 12.11 57.94 648 648 100 0 1150 0 5.9 160 730 890G2 12-12-2019 Alluvium A 7.4 4800 3000 1.54 109.06 0.09 640 <0.001 0.33 640 42 <1 <0.0001 925 <0.001 <0.0001 <1 5 113 927 0.002 <0.001 <0.01 583 <0.005G2 13-11-2019 Alluvium A 7.6 4950 2770 1.54 109.06 0.08 675 <0.001 0.35 675 39 <1 <0.0001 875 <0.001 <0.0001 <1 8 101 900 0.001 <0.001 <0.01 638 0.007G2 11-10-2019 Alluvium A 7.6 4,840 2730 1.54 109.06 0.06 579 <0.001 0.31 579 46 <1 <0.0001 909 <0.001 <0.0001 <1 6.0 113 963 0.007 <0.001 <0.01 572 <0.005G2 11-10-2019 Alluvium A 7.6 4840 2730 1.54 109.06 0.06 579 <0.001 0.31 579 46 <1 <0.0001 909 <0.001 <0.0001 <1 6 113 963 0.007 <0.001 <0.01 572 <0.005G2 22-03-2019 Alluvium A 7.6 4,700 2890 1.34 109.26 0.057 668 <0.001 0.39 668 42 0 <0.0001 796 <0.001 <0.0001 0 7.6 97 840 0.002 <0.001 <0.001 590 <0.005G2 20-02-2019 Alluvium A 7.6 4,660 2900 1.34 109.26 0.073 669 <0.001 0.35 669 36 0 <0.0001 807 <0.001 <0.0001 0 5.2 97 740 0.002 <0.001 <0.001 600 <0.005G1 17-01-2019 Alluvium A 7.4 8,400 5830 1.63 108.37 0.01 498 <0.001 0.16 498 190 0 <0.0001 2055 <0.001 <0.0001 0 7.0 190 1600 0.005 <0.001 <0.001 1400 0.023G3 12-12-2019 Alluvium A 7.6 4940 3120 0.91 107.69 0.01 722 <0.001 0.3 722 36 <1 <0.0001 907 <0.001 <0.0001 <1 3 90 1020 0.002 <0.001 <0.01 587 <0.005G3 13-11-2019 Alluvium A 7.5 5040 2820 0.91 107.69 <0.01 757 <0.001 0.30 757 36 <1 <0.0001 833 <0.001 <0.0001 <1 4 78 992 <0.001 <0.001 <0.01 650 0.009G3 11-10-2019 Alluvium A 7.6 5,090 2900 0.91 107.69 <0.01 632 <0.001 0.24 632 38 <1 <0.0001 909 <0.001 <0.0001 <1 3.0 88 1060 0.003 <0.001 <0.01 588 <0.005G3 11-10-2019 Alluvium A 7.6 5090 2900 0.91 107.69 <0.01 632 <0.001 0.24 632 38 <1 <0.0001 909 <0.001 <0.0001 <1 3 88 1060 0.003 <0.001 <0.01 588 <0.005G3 22-03-2019 Alluvium A 7.5 5,080 3070 0.84 107.76 0.012 717 <0.001 0.37 717 37 0 <0.0001 868 <0.001 <0.0001 0 4.5 80 960 0.002 <0.001 <0.001 620 0.012G3 20-02-2019 Alluvium A 7.5 5,010 3070 0.84 107.76 0.012 716 <0.001 0.36 716 33 0 <0.0001 930 <0.001 <0.0001 0 2.4 80 850 0.002 <0.001 <0.001 640 <0.005G2 17-01-2019 Alluvium A 7.5 4,580 2730 1.34 109.26 0.036 680 <0.001 0.33 680 44 0 <0.0001 807 <0.001 <0.0001 0 7.4 98 800 0.004 <0.001 <0.001 580 <0.005
\\AU127L\H:\Projects-SLR\620-BNE\620-BNE\620.12182 HVO Groundwater Compliance\04 Reports\16_HVO 2019 AEMR\Appendices\Appendix E.xlsx
Sheet1 Printed 04-03-2020 2:23 PM SLR Consulting Australia Pty Ltd

GW-100 05-12-2019 Alluvium A 7.4 10460 6.21 83.39GW-100 27-03-2019 Alluvium A 7.4 10,610 5.86 83.74GW-101 05-12-2019 Alluvium AGW-101 27-03-2019 Alluvium A 12.82 87.68GW-106 05-12-2019 Alluvium A 6.8 9180 23.29 59.01GW-106 28-03-2019 Alluvium A 7.0 8,130 23.24 59.06GW-114 05-12-2019 Alluvium A 6.6 8840 31.88 66.32GW-114 27-03-2019 Alluvium A 6.6 8,600 31.73 66.47
PB01(ALL) 12-12-2019 Alluvium A 9.51 44.86PB01(ALL) 08-11-2019 Alluvium A 7.2 5260 4270 9.51 44.86 3.58 415 0.006 0.12 415 90 <1 0.0013 1430 0.028 <0.0001 <1 19 162 666 0.012 0.051 <0.01 136 0.078PB01(ALL) 11-10-2019 Alluvium A 9.51 44.86PB01(ALL) 11-10-2019 Alluvium A 9.51 44.86PB01(ALL) 22-03-2019 Alluvium A 9.36 45.01PB01(ALL) 26-02-2019 Alluvium A 7.1 4,540 9.36 45.01
G3 17-01-2019 Alluvium A 7.5 4,900 3140 0.84 107.76 0.013 712 <0.001 0.31 712 35 0 <0.0001 832 <0.001 <0.0001 0 4.2 80 940 0.002 <0.001 <0.001 620 <0.005PZ2CH400 14-11-2019 Alluvium 6M* 6.9 1001 8.02 54.51PZ2CH400 7-03-2019 Alluvium 6M* 6.8 1,219 504 2.36 60.17 11 396 0.004 0.038 396 59 0 0.0001 118 0.049 0.13 0.61 <0.0001 0 18.0 20 0.73 51 0.027 0.012 0.004 1 0.13PZ2CH400 25-02-2019 Alluvium 6M* 6.7 1,160 2.36 60.17PZ3CH800 14-11-2019 Alluvium 6M* 7.0 867 9.3 54.86PZ3CH800 25-02-2019 Alluvium 6M* 7 900 514 9.42 54.74 0.44 300 <0.001 0.04 300 67 0 <0.0001 88 0.009 0.17 0.01 <0.0001 0 3.2 38 0.11 44 0.004 0.002 <0.001 36 0.02PB01(ALL) 15-01-2019 Alluvium A 9.36 45.01
Hobdens Well 14-11-2019 Cheshunt / North Pit_Alluvium A 7.6 943Hobdens Well 25-02-2019 Cheshunt / North Pit_Alluvium A 7.5 980C130(AFS1) 08-11-2019 Arrowfield A 7.4 14250 7890 18.43 44.74 0.41 804 0.002 0.15 804 195 <1 0.0002 4740 0.028 0.0001 <1 29 169 2890 0.069 0.006 <0.01 9 0.027
CGW46 04-12-2019 Bayswater 6M 7.4 2700 12.9 59.05CGW46 13-03-2019 Bayswater 6M 7.4 2,810 1600 12.94 59.01 8.4 669 0.003 0.13 669 46 0 0.0001 472 0.031 <0.0001 0 7.8 71 390 0.017 0.008 0.028 98 0.31
B925(BFS) 06-11-2019 Bowfield A 6.9 4920 2800 63.17 -0.72 1.13 1190 <0.001 0.11 1190 12 <1 0.0002 893 0.038 0.0001 <1 14 11 925 0.006 0.004 <0.01 <1 0.075B925(BFS) 26-02-2019 Bowfield A 58.6 3.85
SR012 28-11-2019 Conglomerate/Sandstone A 6.7 14950 8300 27.2 49 0.21 1100 <0.001 <0.05 1100 260 <1 <0.0001 4950 0.002 <0.0001 <1 44 596 2560 0.019 <0.001 <0.01 697 0.020SR012 28-03-2019 Conglomerate/Sandstone A 6.8 12,700 26.71 49.49SR010 28-11-2019 Conglomerate/Warkworth Seam A 7.0 5940 3000 10.58 46.92 <0.01 638 <0.001 <0.05 638 97 <1 <0.0001 1550 <0.001 <0.0001 <1 14 158 1020 <0.001 <0.001 <0.01 257 <0.005SR010 28-03-2019 Conglomerate/Warkworth Seam A 7.6 1,990 10.89 46.61
D010(GM) 08-11-2019 Glen Munro A 6.9 11920 6930 9.19 46.76 0.74 1190 0.001 0.11 1190 160 <1 <0.0001 3600 0.004 <0.0001 <1 34 404 2100 0.004 0.002 <0.01 348 0.010SR009 28-11-2019 Lemington Seam A 7.3 6090 3060 7.1 49 <0.01 849 <0.001 0.07 849 32 <1 <0.0001 1550 <0.001 <0.0001 <1 8 57 1310 <0.001 <0.001 <0.01 72 <0.005SR009 28-03-2019 Lemington Seam A 7.8 4,340 6.94 49.16BZ1-3 14-11-2019 Mt Arthur 6M 7.6 1204 46.76 24.63BZ1-3 25-02-2019 Mt Arthur 6M 7.5 1,243 683 47.05 24.34 2.5 377 <0.001 0.09 377 12 0 <0.0001 108 0.009 <0.0001 0 10.0 22 200 0.011 0.004 <0.001 39 0.12
CHPZ12D 14-11-2019 Mt Arthur 6M 7.3 1335 9.6 53.66CHPZ12D 26-02-2019 Mt Arthur 6M 6.7 1,437 733 9.58 53.68 0.34 515 <0.001 0.12 515 18 0 <0.0001 103 0.007 <0.0001 0 9.1 12 230 0.005 0.001 <0.001 3 0.015CHPZ3D 14-11-2019 Mt Arthur 6M 6.6 1073 10.51 52.45CHPZ3D 25-02-2019 Mt Arthur 6M 6.5 1,037 588 10.57 52.39 0.023 428 <0.001 0.13 428 15 0 <0.0001 88 0.001 <0.0001 0 6.1 10 190 0.002 <0.001 <0.001 2 0.007CHPZ8D 14-11-2019 Mt Arthur 6M 7.2 1373 7.13 52.76CHPZ8D 26-02-2019 Mt Arthur 6M 7 1,345 766 7.08 52.81 1.8 545 0.002 0.07 545 120 0 <0.0001 112 0.008 <0.0001 0 3.1 64 40 0.003 0.003 <0.001 16 0.018LUG Bore 06-11-2019 Mt Arthur A 7.0 8540 4520 <0.01 2350 0.051 0.17 2350 26 <1 <0.0001 1490 <0.001 <0.0001 <1 31 28 1600 <0.001 <0.001 <0.01 <1 0.014LUG Bore 26-02-2019 Mt Arthur A 7.1 8,710
SR011 28-11-2019 Mt Arthur Seam/Underburden A 6.5 16750 10300 34.84 53.36 <0.01 834 <0.001 0.06 834 455 <1 <0.0001 5830 <0.001 <0.0001 <1 36 657 2570 <0.001 <0.001 <0.01 722 <0.005SR011 28-03-2019 Mt Arthur Seam/Underburden A 6.6 13,280 34.6 53.60SR007 28-11-2019 Overburden/Vaux Seam coal A 6.6 6000 3070 35.06 25.84 0.55 729 0.006 <0.05 729 166 <1 <0.0001 1580 0.009 <0.0001 <1 15 313 673 0.095 0.002 <0.01 232 0.028SR007 28-03-2019 Overburden/Vaux Seam coal A 6.6 5,030 35.07 25.83
BUNC45D 14-11-2019 Piercefield 6M 6.7 2510 25.24 48.12BUNC45D 26-02-2019 Piercefield 6M 6.7 2,450 1330 25.35 48.01 0.33 776 <0.001 0.16 776 71 0 <0.0001 352 0.001 <0.0001 0 12.0 50 340 0.001 <0.001 <0.001 3 0.012
B425(WDH) 06-11-2019 Woodlands Hill A 35.82 22.06B425(WDH) 26-02-2019 Woodlands Hill A 35.74 22.14C130(ALL) 15-01-2019 Interburden A 15.99 47.05
\\AU127L\H:\Projects-SLR\620-BNE\620-BNE\620.12182 HVO Groundwater Compliance\04 Reports\16_HVO 2019 AEMR\Appendices\Appendix E.xlsx
Sheet1 Printed 04-03-2020 2:23 PM SLR Consulting Australia Pty Ltd

BZ8-2 14-11-2019 Interburden 6M 7.1 1207 20.71 47.09BZ8-2 25-02-2019 Interburden 6M 7 1,212 661 20.22 47.58 0.31 313 <0.001 0.064 313 31 0 <0.0001 137 <0.001 <0.0001 0 5.9 46 140 <0.001 <0.001 <0.001 47 0.006
C130(ALL) 12-12-2019 Interburden A 16.07 46.97C130(ALL) 08-11-2019 Interburden A 6.9 25100 14100 16.07 46.97 4.5 1150 0.004 <0.05 1150 241 <1 0.0029 8480 0.039 0.0002 <1 69 722 3790 0.013 0.131 <0.01 846 0.099C130(ALL) 11-10-2019 Interburden A 16.07 46.97C130(ALL) 11-10-2019 Interburden A 16.07 46.97C130(ALL) 22-03-2019 Interburden A 15.99 47.05C130(ALL) 26-02-2019 Interburden A 7 27,400 15.99 47.05
NPZ2 05-12-2019 Sandstone/Siltstone A 7.2 14080 29.9 160.575NPZ2 27-03-2019 Sandstone/Siltstone A 7.2 13,640 29.42 161.06NPZ3 05-12-2019 Sandstone/Siltstone A 7.4 13220 23.5 124.9NPZ3 27-03-2019 Sandstone/Siltstone A 7.5 12,690 22.59 125.81NPZ5 05-12-2019 Sandstone/Siltstone A 6.8 6700 21.83 91.93NPZ5 27-03-2019 Sandstone/Siltstone A 6.9 6,700 18.55 95.21SR008 28-11-2019 Sandstone/Siltstone A 6.8 14270 7580 9.76 47.04 0.01 1020 <0.001 0.05 1020 127 <1 <0.0001 4740 <0.001 <0.0001 <1 20 307 2850 <0.001 <0.001 <0.01 378 <0.005SR008 28-03-2019 Sandstone/Siltstone A 7.4 4,250 9.58 47.22
GW-107 05-12-2019 Spoil A 29.2 44.3GW-107 27-03-2019 Spoil A 29.21 44.29GW-108 05-12-2019 Spoil A 60.86 23.54GW-108 27-03-2019 Spoil A 60.89 23.514116P 04-12-2019 Spoil 6M 7.1 14420 23.65 46.524116P 15-03-2019 Spoil 6M 7.00 12,320 8140 23.63 46.54 10.00 765 0.01 0.19 765 160 0 0.00 4240 0.04 <0.00 0 58.0 540 1900 0.08 0.01 0.005 900 0.194119P 05-12-2019 Spoil 6M 7.1 4580 11.18 52.334119P 27-03-2019 Spoil 6M 7 2,530 1760 11.06 52.45 0.012 614 0.079 0.1 614 100 0 <0.0001 289 <0.001 <0.0001 0 19.0 73 330 0.013 <0.001 <0.001 330 0.008DM1 05-12-2019 Spoil A 6.5 10630 25.19 77.54 888 888 <1 <1DM1 27-03-2019 Spoil A 6.6 10,140 25.21 77.52 871 871 0 0DM3 05-12-2019 Spoil A 6.5 9880 30.44 63.7 868 868 <1 <1DM3 27-03-2019 Spoil A 6.5 8,980 30.38 63.76 768 768 0 0DM4 05-12-2019 Spoil A 7 6300 18.24 46.61 959 959 <1 <1DM4 25-03-2019 Spoil A 6.9 6,210 17.99 46.86 911 911 0 0DM7 04-12-2019 Spoil ADM7 15-03-2019 Spoil A
GW-115 05-12-2019 Spoil A 7.1 7740 14.94 53.36GW-115 27-03-2019 Spoil A 6.8 7,540 14.79 53.51
MB14HVO01 04-12-2019 Spoil A 7 6510 36.3 35MB14HVO01 25-03-2019 Spoil A 6.7 7,530 4850 35.74 35.56 <0.005 795 0.064 0.15 795 200 0 <0.0001 1422 <0.001 <0.0001 0 39.0 220 1100 0.054 <0.001 <0.001 1300 0.011MB14HVO02 04-12-2019 Spoil A 7.3 7200 35.9 35MB14HVO02 14-03-2019 Spoil A 6.8 7,450 4840 35.42 35.48 0.01 773 0.18 0.19 773 190 0 <0.0001 1520 0.005 <0.0001 0 40.0 230 1100 0.058 <0.001 <0.001 1100 0.02MB14HVO03 05-12-2019 Spoil A 7 5860 34.36 32.74MB14HVO03 25-03-2019 Spoil A 6.9 6,190 4070 34.2 32.90 <0.005 829 0.13 0.14 829 180 0 <0.0001 1085 <0.001 <0.0001 0 36.0 190 900 0.003 <0.001 <0.001 1000 0.007MB14HVO04 05-12-2019 Spoil A 7 6000 30.06 37.04MB14HVO04 25-03-2019 Spoil A 6.8 6,040 3740 29.75 37.35 0.9 744 0.15 0.13 744 270 0 <0.0001 1012 0.003 <0.0001 0 33.0 220 770 0.082 0.001 <0.001 1200 0.034MB14HVO05 04-12-2019 Spoil A 6.8 8200 36.68 35.02MB14HVO05 15-03-2019 Spoil A 5.7 12,920 17200 36.14 35.56 11 47 0.11 0.4 47 290 0 0.0097 2600 0.027 <0.0001 0 110.0 820 1600 0.86 0.029 0.14 8400 13
\\AU127L\H:\Projects-SLR\620-BNE\620-BNE\620.12182 HVO Groundwater Compliance\04 Reports\16_HVO 2019 AEMR\Appendices\Appendix E.xlsx
Sheet1 Printed 04-03-2020 2:23 PM SLR Consulting Australia Pty Ltd

620.12182.00000-R13-v3.0.docx Page 3 of 4
APPENDIX FHVO Triennial Groundwater Model Review

To: Andrew Speechly At: Hunter Valley Operations Pty Ltd
From: Arash Mohajeri At: SLR Consulting Australia Pty Ltd
Date: 13 February 2020 Ref: 620.12182.50000-M01-v2.0.docx
Subject: HVO Triennial Groundwater Model Review
CONFIDENTIALITY
This document is confidential and may contain legally privileged information. If you are not a named or authorised recipient you must not read, copy, distribute or act in reliance on it. If you have received this document in error, please telephone our operator immediately and return the document by mail.
SLR Consulting Australia Pty Ltd Level 2, 15 Astor Terrace Spring Hill QLD 4000 Australia (PO Box 26 Spring Hill QLD 4004 Australia)
T: +61 7 3858 4800 E: [email protected]
www.slrconsulting.com ABN 29 001 584 612
1 Introduction
The Hunter Valley Operations (HVO) mining complex is located approximately 20 km north-west of Singleton, NSW. As listed below, it is outlined within the consent conditions and HVO Water Management Plan (WMP) that an independent review of the numerical groundwater model is required on a three-yearly basis:
• Schedule 3, Condition 27(c) of Development Consent 450-10-2003- a program to validate and recalibrate (if necessary) the groundwater model for the development, including an independent review of the model every 3 years, and comparison of monitoring results with modelled predictions;
• Schedule 3, Condition 27 of Project Approval 06_0261- a program to periodically update and validate the water balance and groundwater model for the project and compare monitoring results with modelled predictions, unless otherwise agreed by the Secretary.
The latest numerical groundwater model that replicates all approved operations across HVO (north and south) was developed by AGE Consultants as part of HVO South Modification 5 submitted in 2017. This memo presents the three yearly independent review of the HVO South Modification 5 numerical groundwater model.
2 Scope
The scope of this peer review includes the following items:
• Comparison between modelled and actual mine progression at HVO;
• Comparison between modelled and actual recharge;
• Comparison between modelled and actual streamflow;
• Review of predicted changes in groundwater levels for the Project scenario (with HVO South Mod 5), with comparison of model outputs to observed data (i.e. modelled and observed groundwater levels).
The following activities informed this audit:
• Australasian Groundwater and Environmental Consultants 2016 for Hunter Valley Operations South – Modification 5- Environmental Assessment, Appendix G, Groundwater Study–January 2017. 143 pages;
• HVO South Modification 5 groundwater model files provided by AGE;

HVO Triennial Groundwater Model Review SLR Ref: 620.12182.50000-M01-v2.0.docx Date: 13 February 2020
Page 2
• Mine progressions files provided by Hunter Valley Operations.
3 HVO Complex
This section provides a brief description of the HVO Complex of relevance to these three yearly independent groundwater model reviews.
Table 1 presents a summary of mine areas across HVO, approved mining timeframes and activities conducted including January 2016 to December 2019 period. Overall, mining was active at West Pit, Cheshunt Pit, and Riverview Pit over the review period, with rehabilitation of Glider Pit commencing in 2017.
Table 1 Summary of HVO Activities
Mine Area Seam Mined To Approved Life of Mining
Activities
West Pit Bayswater to Hebden seams
1949 to 2025 Mining active
North Pit Vaux Seam 1979 to 2003 Inactive – fully rehabilitated
Alluvial Lands Vaux Seam 1993 to 2003 Inactive – fully rehabilitated
Carrington Pit Bayswater Seam 2000 to 2021 Inactive – not rehabilitated (open pit)
Carrington West Wing Bayswater Seam Not commenced Not commenced
Cheshunt Pit Vaux & Bayswater seams 2002 to 2030 Mining active – down to the Bayswater Seam
Riverview Pit Vaux & Bayswater seams 1997 to 2030 Mining active – down to the Vaux Seam
Glider Pit Vaux Seam 2016 – 2017 Mining completed in 2017 and fully backfilled.
Lemington South
Pit 1
Bowfield Seam
Warkworth Seam
1998 to 2006
2019 to 2030
Inactive – rehabilitated with final void/pit lake present. Used for water storage from LUG Bore abstraction


HVO Triennial Groundwater Model Review SLR Ref: 620.12182.50000-M01-v2.0.docx Date: 13 February 2020
Page 4
4 HVO Groundwater Model Summary
The HVO South numerical groundwater model replicates all approved operations across HVO (north and south) and was developed by AGE Consultants in 2016 as part of HVO South Modification 5 Impact Assessment (AGE 2017).
The model was built around the conceptual groundwater model summarised in Section 5.6 of AGE (2017). Development of the model was based on previous HVO groundwater models, with updates using data from HVO geological model as well as publicly available data (i.e. geological maps and groundwater studies for the surrounding region). The model extends north to include the HVO North and Ravensworth operations, and to the east and south to include the full lateral extent of the Wittingham Coal Measures.
The model uses MODFLOW-USG model code and comprises a total of 1,103,832 cells. The extent of the model was set up relatively large to capture all active mine operations surrounding the proposed modification. The surrounding mines simulated in the model domain are HVO North, Ravensworth, Cumnock, Ashton, United, Wambo and MTW.
The groundwater model calibration replicates steady state (1970 to 2003) and transient groundwater levels (2003 to 2015). The calibration model captured historical mining that occurred at HVO South as well as at surrounding mines that intersected the Wittingham Coal Measures. The transient calibration achieved a 3.61 per cent scaled root mean square (SRMS) error, which is within acceptable limits (i.e., 10 per cent), recommended by the Australian groundwater modelling guidelines (Barnett et al 2012). Therefore, the model calibration was considered valid.
The model simulated the currently approved mine plan at HVO South. The model represented mining using the drain (DRN) package. During the predictive run, drain cells were used to simulate the effect of the proposed mine and other mines in the area. A high drain conductance of 100 m2/day was applied to the drain cells and the drain elevation was set the base of the modelled layer. The model represented the growth of spoil piles by progressively changing the hydraulic conductivities and storage properties of cells behind the active open cut mining area. No recharge was applied to the spoil emplacement areas immediately after drain cells were removed to represent the gradual rewetting of the unsaturated spoil over time (AGE 2017).
The HVO predictive model runs from 1/12/2015 (Year 1) to 1/12/2039 (Year 24). Quarterly stress periods were used so that the model could capture seasonal variability in recharge and streams. Long term average quarterly rainfall and river stage heights were used in the predictive model (AGE 2017).
The groundwater model was peer reviewed by Dr Frans Kalf. The peer review assessed the adequacy of both the hydrogeological data and the numerical model for predicting the impact from Modification 5. The peer review concluded that the hydrogeological description, conceptualisation, model design, simulations and reporting were conducted in a professional manner and described in detail. The review stated that no fatal flaws were found in the description or modelling work (AGE 2017).
The groundwater assessment also went through State and Commonwealth approval pathways and were found to have adequately addressed requirements for modelling groundwater impacts, with approval granted in 2018.

HVO Triennial Groundwater Model Review SLR Ref: 620.12182.50000-M01-v2.0.docx Date: 13 February 2020
Page 5
5 HVO Model Against the Current Conditions
This section presents comparison between the model inputs and results against observations over the review period.
5.1 Modelled and Actual Recharge
Figure 2 compares the actual rainfall at HVO against the rainfall simulated in the model. As discussed in the previous section rainfall long-term quarterly averages were used in the predictive model (1/12/2015 onwards). The figure shows discrepancies between the actual and modelled rainfall, with observed rainfall generally lower than modelled.
Figure 2: Modelled Rainfall against Actual Rainfall (2016-2019)
0
50
100
150
200
250
300
12-2
015
03-2
016
05-2
016
08-2
016
11-2
016
03-2
017
05-2
017
08-2
017
11-2
017
03-2
018
06-2
018
08-2
018
11-2
018
03-2
019
06-2
019
08-2
019
12-2
019
Rai
nfa
ll (m
m)
Date
AGE 2017 Actual

HVO Triennial Groundwater Model Review SLR Ref: 620.12182.50000-M01-v2.0.docx Date: 13 February 2020
Page 6
5.2 Modelled and Actual Stage Height
AGE (2017) suggests that the stream stage height in the HVO South Modification 5 model was based on interpolated gauge levels from NOW stream gauges (NSW DPI, 2014). A linear interpolation was used to the river stage heights recorded from these gauges. The interpolated stage heights were then applied to the model river cells, per stress period. As the groundwater model report has not given any details on why and how the interpolation was applied to river stage heights, it is not possible for the reviewer to comment on whether the methodology used was appropriate. Therefore, the modelled and actual river stage elevations were compared at the location of two gauging stations, Wollombi Brook at Warkworth (ID 210004) and Hunter River at Liddell (ID 210083)
Figure 3 shows a comparison between the modelled stage height and recorded stage height at Wollombi Brook at Warkworth and Hunter River at Liddell. As it is shown in the figure, the modelled stage elevations for Hunter River show negligible difference to the recorded stage elevations. The figure shows there is approximately 1 m difference between the modelled and actual stage elevations for Wollombi Brook. This difference is likely due the methodology used to calculate the stage elevations or the resolution of the regional model. Flow along the Wollombi Brook has also ceased since 2017, while the groundwater model assumed continued flow along Wollombi Brook. This creates greater recharge to the alluvium in the model compared to actual.
Figure 3: Modelled against Actual Stage Elevation for Hunter River @ Liddell and Wollombi Brook @ Warkworth
5.3 Modelled and Actual Stage Mine Progression
Figure 4 compares the modelled mine progression to the actual mine progression from January 2016 to December 2019. As shown in the figures, there are mismatches between the actual and modelled mine progression in several areas of the model. The modelled active mining between January 2016 and December 2019 covers a larger area comparing to the actual mine progression and it also has different shapes.
40
45
50
55
60
65
70
12-2015 06-2016 01-2017 07-2017 02-2018 08-2018 03-2019 10-2019
Hu
nte
r R
ive
r St
age
He
igh
t (m
)
Date
Hunter River @ Liddell - Actual Wollombi Brook @ Warkworth - Actual
Hunter River @ Liddell - Modelled Wollombi Brook @ Warkworth - Modelled


HVO Triennial Groundwater Model Review SLR Ref: 620.12182.50000-M01-v2.0.docx Date: 13 February 2020
Page 8
5.4 Calibration Hydrographs
The calibration data set was updated with the latest recorded water levels at HVO bores. However, re- calculation of the calibration statistics was not possible as the reviewer did not have access to the calibration files and the weights applied to the calibration points. Therefore, the model calibration was assessed by comparing the updated hydrographs to the hydrographs in AGE (2017).
Appendix A shows the regenerated hydrographs for the calibration bores listed in the AGE (2017). Overall, the model has been able to replicate the response of groundwater levels to the mining activities and seasonality from 2016 to the present day. The hydrographs for HVO bores show a general over prediction in water level drawdowns most likely due to the modelled mine progression covering a bigger area in comparison to the actual mine progression as discussed in Section 5.3. Some of the hydrographs show poor match between simulated and observed water levels, indicating that calibration in those areas could be further improved.
The hydrographs of the alluvial bores around Lamington, such as Appleyard Farm bore, show that the model is still underpredicting the starting groundwater levels in alluvium, and is not able to match the declining trends in water levels over recent years (Figure 5). The declining trends in the bore is likely due to Wollombi Brook being dry from 2017. As discussed in Section 5.2, the groundwater model assumed streamflow exists in Wollombi Brook between 2016 and December 2019.
In most of the bores within the Hunter River alluvium, the model continues to replicate response to climate seasonality reasonably well. An exception to this is bores CGW39 and 4034P, which both have groundwater level drawdown predicted, as shown in Figure 6 and Figure 7. Both bores are located within the footprint of the approved Carrington West Wing, which is included in the model as being actively mined while mining has not actually commenced.
The Permian bores located to the south of West Pit and Carrington West Wing area also show an overall over- prediction of water level drawdowns. These is shown in Figure 8 where the simulated water level in bore CGW46 is declining due to mining while the observed water levels is stable. Mismatches as such in the model appear to be to discrepancies between the modelled mine progression and actual mine progression, discussed in Section 5.3.

HVO Triennial Groundwater Model Review SLR Ref: 620.12182.50000-M01-v2.0.docx Date: 13 February 2020
Page 9
Figure 5: Calibration Hydrograph for Appleyard Farm Bore – Wollombi Brook Alluvium
Figure 6: Calibration Hydrograph for Bore CGW39

HVO Triennial Groundwater Model Review SLR Ref: 620.12182.50000-M01-v2.0.docx Date: 13 February 2020
Page 10
Figure 7: Calibration Hydrograph for Bore 4034P
Figure 8: Calibration Hydrograph for Bore CGW46

HVO Triennial Groundwater Model Review SLR Ref: 620.12182.50000-M01-v2.0.docx Date: 13 February 2020
Page 11
6 Conclusions and Recommendations
The hydrogeological description, conceptualisation and model design of AGE’s 2016 groundwater model were revisited and reviewed. As a part of the review process, the modelled recharge, stream stage heights and mine progression were compared against the actual data for 2016 to present time.
The review of the model files showed minor discrepancies between modelled rainfall and river stage heights between 2016 and present day. The review showed differences between mine progression and the actual measurements in different areas of the model domain. The modelled mined area between January 2016 to December 2019 covers a larger than the actual mine area which has likely resulted in overpredicted of groundwater drawdowns.
To calibration data base was updated to include latest measurements up to December 2019. The calibration hydrographs were regenerated. The reviewer was not able to re-calculate the calibration statistics based on the updated calibration data base. Therefore, the model calibration was assessed by comparing the updated hydrographs to the original hydrographs reported in AGE (2017). The updated calibrated hydrographs indicated that despite the discrepancies, the model calibration is still satisfactory.
The overall match between observed and measured levels in the transient calibration is reasonable. However, in some areas of the model domain (i.e., Carrington West Wing area and Lemington Pit) the match between observed and simulated heads is some of the bores is poor with the model predicting more impact than captured by observed water levels. This is likely due to the discrepancies between the actual mine progression and modelled progression and the model not being able to represent these mining activities adequately.
As an overall conclusion, this reviewer considers the hydrogeological description, the conceptualisation of the groundwater system and the numerical model design and the numerical model calibration are still fit for purpose. Given the scale of the discrepancies comparing to the regional scale of the model, the reviewer believes updates to the model to remove the discrepancies will result in insignificant changes to the model predictions. However, groundwater models should periodically be evolved, updated and assessed when new data is available. The reviewer believes updating the mine progression in the model to match the actual mine progression is likely to improve the calibration statistics and hydrographs. Therefore, the reviewer recommends the following updates to the groundwater model:
• Update to Recharge Package (RCH): Update to include to the latest rainfall measurement at site;
• Update to River Package (RIV): Update to include to the latest river stage height measurements at gauging stations 210083 and 210004;
• Update to Drain Package (DRN) and Time-Variant Materials (TVM): Update to ensure modelled and actual mine progressions match; and
• Re-calculate transient calibration statistics and assess the calibration performance.
Yours sincerely
Dr. Arash Mohajeri Associate Groundwater Modeller

HVO Triennial Groundwater Model Review SLR Ref: 620.12182.50000-M01-v2.0.docx Date: 13 February 2020
Page 12
7 References
Australasian Groundwater and Environmental Consultants 2016 for Hunter Valley Operations South – Modification 5- Environmental Assessment, Appendix G, Groundwater Study–January 2017.
MDBC (2001), Groundwater Flow Modelling Guideline, Murray-Darlin Basin Commission, URL: https://www.mdba.gov.au/sites/default/files/archived/mdbc-GW-reports/2175_GW_flow_modelling_guideline.pdf
Checked/ Authorised by: IE

HVO Triennial Groundwater Model Review SLR Ref: 620.12182.50000-M01-v2.0.docx Date: 13 February 2020
Page 13
APPENDIX A
Calibration Hydrographs

1971 1981 1991 2001 2011 2021 2031 2041Year
10
20
30
40
50
60
70
Gro
undw
ater
…le
vel…
(mR
L)
4032P
ObservedSimulated
1971 1981 1991 2001 2011 2021 2031 2041
40
45
50
55
60
65
70
75
4033P
ObservedSimulated
1971 1981 1991 2001 2011 2021 2031 2041Year
10
20
30
40
50
60
70
Gro
undw
ater
…le
vel…
(mR
L)
4034P
ObservedSimulated
1971 1981 1991 2001 2011 2021 2031 2041
10
20
30
40
50
60
70
4035P
ObservedSimulated
1971 1981 1991 2001 2011 2021 2031 2041Year
30
35
40
45
50
55
60
65
Gro
undw
ater
…le
vel…
(mR
L)
4036C
ObservedSimulated
1971 1981 1991 2001 2011 2021 2031 2041
25
30
35
40
45
50
55
60
4037P
ObservedSimulated
1971 1981 1991 2001 2011 2021 2031 2041Year
10
20
30
40
50
60
70
Gro
undw
ater
…le
vel…
(mR
L)
4038C
ObservedSimulated
1971 1981 1991 2001 2011 2021 2031 2041
30
35
40
45
50
55
60
65
4039C_1
ObservedSimulated

1971 1981 1991 2001 2011 2021 2031 2041Year
10
20
30
40
50
60
70
Gro
undw
ater
…le
vel…
(mR
L)
4039C_2
ObservedSimulated
1971 1981 1991 2001 2011 2021 2031 2041
10
20
30
40
50
60
70
4039C_3
ObservedSimulated
1971 1981 1991 2001 2011 2021 2031 2041Year
40
45
50
55
60
65
70
75
Gro
undw
ater
…le
vel…
(mR
L)
4040P
ObservedSimulated
1971 1981 1991 2001 2011 2021 2031 2041
30
35
40
45
50
55
60
65
4051C
ObservedSimulated
1971 1981 1991 2001 2011 2021 2031 2041Year
30
35
40
45
50
55
60
65
Gro
undw
ater
…le
vel…
(mR
L)
4052P
ObservedSimulated
1971 1981 1991 2001 2011 2021 2031 2041
40
45
50
55
60
65
70
75
4053P
ObservedSimulated
1971 1981 1991 2001 2011 2021 2031 2041Year
25
30
35
40
45
50
55
60
Gro
undw
ater
…le
vel…
(mR
L)
4113P
ObservedSimulated
1971 1981 1991 2001 2011 2021 2031 2041
10
0
10
20
30
40
50
60
4116P
ObservedSimulated

1971 1981 1991 2001 2011 2021 2031 2041Year
20
0
20
40
60
Gro
undw
ater
…le
vel…
(mR
L)
4117P
ObservedSimulated
1971 1981 1991 2001 2011 2021 2031 2041
20
25
30
35
40
45
50
55
4119P
ObservedSimulated
1971 1981 1991 2001 2011 2021 2031 2041Year
30
35
40
45
50
55
60
65
Gro
undw
ater
…le
vel…
(mR
L)
APP_FARM
ObservedSimulated
1971 1981 1991 2001 2011 2021 2031 2041
10
15
20
25
30
35
40
45
B334_BFS
ObservedSimulated
1971 1981 1991 2001 2011 2021 2031 2041Year
20
25
30
35
40
45
50
55
Gro
undw
ater
…le
vel…
(mR
L)
B425_WDH
ObservedSimulated
1971 1981 1991 2001 2011 2021 2031 2041
10
15
20
25
30
35
40
45
B631_BFS
ObservedSimulated
1971 1981 1991 2001 2011 2021 2031 2041Year
25
30
35
40
45
50
55
60
Gro
undw
ater
…le
vel…
(mR
L)
B631_WDH
ObservedSimulated
1971 1981 1991 2001 2011 2021 2031 2041
0
10
20
30
40
50
B925_BFS
ObservedSimulated

1971 1981 1991 2001 2011 2021 2031 2041Year
40
45
50
55
60
65
70
75
Gro
undw
ater
…le
vel…
(mR
L)
BC1
ObservedSimulated
1971 1981 1991 2001 2011 2021 2031 2041
35
40
45
50
55
60
65
70
BC1A
ObservedSimulated
1971 1981 1991 2001 2011 2021 2031 2041Year
35
40
45
50
55
60
65
70
Gro
undw
ater
…le
vel…
(mR
L)
BUNC12
ObservedSimulated
1971 1981 1991 2001 2011 2021 2031 204125
30
35
40
45
50
55
60
65BUNC39A_D
ObservedSimulated
1971 1981 1991 2001 2011 2021 2031 2041Year
25
30
35
40
45
50
55
60
65
Gro
undw
ater
…le
vel…
(mR
L)
BUNC39B_S
ObservedSimulated
1971 1981 1991 2001 2011 2021 2031 2041
30
35
40
45
50
55
60
65
BUNC44D
ObservedSimulated
1971 1981 1991 2001 2011 2021 2031 2041Year
30
35
40
45
50
55
60
65
Gro
undw
ater
…le
vel…
(mR
L)
BUNC45A
ObservedSimulated
1971 1981 1991 2001 2011 2021 2031 2041
30
35
40
45
50
55
60
65BUNC45D
ObservedSimulated

1971 1981 1991 2001 2011 2021 2031 2041Year
35
40
45
50
55
60
65
70
75
Gro
undw
ater
…le
vel…
(mR
L)
BUNC46D
ObservedSimulated
1971 1981 1991 2001 2011 2021 2031 2041
20
25
30
35
40
45
50
55
BZ1-1
ObservedSimulated
1971 1981 1991 2001 2011 2021 2031 2041Year
30
35
40
45
50
55
60
65
Gro
undw
ater
…le
vel…
(mR
L)
BZ1-2
ObservedSimulated
1971 1981 1991 2001 2011 2021 2031 2041
25
30
35
40
45
50
55
60BZ1-3
ObservedSimulated
1971 1981 1991 2001 2011 2021 2031 2041Year
25
30
35
40
45
50
55
60
Gro
undw
ater
…le
vel…
(mR
L)
BZ2A_1
ObservedSimulated
1971 1981 1991 2001 2011 2021 2031 204120
25
30
35
40
45
50
55
BZ2A_2
ObservedSimulated
1971 1981 1991 2001 2011 2021 2031 2041Year
35
40
45
50
55
60
65
70
Gro
undw
ater
…le
vel…
(mR
L)
BZ2B
ObservedSimulated
1971 1981 1991 2001 2011 2021 2031 2041
25
30
35
40
45
50
55
60
BZ3-1
ObservedSimulated

1971 1981 1991 2001 2011 2021 2031 2041Year
35
40
45
50
55
60
65
70
Gro
undw
ater
…le
vel…
(mR
L)
BZ3-2
ObservedSimulated
1971 1981 1991 2001 2011 2021 2031 2041
25
30
35
40
45
50
55
60
BZ3-3
ObservedSimulated
1971 1981 1991 2001 2011 2021 2031 2041Year
30
35
40
45
50
55
60
65
70
Gro
undw
ater
…le
vel…
(mR
L)
BZ4A_1
ObservedSimulated
1971 1981 1991 2001 2011 2021 2031 2041
25
30
35
40
45
50
55
60
BZ4A_2
ObservedSimulated
1971 1981 1991 2001 2011 2021 2031 2041Year
25
30
35
40
45
50
55
60
Gro
undw
ater
…le
vel…
(mR
L)
BZ5-1
ObservedSimulated
1971 1981 1991 2001 2011 2021 2031 2041
25
30
35
40
45
50
55
60
BZ8-2
ObservedSimulated
1971 1981 1991 2001 2011 2021 2031 2041Year
30
35
40
45
50
55
60
65
Gro
undw
ater
…le
vel…
(mR
L)
BZ8-3
ObservedSimulated
1971 1981 1991 2001 2011 2021 2031 2041
30
35
40
45
50
55
60
65
C122_WDH
ObservedSimulated

1971 1981 1991 2001 2011 2021 2031 2041Year
20
10
0
10
20
30
40
50
Gro
undw
ater
…le
vel…
(mR
L)
C130_AFS1
ObservedSimulated
1971 1981 1991 2001 2011 2021 2031 2041
20
10
0
10
20
30
40
50
C130_ALL
ObservedSimulated
1971 1981 1991 2001 2011 2021 2031 2041Year
30
20
10
0
10
20
30
40
Gro
undw
ater
…le
vel…
(mR
L)
C130_BFS
ObservedSimulated
1971 1981 1991 2001 2011 2021 2031 2041
20
10
0
10
20
30
40
50
60C130_WDH
ObservedSimulated
1971 1981 1991 2001 2011 2021 2031 2041Year
40
45
50
55
60
65
70
75
Gro
undw
ater
…le
vel…
(mR
L)
C1_WJ039
ObservedSimulated
1971 1981 1991 2001 2011 2021 2031 2041
10
15
20
25
30
35
40
45
C317_BFS
ObservedSimulated
1971 1981 1991 2001 2011 2021 2031 2041Year
30
35
40
45
50
55
60
65
Gro
undw
ater
…le
vel…
(mR
L)
C317_WDH
ObservedSimulated
1971 1981 1991 2001 2011 2021 2031 2041
15
20
25
30
35
40
45
50
C613_BFS
ObservedSimulated

1971 1981 1991 2001 2011 2021 2031 2041Year
10
15
20
25
30
35
40
45
Gro
undw
ater
…le
vel…
(mR
L)
C621_BFS
ObservedSimulated
1971 1981 1991 2001 2011 2021 2031 2041
5
10
15
20
25
30
35
40
C630_BFS
ObservedSimulated
1971 1981 1991 2001 2011 2021 2031 2041Year
30
35
40
45
50
55
60
65
Gro
undw
ater
…le
vel…
(mR
L)
C809_WDH
ObservedSimulated
1971 1981 1991 2001 2011 2021 2031 204125
30
35
40
45
50
55
60
65C919_ALL
ObservedSimulated
1971 1981 1991 2001 2011 2021 2031 2041Year
40
45
50
55
60
65
70
75
Gro
undw
ater
…le
vel…
(mR
L)
CFW55R
ObservedSimulated
1971 1981 1991 2001 2011 2021 2031 2041
40
45
50
55
60
65
70
75
CFW56
ObservedSimulated
1971 1981 1991 2001 2011 2021 2031 2041Year
40
45
50
55
60
65
70
75
Gro
undw
ater
…le
vel…
(mR
L)
CFW57
ObservedSimulated
1971 1981 1991 2001 2011 2021 2031 2041
40
45
50
55
60
65
70
75
CFW57A
ObservedSimulated

1971 1981 1991 2001 2011 2021 2031 2041Year
30
35
40
45
50
55
60
65
Gro
undw
ater
…le
vel…
(mR
L)
CFW59
ObservedSimulated
1971 1981 1991 2001 2011 2021 2031 2041
0
20
40
60
CGW1
ObservedSimulated
1971 1981 1991 2001 2011 2021 2031 2041Year
20
0
20
40
60
Gro
undw
ater
…le
vel…
(mR
L)
CGW2
ObservedSimulated
1971 1981 1991 2001 2011 2021 2031 2041
20
0
20
40
60
CGW3
ObservedSimulated
1971 1981 1991 2001 2011 2021 2031 2041Year
10
20
30
40
50
60
70
Gro
undw
ater
…le
vel…
(mR
L)
CGW34
ObservedSimulated
1971 1981 1991 2001 2011 2021 2031 2041
0
10
20
30
40
50
60
70
CGW35
ObservedSimulated
1971 1981 1991 2001 2011 2021 2031 2041Year
10
20
30
40
50
60
70
Gro
undw
ater
…le
vel…
(mR
L)
CGW38
ObservedSimulated
1971 1981 1991 2001 2011 2021 2031 2041
35
40
45
50
55
60
65
70
CGW39
ObservedSimulated

1971 1981 1991 2001 2011 2021 2031 2041Year
0
10
20
30
40
50
60
70
Gro
undw
ater
…le
vel…
(mR
L)
CGW40
ObservedSimulated
1971 1981 1991 2001 2011 2021 2031 2041
10
0
10
20
30
40
50
60
70
CGW41
ObservedSimulated
1971 1981 1991 2001 2011 2021 2031 2041Year
0
20
40
60
80
Gro
undw
ater
…le
vel…
(mR
L)
CGW42
ObservedSimulated
1971 1981 1991 2001 2011 2021 2031 2041
0
20
40
60
CGW43
ObservedSimulated
1971 1981 1991 2001 2011 2021 2031 2041Year
20
0
20
40
60
Gro
undw
ater
…le
vel…
(mR
L)
CGW44
ObservedSimulated
1971 1981 1991 2001 2011 2021 2031 2041
35
40
45
50
55
60
65
70
CGW45
ObservedSimulated
1971 1981 1991 2001 2011 2021 2031 2041Year
30
35
40
45
50
55
60
65
70
Gro
undw
ater
…le
vel…
(mR
L)
CGW45A
ObservedSimulated
1971 1981 1991 2001 2011 2021 2031 2041
20
30
40
50
60
70
CGW46
ObservedSimulated

1971 1981 1991 2001 2011 2021 2031 2041Year
20
30
40
50
60
70
Gro
undw
ater
…le
vel…
(mR
L)
CGW46A
ObservedSimulated
1971 1981 1991 2001 2011 2021 2031 2041
20
30
40
50
60
70
CGW47
ObservedSimulated
1971 1981 1991 2001 2011 2021 2031 2041Year
10
20
30
40
50
60
70
Gro
undw
ater
…le
vel…
(mR
L)
CGW47A
ObservedSimulated
1971 1981 1991 2001 2011 2021 2031 2041
0
10
20
30
40
50
60
70
CGW48
ObservedSimulated
1971 1981 1991 2001 2011 2021 2031 2041Year
0
10
20
30
40
50
60
70
Gro
undw
ater
…le
vel…
(mR
L)
CGW48A
ObservedSimulated
1971 1981 1991 2001 2011 2021 2031 2041
0
10
20
30
40
50
60
70
CGW49
ObservedSimulated
1971 1981 1991 2001 2011 2021 2031 2041Year
10
0
10
20
30
40
50
60
70
Gro
undw
ater
…le
vel…
(mR
L)
CGW5
ObservedSimulated
1971 1981 1991 2001 2011 2021 2031 2041
25
30
35
40
45
50
55
60
CGW51A
ObservedSimulated

1971 1981 1991 2001 2011 2021 2031 2041Year
10
20
30
40
50
60
70
Gro
undw
ater
…le
vel…
(mR
L)
CGW52
ObservedSimulated
1971 1981 1991 2001 2011 2021 2031 2041
40
45
50
55
60
65
70
75
CGW52A
ObservedSimulated
1971 1981 1991 2001 2011 2021 2031 2041Year
10
20
30
40
50
60
70
Gro
undw
ater
…le
vel…
(mR
L)
CGW53
ObservedSimulated
1971 1981 1991 2001 2011 2021 2031 2041
40
45
50
55
60
65
70
75
CGW53A
ObservedSimulated
1971 1981 1991 2001 2011 2021 2031 2041Year
40
45
50
55
60
65
70
75
Gro
undw
ater
…le
vel…
(mR
L)
CGW54A
ObservedSimulated
1971 1981 1991 2001 2011 2021 2031 2041
40
45
50
55
60
65
70
75
CGW55A
ObservedSimulated
1971 1981 1991 2001 2011 2021 2031 2041Year
40
45
50
55
60
65
70
75
Gro
undw
ater
…le
vel…
(mR
L)
CGW6
ObservedSimulated
1971 1981 1991 2001 2011 2021 2031 2041
35
40
45
50
55
60
65
70
CHPZ10A
ObservedSimulated

1971 1981 1991 2001 2011 2021 2031 2041Year
30
35
40
45
50
55
60
65
Gro
undw
ater
…le
vel…
(mR
L)
CHPZ11A
ObservedSimulated
1971 1981 1991 2001 2011 2021 2031 2041
35
40
45
50
55
60
65
70
CHPZ12A
ObservedSimulated
1971 1981 1991 2001 2011 2021 2031 2041Year
30
35
40
45
50
55
60
65
Gro
undw
ater
…le
vel…
(mR
L)
CHPZ12D
ObservedSimulated
1971 1981 1991 2001 2011 2021 2031 2041
35
40
45
50
55
60
65
70
CHPZ13A
ObservedSimulated
1971 1981 1991 2001 2011 2021 2031 2041Year
35
40
45
50
55
60
65
70
Gro
undw
ater
…le
vel…
(mR
L)
CHPZ13D
ObservedSimulated
1971 1981 1991 2001 2011 2021 2031 2041
35
40
45
50
55
60
65
70
CHPZ14A
ObservedSimulated
1971 1981 1991 2001 2011 2021 2031 2041Year
35
40
45
50
55
60
65
70
Gro
undw
ater
…le
vel…
(mR
L)
CHPZ14D
ObservedSimulated
1971 1981 1991 2001 2011 2021 2031 2041
35
40
45
50
55
60
65
70
CHPZ1A
ObservedSimulated

1971 1981 1991 2001 2011 2021 2031 2041Year
35
40
45
50
55
60
65
70
Gro
undw
ater
…le
vel…
(mR
L)
CHPZ2A
ObservedSimulated
1971 1981 1991 2001 2011 2021 2031 2041
35
40
45
50
55
60
65
70
CHPZ3A
ObservedSimulated
1971 1981 1991 2001 2011 2021 2031 2041Year
35
40
45
50
55
60
65
70
Gro
undw
ater
…le
vel…
(mR
L)
CHPZ3D
ObservedSimulated
1971 1981 1991 2001 2011 2021 2031 2041
35
40
45
50
55
60
65
70
CHPZ4A
ObservedSimulated
1971 1981 1991 2001 2011 2021 2031 2041Year
35
40
45
50
55
60
65
70
Gro
undw
ater
…le
vel…
(mR
L)
CHPZ5A
ObservedSimulated
1971 1981 1991 2001 2011 2021 2031 2041
30
35
40
45
50
55
60
65
CHPZ7A
ObservedSimulated
1971 1981 1991 2001 2011 2021 2031 2041Year
30
35
40
45
50
55
60
65
Gro
undw
ater
…le
vel…
(mR
L)
CHPZ8A
ObservedSimulated
1971 1981 1991 2001 2011 2021 2031 2041
30
35
40
45
50
55
60
65
CHPZ8D
ObservedSimulated

1971 1981 1991 2001 2011 2021 2031 2041Year
35
40
45
50
55
60
65
70
Gro
undw
ater
…le
vel…
(mR
L)
CHPZ9A
ObservedSimulated
1971 1981 1991 2001 2011 2021 2031 2041
0
10
20
30
40
50
60D010_BFS
ObservedSimulated
1971 1981 1991 2001 2011 2021 2031 2041Year
30
35
40
45
50
55
60
65
Gro
undw
ater
…le
vel…
(mR
L)
D010_GM
ObservedSimulated
1971 1981 1991 2001 2011 2021 2031 2041
30
35
40
45
50
55
60
65
D010_WDH
ObservedSimulated
1971 1981 1991 2001 2011 2021 2031 2041Year
10
15
20
25
30
35
40
45
Gro
undw
ater
…le
vel…
(mR
L)
D214_BFS
ObservedSimulated
1971 1981 1991 2001 2011 2021 2031 2041
30
35
40
45
50
55
60
65
D2_WH236
ObservedSimulated
1971 1981 1991 2001 2011 2021 2031 2041Year
25
30
35
40
45
50
55
60
Gro
undw
ater
…le
vel…
(mR
L)
D317_ALL
ObservedSimulated
1971 1981 1991 2001 2011 2021 2031 2041
15
20
25
30
35
40
45
50
D317_BFS
ObservedSimulated

1971 1981 1991 2001 2011 2021 2031 2041Year
20
25
30
35
40
45
50
55
Gro
undw
ater
…le
vel…
(mR
L)
D317_WDH
ObservedSimulated
1971 1981 1991 2001 2011 2021 2031 2041
40
20
0
20
40
60
D406_AFS
ObservedSimulated
1971 1981 1991 2001 2011 2021 2031 2041Year
40
20
0
20
40
60
Gro
undw
ater
…le
vel…
(mR
L)
D406_BFS
ObservedSimulated
1971 1981 1991 2001 2011 2021 2031 2041
40
20
0
20
40
60
D406_WDH
ObservedSimulated
1971 1981 1991 2001 2011 2021 2031 2041Year
200
150
100
50
0
50
Gro
undw
ater
…le
vel…
(mR
L)
D510_AFS
ObservedSimulated
1971 1981 1991 2001 2011 2021 2031 2041
200
150
100
50
0
50
D510_BFS
ObservedSimulated
1971 1981 1991 2001 2011 2021 2031 2041Year
200
150
100
50
0
50
Gro
undw
ater
…le
vel…
(mR
L)
D612_AFS
ObservedSimulated
1971 1981 1991 2001 2011 2021 2031 2041
200
150
100
50
0
50
D612_BFS
ObservedSimulated

1971 1981 1991 2001 2011 2021 2031 2041Year
150
100
50
0
50
Gro
undw
ater
…le
vel…
(mR
L)
D807_BFS
ObservedSimulated
1971 1981 1991 2001 2011 2021 2031 2041
55
60
65
70
75
80
85
90
DM1
ObservedSimulated
1971 1981 1991 2001 2011 2021 2031 2041Year
60
65
70
75
80
85
90
95
Gro
undw
ater
…le
vel…
(mR
L)
DM2
ObservedSimulated
1971 1981 1991 2001 2011 2021 2031 2041
45
50
55
60
65
70
75
80DM3
ObservedSimulated
1971 1981 1991 2001 2011 2021 2031 2041Year
10
20
30
40
50
60
Gro
undw
ater
…le
vel…
(mR
L)
DM4
ObservedSimulated
1971 1981 1991 2001 2011 2021 2031 2041
10
0
10
20
30
40
50
60
DM5_40
ObservedSimulated
1971 1981 1991 2001 2011 2021 2031 2041Year
10
0
10
20
30
40
50
60
Gro
undw
ater
…le
vel…
(mR
L)
DM5_75
ObservedSimulated
1971 1981 1991 2001 2011 2021 2031 204120
10
0
10
20
30
40
50
60
DM6
ObservedSimulated

1971 1981 1991 2001 2011 2021 2031 2041Year
10
0
10
20
30
40
50
60
Gro
undw
ater
…le
vel…
(mR
L)
DM7
ObservedSimulated
1971 1981 1991 2001 2011 2021 2031 204110
0
10
20
30
40
50
60
DM9
ObservedSimulated
1971 1981 1991 2001 2011 2021 2031 2041Year
100
50
0
50
Gro
undw
ater
…le
vel…
(mR
L)
E5038_5
ObservedSimulated
1971 1981 1991 2001 2011 2021 2031 2041
25
30
35
40
45
50
55
60
F1_WF533
ObservedSimulated
1971 1981 1991 2001 2011 2021 2031 2041Year
40
50
60
70
80
90
100
110
120
Gro
undw
ater
…le
vel…
(mR
L)
G1
ObservedSimulated
1971 1981 1991 2001 2011 2021 2031 2041
40
50
60
70
80
90
100
110
120G2
ObservedSimulated
1971 1981 1991 2001 2011 2021 2031 2041Year
90
95
100
105
110
115
120
125
Gro
undw
ater
…le
vel…
(mR
L)
G3
ObservedSimulated
1971 1981 1991 2001 2011 2021 2031 2041
40
45
50
55
60
65
70
75
GA3
ObservedSimulated

1971 1981 1991 2001 2011 2021 2031 2041Year
55
60
65
70
75
80
85
90
Gro
undw
ater
…le
vel…
(mR
L)
GW02
ObservedSimulated
1971 1981 1991 2001 2011 2021 2031 2041
25
30
35
40
45
50
55
60
GW030732
ObservedSimulated
1971 1981 1991 2001 2011 2021 2031 2041Year
25
30
35
40
45
50
55
60
Gro
undw
ater
…le
vel…
(mR
L)
GW030734
Simulated
1971 1981 1991 2001 2011 2021 2031 2041
25
30
35
40
45
50
55
60
GW030735
Simulated
1971 1981 1991 2001 2011 2021 2031 2041Year
25
30
35
40
45
50
55
60
Gro
undw
ater
…le
vel…
(mR
L)
GW030736
Simulated
1971 1981 1991 2001 2011 2021 2031 2041
25
30
35
40
45
50
55
60
GW030740
ObservedSimulated
1971 1981 1991 2001 2011 2021 2031 2041Year
70
75
80
85
90
95
100
105
Gro
undw
ater
…le
vel…
(mR
L)
GW035474
Simulated
1971 1981 1991 2001 2011 2021 2031 2041
25
30
35
40
45
50
55
60
GW042364
Simulated

1971 1981 1991 2001 2011 2021 2031 2041Year
30
35
40
45
50
55
60
65
Gro
undw
ater
…le
vel…
(mR
L)
GW042998
Simulated
1971 1981 1991 2001 2011 2021 2031 2041
85
90
95
100
105
110
115
120
GW043225
ObservedSimulated
1971 1981 1991 2001 2011 2021 2031 2041Year
270
275
280
285
290
295
300
305
Gro
undw
ater
…le
vel…
(mR
L)
GW064382
Simulated
1971 1981 1991 2001 2011 2021 2031 2041
30
35
40
45
50
55
60
65
GW079060
ObservedSimulated
1971 1981 1991 2001 2011 2021 2031 2041Year
65
70
75
80
85
90
95
100
Gro
undw
ater
…le
vel…
(mR
L)
GW079793
ObservedSimulated
1971 1981 1991 2001 2011 2021 2031 2041
40
45
50
55
60
65
70
75
GW08
ObservedSimulated
1971 1981 1991 2001 2011 2021 2031 2041Year
30
35
40
45
50
55
60
65
Gro
undw
ater
…le
vel…
(mR
L)
GW080952
ObservedSimulated
1971 1981 1991 2001 2011 2021 2031 2041
20
10
0
10
20
30
40
50
GW080963
ObservedSimulated

1971 1981 1991 2001 2011 2021 2031 2041Year
50
55
60
65
70
75
80
85
Gro
undw
ater
…le
vel…
(mR
L)
GW080964
ObservedSimulated
1971 1981 1991 2001 2011 2021 2031 2041
45
50
55
60
65
70
75
80
GW080968
ObservedSimulated
1971 1981 1991 2001 2011 2021 2031 2041Year
40
45
50
55
60
65
70
75
Gro
undw
ater
…le
vel…
(mR
L)
GW09
ObservedSimulated
1971 1981 1991 2001 2011 2021 2031 2041
60
65
70
75
80
85
90
95
GW11
ObservedSimulated
1971 1981 1991 2001 2011 2021 2031 2041Year
40
45
50
55
60
65
70
75
Gro
undw
ater
…le
vel…
(mR
L)
GW117
ObservedSimulated
1971 1981 1991 2001 2011 2021 2031 2041
40
45
50
55
60
65
70
75
GW119
ObservedSimulated
1971 1981 1991 2001 2011 2021 2031 2041Year
65
70
75
80
85
90
95
100
Gro
undw
ater
…le
vel…
(mR
L)
GW12
ObservedSimulated
1971 1981 1991 2001 2011 2021 2031 2041
45
50
55
60
65
70
75
80
GW13
ObservedSimulated

1971 1981 1991 2001 2011 2021 2031 2041Year
40
45
50
55
60
65
70
75
Gro
undw
ater
…le
vel…
(mR
L)
GW14
ObservedSimulated
1971 1981 1991 2001 2011 2021 2031 2041
35
40
45
50
55
60
65
70
GW15
ObservedSimulated
1971 1981 1991 2001 2011 2021 2031 2041Year
85
90
95
100
105
110
115
120
Gro
undw
ater
…le
vel…
(mR
L)
GW16
ObservedSimulated
1971 1981 1991 2001 2011 2021 2031 2041
85
90
95
100
105
110
115
120
GW17
ObservedSimulated
1971 1981 1991 2001 2011 2021 2031 2041Year
40
45
50
55
60
65
70
75
Gro
undw
ater
…le
vel…
(mR
L)
GW18
ObservedSimulated
1971 1981 1991 2001 2011 2021 2031 204160
65
70
75
80
85
90
95
GW20_009
ObservedSimulated
1971 1981 1991 2001 2011 2021 2031 2041Year
50
55
60
65
70
75
80
85
Gro
undw
ater
…le
vel…
(mR
L)
GW20_061
ObservedSimulated
1971 1981 1991 2001 2011 2021 2031 2041
20
40
60
80
GW20_129
ObservedSimulated

1971 1981 1991 2001 2011 2021 2031 2041Year
80
85
90
95
100
105
110
115
Gro
undw
ater
…le
vel…
(mR
L)
GW21
ObservedSimulated
1971 1981 1991 2001 2011 2021 2031 2041
45
50
55
60
65
70
75
80
GW22
ObservedSimulated
1971 1981 1991 2001 2011 2021 2031 2041Year
45
50
55
60
65
70
75
80
Gro
undw
ater
…le
vel…
(mR
L)
GW9701
ObservedSimulated
1971 1981 1991 2001 2011 2021 2031 2041
50
55
60
65
70
75
80
85
GW9702
ObservedSimulated
1971 1981 1991 2001 2011 2021 2031 2041Year
50
55
60
65
70
75
80
85
Gro
undw
ater
…le
vel…
(mR
L)
GW9708
ObservedSimulated
1971 1981 1991 2001 2011 2021 2031 2041
45
50
55
60
65
70
75
80
GW9710
ObservedSimulated
1971 1981 1991 2001 2011 2021 2031 2041Year
45
50
55
60
65
70
75
80
Gro
undw
ater
…le
vel…
(mR
L)
GW9809
ObservedSimulated
1971 1981 1991 2001 2011 2021 2031 2041
45
50
55
60
65
70
75
80
GWAR981
ObservedSimulated

1971 1981 1991 2001 2011 2021 2031 2041Year
70
75
80
85
90
95
100
105
Gro
undw
ater
…le
vel…
(mR
L)
GW_100
ObservedSimulated
1971 1981 1991 2001 2011 2021 2031 2041
75
80
85
90
95
100
105
110
GW_101
ObservedSimulated
1971 1981 1991 2001 2011 2021 2031 2041Year
55
60
65
70
75
80
85
90
Gro
undw
ater
…le
vel…
(mR
L)
GW_106
ObservedSimulated
1971 1981 1991 2001 2011 2021 2031 2041
40
45
50
55
60
65
70
75GW_107
ObservedSimulated
1971 1981 1991 2001 2011 2021 2031 2041Year
20
30
40
50
60
70
Gro
undw
ater
…le
vel…
(mR
L)
GW_108
ObservedSimulated
1971 1981 1991 2001 2011 2021 2031 2041
50
55
60
65
70
75
80
85
GW_114
ObservedSimulated
1971 1981 1991 2001 2011 2021 2031 2041Year
40
45
50
55
60
65
70
75
Gro
undw
ater
…le
vel…
(mR
L)
GW_114B
ObservedSimulated
1971 1981 1991 2001 2011 2021 2031 2041
25
30
35
40
45
50
55
60
GW_115
ObservedSimulated

1971 1981 1991 2001 2011 2021 2031 2041Year
150
100
50
0
50
Gro
undw
ater
…le
vel…
(mR
L)
H5032_5
ObservedSimulated
1971 1981 1991 2001 2011 2021 2031 2041
100
50
0
50
100H5038_5
ObservedSimulated
1971 1981 1991 2001 2011 2021 2031 2041Year
25
30
35
40
45
50
55
60
Gro
undw
ater
…le
vel…
(mR
L)
HG1
ObservedSimulated
1971 1981 1991 2001 2011 2021 2031 2041
30
35
40
45
50
55
60
65
HG2
ObservedSimulated
1971 1981 1991 2001 2011 2021 2031 2041Year
30
35
40
45
50
55
60
65
Gro
undw
ater
…le
vel…
(mR
L)
HG2A
ObservedSimulated
1971 1981 1991 2001 2011 2021 2031 204125
30
35
40
45
50
55
60
HG3
ObservedSimulated
1971 1981 1991 2001 2011 2021 2031 2041Year
40
45
50
55
60
65
70
75
Gro
undw
ater
…le
vel…
(mR
L)
HOBDEN
ObservedSimulated
1971 1981 1991 2001 2011 2021 2031 2041
30
35
40
45
50
55
60
65
HV3
ObservedSimulated

1971 1981 1991 2001 2011 2021 2031 2041Year
35
40
45
50
55
60
65
70
Gro
undw
ater
…le
vel…
(mR
L)
HV4
ObservedSimulated
1971 1981 1991 2001 2011 2021 2031 2041
20
0
20
40
60
MB14HVO01
ObservedSimulated
1971 1981 1991 2001 2011 2021 2031 2041Year
20
0
20
40
60
Gro
undw
ater
…le
vel…
(mR
L)
MB14HVO02
ObservedSimulated
1971 1981 1991 2001 2011 2021 2031 2041
20
10
0
10
20
30
40
50
60
MB14HVO03
ObservedSimulated
1971 1981 1991 2001 2011 2021 2031 2041Year
10
20
30
40
50
60
Gro
undw
ater
…le
vel…
(mR
L)
MB14HVO04
ObservedSimulated
1971 1981 1991 2001 2011 2021 2031 2041
10
0
10
20
30
40
50
60
MB14HVO05
ObservedSimulated
1971 1981 1991 2001 2011 2021 2031 2041Year
40
45
50
55
60
65
70
75
Gro
undw
ater
…le
vel…
(mR
L)
MG09_009
ObservedSimulated
1971 1981 1991 2001 2011 2021 2031 2041
35
40
45
50
55
60
65
70
MG09_030
ObservedSimulated

1971 1981 1991 2001 2011 2021 2031 2041Year
0
10
20
30
40
50
60
70
Gro
undw
ater
…le
vel…
(mR
L)
MG09_103
ObservedSimulated
1971 1981 1991 2001 2011 2021 2031 2041
35
40
45
50
55
60
65
70
MG09_170
ObservedSimulated
1971 1981 1991 2001 2011 2021 2031 2041Year
60
40
20
0
20
40
60
Gro
undw
ater
…le
vel…
(mR
L)
MG09_192
ObservedSimulated
1971 1981 1991 2001 2011 2021 2031 2041
40
45
50
55
60
65
70
75
MG8_009
ObservedSimulated
1971 1981 1991 2001 2011 2021 2031 2041Year
30
35
40
45
50
55
60
65
Gro
undw
ater
…le
vel…
(mR
L)
MG8_046
ObservedSimulated
1971 1981 1991 2001 2011 2021 2031 204125
30
35
40
45
50
55
60
MG8_077
ObservedSimulated
1971 1981 1991 2001 2011 2021 2031 2041Year
40
20
0
20
40
60
Gro
undw
ater
…le
vel…
(mR
L)
MG8_101
ObservedSimulated
1971 1981 1991 2001 2011 2021 2031 2041
10
20
30
40
50
60
MTD517_P1
ObservedSimulated

1971 1981 1991 2001 2011 2021 2031 2041Year
80
60
40
20
0
20
40
60
80
Gro
undw
ater
…le
vel…
(mR
L)
MTD517_P2
ObservedSimulated
1971 1981 1991 2001 2011 2021 2031 2041
20
0
20
40
60
80
MTD517_P3
ObservedSimulated
1971 1981 1991 2001 2011 2021 2031 2041Year
20
30
40
50
60
70
80
Gro
undw
ater
…le
vel…
(mR
L)
MTD518_P2
ObservedSimulated
1971 1981 1991 2001 2011 2021 2031 204110
20
30
40
50
60
70
80
MTD518_P3
ObservedSimulated
1971 1981 1991 2001 2011 2021 2031 2041Year
45
50
55
60
65
70
75
80
Gro
undw
ater
…le
vel…
(mR
L)
MTD605_P1
ObservedSimulated
1971 1981 1991 2001 2011 2021 2031 2041
45
50
55
60
65
70
75
80
MTD605_P2
ObservedSimulated
1971 1981 1991 2001 2011 2021 2031 2041Year
50
55
60
65
70
75
80
85
Gro
undw
ater
…le
vel…
(mR
L)
MTD605_P3
ObservedSimulated
1971 1981 1991 2001 2011 2021 2031 2041
35
40
45
50
55
60
65
70
MTD605_P4
ObservedSimulated

1971 1981 1991 2001 2011 2021 2031 2041Year
50
55
60
65
70
75
80
85
Gro
undw
ater
…le
vel…
(mR
L)
MTD613
ObservedSimulated
1971 1981 1991 2001 2011 2021 2031 2041
30
40
50
60
70
80
MTD614_P1
ObservedSimulated
1971 1981 1991 2001 2011 2021 2031 2041Year
30
35
40
45
50
55
60
65
Gro
undw
ater
…le
vel…
(mR
L)
MTD614_P2
ObservedSimulated
1971 1981 1991 2001 2011 2021 2031 2041
0
10
20
30
40
50
60
MTD614_P3
ObservedSimulated
1971 1981 1991 2001 2011 2021 2031 2041Year
25
30
35
40
45
50
55
60
Gro
undw
ater
…le
vel…
(mR
L)
MTD614_P4
ObservedSimulated
1971 1981 1991 2001 2011 2021 2031 2041
20
25
30
35
40
45
50
55
MTD614_P5
ObservedSimulated
1971 1981 1991 2001 2011 2021 2031 2041Year
40
20
0
20
40
60
80
Gro
undw
ater
…le
vel…
(mR
L)
MTD632
ObservedSimulated
1971 1981 1991 2001 2011 2021 2031 2041
60
40
20
0
20
40
60
80
MTD634
ObservedSimulated

1971 1981 1991 2001 2011 2021 2031 2041Year
20
0
20
40
60
80
Gro
undw
ater
…le
vel…
(mR
L)
MTD639_1
ObservedSimulated
1971 1981 1991 2001 2011 2021 2031 2041
20
30
40
50
60
70
MTD639_2
ObservedSimulated
1971 1981 1991 2001 2011 2021 2031 2041Year
20
30
40
50
60
70
Gro
undw
ater
…le
vel…
(mR
L)
MTD640
ObservedSimulated
1971 1981 1991 2001 2011 2021 2031 2041
20
0
20
40
60
80
MTD642
ObservedSimulated
1971 1981 1991 2001 2011 2021 2031 2041Year
0
20
40
60
80
Gro
undw
ater
…le
vel…
(mR
L)
MTD643
ObservedSimulated
1971 1981 1991 2001 2011 2021 2031 2041
0
10
20
30
40
50
60
70
MTOH611
ObservedSimulated
1971 1981 1991 2001 2011 2021 2031 2041Year
10
20
30
40
50
60
70
80
Gro
undw
ater
…le
vel…
(mR
L)
MTOH612
ObservedSimulated
1971 1981 1991 2001 2011 2021 2031 2041
60
70
80
90
100
110
120
NPZ1
ObservedSimulated

1971 1981 1991 2001 2011 2021 2031 2041Year
160
165
170
175
180
185
190
195
Gro
undw
ater
…le
vel…
(mR
L)
NPZ2
ObservedSimulated
1971 1981 1991 2001 2011 2021 2031 2041
120
125
130
135
140
145
150
155
NPZ3
ObservedSimulated
1971 1981 1991 2001 2011 2021 2031 2041Year
20
40
60
80
100
120
Gro
undw
ater
…le
vel…
(mR
L)
NPZ4
ObservedSimulated
1971 1981 1991 2001 2011 2021 2031 2041
70
80
90
100
110
120
130
NPZ5
ObservedSimulated
1971 1981 1991 2001 2011 2021 2031 2041Year
10
20
30
40
50
60
Gro
undw
ater
…le
vel…
(mR
L)
OH1121
ObservedSimulated
1971 1981 1991 2001 2011 2021 2031 2041
150
100
50
0
50
OH1123_1
ObservedSimulated
1971 1981 1991 2001 2011 2021 2031 2041Year
150
100
50
0
50
Gro
undw
ater
…le
vel…
(mR
L)
OH1123_2
ObservedSimulated
1971 1981 1991 2001 2011 2021 2031 2041
150
100
50
0
50
OH1123_3
ObservedSimulated

1971 1981 1991 2001 2011 2021 2031 2041Year
80
60
40
20
0
20
40
60
80
Gro
undw
ater
…le
vel…
(mR
L)
OH1124_2
ObservedSimulated
1971 1981 1991 2001 2011 2021 2031 2041
80
60
40
20
0
20
40
60
OH1124_3
ObservedSimulated
1971 1981 1991 2001 2011 2021 2031 2041Year
30
40
50
60
70
80
Gro
undw
ater
…le
vel…
(mR
L)
OH1125_1
ObservedSimulated
1971 1981 1991 2001 2011 2021 2031 2041
30
40
50
60
70
80
OH1125_2
ObservedSimulated
1971 1981 1991 2001 2011 2021 2031 2041Year
10
0
10
20
30
40
50
60
70
Gro
undw
ater
…le
vel…
(mR
L)
OH1125_3
ObservedSimulated
1971 1981 1991 2001 2011 2021 2031 2041
30
35
40
45
50
55
60
65
OH1126
ObservedSimulated
1971 1981 1991 2001 2011 2021 2031 2041Year
20
25
30
35
40
45
50
55
60
Gro
undw
ater
…le
vel…
(mR
L)
OH1127
ObservedSimulated
1971 1981 1991 2001 2011 2021 2031 2041
40
45
50
55
60
65
70
75
OH1137
ObservedSimulated

1971 1981 1991 2001 2011 2021 2031 2041Year
35
40
45
50
55
60
65
70
Gro
undw
ater
…le
vel…
(mR
L)
OH1138_1
ObservedSimulated
1971 1981 1991 2001 2011 2021 2031 2041
30
35
40
45
50
55
60
65
OH1138_2
ObservedSimulated
1971 1981 1991 2001 2011 2021 2031 2041Year
30
35
40
45
50
55
60
65
Gro
undw
ater
…le
vel…
(mR
L)
OH786
ObservedSimulated
1971 1981 1991 2001 2011 2021 2031 2041
20
25
30
35
40
45
50
55
OH787
ObservedSimulated
1971 1981 1991 2001 2011 2021 2031 2041Year
30
35
40
45
50
55
60
65
Gro
undw
ater
…le
vel…
(mR
L)
OH788
ObservedSimulated
1971 1981 1991 2001 2011 2021 2031 2041
40
45
50
55
60
65
70
75
OH942
ObservedSimulated
1971 1981 1991 2001 2011 2021 2031 2041Year
30
35
40
45
50
55
60
65
Gro
undw
ater
…le
vel…
(mR
L)
OH943
ObservedSimulated
1971 1981 1991 2001 2011 2021 2031 2041
30
35
40
45
50
55
60
65
OH944
ObservedSimulated

1971 1981 1991 2001 2011 2021 2031 2041Year
0
20
40
60
80
Gro
undw
ater
…le
vel…
(mR
L)
P1
ObservedSimulated
1971 1981 1991 2001 2011 2021 2031 2041
40
45
50
55
60
65
70
75P104
ObservedSimulated
1971 1981 1991 2001 2011 2021 2031 2041Year
35
40
45
50
55
60
65
70
Gro
undw
ater
…le
vel…
(mR
L)
P106
ObservedSimulated
1971 1981 1991 2001 2011 2021 2031 2041
40
45
50
55
60
65
70
75P108
ObservedSimulated
1971 1981 1991 2001 2011 2021 2031 2041Year
40
45
50
55
60
65
70
75
Gro
undw
ater
…le
vel…
(mR
L)
P109
ObservedSimulated
1971 1981 1991 2001 2011 2021 2031 2041
10
20
30
40
50
60
70
P11
ObservedSimulated
1971 1981 1991 2001 2011 2021 2031 2041Year
40
45
50
55
60
65
70
75
Gro
undw
ater
…le
vel…
(mR
L)
P110
ObservedSimulated
1971 1981 1991 2001 2011 2021 2031 2041
40
45
50
55
60
65
70
75
P111
ObservedSimulated

1971 1981 1991 2001 2011 2021 2031 2041Year
40
45
50
55
60
65
70
75
Gro
undw
ater
…le
vel…
(mR
L)
P114
ObservedSimulated
1971 1981 1991 2001 2011 2021 2031 2041
40
45
50
55
60
65
70
75
P116
ObservedSimulated
1971 1981 1991 2001 2011 2021 2031 2041Year
30
35
40
45
50
55
60
65
Gro
undw
ater
…le
vel…
(mR
L)
P12
ObservedSimulated
1971 1981 1991 2001 2011 2021 2031 2041
30
35
40
45
50
55
60
65
P13
ObservedSimulated
1971 1981 1991 2001 2011 2021 2031 2041Year
30
35
40
45
50
55
60
65
Gro
undw
ater
…le
vel…
(mR
L)
P15
ObservedSimulated
1971 1981 1991 2001 2011 2021 2031 2041
30
35
40
45
50
55
60
65
P16
ObservedSimulated
1971 1981 1991 2001 2011 2021 2031 2041Year
35
40
45
50
55
60
65
70
Gro
undw
ater
…le
vel…
(mR
L)
P17
ObservedSimulated
1971 1981 1991 2001 2011 2021 2031 2041
30
35
40
45
50
55
60
65
P18
ObservedSimulated

1971 1981 1991 2001 2011 2021 2031 2041Year
30
40
50
60
70
80
Gro
undw
ater
…le
vel…
(mR
L)
P2
ObservedSimulated
1971 1981 1991 2001 2011 2021 2031 2041
30
35
40
45
50
55
60
65
P20
ObservedSimulated
1971 1981 1991 2001 2011 2021 2031 2041Year
35
40
45
50
55
60
65
70
Gro
undw
ater
…le
vel…
(mR
L)
P202
ObservedSimulated
1971 1981 1991 2001 2011 2021 2031 2041
30
35
40
45
50
55
60
65P206
ObservedSimulated
1971 1981 1991 2001 2011 2021 2031 2041Year
30
35
40
45
50
55
60
65
Gro
undw
ater
…le
vel…
(mR
L)
P209
ObservedSimulated
1971 1981 1991 2001 2011 2021 2031 2041
40
45
50
55
60
65
70
75
P27
ObservedSimulated
1971 1981 1991 2001 2011 2021 2031 2041Year
40
45
50
55
60
65
70
75
Gro
undw
ater
…le
vel…
(mR
L)
P28
ObservedSimulated
1971 1981 1991 2001 2011 2021 2031 2041
30
35
40
45
50
55
60
65
P29
ObservedSimulated

1971 1981 1991 2001 2011 2021 2031 2041Year
25
30
35
40
45
50
55
60
Gro
undw
ater
…le
vel…
(mR
L)
P3
ObservedSimulated
1971 1981 1991 2001 2011 2021 2031 2041
60
65
70
75
80
85
90
95
P301
ObservedSimulated
1971 1981 1991 2001 2011 2021 2031 2041Year
70
75
80
85
90
95
100
105
Gro
undw
ater
…le
vel…
(mR
L)
P302
ObservedSimulated
1971 1981 1991 2001 2011 2021 2031 2041
65
70
75
80
85
90
95
100
P303
ObservedSimulated
1971 1981 1991 2001 2011 2021 2031 2041Year
70
80
90
100
110
120
130
Gro
undw
ater
…le
vel…
(mR
L)
P310
ObservedSimulated
1971 1981 1991 2001 2011 2021 2031 2041
100
105
110
115
120
125
130
135
P311
ObservedSimulated
1971 1981 1991 2001 2011 2021 2031 2041Year
70
75
80
85
90
95
100
105
110
Gro
undw
ater
…le
vel…
(mR
L)
P312
ObservedSimulated
1971 1981 1991 2001 2011 2021 2031 204170
75
80
85
90
95
100
105
P314
ObservedSimulated

1971 1981 1991 2001 2011 2021 2031 2041Year
75
80
85
90
95
100
105
110
Gro
undw
ater
…le
vel…
(mR
L)
P315
ObservedSimulated
1971 1981 1991 2001 2011 2021 2031 2041
90
95
100
105
110
115
120
125
P316
ObservedSimulated
1971 1981 1991 2001 2011 2021 2031 2041Year
95
100
105
110
115
120
125
130
Gro
undw
ater
…le
vel…
(mR
L)
P317
ObservedSimulated
1971 1981 1991 2001 2011 2021 2031 2041
95
100
105
110
115
120
125
130
P318
ObservedSimulated
1971 1981 1991 2001 2011 2021 2031 2041Year
100
105
110
115
120
125
130
135
Gro
undw
ater
…le
vel…
(mR
L)
P319
ObservedSimulated
1971 1981 1991 2001 2011 2021 2031 2041
40
45
50
55
60
65
70
75
P32
ObservedSimulated
1971 1981 1991 2001 2011 2021 2031 2041Year
0
10
20
30
40
50
60
Gro
undw
ater
…le
vel…
(mR
L)
P33_113
ObservedSimulated
1971 1981 1991 2001 2011 2021 2031 204130
35
40
45
50
55
60
65
70P33_13
ObservedSimulated

1971 1981 1991 2001 2011 2021 2031 2041Year
20
25
30
35
40
45
50
55
Gro
undw
ater
…le
vel…
(mR
L)
P33_58
ObservedSimulated
1971 1981 1991 2001 2011 2021 2031 2041
40
20
0
20
40
60
P34_144
ObservedSimulated
1971 1981 1991 2001 2011 2021 2031 2041Year
10
20
30
40
50
60
70
80
Gro
undw
ater
…le
vel…
(mR
L)
P34_35
ObservedSimulated
1971 1981 1991 2001 2011 2021 2031 2041
20
30
40
50
60
70
80
90
P34_68.5
ObservedSimulated
1971 1981 1991 2001 2011 2021 2031 2041Year
60
40
20
0
20
40
60
Gro
undw
ater
…le
vel…
(mR
L)
P35_112
ObservedSimulated
1971 1981 1991 2001 2011 2021 2031 2041
40
50
60
70
80
90
P35_16
ObservedSimulated
1971 1981 1991 2001 2011 2021 2031 2041Year
20
30
40
50
60
70
80
90
Gro
undw
ater
…le
vel…
(mR
L)
P35_51
ObservedSimulated
1971 1981 1991 2001 2011 2021 2031 2041
0
10
20
30
40
50
60
70
80P35_60
ObservedSimulated

1971 1981 1991 2001 2011 2021 2031 2041Year
30
40
50
60
70
80
90
Gro
undw
ater
…le
vel…
(mR
L)
P4
ObservedSimulated
1971 1981 1991 2001 2011 2021 2031 2041
30
40
50
60
70
80
P5
ObservedSimulated
1971 1981 1991 2001 2011 2021 2031 2041Year
30
40
50
60
70
80
Gro
undw
ater
…le
vel…
(mR
L)
P6
ObservedSimulated
1971 1981 1991 2001 2011 2021 2031 2041
60
65
70
75
80
85
90
95
P8
ObservedSimulated
1971 1981 1991 2001 2011 2021 2031 2041Year
0
10
20
30
40
50
60
70
80
Gro
undw
ater
…le
vel…
(mR
L)
P9
Simulated
1971 1981 1991 2001 2011 2021 2031 2041
25
30
35
40
45
50
55
60
PB01_ALL
ObservedSimulated
1971 1981 1991 2001 2011 2021 2031 2041Year
40
45
50
55
60
65
70
75
Gro
undw
ater
…le
vel…
(mR
L)
PZ1CH200
ObservedSimulated
1971 1981 1991 2001 2011 2021 2031 2041
40
45
50
55
60
65
70
75
PZ2CH400
ObservedSimulated

1971 1981 1991 2001 2011 2021 2031 2041Year
35
40
45
50
55
60
65
70
Gro
undw
ater
…le
vel…
(mR
L)
PZ3CH800
ObservedSimulated
1971 1981 1991 2001 2011 2021 2031 2041
35
40
45
50
55
60
65
70
PZ4CH1380
ObservedSimulated
1971 1981 1991 2001 2011 2021 2031 2041Year
35
40
45
50
55
60
65
70
Gro
undw
ater
…le
vel…
(mR
L)
PZ5CH1800
ObservedSimulated
1971 1981 1991 2001 2011 2021 2031 2041
40
45
50
55
60
65
70
75
PZ6CH2450
ObservedSimulated
1971 1981 1991 2001 2011 2021 2031 2041Year
30
35
40
45
50
55
60
65
Gro
undw
ater
…le
vel…
(mR
L)
PZ7D
ObservedSimulated
1971 1981 1991 2001 2011 2021 2031 2041
30
35
40
45
50
55
60
65
PZ7S
ObservedSimulated
1971 1981 1991 2001 2011 2021 2031 2041Year
30
35
40
45
50
55
60
65
Gro
undw
ater
…le
vel…
(mR
L)
PZ8D
ObservedSimulated
1971 1981 1991 2001 2011 2021 2031 2041
30
35
40
45
50
55
60
65
PZ8S
ObservedSimulated

1971 1981 1991 2001 2011 2021 2031 2041Year
20
30
40
50
60
70
Gro
undw
ater
…le
vel…
(mR
L)
PZ9D
ObservedSimulated
1971 1981 1991 2001 2011 2021 2031 2041
40
45
50
55
60
65
70
75
PZ9S
ObservedSimulated
1971 1981 1991 2001 2011 2021 2031 2041Year
100
50
0
50
100
Gro
undw
ater
…le
vel…
(mR
L)
S2
ObservedSimulated
1971 1981 1991 2001 2011 2021 2031 2041150
100
50
0
50
S4
ObservedSimulated
1971 1981 1991 2001 2011 2021 2031 2041Year
60
65
70
75
80
85
90
95
Gro
undw
ater
…le
vel…
(mR
L)
S6
ObservedSimulated
1971 1981 1991 2001 2011 2021 2031 2041
35
40
45
50
55
60
65
70
SR001
ObservedSimulated
1971 1981 1991 2001 2011 2021 2031 2041Year
30
35
40
45
50
55
60
65
Gro
undw
ater
…le
vel…
(mR
L)
SR002
ObservedSimulated
1971 1981 1991 2001 2011 2021 2031 2041
30
35
40
45
50
55
60
65
SR003
ObservedSimulated

1971 1981 1991 2001 2011 2021 2031 2041Year
30
35
40
45
50
55
60
65
Gro
undw
ater
…le
vel…
(mR
L)
SR004
ObservedSimulated
1971 1981 1991 2001 2011 2021 2031 2041
30
35
40
45
50
55
60
65
SR005
ObservedSimulated
1971 1981 1991 2001 2011 2021 2031 2041Year
35
40
45
50
55
60
65
70
Gro
undw
ater
…le
vel…
(mR
L)
SR006
ObservedSimulated
1971 1981 1991 2001 2011 2021 2031 2041
25
30
35
40
45
50
55
60
SR007
ObservedSimulated
1971 1981 1991 2001 2011 2021 2031 2041Year
35
40
45
50
55
60
65
70
Gro
undw
ater
…le
vel…
(mR
L)
SR008
ObservedSimulated
1971 1981 1991 2001 2011 2021 2031 2041
35
40
45
50
55
60
65
70
SR009
ObservedSimulated
1971 1981 1991 2001 2011 2021 2031 2041Year
0
10
20
30
40
50
Gro
undw
ater
…le
vel…
(mR
L)
SR010
ObservedSimulated
1971 1981 1991 2001 2011 2021 2031 2041
30
35
40
45
50
55
60
65
SR011
ObservedSimulated

1971 1981 1991 2001 2011 2021 2031 2041Year
40
45
50
55
60
65
70
75
Gro
undw
ater
…le
vel…
(mR
L)
SR012
ObservedSimulated
1971 1981 1991 2001 2011 2021 2031 2041150
125
100
75
50
25
0
25
50
UG133_146
ObservedSimulated
1971 1981 1991 2001 2011 2021 2031 2041Year
150
125
100
75
50
25
0
25
Gro
undw
ater
…le
vel…
(mR
L)
UG133_168
ObservedSimulated
1971 1981 1991 2001 2011 2021 2031 2041
150
125
100
75
50
25
0
25
50
UG133_180
ObservedSimulated
1971 1981 1991 2001 2011 2021 2031 2041Year
150
125
100
75
50
25
0
25
50
Gro
undw
ater
…le
vel…
(mR
L)
UG133_208
ObservedSimulated
1971 1981 1991 2001 2011 2021 2031 2041
60
40
20
0
20
40
60
UG133_219
ObservedSimulated
1971 1981 1991 2001 2011 2021 2031 2041Year
150
125
100
75
50
25
0
25
50
Gro
undw
ater
…le
vel…
(mR
L)
UG133_45
ObservedSimulated
1971 1981 1991 2001 2011 2021 2031 2041150
125
100
75
50
25
0
25
50
UG133_96
ObservedSimulated

1971 1981 1991 2001 2011 2021 2031 2041Year
40
20
0
20
40
60
Gro
undw
ater
…le
vel…
(mR
L)
UG135_110
ObservedSimulated
1971 1981 1991 2001 2011 2021 2031 2041
60
40
20
0
20
UG135_129
ObservedSimulated
1971 1981 1991 2001 2011 2021 2031 2041Year
40
20
0
20
40
60
Gro
undw
ater
…le
vel…
(mR
L)
UG135_176
ObservedSimulated
1971 1981 1991 2001 2011 2021 2031 2041
150
100
50
0
50
UG135_186
ObservedSimulated
1971 1981 1991 2001 2011 2021 2031 2041Year
0
10
20
30
40
50
60
70
Gro
undw
ater
…le
vel…
(mR
L)
UG135_50
ObservedSimulated
1971 1981 1991 2001 2011 2021 2031 2041
50
25
0
25
50
75
100
125
UG138_153
ObservedSimulated
1971 1981 1991 2001 2011 2021 2031 2041Year
40
50
60
70
80
90
100
110
Gro
undw
ater
…le
vel…
(mR
L)
UG138_175
ObservedSimulated
1971 1981 1991 2001 2011 2021 2031 2041
50
60
70
80
90
100
UG138_215
ObservedSimulated

1971 1981 1991 2001 2011 2021 2031 2041Year
40
50
60
70
80
90
Gro
undw
ater
…le
vel…
(mR
L)
UG138_245
ObservedSimulated
1971 1981 1991 2001 2011 2021 2031 2041
20
0
20
40
60
80
UG138_250
ObservedSimulated
1971 1981 1991 2001 2011 2021 2031 2041Year
20
30
40
50
60
70
80
90
Gro
undw
ater
…le
vel…
(mR
L)
UG138_292
ObservedSimulated
1971 1981 1991 2001 2011 2021 2031 2041
30
40
50
60
70
80
90
UG139_263
ObservedSimulated
1971 1981 1991 2001 2011 2021 2031 2041Year
40
50
60
70
80
90
100
110
Gro
undw
ater
…le
vel…
(mR
L)
UG139_281
ObservedSimulated
1971 1981 1991 2001 2011 2021 2031 2041
20
40
60
80
100
UG139_319
ObservedSimulated
1971 1981 1991 2001 2011 2021 2031 2041Year
60
65
70
75
80
85
90
95
Gro
undw
ater
…le
vel…
(mR
L)
UG139_329
ObservedSimulated
1971 1981 1991 2001 2011 2021 2031 2041
65
70
75
80
85
90
95
100
UG139_375
ObservedSimulated

1971 1981 1991 2001 2011 2021 2031 2041Year
0
20
40
60
80
Gro
undw
ater
…le
vel…
(mR
L)
UG139_382
ObservedSimulated
1971 1981 1991 2001 2011 2021 2031 2041
40
50
60
70
80
90
UG139_402
ObservedSimulated
1971 1981 1991 2001 2011 2021 2031 2041Year
20
40
60
80
Gro
undw
ater
…le
vel…
(mR
L)
UG147_090
ObservedSimulated
1971 1981 1991 2001 2011 2021 2031 2041
20
0
20
40
60
80
UG147_157
ObservedSimulated
1971 1981 1991 2001 2011 2021 2031 2041Year
75
50
25
0
25
50
75
Gro
undw
ater
…le
vel…
(mR
L)
UG147_209
ObservedSimulated
1971 1981 1991 2001 2011 2021 2031 2041
125
100
75
50
25
0
25
50
UG147_242
ObservedSimulated
1971 1981 1991 2001 2011 2021 2031 2041Year
125
100
75
50
25
0
25
50
Gro
undw
ater
…le
vel…
(mR
L)
UG147_249
ObservedSimulated
1971 1981 1991 2001 2011 2021 2031 2041
20
0
20
40
60
UG147_260
ObservedSimulated

1971 1981 1991 2001 2011 2021 2031 2041Year
80
85
90
95
100
105
110
115
Gro
undw
ater
…le
vel…
(mR
L)
UG166A_130
ObservedSimulated
1971 1981 1991 2001 2011 2021 2031 2041
70
75
80
85
90
95
100
105
UG166A_153
ObservedSimulated
1971 1981 1991 2001 2011 2021 2031 2041Year
20
40
60
80
100
Gro
undw
ater
…le
vel…
(mR
L)
UG166A_200
ObservedSimulated
1971 1981 1991 2001 2011 2021 2031 2041
45
50
55
60
65
70
75
80
UG166A_238
ObservedSimulated
1971 1981 1991 2001 2011 2021 2031 2041Year
10
0
10
20
30
40
50
60
Gro
undw
ater
…le
vel…
(mR
L)
UG192R_110
ObservedSimulated
1971 1981 1991 2001 2011 2021 2031 2041
40
20
0
20
40
60
UG192R_140
ObservedSimulated
1971 1981 1991 2001 2011 2021 2031 2041Year
80
60
40
20
0
20
40
60
Gro
undw
ater
…le
vel…
(mR
L)
UG192R_170
ObservedSimulated
1971 1981 1991 2001 2011 2021 2031 2041
20
25
30
35
40
45
50
55
UG192R_210
ObservedSimulated

1971 1981 1991 2001 2011 2021 2031 2041Year
10
0
10
20
30
40
50
60
Gro
undw
ater
…le
vel…
(mR
L)
UG192R_30
ObservedSimulated
1971 1981 1991 2001 2011 2021 2031 2041
10
0
10
20
30
40
50
60
UG192R_60
ObservedSimulated
1971 1981 1991 2001 2011 2021 2031 2041Year
40
20
0
20
40
60
Gro
undw
ater
…le
vel…
(mR
L)
UG192R_94
ObservedSimulated
1971 1981 1991 2001 2011 2021 2031 2041
100
80
60
40
20
0
20
40UG193_160
ObservedSimulated
1971 1981 1991 2001 2011 2021 2031 2041Year
80
60
40
20
0
20
40
60
Gro
undw
ater
…le
vel…
(mR
L)
UG193_179
ObservedSimulated
1971 1981 1991 2001 2011 2021 2031 2041
20
25
30
35
40
45
50
55
UG193_210
ObservedSimulated
1971 1981 1991 2001 2011 2021 2031 2041Year
10
0
10
20
30
40
50
60
Gro
undw
ater
…le
vel…
(mR
L)
UG193_27
ObservedSimulated
1971 1981 1991 2001 2011 2021 2031 2041
10
0
10
20
30
40
50
60
UG193_61
ObservedSimulated

1971 1981 1991 2001 2011 2021 2031 2041Year
20
0
20
40
60
Gro
undw
ater
…le
vel…
(mR
L)
UG193_85
ObservedSimulated
1971 1981 1991 2001 2011 2021 2031 2041
20
0
20
40
60
UG196_137
ObservedSimulated
1971 1981 1991 2001 2011 2021 2031 2041Year
80
60
40
20
0
20
40
Gro
undw
ater
…le
vel…
(mR
L)
UG196_160
ObservedSimulated
1971 1981 1991 2001 2011 2021 2031 2041
30
35
40
45
50
55
60
65
UG196_230
ObservedSimulated
1971 1981 1991 2001 2011 2021 2031 2041Year
30
40
50
60
70
80
Gro
undw
ater
…le
vel…
(mR
L)
UG196_45
ObservedSimulated
1971 1981 1991 2001 2011 2021 2031 2041
10
20
30
40
50
60
70
80
UG196_80
ObservedSimulated
1971 1981 1991 2001 2011 2021 2031 2041Year
0
20
40
60
Gro
undw
ater
…le
vel…
(mR
L)
UG220_106
ObservedSimulated
1971 1981 1991 2001 2011 2021 2031 2041
20
0
20
40
60
UG220_110
ObservedSimulated

1971 1981 1991 2001 2011 2021 2031 2041Year
60
40
20
0
20
40
60
Gro
undw
ater
…le
vel…
(mR
L)
UG220_152
ObservedSimulated
1971 1981 1991 2001 2011 2021 2031 2041
10
0
10
20
30
40
50
60
70UG220_207
ObservedSimulated
1971 1981 1991 2001 2011 2021 2031 2041Year
20
0
20
40
60
Gro
undw
ater
…le
vel…
(mR
L)
UG224_105
ObservedSimulated
1971 1981 1991 2001 2011 2021 2031 2041
80
60
40
20
0
20
40
60
UG224_163
ObservedSimulated
1971 1981 1991 2001 2011 2021 2031 2041Year
80
60
40
20
0
20
40
60
Gro
undw
ater
…le
vel…
(mR
L)
UG224_172
ObservedSimulated
1971 1981 1991 2001 2011 2021 2031 2041
25
30
35
40
45
50
55
60
UG224_191
ObservedSimulated
1971 1981 1991 2001 2011 2021 2031 2041Year
10
0
10
20
30
40
50
60
Gro
undw
ater
…le
vel…
(mR
L)
UG224_69
ObservedSimulated
1971 1981 1991 2001 2011 2021 2031 2041
40
20
0
20
40
60
UG225_100
ObservedSimulated

1971 1981 1991 2001 2011 2021 2031 2041Year
60
40
20
0
20
40
Gro
undw
ater
…le
vel…
(mR
L)
UG225_128
ObservedSimulated
1971 1981 1991 2001 2011 2021 2031 2041
100
75
50
25
0
25
50
UG225_178
ObservedSimulated
1971 1981 1991 2001 2011 2021 2031 2041Year
20
0
20
40
60
Gro
undw
ater
…le
vel…
(mR
L)
UG225_58.5
ObservedSimulated
1971 1981 1991 2001 2011 2021 2031 2041
40
20
0
20
40
60
UG225_93.2
ObservedSimulated
1971 1981 1991 2001 2011 2021 2031 2041Year
100
75
50
25
0
25
50
Gro
undw
ater
…le
vel…
(mR
L)
WD456_P2
ObservedSimulated
1971 1981 1991 2001 2011 2021 2031 2041
30
35
40
45
50
55
60
65
WD462_P1
ObservedSimulated
1971 1981 1991 2001 2011 2021 2031 2041Year
150
100
50
0
50
Gro
undw
ater
…le
vel…
(mR
L)
WD462_P3
ObservedSimulated
1971 1981 1991 2001 2011 2021 2031 2041
40
45
50
55
60
65
70
75
WD609
ObservedSimulated

1971 1981 1991 2001 2011 2021 2031 2041Year
35
40
45
50
55
60
65
70
Gro
undw
ater
…le
vel…
(mR
L)
WD615_P1
ObservedSimulated
1971 1981 1991 2001 2011 2021 2031 2041
0
20
40
60
80
WD622_P1
ObservedSimulated
1971 1981 1991 2001 2011 2021 2031 2041Year
100
75
50
25
0
25
50
75
Gro
undw
ater
…le
vel…
(mR
L)
WD622_P2
ObservedSimulated
1971 1981 1991 2001 2011 2021 2031 2041
200
150
100
50
0
50
WD622_P3
ObservedSimulated
1971 1981 1991 2001 2011 2021 2031 2041Year
20
10
0
10
20
30
40
50
60
Gro
undw
ater
…le
vel…
(mR
L)
WD622_P4
ObservedSimulated
1971 1981 1991 2001 2011 2021 2031 2041
25
30
35
40
45
50
55
60
WD625P
ObservedSimulated
1971 1981 1991 2001 2011 2021 2031 2041Year
20
0
20
40
60
Gro
undw
ater
…le
vel…
(mR
L)
WD625_P1
ObservedSimulated
1971 1981 1991 2001 2011 2021 2031 2041
25
30
35
40
45
50
55
60
WD625_P3
ObservedSimulated

1971 1981 1991 2001 2011 2021 2031 2041Year
40
20
0
20
40
60
Gro
undw
ater
…le
vel…
(mR
L)
WD631
ObservedSimulated
1971 1981 1991 2001 2011 2021 2031 2041
40
20
0
20
40
60
WD633
ObservedSimulated
1971 1981 1991 2001 2011 2021 2031 2041Year
150
100
50
0
50
Gro
undw
ater
…le
vel…
(mR
L)
WOH2139A
ObservedSimulated
1971 1981 1991 2001 2011 2021 2031 2041
10
20
30
40
50
60
70
WOH2141A
ObservedSimulated
1971 1981 1991 2001 2011 2021 2031 2041Year
0
10
20
30
40
50
60
70
Gro
undw
ater
…le
vel…
(mR
L)
WOH2141B
ObservedSimulated
1971 1981 1991 2001 2011 2021 2031 2041
35
40
45
50
55
60
65
70
WOH2153A
ObservedSimulated
1971 1981 1991 2001 2011 2021 2031 2041Year
30
35
40
45
50
55
60
65
Gro
undw
ater
…le
vel…
(mR
L)
WOH2153B
ObservedSimulated
1971 1981 1991 2001 2011 2021 2031 2041
30
35
40
45
50
55
60
65
WOH2154A
ObservedSimulated

1971 1981 1991 2001 2011 2021 2031 2041Year
10
20
30
40
50
60
70
80
Gro
undw
ater
…le
vel…
(mR
L)
WOH2155A
ObservedSimulated
1971 1981 1991 2001 2011 2021 2031 2041
20
0
20
40
60
80
WOH2155B
ObservedSimulated
1971 1981 1991 2001 2011 2021 2031 2041Year
20
30
40
50
60
70
80
90
Gro
undw
ater
…le
vel…
(mR
L)
WOH2156A
ObservedSimulated
1971 1981 1991 2001 2011 2021 2031 2041
20
0
20
40
60
80
WOH2156B
ObservedSimulated

620.12182.00000-R13-v3.0.docx Page 4 of 4

ASIA PACIFIC OFFICES
BRISBANELevel 2, 15 Astor TerraceSpring Hill QLD 4000AustraliaT: +61 7 3858 4800F: +61 7 3858 4801
CANBERRAGPO 410Canberra ACT 2600AustraliaT: +61 2 6287 0800F: +61 2 9427 8200
DARWIN5 Foelsche StreetDarwin NT 0800AustraliaT: +61 8 8998 0100F: +61 2 9427 8200
MACKAY21 River StreetMackay QLD 4740AustraliaT: +61 7 3181 3300
MELBOURNESuite 2, 2 Domville AvenueHawthorn VIC 3122AustraliaT: +61 3 9249 9400F: +61 3 9249 9499
NEWCASTLE10 Kings RoadNew Lambton NSW 2305AustraliaT: +61 2 4037 3200F: +61 2 4037 3201
PERTHGround Floor, 503 Murray StreetPerth WA 6000AustraliaT: +61 8 9422 5900F: +61 8 9422 5901
[email protected]: +61 407 810 417
SYDNEY2 Lincoln StreetLane Cove NSW 2066AustraliaT: +61 2 9427 8100F: +61 2 9427 8200
TAMWORTHPO Box 11034Tamworth NSW 2340AustraliaM: +61 408 474 248F: +61 2 9427 8200
TOWNSVILLELevel 1, 514 Sturt StreetTownsville QLD 4810AustraliaT: +61 7 4722 8000F: +61 7 4722 8001
AUCKLAND68 Beach RoadAuckland 1010New ZealandT: +64 27 441 7849
NELSON5 Duncan StreetPort Nelson 7010New ZealandT: +64 274 898 628
NEW PLYMOUTHLevel 2, 10 Devon Street EastNew Plymouth 4310New ZealandT: +64 0800 757 695

Q1 Q2 Q3 Q4 Q1 Q2 Q3 Q4HVOWES201101 [WS190 above Dam 6W, 2.2ha] 5
Weed controlSelective seeding (if req)
HVOWES201301 [West Wilton, 3.7ha] 4Weed control ✔Selective seeding (if req)
HVOWES201401 [West Centre 230, 8ha] 2Weed control ✔Soil investigation ✔Soil amelioration (if req)Selective seeding (if req)
HVOWES201501 [West North 230 Flat, 26.2ha] 3Routine inspection (watching brief) ✔ ✔Weed controlRe-monitor (if req)
HVOWES201502 [West South 230 Flat, 29.2ha] 2Weed controlSelective seeding (if req)
HVOWES201601 [West North 190, 6.2ha] 1Re-monitoring, Soil investigation ✔Soil amelioration (if req)Weed control / spray out ✔ ✔Seeding
HVOWES201602 [West South 230 Flat, 4ha] 5Weed controlSelective seeding (if req)
3
HVOWES201603 [West North 230 Flat, 6.7ha] 3Soil investigation ✔Weed control ✔Selective seeding (if req)
HVOWES201604 [Wilton 210, 3.7ha] 3Weed control ✔Selective seeding (if req)
HVOWES201605 [West South 230 - Nth Slope, 14.2ha] 2Routine inspection (watching brief) ✔Weed control
HVOWES201701 [West North 190, 6.6ha] 1Weed control ✔ ✔ ✔Scope contour repairContour repair
HVOWES201702 [West Wilton 210 - Nth Amphitheatre, 3.6ha] 2Weed control ✔Soil investigation ✔Develop intervention planPlan execution
HVOWES201703 [West South 230 - Nth Slope, 13.1ha] 4Weed controlSelective seeding (if req)
HVOWES201704 [West South 230 Flat, 13ha] 2Weed controlSoil investigation ✔Develop intervention planPlan execution
Notes:Work to occur across the periods shown, however may not occur in all periods shown.Relative priorities balance addressing at-risk areas with maintaining areas demonstrating favourable trajectories. 2020 work plans are indicative only. Final 2020 plans to be informed by observations and trajectory at 2019 monitoring events, and will be detailed in annual reporting. Changes to work plans may occur due to weather events and climatic influences. Where work components are not undertaken details will be provided in annual reporting.
Legend - Rehab Trajectory (after CPS monitoring) Legend - planned workTracking towards success but needs work Primary task timingStable but need work to improve Secondary timing (contingency / follow-up as needed)Failing Legend - s240 IssueFailed 2018 TARP Monitoring event & event trigger(s)Not monitored 2019 Additional sites monitoring event
Failed block - phase reversion to Growth Med. Dev.
Version 4.0; 31/12/19
19Q2GMD Rollback
Priorities1. weed control2. monitor trajectory (natives sown 2018)
19Q2
Priorities1. weed control2. monitor trajectory
19Q2
Priorities1. weed control2. understanding growth medium / degraded area issues3. intervention plan development for degraded portion
19Q2
Priorities1. Weed control 19Q2
Priorities1. weed control2. understanding growth medium3. intervention plan development
19Q2
Veg, Weeds
Priorities1. weed control 19Q2
Priorities1. weed control 19Q2
Priorities1. weed control2. understanding growth medium3. increase diversity
Weeds
Priorities1. weed control2. monitor trajectory
19Q2
Priorities1. weed control 19Q2
Priorities1. additional monitoring2. weed control3. understanding growth medium
Veg, Weeds
Priorities1. weed control2. manage for re-disturbance
19Q2
Priorities1. weed control 19Q2
Priorities1. weed control2. understanding growth medium 19Q2
HVO s240 Rehab Maintenance Schedule 2019-2020 - West Pit - [31 DECEMBER 2019 UPDATE]
Location Maintenance Relative Priority
2019 2020 s240 Issue

Q1 Q2 Q3 Q4 Q1 Q2 Q3 Q4HVORIV201401 [Riverview 145, 5.8ha] 3
Weed controlSelective seeding (if req)
HVORIV201402 [Riverview 145, 10ha] 3Weed controlSelective seeding (if req)
HVORIV201403 [Riverview 145/155, 4.8ha] 1Soil investigation ✔Soil amelioration (if req)Weed controlSelective seeding (if req)
HVORIV201404 [Riverview 155, 8.4ha] 1Soil investigation ✔Weed control / spray outSoil ameliorationSeeding
HVORIV201405 [Riverview 155, 14.3ha] 1Soil investigation ✔Weed control / spray out ✔Soil ameliorationSeeding
HVORIV201406 [Riverview East Amphitheatre & adjacent 155, 5.1ha] 4Weed control ✔Soil investigation ✔Selective seeding (if req)
HVORIV201407 [Riverview 125, 7.8ha] 4Weed control
HVORIV201501 [Riverview 155, 2.4ha] 3Weed controlSelective seeding (if req)
HVORIV201503 [Riverview 145, 6.2ha] 3Weed controlSelective seeding (if req)
HVORIV201601A [Riverview Western Amphitheatre, 3ha] 3Weed control ✔
HVORIV201701 [Riverview Glider 125 Flat, 10ha] 3Weed control ✔
HVORIV201702 [Riverview Glider 110 North Batter, 4.4ha] 3Weed control ✔
HVORIV201703 [Riverview Glider 110 South Batter, 5.4ha] 2Weed control ✔
HVORIV201801 [Riverview 155, 2.2ha] 3Weed control ✔
HVORIV201802 [RivNorth West Batter, 18.8ha] 2Weed control ✔
HVORIV201803 [RivNorth North Batter, 16.3ha] 2Weed control ✔
Riverview North Hayshed block [7.2ha] 1Weed control
Notes:Work to occur across the periods shown, however may not occur in all periods shown.Relative priorities balance addressing at-risk areas with maintaining areas demonstrating favourable trajectories. 2020 work plans are indicative only. Final 2020 plans to be informed by observations and trajectory at 2019 monitoring events, and will be detailed in annual reporting. Changes to work plans may occur due to weather events and climatic influences. Where work components are not undertaken details will be provided in annual reporting. Maintenance in Riverview reflects that majority of blocks are temporary rehabilitation of interim landform and will be progressively re-disturbed with mine advance.
Legend - Rehab Trajectory (after CPS monitoring) Legend - planned workTracking towards success but needs work Primary task timingStable but need work to improve Secondary timing (contingency / follow-up as needed)Failing Legend - s240 IssueFailed 2018 TARP Monitoring event & event trigger(s)Not monitored 2019 Additional sites monitoring event
Failed block - phase reversion to Growth Med. Dev.
Version 4.0; 31/12/19
GMD Rollback
Priorities1. weed control2. monitor trajectory
19Q2
Veg, Weeds19Q2
Priorities1. weed control2. monitor trajectory (sown over to native 19Q2, not yet monitored)
-
Priorities1. weed control2. monitor trajectory (natives sown 2018)
19Q2
Priorities1. weed control2. monitor trajectory
19Q2
Priorities1. weed control2. monitor trajectory
19Q2
Priorities1. weed control2. monitor trajectory3. manage for re-disturbance
19Q2
Priorities1. weed control2. monitor trajectory (natives sown 2018)
19Q2
Priorities1. weed control2. monitor trajectory (natives sown 2018)
19Q2
Priorities1. weed control2. manage for re-disturbance
19Q2
Priorities1. weed control Weeds
Priorities1. weed control Weeds
Priorities1. weed control2. soil amelioration3. manage for re-disturbance
Veg
Priorities1. weed control2. manage for re-disturbance
Veg / GMD
Rollback
Priorities1. weed control2. monitor trajectory3. manage for re-disturbance
19Q2
Priorities1. weed control Weeds
Priorities1. weed control Weeds
Priorities1. weed control2. soil amelioration3. manage for re-disturbance
Veg, Weeds
HVO s240 Rehab Maintenance Schedule 2019-2020 - Riverview Pit - [31 DECEMBER 2019 UPDATE]
Location Maintenance Relative Priority
2019 2020 s240 Issue

Q1 Q2 Q3 Q4 Q1 Q2 Q3 Q4HVOCAR200901 [Carrington, 14.2ha] 5
Stem thinningWeed controlSelective seedingDrainage review
HVOCAR200902 [Carrington, 7.7ha] 5Stem thinningWeed controlSelective seeding
HVOCHE201201 [Cheshunt Rim, 20.8ha] 4Investigate soil issues ✔Develop re-establishment planPlan execution
HVOCHE201501A [Barrys Lower East Slope, 19.6ha] 1Weed control
HVOCHE201501B / HVOCHE201601A [Barrys Upper East Slope, 16.1ha] 1Weed control / spray out ✔Re-establish cover crop ✔Investigate soil issues ✔ ✔Develop re-establishment plan
HVOCHE201702 [Fmr Drill Parkup, 2.2ha] 4Weed controlSelective seeding (if req)
HVOCHE201801 [Barrys Slope, 4.9ha; east portion of 2018 block] 1Weed control ✔ ✔ ✔Routine inspection
HVOCHE201801 [Barrys Slope, 1ha; west portion of 2018 block] 2Weed control ✔
HVOCHE201802 [Barrys 230 Flat, 19.5ha] 4Weed control ✔
HVOLEM201501 [Lemington South, 13.4ha] 4Weed controlSoil investigation ✔Soil amelioration (if req)Selective seeding (if req)
HVOLEM201601 [Lemington South, 5ha] 4Weed controlSoil investigation ✔Soil amelioration (if req)Selective seeding (if req)
Notes:Work to occur across the periods shown, however may not occur in all periods shown.Relative priorities balance addressing at-risk areas with maintaining areas demonstrating favourable trajectories. 2020 work plans are indicative only. Final 2020 plans to be informed by observations and trajectory at 2019 monitoring events, and will be detailed in annual reporting. Changes to work plans may occur due to weather events and climatic influences. Where work components are not undertaken details will be provided in annual reporting. Maintenance of HVOCHE201802 reflects that the block is temporary rehab of an interim landform and will be subsequently re-disturbed by overburden emplacement.
Legend - Rehab Trajectory (after CPS monitoring) Legend - planned workTracking towards success but needs work Primary task timingStable but need work to improve Secondary timing (contingency / follow-up as needed)Failing Legend - s240 IssueFailed 2018 TARP Monitoring event & event trigger(s)Not monitored 2019 Additional sites monitoring event
Failed block - phase reversion to Growth Med. Dev.
Version 4.0; 31/12/19
Veg / GMD
Rollback
Veg, Weeds19Q2
GMD Rollback
Priorities1. weed control2. understanding growth medium
19Q2
Priorities1. weed control Weeds
Priorities1. weed control2. manage for potential re-use of surface layer (temp spoil/compost rehab)
19Q2
Priorities1. weed control2. increase ground cover /surface stability
19Q2
Priorities1. weed control2. monitor trajectory
19Q2
Priorities1. weed control 19Q2
Priorities1. halt exotic establishment & competition2. re-establish cover crop3. understand growth medium
GMD Rollback
Priorities1. open canopy2. weed control3. drainage review
19Q2
HVO s240 Rehab Maintenance Schedule 2019-2020 - Carrington, Cheshunt & Lemington Pits - [31 DECEMER 2019 UPDATE]
Location Maintenance Relative Priority
2019 2020 s240 Issue
Priorities1. weed control2. monitor trajectory (sown to native 19Q2, not yet monitored)
-
Priorities1. open canopy2. weed control3. increase diversity
Weeds
Priorities1. understanding growth medium2. addressing growth medium constraints3. plan development

West North 230 2014 Flat [14.1ha] 1Slashing, spraying ✔Drainage improvementSeeding
West North 230 East Batter [18.3ha] 1Sink hole repairsSlashing, sprayingDevelop intervention planPlan execution
Riverview Glider RL80 [7.6ha] 1Enlarge sediment dam for increased catchment ✔Slashing / spraying ✔Pre-sowing herbicide application (if needed) Sow final vegetation
Cheshunt Barrys Amphitheatre [5.9ha] 1Pre-sowing herbicide application / spot-spraySow native pioneers (grasses)Increase native diversity / sow final vegetation
Cheshunt Barrys Upper West Slope [17ha] 1Re-establish / maintain cover crop ✔Pre-sowing herbicide application / spot-spray ✔Sow final vegetation
West Wilton 210 2014 Flat [9.6ha] 2Slashing, spot spraying ✔Sow native pioneersIncrease native diversity
Cheshunt Barrys Lower West Slope (east) [chute to amphitheatre, 12.1ha] 2Weed control ✔Soil investigationSoil amelioration (if required)Sow final vegetation
Cheshunt Barrys Lower West Slope (west) [west of amphitheatre, 5.7ha] 2Pre-sowing herbicide application / spot-spray ✔Sow final vegetation
Cheshunt Rim [north, central & south; 87.6ha] 2Develop intervention planInstall grazing infrastructurePlan execution
Cheshunt Barrys RL155 2018 Topsoil [7.8ha] 2Re-establish cover crop ✔Residual herbicide applicationSow native pioneers (grasses)Sow native pioneers (trees & shrubs)
Cheshunt Barrys RL155 2013 Topsoil [27.9ha] 2Residual herbicide applicationSlashing / ongoing sprayingSow native pioneers (grasses)
Cheshunt Polo Green [52.4ha] 3Develop intervention planInstall grazing infrastructurePlan execution
West North 230 North Batter [22.8ha] 3Monitor landform & drainage stability ✔Develop intervention planPlan execution
West Wilton 210 2013 North Batter [13ha] 3Monitor landform & drainage stability Develop intervention planPlan execution
Carrington Western OEA [88.6ha] 3Develop intervention planInstall grazing infrastructurePlan execution
South East TSF [23.6ha] 3Hold on ground works proposed during cappingReview medium term landform and drainage plans
Riverview Void [Western Amphitheatre, Void Slope; 34.2] 3Pre-sowing herbicide application (if needed)Ground preparationAerial seed (drone / light aircraft)
Riverview 125 Pasture / CHE2 AOM [12.9ha] 3Slashing / spraying ✔
Riverview 145 Pasture / CHE1 AOM [30.2ha] 3Slashing / spraying ✔
Notes:Work anticipated to occur across the periods shown, however may not occur in all periods shown.Changes to work plans may occur due to weather events, climatic influences, and operational interactions. Where work components are not undertaken details will be provided in annual reporting.
Legend Legend - planned workArea in Growth Medium Development phase Primary task timing
Secondary timing (contingency / follow-up as needed)Version 4.0; 31/12/19
Priorities1. weed control - break seed cycle, prevent exotic re-establishment2. establish pioneer native species3. weed control - manage competition
GMD Phase
Priorities1. weed control - exotic grasses2. augment existing native grasses / establish pioneer native species
GMD Phase
Priorities1. repair sinkholes2. weed control - break seed cycle, prevent exotic re-establishment3. improve growth medium
GMD Phase
Priorities1. enlarge sediment dam2. weed control - break seed cycle, prevent exotic re-establishment3. establish pioneer native species
HVO s240 Rehab Maintenance Schedule - Growth Medium Development Progression [31 DECEMBER 2019 UPDATE]
Location Maintenance Relative Priority
s240 Issue
2019 2020 2021 2022 2023+
Priorities1. weed control 2. manage for re-disturbance (mine advance)
Priorities1. weed control 2. manage for re-disturbance (mine advance)
GMD Phase
GMD Phase
GMD Phase
Priorities1. establish pioneer native species (slope stability)2. weed control3. progression to final vegetation
GMD Phase
Priorities1. weed control2. understanding growth medium3. intervention plan development
GMD Phase
Priorities1. weed control / sowing preparation2. sow to final cover3. weed control / monitor trajectory
GMD Phase
Priorities1. weed control / sowing preparation2. sow to final cover3. weed control / monitor trajectory
GMD Phase
GMD Phase
Priorities1. recommence capping (in process)2. review rehab strategy following cap establishment
Priorities1. weed control / sowing preparation2. establish pioneer native species 3. manage for re-disturbance
GMD Phase
Priorities1. intervention plan development (livestock grazing based) 2. grazing introduction3. sequenced progression to final vegetation
GMD Phase
Priorities1. intervention plan development (livestock grazing based) 2. grazing introduction3. sequenced progression to final vegetation
GMD Phase
GMD Phase
Priorities1. weed control - prevent establishment2. establish pioneer native species3. manage for re-disturbance (over-dumping)
GMD Phase
Priorities1. monitor landform stability2. intervention plan development
GMD Phase
Priorities1. intervention plan development (livestock grazing based) 2. grazing introduction3. sequenced progression to final vegetation
GMD Phase
Priorities1. weed control 2. manage for re-disturbance (over-dumping)
GMD Phase
Priorities1. monitor landform stability2. intervention plan development

North Rehab / Former East TSF / Dam 5N catchment 1Routine inspection of initial stabilisation works ✔Expert development of detailed intervention plan ✔Plan implementation
West South drainage chute 2Confirm reporting catchment and design adequacy Repair / upgrade drainage chute
Cheshunt Rim drainage 2Detailed drainage design for future layoutConstruct / upgrade / repair drainage incl. chute
West South historic rehab 2Review area drainageDevelop detailed, sequenced improvement plan(s)
Historic rehabilitation areas (generally) 4Conduct verification inspectionsIdentify issues of elevated rehab progression riskDevelop maintenance task scopes and priorities
Notes:Initial tasks identified from GCAA Annual Rehab Walkover. Other sources may include: Monthly Inspections, discussions and informal reports. Work anticipated to occur across the periods shown, however may not occur in all periods shown.Changes to work plans may occur due to weather events, climatic influences, and operational interactions. Where work components are not undertaken details will be provided in annual reporting. Outcomes of plan development tasks to be reported at annual reporting and be reflected in subsequent annual work plans.
Legend Legend - planned workOther / general rehab maintenance Primary task timing
Secondary timing (contingency / follow-up as needed)Version 4.0; 31/12/19
HVO s240 Rehab Maintenance Schedule - Other Maintenance [31 DECEMBER 2019 UPDATE]
Location Planning & Maintenance Relative Priority
2019 2020 2021 2022 2023+ s240 Issue
Context / background* Walkover identified minor issues in various historic catchments* Risk ranking / prioritisation required to support decision making & resource allocation
Other Maint.
Context / background* Integrated drainage is degarded. Turbid water has flowed off site. * Vegetation development appears constrained in places.
Other Maint.
Context / background* Integrated drainage throughout catchment is degraded. * Complex cycling occurring (e.g. fruiting fungi) in association with presence of undesirable species. Targeted corrective actions required.
Other Maint.
Context / background* Catchment modifying with development of upper level dumps. * Existing central chute failed. * Clarification of future needs required prior to repair / replacement.
Other Maint.
Context / background* initial migration of rock in drainage chute * timely repair may prevent major failure
Other Maint.

1910_HVO_South_September_2019_AHMP_Compliance_Audit_Report
Arrow Heritage Solutions Pty Ltd, ABN: 44 626 545 515
Hunter Valley Operations South Aboriginal Heritage Management Plan
Compliance Audit Inspection
Report prepared for
Hunter Valley Operations
September 2019
Joel Deacon

2
1910_HVO_South_September_2019_AHMP_Compliance_Audit_Report
Arrow Heritage Solutions Pty Ltd, ABN: 44 626 545 515
Introduction
The Hunter Valley Operations Joint Venture manages the Hunter Valley Operations (HVO) mining complex and associated Biodiversity Areas located in the Hunter Valley. The development of HVO mining operations has occurred through a process of expansion and acquisition and as a result there are two separate development approvals that apply to the operation. The mining & processing activities at HVO are geographically divided by the Hunter River, with movements of coal, overburden, equipment, materials and personnel between two operational areas - HVO North (DA_450-10-2003) and HVO South (PA_06_0261).
The HVO South consent contains a condition requiring the development of an Aboriginal Heritage Management Plan (AHMP), which has been developed (in consultation with the Aboriginal community through the HVO Cultural Heritage Working Group [CHWG]) and approved. Within this AHMP provision is made to conduct biannual AHMP compliance inspections with members of the Aboriginal community throughout the life of operations. The purpose of the compliance inspections is to afford the Aboriginal stakeholders and HVO:
the opportunity to visit mine operations and mine areas to inspect the operational compliance with AHMP provisions and Ground Disturbance Permit procedures;
to inspect and monitor the condition and management of various sites; and to review the effectiveness and performance of AHMP provisions in the management
of cultural heritage at the mine.
The aim is to conduct these compliance inspections at least twice annually. Due to the number of cultural heritage sites within the AHMP area & the time foreseen to inspect all sites, it is not feasible to inspect every site during the same field trip. Therefore, a regular, rolling program of compliance inspections has been implemented that will visit all sites at each location periodically each & every year. A record will be kept of each compliance inspection against each cultural heritage site, so that it can be ensured that each site is inspected regularly.
Proposed Activity and Project Brief The HVO South compliance inspection involved the following elements:
An AHMP compliance inspection report pro-forma will be completed for the nominated inspection areas and Aboriginal cultural heritage sites visited;
Photographs of the inspected Aboriginal cultural heritage sites will also be taken; and The pro-forma will note the outcomes of the inspections including evidence of
compliance and non-compliance with AHMP provisions, recommendations on modifications and improvements to management provisions, recommendations on corrective actions, and other comments associated with AHMP provisions.

3
1910_HVO_South_September_2019_AHMP_Compliance_Audit_Report
Arrow Heritage Solutions Pty Ltd, ABN: 44 626 545 515
Timing & Personnel The HVO South AHMP compliance inspection was conducted on Tuesday 3 September, 2019. The personnel involved in these inspections were:
Joel Deacon – Technical Advisor, Arrow Heritage Solutions; Peter Bowman – Environment and Community Officer, HVO; Danny Franks – Cultural Heritage Field Officer (CHFO), Plains Clans of the
Wonnarua People (PCWP); Mary Franks – CHFO, PCWP; and Rhonda Ward – CHFO, Ungooroo Community and Cultural Services.
Arrow Heritage Solutions were engaged as independent heritage consultants to conduct the AHMP compliance inspection, and Joel Deacon acted as technical advisor and author of this report. HVO’s Environment & Community Officer Peter Bowman arranged the compliance inspection program and escorted the field team. Representatives of the HVO Registered Aboriginal Parties (RAPs) participated in the compliance inspection.
HVO South AHMP Compliance Inspection
A total of 45 Aboriginal heritage sites were inspected in the HVO Southern area (see Map below). Although not active mining zones, these areas were selected for inspection as they are located in areas that are frequently accessed for a variety of activities associated with water and environmental management, as well as being currently leased for pastoral enterprises.

4
1910_HVO_South_September_2019_AHMP_Compliance_Audit_Report
Arrow Heritage Solutions Pty Ltd, ABN: 44 626 545 515

5
1910_HVO_South_September_2019_AHMP_Compliance_Audit_Report
Arrow Heritage Solutions Pty Ltd, ABN: 44 626 545 515
Results The following table summarises the results of the September 2019 HVO South compliance inspection and summarises the information recorded on the individual pro-forma inspection sheets. Using a mobile mapper pre-loaded with the GIS co-ordinates for each Aboriginal heritage site, the field team travelled to each location and attempted to re-locate each site. Sometimes this was not possible due to poor ground surface visibility (GSV), a result which in itself was not overly significant as long as it was determined that the vicinity had not been inadvertently disturbed. The presence and condition of barricading or fencing was noted, as well as the presence and nature of various potential site disturbing factors (e.g erosion, animal, human). General observations of each site were made if necessary, and, based on information provided for all of the above factors, management recommendations were discussed and agreed by the field team for each site.

1910_HVO_South_September_2019_AHMP_Compliance_Audit_Report
Arrow Heritage Solutions Pty Ltd, ABN: 44 626 545 515
Site Name Date Inspected
Site re-identified?
Site intact?
Site fenced/ barricaded?
Fencing/ barricading intact?
Natural erosion
Livestock damage
Human disturbance
Animal disturbance
Pests & weeds
General observations Management recommendations
HVO-1198 3/9/2019 Yes Yes No N/A No No No No No - Nil
HVO-1199
3/9/2019
Yes No No N/A Yes No No No No
Located on/in active flow line – only one artefact relocated Salvage site
HVO-1200 3/9/2019 Yes Yes No N/A No No No No No - Nil
HVO-1201 3/9/2019 Yes Yes No N/A No No No No No - Nil
HVO-1202 3/9/2019 Yes Yes No N/A No No No No No - Nil
HVO-1203 3/9/2019 Yes Yes No N/A No No No No No - Nil
HVO-1204 3/9/2019 Yes Yes No N/A No No No No No - Nil
HVO-1205 3/9/2019 No Yes No N/A No No No No No - Include in next audit
HVO-1206 3/9/2019 Yes Yes No N/A No No No No No - Nil
HVO-1207 3/9/2019 Yes Yes No N/A No No No No No - Nil
HVO-1208 3/9/2019 Yes Yes Yes Yes No No No No No Older hard fencing Some fence wires require mending
HVO-1209 3/9/2019
Yes Yes No N/A No Yes No No No Stock congregate around gate near site Nil
HVO-1252 3/9/2019 No Yes No N/A No No No No No - Include in next audit
HVO-1253 3/9/2019 Yes Yes No N/A No No No No No - Nil
HVO-1254 3/9/2019 Yes Yes No N/A No No No No No - Nil
HVO-1255 3/9/2019 Yes Yes No N/A No No No No No - Nil
HVO-1256 3/9/2019 Yes Yes No N/A No No No No No - Nil
HVO-1257 3/9/2019 Yes Yes No N/A No Yes No No No Located on cattle pad Nil
HVO-1258 3/9/2019 Yes Yes No N/A No Yes No No No Located on cattle pad Nil
HVO-1259 3/9/2019 Yes Yes No N/A No No No No No - Nil
HVO-1260 3/9/2019 Yes Yes No N/A No No No No No - Nil
HVO-1261 3/9/2019 Yes Yes No N/A Yes No No No No Some erosion present Nil
HVO-1262 3/9/2019 Yes Yes No N/A Slight No No No No Slight erosion Nil
HVO-1263 3/9/2019 Yes Yes No N/A No No No No No - Nil
HVO-1264 3/9/2019 Yes Yes No N/A No No No No No - Nil
HVO-1265 3/9/2019
Yes Yes No N/A Severe No No No No Severe erosion but regenerating Nil
HVO-1266 3/9/2019 Yes Yes No N/A No No No No No Axe not found Nil
HVO-1267 3/9/2019 Yes Yes No N/A Slight No No No No - Nil
HVO-1273 3/9/2019 No Yes No N/A No No No No No - Include in next audit
HVO-1274 3/9/2019 Yes Yes No N/A No No No No No - Nil
HVO-1276 3/9/2019 Yes Yes No N/A Yes No No No No - Nil
HVO-1277 3/9/2019
Yes Yes No N/A Severe No No No Boxthorn Evidence of successful weed eradication in area Continue weed eradication program
HVO-1278 3/9/2019 No Yes No N/A Slight No No No No - Include in next audit
HVO-1279 3/9/2019
Yes Yes No N/A Severe No No No No Quartz flake not found but several others Nil
HVO-1280 3/9/2019 Yes Yes No N/A Slight No No No No - Nil
HVO-1281 3/9/2019 No Yes No N/A No No No No No - Include in next audit
HVO-1282 3/9/2019 No Yes No N/A No No No No No - Include in next audit
HVO-1283 3/9/2019 Yes Yes No N/A No No No No No - Nil
HVO-1290 3/9/2019 Yes Yes No N/A No No No No No - Nil
HVO-1291 3/9/2019 Yes Yes No N/A Severe No No No No - Nil

7
1910_HVO_South_September_2019_AHMP_Compliance_Audit_Report
Arrow Heritage Solutions Pty Ltd, ABN: 44 626 545 515
HVO-1292 3/9/2019 Yes Yes No N/A No No No No Ant nest - Nil
HVO-1307 3/9/2019 Yes Yes No N/A No No No No Ant nest - Nil
HVO-1308 3/9/2019 Yes Yes No N/A No No No No No - Nil
HVO-1309 3/9/2019 Yes Yes No N/A Slight No No No No - Nil
HVO-1694 3/9/2019 Yes Yes No N/A No No No No No - Nil
Results of September 2019 HVO South Aboriginal Sites Compliance Inspection

8
1910_HVO_South_September_2019_AHMP_Compliance_Audit_Report
Arrow Heritage Solutions Pty Ltd, ABN: 44 626 545 515
Aboriginal Site Management Recommendations The compliance inspection of the selected HVO South sites showed that most were in good condition and able to be relocated. No management recommendations were provided by the field team for the majority of inspected sites. Recommendations were provided for nine of the Aboriginal heritage sites visited, which are described below.
Repair fencing wires Sites: HVO-1208
HVO-1208 has been fenced with wooden posts and stock-proof wire. This fencing is generally in good repair, however, some broken wires require mending to maintain the fence’s integrity, particularly as it is high traffic area for stock
Broken fence wires at HVO-1208
Include in next audit Sites: HVO-1205, 1252, 1273, 1278, 1281, 1282
Due to poor GSV at some locations as a result of sheet-wash erosion, heavy leaf litter or ground covering vegetation, some Aboriginal heritage sites were unable to be relocated. As the surrounding area was noted as being undisturbed, it is not suggested that the sites have been damaged, rather it is recommended that further attempts are made to relocate these sites during the next scheduled AHMP compliance audit inspection.

9
1910_HVO_South_September_2019_AHMP_Compliance_Audit_Report
Arrow Heritage Solutions Pty Ltd, ABN: 44 626 545 515
Continue weed eradication program Sites: HVO-1277
Boxthorn was identified at this site, however, it is clear that a successful boxthorn eradication program is underway in the vicinity. Although the presence of this species is not specifically detrimental to Aboriginal heritage sites, its presence is noted so that this area can remain included in HVO’s regular weed eradication program. If this area is to be treated, then access for any poisoning or plant removal must be on foot, with no unnecessary ground disturbance to be conducted.
Remnant and poisoned boxthorn at HVO-1277

10
1910_HVO_South_September_2019_AHMP_Compliance_Audit_Report
Arrow Heritage Solutions Pty Ltd, ABN: 44 626 545 515
Suggest salvage next program Sites: HVO-1199
Upon inspection, only one artefact was re-located from HVO-1199, which was originally recorded as containing 12 stone artefacts. The area has been significantly affected by erosion and sheet wash, with the banks of the drainage channel that runs through the site clearly eroding. As there is a moderate risk that artefacts from HVO-1199 are being damaged and moved from this site location, HVO-1199 should be salvaged as soon as is practicable to prevent any further possible damage. An AHIP is not required to implement this measure, as the salvage of this site, with Aboriginal community participation, is authorised under the HVO South AHMP.
Eroded drainage channel at HVO-1199

Hunter Valley Operations Aboriginal Heritage Management Plans October 2019 Compliance Audit Inspections
Report prepared for
Hunter Valley Operations
November 2019
Joel Deacon

2
1915_HVO_AHMP_Compliance_Audits_Report
Arrow Heritage Solutions Pty Ltd, ABN: 44 626 545 515
Introduction
The Hunter Valley Operations Joint Venture (HVOJV) manages the Hunter Valley Operations (HVO) mining complex and associated Biodiversity Areas located in the Hunter Valley. The HVOJV provides management services that include accountability for Aboriginal cultural heritage management & community consultation.
The development of HVO mining operations has occurred through a process of expansion and acquisition and as a result there are two separate development approvals that apply to the operation. The mining & processing activities at HVO are geographically divided by the Hunter River, with movements of coal, overburden, equipment, materials and personnel between two operational areas - HVO North (DA_450-10-2003) and HVO South (PA_06_0261).
Each consent contains a condition requiring the development of an Aboriginal Heritage Management Plan (AHMP). Such plans have been developed (in consultation with the Aboriginal community through the HVO Cultural Heritage Working Group [CHWG]) and approved for each operational area. Within each of these plans provision is made to conduct annual AHMP compliance inspections (biannual for HVO South) with members of the Aboriginal community throughout the life of operations. The purpose of the compliance inspections is to afford the Aboriginal stakeholders and the HVOJV:
the opportunity to visit mine operations and mine areas to inspect the operational compliance with AHMP provisions and Ground Disturbance Permit procedures;
to inspect and monitor the condition and management of various sites; and to review the effectiveness and performance of AHMP provisions in the management
of cultural heritage at the mine.
Due to the number of cultural heritage sites within the AHMP areas & the time foreseen to inspect all sites, it is not feasible to inspect every site during the same field trip. Therefore, a regular, rolling program of compliance inspections has been implemented that will visit all sites at each location periodically each & every year. A record will be kept of each compliance inspection against each cultural heritage site, so that it can be ensured that each site is inspected regularly.
Proposed Activity and Project Brief The compliance inspections involved the following elements:
An AHMP compliance inspection report pro-forma will be completed for the nominated inspection areas and Aboriginal cultural heritage sites visited;
Photographs of the inspected Aboriginal cultural heritage sites will also be taken; The pro-forma will note the outcomes of the inspections including evidence of
compliance and non-compliance with AHMP provisions, recommendations on modifications and improvements to management provisions, recommendations on corrective actions, and other comments associated with AHMP provisions;
Specific site condition monitoring inspection of site CM-CD1, as per Schedule 15 of the HVO North HMP.

3
1915_HVO_AHMP_Compliance_Audits_Report
Arrow Heritage Solutions Pty Ltd, ABN: 44 626 545 515
Timing & Personnel The HVO October 2019 AHMP compliance inspection program was conducted between 29-31 October 2019. The personnel involved in these inspections were:
Name Organisation Tue 29 Oct
Wed 30 Oct
Thu 31 Oct
Joel Deacon Arrow Heritage Solutions X X X
Peter Bowman HVO X X X
Margaret Matthews Aboriginal Native Title Consultants X X X
John Matthews Aboriginal Native Title Consultants X X X
Colleen Stair Hunter Valley Aboriginal Corporation X X X
Brian Horton Hunter Valley Aboriginal Corporation X X X
Aleira French Aleira French Trading X X
Wayne French Aleira French Trading X
Arrow Heritage Solutions were engaged as independent heritage consultants to conduct the AHMP compliance inspections, and Joel Deacon acted as technical advisor and author of this report. HVO’s Environment & Community Officer Peter Bowman arranged the compliance inspection programs and escorted the field team.
HVO North AHMP Compliance Inspection
A total of 15 Aboriginal heritage sites were inspected either side of Lemington Road at HVO North in the Carrington West Wing and Mitchell Pit surrounds, as well as the coal stockpiles area (see Map 1). Although not active mining zones, these areas were selected for inspection for a variety of reasons. Some of the sites are located adjacent to mining pits or active infrastructure areas, while others were visited to obtain further information regarding their extent, contents and condition as the information contained in the HVO sites database was lacking in some regard.
Results The following table details the results of the HVO North compliance inspection and summarises the information recorded on the individual pro-forma inspection sheets. Using a mobile mapper pre-loaded with the GIS co-ordinates for each Aboriginal heritage site, the field team travelled to each locale and attempted to re-identify each site. Sometimes this was not possible due to poor ground surface visibility (GSV), a result which in itself was not overly significant as long as it was determined that the vicinity had not been inadvertently disturbed. Another factor affecting site re-identification was the age of the original recording and the lack of data recorded. The presence and condition of barricading or fencing was noted, as well as the presence and nature of various potential site disturbing factors (e.g erosion, animal, human). General observations of each site were made if necessary, and, based on information provided for all of the above factors, management recommendations were discussed and agreed by the field team for each site.

Map 1: Location of Aboriginal heritage sites inspected during the October 2019 HVO North AHMP compliance inspection program

Site Name Date Inspected
Site re-identified?
Site intact?
Site fenced/ barricaded?
Fencing/ barricading intact?
Natural erosion
Livestock damage
Human disturbance
Animal disturbance
Pests & weeds General observations Management recommendations
C5 29/10/19 No Yes Yes No Yes No No No No - mend barricading
CM-1 30/10/19 No Yes No No No No Road/gate No No - May have been previously salvaged – check AHIMS data when received
CM-2* 30/10/19 Yes Yes Yes Yes No No No No No Within CM-CD1 fence nil
CM-3* 30/10/19 Yes Yes Yes Yes No No No No No Within CM-CD1 fence nil
CM-CD1* 30/10/19 Yes Yes Yes Yes No No No rabbits No - nil
HC-25 29/10/19 Yes Yes No No No No on dam wall and roadside
No No One artefact falls within road reserve
Amend HVO sites database to refine position
HVO-1127 29/10/19 No Yes Yes Yes No No No No No - nil
HVO-1128 29/10/19 Yes Yes Yes Yes No No On conveyor corridor
No No
Update and reduce barricading, remove rubbish
HVO-1129 29/10/19 No Yes Yes Yes No No No No No New hard fence
HVO-215 29/10/19 Yes No No No Yes Yes No No No Dubious hearth, site area is deteriorating
Seek AHIP to excavate area and confirm if hearth or not
HVO-930 29/10/19 Yes Yes No No No No No No termites Field RAPs dubious about cultural origin
Install heritage site signage near track on approaches to site. Engage scarred tree expert to assess this tree (and other HVO trees) and potentially deregister
Ponds Creek (37-2-0190)
29/10/19 Yes Yes No No Yes No Under powerline
No No Fencing not practical as within power easement
Amend HVO sites database to refine position; install signage on track at both ends of site.
Ponds Creek/ Parnells Creek (37-2-0035)
29/10/19 No Yes No No No No No No No Old recording and heavy vegetation
Request site card and report to refine search area
Ponds Creek/ Parnells Creek (37-2-0036)
29/10/19 Yes Yes No No No No No No No - Amend HVO sites database to refine position
T/L3/ Plashette (37-2-0562)
29/10/19 Yes Yes No No Severe creek erosion
No Major powerline
No No Fencing not practical as within power easement
Amend HVO sites database to refine position; install signage on track at both ends of site.
Table 1: Results of the October 2019 HVO North Aboriginal Sites Compliance Inspection
See specific section below for CM-CD1 inspection.

1915_HVO_AHMP_Compliance_Audits_Report
Arrow Heritage Solutions Pty Ltd, ABN: 44 626 545 515
Aboriginal Site Management Recommendations Management recommendations were provided for many of the Aboriginal heritage sites visited. At some sites, more than one management action was recommended. The nature of these recommendations are described below.
Update barricade, wire and/or signage Sites: C5, HVO-1128, HVO-930
C5 and HVO-1128 have been fenced or barricaded in the past and are located in areas that are subject to moderate levels of mining activity or grazing. It is recommended that the barricading, fencing and signage at these sites be repaired or re-instated to prevent inadvertent disturbance. At HVO-930, it would be beneficial to install heritage site signage adjacent to the tracks on the approach to the site.
It should be noted that the new and upgraded barricading specification being trialled and installed at several ACH sites across HVO was received positively by the RAPs in attendance and should be considered as a favourable option when upgraded site protection is warranted.
Suggest salvage next program Sites: HVO-215
HVO-215 is a deteriorating hearth that should be salvaged as soon as is practical, however, it is located outside of the current Mitchell Pit AHIP area. This site was visited during the last audit inspection also, with HVO keen to have as many RAPs as possible familiar with the site prior to any CHWG discussions on its salvage, which would require a new AHIP.
Request and assess further site information Sites: CM1, Ponds Creek/ Parnells Creek (37-2-0035)
These sites were unable to be re-identified during the audit inspection, and prior to any further attempts at re-identification it would be beneficial to obtain and assess any site information held at HVO or within AHIMS. CM1 is located in a former Section 90 Consent to Destroy area, however it is not clear whether this site was in fact salvaged. An assessment of the latest available AHIMS data as well the relevant salvage report for the area may assist. The other site, AHIMS 37-2-0035, was also unable to be re-identified. This site was recorded several decades ago and minimal information is held by HVO regarding its nature or size. Examination of the AHIMS site card and any survey reports would assist in focussing any further re-identification attempts.
Update HVO Aboriginal sites databases Sites: HC-25, Ponds Creek (37-2-0190), Ponds Creek/ Parnells Creek (37-2-0036), T/L3/ Plashette (37-2-0562)
Prior to the October 2019 audit inspection of these sites, the locational and archaeological information held by HVO on them was minimal and/or incomplete. During this audit further information was obtained that should be updated within the “HVO_sites_current” and “HVO_site_extents” GIS databases to keep them current.

7
1915_HVO_AHMP_Compliance_Audits_Report
Arrow Heritage Solutions Pty Ltd, ABN: 44 626 545 515
Remove rubbish from site vicinity Sites: HVO-1128
Although not impacting the artefacts located at HVO-1128, there are several items of scrap metal rubbish within the currently barricaded site extent associated with the adjacent conveyor. These items should be removed when the barricading at this site is upgraded.
Consider engaging a scarred tree expert to assess HVO-930 Sites: HVO-930
Although HVO-930 has been registered within both the HVO Aboriginal sites and the AHIMS databases as a culturally scarred tree, several members of the field team questioned this appraisal and contended that it should be deregistered as a valid site. Although not an unprecedented action for such sites in NSW, HVO may wish to consider engaging, with the CHWG’s concurrence, a scarred tree expert to provide a specialist and final assessment prior to the scarred tree removal process commencing. Consideration of all currently registered scarred trees at HVO may be prudent if this course of action is undertaken.
Scarred tree HVO-930

8
1915_HVO_AHMP_Compliance_Audits_Report
Arrow Heritage Solutions Pty Ltd, ABN: 44 626 545 515
Install signage at site perimeter Sites: Ponds Creek (37-2-0190), T/L3/ Plashette (37-2-0562)
Both these sites were re-identified underneath power-lines within easements accessed by power companies. In both situations it is not feasible to erect fencing or barricading under the power-lines. As an alternative to alert power company staff, signage should be erected next to the tracks on all approaches to the sites stating that Aboriginal cultural material is located throughout the area and that vehicles should remain on formed tracks. Direct notification to the power companies could also be made.
Site TL/3/Plashette is located on exposures throughout both sides of Parnells Creek in between two
power pylons
CM-CD1 The HVO North HMP (Schedule 15) contains a specific Plan of Management for Aboriginal site CM-CD1 (AHIMS ID 37-2-1877) that includes a description of measures that would be implemented to protect, monitor and manage potential impacts on the site by HVO North’s mining operations and associated activities. As shown in Map 2, CM-CD1 includes an area c.450m long and up to 25m in width and is located immediately to the west of HVO Carrington Pit and c.900m north of the Hunter River.

9
1915_HVO_AHMP_Compliance_Audits_Report
Arrow Heritage Solutions Pty Ltd, ABN: 44 626 545 515

10
1915_HVO_AHMP_Compliance_Audits_Report
Arrow Heritage Solutions Pty Ltd, ABN: 44 626 545 515
As part of the brief for the HVO North AHMP compliance inspection audit, the consultant was also required to audit the current condition of CM-CD1 with reference to the management measures outlined in Schedule 15 of the HVO AHMP. It should be positively noted that actions identified in the December 2018 compliance audit have been addressed and the maintenance of the current robust management processes will be the ongoing focus of compliance audits at CM-CD1:
1. A disturbance exclusion buffer area will be maintained around Aboriginal cultural heritage site 37-2-1877 (CM-CD1) of not less than 20m from the boundary of the recorded extent of the CM-CD1 site and incorporating the Older Stratum. During the October 2019 inspection of CM-CD1 no ground disturbance was noted within the disturbance exclusion buffer area (as depicted on the map above and the co-ordinates in 2. below). Comparison of photographs between the current and the previous (December 2018) audit inspections shows a reduction in rubbish and stock impact.
2. The CM-CD1 disturbance exclusion buffer area will be aligned within the following coordinates (MGA 94):
i. North-East corner at E308805 and N6403833 ii. North-West corner at E308696 and N6403791 iii. South-West corner at E308861 and N6403341 iv. South-East corner at E308996 and N6403355
See Point 1.
3. The CM-CD1 disturbance exclusion buffer area is to be zoned as a Zone 1 Restricted Access Area within the HVO North CHZS. All development disturbance activities are to be excluded from within the buffer area. The CM-CD1 disturbance exclusion area is now zoned as Zone 1 in the HVO North CHZS.
4. The CM-CD1 disturbance exclusion buffer area will be delineated with stock-proof fencing and appropriate signage denoting that the area is a Restricted Access Area and no ground disturbance is authorised within the buffer area except where such ground disturbance is authorised under the provisions of this Plan of Management. Ground disturbance, such as for archaeological investigations, may require a consent under relevant legislation. The entirety of CM-CD1, including a substantial buffer, has been delineated with stock-proof fencing and adequate Cultural Heritage Site signage is visible on the fence.
5. Access within the CM-CD1 disturbance exclusion buffer area will be limited to authorised personnel and visitors only either on foot (e.g. for monitoring inspections) or in light vehicles (e.g. for pest, weed and fire management) for the purposes of implementing the management provisions approved under this Plan of Management. No evidence was noted to suggest the contrary has occurred.
6. An annual site condition monitoring inspection will be conducted by HVO personnel with representatives of the CHWG and the results of the inspection reported as an element of the HVO North DA 450-10-2003 Annual Environmental Management Report. The results of the inspection will also be reported to Aboriginal community stakeholders through the CHWG and/or other relevant Aboriginal community consultation forum.

11
1915_HVO_AHMP_Compliance_Audits_Report
Arrow Heritage Solutions Pty Ltd, ABN: 44 626 545 515
This report documents the 2019 annual site condition monitoring inspection.
7. A series of condition and disturbance monitoring photo points will be established within the CM-CD1 disturbance exclusion buffer area and condition monitoring images taken during the course of the annual monitoring inspection. Five unpegged photographic monitoring points were established, and photographs taken of CM-CD1. These points were located in the north-west, north-east, south-west and south-east of the site, as well as the centre. These photographs and their locational information are contained in Appendix A of this report.
8. HVO will determine the nature and risks of potential impacts of blasting activities upon site CM-CD1 as an element of the HVO North blast management plan. Consistent with the results of the risk assessment process used to inform the development of the HVO North blast management plan, HVO will implement appropriate management measures to protect site CM-CD1 from any adverse impact that may be caused by blasting in a manner consistent with the provisions of this Plan of Management. In accordance with Schedule 4 of Condition 40 of the Approval, regular visual monitoring will be undertaken to confirm that impacts have not been caused by blasting vibration or from flyrock impacts. No evidence of any blasting-related disturbance or flyrock impacts were noted during the site inspection. Indeed, blasting activity in the Carrington Pit ceased on the 17th October 2018 and mining and blasting activity was been focused on the eastern side of the Carrington Pit in the years leading up to the cessation of blasting.
9. As mining, and related blasting activities, approach the CM-CD1 disturbance exclusion buffer area, regular visual monitoring to confirm that impacts have not been caused by blasting vibration will be conducted by HVO personnel. Damage to CM-CD1 caused by flyrock is considered a very low risk, however, if it is evident, through regular monitoring, that this risk profile may increase in the future, protective management measures will be considered. See above Point 8.
10. A variety of land management activities will be required to maintain the cultural and environmental values of the CM-CD1 disturbance exclusion buffer area. Land management activities approved under this HMP are as follows.
i. Hand or light vehicle spraying of weeds. ii. Brush cutting by hand to control weeds and vegetation. iii. Prescribed burning and fire protection management. iv. Maintenance of fencing including replacement of posts as required.
No evidence was noted of any adverse impacts to CM-CD1 by any of the land management practices listed above, with no evidence of site disturbance arising from the erection of the new fencing.
Recommendations CM-CD1 is being managed well, with no evident impacts to the site’s cultural heritage values. All recommended actions from the December 2018 compliance inspection have been implemented. No further management actions are recommended as part of this compliance inspection.

12
1915_HVO_AHMP_Compliance_Audits_Report
Arrow Heritage Solutions Pty Ltd, ABN: 44 626 545 515
HVO South AHMP Compliance Inspection
A total of 44 Aboriginal heritage sites were inspected in the Barellan, Nicholls, Lemington South and Southern areas at HVO South (see Map 3). Although not active mining zones, these areas were selected for inspection as they are located in areas that are frequently accessed for a variety of activities associated with water and environmental management, and by third party users.
Results The following table summarises the results of the HVO South compliance inspection and summarises the information recorded on the individual pro-forma inspection sheets. Using a mobile mapper pre-loaded with the GIS co-ordinates for each Aboriginal heritage site, the field team travelled to each location and attempted to re-identify each site. Sometimes this was not possible due to poor ground surface visibility (GSV), a result which in itself was not overly significant as long as it was determined that the vicinity had not been inadvertently disturbed. The presence and condition of barricading or fencing was noted, as well as the presence and nature of various potential site disturbing factors (e.g erosion, animal, human). General observations of each site were made if necessary, and, based on information provided for all of the above factors, management recommendations were discussed and agreed by the field team for each site.

1915_HVO_AHMP_Compliance_Audits_Report Arrow Heritage Solutions Pty Ltd, ABN: 44 626
545 515
Map 3: Location of Aboriginal heritage sites inspected during the HVO South AHMP compliance inspection program

1915_HVO_AHMP_Compliance_Audits_Report
Arrow Heritage Solutions Pty Ltd, ABN: 44 626 545 515
Site Name Date Inspected
Site re-identified
Site intact?
Site fenced/ barricaded?
Fencing/ barricading intact?
Natural erosion
Livestock damage
Human disturbance
Animal disturbance
Pests & weeds
General observations Management recommendations
37-6-3613 31/10/2019 Yes Yes Yes Yes No No No No No - Nil
Heatherlea 30/10/2019 No Yes No No No No No No No Very old recording Request site card and report to refine search area
HVO-130 30/10/2019 Yes Yes Yes Yes No No No No ant nest - Nil
HVO-983 31/10/2019 Yes Yes No No No No No No No Artefacts identified at salvaged locale Collect during next salvage program
HVO-985 31/10/2019 No Yes Yes No No No Track construction No No Heavy ground cover Recommend for salvage
Grenleek Powerline Sites: HVO 1404-11; 1450-5; 1460-5; 1469-75 30/10/2019 Yes Yes Yes No Yes No Beside track No No Many sites close together
Specific barricading/fencing program for clustered sites along powerline easement. Consultation with Transgrid/Ausgrid is recommended to devise the best strategy for managing this shared area.
HVO-1421 30/10/2019 Yes Yes Yes No No No Beside track No No - Fix barricading
HVO-1422 30/10/2019 Yes Yes Yes No No No Beside track No No - Fix barricading
HVO-1425 30/10/2019 No Yes Yes No No No Beside track No No - Fix barricading
HVS-29 31/10/2019 No Yes Yes No No No Under powerlines No No - Fix barricading
ISF 1 31/10/2019 No Yes No No Yes No No No No Old recording Request site card and report to refine search area
NW 1 30/10/2019 No Yes No No No No No No No Old recording Request site card and report to refine search area
United IF1 31/10/2019 No Yes Yes Yes No No Stockpiles No No - Request site card and report to refine search area
WB5 30/10/2019 No Yes No No Yes No Dam construction No No Old recording
Request site card and report to refine search area
WB 15 31/10/2019 Yes Yes No No No No No No No Site outside of fenced area
Amend HVO sites database to refine position
WB 21A 30/10/2019 No Yes Yes Yes No No No No No - Repair fence from tree fall
WB 21B 30/10/2019 Yes Yes Yes Yes No No No Wombats No Artefact on central wombat mound Nil
Wollombi Brook Trench 30/10/2019 No Yes No No No No
Trench alongside track No No
Request site card and report to refine search area
Table 2: Results of HVO South Aboriginal Sites Compliance Inspection

15
1915_HVO_AHMP_Compliance_Audits_Report
Arrow Heritage Solutions Pty Ltd, ABN: 44 626 545 515
Aboriginal Site Management Recommendations Management recommendations were provided for many of the Aboriginal heritage sites visited. At some sites, more than one management action was recommended. The nature of these recommendations are described below.
Mend barricading and signage Sites: HVO-1421, HVO-1422, HVO-1425, HVS-29, WB 21A
WB 21A has been hard fenced with pockets and wire, and is generally in good repair. However, a tree has fallen across a small section of fence that should be removed and the wires re-tensioned. The remaining sites sites have been barricaded in the past and are located in areas subject to regular activity – i.e. under power-lines. It is recommended that the barricading, fencing and signage at these sites be repaired or re-instated to prevent inadvertent disturbance while third parties are accessing the powerline easement.
It should be noted that the new and upgraded barricading specification being trialled and installed at several ACH sites across HVO was received positively by the RAPs in attendance and should be considered as a favourable option when upgraded site protection is warranted.
An example of dilapidated barricading at HVS-29
Fencing along both sides of track – Greenleek Powerline Sites: HVO-1404-11, 1450-5, 1460-5, 1469-75
These sites were originally recorded as small, discrete locations of artefacts either side of a powerline easement track, and have been barricaded separately or in small clusters. Upon inspection during this program, artefacts were noted as occurring throughout exposures and outside of the dilapidated barricaded areas. Although not located on the track itself, their close

16
1915_HVO_AHMP_Compliance_Audits_Report
Arrow Heritage Solutions Pty Ltd, ABN: 44 626 545 515
proximity does constrain access in some parts, particularly at the creek crossing. It is recommended that the fencing be altered so that it is installed along both sides of the track in those locations where sites are present to protect them from inadvertent vehicle disturbance – in effect, restricting vehicle movement off the track and onto areas containing artefacts.
Alternatively, consideration may be given to grading a new track to the west within the powerline easement, which has been comprehensively surveyed for Aboriginal heritage sites. Regardless of which management action is decided, consultation with Transgrid/Ausgrid is recommended to devise the best strategy for managing this shared area.

17
1915_HVO_AHMP_Compliance_Audits_Report
Arrow Heritage Solutions Pty Ltd, ABN: 44 626 545 515
View south along Greenleek powerline corridor across sites shown in Map 4
Request and assess further site information Sites: Heatherlea, ISF 1, NW 1, United IF1, WB 5, Wollombi Brook Trench
These sites were unable to be re-identified during the audit inspection, and prior to any further attempts at re-identification it would be beneficial to obtain and assess any site information held at HVO or within AHIMS. Some sites are located in former Section 90 Consent to Destroy areas, however it is not clear whether they were in fact salvaged. An assessment of the latest available AHIMS data as well the relevant salvage report for the area may assist.
Suggest salvage next program Sites: HVO-983, HVO-985
HVO-985 consists of a single flake on the edge of a track covered by a thick ground covering of galenia. This site has been unable to be re-identified during previous audits and, due to the risk of further disturbance arising from track use it is recommended that this site be salvaged. Also, two mudstone flakes were noted at nearby HVO-983 – a site that had been previously

18
1915_HVO_AHMP_Compliance_Audits_Report
Arrow Heritage Solutions Pty Ltd, ABN: 44 626 545 515
salvaged. For completeness, these artefacts should also be salvaged at the same time. An AHIP is not required to implement this measure, as the salvage of these sites, with Aboriginal community participation, is authorised under the HVO South AHMP.
Location of HVO-985
Update HVO Aboriginal sites databases Sites: WB 15
Prior to the October 2019 audit inspection of this site, the locational and archaeological information held by HVO was minimal and/or incomplete, but did suggest artefactual material was located outside of the current fenced area. During this audit a flake of mudstone was located close to the fenced area. This information should be updated within the “HVO_sites_current” and “HVO_site_extents” GIS databases to keep them current.

19
1915_HVO_AHMP_Compliance_Audits_Report
Arrow Heritage Solutions Pty Ltd, ABN: 44 626 545 515
Recommendations and Actions Arising from Previous Audits During the December 2018 compliance audit at HVO North and South, and the September 2019 additional audit at HVO South, management recommendations were provided for many of the Aboriginal heritage sites visited. The table below outlines the management actions completed with reference to these recommendations.
Recommendation ACH sites involved Actions completed Dec 18: Reinstate barricading, wire &/or signage if activity increases
CM19, CM32, HVO-69, HVO-76, HVO-77, HVO-123, HVO-127, HVO-129, HVO-1792, HVO-1793
Several sites have been rebarricaded or fenced where activity levels have required (see photographs below).
Dec 18: Re-audit in 2019 CM19, CM32, HVO-69, HVO-70, HVO-74, HVO-112, HVO-122, HVO-126, HVO-127, HVO-215, HVO-296, HVO-313, HVO-793, HVO-905, HVO-945, WB-20
Due to the large number of sites at HVO and the short passage of time since last audited, the re-audit of these sites will take place at a later date.
Dec 18: Cattle proof fence along both banks of gully
CM55 Complete, see photograph below.
Dec 18: Discuss options to protect with HVO
HVO-1121, HVO-1122, HVO-1124
HVO-1121 and 1122 have been hard fenced with HVO-1124 to be managed in situ.
Dec 18: Remove stock until sites salvaged
All Mitchell Pit sites Stock was removed prior to the completion of the Mitchell Pit salvage program in July 2019.
Dec 18: Cattle proof fence around tree
HVO-1123 Complete
Dec 18: Remove weeds CM55, HVO-127, HVO-1793, HVO-223
HVO have a comprehensive ongoing weed control program.
Dec 18: Suggest salvage next program
HVO-75, HVO-215 HVO-75 yet to be salvaged, HVO-215 requires AHIP and further consultation.
Dec 18: Barricading along both sides of track
HVO-71, HVO-72 Complete.
Dec 18: Remove historic farm litter and debris
CM-CD1 Complete.
Dec 18: Edit the HVO North CHZS to reflect the CM-CD1 disturbance exclusion area as Zone 1
CM-CD1 Complete.
Dec 18: Alter the CM-CD1 northern fence alignment to encompass the northern tip of disturbance exclusion area
CM-CD1 Complete.
Dec 18: Alter the CM-CD1 western fence alignment, which is dilapidated in segments
CM-CD1 Complete.

20
1915_HVO_AHMP_Compliance_Audits_Report
Arrow Heritage Solutions Pty Ltd, ABN: 44 626 545 515
Recommendation ACH sites involved Actions completed Dec 18: Install new Cultural Heritage Site signage around the CM-CD1 fenced area
CM-CD1 Complete.
Dec 18: Peg the photographic point locations so that the same points can be used from year to year
CM-CD1 Co-ordinates are logged but pegging yet to be installed.
Dec 18: Ensure that the HVO North Blast Management Plan contains sufficient information to ensure no adverse blasting impacts affect CM-CD1
CM-CD1 Complete.
Sep 19: Repair fencing wires HVO-1208 Complete. Sep 19: Include in next audit HVO-1205, HVO-1252,
HVO-1273, HVO-1278, HVO-1281, HVO-1282
Due to the large number of sites at HVO and the short passage of time since last audited, the re-audit of these sites will take place at a later date.
Sep 19: Continue weed eradication program
HVO-1277 HVO have a comprehensive ongoing weed control program.
Sep 19: Suggest salvage next program
HVO-1199 Yet to be salvaged.
Photographs below show examples of new fencing, received positively by the RAPs, installed at HVO
sites as per previous audit recommendations, (top: CM55, middle: HVO-1792, bottom: HVO-127)

21
1915_HVO_AHMP_Compliance_Audits_Report
Arrow Heritage Solutions Pty Ltd, ABN: 44 626 545 515

22
1915_HVO_AHMP_Compliance_Audits_Report
Arrow Heritage Solutions Pty Ltd, ABN: 44 626 545 515
Recommendations from October 2019 and Previous Audits The following ACH management recommendations are provided as a result of the October 2019 AHMPs Compliance Audit, as well as including those recommendations outstanding from earlier audits.
1. Pending increased nearby activity, update barricading, wire and/or signage at ACH sites C5, HVO-1128 HVO-1421, HVO-1422, HVO-1425, HVS-29 and WB 21A;
2. Discuss salvage of hearth HVO-215 with CHWG in context of wider AHIP program at Mitchell Pit south;
3. Request and assess further AHIMS site information for ACH sites CM1, Ponds Creek/ Parnells Creek (37-2-0035), Heatherlea, ISF 1, NW 1, United IF1, WB 5 and Wollombi Brook Trench;
4. Update HVO Aboriginal sites databases with additional information for ACH sites HC-25, Ponds Creek (37-2-0190), Ponds Creek/ Parnells Creek (37-2-0036), T/L3/ Plashette (37-2-0562) and WB 15;
5. Remove rubbish from vicinity of ACH site HVO-1128;
6. Consider engaging a scarred tree expert to re-assess ACH site HVO-930, and potentially include all scarred trees on HVO leases and lands;
7. Install ACH signage at perimeter of sites HVO-930, Ponds Creek (37-2-0190) and T/L3/ Plashette (37-2-0562);
8. Fencing around ACH sites along both sides of the Greenleek Powerline access track, or develop new access route to avoid potential impacts to ACH sites. Consultation with Transgrid/Ausgrid is recommended to devise the best strategy for managing this shared area;
9. After discussions of these recommendations with the CHWG, implement a salvage program including ACH sites HVO-75, HVO-983, HVO-985 and HVO-1199; and
10. Peg CM-CD1 annual photographic location points.

23
1915_HVO_AHMP_Compliance_Audits_Report
Arrow Heritage Solutions Pty Ltd, ABN: 44 626 545 515
APPENDIX A – CM-CD1 PHOTO MONITORING RESULTS Photo Point # Location at CM-CD1 Easting Northing 1 North-west 308614 6403653 2 North-east 308814 6403807 3 South-east 309022 6403297 4 South-west 308860 6403290 5 Centre 308809 6403513
Co-ordinates (GDA94, z56) for CM-CD1 photo monitoring points
Location of CM-CD1 photo monitoring points

24
1915_HVO_AHMP_Compliance_Audits_Report
Arrow Heritage Solutions Pty Ltd, ABN: 44 626 545 515
CM-CD1 Monitoring Point 1 photographs
CMCD-1 photo monitoring point 1, view east.

25
1915_HVO_AHMP_Compliance_Audits_Report
Arrow Heritage Solutions Pty Ltd, ABN: 44 626 545 515
CMCD-1 photo monitoring point 1, view south-east.

26
1915_HVO_AHMP_Compliance_Audits_Report
Arrow Heritage Solutions Pty Ltd, ABN: 44 626 545 515
CMCD-1 photo monitoring point 1, view south.

27
1915_HVO_AHMP_Compliance_Audits_Report
Arrow Heritage Solutions Pty Ltd, ABN: 44 626 545 515
CMCD-1 photo monitoring point 1, view north.

28
1915_HVO_AHMP_Compliance_Audits_Report
Arrow Heritage Solutions Pty Ltd, ABN: 44 626 545 515
CM-CD1 Monitoring Point 2 photographs
CMCD-1 photo monitoring point 2, view south-west.

29
1915_HVO_AHMP_Compliance_Audits_Report
Arrow Heritage Solutions Pty Ltd, ABN: 44 626 545 515
CMCD-1 photo monitoring point 2, view south-south-west.

30
1915_HVO_AHMP_Compliance_Audits_Report
Arrow Heritage Solutions Pty Ltd, ABN: 44 626 545 515
CMCD-1 photo monitoring point 1, view south.

31
1915_HVO_AHMP_Compliance_Audits_Report
Arrow Heritage Solutions Pty Ltd, ABN: 44 626 545 515
CMCD-1 photo monitoring point 1, view west.

32
1915_HVO_AHMP_Compliance_Audits_Report
Arrow Heritage Solutions Pty Ltd, ABN: 44 626 545 515
CMCD-1 photo monitoring point 1, view west-south-west.

33
1915_HVO_AHMP_Compliance_Audits_Report
Arrow Heritage Solutions Pty Ltd, ABN: 44 626 545 515
CM-CD1 Monitoring Point 3 photographs
CMCD-1 photo monitoring point 3, view west.

34
1915_HVO_AHMP_Compliance_Audits_Report
Arrow Heritage Solutions Pty Ltd, ABN: 44 626 545 515
CMCD-1 photo monitoring point 3, view north.

35
1915_HVO_AHMP_Compliance_Audits_Report
Arrow Heritage Solutions Pty Ltd, ABN: 44 626 545 515
CMCD-1 photo monitoring point 1, view north-west.

36
1915_HVO_AHMP_Compliance_Audits_Report
Arrow Heritage Solutions Pty Ltd, ABN: 44 626 545 515
CM-CD1 Monitoring Point 4 photographs
CMCD-1 photo monitoring point 4, view east.

37
1915_HVO_AHMP_Compliance_Audits_Report
Arrow Heritage Solutions Pty Ltd, ABN: 44 626 545 515
CMCD-1 photo monitoring point 4, view north-east.

38
1915_HVO_AHMP_Compliance_Audits_Report
Arrow Heritage Solutions Pty Ltd, ABN: 44 626 545 515
CMCD-1 photo monitoring point 4, view north-north-east.

39
1915_HVO_AHMP_Compliance_Audits_Report
Arrow Heritage Solutions Pty Ltd, ABN: 44 626 545 515
CMCD-1 photo monitoring point 4, view north.

40
1915_HVO_AHMP_Compliance_Audits_Report
Arrow Heritage Solutions Pty Ltd, ABN: 44 626 545 515
CMCD-1 photo monitoring point 1, view north-west.

41
1915_HVO_AHMP_Compliance_Audits_Report
Arrow Heritage Solutions Pty Ltd, ABN: 44 626 545 515
CM-CD1 Monitoring Point 5 photographs
CMCD-1 photo monitoring point 5, view north.

42
1915_HVO_AHMP_Compliance_Audits_Report
Arrow Heritage Solutions Pty Ltd, ABN: 44 626 545 515
CMCD-1 photo monitoring point 5, view north-west.

43
1915_HVO_AHMP_Compliance_Audits_Report
Arrow Heritage Solutions Pty Ltd, ABN: 44 626 545 515
CMCD-1 photo monitoring point 5, view west.

44
1915_HVO_AHMP_Compliance_Audits_Report
Arrow Heritage Solutions Pty Ltd, ABN: 44 626 545 515
CMCD-1 photo monitoring point 5, view south-west.

45
1915_HVO_AHMP_Compliance_Audits_Report
Arrow Heritage Solutions Pty Ltd, ABN: 44 626 545 515
CMCD-1 photo monitoring point 5, view south.

46
1915_HVO_AHMP_Compliance_Audits_Report
Arrow Heritage Solutions Pty Ltd, ABN: 44 626 545 515
CMCD-1 photo monitoring point 5, view south-south-east.

47
1915_HVO_AHMP_Compliance_Audits_Report
Arrow Heritage Solutions Pty Ltd, ABN: 44 626 545 515
CMCD-1 photo monitoring point 5, view south-east.

48
1915_HVO_AHMP_Compliance_Audits_Report
Arrow Heritage Solutions Pty Ltd, ABN: 44 626 545 515
CMCD-1 photo monitoring point 5, view east.

49
1915_HVO_AHMP_Compliance_Audits_Report
Arrow Heritage Solutions Pty Ltd, ABN: 44 626 545 515
CMCD-1 photo monitoring point 5, view east-north-east.

50
1915_HVO_AHMP_Compliance_Audits_Report
Arrow Heritage Solutions Pty Ltd, ABN: 44 626 545 515
CMCD-1 photo monitoring point 5, view north-east.

Departm ent of Planning, Industry & Environm ent4 Parramatta Square, 12 Darcy Street, Parramatta 2150 | T 1300 305 695 | w w w .planning.nsw .gov.au
Mr Tony GalvinGeneral Manager – Hunter Valley OperationsHV Operations Pty LtdPO Box 315SINGLETON NSW 2330
Ref: DA450-10-2003-PA-19 MP06_0261-PA-13
Via Email ONLY: [email protected]
03/06/2020
Dear Mr Galvin
Hunter Valley Operations - DA 450-10-2003 (North) & MP 06_0261 (South)Annual Review 2019
Reference is made to the Annual Review for the period 1 January 2019 to 31 December 2019,submitted to the Department of Planning, Industry and Environment (the Department) as requiredunder Schedule 5, Condition 9 of DA 450-10-2003 (HVO North) and Schedule 5, Condition 4, of ProjectApproval MP 06_0261 (HVO South) (the approvals, as modified).
The Department has reviewed the Annual Review and considers it to satisfy the reporting requirementsof the approval and the Department’s Annual Review Guideline (October 2015).
The Department notes the following:
Section 7.5 – Groundwater: exceedances of groundwater quality trigger values are reportedacross various monitoring locations to have occurred during the reporting period. TheDepartment has reviewed Appendix A – 2019 Annual Groundwater Review and supports therecommendations made in Section 6.2 to better understand the current impact on groundwaterquality within the monitoring network.
The Department notes that the Annual Review was submitted via the Major Projects portal under DA450-10-2003 and MP 06_0261. For future submissions, please only submit reports under one approval(the most recent) and submit a cover letter outlining the submission to the others. This will assist inundertaking timely reviews of required reporting documents.
As required by Schedule 5, Condition 12 of DA 450-10-2003 and Schedule 5, Condition 9 of MP06_0261 of the approvals, please make publicly available a copy of the Annual Review on the companywebsite
Please note that the Department’s acceptance of this Annual Review is not endorsement of thecompliance status of the project. Non-compliances identified in the Annual Review will be assessed inaccordance with the Department’s Compliance Policy. Further correspondence may be sent in relationto non-compliances.
Should you need to discuss the above, please contact James Epstein, Senior Compliance Officer, on(02) 6575 3419 or email to [email protected]
Yours sincerely
Heidi WattersTeam Leader NorthernComplianceAs nominee of the Secretary

Related Documents


