2019 ADFC-Travelbike Bicycle Travel Analysis Summary Report Allgemeiner Deutscher Fahrrad-Club

Welcome message from author
This document is posted to help you gain knowledge. Please leave a comment to let me know what you think about it! Share it to your friends and learn new things together.
Transcript
2019 ADFC-Travelbike
Bicycle Travel Analysis
Summary Report
Allgemeiner DeutscherFahrrad-Club
2019 ADFC-Travelbike Bicycle Travel Analysis
7 March 2019
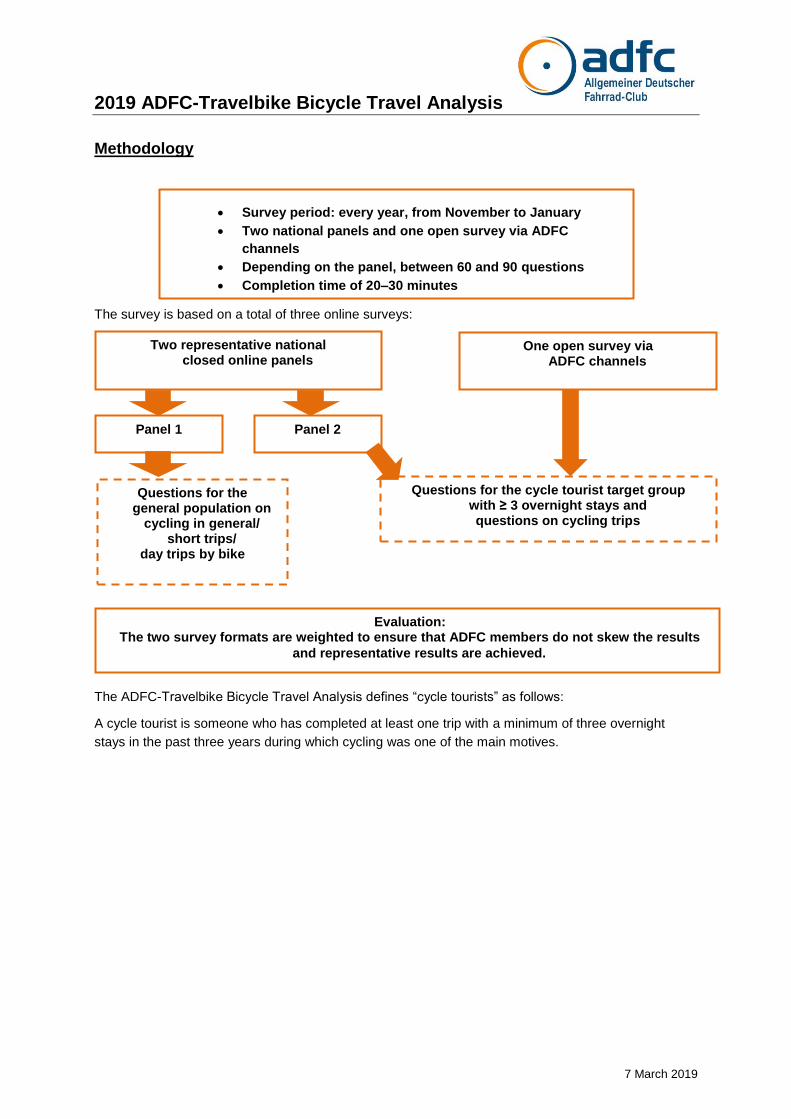
Methodology
The survey is based on a total of three online surveys:
The ADFC-Travelbike Bicycle Travel Analysis defines “cycle tourists” as follows:
A cycle tourist is someone who has completed at least one trip with a minimum of three overnight
stays in the past three years during which cycling was one of the main motives.
Survey period: every year, from November to January
Two national panels and one open survey via ADFC
channels
Depending on the panel, between 60 and 90 questions
Completion time of 20–30 minutes
Two representative national closed online panels
One open survey via ADFC channels
Evaluation: The two survey formats are weighted to ensure that ADFC members do not skew the results
and representative results are achieved.
Panel 1
Panel 2
Questions for the general population on
cycling in general/ short trips/
day trips by bike
Questions for the cycle tourist target group with ≥ 3 overnight stays and questions on cycling trips
2019 ADFC-Travelbike Bicycle Travel Analysis
7 March 2019
Panel 1: Representative national online panel; 1,218 participants with 1,059 evaluable interviews
Panel 2: Second representative national online panel to obtain at least 1,000 cycle tourists for
the evaluation; 3,283 participants
Survey: Open survey via ADFC channels with 3,238 evaluable questionnaires
There were a total of 7,580 evaluable questionnaires.
Since most of the data from ADFC channels is obtained from cycling enthusiasts (proportion of ADFC
members: 42%; by way of comparison, proportion of ADFC members in the national sample: 2.4%),
this data was weighted less in order to prevent bias of results due to these more active cyclists.
Where data is also available from the ADFC-Travelbike Bicycle Travel Analysis in the previous year
(2017 survey period), this has also been provided in brackets. If a comparison is not possible or
meaningful (altered responses, too few respondents), no comparison has been made.
2019 ADFC-Travelbike Bicycle Travel Analysis
7 March 2019
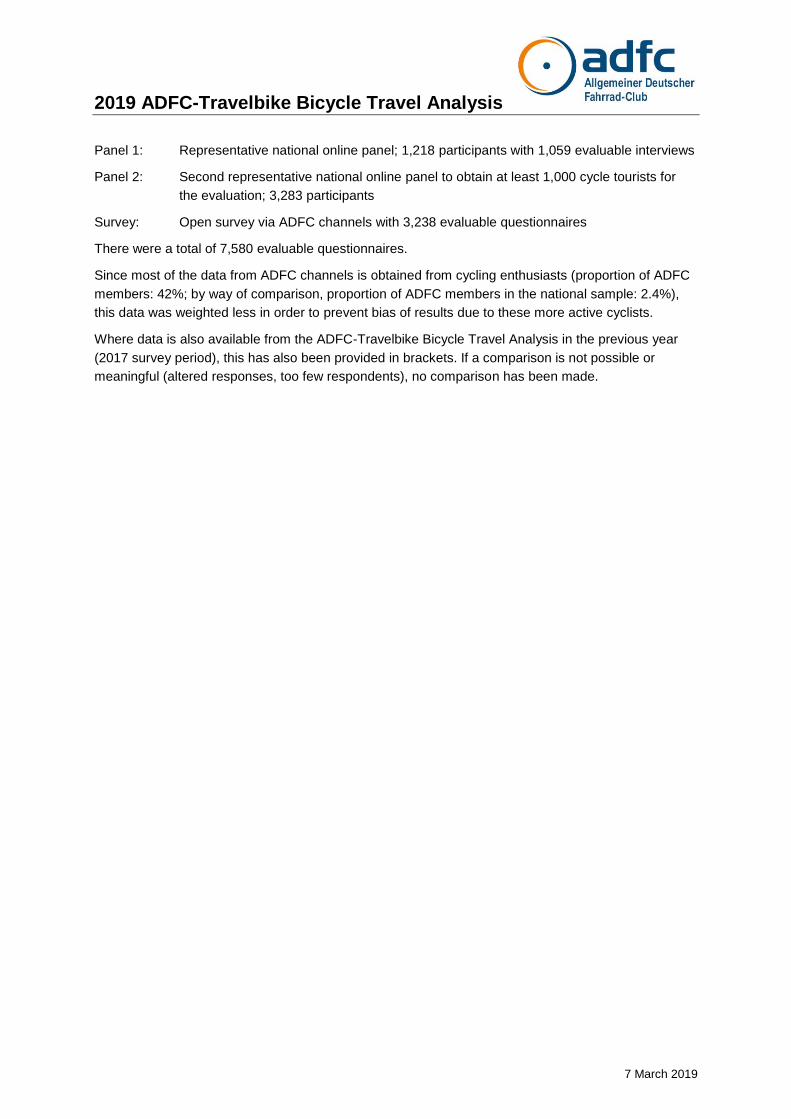
Cycling day trip and holiday volumes
Cycling in general: 79% of Germans cycle occasionally to regularly. Compared to 2017, this
represents an increase of approx. 5%.
Of those who cycle, 75% use their bicycle for everyday journeys, 52% also for cycling day trips
and holidays, and 29% for sports purposes.
Figure 1: Do you cycle?
(Unweighted n=1,057; in %)
Figure 2: What do you use your bicycle for?
(Only respondents who cycle; unweighted n=841)
Yes I cycle regularly. 31,2 (26)
Yes, I cycle occasionally.
47,2 (50)
No, I don't cycle. 21,5 (24)
28,8 (27,3)
52,2 (51,4)
74,6 (74,1)
0,0 20,0 40,0 60,0 80,0
Sport
Day trips and holidays
Everyday journeys
In %

2019 ADFC-Travelbike Bicycle Travel Analysis
7 March 2019
Cycling trips: In 2018, 62% of the cycling population completed at least one day trip by bike.
In 2018, 46% of the cycling population completed at least one day trip by bike in their leisure
time.
An average of 11 day trips were completed during leisure time (2017: 8 day trips). This
corresponds to 258 million day trips during leisure time (2017: 167 million) – an increase of 35%
compared to 2017.
In addition, around 53 million day trips were completed during a holiday. An average of 5 day trips
were completed during holidays.
Figure 3: How many day trips did you go on in 2018 by bike?
(Only respondents who went on day trips; unweighted n=487 (leisure)/172 (holidays))
Cycle tourists: Taking the population as a whole, 11% of cycle tourists went on at least one
cycling trip with a minimum of three overnight stays in the past three years (+1% compared to the previous years).
2018: The proportion of cycle tourists in the total population aged 18+ to go on a cycling trip in 2018 totalled 8% – this corresponds to 5.5 million people and represents a 27% increase compared to 2017 (4.3 million).
Figure 4: Development of cycle tourism (in millions)
2,0
0,7
11,7
8,9
7,7
18,4
50,6
2,8
0,0
0,0
1,5
3,1
19,7
72,9
0,0 20,0 40,0 60,0 80,0
Not specified
51–99
21–50
16–20
11–15
6–10
1–5
Day trips during holidays
Day trips during leisure time
in %
Ø = 4,7 (6)
Ø = 10,9 (8)
4,0 4,5
5,2
4,3
5,5
0
1
2
3
4
5
6
2014 2015 2016 2017 2018
2019 ADFC-Travelbike Bicycle Travel Analysis
7 March 2019
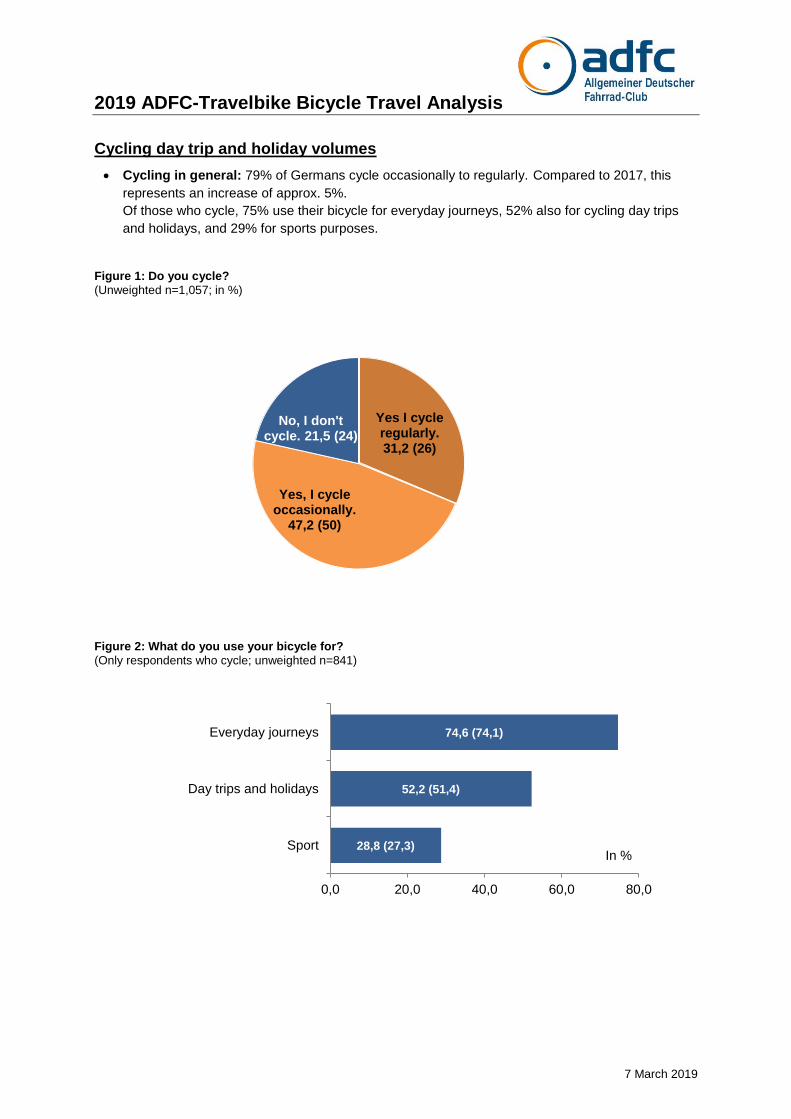
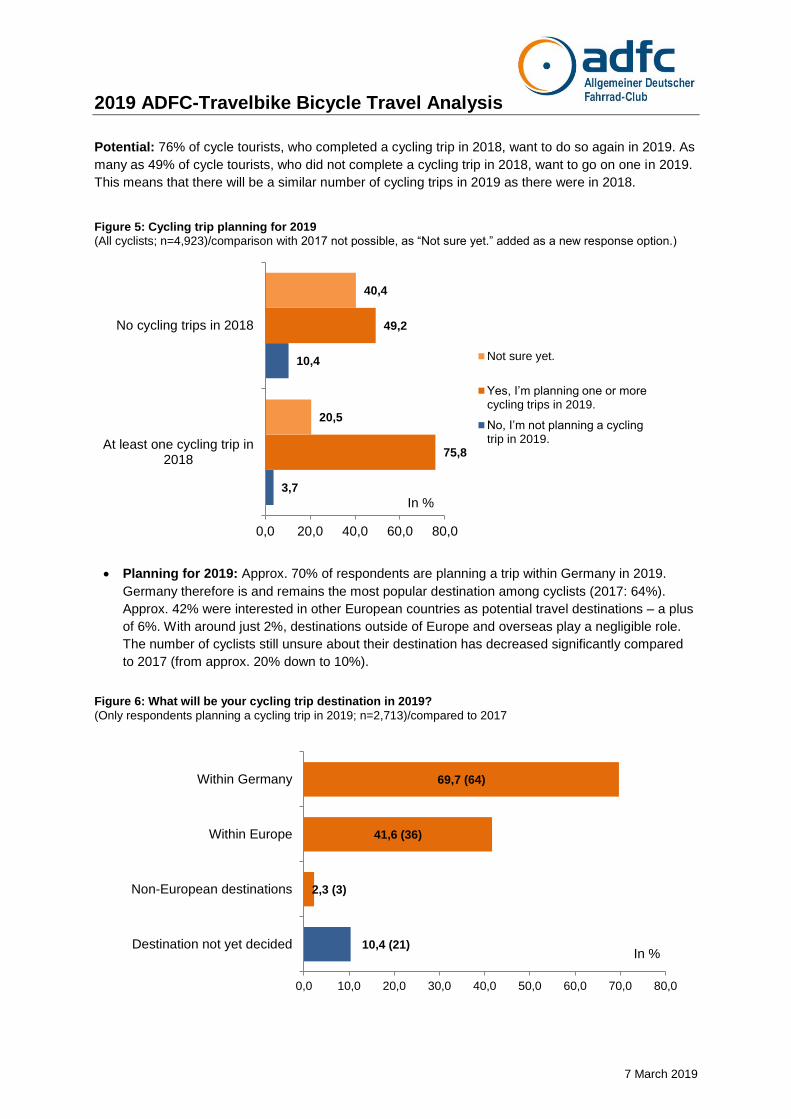
Potential: 76% of cycle tourists, who completed a cycling trip in 2018, want to do so again in 2019. As
many as 49% of cycle tourists, who did not complete a cycling trip in 2018, want to go on one in 2019.
This means that there will be a similar number of cycling trips in 2019 as there were in 2018.
Figure 5: Cycling trip planning for 2019
(All cyclists; n=4,923)/comparison with 2017 not possible, as “Not sure yet.” added as a new response option.)
Planning for 2019: Approx. 70% of respondents are planning a trip within Germany in 2019.
Germany therefore is and remains the most popular destination among cyclists (2017: 64%).
Approx. 42% were interested in other European countries as potential travel destinations – a plus
of 6%. With around just 2%, destinations outside of Europe and overseas play a negligible role.
The number of cyclists still unsure about their destination has decreased significantly compared
to 2017 (from approx. 20% down to 10%).
Figure 6: What will be your cycling trip destination in 2019?
(Only respondents planning a cycling trip in 2019; n=2,713)/compared to 2017
3,7
10,4
75,8
49,2
20,5
40,4
0,0 20,0 40,0 60,0 80,0
At least one cycling trip in2018
No cycling trips in 2018
Not sure yet.
Yes, I’m planning one or more cycling trips in 2019.
No, I’m not planning a cycling trip in 2019.
10,4 (21)
2,3 (3)
41,6 (36)
69,7 (64)
0,0 10,0 20,0 30,0 40,0 50,0 60,0 70,0 80,0
Destination not yet decided
Non-European destinations
Within Europe
Within Germany
In %
In %
2019 ADFC-Travelbike Bicycle Travel Analysis
7 March 2019
Trip behaviour
Start: 61% of day trips start directly from home and 39% from elsewhere. If day trips start from
another location, 68% use a car to get there, 20% take a train and 12% use local public transport.
Approx. 16% drive more than 60 km and around 13% even more than 100 km to reach their
starting point. The average distance to the day trip starting point thus increased slightly in 2018
compared to 2017.
81% of day trippers travel routes that they have planned themselves. However, more than two
thirds of them would prefer ready-made route suggestions.
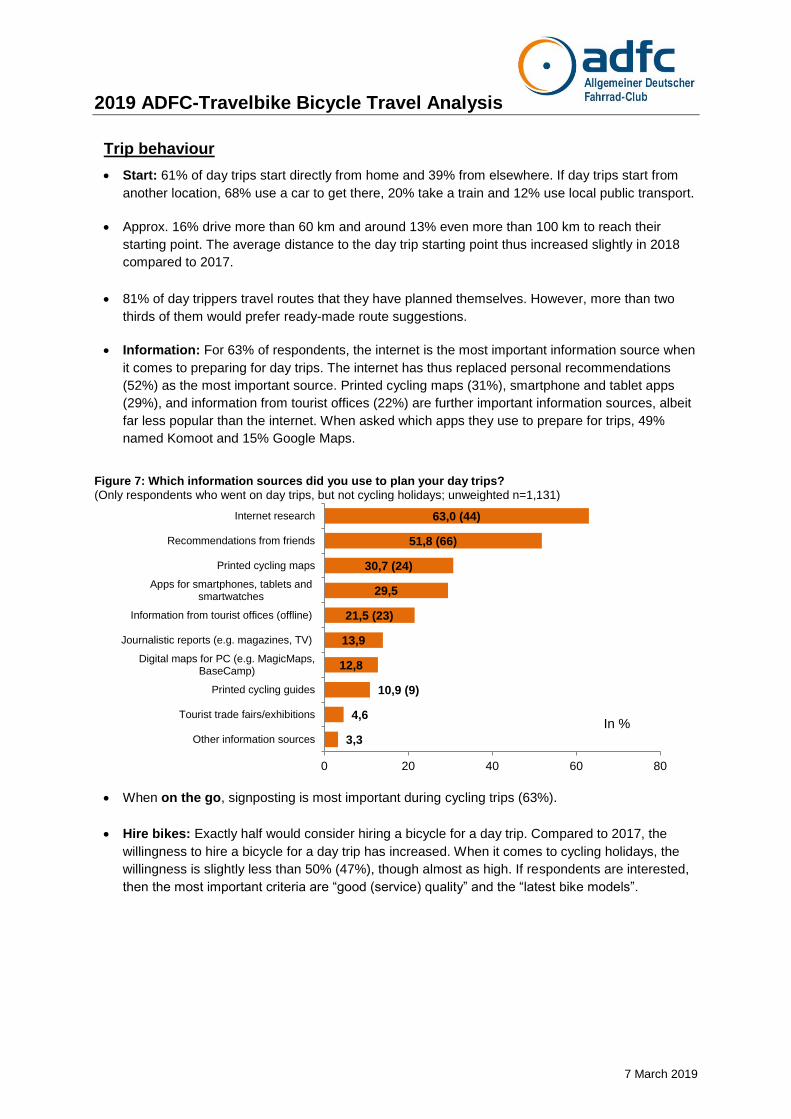
Information: For 63% of respondents, the internet is the most important information source when
it comes to preparing for day trips. The internet has thus replaced personal recommendations
(52%) as the most important source. Printed cycling maps (31%), smartphone and tablet apps
(29%), and information from tourist offices (22%) are further important information sources, albeit
far less popular than the internet. When asked which apps they use to prepare for trips, 49%
named Komoot and 15% Google Maps.
Figure 7: Which information sources did you use to plan your day trips?
(Only respondents who went on day trips, but not cycling holidays; unweighted n=1,131)
When on the go, signposting is most important during cycling trips (63%).
Hire bikes: Exactly half would consider hiring a bicycle for a day trip. Compared to 2017, the
willingness to hire a bicycle for a day trip has increased. When it comes to cycling holidays, the
willingness is slightly less than 50% (47%), though almost as high. If respondents are interested,
then the most important criteria are “good (service) quality” and the “latest bike models”.
3,3
4,6
10,9 (9)
12,8
13,9
21,5 (23)
29,5
30,7 (24)
51,8 (66)
63,0 (44)
0 20 40 60 80
Other information sources
Tourist trade fairs/exhibitions
Printed cycling guides
Digital maps for PC (e.g. MagicMaps,BaseCamp)
Journalistic reports (e.g. magazines, TV)
Information from tourist offices (offline)
Apps for smartphones, tablets andsmartwatches
Printed cycling maps
Recommendations from friends
Internet research
In %
2019 ADFC-Travelbike Bicycle Travel Analysis
7 March 2019
Travel behaviour
Age: On average, cyclists are 52 years old. The 45–64 years age group is most strongly
represented (49%), followed by the 25–44 years age group with 34%. 22% are 65+ years.
Motives: Experiencing nature (86%), exploring unfamiliar regions (65%) and cycling a specific
route (50%) are among the most popular reasons for a cycling trip.
Preparation: Around 50% of cyclists decided on their final destination approx. two months before
the start of their trip. About 22% knew where they were heading three months beforehand.
Approx. 75% of cyclists researched for max. two weeks before they had collected all of the
information they needed for their planned trip. Longer preparation times of up to approx. one
month were extremely rare.
Trip duration: Cycling holidays comprise an average of eight overnight stays – this has remained
relatively constant. Most cycling holidays are shorter trips of up to seven nights (70%). About
25% are short trips with up to three overnight stays.
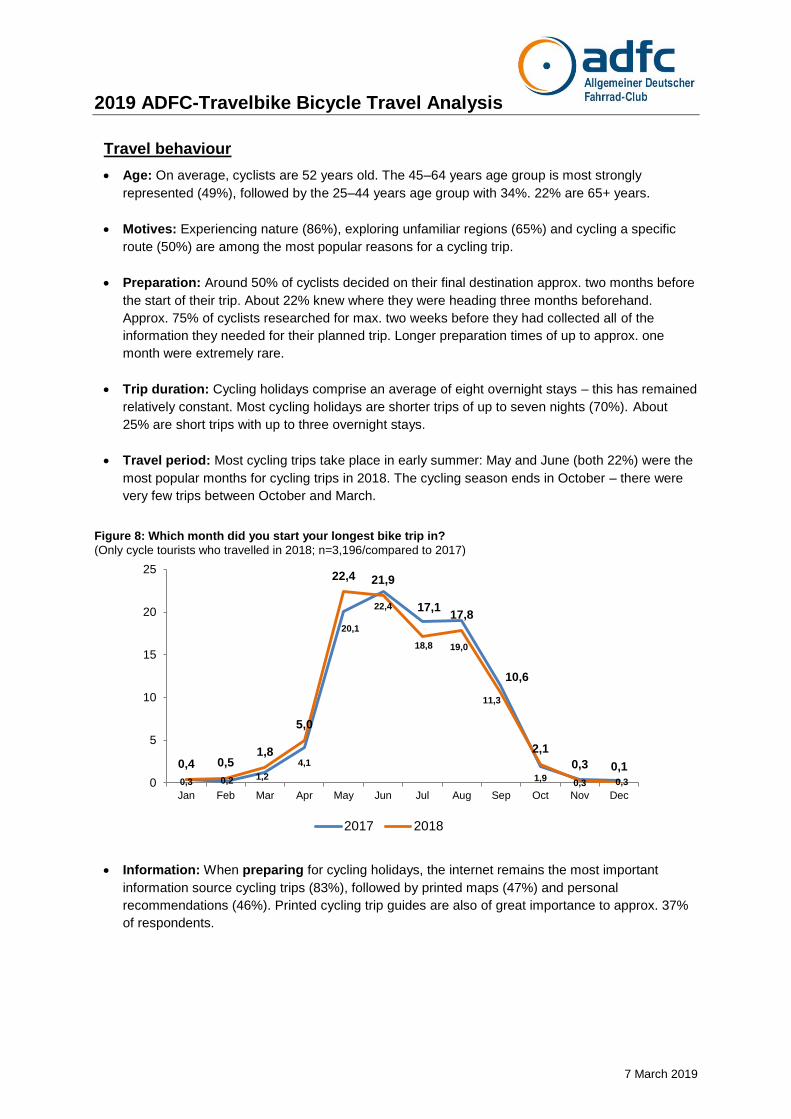
Travel period: Most cycling trips take place in early summer: May and June (both 22%) were the
most popular months for cycling trips in 2018. The cycling season ends in October – there were
very few trips between October and March.
Figure 8: Which month did you start your longest bike trip in?
(Only cycle tourists who travelled in 2018; n=3,196/compared to 2017)
Information: When preparing for cycling holidays, the internet remains the most important
information source cycling trips (83%), followed by printed maps (47%) and personal
recommendations (46%). Printed cycling trip guides are also of great importance to approx. 37%
of respondents.
0,3 0,2 1,2
4,1
20,1
22,4
18,8 19,0
11,3
1,9 0,3 0,3
0,4 0,5 1,8
5,0
22,4 21,9
17,1 17,8
10,6
2,1
0,3 0,1
0
5
10
15
20
25
Jan Feb Mar Apr May Jun Jul Aug Sep Oct Nov Dec
2017 2018
2019 ADFC-Travelbike Bicycle Travel Analysis
7 March 2019
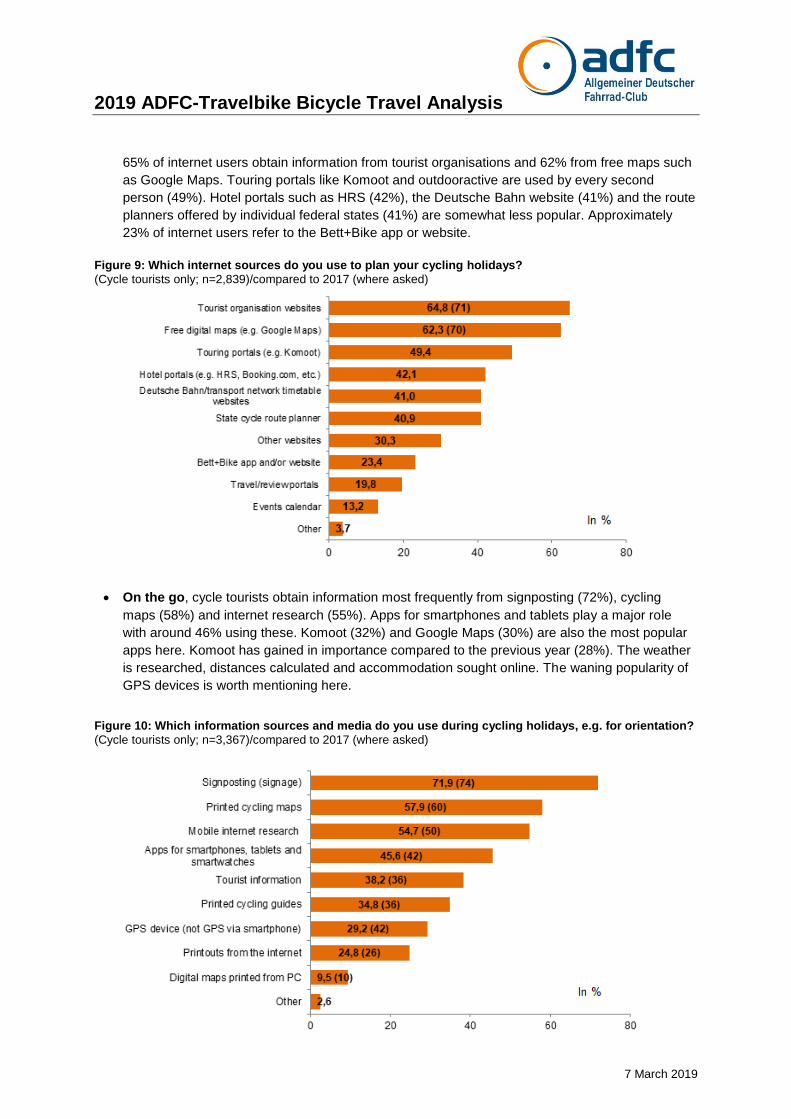
65% of internet users obtain information from tourist organisations and 62% from free maps such
as Google Maps. Touring portals like Komoot and outdooractive are used by every second
person (49%). Hotel portals such as HRS (42%), the Deutsche Bahn website (41%) and the route
planners offered by individual federal states (41%) are somewhat less popular. Approximately
23% of internet users refer to the Bett+Bike app or website.
Figure 9: Which internet sources do you use to plan your cycling holidays?
(Cycle tourists only; n=2,839)/compared to 2017 (where asked)
On the go, cycle tourists obtain information most frequently from signposting (72%), cycling
maps (58%) and internet research (55%). Apps for smartphones and tablets play a major role
with around 46% using these. Komoot (32%) and Google Maps (30%) are also the most popular
apps here. Komoot has gained in importance compared to the previous year (28%). The weather
is researched, distances calculated and accommodation sought online. The waning popularity of
GPS devices is worth mentioning here.
Figure 10: Which information sources and media do you use during cycling holidays, e.g. for orientation?
(Cycle tourists only; n=3,367)/compared to 2017 (where asked)
2019 ADFC-Travelbike Bicycle Travel Analysis
7 March 2019
After their holiday, cycle tourists most frequently report back about their trip during discussions
with friends, family and acquaintances (88%). Social media, travel forums and blogs play a far
lesser role.
Main/additional holiday: For 64% of respondents, the cycling trip was an additional holiday. For
36%, it was their main holiday. If the cycling trip was the main holiday, it comprised an average of
eleven overnight stays. If it was an additional holiday, then just five.
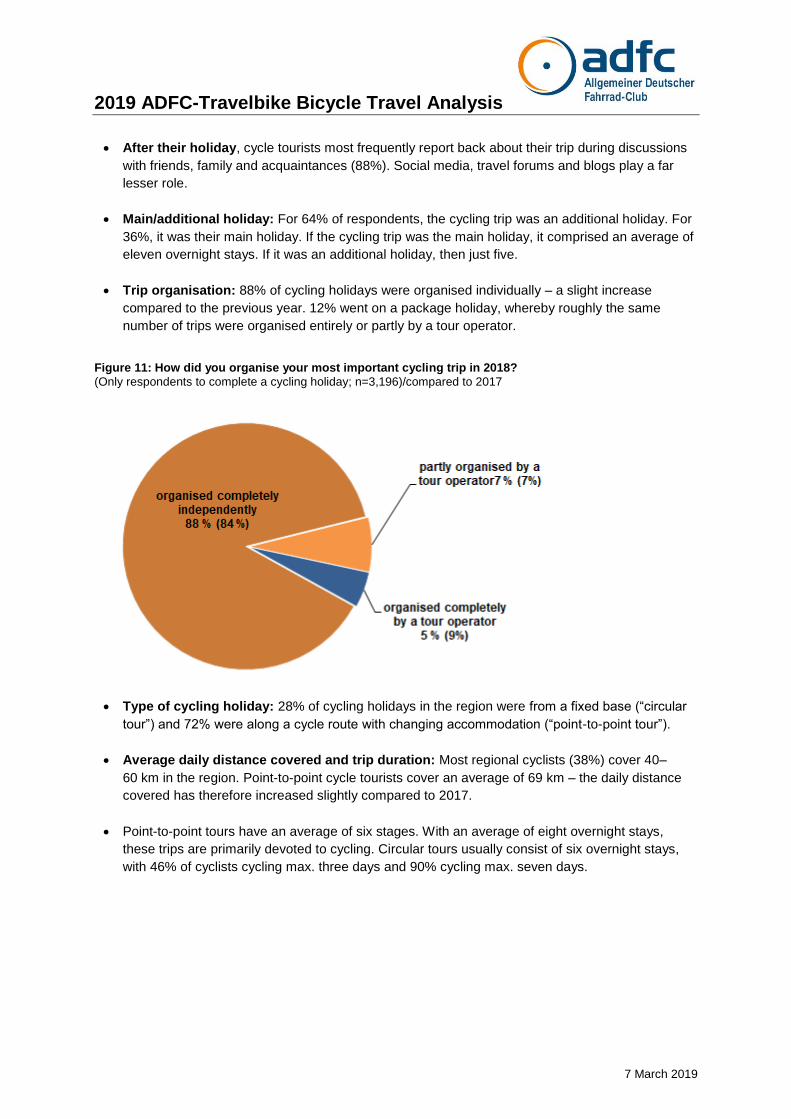
Trip organisation: 88% of cycling holidays were organised individually – a slight increase
compared to the previous year. 12% went on a package holiday, whereby roughly the same
number of trips were organised entirely or partly by a tour operator.
Figure 11: How did you organise your most important cycling trip in 2018?
(Only respondents to complete a cycling holiday; n=3,196)/compared to 2017
Type of cycling holiday: 28% of cycling holidays in the region were from a fixed base (“circular
tour”) and 72% were along a cycle route with changing accommodation (“point-to-point tour”).
Average daily distance covered and trip duration: Most regional cyclists (38%) cover 40–
60 km in the region. Point-to-point cycle tourists cover an average of 69 km – the daily distance
covered has therefore increased slightly compared to 2017.
Point-to-point tours have an average of six stages. With an average of eight overnight stays,
these trips are primarily devoted to cycling. Circular tours usually consist of six overnight stays,
with 46% of cyclists cycling max. three days and 90% cycling max. seven days.
2019 ADFC-Travelbike Bicycle Travel Analysis
7 March 2019
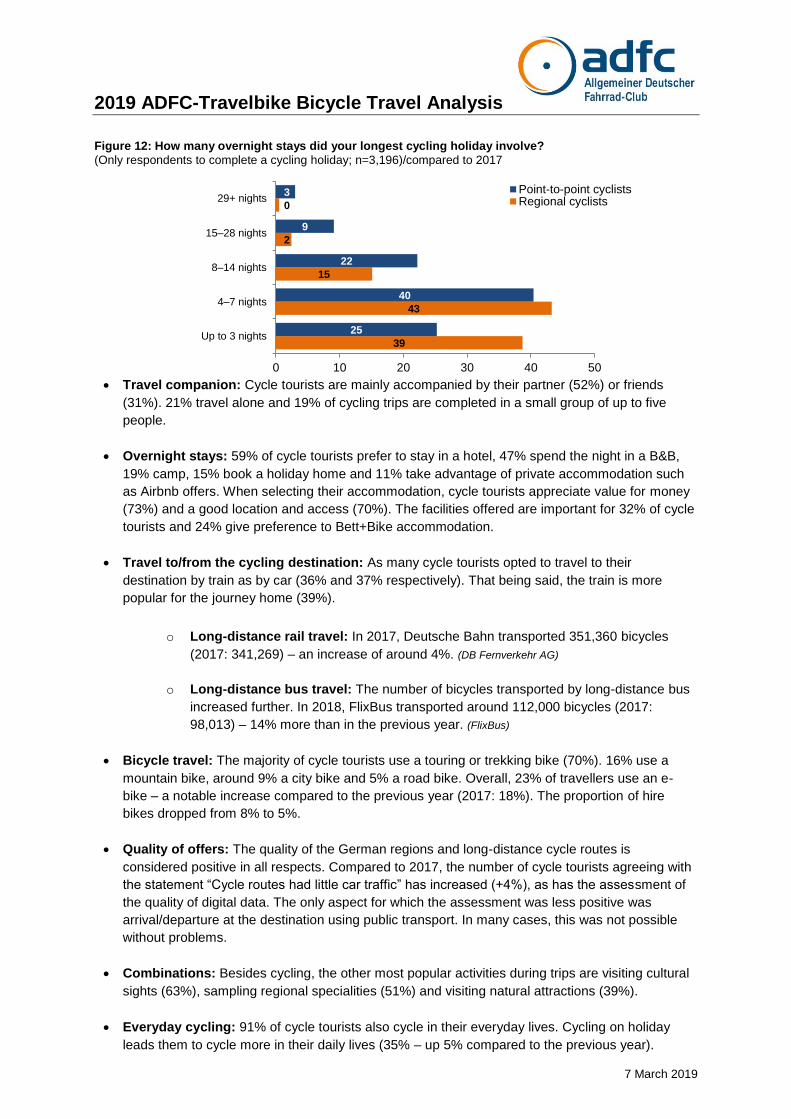
Figure 12: How many overnight stays did your longest cycling holiday involve?
(Only respondents to complete a cycling holiday; n=3,196)/compared to 2017
Travel companion: Cycle tourists are mainly accompanied by their partner (52%) or friends
(31%). 21% travel alone and 19% of cycling trips are completed in a small group of up to five
people.
Overnight stays: 59% of cycle tourists prefer to stay in a hotel, 47% spend the night in a B&B,
19% camp, 15% book a holiday home and 11% take advantage of private accommodation such
as Airbnb offers. When selecting their accommodation, cycle tourists appreciate value for money
(73%) and a good location and access (70%). The facilities offered are important for 32% of cycle
tourists and 24% give preference to Bett+Bike accommodation.
Travel to/from the cycling destination: As many cycle tourists opted to travel to their
destination by train as by car (36% and 37% respectively). That being said, the train is more
popular for the journey home (39%).
o Long-distance rail travel: In 2017, Deutsche Bahn transported 351,360 bicycles
(2017: 341,269) – an increase of around 4%. (DB Fernverkehr AG)
o Long-distance bus travel: The number of bicycles transported by long-distance bus
increased further. In 2018, FlixBus transported around 112,000 bicycles (2017:
98,013) – 14% more than in the previous year. (FlixBus)
Bicycle travel: The majority of cycle tourists use a touring or trekking bike (70%). 16% use a
mountain bike, around 9% a city bike and 5% a road bike. Overall, 23% of travellers use an e-
bike – a notable increase compared to the previous year (2017: 18%). The proportion of hire
bikes dropped from 8% to 5%.
Quality of offers: The quality of the German regions and long-distance cycle routes is
considered positive in all respects. Compared to 2017, the number of cycle tourists agreeing with
the statement “Cycle routes had little car traffic” has increased (+4%), as has the assessment of
the quality of digital data. The only aspect for which the assessment was less positive was
arrival/departure at the destination using public transport. In many cases, this was not possible
without problems.
Combinations: Besides cycling, the other most popular activities during trips are visiting cultural
sights (63%), sampling regional specialities (51%) and visiting natural attractions (39%).
Everyday cycling: 91% of cycle tourists also cycle in their everyday lives. Cycling on holiday
leads them to cycle more in their daily lives (35% – up 5% compared to the previous year).
39
43
15
2
0
25
40
22
9
3
0 10 20 30 40 50
Up to 3 nights
4–7 nights
8–14 nights
15–28 nights
29+ nightsPoint-to-point cyclistsRegional cyclists
2019 ADFC-Travelbike Bicycle Travel Analysis
7 March 2019
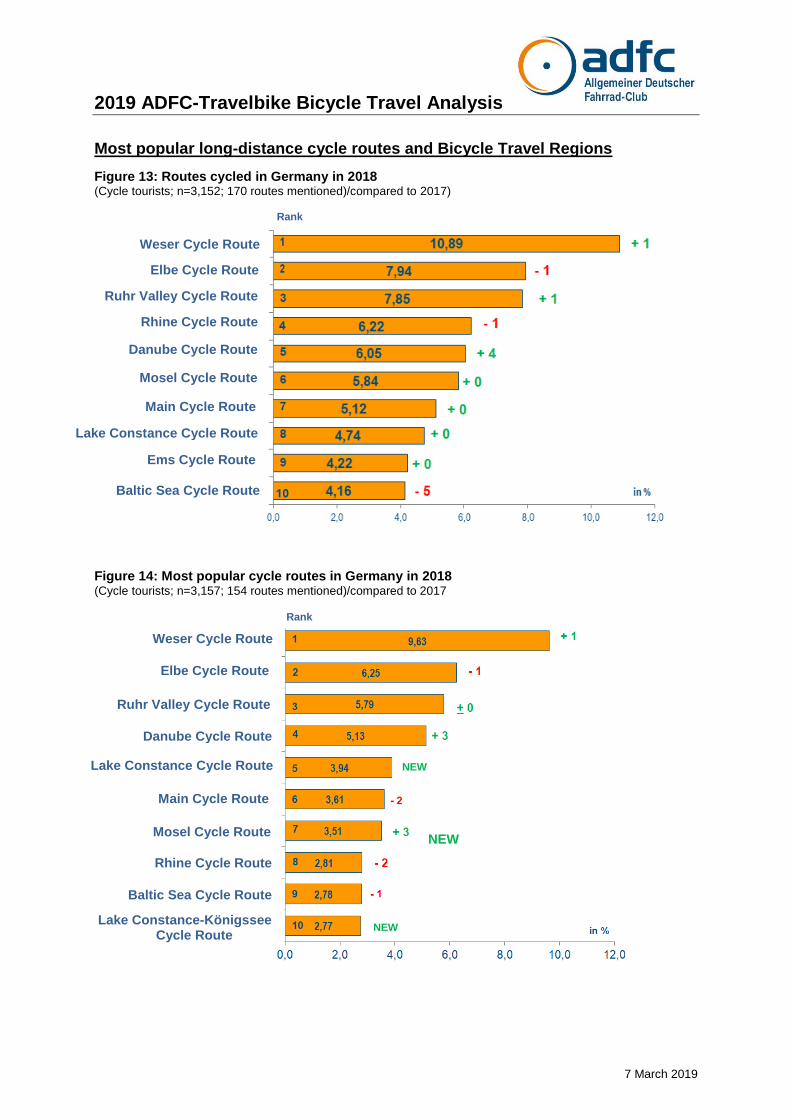
Most popular long-distance cycle routes and Bicycle Travel Regions
Figure 13: Routes cycled in Germany in 2018 (Cycle tourists; n=3,152; 170 routes mentioned)/compared to 2017)
Figure 14: Most popular cycle routes in Germany in 2018 (Cycle tourists; n=3,157; 154 routes mentioned)/compared to 2017
Weser Cycle Route
Elbe Cycle Route
Ruhr Valley Cycle Route
Rhine Cycle Route
Danube Cycle Route
Mosel Cycle Route
Main Cycle Route
Lake Constance Cycle Route
Ems Cycle Route
Baltic Sea Cycle Route
NEW
Rank
Weser Cycle Route
Elbe Cycle Route
Ruhr Valley Cycle Route
Danube Cycle Route
Lake Constance Cycle Route
Main Cycle Route
Mosel Cycle Route
Rhine Cycle Route
Baltic Sea Cycle Route
Lake Constance-Königssee Cycle Route
NEW
NEW
Rank
2019 ADFC-Travelbike Bicycle Travel Analysis
7 March 2019
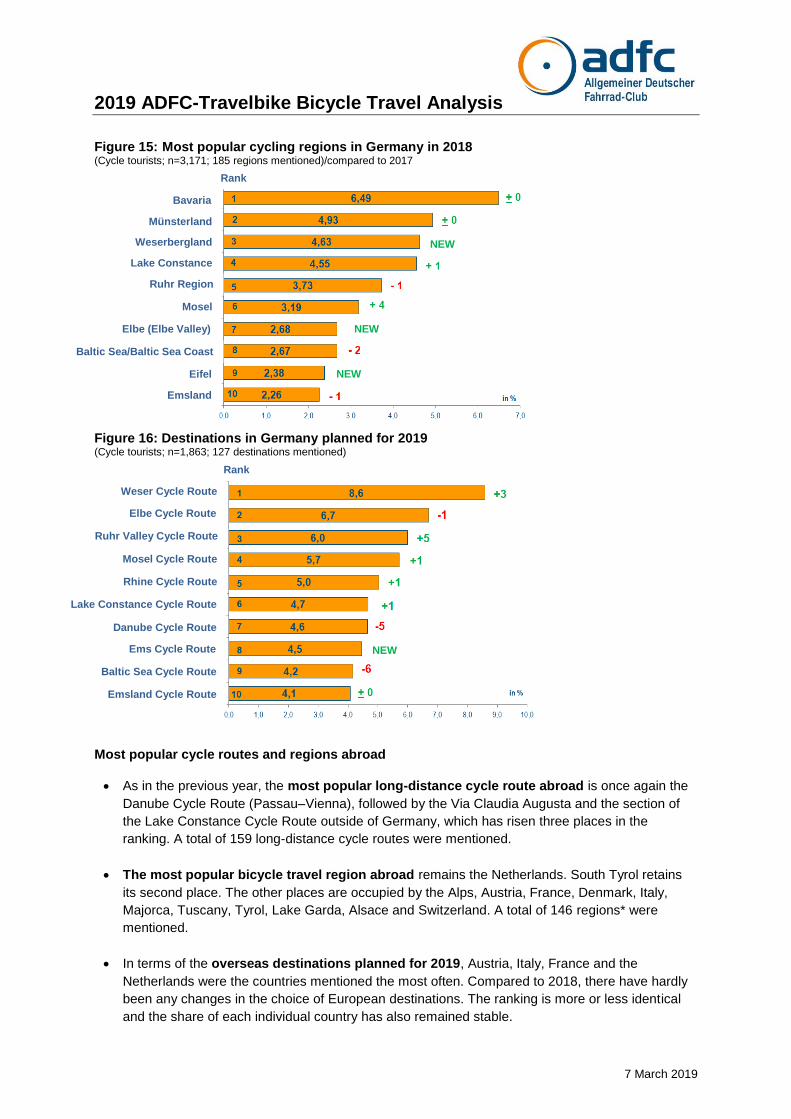
Figure 15: Most popular cycling regions in Germany in 2018 (Cycle tourists; n=3,171; 185 regions mentioned)/compared to 2017
Figure 16: Destinations in Germany planned for 2019 (Cycle tourists; n=1,863; 127 destinations mentioned)
Most popular cycle routes and regions abroad
As in the previous year, the most popular long-distance cycle route abroad is once again the
Danube Cycle Route (Passau–Vienna), followed by the Via Claudia Augusta and the section of
the Lake Constance Cycle Route outside of Germany, which has risen three places in the
ranking. A total of 159 long-distance cycle routes were mentioned.
The most popular bicycle travel region abroad remains the Netherlands. South Tyrol retains
its second place. The other places are occupied by the Alps, Austria, France, Denmark, Italy,
Majorca, Tuscany, Tyrol, Lake Garda, Alsace and Switzerland. A total of 146 regions* were
mentioned.
In terms of the overseas destinations planned for 2019, Austria, Italy, France and the
Netherlands were the countries mentioned the most often. Compared to 2018, there have hardly
been any changes in the choice of European destinations. The ranking is more or less identical
and the share of each individual country has also remained stable.
Rank
Bavaria
Lake Constance
Ruhr Region
Elbe (Elbe Valley)
Baltic Sea/Baltic Sea Coast
Münsterland
Weserbergland
Mosel
Eifel
Emsland
NEW
NEW
NEW
Rank
NEW
Weser Cycle Route
Elbe Cycle Route
Ruhr Valley Cycle Route
Mosel Cycle Route
Rhine Cycle Route
Lake Constance Cycle Route
Danube Cycle Route
Ems Cycle Route
Baltic Sea Cycle Route
Emsland Cycle Route
2019 ADFC-Travelbike Bicycle Travel Analysis
7 March 2019
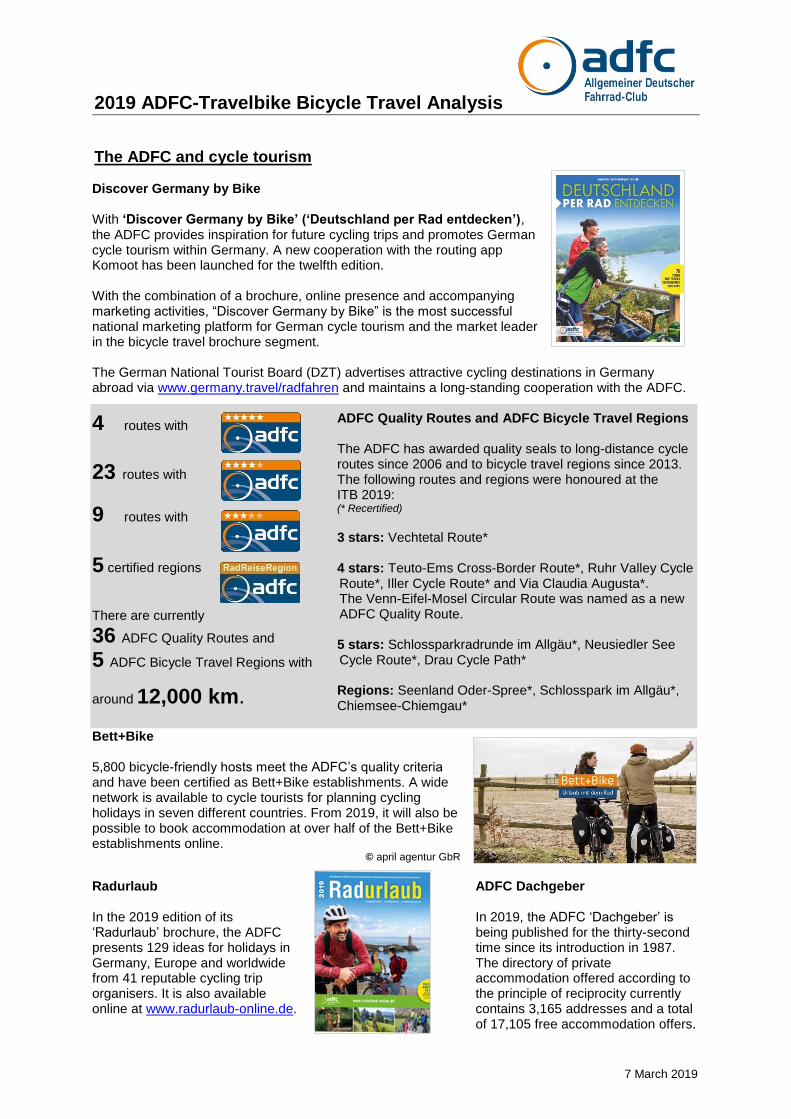
The ADFC and cycle tourism Discover Germany by Bike With ‘Discover Germany by Bike’ (‘Deutschland per Rad entdecken’), the ADFC provides inspiration for future cycling trips and promotes German cycle tourism within Germany. A new cooperation with the routing app Komoot has been launched for the twelfth edition. With the combination of a brochure, online presence and accompanying marketing activities, “Discover Germany by Bike” is the most successful national marketing platform for German cycle tourism and the market leader in the bicycle travel brochure segment. The German National Tourist Board (DZT) advertises attractive cycling destinations in Germany abroad via www.germany.travel/radfahren and maintains a long-standing cooperation with the ADFC.
4 routes with
23 routes with
9 routes with
5 certified regions
There are currently
36 ADFC Quality Routes and
5 ADFC Bicycle Travel Regions with
around 12,000 km.
ADFC Quality Routes and ADFC Bicycle Travel Regions The ADFC has awarded quality seals to long-distance cycle routes since 2006 and to bicycle travel regions since 2013. The following routes and regions were honoured at the ITB 2019: (* Recertified)
3 stars: Vechtetal Route*
4 stars: Teuto-Ems Cross-Border Route*, Ruhr Valley Cycle Route*, Iller Cycle Route* and Via Claudia Augusta*. The Venn-Eifel-Mosel Circular Route was named as a new ADFC Quality Route.
5 stars: Schlossparkradrunde im Allgäu*, Neusiedler See Cycle Route*, Drau Cycle Path* Regions: Seenland Oder-Spree*, Schlosspark im Allgäu*, Chiemsee-Chiemgau*
Bett+Bike 5,800 bicycle-friendly hosts meet the ADFC’s quality criteria and have been certified as Bett+Bike establishments. A wide network is available to cycle tourists for planning cycling holidays in seven different countries. From 2019, it will also be possible to book accommodation at over half of the Bett+Bike establishments online.
© april agentur GbR
Radurlaub In the 2019 edition of its ‘Radurlaub’ brochure, the ADFC presents 129 ideas for holidays in Germany, Europe and worldwide from 41 reputable cycling trip organisers. It is also available online at www.radurlaub-online.de.
ADFC Dachgeber In 2019, the ADFC ‘Dachgeber’ is being published for the thirty-second time since its introduction in 1987. The directory of private accommodation offered according to the principle of reciprocity currently contains 3,165 addresses and a total of 17,105 free accommodation offers.
Related Documents