©2018 JJKeegan+

Welcome message from author
This document is posted to help you gain knowledge. Please leave a comment to let me know what you think about it! Share it to your friends and learn new things together.
Transcript

©2018 JJKeegan+

©2018 JJ Keegan+
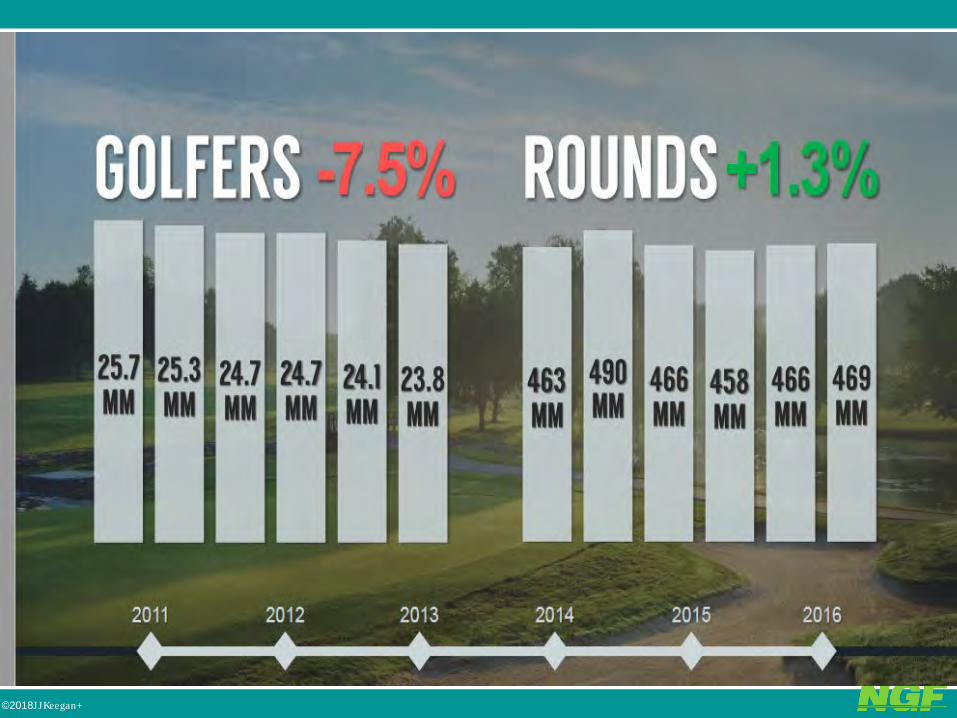
1. Learn the Results of a 7-Month Study Considering 11 Options for Enger and Lester Park
2. Understand the Components to a Financially Successful Golf Operation
3. Grasp the Challenges of the Local Market
4. Hear the Findings of an Extensive Consumer Survey
Lessons to Be Learned

©2018 JJKeegan+
Golf Strategist – 13 years including 7 months as GM operating golf course for client
2016/17/18 Client Engagements:
Municipalities - Cities of Albuquerque, Arlington, Baltimore, Brookings, Chalk Mountain, Duluth, Enid, Gardner, Kent, Killeen, Lancaster, Lexington, Louisville, Mecklenburg County, Minneapolis Park Board, Round Rock, New Braunfels, Odessa, Palo Alto, Salt Lake City, South Bend, South Jordan, Spokane, Stansbury Park, Superior, Yarmouth Daily Fee – Arroyo Trabuco, Cutter Creek, Cypresswood, Plum Creek, Oconee Country Club, Silver Creek, San Vicente, Sun City, Summerlin, Timberline, Thornberry CreekPrivate Clubs – Canyon Lake, Cold Springs, Craigowan, Eagle’s Bluff, Green Meadow, RavennaResorts – Kokanee Springs, Prairie Club
Webinar Series: 20 golf course management teams operating 60 golf courses through a strategic planning process including: Baltimore, Bloomington, Brooklyn Park, Charlotte, Cedar Rapids, Columbus, Crystal Mountain Resort, Fort Worth, Oak Creek/Pelican Hills, Pine Meadow, San Antonio, Virginia Beach, participated.
CEO - Fairway Systems: Golf Management Software – 1989 to 2005 (450 golf courses, 7 countries)
Memberships: GCSAA. Formerly member of NGF, NGCOA and CMAA.
Speaker: NGCOA, NGCOA – Canada, Michigan Golf Course Owners, New England Golf Course Owners, Golf Course Superintendents Association, NRPA, Golf Course Builders, PGA Sections including Wisconsin
Professor: Clemson University, Keiser University – College of Golf, College, Holland College, Golf Academy, Professional Golfers Career College, University of Incarnate Word
Golf Magazine Panelist: Visited 4,750+ golf courses in 49 of the 203 countries, played 1,750+ of the world’s 34,011 courses
Education & Licensing: BBA – TCU, MBA – University of Michigan, CPA – Inactive, Caddie Scholar

©Golf Convergence, 2014©2009, Golf Convergence, Inc.
©2018, JJ Keegan+
The Business of Golf – Series6,722 Copies Sold – 16 Countries – 15 Colleges’ PGM Programs
Published August 17, 2016: 1,140 Copies Sold

©Golf Convergence, 2014©2009, Golf Convergence, Inc.
©2018, JJ Keegan+
Cathy Harbin, PGA, LPGA Kevin Norby, ASGCA Brian Keighin
Wizards
Public GolfOperations and Customer Service
ArchitecturePlayability, Safety, Experience
Water ExpertConditioning, Equipment, Irrigation

©2018 JJKeegan+
INFORMATION IS KNOWLEDGE
OUTSIDE INSIGHT
Our BusinessLocated on the shore of Lake Superior in Duluth, Minnesota, Zenith Research Group was founded in 1983 by Duke Skorich. Patty McNulty joined the ownership team in 1997. With their combined talents and previous business backgrounds, the Zenith Research Group has moved into the top echelon of market research companies in the Upper Midwest, providing market research information, data analysis, and action plans for businesses and government units nationwide.
Our success over the span of more than three decades has established our position as one of the industry’s most qualified and respected firms; our staff is experienced, educated and extremely professional.
In addition to our expansive tele-center capabilities and expertise, our firm has extensive experience in market/marketing research, brand audit/awareness, online research, qualitative (focus group) research, data analysis and media relations, including the critical element of crisis management.
Exceeding ExpectationsIn finding a capable, experienced and results-oriented market research firm to meet your expectations, you also need a company you can trust. Our savvy management team and experienced representatives join forces to develop and then implement comprehensive market research and customer-centered programs that not only generate results, but also add a face and personality to your brand.
Why Does Experience Matter?Zenith Research Group is uniquely qualified to assist you in conducting your survey and market research programs. Through our experience gathering market research, we have the ability to conduct in-depth interviews, manage highly detailed survey and market research projects, and coordinate marketing efforts with our varied professional and governmental client base throughout the country. Simply, there is not another research company in this region capable to act as a dedicated partner committed to ongoing service and brand improvement, exceeding your goal expectations.
In the past 35 years, we’ve built solid relationships with industry, business, government, non-profit and advocacy organizations at all levels throughout America. Our work has shaped legislation to better the lives of all Americans. Our brand research has improved the bottom line of businesses across the country. At the conclusion of every study, we’ve been proud to add our names to the final document.
ZENITH RESEARCH GROUP, INC.3736 East 3rd Street
Duluth Minnesota 55804T: 218.728.6525
WHAT CAN ZENITH RESEARCH DO FOR YOU?
MARKET RESEARCH
STATISTICAL ANALYSIS
STRATEGIC COMMUNICATIONS
SURVEYS, FOCUS GROUPS, CUSTOMER TRACKING AND MORE.
QUALITATIVE AND QUANTITATIVEANALYSIS. INSIGHTFUL DATA.
BROADCAST YOUR MESSAGELOUD AND CLEAR.

©2018 JJKeegan+
The Assets
Category Enger Park Lester Park
Year Opened 1992 1934
Green Fee 26 26
Predictive Index (Ranking out of 15,204 golf courses) 8,362 8,946
Slope Rating 140 132
MOSAIC Attitudinal Behavior Index -6.77% -0.18%

©2018 JJKeegan+
The Options: Financial Model Created
OptionDescriptionHoles Open Clubhouse Equipment
Total Investment -
Net (Millions)
N/A Historical - 2017 54 N/A N/A N/A
FOD Friends of Duluth 34 750,000 750,000 $5,040,000
A Continue As Is, Purchase Maintenance Equipment for Both Courses 54 0 750,000 750,000
B Critical Improvements Only at Both Courses + Maintenance Equipment 54 1,500.000 750,000 9,802,000
1A Sell 9 Holes at Each Golf Course Netting $1.6 million + Maintenance Eq. 36 1,500,000 750,000 5,919,560
1B Critical Improvements + $5 Million Enger Clubhouse Investment 36 5,750,000 750,000 10,169,560
2A Close Lester Completely Realizing $1. 8 million in sales proceeds 27 750,000 500,000 3,890,000
2B City Ceases Operation at Lester With Outside Entity Operating 9 Holes 27 750,000 500,000 3,890,000
2C Critical Improvements at Enger + $2.5 Million Clubhouse 27 2,500,000 500,000 5,640,000
2D Critical Improvements at Enger + $5.0 Million Clubhouse 27 5,000,000 500,000 8,140,000
2E Minimal Improvements at Enger – Pre- Fab Clubhouse 18 500,000 500,000 1,600,000
2F Minimal Improvements at Enger – Pre-Fab Clubhouse 27 500,000 500,000 1,550,000

©2018 JJKeegan+
Option Description Revenues Cost of GoodsNet
Operating Income
Total Expenses EBITDA Debt
ServiceManagement
Fees Cash Flow 5 Year Cash Flow
N/A Historical - 2017 1,730,448 251,988 1,478,460 1,460,421 18,039 0 124,848 106,809 534,046N/A Friends of Duluth 1,832,897 285,029 1,547,869 1,521,080 26,789 378,658 125,000 476,869 2,611,355
A Continue As Is, Purchase Maintenance Equipment for Both Courses 1,477,908 224,466 1,253,442 1,478,444 225,002 48,381 125,000 398,383 2,276,741
B Critical Improvements Only at Both Courses 1,862,969 294,298 1,568,672 1,554,978 13,693 736,430 125,000 847,737 4,349,8521A Sell 9 Holes at Each Golf Course Netting $1.6 million 1,555,847 258,720 1,297,127 1,471,444 174,318 444,740 125,000 744,058 3,540,953
1B Critical Improvements + $5 Million Enger Clubhouse Investment 2,173,089 516,600 1,656,489 1,578,195 78,294 764,045 125,000 810,751 3,968,181
2A Close Lester Completely 1,473,911 199,080 1,274,831 1,332,465 57,633 292,258 90,000 439,891 1,810,574
2B City Ceases Operation at Lester With Outside Entity Operating 9 Holes 1,302,806 180,120 1,122,686 1,307,465 184,779 292,258 90,000 567,037 2,301,350
2C Critical Improvements at Enger + $2.5 Million Clubhouse 1,966,307 403,040 1,563,267 1,619,426 56,159 423,737 90,000 569,895 2,655,375
2D Critical Improvements at Enger + $5.0 Million Clubhouse 2,458,093 620,680 1,837,413 1,718,224 119,188 611,563 90,000 582,375 3,174,721
2E Minimal Improvements at Enger – Pre- Fab Clubhouse 1,046,566 142,200 904,366 1,145,828 241,462 255,444 90,000 586,906 2,978,716
2F Minimal Improvements at Enger – Pre-Fab Clubhouse 1,471,550 199,080 1,272,470 1,257,465 15,005 116,452 90,000 191,447 939,961
N/A Enger 2017 1,046,257 162,452 883,805 1,043,872 160,067 0 Included 160,067 800,335
None of the Options Will Cash Flow Creating an Economic Sustainability Golf Operation

©2018 JJKeegan+
Critical Assumptions in 2F Forecast• Green Fees: $33 – a 26.9% increased from current rates
• Season Passes: $1,000
• Senior Passes Eliminated
• Skyline Cards: $99
• Rounds: 42,000 (52.11% of capacity and a 24.6% increase from 2018). A huge assumption is made that the drop-in rounds at Enger from 38,405 in 2017 to 33,719 in 2018 is an anomaly and not part of a trend mirroring the decline in golf.
• REVPAR %: 55%
• REVPAR for Merchandise, Food and Beverage and Range Consistent With Historical Benchmarks at $3.00, $6.00 and $1.50, respectively.
• Maintenance Expenses Increased from $397,000 to $495,789 which is $347,398 less than the median expended by a 27-hole municipal golf course according to PGA PerformanceTrak

©2018 JJ Keegan+
The Challenges of Financial Forecasts: The Uncertainties1. The Economy – when will we enter a recession?
2. The Duluth marketplace has a “negative” altitudinal behavior towards golf in the MOSAIC Profile.
3. The Golf Industry – projected to decline through 2030 before demand/supply are in balance.
4. The Competitive Set of Courses in Duluth – Nemadji is the buoy on which rates float.
5. Capital costs- rates, maturity and underwriting costs to be incurred in a market of increasing rates?
6. Lester Golf Course Sales Proceeds - proceeds to be realized are unknown and speculative.
7. The Enger Renovation – will it be professionally completed enhancing the golf experience?
8. Enger Critical Model – will one row irrigation with 700 heads for 27 holes create proper conditions?
9. Enger Golf Course – will the slope rating be reduced to widen the golf audience?
10. The Skyline Project – what impact will have on construction and access to the course?
11. The Clubhouse – size, type of construction, ambience, location

©2018 JJ Keegan+
The Challenges of Financial Forecasts: The Uncertainties
12. Driving range – projected to be sub-optimal
13. Management Contract – renewed: what terms? The impact of General Manager salary on one course?
14. Yield Per Round - Can it be effectively increased from 49.84% to 55%?
15. Green Fees - Can it be effectively raised from $26 to $33 after renovation?
16. Season Passes - 36.3% of all rounds are season pass based. No impact on rounds or revenue is forecast from the following changes:
• Senior pass prices increased from $575 to $1,000? • Regular season pass prices increased from $800 to $1,000 be accepted?
17. Skyline Cards - 24.78% of all rounds are card based. Will a rate increase from $49 to $99 have an impact of play? No impact is forecast.
18. BCG has managed the courses extremely cost effectively. Will they able to continue that management in a diminished employment pool of skilled labor?
19. 3rd Party Management Fees Will a reduction from $125,000 to $90,000 be accepted?

©2018 JJ Keegan+
Limited Playing Season of 186 Days
Duluth is Not a Destination for Golf Tourists
Inability to Raise Rates to FMV Based on Golfer Study
No Future Capital Reserves in Projections
No Satisfaction of General Fund Debt
2A – 2F Projections Presume 26% Increase in Rates
2A – 2F Eliminates All Senior Discounts
Furthermore

©2018 JJ Keegan+
General Fund Subsidy Will Be Required Annually
Estimated at $200,000 Per Year To Support 10.7% of the Population
Whose Income is 64.5% Greater than the Typical Duluth Resident

©2018 JJKeegan+
The Role of Government
StrategicVision
Tactical (Functional)
Operational (Execution)
To provide for citizens that which private enterprise would not undertake.
Discretionary(Golf)
Important (Parks, Library, Ball Fields,
First Tee, Par 3, Entry Level Golf - Novices)
Core (Police, Fire, Utilities, Water)

©2018 JJKeegan+
A Community Asset or a Business Enterprise?

©2018 JJKeegan+
Qualitative Importance:The Benefits of a Golf Course
A healthy recreational outlet for residents and enhancement to the overall quality of life.
Promoting a game which inculcates in its participants life skills: courtesy, judgment, honesty, integrity, sportsmanship, respect, confidence, responsibility, and perseverance.
A venue to attract visitors and prospective residents.
A good reflection on the image/brand of the city and community.
Enhancement to local property values.
Golf-related jobs and income to the community through purchases, wages, and taxes.
An exceptional venue for scholastic use in practice rounds and tournaments.
A venue for hosting charity tournaments and other fundraising activities.
A positive use for storm water retention and city effluent water.
An office for those retired

©2018 JJ Keegan+
The Path to Satisfactory Results Has Many Forks
Does Your Golf Course Have to Be Financial
Self Sustaining?
Yes
Cash Flow
Cash Flow + Future Capital
Cash Flow
+ Future Capital + Debt
No

©2018 JJKeegan+

©2018 JJKeegan+
We Create Walls to Protect our Vulnerability
Supply Nationally - Supply Exceeds Demand. Competitive Forces control the prices
Weather Rain, Snow, Sleet, Wind: Unpredictable Variability
Technology Internet & Social Media of endless improvements and update mandates have changed in a marketplace of endless choices in an experience based economy
Time Crunched CultureLifestyle integration of home, work, commuting and a child centered focus on the wants, needs and desires have transferred to millennials seeking high intensity activities of short duration.
Expenses Water, Electricity, Fertilizer, Labor, Benefits

©2018 JJKeegan+
©2018 JJKeegan+

©2018 JJKeegan+

©2018 JJKeegan+

©2018 JJKeegan+
©2018 JJKeegan+
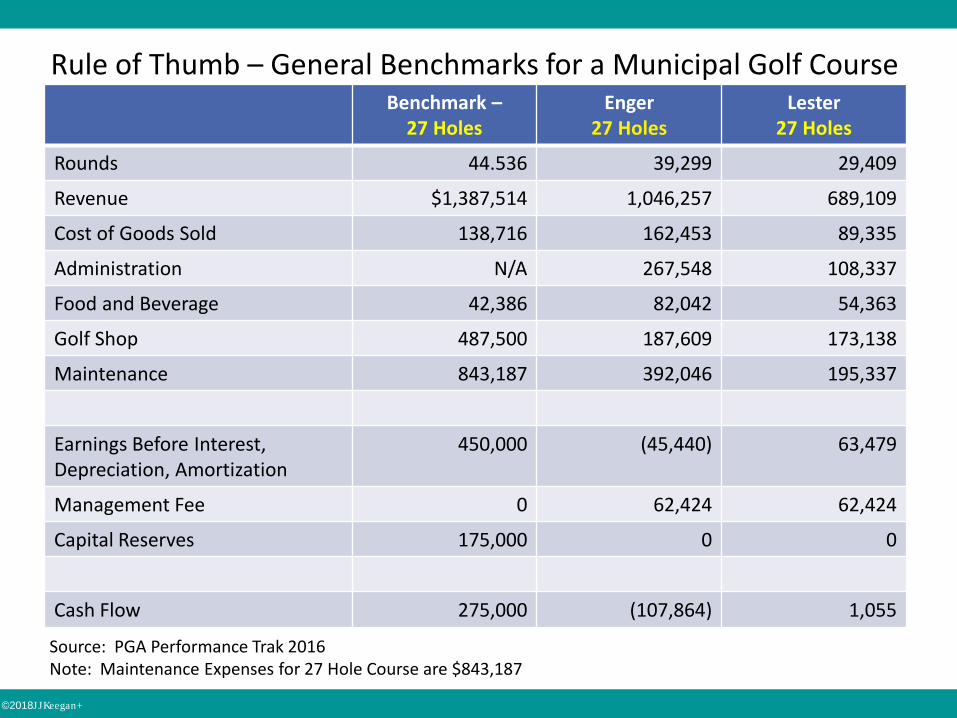
Rule of Thumb – General Benchmarks for a Municipal Golf CourseBenchmark –
27 HolesEnger
27 HolesLester
27 Holes
Rounds 44.536 39,299 29,409
Revenue $1,387,514 1,046,257 689,109
Cost of Goods Sold 138,716 162,453 89,335
Administration N/A 267,548 108,337
Food and Beverage 42,386 82,042 54,363
Golf Shop 487,500 187,609 173,138
Maintenance 843,187 392,046 195,337
Earnings Before Interest, Depreciation, Amortization
450,000 (45,440) 63,479
Management Fee 0 62,424 62,424
Capital Reserves 175,000 0 0
Cash Flow 275,000 (107,864) 1,055
Source: PGA Performance Trak 2016Note: Maintenance Expenses for 27 Hole Course are $843,187

©2018 JJKeegan+
Rule of Thumb – General Benchmarks for a Municipal Golf Course
Benchmark27 Holes
Enger Lester
Revenue $1,387,517 $1,046,257 $689,190
Green Fees, Season Passes
$850,000 485,818 318,350
Carts 257,064 190,814 127,582
Merchandise 110,000 101,335 67,212
Food and Beverage
132,000 204,352 147,937
Range, Lessons and Other
73,900 63,938 28,109
Source: PGA PerformanceTrak 2016: 20 Courses Reporting

©2018 JJKeegan+
Start
1 2 4 5 6 7
GLMA
WeatherImpact
Technology
FinancialMetrics
Facilities Customers
Operations
Uncontrollable Controllable

©2018, JJ Keegan+
MosaicIncome
Age & EthnicityGolfers Per 18
SlopeChampionship
Beginner and Recreational
Beginner and Recreational
Beginner and Recreational
Beginner & RecreationalOpen Park
The Critical PathThe Barriers to A Fiscally Sustainable
Championship Golf Course
Yes
No
Median
Low
Median
Seniors & Young
Families
> Median
= < Median
> Course
= < Median
You Might Have A Chance
©2018, JJ Keegan+
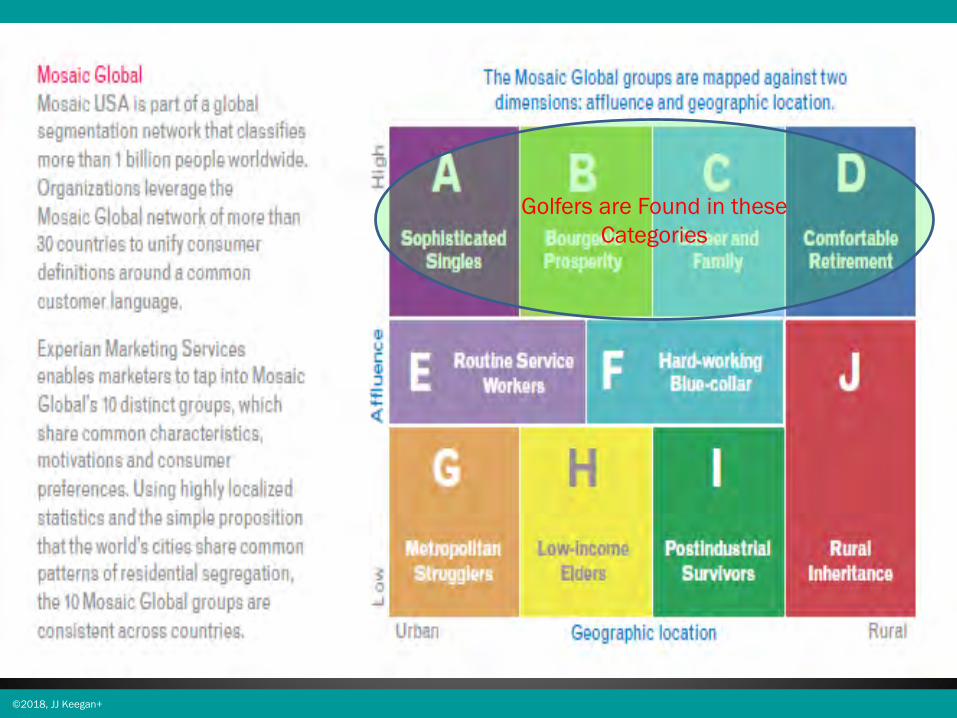
Golfers are Found in these Categories

©2018 JJKeegan+
Enger Park Mosaic Profile
Radial Trade Area, 10 milesNumber Enger Park United States -6.77%
Sophisticated Singles
586 0.44% 2.70%-2.26%
Bourgeois Prosperity
12,719 9.54% 15.70%-6.16%
Career and Family 12,732 9.55% 13.40% -3.85%Comfortable Retirement
18,248 13.69% 8.20%5.49%
Routine Service Workers
15,621 11.72% 17.20%-5.48%
Hard Working Blue Collar
28,061 21.06% 10.40%10.66%
Metropolitan Strugglers
24,991 18.75% 17.10%1.65%
Low Income Elders 7,088 5.32% 2.70% 2.62%Post Industrial Survivors
11,087 8.32% 6.60%1.72%
Rural Inheritance 2,135 1.60% 5.90% -4.30%Total 133,266 100.00% 100.00%
©2018 JJKeegan+
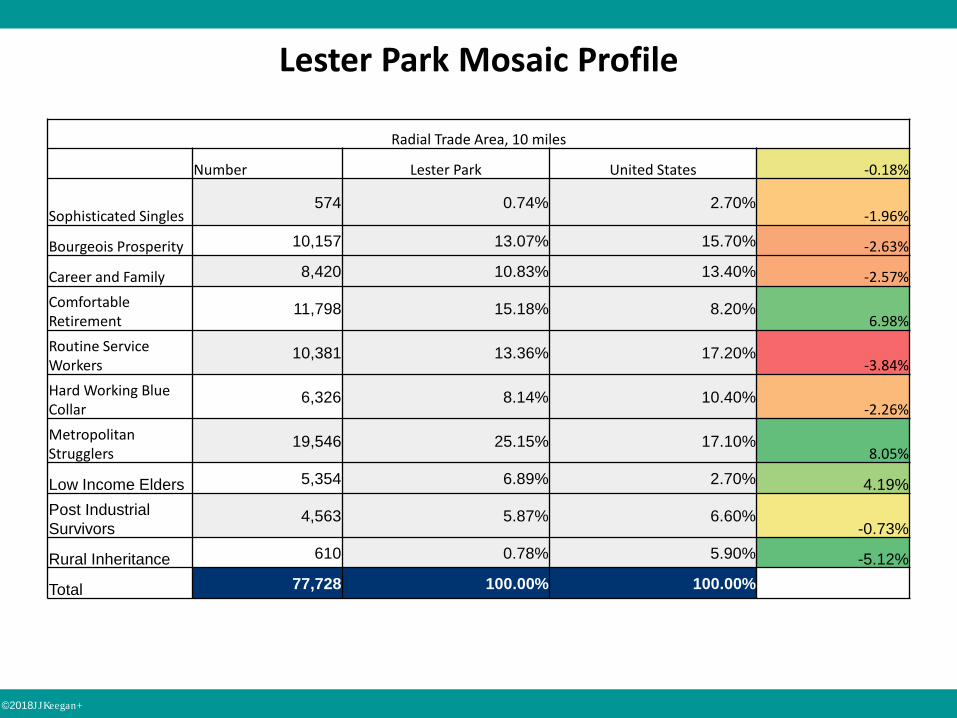
Lester Park Mosaic Profile
Radial Trade Area, 10 miles
Number Lester Park United States -0.18%
Sophisticated Singles574 0.74% 2.70%
-1.96%
Bourgeois Prosperity 10,157 13.07% 15.70% -2.63%
Career and Family 8,420 10.83% 13.40% -2.57%Comfortable Retirement
11,798 15.18% 8.20%6.98%
Routine Service Workers
10,381 13.36% 17.20%-3.84%
Hard Working Blue Collar
6,326 8.14% 10.40%-2.26%
Metropolitan Strugglers
19,546 25.15% 17.10%8.05%
Low Income Elders 5,354 6.89% 2.70% 4.19%Post Industrial Survivors
4,563 5.87% 6.60%-0.73%
Rural Inheritance 610 0.78% 5.90% -5.12%
Total 77,728 100.00% 100.00%

©2018 JJKeegan+
MOSAIC Profile>40 0 0 1 3 4 5 5 5 5
40 0 0 1 3 4 5 5 5 535 0 0 2 4 5 5 4 4 430 0 0 2 4 5 4 4 3 325 0 1 3 5 4 3 3 3 220 0 2 4 5 3 3 2 2 115 0 3 5 4 3 2 2 1 010 1 4 5 3 2 2 1 0 0
5 2 5 4 3 1 1 0 0 0
0 3 5Lester: Front
Back 2Lester: Back Lake/Lake
Front 0 0 0 0
-5 4 4 3 2Enger: Middle Back/Back
Front 0Enger - Front
Middle 0 0-10 5 4 2 1 0 0 0 0 0-15 5 3 2 1 0 0 0 0 0-20 5 3 1 0 0 0 0 0 0-25 5 4 1 0 0 0 0 0 0-30 5 4 0 0 0 0 0 0 0
< -30 5 4 0 0 0 0 0 0 0Slope Rating 110 115 120 125 130 135 140 145 150
Probability of Financial Success for Golf Course Based on Residents with 10 Mile Radius5Excellent4Good3Fair
2Below Average
1Very Challenged
0Little Chance©JJ Keegan+, 2018
Correlation Between MOSAIC PROFILE and Slope RatingPredictor of Potential

©2018 JJKeegan+
The Market Demographics
Enger Park Lester Park 100 CBSA U.S. Data Source
Age (Median) 35.90 34.20 37.30 36.90Demographic Trend Report
Age (Median) 97 93 101 100Calculated
Income (Med Hhld) $45,587 $46,076 $57,264 $53,657 Demographic Trend Report
Income (Median) 85 86 107 100Calculated
Likely Golfer Household Income $81,601 $82,476 $102,503 $96,046 JJ Keegan+ Estimate
Income (Index) 85 86 107 100Calculated
Income (Average Hhld) $61,137 $63,562 $80,080 $73,343 Demographic Trend Report
Income (Median) 83 87 109 100Calculated
Ethnicity (% Cauc.) 90.59% 89.50% 66.50% 71.10%Demographic Trend Report
Ethnicity Index 127 126 94 100Calculated
Hispanic 1.77% 1.85% 20.10% 17.00%Demographic Trend Report
Hispanic Index 10 11 118 100Calculated
African American 2.26% 2.89% 15.00% 13.30%Demographic Trend Report
Black Index 17 22 113 100Calculated
Asian American 1.48% 1.82% 7.10% 5.40%Demographic Trend Report
Asian Index 27 34 131 100Calculated

©2018 JJKeegan+
Demand vs. Supply
Demand Enger Park Lester Park 100 CBSA U.S.
Avid Golfers 3,820 2,132 4,420,367 6,543,657Calculated by 26.8% of Golfers
Total Golfers 14,253 7,957 16,493,905 24,416,632Calculated by 1.415 Golfing Households
Rounds Played 262,882 142,891 288,126,400 451,577,900NGF Demand ReportMarket Supply 286,214 148,706 236,397,100 450,778,300NGF Demand ReportDemand Index 91.85% 96.09% 121.88% 100.18%CalculatedRounds Per Course 32,860 35,723 39,968 30,065CalculatedRounds Played Per Golfer 18.44 17.96 17.47 18.49CalculatedGolf Participation 10.70% 10.24% 8.12% 7.65%CalculatedPopulation 133,266 77,728 203,040,187 319,293,362Demographic Trend Report
Golfers per 18 Holes 1,673 1,641 2,283 1,733Calculated
Green Fee Carts/18 1,154,829 1,160,957 N/A 1,416,063Predictive Index DataAnnual Spending 650 566 N/A 870CalculatedCost Per Round 35.14 32.50 N/A 47.10CalculatedAvid per 18 holes 449 426 607 464CalculatedAvid Household Index 97 92 131 100Calculated

©2018 JJKeegan+
Start
1 2 4 5 6 7
GLMA
WeatherImpact
Technology
FinancialMetrics
Facilities Customers
Operations
Uncontrollable Controllable
©2018 JJKeegan+

©2018 JJ Keegan+
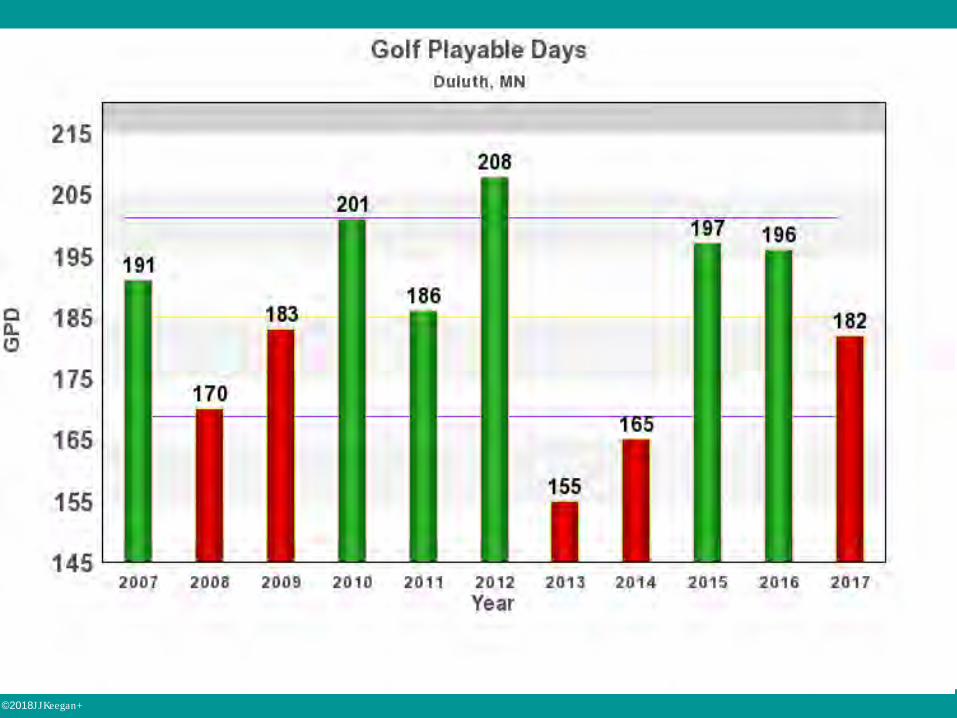
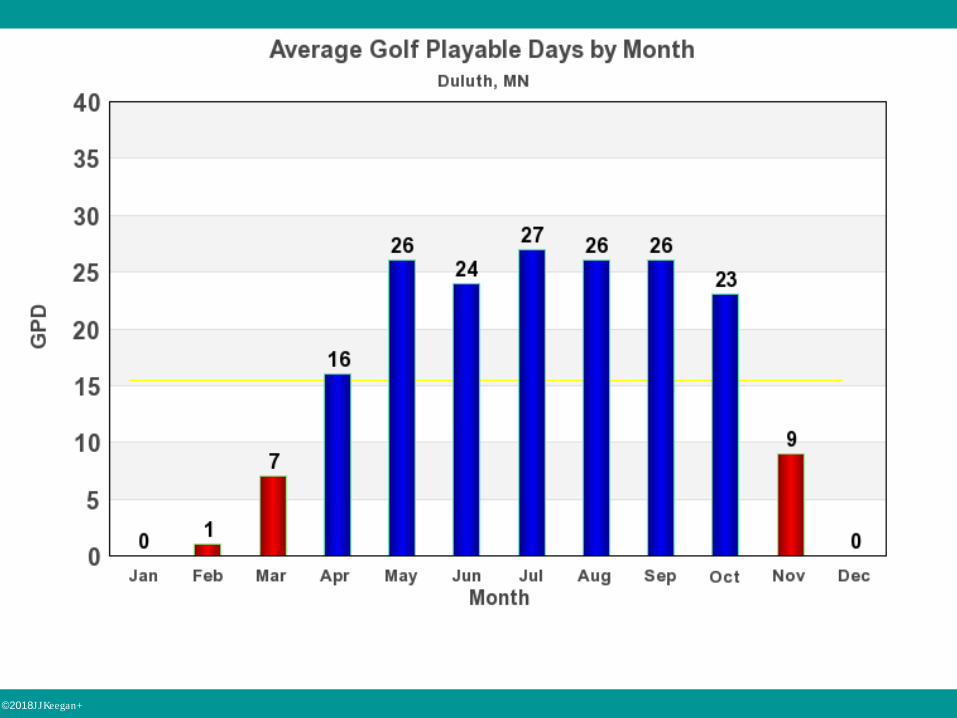
A Golf Playable Day (GPD) is defined as a day where the maximum temperature is above 45 degrees Fahrenheit and below 95 degrees Fahrenheit, precipitation is less than 0.25 inches of rainfall, and wind speed is less than 19 miles per hour. These numbers can be used to compare “good” years with “not good” years. Monthly values can help the owner determine when to have the most staff and plan for the most rounds. The purple lines represent what to expect in a typical year, if the value is above or below these lines it shows it is an abnormal year.
Definition
©2018 JJKeegan+

©2018 JJKeegan+

©2018 JJKeegan+
Unlimited Pass -Walking: Nationally
Unlimited Pass Walking – Duluth Golf
Transferable No YesHoles 18 18Playable Days 260 186Playing Frequency 32% 30%Rounds Played 83 56
Rate Rack $
45.00 $
26.00 Frequency Discount 30% 30%Proper Annual Fee 2,621 1,016 Current Annual Fee 750 Variance 266
Season Passes Underpriced

©2018 JJKeegan+
Season Passes Underpriced

©2018 JJKeegan+
Start
1 2 4 5 6 7
GLMA
WeatherImpact
Technology
FinancialMetrics
Facilities Customers
Operations
Uncontrollable Controllable

©2018 JJKeegan+

©2018 JJKeegan+

©2018 JJKeegan+

©2018 JJKeegan+
Start
1 2 4 5 6 7
GLMA
WeatherImpact
Technology
FinancialMetrics
Facilities Customers
Operations
Uncontrollable Controllable

©2018 JJKeegan+
Thank you
J. J. Keegan, Managing Principal4406 Orofino Place
Castle Rock, CO 80108t 303-283-8880c 303-596-4015
Related Documents