Press release – 1 August 2018 fbredF 2018 INTERIM FINANCIAL REPORT Wednesday 1 August 2018, 7.00 am Regulated information

Welcome message from author
This document is posted to help you gain knowledge. Please leave a comment to let me know what you think about it! Share it to your friends and learn new things together.
Transcript

Press release – 1 August 2018
1
fbredF
2018 INTERIM FINANCIAL REPORT
Wednesday 1 August 2018, 7.00 am Regulated information

Press release – 1 August 2018
2
2018 Interim financial report
The EPRA Earnings for H1 2018 amount to 65.1 million euros, an increase of 14%
compared to H1 2017. The EPRA Earnings per share amount to 2.94 euros, an
increase of 10% compared to H1 2017.
WDP reaffirms its ambition to achieve an EPRA Earnings per share of 6.00 euros for
2018, as well as a target gross dividend of 4.80 euros – a 7%-increase each.
Over the course of the first half of 2018, new investments for a total amount of 150
million euros have been secured.
At the halfway point of the 2016-20 strategic growth plan, an investment volume of
approx. 900 million euros has been identified. This means WDP is on track to achieve
the target investment volume of 1.25 billion euros, as well as the target EPRA
Earnings of 7.00 euros per share – as upgraded at the start of this year.

Press release – 1 August 2018
3
Summary
EPRA Earnings1 for H1 2018 amount to 65.1 million euros, an increase of 13.7% over H1 2017
(57.2 million euros). The EPRA Earnings per share2 for H1 2018 comes to 2.94 euros, an
increase of 10.2% over the figure of 2.67 euros from H1 2017.
The net result (IFRS) – Group share for H1 2018 amounts to 94.2 million euros, driven in part
by a variation of 35.3 million euros (or 1.3%) in the underlying value of the property
portfolio. The net result (IFRS) – Group share per share for H1 2018 amounts to 4.26 euros,
compared to 6.39 euros in H1 2017.
The occupancy rate3 was 97.3% on 30 June 2018, compared to 97.4% on 31 December 2017.
The average remaining duration until the first termination date of the lease agreements and
until the maturity date of the WDP portfolio is 6.0 years and 7.5 years, respectively (including
solar panels).
On 30 June 2018, the gearing ratio was 54.8%/55.1% (IFRS4/proportionate), compared to
50.8%/52.2% on 30 June 2017.
The EPRA NAV5 was 59.3 euros on 30 June 2018, compared to 58.3 euros on 31 December
2017. The IFRS NAV was 56.9 euros on 30 June 2018, compared to 56.3 euros on 31
December 2017.
The total identified investment volume under the 2016-20 growth plan is approx. 900 million
euros. After all, an additional investment volume of 150 million euros was secured in the
first half of 2018. Thus, halfway through the 2016-20 strategic growth plan, WDP is on track
to achieve its target investment volume of 1.25 billion euros. This investment package
includes various leased projects from the recently acquired landholdings and consists
primarily of repeat business with existing clients.
For 2018, WDP confirms its ambition for EPRA Earnings of 6.00 euros per share (an increase
of 7%). Based on the outlook, a dividend of 4.80 euros gross per share is proposed for 2018
(payable in 2019), marking another increase, this time of 7% over 2017.6 For the 2018-20
period, the aim is to achieve a cumulative increase of 25% in the EPRA Earnings, to 7.00
euros per share, compared to 5.60 in 2017. 6
In accordance with the guidelines issued by ESMA (the European Securities and Markets Authority), the Alternative Performance Measures (APM) used by WDP must be defined in a footnote on their first mention in this press release. This definition will also be accompanied by a symbol () so the reader can easily recognise it as an APM definition. Chapters 8 and 9 of this press release also give a reconciliation of these indicators. 1 EPRA Earnings: this figure is the underlying result of the core activities and indicates the degree to which the current dividend payments are supported by the profit. This result is calculated as the net result (IFRS) exclusive of the result on the portfolio, the change in the fair value of financial instruments and depreciation and write-down on solar panels. See also www.epra.com. 2 The EPRA Earnings per share are the EPRA Earnings based on the weighted average number of shares. 3 The occupancy rate is calculated based on the rental values of the leased properties and the unleased space and includes income from solar panels. This does not include developments under construction and/or renovations. 4 The gearing ratio (IFRS) is calculated in the same manner as the gearing ratio (proportionate) in accordance with the GVV/SIR KB, but based on a consolidated balance sheet in accordance with IFRS that incorporates joint ventures using the equity method. 5 EPRA NAV: this is the NAV that was adjusted to include properties and other investments at their fair value and exclude certain line items that are not expected to take shape in a business model with investment properties over the long term. See also www.epra.com. 6 These profit forecasts are based on the current situation, barring presently unforeseen circumstances (such as a substantial deterioration in the economic and financial climate), and a normal number of hours of sunshine.

Press release – 1 August 2018
4
CONTENTS Summary 3
1. Risk factors 5
2. Statement on the interim financial report 6
3. Interim management report 7
3.1 Consolidated key figures 7
3.2 EPRA metrics 8
3.3 Notes on the consolidated results for the first half of 2018 8
3.4 Transactions and realisations 16
3.5 Management of financial resources 23
3.6 Outlook 26
4. Shares and bonds 27
4.1 The share 27
4.2 Bonds 28
4.3 Shareholding 29
4.4 Financial calendar 29
5. Property report 30
5.1 Review of the consolidated property portfolio 30
5.2 Review of the logistics property market in Belgium, Luxemburg, the Netherlands, France and Romania 36
5.3 Conclusions of the property experts 37
6. Condensed consolidated financial statements for the first half of 2018 39
6.1 Condensed consolidated profit and loss account 39
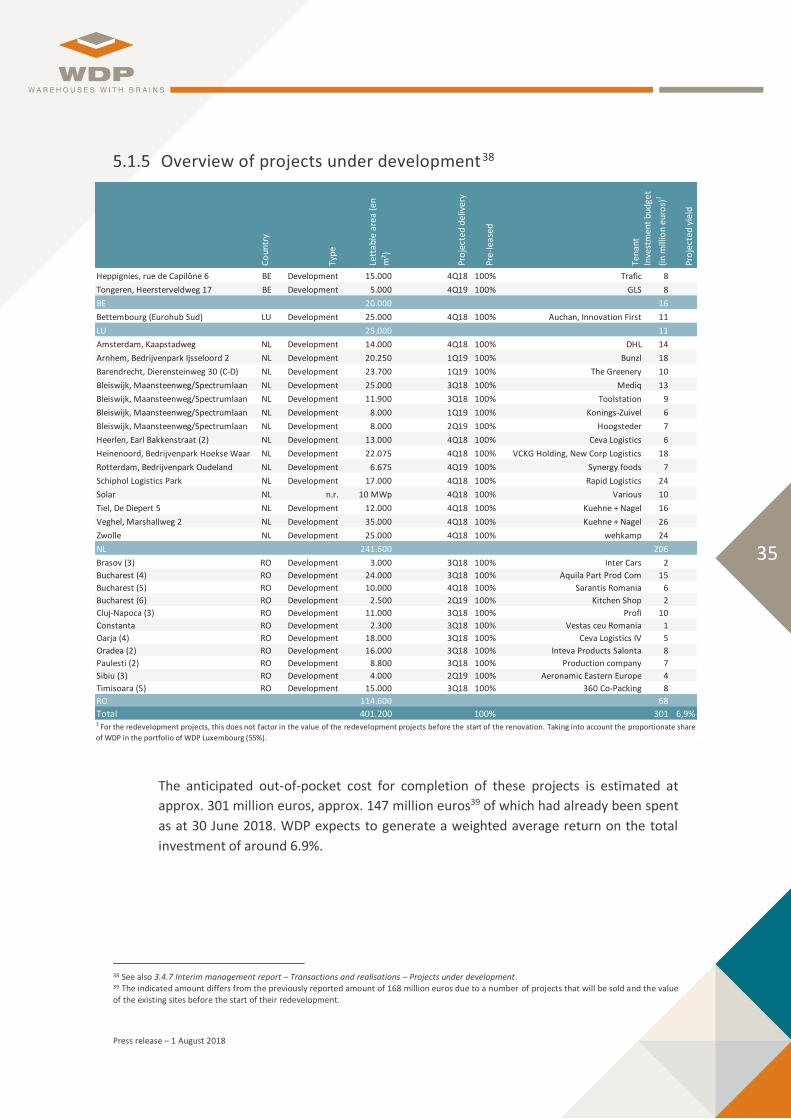
6.2 Condensed consolidated statement of overall income 40
6.3 Other components of comprehensive income 40
6.4 Condensed consolidated balance sheet as at 30 June 2018 41
6.5 Condensed consolidated cash flow statement 42
6.6 Condensed statement of changes in the consolidated equity 43
6.7 Notes 44
7. Statutory auditor’s report 63
8. EPRA Performance measures 64
8.1 EPRA Earnings 64
8.2 EPRA NAV 64
8.3 EPRA cost ratio 65
8.4 EPRA NIY and EPRA TOPPED-UP NIY 65
9. Detailed calculation of the Alternative Performance Measures applied by WDP 66
9.1 Result on the portfolio (including portion for joint ventures) 66
9.2 Changes in the gross rental income based on an unchanged portfolio 66
9.3 Operating margin 66
9.4 Average cost of debt 67
9.5 Financial result (excluding changes in the fair value of the financial instruments) 67
9.6 Hedge ratio 67
9.7 Gearing ratio 68

Press release – 1 August 2018
5
1. Risk factors
WDP’s strategy is to create as much stability as possible for investors with respect to both
dividends and income over the long term. The management and Board of Directors of WDP are
aware of the specific risks associated property portfolio management and strive for optimal risk
management and control.
The Management and Board of Directors of WDP confirm the validity of the risks that the
company may face, their potential impact and the strategy used to mitigate potential impact, as
set out in the 2017 Annual financial report, available at www.wdp.eu.

Press release – 1 August 2018
6
2. Statement on the interim financial report
In accordance with Article 13(§2) of the Belgian Royal Decree of 14 November 2007 setting
obligations on issuers of financial instruments admitted to trading on a regulated market, De
Pauw SA, managed and permanently represented by Tony De Pauw, declares that to its
knowledge:
the condensed interim financial statements, prepared on the basis of accounting policies in
accordance with IFRS and IAS 34 Interim Financial Reporting as adopted by the European
Union, give a true and fair view of the equity, financial situation and results of WDP and the
companies included in the consolidation;
the interim financial report gives a true statement of the main events during the first six
months of the current financial year, their impact on the condensed financial statements,
the main risk factors and uncertainties for the remaining months of the financial year, and
the main transactions between the associated parties and their possible effect on the
condensed financial statements should these transactions be of significant importance and
not concluded under normal market conditions.

Press release – 1 August 2018
7
3. Interim management report
3.1 Consolidated key figures
Operational 30.06.2018 31.12.2017
Fair value of property portfolio (including solar panels) (in million euros) 2.987,5 2.669,8
Gross initial yield (including vacancies)1 (in %) 7,1 7,1
Net initial yield (EPRA)2 (in %) 6,3 6,4
Average lease term (until first break)3 (in years) 6,0 6,2
Occupancy rate4 (in %) 97,3 97,4
Like-for-like rental growth5 (in %) 2,0 1,1
Operating margin6 (in %) 91,6 92,7
Financial 30.06.2018 31.12.2017
Gearing ratio (IFRS)7 54,8 51,5
Gearing ratio (proportional) (in line with the GVV/SIR Royal Decree) 55,1 53,1
Interest Coverage Ratio8 (in x) 4,7 4,9
Average cost of debt (in %)9 2,3 2,6
Average remaining duration of outstanding debt (in years) 4,3 4,1
Average remaining duration of long term credit facilities (in years) 4,6 4,5
Hedge ratio10 (in %) 87 91
Average remaining term of hedges11 (in years) 7,4 7,6
Result (in million euros) 30.06.2018 30.06.2017
Property result 90,1 74,5
Operating result (before the result on the portfolio) 82,5 69,1
Financial result (excluding changes in the fair value of the financial instruments) 12 -15,5 -13,2
EPRA Earnings13 65,1 57,2
Result on the portfolio (including share joint ventures) - Group share 14 35,3 66,3
Changes in the fair value of the financial instruments - Group share -3,5 15,6
Depreciation and write-down on solar panels (including share joint ventures) - Group share -2,6 -2,2
Net result (IFRS) - Groupe share 94,2 137,0
Details per share (in euros) 30.06.2018 30.06.2017
EPRA Earnings15 2,94 2,67
Result on the portfolio (including share joint ventures) - Group share 16 1,59 3,09
Changes in fair value of the financial instruments - Group share -0,16 0,73
Depreciation and write-down on solar panels - Group share -0,12 -0,10
Net result (IFRS) - Group share 4,26 6,39
IFRS NAV17 56,9 51,3
EPRA NAV18 59,3 53,4
EPRA NNNAV19 56,5 50,9
6 The operating margin, obtained by dividing the operating result (before the result on the portfolio) by the property result. Based on the comparison between H1 2018 and H1 2017.7The gearing ratio (IFRS) is calculated in the same manner as the gearing ratio (proportional) in accordance with the Belgian Royal Decree on Regulated Real-Estate Investment Companies (the ‘GVV-
KB’), but based on a consolidated balance sheet in accordance with IFRS that incorporates joint venture using the equity method.8 Defined as operating result before the result on portfolio divided by interest charges less interest and dividends collected less the fee for financial leasing and other. This ratio indicates the extent
to which the company is able to meet its annual interet payments.9 Average cost of debt: this refers to the weighted average yearly interest rate for the reporting period, taking into account the average outstanding debt and the hedging instruments during that same
period.
Key figures
1 Calculated by dividing annualised contractual gross (cash) rents by fair value. The fair value is the value of the property investments after deduction of transaction costs (mainly transfer tax).2 Financial performance indicator calculated according to EPRA's (European Public Real Estate Association) Best Practices Recommendations van EPRA . See also www.epra.com. 3 Including the solar panels which are included in the remaining weighted average term of the green energy certificates.4 Calculated based on the rental values for the leased properties and the non-leased surfaces, including the income from solar panels. Ongoing projects and/or renovations are not considered.5Like-for-l ike rental growth: organic growth of the gross rental income year-on-year on the basis of an unchanged portfolio, excluding development projects, acquisitions and disposals during both
periods of this comparison.
10 Hedge ratio: percentage of fixed-rate and floating-rate debts hedged against interest rate fluctuations by means of derivatives. This economic parameter is not an obligatory parameter under the
Belgian Regulated Real-Estate Investment Companies Act (Wet betreffende de gereglementeerde vastgoedvennootschappen or 'GVV-Wet').11 The remaining duration of debt at fixed rate and interest rate hedges entered into to hedge the debt against interest rate fluctuations.12Financial result (exclusive of change in the fair value of the financial instruments): this is the financial result according to IFRS exclusive of the change in fair value of financial assets and
liabilities, and reflects the actual financial expenses of the company.13EPRA Earnings: this is the underlying result of core activities and indicates the degree to which the current dividend payments are supported by the profit. This result is calculated as the net result
(IFRS) exclusive of the result on the portfolio, the change in the fair value of financial instruments and depreciation and write-down on solar panels. See also www.epra.com. 14Result on the portfolio (including share joint ventures) - Group share: realised and unrealised capital gains/loss with respect to the latest valuation by the property expert, taking into account the
effective or deferred capital gains tax due, including WDP’s proportionate share in the portfolio of associated companies and joint ventures.15 The EPRA Earnings per share is the EPRA earnings based on the weighted average number of shares.
16 Result on the portfolio (including share joint ventures) - Group share per share: this is the result on the portfolio based on the weighted average number of shares.
17 IFRS NAV: Net asset value before profit distribution of the current year in accordance with the IFRS balance sheet. The IFRS NAV is calculated as the shareholders’ equity as per IFRS divided by the
number of shares entitled to dividend on the balance sheet date.18EPRA NAV: this is the NAV that was adjusted to include properties and other investments at their fair value and exclude certain line items that are not expected to take shape in a business model
with real estate investments over the long term. See also www.epra.com.19 EPRA NNNAV: this is the EPRA NAV adjusted to include the fair value of (i) financial instruments, (i i) debts and (i i i) deferred taxes. See also www.epra.com.

Press release – 1 August 2018
8
3.2 EPRA metrics
3.3 Notes on the consolidated results for the first half of 2018
Summary
The EPRA Earnings of WDP for the first half of 2018 amounts to 65.1 million euros. This
result marks an increase of 13.7% over the result of 57.2 million euros over the same
period in 2017. EPRA Earnings per share came to 2.94 euros, an increase of 10.2% over
2.67 euros in the same period last year, including an increase of 3% in outstanding
shares.
This increase in EPRA Earnings primarily stems from strong growth in the WDP portfolio
in 2017-18 through a combination of acquisitions, pre-leased projects and the total
consolidation of the Romanian entity. In addition, operating and financial costs continue
to be actively managed and kept under control.
30.06.2018 31.12.2017
EPRA Earnings (in euros per share)2 2,94 2,67
EPRA NAV (in euros per share)3 59,3 58,3
EPRA NNNAV (in euros per share)4 56,5 55,9
EPRA Net Initial Yield (in %) 6,3 6,4
EPRA Topped-up Net Initial Yield (in %) 6,3 6,4
EPRA vacancy rate (in %) 2,9 2,9
EPRA Cost Ratio (incl. direct vacany costs) (in %)5 8,6 9,0
EPRA Cost Ratio (excl. direct vacany costs) (in %)5 8,1 8,5
5EPRA Cost Ratio: administrative and operating costs (including and excluding direct vacancy costs) divided by the gross rental income. See also
www.epra.com.
EPRA key performance measures1
1 Financial performance indicators calculated according to EPRA's (European Public Real Estate Association) Best Practices Recommendations. Please see
www.epra.com.2 EPRA Earnings: this is the underlying result of core activities and indicates the degree to which the current dividend payments are supported by the profit.
This result is calculated as the net result (IFRS) exclusive of the result on the portfolio, the change in the fair value of financial instruments and depreciation
and write-down on solar panels. See also www.epra.com. Based on the comparison between HY1 2018 and HY1 2017.3EPRA NAV: this is the NAV that was adjusted to include properties and other investments at their fair value and exclude certain line items that are not
expected to take shape in a business model with real estate investments over the long term. See also www.epra.com.4 EPRA NNNAV: EPRA NAV adjusted to include the fair value of (i) financial instruments, (i i) debts and (ii i) deferred taxes. See also www.epra.com.

Press release – 1 August 2018
9
Notes on consolidated profit and loss
For the first half of 2018 (analytical schedule)
Consolidated results (in euros x 1 000) H1 2018 H1 2017 ∆ y/y (abs.) ∆ y/y (%)
Rental income, net of rental-related expenses 83.688 70.011 13.678 19,5%
Indemnification related to early lease terminations 2 402 -400 n.r.
Income from solar energy 7.227 5.601 1.626 29,0%
Other operating income/costs -818 -1.477 659 n.r.
Property result 90.100 74.536 15.563 20,9%
Property charges -3.127 -2.391 -736 30,8%
General company expenses -4.486 -3.082 -1.405 45,6%
Operating result (before the result on the portfolio) 82.486 69.064 13.423 19,4%
Financial result (excl. changes in the fair value of financial instruments) -15.542 -13.170 -2.372 18,0%
Taxes on EPRA Earnings -532 -145 -387 n.r.
Deferred taxes on EPRA Earnings -450 -450 0 n.r.
Share in the results of associated companies and joint ventures 214 1.945 -1.731 n.r.
Minority interests -1.114 0 -1.114 n.r.
EPRA Earnings 65.063 57.244 7.819 13,7%
Changes in the fair value of investment properties (+/-) 36.550 64.592 -28.043 n.r.
Result on disposal of investment property (+/-) -348 -114 -234 n.r.
Deferred taxes on the result on the portfolio (+/-) -933 -21 -913 n.r.
Share in the results of associated companies and joint ventures 485 1.808 -1.323 n.r.
Result on the portfolio 35.753 66.266 -30.512 n.r.
Minority interests -498 0 -498 n.r.
Result on the portfolio - Group share 35.255 66.266 -31.010 n.r.
Changes in the fair value of the financial instruments -3.482 15.638 -19.120 n.r.
Changes in the fair value of the financial instruments -3.482 15.638 -19.120 n.r.
Minority interests 0 0 0 n.r.
Changes in the fair value of the financial instruments - Group share -3.482 15.638 -19.120 n.r.
Depreciation and write-down on solar panels -2.709 -2.003 -706 n.r.
Share in the results of associated companies and joint ventures 0 -160 160 n.r.
Depreciation and write-down on solar panels -2.709 -2.163 -547 n.r.
Minority interests 66 0 66 n.r.
Depreciation and write-down on solar panels - Group share -2.643 -2.163 -481 n.r.
Net result (IFRS) 95.738 136.985 -41.247 n.r.
Minority interests -1.546 0 -1.546 n.r.
Net result (IFRS) - Group share 94.192 136.985 -42.792 n.r.
Key ratios (in euros per share) H1 2018 H1 2017 ∆ y/y (abs.) ∆ y/y (%)
EPRA Earnings1
2,94 2,67 0,27 10,2%
Result for the portfolio - Group share1
1,59 3,09 -1,50 n.r.
Changes in the fair value of the financial instruments - Group share 1-0,16 0,73 -0,89 n.r.
Depreciation and write-down on solar panels - Group share1
-0,12 -0,10 -0,02 n.r.
Net result (IFRS) - Group share1
4,26 6,39 -2,13 n.r.
EPRA Earnings2
2,89 2,62 0,27 10,2%
Weighted average number of shares 22.116.435 21.439.828 676.607 3,2%
Number of outstanding shares at the end of the period 22.506.602 21.816.404 690.198 3,2%1 Calculation based on the weighted average number of shares.
2 Calculation based on the number of shares entitled to dividend.

Press release – 1 August 2018
10
For the second quarter of 2018 (analytical schedule)
Consolidated results (in euros x 1 000) Q2 2018 Q2 2017 ∆ y/y (abs.) ∆ y/y (%)
Rental income, net of rental-related expenses 42.490 35.322 7.168 20,3%
Indemnification related to early lease terminations 2 0 2 n.r.
Income from solar energy 5.297 4.022 1.275 31,7%
Other operating income/costs 952 187 764 n.r.
Property result 48.741 39.532 9.209 23,3%
Property charges -1.617 -1.062 -555 52,2%
General company expenses -2.287 -1.483 -804 54,2%
Operating result (before the result on the portfolio) 44.837 36.987 7.850 21,2%
Financial result (excl. changes in the fair value of financial instruments) -8.023 -6.389 -1.635 25,6%
Taxes on EPRA Earnings -445 -138 -308 n.r.
Deferred taxes on EPRA Earnings -225 -225 0 n.r.
Share in the results of associated companies and joint ventures 118 1.441 -1.323 n.r.
Minority interests -672 0 -672 n.r.
EPRA Earnings 35.590 31.677 3.913 12,4%
Changes in the fair value of investment properties (+/-) 23.975 45.720 -21.746 n.r.
Result on disposal of investment property (+/-) -226 361 -587 n.r.
Deferred taxes on the result on the portfolio (+/-) -359 -44 -316 n.r.
Share in the results of associated companies and joint ventures 485 1.759 -1.273 n.r.
Result on the portfolio 23.874 47.796 -23.922 n.r.
Minority interests -143 0 -143 n.r.
Result on the portfolio - Group share 23.731 47.796 -24.065 n.r.
Changes in the fair value of the financial instruments -6.954 8.100 -15.054 n.r.
Changes in the fair value of the financial instruments -6.954 8.100 -15.054 n.r.
Minority interests 0 0 0 n.r.
Changes in the fair value of the financial instruments - Group share -6.954 8.100 -15.054 n.r.
Depreciation and write-down on solar panels -1.635 -1.131 -504 n.r.
Share in the results of associated companies and joint ventures 0 -80 80 n.r.
Depreciation and write-down on solar panels -1.635 -1.211 -424 n.r.
Minority interests 33 0 33 n.r.
Depreciation and write-down on solar panels - Group share -1.603 -1.211 -391 n.r.
Net result (IFRS) 51.547 86.362 -34.815 n.r.
Minority interests -782 0 -782 n.r.
Net result (IFRS) 50.765 86.362 -35.597 n.r.
Key ratios (in euros per share) Q2 2018 Q2 2017 ∆ y/y (abs.) ∆ y/y (%)
EPRA Earnings1
1,60 1,47 0,13 9,0%
Result for the portfolio - Group share1
1,07 2,22 -1,15 n.r.
Changes in the fair value of the financial instruments - Group share 1 -0,31 0,38 -0,69 n.r.
Depreciation and write-down on solar panels - Group share1
-0,07 -0,06 -0,02 n.r.
Net result (IFRS) - Group share1
2,28 4,01 -1,72 n.r.
EPRA Earnings2
1,58 1,45 0,13 8,9%
Weighted average number of shares 22.222.416 21.552.363 670.053 3,1%
Number of outstanding shares at the end of the period 22.506.602 21.816.404 690.198 3,2%1 Calculation based on the weighted average number of shares.2 Calculation based on the number of shares entitled to dividend.3 The dividend payout ratio is calculated based on the consolidated result. Dividend is distributed on a statutory basis by WDP Comm. VA.

Press release – 1 August 2018
11
Property result
The property result amounts to 90.1 million euros for the first half of 2018, an increase
of 20.9% compared to last year (74.5 million euros). This increase is driven by continued
portfolio growth in 2017-18, in the five countries where WDP is active, primarily through
new pre-leased projects and with a focus on the Netherlands and Romania where
logistics sector growth is currently strong. Based on an unchanged portfolio, the gross
rental income rose by +2.0%7, mainly driven by the indexing of leases. The property
result also includes 7.2 million euros in income from solar panels (compared to 5.6
million euros in the same period last year, when the installed capacity was smaller).
Operating result (before the result on the portfolio)
The operating result (before the result on the portfolio) amounts to 82.5 million euros
for the first half of 2018, an increase of 19.4% compared to the same period last year
(69.1 million euros). Property and other general expenses amounted to 7.6 million euros
for the first half of the year, an increase of 2.1 million euros compared to the costs for
the same period in 2017. The overhead trend for the company is in line with the
underlying portfolio growth (after all, the increase is explained in part by an uptick in
overhead costs in 2017 associated with management fees charged to the Romanian
entity, which was fully consolidated as from 2018, but was formerly incorporated as a
joint venture under the equity method). WDP succeeded in further controlling costs,
with the operating margin for the first half of 2018 coming to 91.6% , in line with the
average in recent years.
Financial result (excluding changes in the fair value of the financial instruments)
The financial result (excluding change in the fair value of the financial instruments)8
amounts to -15.5 million euros for the first half of 2018, an increase over last year (-13.2
million euros) due to higher outstanding financial debt and the loss of the interest
received on loans provided to the Romanian entity which have now been fully
consolidated (previously, using the equity accounting method).
7 Like-for-like rental growth: this is the organic growth in gross rental income year-on-year with an unchanged portfolio, exclusive of project developments, acquisitions and sales during these two comparison periods. 8 Financial result (exclusive of change in the fair value of the financial instruments): this is the financial result according to IFRS exclusive of the change in fair value of financial assets and liabilities, and reflects the actual financial expenses of the company.
Belgium Netherlands France Romania Total IFRS Luxembourg1
I. Rental income 33.720 39.863 3.404 7.074 84.061 467
III. Rental charges2-670 234 64 0 -371 -29
33.051 40.097 3.468 7.074 83.690 4381
2
Gross rental income by country
(in euros x 1 000)
Rental income, net of rental-related expenses
Taken into account the proportional share in WDP's rental income for Luxemburg (55%).
The heading Rental charges consists of Rent to be paid for leased premises and Provisions for trade receivables (additions) .

Press release – 1 August 2018
12
The total financial debt (as per IFRS) amounted to 1,601.9 million euros on 30 June 2018,
compared to 1,168.9 million euros in the same period last year. The average cost of debt
in the first half of 2018 was 2.3%, compared to 2.6% in 2017.
Share in the results of associated companies and joint ventures
The result of 0.2 million euros for the first half of 2018 is primarily from the underlying
result of the core activities of the joint ventures. During 2017, this amount included the
result of the Romanian entity as well.
EPRA Earnings
The EPRA Earnings of WDP for the first half of 2018 amounts to 65.1 million euros. This
result marks an increase of 13.7% over the result of 57.2 million euros in 2017. The EPRA
Earnings per share is up 10.2% year-on-year, including an increase of 3% in the weighted
average number of outstanding shares.
Result on the portfolio (including share joint ventures) – Group share
The result on the portfolio (including share joint ventures) – Group9 share for the first
half of 2018 amounts to +35.3 million euros, or +1.59 euros per share10. For the same
period last year, this result amounted to +66.3 million euros or +3.09 euros per share.
This yields the following results by country for the first half of 2018: Belgium (+10.4
million euros), the Netherlands (+19.6 million euros), France (+2.6 million euros) and
Romania (+2.0 million euros) and Luxembourg (+0.7 million euros).
The revaluation of 35.3 million euros marks a 1.3%-increase in the value of the
underlying portfolio.
Change in the fair value of financial instruments – Group share
The change in the fair value of financial assets and liabilities – Group share11 amounts to
-3.5 million euros or -0.16 euros per share for the first half of 2018 (compared to +15.6
million euros or +0.73 euros per share in 2017). This negative impact stems from the
change in fair value of the interest rate hedges concluded (Interest Rate Swaps) as at 30
June 2018, as a result of a decrease in long-term interest rates during the second quarter
of 2018.
The change in the fair value of these interest rate hedges has been fully accounted for in
the profit and loss account, not in shareholders’ equity. Since this impact involves a non-
9 Result on the portfolio (including portion for joint ventures) – Group share: realised and unrealised capital gains/loss with respect to the latest valuation by the property experts, taking into account the effective or deferred capital gains tax due, including WDP’s proportionate share in the portfolio of affiliated companies and joint ventures. 10 Result on the portfolio (including portion for joint ventures) per share – Group share: this is the result on the portfolio (including the portion for joint ventures) based on the weighted average number of shares. 11 The Change in the fair value of financial assets and liabilities – Group share (non-cash item) is calculated based on the mark-to-market (M-t-M) value of the interest rate hedges concluded.

Press release – 1 August 2018
13
cash and unrealised item, it is excluded from the financial result in the analytical
presentation of the results and is shown separately in the profit and loss account.
Depreciation and write-down on solar panels (including share joint
ventures) – Group share
The solar panels are valued on the balance sheet at fair value based on the revaluation
model in accordance with IAS 16 Tangible fixed assets. In compliance with IAS 16, WDP
must include a depreciation component in its IFRS accounts according to the residual life
of the PV installations. The depreciation is calculated based on the fair value from the
previous balance sheet date. This newly calculated net book value is then revaluated at
fair value. This revaluation is recognised directly in the shareholders’ equity, to the
extent that it still exceeds the historic cost price, plus accumulated depreciations. If it
does not, then it is entered in the profit and loss account. The depreciation component
and write-down amounts to -2.7 million euros. Since this impact involves a non-cash and
unrealised item, it is excluded from the financial result in the analytical presentation of
the results and is shown separately in the profit and loss account.
Net result (IFRS) – Group share
The EPRA Earnings along with the result on the portfolio (including share joint ventures),
the change in the fair value of financial instruments and the depreciation and write-
down for solar panels result in a net result (IFRS) – Group share of 94.2 million euros in
the first half of 2018 (compared to 137.0 million euros in the same period last year).
The difference between the net result (IFRS) – Group share of 94.2 million euros and the
EPRA Earnings of 65.1 million euros is attributable to the negative change in the fair value
of the interest hedging instruments, the positive fluctuation in the value of the portfolio
and the depreciation and write-down of the solar panels.

Press release – 1 August 2018
14
Notes on the consolidated balance sheet for 30 June 2018
Consolidated balance sheet (in euros x 1 000) 30.06.2018 31.12.2017 ∆ y/y (abs.) ∆ y/y (%)
Intangible fixed assets 182 146 36 n.r.
Investment property 2.823.785 2.404.027 419.758 17,5%
Other tangible fixed assets (including solar panels) 115.737 95.876 19.861 20,7%
Financial fixed assets 17.324 97.469 -80.144 -82,2%
Trade receivables and other fixed assets 5.302 3.411 1.891 55,5%
Deferred taxes - assets 0 0 0 n.r.
Participations in associated companies and joint ventures - equity method 11.098 31.626 -20.528 -64,9%
Fixed assets 2.973.428 2.632.554 340.874 12,9%
Assets held for sale 17.862 7.525 10.337 n.r.
Trade receivables 17.019 9.042 7.977 n.r.
Tax receivables and other current assets 16.606 22.830 -6.224 n.r.
Cash and cash equivalents 1.320 1.231 89 n.r.
Accruals and deferrals 7.389 2.116 5.273 n.r.
Current assets 60.196 42.745 17.451 n.r.
Total assets 3.033.624 2.675.299 358.326 n.r.
Capital 172.680 168.873 3.807 2,3%
Issue premiums 588.163 545.154 43.009 7,9%
Reserves 426.193 289.256 136.937 47,3%
Net result for the financial year 94.192 235.156 -140.963 -59,9%
Equity capital attributable to shareholders of the Group 1.281.228 1.238.439 42.790 3,5%
Minority interests 26.701 0 26.701 n.r.
Equity capital 1.307.929 1.238.439 69.490 5,6%
Long term liabilities 1.430.043 1.158.293 271.750 23,5%
Long term financial debt 1.377.891 1.108.966 268.925 24,3%
Other long term liabilities 52.152 49.328 2.824 5,7%
Short term liabilities 295.652 278.566 17.086 6,1%
Short term financial debt 223.995 240.849 -16.854 -7,0%
Other short term liabilities 71.657 37.717 33.940 90,0%
Liabilities 1.725.695 1.436.860 288.835 20,1%
Total liabilities 3.033.624 2.675.299 358.326 13,4%
(in euros per share)
IFRS NAV 56,9 56,3 0,7 1,2%
EPRA NAV 59,3 58,3 1,0 1,7%
Share price 108,4 93,4 15,0 16,0%
Premium/Discount with regard to EPRA NAV 82,9% 60,3% 22,6% n.r.
(in euros x million)
Fair value of the portfolio (including solar panels)1
2.987,5 2.669,8 317,7 11,9%
Debts and liabilities included in the gearing ratio 1.660,4 1.374,3 286,1 20,8%
Balance sheet total 3.034 2.675 358 13,4%
Gearing ratio (IFRS) 54,8% 51,5% 3,3% n.r.
Gearing ratio (proportional)2
55,1% 53,1% 2,0% n.r.1 Including the proportional share of WDP in the portfolio of WDP Luxembourg (55%).2 For the method used in the calculation of the gearing ratio, refer to the RD on Regulated real Estate Companies.
Key ratios 30.06.2018 31.12.2017 ∆ y/y (abs.) ∆ y/y (%)

Press release – 1 August 2018
15
Property portfolio12
According to independent property experts Stadim, JLL, Cushman & Wakefield, CBRE and
BNP Paribas Real Estate, the fair value13 of the WDP property portfolio according to IAS
40 amounted to 2,874.8 million euros on 30 June 2018, compared to 2,567.4 million
euros at the start of the financial year (including the Assets held for sale). Together with
the valuation at fair value of the investments in solar panels14, the total portfolio value
grew to 2,987.5 million euros compared to 2,669.8 million euros at 2017 year-end.
This value of 2,874.8 million euros includes 2,593.5 million euros in completed properties
(standing portfolio). The projects under development account for a value of 167.7 million
euros. In addition, WDP also holds land reserves in places such as Courcelles, Heppignies,
Bleiswijk, ’s-Hertogenbosch and Schiphol and the land bank in Romania, at a fair value
of 113.6 million euros.
The investments in solar panels were valuated at a fair value of 112.7 million euros as at
30 June 2018.
The overall portfolio is valuated at a gross rental yield of 7.1%15. The gross rental yield
after deduction of the estimated market rental value for the unleased parts is 6.9%.
Shareholders’ equity
The group’s shareholders’ equity (IFRS) amounted to 1,281.2 million euros on 30 June
2018, compared to 1,238.4 million euros at the end of 2017.
The shareholders’ equity excluding the fair value of the financial assets and liabilities
(excluding amongst others the cumulative mark-to-market (M-t-M) value of the interest
rate hedges and which is included in IFRS shareholders’ equity), amounted to 1,327.6
million euros on 30 June 2018, compared to 1,281.3 million euros at 2017 year-end. This
increase is a consequence of the capital base growth thanks to profit generation during
2018, the payment of the dividend for the 2017 financial year and the capital increase
following the optional dividend. In addition, the property portfolio also enjoyed value
growth, as estimated by the independent experts.
NAV per share
The EPRA NAV per share amounted to 59.3 euros on 30 June 2018. This marks an
increase of 1.0 euros compared to an EPRA NAV per share of 58.3 euros on 31 December
2017 as a consequence of the profit generation, dividend pay-out and revaluation of the
12 Under IFRS 11 Joint arrangements, the joint ventures (mainly WDP Luxembourg, in which WDP retains 55%) are incorporated using the equity accounting method. WDP’s share in the portfolio of WDP Luxembourg (55%) appears in the statistics in the reporting on the portfolio. 13 For the precise valuation method used, please refer to the BE-REIT press release dated 10 November 2016. 14 Investments in solar panels are valuated in compliance with IAS 16 by applying the revaluation model. 15 Calculated by dividing the annualised contractual gross (cash) rents and the rental value of the unleased parts by the fair value. The fair value is the value of the investment properties after deduction of transaction costs (mainly transfer tax).

Press release – 1 August 2018
16
portfolio. The IFRS NAV per share16 came to 56.9 euros on 30 June 2018, compared to
56.3 euros on 31 December 2017.
Debt
The total (long-term and short-term) financial debts had increased to 1,601.9 million
euros by 30 June 2018, compared to 1,349.8 million euros at the end of December 2017,
mainly due to the consolidation in full of the Romanian entity. The short-term financial
debt of 224 million euros mainly includes the traditional commercial paper programme
(193 million euros).
The balance sheet total rose from 2,675.3 million euros on 31 December 2017 to 3,033.6
million euros by the end of June 2018. The gearing ratio came to 54.8%/55.1%
(IFRS/proportionate) on 30 June 2018, compared to 51.5%/53.1% (IFRS/proportionate)
on 31 December 2017.
The weighted average term of WDP’s outstanding financial debts on 30 June 2018 was
4.3 years17. If only the total drawn and undrawn long-term loans are taken into account,
the weighted average term amounts to 4.6 years18. On 30 June 2018, the total amount
of undrawn and confirmed long-term credit facilities was approx. 160 million euros19.
The average cost of debt was 2.3% in the first half of 2018. The Interest Coverage Ratio20
is equal to 4.7x for the same period, compared to 4.9x for the entire 2017 financial year.
The hedge ratio21, which measures the percentage of financial debt with a fixed or
floating interest rate and subsequently hedges this by means of Interest Rate Swaps
(IRS), comes to 87%, with a weighted average hedged term of 7.4 years.
3.4 Transactions and realisations
Occupancy rate and leasing activity
On 30 June 2018, the portfolio achieved an occupancy rate of 97.3%, compared to 97.4%
at the end of 2017. Out of the 10% of lease contracts reaching their next expiry date in
2018, 95% have already been extended (compared to 47% at the start of the year). This
reaffirms the trust customers have in WDP.
16 The IFRS NAV is calculated as shareholders’ equity as per IFRS divided by the total number of shares entitled to dividend on the balance sheet date. This is the net value according to Belgian GVV/SIR legislation. 17 Including the short-term debts, these mainly consist of the commercial paper programme, which is fully hedged with backup facilities. 18 For some credits, at the request of the company, the lender may decide to extend the credit by means of an extension option. If this option is exercised every time, the weighted average maturity of long-term loans will be 5.0 years. 19 Excluding the credit facilities to hedge the commercial paper programme. 20 Defined as operating result (before result on the portfolio), divided by interest charges, minus interest and dividends collection, minus compensation for financial leasing and others. 21 Hedge ratio: percentage of fixed-rate and floating-rate debts hedged against interest rate fluctuations by means of derivatives. This economic parameter is not an obligatory parameter under the Belgian Regulated Real-Estate Investment Companies Act (the ‘GVV/SIR Act’).

Press release – 1 August 2018
17
Acquisitions and divestments
3.4.2.1 Acquisitions
The first half of 2018 saw the completion of several acquisitions, with a total investment
volume of 33 million euros and a total surface of 71,000 m². All of these acquisitions
were made at prices in line with the fair value determined in the valuations from the
independent property experts. WDP generates an overall gross initial rental yield of
approx. 9.8%22 on this.
Acquisitions completed during the second quarter of 2018
Belgium
ZELLIK, BROEKOOI 170: acquisition of a site of some 14,000 m² for redevelopment in
the immediate vicinity of WDP sites for companies such as Antalis and Euro Pool
System. The investment budget amounts to around 7 million euros.
Romania
TIMISOARA (6): multi-tenant site for among others, Procter & Gamble, totalling
approx. 37,000 m². Thanks to this site’s location on the existing WDP properties in
Timisoara, WDP will be ready to capitalise on potential future demand for additional
real estate from existing and/or new customers. The investment budget amounts to
around 21 million euros.
Summary of all acquisitions during 2018
22 Excluding land reserve.
NEW
NEW
Tenant Lettable
area (in m²)
Investment
budget
(in million euros)
BE Zellik land reserve 14.000 7
BE 14.000 7
RO Brasov (2) Flenco 20.000 5
RO Timisoara (6) Procter & Gamble / various 37.000 21
RO 57.000 26
71.000 33
Location
Total

Press release – 1 August 2018
18
3.4.2.2 Disposals
LEUVEN, VAART 25-35: anticipating the need for more housing in this part of the city,
WDP entered into a partnership agreement with project developer L.I.F.E. to convert the
existing Hungaria building into a residential tower block. I Love Hungaria is slated for
phased completion starting in the spring of 2019. As part of this project, WDP is selling
this site, in collaboration with L.I.F.E.23 67% of the surface area has already been sold.
The site in MEER and part of the site in ANDERLECHT were also sold during the first half
of 2018. An amount of 17.9 million euros in Assets held for sale is currently recognised
in the balance sheet. This involves a building in Puurs, another part of the non-strategic
site in Anderlecht, the site in Aix-en-Provence and part of the site in Leuven.
Projects completed during the first half of 2018
As announced, WDP successfully delivered the following pre-leased projects during the
first half of 2018, for a total surface area of 107,100 m². The initial gross rental yield for
all of these completed projects is 7.3%, with an investment budget of approx. 70 million
euros.
23 See the press release from 30 April 2015.
Tenant Delivery
date
Lettable
area (in m²)
Investment
budget
(in million euros)
NL Bleiswijk, Spectrumlaan 29 Total Exotics 1Q18 4.000 7
NL Bleiswijk, Spectrumlaan 31 Misi 1Q18 7.000 7
NL Echt, Fahrenheitweg Dick Vijn 2Q18 14.000 10
NL Moerdijk, Energieweg 4 Gondrand Traffic 2Q18 18.000 18
NL 43.000 41
RO Aricestii Rahtivani Kamtec 1Q18 4.500 3
RO Oarja (3) Ceva Logistics 2Q18 29.000 10
RO Oradea (1) Kuehne + Nagel 1Q18 4.000 2
RO Paulesti (1) Global Enterprises International 2Q18 4.800 3
RO Ramnicu Valcea (3) Faurecia 1Q18 4.800 3
RO Timisoara (2) TE Connectivity Solutions 1Q18 8.000 4
RO Timisoara (3) Mömax 1Q18 3.000 2
RO Timisoara (4) 360 Co-Packing 1Q18 6.000 2
RO 64.100 29
Total 107.100 70
Location

Press release – 1 August 2018
19
Projects under development
WDP expects the total of projects under development (representing an investment
volume of 301 million euros24) and boasting a total surface area of 401,200 m², to
generate an initial gross rental yield of around 6.9%.
3.4.4.1 Projects identified during the second quarter of 2018
The Netherlands
BLEISWIJK, PRISMAPARK: new construction project with a surface area of around
8,000 m² slated for delivery during the second quarter of 2019. This warehouse will
be leased by fruit and vegetable specialist Hoogsteder Group, a subsidiary of The
Greenery, under a ten-year lease. WDP projects an investment budget of approx. 6.5
million euros to complete this project.
HEERLEN, EARL BAKKENSTRAAT: CEVA Logistics wants to expand an existing surface
at this site. This will involve expansion of the existing warehouse by approx. 13,000
m² (delivery scheduled for: Q4 2018). The lease contract for this extension will have
a term of three and a half years. WDP projects an investment budget of some 6 million
euros.
Romania
BRASOV (3): Inter Cars is expanding its current warehouse by some 3,000 m² of
additional truck parking, under a seven-year lease. Delivery of this expansion is slated
for the third quarter of 2018. The investment budget for WDP is approx. 2 million
euros.
BUCHAREST (6): WDP has broken ground on a site of approx. 2,500 m² for Kitchen
Shop. This new construction project will be delivered during the second quarter of
2019, with investment budget of approx. 1.5 million euros. Kitchen Shop will occupy
the site under a ten-year lease.
24 Cost to come: 154 million euros.
NEW
NEW
NEW
NEW

Press release – 1 August 2018
20
3.4.4.2 Summary of all projects under development
The table below gives a complete list of all projects currently under development.
Sustainability
Tenant Delivery
date
Lettable
area (in m²)
Investment
budget
(in million euros)
BE Heppignies, rue de Capilône 6 Trafic 4Q18 15.000 8
BE Tongeren, Heersterveldweg 17 GLS 4Q19 5.000 8
BE 20.000 16
LU Bettembourg (Eurohub Sud) Auchan + Innovation First 4Q18 25.000 11
LU 25.000 11
NL Amsterdam, Kaapstadweg DHL 4Q18 14.000 14
NL Arnhem, Bedrijvenpark Ijsseloord 2 Bunzl 1Q19 20.250 18
NL Barendrecht, Dierensteinweg 30 (C-D) The Greenery 1Q19 23.700 10
NL Bleiswijk, Maansteenweg/Spectrumlaan (1) Mediq 3Q18 25.000 13
NL Bleiswijk, Maansteenweg/Spectrumlaan (3) Toolstation 3Q18 11.900 9
NL Bleiswijk, Maansteenweg/Spectrumlaan (4) Konings-Zuivel 1Q19 8.000 6
NL Bleiswijk, Maansteenweg/Spectrumlaan (5) Hoogsteder 2Q19 8.000 7
NL Heerlen, Earl Bakkenstraat (2) Ceva Logistics 4Q18 13.000 6
NL Heinenoord, Bedrijvenpark Hoekse Waard VCKG Holding, New Corp Logistics 4Q18 22.075 18
NL Rotterdam, Bedrijvenpark Oudeland Synergy foods 4Q19 6.675 7
NL Schiphol Logistics Park Rapid Logistics 4Q18 17.000 24
NL Solar Various 4Q18 10 MWp 10
NL Tiel, De Diepert 5 Kuehne + Nagel 4Q18 12.000 16
NL Veghel, Marshallweg 2 Kuehne + Nagel 4Q18 35.000 26
NL Zwolle wehkamp 4Q18 25.000 24
NL 241.600 206
RO Brasov (3) Inter Cars 3Q18 3.000 2
RO Bucharest (4) Aquila Part Prod Com 3Q18 24.000 15
RO Bucharest (5) Sarantis Romania 4Q18 10.000 6
RO Bucharest (6) Kitchen Shop 2Q19 2.500 2
RO Cluj-Napoca (3) Profi 3Q18 11.000 10
RO Constanta Vestas ceu Romania 3Q18 2.300 1
RO Oarja (4) Ceva Logistics 3Q18 18.000 5
RO Oradea (2) Inteva Products Salonta 3Q18 16.000 8
RO Paulesti (2) Production company 3Q18 8.800 7
RO Sibiu (3) Aeronamic Eastern Europe 2Q19 4.000 4
RO Timisoara (5) 360 Co-Packing 3Q18 15.000 8
RO 114.600 68
Total 401.200 301
Location

Press release – 1 August 2018
21
Solar panel project in the Netherlands
Currently, the second phase of the solar panel project in the Netherlands is in execution,
for a total investment of approx. 25 million euros and a total additional capacity of 25
MWp by the end of 201925. After delivery, WDP will have a total installed capacity of 85
MWp in its solar power portfolio. Over the medium-term, WDP will strive for a total PV
portfolio of 100 MWp. This is the equivalent of the electricity needs of a city comprising
more than 25,000 families.
Energy monitoring system for the entire property portfolio
WDP and energy management specialist NanoGrid have signed an agreement to fit all
WDP warehouses out with energy monitoring systems by the end of 2018. This energy
monitoring system can optimise customer consumption, which in turn provides savings
on power bills.
Green finance framework
WDP recently issued a green bond as part of the newly implemented green financing
programme. This green finance framework supports the company in its green activities,
such as investments in alternative energy and measures to improve the energy efficiency
of the property portfolio, striving to minimise and to compensate the possible negative
impact on the environment.26
Strong foundation for growth in Romania
As previously announced, WDP has reinforced its capital in WDP Development RO by
converting a subordinated shareholder’s loan into shareholders’ equity, to enable
further growth in the Romanian property portfolio. This structure ensured that the
ownership ratio between the two shareholders, WDP/Jeroen Biermans, changed from
51/49 to 80/20 as at January 2018. Due to this new partnership between the
shareholders and the corresponding shareholdings, WDP will fully consolidate this
activity in its IFRS statements as from 1 January 2018, whereas this was previously
incorporated using the equity accounting method.
This has laid the groundwork for using additional financing from the WDP group to grow
the Romanian property portfolio to a value of 500 million euros by 2020.
This change will not have any impact on operations. Jeroen Biermans remains General
Manager in Romania and a motivated shareholder. Along with his team, he will facilitate
operations in Romania and growth to 500 million euros.
25 Up until now, several commercial agreements have been signed, representing a capacity of 10MWp. 26 All information with respect to this green finance framework, together with an independent opinion are available on www.wdp.eu/green-bond.

Press release – 1 August 2018
22
Changes in policy regarding Dutch REIT status
The Dutch October 2017 Government coalition agreement stated the intention that FBIs,
including WDP through its subsidiary WDP Nederland N.V., will no longer be allowed to
invest directly in Dutch real estate from 2020 onwards, due to the planned abolishment
of the dividend withholding tax (DWT). We expect more clarity on this subject by mid-
September 2018, as part of the Government tax budget for 2019.
Since 35+ countries worldwide, including most of the G20 countries, have existing REIT
legislation in place and more countries are actively considering the introduction of a REIT
regime to foster sustainable investments in infrastructure and real estate, this possible
amendment is against the trend as stated before.
Moreover, non-listed real estate FBI’s are able to restructure themselves and can, in
doing so, potentially maintain tax transparency. This creates an uneven playing field and
is probably an unforeseen, but damaging, side effect of the DWT plans.
We continue to believe that this issue can still be resolved. Our efforts are aimed at
resolving this issue in collaboration with our peers.
In addition, WDP was in talks with the Dutch tax authorities, which have indicated to
WDP that as a shareholder in WDP Nederland N.V., which has the FBI status, it is subject
to a new shareholder test (the conditions depend on factors such as activities and
shareholder structure), by which WDP itself could be considered as an FBI. In the context
of the above, the talks between WDP and the Dutch tax authorities to examine the
specific path forward here – the company believes that it should be able to pass this
shareholder test and that it will be able to reach reasonable agreements with the Dutch
tax authorities – have been suspended.27
27 For information purposes, WDP estimates the difference between the fiscally transparent status of an FBI and the normal taxation regime (pro forma) to be no more than 3% of current EPRA Earnings per share and will in any case not be applied retroactively.

Press release – 1 August 2018
23
3.5 Management of financial resources
Financial key figures
Debt structure
Breakdown
On 30 June 2018, the total outstanding consolidated financial debt came to 1,601.9
million euros. This amount breaks down as follows:
963.9 million euros in traditional bilateral medium and long-term bank loans,
distributed across 14 banks;
193.0 million euros in commercial paper28;
Net financial debt (in million euros) 1.601 1.349
Debt and liabilities included in the gearing ratio (in million euros) 1.660 1.374
Balance sheet total (in million euros) 3.034 2.675
Gearing ratio (IFRS) (in %) 54,8 51,5
Gearing ratio (proportional) (in line with the GVV/SIR Royal Decree)1
55,1 53,1
Interest Coverage Ratio2 (in x) 4,7 4,9
Average cost of debt (in %) 2,3 2,6
Average remaining term of outstanding debts (in years) 4,3 4,1
Average remaining term of long-term credit facilities (in years) 4,6 4,5
Hedge ratio3 (in %) 87 91
Average remaining term of interest rate hedges4 (in year) 7,4 7,6
4 Remaining term of debt at fixed rate and interest rate hedges entered into to hedge the debt against interest rate fluctuations.
Key financial data 30.06.2018 31.12.2017
1 For the method used in the calculation of the gearing ratio, refer to the RD on Regulated Real Estate Companies.2 Defined as operating result (before result for the portfolio) divided by interest changes, minus interest and dividends collection, minus
compensation for financial leasing and others. 3Percentage of fixed-rate and floating-rate debts hedged against interest rate fluctuations by means of derivatives. This economic
parameter is not an obligatory parameter under the Belgian Regulated Real-Estate Investments Companies Act (Wet betreffende de
Gereglementeerde VastgoedVennootschappen or GVV-Wet).

Press release – 1 August 2018
24
425.8 million euros in bond loans;
12.4 million euros in straight loans;
6.8 million euros in lease debts.
Maturity dates
The bulk of the debt instruments used are bullet type instruments, which implies that
over the term, interest liabilities are due on the principal sum and that full repayment of
the capital is due on the final expiry date. 14% of the debts involve short-term liabilities
(mainly straight loans and commercial paper), the other 54% have a maturity of more
than one year and 32% of that expires after more than five years.
The weighted average term of WDP’s outstanding financial debts on 30 June 2018 was
4.3 years29. If only the total drawn and undrawn long-term credits are taken into account,
the weighted average term amounts to 4.6 years30. At 2017 year-end, this was 4.1 and
4.5 years, respectively.
On 30 June 2018, the total amount of undrawn and confirmed long-term credit facilities
amounted to approx. 160 million euros31. Regarding the maturity dates of the long-term
debts in 2018, these respective credit facilities have all been extended.
1 For some credits, at the request of the company, the lender may decide to extend the credit by means of an extension opt-in. In the case of a minimum term, it is assumed that these extension options are not exercised; in the case of a maximum term, it is assumed that they are exercised each time.
29 Including the short-term debts, these mainly consist of the commercial paper programme, which is fully hedged with backup facilities. 30 For some credits, at the request of the company, the lender may decide to extend the credit by means of an extension option. If this option would be executed every time, the weighted average term of long-term credits amounts to 5.0 years. 31 Excluding the credit facilities to hedge the commercial paper programme.
DEBT MATURITY DATES (MINIMUM TERM)1
DEBT MATURITY DATES (MAXIMUM TERM)1

Press release – 1 August 2018
25
Hedges
The hedge ratio, which measures the percentage of financial debts with a fixed or
floating interest rate that are subsequently hedged by means of Interest Rate Swaps
(IRS), comes to 87%, with a weighted average hedged term of 7.4 years.
WDP’s weighted average cost of debt amounts to 2.3% for the first half-year of 2018,
including credit margins, reservation fees for undrawn credit facilities and the cost of
hedging instruments. The average cost of debt amounted to 2.6% in 2017. The Interest
Coverage Ratio is equal to 4.7x for the first half of 2018, compared to 4.9x for the entire
2017 financial year.
Implementation of the financing strategy
Issue of 100 million euros in green bonds in a US private placement
In late March 2018, WDP concluded an agreement with a single US investor
(MetLife Inc.) to issue a US private placement with an eleven-year term for a
total of 100 million euros (with extension option), with a coupon of 2.62%. The
issue took the form of green bonds that will only be used to finance or refinance
WDP’s eligible sustainable assets.
New credit facility
During the first half of 2018, WDP secured an additional credit line of 57 million
euros.
Financial risks
In 2018, WDP has again continuously monitored the potential impact of financial risks
and has taken the necessary measures to manage these risks. These involve the
counterparty risk (insolvency or credit risks with financial partners), liquidity risk (the
non-availability of financing or very costly financing options) and risks relating to interest
rates, budget, contractual agreements and exchange rates.
EVOLUTION HEDGE RATIO

Press release – 1 August 2018
26
For a detailed overview of financial and other risks, their limiting factors and control, see
Chapter 1. Risk factors.
3.6 Outlook
WDP confirms its forecast of an EPRA Earnings per share of 6.00 euros in 2018, an
increase of 7% over 2017. This increase is less than the +10% increase in the first half of
2018 because last year, the completed projects mainly started contributing to the result
starting in the second quarter of 2017, as well as the positive one-off impact in Q4 2017
related to the setting up of a deferred tax asset for the Romanian activities. Excluding
the latter, the underlying increase of the envisaged EPRA Earnings per share for H2 2018
is +8%. Based on this outlook, WDP intends to set a gross dividend of 4.80 euros for 2018,
payable in 2019, also marking an increase of 7%, based on a low pay-out ratio.32
The main driving force behind this is the strong portfolio growth in 2017 thanks to
several acquisitions, pre-leased new construction projects and solar power projects,
which will contribute to the result in full in 2018. In addition, WDP currently holds a
strong project development pipeline of approx. 400,000 m² and a projected investment
of around 300 million euros, which will also contribute to the 2018 result. Moreover, as
at 1 January 2018, WDP has fully consolidated its Romanian entity, increasing its holding
from 51% to 80%, which in financial terms boils down to an acquisition of some 80 million
euros33.
In 2018, 10% of the contracts will reach their next maturity date, 95% of which have
already been extended. Based on information currently available and the current rental
market situation, WDP projects a minimum average occupancy rate of 97% for 2018.
The projected growth in 2018 based on continued execution of the project development
pipeline takes into account a forecast gearing ratio of around 54% for 2018 year-end and
an average cost of debt of 2.4%. WDP still aims for a gearing ratio of between 55 and
60% over the medium term34.
32 These profit forecasts are based on the current situation, barring presently unforeseen circumstances (such as a substantial deterioration in the economic and financial climate), and a normal number of hours of sunshine. 33 Calculation based on the overall portfolio (including solar panels) of WDP Development RO of 280 million euros (80% - 51%) as at 31 December 2017. 34 In principle, in order to reinforce shareholders’ equity, growth plan financing based on a constant capital structure takes into account retained earnings, optional dividends and contributions in kind. The debt component factors in traditional credit facilities and bond issues.

Press release – 1 August 2018
27
4. Shares and bonds
4.1 The share
Price and volume
EURONEXT IPO: 28/06/1999 Listing: continuous ISIN code: BE0003763779 Liquidity provider: Kempen & Co
31 DEC. 17
Number of shares in circulation on closing date 22.506.602 22.009.277 21.326.043
Free float 75% 75% 74%
Market capitalisation (in euros) 2.439.715.657 2.056.326.750 1.810.367.790
Traded volume in shares 2.802.037 4.990.398 5.456.690
Average daily volume (in euros) 2.268.761 1.776.938 1.749.796
Free float velocity1
33,2% 30,4% 34,5%
Stock exchange price
highest 109,80 98,04 93,87
lowest 93,30 82,09 69,85
closing 108,40 93,43 84,89
EPRA NAV (IFRS)2 (in euros) 59,3 58,3 51,2
IFRS NAV3 (in euros) 56,9 56,3 48,4
Dividend payout ratio n.r. 82% 90%
EPRA Earnings/share4 (in euros) 2,94 5,60 5,30
EPRA Earnings/share5 (in euros) 2,89 5,52 4,72
Gross dividend/share (in euros) n.r. 4,50 4,26
Net dividend/share (in euros) n.r. 3,15 2,98
2EPRA NAV: this is the NAV that was adjusted to include properties and other investments at their fair value and exclude certain line items
that are not expected to take shape in a business model with property investments over the long term. See also www.epra.com.
4 On the basis of the pro-rata-temporis basis for the weighted average number of shares over the period.5 On the basis of the number of shares entitled to dividend at the end of each period.
Figures per share 30 JUN. 18 31 DEC.16
1 The number of shares traded per half-year divided by the total number of free float shares at the end of term and then extrapolated to a
term of twelve months.
3 IFRS NAV: the IFRS NAV is calculated as shareholder equity as per IFRS divided by the number of dividend-entitled shares on the balance
sheet date. It pertains to the net value according to GVV/SIR legislation.

Press release – 1 August 2018
28
Long-term price trend and return
4.2 Bonds
Listed bonds
Unlisted bonds
SHARE PRICE VERSUS EPRA NAV
WDP SHARE RETURN VERSUS
EPRA INDEXES
Emittent ISIN code
Nominal
amount
(in million
euros)
Term
(in years) Maturity date Coupon Issue price
Indicative price
30 JUN. 18
WDP Comm. VA BE0002248178 37,1 10 1 April 2026 2,50% 100,0% 100,9%
WDP Comm. VA BE0002249184 22,9 10 1 April 2026 Euribor 3M + 2,00% 100,0% 100,0%
WDP Comm. VA BE0002234038 54,4 7 2 July 2022 2,50% 99,4% 102,4%
WDP Comm. VA BE0002235043 37,8 7 2 July 2022 Euribor 6M + 1,75% 100,0% 99,0%
WDP Comm. VA BE0002216829 125,0 7 13 June 2021 3,38% 101,9% 105,6%
WDP Comm. VA BE0002192582 50,0 7 18 March 2020 3,80% 99,9% 103,9%
Emittent ISIN code
Nominal
amount
(in million
euros)
Term
(in years) Maturity date Coupon Issue price
Indicative price
30 JUN. 18
WDP Comm. VA n.r. 100,0 11 29 March 2029 2,62% 100,0% n.r.

Press release – 1 August 2018
29
4.3 Shareholding
4.4 Financial calendar
26 October 2018 Publication of Q3 2018 results
1 February 2019 Publication of 2018 annual results
24 April 2019 Annual General Meeting
25 April 2019 Ex-dividend date 2018
26 April 2019 Dividend record date 2018
Free float 16.867.293 74,94%
BlackRock-related companies 659.847 29.12.2016 2,93%
Other shareholders under the statutory treshold116.207.446 19.05.2017 72,01%
Family Jos De Pauw (reference shareholder)2
5.639.308 22.05.2018 25,06%
De Pauw NV21 29.12.2017 0,00%
Total 22.506.602 100,00%
2 On 26 October 2012, the reference shareholder, the Jos De Pauw family, assigned all of its shares, held in joint ownership, in joint
ownership under the family company structure RTKA, which institutionalised the existing joint ownership. The holders of voting rights are
the members of the Management Body of the management body RTKA, namely Robert, Tony, Kathleen and Anne De Pauw, to the exclusion
of all other right holders in respect to the participation. Members of this Board of Directors act in mutual consultation with De Pauw NV,
which is fully controlled by the members of RTKA’s Board of Directors. This table shows the reference shareholder’s shareholding at present.
Shareholding
Number of
shares (declared)
Date of the
statement (in %)
1 The number of publicly held shares was determined under the assumption that the total number of shares retained by shareholders
obligated to report major holdings by virtue of the Belgian Act of 2 May 2007 on disclosure of major holdings in issuers whose shares are
admitted for trading on a regulated market and with various provisions has not changed since their most recent declaration of transparency.

Press release – 1 August 2018
30
5. Property report
5.1 Review of the consolidated property portfolio35
Description of the portfolio as at 30 June 2018
The independent property experts Stadim, JLL, Cushman & Wakefield, CBRE and BNP
Paribas Real Estate estimated the fair value36 of the WDP property portfolio (including
Assets held for sale and excluding solar panels) in accordance with IAS 40 at 2,874.8
million euros as at 30 June 2018. The fair value at the end of 2017 amounted to 2,567.4
million euros.
The portfolio breaks down as follows:
35 WDP’s share in the portfolio of WDP Luxembourg (55%) appears in the statistics in the reporting on the portfolio. 36 Impact on fair value of estimated transaction costs resulting from hypothetical disposal of investment properties (-): these are the transfer costs to be paid in the event of a hypothetical disposal of the investment properties. The fair value at which the investment properties are valuated consists of the investment value minus the transaction costs. The average theoretical local transfer taxes deducted from the investment value are as follows for the different countries: Belgium: 2.5%, Netherlands: 6.1%, France: 5.1%, Luxembourg: 7.0% and Romania: 1.5%.
BREAKDOWN OF THE FAIR VALUE OF THE PORTFOLIO BY DESIGNATED USE
GEOGRAPHICAL BREAKDOWN
OF THE FAIR VALUE OF THE
PORTFOLIO
Luxembourg
Existing buildings 993,9 1.223,9 114,5 231,5 11,8 2.575,6
Investment properties under development for own account with
the purpose of being rented out
11,0 92,6 0,0 59,5 4,6 167,7
Land reserves 16,9 49,4 0,5 46,7 0,0 113,6
Assets held for sale 9,0 0,0 8,9 0,0 0,0 17,9
Total 1.030,8 1.365,9 123,9 337,7 16,4 2.874,8
TotalFair value (in million euros) Belgium Netherlands France Romania

Press release – 1 August 2018
31
Changes in fair value during the first half of 2018
In the first half of 2018, WDP invested in new acquisitions, for a total amount of 156.5
million euros (including the increase of the stake of WDP Development RO). In addition,
120.4 million euros were invested for the completion of pre-leased projects for own
account. Furthermore, 0.9 million euros in property was sold.
HISTORIC GROSS RENTAL YIELD OF THE WDP PORTFOLIO
Luxemburg
Number of lettable sites 77 81 9 1 19 187
Gross lettable area (in m²) 1.741.761 1.755.517 197.098 14.772 434.147 4.143.295
Land (in m²) 3.414.080 3.409.322 471.358 28.507 3.241.853 10.565.120
Fair value (in million euros) 1.030,8 1.365,9 123,9 16,4 337,7 2.874,8
% of total fair value 36% 48% 4% 1% 12% 100%
% change in fair value for S1 2018 1,0% 1,4% 2,1% 6,9% 1,0% 1,3%
Vacancy rate (EPRA)1,2 5,6% 1,0% 6,4% 0,0% 0,0% 2,9%
Average lease length till first break (in y)2 4,3 6,4 4,3 1,5 9,1 5,8
WDP gross initial yield3 7,1% 6,8% 6,8% 7,9% 8,3% 7,1%
Effect of vacancies -0,4% -0,1% -0,4% 0,0% 0,0% -0,2%
Adjustment gross to net rental income (EPRA) -0,3% -0,2% -0,1% -0,7% -0,2% -0,2%
Adjustments for transfer taxes -0,2% -0,4% -0,3% -0,5% -0,1% -0,3%
EPRA net initial yield1 6,3% 6,1% 6,1% 6,8% 8,0% 6,3%1 Financial performance indicator calculated according to EPRA's (European Public Real Estate Association) Best Practices Recommendations. Please see www.epra.com.
3 Calculated by dividing the annualised contractual gross (cash) rents and the rental value of the unlet properties by fair value. The fair value is the value of the property
investments after deduction of transaction costs (mainly transfer tax).
Portfolio statistics by country Belgium Netherlands France Romania Total
2 Excluding solar panels.

Press release – 1 August 2018
32
The change in the valuation of the investment properties amounted to an additional
+35.3 million euros during the first half of 2018. The gross rental yield based on the
contractual rents, after addition of the estimated market rental value of the unleased
parts, is 7.1% as at 30 June 2018, stable compared to 7.1% at the end of 2017.
Value and composition of the rental portfolio
The total surface area comprises 1,056.5 hectares, including 77.7 hectares granted in
concession. The balance of 978.8 hectares has a fair value of 941.0 million euros, or 33%
of the total fair value. This gives an average land value of 96 euros/m², excluding
transaction costs. This area also includes the land reserves, particularly in Belgium, the
Netherlands and Romania.
Warehouses 3.292.250 142,6 43,3 80%
Offices adjacent to warehouses 291.210 25,5 87,4 14%
Commercial space 11.163 0,3 29,6 0%
Various uses (mixed-use areas, parking facilities and
filing space)
580.532 10,5 18,0 6%
Total 4.175.154 178,8 42,8 100%
Designated use at 30 JUN. 18
Built surface
(in m²)
Estimated rental
value (in million
euros)
Estimated rental value
per m² (in euros)
% of total
rental value
BREAKDOWN OF PROPERTY PORTFOLIO BY PROPERTY QUALITY TYPE (BASED ON FAIR VALUE)
BREAKDOWN OF PROPERTY
PORTFOLIO BY PROPERTY TYPE
(BASED ON FAIR VALUE)
Press release – 1 August 2018
33
Rental situation of the available buildings
The occupancy rate of the WDP portfolio amounted to 97.3% on 30 June 2018, compared
to 97.4% at the end of 2017 (including solar panels)37. This attests to the success of
WDP’s commercial strategy, which aims to develop long-term relationships with clients
and supports the company’s performance with a high operating margin.
WDP’s practice of building long-term partnerships together with its clients is also
reflected in the fact that the average residual term to the expiry date of a lease contract
is 7.1 years. When the first termination date is taken into account, the average remaining
term is 5.8 years.
If income from solar panels is taken into account, the average remaining term to the final
expiry date is 7.5 years. When the first termination date is taken into account, the
average remaining term is 6.0 years.
37 Excluding solar panels, the occupancy rate is 97.1%.
HISTORICAL OCCUPANCY RATE OF THE WDP PORTFOLIO (INCLUDING SOLAR PANELS)

Press release – 1 August 2018
34
LEASE EXPIRY DATES (UNTIL EARLIEST TERMINATION DATE)
TOP-10 TENANTS RENTAL INCOME AS AT 30
JUNE 2018 BY TENANT
CATEGORY
Press release – 1 August 2018
35
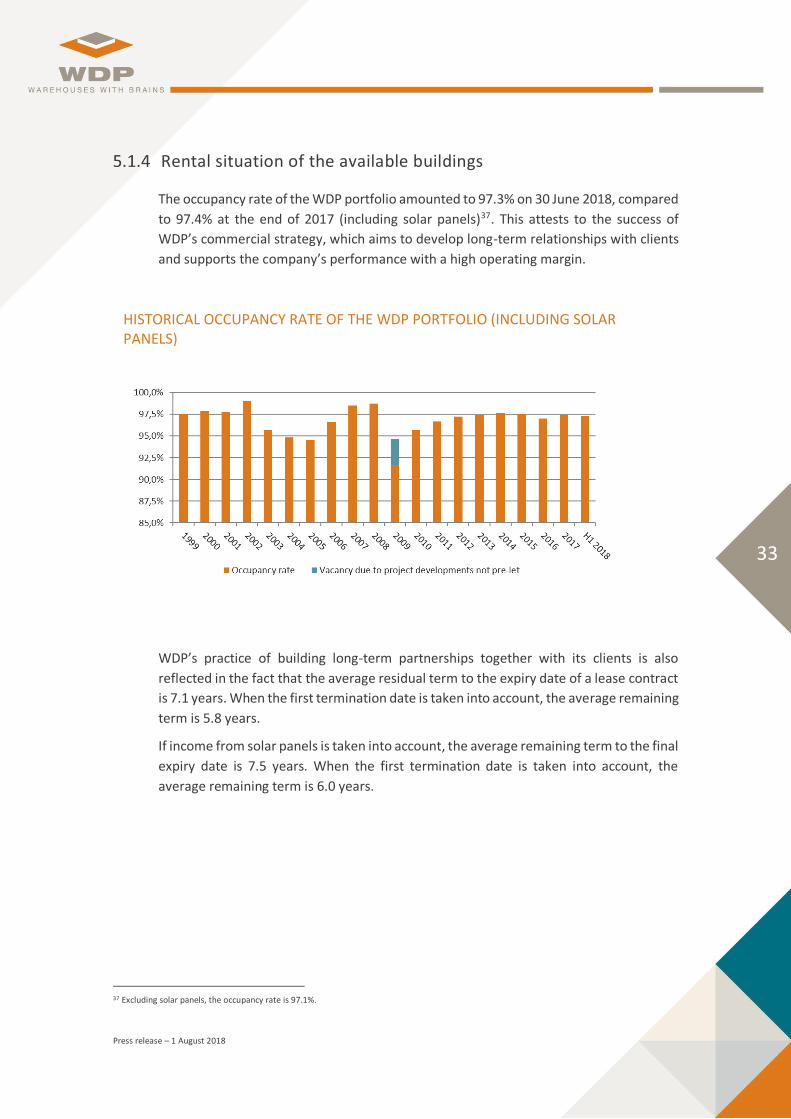
Overview of projects under development38
The anticipated out-of-pocket cost for completion of these projects is estimated at
approx. 301 million euros, approx. 147 million euros39 of which had already been spent
as at 30 June 2018. WDP expects to generate a weighted average return on the total
investment of around 6.9%.
38 See also 3.4.7 Interim management report – Transactions and realisations – Projects under development. 39 The indicated amount differs from the previously reported amount of 168 million euros due to a number of projects that will be sold and the value of the existing sites before the start of their redevelopment.
Heppignies, rue de Capilône 6 BE Development 15.000 4Q18 100% Trafic 8
Tongeren, Heersterveldweg 17 BE Development 5.000 4Q19 100% GLS 8
BE 20.000 16
Bettembourg (Eurohub Sud) LU Development 25.000 4Q18 100% Auchan, Innovation First 11
LU 25.000 11
Amsterdam, Kaapstadweg NL Development 14.000 4Q18 100% DHL 14
Arnhem, Bedrijvenpark Ijsseloord 2 NL Development 20.250 1Q19 100% Bunzl 18
Barendrecht, Dierensteinweg 30 (C-D) NL Development 23.700 1Q19 100% The Greenery 10
Bleiswijk, Maansteenweg/Spectrumlaan (1) NL Development 25.000 3Q18 100% Mediq 13
Bleiswijk, Maansteenweg/Spectrumlaan (3) NL Development 11.900 3Q18 100% Toolstation 9
Bleiswijk, Maansteenweg/Spectrumlaan (4) NL Development 8.000 1Q19 100% Konings-Zuivel 6
Bleiswijk, Maansteenweg/Spectrumlaan (5) NL Development 8.000 2Q19 100% Hoogsteder 7
Heerlen, Earl Bakkenstraat (2) NL Development 13.000 4Q18 100% Ceva Logistics 6
Heinenoord, Bedrijvenpark Hoekse Waard NL Development 22.075 4Q18 100% VCKG Holding, New Corp Logistics 18
Rotterdam, Bedrijvenpark Oudeland NL Development 6.675 4Q19 100% Synergy foods 7
Schiphol Logistics Park NL Development 17.000 4Q18 100% Rapid Logistics 24
Solar NL n.r. 10 MWp 4Q18 100% Various 10
Tiel, De Diepert 5 NL Development 12.000 4Q18 100% Kuehne + Nagel 16
Veghel, Marshallweg 2 NL Development 35.000 4Q18 100% Kuehne + Nagel 26
Zwolle NL Development 25.000 4Q18 100% wehkamp 24
NL 241.600 206
Brasov (3) RO Development 3.000 3Q18 100% Inter Cars 2
Bucharest (4) RO Development 24.000 3Q18 100% Aquila Part Prod Com 15
Bucharest (5) RO Development 10.000 4Q18 100% Sarantis Romania 6
Bucharest (6) RO Development 2.500 2Q19 100% Kitchen Shop 2
Cluj-Napoca (3) RO Development 11.000 3Q18 100% Profi 10
Constanta RO Development 2.300 3Q18 100% Vestas ceu Romania 1
Oarja (4) RO Development 18.000 3Q18 100% Ceva Logistics IV 5
Oradea (2) RO Development 16.000 3Q18 100% Inteva Products Salonta 8
Paulesti (2) RO Development 8.800 3Q18 100% Production company 7
Sibiu (3) RO Development 4.000 2Q19 100% Aeronamic Eastern Europe 4
Timisoara (5) RO Development 15.000 3Q18 100% 360 Co-Packing 8
RO 114.600 68
Total 401.200 100% 301 6,9%1 For the redevelopment projects, this does not factor in the value of the redevelopment projects before the start of the renovation. Taking into account the proportionate share
of WDP in the portfolio of WDP Luxembourg (55%).
Ten
ant
Inve
stm
ent
budg
et
(in m
illio
n eu
ros)
1
Pro
ject
ed y
ield
Co
untr
y
Type
Lett
able
are
a (e
n
m²)
Pro
ject
ed d
eliv
ery
Pre-
lea
sed

Press release – 1 August 2018
36
5.2 Review of the logistics property market in Belgium, Luxemburg, the Netherlands, France and Romania
Belgium and Luxembourg The logistics property market got off to a slow start in 2018. The epicentres for take-up
were the Antwerp-Brussels corridor and the Wallonia region – e.g. Trilogiport in Liège,
primarily driven by e-commerce activities. The leasing rate is in line with the five-year
average, with a higher vacancy rate for the Antwerp-Brussels axis. If we look at the
properties themselves, two striking trends are increased ceiling height (12.2 m) and
automation.
The Netherlands The Dutch logistics sector is one of the most active, mature and extensive in Europe,
supported by the region’s role as a logistics gateway and its high-quality infrastructure.
In line with past years, most sites are pre-leased custom-developments, which entails
further modernisation of the market. In general, existing properties enjoy a high
occupancy rate, with outliers in the logistics hubs around Amsterdam and Schiphol. The
investment volume in industrial properties has increased significantly in recent years.
France The first half of 2018 got off to a slower start than past years, though still beating the
historical average. It is mainly class-A buildings that are popular, along with a series of
newly delivered buildings. The number of newly developed sites will likely increase,
given the demand for more specialised sites, including prescriptions for specific types of
buildings, their environmental impact, etc. New properties are mostly purchased by
logistics service providers and retailers (e-commerce). Economic growth, diversified
demand from clients, new challenges driven by e-commerce and supply chain
optimisation are pushing companies to switch to new large-scale platforms. The average
rent for class-A buildings is stable, from 38 euros per m² in the Lille region to 53 euros
per m² in Île-de-France. Yields have dropped off slightly.
Romania Growth in the industrial sector in Romania and the increase in the number of property
developments come on the heels of sustained economic growth in this region. Further
expansion of roads and infrastructure offers an additional stimulus. The new buildings
are clustered around large cities like Bucharest, Timisoara, Brasov, Sibiu, Cluj, etc. Most
new property developments are pre-leased from the start by logistics service providers,
retailers and producers. The limited supply of space that is immediately available will
continue to stimulate construction of new warehouses in the future, and may result in
more frequent speculative projects. Sources: CBRE, BNP Paribas Real Estate, Cushman & Wakefield and JLL

Press release – 1 August 2018
37
5.3 Conclusions of the property experts
Dear Sirs,
We are pleased to present you with our estimate of the value of the property portfolio
of WDP Comm. VA as of 30 June 2018.
WDP appointed us as independent property experts to determine the investment value
and fair value of its property portfolio. Estimates were made taking into account both
the observations and definitions mentioned in the reports, and the guidelines of the
International Valuation Standards issued by the IVSC.
The fair value is defined in standard IAS 40 as the amount for which the property could
be exchanged between knowledgeable, willing parties in an arm’s length transaction.
IVSC deems these conditions to be met if the above-mentioned definition of market
value is respected. The market value must reflect the current lease contracts, the current
gross margin of self-financing (or cash flow), the reasonable assumptions relating to
potential rental income and the expected costs.
In this context, the transaction costs must be adjusted to the actual situation on the
market. The fair value is calculated by adjusting the investment value based on
customary transaction costs.
As property experts, we possess relevant and recognised credentials as well as up-to-
date experience with properties of a type and location similar to those of the properties
in WDP’s property portfolio.
In giving an estimate of the properties, we took into account both the current rental
agreements and all rights and obligations arising from these agreements.
Each property was valuated separately. The estimates do not account for any potential
capital gain that might be realised by offering the portfolio on the market in its entirety.
Our estimates also do not account for marketing costs specific to a transaction, such as
estate agents’ fees or publicity costs. In addition to an annual inspection of these
properties, our estimates are also based on the information provided by WDP regarding
the rental situation, surface areas, sketches or plans, rental charges and taxes associated
with each property concerned, compliance and environmental pollution. The
information provided was deemed accurate and complete. Our estimates assume that
undisclosed items are not such that they would affect the value of the property.
Each independent property expert is responsible for valuing the part of the portfolio that
was contractually assigned to him or her.
Based on the above statements, we can confirm that the fair value of the property
portfolio of WDP (excluding solar panels but including assets held for sale) on 30 June

Press release – 1 August 2018
38
2018 amounted to 2,874,784,552 euros (two billion, eight hundred and seventy-four
million, seven hundred and eighty-four thousand, five hundred and fifty-two euros)40.
Yours faithfully,
PHILIPPE JANSSENS
CEO | Stadim
ROD SCRIVENER
National Director | Jones Lang LaSalle
HERO KNOL
Director | CBRE Valuation & Advisory Services
FRANK ADEMA
International Partner | Head of Valuation & Advisory - the Netherlands | Cushman &
Wakefield
JEAN-CLAUDE DUBOIS
Director of the International Department | BNP Paribas Real Estate
FRANK WEYERS
Associate Director - Valuation & Advisory | JLL Luxembourg
OVIDIU ION
Head of Valuation | CBRE Romania
40 We obtain this value by adding up the values confirmed by the individual property experts.

Press release – 1 August 2018
39
6. Condensed consolidated financial statements for the first half of 2018
6.1 Condensed consolidated profit and loss account
in euros (x 1 000)
H1 2018 FY 2017 H1 2017
Rental income 84.061 145.661 70.817
Costs related to leases -371 -1.286 -405
Net rental result 83.690 144.375 70.412
Recovery of property costs 0 0 0
Recovery of rental charges an taxes normally paid by the tenant on let properties 8.207 9.239 6.936
Costs payable by tenants and paid out by the owner for rental damage and refurbishment at
end of lease
0 0 0
Rental charges and taxes normally paid by the tenant on let properties -10.098 -11.635 -9.421
Other income and charges related to leases 8.300 12.513 6.610
Property result 90.100 154.493 74.536
Technical costs -2.011 -3.345 -1.496
Commercial costs -458 -683 -294
Property management costs -657 -930 -601
Property charges -3.127 -4.959 -2.391
Property operating results 86.973 149.534 72.145
General company expenses -4.486 -6.695 -3.082
Other operating income and expenses (depreciation and write-down on solar panels)
-2.709 -3.904 -2.003
Operating result (before the result on the portfolio) 79.777 138.935 67.061
Result on disposals of investment properties -348 929 -114
Changes in the fair value of investment properties 36.550 94.763 64.592
Operating result 115.979 234.627 131.539
Financial income 184 3.268 1.037
Net interest charges -15.420 -28.504 -13.967
Other financial charges -306 -498 -240
Changes in the fair value of financial assets and liabilities -3.482 16.470 15.638
Financial result -19.025 -9.264 2.468
Share in the results of associated companies and joint ventures 699 10.803 3.594
Result before taxes 97.653 236.166 137.600
Taxes -1.915 -1.010 -616
Net result 95.738 235.156 136.985
Attributable to:
Minority interests 1.546 0 0
Shareholders of the Group 94.192 235.156 136.985
Weighted average number of shares 22.116.435 21.687.261 21.439.828
Net result per share (in euros) 4,26 10,84 6,39
Diluted net result per share (in euros) 4,26 10,84 6,39
Press release – 1 August 2018
40
6.2 Condensed consolidated statement of overall income
6.3 Other components of comprehensive income
H1 2018 H1 2017
95.738 136.985
1.424 863
Revaluation on solar panels 1.424 917
Revaluation on solar panels in joint ventures 0 -54
97.162 137.848
Attributable to:
Minority interests -1.546 0
Shareholders of the Group 95.616 137.848
II. Other elements of the overall result (recoverable through profit and loss)
Overall result
in euros (x 1 000)
I. Net result
H1 2018 H1 2017
65.063 57.244
Result on the portfolio (including share joint ventures) - Group share1
35.255 66.266
Changes in the fair value of the financial instruments - Group share -3.482 15.638
-2.643 -2.163
94.192 136.985
H1 2018 H1 2017
2,94 2,67
Result on the portfolio (including share joint ventures) - Group share1
1,59 3,09
Changes in the fair value of the financial instruments - Group share -0,16 0,73
-0,12 -0,10
4,26 6,391 Including deferred taxes on portfolio result.2 Calculated on the weighted average number of shares.
in euros (x 1 000)
EPRA Earnings
Depreciation and write-down on solar panels (including share joint ventures) - Group share
Net result (IFRS) - Group share
Depreciation and write-down on solar panels (including share joint ventures) - Group share
Net result (IFRS) - Group share
in euros per share2
EPRA Earnings

Press release – 1 August 2018
41
6.4 Condensed consolidated balance sheet as at 30 June 2018
Balance sheet - Assets (in euros x 1 000) 30.06.2018 31.12.2017 30.06.2017
Fixed assets 2.973.428 2.632.554 2.354.489
Intangible fixed assets 182 146 134
Investment properties 2.823.785 2.404.027 2.188.879
Other tangible fixed assets (including solar panels) 115.737 95.876 92.287
Financial fixed assets 17.324 97.469 51.653
Trade receivables and other non-current assets 5.302 3.411 3.640
Deferred taxes - assets 0 0 0
Participations in associated companies and joint ventures - equity method 11.098 31.626 17.896
Current assets 60.196 42.745 45.401
Assets held for sale 17.862 7.525 11.658
Trade receivables 17.019 9.042 14.546
Tax receivables and other current assets 16.606 22.830 14.954
Cash and cash equivalents 1.320 1.231 550
Accruals and deferrals 7.389 2.116 3.693
Total assets 3.033.624 2.675.299 2.399.890
Balance sheet - Liabilities (in euros x 1 000) 30.06.2018 31.12.2017 30.06.2017
Shareholder's equity 1.307.929 1.238.439 1.120.153
I. Shareholder's equity attributable to the parent company's shareholders 1.281.228 1.238.439 1.120.153
Capital 172.680 168.873 167.515
Issue premiums 588.163 545.154 529.313
Reserves 426.193 289.256 286.340
Net result for the financial year 94.192 235.156 136.985
II. Minority interests 26.701 0 0
Liabilities 1.725.695 1.436.860 1.279.738
I. Non-current liabilities 1.430.043 1.158.293 953.686
Provisions 351 655 669
Non-current financial liabilities 1.377.891 1.108.966 902.583
Other non-current financial liabilities 51.190 48.673 50.434
Trade payables and other non-current debts 0 0 0
Deferred tax liabilities 610 0 0
II. Current liabilities 295.652 278.566 326.052
Current financial liabilities 223.995 240.849 266.364
Other current financial liabilities 0 0 0
Trade payables and other current debts 52.511 22.774 45.481
Other current liabilities 6.117 1.549 1.797
Accruals and deferrals 13.029 13.394 12.410
Total liabilities 3.033.624 2.675.299 2.399.890

Press release – 1 August 2018
42
6.5 Condensed consolidated cash flow statement in euros (x 1 000) H1 2018 H1 2017
Cash and cash equivalents, opening balance 1.231 340
Net cash flows concerning operating activities 111.365 66.777
1. Cash flows concerning operations 111.410 68.877
Profit/loss from operating activities 112.889 150.531
Profit for the year 95.738 136.985
Interest charges 15.420 13.967
Interest received -184 -1.037
Income tax 1.915 616
Adjustments to non-monetary items -26.774 -75.456
Write-downs 3.139 2.348
Depreciations -209 -30
Carried interest charges 2.482 3.268
Interest capitalised during construction 2.007 805
Carried interest income 132 -690
Increase (+)/decrease (-) in provisions -303 -376
Changes in the fair value of investment properties -36.550 -64.592
Increase (+)/decrease (-) in deferred taxes 92 3.211
Changes in fair value of financial derivatives 3.482 -15.638
Share in the result of associated companies and joint ventures -699 -3.648
Increase(+)/decrease (-) in disposals -348 -114
Increase (+)/decrease (-) in working capital requirements 25.295 -6.198
2. Cash flows concerning other operating activities -45 -2.100
Interest received classified by operating activities 52 1.727
Income tax paid/received -97 -3.827
Net cash flows concerning investment activities -153.205 -121.493
1. Acquisitions -224.069 -99.197
Payments regarding purchases of real estate investments -144.594 -90.964
Payments regarding purchases of shares of real estate companies -75.397 -126
Acquisitions of other tangible and intangible fixed assets -4.077 -8.107
2. Transfers 8.135 2.048
Receipts from sale of investment properties 8.135 2.048
Receipts from sale of shares of real estate companies 0 0
3. Financing provided to joint ventures 62.729 -24.344
Financing provided to joint ventures -10.271 -24.344
Repayment of financing provided to joint ventures 73.000 0
Net cash flows concerning financing activities 41.929 54.926
1. Loan acquisition 411.678 303.259
2. Loan repayment -297.613 -180.247
3. Interest paid -19.910 -18.040
4. Dividends paid1-52.226 -50.046
Net increase (+) or decrease (-) in cash and cash equivalents 89 210
Cash and cash equivalents, closing balance 1.320 5501 This only relates to cash-out, because of the optional dividend that was offered in 2018 and 2017, with 68% and 65% of the shareholders
respectively opting for distribution in shares rather than cash.

Press release – 1 August 2018
43
6.6 Condensed statement of changes in the consolidated equity
in euro (x 1 000)
Overige
Totaal eigen vermogen 1.238.439 0 95.738 24.654 1.424 46.815 -99.042 -99 1.307.929
Minderheidsbelangen 0 1.546 25.141 8 6 26.701
Totaal eigen vermogen toerekenbaar aan
aandeelhouders van de Groep1.238.439 0 94.192 -487 1.416 46.815 -99.042 -105 1.281.228
Geplaatst kapitaal 168.873 3.807 172.680
Uitgiftepremies 545.154 43.009 588.163
Reserves 289.256 235.156 -487 1.416 -99.042 -105 426.193
Nettoresultaat van de periode 235.156 -235.156 94.192 94.192
in euro (x 1000)
Overige
Totaal eigen vermogen 1.032.352 0 136.985 0 863 40.746 -90.792 -1 1.120.153
Minderheidsbelangen 0 0
Totaal eigen vermogen toerekenbaar aan
aandeelhouders van de Groep1.032.352 0 136.985 0 863 40.746 -90.792 -1 1.120.153
Geplaatst kapitaal 163.752 3.763 167.515
Uitgiftepremies 492.330 36.983 529.313
Reserves 246.038 130.232 863 -90.792 -1 286.340
Nettoresultaat van de periode 130.232 -130.232 136.985 136.985
01 JAN. 18
Toewijzing
resultaat
2017 30 JUN. 18
Nettoresultaat van
het eerste halfjaar
Variaties in de
reële waarde van
zonnepanelen
Kapitaal-
verhogingen2
Uitgekeerde
dividenden
Minderheids-
belangen 1
1 Het betreft hier de kapitaalverhoging naar aanleiding van het keuzedividend.
1 Het betreft het ontstaan van een minderheidsbelang als gevolg van de integrale consolidatie van WDP Development RO.
01 JAN. 17
Toewijzing
resultaat
2016 30 JUN. 17
Nettoresultaat van
het eerste halfjaar
Variaties in de
reële waarde van
zonnepanelen
Kapitaal-
verhogingen1
Uitgekeerde
dividenden
Minderheids-
belangen
2 Het betreft hier de kapitaalverhoging naar aanleiding van het keuzedividend.

Press release – 1 August 2018
44
6.7 Notes
I. General information on the company
WDP is a public Regulated Real Estate Company and takes the legal form of a
Commanditaire Vennootschap op Aandelen (partnership limited by shares) under
Belgian law. Its registered office is at Blakebergen 15, 1861 Meise (Wolvertem) in
Belgium. The telephone number is +32 (0)52 338 400.
The consolidated financial statements of the company as of 30 June 2018 include the
company and its subsidiaries.
WDP is listed on Euronext Brussels and Amsterdam.
II. Basis of presentation
The consolidated financial statements are drawn up in accordance with the IFRS
(International Financial Reporting Standards) as adopted in the European Union and with
the legal and administrative regulations applicable in Belgium. These standards include
all new and revised standards and interpretations published by the International
Accounting Standards Board (IASB) and the International Financial Reporting
Interpretations Committee (IFRIC) insofar as they apply to the activities of the group and
are effective for financial years commencing on or after 1 January 2018.
The consolidated financial statements are presented in thousands of euros, rounded to
the nearest thousand. The 2017 and 2018 financial years are presented here. For the
historical financial information for the 2016 financial year, please refer to the annual
reports for 2017 and 2016. Accounting methods were consistently applied for the
financial years presented.
Standards and interpretations effective for the financial year beginning on 1 January 2018 (all applicable to financial years starting from 1 January 2018)
Amendment to IAS 40 Transfers of investment property
Amendment to IFRS 2 Classification and measurement of share-based payment
transactions
Amendment to IFRS 4 Applying IFRS 9 Financial Instruments with IFRS 4 Insurance
contracts
Annual improvements to IFRS 2014-2016 cycle: Amendments to IFRS 1 and IAS 28
IFRIC 22 Foreign currency transactions and advance consideration
IFRS 9 Financial instruments and associated amendments

Press release – 1 August 2018
45
IFRS 15 Revenue from contracts with customers
The new standards, amendments and interpretations have no effect on the consolidated
financial statements for 2018. With regard to amended standard IFRS 9, please refer to
Note IX. Financial instruments.
New or amended standards and interpretations that are not yet
effective
A number of new standards, amendments to standards and interpretations have not yet
been adopted in 2018, but they can be adopted prior to their effective dates. WDP has
not yet adopted these. The impact of their adoption – insofar as these new standards,
revised versions or existing standards and interpretations are relevant to WDP – on the
consolidated financial statements for 2018 and the following years is presented below.
Amendment to IAS 19 Plan amendment, curtailment or settlement (applicable to
financial years beginning on or after 1 January 2019, but not yet adopted in the
European Union)
Amendment to IAS 28 Long-term investments in associates and joint ventures
(applicable to financial years beginning on or after 1 January 2019, but not yet
adopted in the European Union)
Amendment of IFRS 9 Prepayment features with negative compensation (applicable
to financial years starting from 1 January 2019)
Amendments to IFRS 10 and IAS 28 Sale or contribution of assets between an
investor and its associate or joint venture (the date of entry into force has been
deferred indefinitely and, consequently, EU approval has been postponed as well)
Annual improvements to IFRS 2015-2017 cycle (applicable to financial years
beginning on or after 1 January 2019, but not yet adopted by the European Union)
IFRIC 23 Uncertainty over income tax treatments (applicable to financial years
beginning on or after 1 January 2019, but not yet adopted by the European Union)
IFRS 14 Regulatory deferral accounts (applicable to financial years beginning on or
after 1 January 2016, but not yet adopted by the European Union)
IFRS 16 Leases (applicable to financial years beginning on or after 1 January 2019)
IFRS 16 introduces significant changes in accounting for leases for the lessee,
removing the distinction between operational and financial leases and recognising
assets and liabilities for all leases (aside from exemptions for short-term leases or
low-value assets). Unlike accounting for leases by the lessee, IFRS 16 keeps almost
all provisions from IAS 17 Leases regarding accounting for leases by the lessor. This
means that lessors must continue to classify leases as operational or financial
leases.

Press release – 1 August 2018
46
Given that WDP acts almost exclusively as a lessor (and has not opted to reassess
whether a contract is or contains a lease in comparison to IAS 17), the impact for
WDP is limited to the contracts with WDP acting as lessee. In cases where WDP is
the lessee in leases classified as operational leases under IAS 17 and these leases
do not fall under the exemptions provided for in IFRS 16 (for instance, for
investment properties for which WDP does not retain bare ownership, but, rather,
only the usufruct through a concession, leasehold, or similar arrangement), this
shall result in recognition of a right of use and additional liability in the consolidated
annual financial statements, given that full ownership shall apply to the asset.
IFRS 17 Insurance contracts (applicable to financial years beginning on or after 1
January 2021, but not yet adopted by the European Union)

Press release – 1 August 2018
47
III. Significant accounting estimates and key uncertainties affecting estimates
Significant estimates in the drawing up of financial statements
Determining whether an entity that owns a portfolio of investment properties
constitutes a business, and therefore assessing whether obtaining control of that entity
is a business combination in the scope of IFRS 3, is a significant judgement.
Through the step acquisition of WDP Development RO, whereby WDP increased its
ownership from 51% to 80% as from January 2018, WDP obtained control over WDP
Development RO, leading to the consolidation of this entity. Considering the current
definition of a business in IFRS 3 and the related guidance, namely with respect to the
existence of substantive processes, management concluded that WDP Development
Romania does not constitute a business. This judgement is also consistent with the latest
expected developments in the definition of a business whereby in case substantially all
of the fair value of gross assets acquired are concentrated in one portfolio of similar
assets, these assets are not considered as a business. For the step acquisition of a
subsidiary that is not a business, the consideration paid is allocated to the identifiable
assets acquired and as such, fully to the investment properties acquired.

Press release – 1 August 2018
48
IV. Segmented information – Operational result
Belgique Pays-Bas France Roumanie Montants
non affectés
Total IFRS Luxembourg3 Autres joint
ventures3
I. Revenus locatifs1
33.720 39.863 3.404 7.074 0 84.061 467
III. Charges relatives à la location -670 234 64 0 0 -371 -29
33.051 40.097 3.468 7.074 0 83.690 438
IV. Récupération des charges
immobilières
0 0 0 0 0 0 0
V. Récupération des charges locatives
et des taxes normalement assumées
par le
locataire sur immeubles loués
5.691 996 1.100 421 0 8.207 12
VI. Frais incombant aux locataires et
assumés par le propriétaire sur
dégâts locatifs et remises en état au
terme du bail
0 0 0 0 0 0 0
VII. Charges locatives et taxes
normalement assumées par le
locataire sur immeubles loués
-6.123 -2.309 -1.096 -570 0 -10.098 -12
VIII. Autres revenus et dépenses liés à la
location2
5.459 1.557 64 1.220 0 8.300 7
38.078 40.341 3.535 8.145 0 90.100 445
IX. Frais techniques -881 -753 -110 -267 0 -2.011 -11
X. Frais commerciaux -318 -74 -68 1 0 -458 -4
XII. Frais de gestion immobilière -696 47 -2 -7 0 -657 0
-1.894 -780 -180 -272 0 -3.127 -15
36.184 39.561 3.355 7.873 0 86.973 430
XIV. Frais généraux de la société 0 0 0 0 -4.486 -4.486 -145
XV. Autres produits/charges
opérationnels (amortissement et
réduction de valeur panneaux
solaires)
-1.323 -1.058 0 -329 0 -2.709 0
34.861 38.503 3.355 7.544 -4.486 79.777 285
XVI. Résultat sur vente d’immeubles de -348 0 0 0 0 -348 0
XVIII. Variations de la juste valeur des
immeubles de placement
10.946 19.612 2.569 3.423 0 36.550 1.122
45.459 58.115 5.924 10.966 -4.486 115.979 1.407
Charges immobilières
Résultat d'exploitation des immeubles
Résultat d'exploitation (avant le résultat sur
le portefeuille)
Résultat d'exploitation
en euros (x 1 000)
Résultat immobilier
Résultat locatif, moins les charges liées à la
location
H1 2018

Press release – 1 August 2018
49
The basis for reporting by segment within WDP is the geographical region. This
segmentation basis reflects the geographical markets in Europe in which WDP is active.
WDP’s business is subdivided into five regions.
This segmentation is important for WDP since the nature of its business, its customers,
etc., exhibit similar economic characteristics within these segments. Business decisions
are taken at this level, and different key performance indicators (such as rental income,
occupancy rates, etc.) are monitored in this manner.
A second segmenting basis is not considered relevant by WDP as the business mainly
focuses on the leasing of logistics sites.
Belgium The
Netherlands
France Unallocated
amounts
Total IFRS Romania3 Luxembourg3
I. Rental income1 32.546 35.294 2.978 0 70.817 1.917 0
III. Rental charges -288 -69 -48 0 -405 0 0
32.258 35.225 2.930 0 70.412 1.917 0
IV. Recovery of property costs 0 0 0 0 0 0 0
V. Recovery of rental charges normally
paid by the tenant on let properties
5.531 439 966 0 6.936 283 0
VI. Costs payable by tenants and paid
out by the owner for rental damage
and refurbishment at end of lease
0 0 0 0 0 0 0
VII. Rental charges and taxes normally
paid by the tenant on let properties
-6.211 -2.158 -1.052 0 -9.421 -318 0
VIII. Other income and charges related to
leases2
5.439 1.093 78 0 6.610 743 0
37.017 34.599 2.921 0 74.537 2.625 0
IX. Technical costs -725 -649 -123 0 -1.496 -226 0
X. Commercial costs -299 27 -22 0 -294 -19 0
XII. Property management costs -746 141 3 0 -601 -5 0
-1.770 -480 -141 0 -2.391 -250 0
35.247 34.118 2.780 0 72.145 2.375 0
XIV. General company expenses 0 0 0 -3.082 -3.082 -445 n.r.
XV. Other operating income and
expenses (depreciation and write-
down on solar panels)
-1.710 -293 0 0 -2.003 -160 0
33.537 33.825 2.780 -3.082 67.061 1.770 0
XVI. Result on disposals of investment
properties
-114 0 0 0 -114 0 0
XVIII. Changes in the fair value of
investment
properties
18.355 44.770 1.467 0 64.592 2.330 0
51.779 78.596 4.246 -3.082 131.539 4.100 0
H1 2017
1 The maximum tenant risk within the WDP portfolio was 10% and the maximum risk per site 5%. See also 5.1. Property Report - Review on the consolidated property portfolio .2 In the first half year 2018, income from solar energy totalled 7.227 mill ion euros against 6.237 mill ion euros in the first half year 2017. This income was generated in Belgium (4.470 mill ion euros), the
Netherlands (1.538 mill ion euros) and Romania (1.220 mill ion euros). They belong to Other income and charges related to leases . 3 The joint venture WDP Luxembourg is recognised using the equity method in accordance with IFRS 11 Joint arrangements. Table shows the operating result (before general costs and according to the 55% share
of WDP) and makes the reconciliation with the 55% share. In 2017, WDP Development RO was a joint venture as well.
(in euros x 1 000)
Rental income, net of rental-related
expenses
Property result
Property charges
Property operating results
Operating result (before result on portfolio)
Operating result

Press release – 1 August 2018
50
V. Segmented information – Assets41
41 Includes property developments in compliance with the IAS 40 standard.
Belgium The
Netherlands
France Romania Total
IFRS
Luxembourg
1.005.135 1.365.907 114.994 337.749 2.823.785 16.398
982.016 1.223.899 114.470 231.531 2.551.916 11.772
7.425 92.580 0 59.487 159.492 4.626
15.694 49.427 524 46.731 112.376 0
Assets held for sale 8.962 0 8.900 0 17.862 0
65.976 32.678 -56 17.139 115.737 0
2.298 228 -56 554 3.024 0
63.678 32.450 0 16.585 112.713 0
Belgium The
Netherlands
France Total
IFRS
Romania Luxembourg
1.000.694 1.282.310 121.022 2.404.027 134.772 12.324
975.344 1.150.470 120.498 2.246.312 75.668 11.798
7.940 70.881 0 78.821 34.389 526
174.100 60.960 524 235.584 24.715 0
7.525 0 0 7.525 0 0
66.566 29.366 -56 95.876 8.885 0
1.876 257 -56 2.077 279 0
64.690 29.109 0 93.799 8.606 0
in euros (x 1 000)
Tangible fixed assets for own use
Tangible fixed assets for own use
Other: solar panels
31.12.2017
Other tangible fixed assets
Investment porperties
in euros (x 1 000)
Existing buildings
Investment properties under
development for own account for the
purpose of being rented out
Land reserves
30.06.2018
Existing buildings
Investment properties under
development for own account for the
purpose of being rented out
Land reserves
Investment porperties
Other: solar panels
Assets held for sale
Other tangible fixed assets

Press release – 1 August 2018
51
VI. Information on subsidiaries
Share of equity 30 JUN. 18 30 JUN. 17
Fully consolidated companies
Name and full address of the registered offices
WDP France SARL - rue Cantrelle 28 - 36000 Châteauroux - Frankrijk 100% 100%WDP Nederland N.V. - Hoge Mosten 2 - 4822 NH Breda - Netherlands with participation in WDP
Development NL N.V. - Hoge Mosten 2 - 4822 NH Breda - Netherlands1100% 100%
WDP Development RO SRL – 1 Baia de Arama Street, Building C, 1st floor, office no. 19, district 2 - Bucharest -
Romania2
80% 51%
Eurologistik 1 Freehold BVBA - Blakebergen 15 - 1861 Wolvertem - Belgium3100% 100%
Colfridis Real Estate BVBA - Blakebergen 15 - 1861 Wolvertem - Belgium5100% 100%
Joint ventures
I Love Hungaria NV - Mechelsesteenweg 64, Bus 401 - 2018 Antwerp - Belgium450% 50%
BST-Logistics NV - Nijverheidsstraat 13 - 2260 Westerlo - Belgium650% 50%
WDP Luxembourg SA - Parc Logistique Eurohub Sud - 3434 Dudelange - Luxembourg755%
7 This concerns a joint venture that has the rights to the Eurohub Sud site of which the Luxembourg government owns 45% and of which WDP acquired 55% of
the share on 13 October 2017 with further development of the site in mind. With the acquisition of this company, in addition to the investment properties,
an external financing arrangement was also acquired for an amount of 9.9 mill ion euros in total.
3 On 7 June 2013 WDP acquired 100% of the shares in Eurologistik 1 Freehold BVBA, holding the rights to an existing logistic site in Vilvoorde. This
transaction is not deemed to be a business combination.
1 WDP Development NL N.V. was founded in August 2011 as a permanent development company for own account of WDP Nederland N.V.
4 This joint venture was established in May 2015 between WDP Comm. VA and project developer L.I.F.E. NV for the redevelopment of the Hungaria building in
Leuven.5 On 30 September 2016, WDP acquired 100% of the shares in Colfridis Real Estate BVBA, which owned the rights to three sites of 35,000 m² in total on the
industrial estate in Londerzeel. This transaction is not deemed to be a business combination. On 6 October 2017, WDP merged with its wholly owned
subsidiary Colfridis Real Estate BVBA.6 This joint venture was established in April 2017 between WDP Comm. VA and project developer Thys Bouwprojecten for the development of the building in
Westerlo, Nijverheidsstraat 13.
2 As from January 2018, the participation in WDP Development RO SRL between the two shareholders (WDP/Jeroen Biermans) has changed from 51/49 to
80/20. As at 1 January 2018, WDP fully consolidated this activity in its IFRS statements rather than using the equity method as in the past. For more
information regarding the impact on the consolidated balance sheet and the consolidated profit and loss account, we refer to Condensed financial
information (according to IFRS 12) in the Annual financial report 2017 .

Press release – 1 August 2018
52
VII. Overview of future income
This table contains an overview of the rental income (including the income from solar
energy) under the current agreements. This is based on the indexed rents to be received
up to and including the final expiry date, as agreed to in the leases.
in euros (x 1 000) 30 JUN. 18 30 JUN. 17
Future rental income (including income from solar energy)
with final expiry date within
one year 171.002 142.000
more than one but less than five years 442.377 385.321
more than five years 567.683 567.642
Total 1.181.061 1.094.963

Press release – 1 August 2018
53
VIII. Investment property42
42 Includes property developments in compliance with the IAS 40 standard.
in euros (x 1 000)
Belgium Netherlands France Romania Total IFRS Romania Luxemburg
Level according to IFRS 3 3 3 3 3 3
at 01/01 1.000.694 1.282.310 121.022 0 2.404.027 134.772 12.324
Investments 2.073 63.985 303 43.990 110.350 0 2.952
New acquisitions 965 0 0 26.079 27.044 0 0
Acquisition of investment properties by means
of share-based payment transactions0 0 0 264.259 264.259 -134.772 0
Transfers to fixed assets held for sale -9.544 0 -8.900 0 -18.444 0 0
Sales and disposals 0 0 0 0 0 0 0
Variations in the fair value 10.947 19.612 2.569 3.422 36.550 0 1.122
at 30/06 1.005.135 1.365.907 114.994 337.749 2.823.785 0 16.398
in euros (x 1 000)
Belgium Netherlands France Total IFRS Romania Luxemburg
Level according to IFRS 3 3 3 3 3
at 01/01 938.356 1.010.231 88.136 2.036.722 70.151 0
Investments 30.139 115.926 2.121 148.366 46.128 0
New acquisitions 0 101.503 26.435 127.937 9.964 12.814
Acquisition of investment properties by means
of share-based payment transactions17.393 0 0 17.393 0 0
Transfers to fixed assets held for sale -14.029 -6.032 0 -20.061 0 0
Sales and disposals -1.095 0 0 -1.095 0 0
Variations in the fair value 29.750 60.683 4.331 94.763 8.529 -490
at 31/12 1.000.694 1.282.310 121.022 2.404.027 134.772 12.324
30 JUN. 18
31 DEC. 17

Press release – 1 August 2018
54
IX. Statement of financial debt
in euros (x 1 000)
30 JUN. 18 31 DEC. 17 30 JUN. 18 31 DEC. 17 30 JUN. 18 31 DEC. 17 30 JUN. 18 31 DEC. 17
Commercial paper 193.000 186.100 193.000 186.100 0 - 0 -
Straight loans 12.381 52.190 12.381 52.190 0 - 0 -
Roll over loans 16.619 613 16.619 613 0 - 0 -
Leasing debt 1.994 1.946 1.994 1.946 0 - 0 -
Current financial liabilities 223.994 240.849 223.994 240.849 0 - 0 -
Roll over loans 947.297 776.871 0 - 592.958 450.649 354.339 326.223
Bond 425.828 326.187 0 - 266.343 266.452 159.485 59.735
Leasing debt 4.766 5.907 0 - 4.352 5.427 415 480
Non-current financial liabilities 1.377.891 1.108.966 0 - 863.653 722.527 514.238 386.438
TOTAL 1.601.886 1.349.815 223.994 240.849 863.653 722.527 514.238 386.438
Included as of < 1 year 1-5 years > 5 years

Press release – 1 August 2018
55
X. Financial instruments
in euros (x 1.000)
IFRS
balance
sheet
section
Level
(IFRS)
Amortised cost
of hedging
instruments
Amortised
cost of loans,
receivables
and financial
obligations
Amortised cost
price
Fair value
Financial fixed assets
Assets at fair value through result – Permitted hedging
instruments
I. E. 2
- Interest Rate Swap 4.799 4.799 4.799
Financial assets at amortised costs I. E. 2 12.525 12.525 12.525
Long-term receivables 0 0 0
- Trade receivables and other non-current assets I. G. 2 5.302 5.302 5.302
Short-term receivables 0 0 0
- Trade receivables II. D. 2 17.019 17.019 17.019
- Cash and cash equivalents II. F. 2 1.320 1.320 1.320
Accruals and deferrals on the assets: interest charges on
loans and permitted hedging instruments
Interest charges on loans 79 79 79
Interest charges on permitted hedging instruments 0 0 0
Total 4.799 36.245 41.044 41.044
Financial liabilities
Non-current financial liabilities
- Bond loan: private placement I. B. 2 300.931 300.931 303.624
- Bond loan: retail bond I. B. 1 124.916 124.916 131.603
- Bank debt I. B. 2 947.278 947.278 947.278
- Financial leasing I. B. 2 5.907 4.766 4.766
Other non-current financial liabilities – Permitted hedging
instruments
I.C.
- Interest Rate Swaps 50.224 50.224 50.224
- Interest Rate Swaps (forward start) 967 967 967
Current financial liabilities
- Commercial paper II. B. 2 192.599 192.599 192.599
- Bank debt II. B. 2 29.402 29.402 29.402
- Financial leasing I. B. and II.
B.
2 1.994 1.994 1.994
- Trade payables and other current debts II. D. 2 52.511 52.511 52.511
Other current financial liabilities – Permitted hedging
instruments
II.C. 2
- Interest Rate Swaps
- Interest Rate Swaps (forward start) 0 0 0
Accruals and deferrals on the liabilities: interest charges
on loans and permitted hedging instruments
0 0 0
Interest charges on loans 4.298 4.298 4.298
Interest charges on permitted hedging instruments 523 523 523
Total 51.713 1.659.836 1.710.408 1.719.788
30 JUN. 18
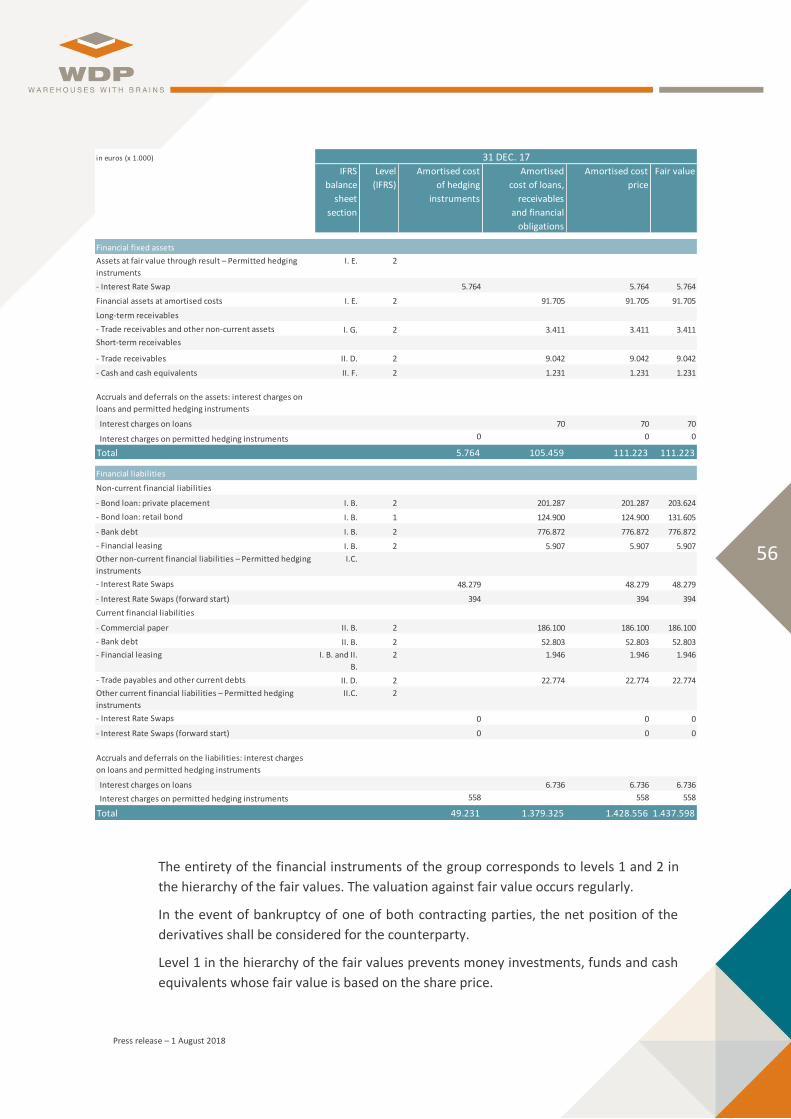
Press release – 1 August 2018
56
The entirety of the financial instruments of the group corresponds to levels 1 and 2 in
the hierarchy of the fair values. The valuation against fair value occurs regularly.
In the event of bankruptcy of one of both contracting parties, the net position of the
derivatives shall be considered for the counterparty.
Level 1 in the hierarchy of the fair values prevents money investments, funds and cash
equivalents whose fair value is based on the share price.
in euros (x 1.000)
IFRS
balance
sheet
section
Level
(IFRS)
Amortised cost
of hedging
instruments
Amortised
cost of loans,
receivables
and financial
obligations
Amortised cost
price
Fair value
Financial fixed assets
Assets at fair value through result – Permitted hedging
instruments
I. E. 2
- Interest Rate Swap 5.764 5.764 5.764
Financial assets at amortised costs I. E. 2 91.705 91.705 91.705
Long-term receivables
- Trade receivables and other non-current assets I. G. 2 3.411 3.411 3.411
Short-term receivables
- Trade receivables II. D. 2 9.042 9.042 9.042
- Cash and cash equivalents II. F. 2 1.231 1.231 1.231
Accruals and deferrals on the assets: interest charges on
loans and permitted hedging instruments
Interest charges on loans 70 70 70
Interest charges on permitted hedging instruments 0 0 0
Total 5.764 105.459 111.223 111.223
Financial liabilities
Non-current financial liabilities
- Bond loan: private placement I. B. 2 201.287 201.287 203.624
- Bond loan: retail bond I. B. 1 124.900 124.900 131.605
- Bank debt I. B. 2 776.872 776.872 776.872
- Financial leasing I. B. 2 5.907 5.907 5.907
Other non-current financial liabilities – Permitted hedging
instruments
I.C.
- Interest Rate Swaps 48.279 48.279 48.279
- Interest Rate Swaps (forward start) 394 394 394
Current financial liabilities
- Commercial paper II. B. 2 186.100 186.100 186.100
- Bank debt II. B. 2 52.803 52.803 52.803
- Financial leasing I. B. and II.
B.
2 1.946 1.946 1.946
- Trade payables and other current debts II. D. 2 22.774 22.774 22.774
Other current financial liabilities – Permitted hedging
instruments
II.C. 2
- Interest Rate Swaps 0 0 0
- Interest Rate Swaps (forward start) 0 0 0
Accruals and deferrals on the liabilities: interest charges
on loans and permitted hedging instruments
Interest charges on loans 6.736 6.736 6.736
Interest charges on permitted hedging instruments 558 558 558
Total 49.231 1.379.325 1.428.556 1.437.598
31 DEC. 17

Press release – 1 August 2018
57
Level 2 in the hierarchy of the fair values concerns the other financial assets and liabilities
whose fair value is based on observable inputs and other data that can be determined,
directly or indirectly, for the assets or liabilities concerned. The valuation techniques
concerning the fair value of the financial instruments at level 2 are the following: the fair
value of the above financial assets and liabilities are valued at the book value except for
bond loans whose fair value is determined based on a discounted cash flow model using
market interest rates, since they are not traded frequently (level 2). Because the other
financial liabilities are incurred at a floating interest rate, the fair value is very close to
the book value.
Level 3 in the hierarchy of the fair values is for a property portfolio whose fair value is
determined based on non-observable inputs.
Financial instruments at fair value (as per IFRS 9)
Based on an analysis of WDP’s situation as at 30 June 2018, IFRS 9 does not have any
significant impact on the consolidated financial statements. The table below shows the
financial instruments as per IFRS 9, in comparison with the previous IFRS standard (IAS
39) which was applicable until 31 December 2017. in euros (x 1.000)
Carrying
amount
IAS 39 category Carrying amount
(includes the impact of
remeasurement due to
impairment if any)
IFRS 9 category
Financial fixed assets
Assets at fair value through profit or loss - permitted hedging
instruments
- Interest Rate Swap 5.764 FA/FL mandatorily measured at FVTPL 5.764 FA/FL mandatorily measured at FVTPL
Loans and receivables - Other 91.705 L&R
Financial assets measured at amortised cost - Other 91.705 AC
Long-term receivables
- Trade receivables and other non-current assets 3.411 L&R 3.411 AC
Short-term receivables
Trade receivables 9.042 L&R 9.042 AC
Cash and cash equivalents 1.231 L&R 1.231 AC
Accruals and deferrals on the assets: interest charges on loans and
permitted hedging instruments
- Interest charges on loans 70 L&R 70 AC
- Interest charges on permitted hedging instruments 0 FA/FL mandatorily measured at FVTPL 0 FA/FL mandatorily measured at FVTPL
Total 111.223 111.223
Financial liabilities
Non-current financial liabilities
- Bond loan: private placement 201.287 FLMatAC 201.287 AC
- Bond loan: retail bond 124.900 FLMatAC 124.900 AC
- Bank debt 776.872 FLMatAC 776.872 AC
- Financial leasing 5.907 FLMatAC 5.907 AC
Other non-current financial liabilities - permitted hedging
instruments
- Interest Rate Swaps 48.279 FA/FL mandatorily measured at FVTPL 48.279 FA/FL mandatorily measured at FVTPL
- Interest Rate Swaps (forward start) 394 FA/FL mandatorily measured at FVTPL 394 FA/FL mandatorily measured at FVTPL
Current financial liabilities
- Commercial paper 186.100 FLMatAC 186.100 AC
- Bank debt 52.803 FLMatAC 52.803 AC
- Financial leasing 1.946 FLMatAC 1.946 AC
- Trade payables and other current debts 22.774 FLMatAC 22.774 AC
Other current financial liabilities - permitted hedging instruments
- Interest Rate Swaps 0 FA/FL mandatorily measured at FVTPL 0 FA/FL mandatorily measured at FVTPL
- Interest Rate Swaps (forward start) 0 FA/FL mandatorily measured at FVTPL 0 FA/FL mandatorily measured at FVTPL
Accruals and deferrals on the liabilities: interest charges on loans
and permitted hedging instruments
- Interest charges on loans 6.736 FLMatAC 6.736 AC
- Interest charges on permitted hedging instruments 558 FA/FL mandatorily measured at FVTPL 558 FA/FL mandatorily measured at FVTPL
Total ######## 1.428.556
IAS 39 IFRS 9
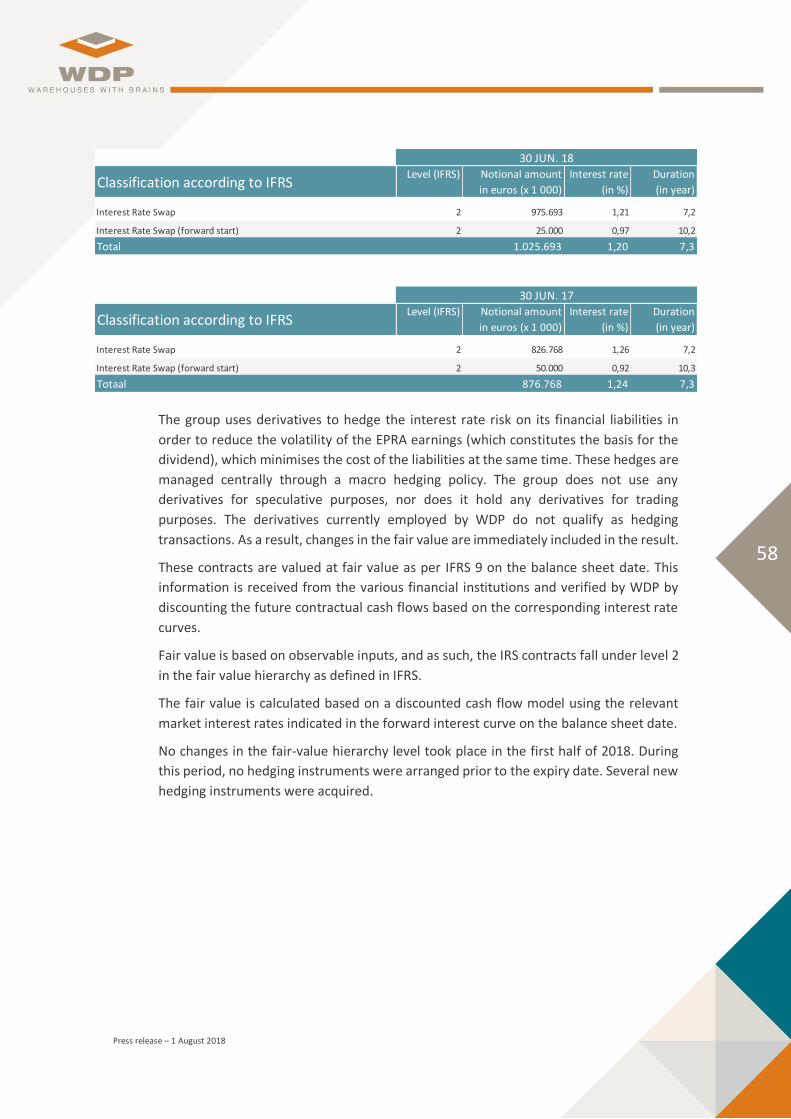
Press release – 1 August 2018
58
The group uses derivatives to hedge the interest rate risk on its financial liabilities in
order to reduce the volatility of the EPRA earnings (which constitutes the basis for the
dividend), which minimises the cost of the liabilities at the same time. These hedges are
managed centrally through a macro hedging policy. The group does not use any
derivatives for speculative purposes, nor does it hold any derivatives for trading
purposes. The derivatives currently employed by WDP do not qualify as hedging
transactions. As a result, changes in the fair value are immediately included in the result.
These contracts are valued at fair value as per IFRS 9 on the balance sheet date. This
information is received from the various financial institutions and verified by WDP by
discounting the future contractual cash flows based on the corresponding interest rate
curves.
Fair value is based on observable inputs, and as such, the IRS contracts fall under level 2
in the fair value hierarchy as defined in IFRS.
The fair value is calculated based on a discounted cash flow model using the relevant
market interest rates indicated in the forward interest curve on the balance sheet date.
No changes in the fair-value hierarchy level took place in the first half of 2018. During
this period, no hedging instruments were arranged prior to the expiry date. Several new
hedging instruments were acquired.
Classification according to IFRSLevel (IFRS) Notional amount
in euros (x 1 000)
Interest rate
(in %)
Duration
(in year)
Interest Rate Swap 2 975.693 1,21 7,2
Interest Rate Swap (forward start) 2 25.000 0,97 10,2
Total 1.025.693 1,20 7,3
Classification according to IFRSLevel (IFRS) Notional amount
in euros (x 1 000)
Interest rate
(in %)
Duration
(in year)
Interest Rate Swap 2 826.768 1,26 7,2
Interest Rate Swap (forward start) 2 50.000 0,92 10,3
Totaal 876.768 1,24 7,3
30 JUN. 18
30 JUN. 17

Press release – 1 August 2018
59
XI. Calculation of the gearing ratio and notes regarding changes in gearing
Additional notes on changes in the gearing ratio
As stipulated in the GVV/SIR legislation, notably in Article 24 of the Belgian Royal Decree
on GVVs/SIRs, when the (proportionate) consolidated gearing ratio of a GVV/SIR exceeds
50%, the GVV/SIR should draw up a financial plan with an implementation schedule
describing the measures to be taken to prevent the gearing ratio from rising above 65%
of consolidated assets. A report is appended to this financial plan by the statutory
auditor in which he confirms that he has verified the method of preparation of the plan,
particularly with regard to its economic basis, and that the figures contained in this plan
agree with those in the accounts of the Regulated Property Company. The interim and
annual financial reports should give an account of how the financial plan was
implemented during the relevant period and how the GVV/SIR will implement the plan
in the future.
1. Changes in gearing ratio
In the first half of 2018, WDP’s consolidated gearing ratio (proportionate) rose from
53.1% on 31 December 2017 to 55.1% on 30 June 2018. This takes into account a total
investment volume of approx. 240 million euros and the dividend pay-out. This was
made possible because the new investments were financed with a combination of both
equity capital and borrowed capital. After all, the shareholders’ equity was reinforced
with approximately 48 million euros through the capital increase following the optional
dividend. In addition, the property portfolio also enjoyed value growth, as estimated by
the independent experts.
30.06.2018 30.06.2018 31.12.2017 31.12.2017
(IFRS) (proportional) (IFRS) (proportional)
Non-current and current liabilities 1.725.695 1.746.794 1.436.860 1.530.038
To be excluded:
- I. Non-current liabilities - A. Provisions 351 351 655 656
- I. Non-current liabilities - C. Other non-current financial liabilities -
Permitted hedging instruments 51.190 51.190 48.673 48.673
- I. Non-current liabilities - F. Deferred taxes - Liabilities 610 1.905 0 894
- II. Current liabilities - A. Provisions 0 0 0 0
- II. Current liabilities - E. Other current liabilities - Other: Hedging instruments 0 0 0 0
Hedging instruments
- II. Current liabilities - F. Accruals and deferred income 13.029 13.347 13.394 13.677
Total debt A 1.660.514 1.680.000 1.374.139 1.466.138
Total assets B 3.033.624 3.054.723 2.675.299 2.768.444
To be excluded:
- E. Financial fixed assets - Financial instruments at fair value
through profit and loss - Permitted hedging instruments 4.799 4.799 5.764 5.764
Total assets B 3.028.825 3.049.924 2.669.535 2.762.681
Gearing ratio A/B 54,8% 55,1% 51,5% 53,1%
in euros (x 1 000)

Press release – 1 August 2018
60
On the basis of the current gearing ratio of 55.1% as of 30 June 2018, WDP still had an
additional investment potential of at least 860 million euros, without exceeding the
maximum gearing ratio of 65%. The potential for further investment amounts to at least
375 million euros before the 60% gearing ratio is exceeded.
On the other hand, the valuations of the portfolio also have an impact on the gearing
ratio. Taking the current capital base into account, the maximum gearing ratio of 65%
would only be exceeded in the case of a decrease in the value of the investment
properties of approx. 475 million euros, or a 17% loss in a property portfolio on the order
of 2,875 million euros. In this respect, WDP is of the opinion that the current gearing
ratio is at an acceptable level and provides sufficient margin to absorb any decreases in
value of the property. Moreover, the appraisal of the independent property experts in
2011-14 indicates stabilisation in the fair value of the portfolio, and since 2015-18 an
upward trend has been identified.
2. Expected changes in the gearing ratio in 2018
In the course of 2018, WDP’s gearing ratio is likely to change from 55.1% (54.8%) as at
30 June 2018 to approximately 54% (54%) as at 31 December 2018. This takes the
following items into account:
Implementation of the current investment programme and scheduled divestments43.
The retained earnings, taking into account the profit forecast for 2018 of approx. 134
million euros, 65.1 million euros of which were already generated in H1 2018.
Over the medium-term, WDP intends to achieve a gearing ratio of between 55% and
60%, with the targets set based on an unchanged capital structure.
3. Conclusion
WDP therefore believes that the gearing ratio will not exceed 65% and that currently, in
the light of prevailing economic and property trends, planned investments and the
expected changes in the shareholders’ equity of the company, no additional measures
need to be taken.
If certain events require adjustment of the company policy, this will happen without
delay and the shareholders will be informed accordingly by the company in its periodic
reports.
43 See also 3.4. Interim management report – Transactions and realisations and 6.4. Condensed consolidated balance sheet as at 30 June 2018.

Press release – 1 August 2018
61
XII. Transactions between affiliates
For 2018, the Manager, De Pauw NV, set the management fee for WDP Comm. VA to
1,675,000 euros. This amount corresponds to the total fee, in line with market rates, for
the Board of Directors in 2018, including the bonus scheme for the executive
management and the management of the GVV/SIR (see also 6.7. Management report –
Corporate governance in the Annual financial report 2017).
XIII. Rights and obligations not included in the balance sheet
WDP Comm. VA and its subsidiaries had established bank guarantees on 30 June 2018
for a total amount of 2,395,133 euros, of which the beneficiaries were classified into the
following categories for the following amounts:
WDP Nederland N.V. has committed to purchasing building land intended for the
construction of business premises at Nieuwegein, Bleiswijk and Schiphol by the end of
2018, the end of 2019 and early 2020, respectively at a total cost of 30 million euros.
WDP has entered into various commitments within the framework of its ongoing
investment programme related to projects and acquisitions, as indicated in the
management report.
The parent company WDP Comm. VA has provided the following securities to its
respective subsidiaries:
A security for the commitments of WDP Nederland N.V. for an amount of 25 million
euros in favour of ABN AMRO (short-term amounts financed through a straight loan
of max. 25 million euros), 15.0 million euros of which has been used.
A security for the commitments of WDP Development RO SRL for an amount of 75
million euros in favour of EIB, 60 million euros of which has been used.
A security for the commitments of WDP Luxembourg SA for a maximum amount of 6
million euros in favour of the Banque et Caisse d’Epargne de l’Etat.
WDP has entered into the following commitments with financiers44:
A commitment to various financiers to refrain from burdening the fixed assets with
mortgages or any other real securities (negative pledge). WDP confirms that as at
44 The term ‘financiers’ means credit institutions as well as financiers through the debt capital markets.
in euros 30 JUN. 18
Environmental 1.412.211
Rent and concession 974.943
Legal -
Services 7.979
Execution of works -

Press release – 1 August 2018
62
30 June 2018, the property portfolio and other assets are not encumbered by any
outstanding mortgages or other assets.
WDP has committed to various financiers that it will continue to qualify as a
GVV/SIR. For the conditions on this, please see the Belgian Act of 12 May 2014 and
the Royal Decree of 13 July 2014. For further information, see the Annual financial
report 2017 available at www.wdp.eu.
For the financing of operations in the Netherlands, WDP has entered into a
commitment with one bank in order to continue to qualify as an ‘FBI’ (‘Fiscale
Beleggingsinstelling’).
For most financial institutions, WDP has committed to maintaining a minimum
interest coverage ratio of 1.5x. For the first half of 2018, this ratio is 4.7x.
For some financiers, WDP has agreed repay the credit if a change of control occurs
and the financier consequently asks for repayment.
For some financiers, WDP has committed to limiting projects that are not yet pre-
leased (project developments not pre-let) to 15% of the book value of the
portfolio45. As at 30 June 2018, this ratio is 0%.
As of 30 June 2018, all covenants with regard to credit institutions and bondholders
entered into by WDP had been complied with.
XIV. Significant events after the balance sheet date
No significant events have occurred after the balance sheet date.
45 Except for one loan, for which this ratio is a maximum of 10%.

Press release – 1 August 2018
63
7. Statutory auditor’s report
Report on review of the consolidated interim financial information for the six-month period ending on 30 June 2018
To the Board of Directors
In the context of our appointment as the company’s statutory auditor, we are hereby reporting to you on the consolidated interim financial information. This consolidated interim financial information comprises the consolidated condensed balance sheet as at 30 June 2018, the consolidated condensed income statement, the consolidated condensed statement of comprehensive income, the consolidated condensed cash flow statement and the condensed statement of changes in the consolidated equity for the period of six months then ended, as well as selective notes I to XIII.
Report on the consolidated interim financial information
We have reviewed the consolidated interim financial information of WDP Comm. VA (the company) and its subsidiaries (jointly the group), prepared in accordance with international standard IAS 34 Interim financial reporting as adopted by the European Union.
The consolidated condensed balance sheet shows total assets of 3,033,624 (,000) euros and the consolidated condensed income statement shows a consolidated profit (group share) for the period then ended of 94,192 (,000) euros.
The Board of Directors is responsible for the preparation and fair presentation of this consolidated interim financial informaion in accordance with international standard IAS 34 Interim financial reporting as adopted by the European Union. Our responsibility is to issue a conclusion on this consolidated interim financial information based on our review.
Scope of the review
We conducted our review in accordance with international standard ISRE 2410 Review of interim financial information, performed by the independent auditor of the entity. This review of interim financial information consists of making inquiries, primarily of persons responsible for financial and accounting matters, and applying analytical and other review procedures. The scope of a review is considerably less than that of an audit conducted in accordance with the International Standards on Auditing. For this reason, the review does not provide us with certainty that we will be aware of all matters of significance that could be detected in an audit. Accordingly, we are not issuing an audit opinion on the consolidated interim financial information.
Conclusion
Based on our review, nothing has come to our attention that causes us to believe that the consolidated interim financial information of WDP Comm. VA has not been prepared, in all material respects, in accordance with IAS 34 Interim financial reporting as adopted by the European Union.
Antwerp, 31 July 2018 THE STATUTORY AUDITOR DELOITTE Bedrijfsrevisoren / Reviseurs d’Entreprises BV o.v.v.e. CVBA Represented by Kathleen De Brabander

Press release – 1 August 2018
64
8. EPRA Performance measures46
8.1 EPRA Earnings
8.2 EPRA NAV
46 EPRA is a registered trademark of the European Public Real-estate Association.
H1 2018 H1 2017
94.192 136.985
Adjustments to calculate the EPRA Earnings, exclude:
I. Changes in value of investment properties, development properties held for investment
and other interests
-33.840 -62.589
- Changes in the value of the real estate portfolio -36.550 -64.592
- Depreciation and write-down on solar panels 2.709 2.003
II. Profit or losses on disposal of investment properties, development properties held for
investment and other interests
348 114
VI. Changes in fair value of financial instruments and associated close-out costs 3.482 -15.638
VIII. Deferred tax in respect of EPRA adjustments 933 21
IX. Adjustments (i) to (viii) to the above in respect of joint ventures -485 -1.648
X. Minority interests in respect of the above 432 0
65.063 57.244
22.116.435 21.439.828
2,94 2,67
Earnings per IFRS income statement
EPRA Earnings
Weighted average number of shares
EPRA Earnings per share (EPS) (in euros)
in euros (x 1 000)
30.06.2018 31.12.2017
IFRS NAV 1.281.228 1.238.439
IFRS NAV/share (in euros) 56,9 56,3
Diluted NAV, after the exercise of options, convertibles and other equity interests 1.281.228 1.238.439
Includes (+/-):
(iv) Fair value of financial instruments 46.391 42.909
(v.a) Deferred tax 6.098 2.631
EPRA NAV 1.333.717 1.283.979
Number of shares 22.506.602 22.009.277
EPRA NAV per share (in euros) 59,3 58,3
EPRA NAV 1.333.717 1.283.979
Includes:
i. Fair value of financial instruments -46.391 -42.909
ii. Fair value of debt -8.921 -9.039
iii. Deferred tax -6.098 -2.631
EPRA NNNAV 1.272.307 1.229.400
Number of shares 22.506.602 22.009.277
EPRA NNNAV per share (in euros) 56,5 55,9
in euros (x 1 000)

Press release – 1 August 2018
65
8.3 EPRA cost ratio
8.4 EPRA NIY and EPRA TOPPED-UP NIY
H1 2018 H1 2017
Include:
I. Administrative/operating expenses (IFRS) 8.309 7.105
III. Management fees less actual/estimated profit element -492 -497
IV. Other operation income/recharges, intended to cover overhead expenses less any related profits -209 -30
V. Administrative/operating expenses of joint ventures expense 8 205
Exclude (if part of the above):
VI. Investment Property Depreciation -429 -345
A 7.186 6.438
IX. Direct vacancy costs -396 -364
B 6.790 6.074
X. Gross rental income less ground rent costs (IFRS) 83.269 69.949
X. Gross rental income less ground rent costs of joint ventures 464 1.887
C 83.733 71.836
A/C 8,6% 9,0%
B/C 8,1% 8,5%EPRA cost ratio (excluding direct vacancy costs)
in euros (x 1 000)
EPRA costs (including direct vacancy costs)
EPRA costs (excluding direct vacancy costs)
Gross rental income
EPRA cost ratio (including direct vacancy costs)
30.06.2018 31.12.2017
Investment property - wholly owned 2.823.785 2.404.027
Investment property - share of joint ventures 33.137 155.863
Assets held for sale 17.862 7.525
Less developments and land reserves -297.002 -232.209
Completed property portfolio 2.577.783 2.335.206
Allowance for estimated purchasers' costs 114.838 98.054
Gross up completed property portfolio valuations B 2.692.621 2.433.260
Annualised cash passing rental income 176.649 161.366
Property outgoings -5.951 -5.621
Annualised net rent A 170.698 155.745
Notional rent expiration of rent free period or other lease incentives 0 0
Topped-up net annualised rent C 170.698 155.745
EPRA NIY A/B 6,3% 6,4%
EPRA TOPPED-UP NIY C/B 6,3% 6,4%
in euros (x 1 000)

Press release – 1 August 2018
66
9. Detailed calculation of the Alternative Performance Measures applied by WDP47
9.1 Result on the portfolio (including portion for joint ventures)
9.2 Changes in the gross rental income based on an unchanged portfolio
9.3 Operating margin
47 Excluding EPRA metrics, some of which are regarded as APMs and reconciled under Chapter 8. EPRA Performance measures.
H1 2018 H1 2017Movement in the fair value of investment property 36.550 64.592
Result on disposal of investment property -348 -114
Deferred taxation on result on the portfolio -933 -21
Participation in the result of associated companies and joint ventures 485 1.808
Result on the portfolio 35.753 66.266
Minority interests -498 0
Result on the portfolio - Group share 35.255 66.266
in euros (x 1 000)
Properties owned throughout the two years 68.160 66.809
Development property 10.452 5.076
Acquisitions 5.767 32
Disposals 162 818
Total 84.541 72.735
To be excluded
Rental income of joint ventures -479 -1.917
Rental income (IFRS) 84.062 70.818
in euros (x 1 000)
H1 2018 H1 2017
H1 2018 H1 2017Property result (IFRS) 90.100 74.536
Operating result (before the portfolio result) (excluding depreciation and write-downs on solar panels) 82.486 69.064
Operating margin 91,6% 92,7%
in euros (x 1 000)

Press release – 1 August 2018
67
9.4 Average cost of debt
9.5 Financial result (excluding changes in the fair value of the financial instruments)
9.6 Hedge ratio
H1 2018 H1 2017
Financial result -19.025 2.468
To be excluded:
Changes in fair value of financial assets and liabilities 3.482 -15.638
Financial result (excluding the changes in fair value of financial instruments) -15.542 -13.170
in euros (x 1 000)
30.06.2018 31.12.2017
Notional amount of Interest Rate Swaps 1.025.693 1.026.768
Fixed-interest financial liabilities 7.181 7.532
Fixed-interest bonds 366.500 266.500
Fixed-interest financial liabilities at balance sheet date and hedging instruments (A) 1.399.374 1.300.800
Current and non-current financial liabilities (IFRS) 1.601.886 1.349.815
Proportional share in joint ventures in current and non-current financial liabilities 11.336 81.091
Financial liabilities at balance sheet date (B) 1.613.222 1.430.906
Hedge ratio (A/B) 87% 91%
in euros (x 1 000)
H1 2018 FY 2017
Financial result (IFRS) -19.025 -9.264
To be excluded:
Financial income -184 -3.268
Changes in fair value of financial assets and liabilities 3.482 -16.470
Interest capitalised during construction -2.007 -1.859
To be included
Interest expenses of joint ventures -63 -857
Effective financial expenses (proportional) (A) -17.797 -31.718
Average outstanding financial liabilities (IFRS) 1.486.872 1.168.489
Average outstanding financial liabilities of joint ventures 28.486 64.487
Average outstanding financial liabilities (proportional) (B) 1.515.357 1.232.976
Annualised Average cost of debt (A/B) 2,3% 2,6%
in euros (x 1 000)

Press release – 1 August 2018
68
9.7 Gearing ratio
30.06.2018 30.06.2018 31.12.2017 31.12.2017
(IFRS) (proportional) (IFRS) (proportional)
Non-current and current liabilities 1.725.695 1.746.794 1.436.860 1.530.038
To be excluded:
- I. Non-current liabilities - A. Provisions 351 351 655 656
- I. Non-current liabilities - C. Other non-current financial liabilities -
Permitted hedging instruments 51.190 51.190 48.673 48.673
- I. Non-current liabilities - F. Deferred taxes - Liabilities 610 1.905 0 894
- II. Current liabilities - A. Provisions 0 0 0 0
- II. Current liabilities - E. Other current liabilities - Other: Hedging instruments 0 0 0 0
Hedging instruments
- II. Current liabilities - F. Accruals and deferred income 13.029 13.347 13.394 13.677
Total debt A 1.660.514 1.680.000 1.374.139 1.466.138
Total assets B 3.033.624 3.054.723 2.675.299 2.768.444
To be excluded:
- E. Financial fixed assets - Financial instruments at fair value
through profit and loss - Permitted hedging instruments 4.799 4.799 5.764 5.764
Total assets B 3.028.825 3.049.924 2.669.535 2.762.681
Gearing ratio A/B 54,8% 55,1% 51,5% 53,1%
in euros (x 1 000)

Press release – 1 August 2018
69
MORE INFORMATION
WDP Comm. VA Joost Uwents Mickael Van den Hauwe
Blakebergen 15 CEO CFO
1861 Wolvertem
Belgium
www.wdp.eu M +32 (0) 476 88 99 26 M +32 (0) 473 93 74 91
[email protected] [email protected] [email protected]
___
WDP develops and invests in logistics property (warehouses and offices). WDP's property portfolio
amounts to around 4 million m². This international portfolio of semi-industrial and logistics buildings
is spread over more than 180 sites at prime logistics locations for storage and distribution in Belgium,
France, the Netherlands, Luxembourg and Romania. More information about WDP can be found on
www.wdp.eu.
___
WDP Comm. VA – BE-REIT (Public Regulated Real Estate Company under Belgian law).
Company number 0417.199.869 (Brussels Trade Register)

Press release – 1 August 2018
70
Disclaimer
Warehouses De Pauw Comm.VA, abbreviated WDP, having its registered office at Blakebergen 15, 1861 Wolvertem
(Belgium), is a public Regulated Real Estate Company, incorporated under Belgian law and listed on Euronext.
This press release contains forward-looking information, forecasts, beliefs, opinions and estimates prepared by WDP,
relating to the currently expected future performance of WDP and the market in which WDP operates (“forward-
looking statements”). By their very nature, forward-looking statements involve inherent risks, uncertainties and
assumptions, both general and specific, and risks exist that the forward-looking statements will not prove accurate.
Investors should be aware that a number of important factors could cause actual results to differ materially from the
plans, objectives, expectations, estimates and intentions expressed in, or implied by, such forward-looking
statements. Such forward-looking statements are based on various hypotheses and assessments of known and
unknown risks, uncertainties and other factors which seemed sound at the time they were made, but which may or
may not prove to be accurate. Some events are difficult to predict and can depend on factors on which WDP has no
control. Statements contained in this press release regarding past trends or activities should not be taken as a
representation that such trends or activities will continue in the future.
This uncertainty is further increased due to financial, operational and regulatory risks and risks related to the
economic outlook, which reduces the predictability of any declaration, forecast or estimate made by WDP.
Consequently, the reality of the earnings, financial situation, performance or achievements of WDP may prove
substantially different from the guidance regarding the future earnings, financial situation, performance or
achievements set out in, or implied by, such forward-looking statements. Given these uncertainties, investors are
advised not to place undue reliance on these forward-looking statements. Additionally, the forward-looking
statements only apply on the date of this press release. WDP expressly disclaims any obligation or undertaking, unless
if required by applicable law, to release any update or revision in respect of any forwardlooking statement, to reflect
any changes in its expectations or any change in the events, conditions, assumptions or circumstances on which such
forward-looking statements are based. Neither WDP, nor its representatives, officers or advisers, guarantee that the
assumptions underlying the forward-looking statements are free from errors, and neither do they make any
representation, warranty or prediction that the results anticipated by such forward-looking statements will be
achieved.
Related Documents