2018 IM 2 C Summary Sheet Roughly 33 million patients check into American hospitals every year, at a rate of about 1 patient per second. Nearly everyone in their lives will try to seek healthcare services, and they will try their best to find the “perfect” hospital for themselves. How to determine whether a hospital is good or not then becomes a question. They also have their own choices and opinions about healthcare services. So, how can we measure the quality of a hospital? Certainly, mortality is a crucial variable — no-one wants to go to hospitals where doctors can’t cure pa- tients. Other factors are also very important, as evaluations need to be well-rounded so patients can truly know the overall quality of a hospital before they go there. In this paper, we considered four factors: mortality, patient ratings, patient safety, and cost to evaluate the quality of American hospitals, then developed two models (AHP and PWSCM) to rank national and local hospitals. Lastly, we developed a software service (Hospital Evaluation Ranking System — HERS) that can use patient’s opinions and their location to find the best hospital they should choose in different circumstances. We built a mortality model (Comparative Mortality Model, CMM) based on disease-caused mortality and operation-caused mortality, which takes into account death distributions in each state, and comparing each hospital’s mortality with the state average.This model ranked the CEDARS-SINAI MEDICAL CEN- TER as the best hospital. Using similar methods, we analyzed the patient ratings, patient safety, and cost of every hospital in the nation, comparing each measure to the state average. From these factors and mortality, we built an AHP model to rank the best hospital in the nation, but found the algorithm inefficient. Based on the AHP model, we developed our own model, called Patient-Weighted State Comparison Model, which can efficiently and accurately rank all the hospitals in the nation. Both the AHP model and our model ranked MAYO CLINIC HOSPITAL as the best hospital in the United States. We also compared our own national rankings with the U.S. News 2017-18 Best Hospitals Honor Roll and found it mostly similar but with a few differences which are caused by the different criteria and ranking methods. Using the PWSCM method, we built a software (HERS) that can acquire the patient’s opinion of the importance of each factor on a scale on 1-10, then using the patient’s zip code, show the highest ranked hospitals near the patient in different situations (Emergency, Non-emergency. . . ). Using Los Angeles as a case study, we found that a patient living near downtown should go to either Ronald Reagan UCLA Medical Center or Centinela Hospital Medical Center, depending on the situation. Although there are some limitations in our model, for it does not include hospital size, staffing, and specific diseases and specialties within hospitals, it is still very adaptable and can be used in different countries once the accurate data are provided. Our model can be used extensively in real-world scenarios, and can give crucial information to patients. It is also very user-friendly, giving the patient much control over their personalization, but encapsulating the important ranking algorithms. We strongly recommend our model because of its accuracy and adaptability, and ease of use. 1 Team Control Number IMMC2018021

Welcome message from author
This document is posted to help you gain knowledge. Please leave a comment to let me know what you think about it! Share it to your friends and learn new things together.
Transcript
2018 IM2C
Summary Sheet
Roughly 33 million patients check into American hospitals every year, at a rate of about 1 patient persecond. Nearly everyone in their lives will try to seek healthcare services, and they will try their best to findthe “perfect” hospital for themselves. How to determine whether a hospital is good or not then becomes aquestion. They also have their own choices and opinions about healthcare services. So, how can we measurethe quality of a hospital?
Certainly, mortality is a crucial variable — no-one wants to go to hospitals where doctors can’t cure pa-tients. Other factors are also very important, as evaluations need to be well-rounded so patients can trulyknow the overall quality of a hospital before they go there. In this paper, we considered four factors:mortality, patient ratings, patient safety, and cost to evaluate the quality of American hospitals,then developed two models (AHP and PWSCM) to rank national and local hospitals. Lastly,we developed a software service (Hospital Evaluation Ranking System — HERS) that can usepatient’s opinions and their location to find the best hospital they should choose in differentcircumstances.
We built a mortality model (Comparative Mortality Model, CMM) based on disease-caused mortality andoperation-caused mortality, which takes into account death distributions in each state, and comparing eachhospital’s mortality with the state average.This model ranked the CEDARS-SINAI MEDICAL CEN-TER as the best hospital.
Using similar methods, we analyzed the patient ratings, patient safety, and cost of every hospital in thenation, comparing each measure to the state average. From these factors and mortality, we built an AHPmodel to rank the best hospital in the nation, but found the algorithm inefficient. Based on the AHP model,we developed our own model, called Patient-Weighted State Comparison Model, which can efficiently andaccurately rank all the hospitals in the nation. Both the AHP model and our model ranked MAYOCLINIC HOSPITAL as the best hospital in the United States. We also compared our own nationalrankings with the U.S. News 2017-18 Best Hospitals Honor Roll and found it mostly similar but with a fewdifferences which are caused by the different criteria and ranking methods.
Using the PWSCM method, we built a software (HERS) that can acquire the patient’s opinion of theimportance of each factor on a scale on 1-10, then using the patient’s zip code, show the highest rankedhospitals near the patient in different situations (Emergency, Non-emergency. . . ). Using Los Angeles as acase study, we found that a patient living near downtown should go to either Ronald ReaganUCLA Medical Center or Centinela Hospital Medical Center, depending on the situation.
Although there are some limitations in our model, for it does not include hospital size, staffing, and specificdiseases and specialties within hospitals, it is still very adaptable and can be used in different countriesonce the accurate data are provided. Our model can be used extensively in real-world scenarios, and cangive crucial information to patients. It is also very user-friendly, giving the patient much control over theirpersonalization, but encapsulating the important ranking algorithms. We strongly recommend our modelbecause of its accuracy and adaptability, and ease of use.
1
Team Control Number IMMC2018021

TO: Dear HERS Users
FROM: HERS original developers
SUBJECT: User instructions
MAY GOD BLESS YOU
FOR A HEALTHY LIFE
√ Local Rankings √ State Ranking √ National Rankings
Our software can compare hospital in three different ranges:
You should select one of the ranges, so that we can tailor our rankings to you preferences.
If you selected the Local Rankings or State Rankings, you should also provide your ZIP code, so that we can help you find best hospitals NEAR YOU!
Welcome to the instruction page of HERS!
Our Hospital Evaluation Ranking System (HERS) uses four major indicators to help you develop customized hospital rankings.Using our hospital rankings and our software, you can find the most ideal hospital for your condition.
To help us develop your personalized hospital rankings, you need to determine the importance for each of the indicators on a range of 1- 10. The more important you think each factor is crucial to your hospital experience, the higher you should rate it.
The indicators are: √ Mortality Rate √ Patients' Rating √ Patient Safety √ Cost
How to use HERS R-D Graph to Choose
an ideal hospital?
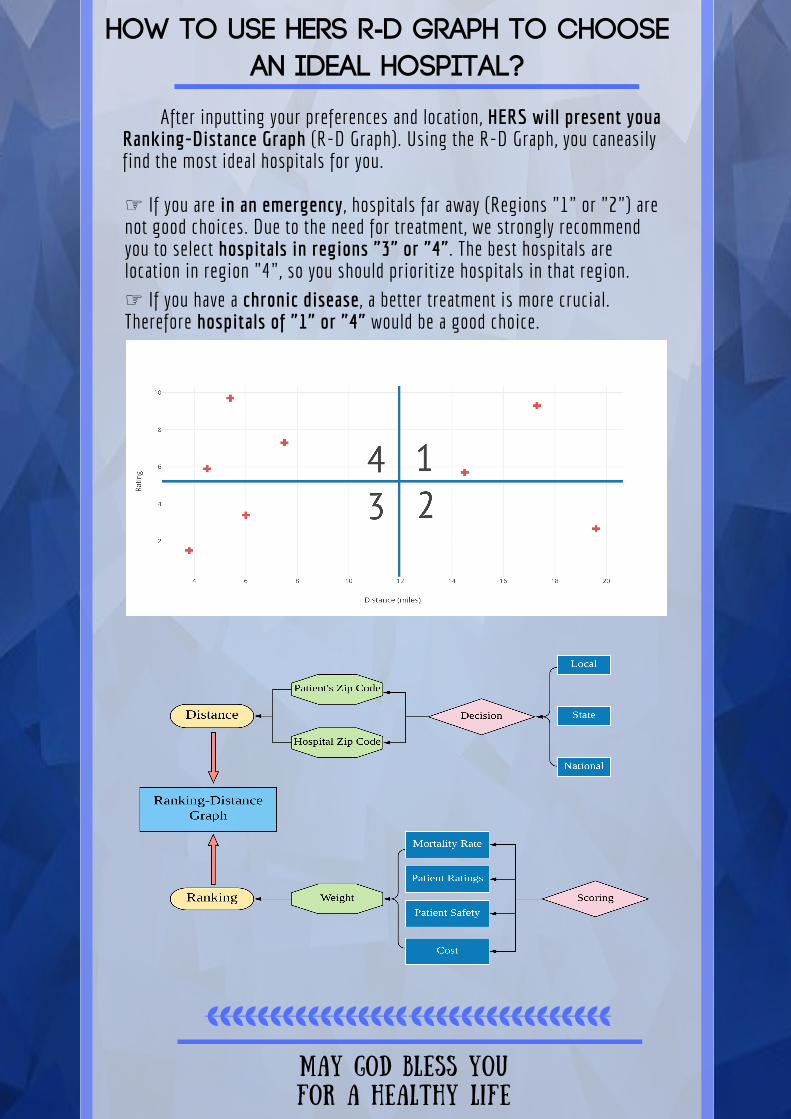
After inputting your preferences and location, HERS will present youaRanking-Distance Graph (R-D Graph). Using the R-D Graph, you caneasilyfind the most ideal hospitals for you.
MAY GOD BLESS YOU
FOR A HEALTHY LIFE
☞ If you are in an emergency, hospitals far away (Regions "1" or "2") arenot good choices. Due to the need for treatment, we strongly recommendyou to select hospitals in regions "3" or "4". The best hospitals arelocation in region "4", so you should prioritize hospitals in that region. ☞ If you have a chronic disease, a better treatment is more crucial.Therefore hospitals of "1" or "4" would be a good choice.
IMMC2018021 Page 1 of 19
1 Introduction
For the sake of maintaining health, people try their best to seek the “perfect” health care system for them-selves, but how to determine whether a hospital is good or not becomes a serious question. Sometimes, inemergencies, individuals will most likely seek the closest hospital to them, but many times people will wantto find the “best” hospital that is around them. Without extensive data or research, this is a very hard thingto achieve.
A hospital may have a satisfying service, but their mortality rate or cost might be very high. Other hos-pitals will have a low mortality rate, but they may have staff shortages and unclean environments, amongother things.
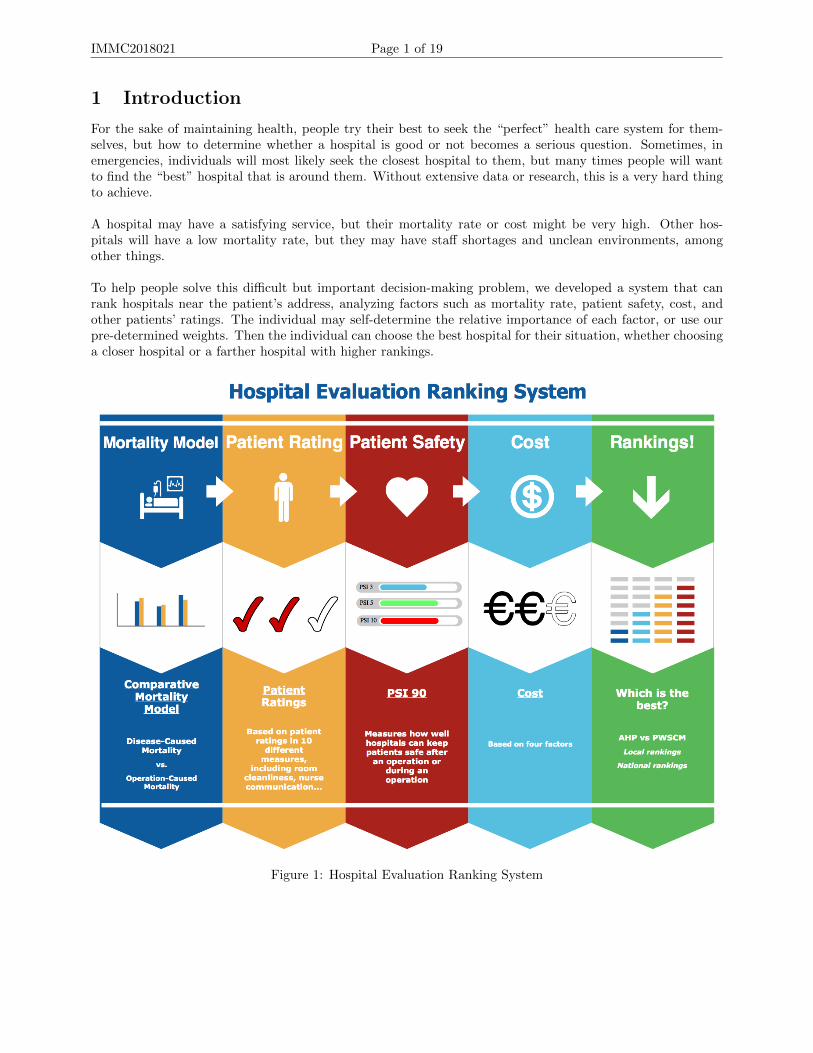
To help people solve this difficult but important decision-making problem, we developed a system that canrank hospitals near the patient’s address, analyzing factors such as mortality rate, patient safety, cost, andother patients’ ratings. The individual may self-determine the relative importance of each factor, or use ourpre-determined weights. Then the individual can choose the best hospital for their situation, whether choosinga closer hospital or a farther hospital with higher rankings.
Figure 1: Hospital Evaluation Ranking System

IMMC2018021 Page 2 of 19
2 Problem Restatement
The question asks us to develop a model for a patient to choose the best hospital using mortality rate amongother factors. Therefore, we are required to:X Develop a mathematical model to measure the quality of hospitals using mortality rate.X Develop a mathematical model that uses other factors in addition to mortality to measure the quality ofa hospital, then rank the best hospitals.X Write a user-friendly memo that allows patients who lack mathematical expertise and computing abilityto be able to choose a hospital that is suitable for them.
3 General Assumptions and Justifications
z The state average for a measure can represent hospitals without data in that measureJustification: Many smaller hospitals within the United States have a smaller dataset to work with, as they
lack the score for a measure. For these cases, an approximation of the hospital quality is the state/nationalaverage for that measure. This can allow all the hospitals to be analyzed and ranked.
z Patient surveys are accurate and unbiasedJustification: A large part of our ranking system is the user experience at that hospital, collected from
surveys[1] describing the hospital service from 10 factors. We assumed that the results from these surveys areaccurate, and correctly reflect the conditions at that hospital. If the data were biased, then it would be almostimpossible to know the actual circumstances of hospitals without direct observation.
z The data collected from each hospital is complete and truthfulJustification: Since all the data we collected were from government-affiliated organizations and depart-
ments, we assumed that hospitals are truthfully reporting their data, including its mortality rate. As withpatient experience, we assumed that no hospitals secluded important information that can drastically changetheir ranking, and gave complete and honest information to health services.
z All the healthcare data are authoritative, and can effectively represent the overall condition at eachhospital
Justification: We obtained data from Medicare.gov and the NIS database [2], among other sources, all ofwhich were deemed authoritative. We can assume that by using these information, a hospital’s overall qualitycan be derived.
z Deaths by certain diseases are evenly distributed within each stateJustification: Deaths by different conditions (e.g. Heart Attack, stroke) vary from state to state, with
some states’ residents having a probability of a heart attack much greater than other states’. We used thisdata to adjust the mortality rate of different hospitals, located in different parts of a state. If the death ratesby disease in different parts of the same state varies, it would be very hard to calculate.
z There are no significant medical breakthroughs after the data was collected (January 2018)Justification: Although the data was collected relatively recently (this year), a huge medical breakthrough
in a procedure or condition would disrupt the mortality rate and greatly affect our rankings.
z The overall quality of a hospital can be qualitatively modeled by several quantitative measures.Justification: Since we have to compare the qualities of different hospitals, we need to quantify the “qual-
ity” of each hospital. Therefore, we shall assume that this quantity can be quantitatively derived from differentmeasures, or else our model would be rendered ineffective.
z Special hospitals are able to cure other diseases.Justification: We analyzed over four thousand hospitals, some of which are special hospitals. It is reason-
able to simplify and assume that those special hospitals has the ability to cure other diseases.
IMMC2018021 Page 3 of 19
z Patients of the same disease have similar average state of health across hospitals.Justification: Large differences in age, sex, etc. will affects the disease-caused mortality rate significantly.
Thus reasonably we assume that there is little difference among patients’ average health conditions betweenhospitals. For example, if hospital A treated a 10 year old child, a 30 year old man, and an 80 year old woman,then hospital B shall be assumed as treating a 10 year old girl, 30 year old man, and 80 year old man.
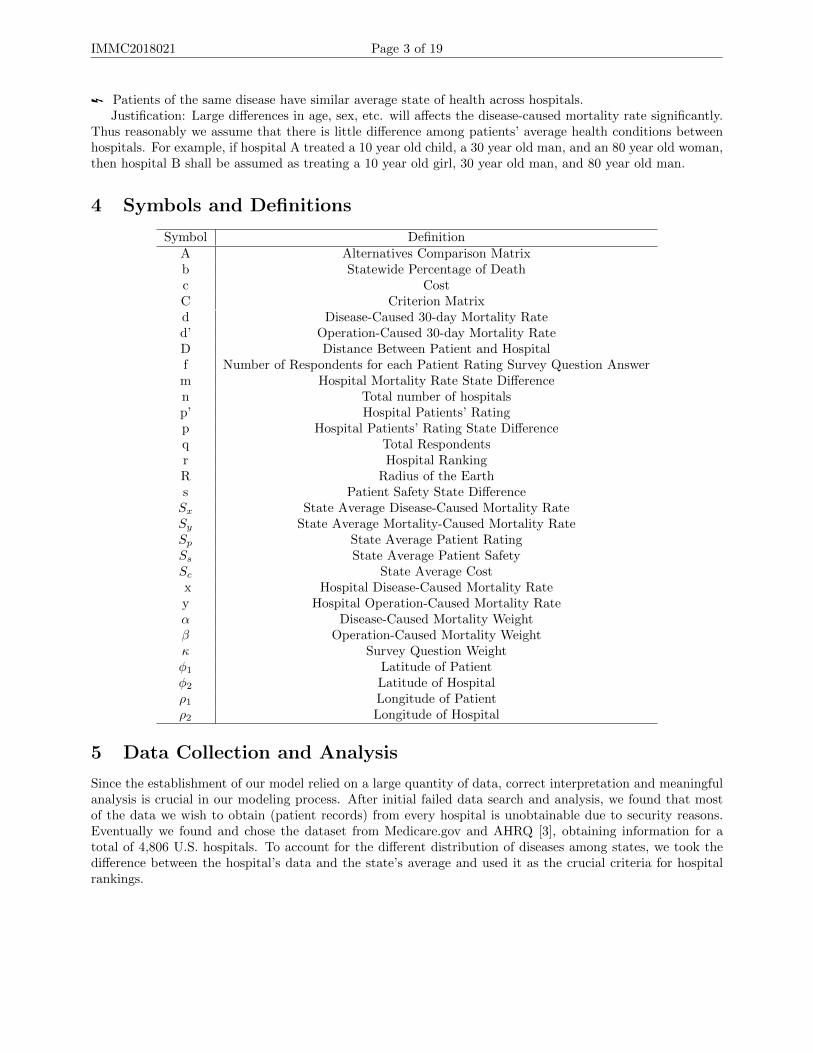
4 Symbols and Definitions
Symbol DefinitionA Alternatives Comparison Matrixb Statewide Percentage of Deathc CostC Criterion Matrixd Disease-Caused 30-day Mortality Rated’ Operation-Caused 30-day Mortality RateD Distance Between Patient and Hospitalf Number of Respondents for each Patient Rating Survey Question Answerm Hospital Mortality Rate State Differencen Total number of hospitalsp’ Hospital Patients’ Ratingp Hospital Patients’ Rating State Differenceq Total Respondentsr Hospital RankingR Radius of the Earths Patient Safety State DifferenceSx State Average Disease-Caused Mortality RateSy State Average Mortality-Caused Mortality RateSp State Average Patient RatingSs State Average Patient SafetySc State Average Costx Hospital Disease-Caused Mortality Ratey Hospital Operation-Caused Mortality Rateα Disease-Caused Mortality Weightβ Operation-Caused Mortality Weightκ Survey Question Weightφ1 Latitude of Patientφ2 Latitude of Hospitalρ1 Longitude of Patientρ2 Longitude of Hospital
5 Data Collection and Analysis
Since the establishment of our model relied on a large quantity of data, correct interpretation and meaningfulanalysis is crucial in our modeling process. After initial failed data search and analysis, we found that mostof the data we wish to obtain (patient records) from every hospital is unobtainable due to security reasons.Eventually we found and chose the dataset from Medicare.gov and AHRQ [3], obtaining information for atotal of 4,806 U.S. hospitals. To account for the different distribution of diseases among states, we took thedifference between the hospital’s data and the state’s average and used it as the crucial criteria for hospitalrankings.
IMMC2018021 Page 4 of 19
6 Comparative Mortality Model
Death is the most tractable outcome of hospital care, since it can be easily measured, is of undisputed impor-tance to everyone, and is very common in hospitals. However, mortality rate itself is a very bad indicator toanalyze hospital performance.
The problem is that we cannot know which conditions and diseases can be prevented at a hospital by onlylooking at its in-hospital mortality rate. For example, two hospitals can have the same mortality rate [4], buthospital A has a high preventable death ratio and a low inevitable death ratio, but hospital B has a muchlower preventable death ratio and a high inevitable death ratio. If we only look at the mortality rate, wemight conclude that both hospitals are of the same quality, but hospital B is actually better than hospital Asince a low preventable death rate means there are less deaths due to preventable (curable) causes.
Inevitable and preventable mortality rates are actually extreme oversimplifications of mortality. In hospi-tals, there are no inevitable diseases and no absolute preventable mortality. We wish to determine factors thatcan indirectly signal a hospital’s quality without oversimplification.
After analysis, we divided mortality into two categories: disease-caused mortality and operation-caused mor-tality. We found that many diseased-caused mortality is not a very good indicator of a hospital’s overall qualitydue to uncertainty and locality, but operation-caused mortality actually is. Most highly praised hospitals andfamous hospitals in the U.S. have very low operation-caused mortality rates, reflecting that they have the bestdoctors and equipment.
6.1 Disease-Caused Mortality
There are thousands of diseases and every patient is affected by one or more of them. It is very difficult tocalculate the exact accurate mortality for each disease and for each hospital. To get an plausible value, wechose five diseases from the Top 10 Deadliest Diseases List [5]: Acute Myocardial Infarction (AMI) (or HeartAttack), Chronic Obstructive Pulmonary Disease (COPD), Heart Failure (HF), Peumonia (PN), and Stroke(STK).
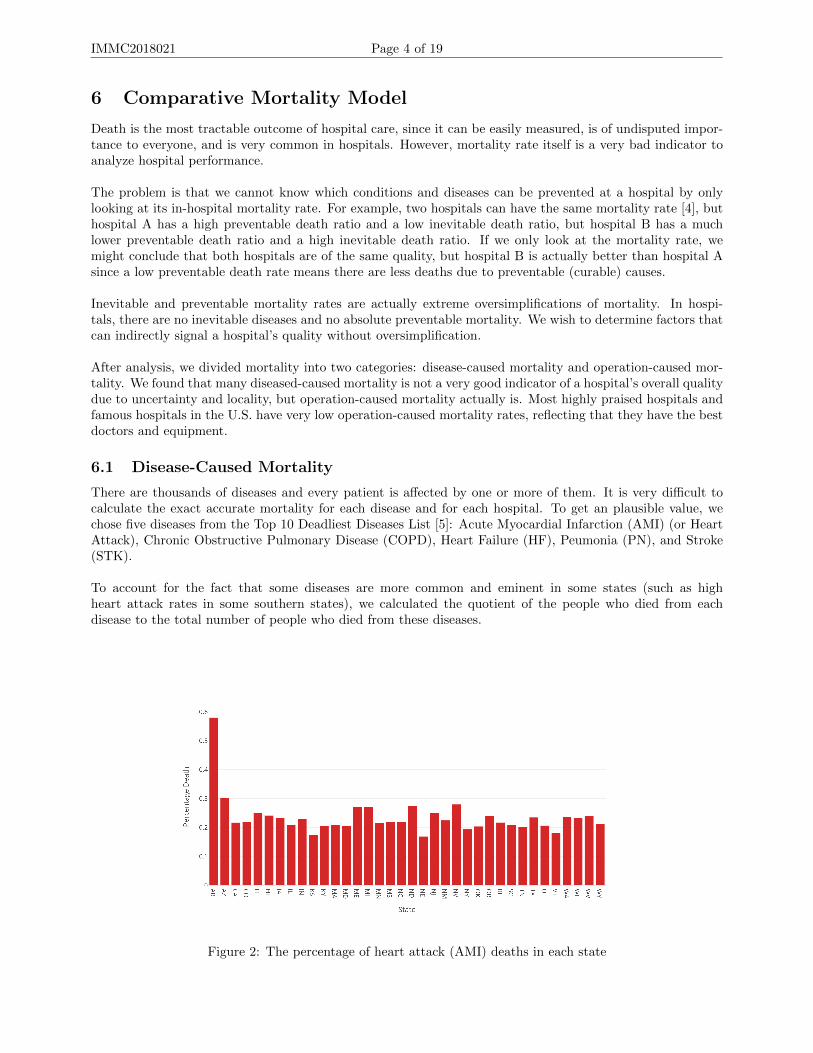
To account for the fact that some diseases are more common and eminent in some states (such as highheart attack rates in some southern states), we calculated the quotient of the people who died from eachdisease to the total number of people who died from these diseases.
Figure 2: The percentage of heart attack (AMI) deaths in each state
IMMC2018021 Page 5 of 19
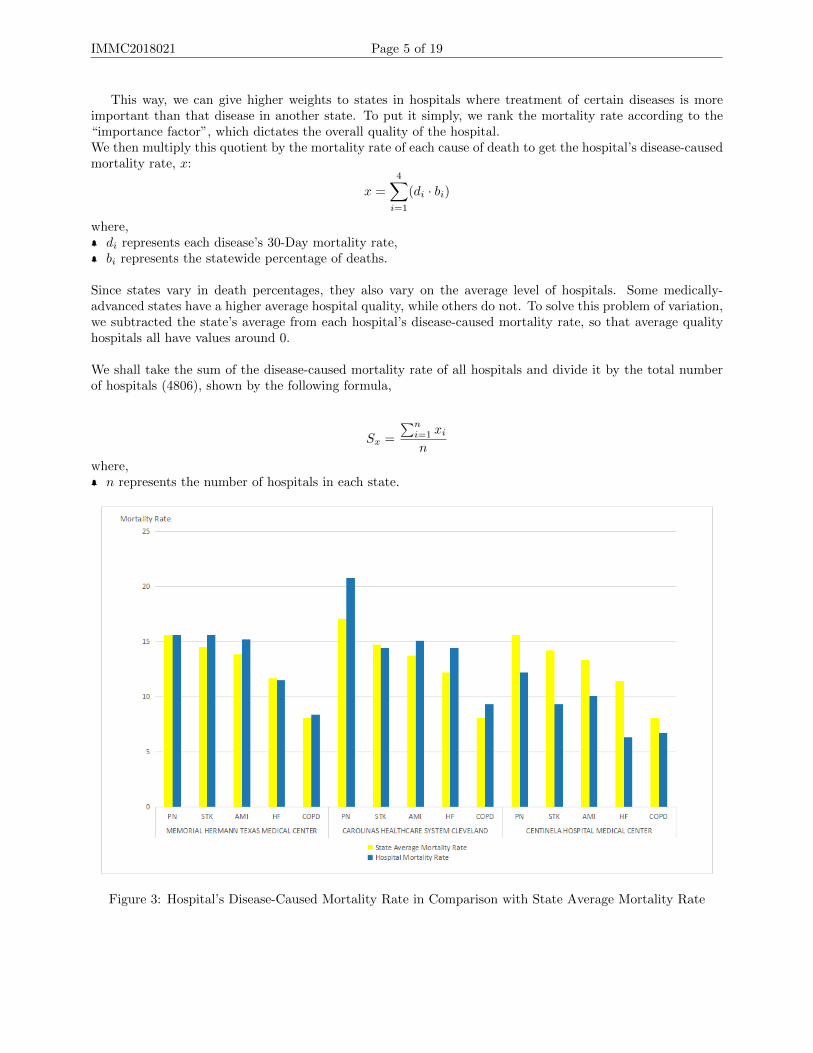
This way, we can give higher weights to states in hospitals where treatment of certain diseases is moreimportant than that disease in another state. To put it simply, we rank the mortality rate according to the“importance factor”, which dictates the overall quality of the hospital.We then multiply this quotient by the mortality rate of each cause of death to get the hospital’s disease-causedmortality rate, x:
x =
4∑i=1
(di · bi)
where, di represents each disease’s 30-Day mortality rate, bi represents the statewide percentage of deaths.
Since states vary in death percentages, they also vary on the average level of hospitals. Some medically-advanced states have a higher average hospital quality, while others do not. To solve this problem of variation,we subtracted the state’s average from each hospital’s disease-caused mortality rate, so that average qualityhospitals all have values around 0.
We shall take the sum of the disease-caused mortality rate of all hospitals and divide it by the total numberof hospitals (4806), shown by the following formula,
Sx =
∑ni=1 xin
where, n represents the number of hospitals in each state.
Figure 3: Hospital’s Disease-Caused Mortality Rate in Comparison with State Average Mortality Rate
IMMC2018021 Page 6 of 19
6.2 Operation-Caused Mortality
Operation-Caused Mortality can better reflect a hospital’s overall quality. We selected three measure: Deathsamong Patients with Serious Treatable Complications after Surgery (PSTCS), Death rate for Coronary ArteryBypass Grafting (CABG), and Serious blood clots after surgery (BC), calculated the hospital operation-causedmortality rate brought by these surgical errors, and compare it to the statewide operation-caused mortalityrate.
Similar to the disease-caused mortality rate, we could write the equation of operation-caused mortality, y,as
y =
n∑i=1
d′i
where, d′i represents the operation-caused mortality rate.
Since these operations do not vary state by state, we will omit the state death percentage from the pre-vious formulas. Adding the hospitals’ rates together and taking the average of the sum, we calculated thestatewide operation-caused mortality rate, as shown by:
Sy =
∑ni=1 yin
where, n represents the number of hospitals in each state.
Taking the difference between each hospital’s operation-caused mortality rate and the state average, we canget the operation-caused mortality difference of each hospital.
6.3 Comparative Mortality
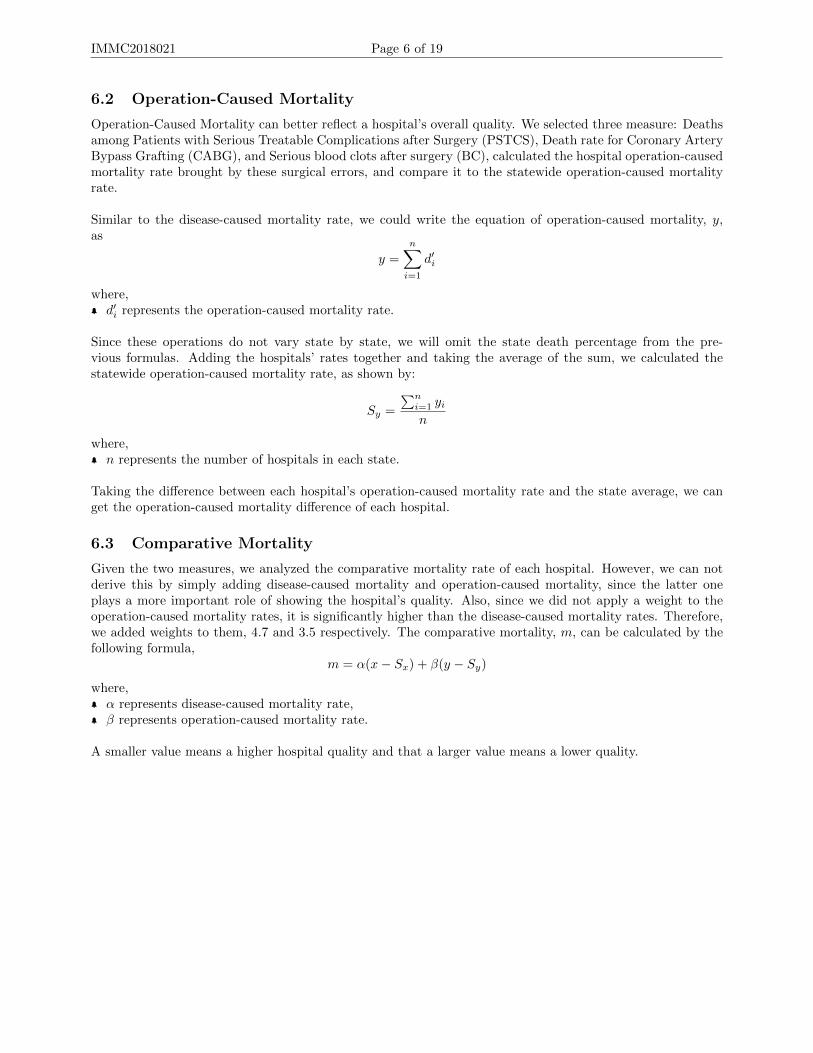
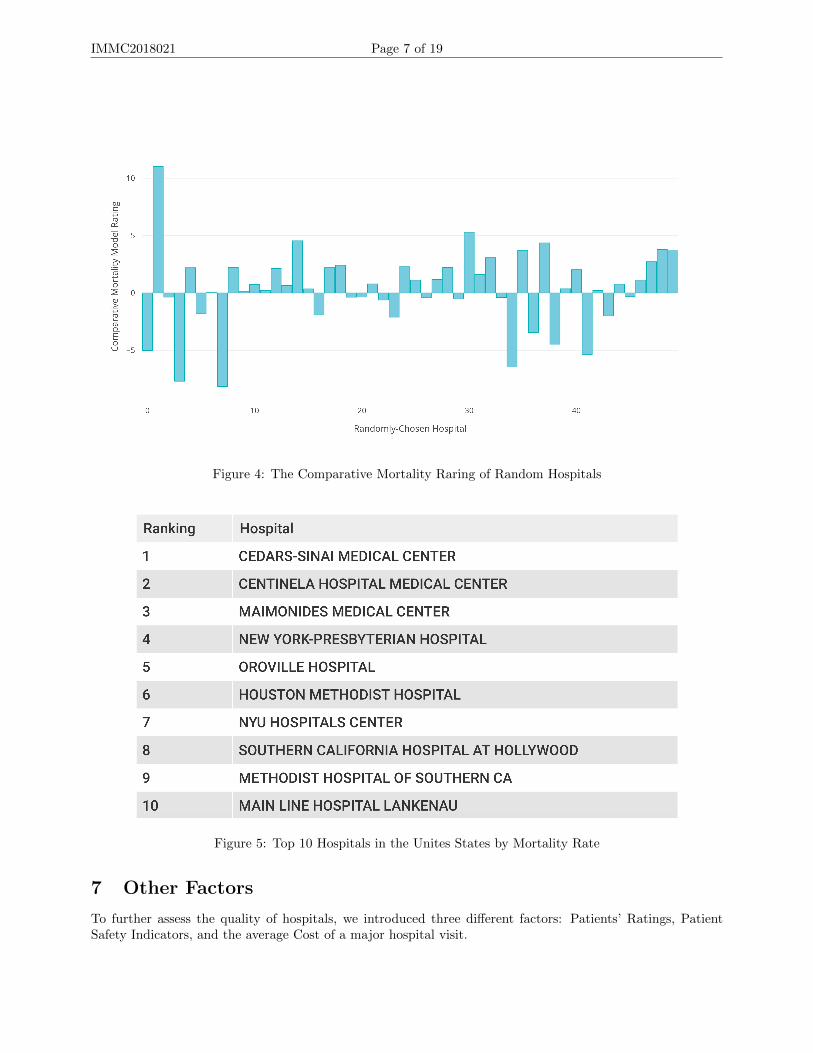
Given the two measures, we analyzed the comparative mortality rate of each hospital. However, we can notderive this by simply adding disease-caused mortality and operation-caused mortality, since the latter oneplays a more important role of showing the hospital’s quality. Also, since we did not apply a weight to theoperation-caused mortality rates, it is significantly higher than the disease-caused mortality rates. Therefore,we added weights to them, 4.7 and 3.5 respectively. The comparative mortality, m, can be calculated by thefollowing formula,
m = α(x− Sx) + β(y − Sy)
where, α represents disease-caused mortality rate, β represents operation-caused mortality rate.
A smaller value means a higher hospital quality and that a larger value means a lower quality.
IMMC2018021 Page 7 of 19
Figure 4: The Comparative Mortality Raring of Random Hospitals
Figure 5: Top 10 Hospitals in the Unites States by Mortality Rate
7 Other Factors
To further assess the quality of hospitals, we introduced three different factors: Patients’ Ratings, PatientSafety Indicators, and the average Cost of a major hospital visit.

IMMC2018021 Page 8 of 19
7.1 Patients’ Ratings
To parameterize patient ratings, we analyzed the data from the Hospital Consumer Assessment of Health-Care Providers and Systems (HCAHPS) [6]. The HCAHPS is a questionnaire given to hospital patients askingabout the hospital’s service during their stay. From this data, we selected ten most important aspects thatpatients evaluated, and analyzed them.
We chose ten aspects from the questionnaire – room cleanliness, nurse communication, doctor communication,staff responsiveness, discharge information, care transition, quietness at night, and hospital recommendation– measures that can attract or repel patients.
In the questionnaire, most answers are reported in three different categories (always, sometimes, never).For example, in the questionnaire, the patient can answer either the room is always clean, sometimes clean,or never clean. Since these answers are not quantitative, we gave then corresponding values: 5, 3, and 1, re-spectively. However, some questions only have true/false answers, which we designated corresponding valuesof 5 and 3.
For each measure, we designated a row matrix of 1x3 (or 1x2) as the number of respondents with eachanswer (fi), and a column matrix κ as the answer values of 5, 3, and 1 or 5 . For instance, if 58% of respon-dents rated the hospitals’ rooms as always clean, 32% as sometimes clean, and 10% as never clean, and 1000people participated in the survey, then
f ∗ κ =
1000 ∗ 0.581000 ∗ 0.321000 ∗ 0.10
(5 3 1)
We can take the sum of this matrix(infinity-norm) and divide by the number of respondents to get a normalizedvalue, then sum all the normalized values for different survey questions, resulting in the equation: Therefore,we apply the formula, shown as
p′ =
10∑i=1
‖fi · κi‖∞qi
where, fi represents a the number of respondents for each question choice, qi represents the total number of people who answered the questions of that factor, κi represents the weight matrix
Since we have ten different factors and each of them will have a score in the range of one to five, thentotal achievable score is fifty. Each hospital in the United States has its own score, and the higher the score,the better the hospital’s service.
As with our comparative mortality model, we will use the difference between each hospital’s score and thestate average score to better compare hospitals on a national level. Thus,
p = (
10∑i=1
‖fi · κi‖∞qi
)− Sp
where Sp =∑n
i=1 p′i
n .
Therefore, the higher p is, the better the hospital’s patient rankings are.
7.2 Patient Safety Indicators
Patient Safety Indicators (PSIs)[7], developed by the Agency for Healthcare Research and Quality (AHRQ)[3]are a set of measures that measure adverse events that patients might experience in a health care system.

IMMC2018021 Page 9 of 19
PSIs can measure how well hospitals can keep patients safe after an operation or during an operation, and ismainly affected by hospital quality. A better hospital will usually have lower PSI rates.
PSI 90 (The Patient Safety and Adverse Events Composite)[8] is a measure using ICD-9-CM diagnosis (A typeof disease classification)[?] to judge a hospital’s overall quality to keep a patient safe. It combines selectedPSIs with different weights to provide a clinical judgment.
Component WeightPSI Indicator Weight
PSI 03 Pressure Ulcer rate 0.059841PSI 06 Iatrogenic Pneumothorax Rate 0.053497PSI 08 In-Hospital Fall with Hip Fracture Rate 0.010097PSI 09 Perioperative Acute Kidney Injury Rate 0.085335PSI 10 Postoperative Acute Kidney Injury Rate 0.041015PSI 11 Postoperative Respiratory Failure 0.304936PSI 12 Perioperative Pulmonary Embolism and Deep Vein Thrombosis Rate Rate 0.208953PSI 13 Postoperative Sepsis Rate 0.216046PSI 14 Postoperative Wound Dehiscence Rate 0.013269PSI 15 Unrecognized Abdominopelvic Accidental Puncture / Laceration Rate 0.007011
[?] Using the information of all American Hospitals, we can calculate the PSI 90 value of each hospital and thestatewide rate. Similarly, we took the difference between the hospital rate and the statewide rate, measuringthe hospitals’ quality of safety.
s = PSI90− Ss = PSI90−∑n
i=1 PSI90in
A smaller s value (sometimes negative) means better quality, and vise versa.
7.3 Cost
Since patients’ age, condition, length of stay, and healthcare are very different, it is hard to approximate theaverage amount of money a patient has to pay during a hospital visit. However, using the data available, wefound that we can measure the cost by using four costs for different parameters:
Heart attack (1)
Heart failure (2)
Hip or knee replacement (3)
Pneumonia (4)
Using these four costs for each hospital, we averaged them and subtracted the state average from these results.This way, we can simplify the payment models at different hospitals using the same parameters.
c =heartAttackCost+ heartFailureCost+ replacementCost+ pneumoniaCost
4− Sc
8 Ranking Models
To make use of our separate factor models, we need a ranking system that can rank the top U.S. hospitalsand local hospitals. To achieve this, we used AHP and our own method, Patient Weighted State ComparisonModel (PWSCM) to rank the top 20 American hospitals.
Both the AHP model and our PWSCM model uses a user-input comparison method. For each of the fourfactors (mortality, patient rating, safety, cost), the user can determine how much each factor means to them,on a scale of 1-10. For example, a user might rate the hospital’s mortality as 6, patient ratings as 7, safety as5, and cost as 4. Therefore, a user-determined importance matrix can be represented as:[
6 7 5 4]

IMMC2018021 Page 10 of 19
Normalizing this matrix, which means dividing each element by the sum of all elements, we get this matrix,which we will call the criterion matrix (C):
C =[0.273 0.318 0.227 0.182
]8.1 Analytic Hierarchy Process Model
Analytic Hierarchy Process (AHP)[9] is a multi-criteria decision analysis technique developed by Prof. ThomasL. Saaty for organizing and analyzing complex decisions. We will first use this model to assess the rankingsof U.S. hospitals.
For the sake of choosing the best hospital (objective), we used mortality rate (m), patient ranking (p), pa-tient safety (s), payment (c) as the criteria, and different hospitals as the alternatives. The hierarchy can bediagrammed as shown below:
Figure 6: Analytic Hierarchy Process Model
We can set the priorities for each criteria according to the criterion matrix C. For our rankings, thecriterion matrix we used was:
C =[0.375 0.375 0.15 0.1
]We can also see the criterion matrix as a 4x4 matrix with pairwise comparisons, as shown:
C =
m p s c
m 1 1 2.5 3.75p 1 1 2.5 3.75s 0.4 0.4 1 1.5c 4
15415
23 1
As we can see, this criterion matrix is consistent, which means that the weights for the criteria are the sameas C.
Furthermore, we can do a pairwise comparison of all the hospitals in each of the four factors. However,since we have data for 4,806 different hospitals, it would take at least 4∗4806∗4806 = 92390544 computationsto get the comparison matrix, then even more to get the principal eigenvectors and eigenvalues. Therefore,we only took the top 200 hospitals ranked by mortality rate to do the AHP ranking.
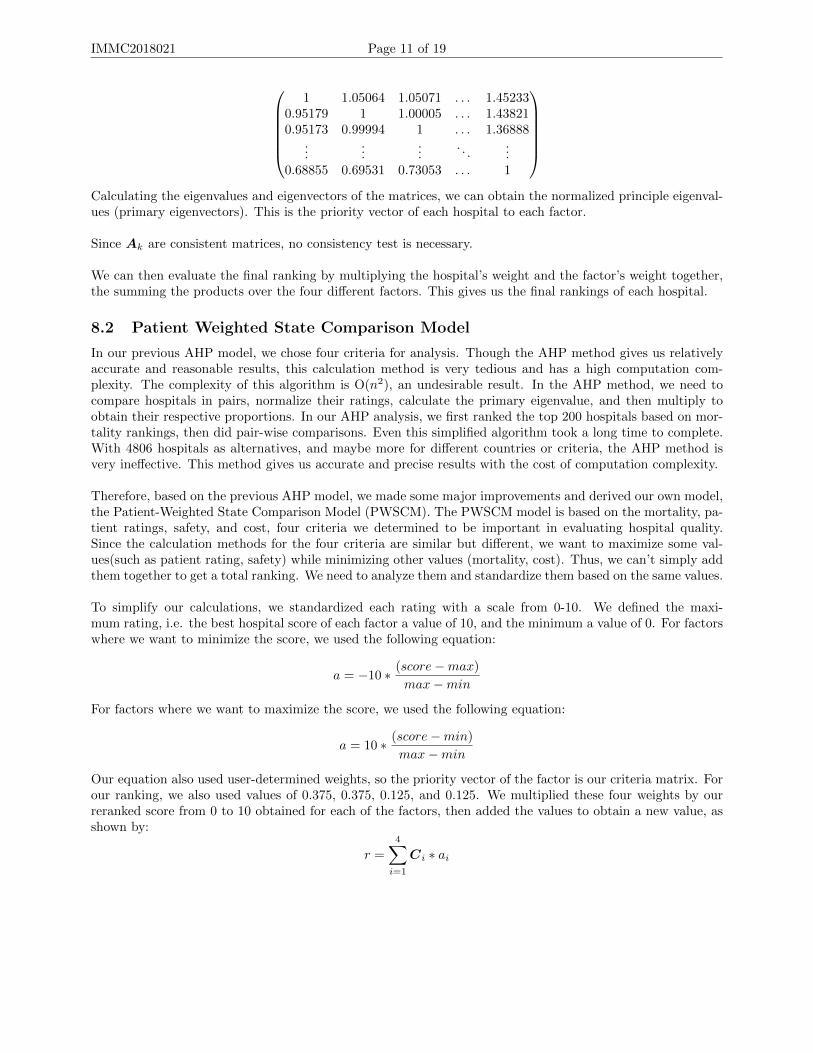
Using pairwise comparisons, we can determine a comparison matrix Ak, with k being each of the four factors.For example, our mortality comparison matrix (A1) is:
IMMC2018021 Page 11 of 19
1 1.05064 1.05071 . . . 1.45233
0.95179 1 1.00005 . . . 1.438210.95173 0.99994 1 . . . 1.36888
......
.... . .
...0.68855 0.69531 0.73053 . . . 1
Calculating the eigenvalues and eigenvectors of the matrices, we can obtain the normalized principle eigenval-ues (primary eigenvectors). This is the priority vector of each hospital to each factor.
Since Ak are consistent matrices, no consistency test is necessary.
We can then evaluate the final ranking by multiplying the hospital’s weight and the factor’s weight together,the summing the products over the four different factors. This gives us the final rankings of each hospital.
8.2 Patient Weighted State Comparison Model
In our previous AHP model, we chose four criteria for analysis. Though the AHP method gives us relativelyaccurate and reasonable results, this calculation method is very tedious and has a high computation com-plexity. The complexity of this algorithm is O(n2), an undesirable result. In the AHP method, we need tocompare hospitals in pairs, normalize their ratings, calculate the primary eigenvalue, and then multiply toobtain their respective proportions. In our AHP analysis, we first ranked the top 200 hospitals based on mor-tality rankings, then did pair-wise comparisons. Even this simplified algorithm took a long time to complete.With 4806 hospitals as alternatives, and maybe more for different countries or criteria, the AHP method isvery ineffective. This method gives us accurate and precise results with the cost of computation complexity.
Therefore, based on the previous AHP model, we made some major improvements and derived our own model,the Patient-Weighted State Comparison Model (PWSCM). The PWSCM model is based on the mortality, pa-tient ratings, safety, and cost, four criteria we determined to be important in evaluating hospital quality.Since the calculation methods for the four criteria are similar but different, we want to maximize some val-ues(such as patient rating, safety) while minimizing other values (mortality, cost). Thus, we can’t simply addthem together to get a total ranking. We need to analyze them and standardize them based on the same values.
To simplify our calculations, we standardized each rating with a scale from 0-10. We defined the maxi-mum rating, i.e. the best hospital score of each factor a value of 10, and the minimum a value of 0. For factorswhere we want to minimize the score, we used the following equation:
a = −10 ∗ (score−max)
max−min
For factors where we want to maximize the score, we used the following equation:
a = 10 ∗ (score−min)
max−min
Our equation also used user-determined weights, so the priority vector of the factor is our criteria matrix. Forour ranking, we also used values of 0.375, 0.375, 0.125, and 0.125. We multiplied these four weights by ourreranked score from 0 to 10 obtained for each of the factors, then added the values to obtain a new value, asshown by:
r =
4∑i=1
Ci ∗ ai

IMMC2018021 Page 12 of 19
This new numerical score is not very intuitive, so we also standardized this value using equation. We sortedthe final values in descending order, and obtained the PWSCM model rankings. We can compare the top 10hospitals ranked by AHP and PWSCM like so:
Figure 7: Two Models’ Top 10 Hospitals Comparison
Most hospitals have no very significant changes in the rankings from the two models, but some hospitalsare not correspondent with each other between the two rankings. The reason for this result is that the AHPranking is not a fully developed ranking. Since we used mortality rates to get 200 hospitals to compare inthe AHP model, the result is not comprehensive enough. Some hospitals, such as the CITIZENS MEDICALCENTER, has a high patient ratings score but a relatively average mortality score. Therefore, it did not evenget considered to be part of the AHP rankings, resulting in this difference.
From these comparisons, we can find that the rankings of our PWSCM model is very similar to the rankingsof the AHP model, further validating our own model. Also, our model has a low time complexity, O(n),much better than the AHP algorithm. Thereby we can conclude that our model in accurate and efficientmulti-criteria decision analysis technique, and we can use it in further analysis, replacing the AHP model.
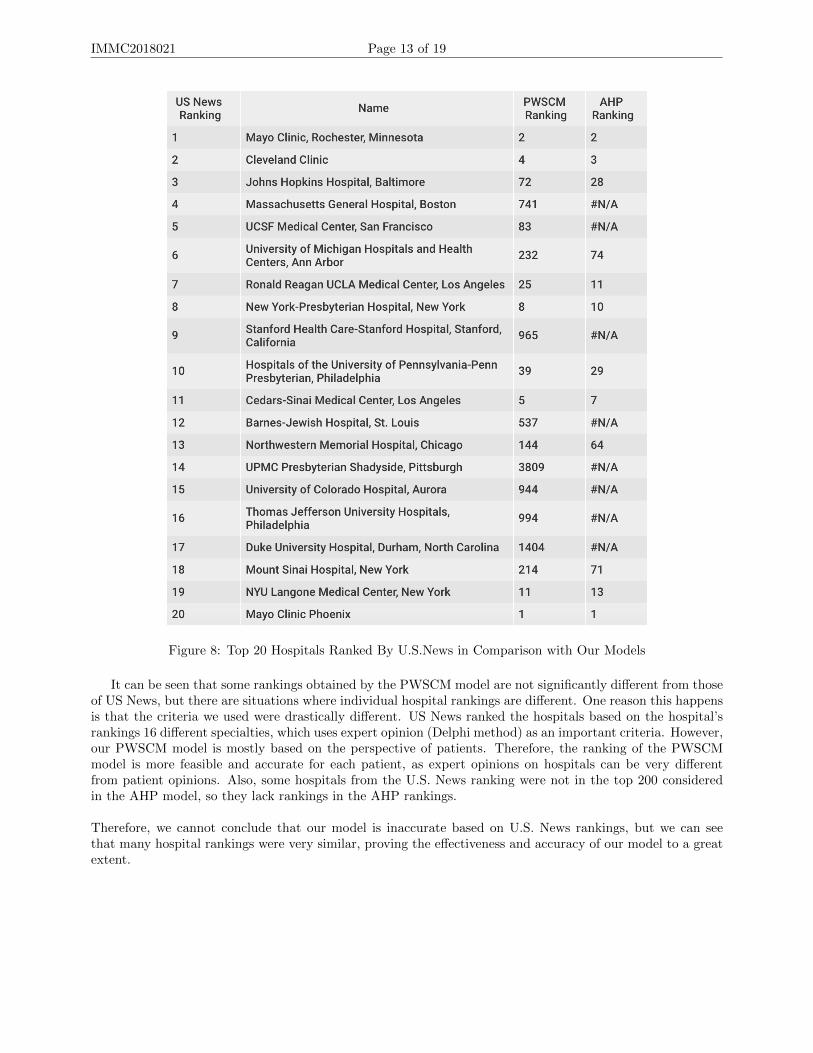
Each year, US NewsWEBSITE will rank all hospitals in the United States. We selected hospitals rankedTOP20 in the US News 2017-2018 Honor Roll, and compared them with our ratings from AHP and PWSCM.
IMMC2018021 Page 13 of 19
Figure 8: Top 20 Hospitals Ranked By U.S.News in Comparison with Our Models
It can be seen that some rankings obtained by the PWSCM model are not significantly different from thoseof US News, but there are situations where individual hospital rankings are different. One reason this happensis that the criteria we used were drastically different. US News ranked the hospitals based on the hospital’srankings 16 different specialties, which uses expert opinion (Delphi method) as an important criteria. However,our PWSCM model is mostly based on the perspective of patients. Therefore, the ranking of the PWSCMmodel is more feasible and accurate for each patient, as expert opinions on hospitals can be very differentfrom patient opinions. Also, some hospitals from the U.S. News ranking were not in the top 200 consideredin the AHP model, so they lack rankings in the AHP rankings.
Therefore, we cannot conclude that our model is inaccurate based on U.S. News rankings, but we can seethat many hospital rankings were very similar, proving the effectiveness and accuracy of our model to a greatextent.

IMMC2018021 Page 14 of 19
9 Algorithm Diagram
Figure 9: Algorithm Diagram
10 Sensitivity Analysis
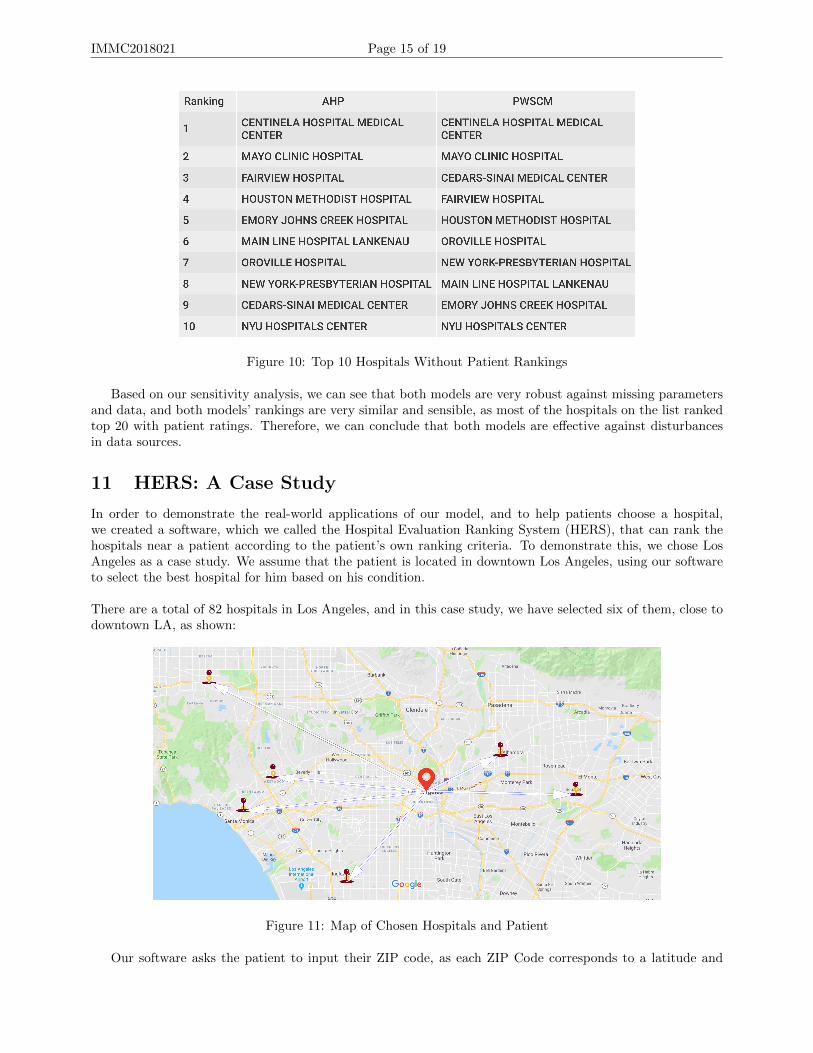
For our sensitivity analysis, we adjusted our models so that it did not include the data for patient ratings.Therefore, the hospitals were ranked nationally by their mortality rate, safety, and cost. The following tableshows the top 10 hospitals ranked by both methods:
IMMC2018021 Page 15 of 19
Figure 10: Top 10 Hospitals Without Patient Rankings
Based on our sensitivity analysis, we can see that both models are very robust against missing parametersand data, and both models’ rankings are very similar and sensible, as most of the hospitals on the list rankedtop 20 with patient ratings. Therefore, we can conclude that both models are effective against disturbancesin data sources.
11 HERS: A Case Study
In order to demonstrate the real-world applications of our model, and to help patients choose a hospital,we created a software, which we called the Hospital Evaluation Ranking System (HERS), that can rank thehospitals near a patient according to the patient’s own ranking criteria. To demonstrate this, we chose LosAngeles as a case study. We assume that the patient is located in downtown Los Angeles, using our softwareto select the best hospital for him based on his condition.
There are a total of 82 hospitals in Los Angeles, and in this case study, we have selected six of them, close todowntown LA, as shown:
Figure 11: Map of Chosen Hospitals and Patient
Our software asks the patient to input their ZIP code, as each ZIP Code corresponds to a latitude and

IMMC2018021 Page 16 of 19
longitude coordinate. We used the U.S. 2010 Census data to obtain the latitude and longitude of the patientand the hospitals, and employed the Haversine Formula [10] to calculate the distance:
D = 2R arcsin (
√sin2 (
ψ2 − ψ1
2) + cos (ψ1) cos (ψ2) sin2 (
ρ2 − ρ12
))
The parameters ψ and ρ is respectively the latitude and longitude of the patient/hospital.
We assumed that the patient’s weights for these four criteria (mortality, patient ratings, patient safety, cost)were 7.5, 7.5, 3, and 2, respectively. Therefore, the criteria matrix C =
[0.375 0.375 0.15 0.1
]. Using the
PWSCM algorithm, we can rank all national hospitals based on this input. To better visualize the resultingdata, we will do a cost-benefit analysis of the distances and the ratings, with distance being the cost andratings as the benefit. Plotting the graph, we get:
Figure 12: R-D Graph of Chosen Hospitals in LA
We can divide the area in the figure into four small areas as follows:
Figure 13: R-D Graph Regions
IMMC2018021 Page 17 of 19
Normally, if a hospital is in close proximity and has a high score, that is, it is located in the area where“4” is located in the map, the hospital will be the preferred target. However, in real situations, special cir-cumstances may arise.
If a patient with an extreme emergency and needs immediate treatment, hospitals that are located far away(in the “1” and “2” areas) are not good choices. Due to the urgency needed for treatment, we recommendselecting certain hospitals in the “3” and “4” areas according to his more own physical conditions.
If this is a patient suffering from a chronic disease, he may not need to go to the nearest hospital withthe closest, but choose a hospital with a better overall assessment. Then hospitals in the “1” and “4“ regionswill be better choices.
In the case where the distance from the hospital to the patient’s location is similar, choosing a hospitalwith a higher ranking is necessarily a better choice (Figure). If the rankings are comparable, but there is alarge difference in distance, we recommend that patients choose a closer hospital.
If the patient during the selection process encounters a situation in which the levels of the two hospitalsare significantly different and the distances between the two hospitals are large (Figure: bottom left + topright), they need to consider their own physical condition and decide which to choose.
The choice of the PWSCM model provides great convenience and leaves greater choice-making to the pa-tients themselves. They only need to provide the ZIP Code of their location and their own opinions on factorimportance. Our method is more user-friendly than the AHP method, which takes a long time to computeand may waste computer memory.
For the patient in downtown Los Angeles that was introduced in the case study, an analysis of graphs showsthat under normal circumstances, choosing one of the three hospitals located in the “4” region of the graphwould be a good choice, either: Centinela Hospital Medical Center, Ronald Reagan UCLA Medical Center,and Santa Monica UCLA Med CTR and Orthopaedic Hospital.
12 Strengths and Weaknesses
12.1 Strengths
1 Our model is very adaptive and it can be used in different countries.- We only used data from the United States, but if data for the specific measures we utilized in our model
were available for other countries, it still can be used for that country.
2 Our model places an emphasis on patients’ experiences, so our model more suitable for patients seekinghealthcare, who might consider comfort as an important measure.
- In our analysis, we gave patient experiences a weight of 0.35, and this can be set by the patient themselves,either higher or lower.
3 Our model can be highly customized for patients.- Most of our parameters can be set by patients themselves, so our model and our rankings presented in
this paper is not a set one; rather, every patient can have his/her own different hospital rankings based ontheir preferences.
4 We built two different ranking models (AHPM and PWSCM) and compared them to the U.S. News 2017-18Best Hospitals Honor Roll, and only a few differences occurred.
- We compared our model with an authoritative ranking, and found that many actually corresponded withthe authoritative rankings. This further proved the accuracy and reliability of our model.
5 Our model is very user friendly.

IMMC2018021 Page 18 of 19
- We have developed a software that has a graphical interface, and only presents easy to understand infor-mation for patients who have none or almost none mathematical knowledge.
6 We have considered different situations that the patient can be in, and gave suggestions for most of them.- Using the distance-ranking graph, patients can choose their own hospital based on their condition and
situation.
7 Compared with an AHP algorithm, our PWSCM is faster, efficient, and accurate.
12.2 Weaknesses
1 We only considered five diseases and three operations for our mortality model and did not subdivide theminto detailed and specific diseases.
- Since there are a lot of different diseases patients might have, we cannot consider all of them in onemodel. So we only selected 5 disease mortality rates to represent the overall quality of a hospital. This mightresult in partial evaluation of a hospital’s medical quality.
2 We applied the state’s average data to hospitals without data in that measure, and it would probablyaffect the final rankings.
- For some smaller hospitals, we do not have complete information, so we substituted the state averagedata into these hospitals. This might result in a deviation of final rankings.
3 We did not fully consider every aspect of a hospital, such as the scale, staff assignment, and number ofbeds.
- Since we did not include these measures, our final rankings might not be very accurate.
4 In our models, we did not consider hospitals with specialties in one or more disease or operations.- Since we do not have complete information, we can only assess the quality of hospitals in some mortality
measures. However, some hospitals great in one area might not have a very good overall medical quality.
5 In our models, we defined a lower cost as being better.- However, cost should not be considered linearly. Some hospitals provide great service whilst having a
relatively high cost. Our models associated cost independently, so cost might not be the best measure to assessthe quality of a hospital.
6 We did not analyze expert opinion in our models.
13 Conclusion and Future Work
Our goal was to devise a mathematical model to assess the quality of a hospital using mortality rates, thenother factors. We built three models to determine a hospital’s quality based on an United States hospitaldatabase. Our models are the CMM (Comparative Mortality Model), the AHP model, and our PWSCM(Patient-Weighted State Comparison Model)
In our CMM, we fully considered mortality rate as consisting of two simplified factors: Inevitable mortalityand preventable mortality, then projected these ideas onto given data, generating the disease-caused mortalitymodel and operation-caused mortality model. Using different weights and state comparisons to combine thesetwo factors, we can reflect a hospital’s actual medical quality.
However, to provide a full evaluation, other factors need to be included. We used patient ratings, patientsafety, and cost as other metrics to evaluate a hospital. These were derived similar to the CMM method.

After getting the comparisons between hospitals and state averages, we utilized AHP to rank hospitals na-tionally. However, AHP is too complicated to do pairwise hospital comparisons over four thousand hospitals,so we did a partial ranking of the top 200 hospitals by mortality. To improve the AHP model and avoid itscomplexity, we developed PWSCM. This method assigns each hospital’s state-wise comparison a value rangingfrom 1-10, then applied the weights. Both evaluation and ranking models ranked MAYO CLINIC HOSPITALas the best hospital.
To utilize our models in a real-world situation, we also developed a software system called HERS, whichuses user-input importance measures of the four factors, then analyzed the best hospitals closest to the pa-tient’s ZIP code. The software system generates a distance-ranking graph, which the patient can use to choosethe best hospital for their circumstances.
Given more time, we can add more criteria that can affect the hospital quality, such as preciser diseaseclassification, staff assignment, hospital scale, etc. We can also rank the best hospitals by specialties whichcorresponds to the patient’s condition.
Figure 14: HERS Software

14 Appendix
14.1 Top 10 Leading Causes of Death in the United States
Rank Disease1 Ischemic Heart Disease or Coronary Artery Disease2 Stroke3 Lower Respiratory Infections4 Chronic Obstructive Pulmonary Disease5 Trachea, Bronchus, and Lung Cancers6 Diabetes Mellitus7 Alzheimer’s Disease and Other Dementias8 Dehydration due to Diarrheal Diseases9 Tuberculosis10 Cirrhosis
14.2 Code
AHPRanking.m
1 numRows = he ight (AHP) ;2 comp matrix = [ 1 , 1 , 5/2 , 15/4 ; 1 , 1 , 5/2 , 15/4 ; 2/5 , 2/5 , 1 , 3/2 ; 4/15 , 4/15 , 2/3 , 1 ] ;3 AHP1 = AHP( : , [ 7 : 1 0 , 1 ] ) ;4 mort matrix = ze ro s (numRows , numRows) ;5 pat i en t mat r i x = ze ro s (numRows , numRows) ;6 ps i mat r i x = ze ro s (numRows , numRows) ;7 spending matr ix = ze ro s (numRows , numRows) ;8 f o r i =1:numRows9 f o r j = 1 :numRows
10 mort matrix ( i , j ) = AHP1{ i , 1}/AHP1{ j , 1 } ;11 pat i en t mat r i x ( i , j ) = AHP1{ i , 2}/AHP1{ j , 2 } ;12 ps i mat r i x ( i , j ) = AHP1{ i , 3}/AHP1{ j , 3 } ;13 spending matr ix ( i , j ) = AHP1{ i , 4}/AHP1{ j , 4 } ;14 end15 end16 [ mort Weight , ˜ ] = e i g ( mort matrix ) ;17 [ pat ient Weight , ˜ ] = e i g ( pa t i en t mat r i x ) ;18 [ psi Weight , ˜ ] = e i g ( p s i mat r i x ) ;19 [ spending Weight , ˜ ] = e i g ( spending matr ix ) ;20 mort Weight = mort Weight ( : , 1 ) ;21 pat ient Weight = pat ient Weight ( : , 1 ) ;22 psi Weight = psi Weight ( : , 1 ) ;23 spending Weight = spending Weight ( : , 1 ) ;24 mort Weight = mort Weight . / sum(mort Weight ) ;25 pat ient Weight = pat ient Weight . / sum( pat ient Weight ) ;26 psi Weight = psi Weight . / sum( psi Weight ) ;27 spending Weight = spending Weight . / sum( spending Weight ) ;28 f o r i = 1 :numRows29 AHP1{ i , 6} = 0.375∗mort Weight ( i , 1 ) +0.375∗ pat ient Weight ( i , 1 ) +0.15∗ psi Weight ( i , 1 ) +0.1∗
spending Weight ( i , 1 ) ;30 end
HospitalDataAnalysis.py
1
2 import pandas as pd3 import math4 import numpy as np5 df = pd . r ead c sv ( ’ . . / Data/ Ho s p i t a l R e v i s e d F l a t f i l e s /Deaths . csv ’ )6 df = df . drop ( [ ’ Provider ID ’ , ’ Address ’ , ’ City ’ , ’ ZIP Code ’ , ’ County Name ’ , ’ Phone Number ’ , ’
Compared to Nat iona l ’ , ’ Lower Estimate ’ , ’ Higher Estimate ’ , ’ Footnote ’ , ’Measure Sta r tDate ’ , ’Measure End Date ’ ] , a x i s = 1)
7 df [ ’ Ranking ’ ] = 0

8 pdf = pd . r ead c sv ( ’ . . / Data/ Hosp i t a l Mor ta l i t y . csv ’ )9 f o r row in df . i t e r t u p l e s ( ) :
10 f o r row2 in pdf . i t e r t u p l e s ( ) :11 i f row [ 2 ] == row2 [ 1 ] and row [ 3 ] == row2 [ 2 ] :12 i f row [ 6 ] != ’Not Ava i l ab l e ’ :13 df . l o c [ row . Index , ’ Ranking ’ ] = f l o a t ( row [ 6 ] ) ∗ f l o a t ( row2 [ 9 ] )14 e l s e :15 i f row [ 3 ] == ’Acute Myocardial I n f a r c t i o n (AMI) 30−Day Morta l i ty Rate ’ :16 df . l o c [ row . Index , ’ Ranking ’ ] = 13 .6∗ f l o a t ( row2 [ 9 ] )17 e l i f row [ 3 ] == ’Death ra t e f o r chron i c ob s t ru c t i v e pulmonary d i s e a s e (COPD)
pa t i en t s ’ :18 df . l o c [ row . Index , ’ Ranking ’ ] = 8∗ f l o a t ( row2 [ 9 ] )19 e l i f row [ 3 ] == ’Death ra t e f o r s t r oke pa t i e n t s ’ :20 df . l o c [ row . Index , ’ Ranking ’ ] = 14 .6∗ f l o a t ( row2 [ 9 ] )21 e l i f row [ 3 ] == ’ Heart f a i l u r e (HF) 30−Day Morta l i ty Rate ’ :22 df . l o c [ row . Index , ’ Ranking ’ ] = 11 .9∗ f l o a t ( row2 [ 9 ] )23 e l i f row [ 3 ] == ’Pneumonia (PN) 30−Day Morta l i ty Rate ’ :24 df . l o c [ row . Index , ’ Ranking ’ ] = 15 .9∗ f l o a t ( row2 [ 9 ] )25 e l i f row [ 2 ] not in row2 and row [ 3 ] == row2 [ 2 ] :26 i f row [ 6 ] != ’Not Ava i l ab l e ’ :27 i f row [ 3 ] == ’Acute Myocardial I n f a r c t i o n (AMI) 30−Day Morta l i ty Rate ’ :28 df . l o c [ row . Index , ’ Ranking ’ ] = f l o a t ( row [ 6 ] ) ∗0.2343529 e l i f row [ 3 ] == ’Death ra t e f o r chron i c ob s t ru c t i v e pulmonary d i s e a s e (COPD)
pa t i en t s ’ :30 df . l o c [ row . Index , ’ Ranking ’ ] = f l o a t ( row [ 6 ] ) ∗0.0511731 e l i f row [ 3 ] == ’Death ra t e f o r s t r oke pa t i e n t s ’ :32 df . l o c [ row . Index , ’ Ranking ’ ] = f l o a t ( row [ 6 ] ) ∗0.3379833 e l i f row [ 3 ] == ’ Heart f a i l u r e (HF) 30−Day Morta l i ty Rate ’ :34 df . l o c [ row . Index , ’ Ranking ’ ] = f l o a t ( row [ 6 ] ) ∗0.1921235 e l i f row [ 3 ] == ’Pneumonia (PN) 30−Day Morta l i ty Rate ’ :36 df . l o c [ row . Index , ’ Ranking ’ ] = f l o a t ( row [ 6 ] ) ∗0.1843737 e l s e :38 i f row [ 3 ] == ’Acute Myocardial I n f a r c t i o n (AMI) 30−Day Morta l i ty Rate ’ :39 df . l o c [ row . Index , ’ Ranking ’ ] = 13 .6∗0 .2343540 e l i f row [ 3 ] == ’Death ra t e f o r chron i c ob s t ru c t i v e pulmonary d i s e a s e (COPD)
pa t i en t s ’ :41 df . l o c [ row . Index , ’ Ranking ’ ] = 8∗0.0511742 e l i f row [ 3 ] == ’Death ra t e f o r s t r oke pa t i e n t s ’ :43 df . l o c [ row . Index , ’ Ranking ’ ] = 14 .6∗0 .3379844 e l i f row [ 3 ] == ’ Heart f a i l u r e (HF) 30−Day Morta l i ty Rate ’ :45 df . l o c [ row . Index , ’ Ranking ’ ] = 11 .9∗0 .1921246 e l i f row [ 3 ] == ’Pneumonia (PN) 30−Day Morta l i ty Rate ’ :47 df . l o c [ row . Index , ’ Ranking ’ ] = 15 .9∗0 .1843748 e f = pd . r ead c sv ( ’ 1 Prime . csv ’ )49 e f = e f . drop ( [ ’Unnamed : 0 ’ , ’ Provider ID ’ , ’ Address ’ , ’ City ’ , ’ ZIP Code ’ , ’ County Name ’ , ’
Phone Number ’ , ’Unnamed : 16 ’ , ’Unnamed : 22 ’ , ’Unnamed : 23 ’ , ’Unnamed : 24 ’ ] , a x i s = 1)50 e f = e f . drop ( [ ’Compared to Nat iona l ’ , ’Unnamed : 13 ’ , ’ Lower Estimate ’ , ’ Higher Estimate ’ , ’
Footnote ’ , ’Measure Sta r t Date ’ , ’Measure End Date ’ ] , a x i s = 1)51 e f = e f . r ep l a c e (np . nan , ’Not Ava i l ab l e ’ , regex=True )52 f o r row in e f . i t e r t u p l e s ( ) :53 i f row [ 7 ] != ’Not Ava i l ab l e ’ :54 e f . l o c [ row . Index , ’ Score ’ ] = row [ 7 ]55 e f = e f . drop ( ’Unnamed : 15 ’ , ax i s = 1)56 df . l o c [ : , ’ Score ’ ] = e f . l o c [ : , ’ Score ’ ]57 f o r row in df . i t e r t u p l e s ( ) :58 i f row [ 6 ] != ’Not Ava i l ab l e ’ :59 i f row [ 3 ] == ’Death ra t e f o r CABG’ :60 df . l o c [ row . Index , ’ Ranking ’ ] = f l o a t ( row [ 6 ] ) ∗0 .461 i f row [ 3 ] == ’ Se r i ou s blood c l o t s a f t e r surgery ’ :62 df . l o c [ row . Index , ’ Ranking ’ ] = f l o a t ( row [ 6 ] ) ∗0 .3563 i f row [ 3 ] == ’ Deaths among Pat i en t s with Se r i ou s Treatable Compl icat ions a f t e r
Surgery ’ :64 df . l o c [ row . Index , ’ Ranking ’ ] = f l o a t ( row [ 6 ] ) ∗0 .02565 e l s e :66 i f row [ 3 ] == ’Death ra t e f o r CABG’ :67 df . l o c [ row . Index , ’ Ranking ’ ] = 3 . 24∗0 . 468 i f row [ 3 ] == ’ Se r i ou s blood c l o t s a f t e r surgery ’ :69 df . l o c [ row . Index , ’ Ranking ’ ] = 4 .35∗0 . 3570 i f row [ 3 ] == ’ Deaths among Pat i en t s with Se r i ou s Treatable Compl icat ions a f t e r
Surgery ’ :71 df [ ’ Category ’ ] = hosL i s t72 df . t o c sv ( ’ HosCateData . csv ’ )73 g f = df . p i v o t t a b l e ( va lue s=’Ranking ’ , index=[ ’ State ’ , ’ Hosp i ta l Name ’ ] , columns=[ ’ Category ’ ] ,
aggfunc=np . sum)74 hf = df . s e t i nd ex ( ’ State ’ )
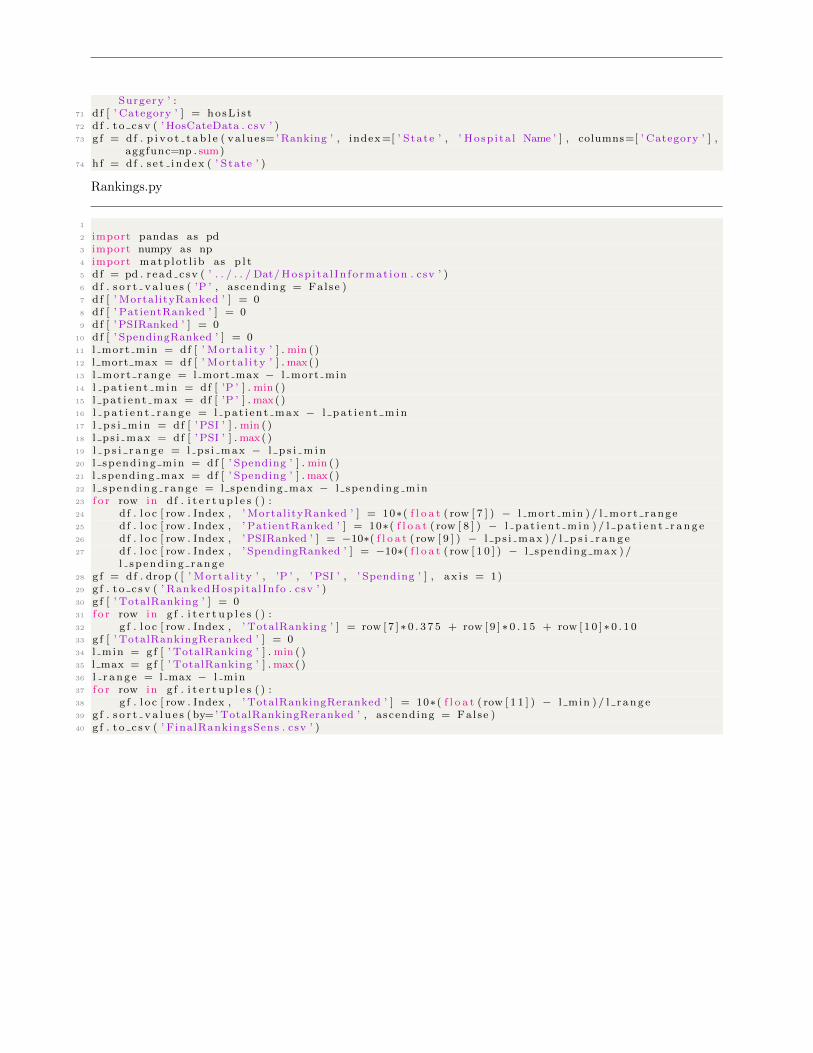
Rankings.py
1
2 import pandas as pd3 import numpy as np4 import matp lo t l i b as p l t5 df = pd . r ead c sv ( ’ . . / . . / Dat/Hosp i ta l In fo rmat ion . csv ’ )6 df . s o r t v a l u e s ( ’P ’ , ascending = False )7 df [ ’ MortalityRanked ’ ] = 08 df [ ’ PatientRanked ’ ] = 09 df [ ’ PSIRanked ’ ] = 0
10 df [ ’ SpendingRanked ’ ] = 011 l mort min = df [ ’ Morta l i ty ’ ] . min ( )12 l mort max = df [ ’ Morta l i ty ’ ] . max( )13 l mor t range = l mort max − l mort min14 l p a t i e n t m in = df [ ’P ’ ] . min ( )15 l pa t i en t max = df [ ’P ’ ] . max( )16 l p a t i e n t r a n g e = l pat i en t max − l p a t i e n t m in17 l p s i m i n = df [ ’ PSI ’ ] . min ( )18 l p s i max = df [ ’ PSI ’ ] . max( )19 l p s i r a n g e = l ps i max − l p s i m i n20 l spend ing min = df [ ’ Spending ’ ] . min ( )21 l spending max = df [ ’ Spending ’ ] . max( )22 l s p end ing range = l spending max − l spend ing min23 f o r row in df . i t e r t u p l e s ( ) :24 df . l o c [ row . Index , ’ MortalityRanked ’ ] = 10∗( f l o a t ( row [ 7 ] ) − l mort min ) / l mor t range25 df . l o c [ row . Index , ’ PatientRanked ’ ] = 10∗( f l o a t ( row [ 8 ] ) − l p a t i e n t m in ) / l p a t i e n t r a n g e26 df . l o c [ row . Index , ’ PSIRanked ’ ] = −10∗( f l o a t ( row [ 9 ] ) − l p s i max ) / l p s i r a n g e27 df . l o c [ row . Index , ’ SpendingRanked ’ ] = −10∗( f l o a t ( row [ 1 0 ] ) − l spending max ) /
l sp end ing range28 g f = df . drop ( [ ’ Morta l i ty ’ , ’P ’ , ’ PSI ’ , ’ Spending ’ ] , a x i s = 1)29 g f . t o c sv ( ’ RankedHospita l Info . csv ’ )30 g f [ ’ TotalRanking ’ ] = 031 f o r row in g f . i t e r t u p l e s ( ) :32 g f . l o c [ row . Index , ’ TotalRanking ’ ] = row [ 7 ] ∗ 0 . 3 7 5 + row [ 9 ] ∗ 0 . 1 5 + row [ 1 0 ] ∗ 0 . 1 033 g f [ ’ TotalRankingReranked ’ ] = 034 l min = g f [ ’ TotalRanking ’ ] . min ( )35 l max = gf [ ’ TotalRanking ’ ] . max( )36 l r a ng e = l max − l min37 f o r row in g f . i t e r t u p l e s ( ) :38 g f . l o c [ row . Index , ’ TotalRankingReranked ’ ] = 10∗( f l o a t ( row [ 1 1 ] ) − l min ) / l r ang e39 g f . s o r t v a l u e s (by=’ TotalRankingReranked ’ , ascending = False )40 g f . t o c sv ( ’ FinalRankingsSens . csv ’ )

References
[1] Hospital compare datasets, 2018. [Hospital Compare data was last updated on Jan 26, 2018.].
[2] National (nationwide) inpatient sample (nis), 2015.
[3] U.S. Department of Health and Human Services. Agency for healthcare research and quality.
[4] wikipedia – mortality rate – the free encyclopedia.
[5] Ann Pietrangelo and Kimberly Holland. The top 10 deadliest diseases, 2017. [Medically Reviewed byDeborah Weatherspoon, PhD, RN, CRNA on September 13, 2017].
[6] Hcahps: Patients’ perspectives of care survey. A federal government website managed and paid for bythe U.S. Centers for Medicare Medicaid Services. 7500 Security Boulevard, Baltimore, MD 21244.
[7] Patient safety indicators, © 2018 Copyright PSI.
[8] Psi 90 (the patient safety and adverse events composite).
[9] wikipedia – analytic hierarchy process (ahp), 2018. last edited on 16 March 2018.
[10] wikipedia – haversine formula, 2017. last edited on 31 December 2017.
Related Documents