Operational Certificate 12218 Annual Report 2018 March 30, 2019 2018 Glenmore Landfill Annual Report Operational Certificate MR 12218 EMS reference # E104956

Welcome message from author
This document is posted to help you gain knowledge. Please leave a comment to let me know what you think about it! Share it to your friends and learn new things together.
Transcript
Operational Certificate 12218 Annual Report 2018 March 30, 2019
2018 Glenmore Landfill Annual Report Operational Certificate MR 12218
EMS reference # E104956
Operational Certificate 12218 Annual Report 2018 March 30, 2019 2
Table of Contents
1. EXECUTIVE SUMMARY ................................................................................................ 3
2. STATISTICS .................................................................................................................... 4
3. OPERATIONAL PLAN FOR THE NEXT 12 MONTHS (SECTION 8 – CSDP) ............ 5
4. DATA AND INFORMATION ........................................................................................... 7
5. LIST OF ATTACHMENTS ............................................................................................12
Operational Certificate 12218 Annual Report 2018 March 30, 2019 3
1. EXECUTIVE SUMMARY The purpose of this annual report is to provide information relevant to Operational Certificate MR 12218 for the Glenmore Landfill for the year 2018. Under the provisions of the Waste Management Act and in accordance with the approved Regional District of Central Okanagan Solid Waste Management Plan, the City of Kelowna is authorized to manage recyclable materials and to discharge waste to the ground at the Glenmore Landfill, located at 2720 John Hindle Drive, in the City of Kelowna.
The City of Kelowna’s most current Comprehensive Site Development Plan (CSDP) was used as guidance for the development and operation of the Glenmore Landfill. Section 8 of the CSDP is the basis of the operating plan and Section 9 forms the closure plan. Based on the projected waste volumes and filling plan, the landfill is expected to be operational until the year 2107.
GHD Canada was then retained in 2016 to perform a GAP analysis, and in 2017 to develop an updated Design, Operations and Closure Plan (DOCP) to replace the existing CSDP. This work started in late 2017, was completed in Q4 2018, and was submitted to the Province in March of 2019. The updated DOCP identifies tasks that need to completed to ensure compliance with the BC Landfill Criteria for Municipal Solid Waste – 2nd Revision dated June 2016. The estimated population contributing to the municipal solid waste handled at the Glenmore Landfill in 2018 was 208,852 based on the BC Government Statistics website (https://www2.gov.bc.ca/gov/content/data/statistics/people-population-community/population/population-estimates accessed on March 8, 2019. This population produced a total of 166916 tonnes of waste (including hydrocarbon contaminated soil) that was deposited at the Glenmore Landfill in 2018. In addition to this volume of waste disposed, an additional 54824 tonnes of organics and 18719 tonnes of recyclable such as concrete, shingles, metal, etc. was recycled for a diversion rate of 30.6% at the Glenmore Landfill in 2018. These waste volume increases in 2018 are primarily related to construction/demolition debris due to regional development, and waste generated by the 2017 Okanagan flood event. Flood mitigation and clean up measures from the 2017 Okanagan flood event continued in 2018, and significant projects are planned for 2019 that will contribute large volumes of debris for disposal. There are other factors that contributed to the increase in waste volumes in 2018, which will impact volumes received in future years. These include:
Selected painted wood products included in the recoverable wood for industrial fuels are now unacceptable and are managed as garbage;
Increase in garbage produced from recycling operations due to restrictions on levels of contamination in recoverable materials; and
Startup of large scale legalized cannabis production facilities in the Central Okanagan.
It is expected that a small amount of waste is likely being imported from out of region due to the higher tipping fees in neighbouring regions. Tipping fees were reviewed as part of the overall site development and 10-year Capital Plan and increased in 2018, with further increases scheduled for 2019 and 2020.
Operational Certificate 12218 Annual Report 2018 March 30, 2019 4
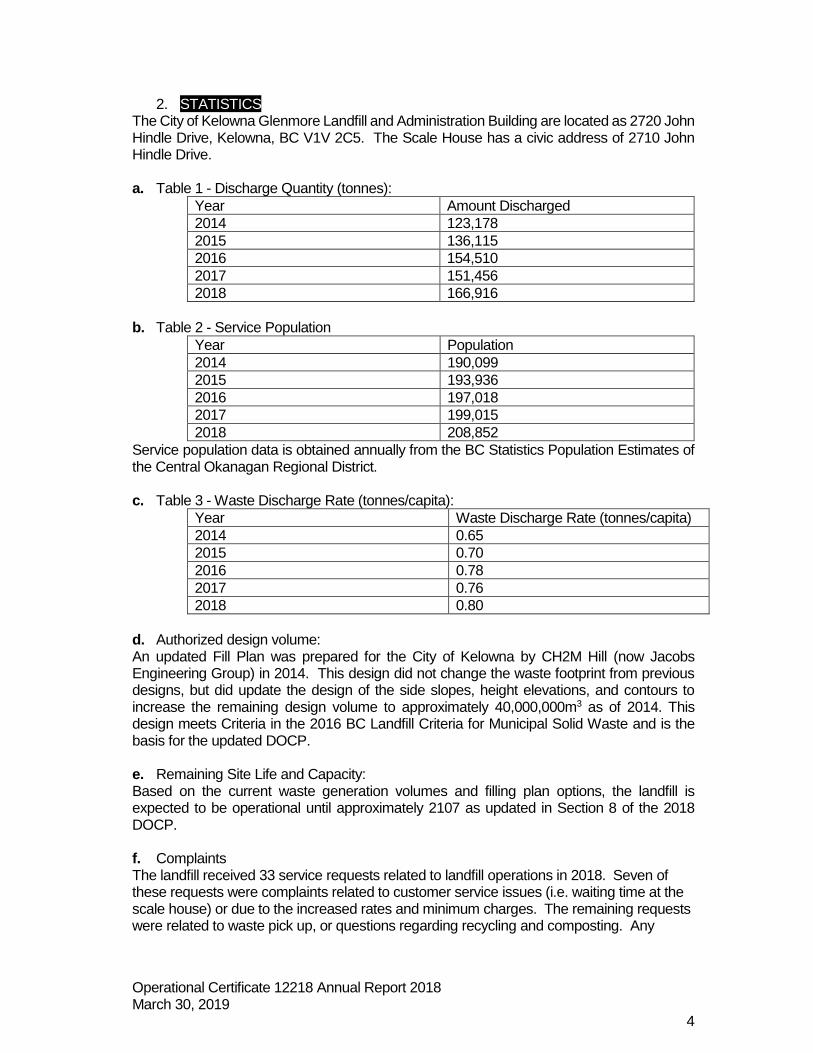
2. STATISTICS The City of Kelowna Glenmore Landfill and Administration Building are located as 2720 John Hindle Drive, Kelowna, BC V1V 2C5. The Scale House has a civic address of 2710 John Hindle Drive. a. Table 1 - Discharge Quantity (tonnes):
Year Amount Discharged
2014 123,178
2015 136,115
2016 154,510
2017 151,456
2018 166,916
b. Table 2 - Service Population
Year Population
2014 190,099
2015 193,936
2016 197,018
2017 199,015
2018 208,852
Service population data is obtained annually from the BC Statistics Population Estimates of the Central Okanagan Regional District. c. Table 3 - Waste Discharge Rate (tonnes/capita):
Year Waste Discharge Rate (tonnes/capita)
2014 0.65
2015 0.70
2016 0.78
2017 0.76
2018 0.80
d. Authorized design volume: An updated Fill Plan was prepared for the City of Kelowna by CH2M Hill (now Jacobs Engineering Group) in 2014. This design did not change the waste footprint from previous designs, but did update the design of the side slopes, height elevations, and contours to increase the remaining design volume to approximately 40,000,000m3 as of 2014. This design meets Criteria in the 2016 BC Landfill Criteria for Municipal Solid Waste and is the basis for the updated DOCP. e. Remaining Site Life and Capacity: Based on the current waste generation volumes and filling plan options, the landfill is expected to be operational until approximately 2107 as updated in Section 8 of the 2018 DOCP. f. Complaints The landfill received 33 service requests related to landfill operations in 2018. Seven of these requests were complaints related to customer service issues (i.e. waiting time at the scale house) or due to the increased rates and minimum charges. The remaining requests were related to waste pick up, or questions regarding recycling and composting. Any
Operational Certificate 12218 Annual Report 2018 March 30, 2019 5
additional complaints were received by phone or in person were not tabulated. Typically, issues in the Service Request System were addressed with 2 business days.
3. OPERATIONAL PLAN FOR THE NEXT 12 MONTHS (SECTION 8 – CSDP) a. Operational and Filling Plan Landfilling will occur in the southern part of Phase 2 area in early 2019 in a 4-meter “I-lift”. When the “I lift” of waste is completed, operations will return to the northern portion of Phase 1 and proceed in a north to south direction placing the 4-meter thick “J-lift”. While filling Phase 1, the historical Glenmore Road entrance referred to as AREA 1 in the DOCP, will be decommissioned, graded, prepared with synthetic liners and have a secondary leachate collection system installed. This secondary leachate collection system will connect to the existing leachate pipes to allow for gravity drainage. It is planned that filling operations will start in Area 1 by fall of 2019. More than 235,000 tonnes of clean fill was received in 2018 and used as cover or placed into the soil stockpile. Indications are that a similar volume should be expected in 2019. Planning and design work is underway for the relocation of the infrastructure in the historical entrance area to other locations on-site. This will include an Operations building incorporating a workshop, heated area to park the equipment to apply daily cover and fire suppression, and a covered area for mechanics to service equipment. Other ancillary infrastructure will be relocated to other buildings and lay-down areas. b. Landfilling Method The area method will be used to place and compact waste in cells of approximately 20,000 m3. A 0.3-meter intermediate soil cover will be applied on the lift and alternate daily cover will be applied on the working face. Wastes will be spread in thin layers (0.6 meters or less) and compacted. Compaction will be achieved using a Tana E525 landfill compactor, with a CAT 836H Compactor used when the TANA is being serviced. c. Glengrow The production of Glengrow compost is located at the 10-hectare site constructed to the south of the Phase 3 area of the landfill. Stockpiling and grinding of yard waste feed stock is still accomplished in the receiving area east of Phase 2. Plans are in the works for relocating the organics and recyclable receiving area adjacent the composting facility to the south of the Phase 3 slough. d. Controls
Litter will be controlled by compaction of the waste and minimizing the working face. Fencing for litter control is placed around the fill area as required.
Dust control will continue by applying water and seeding of exposed areas. Vector control will continue by using a combination of distress calls, harassment
and daily cover. A falconer continues to assist in reducing the impact of nuisance birds.
Mud control for internal roads will be accomplished through the construction and maintenance of all-weather access roads to the working face. Crushed shale and ground up wood chips will be used as a pad at the tipping area. A wheel wash system is in place to minimize mud tracking coming off-site.
Weeds have been mitigated primarily by mowing. Visual aesthetics have been addressed by the planting of additional trees and
shrubs in the new berm along John Hindle Drive and on the hillside to the east of
Operational Certificate 12218 Annual Report 2018 March 30, 2019 6
the residential drop off transfer station. Additional planting project scheduled for 2018 along John Hindle Drive was not completed but is scheduled for the spring of 2019. Further landscaping along the western side of the landfill along Glenmore Road will be evaluated in future years.
e. Heavy Equipment Utilized for Landfill Operations
Caterpillar 836H Landfill Compactor TANA E525 Landfill Compactor Case 921 FXR Front End Loader Rental Komatsu 65 Dozer Komatsu 200 Excavator Volvo 480 Excavator Two 3100 International Roll-off bin trucks Two Komatsu WA 380 Front End Loader Additional Rental equipment as required
f. Landfill Personnel
8 Equipment Operators 9 Landfill Attendants/Spotter 4 Landfill Technicians 1 full time and 4-part time Scale Operators 2 Supervisors 1 Operations Clerk
g. Scale House Operations The City has continued to increase the number of users on the unattended scales using the RFID card system for haulers that qualify for these. Additional staff will be hired in 2019, which allows for the unattended scales to be converted to manual operations and in turn reduce the lineup. A new scale program will be installed in 2019, as the current scale program is no longer supported by the manufacturer.
Operational Certificate 12218 Annual Report 2018 March 30, 2019 7
4. DATA AND INFORMATION
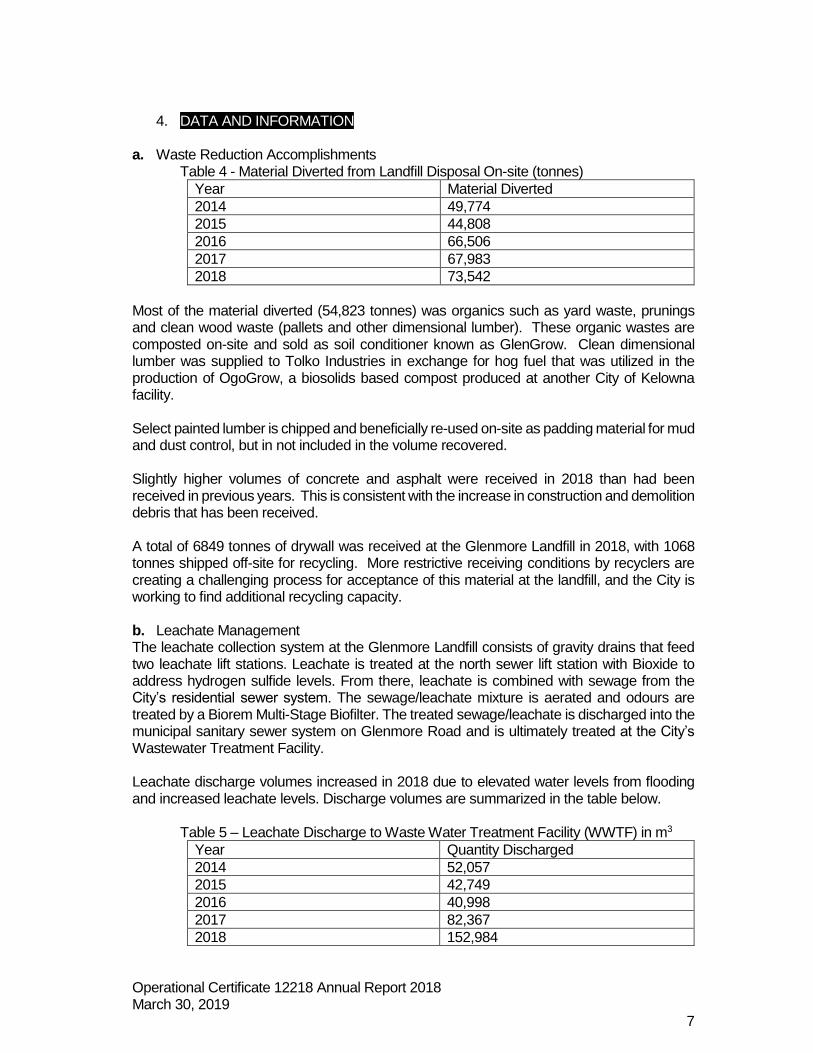
a. Waste Reduction Accomplishments Table 4 - Material Diverted from Landfill Disposal On-site (tonnes)
Year Material Diverted
2014 49,774
2015 44,808
2016 66,506
2017 67,983
2018 73,542
Most of the material diverted (54,823 tonnes) was organics such as yard waste, prunings and clean wood waste (pallets and other dimensional lumber). These organic wastes are composted on-site and sold as soil conditioner known as GlenGrow. Clean dimensional lumber was supplied to Tolko Industries in exchange for hog fuel that was utilized in the production of OgoGrow, a biosolids based compost produced at another City of Kelowna facility. Select painted lumber is chipped and beneficially re-used on-site as padding material for mud and dust control, but in not included in the volume recovered. Slightly higher volumes of concrete and asphalt were received in 2018 than had been received in previous years. This is consistent with the increase in construction and demolition debris that has been received. A total of 6849 tonnes of drywall was received at the Glenmore Landfill in 2018, with 1068 tonnes shipped off-site for recycling. More restrictive receiving conditions by recyclers are creating a challenging process for acceptance of this material at the landfill, and the City is working to find additional recycling capacity. b. Leachate Management The leachate collection system at the Glenmore Landfill consists of gravity drains that feed two leachate lift stations. Leachate is treated at the north sewer lift station with Bioxide to address hydrogen sulfide levels. From there, leachate is combined with sewage from the City’s residential sewer system. The sewage/leachate mixture is aerated and odours are treated by a Biorem Multi-Stage Biofilter. The treated sewage/leachate is discharged into the municipal sanitary sewer system on Glenmore Road and is ultimately treated at the City’s Wastewater Treatment Facility. Leachate discharge volumes increased in 2018 due to elevated water levels from flooding and increased leachate levels. Discharge volumes are summarized in the table below.
Table 5 – Leachate Discharge to Waste Water Treatment Facility (WWTF) in m3
Year Quantity Discharged
2014 52,057
2015 42,749
2016 40,998
2017 82,367
2018 152,984
Operational Certificate 12218 Annual Report 2018 March 30, 2019 8
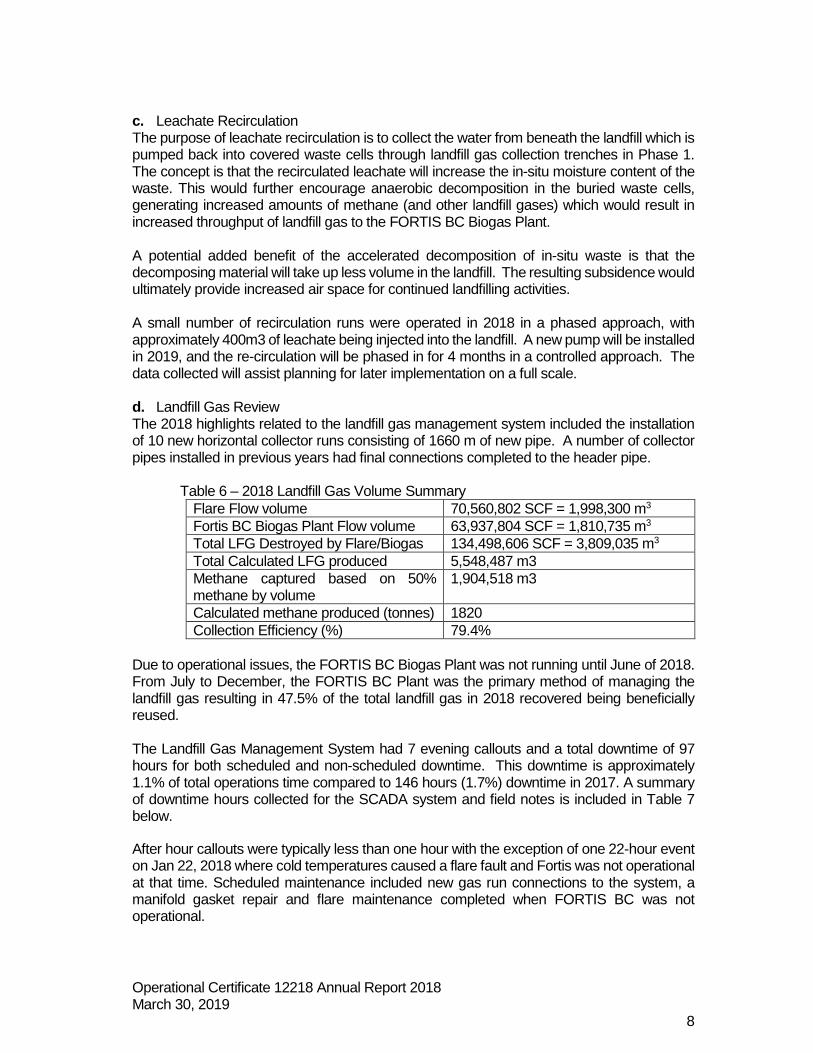
c. Leachate Recirculation The purpose of leachate recirculation is to collect the water from beneath the landfill which is pumped back into covered waste cells through landfill gas collection trenches in Phase 1. The concept is that the recirculated leachate will increase the in-situ moisture content of the waste. This would further encourage anaerobic decomposition in the buried waste cells, generating increased amounts of methane (and other landfill gases) which would result in increased throughput of landfill gas to the FORTIS BC Biogas Plant. A potential added benefit of the accelerated decomposition of in-situ waste is that the decomposing material will take up less volume in the landfill. The resulting subsidence would ultimately provide increased air space for continued landfilling activities. A small number of recirculation runs were operated in 2018 in a phased approach, with approximately 400m3 of leachate being injected into the landfill. A new pump will be installed in 2019, and the re-circulation will be phased in for 4 months in a controlled approach. The data collected will assist planning for later implementation on a full scale. d. Landfill Gas Review The 2018 highlights related to the landfill gas management system included the installation of 10 new horizontal collector runs consisting of 1660 m of new pipe. A number of collector pipes installed in previous years had final connections completed to the header pipe.
Table 6 – 2018 Landfill Gas Volume Summary
Flare Flow volume 70,560,802 SCF = 1,998,300 m3
Fortis BC Biogas Plant Flow volume 63,937,804 SCF = 1,810,735 m3
Total LFG Destroyed by Flare/Biogas 134,498,606 SCF = 3,809,035 m3
Total Calculated LFG produced 5,548,487 m3
Methane captured based on 50% methane by volume
1,904,518 m3
Calculated methane produced (tonnes) 1820
Collection Efficiency (%) 79.4%
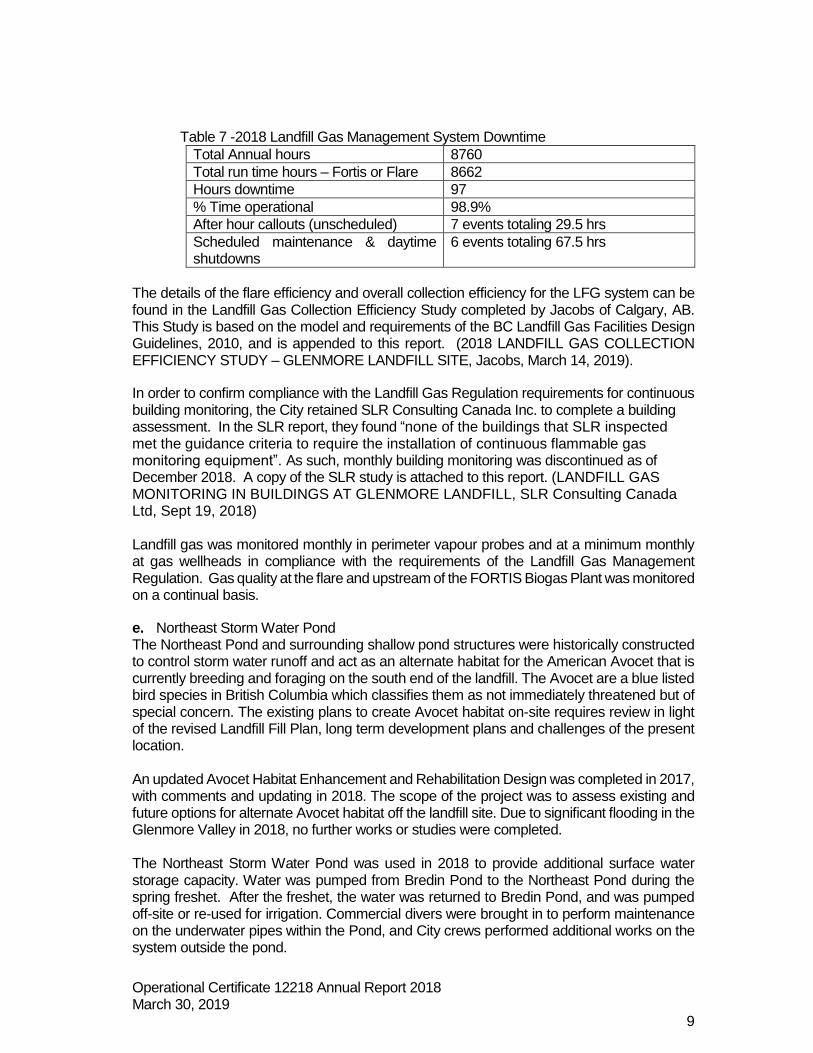
Due to operational issues, the FORTIS BC Biogas Plant was not running until June of 2018. From July to December, the FORTIS BC Plant was the primary method of managing the landfill gas resulting in 47.5% of the total landfill gas in 2018 recovered being beneficially reused. The Landfill Gas Management System had 7 evening callouts and a total downtime of 97 hours for both scheduled and non-scheduled downtime. This downtime is approximately 1.1% of total operations time compared to 146 hours (1.7%) downtime in 2017. A summary of downtime hours collected for the SCADA system and field notes is included in Table 7 below.
After hour callouts were typically less than one hour with the exception of one 22-hour event on Jan 22, 2018 where cold temperatures caused a flare fault and Fortis was not operational at that time. Scheduled maintenance included new gas run connections to the system, a manifold gasket repair and flare maintenance completed when FORTIS BC was not operational.
Operational Certificate 12218 Annual Report 2018 March 30, 2019 9
Table 7 -2018 Landfill Gas Management System Downtime
Total Annual hours 8760
Total run time hours – Fortis or Flare 8662
Hours downtime 97
% Time operational 98.9%
After hour callouts (unscheduled) 7 events totaling 29.5 hrs
Scheduled maintenance & daytime shutdowns
6 events totaling 67.5 hrs
The details of the flare efficiency and overall collection efficiency for the LFG system can be found in the Landfill Gas Collection Efficiency Study completed by Jacobs of Calgary, AB. This Study is based on the model and requirements of the BC Landfill Gas Facilities Design Guidelines, 2010, and is appended to this report. (2018 LANDFILL GAS COLLECTION EFFICIENCY STUDY – GLENMORE LANDFILL SITE, Jacobs, March 14, 2019).
In order to confirm compliance with the Landfill Gas Regulation requirements for continuous building monitoring, the City retained SLR Consulting Canada Inc. to complete a building assessment. In the SLR report, they found “none of the buildings that SLR inspected met the guidance criteria to require the installation of continuous flammable gas monitoring equipment”. As such, monthly building monitoring was discontinued as of December 2018. A copy of the SLR study is attached to this report. (LANDFILL GAS MONITORING IN BUILDINGS AT GLENMORE LANDFILL, SLR Consulting Canada Ltd, Sept 19, 2018) Landfill gas was monitored monthly in perimeter vapour probes and at a minimum monthly at gas wellheads in compliance with the requirements of the Landfill Gas Management Regulation. Gas quality at the flare and upstream of the FORTIS Biogas Plant was monitored on a continual basis.
e. Northeast Storm Water Pond The Northeast Pond and surrounding shallow pond structures were historically constructed to control storm water runoff and act as an alternate habitat for the American Avocet that is currently breeding and foraging on the south end of the landfill. The Avocet are a blue listed bird species in British Columbia which classifies them as not immediately threatened but of special concern. The existing plans to create Avocet habitat on-site requires review in light of the revised Landfill Fill Plan, long term development plans and challenges of the present location. An updated Avocet Habitat Enhancement and Rehabilitation Design was completed in 2017, with comments and updating in 2018. The scope of the project was to assess existing and future options for alternate Avocet habitat off the landfill site. Due to significant flooding in the Glenmore Valley in 2018, no further works or studies were completed. The Northeast Storm Water Pond was used in 2018 to provide additional surface water storage capacity. Water was pumped from Bredin Pond to the Northeast Pond during the spring freshet. After the freshet, the water was returned to Bredin Pond, and was pumped off-site or re-used for irrigation. Commercial divers were brought in to perform maintenance on the underwater pipes within the Pond, and City crews performed additional works on the system outside the pond.
Operational Certificate 12218 Annual Report 2018 March 30, 2019 10
f. Groundwater Groundwater sampling events took place in late May/early June and September/October of 2018 as per the recommendations of the 2017 Annual Report. Some wells could not be accessed due to localized flooding. Selected redundant or unused groundwater monitoring wells were decommissioned as per the recommendations of Golder Associates.
After reviewing Water Quality Monitoring reports in historical Annual Reports, the Ministry of Forests, Lands and Natural Resource Operations and Rural Development (FLNRORD) inspected selected groundwater wells that had been identified as having artesian water conditions. In their October 18, 2018 inspection report, all wells were confirmed as being compliant and in controlled conditions.
Wells were monitored quarterly for water elevations and sampled semi-annually for the parameters of concern by Landfill Environmental Technologists. Samples were submitted to Caro Analytical Services of Kelowna, BC for testing and the data reporting and corresponding interpretation was completed by SNC-Lavalin of Kelowna, BC. The SNC-Lavalin findings are appended to this report (2018 GLENMORE LANDFILL ANNUAL WATER QUALITY REPORT, SNC-Lavalin, (March 13, 2019)).
As noted in the SNC-Lavalin report, no significant changes to water levels or water quality were noted in the results from the 2018 water monitoring program.
g. Surface Water The Glenmore Valley saw significant surface water runoff in the freshet of 2018. Two locations up-gradient from the landfill, Bubna Slough and the Glenmore-Ellison Improvement District’s McKinley Reservoir, both overflowed resulting in a surface water inundation. Pumps were rented, and water was pumped from Tutt Pond to Little Robert Lake as per the Surface Water Management Plan in the CSDP.
As part of a surface water diversion program, a total of 47,596,000 Gallons (180,170 m3) of surface water was diverted from the north of the landfill to Little Robert Lake using the existing storm water piping infrastructure between April 15 and July 10. Curtis Road and the Central Okanagan Regional Park also had elevated water levels in 2018. The City obtained an Emergency Engineer’s Order from the Province to allow for water to be pumped from Robert Lake to Brandt’s Creek and minimize the downstream impacts of the landfill surface water diversion program. To supplement the landfill surface water diversion program, Tutt and Bredin ponds were used as an irrigation source for the associated agricultural operations. Sprinkling occurred intermittently from July through to September. This irrigation process has been used at the site for decades to manage surface water. Due to the high flows, the Landfill Personnel consulted with the City’s external flooding engineer for assistance. The surface water culvert intake north of the site near the Fortis Plant at Bredin Farm was partially plugged to slow down the flow. The southwest corner of Bredin Farm was flooded to allow for additional emergency storage capacity. As a contingency an overflow was installed in the berm through the northern ring road, and the existing on-site ditches and culverts were cleaned. As a precaution, additional piping was installed in ditching as secondary overflows and landfill leachate treatment and electrical buildings in the northwest corner of the site were sandbagged to prevent damage to infrastructure.
Operational Certificate 12218 Annual Report 2018 March 30, 2019 11
Historically, irrigation on agricultural properties and storage/evaporation was sufficient to manage the surface water volumes for the landfill. In response to increasing groundwater elevation and full surface water bodies in the Glenmore Valley, the 2018 DOCP included an updated Surface Water Management Plan to provide a conceptual design to improve the surface water collection and diversion. The City will be working with Consultants in 2019 to develop a preliminary design to implement this Plan, and ensure that it addresses water flows both up-gradient and down-gradient of the landfill.
Based upon recommendations from Golder Associates in previous years, water levels were not pumped below a specified elevation in Tutt Pond to eliminate the risk of leachate from being drawn into the pond while a Human Health and Environmental Risk Assessment – Evaluating Water Use From Tutt Pond and Bredin Pond, Glenmore Landfill, Sept 24, 2018, SNC-Lavalin (HHERA) was completed. This HHERA was completed to assist with future surface water management options and has been included in the Appendices of this report. Water levels in 2018 in Tutt Pond were maintained above the levels described by Golder Associates in previous Water Quality Monitoring reports. The HHERA assessed the risks for use of pond waters for irrigating, compost watering, dust control and landscape watering scenarios. The report concluded that there were no unacceptable risks to human health. Potential low to medium ecological risk was identified related to increasing pH and sodium concentrations over time for irrigating, compost watering and landscape watering. No risk was identified for dust control use. If water is used for irrigation in the future which it is, additional pH and sodium water sampling and annual pH and sodium adsorption ratio soil testing is required. This testing will be completed as part of the 2019 environmental monitoring program. The four on-site surface water ponds were sampled in April, May, September and November 2018. Samples were submitted to Caro Analytical Services of Kelowna, BC for testing and the data reporting and corresponding interpretation was completed by SNC-Lavalin of Kelowna, BC. The SNC-Lavalin findings are appended to this report 2018 GLENMORE LANDFILL ANNUAL WATER QUALITY REPORT, SNC-Lavalin, (March 13, 2019). Tutt Pond was also sampled four additional events during the off-site water diversion program.
As noted in the SNC-Lavalin report, no significant changes to water levels or water quality were noted in the results from the 2018 water monitoring program.
h. Leachate Sampling As required in the operational certificate, leachate samples were collected at three locations on the Landfill site in March, June, September and December 2017. Samples were representative of Phase 1, Phase 2 and leachate prior to Bioxide treatment and aeration.
Samples were taken and submitted for parameters of concern by Landfill Environmental Technologists. Samples were submitted to Caro Analytical Services of Kelowna, BC for testing and the data reporting and corresponding interpretation was completed by SNC-Lavalin of Kelowna, BC. The SNC-Lavalin findings are appended to this report 2018 GLENMORE LANDFILL ANNUAL WATER QUALITY REPORT, SNC-Lavalin, (March 13, 2019).
i. Hydrogeological Review No additional hydrogeological investigations or reviews were completed in 2018.
Operational Certificate 12218 Annual Report 2018 March 30, 2019 12
j. Vegetation Analysis Observations of vegetation at the landfill perimeter were conducted monthly. There were no visible indications of adverse effects on plants due to leachate or landfill gas migrating to the root zones. The landscaped berm along Glenmore Road lost the majority of the trees due to a failure in the irrigation system. This section of landscaping will be replaced when internal road alignment work is addressed in the next two to four years. k. Financial Security The updated Financial Security Plan was completed in the updated DOCP to meet the requirements of the Second Edition of Landfill Criteria For Municipal Solid Waste (June 2016). The Financial Security Plan was calculated based on estimated closure costs plus post-closure Operations and Monitoring of 80 years as determined by the Contaminating Lifespan Analysis. The Financial Closure Fund will be updated with the assistance of the City Financial department based on the PS 3270 Accounting Principles. This fund is currently calculated to be just over $81M. Tipping fee rates have been scheduled for adjustment in 2019 and 2020 to ensure funding for projects based on the 2018 DOCP and the City’s 10-year Capital Plan. As in previous years, excess revenues were deposited into a reserve fund that will be used to develop the site for infrastructure and capital costs for items such as leachate, landfill gas, and water management systems, and to cover the cost of landfill closure and post closure.
5. LIST OF ATTACHMENTS 2018 GLENMORE LANDFILL ANNUAL WATER QUALITY REPORT, SNC-Lavalin, (March 13, 2019) 2018 LANDFILL GAS COLLECTION EFFICIENCY STUDY – GLENMORE LANDFILL SITE, Jacobs, (March 14, 2019) HUMAN HEALTH AND ECOLOGICAL RISK ASSESMENT – SNC-Lavalin (September 24, 2018) LANDFILL GAS MONITORING IN BUILDINGS AT GLENMORE LANDFILL, SLR Consulting Canada Ltd, (Sept 19, 2018)
ATTACHMENT 1
2018 GLENMORE
LANDFILL ANNUAL WATER
QUALITY REPORT, SNC-
Lavalin, (March 13, 2019)
2018 Glenmore Landfill Annual Water Quality Report
City of Kelowna
Table of Contents
1 Introduction 1
2 Site Description 2
3 Scope of Work 3
4 Additional Site Works – By City 5
5 Groundwater and Surface Water Assessment Criteria 6
5.1 Leachate Indicator Parameters 6
6 Groundwater and Surface Water Levels 8
7 Groundwater Geochemistry 9
7.1 Analytical Results 9
7.2 Groundwater Quality 9
7.2.1 Field Observations 9
7.2.2 Moderate to High Leachate Monitoring Wells 9
7.2.3 Low to Minimal Leachate-Impacted Monitoring Wells 10
7.2.4 Comparison to Background Groundwater Quality 10
8 Surface Water Geochemistry 11
9 Leachate Chemistry 12
10 Results of QA/QC Program 13
11 Conclusions and Recommendations 14
12 Proposed 2019 Monitoring Program 15
12.1 Groundwater Elevations 15
12.2 Groundwater Quality 15
12.3 Surface Water Quality 15
12.4 Leachate Quality 15
12.5 Data Analysis and Reporting 15
13 Closure 16
14 References 17
Internal Ref: 662036 March 13, 2019
i © 2019 SNC-Lavalin Inc. All Rights Reserved. Confidential.
2018 Glenmore Landfill Annual Water Quality Report
City of Kelowna
Table of Contents (Cont’d)
In-Text Tables
Table 1: Summary of sampling locations and analysis in 2018 3
Figures
A. Water Elevations South End
B. Water Elevations Centre South
C. Water Elevations Centre A
D. Water Elevations Centre B
E. Water Elevations North
F. Water Elevations Northeast
Drawings
› 662036-001: Key Plan
› 662036-001: Site Plan
Appendices
I: ENV Operation Certificate 12218
II: May 25, 2011 Letter from BC Ministry of Environment and Climate Change Strategy re Glenmore
Landfill
III: Methodology and Quality Assurance/ Quality Control
IV: October 18, 2018 FLNRORD Artesian Well Inspection Report
V: Monitoring Data
VI: Tables
VII: Analytical Results for Leachate
P:\CP\CITY OF KELOWNA\662036 GLENMORE LANDFILL WATER MONITORING\50_DELIV\53_FINAL_RPTSTRANS\20190313_662036_RPT_GLENMORELANDFILL_ANNUALWATERMONITORING.DOCX
Internal Ref: 662036 March 13, 2019
ii © 2019 SNC-Lavalin Inc. All Rights Reserved. Confidential.
2018 Glenmore Landfill Annual Water Quality Report
City of Kelowna
1 Introduction This report summarizes the results of the 2018 annual water quality monitoring program for the City of
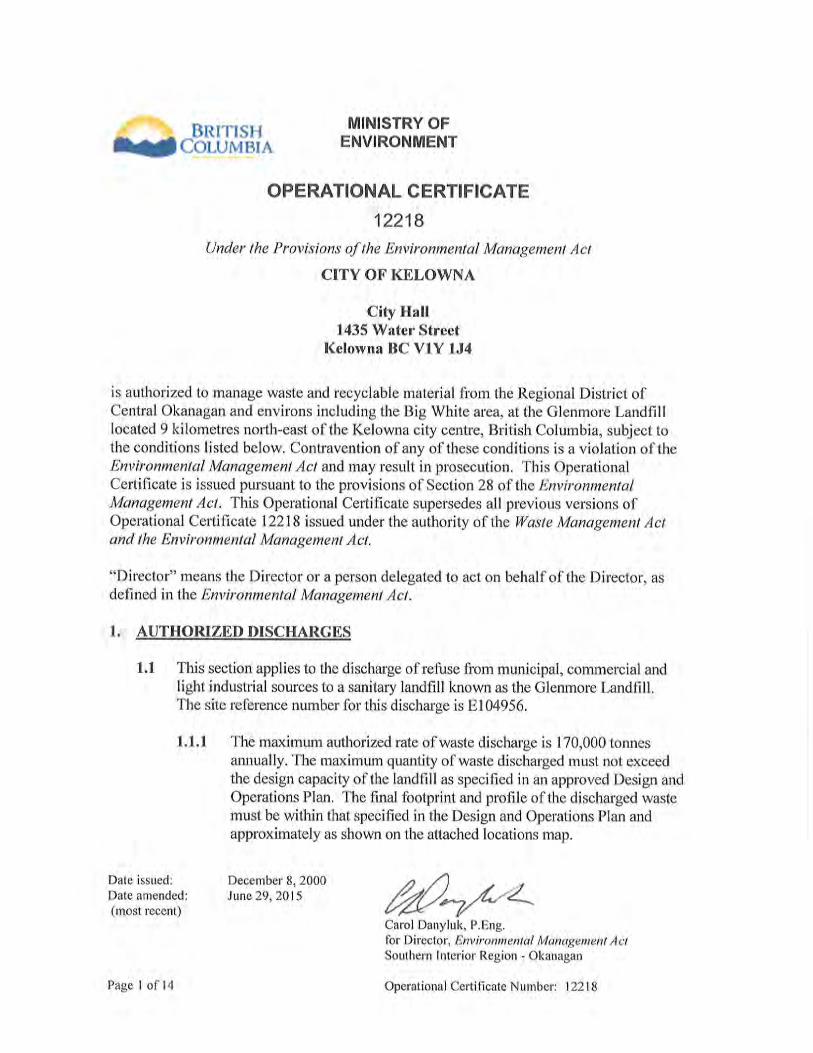
Kelowna’s Glenmore Landfill located in Kelowna BC. The intent of this report is to satisfy the water
monitoring requirements of the current Glenmore Landfill Operational Certificate (OC) 12218 (Appendix I)
and to satisfy the recommendations made by the BC Ministry of Environment and Climate Change Strategy
in their letter to the City of Kelowna dated May 25, 2011 (Appendix II).
Internal Ref: 662036 March 13, 2019
1
© 2019 SNC-Lavalin Inc. All Rights Reserved. Confidential.
2018 Glenmore Landfill Annual Water Quality Report
City of Kelowna
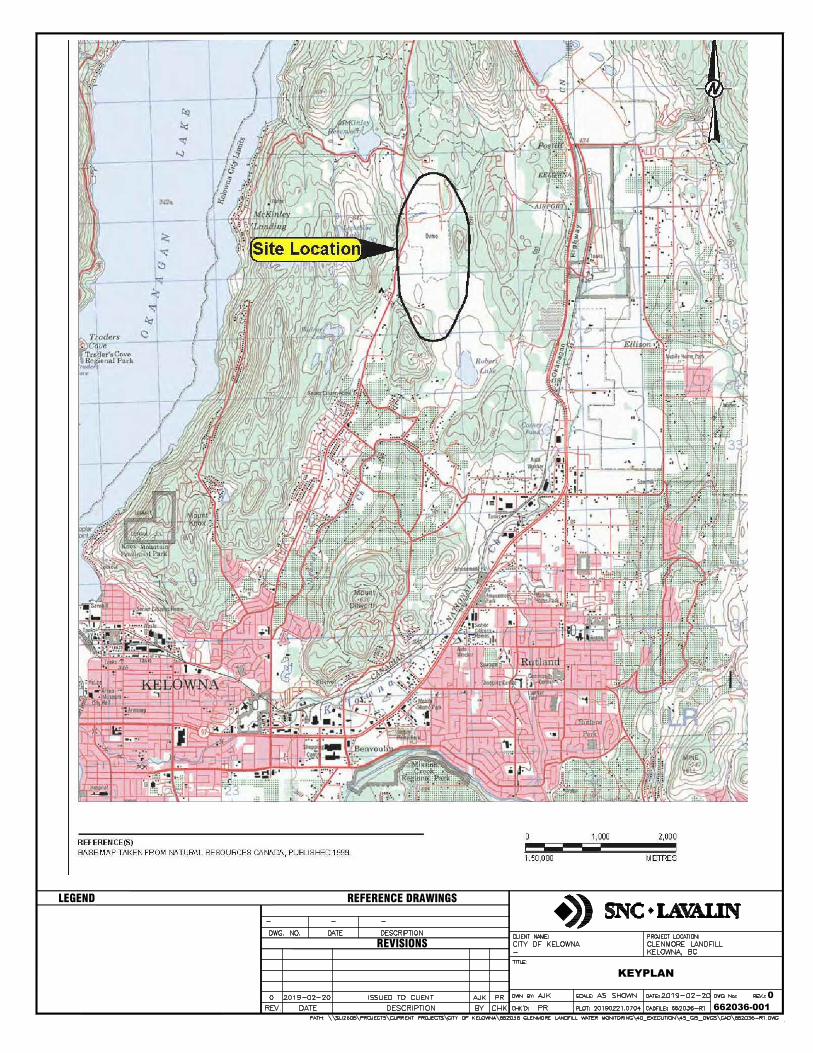
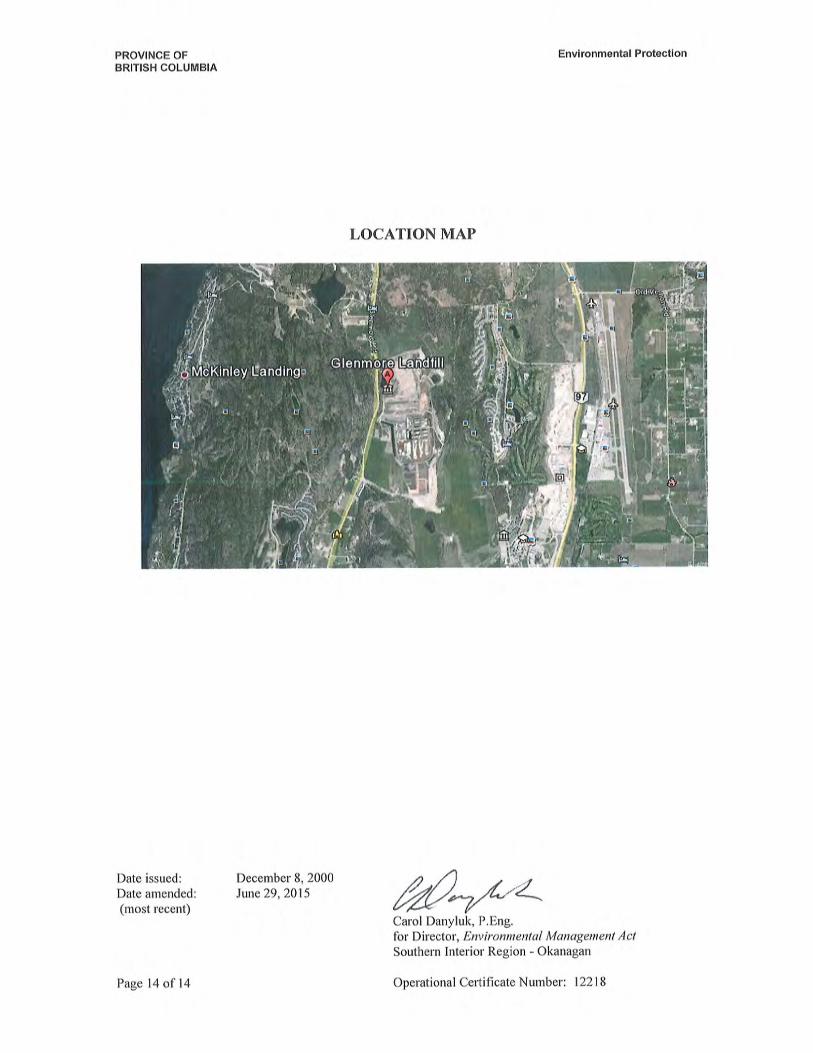
2 Site Description The Glenmore Landfill is located in the north end of the City of Kelowna as seen in Drawing 662036-001 -
Key Plan. The exact Site Plan for the Glenmore Landfill is provided in OC 12218 (Appendix B).
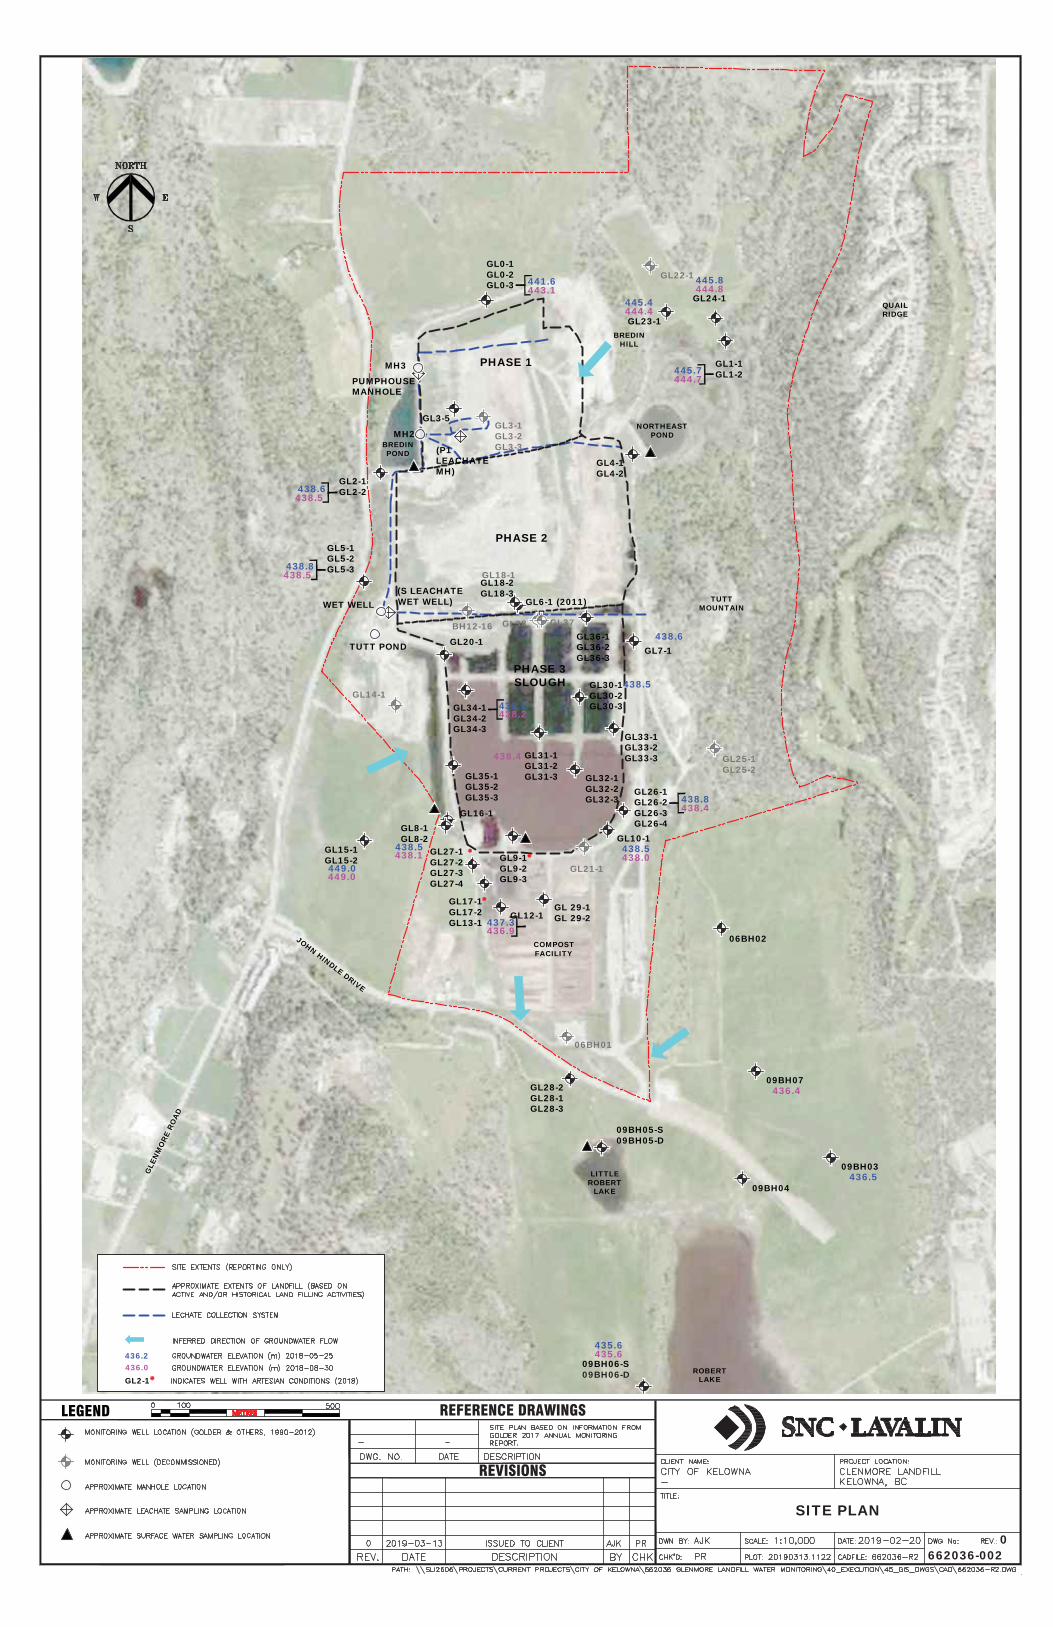
Drawing 662036-002 - Site Plan also identifies the approximate boundaries of the Site Plan as well as other
main areas and key features of the Glenmore Landfill including: Phase 1, Phase 2, Phase 3 (slough),
compost facility, well locations and the leachate collection system. There are several well locations that are
outside the boundaries of the Site Plan including the GL15 well series (two wells) located to the southwest,
the GL28 well series (three wells) located to the south, 06BH-02 and 09BH series (seven wells) located
south and southeast of the site. Wells 06BH and 09BH are owned by the University of British Columbia
(UBC). The City of Kelowna has been given permission by UBC to monitor and sample groundwater at
these wells.
Internal Ref: 662036 March 13, 2019
2
© 2019 SNC-Lavalin Inc. All Rights Reserved. Confidential.
2018 Glenmore Landfill Annual Water Quality Report
City of Kelowna
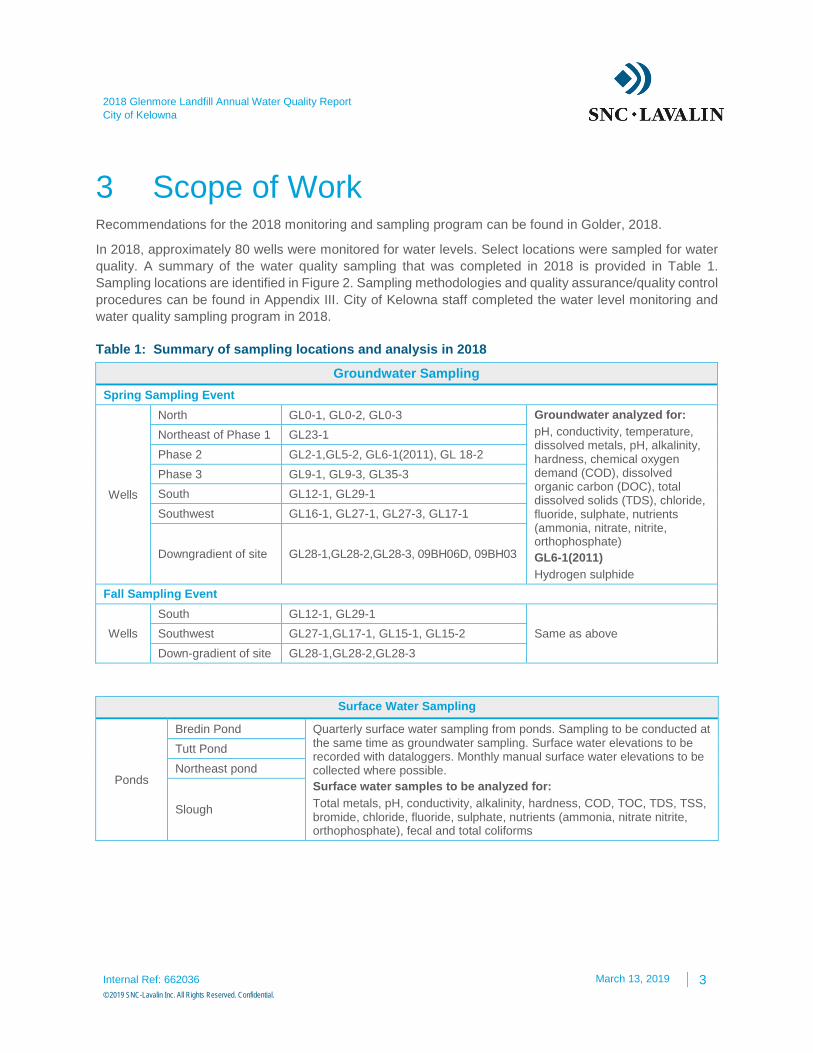
3 Scope of Work Recommendations for the 2018 monitoring and sampling program can be found in Golder, 2018.
In 2018, approximately 80 wells were monitored for water levels. Select locations were sampled for water
quality. A summary of the water quality sampling that was completed in 2018 is provided in Table 1.
Sampling locations are identified in Figure 2. Sampling methodologies and quality assurance/quality control
procedures can be found in Appendix III. City of Kelowna staff completed the water level monitoring and
water quality sampling program in 2018.
Table 1: Summary of sampling locations and analysis in 2018
Groundwater Sampling
Spring Sampling Event
Wells
North GL0-1, GL0-2, GL0-3 Groundwater analyzed for:
pH, conductivity, temperature, dissolved metals, pH, alkalinity, hardness, chemical oxygen demand (COD), dissolved organic carbon (DOC), total dissolved solids (TDS), chloride, fluoride, sulphate, nutrients (ammonia, nitrate, nitrite, orthophosphate)
GL6-1(2011)
Hydrogen sulphide
Northeast of Phase 1 GL23-1
Phase 2 GL2-1,GL5-2, GL6-1(2011), GL 18-2
Phase 3 GL9-1, GL9-3, GL35-3
South GL12-1, GL29-1
Southwest GL16-1, GL27-1, GL27-3, GL17-1
Downgradient of site GL28-1,GL28-2,GL28-3, 09BH06D, 09BH03
Fall Sampling Event
Wells
South GL12-1, GL29-1
Same as above Southwest GL27-1,GL17-1, GL15-1, GL15-2
Down-gradient of site GL28-1,GL28-2,GL28-3
Surface Water Sampling
Ponds
Bredin Pond Quarterly surface water sampling from ponds. Sampling to be conducted at the same time as groundwater sampling. Surface water elevations to be recorded with dataloggers. Monthly manual surface water elevations to be collected where possible.
Surface water samples to be analyzed for:
Total metals, pH, conductivity, alkalinity, hardness, COD, TOC, TDS, TSS, bromide, chloride, fluoride, sulphate, nutrients (ammonia, nitrate nitrite, orthophosphate), fecal and total coliforms
Tutt Pond
Northeast pond
Slough
Internal Ref: 662036 March 13, 2019
3
© 2019 SNC-Lavalin Inc. All Rights Reserved. Confidential.
2018 Glenmore Landfill Annual Water Quality Report
City of Kelowna
Surface Water Sampling
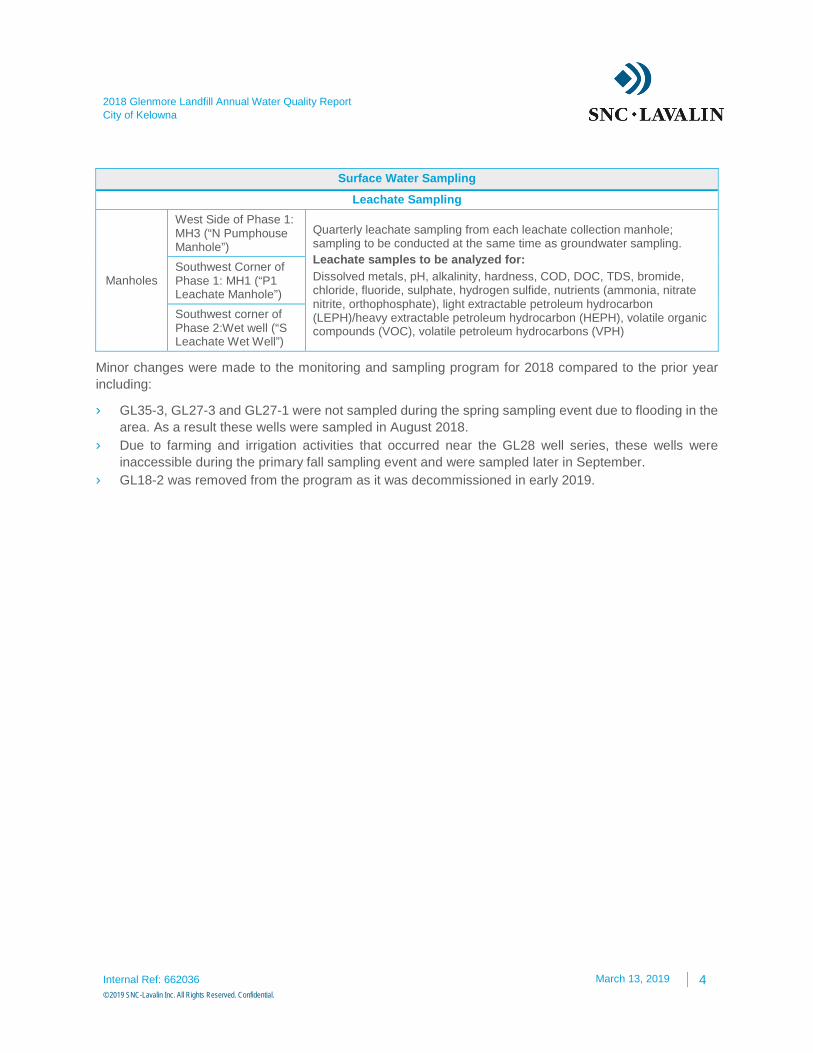
Leachate Sampling
Manholes
West Side of Phase 1: MH3 (“N Pumphouse Manhole”)
Quarterly leachate sampling from each leachate collection manhole; sampling to be conducted at the same time as groundwater sampling.
Leachate samples to be analyzed for:
Dissolved metals, pH, alkalinity, hardness, COD, DOC, TDS, bromide, chloride, fluoride, sulphate, hydrogen sulfide, nutrients (ammonia, nitrate nitrite, orthophosphate), light extractable petroleum hydrocarbon (LEPH)/heavy extractable petroleum hydrocarbon (HEPH), volatile organic compounds (VOC), volatile petroleum hydrocarbons (VPH)
Southwest Corner of Phase 1: MH1 (“P1 Leachate Manhole”)
Southwest corner of Phase 2:Wet well (“S Leachate Wet Well”)
Minor changes were made to the monitoring and sampling program for 2018 compared to the prior year
including:
› GL35-3, GL27-3 and GL27-1 were not sampled during the spring sampling event due to flooding in the
area. As a result these wells were sampled in August 2018.
› Due to farming and irrigation activities that occurred near the GL28 well series, these wells were
inaccessible during the primary fall sampling event and were sampled later in September.
› GL18-2 was removed from the program as it was decommissioned in early 2019.
Internal Ref: 662036 March 13, 2019
4
© 2019 SNC-Lavalin Inc. All Rights Reserved. Confidential.
2018 Glenmore Landfill Annual Water Quality Report
City of Kelowna
4 Additional Site Works – By City The City of Kelowna completed the following additional site work in 2018:
› Due to flooding in the four GL27 well series area the ground level in that area was raised to prevent the
area from flooding in the future. The piezometers were extended and resurveyed on Nov 20, 2018.
› GL17-1, GL27-1 (only artesian in 2017), GL9-1 and GL2-1 were identified in the 2016 and/or 2017
Glenmore Landfill Annual reports as presenting artesian conditions. The Provincial Ministry of Forests,
Lands, Natural Resource Operations and Rural Development conducted an inspection of these
monitoring wells on October 10, 2018 in order to determine if the wells meet the definition of control as
specified under section 52 of the Water Sustainability Act (WSA). Through site inspection, well records,
reports and knowledge of the City of Kelowna Civic Operations staff, the four well were classified as
artesian and did not identify compliance issues with respect to the WSA or the Groundwater Protection
Regulation (GPR). A detailed overview of this inspection can be found in Appendix IV. It is noted that
field records confirmed that well GL2-1 was not under artesian conditions when measured in 2017, as
incorrectly identified by Golder in the 2017 annual report.
Pumping of surface water off site was conducted during 2018 due to significant flooding on site. Pumping
started on April 16, 2018 and stopped on July 26, 2018.
Internal Ref: 662036 March 13, 2019
5
© 2019 SNC-Lavalin Inc. All Rights Reserved. Confidential.
2018 Glenmore Landfill Annual Water Quality Report
City of Kelowna
5 Groundwater and Surface Water
Assessment Criteria Water quality data collected in 2018 was reviewed by SNC-Lavalin and compared to the applicable
standards and criteria.
› Contaminated Sites Regulation1 (CSR) aquatic life (AW) standards were used in the comparison of all
groundwater quality results.
› British Columbia Approved Water Quality Guidelines2 (BCWQG) AW guidelines were used in the
comparison of
- GL28 well series, GL23-1, 09BH03, and 09BH06-D
› BCWQG IW and CSR IW guidelines were applied to groundwater quality and surface water quality at
Bredin and Tutt pond. Bredin pond was previously used for irrigations purposed and Tutt pond is
currently used for irrigation.
› The GL28 well series, being the most down gradient wells of the study site, was compared to the
Canadian Drinking Water Quality Guidelines3 (CDWQG), BCWQG Drinking Water (DW) guidelines,
and the CSR DW guidelines.
Leachate at the site is treated with Bioxide at the north sewer lift station to address potentially elevated
hydrogen sulfide levels. The sewage/leachate mixture is also aerated and odours are treated by a Biorem
Multi-Stage Biofilter. The treated sewage/leachate is discharged into the municipal sanitary sewer system
on Glenmore Road and is ultimately treated at the City’s Wastewater Treatment Facility. Leachate is no
longer discharged to the sewer force main to the Quail Ridge subdivision as of November 2016. Therefore,
analytical results for treated leachate samples were not compared to the applicable groundwater standards,
and/or surface water guidelines.
5.1 Leachate Indicator Parameters
The primary leachate indicator parameters used to evaluate water quality in landfill leachate, groundwater,
and receiving environment surface waters include the following:
› Electrical Conductivity (EC) and Total Dissolved Solids (TDS): These are measures of the ionic
strength of solution, which tend to be higher in leachate than natural waters.
› Alkalinity: Alkalinity increases downgradient of landfills primarily due to elevated levels of dissolved
carbon dioxide in affected water (produced by the biological breakdown of organic material) causing
the dissolution of carbonate from natural geologic materials in groundwater.
› Chloride: Chloride is generally abundant in waste and is formed in part by the degradation of paper
products and food wastes. Chloride is a useful leachate indicator parameter as it is not subject to
retardation processes and thus migrates at essentially the same rate as groundwater flow.
1 Contaminated Sites Regulation (CSR), B.C. Reg. 375/96, includes amendments up to B.C. Reg. 13/2019, January 24, 2019.
2 British Columbia Approved Water Quality Guidelines, includes Working Water Quality Guidelines for BC (BCWQG). British Columbia Ministry of Environment & Climate Change Strategy, updated March 2018.
3 Guidelines for Canadian Drinking Water Quality (CDWQG), Health Canada, February 2017.
Internal Ref: 662036 March 13, 2019
6
© 2019 SNC-Lavalin Inc. All Rights Reserved. Confidential.
2018 Glenmore Landfill Annual Water Quality Report
City of Kelowna
› Sodium: Is a dominant monovalent cation and also measure of ionic strength which tends to be high
in leachate; however, it is subject to geochemical processes that affect it’s concentrations in solution
depending on conditions such as cation exchange, dissolution, or precipitation.
› Ammonia: High concentrations of ammonia are observed when a landfill enters its anaerobic stage. In
the anaerobic stage, anaerobic decomposition dominates and the entire landfill is in a chemically
reducing state that results in more ammonia than nitrate or nitrite.
› Nitrate: Conversely to ammonia, nitrate is reduced during the anaerobic stage and is typically present
in leachate at low (or non-detectable) concentrations.
› Boron: Boron concentrations are often observed to increase in leachate affected waters.
› Iron and Manganese: Concentrations typically increase in landfill-affected groundwater due to the
alteration of redox conditions within the groundwater. The breakdown of dissolved organic matter within
leachate consumes dissolved oxygen and related oxygen sources in groundwater and creates reducing
conditions. Where conditions are reducing, naturally-occurring iron and manganese oxides within the
geologic material are reduced to more soluble forms, which results in an increase in dissolved iron and
manganese concentrations.
› Biological Oxygen Demand (BOD) and Chemical Oxygen Demand (COD): BOD is the amount of
dissolved oxygen needed by aerobic bacteria to break down organic matter. COD is the total
measurement of all chemicals in the water that can be oxidized. The relationship between BOD & COD
provides an indication of how readily biodegradable leachate is. A COD:BOD ratio of 2:1, (i.e., the COD
value is twice the BOD concentration) is generally indicative of a biodegradable effluent. Higher
COD:BOD ratios are indicative of the presence of recalcitrant, harder to degrade compounds. Typically
for treated municipal leachate it is not uncommon to see COD:BOD ratios of 10:1 to 20:1.
Internal Ref: 662036 March 13, 2019
7
© 2019 SNC-Lavalin Inc. All Rights Reserved. Confidential.
2018 Glenmore Landfill Annual Water Quality Report
City of Kelowna
6 Groundwater and Surface Water Levels The results of groundwater and surface water elevation monitoring are summarized in Tables 2a and 2b
(Appendix V).
Based on groundwater elevations measured on May 25 and August 30, 2018, the general groundwater flow
direction was from north, inwards from the east and west, towards the south and off the site, consistent with
previous monitoring results (Figure 2).
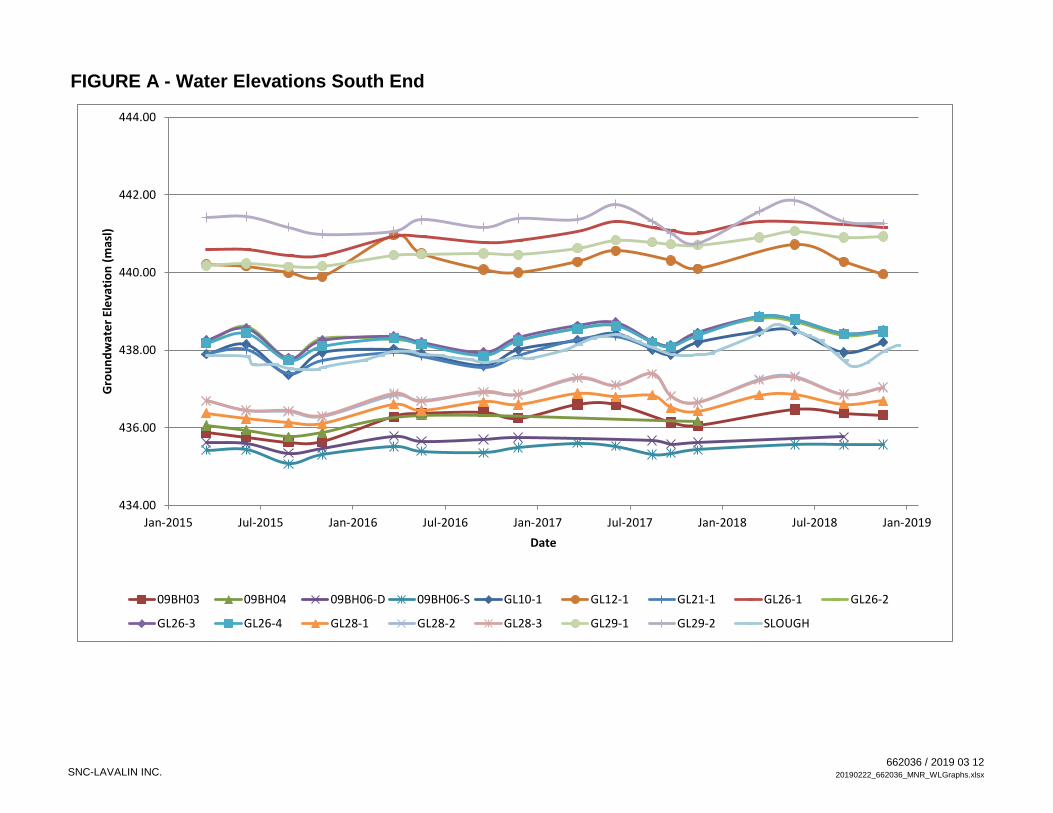
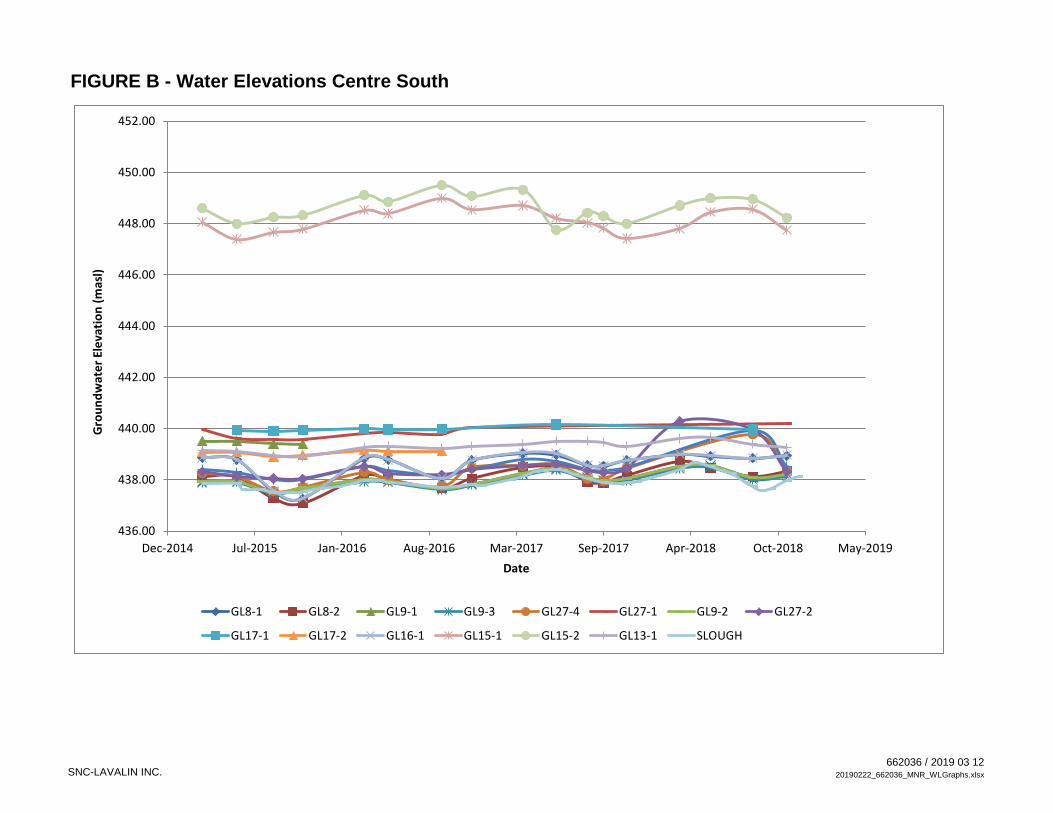
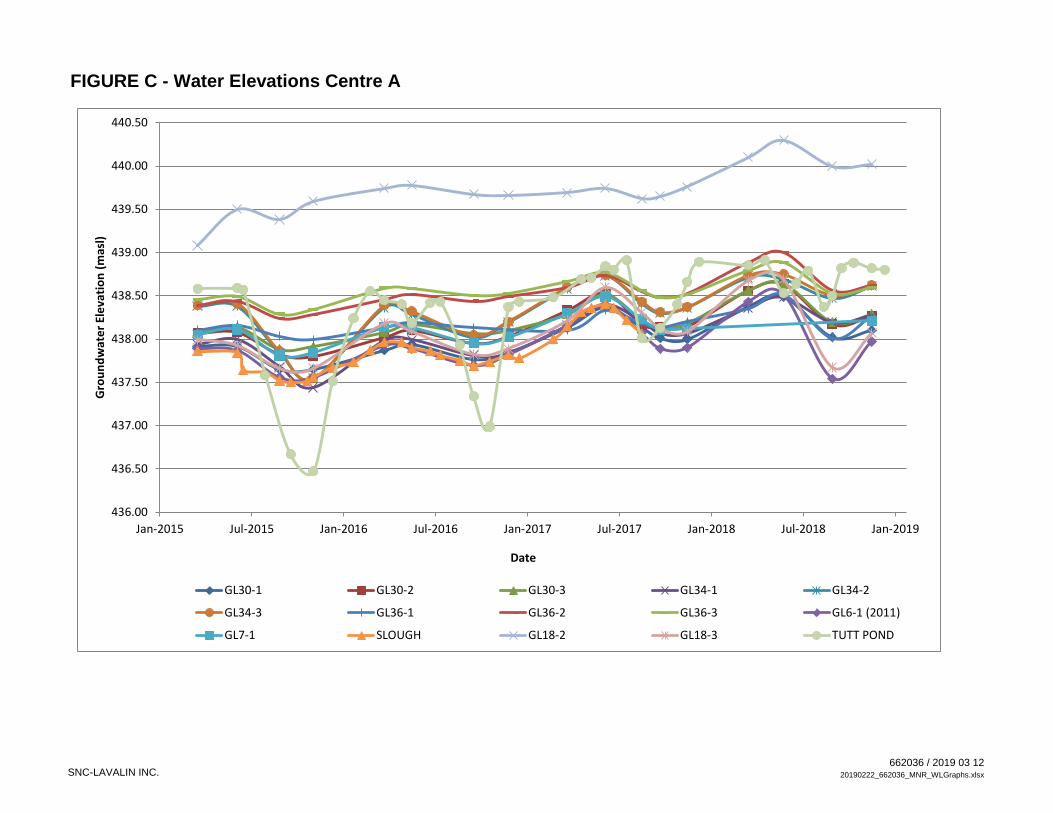
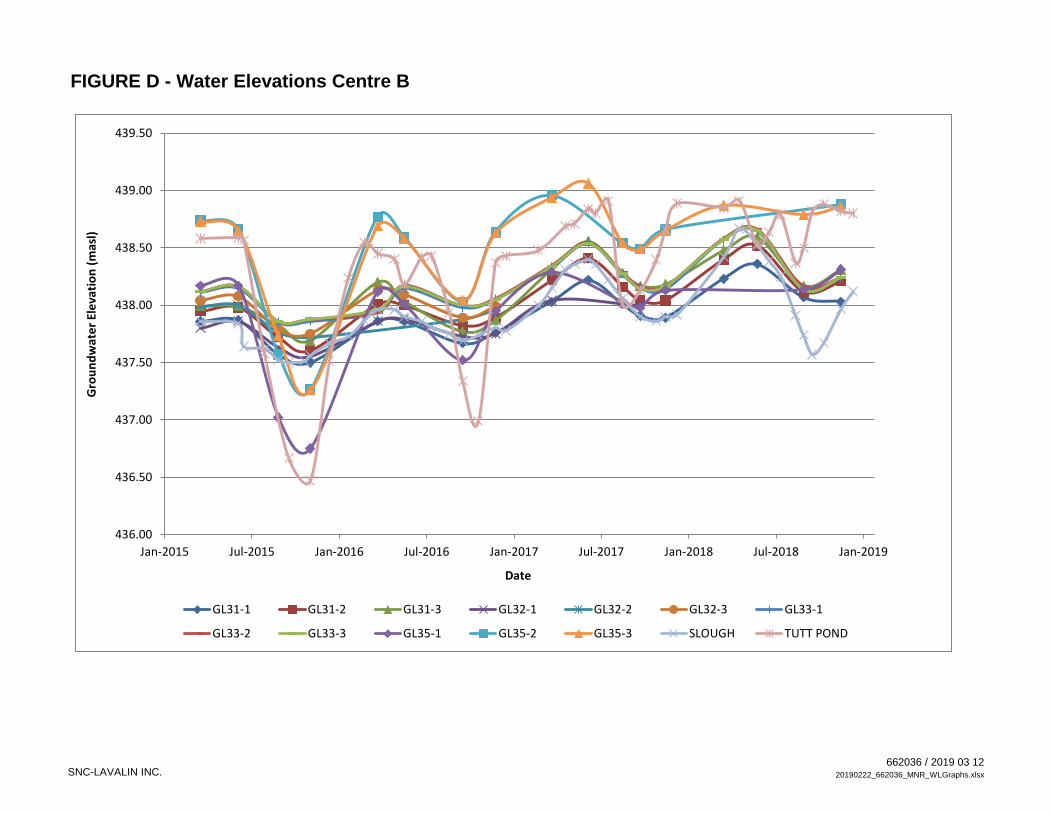
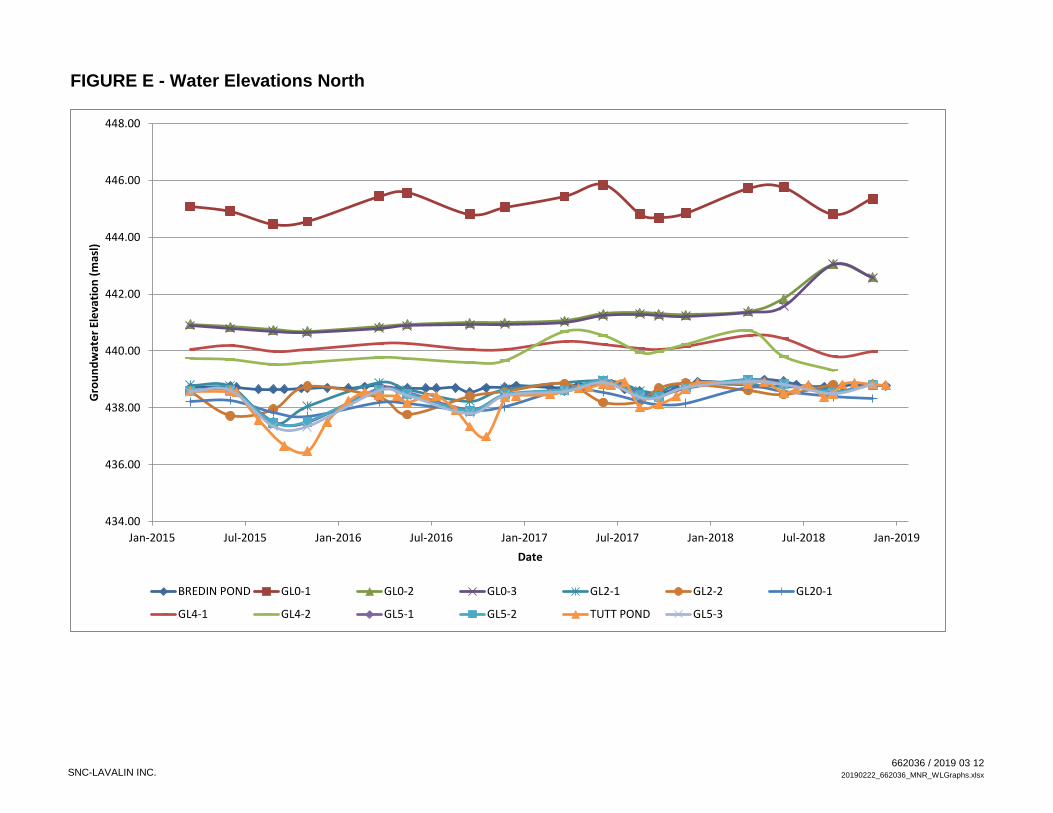
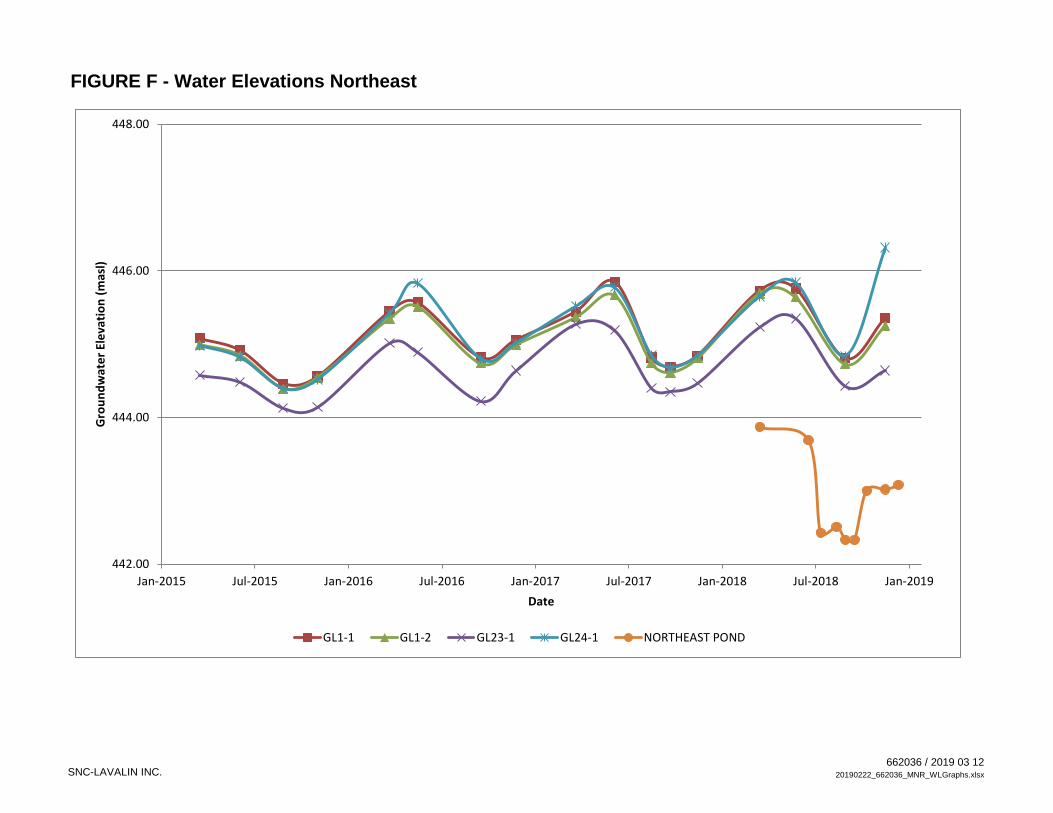
Trends in surface water and groundwater elevations observed between December 2014 and October 2018
are shown in Figures 3a-f (Figures Appendix). Groundwater levels in 2018 were generally consistent with
2017 and remain relatively high compared to pre-2016 conditions. Seasonally, groundwater elevations were
highest in June and have generally maintained those levels up to November 2018.
Surface water levels at several locations (Tutt pond, Northeast pond, Bredin pond) fluctuated greater than
in the past in 2018 due to the increased management of flood waters on site.
Internal Ref: 662036 March 13, 2019
8
© 2019 SNC-Lavalin Inc. All Rights Reserved. Confidential.
2018 Glenmore Landfill Annual Water Quality Report
City of Kelowna
7 Groundwater Geochemistry
7.1 Analytical Results
Groundwater analytical results for 2018 including all parameters exceeding any applicable standards or
criteria are presented in Table 3a-d (Appendix VI).
The groundwater quality data collected during the Spring and Fall sampling events in 2018 were compared
to applicable provincial and federal standards and/or criteria and assessed for general spatial and temporal
trends in concentrations. The associated laboratory results were provided to SNC-Lavalin by the City of
Kelowna and CARO Analytical Services.
7.2 Groundwater Quality
7.2.1 Field Observations
During the 2018 sampling events, hydrogen sulphide gas-like and leachate-like odours were noted at
GL6-1(2011) in June. This is consistent with the 2017 observations. An organic musty odour was notes at
GL12-1 in June and September 2018, the same odour was noted at September 2017 sampling.
Hydrogen sulphide gas-like odour was noted at the following leachate sample locations:
› S Leachate wet well on August 16, 2018
› N pumphouse manhole on November 8, 2018
› S leachate wet well on November 8, 2018
› P1 Leachate manhole on November 8, 2018
A hydrogen sulphide gas-like and leachate-like odour was noted at the following leachate sample locations:
› P1 Leachate manhole on August 16, 2018
› S Leachate wet well on March 15, 2018
› N Pumphouse manhole on May 24, 2018
A leachate-like odour was noted at the following leachate sample locations:
› P1 Leachate manhole on March 15, 2018
› P1 pumphouse manhole on May 24, 2018
› S Leachate wet well on May 24, 2018
7.2.2 Moderate to High Leachate Monitoring Wells
Moderate to high concentrations of leachate indicator parameters continue to be present at the following
groundwater monitoring wells: GL5-2, GL6-1(2011), GL9-3, GL12-1, , GL16-1, GL18-2, GL24-1, GL27-3
and GL35-3. Key leachate indicator parameters including chloride, fluoride, sulfate, sulfide, COD, TDS,
ammonia, boron, chromium, and dissolved iron remained generally consistent with historic sampling results.
High parameter concentrations in groundwater at GL15-2 may be due to agricultural practices and irrigation
of the surrounding agricultural fields, as this well is located upgradient from the site (Golder, 2018).
Internal Ref: 662036 March 13, 2019
9
© 2019 SNC-Lavalin Inc. All Rights Reserved. Confidential.
2018 Glenmore Landfill Annual Water Quality Report
City of Kelowna
Golder, 2018 noted the possibility that increased concentrations of TDS, chloride, fluoride and sulphate at
GL9-3 in 2016 and 2017 may be indicative of leachate migration toward the south. Water quality results
from 2018 indicate reductions in chloride and sulphate compared with 2017 and slightly increased levels of
fluoride and TDS. GL9-3 is clearly impacted by leachate however the results from the last two years are
not indicative of increased leachate migration to the south or increased leachate concentrations within the
area of GL9-3.
7.2.3 Low to Minimal Leachate-Impacted Monitoring Wells
The concentrations of leachate indicator parameters in groundwater wells GL0-1, GL0-2, GL0-3, GL2-1,
GL9-1, GL17-1, GL23-1, GL27-1, GL28-1, GL28-2, GL28-3, GL29-1, 09BH03 and 09BH06-D remain within
the range of those reported historically. No significant changes in the 2018 groundwater quality were noted
at these wells as compared to historic values with the exception of:
› Nitrate levels in GL28 series of wells was elevated compared to historic levels. This is thought to be
unrelated to the Glenmore Landfill and is likely related to surface water contamination from local
agriculture activity, similar to levels observed in other agricultural wells located off site .
7.2.4 Comparison to Background Groundwater Quality
The GL28 well series is located down gradient and immediately off site and as a result can be used to
determine if leachate is migrating off site. The GL28 well series water quality data was compared with water
quality data from wells considered to be representative of local background groundwater quality located up
gradient (GL23-1 and GL1- 2) or far down gradient (09BH03 and 09BH06-D). Well data from several wells
representing background conditions was used for this comparison due to the large number of influences
impacting background groundwater quality at each well site including but not limited to current and historic
land use, geology, and impacts from surface water. The results of the comparison are shown in Table 3d
and suggest that groundwater quality in the GL28 well series is not impacted by leachate and any
exceedances of provincial and federal drinking water quality guidelines are associated with local
background groundwater quality conditions. Wells with moderate to high concentrations of leachate
indicator parameters identified above exhibit significantly higher (multiples to orders of magnitude)
concentrations of leachate indicator parameters.
Internal Ref: 662036 March 13, 2019
10
© 2019 SNC-Lavalin Inc. All Rights Reserved. Confidential.
2018 Glenmore Landfill Annual Water Quality Report
City of Kelowna
8 Surface Water Geochemistry Surface water samples were collected from Bredin Pond, Northeast Pond, Tutt Pond and the Slough throughout
2018. The analytical results of the surface water samples are presented in Tables 4a, b (Appendix VI). The
results are compared to the BCWQG guidelines and parameter exceedances are identified.
In general the surface water parameter concentrations collected at Bredin Pond, Tutt pond, Northeast pond
and the slough were consistent with those reported in 2017 with the following exceptions:
› A decrease in chloride and sulphate at the Slough
› A decrease in sulphate at Tutt Pond
These decreases in chloride and sulphate concentrations at the Slough and Tutt Pond were likely
associated with the use of these areas to manage flood water and the associated dilution effect. No impacts
from the Slough were observed in the surface water samples collected from Tutt Pond.
Internal Ref: 662036 March 13, 2019
11
© 2019 SNC-Lavalin Inc. All Rights Reserved. Confidential.
2018 Glenmore Landfill Annual Water Quality Report
City of Kelowna
9 Leachate Chemistry Leachate quality in the samples was collected from three different locations of the leachate collection system
including the N Pumphouse Manhole, S Leachate Wet Well, and the P1 Leachate Manhole (Figure 2).
Leachate quality data is presented in Table 5 (Appendix VII). The 2018 leachate quality results are consistent
with historic results. Leachate indicator parameters are variable between sample locations and seasonal
sampling events. A detailed comparison of leachate quality data and groundwater quality data was not
completed however sulfide and ammonia concentrations were significantly higher in leachate, except for
samples collected in June from GL6-1(2011), and chloride was generally higher in the moderate to high
leachate-impacted wells in the areas of Phase 2/Phase 3. The increasing concentrations at GL6-1 (2011) are
likely related to its proximity to the leachate collection system and recent historic landfilling activity. All leachate
samples exhibited hydrocarbon and VOC parameter concentrations which is consistent with historic results.
Internal Ref: 662036 March 13, 2019
12
© 2019 SNC-Lavalin Inc. All Rights Reserved. Confidential.
2018 Glenmore Landfill Annual Water Quality Report
City of Kelowna
10 Results of QA/QC Program QA/QC procedures included analyzing blind field duplicate samples. Analytical results for the original
samples and corresponding blind duplicate samples were compared using the calculated variability of the
results, as expressed by the Relative Percent Difference (RPDDUP), which is defined as the absolute value
of the difference between the results for the original and duplicate samples, divided by the average of the
results. Because of the poor precision near the laboratory detection limit, RPDDUP values are only calculated
for sample sets in which the analytical results of the original or the duplicate sample is greater than five
times the Practical Quantitation Limit (PQL).
The RPDDUP trigger criteria for all parameters in surface and groundwater duplicates is 50% as specified in
the BC Field Sampling Manual.
A total of seventeen wells were sampled in May/June 2018 with three field duplicate samples for a total of
17.6% field duplicate analysis. Three wells were sampled in August 2018 due to spring time flooding with
zero field duplicates sampled. During September 2018, 9 wells were sampled with 1 field duplicate for 11%
field duplicate analysis. The target of 10% field duplicate analysis was met during both the spring and fall
sampling program. Field duplicate sample analyses are presented in Tables 3 to 5.
All of the RPDDUP values calculated between the groundwater and surface water sample and duplicate pairs
collected in 2018 met the Data Quality Objectives (DQO).
Review of Caro’s standard internal QA/QC procedures indicated acceptable reproducibility of laboratory
results.
The analytical results were considered to be reliable.
Internal Ref: 662036 March 13, 2019
13
© 2019 SNC-Lavalin Inc. All Rights Reserved. Confidential.
2018 Glenmore Landfill Annual Water Quality Report
City of Kelowna
11 Conclusions and Recommendations No significant changes to water levels or water quality were noted in the results from the 2018 water
monitoring program. Monitoring should be continued in order to evaluate spatial and temporal trends in
groundwater and surface water levels and water quality across the site and off-site. It is recommended that
the City of Kelowna consider the need for further investigation should any physical or operational changes
be made to the Landfill in order to determine whether these changes might impact groundwater flow or
groundwater quality on and off- site.
The GL28 well series situated immediately down gradient and off site continue to reflect background
groundwater quality with the exception of increased nitrate concentrations which is likely the result of
surface water contamination from local agriculture activity.
Recommendations to complete a detailed groundwater assessment and additional groundwater monitoring
wells are forthcoming in the Glenmore Landfill Design, Operations and Closure Plan.
Internal Ref: 662036 March 13, 2019
14
© 2019 SNC-Lavalin Inc. All Rights Reserved. Confidential.
2018 Glenmore Landfill Annual Water Quality Report
City of Kelowna
12 Proposed 2019 Monitoring Program The following recommendations are provided for the 2019 monitoring program.
12.1 Groundwater Elevations
Groundwater levels form all accessible wells on and off-site should continue to be recorded on a quarterly
basis to observe seasonal trends.
12.2 Groundwater Quality
Groundwater samples should continue to be collected semi-annually from the wells listed in Table 1 and
any new wells constructed in 2019. Sampling should continue to be conducted each spring, when
groundwater levels are highest, and in the fall when groundwater levels are low.
All groundwater samples should continue to be measured for the following field parameters: pH,
conductivity and temperature. In addition, all groundwater samples should be analyzed for the following
parameters: dissolves metals, pH, alkalinity, hardness, chemical oxygen demand, dissolved organic
carbon, total dissolved solids, chloride, fluoride, sulphate and nutrients; ammonia, nitrate, nitrite,
orthophosphate.
Groundwater samples from GL6-1 (2011) should continue to be analyzed for hydrogen sulphide.
12.3 Surface Water Quality
Surface water levels should continue to be recorded with the electric data loggers currently in place. Data
should be downloaded quarterly and manual surface water level measurements should be conducted to
confirm the data logger measurements. Surface water sampling should continue to be collected on a
quarterly basis at Bredin Pond, Tutt Pond, Northeast Pond and the Slough to confirm the surface water
quality at these locations and its potential impact on groundwater quality in areas where this surface water
is used for irrigation purposes. All samples should continue to be measured and/or analyzed for the
parameters listed in Table 1.
12.4 Leachate Quality
Leachate sampling and analysis should be conducted quarterly from each leachate collection sumps. Leachate
samples and groundwater samples should be taken at the same time to compare groundwater quality.
12.5 Data Analysis and Reporting
Semi-annual groundwater sampling, quarterly groundwater level monitoring and monthly surface water data
should continue to be evaluated and compared to the applicable provincial and/or federal standards.
Internal Ref: 662036 March 13, 2019
15
© 2019 SNC-Lavalin Inc. All Rights Reserved. Confidential.
2018 Glenmore Landfill Annual Water Quality Report
City of Kelowna
13 Closure This report fulfills the information required to evaluate the groundwater quality and trends required at this
time. For additional information please contact the undersigned.
Internal Ref: 662036 March 13, 2019
16
© 2019 SNC-Lavalin Inc. All Rights Reserved. Confidential.
2018 Glenmore Landfill Annual Water Quality Report
City of Kelowna
14 References Golder, 2018. 2017 Annual Water Quality Monitoring Report, Glenmore Landfill, Kelowna B.C. Prepared
for the City of Kelowna.
Internal Ref: 662036 March 13, 2019
17
© 2019 SNC-Lavalin Inc. All Rights Reserved. Confidential.
Figures
A. Water Elevations South End
B. Water Elevations Centre South
C. Water Elevations Centre A
D. Water Elevations Centre B
E. Water Elevations North
F. Water Elevations Northeast
SNC-LAVALIN INC. 662036 / 2019 03 12
20190222_662036_MNR_WLGraphs.xlsx
FIGURE A - Water Elevations South End
434.00
436.00
438.00
440.00
442.00
444.00
Jan-2015 Jul-2015 Jan-2016 Jul-2016 Jan-2017 Jul-2017 Jan-2018 Jul-2018 Jan-2019
Gro
undw
ater
Ele
vatio
n (m
asl)
Date
09BH03 09BH04 09BH06-D 09BH06-S GL10-1 GL12-1 GL21-1 GL26-1 GL26-2
GL26-3 GL26-4 GL28-1 GL28-2 GL28-3 GL29-1 GL29-2 SLOUGH
SNC-LAVALIN INC. 662036 / 2019 03 12
20190222_662036_MNR_WLGraphs.xlsx
FIGURE B - Water Elevations Centre South
436.00
438.00
440.00
442.00
444.00
446.00
448.00
450.00
452.00
Dec-2014 Jul-2015 Jan-2016 Aug-2016 Mar-2017 Sep-2017 Apr-2018 Oct-2018 May-2019
Gro
undw
ater
Ele
vatio
n (m
asl)
Date
GL8-1 GL8-2 GL9-1 GL9-3 GL27-4 GL27-1 GL9-2 GL27-2
GL17-1 GL17-2 GL16-1 GL15-1 GL15-2 GL13-1 SLOUGH
SNC-LAVALIN INC. 662036 / 2019 03 12
20190222_662036_MNR_WLGraphs.xlsx
FIGURE C - Water Elevations Centre A
436.00
436.50
437.00
437.50
438.00
438.50
439.00
439.50
440.00
440.50
Jan-2015 Jul-2015 Jan-2016 Jul-2016 Jan-2017 Jul-2017 Jan-2018 Jul-2018 Jan-2019
Gro
undw
ater
Ele
vatio
n (m
asl)
Date
GL30-1 GL30-2 GL30-3 GL34-1 GL34-2
GL34-3 GL36-1 GL36-2 GL36-3 GL6-1 (2011)
GL7-1 SLOUGH GL18-2 GL18-3 TUTT POND
SNC-LAVALIN INC. 662036 / 2019 03 12
20190222_662036_MNR_WLGraphs.xlsx
FIGURE D - Water Elevations Centre B
436.00
436.50
437.00
437.50
438.00
438.50
439.00
439.50
Jan-2015 Jul-2015 Jan-2016 Jul-2016 Jan-2017 Jul-2017 Jan-2018 Jul-2018 Jan-2019
Gro
undw
ater
Ele
vatio
n (m
asl)
Date
GL31-1 GL31-2 GL31-3 GL32-1 GL32-2 GL32-3 GL33-1
GL33-2 GL33-3 GL35-1 GL35-2 GL35-3 SLOUGH TUTT POND
SNC-LAVALIN INC. 662036 / 2019 03 12
20190222_662036_MNR_WLGraphs.xlsx
FIGURE E - Water Elevations North
434.00
436.00
438.00
440.00
442.00
444.00
446.00
448.00
Jan-2015 Jul-2015 Jan-2016 Jul-2016 Jan-2017 Jul-2017 Jan-2018 Jul-2018 Jan-2019
Gro
undw
ater
Ele
vatio
n (m
asl)
Date
BREDIN POND GL0-1 GL0-2 GL0-3 GL2-1 GL2-2 GL20-1
GL4-1 GL4-2 GL5-1 GL5-2 TUTT POND GL5-3
SNC-LAVALIN INC. 662036 / 2019 03 12
20190222_662036_MNR_WLGraphs.xlsx
FIGURE F - Water Elevations Northeast
442.00
444.00
446.00
448.00
Jan-2015 Jul-2015 Jan-2016 Jul-2016 Jan-2017 Jul-2017 Jan-2018 Jul-2018 Jan-2019
Gro
undw
ater
Ele
vatio
n (m
asl)
Date
GL1-1 GL1-2 GL23-1 GL24-1 NORTHEAST POND

Drawings
› 662036-001: Key Plan
› 662036-001: Site Plan
LEGEND
662036-0010
REVISIONS
REFERENCE DRAWINGS
KEYPLAN
AutoCAD SHX Text
CHK'D:
AutoCAD SHX Text
TITLE:
AutoCAD SHX Text
REV.:
AutoCAD SHX Text
DWG No:
AutoCAD SHX Text
CLIENT NAME:
AutoCAD SHX Text
SCALE:
AutoCAD SHX Text
DATE:
AutoCAD SHX Text
PROJECT LOCATION:
AutoCAD SHX Text
DWN BY:
AutoCAD SHX Text
CITY OF KELOWNA
AutoCAD SHX Text
-
AutoCAD SHX Text
CLENMORE LANDFILL
AutoCAD SHX Text
KELOWNA, BC
AutoCAD SHX Text
2019-02-20
AutoCAD SHX Text
AS SHOWN
AutoCAD SHX Text
AJK
AutoCAD SHX Text
PR
AutoCAD SHX Text
0
AutoCAD SHX Text
2019-02-20
AutoCAD SHX Text
ISSUED TO CLIENT
AutoCAD SHX Text
AJK
AutoCAD SHX Text
PR
AutoCAD SHX Text
-
AutoCAD SHX Text
-
AutoCAD SHX Text
-
AutoCAD SHX Text
DWG. NO.
AutoCAD SHX Text
DATE
AutoCAD SHX Text
DESCRIPTION
AutoCAD SHX Text
CHK
AutoCAD SHX Text
BY
AutoCAD SHX Text
DESCRIPTION
AutoCAD SHX Text
REV.
AutoCAD SHX Text
DATE
AutoCAD SHX Text
PLOT:
AutoCAD SHX Text
CADFILE:
AutoCAD SHX Text
PATH: \\SLI2606\PROJECTS\CURRENT PROJECTS\CITY OF KELOWNA\662036 GLENMORE LANDFILL WATER MONITORING\40_EXECUTION\45_GIS_DWGS\CAD\662036-R1.DWG\\SLI2606\PROJECTS\CURRENT PROJECTS\CITY OF KELOWNA\662036 GLENMORE LANDFILL WATER MONITORING\40_EXECUTION\45_GIS_DWGS\CAD\662036-R1.DWG
09BH06-S09BH06-D
09BH03
09BH04
09BH07
09BH05-S09BH05-D
06BH02
GL28-2GL28-1GL28-3
GL12-1GL 29-1GL 29-2
GL21-1
GL10-1
GL26-1GL26-2GL26-3GL26-4
GL25-1GL25-2
GL9-1GL9-2GL9-3
GL17-1GL17-2GL13-1
GL33-1GL33-2GL33-3
GL32-1GL32-2GL32-3
GL31-1GL31-2GL31-3
GL30-1GL30-2GL30-3GL34-1
GL34-2GL34-3
GL20-1
GL38 GL37
GL6-1 (2011)
GL36-1GL36-2GL36-3
GL7-1
GL2-1GL2-2
GL4-1GL4-2
GL1-1GL1-2
GL24-1
GL3-5GL3-1GL3-2GL3-3
GL18-1GL18-2GL18-3
BH12-16
06BH01
JOHN HINDLE DRIVE
ROBERTLAKE
LITTLEROBERT
LAKE
COMPOSTFACILITY
GLE
NM
ORE
RO
AD
PHASE 3SLOUGH
PHASE 2
PHASE 1
TUTTMOUNTAIN
QUAILRIDGE
BREDINPOND
NORTHEASTPOND
GL15-1GL15-2
GL16-1
GL35-1GL35-2GL35-3
GL5-1GL5-2GL5-3
GL23-1
GL22-1GL0-1GL0-2GL0-3
BREDINHILL
GL14-1
PUMPHOUSEMANHOLE
(P1LEACHATEMH)
(S LEACHATEWET WELL)WET WELL
MH2
MH3
TUTT POND
GL27-1GL27-2GL27-3GL27-4
GL8-1GL8-2
435.6435.6
436.5
436.4
438.5438.0
438.8438.4
438.6
438.5
445.7444.7
445.8444.8
445.4444.4
441.6443.1
438.6438.5
438.8438.5
438.5
438.4
449.0449.0
437.3436.9
438.5438.1
438.2
436.2436.0GL2-1
LEGEND REFERENCE DRAWINGS
REVISIONS
662036-0020
SITE PLAN
Appendix I
ENV Operation Certificate 12218

Appendix II
May 25, 2011 Letter from BC Ministry of Environment and Climate Change Strategy re Glenmore Landfill

Appendix III
Methodology and Quality Assurance / Quality Control
2018 Glenmore Landfill Annual Water Quality Report
City of Kelowna
Methodology and Quality Assurance/ Quality Control
Groundwater Monitoring
Groundwater levels were measures in 2018 by City staff at all on and off-site monitoring wells on March 16,
May 25, August 30, November 16. Water Levels were measured off a permanent marking on the top of the
PVC pipe in each well. Groundwater elevations were measured relative to the geodetic data obtained during
site surveys. Groundwater flow direction was inferred form trends collected during the 2018 monitoring
program.
Groundwater Sampling
Groundwater samples were collected during three sampling events in 2018 by City staff. Samples were
taken from select locations on and off-site. Sample dates in 2018 were May 28 and 29, June 4 and 12,
August 15, September 19, 25 and 28. Sampling procedures were in accordance with the 2018 monitoring
program. Sample bottles, preservatives, filters and coolers used for groundwater sampling were obtained
by the City.
In general, a peristaltic pump was used for groundwater sampling with the exception of GL0-2, GL0-3, and
GL9-1 which used a submersible pump. Field measurements were obtained during well development prior
to sampling. Samples were taken once the field parameters stabilized. Samples were filtered (when
applicable) and stored in a cooler on ice or in a refrigerator. Samples were submitted to Caro Analytical
services for analysis of specified parameters shown in Tables 3a to 3d. Duplicates were collected during
each sampling event, these results can be found in Tables 3a to 3d.
Surface Water Monitoring and Sampling
Surface water levels were measured manually in 2018 by City staff on a monthly basis at the Tutt Pond
Manhole, Bredin Pond, Northeast Pond and Slough. Data loggers were used in Bredin Pond, Tutt Pond,
Northeast Pond, Slough and East Pond.
Surface water samples in 2018 were collected by City staff April 4, 17 and 20, May 3 and 23, June 14 and
15, July 12, September 6, and November 7 and 8. Samples were submitted to Caro by the City for analytics
of the parameters shown in Table 4a and Table 4b.
Leachate Sampling
Leachate samples were collected by City staff on March 15, May 24, August 16 and November 8 at P1
Leachate Manhole, S Leachate Wet Well and N Pumphouse Manhole. See Figure 2 for leachate sample
locations. The leachate samples were submitted to Caro by the City for analysis of the parameters seen in
Table 5.
Quality Assurance/ Quality Control
QA/QC procedures included analyzing blind field duplicate samples. Analytical results for the original
samples and corresponding blind duplicate samples were compared using the calculated variability of the
results, as expressed by the Relative Percent Difference (RPDDUP), which is defined as the absolute value
Internal Ref: 662036 March 13, 2019
1
© 2019 SNC-Lavalin Inc. All Rights Reserved. Confidential.
2018 Glenmore Landfill Annual Water Quality Report
City of Kelowna
of the difference between the results for the original and duplicate samples, divided by the average of the
results. Because of the poor precision near the laboratory detection limit, RPDDUP values are only calculated
for sample sets in which the analytical results of the original or the duplicate sample is greater than five
times the Practical Quantitation Limit (PQL).
The RPDDUP trigger criteria for all parameters in surface and groundwater duplicates is 50% as specified in
the BC Field Sampling Manual.
A total of seventeen wells were sampled in May/June 2018 with three field duplicate samples for a total of
17.6% field duplicate analysis. Three wells were sampled in August 2018 due to spring time flooding with
zero field duplicates sampled. During September 2018, 9 wells were sampled with 1 field duplicate for 11%
field duplicate analysis. The target of 10% field duplicate analysis was met during both the spring and fall
sampling program. Field duplicate sample analyses are presented in Tables 3 to 5.
All of the RPDDUP values calculated between the groundwater and surface water sample and duplicate pairs
collected in 2018 met the Data Quality Objectives (DQO).
Review of Caro’s standard internal QA/QC procedures indicated acceptable reproducibility of laboratory
results.
The analytical results were considered to be reliable.
Internal Ref: 662036 March 13, 2019
2
© 2019 SNC-Lavalin Inc. All Rights Reserved. Confidential.
Appendix IV
October 18, 2018 FLNRORD Artesian Well Inspection Report
October 30, 2018 File: 38000-25/CI-KELOWNA
REGISTERED MAIL
CITY OF KELOWNA
City Hall
1435 Water Street
Kelowna, BC
V1Y 1J4
Dear CITY OF KELOWNA:
Re: Glenmore Landfill Well Inspection Notice
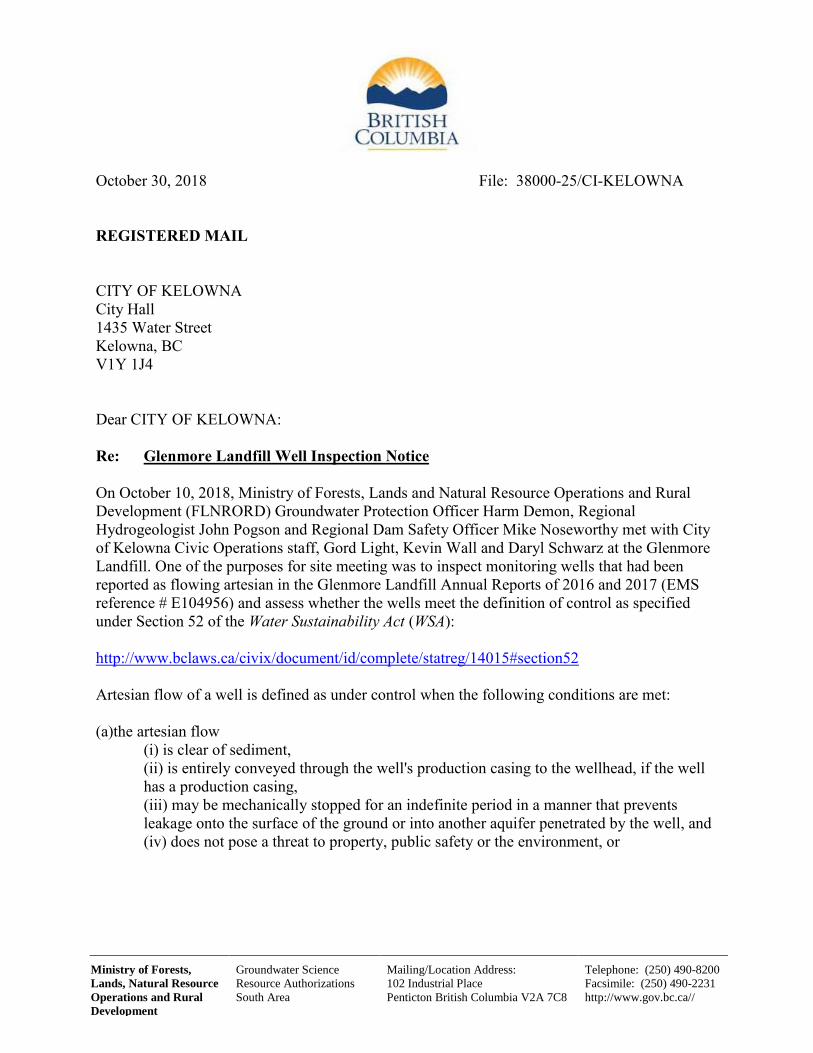
On October 10, 2018, Ministry of Forests, Lands and Natural Resource Operations and Rural
Development (FLNRORD) Groundwater Protection Officer Harm Demon, Regional
Hydrogeologist John Pogson and Regional Dam Safety Officer Mike Noseworthy met with City
of Kelowna Civic Operations staff, Gord Light, Kevin Wall and Daryl Schwarz at the Glenmore
Landfill. One of the purposes for site meeting was to inspect monitoring wells that had been
reported as flowing artesian in the Glenmore Landfill Annual Reports of 2016 and 2017 (EMS
reference # E104956) and assess whether the wells meet the definition of control as specified
under Section 52 of the Water Sustainability Act (WSA):
http://www.bclaws.ca/civix/document/id/complete/statreg/14015#section52
Artesian flow of a well is defined as under control when the following conditions are met:
(a)the artesian flow
(i) is clear of sediment,
(ii) is entirely conveyed through the well's production casing to the wellhead, if the well
has a production casing,
(iii) may be mechanically stopped for an indefinite period in a manner that prevents
leakage onto the surface of the ground or into another aquifer penetrated by the well, and
(iv) does not pose a threat to property, public safety or the environment, or
Ministry of Forests,
Lands, Natural Resource
Operations and Rural
Development
Groundwater Science
Resource Authorizations
South Area
Mailing/Location Address:
102 Industrial Place
Penticton British Columbia V2A 7C8
Telephone: (250) 490-8200
Facsimile: (250) 490-2231
http://www.gov.bc.ca//
File: 38000-25/CI-KELOWNA Date: October 30, 2018
Ministry of Forests,
Lands, Natural Resource
Operations and Rural
Development
Groundwater Science
Resource Authorizations
South Area
Mailing/Location Address:
102 Industrial Place
Penticton British Columbia V2A 7C8
Telephone: (250) 490-8200
Facsimile: (250) 490-2231
http://www.gov.bc.ca//
- 2 -
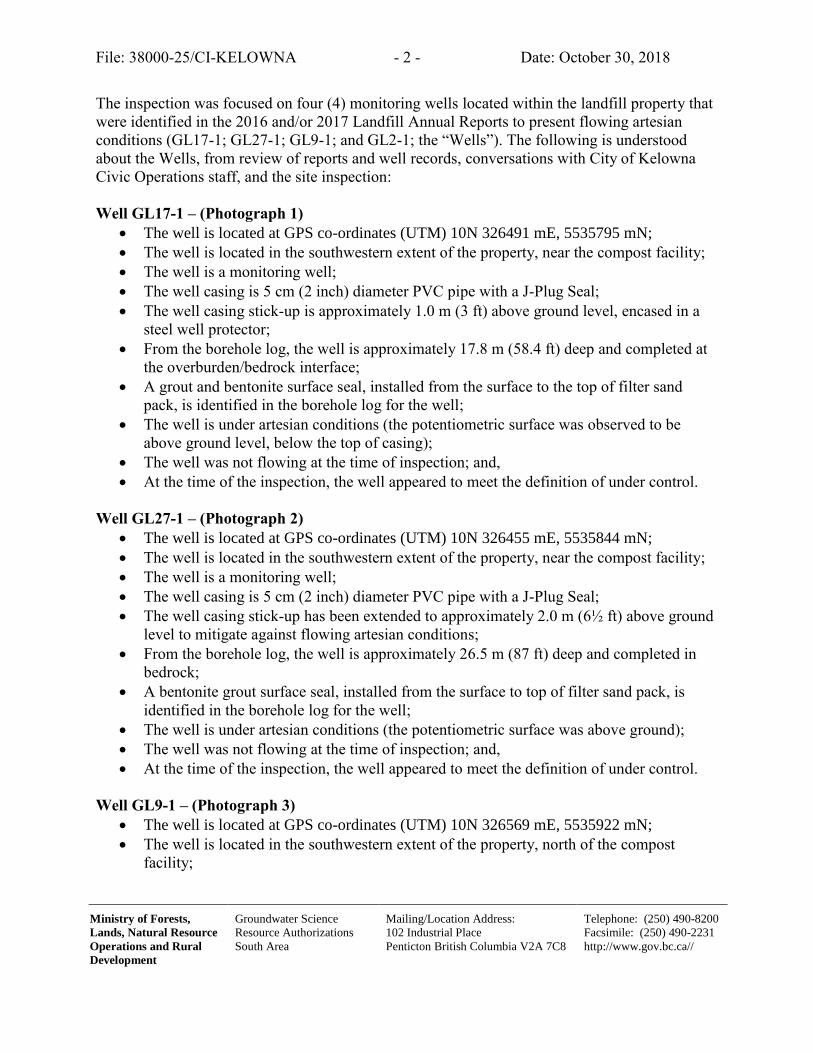
The inspection was focused on four (4) monitoring wells located within the landfill property that
were identified in the 2016 and/or 2017 Landfill Annual Reports to present flowing artesian
conditions (GL17-1; GL27-1; GL9-1; and GL2-1; the “Wells”). The following is understood
about the Wells, from review of reports and well records, conversations with City of Kelowna
Civic Operations staff, and the site inspection:
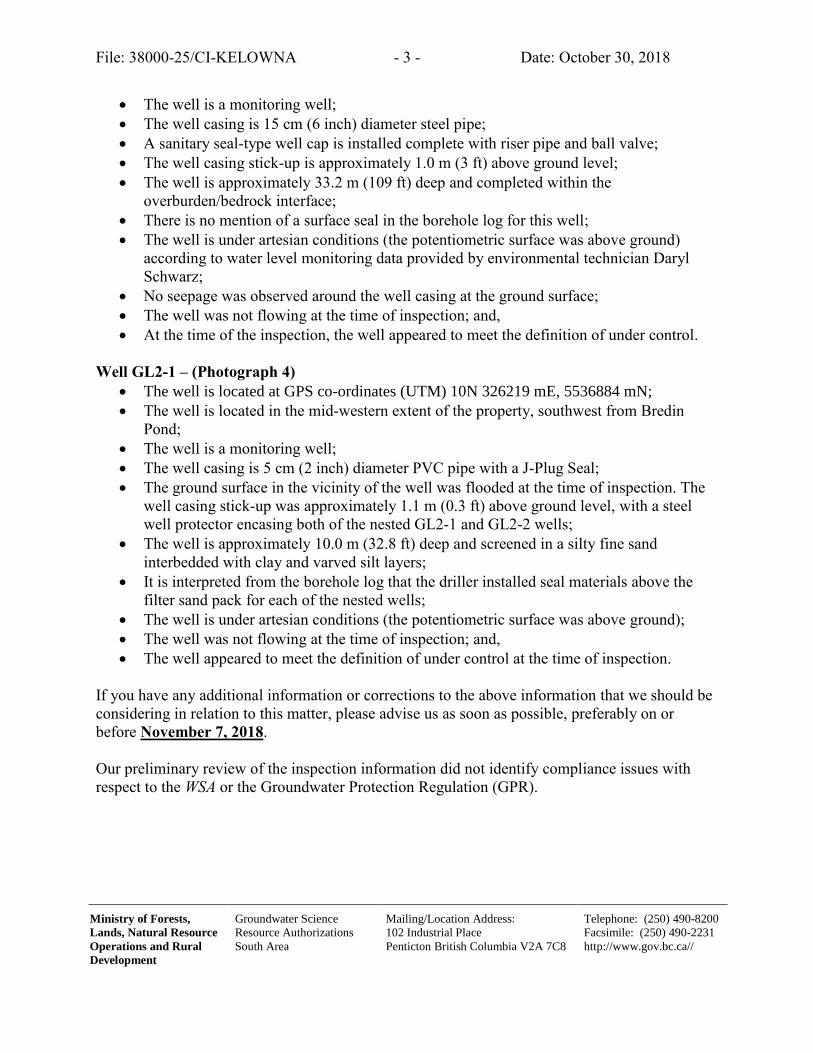
Well GL17-1 – (Photograph 1)
• The well is located at GPS co-ordinates (UTM) 10N 326491 mE, 5535795 mN;
• The well is located in the southwestern extent of the property, near the compost facility;
• The well is a monitoring well;
• The well casing is 5 cm (2 inch) diameter PVC pipe with a J-Plug Seal;
• The well casing stick-up is approximately 1.0 m (3 ft) above ground level, encased in a
steel well protector;
• From the borehole log, the well is approximately 17.8 m (58.4 ft) deep and completed at
the overburden/bedrock interface;
• A grout and bentonite surface seal, installed from the surface to the top of filter sand
pack, is identified in the borehole log for the well;
• The well is under artesian conditions (the potentiometric surface was observed to be
above ground level, below the top of casing);
• The well was not flowing at the time of inspection; and,
• At the time of the inspection, the well appeared to meet the definition of under control.
Well GL27-1 – (Photograph 2)
• The well is located at GPS co-ordinates (UTM) 10N 326455 mE, 5535844 mN;
• The well is located in the southwestern extent of the property, near the compost facility;
• The well is a monitoring well;
• The well casing is 5 cm (2 inch) diameter PVC pipe with a J-Plug Seal;
• The well casing stick-up has been extended to approximately 2.0 m (6½ ft) above ground
level to mitigate against flowing artesian conditions;
• From the borehole log, the well is approximately 26.5 m (87 ft) deep and completed in
bedrock;
• A bentonite grout surface seal, installed from the surface to top of filter sand pack, is
identified in the borehole log for the well;
• The well is under artesian conditions (the potentiometric surface was above ground);
• The well was not flowing at the time of inspection; and,
• At the time of the inspection, the well appeared to meet the definition of under control.
Well GL9-1 – (Photograph 3)
• The well is located at GPS co-ordinates (UTM) 10N 326569 mE, 5535922 mN;
• The well is located in the southwestern extent of the property, north of the compost
facility;
File: 38000-25/CI-KELOWNA Date: October 30, 2018
Ministry of Forests,
Lands, Natural Resource
Operations and Rural
Development
Groundwater Science
Resource Authorizations
South Area
Mailing/Location Address:
102 Industrial Place
Penticton British Columbia V2A 7C8
Telephone: (250) 490-8200
Facsimile: (250) 490-2231
http://www.gov.bc.ca//
- 3 -
• The well is a monitoring well;
• The well casing is 15 cm (6 inch) diameter steel pipe;
• A sanitary seal-type well cap is installed complete with riser pipe and ball valve;
• The well casing stick-up is approximately 1.0 m (3 ft) above ground level;
• The well is approximately 33.2 m (109 ft) deep and completed within the
overburden/bedrock interface;
• There is no mention of a surface seal in the borehole log for this well;
• The well is under artesian conditions (the potentiometric surface was above ground)
according to water level monitoring data provided by environmental technician Daryl
Schwarz;
• No seepage was observed around the well casing at the ground surface;
• The well was not flowing at the time of inspection; and,
• At the time of the inspection, the well appeared to meet the definition of under control.
Well GL2-1 – (Photograph 4)
• The well is located at GPS co-ordinates (UTM) 10N 326219 mE, 5536884 mN;
• The well is located in the mid-western extent of the property, southwest from Bredin
Pond;
• The well is a monitoring well;
• The well casing is 5 cm (2 inch) diameter PVC pipe with a J-Plug Seal;
• The ground surface in the vicinity of the well was flooded at the time of inspection. The
well casing stick-up was approximately 1.1 m (0.3 ft) above ground level, with a steel
well protector encasing both of the nested GL2-1 and GL2-2 wells;
• The well is approximately 10.0 m (32.8 ft) deep and screened in a silty fine sand
interbedded with clay and varved silt layers;
• It is interpreted from the borehole log that the driller installed seal materials above the
filter sand pack for each of the nested wells;
• The well is under artesian conditions (the potentiometric surface was above ground);
• The well was not flowing at the time of inspection; and,
• The well appeared to meet the definition of under control at the time of inspection.
If you have any additional information or corrections to the above information that we should be
considering in relation to this matter, please advise us as soon as possible, preferably on or
before November 7, 2018.
Our preliminary review of the inspection information did not identify compliance issues with
respect to the WSA or the Groundwater Protection Regulation (GPR).
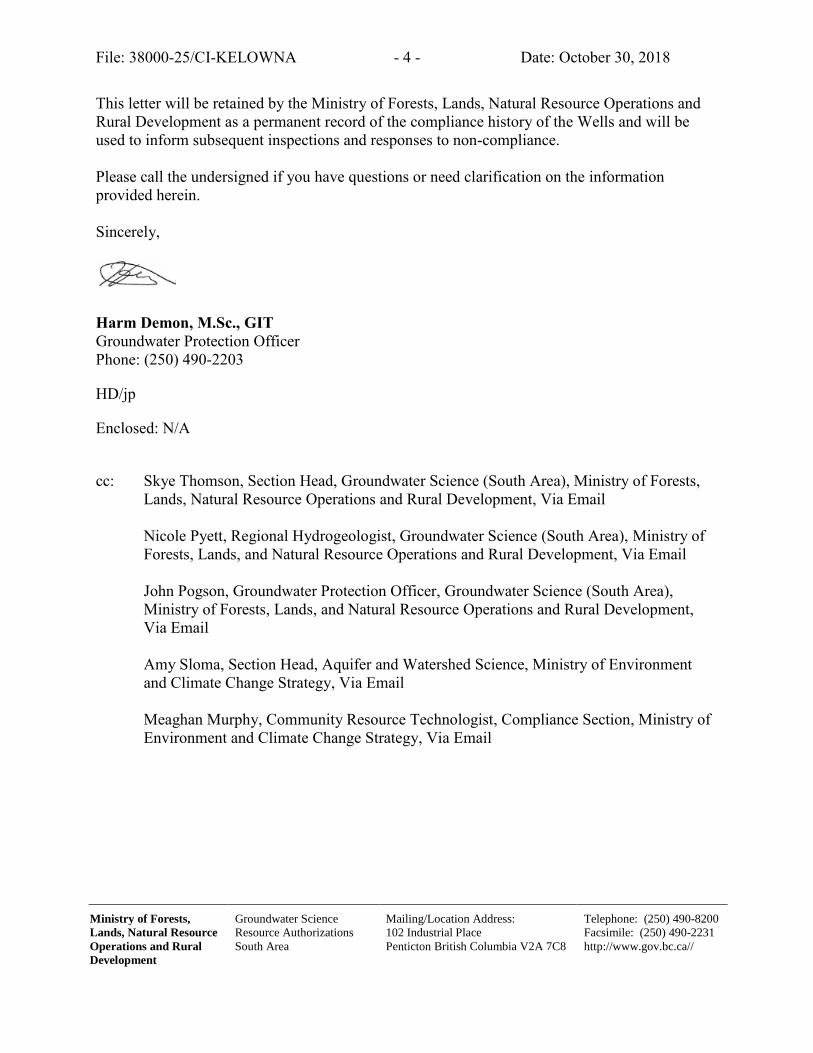
File: 38000-25/CI-KELOWNA Date: October 30, 2018
Ministry of Forests,
Lands, Natural Resource
Operations and Rural
Development
Groundwater Science
Resource Authorizations
South Area
Mailing/Location Address:
102 Industrial Place
Penticton British Columbia V2A 7C8
Telephone: (250) 490-8200
Facsimile: (250) 490-2231
http://www.gov.bc.ca//
- 4 -
This letter will be retained by the Ministry of Forests, Lands, Natural Resource Operations and
Rural Development as a permanent record of the compliance history of the Wells and will be
used to inform subsequent inspections and responses to non-compliance.
Please call the undersigned if you have questions or need clarification on the information
provided herein.
Sincerely,
Harm Demon, M.Sc., GIT
Groundwater Protection Officer
Phone: (250) 490-2203
HD/jp
Enclosed: N/A
cc: Skye Thomson, Section Head, Groundwater Science (South Area), Ministry of Forests,
Lands, Natural Resource Operations and Rural Development, Via Email
Nicole Pyett, Regional Hydrogeologist, Groundwater Science (South Area), Ministry of
Forests, Lands, and Natural Resource Operations and Rural Development, Via Email
John Pogson, Groundwater Protection Officer, Groundwater Science (South Area),
Ministry of Forests, Lands, and Natural Resource Operations and Rural Development,
Via Email
Amy Sloma, Section Head, Aquifer and Watershed Science, Ministry of Environment
and Climate Change Strategy, Via Email
Meaghan Murphy, Community Resource Technologist, Compliance Section, Ministry of
Environment and Climate Change Strategy, Via Email
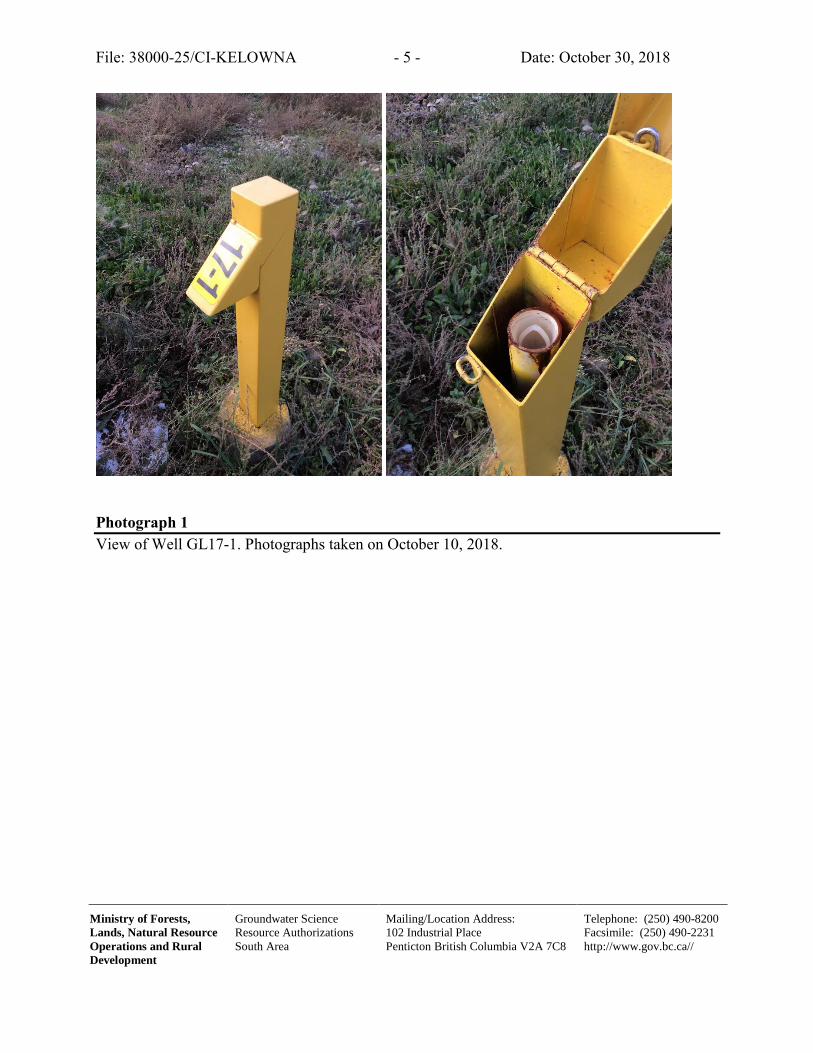
File: 38000-25/CI-KELOWNA Date: October 30, 2018
Ministry of Forests,
Lands, Natural Resource
Operations and Rural
Development
Groundwater Science
Resource Authorizations
South Area
Mailing/Location Address:
102 Industrial Place
Penticton British Columbia V2A 7C8
Telephone: (250) 490-8200
Facsimile: (250) 490-2231
http://www.gov.bc.ca//
- 5 -
Photograph 1
View of Well GL17-1. Photographs taken on October 10, 2018.
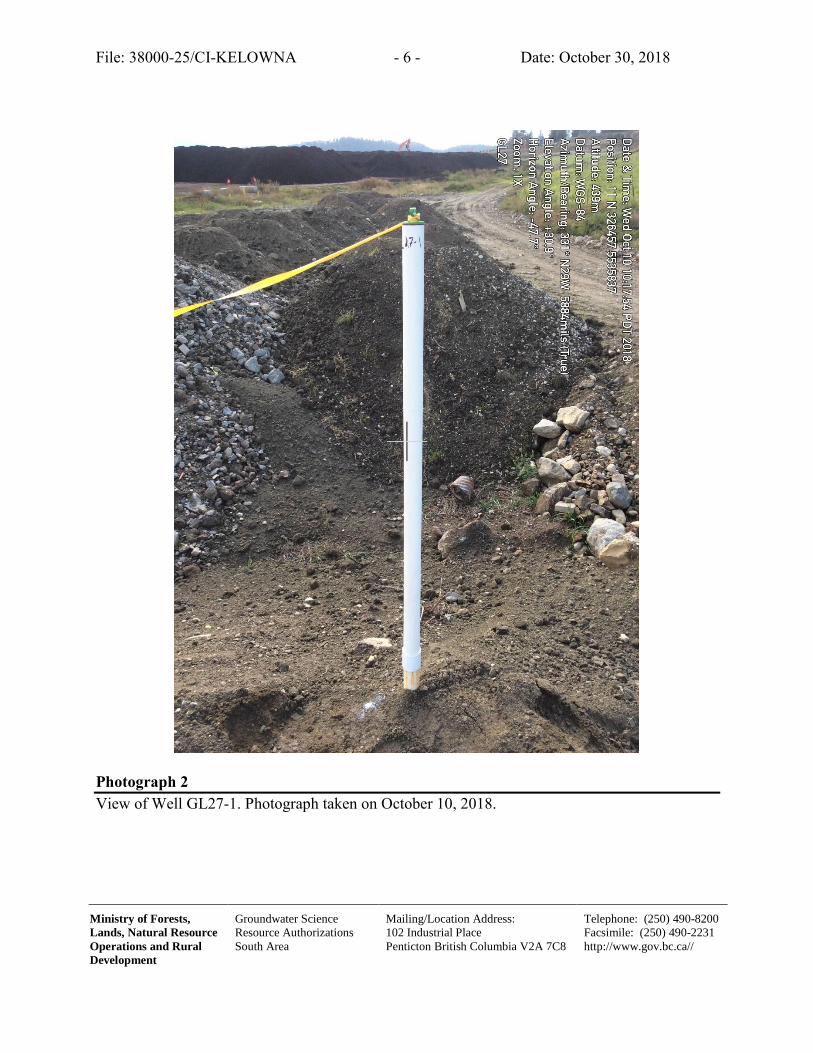
File: 38000-25/CI-KELOWNA Date: October 30, 2018
Ministry of Forests,
Lands, Natural Resource
Operations and Rural
Development
Groundwater Science
Resource Authorizations
South Area
Mailing/Location Address:
102 Industrial Place
Penticton British Columbia V2A 7C8
Telephone: (250) 490-8200
Facsimile: (250) 490-2231
http://www.gov.bc.ca//
- 6 -
Photograph 2
View of Well GL27-1. Photograph taken on October 10, 2018.
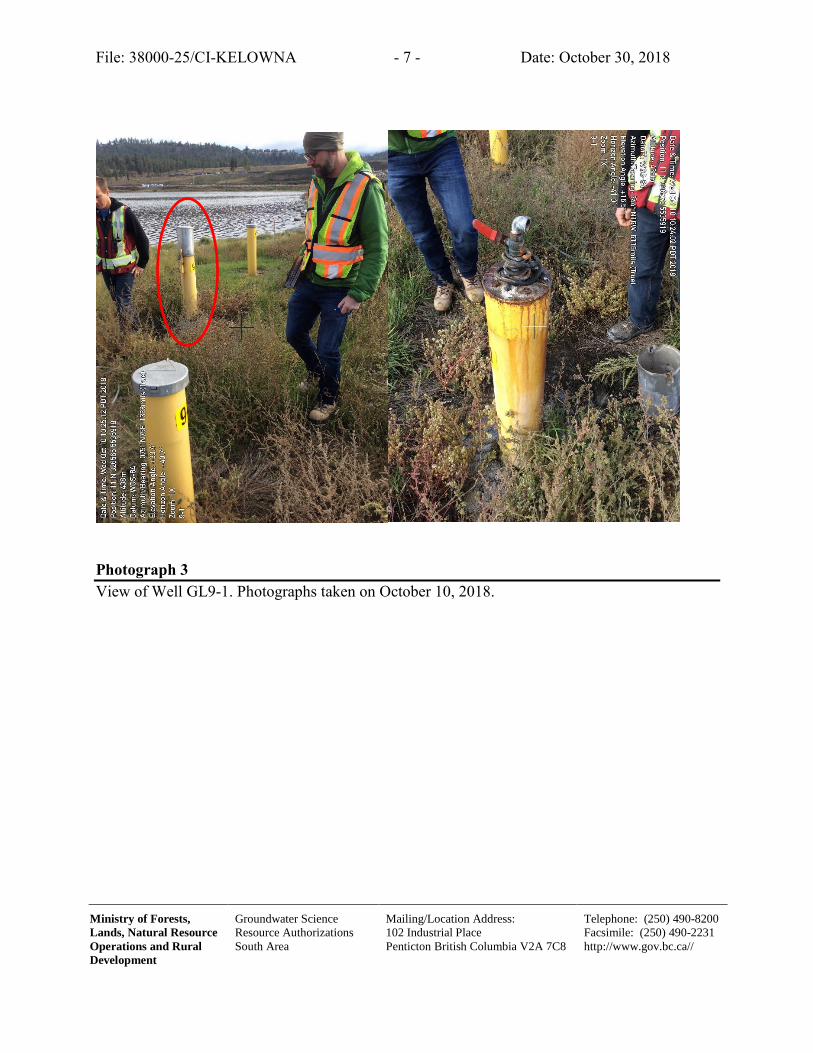
File: 38000-25/CI-KELOWNA Date: October 30, 2018
Ministry of Forests,
Lands, Natural Resource
Operations and Rural
Development
Groundwater Science
Resource Authorizations
South Area
Mailing/Location Address:
102 Industrial Place
Penticton British Columbia V2A 7C8
Telephone: (250) 490-8200
Facsimile: (250) 490-2231
http://www.gov.bc.ca//
- 7 -
Photograph 3
View of Well GL9-1. Photographs taken on October 10, 2018.
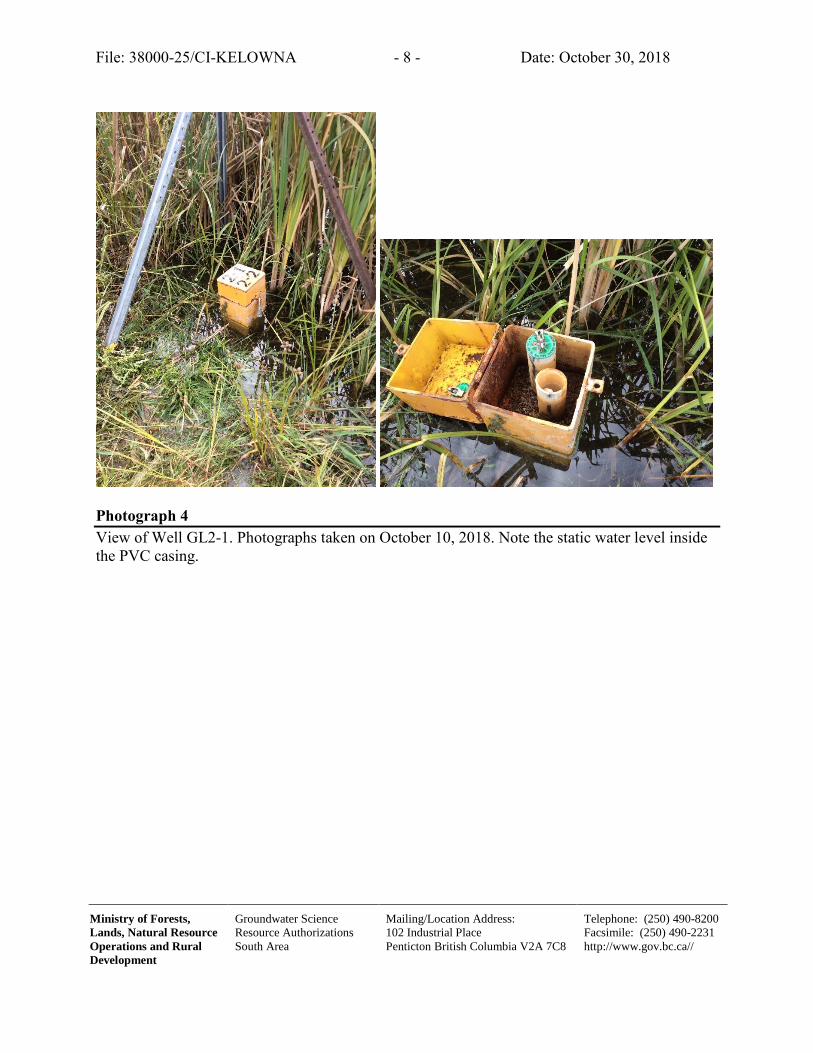
File: 38000-25/CI-KELOWNA Date: October 30, 2018
Ministry of Forests,
Lands, Natural Resource
Operations and Rural
Development
Groundwater Science
Resource Authorizations
South Area
Mailing/Location Address:
102 Industrial Place
Penticton British Columbia V2A 7C8
Telephone: (250) 490-8200
Facsimile: (250) 490-2231
http://www.gov.bc.ca//
- 8 -
Photograph 4
View of Well GL2-1. Photographs taken on October 10, 2018. Note the static water level inside
the PVC casing.

Appendix V
Monitoring Data
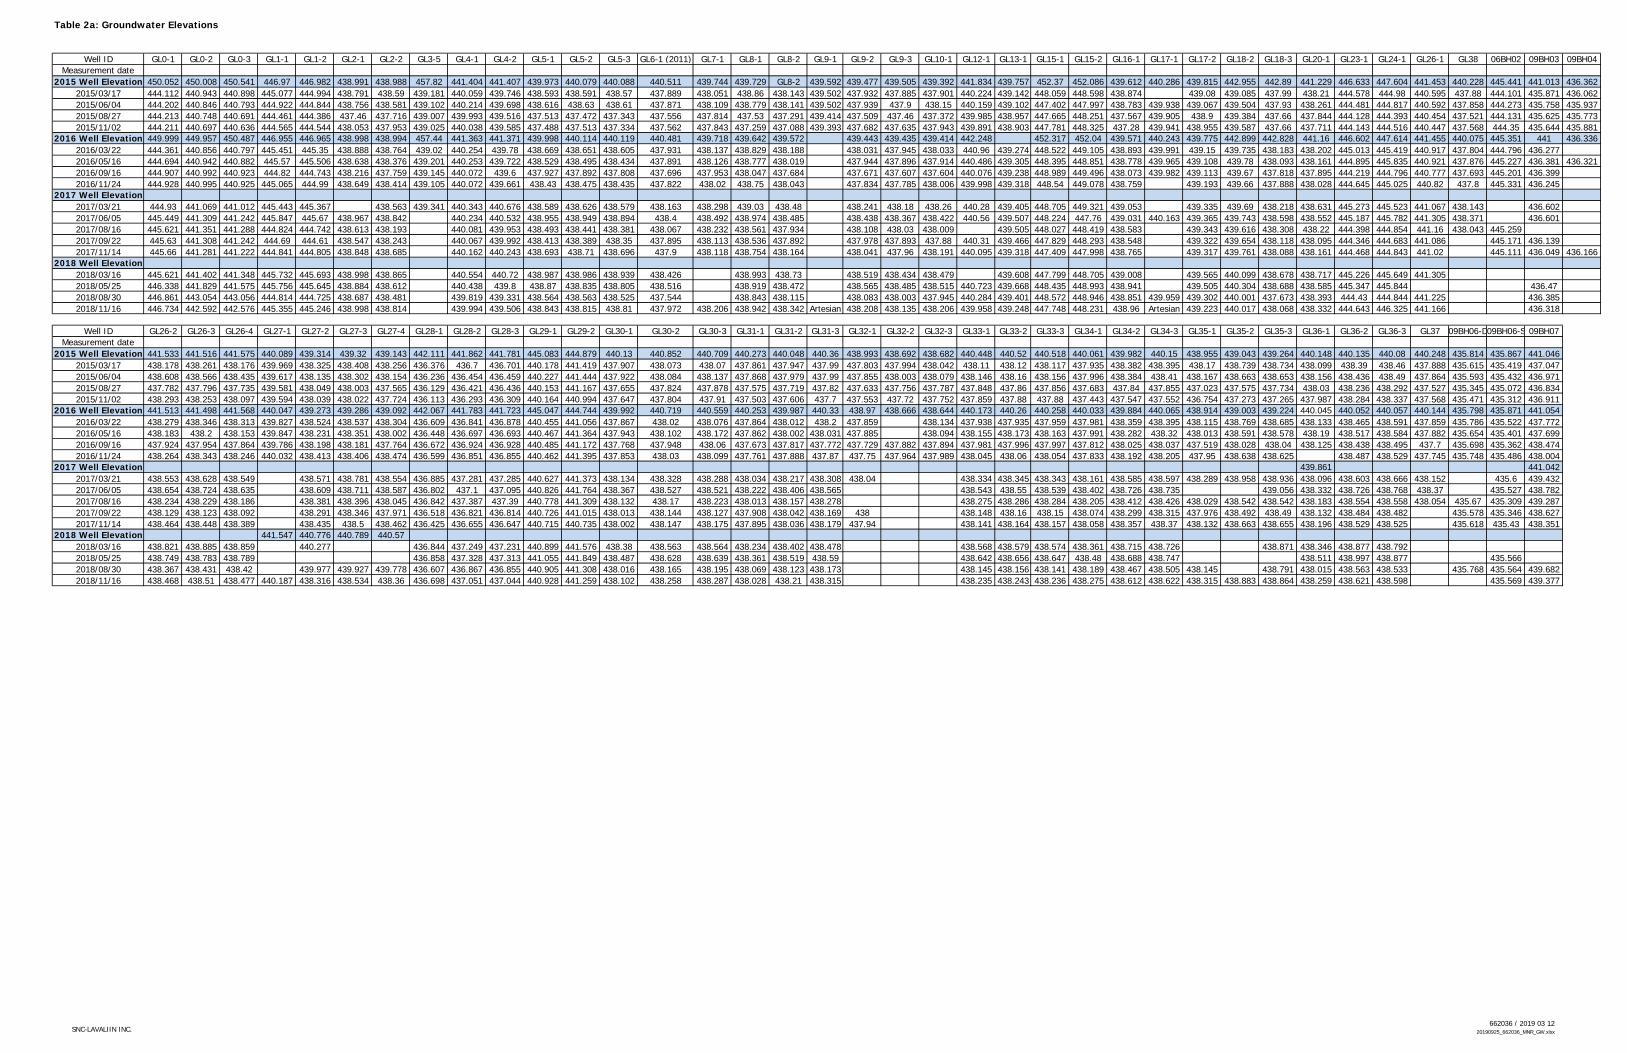
SNC-LAVALIIN INC. 662036 / 2019 03 12
20190925_662036_MNR_GW.xlsx
Table 2a: Groundwater Elevations
Well ID GL0-1 GL0-2 GL0-3 GL1-1 GL1-2 GL2-1 GL2-2 GL3-5 GL4-1 GL4-2 GL5-1 GL5-2 GL5-3 GL6-1 (2011) GL7-1 GL8-1 GL8-2 GL9-1 GL9-2 GL9-3 GL10-1 GL12-1 GL13-1 GL15-1 GL15-2 GL16-1 GL17-1 GL17-2 GL18-2 GL18-3 GL20-1 GL23-1 GL24-1 GL26-1 GL38 06BH02 09BH03 09BH04Measurement date
2015 Well Elevation 450.052 450.008 450.541 446.97 446.982 438.991 438.988 457.82 441.404 441.407 439.973 440.079 440.088 440.511 439.744 439.729 GL8-2 439.592 439.477 439.505 439.392 441.834 439.757 452.37 452.086 439.612 440.286 439.815 442.955 442.89 441.229 446.633 447.604 441.453 440.228 445.441 441.013 436.3622015/03/17 444.112 440.943 440.898 445.077 444.994 438.791 438.59 439.181 440.059 439.746 438.593 438.591 438.57 437.889 438.051 438.86 438.143 439.502 437.932 437.885 437.901 440.224 439.142 448.059 448.598 438.874 439.08 439.085 437.99 438.21 444.578 444.98 440.595 437.88 444.101 435.871 436.0622015/06/04 444.202 440.846 440.793 444.922 444.844 438.756 438.581 439.102 440.214 439.698 438.616 438.63 438.61 437.871 438.109 438.779 438.141 439.502 437.939 437.9 438.15 440.159 439.102 447.402 447.997 438.783 439.938 439.067 439.504 437.93 438.261 444.481 444.817 440.592 437.858 444.273 435.758 435.9372015/08/27 444.213 440.748 440.691 444.461 444.386 437.46 437.716 439.007 439.993 439.516 437.513 437.472 437.343 437.556 437.814 437.53 437.291 439.414 437.509 437.46 437.372 439.985 438.957 447.665 448.251 437.567 439.905 438.9 439.384 437.66 437.844 444.128 444.393 440.454 437.521 444.131 435.625 435.7732015/11/02 444.211 440.697 440.636 444.565 444.544 438.053 437.953 439.025 440.038 439.585 437.488 437.513 437.334 437.562 437.843 437.259 437.088 439.393 437.682 437.635 437.943 439.891 438.903 447.781 448.325 437.28 439.941 438.955 439.587 437.66 437.711 444.143 444.516 440.447 437.568 444.35 435.644 435.881
2016 Well Elevation 449.999 449.957 450.487 446.955 446.965 438.998 438.994 457.44 441.363 441.371 439.998 440.114 440.119 440.481 439.718 439.642 439.572 439.443 439.435 439.414 442.248 452.317 452.04 439.571 440.243 439.775 442.899 442.828 441.16 446.602 447.614 441.455 440.075 445.351 441 436.3362016/03/22 444.361 440.856 440.797 445.451 445.35 438.888 438.764 439.02 440.254 439.78 438.669 438.651 438.605 437.931 438.137 438.829 438.188 438.031 437.945 438.033 440.96 439.274 448.522 449.105 438.893 439.991 439.15 439.735 438.183 438.202 445.013 445.419 440.917 437.804 444.796 436.2772016/05/16 444.694 440.942 440.882 445.57 445.506 438.638 438.376 439.201 440.253 439.722 438.529 438.495 438.434 437.891 438.126 438.777 438.019 437.944 437.896 437.914 440.486 439.305 448.395 448.851 438.778 439.965 439.108 439.78 438.093 438.161 444.895 445.835 440.921 437.876 445.227 436.381 436.3212016/09/16 444.907 440.992 440.923 444.82 444.743 438.216 437.759 439.145 440.072 439.6 437.927 437.892 437.808 437.696 437.953 438.047 437.684 437.671 437.607 437.604 440.076 439.238 448.989 449.496 438.073 439.982 439.113 439.67 437.818 437.895 444.219 444.796 440.777 437.693 445.201 436.3992016/11/24 444.928 440.995 440.925 445.065 444.99 438.649 438.414 439.105 440.072 439.661 438.43 438.475 438.435 437.822 438.02 438.75 438.043 437.834 437.785 438.006 439.998 439.318 448.54 449.078 438.759 439.193 439.66 437.888 438.028 444.645 445.025 440.82 437.8 445.331 436.245
2017 Well Elevation2017/03/21 444.93 441.069 441.012 445.443 445.367 438.563 439.341 440.343 440.676 438.589 438.626 438.579 438.163 438.298 439.03 438.48 438.241 438.18 438.26 440.28 439.405 448.705 449.321 439.053 439.335 439.69 438.218 438.631 445.273 445.523 441.067 438.143 436.6022017/06/05 445.449 441.309 441.242 445.847 445.67 438.967 438.842 440.234 440.532 438.955 438.949 438.894 438.4 438.492 438.974 438.485 438.438 438.367 438.422 440.56 439.507 448.224 447.76 439.031 440.163 439.365 439.743 438.598 438.552 445.187 445.782 441.305 438.371 436.6012017/08/16 445.621 441.351 441.288 444.824 444.742 438.613 438.193 440.081 439.953 438.493 438.441 438.381 438.067 438.232 438.561 437.934 438.108 438.03 438.009 439.505 448.027 448.419 438.583 439.343 439.616 438.308 438.22 444.398 444.854 441.16 438.043 445.2592017/09/22 445.63 441.308 441.242 444.69 444.61 438.547 438.243 440.067 439.992 438.413 438.389 438.35 437.895 438.113 438.536 437.892 437.978 437.893 437.88 440.31 439.466 447.829 448.293 438.548 439.322 439.654 438.118 438.095 444.346 444.683 441.086 445.171 436.1392017/11/14 445.66 441.281 441.222 444.841 444.805 438.848 438.685 440.162 440.243 438.693 438.71 438.696 437.9 438.118 438.754 438.164 438.041 437.96 438.191 440.095 439.318 447.409 447.998 438.765 439.317 439.761 438.088 438.161 444.468 444.843 441.02 445.111 436.049 436.166
2018 Well Elevation2018/03/16 445.621 441.402 441.348 445.732 445.693 438.998 438.865 440.554 440.72 438.987 438.986 438.939 438.426 438.993 438.73 438.519 438.434 438.479 439.608 447.799 448.705 439.008 439.565 440.099 438.678 438.717 445.226 445.649 441.3052018/05/25 446.338 441.829 441.575 445.756 445.645 438.884 438.612 440.438 439.8 438.87 438.835 438.805 438.516 438.919 438.472 438.565 438.485 438.515 440.723 439.668 448.435 448.993 438.941 439.505 440.304 438.688 438.585 445.347 445.844 436.472018/08/30 446.861 443.054 443.056 444.814 444.725 438.687 438.481 439.819 439.331 438.564 438.563 438.525 437.544 438.843 438.115 438.083 438.003 437.945 440.284 439.401 448.572 448.946 438.851 439.959 439.302 440.001 437.673 438.393 444.43 444.844 441.225 436.3852018/11/16 446.734 442.592 442.576 445.355 445.246 438.998 438.814 439.994 439.506 438.843 438.815 438.81 437.972 438.206 438.942 438.342 Artesian 438.208 438.135 438.206 439.958 439.248 447.748 448.231 438.96 Artesian 439.223 440.017 438.068 438.332 444.643 446.325 441.166 436.318
Well ID GL26-2 GL26-3 GL26-4 GL27-1 GL27-2 GL27-3 GL27-4 GL28-1 GL28-2 GL28-3 GL29-1 GL29-2 GL30-1 GL30-2 GL30-3 GL31-1 GL31-2 GL31-3 GL32-1 GL32-2 GL32-3 GL33-1 GL33-2 GL33-3 GL34-1 GL34-2 GL34-3 GL35-1 GL35-2 GL35-3 GL36-1 GL36-2 GL36-3 GL37 09BH06-D09BH06-S 09BH07Measurement date
2015 Well Elevation 441.533 441.516 441.575 440.089 439.314 439.32 439.143 442.111 441.862 441.781 445.083 444.879 440.13 440.852 440.709 440.273 440.048 440.36 438.993 438.692 438.682 440.448 440.52 440.518 440.061 439.982 440.15 438.955 439.043 439.264 440.148 440.135 440.08 440.248 435.814 435.867 441.0462015/03/17 438.178 438.261 438.176 439.969 438.325 438.408 438.256 436.376 436.7 436.701 440.178 441.419 437.907 438.073 438.07 437.861 437.947 437.99 437.803 437.994 438.042 438.11 438.12 438.117 437.935 438.382 438.395 438.17 438.739 438.734 438.099 438.39 438.46 437.888 435.615 435.419 437.0472015/06/04 438.608 438.566 438.435 439.617 438.135 438.302 438.154 436.236 436.454 436.459 440.227 441.444 437.922 438.084 438.137 437.868 437.979 437.99 437.855 438.003 438.079 438.146 438.16 438.156 437.996 438.384 438.41 438.167 438.663 438.653 438.156 438.436 438.49 437.864 435.593 435.432 436.9712015/08/27 437.782 437.796 437.735 439.581 438.049 438.003 437.565 436.129 436.421 436.436 440.153 441.167 437.655 437.824 437.878 437.575 437.719 437.82 437.633 437.756 437.787 437.848 437.86 437.856 437.683 437.84 437.855 437.023 437.575 437.734 438.03 438.236 438.292 437.527 435.345 435.072 436.8342015/11/02 438.293 438.253 438.097 439.594 438.039 438.022 437.724 436.113 436.293 436.309 440.164 440.994 437.647 437.804 437.91 437.503 437.606 437.7 437.553 437.72 437.752 437.859 437.88 437.88 437.443 437.547 437.552 436.754 437.273 437.265 437.987 438.284 438.337 437.568 435.471 435.312 436.911
2016 Well Elevation 441.513 441.498 441.568 440.047 439.273 439.286 439.092 442.067 441.783 441.723 445.047 444.744 439.992 440.719 440.559 440.253 439.987 440.33 438.97 438.666 438.644 440.173 440.26 440.258 440.033 439.884 440.065 438.914 439.003 439.224 440.045 440.052 440.057 440.144 435.798 435.871 441.0542016/03/22 438.279 438.346 438.313 439.827 438.524 438.537 438.304 436.609 436.841 436.878 440.455 441.056 437.867 438.02 438.076 437.864 438.012 438.2 437.859 438.134 437.938 437.935 437.959 437.981 438.359 438.395 438.115 438.769 438.685 438.133 438.465 438.591 437.859 435.786 435.522 437.7722016/05/16 438.183 438.2 438.153 439.847 438.231 438.351 438.002 436.448 436.697 436.693 440.467 441.364 437.943 438.102 438.172 437.862 438.002 438.031 437.885 438.094 438.155 438.173 438.163 437.991 438.282 438.32 438.013 438.591 438.578 438.19 438.517 438.584 437.882 435.654 435.401 437.6992016/09/16 437.924 437.954 437.864 439.786 438.198 438.181 437.764 436.672 436.924 436.928 440.485 441.172 437.768 437.948 438.06 437.673 437.817 437.772 437.729 437.882 437.894 437.981 437.996 437.997 437.812 438.025 438.037 437.519 438.028 438.04 438.125 438.438 438.495 437.7 435.698 435.362 438.4742016/11/24 438.264 438.343 438.246 440.032 438.413 438.406 438.474 436.599 436.851 436.855 440.462 441.395 437.853 438.03 438.099 437.761 437.888 437.87 437.75 437.964 437.989 438.045 438.06 438.054 437.833 438.192 438.205 437.95 438.638 438.625 438.487 438.529 437.745 435.748 435.486 438.004
2017 Well Elevation 439.861 441.0422017/03/21 438.553 438.628 438.549 438.571 438.781 438.554 436.885 437.281 437.285 440.627 441.373 438.134 438.328 438.288 438.034 438.217 438.308 438.04 438.334 438.345 438.343 438.161 438.585 438.597 438.289 438.958 438.936 438.096 438.603 438.666 438.152 435.6 439.4322017/06/05 438.654 438.724 438.635 438.609 438.711 438.587 436.802 437.1 437.095 440.826 441.764 438.367 438.527 438.521 438.222 438.406 438.565 438.543 438.55 438.539 438.402 438.726 438.735 439.056 438.332 438.726 438.768 438.37 435.527 438.7822017/08/16 438.234 438.229 438.186 438.381 438.396 438.045 436.842 437.387 437.39 440.778 441.309 438.132 438.17 438.223 438.013 438.157 438.278 438.275 438.286 438.284 438.205 438.412 438.426 438.029 438.542 438.542 438.183 438.554 438.558 438.054 435.67 435.309 439.2872017/09/22 438.129 438.123 438.092 438.291 438.346 437.971 436.518 436.821 436.814 440.726 441.015 438.013 438.144 438.127 437.908 438.042 438.169 438 438.148 438.16 438.15 438.074 438.299 438.315 437.976 438.492 438.49 438.132 438.484 438.482 435.578 435.346 438.6272017/11/14 438.464 438.448 438.389 438.435 438.5 438.462 436.425 436.655 436.647 440.715 440.735 438.002 438.147 438.175 437.895 438.036 438.179 437.94 438.141 438.164 438.157 438.058 438.357 438.37 438.132 438.663 438.655 438.196 438.529 438.525 435.618 435.43 438.351
2018 Well Elevation 441.547 440.776 440.789 440.572018/03/16 438.821 438.885 438.859 440.277 436.844 437.249 437.231 440.899 441.576 438.38 438.563 438.564 438.234 438.402 438.478 438.568 438.579 438.574 438.361 438.715 438.726 438.871 438.346 438.877 438.7922018/05/25 438.749 438.783 438.789 436.858 437.328 437.313 441.055 441.849 438.487 438.628 438.639 438.361 438.519 438.59 438.642 438.656 438.647 438.48 438.688 438.747 438.511 438.997 438.877 435.5662018/08/30 438.367 438.431 438.42 439.977 439.927 439.778 436.607 436.867 436.855 440.905 441.308 438.016 438.165 438.195 438.069 438.123 438.173 438.145 438.156 438.141 438.189 438.467 438.505 438.145 438.791 438.015 438.563 438.533 435.768 435.564 439.6822018/11/16 438.468 438.51 438.477 440.187 438.316 438.534 438.36 436.698 437.051 437.044 440.928 441.259 438.102 438.258 438.287 438.028 438.21 438.315 438.235 438.243 438.236 438.275 438.612 438.622 438.315 438.883 438.864 438.259 438.621 438.598 435.569 439.377
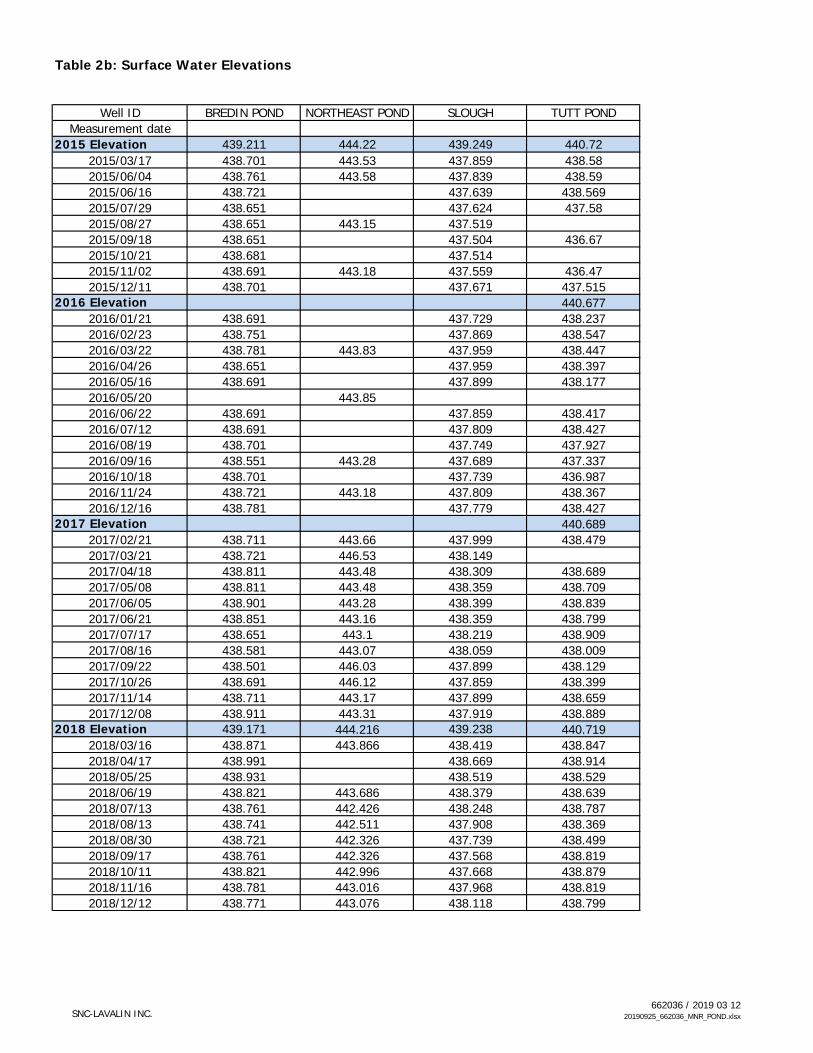
SNC-LAVALIN INC. 662036 / 2019 03 12
20190925_662036_MNR_POND.xlsx
Table 2b: Surface Water Elevations
Well ID BREDIN POND NORTHEAST POND SLOUGH TUTT PONDMeasurement date
2015 Elevation 439.211 444.22 439.249 440.722015/03/17 438.701 443.53 437.859 438.582015/06/04 438.761 443.58 437.839 438.592015/06/16 438.721 437.639 438.5692015/07/29 438.651 437.624 437.582015/08/27 438.651 443.15 437.5192015/09/18 438.651 437.504 436.672015/10/21 438.681 437.5142015/11/02 438.691 443.18 437.559 436.472015/12/11 438.701 437.671 437.515
2016 Elevation 440.6772016/01/21 438.691 437.729 438.2372016/02/23 438.751 437.869 438.5472016/03/22 438.781 443.83 437.959 438.4472016/04/26 438.651 437.959 438.3972016/05/16 438.691 437.899 438.1772016/05/20 443.852016/06/22 438.691 437.859 438.4172016/07/12 438.691 437.809 438.4272016/08/19 438.701 437.749 437.9272016/09/16 438.551 443.28 437.689 437.3372016/10/18 438.701 437.739 436.9872016/11/24 438.721 443.18 437.809 438.3672016/12/16 438.781 437.779 438.427
2017 Elevation 440.6892017/02/21 438.711 443.66 437.999 438.4792017/03/21 438.721 446.53 438.1492017/04/18 438.811 443.48 438.309 438.6892017/05/08 438.811 443.48 438.359 438.7092017/06/05 438.901 443.28 438.399 438.8392017/06/21 438.851 443.16 438.359 438.7992017/07/17 438.651 443.1 438.219 438.9092017/08/16 438.581 443.07 438.059 438.0092017/09/22 438.501 446.03 437.899 438.1292017/10/26 438.691 446.12 437.859 438.3992017/11/14 438.711 443.17 437.899 438.6592017/12/08 438.911 443.31 437.919 438.889
2018 Elevation 439.171 444.216 439.238 440.7192018/03/16 438.871 443.866 438.419 438.8472018/04/17 438.991 438.669 438.9142018/05/25 438.931 438.519 438.5292018/06/19 438.821 443.686 438.379 438.6392018/07/13 438.761 442.426 438.248 438.7872018/08/13 438.741 442.511 437.908 438.3692018/08/30 438.721 442.326 437.739 438.4992018/09/17 438.761 442.326 437.568 438.8192018/10/11 438.821 442.996 437.668 438.8792018/11/16 438.781 443.016 437.968 438.8192018/12/12 438.771 443.076 438.118 438.799
Appendix VI
Tables
3a: Summary of Analytical Results for Groundwater – Inorganics
3b: Summary of Analytical Results for Groundwater – Dissolved Metals
3c: Summary of Analytical Results for Groundwater – Drinking Water Comparison - Inorganics
3d: Summary of Analytical Results for Groundwater – Drinking Water Comparison - Dissolved Metals
4a: Summary of Analytical Results for Surface Water – Inorganics
4b: Summary of Analytical Results for Surface Water – Total Metals
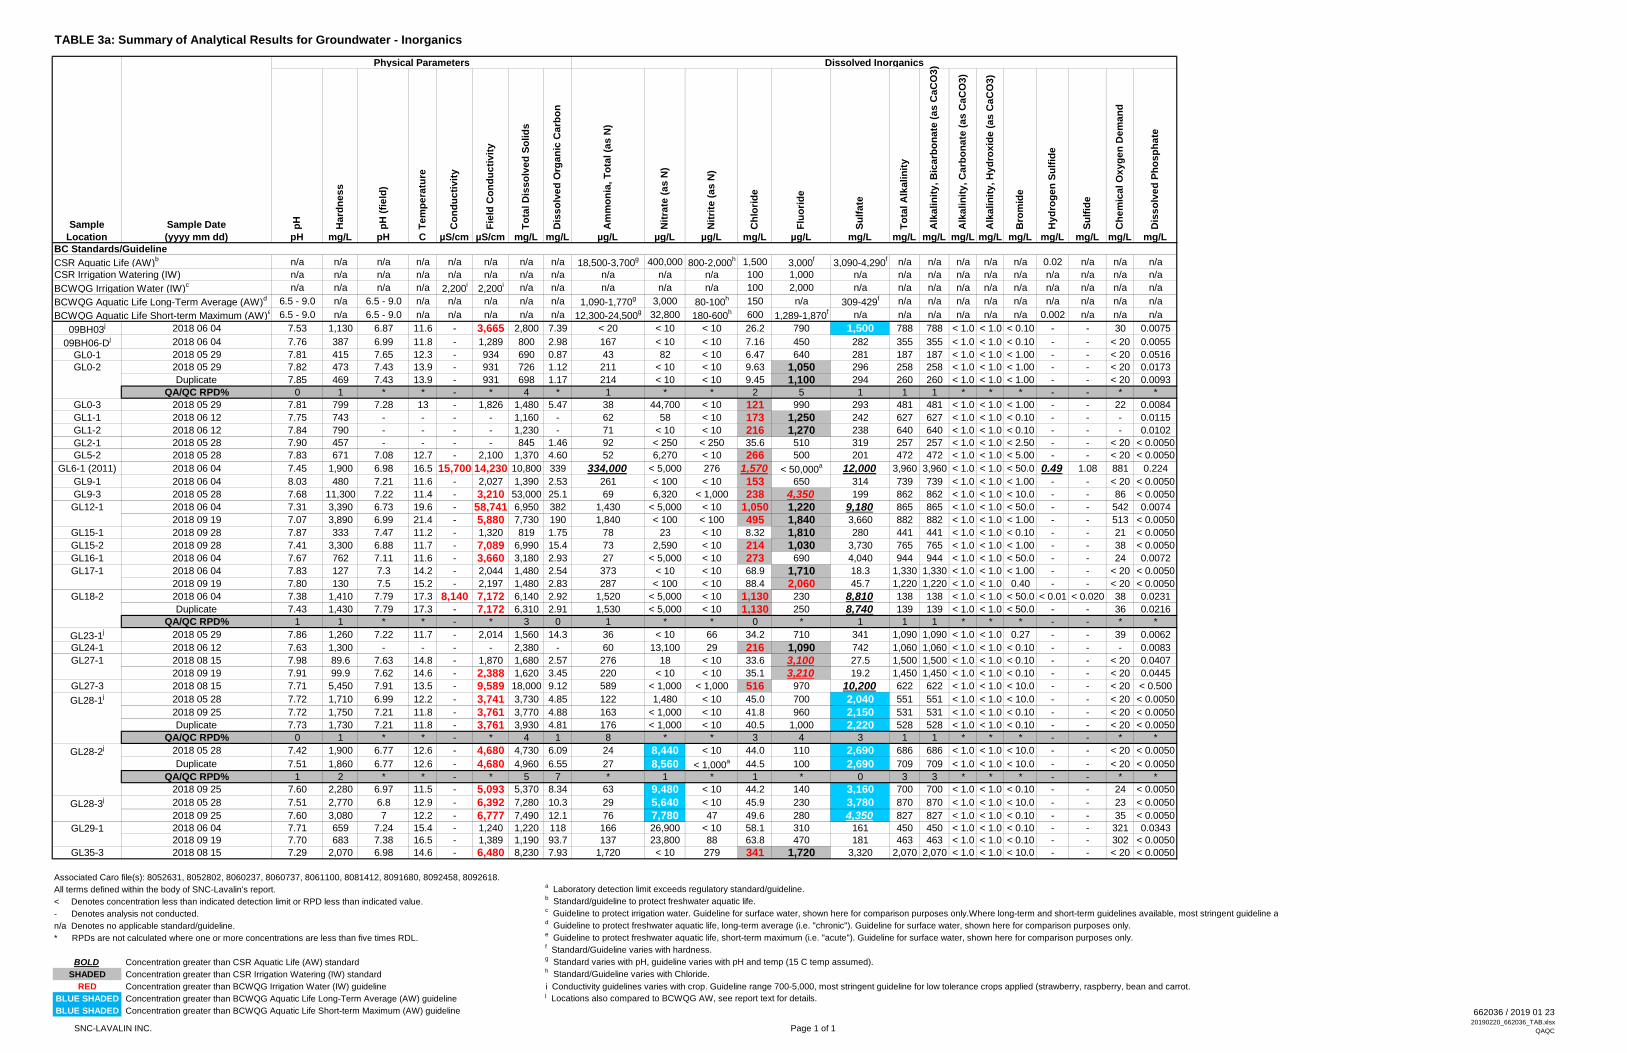
SNC-LAVALIN INC. Page 1 of 1
662036 / 2019 01 2320190220_662036_TAB.xlsx
QAQC
TABLE 3a: Summary of Analytical Results for Groundwater - Inorganics
Physical Parameters Dissolved Inorganics
Sample Sample Date pH
Ha
rdn
es
s
pH
(fi
eld
)
Te
mp
era
ture
Co
nd
uc
tiv
ity
Fie
ld C
on
du
cti
vit
y
To
tal D
iss
olv
ed
So
lid
s
Dis
so
lve
d O
rga
nic
Ca
rbo
n
Am
mo
nia
, T
ota
l (a
s N
)
Nit
rate
(a
s N
)
Nit
rite
(a
s N
)
Ch
lori
de
Flu
ori
de
Su
lfa
te
To
tal A
lka
lin
ity
Alk
alin
ity
, B
ica
rbo
na
te (
as
Ca
CO
3)
Alk
alin
ity
, C
arb
on
ate
(a
s C
aC
O3
)
Alk
alin
ity
, H
yd
rox
ide
(a
s C
aC
O3
)
Bro
mid
e
Hy
dro
ge
n S
ulf
ide
Su
lfid
e
Ch
em
ica
l O
xy
ge
n D
em
an
d
Dis
so
lve
d P
ho
sp
ha
te
Location (yyyy mm dd) pH mg/L pH C µS/cm µS/cm mg/L mg/L µg/L µg/L µg/L mg/L µg/L mg/L mg/L mg/L mg/L mg/L mg/L mg/L mg/L mg/L mg/L
BC Standards/Guideline
CSR Aquatic Life (AW)b n/a n/a n/a n/a n/a n/a n/a n/a 18,500-3,700
g 400,000 800-2,000h 1,500 3,000
f3,090-4,290
f n/a n/a n/a n/a n/a 0.02 n/a n/a n/a
CSR Irrigation Watering (IW) n/a n/a n/a n/a n/a n/a n/a n/a n/a n/a n/a 100 1,000 n/a n/a n/a n/a n/a n/a n/a n/a n/a n/a
BCWQG Irrigation Water (IW)c n/a n/a n/a n/a 2,200
i2,200
i n/a n/a n/a n/a n/a 100 2,000 n/a n/a n/a n/a n/a n/a n/a n/a n/a n/a
BCWQG Aquatic Life Long-Term Average (AW)d 6.5 - 9.0 n/a 6.5 - 9.0 n/a n/a n/a n/a n/a 1,090-1,770
g 3,000 80-100h 150 n/a 309-429
f n/a n/a n/a n/a n/a n/a n/a n/a n/a
BCWQG Aquatic Life Short-term Maximum (AW)e 6.5 - 9.0 n/a 6.5 - 9.0 n/a n/a n/a n/a n/a 12,300-24,500
g 32,800 180-600h 600 1,289-1,870
f n/a n/a n/a n/a n/a n/a 0.002 n/a n/a n/a
09BH03j 2018 06 04 7.53 1,130 6.87 11.6 - 3,665 2,800 7.39 < 20 < 10 < 10 26.2 790 1,500 788 788 < 1.0 < 1.0 < 0.10 - - 30 0.0075
09BH06-Dj 2018 06 04 7.76 387 6.99 11.8 - 1,289 800 2.98 167 < 10 < 10 7.16 450 282 355 355 < 1.0 < 1.0 < 0.10 - - < 20 0.0055
GL0-1 2018 05 29 7.81 415 7.65 12.3 - 934 690 0.87 43 82 < 10 6.47 640 281 187 187 < 1.0 < 1.0 < 1.00 - - < 20 0.0516
GL0-2 2018 05 29 7.82 473 7.43 13.9 - 931 726 1.12 211 < 10 < 10 9.63 1,050 296 258 258 < 1.0 < 1.0 < 1.00 - - < 20 0.0173
Duplicate 7.85 469 7.43 13.9 - 931 698 1.17 214 < 10 < 10 9.45 1,100 294 260 260 < 1.0 < 1.0 < 1.00 - - < 20 0.0093
QA/QC RPD% 0 1 * * - * 4 * 1 * * 2 5 1 1 1 * * * - - * *
GL0-3 2018 05 29 7.81 799 7.28 13 - 1,826 1,480 5.47 38 44,700 < 10 121 990 293 481 481 < 1.0 < 1.0 < 1.00 - - 22 0.0084
GL1-1 2018 06 12 7.75 743 - - - - 1,160 - 62 58 < 10 173 1,250 242 627 627 < 1.0 < 1.0 < 0.10 - - - 0.0115
GL1-2 2018 06 12 7.84 790 - - - - 1,230 - 71 < 10 < 10 216 1,270 238 640 640 < 1.0 < 1.0 < 0.10 - - - 0.0102
GL2-1 2018 05 28 7.90 457 - - - - 845 1.46 92 < 250 < 250 35.6 510 319 257 257 < 1.0 < 1.0 < 2.50 - - < 20 < 0.0050
GL5-2 2018 05 28 7.83 671 7.08 12.7 - 2,100 1,370 4.60 52 6,270 < 10 266 500 201 472 472 < 1.0 < 1.0 < 5.00 - - < 20 < 0.0050
GL6-1 (2011) 2018 06 04 7.45 1,900 6.98 16.5 15,700 14,230 10,800 339 334,000 < 5,000 276 1,570 < 50,000a 12,000 3,960 3,960 < 1.0 < 1.0 < 50.0 0.49 1.08 881 0.224
GL9-1 2018 06 04 8.03 480 7.21 11.6 - 2,027 1,390 2.53 261 < 100 < 10 153 650 314 739 739 < 1.0 < 1.0 < 1.00 - - < 20 < 0.0050
GL9-3 2018 05 28 7.68 11,300 7.22 11.4 - 3,210 53,000 25.1 69 6,320 < 1,000 238 4,350 199 862 862 < 1.0 < 1.0 < 10.0 - - 86 < 0.0050
GL12-1 2018 06 04 7.31 3,390 6.73 19.6 - 58,741 6,950 382 1,430 < 5,000 < 10 1,050 1,220 9,180 865 865 < 1.0 < 1.0 < 50.0 - - 542 0.0074
2018 09 19 7.07 3,890 6.99 21.4 - 5,880 7,730 190 1,840 < 100 < 100 495 1,840 3,660 882 882 < 1.0 < 1.0 < 1.00 - - 513 < 0.0050
GL15-1 2018 09 28 7.87 333 7.47 11.2 - 1,320 819 1.75 78 23 < 10 8.32 1,810 280 441 441 < 1.0 < 1.0 < 0.10 - - 21 < 0.0050
GL15-2 2018 09 28 7.41 3,300 6.88 11.7 - 7,089 6,990 15.4 73 2,590 < 10 214 1,030 3,730 765 765 < 1.0 < 1.0 < 1.00 - - 38 < 0.0050
GL16-1 2018 06 04 7.67 762 7.11 11.6 - 3,660 3,180 2.93 27 < 5,000 < 10 273 690 4,040 944 944 < 1.0 < 1.0 < 50.0 - - 24 0.0072
GL17-1 2018 06 04 7.83 127 7.3 14.2 - 2,044 1,480 2.54 373 < 10 < 10 68.9 1,710 18.3 1,330 1,330 < 1.0 < 1.0 < 1.00 - - < 20 < 0.0050
2018 09 19 7.80 130 7.5 15.2 - 2,197 1,480 2.83 287 < 100 < 10 88.4 2,060 45.7 1,220 1,220 < 1.0 < 1.0 0.40 - - < 20 < 0.0050
GL18-2 2018 06 04 7.38 1,410 7.79 17.3 8,140 7,172 6,140 2.92 1,520 < 5,000 < 10 1,130 230 8,810 138 138 < 1.0 < 1.0 < 50.0 < 0.01 < 0.020 38 0.0231
Duplicate 7.43 1,430 7.79 17.3 - 7,172 6,310 2.91 1,530 < 5,000 < 10 1,130 250 8,740 139 139 < 1.0 < 1.0 < 50.0 - - 36 0.0216
QA/QC RPD% 1 1 * * - * 3 0 1 * * 0 * 1 1 1 * * * - - * *
GL23-1j 2018 05 29 7.86 1,260 7.22 11.7 - 2,014 1,560 14.3 36 < 10 66 34.2 710 341 1,090 1,090 < 1.0 < 1.0 0.27 - - 39 0.0062
GL24-1 2018 06 12 7.63 1,300 - - - - 2,380 - 60 13,100 29 216 1,090 742 1,060 1,060 < 1.0 < 1.0 < 0.10 - - - 0.0083
GL27-1 2018 08 15 7.98 89.6 7.63 14.8 - 1,870 1,680 2.57 276 18 < 10 33.6 3,100 27.5 1,500 1,500 < 1.0 < 1.0 < 0.10 - - < 20 0.0407
2018 09 19 7.91 99.9 7.62 14.6 - 2,388 1,620 3.45 220 < 10 < 10 35.1 3,210 19.2 1,450 1,450 < 1.0 < 1.0 < 0.10 - - < 20 0.0445
GL27-3 2018 08 15 7.71 5,450 7.91 13.5 - 9,589 18,000 9.12 589 < 1,000 < 1,000 516 970 10,200 622 622 < 1.0 < 1.0 < 10.0 - - < 20 < 0.500
GL28-1j 2018 05 28 7.72 1,710 6.99 12.2 - 3,741 3,730 4.85 122 1,480 < 10 45.0 700 2,040 551 551 < 1.0 < 1.0 < 10.0 - - < 20 < 0.0050
2018 09 25 7.72 1,750 7.21 11.8 - 3,761 3,770 4.88 163 < 1,000 < 10 41.8 960 2,150 531 531 < 1.0 < 1.0 < 0.10 - - < 20 < 0.0050
Duplicate 7.73 1,730 7.21 11.8 - 3,761 3,930 4.81 176 < 1,000 < 10 40.5 1,000 2,220 528 528 < 1.0 < 1.0 < 0.10 - - < 20 < 0.0050
QA/QC RPD% 0 1 * * - * 4 1 8 * * 3 4 3 1 1 * * * - - * *
GL28-2j 2018 05 28 7.42 1,900 6.77 12.6 - 4,680 4,730 6.09 24 8,440 < 10 44.0 110 2,690 686 686 < 1.0 < 1.0 < 10.0 - - < 20 < 0.0050
Duplicate 7.51 1,860 6.77 12.6 - 4,680 4,960 6.55 27 8,560 < 1,000a 44.5 100 2,690 709 709 < 1.0 < 1.0 < 10.0 - - < 20 < 0.0050
QA/QC RPD% 1 2 * * - * 5 7 * 1 * 1 * 0 3 3 * * * - - * *
2018 09 25 7.60 2,280 6.97 11.5 - 5,093 5,370 8.34 63 9,480 < 10 44.2 140 3,160 700 700 < 1.0 < 1.0 < 0.10 - - 24 < 0.0050
GL28-3j 2018 05 28 7.51 2,770 6.8 12.9 - 6,392 7,280 10.3 29 5,640 < 10 45.9 230 3,780 870 870 < 1.0 < 1.0 < 10.0 - - 23 < 0.0050
2018 09 25 7.60 3,080 7 12.2 - 6,777 7,490 12.1 76 7,780 47 49.6 280 4,350 827 827 < 1.0 < 1.0 < 0.10 - - 35 < 0.0050
GL29-1 2018 06 04 7.71 659 7.24 15.4 - 1,240 1,220 118 166 26,900 < 10 58.1 310 161 450 450 < 1.0 < 1.0 < 0.10 - - 321 0.0343
2018 09 19 7.70 683 7.38 16.5 - 1,389 1,190 93.7 137 23,800 88 63.8 470 181 463 463 < 1.0 < 1.0 < 0.10 - - 302 < 0.0050
GL35-3 2018 08 15 7.29 2,070 6.98 14.6 - 6,480 8,230 7.93 1,720 < 10 279 341 1,720 3,320 2,070 2,070 < 1.0 < 1.0 < 10.0 - - < 20 < 0.0050
Associated Caro file(s): 8052631, 8052802, 8060237, 8060737, 8061100, 8081412, 8091680, 8092458, 8092618.
All terms defined within the body of SNC-Lavalin's report.a Laboratory detection limit exceeds regulatory standard/guideline.
< Denotes concentration less than indicated detection limit or RPD less than indicated value.b Standard/guideline to protect freshwater aquatic life.
- Denotes analysis not conducted.c Guideline to protect irrigation water. Guideline for surface water, shown here for comparison purposes only.Where long-term and short-term guidelines available, most stringent guideline a
n/a Denotes no applicable standard/guideline.d Guideline to protect freshwater aquatic life, long-term average (i.e. "chronic"). Guideline for surface water, shown here for comparison purposes only.
* RPDs are not calculated where one or more concentrations are less than five times RDL.e Guideline to protect freshwater aquatic life, short-term maximum (i.e. "acute"). Guideline for surface water, shown here for comparison purposes only.
f Standard/Guideline varies with hardness.
BOLD Concentration greater than CSR Aquatic Life (AW) standardg Standard varies with pH, guideline varies with pH and temp (15 C temp assumed).
SHADED Concentration greater than CSR Irrigation Watering (IW) standardh Standard/Guideline varies with Chloride.
RED Concentration greater than BCWQG Irrigation Water (IW) guideline i Conductivity guidelines varies with crop. Guideline range 700-5,000, most stringent guideline for low tolerance crops applied (strawberry, raspberry, bean and carrot.
BLUE SHADED Concentration greater than BCWQG Aquatic Life Long-Term Average (AW) guidelinej Locations also compared to BCWQG AW, see report text for details.
BLUE SHADED Concentration greater than BCWQG Aquatic Life Short-term Maximum (AW) guideline
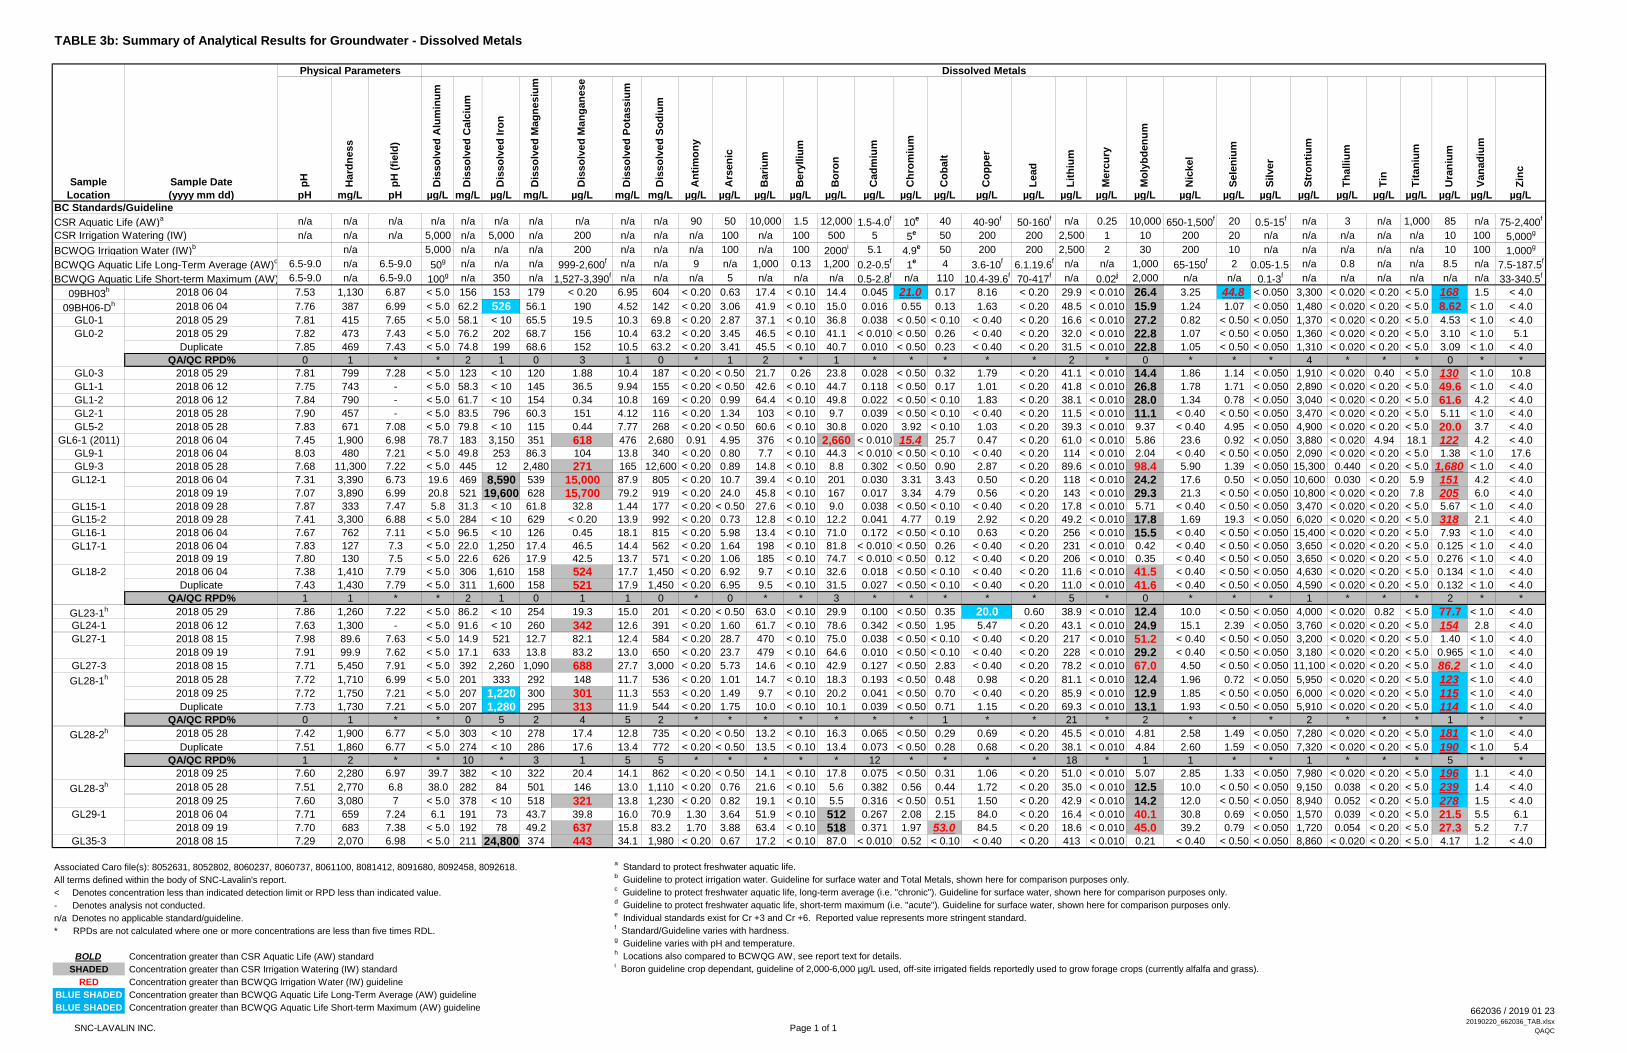
SNC-LAVALIN INC. Page 1 of 1
662036 / 2019 01 2320190220_662036_TAB.xlsx
QAQC
TABLE 3b: Summary of Analytical Results for Groundwater - Dissolved Metals
Physical Parameters Dissolved Metals
Sample Sample Date pH
Hard
ness
pH
(fi
eld
)
Dis
so
lved
Alu
min
um
Dis
so
lved
Calc
ium
Dis
so
lved
Iro
n
Dis
so
lved
Mag
nesiu
m
Dis
so
lved
Man
gan
ese
Dis
so
lved
Po
tassiu
m
Dis
so
lved
So
diu
m
An
tim
on
y
Ars
en
ic
Bari
um
Bery
lliu
m
Bo
ron
Cad
miu
m
Ch
rom
ium
Co
balt
Co
pp
er
Lead
Lit
hiu
m
Merc
ury
Mo
lyb
den
um
Nic
kel
Sele
niu
m
Silver
Str
on
tiu
m
Th
alliu
m
Tin
Tit
an
ium
Ura
niu
m
Van
ad
ium
Zin
c
Location (yyyy mm dd) pH mg/L pH µg/L mg/L µg/L mg/L µg/L mg/L mg/L µg/L µg/L µg/L µg/L µg/L µg/L µg/L µg/L µg/L µg/L µg/L µg/L µg/L µg/L µg/L µg/L µg/L µg/L µg/L µg/L µg/L µg/L µg/L
BC Standards/Guideline
CSR Aquatic Life (AW)a n/a n/a n/a n/a n/a n/a n/a n/a n/a n/a 90 50 10,000 1.5 12,000 1.5-4.0
f10
e 40 40-90f
50-160f n/a 0.25 10,000 650-1,500
f 20 0.5-15f n/a 3 n/a 1,000 85 n/a 75-2,400
f
CSR Irrigation Watering (IW) n/a n/a n/a 5,000 n/a 5,000 n/a 200 n/a n/a n/a 100 n/a 100 500 5 5e 50 200 200 2,500 1 10 200 20 n/a n/a n/a n/a n/a 10 100 5,000
g
BCWQG Irrigation Water (IW)b n/a 5,000 n/a n/a n/a 200 n/a n/a n/a 100 n/a 100 2000
i 5.1 4.9e 50 200 200 2,500 2 30 200 10 n/a n/a n/a n/a n/a 10 100 1,000
g
BCWQG Aquatic Life Long-Term Average (AW)c 6.5-9.0 n/a 6.5-9.0 50
g n/a n/a n/a 999-2,600f n/a n/a 9 n/a 1,000 0.13 1,200 0.2-0.5
f1
e 4 3.6-10f
6.1.19.6f n/a n/a 1,000 65-150
f 2 0.05-1.5f n/a 0.8 n/a n/a 8.5 n/a 7.5-187.5
f
BCWQG Aquatic Life Short-term Maximum (AW) 6.5-9.0 n/a 6.5-9.0 100g n/a 350 n/a 1,527-3,390
f n/a n/a n/a 5 n/a n/a n/a 0.5-2.8f n/a 110 10.4-39.6
f70-417
f n/a 0.02j 2,000 n/a n/a 0.1-3
f n/a n/a n/a n/a n/a n/a 33-340.5f
09BH03h 2018 06 04 7.53 1,130 6.87 < 5.0 156 153 179 < 0.20 6.95 604 < 0.20 0.63 17.4 < 0.10 14.4 0.045 21.0 0.17 8.16 < 0.20 29.9 < 0.010 26.4 3.25 44.8 < 0.050 3,300 < 0.020 < 0.20 < 5.0 168 1.5 < 4.0
09BH06-Dh 2018 06 04 7.76 387 6.99 < 5.0 62.2 526 56.1 190 4.52 142 < 0.20 3.06 41.9 < 0.10 15.0 0.016 0.55 0.13 1.63 < 0.20 48.5 < 0.010 15.9 1.24 1.07 < 0.050 1,480 < 0.020 < 0.20 < 5.0 8.62 < 1.0 < 4.0
GL0-1 2018 05 29 7.81 415 7.65 < 5.0 58.1 < 10 65.5 19.5 10.3 69.8 < 0.20 2.87 37.1 < 0.10 36.8 0.038 < 0.50 < 0.10 < 0.40 < 0.20 16.6 < 0.010 27.2 0.82 < 0.50 < 0.050 1,370 < 0.020 < 0.20 < 5.0 4.53 < 1.0 < 4.0
GL0-2 2018 05 29 7.82 473 7.43 < 5.0 76.2 202 68.7 156 10.4 63.2 < 0.20 3.45 46.5 < 0.10 41.1 < 0.010 < 0.50 0.26 < 0.40 < 0.20 32.0 < 0.010 22.8 1.07 < 0.50 < 0.050 1,360 < 0.020 < 0.20 < 5.0 3.10 < 1.0 5.1
Duplicate 7.85 469 7.43 < 5.0 74.8 199 68.6 152 10.5 63.2 < 0.20 3.41 45.5 < 0.10 40.7 0.010 < 0.50 0.23 < 0.40 < 0.20 31.5 < 0.010 22.8 1.05 < 0.50 < 0.050 1,310 < 0.020 < 0.20 < 5.0 3.09 < 1.0 < 4.0
QA/QC RPD% 0 1 * * 2 1 0 3 1 0 * 1 2 * 1 * * * * * 2 * 0 * * * 4 * * * 0 * *
GL0-3 2018 05 29 7.81 799 7.28 < 5.0 123 < 10 120 1.88 10.4 187 < 0.20 < 0.50 21.7 0.26 23.8 0.028 < 0.50 0.32 1.79 < 0.20 41.1 < 0.010 14.4 1.86 1.14 < 0.050 1,910 < 0.020 0.40 < 5.0 130 < 1.0 10.8
GL1-1 2018 06 12 7.75 743 - < 5.0 58.3 < 10 145 36.5 9.94 155 < 0.20 < 0.50 42.6 < 0.10 44.7 0.118 < 0.50 0.17 1.01 < 0.20 41.8 < 0.010 26.8 1.78 1.71 < 0.050 2,890 < 0.020 < 0.20 < 5.0 49.6 < 1.0 < 4.0
GL1-2 2018 06 12 7.84 790 - < 5.0 61.7 < 10 154 0.34 10.8 169 < 0.20 0.99 64.4 < 0.10 49.8 0.022 < 0.50 < 0.10 1.83 < 0.20 38.1 < 0.010 28.0 1.34 0.78 < 0.050 3,040 < 0.020 < 0.20 < 5.0 61.6 4.2 < 4.0
GL2-1 2018 05 28 7.90 457 - < 5.0 83.5 796 60.3 151 4.12 116 < 0.20 1.34 103 < 0.10 9.7 0.039 < 0.50 < 0.10 < 0.40 < 0.20 11.5 < 0.010 11.1 < 0.40 < 0.50 < 0.050 3,470 < 0.020 < 0.20 < 5.0 5.11 < 1.0 < 4.0
GL5-2 2018 05 28 7.83 671 7.08 < 5.0 79.8 < 10 115 0.44 7.77 268 < 0.20 < 0.50 60.6 < 0.10 30.8 0.020 3.92 < 0.10 1.03 < 0.20 39.3 < 0.010 9.37 < 0.40 4.95 < 0.050 4,900 < 0.020 < 0.20 < 5.0 20.0 3.7 < 4.0
GL6-1 (2011) 2018 06 04 7.45 1,900 6.98 78.7 183 3,150 351 618 476 2,680 0.91 4.95 376 < 0.10 2,660 < 0.010 15.4 25.7 0.47 < 0.20 61.0 < 0.010 5.86 23.6 0.92 < 0.050 3,880 < 0.020 4.94 18.1 122 4.2 < 4.0
GL9-1 2018 06 04 8.03 480 7.21 < 5.0 49.8 253 86.3 104 13.8 340 < 0.20 0.80 7.7 < 0.10 44.3 < 0.010 < 0.50 < 0.10 < 0.40 < 0.20 114 < 0.010 2.04 < 0.40 < 0.50 < 0.050 2,090 < 0.020 < 0.20 < 5.0 1.38 < 1.0 17.6
GL9-3 2018 05 28 7.68 11,300 7.22 < 5.0 445 12 2,480 271 165 12,600 < 0.20 0.89 14.8 < 0.10 8.8 0.302 < 0.50 0.90 2.87 < 0.20 89.6 < 0.010 98.4 5.90 1.39 < 0.050 15,300 0.440 < 0.20 < 5.0 1,680 < 1.0 < 4.0
GL12-1 2018 06 04 7.31 3,390 6.73 19.6 469 8,590 539 15,000 87.9 805 < 0.20 10.7 39.4 < 0.10 201 0.030 3.31 3.43 0.50 < 0.20 118 < 0.010 24.2 17.6 0.50 < 0.050 10,600 0.030 < 0.20 5.9 151 4.2 < 4.0
2018 09 19 7.07 3,890 6.99 20.8 521 19,600 628 15,700 79.2 919 < 0.20 24.0 45.8 < 0.10 167 0.017 3.34 4.79 0.56 < 0.20 143 < 0.010 29.3 21.3 < 0.50 < 0.050 10,800 < 0.020 < 0.20 7.8 205 6.0 < 4.0
GL15-1 2018 09 28 7.87 333 7.47 5.8 31.3 < 10 61.8 32.8 1.44 177 < 0.20 < 0.50 27.6 < 0.10 9.0 0.038 < 0.50 < 0.10 < 0.40 < 0.20 17.8 < 0.010 5.71 < 0.40 < 0.50 < 0.050 3,470 < 0.020 < 0.20 < 5.0 5.67 < 1.0 < 4.0
GL15-2 2018 09 28 7.41 3,300 6.88 < 5.0 284 < 10 629 < 0.20 13.9 992 < 0.20 0.73 12.8 < 0.10 12.2 0.041 4.77 0.19 2.92 < 0.20 49.2 < 0.010 17.8 1.69 19.3 < 0.050 6,020 < 0.020 < 0.20 < 5.0 318 2.1 < 4.0
GL16-1 2018 06 04 7.67 762 7.11 < 5.0 96.5 < 10 126 0.45 18.1 815 < 0.20 5.98 13.4 < 0.10 71.0 0.172 < 0.50 < 0.10 0.63 < 0.20 256 < 0.010 15.5 < 0.40 < 0.50 < 0.050 15,400 < 0.020 < 0.20 < 5.0 7.93 < 1.0 < 4.0
GL17-1 2018 06 04 7.83 127 7.3 < 5.0 22.0 1,250 17.4 46.5 14.4 562 < 0.20 1.64 198 < 0.10 81.8 < 0.010 < 0.50 0.26 < 0.40 < 0.20 231 < 0.010 0.42 < 0.40 < 0.50 < 0.050 3,650 < 0.020 < 0.20 < 5.0 0.125 < 1.0 < 4.0
2018 09 19 7.80 130 7.5 < 5.0 22.6 626 17.9 42.5 13.7 571 < 0.20 1.06 185 < 0.10 74.7 < 0.010 < 0.50 0.12 < 0.40 < 0.20 206 < 0.010 0.35 < 0.40 < 0.50 < 0.050 3,650 < 0.020 < 0.20 < 5.0 0.276 < 1.0 < 4.0
GL18-2 2018 06 04 7.38 1,410 7.79 < 5.0 306 1,610 158 524 17.7 1,450 < 0.20 6.92 9.7 < 0.10 32.6 0.018 < 0.50 < 0.10 < 0.40 < 0.20 11.6 < 0.010 41.5 < 0.40 < 0.50 < 0.050 4,630 < 0.020 < 0.20 < 5.0 0.134 < 1.0 < 4.0
Duplicate 7.43 1,430 7.79 < 5.0 311 1,600 158 521 17.9 1,450 < 0.20 6.95 9.5 < 0.10 31.5 0.027 < 0.50 < 0.10 < 0.40 < 0.20 11.0 < 0.010 41.6 < 0.40 < 0.50 < 0.050 4,590 < 0.020 < 0.20 < 5.0 0.132 < 1.0 < 4.0
QA/QC RPD% 1 1 * * 2 1 0 1 1 0 * 0 * * 3 * * * * * 5 * 0 * * * 1 * * * 2 * *
GL23-1h 2018 05 29 7.86 1,260 7.22 < 5.0 86.2 < 10 254 19.3 15.0 201 < 0.20 < 0.50 63.0 < 0.10 29.9 0.100 < 0.50 0.35 20.0 0.60 38.9 < 0.010 12.4 10.0 < 0.50 < 0.050 4,000 < 0.020 0.82 < 5.0 77.7 < 1.0 < 4.0
GL24-1 2018 06 12 7.63 1,300 - < 5.0 91.6 < 10 260 342 12.6 391 < 0.20 1.60 61.7 < 0.10 78.6 0.342 < 0.50 1.95 5.47 < 0.20 43.1 < 0.010 24.9 15.1 2.39 < 0.050 3,760 < 0.020 < 0.20 < 5.0 154 2.8 < 4.0
GL27-1 2018 08 15 7.98 89.6 7.63 < 5.0 14.9 521 12.7 82.1 12.4 584 < 0.20 28.7 470 < 0.10 75.0 0.038 < 0.50 < 0.10 < 0.40 < 0.20 217 < 0.010 51.2 < 0.40 < 0.50 < 0.050 3,200 < 0.020 < 0.20 < 5.0 1.40 < 1.0 < 4.0
2018 09 19 7.91 99.9 7.62 < 5.0 17.1 633 13.8 83.2 13.0 650 < 0.20 23.7 479 < 0.10 64.6 0.010 < 0.50 < 0.10 < 0.40 < 0.20 228 < 0.010 29.2 < 0.40 < 0.50 < 0.050 3,180 < 0.020 < 0.20 < 5.0 0.965 < 1.0 < 4.0
GL27-3 2018 08 15 7.71 5,450 7.91 < 5.0 392 2,260 1,090 688 27.7 3,000 < 0.20 5.73 14.6 < 0.10 42.9 0.127 < 0.50 2.83 < 0.40 < 0.20 78.2 < 0.010 67.0 4.50 < 0.50 < 0.050 11,100 < 0.020 < 0.20 < 5.0 86.2 < 1.0 < 4.0
GL28-1h 2018 05 28 7.72 1,710 6.99 < 5.0 201 333 292 148 11.7 536 < 0.20 1.01 14.7 < 0.10 18.3 0.193 < 0.50 0.48 0.98 < 0.20 81.1 < 0.010 12.4 1.96 0.72 < 0.050 5,950 < 0.020 < 0.20 < 5.0 123 < 1.0 < 4.0
2018 09 25 7.72 1,750 7.21 < 5.0 207 1,220 300 301 11.3 553 < 0.20 1.49 9.7 < 0.10 20.2 0.041 < 0.50 0.70 < 0.40 < 0.20 85.9 < 0.010 12.9 1.85 < 0.50 < 0.050 6,000 < 0.020 < 0.20 < 5.0 115 < 1.0 < 4.0
Duplicate 7.73 1,730 7.21 < 5.0 207 1,280 295 313 11.9 544 < 0.20 1.75 10.0 < 0.10 10.1 0.039 < 0.50 0.71 1.15 < 0.20 69.3 < 0.010 13.1 1.93 < 0.50 < 0.050 5,910 < 0.020 < 0.20 < 5.0 114 < 1.0 < 4.0
QA/QC RPD% 0 1 * * 0 5 2 4 5 2 * * * * * * * 1 * * 21 * 2 * * * 2 * * * 1 * *
GL28-2h 2018 05 28 7.42 1,900 6.77 < 5.0 303 < 10 278 17.4 12.8 735 < 0.20 < 0.50 13.2 < 0.10 16.3 0.065 < 0.50 0.29 0.69 < 0.20 45.5 < 0.010 4.81 2.58 1.49 < 0.050 7,280 < 0.020 < 0.20 < 5.0 181 < 1.0 < 4.0
Duplicate 7.51 1,860 6.77 < 5.0 274 < 10 286 17.6 13.4 772 < 0.20 < 0.50 13.5 < 0.10 13.4 0.073 < 0.50 0.28 0.68 < 0.20 38.1 < 0.010 4.84 2.60 1.59 < 0.050 7,320 < 0.020 < 0.20 < 5.0 190 < 1.0 5.4
QA/QC RPD% 1 2 * * 10 * 3 1 5 5 * * * * * 12 * * * * 18 * 1 1 * * 1 * * * 5 * *
2018 09 25 7.60 2,280 6.97 39.7 382 < 10 322 20.4 14.1 862 < 0.20 < 0.50 14.1 < 0.10 17.8 0.075 < 0.50 0.31 1.06 < 0.20 51.0 < 0.010 5.07 2.85 1.33 < 0.050 7,980 < 0.020 < 0.20 < 5.0 196 1.1 < 4.0
GL28-3h 2018 05 28 7.51 2,770 6.8 38.0 282 84 501 146 13.0 1,110 < 0.20 0.76 21.6 < 0.10 5.6 0.382 0.56 0.44 1.72 < 0.20 35.0 < 0.010 12.5 10.0 < 0.50 < 0.050 9,150 0.038 < 0.20 < 5.0 239 1.4 < 4.0
2018 09 25 7.60 3,080 7 < 5.0 378 < 10 518 321 13.8 1,230 < 0.20 0.82 19.1 < 0.10 5.5 0.316 < 0.50 0.51 1.50 < 0.20 42.9 < 0.010 14.2 12.0 < 0.50 < 0.050 8,940 0.052 < 0.20 < 5.0 278 1.5 < 4.0
GL29-1 2018 06 04 7.71 659 7.24 6.1 191 73 43.7 39.8 16.0 70.9 1.30 3.64 51.9 < 0.10 512 0.267 2.08 2.15 84.0 < 0.20 16.4 < 0.010 40.1 30.8 0.69 < 0.050 1,570 0.039 < 0.20 < 5.0 21.5 5.5 6.1
2018 09 19 7.70 683 7.38 < 5.0 192 78 49.2 637 15.8 83.2 1.70 3.88 63.4 < 0.10 518 0.371 1.97 53.0 84.5 < 0.20 18.6 < 0.010 45.0 39.2 0.79 < 0.050 1,720 0.054 < 0.20 < 5.0 27.3 5.2 7.7
GL35-3 2018 08 15 7.29 2,070 6.98 < 5.0 211 24,800 374 443 34.1 1,980 < 0.20 0.67 17.2 < 0.10 87.0 < 0.010 0.52 < 0.10 < 0.40 < 0.20 413 < 0.010 0.21 < 0.40 < 0.50 < 0.050 8,860 < 0.020 < 0.20 < 5.0 4.17 1.2 < 4.0
Associated Caro file(s): 8052631, 8052802, 8060237, 8060737, 8061100, 8081412, 8091680, 8092458, 8092618.a Standard to protect freshwater aquatic life.
All terms defined within the body of SNC-Lavalin's report.b Guideline to protect irrigation water. Guideline for surface water and Total Metals, shown here for comparison purposes only.
< Denotes concentration less than indicated detection limit or RPD less than indicated value.c Guideline to protect freshwater aquatic life, long-term average (i.e. "chronic"). Guideline for surface water, shown here for comparison purposes only.
- Denotes analysis not conducted.d Guideline to protect freshwater aquatic life, short-term maximum (i.e. "acute"). Guideline for surface water, shown here for comparison purposes only.
n/a Denotes no applicable standard/guideline.e Individual standards exist for Cr +3 and Cr +6. Reported value represents more stringent standard.
* RPDs are not calculated where one or more concentrations are less than five times RDL.f Standard/Guideline varies with hardness.
g Guideline varies with pH and temperature.
BOLD Concentration greater than CSR Aquatic Life (AW) standardh Locations also compared to BCWQG AW, see report text for details.
SHADED Concentration greater than CSR Irrigation Watering (IW) standardi Boron guideline crop dependant, guideline of 2,000-6,000 µg/L used, off-site irrigated fields reportedly used to grow forage crops (currently alfalfa and grass).
RED Concentration greater than BCWQG Irrigation Water (IW) guideline
BLUE SHADED Concentration greater than BCWQG Aquatic Life Long-Term Average (AW) guideline
BLUE SHADED Concentration greater than BCWQG Aquatic Life Short-term Maximum (AW) guideline
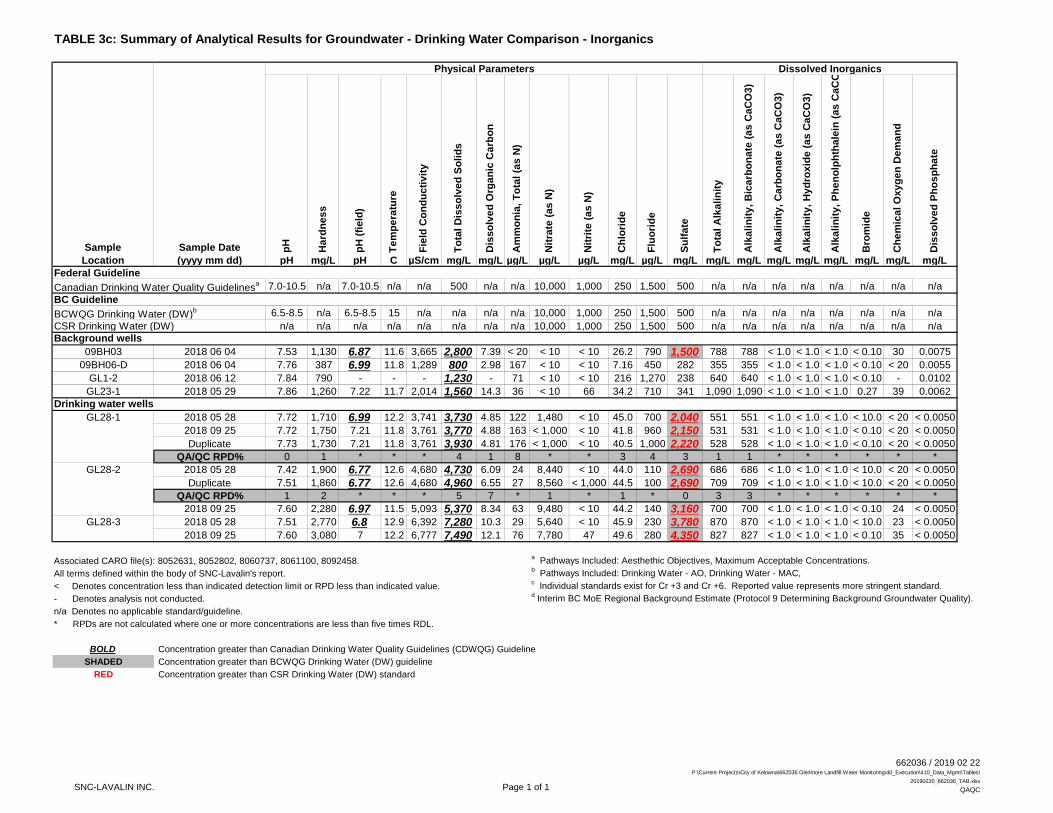
SNC-LAVALIN INC. Page 1 of 1
662036 / 2019 02 22 P:\Current Projects\City of Kelowna\662036 Glenmore Landfill Water Monitoring\40_Execution\410_Data_Mgmt\Tables\
20190220_662036_TAB.xlsx
QAQC
TABLE 3c: Summary of Analytical Results for Groundwater - Drinking Water Comparison - Inorganics
Physical Parameters Dissolved Inorganics
Sample Sample Date pH
Ha
rdn
es
s
pH
(fi
eld
)
Te
mp
era
ture
Fie
ld C
on
du
cti
vit
y
To
tal
Dis
so
lve
d S
oli
ds
Dis
so
lve
d O
rga
nic
Ca
rbo
n
Am
mo
nia
, T
ota
l (a
s N
)
Nit
rate
(a
s N
)
Nit
rite
(a
s N
)
Ch
lori
de
Flu
ori
de
Su
lfa
te
To
tal
Alk
ali
nit
y
Alk
ali
nit
y,
Bic
arb
on
ate
(a
s C
aC
O3
)
Alk
ali
nit
y,
Ca
rbo
na
te (
as
Ca
CO
3)
Alk
ali
nit
y,
Hy
dro
xid
e (
as
Ca
CO
3)
Alk
ali
nit
y,
Ph
en
olp
hth
ale
in (
as
Ca
CO
Bro
mid
e
Ch
em
ica
l O
xy
ge
n D
em
an
d
Dis
so
lve
d P
ho
sp
ha
te
Location (yyyy mm dd) pH mg/L pH C µS/cm mg/L mg/L µg/L µg/L µg/L mg/L µg/L mg/L mg/L mg/L mg/L mg/L mg/L mg/L mg/L mg/L
Federal Guideline
Canadian Drinking Water Quality Guidelinesa 7.0-10.5 n/a 7.0-10.5 n/a n/a 500 n/a n/a 10,000 1,000 250 1,500 500 n/a n/a n/a n/a n/a n/a n/a n/a
BC Guideline
BCWQG Drinking Water (DW)b 6.5-8.5 n/a 6.5-8.5 15 n/a n/a n/a n/a 10,000 1,000 250 1,500 500 n/a n/a n/a n/a n/a n/a n/a n/a
CSR Drinking Water (DW) n/a n/a n/a n/a n/a n/a n/a n/a 10,000 1,000 250 1,500 500 n/a n/a n/a n/a n/a n/a n/a n/a
09BH03 2018 06 04 7.53 1,130 6.87 11.6 3,665 2,800 7.39 < 20 < 10 < 10 26.2 790 1,500 788 788 < 1.0 < 1.0 < 1.0 < 0.10 30 0.0075
09BH06-D 2018 06 04 7.76 387 6.99 11.8 1,289 800 2.98 167 < 10 < 10 7.16 450 282 355 355 < 1.0 < 1.0 < 1.0 < 0.10 < 20 0.0055
GL1-2 2018 06 12 7.84 790 - - - 1,230 - 71 < 10 < 10 216 1,270 238 640 640 < 1.0 < 1.0 < 1.0 < 0.10 - 0.0102
GL23-1 2018 05 29 7.86 1,260 7.22 11.7 2,014 1,560 14.3 36 < 10 66 34.2 710 341 1,090 1,090 < 1.0 < 1.0 < 1.0 0.27 39 0.0062
GL28-1 2018 05 28 7.72 1,710 6.99 12.2 3,741 3,730 4.85 122 1,480 < 10 45.0 700 2,040 551 551 < 1.0 < 1.0 < 1.0 < 10.0 < 20 < 0.0050
2018 09 25 7.72 1,750 7.21 11.8 3,761 3,770 4.88 163 < 1,000 < 10 41.8 960 2,150 531 531 < 1.0 < 1.0 < 1.0 < 0.10 < 20 < 0.0050
Duplicate 7.73 1,730 7.21 11.8 3,761 3,930 4.81 176 < 1,000 < 10 40.5 1,000 2,220 528 528 < 1.0 < 1.0 < 1.0 < 0.10 < 20 < 0.0050
QA/QC RPD% 0 1 * * * 4 1 8 * * 3 4 3 1 1 * * * * * *
GL28-2 2018 05 28 7.42 1,900 6.77 12.6 4,680 4,730 6.09 24 8,440 < 10 44.0 110 2,690 686 686 < 1.0 < 1.0 < 1.0 < 10.0 < 20 < 0.0050
Duplicate 7.51 1,860 6.77 12.6 4,680 4,960 6.55 27 8,560 < 1,000 44.5 100 2,690 709 709 < 1.0 < 1.0 < 1.0 < 10.0 < 20 < 0.0050
QA/QC RPD% 1 2 * * * 5 7 * 1 * 1 * 0 3 3 * * * * * *
2018 09 25 7.60 2,280 6.97 11.5 5,093 5,370 8.34 63 9,480 < 10 44.2 140 3,160 700 700 < 1.0 < 1.0 < 1.0 < 0.10 24 < 0.0050
GL28-3 2018 05 28 7.51 2,770 6.8 12.9 6,392 7,280 10.3 29 5,640 < 10 45.9 230 3,780 870 870 < 1.0 < 1.0 < 1.0 < 10.0 23 < 0.0050
2018 09 25 7.60 3,080 7 12.2 6,777 7,490 12.1 76 7,780 47 49.6 280 4,350 827 827 < 1.0 < 1.0 < 1.0 < 0.10 35 < 0.0050
Associated CARO file(s): 8052631, 8052802, 8060737, 8061100, 8092458.a Pathways Included: Aesthethic Objectives, Maximum Acceptable Concentrations.
All terms defined within the body of SNC-Lavalin's report.b Pathways Included: Drinking Water - AO, Drinking Water - MAC,
< Denotes concentration less than indicated detection limit or RPD less than indicated value.c Individual standards exist for Cr +3 and Cr +6. Reported value represents more stringent standard.
- Denotes analysis not conducted.d Interim BC MoE Regional Background Estimate (Protocol 9 Determining Background Groundwater Quality).
n/a Denotes no applicable standard/guideline.
* RPDs are not calculated where one or more concentrations are less than five times RDL.
BOLD Concentration greater than Canadian Drinking Water Quality Guidelines (CDWQG) Guideline
SHADED Concentration greater than BCWQG Drinking Water (DW) guideline
RED Concentration greater than CSR Drinking Water (DW) standard
Background wells
Drinking water wells
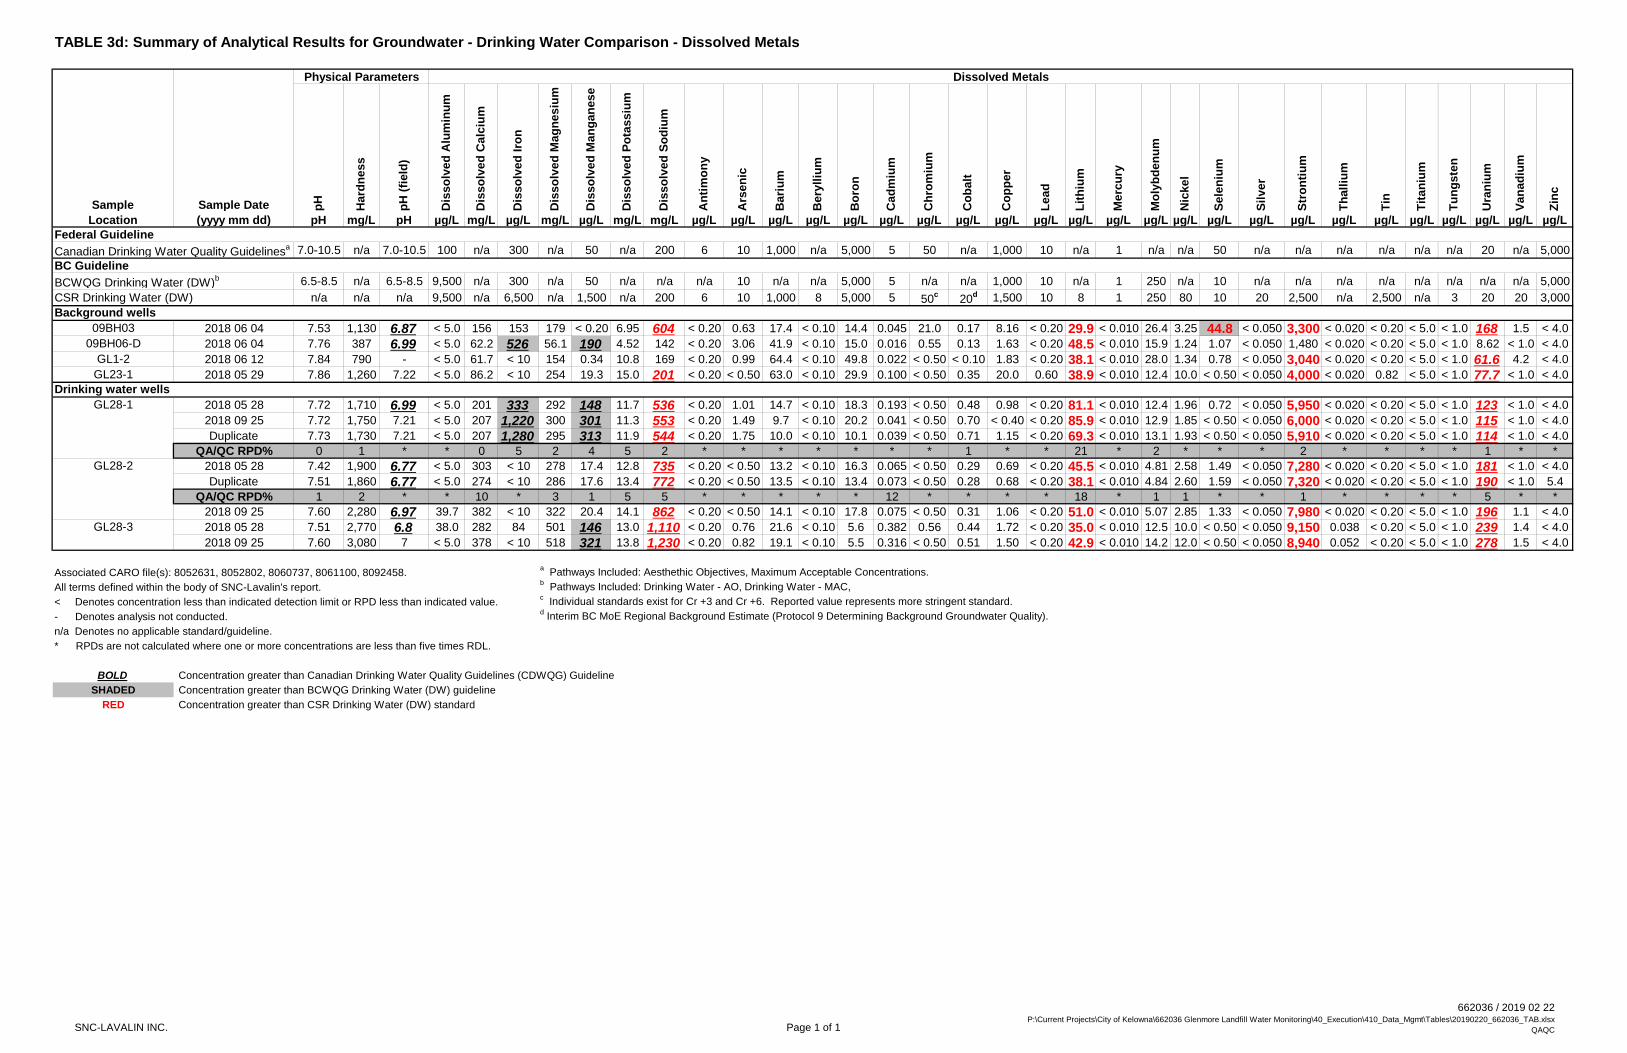
SNC-LAVALIN INC. Page 1 of 1
662036 / 2019 02 22 P:\Current Projects\City of Kelowna\662036 Glenmore Landfill Water Monitoring\40_Execution\410_Data_Mgmt\Tables\20190220_662036_TAB.xlsx
QAQC
TABLE 3d: Summary of Analytical Results for Groundwater - Drinking Water Comparison - Dissolved Metals
Physical Parameters Dissolved Metals
Sample Sample Date pH
Hard
ness
pH
(fi
eld
)
Dis
so
lved
Alu
min
um
Dis
so
lved
Calc
ium
Dis
so
lved
Iro
n
Dis
so
lved
Mag
nesiu
m
Dis
so
lved
Man
gan
ese
Dis
so
lved
Po
tassiu
m
Dis
so
lved
So
diu
m
An
tim
on
y
Ars
en
ic
Bari
um
Bery
lliu
m
Bo
ron
Cad
miu
m
Ch
rom
ium
Co
balt
Co
pp
er
Lead
Lit
hiu
m
Merc
ury
Mo
lyb
den
um
Nic
kel
Sele
niu
m
Sil
ver
Str
on
tiu
m
Th
all
ium
Tin
Tit
an
ium
Tu
ng
ste
n
Ura
niu
m
Van
ad
ium
Zin
c
Location (yyyy mm dd) pH mg/L pH µg/L mg/L µg/L mg/L µg/L mg/L mg/L µg/L µg/L µg/L µg/L µg/L µg/L µg/L µg/L µg/L µg/L µg/L µg/L µg/L µg/L µg/L µg/L µg/L µg/L µg/L µg/L µg/L µg/L µg/L µg/L
Federal Guideline
Canadian Drinking Water Quality Guidelinesa 7.0-10.5 n/a 7.0-10.5 100 n/a 300 n/a 50 n/a 200 6 10 1,000 n/a 5,000 5 50 n/a 1,000 10 n/a 1 n/a n/a 50 n/a n/a n/a n/a n/a n/a 20 n/a 5,000
BC Guideline
BCWQG Drinking Water (DW)b 6.5-8.5 n/a 6.5-8.5 9,500 n/a 300 n/a 50 n/a n/a n/a 10 n/a n/a 5,000 5 n/a n/a 1,000 10 n/a 1 250 n/a 10 n/a n/a n/a n/a n/a n/a n/a n/a 5,000
CSR Drinking Water (DW) n/a n/a n/a 9,500 n/a 6,500 n/a 1,500 n/a 200 6 10 1,000 8 5,000 5 50c
20d 1,500 10 8 1 250 80 10 20 2,500 n/a 2,500 n/a 3 20 20 3,000
09BH03 2018 06 04 7.53 1,130 6.87 < 5.0 156 153 179 < 0.20 6.95 604 < 0.20 0.63 17.4 < 0.10 14.4 0.045 21.0 0.17 8.16 < 0.20 29.9 < 0.010 26.4 3.25 44.8 < 0.050 3,300 < 0.020 < 0.20 < 5.0 < 1.0 168 1.5 < 4.0
09BH06-D 2018 06 04 7.76 387 6.99 < 5.0 62.2 526 56.1 190 4.52 142 < 0.20 3.06 41.9 < 0.10 15.0 0.016 0.55 0.13 1.63 < 0.20 48.5 < 0.010 15.9 1.24 1.07 < 0.050 1,480 < 0.020 < 0.20 < 5.0 < 1.0 8.62 < 1.0 < 4.0
GL1-2 2018 06 12 7.84 790 - < 5.0 61.7 < 10 154 0.34 10.8 169 < 0.20 0.99 64.4 < 0.10 49.8 0.022 < 0.50 < 0.10 1.83 < 0.20 38.1 < 0.010 28.0 1.34 0.78 < 0.050 3,040 < 0.020 < 0.20 < 5.0 < 1.0 61.6 4.2 < 4.0
GL23-1 2018 05 29 7.86 1,260 7.22 < 5.0 86.2 < 10 254 19.3 15.0 201 < 0.20 < 0.50 63.0 < 0.10 29.9 0.100 < 0.50 0.35 20.0 0.60 38.9 < 0.010 12.4 10.0 < 0.50 < 0.050 4,000 < 0.020 0.82 < 5.0 < 1.0 77.7 < 1.0 < 4.0
GL28-1 2018 05 28 7.72 1,710 6.99 < 5.0 201 333 292 148 11.7 536 < 0.20 1.01 14.7 < 0.10 18.3 0.193 < 0.50 0.48 0.98 < 0.20 81.1 < 0.010 12.4 1.96 0.72 < 0.050 5,950 < 0.020 < 0.20 < 5.0 < 1.0 123 < 1.0 < 4.0
2018 09 25 7.72 1,750 7.21 < 5.0 207 1,220 300 301 11.3 553 < 0.20 1.49 9.7 < 0.10 20.2 0.041 < 0.50 0.70 < 0.40 < 0.20 85.9 < 0.010 12.9 1.85 < 0.50 < 0.050 6,000 < 0.020 < 0.20 < 5.0 < 1.0 115 < 1.0 < 4.0
Duplicate 7.73 1,730 7.21 < 5.0 207 1,280 295 313 11.9 544 < 0.20 1.75 10.0 < 0.10 10.1 0.039 < 0.50 0.71 1.15 < 0.20 69.3 < 0.010 13.1 1.93 < 0.50 < 0.050 5,910 < 0.020 < 0.20 < 5.0 < 1.0 114 < 1.0 < 4.0
QA/QC RPD% 0 1 * * 0 5 2 4 5 2 * * * * * * * 1 * * 21 * 2 * * * 2 * * * * 1 * *
GL28-2 2018 05 28 7.42 1,900 6.77 < 5.0 303 < 10 278 17.4 12.8 735 < 0.20 < 0.50 13.2 < 0.10 16.3 0.065 < 0.50 0.29 0.69 < 0.20 45.5 < 0.010 4.81 2.58 1.49 < 0.050 7,280 < 0.020 < 0.20 < 5.0 < 1.0 181 < 1.0 < 4.0
Duplicate 7.51 1,860 6.77 < 5.0 274 < 10 286 17.6 13.4 772 < 0.20 < 0.50 13.5 < 0.10 13.4 0.073 < 0.50 0.28 0.68 < 0.20 38.1 < 0.010 4.84 2.60 1.59 < 0.050 7,320 < 0.020 < 0.20 < 5.0 < 1.0 190 < 1.0 5.4
QA/QC RPD% 1 2 * * 10 * 3 1 5 5 * * * * * 12 * * * * 18 * 1 1 * * 1 * * * * 5 * *
2018 09 25 7.60 2,280 6.97 39.7 382 < 10 322 20.4 14.1 862 < 0.20 < 0.50 14.1 < 0.10 17.8 0.075 < 0.50 0.31 1.06 < 0.20 51.0 < 0.010 5.07 2.85 1.33 < 0.050 7,980 < 0.020 < 0.20 < 5.0 < 1.0 196 1.1 < 4.0
GL28-3 2018 05 28 7.51 2,770 6.8 38.0 282 84 501 146 13.0 1,110 < 0.20 0.76 21.6 < 0.10 5.6 0.382 0.56 0.44 1.72 < 0.20 35.0 < 0.010 12.5 10.0 < 0.50 < 0.050 9,150 0.038 < 0.20 < 5.0 < 1.0 239 1.4 < 4.0
2018 09 25 7.60 3,080 7 < 5.0 378 < 10 518 321 13.8 1,230 < 0.20 0.82 19.1 < 0.10 5.5 0.316 < 0.50 0.51 1.50 < 0.20 42.9 < 0.010 14.2 12.0 < 0.50 < 0.050 8,940 0.052 < 0.20 < 5.0 < 1.0 278 1.5 < 4.0
Associated CARO file(s): 8052631, 8052802, 8060737, 8061100, 8092458.a Pathways Included: Aesthethic Objectives, Maximum Acceptable Concentrations.
All terms defined within the body of SNC-Lavalin's report.b Pathways Included: Drinking Water - AO, Drinking Water - MAC,
< Denotes concentration less than indicated detection limit or RPD less than indicated value.c Individual standards exist for Cr +3 and Cr +6. Reported value represents more stringent standard.
- Denotes analysis not conducted.d Interim BC MoE Regional Background Estimate (Protocol 9 Determining Background Groundwater Quality).
n/a Denotes no applicable standard/guideline.
* RPDs are not calculated where one or more concentrations are less than five times RDL.
BOLD Concentration greater than Canadian Drinking Water Quality Guidelines (CDWQG) Guideline
SHADED Concentration greater than BCWQG Drinking Water (DW) guideline
RED Concentration greater than CSR Drinking Water (DW) standard
Background wells
Drinking water wells
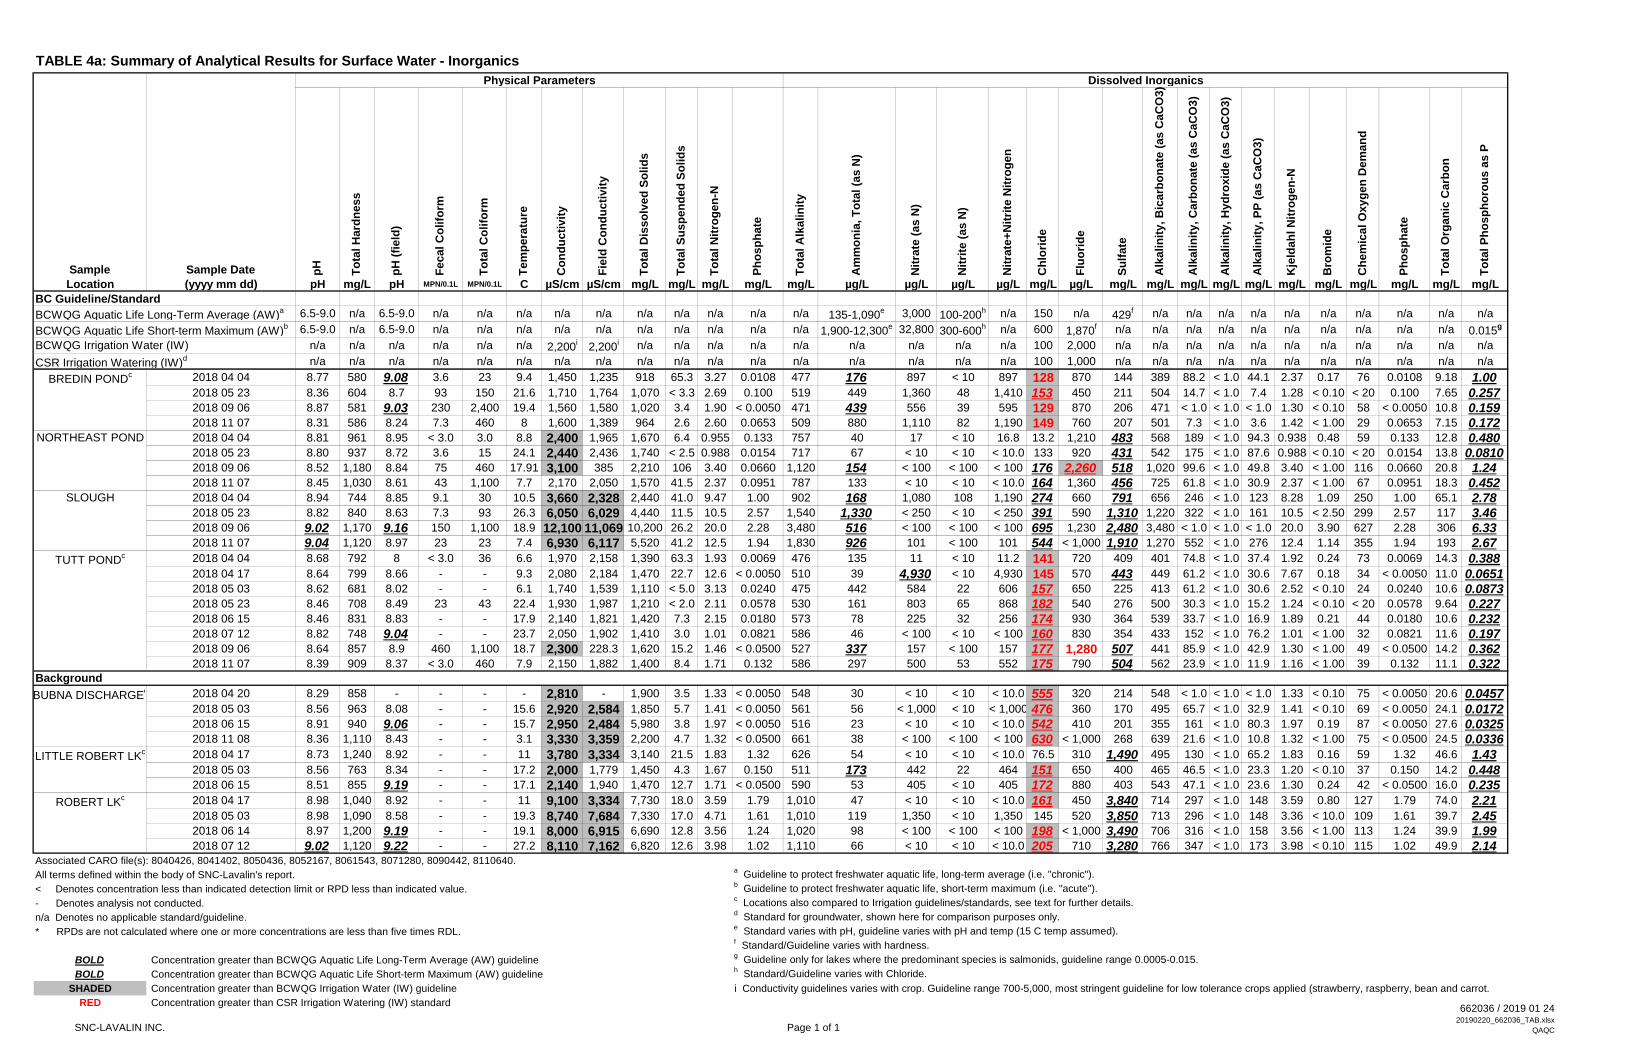
SNC-LAVALIN INC. Page 1 of 1
662036 / 2019 01 2420190220_662036_TAB.xlsx
QAQC
TABLE 4a: Summary of Analytical Results for Surface Water - Inorganics
Physical Parameters Dissolved Inorganics
Sample Sample Date pH
To
tal H
ard
ness
pH
(fi
eld
)
Fecal C
olifo
rm
To
tal C
olifo
rm
Tem
pera
ture
Co
nd
ucti
vit
y
Fie
ld C
on
du
cti
vit
y
To
tal D
isso
lved
So
lid
s
To
tal S
usp
en
ded
So
lid
s
To
tal N
itro
gen
-N
Ph
osp
hate
To
tal A
lkalin
ity
Am
mo
nia
, T
ota
l (a
s N
)
Nit
rate
(as N
)
Nit
rite
(as N
)
Nit
rate
+N
itri
te N
itro
gen
Ch
lori
de
Flu
ori
de
Su
lfate
Alk
alin
ity, B
icarb
on
ate
(as C
aC
O3)
Alk
alin
ity, C
arb
on
ate
(as C
aC
O3)
Alk
alin
ity, H
yd
roxid
e (
as C
aC
O3)
Alk
alin
ity, P
P (
as C
aC
O3)
Kje
ldah
l N
itro
gen
-N
Bro
mid
e
Ch
em
ical O
xyg
en
Dem
an
d
Ph
osp
hate
To
tal O
rgan
ic C
arb
on
To
tal P
ho
sp
ho
rou
s a
s P
Location (yyyy mm dd) pH mg/L pH MPN/0.1L MPN/0.1L C µS/cm µS/cm mg/L mg/L mg/L mg/L mg/L µg/L µg/L µg/L µg/L mg/L µg/L mg/L mg/L mg/L mg/L mg/L mg/L mg/L mg/L mg/L mg/L mg/L
BC Guideline/Standard
BCWQG Aquatic Life Long-Term Average (AW)a 6.5-9.0 n/a 6.5-9.0 n/a n/a n/a n/a n/a n/a n/a n/a n/a n/a 135-1,090
e 3,000 100-200h n/a 150 n/a 429
f n/a n/a n/a n/a n/a n/a n/a n/a n/a n/a
BCWQG Aquatic Life Short-term Maximum (AW)b 6.5-9.0 n/a 6.5-9.0 n/a n/a n/a n/a n/a n/a n/a n/a n/a n/a 1,900-12,300
e 32,800 300-600h n/a 600 1,870
f n/a n/a n/a n/a n/a n/a n/a n/a n/a n/a 0.015g
BCWQG Irrigation Water (IW) n/a n/a n/a n/a n/a n/a 2,200i
2,200i n/a n/a n/a n/a n/a n/a n/a n/a n/a 100 2,000 n/a n/a n/a n/a n/a n/a n/a n/a n/a n/a n/a
CSR Irrigation Watering (IW)d n/a n/a n/a n/a n/a n/a n/a n/a n/a n/a n/a n/a n/a n/a n/a n/a n/a 100 1,000 n/a n/a n/a n/a n/a n/a n/a n/a n/a n/a n/a
BREDIN PONDc 2018 04 04 8.77 580 9.08 3.6 23 9.4 1,450 1,235 918 65.3 3.27 0.0108 477 176 897 < 10 897 128 870 144 389 88.2 < 1.0 44.1 2.37 0.17 76 0.0108 9.18 1.00
2018 05 23 8.36 604 8.7 93 150 21.6 1,710 1,764 1,070 < 3.3 2.69 0.100 519 449 1,360 48 1,410 153 450 211 504 14.7 < 1.0 7.4 1.28 < 0.10 < 20 0.100 7.65 0.2572018 09 06 8.87 581 9.03 230 2,400 19.4 1,560 1,580 1,020 3.4 1.90 < 0.0050 471 439 556 39 595 129 870 206 471 < 1.0 < 1.0 < 1.0 1.30 < 0.10 58 < 0.0050 10.8 0.1592018 11 07 8.31 586 8.24 7.3 460 8 1,600 1,389 964 2.6 2.60 0.0653 509 880 1,110 82 1,190 149 760 207 501 7.3 < 1.0 3.6 1.42 < 1.00 29 0.0653 7.15 0.172
NORTHEAST POND 2018 04 04 8.81 961 8.95 < 3.0 3.0 8.8 2,400 1,965 1,670 6.4 0.955 0.133 757 40 17 < 10 16.8 13.2 1,210 483 568 189 < 1.0 94.3 0.938 0.48 59 0.133 12.8 0.4802018 05 23 8.80 937 8.72 3.6 15 24.1 2,440 2,436 1,740 < 2.5 0.988 0.0154 717 67 < 10 < 10 < 10.0 133 920 431 542 175 < 1.0 87.6 0.988 < 0.10 < 20 0.0154 13.8 0.08102018 09 06 8.52 1,180 8.84 75 460 17.91 3,100 385 2,210 106 3.40 0.0660 1,120 154 < 100 < 100 < 100 176 2,260 518 1,020 99.6 < 1.0 49.8 3.40 < 1.00 116 0.0660 20.8 1.242018 11 07 8.45 1,030 8.61 43 1,100 7.7 2,170 2,050 1,570 41.5 2.37 0.0951 787 133 < 10 < 10 < 10.0 164 1,360 456 725 61.8 < 1.0 30.9 2.37 < 1.00 67 0.0951 18.3 0.452
SLOUGH 2018 04 04 8.94 744 8.85 9.1 30 10.5 3,660 2,328 2,440 41.0 9.47 1.00 902 168 1,080 108 1,190 274 660 791 656 246 < 1.0 123 8.28 1.09 250 1.00 65.1 2.782018 05 23 8.82 840 8.63 7.3 93 26.3 6,050 6,029 4,440 11.5 10.5 2.57 1,540 1,330 < 250 < 10 < 250 391 590 1,310 1,220 322 < 1.0 161 10.5 < 2.50 299 2.57 117 3.462018 09 06 9.02 1,170 9.16 150 1,100 18.9 12,100 11,069 10,200 26.2 20.0 2.28 3,480 516 < 100 < 100 < 100 695 1,230 2,480 3,480 < 1.0 < 1.0 < 1.0 20.0 3.90 627 2.28 306 6.332018 11 07 9.04 1,120 8.97 23 23 7.4 6,930 6,117 5,520 41.2 12.5 1.94 1,830 926 101 < 100 101 544 < 1,000 1,910 1,270 552 < 1.0 276 12.4 1.14 355 1.94 193 2.67
TUTT PONDc 2018 04 04 8.68 792 8 < 3.0 36 6.6 1,970 2,158 1,390 63.3 1.93 0.0069 476 135 11 < 10 11.2 141 720 409 401 74.8 < 1.0 37.4 1.92 0.24 73 0.0069 14.3 0.388
2018 04 17 8.64 799 8.66 - - 9.3 2,080 2,184 1,470 22.7 12.6 < 0.0050 510 39 4,930 < 10 4,930 145 570 443 449 61.2 < 1.0 30.6 7.67 0.18 34 < 0.0050 11.0 0.06512018 05 03 8.62 681 8.02 - - 6.1 1,740 1,539 1,110 < 5.0 3.13 0.0240 475 442 584 22 606 157 650 225 413 61.2 < 1.0 30.6 2.52 < 0.10 24 0.0240 10.6 0.08732018 05 23 8.46 708 8.49 23 43 22.4 1,930 1,987 1,210 < 2.0 2.11 0.0578 530 161 803 65 868 182 540 276 500 30.3 < 1.0 15.2 1.24 < 0.10 < 20 0.0578 9.64 0.2272018 06 15 8.46 831 8.83 - - 17.9 2,140 1,821 1,420 7.3 2.15 0.0180 573 78 225 32 256 174 930 364 539 33.7 < 1.0 16.9 1.89 0.21 44 0.0180 10.6 0.2322018 07 12 8.82 748 9.04 - - 23.7 2,050 1,902 1,410 3.0 1.01 0.0821 586 46 < 100 < 10 < 100 160 830 354 433 152 < 1.0 76.2 1.01 < 1.00 32 0.0821 11.6 0.1972018 09 06 8.64 857 8.9 460 1,100 18.7 2,300 228.3 1,620 15.2 1.46 < 0.0500 527 337 157 < 100 157 177 1,280 507 441 85.9 < 1.0 42.9 1.30 < 1.00 49 < 0.0500 14.2 0.3622018 11 07 8.39 909 8.37 < 3.0 460 7.9 2,150 1,882 1,400 8.4 1.71 0.132 586 297 500 53 552 175 790 504 562 23.9 < 1.0 11.9 1.16 < 1.00 39 0.132 11.1 0.322
BUBNA DISCHARGEc 2018 04 20 8.29 858 - - - - 2,810 - 1,900 3.5 1.33 < 0.0050 548 30 < 10 < 10 < 10.0 555 320 214 548 < 1.0 < 1.0 < 1.0 1.33 < 0.10 75 < 0.0050 20.6 0.0457
2018 05 03 8.56 963 8.08 - - 15.6 2,920 2,584 1,850 5.7 1.41 < 0.0050 561 56 < 1,000 < 10 < 1,000 476 360 170 495 65.7 < 1.0 32.9 1.41 < 0.10 69 < 0.0050 24.1 0.01722018 06 15 8.91 940 9.06 - - 15.7 2,950 2,484 5,980 3.8 1.97 < 0.0050 516 23 < 10 < 10 < 10.0 542 410 201 355 161 < 1.0 80.3 1.97 0.19 87 < 0.0050 27.6 0.03252018 11 08 8.36 1,110 8.43 - - 3.1 3,330 3,359 2,200 4.7 1.32 < 0.0500 661 38 < 100 < 100 < 100 630 < 1,000 268 639 21.6 < 1.0 10.8 1.32 < 1.00 75 < 0.0500 24.5 0.0336
LITTLE ROBERT LKc 2018 04 17 8.73 1,240 8.92 - - 11 3,780 3,334 3,140 21.5 1.83 1.32 626 54 < 10 < 10 < 10.0 76.5 310 1,490 495 130 < 1.0 65.2 1.83 0.16 59 1.32 46.6 1.43
2018 05 03 8.56 763 8.34 - - 17.2 2,000 1,779 1,450 4.3 1.67 0.150 511 173 442 22 464 151 650 400 465 46.5 < 1.0 23.3 1.20 < 0.10 37 0.150 14.2 0.4482018 06 15 8.51 855 9.19 - - 17.1 2,140 1,940 1,470 12.7 1.71 < 0.0500 590 53 405 < 10 405 172 880 403 543 47.1 < 1.0 23.6 1.30 0.24 42 < 0.0500 16.0 0.235
ROBERT LKc 2018 04 17 8.98 1,040 8.92 - - 11 9,100 3,334 7,730 18.0 3.59 1.79 1,010 47 < 10 < 10 < 10.0 161 450 3,840 714 297 < 1.0 148 3.59 0.80 127 1.79 74.0 2.21
2018 05 03 8.98 1,090 8.58 - - 19.3 8,740 7,684 7,330 17.0 4.71 1.61 1,010 119 1,350 < 10 1,350 145 520 3,850 713 296 < 1.0 148 3.36 < 10.0 109 1.61 39.7 2.452018 06 14 8.97 1,200 9.19 - - 19.1 8,000 6,915 6,690 12.8 3.56 1.24 1,020 98 < 100 < 100 < 100 198 < 1,000 3,490 706 316 < 1.0 158 3.56 < 1.00 113 1.24 39.9 1.992018 07 12 9.02 1,120 9.22 - - 27.2 8,110 7,162 6,820 12.6 3.98 1.02 1,110 66 < 10 < 10 < 10.0 205 710 3,280 766 347 < 1.0 173 3.98 < 0.10 115 1.02 49.9 2.14
Associated CARO file(s): 8040426, 8041402, 8050436, 8052167, 8061543, 8071280, 8090442, 8110640.
All terms defined within the body of SNC-Lavalin's report.a Guideline to protect freshwater aquatic life, long-term average (i.e. "chronic").
< Denotes concentration less than indicated detection limit or RPD less than indicated value.b Guideline to protect freshwater aquatic life, short-term maximum (i.e. "acute").
- Denotes analysis not conducted.c Locations also compared to Irrigation guidelines/standards, see text for further details.
n/a Denotes no applicable standard/guideline.d Standard for groundwater, shown here for comparison purposes only.
* RPDs are not calculated where one or more concentrations are less than five times RDL.e Standard varies with pH, guideline varies with pH and temp (15 C temp assumed).
f Standard/Guideline varies with hardness.
BOLD Concentration greater than BCWQG Aquatic Life Long-Term Average (AW) guidelineg Guideline only for lakes where the predominant species is salmonids, guideline range 0.0005-0.015.
BOLD Concentration greater than BCWQG Aquatic Life Short-term Maximum (AW) guidelineh Standard/Guideline varies with Chloride.
SHADED Concentration greater than BCWQG Irrigation Water (IW) guideline i Conductivity guidelines varies with crop. Guideline range 700-5,000, most stringent guideline for low tolerance crops applied (strawberry, raspberry, bean and carrot.
RED Concentration greater than CSR Irrigation Watering (IW) standard
Background
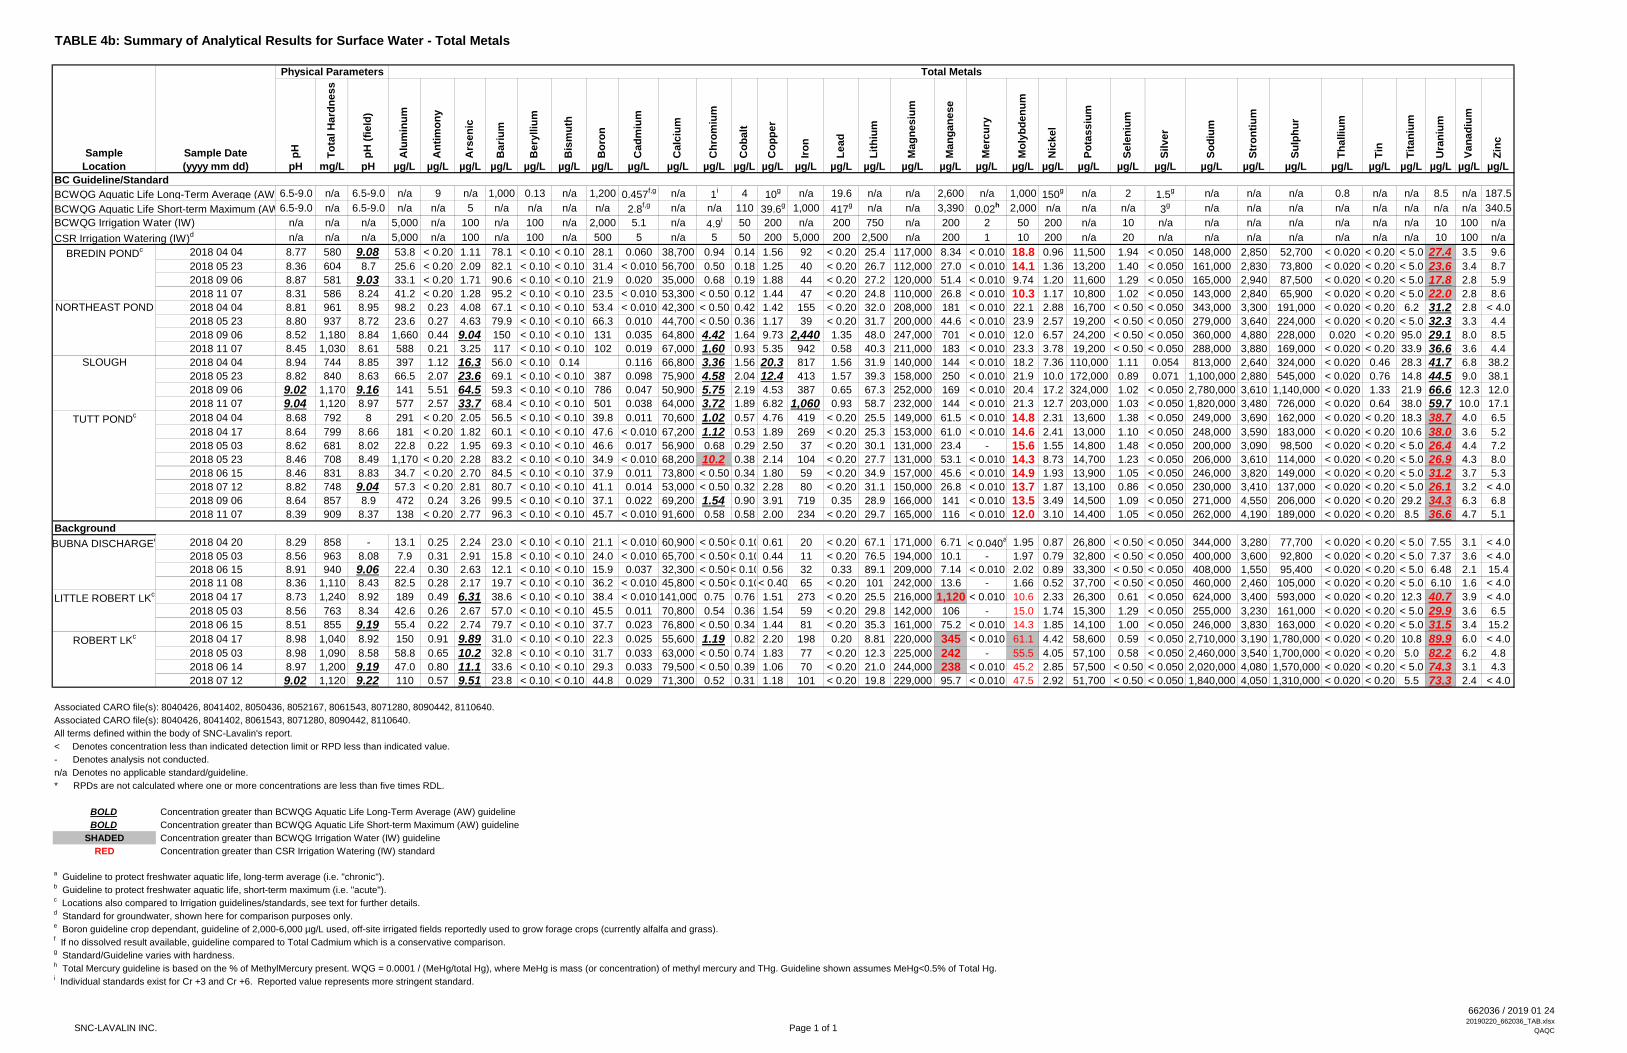
SNC-LAVALIN INC. Page 1 of 1
662036 / 2019 01 2420190220_662036_TAB.xlsx
QAQC
TABLE 4b: Summary of Analytical Results for Surface Water - Total Metals
Physical Parameters Total Metals
Sample Sample Date pH
To
tal H
ard
ne
ss
pH
(fi
eld
)
Alu
min
um
An
tim
on
y
Ars
en
ic
Ba
riu
m
Be
rylliu
m
Bis
mu
th
Bo
ron
Ca
dm
ium
Ca
lciu
m
Ch
rom
ium
Co
ba
lt
Co
pp
er
Iro
n
Le
ad
Lit
hiu
m
Ma
gn
es
ium
Ma
ng
an
es
e
Me
rcu
ry
Mo
lyb
de
nu
m
Nic
ke
l
Po
tas
siu
m
Se
len
ium
Silv
er
So
diu
m
Str
on
tiu
m
Su
lph
ur
Th
alliu
m
Tin
Tit
an
ium
Ura
niu
m
Va
na
diu
m
Zin
c
Location (yyyy mm dd) pH mg/L pH µg/L µg/L µg/L µg/L µg/L µg/L µg/L µg/L µg/L µg/L µg/L µg/L µg/L µg/L µg/L µg/L µg/L µg/L µg/L µg/L µg/L µg/L µg/L µg/L µg/L µg/L µg/L µg/L µg/L µg/L µg/L µg/L
BC Guideline/Standard
BCWQG Aquatic Life Long-Term Average (AW 6.5-9.0 n/a 6.5-9.0 n/a 9 n/a 1,000 0.13 n/a 1,200 0.457f,g n/a 1
i 4 10g n/a 19.6 n/a n/a 2,600 n/a 1,000 150
g n/a 2 1.5g n/a n/a n/a 0.8 n/a n/a 8.5 n/a 187.5
BCWQG Aquatic Life Short-term Maximum (AW6.5-9.0 n/a 6.5-9.0 n/a n/a 5 n/a n/a n/a n/a 2.8f,g n/a n/a 110 39.6
g 1,000 417g n/a n/a 3,390 0.02
h 2,000 n/a n/a n/a 3g n/a n/a n/a n/a n/a n/a n/a n/a 340.5
BCWQG Irrigation Water (IW) n/a n/a n/a 5,000 n/a 100 n/a 100 n/a 2,000 5.1 n/a 4.9i 50 200 n/a 200 750 n/a 200 2 50 200 n/a 10 n/a n/a n/a n/a n/a n/a n/a 10 100 n/a
CSR Irrigation Watering (IW)d n/a n/a n/a 5,000 n/a 100 n/a 100 n/a 500 5 n/a 5 50 200 5,000 200 2,500 n/a 200 1 10 200 n/a 20 n/a n/a n/a n/a n/a n/a n/a 10 100 n/a
BREDIN PONDc 2018 04 04 8.77 580 9.08 53.8 < 0.20 1.11 78.1 < 0.10 < 0.10 28.1 0.060 38,700 0.94 0.14 1.56 92 < 0.20 25.4 117,000 8.34 < 0.010 18.8 0.96 11,500 1.94 < 0.050 148,000 2,850 52,700 < 0.020 < 0.20 < 5.0 27.4 3.5 9.6
2018 05 23 8.36 604 8.7 25.6 < 0.20 2.09 82.1 < 0.10 < 0.10 31.4 < 0.010 56,700 0.50 0.18 1.25 40 < 0.20 26.7 112,000 27.0 < 0.010 14.1 1.36 13,200 1.40 < 0.050 161,000 2,830 73,800 < 0.020 < 0.20 < 5.0 23.6 3.4 8.7
2018 09 06 8.87 581 9.03 33.1 < 0.20 1.71 90.6 < 0.10 < 0.10 21.9 0.020 35,000 0.68 0.19 1.88 44 < 0.20 27.2 120,000 51.4 < 0.010 9.74 1.20 11,600 1.29 < 0.050 165,000 2,940 87,500 < 0.020 < 0.20 < 5.0 17.8 2.8 5.9
2018 11 07 8.31 586 8.24 41.2 < 0.20 1.28 95.2 < 0.10 < 0.10 23.5 < 0.010 53,300 < 0.50 0.12 1.44 47 < 0.20 24.8 110,000 26.8 < 0.010 10.3 1.17 10,800 1.02 < 0.050 143,000 2,840 65,900 < 0.020 < 0.20 < 5.0 22.0 2.8 8.6
NORTHEAST POND 2018 04 04 8.81 961 8.95 98.2 0.23 4.08 67.1 < 0.10 < 0.10 53.4 < 0.010 42,300 < 0.50 0.42 1.42 155 < 0.20 32.0 208,000 181 < 0.010 22.1 2.88 16,700 < 0.50 < 0.050 343,000 3,300 191,000 < 0.020 < 0.20 6.2 31.2 2.8 < 4.0
2018 05 23 8.80 937 8.72 23.6 0.27 4.63 79.9 < 0.10 < 0.10 66.3 0.010 44,700 < 0.50 0.36 1.17 39 < 0.20 31.7 200,000 44.6 < 0.010 23.9 2.57 19,200 < 0.50 < 0.050 279,000 3,640 224,000 < 0.020 < 0.20 < 5.0 32.3 3.3 4.4
2018 09 06 8.52 1,180 8.84 1,660 0.44 9.04 150 < 0.10 < 0.10 131 0.035 64,800 4.42 1.64 9.73 2,440 1.35 48.0 247,000 701 < 0.010 12.0 6.57 24,200 < 0.50 < 0.050 360,000 4,880 228,000 0.020 < 0.20 95.0 29.1 8.0 8.5
2018 11 07 8.45 1,030 8.61 588 0.21 3.25 117 < 0.10 < 0.10 102 0.019 67,000 1.60 0.93 5.35 942 0.58 40.3 211,000 183 < 0.010 23.3 3.78 19,200 < 0.50 < 0.050 288,000 3,880 169,000 < 0.020 < 0.20 33.9 36.6 3.6 4.4
SLOUGH 2018 04 04 8.94 744 8.85 397 1.12 16.3 56.0 < 0.10 0.14 0.116 66,800 3.36 1.56 20.3 817 1.56 31.9 140,000 144 < 0.010 18.2 7.36 110,000 1.11 0.054 813,000 2,640 324,000 < 0.020 0.46 28.3 41.7 6.8 38.2
2018 05 23 8.82 840 8.63 66.5 2.07 23.6 69.1 < 0.10 < 0.10 387 0.098 75,900 4.58 2.04 12.4 413 1.57 39.3 158,000 250 < 0.010 21.9 10.0 172,000 0.89 0.071 1,100,000 2,880 545,000 < 0.020 0.76 14.8 44.5 9.0 38.1
2018 09 06 9.02 1,170 9.16 141 5.51 64.5 59.3 < 0.10 < 0.10 786 0.047 50,900 5.75 2.19 4.53 387 0.65 67.3 252,000 169 < 0.010 20.4 17.2 324,000 1.02 < 0.050 2,780,000 3,610 1,140,000 < 0.020 1.33 21.9 66.6 12.3 12.0
2018 11 07 9.04 1,120 8.97 577 2.57 33.7 68.4 < 0.10 < 0.10 501 0.038 64,000 3.72 1.89 6.82 1,060 0.93 58.7 232,000 144 < 0.010 21.3 12.7 203,000 1.03 < 0.050 1,820,000 3,480 726,000 < 0.020 0.64 38.0 59.7 10.0 17.1
TUTT PONDc 2018 04 04 8.68 792 8 291 < 0.20 2.05 56.5 < 0.10 < 0.10 39.8 0.011 70,600 1.02 0.57 4.76 419 < 0.20 25.5 149,000 61.5 < 0.010 14.8 2.31 13,600 1.38 < 0.050 249,000 3,690 162,000 < 0.020 < 0.20 18.3 38.7 4.0 6.5
2018 04 17 8.64 799 8.66 181 < 0.20 1.82 60.1 < 0.10 < 0.10 47.6 < 0.010 67,200 1.12 0.53 1.89 269 < 0.20 25.3 153,000 61.0 < 0.010 14.6 2.41 13,000 1.10 < 0.050 248,000 3,590 183,000 < 0.020 < 0.20 10.6 38.0 3.6 5.2
2018 05 03 8.62 681 8.02 22.8 0.22 1.95 69.3 < 0.10 < 0.10 46.6 0.017 56,900 0.68 0.29 2.50 37 < 0.20 30.1 131,000 23.4 - 15.6 1.55 14,800 1.48 < 0.050 200,000 3,090 98,500 < 0.020 < 0.20 < 5.0 26.4 4.4 7.2
2018 05 23 8.46 708 8.49 1,170 < 0.20 2.28 83.2 < 0.10 < 0.10 34.9 < 0.010 68,200 10.2 0.38 2.14 104 < 0.20 27.7 131,000 53.1 < 0.010 14.3 8.73 14,700 1.23 < 0.050 206,000 3,610 114,000 < 0.020 < 0.20 < 5.0 26.9 4.3 8.0
2018 06 15 8.46 831 8.83 34.7 < 0.20 2.70 84.5 < 0.10 < 0.10 37.9 0.011 73,800 < 0.50 0.34 1.80 59 < 0.20 34.9 157,000 45.6 < 0.010 14.9 1.93 13,900 1.05 < 0.050 246,000 3,820 149,000 < 0.020 < 0.20 < 5.0 31.2 3.7 5.3
2018 07 12 8.82 748 9.04 57.3 < 0.20 2.81 80.7 < 0.10 < 0.10 41.1 0.014 53,000 < 0.50 0.32 2.28 80 < 0.20 31.1 150,000 26.8 < 0.010 13.7 1.87 13,100 0.86 < 0.050 230,000 3,410 137,000 < 0.020 < 0.20 < 5.0 26.1 3.2 < 4.0
2018 09 06 8.64 857 8.9 472 0.24 3.26 99.5 < 0.10 < 0.10 37.1 0.022 69,200 1.54 0.90 3.91 719 0.35 28.9 166,000 141 < 0.010 13.5 3.49 14,500 1.09 < 0.050 271,000 4,550 206,000 < 0.020 < 0.20 29.2 34.3 6.3 6.8
2018 11 07 8.39 909 8.37 138 < 0.20 2.77 96.3 < 0.10 < 0.10 45.7 < 0.010 91,600 0.58 0.58 2.00 234 < 0.20 29.7 165,000 116 < 0.010 12.0 3.10 14,400 1.05 < 0.050 262,000 4,190 189,000 < 0.020 < 0.20 8.5 36.6 4.7 5.1
Background
BUBNA DISCHARGEc 2018 04 20 8.29 858 - 13.1 0.25 2.24 23.0 < 0.10 < 0.10 21.1 < 0.010 60,900 < 0.50< 0.10 0.61 20 < 0.20 67.1 171,000 6.71 < 0.040
a 1.95 0.87 26,800 < 0.50 < 0.050 344,000 3,280 77,700 < 0.020 < 0.20 < 5.0 7.55 3.1 < 4.0
2018 05 03 8.56 963 8.08 7.9 0.31 2.91 15.8 < 0.10 < 0.10 24.0 < 0.010 65,700 < 0.50< 0.10 0.44 11 < 0.20 76.5 194,000 10.1 - 1.97 0.79 32,800 < 0.50 < 0.050 400,000 3,600 92,800 < 0.020 < 0.20 < 5.0 7.37 3.6 < 4.0
2018 06 15 8.91 940 9.06 22.4 0.30 2.63 12.1 < 0.10 < 0.10 15.9 0.037 32,300 < 0.50< 0.10 0.56 32 0.33 89.1 209,000 7.14 < 0.010 2.02 0.89 33,300 < 0.50 < 0.050 408,000 1,550 95,400 < 0.020 < 0.20 < 5.0 6.48 2.1 15.4
2018 11 08 8.36 1,110 8.43 82.5 0.28 2.17 19.7 < 0.10 < 0.10 36.2 < 0.010 45,800 < 0.50< 0.10< 0.40 65 < 0.20 101 242,000 13.6 - 1.66 0.52 37,700 < 0.50 < 0.050 460,000 2,460 105,000 < 0.020 < 0.20 < 5.0 6.10 1.6 < 4.0
LITTLE ROBERT LKc 2018 04 17 8.73 1,240 8.92 189 0.49 6.31 38.6 < 0.10 < 0.10 38.4 < 0.010 141,000 0.75 0.76 1.51 273 < 0.20 25.5 216,000 1,120 < 0.010 10.6 2.33 26,300 0.61 < 0.050 624,000 3,400 593,000 < 0.020 < 0.20 12.3 40.7 3.9 < 4.0
2018 05 03 8.56 763 8.34 42.6 0.26 2.67 57.0 < 0.10 < 0.10 45.5 0.011 70,800 0.54 0.36 1.54 59 < 0.20 29.8 142,000 106 - 15.0 1.74 15,300 1.29 < 0.050 255,000 3,230 161,000 < 0.020 < 0.20 < 5.0 29.9 3.6 6.5
2018 06 15 8.51 855 9.19 55.4 0.22 2.74 79.7 < 0.10 < 0.10 37.7 0.023 76,800 < 0.50 0.34 1.44 81 < 0.20 35.3 161,000 75.2 < 0.010 14.3 1.85 14,100 1.00 < 0.050 246,000 3,830 163,000 < 0.020 < 0.20 < 5.0 31.5 3.4 15.2
ROBERT LKc 2018 04 17 8.98 1,040 8.92 150 0.91 9.89 31.0 < 0.10 < 0.10 22.3 0.025 55,600 1.19 0.82 2.20 198 0.20 8.81 220,000 345 < 0.010 61.1 4.42 58,600 0.59 < 0.050 2,710,000 3,190 1,780,000 < 0.020 < 0.20 10.8 89.9 6.0 < 4.0
2018 05 03 8.98 1,090 8.58 58.8 0.65 10.2 32.8 < 0.10 < 0.10 31.7 0.033 63,000 < 0.50 0.74 1.83 77 < 0.20 12.3 225,000 242 - 55.5 4.05 57,100 0.58 < 0.050 2,460,000 3,540 1,700,000 < 0.020 < 0.20 5.0 82.2 6.2 4.8
2018 06 14 8.97 1,200 9.19 47.0 0.80 11.1 33.6 < 0.10 < 0.10 29.3 0.033 79,500 < 0.50 0.39 1.06 70 < 0.20 21.0 244,000 238 < 0.010 45.2 2.85 57,500 < 0.50 < 0.050 2,020,000 4,080 1,570,000 < 0.020 < 0.20 < 5.0 74.3 3.1 4.3
2018 07 12 9.02 1,120 9.22 110 0.57 9.51 23.8 < 0.10 < 0.10 44.8 0.029 71,300 0.52 0.31 1.18 101 < 0.20 19.8 229,000 95.7 < 0.010 47.5 2.92 51,700 < 0.50 < 0.050 1,840,000 4,050 1,310,000 < 0.020 < 0.20 5.5 73.3 2.4 < 4.0
Associated CARO file(s): 8040426, 8041402, 8050436, 8052167, 8061543, 8071280, 8090442, 8110640.
Associated CARO file(s): 8040426, 8041402, 8061543, 8071280, 8090442, 8110640.
All terms defined within the body of SNC-Lavalin's report.
< Denotes concentration less than indicated detection limit or RPD less than indicated value.
- Denotes analysis not conducted.
n/a Denotes no applicable standard/guideline.
* RPDs are not calculated where one or more concentrations are less than five times RDL.
BOLD Concentration greater than BCWQG Aquatic Life Long-Term Average (AW) guideline
BOLD Concentration greater than BCWQG Aquatic Life Short-term Maximum (AW) guideline
SHADED Concentration greater than BCWQG Irrigation Water (IW) guideline
RED Concentration greater than CSR Irrigation Watering (IW) standard
a Guideline to protect freshwater aquatic life, long-term average (i.e. "chronic").
b Guideline to protect freshwater aquatic life, short-term maximum (i.e. "acute").
c Locations also compared to Irrigation guidelines/standards, see text for further details.
d Standard for groundwater, shown here for comparison purposes only.
e Boron guideline crop dependant, guideline of 2,000-6,000 µg/L used, off-site irrigated fields reportedly used to grow forage crops (currently alfalfa and grass).
f If no dissolved result available, guideline compared to Total Cadmium which is a conservative comparison.
g Standard/Guideline varies with hardness.
h Total Mercury guideline is based on the % of MethylMercury present. WQG = 0.0001 / (MeHg/total Hg), where MeHg is mass (or concentration) of methyl mercury and THg. Guideline shown assumes MeHg<0.5% of Total Hg.
i Individual standards exist for Cr +3 and Cr +6. Reported value represents more stringent standard.
Appendix VII
Analytical Results for Leachate
Table 5: Summary of Analytical Results for Leachate
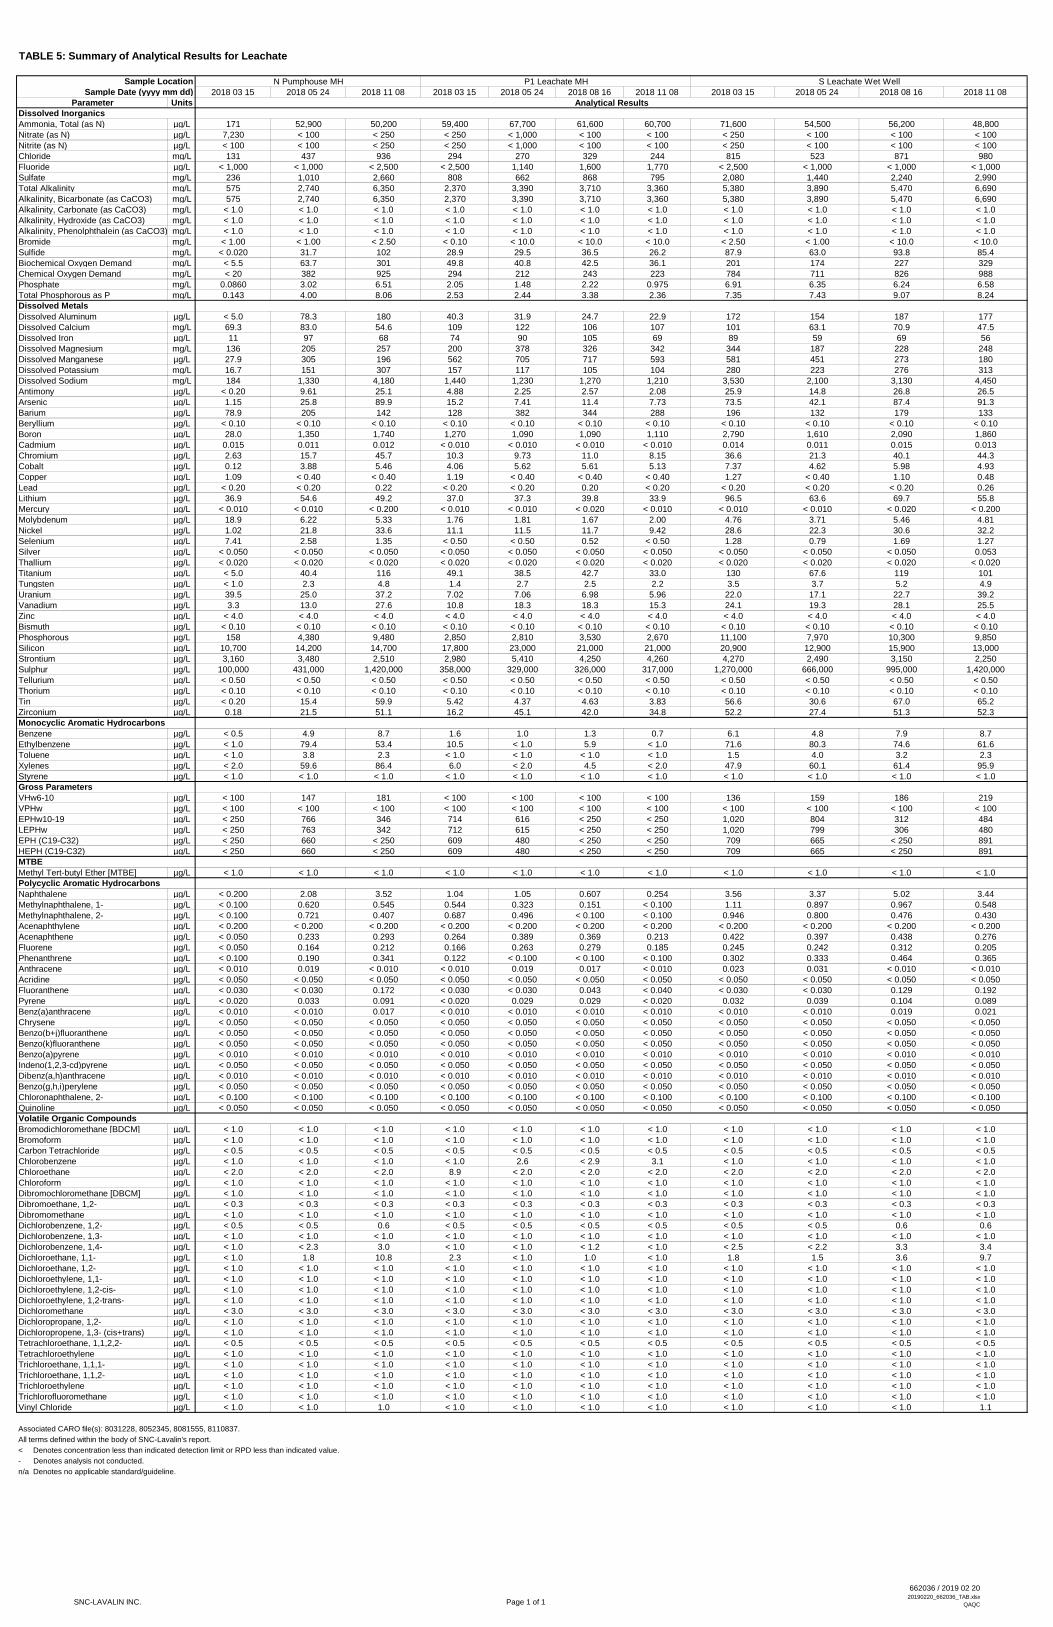
SNC-LAVALIN INC. Page 1 of 1
662036 / 2019 02 2020190220_662036_TAB.xlsx
QAQC
TABLE 5: Summary of Analytical Results for Leachate
Sample Location N Pumphouse MH P1 Leachate MH S Leachate Wet Well
Sample Date (yyyy mm dd) 2018 03 15 2018 05 24 2018 11 08 2018 03 15 2018 05 24 2018 08 16 2018 11 08 2018 03 15 2018 05 24 2018 08 16 2018 11 08
Parameter Units Analytical Results
Dissolved Inorganics
Ammonia, Total (as N) µg/L 171 52,900 50,200 59,400 67,700 61,600 60,700 71,600 54,500 56,200 48,800
Nitrate (as N) µg/L 7,230 < 100 < 250 < 250 < 1,000 < 100 < 100 < 250 < 100 < 100 < 100
Nitrite (as N) µg/L < 100 < 100 < 250 < 250 < 1,000 < 100 < 100 < 250 < 100 < 100 < 100
Chloride mg/L 131 437 936 294 270 329 244 815 523 871 980
Fluoride µg/L < 1,000 < 1,000 < 2,500 < 2,500 1,140 1,600 1,770 < 2,500 < 1,000 < 1,000 < 1,000
Sulfate mg/L 236 1,010 2,660 808 662 868 795 2,080 1,440 2,240 2,990
Total Alkalinity mg/L 575 2,740 6,350 2,370 3,390 3,710 3,360 5,380 3,890 5,470 6,690
Alkalinity, Bicarbonate (as CaCO3) mg/L 575 2,740 6,350 2,370 3,390 3,710 3,360 5,380 3,890 5,470 6,690
Alkalinity, Carbonate (as CaCO3) mg/L < 1.0 < 1.0 < 1.0 < 1.0 < 1.0 < 1.0 < 1.0 < 1.0 < 1.0 < 1.0 < 1.0
Alkalinity, Hydroxide (as CaCO3) mg/L < 1.0 < 1.0 < 1.0 < 1.0 < 1.0 < 1.0 < 1.0 < 1.0 < 1.0 < 1.0 < 1.0
Alkalinity, Phenolphthalein (as CaCO3) mg/L < 1.0 < 1.0 < 1.0 < 1.0 < 1.0 < 1.0 < 1.0 < 1.0 < 1.0 < 1.0 < 1.0
Bromide mg/L < 1.00 < 1.00 < 2.50 < 0.10 < 10.0 < 10.0 < 10.0 < 2.50 < 1.00 < 10.0 < 10.0
Sulfide mg/L < 0.020 31.7 102 28.9 29.5 36.5 26.2 87.9 63.0 93.8 85.4
Biochemical Oxygen Demand mg/L < 5.5 63.7 301 49.8 40.8 42.5 36.1 201 174 227 329
Chemical Oxygen Demand mg/L < 20 382 925 294 212 243 223 784 711 826 988
Phosphate mg/L 0.0860 3.02 6.51 2.05 1.48 2.22 0.975 6.91 6.35 6.24 6.58
Total Phosphorous as P mg/L 0.143 4.00 8.06 2.53 2.44 3.38 2.36 7.35 7.43 9.07 8.24
Dissolved Metals
Dissolved Aluminum µg/L < 5.0 78.3 180 40.3 31.9 24.7 22.9 172 154 187 177
Dissolved Calcium mg/L 69.3 83.0 54.6 109 122 106 107 101 63.1 70.9 47.5
Dissolved Iron µg/L 11 97 68 74 90 105 69 89 59 69 56
Dissolved Magnesium mg/L 136 205 257 200 378 326 342 344 187 228 248
Dissolved Manganese µg/L 27.9 305 196 562 705 717 593 581 451 273 180
Dissolved Potassium mg/L 16.7 151 307 157 117 105 104 280 223 276 313
Dissolved Sodium mg/L 184 1,330 4,180 1,440 1,230 1,270 1,210 3,530 2,100 3,130 4,450
Antimony µg/L < 0.20 9.61 25.1 4.88 2.25 2.57 2.08 25.9 14.8 26.8 26.5
Arsenic µg/L 1.15 25.8 89.9 15.2 7.41 11.4 7.73 73.5 42.1 87.4 91.3
Barium µg/L 78.9 205 142 128 382 344 288 196 132 179 133
Beryllium µg/L < 0.10 < 0.10 < 0.10 < 0.10 < 0.10 < 0.10 < 0.10 < 0.10 < 0.10 < 0.10 < 0.10
Boron µg/L 28.0 1,350 1,740 1,270 1,090 1,090 1,110 2,790 1,610 2,090 1,860
Cadmium µg/L 0.015 0.011 0.012 < 0.010 < 0.010 < 0.010 < 0.010 0.014 0.011 0.015 0.013
Chromium µg/L 2.63 15.7 45.7 10.3 9.73 11.0 8.15 36.6 21.3 40.1 44.3
Cobalt µg/L 0.12 3.88 5.46 4.06 5.62 5.61 5.13 7.37 4.62 5.98 4.93
Copper µg/L 1.09 < 0.40 < 0.40 1.19 < 0.40 < 0.40 < 0.40 1.27 < 0.40 1.10 0.48
Lead µg/L < 0.20 < 0.20 0.22 < 0.20 < 0.20 0.20 < 0.20 < 0.20 < 0.20 < 0.20 0.26
Lithium µg/L 36.9 54.6 49.2 37.0 37.3 39.8 33.9 96.5 63.6 69.7 55.8
Mercury µg/L < 0.010 < 0.010 < 0.200 < 0.010 < 0.010 < 0.020 < 0.010 < 0.010 < 0.010 < 0.020 < 0.200
Molybdenum µg/L 18.9 6.22 5.33 1.76 1.81 1.67 2.00 4.76 3.71 5.46 4.81
Nickel µg/L 1.02 21.8 33.6 11.1 11.5 11.7 9.42 28.6 22.3 30.6 32.2
Selenium µg/L 7.41 2.58 1.35 < 0.50 < 0.50 0.52 < 0.50 1.28 0.79 1.69 1.27
Silver µg/L < 0.050 < 0.050 < 0.050 < 0.050 < 0.050 < 0.050 < 0.050 < 0.050 < 0.050 < 0.050 0.053
Thallium µg/L < 0.020 < 0.020 < 0.020 < 0.020 < 0.020 < 0.020 < 0.020 < 0.020 < 0.020 < 0.020 < 0.020
Titanium µg/L < 5.0 40.4 116 49.1 38.5 42.7 33.0 130 67.6 119 101
Tungsten µg/L < 1.0 2.3 4.8 1.4 2.7 2.5 2.2 3.5 3.7 5.2 4.9
Uranium µg/L 39.5 25.0 37.2 7.02 7.06 6.98 5.96 22.0 17.1 22.7 39.2
Vanadium µg/L 3.3 13.0 27.6 10.8 18.3 18.3 15.3 24.1 19.3 28.1 25.5
Zinc µg/L < 4.0 < 4.0 < 4.0 < 4.0 < 4.0 < 4.0 < 4.0 < 4.0 < 4.0 < 4.0 < 4.0
Bismuth µg/L < 0.10 < 0.10 < 0.10 < 0.10 < 0.10 < 0.10 < 0.10 < 0.10 < 0.10 < 0.10 < 0.10
Phosphorous µg/L 158 4,380 9,480 2,850 2,810 3,530 2,670 11,100 7,970 10,300 9,850
Silicon µg/L 10,700 14,200 14,700 17,800 23,000 21,000 21,000 20,900 12,900 15,900 13,000
Strontium µg/L 3,160 3,480 2,510 2,980 5,410 4,250 4,260 4,270 2,490 3,150 2,250
Sulphur µg/L 100,000 431,000 1,420,000 358,000 329,000 326,000 317,000 1,270,000 666,000 995,000 1,420,000
Tellurium µg/L < 0.50 < 0.50 < 0.50 < 0.50 < 0.50 < 0.50 < 0.50 < 0.50 < 0.50 < 0.50 < 0.50
Thorium µg/L < 0.10 < 0.10 < 0.10 < 0.10 < 0.10 < 0.10 < 0.10 < 0.10 < 0.10 < 0.10 < 0.10
Tin µg/L < 0.20 15.4 59.9 5.42 4.37 4.63 3.83 56.6 30.6 67.0 65.2
Zirconium µg/L 0.18 21.5 51.1 16.2 45.1 42.0 34.8 52.2 27.4 51.3 52.3
Monocyclic Aromatic Hydrocarbons
Benzene µg/L < 0.5 4.9 8.7 1.6 1.0 1.3 0.7 6.1 4.8 7.9 8.7
Ethylbenzene µg/L < 1.0 79.4 53.4 10.5 < 1.0 5.9 < 1.0 71.6 80.3 74.6 61.6
Toluene µg/L < 1.0 3.8 2.3 < 1.0 < 1.0 < 1.0 < 1.0 1.5 4.0 3.2 2.3
Xylenes µg/L < 2.0 59.6 86.4 6.0 < 2.0 4.5 < 2.0 47.9 60.1 61.4 95.9
Styrene µg/L < 1.0 < 1.0 < 1.0 < 1.0 < 1.0 < 1.0 < 1.0 < 1.0 < 1.0 < 1.0 < 1.0
Gross Parameters
VHw6-10 µg/L < 100 147 181 < 100 < 100 < 100 < 100 136 159 186 219
VPHw µg/L < 100 < 100 < 100 < 100 < 100 < 100 < 100 < 100 < 100 < 100 < 100
EPHw10-19 µg/L < 250 766 346 714 616 < 250 < 250 1,020 804 312 484
LEPHw µg/L < 250 763 342 712 615 < 250 < 250 1,020 799 306 480
EPH (C19-C32) µg/L < 250 660 < 250 609 480 < 250 < 250 709 665 < 250 891
HEPH (C19-C32) µg/L < 250 660 < 250 609 480 < 250 < 250 709 665 < 250 891
MTBE
Methyl Tert-butyl Ether [MTBE] µg/L < 1.0 < 1.0 < 1.0 < 1.0 < 1.0 < 1.0 < 1.0 < 1.0 < 1.0 < 1.0 < 1.0
Polycyclic Aromatic Hydrocarbons
Naphthalene µg/L < 0.200 2.08 3.52 1.04 1.05 0.607 0.254 3.56 3.37 5.02 3.44
Methylnaphthalene, 1- µg/L < 0.100 0.620 0.545 0.544 0.323 0.151 < 0.100 1.11 0.897 0.967 0.548
Methylnaphthalene, 2- µg/L < 0.100 0.721 0.407 0.687 0.496 < 0.100 < 0.100 0.946 0.800 0.476 0.430
Acenaphthylene µg/L < 0.200 < 0.200 < 0.200 < 0.200 < 0.200 < 0.200 < 0.200 < 0.200 < 0.200 < 0.200 < 0.200
Acenaphthene µg/L < 0.050 0.233 0.293 0.264 0.389 0.369 0.213 0.422 0.397 0.438 0.276
Fluorene µg/L < 0.050 0.164 0.212 0.166 0.263 0.279 0.185 0.245 0.242 0.312 0.205
Phenanthrene µg/L < 0.100 0.190 0.341 0.122 < 0.100 < 0.100 < 0.100 0.302 0.333 0.464 0.365
Anthracene µg/L < 0.010 0.019 < 0.010 < 0.010 0.019 0.017 < 0.010 0.023 0.031 < 0.010 < 0.010
Acridine µg/L < 0.050 < 0.050 < 0.050 < 0.050 < 0.050 < 0.050 < 0.050 < 0.050 < 0.050 < 0.050 < 0.050
Fluoranthene µg/L < 0.030 < 0.030 0.172 < 0.030 < 0.030 0.043 < 0.040 < 0.030 < 0.030 0.129 0.192
Pyrene µg/L < 0.020 0.033 0.091 < 0.020 0.029 0.029 < 0.020 0.032 0.039 0.104 0.089
Benz(a)anthracene µg/L < 0.010 < 0.010 0.017 < 0.010 < 0.010 < 0.010 < 0.010 < 0.010 < 0.010 0.019 0.021
Chrysene µg/L < 0.050 < 0.050 < 0.050 < 0.050 < 0.050 < 0.050 < 0.050 < 0.050 < 0.050 < 0.050 < 0.050
Benzo(b+j)fluoranthene µg/L < 0.050 < 0.050 < 0.050 < 0.050 < 0.050 < 0.050 < 0.050 < 0.050 < 0.050 < 0.050 < 0.050
Benzo(k)fluoranthene µg/L < 0.050 < 0.050 < 0.050 < 0.050 < 0.050 < 0.050 < 0.050 < 0.050 < 0.050 < 0.050 < 0.050
Benzo(a)pyrene µg/L < 0.010 < 0.010 < 0.010 < 0.010 < 0.010 < 0.010 < 0.010 < 0.010 < 0.010 < 0.010 < 0.010
Indeno(1,2,3-cd)pyrene µg/L < 0.050 < 0.050 < 0.050 < 0.050 < 0.050 < 0.050 < 0.050 < 0.050 < 0.050 < 0.050 < 0.050
Dibenz(a,h)anthracene µg/L < 0.010 < 0.010 < 0.010 < 0.010 < 0.010 < 0.010 < 0.010 < 0.010 < 0.010 < 0.010 < 0.010
Benzo(g,h,i)perylene µg/L < 0.050 < 0.050 < 0.050 < 0.050 < 0.050 < 0.050 < 0.050 < 0.050 < 0.050 < 0.050 < 0.050
Chloronaphthalene, 2- µg/L < 0.100 < 0.100 < 0.100 < 0.100 < 0.100 < 0.100 < 0.100 < 0.100 < 0.100 < 0.100 < 0.100
Quinoline µg/L < 0.050 < 0.050 < 0.050 < 0.050 < 0.050 < 0.050 < 0.050 < 0.050 < 0.050 < 0.050 < 0.050
Volatile Organic Compounds
Bromodichloromethane [BDCM] µg/L < 1.0 < 1.0 < 1.0 < 1.0 < 1.0 < 1.0 < 1.0 < 1.0 < 1.0 < 1.0 < 1.0
Bromoform µg/L < 1.0 < 1.0 < 1.0 < 1.0 < 1.0 < 1.0 < 1.0 < 1.0 < 1.0 < 1.0 < 1.0
Carbon Tetrachloride µg/L < 0.5 < 0.5 < 0.5 < 0.5 < 0.5 < 0.5 < 0.5 < 0.5 < 0.5 < 0.5 < 0.5
Chlorobenzene µg/L < 1.0 < 1.0 < 1.0 < 1.0 2.6 < 2.9 3.1 < 1.0 < 1.0 < 1.0 < 1.0
Chloroethane µg/L < 2.0 < 2.0 < 2.0 8.9 < 2.0 < 2.0 < 2.0 < 2.0 < 2.0 < 2.0 < 2.0
Chloroform µg/L < 1.0 < 1.0 < 1.0 < 1.0 < 1.0 < 1.0 < 1.0 < 1.0 < 1.0 < 1.0 < 1.0
Dibromochloromethane [DBCM] µg/L < 1.0 < 1.0 < 1.0 < 1.0 < 1.0 < 1.0 < 1.0 < 1.0 < 1.0 < 1.0 < 1.0
Dibromoethane, 1,2- µg/L < 0.3 < 0.3 < 0.3 < 0.3 < 0.3 < 0.3 < 0.3 < 0.3 < 0.3 < 0.3 < 0.3
Dibromomethane µg/L < 1.0 < 1.0 < 1.0 < 1.0 < 1.0 < 1.0 < 1.0 < 1.0 < 1.0 < 1.0 < 1.0
Dichlorobenzene, 1,2- µg/L < 0.5 < 0.5 0.6 < 0.5 < 0.5 < 0.5 < 0.5 < 0.5 < 0.5 0.6 0.6
Dichlorobenzene, 1,3- µg/L < 1.0 < 1.0 < 1.0 < 1.0 < 1.0 < 1.0 < 1.0 < 1.0 < 1.0 < 1.0 < 1.0
Dichlorobenzene, 1,4- µg/L < 1.0 < 2.3 3.0 < 1.0 < 1.0 < 1.2 < 1.0 < 2.5 < 2.2 3.3 3.4
Dichloroethane, 1,1- µg/L < 1.0 1.8 10.8 2.3 < 1.0 1.0 < 1.0 1.8 1.5 3.6 9.7
Dichloroethane, 1,2- µg/L < 1.0 < 1.0 < 1.0 < 1.0 < 1.0 < 1.0 < 1.0 < 1.0 < 1.0 < 1.0 < 1.0
Dichloroethylene, 1,1- µg/L < 1.0 < 1.0 < 1.0 < 1.0 < 1.0 < 1.0 < 1.0 < 1.0 < 1.0 < 1.0 < 1.0
Dichloroethylene, 1,2-cis- µg/L < 1.0 < 1.0 < 1.0 < 1.0 < 1.0 < 1.0 < 1.0 < 1.0 < 1.0 < 1.0 < 1.0
Dichloroethylene, 1,2-trans- µg/L < 1.0 < 1.0 < 1.0 < 1.0 < 1.0 < 1.0 < 1.0 < 1.0 < 1.0 < 1.0 < 1.0
Dichloromethane µg/L < 3.0 < 3.0 < 3.0 < 3.0 < 3.0 < 3.0 < 3.0 < 3.0 < 3.0 < 3.0 < 3.0
Dichloropropane, 1,2- µg/L < 1.0 < 1.0 < 1.0 < 1.0 < 1.0 < 1.0 < 1.0 < 1.0 < 1.0 < 1.0 < 1.0
Dichloropropene, 1,3- (cis+trans) µg/L < 1.0 < 1.0 < 1.0 < 1.0 < 1.0 < 1.0 < 1.0 < 1.0 < 1.0 < 1.0 < 1.0
Tetrachloroethane, 1,1,2,2- µg/L < 0.5 < 0.5 < 0.5 < 0.5 < 0.5 < 0.5 < 0.5 < 0.5 < 0.5 < 0.5 < 0.5
Tetrachloroethylene µg/L < 1.0 < 1.0 < 1.0 < 1.0 < 1.0 < 1.0 < 1.0 < 1.0 < 1.0 < 1.0 < 1.0
Trichloroethane, 1,1,1- µg/L < 1.0 < 1.0 < 1.0 < 1.0 < 1.0 < 1.0 < 1.0 < 1.0 < 1.0 < 1.0 < 1.0
Trichloroethane, 1,1,2- µg/L < 1.0 < 1.0 < 1.0 < 1.0 < 1.0 < 1.0 < 1.0 < 1.0 < 1.0 < 1.0 < 1.0
Trichloroethylene µg/L < 1.0 < 1.0 < 1.0 < 1.0 < 1.0 < 1.0 < 1.0 < 1.0 < 1.0 < 1.0 < 1.0
Trichlorofluoromethane µg/L < 1.0 < 1.0 < 1.0 < 1.0 < 1.0 < 1.0 < 1.0 < 1.0 < 1.0 < 1.0 < 1.0
Vinyl Chloride µg/L < 1.0 < 1.0 1.0 < 1.0 < 1.0 < 1.0 < 1.0 < 1.0 < 1.0 < 1.0 1.1
Associated CARO file(s): 8031228, 8052345, 8081555, 8110837.
All terms defined within the body of SNC-Lavalin's report.
< Denotes concentration less than indicated detection limit or RPD less than indicated value.
- Denotes analysis not conducted.
n/a Denotes no applicable standard/guideline.
SNC-Lavalin Inc.
Suite 100 - 1358 St. Paul Street
Kelowna, British Columbia, Canada V1Y 2E1
250.861.9070 604.515.5150
www.snclavalin.com
ATTACHMENT 2
2018 LANDFILL GAS
COLLECTION EFFICIENCY
STUDY – GLENMORE
LANDFILL SITE, Jacobs,
(March 14, 2019)
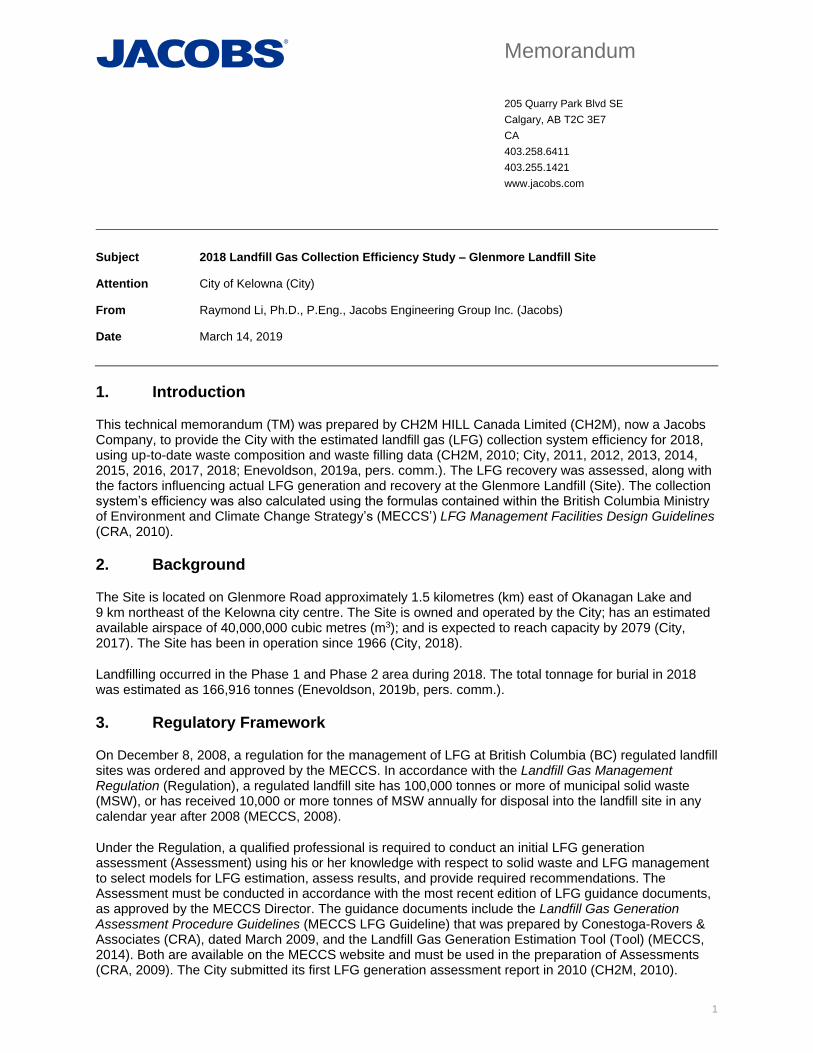
Memorandum
205 Quarry Park Blvd SE
Calgary, AB T2C 3E7
CA
403.258.6411
403.255.1421
www.jacobs.com
1
Subject 2018 Landfill Gas Collection Efficiency Study – Glenmore Landfill Site
Attention City of Kelowna (City)
From Raymond Li, Ph.D., P.Eng., Jacobs Engineering Group Inc. (Jacobs)
Date March 14, 2019
1. Introduction
This technical memorandum (TM) was prepared by CH2M HILL Canada Limited (CH2M), now a Jacobs Company, to provide the City with the estimated landfill gas (LFG) collection system efficiency for 2018, using up-to-date waste composition and waste filling data (CH2M, 2010; City, 2011, 2012, 2013, 2014, 2015, 2016, 2017, 2018; Enevoldson, 2019a, pers. comm.). The LFG recovery was assessed, along with the factors influencing actual LFG generation and recovery at the Glenmore Landfill (Site). The collection system’s efficiency was also calculated using the formulas contained within the British Columbia Ministry of Environment and Climate Change Strategy’s (MECCS’) LFG Management Facilities Design Guidelines (CRA, 2010).
2. Background
The Site is located on Glenmore Road approximately 1.5 kilometres (km) east of Okanagan Lake and 9 km northeast of the Kelowna city centre. The Site is owned and operated by the City; has an estimated available airspace of 40,000,000 cubic metres (m3); and is expected to reach capacity by 2079 (City, 2017). The Site has been in operation since 1966 (City, 2018).
Landfilling occurred in the Phase 1 and Phase 2 area during 2018. The total tonnage for burial in 2018 was estimated as 166,916 tonnes (Enevoldson, 2019b, pers. comm.).
3. Regulatory Framework
On December 8, 2008, a regulation for the management of LFG at British Columbia (BC) regulated landfill sites was ordered and approved by the MECCS. In accordance with the Landfill Gas Management Regulation (Regulation), a regulated landfill site has 100,000 tonnes or more of municipal solid waste (MSW), or has received 10,000 or more tonnes of MSW annually for disposal into the landfill site in any calendar year after 2008 (MECCS, 2008).
Under the Regulation, a qualified professional is required to conduct an initial LFG generation assessment (Assessment) using his or her knowledge with respect to solid waste and LFG management to select models for LFG estimation, assess results, and provide required recommendations. The Assessment must be conducted in accordance with the most recent edition of LFG guidance documents, as approved by the MECCS Director. The guidance documents include the Landfill Gas Generation Assessment Procedure Guidelines (MECCS LFG Guideline) that was prepared by Conestoga-Rovers & Associates (CRA), dated March 2009, and the Landfill Gas Generation Estimation Tool (Tool) (MECCS, 2014). Both are available on the MECCS website and must be used in the preparation of Assessments (CRA, 2009). The City submitted its first LFG generation assessment report in 2010 (CH2M, 2010).
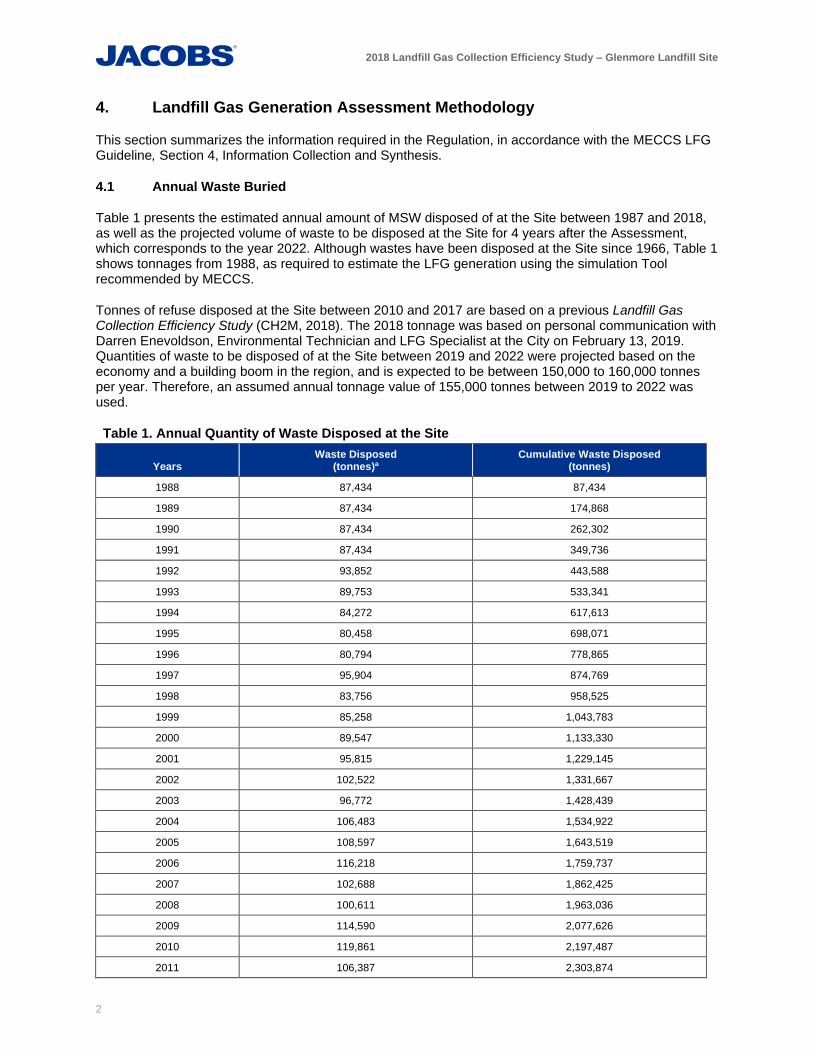
2018 Landfill Gas Collection Efficiency Study – Glenmore Landfill Site
2
4. Landfill Gas Generation Assessment Methodology
This section summarizes the information required in the Regulation, in accordance with the MECCS LFG Guideline, Section 4, Information Collection and Synthesis.
4.1 Annual Waste Buried
Table 1 presents the estimated annual amount of MSW disposed of at the Site between 1987 and 2018, as well as the projected volume of waste to be disposed at the Site for 4 years after the Assessment, which corresponds to the year 2022. Although wastes have been disposed at the Site since 1966, Table 1 shows tonnages from 1988, as required to estimate the LFG generation using the simulation Tool recommended by MECCS.
Tonnes of refuse disposed at the Site between 2010 and 2017 are based on a previous Landfill Gas Collection Efficiency Study (CH2M, 2018). The 2018 tonnage was based on personal communication with Darren Enevoldson, Environmental Technician and LFG Specialist at the City on February 13, 2019. Quantities of waste to be disposed of at the Site between 2019 and 2022 were projected based on the economy and a building boom in the region, and is expected to be between 150,000 to 160,000 tonnes per year. Therefore, an assumed annual tonnage value of 155,000 tonnes between 2019 to 2022 was used.
Table 1. Annual Quantity of Waste Disposed at the Site
Years Waste Disposed
(tonnes)a Cumulative Waste Disposed
(tonnes)
1988 87,434 87,434
1989 87,434 174,868
1990 87,434 262,302
1991 87,434 349,736
1992 93,852 443,588
1993 89,753 533,341
1994 84,272 617,613
1995 80,458 698,071
1996 80,794 778,865
1997 95,904 874,769
1998 83,756 958,525
1999 85,258 1,043,783
2000 89,547 1,133,330
2001 95,815 1,229,145
2002 102,522 1,331,667
2003 96,772 1,428,439
2004 106,483 1,534,922
2005 108,597 1,643,519
2006 116,218 1,759,737
2007 102,688 1,862,425
2008 100,611 1,963,036
2009 114,590 2,077,626
2010 119,861 2,197,487
2011 106,387 2,303,874
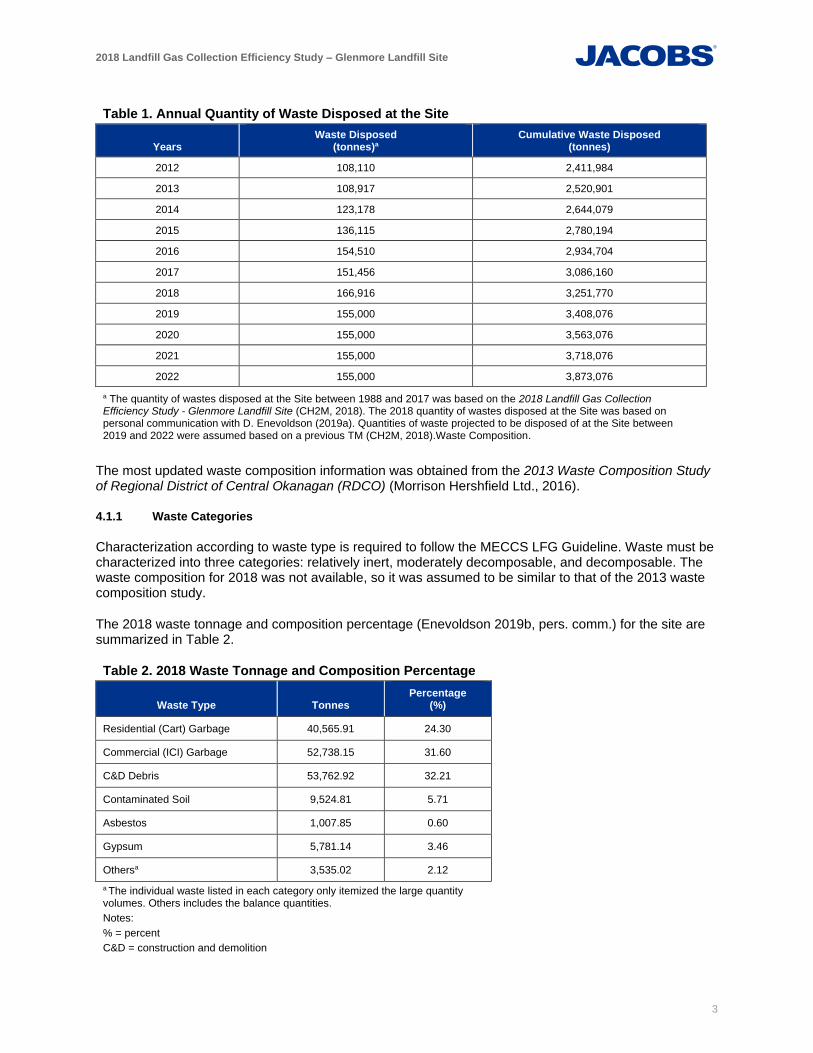
2018 Landfill Gas Collection Efficiency Study – Glenmore Landfill Site
3
Table 1. Annual Quantity of Waste Disposed at the Site
Years Waste Disposed
(tonnes)a Cumulative Waste Disposed
(tonnes)
2012 108,110 2,411,984
2013 108,917 2,520,901
2014 123,178 2,644,079
2015 136,115 2,780,194
2016 154,510 2,934,704
2017 151,456 3,086,160
2018 166,916 3,251,770
2019 155,000 3,408,076
2020 155,000 3,563,076
2021 155,000 3,718,076
2022 155,000 3,873,076
a The quantity of wastes disposed at the Site between 1988 and 2017 was based on the 2018 Landfill Gas Collection Efficiency Study - Glenmore Landfill Site (CH2M, 2018). The 2018 quantity of wastes disposed at the Site was based on personal communication with D. Enevoldson (2019a). Quantities of waste projected to be disposed of at the Site between 2019 and 2022 were assumed based on a previous TM (CH2M, 2018).Waste Composition.
The most updated waste composition information was obtained from the 2013 Waste Composition Study of Regional District of Central Okanagan (RDCO) (Morrison Hershfield Ltd., 2016).
4.1.1 Waste Categories
Characterization according to waste type is required to follow the MECCS LFG Guideline. Waste must be characterized into three categories: relatively inert, moderately decomposable, and decomposable. The waste composition for 2018 was not available, so it was assumed to be similar to that of the 2013 waste composition study.
The 2018 waste tonnage and composition percentage (Enevoldson 2019b, pers. comm.) for the site are summarized in Table 2.
Table 2. 2018 Waste Tonnage and Composition Percentage
Waste Type Tonnes Percentage
(%)
Residential (Cart) Garbage 40,565.91 24.30
Commercial (ICI) Garbage 52,738.15 31.60
C&D Debris 53,762.92 32.21
Contaminated Soil 9,524.81 5.71
Asbestos 1,007.85 0.60
Gypsum 5,781.14 3.46
Othersa 3,535.02 2.12
a The individual waste listed in each category only itemized the large quantity volumes. Others includes the balance quantities.
Notes:
% = percent
C&D = construction and demolition
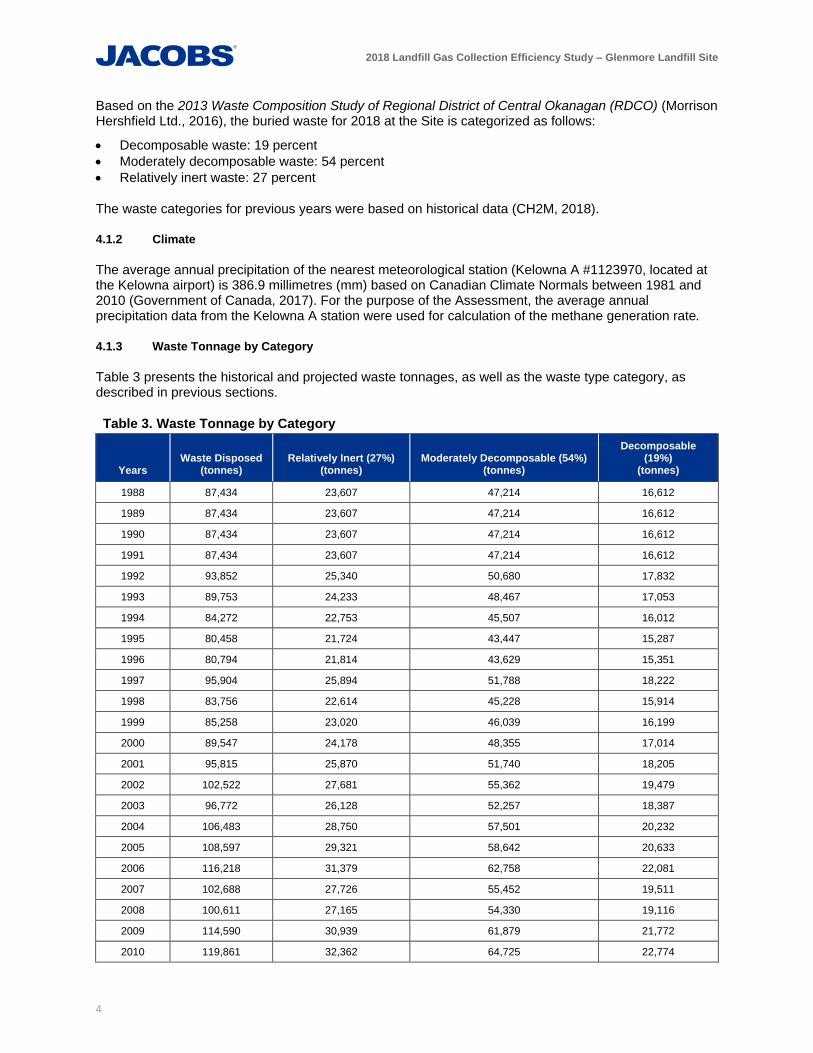
2018 Landfill Gas Collection Efficiency Study – Glenmore Landfill Site
4
Based on the 2013 Waste Composition Study of Regional District of Central Okanagan (RDCO) (Morrison Hershfield Ltd., 2016), the buried waste for 2018 at the Site is categorized as follows:
• Decomposable waste: 19 percent
• Moderately decomposable waste: 54 percent
• Relatively inert waste: 27 percent
The waste categories for previous years were based on historical data (CH2M, 2018).
4.1.2 Climate
The average annual precipitation of the nearest meteorological station (Kelowna A #1123970, located at the Kelowna airport) is 386.9 millimetres (mm) based on Canadian Climate Normals between 1981 and 2010 (Government of Canada, 2017). For the purpose of the Assessment, the average annual precipitation data from the Kelowna A station were used for calculation of the methane generation rate.
4.1.3 Waste Tonnage by Category
Table 3 presents the historical and projected waste tonnages, as well as the waste type category, as described in previous sections.
Table 3. Waste Tonnage by Category
Years Waste Disposed
(tonnes) Relatively Inert (27%)
(tonnes) Moderately Decomposable (54%)
(tonnes)
Decomposable (19%)
(tonnes)
1988 87,434 23,607 47,214 16,612
1989 87,434 23,607 47,214 16,612
1990 87,434 23,607 47,214 16,612
1991 87,434 23,607 47,214 16,612
1992 93,852 25,340 50,680 17,832
1993 89,753 24,233 48,467 17,053
1994 84,272 22,753 45,507 16,012
1995 80,458 21,724 43,447 15,287
1996 80,794 21,814 43,629 15,351
1997 95,904 25,894 51,788 18,222
1998 83,756 22,614 45,228 15,914
1999 85,258 23,020 46,039 16,199
2000 89,547 24,178 48,355 17,014
2001 95,815 25,870 51,740 18,205
2002 102,522 27,681 55,362 19,479
2003 96,772 26,128 52,257 18,387
2004 106,483 28,750 57,501 20,232
2005 108,597 29,321 58,642 20,633
2006 116,218 31,379 62,758 22,081
2007 102,688 27,726 55,452 19,511
2008 100,611 27,165 54,330 19,116
2009 114,590 30,939 61,879 21,772
2010 119,861 32,362 64,725 22,774
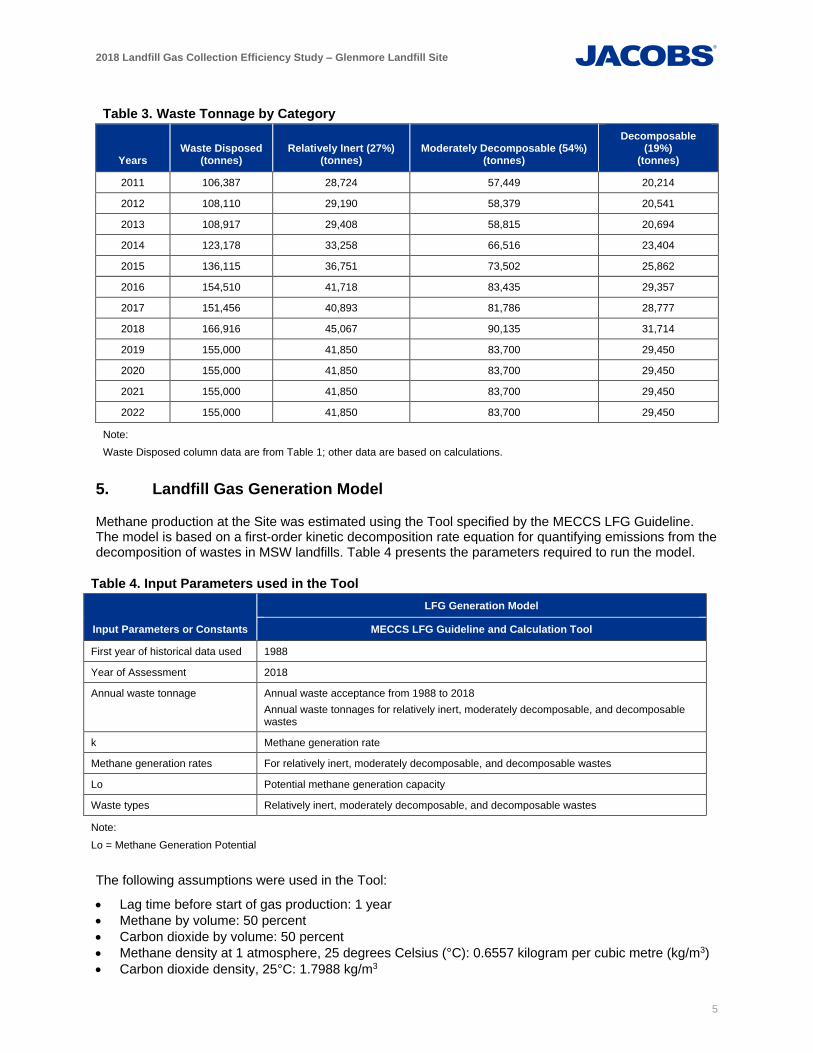
2018 Landfill Gas Collection Efficiency Study – Glenmore Landfill Site
5
Table 3. Waste Tonnage by Category
Years Waste Disposed
(tonnes) Relatively Inert (27%)
(tonnes) Moderately Decomposable (54%)
(tonnes)
Decomposable (19%)
(tonnes)
2011 106,387 28,724 57,449 20,214
2012 108,110 29,190 58,379 20,541
2013 108,917 29,408 58,815 20,694
2014 123,178 33,258 66,516 23,404
2015 136,115 36,751 73,502 25,862
2016 154,510 41,718 83,435 29,357
2017 151,456 40,893 81,786 28,777
2018 166,916 45,067 90,135 31,714
2019 155,000 41,850 83,700 29,450
2020 155,000 41,850 83,700 29,450
2021 155,000 41,850 83,700 29,450
2022 155,000 41,850 83,700 29,450
Note:
Waste Disposed column data are from Table 1; other data are based on calculations.
5. Landfill Gas Generation Model
Methane production at the Site was estimated using the Tool specified by the MECCS LFG Guideline. The model is based on a first-order kinetic decomposition rate equation for quantifying emissions from the decomposition of wastes in MSW landfills. Table 4 presents the parameters required to run the model.
Table 4. Input Parameters used in the Tool
Input Parameters or Constants
LFG Generation Model
MECCS LFG Guideline and Calculation Tool
First year of historical data used 1988
Year of Assessment 2018
Annual waste tonnage Annual waste acceptance from 1988 to 2018
Annual waste tonnages for relatively inert, moderately decomposable, and decomposable wastes
k Methane generation rate
Methane generation rates For relatively inert, moderately decomposable, and decomposable wastes
Lo Potential methane generation capacity
Waste types Relatively inert, moderately decomposable, and decomposable wastes
Note:
Lo = Methane Generation Potential
The following assumptions were used in the Tool:
• Lag time before start of gas production: 1 year
• Methane by volume: 50 percent
• Carbon dioxide by volume: 50 percent
• Methane density at 1 atmosphere, 25 degrees Celsius (°C): 0.6557 kilogram per cubic metre (kg/m3)
• Carbon dioxide density, 25°C: 1.7988 kg/m3

2018 Landfill Gas Collection Efficiency Study – Glenmore Landfill Site
6
5.1 Model Input Parameters Used and Justification
5.1.1 Methane Generation Rate
Input parameters used for the constant, k, are based on the MECCS LFG Guideline, Table 5.2 (CRA, 2009).
According to the annual precipitation (386.9 mm, as mentioned in Section 3.3), the model input k-values for this site are as follows:
• 0.01/year (y) for relatively inert waste
• 0.02/y for moderately decomposable waste
• 0.05/y for decomposable waste
However, the National Inventory Report 1990-2011: Greenhouse Gas Sources and Sinks in Canada (NIR) (ECCC, 2013) adopted a new methodology in 2011, which uses a new formula to calculate average k-value from precipitation. No further revision on this methodology was found in the current edition of the NIR (ECCC, 2016). With the new NIR methodology, the average k-value for the precipitation of 386.9 mm is 0.010. Proportionally, the new k-value for each category is as follows:
• 0.00375/y for relatively inert waste
• 0.00750/y for moderately decomposable waste
• 0.01875/y for decomposable waste
5.1.2 Methane Generation Potential (Lo)
The input parameters used for the Lo-value are based on the MECCS LFG Guideline, Table 5.1 (CRA, 2009). For this Site, the model uses the following Lo-values:
• 20 m3 methane per metric tonne of waste for relatively inert waste
• 120 m3 methane per metric tonne of waste for moderately decomposable waste
• 160 m3 methane per metric tonne of waste for decomposable waste
According to the MECCS LFG Guideline, Section 5.4, the selected k-value should be corrected based on the landfill’s operations and maintenance practices, including stormwater management, cover properties, and the extent of leachate recirculation or stormwater injection. Based on Tables 5.3 and 5.4 of the MECCS LFG Guideline, the water addition factor appropriate for the Site conditions in 2018 is 1.0. The reasons are as follows:
• There is partial infiltration of stormwater into the waste.
• There has been 410 m3 of leachate recirculating into the waste during 2018 (Enevoldson, 2019b, pers. comm.).
6. Landfill Gas Model Results
This section presents the results of the updated Assessment, in accordance with the Regulation and the MECCS LFG Guideline, Section 7, Landfill Generation Assessment Reporting. Table 5 presents the updated annual methane production using the Tool (Attachment 1).
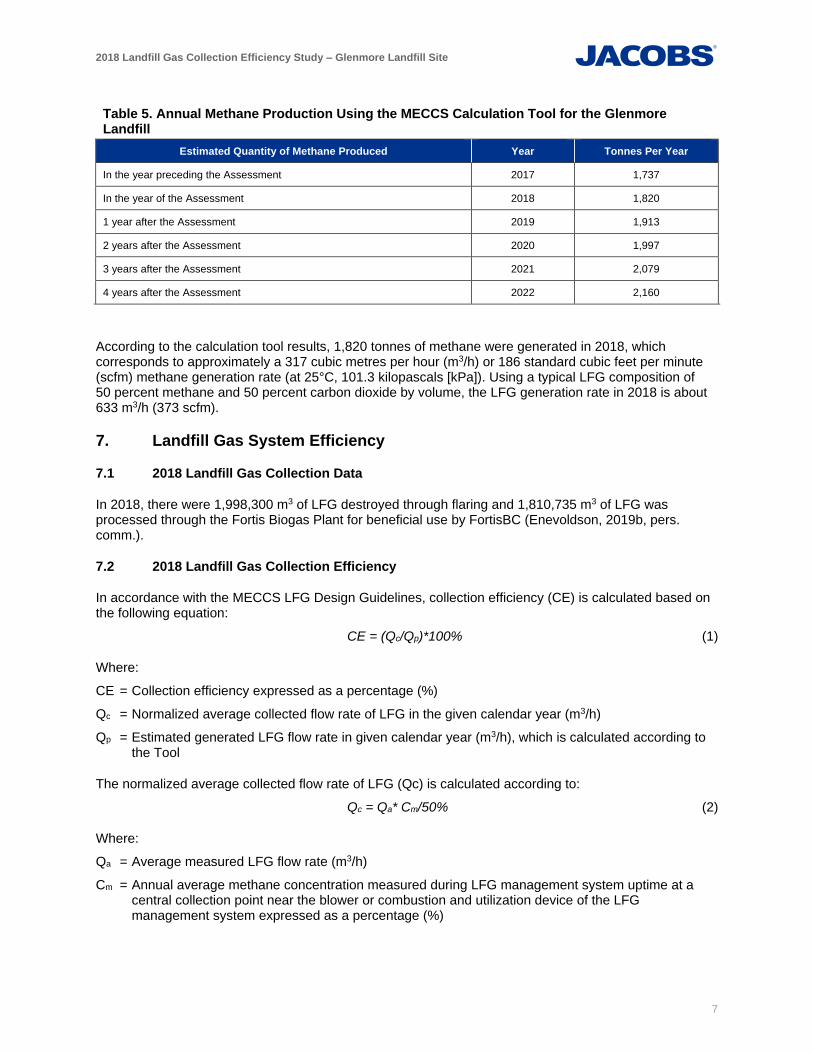
2018 Landfill Gas Collection Efficiency Study – Glenmore Landfill Site
7
Table 5. Annual Methane Production Using the MECCS Calculation Tool for the Glenmore Landfill
Estimated Quantity of Methane Produced Year Tonnes Per Year
In the year preceding the Assessment 2017 1,737
In the year of the Assessment 2018 1,820
1 year after the Assessment 2019 1,913
2 years after the Assessment 2020 1,997
3 years after the Assessment 2021 2,079
4 years after the Assessment 2022 2,160
According to the calculation tool results, 1,820 tonnes of methane were generated in 2018, which corresponds to approximately a 317 cubic metres per hour (m3/h) or 186 standard cubic feet per minute (scfm) methane generation rate (at 25°C, 101.3 kilopascals [kPa]). Using a typical LFG composition of 50 percent methane and 50 percent carbon dioxide by volume, the LFG generation rate in 2018 is about 633 m3/h (373 scfm).
7. Landfill Gas System Efficiency
7.1 2018 Landfill Gas Collection Data
In 2018, there were 1,998,300 m3 of LFG destroyed through flaring and 1,810,735 m3 of LFG was processed through the Fortis Biogas Plant for beneficial use by FortisBC (Enevoldson, 2019b, pers. comm.).
7.2 2018 Landfill Gas Collection Efficiency
In accordance with the MECCS LFG Design Guidelines, collection efficiency (CE) is calculated based on the following equation:
CE = (Qc/Qp)*100% (1)
Where:
CE = Collection efficiency expressed as a percentage (%)
Qc = Normalized average collected flow rate of LFG in the given calendar year (m3/h)
Qp = Estimated generated LFG flow rate in given calendar year (m3/h), which is calculated according to the Tool
The normalized average collected flow rate of LFG (Qc) is calculated according to:
Qc = Qa* Cm/50% (2)
Where:
Qa = Average measured LFG flow rate (m3/h)
Cm = Annual average methane concentration measured during LFG management system uptime at a central collection point near the blower or combustion and utilization device of the LFG management system expressed as a percentage (%)
2018 Landfill Gas Collection Efficiency Study – Glenmore Landfill Site
8
The average measured LFG flow rate (Qa) is measured according to the following:
Qa = VLFG/(24*365) (3)
Where:
VLFG = Total volume of LFG collected in the calendar year 2018 (cubic metres per year [m3/y]); 2018 has 365 days
Based on this formula:
Qa = VLFG/(24*365)
Qa = 3,809,035 m3/(24*365 hr)
= 434.82 m3/h
Qp = 5,548,487 m3/(24*365 hr)
= 633.39 m3/h for 2018
Based on record data:
Cm = 57.85% (Enevoldson, 2019b, pers. comm.)
Qc = Qa* Cm/50%
= 434.82*57.85%/50%
= 503.09 m3/h
CE = (Qc/Qp)*100%
= (503.09/633.39)*100%
= 79.43%
The final collection efficiency of the LFG collection system is estimated to be 79 percent.
8. Limitations
The findings and conclusions of this TM are based on information provided by the City, which is assumed to be correct, and certain assumptions as outlined in the report. Except as provided for in this report, Jacobs has made no independent investigation as to the accuracy or completeness of the information obtained from the City or from other secondary sources during completion of this work. In some cases, however, information data gaps exist. The interpretation and findings of this report were limited in these situations.
This TM was prepared using analyses and procedures consistent with generally accepted professional engineering consulting principles and practices. No other warranty, expressed or implied, is made. This TM is solely for the use and information of the City Kelowna (our client) unless otherwise noted. Any reliance on this TM by a third party is at such party's sole risk.
Criteria contained herein apply to conditions existing when services were performed and are intended only for the purposes, locations, and project parameters indicated. Jacobs is not responsible for the impacts of any changes in environmental standards, practices, or regulations subsequent to performance of services.
9. References
British Columbia Ministry of Environment and Climate Change Strategy (MECCS). 2008. Landfill Gas Management Regulation. Province of BC, ordered and approved December 8, 2008.
2018 Landfill Gas Collection Efficiency Study – Glenmore Landfill Site
9
British Columbia Ministry of Environment and Climate Change Strategy (MECCS). 2014. Landfill Gas Generation Estimation Tool. http://www2.gov.bc.ca/gov/content/environment/waste-management/garbage/landfills. Accessed March 5, 2019.
CH2M HILL Canada Limited (CH2M). 2010. Landfill Gas Generation Assessment Report – Glenmore Landfill Site.
CH2M HILL Canada Limited (CH2M). 2018. 2017 Landfill Gas Collection Efficiency Study – Glenmore Landfill Site.
City of Kelowna (City). 2011. 2010 Glenmore Landfill Annual Report.
City of Kelowna (City). 2012. 2011 Glenmore Landfill Annual Report.
City of Kelowna (City). 2013. 2012 Glenmore Landfill Annual Report.
City of Kelowna (City). 2014. 2013 Glenmore Landfill Annual Report.
City of Kelowna (City). 2015. 2014 Glenmore Landfill Annual Report.
City of Kelowna (City). 2016. 2015 Glenmore Landfill Annual Report.
City of Kelowna (City). 2017. 2016 Glenmore Landfill Annual Report.
City of Kelowna (City). 2018. 2017 Glenmore Landfill Annual Report.
Conestoga-Rovers & Associates (CRA). 2009. Landfill Gas Generation Assessment Procedure Guidelines. Prepared for the MECCS. March.
Conestoga-Rovers & Associates (CRA). 2010. Landfill Gas Management Facilities Design Guidelines. Prepared for the MECCS. March.
Enevoldson, D., Environmental Technician and LFG Specialist, City of Kelowna. 2019a. Personal communication (email) with Chuck Smith, Jacobs. January 31.
Enevoldson, D., Environmental Technician and LFG Specialist, City of Kelowna. 2019b. Personal communication (email) with Raymond Li, Jacobs. February 6, 12,13, and 20.
Environment and Climate Change Canada (ECCC). 2013. National Inventory Report 1990-2011: Greenhouse Gas Sources and Sinks in Canada. https://unfccc.int/process/transparency-and-reporting/reporting-and-review-under-the-convention/greenhouse-gas-inventories/submissions-of-annual-greenhouse-gas-inventories-for-2017/submissions-of-annual-ghg-inventories-2013. Accessed February 27, 2019.
Environment and Climate Change Canada (ECCC). 2016. National Inventory Report 1990-2014: Greenhouse Gas Sources and Sinks in Canada. https://unfccc.int/files/national_reports/annex_i_ghg_inventories/national_inventories_submissions/application/zip/can-2016-nir-14apr16.zip. Accessed February 27, 2019.
Government of Canada. 2017. 1981-2010 Climate Normals & Averages. July 20. http://climate.weather.gc.ca/climate_normals/index_e.html?StationName=red%20deer&SearchType=BeginsWith&StnId=2133. Accessed February 27, 2018.
Morrison Hershfield Ltd. 2016. 2013 Waste Composition Study of Regional District of Central Okanagan. Prepared for the City of Kelowna.
1
Attachment 1
British Columbia Ministry of Environment
and Climate Change Strategy’s Methane
Generation Estimation Tool Results for the
Glenmore Landfill Site
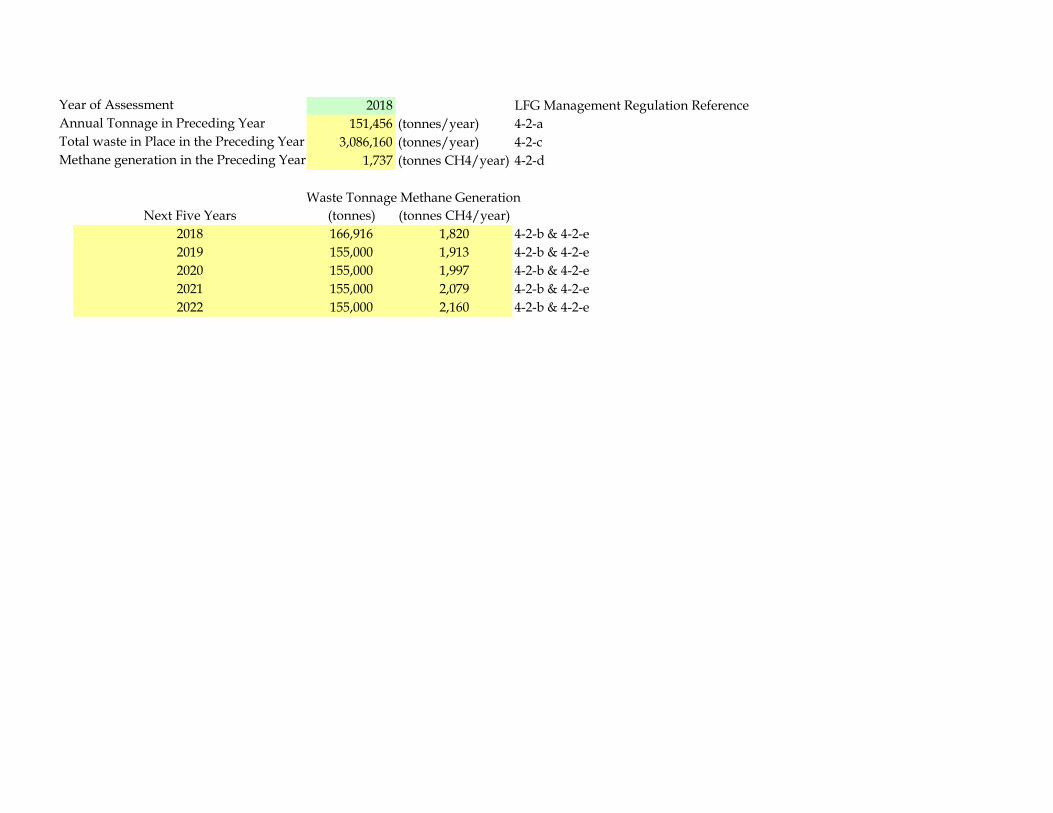
2018 LFG Management Regulation Reference151,456 (tonnes/year) 4-2-a
3,086,160 (tonnes/year) 4-2-c
Year of AssessmentAnnual Tonnage in Preceding Year Total waste in Place in the Preceding Year Methane generation in the Preceding Year 1,737 (tonnes CH4/year) 4-2-d
Waste Tonnage Methane Generation(tonnes) (tonnes CH4/year)
2018 166,916 1,820 4-2-b & 4-2-e2019 155,000 1,913 4-2-b & 4-2-e2020 155,000 1,997 4-2-b & 4-2-e2021 155,000 2,079 4-2-b & 4-2-e2022 155,000 2,160 4-2-b & 4-2-e
Next Five Years
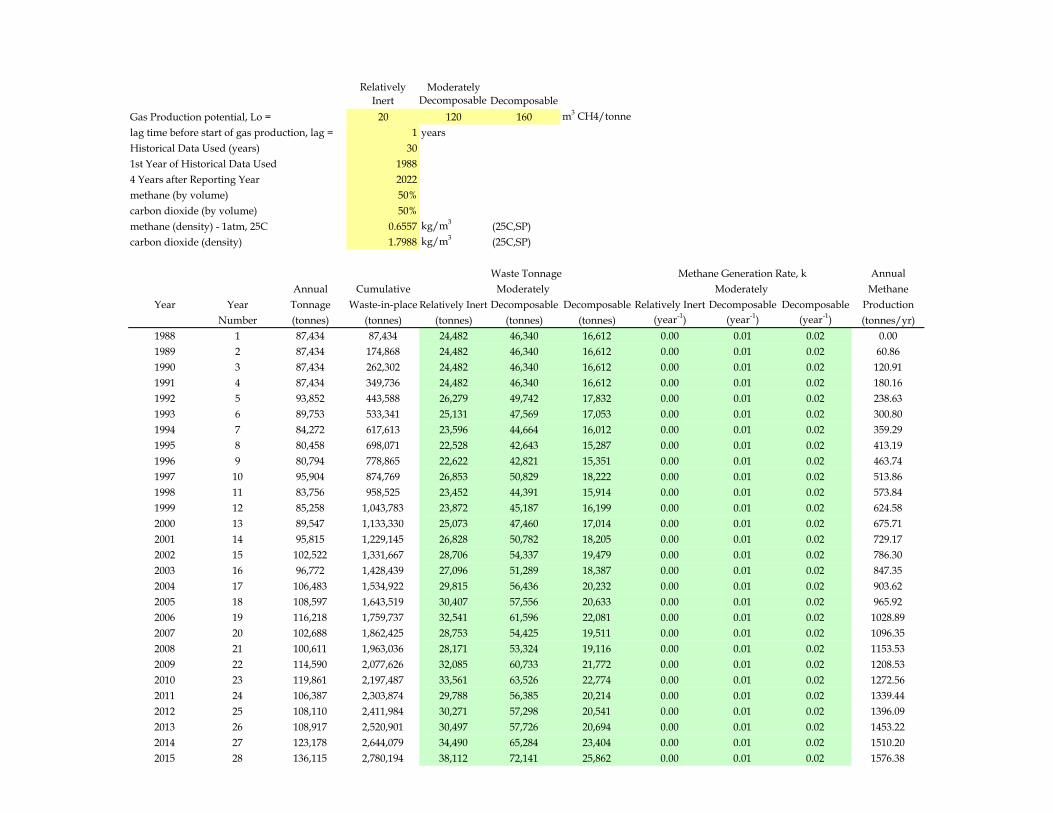
Relatively Inert
Moderately Decomposable Decomposable
Gas Production potential, Lo = 20 120 160 m3 CH4/tonne lag time before start of gas production, lag = 1 yearsHistorical Data Used (years) 301st Year of Historical Data Used 19884 Years after Reporting Year 2022methane (by volume) 50%carbon dioxide (by volume) 50%methane (density) - 1atm, 25C 0.6557 kg/m3 (25C,SP)carbon dioxide (density) 1.7988 kg/m3 (25C,SP)
AnnualAnnual Cumulative Moderately Moderately Methane
Year Year Tonnage Waste-in-place Relatively Inert Decomposable Decomposable Relatively Inert Decomposable Decomposable ProductionNumber (tonnes) (tonnes) (tonnes) (tonnes) (tonnes) (year-1) (year-1) (year-1) (tonnes/yr)
1988 1 87,434 87,434 24,482 46,340 16,612 0.00 0.01 0.02 0.001989 2 87,434 174,868 24,482 46,340 16,612 0.00 0.01 0.02 60.861990 3 87,434 262,302 24,482 46,340 16,612 0.00 0.01 0.02 120.911991 4 87,434 349,736 24,482 46,340 16,612 0.00 0.01 0.02 180.161992 5 93,852 443,588 26,279 49,742 17,832 0.00 0.01 0.02 238.631993 6 89,753 533,341 25,131 47,569 17,053 0.00 0.01 0.02 300.801994 7 84,272 617,613 23,596 44,664 16,012 0.00 0.01 0.02 359.291995 8 80,458 698,071 22,528 42,643 15,287 0.00 0.01 0.02 413.191996 9 80,794 778,865 22,622 42,821 15,351 0.00 0.01 0.02 463.741997 10 95,904 874,769 26,853 50,829 18,222 0.00 0.01 0.02 513.861998 11 83,756 958,525 23,452 44,391 15,914 0.00 0.01 0.02 573.841999 12 85,258 1,043,783 23,872 45,187 16,199 0.00 0.01 0.02 624.582000 13 89,547 1,133,330 25,073 47,460 17,014 0.00 0.01 0.02 675.712001 14 95,815 1,229,145 26,828 50,782 18,205 0.00 0.01 0.02 729.172002 15 102,522 1,331,667 28,706 54,337 19,479 0.00 0.01 0.02 786.302003 16 96,772 1,428,439 27,096 51,289 18,387 0.00 0.01 0.02 847.352004 17 106,483 1,534,922 29,815 56,436 20,232 0.00 0.01 0.02 903.622005 18 108,597 1,643,519 30,407 57,556 20,633 0.00 0.01 0.02 965.922006 19 116,218 1,759,737 32,541 61,596 22,081 0.00 0.01 0.02 1028.892007 20 102,688 1,862,425 28,753 54,425 19,511 0.00 0.01 0.02 1096.352008 21 100,611 1,963,036 28,171 53,324 19,116 0.00 0.01 0.02 1153.532009 22 114,590 2,077,626 32,085 60,733 21,772 0.00 0.01 0.02 1208.532010 23 119,861 2,197,487 33,561 63,526 22,774 0.00 0.01 0.02 1272.562011 24 106,387 2,303,874 29,788 56,385 20,214 0.00 0.01 0.02 1339.442012 25 108,110 2,411,984 30,271 57,298 20,541 0.00 0.01 0.02 1396.092013 26 108,917 2,520,901 30,497 57,726 20,694 0.00 0.01 0.02 1453.222014 27 123,178 2,644,079 34,490 65,284 23,404 0.00 0.01 0.02 1510.202015 28 136,115 2,780,194 38,112 72,141 25,862 0.00 0.01 0.02 1576.38
Waste Tonnage Methane Generation Rate, k
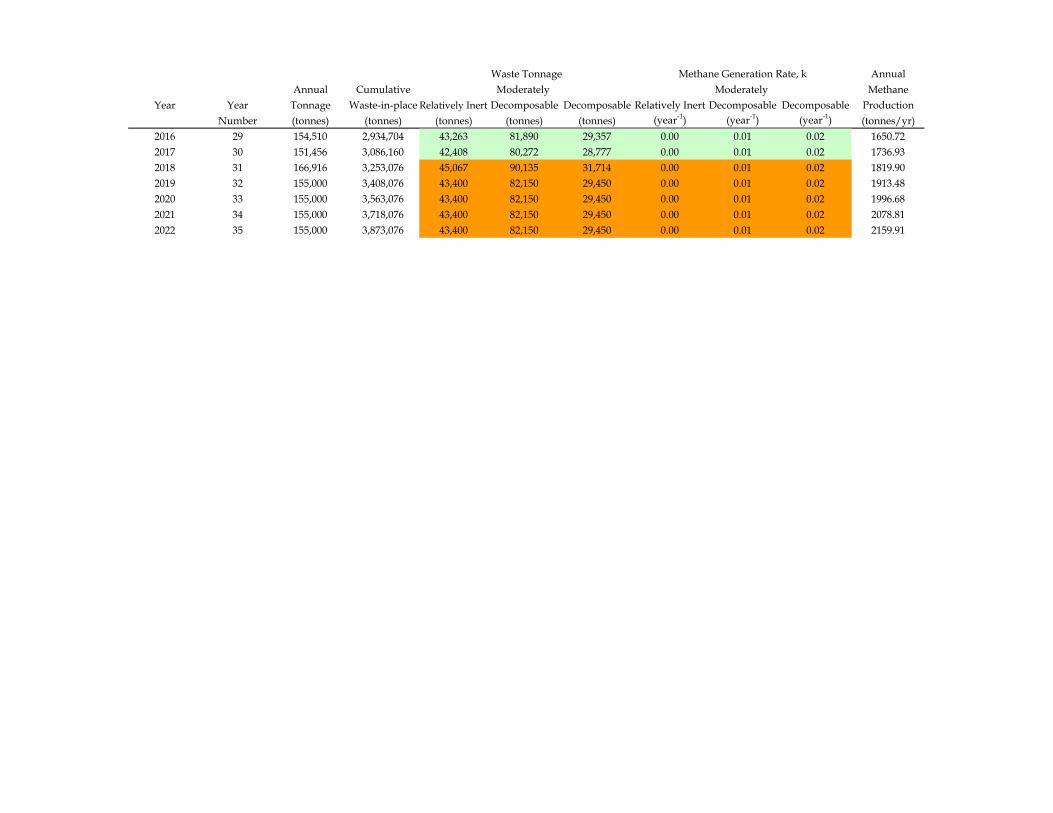
AnnualAnnual Cumulative Moderately Moderately Methane
Year Year Tonnage Waste-in-place Relatively Inert Decomposable Decomposable Relatively Inert Decomposable Decomposable ProductionNumber (tonnes) (tonnes) (tonnes) (tonnes) (tonnes) (year-1) (year-1) (year-1) (tonnes/yr)
Waste Tonnage Methane Generation Rate, k
2016 29 154,510 2,934,704 43,263 81,890 29,357 0.00 0.01 0.02 1650.722017 30 151,456 3,086,160 42,408 80,272 28,777 0.00 0.01 0.02 1736.932018 31 166,916 3,253,076 45,067 90,135 31,714 0.00 0.01 0.02 1819.902019 32 155,000 3,408,076 43,400 82,150 29,450 0.00 0.01 0.02 1913.482020 33 155,000 3,563,076 43,400 82,150 29,450 0.00 0.01 0.02 1996.682021 34 155,000 3,718,076 43,400 82,150 29,450 0.00 0.01 0.02 2078.812022 35 155,000 3,873,076 43,400 82,150 29,450 0.00 0.01 0.02 2159.91

ATTACHMENT 3
HUMAN HEALTH AND
ECOLOGICAL RISK
ASSESMENT – SNC-Lavalin
(September 24, 2018)
Human Health And Ecological Risk Assessment
City of Kelowna
Executive Summary The City of Kelowna (the City) retained SNC-Lavalin Inc. (SNC-Lavalin) to conduct a Human Health and
Ecological Risk Assessment (HHERA), evaluating the potential use of surface water from Tutt Pond
and/or Bredin Pond (the Ponds), located at the Glenmore Landfill (the Site), for any or all of the following
uses: irrigation watering, compost watering, dust control for on-Site roads, and landscape watering.
The HHERA is based on Site information and analytical data that has been collected and provided to
SNC-Lavalin by the City. It is understood that the intention of the risk assessment-based approach to
evaluate surface water use from the Ponds is for due diligence purposes, and not to obtain an instrument
(e.g., a Certificate of Compliance) from the BC Ministry of Environment & Climate Change Strategy
(ENV).
SNC-Lavalin previously completed a Problem Formulation for this HHERA (SNC-Lavalin, 2018). The
Problem Formulation is the first step and the information gathering stage in a risk assessment; the
Problem Formulation describes the site setting, identifies the contaminants of potential concern (COPCs)
and receptors of concern (ROCs; both human and ecological), as well as the pathways by which the
ROCs have the potential to be exposed to the COPCs. A conceptual site model (CSM) was developed for
the Site, and a preliminary literature review was conducted to determine the most effective path forward
(e.g., risk assessment, development of site-specific criteria, etc.) to evaluate risks associated with use of
water from the Ponds for the purposes listed above. The literature review was performed to assist in the
identification of COPCs and to confirm that adequate information was available for a future HHERA to
successfully evaluate the intended Pond surface water use.
A Data Gap Analysis outlined the additional information required to complete the HHERA. The Problem
Formulation previously conducted by SNC-Lavalin has been included and updated in the current HHERA
report with information and analytical data collected since its completion. The HHERA built upon the
previous Problem Formulation and incorporated the new data collected since its completion; the results of
the HHERA will be used to determine whether or not use of surface water from the Ponds for any of the
above-listed uses would result in potentially unacceptable risks to human health or ecological receptors.
The CSM for the Site identified the following potentially operable exposure pathways for human and
ecological receptors that required further evaluation for each of the potential water use scenarios:
Irrigation Watering Scenario
› Farmers and agricultural workers, through direct contact with soil (including incidental ingestion,
dermal contact and particulate inhalation pathways) and dermal contact with irrigation water;
› Soil invertebrates, through direct contact with soil;
› Forage crops, through direct contact with surface waters used for irrigation and uptake from soil; and
› Livestock, through direct contact with soil and indirect exposure through the consumption of forage
crops.
Compost Watering Scenario
› Residents, through direct contact (including incidental ingestion, dermal contact and particulate
inhalation pathways) with compost and indirect exposure through the consumption of backyard
garden produce grown in compost;
Internal Ref: 652126 / 654763 September 24, 2018
i © 2018 SNC-Lavalin Inc. All Rights Reserved. Confidential.
Human Health And Ecological Risk Assessment
City of Kelowna
› Landfill workers, through direct contact (including incidental ingestion, dermal contact and particulate
inhalation pathways) with compost and dermal contact with water during irrigation system set up;
› Soil invertebrates, through direct contact with soil; and
› Future vegetation, including edible and ornamental vegetation grown in gardens where compost is
applied.
Dust Control Scenario
› Landfill workers, through direct contact (i.e., incidental ingestion, dermal contact and inhalation of soil
particulate) with road soils and dermal contact with water during truck filling.
Landscape Watering Scenario
› Landfill or irrigation workers, through infrequent direct contact (including incidental ingestion, dermal
contact and particulate inhalation pathways) with soil in the landscaped areas and dermal contact
with water (irrigation workers only);
› Soil invertebrates, through direct contact with soil in the landscaped areas; and
› Ornamental vegetation, through surface water deposition and uptake from soil.
A human health risk assessment (HHRA) was conducted to identify potential risks to human receptors,
and an ecological risk assessment (ERA) was conducted to identify potential risks to crop health and
ecological receptors exposed to COPCS via the potential exposure pathways outlined above. Results of
the HHRA and ERA are summarized below.
Human Health Risk Assessment
Final COPCs that were retained for evaluation in the HHRA included: fluoride, sulphate, sodium,
strontium and uranium. Potentially operable exposure pathways which required further quantitative
evaluation in the HHRA were identified for farmers and agricultural workers in the irrigation watering
scenario; residents and landfill workers for the compost watering scenario; landfill workers for the dust
control scenario; and landfill workers and/or irrigation workers in the landscape watering scenario.
Based on the outcomes of the risk estimate calculations for the listed receptor groups, it can be
concluded that the use of Pond water for any of the irrigation watering, compost watering, dust control
and landscape watering scenarios will not result in unacceptable risks to human health.
Ecological Risk Assessment
Final Pond water COPCs that were retained for evaluation of crop health and ecological receptors
included pH, ammonia, total dissolved solids (TDS)/total organic carbon (TOC)/total suspended soils
(TSS), conductivity, nitrate, nitrite, sodium, strontium, and uranium. Upon further evaluation of the
potentially operable pathways, and in consideration of each of the identified COPCs individually, the
following conclusions were obtained:
Irrigation Watering Scenario
› Soil invertebrates and forage crops – potential low to medium risk related to increases in field soil pH
and sodium concentrations over time, as well as from direct contact with sodium in Pond water
(vegetation only).
Internal Ref: 652126 / 654763 September 24, 2018
ii © 2018 SNC-Lavalin Inc. All Rights Reserved. Confidential.
Human Health And Ecological Risk Assessment
City of Kelowna
Compost Watering Scenario
› Soil invertebrates and vegetation – potential low to medium risk related to increases in compost pH
and sodium concentrations over time.
Dust Control Scenario
› No potential risks for ecological receptors in the dust control scenario were identified, as they are not
present or associated with landfill road soils that would be watered for dust control.
Landscape Watering Scenario
› Soil invertebrates and ornamental vegetation – potential low to medium risk related to increases in
landscape soil pH and sodium concentrations over time, as well as from direct contact with sodium in
Pond water (vegetation only).
Effects to crop health and success have not been observed in the Tutt Water Area that has been irrigated
using Tutt Pond water for many years, and no stressed vegetation attributed to this water use has been
noted. Despite this, given the potential for the degradation of soil quality over time (i.e., continued
increase in pH or sodium concentrations over time), as well as the potential for foliar damage (from direct
contact with sodium in Pond water), if continued use of Pond water as irrigation water is desirable or if
Pond water is to be used for landscape watering purposes, continued monitoring of pH and sodium levels
in Pond water (which should be achieved through the current surface water monitoring program at the
Site), as well as the annual collection of soil samples from the agricultural fields following the irrigation
season, for ongoing monitoring of pH and measurement of sodium concentrations (using the saturated
paste method) and sodium adsorption ratio (SAR) is recommended.
Both pH measurements and sodium concentrations were both higher in compost than in field soils; as a
result, watering with Pond water has the potential to continue to elevate these parameters, potentially to
levels that would affect future soil invertebrates and/or plants exposed to the soils. Therefore, it is
recommended that the potential for these continued increases be considered in the decision making
regarding the duration of on-Site compost storage and watering, in conjunction with any applicable
compost regulations specific to pH or sodium concentrations.
Internal Ref: 652126 / 654763 September 24, 2018
iii © 2018 SNC-Lavalin Inc. All Rights Reserved. Confidential.
Human Health And Ecological Risk Assessment
City of Kelowna
Table of Contents
Executive Summary i
1 Introduction 1
1.1 Previous Environmental Investigations 1
2 Problem Formulation 3
2.1 Site Description 3
2.2 Proposed Pond Surface Water Uses 4
2.3 Receptor Selection and Exposure Pathways 4
2.3.1 Irrigation Watering Scenario 4
2.3.2 Compost Watering Scenario 6
2.3.3 Dust Control Scenario 7
2.3.4 Landscape Watering Scenario 8
2.3.5 Receptors and Pathways Retained for Further Evaluation 9
2.4 Contaminants of Potential Concern 10
2.4.1 Crop Health and Ecological Receptor COPCs 11
2.4.2 Human Health COPCs 12
2.4.3 Additional Lines of Evidence for COPC Screening 13
2.4.3.1 Tutt Water Area Soil and Vegetation Analytical Data 13
2.4.3.1.1 Comparison of Soil Data to Applicable Standards 14
2.4.3.1.2 Comparison of Tutt Water Area to Reference Area 14
2.4.4 Final List of Pond Surface Water COPCs 16
2.4.5 Bioaccumulation and/or Biomagnification of COPCs 17
3 Human Health Exposure Assessment 18
3.1 Exposure Point Concentrations 19
3.2 Receptor Characterization 20
3.2.1 Irrigation Watering Scenario 20
3.2.2 Compost Watering Scenario 21
3.2.3 Dust Control Scenario 22
3.2.4 Landscape Watering Scenario 22
3.3 Exposure Equations 24
3.3.1 Dermal Contact with Pond Water 24
3.3.2 Incidental Ingestion of Soil 24
3.3.3 Dermal Contact with Soil 25
3.3.4 Inhalation of Soil Particulate 25
Internal Ref: 652126 / 654763 September 24, 2018
© 2018 SNC-Lavalin Inc. All Rights Reserved. Confidential.
Human Health And Ecological Risk Assessment
City of Kelowna
Table of Contents (Cont’d)
3.4 Exposure Amortization 26
3.5 Bioavailability Assessment 26
4 Human Health Toxicity Assessment 28
4.1 Toxicity Reference Values 28
5 Human Health Risk Characterization 29
5.1 Estimation of Non-Cancer Risks 29
5.2 Results of the HHRA 29
5.2.1 Irrigation Watering Scenario 29
5.2.2 Compost Watering Scenario 30
5.2.3 Dust Control Scenario 31
5.2.4 Landscape Watering Scenario 31
6 Ecological Risk Assessment 32
6.1 Additional Lines of Evidence 33
6.1.1 Evaluation of Concentrations over Time 33
6.1.2 Qualitative Evaluation of Crop Health and Success 33
6.1.2.1 Photograph Review 33
6.1.2.2 Farmer Interview 34
6.2 Further Evaluation of COPCs 34
6.2.1 pH 34
6.2.1.1 Irrigation Watering Scenario 35
6.2.1.2 Compost Watering Scenario 37
6.2.1.3 Risk Summary for pH 37
6.2.2 Conductivity and Sodium 38
6.2.2.1 Irrigation Watering Scenario 39
6.2.2.2 Compost Watering Scenario 44
6.2.2.3 Risk Summary for Conductivity and Sodium 44
6.2.3 Ammonia, Nitrate and Nitrite 46
6.2.3.1 Irrigation Watering Scenario 47
6.2.3.2 Compost Watering Scenario 47
6.2.3.3 Risk Summary for Ammonia, Nitrate and Nitrite 48
6.2.4 TDS/TOC/TSS 48
6.2.4.1 Risk Summary for TDS, TOC and TSS 49
Internal Ref: 652126 / 654763 September 24, 2018
© 2018 SNC-Lavalin Inc. All Rights Reserved. Confidential.
Human Health And Ecological Risk Assessment
City of Kelowna
Table of Contents (Cont’d)
6.2.5 Strontium 49
6.2.5.1 Irrigation Watering Scenario 50
6.2.5.2 Compost Watering Scenario 51
6.2.5.3 Risk Summary for Strontium 51
6.2.6 Uranium 51
6.2.6.1 Irrigation Watering Scenario 52
6.2.6.2 Compost Watering Scenario 55
6.2.6.3 Risk Summary for Uranium 55
6.3 Ecological Risk Summary 56
7 References 59
8 Notice to Reader 60
In-Text Figures
Figure 1: Soil pH – Tutt Water Area vs Reference Area 36 Figure 2: Relationship between Conductivity and SAR 41 Figure 3: Sodium Soil Concentrations – Tutt Water Area versus Reference Area 42 Figure 4: Sodium Tissue Concentrations – Tutt Water Area versus Reference Area 43 Figure 5: Uranium Soil Concentrations – Tutt Water Area versus Reference Area 53 Figure 6: Uranium Tissue Concentrations – Tutt Water Area versus Reference Area 54
Internal Ref: 652126 / 654763 September 24, 2018
© 2018 SNC-Lavalin Inc. All Rights Reserved. Confidential.
Human Health And Ecological Risk Assessment
City of Kelowna
Table of Contents (Cont’d)
In-Text Tables
Table 1: Preliminary and Unknown COPCs for Pond Surface Water for Crop Health and Ecological
Receptors 12 Table 2: Preliminary COPCs for Pond Surface Water for Human Health 13 Table 3: Refinement of Preliminary and Unknown COPCs for Pond Surface Water for Crop Health
and Ecological Receptors 15 Table 4: Final List of Pond Surface Water COPCs 17 Table 5: Potentially Operable Exposure Pathways to be Evaluated in the HHRA 18 Table 6: Exposure Point Concentrations for Human Receptors 20 Table 7: Assumed Receptor Characteristics for Toddlers and Adults 23 Table 8: Assumed Exposure Frequency and Duration for the ROC Groups in Each Scenario 23 Table 9: RAFDERM Values for COPCs 26 Table 10: Summary of Oral/Dermal TRVs 28 Table 11: Summary of Human Health Risk Estimates for the Irrigation Watering Scenario 30 Table 12: Summary of Risk Estimates for the Compost Watering Scenario 30 Table 13: Summary of Risk Estimates for the Dust Control Scenario 31 Table 14: Summary of Risk Estimates for the Landscape Watering Scenario 31 Table 15: Potentially Operable Exposure Pathways to be Evaluated in the ERA 32 Table 16: Summary of pH Analytical Data for Pond Water and Soil 35 Table 17: Risk Summary - pH 37 Table 18: Summary of Conductivity Measurements and Sodium Analytical Data for Pond Water, Soil
and Tissue 38 Table 19: Summary of SAR and Conductivity Values for Bredin Pond and Tutt Pond 40 Table 20: Risk Summary - Conductivity and Sodium 45 Table 21: Summary of Ammonia, Nitrate and Nitrite Analytical Data for Pond Water, Soil and Tissue 46 Table 22: Risk Summary - Ammonia/Nitrate/Nitrite 48 Table 23: Risk Summary – TDS/TOC/TSS 49 Table 24: Summary of Strontium Analytical Data for Pond Water, Soil and Tissue 50 Table 25 Risk Summary - Strontium 51 Table 26: Summary of Uranium Analytical Data for Soil and Tissue 52 Table 27: Risk Summary - Uranium 56 Table 28: Potentially Operable Exposure Pathways to be Evaluated in the ERA 57
Drawing
› Figure 1 – Conceptual Site Model: Glenmore Landfill Surface Water Uses
Internal Ref: 652126 / 654763 September 24, 2018
© 2018 SNC-Lavalin Inc. All Rights Reserved. Confidential.
Human Health And Ecological Risk Assessment
City of Kelowna
Table of Contents (Cont’d)
Appendices
I: COPC Screening
II: Statistical Outputs
III: HHRA Detailed Risk Estimates
IV: Farmer Interview Summary
V: GEID Water Quality Results
P:\CP\City Of Kelowna\652126\5.0 Del\20180924_652126_Rpt_Hhera_Tutt_Bredin_Pond_Water_Use_Final.Docx
Internal Ref: 652126 / 654763 September 24, 2018
© 2018 SNC-Lavalin Inc. All Rights Reserved. Confidential.
Human Health And Ecological Risk Assessment
City of Kelowna
1 Introduction The City of Kelowna (the City) retained SNC-Lavalin Inc. (SNC-Lavalin) to conduct a Human Health and
Ecological Risk Assessment (HHERA), evaluating the potential use of surface water from Tutt Pond
and/or Bredin Pond (the Ponds), located at the Glenmore Landfill (the Site), for any or all of the following
uses: irrigation watering, compost watering, dust control for on-Site roads, and landscape watering.
The HHERA is based on Site information and analytical data that has been collected and provided to
SNC-Lavalin by the City. It is understood that the intention of the risk assessment-based approach to
evaluate surface water use from the Ponds is for due diligence purposes, and not to obtain an instrument
(e.g., a Certificate of Compliance) from the BC Ministry of Environment & Climate Change Strategy
(ENV).
SNC-Lavalin previously completed a Problem Formulation for this HHERA (SNC-Lavalin, 2018). The
Problem Formulation is the first step and the information gathering stage in a risk assessment; the
Problem Formulation describes the site setting, identifies the contaminants of potential concern (COPCs)
and receptors of concern (ROCs; both human and ecological), as well as the pathways by which the
ROCs have the potential to be exposed to the COPCs. A conceptual site model (CSM) was developed for
the Site, and a preliminary literature review was conducted to determine the most effective path forward
(e.g., risk assessment, development of site-specific criteria, etc.) to evaluate risks associated with use of
water from the Ponds for the purposes listed above. The literature review was performed to assist in the
identification of COPCs and to confirm that adequate information was available for a future HHERA to
successfully evaluate the intended Pond surface water use.
A Data Gap Analysis outlined the additional information required to complete the HHERA. The Problem
Formulation previously conducted by SNC-Lavalin has been included and updated in the current HHERA
report with information and analytical data collected since its completion. The HHERA built upon the
previous Problem Formulation and incorporated the new data collected since its completion; the results of
the HHERA will be used to determine whether or not use of surface water from the Ponds for any of the
above-listed uses would result in potentially unacceptable risks to human health or ecological receptors.
1.1 Previous Environmental Investigations
The HHERA is based on investigations and information collected during the period of 2013 to present, as
reported in the following documents:
› Surface Water and Groundwater Management Strategy, City of Kelowna, Glenmore Landfill, from
Golder Associates Ltd. (Golder) dated July 21, 2016 (Golder, 2016).
› 2016 Annual Water Quality Monitoring Report, Glenmore Landfill, Kelowna, BC, from Golder, dated
January 27, 2017 (Golder, 2017).
› 2017 Annual Water Quality Monitoring Report, Glenmore Landfill, Kelowna, BC, from Golder, dated
February 21, 2018 (Golder, 2018).
› City of Kelowna, Surface Water Quality Results from 2017 – received by from the City email on
January 23, 2018 (City of Kelowna, 2018).
Internal Ref: 652126 / 654763 September 24, 2018
1
© 2018 SNC-Lavalin Inc. All Rights Reserved. Confidential.
Human Health And Ecological Risk Assessment
City of Kelowna
› Glenmore Ellison Improvement District (GEID), Glenmore Comprehensive Water Quality Results,
Available for 2013 to 2017. Recent (2016 and 2017) results obtained from
http://glenmoreellison.com/water_quality/, with previous results (from 2013 to 2015) provided by the
City.
› City of Kelowna, GlenGrow Analytical Results (compost analytical results).
› City of Kelowna, OgoGrow Analytical Results (compost analytical results).
› Soil and vegetation sampling results:
- Vegetation and soil analytical results - collected in April and August of 2016, and provided by the
City;
- Vegetation and soil analytical results - collected in May of 2018 and provided by the City;
- Additional soil analytical results – collected in July of 2018 and provided by the City; and
- Photographs taken at the fields, notes on sampling methods and field notes taken from sampling
events in both 2017 and 2018.
› An email outlining information obtained from an informal interview with the farmer who works the
fields irrigated by Tutt Pond water (City of Kelowna, 2018; Appendix IV).
The results presented in these reports were evaluated as part of the HHERA and are further discussed in
the following sections of the report.
Internal Ref: 652126 / 654763 September 24, 2018
2
© 2018 SNC-Lavalin Inc. All Rights Reserved. Confidential.
Human Health And Ecological Risk Assessment
City of Kelowna
2 Problem Formulation
2.1 Site Description
The Glenmore Landfill is the only solid waste disposal facility in the Central Okanagan Regional District.
The Site is located in the narrow Glenmore Valley, with a mix of roads, rural development, agriculture and
natural forested land. Operations at the Site are associated with the following main areas:
› Phases 1 and 2 – located in the northern and central portions of the Site, currently used for active
disposal of municipal solid waste;
› Phase 3 – located south of Phase 2, currently consists of a slough, historically used for disposal, and
proposed for future disposal of municipal solid waste;
› Compost facility – located in the southern portion of the Site, currently used to facilitate composting
operations; and
› Northeast segment – located in the northeast corner of the Site, includes the Northeast Pond.
Four surface water bodies are currently present at the Site: the Northeast Pond, Bredin Pond, Tutt Pond
and the Slough. These ponds generally receive inflow from direct precipitation, shallow groundwater
discharge and overland flow related to run-off events (Golder, 2016). The Northeast Pond can drain
(when drain valve is open) to Bredin Pond, Bredin Pond drains to Tutt Pond and Tutt Pond drains to the
Slough. Water can also be pumped up to the Northeast Pond from Bredin Pond via the Bredin Pump
House. The two ponds of interest for the current assessment are Bredin Pond and Tutt Pond. Information
regarding these Ponds was obtained from the Golder (2016) report and is briefly summarized below.
Bredin Pond was constructed in 1994, and has a clay liner along the base and sides, with inputs including
groundwater flow, piped seepage water from the Northeast Pond and direct precipitation run-off. The water
volume in Bredin Pond typically ranges from 25,000 to 40,000 m3, with the water level varying by less than
1 m in elevation. Surface water from Bredin Pond was previously pumped to the neighbouring farmer to be
used as a source of irrigation water; however, this has not occurred since circa 2008. When levels in
Bredin Pond reach the outlet elevation, water from Bredin Pond flows overland towards Tutt Pond.
Tutt Pond does not have a constructed clay liner, but may be partially situated within the native clay unit
present in the near-surface across the Site. Inputs to Tutt Pond include groundwater flow, inflow from
Bredin Pond and catchment area, as well as from precipitation run-off (including run-off from adjacent
agricultural fields). The volume of water in Tutt Pond typically ranges from 12,000 m3 to 45,000 m3; water
levels in Tutt Pond fluctuate more than those at Bredin Pond, as water from Tutt Pond is pumped to the
neighbouring farmer for use as irrigation water. In 2015 to 2017, it is estimated that a total of
approximately 70,000 m3, 76,120 m2 and 60,700 m3, respectively, was pumped out of Tutt Pond for
irrigation use. Tutt Pond water provides only a portion of the irrigation water used at the agricultural lands,
and generally occurs through the summer months (from late May/early June to October).
Internal Ref: 652126 / 654763 September 24, 2018
3
© 2018 SNC-Lavalin Inc. All Rights Reserved. Confidential.
Human Health And Ecological Risk Assessment
City of Kelowna
2.2 Proposed Pond Surface Water Uses
The HHERA was conducted to evaluate the potential use of surface water from Tutt Pond and/or
Bredin Pond for any or all of the following uses:
› Irrigation water – water from Bredin Pond and Tutt Pond was proposed to be used to irrigate fields
used to grow forage crops (e.g., alfalfa) for the consumption by livestock or to grow woody biomass
for incorporation into compost material produced at the Site. Water is not to be directly consumed by
livestock.
- Bredin Pond water was previously used as irrigation water at the adjacent agricultural lands to the
north until circa 2008. In the summer of 2018, sprinklers were again set up on the adjacent
agricultural land and were irrigated from Bredin Pond.
- Tutt Pond water has been used as irrigation water at the adjacent agricultural lands
(the “Tutt Farm”) for several years, though the specific year of initiation of use for irrigation
purposes is unknown. Tutt Pond was constructed in 1986 and the pump house can be seen in the
2000 air photo.
› Compost watering – water from Bredin Pond and Tutt Pond was proposed for use to water compost
piles. Currently, compost piles stored at the Site are watered with water provided by the Glenmore Ellison
Irrigation District (GEID), and, between January 2010 and May 2016, an average of approximately
11,000 m3 is provided annually by the GEID for compost watering purposes (Golder, 2016).
› Dust control – water from Bredin Pond and Tutt Pond was proposed to be used to control dust along
Site roads. Data available from the City for 2014 indicates that a total of 10,201 m3 of GEID water was
used for dust control purposes on Site roads (Golder, 2016).
› Landscape watering – water from Bredin Pond and Tutt Pond was proposed to be used for watering a
landscaped berm on a seasonal basis. Golder (2016) estimates that approximately 4,360 m3 of water,
currently obtained from the GEID, is applied to the landscaped berm located to the west and
northwest of Bredin Pond on a seasonal basis.
These proposed uses for surface water will be used in the next section to form the basis for the
identification of ROCs and potential transport and exposure pathways to generate the CSM.
2.3 Receptor Selection and Exposure Pathways The list of proposed Pond surface water uses, as listed in Section 2.2, above, provides the basis for the
surface water COPC transport, identification of both human and ecological ROCs and potential exposure
pathways for these receptors. Both human and ecological receptors associated with these proposed uses
are outlined in the sections following. ROCs and exposure pathways are summarized in the Conceptual
Site Model, presented as Figure 1 following the text of the report.
2.3.1 Irrigation Watering Scenario
Surface water from Tutt Pond and Bredin Pond is being proposed for use as irrigation water on adjacent
agricultural fields that are used to grow forage crops for consumption by livestock. Water will not be
consumed directly by livestock. Both human and ecological ROCs were identified, including agricultural
ROCs, and include the following:
› Human ROCs
Internal Ref: 652126 / 654763 September 24, 2018
4
© 2018 SNC-Lavalin Inc. All Rights Reserved. Confidential.
Human Health And Ecological Risk Assessment
City of Kelowna
- Farmers
- Agricultural workers
› Agricultural ROCs
- Forage crop plants
- Livestock
› Ecological ROCs
- Soil invertebrates
- Wildlife (includes reptiles, birds and mammals)
If water from the Ponds is used as irrigation water, the COPCs identified in surface water in the Ponds will
be transported to the adjacent fields and deposited on crop and associated soils. It is assumed that
farmers/agricultural workers would have limited direct contact with irrigation water, as irrigation systems
are likely mechanical/automated; however, some dermal contact with the water is possible (e.g., when
setting up or servicing irrigation systems) and thus human dermal contact with the Pond surface water
should be considered as an operable exposure pathway requiring further evaluation. Additionally,
farmers/workers would be likely to have significant contact with soils, and thus direct soil contact
pathways, (including incidental ingestion, dermal contact and particulate inhalation), were also identified
as operable exposure pathways for these human ROCs.
The presence of wildlife on the agricultural land will likely be limited, due to fencing or other measures
likely in place to protect forage crops from wildlife consumption. Livestock are anticipated to have the
greatest exposure to surface water COPCs through direct contact with soils and consumption of forage
crops; as a result, for these pathways the evaluation of potential exposures via direct soil contact and
crop consumption by livestock will be considered protective of wildlife exposed via the same pathways.
Wildlife will, however, be considered in the case that bioaccumulative COPCs are identified.
The crops themselves will be directly exposed to surface water COPCs as the water is deposited on
above-ground leaves and shoots during irrigation. As noted, in addition, the water (and COPCs) would be
deposited on soil. Some surface water parameters may alter soil chemistry (e.g., pH) or have the potential
to accumulate in soils (e.g., metals). Alteration of soil chemistry may affect plant growth (current and
future), while accumulated parameters, such as metals, may be taken up by plants, with the potential to
result in direct toxicity to plants, toxicity to ROCs in direct contact with soil (e.g., soil invertebrates,
livestock, wildlife and/or human ROCs), or toxicity to ROCs that consume the plants (e.g., livestock).
As a result, the following ROCs and potentially operable exposure pathways were identified and retained
for evaluation for this proposed water use:
› Farmers and agricultural workers, through direct contact with soil (including incidental ingestion,
dermal contact and particulate inhalation pathways) and dermal contact with irrigation water;
› Soil invertebrates, through direct contact with soil;
› Forage crops, through direct contact with surface waters used for irrigation and uptake from soil;
› Livestock, through direct contact with soil and indirect exposure through the consumption of forage
crops; and
› Wildlife, through direct contact with soil and indirect exposure through the consumption of crop
plants/soil invertebrates/other wildlife, if bioaccumulative COPCs are identified.
Internal Ref: 652126 / 654763 September 24, 2018
5
© 2018 SNC-Lavalin Inc. All Rights Reserved. Confidential.
Human Health And Ecological Risk Assessment
City of Kelowna
It is noted that, in some cases, landfill workers will set up sprinklers, instead of the farmers; however, the
exposures of landfill workers to surface water COPCs are likely to be less than those anticipated for the
farmers, and thus only farmers were retained as ROCs for the irrigation watering scenario. These ROCs
and pathways are depicted on the CSM (Figure 1), attached. While wildlife exposure pathways are
included on the CSM for this proposed water use, as noted the pathways are only considered significant
and requiring further evaluation in the event that bioaccumulative COPCs are identified (discussed in
Section 2.4.5).
2.3.2 Compost Watering Scenario
Surface water from Tutt Pond and Bredin Pond is being proposed for watering compost. For GlenGrow
compost, composting typically takes approximately one year, with piles turned at least 5 times, but
typically turned 8 to 10 times during that year. Watering of compost typically occurs when piles are
turned, between April and October.
Future use of the compost will vary. GlenGrow and OgoGrow compost are marketed for use on vegetable
gardens, flower gardens, lawns, shrubs, pots and planters (City of Kelowna, 2018). Purchasers include
individuals, but also larger scale commercial farming operations or commercial users who purchase
compost to use as an ingredient in their own marketed products.
In deciding whether the Ponds’ surface water should be used for compost watering, additional
considerations (i.e., beyond those related to potential contaminants, addressed in the current HHERA)
may be required. These include consideration of whether or not existing certifications (e.g., Pacific
Agriculture Certification Society [PACS]) would be impacted by the change in the source of compost
water, and/or the public perception of using a non-potable water source for compost watering purposes.
Though these factors are not considered in the current HHERA, they may be important factors in
determining whether or not Ponds surface water would be used for compost watering purposes at the
Site.
As described above, compost uses vary, and thus receptors with the potential to contact any
contaminants (if present) in compost also vary. Compost may be used to create further products, and a
number of receptors (including landscapers and compost haulers) may be exposed to the compost.
Though many receptors have the potential to be exposed to compost, the receptor associated with the
most significant potential exposure pathways for human ROCs is likely associated with the use of this
compost in backyard gardens used to grow edible vegetation for human consumption (e.g., backyard
vegetable gardens); as a result, this use was conservatively retained for evaluation of associated
exposure pathways and risks. The evaluation of this receptor group for potential risks will be protective of
all other receptors that will likely have less exposure to the compost material.
Receptors were identified for backyard garden use, and include the following:
› Human ROCs
- Residents (all ages)
- Landfill worker, applying the water to the compost
› Agricultural ROCs
- Backyard garden produce and other vegetation (e.g., ornamental plants)
Internal Ref: 652126 / 654763 September 24, 2018
6
© 2018 SNC-Lavalin Inc. All Rights Reserved. Confidential.
Human Health And Ecological Risk Assessment
City of Kelowna
› Ecological ROCs
- Soil invertebrates
- Wildlife (includes reptiles, birds and mammals)
Though landfill workers wear protective clothing when applying surface water to the compost, direct
contact with Pond surface water is known to occur on a daily basis, during set up of the irrigation system.
As a result, evaluation of potential contact of surface water COPCs by the landfill worker for this proposed
water use will be considered in the HHERA.
Exposure of ecological ROCs to compost in small backyard garden beds will likely be limited, due to the
size of the garden, fencing/parceling of yard space and human presence and activity in backyards.
Wildlife will, however, be considered if bioaccumulative COPCs are identified.
COPCs identified in surface water in the Ponds will be deposited on compost material as it decomposes
in large piles at the Site. Surface water COPCs have the potential to alter compost chemistry (e.g., pH) or
to accumulate in compost (e.g., metals) to levels that may affect future plant growth. Additionally, these
accumulated COPCs may be taken up by plants, including backyard garden produce, once the materials
are used in backyard gardens, resulting in direct toxicity to plants, toxicity to ROCs in direct contact with
soil (e.g., soil invertebrates, residents tending to their gardens), or toxicity to ROCs that consume the
plants (e.g., gardeners/residents).
The following ROCs and potentially operable exposure pathways were identified and retained for
evaluation for this proposed water use:
› Residents, through direct contact (including incidental ingestion, dermal contact and particulate
inhalation pathways) with compost and indirect exposure through the consumption of backyard
garden produce grown in compost;
› Landfill workers, through direct contact (including incidental ingestion, dermal contact and particulate
inhalation pathways) with compost and dermal contact with water during irrigation system set up;
› Soil invertebrates, through direct contact with soil;
› Future vegetation, including edible and ornamental vegetation grown in gardens where compost is
applied; and
› Wildlife, through direct contact with soil and indirect exposure through the consumption of plants/soil
invertebrates/other wildlife, if bioaccumulative COPCs identified.
These ROCs and pathways are depicted on the CSM (Figure 1), attached. As noted, operable exposure
pathways will only be identified for wildlife in the event that bioaccumulative COPCs are identified
(discussed in Section 2.4.5).
2.3.3 Dust Control Scenario
Surface water from Tutt Pond and Bredin Pond is being proposed for watering roads to keep dust from
landfill traffic to a minimum. If surface water is used on the roadways, it is possible that COPCs present in
the water could accumulate in the road soils; landfill workers would then have the potential to directly
contact COPCs in road soils. Additionally, Site visitors, including customers and contractors, will also
have the potential to be exposed to COPCs in road soils.
Internal Ref: 652126 / 654763 September 24, 2018
7
© 2018 SNC-Lavalin Inc. All Rights Reserved. Confidential.
Human Health And Ecological Risk Assessment
City of Kelowna
Receptors identified for this proposed water use include the following:
› Human ROCs
- Landfill workers
- Site visitors
Exposure of ecological ROCs to any accumulated COPCs in road soils is unlikely, due to the industrial
nature of the site and the use of the watered soils as roadways. As a result, no ecological ROCs were
identified for further evaluation in the HHERA for this potential future water use.
It is unlikely that the landfill workers applying surface water to the dirt roadways would be significantly
exposed to COPCs through direct contact with Pond surface water during application to roads as roads
are watered using a tank/truck system. Additionally, as they are working on an industrial landfill site, it is
likely that workers would be wearing protective clothing and gloves. However, it is possible that dermal
contact with water could occur while trucks used for road watering are being filled by landfill workers; as a
result, landfill worker dermal contact with surface water COPCs for this proposed water use was identified
as a possible operable exposure pathway. Since exposure frequency and duration of exposure to road
soils and water would be much higher for landfill workers than the other identified potential human ROCs
at the Site (e.g., customers and contractors), only landfill workers will be retained for further evaluation in
a risk assessment. The evaluation of this landfill worker receptor group is protective of all other human
receptors that will likely have less exposure to the road soils.
The following ROCs and potentially operable exposure pathways were identified and retained for
evaluation for this proposed water use:
› Landfill workers, through direct contact (i.e., incidental ingestion, dermal contact and inhalation of soil
particulate) with road soils and dermal contact with water during truck filling.
Landfill workers and their potentially operable exposure pathways are depicted on the CSM (Figure 1),
attached.
2.3.4 Landscape Watering Scenario
Surface water from Tutt Pond and Bredin Pond is being proposed for watering on-Site ornamental
landscaping. Receptors were identified for this landscape watering use, and include the following:
› Human ROCs
- Landfill and/or irrigation workers
› Ecological ROCs
- Soil invertebrates
- Ornamental vegetation
- Wildlife (includes reptiles, birds and mammals)
It is unlikely that the landfill workers would be significantly exposed to COPCs in the Pond surface water
as watering of landscaped areas would occur at night via an automated irrigation system. As a result,
landfill worker potential direct contact with surface water COPCs for this proposed water use was not
identified as a significant operable exposure pathway; however, it is possible that irrigation workers would
have limited contact with water during the annual irrigation system set up, and thus this potential
exposure pathway for this ROC group will be considered in the HHERA.
Internal Ref: 652126 / 654763 September 24, 2018
8
© 2018 SNC-Lavalin Inc. All Rights Reserved. Confidential.
Human Health And Ecological Risk Assessment
City of Kelowna
Additionally, landfill workers planting vegetation or irrigation workers working on the system have the
potential to directly contact soils, and any COPCs from the Pond water that have accumulated in the soils
over time. Though this direct soil contact is likely to be infrequent (annually for irrigation, perhaps every
five years for vegetation planting) and exposure likely to be insignificant, this pathway is considered
operable and will also be evaluated in the HHERA.
Exposure of wildlife ROCs to watered soils in the relatively small landscaped areas will be limited, due to
the size of areas and the industrial nature of the Site; however, soil invertebrates and plants will be in
direct contact with the watered soils, and thus operable exposure pathways are identified for these ROCs.
Additionally, wildlife will be considered if bioaccumulative COPCs are identified.
COPCs identified in surface water in the Ponds will deposited on the ornamental vegetation and the soil
in the landscaped areas. The ornamental vegetation will be directly exposed to surface water COPCs
through deposition on above-ground leaves and shoots. Additionally, some parameters may alter soil
chemistry (e.g., pH) or accumulate in soils (e.g., metals). Alteration of soil chemistry may affect plant
growth, while accumulated parameters, such as metals, may be taken up by plants, resulting in direct
toxicity to plants, toxicity to ROCs in direct contact with soil (e.g., soil invertebrates, wildlife and/or
landscape workers), or toxicity to ROCs that consume the plants (e.g., wildlife).
The following ROCs and potentially operable exposure pathways were identified and retained for
evaluation for this proposed water use:
› Landfill or irrigation workers, through infrequent direct contact (including incidental ingestion, dermal
contact and particulate inhalation pathways) with soil in the landscaped areas and dermal contact
with water (irrigation workers only);
› Soil invertebrates, through direct contact with soil in the landscaped areas;
› Ornamental vegetation, through surface water deposition and uptake from soil; and
› Wildlife, through direct contact with soil and indirect exposure through the consumption of plants/soil
invertebrates/other wildlife, if bioaccumulative COPCs are identified.
These ROCs and pathways are depicted on the CSM (Figure 1), attached. As with the other water uses,
operable exposure pathways will only be identified for wildlife in the event that bioaccumulative COPCs
are identified (discussed in Section 2.4.5).
2.3.5 Receptors and Pathways Retained for Further Evaluation
The CSM presents a summary of the findings of the receptors and potentially operable exposure
pathways identified for each of the proposed water uses (i.e., a summary of Section 2.3.1 to 2.3.4). In the
current HHERA, only receptors groups with the highest frequency and duration of exposure will be
retained for quantitative evaluation, with evaluation of these receptor groups considered protective of
those with less frequent/shorter durations of exposure. Receptors considered for further quantitative
evaluation will be identified in the Exposure Assessment section (Section 3).
Internal Ref: 652126 / 654763 September 24, 2018
9
© 2018 SNC-Lavalin Inc. All Rights Reserved. Confidential.
Human Health And Ecological Risk Assessment
City of Kelowna
2.4 Contaminants of Potential Concern
Surface water analytical data collected during the period of 2013 to early 2018 is available for both Bredin
and Tutt Pond, as samples have been collected from these Ponds over the last several years as part of
an ongoing water quality monitoring program. Analytical data from a total of 18 sampling events for
Bredin Pond and 23 sampling events for Tutt Pond were considered in the identification of COPCs,
including the following:
› 4 samples collected in 2013 (April, May, July, October; Golder, 2016);
› 3 (Bredin Pond) or 5 (Tutt Pond) samples collected in 2014 (March, May, July [Tutt Pond only]
August, September [Tutt Pond only]; Golder, 2016);
› 3 (Bredin Pond) or 4 (Tutt Pond) samples collected in 2015 (March, June, September [Tutt Pond
only], October; Golder, 2016);
› 3 samples collected in 2016 (May, September, November; Golder, 2017);
› 4 samples collected in 2017 (April, June, September, November; City of Kelowna, 2018); and
› 3 samples (Tutt Pond) and 1 sample (Bredin Pond) collected in 2018 (2 events in April, 1 in May).
A detailed screening of available water quality data from each of the Ponds was conducted to identify
COPCs for both crop health and agricultural receptors, as well as for human health associated with direct
contact with Pond water. Direct use of surface water from the Ponds to water adjacent agricultural lands
constitutes “irrigation use” and guidelines/standards protective of irrigation water use (IW) would be
applicable, as they are calculated to allow for indefinite application to agricultural soil, without degradation
of soil quality. Additionally, the application of IW guidelines/standards would be protective of use of Ponds
water for watering compost and landscaping present on the Site; however, it is acknowledged that other
factors (e.g., effects to PACS certification or public perception) may need to be considered when
determining whether or not to use the Ponds’ surface water for compost watering purposes at the Site.
The application of IW standards/guidelines for screening purposes will therefore be used to
conservatively identify COPCs relevant to crop health and ecological receptors for all proposed surface
water uses for Tutt Pond and Bredin Pond water.
Sources of guidelines/standards used to evaluate IW use of water from the Ponds included the following:
› BC WQGs – Approved WQGs and Working WQGs (if Approved WQGs not available), for IW.
› BC Contaminated Sites Regulation1 (CSR) Schedule 3.2, Generic Numerical Water Standards, for IW.
Screening included the comparison of maximum and statistical representations (where relevant) of
concentrations to irrigation-specific guidelines/standards which are protective of plant health and soil
quality; however, it is noted that these standards do not consider the uptake of chemicals through the
food chain, and not all parameters have an associated IW guideline/standard.
For parameters lacking BC guidelines, guidelines specific to irrigation use from other agencies, including
the Canadian Council of Ministers of the Environment (CCME), the United States Environmental
Protection Agency (US EPA), or other reputable agencies, were reviewed; however, no additional
guidelines/standards protective of irrigation use for parameters without BC standards were located.
1 Contaminated Sites Regulation (CSR), B.C. Reg. 375/96, includes amendments up to B.C. Reg. 116/2018, June 14, 2018. Internal Ref: 652126 / 654763 September 24, 2018
10
© 2018 SNC-Lavalin Inc. All Rights Reserved. Confidential.
Human Health And Ecological Risk Assessment
City of Kelowna
As standards specific to human dermal contact with water are not available, concentrations of parameters
measured in surface water were conservatively screened with standards protective of the drinking water
(DW) pathway, as follows:
› BC CSR Schedule 3.2, Generic Numerical Water Standards, for DW.
The following sections outlining the screening process to identify COPCs for Pond water, related to both
crop health and ecological receptors, as well as human health. Additional lines of evidence (LoEs) were
also used to refine the list of COPCs retained for further evaluation.
2.4.1 Crop Health and Ecological Receptor COPCs
Maximum values or concentrations of each parameter measured in Bredin Pond and Tutt Pond since
2013 were compared to applicable BC WQG or CSR Schedule 3.2 IW guidelines/standards (see Table A
of Appendix I). If the maximum measured concentrations exceeded an applicable guideline/standard in
Bredin or Tutt Pond, the parameter was retained as a Preliminary COPC for that Pond. Several
parameters did not have associated BC IW guidelines/standards, and thus guidelines from other
regulatory bodies were sought; however, no guidelines were identified from the CCME, US EPA or other
regulatory agencies. These parameters are retained and listed in Table 1, below, as “Unknown COPCs”
and will be considered further in the HHERA. If a guideline/standard was not available, but measured
concentrations never exceeded the analytical detection limit, the parameter was not retained as a
Preliminary COPC fro crop health and ecological receptors. Additionally, water quality parameters without
applicable guidelines but dependent with other parameters that do have applicable guidelines (e.g., no
guideline available for alkalinity/bicarbonate/carbonate, but guideline available for pH, etc.) were not
retained as Unknown COPCs.
If the maximum concentration exceeded the applicable BC WQGs, but the applicable guideline was a
long-term or 30-day average guideline, then an average concentration was calculated for samples
collected from each pond over the years sampled, and the average concentration was compared to the
long-term guideline. This was considered appropriate, as several sampling events occurred in the months
when surface water would be likely to be used for irrigation purposes (i.e., 11 of 18 samples from
Bredin Pond and 15 of 23 samples from Tutt Pond were collected during the identified watering months of
May to October) and concentrations were observed to be relatively stable over time.
A summary of Preliminary and Unknown crop health and ecological receptor COPCs for Bredin Pond and
Tutt Pond is provided in Table 1, below. The COPC screening process and applicable
standards/guidelines are summarized in Appendix I, Table A.
Internal Ref: 652126 / 654763 September 24, 2018
11
© 2018 SNC-Lavalin Inc. All Rights Reserved. Confidential.
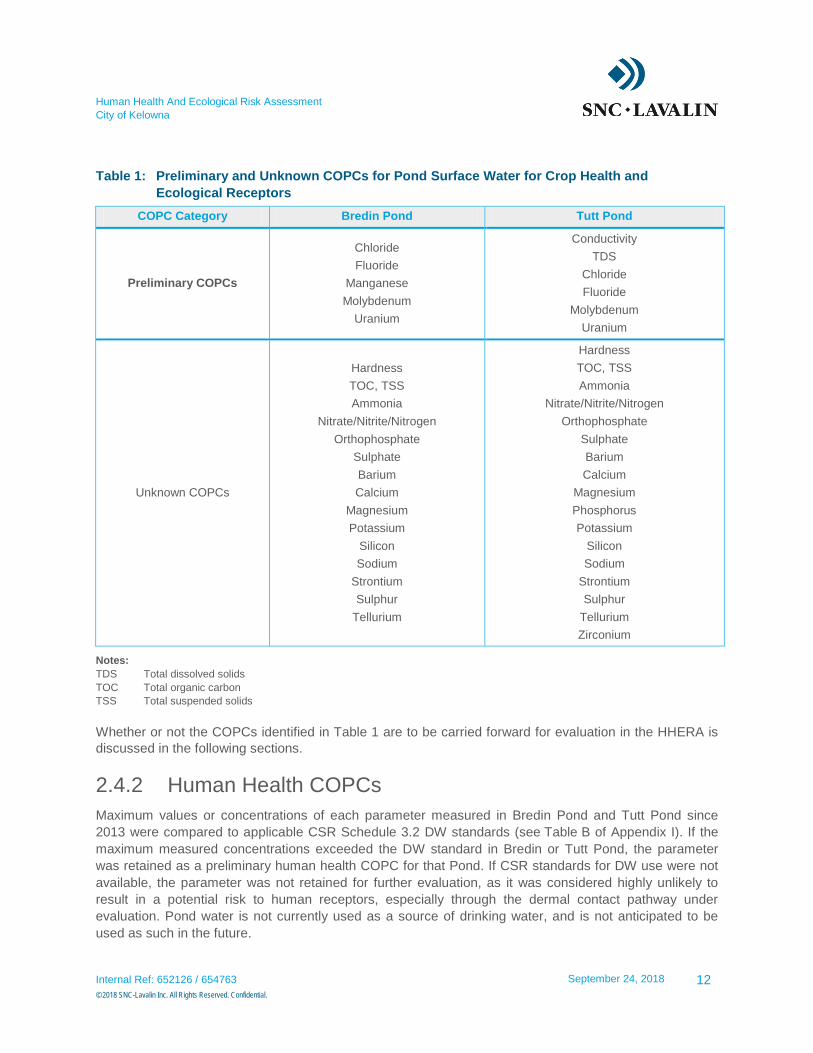
Human Health And Ecological Risk Assessment
City of Kelowna
Table 1: Preliminary and Unknown COPCs for Pond Surface Water for Crop Health and
Ecological Receptors
COPC Category Bredin Pond Tutt Pond
Preliminary COPCs
Chloride
Fluoride
Manganese
Molybdenum
Uranium
Conductivity
TDS
Chloride
Fluoride
Molybdenum
Uranium
Unknown COPCs
Hardness
TOC, TSS
Ammonia
Nitrate/Nitrite/Nitrogen
Orthophosphate
Sulphate
Barium
Calcium
Magnesium
Potassium
Silicon
Sodium
Strontium
Sulphur
Tellurium
Hardness
TOC, TSS
Ammonia
Nitrate/Nitrite/Nitrogen
Orthophosphate
Sulphate
Barium
Calcium
Magnesium
Phosphorus
Potassium
Silicon
Sodium
Strontium
Sulphur
Tellurium
Zirconium
Notes:
TDS Total dissolved solids
TOC Total organic carbon
TSS Total suspended solids
Whether or not the COPCs identified in Table 1 are to be carried forward for evaluation in the HHERA is
discussed in the following sections.
2.4.2 Human Health COPCs
Maximum values or concentrations of each parameter measured in Bredin Pond and Tutt Pond since
2013 were compared to applicable CSR Schedule 3.2 DW standards (see Table B of Appendix I). If the
maximum measured concentrations exceeded the DW standard in Bredin or Tutt Pond, the parameter
was retained as a preliminary human health COPC for that Pond. If CSR standards for DW use were not
available, the parameter was not retained for further evaluation, as it was considered highly unlikely to
result in a potential risk to human receptors, especially through the dermal contact pathway under
evaluation. Pond water is not currently used as a source of drinking water, and is not anticipated to be
used as such in the future.
Internal Ref: 652126 / 654763 September 24, 2018
12
© 2018 SNC-Lavalin Inc. All Rights Reserved. Confidential.
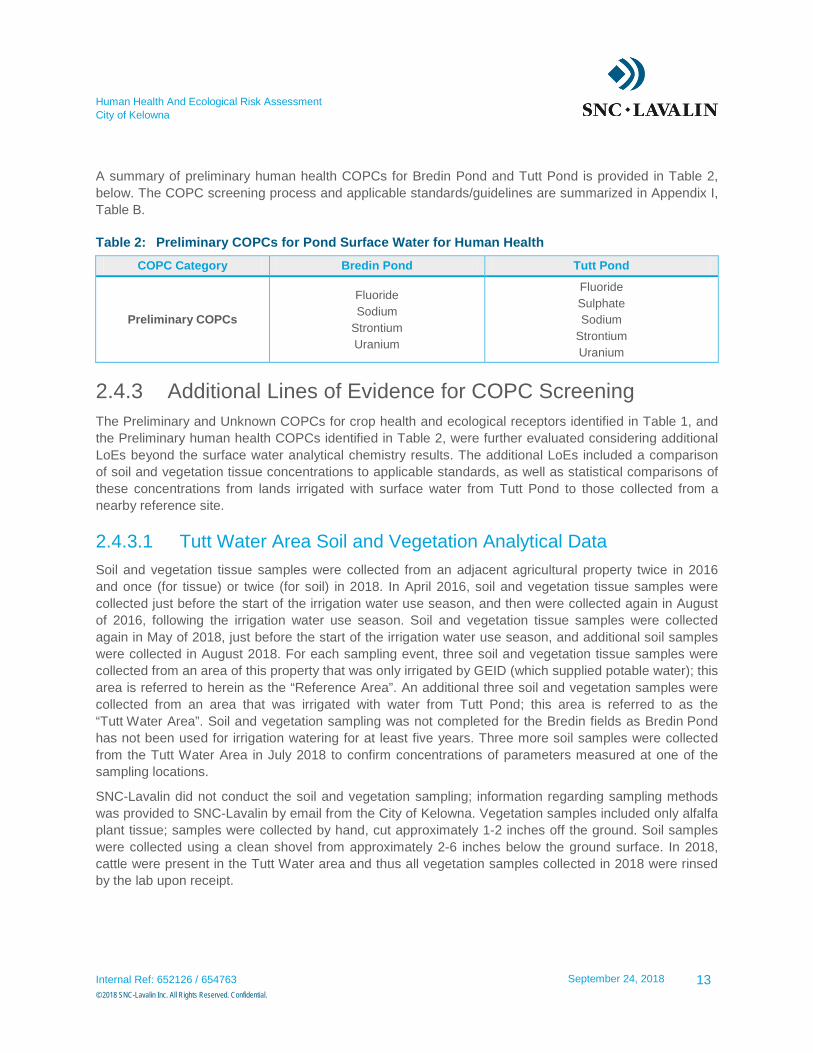
Human Health And Ecological Risk Assessment
City of Kelowna
A summary of preliminary human health COPCs for Bredin Pond and Tutt Pond is provided in Table 2,
below. The COPC screening process and applicable standards/guidelines are summarized in Appendix I,
Table B.
Table 2: Preliminary COPCs for Pond Surface Water for Human Health
COPC Category Bredin Pond Tutt Pond
Preliminary COPCs
Fluoride
Sodium
Strontium
Uranium
Fluoride
Sulphate
Sodium
Strontium
Uranium
2.4.3 Additional Lines of Evidence for COPC Screening
The Preliminary and Unknown COPCs for crop health and ecological receptors identified in Table 1, and
the Preliminary human health COPCs identified in Table 2, were further evaluated considering additional
LoEs beyond the surface water analytical chemistry results. The additional LoEs included a comparison
of soil and vegetation tissue concentrations to applicable standards, as well as statistical comparisons of
these concentrations from lands irrigated with surface water from Tutt Pond to those collected from a
nearby reference site.
2.4.3.1 Tutt Water Area Soil and Vegetation Analytical Data
Soil and vegetation tissue samples were collected from an adjacent agricultural property twice in 2016
and once (for tissue) or twice (for soil) in 2018. In April 2016, soil and vegetation tissue samples were
collected just before the start of the irrigation water use season, and then were collected again in August
of 2016, following the irrigation water use season. Soil and vegetation tissue samples were collected
again in May of 2018, just before the start of the irrigation water use season, and additional soil samples
were collected in August 2018. For each sampling event, three soil and vegetation tissue samples were
collected from an area of this property that was only irrigated by GEID (which supplied potable water); this
area is referred to herein as the “Reference Area”. An additional three soil and vegetation samples were
collected from an area that was irrigated with water from Tutt Pond; this area is referred to as the
“Tutt Water Area”. Soil and vegetation sampling was not completed for the Bredin fields as Bredin Pond
has not been used for irrigation watering for at least five years. Three more soil samples were collected
from the Tutt Water Area in July 2018 to confirm concentrations of parameters measured at one of the
sampling locations.
SNC-Lavalin did not conduct the soil and vegetation sampling; information regarding sampling methods
was provided to SNC-Lavalin by email from the City of Kelowna. Vegetation samples included only alfalfa
plant tissue; samples were collected by hand, cut approximately 1-2 inches off the ground. Soil samples
were collected using a clean shovel from approximately 2-6 inches below the ground surface. In 2018,
cattle were present in the Tutt Water area and thus all vegetation samples collected in 2018 were rinsed
by the lab upon receipt.
Internal Ref: 652126 / 654763 September 24, 2018
13
© 2018 SNC-Lavalin Inc. All Rights Reserved. Confidential.
Human Health And Ecological Risk Assessment
City of Kelowna
In 2016, both soil and tissue samples were sent to ALS Environmental in Burnaby, BC and were analyzed
for metals. It is noted that concentrations of several of the identified preliminary and Unknown COPCs,
including chloride, fluoride, ammonia, nitrate/nitrite/nitrogen, orthophosphate, sulphate/sulphur and silicon
were not analyzed by ALS in 2016. In 2018, soil samples were again sent to ALS, but vegetation samples
were send to CARO Analytical Services (CARO) to enable the analysis of the previously identified
preliminary and Unknown COPCs listed above.
The following sections outline an evaluation of soil and tissue analytical data, including a comparison of
soil analytical data to relevant standards, and statistical comparisons of the concentrations measured in
soil and tissue from the Tutt Water Area to those in the Reference Area. Results from these LoEs will be
used to refine the surface water COPCs that were previously identified for crop health and ecological
ROCs (Section 2.4.1).
2.4.3.1.1 Comparison of Soil Data to Applicable Standards
Conservatively, to further evaluate potential differences in soil quality at the Tutt Water Area that could be
related to irrigation with Tutt Pond water, maximum concentrations of soil parameters in both Reference
Area and Tutt Water Area soil samples were screened against BC CSR Schedule 3.1 Part 1 soil
standards for Agricultural land use (AL). Where Part 1 standards were not available, the lowest of Part 2
(protective of human health) or Part 3 (protective of ecological health) soil standards were used for
screening purposes. Where BC CSR soil standards were not available, CCME AL soil guidelines were
used. Parameters for which the maximum measured concentration in Tutt Water Area soils exceeded an
applicable AL standard were added to the list of Preliminary COPCs for crop health and ecological
receptors. Additionally, to identify further human health COPCs, soil concentrations were compared to
BC CSR Schedule 3.1 Part 1 AL soil standards protective of the human intake of soil pathway.
Based on this evaluation, pH, chromium, iron and sodium were identified as additional COPCs (Table C,
Appendix I). These additional COPCs will be evaluated further through the consideration of additional
LoEs, below. No human health COPCs were added to the list of Preliminary COPCs (Table D,
Appendix I).
2.4.3.1.2 Comparison of Tutt Water Area to Reference Area
Comparisons of soil quality and tissue metals concentrations were made between samples collected from
the Tutt Water Area and the Reference Area, to provide evidence as to whether use of the Tutt Pond
water for irrigation purposes is affecting certain parameters (e.g., pH) and/or the concentrations of metals
in soils and/or alfalfa tissue. These comparisons were only done for parameters identified as preliminary
or Unknown COPCs after the first refinement, as listed in Table 2, above.
A statistical approach was used using non-parametric statistics; these tests assume similar variance,
though this could not be confirmed for all parameters due to the limited sample size for soil and/or alfalfa
tissue available from each area. However, a Gehan test at a 5% significance level was used to provide an
indication of whether or not concentrations measured in soil and tissue from the Tutt Water Area are
significantly different from those in the Reference Area.
Internal Ref: 652126 / 654763 September 24, 2018
14
© 2018 SNC-Lavalin Inc. All Rights Reserved. Confidential.
Human Health And Ecological Risk Assessment
City of Kelowna
Notable results from these statistical comparisons include the following:
Soil
› Soil concentrations of barium, calcium, molybdenum, sulphur and uranium in the Tutt Water Area
were found to be significantly lower than the soil concentrations in the Reference Area.
› Concentrations of sodium, strontium and nitrite in the Tutt Water Area were significantly higher than
the soil concentrations in the Reference Area.
› Soil pH in the Tutt Water Area was significantly higher than in the Reference Area.
› There does not appear to be a significant difference in soil concentrations for magnesium, phosphorus,
chromium, iron, potassium, zirconium, chloride, fluoride, nitrate, sulphate, silicon, total available nitrogen,
phosphate or plant available ammonium, nitrate and nitrate between the Tutt Water Area and the
Reference Area.
Tissue
› Tissue concentrations of sodium and ammonia in alfalfa collected from the Tutt Water Area appear to
be significantly higher than the tissue concentrations in the Reference Area.
› There does not appear to be a significant difference in tissue concentrations for calcium, chloride,
chromium, iron, magnesium, potassium, phosphorus, tellurium, zirconium, chloride, sulphate and
silicon.
Based on these results, the list of preliminary and Unknown COPCs for crop health and ecological
receptors has been refined in Table 3, below.
Table 3: Refinement of Preliminary and Unknown COPCs for Pond Surface Water for Crop Health
and Ecological Receptors
COPC Category Bredin Pond Tutt Pond
Final COPCs
pH
Ammonia Chloride
Fluoride
Chromium
Iron
Molybdenum
Nitrate Nitrite
Sodium Strontium Uranium
pH
Ammonia Conductivity
TDS*
Chloride
Fluoride
Chromium
Iron
Molybdenum
Nitrate Nitrite
Sodium Strontium Uranium
Internal Ref: 652126 / 654763 September 24, 2018
15
© 2018 SNC-Lavalin Inc. All Rights Reserved. Confidential.
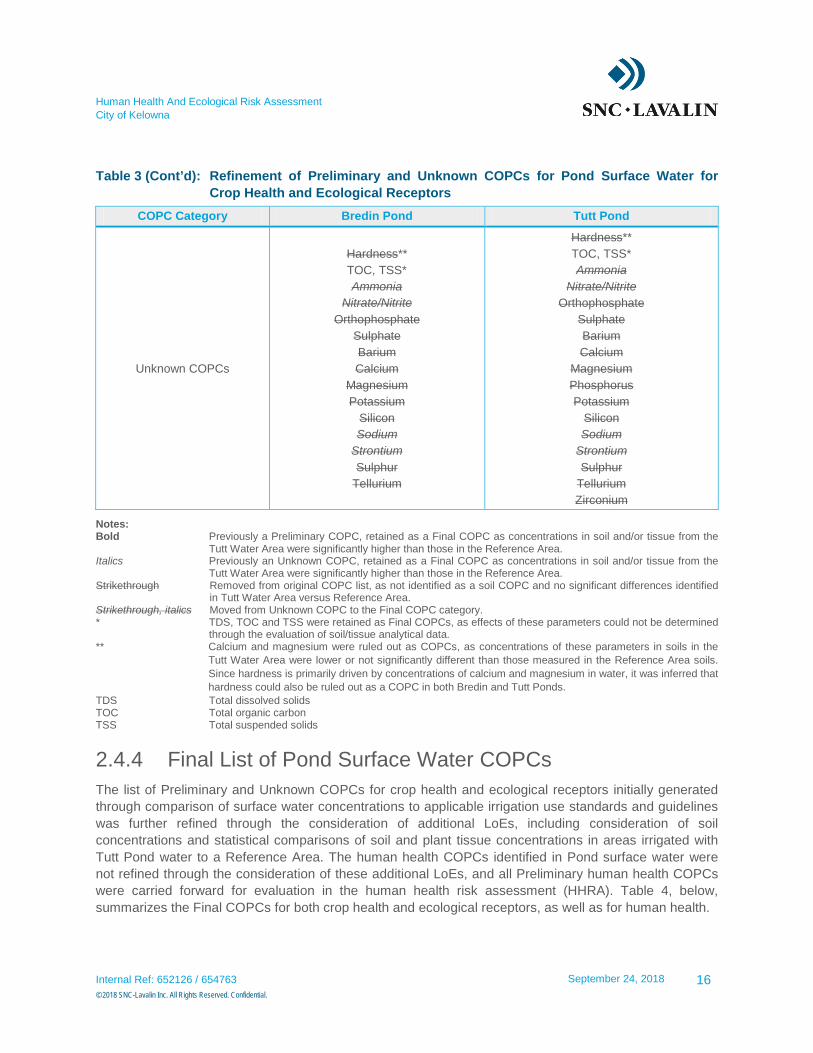
Human Health And Ecological Risk Assessment
City of Kelowna
Table 3 (Cont’d): Refinement of Preliminary and Unknown COPCs for Pond Surface Water for
Crop Health and Ecological Receptors
COPC Category Bredin Pond Tutt Pond
Unknown COPCs
Hardness**
TOC, TSS*
Ammonia Nitrate/Nitrite
Orthophosphate
Sulphate
Barium
Calcium
Magnesium
Potassium
Silicon
Sodium Strontium Sulphur
Tellurium
Hardness**
TOC, TSS*
Ammonia Nitrate/Nitrite
Orthophosphate
Sulphate
Barium
Calcium
Magnesium
Phosphorus
Potassium
Silicon
Sodium Strontium Sulphur
Tellurium
Zirconium
Notes: Bold Previously a Preliminary COPC, retained as a Final COPC as concentrations in soil and/or tissue from the
Tutt Water Area were significantly higher than those in the Reference Area. Italics Previously an Unknown COPC, retained as a Final COPC as concentrations in soil and/or tissue from the
Tutt Water Area were significantly higher than those in the Reference Area. Strikethrough Removed from original COPC list, as not identified as a soil COPC and no significant differences identified
in Tutt Water Area versus Reference Area. Strikethrough, italics Moved from Unknown COPC to the Final COPC category. *. TDS, TOC and TSS were retained as Final COPCs, as effects of these parameters could not be determined
through the evaluation of soil/tissue analytical data. ** Calcium and magnesium were ruled out as COPCs, as concentrations of these parameters in soils in the
Tutt Water Area were lower or not significantly different than those measured in the Reference Area soils.
Since hardness is primarily driven by concentrations of calcium and magnesium in water, it was inferred that
hardness could also be ruled out as a COPC in both Bredin and Tutt Ponds.
TDS Total dissolved solids TOC Total organic carbon TSS Total suspended solids
2.4.4 Final List of Pond Surface Water COPCs
The list of Preliminary and Unknown COPCs for crop health and ecological receptors initially generated
through comparison of surface water concentrations to applicable irrigation use standards and guidelines
was further refined through the consideration of additional LoEs, including consideration of soil
concentrations and statistical comparisons of soil and plant tissue concentrations in areas irrigated with
Tutt Pond water to a Reference Area. The human health COPCs identified in Pond surface water were
not refined through the consideration of these additional LoEs, and all Preliminary human health COPCs
were carried forward for evaluation in the human health risk assessment (HHRA). Table 4, below,
summarizes the Final COPCs for both crop health and ecological receptors, as well as for human health.
Internal Ref: 652126 / 654763 September 24, 2018
16
© 2018 SNC-Lavalin Inc. All Rights Reserved. Confidential.
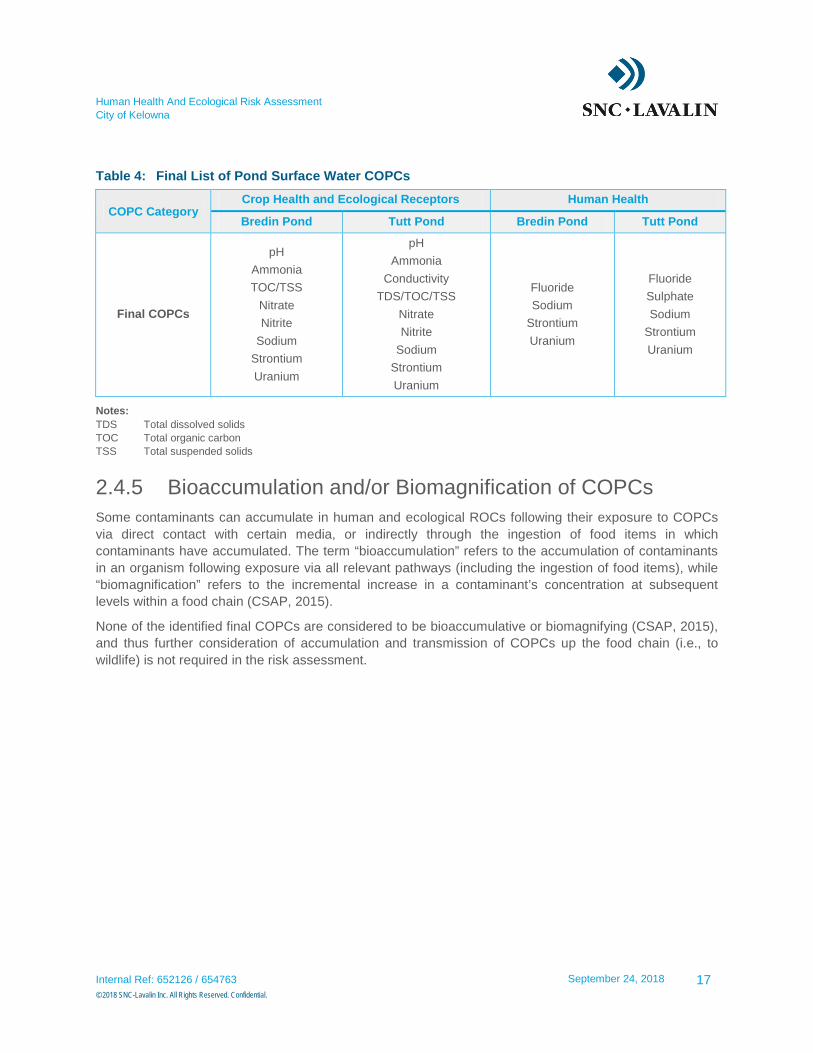
Human Health And Ecological Risk Assessment
City of Kelowna
Table 4: Final List of Pond Surface Water COPCs
COPC Category Crop Health and Ecological Receptors Human Health
Bredin Pond Tutt Pond Bredin Pond Tutt Pond
Final COPCs
pH
Ammonia
TOC/TSS
Nitrate
Nitrite
Sodium
Strontium
Uranium
pH
Ammonia
Conductivity
TDS/TOC/TSS
Nitrate
Nitrite
Sodium
Strontium
Uranium
Fluoride
Sodium
Strontium
Uranium
Fluoride
Sulphate
Sodium
Strontium
Uranium
Notes:
TDS Total dissolved solids
TOC Total organic carbon
TSS Total suspended solids
2.4.5 Bioaccumulation and/or Biomagnification of COPCs
Some contaminants can accumulate in human and ecological ROCs following their exposure to COPCs
via direct contact with certain media, or indirectly through the ingestion of food items in which
contaminants have accumulated. The term “bioaccumulation” refers to the accumulation of contaminants
in an organism following exposure via all relevant pathways (including the ingestion of food items), while
“biomagnification” refers to the incremental increase in a contaminant’s concentration at subsequent
levels within a food chain (CSAP, 2015).
None of the identified final COPCs are considered to be bioaccumulative or biomagnifying (CSAP, 2015),
and thus further consideration of accumulation and transmission of COPCs up the food chain (i.e., to
wildlife) is not required in the risk assessment.
Internal Ref: 652126 / 654763 September 24, 2018
17
© 2018 SNC-Lavalin Inc. All Rights Reserved. Confidential.
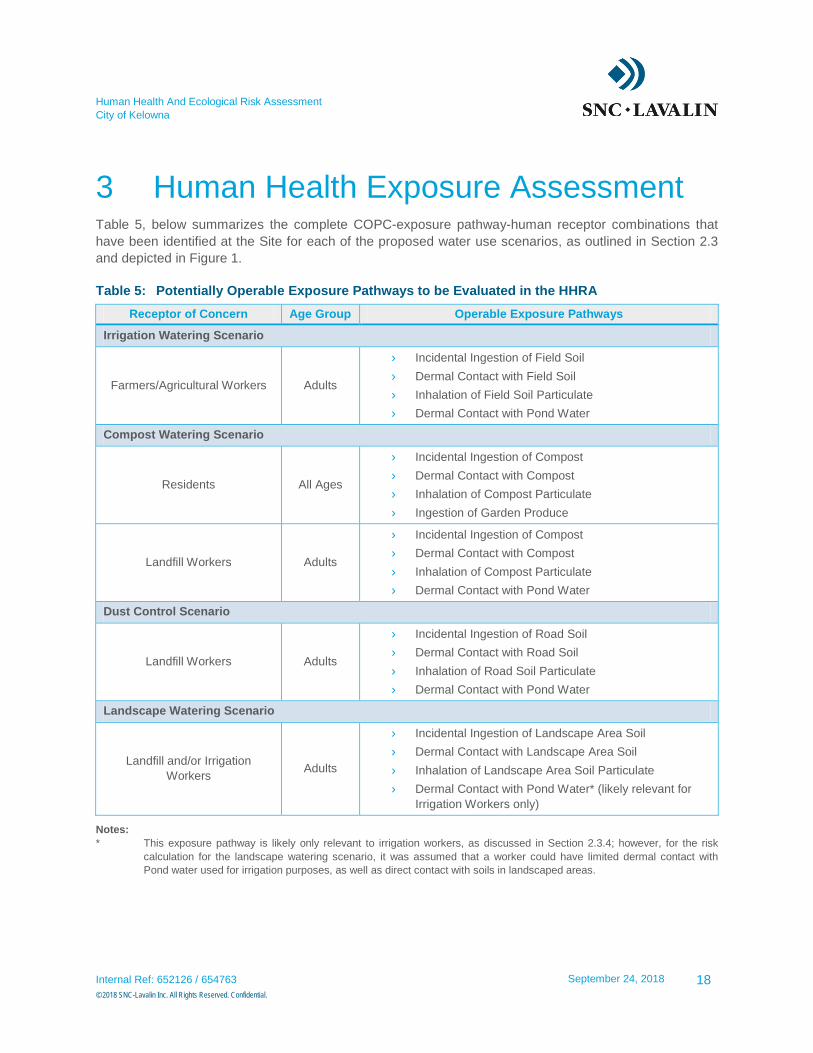
Human Health And Ecological Risk Assessment
City of Kelowna
3 Human Health Exposure Assessment Table 5, below summarizes the complete COPC-exposure pathway-human receptor combinations that
have been identified at the Site for each of the proposed water use scenarios, as outlined in Section 2.3
and depicted in Figure 1.
Table 5: Potentially Operable Exposure Pathways to be Evaluated in the HHRA
Receptor of Concern Age Group Operable Exposure Pathways
Irrigation Watering Scenario
Farmers/Agricultural Workers Adults
› Incidental Ingestion of Field Soil
› Dermal Contact with Field Soil
› Inhalation of Field Soil Particulate
› Dermal Contact with Pond Water
Compost Watering Scenario
Residents All Ages
› Incidental Ingestion of Compost
› Dermal Contact with Compost
› Inhalation of Compost Particulate
› Ingestion of Garden Produce
Landfill Workers Adults
› Incidental Ingestion of Compost
› Dermal Contact with Compost
› Inhalation of Compost Particulate
› Dermal Contact with Pond Water
Dust Control Scenario
Landfill Workers Adults
› Incidental Ingestion of Road Soil
› Dermal Contact with Road Soil
› Inhalation of Road Soil Particulate
› Dermal Contact with Pond Water
Landscape Watering Scenario
Landfill and/or Irrigation
Workers Adults
› Incidental Ingestion of Landscape Area Soil
› Dermal Contact with Landscape Area Soil
› Inhalation of Landscape Area Soil Particulate
› Dermal Contact with Pond Water* (likely relevant for
Irrigation Workers only)
Notes:
* . This exposure pathway is likely only relevant to irrigation workers, as discussed in Section 2.3.4; however, for the risk
calculation for the landscape watering scenario, it was assumed that a worker could have limited dermal contact with
Pond water used for irrigation purposes, as well as direct contact with soils in landscaped areas.
Internal Ref: 652126 / 654763 September 24, 2018
18
© 2018 SNC-Lavalin Inc. All Rights Reserved. Confidential.
Human Health And Ecological Risk Assessment
City of Kelowna
3.1 Exposure Point Concentrations
An exposure point concentration (EPC) is the concentration of a COPC in each exposure medium that a
receptor has the potential to be exposed to. In the above-identified potential exposure scenarios, human
receptors have the potential to directly contact COPCs identified in surface water through dermal contact,
and also to directly contact these COPCs if they accumulate in soils watered with Pond water.
Farmers and agricultural workers (in the irrigation water scenario) and landfill workers (in all other
scenarios) have the potential to be exposed to COPCs through dermal contact with Pond water. The
maximum concentration of COPCs measured in either Bredin or Tutt Pond in the past five years of
monitoring events (as described in Section 2.4) were retained as EPCs in the HHRA; these
concentrations are summarized in Table 6, below.
Analytical data for soil is available for the Tutt Water Area (as described in Section 2.4.3.1); this area has
been irrigated with Tutt Pond water for several years. Since water from the Ponds has not yet been
applied to soils associated with the Site roadway and landscaped areas, COPC concentration data from
the Tutt Pond Water Area soils was used as a conservative representation of potential future COPC
concentrations in these other soil types. Maximum concentrations of COPCs measured in the Tutt Water
Area were used to evaluate potential direct contact exposures for: farmers and agricultural workers in the
irrigation water scenario; landfill workers in the road dust control scenario; and, landfill and/or irrigation
workers in the landscape watering scenario. These concentrations are summarized in Table 6, below. It is
acknowledged that receptor exposure to COPCs in soil or Pond water would not be solely to maximum
concentrations, but rather to a range of concentrations; hence, this use of maximum concentrations will
result in an overestimate of anticipated exposures.
Analytical data for OgoGrow and GlenGrow compost was provided to SNC-Lavalin by the City. Since Pond
water has not yet been used on compost, future compost concentrations were amended to predict potential
concentrations following watering with water from Tutt or Bredin Pond. To achieve this, average
concentrations of COPCs measured in Tutt Water Area soils were compared to the average concentrations
of COPCs measured in Reference Area soils; the percent difference between these average concentrations
was then used to adjust the measured compost concentration to estimate a potential, worst-case compost
concentration; this approach is considered conservative and likely to over-predict compost concentrations
as Tutt Water Area soils have been irrigated with Pond water for several years, and it is unlikely that
compost stored at the Site would be watered with Pond water over such an extended period. Adjusted
compost concentrations are provided in Table E of Appendix I. To determine EPCs for compost, the
maximum of the Tutt Water Area concentration or the adjusted concentrations estimated for compost was
retained as an EPC for both residents and landfill workers with respect to the compost watering scenario, as
summarized in Table 6, below.
In addition to the direct exposure pathways outlined above, one indirect exposure pathway was identified;
in the compost watering scenario, residents have the potential to be indirectly exposed to COPCs through
the ingestion of edible vegetation grown in their backyard gardens. However, since all measured or
estimated (for compost) soil concentrations were well below the applicable CSR Schedule 3.1 standards
for the protection of agricultural use of soils, this indirect exposure pathway was not further evaluated in
the HHRA.
COPC EPCs identified in Pond water and soil are summarized in Table 6, below.
Internal Ref: 652126 / 654763 September 24, 2018
19
© 2018 SNC-Lavalin Inc. All Rights Reserved. Confidential.
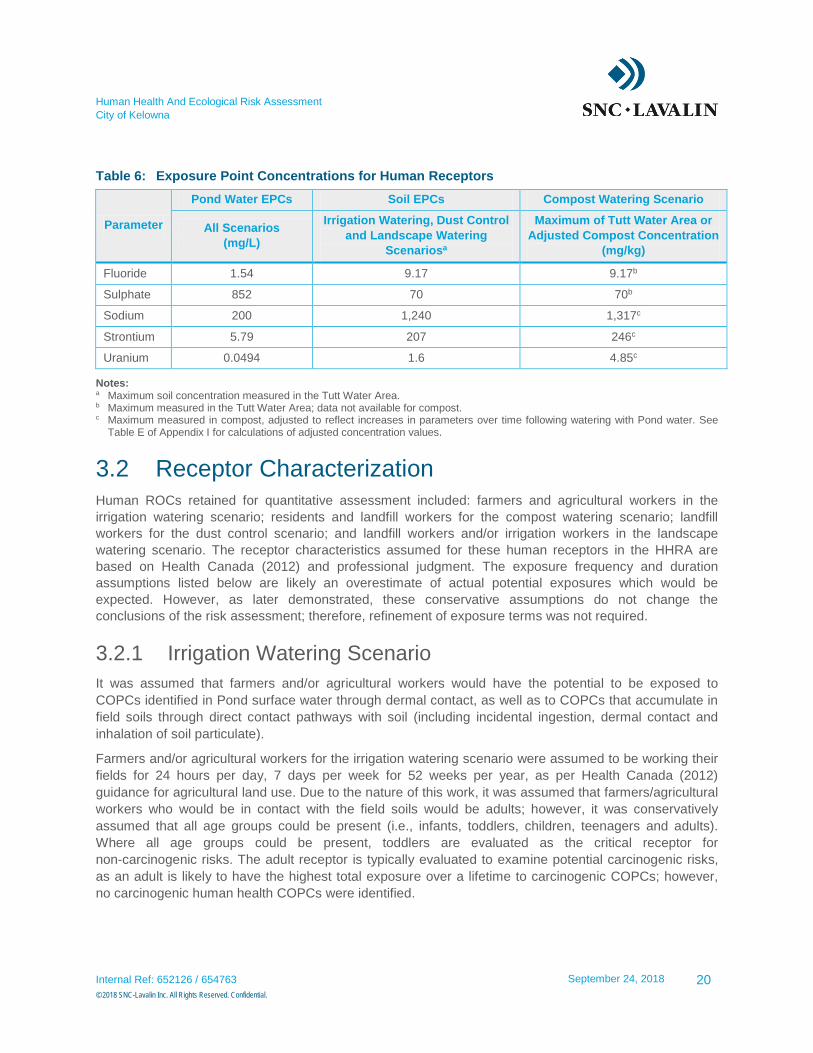
Human Health And Ecological Risk Assessment
City of Kelowna
Table 6: Exposure Point Concentrations for Human Receptors
Parameter
Pond Water EPCs Soil EPCs Compost Watering Scenario
All Scenarios
(mg/L)
Irrigation Watering, Dust Control
and Landscape Watering
Scenariosa
Maximum of Tutt Water Area or
Adjusted Compost Concentration
(mg/kg)
Fluoride 1.54 9.17 9.17b
Sulphate 852 70 70b
Sodium 200 1,240 1,317c
Strontium 5.79 207 246c
Uranium 0.0494 1.6 4.85c
Notes: a Maximum soil concentration measured in the Tutt Water Area. b Maximum measured in the Tutt Water Area; data not available for compost. c Maximum measured in compost, adjusted to reflect increases in parameters over time following watering with Pond water. See
Table E of Appendix I for calculations of adjusted concentration values.
3.2 Receptor Characterization
Human ROCs retained for quantitative assessment included: farmers and agricultural workers in the
irrigation watering scenario; residents and landfill workers for the compost watering scenario; landfill
workers for the dust control scenario; and landfill workers and/or irrigation workers in the landscape
watering scenario. The receptor characteristics assumed for these human receptors in the HHRA are
based on Health Canada (2012) and professional judgment. The exposure frequency and duration
assumptions listed below are likely an overestimate of actual potential exposures which would be
expected. However, as later demonstrated, these conservative assumptions do not change the
conclusions of the risk assessment; therefore, refinement of exposure terms was not required.
3.2.1 Irrigation Watering Scenario
It was assumed that farmers and/or agricultural workers would have the potential to be exposed to
COPCs identified in Pond surface water through dermal contact, as well as to COPCs that accumulate in
field soils through direct contact pathways with soil (including incidental ingestion, dermal contact and
inhalation of soil particulate).
Farmers and/or agricultural workers for the irrigation watering scenario were assumed to be working their
fields for 24 hours per day, 7 days per week for 52 weeks per year, as per Health Canada (2012)
guidance for agricultural land use. Due to the nature of this work, it was assumed that farmers/agricultural
workers who would be in contact with the field soils would be adults; however, it was conservatively
assumed that all age groups could be present (i.e., infants, toddlers, children, teenagers and adults).
Where all age groups could be present, toddlers are evaluated as the critical receptor for
non-carcinogenic risks. The adult receptor is typically evaluated to examine potential carcinogenic risks,
as an adult is likely to have the highest total exposure over a lifetime to carcinogenic COPCs; however,
no carcinogenic human health COPCs were identified.
Internal Ref: 652126 / 654763 September 24, 2018
20
© 2018 SNC-Lavalin Inc. All Rights Reserved. Confidential.
Human Health And Ecological Risk Assessment
City of Kelowna
Additionally, farmers and agricultural workers were assumed to dermally contact Pond surface water
while setting up and/or adjusting irrigation lines for one hour every day. This essentially assumes that a
farmer’s hands would be fully submerged in Pond water for one hour each day, which is highly unlikely.
Contact with Pond water is more likely to be through occasional splashing and brief exposure while
adjusting lines. Therefore, this assumption is likely an overestimate of actual dermal exposures to Pond
water.
Crops grown in the areas where Pond water is currently used and/or is anticipated to be used at the
adjacent property are forage crops, not for human consumption; therefore, potential indirect exposure to
COPCs through the consumption of crop vegetation grown in the areas proposed for Pond water irrigation
was not evaluated. If this assumption changes, and crops are grown for human consumption in these
areas, further evaluation of this potential exposure pathway is recommended.
Table 7, below, summarizes the receptor characteristics for a toddler (the critical receptor identified for
this ROC group). Table 8, below, provides a summary of the assumed exposure frequency and duration
for farmers and/or agricultural workers.
3.2.2 Compost Watering Scenario
It was assumed that Landfill workers would have the potential to be exposed to COPCs identified in Pond
surface water through dermal contact as they set up and employ watering lines, as well as to COPCs that
accumulate in compost through direct contact pathways with soil (including incidental ingestion, dermal
contact and inhalation of soil particulate).
Though landfill workers wear protective clothing when applying surface water to the compost, direct
contact with Pond surface water is known to occur on a daily basis, during set up of the irrigation system.
As a result, Landfill workers were assumed to contact Pond water (i.e., hands fully submerged, as
described above) for one hour each day that they are working at the Site. Dermal exposure to Pond water
is unlikely to be so prolonged, and thus this assumption is considered to be an overestimate of actual
dermal exposures to Pond water.
Landfill workers were assumed to be present at the Site for 10 hours per day, 5 days per week for
52 weeks per year, as per Health Canada (2012) guidance for industrial workers. Due to the nature of the
work, landfill workers were assumed to be adults.
Additionally, residents using compost in backyard gardens were retained for further evaluation, as
residents tending to their gardens may directly contact accumulated COPCs in compost, and/or these
COPCs may taken up by garden produce grown in the compost. However, as described in the EPC
screening section above, since maximum measured and/or predicted concentrations of COPCs in
compost were below the applicable AL standards, this indirect exposure pathway was not retained for
quantitative evaluation in the HHRA. As a result, the exposure pathways for the resident gardener
retained for evaluation include only those associated with direct contact with compost. Residents were
assumed to have contact with garden soils 24 hours per day, 7 days per week for 52 weeks per year, as
per Health Canada (2012) guidance for residential receptors. Residents were considered to be of all
ages, and thus the toddler was retained as the critical receptor for non-carcinogenic exposures.
Table 7, below, summarizes the receptor characteristics for toddlers (the critical receptor for residents)
and adults (the critical receptor for landfill workers). Table 8 provides a summary of the assumed
exposure frequency and durations for landfill workers at the Site and off-Site residents potentially
exposed to compost in backyard gardens.
Internal Ref: 652126 / 654763 September 24, 2018
21
© 2018 SNC-Lavalin Inc. All Rights Reserved. Confidential.
Human Health And Ecological Risk Assessment
City of Kelowna
3.2.3 Dust Control Scenario
It is unlikely that the landfill workers applying surface water to the dirt roadways would be significantly
exposed to COPCs through direct contact with Pond surface water during application to roads as roads
are watered using a tank/truck system. Additionally, as they are working on an industrial landfill site, it is
likely that workers would be wearing protective clothing and gloves. However, it is possible that dermal
contact with water could occur while trucks used for road watering are being filled by landfill workers; as a
result, it was assumed that landfill workers could contact Pond water (i.e., hands fully submerged, as
described above) for one hour each day that they are working at the Site. It was also assumed that
Landfill workers would have contact with COPCs that accumulate in road soils, through direct contact
pathways with soil (including incidental ingestion, dermal contact and inhalation of soil particulate).
Landfill workers were assumed to be present at the Site for 10 hours per day, 5 days per week for
52 weeks per year, as per Health Canada (2012) guidance for industrial workers. Due to the nature of the
work, landfill workers were assumed to be adults.
Table 7, below, summarizes the receptor characteristics for an adult (the critical receptor for landfill
workers). Table 8, below, provides a summary of the assumed exposure frequency and durations for
landfill workers at the Site.
3.2.4 Landscape Watering Scenario
It is unlikely that the landfill workers would be significantly exposed to COPCs in the Pond surface water
as watering of landscaped areas would occur at night via an automated irrigation system. As a result,
landfill worker potential direct contact with surface water COPCs for this proposed water use was not
identified as a significant operable exposure pathway. It is possible, however, that irrigation workers
would have limited contact with water during the annual irrigation system set up. For the purposes of the
HHRA, it was assumed that dermal contact with Pond water in this scenario would be for approximately
one hour each day that the worker was at the Site, even though contact is likely to occur on a much less
frequent basis (i.e., likely only once or twice annually).
In addition, landfill workers and/or irrigation workers were assumed to have the potential to be exposed to
COPCs that accumulate in landscape soils, through direct contact pathways with soil (including incidental
ingestion, dermal contact and inhalation of soil particulate). Though irrigation workers are unlikely to have
significant contact with landscape soils, and landfill workers are unlikely to have significant contact with
Pond water, these exposures were conservatively evaluated together, for one landfill/irrigation worker
receptor. Landfill/irrigation workers were assumed to be present at the Site for 10 hours per day, 5 days
per week for 52 weeks per year, as per Health Canada (2012) guidance for industrial workers. These
exposure assumptions are very conservative, as irrigation workers are only likely to be adjusting the
irrigation system once annually, and landfill workers are unlikely to spend this amount of time exposed to
landscape soils; however, this overly conservative assumption did not affect the results of the HHRA, and
thus did not need to be refined in the calculation of risk estimates. Due to the nature of the work, landfill
workers were assumed to be adults;
Table 7, below, summarizes the receptor characteristics for an adult (the critical receptor for
landscape/irrigation workers). Table 8, below, provides a summary of the assumed exposure frequency
and durations for Landfill workers at the Site.
Internal Ref: 652126 / 654763 September 24, 2018
22
© 2018 SNC-Lavalin Inc. All Rights Reserved. Confidential.
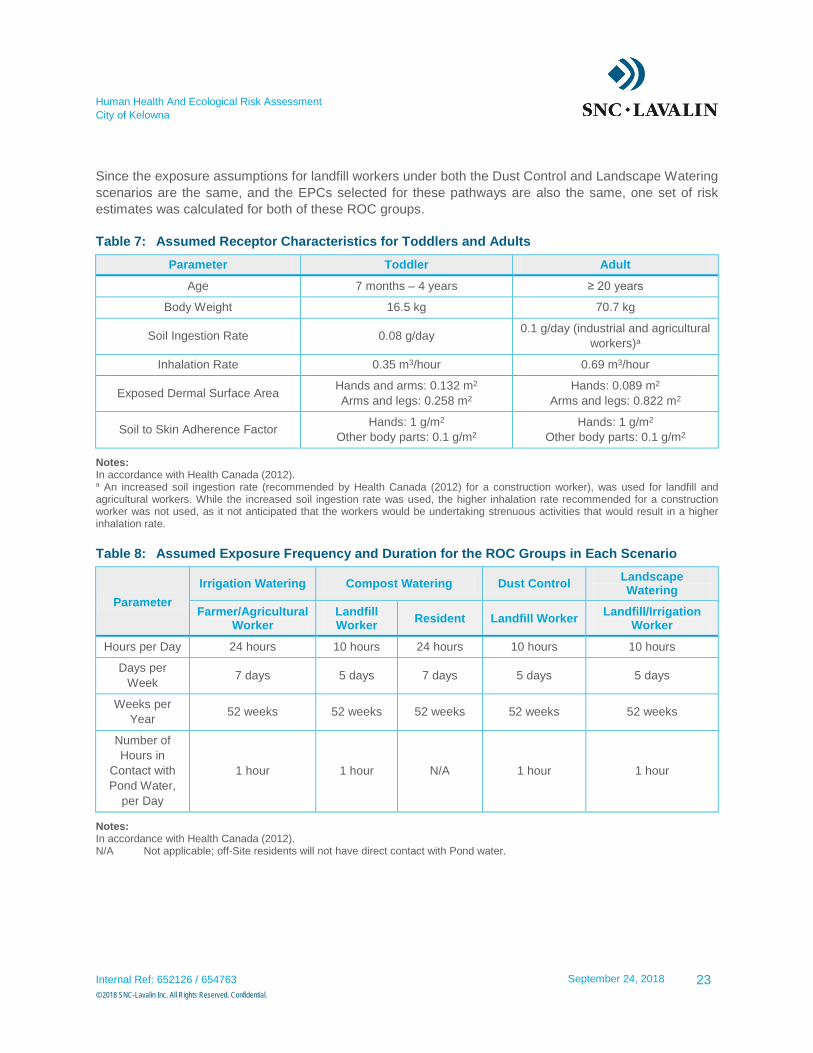
Human Health And Ecological Risk Assessment
City of Kelowna
Since the exposure assumptions for landfill workers under both the Dust Control and Landscape Watering
scenarios are the same, and the EPCs selected for these pathways are also the same, one set of risk
estimates was calculated for both of these ROC groups.
Table 7: Assumed Receptor Characteristics for Toddlers and Adults
Parameter Toddler Adult
Age 7 months – 4 years ≥ 20 years
Body Weight 16.5 kg 70.7 kg
Soil Ingestion Rate 0.08 g/day 0.1 g/day (industrial and agricultural
workers)a
Inhalation Rate 0.35 m3/hour 0.69 m3/hour
Exposed Dermal Surface Area Hands and arms: 0.132 m2
Arms and legs: 0.258 m2
Hands: 0.089 m2
Arms and legs: 0.822 m2
Soil to Skin Adherence Factor Hands: 1 g/m2
Other body parts: 0.1 g/m2
Hands: 1 g/m2
Other body parts: 0.1 g/m2
Notes:
In accordance with Health Canada (2012). a An increased soil ingestion rate (recommended by Health Canada (2012) for a construction worker), was used for landfill and agricultural workers. While the increased soil ingestion rate was used, the higher inhalation rate recommended for a construction worker was not used, as it not anticipated that the workers would be undertaking strenuous activities that would result in a higher inhalation rate.
Table 8: Assumed Exposure Frequency and Duration for the ROC Groups in Each Scenario
Parameter
Irrigation Watering Compost Watering Dust Control Landscape Watering
Farmer/Agricultural Worker
Landfill Worker
Resident Landfill Worker Landfill/Irrigation
Worker
Hours per Day 24 hours 10 hours 24 hours 10 hours 10 hours
Days per
Week 7 days 5 days 7 days 5 days 5 days
Weeks per
Year 52 weeks 52 weeks 52 weeks 52 weeks 52 weeks
Number of
Hours in
Contact with
Pond Water,
per Day
1 hour 1 hour N/A 1 hour 1 hour
Notes:
In accordance with Health Canada (2012). N/A Not applicable; off-Site residents will not have direct contact with Pond water.
Internal Ref: 652126 / 654763 September 24, 2018
23
© 2018 SNC-Lavalin Inc. All Rights Reserved. Confidential.
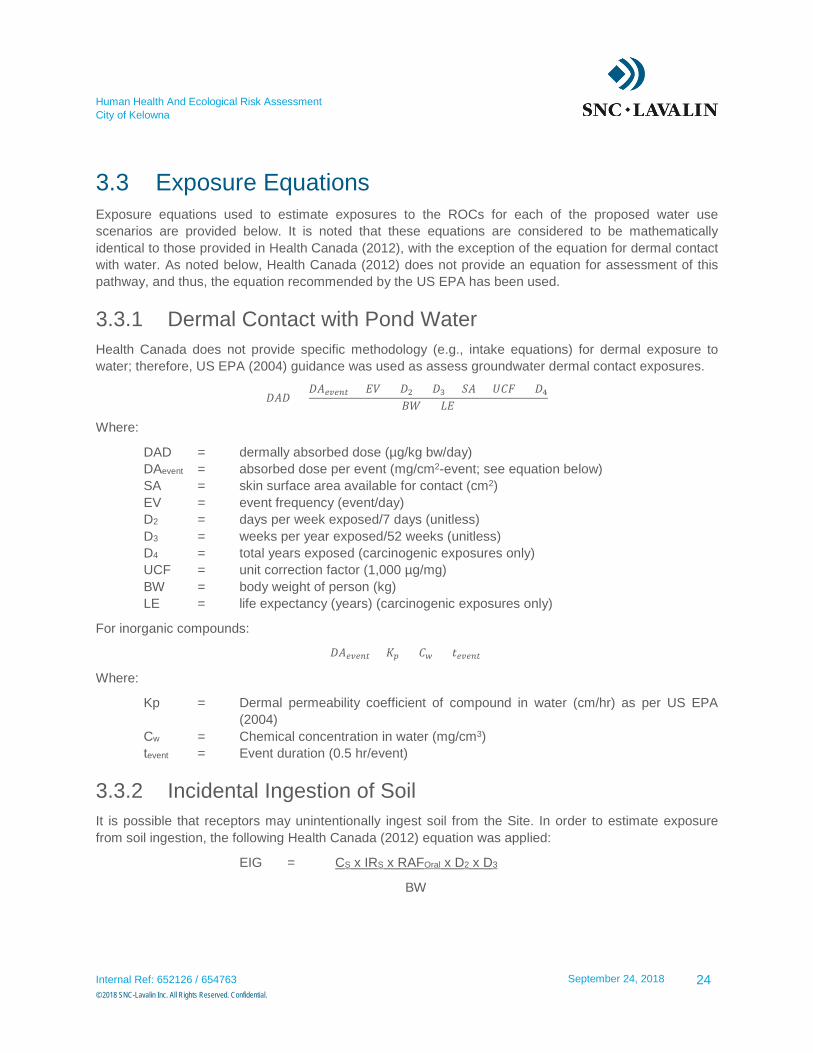
Human Health And Ecological Risk Assessment
City of Kelowna
3.3 Exposure Equations
Exposure equations used to estimate exposures to the ROCs for each of the proposed water use
scenarios are provided below. It is noted that these equations are considered to be mathematically
identical to those provided in Health Canada (2012), with the exception of the equation for dermal contact
with water. As noted below, Health Canada (2012) does not provide an equation for assessment of this
pathway, and thus, the equation recommended by the US EPA has been used.
3.3.1 Dermal Contact with Pond Water
Health Canada does not provide specific methodology (e.g., intake equations) for dermal exposure to
water; therefore, US EPA (2004) guidance was used as assess groundwater dermal contact exposures.
𝐷𝐷𝐷𝐷𝐷𝐷 = 𝐷𝐷𝐷𝐷𝑒𝑒𝑒𝑒𝑒𝑒𝑒𝑒𝑒𝑒 × 𝐸𝐸𝐸𝐸 × 𝐷𝐷2 × 𝐷𝐷3 × 𝑆𝑆𝐷𝐷 × 𝑈𝑈𝑈𝑈𝑈𝑈 × 𝐷𝐷4
𝐵𝐵𝐵𝐵 × 𝐿𝐿𝐸𝐸
Where:
DAD = dermally absorbed dose (µg/kg bw/day)
DAevent = absorbed dose per event (mg/cm2-event; see equation below)
SA = skin surface area available for contact (cm2)
EV = event frequency (event/day)
D2 = days per week exposed/7 days (unitless)
D3 = weeks per year exposed/52 weeks (unitless)
D4 = total years exposed (carcinogenic exposures only)
UCF = unit correction factor (1,000 µg/mg)
BW = body weight of person (kg)
LE = life expectancy (years) (carcinogenic exposures only)
For inorganic compounds:
𝐷𝐷𝐷𝐷𝑒𝑒𝑒𝑒𝑒𝑒𝑒𝑒𝑒𝑒 = 𝐾𝐾𝑝𝑝 × 𝑈𝑈𝑤𝑤 × 𝑡𝑡𝑒𝑒𝑒𝑒𝑒𝑒𝑒𝑒𝑒𝑒
Where:
Kp = Dermal permeability coefficient of compound in water (cm/hr) as per US EPA
(2004)
Cw = Chemical concentration in water (mg/cm3)
tevent = Event duration (0.5 hr/event)
3.3.2 Incidental Ingestion of Soil
It is possible that receptors may unintentionally ingest soil from the Site. In order to estimate exposure
from soil ingestion, the following Health Canada (2012) equation was applied:
EIG = CS x IRS x RAFOral x D2 x D3
BW
Internal Ref: 652126 / 654763 September 24, 2018
24
© 2018 SNC-Lavalin Inc. All Rights Reserved. Confidential.
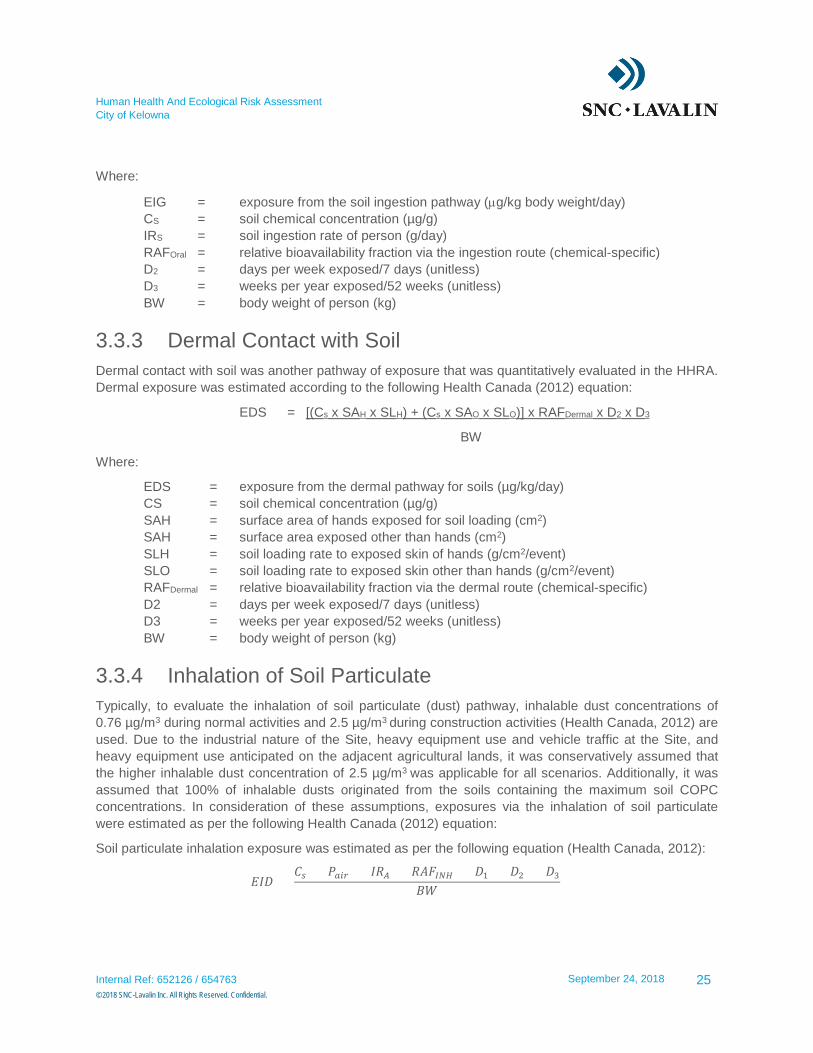
Human Health And Ecological Risk Assessment
City of Kelowna
Where:
EIG = exposure from the soil ingestion pathway (µg/kg body weight/day)
CS = soil chemical concentration (µg/g)
IRS = soil ingestion rate of person (g/day)
RAFOral = relative bioavailability fraction via the ingestion route (chemical-specific)
D2 = days per week exposed/7 days (unitless)
D3 = weeks per year exposed/52 weeks (unitless)
BW = body weight of person (kg)
3.3.3 Dermal Contact with Soil
Dermal contact with soil was another pathway of exposure that was quantitatively evaluated in the HHRA.
Dermal exposure was estimated according to the following Health Canada (2012) equation:
EDS = [(Cs x SAH x SLH) + (Cs x SAO x SLO)] x RAFDermal x D2 x D3
BW
Where:
EDS = exposure from the dermal pathway for soils (µg/kg/day)
CS = soil chemical concentration (µg/g)
SAH = surface area of hands exposed for soil loading (cm2)
SAH = surface area exposed other than hands (cm2)
SLH = soil loading rate to exposed skin of hands (g/cm2/event)
SLO = soil loading rate to exposed skin other than hands (g/cm2/event)
RAFDermal = relative bioavailability fraction via the dermal route (chemical-specific)
D2 = days per week exposed/7 days (unitless)
D3 = weeks per year exposed/52 weeks (unitless)
BW = body weight of person (kg)
3.3.4 Inhalation of Soil Particulate
Typically, to evaluate the inhalation of soil particulate (dust) pathway, inhalable dust concentrations of
0.76 µg/m3 during normal activities and 2.5 µg/m3 during construction activities (Health Canada, 2012) are
used. Due to the industrial nature of the Site, heavy equipment use and vehicle traffic at the Site, and
heavy equipment use anticipated on the adjacent agricultural lands, it was conservatively assumed that
the higher inhalable dust concentration of 2.5 µg/m3 was applicable for all scenarios. Additionally, it was
assumed that 100% of inhalable dusts originated from the soils containing the maximum soil COPC
concentrations. In consideration of these assumptions, exposures via the inhalation of soil particulate
were estimated as per the following Health Canada (2012) equation:
Soil particulate inhalation exposure was estimated as per the following equation (Health Canada, 2012):
𝐸𝐸𝐸𝐸𝐷𝐷 = 𝑈𝑈𝑠𝑠 × 𝑃𝑃𝑎𝑎𝑎𝑎𝑎𝑎 × 𝐸𝐸𝐼𝐼𝐴𝐴 × 𝐼𝐼𝐷𝐷𝑈𝑈𝐼𝐼𝐼𝐼𝐼𝐼 × 𝐷𝐷1 × 𝐷𝐷2 × 𝐷𝐷3
𝐵𝐵𝐵𝐵
Internal Ref: 652126 / 654763 September 24, 2018
25
© 2018 SNC-Lavalin Inc. All Rights Reserved. Confidential.
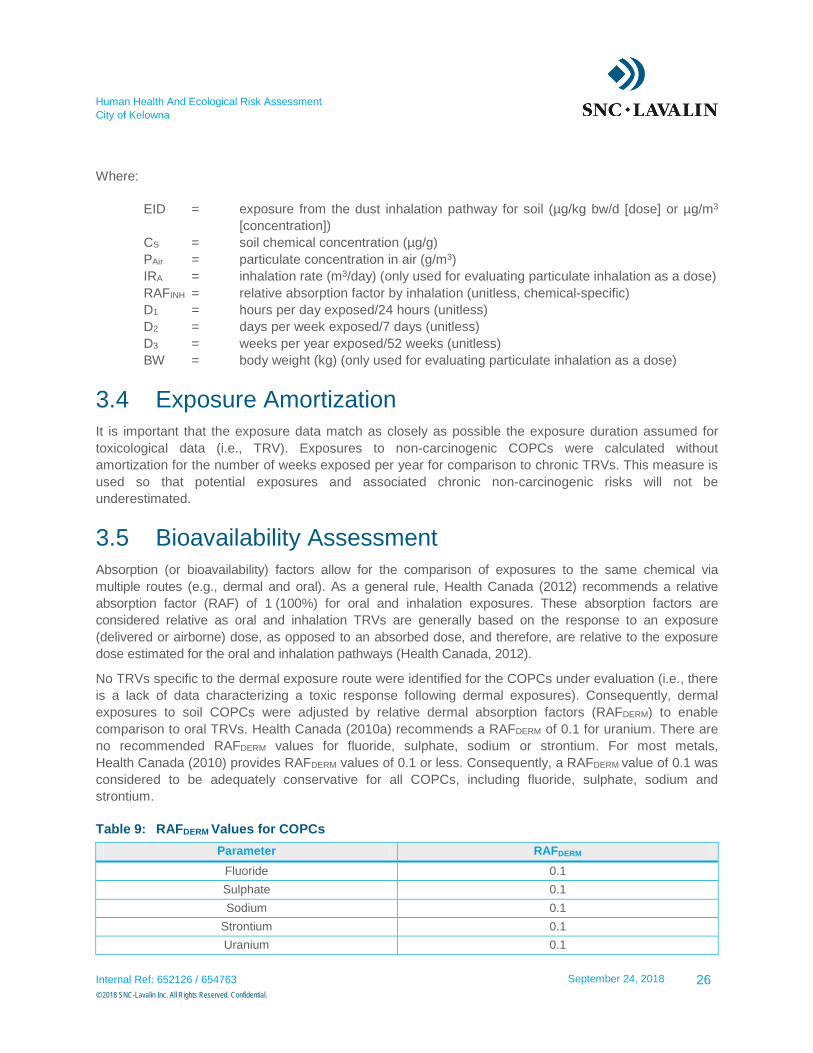
Human Health And Ecological Risk Assessment
City of Kelowna
Where:
EID = exposure from the dust inhalation pathway for soil (µg/kg bw/d [dose] or µg/m3
[concentration])
CS = soil chemical concentration (µg/g)
PAir = particulate concentration in air (g/m3)
IRA = inhalation rate (m3/day) (only used for evaluating particulate inhalation as a dose)
RAFINH = relative absorption factor by inhalation (unitless, chemical-specific)
D1 = hours per day exposed/24 hours (unitless)
D2 = days per week exposed/7 days (unitless)
D3 = weeks per year exposed/52 weeks (unitless)
BW = body weight (kg) (only used for evaluating particulate inhalation as a dose)
3.4 Exposure Amortization
It is important that the exposure data match as closely as possible the exposure duration assumed for
toxicological data (i.e., TRV). Exposures to non-carcinogenic COPCs were calculated without
amortization for the number of weeks exposed per year for comparison to chronic TRVs. This measure is
used so that potential exposures and associated chronic non-carcinogenic risks will not be
underestimated.
3.5 Bioavailability Assessment
Absorption (or bioavailability) factors allow for the comparison of exposures to the same chemical via
multiple routes (e.g., dermal and oral). As a general rule, Health Canada (2012) recommends a relative
absorption factor (RAF) of 1 (100%) for oral and inhalation exposures. These absorption factors are
considered relative as oral and inhalation TRVs are generally based on the response to an exposure
(delivered or airborne) dose, as opposed to an absorbed dose, and therefore, are relative to the exposure
dose estimated for the oral and inhalation pathways (Health Canada, 2012).
No TRVs specific to the dermal exposure route were identified for the COPCs under evaluation (i.e., there
is a lack of data characterizing a toxic response following dermal exposures). Consequently, dermal
exposures to soil COPCs were adjusted by relative dermal absorption factors (RAFDERM) to enable
comparison to oral TRVs. Health Canada (2010a) recommends a RAFDERM of 0.1 for uranium. There are
no recommended RAFDERM values for fluoride, sulphate, sodium or strontium. For most metals,
Health Canada (2010) provides RAFDERM values of 0.1 or less. Consequently, a RAFDERM value of 0.1 was
considered to be adequately conservative for all COPCs, including fluoride, sulphate, sodium and
strontium.
Table 9: RAFDERM Values for COPCs
Parameter RAFDERM
Fluoride 0.1
Sulphate 0.1
Sodium 0.1
Strontium 0.1
Uranium 0.1
Internal Ref: 652126 / 654763 September 24, 2018
26
© 2018 SNC-Lavalin Inc. All Rights Reserved. Confidential.
Human Health And Ecological Risk Assessment
City of Kelowna
TRVs specific to the dermal exposure route were not identified for the COPCs under evaluation in Pond
water; therefore, dermal exposures to COPCs in groundwater were adjusted by dermal permeability
coefficients (KP) for comparison to oral TRVs. The KP values used in the HHRA are provided in the tables
summarizing the detailed risk estimates (Appendix III).
Internal Ref: 652126 / 654763 September 24, 2018
27
© 2018 SNC-Lavalin Inc. All Rights Reserved. Confidential.
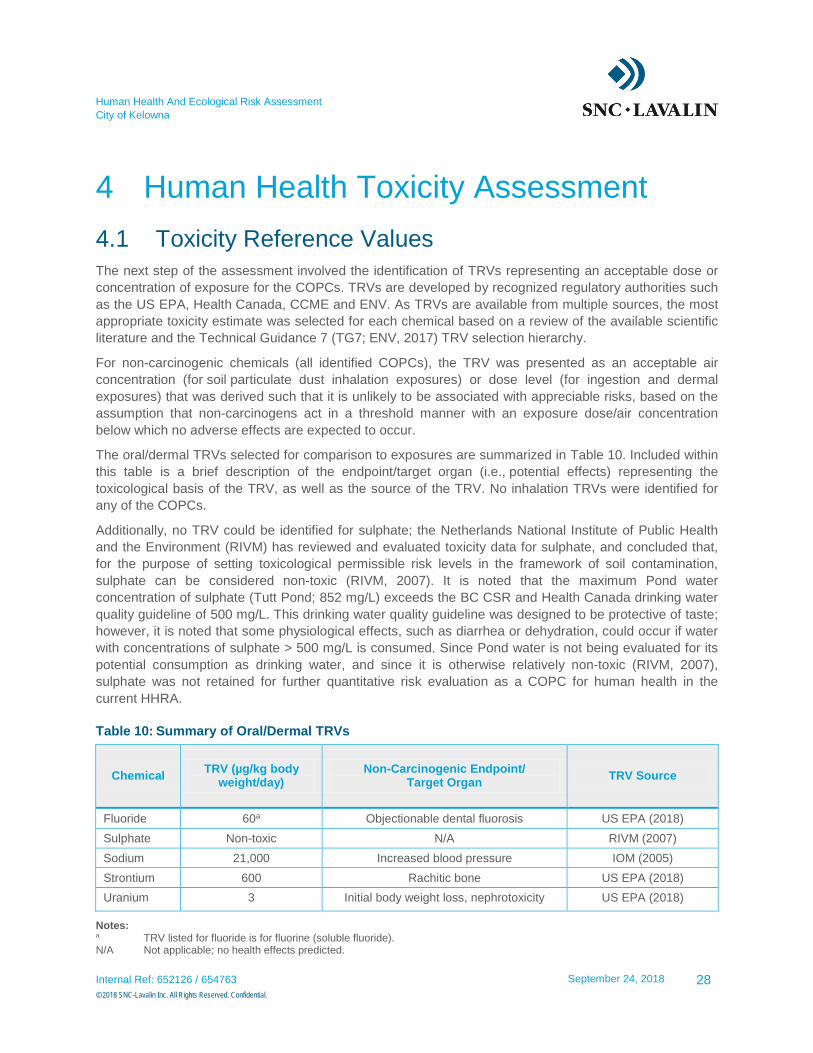
Human Health And Ecological Risk Assessment
City of Kelowna
4 Human Health Toxicity Assessment
4.1 Toxicity Reference Values
The next step of the assessment involved the identification of TRVs representing an acceptable dose or
concentration of exposure for the COPCs. TRVs are developed by recognized regulatory authorities such
as the US EPA, Health Canada, CCME and ENV. As TRVs are available from multiple sources, the most
appropriate toxicity estimate was selected for each chemical based on a review of the available scientific
literature and the Technical Guidance 7 (TG7; ENV, 2017) TRV selection hierarchy.
For non-carcinogenic chemicals (all identified COPCs), the TRV was presented as an acceptable air
concentration (for soil particulate dust inhalation exposures) or dose level (for ingestion and dermal
exposures) that was derived such that it is unlikely to be associated with appreciable risks, based on the
assumption that non-carcinogens act in a threshold manner with an exposure dose/air concentration
below which no adverse effects are expected to occur.
The oral/dermal TRVs selected for comparison to exposures are summarized in Table 10. Included within
this table is a brief description of the endpoint/target organ (i.e., potential effects) representing the
toxicological basis of the TRV, as well as the source of the TRV. No inhalation TRVs were identified for
any of the COPCs.
Additionally, no TRV could be identified for sulphate; the Netherlands National Institute of Public Health
and the Environment (RIVM) has reviewed and evaluated toxicity data for sulphate, and concluded that,
for the purpose of setting toxicological permissible risk levels in the framework of soil contamination,
sulphate can be considered non-toxic (RIVM, 2007). It is noted that the maximum Pond water
concentration of sulphate (Tutt Pond; 852 mg/L) exceeds the BC CSR and Health Canada drinking water
quality guideline of 500 mg/L. This drinking water quality guideline was designed to be protective of taste;
however, it is noted that some physiological effects, such as diarrhea or dehydration, could occur if water
with concentrations of sulphate > 500 mg/L is consumed. Since Pond water is not being evaluated for its
potential consumption as drinking water, and since it is otherwise relatively non-toxic (RIVM, 2007),
sulphate was not retained for further quantitative risk evaluation as a COPC for human health in the
current HHRA.
Table 10: Summary of Oral/Dermal TRVs
Chemical TRV (µg/kg body
weight/day) Non-Carcinogenic Endpoint/
Target Organ TRV Source
Fluoride 60a Objectionable dental fluorosis US EPA (2018)
Sulphate Non-toxic N/A RIVM (2007)
Sodium 21,000 Increased blood pressure IOM (2005)
Strontium 600 Rachitic bone US EPA (2018)
Uranium 3 Initial body weight loss, nephrotoxicity US EPA (2018)
Notes: a TRV listed for fluoride is for fluorine (soluble fluoride). N/A Not applicable; no health effects predicted.
Internal Ref: 652126 / 654763 September 24, 2018
28
© 2018 SNC-Lavalin Inc. All Rights Reserved. Confidential.
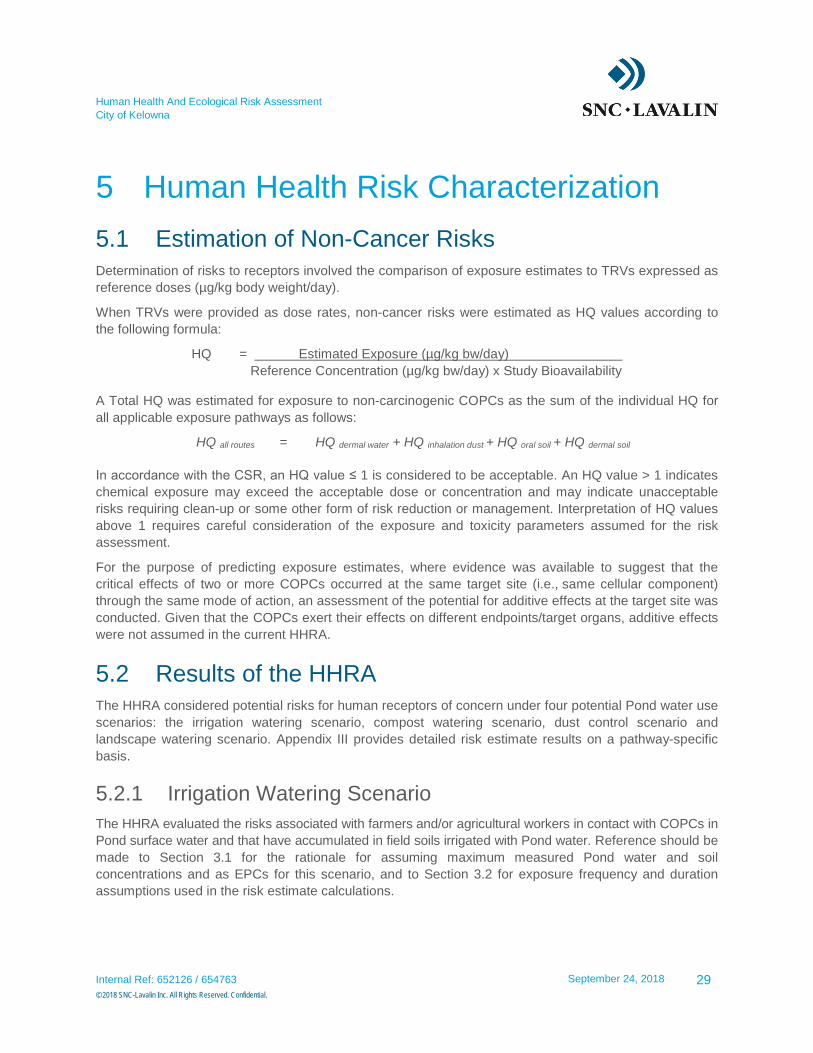
Human Health And Ecological Risk Assessment
City of Kelowna
5 Human Health Risk Characterization
5.1 Estimation of Non-Cancer Risks
Determination of risks to receptors involved the comparison of exposure estimates to TRVs expressed as
reference doses (µg/kg body weight/day).
When TRVs were provided as dose rates, non-cancer risks were estimated as HQ values according to
the following formula:
HQ = Estimated Exposure (µg/kg bw/day)
Reference Concentration (µg/kg bw/day) x Study Bioavailability
A Total HQ was estimated for exposure to non-carcinogenic COPCs as the sum of the individual HQ for
all applicable exposure pathways as follows:
HQ all routes = HQ dermal water + HQ inhalation dust + HQ oral soil + HQ dermal soil
In accordance with the CSR, an HQ value ≤ 1 is considered to be acceptable. An HQ value > 1 indicates
chemical exposure may exceed the acceptable dose or concentration and may indicate unacceptable
risks requiring clean-up or some other form of risk reduction or management. Interpretation of HQ values
above 1 requires careful consideration of the exposure and toxicity parameters assumed for the risk
assessment.
For the purpose of predicting exposure estimates, where evidence was available to suggest that the
critical effects of two or more COPCs occurred at the same target site (i.e., same cellular component)
through the same mode of action, an assessment of the potential for additive effects at the target site was
conducted. Given that the COPCs exert their effects on different endpoints/target organs, additive effects
were not assumed in the current HHRA.
5.2 Results of the HHRA
The HHRA considered potential risks for human receptors of concern under four potential Pond water use
scenarios: the irrigation watering scenario, compost watering scenario, dust control scenario and
landscape watering scenario. Appendix III provides detailed risk estimate results on a pathway-specific
basis.
5.2.1 Irrigation Watering Scenario
The HHRA evaluated the risks associated with farmers and/or agricultural workers in contact with COPCs in
Pond surface water and that have accumulated in field soils irrigated with Pond water. Reference should be
made to Section 3.1 for the rationale for assuming maximum measured Pond water and soil
concentrations and as EPCs for this scenario, and to Section 3.2 for exposure frequency and duration
assumptions used in the risk estimate calculations.
Internal Ref: 652126 / 654763 September 24, 2018
29
© 2018 SNC-Lavalin Inc. All Rights Reserved. Confidential.
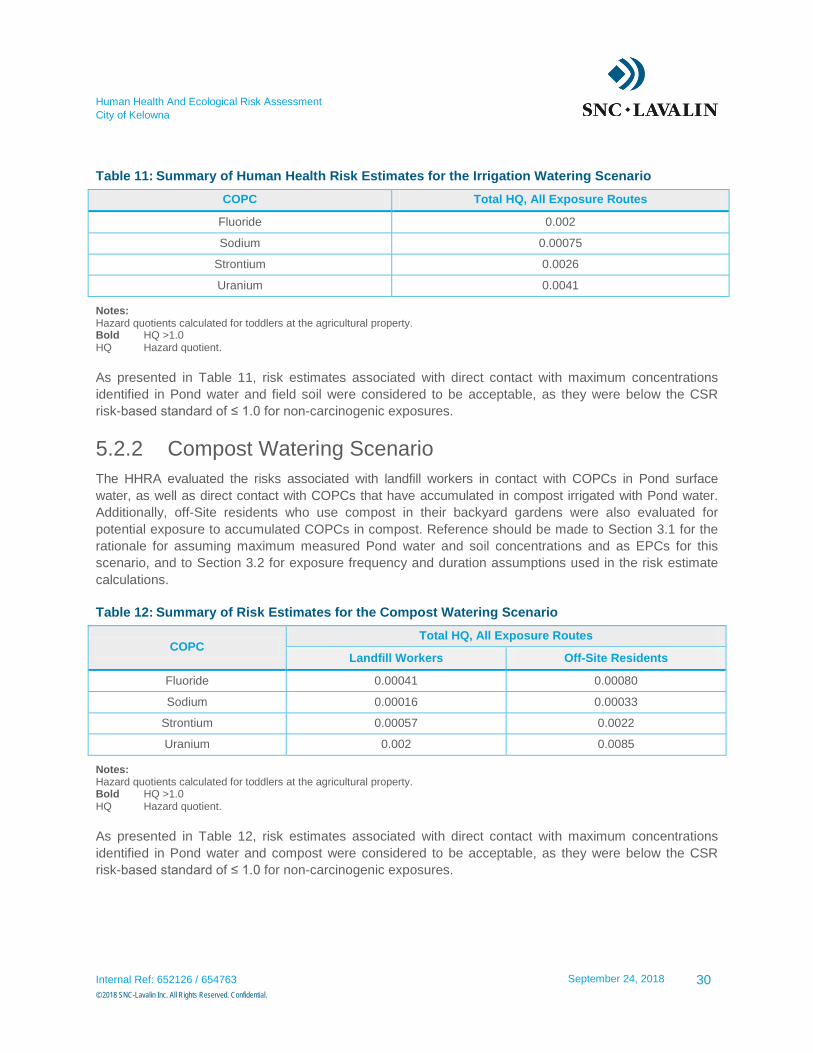
Human Health And Ecological Risk Assessment
City of Kelowna
Table 11: Summary of Human Health Risk Estimates for the Irrigation Watering Scenario
COPC Total HQ, All Exposure Routes
Fluoride 0.002
Sodium 0.00075
Strontium 0.0026
Uranium 0.0041
Notes: Hazard quotients calculated for toddlers at the agricultural property. Bold HQ >1.0 HQ Hazard quotient.
As presented in Table 11, risk estimates associated with direct contact with maximum concentrations
identified in Pond water and field soil were considered to be acceptable, as they were below the CSR
risk-based standard of ≤ 1.0 for non-carcinogenic exposures.
5.2.2 Compost Watering Scenario
The HHRA evaluated the risks associated with landfill workers in contact with COPCs in Pond surface
water, as well as direct contact with COPCs that have accumulated in compost irrigated with Pond water.
Additionally, off-Site residents who use compost in their backyard gardens were also evaluated for
potential exposure to accumulated COPCs in compost. Reference should be made to Section 3.1 for the
rationale for assuming maximum measured Pond water and soil concentrations and as EPCs for this
scenario, and to Section 3.2 for exposure frequency and duration assumptions used in the risk estimate
calculations.
Table 12: Summary of Risk Estimates for the Compost Watering Scenario
COPC Total HQ, All Exposure Routes
Landfill Workers Off-Site Residents
Fluoride 0.00041 0.00080
Sodium 0.00016 0.00033
Strontium 0.00057 0.0022
Uranium 0.002 0.0085
Notes: Hazard quotients calculated for toddlers at the agricultural property. Bold HQ >1.0 HQ Hazard quotient.
As presented in Table 12, risk estimates associated with direct contact with maximum concentrations
identified in Pond water and compost were considered to be acceptable, as they were below the CSR
risk-based standard of ≤ 1.0 for non-carcinogenic exposures.
Internal Ref: 652126 / 654763 September 24, 2018
30
© 2018 SNC-Lavalin Inc. All Rights Reserved. Confidential.
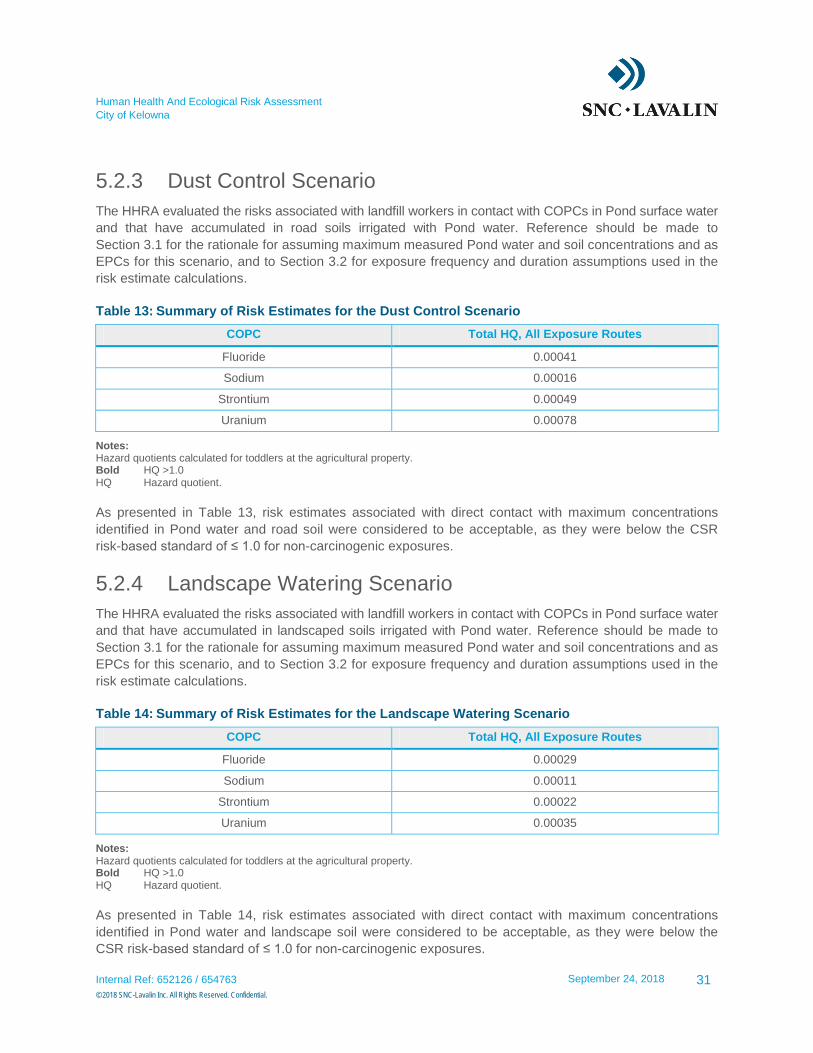
Human Health And Ecological Risk Assessment
City of Kelowna
5.2.3 Dust Control Scenario
The HHRA evaluated the risks associated with landfill workers in contact with COPCs in Pond surface water
and that have accumulated in road soils irrigated with Pond water. Reference should be made to
Section 3.1 for the rationale for assuming maximum measured Pond water and soil concentrations and as
EPCs for this scenario, and to Section 3.2 for exposure frequency and duration assumptions used in the
risk estimate calculations.
Table 13: Summary of Risk Estimates for the Dust Control Scenario
COPC Total HQ, All Exposure Routes
Fluoride 0.00041
Sodium 0.00016
Strontium 0.00049
Uranium 0.00078
Notes: Hazard quotients calculated for toddlers at the agricultural property. Bold HQ >1.0 HQ Hazard quotient.
As presented in Table 13, risk estimates associated with direct contact with maximum concentrations
identified in Pond water and road soil were considered to be acceptable, as they were below the CSR
risk-based standard of ≤ 1.0 for non-carcinogenic exposures.
5.2.4 Landscape Watering Scenario
The HHRA evaluated the risks associated with landfill workers in contact with COPCs in Pond surface water
and that have accumulated in landscaped soils irrigated with Pond water. Reference should be made to
Section 3.1 for the rationale for assuming maximum measured Pond water and soil concentrations and as
EPCs for this scenario, and to Section 3.2 for exposure frequency and duration assumptions used in the
risk estimate calculations.
Table 14: Summary of Risk Estimates for the Landscape Watering Scenario
COPC Total HQ, All Exposure Routes
Fluoride 0.00029
Sodium 0.00011
Strontium 0.00022
Uranium 0.00035
Notes: Hazard quotients calculated for toddlers at the agricultural property. Bold HQ >1.0 HQ Hazard quotient.
As presented in Table 14, risk estimates associated with direct contact with maximum concentrations
identified in Pond water and landscape soil were considered to be acceptable, as they were below the
CSR risk-based standard of ≤ 1.0 for non-carcinogenic exposures.
Internal Ref: 652126 / 654763 September 24, 2018
31
© 2018 SNC-Lavalin Inc. All Rights Reserved. Confidential.
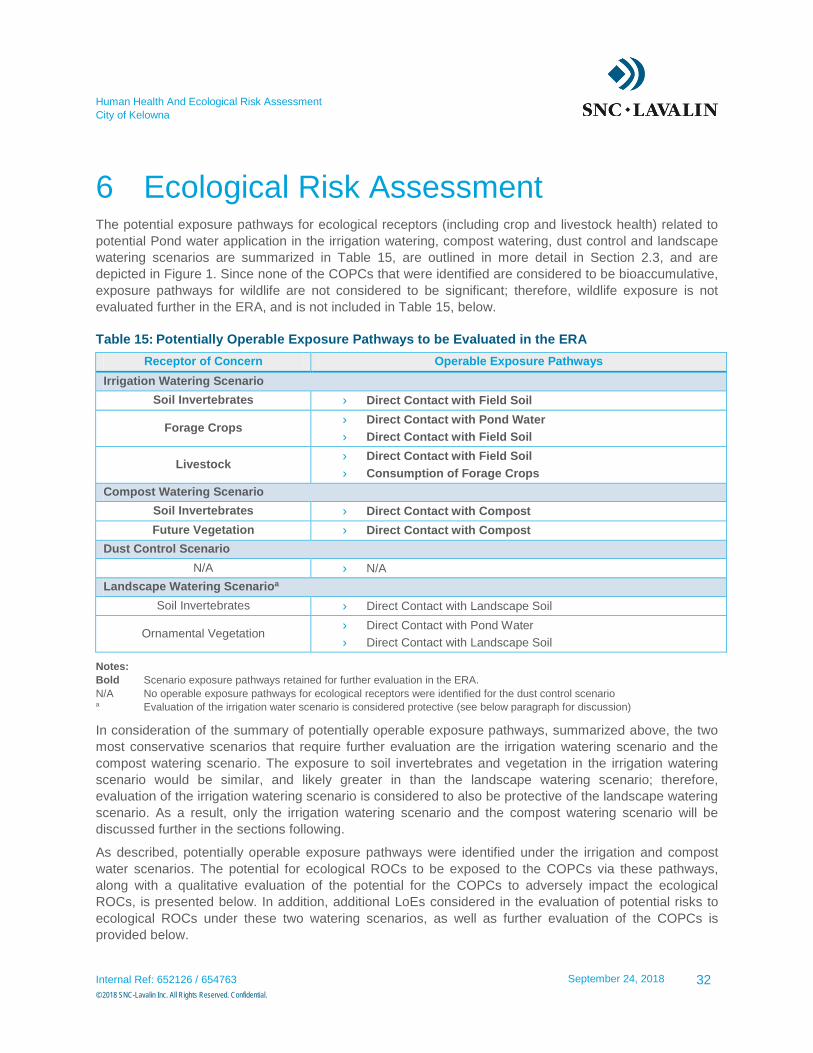
Human Health And Ecological Risk Assessment
City of Kelowna
6 Ecological Risk Assessment The potential exposure pathways for ecological receptors (including crop and livestock health) related to
potential Pond water application in the irrigation watering, compost watering, dust control and landscape
watering scenarios are summarized in Table 15, are outlined in more detail in Section 2.3, and are
depicted in Figure 1. Since none of the COPCs that were identified are considered to be bioaccumulative,
exposure pathways for wildlife are not considered to be significant; therefore, wildlife exposure is not
evaluated further in the ERA, and is not included in Table 15, below.
Table 15: Potentially Operable Exposure Pathways to be Evaluated in the ERA
Receptor of Concern Operable Exposure Pathways
Irrigation Watering Scenario
Soil Invertebrates › Direct Contact with Field Soil
Forage Crops › Direct Contact with Pond Water
› Direct Contact with Field Soil
Livestock › Direct Contact with Field Soil
› Consumption of Forage Crops
Compost Watering Scenario
Soil Invertebrates › Direct Contact with Compost
Future Vegetation › Direct Contact with Compost
Dust Control Scenario
N/A › N/A
Landscape Watering Scenarioa
Soil Invertebrates › Direct Contact with Landscape Soil
Ornamental Vegetation › Direct Contact with Pond Water
› Direct Contact with Landscape Soil
Notes:
Bold Scenario exposure pathways retained for further evaluation in the ERA.
N/A No operable exposure pathways for ecological receptors were identified for the dust control scenario a Evaluation of the irrigation water scenario is considered protective (see below paragraph for discussion)
In consideration of the summary of potentially operable exposure pathways, summarized above, the two
most conservative scenarios that require further evaluation are the irrigation watering scenario and the
compost watering scenario. The exposure to soil invertebrates and vegetation in the irrigation watering
scenario would be similar, and likely greater in than the landscape watering scenario; therefore,
evaluation of the irrigation watering scenario is considered to also be protective of the landscape watering
scenario. As a result, only the irrigation watering scenario and the compost watering scenario will be
discussed further in the sections following.
As described, potentially operable exposure pathways were identified under the irrigation and compost
water scenarios. The potential for ecological ROCs to be exposed to the COPCs via these pathways,
along with a qualitative evaluation of the potential for the COPCs to adversely impact the ecological
ROCs, is presented below. In addition, additional LoEs considered in the evaluation of potential risks to
ecological ROCs under these two watering scenarios, as well as further evaluation of the COPCs is
provided below.
Internal Ref: 652126 / 654763 September 24, 2018
32
© 2018 SNC-Lavalin Inc. All Rights Reserved. Confidential.
Human Health And Ecological Risk Assessment
City of Kelowna
6.1 Additional Lines of Evidence
6.1.1 Evaluation of Concentrations over Time
Further comparison between concentrations of parameters and metals in soils and alfalfa tissue over time
in the Tutt Water Area was conducted, to determine if concentrations in soil and/or tissue changed in a
detectable way following approximately two seasons of irrigation using Tutt Pond water. April 2016 soil
and tissue results from the Tutt Water Area were compared to May/July 2018 soil and tissue results from
the Tutt Water Area. Non-parametric statistics were used; these tests assume similar variance, though
this could not be confirmed for all parameters due to the limited sample size of soil and/or alfalfa tissue
available from each area. Using a Gehan test at a 5% significance level, the following results were
obtained for the final COPCs:
› No significant differences were identified between 2016 and 2018 soil analytical results; and
› Tissue concentrations of sodium in the Tutt Water Area appear to be significantly higher in 2018
samples than 2016 samples.
These results indicate that no parameters in soil are increasing markedly over approximately two seasons
of irrigation with Pond water; however, sample sizes are relatively small, and concentrations are only
available for 2 years, which is a relatively limited timeframe over which to complete a statistical evaluation
of temporal changes. Further recommendations for potential monitoring of concentrations of given
COPCs over time will be presented in Section 4.4 to address this uncertainty.
6.1.2 Qualitative Evaluation of Crop Health and Success
To evaluate crop health and success in the Tutt Water Area compared to the Reference Area, additional
information was collected and evaluated, including:
› Photographs of the fields and plants from the 2016 sampling event and the 2018 sampling event were
reviewed.
› An interview with the farmer managing the fields was interviewed to discuss crop yields over time and
any differences noted between the two areas.
A review of these two additional LoEs, as summarized in the sections below, indicate no observed
difference in crop production quantity or quality between the Reference Area and Tutt Water Area, as well
as over time within the Tutt Water Area.
6.1.2.1 Photograph Review
Photographs from the 2016 and 2018 soil and vegetation sampling events were reviewed to enable a
qualitative evaluation of vegetation condition in each of the Tutt Water and Reference Areas at the
sampling locations. Tutt Water Area photos were compared to Reference Area photos taken during the
same sampling event; no marked difference between Tutt Water Area vegetation and Reference Area
vegetation were observed.
Internal Ref: 652126 / 654763 September 24, 2018
33
© 2018 SNC-Lavalin Inc. All Rights Reserved. Confidential.
Human Health And Ecological Risk Assessment
City of Kelowna
6.1.2.2 Farmer Interview
A representative from the City met with the farmer and discussed the crop health and success over time,
in the context of irrigation with Pond water. SNC-Lavalin received the following information from the City
(City of Kelowna, 2018; Appendix IV):
“I spoke to Marvin Tonn and asked him the questions from SNC Lavalin for the Risk Assessment
He said that he has never noticed a difference in crop production quantity or quality, either between the 2 water irrigation sources or even over the years within the one water source. That would include no noted stress of the plants in either location.
Marvin said typically any crop issues have been localized. This would be items such as mole infestation or standing water in that one low channel that runs back to Tutt Pond as opposed to any crop problems on either side of the channel in the field.”
6.2 Further Evaluation of COPCs
Additional evaluation of the applicable guidelines/standards, and other LoEs (outlined above) have been
used to evaluate each of the final COPCs for ecological receptors. Identified IW guidelines/standards
were BC WQG (Approved or Working) and CSR Schedule 3.2 IW standards available from the BC CSR.
These guidelines/standards are primarily based on the guidelines developed by the CCME and the
CCME provides factsheets that describe in detail how the IW guidelines were developed. These fact
sheets (or other technical reports providing derivation details) were reviewed, with the supporting
information for the guidelines discussed in the following sections. The supporting information was used to
determine the applicability of the standards/guidelines, and in the evaluation of the potential for adverse
impacts (i.e., unacceptable risks) to the ecological receptors of concern retained for evaluation under the
irrigation and compost watering scenarios. Consideration was also given to the concentrations of the
identified COPCs measured in GEID water over time (from 2013 to 2017), as GEID water has been used
for several years to irrigate crops in the Reference Area.
6.2.1 pH
Though the maximum pH measured in Bredin Pond was greater than the applicable CCME guideline
protective of irrigation water, pH was not initially retained as a COPC for crop health and ecological
receptors, as the average concentration was below the applicable guideline; however, upon evaluation of
the soil quality data for the adjacent field, it was noted that the pH of the Tutt Water Area was significantly
higher than that of soils in the Reference Area. As a result, pH was retained as a COPC requiring further
evaluation. Table 16, below, summarizes the pH values measured in Pond water, soils from the
Tutt Water Area and Reference Area, as well as compost pH values.
Internal Ref: 652126 / 654763 September 24, 2018
34
© 2018 SNC-Lavalin Inc. All Rights Reserved. Confidential.
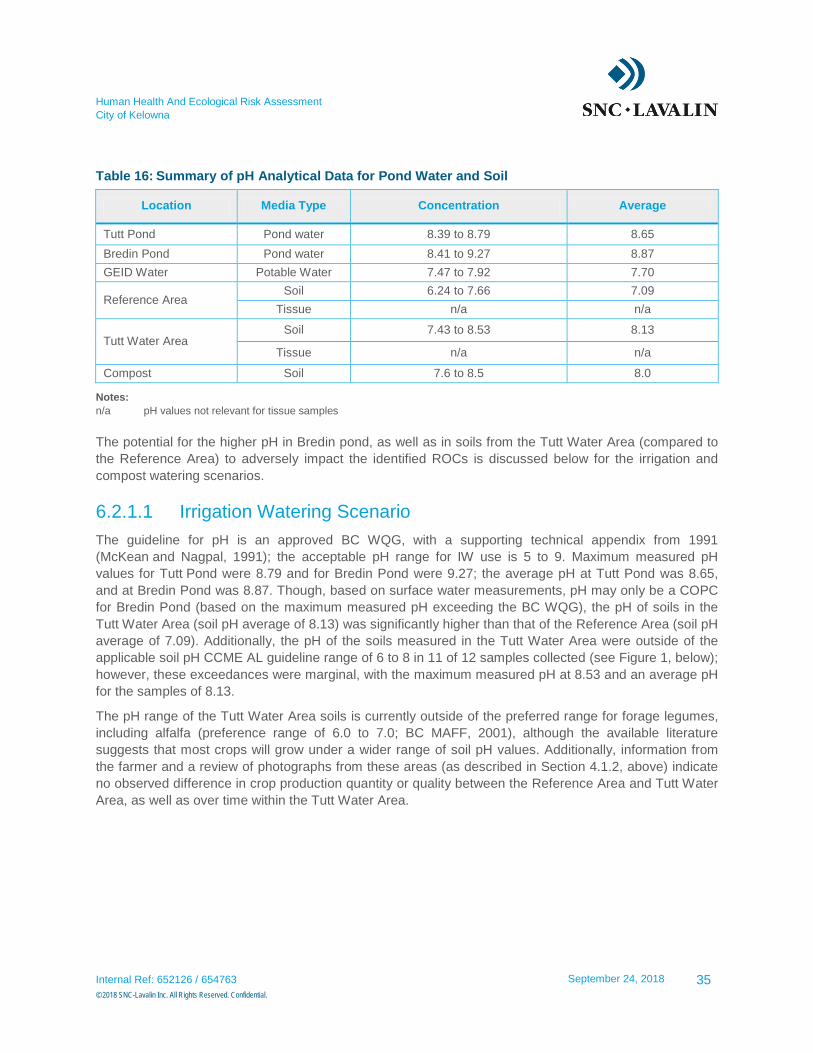
Human Health And Ecological Risk Assessment
City of Kelowna
Table 16: Summary of pH Analytical Data for Pond Water and Soil
Location Media Type Concentration Average
Tutt Pond Pond water 8.39 to 8.79 8.65
Bredin Pond Pond water 8.41 to 9.27 8.87
GEID Water Potable Water 7.47 to 7.92 7.70
Reference Area Soil 6.24 to 7.66 7.09
Tissue n/a n/a
Tutt Water Area Soil 7.43 to 8.53 8.13
Tissue n/a n/a
Compost Soil 7.6 to 8.5 8.0
Notes:
n/a pH values not relevant for tissue samples
The potential for the higher pH in Bredin pond, as well as in soils from the Tutt Water Area (compared to
the Reference Area) to adversely impact the identified ROCs is discussed below for the irrigation and
compost watering scenarios.
6.2.1.1 Irrigation Watering Scenario
The guideline for pH is an approved BC WQG, with a supporting technical appendix from 1991
(McKean and Nagpal, 1991); the acceptable pH range for IW use is 5 to 9. Maximum measured pH
values for Tutt Pond were 8.79 and for Bredin Pond were 9.27; the average pH at Tutt Pond was 8.65,
and at Bredin Pond was 8.87. Though, based on surface water measurements, pH may only be a COPC
for Bredin Pond (based on the maximum measured pH exceeding the BC WQG), the pH of soils in the
Tutt Water Area (soil pH average of 8.13) was significantly higher than that of the Reference Area (soil pH
average of 7.09). Additionally, the pH of the soils measured in the Tutt Water Area were outside of the
applicable soil pH CCME AL guideline range of 6 to 8 in 11 of 12 samples collected (see Figure 1, below);
however, these exceedances were marginal, with the maximum measured pH at 8.53 and an average pH
for the samples of 8.13.
The pH range of the Tutt Water Area soils is currently outside of the preferred range for forage legumes,
including alfalfa (preference range of 6.0 to 7.0; BC MAFF, 2001), although the available literature
suggests that most crops will grow under a wider range of soil pH values. Additionally, information from
the farmer and a review of photographs from these areas (as described in Section 4.1.2, above) indicate
no observed difference in crop production quantity or quality between the Reference Area and Tutt Water
Area, as well as over time within the Tutt Water Area.
Internal Ref: 652126 / 654763 September 24, 2018
35
© 2018 SNC-Lavalin Inc. All Rights Reserved. Confidential.
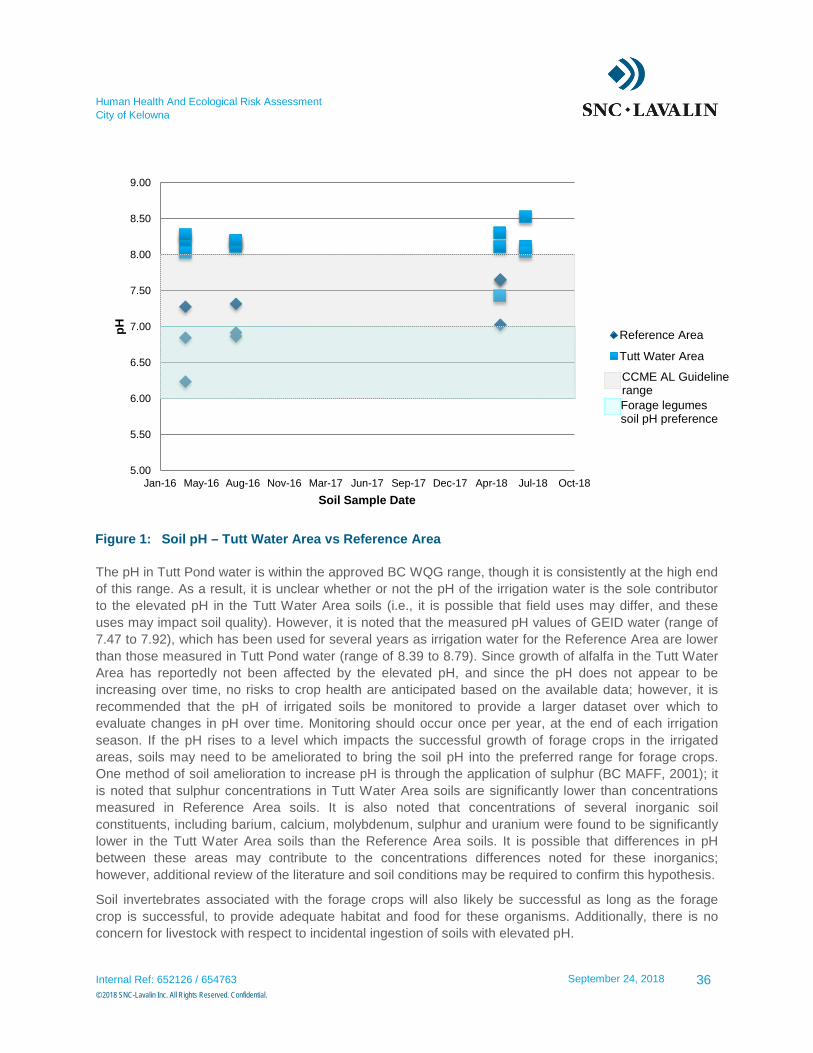
Human Health And Ecological Risk Assessment
City of Kelowna
Figure 1: Soil pH – Tutt Water Area vs Reference Area
The pH in Tutt Pond water is within the approved BC WQG range, though it is consistently at the high end
of this range. As a result, it is unclear whether or not the pH of the irrigation water is the sole contributor
to the elevated pH in the Tutt Water Area soils (i.e., it is possible that field uses may differ, and these
uses may impact soil quality). However, it is noted that the measured pH values of GEID water (range of
7.47 to 7.92), which has been used for several years as irrigation water for the Reference Area are lower
than those measured in Tutt Pond water (range of 8.39 to 8.79). Since growth of alfalfa in the Tutt Water
Area has reportedly not been affected by the elevated pH, and since the pH does not appear to be
increasing over time, no risks to crop health are anticipated based on the available data; however, it is
recommended that the pH of irrigated soils be monitored to provide a larger dataset over which to
evaluate changes in pH over time. Monitoring should occur once per year, at the end of each irrigation
season. If the pH rises to a level which impacts the successful growth of forage crops in the irrigated
areas, soils may need to be ameliorated to bring the soil pH into the preferred range for forage crops.
One method of soil amelioration to increase pH is through the application of sulphur (BC MAFF, 2001); it
is noted that sulphur concentrations in Tutt Water Area soils are significantly lower than concentrations
measured in Reference Area soils. It is also noted that concentrations of several inorganic soil
constituents, including barium, calcium, molybdenum, sulphur and uranium were found to be significantly
lower in the Tutt Water Area soils than the Reference Area soils. It is possible that differences in pH
between these areas may contribute to the concentrations differences noted for these inorganics;
however, additional review of the literature and soil conditions may be required to confirm this hypothesis.
Soil invertebrates associated with the forage crops will also likely be successful as long as the forage
crop is successful, to provide adequate habitat and food for these organisms. Additionally, there is no
concern for livestock with respect to incidental ingestion of soils with elevated pH.
5.00
5.50
6.00
6.50
7.00
7.50
8.00
8.50
9.00
Jan-16 May-16 Aug-16 Nov-16 Mar-17 Jun-17 Sep-17 Dec-17 Apr-18 Jul-18 Oct-18
pH
Soil Sample Date
Reference Area
Tutt Water Area
CCME AL Guideline range
Forage legumes soil pH preference
Internal Ref: 652126 / 654763 September 24, 2018
36
© 2018 SNC-Lavalin Inc. All Rights Reserved. Confidential.
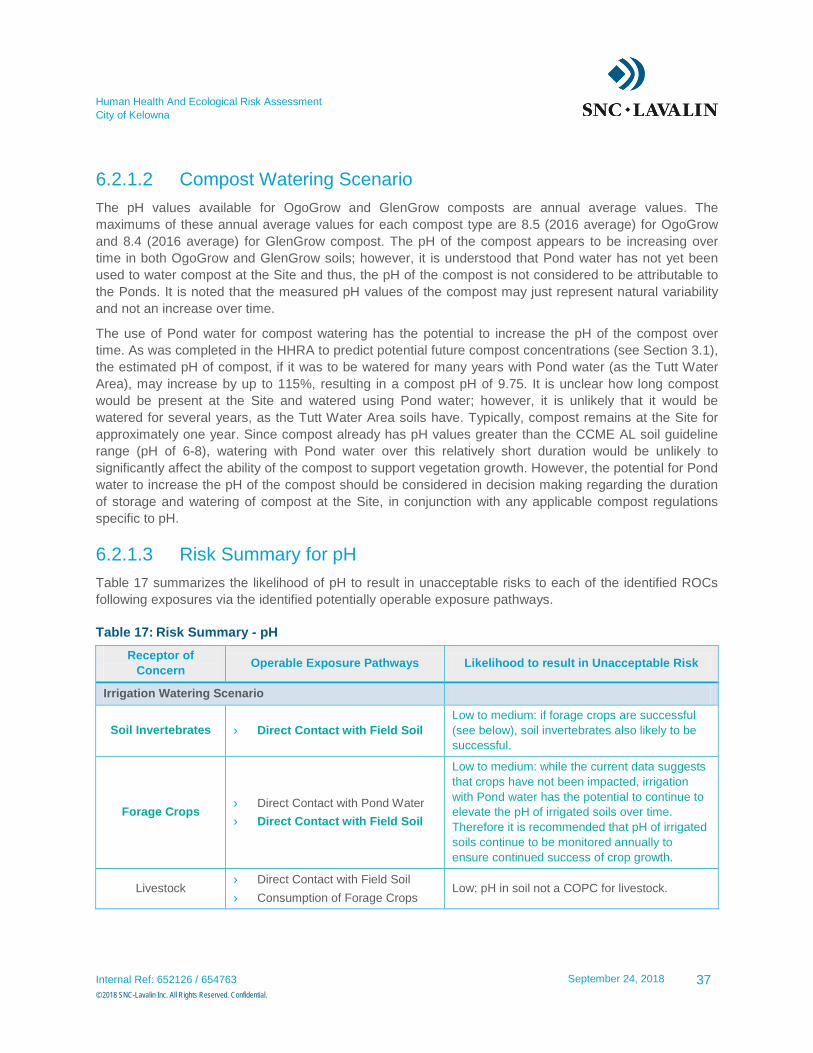
Human Health And Ecological Risk Assessment
City of Kelowna
6.2.1.2 Compost Watering Scenario
The pH values available for OgoGrow and GlenGrow composts are annual average values. The
maximums of these annual average values for each compost type are 8.5 (2016 average) for OgoGrow
and 8.4 (2016 average) for GlenGrow compost. The pH of the compost appears to be increasing over
time in both OgoGrow and GlenGrow soils; however, it is understood that Pond water has not yet been
used to water compost at the Site and thus, the pH of the compost is not considered to be attributable to
the Ponds. It is noted that the measured pH values of the compost may just represent natural variability
and not an increase over time.
The use of Pond water for compost watering has the potential to increase the pH of the compost over
time. As was completed in the HHRA to predict potential future compost concentrations (see Section 3.1),
the estimated pH of compost, if it was to be watered for many years with Pond water (as the Tutt Water
Area), may increase by up to 115%, resulting in a compost pH of 9.75. It is unclear how long compost
would be present at the Site and watered using Pond water; however, it is unlikely that it would be
watered for several years, as the Tutt Water Area soils have. Typically, compost remains at the Site for
approximately one year. Since compost already has pH values greater than the CCME AL soil guideline
range (pH of 6-8), watering with Pond water over this relatively short duration would be unlikely to
significantly affect the ability of the compost to support vegetation growth. However, the potential for Pond
water to increase the pH of the compost should be considered in decision making regarding the duration
of storage and watering of compost at the Site, in conjunction with any applicable compost regulations
specific to pH.
6.2.1.3 Risk Summary for pH
Table 17 summarizes the likelihood of pH to result in unacceptable risks to each of the identified ROCs
following exposures via the identified potentially operable exposure pathways.
Table 17: Risk Summary - pH
Receptor of
Concern Operable Exposure Pathways Likelihood to result in Unacceptable Risk
Irrigation Watering Scenario
Soil Invertebrates › Direct Contact with Field Soil
Low to medium: if forage crops are successful
(see below), soil invertebrates also likely to be
successful.
Forage Crops › Direct Contact with Pond Water
› Direct Contact with Field Soil
Low to medium: while the current data suggests
that crops have not been impacted, irrigation
with Pond water has the potential to continue to
elevate the pH of irrigated soils over time.
Therefore it is recommended that pH of irrigated
soils continue to be monitored annually to
ensure continued success of crop growth.
Livestock › Direct Contact with Field Soil
› Consumption of Forage Crops Low: pH in soil not a COPC for livestock.
Internal Ref: 652126 / 654763 September 24, 2018
37
© 2018 SNC-Lavalin Inc. All Rights Reserved. Confidential.
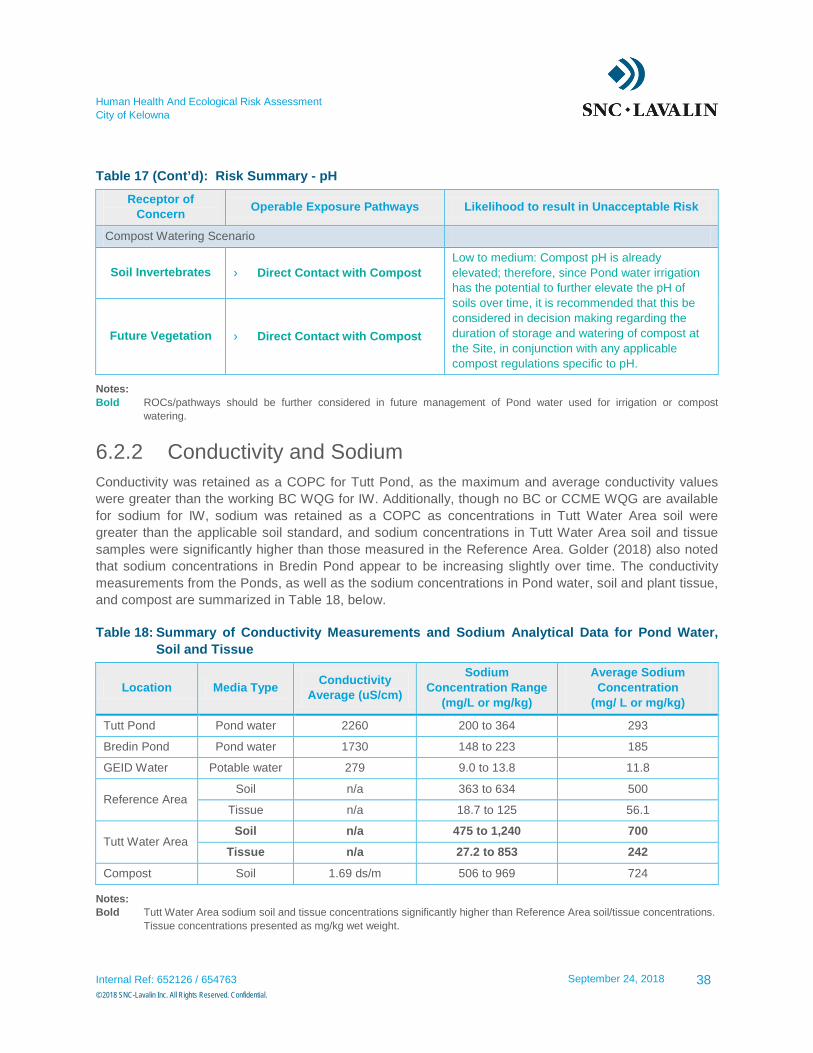
Human Health And Ecological Risk Assessment
City of Kelowna
Table 17 (Cont’d): Risk Summary - pH
Receptor of
Concern Operable Exposure Pathways Likelihood to result in Unacceptable Risk
Compost Watering Scenario
Soil Invertebrates › Direct Contact with Compost
Low to medium: Compost pH is already
elevated; therefore, since Pond water irrigation
has the potential to further elevate the pH of
soils over time, it is recommended that this be
considered in decision making regarding the
duration of storage and watering of compost at
the Site, in conjunction with any applicable
compost regulations specific to pH.
Future Vegetation › Direct Contact with Compost
Notes:
Bold ROCs/pathways should be further considered in future management of Pond water used for irrigation or compost
watering.
6.2.2 Conductivity and Sodium
Conductivity was retained as a COPC for Tutt Pond, as the maximum and average conductivity values
were greater than the working BC WQG for IW. Additionally, though no BC or CCME WQG are available
for sodium for IW, sodium was retained as a COPC as concentrations in Tutt Water Area soil were
greater than the applicable soil standard, and sodium concentrations in Tutt Water Area soil and tissue
samples were significantly higher than those measured in the Reference Area. Golder (2018) also noted
that sodium concentrations in Bredin Pond appear to be increasing slightly over time. The conductivity
measurements from the Ponds, as well as the sodium concentrations in Pond water, soil and plant tissue,
and compost are summarized in Table 18, below.
Table 18: Summary of Conductivity Measurements and Sodium Analytical Data for Pond Water,
Soil and Tissue
Location Media Type Conductivity
Average (uS/cm)
Sodium
Concentration Range
(mg/L or mg/kg)
Average Sodium
Concentration
(mg/ L or mg/kg)
Tutt Pond Pond water 2260 200 to 364 293
Bredin Pond Pond water 1730 148 to 223 185
GEID Water Potable water 279 9.0 to 13.8 11.8
Reference Area Soil n/a 363 to 634 500
Tissue n/a 18.7 to 125 56.1
Tutt Water Area Soil n/a 475 to 1,240 700
Tissue n/a 27.2 to 853 242
Compost Soil 1.69 ds/m 506 to 969 724
Notes:
Bold Tutt Water Area sodium soil and tissue concentrations significantly higher than Reference Area soil/tissue concentrations.
Tissue concentrations presented as mg/kg wet weight.
Internal Ref: 652126 / 654763 September 24, 2018
38
© 2018 SNC-Lavalin Inc. All Rights Reserved. Confidential.
Human Health And Ecological Risk Assessment
City of Kelowna
The potential for the conductivity of the Pond water, as well as the elevated sodium concentrations in the
Tutt Water Area soil and tissues (compared to the Reference Area) to adversely impact the identified
ROCs is discussed below for the irrigation and compost watering scenarios.
6.2.2.1 Irrigation Watering Scenario
Conductivity is a measure of a solution’s ability to conduct electricity; in many cases it is linked directly to
TDS and dissolved salts present in a solution. The screening benchmark used to evaluate conductivity is
a working BC WQG, which is crop-dependent and based on a 1987 CCME guideline. The 1987 CCME
guideline document indicates that it is difficult to separate the potential effects of conductivity and salinity
present in irrigation water, and that consideration of these parameters in tandem (through calculation of
the sodium absorption ratio (SAR) and evaluation in conjunction with conductivity measurements) would
assist in the evaluation of potential outcomes of using water with elevated conductivity values for irrigation
use. Sodium in water can affect plants in five different ways (CCME, 1987): (1) direct root uptake and
accumulation of toxic levels of sodium in the plant, (2) direct foliar absorption from sprinklers (3) nutritional
imbalance due to insufficient concentrations of calcium and magnesium to prevent uptake and
accumulation of sodium, (4) impairment of soil physical conditions (i.e., effects to soil permeability),
(5) osmotic stress.
As mentioned above, when applied to a crop by sprinkler irrigation, water with elevated concentrations of
sodium may result in foliar damage, due to excessive absorption of sodium directly by the leaves (CCME,
1987). Fruit trees are most sensitive to this kind of damage, followed by grapes, peppers, potatoes and
tomatoes. Alfalfa is listed as a moderately tolerant crop, with foliar damage recorded at sodium
concentrations ranging from 230 mg/L to 460 mg/L (CCME, 1987). While Bredin Pond sodium
concentrations are below this range, Tutt Pond water sodium concentrations have ranged from 200 mg/L
to 364 mg/L, indicating the potential for foliar damage to alfalfa crops irrigated with Tutt Pond water.
Irrigating soils with elevated sodium concentrations can also lead to the accumulation of sodium
concentrations in soil, eventually to levels that are toxic to soil invertebrates and plants. The lowest
BC CSR standard for sodium in agricultural soils is 200 mg/kg; this is the standard protective of toxicity to
soil invertebrates and plants, but is specific to sodium concentrations measured using the saturated paste
method. Though soil samples collected from both the Tutt Water Area and the Reference Area appear to
have sodium concentrations greater than this standard (see Table 18), the sodium concentrations were
obtained using the analysis used for metals (CRC ICPMS). Sodium concentrations measured in soil using
the saturated paste method will likely be lower than those measured using the CRC ICPMS method, but
were not obtained during the soil sampling program at the irrigated agricultural field.
Additionally, excess sodium in irrigation water relative to calcium and magnesium, or relative to the total
soluble salt content, can adversely affect soil structure and reduce soil permeability and aeration. Soil
concentrations in both soil (Figure 3) and plant tissue (Figure 4) were significantly higher in the Tutt Water
Area than in the Reference Area, suggesting that the irrigation of the area with Tutt Pond water has
resulted in an increase in soil sodium concentrations.
CCME (1987) indicates that soils can be protected from unfavourable concentrations of conductivity and
sodium if the SAR is calculated to determine the suitability of irrigation water use on a site-by-site basis.
As a result, to evaluate both the potential effects of Pond water conductivity and sodium concentrations
for irrigation water use and compost watering purposes, the SAR values were calculated for Pond water
and compared to the suitable tolerance ranges: CCME (1987) indicates that SAR values below 3 would
result in no restriction on use, while SAR values in the 3 to 9 range may result in slight to moderate
restrictions, with SAR values greater than 9 resulting in severe watering restrictions.
Internal Ref: 652126 / 654763 September 24, 2018
39
© 2018 SNC-Lavalin Inc. All Rights Reserved. Confidential.
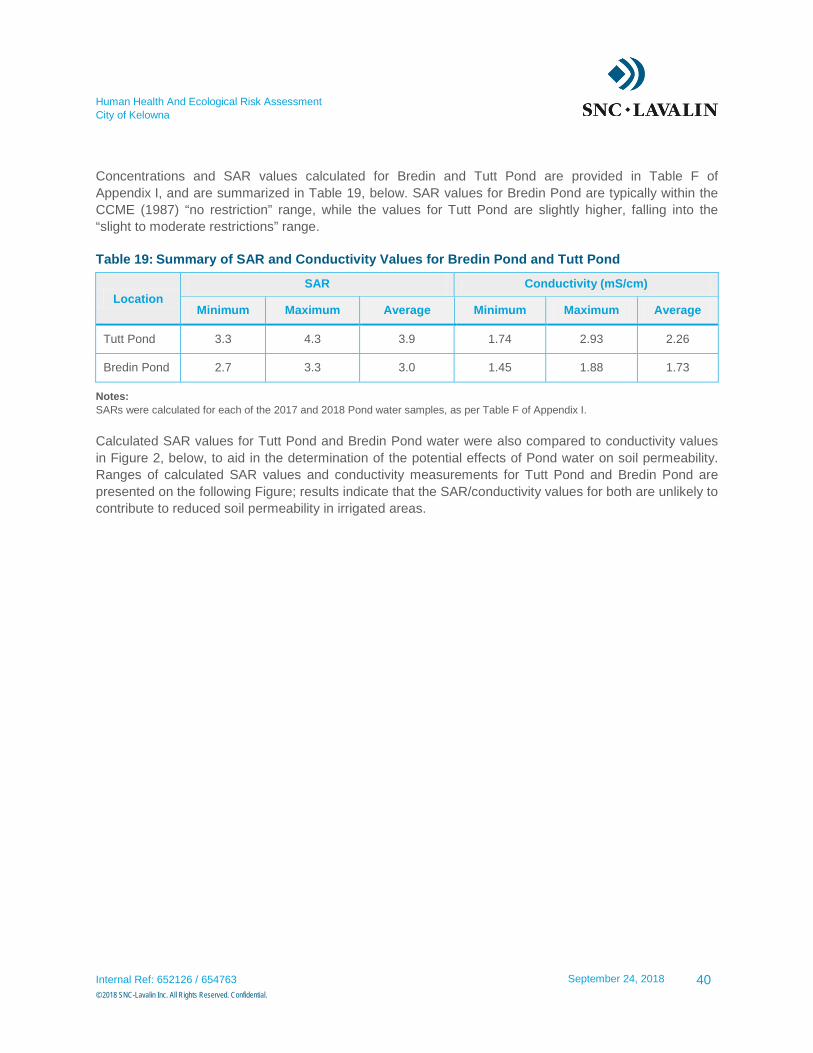
Human Health And Ecological Risk Assessment
City of Kelowna
Concentrations and SAR values calculated for Bredin and Tutt Pond are provided in Table F of
Appendix I, and are summarized in Table 19, below. SAR values for Bredin Pond are typically within the
CCME (1987) “no restriction” range, while the values for Tutt Pond are slightly higher, falling into the
“slight to moderate restrictions” range.
Table 19: Summary of SAR and Conductivity Values for Bredin Pond and Tutt Pond
Location
SAR Conductivity (mS/cm)
Minimum Maximum Average Minimum Maximum Average
Tutt Pond 3.3 4.3 3.9 1.74 2.93 2.26
Bredin Pond 2.7 3.3 3.0 1.45 1.88 1.73
Notes:
SARs were calculated for each of the 2017 and 2018 Pond water samples, as per Table F of Appendix I.
Calculated SAR values for Tutt Pond and Bredin Pond water were also compared to conductivity values
in Figure 2, below, to aid in the determination of the potential effects of Pond water on soil permeability.
Ranges of calculated SAR values and conductivity measurements for Tutt Pond and Bredin Pond are
presented on the following Figure; results indicate that the SAR/conductivity values for both are unlikely to
contribute to reduced soil permeability in irrigated areas.
Internal Ref: 652126 / 654763 September 24, 2018
40
© 2018 SNC-Lavalin Inc. All Rights Reserved. Confidential.
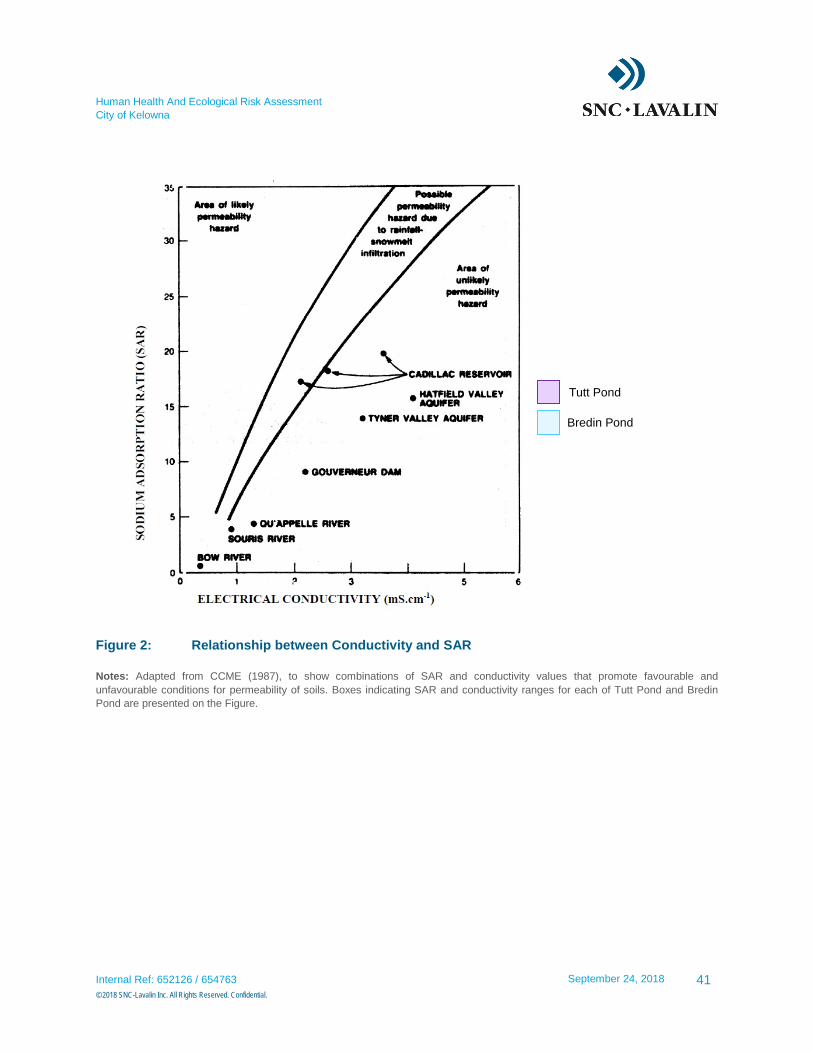
Human Health And Ecological Risk Assessment
City of Kelowna
Figure 2: Relationship between Conductivity and SAR
Notes: Adapted from CCME (1987), to show combinations of SAR and conductivity values that promote favourable and
unfavourable conditions for permeability of soils. Boxes indicating SAR and conductivity ranges for each of Tutt Pond and Bredin
Pond are presented on the Figure.
Bredin Pond
Tutt Pond
Internal Ref: 652126 / 654763 September 24, 2018
41
© 2018 SNC-Lavalin Inc. All Rights Reserved. Confidential.
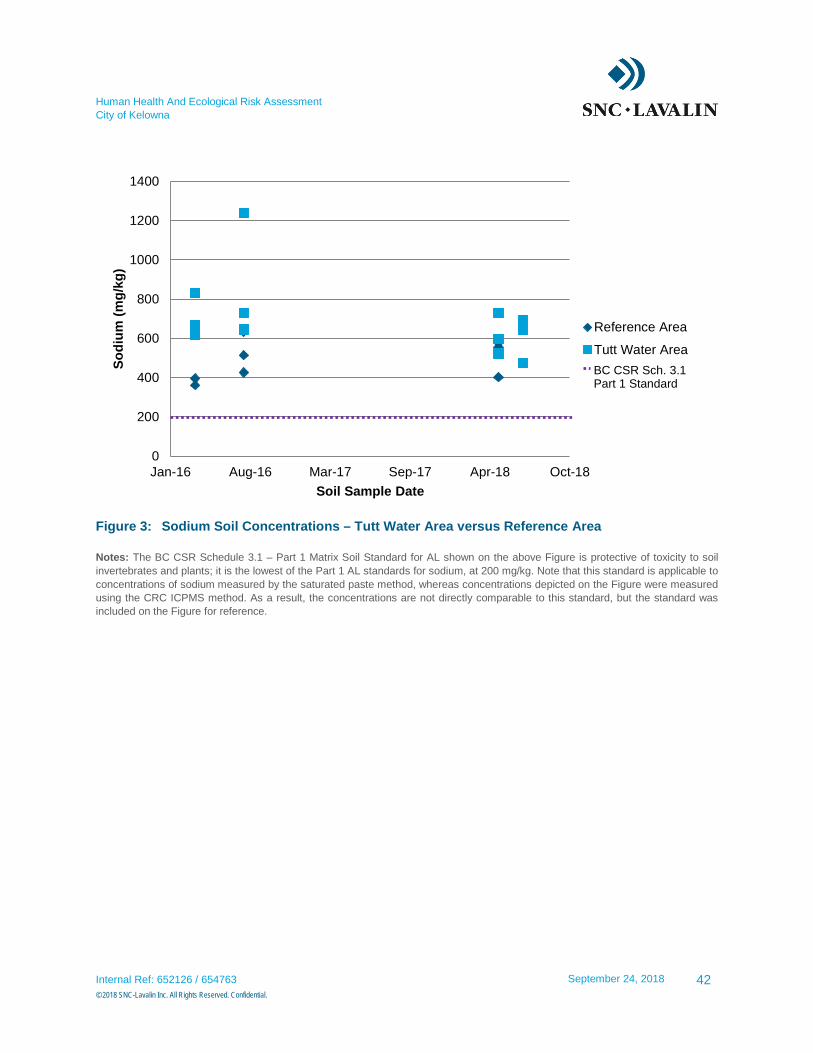
Human Health And Ecological Risk Assessment
City of Kelowna
Figure 3: Sodium Soil Concentrations – Tutt Water Area versus Reference Area
Notes: The BC CSR Schedule 3.1 – Part 1 Matrix Soil Standard for AL shown on the above Figure is protective of toxicity to soil
invertebrates and plants; it is the lowest of the Part 1 AL standards for sodium, at 200 mg/kg. Note that this standard is applicable to
concentrations of sodium measured by the saturated paste method, whereas concentrations depicted on the Figure were measured
using the CRC ICPMS method. As a result, the concentrations are not directly comparable to this standard, but the standard was
included on the Figure for reference.
0
200
400
600
800
1000
1200
1400
Jan-16 Aug-16 Mar-17 Sep-17 Apr-18 Oct-18
So
diu
m (
mg
/kg
)
Soil Sample Date
Reference Area
Tutt Water Area
BC CSR Sch. 3.1 Part 1 Standard
Internal Ref: 652126 / 654763 September 24, 2018
42
© 2018 SNC-Lavalin Inc. All Rights Reserved. Confidential.
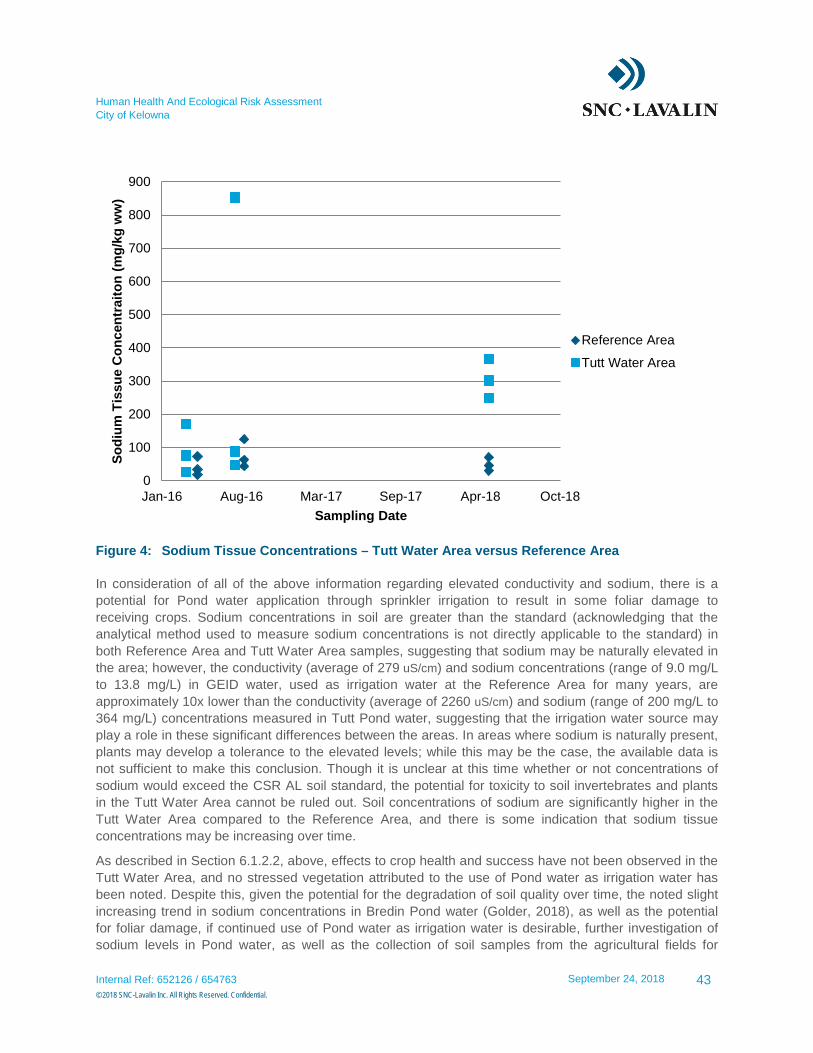
Human Health And Ecological Risk Assessment
City of Kelowna
Figure 4: Sodium Tissue Concentrations – Tutt Water Area versus Reference Area
In consideration of all of the above information regarding elevated conductivity and sodium, there is a
potential for Pond water application through sprinkler irrigation to result in some foliar damage to
receiving crops. Sodium concentrations in soil are greater than the standard (acknowledging that the
analytical method used to measure sodium concentrations is not directly applicable to the standard) in
both Reference Area and Tutt Water Area samples, suggesting that sodium may be naturally elevated in
the area; however, the conductivity (average of 279 uS/cm) and sodium concentrations (range of 9.0 mg/L
to 13.8 mg/L) in GEID water, used as irrigation water at the Reference Area for many years, are
approximately 10x lower than the conductivity (average of 2260 uS/cm) and sodium (range of 200 mg/L to
364 mg/L) concentrations measured in Tutt Pond water, suggesting that the irrigation water source may
play a role in these significant differences between the areas. In areas where sodium is naturally present,
plants may develop a tolerance to the elevated levels; while this may be the case, the available data is
not sufficient to make this conclusion. Though it is unclear at this time whether or not concentrations of
sodium would exceed the CSR AL soil standard, the potential for toxicity to soil invertebrates and plants
in the Tutt Water Area cannot be ruled out. Soil concentrations of sodium are significantly higher in the
Tutt Water Area compared to the Reference Area, and there is some indication that sodium tissue
concentrations may be increasing over time.
As described in Section 6.1.2.2, above, effects to crop health and success have not been observed in the
Tutt Water Area, and no stressed vegetation attributed to the use of Pond water as irrigation water has
been noted. Despite this, given the potential for the degradation of soil quality over time, the noted slight
increasing trend in sodium concentrations in Bredin Pond water (Golder, 2018), as well as the potential
for foliar damage, if continued use of Pond water as irrigation water is desirable, further investigation of
sodium levels in Pond water, as well as the collection of soil samples from the agricultural fields for
0
100
200
300
400
500
600
700
800
900
Jan-16 Aug-16 Mar-17 Sep-17 Apr-18 Oct-18
So
diu
m T
issu
e C
on
cen
trait
on
(m
g/k
g w
w)
Sampling Date
Reference Area
Tutt Water Area
Internal Ref: 652126 / 654763 September 24, 2018
43
© 2018 SNC-Lavalin Inc. All Rights Reserved. Confidential.
Human Health And Ecological Risk Assessment
City of Kelowna
measurement of sodium concentrations (using the saturated paste method) and SAR, is recommended.
There is no concern for livestock with respect to incidental ingestion of soils with elevated sodium, due to
the limited toxicity associated with incidental ingestion.
6.2.2.2 Compost Watering Scenario
Concentrations of sodium in compost are greater than those measured in Reference Area soil and are
slightly lower than those measured in Tutt Water Area soils. Though not directly applicable to compost,
for reference purposes, the BC CSR AL soil standards for sodium were compared to the compost sodium
levels as the CSR standards provide pathway specific endpoints. All recorded average sodium
concentrations in compost (before irrigation with Pond water has begun) appear to be greater than the
applicable BC CSR AL soil standard protective of toxicity to soil invertebrates and plants; however, it is
noted that the sodium concentrations were obtained using the analysis used for metals (CRC ICPMS).
Sodium concentrations measured in compost using the saturated paste method will likely be lower than
those measured using the CRC ICPMS method, but do not appear to have been obtained through the
compost sampling/analysis program.
The use of Pond water for compost watering may continue to increase the sodium concentrations of the
compost over time. As was completed in the HHRA to predict potential future compost concentrations
(see Section 3.2), the estimated sodium concentrations in compost, if watered for many years with Pond
water (as the Tutt Water Area), may increase by up to 140%, with a maximum estimated concentration of
1,357 mg/kg. Compost would only be present at the Site and watered using Pond water for approximately
one year, and watered between 5 and 10 times during that period. Since compost may already have
sodium concentrations greater than the BC CSR soil standard, relatively infrequent watering with Pond
water over approximately one year would be unlikely to significantly affect the ability of the compost to
support soil invertebrates and/or vegetation growth. However, the potential for Pond water to increase the
sodium concentrations in compost should be considered in decision making regarding the duration of
storage and watering of compost at the Site, in conjunction with any applicable compost regulations
specific to sodium.
6.2.2.3 Risk Summary for Conductivity and Sodium
Table 20 summarizes the likelihood of conductivity and/or sodium to result in unacceptable risks to each
of the identified ROCs exposed via the identified potentially operable exposure pathways.
Internal Ref: 652126 / 654763 September 24, 2018
44
© 2018 SNC-Lavalin Inc. All Rights Reserved. Confidential.
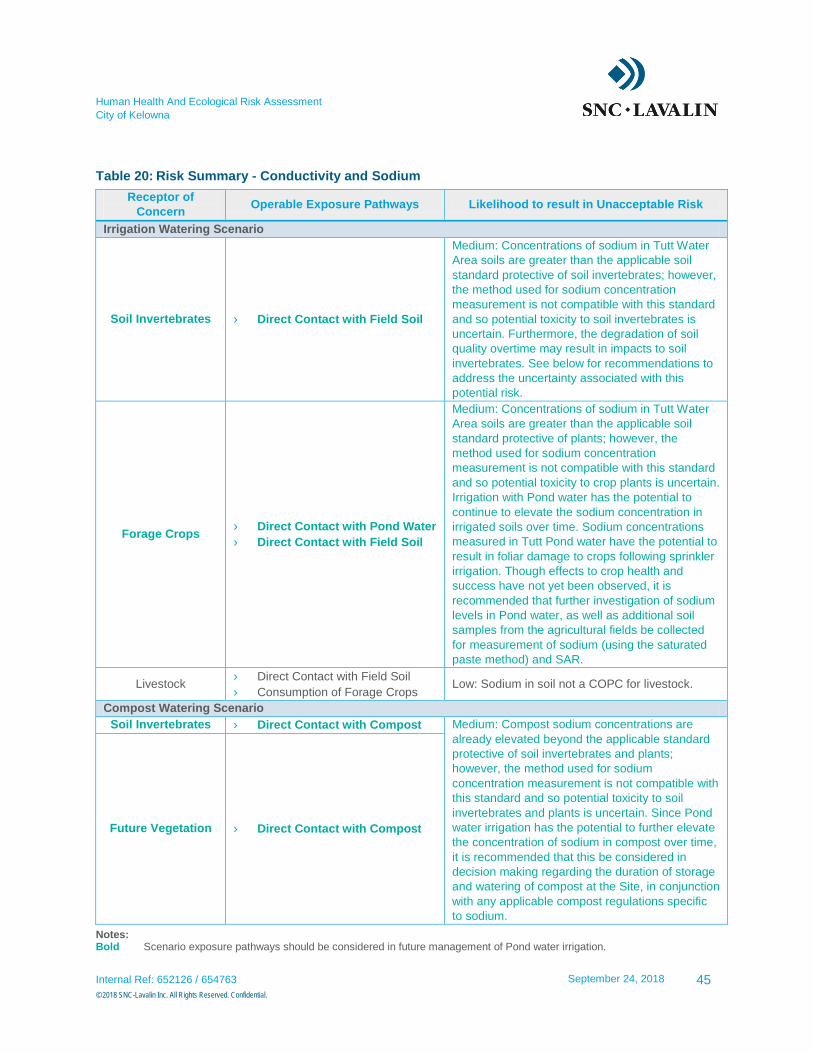
Human Health And Ecological Risk Assessment
City of Kelowna
Table 20: Risk Summary - Conductivity and Sodium
Receptor of
Concern Operable Exposure Pathways Likelihood to result in Unacceptable Risk
Irrigation Watering Scenario
Soil Invertebrates › Direct Contact with Field Soil
Medium: Concentrations of sodium in Tutt Water
Area soils are greater than the applicable soil
standard protective of soil invertebrates; however,
the method used for sodium concentration
measurement is not compatible with this standard
and so potential toxicity to soil invertebrates is
uncertain. Furthermore, the degradation of soil
quality overtime may result in impacts to soil
invertebrates. See below for recommendations to
address the uncertainty associated with this
potential risk.
Forage Crops › Direct Contact with Pond Water
› Direct Contact with Field Soil
Medium: Concentrations of sodium in Tutt Water
Area soils are greater than the applicable soil
standard protective of plants; however, the
method used for sodium concentration
measurement is not compatible with this standard
and so potential toxicity to crop plants is uncertain.
Irrigation with Pond water has the potential to
continue to elevate the sodium concentration in
irrigated soils over time. Sodium concentrations
measured in Tutt Pond water have the potential to
result in foliar damage to crops following sprinkler
irrigation. Though effects to crop health and
success have not yet been observed, it is
recommended that further investigation of sodium
levels in Pond water, as well as additional soil
samples from the agricultural fields be collected
for measurement of sodium (using the saturated
paste method) and SAR.
Livestock › Direct Contact with Field Soil
› Consumption of Forage Crops Low: Sodium in soil not a COPC for livestock.
Compost Watering Scenario
Soil Invertebrates › Direct Contact with Compost Medium: Compost sodium concentrations are
already elevated beyond the applicable standard
protective of soil invertebrates and plants;
however, the method used for sodium
concentration measurement is not compatible with
this standard and so potential toxicity to soil
invertebrates and plants is uncertain. Since Pond
water irrigation has the potential to further elevate
the concentration of sodium in compost over time,
it is recommended that this be considered in
decision making regarding the duration of storage
and watering of compost at the Site, in conjunction
with any applicable compost regulations specific
to sodium.
Future Vegetation › Direct Contact with Compost
Notes: Bold Scenario exposure pathways should be considered in future management of Pond water irrigation.
Internal Ref: 652126 / 654763 September 24, 2018
45
© 2018 SNC-Lavalin Inc. All Rights Reserved. Confidential.
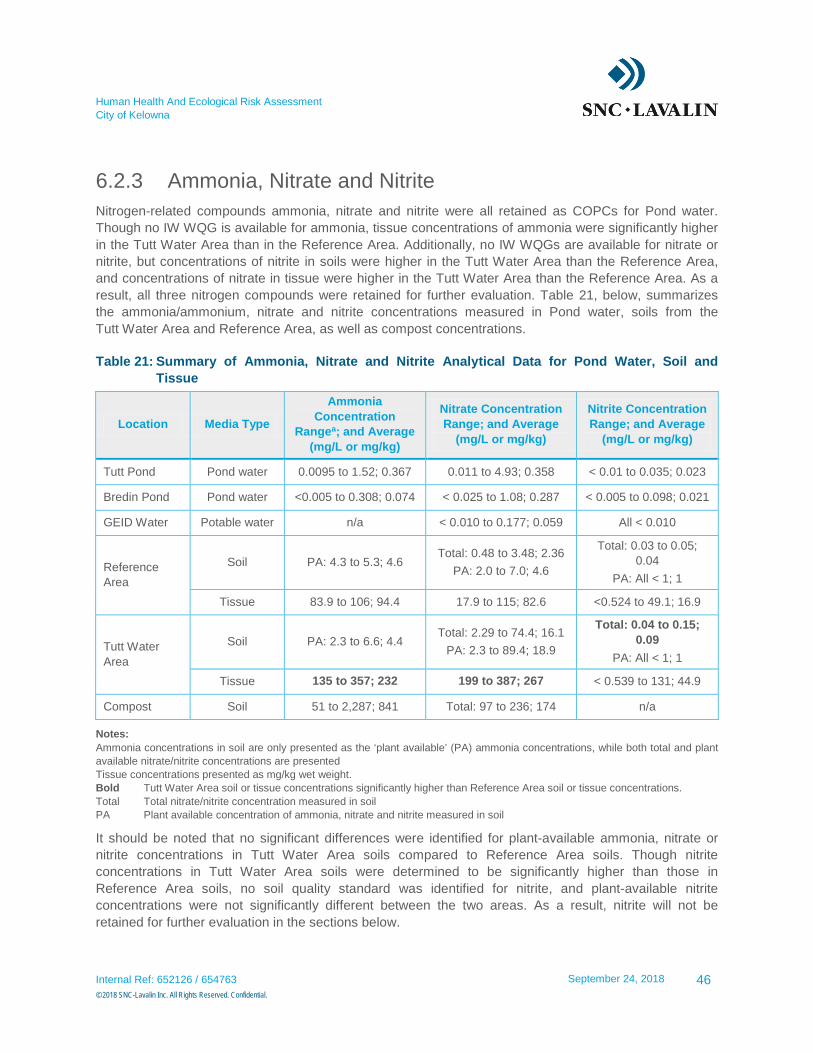
Human Health And Ecological Risk Assessment
City of Kelowna
6.2.3 Ammonia, Nitrate and Nitrite
Nitrogen-related compounds ammonia, nitrate and nitrite were all retained as COPCs for Pond water.
Though no IW WQG is available for ammonia, tissue concentrations of ammonia were significantly higher
in the Tutt Water Area than in the Reference Area. Additionally, no IW WQGs are available for nitrate or
nitrite, but concentrations of nitrite in soils were higher in the Tutt Water Area than the Reference Area,
and concentrations of nitrate in tissue were higher in the Tutt Water Area than the Reference Area. As a
result, all three nitrogen compounds were retained for further evaluation. Table 21, below, summarizes
the ammonia/ammonium, nitrate and nitrite concentrations measured in Pond water, soils from the
Tutt Water Area and Reference Area, as well as compost concentrations.
Table 21: Summary of Ammonia, Nitrate and Nitrite Analytical Data for Pond Water, Soil and
Tissue
Location Media Type
Ammonia
Concentration
Rangea; and Average
(mg/L or mg/kg)
Nitrate Concentration
Range; and Average
(mg/L or mg/kg)
Nitrite Concentration
Range; and Average
(mg/L or mg/kg)
Tutt Pond Pond water 0.0095 to 1.52; 0.367 0.011 to 4.93; 0.358 < 0.01 to 0.035; 0.023
Bredin Pond Pond water <0.005 to 0.308; 0.074 < 0.025 to 1.08; 0.287 < 0.005 to 0.098; 0.021
GEID Water Potable water n/a < 0.010 to 0.177; 0.059 All < 0.010
Reference
Area
Soil PA: 4.3 to 5.3; 4.6 Total: 0.48 to 3.48; 2.36
PA: 2.0 to 7.0; 4.6
Total: 0.03 to 0.05;
0.04
PA: All < 1; 1
Tissue 83.9 to 106; 94.4 17.9 to 115; 82.6 <0.524 to 49.1; 16.9
Tutt Water
Area
Soil PA: 2.3 to 6.6; 4.4 Total: 2.29 to 74.4; 16.1
PA: 2.3 to 89.4; 18.9
Total: 0.04 to 0.15;
0.09
PA: All < 1; 1
Tissue 135 to 357; 232 199 to 387; 267 < 0.539 to 131; 44.9
Compost Soil 51 to 2,287; 841 Total: 97 to 236; 174 n/a
Notes:
Ammonia concentrations in soil are only presented as the ‘plant available’ (PA) ammonia concentrations, while both total and plant
available nitrate/nitrite concentrations are presented
Tissue concentrations presented as mg/kg wet weight.
Bold Tutt Water Area soil or tissue concentrations significantly higher than Reference Area soil or tissue concentrations.
Total Total nitrate/nitrite concentration measured in soil
PA Plant available concentration of ammonia, nitrate and nitrite measured in soil
It should be noted that no significant differences were identified for plant-available ammonia, nitrate or
nitrite concentrations in Tutt Water Area soils compared to Reference Area soils. Though nitrite
concentrations in Tutt Water Area soils were determined to be significantly higher than those in
Reference Area soils, no soil quality standard was identified for nitrite, and plant-available nitrite
concentrations were not significantly different between the two areas. As a result, nitrite will not be
retained for further evaluation in the sections below.
Internal Ref: 652126 / 654763 September 24, 2018
46
© 2018 SNC-Lavalin Inc. All Rights Reserved. Confidential.
Human Health And Ecological Risk Assessment
City of Kelowna
The potential for the ammonium and nitrate to adversely impact the identified ROCs is discussed below
for the irrigation and compost watering scenarios.
6.2.3.1 Irrigation Watering Scenario
Ammonia and nitrate were retained as Pond water COPCs for further evaluation with regards to the use
of Pond water as irrigation water, as both ammonia and nitrate concentrations in tissue samples collected
from the Tutt Water Area were significantly greater than the Reference Area. These parameters were not
measured in tissue samples until 2018; therefore, this comparison was completed for three samples
collected from the Tutt Water Area, and three samples collected from the Reference Area only. It is noted
that the GEID water concentrations of nitrate (range of <0.010 to 0.177) tended to be lower than those
measured in Tutt Pond water (range of 0.011 to 4.93), but that soil concentrations of nitrate in the
Reference Area were not significantly lower than in the Tutt Water Area.
No CSR standards or CCME guidelines are available for ammonium or nitrate in soil. A cursory literature
review returned a document outlining Guidelines for Investigating and Remediating Nitrate/Ammonia Contamination from Agricultural Chemical Releases, published by the Kansas Department of Health and Environment (KDHE, 2007). This document outlines a Remedial Action Objective (RAO) for nitrate plus
ammonium as N in soil of 40 mg/kg. Since the average Tutt Water Area soil combined ammonium and
nitrate concentration is 20.5 mg/kg, soils are considered to be well within this range. Only one soil
sample, collected at TUTT S-1, returned a concentration of nitrate at 74.4 mg/kg, above this RAO; to
evaluate this exceedance, three additional soil samples were collected within approximately 5 m of the
original sampling locations; nitrate concentrations in these additional samples ranged from 2.3 mg/kg to
3.7 mg/kg. As a result, it was concluded that the initial elevated concentration of nitrate was localized, and
was likely related to the use of the field for cattle grazing and the possible presence of fecal matter in the
original sample.
As a result, though differences in ammonia and nitrate concentrations in plant tissue were identified,
differences in soil ammonia and nitrate concentrations, as well as soil concentrations of plant-available
ammonia and nitrate, were not significantly different between the Tutt Water Area and Reference Area.
Since nitrogen-compounds are used in fertilizers to promote vegetation growth, ammonia and nitrate are
unlikely to result in any adverse effects to crop growth following irrigation with Pond water. This is
supported by the qualitative observations made by the famer, who has not observed differences in crop
health or success in the Tutt Water Area, versus the Reference Area.
Additionally, there is no concern for livestock with respect to incidental ingestion of soils with elevated
ammonium or nitrate, due to the limited toxicity associated with incidental ingestion.
6.2.3.2 Compost Watering Scenario
Similar to pH and sodium, concentrations of ammonia and nitrate in compost are greater than those
measured in Reference Area and Tutt Water Area soils. The use of Pond water as compost water may
continue to increase the ammonia and/or nitrate concentrations of the compost over time However, since
nitrogen-compounds are used in fertilizers to promote vegetation growth, ammonia and nitrate are
unlikely to result in any adverse effects to vegetation planted in compost.
Internal Ref: 652126 / 654763 September 24, 2018
47
© 2018 SNC-Lavalin Inc. All Rights Reserved. Confidential.
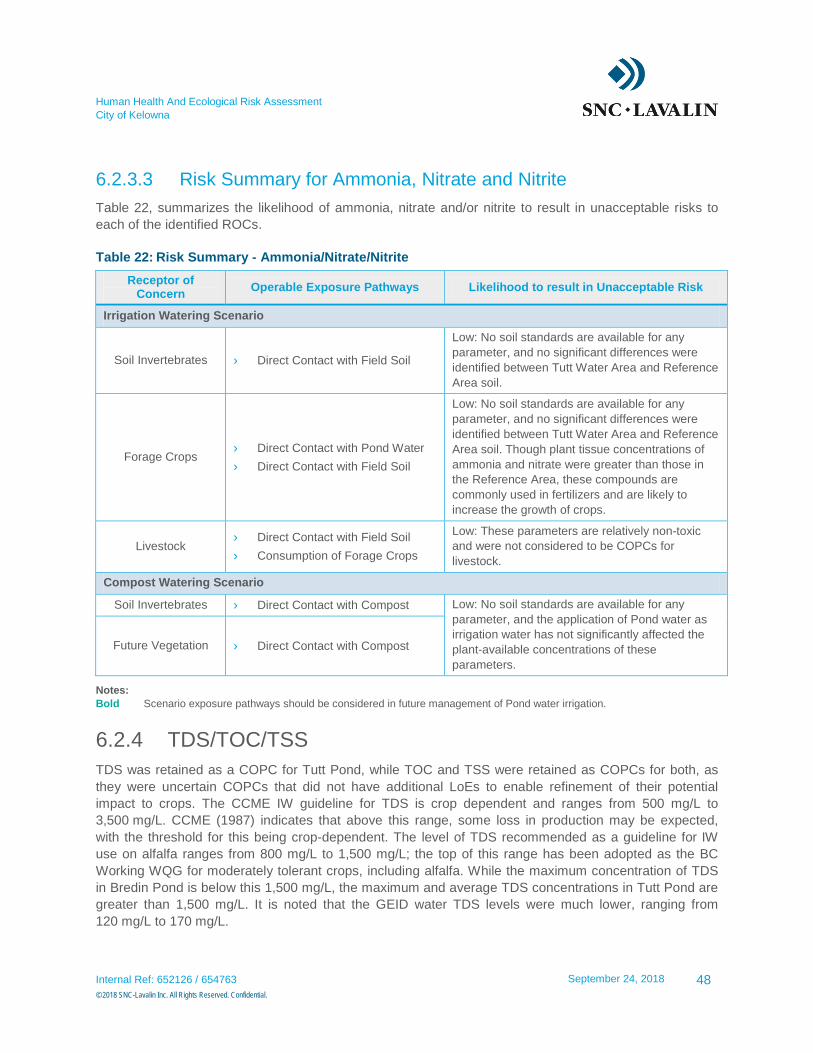
Human Health And Ecological Risk Assessment
City of Kelowna
6.2.3.3 Risk Summary for Ammonia, Nitrate and Nitrite
Table 22, summarizes the likelihood of ammonia, nitrate and/or nitrite to result in unacceptable risks to
each of the identified ROCs.
Table 22: Risk Summary - Ammonia/Nitrate/Nitrite
Receptor of Concern
Operable Exposure Pathways Likelihood to result in Unacceptable Risk
Irrigation Watering Scenario
Soil Invertebrates › Direct Contact with Field Soil
Low: No soil standards are available for any
parameter, and no significant differences were
identified between Tutt Water Area and Reference
Area soil.
Forage Crops › Direct Contact with Pond Water
› Direct Contact with Field Soil
Low: No soil standards are available for any
parameter, and no significant differences were
identified between Tutt Water Area and Reference
Area soil. Though plant tissue concentrations of
ammonia and nitrate were greater than those in
the Reference Area, these compounds are
commonly used in fertilizers and are likely to
increase the growth of crops.
Livestock › Direct Contact with Field Soil
› Consumption of Forage Crops
Low: These parameters are relatively non-toxic
and were not considered to be COPCs for
livestock.
Compost Watering Scenario
Soil Invertebrates › Direct Contact with Compost Low: No soil standards are available for any
parameter, and the application of Pond water as
irrigation water has not significantly affected the
plant-available concentrations of these
parameters.
Future Vegetation › Direct Contact with Compost
Notes:
Bold Scenario exposure pathways should be considered in future management of Pond water irrigation.
6.2.4 TDS/TOC/TSS
TDS was retained as a COPC for Tutt Pond, while TOC and TSS were retained as COPCs for both, as
they were uncertain COPCs that did not have additional LoEs to enable refinement of their potential
impact to crops. The CCME IW guideline for TDS is crop dependent and ranges from 500 mg/L to
3,500 mg/L. CCME (1987) indicates that above this range, some loss in production may be expected,
with the threshold for this being crop-dependent. The level of TDS recommended as a guideline for IW
use on alfalfa ranges from 800 mg/L to 1,500 mg/L; the top of this range has been adopted as the BC
Working WQG for moderately tolerant crops, including alfalfa. While the maximum concentration of TDS
in Bredin Pond is below this 1,500 mg/L, the maximum and average TDS concentrations in Tutt Pond are
greater than 1,500 mg/L. It is noted that the GEID water TDS levels were much lower, ranging from
120 mg/L to 170 mg/L.
Internal Ref: 652126 / 654763 September 24, 2018
48
© 2018 SNC-Lavalin Inc. All Rights Reserved. Confidential.
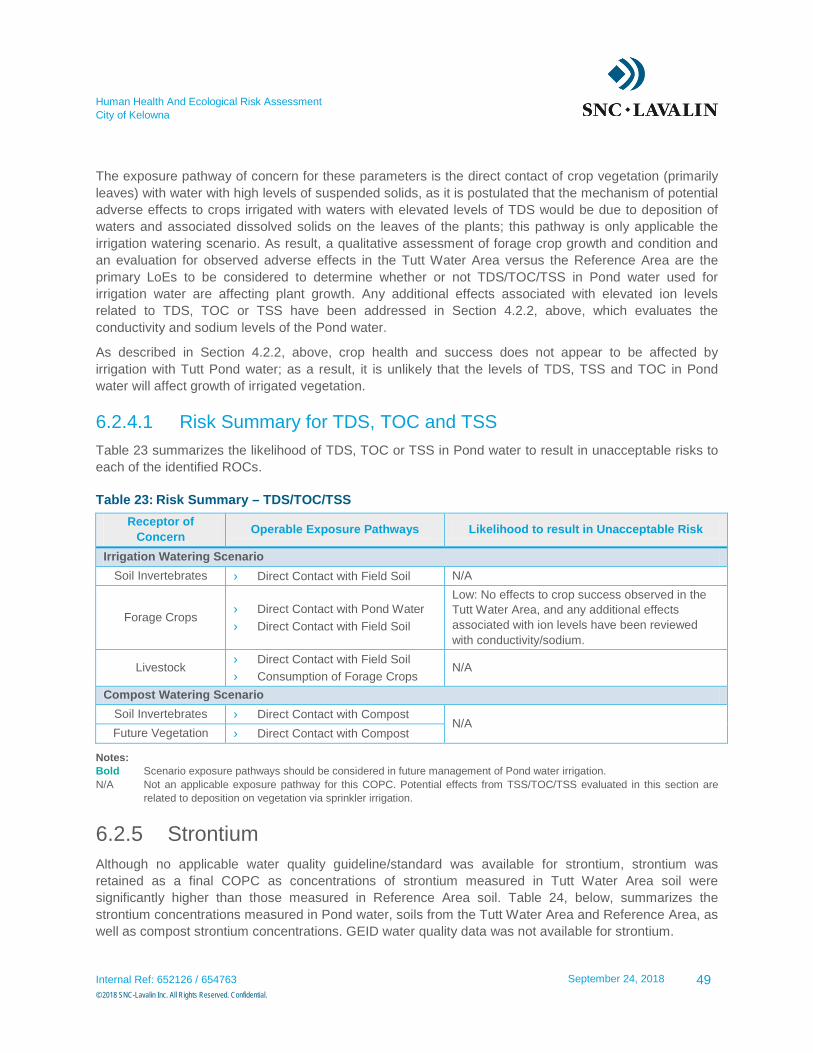
Human Health And Ecological Risk Assessment
City of Kelowna
The exposure pathway of concern for these parameters is the direct contact of crop vegetation (primarily
leaves) with water with high levels of suspended solids, as it is postulated that the mechanism of potential
adverse effects to crops irrigated with waters with elevated levels of TDS would be due to deposition of
waters and associated dissolved solids on the leaves of the plants; this pathway is only applicable the
irrigation watering scenario. As result, a qualitative assessment of forage crop growth and condition and
an evaluation for observed adverse effects in the Tutt Water Area versus the Reference Area are the
primary LoEs to be considered to determine whether or not TDS/TOC/TSS in Pond water used for
irrigation water are affecting plant growth. Any additional effects associated with elevated ion levels
related to TDS, TOC or TSS have been addressed in Section 4.2.2, above, which evaluates the
conductivity and sodium levels of the Pond water.
As described in Section 4.2.2, above, crop health and success does not appear to be affected by
irrigation with Tutt Pond water; as a result, it is unlikely that the levels of TDS, TSS and TOC in Pond
water will affect growth of irrigated vegetation.
6.2.4.1 Risk Summary for TDS, TOC and TSS
Table 23 summarizes the likelihood of TDS, TOC or TSS in Pond water to result in unacceptable risks to
each of the identified ROCs.
Table 23: Risk Summary – TDS/TOC/TSS
Receptor of
Concern Operable Exposure Pathways Likelihood to result in Unacceptable Risk
Irrigation Watering Scenario
Soil Invertebrates › Direct Contact with Field Soil N/A
Forage Crops › Direct Contact with Pond Water
› Direct Contact with Field Soil
Low: No effects to crop success observed in the
Tutt Water Area, and any additional effects
associated with ion levels have been reviewed
with conductivity/sodium.
Livestock › Direct Contact with Field Soil
› Consumption of Forage Crops N/A
Compost Watering Scenario
Soil Invertebrates › Direct Contact with Compost N/A
Future Vegetation › Direct Contact with Compost
Notes:
Bold Scenario exposure pathways should be considered in future management of Pond water irrigation.
N/A Not an applicable exposure pathway for this COPC. Potential effects from TSS/TOC/TSS evaluated in this section are
related to deposition on vegetation via sprinkler irrigation.
6.2.5 Strontium
Although no applicable water quality guideline/standard was available for strontium, strontium was
retained as a final COPC as concentrations of strontium measured in Tutt Water Area soil were
significantly higher than those measured in Reference Area soil. Table 24, below, summarizes the
strontium concentrations measured in Pond water, soils from the Tutt Water Area and Reference Area, as
well as compost strontium concentrations. GEID water quality data was not available for strontium.
Internal Ref: 652126 / 654763 September 24, 2018
49
© 2018 SNC-Lavalin Inc. All Rights Reserved. Confidential.
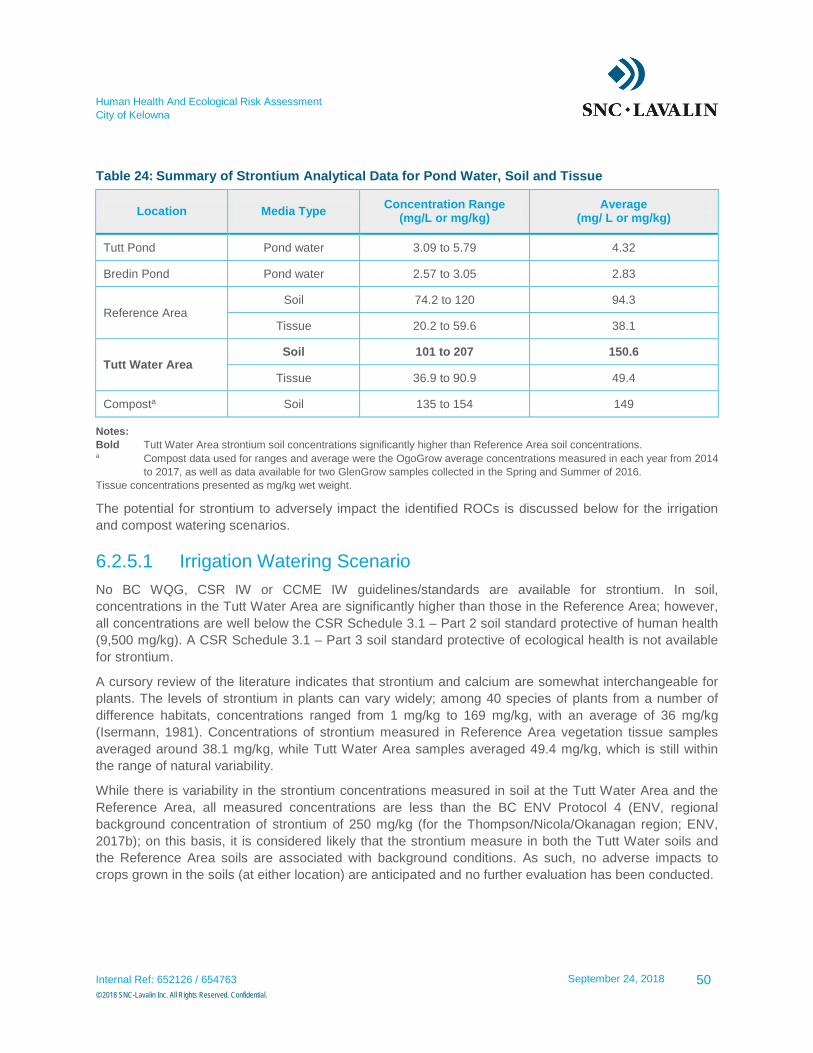
Human Health And Ecological Risk Assessment
City of Kelowna
Table 24: Summary of Strontium Analytical Data for Pond Water, Soil and Tissue
Location Media Type Concentration Range
(mg/L or mg/kg) Average
(mg/ L or mg/kg)
Tutt Pond Pond water 3.09 to 5.79 4.32
Bredin Pond Pond water 2.57 to 3.05 2.83
Reference Area Soil 74.2 to 120 94.3
Tissue 20.2 to 59.6 38.1
Tutt Water Area Soil 101 to 207 150.6
Tissue 36.9 to 90.9 49.4
Composta Soil 135 to 154 149
Notes:
Bold Tutt Water Area strontium soil concentrations significantly higher than Reference Area soil concentrations. a Compost data used for ranges and average were the OgoGrow average concentrations measured in each year from 2014
to 2017, as well as data available for two GlenGrow samples collected in the Spring and Summer of 2016.
Tissue concentrations presented as mg/kg wet weight.
The potential for strontium to adversely impact the identified ROCs is discussed below for the irrigation
and compost watering scenarios.
6.2.5.1 Irrigation Watering Scenario
No BC WQG, CSR IW or CCME IW guidelines/standards are available for strontium. In soil,
concentrations in the Tutt Water Area are significantly higher than those in the Reference Area; however,
all concentrations are well below the CSR Schedule 3.1 – Part 2 soil standard protective of human health
(9,500 mg/kg). A CSR Schedule 3.1 – Part 3 soil standard protective of ecological health is not available
for strontium.
A cursory review of the literature indicates that strontium and calcium are somewhat interchangeable for
plants. The levels of strontium in plants can vary widely; among 40 species of plants from a number of
difference habitats, concentrations ranged from 1 mg/kg to 169 mg/kg, with an average of 36 mg/kg
(Isermann, 1981). Concentrations of strontium measured in Reference Area vegetation tissue samples
averaged around 38.1 mg/kg, while Tutt Water Area samples averaged 49.4 mg/kg, which is still within
the range of natural variability.
While there is variability in the strontium concentrations measured in soil at the Tutt Water Area and the
Reference Area, all measured concentrations are less than the BC ENV Protocol 4 (ENV, regional
background concentration of strontium of 250 mg/kg (for the Thompson/Nicola/Okanagan region; ENV,
2017b); on this basis, it is considered likely that the strontium measure in both the Tutt Water soils and
the Reference Area soils are associated with background conditions. As such, no adverse impacts to
crops grown in the soils (at either location) are anticipated and no further evaluation has been conducted.
Internal Ref: 652126 / 654763 September 24, 2018
50
© 2018 SNC-Lavalin Inc. All Rights Reserved. Confidential.
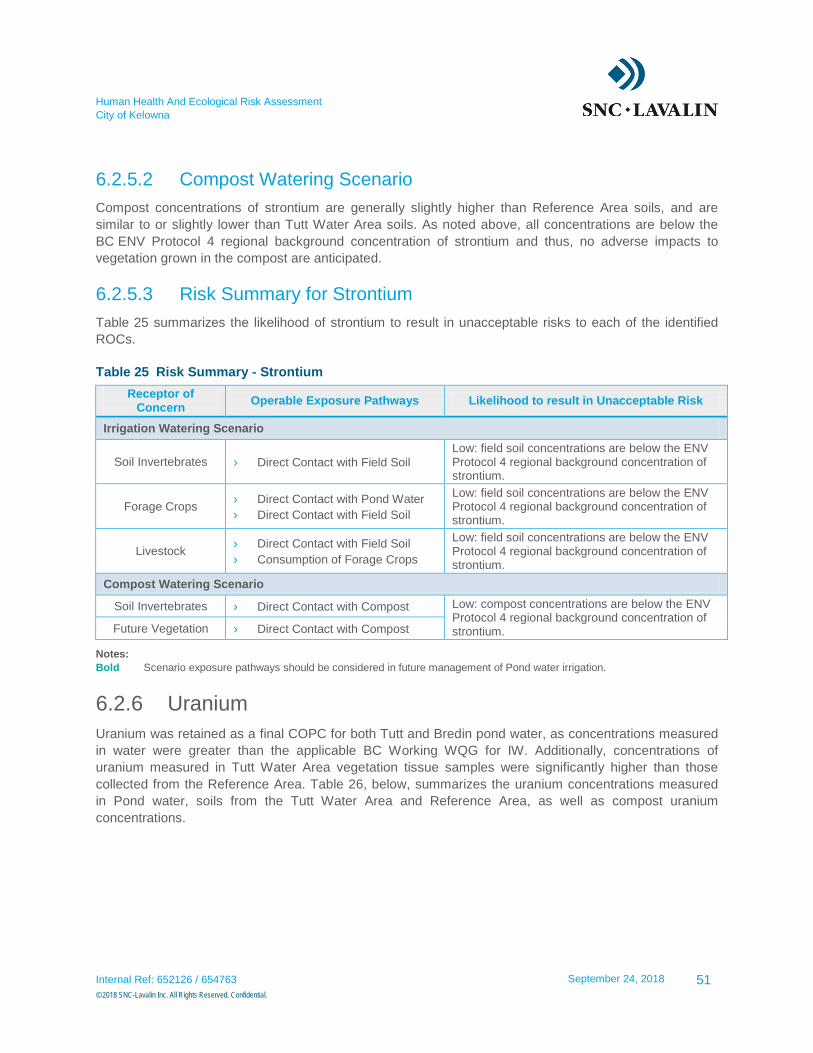
Human Health And Ecological Risk Assessment
City of Kelowna
6.2.5.2 Compost Watering Scenario
Compost concentrations of strontium are generally slightly higher than Reference Area soils, and are
similar to or slightly lower than Tutt Water Area soils. As noted above, all concentrations are below the
BC ENV Protocol 4 regional background concentration of strontium and thus, no adverse impacts to
vegetation grown in the compost are anticipated.
6.2.5.3 Risk Summary for Strontium
Table 25 summarizes the likelihood of strontium to result in unacceptable risks to each of the identified
ROCs.
Table 25 Risk Summary - Strontium
Receptor of Concern
Operable Exposure Pathways Likelihood to result in Unacceptable Risk
Irrigation Watering Scenario
Soil Invertebrates › Direct Contact with Field Soil
Low: field soil concentrations are below the ENV Protocol 4 regional background concentration of strontium.
Forage Crops › Direct Contact with Pond Water
› Direct Contact with Field Soil
Low: field soil concentrations are below the ENV Protocol 4 regional background concentration of strontium.
Livestock › Direct Contact with Field Soil
› Consumption of Forage Crops
Low: field soil concentrations are below the ENV Protocol 4 regional background concentration of strontium.
Compost Watering Scenario
Soil Invertebrates › Direct Contact with Compost Low: compost concentrations are below the ENV Protocol 4 regional background concentration of strontium. Future Vegetation › Direct Contact with Compost
Notes:
Bold Scenario exposure pathways should be considered in future management of Pond water irrigation.
6.2.6 Uranium
Uranium was retained as a final COPC for both Tutt and Bredin pond water, as concentrations measured
in water were greater than the applicable BC Working WQG for IW. Additionally, concentrations of
uranium measured in Tutt Water Area vegetation tissue samples were significantly higher than those
collected from the Reference Area. Table 26, below, summarizes the uranium concentrations measured
in Pond water, soils from the Tutt Water Area and Reference Area, as well as compost uranium
concentrations.
Internal Ref: 652126 / 654763 September 24, 2018
51
© 2018 SNC-Lavalin Inc. All Rights Reserved. Confidential.
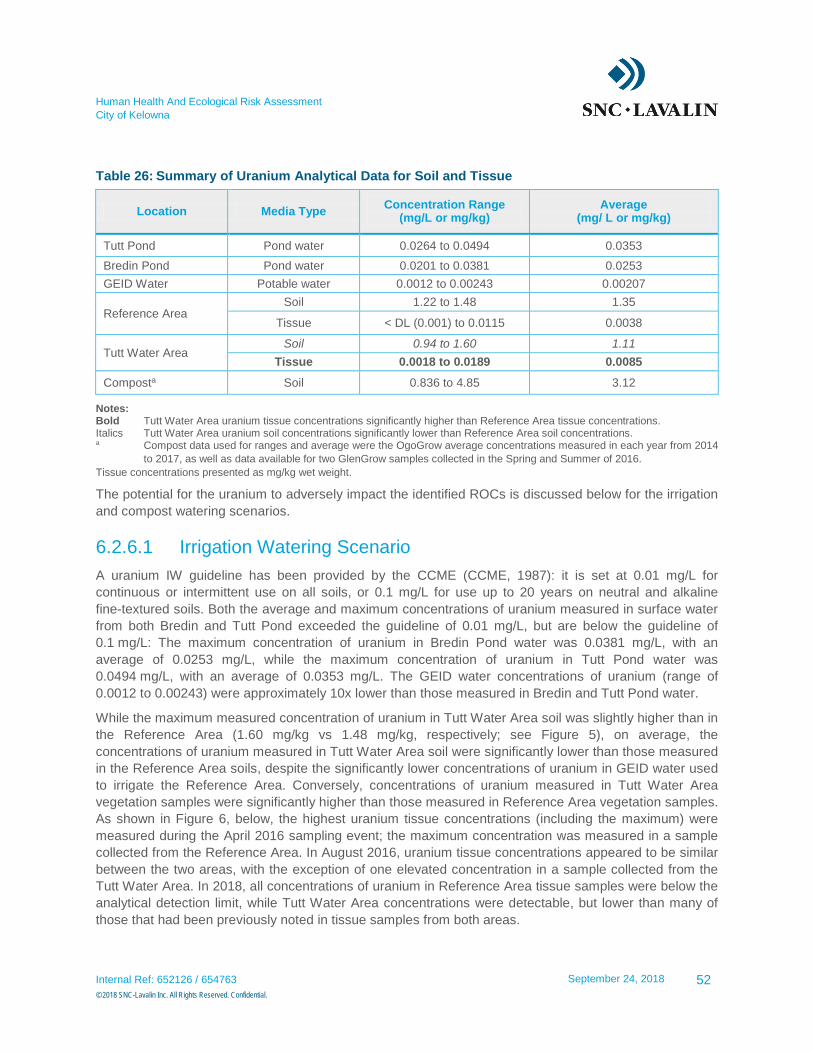
Human Health And Ecological Risk Assessment
City of Kelowna
Table 26: Summary of Uranium Analytical Data for Soil and Tissue
Location Media Type Concentration Range
(mg/L or mg/kg) Average
(mg/ L or mg/kg)
Tutt Pond Pond water 0.0264 to 0.0494 0.0353
Bredin Pond Pond water 0.0201 to 0.0381 0.0253
GEID Water Potable water 0.0012 to 0.00243 0.00207
Reference Area Soil 1.22 to 1.48 1.35
Tissue < DL (0.001) to 0.0115 0.0038
Tutt Water Area Soil 0.94 to 1.60 1.11
Tissue 0.0018 to 0.0189 0.0085
Composta Soil 0.836 to 4.85 3.12
Notes: Bold Tutt Water Area uranium tissue concentrations significantly higher than Reference Area tissue concentrations. Italics Tutt Water Area uranium soil concentrations significantly lower than Reference Area soil concentrations. a Compost data used for ranges and average were the OgoGrow average concentrations measured in each year from 2014
to 2017, as well as data available for two GlenGrow samples collected in the Spring and Summer of 2016.
Tissue concentrations presented as mg/kg wet weight.
The potential for the uranium to adversely impact the identified ROCs is discussed below for the irrigation
and compost watering scenarios.
6.2.6.1 Irrigation Watering Scenario
A uranium IW guideline has been provided by the CCME (CCME, 1987): it is set at 0.01 mg/L for
continuous or intermittent use on all soils, or 0.1 mg/L for use up to 20 years on neutral and alkaline
fine-textured soils. Both the average and maximum concentrations of uranium measured in surface water
from both Bredin and Tutt Pond exceeded the guideline of 0.01 mg/L, but are below the guideline of
0.1 mg/L: The maximum concentration of uranium in Bredin Pond water was 0.0381 mg/L, with an
average of 0.0253 mg/L, while the maximum concentration of uranium in Tutt Pond water was
0.0494 mg/L, with an average of 0.0353 mg/L. The GEID water concentrations of uranium (range of
0.0012 to 0.00243) were approximately 10x lower than those measured in Bredin and Tutt Pond water.
While the maximum measured concentration of uranium in Tutt Water Area soil was slightly higher than in
the Reference Area (1.60 mg/kg vs 1.48 mg/kg, respectively; see Figure 5), on average, the
concentrations of uranium measured in Tutt Water Area soil were significantly lower than those measured
in the Reference Area soils, despite the significantly lower concentrations of uranium in GEID water used
to irrigate the Reference Area. Conversely, concentrations of uranium measured in Tutt Water Area
vegetation samples were significantly higher than those measured in Reference Area vegetation samples.
As shown in Figure 6, below, the highest uranium tissue concentrations (including the maximum) were
measured during the April 2016 sampling event; the maximum concentration was measured in a sample
collected from the Reference Area. In August 2016, uranium tissue concentrations appeared to be similar
between the two areas, with the exception of one elevated concentration in a sample collected from the
Tutt Water Area. In 2018, all concentrations of uranium in Reference Area tissue samples were below the
analytical detection limit, while Tutt Water Area concentrations were detectable, but lower than many of
those that had been previously noted in tissue samples from both areas.
Internal Ref: 652126 / 654763 September 24, 2018
52
© 2018 SNC-Lavalin Inc. All Rights Reserved. Confidential.
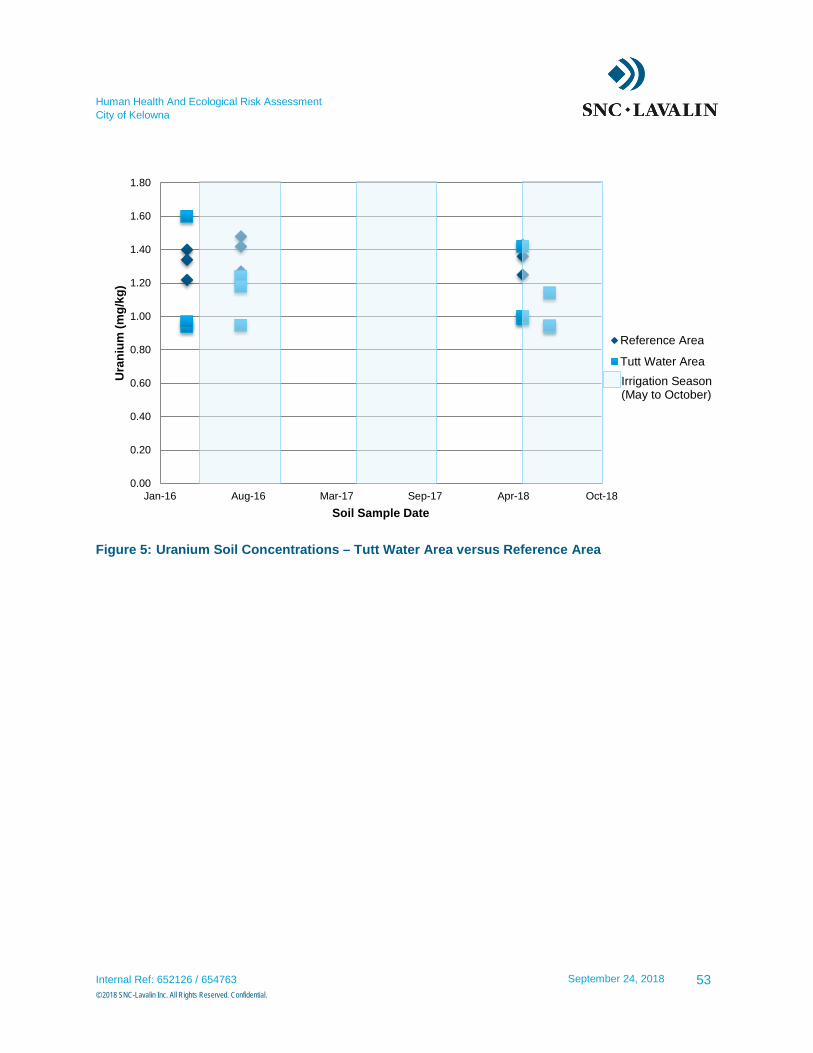
Human Health And Ecological Risk Assessment
City of Kelowna
Figure 5: Uranium Soil Concentrations – Tutt Water Area versus Reference Area
0.00
0.20
0.40
0.60
0.80
1.00
1.20
1.40
1.60
1.80
Jan-16 Aug-16 Mar-17 Sep-17 Apr-18 Oct-18
Ura
niu
m (
mg
/kg
)
Soil Sample Date
Reference Area
Tutt Water Area
Irrigation Season (May to October)
Internal Ref: 652126 / 654763 September 24, 2018
53
© 2018 SNC-Lavalin Inc. All Rights Reserved. Confidential.
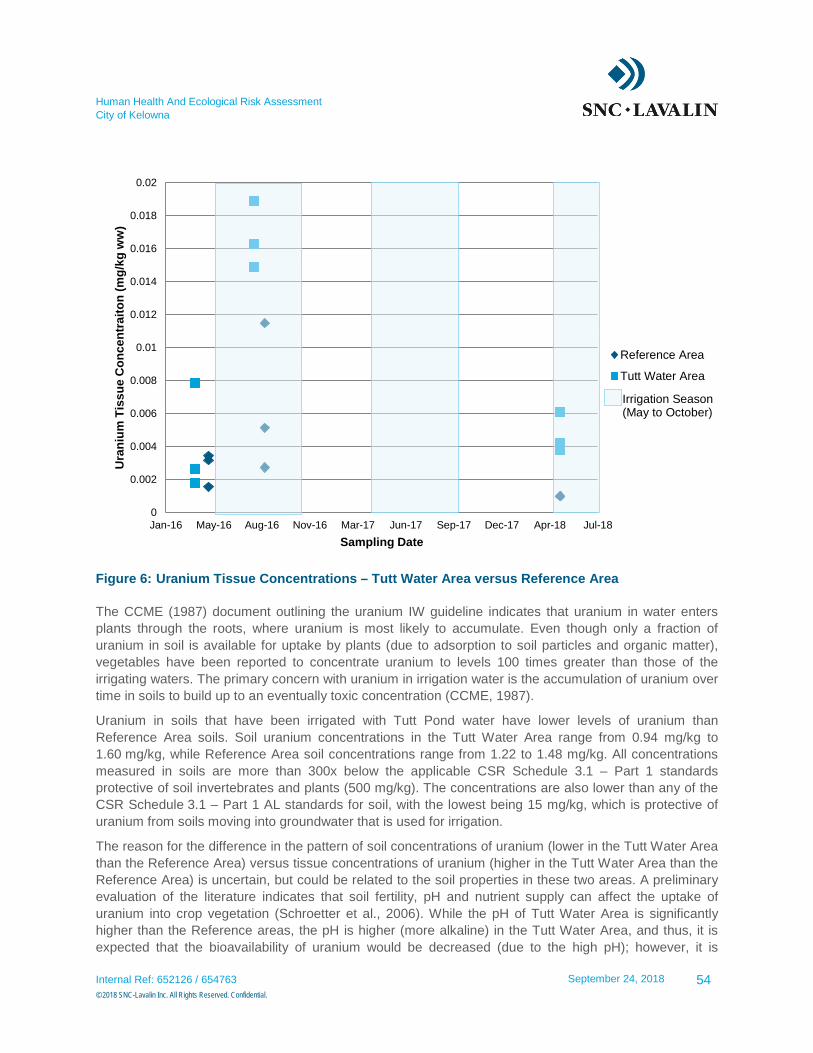
Human Health And Ecological Risk Assessment
City of Kelowna
Figure 6: Uranium Tissue Concentrations – Tutt Water Area versus Reference Area
The CCME (1987) document outlining the uranium IW guideline indicates that uranium in water enters
plants through the roots, where uranium is most likely to accumulate. Even though only a fraction of
uranium in soil is available for uptake by plants (due to adsorption to soil particles and organic matter),
vegetables have been reported to concentrate uranium to levels 100 times greater than those of the
irrigating waters. The primary concern with uranium in irrigation water is the accumulation of uranium over
time in soils to build up to an eventually toxic concentration (CCME, 1987).
Uranium in soils that have been irrigated with Tutt Pond water have lower levels of uranium than
Reference Area soils. Soil uranium concentrations in the Tutt Water Area range from 0.94 mg/kg to
1.60 mg/kg, while Reference Area soil concentrations range from 1.22 to 1.48 mg/kg. All concentrations
measured in soils are more than 300x below the applicable CSR Schedule 3.1 – Part 1 standards
protective of soil invertebrates and plants (500 mg/kg). The concentrations are also lower than any of the
CSR Schedule 3.1 – Part 1 AL standards for soil, with the lowest being 15 mg/kg, which is protective of
uranium from soils moving into groundwater that is used for irrigation.
The reason for the difference in the pattern of soil concentrations of uranium (lower in the Tutt Water Area
than the Reference Area) versus tissue concentrations of uranium (higher in the Tutt Water Area than the
Reference Area) is uncertain, but could be related to the soil properties in these two areas. A preliminary
evaluation of the literature indicates that soil fertility, pH and nutrient supply can affect the uptake of
uranium into crop vegetation (Schroetter et al., 2006). While the pH of Tutt Water Area is significantly
higher than the Reference areas, the pH is higher (more alkaline) in the Tutt Water Area, and thus, it is
expected that the bioavailability of uranium would be decreased (due to the high pH); however, it is
0
0.002
0.004
0.006
0.008
0.01
0.012
0.014
0.016
0.018
0.02
Jan-16 May-16 Aug-16 Nov-16 Mar-17 Jun-17 Sep-17 Dec-17 Apr-18 Jul-18
Ura
niu
m T
iss
ue
Co
nc
en
tra
ito
n (
mg
/kg
ww
)
Sampling Date
Reference Area
Tutt Water Area
Irrigation Season (May to October)
Internal Ref: 652126 / 654763 September 24, 2018
54
© 2018 SNC-Lavalin Inc. All Rights Reserved. Confidential.
Human Health And Ecological Risk Assessment
City of Kelowna
possible that the higher pH in combination with differences in available nutrients, could result in increase
uptake of uranium from soils.
The primary driver of the CCME IW guideline is to prevent the accumulation of uranium in soils, which is
not occurring in the Tutt Water Area, where irrigation with Pond water has occurred for several years.
Concentrations of uranium in soil and tissue at the Tutt Water Area appear to be, at a minimum stable, or
slightly decreasing. No differences in crop health or success have been identified between the Tutt Water
Area and the Reference Area. Therefore, uranium in Pond water is unlikely to adversely impact crop
health and soil invertebrates, as well as soil quality over time if used for irrigation watering purposes.
Finally, livestock are also unlikely to be adversely impacted by uranium accumulation (if occurring) in
vegetation tissue in the Tutt Water Area. In addition to being below the CSR Schedule 3.1 – Part 1
standards protective of toxicity to soil invertebrates and plants, Tutt Water Area soil concentrations
(ranging from 0.94 mg/kg to 1.60 mg/kg) are also well below the standard protective of livestock ingesting
soil and fodder (35 mg/kg). Furthermore, the maximum concentration of uranium measured in Pond water
(0.0494 mg/L, measured in Tutt Pond) is below the BC WQG protective of livestock watering, which is
0.200 mg/L (i.e., the guideline that would protect livestock if livestock were using Pond water as a drinking
water source). If Pond water is safe for livestock to drink, it can be assumed that it is also safe to use for
watering forage crops that they consume. Based on the above, further quantitative evaluation of
exposures and potential risks to livestock ingesting forage crops grown in the irrigated soils is not
warranted.
6.2.6.2 Compost Watering Scenario
OgoGrow compost has higher concentrations of uranium (ranging from 3.35 mg/kg to 4.85 mg/kg) than
Reference Area or Tutt Water Area soils (ranging from 0.94 mg/kg to 1.60 mg/kg), while concentrations of
uranium measured in GlenGrow compost (0.836 mg/kg and 1.42 mg/kg) are close to those measured in
Reference Area and Tutt Water Area soils. Though not directly applicable to compost, for reference
purposes, the BC CSR AL soil standards for uranium were compared to the compost uranium levels as
the CSR standards provide pathway specific endpoints. However, since the concentrations of uranium in
soil are well below all applicable CSR Schedule 3.1 – Part 1 AL standards, including over 100 x less than
the standard protective of toxicity to soil invertebrates and plants, and since concentrations are unlikely to
significantly increase following the short-term application of Pond water for watering purposes, it is
unlikely that there would be any risks to ecological receptors or vegetation health associated with the use
of future compost.
6.2.6.3 Risk Summary for Uranium
Table 27 summarizes the likelihood of uranium resulting in unacceptable risks to each of the identified
ROCs.
Internal Ref: 652126 / 654763 September 24, 2018
55
© 2018 SNC-Lavalin Inc. All Rights Reserved. Confidential.
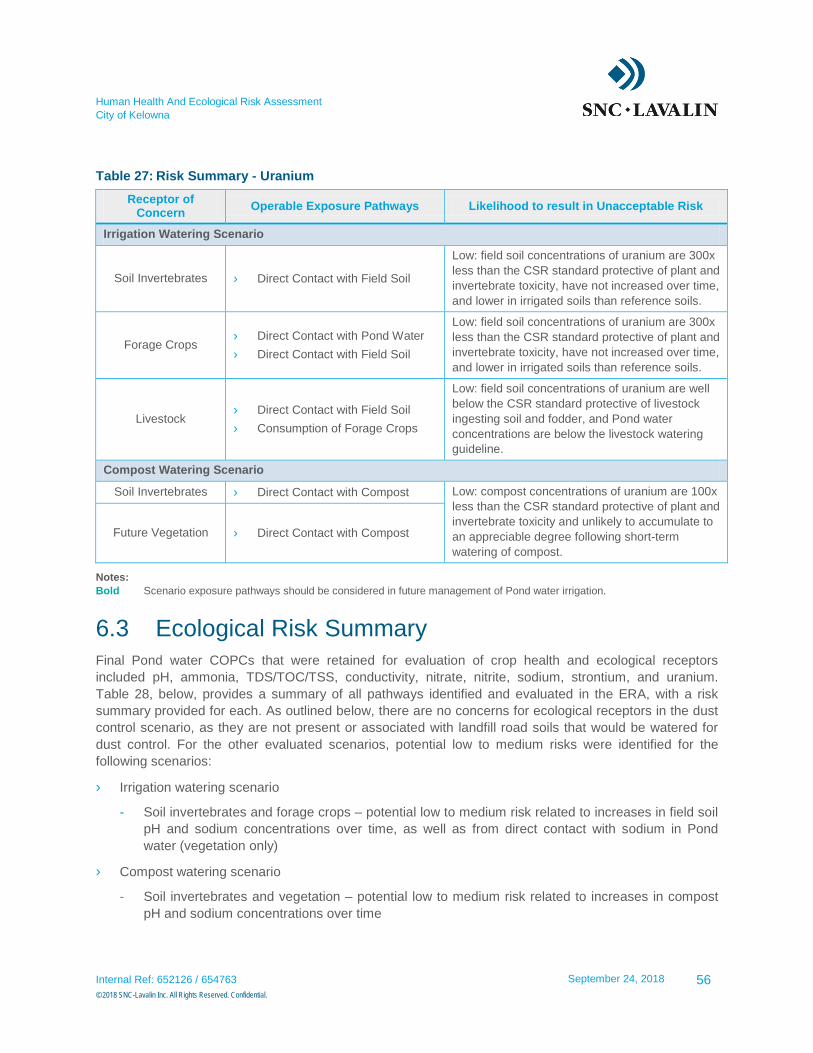
Human Health And Ecological Risk Assessment
City of Kelowna
Table 27: Risk Summary - Uranium
Receptor of Concern
Operable Exposure Pathways Likelihood to result in Unacceptable Risk
Irrigation Watering Scenario
Soil Invertebrates › Direct Contact with Field Soil
Low: field soil concentrations of uranium are 300x
less than the CSR standard protective of plant and
invertebrate toxicity, have not increased over time,
and lower in irrigated soils than reference soils.
Forage Crops › Direct Contact with Pond Water
› Direct Contact with Field Soil
Low: field soil concentrations of uranium are 300x
less than the CSR standard protective of plant and
invertebrate toxicity, have not increased over time,
and lower in irrigated soils than reference soils.
Livestock › Direct Contact with Field Soil
› Consumption of Forage Crops
Low: field soil concentrations of uranium are well
below the CSR standard protective of livestock
ingesting soil and fodder, and Pond water
concentrations are below the livestock watering
guideline.
Compost Watering Scenario
Soil Invertebrates › Direct Contact with Compost Low: compost concentrations of uranium are 100x
less than the CSR standard protective of plant and
invertebrate toxicity and unlikely to accumulate to
an appreciable degree following short-term
watering of compost.
Future Vegetation › Direct Contact with Compost
Notes:
Bold Scenario exposure pathways should be considered in future management of Pond water irrigation.
6.3 Ecological Risk Summary
Final Pond water COPCs that were retained for evaluation of crop health and ecological receptors
included pH, ammonia, TDS/TOC/TSS, conductivity, nitrate, nitrite, sodium, strontium, and uranium.
Table 28, below, provides a summary of all pathways identified and evaluated in the ERA, with a risk
summary provided for each. As outlined below, there are no concerns for ecological receptors in the dust
control scenario, as they are not present or associated with landfill road soils that would be watered for
dust control. For the other evaluated scenarios, potential low to medium risks were identified for the
following scenarios:
› Irrigation watering scenario
- Soil invertebrates and forage crops – potential low to medium risk related to increases in field soil
pH and sodium concentrations over time, as well as from direct contact with sodium in Pond
water (vegetation only)
› Compost watering scenario
- Soil invertebrates and vegetation – potential low to medium risk related to increases in compost
pH and sodium concentrations over time
Internal Ref: 652126 / 654763 September 24, 2018
56
© 2018 SNC-Lavalin Inc. All Rights Reserved. Confidential.
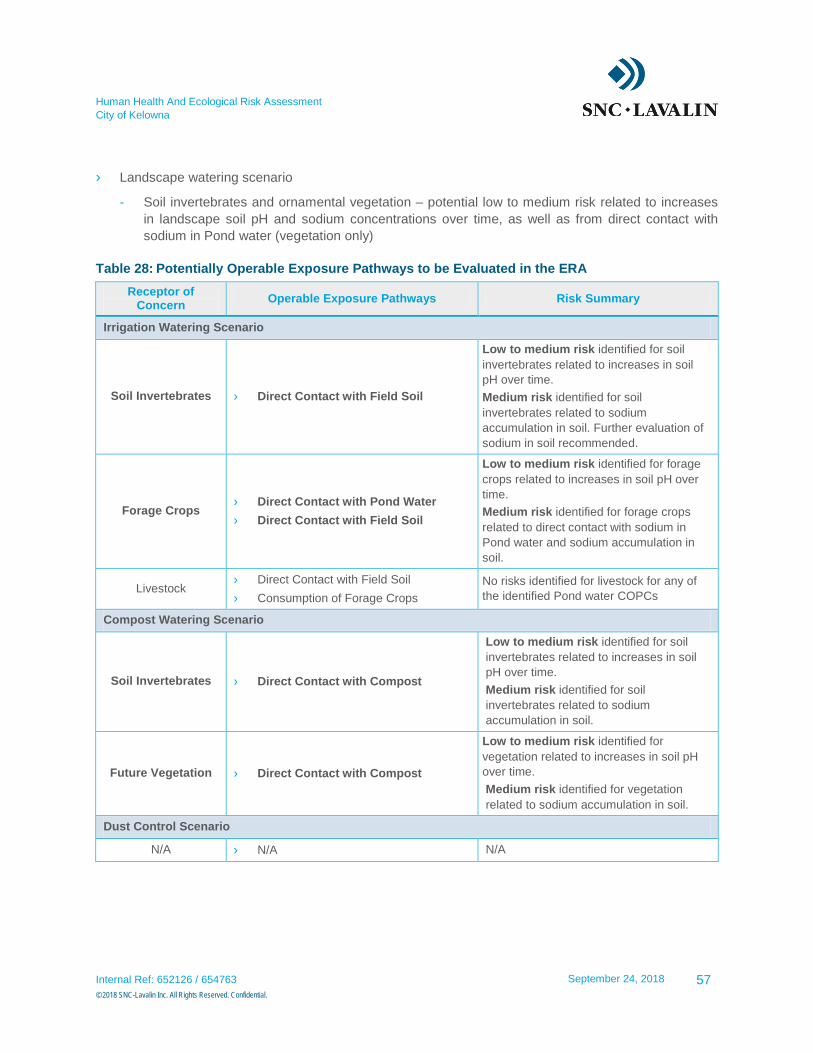
Human Health And Ecological Risk Assessment
City of Kelowna
› Landscape watering scenario
- Soil invertebrates and ornamental vegetation – potential low to medium risk related to increases
in landscape soil pH and sodium concentrations over time, as well as from direct contact with
sodium in Pond water (vegetation only)
Table 28: Potentially Operable Exposure Pathways to be Evaluated in the ERA
Receptor of Concern
Operable Exposure Pathways Risk Summary
Irrigation Watering Scenario
Soil Invertebrates › Direct Contact with Field Soil
Low to medium risk identified for soil
invertebrates related to increases in soil
pH over time.
Medium risk identified for soil
invertebrates related to sodium
accumulation in soil. Further evaluation of
sodium in soil recommended.
Forage Crops › Direct Contact with Pond Water
› Direct Contact with Field Soil
Low to medium risk identified for forage
crops related to increases in soil pH over
time.
Medium risk identified for forage crops
related to direct contact with sodium in
Pond water and sodium accumulation in
soil.
Livestock › Direct Contact with Field Soil
› Consumption of Forage Crops
No risks identified for livestock for any of
the identified Pond water COPCs
Compost Watering Scenario
Soil Invertebrates › Direct Contact with Compost
Low to medium risk identified for soil
invertebrates related to increases in soil
pH over time.
Medium risk identified for soil
invertebrates related to sodium
accumulation in soil.
Future Vegetation › Direct Contact with Compost
Low to medium risk identified for
vegetation related to increases in soil pH
over time.
Medium risk identified for vegetation
related to sodium accumulation in soil.
Dust Control Scenario
N/A › N/A N/A
Internal Ref: 652126 / 654763 September 24, 2018
57
© 2018 SNC-Lavalin Inc. All Rights Reserved. Confidential.
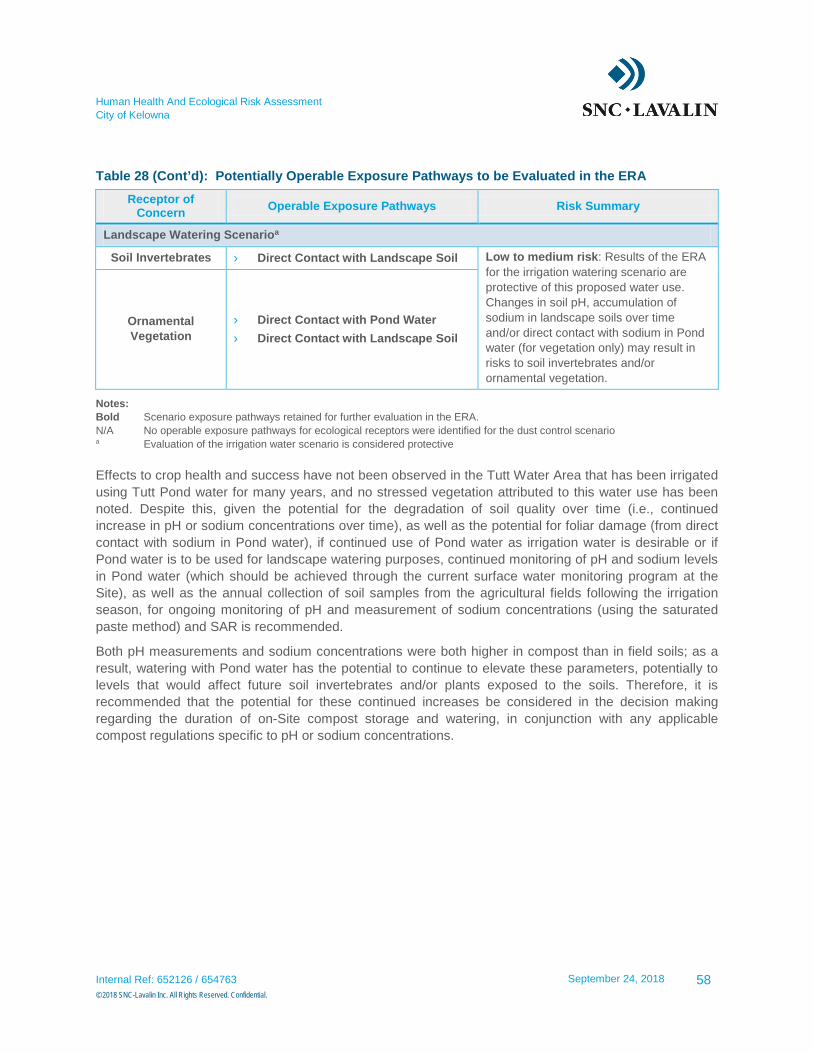
Human Health And Ecological Risk Assessment
City of Kelowna
Table 28 (Cont’d): Potentially Operable Exposure Pathways to be Evaluated in the ERA
Receptor of Concern
Operable Exposure Pathways Risk Summary
Landscape Watering Scenarioa
Soil Invertebrates › Direct Contact with Landscape Soil Low to medium risk: Results of the ERA
for the irrigation watering scenario are
protective of this proposed water use.
Changes in soil pH, accumulation of
sodium in landscape soils over time
and/or direct contact with sodium in Pond
water (for vegetation only) may result in
risks to soil invertebrates and/or
ornamental vegetation.
Ornamental
Vegetation
› Direct Contact with Pond Water
› Direct Contact with Landscape Soil
Notes:
Bold Scenario exposure pathways retained for further evaluation in the ERA.
N/A No operable exposure pathways for ecological receptors were identified for the dust control scenario a Evaluation of the irrigation water scenario is considered protective
Effects to crop health and success have not been observed in the Tutt Water Area that has been irrigated
using Tutt Pond water for many years, and no stressed vegetation attributed to this water use has been
noted. Despite this, given the potential for the degradation of soil quality over time (i.e., continued
increase in pH or sodium concentrations over time), as well as the potential for foliar damage (from direct
contact with sodium in Pond water), if continued use of Pond water as irrigation water is desirable or if
Pond water is to be used for landscape watering purposes, continued monitoring of pH and sodium levels
in Pond water (which should be achieved through the current surface water monitoring program at the
Site), as well as the annual collection of soil samples from the agricultural fields following the irrigation
season, for ongoing monitoring of pH and measurement of sodium concentrations (using the saturated
paste method) and SAR is recommended.
Both pH measurements and sodium concentrations were both higher in compost than in field soils; as a
result, watering with Pond water has the potential to continue to elevate these parameters, potentially to
levels that would affect future soil invertebrates and/or plants exposed to the soils. Therefore, it is
recommended that the potential for these continued increases be considered in the decision making
regarding the duration of on-Site compost storage and watering, in conjunction with any applicable
compost regulations specific to pH or sodium concentrations.
Internal Ref: 652126 / 654763 September 24, 2018
58
© 2018 SNC-Lavalin Inc. All Rights Reserved. Confidential.
Human Health And Ecological Risk Assessment
City of Kelowna
7 References British Columbia Ministry of Environment & Climate Change Strategy (ENV). 2018. Approved Water
Quality Guidelines. Available at https://www2.gov.bc.ca/gov/content/environment/air-land-
water/water/water-quality/water-quality-guidelines/approved-water-quality-guidelines.
British Columbia Ministry of Environment & Climate Change Strategy (ENV). British Columbia Working
Water Quality Guidelines: Aquatic Life, Wildlife and Agriculture. Water Protection and
Sustainability Branch. June 2017.
British Columbia Ministry of Environment & Climate Change Strategy (ENV). 2017b. Protocol 4 for
Contaminated Sites, Establishing Background Concentrations in Soil. November 1, 2017.
British Columbia Ministry of Agriculture, Food and Fisheries. 2001. Soil Factsheet, Soil pH. Order No.
637.100-1, Revised July 2001, Agdex: 534.
Canadian Council of Ministers of the Environment (CCME). 1987. Canadian Water Quality Guidelines.
Canadian Council of Ministers of the Environment (CCME). 1999. Canadian Environmental Quality
Guidelines, Canadian Council of Ministers of the Environment, Winnipeg.
Available at http://ceqg-rcqe.ccme.ca/en/index.html.
Council of Approved Professionals (CSAP). 2015. Bioaccumulation Research Project. Prepared by SLR
Consulting (Canada) Ltd. for CSAP. August, 2015.
City of Kelowna. 2017a. Tutts Lands Vegetation and Soil Summary.
City of Kelowna. 2018. City of Kelowna, Okanagan compost. Available at https://www.kelowna.ca/city-
services/garbage-recycling-yard-waste/okanagan-compost, accessed on January 8, 2018.
GlenGrow. 2016. City of Kelowna, GlenGrow Analytical Results.
Glenmore Ellison Improvement District (GEID). 2018. Glenmore Comprehensive Water Quality Results.
Available at http://glenmoreellison.com/water_quality/. Accessed on September 18, 2018.
Golder Associates Ltd. (Golder). 2016. Surface Water and Groundwater Management Strategy,
City of Kelowna, Glenmore Landfill. July 21, 2016.
Golder Associates Ltd. (Golder). 2017. 2016 Annual Water Quality Monitoring Report, Glenmore Landfill,
Kelowna, BC. January 27, 2017.
Golder Associates Ltd. (Golder). 2018. 2017 Annual Water Quality Monitoring Report, Glenmore Landfill,
Kelowna, BC. February 21, 2018.
Isermann, K. 1981. Uptake of Stable Strontium by Plants and Effects on Plant Growth. In: Skoryna S.C.
(eds), Handbook of Stable Strontium. Springer, Boston, MA.
OgoGrow. 2016. City of Kelowna, OgoGrow Analytical Results.
Schroetter, S., M. Rivas, M. Lamas, J. Fleckenstein and E. Schnug. 2006. Factors Affecting the Plant
Availability of Uranium in Soils. In: Merkel B.J. and A. Hasche-Berger (eds), Uranium in the
Environment. Springer, Berlin, Heidelberg.
Internal Ref: 652126 / 654763 September 24, 2018
59
© 2018 SNC-Lavalin Inc. All Rights Reserved. Confidential.
Human Health And Ecological Risk Assessment
City of Kelowna
8 Notice to Reader This report has been prepared and the work referred to in this report have been undertaken by
SNC-Lavalin Inc. (SNC-Lavalin) for the exclusive use of City of Kelowna, who has been party to the
development of the scope of work and understands its limitations. The methodology, findings, conclusions
and recommendations in this report are based solely upon the scope of work and subject to the time and
budgetary considerations described in the proposal and/or contract pursuant to which this report was
issued. Any use, reliance on, or decision made by a third party based on this report is the sole
responsibility of such third party. SNC-Lavalin accepts no liability or responsibility for any damages that
may be suffered or incurred by any third party as a result of the use of, reliance on, or any decision made
based on this report.
The findings, conclusions and recommendations in this report (i) have been developed in a manner
consistent with the level of skill normally exercised by professionals currently practicing under similar
conditions in the area, and (ii) reflect SNC-Lavalin’s best judgment based on information available at the
time of preparation of this report. No other warranties, either expressed or implied, are made as to the
professional services provided under the terms of our original contract and included in this report. The
findings and conclusions contained in this report are valid only as of the date of this report and may be
based, in part, upon information provided by others. If any of the information is inaccurate, new
information is discovered, site conditions change or standards are amended, modifications to this report
may be necessary. The results of this assessment should in no way be construed as a warranty that the
subject site is free from any and all environmental impact.
Any soil and rock descriptions in this report and associated logs have been made with the intent of
providing general information on the subsurface conditions of the site. This information should not be
used as geotechnical data for any purpose unless specifically addressed in the text of this report.
Groundwater conditions described in this report refer only to those observed at the location and time of
observation noted in the report.
This report must be read as a whole, as sections taken out of context may be misleading. If discrepancies
occur between the preliminary (draft) and final version of this report, it is the final version that takes
precedence. Nothing in this report is intended to constitute or provide a legal opinion.
The contents of this report are confidential and proprietary. Other than by City of Kelowna, copying or
distribution of this report or use of or reliance on the information contained herein, in whole or in part, is
not permitted without the express written permission of City of Kelowna and SNC-Lavalin.
Internal Ref: 652126 / 654763 September 24, 2018
60
© 2018 SNC-Lavalin Inc. All Rights Reserved. Confidential.

Drawing
› Figure 1 – Conceptual Site Model: Glenmore Landfill Surface Water Uses
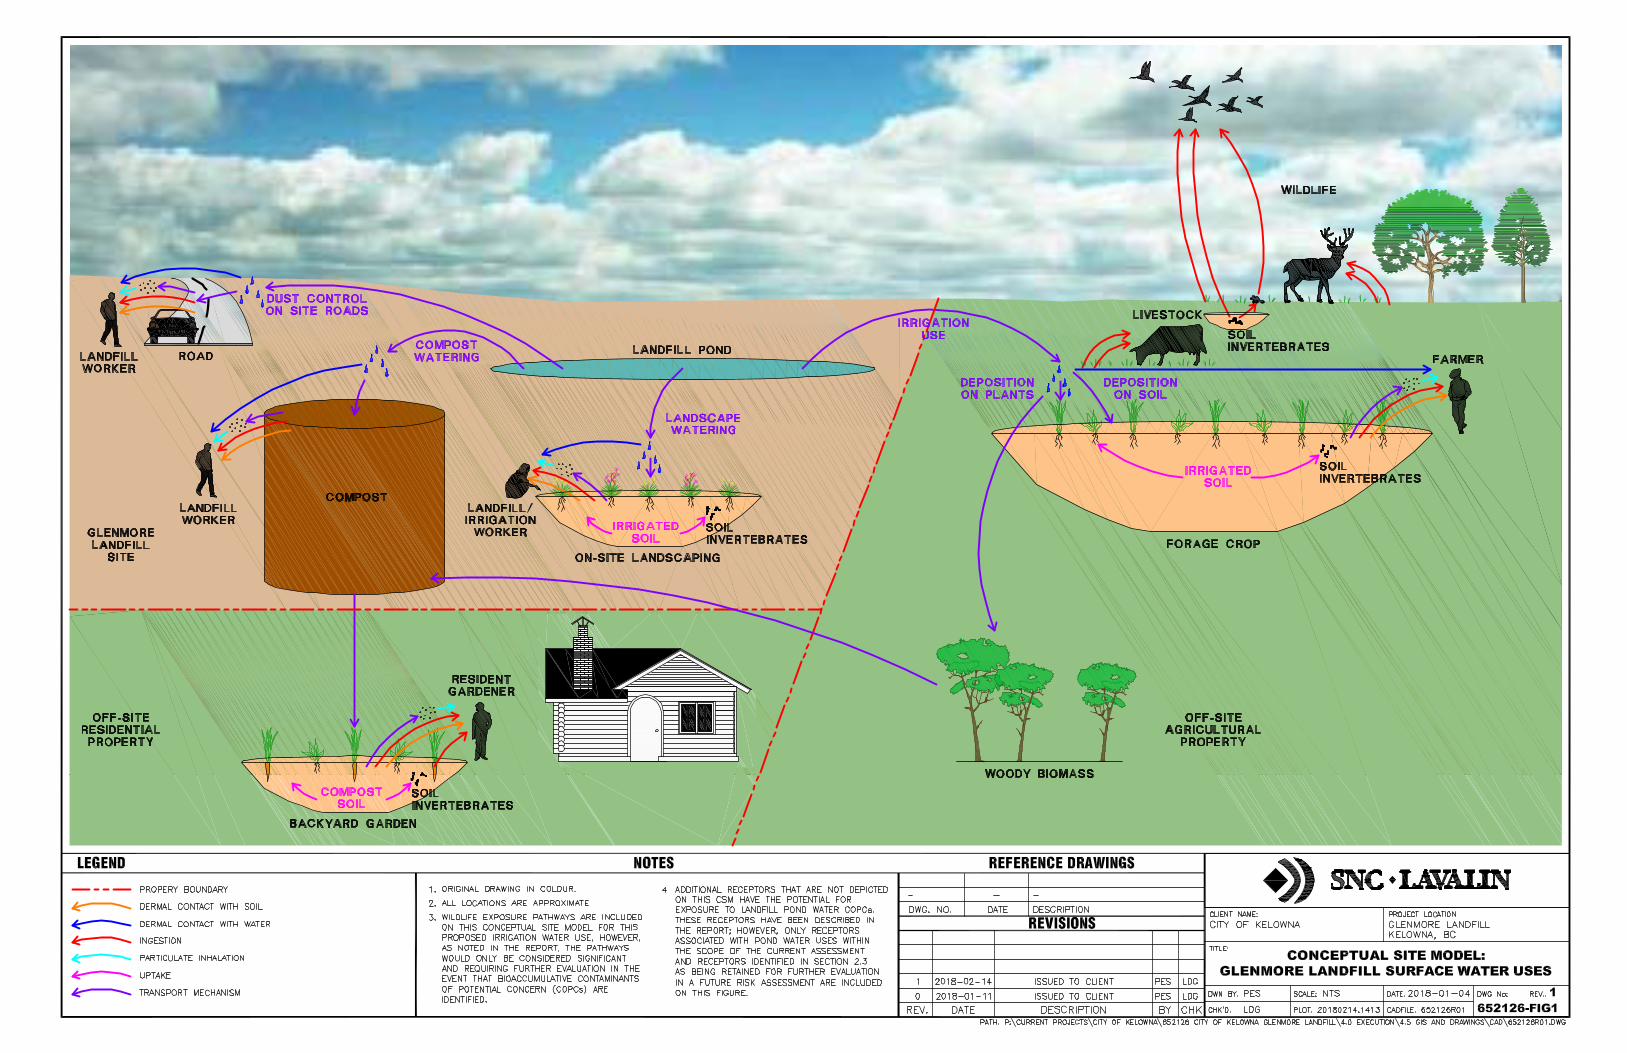

Appendix I
COPC Screening
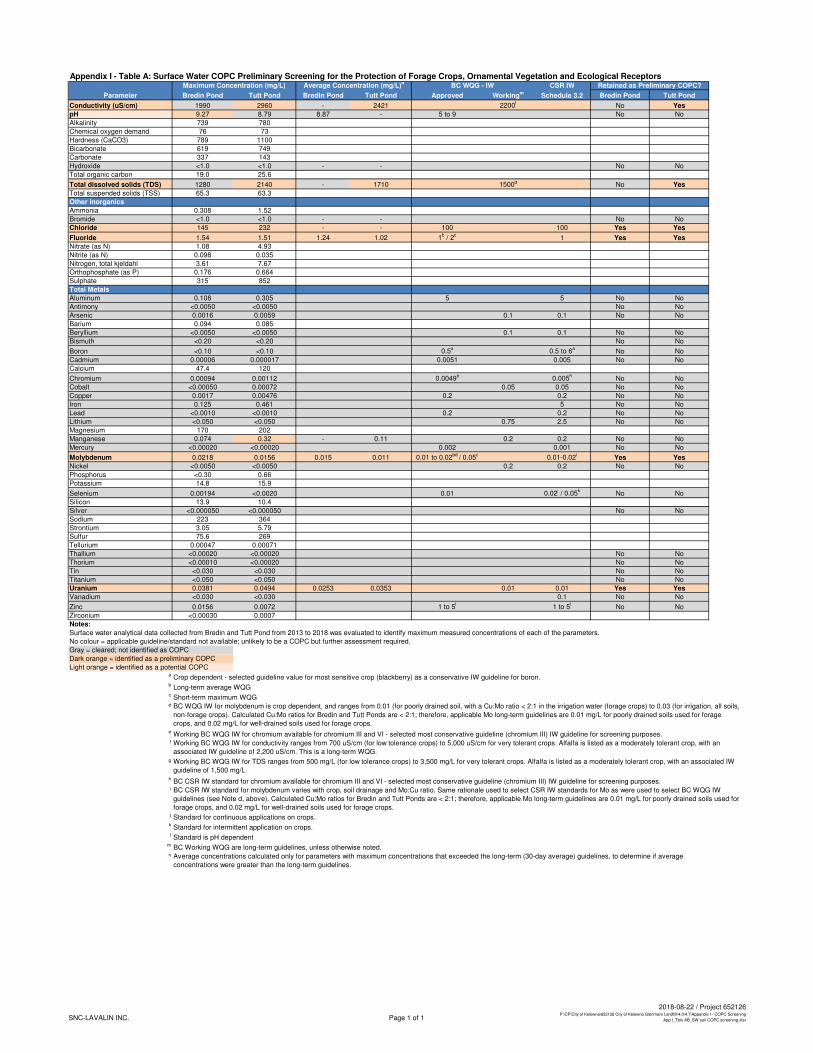
Appendix I - Table A: Surface Water COPC Preliminary Screening for the Protection of Forage Crops, Ornamental Vegetation and Ecological ReceptorsCSR IW
Bredin Pond Tutt Pond Bredin Pond Tutt Pond Approved Workingm
Schedule 3.2 Bredin Pond Tutt Pond
Conductivity (uS/cm) 1990 2960 - 2421 2200f
No Yes
pH 9.27 8.79 8.87 - 5 to 9 No No
Alkalinity 739 780
Chemical oxygen demand 76 73
Hardness (CaCO3) 789 1100
Bicarbonate 619 749
Carbonate 337 143
Hydroxide <1.0 <1.0 - - No No
Total organic carbon 19.0 25.6
Total dissolved solids (TDS) 1280 2140 - 1710 1500g
No Yes
Total suspended solids (TSS) 65.3 63.3
Other inorganics
Ammonia 0.308 1.52
Bromide <1.0 <1.0 - - No No
Chloride 145 232 - - 100 100 Yes Yes
Fluoride 1.54 1.51 1.24 1.02 1b / 2
c1 Yes Yes
Nitrate (as N) 1.08 4.93
Nitrite (as N) 0.098 0.035
Nitrogen, total kjeldahl 3.61 7.67
Orthophosphate (as P) 0.176 0.664
Sulphate 315 852
Total Metals
Aluminum 0.108 0.305 5 5 No No
Antimony <0.0050 <0.0050 No No
Arsenic 0.0016 0.0059 0.1 0.1 No No
Barium 0.094 0.085
Beryllium <0.0050 <0.0050 0.1 0.1 No No
Bismuth <0.20 <0.20 No No
Boron <0.10 <0.10 0.5a
0.5 to 6a
No No
Cadmium 0.00006 0.000017 0.0051 0.005 No No
Calcium 47.4 120
Chromium 0.00094 0.00112 0.0049e
0.005h
No No
Cobalt <0.00050 0.00072 0.05 0.05 No No
Copper 0.0017 0.00476 0.2 0.2 No No
Iron 0.125 0.461 5 No No
Lead <0.0010 <0.0010 0.2 0.2 No No
Lithium <0.050 <0.050 0.75 2.5 No No
Magnesium 170 202
Manganese 0.074 0.32 - 0.11 0.2 0.2 No No
Mercury <0.00020 <0.00020 0.002 0.001 No No
Molybdenum 0.0218 0.0156 0.015 0.011 0.01 to 0.02bd
/ 0.05c
0.01-0.02i
Yes Yes
Nickel <0.0050 <0.0050 0.2 0.2 No No
Phosphorus <0.30 0.66
Potassium 14.8 15.9
Selenium 0.00194 <0.0020 0.01 0.02j / 0.05
kNo No
Silicon 13.9 10.4
Silver <0.000050 <0.000050 No No
Sodium 223 364
Strontium 3.05 5.79
Sulfur 75.6 269
Tellurium 0.00047 0.00071
Thallium <0.00020 <0.00020 No No
Thorium <0.00010 <0.00020 No No
Tin <0.030 <0.030 No No
Titanium <0.050 <0.050 No No
Uranium 0.0381 0.0494 0.0253 0.0353 0.01 0.01 Yes Yes
Vanadium <0.030 <0.030 0.1 No No
Zinc 0.0156 0.0072 1 to 5l
1 to 5l
No No
Zirconium <0.00030 0.0007
Notes:
Surface water analytical data collected from Bredin and Tutt Pond from 2013 to 2018 was evaluated to identify maximum measured concentrations of each of the parameters.
No colour = applicable guideline/standard not available; unlikely to be a COPC but further assessment required.
Gray = cleared; not identified as COPC
Dark orange = identified as a preliminary COPC
Light orange = identified as a potential COPCa Crop dependent - selected guideline value for most sensitive crop (blackberry) as a conservative IW guideline for boron.b Long-term average WQGc Short-term maximum WQGd
e Working BC WQG IW for chromium available for chromium III and VI - selected most conservative guideline (chromium III) IW guideline for screening purposes.f
g
h BC CSR IW standard for chromium available for chromium III and VI - selected most conservative guideline (chromium III) IW guideline for screening purposes.i
j Standard for continuous applications on crops.k Standard for intermittent application on crops.l Standard is pH dependent
m BC Working WQG are long-term guidelines, unless otherwise noted.n Average concentrations calculated only for parameters with maximum concentrations that exceeded the long-term (30-day average) guidelines, to determine if average
concentrations were greater than the long-term guidelines.
Working BC WQG IW for TDS ranges from 500 mg/L (for low tolerance crops) to 3,500 mg/L for very tolerant crops. Alfalfa is listed as a moderately tolerant crop, with an associated IW
guideline of 1,500 mg/L.
Working BC WQG IW for conductivity ranges from 700 uS/cm (for low tolerance crops) to 5,000 uS/cm for very tolerant crops. Alfalfa is listed as a moderately tolerant crop, with an
associated IW guideline of 2,200 uS/cm. This is a long-term WQG.
BC WQG IW for molybdenum is crop dependent, and ranges from 0.01 (for poorly drained soil, with a Cu:Mo ratio < 2:1 in the irrigation water (forage crops) to 0.03 (for irrigation, all soils,
non-forage crops). Calculated Cu:Mo ratios for Bredin and Tutt Ponds are < 2:1; therefore, applicable Mo long-term guidelines are 0.01 mg/L for poorly drained soils used for forage
crops, and 0.02 mg/L for well-drained soils used for forage crops.
BC CSR IW standard for molybdenum varies with crop, soil drainage and Mo:Cu ratio. Same rationale used to select CSR IW standards for Mo as were used to select BC WQG IW
guidelines (see Note d, above). Calculated Cu:Mo ratios for Bredin and Tutt Ponds are < 2:1; therefore, applicable Mo long-term guidelines are 0.01 mg/L for poorly drained soils used for
forage crops, and 0.02 mg/L for well-drained soils used for forage crops.
Parameter
Maximum Concentration (mg/L) BC WQG - IW Retained as Preliminary COPC?Average Concentration (mg/L)n
SNC-LAVALIN INC. Page 1 of 1
2018-08-22 / Project 652126P:\CP\City of Kelowna\652126 City of Kelowna Glenmore Landfill\4.0\4.7\Appendix I - COPC Screening
App I_Tbls AB_SW soil COPC screening.xlsx
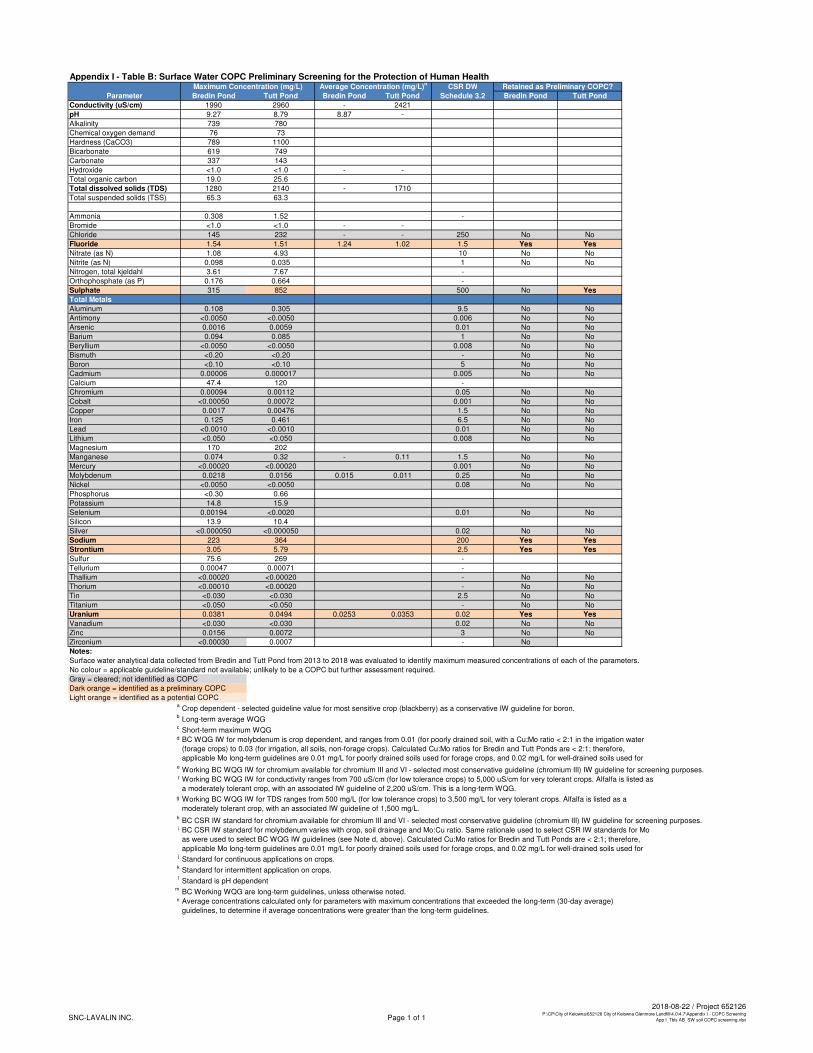
Appendix I - Table B: Surface Water COPC Preliminary Screening for the Protection of Human HealthCSR DW
Bredin Pond Tutt Pond Bredin Pond Tutt Pond Schedule 3.2 Bredin Pond Tutt Pond
Conductivity (uS/cm) 1990 2960 - 2421
pH 9.27 8.79 8.87 -
Alkalinity 739 780
Chemical oxygen demand 76 73
Hardness (CaCO3) 789 1100
Bicarbonate 619 749
Carbonate 337 143
Hydroxide <1.0 <1.0 - -
Total organic carbon 19.0 25.6
Total dissolved solids (TDS) 1280 2140 - 1710
Total suspended solids (TSS) 65.3 63.3
Orther inorganics
Ammonia 0.308 1.52 -
Bromide <1.0 <1.0 - -
Chloride 145 232 - - 250 No No
Fluoride 1.54 1.51 1.24 1.02 1.5 Yes Yes
Nitrate (as N) 1.08 4.93 10 No No
Nitrite (as N) 0.098 0.035 1 No No
Nitrogen, total kjeldahl 3.61 7.67 -
Orthophosphate (as P) 0.176 0.664 -
Sulphate 315 852 500 No Yes
Total Metals
Aluminum 0.108 0.305 9.5 No No
Antimony <0.0050 <0.0050 0.006 No No
Arsenic 0.0016 0.0059 0.01 No No
Barium 0.094 0.085 1 No No
Beryllium <0.0050 <0.0050 0.008 No No
Bismuth <0.20 <0.20 - No No
Boron <0.10 <0.10 5 No No
Cadmium 0.00006 0.000017 0.005 No No
Calcium 47.4 120 -
Chromium 0.00094 0.00112 0.05 No No
Cobalt <0.00050 0.00072 0.001 No No
Copper 0.0017 0.00476 1.5 No No
Iron 0.125 0.461 6.5 No No
Lead <0.0010 <0.0010 0.01 No No
Lithium <0.050 <0.050 0.008 No No
Magnesium 170 202
Manganese 0.074 0.32 - 0.11 1.5 No No
Mercury <0.00020 <0.00020 0.001 No No
Molybdenum 0.0218 0.0156 0.015 0.011 0.25 No No
Nickel <0.0050 <0.0050 0.08 No No
Phosphorus <0.30 0.66
Potassium 14.8 15.9
Selenium 0.00194 <0.0020 0.01 No No
Silicon 13.9 10.4
Silver <0.000050 <0.000050 0.02 No No
Sodium 223 364 200 Yes Yes
Strontium 3.05 5.79 2.5 Yes Yes
Sulfur 75.6 269 -
Tellurium 0.00047 0.00071 -
Thallium <0.00020 <0.00020 - No No
Thorium <0.00010 <0.00020 - No No
Tin <0.030 <0.030 2.5 No No
Titanium <0.050 <0.050 - No No
Uranium 0.0381 0.0494 0.0253 0.0353 0.02 Yes Yes
Vanadium <0.030 <0.030 0.02 No No
Zinc 0.0156 0.0072 3 No No
Zirconium <0.00030 0.0007 - No
Notes:
Surface water analytical data collected from Bredin and Tutt Pond from 2013 to 2018 was evaluated to identify maximum measured concentrations of each of the parameters.
No colour = applicable guideline/standard not available; unlikely to be a COPC but further assessment required.
Gray = cleared; not identified as COPC
Dark orange = identified as a preliminary COPC
Light orange = identified as a potential COPCa
Crop dependent - selected guideline value for most sensitive crop (blackberry) as a conservative IW guideline for boron.b
Long-term average WQGc
Short-term maximum WQGd
eWorking BC WQG IW for chromium available for chromium III and VI - selected most conservative guideline (chromium III) IW guideline for screening purposes.
f
g
hBC CSR IW standard for chromium available for chromium III and VI - selected most conservative guideline (chromium III) IW guideline for screening purposes.
i
jStandard for continuous applications on crops.
kStandard for intermittent application on crops.
lStandard is pH dependent
mBC Working WQG are long-term guidelines, unless otherwise noted.
n
Working BC WQG IW for conductivity ranges from 700 uS/cm (for low tolerance crops) to 5,000 uS/cm for very tolerant crops. Alfalfa is listed as
a moderately tolerant crop, with an associated IW guideline of 2,200 uS/cm. This is a long-term WQG.
Working BC WQG IW for TDS ranges from 500 mg/L (for low tolerance crops) to 3,500 mg/L for very tolerant crops. Alfalfa is listed as a
moderately tolerant crop, with an associated IW guideline of 1,500 mg/L.
BC CSR IW standard for molybdenum varies with crop, soil drainage and Mo:Cu ratio. Same rationale used to select CSR IW standards for Mo
as were used to select BC WQG IW guidelines (see Note d, above). Calculated Cu:Mo ratios for Bredin and Tutt Ponds are < 2:1; therefore,
applicable Mo long-term guidelines are 0.01 mg/L for poorly drained soils used for forage crops, and 0.02 mg/L for well-drained soils used for
Average concentrations calculated only for parameters with maximum concentrations that exceeded the long-term (30-day average)
guidelines, to determine if average concentrations were greater than the long-term guidelines.
Parameter
Maximum Concentration (mg/L) Average Concentration (mg/L)n
Retained as Preliminary COPC?
BC WQG IW for molybdenum is crop dependent, and ranges from 0.01 (for poorly drained soil, with a Cu:Mo ratio < 2:1 in the irrigation water
(forage crops) to 0.03 (for irrigation, all soils, non-forage crops). Calculated Cu:Mo ratios for Bredin and Tutt Ponds are < 2:1; therefore,
applicable Mo long-term guidelines are 0.01 mg/L for poorly drained soils used for forage crops, and 0.02 mg/L for well-drained soils used for
forage crops.
SNC-LAVALIN INC. Page 1 of 1
2018-08-22 / Project 652126P:\CP\City of Kelowna\652126 City of Kelowna Glenmore Landfill\4.0\4.7\Appendix I - COPC Screening
App I_Tbls AB_SW soil COPC screening.xlsx
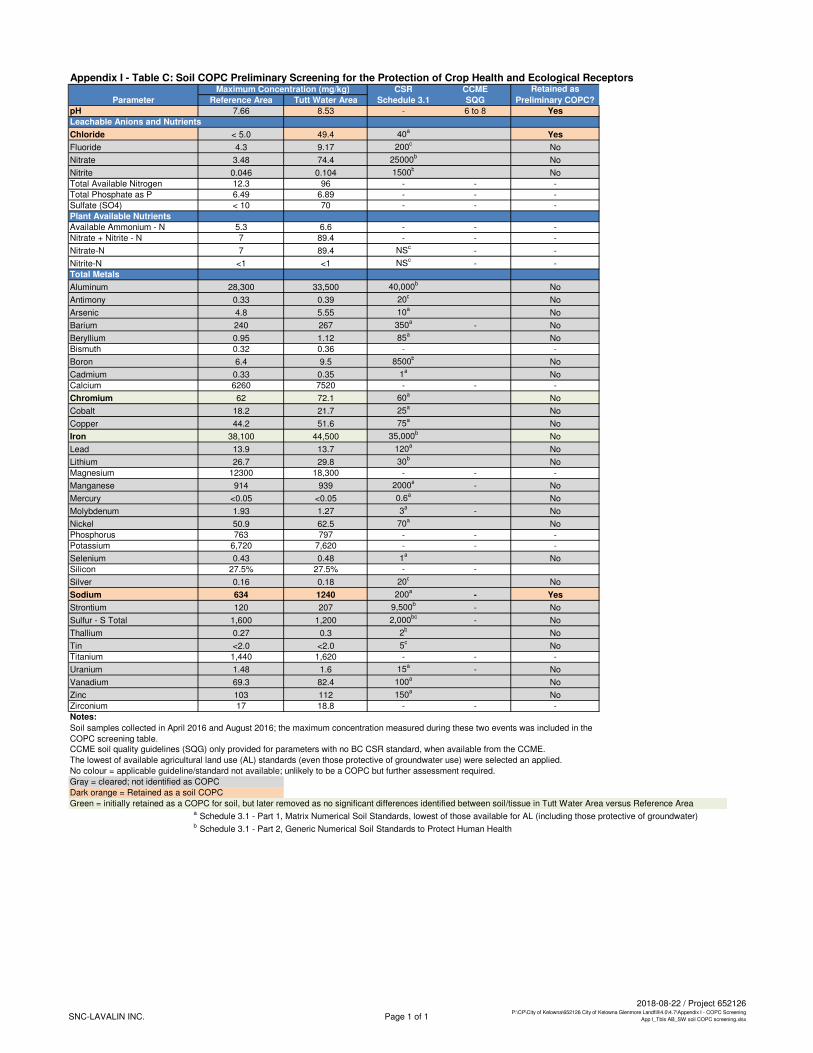
Appendix I - Table C: Soil COPC Preliminary Screening for the Protection of Crop Health and Ecological ReceptorsCSR CCME
Reference Area Tutt Water Area Schedule 3.1 SQG
pH 7.66 8.53 - 6 to 8 Yes
Leachable Anions and Nutrients
Chloride < 5.0 49.4 40a
Yes
Fluoride 4.3 9.17 200c
No
Nitrate 3.48 74.4 25000b
No
Nitrite 0.046 0.104 1500b
No
Total Available Nitrogen 12.3 96 - - -
Total Phosphate as P 6.49 6.89 - - -
Sulfate (SO4) < 10 70 - - -
Plant Available Nutrients
Available Ammonium - N 5.3 6.6 - - -
Nitrate + Nitrite - N 7 89.4 - - -
Nitrate-N 7 89.4 NSc
- -
Nitrite-N <1 <1 NSc
- -
Total Metals
Aluminum 28,300 33,500 40,000b
No
Antimony 0.33 0.39 20c
No
Arsenic 4.8 5.55 10a
No
Barium 240 267 350a
- No
Beryllium 0.95 1.12 85a
No
Bismuth 0.32 0.36 - -
Boron 6.4 9.5 8500b
No
Cadmium 0.33 0.35 1a
No
Calcium 6260 7520 - - -
Chromium 62 72.1 60a
No
Cobalt 18.2 21.7 25a
No
Copper 44.2 51.6 75a
No
Iron 38,100 44,500 35,000b
No
Lead 13.9 13.7 120a
No
Lithium 26.7 29.8 30b
No
Magnesium 12300 18,300 - - -
Manganese 914 939 2000a
- No
Mercury <0.05 <0.05 0.6a
No
Molybdenum 1.93 1.27 3a
- No
Nickel 50.9 62.5 70a
No
Phosphorus 763 797 - - -
Potassium 6,720 7,620 - - -
Selenium 0.43 0.48 1a
No
Silicon 27.5% 27.5% - -
Silver 0.16 0.18 20c
No
Sodium 634 1240 200a
- Yes
Strontium 120 207 9,500b
- No
Sulfur - S Total 1,600 1,200 2,000bc
- No
Thallium 0.27 0.3 2b
No
Tin <2.0 <2.0 5c
No
Titanium 1,440 1,620 - - -
Uranium 1.48 1.6 15a
- No
Vanadium 69.3 82.4 100a
No
Zinc 103 112 150a
No
Zirconium 17 18.8 - - -
Notes:
CCME soil quality guidelines (SQG) only provided for parameters with no BC CSR standard, when available from the CCME.
The lowest of available agricultural land use (AL) standards (even those protective of groundwater use) were selected an applied.
No colour = applicable guideline/standard not available; unlikely to be a COPC but further assessment required.
Gray = cleared; not identified as COPC
Dark orange = Retained as a soil COPC
Green = initially retained as a COPC for soil, but later removed as no significant differences identified between soil/tissue in Tutt Water Area versus Reference Areaa
Schedule 3.1 - Part 1, Matrix Numerical Soil Standards, lowest of those available for AL (including those protective of groundwater)b
Schedule 3.1 - Part 2, Generic Numerical Soil Standards to Protect Human Health
Retained as
Preliminary COPC?Parameter
Maximum Concentration (mg/kg)
Soil samples collected in April 2016 and August 2016; the maximum concentration measured during these two events was included in the
COPC screening table.
SNC-LAVALIN INC. Page 1 of 1
2018-08-22 / Project 652126P:\CP\City of Kelowna\652126 City of Kelowna Glenmore Landfill\4.0\4.7\Appendix I - COPC Screening
App I_Tbls AB_SW soil COPC screening.xlsx
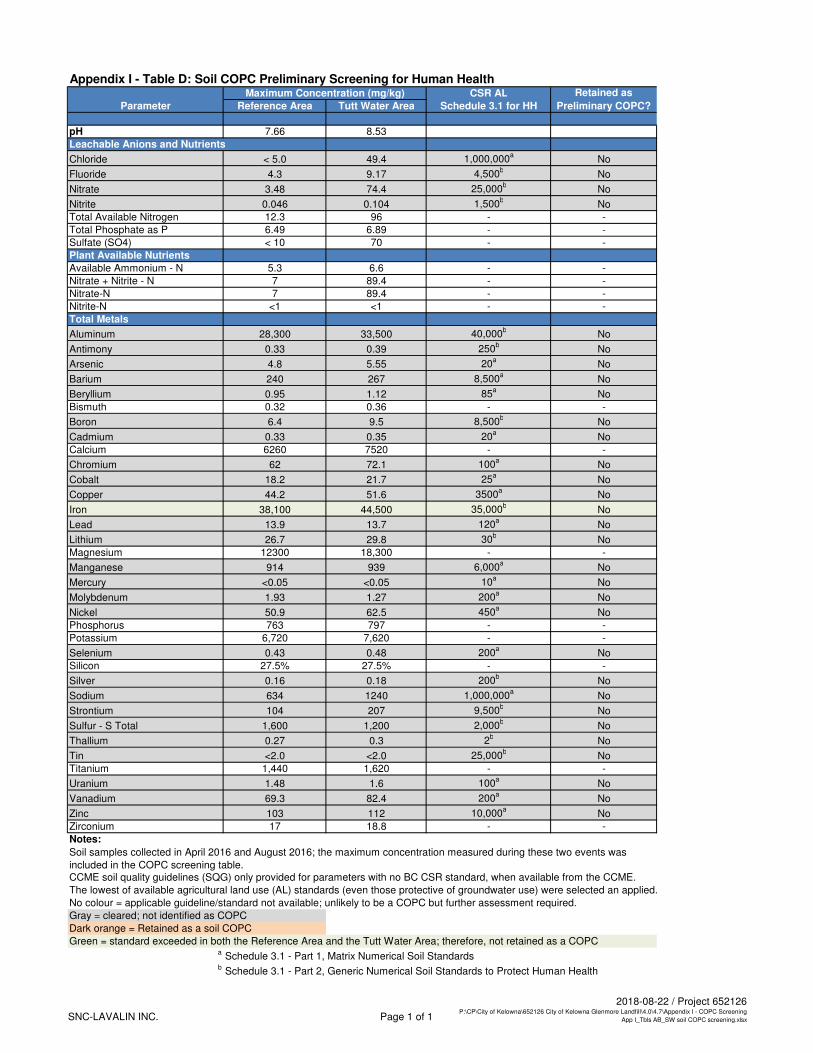
Appendix I - Table D: Soil COPC Preliminary Screening for Human HealthCSR AL
Reference Area Tutt Water Area Schedule 3.1 for HH
pH 7.66 8.53
Leachable Anions and Nutrients
Chloride < 5.0 49.4 1,000,000a
No
Fluoride 4.3 9.17 4,500b
No
Nitrate 3.48 74.4 25,000b
No
Nitrite 0.046 0.104 1,500b
No
Total Available Nitrogen 12.3 96 - -
Total Phosphate as P 6.49 6.89 - -
Sulfate (SO4) < 10 70 - -
Plant Available Nutrients
Available Ammonium - N 5.3 6.6 - -
Nitrate + Nitrite - N 7 89.4 - -
Nitrate-N 7 89.4 - -
Nitrite-N <1 <1 - -
Total Metals
Aluminum 28,300 33,500 40,000b
No
Antimony 0.33 0.39 250b
No
Arsenic 4.8 5.55 20a
No
Barium 240 267 8,500a
No
Beryllium 0.95 1.12 85a
No
Bismuth 0.32 0.36 - -
Boron 6.4 9.5 8,500b
No
Cadmium 0.33 0.35 20a
No
Calcium 6260 7520 - -
Chromium 62 72.1 100a
No
Cobalt 18.2 21.7 25a
No
Copper 44.2 51.6 3500a
No
Iron 38,100 44,500 35,000b
No
Lead 13.9 13.7 120a
No
Lithium 26.7 29.8 30b
No
Magnesium 12300 18,300 - -
Manganese 914 939 6,000a
No
Mercury <0.05 <0.05 10a
No
Molybdenum 1.93 1.27 200a
No
Nickel 50.9 62.5 450a
No
Phosphorus 763 797 - -
Potassium 6,720 7,620 - -
Selenium 0.43 0.48 200a
No
Silicon 27.5% 27.5% - -
Silver 0.16 0.18 200b
No
Sodium 634 1240 1,000,000a
No
Strontium 104 207 9,500b
No
Sulfur - S Total 1,600 1,200 2,000b
No
Thallium 0.27 0.3 2b
No
Tin <2.0 <2.0 25,000b
No
Titanium 1,440 1,620 - -
Uranium 1.48 1.6 100a
No
Vanadium 69.3 82.4 200a
No
Zinc 103 112 10,000a
No
Zirconium 17 18.8 - -
Notes:
CCME soil quality guidelines (SQG) only provided for parameters with no BC CSR standard, when available from the CCME.
The lowest of available agricultural land use (AL) standards (even those protective of groundwater use) were selected an applied.
No colour = applicable guideline/standard not available; unlikely to be a COPC but further assessment required.
Gray = cleared; not identified as COPC
Dark orange = Retained as a soil COPC
Green = standard exceeded in both the Reference Area and the Tutt Water Area; therefore, not retained as a COPCa
Schedule 3.1 - Part 1, Matrix Numerical Soil Standardsb
Schedule 3.1 - Part 2, Generic Numerical Soil Standards to Protect Human Health
Parameter
Maximum Concentration (mg/kg) Retained as
Preliminary COPC?
Soil samples collected in April 2016 and August 2016; the maximum concentration measured during these two events was
included in the COPC screening table.
SNC-LAVALIN INC. Page 1 of 1
2018-08-22 / Project 652126P:\CP\City of Kelowna\652126 City of Kelowna Glenmore Landfill\4.0\4.7\Appendix I - COPC Screening
App I_Tbls AB_SW soil COPC screening.xlsx
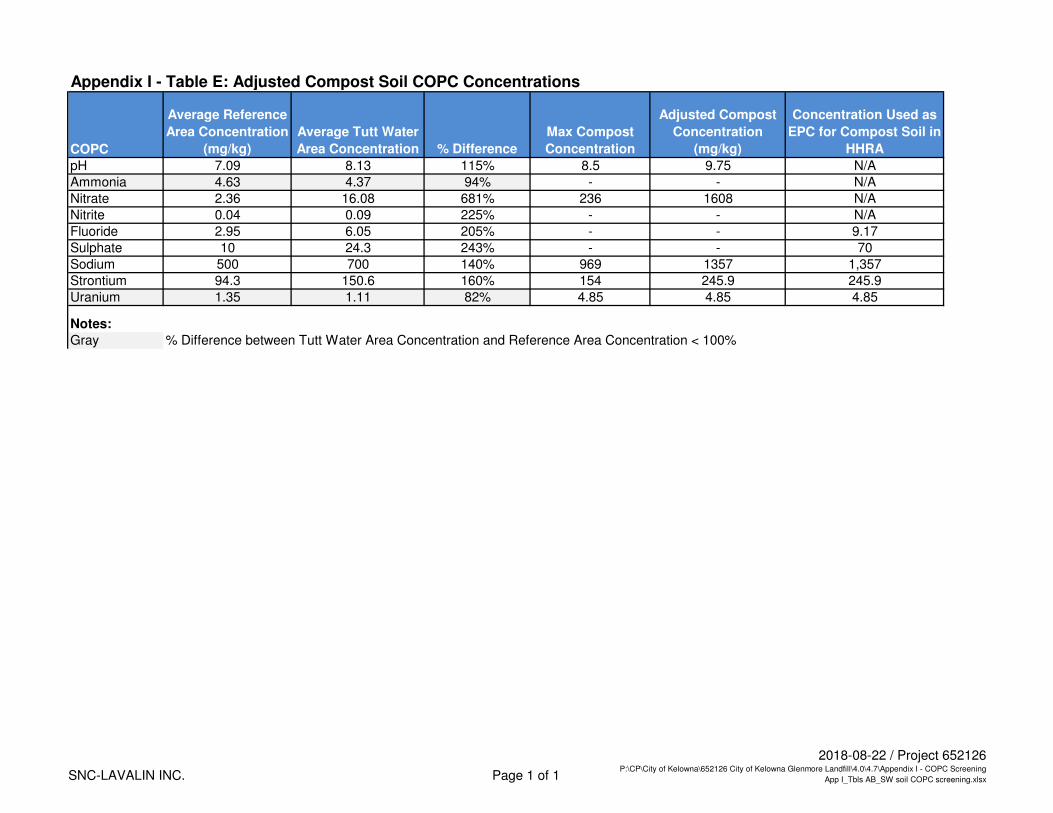
Appendix I - Table E: Adjusted Compost Soil COPC Concentrations
COPC
Average Reference
Area Concentration
(mg/kg)
Average Tutt Water
Area Concentration % Difference
Max Compost
Concentration
Adjusted Compost
Concentration
(mg/kg)
Concentration Used as
EPC for Compost Soil in
HHRA
pH 7.09 8.13 115% 8.5 9.75 N/A
Ammonia 4.63 4.37 94% - - N/A
Nitrate 2.36 16.08 681% 236 1608 N/A
Nitrite 0.04 0.09 225% - - N/A
Fluoride 2.95 6.05 205% - - 9.17
Sulphate 10 24.3 243% - - 70
Sodium 500 700 140% 969 1357 1,357
Strontium 94.3 150.6 160% 154 245.9 245.9
Uranium 1.35 1.11 82% 4.85 4.85 4.85
Notes:
Gray % Difference between Tutt Water Area Concentration and Reference Area Concentration < 100%
SNC-LAVALIN INC. Page 1 of 1
2018-08-22 / Project 652126P:\CP\City of Kelowna\652126 City of Kelowna Glenmore Landfill\4.0\4.7\Appendix I - COPC Screening
App I_Tbls AB_SW soil COPC screening.xlsx
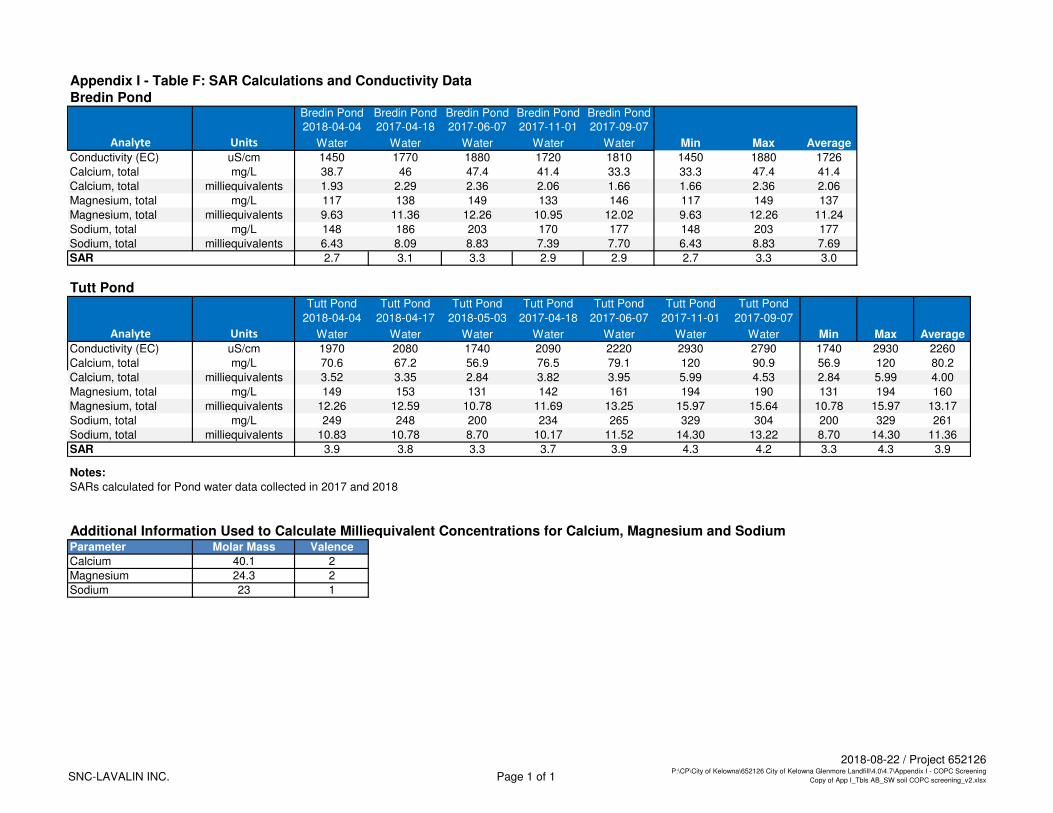
Appendix I - Table F: SAR Calculations and Conductivity Data Bredin Pond
Bredin Pond Bredin Pond Bredin Pond Bredin Pond Bredin Pond
2018-04-04 2017-04-18 2017-06-07 2017-11-01 2017-09-07
Water Water Water Water Water
Conductivity (EC) uS/cm 1450 1770 1880 1720 1810 1450 1880 1726
Calcium, total mg/L 38.7 46 47.4 41.4 33.3 33.3 47.4 41.4
Calcium, total milliequivalents 1.93 2.29 2.36 2.06 1.66 1.66 2.36 2.06
Magnesium, total mg/L 117 138 149 133 146 117 149 137
Magnesium, total milliequivalents 9.63 11.36 12.26 10.95 12.02 9.63 12.26 11.24
Sodium, total mg/L 148 186 203 170 177 148 203 177
Sodium, total milliequivalents 6.43 8.09 8.83 7.39 7.70 6.43 8.83 7.69
SAR 2.7 3.1 3.3 2.9 2.9 2.7 3.3 3.0
Tutt PondTutt Pond Tutt Pond Tutt Pond Tutt Pond Tutt Pond Tutt Pond Tutt Pond
2018-04-04 2018-04-17 2018-05-03 2017-04-18 2017-06-07 2017-11-01 2017-09-07
Water Water Water Water Water Water Water
Conductivity (EC) uS/cm 1970 2080 1740 2090 2220 2930 2790 1740 2930 2260
Calcium, total mg/L 70.6 67.2 56.9 76.5 79.1 120 90.9 56.9 120 80.2
Calcium, total milliequivalents 3.52 3.35 2.84 3.82 3.95 5.99 4.53 2.84 5.99 4.00
Magnesium, total mg/L 149 153 131 142 161 194 190 131 194 160
Magnesium, total milliequivalents 12.26 12.59 10.78 11.69 13.25 15.97 15.64 10.78 15.97 13.17
Sodium, total mg/L 249 248 200 234 265 329 304 200 329 261
Sodium, total milliequivalents 10.83 10.78 8.70 10.17 11.52 14.30 13.22 8.70 14.30 11.36
SAR 3.9 3.8 3.3 3.7 3.9 4.3 4.2 3.3 4.3 3.9
Notes:
SARs calculated for Pond water data collected in 2017 and 2018
Additional Information Used to Calculate Milliequivalent Concentrations for Calcium, Magnesium and SodiumParameter Molar Mass Valence
Calcium 40.1 2
Magnesium 24.3 2
Sodium 23 1
UnitsAnalyte Min Max Average
Analyte Units Min Max Average
SNC-LAVALIN INC. Page 1 of 1
2018-08-22 / Project 652126P:\CP\City of Kelowna\652126 City of Kelowna Glenmore Landfill\4.0\4.7\Appendix I - COPC Screening
Copy of App I_Tbls AB_SW soil COPC screening_v2.xlsx

Appendix II
Statistical Outputs
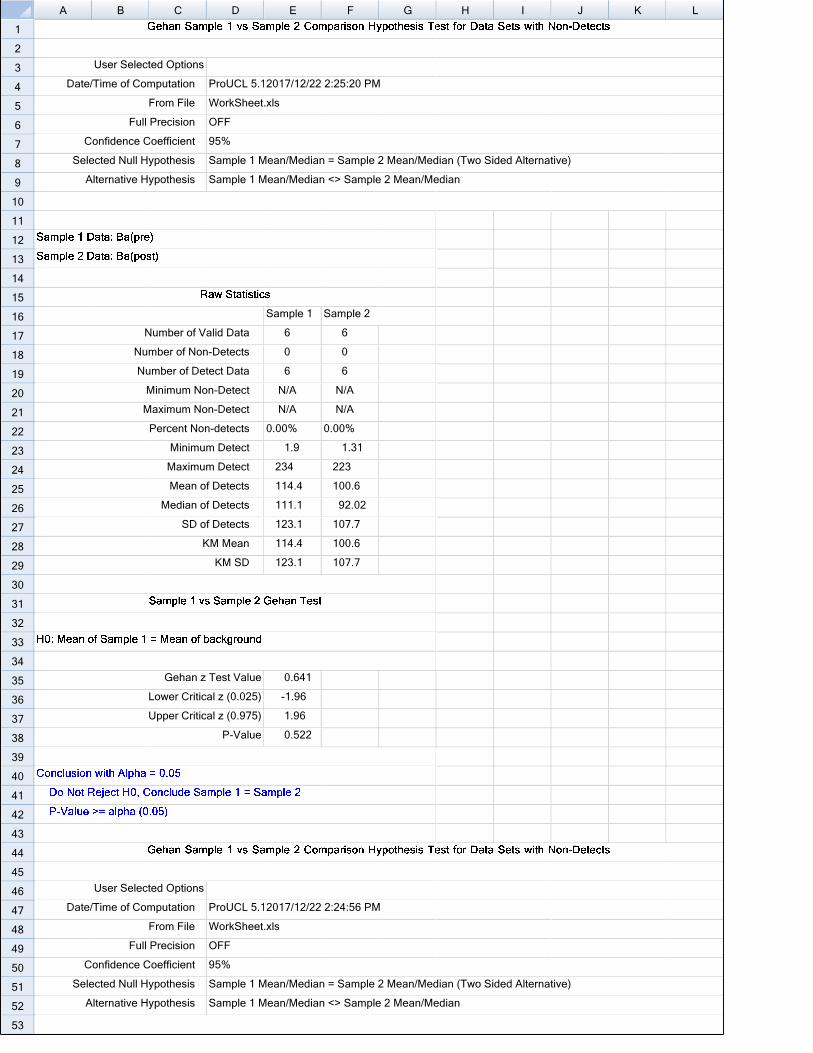
A B C D E F G H I J K L
1
2
3
4
5
6
7
8
9
10
11
12
13
14
15
16
17
18
19
20
21
22
23
24
25
26
27
28
29
30
31
32
33
34
35
36
37
38
39
40
41
42
43
44
45
46
47
48
49
50
51
52
53
User Selectted Options
Date//Time of Commputation ProUCL 5.12017/12/22 2:25:20 PMM
From File WorkSheet..xls
Full Precision OFF
Confidence C Coefficient 95%
Seleected Null Hy ypothesis Sample 1 M Mean/Median n = Sample 2 2 Mean/Meddian (Two Si ded Alternattive)
AAlternative Hy ypothesis Sample 1 M Mean/Median n <> Sample e 2 Mean/Meedian
Sample 1 Sample 2
NNumber of Va alid Data 6 6
Nummber of Nonn-Detects 0 0
Nuumber of Dettect Data 6 6
MMinimum No on-Detect N/A N/A
MMaximum No on-Detect N/A N/A
Percent Nonn-detects 0.00% 0.00%
Minimumm Detect 1.9 1.31
Maximumm Detect 234 223
Mean of f Detects 114.4 100.6
Median of f Detects 111.1 92.02
SD of f Detects 123.1 107.7
KKM Mean 114.4 100.6
KM SD 123.1 107.7
Gehan z Test Value 0.641
LLower Critical z (0.025) -1.96
UUpper Critical z (0.975) 1.96
P-Value 0.522
User Selectted Options
Date//Time of Commputation ProUCL 5.12017/12/22 2:24:56 PMM
From File WorkSheet..xls
Full Precision OFF
Confidence C Coefficient 95%
Seleected Null Hy ypothesis Sample 1 M Mean/Median n = Sample 2 2 Mean/Meddian (Two Si ded Alternattive)
AAlternative Hy ypothesis Sample 1 M Mean/Median n <> Sample e 2 Mean/Meedian

A B C D E F G H I J K L
54
55
56
57
58
59
60
61
62
63
64
65
66
67
68
69
70
71
72
73
74
75
76
77
78
79
80
81
82
83
84
85
86
87
88
89
90
91
92
93
94
95
96
97
98
99
100
101
102
103
104
105
106
Sample 1 Sample 2
NNumber of Va alid Data 6 6
Nummber of Nonn-Detects 0 0
Nuumber of Dettect Data 6 6
MMinimum No on-Detect N/A N/A
MMaximum No on-Detect N/A N/A
Percent Nonn-detects 0.00% 0.00%
Minimumm Detect 1410 1450
Maximumm Detect 4950 5590
Mean of f Detects 3073 4338
Median of f Detects 2980 5060
SD of f Detects 1722 1623
KKM Mean 3073 4338
KM SD 1722 1623
Gehan z Test Value -1.601
LLower Critical z (0.025) -1.96
UUpper Critical z (0.975) 1.96
P-Value 0.109
User Selectted Options
Date//Time of Commputation ProUCL 5.12017/12/22 2:32:29 PMM
From File WorkSheet..xls
Full Precision OFF
Confidence C Coefficient 95%
Seleected Null Hy ypothesis Sample 1 M Mean/Median n = Sample 2 2 Mean/Meddian (Two Si ded Alternattive)
AAlternative Hy ypothesis Sample 1 M Mean/Median n <> Sample e 2 Mean/Meedian
Sample 1 Sample 2
NNumber of Va alid Data 6 6
Nummber of Nonn-Detects 0 0
Nuumber of Dettect Data 6 6
MMinimum No on-Detect N/A N/A
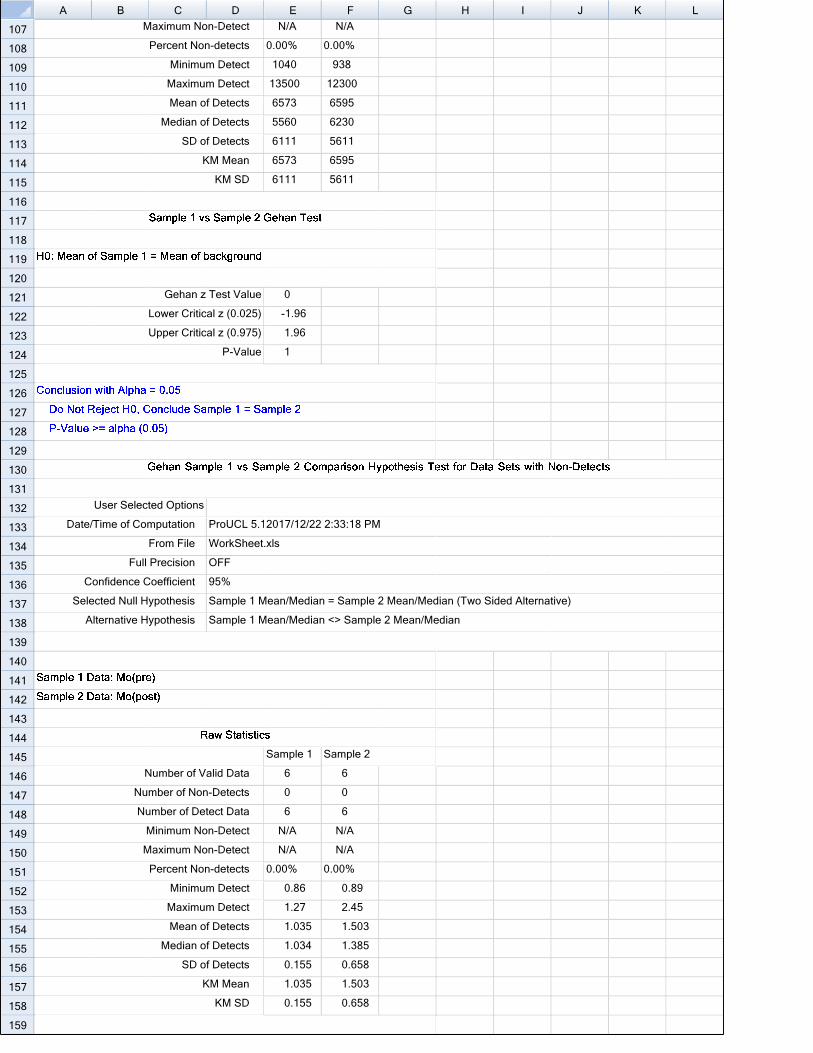
A B C D E F G H I J K L
107
108
109
110
111
112
113
114
115
116
117
118
119
120
121
122
123
124
125
126
127
128
129
130
131
132
133
134
135
136
137
138
139
140
141
142
143
144
145
146
147
148
149
150
151
152
153
154
155
156
157
158
159
MMaximum No on-Detect N/A N/A
Percent Nonn-detects 0.00% 0.00%
Minimumm Detect 1040 938
Maximumm Detect 13500 12300
Mean of f Detects 6573 6595
Median of f Detects 5560 6230
SD of f Detects 6111 5611
KKM Mean 6573 6595
KM SD 6111 5611
Gehan z Test Value 0
LLower Critical z (0.025) -1.96
UUpper Critical z (0.975) 1.96
P-Value 1
User Selectted Options
Date//Time of Commputation ProUCL 5.12017/12/22 2:33:18 PMM
From File WorkSheet..xls
Full Precision OFF
Confidence C Coefficient 95%
Seleected Null Hy ypothesis Sample 1 M Mean/Median n = Sample 2 2 Mean/Meddian (Two Si ded Alternattive)
AAlternative Hy ypothesis Sample 1 M Mean/Median n <> Sample e 2 Mean/Meedian
Sample 1 Sample 2
NNumber of Va alid Data 6 6
Nummber of Nonn-Detects 0 0
Nuumber of Dettect Data 6 6
MMinimum No on-Detect N/A N/A
MMaximum No on-Detect N/A N/A
Percent Nonn-detects 0.00% 0.00%
Minimumm Detect 0.86 0.89
Maximumm Detect 1.27 2.45
Mean of f Detects 1.035 1.503
Median of f Detects 1.034 1.385
SD of f Detects 0.155 0.658
KKM Mean 1.035 1.503
KM SD 0.155 0.658
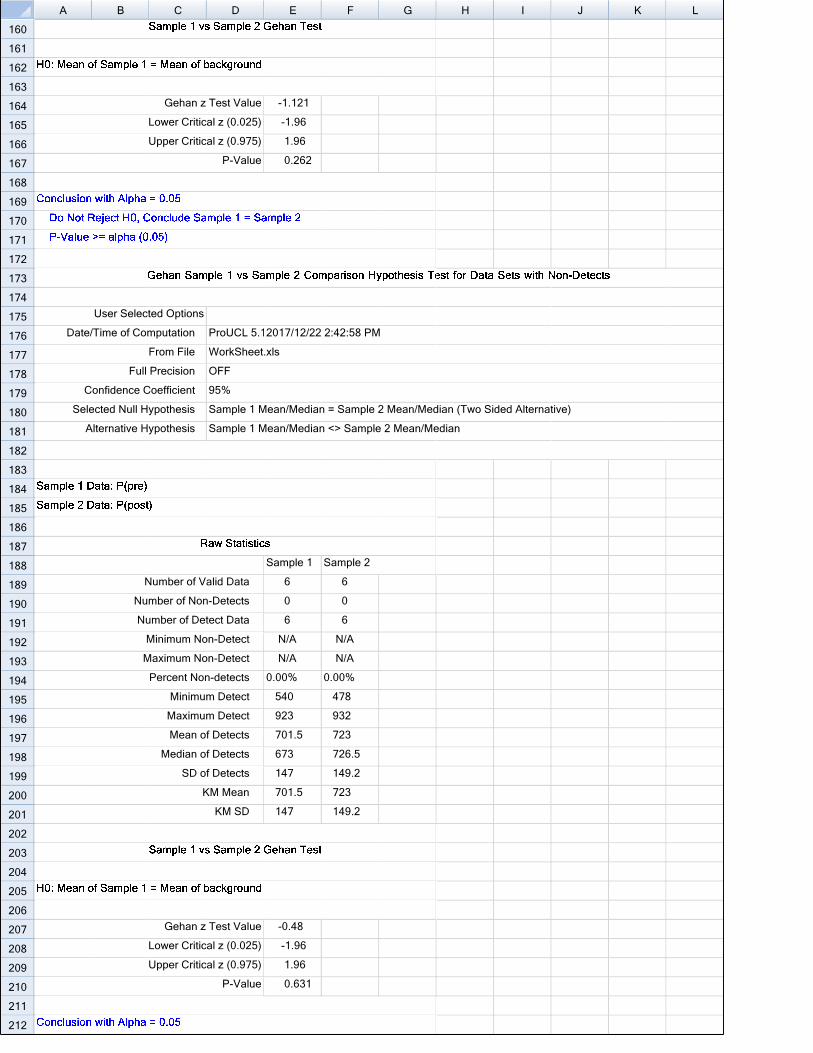
A B C D E F G H I J K L
160
161
162
163
164
165
166
167
168
169
170
171
172
173
174
175
176
177
178
179
180
181
182
183
184
185
186
187
188
189
190
191
192
193
194
195
196
197
198
199
200
201
202
203
204
205
206
207
208
209
210
211
212
Gehan z Test Value -1.121
LLower Critical z (0.025) -1.96
UUpper Critical z (0.975) 1.96
P-Value 0.262
User Selectted Options
Date//Time of Commputation ProUCL 5.12017/12/22 2:42:58 PMM
From File WorkSheet..xls
Full Precision OFF
Confidence C Coefficient 95%
Seleected Null Hy ypothesis Sample 1 M Mean/Median n = Sample 2 2 Mean/Meddian (Two Si ded Alternattive)
AAlternative Hy ypothesis Sample 1 M Mean/Median n <> Sample e 2 Mean/Meedian
Sample 1 Sample 2
NNumber of Va alid Data 6 6
Nummber of Nonn-Detects 0 0
Nuumber of Dettect Data 6 6
MMinimum No on-Detect N/A N/A
MMaximum No on-Detect N/A N/A
Percent Nonn-detects 0.00% 0.00%
Minimumm Detect 540 478
Maximumm Detect 923 932
Mean of f Detects 701.5 723
Median of f Detects 673 726.5
SD of f Detects 147 149.2
KKM Mean 701.5 723
KM SD 147 149.2
Gehan z Test Value -0.48
LLower Critical z (0.025) -1.96
UUpper Critical z (0.975) 1.96
P-Value 0.631
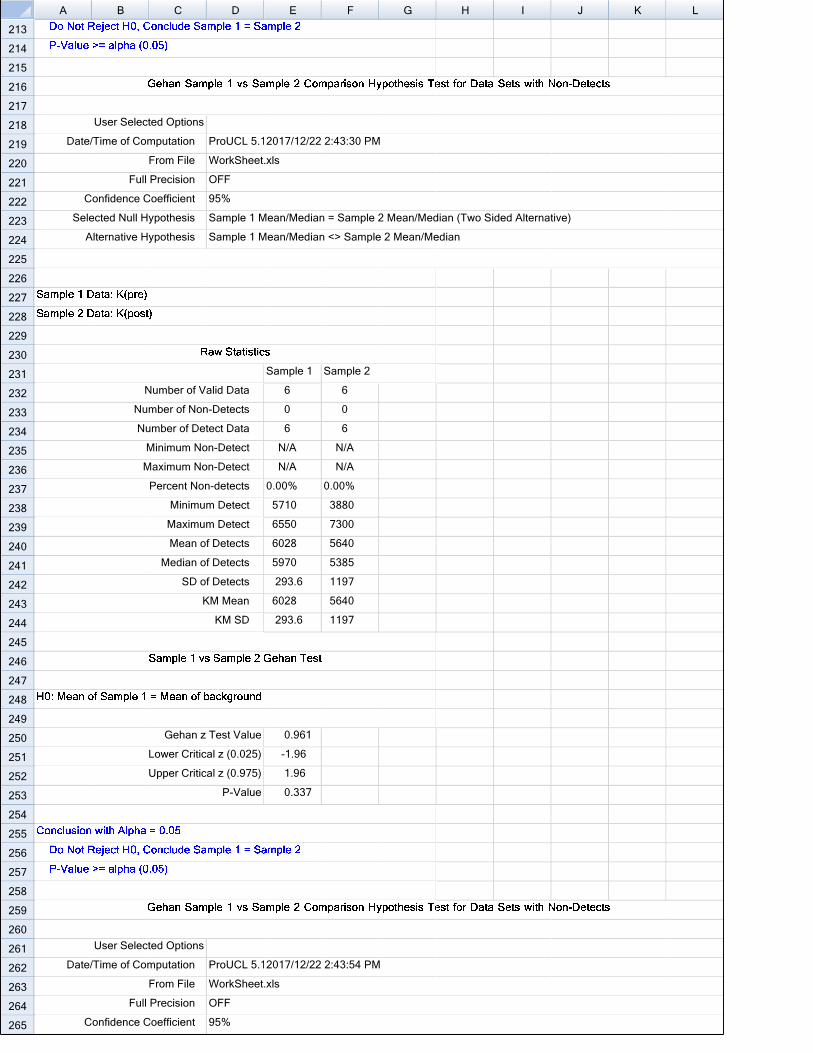
A B C D E F G H I J K L
213
214
215
216
217
218
219
220
221
222
223
224
225
226
227
228
229
230
231
232
233
234
235
236
237
238
239
240
241
242
243
244
245
246
247
248
249
250
251
252
253
254
255
256
257
258
259
260
261
262
263
264
265
User Selectted Options
Date//Time of Commputation ProUCL 5.12017/12/22 2:43:30 PMM
From File WorkSheet..xls
Full Precision OFF
Confidence C Coefficient 95%
Seleected Null Hy ypothesis Sample 1 M Mean/Median n = Sample 2 2 Mean/Meddian (Two Si ded Alternattive)
AAlternative Hy ypothesis Sample 1 M Mean/Median n <> Sample e 2 Mean/Meedian
Sample 1 Sample 2
NNumber of Va alid Data 6 6
Nummber of Nonn-Detects 0 0
Nuumber of Dettect Data 6 6
MMinimum No on-Detect N/A N/A
MMaximum No on-Detect N/A N/A
Percent Nonn-detects 0.00% 0.00%
Minimumm Detect 5710 3880
Maximumm Detect 6550 7300
Mean of f Detects 6028 5640
Median of f Detects 5970 5385
SD of f Detects 293.6 1197
KKM Mean 6028 5640
KM SD 293.6 1197
Gehan z Test Value 0.961
LLower Critical z (0.025) -1.96
UUpper Critical z (0.975) 1.96
P-Value 0.337
User Selectted Options
Date//Time of Commputation ProUCL 5.12017/12/22 2:43:54 PMM
From File WorkSheet..xls
Full Precision OFF
Confidence C Coefficient 95%
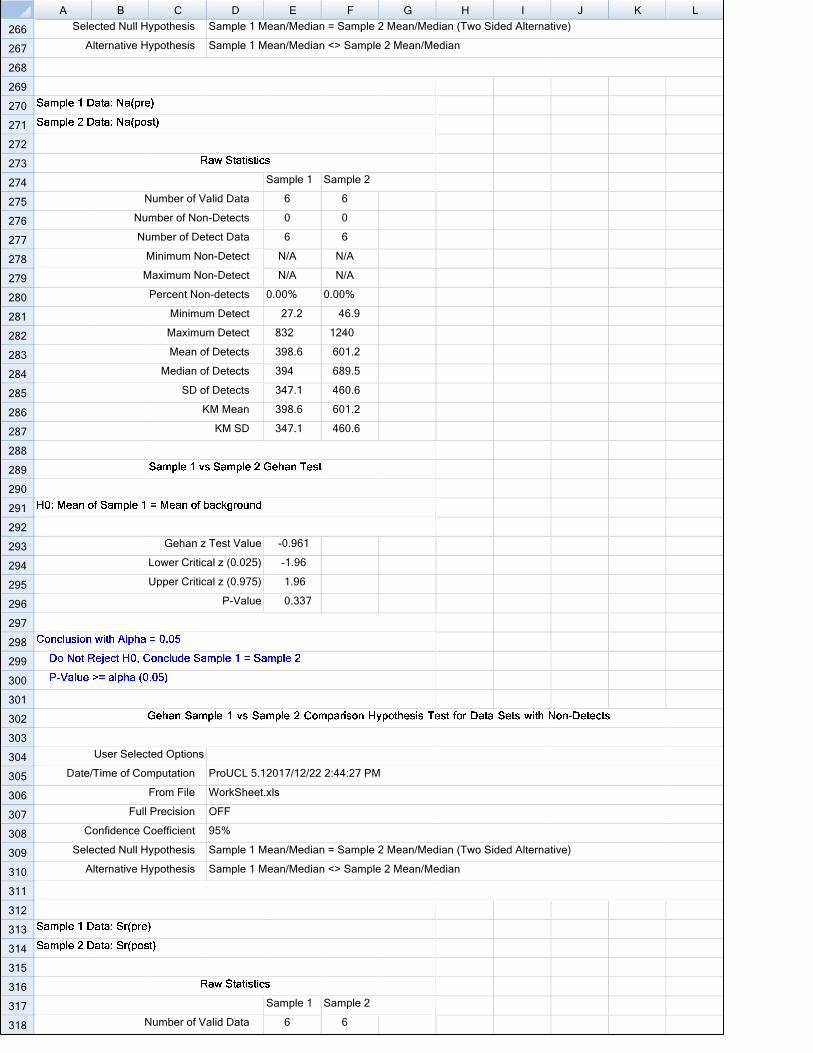
A B C D E F G H I J K L
266
267
268
269
270
271
272
273
274
275
276
277
278
279
280
281
282
283
284
285
286
287
288
289
290
291
292
293
294
295
296
297
298
299
300
301
302
303
304
305
306
307
308
309
310
311
312
313
314
315
316
317
318
Seleected Null Hy ypothesis Sample 1 M Mean/Median n = Sample 2 2 Mean/Meddian (Two Si ded Alternattive)
AAlternative Hy ypothesis Sample 1 M Mean/Median n <> Sample e 2 Mean/Meedian
Sample 1 Sample 2
NNumber of Va alid Data 6 6
Nummber of Nonn-Detects 0 0
Nuumber of Dettect Data 6 6
MMinimum No on-Detect N/A N/A
MMaximum No on-Detect N/A N/A
Percent Nonn-detects 0.00% 0.00%
Minimumm Detect 27.2 46.9
Maximumm Detect 832 1240
Mean of f Detects 398.6 601.2
Median of f Detects 394 689.5
SD of f Detects 347.1 460.6
KKM Mean 398.6 601.2
KM SD 347.1 460.6
Gehan z Test Value -0.961
LLower Critical z (0.025) -1.96
UUpper Critical z (0.975) 1.96
P-Value 0.337
User Selectted Options
Date//Time of Commputation ProUCL 5.12017/12/22 2:44:27 PMM
From File WorkSheet..xls
Full Precision OFF
Confidence C Coefficient 95%
Seleected Null Hy ypothesis Sample 1 M Mean/Median n = Sample 2 2 Mean/Meddian (Two Si ded Alternattive)
AAlternative Hy ypothesis Sample 1 M Mean/Median n <> Sample e 2 Mean/Meedian
Sample 1 Sample 2
NNumber of Va alid Data 6 6
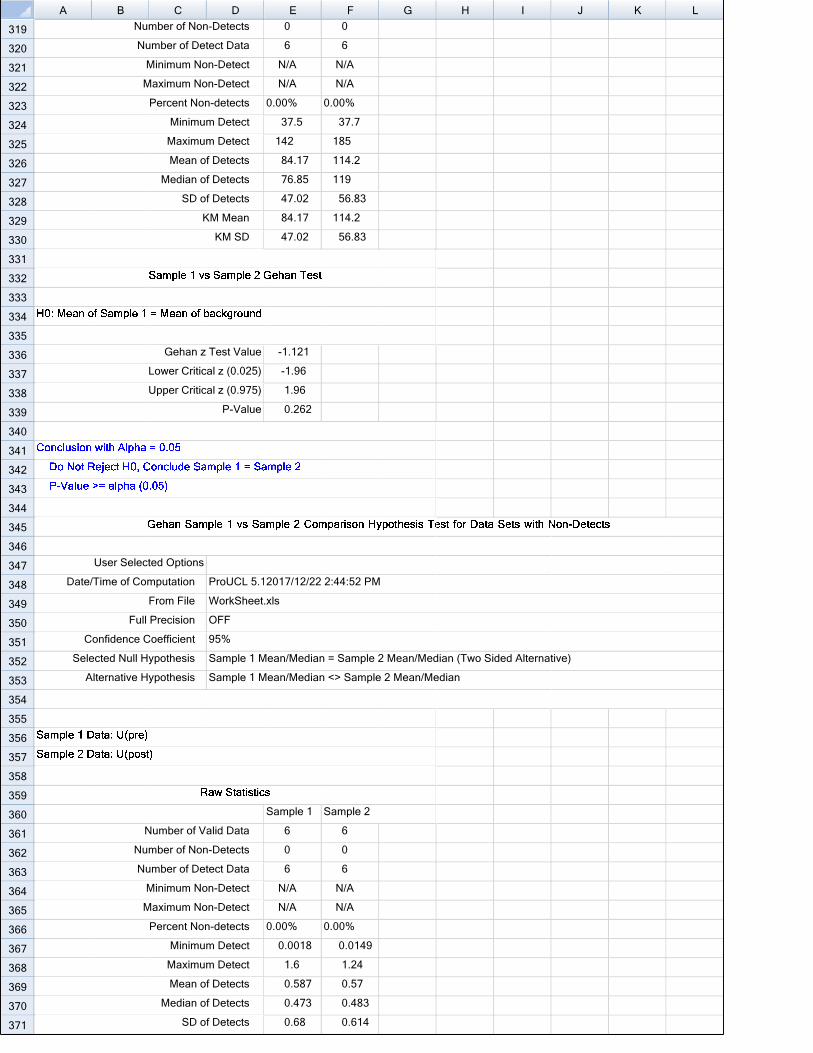
A B C D E F G H I J K L
319
320
321
322
323
324
325
326
327
328
329
330
331
332
333
334
335
336
337
338
339
340
341
342
343
344
345
346
347
348
349
350
351
352
353
354
355
356
357
358
359
360
361
362
363
364
365
366
367
368
369
370
371
Nummber of Nonn-Detects 0 0
Nuumber of Dettect Data 6 6
MMinimum No on-Detect N/A N/A
MMaximum No on-Detect N/A N/A
Percent Nonn-detects 0.00% 0.00%
Minimumm Detect 37.5 37.7
Maximumm Detect 142 185
Mean of f Detects 84.17 114.2
Median of f Detects 76.85 119
SD of f Detects 47.02 56.83
KKM Mean 84.17 114.2
KM SD 47.02 56.83
Gehan z Test Value -1.121
LLower Critical z (0.025) -1.96
UUpper Critical z (0.975) 1.96
P-Value 0.262
User Selectted Options
Date//Time of Commputation ProUCL 5.12017/12/22 2:44:52 PMM
From File WorkSheet..xls
Full Precision OFF
Confidence C Coefficient 95%
Seleected Null Hy ypothesis Sample 1 M Mean/Median n = Sample 2 2 Mean/Meddian (Two Si ded Alternattive)
AAlternative Hy ypothesis Sample 1 M Mean/Median n <> Sample e 2 Mean/Meedian
Sample 1 Sample 2
NNumber of Va alid Data 6 6
Nummber of Nonn-Detects 0 0
Nuumber of Dettect Data 6 6
MMinimum No on-Detect N/A N/A
MMaximum No on-Detect N/A N/A
Percent Nonn-detects 0.00% 0.00%
Minimumm Detect 0.0018 0.0149
Maximumm Detect 1.6 1.24
Mean of f Detects 0.587 0.57
Median of f Detects 0.473 0.483
SD of f Detects 0.68 0.614
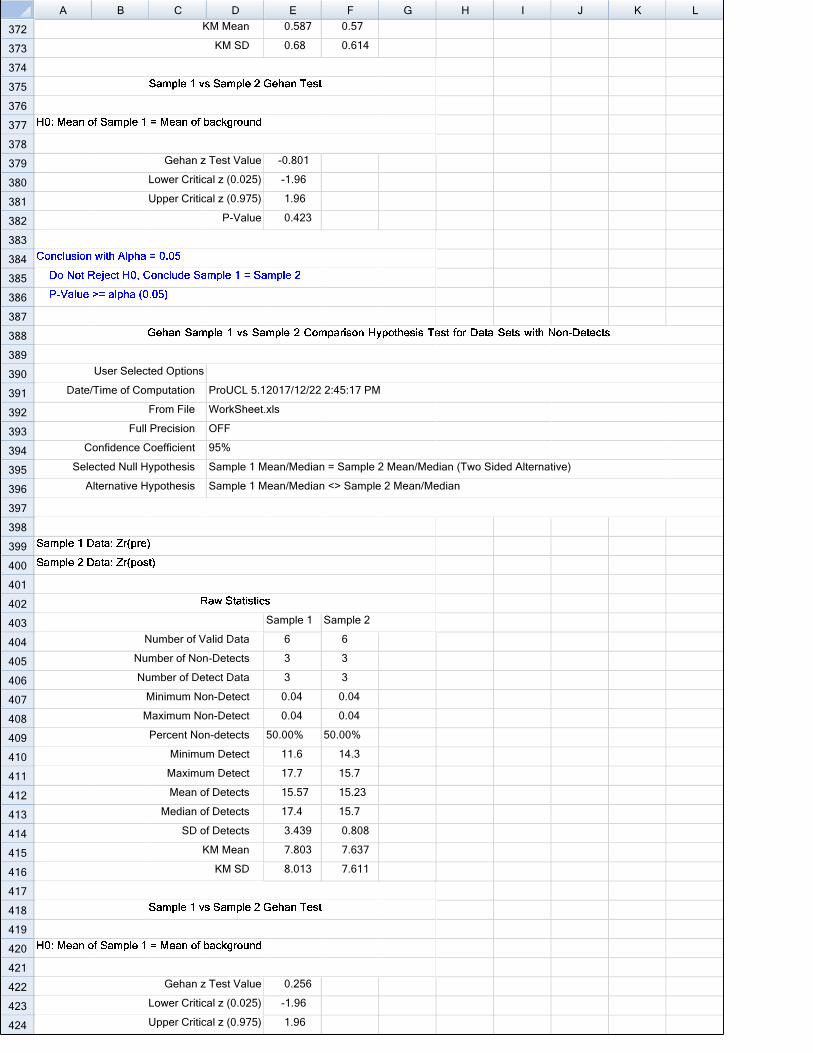
A B C D E F G H I J K L
372
373
374
375
376
377
378
379
380
381
382
383
384
385
386
387
388
389
390
391
392
393
394
395
396
397
398
399
400
401
402
403
404
405
406
407
408
409
410
411
412
413
414
415
416
417
418
419
420
421
422
423
424
KKM Mean 0.587 0.57
KM SD 0.68 0.614
Gehan z Test Value -0.801
LLower Critical z (0.025) -1.96
UUpper Critical z (0.975) 1.96
P-Value 0.423
User Selectted Options
Date//Time of Commputation ProUCL 5.12017/12/22 2:45:17 PMM
From File WorkSheet..xls
Full Precision OFF
Confidence C Coefficient 95%
Seleected Null Hy ypothesis Sample 1 M Mean/Median n = Sample 2 2 Mean/Meddian (Two Si ded Alternattive)
AAlternative Hy ypothesis Sample 1 M Mean/Median n <> Sample e 2 Mean/Meedian
Sample 1 Sample 2
NNumber of Va alid Data 6 6
Nummber of Nonn-Detects 3 3
Nuumber of Dettect Data 3 3
MMinimum No on-Detect 0.04 0.04
MMaximum No on-Detect 0.04 0.04
Percent Nonn-detects 50.00% 50.00%
Minimumm Detect 11.6 14.3
Maximumm Detect 17.7 15.7
Mean of f Detects 15.57 15.23
Median of f Detects 17.4 15.7
SD of f Detects 3.439 0.808
KKM Mean 7.803 7.637
KM SD 8.013 7.611
Gehan z Test Value 0.256
LLower Critical z (0.025) -1.96
UUpper Critical z (0.975) 1.96

A B C D E F G H I J K L
425
426
427
428
429
430
P-Value 0.798
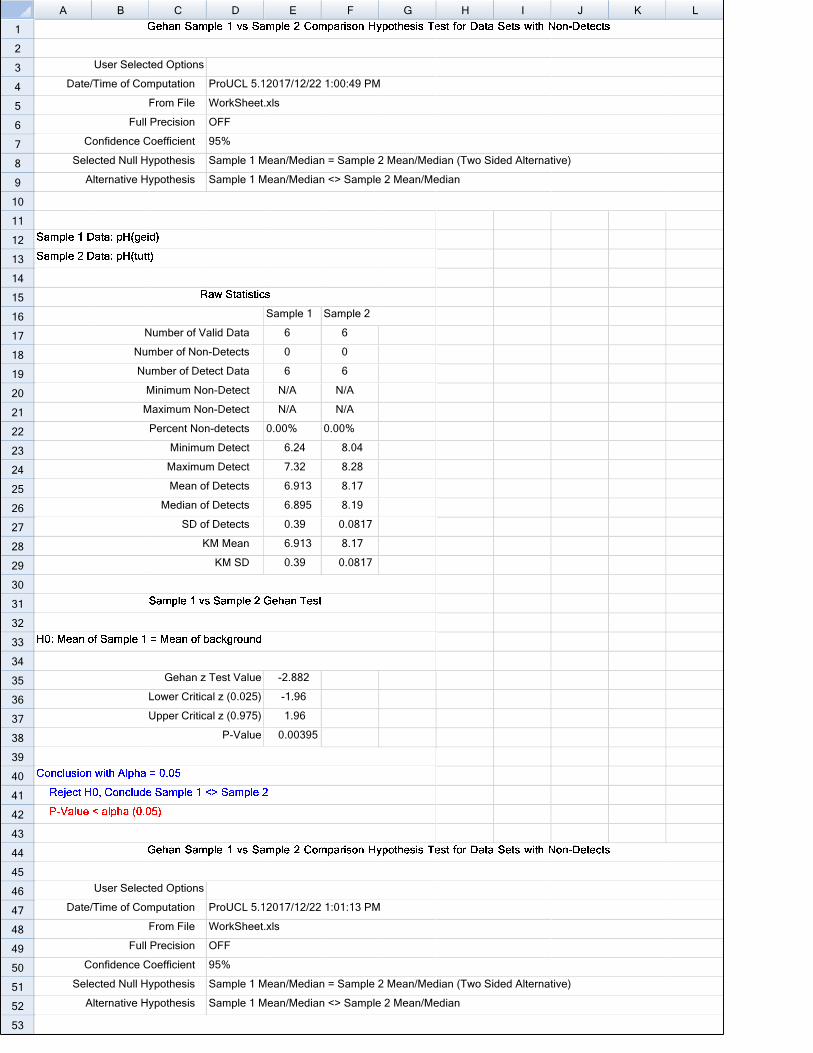
A B C D E F G H I J K L
1
2
3
4
5
6
7
8
9
10
11
12
13
14
15
16
17
18
19
20
21
22
23
24
25
26
27
28
29
30
31
32
33
34
35
36
37
38
39
40
41
42
43
44
45
46
47
48
49
50
51
52
53
User Selectted Options
Date//Time of Commputation ProUCL 5.12017/12/22 1:00:49 PMM
From File WorkSheet..xls
Full Precision OFF
Confidence C Coefficient 95%
Seleected Null Hy ypothesis Sample 1 M Mean/Median n = Sample 2 2 Mean/Meddian (Two Si ded Alternattive)
AAlternative Hy ypothesis Sample 1 M Mean/Median n <> Sample e 2 Mean/Meedian
Sample 1 Sample 2
NNumber of Va alid Data 6 6
Nummber of Nonn-Detects 0 0
Nuumber of Dettect Data 6 6
MMinimum No on-Detect N/A N/A
MMaximum No on-Detect N/A N/A
Percent Nonn-detects 0.00% 0.00%
Minimumm Detect 6.24 8.04
Maximumm Detect 7.32 8.28
Mean of f Detects 6.913 8.17
Median of f Detects 6.895 8.19
SD of f Detects 0.39 0.0817
KKM Mean 6.913 8.17
KM SD 0.39 0.0817
Gehan z Test Value -2.882
LLower Critical z (0.025) -1.96
UUpper Critical z (0.975) 1.96
P-Value 0.00395
User Selectted Options
Date//Time of Commputation ProUCL 5.12017/12/22 1:01:13 PMM
From File WorkSheet..xls
Full Precision OFF
Confidence C Coefficient 95%
Seleected Null Hy ypothesis Sample 1 M Mean/Median n = Sample 2 2 Mean/Meddian (Two Si ded Alternattive)
AAlternative Hy ypothesis Sample 1 M Mean/Median n <> Sample e 2 Mean/Meedian
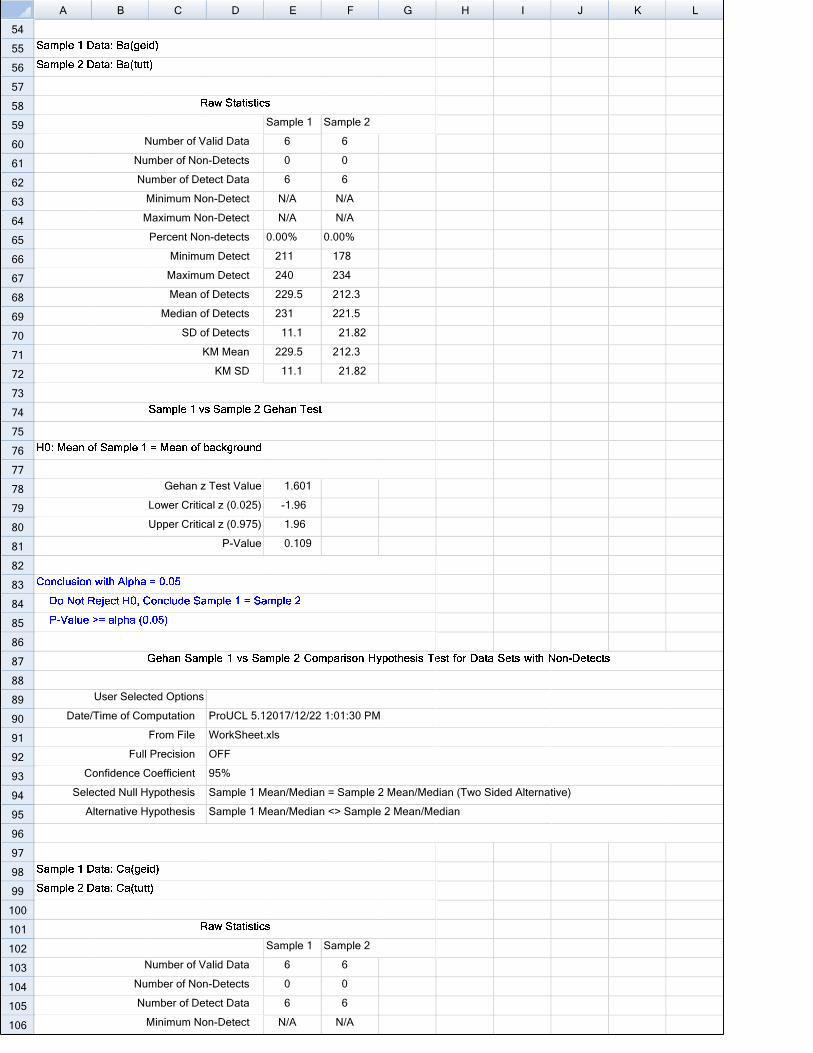
A B C D E F G H I J K L
54
55
56
57
58
59
60
61
62
63
64
65
66
67
68
69
70
71
72
73
74
75
76
77
78
79
80
81
82
83
84
85
86
87
88
89
90
91
92
93
94
95
96
97
98
99
100
101
102
103
104
105
106
Sample 1 Sample 2
NNumber of Va alid Data 6 6
Nummber of Nonn-Detects 0 0
Nuumber of Dettect Data 6 6
MMinimum No on-Detect N/A N/A
MMaximum No on-Detect N/A N/A
Percent Nonn-detects 0.00% 0.00%
Minimumm Detect 211 178
Maximumm Detect 240 234
Mean of f Detects 229.5 212.3
Median of f Detects 231 221.5
SD of f Detects 11.1 21.82
KKM Mean 229.5 212.3
KM SD 11.1 21.82
Gehan z Test Value 1.601
LLower Critical z (0.025) -1.96
UUpper Critical z (0.975) 1.96
P-Value 0.109
User Selectted Options
Date//Time of Commputation ProUCL 5.12017/12/22 1:01:30 PMM
From File WorkSheet..xls
Full Precision OFF
Confidence C Coefficient 95%
Seleected Null Hy ypothesis Sample 1 M Mean/Median n = Sample 2 2 Mean/Meddian (Two Si ded Alternattive)
AAlternative Hy ypothesis Sample 1 M Mean/Median n <> Sample e 2 Mean/Meedian
Sample 1 Sample 2
NNumber of Va alid Data 6 6
Nummber of Nonn-Detects 0 0
Nuumber of Dettect Data 6 6
MMinimum No on-Detect N/A N/A
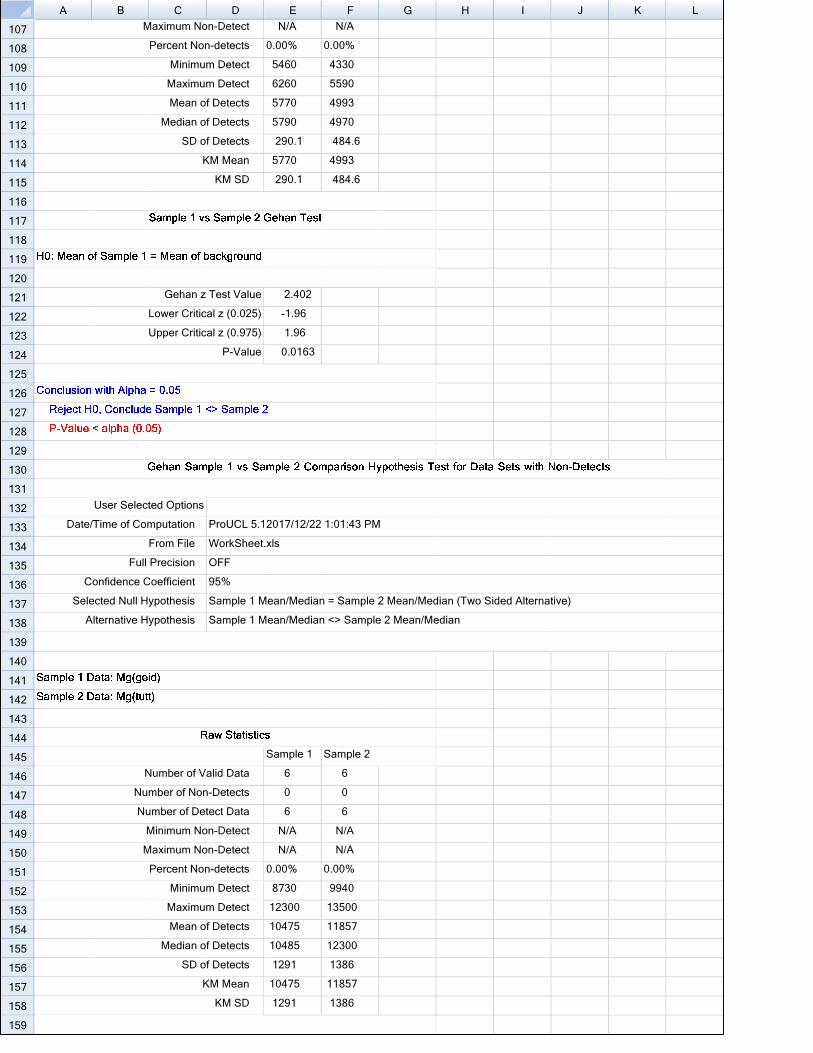
A B C D E F G H I J K L
107
108
109
110
111
112
113
114
115
116
117
118
119
120
121
122
123
124
125
126
127
128
129
130
131
132
133
134
135
136
137
138
139
140
141
142
143
144
145
146
147
148
149
150
151
152
153
154
155
156
157
158
159
MMaximum No on-Detect N/A N/A
Percent Nonn-detects 0.00% 0.00%
Minimumm Detect 5460 4330
Maximumm Detect 6260 5590
Mean of f Detects 5770 4993
Median of f Detects 5790 4970
SD of f Detects 290.1 484.6
KKM Mean 5770 4993
KM SD 290.1 484.6
Gehan z Test Value 2.402
LLower Critical z (0.025) -1.96
UUpper Critical z (0.975) 1.96
P-Value 0.0163
User Selectted Options
Date//Time of Commputation ProUCL 5.12017/12/22 1:01:43 PMM
From File WorkSheet..xls
Full Precision OFF
Confidence C Coefficient 95%
Seleected Null Hy ypothesis Sample 1 M Mean/Median n = Sample 2 2 Mean/Meddian (Two Si ded Alternattive)
AAlternative Hy ypothesis Sample 1 M Mean/Median n <> Sample e 2 Mean/Meedian
Sample 1 Sample 2
NNumber of Va alid Data 6 6
Nummber of Nonn-Detects 0 0
Nuumber of Dettect Data 6 6
MMinimum No on-Detect N/A N/A
MMaximum No on-Detect N/A N/A
Percent Nonn-detects 0.00% 0.00%
Minimumm Detect 8730 9940
Maximumm Detect 12300 13500
Mean of f Detects 10475 11857
Median of f Detects 10485 12300
SD of f Detects 1291 1386
KKM Mean 10475 11857
KM SD 1291 1386
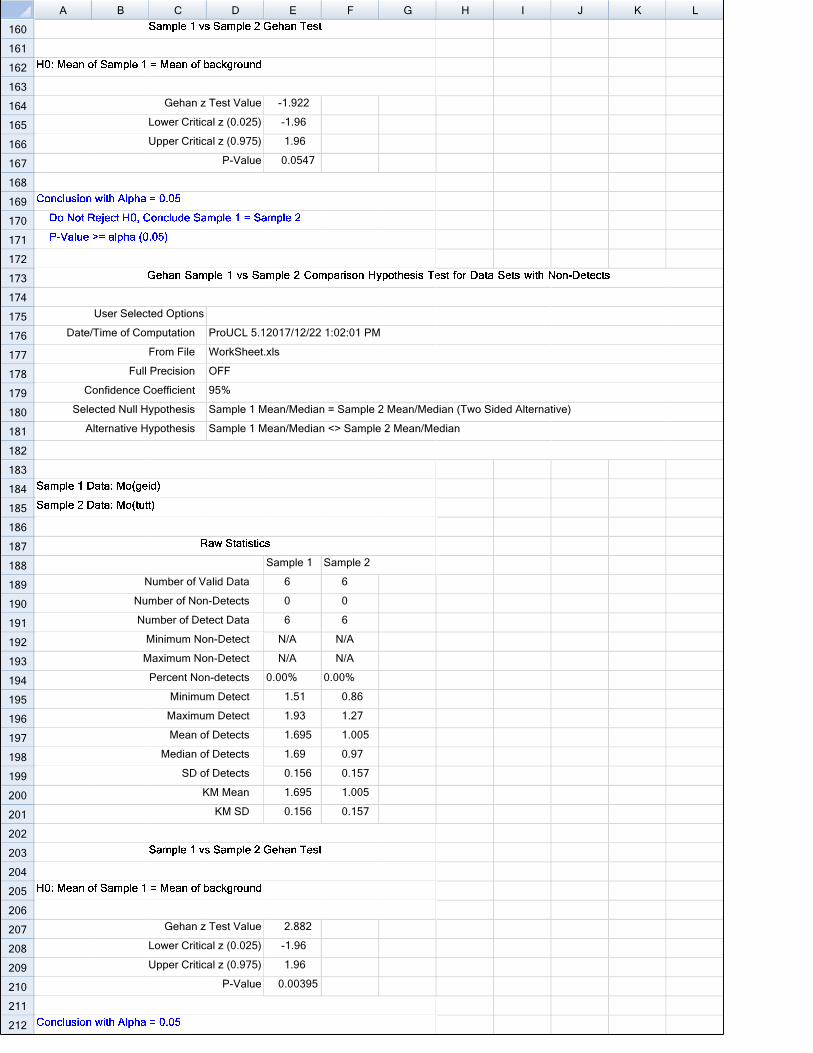
A B C D E F G H I J K L
160
161
162
163
164
165
166
167
168
169
170
171
172
173
174
175
176
177
178
179
180
181
182
183
184
185
186
187
188
189
190
191
192
193
194
195
196
197
198
199
200
201
202
203
204
205
206
207
208
209
210
211
212
Gehan z Test Value -1.922
LLower Critical z (0.025) -1.96
UUpper Critical z (0.975) 1.96
P-Value 0.0547
User Selectted Options
Date//Time of Commputation ProUCL 5.12017/12/22 1:02:01 PMM
From File WorkSheet..xls
Full Precision OFF
Confidence C Coefficient 95%
Seleected Null Hy ypothesis Sample 1 M Mean/Median n = Sample 2 2 Mean/Meddian (Two Si ded Alternattive)
AAlternative Hy ypothesis Sample 1 M Mean/Median n <> Sample e 2 Mean/Meedian
Sample 1 Sample 2
NNumber of Va alid Data 6 6
Nummber of Nonn-Detects 0 0
Nuumber of Dettect Data 6 6
MMinimum No on-Detect N/A N/A
MMaximum No on-Detect N/A N/A
Percent Nonn-detects 0.00% 0.00%
Minimumm Detect 1.51 0.86
Maximumm Detect 1.93 1.27
Mean of f Detects 1.695 1.005
Median of f Detects 1.69 0.97
SD of f Detects 0.156 0.157
KKM Mean 1.695 1.005
KM SD 0.156 0.157
Gehan z Test Value 2.882
LLower Critical z (0.025) -1.96
UUpper Critical z (0.975) 1.96
P-Value 0.00395
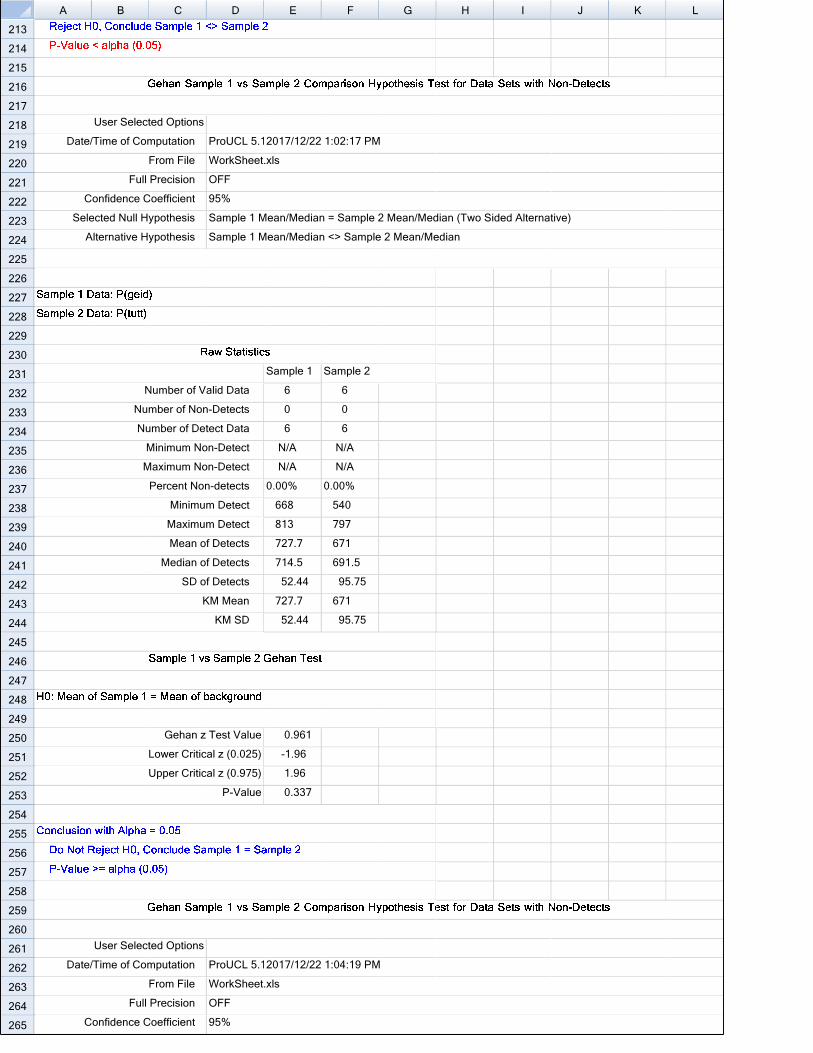
A B C D E F G H I J K L
213
214
215
216
217
218
219
220
221
222
223
224
225
226
227
228
229
230
231
232
233
234
235
236
237
238
239
240
241
242
243
244
245
246
247
248
249
250
251
252
253
254
255
256
257
258
259
260
261
262
263
264
265
User Selectted Options
Date//Time of Commputation ProUCL 5.12017/12/22 1:02:17 PMM
From File WorkSheet..xls
Full Precision OFF
Confidence C Coefficient 95%
Seleected Null Hy ypothesis Sample 1 M Mean/Median n = Sample 2 2 Mean/Meddian (Two Si ded Alternattive)
AAlternative Hy ypothesis Sample 1 M Mean/Median n <> Sample e 2 Mean/Meedian
Sample 1 Sample 2
NNumber of Va alid Data 6 6
Nummber of Nonn-Detects 0 0
Nuumber of Dettect Data 6 6
MMinimum No on-Detect N/A N/A
MMaximum No on-Detect N/A N/A
Percent Nonn-detects 0.00% 0.00%
Minimumm Detect 668 540
Maximumm Detect 813 797
Mean of f Detects 727.7 671
Median of f Detects 714.5 691.5
SD of f Detects 52.44 95.75
KKM Mean 727.7 671
KM SD 52.44 95.75
Gehan z Test Value 0.961
LLower Critical z (0.025) -1.96
UUpper Critical z (0.975) 1.96
P-Value 0.337
User Selectted Options
Date//Time of Commputation ProUCL 5.12017/12/22 1:04:19 PMM
From File WorkSheet..xls
Full Precision OFF
Confidence C Coefficient 95%
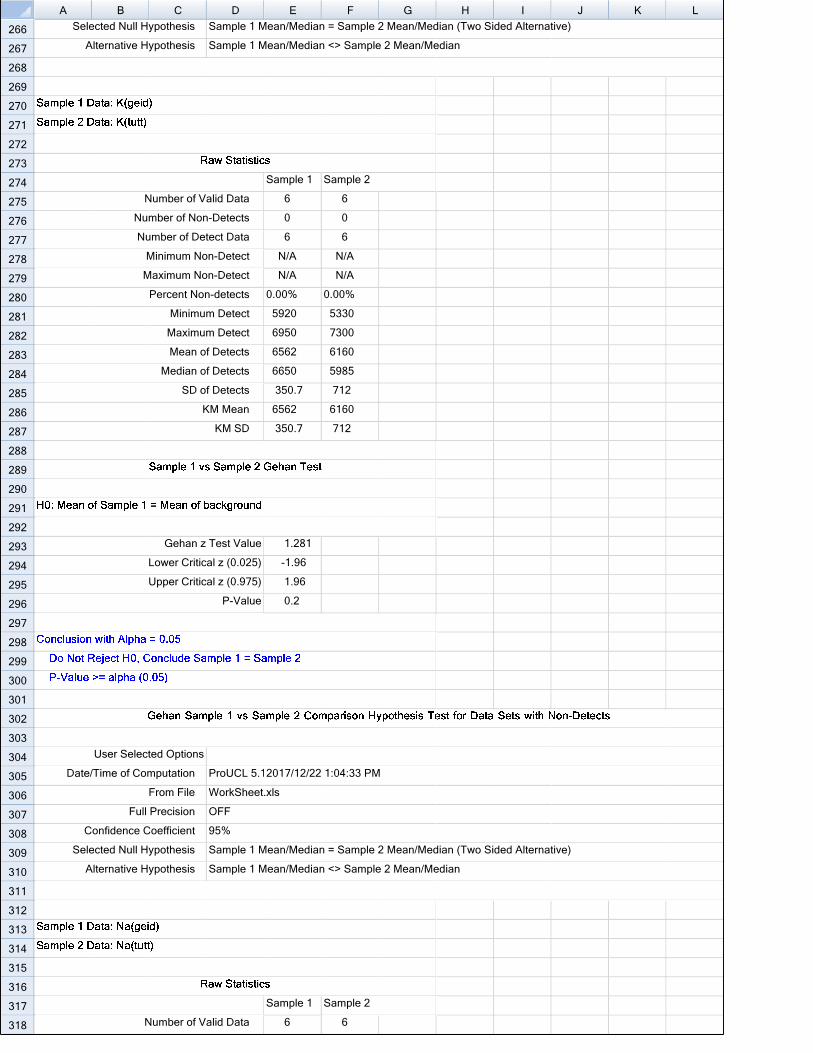
A B C D E F G H I J K L
266
267
268
269
270
271
272
273
274
275
276
277
278
279
280
281
282
283
284
285
286
287
288
289
290
291
292
293
294
295
296
297
298
299
300
301
302
303
304
305
306
307
308
309
310
311
312
313
314
315
316
317
318
Seleected Null Hy ypothesis Sample 1 M Mean/Median n = Sample 2 2 Mean/Meddian (Two Si ded Alternattive)
AAlternative Hy ypothesis Sample 1 M Mean/Median n <> Sample e 2 Mean/Meedian
Sample 1 Sample 2
NNumber of Va alid Data 6 6
Nummber of Nonn-Detects 0 0
Nuumber of Dettect Data 6 6
MMinimum No on-Detect N/A N/A
MMaximum No on-Detect N/A N/A
Percent Nonn-detects 0.00% 0.00%
Minimumm Detect 5920 5330
Maximumm Detect 6950 7300
Mean of f Detects 6562 6160
Median of f Detects 6650 5985
SD of f Detects 350.7 712
KKM Mean 6562 6160
KM SD 350.7 712
Gehan z Test Value 1.281
LLower Critical z (0.025) -1.96
UUpper Critical z (0.975) 1.96
P-Value 0.2
User Selectted Options
Date//Time of Commputation ProUCL 5.12017/12/22 1:04:33 PMM
From File WorkSheet..xls
Full Precision OFF
Confidence C Coefficient 95%
Seleected Null Hy ypothesis Sample 1 M Mean/Median n = Sample 2 2 Mean/Meddian (Two Si ded Alternattive)
AAlternative Hy ypothesis Sample 1 M Mean/Median n <> Sample e 2 Mean/Meedian
Sample 1 Sample 2
NNumber of Va alid Data 6 6
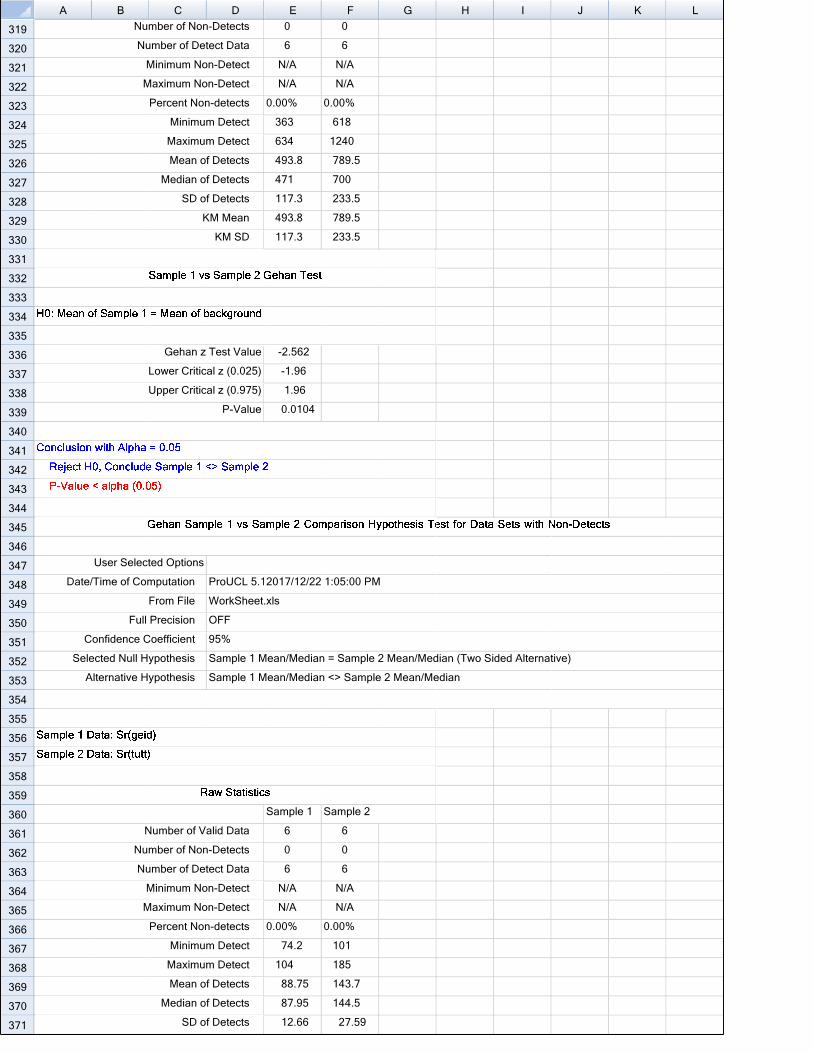
A B C D E F G H I J K L
319
320
321
322
323
324
325
326
327
328
329
330
331
332
333
334
335
336
337
338
339
340
341
342
343
344
345
346
347
348
349
350
351
352
353
354
355
356
357
358
359
360
361
362
363
364
365
366
367
368
369
370
371
Nummber of Nonn-Detects 0 0
Nuumber of Dettect Data 6 6
MMinimum No on-Detect N/A N/A
MMaximum No on-Detect N/A N/A
Percent Nonn-detects 0.00% 0.00%
Minimumm Detect 363 618
Maximumm Detect 634 1240
Mean of f Detects 493.8 789.5
Median of f Detects 471 700
SD of f Detects 117.3 233.5
KKM Mean 493.8 789.5
KM SD 117.3 233.5
Gehan z Test Value -2.562
LLower Critical z (0.025) -1.96
UUpper Critical z (0.975) 1.96
P-Value 0.0104
User Selectted Options
Date//Time of Commputation ProUCL 5.12017/12/22 1:05:00 PMM
From File WorkSheet..xls
Full Precision OFF
Confidence C Coefficient 95%
Seleected Null Hy ypothesis Sample 1 M Mean/Median n = Sample 2 2 Mean/Meddian (Two Si ded Alternattive)
AAlternative Hy ypothesis Sample 1 M Mean/Median n <> Sample e 2 Mean/Meedian
Sample 1 Sample 2
NNumber of Va alid Data 6 6
Nummber of Nonn-Detects 0 0
Nuumber of Dettect Data 6 6
MMinimum No on-Detect N/A N/A
MMaximum No on-Detect N/A N/A
Percent Nonn-detects 0.00% 0.00%
Minimumm Detect 74.2 101
Maximumm Detect 104 185
Mean of f Detects 88.75 143.7
Median of f Detects 87.95 144.5
SD of f Detects 12.66 27.59
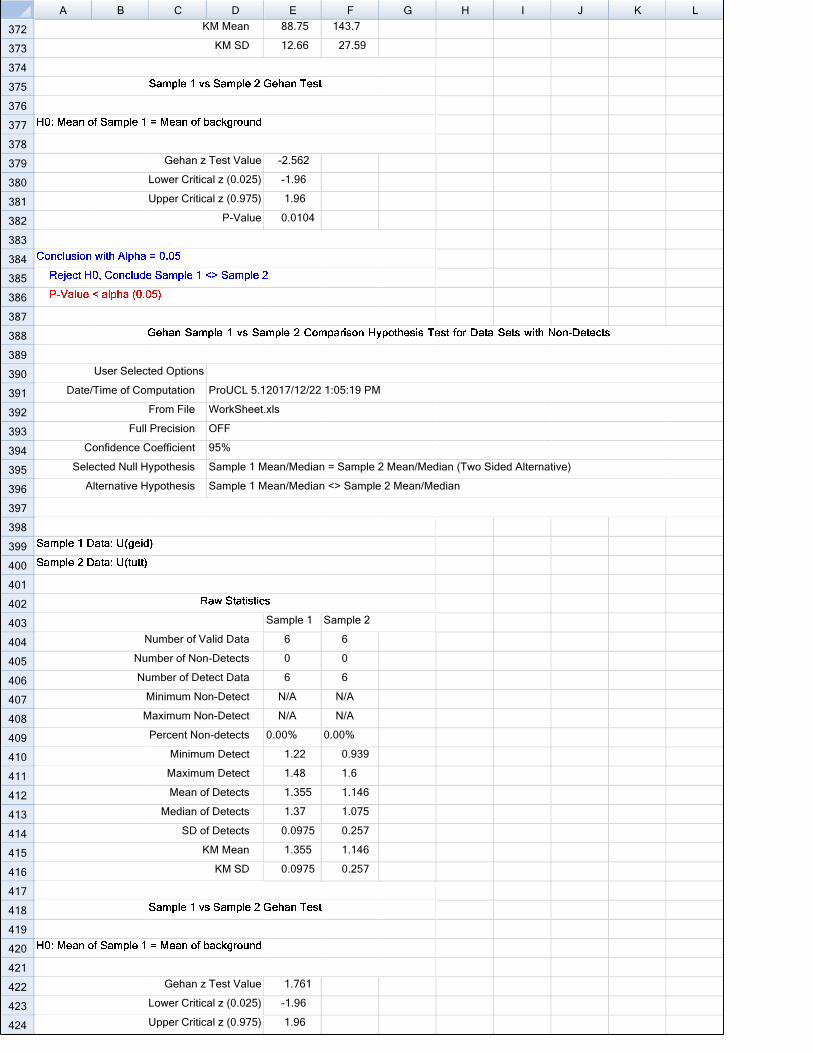
A B C D E F G H I J K L
372
373
374
375
376
377
378
379
380
381
382
383
384
385
386
387
388
389
390
391
392
393
394
395
396
397
398
399
400
401
402
403
404
405
406
407
408
409
410
411
412
413
414
415
416
417
418
419
420
421
422
423
424
KKM Mean 88.75 143.7
KM SD 12.66 27.59
Gehan z Test Value -2.562
LLower Critical z (0.025) -1.96
UUpper Critical z (0.975) 1.96
P-Value 0.0104
User Selectted Options
Date//Time of Commputation ProUCL 5.12017/12/22 1:05:19 PMM
From File WorkSheet..xls
Full Precision OFF
Confidence C Coefficient 95%
Seleected Null Hy ypothesis Sample 1 M Mean/Median n = Sample 2 2 Mean/Meddian (Two Si ded Alternattive)
AAlternative Hy ypothesis Sample 1 M Mean/Median n <> Sample e 2 Mean/Meedian
Sample 1 Sample 2
NNumber of Va alid Data 6 6
Nummber of Nonn-Detects 0 0
Nuumber of Dettect Data 6 6
MMinimum No on-Detect N/A N/A
MMaximum No on-Detect N/A N/A
Percent Nonn-detects 0.00% 0.00%
Minimumm Detect 1.22 0.939
Maximumm Detect 1.48 1.6
Mean of f Detects 1.355 1.146
Median of f Detects 1.37 1.075
SD of f Detects 0.0975 0.257
KKM Mean 1.355 1.146
KM SD 0.0975 0.257
Gehan z Test Value 1.761
LLower Critical z (0.025) -1.96
UUpper Critical z (0.975) 1.96
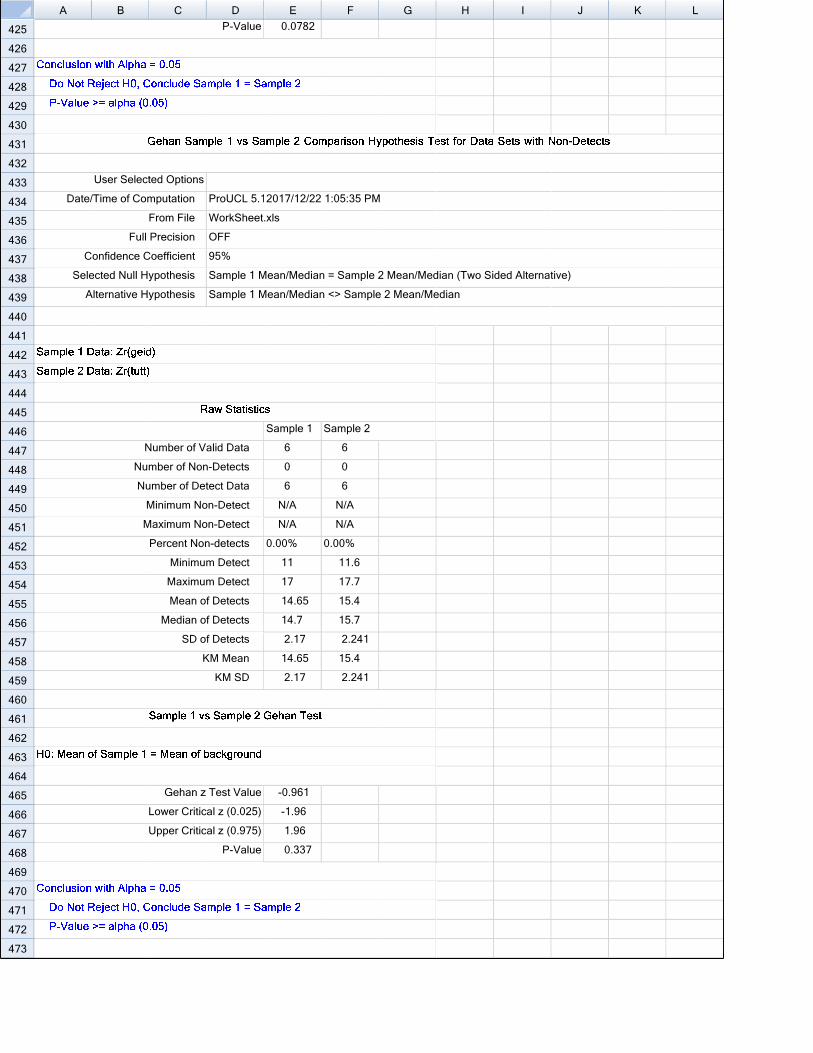
A B C D E F G H I J K L
425
426
427
428
429
430
431
432
433
434
435
436
437
438
439
440
441
442
443
444
445
446
447
448
449
450
451
452
453
454
455
456
457
458
459
460
461
462
463
464
465
466
467
468
469
470
471
472
473
P-Value 0.0782
User Selectted Options
Date//Time of Commputation ProUCL 5.12017/12/22 1:05:35 PMM
From File WorkSheet..xls
Full Precision OFF
Confidence C Coefficient 95%
Seleected Null Hy ypothesis Sample 1 M Mean/Median n = Sample 2 2 Mean/Meddian (Two Si ded Alternattive)
AAlternative Hy ypothesis Sample 1 M Mean/Median n <> Sample e 2 Mean/Meedian
Sample 1 Sample 2
NNumber of Va alid Data 6 6
Nummber of Nonn-Detects 0 0
Nuumber of Dettect Data 6 6
MMinimum No on-Detect N/A N/A
MMaximum No on-Detect N/A N/A
Percent Nonn-detects 0.00% 0.00%
Minimumm Detect 11 11.6
Maximumm Detect 17 17.7
Mean of f Detects 14.65 15.4
Median of f Detects 14.7 15.7
SD of f Detects 2.17 2.241
KKM Mean 14.65 15.4
KM SD 2.17 2.241
Gehan z Test Value -0.961
LLower Critical z (0.025) -1.96
UUpper Critical z (0.975) 1.96
P-Value 0.337
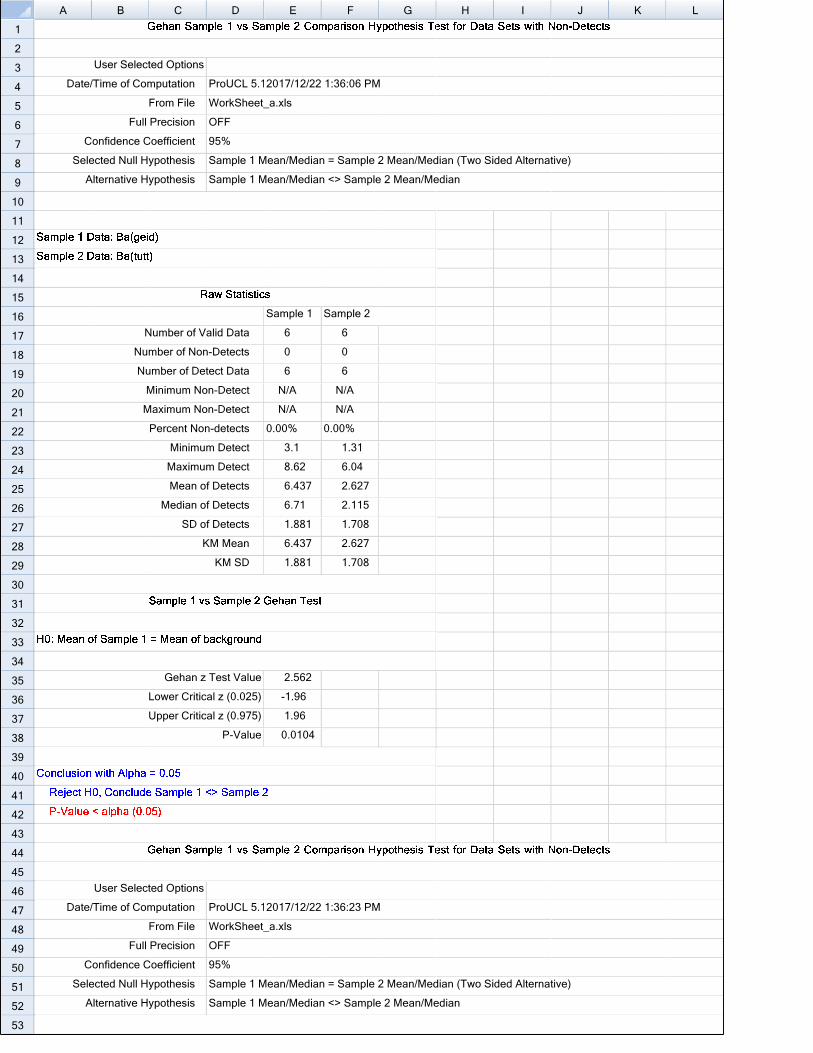
A B C D E F G H I J K L
1
2
3
4
5
6
7
8
9
10
11
12
13
14
15
16
17
18
19
20
21
22
23
24
25
26
27
28
29
30
31
32
33
34
35
36
37
38
39
40
41
42
43
44
45
46
47
48
49
50
51
52
53
User Selectted Options
Date//Time of Commputation ProUCL 5.12017/12/22 1:36:06 PMM
From File WorkSheet__a.xls
Full Precision OFF
Confidence C Coefficient 95%
Seleected Null Hy ypothesis Sample 1 M Mean/Median n = Sample 2 2 Mean/Meddian (Two Si ded Alternattive)
AAlternative Hy ypothesis Sample 1 M Mean/Median n <> Sample e 2 Mean/Meedian
Sample 1 Sample 2
NNumber of Va alid Data 6 6
Nummber of Nonn-Detects 0 0
Nuumber of Dettect Data 6 6
MMinimum No on-Detect N/A N/A
MMaximum No on-Detect N/A N/A
Percent Nonn-detects 0.00% 0.00%
Minimumm Detect 3.1 1.31
Maximumm Detect 8.62 6.04
Mean of f Detects 6.437 2.627
Median of f Detects 6.71 2.115
SD of f Detects 1.881 1.708
KKM Mean 6.437 2.627
KM SD 1.881 1.708
Gehan z Test Value 2.562
LLower Critical z (0.025) -1.96
UUpper Critical z (0.975) 1.96
P-Value 0.0104
User Selectted Options
Date//Time of Commputation ProUCL 5.12017/12/22 1:36:23 PMM
From File WorkSheet__a.xls
Full Precision OFF
Confidence C Coefficient 95%
Seleected Null Hy ypothesis Sample 1 M Mean/Median n = Sample 2 2 Mean/Meddian (Two Si ded Alternattive)
AAlternative Hy ypothesis Sample 1 M Mean/Median n <> Sample e 2 Mean/Meedian

A B C D E F G H I J K L
54
55
56
57
58
59
60
61
62
63
64
65
66
67
68
69
70
71
72
73
74
75
76
77
78
79
80
81
82
83
84
85
86
87
88
89
90
91
92
93
94
95
96
97
98
99
100
101
102
103
104
105
106
Sample 1 Sample 2
NNumber of Va alid Data 6 6
Nummber of Nonn-Detects 0 0
Nuumber of Dettect Data 6 6
MMinimum No on-Detect N/A N/A
MMaximum No on-Detect N/A N/A
Percent Nonn-detects 0.00% 0.00%
Minimumm Detect 2310 1410
Maximumm Detect 4440 5130
Mean of f Detects 3095 2418
Median of f Detects 3145 1565
SD of f Detects 778.8 1531
KKM Mean 3095 2418
KM SD 778.8 1531
Gehan z Test Value 1.121
LLower Critical z (0.025) -1.96
UUpper Critical z (0.975) 1.96
P-Value 0.262
User Selectted Options
Date//Time of Commputation ProUCL 5.12017/12/22 1:36:56 PMM
From File WorkSheet__a.xls
Full Precision OFF
Confidence C Coefficient 95%
Seleected Null Hy ypothesis Sample 1 M Mean/Median n = Sample 2 2 Mean/Meddian (Two Si ded Alternattive)
AAlternative Hy ypothesis Sample 1 M Mean/Median n <> Sample e 2 Mean/Meedian
Sample 1 Sample 2
NNumber of Va alid Data 6 6
Nummber of Nonn-Detects 0 0
Nuumber of Dettect Data 6 6
MMinimum No on-Detect N/A N/A
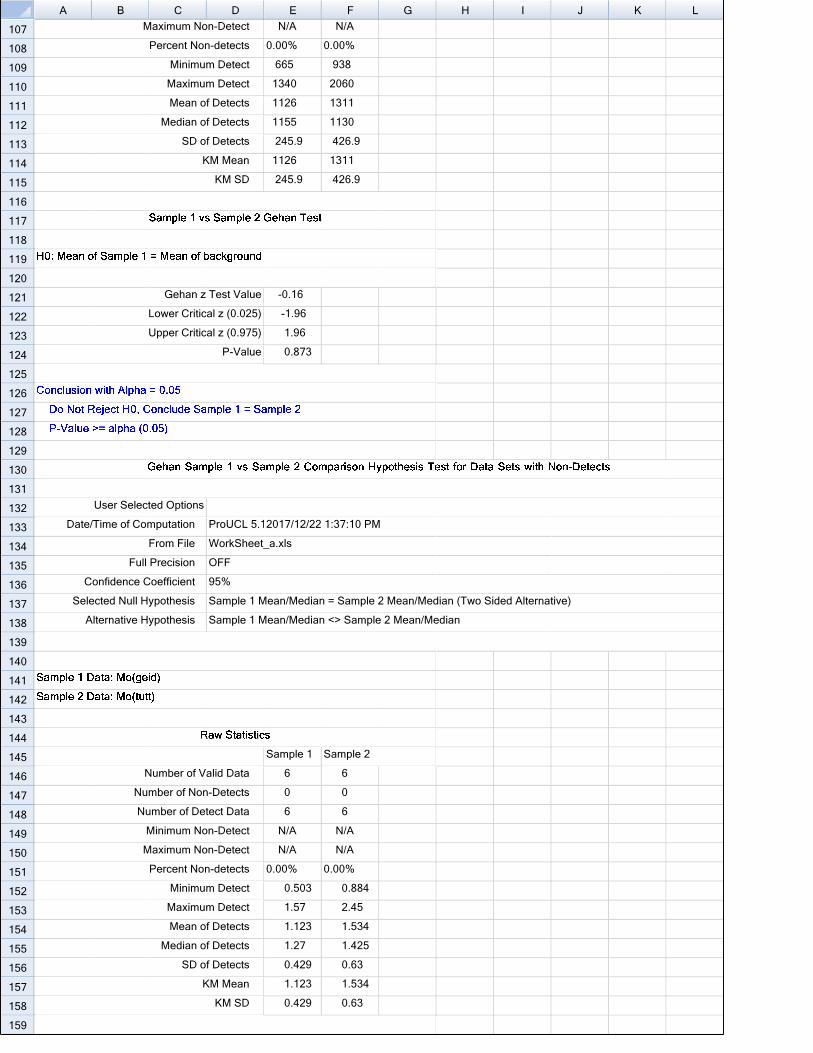
A B C D E F G H I J K L
107
108
109
110
111
112
113
114
115
116
117
118
119
120
121
122
123
124
125
126
127
128
129
130
131
132
133
134
135
136
137
138
139
140
141
142
143
144
145
146
147
148
149
150
151
152
153
154
155
156
157
158
159
MMaximum No on-Detect N/A N/A
Percent Nonn-detects 0.00% 0.00%
Minimumm Detect 665 938
Maximumm Detect 1340 2060
Mean of f Detects 1126 1311
Median of f Detects 1155 1130
SD of f Detects 245.9 426.9
KKM Mean 1126 1311
KM SD 245.9 426.9
Gehan z Test Value -0.16
LLower Critical z (0.025) -1.96
UUpper Critical z (0.975) 1.96
P-Value 0.873
User Selectted Options
Date//Time of Commputation ProUCL 5.12017/12/22 1:37:10 PMM
From File WorkSheet__a.xls
Full Precision OFF
Confidence C Coefficient 95%
Seleected Null Hy ypothesis Sample 1 M Mean/Median n = Sample 2 2 Mean/Meddian (Two Si ded Alternattive)
AAlternative Hy ypothesis Sample 1 M Mean/Median n <> Sample e 2 Mean/Meedian
Sample 1 Sample 2
NNumber of Va alid Data 6 6
Nummber of Nonn-Detects 0 0
Nuumber of Dettect Data 6 6
MMinimum No on-Detect N/A N/A
MMaximum No on-Detect N/A N/A
Percent Nonn-detects 0.00% 0.00%
Minimumm Detect 0.503 0.884
Maximumm Detect 1.57 2.45
Mean of f Detects 1.123 1.534
Median of f Detects 1.27 1.425
SD of f Detects 0.429 0.63
KKM Mean 1.123 1.534
KM SD 0.429 0.63
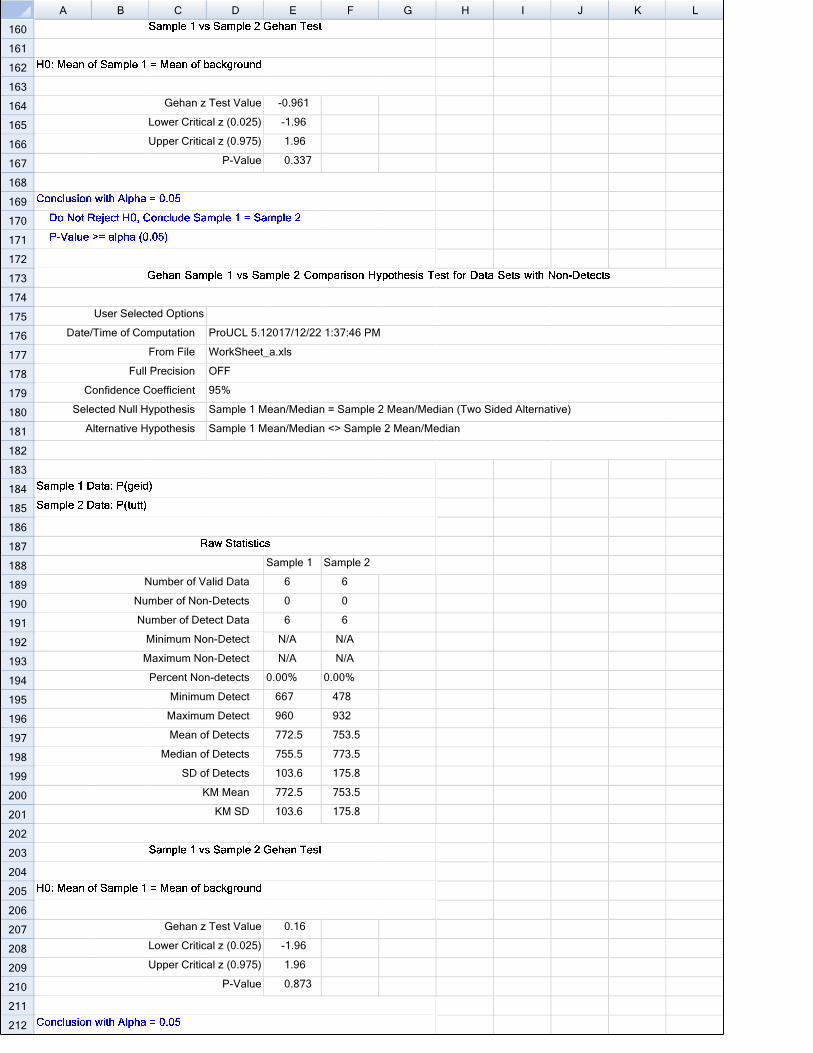
A B C D E F G H I J K L
160
161
162
163
164
165
166
167
168
169
170
171
172
173
174
175
176
177
178
179
180
181
182
183
184
185
186
187
188
189
190
191
192
193
194
195
196
197
198
199
200
201
202
203
204
205
206
207
208
209
210
211
212
Gehan z Test Value -0.961
LLower Critical z (0.025) -1.96
UUpper Critical z (0.975) 1.96
P-Value 0.337
User Selectted Options
Date//Time of Commputation ProUCL 5.12017/12/22 1:37:46 PMM
From File WorkSheet__a.xls
Full Precision OFF
Confidence C Coefficient 95%
Seleected Null Hy ypothesis Sample 1 M Mean/Median n = Sample 2 2 Mean/Meddian (Two Si ded Alternattive)
AAlternative Hy ypothesis Sample 1 M Mean/Median n <> Sample e 2 Mean/Meedian
Sample 1 Sample 2
NNumber of Va alid Data 6 6
Nummber of Nonn-Detects 0 0
Nuumber of Dettect Data 6 6
MMinimum No on-Detect N/A N/A
MMaximum No on-Detect N/A N/A
Percent Nonn-detects 0.00% 0.00%
Minimumm Detect 667 478
Maximumm Detect 960 932
Mean of f Detects 772.5 753.5
Median of f Detects 755.5 773.5
SD of f Detects 103.6 175.8
KKM Mean 772.5 753.5
KM SD 103.6 175.8
Gehan z Test Value 0.16
LLower Critical z (0.025) -1.96
UUpper Critical z (0.975) 1.96
P-Value 0.873
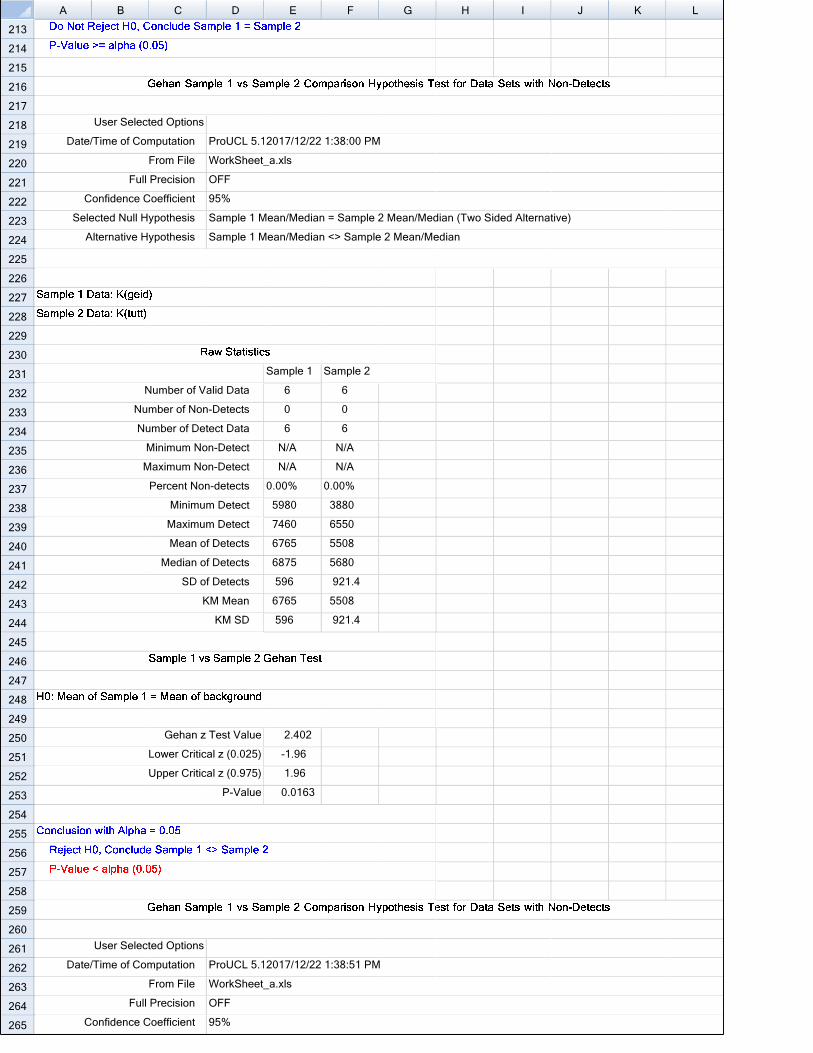
A B C D E F G H I J K L
213
214
215
216
217
218
219
220
221
222
223
224
225
226
227
228
229
230
231
232
233
234
235
236
237
238
239
240
241
242
243
244
245
246
247
248
249
250
251
252
253
254
255
256
257
258
259
260
261
262
263
264
265
User Selectted Options
Date//Time of Commputation ProUCL 5.12017/12/22 1:38:00 PMM
From File WorkSheet__a.xls
Full Precision OFF
Confidence C Coefficient 95%
Seleected Null Hy ypothesis Sample 1 M Mean/Median n = Sample 2 2 Mean/Meddian (Two Si ded Alternattive)
AAlternative Hy ypothesis Sample 1 M Mean/Median n <> Sample e 2 Mean/Meedian
Sample 1 Sample 2
NNumber of Va alid Data 6 6
Nummber of Nonn-Detects 0 0
Nuumber of Dettect Data 6 6
MMinimum No on-Detect N/A N/A
MMaximum No on-Detect N/A N/A
Percent Nonn-detects 0.00% 0.00%
Minimumm Detect 5980 3880
Maximumm Detect 7460 6550
Mean of f Detects 6765 5508
Median of f Detects 6875 5680
SD of f Detects 596 921.4
KKM Mean 6765 5508
KM SD 596 921.4
Gehan z Test Value 2.402
LLower Critical z (0.025) -1.96
UUpper Critical z (0.975) 1.96
P-Value 0.0163
User Selectted Options
Date//Time of Commputation ProUCL 5.12017/12/22 1:38:51 PMM
From File WorkSheet__a.xls
Full Precision OFF
Confidence C Coefficient 95%

A B C D E F G H I J K L
266
267
268
269
270
271
272
273
274
275
276
277
278
279
280
281
282
283
284
285
286
287
288
289
290
291
292
293
294
295
296
297
298
299
300
301
302
303
304
305
306
307
308
309
310
311
312
313
314
315
316
317
318
Seleected Null Hy ypothesis Sample 1 M Mean/Median n = Sample 2 2 Mean/Meddian (Two Si ded Alternattive)
AAlternative Hy ypothesis Sample 1 M Mean/Median n <> Sample e 2 Mean/Meedian
Sample 1 Sample 2
NNumber of Va alid Data 6 6
Nummber of Nonn-Detects 0 0
Nuumber of Dettect Data 6 6
MMinimum No on-Detect N/A N/A
MMaximum No on-Detect N/A N/A
Percent Nonn-detects 0.00% 0.00%
Minimumm Detect 18.7 27.2
Maximumm Detect 125 853
Mean of f Detects 59.75 210.3
Median of f Detects 53.75 82.4
SD of f Detects 37.57 318.7
KKM Mean 59.75 210.3
KM SD 37.57 318.7
Gehan z Test Value -1.281
LLower Critical z (0.025) -1.96
UUpper Critical z (0.975) 1.96
P-Value 0.2
User Selectted Options
Date//Time of Commputation ProUCL 5.12017/12/22 1:39:03 PMM
From File WorkSheet__a.xls
Full Precision OFF
Confidence C Coefficient 95%
Seleected Null Hy ypothesis Sample 1 M Mean/Median n = Sample 2 2 Mean/Meddian (Two Si ded Alternattive)
AAlternative Hy ypothesis Sample 1 M Mean/Median n <> Sample e 2 Mean/Meedian
Sample 1 Sample 2
NNumber of Va alid Data 6 6
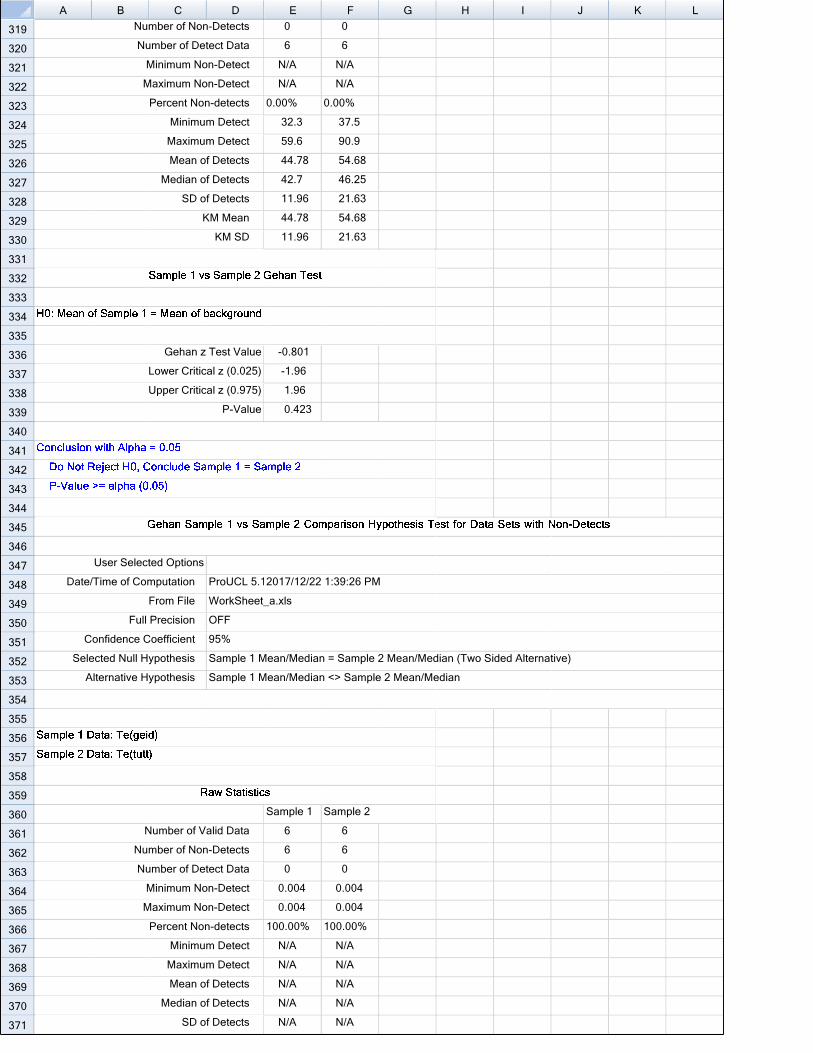
A B C D E F G H I J K L
319
320
321
322
323
324
325
326
327
328
329
330
331
332
333
334
335
336
337
338
339
340
341
342
343
344
345
346
347
348
349
350
351
352
353
354
355
356
357
358
359
360
361
362
363
364
365
366
367
368
369
370
371
Nummber of Nonn-Detects 0 0
Nuumber of Dettect Data 6 6
MMinimum No on-Detect N/A N/A
MMaximum No on-Detect N/A N/A
Percent Nonn-detects 0.00% 0.00%
Minimumm Detect 32.3 37.5
Maximumm Detect 59.6 90.9
Mean of f Detects 44.78 54.68
Median of f Detects 42.7 46.25
SD of f Detects 11.96 21.63
KKM Mean 44.78 54.68
KM SD 11.96 21.63
Gehan z Test Value -0.801
LLower Critical z (0.025) -1.96
UUpper Critical z (0.975) 1.96
P-Value 0.423
User Selectted Options
Date//Time of Commputation ProUCL 5.12017/12/22 1:39:26 PMM
From File WorkSheet__a.xls
Full Precision OFF
Confidence C Coefficient 95%
Seleected Null Hy ypothesis Sample 1 M Mean/Median n = Sample 2 2 Mean/Meddian (Two Si ded Alternattive)
AAlternative Hy ypothesis Sample 1 M Mean/Median n <> Sample e 2 Mean/Meedian
Sample 1 Sample 2
NNumber of Va alid Data 6 6
Nummber of Nonn-Detects 6 6
Nuumber of Dettect Data 0 0
MMinimum No on-Detect 0.004 0.004
MMaximum No on-Detect 0.004 0.004
Percent Nonn-detects 100.00% 100.00%
Minimumm Detect N/A N/A
Maximumm Detect N/A N/A
Mean of f Detects N/A N/A
Median of f Detects N/A N/A
SD of f Detects N/A N/A
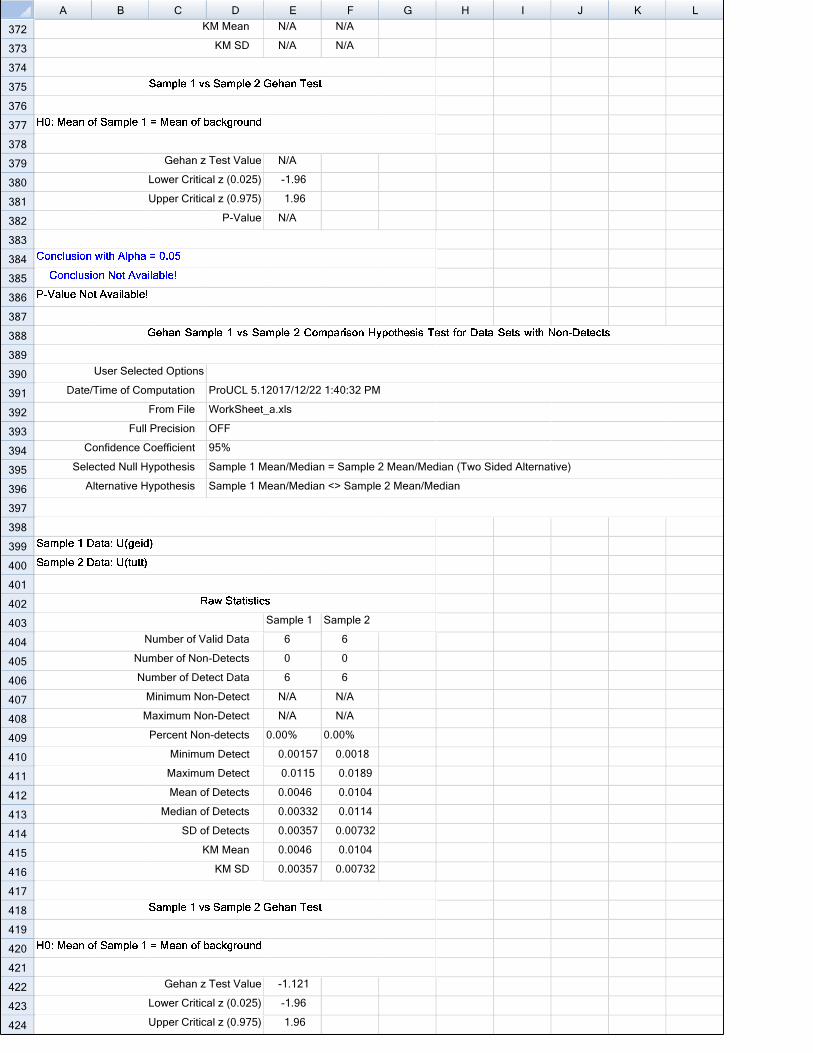
A B C D E F G H I J K L
372
373
374
375
376
377
378
379
380
381
382
383
384
385
386
387
388
389
390
391
392
393
394
395
396
397
398
399
400
401
402
403
404
405
406
407
408
409
410
411
412
413
414
415
416
417
418
419
420
421
422
423
424
KKM Mean N/A N/A
KM SD N/A N/A
Gehan z Test Value N/A
LLower Critical z (0.025) -1.96
UUpper Critical z (0.975) 1.96
P-Value N/A
User Selectted Options
Date//Time of Commputation ProUCL 5.12017/12/22 1:40:32 PMM
From File WorkSheet__a.xls
Full Precision OFF
Confidence C Coefficient 95%
Seleected Null Hy ypothesis Sample 1 M Mean/Median n = Sample 2 2 Mean/Meddian (Two Si ded Alternattive)
AAlternative Hy ypothesis Sample 1 M Mean/Median n <> Sample e 2 Mean/Meedian
Sample 1 Sample 2
NNumber of Va alid Data 6 6
Nummber of Nonn-Detects 0 0
Nuumber of Dettect Data 6 6
MMinimum No on-Detect N/A N/A
MMaximum No on-Detect N/A N/A
Percent Nonn-detects 0.00% 0.00%
Minimumm Detect 0.00157 0.0018
Maximumm Detect 0.0115 0.0189
Mean of f Detects 0.0046 0.0104
Median of f Detects 0.00332 0.0114
SD of f Detects 0.00357 0.00732
KKM Mean 0.0046 0.0104
KM SD 0.00357 0.00732
Gehan z Test Value -1.121
LLower Critical z (0.025) -1.96
UUpper Critical z (0.975) 1.96
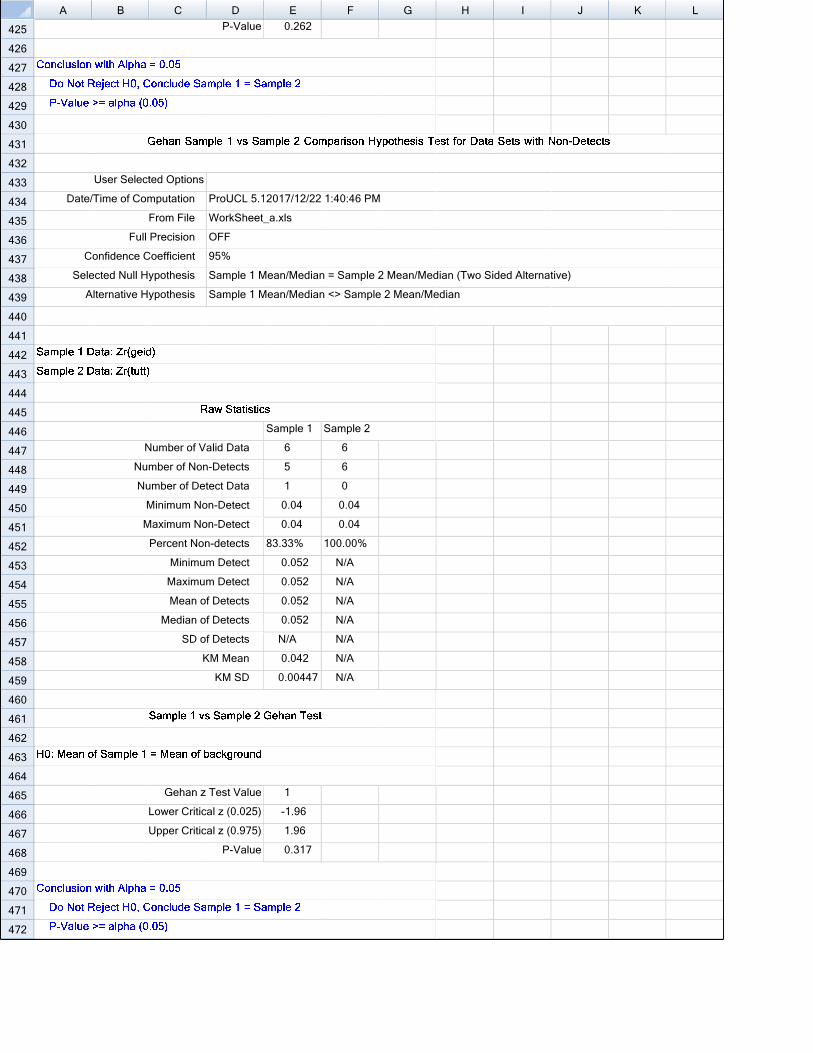
A B C D E F G H I J K L
425
426
427
428
429
430
431
432
433
434
435
436
437
438
439
440
441
442
443
444
445
446
447
448
449
450
451
452
453
454
455
456
457
458
459
460
461
462
463
464
465
466
467
468
469
470
471
472
P-Value 0.262
User Selectted Options
Date//Time of Commputation ProUCL 5.12017/12/22 1:40:46 PMM
From File WorkSheet__a.xls
Full Precision OFF
Confidence C Coefficient 95%
Seleected Null Hy ypothesis Sample 1 M Mean/Median n = Sample 2 2 Mean/Meddian (Two Si ded Alternattive)
AAlternative Hy ypothesis Sample 1 M Mean/Median n <> Sample e 2 Mean/Meedian
Sample 1 Sample 2
NNumber of Va alid Data 6 6
Nummber of Nonn-Detects 5 6
Nuumber of Dettect Data 1 0
MMinimum No on-Detect 0.04 0.04
MMaximum No on-Detect 0.04 0.04
Percent Nonn-detects 83.33% 100.00%
Minimumm Detect 0.052 N/A
Maximumm Detect 0.052 N/A
Mean of f Detects 0.052 N/A
Median of f Detects 0.052 N/A
SD of f Detects N/A N/A
KKM Mean 0.042 N/A
KM SD 0.00447 N/A
Gehan z Test Value 1
LLower Critical z (0.025) -1.96
UUpper Critical z (0.975) 1.96
P-Value 0.317

Appendix III
HHRA Detailed Risk Estimates
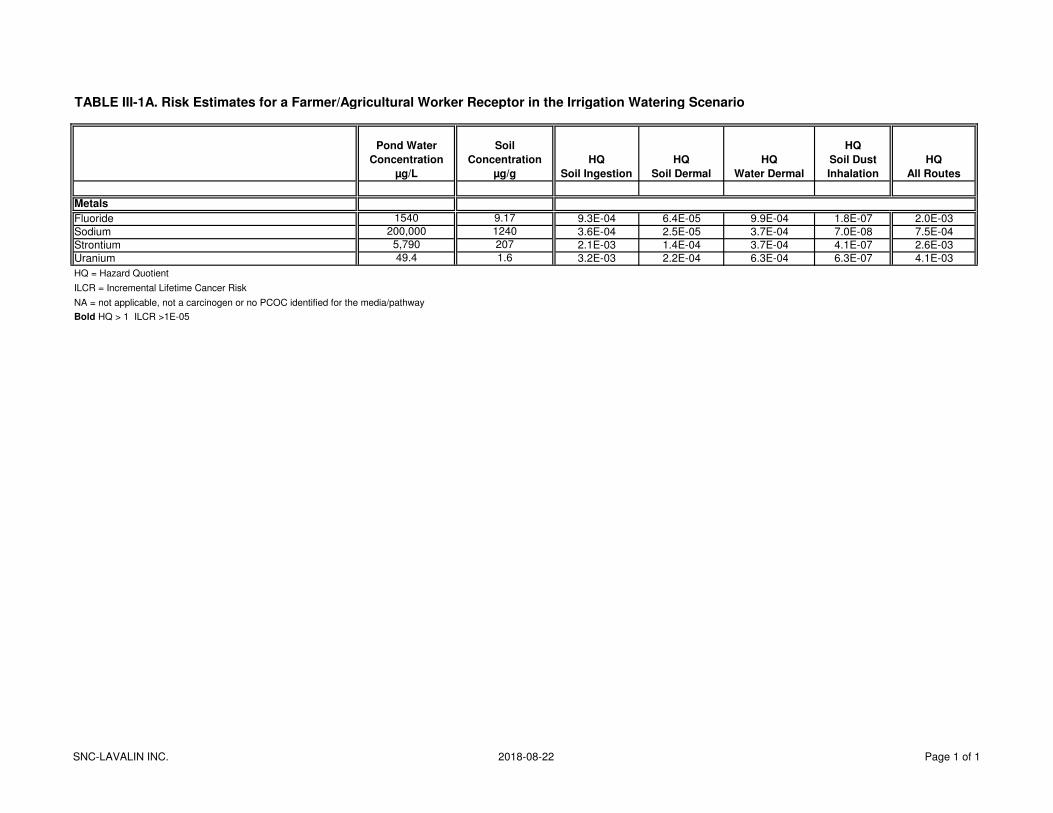
TABLE III-1A. Risk Estimates for a Farmer/Agricultural Worker Receptor in the Irrigation Watering Scenario
Pond Water
Concentration
µg/L
Soil
Concentration
µg/g
HQ
Soil Ingestion
HQ
Soil Dermal
HQ
Water Dermal
HQ
Soil Dust
Inhalation
HQ
All Routes
Metals
Fluoride 1540 9.17 9.3E-04 6.4E-05 9.9E-04 1.8E-07 2.0E-03
Sodium 200,000 1240 3.6E-04 2.5E-05 3.7E-04 7.0E-08 7.5E-04
Strontium 5,790 207 2.1E-03 1.4E-04 3.7E-04 4.1E-07 2.6E-03
Uranium 49.4 1.6 3.2E-03 2.2E-04 6.3E-04 6.3E-07 4.1E-03
HQ = Hazard Quotient
ILCR = Incremental Lifetime Cancer Risk
NA = not applicable, not a carcinogen or no PCOC identified for the media/pathway
Bold HQ > 1 ILCR >1E-05
SNC-LAVALIN INC. 2018-08-22 Page 1 of 1

Fluoride - - 1.0E-03 - 1.0E+00 - - 1.5E+03 1.5E-03 1.5E-06
Sodium - - 1.0E-03 - 1.0E+00 - - 2.0E+05 2.0E-01 2.0E-04
Strontium - - 1.0E-03 - 1.0E+00 - - 5.8E+03 5.8E-03 5.8E-06
Uranium - - 1.0E-03 - 1.0E+00 - - 4.9E+01 4.9E-05 4.9E-08
Notes:
Metals
Methodology as per text.
tevent
(hr/event)
DAevent
(mg/cm2-event)
TABLE III-1B. Chemical Specific Parameters used to Estimate Dermally Absorbed Dose from Groundwater
Chemical of Potential Concern Log KowB
(unitless)
(Kp)
(cm/hr)T
(hr/event)
t*
(hr)
FA
(unitless)Cw
(ug/L)
Cw
(mg/cm3)
SNC-LAVALIN INC. 2018-08-22 Page 1 of 1
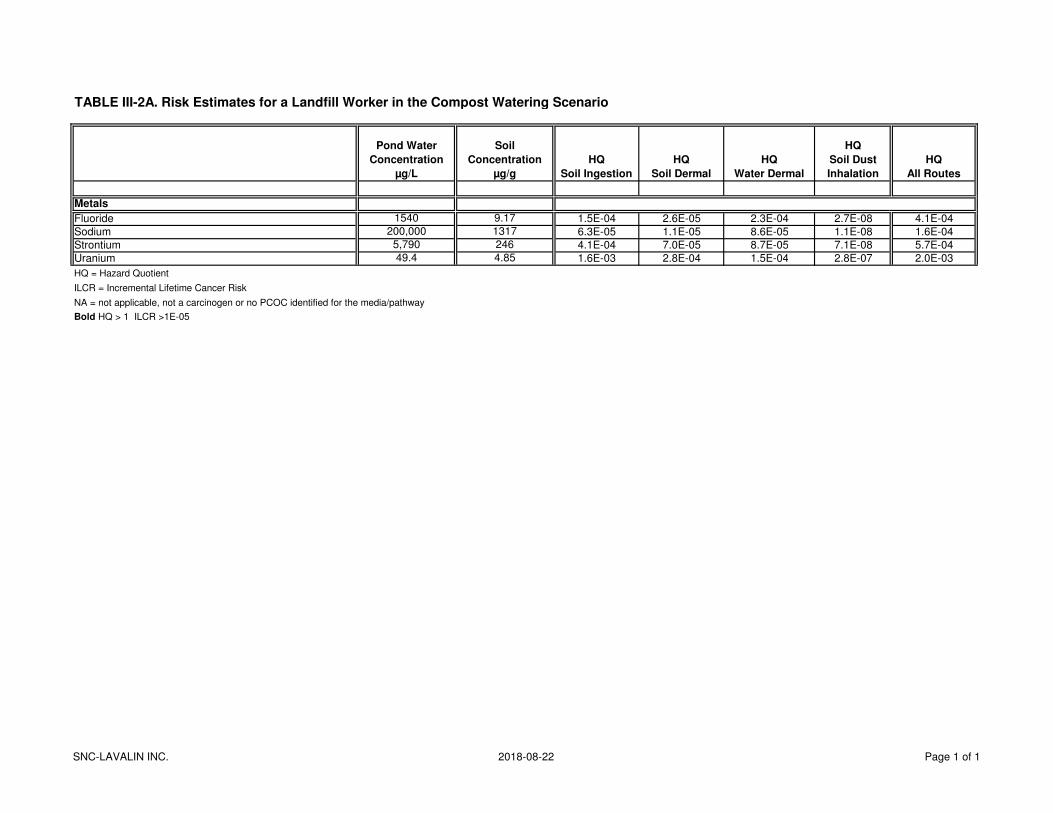
TABLE III-2A. Risk Estimates for a Landfill Worker in the Compost Watering Scenario
Pond Water
Concentration
µg/L
Soil
Concentration
µg/g
HQ
Soil Ingestion
HQ
Soil Dermal
HQ
Water Dermal
HQ
Soil Dust
Inhalation
HQ
All Routes
Metals
Fluoride 1540 9.17 1.5E-04 2.6E-05 2.3E-04 2.7E-08 4.1E-04
Sodium 200,000 1317 6.3E-05 1.1E-05 8.6E-05 1.1E-08 1.6E-04
Strontium 5,790 246 4.1E-04 7.0E-05 8.7E-05 7.1E-08 5.7E-04
Uranium 49.4 4.85 1.6E-03 2.8E-04 1.5E-04 2.8E-07 2.0E-03
HQ = Hazard Quotient
ILCR = Incremental Lifetime Cancer Risk
NA = not applicable, not a carcinogen or no PCOC identified for the media/pathway
Bold HQ > 1 ILCR >1E-05
SNC-LAVALIN INC. 2018-08-22 Page 1 of 1

Fluoride - - 1.0E-03 - 1.0E+00 - - 1.5E+03 1.5E-03 1.5E-06
Sodium - - 1.0E-03 - 1.0E+00 - - 2.0E+05 2.0E-01 2.0E-04
Strontium - - 1.0E-03 - 1.0E+00 - - 5.8E+03 5.8E-03 5.8E-06
Uranium - - 1.0E-03 - 1.0E+00 - - 4.9E+01 4.9E-05 4.9E-08
Notes:
tevent
(hr/event)
DAevent
(mg/cm2-event)
TABLE III-2B. Chemical Specific Parameters used to Estimate Dermally Absorbed Dose from Groundwater
Chemical of Potential Concern Log KowB
(unitless)
(Kp)
(cm/hr)T
(hr/event)
t*
(hr)
FA
(unitless)Cw
(ug/L)
Cw
(mg/cm3)
Metals
Methodology as per text.
SNC-LAVALIN INC. 2018-08-22 Page 1 of 1
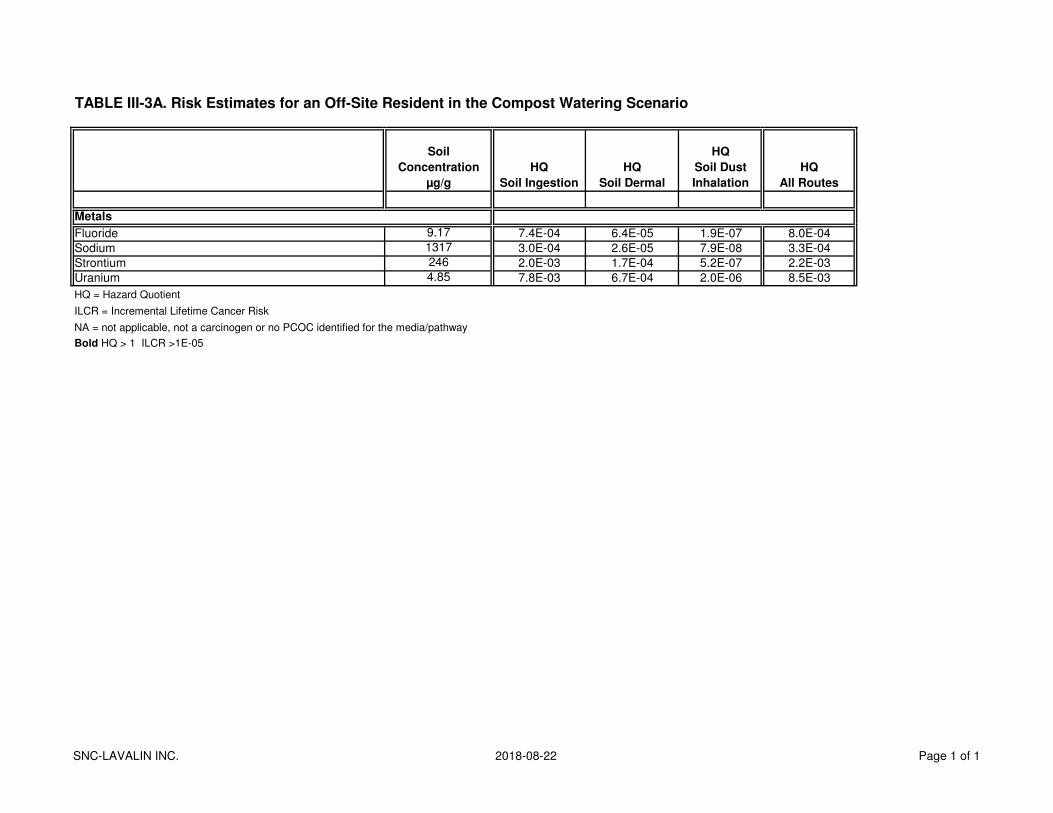
TABLE III-3A. Risk Estimates for an Off-Site Resident in the Compost Watering Scenario
Soil
Concentration
µg/g
HQ
Soil Ingestion
HQ
Soil Dermal
HQ
Soil Dust
Inhalation
HQ
All Routes
Metals
Fluoride 9.17 7.4E-04 6.4E-05 1.9E-07 8.0E-04
Sodium 1317 3.0E-04 2.6E-05 7.9E-08 3.3E-04
Strontium 246 2.0E-03 1.7E-04 5.2E-07 2.2E-03
Uranium 4.85 7.8E-03 6.7E-04 2.0E-06 8.5E-03
HQ = Hazard Quotient
ILCR = Incremental Lifetime Cancer Risk
NA = not applicable, not a carcinogen or no PCOC identified for the media/pathway
Bold HQ > 1 ILCR >1E-05
SNC-LAVALIN INC. 2018-08-22 Page 1 of 1

Fluoride - - 1.0E-03 - 1.0E+00 - - 0.0E+00 0.0E+00 0.0E+00
Sodium - - 1.0E-03 - 1.0E+00 - - 0.0E+00 0.0E+00 0.0E+00
Strontium - - 1.0E-03 - 1.0E+00 - - 0.0E+00 0.0E+00 0.0E+00
Uranium - - 1.0E-03 - 1.0E+00 - - 0.0E+00 0.0E+00 0.0E+00
Notes:
Metals
Methodology as per text.
tevent
(hr/event)
DAevent
(mg/cm2-event)
TABLE III-3B. Chemical Specific Parameters used to Estimate Dermally Absorbed Dose from Groundwater
Chemical of Potential Concern Log KowB
(unitless)
(Kp)
(cm/hr)T
(hr/event)
t*
(hr)
FA
(unitless)Cw
(ug/L)
Cw
(mg/cm3)
SNC-LAVALIN INC. 2018-08-22 Page 1 of 1

TABLE III-4A. Risk Estimates for a Landfill Worker in the Dust Control and Landscape Watering Scenarios
Pond Water
Concentration
µg/L
Soil
Concentration
µg/g
HQ
Soil Ingestion
HQ
Soil Dermal
HQ
Water Dermal
HQ
Soil Dust
Inhalation
HQ
All Routes
Metals
Fluoride 1540 9.17 1.5E-04 2.6E-05 2.3E-04 2.7E-08 4.1E-04
Sodium 200,000 1240 5.9E-05 1.0E-05 8.6E-05 1.0E-08 1.6E-04
Strontium 5,790 207 3.5E-04 5.9E-05 8.7E-05 6.0E-08 4.9E-04
Uranium 49.4 1.6 5.4E-04 9.2E-05 1.5E-04 9.3E-08 7.8E-04
HQ = Hazard Quotient
ILCR = Incremental Lifetime Cancer Risk
NA = not applicable, not a carcinogen or no PCOC identified for the media/pathway
Bold HQ > 1 ILCR >1E-05
SNC-LAVALIN INC. 2018-08-22 Page 1 of 1
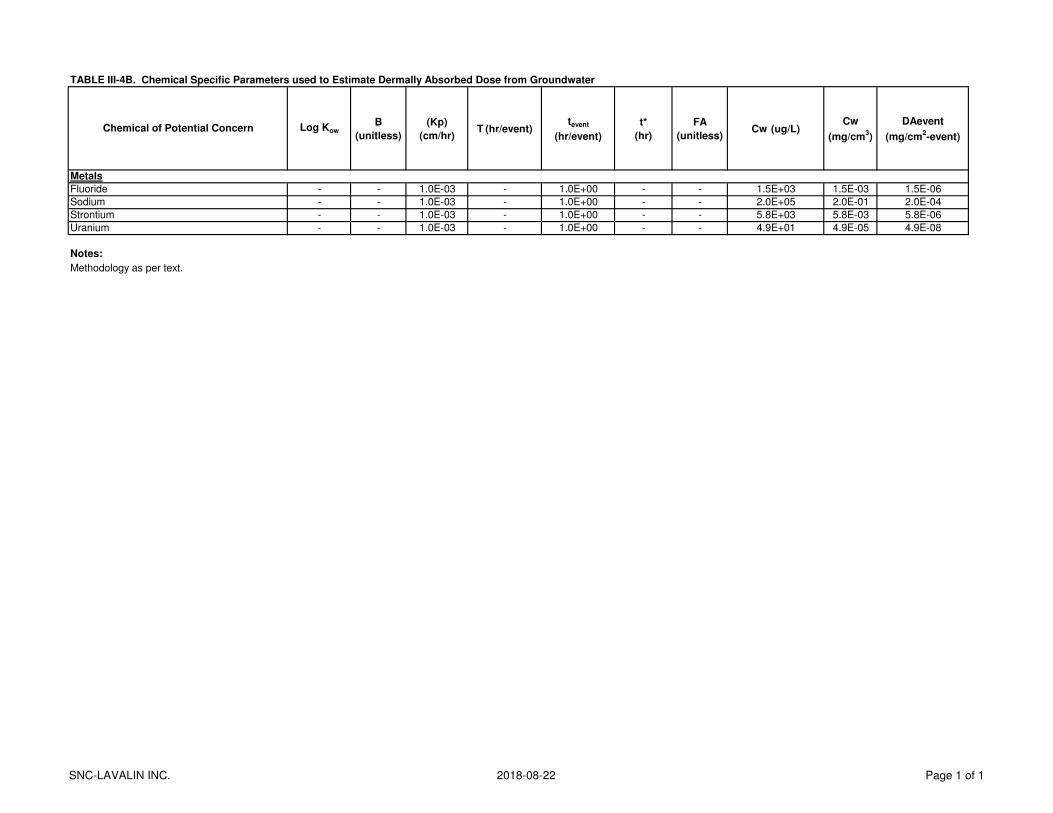
Fluoride - - 1.0E-03 - 1.0E+00 - - 1.5E+03 1.5E-03 1.5E-06
Sodium - - 1.0E-03 - 1.0E+00 - - 2.0E+05 2.0E-01 2.0E-04
Strontium - - 1.0E-03 - 1.0E+00 - - 5.8E+03 5.8E-03 5.8E-06
Uranium - - 1.0E-03 - 1.0E+00 - - 4.9E+01 4.9E-05 4.9E-08
Notes:
tevent
(hr/event)
DAevent
(mg/cm2-event)
TABLE III-4B. Chemical Specific Parameters used to Estimate Dermally Absorbed Dose from Groundwater
Chemical of Potential Concern Log KowB
(unitless)
(Kp)
(cm/hr)T
(hr/event)
t*
(hr)
FA
(unitless)Cw
(ug/L)
Cw
(mg/cm3)
Metals
Methodology as per text.
SNC-LAVALIN INC. 2018-08-22 Page 1 of 1

Appendix IV
Farmer Interview Summary
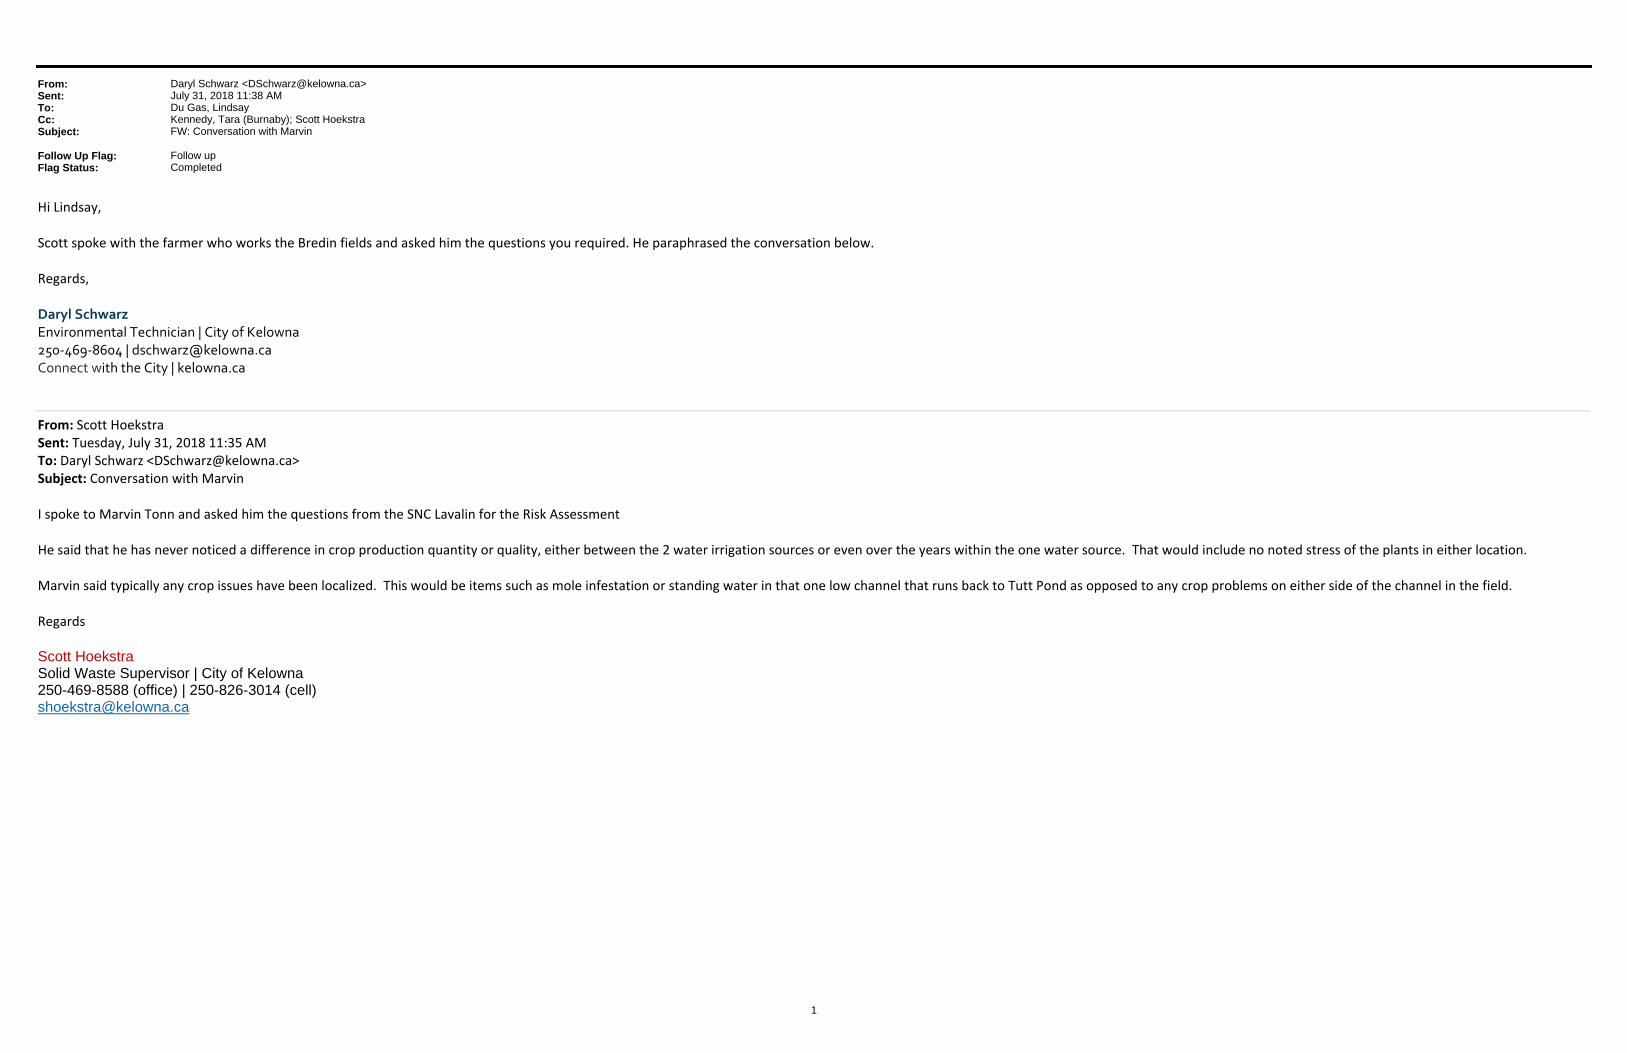
1
From: Daryl Schwarz <[email protected]>Sent: July 31, 2018 11:38 AMTo: Du Gas, LindsayCc: Kennedy, Tara (Burnaby); Scott HoekstraSubject: FW: Conversation with Marvin
Follow Up Flag: Follow upFlag Status: Completed
Hi Lindsay,
Scott spoke with the farmer who works the Bredin fields and asked him the questions you required. He paraphrased the conversation below.
Regards,
Daryl Schwarz Environmental Technician | City of Kelowna 250‐469‐8604 | [email protected] Connect with the City | kelowna.ca
From: Scott Hoekstra Sent: Tuesday, July 31, 2018 11:35 AM To: Daryl Schwarz <[email protected]> Subject: Conversation with Marvin
I spoke to Marvin Tonn and asked him the questions from the SNC Lavalin for the Risk Assessment
He said that he has never noticed a difference in crop production quantity or quality, either between the 2 water irrigation sources or even over the years within the one water source. That would include no noted stress of the plants in either location.
Marvin said typically any crop issues have been localized. This would be items such as mole infestation or standing water in that one low channel that runs back to Tutt Pond as opposed to any crop problems on either side of the channel in the field.
Regards
Scott Hoekstra Solid Waste Supervisor | City of Kelowna 250-469-8588 (office) | 250-826-3014 (cell) [email protected]

Appendix V
GEID Water Quality Results
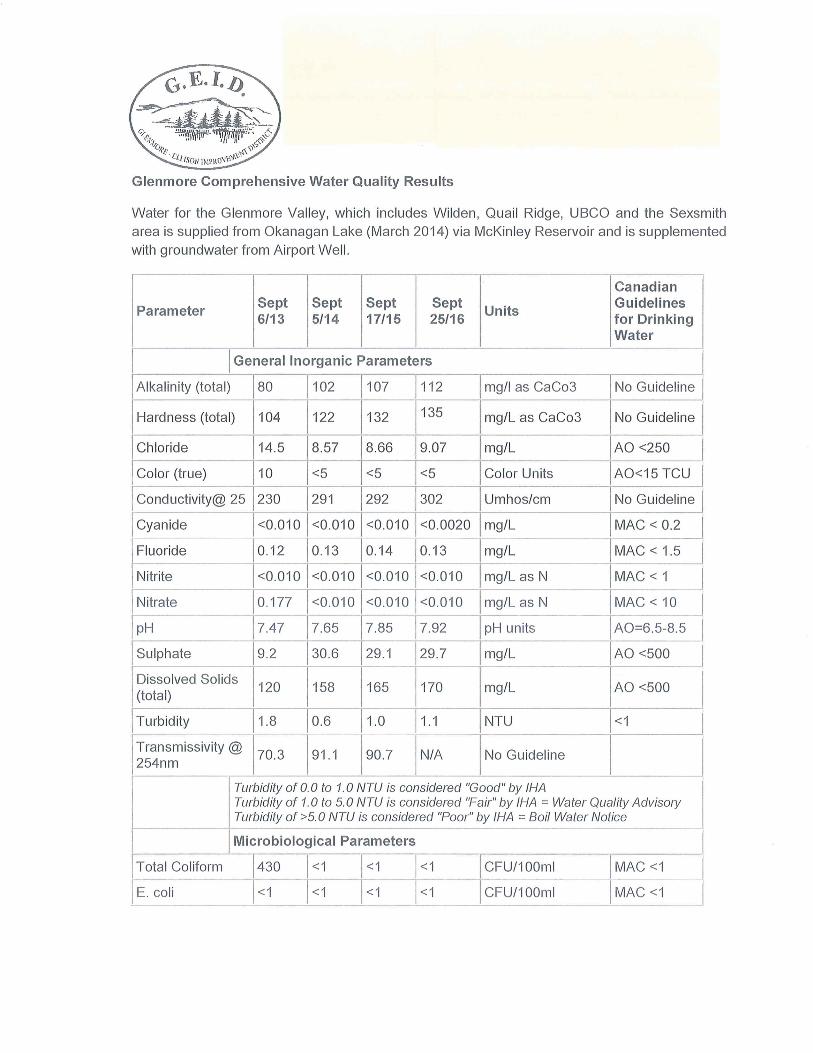
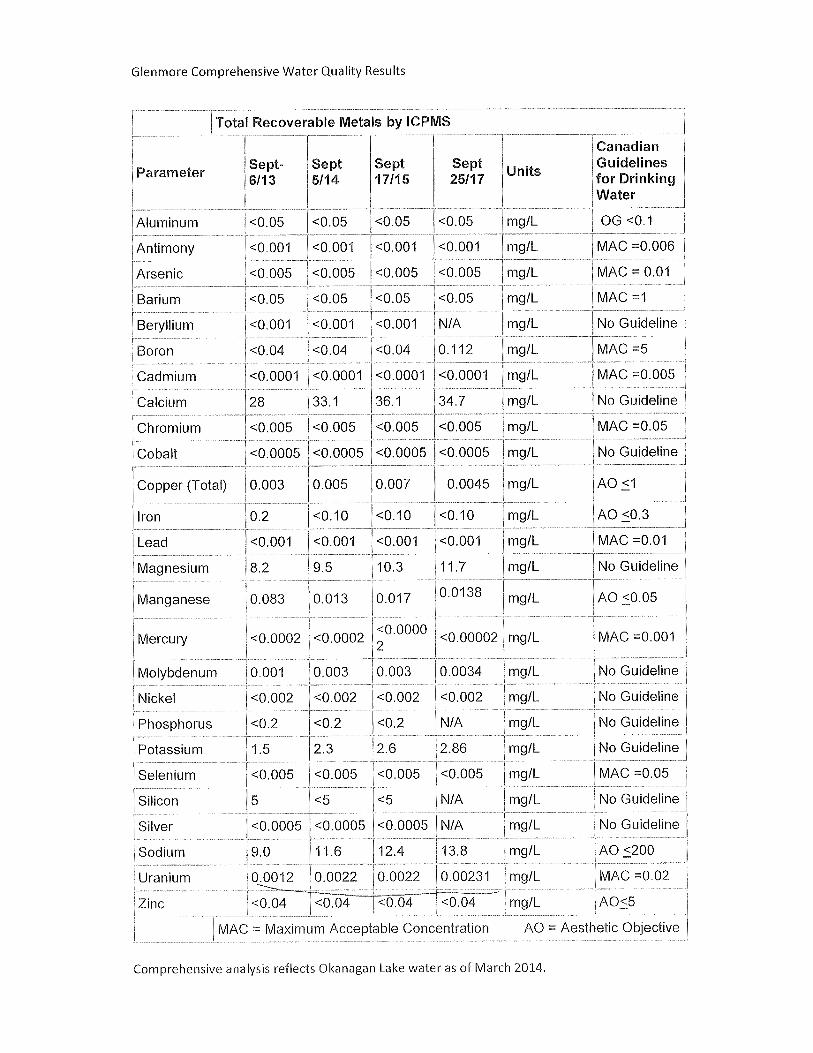
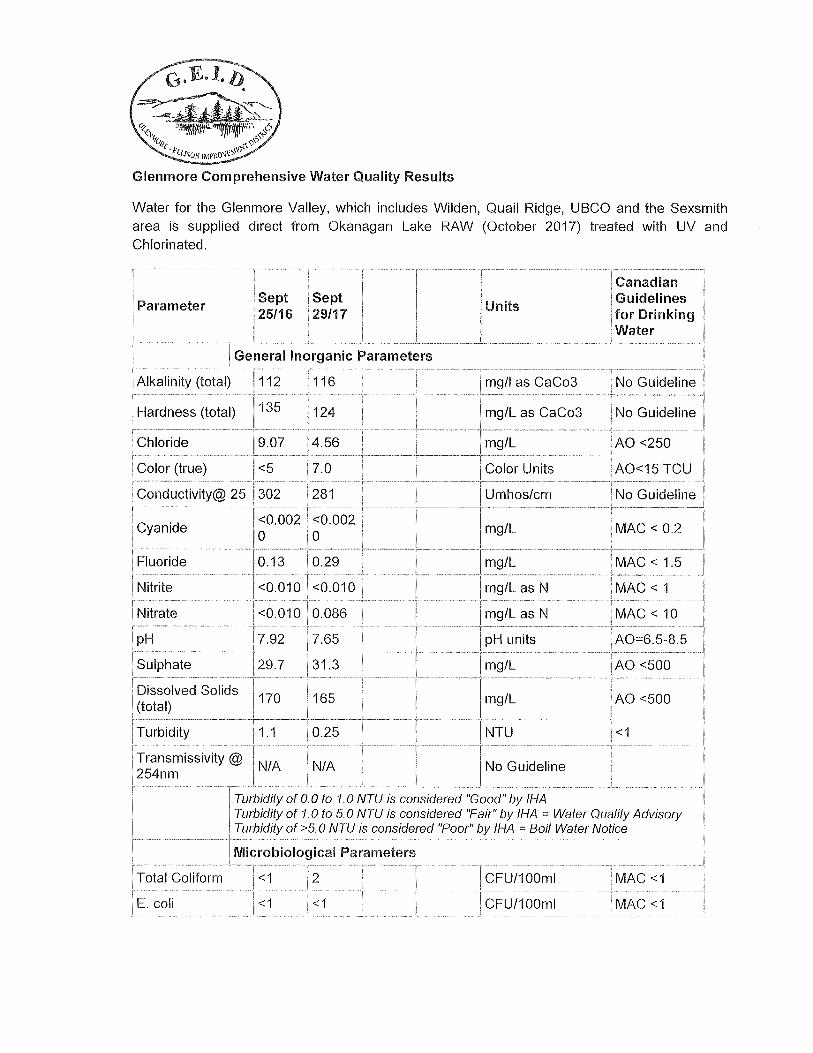
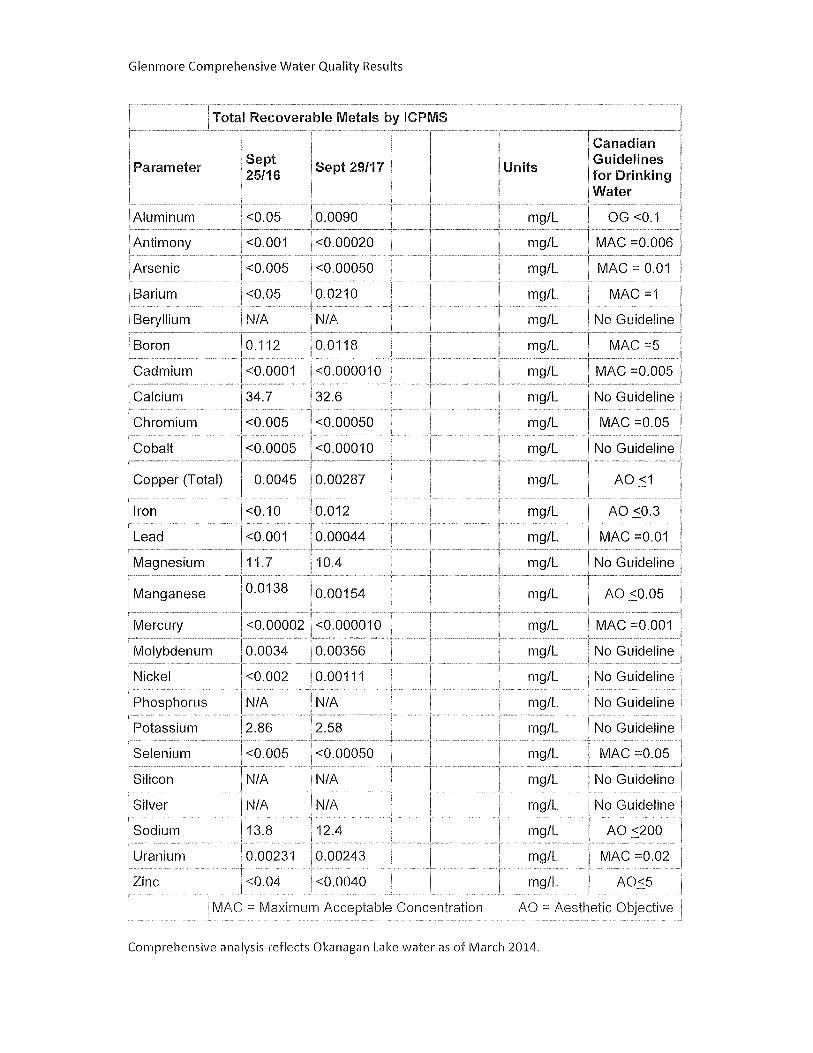
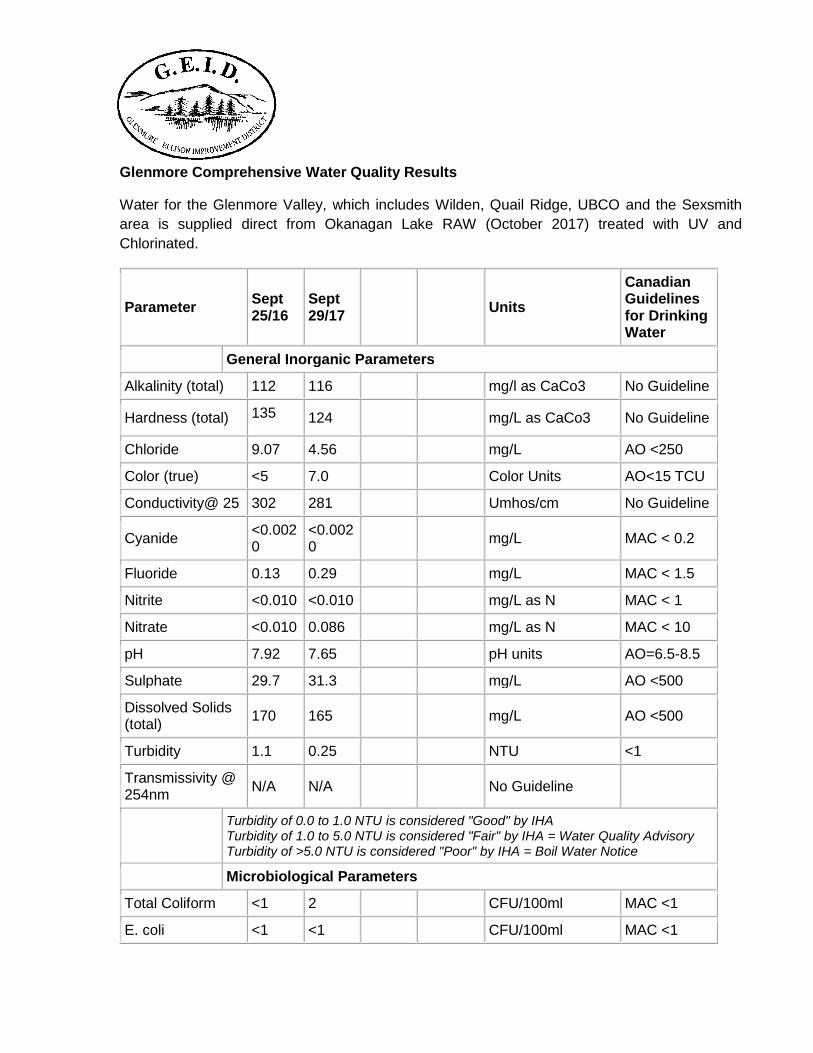
Glenmore Comprehensive Water Quality Results
Water for the Glenmore Valley, which includes Wilden, Quail Ridge, UBCO and the Sexsmith
area is supplied direct from Okanagan Lake RAW (October 2017) treated with UV and
Chlorinated.
Parameter Sept 25/16
Sept 29/17
Units
Canadian Guidelines for Drinking Water
General Inorganic Parameters
Alkalinity (total) 112 116 mg/l as CaCo3 No Guideline
Hardness (total) 135 124 mg/L as CaCo3 No Guideline
Chloride 9.07 4.56 mg/L AO <250
Color (true) <5 7.0 Color Units AO<15 TCU
Conductivity@ 25 302 281 Umhos/cm No Guideline
Cyanide <0.0020
<0.0020
mg/L MAC < 0.2
Fluoride 0.13 0.29 mg/L MAC < 1.5
Nitrite <0.010 <0.010 mg/L as N MAC < 1
Nitrate <0.010 0.086 mg/L as N MAC < 10
pH 7.92 7.65 pH units AO=6.5-8.5
Sulphate 29.7 31.3 mg/L AO <500
Dissolved Solids (total)
170 165 mg/L AO <500
Turbidity 1.1 0.25 NTU <1
Transmissivity @ 254nm
N/A N/A No Guideline
Turbidity of 0.0 to 1.0 NTU is considered "Good" by IHA Turbidity of 1.0 to 5.0 NTU is considered "Fair" by IHA = Water Quality Advisory Turbidity of >5.0 NTU is considered "Poor" by IHA = Boil Water Notice
Microbiological Parameters
Total Coliform <1 2 CFU/100ml MAC <1
E. coli <1 <1 CFU/100ml MAC <1
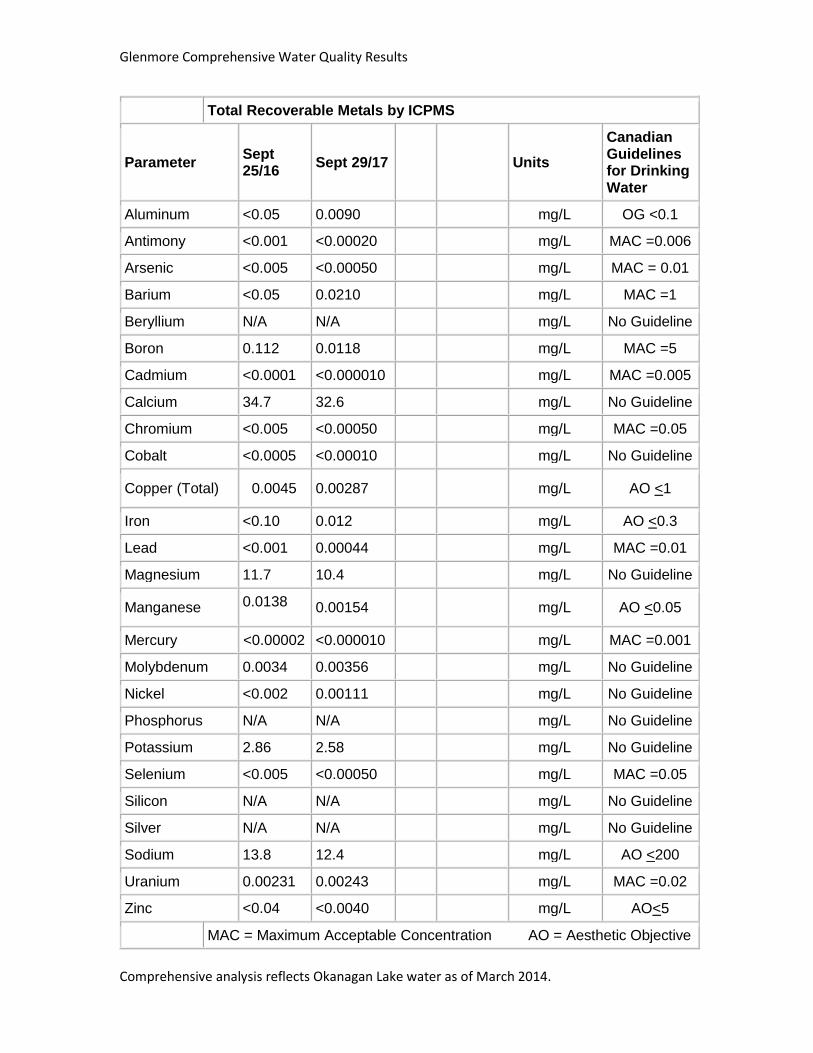
Glenmore Comprehensive Water Quality Results
Total Recoverable Metals by ICPMS
Parameter Sept 25/16
Sept 29/17 Units
Canadian Guidelines for Drinking Water
Aluminum <0.05 0.0090 mg/L OG <0.1
Antimony <0.001 <0.00020 mg/L MAC =0.006
Arsenic <0.005 <0.00050 mg/L MAC = 0.01
Barium <0.05 0.0210 mg/L MAC =1
Beryllium N/A N/A mg/L No Guideline
Boron 0.112 0.0118 mg/L MAC =5
Cadmium <0.0001 <0.000010 mg/L MAC =0.005
Calcium 34.7 32.6 mg/L No Guideline
Chromium <0.005 <0.00050 mg/L MAC =0.05
Cobalt <0.0005 <0.00010 mg/L No Guideline
Copper (Total) 0.0045 0.00287 mg/L AO <1
Iron <0.10 0.012 mg/L AO <0.3
Lead <0.001 0.00044 mg/L MAC =0.01
Magnesium 11.7 10.4 mg/L No Guideline
Manganese 0.0138 0.00154 mg/L AO <0.05
Mercury <0.00002 <0.000010 mg/L MAC =0.001
Molybdenum 0.0034 0.00356 mg/L No Guideline
Nickel <0.002 0.00111 mg/L No Guideline
Phosphorus N/A N/A mg/L No Guideline
Potassium 2.86 2.58 mg/L No Guideline
Selenium <0.005 <0.00050 mg/L MAC =0.05
Silicon N/A N/A mg/L No Guideline
Silver N/A N/A mg/L No Guideline
Sodium 13.8 12.4 mg/L AO <200
Uranium 0.00231 0.00243 mg/L MAC =0.02
Zinc <0.04 <0.0040 mg/L AO<5
MAC = Maximum Acceptable Concentration AO = Aesthetic Objective
Comprehensive analysis reflects Okanagan Lake water as of March 2014.

SNC-Lavalin Inc.
8648 Commerce Court
Burnaby, British Columbia, Canada V5A 4N6
604.515.5151 604.515.5150
www.snclavalin.com

ATTACHMENT 4
LANDFILL GAS
MONITORING IN
BUILDINGS AT GLENMORE
LANDFILL, SLR Consulting
Canada Ltd, (Sept 19, 2018)
SLR Consulting (Canada) Ltd. 200-1475 Ellis StreetKelowna, BC V1Y 2A3
Tel: 250-762-7202 Fax: 250-763-7303
Memorandum
To: Darren Enevoldson From: Erica Milligan
Company: City of Kelowna
cc: Date: September 19, 2018
Subject: LANDFILL GAS MONITORING IN BUILDINGS AT GLENMORE LANDFILL,
2710 – 2720 JOHN HINDLE DRIVE, KELOWNA, BC
Background and Objectives
SLR Consulting Canada Limited (SLR) was retained by the City of Kelowna (the City) under PO527869 dated July 9, 2018 to prepare a Technical Memorandum that will assist the City in understanding what, if any, permanent gas monitoring equipment is required to be installed in buildings that lie within a distance of 300 metres from waste deposited in the City’s Glenmore landfill.
The landfill is governed by a permit that requires compliance with the British Columbia Landfill Gas Design Guidelines (the Guidelines) and includes the need to incorporate continuous monitoring for flammable gas in buildings located within 300 metres of the edge of waste.
Performance Standard 4 of the Guidelines states that ‘Combustible gas concentrations measured in on-site buildings cannot exceed 20 percent of the lower explosive limit of methane (1 percent by volume) at any time’.
Design Standard 10 of the Guidelines states that ‘All buildings on the landfill site must have continuous combustible gas measurement equipment’. It further states that ‘an on-site building is defined as any structure or facility with walls, a roof, and a foundation, and that is accessible by people. A building that is elevated and not in contact with the soil below the ground surface does not qualify as a ‘building’’ in this definition, and therefore does not require monitoring for combustible gas concentrations. However, vents should be installed within all buildings that do not require air monitoring as per this definition’.
The above criteria have formed the basis to define which buildings would be in need of continuous flammable gas monitoring and which would be adequately served by the installation of wall vents. In progressing the assessment, SLR has:
SLR 1 CONFIDENTIAL
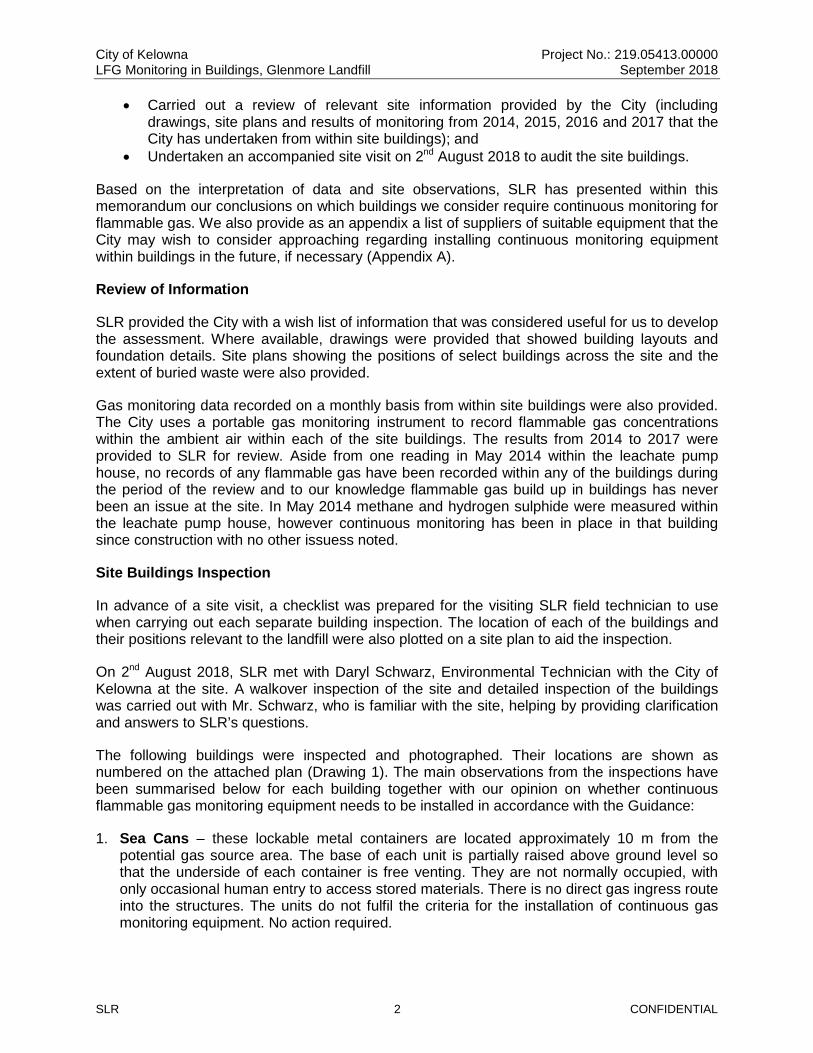
City of Kelowna Project No.: 219.05413.00000 LFG Monitoring in Buildings, Glenmore Landfill September 2018
• Carried out a review of relevant site information provided by the City (including drawings, site plans and results of monitoring from 2014, 2015, 2016 and 2017 that the City has undertaken from within site buildings); and
• Undertaken an accompanied site visit on 2nd August 2018 to audit the site buildings.
Based on the interpretation of data and site observations, SLR has presented within this memorandum our conclusions on which buildings we consider require continuous monitoring for flammable gas. We also provide as an appendix a list of suppliers of suitable equipment that the City may wish to consider approaching regarding installing continuous monitoring equipment within buildings in the future, if necessary (Appendix A).
Review of Information
SLR provided the City with a wish list of information that was considered useful for us to develop the assessment. Where available, drawings were provided that showed building layouts and foundation details. Site plans showing the positions of select buildings across the site and the extent of buried waste were also provided.
Gas monitoring data recorded on a monthly basis from within site buildings were also provided. The City uses a portable gas monitoring instrument to record flammable gas concentrations within the ambient air within each of the site buildings. The results from 2014 to 2017 were provided to SLR for review. Aside from one reading in May 2014 within the leachate pump house, no records of any flammable gas have been recorded within any of the buildings during the period of the review and to our knowledge flammable gas build up in buildings has never been an issue at the site. In May 2014 methane and hydrogen sulphide were measured within the leachate pump house, however continuous monitoring has been in place in that building since construction with no other issuess noted.
Site Buildings Inspection
In advance of a site visit, a checklist was prepared for the visiting SLR field technician to use when carrying out each separate building inspection. The location of each of the buildings and their positions relevant to the landfill were also plotted on a site plan to aid the inspection.
On 2nd August 2018, SLR met with Daryl Schwarz, Environmental Technician with the City of Kelowna at the site. A walkover inspection of the site and detailed inspection of the buildings was carried out with Mr. Schwarz, who is familiar with the site, helping by providing clarification and answers to SLR’s questions.
The following buildings were inspected and photographed. Their locations are shown as numbered on the attached plan (Drawing 1). The main observations from the inspections have been summarised below for each building together with our opinion on whether continuous flammable gas monitoring equipment needs to be installed in accordance with the Guidance:
1. Sea Cans – these lockable metal containers are located approximately 10 m from the potential gas source area. The base of each unit is partially raised above ground level so that the underside of each container is free venting. They are not normally occupied, with only occasional human entry to access stored materials. There is no direct gas ingress route into the structures. The units do not fulfil the criteria for the installation of continuous gas monitoring equipment. No action required.
SLR 2 CONFIDENTIAL
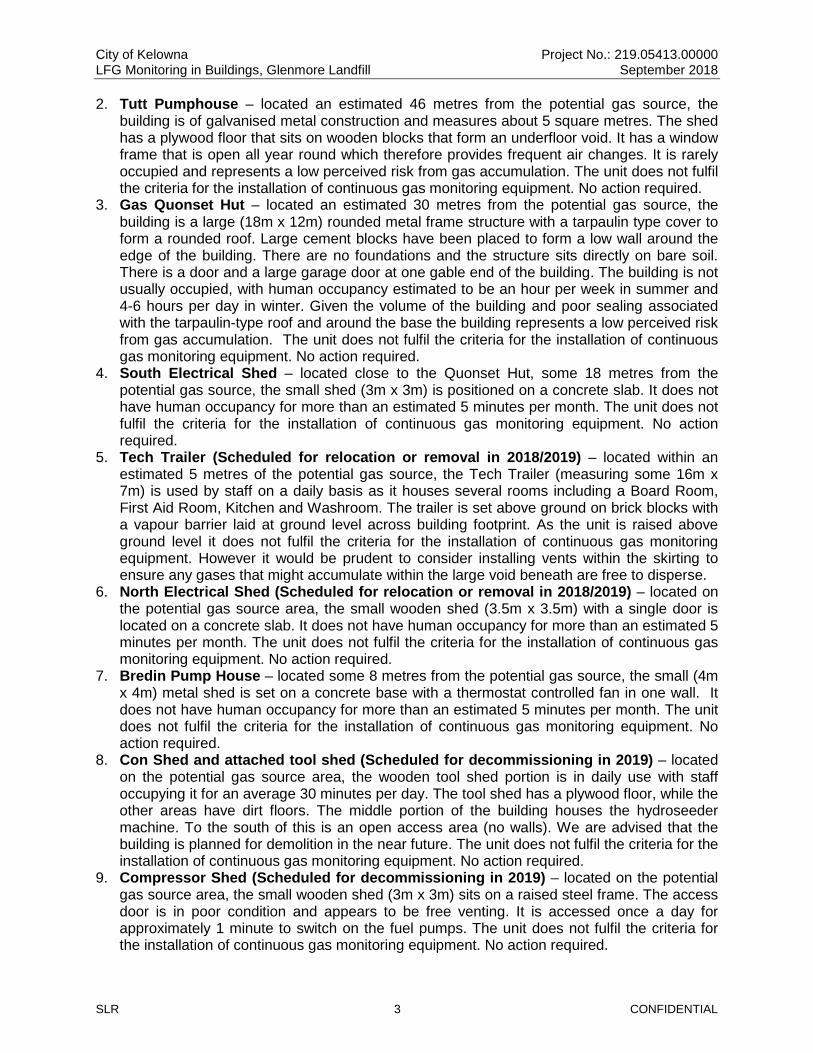
City of Kelowna Project No.: 219.05413.00000 LFG Monitoring in Buildings, Glenmore Landfill September 2018
2. Tutt Pumphouse – located an estimated 46 metres from the potential gas source, the building is of galvanised metal construction and measures about 5 square metres. The shed has a plywood floor that sits on wooden blocks that form an underfloor void. It has a window frame that is open all year round which therefore provides frequent air changes. It is rarely occupied and represents a low perceived risk from gas accumulation. The unit does not fulfil the criteria for the installation of continuous gas monitoring equipment. No action required.
3. Gas Quonset Hut – located an estimated 30 metres from the potential gas source, the building is a large (18m x 12m) rounded metal frame structure with a tarpaulin type cover to form a rounded roof. Large cement blocks have been placed to form a low wall around the edge of the building. There are no foundations and the structure sits directly on bare soil. There is a door and a large garage door at one gable end of the building. The building is not usually occupied, with human occupancy estimated to be an hour per week in summer and 4-6 hours per day in winter. Given the volume of the building and poor sealing associated with the tarpaulin-type roof and around the base the building represents a low perceived risk from gas accumulation. The unit does not fulfil the criteria for the installation of continuous gas monitoring equipment. No action required.
4. South Electrical Shed – located close to the Quonset Hut, some 18 metres from the potential gas source, the small shed (3m x 3m) is positioned on a concrete slab. It does not have human occupancy for more than an estimated 5 minutes per month. The unit does not fulfil the criteria for the installation of continuous gas monitoring equipment. No action required.
5. Tech Trailer (Scheduled for relocation or removal in 2018/2019) – located within an estimated 5 metres of the potential gas source, the Tech Trailer (measuring some 16m x 7m) is used by staff on a daily basis as it houses several rooms including a Board Room, First Aid Room, Kitchen and Washroom. The trailer is set above ground on brick blocks with a vapour barrier laid at ground level across building footprint. As the unit is raised above ground level it does not fulfil the criteria for the installation of continuous gas monitoring equipment. However it would be prudent to consider installing vents within the skirting to ensure any gases that might accumulate within the large void beneath are free to disperse.
6. North Electrical Shed (Scheduled for relocation or removal in 2018/2019) – located on the potential gas source area, the small wooden shed (3.5m x 3.5m) with a single door is located on a concrete slab. It does not have human occupancy for more than an estimated 5 minutes per month. The unit does not fulfil the criteria for the installation of continuous gas monitoring equipment. No action required.
7. Bredin Pump House – located some 8 metres from the potential gas source, the small (4m x 4m) metal shed is set on a concrete base with a thermostat controlled fan in one wall. It does not have human occupancy for more than an estimated 5 minutes per month. The unit does not fulfil the criteria for the installation of continuous gas monitoring equipment. No action required.
8. Con Shed and attached tool shed (Scheduled for decommissioning in 2019) – located on the potential gas source area, the wooden tool shed portion is in daily use with staff occupying it for an average 30 minutes per day. The tool shed has a plywood floor, while the other areas have dirt floors. The middle portion of the building houses the hydroseeder machine. To the south of this is an open access area (no walls). We are advised that the building is planned for demolition in the near future. The unit does not fulfil the criteria for the installation of continuous gas monitoring equipment. No action required.
9. Compressor Shed (Scheduled for decommissioning in 2019) – located on the potential gas source area, the small wooden shed (3m x 3m) sits on a raised steel frame. The access door is in poor condition and appears to be free venting. It is accessed once a day for approximately 1 minute to switch on the fuel pumps. The unit does not fulfil the criteria for the installation of continuous gas monitoring equipment. No action required.
SLR 3 CONFIDENTIAL
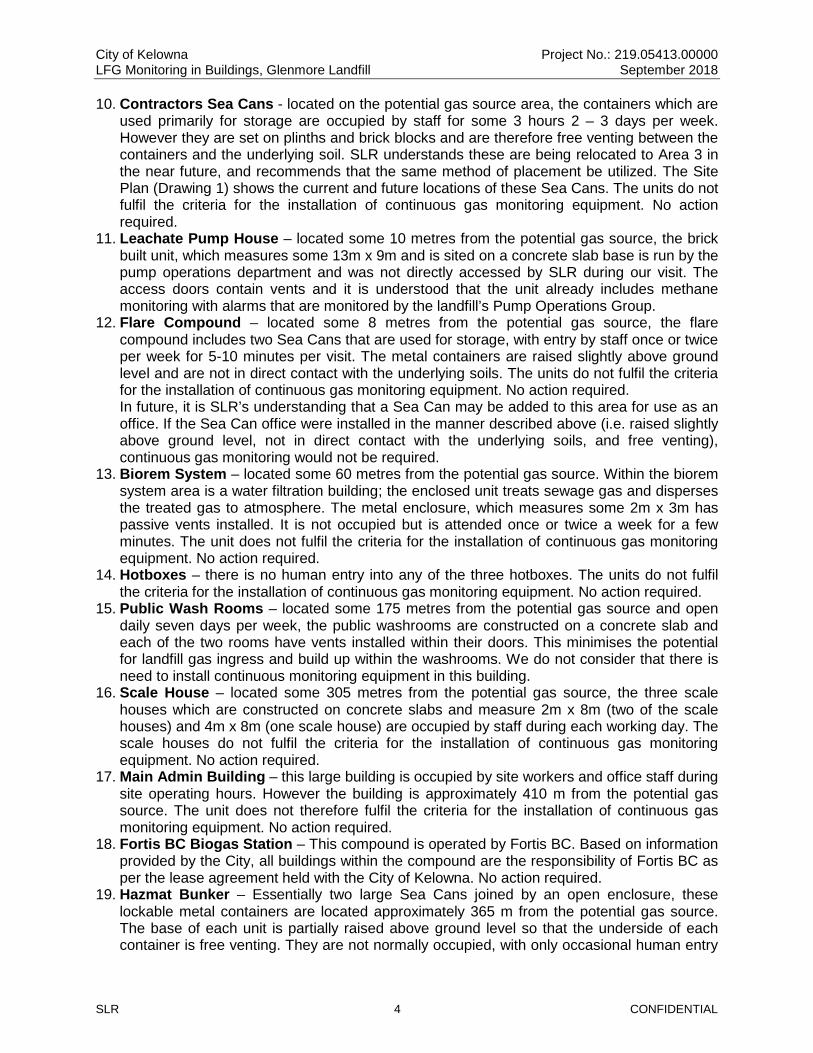
City of Kelowna Project No.: 219.05413.00000 LFG Monitoring in Buildings, Glenmore Landfill September 2018
10. Contractors Sea Cans - located on the potential gas source area, the containers which are used primarily for storage are occupied by staff for some 3 hours 2 – 3 days per week. However they are set on plinths and brick blocks and are therefore free venting between the containers and the underlying soil. SLR understands these are being relocated to Area 3 in the near future, and recommends that the same method of placement be utilized. The Site Plan (Drawing 1) shows the current and future locations of these Sea Cans. The units do not fulfil the criteria for the installation of continuous gas monitoring equipment. No action required.
11. Leachate Pump House – located some 10 metres from the potential gas source, the brick built unit, which measures some 13m x 9m and is sited on a concrete slab base is run by the pump operations department and was not directly accessed by SLR during our visit. The access doors contain vents and it is understood that the unit already includes methane monitoring with alarms that are monitored by the landfill’s Pump Operations Group.
12. Flare Compound – located some 8 metres from the potential gas source, the flare compound includes two Sea Cans that are used for storage, with entry by staff once or twice per week for 5-10 minutes per visit. The metal containers are raised slightly above ground level and are not in direct contact with the underlying soils. The units do not fulfil the criteria for the installation of continuous gas monitoring equipment. No action required. In future, it is SLR’s understanding that a Sea Can may be added to this area for use as an office. If the Sea Can office were installed in the manner described above (i.e. raised slightly above ground level, not in direct contact with the underlying soils, and free venting), continuous gas monitoring would not be required.
13. Biorem System – located some 60 metres from the potential gas source. Within the biorem system area is a water filtration building; the enclosed unit treats sewage gas and disperses the treated gas to atmosphere. The metal enclosure, which measures some 2m x 3m has passive vents installed. It is not occupied but is attended once or twice a week for a few minutes. The unit does not fulfil the criteria for the installation of continuous gas monitoring equipment. No action required.
14. Hotboxes – there is no human entry into any of the three hotboxes. The units do not fulfil the criteria for the installation of continuous gas monitoring equipment. No action required.
15. Public Wash Rooms – located some 175 metres from the potential gas source and open daily seven days per week, the public washrooms are constructed on a concrete slab and each of the two rooms have vents installed within their doors. This minimises the potential for landfill gas ingress and build up within the washrooms. We do not consider that there is need to install continuous monitoring equipment in this building.
16. Scale House – located some 305 metres from the potential gas source, the three scale houses which are constructed on concrete slabs and measure 2m x 8m (two of the scale houses) and 4m x 8m (one scale house) are occupied by staff during each working day. The scale houses do not fulfil the criteria for the installation of continuous gas monitoring equipment. No action required.
17. Main Admin Building – this large building is occupied by site workers and office staff during site operating hours. However the building is approximately 410 m from the potential gas source. The unit does not therefore fulfil the criteria for the installation of continuous gas monitoring equipment. No action required.
18. Fortis BC Biogas Station – This compound is operated by Fortis BC. Based on information provided by the City, all buildings within the compound are the responsibility of Fortis BC as per the lease agreement held with the City of Kelowna. No action required.
19. Hazmat Bunker – Essentially two large Sea Cans joined by an open enclosure, these lockable metal containers are located approximately 365 m from the potential gas source. The base of each unit is partially raised above ground level so that the underside of each container is free venting. They are not normally occupied, with only occasional human entry
SLR 4 CONFIDENTIAL
City of Kelowna Project No.: 219.05413.00000 LFG Monitoring in Buildings, Glenmore Landfill September 2018
to deposit hazardous materials. There is no direct gas ingress route into the structures. The units do not fulfil the criteria for the installation of continuous gas monitoring equipment. No action required.
20. Contractor shed – SLR did not inspect this building during the site visit, as it is located more than 500 m from the potential gas source area. Based on information provided by the City, the shed is a portable plastic lockable building, situated on the ground surface. The shed is not normally occupied, with only occasional human entry to access stored materials or to act as a weather shelter. There is no direct gas ingress route into the structure. The unit does not fulfil the criteria for the installation of continuous gas monitoring equipment. No action required.
21. Sea Cans – these lockable metal containers are located within the potential gas source area. The base of each unit is partially raised above ground level so that the underside of each container is free venting. They are not normally occupied, with only occasional human entry to access stored materials. There is no direct gas ingress route into the structures. The units do not fulfil the criteria for the installation of continuous gas monitoring equipment. No action required.
Conclusions and Recommendations
From the assessment none of the buildings that SLR inspected met the guidance criteria to require the installation of continuous flammable gas monitoring equipment. Most of the buildings are not subject to human occupation and most are either above ground level (not in contact with the base soils) or are subject to sufficient free venting that potential build-up of flammable gas would be negligible.
We consider that one building requires further attention. We recommend the following:
• That the skirting that surrounds the underside of the Tech Trailer (building reference number 5) is inspected and in the absence of sufficient free venting that a series of vents are installed at approximately 5 metre intervals around the skirting to ensure adequate dispersal of any gases accumulating beneath the trailer which is in daily use by staff, if the building continues to be used for its current purpose and remains in its current location.
SLR 5 CONFIDENTIAL
City of Kelowna Project No.: 219.05413.00000 LFG Monitoring in Buildings, Glenmore Landfill September 2018
Closure
We trust the information presented meets your current needs. Should you have any questions or concerns, please do not hesitate to contact the undersigned.
Yours sincerely, SLR Consulting (Canada) Ltd.
Iestyn Davies Erica Milligan, M.Sc., P.Ag. Principal, Waste and Resource Management Environmental Scientist
Enc.
Drawing 1 – Site Plan Appendix A – Continuous Flammable Gas Monitoring Equipment Options
SLR 6 CONFIDENTIAL
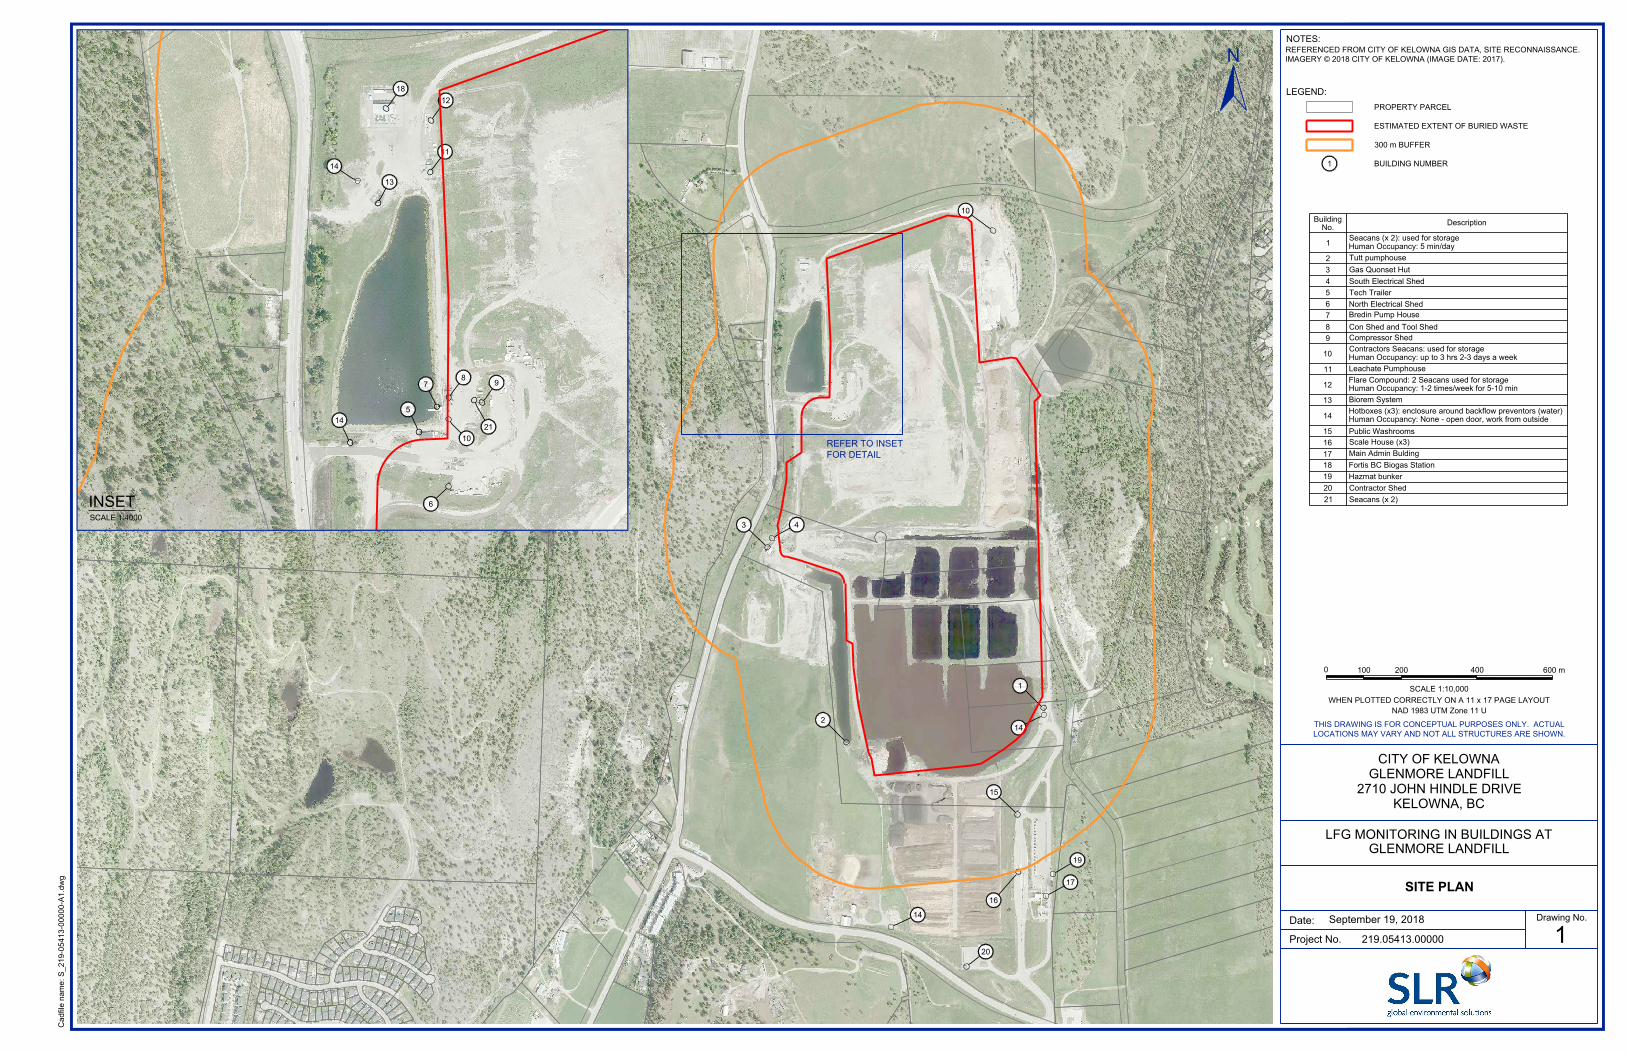
REFER TO INSET
FOR DETAIL
16
17
15
14
2
1
3 4
10
14
20
19
5
7
8
9
10
6
11
12
14
13
14
18
21
Ca
dfile
n
am
e: S
_2
19
-0
54
13
-0
00
00
-A
1.d
wg
1
Drawing No.
September 19, 2018
Project No. 219.05413.00000
Date:
LFG MONITORING IN BUILDINGS AT
GLENMORE LANDFILL
SITE PLAN
REFERENCED FROM CITY OF KELOWNA GIS DATA, SITE RECONNAISSANCE.
IMAGERY © 2018 CITY OF KELOWNA (IMAGE DATE: 2017).
PROPERTY PARCEL
ESTIMATED EXTENT OF BURIED WASTE
300 m BUFFER
BUILDING NUMBER
NOTES:
LEGEND:
N
THIS DRAWING IS FOR CONCEPTUAL PURPOSES ONLY. ACTUAL
LOCATIONS MAY VARY AND NOT ALL STRUCTURES ARE SHOWN.
CITY OF KELOWNA
GLENMORE LANDFILL
2710 JOHN HINDLE DRIVE
KELOWNA, BC
SCALE 1:10,000
600 m4002001000
NAD 1983 UTM Zone 11 U
WHEN PLOTTED CORRECTLY ON A 11 x 17 PAGE LAYOUT
1
INSET
SCALE 1:4000
Building
No.
Description
1
Seacans (x 2): used for storage
Human Occupancy: 5 min/day
2
Tutt pumphouse
3 Gas Quonset Hut
4 South Electrical Shed
5 Tech Trailer
6 North Electrical Shed
7
Bredin Pump House
8 Con Shed and Tool Shed
9Compressor Shed
10
Contractors Seacans: used for storage
Human Occupancy: up to 3 hrs 2-3 days a week
11
Leachate Pumphouse
12
Flare Compound: 2 Seacans used for storage
Human Occupancy: 1-2 times/week for 5-10 min
13Biorem System
14
Hotboxes (x3): enclosure around backflow preventors (water)
Human Occupancy: None - open door, work from outside
15 Public Washrooms
16Scale House (x3)
17
Main Admin Bulding
18 Fortis BC Biogas Station
19 Hazmat bunker
20 Contractor Shed
21 Seacans (x 2)
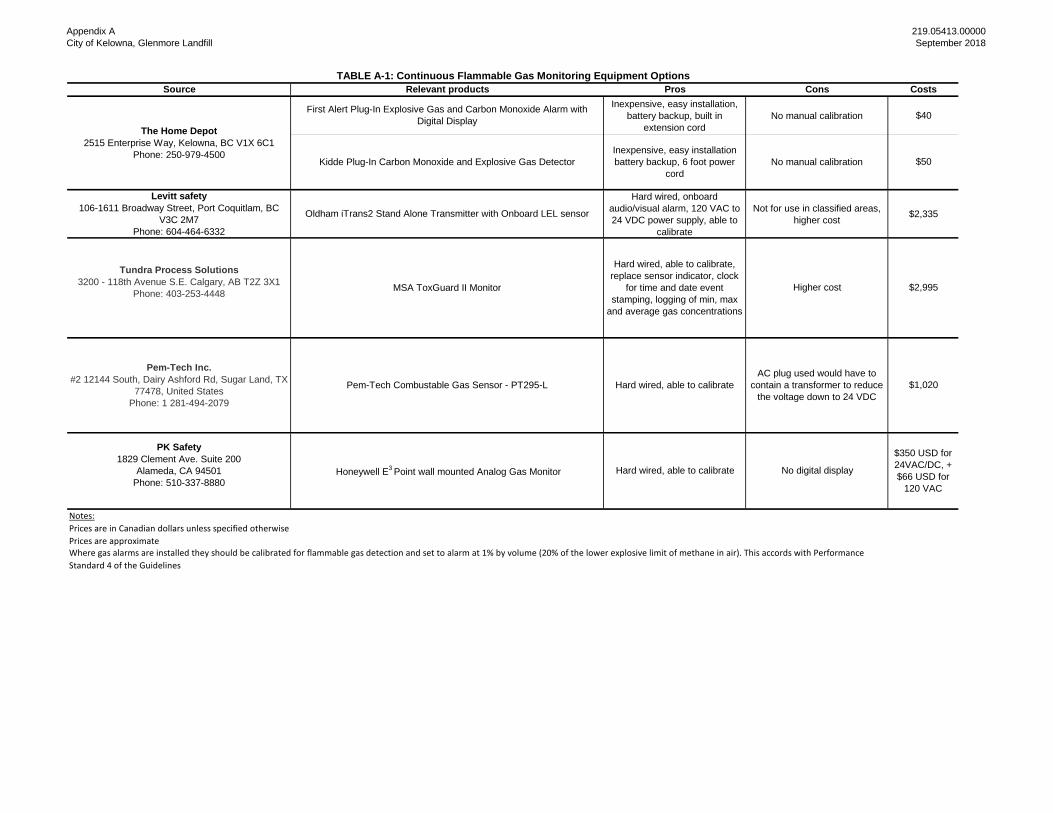
Appendix A
City of Kelowna, Glenmore Landfill
219.05413.00000
September 2018
Pros Cons Costs
Inexpensive, easy installation,
battery backup, built in
extension cord
No manual calibration $40
Hard wired, onboard
audio/visual alarm, 120 VAC to
24 VDC power supply, able to
calibrate
Not for use in classified areas,
higher cost$2,335
Notes:Prices are in Canadian dollars unless specified otherwisePrices are approximate
TABLE A-1: Continuous Flammable Gas Monitoring Equipment Options
First Alert Plug-In Explosive Gas and Carbon Monoxide Alarm with
Digital Display
No manual calibration
Source
The Home Depot
2515 Enterprise Way, Kelowna, BC V1X 6C1
Phone: 250-979-4500Kidde Plug-In Carbon Monoxide and Explosive Gas Detector
Relevant products
$50
Levitt safety
106-1611 Broadway Street, Port Coquitlam, BC
V3C 2M7
Phone: 604-464-6332
Oldham iTrans2 Stand Alone Transmitter with Onboard LEL sensor
Tundra Process Solutions
3200 - 118th Avenue S.E. Calgary, AB T2Z 3X1
Phone: 403-253-4448MSA ToxGuard II Monitor
Inexpensive, easy installation
battery backup, 6 foot power
cord
Hard wired, able to calibrate,
replace sensor indicator, clock
for time and date event
stamping, logging of min, max
and average gas concentrations
Where gas alarms are installed they should be calibrated for flammable gas detection and set to alarm at 1% by volume (20% of the lower explosive limit of methane in air). This accords with Performance Standard 4 of the Guidelines
$1,020
$2,995
PK Safety
1829 Clement Ave. Suite 200
Alameda, CA 94501
Phone: 510-337-8880 Honeywell E
3 Point wall mounted Analog Gas Monitor Hard wired, able to calibrate No digital display
$350 USD for
24VAC/DC, +
$66 USD for
120 VAC
Higher cost
Pem-Tech Inc.
#2 12144 South, Dairy Ashford Rd, Sugar Land, TX
77478, United States
Phone: 1 281-494-2079
Pem-Tech Combustable Gas Sensor - PT295-L Hard wired, able to calibrate
AC plug used would have to
contain a transformer to reduce
the voltage down to 24 VDC
Calgary, AB
1185-10201 Southport Rd SW Calgary, AB T2W 4X9 Canada Tel: (403) 266-2030 Fax: (403) 263-7906
Edmonton, AB
6940 Roper Road Edmonton, AB T6B 3H9 Canada Tel: (780) 490-7893 Fax: (780) 490-7819
Grande Prairie, AB
10015 102 Street
Grande Prairie, AB T8V 2V5 Canada Tel: (780) 513-6819 Fax: (780) 513-6821
Kamloops, BC
8 West St. Paul Street Kamloops, BC V2C 1G1 Canada Tel: (250) 374-8749 Fax: (250) 374-8656
Kelowna, BC
200-1475 Ellis Street Kelowna, BC V1Y 2A3 Canada Tel: (250) 762-7202 Fax: (250) 763-7303
Markham, ON
200 - 300 Town Centre Blvd Markham, ON L3R 5Z6 Canada Tel: (905) 415-7248 Fax: (905) 415-1019
Nanaimo, BC
9-6421 Applecross Road Nanaimo, BC V9V 1N1 Canada Tel: (250) 390-5050 Fax: (250) 390-5042
Ottawa, ON
43 Auriga Drive, Suite 203 Ottawa, ON K2E 7YE Canada Tel: (613) 725-1777 Fax: (905) 415-1019
Prince George, BC
1586 Ogilvie Street Prince George, BC V2N 1W9 Canada Tel: (250) 562-4452 Fax: (250) 562-4458
Regina, SK
1048 Winnipeg Street Regina, SK S4R 8P8 Canada Tel: (306) 525-4690 Fax (306) 525-4691
Saskatoon, SK
620-3530 Millar Avenue Saskatoon, SK S7P 0B6 Canada Tel: (306) 374-6800 Fax: (306) 374-6077
Toronto, ON
36 King Street East, 4th Floor
Toronto, ON M5C 3B2 Canada Tel: (905) 415-7248 Fax: (905) 415-1019
Vancouver, BC (Head Office)
200-1620 West 8th
Avenue Vancouver, BC V6J 1V4 Canada Tel: (604) 738-2500 Fax: (604) 738-2508
Victoria, BC
6-40 Cadillac Avenue Victoria, BC V8Z 1T2 Canada Tel: (250) 475-9595 Fax: (250) 475-9596
Winnipeg, MB
1353 Kenaston Boulevard Winnipeg, MB R3P 2P2 Canada Tel: (204) 477-1848 Fax: (204) 475-1649
Whitehorse, YT
6131 6th
Avenue Whitehorse, YT Y1A 1N2 Canada Tel: (867) 689-2021
Yellowknife, NT
Unit 44, 5022 49 Street Yellowknife, NT X1A 3R8 Canada Tel: (867) 765-5695
Related Documents


