TSX: ENF 2018 First Quarter Report

Welcome message from author
This document is posted to help you gain knowledge. Please leave a comment to let me know what you think about it! Share it to your friends and learn new things together.
Transcript

TSX: ENF
2018 First Quarter Report

ENBRIDGE INCOME FUND HOLDINGS INC.MANAGEMENT’S DISCUSSION AND ANALYSISMarch 31, 2018

2
GLOSSARY DRIP Dividend Reinvestment and Share Purchase Plan
ECT Enbridge Commercial Trust
EIPLP Enbridge Income Partners LP
Enbridge Enbridge Inc.
ENF or the Company Enbridge Income Fund Holdings Inc.
Fund Units Ordinary trust units of the Fund
IFRS International Financial Reporting Standards
MD&A Management’s Discussion and Analysis
the Fund Enbridge Income Fund
the Fund Group The Fund, ECT, EIPLP and the subsidiaries and investees of EIPLP

3
MANAGEMENT’S DISCUSSION & ANALYSIS FOR THE THREE MONTHS ENDED MARCH 31, 2018 This Management’s Discussion and Analysis (MD&A) dated May 10, 2018 should be read in conjunction with the unaudited interim financial statements and notes thereto of Enbridge Income Fund Holdings Inc. as at and for the three months ended March 31, 2018, prepared in accordance with International Financial Reporting Standards (IFRS). It should also be read in conjunction with the audited financial statements and MD&A contained in Enbridge Income Fund Holdings Inc.'s Annual Report for the year ended December 31, 2017. All financial information is presented in Canadian dollars, unless otherwise indicated. Additional information related to Enbridge Income Fund Holdings Inc., including its Annual Information Form, is available on SEDAR at www.sedar.com.
OVERVIEW The terms “we,” “our,” “us”, "ENF" and “the Company” as used in this MD&A refer to Enbridge Income Fund Holdings Inc. unless the context suggests otherwise. The Company is a publicly traded corporation whose common shares trade on the Toronto Stock Exchange (TSX) under the symbol ENF. Our business is limited to our ownership interest in Enbridge Income Fund (the Fund) and our objective is to pay out a high proportion of distributable cash in the form of dividends to shareholders. The Fund is an unincorporated open-ended trust established by a trust indenture under the laws of the Province of Alberta. The Fund, through its indirect investment in Enbridge Income Partners LP (EIPLP), is involved in the transportation, storage and generation of energy. EIPLP owns interests in liquids transportation and storage assets, including the Canadian Mainline, the Regional Oil Sands System, a 50% interest in the Alliance Pipeline system, which transports natural gas from Canada to the United States, and interests in renewable and alternative power generation assets. Readers are encouraged to read EIPLP’s consolidated financial statements and MD&A which are filed under the Fund’s profile on SEDAR at www.sedar.com. The unitholders of the Fund are the Company and Enbridge Inc. (Enbridge), a North American transporter, distributor and generator of energy listed on the TSX and New York Stock Exchange. We are managed by Enbridge Management Services Inc. (the Manager or EMSI), a wholly-owned subsidiary of Enbridge. EMSI also serves as the manager of the Fund, Enbridge Commercial Trust (ECT), which is a wholly-owned investment of the Fund, and EIPLP. EIPLP is a limited partnership between ECT and Enbridge. The Fund, ECT, EIPLP and the subsidiaries and investees of EIPLP are collectively referred to as the Fund Group. At March 31, 2018, Enbridge held 19.9% of the Company’s common shares, with public shareholders holding the remaining 80.1%. Also at March 31, 2018, we held 70.7% of the issued and outstanding ordinary trust units of the Fund (Fund Units) and Enbridge held the remaining 29.3%. Our overall economic interest in the Fund Group was 21.8% as at March 31, 2018.

4
ENBRIDGE INCOME FUND HOLDINGS INC. PERFORMANCE OVERVIEW Our earnings and cash flows are derived from our investment in the Fund and are dependent upon our ownership interest, the cash distributions per unit paid by the Fund and income taxes. Readers are encouraged to read the Fund’s financial statements and MD&A, which are filed on SEDAR at www.sedar.com.
Three months ended
March 31, 2018 2017
(millions of Canadian dollars, except per unit, per share and share amounts) Earnings/(loss)
Fund Unit distribution per unit 0.6402 0.5376 Cash distributions declared to holders of Fund Units 158 118 Percentage of Fund Units held by ENF 70.6% - 70.7% 56.9% - 57.0% Distribution income, ENF 111 67 Unrealized fair value change in investment (341) (205) Interest income and other 1 1 Income taxes recovery1 45 27 Loss, ENF1 (184) (110) Loss per common share1 (1.06) (0.88) Diluted loss per common share1 (1.06) (0.88)
Adjusted earnings Adjusted earnings 111 67 Adjusted earnings per common share 0.64 0.54 Adjusted diluted earnings per common share 0.63 0.53
Cash flow data Cash provided by operating activities 137 68 Cash used in investing activities (67) (18) Cash used in financing activities (69) (49)
Dividends Dividends declared 98 64 Dividends per common share 0.5649 0.5133 Adjusted dividend payout ratio 88.3% 95.6%
Number of common shares outstanding2 174,662,947 124,611,088 1 Comparative information for the three months ended March 31, 2017 has been retrospectively adjusted to reflect the adoption of IFRS
9. Refer to Changes in Accounting Policies. 2 As at March 31, 2018 and 2017, respectively.
LOSS For the first quarter of 2018, we incurred a loss of $184 million compared with a loss of $110 million in the first quarter of 2017. The comparability of our earnings was impacted by non-operating factors, which are listed as adjusting items in the Non-GAAP Reconciliation table in Non-GAAP Measures. Details of non-operating factors impacting the comparability of our earnings period-over-period include:
• unrealized fair value losses of $341 million in the first quarter of 2018 compared with $205 million in 2017 arising from changes in the fair value of our investment in the Fund, which is determined with reference to our common share price. Effective January 1, 2018, ENF adopted IFRS 9 Financial Instruments on a retrospective basis, resulting in the unrealized fair value change being recognized in earnings, rather than in other comprehensive income. Refer to Non-GAAP Measures and Changes in Accounting Policies for further discussion.
After taking into consideration the factors above, the remaining increase is primarily explained by the following significant business factors:
• an increase in distribution income received from Fund Units for the first three months of 2018 compared with the first three months of 2017 as the Fund increased its monthly Fund Unit

5
distribution to $0.2134 per unit in January 2018 and we increased our ownership of the Fund. In December 2017, we used proceeds from our common equity offerings to invest in additional Fund Units. In April 2017, we acquired additional Fund Units as a result of Enbridge's non-monetary exchange of Fund Units for common shares of the Company. We also purchased additional Fund Units on a monthly basis using cash retained under our Dividend Reinvestment and Share Purchase Plan (DRIP); and
• a comparable amount of taxes incurred on distributions received from the Fund, which varies depending on the taxability of such distributions in any given period. To the extent that a portion of the distribution represents a tax-free inter-corporate dividend or return of capital, current tax will not be incurred on that portion of the distribution.
ADJUSTED EARNINGS Adjusted earnings were $111 million for the first three months of 2018 compared with $67 million for the first three months of 2017. Our adjusted earnings were impacted by the same factors impacting our loss as discussed in Enbridge Income Fund Holdings Inc. Performance Overview – Loss, which primarily included an increase in distribution income received from the Fund. CASH FLOWS Cash provided by operating activities increased to $137 million in the first quarter of 2018 from $68 million in the first quarter of 2017, while cash used in investing activities increased to $67 million from $18 million. For the three months ended March 31, 2018, cash used in financing activities increased to $69 million from $49 million for the same period in 2017. Factors impacting our cash flows period-over-period primarily include:
• an increase in cash provided by operating activities primarily due to greater distributions received from the Fund in 2018;
• an increase in cash used in investing activities largely due to an increase in net advances made to a subsidiary of EIPLP on a subordinated demand loan and additional Fund Units acquired through the DRIP in 2018; and
• an increase in cash used in financing activities as a result of an increase in dividends paid. Refer to Liquidity and Capital Resources – Sources and Uses of Cash for further discussion. DIVIDENDS We pay monthly dividends to our shareholders. Dividends for the three months ended March 31, 2018 were declared at an aggregate quarterly rate of $0.5649 (2017 - $0.5133) per common share, representing total dividends of $98 million (2017 - $64 million) and an adjusted dividend payout ratio of 88.3% (2017 - 95.6%). Factors impacting our dividends period-over-period primarily include:
• an increase in our monthly dividend per common share in January 2018 by 10% over the 2017 dividends declared to $0.1883 per common share, which is consistent with our anticipated dividend growth due to expected Fund Group earnings and cash flow performance from our asset base; and
• an increase in our common shares outstanding during the first quarter of 2018 following our common equity offering in December 2017 and Enbridge's non-monetary exchange of Fund Units for common shares of the Company in April 2017.

6
FORWARD-LOOKING INFORMATION Forward-looking information, or forward-looking statements, have been included in this MD&A to provide information about the Company and the Fund Group, including management’s assessment of the Company and the Fund Group’s future plans and operations. This information may not be appropriate for other purposes. Forward-looking statements are typically identified by words such as "anticipate", "expect", "project", “estimate”, “forecast”, “plan”, “intend”, “target”, “believe”, “likely” and similar words suggesting future outcomes or statements regarding an outlook. Forward-looking information or statements included or incorporated by reference in this document include, but are not limited to, statements with respect to the following: earnings/(loss) or adjusted earnings/(loss); earnings/(loss) or adjusted earnings/(loss) per share; cash flows; dividends or distributions; distributions to the Company by the Fund; dividend growth and dividend payout expectation; working capital requirements; sources of liquidity and sufficiency of financial resources; flexibility of distributions; organic growth opportunities; use of retained cash; and investment opportunities. Although the Company believes these forward-looking statements are reasonable based on the information available on the date such statements are made and processes used to prepare the information, such statements are not guarantees of future performance and readers are cautioned against placing undue reliance on forward-looking statements. By their nature, these statements involve a variety of assumptions, known and unknown risks and uncertainties and other factors, which may cause actual results, levels of activity and achievements to differ materially from those expressed or implied by such statements. Material assumptions include assumptions about the following: supply of and demand for crude oil, natural gas, natural gas liquids (NGL) and renewable energy; prices of crude oil, natural gas, NGL and renewable energy; exchange rates; inflation; Canadian pipeline export capacity; levels of competition; interest rates; availability and price of labor and construction materials; operational reliability; customer and regulatory approvals; maintenance of support and regulatory approvals for the Fund Group’s projects; anticipated in-service dates; weather; the impact of the dividend policy on the Company’s or the Fund Group’s future cash flows; use of retained cash for future income tax payments; access to equity markets; potential acquisitions, dispositions or other strategic transactions; the Fund Group’s credit ratings; capital project funding; earnings/(loss) or adjusted earnings/(loss); earnings/(loss) per share; cash flows; and dividends or distributions. Assumptions regarding the supply of and demand for crude oil, natural gas, NGL and renewable energy, and the prices of these commodities, are material to and underlie all forward-looking statements. These factors are relevant to all forward-looking statements as they may impact current and future levels of demand for the Fund Group’s services. Similarly, exchange rates, inflation and interest rates impact the economies and business environments in which the Company and the Fund Group operate and may impact levels of demand for the Fund Group’s services and cost of inputs, and are therefore inherent in all forward-looking statements. Due to the interdependencies and correlation of these macroeconomic factors, the impact of any one assumption on a forward-looking statement cannot be determined with certainty, particularly with respect to earnings/(loss), adjusted earnings/(loss) and associated per share amounts, or future dividends or distributions. The most relevant assumptions associated with forward-looking statements on projects under construction, including completion dates and capital expenditures, include the following: availability and price of labor and construction materials; effects of inflation and foreign exchange rates on labor and material costs; effects of interest rates on borrowing costs; and the impact of weather and customer, government and regulatory approvals on construction and in-service schedules and cost recovery regimes. The Company’s forward-looking statements are subject to risks and uncertainties pertaining to future dividends, operating performance, regulatory parameters, project approval and support, renewals of rights of way, weather, economic and competitive conditions, public opinion, changes in tax laws and tax rates, changes in trade agreements, exchange rates, interest rates, commodity prices, political decisions and supply of and demand for commodities, including but not limited to those risks and uncertainties discussed in this MD&A and in the Company’s other filings with Canadian securities regulators. The impact of any one risk, uncertainty or factor on a particular forward-looking statement is not determinable with certainty as these are interdependent and the Company’s future course of action depends on management’s assessment of all information available at the relevant time. Except to the extent required by applicable law, the Company assumes no obligation to publicly update or revise any forward-looking statements made in this MD&A or otherwise, whether as a result of new information, future events or otherwise. All subsequent forward-looking statements, whether written or oral, attributable to the Company or persons acting on the Company’s behalf, are expressly qualified in their entirety by these cautionary statements.

7
NON-GAAP MEASURES This MD&A contains references to our adjusted earnings and adjusted earnings per common share. Our adjusted earnings represent our earnings adjusted for non-operating factors. These factors, referred to as adjusting items, are reconciled and discussed in Non-GAAP Reconciliation – Loss to Adjusted Earnings. The Manager believes the presentation of our adjusted earnings give useful information to shareholders as they provide increased transparency and insight into the performance of ENF. The Manager uses our adjusted earnings to set targets, including the distribution payout target, and to assess the performance of ENF. Our adjusted earnings and adjusted earnings per common share are not measures that have standardized meanings prescribed by generally accepted accounting principles in the United States of America (U.S. GAAP) and are not U.S. GAAP measures. Therefore, these measures may not be comparable with similar measures presented by other issuers. The table below provides a reconciliation of the GAAP and non-GAAP measures. NON-GAAP RECONCILIATION – LOSS TO ADJUSTED EARNINGS
Three months ended March 31, 2018 2017 (millions of Canadian dollars)
Loss1 (184) (110 ) Adjusting items: Unrealized fair value change in investment, net of tax2 295 177
Adjusted earnings 111 67 1 Comparative information for the three months ended March 31, 2017 has been retrospectively adjusted to reflect the adoption of IFRS
9. Refer to Changes in Accounting Policies. 2 Represents unrealized fair value changes arising from the change in the fair value of our investment in the Fund, which is determined
with reference to our common share price. Effective January 1, 2018, ENF adopted IFRS 9 Financial Instruments on a retrospective basis, resulting in the unrealized fair value change being recognized in earnings, rather than in other comprehensive income. Refer to Changes in Accounting Policies.
Adjusted earnings were $111 million for the first quarter of 2018 compared with $67 million for the first quarter of 2017. Significant business factors increasing our adjusted earnings period-over-period include:
• an increase in distribution income received from the Fund due to the higher Fund Unit distribution rate that commenced in January 2018 and our purchase of additional Fund Units in December 2017, as well as our increase in Fund Units held as a result of Enbridge's non-monetary exchange of Fund Units for common shares of the Company in April 2017.
LIQUIDITY AND CAPITAL RESOURCES We pay out a high proportion of distributions received from the Fund. Retained cash is expected to be used for future income tax payments and as a reserve to sustain a predictable stream of dividends to our shareholders over the long term. Cash not required to fund dividends or to meet working capital requirements is advanced to a subsidiary corporation of EIPLP pursuant to a subordinated demand loan with an interest rate of 4.3% per annum. At March 31, 2018, $113 million (December 31, 2017 - $72 million) was outstanding from EIPHI. Our working capital requirements are not expected to be significant in 2018. We have an agreement with ECT whereby ECT reimburses us for all expenses incurred relating to the normal course administration of the Company as a publicly traded corporation. We did not have any outstanding long-term debt as at March 31, 2018 and December 31, 2017.

8
Additional capital resources to finance our future investment in the Fund are expected to be available through access to equity markets, subject to our ability to access the market on favorable terms. SOURCES AND USES OF CASH
Three months ended March 31,
2018 2017 (millions of Canadian dollars)
Operating activities 137 68
Investing activities (67) (18 ) Financing activities (69) (49 ) Increase in cash and cash equivalents 1 1
Significant sources and uses of cash for the three months ended March 31, 2018 and 2017 are summarized below: Operating Activities Cash provided by operating activities reflects cash distributions received from the Fund, net of income taxes. Factors impacting the increase in cash provided by operating activities period-over-period primarily include:
• an increase in distributions received from the Fund in the first quarter of 2018 due to a higher
Fund Unit distribution rate that commenced in January 2018 and our increased ownership of the Fund in 2018; and
• the reimbursement of share issue costs from the Fund, pursuant to a payment assistance agreement, that we paid in connection with our public equity offering in December 2017.
Investing Activities Cash used in investing activities primarily reflects the additional purchase of Fund Units, as well as advances to and repayments from a subsidiary of EIPLP pursuant to a subordinated demand loan, which are considered related party transactions. Factors impacting the increase in cash used in investing activities period-over-period primarily include:
• an increase in the amount of cash retained in respect of reinvested dividends to $26 million for
the three months ended March 31, 2018 (2017 - $14 million), for which the proceeds were used to purchase 1.0 million Fund Units (2017 - 0.4 million). This represents an average participation rate in the DRIP of 27.0% (2017 - 22.9%); and
• net advances of $41 million made to a subsidiary of EIPLP pursuant to a subordinated demand loan in the first three months of 2018 compared with $4 million in the corresponding period of 2017.
Financing Activities Cash used in financing activities primarily reflects common share issuances as well as our payment of monthly dividends to our shareholders, net of cash retained in respect of reinvested dividends under the DRIP. Our shareholders are able to participate in the DRIP, which enables the participants to reinvest their dividends in common shares of the Company at a 2% discount to market price. Factors impacting the increase in cash used in financing activities period-over-period primarily include:
• an increase in dividends paid in 2018 as a result of additional common shares outstanding and
the increase in monthly dividends paid per common share, which commenced in January 2018. The increase in dividends paid was partially offset by an increase in the amount of cash retained in respect of reinvested dividends discussed above.

9
CHANGES IN ACCOUNTING POLICIES ADOPTION OF NEW STANDARDS Financial Instruments Effective January 1, 2018, the Company adopted IFRS 9 on a retrospective basis. IFRS 9 Financial Instruments completes the International Accounting Standards Board's (IASB) project to replace International Accounting Standard (IAS) 39 Financial Instruments: Recognition and Measurement. IFRS 9 introduces a single approach to determining whether a financial asset is measured at amortized cost or fair value and replaces the multiple rules in IAS 39. The single approach is based on how an entity manages its financial instruments in the context of its business model and the contractual cash flow characteristics of the financial assets. Upon adoption of IFRS 9, the Company's investment in the Fund is no longer accounted for as an available for sale investment at fair value through other comprehensive income. Instead, the gains and losses, net of taxes, arising from changes in fair value of the investment are accounted for within earnings. IFRS 9 also introduces the expected credit loss model which replaces the incurred loss model. Under the expected credit loss model, any credit losses are estimated based on a probability weighted average expected future cash flows taking into account all possible events of default over the life of the loan and receivables. The adoption of the credit loss model did not have a material impact on the Company’s financial statements. The following table presents the effect on the financial statement line items impacted by the adoption of IFRS 9 for the comparative periods:
Before IFRS 9
adoption Impact of adoption
Three months ended March 31, 2017
(unaudited; millions of Canadian dollars)
Earnings/(loss) before tax 68 (205 ) (137) Income tax recovery/(expense) (1) 28 27
Earnings/(loss) 67 (177 ) (110) Other comprehensive income/(loss) Other comprehensive loss (205) 205 —
Income tax recovery/(expense) 28 (28 ) —
Comprehensive loss (110) — (110)
Before IFRS 9
adoption Impact of adoption December 31, 2017
(unaudited; millions of Canadian dollars)
Retained earnings 94 360 454 Accumulated other comprehensive income 360 (360 ) —

10
SELECTED QUARTERLY FINANCIAL INFORMATION
2018 2017 2016
Q1 Q4 Q3 Q2 Q1 Q4 Q3 Q2 (millions of Canadian dollars, except per
share amounts)
Revenues 112 86 79 80 68 67 67 68 Earnings/(loss)1 (184 ) (171) 68 (35) (110) 142 266 353 Earnings/(loss) per common share1 (1.06 ) (1.11) 0.46 (0.25) (0.88) 1.15 2.16 3.00 Diluted earnings/(loss) per common
share1 (1.06 ) (1.11) 0.46
(0.25) (0.88) 0.64
0.80
0.92
Dividends declared 98 80 76 75 64 58 58 58 Dividends declared per common share 0.5649 0.5133 0.5133 0.5133 0.5133 0.4665 0.4665 0.4665
1 Comparative information for the three months ended March 31, 2017 has been retrospectively adjusted to reflect the adoption of IFRS 9. Refer to Changes in Accounting Policies.
Significant items that have impacted our financial results are as follows:
• Earnings/(loss) and Earnings/(loss) per common share for each period included non-cash, unrealized fair value gains and losses arising from our investment in the Fund, which are considered to be a non-operating factor.
• In January 2018, we increased our dividend per common share by 10% to $0.1883 per month effective with the January dividend as a result of the anticipated growth in distributions from the Fund.
• In December 2017, we completed a public equity offering of 20.7 million common shares at a price of $27.80 per share for gross proceeds of $575 million. Concurrent with the closing of the public equity offering, Enbridge subscribed for 5.1 million common shares for gross proceeds of $143 million, on a private placement basis, to maintain its 19.9% ownership interest in the Company. Upon closing of the transaction, Enbridge’s economic interest in the Fund Group and the Company decreased from 84.6% to 82.5% and our economic interest in the Fund Group increased from 19.2% to 21.8%.
• Following our public offering in December 2017, we subscribed for 25.8 million of Fund Units as a result of our issuance of common shares to the public and Enbridge, which increased our total Fund Units owned to 173.7 million at that time. The incremental ownership of the Fund Units increased the amount of distributions received on the Fund Units and, therefore, increased our revenues and earnings.
• In April 2017, Enbridge exchanged 21.7 million Fund Units for an equivalent amount of the Company’s common shares. In order to maintain its 19.9% interest in the Company, Enbridge retained 4.3 million of the common shares issued pursuant to such exchange and sold the remaining balance to the public.
• In January 2017, we increased our dividend per common share by 10% to $0.1711 per month effective with the January dividend.
• In April 2016, we subscribed for 25.4 million Fund Units with proceeds from our issuance of common shares to the public and Enbridge, which increased our total Fund Units owned to 122.9 million at that time. The incremental ownership of the Fund Units increased the amount of distributions received on the Fund Units and, therefore, increased our revenues and earnings.
• EIPLP Class C units, ECT Preferred Units and Fund Units held by Enbridge, directly and indirectly, may be exchanged into common shares of the Company, subject to certain restrictions, creating potential dilution of the Company’s earnings per common share.
OUTSTANDING SHARE DATA As at April 27, 2018, 174,963,276 common shares and one special voting share of the Company were issued and outstanding.

ENBRIDGE INCOME FUND HOLDINGS INC.FINANCIAL STATEMENTSMarch 31, 2018

12
ENBRIDGE INCOME FUND HOLDINGS INC. STATEMENTS OF COMPREHENSIVE INCOME
Three months ended
March 31, 2018 20171 (unaudited; millions of Canadian dollars, except per share amounts)
Distribution and other income 112 68
Unrealized fair value change in investment (Note 5) (341) (205 ) Loss before tax (229) (137 ) Income tax recovery 45 27
Loss (184) (110 ) Other comprehensive income — —
Comprehensive loss (184) (110 ) Basic and diluted loss per common share (1.06) (0.88 )
See accompanying notes to the interim financial statements.
1 Retrospectively adjusted to reflect the adoption of International Financial Reporting Standards (IFRS) 9 (Note 3).

CONFIDENTIAL DRAFT - NOT FOR DISTRIBUTION
13
ENBRIDGE INCOME FUND HOLDINGS INC. STATEMENTS OF CHANGES IN SHAREHOLDERS’ EQUITY
Special Common voting Share Retained shares share premium earnings1 Total (unaudited; millions of Canadian dollars) December 31, 2017 4,469 — 192 454 5,115 Comprehensive loss — — — (184) (184 ) Common share dividends declared — — — (98) (98 ) Dividend reinvestment and share purchase plan 26 — — — 26 March 31, 2018 4,495 — 192 172 4,859
Special Common voting Share Retained shares share premium earnings1 Total (unaudited; millions of Canadian dollars) December 31, 2016 2,984 — 192 997 4,173 Comprehensive loss — — — (110) (110 ) Common share dividends declared — — — (64) (64 ) Dividend reinvestment and share purchase plan 14 — — — 14 March 31, 2017 2,998 — 192 823 4,013
See accompanying notes to the interim financial statements. 1 Retrospectively adjusted to reflect the adoption of IFRS 9 (Note 3).

CONFIDENTIAL DRAFT - NOT FOR DISTRIBUTION
14
ENBRIDGE INCOME FUND HOLDINGS INC. STATEMENTS OF CASH FLOWS
Three months ended
March 31, 2018 20171 (unaudited; millions of Canadian dollars)
Operating activities Loss (184) (110 ) Adjustments to reconcile loss to net cash provided by operating activities: Unrealized fair value change in investment 341 205
Deferred income tax recovery (46) (27 ) Changes in operating assets and liabilities 26 —
Net cash provided by operating activities 137 68
Investing activities Purchase of Enbridge Income Fund trust units (26) (14 ) Demand loan advances to affiliate (50) (14 ) Demand loan repayments from affiliate 9 10
Net cash used in investing activities (67) (18 ) Financing activities Common share dividends paid (69) (49 ) Net cash used in financing activities (69) (49 ) Net increase in cash and cash equivalents 1 1 Cash and cash equivalents at beginning of period — —
Cash and cash equivalents at end of period 1 1
Supplementary cash flow information Cash paid for income tax — 1
See accompanying notes to the interim financial statements. 1 Retrospectively adjusted to reflect the adoption of IFRS 9 (Note 3).

CONFIDENTIAL DRAFT - NOT FOR DISTRIBUTION
15
ENBRIDGE INCOME FUND HOLDINGS INC. STATEMENTS OF FINANCIAL POSITION
March 31, December 31, 2018 20171 (unaudited; millions of Canadian dollars)
Assets Current assets Cash and cash equivalents 1 —
Accounts receivable and other — 1
Accounts receivable from affiliate — 23
Demand loan due from affiliate 113 72
Income taxes receivable 3 4
Distributions receivable 37 31
154 131 Investment in Enbridge Income Fund (Notes 5 and 8) 4,763 5,078
Total assets 4,917 5,209
Liabilities and shareholders’ equity Current liabilities Accounts payable and other 8 1
Dividends payable 33 30
41 31 Deferred income taxes 17 63
58 94 Shareholders’ equity Share capital 4,495 4,469
Share premium 192 192
Retained earnings 172 454
4,859 5,115 Total liabilities and shareholders' equity 4,917 5,209
See accompanying notes to the interim financial statements. 1 Retrospectively adjusted to reflect the adoption of IFRS 9 (Note 3).
CONFIDENTIAL DRAFT - NOT FOR DISTRIBUTION
16
NOTES TO THE INTERIM FINANCIAL STATEMENTS (unaudited)
1. BUSINESS OVERVIEW Enbridge Income Fund Holdings Inc. (ENF or the Company) is a publicly traded corporation, incorporated on March 26, 2010 under the laws of the Province of Alberta. The Company’s common shares commenced trading on the Toronto Stock Exchange on December 21, 2010. The Company holds an investment in Enbridge Income Fund (the Fund), which is an unincorporated open-ended trust established by a trust indenture under the laws of the Province of Alberta. The business of the Company is limited to its investment in the Fund. The Fund, through its indirect investment in Enbridge Income Partners LP (EIPLP), is involved in the transportation, storage and generation of energy. EIPLP owns interests in liquids transportation and storage assets, including the Canadian Mainline, the Regional Oil Sands System, a 50% interest in the Alliance Pipeline, which transports natural gas from Canada to the United States, and interests in renewable and alternative power generation assets.
2. BASIS OF PREPARATION The accompanying unaudited interim condensed financial statements of the Company have been prepared in accordance with IFRS International Accounting Standard (IAS) 34, Interim Financial Reporting. They do not include all of the information and notes required by IFRS for annual financial statements and should therefore be read in conjunction with ENF’s audited annual financial statements and notes for the year ended December 31, 2017. These interim condensed financial statements follow the same significant accounting policies as those included in ENF’s annual financial statements for the year ended December 31, 2017, except for the adoption of new standards (Note 3). These financial statements were authorized for issuance by the Board of Directors of the Company (the Board) on May 10, 2018.
3. CHANGES IN ACCOUNTING POLICIES ADOPTION OF NEW STANDARDS Financial Instruments Effective January 1, 2018, the Company adopted IFRS 9 on a retrospective basis. IFRS 9 Financial Instruments completes the International Accounting Standards Board's project to replace IAS 39 Financial Instruments: Recognition and Measurement. IFRS 9 introduces a single approach to determining whether a financial asset is measured at amortized cost or fair value and replaces the multiple rules in IAS 39. The single approach is based on how an entity manages its financial instruments in the context of its business model and the contractual cash flow characteristics of the financial assets. Upon adoption of IFRS 9, the Company's investment in the Fund is no longer accounted for as an available for sale investment at fair value through other comprehensive income. Instead, the gains and losses, net of taxes, arising from changes in fair value of the investment are accounted for within earnings. IFRS 9 also introduces the expected credit loss model which replaces the incurred loss model. Under the expected credit loss model, any credit losses are estimated based on a probability weighted average expected future cash flows taking into account all possible events of default over the life of the loan and receivables. The adoption of the credit loss model did not have a material impact on the Company’s financial statements.

CONFIDENTIAL DRAFT - NOT FOR DISTRIBUTION
17
The following table presents the effect on the financial statement line items impacted by the adoption of IFRS 9 for the comparative periods:
Before IFRS 9
adoption Impact of adoption
Three months ended March 31, 2017
(unaudited; millions of Canadian dollars)
Earnings/(loss) before tax 68 (205 ) (137) Income tax recovery/(expense) (1) 28 27
Earnings/(loss) 67 (177 ) (110) Other comprehensive income/(loss) Other comprehensive loss (205) 205 —
Income tax recovery/(expense) 28 (28 ) —
Comprehensive loss (110) — (110)
Before IFRS 9
adoption Impact of adoption December 31, 2017
(unaudited; millions of Canadian dollars)
Retained earnings 94 360 454 Accumulated other comprehensive income 360 (360 ) —
4. EARNINGS PER COMMON SHARE BASIC Loss per common share is calculated by dividing loss by the weighted average number of common shares outstanding. DILUTED Enbridge Inc. (Enbridge) directly and indirectly holds ordinary trust units of the Fund (Fund Units), preferred units of Enbridge Commercial Trust (ECT Preferred Units) and EIPLP Class C units, which may be exchanged into common shares of the Company. If the securities are exchanged into common shares of the Company, the Company would subscribe for the same number of additional Fund Units, which would increase the Company’s distribution income. Weighted average common shares outstanding to calculate basic and diluted loss per common share for the three months ended March 31, 2018 were 174 million (2017 - 124 million). For the three months ended March 31, 2018, anti-dilutive convertible securities of 72.5 million of Fund Units, 87.7 million ECT Preferred Units and 442.9 million Class C Units (2017 - 94.2 million, 87.7 million and 442.9 million, respectively) were excluded from the diluted loss per common share calculation.

CONFIDENTIAL DRAFT - NOT FOR DISTRIBUTION
18
5. INVESTMENT IN ENBRIDGE INCOME FUND At March 31, 2018, the Company owned 174.3 million units (December 31, 2017 - 173.7 million), or 70.7% (December 31, 2017 - 70.6%), of the Fund’s issued and outstanding Fund Units.
Three months ended Year ended March 31, 2018 December 31, 2017 (millions of Canadian dollars)
Balance at beginning of period 5,078 4,235
Investment acquired1,2,3 26 1,485
Fair value change for the period (341) (642) Balance at end of period 4,763 5,078
1 During the three months ended March 31, 2018 and the year ended December 31, 2017, the Company used the cash retained and invested under its Dividend Reinvestment and Share Purchase Plan to purchase one million and two million Fund Units, respectively.
2 On April 18, 2017, the Company received 21.7 million Fund Units in connection with Enbridge’s exchange of 21.7 million Fund Units for common shares of the Company.
3 On December 7, 2017, the Company used the proceeds from its public equity offering to purchase 25.8 million Fund Units.
DISTRIBUTION INCOME The Fund declared distributions on a monthly basis at a rate of $0.2134 (2017 - $0.1792) per unit during the three months ended March 31, 2018 or $111 million (2017 - $67 million) in aggregate to the Company. SUMMARIZED FINANCIAL INFORMATION1 Summarized financial information of the Fund which supports the Company’s earnings, derived from the Fund’s financial statements prepared in accordance with generally accepted accounting principles in the United States of America (U.S. GAAP), was as follows:
Three months ended March 31,
2018 2017 (millions of Canadian dollars)
Income/(loss) from equity investments (68) 92
Earnings/(loss) (85) 74
Other comprehensive income/(loss) 15 (4 ) Total comprehensive income/(loss) (70) 70
1 Summarized financial information of the Fund is prepared in accordance with U.S. GAAP. As such the results may have been different had they been prepared in accordance with IFRS.
March 31, December 31, 2018 2017 (millions of Canadian dollars)
Current assets 837 1,018
Non-current assets 2,579 2,846
Current liabilities 513 225 Non-current liabilities 1,926 2,420
1 Summarized financial information of the Fund is prepared in accordance with U.S. GAAP. As such the results may have been different had they been prepared in accordance with IFRS.

CONFIDENTIAL DRAFT - NOT FOR DISTRIBUTION
19
6. SHARE CAPITAL AND SHARE PREMIUM DIVIDENDS The Company declared monthly dividends of $0.1883 per share for each month during the three months ended March 31, 2018, which were paid in the following month (2017 - $0.1711). In March 2018, the Company announced a monthly dividend of $0.1883 per common share to be paid on April 16, 2018 to shareholders of record on April 2, 2018. In April 2018, the Company announced a monthly dividend of $0.1883 per common share to be paid on May 15, 2018 to shareholders of record on April 30, 2018. On May 7, 2018, the Board declared a monthly dividend of $0.1883 per common share to be paid on June 15, 2018 to shareholders of record on May 30, 2018.
7. INCOME TAX The effective income tax rate for the three months ended March 31, 2018 was 19.7% (2017 - 19.7%). The Company incurred minimal current income taxes for the three months ended March 31, 2018 and 2017.
8. RISK MANAGEMENT AND FINANCIAL INSTRUMENTS The fair value of financial instruments reflects the Company’s best estimates of market value based on valuation techniques, supported by observable market prices where available. The fair value of loans and receivables and other financial liabilities approximate their carrying value due to the short period to maturity. The Company categorizes those financial assets and liabilities measured at fair value into one of three different levels depending on the observability of the inputs employed in the measurement. LEVEL 1 Level 1 includes financial instruments measured at fair value based on unadjusted quoted prices for identical assets and liabilities in active markets that are accessible at the measurement date. An active market for a financial instrument is considered to be a market where transactions occur with sufficient frequency and volume to provide pricing information on an ongoing basis. The Company did not have any financial instruments categorized as Level 1 as at March 31, 2018 or December 31, 2017. LEVEL 2 Level 2 includes financial instrument valuations determined using directly or indirectly observable inputs other than quoted prices included within Level 1. The fair value measurement of the investment in the Fund is classified as Level 2, as the valuation technique references the quoted market price of the Company’s common shares, and adjusts for assets and liabilities not applicable to the Fund. At March 31, 2018, the Company’s investment in the Fund had a fair value of $4.8 billion (December 31, 2017 - $5.1 billion). LEVEL 3 Level 3 includes financial instrument valuations based on inputs which are less observable, unavailable or where the observable data does not support a significant portion of the financial instruments’ fair value. Generally, Level 3 financial instruments are longer dated transactions, occur in less active markets, occur at locations where pricing information is not available or have no binding broker quote to support Level 2 classification. The Company did not have any financial instruments categorized as Level 3 as at March 31, 2018 or December 31, 2017. The Company’s policy is to recognize transfers as at the last day of the reporting period. There were no transfers between levels as at March 31, 2018 or 2017.

ENBRIDGE INCOME FUND MANAGEMENT’S DISCUSSION AND ANALYSISMarch 31, 2018

21
GLOSSARY Adjusted EBITDA Adjusted earnings before interest, income taxes and depreciation and
amortization
DCF Distributable cash flow
EBITDA Earnings before interest, income taxes and depreciation and amortization
ECT Enbridge Commercial Trust
EIPLP Enbridge Income Partners LP
Enbridge Enbridge Inc.
ENF Enbridge Income Fund Holdings Inc.
Fund Units Ordinary trust units of the Fund
MD&A Management’s Discussion and Analysis
MTN Medium-term note
the Fund Enbridge Income Fund
the Fund Group The Fund, ECT, EIPLP and the subsidiaries and investees of EIPLP
the Manager or EMSI Enbridge Management Services Inc.
U.S. GAAP Generally accepted accounting principles in the United States of America

22
MANAGEMENT’S DISCUSSION & ANALYSIS FOR THE THREE MONTHS ENDED MARCH 31, 2018 This Management’s Discussion and Analysis (MD&A) dated May 10, 2018 should be read in conjunction with the unaudited interim financial statements and notes thereto of Enbridge Income Fund as at and for the three months ended March 31, 2018, prepared in accordance with generally accepted accounting principles in the United States of America (U.S. GAAP). It should also be read in conjunction with the audited financial statements and MD&A for the year ended December 31, 2017. All financial measures presented in this MD&A are expressed in Canadian dollars, unless otherwise indicated. Additional information related to Enbridge Income Fund, including its Annual Information Form, is available on SEDAR at www.sedar.com. Additional information related to Enbridge Income Partners LP (EIPLP), including its financial statements and MD&A, is also available on SEDAR under Enbridge Income Fund's profile.
OVERVIEW The terms “we,” “our,” “us” and “the Fund” as used in this MD&A refer to Enbridge Income Fund unless the context suggests otherwise. The Fund is an unincorporated open-ended trust established by a trust indenture under the laws of the Province of Alberta. We, through our indirect investment in EIPLP, are involved in the transportation, storage and generation of energy. EIPLP owns interests in liquids transportation and storage assets, including the Canadian Mainline, the Regional Oil Sands System, a 50% interest in the Alliance Pipeline, which transports natural gas from Canada to the United States, and interests in renewable and alternative power generation assets. EIPLP is a partnership between Enbridge Commercial Trust (ECT) and Enbridge Inc. (Enbridge). The unitholders of the Fund are Enbridge Income Fund Holdings Inc. (ENF), a public company listed on the Toronto Stock Exchange (TSX), and Enbridge, a North American transporter, distributor and generator of energy listed on the TSX and New York Stock Exchange. The Fund is a member of the Fund Group, which also includes ECT, EIPLP and the subsidiaries and investees of EIPLP. We own a direct investment in ECT and an indirect investment in EIPLP. Our financial performance is underpinned by the results of EIPLP, which holds the underlying operating entities and investments of the Fund Group. Enbridge, through its wholly-owned subsidiary Enbridge Management Services Inc. (the Manager or EMSI), is responsible for the operations and day-to-day management of the Fund Group. The Manager also provides administrative and general support services to the Fund Group. Enbridge’s total economic interest in the Fund Group and ENF was 82.5% at March 31, 2018 based on its indirect interest in the Fund through ENF, its direct interest in the Fund through ordinary trust units of the Fund (Fund Units), its interest in preferred units of ECT and its direct and indirect interest in units of EIPLP.

23
ENBRIDGE INCOME FUND PERFORMANCE OVERVIEW
Three months ended March 31, 2018 2017 (millions of Canadian dollars, except per unit amounts) Earnings/(loss) (85) 74
Cash flow data Cash provided by operating activities 124 122
Cash provided by/(used in) investing activities 203 (233 ) Cash provided by/(used in) financing activities (324) 113
Distributions Fund Unit distributions declared 158 118 Fund Unit distribution per unit 0.6402 0.5376
EARNINGS/(LOSS) For the first quarter of 2018, we incurred a loss of $85 million compared with earnings of $74 million in 2017. Our earnings are primarily comprised of income from our indirect investment in EIPLP, reduced by incentive fees and preferred distributions paid to Enbridge by ECT. Our equity investment earnings were impacted by a number of unusual, non-recurring or non-operating factors in EIPLP’s earnings during the first quarters of 2018 and 2017, the most noteworthy of which relate to a non-cash, unrealized derivative loss of $293 million (2017 - $165 million gain), an asset write-down loss of $98 million (2017 - nil) and an asset impairment within an equity investment of $22 million (2017 - nil). After taking into consideration the unusual, non-recurring or non-operating factors above, the remaining increase in our indirect equity earnings of EIPLP is primarily explained by the following significant business factors:
• stronger performance from the Canadian Mainline within EIPLP's Liquids Pipelines segment in 2018, primarily due to a higher foreign exchange hedge rate used to record United States dollar denominated Canadian Mainline revenues, a higher Canadian Mainline International Joint Tariff (IJT) Residual Benchmark Toll and higher throughput driven by capacity optimization initiatives implemented in 2017;
• additional revenue generated from assets placed into service in 2017 within the Regional Oil Sands System; and
• stronger contributions from EIPLP's Gas Pipelines and Green Power segments in 2018. Refer to Non-GAAP Measures – Enbridge Income Partners LP Performance Overview – EIPLP Adjusted EBITDA for further discussion. CASH FLOWS Cash provided by operating activities increased to $124 million in the first quarter of 2018 from $122 million in 2017, while cash provided by investing activities increased to $203 million compared with cash used in investing activities of $233 million. Cash used in financing activities for the three months ended March 31, 2018 increased to $324 million compared with cash provided by financing activities of $113 million for the same period in 2017. Factors impacting our cash flows period-over-period primarily include:
• an increase in cash provided by operating activities primarily due to higher distributions received from ECT in the first quarter of 2018, driven by an increase in the ECT common unit distribution rate commencing in January 2018 and our purchase of additional ECT common units in December 2017. Distributions received from ECT are underpinned by distributions from EIPLP

24
and reflect the impacts to earnings discussed above. This increase was partially offset by our reimbursement to ENF of share issue costs, pursuant to a payment assistance agreement, that ENF paid in connection with its public equity offering in December 2017;
• an increase in cash provided by investing activities as we received net repayments on a demand note receivable from ECT in the first quarter of 2018 compared with issuing net advances to ECT in 2017; and
• an increase in cash used in financing activities due to credit facility repayments and an increase in Fund Unit distributions paid in the first quarter of 2018.
Refer to Liquidity and Capital Resources – Sources and Uses of Cash for further discussion. DISTRIBUTIONS We pay monthly distributions to our unitholders. For the first three months of 2018, distributions were declared monthly at a quarterly aggregate rate of $0.6402 (2017 - $0.5376) per unit, representing total distributions of $158 million (2017 - $118 million). Factors impacting our distributions to partners period-over-period primarily include:
• an increase in distributions that resulted from a higher Fund Unit distribution rate commencing in
January 2018 and a greater number of Fund Units outstanding following our issuance in December 2017.
RECENT DEVELOPMENTS REVISED FERC POLICY ON TREATMENT OF INCOME TAXES On March 15, 2018, the Federal Energy Regulatory Commission (FERC) changed its long-standing policy on the treatment of income tax amounts included in the rates of pipelines and other entities subject to cost of service rate regulation within a Master Limited Partnership (MLP). Although we are not directly impacted by the FERC actions, under the IJT mechanism, reductions in the Enbridge Energy Partners, L.P. (EEP) tariff will create an offsetting revenue increase on EIPLP's Canadian Mainline, which would impact our indirect equity earnings from EIPLP. This impact is subject to the outcome of any alternatives that may mitigate the impacts of the policy change at EEP as well as further clarification from the FERC on the application of its new policy. ASSET MONETIZATION On May 9, 2018, EIPLP entered into agreements with the Canadian Pension Plan Investment Board whereby EIPLP will monetize a 49% interest in wind and solar facilities included within its Green Power segment (the Assets) for cash proceeds of approximately $1.05 billion. EIPLP will continue to own a 51% interest in these Assets and Enbridge will continue to manage, operate and provide administrative services for the Assets. The transaction is subject to closing adjustments and conditions customary in transactions of this nature. Closing is expected to occur during the third quarter of 2018 subject to the receipt of all necessary regulatory approvals and consents. Upon closing, the Fund Group will utilize the proceeds to redeem Fund Units and pay back debt, as determined closer to closing. There are no plans to use any proceeds to redeem publicly held shares of ENF at this time.
25
FORWARD-LOOKING INFORMATION Forward-looking information, or forward-looking statements, have been included in this MD&A to provide information about the Fund Group, including management’s assessment of future plans and operations of the Fund Group. This information may not be appropriate for other purposes. Forward-looking statements are typically identified by words such as "anticipate", "expect", "project", “estimate”, “forecast”, “plan”, “intend”, “target”, “believe”, “likely” and similar words suggesting future outcomes or statements regarding an outlook. Forward-looking information or statements included or incorporated by reference in this document include, but are not limited to, statements with respect to the following: earnings/(loss); adjusted earnings/(loss), adjusted earnings before interest, income taxes and depreciation and amortization (EBITDA); distributable cash flow (DCF); cash flows; capital expenditures; capital requirements through 2018; organic growth opportunities beyond secured projects; impact of hedging program; future distributions to the Fund by ECT; use of proceeds from the sale of Fund Units; taxation of distributions; and future distributions and distribution targets. Although the Fund believes these forward-looking statements are reasonable based on the information available on the date such statements are made and processes used to prepare the information, such statements are not guarantees of future performance and readers are cautioned against placing undue reliance on forward-looking statements. By their nature, these statements involve a variety of assumptions, known and unknown risks and uncertainties and other factors, which may cause actual results, levels of activity and achievements to differ materially from those expressed or implied by such statements. Material assumptions include assumptions about the following: supply, demand and prices for crude oil, natural gas, natural gas liquids (NGL) and renewable energy; exchange rates; inflation; Canadian pipeline export capacity; levels of competition; anticipated operating and capital requirements; interest rates; availability and price of labor and construction materials; operational reliability; customer and regulatory approvals; maintenance of support and regulatory approvals for the Fund Group’s projects; potential acquisitions, dispositions or other strategic transactions; in-service dates; weather; the Fund Group’s credit ratings; earnings/(loss); adjusted earnings/(loss) or adjusted earnings before interest, income taxes and depreciation and amortization (adjusted EBITDA); cash flows and DCF; and distributions. Assumptions regarding the expected supply of and demand for crude oil, natural gas, NGL and renewable energy, and the prices of these commodities, are material to and underlie all forward-looking statements. These factors are relevant to all forward-looking statements as they may impact current and future level of demand for the Fund Group’s services. Similarly, exchange rates, inflation and interest rates impact the economies and business environments in which the Fund Group operates and may impact level of demand for the Fund Group’s services and cost of inputs, and are therefore inherent in all forward-looking statements. Due to the interdependencies and correlation of these macroeconomic factors, the impact of any one assumption on a forward-looking statement cannot be determined with certainty, particularly with respect to earnings/(loss), adjusted earnings/(loss), adjusted EBITDA, DCF or future distributions. The most relevant assumptions associated with forward-looking statements on projects under construction, including completion dates and capital expenditures include the following: availability and price of labor and construction materials; effects of inflation and foreign exchange rates on labor and material costs; effects of interest rates on borrowing costs; impact of weather; and customer, government and regulatory approvals on construction and in-service schedules and cost recovery regimes. The Fund Group’s forward-looking statements are subject to risks and uncertainties pertaining to operating performance, regulatory parameters, project approval and support, renewals of rights of way, weather, economic and competitive conditions, public opinion, changes in tax laws and tax rates, changes in trade agreements; exchange rates, interest rates, commodity prices and supply of and demand for commodities, including but not limited to those risks and uncertainties discussed in this MD&A and in the Fund Group’s other filings with Canadian securities regulators. The impact of any one risk, uncertainty or factor on a particular forward-looking statement is not determinable with certainty as these are interdependent and the Fund Group’s future course of action depends on management’s assessment of all information available at the relevant time. Except to the extent required by applicable law, the Fund assumes no obligation to publicly update or revise any forward-looking statements made in this MD&A or otherwise, whether as a result of new information, future events or otherwise. All subsequent forward-looking statements, whether written or oral, attributable to the Fund Group or persons acting on the Fund Group’s behalf, are expressly qualified in their entirety by these cautionary statements.

26
NON-GAAP MEASURES This MD&A contains references to our adjusted earnings, EIPLP adjusted EBITDA and EIPLP DCF. Our adjusted earnings represent our earnings adjusted for unusual, non-recurring or non-operating factors, including unusual, non-recurring or non-operating factors underpinning our indirect equity earnings of EIPLP. EIPLP adjusted EBITDA represents EIPLP’s EBITDA adjusted for unusual, non-recurring or non-operating factors on a consolidated basis. These factors, referred to as adjusting items, are reconciled and discussed in Non-GAAP Measures – Non-GAAP Reconciliation – Earnings to Adjusted Earnings and Enbridge Income Partners LP Performance Overview. EIPLP DCF represents EIPLP’s cash available to fund distributions on EIPLP Class A and EIPLP Class C units, as well as for debt repayments and reserves. EIPLP DCF consists of EIPLP adjusted EBITDA further adjusted for non-cash items, representing cash flow from EIPLP’s underlying businesses, less deductions for maintenance capital expenditures, interest expense, applicable taxes and further adjusted for unusual, non-recurring or non-operating factors not indicative of the underlying or sustainable cash flows of the business. EIPLP DCF is important to unitholders as the Fund Group’s objective is to provide a predictable flow of distributions to unitholders. The Manager believes the presentation of our adjusted earnings, EIPLP adjusted EBITDA and EIPLP DCF give useful information to unitholders as they provide increased transparency and insight into the performance of the Fund Group. The Manager uses our adjusted earnings, EIPLP adjusted EBITDA and EIPLP DCF to set targets, including the distribution payout target, and to assess the performance of the Fund Group. Our adjusted earnings, EIPLP adjusted EBITDA and EIPLP DCF are not measures that have standardized meanings prescribed by U.S. GAAP and are not U.S. GAAP measures. Therefore, these measures may not be comparable with similar measures presented by other issuers. The tables below provide a reconciliation of the GAAP and non-GAAP measures. NON-GAAP RECONCILIATION – EARNINGS TO ADJUSTED EARNINGS
Three months ended March 31, 2018 2017 (millions of Canadian dollars)
Earnings/(loss) (85) 74
Fund adjusting items: Adjusting items at EIPLP1 187 (55 ) Adjusted earnings 102 19
1 Represents ECT’s portion of the unusual, non-recurring or non-operating items within earnings of EIPLP.
Adjusted earnings were $102 million for the first three months of 2018 compared with $19 million for 2017. Our adjusted earnings were impacted by the same factors impacting earnings as discussed in Enbridge Income Fund Performance Overview – Earnings/(Loss); however, we adjusted for ECT’s portion of the unusual, non-recurring or non-operating items within earnings of EIPLP, the most noteworthy of which relate to a non-cash, unrealized derivative loss of $293 million (2017 - $165 million gain), an asset write-down loss of $98 million (2017 - nil) and an asset impairment within an equity investment of $22 million (2017 - nil). The increase in adjusted earnings reflected the stronger operating results discussed at Non-GAAP Measures – Enbridge Income Partners LP Performance Overview – EIPLP Adjusted EBITDA.

27
ENBRIDGE INCOME PARTNERS LP PERFORMANCE OVERVIEW
Three months ended March 31, 2018 2017 (millions of Canadian dollars, except per unit amounts)
Earnings before interest, income taxes and depreciation and amortization 484 778
Adjusting items: Changes in unrealized derivative fair value (gain)/loss 293 (165 ) Asset write-down loss 98 —
Equity investment asset impairment 22 —
Other 10 10
EIPLP adjusted EBITDA1 907 623
EIPLP DCF1 742 475 Distributions Cash distributions declared to ECT2 268 220
Cash distributions declared to Enbridge3 316 250
TPDR and Class D unit distributions declared to Enbridge4 115 72
1 EIPLP adjusted EBITDA and EIPLP DCF are non-GAAP measures that do not have a standardized meaning prescribed by U.S. GAAP. For more information, see Non-GAAP Measures.
2 Class A unit distributions to ECT paid in cash. 3 Class C unit and Incentive Distribution Right (IDR) distributions paid in cash. IDR represents the cash component of the Special
Interest Rights (SIR) distribution. 4 Class D unit and Temporary Performance Distribution Right (TPDR) distributions paid in-kind. TPDR distributes Class D units and
refers to the paid-in-kind component of the SIR distribution. Class D unit distributions are also paid-in-kind with the issuance of additional Class D units.
EIPLP Adjusted EBITDA Significant business factors increasing EIPLP's adjusted EBITDA period-over-period include:
• a higher foreign exchange hedge rate used to record United States dollar denominated Canadian Mainline revenues of $1.25 in 2018 compared with $1.04 in 2017. The IJT Benchmark Toll and its components are set in United States dollars, and the majority of EIPLP's foreign exchange risk on Canadian Mainline revenues is hedged;
• higher Canadian Mainline revenues due to a higher Canadian Mainline IJT Residual Benchmark Toll of US$1.64 for the first quarter in 2018 compared to US$1.47 for the corresponding period of 2017;
• strengthened Canadian Mainline throughput in 2018 driven by capacity optimization initiatives implemented in 2017;
• additional revenue generated on assets placed into service in 2017, including Athabasca Pipeline Twin, Norlite Pipeline System, Japan Canada Oil Sands Limited Hangingstone and Wood Buffalo Extension;
• an increase in seasonal firm service revenue in 2018 at Alliance Pipeline within EIPLP's Gas Pipelines segment; and
• stronger contributions from EIPLP's Green Power segment due to stronger wind resources and a gain from an arbitration settlement in 2018.
EIPLP DCF Significant business factors impacting EIPLP's DCF period-over-period include:
• stronger contributions from EIPLP's Canadian Mainline due to a higher quarter-over-quarter Canadian Mainline IJT Residual Benchmark Toll, a higher foreign exchange hedge rate used to record United States dollar denominated Canadian Mainline revenues, and stronger Canadian Mainline throughput as a result of capacity optimization initiatives implemented in 2017;

28
• additional contributions from Regional Oil Sands System assets placed into service in 2017; • higher cash distributions received from Alliance Pipeline; and • greater receipts of cash net of revenue recognized for contracts under deferred revenue
arrangements; partially offset by • higher interest expense due to lower capitalized interest and higher levels of debt outstanding
in 2018; • higher adjusted current income taxes, primarily due to an increase in adjusted earnings before
income taxes in 2018; and • greater IDR cash distributions paid by EIPLP, which increase as Fund Unit distributions increase.
EIPLP Distributions Factors impacting EIPLP's distributions to partners period-over-period primarily include:
• an increase in cash distributions declared to ECT due to a higher distribution rate for Class A units in the first quarter of 2018 as well as additional Class A units outstanding to ECT following the December 2017 issuance;
• an increase in cash distributions declared to Enbridge due to a higher distribution rate for Class C units in the first quarter of 2018 and an increase in IDR distributions; and
• an increase in paid in-kind distributions declared to Enbridge due to a higher distribution rate for Class D units in the first quarter of 2018 and additional Class D units outstanding during the first three months of 2018.
The distributions received by ECT are used to fund the fees paid to Enbridge and distributions payable to its unitholders, Enbridge and the Fund.
LIQUIDITY AND CAPITAL RESOURCES In keeping with our low risk value proposition, we actively monitor and manage exposure to financial risks. Our financing strategy is to maintain strong investment grade credit ratings and ongoing access to capital markets. To protect against more severe market disruptions, the Manager targets to maintain sufficient liquidity in the form of committed standby credit facilities to finance anticipated operating and capital requirements for at least one year without having to access long-term capital markets.
BANK CREDIT AND LIQUIDITY Long-term debt consists of medium-term notes (MTNs) and a committed credit facility. As at March 31, 2018, we had a $1,500 million committed credit facility, of which $555 million (December 31, 2017 - $755 million) was drawn and letters of credit totaling $11 million (December 31, 2017 - $11 million) were issued, leaving $934 million (December 31, 2017 - $734 million) unutilized. The Fund must adhere to covenants under its credit facility agreement, including covenants that limit outstanding debt to a percentage of the Fund’s and EIPLP’s capitalization. The Fund was in compliance with all covenants as at March 31, 2018. SOURCES AND USES OF CASH Our primary uses of cash are distributions to unitholders, investments, administrative expense and interest and principal repayments on our long-term debt. Liquidity can be met through a variety of sources including cash distributions from ECT, new offerings of debt and equity, draws under our committed standby credit facilities, as well as loans from affiliates. The Fund maintains a current MTN shelf prospectus with Canadian securities regulators, which enables ready access to Canadian public capital markets, subject to market conditions.

29
Three months ended March 31, 2018 2017 (millions of Canadian dollars)
Operating activities 124 122
Investing activities 203 (233 ) Financing activities (324) 113
Increase in cash and cash equivalents 3 2 Significant sources and uses of cash for the three months ended March 31, 2018 and 2017 are summarized below: Operating Activities Cash provided by operating activities primarily reflects distributions received from our investment in ECT. Factors impacting the increase in cash provided by operating activities period-over-period primarily include:
• an increase in distributions received from ECT in the first quarter of 2018 due to a higher ECT common unit distribution rate as well as our purchase of ECT common units in December 2017; partially offset by
• our reimbursement to ENF of share issue costs, pursuant to a payment assistance agreement, that ENF paid in connection with its public equity offering in December 2017.
Investing Activities Cash provided by investing activities primarily reflects additional investments in ECT common units along with issuances and repayments of loans to affiliates. Factors impacting the increase in cash provided by investing activities period-over-period primarily include:
• net repayments of $203 million on a demand note receivable from ECT in the first quarter of 2018 compared with net advances of $233 million in 2017.
Financing Activities Cash used in financing activities primarily relates to issuances and repayments of external debt and loans from affiliates, along with the payment of Fund Unit distributions. In addition, ENF subscribes for additional Fund Units each month using proceeds from its common share issuances under its Dividend Reinvestment and Share Purchase Plan. Factors impacting the increase in cash used in financing activities period-over-period primarily include:
• an increase in credit facility repayments in the first three months of 2018; and • an increase in Fund Unit distributions paid due to a higher distribution rate that commenced in
January 2018 and additional Fund Units outstanding following the issuance to ENF in December 2017; partially offset by
• an increase in the amount of cash ENF retained in respect of reinvested dividends of $26 million in 2017 (2017 - $14 million), for which the proceeds were used to purchase 1.0 million Fund Units (2017 - 0.4 million).

30
ANALYSIS OF CASH DISTRIBUTIONS DECLARED
Three months ended March 31, 2018 2017 (millions of Canadian dollars)
Cash provided by operating activities 124 122
Earnings/(loss) (85) 74
Cash distributions declared 158 118
Excess/(shortfall) of cash provided by operating activities over cash distributions declared (34) 4
Shortfall of earnings over cash distributions declared (243) (44 )
Cash distributions received from our investment in ECT are the primary source of cash flow we use to pay distributions to our unitholders and service our long-term debt. In the first quarter of 2018, there was a shortfall of cash provided by operating activities over cash distributions declared, largely due to our reimbursement to ENF of share issue costs, pursuant to a payment assistance agreement, that ENF paid in connection with its public equity offering in December 2017. Earnings were $243 million and $44 million less than cash distributions declared for the first three months of 2018 and 2017, respectively. Earnings reflected non-cash items such as income from equity investments, which was impacted by the factors discussed in Non-GAAP Measures – Enbridge Income Partners LP Performance Overview.
QUARTERLY FINANCIAL INFORMATION
2018 2017 2016 Q1 Q4 Q3 Q2 Q1 Q4 Q3 Q2 (millions of Canadian dollars)
Income/(loss) from equity investment (68 ) 81
148
123
92
477
27
5
Earnings/(loss) (85 ) (9) 132 105 74 446 5 (19 ) Cash distributions received in
excess of/(less than) equity earnings 246
63
(9 ) 17
49
(85) 102
123
Fund Unit distributions declared 158
124
118
117
118
117
117
117
Fund Unit distribution per unit 0.6402 0.5376 0.5376 0.5376 0.5376 0.5376 0.5376 0.5376
Several factors impact comparability of our financial results through our indirect investment in EIPLP, including, but not limited to, fluctuations in market prices such as foreign exchange rates and commodity prices, disposals of investments or assets and the timing of in-service dates of new projects. EIPLP actively manages its exposure to market risks including, but not limited to, interest rates, commodity prices and foreign exchange rates. To the extent derivative instruments used to manage these risks are non-qualifying for the purposes of applying hedge accounting, non-cash, unrealized derivative gains and losses on these instruments will impact earnings.

31
In addition to the impacts of non-cash, unrealized derivative gains and losses outlined above, significant items that have impacted our financial results are as follows:
• In January 2018, we increased our Fund Unit distribution rate to $0.2134 per month effective with the January distribution.
• In December 2017, ENF completed a public equity offering of 20.7 million common shares at a price of $27.80 per share for gross proceeds of $575 million. Concurrent with the closing of the public equity offering, Enbridge subscribed for 5.1 million ENF common shares for gross proceeds of $143 million, on a private placement basis, to maintain its 19.9% ownership interest in ENF. Upon closing of the transaction, Enbridge’s economic interest in the Fund Group and ENF decreased from 84.6% to 82.5% and ENF's economic interest in the Fund Group increased from 19.2% to 21.8%.
• In December 2017, ENF used the gross proceeds from its common share issuance to subscribe for 25.8 million Fund Units for gross proceeds of $718 million, which were, in turn, used to invest in 25.8 million ECT common units. ECT used the proceeds to invest in 25.8 million Class A units of EIPLP, increasing our indirect investment in EIPLP to 46.9%.
• In April 2017, Enbridge exchanged 21.7 million Fund Units for an equivalent amount of ENF common shares. In order to maintain its 19.9% interest in ENF, Enbridge retained 4.3 million of the common shares issued pursuant to such exchange and sold the remaining balance to the public.
• The fourth quarter of 2016 includes the sale of South Prairie Region assets, which closed on December 1, 2016, resulting in a before-tax gain of $850 million within EIPLP. Following the sale, a one-time cash distribution of $264 million was received from ECT.
• The second quarter of 2016 includes reduced equity earnings from EIPLP due to the northeastern Alberta wildfires.
• In April 2016, ENF completed a public equity offering of 20.4 million common shares at a price of $28.25 per share for gross proceeds of $575 million. Concurrent with the closing of the equity offering, Enbridge subscribed for 5.0 million ENF common shares for gross proceeds of $143 million, on a private placement basis. ENF used the gross proceeds from its common share issuance to subscribe for 25.4 million Fund Units for gross proceeds of $718 million, which were, in turn, used to invest in 25.4 million ECT common units.
RISK MANAGEMENT AND FINANCIAL INSTRUMENTS Maintaining a reliable and low risk business model is central to the Fund Group’s objective of paying out a predictable cash flow to unitholders. The Fund Group actively manages both financial and non-financial risk exposures. The Fund Group performs an annual corporate risk assessment to identify all potential risks. Risks are ranked based on severity and likelihood both before and after mitigating actions. In addition, the Fund Group has adopted a Cash Flow at Risk (CFAR) policy to manage exposure to movements in interest rates, foreign exchange rates and commodity prices. CFAR is a statistically derived measurement that quantifies the maximum adverse impact on cash flows over a specified period of time within a pre-defined level of statistical confidence. The Fund Group’s CFAR limit has been set at 2.5% of forward annual DCF of the Fund Group. INTEREST RATE RISK Our earnings, cash flows and other comprehensive income (OCI) are subject to movements in interest rates. We use qualifying derivative instruments to manage interest rate risk. Refer to the Fund’s 2017 Annual MD&A for further details on financial instrument risk management.

32
EFFECT OF DERIVATIVE INSTRUMENTS ON THE STATEMENTS OF EARNINGS AND COMPREHENSIVE INCOME The following table presents the effect of cash flow hedges on our earnings and comprehensive income:
Three months ended
March 31, 2018 2017 (millions of Canadian dollars)
Amount of unrealized gain/(loss) recognized in OCI Interest rate contracts 1 (9 )
Amount of loss reclassified from Accumulated other comprehensive income (AOCI) to earnings
(effective portion)
Interest rate contracts1 1 1
Amount of loss reclassified from AOCI to earnings (ineffective portion and amount excluded from effectiveness testing)
Interest rate contracts1 — 1
1 Reported within Interest expense in the Statements of Earnings.
LIQUIDITY RISK Liquidity risk is the risk that we will not be able to meet our financial obligations, including commitments, as they become due. In order to manage this risk, we forecast cash requirements over the near and long term to determine whether sufficient funds will be available when required. Our primary sources of liquidity and capital resources are funds generated from our indirect investment in EIPLP, draws under committed credit facilities, the issuance of MTNs and the issuance of Fund Units. The Fund maintains a current MTN shelf prospectus with Canadian securities regulators, which enables ready access to Canadian public capital markets, subject to market conditions. Additional liquidity, if necessary, is expected to be available through intercompany transactions with Enbridge or other related entities.
CREDIT RISK Entering into derivative instruments may result in exposure to credit risk. Credit risk arises from the possibility that a counterparty will default on its contractual obligations. We enter into risk management transactions only with institutions that possess investment grade credit ratings. Credit risk relating to derivative counterparties is mitigated by credit exposure limits and contractual requirements, netting arrangements and ongoing monitoring of counterparty credit exposure using external credit rating services and other analytical tools.
CHANGES IN ACCOUNTING POLICIES ADOPTION OF NEW STANDARDS Simplifying Cash Flow Classification Effective January 1, 2018, we adopted Accounting Standards Update (ASU) 2016-15 on a retrospective basis. The new standard reduces diversity in practice of how certain cash receipts and cash payments are classified in the statement of cash flows. The new guidance addresses eight specific presentation issues. We assessed each of the eight specific presentation issues and the adoption of this ASU did not have a material impact on our financial statements. Recognition and Measurement of Financial Assets and Liabilities Effective January 1, 2018, we adopted ASU 2016-01 on a prospective basis. The new standard addresses certain aspects of recognition, measurement, presentation and disclosure of financial assets and liabilities. Investments in equity securities, excluding equity method and consolidated investments, are no longer classified as trading or available-for-sale securities. All investments in equity securities with readily determinable fair values are classified as investments at fair value through net income. Investments in equity securities without readily determinable fair values are measured using the fair value

33
measurement alternative and are recorded at cost minus impairment, if any, plus or minus changes resulting from observable price changes in orderly transactions for an identical or similar investment of the same issuer. Investments in equity securities measured using the fair value measurement alternative are reviewed for indicators of impairment each reporting period. Fair value of financial instruments for disclosure purposes is measured using an exit price, which is the price that would be received to sell an asset or transfer a liability in an orderly transaction between market participants at the measurement date. The adoption of this accounting update did not have a material impact on our financial statements.
FUND OWNERSHIP The following table presents the direct and indirect ownership of the Fund:
As at April 27, 2018 (number Fund Units outstanding)
Held by Enbridge 72,492,383
Held by ENF 174,963,276
247,455,659

ENBRIDGE INCOME FUND FINANCIAL STATEMENTSMarch 31, 2018

35
ENBRIDGE INCOME FUND STATEMENTS OF EARNINGS
Three months ended
March 31, 2018 2017 (unaudited; millions of Canadian dollars)
Income/(loss) from equity investment in Enbridge Commercial Trust (Note 3) (68) 92
Other income – affiliates 7 6
Interest expense (24) (24 ) Earnings/(loss) attributable to unitholders (85) 74
See accompanying notes to the interim financial statements.

36
ENBRIDGE INCOME FUND STATEMENTS OF COMPREHENSIVE INCOME
Three months ended
March 31, 2018 2017 (unaudited; millions of Canadian dollars)
Earnings/(loss) (85) 74
Other comprehensive income/(loss) Change in unrealized gain/(loss) on cash flow hedges 1 (7 ) Other comprehensive income from equity investee (Note 3) 13 3
Reclassification to earnings of loss on cash flow hedges 1 —
Other comprehensive income/(loss) 15 (4 ) Comprehensive income/(loss) (70) 70
See accompanying notes to the interim financial statements.

37
ENBRIDGE INCOME FUND STATEMENTS OF CHANGES IN UNITHOLDERS’ EQUITY
Deficit
Accumulated other
comprehensive loss Total
(unaudited; millions of Canadian dollars) December 31, 2017 (5,880) (97) (5,977)
Enbridge Income Partners LP retrospective adoption of
accounting standard (Note 3) (68) —
(68)
Loss attributable to unitholders (85) — (85) Other comprehensive income — 15 15 Distributions to unitholders (158) — (158) Redemption value adjustment attributable to trust units (Note 5) 485 — 485 Equity investment dilution gain, net (Note 3) 28 — 28 March 31, 2018 (5,678) (82) (5,760)
Deficit
Accumulated other
comprehensive loss Total
(unaudited; millions of Canadian dollars) December 31, 2016 (6,575) (182) (6,757) Earnings attributable to unitholders 74 — 74 Other comprehensive loss — (4) (4) Distributions to unitholders (118) — (118) Redemption value adjustment attributable to trust units (Note 5) 360 — 360 Equity investment dilution gain, net 22 — 22 March 31, 2017 (6,237) (186) (6,423)
See accompanying notes to the interim financial statements.

38
ENBRIDGE INCOME FUND STATEMENTS OF CASH FLOWS
Three months ended
March 31, 2018 2017 (unaudited; millions of Canadian dollars)
Operating activities Earnings/(loss) (85) 74
Adjustments to reconcile earnings to net cash provided by operating activities: (Earnings)/loss from equity investments (Note 3) 68 (92 ) Distributions from equity (Note 3) 178 141
Other 2 —
Changes in operating assets and liabilities (39) (1 ) Net cash provided by operating activities 124 122
Investing activities Affiliate loans, net 203 (233 ) Net cash provided by/(used in) investing activities 203 (233 ) Financing activities Net change in bank indebtedness — 7
Net change in credit facility draws (200) 210
Trust units issued, net 26 14
Trust unit distributions declared (158) (118 ) Change in distributions payable 8 —
Net cash provided by/(used in) financing activities (324) 113
Net increase in cash and cash equivalents 3 2 Cash and cash equivalents at beginning of period 2 6
Cash and cash equivalents at end of period 5 8 See accompanying notes to the interim financial statements.

39
ENBRIDGE INCOME FUND STATEMENTS OF FINANCIAL POSITION
March 31, December 31, 2018 2017 (unaudited; millions of Canadian dollars)
Assets Current assets Cash and cash equivalents 5 2
Demand note receivable from Enbridge Commercial Trust (Note 7) 746 949
Accounts receivable from affiliates 64 54
Accounts receivable and other 9 2
Current portion of derivative assets (Note 6) 1 1
Current portion of derivative assets from affiliates (Note 6) 12 10
837 1,018 Long-term note receivable from Enbridge Commercial Trust (Note 7) 100 100
Long-term investment (Note 3) 2,429 2,702
Long-term portion of derivative assets from affiliates (Note 6) 49 43
Deferred amounts and other assets 1 1
Total assets 3,416 3,864
Liabilities and unitholders' equity Current liabilities Interest payable 21 19
Current portion of derivative liabilities (Note 6) 14 12
Current portion of derivative liabilities to affiliates (Note 6) — 1
Accounts payable and other 1 1
Other accounts payable to affiliates — 23
Distributions payable to affiliates 54 46
Current portion of long-term debt 423 123
513 225 Long-term debt 1,877 2,377
Long-term portion of derivative liabilities (Note 6) 49 43
2,439 2,645 Trust units (Note 5) 6,737 7,196
6,737 7,196 Unitholders' deficit
Deficit (5,678) (5,880) Accumulated other comprehensive loss (82) (97) (5,760) (5,977) Total liabilities and unitholders' equity 3,416 3,864
See accompanying notes to the interim financial statements.

40
NOTES TO THE INTERIM FINANCIAL STATEMENTS (unaudited)
1. BASIS OF PRESENTATION The accompanying unaudited interim financial statements of Enbridge Income Fund (the Fund) have been prepared in accordance with generally accepted accounting principles in the United States of America (U.S. GAAP) for interim financial information. They do not include all of the information and footnotes required by U.S. GAAP for annual financial statements and should therefore be read in conjunction with the Fund’s audited annual financial statements and notes for the year ended December 31, 2017. In the opinion of management, the interim financial statements contain all normal recurring adjustments necessary to present fairly the Fund’s financial position, results of operations and cash flows for the interim periods reported. These interim financial statements follow the same significant accounting policies as those included in the Fund’s annual audited financial statements for the year ended December 31, 2017, except for the adoption of new standards (Note 2). Amounts are stated in Canadian dollars unless otherwise noted.
2. CHANGES IN ACCOUNTING POLICIES ADOPTION OF NEW STANDARDS Simplifying Cash Flow Classification Effective January 1, 2018, the Fund adopted Accounting Standards Update (ASU) 2016-15 on a retrospective basis. The new standard reduces diversity in practice of how certain cash receipts and cash payments are classified in the statement of cash flows. The new guidance addresses eight specific presentation issues. The Fund assessed each of the eight specific presentation issues and the adoption of this ASU did not have a material impact on its financial statements. Recognition and Measurement of Financial Assets and Liabilities Effective January 1, 2018, the Fund adopted ASU 2016-01 on a prospective basis. The new standard addresses certain aspects of recognition, measurement, presentation and disclosure of financial assets and liabilities. Investments in equity securities, excluding equity method and consolidated investments, are no longer classified as trading or available-for-sale securities. All investments in equity securities with readily determinable fair values are classified as investments at fair value through net income. Investments in equity securities without readily determinable fair values are measured using the fair value measurement alternative and are recorded at cost minus impairment, if any, plus or minus changes resulting from observable price changes in orderly transactions for an identical or similar investment of the same issuer. Investments in equity securities measured using the fair value measurement alternative are reviewed for indicators of impairment each reporting period. Fair value of financial instruments for disclosure purposes is measured using an exit price, which is the price that would be received to sell an asset or transfer a liability in an orderly transaction between market participants at the measurement date. The adoption of this accounting update did not have a material impact on the Fund’s financial statements.
3. LONG-TERM INVESTMENT
INVESTMENT IN ENBRIDGE COMMERCIAL TRUST As at March 31, 2018, the Fund’s maximum exposure to loss is limited to the carrying amount of its equity investment in Enbridge Commercial Trust (ECT), which is $2,429 million (December 31, 2017 - $2,702 million). As at March 31, 2018, the carrying value of ECT’s assets was $4,967 million and the carrying value of its liabilities was $2,538 million.

41
March 31, December 31, 2018 2017 (millions of Canadian dollars)
Investment balance at beginning of period 2,702 2,244
Investment acquired — 718
Equity investment income/(loss) (68) 444
Equity investment other comprehensive income/(loss) 13 (2) Retrospective adoption of accounting standard1 (68) —
Equity investment dilution gain/(loss), net 28 (138) Distributions (178) (564) Investment balance at end of period 2,429 2,702
1 Effective January 1, 2018, Enbridge Income Partners LP (EIPLP) adopted Accounting Standards Codification (ASC) 606 - Revenues from Contracts with Customers on a modified retrospective basis.
As at March 31, 2018, the Fund owned 332 million (December 31, 2017 - 332 million) units of ECT, representing all of ECT’s issued and outstanding common units. Summarized financial information of ECT accounted for under the equity method was as follows:
Three months ended
March 31, 2018 2017 (millions of Canadian dollars)
Income from equity investment in EIPLP 24 174
Incentive fee - affiliate (32) (31 ) Operating and administrative expense — (1 ) Other income - affiliate 4 3
Interest expense - affiliate1 (64) (53 ) Earnings attributable to unitholder (68) 92
1 For the three months ended March 31, 2018, interest expense includes $56 million (2017 - $47 million) of ECT Preferred Unit distributions to Enbridge Inc. (Enbridge) and $8 million (2017 - $6 million) of interest expense on notes payable to the Fund.
March 31, December 31, 2018 2017 (millions of Canadian dollars)
Demand note receivable from EIPLP 223 427
Other current assets 93 81
Long-term note receivable from EIPLP 100 100
Long-term investment 4,551 4,822
Due to affiliates 36 34
Demand note payable to the Fund 746 949
Distributions payable to affiliates 78 67
Long-term notes payable to the Fund 100 100
Preferred units 1,578 1,578
Trust units 9,109 9,766 Unitholder's deficit (6,680) (7,064)
INDIRECT INVESTMENT IN EIPLP At March 31, 2018, the Fund, through its 100% ownership of ECT, owned 408 million (December 31, 2017 - 408 million) of the issued and outstanding EIPLP Class A Units, representing an indirect ownership of 46.7% (December 31, 2017 - 46.9%) of EIPLP’s total issued and outstanding common units.
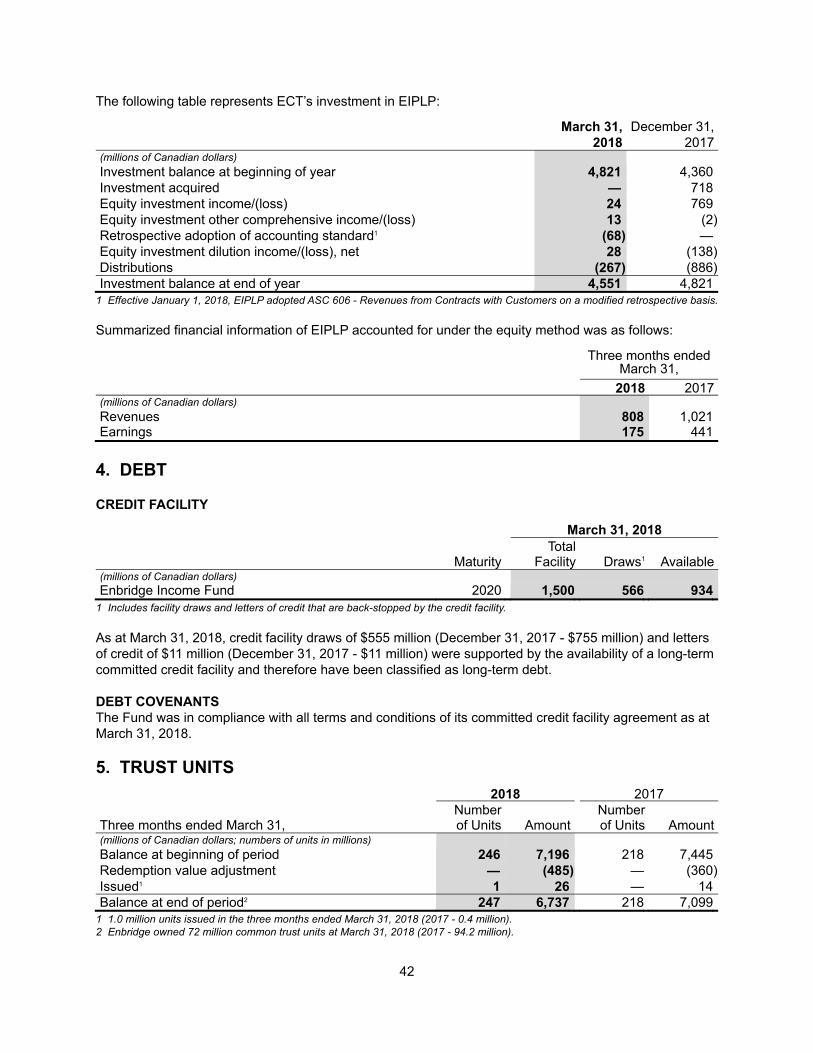
42
The following table represents ECT’s investment in EIPLP:
March 31, December 31, 2018 2017 (millions of Canadian dollars)
Investment balance at beginning of year 4,821 4,360
Investment acquired — 718
Equity investment income/(loss) 24 769
Equity investment other comprehensive income/(loss) 13 (2) Retrospective adoption of accounting standard1 (68) —
Equity investment dilution income/(loss), net 28 (138) Distributions (267) (886) Investment balance at end of year 4,551 4,821
1 Effective January 1, 2018, EIPLP adopted ASC 606 - Revenues from Contracts with Customers on a modified retrospective basis.
Summarized financial information of EIPLP accounted for under the equity method was as follows:
Three months ended
March 31,
2018 2017 (millions of Canadian dollars)
Revenues 808 1,021 Earnings 175 441
4. DEBT CREDIT FACILITY
March 31, 2018 Total Maturity Facility Draws1 Available (millions of Canadian dollars) Enbridge Income Fund 2020 1,500 566 934
1 Includes facility draws and letters of credit that are back-stopped by the credit facility.
As at March 31, 2018, credit facility draws of $555 million (December 31, 2017 - $755 million) and letters of credit of $11 million (December 31, 2017 - $11 million) were supported by the availability of a long-term committed credit facility and therefore have been classified as long-term debt. DEBT COVENANTS The Fund was in compliance with all terms and conditions of its committed credit facility agreement as at March 31, 2018.
5. TRUST UNITS
2018 2017 Number Number Three months ended March 31, of Units Amount of Units Amount (millions of Canadian dollars; numbers of units in millions)
Balance at beginning of period 246 7,196 218 7,445
Redemption value adjustment — (485 ) — (360 ) Issued1 1 26 — 14
Balance at end of period2 247 6,737 218 7,099 1 1.0 million units issued in the three months ended March 31, 2018 (2017 - 0.4 million). 2 Enbridge owned 72 million common trust units at March 31, 2018 (2017 - 94.2 million).

43
6. RISK MANAGEMENT AND FINANCIAL INSTRUMENTS MARKET RISK The Fund’s earnings, cash flows and other comprehensive income (OCI) are subject to movements in interest rates and foreign exchange rates. The Fund acts as an intermediary to pass along the foreign exchange risks to EIPLP. Formal risk management policies, processes and systems have been designed to mitigate these risks. The following summarizes the types of market risks to which the Fund is exposed and the risk management instruments used to mitigate them. Interest Rate Risk The Fund’s earnings, cash flows and OCI are exposed to short term interest rate variability due to the regular repricing of its variable rate debt, primarily credit facilities. Floating to fixed interest rate swaps are used to hedge against the effect of future interest rate movements. The Fund has implemented a program to mitigate the volatility of short-term interest rates on interest expense with the execution of floating to fixed rate interest rate swaps at an average swap rate of 2.5%. The Fund’s earnings and cash flows are also exposed to variability in longer term interest rates ahead of anticipated fixed rate debt issuances. Forward starting interest rate swaps may be used to hedge against the effect of future interest rate movements. The Fund has implemented a program to mitigate its exposure to long-term interest rate variability on select forecast term debt issuances. In December 2017, the Fund canceled all forecasted fixed rate debt issuances for 2018 and 2019. At that time, the Fund terminated all active long-term interest rate swaps. The Fund may elect to utilize the program in the future. The Fund uses qualifying derivative instruments to manage interest rate risk. TOTAL DERIVATIVE INSTRUMENTS The following table summarizes the Statements of Financial Position location, carrying value and fair value of the Fund’s derivative instruments. The Fund did not have any outstanding fair value hedges or net investment hedges as at March 31, 2018 or December 31, 2017. The Fund enters into individual International Swaps and Derivatives Association, Inc. agreements, or other similar derivative agreements, with certain of its financial derivative counterparties. These agreements provide for the net settlement of derivative instruments outstanding with specific counterparties in the event of bankruptcy or other significant credit event, and would reduce the Fund’s credit risk exposure on financial derivative asset positions outstanding with the counterparties in these particular circumstances. The following table also summarizes the maximum potential settlement in the event of these specific circumstances. All amounts are presented gross in the Statements of Financial Position.

44
March 31, 2018
Derivative Instruments
used as Cash Flow Hedges
Non- Qualifying Derivative
Instruments
Total Gross Derivative
Instruments as Presented
Amounts Available for Offset
Total Net Derivative
Instruments
(millions of Canadian dollars) Current portion of derivative assets
Foreign exchange contracts — 1 1 — 1 — 1 1 — 1
Current portion of derivative assets - affiliates Foreign exchange contracts — 12 12 — 12
— 12 12 — 12 Long-term portion of derivative assets - affiliates
Foreign exchange contracts — 49 49 — 49 — 49 49 — 49
Current portion of derivative liabilities
Interest rate contracts — (1 ) (1) — (1 )
Foreign exchange contracts — (13 ) (13) — (13 ) — (14 ) (14) — (14 )
Current portion of derivative liabilities - affiliates
Foreign exchange contracts — — — — — — — — — —
Long-term portion of derivative liabilities
Foreign exchange contracts — (49 ) (49) — (49 ) — (49 ) (49) — (49 )
Long-term portion of derivative liabilities - affiliates
Interest rate contracts — — — — — — — — — —
Total net derivative liability
Interest rate contracts — (1 ) (1) — (1 )
Foreign exchange contracts — — — — — — (1 ) (1) — (1 )
December 31, 2017
Derivative Instruments
used as Cash Flow Hedges
Non- Qualifying Derivative
Instruments
Total Gross Derivative
Instruments as Presented
Amounts Available for Offset
Total Net Derivative
Instruments
(millions of Canadian dollars) Current portion of derivative assets
Foreign exchange contracts — 1 1 — 1 — 1 1 — 1
Current portion of derivative assets - affiliates
Foreign exchange contracts — 10 10 (1) 9 — 10 10 (1) 9
Long-term portion of derivative assets - affiliates
Foreign exchange contracts — 43 43 — 43 — 43 43 — 43
Current portion of derivative liabilities
Interest rate contracts (2) — (2) — (2 )
Foreign exchange contracts — (10 ) (10) — (10 ) (2) (10 ) (12) — (12 )
Current portion of derivative liabilities - affiliates
Foreign exchange contracts — (1 ) (1) 1 — — (1 ) (1) 1 —
Long-term portion of derivative liabilities
Foreign exchange contracts — (43 ) (43) — (43 ) — (43 ) (43) — (43 )
Long-term portion of derivative liabilities - affiliates
Interest rate contracts — — — — — — — — — —
Total net derivative liability
Interest rate contracts (2) — (2) — (2 )
Foreign exchange contracts — — — — — (2) — (2) — (2 )

45
The following table summarizes the maturity and notional principal or quantity outstanding related to the Fund’s derivative instruments:
March 31, 2018 2018 2019 2020 2021 2022 Thereafter Interest rate contracts - short-term borrowings (millions of
Canadian dollars) 235
1
—
—
—
—
Foreign exchange contracts - United States dollar forwards - purchase (millions of United States dollars) 69
57
63
69
72
150
Foreign exchange contracts - United States dollar forwards - sell (millions of United States dollars) 69
57
63
69
72
150
December 31, 2017 2018 2019 2020 2021 2022 Thereafter Interest rate contracts - short-term borrowings (millions of
Canadian dollars) 319
1
—
—
—
—
Foreign exchange contracts - United States dollar forwards - purchase (millions of United States dollars) 92
57
63
69
72
150
Foreign exchange contracts - United States dollar forwards - sell (millions of United States dollars) 92
57
63
69
72
150
Effect of Derivative Instruments on the Statements of Earnings and Comprehensive Income The following table presents the effect of cash flow hedges on the Fund’s earnings and comprehensive income:
Three months ended March 31, 2018 2017 (millions of Canadian dollars)
Amount of unrealized gain/(loss) recognized in OCI Interest rate contracts 1 (9 )
Amount of loss reclassified from accumulated other comprehensive income (AOCI) to earnings (effective portion)
Interest rate contracts1 1 1
Amount of loss reclassified from AOCI to earnings (ineffective portion and amount excluded from effectiveness testing) Interest rate contracts1 — 1
1 Reported within Interest expense in the Statements of Earnings.
The estimated net amount of existing losses reported in AOCI that is expected to be reclassified to net income within the next 12 months is zero. Actual amounts reclassified to earnings depend on the interest rates in effect when derivative contracts that are currently outstanding are settled. Non-Qualifying Derivatives The net unrealized gains and losses associated with changes in the fair value of the Fund’s non-qualifying derivatives was $1 million loss and nil for the three months ended March 31, 2018 and 2017, respectfully. LIQUIDITY RISK Liquidity risk is the risk that the Fund will not be able to meet its financial obligations, including commitments, as they become due. In order to manage this risk, the Fund forecasts cash requirements over the near and long term to determine whether sufficient funds will be available when required. The Fund’s primary sources of liquidity and capital resources are funds generated from its indirect investment in EIPLP, draws under committed credit facilities, the issuance of medium-term notes (MTNs) and the issuance of ordinary trust units of the Fund (Fund Units). The Fund also maintains a current MTN shelf prospectus with Canadian securities regulators, which enables, subject to market conditions, ready access to Canadian public capital markets. Additional liquidity, if necessary, is expected to be available through intercompany transactions with Enbridge or other related entities.

46
CREDIT RISK Entering into derivative instruments may result in exposure to credit risk. Credit risk arises from the possibility that a counterparty will default on its contractual obligations. The Fund enters into risk management transactions only with institutions that possess investment grade credit ratings. Credit risk relating to derivative counterparties is mitigated by credit exposure limits and contractual requirements, netting arrangements and ongoing monitoring of counterparty credit exposure using external credit rating services and other analytical tools. The Fund has credit concentrations and credit exposure, with respect to derivative instruments, in the following counterparty segments:
March 31, December 31, 2018 2017 (millions of Canadian dollars)
European financial institutions — 1
Due from affiliates 61 53
61 54
FAIR VALUE MEASUREMENTS The Fund’s financial assets and liabilities measured at fair value on a recurring basis include derivative instruments. The fair value of derivative instruments reflects the Fund’s best estimates of market value based on generally accepted valuation techniques or models and are supported by observable market prices and rates. When such values are not available, the Fund uses discounted cash flow analysis from applicable yield curves based on observable market inputs to estimate fair value. FAIR VALUE OF FINANCIAL INSTRUMENTS The Fund categorizes those financial assets and liabilities measured at fair value into one of three different levels depending on the observability of the inputs employed in the measurement. Level 1 Level 1 includes financial instruments measured at fair value based on unadjusted quoted prices for identical assets and liabilities in active markets that are accessible at the measurement date. An active market for a financial instrument is considered to be a market where transactions occur with sufficient frequency and volume to provide pricing information on an ongoing basis. The Fund did not have any financial instruments categorized as Level 1 as at March 31, 2018 or December 31, 2017. Level 2 Level 2 includes financial instrument valuations determined using directly or indirectly observable inputs other than quoted prices included within Level 1. Financial instruments in this category are valued using models or other industry standard valuation techniques derived from observable market data. Such valuation techniques include inputs such as quoted forward prices, time value, volatility factors and broker quotes that can be observed or corroborated in the market for the entire duration of the financial instrument. Financial instruments valued using Level 2 inputs include non-exchange traded derivatives such as over-the-counter interest rate swaps for which observable inputs can be obtained. Level 3 Level 3 includes financial instrument valuations based on inputs which are less observable, unavailable or where the observable data does not support a significant portion of the financial instruments’ fair value. Generally, Level 3 financial instruments are longer dated transactions, occur in less active markets, occur at locations where pricing information is not available or have no binding broker quote to support Level 2 classification. The Fund did not have any financial instruments categorized as Level 3 as at March 31, 2018 or December 31, 2017.

47
The Fund uses the most observable inputs available to estimate the fair value of its financial instruments. When possible, the Fund estimates the fair value of its financial instruments based on quoted market prices. If quoted market prices are not available, the Fund uses estimates from third party brokers. For non-exchange traded derivatives classified in Levels 2 and 3, the Fund uses standard valuation techniques to calculate the estimated fair value. These methods include discounted cash flows for forwards and swaps. Depending on the type of financial instrument and nature of the underlying risk, the Fund uses observable market prices (interest or foreign exchange) and volatility as primary inputs to these valuation techniques. Finally, the Fund considers its own credit default swap spread as well as the credit default swap spreads associated with its counterparties in its estimation of fair value. The Fund has categorized its financial instruments, measured at fair value as follows:
Total Gross
Derivative March 31, 2018 Level 1 Level 2 Level 3 Instruments (millions of Canadian dollars)
Financial assets Current derivative assets — 13 — 13
Long-term derivative assets — 49 — 49
Financial liabilities Current derivative liabilities — (14) — (14 ) Long-term derivative liabilities — (49) — (49 )
Total net liability — (1) — (1 )
Total Gross
Derivative December 31, 2017 Level 1 Level 2 Level 3 Instruments (in millions of Canadian dollars) Financial assets
Current derivative assets — 11 — 11 Long-term derivative assets — 43 — 43
Financial liabilities Current derivative liabilities — (13) — (13 ) Long-term derivative liabilities — (43) — (43 )
Total net liability — (2) — (2 )
The Fund’s policy is to recognize transfers as at the last day of the reporting period. There were no transfers between levels as at March 31, 2018 or December 31, 2017. FAIR VALUE OF OTHER FINANCIAL INSTRUMENTS At March 31, 2018, the Fund’s long-term debt had a carrying value of $2,305 million (December 31, 2017 - $2,500 million) before debt issuance costs and a fair value of $2,361 million (December 31, 2017 - $2,571 million). The fair value of other financial assets and liabilities other than derivative instruments and long-term debt approximate their cost due to the short period to maturity.

48
7. RELATED PARTY TRANSACTIONS DEMAND NOTE RECEIVABLE FROM ENBRIDGE COMMERCIAL TRUST
March 31, December 31, 2018 2017 (millions of Canadian dollars) Floating interest rate note, due on demand from ECT 746 949
LONG-TERM NOTE RECEIVABLE FROM ENBRIDGE COMMERCIAL TRUST
March 31, December 31, 2018 2017 (millions of Canadian dollars) 7.00% note due November 12, 2020 from ECT 100 100
8. SUBSEQUENT EVENT On May 9, 2018, EIPLP entered into agreements to sell a 49% interest in wind and solar facilities included within its Green Power segment (the Assets) to an unrelated party for cash consideration of approximately $1.05 billion. EIPLP will maintain a 51% interest in the Assets and Enbridge will continue to manage, operate and provide administrative services for the Assets. The transaction is subject to closing adjustments and conditions customary in transactions of this nature. Closing is expected to occur during the third quarter of 2018 subject to the receipt of all necessary regulatory approvals and consents.
ENBRIDGE INCOME PARTNERS LP MANAGEMENT’S DISCUSSION AND ANALYSISMarch 31, 2018

50
GLOSSARY Adjusted EBITDA Adjusted earnings before interest, income taxes and depreciation and
amortization
ASU Accounting Standards Update
Canadian L3R Program Canadian portion of the Line 3 Replacement Program
DCF Distributable cash flow
EBITDA Earnings before interest, income taxes and depreciation and amortization
ECT Enbridge Commercial Trust
EIPLP Enbridge Income Partners LP
Enbridge Enbridge Inc.
EPI Enbridge Pipelines Inc.
IDR Incentive Distribution Right
IJT International Joint Tariff
MD&A Management's Discussion and Analysis
MNPUC Minnesota Public Utilities Commission
the Fund Enbridge Income Fund
the Fund Group The Fund, ECT, EIPLP and the subsidiaries and investees of EIPLP
the Manager or EMSI Enbridge Management Services Inc.

51
MANAGEMENT’S DISCUSSION AND ANALYSIS FOR THE THREE MONTHS ENDED MARCH 31, 2018 This Management’s Discussion and Analysis (MD&A) dated May 10, 2018 should be read in conjunction with the unaudited interim consolidated financial statements and notes thereto of Enbridge Income Partners LP as at and for the three months ended March 31, 2018, prepared in accordance with generally accepted accounting principles in the United States of America (U.S. GAAP). It should also be read in conjunction with the audited consolidated financial statements and MD&A for the year ended December 31, 2017. All financial measures presented in this MD&A are expressed in Canadian dollars, unless otherwise indicated. Enbridge Income Partners LP supplements Enbridge Income Fund’s (the Fund) financial statements and MD&A, and additional information related to Enbridge Income Partners LP is available under the Fund’s profile on SEDAR at www.sedar.com. Effective December 31, 2017, Enbridge Income Partners LP revised its segmented information presentation on a retrospective basis to align with current changes in reporting to the Chief Operating Decision Maker in assessing Enbridge Income Partners LP's performance and making decisions on allocation of resources to the segments. Enbridge Income Partners LP changed its profit measure to Earnings before interest, income taxes and depreciation and amortization (EBITDA) from its previous measure of Earnings before interest and income taxes.
OVERVIEW The terms “we,” “our,” “us” and “EIPLP” as used in this MD&A refer to Enbridge Income Partners LP unless the context suggests otherwise. EIPLP was formed in 2002, and we are involved in the generation, transportation and storage of energy through our interests in our liquids pipelines business, including the Canadian Mainline and the Regional Oil Sands System, our 50% interest in the Alliance Pipeline, which transports natural gas from Canada to the United States, and our renewable and alternative power generation assets. EIPLP is a member of the Fund Group, which also includes Enbridge Commercial Trust (ECT) and the Fund. We hold all of the underlying operating entities of the Fund Group through our subsidiaries and investees. Enbridge Inc. (Enbridge), through its wholly-owned subsidiary, Enbridge Management Services Inc. (the Manager or EMSI), is responsible for the operations and day-to-day management of the Fund Group. The Manager also provides administrative and general support services to the Fund Group. The limited partners of EIPLP are ECT and Enbridge and certain of its subsidiaries. We conduct our business through three business segments: Liquids Pipelines, Gas Pipelines and Green Power. Liquids Pipelines Liquids Pipelines consists of common carrier and contract pipelines, feeder pipelines and gathering systems that transport crude oil, natural gas liquids (NGL) and terminals in Canada, including Canadian Mainline, Regional Oil Sands System, Southern Lights Pipeline, which includes the Canadian portion of Southern Lights Pipeline and Class A units of certain Enbridge subsidiaries which provide a defined cash flow stream (Southern Lights Class A units) from the United States portion of Southern Lights Pipeline, Bakken Expansion Pipeline and Storage Facilities and Other. Gas Pipelines Gas Pipelines includes our 50% interest in the Alliance Pipeline system, which transports liquids-rich natural gas from northeast British Columbia, northwest Alberta and the Bakken area of North Dakota to Channahon, Illinois.

52
Green Power Green Power consists of wind facilities, solar facilities and waste heat recovery facilities located in the provinces of Alberta, Saskatchewan, Ontario and Quebec. Eliminations and Other In addition to the segments noted above, Eliminations and Other includes operating and administrative costs and foreign exchange costs which are not allocated to business segments. Also included in Eliminations and Other are new business development activities, general corporate investments and elimination of transactions between segments required to present financial performance and financial position on a consolidated basis.
CONSOLIDATED EARNINGS
Three months ended
March 31,
2018 2017 (millions of Canadian dollars)
Liquids Pipelines 335 650
Gas Pipelines 63 59
Green Power 61 68
Eliminations and Other 25 1
Earnings before interest, income taxes and depreciation and amortization 484 778
Depreciation and amortization (178) (159 ) Interest expense (116) (98 ) Income tax expense (15) (80 ) Special interest rights distributions - TPDR1 (101) (66 ) Special interest rights distributions - IDR2 (32) (12 ) Earnings attributable to general and limited partners 42 363
1 Temporary Performance Distribution Right (TPDR) distributes Class D units and refers to the paid-in-kind component of the Special Interest Rights (SIR) distribution. Class D unit distributions are also paid-in-kind with the issuance of additional Class D units (see Liquidity and Capital Resources – Sources and Uses of Cash – Distributions).
2 Incentive Distribution Right (IDR) refers to the cash component of the SIR distribution (see Liquidity and Capital Resources – Sources and Uses of Cash – Distributions).
EARNINGS ATTRIBUTABLE TO GENERAL AND LIMITED PARTNERS Earnings attributable to general and limited partners were $42 million for the first quarter of 2018 compared with $363 million for 2017. The comparability of our earnings was impacted by a number of unusual, non-recurring or non-operating factors that are listed in the Non-GAAP Reconciliation tables and discussed in the results for each reporting segment. Details of significant unusual, non-recurring or non-operating factors impacting the comparability of our earnings attributable to general and limited partners period-over-period include:
• a non-cash, unrealized derivative loss for the Canadian Mainline of $288 million in the first quarter of 2018 ($211 million after-tax) compared with a gain of $155 million ($113 million after-tax) in 2017, reflecting net fair value gains and losses arising from changes in the mark-to-market value of derivative financial instruments used to manage foreign exchange rates, power costs and the price of allowance oil that are inherent in the Competitive Toll Settlement (CTS), which drives Canadian Mainline revenue;
• a loss of $98 million in 2018 related to Line 10, a component of the Canadian Mainline, resulting from its classification as an asset held for sale and the subsequent measurement at the lower of carrying value or fair value less costs to sell; and
• a loss of $22 million ($16 million after-tax) in 2018 from our equity investment in NRGreen Power Limited Partnership's (NRGreen) Chickadee Creek waste heat recovery facility located in Alberta.

53
As it pertains to the non-cash, unrealized derivative fair value gains and losses discussed above, we have a comprehensive long-term economic hedging program to mitigate interest rate, foreign exchange and commodity price risks that create volatility in short-term earnings through the recognition of non-cash, unrealized gains and losses on financial derivative instruments used to hedge these risks. Over the long term, we believe our hedging program supports reliable cash flows. After taking into consideration the factors above, the remaining increase is primarily explained by the following significant business factors:
• stronger performance from the Canadian Mainline within our Liquids Pipelines segment in 2018, primarily due to a higher foreign exchange hedge rate used to record United States dollar denominated Canadian Mainline revenues, a higher Canadian Mainline International Joint Tariff (IJT) Residual Benchmark Toll and higher throughput driven by capacity optimization initiatives implemented in 2017;
• additional revenue generated from assets placed into service in 2017 within the Regional Oil Sands System; and
• stronger contributions from our Gas Pipelines and Green Power segments in 2018; partially offset by
• an increase in interest expense due to lower capitalized interest and higher levels of debt outstanding in 2018; and
• higher income tax expense after adjusting for the tax impacts of the unusual, non-recurring or non-operating factors discussed above, primarily reflecting the increase in adjusted earnings before income taxes in 2018.
Refer to Non-GAAP Measures – Non-GAAP Reconciliations – Adjusted Earnings Attributable to General and Limited Partners and the results of operations for each reporting segment for further discussion. FORWARD-LOOKING INFORMATION Forward-looking information, or forward-looking statements, have been included in this MD&A to provide information about EIPLP and EIPLP’s subsidiaries and affiliates, including management’s assessment of EIPLP’s plans and operations. This information may not be appropriate for other purposes. Forward-looking statements are typically identified by words such as “anticipate”, “expect”, “project”, “estimate”, “forecast”, “plan”, “intend”, “target”, “believe”, “likely” and similar words suggesting future outcomes or statements regarding an outlook. Forward-looking information or statements included or incorporated by reference in this document include, but are not limited to, statements with respect to the following: earnings/(loss) or adjusted earnings/(loss); EBITDA or adjusted earnings before interest, income taxes and depreciation and amortization (adjusted EBITDA); effect of the increase or decrease of the Canadian Mainline IJT Residual Benchmark Toll on adjusted EBITDA; distributable cash flow (DCF); cash flows; distributions and policy; costs related to announced projects and projects under construction; in-service dates for announced projects and projects under construction; capital expenditures; recovery of the costs of the Canadian portion of the Line 3 Replacement Program (Canadian L3R Program) through the use of surcharges; actions of regulators; commodity prices; supply forecasts; impact of hedging program; impact of the Canadian L3R Program on existing integrity programs; outcome of proceedings in respect of the Canadian L3R Program and the United States portion of the Line 3 Replacement Program (U.S. L3R Program); Alliance Pipeline operating model and expansion project; and sources of liquidity and sufficiency of financial resources. Although EIPLP believes these forward-looking statements are reasonable based on the information available on the date such statements are made and processes used to prepare the information, such statements are not guarantees of future performance and readers are cautioned against placing undue reliance on forward-looking statements. By their nature, these statements involve a variety of assumptions, known and unknown risks and uncertainties and other factors, which may cause actual results, levels of activity and achievements to differ materially from those expressed or implied by such statements. Material assumptions include assumptions about the following: supply of and demand for crude oil, natural gas, NGL and renewable energy; prices of crude oil, natural gas, NGL and renewable energy; exchange rates; inflation; Canadian pipeline export capacity; levels of competition; interest rates; availability and price of labor and construction materials; operational reliability; customer and regulatory approvals; maintenance of support and regulatory approvals for EIPLP’s projects (including the Canadian and U.S. L3R Program); anticipated in-service dates; weather; credit ratings; capital project funding; anticipated refinancing of debt upon maturity; potential acquisitions, dispositions or other strategic transactions; earnings/(loss) or adjusted

54
earnings/(loss); EBITDA or adjusted EBITDA; cash flows and DCF; and distributions. Assumptions regarding the expected supply of and demand for crude oil, natural gas, NGL and renewable energy, and the prices of these commodities, are material to and underlie all forward-looking statements. These factors are relevant to all forward-looking statements as they may impact current and future levels of demand for EIPLP’s services. Similarly, exchange rates, inflation and interest rates impact the economies and business environments in which EIPLP operates and may impact levels of demand for EIPLP’s services and cost of inputs, and are therefore inherent in all forward-looking statements. Due to the interdependencies and correlation of these macroeconomic factors, the impact of any one assumption on a forward-looking statement cannot be determined with certainty, particularly with respect to earnings/(loss), adjusted earnings/(loss), EBITDA, adjusted EBITDA, DCF, cash flows and distributions. The most relevant assumptions associated with forward-looking statements on announced projects and projects under construction, including estimated completion dates and expected capital expenditures, include the following: availability and price of labor and construction materials; effects of inflation and foreign exchange rates on labor and material costs; effects of interest rates on borrowing costs; and impact of weather and customer, government and regulatory approvals on construction and in-service schedules and cost recovery regimes. EIPLP’s forward-looking statements are subject to risks and uncertainties pertaining to distribution policy, operating performance, regulatory parameters, project approval and support, renewals of rights of way, weather, economic and competitive conditions, public opinion, changes in tax laws and tax rates, changes in trade agreements, exchange rates, interest rates, commodity prices, political decisions and supply of and demand for commodities, including but not limited to those risks and uncertainties discussed in this MD&A. The impact of any one risk, uncertainty or factor on a particular forward-looking statement is not determinable with certainty as these are interdependent and EIPLP’s future course of action depends on management’s assessment of all information available at the relevant time. Except to the extent required by applicable law, EIPLP assumes no obligation to publicly update or revise any forward-looking statements made in this MD&A or otherwise, whether as a result of new information, future events or otherwise. All subsequent forward-looking statements, whether written or oral, attributable to EIPLP or persons acting on EIPLP’s behalf, are expressly qualified in their entirety by these cautionary statements.
NON-GAAP MEASURES This MD&A contains references to adjusted EBITDA, adjusted earnings and DCF. Adjusted EBITDA represents EBITDA adjusted for unusual, non-recurring or non-operating factors on both a consolidated and segmented basis. Adjusted earnings represent earnings adjusted for unusual, non-recurring or non-operating factors included in adjusted EBITDA, as well as adjustments for unusual, non-recurring or non-operating factors in respect of interest expense and income taxes on a consolidated basis. These factors, referred to as adjusting items, are reconciled and discussed in the financial results sections for the affected business segments. DCF represents cash available to fund distributions on Class A and Class C units, as well as for debt repayments and reserves. DCF consists of adjusted EBITDA further adjusted for non-cash items, representing cash flow from our underlying businesses, less deductions for maintenance capital expenditures, interest expense, applicable taxes and further adjusted for unusual, non-recurring or non-operating factors not indicative of the underlying or sustainable cash flows of the business. DCF is important to unitholders as the Fund Group’s objective is to provide a predictable flow of distributions to unitholders. The Manager believes the presentation of adjusted EBITDA, adjusted earnings and DCF give useful information to partners and unitholders as they provide increased transparency and insight into our performance. The Manager uses adjusted EBITDA, adjusted earnings and DCF to set targets and to assess our performance. Adjusted EBITDA, adjusted earnings and DCF are not measures that have standardized meaning prescribed by U.S. GAAP and are not U.S. GAAP measures. Therefore, these measures may not be comparable with similar measures presented by other issuers.

55
The tables below provide a reconciliation of the GAAP and non-GAAP measures. NON-GAAP RECONCILIATIONS EBITDA to Adjusted EBITDA
Three months ended March 31, 2018 2017 (millions of Canadian dollars)
Earnings before interest, income taxes and depreciation and amortization 484 778
Adjusting items1: Changes in unrealized derivative fair value (gain)/loss2 293 (165 ) Asset write-down loss 98 —
Equity investment asset impairment 22 —
Unrealized (gain)/loss on translation of United States dollar intercompany loan
receivable (13) 6
Lease termination costs 23 —
Leak remediation costs — 7
Leak insurance recoveries — (3 ) Adjusted earnings before interest, income taxes and amortization and
depreciation 907
623
1 The above table summarizes adjusting items by nature. For a detailed listing of adjusting items by segment, refer to individual segment discussions.
2 Changes in unrealized derivative fair value gains and losses are presented net of amounts realized on the settlement of derivative contracts during the applicable period.
Adjusted EBITDA to Adjusted Earnings
Three months ended March 31, 2018 2017 (millions of Canadian dollars)
Liquids Pipelines 751 493
Gas Pipelines 63 57
Green Power 81 66
Eliminations and Other 12 7
Adjusted earnings before interest, income taxes and depreciation and amortization 907
623
Depreciation and amortization (178) (159 ) Interest expense1 (116) (100 ) Income tax expense1 (104) (37 ) Special interest rights distributions - TPDR (101) (66 ) Special interest rights distributions - IDR (32) (12 ) Adjusted earnings attributable to general and limited partners 376 249
1 These balances are presented net of adjusting items.
Adjusted Earnings Attributable to General and Limited Partners Adjusted earnings attributable to general and limited partners were $376 million for the first quarter of 2018 compared with $249 million for the same quarter in 2017. Significant business factors increasing our adjusted earnings attributable to general and limited partners period-over-period include:
• a higher foreign exchange hedge rate used to record United States dollar denominated Canadian Mainline revenues in 2018. The IJT Benchmark Toll and its components are set in United States dollars, and the majority of our foreign exchange risk on Canadian Mainline revenues is hedged;

56
• higher Canadian Mainline revenues due to a higher Canadian Mainline IJT Residual Benchmark Toll of US$1.64 for the first quarter in 2018 compared to US$1.47 for the corresponding period of 2017;
• strengthened Canadian Mainline throughput in 2018 driven by capacity optimization initiatives implemented in 2017;
• additional revenue generated on assets placed into service in 2017, including Athabasca Pipeline Twin, Norlite Pipeline System (Norlite), Japan Canada Oil Sands Limited (JACOS) Hangingstone and Wood Buffalo Extension;
• an increase in seasonal firm service revenue in 2018 at Alliance Pipeline within our Gas Pipelines segment; and
• stronger contributions from our Green Power segment due to stronger wind resources and a gain from an arbitration settlement in 2018.
The positive factors above were partially offset by:
• an increase in interest expense due to lower capitalized interest and higher levels of debt
outstanding in 2018; and • higher adjusted income tax expense, primarily driven by the increase in adjusted earnings before
income taxes in 2018. Cash Provided by Operating Activities to Distributable Cash Flow
Three months ended March 31, 2018 2017 (unaudited; millions of Canadian dollars)
Cash provided by operating activities 798 562
Adjusted for changes in operating assets and liabilities (77) (65 ) 721 497 Maintenance capital expenditures1 (18) (19 ) Significant adjusting items: Special interest rights distributions - IDR (32) (12 ) Other receipts of cash not recognized in revenue2 29 8
Lease termination costs 23 —
Leak remediation costs — 7
Leak insurance recoveries — (3 ) Other adjusting items 19 (3 ) Distributable cash flow 742 475
1 Maintenance capital expenditures are expenditures that are required for the ongoing support and maintenance of the existing pipeline system or that are necessary to maintain the service capability of the existing assets (including the replacement of components that are worn, obsolete or completing their useful lives). For the purpose of DCF, maintenance capital excludes expenditures that extend asset useful lives, increase capacities from existing levels or reduce costs to enhance revenues or provide enhancements to the service capability of the existing assets. Maintenance capital expenditures occur primarily within our Liquids Pipelines segment.
2 Consists of cash received net of revenue recognized for contracts under make-up rights and similar deferred revenue arrangements.

57
Adjusted EBITDA to Distributable Cash Flow
Three months ended March 31, 2018 2017 (millions of Canadian dollars)
Adjusted earnings before interest, income taxes and depreciation and amortization 907 623
Cash distributions less than equity earnings1 (5) (11) Maintenance capital expenditures2 (18) (19) Interest expense1 (110) (94) Current income taxes1 (44) (24) Special interest rights distributions - IDR (32) (12) Other receipts of cash not recognized in revenue3 29 8
Other adjusting items 15 4
Distributable cash flow 742 475 1 These balances are presented net of adjusting items. 2 Maintenance capital expenditures are expenditures that are required for the ongoing support and maintenance of the existing
pipeline system or that are necessary to maintain the service capability of the existing assets (including the replacement of components that are worn, obsolete or completing their useful lives). For the purpose of DCF, maintenance capital excludes expenditures that extend asset useful lives, increase capacities from existing levels or reduce costs to enhance revenues or provide enhancements to the service capability of the existing assets. Maintenance capital expenditures occur primarily within our Liquids Pipelines segment.
3 Consists of cash received net of revenue recognized for contracts under make-up rights and similar deferred revenue arrangements.
Distributable Cash Flow DCF represents cash available to fund distributions on Class A and Class C units, as well as for debt repayments and reserves. Such reserves are determined by the Manager and are used for payment of committed charges, such as interest and income taxes, and for execution of the capital maintenance program. Our DCF was $742 million for the first three months of 2018 compared with $475 million for the same period in 2017. Significant business factors impacting our DCF period-over-period include:
• stronger contributions from our Canadian Mainline due to a higher quarter-over-quarter Canadian Mainline IJT Residual Benchmark Toll, a higher foreign exchange hedge rate used to record United States dollar denominated Canadian Mainline revenues, and stronger Canadian Mainline throughput as a result of capacity optimization initiatives implemented in 2017;
• additional contributions from Regional Oil Sands System assets placed into service in 2017; • higher cash distributions received from Alliance Pipeline; and • greater receipts of cash net of revenue recognized for contracts under deferred revenue
arrangements; partially offset by • higher interest expense due to lower capitalized interest and higher levels of debt outstanding in
2018; • higher adjusted current income taxes, primarily due to an increase in adjusted earnings before
income taxes in 2018; and • greater IDR cash distributions paid, which increase as ordinary trust unit of the Fund (Fund Unit)
distributions increase.

58
RECENT DEVELOPMENTS ALLIANCE PIPELINE NEW OPERATING MODEL On March 27, 2018, Alliance Pipeline announced the operation and administration of Alliance Pipeline will be converted into an owner-operator model, with its functions being split between us and Pembina Pipeline Corporation (Pembina). We hold a 50% interest in Alliance Pipeline, while Pembina holds the remaining 50% interest. We have been working together with Pembina to develop a business structure for Alliance Pipeline that allows the business to safely and efficiently deliver more value to all stakeholders. The implementation of the new operating model is expected to be completed during the summer of 2018. REVISED FERC POLICY ON TREATMENT OF INCOME TAXES On March 15, 2018, the Federal Energy Regulatory Commission (FERC) changed its long-standing policy on the treatment of income tax amounts included in the rates of pipelines and other entities subject to cost of service rate regulation within a Master Limited Partnership (MLP). Although EIPLP is not directly impacted by the FERC actions, under the IJT mechanism, reductions in the Enbridge Energy Partners, L.P. (EEP) tariff will create an offsetting revenue increase on the Canadian Mainline. This impact is subject to the outcome of any alternatives that may mitigate the impacts of the policy change at EEP as well as further clarification from the FERC on the application of its new policy. ASSET MONETIZATION On May 9, 2018, we entered into agreements with the Canadian Pension Plan Investment Board whereby we will monetize a 49% interest in wind and solar facilities included within our Green Power segment (the Assets) for cash proceeds of approximately $1.05 billion. We will continue to own a 51% interest in these Assets and Enbridge will continue to manage, operate and provide administrative services for the Assets. The transaction is subject to closing adjustments and conditions customary in transactions of this nature. Closing is expected to occur during the third quarter of 2018 subject to the receipt of all necessary regulatory approvals and consents. Upon closing, the Fund Group will utilize the proceeds to redeem Fund Units and pay back debt, as determined closer to closing. There are no plans to use any proceeds to redeem publicly held shares of Enbridge Income Fund Holdings Inc. at this time.
OTHER ANNOUNCED PROJECT UNDER DEVELOPMENT GAS PIPELINES The following project has not yet met our criteria to be classified as commercially secured:
• Alliance Pipeline Expansion Project - on March 28, 2018, Alliance Pipeline announced an open
season for binding bids for additional long-term firm transportation service contracts on the Alliance Pipeline Canada and Alliance Pipeline US systems in support of up to 400 million cubic feet per day (mmcf/d) of expanded services on Alliance Pipeline Canada and up to 430 mmcf/d of expanded services on Alliance Pipeline US. The open season closes on May 30, 2018. The projected in-service date for the potential expansion is the fourth quarter of 2021.
GROWTH PROJECT - REGULATORY MATTERS Canadian Line 3 Replacement Program The Canadian L3R program involves the replacement of the existing Line 3 crude oil pipeline between Hardisty, Alberta and Gretna, Manitoba. The Canadian L3R Program is currently under construction. The U.S. L3R Program is being executed by EEP and will complement existing integrity programs by replacing approximately 576 kilometers (358 miles) of the remaining line segments of the existing Line 3 pipeline between Neche, North Dakota and Superior, Wisconsin. EEP has the authorization to replace

59
Line 3 in North Dakota and Wisconsin. EEP is in the process of obtaining the appropriate permits for constructing the U.S. L3R Program in Minnesota. The project requires both a Certificate of Need and an approval of the pipeline’s route (Route Permit) from the Minnesota Public Utilities Commission (MNPUC). On February 1, 2016, the MNPUC issued a written order requiring the Minnesota Department of Commerce (DOC) to prepare an Environmental Impact Statement (EIS) before the Certificate of Need and Route Permit processes commence. The DOC issued the final EIS on August 17, 2017. The MNPUC determined the final EIS to be inadequate in four specific areas on December 7, 2017, which the MNPUC directed the DOC to address. As a result, the DOC provided a supplemental EIS on February 12, 2018 and the MNPUC deemed it adequate on March 15, 2018. Progress continues with the parallel Certificate and Route Permit dockets, with public and evidentiary hearings now complete. On April 23, 2018, an Administrative Law Judge (ALJ) issued Findings of Fact, Conclusions of Law and Recommendation (the ALJ Report) to the MNPUC in connection with EEP's application for a Certificate and Route Permit. The ALJ recommended that the MNPUC grant EEP's application for a Certificate, but only if the MNPUC also selects a route that would require in-trench replacement of the existing Line 3, which is not EEP's preferred route. The ALJ Report is not binding on the MNPUC and the MNPUC is expected to issue a ruling in the Certificate and Route Permit dockets late in the second quarter of 2018. EEP believes that its preferred route remains the best solution for Minnesota and EEP intends to continue its efforts to secure MNPUC approval for its preferred route. On May 9, 2018, EEP filed its exceptions to the ALJ Report with the MNPUC, in which EEP set out its proposed revisions to the ALJ’s summary of the evidentiary record, as well as EEP's points of disagreement with her conclusions and route recommendation.
FINANCIAL RESULTS LIQUIDS PIPELINES Earnings Before Interest, Income Taxes and Depreciation and Amortization
Three months ended March 31, 2018 2017 (millions of Canadian dollars)
Canadian Mainline 481 315
Regional Oil Sands System 222 131
Southern Lights Pipeline 28 32
Bakken Expansion Pipeline 5 8
Storage Facilities and Other 15 7
Adjusted earnings before interest, income taxes and depreciation and amortization 751
493
Canadian Mainline - changes in unrealized derivative fair value gain/(loss) (288) 155
Canadian Mainline - asset write-down loss (98) —
Canadian Mainline - lease termination costs (23) —
Canadian Mainline - leak remediation costs — (7 ) Regional Oil Sands System - leak insurance recoveries — 3
Southern Lights Pipeline - changes in unrealized derivative fair value gain (7) 6
Earnings before interest, income taxes and depreciation and amortization 335 650
Additional details on items impacting Liquids Pipelines EBITDA include:
• Canadian Mainline EBITDA for each period reflected a non-cash, unrealized gain and loss, reflecting net fair value gains and losses arising from changes in the mark-to-market value of derivative financial instruments used to manage foreign exchange and commodity price risks inherent within the CTS;

60
• Canadian Mainline EBITDA for 2018 reflected a loss related to Line 10, a component of the Canadian Mainline, resulting from its classification as an asset held for sale and the subsequent measurement at the lower of carrying value or fair value less costs to sell;
• Canadian Mainline EBITDA for 2018 reflected office lease termination costs; • Canadian Mainline EBITDA for 2017 included charges related to the crude oil release on Line 2A,
which occurred in February 2017; • Regional Oil Sands System EBITDA for 2017 included insurance recoveries associated with the
Line 37 crude oil release, which occurred in June 2013; and • Southern Lights Pipeline EBITDA for each period reflected net fair value gains on derivative
financial instruments used to manage foreign exchange risk on United States dollar cash flows from Southern Lights Class A units.
Canadian Mainline Canadian Mainline adjusted EBITDA was $481 million for the first quarter of 2018 compared with $315 million for 2017. Significant business factors increasing Canadian Mainline adjusted EBITDA period-over-period include:
• higher average throughput in the first quarter of 2018 driven by capacity optimization initiatives implemented in 2017;
• a higher average Canadian Mainline IJT Residual Benchmark Toll of US$1.64 in the first quarter of 2018 compared with US$1.47 in 2017; and
• a higher foreign exchange hedge rate used to record United States dollar denominated Canadian Mainline revenues of $1.25 in 2018 compared with $1.04 in 2017.
Supplemental information related to the Canadian Mainline for the three months ended March 31, 2018 and 2017 is provided below:
March 31, 2018 2017 (United States dollars per barrel)
IJT Benchmark Toll1 $4.07 $4.05
Lakehead System Local Toll2 $2.43 $2.58 Canadian Mainline IJT Residual Benchmark Toll3 $1.64 $1.47
1 The IJT Benchmark Toll is per barrel of heavy crude oil transported from Hardisty, Alberta to Chicago, Illinois. A separate distance adjusted toll applies to shipments originating at receipt points other than Hardisty and lighter hydrocarbon liquids pay a lower toll than heavy crude oil. Effective July 1, 2017 this toll increased to US$4.07.
2 The Lakehead System Local Toll is per barrel of heavy crude oil transported from Neche, North Dakota to Chicago, Illinois. Effective April 1, 2017, this toll decreased to US$2.43. Effective April 1, 2018, this toll decreased to US$2.18.
3 The Canadian Mainline IJT Residual Benchmark Toll is per barrel of heavy crude oil transported from Hardisty, Alberta to Gretna, Manitoba. For any shipment, this toll is the difference between the IJT Benchmark Toll and the Lakehead System Local Toll. Effective April 1, 2017, this toll increased to US$1.62, coinciding with the revised Lakehead System Local Toll. Effective July 1, 2017 this toll increased to US$1.64. Effective April 1, 2018, this toll increased to US$1.89, coinciding with the revised Lakehead System Local Toll.

61
Throughput Volume1
Three months ended
March 31,
2018 2017 (thousands of barrels per day) Average throughput volume1 2,625 2,593
1 Throughput volume represents mainline deliveries ex-Gretna, Manitoba which is made up of United States and eastern Canada deliveries originating from western Canada.
Regional Oil Sands System Regional Oil Sands System adjusted EBITDA was $222 million for the first quarter of 2018 compared with $131 million for 2017. Significant business factors impacting Regional Oil Sands System adjusted EBITDA period-over-period include:
• additional EBITDA generated in the first quarter of 2018 as a result of new projects that went into service in 2017, including Athabasca Pipeline Twin, Norlite, JACOS Hangingstone and Wood Buffalo Extension.
GAS PIPELINES Earnings Before Interest, Income Taxes and Depreciation and Amortization
Three months ended March 31, 2018 2017 (millions of Canadian dollars)
Gas Pipelines 63 57
Adjusted earnings before interest, income taxes and depreciation and amortization 63
57
Changes in unrealized derivative fair value gain — 2 Earnings before interest, income taxes and depreciation and amortization 63 59
Additional details on items impacting Gas Pipelines EBITDA include:
• Gas Pipelines EBITDA for 2017 reflected a non-cash, unrealized fair value gain, reflecting net fair value gains and losses arising from the change in the mark-to-market of derivative financial instruments used to manage foreign exchange exposures associated with United States dollar denominated distributions from Alliance Pipeline.
Gas Pipelines adjusted EBITDA was $63 million for the first quarter of 2018 compared with $57 million for 2017. Significant business factors impacting Gas Pipelines adjusted EBITDA period-over-period include:
• increased earnings at Alliance Pipeline primarily due to higher revenues resulting from strong demand for seasonal firm and interruptible service in the first quarter of 2018.
Throughput Volume
Three months ended March 31, 2018 2017 (millions of cubic feet per day)
Average throughput volume Alliance Pipeline - Canada 1,637 1,629
Alliance Pipeline - US 1,749 1,724

62
GREEN POWER Earnings Before Interest, Income Taxes and Depreciation and Amortization
Three months ended March 31, 2018 2017 (millions of Canadian dollars)
Green Power 81 66
Adjusted earnings before interest, income taxes and depreciation and amortization 81
66
Changes in unrealized derivative fair value gain 2 2
Equity investment asset impairment (22) —
Earnings before interest, income taxes and depreciation and amortization 61 68
Additional details on items impacting Green Power EBITDA include:
• Green Power EBITDA for each period reflected a non-cash, unrealized fair value gain, reflecting net fair value gains and losses arising from the change in the mark-to-market of derivative financial instruments used to manage commodity price risk; and
• Green Power EBITDA for 2018 reflected an asset impairment charge from our equity investment in NRGreen related to the Chickadee Creek waste heat recovery facility in Alberta.
Green Power adjusted EBITDA was $81 million for the first quarter 2018 compared with $66 million for 2017. Significant business factors impacting Green Power adjusted EBITDA period-over-period include:
• stronger wind resources across all wind facilities in the first quarter of 2018; and • a net gain of $11 million from an arbitration settlement related to our wind facilities located in
Quebec. Production Three months ended March 31, 2018 2017 (thousands of megawatt hours produced)
Wind Facilities 782 706
Solar Facilities 28 26 Waste Heat Facilities 30 28
ELIMINATIONS AND OTHER Earnings Before Interest, Income Taxes and Depreciation and Amortization
Three months ended March 31, 2018 2017 (millions of Canadian dollars)
Dividend income from affiliate 10 10
Other 2 (3 ) Adjusted earnings before interest, income taxes and depreciation and
amortization 12
7
Unrealized gain/(loss) on translation of United States dollar intercompany loan receivable 13
(6 )
Earnings before interest, income taxes and depreciation and amortization 25 1

63
Eliminations and Other primarily includes dividend income from our Series A Preferred Shares investment in Enbridge Employee Services Canada Inc. and realized foreign exchange gains and losses generated from repayments received from a subsidiary on an intercompany loan receivable denominated in United States dollars.
LIQUIDITY AND CAPITAL RESOURCES Our primary uses of cash are distributions to our partners, administrative and operational expenses, maintenance and growth capital spending, as well as interest and principal repayments on our long-term debt. We generate cash from operations, commercial paper issuances and credit facility draws, through the periodic issuance of public term debt and the issuance of units to our partners. Additionally, to ensure ongoing liquidity and to mitigate the risk of capital market disruption, we maintain a committed bank credit facility. In addition to ensuring adequate liquidity, we actively manage our bank funding sources to optimize pricing and other terms. All of the above noted debt, commercial paper and credit facility are held through our wholly-owned subsidiary, Enbridge Pipelines Inc. (EPI). Additional liquidity, if necessary, is expected to be available through intercompany transactions with Enbridge, the Fund or other related entities. BANK CREDIT AND LIQUIDITY Long-term debt primarily consists of a committed credit facility and medium-term notes. As at March 31, 2018, EIPLP's subsidiary, EPI, had a $3,000 million (December 31, 2017 - $3,005 million) committed credit facility, of which $1,270 million (December 31, 2017 - $1,567 million) was unutilized. In addition to this committed credit facility, EPI had access to Enbridge's demand letter of credit facilities at March 31, 2018 and December 31, 2017 totaling $500 million, of which $19 million (December 31, 2017 - $19 million) letters of credit were issued by EPI. EPI must adhere to covenants under its credit facility agreement and Trust Indenture. Under the terms of EPI’s Trust Indenture, in order to continue to issue long-term debt, EPI must maintain a ratio of Consolidated Funded Obligations to Total Consolidated Capitalization of less than 75%. Total Consolidated Capitalization consists of shareholder’s equity, long-term debt and deferred income taxes. As at March 31, 2018, EPI was in compliance with all debt covenants. Our net available liquidity of $1,314 million, as at March 31, 2018, was inclusive of $44 million of unrestricted cash and cash equivalents. Our net available liquidity, together with cash from operations, intercompany funding and proceeds of debt capital market transactions, is expected to be sufficient to finance capital expenditures requirements, fund liabilities as they become due, fund debt retirements and pay distributions. SOURCES AND USES OF CASH
Three months ended March 31, 2018 2017 (millions of Canadian dollars)
Operating activities 798 562
Investing activities (330) (450 ) Financing activities (442) (123 ) Effect of translation of foreign denominated cash and cash equivalents 1 —
Increase/(decrease) in cash and cash equivalents 27 (11 )

64
Significant sources and uses of cash for the three months ended March 31, 2018 and 2017 are summarized below: Operating Activities Factors impacting the increase in cash provided by operating activities period-over-period primarily include:
• the operating factors discussed under Consolidated Earnings – Earnings Attributable to General and Limited Partners, which primarily included stronger contributions from our Liquids Pipelines segment; and
• fluctuations in our operating assets and liabilities in the normal course due to various factors including the timing of tax payments, general variations in activity levels within our businesses, as well as timing of cash receipts and payments.
Investing Activities Cash used in investing activities primarily relates to capital expenditures to execute our growth capital program. The timing of capital expenditures is impacted by project approval, construction and in-service dates. Factors impacting the decrease in cash used in investing activities period-over-period primarily include:
• a decrease in capital expenditures to $334 million in the first quarter of 2018 from $401 million in 2017, due to the completion of several growth projects in 2017, partially offset by higher spending on the Canadian L3R Program in the first quarter of 2018.
Financing Activities Cash used in financing activities primarily relates to issuances and repayments of external debt and loans from affiliates, along with cash distributions to partners. Factors impacting the increase in cash used in financing activities period-over-period primarily include:
• net repayments of $162 million on affiliate loans in the first quarter of 2018 compared with net
advances of $237 million in 2017; • an increase in distributions to partners due to higher distribution rates for our Class A and C units
commencing in January 2018 as well as additional Class A units outstanding following our December 2017 issuance; and
• an increase in IDR distributions; partially offset by • an increase in credit facility draws in the first three months of 2018.
Distributions The following tables summarize the cash and non-cash distributions declared by EIPLP for the three months ended March 31, 2018 and 2017. Class A Units
2018 2017
Distribution Total
Distribution Total per Unit1 per Unit1
(millions of Canadian dollars, except distribution rate) Three months ended March 31, 0.6555 268 0.5760 220
1 Class A unit distributions are declared monthly and paid in cash in the following month.

65
Class C Units
2018 2017
Distribution Total
Distribution Total per Unit1 per Unit1
(millions of Canadian dollars, except distribution rate) Three months ended March 31, 0.6402 284 0.5376 238
1 Class C unit distributions are declared monthly and paid in cash in the following month.
Class D Units
2018 2017
Distribution Distribution per Unit1 Total per Unit1 Total
(millions of Canadian dollars, except distribution rate) Three months ended March 31, 0.6402 14 0.5376 6
1 Class D unit distributions are declared monthly and paid-in-kind with the issuance of additional Class D units in the following month.
Special Interest Rights – TPDR
2018 2017 Total1 Total1 (millions of Canadian dollars) Three months ended March 31, 101 66
1 TPDR distributions are declared monthly and paid-in-kind to holders of the SIR with the issuance of additional Class D units in the following month.
Special Interest Rights – IDR
2018 2017 Total1 Total1 (millions of Canadian dollars) Three months ended March 31, 32 12
1 IDR distributions are declared monthly and paid in cash to holders of the SIR in the following month.
CAPITAL EXPENDITURE COMMITMENTS We have signed contracts for the purchase of services, pipe and other materials totaling $422 million, which are expected to be paid over the next five years. LITIGATION EIPLP and its subsidiaries are subject to various legal and regulatory actions and proceedings which arise in the normal course of business, including interventions in regulatory proceedings and challenges to regulatory approvals and permits by special interest groups. While the final outcome of such actions and proceedings cannot be predicted with certainty, management believes that the resolution of such actions and proceedings will not have a material impact on EIPLP’s consolidated financial position or results of operations.

66
QUARTERLY FINANCIAL INFORMATION
2018 2017 2016 Q1 Q4 Q3 Q2 Q1 Q4 Q3 Q2 (millions of Canadian dollars)
Revenues 808 1,047 1,223 1,104 1,021 787 853 742 Earnings attributable to
general and limited partners 42 332
487
431
363
890
221
172
Several factors impact comparability of our financial results, including, but not limited to, fluctuations in market prices such as foreign exchange rates and commodity prices, disposals of investments or assets and the timing of in-service dates of new projects. Our revenues can be impacted by several factors. Our transportation assets operating under market-based arrangements generate revenues driven by volumes transported and the corresponding tolls for transportation services. For assets operating under take-or-pay contracts, revenues reflect the terms of the underlying contract for services or capacity. For rate-regulated assets, revenues are charged in accordance with tolls established by the regulator, and in most cost-of-service based arrangements are reflective of our cost to provide the service plus a regulator-approved rate of return. In addition, our electricity sales can be impacted by weather conditions. We actively manage our exposure to market risks including, but not limited to, commodity prices, interest rates and foreign exchange rates. To the extent derivative instruments used to manage these risks are non-qualifying for the purposes of applying hedge accounting, changes in unrealized derivative fair value gains and losses on these instruments will impact earnings. In addition to the impacts of changes in unrealized gains and losses outlined above, significant items that have impacted our financial results are as follows:
• In the first quarter of 2018, we recorded a loss of $98 million related to our Line 10 crude oil
pipeline and $22 million related to NRGreen's Chickadee Creek waste heat recovery facility in Alberta.
• We issued 25.8 million Class A units to ECT in December 2017. The proceeds were used to fund our secured growth program.
• Included in the fourth quarter of 2016 was a before-tax gain of $850 million related to the disposition of the South Prairie Region assets within our Liquids Pipelines segment.
• Included in the second and third quarters of 2016 were after-tax costs of $15 million and $13 million, respectively, incurred in relation to the restart of certain of our pipelines and facilities following the northeastern Alberta wildfires.
• We issued 25.4 million Class A units to ECT in April 2016. The proceeds were used to fund our secured growth program.
• Our Green Power segment is subject to seasonal variations. This is driven by generally stronger wind resources in the first and fourth quarters and stronger solar resources in the second and third quarters. Although these trends are offsetting, revenues and earnings are generally expected to be lowest in the third quarter, attributable to seasonally weaker wind resources.
Finally, we undertook a substantial capital program in recent years and the timing of construction and completion of growth projects may impact the comparability of quarterly results. Refer to EIPLP’s 2017 Annual MD&A for further details on our recent capital expansion initiatives, including construction commencement and in-service dates.

67
RISK MANAGEMENT AND FINANCIAL INSTRUMENTS Maintaining a reliable and low risk business model is central to our objective of paying out a predictable cash flow to partners. The Fund Group actively manages both financial and non-financial risks that we are exposed to. The Fund Group performs an annual corporate risk assessment to identify all potential risks. Risks are ranked based on severity and likelihood both before and after mitigating actions. In addition, the Fund Group has adopted a Cash Flow at Risk (CFAR) policy to manage exposure to movements in interest rates, foreign exchange rates and commodity prices. CFAR is a statistically derived measurement that quantifies the maximum adverse impact on cash flows over a specified period of time within a pre-defined level of statistical confidence. The Fund Group’s CFAR limit has been set at 2.5% of forward annual DCF of the Fund Group. Our earnings, cash flows and other comprehensive income (OCI) are subject to movements in foreign exchange rates, interest rates and commodity prices. We use a combination of qualifying and non-qualifying derivative instruments to manage the risks. Refer to EIPLP’s 2017 Annual MD&A for further details on financial instrument risk management. THE EFFECT OF DERIVATIVE INSTRUMENTS ON THE STATEMENTS OF EARNINGS AND COMPREHENSIVE INCOME The following table presents the effect of cash flow hedges on our consolidated earnings and consolidated comprehensive income, before the effect of income taxes.
Three months ended March 31, 2018 2017 (millions of Canadian dollars)
Amount of unrealized gain/(loss) recognized in OCI Cash flow hedges Interest rate contracts 9 (12 ) Commodity contracts (2) 20
7 8
Amount of (gain)/loss reclassified from Accumulated other comprehensive income (AOCI) to earnings (effective portion) Interest rate contracts1 6 5
Commodity contracts2 (1) (2 ) 5 3
Amount of loss reclassified from AOCI to earnings (ineffective portion and amount excluded from effectiveness testing) Interest rate contracts1 — 1
— 1
Amount of gain/(loss) from non-qualifying derivatives included in earnings Foreign exchange contracts3 (305) 161
Commodity contracts2 13 (1 ) (292) 160
1 Reported within Interest expense in the Consolidated Statements of Earnings. 2 Reported within Transportation and other services revenues, Electricity sales revenues, Operating and administrative expense
and Other income/(expense) in the Consolidated Statements of Earnings. 3 Reported within Transportation and other services revenues and Other income/(expense) in the Consolidated Statements of
Earnings.
LIQUIDITY RISK Liquidity risk is the risk we will not be able to meet our financial obligations, including commitments and guarantees, as they become due. In order to manage this risk, we forecast cash requirements over the near and long term to determine whether sufficient funds will be available when required. We generate cash from operations, commercial paper issuances and credit facility draws, through the periodic

68
issuance of public term debt and issuance of units to our partners. Additionally, to ensure ongoing liquidity and to mitigate the risk of market disruption, we maintain a committed bank credit facility. We actively manage our bank funding sources to optimize pricing and other terms. Additional liquidity, if necessary, is expected to be available through intercompany transactions with Enbridge or other related entities. CREDIT RISK Entering into derivative instruments may result in exposure to credit risk. Credit risk arises from the possibility that a counterparty will default on its contractual obligations. In order to mitigate this risk, we enter into risk management transactions primarily with institutions that possess investment grade credit ratings. Credit risk relating to derivative counterparties is mitigated by credit exposure limits and contractual requirements, netting arrangements and ongoing monitoring of counterparty credit exposure using external credit rating services and other analytical tools.
CHANGES IN ACCOUNTING POLICIES ADOPTION OF NEW STANDARDS Clarifying Guidance on Derecognition and Partial Sales of Nonfinancial Assets Effective January 1, 2018, we adopted Accounting Standards Update (ASU) 2017-05 on a modified retrospective basis. The new standard clarifies the scope provisions of nonfinancial assets and how to allocate consideration to each distinct asset upon sale or partial sale, and amends the guidance for derecognition of a distinct nonfinancial asset in partial sale transactions so that an in-scope partial sale results in the recognition of a full gain or loss. The adoption of this accounting update did not have a material impact on our consolidated financial statements. Simplifying Cash Flow Classification Effective January 1, 2018, we adopted ASU 2016-15 on a retrospective basis. The new standard reduces diversity in practice of how certain cash receipts and cash payments are classified in the statement of cash flows. The new guidance addresses eight specific presentation issues. We assessed each of the eight specific presentation issues and the adoption of this ASU did not have a material impact on our consolidated financial statements. Recognition and Measurement of Financial Assets and Liabilities Effective January 1, 2018, we adopted ASU 2016-01 on a prospective basis. The new standard addresses certain aspects of recognition, measurement, presentation and disclosure of financial assets and liabilities. Investments in equity securities, excluding equity method and consolidated investments, are no longer classified as trading or available-for-sale securities. All investments in equity securities with readily determinable fair values are classified as investments at fair value through net income. Investments in equity securities without readily determinable fair values are measured using the fair value measurement alternative and are recorded at cost minus impairment, if any, plus or minus changes resulting from observable price changes in orderly transactions for an identical or similar investment of the same issuer. Investments in equity securities measured using the fair value measurement alternative are reviewed for indicators of impairment each reporting period. Fair value of financial instruments for disclosure purposes is measured using an exit price, which is the price that would be received to sell an asset or transfer a liability in an orderly transaction between market participants at the measurement date. The adoption of this accounting update did not have a material impact on our consolidated financial statements. Revenue from Contracts with Customers Effective January 1, 2018, we adopted ASU 2014-09 on a modified retrospective basis to contracts that were not complete at the date of initial application. The new standard was issued with the intent of significantly enhancing consistency and comparability of revenue recognition practices across entities and industries. The new standard establishes a single, principles-based five-step model to be applied to all
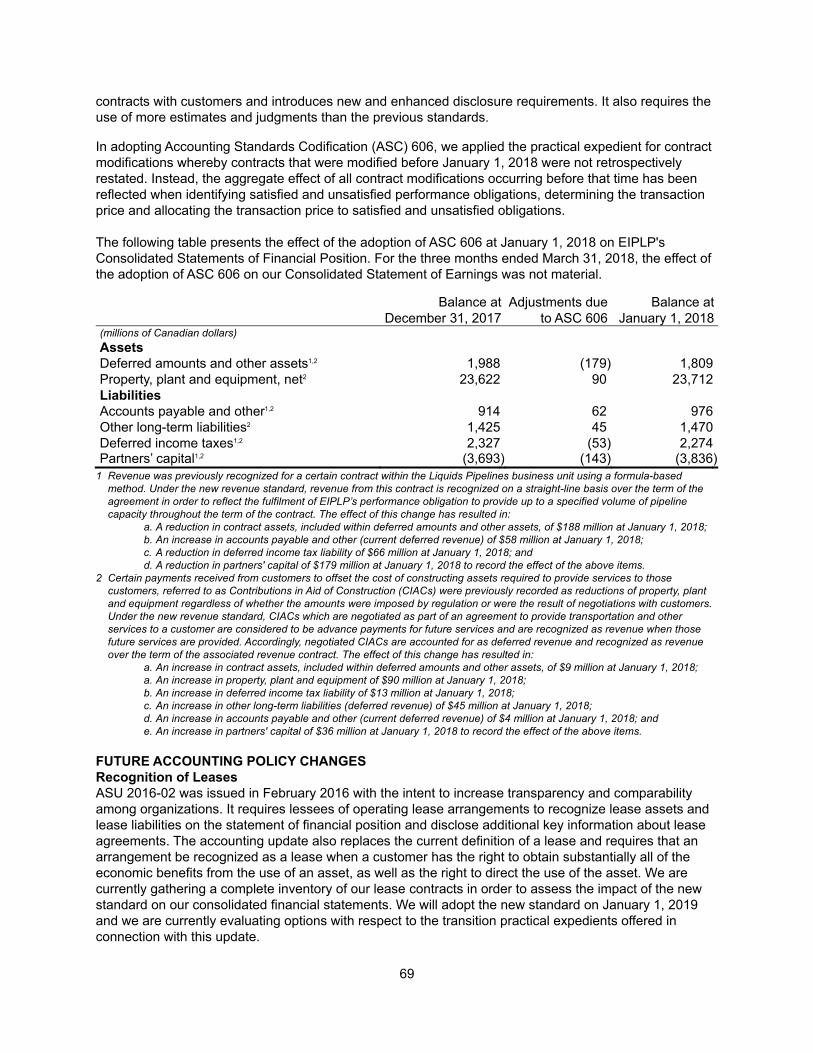
69
contracts with customers and introduces new and enhanced disclosure requirements. It also requires the use of more estimates and judgments than the previous standards.
In adopting Accounting Standards Codification (ASC) 606, we applied the practical expedient for contract modifications whereby contracts that were modified before January 1, 2018 were not retrospectively restated. Instead, the aggregate effect of all contract modifications occurring before that time has been reflected when identifying satisfied and unsatisfied performance obligations, determining the transaction price and allocating the transaction price to satisfied and unsatisfied obligations. The following table presents the effect of the adoption of ASC 606 at January 1, 2018 on EIPLP's Consolidated Statements of Financial Position. For the three months ended March 31, 2018, the effect of the adoption of ASC 606 on our Consolidated Statement of Earnings was not material.
Balance at
December 31, 2017 Adjustments due
to ASC 606 Balance at
January 1, 2018 (millions of Canadian dollars)
Assets Deferred amounts and other assets1,2 1,988 (179) 1,809
Property, plant and equipment, net2 23,622 90 23,712
Liabilities Accounts payable and other1,2 914 62 976
Other long-term liabilities2 1,425 45 1,470
Deferred income taxes1,2 2,327 (53) 2,274 Partners’ capital1,2 (3,693) (143) (3,836)
1 Revenue was previously recognized for a certain contract within the Liquids Pipelines business unit using a formula-based method. Under the new revenue standard, revenue from this contract is recognized on a straight-line basis over the term of the agreement in order to reflect the fulfilment of EIPLP’s performance obligation to provide up to a specified volume of pipeline capacity throughout the term of the contract. The effect of this change has resulted in:
a. A reduction in contract assets, included within deferred amounts and other assets, of $188 million at January 1, 2018; b. An increase in accounts payable and other (current deferred revenue) of $58 million at January 1, 2018; c. A reduction in deferred income tax liability of $66 million at January 1, 2018; and d. A reduction in partners' capital of $179 million at January 1, 2018 to record the effect of the above items.
2 Certain payments received from customers to offset the cost of constructing assets required to provide services to those customers, referred to as Contributions in Aid of Construction (CIACs) were previously recorded as reductions of property, plant and equipment regardless of whether the amounts were imposed by regulation or were the result of negotiations with customers. Under the new revenue standard, CIACs which are negotiated as part of an agreement to provide transportation and other services to a customer are considered to be advance payments for future services and are recognized as revenue when those future services are provided. Accordingly, negotiated CIACs are accounted for as deferred revenue and recognized as revenue over the term of the associated revenue contract. The effect of this change has resulted in:
a. An increase in contract assets, included within deferred amounts and other assets, of $9 million at January 1, 2018; a. An increase in property, plant and equipment of $90 million at January 1, 2018; b. An increase in deferred income tax liability of $13 million at January 1, 2018; c. An increase in other long-term liabilities (deferred revenue) of $45 million at January 1, 2018; d. An increase in accounts payable and other (current deferred revenue) of $4 million at January 1, 2018; and e. An increase in partners' capital of $36 million at January 1, 2018 to record the effect of the above items.
FUTURE ACCOUNTING POLICY CHANGES Recognition of Leases ASU 2016-02 was issued in February 2016 with the intent to increase transparency and comparability among organizations. It requires lessees of operating lease arrangements to recognize lease assets and lease liabilities on the statement of financial position and disclose additional key information about lease agreements. The accounting update also replaces the current definition of a lease and requires that an arrangement be recognized as a lease when a customer has the right to obtain substantially all of the economic benefits from the use of an asset, as well as the right to direct the use of the asset. We are currently gathering a complete inventory of our lease contracts in order to assess the impact of the new standard on our consolidated financial statements. We will adopt the new standard on January 1, 2019 and we are currently evaluating options with respect to the transition practical expedients offered in connection with this update.

70
Further, ASU 2018-01 was issued in January 2018 to address stakeholder concerns about the costs and complexity of complying with the transition provisions of the new lease requirements as they relate to land easements. The amendments provide an optional transition practical expedient to not evaluate existing or expired land easements that were not previously accounted for as leases under existing guidance. We intend to elect this practical expedient in connection with the adoption of the new lease requirements.
EIPLP OWNERSHIP The following presents the partners' ownership of EIPLP:
As at April 27, 2018 (number of units outstanding)
Class A units Held by Enbridge Income Partners GP Inc. 40,471
Held by Enbridge Commercial Trust 408,045,956
408,086,427 Class C units1 Held by Enbridge Inc. 442,923,363
Class D units2 Held by Enbridge Inc. 24,045,238
Class E unit Held by Enbridge Inc. 1
Special Interest Rights - SIR Held by Enbridge Inc. 1,000
1 Class C units may, at the option of the holder, be exchanged in whole or in part for preferred units of ECT, Fund Units or Enbridge Income Fund Holdings Inc. common shares.
2 The Class D units may, at the option of the holder, be exchanged for Class C units commencing on the fourth anniversary of the year of issuance.

ENBRIDGE INCOME PARTNERS LP FINANCIAL STATEMENTSMarch 31, 2018

72
ENBRIDGE INCOME PARTNERS LP CONSOLIDATED STATEMENTS OF EARNINGS
Three months ended March 31,
2018 2017 (unaudited; millions of Canadian dollars)
Operating revenues Transportation and other services 706 933
Electricity sales 82 77
Revenues - affiliates 20 11
Total operating revenues 808 1,021
Operating expenses Operating and administrative 207 221
Operating and administrative, net - affiliates 97 109
Depreciation and amortization 178 159
Environmental costs, net of recoveries (10) (4 ) Asset impairment (Note 5) 98 —
Total operating expenses 570 485
Operating income 238 536
Income from equity investments 44 59
Other income/(expense) Interest income - affiliates 9 15
Dividend income from affiliated company 10 10
Other 5 (1 ) Interest expense (49) (32 ) Interest expense - affiliates (67) (66 ) Earnings before income tax 190 521
Income tax expense (15) (80 ) Earnings 175 441 Special interest rights distributions Temporary performance distribution rights (101) (66 ) Incentive distribution rights (32) (12 ) Earnings attributable to general and limited partners 42 363
Earnings attributable to general partner's interest — —
Earnings attributable to limited partners' interests 42 363
42 363 See accompanying notes to the interim financial statements.

73
ENBRIDGE INCOME PARTNERS LP CONSOLIDATED STATEMENTS OF COMPREHENSIVE INCOME
Three months ended March 31,
2018 2017 (unaudited; millions of Canadian dollars)
Earnings 175 441
Other comprehensive income/(loss), net of tax Change in unrealized gain on cash flow hedges 5 7
Reclassification to earnings of loss on cash flow hedges 4 3
Foreign currency translation adjustments 17 (4 ) Other comprehensive income, net of tax 26 6 Comprehensive income 201 447
See accompanying notes to the interim financial statements.

74
ENBRIDGE INCOME PARTNERS LP CONSOLIDATED STATEMENTS OF PARTNERS’ CAPITAL
General partner's capital
deficit
Limited partners' capital - Enbridge Commercial Trust
Special interest rights
Accumulated other
comprehensive loss Total
(unaudited; millions of Canadian dollars)
December 31, 2017 (8,758 ) 2,697 2,565 (197) (3,693 )
Retrospective adoption of accounting
standard (Note 2) —
(143) —
—
(143 )
Earnings allocation — 23 — — 23 Other comprehensive loss, net of tax — — — 26 26
Redemption value adjustment
attributable to Class C and D units —
636
—
—
636
Distributions — (268) — — (268 ) March 31, 2018 (8,758 ) 2,945 2,565 (171) (3,419 )
General partner's capital
deficit
Limited partners' capital - Enbridge Commercial Trust
Special interest rights
Accumulated other
comprehensive loss Total
(unaudited; millions of Canadian dollars)
December 31, 2016 (8,758 ) — 2,565 (196) (6,389 )
Earnings allocation — 174 — — 174 Other comprehensive loss, net of tax — — — 6 6
Redemption value adjustment
attributable to Class C and D units —
698
—
—
698
Distributions — (220) — — (220 ) March 31, 2017 (8,758 ) 652 2,565 (190) (5,731 )
See accompanying notes to the interim financial statements.

75
ENBRIDGE INCOME PARTNERS LP CONSOLIDATED STATEMENTS OF CASH FLOWS
Three months ended March 31,
2018 2017 (unaudited; millions of Canadian dollars) Operating activities Earnings 175 441 Adjustments to reconcile earnings to net cash provided by operating activities: Depreciation and amortization 178 159 Deferred income tax (recovery)/expense (29) 57 Changes in unrealized (gain)/loss on derivative instruments, net (Note 10) 292 (160 ) Cash distributions in excess of/(less than) equity earnings 10 (11 ) Asset impairment (Note 5) 98 — Unrealized (gain)/loss on foreign intercompany loan (13) 6 Other 10 5 Changes in operating assets and liabilities 77 65 Net cash provided by operating activities 798 562 Investing activities Capital expenditures (334) (401 ) Joint venture financing 4 (39 ) Long-term investments 7 — Restricted long-term investments (12) (13 ) Additions to intangible assets — (1 ) Long-term receivable from affiliate 5 4 Net cash used in investing activities (330) (450 ) Financing activities Affiliate loans, net (162) 237 Net change in commercial paper and credit facility draws 281 108 Debenture and term note repayments (9) — Distributions to partners (552) (468 ) Net cash used in financing activities (442) (123 ) Effect of translation of foreign denominated cash and cash equivalents 1 — Net increase/(decrease) in cash and cash equivalents 27 (11 ) Cash and cash equivalents at beginning of period 17 122 Cash and cash equivalents at end of period 44 111 Supplementary cash flow information Property, plant and equipment non-cash accruals 243 303
See accompanying notes to the interim financial statements.

76
ENBRIDGE INCOME PARTNERS LP CONSOLIDATED STATEMENTS OF FINANCIAL POSITION
March 31, December 31, 2018 2017 (unaudited; millions of Canadian dollars) Assets Current assets Cash and cash equivalents 44 17 Accounts receivable and other 496 525 Accounts receivable from affiliates 116 141 Loans to affiliates 3 3 659 686 Property, plant and equipment, net 23,576 23,622 Long-term receivable from affiliate 726 710 Investment in affiliated company 514 514 Long-term investments 420 431 Restricted long-term investments 148 135 Deferred amounts and other assets 1,825 1,988 Intangible assets, net 105 107 Goodwill 29 29 Deferred income taxes 110 109 Asset held for sale (Note 5) 88 — Total assets 28,200 28,331 Liabilities and partners’ capital Current liabilities Accounts payable and other 783 914 Accounts payable to affiliates 388 314 Distributions payable to affiliates 233 188 Interest payable 55 62 Loans from affiliates (Note 12) 393 555 Current portion of long-term debt 318 327 2,170 2,360 Long-term debt 6,424 6,132 Other long-term liabilities 1,787 1,425 Loans from affiliates (Note 12) 5,801 5,801 Deferred income taxes 2,270 2,327 18,452 18,045 Contingencies Class C units (Note 8) 12,074 12,947 Class D units (Note 8) 618 557 Class E unit 475 475 13,167 13,979 Partners’ capital General partner’s capital deficit (8,758) (8,758 ) Limited partners’ capital 2,945 2,697 Special interest rights 2,565 2,565 Accumulated other comprehensive loss (Note 9) (171) (197 ) (3,419) (3,693 ) Total liabilities and partners' capital 28,200 28,331
See accompanying notes to the interim financial statements.

77
NOTES TO THE INTERIM CONSOLIDATED FINANCIAL STATEMENTS (unaudited)
1. BASIS OF PRESENTATION The accompanying unaudited interim consolidated financial statements of Enbridge Income Partners LP (EIPLP) have been prepared in accordance with generally accepted accounting principles in the United States of America (U.S. GAAP) for interim consolidated financial information. They do not include all of the information and notes required by U.S. GAAP for annual consolidated financial statements and should therefore be read in conjunction with EIPLP’s audited annual consolidated financial statements and notes for the year ended December 31, 2017. In the opinion of management, the interim consolidated financial statements contain all normal recurring adjustments necessary to present fairly EIPLP’s financial position, results of operations and cash flows for the interim periods reported. These interim consolidated financial statements follow the same significant accounting policies as those included in EIPLP’s annual consolidated financial statements for the year ended December 31, 2017, except for the adoption of new standards (Note 2) and the presentation of Cash and cash equivalents to include Bank indebtedness, discussed below. Certain comparative amounts presented have been restated accordingly to be consistent with the current period presentation. Amounts are stated in Canadian dollars unless otherwise noted. Effective September 30, 2017, EIPLP combined Cash and cash equivalents and amounts previously presented as Bank indebtedness where the corresponding bank accounts are subject to cash pooling arrangements. As at March 31, 2017 and December 31, 2017, $304 million and $77 million of Bank indebtedness has been combined within Cash and cash equivalents in EIPLP's Consolidated Statements of Cash Flows and Consolidated Statements of Financial Position, respectively. Net cash provided by financing activities in the Consolidated Statements of Cash Flows for the three months ended March 31, 2017 has been reduced by $133 million to reflect this change. EIPLP’s operations and earnings for interim periods can be affected by seasonal fluctuations, such as the supply of and demand for crude oil and natural gas, and may not be indicative of annual results.
2. CHANGES IN ACCOUNTING POLICIES ADOPTION OF NEW STANDARDS Clarifying Guidance on Derecognition and Partial Sales of Nonfinancial Assets Effective January 1, 2018, EIPLP adopted Accounting Standards Update (ASU) 2017-05 on a modified retrospective basis. The new standard clarifies the scope provisions of nonfinancial assets and how to allocate consideration to each distinct asset upon sale or partial sale, and amends the guidance for derecognition of a distinct nonfinancial asset in partial sale transactions so that an in-scope partial sale results in the recognition of a full gain or loss. The adoption of this accounting update did not have a material impact on EIPLP's consolidated financial statements. Simplifying Cash Flow Classification Effective January 1, 2018, EIPLP adopted ASU 2016-15 on a retrospective basis. The new standard reduces diversity in practice of how certain cash receipts and cash payments are classified in the statement of cash flows. The new guidance addresses eight specific presentation issues. EIPLP assessed each of the eight specific presentation issues and the adoption of this ASU did not have a material impact on its consolidated financial statements.

78
Recognition and Measurement of Financial Assets and Liabilities Effective January 1, 2018, EIPLP adopted ASU 2016-01 on a prospective basis. The new standard addresses certain aspects of recognition, measurement, presentation and disclosure of financial assets and liabilities. Investments in equity securities, excluding equity method and consolidated investments, are no longer classified as trading or available-for-sale securities. All investments in equity securities with readily determinable fair values are classified as investments at fair value through net income. Investments in equity securities without readily determinable fair values are measured using the fair value measurement alternative and are recorded at cost minus impairment, if any, plus or minus changes resulting from observable price changes in orderly transactions for an identical or similar investment of the same issuer. Investments in equity securities measured using the fair value measurement alternative are reviewed for indicators of impairment each reporting period. Fair value of financial instruments for disclosure purposes is measured using an exit price, which is the price that would be received to sell an asset or transfer a liability in an orderly transaction between market participants at the measurement date. The adoption of this accounting update did not have a material impact on EIPLP's consolidated financial statements. Revenue from Contracts with Customers Effective January 1, 2018, EIPLP adopted ASU 2014-09 on a modified retrospective basis to contracts that were not complete at the date of initial application. The new standard was issued with the intent of significantly enhancing consistency and comparability of revenue recognition practices across entities and industries. The new standard establishes a single, principles-based five-step model to be applied to all contracts with customers and introduces new and enhanced disclosure requirements. It also requires the use of more estimates and judgments than the previous standards.
In adopting Accounting Standards Codification (ASC) 606, EIPLP applied the practical expedient for contract modifications whereby contracts that were modified before January 1, 2018 were not retrospectively restated. Instead, the aggregate effect of all contract modifications occurring before that time has been reflected when identifying satisfied and unsatisfied performance obligations, determining the transaction price and allocating the transaction price to satisfied and unsatisfied obligations. The following table presents the effect of the adoption of ASC 606 at January 1, 2018 on EIPLP's Consolidated Statements of Financial Position. For the three months ended March 31, 2018, the effect of the adoption of ASC 606 on EIPLP's Consolidated Statement of Earnings was not material.
Balance at
December 31, 2017 Adjustments due
to ASC 606 Balance at
January 1, 2018 (millions of Canadian dollars)
Assets Deferred amounts and other assets1,2 1,988 (179) 1,809
Property, plant and equipment, net2 23,622 90 23,712
Liabilities Accounts payable and other1,2 914 62 976
Other long-term liabilities2 1,425 45 1,470
Deferred income taxes1,2 2,327 (53) 2,274 Partners’ capital1,2 (3,693) (143) (3,836)
1 Revenue was previously recognized for a certain contract within the Liquids Pipelines business unit using a formula-based method. Under the new revenue standard, revenue from this contract is recognized on a straight-line basis over the term of the agreement in order to reflect the fulfilment of EIPLP’s performance obligation to provide up to a specified volume of pipeline capacity throughout the term of the contract. The effect of this change has resulted in:
a. A reduction in contract assets, included within deferred amounts and other assets, of $188 million at January 1, 2018; b. An increase in accounts payable and other (current deferred revenue) of $58 million at January 1, 2018; c. A reduction in deferred income tax liability of $66 million at January 1, 2018; and d. A reduction in partners' capital of $179 million at January 1, 2018 to record the effect of the above items.
2 Certain payments received from customers to offset the cost of constructing assets required to provide services to those customers, referred to as Contributions in Aid of Construction (CIACs) were previously recorded as reductions of property, plant and equipment regardless of whether the amounts were imposed by regulation or were the result of negotiations with customers.
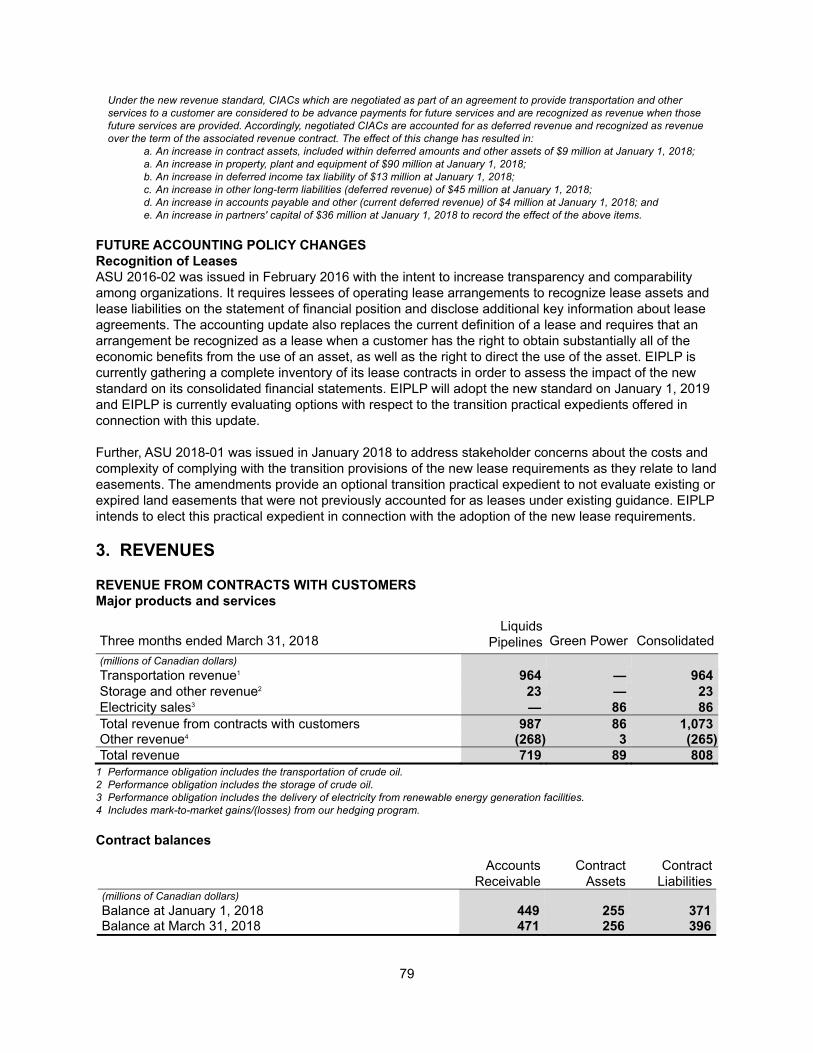
79
Under the new revenue standard, CIACs which are negotiated as part of an agreement to provide transportation and other services to a customer are considered to be advance payments for future services and are recognized as revenue when those future services are provided. Accordingly, negotiated CIACs are accounted for as deferred revenue and recognized as revenue over the term of the associated revenue contract. The effect of this change has resulted in:
a. An increase in contract assets, included within deferred amounts and other assets of $9 million at January 1, 2018; a. An increase in property, plant and equipment of $90 million at January 1, 2018; b. An increase in deferred income tax liability of $13 million at January 1, 2018; c. An increase in other long-term liabilities (deferred revenue) of $45 million at January 1, 2018; d. An increase in accounts payable and other (current deferred revenue) of $4 million at January 1, 2018; and e. An increase in partners' capital of $36 million at January 1, 2018 to record the effect of the above items.
FUTURE ACCOUNTING POLICY CHANGES Recognition of Leases ASU 2016-02 was issued in February 2016 with the intent to increase transparency and comparability among organizations. It requires lessees of operating lease arrangements to recognize lease assets and lease liabilities on the statement of financial position and disclose additional key information about lease agreements. The accounting update also replaces the current definition of a lease and requires that an arrangement be recognized as a lease when a customer has the right to obtain substantially all of the economic benefits from the use of an asset, as well as the right to direct the use of the asset. EIPLP is currently gathering a complete inventory of its lease contracts in order to assess the impact of the new standard on its consolidated financial statements. EIPLP will adopt the new standard on January 1, 2019 and EIPLP is currently evaluating options with respect to the transition practical expedients offered in connection with this update. Further, ASU 2018-01 was issued in January 2018 to address stakeholder concerns about the costs and complexity of complying with the transition provisions of the new lease requirements as they relate to land easements. The amendments provide an optional transition practical expedient to not evaluate existing or expired land easements that were not previously accounted for as leases under existing guidance. EIPLP intends to elect this practical expedient in connection with the adoption of the new lease requirements.
3. REVENUES REVENUE FROM CONTRACTS WITH CUSTOMERS Major products and services
Three months ended March 31, 2018 Liquids
Pipelines Green Power Consolidated
(millions of Canadian dollars)
Transportation revenue1 964 — 964
Storage and other revenue2 23 — 23
Electricity sales3 — 86 86
Total revenue from contracts with customers 987 86 1,073 Other revenue4 (268 ) 3 (265) Total revenue 719 89 808
1 Performance obligation includes the transportation of crude oil. 2 Performance obligation includes the storage of crude oil. 3 Performance obligation includes the delivery of electricity from renewable energy generation facilities. 4 Includes mark-to-market gains/(losses) from our hedging program.
Contract balances
Accounts
Receivable Contract
Assets Contract
Liabilities (millions of Canadian dollars)
Balance at January 1, 2018 449 255 371 Balance at March 31, 2018 471 256 396

80
Payments are received monthly from customers under long-term transportation contracts. Contract assets represent the amount of revenue which has been recognized in advance of payments received for performance obligations EIPLP has fulfilled (or partially fulfilled) and prior to the point in time at which EIPLP's right to the payment is unconditional. Amounts included in contract assets are transferred to accounts receivable when EIPLP's right to the consideration becomes unconditional. Contract liabilities primarily relate to make-up rights and deferred revenues. Revenue recognized during the current period relating to make-up rights and deferred revenues that existed at December 31, 2017 was $11 million. Increases in contract liabilities from cash received, net of amounts recognized as revenue during the three months ended March 31, 2018 were $36 million during the period. Timing of revenue recognition
Liquids Green Three months ended March 31, 2018 Pipelines1 Power2 Total (millions of Canadian dollars) Revenue from products and services transferred over time 987 86 1,073
1 Revenue from crude oil pipeline transportation and storage. 2 Revenue from electricity sales.
Revenue to be recognized from unfulfilled performance obligations The total revenue from performance obligations expected to be fulfilled in future periods is $16.6 billion, of which $1.0 billion and $1.1 billion is expected to be recognized during the nine months ending December 31, 2018 and year ending December 31, 2019, respectively. The revenues excluded from the amounts above based on optional exemptions available under ASC 606, as explained below, represent a significant portion of EIPLP's overall revenues and revenues from contracts with customers. Certain revenues such as flow-through operating costs charged to shippers are recognized at the amount for which we have the right to invoice our customers. Those revenues are not included in the amounts for revenue to be recognized in the future from unfulfilled performance obligations above. Variable consideration is excluded from the amounts above due to the uncertainty of the associated consideration, which is generally resolved when actual volumes and prices are determined. Additionally, the effect of escalation on certain tolls which are contractually escalated for inflation has not been reflected in the amounts above as it is not possible to reliably estimate future inflation rates. Finally, revenues from contracts with customers which have an original expected duration of one year or less are excluded from the amounts above.
SIGNIFICANT JUDGMENTS MADE IN RECOGNIZING REVENUE Long-term transportation agreements For long-term transportation agreements, significant judgments pertain to the period over which revenue is recognized and whether the agreement provides for make-up rights for the shippers. Transportation revenue earned from firm contracted capacity arrangements is recognized ratably over the contract period. Transportation revenue from interruptible or volumetric-based arrangements is recognized when services are performed. Estimates of variable consideration Revenue from arrangements subject to variable consideration is recognized only when the amount of variable consideration can be reasonably estimated. This occurs when actual volumes are sold or transported and actual tolls are determined.

81
Recognition and measurement of revenue Performance obligations satisfied over time For arrangements involving the transportation of crude oil where the transportation services are simultaneously received and consumed by the shipper or customer, EIPLP recognizes revenue over time using an output method based on volumes of commodities delivered or transported. Determination of tolls Prices for transportation services are determined based on the capital cost of the pipelines and associated infrastructure required to provide such services plus a rate of return on capital invested that is determined either through negotiations with customers or through regulatory processes for those operations that are subject to rate regulation.
4. SEGMENTED INFORMATION Effective December 31, 2017, EIPLP revised its segmented information presentation on a retrospective basis to present Earnings before interest, income taxes and depreciation and amortization of each segment as opposed to Earnings before interest and income taxes. Segmented information for the three months ended March 31, 2018 and 2017 are as follows:
Liquids Gas Green Eliminations Three months ended March 31, 2018 Pipelines Pipelines Power and Other Consolidated (millions of Canadian dollars)
Revenues 719 — 89 — 808 Operating and administrative (296) — (8) — (304) Environmental costs, net of recoveries 10 — — — 10 Asset impairment (98) — — — (98)
335 — 81 — 416 Income/(loss) from equity investments — 64 (20) — 44 Other income/(loss) — (1) — 25 24 Earnings before interest and income taxes and
depreciation and amortization 335 63 61 25 484 Depreciation and amortization (178) Interest expense (116) Income tax expense (15) Special interest rights distributions (133) Earnings attributable to general and limited partners 42 Capital expenditures 332 — 2 — 334
Liquids Gas Green Eliminations Three months ended March 31, 2017 Pipelines Pipelines Power and Other Consolidated (millions of Canadian dollars)
Revenues 938 — 83 — 1,021 Operating and administrative (311) — (16) (3) (330) Environmental costs, net of recoveries 4 — — — 4
631 — 67 (3) 695 Income from equity investments — 58 1 — 59 Other income 19 1 — 4 24 Earnings before interest and income taxes and
depreciation and amortization 650 59 68 1 778 Depreciation and amortization (159) Interest expense (98) Income tax expense (80) Special interest rights distributions (78) Earnings attributable to general and limited partners 363 Capital expenditures 400 — 1 — 401

82
TOTAL ASSETS
March 31, December 31,
2018 2017 (millions of Canadian dollars)
Liquids Pipelines 24,923 25,061
Gas Pipelines 396 386
Green Power 2,132 2,156
Eliminations and Other 749 728
28,200 28,331
5. ASSET HELD FOR SALE As at March 31, 2018, EIPLP satisfied the condition as set out in the agreement for the sale of its Line 10 crude oil pipeline (Line 10), which is a component of the Canadian Mainline included within its Liquids Pipelines segment. Line 10 originates near Hamilton, Ontario and terminates near Buffalo, New York. EIPLP owns the Canadian portion of Line 10, while Enbridge Energy Partners, L.P., a subsidiary of Enbridge Inc. (Enbridge), owns the United States portion. EIPLP expects to close the sale of Line 10 within one year, subject to regulatory approval and certain closing conditions. As such, EIPLP classified Line 10 as an asset held for sale and measured it at the lower of carrying value or fair value less costs to sell, which resulted in a loss of $98 million included within Asset impairment on the Consolidated Statements of Earnings for the three months ended March 31, 2018.
6. LONG TERM INVESTMENTS During the three months ended March 31, 2018, NRGreen Power Limited Partnership (NRGreen) recorded a pre-tax asset impairment charge related to the Chickadee Creek Waste Heat Recovery Facility (Chickadee Creek) located in Alberta of $43 million ($22 million attributable to EIPLP). Chickadee Creek generates waste heat from the Alliance Pipeline and sells the power generated to the Alberta power grid at market rates. EIPLP holds a 50% investment in NRGreen which is included within the Green Power segment. The impairment charge is recorded within EIPLP’s Income from equity investments within the Consolidated Statements of Earnings.
7. DEBT CREDIT FACILITY
March 31, 2018 Total Maturity Facility Draws1 Available (millions of Canadian dollars) Enbridge Pipelines Inc. 2019 3,000 1,730 1,270
1 Includes facility draws and commercial paper issuances that are back-stopped by the credit facility.
The credit facility serves as a back-stop to the commercial paper program and EIPLP's subsidiary, Enbridge Pipelines Inc. (EPI), has the option to extend the facility, which is currently set to mature in July 2019. As at March 31, 2018, commercial paper and credit facility draws of $1,730 million (December 31, 2017 - $1,438 million) were supported by the availability of a long-term committed credit facility and therefore have been classified as long-term debt.

83
DEBT COVENANTS EPI was in compliance with all terms and conditions of its committed credit facility agreement and Trust Indenture as at March 31, 2018.
8. PARTNERS' CAPITAL EXCHANGEABLE UNITS Class C Units
2018 2017 Number Number Three months ended March 31, of Units Amount of Units Amount (millions of Canadian dollars; number of units in millions)
Balance at beginning of period 443 12,947 443 15,104
Earnings allocation — 18 — 184
Class C unit distribution — (284 ) — (238 ) 443 12,681 443 15,050 Fair market value adjustment — (607 ) — (677 ) Balance at end of period 443 12,074 443 14,373
Class D Units
2018 2017 Number
Amount Number
Amount Three months ended March 31, of Units of Units (millions of Canadian dollars; number of units in millions)
Balance at beginning of period 19 557 10 341
Class D units issued1 3 103 2 72
Earnings allocation — 1 — 5
Class D unit distribution2 1 (14 ) — (6 ) 23 647 12 412 Fair market value adjustment — (29 ) — (21 ) Balance at end of period 23 618 12 391
1 Class D units issued on payment of Temporary Performance Distribution Right distributions. 2 For the three months ended March 31, 2017 there were 0.2 million Class D units issued on payment of Class D distributions.
9. COMPONENTS OF ACCUMULATED OTHER COMPREHENSIVE LOSS Changes in Accumulated other comprehensive loss (AOCI) for the three months ended March 31, 2018 and 2017 are as follows: Cumulative Cash Flow Translation Hedges Adjustment Total (millions of Canadian dollars) Balance at January 1, 2018 (230) 33 (197) Other comprehensive income retained in AOCI 7 17 24 Other comprehensive (income)/loss reclassified to earnings Interest rate contracts1 6 — 6 Commodity contracts2 (1) — (1) 12 17 29 Tax impact Income tax on amounts retained in AOCI (2) — (2) Income tax on amounts reclassified to earnings (1) — (1) (3) — (3) Balance at March 31, 2018 (221) 50 (171)

84
Cumulative Cash Flow Translation Hedges Adjustment Total (millions of Canadian dollars) Balance at January 1, 2017 (269) 73 (196) Other comprehensive income/(loss) retained in AOCI 10 (4) 6 Other comprehensive (income)/loss reclassified to earnings Interest rate contracts1 6 — 6 Commodity contracts2 (2) — (2) 14 (4) 10 Tax impact Income tax on amounts retained in AOCI (3) — (3) Income tax on amounts reclassified to earnings (1) — (1) (4) — (4) Balance at March 31, 2017 (259) 69 (190)
1 Reported within Interest expense in the Consolidated Statements of Earnings. 2 Reported within Electricity sales in the Consolidated Statements of Earnings.
10. RISK MANAGEMENT AND FINANCIAL INSTRUMENTS MARKET RISK EIPLP’s earnings, cash flows and other comprehensive income (OCI) are subject to movements in foreign exchange rates, interest rates and commodity prices (collectively, market risk). Formal risk management policies, processes and systems have been designed to mitigate these risks. The following summarizes the types of market risks to which EIPLP is exposed and the risk management instruments used to mitigate them. EIPLP uses a combination of qualifying and non-qualifying derivative instruments to manage the risks noted below. Foreign Exchange Risk EIPLP generates certain revenues, incurs expenses and holds investments and subsidiaries that are denominated in currencies other than Canadian dollars. As a result, EIPLP’s earnings, cash flows and OCI are exposed to fluctuations resulting from foreign exchange rate variability. EIPLP has implemented a policy whereby, at a minimum, it hedges a level of foreign currency denominated cash flow exposures over a five year forecast horizon. A combination of qualifying and non-qualifying derivative instruments is used to hedge anticipated foreign currency denominated revenues and expenses, and to manage variability in cash flows. Interest Rate Risk EIPLP’s earnings, cash flows and OCI are exposed to short-term interest rate variability due to the regular repricing of its variable rate debt, primarily commercial paper. Pay fixed-receive floating interest rate swaps are used to hedge against the effect of future interest rate movements. EIPLP has implemented a program to significantly mitigate the volatility of short-term interest rates on interest expense via execution of floating to fixed rate interest rate swaps with an average swap rate of 2.4%. EIPLP’s earnings, cash flows and OCI are also exposed to variability in longer term interest rates ahead of anticipated fixed rate debt issuances. Forward starting interest rate swaps are used to hedge against the effect of future interest rate movements. EIPLP has implemented a program to significantly mitigate its exposure to long-term interest rate variability on select forecast term debt issuances via execution of floating to fixed rate interest rate swaps with an average swap rate of 3.0%. EIPLP’s portfolio mix of fixed and variable rate debt instruments is managed by the Fund Group, which also includes Enbridge Commercial Trust (ECT) and the Fund.
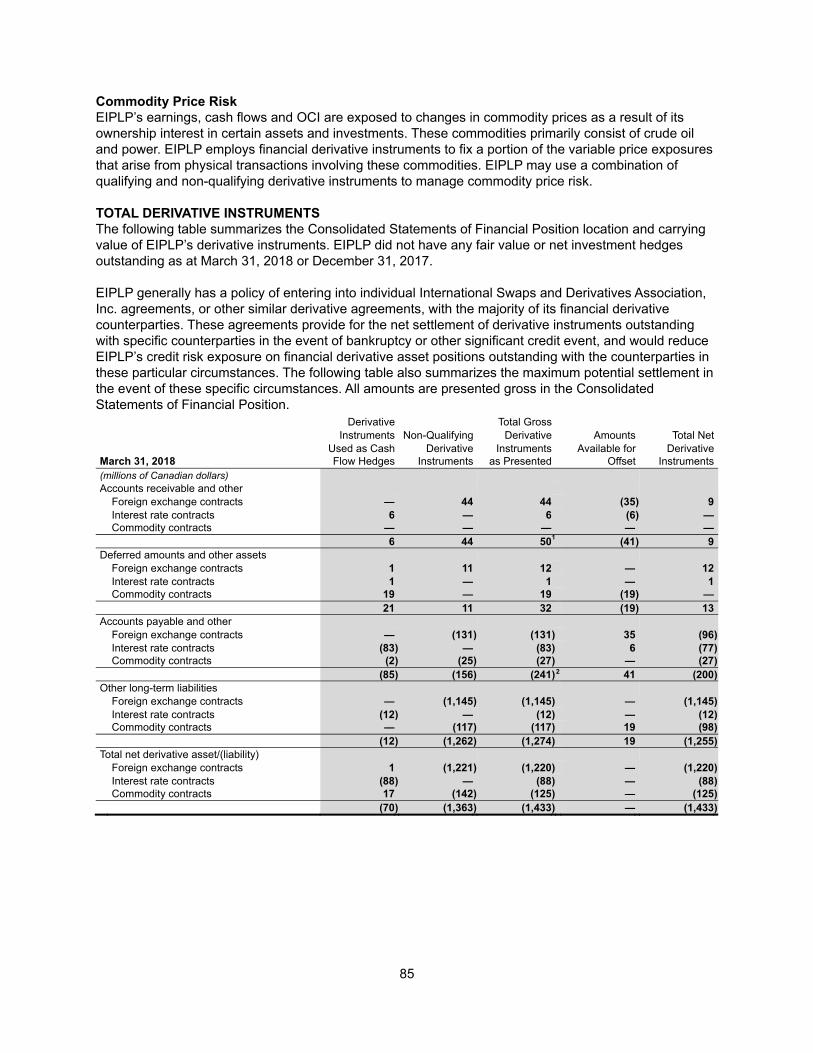
85
Commodity Price Risk EIPLP’s earnings, cash flows and OCI are exposed to changes in commodity prices as a result of its ownership interest in certain assets and investments. These commodities primarily consist of crude oil and power. EIPLP employs financial derivative instruments to fix a portion of the variable price exposures that arise from physical transactions involving these commodities. EIPLP may use a combination of qualifying and non-qualifying derivative instruments to manage commodity price risk. TOTAL DERIVATIVE INSTRUMENTS The following table summarizes the Consolidated Statements of Financial Position location and carrying value of EIPLP’s derivative instruments. EIPLP did not have any fair value or net investment hedges outstanding as at March 31, 2018 or December 31, 2017. EIPLP generally has a policy of entering into individual International Swaps and Derivatives Association, Inc. agreements, or other similar derivative agreements, with the majority of its financial derivative counterparties. These agreements provide for the net settlement of derivative instruments outstanding with specific counterparties in the event of bankruptcy or other significant credit event, and would reduce EIPLP’s credit risk exposure on financial derivative asset positions outstanding with the counterparties in these particular circumstances. The following table also summarizes the maximum potential settlement in the event of these specific circumstances. All amounts are presented gross in the Consolidated Statements of Financial Position. Derivative Total Gross Instruments Non-Qualifying Derivative Amounts Total Net
Used as Cash Derivative Instruments Available for Derivative March 31, 2018 Flow Hedges Instruments as Presented Offset Instruments (millions of Canadian dollars) Accounts receivable and other Foreign exchange contracts — 44 44 (35) 9 Interest rate contracts 6 — 6 (6) — Commodity contracts — — — — —
6 44 501 (41) 9 Deferred amounts and other assets
Foreign exchange contracts 1 11 12 — 12 Interest rate contracts 1 — 1 — 1 Commodity contracts 19 — 19 (19) —
21 11 32 (19) 13 Accounts payable and other
Foreign exchange contracts — (131) (131) 35 (96)
Interest rate contracts (83) — (83) 6 (77)
Commodity contracts (2) (25) (27) — (27) (85) (156) (241) 2 41 (200)
Other long-term liabilities
Foreign exchange contracts — (1,145) (1,145) — (1,145)
Interest rate contracts (12) — (12) — (12)
Commodity contracts — (117) (117) 19 (98) (12) (1,262) (1,274) 19 (1,255)
Total net derivative asset/(liability)
Foreign exchange contracts 1 (1,221) (1,220) — (1,220)
Interest rate contracts (88) — (88) — (88)
Commodity contracts 17 (142) (125) — (125) (70) (1,363) (1,433) — (1,433)

86
Derivative Total Gross Instruments Non-Qualifying Derivative Amounts Total Net
Used as Cash Derivative Instruments Available for Derivative December 31, 2017 Flow Hedges Instruments as Presented Offset Instruments (millions of Canadian dollars) Accounts receivable and other Foreign exchange contracts — 77 77 (69) 8 Interest rate contracts 6 — 6 (6) — Commodity contracts 2 — 2 (2) —
8 77 851 (77) 8 Deferred amounts and other assets
Foreign exchange contracts 1 18 19 — 19 Interest rate contracts 1 — 1 — 1 Commodity contracts 17 — 17 (16) 1
19 18 37 (16) 21 Accounts payable and other
Foreign exchange contracts — (143) (143) 69 (74)
Interest rate contracts (90) — (90) 6 (84)
Commodity contracts — (29) (29) 2 (27) (90) (172) (262) 2 77 (185)
Other long-term liabilities
Foreign exchange contracts — (868) (868) — (868)
Interest rate contracts (14) — (14) — (14)
Commodity contracts — (126) (126) 16 (110) (14) (994) (1,008) 16 (992)
Total net derivative asset/(liability)
Foreign exchange contracts 1 (916) (915) — (915)
Interest rate contracts (97) — (97) — (97)
Commodity contracts 19 (155) (136) — (136) (77) (1,071) (1,148) — (1,148)
1 Reported within Accounts receivable and other (2018 - $11 million; December 31, 2017 - $7 million) and Accounts receivable from affiliates (2018 - $39 million; December 31, 2017 - $78 million) on the Consolidated Statements of Financial Position.
2 Reported within Accounts payable and other (2018 - $37 million; December 31, 2017 - $41 million) and Accounts payable to affiliates (2018 - $204 million; December 31, 2017 - $221 million) on the Consolidated Statements of Financial Position.
The following table summarizes the maturity and notional principal or quantity outstanding related to EIPLP’s derivative instruments:
March 31, 2018 2018 2019 2020 2021 2022 Thereafter
Interest rate contracts - short-term borrowings (millions of
Canadian dollars) 950 561 334 38 25 166 Interest rate contracts - long-term debt (millions of
Canadian dollars) 1,170
400
125
—
—
—
Foreign exchange contracts - United States dollar forwards - sell (millions of United States dollars) 1,695 1,807 2,060 1,687 1,675 3,489 Foreign exchange contracts - United States dollar forwards - purchase (millions of United States dollars) 459 2 1 — — — Commodity contracts - crude oil (millions of barrels) — (1) — — — — Commodity contracts - power (megawatt hours (MW/H))
1 32 31 35 (3) (43) (43 )
December 31, 2017 2018 2019 2020 2021 2022 Thereafter
Interest rate contracts - short-term borrowings (millions of
Canadian dollars) 1,227 81 25 25 25 166 Interest rate contracts - long-term debt (millions of
Canadian dollars) 1,170
400
125
—
—
—
Foreign exchange contracts - United States dollar forwards - sell (millions of United States dollars) 2,107 1,807 2,060 1,687 1,675 1,820 Foreign exchange contracts - United States dollar forwards - purchase (millions of United States dollars) 414 2 2 — — — Commodity contracts - power (MW/H)
1 30 31 35 (3) (43) (43 )
1 Thereafter includes an average of (43) MW/H for 2023 through 2025.

87
The Effect of Derivative Instruments on the Statements of Earnings and Comprehensive Income The following table presents the effect of cash flow hedges on EIPLP’s consolidated earnings and consolidated comprehensive income, before the effect of income taxes:
Three months ended March 31,
2018 2017 (millions of Canadian dollars)
Amount of unrealized gain/(loss) recognized in OCI Cash flow hedges Interest rate contracts 9 (12 ) Commodity contracts (2) 20
7 8
Amount of (gain)/loss reclassified from AOCI to earnings (effective portion) Interest rate contracts1 6 5
Commodity contracts2 (1) (2 ) 5 3
Amount of loss reclassified from AOCI to earnings (ineffective portion and amount excluded from effectiveness testing) Interest rate contracts1 — 1
— 1 1 Reported within Interest expense in the Consolidated Statements of Earnings. 2 Reported within Transportation and other services revenues, Electricity sales revenues, and Other income/(expense) in the
Consolidated Statements of Earnings.
EIPLP estimates that $4 million of AOCI related to cash flow hedges will be reclassified to earnings in the next 12 months. Actual amounts reclassified to earnings depend on the foreign exchange rates, interest rates and commodity prices in effect when derivative contracts that are currently outstanding mature. For all forecasted transactions, the maximum term over which EIPLP is hedging exposures to the variability of cash flows is 33 months at March 31, 2018. Non-Qualifying Derivatives The following table presents the unrealized gains and losses associated with changes in the fair value of EIPLP’s non-qualifying derivatives:
Three months ended March 31,
2018 2017 (millions of Canadian dollars)
Foreign exchange contracts1 (305) 161
Commodity contracts2 13 (1 ) Total unrealized derivative fair value gain/(loss) (292) 160
1 Reported within Transportation and other services revenues (2018 - $299 million loss; 2017 - $158 million gain) and Other income/(expense) (2018 - $6 million loss; 2017 - $3 million gain) in the Consolidated Statements of Earnings.
2 Reported within Transportation and other services revenues (2018 - $1 million loss; 2017 - $3 million gain), Electricity sales revenues (2018 - $2 million gain; 2017 - $2 million gain) and Operating and administrative expense (2018 - $12 million gain; 2017 - $6 million loss) in the Consolidated Statements of Earnings.
LIQUIDITY RISK Liquidity risk is the risk EIPLP will not be able to meet its financial obligations, including commitments and guarantees, as they become due. In order to manage this risk, EIPLP forecasts cash requirements over the near and long term to determine whether sufficient funds will be available when required. EIPLP generates cash from operations, commercial paper issuances and credit facility draws, through the periodic issuance of public term debt and issuance of units to its partners. Additionally, to ensure ongoing liquidity and to mitigate the risk of market disruption, EIPLP maintains a committed bank credit facility. EIPLP actively manages its bank funding sources to optimize pricing and other terms. Additional liquidity,

88
if necessary, is expected to be available through intercompany transactions with Enbridge or other related entities. CREDIT RISK Entering into derivative instruments may result in exposure to credit risk. Credit risk arises from the possibility that a counterparty will default on its contractual obligations. In order to mitigate this risk, EIPLP enters into risk management transactions primarily with institutions that possess investment grade credit ratings. Credit risk relating to derivative counterparties is mitigated by credit exposure limits and contractual requirements, netting arrangements and ongoing monitoring of counterparty credit exposure using external credit rating services and other analytical tools. EIPLP has credit concentrations and credit exposure, with respect to derivative instruments, in the following counterparty segments:
March 31, December 31, 2018 2017 (millions of Canadian dollars)
Canadian financial institutions 1 8
United States financial institutions 1 —
European financial institutions 12 17
Other1 6 9
20 34 1 Other is comprised of primarily Enbridge and its affiliates.
Derivative assets are adjusted for non-performance risk of EIPLP’s counterparties using their credit default swap spread rates, and are reflected in the fair value. For derivative liabilities, EIPLP’s non-performance risk is considered in the valuation. Credit risk also arises from trade and other long-term receivables, and is mitigated through credit exposure limits, contractual requirements, assessment of credit ratings and netting arrangements. Generally, EIPLP classifies and provides for receivables older than 30 days as past due. The maximum exposure to credit risk related to non-derivative financial assets is their carrying value. FAIR VALUE MEASUREMENTS EIPLP’s financial assets and liabilities measured at fair value on a recurring basis include derivative instruments. EIPLP also discloses the fair value of other financial instruments not measured at fair value. The fair value of financial instruments reflects EIPLP’s best estimates of market value based on generally accepted valuation techniques or models and are supported by observable market prices and rates. When such values are not available, EIPLP uses discounted cash flow analysis from applicable yield curves based on observable market inputs to estimate fair value. FAIR VALUE OF FINANCIAL INSTRUMENTS EIPLP categorizes its derivative instruments measured at fair value into one of three different levels depending on the observability of the inputs employed in the measurement. Level 1 Level 1 includes derivatives measured at fair value based on unadjusted quoted prices for identical assets and liabilities in active markets that are accessible at the measurement date. An active market for a derivative is considered to be a market where transactions occur with sufficient frequency and volume to provide pricing information on an ongoing basis. EIPLP does not have any financial instruments valued using Level 1 inputs.

89
Level 2 Level 2 includes derivative valuations determined using directly or indirectly observable inputs other than quoted prices included within Level 1. Derivatives in this category are valued using models or other industry standard valuation techniques derived from observable market data. Such valuation techniques include inputs such as quoted forward prices, time value, volatility factors and broker quotes that can be observed or corroborated in the market for the entire duration of the derivative. Derivatives valued using Level 2 inputs include non-exchange traded derivatives such as over-the-counter foreign exchange forward contracts and interest rate swaps for which observable inputs can be obtained. EIPLP has also categorized the fair value of its Investment in affiliated company and Long-term debt as Level 2. The fair value is based on quoted market prices for instruments of similar yield, credit risk and tenor. Level 3 Level 3 includes derivative valuations based on inputs which are less observable, unavailable or where the observable data does not support a significant portion of the derivatives' fair value. Generally, Level 3 derivatives are longer dated transactions, occur in less active markets, occur at locations where pricing information is not available or have no binding broker quote to support Level 2 classification. EIPLP has developed methodologies, benchmarked against industry standards, to determine fair value for these derivatives based on extrapolation of observable future prices and rates. Derivatives valued using Level 3 inputs include long-dated derivative power contracts, basis swaps, commodity swaps, power and energy swaps and options. EIPLP uses the most observable inputs available to estimate the fair value of its derivatives. When possible, EIPLP estimates the fair value of its derivatives based on quoted market prices. If quoted market prices are not available, EIPLP uses estimates from third party brokers. For non-exchange traded derivatives classified in Levels 2 and 3, EIPLP uses standard valuation techniques to calculate the estimated fair value. These methods include discounted cash flows for forwards and swaps and Black-Scholes-Merton pricing models for options. Depending on the type of derivative and nature of the underlying risk, EIPLP uses observable market prices (interest, foreign exchange and commodity) and volatility as primary inputs to these valuation techniques. Finally, EIPLP considers its own credit default swap spread as well as the credit default swap spreads associated with its counterparties in its estimation of fair value.

90
Fair Value of Derivatives EIPLP has categorized its derivative assets and liabilities measured at fair value as follows:
Total Gross
Derivative March 31, 2018 Level 1 Level 2 Level 3 Instruments (millions of Canadian dollars) Financial assets Current derivative assets Foreign exchange contracts — 44 — 44 Interest rate contracts — 6 — 6 Commodity contracts — — — —
— 50 — 50 Long-term derivative assets
Foreign exchange contracts — 12 — 12 Interest rate contracts — 1 — 1 Commodity contracts — — 19 19
— 13 19 32 Financial liabilities
Current derivative liabilities Foreign exchange contracts — (131) — (131 )
Interest rate contracts — (83) — (83 )
Commodity contracts — (7) (20) (27 ) — (221) (20) (241 )
Long-term derivative liabilities
Foreign exchange contracts — (1,145) — (1,145 )
Interest rate contracts — (12) — (12 )
Commodity contracts — (1) (116) (117 ) — (1,158) (116) (1,274 )
Total net financial liability
Foreign exchange contracts — (1,220) — (1,220 )
Interest rate contracts — (88) — (88 )
Commodity contracts — (8) (117) (125 ) — (1,316) (117) (1,433 )

91
Total Gross
Derivative December 31, 2017 Level 1 Level 2 Level 3 Instruments (millions of Canadian dollars) Financial assets Current derivative assets Foreign exchange contracts — 77 — 77 Interest rate contracts — 6 — 6 Commodity contracts — — 2 2
— 83 2 85 Long-term derivative assets
Foreign exchange contracts — 19 — 19 Interest rate contracts — 1 — 1 Commodity contracts — — 17 17
— 20 17 37 Financial liabilities
Current derivative liabilities Foreign exchange contracts — (143) — (143 )
Interest rate contracts — (90) — (90 )
Commodity contracts — (5) (24) (29 ) — (238) (24) (262 )
Long-term derivative liabilities
Foreign exchange contracts — (868) — (868 )
Interest rate contracts — (14) — (14 )
Commodity contracts — (1) (125) (126 ) — (883) (125) (1,008 )
Total net financial liability
Foreign exchange contracts — (915) — (915 )
Interest rate contracts — (97) — (97 )
Commodity contracts — (6) (130) (136 ) — (1,018) (130) (1,148 )
The significant unobservable inputs used in fair value measurement of Level 3 derivative instruments were as follows:
Weighted Unobservable Minimum Maximum Average Unit of March 31, 2018 Fair Value Input Price Price Price Measurement (fair value in millions of Canadian dollars) Commodity contracts - financial1 Power (117) Forward power price 35.44 76.27 51.90 $/MW/H
1 Financial forward commodity contracts are valued using a market approach valuation technique.
If adjusted, the significant unobservable inputs disclosed in the table above would have a direct impact on the fair value of EIPLP’s Level 3 derivative instruments. The significant unobservable inputs used in the fair value measurement of Level 3 derivative instruments include forward commodity prices and for option contracts, price volatility. Changes in forward commodity prices could result in significantly different fair values for EIPLP’s Level 3 derivatives. Changes in price volatility would change the value of the option contracts. Generally, a change in the estimate of forward commodity prices is unrelated to a change in the estimate of price volatility.

92
Changes in net fair value of derivative assets and liabilities classified as Level 3 in the fair value hierarchy were as follows:
Three months ended March 31,
2018 2017 (millions of Canadian dollars)
Level 3 net derivative liability at beginning of period (130) (181 ) Total gains/(loss), unrealized Included in earnings1 15 (4 ) Included in OCI (2) 19
Level 3 net derivative liability at end of period (117) (166 ) 1 Reported within Transportation and other services revenues, and Operating and administrative expense in the Consolidated
Statements of Earnings.
EIPLP’s policy is to recognize transfers as at the last day of the reporting period. There were no transfers between levels as at March 31, 2018 or 2017. Fair Value of Other Financial Instruments EIPLP had Restricted long-term investments held in trust totaling $148 million as at March 31, 2018 (December 31, 2017 - $135 million) which are recognized at fair value. At March 31, 2018, EIPLP’s long-term debt had a carrying value of $6,761 million (December 31, 2017 - $6,476 million) before debt issuance costs and a fair value of $7,185 million (December 31, 2017 - $6,942 million). At March 31, 2018, EPI, a subsidiary of EIPLP, had an investment of $514 million (December 31, 2017 - $514 million) in non-voting, redeemable Series A Preferred Shares in Enbridge Employee Services Canada Inc. EIPLP has classified this investment in affiliated company as available-for-sale debt security and carries it at fair value, with changes in fair value recorded in OCI. As at March 31, 2018, the fair value of this investment approximates its cost and redemption value. EIPLP holds Class A units of certain Enbridge subsidiaries which provide defined, scheduled and fixed distributions that represent the equity cash flows derived from the core rate base of the United States portion of Southern Lights Pipeline until June 30, 2040. At March 31, 2018, EIPLP’s investment had a carrying value of $746 million (December 31, 2017 - $729 million) included in Long-term receivable from affiliate on the Consolidated Statements of Financial Position and a fair value of $688 million (December 31, 2017 - $658 million). The fair value of other financial assets and liabilities, other than those disclosed above, approximates its cost due to the short period to maturity.
11. INCOME TAXES The effective income tax rate for the three months ended March 31, 2018 was 7.9% (2017 - 15.4%). The period-over-period decrease in the effective tax rate is primarily due to the effects of rate-regulated accounting for income taxes and other permanent items relative to lower earnings in 2018.

93
12. RELATED PARTY TRANSACTIONS Loans from Affiliates The following loans from affiliates are evidenced by formal loan agreements:
March 31, 2018 December 31, 2017 Weighted Weighted Average Average Interest Interest Maturity Rate Amount Rate Amount (in millions of Canadian dollars)
Enbridge 2020-2064 4.5% 4,191 4.5% 4,191
Enbridge 2025 4.0% 124 4.0% 124
Enbridge Current — 57 — 57
Enbridge Income Fund Holdings Inc. Current 4.3% 113 4.3% 72
ECT Current 2.7% 223 2.4% 426
ECT 2020 7.1% 100 7.1% 100
Enbridge 2045 4.0% 734 4.0% 734
Enbridge 2045 4.0% 652 4.0% 652
6,194 6,356 Current portion of loans from affiliates (393 ) (555 ) 5,801 5,801
13. CONTINGENCIES LITIGATION EIPLP and its subsidiaries are subject to various legal and regulatory actions and proceedings which arise in the normal course of business, including interventions in regulatory proceedings and challenges to regulatory approvals and permits by special interest groups. While the final outcome of such actions and proceedings cannot be predicted with certainty, the Manager believes that the resolution of such actions and proceedings will not have a material impact on EIPLP’s consolidated financial position or results of operations.
14. SUBSEQUENT EVENT On May 9, 2018, EIPLP entered into agreements to sell a 49% interest in wind and solar facilities included within the Green Power segment (the Assets) to an unrelated party for cash consideration of approximately $1.05 billion. EIPLP will maintain a 51% interest in the Assets and Enbridge will continue to manage, operate and provide administrative services for the Assets. The transaction is subject to closing adjustments and conditions customary in transactions of this nature. Closing is expected to occur during the third quarter of 2018 subject to the receipt of all necessary regulatory approvals and consents.

200, 425 – 1st Street S. W. Calgary, Alberta, Canada T2P 3L8
Telephone: 403-231-3900 Facsimile: 403-231-3920 Toll free: 866-859-5957
enbridgeincomefund.com
Related Documents