2018 FCC FARMLAND VALUES REPORT This report covers the period from January 1 to December 31, 2018 Published on April 29, 2019

Welcome message from author
This document is posted to help you gain knowledge. Please leave a comment to let me know what you think about it! Share it to your friends and learn new things together.
Transcript

2 0 1 8 F C C F A R M L A N D V A L U E S R E P O R T
This report covers the period from January 1 to December 31, 2018
Published on April 29, 2019
1
2 Introduction
3 Methodology
4 National trend
5 Key takeaways
6 British Columbia
9 Alberta
11 Saskatchewan
13 Manitoba
15 Ontario
17 Quebec
19 New Brunswick
20 Nova Scotia
21 Prince Edward Island
22 Newfoundland and Labrador
23 Contact
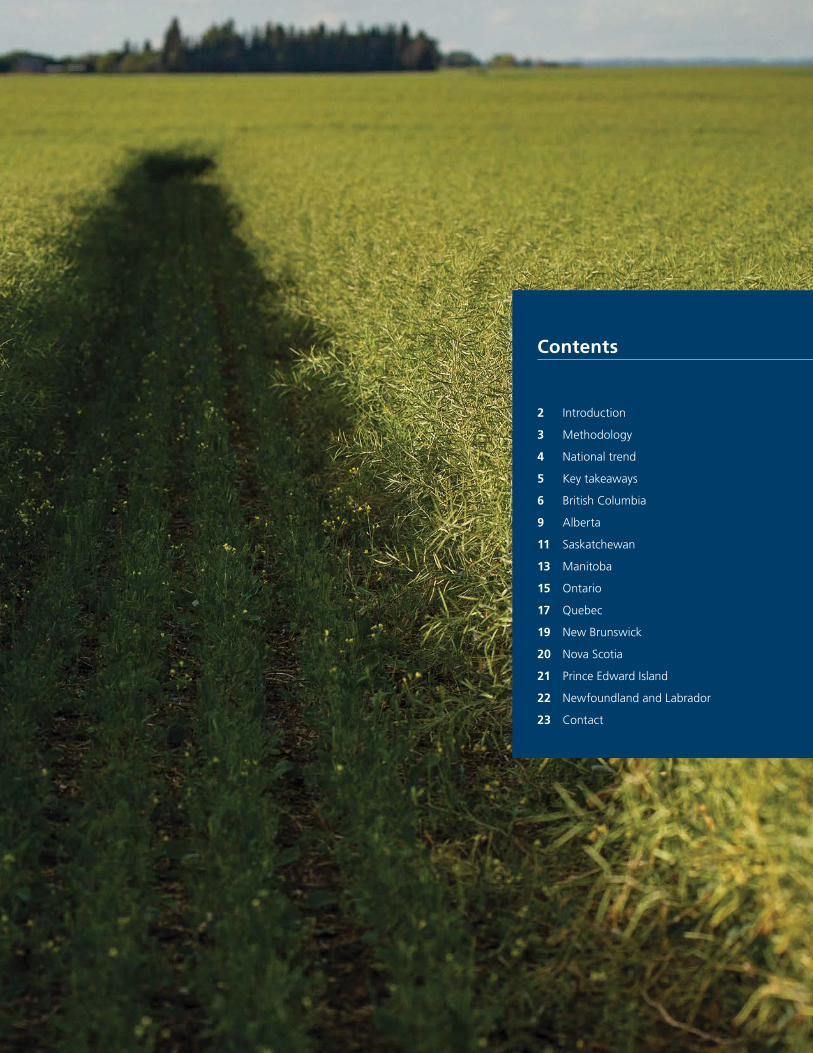
Contents
2018 FCC Farmland Values Report
Farm Credit Canada (FCC) understands the value of having access to solid
market information when making management decisions. That’s why FCC
compiles and releases the Farmland Values Report. It tracks and highlights
average changes in farmland values – regionally, provincially and nationally
– and provides a value indicator that allows for a region-to-region price per
acre comparison.
Price, of course, is only one factor that must be considered when purchasing
land. Other factors include the location, timing of an expansion, and the
individual’s financial situation and personal goals. Producers should have
and maintain a risk management plan that takes into account possible
economic changes, ensuring their budgets have room to flex if commodity
prices, yields or interest rates shift. Market conditions can change rapidly
and this can impact values.
This report describes changes from January 1 to December 31, 2018. It
provides one source of information to help producers manage risk and
make informed business decisions.
2 0 1 8 F C C F A R M L A N D V A L U E S R E P O R T
1
Methodology
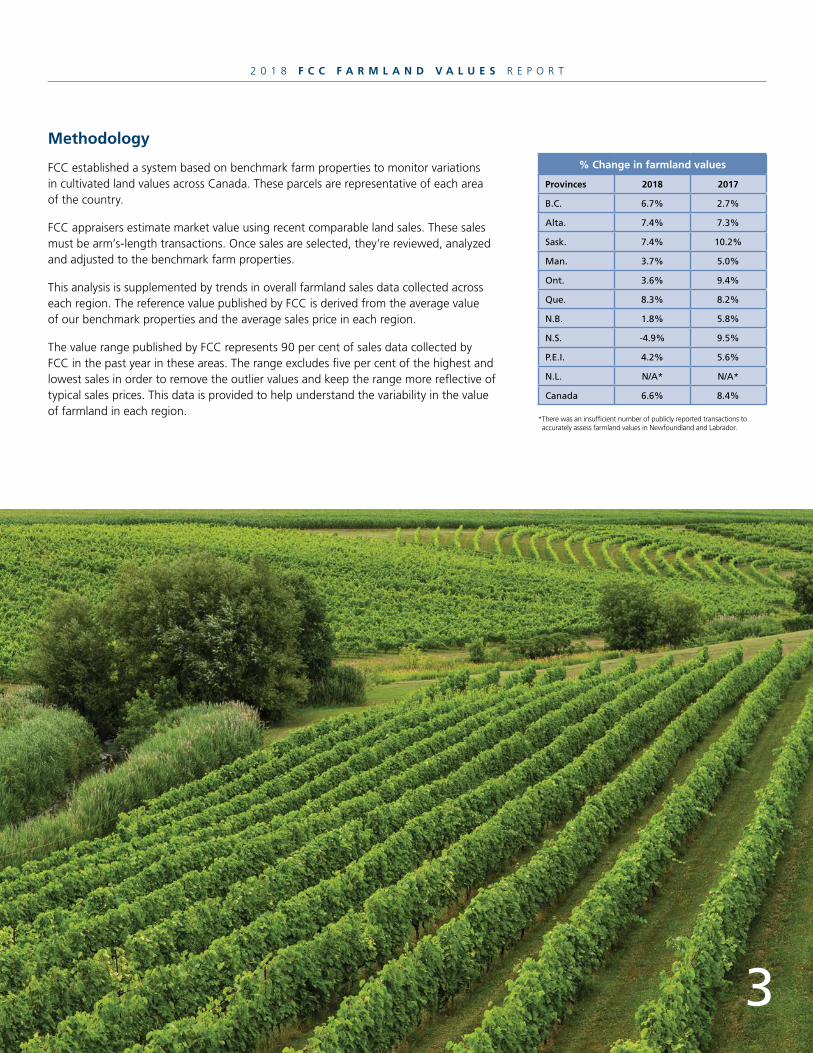
FCC established a system based on benchmark farm properties to monitor variations in cultivated land values across Canada. These parcels are representative of each area of the country.
FCC appraisers estimate market value using recent comparable land sales. These sales must be arm’s-length transactions. Once sales are selected, they’re reviewed, analyzed and adjusted to the benchmark farm properties.
This analysis is supplemented by trends in overall farmland sales data collected across each region. The reference value published by FCC is derived from the average value of our benchmark properties and the average sales price in each region.
The value range published by FCC represents 90 per cent of sales data collected by FCC in the past year in these areas. The range excludes five per cent of the highest and lowest sales in order to remove the outlier values and keep the range more reflective of typical sales prices. This data is provided to help understand the variability in the value of farmland in each region.
% Change in farmland values
Provinces 2018 2017
B.C. 6.7% 2.7%
Alta. 7.4% 7.3%
Sask. 7.4% 10.2%
Man. 3.7% 5.0%
Ont. 3.6% 9.4%
Que. 8.3% 8.2%
N.B. 1.8% 5.8%
N.S. -4.9% 9.5%
P.E.I. 4.2% 5.6%
N.L. N/A* N/A*
Canada 6.6% 8.4%
3
* There was an insufficient number of publicly reported transactions to accurately assess farmland values in Newfoundland and Labrador.

2 0 1 8 F C C F A R M L A N D V A L U E S R E P O R T
CanadaAnnual % change in farmland values
6.6%
5.2%
14.8%
19.5%
22.1%
14.3%
10.1%
7.9%
8.4%
6.6%2018
2017
2016
2015
2014
2013
2012
2011
2010
2009
Canada6.6%
*There was an insufficient number of publicly reported transactions in 2018 to accurately assess farmland values in Newfoundland and Labrador.
Provincial comparison of farmland values Annual % change in farmland values January 1 to December 31, 2018
National trend
The average value of Canadian farmland increased 6.6 per cent in 2018, following gains of 8.4 per cent in 2017 and 7.9 per cent in 2016.
In all provinces except Nova Scotia, average farmland values increased. Quebec experienced the highest average increase at 8.3 per cent, followed by Saskatchewan and Alberta, both at 7.4 per cent, and British Columbia at 6.7 per cent. The rest of the provinces were below the national average with Prince Edward Island’s average increase at 4.2 per cent, Manitoba at 3.7 per cent, Ontario at 3.6 per cent and New Brunswick at 1.8 per cent. Nova Scotia recorded a decrease in average farmland values of 4.9 per cent. Note that in Newfoundland and Labrador there were not enough publicly reported transactions to fully assess farmland values.
When looking at the national results, it’s important to remember the reported number is an average. The differences between regions within each province vary widely.
N.L.N/A*
B.C.6.7%
ALTA.7.4%
SASK.7.4%
MAN.3.7%
ONT.3.6%
QUE.8.3%
N.B.1.8%
P.E.I.4.2%
N.S.-4.9%
1
Key takeaways
Less is more: The average farmland value in Canada continued its steady climb
in 2018, driven by fewer but more strategic investments by producers. Whether
it means paying a higher price for land that has potential to be more productive
or buying in blocks to improve the efficiency of their operations, producers are
sharpening their pencils with an eye on variable commodity prices.
Reflect and refresh: With the steady climb in farmland values, now is a good
time for producers to review and adjust their business plans to reflect possible
pressures on farm income and higher borrowing costs, assess their overall
financial position and focus on increasing productivity.
Manage your risk: Farm operations need to exercise caution, especially in regions
where the growth rate of farmland values exceeded that of farm income in
recent years. They also need to review the financial risks they are exposed to.
Knowing the cost of production can help producers understand the impact of
fluctuations in commodity prices and interest rates and/or unforeseen variations
in production. These events can diminish the ability to safeguard and build
equity in the operation and successfully meet cash flow requirements.
2 0 1 8 F C C F A R M L A N D V A L U E S R E P O R T
British Columbia
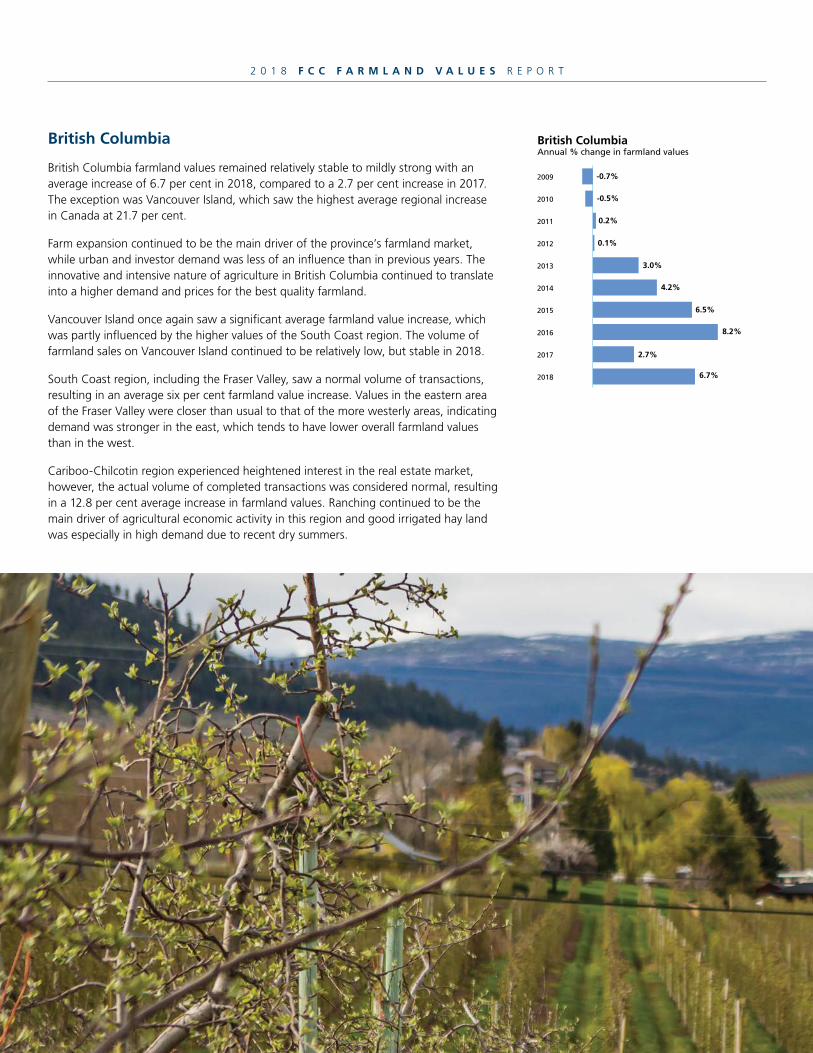
British Columbia farmland values remained relatively stable to mildly strong with an average increase of 6.7 per cent in 2018, compared to a 2.7 per cent increase in 2017. The exception was Vancouver Island, which saw the highest average regional increase in Canada at 21.7 per cent.
Farm expansion continued to be the main driver of the province’s farmland market, while urban and investor demand was less of an influence than in previous years. The innovative and intensive nature of agriculture in British Columbia continued to translate into a higher demand and prices for the best quality farmland.
Vancouver Island once again saw a significant average farmland value increase, which was partly influenced by the higher values of the South Coast region. The volume of farmland sales on Vancouver Island continued to be relatively low, but stable in 2018.
South Coast region, including the Fraser Valley, saw a normal volume of transactions, resulting in an average six per cent farmland value increase. Values in the eastern area of the Fraser Valley were closer than usual to that of the more westerly areas, indicating demand was stronger in the east, which tends to have lower overall farmland values than in the west.
Cariboo-Chilcotin region experienced heightened interest in the real estate market, however, the actual volume of completed transactions was considered normal, resulting in a 12.8 per cent average increase in farmland values. Ranching continued to be the main driver of agricultural economic activity in this region and good irrigated hay land was especially in high demand due to recent dry summers.
British ColumbiaAnnual % change in farmland values
2018
2017
2016
2015
2014
2013
2012
2011
2010
2009
4.2%
3.0%
6.5%
8.2%
2.7%
6.7%
0.1%
0.2%
-0.5%
-0.7%

2 0 1 8 F C C F A R M L A N D V A L U E S R E P O R T
1
British Columbia farmland regionsRegion % change Value $/acre* Value range**
Peace Region-Northern B.C.
Cariboo-Chilcotin
Vancouver Island
South Coast
Thompson-Nicola
Okanagan
Kootenay
6.6%
12.8%
21.7%
6.0%
0.0%
6.4%
0.0%
$1,645
$2,760
$50,858
$94,657
$10,309
$97,903
$45,073
$900 – $2,600
$1,200 – $3,100
$21,500 – $79,300
$49,700 – $218,900
$6,200 – $11,200
$8,000 – $148,800
$4,400 – $23,900
Vancouver
Victoria
7
* FCC reference value $/acre.
** The value range represents 90% of the sales in each area and excludes the top and bottom 5%.

2 0 1 8 F C C F A R M L A N D V A L U E S R E P O R T
Peace Region-Northern B.C. saw higher farmland values for the highest quality land, but otherwise the market was generally stable with a 6.6 per cent average increase. The bulk of land sales involved smaller transactions, though there were a few sales of larger land tracts.
Okanagan region saw substantial demand, even for smaller parcels, primarily for vineyard establishment. In addition, a number of larger vineyard expansion projects continued to drive demand for quality vineyard land, contributing to the region’s average 6.4 per cent farmland value increase. The tree fruit sector continued to be a significant part of Okanagan agriculture but played a lesser role in the land market in 2018.
Thompson-Nicola and Kootenay regions both recorded no increase in average farmland values. Thompson-Nicola, with its diversity of acreages and small and intensive farm operations, was stable in both volume of farmland sales and price, while Kootenay had limited farmland sales, especially for orchard properties.
2 0 1 8 F C C F A R M L A N D V A L U E S R E P O R T
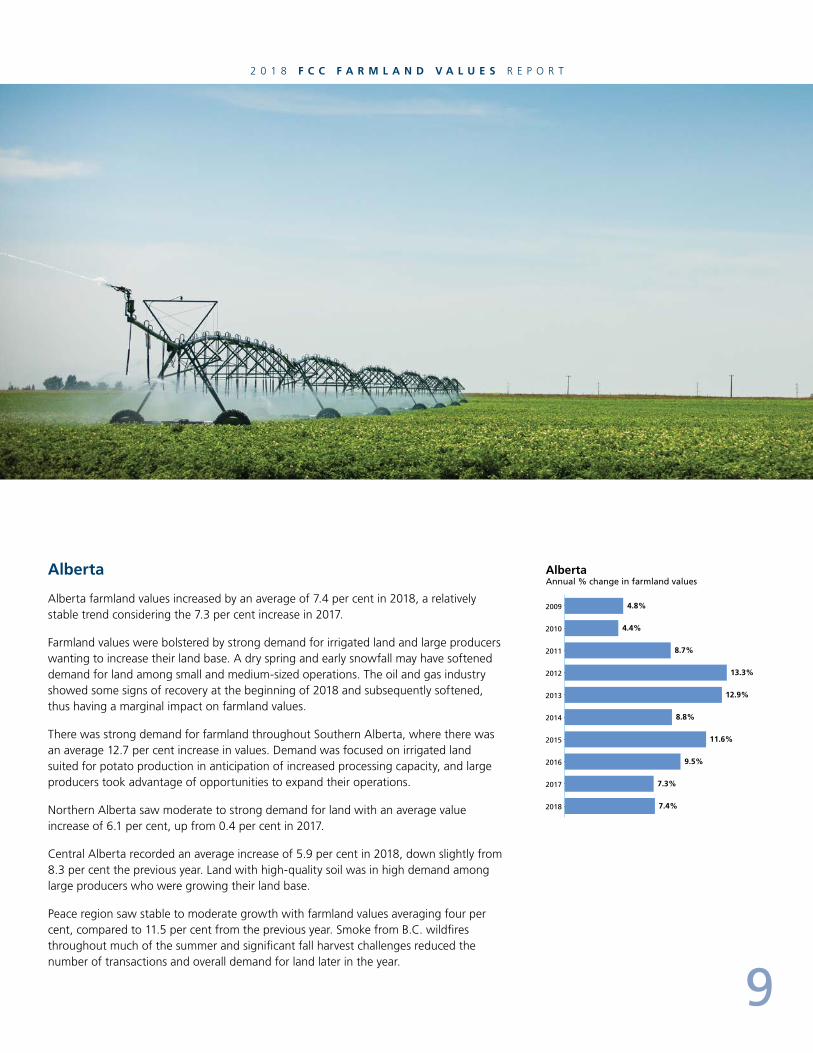
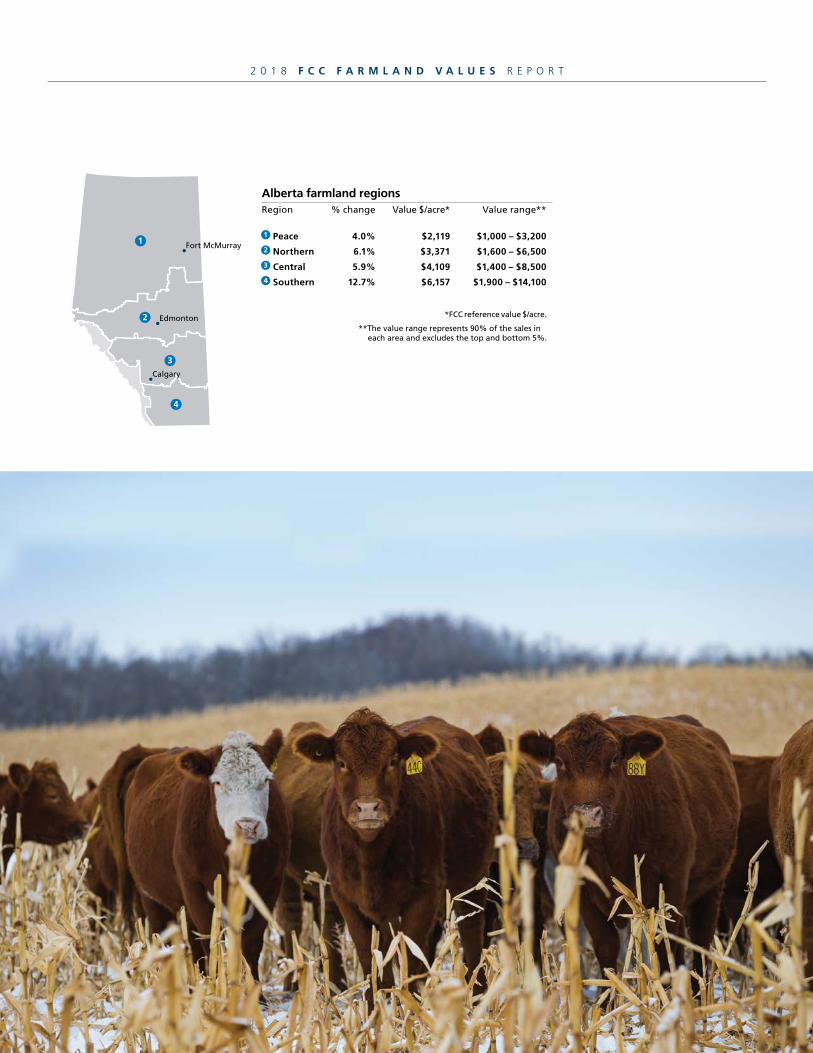
Alberta
Alberta farmland values increased by an average of 7.4 per cent in 2018, a relatively stable trend considering the 7.3 per cent increase in 2017.
Farmland values were bolstered by strong demand for irrigated land and large producers wanting to increase their land base. A dry spring and early snowfall may have softened demand for land among small and medium-sized operations. The oil and gas industry showed some signs of recovery at the beginning of 2018 and subsequently softened, thus having a marginal impact on farmland values.
There was strong demand for farmland throughout Southern Alberta, where there was an average 12.7 per cent increase in values. Demand was focused on irrigated land suited for potato production in anticipation of increased processing capacity, and large producers took advantage of opportunities to expand their operations.
Northern Alberta saw moderate to strong demand for land with an average value increase of 6.1 per cent, up from 0.4 per cent in 2017.
Central Alberta recorded an average increase of 5.9 per cent in 2018, down slightly from 8.3 per cent the previous year. Land with high-quality soil was in high demand among large producers who were growing their land base.
Peace region saw stable to moderate growth with farmland values averaging four per cent, compared to 11.5 per cent from the previous year. Smoke from B.C. wildfires throughout much of the summer and significant fall harvest challenges reduced the number of transactions and overall demand for land later in the year.
AlbertaAnnual % change in farmland values
0 3 6 9 12 15
4.8%
4.4%
8.7%
13.3%
12.9%
8.8%
11.6%
9.5%
7.3%
7.4%2018
2017
2016
2015
2014
2013
2012
2011
2010
2009
9
2 0 1 8 F C C F A R M L A N D V A L U E S R E P O R T
Alberta farmland regionsRegion % change Value $/acre* Value range**
Peace
Northern
Central
Southern
4.0%
6.1%
5.9%
12.7%
$2,119
$3,371
$4,109
$6,157
$1,000 – $3,200
$1,600 – $6,500
$1,400 – $8,500
$1,900 – $14,100
Fort McMurray
Edmonton
Calgary
* FCC reference value $/acre.
** The value range represents 90% of the sales in each area and excludes the top and bottom 5%.
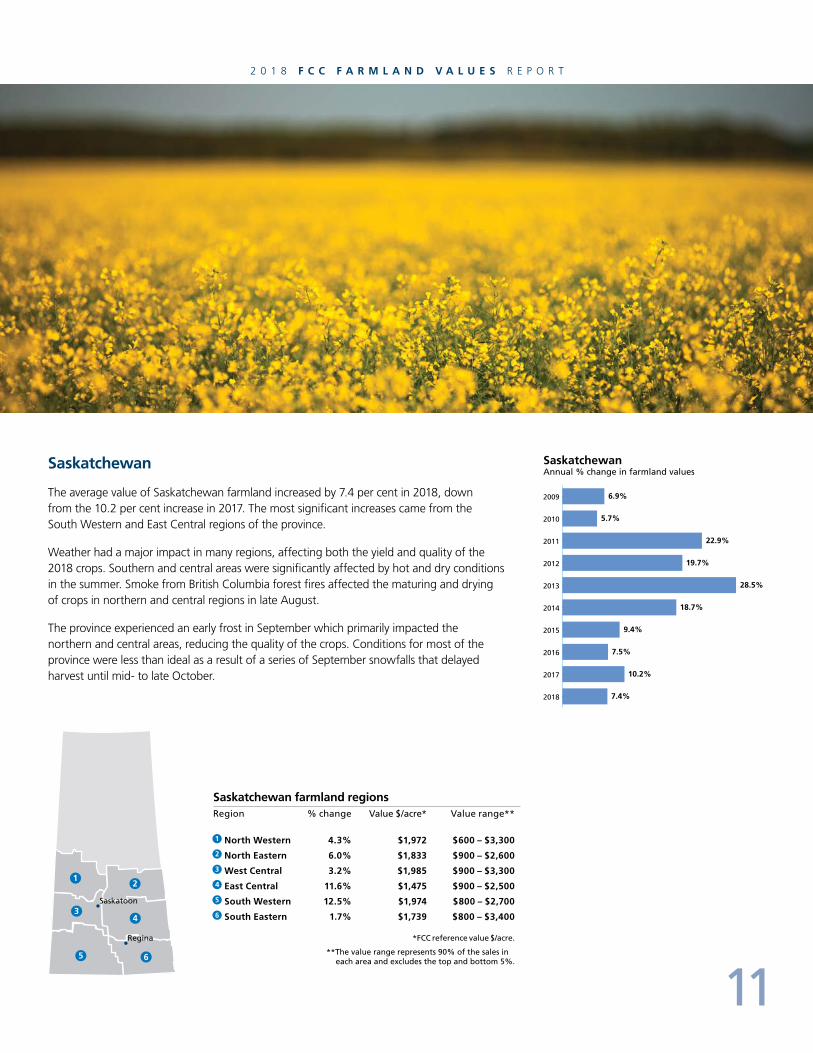
Saskatchewan farmland regionsRegion % change Value $/acre* Value range**
North Western
North Eastern
West Central
East Central
South Western
South Eastern
4.3%
6.0%
3.2%
11.6%
12.5%
1.7%
$1,972
$1,833
$1,985
$1,475
$1,974
$1,739
$600 – $3,300
$900 – $2,600
$900 – $3,300
$900 – $2,500
$800 – $2,700
$800 – $3,400
2 0 1 8 F C C F A R M L A N D V A L U E S R E P O R T
Saskatchewan
The average value of Saskatchewan farmland increased by 7.4 per cent in 2018, down from the 10.2 per cent increase in 2017. The most significant increases came from the South Western and East Central regions of the province.
Weather had a major impact in many regions, affecting both the yield and quality of the 2018 crops. Southern and central areas were significantly affected by hot and dry conditions in the summer. Smoke from British Columbia forest fires affected the maturing and drying of crops in northern and central regions in late August.
The province experienced an early frost in September which primarily impacted the northern and central areas, reducing the quality of the crops. Conditions for most of the province were less than ideal as a result of a series of September snowfalls that delayed harvest until mid- to late October.
SaskatchewanAnnual % change in farmland values
6.9%
5.7%
22.9%
19.7%
28.5%
18.7%
9.4%
7.5%
10.2%
7.4%2018
2017
2016
2015
2014
2013
2012
2011
2010
2009
Saskatoon
Regina
11* FCC reference value $/acre.
** The value range represents 90% of the sales in each area and excludes the top and bottom 5%.

2 0 1 8 F C C F A R M L A N D V A L U E S R E P O R T
Many transactions were driven by producers looking to buy and sell land to form larger blocks for efficiencies. Implementation of family farm transition plans and sales between land owners and renters also played a role.
The South Western and East Central regions experienced the most significant average farmland value increases at 12.5 and 11.6 per cent, respectively. These increases were largely due to a competitive market with a limited supply of land for sale, as well as strategic purchases of lower-valued land for potential future gains in productivity. As a result, many parcels sold for a premium price.
The North Eastern region average farmland value increase of six per cent was driven by strong demand for good quality land in a competitive market with limited land available for sale.
The West Central and North Western regions saw average increases of 3.2 and 4.3 per cent. These increases were modest relative to previous years.
The South Eastern region average farmland value increase of 1.7 per cent remained relatively stable, except for a couple of areas where more land became available to purchase.

2 0 1 8 F C C F A R M L A N D V A L U E S R E P O R T
Manitoba
Manitoba’s average farmland values increased by 3.7 per cent in 2018, following a five per cent increase in 2017.
Similar to other parts of the Prairies, farmland values in several regions of Manitoba were influenced by challenging weather conditions throughout the growing and harvest seasons. Cereal and canola yields were generally average to above-average throughout the province, while soybeans, hay and feed corn yields were negatively impacted by a lack of moisture in mid- to late summer and poor harvest conditions. The potato crop generally yielded average to above-average, although most areas were hit by an early frost.
Eastman region recorded the province’s largest average farmland value increase of 7.3 per cent, the same as 2017. Many of the same factors supporting increased farmland values – sales between land owners and renters, farm operation expansions and next generation land purchases – came into play in this region.
Westman region had an average farmland value increase of four per cent, compared to a 5.7 per cent increase in 2017. The region was impacted by hot, dry conditions during the growing season and a delayed harvest in the northern areas due to early snowfall, although there were variations in yield depending on the type of crop.
Central Plains-Pembina Valley region had an average farmland value increase of four per cent, compared to no increase in 2017. The region was impacted by hot and dry conditions during the growing season and a delayed harvest, resulting in variations in yield depending on the type of crop. This region is the main potato-growing area and yields were average to above-average in the southern area, while frost had a more significant impact on the central and northern areas. The region is also the hub for primary potato processing, which is undergoing a major increase in capacity. This will increase future demand for potato acres.
ManitobaAnnual % change in farmland values
11.7%
4.7%
4.4%
25.6%
25.6%
12.2%
12.4%
8.1%
5.0%
3.7%2018
2017
2016
2015
2014
2013
2012
2011
2010
2009
13
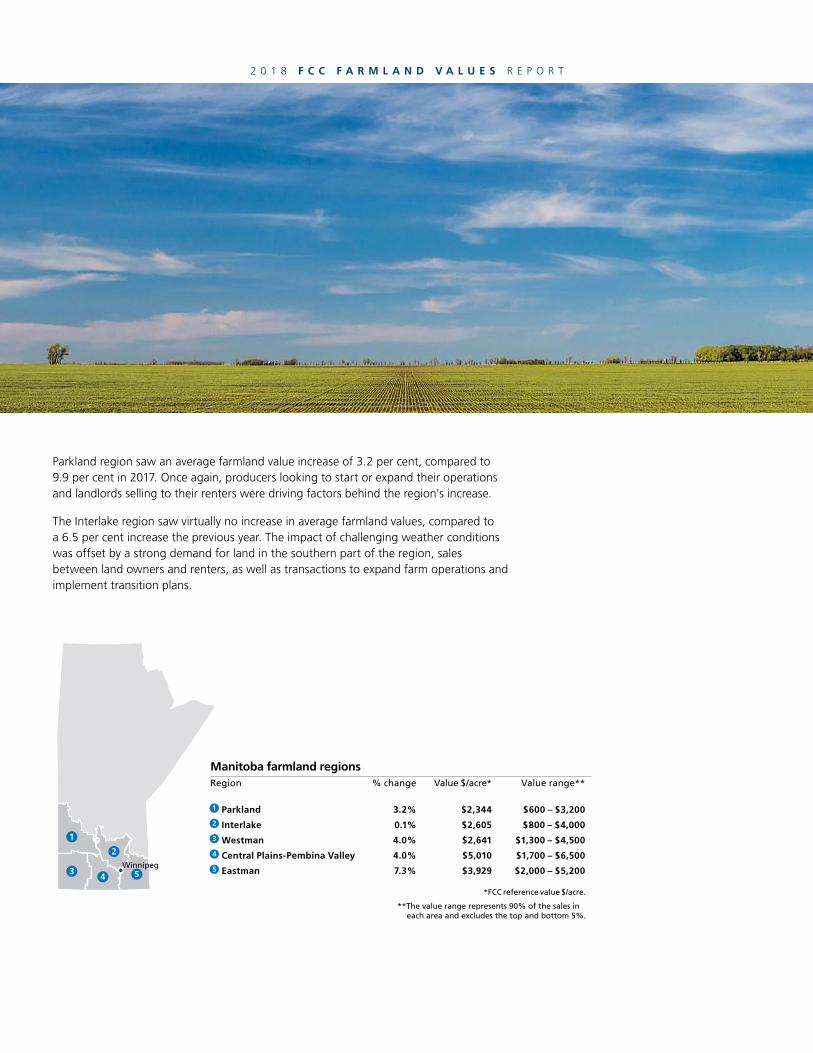
Manitoba farmland regionsRegion % change Value $/acre* Value range**
Parkland
Interlake
Westman
Central Plains-Pembina Valley
Eastman
3.2%
0.1%
4.0%
4.0%
7.3%
$2,344
$2,605
$2,641
$5,010
$3,929
$600 – $3,200
$800 – $4,000
$1,300 – $4,500
$1,700 – $6,500
$2,000 – $5,200
2 0 1 8 F C C F A R M L A N D V A L U E S R E P O R T
Parkland region saw an average farmland value increase of 3.2 per cent, compared to 9.9 per cent in 2017. Once again, producers looking to start or expand their operations and landlords selling to their renters were driving factors behind the region’s increase.
The Interlake region saw virtually no increase in average farmland values, compared to a 6.5 per cent increase the previous year. The impact of challenging weather conditions was offset by a strong demand for land in the southern part of the region, sales between land owners and renters, as well as transactions to expand farm operations and implement transition plans.
Winnipeg
* FCC reference value $/acre.
** The value range represents 90% of the sales in each area and excludes the top and bottom 5%.
2 0 1 8 F C C F A R M L A N D V A L U E S R E P O R T
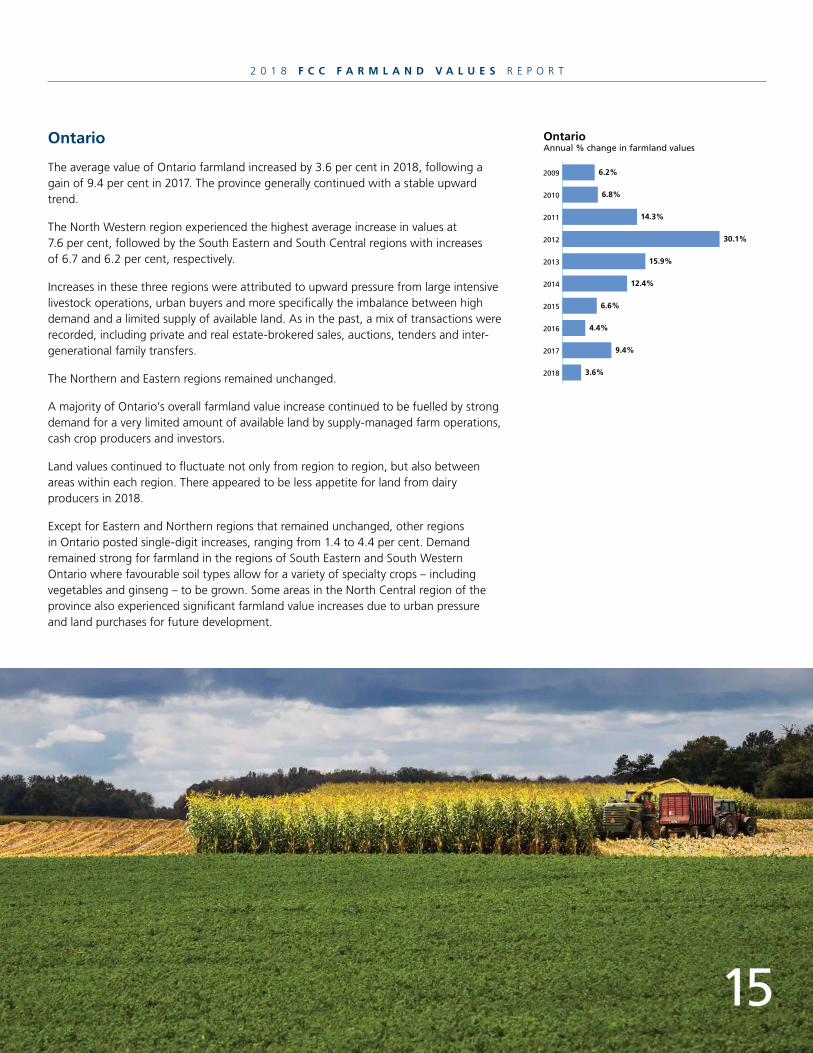
Ontario
The average value of Ontario farmland increased by 3.6 per cent in 2018, following a gain of 9.4 per cent in 2017. The province generally continued with a stable upward trend.
The North Western region experienced the highest average increase in values at 7.6 per cent, followed by the South Eastern and South Central regions with increases of 6.7 and 6.2 per cent, respectively.
Increases in these three regions were attributed to upward pressure from large intensive livestock operations, urban buyers and more specifically the imbalance between high demand and a limited supply of available land. As in the past, a mix of transactions were recorded, including private and real estate-brokered sales, auctions, tenders and inter-generational family transfers.
The Northern and Eastern regions remained unchanged.
A majority of Ontario’s overall farmland value increase continued to be fuelled by strong demand for a very limited amount of available land by supply-managed farm operations, cash crop producers and investors.
Land values continued to fluctuate not only from region to region, but also between areas within each region. There appeared to be less appetite for land from dairy producers in 2018.
Except for Eastern and Northern regions that remained unchanged, other regions in Ontario posted single-digit increases, ranging from 1.4 to 4.4 per cent. Demand remained strong for farmland in the regions of South Eastern and South Western Ontario where favourable soil types allow for a variety of specialty crops – including vegetables and ginseng – to be grown. Some areas in the North Central region of the province also experienced significant farmland value increases due to urban pressure and land purchases for future development.
OntarioAnnual % change in farmland values
6.2%
6.8%
14.3%
30.1%
15.9%
12.4%
6.6%
4.4%
9.4%
3.6%2018
2017
2016
2015
2014
2013
2012
2011
2010
2009
15

2 0 1 8 F C C F A R M L A N D V A L U E S R E P O R T
Ontario farmland regionsRegion % change Value $/acre* Value range**
Northern
Eastern
North Western
North Central
South Western
South Central
Southern
South Eastern
0.0%
0.0%
7.6%
1.4%
4.4%
6.2%
2.4%
6.7%
$3,621
$9,686
$9,049
$7,103
$17,561
$16,535
$12,435
$10,593
$500 – $4,600
$2,400 – $16,800
$5,100 – $16,700
$3,500 – $14,800
$11,600 – $23,600
$9,500 – $24,000
$7,800 – $20,000
$6,100 – $21,400
Ottawa
Toronto
* FCC reference value $/acre.
** The value range represents 90% of the sales in each area and excludes the top and bottom 5%.
2 0 1 8 F C C F A R M L A N D V A L U E S R E P O R T
17
Quebec
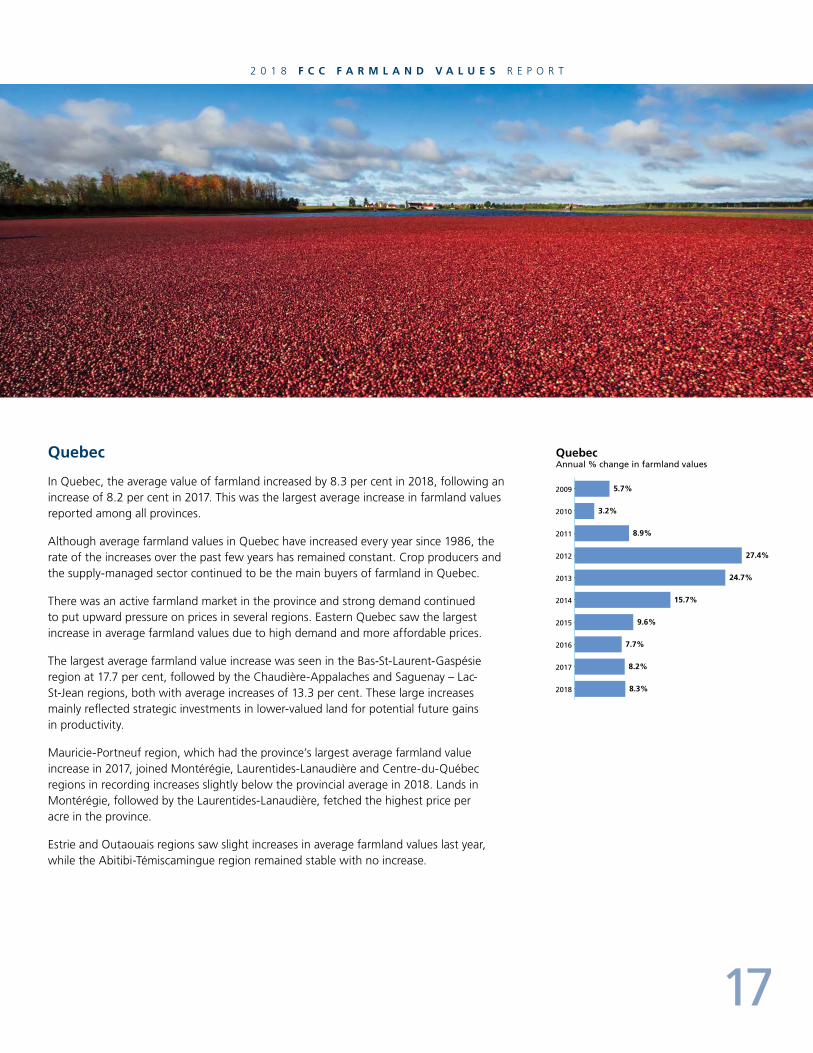
In Quebec, the average value of farmland increased by 8.3 per cent in 2018, following an increase of 8.2 per cent in 2017. This was the largest average increase in farmland values reported among all provinces.
Although average farmland values in Quebec have increased every year since 1986, the rate of the increases over the past few years has remained constant. Crop producers and the supply-managed sector continued to be the main buyers of farmland in Quebec.
There was an active farmland market in the province and strong demand continued to put upward pressure on prices in several regions. Eastern Quebec saw the largest increase in average farmland values due to high demand and more affordable prices.
The largest average farmland value increase was seen in the Bas-St-Laurent-Gaspésie region at 17.7 per cent, followed by the Chaudière-Appalaches and Saguenay – Lac- St-Jean regions, both with average increases of 13.3 per cent. These large increases mainly reflected strategic investments in lower-valued land for potential future gains in productivity.
Mauricie-Portneuf region, which had the province’s largest average farmland value increase in 2017, joined Montérégie, Laurentides-Lanaudière and Centre-du-Québec regions in recording increases slightly below the provincial average in 2018. Lands in Montérégie, followed by the Laurentides-Lanaudière, fetched the highest price per acre in the province.
Estrie and Outaouais regions saw slight increases in average farmland values last year, while the Abitibi-Témiscamingue region remained stable with no increase.
QuebecAnnual % change in farmland values
5.7%
3.2%
8.9%
27.4%
24.7%
15.7%
9.6%
7.7%
8.2%
8.3%2018
2017
2016
2015
2014
2013
2012
2011
2010
2009
17
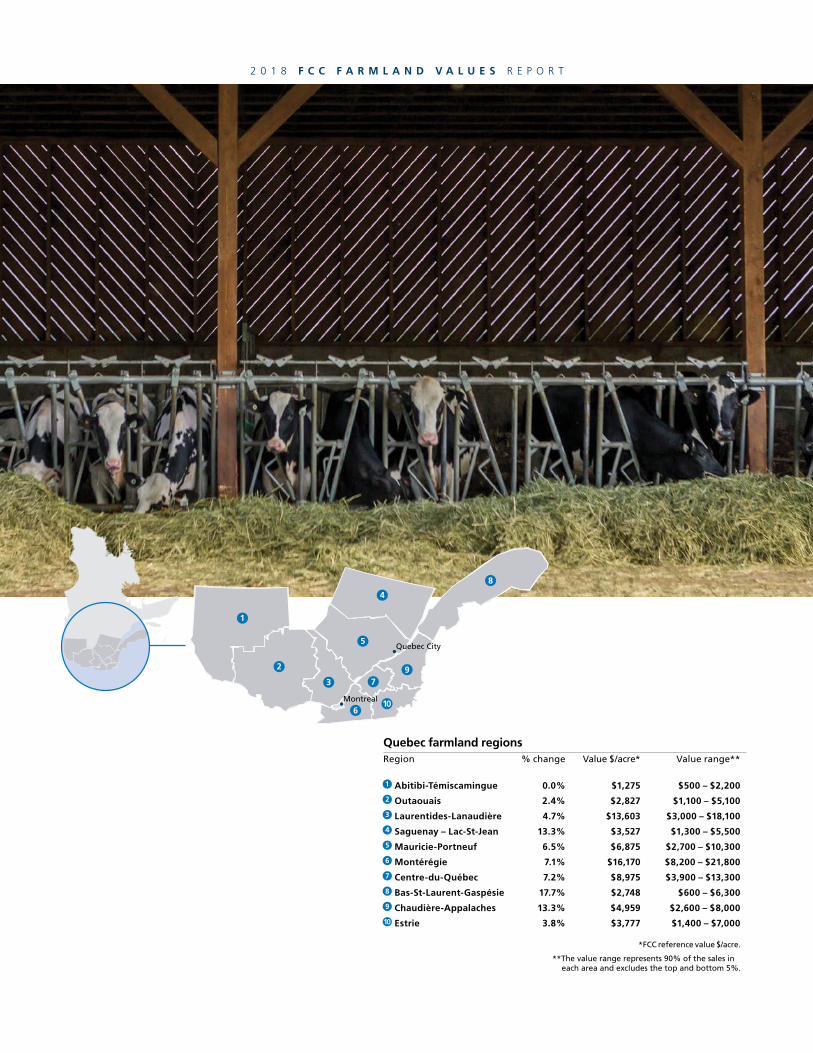
Quebec farmland regionsRegion % change Value $/acre* Value range**
Abitibi-Témiscamingue
Outaouais
Laurentides-Lanaudière
Saguenay – Lac-St-Jean
Mauricie-Portneuf
Montérégie
Centre-du-Québec
Bas-St-Laurent-Gaspésie
Chaudière-Appalaches
Estrie
0.0%
2.4%
4.7%
13.3%
6.5%
7.1%
7.2%
17.7%
13.3%
3.8%
$1,275
$2,827
$13,603
$3,527
$6,875
$16,170
$8,975
$2,748
$4,959
$3,777
$500 – $2,200
$1,100 – $5,100
$3,000 – $18,100
$1,300 – $5,500
$2,700 – $10,300
$8,200 – $21,800
$3,900 – $13,300
$600 – $6,300
$2,600 – $8,000
$1,400 – $7,000
2 0 1 8 F C C F A R M L A N D V A L U E S R E P O R T
Quebec City
Montreal
* FCC reference value $/acre.
** The value range represents 90% of the sales in each area and excludes the top and bottom 5%.

New Brunswick farmland regionsRegion % change Value $/acre* Value range**
Western
Northern
Southern
8.3%
0.0%
-4.4%
$4,729
$5,081
$1,702
$1,000 – $5,900
$1,900 – $4,600
$1,000 – $2,500
2 0 1 8 F C C F A R M L A N D V A L U E S R E P O R T
New Brunswick
New Brunswick’s farmland values saw a modest average increase of 1.8 per cent, following a 5.8 per cent increase in 2017. Average farmland values in the northwest portion of the province generally increased, while values in the northeast remained unchanged and values in the southern half of the province saw a slight decrease.
Among the defined regions, Western saw an 8.3 per cent average increase in farmland values, representing the largest regional increase in the province. The region was influenced by strong potato prices throughout the northwest portion of the province, creating an upswing in demand and higher-priced sales for cultivated potato land. Established producers looking to expand their land base for improved crop rotations accounted for almost all land purchases in this region.
Reduced demand from dairy operations relative to 2017 led to a 4.4 per cent decrease in average farmland values in the southern half of the province. Transactions in this region were mainly initiated by established farms buying vacant cultivated land.
Land transactions in blueberry regions were down in 2018 relative to 2017 and were mainly driven by established producers.
New BrunswickAnnual % change in farmland values
8.2%
2.4%
1.3%
0.0%
7.2%
8.0%
4.6%
1.9%
5.8%
1.8%2018
2017
2016
2015
2014
2013
2012
2011
2010
2009
Fredericton
19
* FCC reference value $/acre.
** The value range represents 90% of the sales in each area and excludes the top and bottom 5%.
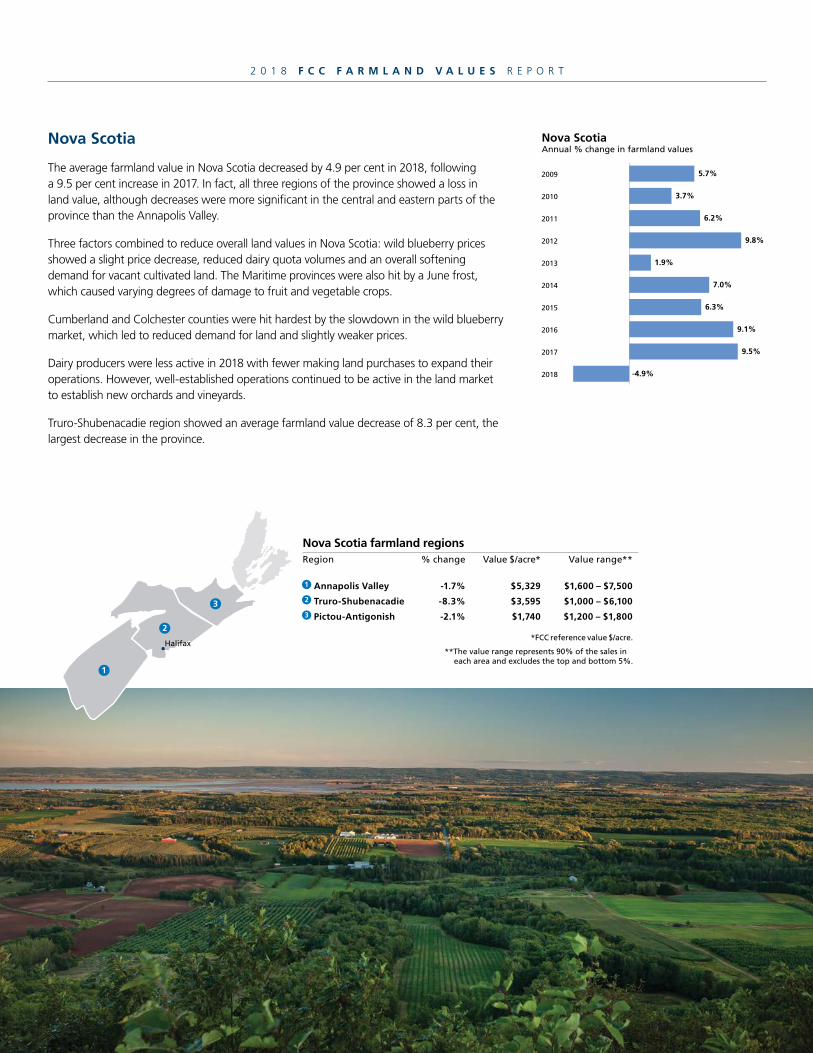
Nova Scotia farmland regionsRegion % change Value $/acre* Value range**
Annapolis Valley
Truro-Shubenacadie
Pictou-Antigonish
-1.7%
-8.3%
-2.1%
$5,329
$3,595
$1,740
$1,600 – $7,500
$1,000 – $6,100
$1,200 – $1,800
Nova Scotia
The average farmland value in Nova Scotia decreased by 4.9 per cent in 2018, following a 9.5 per cent increase in 2017. In fact, all three regions of the province showed a loss in land value, although decreases were more significant in the central and eastern parts of the province than the Annapolis Valley.
Three factors combined to reduce overall land values in Nova Scotia: wild blueberry prices showed a slight price decrease, reduced dairy quota volumes and an overall softening demand for vacant cultivated land. The Maritime provinces were also hit by a June frost, which caused varying degrees of damage to fruit and vegetable crops.
Cumberland and Colchester counties were hit hardest by the slowdown in the wild blueberry market, which led to reduced demand for land and slightly weaker prices.
Dairy producers were less active in 2018 with fewer making land purchases to expand their operations. However, well-established operations continued to be active in the land market to establish new orchards and vineyards.
Truro-Shubenacadie region showed an average farmland value decrease of 8.3 per cent, the largest decrease in the province.
Nova ScotiaAnnual % change in farmland values
5.7%
3.7%
6.2%
9.8%
1.9%
7.0%
6.3%
9.1%
9.5%
-4.9%2018
2017
2016
2015
2014
2013
2012
2011
2010
2009
Halifax
2 0 1 8 F C C F A R M L A N D V A L U E S R E P O R T
* FCC reference value $/acre.
** The value range represents 90% of the sales in each area and excludes the top and bottom 5%.

Prince Edward Island farmland regionsRegion % change Value $/acre* Value range**
Prince
Queens
Kings
6.7%
0.4%
7.1%
$4,586
$3,634
$3,176
$2,000 – $5,500
$2,300 – $5,000
$2,000 – $4,800
2 0 1 8 F C C F A R M L A N D V A L U E S R E P O R T
Prince Edward Island
All regions of Prince Edward Island saw farmland values rise for an average increase of 4.2 per cent in 2018, following a 5.6 per cent increase in 2017.
Prince Edward Island’s farmland values were influenced by a number of factors in 2018: consistently strong demand from potato processors that led producers to expand, an influx of new families seeking land in rural areas and a high volume of farmland transactions.
Large operators appeared more willing to travel greater distances in order to produce crops, which has increased demand in regions that have had lower demand for available land in the past. Most land in the province was sold through private sales.
Prince Edward Island’s 2018 potato crop – which was impacted by a cold spring, delayed planting and an unusually cold, wet fall – has yet to be reflected in the province’s land market.
Prince Edward IslandAnnual % change in farmland values
-1.4%
3.2%
1.5%
9.0%
4.4%
9.3%
8.5%
13.4%
5.6%
4.2%2018
2017
2016
2015
2014
2013
2012
2011
2010
2009
Charlottetown
21
* FCC reference value $/acre.
** The value range represents 90% of the sales in each area and excludes the top and bottom 5%.

Newfoundland and Labrador farmland regionsRegion % change Value $/acre* Value range**
West
East
N/A
N/A
N/A
N/A
N/A
N/A
Newfoundland and Labrador
For the third consecutive year, there was an insufficient number of publicly reported transactions in 2018 to fully assess farmland values in Newfoundland and Labrador.
St. John's
Newfoundland and LabradorAnnual % change in farmland values
2.8%
0.7%
0.0%
0.0%
0.0%
0.0%
7.7%
N/A*
N/A*
N/A*2018
2017
2016
2015
2014
2013
2012
2011
2010
2009
*There was an insufficient number of publicly reported transactions to accurately assess farmland values in Newfoundland and Labrador.
2 0 1 8 F C C F A R M L A N D V A L U E S R E P O R T
* FCC reference value $/acre.
** The value range represents 90% of the sales in each area and excludes the top and bottom 5%.
Contact
British Columbia
Bill Wiebe Senior Appraiser (English) [email protected] 604-870-2719
Alberta
Robert McDonald Senior Appraiser (English) [email protected] 780-495-4546
Lisa Land Manager, Valuation and Environmental Risk (English) [email protected] 403-292-8624
Saskatchewan
Amber Tuplin Senior Appraiser (English) [email protected] 306-778-4344
Cathy Gale Director, Valuation and Environmental Risk (English) [email protected] 306-780-8336
Manitoba
Claude Jacques Senior Appraiser (bilingual) [email protected] 204-239-8472
Ontario
Dale Litt Senior Appraiser (English) [email protected] 519-291-2192
Janet Metherel Manager, Valuation and Environmental Risk (English) [email protected] 647-382-0137
Quebec
Hugues Laverdure Director, Valuation and Environmental Risk (bilingual) [email protected] 450-771-6771
New Brunswick and Newfoundland & Labrador
Charles Dubé Senior Appraiser (bilingual) [email protected] 506-851-7141
Prince Edward Island and Nova Scotia
Patrick Doohan Appraiser (bilingual) [email protected] 902-892-8791
Cette publication est également offerte en français.

79744 E 20190412 JW
For more information, contact us at 1-888-332-3301 or email [email protected]
fcc.ca/FarmlandValues
Related Documents