ound_3 5 TRA Bank Name All other banks LEI Code xxxxxxxxxxxxxxxxxxxx Country Code OT Al 2018 EU-wide Transparency Exercise

Welcome message from author
This document is posted to help you gain knowledge. Please leave a comment to let me know what you think about it! Share it to your friends and learn new things together.
Transcript

Round_3
Master_version_2015 TRA Templates 26102015Bank Name All other banks
LEI Code xxxxxxxxxxxxxxxxxxxx
Country Code OT
Al
2018 EU-wide Transparency Exercise
201712 201806
(mln EUR, %)As of 31/12/2017 As of 30/06/2018 COREP CODE REGULATION
A OWN FUNDS 197,495 200,140 C 01.00 (r010,c010) Articles 4(118) and 72 of CRR
A.1COMMON EQUITY TIER 1 CAPITAL (net of deductions and after applying
transitional adjustments)161,505 166,190 C 01.00 (r020,c010) Article 50 of CRR
A.1.1Capital instruments eligible as CET1 Capital (including share premium and net own capital
instruments)65,378 63,109 C 01.00 (r030,c010) Articles 26(1) points (a) and (b), 27 to 29, 36(1) point (f) and 42 of CRR
A.1.2 Retained earnings 79,795 83,814 C 01.00 (r130,c010) Articles 26(1) point (c), 26(2) and 36 (1) points (a) and (l) of CRR
A.1.3 Accumulated other comprehensive income 682 1,451 C 01.00 (r180,c010) Articles 4(100), 26(1) point (d) and 36 (1) point (l) of CRR
A.1.4 Other Reserves 26,334 29,033 C 01.00 (r200,c010) Articles 4(117) and 26(1) point (e) of CRR
A.1.5 Funds for general banking risk 0 0 C 01.00 (r210,c010) Articles 4(112), 26(1) point (f) and 36 (1) point (l) of CRR
A.1.6 Minority interest given recognition in CET1 capital 233 0 C 01.00 (r230,c010) Article 84 of CRR
A.1.7 Adjustments to CET1 due to prudential filters -4,233 -4,663 C 01.00 (r250,c010) Articles 32 to 35 of and 36 (1) point (l) of CRR
A.1.8 (-) Intangible assets (including Goodwill) -2,167 -2,317 C 01.00 (r300,c010) + C 01.00 (r340,c010) Articles 4(113), 36(1) point (b) and 37 of CRR. Articles 4(115), 36(1) point (b) and 37 point (a)
of CCR
A.1.9(-) DTAs that rely on future profitability and do not arise from temporary differences net of
associated DTLs -734 -457 C 01.00 (r370,c010) Articles 36(1) point (c) and 38 of CRR
A.1.10 (-) IRB shortfall of credit risk adjustments to expected losses -757 -998 C 01.00 (r380,c010) Articles 36(1) point (d), 40 and 159 of CRR
A.1.11 (-) Defined benefit pension fund assets -2,062 -2,564 C 01.00 (r390,c010) Articles 4(109), 36(1) point (e) and 41 of CRR
A.1.12 (-) Reciprocal cross holdings in CET1 Capital 0 0 C 01.00 (r430,c010) Articles 4(122), 36(1) point (g) and 44 of CRR
A.1.13 (-) Excess deduction from AT1 items over AT1 Capital 0 0 C 01.00 (r440,c010) Article 36(1) point (j) of CRR
A.1.14 (-) Deductions related to assets which can alternatively be subject to a 1.250% risk weight -122 -73C 01.00 (r450,c010) + C 01.00 (r460,c010)
+ C 01.00 (r470,c010) + C 01.00
(r471,c010)+ C 01.00 (r472,c010)
Articles 4(36), 36(1) point (k) (i) and 89 to 91 of CRR; Articles 36(1) point (k) (ii), 243(1) point
(b), 244(1) point (b) and 258 of CRR; Articles 36(1) point k) (iii) and 379(3) of CRR; Articles
36(1) point k) (iv) and 153(8) of CRR and Articles 36(1) point k) (v) and 155(4) of CRR.
A.1.14.1 Of which: from securitisation positions (-) -115 -59 C 01.00 (r460,c010) Articles 36(1) point (k) (ii), 243(1) point (b), 244(1) point (b) and 258 of CRR
A.1.15(-) Holdings of CET1 capital instruments of financial sector entities where the institiution
does not have a significant investment-869 0 C 01.00 (r480,c010) Articles 4(27), 36(1) point (h); 43 to 46, 49 (2) and (3) and 79 of CRR
A.1.16 (-) Deductible DTAs that rely on future profitability and arise from temporary differences -172 -190 C 01.00 (r490,c010) Articles 36(1) point (c) and 38; Articles 48(1) point (a) and 48(2) of CRR
A.1.17(-) Holdings of CET1 capital instruments of financial sector entities where the institiution
has a significant investment0 0 C 01.00 (r500,c010) Articles 4(27); 36(1) point (i); 43, 45; 47; 48(1) point (b); 49(1) to (3) and 79 of CRR
A.1.18 (-) Amount exceding the 17.65% threshold 0 0 C 01.00 (r510,c010) Article 48 of CRR
A.1.19 (-) Additional deductions of CET1 Capital due to Article 3 CRR -83 0 C 01.00 (r524,c010) Article 3 CRR
A.1.20 CET1 capital elements or deductions - other 1 -2 C 01.00 (r529,c010) -
A.1.21 Transitional adjustments 280 47 CA1 {1.1.1.6 + 1.1.1.8 + 1.1.1.26} -
A.1.21.1 Transitional adjustments due to grandfathered CET1 Capital instruments (+/-) 1 0 C 01.00 (r220,c010) Articles 483(1) to (3), and 484 to 487 of CRR
A.1.21.2 Transitional adjustments due to additional minority interests (+/-) 59 0 C 01.00 (r240,c010) Articles 479 and 480 of CRR
A.1.21.3 Other transitional adjustments to CET1 Capital (+/-) 220 47 C 01.00 (r520,c010) Articles 469 to 472, 478 and 481 of CRR
A.2 ADDITIONAL TIER 1 CAPITAL (net of deductions and after transitional adjustments) 9,654 10,272 C 01.00 (r530,c010) Article 61 of CRR
A.2.1 Additional Tier 1 Capital instruments 9,600 10,224 C 01.00 (r540,c010) + C 01.00 (r670,c010)
A.2.2 (-) Excess deduction from T2 items over T2 capital 0 0 C 01.00 (r720,c010)
A.2.3 Other Additional Tier 1 Capital components and deductions 0 0
C 01.00 (r690,c010) + C 01.00 (r700,c010)
+ C 01.00 (r710,c010) + C 01.00
(r740,c010) + C 01.00 (r744,c010) + C
01.00 (r748,c010)
A.2.4 Additional Tier 1 transitional adjustments 53 48C 01.00 (r660,c010) + C 01.00 (r680,c010)
+ C 01.00 (r730,c010)
A.3 TIER 1 CAPITAL (net of deductions and after transitional adjustments) 171,159 176,462 C 01.00 (r015,c010) Article 25 of CRR
A.4 TIER 2 CAPITAL (net of deductions and after transitional adjustments) 26,337 23,678 C 01.00 (r750,c010) Article 71 of CRR
A.4.1 Tier 2 Capital instruments 25,760 23,475 C 01.00 (r760,c010) + C 01.00 (r890,c010)
A.4.2 Other Tier 2 Capital components and deductions 282 180
C 01.00 (r910,c010) + C 01.00 (r920,c010)
+ C 01.00 (r930,c010) + C 01.00
(r940,c010) + C 01.00 (r950,c010) + C
01.00 (r970,c010) + C 01.00 (r974,c010) +
C 01.00 (r978,c010)
A.4.3 Tier 2 transitional adjustments 294 24C 01.00 (r880,c010) + C 01.00 (r900,c010)
+ C 01.00 (r960,c010)
B TOTAL RISK EXPOSURE AMOUNT 1,087,489 1,103,082 C 02.00 (r010,c010) Articles 92(3), 95, 96 and 98 of CRR
B.1 Of which: Transitional adjustments included 0 11,955 C 05.01 (r010;c040)
C.1 COMMON EQUITY TIER 1 CAPITAL RATIO (transitional period) 14.85% 15.07% CA3 {1} -
C.2 TIER 1 CAPITAL RATIO (transitional period) 15.74% 16.00% CA3 {3} -
C.3 TOTAL CAPITAL RATIO (transitional period) 18.16% 18.14% CA3 {5} -
CET1 Capital
Fully loadedD COMMON EQUITY TIER 1 CAPITAL (fully loaded) 161,225 166,144
[A.1-A.1.13-A.1.21+MIN(A.2+A.1.13-
A.2.2-A.2.4+MIN(A.4+A.2.2-
A.4.3,0),0)]
-
CET1 RATIO (%)
Fully loaded1 E COMMON EQUITY TIER 1 CAPITAL RATIO (fully loaded) 14.83% 15.23% [D.1]/[B-B.1] -
F Adjustments to CET1 due to IFRS 9 transitional arrangements 47 C 05.01 (r440,c010)
F Adjustments to AT1 due to IFRS 9 transitional arrangements 0 C 05.01 (r440,c020)
F Adjustments to T2 due to IFRS 9 transitional arrangements -1 C 05.01 (r440,c030)
F Adjustments included in RWAs due to IFRS 9 transitional arrangements 34 C 05.01 (r440,c040)
(1)The fully loaded CET1 ratio is an estimate calculated based on bank’s supervisory reporting. Therefore, any capital instruments that are not eligible from a regulatory point of view at the reporting date are not taken into account in this calculation.
Fully loaded CET1 capital ratio estimation is based on the formulae stated in column “COREP CODE” – please note that this might lead to differences to fully loaded CET1 capital ratios published by the participating banks e.g. in their Pillar 3 disclosure
Memo items
2018 EU-wide Transparency Exercise
Capital
All other banks
OWN FUNDS
Transitional period
OWN FUNDS
REQUIREMENTS
CAPITAL RATIOS (%)
Transitional period

201712 201806
(mln EUR, %)
As of
31/12/2017
As of
30/06/2018COREP CODE REGULATION
A.1 Tier 1 capital - transitional definition 171,159 176,462 C 47.00 (r320,c010)
A.2 Tier 1 capital - fully phased-in definition 170,826 176,368 C 47.00 (r310,c010)
B.1 Total leverage ratio exposures - using a transitional definition of Tier 1 capital 3,099,105 3,382,734 C 47.00 (r300,c010)
B.2 Total leverage ratio exposures - using a fully phased-in definition of Tier 1 capital 3,098,894 3,382,690 C 47.00 (r290,c010)
C.1 Leverage ratio - using a transitional definition of Tier 1 capital 5.5% 5.2% C 47.00 (r340,c010)
C.2 Leverage ratio - using a fully phased-in definition of Tier 1 capital 5.5% 5.2% C 47.00 (r330,c010)
2018 EU-wide Transparency ExerciseLeverage ratio
All other banks
Article 429 of the CRR; Delegated Regulation (EU) 2015/62 of 10 October 2014 amending
CRR

201712 201806
(mln EUR)
As of 31/12/2017 as of 30/06/2018
Risk exposure amounts for credit risk 570,642 578,016
Risk exposure amount for securitisation and re-securitisations in the banking book 5,094 4,371
Risk exposure amount for contributions to the default fund of a CCP 3,499 3,264
Risk exposure amount Other credit risk 562,049 570,381
Risk exposure amount for position, foreign exchange and commodities (Market risk) 306,644 323,177
of which: Risk exposure amount for securitisation and re-securitisations in the trading book1 22,427 21,054
Risk exposure amount for Credit Valuation Adjustment 107,269 92,869
Risk exposure amount for operational risk 76,330 77,905
Other risk exposure amounts 26,604 31,116
Total Risk Exposure Amount 1,087,489 1,103,082
(1)
May include hedges, which are not securitisation positions, as per Article 338.3 of CRR
2018 EU-wide Transparency Exercise
Risk exposure amounts
All other banks

201712 201806
(mln EUR)
Interest income 8,602 3,601
Of which debt securities income 615 166
Of which loans and advances income 6,318 3,002
Interest expenses 6,477 2,996
(Of which deposits expenses) 3,382 2,176
(Of which debt securities issued expenses) 1,547 300
(Expenses on share capital repayable on demand) 0 0
Dividend income 3 4
Net Fee and commission income 1,119 968
Gains or (-) losses on derecognition of financial assets and liabilities not measured at fair value through profit or loss, and of non financial
assets, net108 29
Gains or (-) losses on financial assets and liabilities held for trading, net 4,895 2,349
Gains or (-) losses on financial assets and liabilities at fair value through profit or loss, net -247 351
Gains or (-) losses from hedge accounting, net 11 -16
Exchange differences [gain or (-) loss], net 9 10
Net other operating income /(expenses) 491 -136
TOTAL OPERATING INCOME, NET 8,515 4,164
(Administrative expenses) 5,708 2,932
(Depreciation) 243 104
Modification gains or (-) losses, net n.a. 0
(Provisions or (-) reversal of provisions) 149 152
(Commitments and guarantees given) -7 0
(Other provisions) 157 152
Of which pending legal issues and tax litigation1 51
Of which restructuring1 30
(Increases or (-) decreases of the fund for general banking risks, net)2 0 0
(Impairment or (-) reversal of impairment on financial assets not measured at fair value through profit or loss) 336 -128
(Financial assets at fair value through other comprehensive income) n.a. 0
(Financial assets at amortised cost) n.a. -152
(Impairment or (-) reversal of impairment of investments in subsidaries, joint ventures and associates and on non-financial assets) -269 1
(of which Goodwill) 0 0
Negative goodwill recognised in profit or loss 0 0
Share of the profit or (-) loss of investments in subsidaries, joint ventures and associates 362 0
Profit or (-) loss from non-current assets and disposal groups classified as held for sale not qualifying as discontinued operations -2 5
PROFIT OR (-) LOSS BEFORE TAX FROM CONTINUING OPERATIONS 2,707 1,108
PROFIT OR (-) LOSS AFTER TAX FROM CONTINUING OPERATIONS 2,248 878
Profit or (-) loss after tax from discontinued operations 0 0
PROFIT OR (-) LOSS FOR THE YEAR 2,248 878
Of which attributable to owners of the parent 2,130 877 (1)
Information available only as of end of the year(2)
For IFRS compliance banks “zero” in cell “Increases or (-) decreases of the fund for general banking risks, net” must be read as “n.a.”
2018 EU-wide Transparency ExerciseP&L
All other banks
As of 31/12/2017 As of 30/06/2018
201712 201806 201712 201712 201712 201712 201712 201712 201712 201712 201712 201712 201806 201806 201806 201806 201806 201806 201806 201806 201806 201806
As of 31/12/2017 As of 30/06/2018
(mln EUR)
MULTIPLICATION
FACTOR (mc) x
AVERAGE OF
PREVIOUS 60
WORKING DAYS
(VaRavg)
PREVIOUS
DAY (VaRt-1)
MULTIPLICATION
FACTOR (ms) x
AVERAGE OF
PREVIOUS 60
WORKING DAYS
(SVaRavg)
LATEST AVAILABLE
(SVaRt-1)
12 WEEKS
AVERAGE
MEASURE
LAST MEASURE FLOOR
12 WEEKS
AVERAGE
MEASURE
LAST
MEASURE
MULTIPLICATION
FACTOR (mc) x
AVERAGE OF
PREVIOUS 60
WORKING DAYS
(VaRavg)
PREVIOUS DAY
(VaRt-1)
MULTIPLICATION
FACTOR (ms) x
AVERAGE OF
PREVIOUS 60
WORKING DAYS
(SVaRavg)
LATEST
AVAILABLE (SVaRt-
1)
12 WEEKS
AVERAGE
MEASURE
LAST
MEASUREFLOOR
12 WEEKS
AVERAGE
MEASURE
LAST
MEASURE
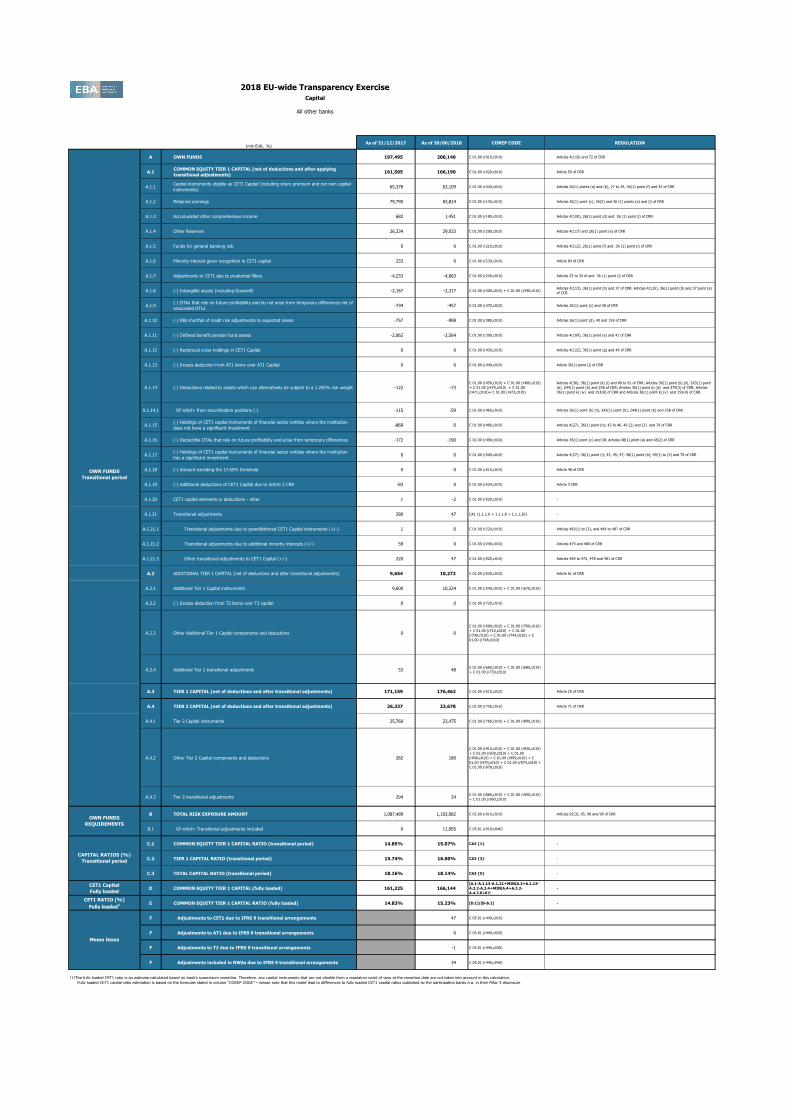
Traded Debt Instruments 79,195 92,417 662 325 2,136 886 574 261 1,747 755
Of which: General risk 26,804 33,502 501 228 1,498 627 474 201 1,295 528
Of which: Specific risk 51,823 57,548 309 142 1,126 434 225 105 938 386
Equities 36,216 36,122 362 136 1,177 352 514 290 1,191 829
Of which: General risk 12,388 11,267 68 20 155 41 200 147 440 419
Of which: Specific risk 20,300 19,514 317 124 1,059 321 323 147 765 417
Foreign exchange risk 20,164 19,552 174 77 437 156 110 49 230 101
Commodities risk 5,090 7,982 50 24 63 30 65 49 73 62
Total 140,665 156,073 2,109 914 7,033 3,760 2,732 2,470 272 160 229 153,130 2,246 1,079 7,366 4,593 2,564 2,371 240 194 192 157,296
STRESSED VaR (Memorandum item)
INCREMENTAL
DEFAULT AND
MIGRATION RISK
CAPITAL CHARGE
ALL PRICE RISKS CAPITAL CHARGE
FOR CTP
TOTAL RISK
EXPOSURE
AMOUNT
As of 31/12/2017 As of 30/06/2018
ALL PRICE RISKS CAPITAL CHARGE
FOR CTP
TOTAL RISK
EXPOSURE
AMOUNT
VaR (Memorandum item)
TOTAL RISK EXPOSURE AMOUNT TOTAL RISK EXPOSURE AMOUNT
VaR (Memorandum item) STRESSED VaR (Memorandum item)
INCREMENTAL DEFAULT
AND MIGRATION RISK
CAPITAL CHARGE
2018 EU-wide Transparency ExerciseMarket Risk
All other banks
SA IM IM

201712 201712 201712 201712 201806 201806 201806 201806
(mln EUR, %)
Central governments or central banks 165,836 132,901 18,474 154,949 136,739 20,986
Regional governments or local authorities 5,437 4,581 574 2,776 2,290 536
Public sector entities 19,028 10,397 1,780 7,963 6,888 1,705
Multilateral Development Banks 2,787 2,776 81 4,309 3,595 28
International Organisations 1,382 1,274 0 1,234 1,225 0
Institutions 550,121 317,487 68,406 424,106 369,429 70,112
Corporates 388,477 210,722 180,998 250,120 196,684 184,212
of which: SME 11,993 8,385 7,991 7,833 6,145 5,838
Retail 17,283 7,634 5,631 18,751 8,109 5,990
of which: SME 834 527 301 759 514 294
Secured by mortgages on immovable property 82,718 79,182 31,100 86,910 82,754 32,368
of which: SME 6,872 6,580 4,692 5,691 5,433 4,123
Exposures in default 8,241 4,758 5,269 3,218 7,320 4,688 5,350 2,468
Items associated with particularly high risk 18,150 15,251 22,911 24,227 21,289 31,961
Covered bonds 1,180 1,180 116 1,288 1,288 129
Claims on institutions and corporates with a ST credit assessment 59,888 35,833 20,864 36,625 36,261 18,447
Collective investments undertakings (CIU) 2 2 2 502 502 466
Equity 4,213 4,205 4,358 512 508 611
Securitisation 8,692 8,674 3,698 6,779 6,758 3,687
Other exposures 7,707 7,703 7,121 5,922 5,921 6,020
Standardised Total 1,341,142 844,560 371,383 3,519 1,034,294 884,928 382,609 3,016(1) Original exposure, unlike Exposure value, is reported before taking into account any effect due to credit conversion factors or credit risk mitigation techniques (e.g. substitution effects).
1 (mln EUR, %)
Central governments or central banks 7,498 7,509 816 10,392 10,447 789
Regional governments or local authorities 97 98 20 36 36 7
Public sector entities 62 40 8 47 22 5
Multilateral Development Banks 40 40 0 26 26 0
International Organisations 0 0 0 0 0 0
Institutions 136,439 93,754 12,400 126,546 119,023 12,218
Corporates 86,543 43,523 29,265 46,351 35,200 33,615
of which: SME 266 250 249 234 230 230
Retail 3 3 2 2 1 1
of which: SME 0 0 0 0 0 0
Secured by mortgages on immovable property 981 849 531 1,175 930 627
of which: SME 104 104 104 116 116 116
Exposures in default 164 156 232 7 258 252 377 5
Items associated with particularly high risk 124 119 179 1,654 1,649 2,473
Covered bonds 0 0 0 5 5 1
Claims on institutions and corporates with a ST credit assessment 5,708 5,554 2,091 8,562 8,120 3,179
Collective investments undertakings (CIU) 0 0 0 4 4 4
Equity 325 325 382 279 278 296
Securitisation
Other exposures 1,263 1,263 2,462 934 934 1,298
Standardised Total2
10 9(1) Original exposure, unlike Exposure value, is reported before taking into account any effect due to credit conversion factors or credit risk mitigation techniques (e.g. substitution effects). (2) Total value adjustments and provisions per country of counterparty excludes those for securistisation exposures, additional valuation adjustments (AVAs) and other own funds reductions related to the exposures, but includes general credit risk adjustments.
2 (mln EUR, %)
Central governments or central banks 1,390 1,389 40 555 555 71
Regional governments or local authorities 524 515 104 547 532 106
Public sector entities 872 882 316 1,316 1,141 372
Multilateral Development Banks 159 159 0 97 97 0
International Organisations 0 0 0 0 0 0
Institutions 139,265 63,346 17,080 85,107 78,057 21,013
Corporates 60,147 27,308 23,738 30,401 24,268 21,295
of which: SME 39 22 22 21 21 21
Retail 1 1 1 1 0 0
of which: SME 1 0 0 0 0 0
Secured by mortgages on immovable property 107 106 99 124 122 117
of which: SME 53 52 52 44 44 44
Exposures in default 3 2 3 0 2 2 2 0
Items associated with particularly high risk 792 721 1,081 1,126 1,071 1,606
Covered bonds 0 0 0 0 0 0
Claims on institutions and corporates with a ST credit assessment 40,641 16,907 8,460 13,634 13,463 6,722
Collective investments undertakings (CIU) 0 0 0 0 0 0
Equity 5 5 5 3 3 3
Securitisation
Other exposures 539 536 536 1,056 1,055 1,053
Standardised Total2
40 36(1) Original exposure, unlike Exposure value, is reported before taking into account any effect due to credit conversion factors or credit risk mitigation techniques (e.g. substitution effects). (2) Total value adjustments and provisions per country of counterparty excludes those for securistisation exposures, additional valuation adjustments (AVAs) and other own funds reductions related to the exposures, but includes general credit risk adjustments.
3 (mln EUR, %)
Central governments or central banks 35,566 29,131 20 33,290 31,261 4
Regional governments or local authorities 536 252 7 222 222 10
Public sector entities 3,279 1,702 8 596 157 1
Multilateral Development Banks 0 0 0 0 0 0
International Organisations 0 0 0 0 0 0
Institutions 60,485 49,224 4,405 54,325 51,021 4,048
Corporates 9,860 5,971 5,311 7,805 6,744 6,486
of which: SME 160 158 158 150 150 150
Retail 7 5 4 4 1 1
of which: SME 2 1 1 0 0 0
Secured by mortgages on immovable property 539 76 52 422 28 26
of which: SME 3 3 2 2 2 2
Exposures in default 2 0 0 0 0 0 0 0
Items associated with particularly high risk 13 13 19 93 93 139
Covered bonds 8 8 1 0 0 0
Claims on institutions and corporates with a ST credit assessment 1,460 1,488 978 1,254 1,280 817
Collective investments undertakings (CIU) 0 0 0 0 0 0
Equity 8 8 8 1 1 2
Securitisation
Other exposures 1 1 1 0 0 0
Standardised Total2
6 0(1) Original exposure, unlike Exposure value, is reported before taking into account any effect due to credit conversion factors or credit risk mitigation techniques (e.g. substitution effects). (2) Total value adjustments and provisions per country of counterparty excludes those for securistisation exposures, additional valuation adjustments (AVAs) and other own funds reductions related to the exposures, but includes general credit risk adjustments.
Risk exposure
amount
Value adjustments
and provisions2
GERMANY
Original Exposure1
Exposure Value1 Risk exposure
amount
Value adjustments
and provisions2 Original Exposure
1 Exposure Value
1
Risk exposure
amount
Value adjustments
and provisions2
UNITED STATES
Standardised Approach
As of 31/12/2017 As of 30/06/2018
Original Exposure1
Exposure Value1 Risk exposure
amount
Value adjustments
and provisions2 Original Exposure
1 Exposure Value
1
Risk exposure
amount
Value adjustments
and provisions2
UNITED KINGDOM
Standardised Approach
As of 31/12/2017 As of 30/06/2018
Original Exposure1
Exposure Value1 Risk exposure
amount
Value adjustments
and provisions2 Original Exposure
1 Exposure Value
1
Standardised Approach
As of 31/12/2017 As of 30/06/2018
Original Exposure1
Exposure Value1 Risk exposure
amount
Value adjustments
and provisionsOriginal Exposure
1 Exposure Value
1
2018 EU-wide Transparency Exercise
Credit Risk - Standardised Approach
All other banks
Standardised Approach
As of 31/12/2017 As of 30/06/2018
Risk exposure
amount
Value adjustments
and provisions
Consolidated data

201712 201712 201712 201712 201806 201806 201806 201806
2018 EU-wide Transparency Exercise
Credit Risk - Standardised Approach
All other banks
Standardised Approach
4 (mln EUR, %)
Central governments or central banks 13,240 13,035 0 8,263 8,204 2
Regional governments or local authorities 211 211 42 302 302 60
Public sector entities 278 233 31 93 92 10
Multilateral Development Banks 5 5 0 3 3 0
International Organisations 0 0 0 0 0 0
Institutions 64,239 22,491 5,582 40,814 36,312 5,652
Corporates 24,774 15,489 7,793 14,812 8,957 7,567
of which: SME 158 149 149 204 196 196
Retail 0 0 0 0 0 0
of which: SME 0 0 0 0 0 0
Secured by mortgages on immovable property 104 50 47 124 70 68
of which: SME 22 22 22 19 19 19
Exposures in default 0 0 0 0 0 0 0 0
Items associated with particularly high risk 14 8 13 25 6 9
Covered bonds 4 4 0 7 7 1
Claims on institutions and corporates with a ST credit assessment 2,134 2,160 1,082 3,788 3,842 1,916
Collective investments undertakings (CIU) 0 0 0 0 0 0
Equity 0 0 0 1 1 1
Securitisation
Other exposures 0 0 0 1 1 1
Standardised Total2
5 0(1) Original exposure, unlike Exposure value, is reported before taking into account any effect due to credit conversion factors or credit risk mitigation techniques (e.g. substitution effects). (2) Total value adjustments and provisions per country of counterparty excludes those for securistisation exposures, additional valuation adjustments (AVAs) and other own funds reductions related to the exposures, but includes general credit risk adjustments.
5 (mln EUR, %)
Central governments or central banks 12 12 12 0 0 0
Regional governments or local authorities 0 0 0 0 0 0
Public sector entities 0 0 0 0 0 0
Multilateral Development Banks 0 0 0 0 0 0
International Organisations 0 0 0 0 0 0
Institutions 30 29 6 159 114 23
Corporates 30,855 14,232 14,247 18,259 14,871 14,779
of which: SME 62 62 62 23 23 23
Retail 0 0 0 0 0 0
of which: SME 0 0 0 0 0 0
Secured by mortgages on immovable property 42 42 42 41 41 41
of which: SME 26 26 26 26 26 26
Exposures in default 0 0 0 0 132 116 116 0
Items associated with particularly high risk 11,959 10,568 15,886 14,821 13,276 19,923
Covered bonds 0 0 0 0 0 0
Claims on institutions and corporates with a ST credit assessment 0 0 0 9 1 1
Collective investments undertakings (CIU) 0 0 0 0 0 0
Equity 4 4 4 0 0 0
Securitisation
Other exposures 0 0 0 0 0 0
Standardised Total2
0 0(1) Original exposure, unlike Exposure value, is reported before taking into account any effect due to credit conversion factors or credit risk mitigation techniques (e.g. substitution effects). (2) Total value adjustments and provisions per country of counterparty excludes those for securistisation exposures, additional valuation adjustments (AVAs) and other own funds reductions related to the exposures, but includes general credit risk adjustments.
6 (mln EUR, %)
Central governments or central banks 213 213 42 1,976 1,976 209
Regional governments or local authorities 3 3 1 0 0 0
Public sector entities 0 0 0 0 0 0
Multilateral Development Banks 6 6 3 1 1 1
International Organisations 0 0 0 0 0 0
Institutions 32,445 12,027 4,170 24,375 16,484 5,520
Corporates 19,184 8,262 7,364 8,099 7,955 7,106
of which: SME 0 0 0 0 0 0
Retail 0 0 0 0 0 0
of which: SME 0 0 0 0 0 0
Secured by mortgages on immovable property 0 0 0 0 0 0
of which: SME 0 0 0 0 0 0
Exposures in default 4 4 6 0 4 4 5 0
Items associated with particularly high risk 0 0 0 0 0 0
Covered bonds 0 0 0 0 0 0
Claims on institutions and corporates with a ST credit assessment 1,848 1,855 928 2,981 3,028 1,517
Collective investments undertakings (CIU) 0 0 0 0 0 0
Equity 11 11 11 13 13 13
Securitisation
Other exposures 0 0 0 0 0 0
Standardised Total2
0 0(1) Original exposure, unlike Exposure value, is reported before taking into account any effect due to credit conversion factors or credit risk mitigation techniques (e.g. substitution effects). (2) Total value adjustments and provisions per country of counterparty excludes those for securistisation exposures, additional valuation adjustments (AVAs) and other own funds reductions related to the exposures, but includes general credit risk adjustments.
7 (mln EUR, %)
Central governments or central banks 939 888 0 368 368 0
Regional governments or local authorities 0 0 0 0 0 0
Public sector entities 0 0 0 0 0 0
Multilateral Development Banks 96 96 0 209 209 0
International Organisations 4 4 0 4 4 0
Institutions 3,565 1,925 408 2,583 1,648 376
Corporates 19,954 13,449 14,177 21,153 16,111 15,475
of which: SME 34 34 34 36 36 36
Retail 1 1 0 0 0 0
of which: SME 1 1 0 0 0 0
Secured by mortgages on immovable property 328 55 55 646 129 128
of which: SME 0 0 0 0 0 0
Exposures in default 4 4 4 0 4 4 4 0
Items associated with particularly high risk 399 279 546 532 482 722
Covered bonds 0 0 0 0 0 0
Claims on institutions and corporates with a ST credit assessment 188 184 39 107 105 22
Collective investments undertakings (CIU) 0 0 0 159 159 159
Equity 1 1 1 4 4 7
Securitisation
Other exposures 86 86 33 75 75 59
Standardised Total2
0 0(1) Original exposure, unlike Exposure value, is reported before taking into account any effect due to credit conversion factors or credit risk mitigation techniques (e.g. substitution effects). (2) Total value adjustments and provisions per country of counterparty excludes those for securistisation exposures, additional valuation adjustments (AVAs) and other own funds reductions related to the exposures, but includes general credit risk adjustments.
Risk exposure
amount
Value adjustments
and provisions2
LUXEMBOURG
Original Exposure1
Exposure Value1 Risk exposure
amount
Value adjustments
and provisions2 Original Exposure
1 Exposure Value
1
Risk exposure
amount
Value adjustments
and provisions2
JAPAN
Standardised Approach
As of 31/12/2017 As of 30/06/2018
Original Exposure1
Exposure Value1 Risk exposure
amount
Value adjustments
and provisions2 Original Exposure
1 Exposure Value
1
Risk exposure
amount
Value adjustments
and provisions2
CAYMAN ISLANDS
Standardised Approach
As of 31/12/2017 As of 30/06/2018
Original Exposure1
Exposure Value1 Risk exposure
amount
Value adjustments
and provisions2 Original Exposure
1 Exposure Value
1
Risk exposure
amount
Value adjustments
and provisions2
FRANCE
Standardised Approach
As of 31/12/2017 As of 30/06/2018
Original Exposure1
Exposure Value1 Risk exposure
amount
Value adjustments
and provisions2 Original Exposure
1 Exposure Value
1
Standardised Approach
As of 31/12/2017 As of 30/06/2018
201712 201712 201712 201712 201806 201806 201806 201806
2018 EU-wide Transparency Exercise
Credit Risk - Standardised Approach
All other banks
Standardised Approach
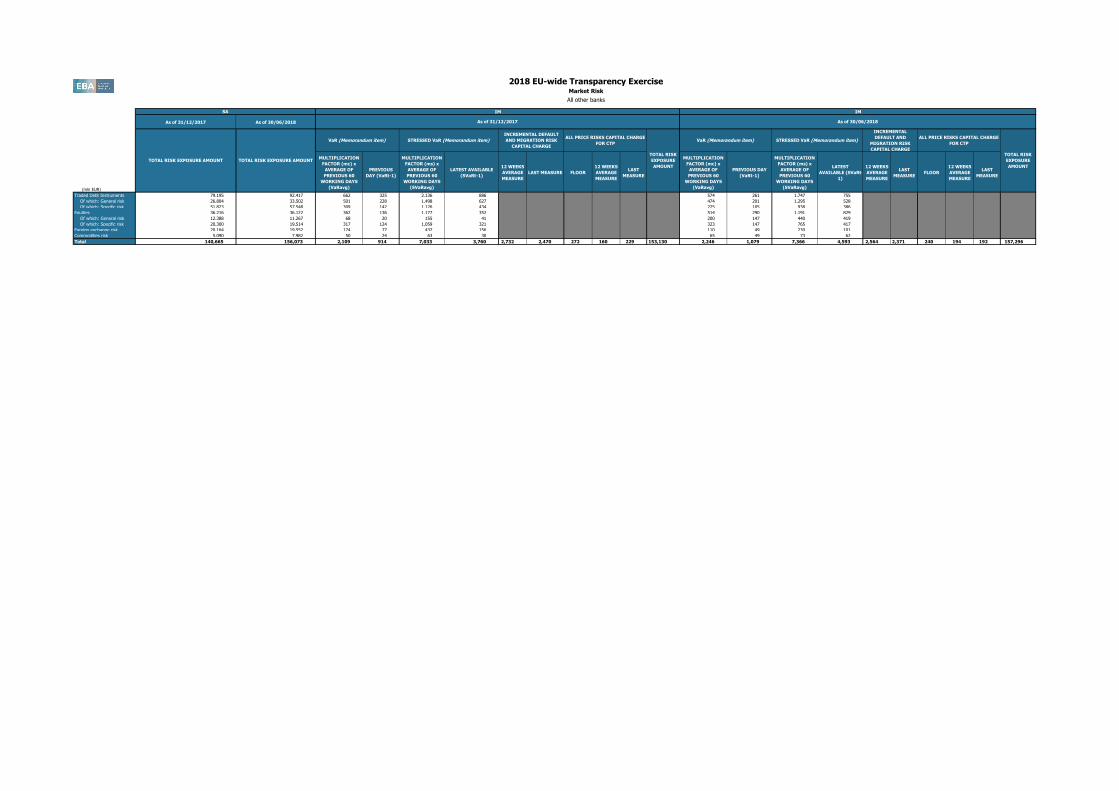
8 (mln EUR, %)
Central governments or central banks 574 564 3 422 403 10
Regional governments or local authorities 0 0 0 0 0 0
Public sector entities 73 42 8 18 14 3
Multilateral Development Banks 0 0 0 0 0 0
International Organisations 17 17 0 6 6 0
Institutions 12,518 6,727 2,091 12,890 7,469 2,054
Corporates 7,698 3,892 3,125 6,772 5,024 4,003
of which: SME 8 8 8 10 10 10
Retail 3 1 1 0 0 0
of which: SME 0 0 0 0 0 0
Secured by mortgages on immovable property 18 17 9 14 13 8
of which: SME 5 5 5 5 5 5
Exposures in default 1 0 0 0 0 0 0 0
Items associated with particularly high risk 29 29 44 329 329 494
Covered bonds 0 0 0 0 0 0
Claims on institutions and corporates with a ST credit assessment 324 314 110 928 912 423
Collective investments undertakings (CIU) 0 0 0 0 0 0
Equity 7 7 7 0 0 0
Securitisation
Other exposures 1 1 1 3 3 3
Standardised Total2
1 1(1) Original exposure, unlike Exposure value, is reported before taking into account any effect due to credit conversion factors or credit risk mitigation techniques (e.g. substitution effects). (2) Total value adjustments and provisions per country of counterparty excludes those for securistisation exposures, additional valuation adjustments (AVAs) and other own funds reductions related to the exposures, but includes general credit risk adjustments.
9 (mln EUR, %)
Central governments or central banks 1,779 1,779 0 614 606 2
Regional governments or local authorities 12 12 2 0 0 0
Public sector entities 562 272 54 709 709 142
Multilateral Development Banks 0 0 0 0 0 0
International Organisations 0 0 0 0 0 0
Institutions 6,246 4,274 1,113 5,157 4,395 1,788
Corporates 17,152 8,435 8,219 12,686 9,382 9,081
of which: SME 380 84 84 6 6 6
Retail 0 0 0 0 0 0
of which: SME 0 0 0 0 0 0
Secured by mortgages on immovable property 18 18 10 1 1 1
of which: SME 1 1 1 1 1 1
Exposures in default 129 129 133 0 104 104 106 0
Items associated with particularly high risk 110 107 161 232 84 126
Covered bonds 0 0 0 2 2 0
Claims on institutions and corporates with a ST credit assessment 548 511 257 541 543 279
Collective investments undertakings (CIU) 0 0 0 0 0 0
Equity 0 0 0 21 21 31
Securitisation
Other exposures 2 2 2 5 5 5
Standardised Total2
0 113(1) Original exposure, unlike Exposure value, is reported before taking into account any effect due to credit conversion factors or credit risk mitigation techniques (e.g. substitution effects). (2) Total value adjustments and provisions per country of counterparty excludes those for securistisation exposures, additional valuation adjustments (AVAs) and other own funds reductions related to the exposures, but includes general credit risk adjustments.
10 (mln EUR, %)
Central governments or central banks 7,337 503 99 9,069 273 107
Regional governments or local authorities 348 348 247 358 358 233
Public sector entities 62 62 49 76 76 59
Multilateral Development Banks 0 0 0 0 0 0
International Organisations 0 0 0 0 0 0
Institutions 8,077 3,836 1,920 4,215 3,801 1,647
Corporates 5,961 4,498 4,360 4,740 3,817 3,833
of which: SME 904 893 893 828 815 815
Retail 0 0 0 0 0 0
of which: SME 0 0 0 0 0 0
Secured by mortgages on immovable property 33 33 32 26 26 25
of which: SME 25 25 25 24 24 24
Exposures in default 84 20 30 0 0 0 0 0
Items associated with particularly high risk 2 1 2 56 55 83
Covered bonds 0 0 0 0 0 0
Claims on institutions and corporates with a ST credit assessment 158 162 221 233 237 283
Collective investments undertakings (CIU) 0 0 0 0 0 0
Equity 0 0 0 9 9 9
Securitisation
Other exposures 0 0 0 0 0 0
Standardised Total2
0 1(1) Original exposure, unlike Exposure value, is reported before taking into account any effect due to credit conversion factors or credit risk mitigation techniques (e.g. substitution effects). (2) Total value adjustments and provisions per country of counterparty excludes those for securistisation exposures, additional valuation adjustments (AVAs) and other own funds reductions related to the exposures, but includes general credit risk adjustments.
Risk exposure
amount
Value adjustments
and provisions2
ITALY
Original Exposure1
Exposure Value1 Risk exposure
amount
Value adjustments
and provisions2 Original Exposure
1 Exposure Value
1
Risk exposure
amount
Value adjustments
and provisions2
NETHERLANDS
Standardised Approach
As of 31/12/2017 As of 30/06/2018
Original Exposure1
Exposure Value1 Risk exposure
amount
Value adjustments
and provisions2 Original Exposure
1 Exposure Value
1
Risk exposure
amount
Value adjustments
and provisions2
SWITZERLAND
Standardised Approach
As of 31/12/2017 As of 30/06/2018
Original Exposure1
Exposure Value1 Risk exposure
amount
Value adjustments
and provisions2 Original Exposure
1 Exposure Value
1
Standardised Approach
As of 31/12/2017 As of 30/06/2018
201712 201712 201712 201712 201712 201712 201806 201806 201806 201806 201806 201806
(mln EUR, %)
Of which:
defaulted(2)
Of which:
defaulted
Of which:
defaulted
Of which:
defaulted
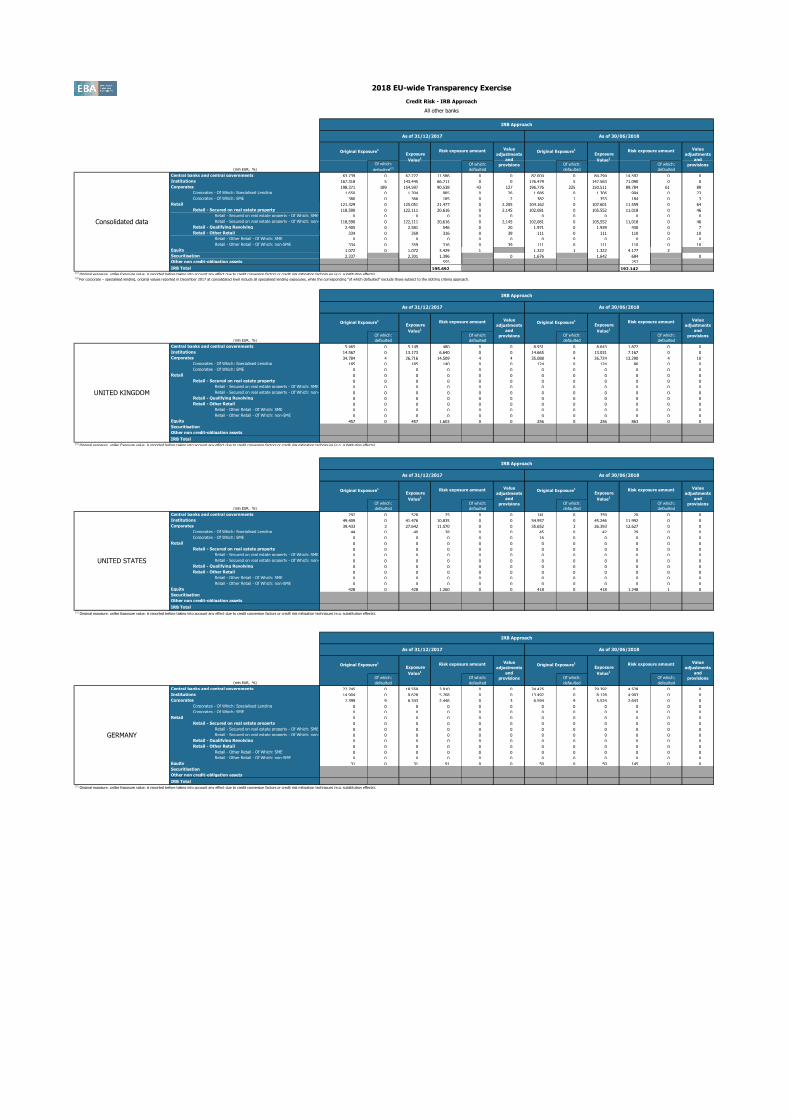
Central banks and central governments 63,739 0 67,222 11,586 0 0 82,004 0 84,294 14,592 0 0
Institutions 167,318 5 143,445 66,711 0 0 176,479 5 147,563 71,090 0 0
Corporates 198,371 189 154,597 90,538 43 127 196,776 225 150,511 89,784 61 89
Corporates - Of Which: Specialised Lending 1,650 0 1,304 985 0 26 1,686 0 1,306 994 0 23
Corporates - Of Which: SME 380 0 366 185 0 2 382 1 353 184 0 3
Retail 121,329 0 125,051 21,477 0 2,205 104,162 0 107,601 11,559 0 64
Retail - Secured on real estate property 118,590 0 122,111 20,616 0 2,145 102,081 0 105,552 11,018 0 46
Retail - Secured on real estate property - Of Which: SME 0 0 0 0 0 0 0 0 0 0 0 0
Retail - Secured on real estate property - Of Which: non-
SME118,590 0 122,111 20,616 0 2,145 102,081 0 105,552 11,018 0 46
Retail - Qualifying Revolving 2,405 0 2,581 546 0 20 1,971 0 1,939 430 0 7
Retail - Other Retail 334 0 359 316 0 39 111 0 111 110 0 10
Retail - Other Retail - Of Which: SME 0 0 0 0 0 0 0 0 0 0 0 0
Retail - Other Retail - Of Which: non-SME 334 0 359 316 0 39 111 0 111 110 0 10
Equity 1,072 0 1,072 3,429 1 1,322 1 1,322 4,177 2
Securitisation 2,337 2,301 1,396 0 1,676 1,642 684 0
Other non credit-obligation assets 555 257
IRB Total 195,692 192,142(1) Original exposure, unlike Exposure value, is reported before taking into account any effect due to credit conversion factors or credit risk mitigation techniques (e.g. substitution effects). (2) For corporate – specialised lending, original values reported in December 2017 at consolidated level include all specialised lending exposures, while the corresponding “of which defaulted” exclude those subject to the slotting criteria approach.
1 (mln EUR, %)
Of which:
defaulted
Of which:
defaulted
Of which:
defaulted
Of which:
defaulted
Central banks and central governments 5,465 0 5,149 480 0 0 8,931 0 8,643 1,872 0 0
Institutions 14,567 0 13,173 6,640 0 0 14,665 0 13,031 7,167 0 0
Corporates 34,784 4 26,716 14,509 4 4 35,088 4 26,724 13,290 4 10
Corporates - Of Which: Specialised Lending 185 0 185 140 0 0 124 0 124 86 0 0
Corporates - Of Which: SME 0 0 0 0 0 0 0 0 0 0 0 0
Retail 0 0 0 0 0 0 0 0 0 0 0 0
Retail - Secured on real estate property 0 0 0 0 0 0 0 0 0 0 0 0
Retail - Secured on real estate property - Of Which: SME 0 0 0 0 0 0 0 0 0 0 0 0
Retail - Secured on real estate property - Of Which: non-
SME0 0 0 0 0 0 0 0 0 0 0 0
Retail - Qualifying Revolving 0 0 0 0 0 0 0 0 0 0 0 0
Retail - Other Retail 0 0 0 0 0 0 0 0 0 0 0 0
Retail - Other Retail - Of Which: SME 0 0 0 0 0 0 0 0 0 0 0 0
Retail - Other Retail - Of Which: non-SME 0 0 0 0 0 0 0 0 0 0 0 0
Equity 457 0 457 1,603 0 0 256 0 256 863 0 0
Securitisation
Other non credit-obligation assets
IRB Total(1) Original exposure, unlike Exposure value, is reported before taking into account any effect due to credit conversion factors or credit risk mitigation techniques (e.g. substitution effects).
2 (mln EUR, %)
Of which:
defaulted
Of which:
defaulted
Of which:
defaulted
Of which:
defaulted
Central banks and central governments 292 0 528 25 0 0 141 0 359 20 0 0
Institutions 49,409 0 41,476 10,835 0 0 54,957 0 45,246 11,992 0 0
Corporates 39,433 3 27,642 11,570 0 0 35,652 3 26,393 12,627 0 0
Corporates - Of Which: Specialised Lending 44 0 40 28 0 0 45 0 42 29 0 0
Corporates - Of Which: SME 0 0 0 0 0 0 16 0 0 0 0 0
Retail 0 0 0 0 0 0 0 0 0 0 0 0
Retail - Secured on real estate property 0 0 0 0 0 0 0 0 0 0 0 0
Retail - Secured on real estate property - Of Which: SME 0 0 0 0 0 0 0 0 0 0 0 0
Retail - Secured on real estate property - Of Which: non-
SME0 0 0 0 0 0 0 0 0 0 0 0
Retail - Qualifying Revolving 0 0 0 0 0 0 0 0 0 0 0 0
Retail - Other Retail 0 0 0 0 0 0 0 0 0 0 0 0
Retail - Other Retail - Of Which: SME 0 0 0 0 0 0 0 0 0 0 0 0
Retail - Other Retail - Of Which: non-SME 0 0 0 0 0 0 0 0 0 0 0 0
Equity 428 0 428 1,260 0 0 418 0 418 1,248 1 0
Securitisation
Other non credit-obligation assets
IRB Total(1) Original exposure, unlike Exposure value, is reported before taking into account any effect due to credit conversion factors or credit risk mitigation techniques (e.g. substitution effects).
3 (mln EUR, %)
Of which:
defaulted
Of which:
defaulted
Of which:
defaulted
Of which:
defaulted
Central banks and central governments 22,745 0 18,559 3,910 0 0 34,425 0 29,397 4,528 0 0
Institutions 14,904 0 9,628 5,768 0 0 13,492 0 8,128 4,993 0 0
Corporates 7,399 9 6,343 2,446 0 3 6,594 9 5,524 2,643 0 0
Corporates - Of Which: Specialised Lending 0 0 0 0 0 0 0 0 0 0 0 0
Corporates - Of Which: SME 0 0 0 0 0 0 0 0 0 0 0 0
Retail 0 0 0 0 0 0 0 0 0 0 0 0
Retail - Secured on real estate property 0 0 0 0 0 0 0 0 0 0 0 0
Retail - Secured on real estate property - Of Which: SME 0 0 0 0 0 0 0 0 0 0 0 0
Retail - Secured on real estate property - Of Which: non-
SME0 0 0 0 0 0 0 0 0 0 0 0
Retail - Qualifying Revolving 0 0 0 0 0 0 0 0 0 0 0 0
Retail - Other Retail 0 0 0 0 0 0 0 0 0 0 0 0
Retail - Other Retail - Of Which: SME 0 0 0 0 0 0 0 0 0 0 0 0
Retail - Other Retail - Of Which: non-SME 0 0 0 0 0 0 0 0 0 0 0 0
Equity 31 0 31 91 0 0 50 0 50 145 0 0
Securitisation
Other non credit-obligation assets
IRB Total(1) Original exposure, unlike Exposure value, is reported before taking into account any effect due to credit conversion factors or credit risk mitigation techniques (e.g. substitution effects).
Risk exposure amount Value
adjustments
and
provisions
GERMANY
Original Exposure1
Exposure
Value1
Risk exposure amount Value
adjustments
and
provisions
Original Exposure1
Exposure
Value1
Risk exposure amount Value
adjustments
and
provisions
UNITED STATES
IRB Approach
As of 31/12/2017 As of 30/06/2018
Original Exposure1
Exposure
Value1
Risk exposure amount Value
adjustments
and
provisions
Original Exposure1
Exposure
Value1
Risk exposure amount Value
adjustments
and
provisions
UNITED KINGDOM
IRB Approach
As of 31/12/2017 As of 30/06/2018
Original Exposure1
Exposure
Value1
Risk exposure amount Value
adjustments
and
provisions
Original Exposure1
Exposure
Value1
IRB Approach
As of 31/12/2017 As of 30/06/2018
Original Exposure1
Exposure
Value1
Risk exposure amount Value
adjustments
and
provisions
Original Exposure1
Exposure
Value1
2018 EU-wide Transparency Exercise
Credit Risk - IRB Approach
All other banks
IRB Approach
As of 31/12/2017 As of 30/06/2018
Risk exposure amount Value
adjustments
and
provisions
Consolidated data

201712 201712 201712 201712 201712 201712 201806 201806 201806 201806 201806 201806
2018 EU-wide Transparency Exercise
Credit Risk - IRB Approach
All other banks
4 (mln EUR, %)
Of which:
defaulted
Of which:
defaulted
Of which:
defaulted
Of which:
defaulted
Central banks and central governments 6,031 0 6,754 476 0 0 8,928 0 9,658 619 0 0
Institutions 10,533 0 9,745 3,852 0 0 11,553 0 10,073 3,654 0 0
Corporates 8,924 0 6,444 3,426 0 6 8,804 0 6,245 3,145 0 0
Corporates - Of Which: Specialised Lending 0 0 0 0 0 0 0 0 0 0 0 0
Corporates - Of Which: SME 0 0 0 0 0 0 0 0 0 0 0 0
Retail 0 0 0 0 0 0 0 0 0 0 0 0
Retail - Secured on real estate property 0 0 0 0 0 0 0 0 0 0 0 0
Retail - Secured on real estate property - Of Which: SME 0 0 0 0 0 0 0 0 0 0 0 0
Retail - Secured on real estate property - Of Which: non-
SME0 0 0 0 0 0 0 0 0 0 0 0
Retail - Qualifying Revolving 0 0 0 0 0 0 0 0 0 0 0 0
Retail - Other Retail 0 0 0 0 0 0 0 0 0 0 0 0
Retail - Other Retail - Of Which: SME 0 0 0 0 0 0 0 0 0 0 0 0
Retail - Other Retail - Of Which: non-SME 0 0 0 0 0 0 0 0 0 0 0 0
Equity 16 0 16 47 0 0 15 0 15 45 0 0
Securitisation
Other non credit-obligation assets
IRB Total(1) Original exposure, unlike Exposure value, is reported before taking into account any effect due to credit conversion factors or credit risk mitigation techniques (e.g. substitution effects).
5 (mln EUR, %)
Of which:
defaulted
Of which:
defaulted
Of which:
defaulted
Of which:
defaulted
Central banks and central governments 0 0 0 0 0 0 0 0 0 0 0 0
Institutions 1,480 0 1,467 1,917 0 0 1,977 0 1,918 2,315 0 0
Corporates 21,388 0 16,391 16,170 0 0 20,408 25 14,966 15,204 0 0
Corporates - Of Which: Specialised Lending 0 0 0 0 0 0 0 0 0 0 0 0
Corporates - Of Which: SME 0 0 0 0 0 0 0 0 0 0 0 0
Retail 0 0 0 0 0 0 0 0 0 0 0 0
Retail - Secured on real estate property 0 0 0 0 0 0 0 0 0 0 0 0
Retail - Secured on real estate property - Of Which: SME 0 0 0 0 0 0 0 0 0 0 0 0
Retail - Secured on real estate property - Of Which: non-
SME0 0 0 0 0 0 0 0 0 0 0 0
Retail - Qualifying Revolving 0 0 0 0 0 0 0 0 0 0 0 0
Retail - Other Retail 0 0 0 0 0 0 0 0 0 0 0 0
Retail - Other Retail - Of Which: SME 0 0 0 0 0 0 0 0 0 0 0 0
Retail - Other Retail - Of Which: non-SME 0 0 0 0 0 0 0 0 0 0 0 0
Equity 17 0 17 60 0 0 22 0 22 73 0 0
Securitisation
Other non credit-obligation assets
IRB Total(1) Original exposure, unlike Exposure value, is reported before taking into account any effect due to credit conversion factors or credit risk mitigation techniques (e.g. substitution effects).
6 (mln EUR, %)
Of which:
defaulted
Of which:
defaulted
Of which:
defaulted
Of which:
defaulted
Central banks and central governments 405 0 405 56 0 0 250 0 250 35 0 0
Institutions 12,858 0 11,761 3,897 0 0 12,952 0 11,800 3,666 0 0
Corporates 7,236 0 7,375 1,600 0 0 4,396 0 4,769 1,097 0 0
Corporates - Of Which: Specialised Lending 0 0 0 0 0 0 0 0 0 0 0 0
Corporates - Of Which: SME 0 0 0 0 0 0 0 0 0 0 0 0
Retail 0 0 0 0 0 0 0 0 0 0 0 0
Retail - Secured on real estate property 0 0 0 0 0 0 0 0 0 0 0 0
Retail - Secured on real estate property - Of Which: SME 0 0 0 0 0 0 0 0 0 0 0 0
Retail - Secured on real estate property - Of Which: non-
SME0 0 0 0 0 0 0 0 0 0 0 0
Retail - Qualifying Revolving 0 0 0 0 0 0 0 0 0 0 0 0
Retail - Other Retail 0 0 0 0 0 0 0 0 0 0 0 0
Retail - Other Retail - Of Which: SME 0 0 0 0 0 0 0 0 0 0 0 0
Retail - Other Retail - Of Which: non-SME 0 0 0 0 0 0 0 0 0 0 0 0
Equity 3 0 3 8 0 0 6 0 6 18 0 0
Securitisation
Other non credit-obligation assets
IRB Total(1) Original exposure, unlike Exposure value, is reported before taking into account any effect due to credit conversion factors or credit risk mitigation techniques (e.g. substitution effects).
7 (mln EUR, %)
Of which:
defaulted
Of which:
defaulted
Of which:
defaulted
Of which:
defaulted
Central banks and central governments 12 0 15 3 0 0 223 0 230 50 0 0
Institutions 2,884 0 2,555 1,472 0 0 2,697 0 2,664 1,533 0 0
Corporates 8,331 0 6,488 5,556 0 3 10,197 0 7,098 5,955 0 0
Corporates - Of Which: Specialised Lending 0 0 0 0 0 0 0 0 0 0 0 0
Corporates - Of Which: SME 0 0 0 0 0 0 0 0 0 0 0 0
Retail 0 0 0 0 0 0 0 0 0 0 0 0
Retail - Secured on real estate property 0 0 0 0 0 0 0 0 0 0 0 0
Retail - Secured on real estate property - Of Which: SME 0 0 0 0 0 0 0 0 0 0 0 0
Retail - Secured on real estate property - Of Which: non-
SME0 0 0 0 0 0 0 0 0 0 0 0
Retail - Qualifying Revolving 0 0 0 0 0 0 0 0 0 0 0 0
Retail - Other Retail 0 0 0 0 0 0 0 0 0 0 0 0
Retail - Other Retail - Of Which: SME 0 0 0 0 0 0 0 0 0 0 0 0
Retail - Other Retail - Of Which: non-SME 0 0 0 0 0 0 0 0 0 0 0 0
Equity 13 0 13 48 0 0 14 0 14 51 0 0
Securitisation
Other non credit-obligation assets
IRB Total(1) Original exposure, unlike Exposure value, is reported before taking into account any effect due to credit conversion factors or credit risk mitigation techniques (e.g. substitution effects).
Risk exposure amount Value
adjustments
and
provisions
LUXEMBOURG
Original Exposure1
Exposure
Value1
Risk exposure amount Value
adjustments
and
provisions
Original Exposure1
Exposure
Value1
Risk exposure amount Value
adjustments
and
provisions
JAPAN
IRB Approach
As of 31/12/2017 As of 30/06/2018
Original Exposure1
Exposure
Value1
Risk exposure amount Value
adjustments
and
provisions
Original Exposure1
Exposure
Value1
Risk exposure amount Value
adjustments
and
provisions
CAYMAN ISLANDS
IRB Approach
As of 31/12/2017 As of 30/06/2018
Original Exposure1
Exposure
Value1
Risk exposure amount Value
adjustments
and
provisions
Original Exposure1
Exposure
Value1
Risk exposure amount Value
adjustments
and
provisions
FRANCE
IRB Approach
As of 31/12/2017 As of 30/06/2018
Original Exposure1
Exposure
Value1
Risk exposure amount Value
adjustments
and
provisions
Original Exposure1
Exposure
Value1
IRB Approach
As of 31/12/2017 As of 30/06/2018

201712 201712 201712 201712 201712 201712 201806 201806 201806 201806 201806 201806
2018 EU-wide Transparency Exercise
Credit Risk - IRB Approach
All other banks
8 (mln EUR, %)
Of which:
defaulted
Of which:
defaulted
Of which:
defaulted
Of which:
defaulted
Central banks and central governments 1,407 0 1,407 29 0 0 484 0 483 10 0 0
Institutions 9,732 0 12,451 2,461 0 0 10,436 0 10,108 2,980 0 0
Corporates 2,519 0 2,036 1,187 0 0 2,957 0 2,416 988 0 0
Corporates - Of Which: Specialised Lending 0 0 0 0 0 0 0 0 0 0 0 0
Corporates - Of Which: SME 0 0 0 0 0 0 0 0 0 0 0 0
Retail 0 0 0 0 0 0 0 0 0 0 0 0
Retail - Secured on real estate property 0 0 0 0 0 0 0 0 0 0 0 0
Retail - Secured on real estate property - Of Which: SME 0 0 0 0 0 0 0 0 0 0 0 0
Retail - Secured on real estate property - Of Which: non-
SME0 0 0 0 0 0 0 0 0 0 0 0
Retail - Qualifying Revolving 0 0 0 0 0 0 0 0 0 0 0 0
Retail - Other Retail 0 0 0 0 0 0 0 0 0 0 0 0
Retail - Other Retail - Of Which: SME 0 0 0 0 0 0 0 0 0 0 0 0
Retail - Other Retail - Of Which: non-SME 0 0 0 0 0 0 0 0 0 0 0 0
Equity 36 0 36 105 0 0 85 0 85 247 0 0
Securitisation
Other non credit-obligation assets
IRB Total(1) Original exposure, unlike Exposure value, is reported before taking into account any effect due to credit conversion factors or credit risk mitigation techniques (e.g. substitution effects).
9 (mln EUR, %)
Of which:
defaulted
Of which:
defaulted
Of which:
defaulted
Of which:
defaulted
Central banks and central governments 55 0 31 3 0 0 121 0 96 6 0 0
Institutions 3,011 0 2,691 1,164 0 0 2,830 0 2,374 967 0 0
Corporates 7,648 0 5,104 3,418 0 2 8,340 0 5,724 4,228 0 0
Corporates - Of Which: Specialised Lending 0 0 0 0 0 0 0 0 0 0 0 0
Corporates - Of Which: SME 0 0 0 0 0 0 0 0 0 0 0 0
Retail 0 0 0 0 0 0 0 0 0 0 0 0
Retail - Secured on real estate property 0 0 0 0 0 0 0 0 0 0 0 0
Retail - Secured on real estate property - Of Which: SME 0 0 0 0 0 0 0 0 0 0 0 0
Retail - Secured on real estate property - Of Which: non-
SME0 0 0 0 0 0 0 0 0 0 0 0
Retail - Qualifying Revolving 0 0 0 0 0 0 0 0 0 0 0 0
Retail - Other Retail 0 0 0 0 0 0 0 0 0 0 0 0
Retail - Other Retail - Of Which: SME 0 0 0 0 0 0 0 0 0 0 0 0
Retail - Other Retail - Of Which: non-SME 0 0 0 0 0 0 0 0 0 0 0 0
Equity 5 0 5 14 0 0 6 0 6 18 0 0
Securitisation
Other non credit-obligation assets
IRB Total(1) Original exposure, unlike Exposure value, is reported before taking into account any effect due to credit conversion factors or credit risk mitigation techniques (e.g. substitution effects).
10 (mln EUR, %)
Of which:
defaulted
Of which:
defaulted
Of which:
defaulted
Of which:
defaulted
Central banks and central governments 4,593 0 4,037 3,741 0 0 5,147 0 4,761 4,814 0 0
Institutions 1,829 5 1,176 1,469 0 0 1,839 5 1,211 1,427 0 0
Corporates 3,398 10 2,267 2,500 0 9 3,793 10 2,733 2,796 0 0
Corporates - Of Which: Specialised Lending 0 0 0 0 0 0 0 0 0 0 0 0
Corporates - Of Which: SME 0 0 0 0 0 0 0 0 0 0 0 0
Retail 0 0 0 0 0 0 0 0 0 0 0 0
Retail - Secured on real estate property 0 0 0 0 0 0 0 0 0 0 0 0
Retail - Secured on real estate property - Of Which: SME 0 0 0 0 0 0 0 0 0 0 0 0
Retail - Secured on real estate property - Of Which: non-
SME0 0 0 0 0 0 0 0 0 0 0 0
Retail - Qualifying Revolving 0 0 0 0 0 0 0 0 0 0 0 0
Retail - Other Retail 0 0 0 0 0 0 0 0 0 0 0 0
Retail - Other Retail - Of Which: SME 0 0 0 0 0 0 0 0 0 0 0 0
Retail - Other Retail - Of Which: non-SME 0 0 0 0 0 0 0 0 0 0 0 0
Equity 2 0 2 5 0 0 3 0 3 8 0 0
Securitisation
Other non credit-obligation assets
IRB Total(1) Original exposure, unlike Exposure value, is reported before taking into account any effect due to credit conversion factors or credit risk mitigation techniques (e.g. substitution effects).
Risk exposure amount Value
adjustments
and
provisions
ITALY
Original Exposure1
Exposure
Value1
Risk exposure amount Value
adjustments
and
provisions
Original Exposure1
Exposure
Value1
Risk exposure amount Value
adjustments
and
provisions
NETHERLANDS
IRB Approach
As of 31/12/2017 As of 30/06/2018
Original Exposure1
Exposure
Value1
Risk exposure amount Value
adjustments
and
provisions
Original Exposure1
Exposure
Value1
Risk exposure amount Value
adjustments
and
provisions
SWITZERLAND
IRB Approach
As of 31/12/2017 As of 30/06/2018
Original Exposure1
Exposure
Value1
Risk exposure amount Value
adjustments
and
provisions
Original Exposure1
Exposure
Value1
IRB Approach
As of 31/12/2017 As of 30/06/2018

201712 201712 201712 201712 201712 201712 201712 201712 201712 201712 201712 201712 201712 201712 201712 201712 201712 201712
2018 EU-wide Transparency Exercise
Sovereign Exposure
All other banks
(mln EUR)
of which:
loans and
advances
of which:
debt
securities
of which:
Loans and
advances
of which:
Debt
securities
of which:
Loans and
advances
of which:
Debt
securities
of which:
Loans and
advances
of which:
Debt
securities
of which:
Loans and
advances
of which:
Debt
securities
of which:
Loans and
advances
of which:
Debt
securities
TOTAL - ALL COUNTRIES 22,905.6 7,290.6 15,615.0 10,213.9 0.2 10,213.7 526.9 428.1 98.8 10,991.3 0.0 10,991.3 7,554.6 7,549.1 5.5 1,821.6 0.0 1,821.6
Austria 2,284.0 1,461.6 822.4
Belgium 712.4 3.5 708.9
Bulgaria 0.0 0.0 0.0
Croatia 0.9 0.0 0.9
Cyprus 3.0 0.1 3.0
Czech Republic 6.8 0.0 6.8
Denmark 1,595.4 1,581.9 13.5
Estonia 5.5 0.0 5.5
Finland 340.2 12.3 327.9
France 781.3 99.6 681.7
Germany 1,329.6 150.8 1,178.8
Greece 41.9 0.5 41.4
Hungary 179.5 39.9 139.5
Ireland 61.1 0.4 60.7
Italy 1,216.2 57.6 1,158.6
Latvia 219.9 24.1 195.8
Lithuania 17.0 0.0 17.0
Luxembourg 974.7 3.3 971.4
Malta 0.0 0.0 0.0
Netherlands 91.1 0.4 90.7
Poland 285.9 3.0 282.9
Portugal 276.5 25.3 251.2
Romania 0.1 0.0 0.1
Slovakia 17.4 0.0 17.4
Slovenia 8.7 0.1 8.6
Spain 698.3 3.4 694.9
Sweden 913.9 291.6 622.3
United Kingdom 2,872.8 354.1 2,518.7
Iceland 0.0 0.0 0.0
Liechtenstein 0.0 0.0 0.0
Norway 0.0 0.0 0.0
Switzerland 6.3 3.8 2.5
Australia 29.1 23.0 6.1
Canada 524.8 464.4 60.4
China 240.4 4.5 235.9
Hong Kong 21.8 4.6 17.2
Japan 410.9 0.0 410.8
U.S. 2,772.9 597.4 2,175.5
Other advanced economies non EEA 558.3 110.2 448.1
Other Central and eastern Europe countries non EEA 181.5 57.8 123.7
Middle East 278.4 51.5 226.9
Latin America and the Caribbean 1,086.5 1,068.4 18.1
Africa 486.1 222.1 264.0
Others 1,374.8 569.4 805.4
Note:
Information disclosed in this template is sourced from FINREP templates F 20 and F 04.
The information reported covers all exposures to “General governments” as defined in paragraph 41 (b) of Annex V of ITS on Supervisory reporting: “central governments, state or regional governments, and local governments, including administrative bodies and non-commercial undertakings, but excluding public companies and private companies held by these administrations
that have a commercial activity (which shall be reported under “non-financial corporations”); social security funds; and international organisations, such as the European Community, the International Monetary Fund and the Bank for International Settlements.
Regions:
Other advanced non EEA: Israel, Korea, New Zealand, Russia, San Marino, Singapore and Taiwan.
Other CEE non EEA: Albania, Bosnia and Herzegovina, FYR Macedonia, Montenegro, Serbia and Turkey.
Middle East: Bahrain, Djibouti, Iran, Iraq, Jordan, Kuwait, Lebanon, Libya, Oman, Qatar, Saudi Arabia, Sudan, Syria, United Arab Emirates and Yemen.
(1) Includes "Trading financial assets" portfolio for banks reporting under GAAP(2) Includes "Non-trading non-derivative financial assets measured at fair value through profit or loss" portfolio for banks reporting under GAAP(3) Includes "Non-trading non-derivative financial assets measured at fair value to equity" portfolio for banks reporting under GAAP(4) Includes "Non-trading debt instruments measured at a cost-based method" and "Other non-trading non-derivative financial assets" portfolio for banks reporting under GAAP
Latin America: Argentina, Belize, Bolivia, Brazil, Chile, Colombia, Costa Rica, Dominica, Dominican Republic, Ecuador, El Salvador, Grenada, Guatemala, Guyana, Haiti, Honduras, Jamaica, Mexico, Nicaragua, Panama, Paraguay, Peru, St. Kitts and Nevis, St. Lucia, St. Vincent and the Grenadines, Suriname, Trinidad and Tobago, Uruguay, Venezuela,Antigua And Barbuda, Aruba, Bahamas, Barbados,
Cayman Islands, Cuba, French Guiana, Guadeloupe, Martinique, Puerto Rico, Saint Barthélemy, Turks And Caicos Islands, Virgin Islands (British), Virgin Islands (U.S. ).
Africa: Algeria, Egypt, Morocco, South Africa, Angola, Benin, Botswana, Burkina Faso, Burundi, Cameroon, Cape Verde, Central African Republic, Chad, Comoros, Congo, Congo, The Democratic Republic Of The, Côte D'Ivoire, Equatorial Guinea, Eritrea, Ethiopia, Gabon, Gambia, Ghana, Guinea, Guinea-Bissau, Kenya, Lesotho, Liberia, Madagascar, Malawi, Mali, Mauritius, Mauritania, Mozambique, Namibia,
Niger, Nigeria, Rwanda, Sao Tome And Principe, Senegal, Seychelles, Sierra Leone, South Sudan, Swaziland, Tanzania, United Republic Of, Togo, Uganda, Zambia, Zimbabwe and Tunisia.
As of 31/12/2017
Country / Region
Financial assets: Carrying Amount
Memo: breakdown by accounting portfolio
Held for
trading1
Designated at
fair value
through profit
or loss2
Available-for-
sale3
Loans and
Receivables4
Held-to-
maturity
investments
201806 201806 201806 201806 201806 201806 201806 201806 201806 201806 201806 201806 201806
2018 EU-wide Transparency Exercise
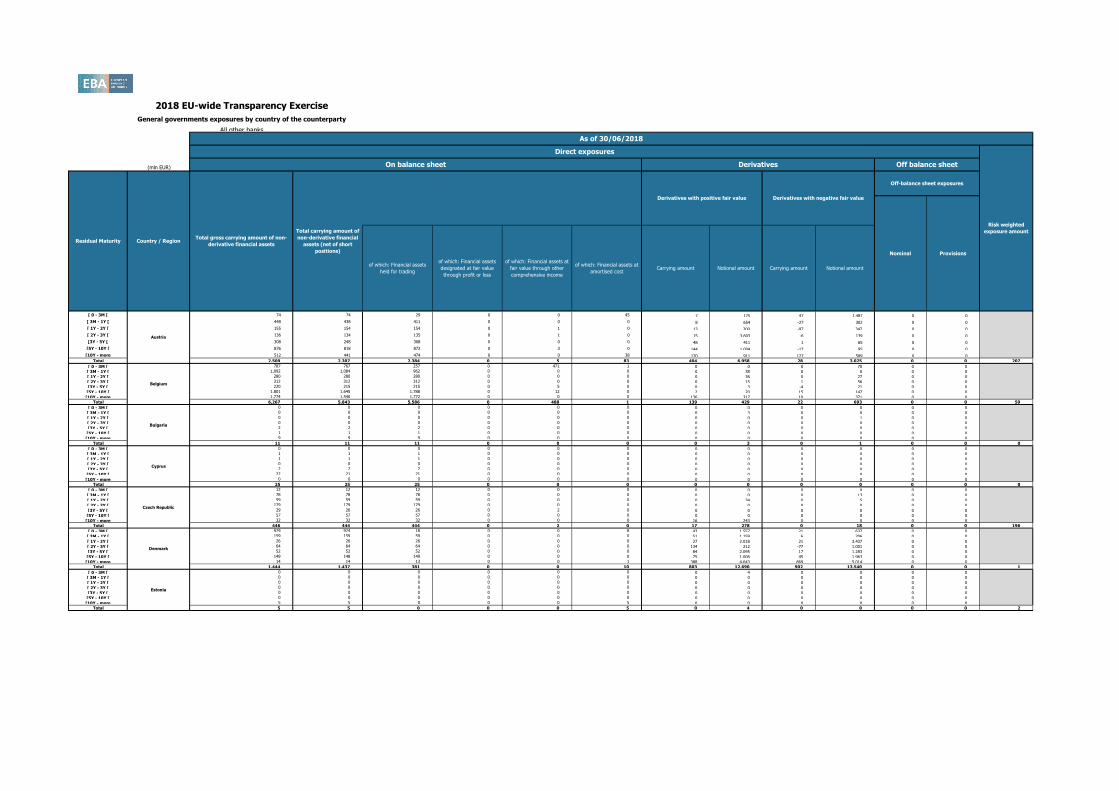
General governments exposures by country of the counterparty
All other banks
(mln EUR)
[ 0 - 3M [ 74 74 29 0 0 45 7 175 47 1,487 0 0
[ 3M - 1Y [ 448 438 411 0 0 0 8 654 -27 302 0 0
[ 1Y - 2Y [ 155 154 154 0 1 0 13 200 -97 347 0 0
[ 2Y - 3Y [ 136 134 135 0 1 0 15 3,603 -6 139 0 0
[3Y - 5Y [ 308 248 308 0 0 0 48 411 1 65 0 0
[5Y - 10Y [ 876 818 872 0 3 0 144 1,004 -17 95 0 0
[10Y - more 512 441 474 0 0 38 170 911 127 589 0 0Total 2,509 2,307 2,384 0 5 83 404 6,958 28 3,025 0 0 207
[ 0 - 3M [ 787 767 257 0 471 1 0 0 0 70 0 0
[ 3M - 1Y [ 1,092 1,084 962 0 0 0 0 38 0 0 0 0
[ 1Y - 2Y [ 280 280 280 0 0 0 0 36 0 27 0 0
[ 2Y - 3Y [ 312 312 312 0 0 0 0 15 1 56 0 0
[3Y - 5Y [ 220 215 215 0 5 0 0 3 -4 21 0 0
[5Y - 10Y [ 1,801 1,645 1,788 0 12 0 2 20 15 147 0 0
[10Y - more 1,774 1,540 1,772 0 0 0 136 317 10 371 0 0Total 6,267 5,843 5,586 0 488 1 139 429 22 693 0 0 59
[ 0 - 3M [ 0 0 0 0 0 0 0 0 0 0 0 0
[ 3M - 1Y [ 0 0 0 0 0 0 0 3 0 0 0 0
[ 1Y - 2Y [ 0 0 0 0 0 0 0 0 0 1 0 0
[ 2Y - 3Y [ 0 0 0 0 0 0 0 0 0 0 0 0
[3Y - 5Y [ 2 2 2 0 0 0 0 0 0 0 0 0
[5Y - 10Y [ 1 1 1 0 0 0 0 0 0 0 0 0
[10Y - more 9 9 9 0 0 0 0 0 0 0 0 0Total 11 11 11 0 0 0 0 3 0 1 0 0 0
[ 0 - 3M [ 0 0 0 0 0 0 0 0 0 0 0 0
[ 3M - 1Y [ 1 1 1 0 0 0 0 0 0 0 0 0
[ 1Y - 2Y [ 1 1 1 0 0 0 0 0 0 0 0 0
[ 2Y - 3Y [ 0 0 0 0 0 0 0 0 0 0 0 0
[3Y - 5Y [ 2 2 2 0 0 0 0 0 0 0 0 0
[5Y - 10Y [ 22 21 21 0 0 0 0 0 0 0 0 0
[10Y - more 0 0 0 0 0 0 0 0 0 0 0 0Total 25 25 25 0 0 0 0 0 0 0 0 0 0
[ 0 - 3M [ 12 12 12 0 0 0 0 0 0 0 0 0
[ 3M - 1Y [ 78 78 78 0 0 0 0 0 0 13 0 0
[ 1Y - 2Y [ 59 59 59 0 0 0 0 34 0 5 0 0
[ 2Y - 3Y [ 179 179 179 0 0 0 0 0 0 0 0 0
[3Y - 5Y [ 29 26 26 0 2 0 0 0 0 0 0 0
[5Y - 10Y [ 57 57 57 0 0 0 0 0 0 0 0 0
[10Y - more 32 32 32 0 0 0 16 243 0 0 0 0Total 446 444 444 0 2 0 17 278 0 18 0 0 196
[ 0 - 3M [ 979 974 18 0 0 8 43 1,557 21 637 0 0
[ 3M - 1Y [ 159 159 59 0 0 0 51 1,159 6 206 0 0
[ 1Y - 2Y [ 26 26 26 0 0 0 27 2,018 21 3,437 0 0
[ 2Y - 3Y [ 64 64 64 0 0 0 134 212 -77 1,001 0 0
[3Y - 5Y [ 52 52 52 0 0 0 84 2,095 17 1,283 0 0
[5Y - 10Y [ 149 148 149 0 0 0 75 1,006 45 1,963 0 0
[10Y - more 14 14 13 0 0 1 388 4,643 869 5,014 0 0Total 1,444 1,437 381 0 0 10 803 12,690 902 13,540 0 0 1
[ 0 - 3M [ 0 0 0 0 0 0 0 4 0 0 0 0
[ 3M - 1Y [ 0 0 0 0 0 0 0 0 0 0 0 0
[ 1Y - 2Y [ 0 0 0 0 0 0 0 0 0 0 0 0
[ 2Y - 3Y [ 0 0 0 0 0 0 0 0 0 0 0 0
[3Y - 5Y [ 0 0 0 0 0 0 0 0 0 0 0 0
[5Y - 10Y [ 0 0 0 0 0 0 0 0 0 0 0 0
[10Y - more 5 5 0 0 0 5 0 0 0 0 0 0Total 5 5 0 0 0 5 0 4 0 0 0 0 2
Cyprus
Czech Republic
Denmark
Estonia
Notional amount Carrying amount Notional amount
Austria
Belgium
Bulgaria
Residual Maturity Country / RegionTotal gross carrying amount of non-
derivative financial assets
Total carrying amount of
non-derivative financial
assets (net of short
positions)
As of 30/06/2018
Direct exposures
Risk weighted
exposure amount
On balance sheet Derivatives Off balance sheet
Off-balance sheet exposures
Nominal Provisions
Carrying amount
Derivatives with positive fair value Derivatives with negative fair value
of which: Financial assets
held for trading
of which: Financial assets
designated at fair value
through profit or loss
of which: Financial assets at
fair value through other
comprehensive income
of which: Financial assets at
amortised cost

201806 201806 201806 201806 201806 201806 201806 201806 201806 201806 201806 201806 201806
2018 EU-wide Transparency Exercise
General governments exposures by country of the counterparty
All other banks
(mln EUR)
Notional amount Carrying amount Notional amount
Austria
Residual Maturity Country / RegionTotal gross carrying amount of non-
derivative financial assets
Total carrying amount of
non-derivative financial
assets (net of short
positions)
As of 30/06/2018
Direct exposures
Risk weighted
exposure amount
On balance sheet Derivatives Off balance sheet
Off-balance sheet exposures
Nominal Provisions
Carrying amount
Derivatives with positive fair value Derivatives with negative fair value
of which: Financial assets
held for trading
of which: Financial assets
designated at fair value
through profit or loss
of which: Financial assets at
fair value through other
comprehensive income
of which: Financial assets at
amortised cost
[ 0 - 3M [ 885 61 35 0 1 849 0 15 24 828 0 0
[ 3M - 1Y [ 2 2 2 0 0 0 31 2,436 -1 253 0 0
[ 1Y - 2Y [ 72 49 59 0 5 9 7 202 -1 765 0 0
[ 2Y - 3Y [ 413 409 410 0 2 1 18 369 -8 905 0 0
[3Y - 5Y [ 446 430 433 0 7 5 72 617 2 156 0 0
[5Y - 10Y [ 1,941 1,898 1,907 0 10 23 46 1,946 -60 854 0 0
[10Y - more 332 268 315 0 1 16 10 581 12 956 2 0Total 4,090 3,116 3,160 0 27 903 183 6,166 -32 4,716 2 0 35
[ 0 - 3M [ 3,305 3,323 1,349 0 1,473 324 24 2,541 206 6,784 0 0
[ 3M - 1Y [ 4,363 4,290 3,705 0 522 0 60 1,915 18 2,428 0 0
[ 1Y - 2Y [ 1,820 1,560 1,708 0 1 0 57 1,038 -36 806 0 0
[ 2Y - 3Y [ 1,386 1,149 1,338 0 0 0 79 1,605 -31 668 0 0
[3Y - 5Y [ 3,083 2,270 2,684 0 1 0 67 1,170 -44 679 60 0
[5Y - 10Y [ 12,305 11,402 12,228 0 17 0 172 2,010 109 2,294 0 0
[10Y - more 5,821 4,789 5,729 0 0 2 512 1,409 117 1,990 50 0Total 32,082 28,783 28,742 0 2,014 326 970 11,688 339 15,649 111 0 174
[ 0 - 3M [ 3,966 3,957 1,877 346 150 1,543 105 2,478 222 6,413 0 0
[ 3M - 1Y [ 2,608 2,517 1,499 0 396 0 296 12,124 30 10,630 0 0
[ 1Y - 2Y [ 2,995 2,758 2,851 0 0 0 449 12,109 -74 10,970 0 0
[ 2Y - 3Y [ 609 538 562 0 0 0 397 5,733 307 6,750 0 0
[3Y - 5Y [ 5,189 4,970 4,688 0 191 0 886 15,786 228 7,130 0 0
[5Y - 10Y [ 12,008 11,219 11,452 0 139 0 1,460 14,655 369 9,297 0 0
[10Y - more 6,018 4,567 4,479 0 0 331 8,645 25,194 2,779 19,190 0 0Total 33,392 30,527 27,408 346 877 1,874 12,238 88,079 3,860 70,380 0 0 273
[ 0 - 3M [ 6 6 6 0 0 0 0 0 0 0 0 0
[ 3M - 1Y [ 0 0 0 0 0 0 0 3 0 2 0 0
[ 1Y - 2Y [ 1 1 1 0 0 0 0 0 0 1 0 0
[ 2Y - 3Y [ 2 2 2 0 0 0 0 99 14 6 0 0
[3Y - 5Y [ 10 7 7 0 3 0 7 311 0 0 0 0
[5Y - 10Y [ 1 1 1 0 0 0 0 0 0 0 0 0
[10Y - more 2 2 2 0 0 0 0 0 0 0 0 0Total 22 19 19 0 3 0 7 412 14 8 0 0 31
[ 0 - 3M [ 60 60 59 0 0 0 0 0 0 0 0 0
[ 3M - 1Y [ 184 184 184 0 0 0 6 250 0 0 0 0
[ 1Y - 2Y [ 0 0 0 0 0 0 16 184 0 4 0 0
[ 2Y - 3Y [ 0 0 0 0 0 0 0 0 0 0 0 0
[3Y - 5Y [ 44 44 44 0 0 0 3 32 0 0 0 0
[5Y - 10Y [ 34 32 34 0 0 0 50 762 50 429 0 0
[10Y - more 60 54 59 0 0 0 29 1,501 0 0 0 0Total 381 374 380 0 0 0 104 2,729 50 433 0 0 50
[ 0 - 3M [ 63 63 5 0 0 58 0 105 0 33 0 0
[ 3M - 1Y [ 7 7 7 0 0 0 1 119 32 267 0 0
[ 1Y - 2Y [ 16 16 16 0 0 0 0 17 1 113 0 0
[ 2Y - 3Y [ 124 124 124 0 0 0 1 16 1 39 0 0
[3Y - 5Y [ 68 68 68 0 0 0 0 6 29 500 0 0
[5Y - 10Y [ 127 126 127 0 0 0 22 726 60 0 0 0
[10Y - more 43 43 3 0 0 40 0 0 0 0 0 0Total 448 447 350 0 0 98 25 990 123 952 0 0 47
[ 0 - 3M [ 12 12 12 0 0 0 0 0 0 0 0 0
[ 3M - 1Y [ 40 40 40 0 0 0 0 19 0 12 0 0
[ 1Y - 2Y [ 22 17 21 0 2 0 0 0 0 9 0 0
[ 2Y - 3Y [ 64 64 64 0 0 0 3 245 0 0 0 0
[3Y - 5Y [ 67 60 62 0 5 0 1 21 0 0 0 0
[5Y - 10Y [ 123 79 108 0 15 0 0 0 0 0 0 0
[10Y - more 264 248 264 0 0 0 0 0 0 0 0 0Total 593 520 571 0 22 0 4 285 0 21 0 0 1
Finland
France
Germany
Croatia
Greece
Hungary
Ireland
201806 201806 201806 201806 201806 201806 201806 201806 201806 201806 201806 201806 201806
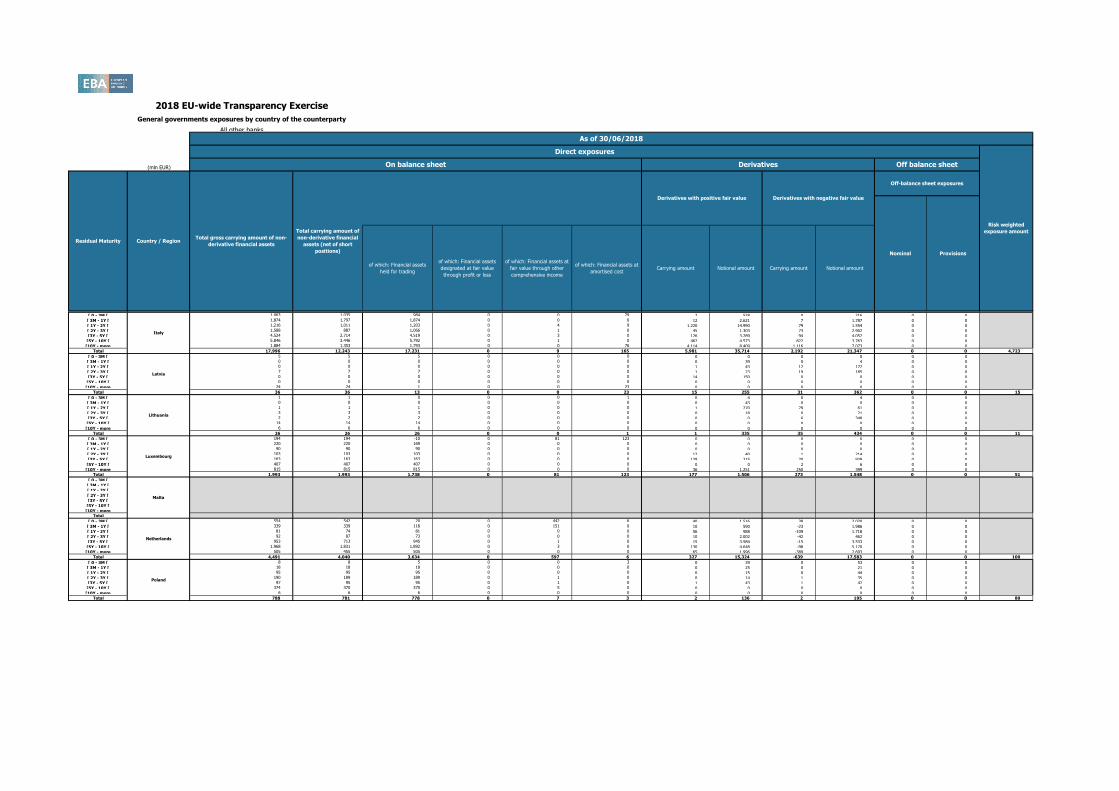
2018 EU-wide Transparency Exercise
General governments exposures by country of the counterparty
All other banks
(mln EUR)
Notional amount Carrying amount Notional amount
Austria
Residual Maturity Country / RegionTotal gross carrying amount of non-
derivative financial assets
Total carrying amount of
non-derivative financial
assets (net of short
positions)
As of 30/06/2018
Direct exposures
Risk weighted
exposure amount
On balance sheet Derivatives Off balance sheet
Off-balance sheet exposures
Nominal Provisions
Carrying amount
Derivatives with positive fair value Derivatives with negative fair value
of which: Financial assets
held for trading
of which: Financial assets
designated at fair value
through profit or loss
of which: Financial assets at
fair value through other
comprehensive income
of which: Financial assets at
amortised cost
[ 0 - 3M [ 1,063 1,035 984 0 0 79 2 528 0 216 0 0
[ 3M - 1Y [ 1,874 1,797 1,874 0 0 0 12 2,621 7 1,787 0 0
[ 1Y - 2Y [ 1,216 1,011 1,203 0 4 9 1,220 14,990 79 1,554 0 0
[ 2Y - 3Y [ 1,588 887 1,066 0 1 0 45 1,303 73 2,902 0 0
[3Y - 5Y [ 4,524 2,714 4,519 0 3 0 126 3,289 94 4,052 0 0
[5Y - 10Y [ 5,846 3,446 5,792 0 1 0 462 4,573 822 3,763 0 0
[10Y - more 1,884 1,353 1,793 0 0 76 4,114 8,409 1,116 7,073 0 0Total 17,996 12,243 17,231 0 9 165 5,981 35,714 2,192 21,347 0 0 4,723
[ 0 - 3M [ 5 5 5 0 0 0 0 0 0 0 0 0
[ 3M - 1Y [ 0 0 0 0 0 0 0 39 0 4 0 0
[ 1Y - 2Y [ 0 0 0 0 0 0 1 43 12 172 0 0
[ 2Y - 3Y [ 7 7 7 0 0 0 1 23 19 185 0 0
[3Y - 5Y [ 0 0 0 0 0 0 14 150 0 0 0 0
[5Y - 10Y [ 0 0 0 0 0 0 0 0 0 0 0 0
[10Y - more 24 24 1 0 0 23 0 0 0 0 0 0Total 36 36 13 0 0 23 15 255 31 362 0 0 15
[ 0 - 3M [ 1 1 0 0 0 1 0 4 0 4 0 0
[ 3M - 1Y [ 0 0 0 0 0 0 0 43 0 0 0 0
[ 1Y - 2Y [ 1 1 1 0 0 0 1 270 29 61 0 0
[ 2Y - 3Y [ 3 3 3 0 0 0 0 18 0 21 0 0
[3Y - 5Y [ 2 2 2 0 0 0 0 0 6 348 0 0
[5Y - 10Y [ 14 14 14 0 0 0 0 0 0 0 0 0
[10Y - more 6 6 6 0 0 0 0 0 0 0 0 0Total 26 26 26 0 0 1 1 335 35 434 0 0 11
[ 0 - 3M [ 194 194 -10 0 81 123 0 0 0 0 0 0
[ 3M - 1Y [ 220 220 169 0 0 0 0 0 0 0 0 0
[ 1Y - 2Y [ 90 90 90 0 0 0 0 0 0 0 0 0
[ 2Y - 3Y [ 103 103 103 0 0 0 12 40 1 214 0 0
[3Y - 5Y [ 163 163 163 0 0 0 129 215 20 928 0 0
[5Y - 10Y [ 407 407 407 0 0 0 0 0 2 6 0 0
[10Y - more 815 815 815 0 0 0 36 1,251 250 399 0 0Total 1,993 1,993 1,738 0 81 123 177 1,506 273 1,548 0 0 51
[ 0 - 3M [ 0 0 0 0 0 0 0 0 0 0 0 0
[ 3M - 1Y [ 0 0 0 0 0 0 0 0 0 0 0 0
[ 1Y - 2Y [ 0 0 0 0 0 0 0 0 0 0 0 0
[ 2Y - 3Y [ 0 0 0 0 0 0 0 0 0 0 0 0
[3Y - 5Y [ 0 0 0 0 0 0 0 0 0 0 0 0
[5Y - 10Y [ 0 0 0 0 0 0 0 0 0 0 0 0
[10Y - more 0 0 0 0 0 0 0 0 0 0 0 0Total 0 0 0 0 0 0 0 0 0 0 0 0 0
[ 0 - 3M [ 554 542 20 0 442 6 40 1,516 38 2,020 0 0
[ 3M - 1Y [ 339 339 118 0 151 0 10 590 -23 1,986 0 0
[ 1Y - 2Y [ 81 74 81 0 0 0 56 988 -109 1,718 0 0
[ 2Y - 3Y [ 92 87 73 0 0 0 10 2,002 -42 462 0 0
[3Y - 5Y [ 953 713 945 0 1 0 15 3,584 -15 3,533 0 0
[5Y - 10Y [ 1,968 1,831 1,892 0 3 0 130 4,648 -98 5,170 0 0
[10Y - more 505 455 505 0 0 0 65 1,996 -389 2,693 0 0Total 4,491 4,040 3,634 0 597 6 327 15,324 -639 17,583 0 0 100
[ 0 - 3M [ 8 8 5 0 0 3 0 39 0 53 0 0
[ 3M - 1Y [ 18 18 18 0 0 0 0 25 0 21 0 0
[ 1Y - 2Y [ 95 95 95 0 0 0 0 15 0 44 0 0
[ 2Y - 3Y [ 190 189 189 0 1 0 0 14 1 35 0 0
[3Y - 5Y [ 97 95 95 0 1 0 1 43 1 42 0 0
[5Y - 10Y [ 374 370 370 0 5 0 0 0 0 0 0 0
[10Y - more 6 6 6 0 0 0 0 0 0 0 0 0Total 788 781 778 0 7 3 2 136 2 195 0 0 80
Latvia
Lithuania
Luxembourg
Malta
Netherlands
Poland
Italy

201806 201806 201806 201806 201806 201806 201806 201806 201806 201806 201806 201806 201806
2018 EU-wide Transparency Exercise
General governments exposures by country of the counterparty
All other banks
(mln EUR)
Notional amount Carrying amount Notional amount
Austria
Residual Maturity Country / RegionTotal gross carrying amount of non-
derivative financial assets
Total carrying amount of
non-derivative financial
assets (net of short
positions)
As of 30/06/2018
Direct exposures
Risk weighted
exposure amount
On balance sheet Derivatives Off balance sheet
Off-balance sheet exposures
Nominal Provisions
Carrying amount
Derivatives with positive fair value Derivatives with negative fair value
of which: Financial assets
held for trading
of which: Financial assets
designated at fair value
through profit or loss
of which: Financial assets at
fair value through other
comprehensive income
of which: Financial assets at
amortised cost
[ 0 - 3M [ 80 79 73 0 0 6 0 8 0 0 0 0
[ 3M - 1Y [ 65 37 63 0 2 0 0 16 0 9 0 0
[ 1Y - 2Y [ 94 84 84 0 10 0 16 289 0 56 0 0
[ 2Y - 3Y [ 16 15 15 0 1 0 1 45 45 412 0 0
[3Y - 5Y [ 57 52 53 0 0 4 43 239 15 93 0 0
[5Y - 10Y [ 940 914 931 0 8 0 25 118 0 9 0 0
[10Y - more 452 406 452 0 0 0 53 90 0 0 0 0Total 1,704 1,588 1,672 0 21 10 138 804 61 579 0 0 247
[ 0 - 3M [ 88 88 88 0 0 0 0 9 0 9 0 0
[ 3M - 1Y [ 9 9 9 0 0 0 0 0 0 0 0 0
[ 1Y - 2Y [ 4 4 4 0 0 0 0 0 0 1 0 0
[ 2Y - 3Y [ 2 2 2 0 0 0 0 0 0 0 0 0
[3Y - 5Y [ 20 20 20 0 0 0 0 0 0 0 0 0
[5Y - 10Y [ 9 9 9 0 0 0 0 0 0 0 0 0
[10Y - more 31 31 31 0 0 0 0 0 0 0 0 0Total 164 164 164 0 0 0 0 9 0 9 0 0 0
[ 0 - 3M [ 6 6 6 0 0 0 0 35 0 19 0 0
[ 3M - 1Y [ 1 1 1 0 0 0 1 98 0 5 0 0
[ 1Y - 2Y [ 1 1 1 0 0 0 0 39 1 96 0 0
[ 2Y - 3Y [ 0 0 0 0 0 0 0 0 0 0 0 0
[3Y - 5Y [ 28 28 28 0 0 0 0 0 0 0 0 0
[5Y - 10Y [ 29 29 29 0 0 0 0 10 0 13 0 0
[10Y - more 13 13 13 0 0 0 0 0 0 0 0 0Total 79 79 79 0 0 0 2 182 2 133 0 0 78
[ 0 - 3M [ 59 59 0 0 0 59 0 4 0 33 0 0
[ 3M - 1Y [ 1 1 1 0 0 0 1 90 59 381 0 0
[ 1Y - 2Y [ 1 1 1 0 0 0 0 4 1 69 0 0
[ 2Y - 3Y [ 12 12 12 0 0 0 0 22 0 12 0 0
[3Y - 5Y [ 1 1 1 0 0 0 0 9 0 9 0 0
[5Y - 10Y [ 55 53 53 0 2 0 0 10 0 0 0 0
[10Y - more 3 3 3 0 0 0 0 0 0 0 0 0Total 133 131 71 0 2 59 1 140 60 503 0 0 30
[ 0 - 3M [ 475 473 466 0 1 8 24 126 1 154 0 0
[ 3M - 1Y [ 415 381 412 0 3 0 24 463 0 22 0 0
[ 1Y - 2Y [ 407 340 403 0 4 0 5 453 5 545 0 0
[ 2Y - 3Y [ 573 476 563 0 3 7 2 122 5 431 0 0
[3Y - 5Y [ 378 214 373 0 5 0 16 888 6 317 0 0
[5Y - 10Y [ 2,925 1,916 2,915 0 9 0 117 272 1 108 0 0
[10Y - more 1,583 1,342 1,583 0 0 0 14 25 0 0 0 0Total 6,755 5,143 6,714 0 24 16 202 2,350 18 1,576 0 0 129
[ 0 - 3M [ 636 636 5 0 0 299 23 11,071 -3 5,449 0 0
[ 3M - 1Y [ 847 843 48 0 0 0 50 1,546 -28 4,647 0 0
[ 1Y - 2Y [ 279 279 43 0 0 2 359 644 -277 13,107 0 0
[ 2Y - 3Y [ 109 107 85 0 0 7 139 1,374 -69 51 0 0
[3Y - 5Y [ 227 227 98 0 0 129 28 127 -13 6 0 0
[5Y - 10Y [ 270 246 270 0 0 0 15 203 -1 8 0 0
[10Y - more 144 138 144 0 0 0 23 173 -18 94 0 0Total 2,512 2,475 693 0 0 437 637 15,138 -409 23,363 0 0 917
[ 0 - 3M [ 3,402 3,411 1,803 1,028 509 62 31 1,091 43 1,182 48 0
[ 3M - 1Y [ 760 737 386 0 373 1 148 2,402 67 2,070 290 0
[ 1Y - 2Y [ 3,907 3,553 3,841 0 61 0 55 2,043 31 1,744 0 0
[ 2Y - 3Y [ 710 619 527 0 183 0 26 665 -27 1,955 0 0
[3Y - 5Y [ 2,777 2,245 2,338 0 426 2 98 1,901 14 1,292 0 0
[5Y - 10Y [ 9,993 7,737 8,087 0 1,897 7 131 2,168 37 1,281 0 0
[10Y - more 26,317 23,560 23,603 0 1,127 253 538 3,085 757 2,969 4 0Total 47,866 41,862 40,585 1,028 4,575 326 1,026 13,355 922 12,493 342 0 828
United Kingdom
Sweden
Portugal
Romania
Slovakia
Slovenia
Spain

201806 201806 201806 201806 201806 201806 201806 201806 201806 201806 201806 201806 201806
2018 EU-wide Transparency Exercise
General governments exposures by country of the counterparty
All other banks
(mln EUR)
Notional amount Carrying amount Notional amount
Austria
Residual Maturity Country / RegionTotal gross carrying amount of non-
derivative financial assets
Total carrying amount of
non-derivative financial
assets (net of short
positions)
As of 30/06/2018
Direct exposures
Risk weighted
exposure amount
On balance sheet Derivatives Off balance sheet
Off-balance sheet exposures
Nominal Provisions
Carrying amount
Derivatives with positive fair value Derivatives with negative fair value
of which: Financial assets
held for trading
of which: Financial assets
designated at fair value
through profit or loss
of which: Financial assets at
fair value through other
comprehensive income
of which: Financial assets at
amortised cost
[ 0 - 3M [ 0 0 0 0 0 0 0 0 0 4 0 0
[ 3M - 1Y [ 0 0 0 0 0 0 0 0 0 0 0 0
[ 1Y - 2Y [ 0 0 0 0 0 0 0 0 0 0 0 0
[ 2Y - 3Y [ 1 1 1 0 0 0 0 0 0 0 0 0
[3Y - 5Y [ 0 0 0 0 0 0 0 0 0 0 0 0
[5Y - 10Y [ 0 0 0 0 0 0 0 0 0 0 0 0
[10Y - more 0 0 0 0 0 0 0 0 0 0 0 0Total 1 1 1 0 0 0 0 0 0 4 0 0 0
[ 0 - 3M [ 0 0 0 0 0 0 0 0 0 0 0 0
[ 3M - 1Y [ 0 0 0 0 0 0 0 0 0 0 0 0
[ 1Y - 2Y [ 0 0 0 0 0 0 0 0 0 0 0 0
[ 2Y - 3Y [ 0 0 0 0 0 0 0 0 0 0 0 0
[3Y - 5Y [ 0 0 0 0 0 0 0 0 0 0 0 0
[5Y - 10Y [ 0 0 0 0 0 0 0 0 0 0 0 0
[10Y - more 0 0 0 0 0 0 0 0 0 0 0 0Total 0 0 0 0 0 0 0 0 0 0 0 0 0
[ 0 - 3M [ 8 7 7 0 0 0 75 72 -44 0 0 0
[ 3M - 1Y [ 161 158 161 0 0 0 25 499 -18 20 0 0
[ 1Y - 2Y [ 50 50 50 0 0 0 672 2,788 -472 119 0 0
[ 2Y - 3Y [ 211 209 211 0 0 0 604 1,447 -574 293 0 0
[3Y - 5Y [ 34 34 34 0 0 0 804 3,515 -462 425 0 0
[5Y - 10Y [ 273 258 273 0 0 0 12 437 -8 279 0 0
[10Y - more 14 14 14 0 0 0 33 183 0 73 0 0Total 751 729 751 0 0 0 2,224 8,940 -1,579 1,209 0 0 1,794
[ 0 - 3M [ 79 79 3 0 0 77 34 1,374 13 737 0 0
[ 3M - 1Y [ 84 84 29 0 0 0 1 254 77 503 0 0
[ 1Y - 2Y [ 21 21 21 0 0 0 1 99 1 221 0 0
[ 2Y - 3Y [ 160 160 160 0 0 0 8 330 10 408 0 0
[3Y - 5Y [ 288 288 288 0 0 0 1 46 6 187 0 0
[5Y - 10Y [ 81 80 81 0 0 0 4 92 0 4 0 0
[10Y - more 401 406 398 0 0 3 1 48 14 524 0 0Total 1,114 1,119 980 0 0 80 51 2,242 121 2,584 0 0 6
[ 0 - 3M [ 46 55 33 1 0 12 67 8,178 39 7,647 0 0
[ 3M - 1Y [ 237 435 237 0 0 0 177 22,568 180 26,839 0 0
[ 1Y - 2Y [ 661 612 661 0 0 0 28 9,726 13 10,076 0 0
[ 2Y - 3Y [ 412 407 412 0 0 0 65 5,036 25 8,550 0 0
[3Y - 5Y [ 914 866 798 0 34 0 35 8,278 28 3,705 0 0
[5Y - 10Y [ 347 304 347 0 0 0 6 154 26 641 0 0
[10Y - more 111 105 50 0 0 60 884 3,146 102 2,865 0 0Total 2,729 2,785 2,539 1 34 72 1,262 57,086 412 60,324 0 0 148
[ 0 - 3M [ 2 2 0 0 0 2 1 112 0 148 0 0
[ 3M - 1Y [ 0 0 0 0 0 0 1 26 0 0 0 0
[ 1Y - 2Y [ 0 0 0 0 0 0 0 0 0 0 0 0
[ 2Y - 3Y [ 0 0 0 0 0 0 0 2 0 2 0 0
[3Y - 5Y [ 1 1 1 0 0 0 0 0 0 0 0 0
[5Y - 10Y [ 0 0 0 0 0 0 0 0 0 0 0 0
[10Y - more 1 1 0 0 0 0 0 0 0 0 0 0Total 5 5 1 0 0 2 2 140 0 151 0 0 1
[ 0 - 3M [ 4,886 4,886 3,656 0 766 0 0 39 0 329 0 0
[ 3M - 1Y [ 3,089 3,086 2,857 0 232 0 0 30 0 82 0 0
[ 1Y - 2Y [ 1,311 1,311 1,061 0 0 0 1 58 2 155 0 0
[ 2Y - 3Y [ 641 640 641 0 0 0 4 193 3 129 0 0
[3Y - 5Y [ 1,574 1,574 1,574 0 0 0 4 102 7 196 0 0
[5Y - 10Y [ 1,044 1,042 1,042 0 0 0 1 28 3 110 0 0
[10Y - more 1,817 1,807 1,817 0 0 0 0 0 0 0 0 0Total 14,361 14,345 12,647 0 999 0 11 450 16 1,001 0 0 234
Iceland
Liechtenstein
Norway
Australia
Canada
Hong Kong
Japan

201806 201806 201806 201806 201806 201806 201806 201806 201806 201806 201806 201806 201806
2018 EU-wide Transparency Exercise
General governments exposures by country of the counterparty
All other banks
(mln EUR)
Notional amount Carrying amount Notional amount
Austria
Residual Maturity Country / RegionTotal gross carrying amount of non-
derivative financial assets
Total carrying amount of
non-derivative financial
assets (net of short
positions)
As of 30/06/2018
Direct exposures
Risk weighted
exposure amount
On balance sheet Derivatives Off balance sheet
Off-balance sheet exposures
Nominal Provisions
Carrying amount
Derivatives with positive fair value Derivatives with negative fair value
of which: Financial assets
held for trading
of which: Financial assets
designated at fair value
through profit or loss
of which: Financial assets at
fair value through other
comprehensive income
of which: Financial assets at
amortised cost
[ 0 - 3M [ 290 331 204 3 34 49 23 1,159 13 1,119 0 0
[ 3M - 1Y [ 844 844 793 0 51 0 9 518 9 866 0 0
[ 1Y - 2Y [ 2,334 2,305 2,108 0 129 0 3 226 2 153 0 0
[ 2Y - 3Y [ 2,732 2,673 2,726 0 0 0 8 333 3 109 0 0
[3Y - 5Y [ 2,736 2,607 2,432 0 209 0 11 186 7 175 0 0
[5Y - 10Y [ 6,185 5,399 5,502 0 42 0 1 28 1 12 0 0
[10Y - more 4,670 4,636 4,107 0 0 0 0 1 12 33 0 0Total 19,792 18,796 17,872 3 465 49 54 2,451 47 2,467 0 0 337
[ 0 - 3M [ 1,256 1,255 4 471 0 781 1 324 1 410 0 0
[ 3M - 1Y [ 57 57 57 0 0 0 1 184 2 280 0 0
[ 1Y - 2Y [ 170 170 170 0 0 0 3 227 3 208 0 0
[ 2Y - 3Y [ 82 82 82 0 0 0 3 203 6 397 0 0
[3Y - 5Y [ 122 122 122 0 0 0 15 597 13 516 0 0
[5Y - 10Y [ 36 32 36 0 0 0 0 4 1 34 0 0
[10Y - more 180 180 144 0 0 36 0 0 0 0 0 0Total 1,904 1,898 616 471 0 817 23 1,539 25 1,847 0 0 1,213
[ 0 - 3M [ 2 2 2 0 0 0 11 669 1 132 0 0
[ 3M - 1Y [ 2 2 2 0 0 0 0 25 0 0 0 0
[ 1Y - 2Y [ 0 0 0 0 0 0 0 0 46 500 0 0
[ 2Y - 3Y [ 0 0 0 0 0 0 0 0 1 8 0 0
[3Y - 5Y [ 0 0 0 0 0 0 0 0 0 0 0 0
[5Y - 10Y [ 0 0 0 0 0 0 0 0 15 79 0 0
[10Y - more 0 0 0 0 0 0 0 0 0 0 0 0Total 5 5 5 0 0 0 11 694 63 719 0 0 8
[ 0 - 3M [ 691 683 109 73 0 397 295 14,599 450 25,202 0 0
[ 3M - 1Y [ 55 52 55 0 0 0 129 5,930 124 30,756 0 0
[ 1Y - 2Y [ 334 332 334 0 0 0 28 2,653 27 5,005 0 0
[ 2Y - 3Y [ 51 52 51 0 0 0 5 909 18 849 0 0
[3Y - 5Y [ 131 127 131 0 0 0 42 2,049 21 1,333 0 0
[5Y - 10Y [ 481 472 481 0 0 0 66 768 32 497 0 0
[10Y - more 362 349 324 0 0 14 218 3,187 9 261 0 0Total 2,105 2,067 1,485 73 0 410 782 30,094 680 63,903 0 0 3,376
[ 0 - 3M [ 70 21 23 0 0 3 1 381 1 221 0 0
[ 3M - 1Y [ 78 46 49 0 0 0 253 1,217 255 1,420 0 0
[ 1Y - 2Y [ 18 18 18 0 0 0 84 907 87 1,059 0 0
[ 2Y - 3Y [ 23 23 23 0 0 0 164 1,425 164 1,398 0 0
[3Y - 5Y [ 143 142 143 0 0 0 87 1,625 103 1,806 0 0
[5Y - 10Y [ 297 297 244 0 0 53 11 86 8 63 0 0
[10Y - more 144 134 144 0 0 0 0 0 0 0 0 0Total 773 681 645 0 0 57 600 5,641 617 5,967 0 0 1
[ 0 - 3M [ 515 514 110 28 0 217 20 3,443 34 3,246 0 0
[ 3M - 1Y [ 8 8 8 0 0 0 59 2,025 -16 743 0 0
[ 1Y - 2Y [ 55 55 55 0 0 0 2 60 1 92 0 0
[ 2Y - 3Y [ 85 85 85 0 0 0 12 183 5 148 0 0
[3Y - 5Y [ 748 629 629 0 0 0 32 442 25 440 0 0
[5Y - 10Y [ 1,096 1,077 1,077 0 0 0 1 30 1 49 0 0
[10Y - more 151 144 150 0 0 0 54 354 86 903 0 0Total 2,658 2,511 2,115 28 0 217 180 6,537 136 5,621 0 0 4,855
[ 0 - 3M [ 347 347 346 0 0 1 34 90 -32 93 0 0
[ 3M - 1Y [ 1,451 1,451 1,451 0 0 0 6 853 4 2,780 0 0
[ 1Y - 2Y [ 471 471 471 0 0 0 13 1,131 13 960 0 0
[ 2Y - 3Y [ 816 816 816 0 0 0 15 1,080 15 1,283 0 0
[3Y - 5Y [ 316 316 238 0 0 0 98 3,733 99 3,602 0 0
[5Y - 10Y [ 376 376 289 0 0 87 55 314 49 245 0 0
[10Y - more 1,221 1,209 283 0 0 938 0 0 2 66 3,152 0Total 4,998 4,987 3,893 0 0 1,026 221 7,200 149 9,029 3,152 0 1,198
Other Central and eastern
Europe countries non EEA
Middle East
Latin America and the
Caribbean
Other advanced economies
non EEA
U.S.
China
Switzerland

201806 201806 201806 201806 201806 201806 201806 201806 201806 201806 201806 201806 201806
2018 EU-wide Transparency Exercise
General governments exposures by country of the counterparty
All other banks
(mln EUR)
Notional amount Carrying amount Notional amount
Austria
Residual Maturity Country / RegionTotal gross carrying amount of non-
derivative financial assets
Total carrying amount of
non-derivative financial
assets (net of short
positions)
As of 30/06/2018
Direct exposures
Risk weighted
exposure amount
On balance sheet Derivatives Off balance sheet
Off-balance sheet exposures
Nominal Provisions
Carrying amount
Derivatives with positive fair value Derivatives with negative fair value
of which: Financial assets
held for trading
of which: Financial assets
designated at fair value
through profit or loss
of which: Financial assets at
fair value through other
comprehensive income
of which: Financial assets at
amortised cost
[ 0 - 3M [ 3,272 3,269 3,266 0 0 6 0 70 0 49 0 0
[ 3M - 1Y [ 2,207 2,207 2,103 104 0 0 0 200 0 250 0 0
[ 1Y - 2Y [ 64 64 30 0 0 0 1 431 2 541 0 0
[ 2Y - 3Y [ 105 105 105 0 0 0 5 515 7 564 0 0
[3Y - 5Y [ 255 239 255 0 0 0 23 749 28 841 0 0
[5Y - 10Y [ 839 827 720 0 0 119 28 545 12 179 0 0
[10Y - more 1,032 1,016 938 0 0 94 0 0 0 0 97 0Total 7,775 7,727 7,416 104 0 220 58 2,511 49 2,425 97 0 557
[ 0 - 3M [ 407 1,294 141 0 181 12 39 2,465 43 2,013 1 0
[ 3M - 1Y [ 1,125 1,038 786 0 55 3 28 1,832 8 1,111 1 0
[ 1Y - 2Y [ 745 624 238 0 416 2 4 476 5 506 0 0
[ 2Y - 3Y [ 233 211 231 0 0 2 4 357 4 383 0 0
[3Y - 5Y [ 492 292 465 0 23 4 14 600 11 549 0 0
[5Y - 10Y [ 1,319 1,147 850 0 407 53 0 23 0 23 2 0
[10Y - more 5,276 5,172 530 0 0 4,741 0 0 0 51 7 0
Total 9,596 9,778 3,241 0 1,082 4,816 88 5,752 72 4,636 12 0 212
Notes and definitions
(2) The exposures reported cover only exposures to central, regional and local governments on immediate borrower basis, and do not include exposures to other counterparts with full or partial government guarantees
(3) The banks disclose the exposures in the "Financial assets held for trading" portfolio after offsetting the cash short positions having the same maturities.
(4) The exposures reported include the positions towards counterparts (other than sovereign) on sovereign credit risk (i.e. CDS, financial guarantees) booked in all the accounting portfolio (on-off balance sheet). Irrespective of the denomination and or accounting classification of the positions the economic substance over the form must be used as a criteria for the identification of the exposures to be included in this column. This item does not include exposures to counterparts (other than sovereign) with full or partial government guarantees by central, regional and local governments
Regions:
Other advanced non EEA: Israel, Korea, New Zealand, Russia, San Marino, Singapore and Taiwan.
Other CEE non EEA: Albania, Bosnia and Herzegovina, FYR Macedonia, Montenegro, Serbia and Turkey.
Middle East: Bahrain, Djibouti, Iran, Iraq, Jordan, Kuwait, Lebanon, Libya, Oman, Qatar, Saudi Arabia, Sudan, Syria, United Arab Emirates and Yemen.
(1) Information on sovereign exposures is only available for institutions that have sovereign exposures of at least 1% of total “Debt securities and loans receivables”. Country of breakdown is only available for institutions that hold non-domestic sovereign exposures of 10% or more compared to total
sovereign exposures. Where the latter threshold is not met, information is disclosed through the aggregate "Others".
(5) Residual countries not reported separately in the Transparency exercise
Latin America: Argentina, Belize, Bolivia, Brazil, Chile, Colombia, Costa Rica, Dominica, Dominican Republic, Ecuador, El Salvador, Grenada, Guatemala, Guyana, Haiti, Honduras, Jamaica, Mexico, Nicaragua, Panama, Paraguay, Peru, St. Kitts and Nevis, St. Lucia, St. Vincent and the Grenadines, Suriname, Trinidad and Tobago, Uruguay, Venezuela,Antigua And Barbuda, Aruba, Bahamas, Barbados, Cayman Islands, Cuba, French Guiana, Guadeloupe, Martinique, Puerto
Rico, Saint Barthélemy, Turks And Caicos Islands, Virgin Islands (British), Virgin Islands (U.S. ).
Africa: Algeria, Egypt, Morocco, South Africa, Angola, Benin, Botswana, Burkina Faso, Burundi, Cameroon, Cape Verde, Central African Republic, Chad, Comoros, Congo, Congo, The Democratic Republic Of The, Côte D'Ivoire, Equatorial Guinea, Eritrea, Ethiopia, Gabon, Gambia, Ghana, Guinea, Guinea-Bissau, Kenya, Lesotho, Liberia, Madagascar, Malawi, Mali, Mauritius, Mauritania, Mozambique, Namibia, Niger, Nigeria, Rwanda, Sao Tome And Principe, Senegal,
Seychelles, Sierra Leone, South Sudan, Swaziland, Tanzania, United Republic Of, Togo, Uganda, Zambia, Zimbabwe and Tunisia.
Africa
Others
Information disclosed in this template is sourced from COREP template C 33, introduced with the reporting framework 2.7, applicable for reports as of 31 march 2018.

201712 201712 201712 201712 201712 201712 201712 201806 201806 201806 201806 201806 201806 201806
(mln EUR)
Of which:
defaulted
Of which:
defaulted
Debt securities (including at amortised cost and fair value) 24,243 0 3 0 9 1 0 19,791 0 0 0 3 0 0
Central banks 132 0 0 0 0 0 0 0 0 0 0 0 0 0
General governments 12,059 0 1 0 1 1 0 9,234 0 0 0 1 0 0
Credit institutions 5,336 0 1 0 8 0 0 3,439 0 0 0 0 0 0
Other financial corporations 1,850 0 0 0 0 0 0 2,168 0 0 0 0 0 0
Non-financial corporations 4,866 0 1 0 0 0 0 4,950 0 0 0 1 0 0
Loans and advances(including at amortised cost and fair value) 359,331 810 13,767 12,264 565 5,261 8,021 370,408 608 9,169 8,084 323 2,685 6,088
Central banks 21,467 0 0 0 0 0 0 36,886 1 0 0 0 0 0
General governments 7,990 1 30 28 4 9 18 6,136 1 25 25 3 4 14
Credit institutions 31,050 10 10 3 4 5 0 39,836 10 6 6 0 3 0
Other financial corporations 109,939 30 68 26 4 28 7 117,273 70 45 45 3 11 1
Non-financial corporations 31,621 73 1,745 1,596 165 710 891 25,850 153 1,550 1,431 136 462 930
of which: small and medium-sized enterprises at amortised cost 13,343 34 969 890 100 358 537 9,450 24 941 894 105 311 585
Households 157,264 696 11,915 10,611 387 4,508 7,105 144,427 372 7,543 6,578 180 2,206 5,143
DEBT INSTRUMENTS other than HFT 383,574 810 13,770 12,264 574 5,262 8,021 390,199 608 9,169 8,084 326 2,685 6,088
OFF-BALANCE SHEET EXPOSURES 57,083 72 69 4 7 10 25,171 48 44 4 1 9
(1) For the definition of non-performing exposures please refer to COMMISSION IMPLEMENTING REGULATION (EU) 2015/227 of 9 January 2015, ANNEX V, Part 2-Template related instructions, subtitle 29(2) Insitutions report here collective allowances for incurrred but not reported losses (instruments at amortised cost) and changes in fair value of performing exposures due to credit risk and provisions (instruments at fair value other than HFT)(3) Insitutions report here specific allowances for financial assets, individually and collectively estimated (instruments at amortised cost) and changes in fair value of NPE due to credit risk and provisions (instruments at fair value other than HFT)
On non-
performing
exposures3
(4) For the on-balance sheet items, accumulated impairments and accumulated negative changes in fair value due to credit risk are disclosed with a positive sign if they are decreasing assets. Following this sign convention, information is disclosed with the opposite sign of what is reported according to the FINREP framework (templates F 18.00 / F 19.00), which follows a sign convention
based on a credit/debit convention, as explained in Annex V, Part 1 paragraphs 9 and 10 of Regulation (EU) No 680/2014 - ITS on Supervisory reporting. However, for the off-balance sheet instruments, the same item (‘Accumulated impairment, accumulated changes in fair value due to credit risk and provisions’) is disclosed consistently with the FINREP sign convention. This is because,
based on this sign convention, the provisions on off-balance sheet commitments are generally reported with a positive sign.
Collaterals and
financial
guarantees
received on non-
performing
exposures
Of which
performing but
past due >30
days and <=90
days
Of which non-performing1
On performing
exposures2
On non-
performing
exposures3
Of which
performing but
past due >30
days and <=90
days
Of which non-performing1
On performing
exposures2
Gross carrying amount
Accumulated impairment,
accumulated changes in fair
value due to credit risk and
provisions4
Collaterals and
financial
guarantees
received on non-
performing
exposures
Gross carrying amount
Accumulated impairment,
accumulated changes in fair
value due to credit risk and
provisions4
2018 EU-wide Transparency ExercisePerforming and non-performing exposures
All other banks
As of 31/12/2017 As of 30/06/2018

201712 201712 201712 201712 201712 201806 201806 201806 201806 201806
(mln EUR)
Debt securities (including at amortised cost and fair value) 1 1 0 0 0 0 0 0 0 0
Central banks 0 0 0 0 0 0 0 0 0 0
General governments 0 0 0 0 0 0 0 0 0 0
Credit institutions 1 1 0 0 0 0 0 0 0 0
Other financial corporations 0 0 0 0 0 0 0 0 0 0
Non-financial corporations 1 1 0 0 0 0 0 0 0 0
Loans and advances (including at amortised cost and fair value) 11,592 7,068 2,230 2,121 8,376 6,021 2,943 662 583 4,456
Central banks 0 0 0 0 0 0 0 0 0 0
General governments 30 18 5 5 18 22 14 2 1 15
Credit institutions 0 0 0 0 0 0 0 0 0 0
Other financial corporations 9 6 2 2 4 1 1 0 0 1
Non-financial corporations 1,475 781 243 217 816 1,224 636 165 137 618
of which: small and medium-sized enterprises at amortised cost 791 418 133 110 343 735 393 116 93 295
Households 10,078 6,263 1,979 1,897 7,538 4,775 2,293 495 445 3,822
DEBT INSTRUMENTS other than HFT 11,593 7,069 2,230 2,121 8,376 6,021 2,943 662 583 4,456
Loan commitments given 66 16 0 0 7 44 11 0 0 5
(1) For the definition of forborne exposures please refer to COMMISSION IMPLEMENTING REGULATION (EU) 2015/227 of 9 January 2015, ANNEX V, Part 2-Template related instructions, subtitle 30(2) For the on-balance sheet items, accumulated impairments and accumulated negative changes in fair value due to credit risk are disclosed with a positive sign if they are decreasing assets. Following this sign convention, information is disclosed with the opposite sign of what is reported according to the FINREP framework (templates F 18.00 / F 19.00), which follows a sign convention based on a
credit/debit convention, as explained in Annex V, Part 1 paragraphs 9 and 10 of Regulation (EU) No 680/2014 - ITS on Supervisory reporting. However, for the off-balance sheet instruments, the same item (‘Accumulated impairment, accumulated changes in fair value due to credit risk and provisions’) is disclosed consistently with the FINREP sign convention. This is because, based on this sign convention,
the provisions on off-balance sheet commitments are generally reported with a positive sign.
Collateral and financial
guarantees received on
exposures with
forbearance measures
Of which non-
performing
exposures with
forbearance
measures
Of which on non-
performing
exposures with
forbearance
measures
Of which non-
performing
exposures with
forbearance
measures
Of which on non-
performing
exposures with
forbearance
measures
Gross carrying amount of exposures
with forbearance measures
Accumulated impairment, accumulated
changes in fair value due to credit risk and
provisions for exposures with forbearance
measures2
Collateral and financial
guarantees received on
exposures with
forbearance measures
Gross carrying amount of exposures
with forbearance measures
Accumulated impairment, accumulated
changes in fair value due to credit risk and
provisions for exposures with forbearance
measures2
2018 EU-wide Transparency ExerciseForborne exposures
All other banks
As of 31/12/2017 As of 30/06/2018
Related Documents