Research report 2018 Data Breach Investigations Report 11 th edition http://bfy.tw/HJvH

Welcome message from author
This document is posted to help you gain knowledge. Please leave a comment to let me know what you think about it! Share it to your friends and learn new things together.
Transcript

Research report2018 Data Breach Investigations Report11th edition
http://bfy.tw/HJvH

2
First-time reader?Don’t be shy—welcome to the party. As always, this report is comprised of real-world data breaches and security incidents—either investigated by us or provided by one of our outstanding data contributors.
The statements you will read in the pages that follow are data-driven, either by the incident corpus that is the foundation of this publication, or by non-incident datasets contributed by several security vendors.
We combat bias by utilizing these types of data as opposed to surveys, and collecting similar data from multiple sources. We use analysis of non-incident datasets to enrich and support our incident and breach findings. Alas, as with any security report, some level of bias does remain, which we discuss in Appendix E.
Incidents vs. breaches
We talk a lot about incidents and breaches and we use the following definitions:
IncidentA security event that compromises the integrity, confidentiality or availability of an information asset.
BreachAn incident that results in the confirmed disclosure—not just potential exposure—of data to an unauthorized party.
VERIS resources
The Vocabulary for Event Recording and Incident Sharing (VERIS) is free to use and we encourage people to integrate it into their existing incident response reporting, or at least kick the tires.
veriscommunity.net features information on the framework with examples and enumeration listings.
github.com/vz-risk/veris features the full VERIS schema.
github.com/vz-risk/vcdb provides access to our database on publicly disclosed breaches, the VERIS Community Database.
About the cover
The arc diagram on the cover is based on the data in Appendix C: Beaten paths. It illustrates the actors, actions, and attributes as nodes; and the order of their occurrence in attack paths as edges—see the callout on page 54 for more information. We've counted how many times each node occurs in each path and sized them accordingly—the larger the node, the more times it appeared. The edges between nodes are represented as arcs between points. The color of each arc is based on how often an attack proceeds from one node to the next.
3
ContentsFirst-time reader? . . . . . . . . . . . . . . . . . . . . . . . . . . . . . . . . . . . . . . . . . . . . . . . . . . . . . . . . . . . . . . . . . . . . 2
Introduction . . . . . . . . . . . . . . . . . . . . . . . . . . . . . . . . . . . . . . . . . . . . . . . . . . . . . . . . . . . . . . . . . . . . . . . . . . 4
Summary of findings . . . . . . . . . . . . . . . . . . . . . . . . . . . . . . . . . . . . . . . . . . . . . . . . . . . . . . . . . . . . . . . . . . 5
Results and analysis . . . . . . . . . . . . . . . . . . . . . . . . . . . . . . . . . . . . . . . . . . . . . . . . . . . . . . . . . . . . . . . . . . 6
Social attacks: We’re only human . . . . . . . . . . . . . . . . . . . . . . . . . . . . . . . . . . . . . . . . . . . . . . . . . . . . . . 11
Ransomware, botnets, and other malware insights . . . . . . . . . . . . . . . . . . . . . . . . . . . . . . . . . . . . . . . 14
Denial of Service: Storm preparations . . . . . . . . . . . . . . . . . . . . . . . . . . . . . . . . . . . . . . . . . . . . . . . . . . 19
Incident Classification Patterns . . . . . . . . . . . . . . . . . . . . . . . . . . . . . . . . . . . . . . . . . . . . . . . . . . . . . . . . 22
Mind your own industry . . . . . . . . . . . . . . . . . . . . . . . . . . . . . . . . . . . . . . . . . . . . . . . . . . . . . . . . . . . . . . . 25
Accommodation and Food Services . . . . . . . . . . . . . . . . . . . . . . . . . . . . . . . . . . . . . . . . . . . . . . . . . . . 27
Education . . . . . . . . . . . . . . . . . . . . . . . . . . . . . . . . . . . . . . . . . . . . . . . . . . . . . . . . . . . . . . . . . . . . . . . . . . 29
Financial and Insurance . . . . . . . . . . . . . . . . . . . . . . . . . . . . . . . . . . . . . . . . . . . . . . . . . . . . . . . . . . . . . . 31
Healthcare . . . . . . . . . . . . . . . . . . . . . . . . . . . . . . . . . . . . . . . . . . . . . . . . . . . . . . . . . . . . . . . . . . . . . . . . . . 33
Information . . . . . . . . . . . . . . . . . . . . . . . . . . . . . . . . . . . . . . . . . . . . . . . . . . . . . . . . . . . . . . . . . . . . . . . . . 35
Manufacturing . . . . . . . . . . . . . . . . . . . . . . . . . . . . . . . . . . . . . . . . . . . . . . . . . . . . . . . . . . . . . . . . . . . . . . 37
Professional, Technical and Scientific Services . . . . . . . . . . . . . . . . . . . . . . . . . . . . . . . . . . . . . . . . . . 39
Public Administration . . . . . . . . . . . . . . . . . . . . . . . . . . . . . . . . . . . . . . . . . . . . . . . . . . . . . . . . . . . . . . . . . 41
Retail . . . . . . . . . . . . . . . . . . . . . . . . . . . . . . . . . . . . . . . . . . . . . . . . . . . . . . . . . . . . . . . . . . . . . . . . . . . . . 44
Wrap up . . . . . . . . . . . . . . . . . . . . . . . . . . . . . . . . . . . . . . . . . . . . . . . . . . . . . . . . . . . . . . . . . . . . . . . . . . . . 47
Appendices . . . . . . . . . . . . . . . . . . . . . . . . . . . . . . . . . . . . . . . . . . . . . . . . . . . . . . . . . . . . . . . . . . . . . . . . . 48
Appendix A: Countering cybersecurity threats . . . . . . . . . . . . . . . . . . . . . . . . . . . . . . . . . . . . . . . . . 49
Appendix B: Feeling vulnerable? . . . . . . . . . . . . . . . . . . . . . . . . . . . . . . . . . . . . . . . . . . . . . . . . . . . . . . 50
Appendix C: Beaten paths . . . . . . . . . . . . . . . . . . . . . . . . . . . . . . . . . . . . . . . . . . . . . . . . . . . . . . . . . . . . 54
Appendix D: Year in review . . . . . . . . . . . . . . . . . . . . . . . . . . . . . . . . . . . . . . . . . . . . . . . . . . . . . . . . . . . 58
Appendix E: Methodology . . . . . . . . . . . . . . . . . . . . . . . . . . . . . . . . . . . . . . . . . . . . . . . . . . . . . . . . . . . 60
Appendix F: Data destruction . . . . . . . . . . . . . . . . . . . . . . . . . . . . . . . . . . . . . . . . . . . . . . . . . . . . . . . . . 63
Appendix G: Timely and appropriate breach response for better outcomes . . . . . . . . . . . . . . . . 64
Appendix H: Web applications . . . . . . . . . . . . . . . . . . . . . . . . . . . . . . . . . . . . . . . . . . . . . . . . . . . . . . . . . 65
Appendix I: Contributing organizations . . . . . . . . . . . . . . . . . . . . . . . . . . . . . . . . . . . . . . . . . . . . . . . . 66

4
IntroductionI would give all my fame for a pot of ale, and safety
Henry V: Act 3, Scene 2
A most sincere thank you, dear reader, for joining us for this, the 11th installment of the Verizon Data Breach Investigations Report (DBIR). It is difficult to overstate our gratitude to you for your continued interest in and support of this publication. Over the last 11 years, there have been various twists and turns, iterations and additions to the DBIR, but our ultimate goal has remained the same—to inform you on the threats you face and to provide support, instruction and encouragement on how best to protect against them.
This year we have over 53,000 incidents and 2,216 confirmed data breaches.
The report is full of dirty deeds and unscrupulous activities committed by strangers far away and by those you thought you knew. It is our continued hope that you can take away useful and instructive tips from this report to help you avoid having those things happen to you in 2018.
The quote at the beginning of this section was spoken by a young boy about to go into battle for the first time, and if we are honest, we can all probably identify with him to some degree. We all crave safety (and perhaps also ale), but it seems there’s no safety to be had in today’s world. The reality is that there has never been a world devoid of risk at any time, but at least in the past no one was bombarded by incessant negativity (unless their mother in law lived with them), with rumors of disaster, economic collapse, war and famine pouring in an unending stream into their lives from TVs, laptops, tablets and phones. Modernity affords us little refuge from the onslaught of depressing and distressing media headlines. What then should we do? Unplug everything, stock up on MREs (meals ready to eat) and move to the mountains? It’s one option, but you’d probably miss things such as indoor plumbing and air conditioning. Another (and we think, better) alternative is to accept that while there’s little guarantee of total safety, there does exist the ability to proactively act to protect what you value.
At first glance, it is possible that one could view this report as describing an information security dystopia since it is made up of incidents where the bad guys won, but we don’t think that is the correct way to look at it. Rather than simply seeing the DBIR as a litany of nefarious events that have been successfully perpetrated against others and therefore, may happen to you, think of it more as a recipe for success. If you want your security program to prosper and mature, defend against the threats exposed in these pages.
The DBIR was created to provide a place for a security practitioner to look for data-driven, real-world views on what commonly befalls companies with regard to cybercrime. That need to know what is happening and what we can do to protect ourselves is why the DBIR remains relevant over a decade later. We hope that as in years past, you will be able to use this report and the information it contains to increase your awareness of what tactics attackers are likely to use against organizations in your industry, as a tool to encourage executives to support much-needed security initiatives, and as a way to illustrate to employees the importance of security and how they can help. As always, this report would not be possible without the collaboration of our data-sharing community, so thank you again, contributors. We also encourage you, the reader, to consider joining forces with us in the future by providing data that can be added to this corpus that will help us all to be better informed and thereby better equipped to keep ourselves out of the headlines.
The report will begin with a few high-level trends and findings from this year’s data. Next, we will take a look at problems such as malware (with a focus on ransomware), Denial of Service (DoS) attacks and the social engineering aspect of cybercrime, and how they continue to plague us. From there we will take a brief look at the nine incident classification patterns (yes, they still cover the vast majority of both incidents and breaches), and then we will dig deeper into the various industries that we have sufficient data to examine in detail. We will explore the beauty that is vulnerability management and dip our toes into analysis of event chains and the paths taken by the adversary. Finally, we wrap things up with our annual review of the newsworthy InfoSec events from 2017.
Data subsetsWe have received a considerable amount of breach data involving botnets that target organizations’ customers, infecting their personally owned devices with malware that captures login details. Those credentials are then used to access banking applications and other sites with authentication. These are legitimate breaches, but due to the sheer number of them (over 43,000 successful accesses via stolen credentials), they would drown out everything else. We point out where this exclusion would have most affected results, and discuss these breaches separately in the “Ransomware, botnets, and other malware” insights section. We have created subsets of other bulk incidents in the past, and detailed those in “Appendix E: Methodology.”

5
Summary of findings1
1. We filtered out point-of-sale (POS) malware associated with a spree that affected numerous victims in the Accommodation and Food Services industry as it did not reflect the vector percentage across all industries.
Who’s behind the breaches?
73% perpetrated by outsiders
28% involved internal actors
2% involved partners
2% featured multiple parties
50% of breaches were carried out by organized criminal groups
12% of breaches involved actors identified as nation-state or state-affiliated
Who are the victims?
24% of breaches affected healthcare organizations
15% of breaches involved accommodation and food services
14% were breaches of public sector entities
58% of victims are categorized as small businesses
What tactics are utilized?
48% of breaches featured hacking
30% included malware
17% of breaches had errors as causal events
17% were social attacks
12% involved privilege misuse
11% of breaches involved physical actions
What are other commonalities?
49% of non-POS malware was installed via malicious email1
76% of breaches were financially motivated
13% of breaches were motivated by the gain of strategic advantage (espionage)
68% of breaches took months or longer to discover

6
Results and analysisWe have strived to diversify our annual dataset by engaging external collaborators, domestic and international, public and private, large and small. We have seen our number of contributors increase over the years and have realized changes in our contributor base in every year since the third publication. These changes in contributors, and the potential changes in their areas of focus add a layer of difficulty when identifying trends over time. We must be diligent to ensure we are not making a proclamation that is heavily influenced by a single contributor or an isolated event. What follows is a look back in time regarding several components of data breaches, namely the threat actors, their motives, and the actions they leverage. A closer look at overall results specific to this year’s dataset is also included.
We define who is behind the data breach as the threat actor. You may have different and less G-rated names for them, which is fine—we do not judge. When looking at how threat actors are represented from a high level we see that individuals outside of the organization continue their reign as the most common thorn in your side.
Financial
0%
20%
40%
60%
80%
Bre
ache
s
20132012 20172015 20162014
Actor motives in breaches
FunOther
Grudge
Espionage
0%
20%
40%
60%
Bre
ache
s
2011 20122010 20172015 20162013 2014
Actors involved in breaches
Partner Multiple
Internal
External
Figure 1. Threat actors within breaches over time Figure 2. Threat actor motives within breaches over time
7
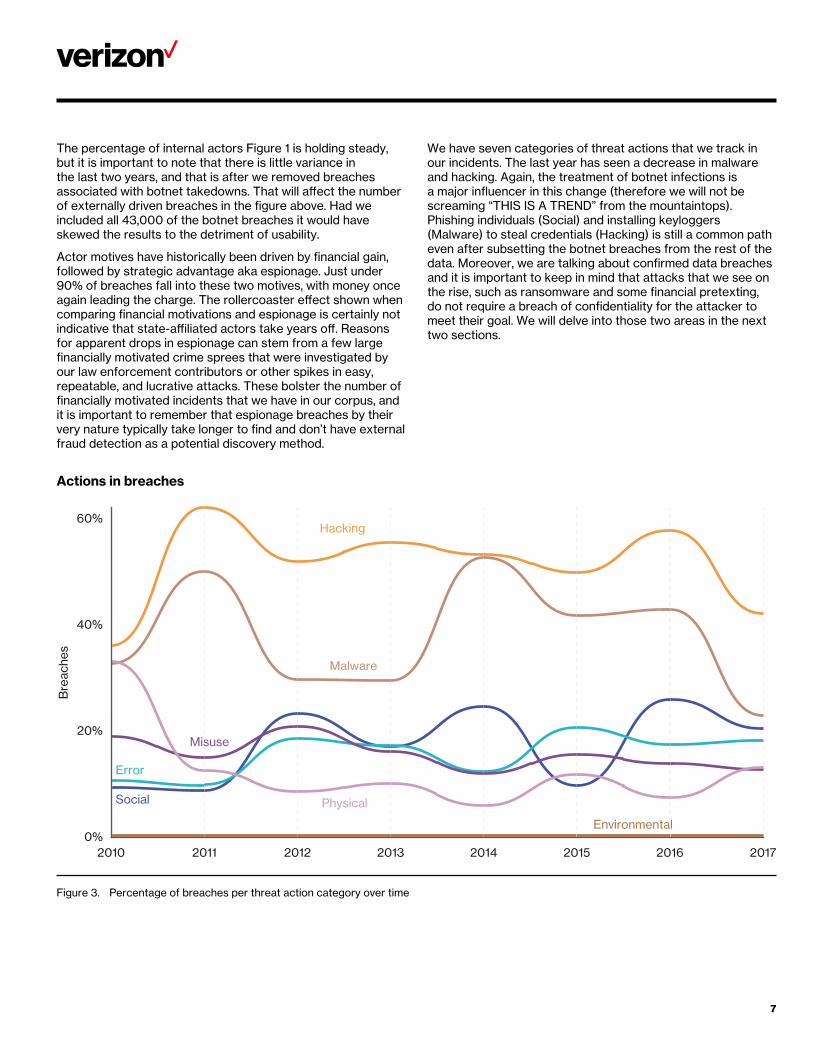
The percentage of internal actors Figure 1 is holding steady, but it is important to note that there is little variance in the last two years, and that is after we removed breaches associated with botnet takedowns. That will affect the number of externally driven breaches in the figure above. Had we included all 43,000 of the botnet breaches it would have skewed the results to the detriment of usability.
Actor motives have historically been driven by financial gain, followed by strategic advantage aka espionage. Just under 90% of breaches fall into these two motives, with money once again leading the charge. The rollercoaster effect shown when comparing financial motivations and espionage is certainly not indicative that state-affiliated actors take years off. Reasons for apparent drops in espionage can stem from a few large financially motivated crime sprees that were investigated by our law enforcement contributors or other spikes in easy, repeatable, and lucrative attacks. These bolster the number of financially motivated incidents that we have in our corpus, and it is important to remember that espionage breaches by their very nature typically take longer to find and don’t have external fraud detection as a potential discovery method.
We have seven categories of threat actions that we track in our incidents. The last year has seen a decrease in malware and hacking. Again, the treatment of botnet infections is a major influencer in this change (therefore we will not be screaming “THIS IS A TREND” from the mountaintops). Phishing individuals (Social) and installing keyloggers (Malware) to steal credentials (Hacking) is still a common path even after subsetting the botnet breaches from the rest of the data. Moreover, we are talking about confirmed data breaches and it is important to keep in mind that attacks that we see on the rise, such as ransomware and some financial pretexting, do not require a breach of confidentiality for the attacker to meet their goal. We will delve into those two areas in the next two sections.
0%
20%
40%
60%
Bre
ache
s
Environmental
Social
Error
Misuse
Malware
Physical
Hacking
20112010 20132012 20152014 2016 2017
Actions in breaches
Figure 3. Percentage of breaches per threat action category over time

8
Overall findings
The industry sections will feature specific actions, actors, asset and attribute data. Below are the overall “greatest hits” for this year’s dataset. Longtime readers can think of this as a quick study guide based on the 4As (Actor, Action, Asset, Attribute).
DoS (hacking)21,409
Loss (error)3,740
Phishing (social)
Misdelivery (error)
Ransomware (malware)
C2 (malware)
Use of stolen credentials (hacking)
RAM scraper (malware)
Privilege abuse (misuse)
Use of backdoor or C2 (hacking)
Backdoor (malware)
Theft (physical)
Pretexting (social)
Skimmer (physical)
Data mishandling (misuse)
Spyware/Keylogger (malware)
Brute force (hacking)
Capture app data (malware)
Misconfiguration (error)
Publishing error (error)
Top 20 action varieties in incidents
1,192
973
787
631
424
318
233
221
207
190
170
139
122
121
109
102
80
76Inciden
ts
100%0% 20% 40% 60% 80%
Figure 4. Top 20 threat action varieties (incidents) (n=30,362)
Use of stolen credentials (hacking)399
RAM scraper (malware)312
Phishing (social)236
Privilege abuse (misuse)201
Misdelivery (error)187
Top 20 action varieties in breaches
Use of backdoor or C2 (hacking)148
Theft (physical)123
C2 (malware)117
Backdoor (malware)115
Pretexting (social)114
Skimmer (physical)109
Brute force (hacking)92
Spyware/keylogger (malware)74
Misconfiguration (error)66
Publishing error (error)59
Data mishandling (misuse)55
Capture app data (malware)54
Export data (malware)51
SQLi (hacking)45
Password dumper (malware)45B
reac
hes
100%0% 20% 40% 60% 80%
Figure 5. Top 20 threat action varieties (confirmed data breaches) (n=1,799)

9
Organized crime681
Una�liated215
State-a�liated138
Nation-state
Former employee
Other
Acquaintance
Activist
Competitor
Customer
21
15
9
7
6
4
1
Top external actor varieties in breaches
Breac
hes
100%0% 20% 40% 60% 80%
System admin72
End-user62
Other62
Doctor or nurse32
Developer
Manager
Executive
Cashier
Finance
Human resources
15
9
8
6
6
5
Top internal actor varieties in breaches
Breac
hes
100%0% 20% 40% 60% 80%
Figure 6. Top external actor varieties within confirmed data breaches (n=1,097)
Figure 7. Top internal actor varieties within confirmed data breaches (n=277)
Database (server)398
POS terminal (user device)321
POS controller (server)320
Web app (server)279
Desktop (user device)260
Documents (media)229
Mail (server)
Human resources (person)
Laptop (user device)
Gas pump terminal (terminal)
Top assets involved in breaches
125
117
79
58Breac
hes
100%0% 20% 40% 60% 80%
Personal
Payment563
Medical505
Credentials221
Internal
Secrets
System
Bank
Classified
154
137
62
60
24
Top data varieties compromised
730
Breac
hes
100%0% 20% 40% 60% 80%
Figure 8. Top varieties of assets within confirmed data breaches (n=2,023)
Figure 9. Top data varieties compromised (n=2,037)

10
Breach timeline
When breaches are successful, the time to compromise continues to be very short. While we cannot determine how much time is spent in intelligence gathering or other adversary preparations, the time from first action in an event chain to initial compromise of an asset is most often measured in seconds or minutes. The discovery time is likelier to be weeks or months. The discovery time is also very dependent on the type of attack, with payment card compromises often discovered based on the fraudulent use of the stolen data (typically weeks or months) as opposed to a stolen laptop which is discovered when the victim realizes they have been burglarized.
Let’s get the obvious and infeasible goal of “Don’t get compromised” out of the way. A focus on understanding what data types are likely to be targeted and the application of controls to make it difficult (even with an initial device compromise) to access and exfiltrate is key. We do not have a lot of data around time to exfiltration, but improvements in that metric, combined with time to discovery can result in the prevention of a high-impact confirmed data breach.
0%
20%
40%
60%
Bre
ache
s
Seconds Minutes Hours Days Weeks Months Years
Breach timelines
0%
20%
40%
60%
Compromise, n=171
0%
20%
40%
60%
Exfiltration, n=56
0%
20%
40%
60%
Discovery, n=562
Containment, n=82
Figure 10. Time span of events

11
Social attacks: We’re only humanThis section does not include incidents where organizations’ customers were the phishing targets. Phishing and pretexting represent 98% of social incidents and 93% of breaches. Email continues to be the most common vector (96%).
Frequency 1,450 incidents, 381 with confirmed data disclosure
Top 3 patterns Crimeware, Everything Else, and Cyber-Espionage represent 93% of all security incidents
Threat actors 99% External, 6% Internal, <1% Partner (breaches)
Actor motives 59% Financial, 38% Espionage (breaches)
Data compromised
47% Personal, 26% Secrets, 22% Internal, 17% Credentials
Defining moments
There are two main varieties of social attack that we are going to focus on in this section, and they share a lot of similarities. Phishing (1,192 incidents, 236 confirmed data breaches) is the crafting of a message that is sent typically via email and is designed to influence the recipient to “take the bait” via a simple mouse click. That bait is most often a malicious attachment but can also be a link to a page that will request credentials or drop malware. Pretexting (170 incidents, 114 confirmed data breaches) is the creation of a false narrative to obtain information or influence behavior.
There is a grey area here in that there is a level of pretext to every phishing email and thus there is not always a clear line to draw between the two. For the purposes of this study, pretexting was reserved for social attacks that include a level of dialogue or back and forth (and this certainly is the case when the pretexting is over the phone), but also if a specific persona was used by the attacker. In cases where executives were impersonated, often using their legitimate email accounts, it was marked as pretexting. The more “fire and forget” approach was marked as phishing. It would be easier to merely mark everything as phishing, it is the more common term after all, but there are some differences between the attacks that are of interest. Note we don’t want to imply mutual exclusivity either. We have incidents where an employee is phished, leading to email account compromise, leading to establishing a pretext against a second human target.
Vexed with pretext
One of the differences between pretexting and phishing events is the lack of reliance on malware installation in the former for the attacker to meet their end goal. Malware was found in less than 10% of incidents that featured pretexting in contrast to phishing incidents where malware was present over two-thirds of the time. So, pretexting is less about gaining a foothold and more about acquiring information directly from the actions taken by the target. The two scenarios that were most prevalent in pretexting attacks were those targeting employees who either worked in finance or human resources. The finance employees were emailed by the threat actor impersonating the CEO or other executive and influenced into transferring money. Sometimes via wire transfer, sometimes by being presented with phony invoices to handle. In some cases, more up-front work had been done to compromise the email account of the executive that was being impersonated (hence the common term Business Email Compromise). In other cases, the email address is spoofed or the email is sent with a similar looking username and domain. The latter presents a situation where a confidentiality loss does not necessarily have to occur for a successful attack. These attacks are also very lucrative, with numerous six-figure losses as part of the scam.
The incidents targeting human resources staff do have a confidentiality loss associated with them. The data most often coveted in these incidents is the W-2 information of employees—loaded with salary and other personal information that can be used to file fraudulent tax returns on their behalf and directly depositing any refunds to the attackers’ account. The persona used in these will be similar to the attacks against the finance department, after all you wouldn’t just send this information to anyone—would you? We have seen financial pretexting rise from 61 incidents in the 2017 DBIR to 170 this year. While the pretexts associated with fraudulent transactions have increased from last year, the big jump stems from an 83 incident increase in attacks targeting HR staff.

12
I feel no curiosity
That is the mantra users should have when deciding on whether they should click on the attachment referencing a shipping notice for the item they don’t remember purchasing. Alas, while pretexting may have been one of the movers and shakers in this year’s dataset, phishing’s heyday has not ended. It is still far and away the most common method of social attack. Unlike pretexting, which is financially motivated over 95% of the time, motives for phishing are split between financial (59%) and espionage (41%). Phishing is often used as the lead action of an attack and is followed by malware installation and other actions that ultimately lead to exfiltration of data. More on the sheer volume of email-borne malware awaits you in the next section. With “only” 13% of breaches featuring phishing, it may appear to be feeding from the bottom this year. This is perhaps a good time to reiterate the fact that banking Trojan botnets were removed from these numbers. Furthermore, 70% of breaches associated with nation-state or state-affiliated actors involved phishing.
Get back on the train
For the sixth straight year we are able to report not only on how phishing is represented in our incident and breach dataset, but also provide some insight from four contributors specializing in security awareness training via sanctioned phishing campaigns. We will explore how susceptible organizations are to phishing right after we present our data on the top industries affected by data breaches featuring social attacks, and the data varieties most frequently targeted.
Normally when we start talking phishing, it’s all doom and gloom. But you know what? Most people never click phishing emails. That’s right, when analyzing results from phishing simulations the data showed that in the normal (median) organization, 78% of people don’t click a single phish all year. That’s pretty good news. Unfortunately, on average 4%2 of people in any given phishing campaign will click it, and the vampire only needs one person to let them in. See the “Feeling vulnerable” appendix for a little bit about how different it looks inside an organization versus the outside, but I’m sure you can guess. The actor is best left outside the walls.
78% of people didn’t click a single phish all year.
2. This is actually an improvement. It was 11% in 2014 (Verizon 2015 DBIR, page 12).
Public (92)96
Healthcare (62)56
Education (61)41
Professional (54)28
Financial (52)
Manufacturing (31-33)
Other services (81)
Information (51)
Utilities (22)
Entertainment (71)
Top industries in social breaches
25
18
15
15
14
11Breac
hes
100%0% 20% 40% 60% 80%
Figure 11. Top industries within Social breaches (n=351)
Personal171
Secrets94
Internal80
Credentials61
Medical
System
Classified
Bank
Copyrighted
Payment
Virtual currency
Data varieties compromised in social breaches
22
20
14
11
4
4
1Breac
hes
100%0% 20% 40% 60% 80%
Figure 12. Data varieties compromised in Social breaches (n=362)

13
Part of your overall strategy to combat phishing could be that you can try and find those 4% of people ahead of time and plan for them to click. As Figure 13 shows, the more phishing emails someone has clicked, the more they are likely to click in the future.
0%
10%
20%
Clic
k ra
te o
n fu
ture
em
ails
Likelihood of clicking based on previous performance
Number of phishing emails previously clicked by user
50 10 15 20
30%
Figure 13. Click rates of users based on historical performance in phishing tests (n=2,771,850)
However, it may not be just the “4%” that need more training or other controls (more on that later). Additional guidance should also be bestowed on users that don’t report the phishing! Only 17% of phishing campaigns were reported. And as Figure 14 shows, almost no campaigns are reported by the majority of the people phished. Reducing the amount of time to detect and ultimately respond to phishing attacks is another key component in your defense.
3. It was 1 minute, 22 seconds back in 2014 (Verizon 2015 DBIR, page 13), and looking back maybe those were control subjects. If you are opening every email within 2 minutes, how are you getting any real work done?
4. telegraph-office.com/pages/turner.html
So, if it does get reported, how long do you have to do something about it? The test results came back and the diagnosis was the time until the first click in most campaigns is 16 minutes.3 Most people who are going to click a phishing email do so in just over an hour. The first report from a savvy user normally comes in around 28 minutes with half of the reports done by 33 minutes. So you may not catch the first click but you might be able to limit the number of future clickers.
Things to consider
Clicks happenSome people will click an attachment faster than Harry Turner.4 Perhaps you send them a tablet and a keyboard or a laptop running a sandboxed OS that only runs signed code.
DEFCON “Meh”Reduce the impact of a compromised user device by segmenting clients from critical assets, and using strong authentication (i.e., more than a keylogger is needed to compromise) to access other security zones within your network. If you use email in the cloud, require a second factor.
Talking about practiceTrain the responders along with the end-user base. Test your ability to detect a campaign, identify potential infected hosts, determine device activity post-compromise, and confirm existence of data exfiltration. Practice, practice, practice to react quickly and efficiently to limit the impact of a successful phish.
Role-playing gamesProvide role-specific training to users that are targeted based on their privileges or access to data. Educate employees with access to employee data such as W-2s or the ability to transfer funds that they are likely targets. Increase their level of skepticism—it isn’t paranoia if someone really is out to get them.
Num
ber
of c
ampa
igns
Percent of people who reported the campaign
Most campaigns have few or no people report them.
Few campaigns are reported by most people.
25%0% 50% 75% 100%
Reporting rates of phishing campaigns
Figure 14. Reporting rates of phishing campaigns (n=9,697)

14
Ransomware, botnets, and other malware insights
5. Not those so much, the new new ones.
If you are perusing this fine report and have not heard about ransomware, let us be the first to say, “Congratulations on being unfrozen from that glacier!” A lot has happened over the last couple of years. The Chicago Cubs won the World Series, a car was just shot into outer space for fun, and the new Star Wars movies are really good.5 We won’t bring up politics as it may be too much for you to handle as you assimilate back into society—especially after we talk more about the scourge that is ransomware.
Ransomware within malware incidents
0%
10%
20%
30%
40%
Inci
dent
s
201720162015201420132012
Figure 15. Ransomware within malware incidents over time
Ransomware was first mentioned in the 2013 DBIR and we referenced that these schemes could “blossom as an effective tool of choice for online criminals”. And blossom they did! Now we have seen this style of malware overtake all others to be the most prevalent variety of malicious code for this year’s dataset. Ransomware is an interesting phenomenon that, when viewed through the mind of an attacker, makes perfect sense.
Ransomware can be:
• Used in completely opportunistic attacks affecting individuals’ home computers as well as targeted strikes against organizations
• Attempted with little risk or cost to the adversary involved
• Successful with no reliance on having to monetize stolen data
• Deployed across numerous devices in organizations to inflict bigger impacts and thus command bigger ransoms
0%
100%
75%
50%
25%
Inci
dent
s
201720162015201420132012
Asset categories within Ransomware incidents
User device
Person
Server
Network Embedded
Figure 16. Asset categories within Ransomware incidents over time
Figure 16 provides some clues on the larger impacts that ransomware is having. Focusing on the increase in server assets that were affected over time we see that infections aren’t limited to the first desktop that is infected. Lateral movement and other post-compromise activities often reel in other systems that are available for infection and obscuration. Encrypting a file server or database is more damaging than a single user device.

15
Those evil-natured botnets
As stated in the introduction, this year we again received a large number of botnet infections. The last two years we left Dridex-related breaches in the dataset. This year, while Dridex isn’t a big thing anymore, other botnets still are (to the tune of over 43,000 breaches involving use of customer credentials stolen from botnet infected clients). We have pulled these breaches out to look at separately so that it doesn’t overshadow other findings. Lest you be fooled, this is a global problem with victims on every populated continent as you can see in Figure 17.6
Botnets can affect you in two different ways. The first way, you never even see the bot. Instead, your users download the bot, it steals their credentials, and then uses them to log in to your systems. The aforementioned bounty of data provided through botnet takedowns represents this case. This attack primarily targeted banking organizations (91%) though Information (5%) and Professional Services organizations (2%) were victims as well.
6. Note: We didn’t normalize this by population. We’re trying to impress the global nature of the victims, not pit countries against each other.
The second way organizations are affected involves compromised hosts within your network acting as foot soldiers in a botnet. Figure 18 sheds some light on organizations’ response to this event. It displays 12 unique botnets chosen at random from a rather large dataset. The data shows that most organizations clear most bots in the first month (give or take a couple of days). However, there’s a bump for several botnets way on the right side calling out organizations that are struggling to clear the infection.
So, if you’re the kind of organization where your users are targeted, add a second factor to their authentication. And whether or not the first scenario applies to you; if you’ve got computers, the second definitely will. Have an operational ability to find and remove botnet malware so that you’re on the left side of Figure 18, not the right.
1–69 70–378 379–13,316 13,317+No data
Geographic spread of botnet breaches
Figure 17. Botnet breaches by country (n=43,112)

16
0 100 200Days
Bot
nets
Days taken to contain botnets
Figure 18. Days to botnet containment
17
Num
ber
of o
rgan
izat
ions
Days
100 200 300
Days receiving malware per organization
Most organizations receive malware on six or fewer days per year
Fewer than 1.8% of organizations receive malware every other day or more
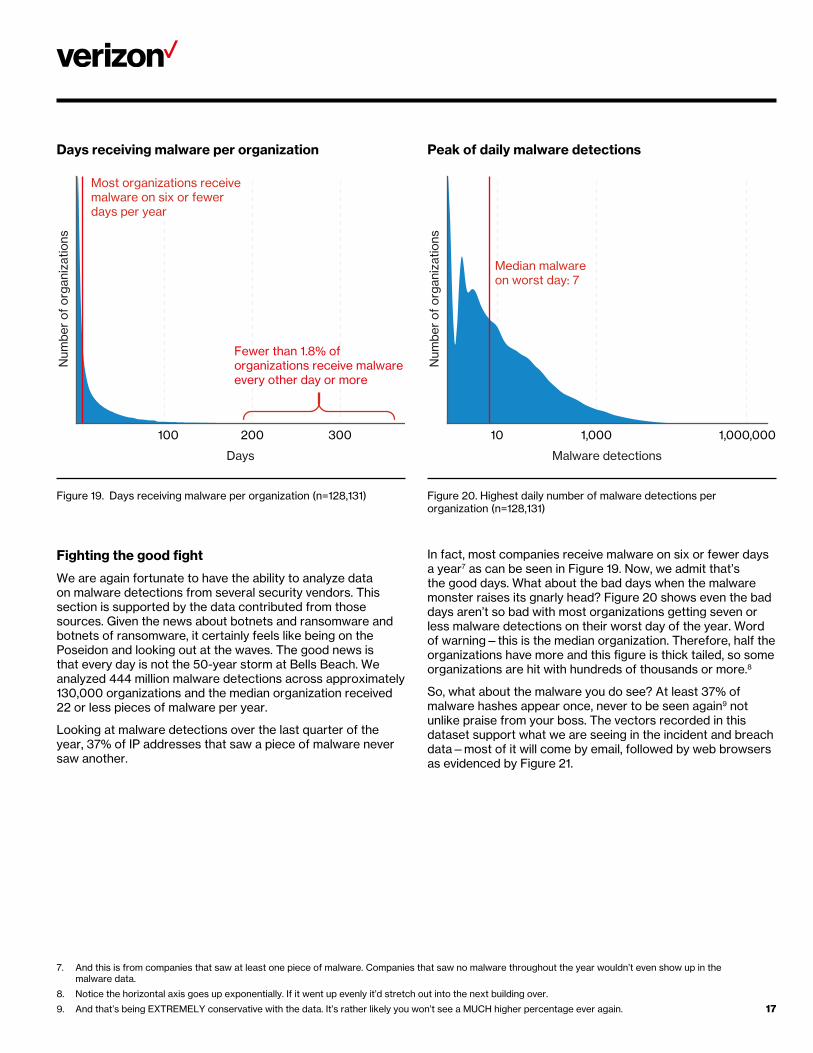
Figure 19. Days receiving malware per organization (n=128,131)
Fighting the good fight
We are again fortunate to have the ability to analyze data on malware detections from several security vendors. This section is supported by the data contributed from those sources. Given the news about botnets and ransomware and botnets of ransomware, it certainly feels like being on the Poseidon and looking out at the waves. The good news is that every day is not the 50-year storm at Bells Beach. We analyzed 444 million malware detections across approximately 130,000 organizations and the median organization received 22 or less pieces of malware per year.
Looking at malware detections over the last quarter of the year, 37% of IP addresses that saw a piece of malware never saw another.
7. And this is from companies that saw at least one piece of malware. Companies that saw no malware throughout the year wouldn’t even show up in the malware data.
8. Notice the horizontal axis goes up exponentially. If it went up evenly it’d stretch out into the next building over.
9. And that’s being EXTREMELY conservative with the data. It’s rather likely you won’t see a MUCH higher percentage ever again.
Num
ber
of o
rgan
izat
ions
Malware detections
10 1,000 1,000,000
Peak of daily malware detections
Median malware on worst day: 7
Figure 20. Highest daily number of malware detections per organization (n=128,131)
In fact, most companies receive malware on six or fewer days a year7 as can be seen in Figure 19. Now, we admit that’s the good days. What about the bad days when the malware monster raises its gnarly head? Figure 20 shows even the bad days aren’t so bad with most organizations getting seven or less malware detections on their worst day of the year. Word of warning—this is the median organization. Therefore, half the organizations have more and this figure is thick tailed, so some organizations are hit with hundreds of thousands or more.8
So, what about the malware you do see? At least 37% of malware hashes appear once, never to be seen again9 not unlike praise from your boss. The vectors recorded in this dataset support what we are seeing in the incident and breach data—most of it will come by email, followed by web browsers as evidenced by Figure 21.

18
Email 92.4%
6.3%
1.3%
Web
Other
0% 25% 50% 75% 100%
Frequency of malware vectors
Tra
�c
type
Figure 21. Frequency of malware vectors within detected malware (n=58,987,788)
js 37.2%
20.8%
14.8%
14.4%
7.0%
3.3%
vbs
Other
MS O�ce
Windows executable
0% 10% 20% 30% 40%
Frequency of malware file types
File
typ
e
Figure 22. Frequency of malware file types within detected malware (n=436,481,686)
10. And many of the PDFs were just a vehicle for a macro-enabled Office document, embedded within.
11. Even a basic XOR gate would potentially hide an executable from automatic detection.
12. We saw a significant amount of malware disabling proxy settings.
Choosing the form of the destructor
The next question is, what form will the malware take? Figure 22 lays out the percentage breakdown pretty clearly but let’s take it to the next level. JavaScript (.js), Visual Basic Script (.vbs), MS Office and PDF10 tend to be the file types found in first-stage malware. They’re what sneaks in the door. They then drop the second-stage malware. In this case, it’s predominantly Windows executables. Note, once the first-stage malware is in the door, they can invite their second-stage friends in any way they want. They can be dressed up as something else.11 They can invite them in via another route.12 Once the first unwelcome guest is in, it’s much harder to catch the rest before they execute and wreck the place.
Malware—it won’t always look the same, like your brother when he uses the combover, it can and will attempt to change its appearance. Therefore, you can’t rely solely on what you or others have seen in the past as a sure means to recognize it again in the future. But it does follow some well-trodden paths and often presents itself in common forms, so you can at least have an idea of what to look for.

19
Denial of Service: Storm preparations
13. Network, ISP, CDN, Endpoint, etc. See the DDoS section from the Verizon 2017 DBIR for details.
For several years running we have received a veritable cornucopia of Distributed Denial of Service (DDoS) incident data. We added 21,409 to our dataset this year alone, but we will not dwell too much on that number.
These hatches are not going to batten themselves
We do not get fixated on incident count because it is difficult to identify distinct and separate attacks as opposed to one attacker that may be starting and stopping and restarting. On the flip side, an organization can be under several different attacks simultaneously. Finally, DDoSs can be identified by multiple entities (and thus mitigated at multiple places).13 The focus should be less on the number of incidents and more on realizing that the degree of certainty that they will occur is almost in the same class as death and taxes.
You know you’ve heard it. So have we. “DDoSs are used to cover up real breaches.” Not unlike, “the government is covering up evidence of alien visitation”, it is often heard but not so easy to prove. This year’s dataset only had one breach that involved a DoS, and in that one, the breach was a compromised asset used to help launch a DDoS, not the other way around. In fact, we’ve never had a year with more than single-digit breaches in the Denial of Service pattern. Like the aliens, they may be out there, but we aren’t seeing them.
100K
10M
1B
Length of DDoS
Pea
k D
DoS
pac
kets
per
sec
ond
Sec
onds
Min
utes
Hou
rs
Day
s
Wee
ks
Duration and intensity of DDos attacks
If most attacks were big and long, they’d be here
Figure 23. DDoS durations and bandwidth (n=842,590)
While the prevalence of attacks is important to acknowledge, the data shows that these attacks on average, are more like a thunderstorm than a Category 5 hurricane. Figure 23 shows you that while it is important to prepare for major storms, they are not battering our shores with regularity. You will find that most of the attacks are measured in minutes, noting the axes since the lines aren’t evenly spaced. As far as attack strength, the median size of a DDoS has been getting smaller as time has gone on. Figure 24 illustrates the slow reduction in median DDoS size. This year it fell below a gigabit per second.

20
0.62Gbps
0.14Mppspps
bps
100 1K 10K 100K 1M 10M 100M
1K 10K 100K 1M 10M 100M 1B 10B 100B
Count
Den
sity
2013
n=1,929
2014
n=2,782
2015
n=6,149
2016
n=10,427
2017
n=7,889
DDoS attack bandwidth and packet count levels
Den
sity
14. CLDAP, CharGEN, DNS, memecached, NetBIOS, NTP, RIP, RPC, SNMP, SSDP, ECHO, etc.
Figure 24. DDoS attack bandwidth and packet count levels
Most days the sun will shine on your backdoor
Most companies that do suffer a DDoS normally aren’t under attack that long each year—the median is three days. Some organizations have to contend with more days under some level of attack, but the good news is that the majority of the organizations in our data are not close to realizing consistent waves of attack.
Amped up
In Figure 25, we see amplification attacks dominating by 2017. Amplification attacks take advantage of the ability to send small spoofed packets to services that, as part of their normal operation, will in turn reply back to the victim with a much larger response. It is similar to asking a friend “How are you?” and then receiving a twenty-minute response about the price of gas, how much they love CrossFitTM, their cat’s hairball problem, etc.
Amplification attacks are reliant on people leaving services14 open and with vulnerable configurations to the internet. Don’t be that person.

21
Amplified
Not amplified25%
50%
75%
100%
2013 2014 2015 2016 2017
Per
cent
of
DD
oS a
ttac
ks
Relative prevalence of amplified DDoS attacks
Figure 25. Amplification DDoS attacks over time (n=3,272) Things to consider
Don’t roll the diceWhile we are not seeing the biggest and baddest attacks on a daily basis, ensure that you have retained DDoS mitigation services commensurate to your tolerance to availability loss. Verify that you have covered all of your bases from a scoping standpoint.
Things can really get rough when you go it aloneIn addition to the above, find out from your ISP(s) what defenses are already built-in as there may be pre-existing relief in the form of rate throttling amplifiable services when anomalous volumes of traffic are detected. While this will not stop powerful attacks, it may help with smaller spikes in traffic.
Avoid tunnel visionUnderstand that availability issues can occur without a DDoS attack. Identify and patch server vulnerabilities with availability impacts. Perform capacity planning testing to handle spikes in legitimate traffic. Build in redundancy and conduct failover testing.

22
Incident Classification PatternsSince the 2014 report, a series of nine patterns have been used to categorize security incidents and data breaches that share similar characteristics. This was done in an effort to communicate that the majority of incidents/breaches, even targeted, sophisticated attacks, generally share enough commonalities to categorize them, and study how often each pattern is found in a particular industry's dataset.
When we first identified the patterns, five years ago, we reported that 92% of the incidents in our corpus going back 10 years could be categorized into one of the nine patterns. Hank Williams, Jr., is not the only one who finds old habits hard to break apparently. It appears to be the case for threat actors too, especially if tried-and-true methods continue to yield results. Fast-forwarding to today with over 333,000 incidents and over 16,000 data breaches, the numbers reveal that 94% of security incidents and 90% of data breaches continue to find a home within one of the original nine patterns.
Denial of Service21,409
Privilege Misuse
Crimeware
Web Applications
Lost and Stolen Assets
Miscellaneous Errors
Everything Else
Cyber-Espionage
Point of Sale
Payment Card Skimmers
Incidents per pattern
3,930
4,850
2,106
736
347
330
143
10,637
8,846
Inciden
ts
100%0% 20% 40% 60% 80%
Web Applications414
Miscellaneous Errors
Point of Sale
Everything Else
Privilege Misuse
Cyber-Espionage
Lost and Stolen Assets
Crimeware
Payment Card Skimmers
Denial of Service
Breaches per pattern
171
145
140
111
0
347
324
308
276
Breac
hes
100%0% 20% 40% 60% 80%
Figure 26. Percentage and count of incidents per pattern (n=53,308) Figure 27. Percentage and count of breaches per pattern (n=2,216)

23
Classification struggle
We have seen some variance in the overall representation of particular patterns over the years. Often the increase or decrease is a product of changes in our pool of data contributors, or a spike due to an influx of information (our inclusion of data associated with botnet takedowns in 2016 and 2017 is a prime example). It is highly recommended that readers focus more on how these patterns are broken out in your own particular industry rather than on the entire dataset. The “Mind your own industry” section will showcase how often industries are impacted by these patterns. The threat actions or tactics within each pattern do not feature enough noteworthy changes from last year to merit devoting an entire section per pattern in this year’s report. Instead, we will define each of the patterns below and focus on them more within each industry section.
This year we want to put the data to work for the information security community beyond what we can do in a written report or a limited number of pages. This portal provides interactive detail to the DBIR based on the exact same data and processes as the written report. So head over, dig in, and get to know the DBIR data a bit better! verizonenterprise.com/verizon-insights-lab/dbir/tool/
And now for something completely different
We don’t expect much change in the patterns, because ... well, they are patterns. It is interesting to take a look into the breaches that eschewed labels and joined other free spirits in the Everything Else bucket.
While often it is a lack of detail as opposed to unique tactics that will land a particular breach in this category, we were able to pull out some attacks to talk about (again) here. Financially motivated pretexting (32%) and phishing (15%) can be found in this pattern. We covered these in depth in the “Social attacks” section, so we won’t repeat it here. The prevalence of financially motivated social attacks that are not a means to install crimeware will likely lead to discussions on pattern expansion in the future.
Crimeware
All instances involving malware that did not fit into a more specific pattern. The majority of incidents that comprise this pattern are opportunistic in nature and are financially motivated.
Notable findingsWithin the 1,379 incidents where a specific malware functionality was recorded, ransomware (56%) is still the top variety of malware found. Command and control (36%) is next.
Cyber-Espionage
Incidents in this pattern include unauthorized network or system access linked to state-affiliated actors and/or exhibiting the motive of espionage.
Notable findingsThreat actors attributed to state-affiliated groups or nation-states combine to make up 93% of breaches, with former employees, competitors, and organized criminal groups representing the rest. Phishing campaigns leading to installation and use of C2 and backdoor malware are still a common event chain found within this pattern. Breaches involving internal actors are categorized in the Insider and Privilege Misuse pattern.
Denial of Service
Any attack intended to compromise the availability of networks and systems. Includes both network and application attacks designed to overwhelm systems, resulting in performance degradation or interruption of service.
Notable findingsThis pattern is based on the specific hacking action variety of DoS. In addition to the industry sections, more information can be found in the “Denial of Service” section.
Insider and Privilege Misuse
All incidents tagged with the action category of Misuse—any unapproved or malicious use of organizational resources—fall within this pattern.
Notable findingsThis is mainly insider-only misuse, but outsiders (due to collusion) and partners (because they are granted privileges) show up as well.

24
Miscellaneous Errors
Incidents in which unintentional actions directly compromised an attribute of a security asset.
Notable findingsOver half of the breaches in this pattern were attributable to misdelivery of information—the sending of data to the wrong recipient. Misconfigurations, notably unsecured databases, as well as publishing errors were also prevalent.
Payment Card Skimmers
All incidents in which a skimming device was physically implanted (tampering) on an asset that reads magnetic stripe data from a payment card.
Notable findingsWhile commonly associated with ATMs, gas pump terminals were just as likely to be targeted in this year’s dataset.
Point of Sale Intrusions
Remote attacks against the environments where card-present retail transactions are conducted. POS terminals and POS controllers are the targeted assets. Physical tampering of PIN entry device (PED) pads or swapping out devices is covered by Payment Card Skimmers.
Notable findingsThe Accommodation and Food Services industry is again the hardest hit by this pattern; POS breaches were over 40 times more likely to match NAICS 72 than the average industry.
Physical Theft and Loss
Any incident where an information asset went missing, whether through misplacement or malice.
Notable findingsThe top two assets found in Physical Theft and Loss breaches are paper documents and laptops. When recorded, the most common location of theft was at the victim’s work area, or from employee-owned vehicles.
Web Application Attacks
Any incident in which a web application was the vector of attack. This includes exploits of code-level vulnerabilities in the application as well as thwarting authentication mechanisms.
Notable findingsThe number of breaches in this pattern are reduced due to the filtering of botnet-related attacks on web applications using credentials stolen from customer-owned devices. Use of stolen credentials is still the top variety of hacking in breaches involving web applications, followed by SQLi.
Going mobile
In the 2013 DBIR, we stated: “With respect to mobile devices, obviously mobile malware is a legitimate concern. Nevertheless, data breaches involving mobile devices in the breach event chain are still uncommon in the types of cases Verizon and our DBIR partners investigate.” That statement remains accurate today. But we’re not recommending that mobile device security should be ignored. Since mobile malware does exist, and mobile devices are used for enterprise data access and communication, we wanted to know more about the malware functionalities, installation vectors and other useful factoids that might shed some light in this area.
We have been provided with some illumination this year from Lookout Mobile Security, based on their analysis of Android and iOS apps. In its research, Lookout identified five top types of malware:
• Adware: Displays advertisements over the top of other applications
• Chargeware: Applications that charge users for services without proper notification
• Riskware: Applications with code and libraries that reduce the overall security posture of a device
• Spyware or Surveillanceware: Silently gathers sensitive information for a third party
• Trojans: Applications that masquerade as legitimate ones
While some of the categories above could be brushed off as “nuisanceware” or simply a consumer issue, applications with capabilities of capturing and exfiltrating data do exist and organizations need to be mindful of the potential impact of a compromised corporate mobile device. As mobile devices often provide privileged access to the enterprise environment and hold two-factor authentication credentials, these classes of malware and device-based attacks can result in more damage than adware or click fraud. The potential for these infections does exist, and a common vector is the use of phishing/SMiShing and other social attacks that entice the mobile user to download applications outside of official platform marketplaces.
There is evidence that some actors are expanding from traditional user devices and beginning to target mobile. Take the Dark Caracal group, which was found to have stolen hundreds of thousands of text messages, photos, call recordings, documents and sensitive personal data mostly from mobile devices. While this is merely one example, we will continue to research this space to determine if more criminal elements adopt a mobile-specific attack strategy. After all, mobile technology is here to stay and in the cybercriminal community, “imitation is the sincerest form of flattery.”

25
Mind your own industryWe believe that one of the best uses of the DBIR is to look at the data from the perspective of specific industries. The breakout of incidents and breaches by industry and size provides a wealth of information, but mostly about the population of this year’s dataset. A particular industry’s representation below cannot be used as a security gauge—more does not necessarily correlate to less secure. The totals below are influenced by our sources, by industry or data-specific disclosure laws, or just by how much someone would want to DoS you.
Incidents Breaches
Large Small Unknown Total Large Small Unknown Total
Accommodation (72) 40 296 32 368 31 292 15 338
Administrative (56) 7 15 11 33 5 12 1 18
Agriculture (11) 1 0 4 5 0 0 0 0
Construction (23) 2 11 10 23 0 5 5 10
Education (61) 42 26 224 292 30 15 56 101
Entertainment (71) 6 19 7,163 7,188 5 17 11 33
Financial (52) 74 74 450 598 39 52 55 146
Healthcare (62) 165 152 433 750 99 112 325 536
Information (51) 54 76 910 1,040 29 50 30 109
Management (55) 1 0 1 2 0 0 0 0
Manufacturing (31–33) 375 21 140 536 28 15 28 71
Mining (21) 3 3 20 26 3 3 0 6
Other Services (81) 5 11 46 62 2 7 26 35
Professional (54) 158 59 323 540 24 39 69 132
Public (92) 22,429 51 308 22,788 111 31 162 304
Real Estate (53) 2 5 24 31 2 4 14 20
Retail (44–45) 56 111 150 317 38 86 45 169
Trade (42) 13 5 13 31 6 4 2 12
Transportation (48–49) 15 9 35 59 7 6 5 18
Utilities (22) 14 8 24 46 4 3 11 18
Unknown 1,043 9 17,521 18,573 82 3 55 140
Total 24,505 961 27,842 53,308 545 756 915 2,216
Table 1. Security incidents and breaches by victim industry and organization size

26
What is more beneficial than getting lost in the numbers is to look at how different the breakouts of actors, motives, tactics, and attack patterns look across industries. Some industries handle significant amounts of payment card data, some have databases full to the brim with personally identifiable information (PII), some protect classified information and some are lucky enough to do all of the above. There are attack types that we must be aware of regardless of industry, but other tactics may be as scarce as dissenters in a North Korean cabinet meeting in one industry, but as ubiquitous as selfie sticks at the Trevi Fountain in another.
Figure 28 below offers a quick way to find differences (and similarities) among select industries. We will again cover each of the industries that give us enough data this year to have a seat at the table and call out their highlight reel. There is a lot to take in in the Figure below, but it effectively maps out the most prevalent incident patterns, threat actions, and affected assets per industry. Focus on the heavily shaded cells in your industry, pick a pattern and compare your industry’s percent (or count) to everyone else—the world is your oyster. Flip over to your industry-specific section for more pearls of wisdom.
307 14 24 27 8 24 25 90 45
11 41 24 55 15 18 28 97 6
Patterns
Acc
omm
odat
ion
Edu
catio
n
Fin
anci
al
Hea
lthca
re
Info
rmat
ion
Man
ufac
turin
g
Pub
lic
Pro
fess
iona
l
Ret
ail
21 19 49 154 57 284 248 5,988 26Crimeware
Environmental
14 46 63 105 69 314 257 171 10Social
Person
Breaches
Hacking 324 210 400 139 880 150 201 925 176
Malware 326 35 70 185 70 359 296 6,121 71
Physical 10 11 64 87 3 16 12 23 89
Misuse 7 7 21 138 5 22 28 10,311 11
Denial of Service 2 151 336 1 580 74 104 703 85
Payment Card Skimmers 6 49 5 1 1 81
Privilege Misuse
1 12 9 24 4 82 41 120Cyber-Espionage
7 7 21 138 5 22 28 10,311 11
Point of Sale 306 2 1 2 1 11
Miscellaneous Errors 2 16 22 181 34 3 30 1,774 11
Lost and Stolen Assets 4 10 16 96 3 15 17 3,728 7
Web Applications 11 29 36 88 277 17 34 97 73
Everything Else 13 48 59 63 81 39 41 68 12
ServerUser Dev
Media
Embedded
Network
Kiosk/terminal
15 45 62 104 69 314 258 172 9
338 210 419 299 920 127 202 885 189
306 28 42 115 30 336 290 3,851 22
5 6 25 193 2 11 12 827 16
1 1 3
1 8 3 4 2 2 1 1
6 50 6 1 2 1 82
302 2 1 2 1 10
316 46 50 121 62 47 66 159 77
10 41 25 56 15 18 28 96 7
Error 2 17 26 203 36 5 35 5,482 12 1 16 21 188 28 2 27 55 10
6 8 49 68 2 8 15 67
5 3 11 128 2 8 17 51 8
11 36 19 54 28 17 30 52 8
10 26 29 81 45 15 28 49 64
2 7 10 73 2 8 17 5
1 15 20 172 27 2 27 50 9
5 2 8 14 3 8 9 9 4
5 3 11 128 2 8 17 51 8
1 12 8 9 2 22 14 77
4 40 5 1 61
322 42 64 245 86 42 76 105 89
302 20 19 52 4 16 29 98 13
3 5 16 183 2 1 7 36 12
1 1 1
4 38 5 1 62
0% 25% 50% 75% 100%
Edu
catio
n
Fin
anci
al
Hea
lthca
re
Info
rmat
ion
Man
ufac
turin
g
Pub
lic
Pro
fess
iona
l
Ret
ail
Acc
omm
odat
ion
Incidents
Actions
Assets
Figure 28. Industry comparison (left: all security incidents, right: only confirmed data breaches)

27
Accommodation and Food Services
This vertical continues to be dominated by opportunistic and financially motivated POS breaches. The main threat actions continue to be hacking and malware.
Frequency 368 incidents, 338 with confirmed data disclosures
Top 3 patterns Point of Sale Intrusions, Everything Else and Web Application Attacks patterns represent 96% of all data breaches within Accommodation and Food Services
Threat actors External (99%), Internal (1%)
Actor motives Financial (99%), All other motives (<1%)
Data compromised
93% Payment, 5% Personal and 2% Credentials
Get away from it all
There are an endless number of travel-related commercials that urge you to fly away, stay at an exotic locale, and sample unfamiliar native cuisine. They promise escape, novelty, excitement and change. The breach-related findings for those hotels and restaurants, however, do not. Although we collected one-third more breaches and incidents since last year, the data still illustrates yet more of the same financially motivated POS breaches that we have seen dominate this vertical in past years. In fact, the Point of Sale pattern accounts for 90% of all breaches within this industry vertical. To further underline this issue, breaches in NAICS code 72 are over 100 times more likely to have an asset variety of POS controller than other verticals represented in our dataset. As stated in previous reports, often restaurants are smaller organizations without the luxury of trained security staff, but they are forced to rely almost exclusively on payment cards for their existence, so this finding is not unexpected but is certainly unfortunate. These attacks are overwhelmingly motivated by financial gain and perpetrated by organized crime.
The other 10% of breaches are scattered across multiple patterns with Everything Else and Web Application Attacks coming in at around 3% each. That ratio of those two patterns in relation to the first is roughly the same as the well-known “friends who are busy that day vs. friends who will help you move” rule.
0%
25%
50%
75%B
reac
hes
20112010 201720162014 201520132012
Actions seen in Accommodation breaches
Malware
Misuse
Social
PhysicalError
Hacking
Figure 29. Threat actions within Accommodation and Food Services breaches over time

28
Action types
With regard to the most common action types we see in Accommodation and Food Services, the ever-present combination of hacking and malware continues to be the proverbial “burger and fries” of the industry, stolen credentials (81%), which are often taken en masse from a POS service provider breach and then used to compromise the POS systems of the service provider’s customers, and brute force (18%) are the most common varieties of hacking. 96% of malware-related breaches utilize RAM scrapers to capture volatile POS transactional data. After RAM scrapers there is a huge drop off in frequency until we see functionalities such as C2, keyloggers and password dumpers all showing up in approximately 5% of cases or less. However, it is important to remember that most RAM-scraping malware does have other functionalities (such as C2, keylogging, and exporting data) but we typically were not provided with the identity of the POS malware family. Without the name of the family, we only know what actions were explicitly recorded, not the additional functionalities the malware may harbor so this finding is therefore more likely indicative of a classification issue than a drastic change.
What time is checkout?
Don’t expect a mint on your pillow or a nightly offer of a “turndown service” from hackers to alert you to their presence. Breaches aren’t discovered for months in 96% of cases. When they are discovered it is typically via external sources such as detection as a Common Point of Purchase (CPP) or by law enforcement.
Things to consider
Useless as the G in lasagnaThe use of default or easily guessable passwords is as en vogue as tight rolling your jeans. Stop it—in fact passwords regardless of length or complexity are not sufficient on their own. No matter who administers your POS environment (whether in-house or outsourced) they should be required to use two-factor authentication.
Random acts of scrapingAs evidenced by the great number of “integrity” issues in our caseload, illicit software installation continues to be rampant. Although we cannot provide actual numbers or percentages, many breaches continue to involve assets without basic antivirus protection installed.
Looking for danger signsStill waiting … for a good reason that your POS server should be visible from the internet. It’s OK, we have time. Many victims could easily become an above-the-median hanging fruit by simply filtering what external IP addresses can reach the remote access mechanism of their POS controller.

29
Education
This section will focus on data breaches, but it is worthy of mention that Denial of Service attacks remain extremely common in Education, and Cyber-Espionage is still a significant pattern.
Frequency 292 incidents, 101 with confirmed data disclosure
Top 3 patterns Everything Else, Web Application Attacks and Miscellaneous Errors represent 76% of breaches
Threat actors External (81%), Internal (19%), Partner (2%), Multiple parties (2%) (breaches)
Actor motives Financial (70%), Espionage (20%), Fun (11%)
Data compromised
72% Personal, 14% Secrets and 11% Medical
Education can be a taxing experience
The Everything Else pattern took the number one place in Education this year, accounting for 36% of breaches. This pattern is often the cyber equivalent of a “lost and found” bin for various types of incidents we encounter that do not provide enough granularity or detail for us to place in one of the other patterns. In this case, however, it is largely the result of a social engineering scenario that has become increasingly common: the W-2 scam. But we discussed that at some length in the “Social attacks” section earlier in the report, so suffice it to say that there were 22 instances of it in the Education vertical this year. It is not immediately clear why this scenario has figured so prominently in Education, but it may be due to the more “open source” nature of schools and universities. Typically, there is more transparency in educational institutions regarding the disclosure of data such as the names, job roles and contact information of employees than exist in other verticals and this no doubt aids the attacker in those situations.
Payment CardSkimmers
0%
10%
20%
30%
Bre
ache
s
2011 20122010 20172015 20162013 2014
Patterns seen in Education breaches
Crimeware
Everything ElseLost/Stolen Assets
MiscellaneousErrors
Point of Sale
Privilege Misuse
Web ApplicationsCyber-Espionage
Figure 30. Incident classification patterns within Education breaches over time

30
“You get a line, I’ll get a pole”
But while we are talking about social attacks, the second most common action type in Education incidents is Social (present in 16% of incidents and 41% of breaches). This finding relates back to another important pattern in Education, that of Cyber-Espionage. Last year Cyber-Espionage (which typically has a strong social component—usually phishing) was one of the top patterns present in Education breaches (25%), and although it falls to 12% of all breaches this year it is clear that state-affiliated actors are still hard at work in this vertical. So, whether they are interested in highly sensitive research, the technical specs for collaborative projects with major industry or simply the details of safe-space allocation, it is clear that the bad guys still want to know what our educational entities are up to.
Extra credit assignment
Hacking is the dominant action type in Education (72%) from an incidents perspective, which is largely due to the continuing prevalence of DoS attacks in this vertical. If we focus on breaches only, however, the percentage of hacking drops to 44%. If your favorite number is 4415, you will be happy to know that the use of backdoor or C2 and use of stolen credentials were present 44% of the time in the aforementioned 44%. Education has a somewhat higher percentage of insider problems than many, but not all (looking at you, Healthcare) industries. Employees make mistakes, and this industry is not immune, with 16% of breaches featuring a causal error.
15. We’re partial to 42.
Things to consider
Keep school in sessionIf you are in this vertical you can expect to be the target of DoS attacks. This is becoming even more of a priority with online classes becoming more commonplace. Make sure you have adequate DoS protection against these attacks and an appropriate mitigation plan in place for when they do occur. Start studying your provider agreements now so that you won’t have to cram at the last moment to be knowledgeable regarding their contents.
Education is not just for studentsBoth phishing attacks and miscellaneous errors begin with your staff. Make sure that you conduct regular security training to lessen the effectiveness the former and have routine security audits to protect against the latter.
Don’t use last year’s text bookWeb application attacks continue to be a problem for Education. Making sure that you are using the current version of the software will often keep you from a failing grade.

31
Financial and Insurance
16. en.wikipedia.org/wiki/Operation_Ababil
17. Only slightly more elegant than this: youtube.com/watch?v=WP3VHIWL784
18. Achievement Unlocked: Proactively handle any “What about ATM jackpotting?” questions
Banking Trojan botnets and Denial of Service are by far the most common attacks. ATMs are still a targeted asset.
Frequency 598 incidents, 146 with confirmed data disclosure
Top patterns Denial of Service, Everything Else, Crimeware and Payment Card Skimmers represent 82% of all security incidents
Threat actors 92% External, 7% Internal, 1% Partner
Actor motives 93% Financial, 5% Espionage
Data compromised
36% Personal, 34% Payment, 13% Bank
We will begin with the acknowledgement that attacks on web application authentication mechanisms driven by banking Trojan botnets happen—a lot. Had we included the almost 40,000 of them as part of the analysis, nothing else would come to light. And while important, these attacks are not the only cause for concern for the industry.
Denial of Service attacks are again the top pattern within Financial and Insurance. Even though these current incidents are not as high profile as the attacks of yesteryear16, they are not extinct. So, while you are strengthening authentication into your applications, ensure that you have controls and response plans in place for availability attacks as well.
Payment card skimmers are still being installed on ATMs by organized criminal groups. While there are various levels of sophistication in the construction of card readers to make them less noticeable, there are few year-to-year changes to report on. ATM jackpotting is another attack that targets ATMs and is receiving a fair amount of press. This is another form of tampering in which physical access results in software and/or hardware installation to cause the ATM to spit out money.17 While this eliminates the need to clone debit cards, the tampering is more intrusive than overlays. These attacks have only recently been conducted in the US and any that have made the news are not in this year’s dataset.18
As we did last year, in an effort to highlight incidents that did not involve DoS, botnets, or ATM skimmers we filtered and then looked at the pattern breakdown:
Everything Else59
Crimeware
Web Applications
Miscellaneous Errors
Privilege Misuse
Lost and Stolen Assets
Cyber-Espionage
Point of Sale
Select patterns within Financial
9
16
2
49
36
22
21
Inciden
ts
100%0% 20% 40% 60% 80%
Figure 31. Incident classification patterns within select Financial and Insurance industry incidents (n=213)

32
The strong showing for Everything Else was interesting enough to lead to an instant replay (looking deeper into the data). Upon further review it was discovered that over half of these incidents were instances of phishing, but without conclusive evidence on either the motives or the next actions that would be necessary to categorize them.
Ransomware was the top malware functionality and behind the majority of the incidents falling into the Crimeware bucket. We discussed ransomware in depth in the “Ransomware, botnets, and other malware insights” section. In lieu of repetition, there are two non-findings that are interesting. First, banking information (13%) trails both PII (36%) and payment card information (34%) as the most frequent data variety compromised.19 This segues into the other absence—in prior years the “evil bank employee” scenario was more at the forefront with bank tellers conducting fraudulent transactions, or sometimes colluding with outside criminal groups. Hopefully this is a testament to both the fraud detection capabilities of this industry (it is one of the top breach discovery methods) and the resulting deterrence it has on the rank and file.
19. Again, this is after removing breaches where stolen customer credentials were used to access account information via banking applications.
Things to consider
Keep it upThe banking industry has seen a steady stream of DoS attacks over the last few years. It is unlikely that will change anytime soon, so be sure you have adequate protection against this very common problem.
Ramp them upThe high showing for Everything Else is largely due to social attacks in the form of phishing. Make sure employees know what to look for with regard to this kind of attack, and give them a quick and easy way to report it.
Back it upEnsure that you have routine backups to fall back on in the not unlikely case of a ransomware attack. Segregate assets that are more critical to protect them and prioritize them with regard to business continuity.

33
Healthcare
20. But not the “Methodology” appendix as that is how we try to assure you this isn’t fluff!
The Healthcare vertical is rife with Error and Misuse. In fact, it is the only industry vertical that has more internal actors behind breaches than external. In addition to these problem areas, ransomware is endemic in the industry.
Frequency 750 incidents, 536 with confirmed data disclosure
Top 3 patterns Miscellaneous Errors, Crimeware and Privilege Misuse represent 63% of incidents within Healthcare
Threat actors 43% External, 56% Internal, 4% Partner and 2% Multiple parties (breaches)
Actor motives 75% Financial, 13% Fun, 5% Convenience, 5% Espionage (all incidents)
Data compromised
Medical (79%), Personal (37%), Payment (4%)
Not easy like Sunday morning
If we were to assess the overall wellness of the Healthcare vertical with regard to security, the prognosis would not be terrifying, but neither would it be encouraging. Something along the lines of “greatly improve your diet, stop smoking and increase your workout routine or else” would cover it. Before we judge them too harshly, however, we must keep in mind a few important facts about the Healthcare vertical:
• They deal with a vast amount of highly sensitive data that they must retain and protect
• That data must be kept current and accurate and must be accessible in a very timely manner for the healthcare professionals who need it (as life or death decisions might be based on it)
• It is subject to a much higher standard of scrutiny with regard to privacy and disclosure requirements than are most other verticals, due to regulations such as the Health Insurance Portability and Accountability Act (HIPAA) and the Health Information Technology for Economic and Clinical Health (HITECH) Act
Et tu, Brute?
As Caesar found out the hard way, often those who do you the most harm can be those closest to you. The Healthcare industry has the dubious distinction of being the only vertical that has a greater insider threat (when looking at breaches) than it does an external threat. This somewhat bleak finding is linked closely to the fact that there is a large amount of both errors and employee misuse in this vertical. With regard to incidents Healthcare is almost seven times more likely to feature a causal error than other verticals in our dataset, but you might not want to ponder that when you go in to get that appendix20 removed.
Errors most often appear in the form of misdelivery (62%)—which is the sending of something intended for one person to a different recipient—and is followed by a grouping of misplacing assets, misconfigurations, publishing errors and disposal errors.
Misuse, on the other hand, takes the form of privilege abuse (using logical access to assets, often databases, without having a legitimate medical or business need to do so) in 74% of cases. Interestingly, the motive (when known) is most often (47%) that of “fun or curiosity.” Examples of this are when an employee sees that their date from last weekend just came in for a checkup, or a celebrity visits the hospital and curiosity gets the better of common sense. Not to be forgotten, our faithful friend avarice is still alive and well, with financial gain being the motivation in 40% of internal misuse breaches.

34
Error203
Malware
Hacking
Misuse
Social
Physical
Environmental
Actions within Healthcare
0
185
139
138
105
87
Inciden
ts
100%0% 20% 40% 60% 80%
Figure 32. Threat action categories within Healthcare incidents (n=750)
Ransomware is everywhere
No doubt over Thanksgiving dinner you and your family fell in to conversation about the possible reasons for the rise of the Crimeware pattern to the number two position in the Healthcare vertical. Of course, you did. It’s only natural. It is due to the ransomware epidemic that continues to plague the Healthcare industry. Ransomware accounts for 85% of all malware in Healthcare. Due to Department of Health and Human Services regulations, ransomware outbreaks are treated as breaches (rather than data at risk) for reporting purposes. Consequently, it is difficult to know if Healthcare is more susceptible to ransomware than are organizations in other industries, or if the high percentages of it being recorded are simply a product of more stringent reporting requirements. Regardless of the reason, the wise security practitioner will take immediate steps to combat this ubiquitous attack type. Due to the ease of the attack, the low risk for the criminal, and the potential for high monetary yields, it is likely here for a lengthy stay in spite of the quality of the hospital food.
Please do not feed the phish
Social attacks (mostly phishing and pretexting) appear in approximately 14% of incidents in Healthcare and are a definite matter for concern. Phishing (70% of social attacks) occurs when an attacker sends a communication—usually an email—to an individual attempting to influence them to open an infected file or click on a malicious link. Once the victim clicks, the criminal can upload malware and engage in other insidious acts that will enable prolonged access to the system.
Pretexting (20%) is a similar social attack but is somewhat more involved. In this scenario, the criminal emails, calls or even visits an employee in person and engages them in conversation to fool the victim into providing the attacker with credentials, or other sensitive data, with which they can launch an attack. Like a sort of Norman Vincent Peale gone wrong. Healthcare has a wide attack surface for social tactics due to the very nature of what they do. Relatives and friends calling in to check on patients, third-party providers of equipment and services and so on can provide a social engineering criminal with a great deal of both opportunities and cover.
Please report to lost and stolen
The theft of assets accounts for 90% of the physical action types in Healthcare. The number of stolen assets also went up this year, but that is likely caseload bias. Regardless, laptops and other portable devices, and paper documents consistently go missing from healthcare organizations each year. Victim work areas (offices) account for 36% of theft locations, and employees’ personal vehicles account for 32% of theft. The latter is particularly worrisome because in many instances, the asset in question residing in an employee’s personal vehicle was likely to be a policy violation. However, it must be admitted that we do not have the hard data to definitively prove that statement, but it is offered in the same spirit as “Do you know what the penalty for cruelty to laptops is in this state? No, sir, I don’t. Well, it’s probably pretty stiff.”
Things to consider
Dr., I can’t read this RxThe theft or misplacement of unencrypted devices continues to feed our breach dataset. Full Disk Encryption (FDE) is both an effective and low-cost method of keeping sensitive data out of the hands of criminals. FDE mitigates the consequences of physical theft of assets by limiting exposure to fines and reporting requirements. Reduce your risk footprint where you can. Seriously, please do this as we are tired of repeating this same recommendation!
Institute a smackdown policyEnsure that policies and procedures are in place which mandate monitoring of internal Protected Health Information (PHI) accesses. Make all employees aware via security training and warning banners that if they view any patient data without a legitimate business need there is potential for corrective actions.
Don’t spread the virusPreventive controls regarding defending against malware installation are of utmost importance. Take steps to minimize the impact that ransomware can have on your network. Our data shows that the most common vectors of malware are via email and malicious websites, so focus your efforts around those factors.

35
Information
DoS attacks continue to be endemic in the Information vertical, and when incidents become data breaches the culprits are most often financially motivated external attackers using web application attacks.
Frequency 1,040 incidents, 109 with confirmed data disclosure
Top 3 patterns Web Applications, Everything Else, and Miscellaneous Errors represent 92% of breaches within Information
Threat actors External (74%), Internal (23%), Partner (4%) (breaches)
Actor motives Financial (81%), Espionage (6%), Ideology (6%), Fun (4%) (breaches)
Data compromised
Personal (56%), Credentials (41%), Internal (9%)
I’ll need some information first, just the basic facts
While using NAICS categories can be very useful for our purposes, there are times when one wonders who exactly was involved in deciding what goes into certain categories. Information (NAICS 51) is one such case and is very broad in scope, including company types that at times seem like odd bedfellows. It covers publishers, motion picture, sound recording industries, telecommunications, data processing companies and broadcasting to name but a few. The possible scenarios that spring to mind for things to go wrong from a data breach point of view in this NAICS code are truly astonishing, both in number and variety.
Sadly, it is not our role to speculate on what our lurid imaginations could create from such a witches’ brew, but only to report on what does indeed most frequently go awry. With regard to overall incidents, it’s without doubt most frequently DoS attacks. 56% of the 1,040 incidents we saw in 2017 can be attributed to this rapscallion, which isn’t inexplicable when you consider that many of the organizations in this vertical have a very large web-based presence.
Use of stolen credentials10
SQLi
Path traversal
6
Use of backdoor or C2
Abuse of functionality
Brute force
Footprinting
Forced browsing
Other
Session prediction
Top hacking varieties within Information
1
2
2
1
1
1
1
1Breac
hes
100%0% 20% 40% 60% 80%
Figure 33. Top hacking varieties within Information breaches (n=22)
The findings are somewhat more varied, although fewer in number, when one takes a look from the perspective of confirmed data disclosure. Web Application Attacks make up 41% of breaches, and as the chart above illustrates, the use of stolen credentials is one of the primary methods the attacker uses to gain unauthorized access via the World Wide Web, the information superhighway.

36
Web application45
Other
Backdoor or C2
Desktop sharing
Partner
Top hacking vectors within Information
2
1
1
1Breac
hes
100%0% 20% 40% 60% 80%
Figure 34. Top hacking vectors within Information breaches (n=49)
Database (server)43
Web app (server)39
Human resources (person)9
Mail (server)
Other (person)
POS controller (server)
VM host (server)
Laptop (user device)
Documents (media)
Router or switch (network)
Top assets involved in Information
4
3
2
2
2
1
1Breac
hes
100%0% 20% 40% 60% 80%
Figure 35. Affected assets within Information breaches (n=99)
Can you show me where it hurts?
However, the chart only tells part of the story (do any charts tell the whole story?). The reason in this case is that in many instances the vector of attack is not clearly outlined. Like a doctor attempting to ascertain the root cause from the visible symptoms, we must examine the data corpus a bit more thoroughly. There is typically enough data to show us that the affected asset was a database for example, and it was “hacked”—but the path the criminal took (the vector) to get there is not always clearly outlined.
This, in large part, explains why the Everything Else pattern (which, as we said earlier is a sort of catch-all for low-detailed attacks) is one of the top patterns in this vertical. To revisit our medical analogy above, we can tell by the symptoms that there is an infection present but not whether it is viral or bacterial in nature. It is certainly possible that they gained an initial foothold in the database via a web application and that many of these attacks might find a home in the Web Application Attacks pattern, but the devil is in the (lack of) details. Social attacks on HR employees also make a showing in this pattern, indicating that the Healthcare industry is not the only one being targeted in W-2 pretexting scams.
Did you mean to post that?
Unfortunately, a great chasm often exists between the employee of the résumé and the employee in fact. That may be why Miscellaneous Errors rounds out the top three patterns for this vertical. It can be attributed largely to misconfigured databases and publishing errors (making data viewable to audiences not intended to see it), and while irksome and sometimes expensive, they occurred due to the carelessness of employees and were not motivated by financial gain as were the attacks mentioned above.
Things to consider
2FA! 2FA!Implement two-factor or multi-factor authentication in your enterprise for those who administer any web applications or databases. If at all possible establish two-factor authentication with all users in your organization.
Avoid being the next Get Wrecked memeDoS protection is a must for companies in this vertical. Monitor your daily usage and prepare for spikes in traffic that are indicative of larger than normal legitimate usage.
Make it all clean and niceImplement a routine checklist for general security hygiene, and have sys admins make sure that the systems you build are built to deploy patches and updates in a timely fashion. Automate anything you can as this reduces the human error associated with many breaches we see. Conduct routine scans to discover misconfigurations before an adversary does.

37
Manufacturing
21. We would be remiss if we did not point out that this statement is about espionage motive as a whole, and not just the Cyber-Espionage pattern. When current employees acquire and exfiltrate sensitive data, it is placed under the Insider and Privilege Misuse pattern, even if their motive was espionage.
Espionage motives fell from a percentage standpoint, but this industry is still a target for state-affiliated adversaries.
Frequency 536 incidents, 73 with confirmed data disclosure
Top 3 patterns Cyber-Espionage, Everything Else and Web Applications represent 76% of breaches within Manufacturing
Threat actors External (89%), Internal (13%) (breaches)
Actor motive Financial (53%), Espionage (47%), and Fun (2%) (breaches)
Data compromised
Personal (32%), Secrets (30%), Credentials (24%)
If you build it, they will come
The Zhuangzi says, “The petty thief is imprisoned but the big thief becomes a feudal lord.” That still has the ring of truth to it a couple millennia later. Have you ever had a deep and meaningful thought, and then some time later read the same thought expressed better by someone who had been dead for centuries? D’oh! Alas, there really isn’t much new under the sun, but you can bet your bottom dollar if you do have an original idea someone will want to steal it. This is particularly true in the Manufacturing vertical. A cybercriminal can steal a year’s worth of your planning, research and development, and other secret information and then use that ill-gotten advantage to bring your idea to market first and more cheaply.
This extremely impolite behavior explains why Cyber-Espionage is again prominent in this vertical, accounting for 31% of all breaches. Like the kid in middle school who did no work on the team project but still got a good grade because of your effort, state-affiliated actors, and current21 or former employees stealing valuable intellectual property via espionage to gain a competitive advantage, was the motivation behind 47% of breaches. This year, incidents and breaches are both down from the 2017 report (620 incidents including 124 breaches), and the margin by which the Cyber-Espionage pattern leads is not as pronounced as it was then. However, this flagitious form of “rapid prototyping” is a very real threat to manufacturers.
Personal21
Secrets20
Credentials16
System9
Payment
Internal
Medical
Other
Bank
Digital certificate
Data varieties compromised in Manufacturing
4
2
2
1
1
Source code1
6
Breac
hes
100%0% 20% 40% 60% 80%
Figure 36. Compromised data varieties within Manufacturing breaches (n=66)
38
Secret lovers
… that’s what they are. At least that is what the data shows in this vertical. Personal data (32%) and Secrets (29%) are almost tied for first place. Credentials (24%) also make a solid appearance as mentioned above, and stolen credentials can be used to advance attacks and ultimately compromise other data types. When we look at targeted versus opportunistic attacks, we see that (when known) breaches in this vertical are 86% targeted. Since, overall, the vast majority of attacks are opportunistic in nature, this finding underlines the point that criminals go after certain Manufacturing entities with a very specific purpose in mind. The victim organization is chosen because they have trade secrets that are highly desirable to the attacker. Unlike many other industry verticals such as Retail, Financial and Insurance and Accommodation and Food Services in which the motivation is nearly always financial and carried out almost exclusively by organized crime, Manufacturing shows a greater percentage of state-affiliated actors (53%) than it does organized crime (35%). Likewise, the motives of the actors are much closer to an equal division between financial (53%) and espionage (47%).
Things to consider
Joy in divisionKeep highly sensitive and secret data separated from the rest of your network. Restrict access to it to only those individuals who absolutely require it to do their jobs. Even then, monitor that access routinely to make sure the data is not being copied, moved or accessed in a suspicious manner.
There can only be 9 “00” agentsIt is not only state-affiliated actors you must concern yourself with if you wish to keep your secrets safe. Implement data loss prevention (DLP) controls to identify and block transfers of data by employees, and especially those who are terminated or resigning.
Reeling them inWhile this recommendation may be verging on the repetitive, most external espionage cases begin with some type of phishing attack. Provide your employees with a very quick and easy way to report social attacks and encourage them to do so.
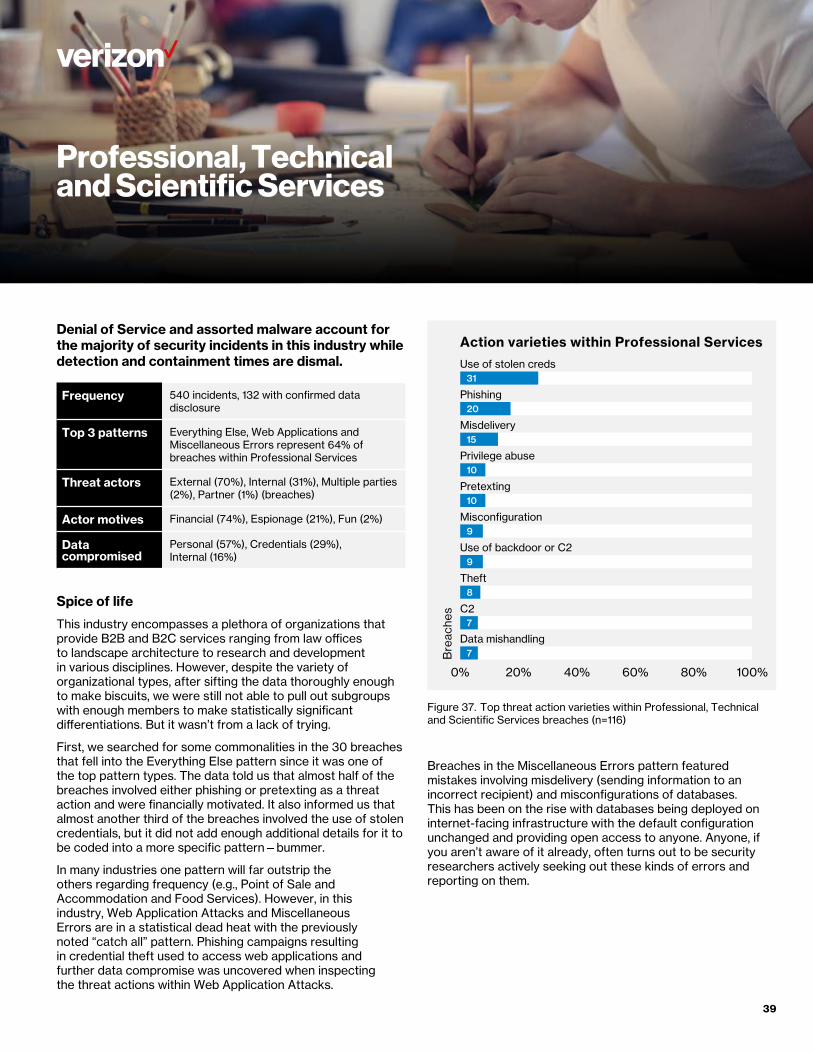
39
Professional, Technical and Scientific Services
Denial of Service and assorted malware account for the majority of security incidents in this industry while detection and containment times are dismal.
Frequency 540 incidents, 132 with confirmed data disclosure
Top 3 patterns Everything Else, Web Applications and Miscellaneous Errors represent 64% of breaches within Professional Services
Threat actors External (70%), Internal (31%), Multiple parties (2%), Partner (1%) (breaches)
Actor motives Financial (74%), Espionage (21%), Fun (2%)
Data compromised
Personal (57%), Credentials (29%), Internal (16%)
Spice of life
This industry encompasses a plethora of organizations that provide B2B and B2C services ranging from law offices to landscape architecture to research and development in various disciplines. However, despite the variety of organizational types, after sifting the data thoroughly enough to make biscuits, we were still not able to pull out subgroups with enough members to make statistically significant differentiations. But it wasn’t from a lack of trying.
First, we searched for some commonalities in the 30 breaches that fell into the Everything Else pattern since it was one of the top pattern types. The data told us that almost half of the breaches involved either phishing or pretexting as a threat action and were financially motivated. It also informed us that almost another third of the breaches involved the use of stolen credentials, but it did not add enough additional details for it to be coded into a more specific pattern—bummer.
In many industries one pattern will far outstrip the others regarding frequency (e.g., Point of Sale and Accommodation and Food Services). However, in this industry, Web Application Attacks and Miscellaneous Errors are in a statistical dead heat with the previously noted “catch all” pattern. Phishing campaigns resulting in credential theft used to access web applications and further data compromise was uncovered when inspecting the threat actions within Web Application Attacks.
Use of stolen creds31
Phishing20
Misdelivery15
Privilege abuse10
Pretexting10
Misconfiguration9
Use of backdoor or C29
Theft8
C27
Data mishandling7
Action varieties within Professional Services
Breac
hes
100%0% 20% 40% 60% 80%
Figure 37. Top threat action varieties within Professional, Technical and Scientific Services breaches (n=116)
Breaches in the Miscellaneous Errors pattern featured mistakes involving misdelivery (sending information to an incorrect recipient) and misconfigurations of databases. This has been on the rise with databases being deployed on internet-facing infrastructure with the default configuration unchanged and providing open access to anyone. Anyone, if you aren’t aware of it already, often turns out to be security researchers actively seeking out these kinds of errors and reporting on them.

40
Zooming out
Since we did not find enough answers when we confined our attention to confirmed data disclosure events, we decided to cast our nets a bit wider and take a look at all incidents (not just confirmed breaches) in this industry. When we do that two patterns make up a big part of the picture: Crimeware (46% of all incidents) and Denial of Service attacks (20% of incidents). However, with regard to the former, the data was somewhat light on details and consisted of scenarios such as successful phishing attacks that lead to malware installation, but without the functionality of the malware recorded, and without confirmation of data loss. At the end of the day, since both attacks can be disruptive to business (particularly for those who rely heavily on their internet presence to conduct business), we can only conclude that either existing controls prevented the breach, the breach was successful but the aim was not to steal data, or we knew of a successful attack but were unable to confirm any data loss associated with it.
All external46
All internal31
Customer (internal)20
Unrelated third party (external)8
Reported by employee (internal)8
Fraud detection (external)5
IT review (internal)
Netork Intrusion Detection Systems (internal)
Discovery methods in Professional Services
5
5Breac
hes
100%0% 20% 40% 60% 80%
Figure 38. Top breach discovery methods within Professional, Technical and Scientific Services (n=77)
Tempus Fugit
Moving on to the breach timeline, when the time to compromise was known it was found that it was taking hours or less for the attackers. Meanwhile, more often than not breaches are taking days, or longer before they are detected. When one considers that in 60% of cases, the breach was discovered by an external party it seems there is not a great deal of self-evaluation happening with regard to security.
Almost certainly, when you have to wait for your customer (26%) to tell you that you have been breached, it is likely to have taken longer and done more damage than it would have if it had been discovered internally. Likewise, if an external unrelated third party (10%), informs you that your database has been found lacking in regard to security, it is not a good indicator of program maturity either.
Things to consider
You are more than a labelBusiness services organizations are not all alike in what they offer or the fields in which they specialize. If you align or do significant amount of business with a particular industry, understand their threat profile and use it to make security decisions. Don’t be an unknowing participant in an attack against your client’s sensitive data.
The DoS and Don’tsDoS attacks make up a significant portion of incidents for this NAICS code, regardless of the specific nature of the organization. Have a DoS protection service and understand at least the basics of the agreement in the not unlikely event you are attacked.
Establish boundariesWe have seen numerous examples of POS breaches where the vendor didn’t establish some basic security controls on the assets, and neither did the client. An unchanged default password later and the asset is breached. This is a simplistic example, but a lesson can be learned from this. When it comes to protection of client data, whether in an IT services relationship or other service provider engagement, eliminate diffusion of responsibility wherever possible up front and before fingers begin to be pointed.

41
Public Administration
Cyberespionage remains a large concern for the public sector, with state-affiliated actors accounting for over half of all breaches. Privilege misuse and error by insiders account for a third of breaches.
Frequency 22,788 incidents, 304 with confirmed data disclosure
Top 3 patterns Cyber-Espionage, Privilege Misuse, Everything Else, Web Applications, and Miscellaneous Errors represent 92% of breaches
Threat actors External (67%), Internal (34%), Partner (2%), Multiple parties (3%) (breaches)
Actor motives 44% Espionage, 36% Financial, 14% Fun (breaches)
Data compromised
Personal (41%), Secrets (24%) Medical (14%)
Close enough for government work
A quick look at the number of incidents within this industry could provide many malcontented citizens with another verbal Molotov cocktail to hurl at the walls of government. But, as in prior years, it is our duty to point out that there is more going on here than meets the eye. In the United States, entities of the federal government are required to report security incidents to the US-CERT. You may recall seeing their logo on our partner page, and thanks in large part to them and other contributors we have a degree of visibility into what is going on in the public sector in the US. It is important to keep in mind that many of these incidents are of the general policy violations ilk, or routine malware events in which a system gets infected and is cleaned up by a regular process that does not result in any breach of data. No harm, no foul. In other industry verticals they would not be required to disclose such events, and therefore we do not see them. For the purposes of this report, we will focus on the 304 confirmed data breaches that were reported.
Cyber-Espionage77
Everything Else52
Privilege Misuse51
Miscellaneous Errors50
Web Applications49
Lost and Stolen Assets
Crimeware
Payment Card Skimmers
Point of Sale
Denial of Service
Patterns within Public
17
9
0
0
1
Breac
hes
100%0% 20% 40% 60% 80%
Figure 39. Incident Classification Patterns within Public Administration breaches (n=304)

42
The past several years have provided us with a few constants with regard to attack patterns for this sector. The familiar faces looking back at us like an old episode of Hollywood Squares include Cyber-Espionage, Privilege Misuse and Miscellaneous Errors to name a few. This year we have a rat pack of five patterns that show statistically similar numbers, with a new arrival in the form of the Everything Else pattern.22
The consistent association of espionage with government targets is not shocking. Governments like to know what their counterparts in other countries are up to, and this year is no different. When the threat actor is known, state-affiliated adversaries tend to figure somewhat prevalently.
State-a�liated61
Una�liated30
Nation-state16
Organized crime11
Activist
Acquaintance
Customer
External actor varieties within Public
2
1
1Breac
hes
100%0% 20% 40% 60% 80%
Figure 40. External actor varieties within Public Administration breaches (n=122)
22. Over three-quarters of the breaches within Everything Else featured hacking as an action. Much to our chagrin most did not have a particular variety of hacking recorded, nor what asset was affected.
Phishing attacks, installations and subsequent uses of backdoors or C2 channels are front and center in espionage related breaches. Malware functionalities that are often used to pop credentials, in the form of keyloggers and password dumpers, are also found in significant numbers.
Phishing74
Use of backdoor or C261
Backdoor59
C249
Spyware/keylogger35
Password dumper
Downloader
Exploit vulnerability
Other
Capture app data
Cyber-Espionage action varieties within Public
20
16
16
15
15Breac
hes
100%0% 20% 40% 60% 80%
Figure 41. Top Cyber-Espionage threat action varieties within Public Administration Cyber-Espionage breaches (n=76)

43
Personnel’s personalities and personal information
Governments have a unique relationship to the people whose data they maintain—there are a number of roles, depending on the area and level of the government. Governments are storing information not only for citizens they serve, but also the citizens under their employ—governments remain the largest employer for most countries. Personal information is in the top group of data varieties lost in Public Administration breaches, along with secrets23 attributed to espionage.
Personal103
Secrets60
Medical34
Credentials32
Internal32
System23
Classified19
Payment
Bank6
Data compromised in Public
4
7
Breac
hes
100%0% 20% 40% 60% 80%
Figure 42. Data varieties compromised in Public Administration breaches (n=250)
Not only do governments have to worry about the protection of personal data, but also must address personnel as a likely driver of breaches. Public Administration trails only Healthcare in the prevalence of insiders as causal actors in data breaches. Malicious or inappropriate behavior is categorized in the Privilege Misuse pattern. Most often the misuse is privilege abuse (78%) which is using existing privileges in a manner that is unauthorized and/or out of policy. Mishandling of data and unapproved workarounds (both 24%) are other ways that insiders will misuse their access to systems and data. Erroneous behavior will fall either into Miscellaneous Errors, where acts such as misdelivery of data or publishing errors are recorded, or Lost and Stolen Assets if the breach was caused by a misplaced organizational asset.
23. The VERIS (Vocabulary for Event Recording and Incident Sharing) framework features a data variety of Secrets as well as Classified. It is likely that many of the breaches actually dealt with classified information as opposed to intellectual property.
Finally, with regard to timelines, the small sample of breaches where time to compromise was known were indicative of quick compromises, much like we see for the entire dataset. In contrast, almost half of breaches were discovered months or years after the initial compromise.
Things to consider
Everybody wants youDepending on function, government entities may be targeted by state-affiliated groups, organized crime or employees. Keep in mind the type of data you handle and consider who might benefit from access to it and plan your security accordingly.
Auditor, audit thyselfDetection and remediation times are poor. Conduct routine monitoring and security audits to help stop the bleeding faster.
It’s a privilege, not a rightMake sure that access privileges are provided on a “need to know” basis and have exit programs in place when employees leave the organization to ensure access to systems is closed upon their exit.

44
Retail
Retailers with online presences continue to be targeted for DoS attacks. Payment card skimmers remain a problem for the brick and mortar set.
Frequency 317 incidents, 169 with confirmed data disclosure
Top 3 patterns Denial of Service, Web Applications, and Payment Card Skimmers represent 75% of incidents
Threat actors 93% External, 7% Internal (all incidents)
Actor motives 96% Financial, 1% Fun, 1% Convenience (all incidents)
Data compromised
Payment (73%), Personal (16%), Credentials (8%)
Open for business
Those who live by the sword are destined to die by the sword, we’re told. The Retail sector equivalent is that those whose livelihood relies on their website shall die by the website when a DoS attack hits. DoS attacks remain a major area of concern for retailers for just this reason, and for those who make their living entirely by their e-commerce site, mitigation plans are a must, not a luxury.
While the DBIR does not classify DoS attacks as breaches—since the confidentiality of data is not typically compromised in these attacks—the potential result of downtime or even performance degradation can wreak havoc on the bottom line.
Denial of Service85
Payment Card Skimmers81
Web Applications73
Crimeware26
Everything Else
Point of Sale
Privilege Misuse
Miscellaneous Errors
Lost and Stolen Assets
Cyber-Espionage
Patterns within Retail
12
11
11
11
7
0Inciden
ts
100%0% 20% 40% 60% 80%
Figure 43. Incident Classification Patterns within Retail incidents (n=317)

45
Other
Spyware/keylogger
Packet snier
Rootkit
Worm
Brute force
Adminware
Downloader
C26
Backdoor7
RAM scraper10
Export data15
Ransomware16
Capture app data23
Malware varieties within Retail
3
2
2
2
2
1
1
1Inciden
ts
100%0% 20% 40% 60% 80%
Figure 44. Malware varieties within Retail incidents (n=63)
E-commerce application “enhancements”
When we look at confirmed breaches, Web Application Attacks remain prevalent. Input validation weaknesses such as OS Commanding or SQLi as well as use of stolen credentials are examples of hacking techniques used to compromise a web application. Once the device is compromised, we often see code modifications in the payment application designed to capture payment card data as it is read into the app, as well as exfiltration of the data. Essentially the criminals are turning a PCI-compliant application that does not store payment card data into a very non-PCI-compliant and criminal-controlled data harvester.
Desktop (user device)
Mail (server)
Laptop (user device)
POS controller (server)
POS terminal (user device)
Documents (media)
ATM (terminal)
Database (server)
Gas pump terminal (terminal)66
Web app (server)156
Top asset varieties within Retail
14
14
13
11
9
8
5
4Inciden
ts
100%0% 20% 40% 60% 80%
Figure 45. Asset varieties within Retail incidents (n=300)
Looking at the malware varieties above, the previously mentioned combination of malware that captures and exfiltrates payment cards is evident. Sandwiched in between those two is ransomware, so the Retail industry can empathize with most others as a victim of that form of attack.

46
Terminal velocity
For the traditional brick and mortar incarnation of retail establishments, payment card skimmers were reprising their role from last year and accounting for almost a third of breaches in this sector. Most of those (87%) were found in gas pump terminals. Tampering of in-store PIN entry devices (PED pads) was not non-existent, but nowhere near as prevalent as gas pumps. It used to be that we’d see the criminals swapping out the devices while the employees were distracted by a partner. Speculation is not what we aim for in this report, but perhaps the efforts involved to successfully a) acquire and reconfigure a PED pad, b) swap the malicious device without anyone noticing immediately or after the fact, and c) accomplishing step b in reverse, are not worth the potential monetary gain. Especially when a gas pump skimmer can be installed in the amount of time it took you to read this section.
Please do not touch
A cause for hope is the low number of RAM scraping malware that would align with POS intrusions. Retailers, both large and small, have made their way into our reports due to compromises of their POS environments. We are not going to write up a victory speech, but will hope this is an indicator of improvements in restricting access to retail payment card information environments from the internet and strengthening the authentication for those who are allowed. Who knows, with contactless payment methods becoming more common, maybe one day RAM scrapers will go the way of the horse and buggy. Let’s just hope they aren’t replaced with another attack that is just as fruitful for the criminal element.
Things to consider
Protect the kingE-commerce applications are a critical asset for retailers. Defenses against availability as well as integrity and confidentiality losses must be implemented, tested, and refined. See the DoS section for more recommendations.
Loss preventionRetailers for years have used loss prevention controls, i.e. cameras, security guards and store layout designs, to rein in old-fashioned shoplifting. Extend that mentality to identify tampering of any card processing device—gas pumps in particular.
Keep up with the timesEmbrace technologies that make it harder for criminals to conduct card-present fraud. Chip and PIN, contactless-enabled POS terminals, as examples. Make the adversary shift their tactics.
47
Wrap upThis concludes another DBIR, so let us take a page from the Fabulous Thunderbirds down in Austin and wrap it up. And speaking of “keeping it weird,” it seems that the criminals will continue to do that for us, leaving us free to prepare for whatever they bring against us. And as we mentioned at the beginning of this report, it is certainly possible to be aware of what is most likely to befall your organization and how to plan accordingly. Fourteen years’ worth of data, collaboration, research and analysis continues to show us that although almost anything is possible (and we’ve seen a few things that beggar belief), criminals are, as a rule, most likely to continue to use the tools against you that have been most effective in the past. Knowing where your organization is in the food chain for criminals gives you an advantage, so be sure to use it.
Once again, we say a heartfelt thank you to our readers, our contributors and our supporters. Without your invaluable assistance this document would not be possible and we are truly grateful. Lastly, let us urge you to keep sharing! Share your experience, share your insight and whenever possible your data, as it is only by so doing that we can be better prepared to meet our foes. As Benjamin Franklin so aptly stated, “We must all hang together, or most assuredly we will all hang separately.” We very much hope to meet you here again next year.
Questions? Comments? Brilliant ideas?
We want to hear them. Drop us a line at [email protected], find us on LinkedIn, or tweet @VZdbir with the hashtag #dbir.

4848
Appendices

49
Appendix A: Countering cybersecurity threats
Robert Novy Deputy Assistant Director United States Secret Service
2017 blurred some of the distinctions previously made between cybersecurity threats. North Korea and Russia were responsible for the WannaCry and NotPetya global attacks, respectively, which had more in common with criminal ransomware campaigns than the sort of nation-state cyberattacks previously encountered. These incidents also represent the ongoing diffusion of malicious cyber capabilities to new actors who employ them in novel ways or in new regions. For example, the recent emergence of “jackpotting” attacks against ATMs located in the US is just one manifestation of the spread of an existing capability.
For the Secret Service, our cybercrime focus is on its impact, or potential impact, on the integrity of financial and payment systems—after all, the Secret Service was founded in 1865 to safeguard these systems from criminal exploitation. Our modern financial system depends heavily on information technology for convenience and efficiency, but criminals continually adapt their tactics to exploit vulnerabilities within expanding networks for their illicit financial gain. It is for this reason that the Secret Service was assigned responsibility to investigate cybercrimes, when they first became specific violations of US law in 1984.
The Secret Service continues to assess that the most significant threat to financial and payment systems is the transnational network of Russian-speaking cybercriminals that emerged from the former Soviet Union states in Eastern Europe; however, we are seeing new actors target financial and payment systems and rapidly develop sophisticated capabilities by leveraging the range of cyber tools and services available through these existing cybercriminal networks. Accordingly, we are continuing to evaluate cybercriminal trends and adapt our approaches to combat them.
Cybersecurity risks are products of three elements: threat, vulnerability, and impact. Whereas other reports on cybersecurity risks look at a single component of the risk landscape, the DBIR is an annual opportunity to consider the holistic risk picture based on evaluating actual incidents, rather than viewing single elements of cybersecurity risk in a vacuum. This enables organizations to prioritize and align their resources to reduce their cybersecurity risks. Consequently, organizations can avoid over-reactions to the cybersecurity headline or incident of the day.
For the Secret Service, our core focus is countering the criminal threat. Financial gain continues to be a primary driver of the most sophisticated criminal schemes and presents evolving challenges as criminal networks reinvest the revenue they generate into developing more sophisticated capabilities. In FY 2017, Secret Service financial and cyber-crime investigations prevented over $3 billion in fraud losses. However, the true measure of our effectiveness is the degree we are able to disrupt the proliferation of malicious cyber capabilities and bring those behind them to face justice.
The US Secret Service continues to relentlessly pursue, extradite and arrest transnational cybercriminals across the globe. We have long contended that the apprehension of highly skilled cybercriminals is a critical function in disrupting the worldwide growth of illicit cyber capability and mitigating the threat to the US financial sector. However, we also embrace opportunities to counter transnational cybercrime by addressing vulnerabilities and reducing the impact. Through our network of field offices and Financial and Electronic Crimes Task Forces, we partner directly with organizations to help them better understand the threats they face so they can identify the most effective mitigation strategies to reduce their level of exposure and increase their overall resilience. We also share information through Information Sharing and Analysis Organizations, DHS and our interagency partners, and industry reports, like the DBIR, to broadly improve understanding cybersecurity risks and trends to improve security.
The Secret Service does not execute its mission alone, but rather through partnership with other agencies and organizations. The Secret Service remains committed to working with all potential partners for the purpose of preventing, detecting and investigating cybercrimes. We hope this year’s DBIR, like those of the past, will aid our partners in improving their cybersecurity as we continue to focus on working with our partners throughout the law enforcement community to counter cybersecurity threats.

50
Appendix B: Feeling vulnerable?
24. Verizon 2017 DBIR, Appendix B: The Patch Process Leftovers.
25. See the “Methodology” appendix for caveats about small sample sizes and similar bars.
Last year24 we talked about how just looking at what percent of findings are fixed doesn’t tell the whole story. We also pointed out that findings not fixed during the quarter tend to be forgotten and take a much longer time to fix (if they ever are).
This year, we wanted to use the vulnerability and other data as a lens into what we leave lying around our networks, and then compare it to what actors actually look for.
To truly manage vulnerabilities and not play Whac-A-Mole with scan findings, you need to trust your asset management, understand how your vulnerabilities fit into the context of your organization, and be able to analyze the paths attackers might take in that context.
First, at most, 6% of breaches can be attributed to patchable vulnerabilities this year. And a third of those still involved phishing or credentials. Figure 4625 gives us a quick peak at the types of data taken using vulnerabilities. Personal data is still near the top, but medical data has dropped and system information, sensitive internal data, and trade secrets have sprung up.
Personal33
Payment30
System30
Internal20
Secrets19
Credentials18
Classified13
Bank
Medical
Other
Virtual currency
Compromised data varieties in potential exploit
6
2
2
1Breac
hes
100%0% 20% 40% 60% 80%
Figure 46. Compromised data varieties within potential exploit breaches (n=128)
So, what does it look like when attackers are using their knowledge of your network rather than your emails or credentials for their nefarious needs? Figure 47 gives an idea of what attackers are looking for based on honeypot data. Telnet and SSH (Secure Socket Shell) are highly likely to be credential guessing. HTML could be either vulnerabilities or credentials and SMB (Server Message Block) is most certainly looking for vulnerabilities.

51
Ser
vice
(Por
t)
SIP(5060)
RDP(3389)
SMB(445)
HTML(80)
SSH(22)
Telnet(23)
Median frequency of occurence0% 10% 20% 30% 40%
Port targeting frequency in honeypots
Figure 47. Port targeting frequency in honeypots (n=145,438,160)
On the other hand, Figure 48, is derived from Intrusion Protection System (IPS) data and, after removing alerts that were only suspicious, (not clearly malicious), and DoS, we get a much different picture. A flavor of password brute force is still at the top, but represented only in that single row. The following malice leans much more toward application exploits. Granted, if you’re running enterprise IPS, hopefully you’ve already shut down telnet, but it still shows a stark contrast between what gets thrown against the internet blindly and what organizations are likely to see.26 Additionally, these are not all server vulnerabilities. The “memory corruption” bucket is predominantly made up of client-application vulnerabilities.
26. A word of advice, you probably should be defended against both, starting with the “whole internet” threats.
WordPressand webmail
brute force
Memory corruption
Certificate forgery
Bu�er overflow
Padding Oracle
URI redirection
Command and control
Use after free vulnerability
Backdoor
Malvertisement
0% 25% 50% 75%
Mal
ice
type
det
ecte
d
Top attack types detected by IPS
Figure 48. Top attack types detected by IPS (n=624,955,428,504)
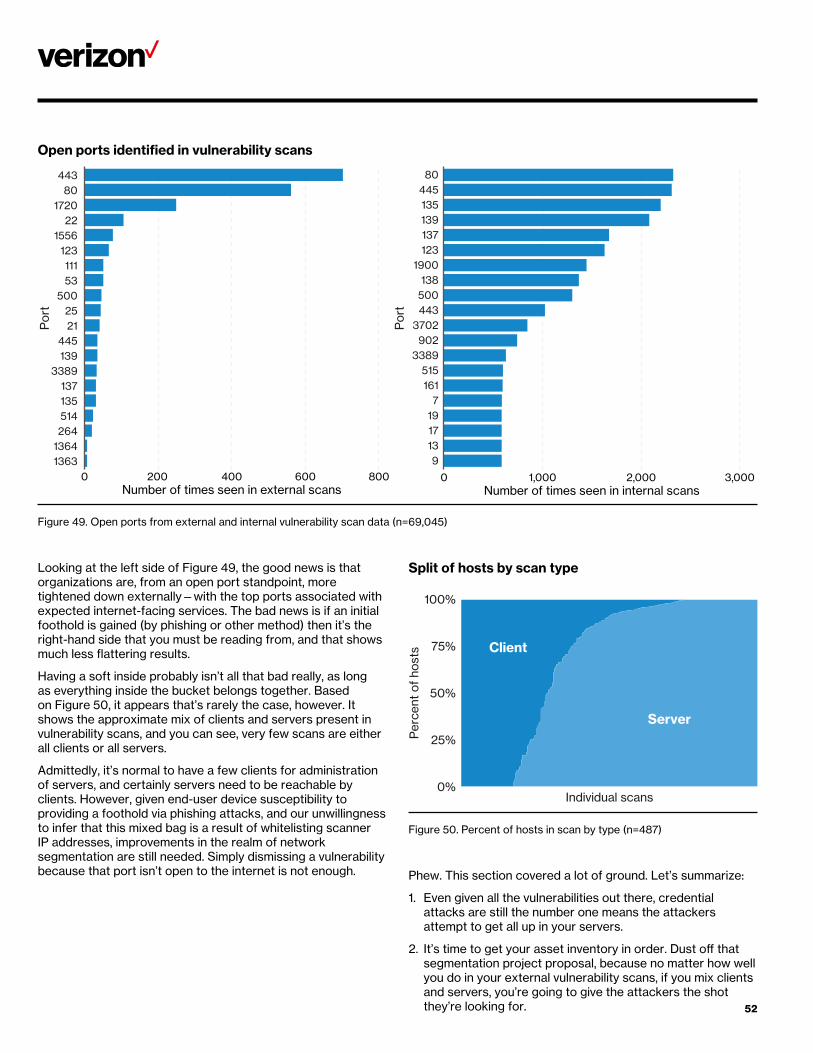
52
Open ports identified in vulnerability scans
0 200 400 600 800Number of times seen in internal scans
0 1,000 2,000
443 8080 445
1720 13522 139
1556 137123 123111 190053 138
500 50025 44321 3702
445 902139 3389
3389 515137 161135 7514 19264 17
1364 131363 9
3,000Number of times seen in external scans
Por
t
Por
t
Figure 49. Open ports from external and internal vulnerability scan data (n=69,045)
Looking at the left side of Figure 49, the good news is that organizations are, from an open port standpoint, more tightened down externally—with the top ports associated with expected internet-facing services. The bad news is if an initial foothold is gained (by phishing or other method) then it’s the right-hand side that you must be reading from, and that shows much less flattering results.
Having a soft inside probably isn’t all that bad really, as long as everything inside the bucket belongs together. Based on Figure 50, it appears that’s rarely the case, however. It shows the approximate mix of clients and servers present in vulnerability scans, and you can see, very few scans are either all clients or all servers.
Admittedly, it’s normal to have a few clients for administration of servers, and certainly servers need to be reachable by clients. However, given end-user device susceptibility to providing a foothold via phishing attacks, and our unwillingness to infer that this mixed bag is a result of whitelisting scanner IP addresses, improvements in the realm of network segmentation are still needed. Simply dismissing a vulnerability because that port isn’t open to the internet is not enough.
0%
25%
50%
75%
100%
Individual scans
Per
cent
of
host
s
Split of hosts by scan type
Client
Server
Figure 50. Percent of hosts in scan by type (n=487)
Phew. This section covered a lot of ground. Let’s summarize:
1. Even given all the vulnerabilities out there, credential attacks are still the number one means the attackers attempt to get all up in your servers.
2. It’s time to get your asset inventory in order. Dust off that segmentation project proposal, because no matter how well you do in your external vulnerability scans, if you mix clients and servers, you’re going to give the attackers the shot they’re looking for.

53
Vulnerability coordination
For every patch that you need to apply, someone has to create it and it is often an external source that will identify the weakness. When that’s the case, here’s a window into that process based on CERT/CC’s analysis of 24 years27 of vulnerability coordination email. The focus was on how long a given conversation would last regarding a particular finding and how many parties were involved based on the number of unique email address domains in the thread.
27. 24 years, 10 months, 19 days, 9 hours, 49 minutes, and 8 seconds. Ish.
28. Though sometimes it may feel like the reaper.
29. resources.sei.cmu.edu/library/asset-view.cfm?assetid=503330
Figure 51 shows that most vulnerability disclosures were resolved in 57 days and involved four email domains. In the span of a month or two, the parties working together can obtain a Nash equilibrium of sorts and the patch writing can commence. But what about the big ones? Does a disclosure involving lots of affected parties correlate with longer discussion cycles? Nope. No need to fear the disclosure.28
While this hopefully provides a bit of perspective on the whole vulnerability disclosure thing, if you need a working knowledge of it, download CERT/CC’s report: The CERT Guide to Coordinated Vulnerability Disclosure.29
Number of participants in vulnerability disclosures, and time of discussion
The median length to coordinate is 57 days. The median number of email domains involved is 4.
00
50
100
150
200
1,000 2,000Days
Rec
ipie
nt d
omai
ns in
volv
ed
3,000
00
Figure 51. Relationship between number of parties involved in vulnerability disclosures and time of vulnerability discussion (n=10,671)

54
Appendix C: Beaten pathsMany people like to think of a breach as a single point in time event. While thinking about it like that may be of assistance when trying to wrap your head around the idea of one, in most cases breaches are made of numerous things that occur in a given order. You can visualize it as a game of golf. The golfer is the attacker and their goal is to reach your most sensitive data (located in the cup). They bring to the game their skill, the right clubs for the hole depending on the approach, and almost certainly a flat-brimmed Rickey Fowler cap. The victim organization is the course designer, and depending on the value of what resides in that particular cup, they can use sand traps, water hazards, pin placement and so on in order to prevent the attacker from scoring par (or god forbid, a birdie) on that hole. Or, if they can’t keep a scratch golfer from attaining their goal, then they can at least prolong the process long enough for security staff to notice there is an unwanted player on the course and to escort them off the premises.
The golfer tees off, sets up an approach shot, putts and so on. All in a given pattern. Likewise, the course defends itself at intervals along the way using the various means at its disposal. Understanding what those steps are and how they tend to play out can be of great value to the security practitioner.
The steps a given breach takes can provide additional information regarding the event, such as:
• A deeper understanding of the breach itself
• Being able to see each step affords you the possibility of determining the points at which it might be possible to mitigate the attack
• An ability to threat model alternative paths the attackers could take to bypass your mitigations if the path continues past the point where the actor stopped
0
25
50
75
100
Bre
ache
s
1050Number of events
Number of events per breach
Figure 52. Number of events per breach (n=159)
While it’s our belief that this section can be of benefit to our readers, there are a couple of caveats. Firstly, we have only recently updated the VERIS schema to allow for collection of event chain data. Secondly, not all incident and breach records offer enough details to attempt to map out the path traveled by the threat actor. The dataset isn’t yet large enough to be highly representative, but does provide some insight.
We collect an action, actor, asset and attribute at each step. Each may be “unknown” or omitted completely if it did not occur in that particular step of the attack. To create a single path, we place the actor from the first step at the beginning of the path. It’s followed by the action and then the attribute present in the step. For the remaining steps it proceeds from action to attribute to action of the next step, skipping over any omitted ones.
Understanding breaches better is a primary goal of the DBIR, and to that end Figure 52 illustrates an interesting possibility. Most breaches that we see have a very small number of steps involved. Yes, this goes against the prevailing idea of breaches usually being long, complex affairs. Let’s be clear that we are not advising you to bet the family farm on this. As mentioned above, we are just dipping our toes into this new feature of the VERIS framework and this section’s goal is to inform VERIS users about the new capability and get people thinking about this more advanced way to think about security incidents.
Could someone have missed a step? Do we sometimes not know how credentials were stolen or how malicious code ended up on a device? Of course. Having acknowledged those limitations there are still a lot of areas to touch on now, and hopefully dig deeper into in the future.
Frequency at beginning or middle
Frequency atend of breach
Confidentiality
7.5%
35.2%
2.5%
80.5%
10.7%35.8%
Likelihood of compromise at the end of breach
Attribute
Integrity
Availability
Figure 53. Likelihood an attribute will be compromised at the end of a breach (n=159)

55
Our sample of event chain data shows that attributes are different depending on where in the breach they are involved, for example if they are in earlier events, or at the end of a breach. 81% of breaches’ final event features in a loss of confidentiality. Confidentiality is compromised outside of the final event of the breach 32% of the time (keep in mind a confidentiality loss can occur in several events along the chain). On the other hand, while integrity is compromised in earlier steps of a breach 33% of the time, only 10% of breaches end in an integrity compromise.
30. There’s another aspect to this. If there is a large enough population of victims vulnerable to short paths that opportunistic attackers can discover, they won’t have any incentive to increase their path length, regardless of how easy it is. If there are enough gazelles slower than you, that can be a good thing and existing controls may be commensurate to the existing risk.
In Figures 54 and 55, you can see that breaches typically progress. It may not make sense for the attacker to take the attack farther down the path for a small increase in victims. But as those additional steps get commoditized, it becomes economically feasible to continue the path longer. A real-world example would be a ransomware family that encrypted only the first device compromised versus automating lateral movement and installing on other devices before “flipping the switch”. Plan now to stop the longer attacks as, by the time your plan’s in place, they may have been commoditized.30
Bre
ache
s
0%
25%
50%
75%
100%
0%
25%
50%
75%
100%
0%
25%
50%
75%
100%
Prevalence of actions and attributes at di�erent steps of a breach
1208040
Confidentiality
5 10 15
Availability
5 10 15
Hacking
5 10 15
Malware
5 10 15
Integrity
5 10 15
Misuse
5 10 15
Social
5 10 15
Physical
5 10 15
Unknown action
5 10 15Step
Step
Step
Step
Step
Step
Step
Step
Step
Number of breaches
Figure 54. Frequency of actions and attributes at different steps of a breach (n=159)

56
Physical
Misuse
Social
Hacking
Malware
Unknown
Confidentiality
Integrity
Availability
Unknown
Confidentiality
Integrity
Availability
Unknown
Confidentiality
Integrity
Availability
Unknown
Confidentiality
Integrity
Availability
Unknown
Confidentiality
Integrity
Availability
Unknown
Confidentiality
Integrity
Availability
Unknown
Step
External(107)
Internal (52)
Partner(2)
Attacker type
87654321
How attackers pivoted between techniques to violate di�erent security properties
Figure 55. Attack paths

57
It’s not just about what the attackers do however—it’s also about your own network. Figure 56 was provided by a partner who specializes in simulating attacks and how attack paths are successfully blocked. We used this data to compare success rates of organizations in blocking one- and two-step paths. We see that for one-step paths, they’re roughly evenly split between being blocked most of the time and not being blocked at all (the big bubbles at the top and bottom). On the other hand, two-step paths were successfully blocked 75% of the time.
While the future benefits may lie in finding the overlap between attack paths that attackers use and that organizations are vulnerable to, and then utilizing mitigations on the path that are advantageous for defenders but difficult for attackers to route around, we have not arrived there yet.
Still, attack path testing can be helpful in security unit and integration testing. And don’t overlook the benefit of using it to test your security operations. At the end of the day, they’re your last line of defense. If you don’t know how well they do, you don’t know your security posture.
How often one and two event test scenarios are blocked
25%
50%
75%
100%
Number of events in attack chain
Per
cent
age
of r
uns
bloc
ked
One-event Two-events
Figure 56. How often one- and two-step event test scenarios are blocked (n=688)

58
Appendix D: Year in review
JanuaryThe Verizon Threat Research and Advisory Center began 2017 much like 2016 by processing intelligence about a cyberattack on the Ukraine’s electricity infrastructure. Another cyber-conflict campaign continued into 2017 as organizations in Saudi Arabia continued to be targeted for Shamoon 2 disk wiper attacks. Cybercriminals continued to drive revenue with ransomware. January saw incidents of what would become significant trends for 2017: Sundown exploit kit (EK) was delivering a Monero cryptocurrency mining Trojan. Ploutus ATM malware was “jackpotting” ATMs in Latin America.
FebruaryIn February we collected intelligence about a cybercrime campaign the Lazarus threat actor launched in October 2016. A watering hole attack on a Polish financial regulator was quickly discovered and reported after it infected a Polish bank. Intelligence unraveled the campaign, which spanned at least 31 countries. Several cyberespionage operations were the focus of intelligence. The China-based NetTraveller and Deep Panda were attacking neighboring countries.
MarchWikiLeaks began releasing “Vault7” files leaked from the US Central Intelligence Agency in early March. A new patch for Apache Struts fixed the vulnerability that was to contribute to one of the milestone InfoSec events in 2017. New sophisticated attacks on banks focused on the RTM Group and FIN7 threat actors. March was the final month for Microsoft Security Bulletins. Three of the 18 bulletins patched vulnerabilities that were already being exploited in the wild. A cryptocurrency mining variant of the Mirai Internet of Things (IoT) worm began spreading.
AprilIntelligence about two campaigns by the Stone Panda (APT10, MenuPass, POTASSIUM) threat actor kicked off April. “Operation Trade Secret” was a watering hole attack on the National Foreign Trade Council’s website to spread the Scanbox exploitation framework. “Operation Cloud Hopper” was a complex campaign attacking Managed Service Providers to install a variety of remote access Trojans (RAT). Microsoft patched two more vulnerabilities after they had been attacked. CVE-2017-0199, a remote code execution vulnerability in Office and WordPad, became one of the most frequently exploited vulnerabilities for 2017. The Shadow Brokers released some of the files stolen or leaked from the NSA. Hackers stole 3,816 Bitcoins (then valued at about US$5.3 million) from South Korean cryptocurrency exchange Yapizon.
MayThe WannaCry pseudo-ransomware worm attack began on May 12. It infected hundreds of thousands of victims using recently released Shadow Brokers exploits DoublePulsar and EternalBlue. Malware analysts quickly linked WannaCry to Lazarus. For the third consecutive month Microsoft Tuesday patched zero-day attacks. Three zero-day vulnerabilities had been used by Turla and Fancy Bear (APT28, Sofacy, Sednit, Pawn Storm, STRONTIUM). The Adylkuzz cryptomining Trojan began spreading by exploiting the same two Shadow Brokers exploits used in WannaCry.
JuneIn June, the EternalBlue exploit spread the infamous Gh0stRAT in Singapore. Deep Panda was attacking legal and investment firms around the world. Microsoft extended their streak of zero-day attacks in their products a fourth month. Microsoft released patches for 96 vulnerabilities including two that were already being exploited in the wild. The Industroyer and CrashOverride reports detailed the attacks on the Ukraine power grid in December 2016. Korean cryptocurrency exchange Bithumb had a malware infection resulting in the theft of about US$1.1 million.
JulyThe year 2017 in InfoSec may be most-remembered for the NotPetya cyberattack on Ukraine on June 27. Three days after NotPetya struck it was linked to the Russian Sandworm Team (BlackEnergy or Telebots). Transferring malware to victims using Microsoft Office templates was reported, presaging similar “living off the land” attacks that became popular in October. Israeli startup CoinDash conducted an initial coin offering (ICO). Within hours, they lost about US$7.5 million after a hacker changed the Ethereum address on the ICO web page.
AugustCybercrime drove evil on the internet in August versus cyber-conflict and cyberespionage. Miscreants released variants of banking Trojans including Trickbot, Ursnif and Nymain. Sophisticated attacks by Anunak (Carbanak, Cobalt) indicated adoption of supply-chain tactics similar to those used in the NotPetya attack. Anunak exploited zero-day vulnerabilities, used watering hole attacks, and compromised business partners to gain access to their targets. The preponderance of intelligence for the Lazarus threat actor indicated attacks on the financial services infrastructure and cryptocurrency theft had become priorities. The variety and volume of cryptomining Trojans surged in the last half of August.

59
SeptemberNotPetya competes with Equifax for the top milestone in InfoSec in 2017. On September 7, Equifax announced the data breach affecting millions of Americans and hundreds of thousands of residents of other countries. The depth of breached information was unprecedented, including Social Security numbers, driver’s license numbers, credit card numbers, tax identification numbers, email addresses and drivers’ license information beyond the license numbers. Equifax soon acknowledged the breach exploited the vulnerability in Apache Struts’ Jakarta multipart parser. A patch for that vulnerability had been released in March. A supply-chain attack on the freeware utility CCleaner targeted at least 18 companies in a campaign probably mounted by a threat actor aligned with China. Although it was quickly discovered and neutralized, it blazed a trail for future supply-chain attacks. After a two-month respite from zero-day attacks exploiting Microsoft products, a vulnerability in .NET framework, CVE-2017-8759, was used to target Russian-speaking users to install FinSpy commercial spyware.
OctoberFar East International Bank in Taiwan reported fraudulent malware-enabled SWIFT transfers on October 6. Miscreants attempted to steal US$60 million, but the bank recovered at least US$46 million. Intelligence quickly tied the Taiwan heist to Lazarus. Attacks on a zero-day vulnerability in Office surfaced on September 28. Microsoft released another zero-day patch on October 10. Attacks installing FinSpy continued in October using an unknown and unpatched vulnerability in Adobe Flash Player. Adobe patched it six days later. Anunak spoofed the US Security and Exchange commission for precisely targeted malicious messages. They exploited the native Windows Dynamic Data Exchange protocol to infect targeted systems with the DNSMessenger Trojan. On October 24, a new ransomware campaign, BadRabbit, was launched using malware pre-positioned on websites popular in Russia, Ukraine and Eastern Europe. About 70% of the victims had Russian IP addresses. Ukraine suffered the greatest disruption of critical web properties and infrastructure. In less than two days, the attack was linked to the Russian Telebots (Sandworm Team) threat actor.
NovemberNovember marked the beginning of the “Gold Rush” by cybercriminals to cash in on the huge surge in values in cryptocurrencies. Cybercriminals had been spreading cryptomining malware since at least 2011. In November cryptocurrency cybercrimes, from outright theft to hijacking the processing cycles, increased by more than one order of magnitude. Japanese companies were attacked using a pair of Trojans, ONI and MBR-ONI. They wiped the disks of their victims, probably to eliminate logs and other artifacts. The cryptocurrency startup “Parity” lost control of US$150 million in Ethereum. Experts disagree on whether the loss was the result of accident or malice. Stone Panda resurfaced, attacking Japanese companies using documents weaponized with the zero-day exploit in .NET framework that Microsoft patched in September.
DecemberIntelligence collections in December began with updates on the Russian actors Turla Group and Anunak. One of the vulnerabilities Microsoft patched in November was CVE-2017-11882 in Office Equation Editor. Anunak began exploiting it for cybercrime and the Iranian actor OilRig used it for cyberespionage attacks within weeks. Then we had to reset almost every tool, tactic and procedure (TTP) for Anunak. They had forgone spear phishing with Windows Trojans and their initial intrusion vector exploited the Jakarta multipart parser vulnerability in Apache Struts. It was the same vulnerability used for the initial intrusion of Equifax. Anunak exploited their victim’s Linux servers before moving on to compromising Windows systems. Cryptocurrency exchange NiceHash lost US$60 million. YouBit closed after the loss of 17% of their cryptocurrency assets. The Verizon Threat Advisory Research Center (VTRAC) closed out 2017 awash in the flood of cryptocurrency cybercrime intelligence.

60
Appendix E: MethodologyOne of the things readers value most about this report is the level of rigor and integrity we employ when collecting, analyzing, and presenting data. Knowing our readership cares about such things and consumes this information with a keen eye helps keep us honest. Detailing our methods is an important part of that honesty.
Our overall methodology remains intact and largely unchanged from previous years. All incidents included in this report were individually reviewed and converted (if necessary) into the VERIS framework to create a common, anonymous aggregate dataset. If you are unfamiliar with the VERIS framework, it is short for Vocabulary for Event Recording and Incident Sharing, it is free to use, and links to VERIS resources are at the beginning of this report.
The collection method and conversion techniques differed between contributors. In general, three basic methods (expounded below) were used to accomplish this:
1. Direct recording of paid external forensic investigations and related intelligence operations conducted by Verizon using the VERIS Webapp
2. Direct recording by contributors using VERIS
3. Converting contributors’ existing schema into VERIS
All contributors received instruction to omit any information that might identify organizations or individuals involved.
Reviewed spreadsheets and VERIS Webapp JavaScript Object Notation (JSON) are ingested by an automated workflow that converts the incidents and breaches within into the VERIS JSON format as necessary, adds missing enumerations, and then validates the record against business logic and the VERIS schema. The automated workflow subsets the data and analyzes the results. Based on the results of this exploratory analysis, the validation logs from the workflow, and discussions with the contributors providing the data, the data is cleaned and re-analyzed. This process runs for roughly three months as data is collected and analyzed.
Incident eligibility
For a potential entry to be eligible for the incident/breach corpus, a couple of requirements must be met. The entry must be a confirmed security incident defined as a loss of confidentiality, integrity, or availability. In addition to meeting the baseline definition of “security incident” the entry is assessed for quality. We create a subset of incidents that pass our quality filter. The details of what is a “quality” incident are:
• The incident must have at least seven enumerations (e.g. threat actor variety, threat action category, variety of integrity loss et al.) across 34 fields OR be a DDoS attack. Exceptions are given to confirmed data breaches with less than seven enumerations
• The incident must have at least one known VERIS threat action category (hacking, malware, etc.)
To pass the quality filter, the incident must also be within the time frame of analysis, (November 1, 2016 to October 31, 2017 for this report). The 2017 caseload is the primary analytical focus of the report, but the entire range of data is referenced throughout, notably in trending graphs. We also exclude incidents and breaches affecting individuals that cannot be tied to an organizational attribute loss. If your friend’s laptop was hit with CryptoLocker it would not be included in this report.
Lastly, for something to be eligible for inclusion in the DBIR, we have to know about it, which brings us to sample bias.
61
Data subsets
We already mentioned the subset of incidents that passed our quality requirements, but as part of our analysis there are other instances where we define subsets of data. These subsets consist of legitimate incidents that would eclipse smaller trends if left in. These are removed and analyzed separately (as called out in the relevant sections). This year we have three subsets of legitimate incidents that are not analyzed as part of the overall corpus:
1. As with last year, we separately analyzed a subset of web servers that were identified as secondary targets (such as taking over a website to spread malware)
2. We separated and note a subset of several thousand breaches of websites to harvest credit card numbers. These are discovered using a single search for the unique malware used. They can be found in a separate directory in the VERIS Community Database (VCDB) repository
3. We separately analyze botnet-related incidents
Finally, we create some subsets to help further our analysis. In particular, a single subset is used for all analysis within the DBIR unless otherwise stated. It includes only quality incidents as described above, removes a large number of non-specific DDoS incidents, and the aforementioned three subsets.
Acknowledgement of sample bias
We would like to reiterate that we make no claim that the findings of this report are representative of all data breaches in all organizations at all times. Even though the combined records from all our contributors more closely reflect reality than any of them in isolation, it is still a sample. And although we believe many of the findings presented in this report to be appropriate for generalization (and our confidence in this grows as we gather more data and compare it to that of others), bias undoubtedly exists. Unfortunately, we cannot measure exactly how much bias exists (i.e., in order to give a precise margin of error). We have no way of knowing what proportion of all data breaches are represented because we have no way of knowing the total number of data breaches across all organizations in 2017. Many breaches go unreported (though our sample does contain many of those). Many more are as yet unknown by the victim (and thereby unknown to us).
While we believe many of the findings presented in this report to be appropriate, generalization, bias, and methodological flaws undoubtedly exist. However, with 67 contributing organizations this year, we’re aggregating across the different collection methods, priorities, and goals of our partners. We hope this aggregation will help minimize the influence of any individual shortcomings in each of the samples, and the whole of this research will be greater than the sum of its parts.
31. Wilson method, 95% confidence level.
32. If you wonder why we treat them as hypotheses rather than findings, to confirm or deny our hypothesis would require a second, unique dataset we had not inspected ahead of time.
Statistical analysis
We strive for statistical correctness in the DBIR. In this year’s data sample, the confidence interval is at least +/- 2% for breaches and +/- 0.4% for incidents.31 Subsets of the data (such as breaches within the Espionage pattern) will be even wider as the sample size is smaller. We have tried to treat every statement within the DBIR as a hypothesis32 based on exploratory analysis and ensure that each statement is accurate at a given confidence level (normally 95%).
Our data is non-exclusively multinomial meaning a single feature, such as “Action”, can have multiple values (i.e., “social”, “malware”, and “hacking”). This means that percentages do not necessarily add up to 100%. For example, if there are five botnet breaches, the sample size is five. However, since each botnet used phishing, installed keyloggers, and used stolen credentials, there would be five social actions, five hacking actions, and five malware actions, adding up to 300%. This is normal, expected, and handled correctly in our analysis and tooling.
When looking at the findings, “unknown” is equivalent to “unmeasured”. If a record (or collection of records) contains elements that have been marked as “unknown” (whether it’s something as basic as the number of records involved in the incident, or as complex as what specific capabilities a piece of malware contained) we can’t make statements about that particular element as it stands in the record—we can’t measure where we have too little information.
Because they are “unmeasured,” they are not counted in sample sizes. The enumeration “Other” is, however, counted as it means the value was known but not part of VERIS. Finally, “Not Applicable”, (normally “NA”), may be counted or not counted depending on the hypothesis.

62
Non-incident data
The 2018 DBIR includes sections that required the analysis of data that did not fit into our usual categories of “incident” or “breach.” Examples of non-incident data include malware, patching, phishing, DDoS, and other types of data. The sample sizes for non-incident data tend to be much larger than the incident data, but from fewer sources. We make every effort to normalize the data, (for example reporting on the median organization rather than the average of all data). We also attempt to combine multiple contributors with similar data to conduct the analysis wherever possible. Once analysis is complete, we try to discuss our findings with the relevant contributor(s) so as to validate it against their knowledge of the data.
Bar chart statistical significance
When we have a bar chart, we like to say things like “the top bar is bigger than the bottom bar”. That works when the bars are very different, but less so when they are close. We feel it is best to present the data, but also be clear about the caveats.
Server249
User device148
Database (server)107
Desktop (user device)106
107
148
249
Asset varieties in large victim breaches
100%0% 20% 40% 60% 80%Breac
hes
Figure 57. Top asset varieties in large victim breaches (n=492)
For example, in Figure 57, we know that servers are more common than user devices at over a 99.9% confidence level. On the other hand, we don’t even have a 0.1% confidence that desktops are more common than databases. In the end, anyone interested can calculate the confidence for themselves using the number on the bar and the sample size (n).
63
Appendix F: Data destruction
33. ics-cert.us-cert.gov/sites/default/files/documents/Destructive_Malware_White_Paper_S508C.pdf
34. HT @hasherezade
Advanced Threat Research Team McAfee Labs
Intuitively, a data breach implies data exfiltration. In 2017 we have seen numerous examples of data breaches—with much of that information finding its way into underground markets to be sold and resold. Far less common but no less concerning is when the data is not exfiltrated but is destroyed. In early 2017 we learned of Shamoon 2, a data-wiping campaign that was a follow-up to a 2012 campaign targeting the oil industry. This campaign targeted Saudi Arabia, specifically the labor ministry and chemical firms. Although the world has been subjected to data destruction attacks before, recent threats have included specific targets for geopolitical, financial, or simply disruptive means. One example of this was MBR-ONI, a ransomware that targeted various Japanese organizations in 2017. It was likely used to disrupt operations and provide a cover for further malicious activity. Data destruction code was also found in some variants of the Gh0st Remote Access Trojan as well as in malware used in high-profile advanced persistent threats (APTs) such as Shamoon 2. This APT targeted a range of sectors including public, energy, and financial.33
NotPetya and WannaCry are two examples in 2017 of data destruction under the guise of something else, in both cases ransomware. Not only did these threats reach mainstream media due to their impact, they also caused major headaches and confusion across the globe.
NotPetya was first observed in mid-2017 and resembled its predecessor Petya in many ways, including its ability to encrypt the master boot record (MBR) and its use of Bitcoin as the primary form of ransom payment. NotPetya also encrypted far more files than the original Petya. The combination of file and MBR encryption caused the infected device, along with any data stored, to become unusable. What also set the malicious software apart from the original is instead of backing up the Salsa20 cipher key, which is used to recover the disk, NotPetya instead erased the key.34 The key feature tipped off the security industry to the malware’s intent. The authors wanted complete destruction of the systems. This important factor shows the threat actors behind the malware had neither the intention nor the capability of releasing the encrypted files even if the ransom was paid.
WannaCry exploded onto the scene in May 2017 and demanded a ransom of US$300 for the decryption key. The ransomware, which took advantage of the same SMB flaws exploited by NotPetya, is estimated to have infected more than 300,000 systems across 150 countries in a matter of days. As WannaCry spread, there were increasing reports that those who paid the ransom never received the decryption keys to recover their files, raising questions about both the effectiveness of the malware, as well as the use of “ransomware” as opposed to “wiper” to describe the threat. Researchers later discovered that WannaCry was unable to determine which victim had paid the ransom, due to a code flaw that was probably intentional. This defect rendered the infected files virtually undecryptable.
64
Appendix G: Timely and appropriate breach response for better outcomes
35. eugdpr.org/
Joe Hancock and Hugo Plowman Mishcon de Reya LLP
Over the past year, we have seen a steady increase in reports from our clients of financial fraud and other attacks targeting their financial assets. These attacks are sector agnostic, and the majority of our instructions are triggered by clients who fear losses of under £1m. It seems that financially motivated attackers are content to take what they can get, and are targeting a wider base of businesses to make their business model successful. The single most important factor which determines the prospects of making a successful recovery after a financial fraud of this nature is the speed of response. If action is delayed until after the “golden 24 hours” following a financial fraud, it makes recovery of funds through the banking system much more difficult.
By contrast, our experience over the past year shows that attackers who wish to gain access to information assets or trade secrets are much more targeted and adopt an “all or nothing” approach. The majority of data breaches that we have seen during this period involve some form of “insider” component. As a result of the level of access often afforded to insiders and with the luxury of the time that they have to extract data, the average volume of data taken per breach still remains unacceptably high. While it is possible that smaller data breaches go unnoticed or unreported and are less keenly felt by the business than the loss of cash or mass data, we remain of the view that businesses could do more to protect against the insider threat and to ensure that one breach does not lead to the loss or corruption of all data.
Regardless of motive, response to a data theft incident that has been perpetrated by an insider must also be swift. The quicker the notification, and the quicker that the response team can mobilize and respond, the better chance we have of securing the necessary evidence to identify the wrongdoer, recover assets and otherwise minimize the commercial and reputational impact of a breach.
In addition to being prompt, an effective, business-led response is needed. The focus should be on recovering funds and data but at the same time providing timely communications to stakeholders, as well as notifying data subjects and regulators. In the coming year, we expect a focus, both in the public and private sector in the UK, on holding those responsible for cybercrime to account, and a more rapid approach to dealing with the business impact of a breach given the arrival of the new General Data Protection Regulation.35
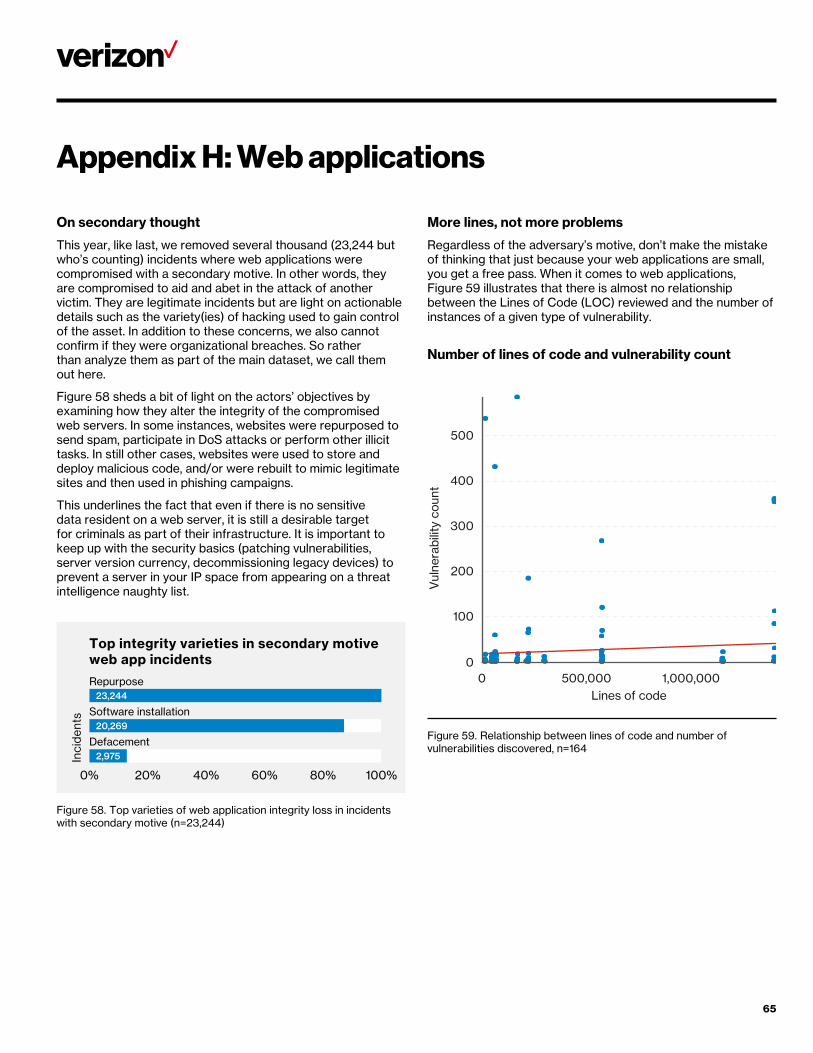
65
Appendix H: Web applications
On secondary thought
This year, like last, we removed several thousand (23,244 but who’s counting) incidents where web applications were compromised with a secondary motive. In other words, they are compromised to aid and abet in the attack of another victim. They are legitimate incidents but are light on actionable details such as the variety(ies) of hacking used to gain control of the asset. In addition to these concerns, we also cannot confirm if they were organizational breaches. So rather than analyze them as part of the main dataset, we call them out here.
Figure 58 sheds a bit of light on the actors’ objectives by examining how they alter the integrity of the compromised web servers. In some instances, websites were repurposed to send spam, participate in DoS attacks or perform other illicit tasks. In still other cases, websites were used to store and deploy malicious code, and/or were rebuilt to mimic legitimate sites and then used in phishing campaigns.
This underlines the fact that even if there is no sensitive data resident on a web server, it is still a desirable target for criminals as part of their infrastructure. It is important to keep up with the security basics (patching vulnerabilities, server version currency, decommissioning legacy devices) to prevent a server in your IP space from appearing on a threat intelligence naughty list.
Repurpose23,244
Software installation20,269
Defacement2,975
Top integrity varieties in secondary motive web app incidents
Inciden
ts
100%0% 20% 40% 60% 80%
Figure 58. Top varieties of web application integrity loss in incidents with secondary motive (n=23,244)
More lines, not more problems
Regardless of the adversary’s motive, don’t make the mistake of thinking that just because your web applications are small, you get a free pass. When it comes to web applications, Figure 59 illustrates that there is almost no relationship between the Lines of Code (LOC) reviewed and the number of instances of a given type of vulnerability.
0
100
200
300
400
500V
ulne
rabi
lity
coun
t
0 500,000 1,000,000Lines of code
Number of lines of code and vulnerability count
Figure 59. Relationship between lines of code and number of vulnerabilities discovered, n=164

66
Appendix I: Contributing organizations
DEF
ENSE SECURITY SERVIC
E
UN
I TED S TAT E S O F A MER I CA
V C
D B

67

verizonenterprise.com© 2018 Verizon. All Rights Reserved. The Verizon name and logo and all other names, logos, and slogans identifying Verizon’s products and services are trademarks and service marks or registered trademarks and service marks of Verizon Trademark Services LLC or its affiliates in the United States and/or other countries. All other trademarks and service marks are the property of their respective owners. 04/18
Contributing organizations
Akamai Technologies
Arbor Networks
AsTech Consulting
AttackIQ
Beyond Trust
BitSight
Bit-x-bit
Center for Internet Security
CERT-CC
CERT Insider Threat Center
CERT European Union
Champlain College’s Senator Patrick Leahy Center for Digital Investigation
Check Point Software Technologies Ltd
Chubb
Cisco Security Services
Computer Incident Response Center Luxembourg (CIRCL)
CrowdStrike
Cybercrime Central Unit of the Guardia Civil (Spain)
CyberSecurity Malaysia, an agency under the Ministry of Science, Technology and Innovation (MOSTI)
Cyentia Institute
Cylance
Dell
DFDR Forensics
Digital Edge
DSS
Edgescan
Emergence Insurance
Fortinet
G-C Partners
GRA Quantum
Graphistry
Grey Noise
Industrial Control Systems Cyber Emergency Response Team (ICS-CERT)
Interset
Irish Reporting and Information Security Services (IRISS-CERT)
ICSA Labs
JPCERT/CC
Kaspersky Lab
KnowBe4
Lares Consulting
LIFARS
Lookout
Malicious Streams
McAfee
Mishcon de Reya
MWR InfoSecurity
National Cybersecurity and Communications Integration Center (NCCIC)
NetDilligence
OpenText (formerly Guidance Software)
Palo Alto Networks
Proofpoint
Pwnie Express
Qualys
Rapid7
S21Sec
Social-Engineer, Inc.
SwissCom
Tripwire
US Secret Service
US Computer Emergency Readiness Team (US-CERT)
VERIS Community Database
Verizon DOS Defense
Verizon Network Operations and Engineering
Verizon Professional Services
Verizon Threat Research Advisory Center
Vestige Ltd
Winston and Strawn
Zscaler
Related Documents