2018: Best Colleges - Main Survey Introduction BEST COLLEGES Data Collection U.S. News has begun collecting data for the 2019 edition of Best Colleges. The U.S. News surveys ask about many aspects of your institution that are important to potential college applicants across the country, other educational intuitions, and the public at large. Survey Deadline: May 10th, 2018 There are 3 steps in the U.S. News data collection process: Step 1: Data - Fill in as much of the survey as possible. Step 2: Assessment - After lling in your data, navigate to the ‘Main Survey Assessment’ section. The assessment runs a comparison between your current data and the data submitted last year. The assessment will identify potential errors between the two years of data. For more information please go to the main assessment section. Step 3: Verication - After reviewing the assessment and xing any remaining errors, navigate to the section titled ‘Verication’. This is where the survey submission takes place. Please take some time to review your survey data one last time. When you are ready, please select the check box, ll out the identication information and hit the red ‘Submit Survey’ button. Important Icons * The red asterisk located next to a few question numbers indicated that the question is mandatory. If the question is not answered you will be unable to submit the survey. All assessment ags are mandatory and must be addressed. The red x indicates that you have not lled out the question correctly. There will be a line of text that accompanies the icon letting you know what the exact problem is. Once the issue is corrected, the x will disappear. All failed validations must be xed before the survey can be submitted. The gold shield indicates that the question has been used in past U.S. News Best Colleges rankings calculations or is under consideration for future use. The question mark indicates a tip on how to answer that particular question. The checkbox indicates the assessment section of the survey. The upward arrow indicates the verication section of the survey. This is where the submission button is located. Entering Data To move between elds, you may either click on the eld you wish to move to or press the Tab key until you reach that eld. To move between individual pages of the survey, click on the "Next" or "Previous" links at the bottom of the page. You may also click on the section links listed in the index on the right-hand side of the screen and go to any page in the survey. Saving Data Saving data happens when a few actions are taken. One, you select the ‘Next’ button at the bottom of the page. Two, you select and navigate to another section in the question index. Three, you hit the ‘Save’ button at the bottom of a page. If you plan on leaving the survey before completion, please hit the save button before exiting the survey. Getting Help If you have questions or encounter problems while you are completing the survey, click the "Help" button on the top right-hand side of the screen. This will direct you to the data collector assigned to your institution. The Common Data Set U.S. News is again using questions from the Common Data Set (CDS). The CDS initiative is a collaborative effort among data providers in the higher education community and publishers as represented by the College Board, Thomson Peterson's, and U.S. News & World Report. We hope that this effort to standardize data denitions makes it easier to complete our questionnaire. For easy reference, all CDS items are noted throughout the Main and Financial Aid surveys. The CDS does not cover any of the questions on the Finance survey. Please note that some of the questions used in the Best Colleges rankings are unique to the U.S. News survey and are not included on the CDS. After you have submitted your CDS, you will have an opportunity to submit information for these questions. All CDS submissions must be received by May 2nd 2018 in order to allow enough time for data entry and processing in-house. Please contact your data collector for more information. PRINT SURVEY

2018: Best Colleges - Main Sur vey - oir.uga.edu · missing data ll-ins will work, contact Bob Morse at [email protected] (mailto:[email protected]) . On behalf of the data collect
Sep 14, 2019
Welcome message from author
This document is posted to help you gain knowledge. Please leave a comment to let me know what you think about it! Share it to your friends and learn new things together.
Transcript

2018: Best Colleges - Main SurveyIntroduction
BEST COLLEGES
Data CollectionU.S. News has begun collecting data for the 2019 edition of Best Colleges. The U.S. News surveys ask about many aspects of your institutionthat are important to potential college applicants across the country, other educational intuitions, and the public at large.Survey Deadline: May 10th, 2018There are 3 steps in the U.S. News data collection process:Step 1: Data - Fill in as much of the survey as possible.Step 2: Assessment - After �lling in your data, navigate to the ‘Main Survey Assessment’ section. The assessment runs a comparisonbetween your current data and the data submitted last year. The assessment will identify potential errors between the two years of data. Formore information please go to the main assessment section.Step 3: Veri�cation - After reviewing the assessment and �xing any remaining errors, navigate to the section titled ‘Veri�cation’. This is wherethe survey submission takes place. Please take some time to review your survey data one last time. When you are ready, please select thecheck box, �ll out the identi�cation information and hit the red ‘Submit Survey’ button.Important Icons
* The red asterisk located next to a few question numbers indicated that the question is mandatory. If the question is not answered you
will be unable to submit the survey. All assessment �ags are mandatory and must be addressed.The red x indicates that you have not �lled out the question correctly. There will be a line of text that accompanies the icon letting you
know what the exact problem is. Once the issue is corrected, the x will disappear. All failed validations must be �xed before the survey canbe submitted.
The gold shield indicates that the question has been used in past U.S. News Best Colleges rankings calculations or is under considerationfor future use.
The question mark indicates a tip on how to answer that particular question.The checkbox indicates the assessment section of the survey.The upward arrow indicates the veri�cation section of the survey. This is where the submission button is located.
Entering Data To move between �elds, you may either click on the �eld you wish to move to or press the Tab key until you reach that �eld. To move between
individual pages of the survey, click on the "Next" or "Previous" links at the bottom of the page. You may also click on the section links listedin the index on the right-hand side of the screen and go to any page in the survey.Saving Data
Saving data happens when a few actions are taken. One, you select the ‘Next’ button at the bottom of the page. Two, you select and navigateto another section in the question index. Three, you hit the ‘Save’ button at the bottom of a page. If you plan on leaving the survey beforecompletion, please hit the save button before exiting the survey.Getting Help
If you have questions or encounter problems while you are completing the survey, click the "Help" button on the top right-hand side of thescreen. This will direct you to the data collector assigned to your institution. The Common Data Set
U.S. News is again using questions from the Common Data Set (CDS). The CDS initiative is a collaborative effort among data providers in thehigher education community and publishers as represented by the College Board, Thomson Peterson's, and U.S. News & World Report. Wehope that this effort to standardize data de�nitions makes it easier to complete our questionnaire.For easy reference, all CDS items are noted throughout the Main and Financial Aid surveys. The CDS does not cover any of the questions onthe Finance survey. Please note that some of the questions used in the Best Colleges rankings are unique to the U.S. News survey and are notincluded on the CDS. After you have submitted your CDS, you will have an opportunity to submit information for these questions.All CDS submissions must be received by May 2nd 2018 in order to allow enough time for data entry and processing in-house. Please contactyour data collector for more information.
PRINT SURVEY

New Questions Main Statistical Survey
46 - admissions by residency86 - CLEP and DSST106 - gap year162 - part-time instructional faculty salaries174 - 2016-2017 graduate salaries among those employed part-time240 - formal internship program241 - internship compensation
Financial Aid Survey16, 17 - no loan �nancial aid policy
Questions Used in the Best Colleges RankingThe questions or question areas listed below are the data points that are used in the U.S. News Best Colleges ranking calculations. Moredetails on the U.S. News Best Colleges rankings can be found here: https://www.usnews.com/education/best-colleges/articles/how-us-news-calculated-the-rankings (https://www.usnews.com/education/best-colleges/articles/how-us-news-calculated-the-rankings)Please note: The primary factor used to determine whether a school will be eligible to be ranked in the 2019 edition of the U.S. News BestColleges rankings is question 57: Does your institution make use of SAT, ACT, or SAT Subject Test scores in admission decisions for �rst-time,�rst-year, degree-seeking applicants?The answer to this question must be "Yes" in order for a school to be ranked in the 2019 edition of the U.S. News Best Colleges rankings. Aschool that answers "No" will not be included in the rankings and will be listed as an "Unranked School." Test optional schools should answerquestion 57 as Yes. Only schools that don’t use SAT or ACT test at all in admission should answer as No. If you have questions on the Best Colleges ranking methodology, which schools qualify to be ranked or unranked, U.S. News publications orhow these statistical surveys are used in the rankings, contact Bob Morse, Chief Data Strategist, at [email protected](mailto:[email protected]).Main Statistical Survey
2017 Fall enrollment: 26-292016 Fall enrollment: 30-33Six-Year Graduation rates: 36, 37, 41Income-based Six-Year Graduation Rates: 36,37First-year (freshman) retention rates: 42, 43First-year (freshman) applications and acceptances: 45SAT and ACT scores and testing polices: 57, 58, 67-71, 73, 77SAT/ACT score reporting inclusion for all scores: 78SAT/ACT score reporting inclusion for all students: 79High school class standing: 81Undergraduate alumni giving: 153,155Total number of instructional faculty (current year): 156 all three columnsTotal number with doctorate or other terminal degree (current year): 156 full-time columnTotal number of instructional faculty (last year): 157 all three columns. Total number with doctorate or other terminal degree (last year): 157 full-time column Student to faculty ratio: 158-159Full-time faculty salaries: 160, 161Part-time faculty salaries: 162 (in consideration for future use)Class sections: 163
Note: Not all last year’s ranking indicators listed above are used in the calculation. Some are used only when current year data is not provided.Financial Aid Survey
Number of pell grants recieved in 2016-2017: 19Finance Survey
All expenditure questions from both years. This information is used to compute the �nancial resources per student variable in the BestColleges rankings.Diversity Rankings
Uses column labeled "Degree-Seeking Undergraduates" in question 34, Enrollment by Racial & Ethnic Category) from the Main statisticalsurvey.Best Values Rankings

Estimated expenses for a typical full-time undergraduate students: question 10 (both residents columns)Need-Based Aid for full-time undergraduate students: question 14 only current year actual or estimated is accepted In state/Out-of-statestudent aid awarded: question 43-45 (public institutions only)Percentage of students with need whose need is fully met: question 14h and 14i
Best Colleges for VeteransMilitary enrollment: 126G.I. Bill certi�ed: 127Yellow Ribbon participant: 128In-state tuition for active servicemen: 9 (�nancial aid survey)
Important Notice: U.S. News in its discretion will attempt to do cross-checking of data from what information schools have submitted ontheir Fall 2017 IPEDS Institutional Characteristics survey that appears on the U.S. Department of Education's College Navigator web sitehttp://nces.ed.gov/collegenavigator/ (http://nces.ed.gov/collegenavigator/) or can be downloaded from the IPEDS website, provided that theschools are ultimately responsible for the accuracy of the data that they submit. If you need more details on how the cross-checking ormissing data �ll-ins will work, contact Bob Morse at [email protected] (mailto:[email protected]).On behalf of the data collectors, reporters, and editors here at U.S. News and our many appreciative readers, thank you for your time andeffort.Matthew Mason, Data Collection Manager
Robert J. Morse, Chief Data Strategist Eric Brooks, Senior Data Analyst
U.S. News & World Report
Contact Information
Survey Contact #1:
Survey contacts can only be updated by your Data Collector. For their contact information, please click on the'help' icon above.
Name:
Paul Klute
Job Title:
Director of Institutional Research
Email:
Phone:
Survey Contact #2:
Name:
Mary Moore
Job Title:
Institutional Research Analyst
Email:
Phone:
7064253183

Survey Contact #3:
Name:
Julie Davis
Job Title:
Institutional Research Analyst
Email:
Phone:
7064253183
Public Relations Contacts:
These contacts will receive the embargoed ranking information prior to the o�cial rankings release. Please do not list the survey contactshere. The survey contacts will also receive the embargoed information prior to the o�cial release.
This data is rolled over from last year.
Contact 1 - Name:
Jan Gleason
Contact 1 - Email:
Contact 1 - Phone:
706-542-1024
Contact 2 - Name:
Karri Hobson-Pape
Contact 2 - Email:
Contact 2 - Phone:
706-542-8090
General Information
If any of the general information is incorrect, please enter the correct information. Note that cross-references to Common Data Set itemsappear in parentheses as (CDS xx), next to our questions.For any assistance, please contact your data collector by clicking the 'Help' icon at the top of the survey.1.) Name of college or university:
CDS A1
University of Georgia
2.) Mailing address:
CDS A1 This data is rolled over from last year.
Administration Building
3.) City:

CDS A1 This data is rolled over from last year.
Athens
4.) State:
CDS A1 This data is rolled over from last year.
Georgia
5.) Zip:
CDS A1 This data is rolled over from last year.
30602
6.) International Postal Code (If applicable):
This data is rolled over from last year.
7.) Main phone:
CDS A1 This data is rolled over from last year.
706-542-3000
8.) Source of institutional control: *
CDS A2 This data is rolled over from last year.
Public
Private (nonpro�t)
Proprietary
No Answer
9.) In what year was your institution founded?
This data is rolled over from last year.
1785
10.) Religious A�liation:
This data is rolled over from last year.
11.) Which of the following best describes the campus setting of your institution?
This data is rolled over from last year.
Urban (located within a major city)
City
Suburban
Rural
No Answer
12.) Classify your undergraduate institution:
CDS A3 This data is rolled over from last year.
Coeducational college

Men's college
Women's college
No Answer
13.) Academic Year Calendar:
CDS A4 This data is rolled over from last year.
Semester
Quarter
Trimester
4-1-4
Continuous
Differs by program (Describe in Comments)
Other (Describe in Comments)
No Answer
Make a comment on your choice here:
14.) Degrees Offered by your Institution:
CDS A5 This data is rolled over from last year.
Certi�cate
Diploma
Associate
Transfer
Terminal
Bachelor's
Post-bachelor's certi�cate
Master's
Post-master's certi�cate
Doctoral degree - research/scholarship
Doctoral degree - professional practice
Doctoral degree - other

15.) Admissions o�ce mailing address:
CDS A1 This data is rolled over from last year.
Terrell Hall
16.) City:
CDS A1 This data is rolled over from last year.
Athens
17.) State:
CDS A1 This data is rolled over from last year.
Georgia
18.) Zip:
CDS A1 This data is rolled over from last year.
30602
19.) Admissions phone number:
CDS A1 This data is rolled over from last year.
706-542-8776
20.) Admissions Email address:
CDS A1 This data is rolled over from last year.
21.) WWW home page address:
CDS A1 This data is rolled over from last year.
http://www.admissions.uga.edu
22.) Is there a separate URL application site on the Internet? If so, please specify:
CDS A1 This data is rolled over from last year.
https://apply.uga.edu/apply
23.) Do you accept the Common Application?
This data is rolled over from last year.
Yes
No
No Answer
24.) What year did you begin accepting the Common Application?
This data is rolled over from last year.
25.) Respondent information. Who is completing this survey?
Name:

Julie Davis
Title:
Assistant Director for Institutional Research
Email:
Phone:
706-425-3183
2017 Enrollment
Institutional Enrollment: Provide numbers of students for each of the following categories as of the institution's o�cial fall reporting date oras of October 15, 2017. Please report students formerly designated as "�rst professional" in the graduate cells. Last year's enrollment grid isincluded for your reference.26.) 2017 Enrollment: *
CDS B1 This question is used in the Rankings calculation.
Full-Time: Men Full-Time: Women Part-Time: Men Part-Time: Women
Degree-seeking, �rst-time freshmen 2267 3542 6 11
Other �rst-year, degree-seeking 205 252 14 20
All other degree- seeking 9131 11662 793 820
Total degree-seeking 11603 15456 813 851
All other undergraduates enrolled incredit course 35 48 13 29
Total undergraduates 11638 15504 826 880
Graduate degree seeking, �rst-time 805 1185 201 232
All other graduate degree seeking 1966 2821 532 881
All other graduates enrolled in creditcourses 19 29 30 57
Total graduates 2790 4035 763 1170
27.) Total 2017 enrollment, all undergraduates:
CDS B1 This question is used in the Rankings calculation.
28848

28.) Total 2017 enrollment, all graduates:
CDS B1 This question is used in the Rankings calculation.
8758
29.) GRAND TOTAL - 2017 Enrollment: *
CDS B1 This question is used in the Rankings calculation.
37606
2016 Enrollment
30.) 2016 Enrollment:
This question is used in the Rankings calculation. This data is rolled over from last year.
Full-Time: Men Full-Time: Women Part-Tme: Men Part-Time: Women
Degree-seeking, �rst-time freshmen 2146 3255 18 14
Other �rst-year, degree-seeking 247 250 18 19
All other degree- seeking 8825 11526 772 738
Total degree-seeking 11218 15031 808 771
All other undergraduates enrolled incredit courses 26 53 15 29
Total undergraduates 11244 15084 823 800
Graduate degree-seeking, �rst-time 788 1119 179 231
All other graduate degree-seeking 1937 2817 563 852
All other graduates enrolled in creditcourses 11 6 39 81
Total graduates 2736 3942 781 1164
31.) Total 2016 enrollment, all undergraduates:
This question is used in the Rankings calculation. This data is rolled over from last year.
27951
32.) Total 2016 enrollment, all graduates:
This question is used in the Rankings calculation. This data is rolled over from last year.
8623

33.) GRAND TOTAL - 2016 Enrollment:
This question is used in the Rankings calculation. This data is rolled over from last year.
36574
Ethnicity Enrollment and Degrees Awarded
Enrollment by Racial & Ethnic Category: Provide numbers of undergraduates for each of the following categories as of the institution's o�cialfall reporting date or as of October 15, 2017. Include international students only in the category "Nonresident aliens." Report as yourinstitution reports to IPEDS: persons who are Hispanic should be reported only on the Hispanic line, not under any race, and persons who arenon-Hispanic multi-racial should be reported only under "Two or more races."Notes:
Degree seeking undergraduates (2nd column) should include the degree seeking, �rst-time, �rst year students in column one.If there are no students in a category, enter zero.
34.) Ethnicity Grid:
CDS B2
Degree-seeking �rst-time, �rst year students Degree-seeking Undergraduates
Non-resident aliens 70 458
Hispanic 390 1754
Black or African American, non-Hispanic 466 2250
White, non-Hispanic 3959 19898
American Indian or Alaskan Native, non-Hispanic 4 29
Asian, non-Hispanic 642 2960
Native Hawaiian or other Paci�c Islander, non-Hispanic 2 24
Two or more races, non-Hispanic 236 1092
Race/ethnicity unknown 57 258
Total 5826 28723
35.) Number of degrees awarded by your institution from July 1, 2016 to June 30, 2017:
CDS B3
Certi�cate/diploma
705
Associate degrees

0
Bachelor's degrees
7128
Post-bachelor's certi�cates
143
Master's degrees
1684
Post-master's certi�cates
69
Doctoral degrees - research/scholarship
543
Doctoral degrees - professional practice
424
Doctoral degrees - other
0
Grad and Retention Rates
36.) Graduation rates - 2010 Cohort:
The following questions ask for information needed to calculate the six-year graduation rate for the cohort of full-time, �rst-time, bachelor's(or equivalent) degree-seeking undergraduate students who entered your institution in the Fall of 2010.Include students who entered your institution during the Summer term preceding Fall of 2010.
B4-B11 This question is used in the Rankings calculation. This data is rolled over from last year.

Recipientsof aFederalPell Grant
Recipients of asubsidizedStafford Loan whodid not receive aPell Grant
Students who didnot receive either aPell Grant or asubsidized StaffordLoan
Total
A - Initial 2010 cohort of �rst-time, full-time, bachelor's (or equivalent)degree-seeking undergraduate students 1023 279 3365
B - Of the initial 2010 cohort, how many did not persist and did notgraduate for the following reasons: deceased, permanently disabled,armed forces, foreign aid service of the federal government, or o�cialchurch missions; total allowable exclusions
0 0 0 0
C - Final 2010 cohort, after adjusting for allowable exclusions 1023 279 3365
D - Of the initial 2010 cohort, how many completed the program in fouryears or less (by Aug. 31, 2014) 555 157 2235
E - Of the initial 2010 cohort, how many completed the program in morethan four years but in �ve years or less (after Aug. 31, 2014 and by Aug. 31,2015)
230 48 621 899
F - Of the initial 2010 cohort, how many completed the program in morethan �ve years but in six years or less (after Aug. 31, 2015 and by Aug. 31,2016)
43 9 60 112
G - Total graduating within six years (sum of lines D, E, and F) 828 214 2916
H - Six-year graduation rate for 2010 cohort (percent) 81 77 87 85
37.) Graduation rates - 2011 Cohort:
The following questions ask for information needed to calculate the six-year graduation rate for the cohort of full-time, �rst-time, bachelor's(or equivalent) degree-seeking undergraduate students who entered your institution in the Fall of 2011.Include students who entered your institution during the Summer term preceding Fall of 2011.
B4-B11 This question is used in the Rankings calculation.
466
466
294
395

Recipientsof aFederalPell Grant
Recipients of asubsidizedStafford Loan whodid not receive aPell Grant
Students who didnot receive either aPell Grant or asubsidized StaffordLoan
Total
A - Initial 2011 cohort of �rst-time, full-time, bachelor's (or equivalent)degree-seeking undergraduate students 1293 504 3673
B - Of the initial 2011 cohort, how many did not persist and did notgraduate for the following reasons: deceased, permanently disabled,armed forces, foreign aid service of the federal government, or o�cialchurch missions; total allowable exclusions
0 0 0 0
C - Final 2011 cohort, after adjusting for allowable exclusions 1293 504 3673
D - Of the initial 2011 cohort, how many completed the program in fouryears or less (by Aug. 31, 2015) 703 289 2437
E - Of the initial 2011 cohort, how many completed the program in morethan four years but in �ve years or less (after Aug. 31, 2015 and by Aug. 31,2016)
284 93 713
F - Of the initial 2011 cohort, how many completed the program in morethan �ve years but in six years or less (after Aug. 31, 2016 and by Aug. 31,2017)
52 19 74 145
G - Total graduating within six years (sum of lines D, E, and F) 1039 401 3224
H - Six-year graduation rate for 2011 cohort (percent) 80 80 88 85
38.) Of the students reported in question 37, line C, total column, the number of nonresident alien (international) students:
46
39.) Of the students reported in question 37, line G, total column, the number of nonresident alien (international) students:
36
40.) Six-year graduation rate for 2011 cohort of �rst-time, full-time, bachelor's (or equivalent) degree-seeking undergraduate nonresident alien (international) students:
78
41.) Historical six-year graduation rates:
Please verify the percent of �rst-time, full-time, degree-seeking freshmen who entered in:
This question is used in the Rankings calculation. This data is rolled over from last year.
Fall 2009 and completed a bachelor's degree from your school before fall 2015 (percent)
Fall 2008 and completed a bachelor's degree from your school before fall 2014 (percent)
42.) First-year (freshman) retention rate:
For the cohort of all �rst-time, full-time, bachelor's degree-seeking undergraduate students who entered your institution in fall 2016 (or thepreceding summer term), what percentage was enrolled at your institution in fall 2017 (i.e. enrolled on the date your institution calculates itso�cial enrollment for fall 2017)?
547
547
342
109
466
85 %
85 %

CDS B22 This question is used in the Rankings calculation.
43.) Historical �rst-year (freshman) retention rates:
Please con�rm the following historical freshman retention rates (calculated as above). The percentage of �rst-time, full-time, degree-seekingfreshman who entered in:
This question is used in the Rankings calculation. This data is rolled over from last year.
Fall of 2015 and returned to your institution in fall 2016 (percent)
Fall of 2014 and returned to your institution in fall 2015 (percent)
Fall of 2013 and returned to your institution in fall 2014 (percent)
44.) International student retention rate:
For the cohort of �rst-time, full-time, bachelor's degree-seeking nonresident alien (international) students who entered your institution in fall2016 (or the preceding summer term), what percentage was enrolled at your institution in fall 2017 (i.e., enrolled on the date your institutecalculates its o�cial enrollment for fall 2017)?
Admission
45.) Provide the number of degree-seeking, �rst-time, �rst-year students who applied, were admitted, and enrolled (full- or part-time) in fall 2017:
Include early decision, early action, and students who began studies during summer in this cohort.Applicants should include only those students who ful�lled the requirements for consideration for admission (i.e., who completedactionable applications) and who have been noti�ed of one of the following actions: admission, non-admission, placement on waiting list,or application withdrawn (by applicant or institution).Admitted applicants should include wait-listed students who were subsequently offered admission.Fall 2016 data is included for your reference.
CDS C1 This question is used in the Rankings calculation. This data is rolled over from last year.
96 %
95 %
95 %
94 %
93 %

Fall 2017 Fall 2016
Total men applied 9715 9033
Total women applied 14450 13661
Total applications 24165 22694
Total men admitted 4845 4578
Total women admitted 8207 7654
Total admitted 13052 12232
Total full-time, �rst-time, �rst-year (freshman) men enrolled 2267 2146
Total part-time, �rst-time, �rst-year (freshman) men enrolled 6 18
Total full-time, �rst-time, �rst-year (freshman) women enrolled 3542 3255
Total part-time, �rst-time, �rst-year (freshman) women enrolled 11 14
Total �rst-time, �rst-year enrolled, men and women, full- and part-time 5826 5433
46.) Please break down the previous question by residency of the applicants: Fall 2017
Do not include international applicants in this grid. That information is captured in the 'International Applicant Info' section.

In-state Out-of-state
Total men applied 6095 3620
Total women applied 8071 6379
Total applications 14166 9999
Total men admitted 3578 1267
Total women admitted 5251 2956
Total admitted 8829 4223
Total full-time, �rst-time, �rst-year (freshman) men enrolled 2049 218
Total part-time, �rst-time, �rst-year (freshman) men enrolled 6 0
Total full-time, �rst-time, �rst-year (freshman) women enrolled 2990 552
Total part-time, �rst-time, �rst-year (freshman) women enrolled 10 1
Total �rst-time, �rst-year enrolled, men and women, full- and part-time 5055 771
47.) Do you have a policy of placing students on a waiting list?
Freshman wait-listed students: students who met admission requirements but whose �nal admission was contingent on space availability
CDS C2 This data is rolled over from last year.
Yes
No
No Answer
48.) Please answer the questions below for fall 2017 admissions:
CDS C2
Number of quali�ed applicants offered a place on waiting list:
889
Number accepting a place on the waiting list:
531
Number of wait-listed students admitted:
31

Admission Requirements
49.) Check the appropriate box to identify your high school completion requirement for degree-seeking entering students.
CDS C3 This data is rolled over from last year.
High school diploma is required and GED is accepted
High school diploma is required and GED is not accepted
High school diploma or equivalent is not required
No Answer
50.) Does your institution require or recommend a general college-preparatory program for degree-seeking students?
CDS C4 This data is rolled over from last year.
Require
Recommend
Neither require nor recommend
No Answer
51.) Specify the distribution of academic high school course units required and/or recommended of all or most degree-seeking students using Carnegie units (one unit equalsone year of study or its equivalent). If you use a different system for calculating units, please convert.
CDS C5 This data is rolled over from last year.

Units Required Units Recommended
English 4 4
Mathematics 4 4
Science 4 4
Of the science units, units that must be lab 2 2
Foreign language 2 3
Social studies 3 3
History
Academic electives 1
Computer Science
Visual / Performing Arts
Other
Total 17 19
52.) Please specify 'Other' high school course in the grid above:
This data is rolled over from last year.
53.) Do you have an open admission policy, under which virtually all secondary school graduates or students with GED equivalency diplomas are admitted without regard toacademic record, test scores, or other quali�cations?
CDS C6 This data is rolled over from last year.
Yes
No
No Answer
54.) Open admission policy as described above for most students, but:
This data is rolled over from last year.
Selective admission for out-of-state students
Selective admission to some programs

55.) Relative importance of each of the following academic and nonacademic factors in your �rst-time, �rst-year, degree-seeking (freshman) admission decisions. Pleasemark one column from each row.Academic:
CDS C7 This data is rolled over from last year.
Very Important Important Considered Not Considered No Answer
Rigor of secondaryschool record
Class rank
Academic GPA
Recommendation(s)
Standardized testscores
Application essay
56.) Nonacademic:
CDS C7 This data is rolled over from last year.
Very Important Important Considered Not Considered No Answer
Interview
Extracurricularactivities
Talent/ability
Character/personalqualities
First generation
Alumni/ae relation
Geographical residence
State residency
Religiousa�liation/commitment
Racial/ethnic status
Volunteer Work
Work experience
Level of applicant'sinterest
SAT and ACT Policies
57.) Does your institution make use of SAT, ACT, or SAT Subject Test scores in admission decisions for �rst-time, �rst-year, degree-seeking applicants?

Important Note: Schools that answer “no” to this question will not be ranked in the next edition of Best Colleges. Test-optional schoolsshould answer “yes.”)
*
CDS C8 This question is used in the Rankings calculation. This data is rolled over from last year.
Yes
No
58.) Select the appropriate boxes to re�ect your institution's policies for use in admission for Fall 2017.
CDS C8A This question is used in the Rankings calculation. This data is rolled over from last year.
Required Recommended Required forsome
Considered ifsubmitted Not used Row not
applicable No Answer
SAT or ACT
ACT Only
SAT Only
SAT and SATSubject Testsor ACT
SAT SubjectTests
59.) If SAT and/or ACT exams are not required for all applicants, which of the following best describes your institutions admissions policy:
Test �exible -- Applicants are required to submit standardized test scores, but may submit alternative exam scores (e.g. SAT Subject Tests,AP exams, IB exams) instead of ACT or SAT scores.Test optional -- Applicants are not always required to submit standardized test scores, but standardized test scores are considered inadmissions decisions.Test blind -- Applicants are not required to submit standardized test scores and standardized test scores are not considered in admissionsdecisions.Test optional only for international applicants -- Only international applicants may apply without submitting SAT or ACT exams
This data is rolled over from last year.
Test �exible
Test optional
Test blind
Test optional only for international applicants
No Answer
60.) If your institution will make use of the ACT in admission decisions for �rst-time, �rst-year, degree-seeking applicants for Fall 2019, please indicate which ONE of thefollowing applies (regardless of whether the writing score will be used in the admissions process):
CDS C8B This data is rolled over from last year.
ACT with Writing required
ACT with Writing recommended
ACT with or without Writing accepted
No Answer
61.) If your institution will make use of the SAT in admission decisions for �rst-time, �rst-year, degree-seeking applicants for Fall 2019, please indicate which ONE of thefollowing applies (regardless of whether the writing score will be used in the admissions process):

CDS C8B This data is rolled over from last year.
SAT with Essay component required
SAT with Essay component recommended
SAT with or without Essay component accepted
No Answer
62.) Please indicate how your institution will use the SAT or ACT essay component:
CDS C8C This data is rolled over from last year.
SAT essay ACT essay
For admission
For placement
For advising
In place of an application essay
As a validity check on the application essay
No college policy as of now
Not using essay component
63.) Does your institution use applicants' test scores for academic advising?
CDS C8D This data is rolled over from last year.
Yes
No
No Answer
64.) Latest date by which SAT or ACT scores must be received for fall-term admission:
CDS C8E This data is rolled over from last year.
01/24
65.) Latest date by which SAT Subject Tests scores must be received for fall-term admission:
CDS C8E This data is rolled over from last year.
01/24
66.) If necessary, use this space to clarify your test policies (e.g., if tests are recommended for some students, or if tests are not required of some students). Do not includebullets, paragraph breaks, special characters, or other special formatting:
CDS C8F This data is rolled over from last year.
Test scores from the January sitting will be considered provided the student applied by our deadline of January 1st. Test Scores must be sent directly AND electronically from testing agencies.

66.) Test Score Submission: In the following questions, please provide the percent and number of �rst-time, �rst-year students enrolled in fall 2017 who submitted nationalstandardized (SAT/ACT) test scores:
Include information for ALL enrolled, �rst-time, �rst-year (freshman) degree-seeking students -- full, or part-time-- who submitted testscores, including students who began studies during summer, international students / nonresident aliens, and students admitted underspecial arrangements.Do not include partial test scores (e.g., mathematics scores but not critical reading for a category of students) or combine otherstandardized test results (such as TOEFL) in these items.Do not convert SAT scores to ACT scores and vice versa.Important Note: Do convert Old SAT scores (2017) to New SAT scores using the College Board's concordance tools and tables(https://collegereadiness.collegeboard.org/educators/higher-ed/scoring-changes/concordance?excmpid=MTG352-PR-3-opg)
CDS C9
67.) How many �rst-time, �rst-year (freshman) degree-seeking students who enrolled submitted SAT scores?
CDS C9 This question is used in the Rankings calculation. This data is rolled over from last year.
Fall 2017:
3946
Fall 2016:
3998
68.) What percent of �rst-time, �rst-year (freshman) degree-seeking students who enrolled submitted SAT scores?
CDS C9 This question is used in the Rankings calculation. This data is rolled over from last year.
Fall 2017:
Fall 2016:
69.) How many �rst-time, �rst-year (freshman) degree-seeking students who enrolled submitted ACT scores?
CDS C9 This question is used in the Rankings calculation. This data is rolled over from last year.
Fall 2017:
4319
Fall 2016:
3904
70.) What percent of �rst-time, �rst-year (freshman) degree-seeking students who enrolled submitted ACT scores?
CDS C9 This question is used in the Rankings calculation. This data is rolled over from last year.
Fall 2017:
Fall 2016:
71.) SAT Percentiles: Evidence-Based Reading and Writing & Math
Include all enrolled �rst-time, �rst-year (freshman) degree-seeking students who submitted SAT scores:
68 %
74 %
74 %
72 %

CDS C9 This question is used in the Rankings calculation. This data is rolled over from last year.
2017 - 25th Percentile 2017 - 75th Percentile 2016 - 25th Percentile 2016 - 75th Percentile
SAT Evidence-Based Reading andWriting 610 690 570 670
SAT Math 590 680 570 670
72.) SAT Percentiles: Essay
Include all enrolled �rst-time, �rst-year (freshman) degree-seeking students who submitted SAT scores
CDS C9 This data is rolled over from last year.
2017 - 25th Percentile 2017 - 75th Percentile 2016 - 25th Percentile 2016 - 75th Percentile
SAT Essay 6 8
73.) ACT Percentiles: Composite Score
Include all enrolled �rst-time, �rst-year (freshman) degree-seeking students who submitted ACT scores
CDS C9 This question is used in the Rankings calculation. This data is rolled over from last year.
2017 - 25th Percentile 2017 - 75th Percentile 2016 - 25th Percentile 2016 - 75th Percentile
ACT CompositeScore 26 31 26 31
74.) ACT Percentiles:
Include all enrolled �rst-time, �rst-year (freshman) degree-seeking students who submitted ACT scores
CDS C9 This data is rolled over from last year.
2017 - 25th Percentile 2017 - 75th Percentile 2016 - 25th Percentile 2016 - 75th Percentile
ACTEnglish 26 33 26 33
ACT Math 25 30 25 30
ACT Writing
75.) Percent of �rst-time, �rst-year (freshman) students enrolled in fall 2017 with SAT scores in each range:
CDS C9

SAT Evidence-Based Reading and Writing SAT Math
700-800 23.14 20.5
600-699 60.8 51.17
500-599 15.23 26.46
400-499 0.79 1.8
300-399 0.04 0.07
200-299
76.) Percent of �rst-time, �rst-year (freshman) students enrolled in fall 2017 with ACT scores in each range:
CDS C9
ACT Composite ACT English ACT Math
30-36 44.76 54.48 27.55
24-29 47.6 35.52 60.31
18-23 7.43 9.15 11.42
12-17 0.21 0.79 0.72
6-11 0.06
Below 6
77.) Average Test Scores: Please enter average test scores for all full- and part-time, �rst-time, �rst-year (freshman) students enrolling in the fall of 2017, including studentswho began studies during the summer, international students / nonresident aliens, and students admitted under special arrangements. Last year's data is provided for yourreference.Please ignore the SAT Writing column
This question is used in the Rankings calculation. This data is rolled over from last year.
SAT Evidence-Based Reading andWriting SAT Math SAT Writing ACT Composite
Fall2017 651 637 29
Fall2016 626 632 619 29
78.) Does the data reported in questions 67-77 include all �rst-time, �rst-year (freshman) degree-seeking students enrolled in Fall 2017 who reported SAT and/or ACT testscores, regardless if those scores were considered for admissions?

This question is used in the Rankings calculation.
Yes
No
79.) Were test scores of the following groups of students who provided test score information included in the calculation of SAT and ACT scores for �rst-time, �rst-year(freshman) degree-seeking students who enrolled in fall of 2017?
This question is used in the Rankings calculation.
Yes No Not Applicable No Answer
All international students
All minority students
All student athletes
All legacy/children ofalumni admits
All special admissionarrangements
All students who beganstudies in summer 2017
80.) Were test scores of the following groups of students who provided test score information included in the calculation of SAT and ACT scores for �rst-time, �rst-year(freshman) degree-seeking students who enrolled in fall of 2016?
This data is rolled over from last year.
Yes No Not Applicable No Answer
All international students
All minority students
All student athletes
All legacy/children ofalumni admits
All special admissionarrangements
All students who beganstudies in summer 2016
HS Standing and GPA
81.) High School Class Standing: Please enter the percent of all degree-seeking, �rst-time, �rst-year (freshman) students who had high school class rank within each of thefollowing ranges. "Freshman" includes all full- and part-time, �rst-time, �rst-year students who enrolled in fall of 2017, including students who began studies during the summer,international students / nonresident aliens, and students admitted under special arrangements. We have provided the data that was submitted last year for your reference.
CDS C10 This question is used in the Rankings calculation. This data is rolled over from last year.

Fall 2017 Fall 2016
% in top tenth of high school graduating class 54 55
% in top quarter of high school graduating class 90 91
% in top half of high school graduating class 99 99
% in bottom half of high school graduating class 1 1
% in bottom quarter of high school graduating class 0 0
% of total �rst-time, �rst-year (freshman) students who submitted high schoolclass rank 61 66
82.) Percentage of all enrolled, degree-seeking, �rst-time, �rst-year (freshman) students who had high school grade-point averages within each of the following ranges (using4.0 scale). Report information only for those students from whom you collected high school GPA.
CDS C11
Percent who had GPA of 3.75 and higher
Percent who had GPA between 3.50 and 3.74
Percent who had GPA between 3.25 and 3.49
Percent who had GPA between 3.00 and 3.24
Percent who had GPA between 2.50 and 2.99
Percent who had GPA between 2.00 and 2.49
Percent who had GPA between 1.00 and 1.99
Percent who had GPA below 1.00
83.) What percent of total, �rst-time, �rst-year (freshman) students who enrolled in the fall of 2017 submitted high school GPA?
CDS C12
84.) What was the average high school GPA of all �rst-time, �rst-year (freshman) students who enrolled in the fall of 2017 and submitted GPA?
CDS C12
89 %
9 %
1 %
1 %
0 %
0 %
0 %
0 %
99 %

4
85.) What was the GPA of �rst-time, �rst-year fall 2017 students at the 25th and 75th percentile?
25th 75th
GPA 4.0 4.0
College-level Exams
86.) College Credit and placement options offered during the 2017-2018 academic year:
This data is rolled over from last year.
Credit only Placement only Credit and/orplacement Not used No Answer
College EntranceExamination Board(CEEB) AdvancedPlacement
InternationalBaccalaureate
College-LevelExamination Program(CLEP)
DSST
87.) How many �rst-time, �rst-year, degree-seeking enrolled students who enrolled in Fall 2017 received college credit for at least one of the following exams?
Advanced Placement (AP)
4636
International Baccalaureate (IB)
319
88.) Credit/placement offered for Advanced Placement (AP) scores:
This data is rolled over from last year.
2
3
4
5
89.) Is there a maximum number of AP exams your institution will accept for credit toward an undergraduate degree?
This data is rolled over from last year.
Yes
No
No Answer
90.) If yes, what is the maximum number?
This data is rolled over from last year.

91.) Credit/placement offered for International Baccalaureate (IB) scores:
This data is rolled over from last year.
Standard Level (SL) Higher Level (HL)
2
3
4
5
6
7
Applications
92.) Does your institution have an application fee?
CDS C13 This data is rolled over from last year.
Yes
No
No Answer
93.) Amount of application fee:
CDS C13 This data is rolled over from last year.
94.) If you have an application fee and online application option, please indicate policy for students who apply online.
CDS C13 This data is rolled over from last year.
Same fee
Free
Reduced
No Answer
95.) What is the fee for students who apply online?
This data is rolled over from last year.
96.) Can the fee be waived for applicants with �nancial need?
CDS C13 This data is rolled over from last year.
Yes
No
70$
$

No Answer
97.) Is the application fee refundable:
This data is rolled over from last year.
Yes
No
No Answer
98.) Does your institution have an application closing date?
CDS C14 This data is rolled over from last year.
Yes
No
No Answer
99.) Application closing date (Fall):
CDS C14 This data is rolled over from last year.
01/01
100.) Application priority date:
CDS C14 This data is rolled over from last year.
10/15
101.) Are �rst-time, �rst-year students accepted for terms other than the fall?
CDS C15 This data is rolled over from last year.
Yes
No
No Answer
102.) Noti�cation to Applicants of Admission Decision Sent:
CDS C16 This data is rolled over from last year.
On a rolling basis beginning:
By:
Other:
12/1 Early Action; 4/1 Regular
103.) Reply policy for admitted applicants
CDS C17 This data is rolled over from last year.
Must reply by:

No set date (do not leave comment)
Must reply by May 1 or within (X) weeks if noti�ed thereafter
2
Other:
104.) Deferred admission: Does your institution allow students to postpone enrollment after admission?
CDS C18 This data is rolled over from last year.
Yes
No
No Answer
105.) Maximum period of postponement:
This data is rolled over from last year.
one academic year
106.) Has your college designed an in-house gap year program for incoming �rst-year students?
Yes
No
No Answer
107.) Early admission of high school students: Does your institution allow high school students to enroll as full-time, �rst-time, �rst-year (freshman) students one year or morebefore high school graduation?
CDS C19 This data is rolled over from last year.
Yes
No
No Answer
108.) Early Decision Admissions: Does your institution offer an early decision plan for �rst-time, �rst-year (freshman) applicants for fall enrollment?
CDS C21 This data is rolled over from last year.
Yes
No
No Answer
109.) Early Decision Admissions: Fall 2017
Please count degree-seeking, �rst-time, �rst-year students who applied, were admitted, and enrolled (full- or part-time)
Applications:
Accepted Applications:

Enrolled:
110.) Early Decision Dates:
CDS C21 This data is rolled over from last year.
First or only early decision plan closing date:
First or only early decision plan noti�cation date:
Other early decision plan closing date:
Other early decision plan noti�cation date:
111.) Early Action Admissions. Do you have a nonbinding early action plan whereby students are noti�ed of an admission decision well in advance of the regular noti�cationdate but do not have to commit to attending your college?
CDS C22 This data is rolled over from last year.
Yes
No
No Answer
112.) Early Action Admissions: Fall 2017
Please count degree-seeking, �rst-time, �rst-year students who applied, were admitted, and enrolled (full- or part-time)
Applications:
15548
Accepted Applications:
10020
Enrolled:
4342
113.) Early Action Dates:
CDS C22 This data is rolled over from last year.
Early action plan closing date:
10/15
Early action plan noti�cation date:
12/01
114.) Is your early action plan a "restrictive" plan under which you limit students from applying to other early plans?
This data is rolled over from last year.

Yes
No
No Answer
Applications, Part 2
115.) Check special requirements for admission to speci�c programs:
This data is rolled over from last year.
Portfolio required of art program applicants
Audition required of music program applicants
Audition required of dance program applicants
Audition required of theatre program applicants
R.N. required of nursing program applicants
116.) Does your institution offer conditional admission for applicants who are not normally admissible due to academic de�ciencies and/or economic disadvantages? Thisincludes both domestic and international students.
This data is rolled over from last year.
Yes
No
No Answer
117.) Campus visit is:
This data is rolled over from last year.
Required
Recommended
Neither required/recommended
No Answer
118.) Admission interview is:
This data is rolled over from last year.
Required
Recommended
Neither required/recommended
No Answer
119.) Off-Campus admissions interviews:
This data is rolled over from last year.
May be arranged with an admission representative
May not be arranged with an admission representative
Are not available
No Answer
120.) Tuition deposit amount:
This data is rolled over from last year.

121.) Tuition deposit is:
This data is rolled over from last year.
Nonrefundable
Partially refundable
Refundable
No Answer
122.) Tuition deposit is refundable if withdrawn by:
This data is rolled over from last year.
123.) Amount for housing deposit:
CDS C17 This data is rolled over from last year.
124.) Deadline for housing deposit:
CDS C17 This data is rolled over from last year.
125.) Is housing deposit refundable if student does not enroll?
CDS C17 This data is rolled over from last year.
Yes, in full
Yes, in part
No
No Answer
Veterans and Military
126.) Military Enrollment:
Provide numbers of undergraduate students, full-time and part-time, for each of the following categories as of the institution's o�cial fallreporting date or as of October 15, 2017Military Active Service Members includes Active duty and Active guard reserve onlyROTC should not be counted
This data is rolled over from last year.
Fall 2017 Fall 2016
Military Veterans 92 92
Military Active Service Members 30 38
Total: Military Veterans and Active Service Members 122 130
300$
$

127.) Is your institution certi�ed for the G.I. Bill?
This data is rolled over from last year.
Yes
No
No Answer
128.) Does your institution participate in the Yellow Ribbon Program through undergraduate programs?
This data is rolled over from last year.
Yes
No
No Answer
129.) ROTC programs offered in cooperation with the Reserve O�cers' Training Corps during the 2017- 2018 academic year.Army ROTC:
CDS F3 This data is rolled over from last year.
Offered on campus
Offered at cooperating institution
Not offered
No Answer
130.) Name of cooperating institution:
This data is rolled over from last year.
131.) Navy ROTC:
CDS F3 This data is rolled over from last year.
Offered on campus
Offered at cooperating institution
Not offered
No Answer
132.) Name of cooperating institution:
This data is rolled over from last year.
133.) Air Force ROTC:
CDS F3 This data is rolled over from last year.
Offered on campus
Offered at cooperating institution
Not offered
No Answer
134.) Name of cooperating institution:
This data is rolled over from last year.
Transfers
135.) Does your institution enroll transfer students?

CDS D1 This data is rolled over from last year.
Yes
No
No Answer
136.) May transfer students earn advanced standing credit by transferring credits earned from course work completed at other colleges/universities?
This data is rolled over from last year.
Yes
No
No Answer
137.) Provide the number of students who applied, were admitted, and enrolled as degree-seeking transfer students in fall 2017
CDS D2
Applicants Admitted Enrolled
Men 1285 938 702
Women 1252 910 652
Total 2537 1848 1354
138.) Of the newly enrolled degree-seeking transfer students reported in the grid above, how many:
Entered with credits granted by a community college?
Had an associate degree granted by another institution?
139.) Indicate terms for which transfers may enroll:
CDS D3 This data is rolled over from last year.
Fall
Winter
Spring
Summer
140.) Must a transfer applicant have a minimum number of credits completed or else must apply as an entering freshman?
CDS D4 This data is rolled over from last year.
Yes
No
No Answer
141.) What is the minimum number of credits?
This data is rolled over from last year.
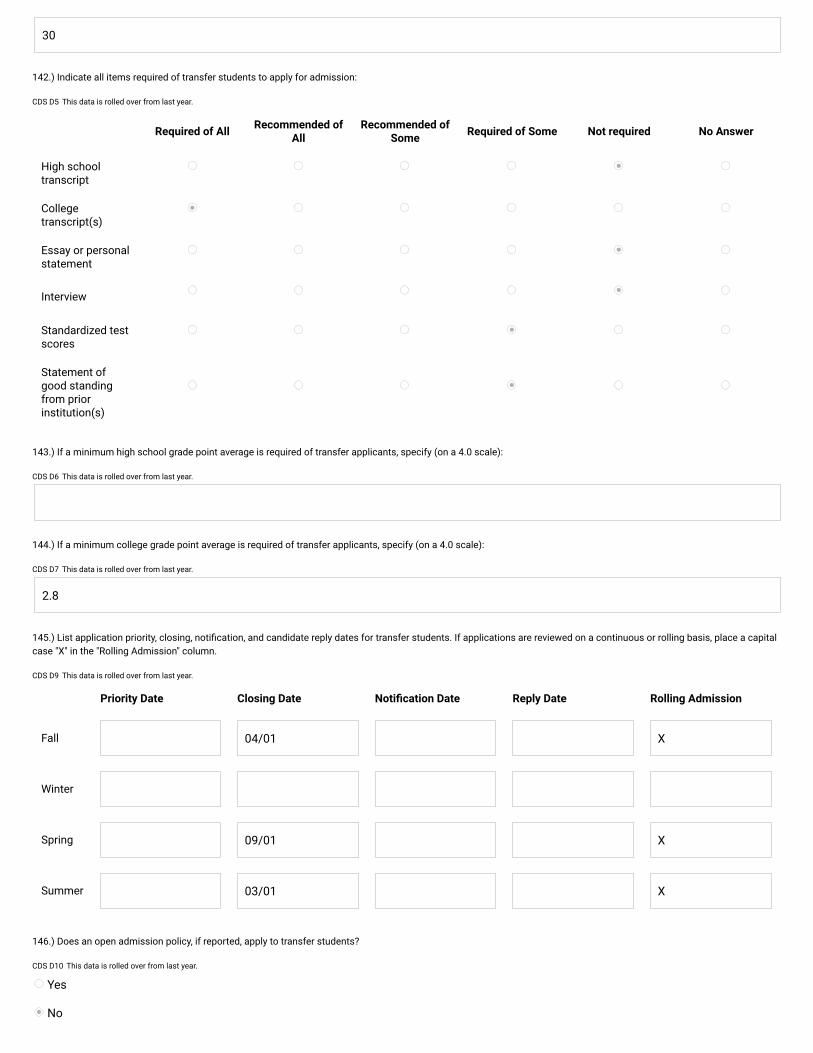
30
142.) Indicate all items required of transfer students to apply for admission:
CDS D5 This data is rolled over from last year.
Required of All Recommended ofAll
Recommended ofSome Required of Some Not required No Answer
High schooltranscript
Collegetranscript(s)
Essay or personalstatement
Interview
Standardized testscores
Statement ofgood standingfrom priorinstitution(s)
143.) If a minimum high school grade point average is required of transfer applicants, specify (on a 4.0 scale):
CDS D6 This data is rolled over from last year.
144.) If a minimum college grade point average is required of transfer applicants, specify (on a 4.0 scale):
CDS D7 This data is rolled over from last year.
2.8
145.) List application priority, closing, noti�cation, and candidate reply dates for transfer students. If applications are reviewed on a continuous or rolling basis, place a capitalcase "X" in the "Rolling Admission" column.
CDS D9 This data is rolled over from last year.
Priority Date Closing Date Noti�cation Date Reply Date Rolling Admission
Fall 04/01 X
Winter
Spring 09/01 X
Summer 03/01 X
146.) Does an open admission policy, if reported, apply to transfer students?
CDS D10 This data is rolled over from last year.
Yes
No

No Answer
147.) Report the lowest grade earned for any course that may be transferred for credit:
CDS D12 This data is rolled over from last year.
65
148.) Maximum number of credits or courses that may be transferred from the following institutions:
CDS D13 This data is rolled over from last year.
Two-year institution:
Four-year institution:
149.) Minimum number of credits that transfers must complete at your institution to earn the following degrees:
CDS D15 & D16 This data is rolled over from last year.
Associate degree:
Bachelor's degree:
45
150.) Does your institution have a guaranteed admission agreement with at least one other college/university?
This data is rolled over from last year.
Yes
No
No Answer
151.) URL for additional information on guaranteed admission agreements at your institution:
This data is rolled over from last year.
152.) Please select the institutions from the following list with which your college/university has a guaranteed admission agreement:
This data is rolled over from last year.
Alumni Giving
Undergraduate Alumni Giving: Please enter information on undergraduate alumni giving, as de�ned below. As noted, exclude former studentswho earned only graduate degrees and undergraduates who didn’t graduate from your institution. Additionally, exclude all student giving (e.g.,senior class gift) unless you count the entire senior student body in the alumni of record total.Please follow the standards set by the Council for Aid to Education (CAE) and the Council for Advancement and Support of Education (CASE),and used for reporting to CAE for the Voluntary Support of Education Survey when answering these questions.

What was the number of undergraduate alumni of record at your institution? (Alumni of record are former full- or part-time students with anundergraduate degree from your institution and for whom you believe you have a valid address or other way to make contact (telephone, email,etc.))Note: The alumni giving data reported to U.S. News should be the same as what was reported to the Council for Aid to Education forundergraduate alumni in its annual Voluntary Support of Education Survey. If you do not break down undergraduate-only giving for the CAEsurvey, you must still do so for this report.153.) What was the number of undergraduate alumni of record at your institution?
This question is used in the Rankings calculation. This data is rolled over from last year.
2016-2017
231178
2015-2016
229221
154.) What was the number of undergraduate alumni solicited at least once during the year?
This question is used in the Rankings calculation. This data is rolled over from last year.
2016-2017
230395
2015-2016
228308
155.) What was the number of undergraduate alumni donors for your institution in the following years?
This question is used in the Rankings calculation. This data is rolled over from last year.
2016-2017
31022
2015-2016
31480
Faculty: Counts
Please report number of instructional faculty members in each category for Fall 2017. Include faculty who are on your institution's payroll onthe census date your institution uses for IPEDS/AAUP. Fall 2016 data is provided for your reference.
Full-time Part-time
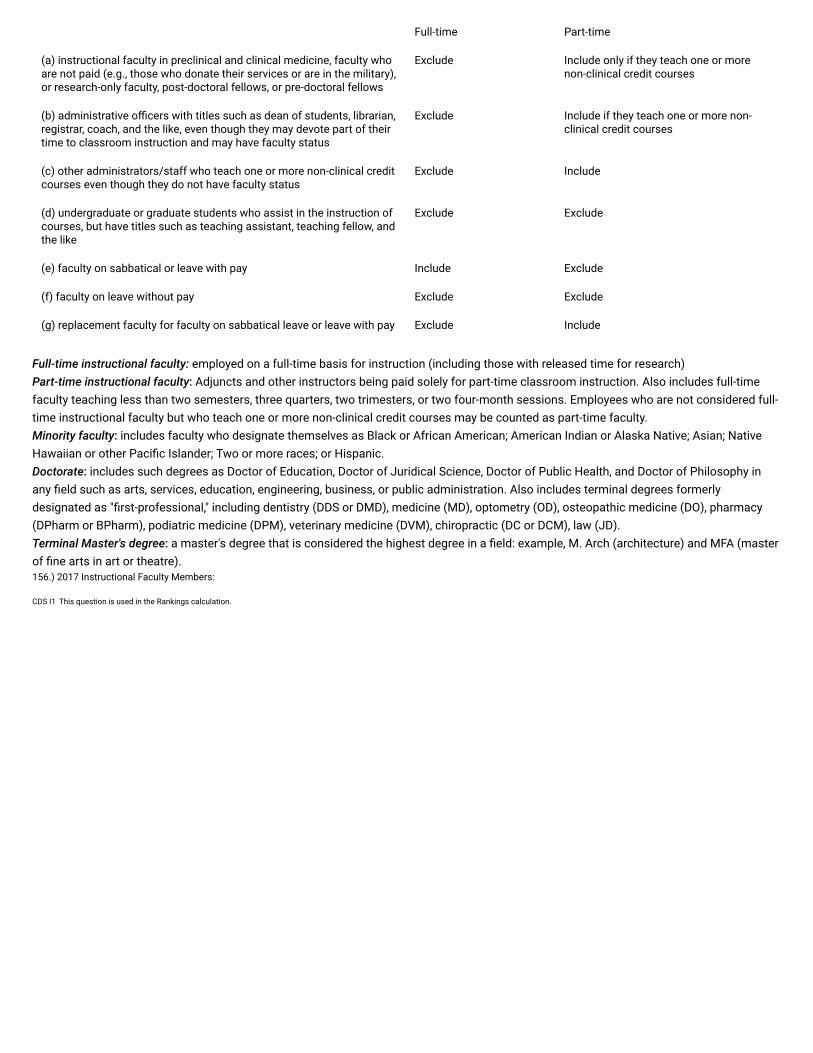
(a) instructional faculty in preclinical and clinical medicine, faculty whoare not paid (e.g., those who donate their services or are in the military),or research-only faculty, post-doctoral fellows, or pre-doctoral fellows
Exclude Include only if they teach one or morenon-clinical credit courses
(b) administrative o�cers with titles such as dean of students, librarian,registrar, coach, and the like, even though they may devote part of theirtime to classroom instruction and may have faculty status
Exclude Include if they teach one or more non-clinical credit courses
(c) other administrators/staff who teach one or more non-clinical creditcourses even though they do not have faculty status
Exclude Include
(d) undergraduate or graduate students who assist in the instruction ofcourses, but have titles such as teaching assistant, teaching fellow, andthe like
Exclude Exclude
(e) faculty on sabbatical or leave with pay Include Exclude
(f) faculty on leave without pay Exclude Exclude
(g) replacement faculty for faculty on sabbatical leave or leave with pay Exclude Include
Full-time instructional faculty: employed on a full-time basis for instruction (including those with released time for research)Part-time instructional faculty: Adjuncts and other instructors being paid solely for part-time classroom instruction. Also includes full-timefaculty teaching less than two semesters, three quarters, two trimesters, or two four-month sessions. Employees who are not considered full-time instructional faculty but who teach one or more non-clinical credit courses may be counted as part-time faculty.Minority faculty: includes faculty who designate themselves as Black or African American; American Indian or Alaska Native; Asian; NativeHawaiian or other Paci�c Islander; Two or more races; or Hispanic.Doctorate: includes such degrees as Doctor of Education, Doctor of Juridical Science, Doctor of Public Health, and Doctor of Philosophy inany �eld such as arts, services, education, engineering, business, or public administration. Also includes terminal degrees formerlydesignated as "�rst-professional," including dentistry (DDS or DMD), medicine (MD), optometry (OD), osteopathic medicine (DO), pharmacy(DPharm or BPharm), podiatric medicine (DPM), veterinary medicine (DVM), chiropractic (DC or DCM), law (JD).Terminal Master's degree: a master's degree that is considered the highest degree in a �eld: example, M. Arch (architecture) and MFA (masterof �ne arts in art or theatre).156.) 2017 Instructional Faculty Members:
CDS I1 This question is used in the Rankings calculation.

Full time Part time Total
Total number of instructional faculty 2028 279 2307
Total number who are members of minority groups 395 42 437
Total number who are women 800 127 927
Total number who are men 1228 152 1380
Total number who are non-resident aliens (international) 376 15 391
Total number with doctorate or other terminal degree 1913 186 2099
Total number whose highest degree is a master's but not a terminal master's 105 77 182
Total number whose highest degree is a bachelor's 10 16 26
Total number whose highest degree is unknown or other 0 0 0
Total number in stand-alone graduate professional programs in which facultyteach virtually only graduate-level students 189 26 215
Total number whose highest degree is a Doctorate 1716 124 1840
157.) 2016 Instructional Faculty Members
This data is rolled over from last year.

Full time Part time Total
Total number of instructional faculty 2012 256 2268
Total number who are members of minority groups 390 38 428
Total number who are women 776 123 899
Total number who are men 1236 133 1369
Total number who are non-resident aliens (international) 342 11 353
Total number with doctorate or other terminal degree 1905 165 2070
Total number whose highest degree is a master's but not a terminal master's 100 76 176
Total number whose highest degree is a bachelor's 7 15 22
Total number whose highest degree is unknown or other 0 0 0
Total number in stand-alone graduate professional programs in which facultyteach virtually only graduate-level students 242 25 267
Total number whose highest degree is a Doctorate 1714 91 1805
158.) 2017 Student Faculty Ratio
CDS I2 This question is used in the Rankings calculation.
X number of students to 1 faculty
17
Based on X number of students
33586
Based on Y number of faculty
1923
159.) Fall 2016 student to faculty ratio (provided for your reference, based on X students to 1 faculty)
This data is rolled over from last year.
18
Faculty: Salaries
Please report the salaries of full-time & part-time instructional faculty members in for the 2017-2018 academic year. Data from the 2016-2017 academic year is provided for your reference.

The following de�nitions of instructional faculty are used by the American Association of University Professors (AAUP) and should bereported to U.S. News the same way.
Full-time Part-time
(a) instructional faculty in preclinical and clinical medicine, faculty whoare not paid (e.g., those who donate their services or are in the military),or research-only faculty, post-doctoral fellows, or pre-doctoral fellows
Exclude Exclude
(b) administrative o�cers with titles such as dean of students, librarian,registrar, coach, and the like, even though they may devote part of theirtime to classroom instruction and may have faculty status
Exclude Exclude
(c) other administrators/staff who teach one or more non-clinical creditcourses even though they do not have faculty status
Exclude Exclude
(d) undergraduate or graduate students who assist in the instruction ofcourses, but have titles such as teaching assistant, teaching fellow, andthe like
Exclude Exclude
(e) faculty on sabbatical or leave with pay Include Exclude
(f) faculty on leave without pay Exclude Exclude
(g) replacement faculty for faculty on sabbatical leave or leave with pay Exclude Include
Full-time Instructional Faculty: include full-time faculty members for the entire institution, excluding clinical or basic science faculty located inschools of medicine and/or military faculty. For the purpose of this survey, include all members of the "Primarily Instructional: and"Instructional/Research Public Service" staff who are employed full-time and whose regular assignments has an instruction component(including released time for research), regardless of whether they are formally designated "faculty".Primarily Instructional: an occupational category used to classify persons whose speci�c assignments customarily are made for the purposeof providing instruction or teaching. Regardless of title, academic rank, or tenure status, these employees formally spend the majority of theirtime providing instruction or teaching.Instructional/Research/Public Service: refers to an occupational category used to classify persons for whom it is not possible to differentiatebetween instruction or teaching, research, and public service because each of these functions is an integral component of his/her regularassignment. Regardless of title, academic rank, or tenure status, these employees spend the majority of their time providing instruction,research, and/or public service. Part-time Instructional Faculty: include only those speci�c individual 2017-2018 faculty members who were designated as less than full-timewhose regular assignment has an instruction component (including released time for research), regardless of whether they are formallydesignated "part-time faculty." As with full-time the unduplicated combined total of “Primarily Instructional” and“Instructional/Research/Public Service” excluding clinical or basic science faculty, medical faculty in schools of medicine, and militaryfaculty. Casual employees, hired on an ad-hoc basis or occasional basis to meet short-term needs) and students in the College Work-Studyprogram are not considered part-time faculty, even if they have an instructional component. Graduate Teaching Assistant: include all individuals that assist faculty or other instructional staff in postsecondary institutions by performingteaching or teaching-related duties, such as teaching lower level courses, developing teaching materials, preparing and giving examination,and grading examinations or papers. Graduate Teaching Assistants must be enrolled in a graduate school program. Include theunduplicated combined total of "Primarily Instructional" and "Instructional/Research/Public Service" excluding clinical or basic science,medical and military graduate teaching assistants. Include graduate teaching assistants who are (a) instructor of record for an organizedclass section, (b) the instructor of record for a laboratory section or individualized instruction session, (c) assisting faculty and are not theinstructor of record, and (d) "�oating" graduate teaching assistants who have a roll that primarily supports instruction but is not directlyassociated with one section or faculty member.160.) Full-time Instructional Faculty Salaries - 2017-2018 Academic Year:
Note: If you cannot split out the fringe bene�ts, please include them in the salaries column.
This question is used in the Rankings calculation.

Number of Faculty(Form 2, Sec. 1&2, Cols1 & 6)
Salary Expenditures(Form 2, Sec. 1&2, Cols2 & 7)
Fringe Bene�t Expenditures (Form3, Sec 1&2 Line 12, Cols 1, 3, & 5)
Total Expenditures(Salary and FringeBene�ts)
Professor, 9-month(contract length) 545 73510183 19079390 92589573
Associate professor, 9-month (contract length) 445 43480223 12748344 56228567
Assistant professor, 9-month (contract length) 347 31079435 9346022 40425457
Professor, 12-month(contract length) 187 26244618 7064225 33308843
Associate professor,12-month (contractlength)
109 12119571 3626320 15745891
Assistant professor, 12-month (contract length) 102 10841260 3259004 14100264
161.) Full-time Instructional Faculty Salaries - 2016-2017 Academic Year:
This question is used in the Rankings calculation. This data is rolled over from last year.
Number of Faculty(Form 2, Sec. 1&2, Cols1 & 6)
Salary Expenditures(Form 2, Sec. 1&2, Cols2 & 7)
Fringe Bene�t Expenditures (Form3, Sec 1&2 Line 12, Cols 1, 3, & 5)
Total Expenditures(Salary and FringeBene�ts)
Professor, 9-month(contract length) 532 69623005 17323466 86946471
Associate professor, 9-month (contract length) 435 41686484 11884342 53570826
Assistant professor, 9-month (contract length) 366 31757561 9333108 41090669
Professor, 12-month(contract length) 199 27851214 7042402 34893616
Associate professor,12-month (contractlength)
113 12326121 3551586 15877707
Assistant professor, 12-month (contract length) 96 9972730 2898024 12870754
162.) Part-time Instructional Faculty Salaries - 2017-2018 Academic Year:
Report the total contracted salaries for these faculty and do not include any bene�ts
This question is used in the Rankings calculation.

Number of Faculty (Form 6, Sec. 1, Col 5) Total Contracted Salaries (Form 6, Sec. 1, Col 6)
Part-time Faculty 268 6393718
Graduate Teaching Assistant 935 16129445
Total 1203 22523163
Class Sections
163.) Undergraduate Class Size: In the table below, please use the following de�nitions to report information about the size of class sections offered in the Fall 2017 term. Fall2016 data provided for your reference.
Class Sections: A class section is an organized course offered for credit, identi�ed by discipline and number, meeting at a stated time ortimes in a classroom or similar setting, and not a subsection such as a laboratory or discussion session. Undergraduate class sections arede�ned as any sections in which at least one degree-seeking undergraduate student is enrolled for credit. Exclude distance learning classesand noncredit classes and individual instruction such as dissertation or thesis research, music instruction, or one-to-one readings. Excludestudents in independent study, co-operative programs, internships, foreign language taped tutor sessions, practicums, and all students in one-on-one classes. Each class section should be counted only once and should not be duplicated because of course catalog cross-listings.
CDS I3 This question is used in the Rankings calculation. This data is rolled over from last year.
2017 Undergraduate Class Sections 2016 Undergraduate Class Sections
2-9 325 406
10-19 1631 1494
20-29 1050 1097
30-39 468 440
40-49 324 277
50-99 250 252
100+ 223 206
Total 4271 4172
164.) Of the "undergraduate class sections" entered in the previous question for fall 2017, how many o�cially list a graduate teaching assistant as the primary instructor?
845
Degrees/Majors
165.) Unique Qualities during the 2017-2018 academic year.

As part of each entry in a directory of colleges and universities, U.S. News would like to feature a brief description of the school's mission andunique qualities. Please provide a summary of what makes your school special. What are its strengths and attributes? Maximum number ofallowable characters is 4000. Please do not include bullets, paragraph breaks, special characters, or other special formatting.This data is rolled over from last year.
Chartered by the state of Georgia in 1785, the University of Georgia is the birthplace of public higher education in America — launching our nation’s great tradition of world-class public education. What began as a commitment to inspire the next generation grows stronger today through global research, hands-on experiential learning and extensive outreach. One of America’s “Public Ivies” and a top 12 best value in public higher education, the University of Georgia tackles some of the world’s grand challenges — from combating infectious disease and securing the world’s food supply to advancing economic growth and analyzing the environment. As Georgia’s �agship institution, the university is recognized for its commitment to student excellence, particularly through an emphasis on rigorous learning experiences both inside and outside the classroom, hands-on research, and leadership opportunities. These experiences contribute to the university’s exceptional retention, graduation and career-placement rates. The honors program is ranked among the top 10 in the country and among public universities has been one of the nation’s top three producers of Rhodes Scholars over the past two decades. Scholars at the University of Georgia are committed to improving the quality of life for all and lead discovery in pivotal �elds such as vaccine development, biomedical research, cybersecurity, and plant sciences. One of the nation’s top universities for technology commercialization and licensing income, the University of Georgia has invented nearly 700 commercial products currently in the marketplace. The university is also home to the Peabody Awards, the most prestigious prize in electronic media. With its comprehensive reach, the university’s 17 colleges and schools enroll 37,000 students and have produced 315,000 alumni living worldwide. The University of Georgia’s initiatives extend globally while touching every corner of the state, realizing the university’s land-grant and sea-grant missions. The university’s eight Public Service and Outreach units, which are among the strongest in the nation, help create jobs, develop leaders and address critical challenges. Research, outreach and extension serve as major drivers of economic and workforce development and spark successful partnerships that create new businesses and train the workforce of tomorrow. The university’s threefold teaching, research and service mission spans the globe with campuses in �ve Georgia locations, Washington, D.C., England, Costa Rica and Italy, as well as partnerships in more than 50 countries on six continents. Located in the Classic City of Athens, approximately an hour northeast of Atlanta, the university thrives in a community that promotes the bene�ts of a culture-rich college town with a strong economic center. The campus is home to more than 600 registered student and service organizations. The university’s athletic programs are among the most successful in NCAA Division I and the 19 varsity athletic teams compete as Georgia Bulldogs, with “Uga” consistently ranking as one of the nation’s most recognized mascots. At the University of Georgia, it’s more than a mission. It’s a commitment we make to our students, the state of Georgia and the world.
166.) Popular Majors - 2017 Graduates:Using CIP 2010 codes, please identify the �ve majors with the largest percent of bachelor’s degrees awarded by your institution between July 1, 2016 and June 30, 2017. Only�ve majors can be entered. For more information on CIP 2010 click here (https://nces.ed.gov/ipeds/cipcode/browse.aspx?y=55). Last year's information (2016 graduates) isincluded for your reference.
CDS J1

CIP Code Number Percent of Graduates
Popular Major #1 52.0801 7.7
Popular Major #2 42.0101 6.1
Popular Major #3 26.0101 5.9
Popular Major #4 52.1401 4.7
Popular Major #5 45.0901 2.9
167.) Popular Majors - 2016 Graduates:
This data is rolled over from last year.
CIP Code Number Percent of Graduates
Popular Major #1 42.0101 6.84
Popular Major #2 52.0801 6.78
Popular Major #3 26.0101 5.73
Popular Major #4 52.1401 4.05
Popular Major #5 45.0901 3.02
168.) Majors Offered
Note: Please use CIP 2010 codes in answering the questions below. When reporting majors, please do not list majors in conjunction with aconcentration, emphasis, minor, or subject area. Concentrations, etc., may be reported in the minors question.Select majors leading to a bachelor's degree:This data is rolled over from last year.

01.0102--Agribusiness/Agricultural Business Operations
01.0103--Agricultural Economics
01.0607--Turf and Turfgrass Management
01.0802--Agricultural Communication/Journalism
01.0901--Animal Sciences, General
01.0903--Animal Health
01.0905--Dairy Science
01.0907--Poultry Science
01.1001--Food Science
01.1103--Horticultural Science
01.1201--Soil Science and Agronomy, General
11.0701--Computer Science
13.1001--Special Education and Teaching, General
13.1203--Junior High/Intermediate/Middle School Education and Teaching
13.1210--Early Childhood Education and Teaching
13.1301--Agricultural Teacher Education
13.1305--English/Language Arts Teacher Education
13.1306--Foreign Language Teacher Education
13.1308--Family and Consumer Sciences/Home Economics Teacher Education
13.1311--Mathematics Teacher Education
13.1312--Music Teacher Education
13.1316--Science Teacher Education/General Science Teacher Education
13.1318--Social Studies Teacher Education
14.0301--Agricultural Engineering
14.0801--Civil Engineering, General
14.0901--Computer Engineering, General
14.1001--Electrical and Electronics Engineering
14.1401--Environmental/Environmental Health Engineering
14.1901--Mechanical Engineering
14.4301--Biochemical Engineering
14.4501--Biological/Biosystems Engineering
16.0102--Linguistics
16.0104--Comparative Literature
16.0402--Russian Language and Literature
16.0501--German Language and Literature

16.0901--French Language and Literature
16.0905--Spanish Language and Literature
16.1101--Arabic Language and Literature
19.0202--Family and Consumer Sciences/Human Sciences Communication
19.0401--Family Resource Management Studies, General
19.0402--Consumer Economics
19.0501--Foods, Nutrition, and Wellness Studies, General
19.0601--Housing and Human Environments, General
19.0701--Human Development and Family Studies, General
23.0101--English Language and Literature, General
24.0101--Liberal Arts and Sciences/Liberal Studies
24.0102--General Studies
26.0101--Biology/Biological Sciences, General
26.0210--Biochemistry and Molecular Biology
26.0301--Botany/Plant Biology
26.0401--Cell/Cellular Biology and Histology
26.0502--Microbiology, General
26.0702--Entomology
26.0801--Genetics, General
26.1201--Biotechnology
26.1301--Ecology
27.0101--Mathematics, General
27.0501--Statistics, General
03.0104--Environmental Science
03.0207--Natural Resource Recreation and Tourism
03.0501--Forestry, General
03.0601--Wildlife, Fish and Wildlands Science and Management
30.0101--Biological and Physical Sciences
30.1901--Nutrition Sciences
30.2501--Cognitive Science
31.0501--Health and Physical Education/Fitness, General
31.0504--Sport and Fitness Administration/Management
31.0505--Kinesiology and Exercise Science
38.0101--Philosophy
38.0201--Religion/Religious Studies

04.0601--Landscape Architecture
40.0501--Chemistry, General
40.0601--Geology/Earth Science, General
40.0801--Physics, General
42.0101--Psychology, General
43.0103--Criminal Justice/Law Enforcement Administration
44.0701--Social Work
45.0201--Anthropology
45.0601--Economics, General
45.0701--Geography
45.0901--International Relations and Affairs
45.1001--Political Science and Government, General
45.1101--Sociology
05.0134--Latin American and Caribbean Studies
05.0201--African-American/Black Studies
05.0207--Women\'s Studies
50.0301--Dance, General
50.0501--Drama and Dramatics/Theatre Arts, General
50.0601--Film/Cinema/Video Studies
50.0701--Art/Art Studies, General
50.0702--Fine/Studio Arts, General
50.0703--Art History, Criticism and Conservation
50.0901--Music, General
50.0903--Music Performance, General
50.0904--Music Theory and Composition
51.0201--Communication Sciences and Disorders, General
51.0913--Athletic Training/Trainer
51.2010--Pharmaceutical Sciences
51.2202--Environmental Health
51.2207--Public Health Education and Promotion
51.2305--Music Therapy/Therapist
51.3101--Dietetics/Dietitian
52.0101--Business/Commerce, General
52.0201--Business Administration and Management, General
52.0301--Accounting

52.0601--Business/Managerial Economics
52.0801--Finance, General
52.1101--International Business/Trade/Commerce
52.1201--Management Information Systems, General
52.1401--Marketing/Marketing Management, General
52.1501--Real Estate
52.1701--Insurance
52.1902--Fashion Merchandising
54.0101--History, General
09.0101--Speech Communication and Rhetoric
09.0401--Journalism
09.0702--Digital Communication and Media/Multimedia
09.0902--Public Relations/Image Management
09.0903--Advertising
16.09--Romance Languages, Literatures, and Linguistics, General
16.12--Classics and Classical Languages, Literatures, and Linguistics, General
01--Agriculture, General
16.03--East Asian Languages, Literatures, and Linguistics, General
40.0201--Astronomy
40.0401--Atmospheric Sciences and Meteorology, General
169.) Minors Offered
Select minors and other miscellaneous programs offered for undergraduates:This data is rolled over from last year.

01.0102--Agribusiness/Agricultural Business Operations
01.0103--Agricultural Economics
01.0601--Applied Horticulture/Horticulture Operations, General
01.0607--Turf and Turfgrass Management
01.0901--Animal Sciences, General
01.0905--Dairy Science
01.0907--Poultry Science
01.1001--Food Science
01.1102--Agronomy and Crop Science
01.1103--Horticultural Science
01.1201--Soil Science and Agronomy, General
11.0701--Computer Science
13.1401--Teaching English as a Second or Foreign Language/ESL Language Instructor
16.0102--Linguistics
16.0104--Comparative Literature
16.0201--African Languages, Literatures, and Linguistics
16.03--East Asian Languages, Literatures, and Linguistics, General
16.0301--Chinese Language and Literature
16.0302--Japanese Language and Literature
16.0303--Korean Language and Literature
16.0402--Russian Language and Literature
16.0501--German Language and Literature
16.0901--French Language and Literature
16.0902--Italian Language and Literature
16.0904--Portuguese Language and Literature
16.0905--Spanish Language and Literature
16.1101--Arabic Language and Literature
16.1202--Ancient/Classical Greek Language and Literature
16.1203--Latin Language and Literature
19.0402--Consumer Economics
19.0501--Foods, Nutrition, and Wellness Studies, General
19.0601--Housing and Human Environments, General
19.0701--Human Development and Family Studies, General
23.0101--English Language and Literature, General
26.0101--Biology/Biological Sciences, General

26.0210--Biochemistry and Molecular Biology
26.0301--Botany/Plant Biology
26.0305--Plant Pathology/Phytopathology
26.0401--Cell/Cellular Biology and Histology
26.0502--Microbiology, General
26.0702--Entomology
26.0801--Genetics, General
26.1201--Biotechnology
26.1301--Ecology
27.0101--Mathematics, General
27.0501--Statistics, General
28.0199--Air Force ROTC, Air Science and Operations, Other
28.0399--Army ROTC, Military Science and Operations, Other
03.0103--Environmental Studies
03.0204--Natural Resource Economics
30.1901--Nutrition Sciences
30.2202--Classical, Ancient Mediterranean and Near Eastern Studies and Archaeology
30.2501--Cognitive Science
31.0505--Kinesiology and Exercise Science
38.0101--Philosophy
38.0201--Religion/Religious Studies
40.0201--Astronomy
40.0501--Chemistry, General
40.0601--Geology/Earth Science, General
40.0801--Physics, General
45.0201--Anthropology
45.0701--Geography
45.1001--Political Science and Government, General
45.1101--Sociology
05.0101--African Studies
05.0124--French Studies
05.0134--Latin American and Caribbean Studies
05.0201--African-American/Black Studies
05.0207--Women\'s Studies
50.0301--Dance, General

50.0501--Drama and Dramatics/Theatre Arts, General
50.0601--Film/Cinema/Video Studies
50.0702--Fine/Studio Arts, General
50.0703--Art History, Criticism and Conservation
50.0910--Jazz/Jazz Studies
51.2010--Pharmaceutical Sciences
51.2201--Public Health, General
51.2202--Environmental Health
51.2210--International Public Health/International Health
52.1902--Fashion Merchandising
54.0101--History, General
54.0103--European History
09.0101--Speech Communication and Rhetoric
13.1102--College Student Counseling and Personnel Services
31.0504--Sport and Fitness Administration/Management
44--Public Administration and Social Service Professions
44.0401--Public Administration
01--Agriculture, General
03.0601--Wildlife, Fish and Wildlands Science and Management
13.1001--Special Education and Teaching, General
13.1203--Junior High/Intermediate/Middle School Education and Teaching
13.1308--Family and Consumer Sciences/Home Economics Teacher Education
14.0301--Agricultural Engineering
14.4501--Biological/Biosystems Engineering
16.09--Romance Languages, Literatures, and Linguistics, General
16.12--Classics and Classical Languages, Literatures, and Linguistics, General
50.0701--Art/Art Studies, General
51.2207--Public Health Education and Promotion
52.0201--Business Administration and Management, General
52.0601--Business/Managerial Economics
52.1401--Marketing/Marketing Management, General
01.0308--Agroecology and Sustainable Agriculture
01.0701--International Agriculture
01.0801--Agricultural and Extension Education Services
01.1105--Plant Protection and Integrated Pest Management

03.0205--Water, Wetlands, and Marine Resources Management
03.0501--Forestry, General
05.0103--Asian Studies/Civilization
05.0121--Commonwealth Studies
05.0202--American Indian/Native American Studies
09.0702--Digital Communication and Media/Multimedia
09.0906--Sports Communication
11.0101--Computer and Information Sciences, General
14.1201--Engineering Physics/Applied Physics
14.1301--Engineering Science
14.2401--Ocean Engineering
22--Non-Professional General Legal Studies (Undergraduate)
23.1301--Writing, General
24.0103--Humanities/Humanistic Studies
30.1201--Historic Preservation and Conservation
30.1301--Medieval and Renaissance Studies
30.2001--International/Global Studies
30.3301--Sustainability Studies
40.0401--Atmospheric Sciences and Meteorology, General
45.0301--Archeology
45.0702--Geographic Information Science and Cartography
50.1003--Music Management
51.2099--Pharmacy, Pharmaceutical Sciences, and Administration, Other
52.0213--Organizational Leadership
52.0701--Entrepreneurship/Entrepreneurial Studies
52.1304--Actuarial Science
11.1003--Computer and Information Systems Security/Information Assurance
13.1301--Agricultural Teacher Education
13.1311--Mathematics Teacher Education
30.3001--Computational Science
31.0501--Health and Physical Education/Fitness, General
40.0509--Environmental Chemistry
52.1001--Human Resources Management/Personnel Administration, General
01.0307--Horse Husbandry/Equine Science and Management
01.0605--Landscaping and Groundskeeping

01.1002--Food Technology and Processing
01.1101--Plant Sciences, General
03.0104--Environmental Science
03.0201--Natural Resources Management and Policy
05.0210--Disability Studies
09.0904--Political Communication
11.0102--Arti�cial Intelligence
11.0104--Informatics
13.1209--Kindergarten/Preschool Education and Teaching
13.1210--Early Childhood Education and Teaching
13.1325--French Language Teacher Education
13.1326--German Language Teacher Education
13.1330--Spanish Language Teacher Education
13.1333--Latin Teacher Education
13.1338--Environmental Education
14.0501--Bioengineering and Biomedical Engineering
14.1001--Electrical and Electronics Engineering
16.1408--Vietnamese Language and Literature
19.0401--Family Resource Management Studies, General
19.0706--Child Development
19.0901--Apparel and Textiles, General
23.1302--Creative Writing
23.1304--Rhetoric and Composition
23.1401--General Literature
23.1402--American Literature (United States)
26.0701--Zoology/Animal Biology
26.1302--Marine Biology and Biological Oceanography
26.1304--Aquatic Biology/Limnology
26.1501--Neuroscience
27.0301--Applied Mathematics, General
43.0103--Criminal Justice/Law Enforcement Administration
43.0302--Crisis/Emergency/Disaster Management
45.0601--Economics, General
45.0602--Applied Economics
45.1201--Urban Studies/Affairs

50.0102--Digital Arts
50.0201--Crafts/Craft Design, Folk Art and Artisanry
50.0408--Interior Design
50.0409--Graphic Design
50.0605--Photography
50.0705--Drawing
50.0706--Intermedia/Multimedia
50.0708--Painting
50.0710--Printmaking
50.0711--Ceramic Arts and Ceramics
50.0712--Fiber, Textile and Weaving Arts
50.0713--Metal and Jewelry Arts
50.0901--Music, General
50.0913--Music Technology
52.0203--Logistics, Materials, and Supply Chain Management
52.1201--Management Information Systems, General
52.1501--Real Estate
52.1804--Selling Skills and Sales Operations
Graduate Career Data
Note: The following six questions refer to graduates who received a Bachelor's degree between July 1st, 2016 through June30th, 2017. Please report data as of six months from the date of graduation.170.) Total number of graduates:
6479
171.) Total number of employed graduates:
Full-time: graduate works 30 or more hours per weekPart-time: graduate works less than 30 hours a week
Employed Full-time:
3200
Employed Part-time:
198
172.) Among those reported in the previous question, how many employed graduates fall in to the following categories:

Employed Full-time: Employed Part-time:
Entrepreneur: 169
Temporary/Contract work:
Freelance:
Postgraduate Internship or Fellowship: 354 29
173.) Other Graduates:
Please provide the number of graduates on record who participated in following categories. For the graduates with no record, please countthem under 'No Information'.
Service Programs (e.g. Peace Corps, AmeriCorps, etc):
42
Military Service:
Enrolled in Continuing Education:
1368
Seeking Employment:
253
Seeking Continuing Education:
Not Seeking Employment:
60
No Information:
1358
174.) Salary Data:

Employed Full-time: Employed Part-time:
# of Graduates Reporting Salaries: 1415
Mean Salary: 48724
Median Salary: 47000
# of Graduates Reporting Bonuses: 513
Mean Bonus: 6353
Median Bonus: 5000
175.) Of those enrolled in continuing education, how many graduates went on to attend...
Medical School:
290
Law School:
122
Graduate Education Program:
144
Graduate Engineering Program:
41
Graduate Nursing Program:
176.) List up to three of your institution's most prominent alumni/ae along with their titles or �elds of endeavor:
This data is rolled over from last year.
Alumni 1
Dan Amos, Chairman and CEO of AFLAC Inc.
Alumni 2
Maria Taylor, Sports analyst and reporter for ESPN’s College GameDay
Alumni 3
Amy Robach, American television journalist, co-anchor for ABC’s 20/20
177.) Please select the graduate schools most commonly attended by your recent graduates:
This data is rolled over from last year.
Armstrong State University (GA), Auburn University (AL), Boston University (MA), Clemson University (SC), Columbia University (NY), Duke University (NC), Emory University (GA), Florida State University (FL), George Washington University (DC), Georgetown University (DC), Georgia College & State University (GA), Georgia Institute of Technology (GA), Georgia Southern University (GA), Georgia State University (GA), Kennesaw State University (GA), Louisiana State University--Shreveport (LA), Medical University of South Carolina (SC), Mercer University (GA), Morehouse College (GA), New York University (NY), North Carolina State University--Raleigh (NC), Ohio State University--

Columbus (OH), University of Alabama--Birmingham (AL), University of Florida (FL), University of Georgia (GA), University of Louisville (KY), University of Miami (FL), University of North Carolina--Chapel Hill (NC), University of North Georgia (GA), University of Pennsylvania (PA), University of South Carolina (SC), University of South Florida (FL), University of Texas--Austin (TX), University of Virginia (VA), University of West Georgia (GA), Valdosta State University (GA), Vanderbilt University (TN)
178.) Please list any other commonly attended graduate schools not included in the previous question:
Augusta University (GA)
Programs Offered
179.) Academic Offerings and Policies
Special Study Options: For the following questions, please check each program offered. Then report the percent of 2017 graduating seniorswho have participated in these programs during their undergraduate years.Note: De�nitions of these programs can be found here at www.commondataset.org
CDS E1 This data is rolled over from last year.
Accelerated program
Cooperative education program
Cross-registration
Distance learning
Double major
Dual enrollment
English as a second language (ESL)
Exchange student program (domestic)
External degree program
Honors program
Independent study

Internships
Liberal arts/career combination
Student-designed major
Study abroad
Teacher certi�cate program
Weekend college
180.) Undergraduate Academic Programs of Study
Please check each academic program offered and report the percent of 2017 graduating seniors who have participated in these programsduring their undergraduate years.First-year Experiences: Curricular and/or co-curricular programs beyond orientation that bring together faculty and/or staff and groups of�rst-year students to: address the development of knowledge, skills, and/or perspectives for academic and college success; promotemeaningful student-faculty interaction (one-on-one or in small groups).Learning Communities: Groups of students that take part as a cohort in intentional, institutionally-designed curricula, most often consistingof at least two linked courses, that are designed to address academic and social development inside and outside the classroom throughplanned interactions among the cohort and with the faculty.Senior Capstone of Culminating Academic Experiences: Integrative, credit-bearing experiences, offered in the last stages of a student’sprogram of studies, which aim to have the student synthesize the academic experience, often in the creation of a product that demonstratesthe ability to frame and resolve an open-ended question, or of a performance or an exhibit.Undergraduate Research: Self-directed academic work by an individual student or by small groups of students that deals with an open-endedissue with the expectation of a substantial scholarly or creative product that can be formally presented on or off campus. Such work isundertaken with a faculty mentor for at least one academic term or intensive summer, and students understand their roles asresearchers/creators and act in those roles.Service Learning: An academically-based instructional strategy, credit-bearing or required for a degree, that provides students with bothmeaningful service opportunities in interactive partnership with the community and academic structures for analysis and re�ection on theircontributions and learning.Study Abroad: Substantial academic, credit-bearing study, the equivalent of at least one full course, under faculty supervision, conductedoutside the United States but approved by the home institution, which includes substantive interaction between the student and the hostculture and/or environment.Internships, Cooperative Education, or Practica: The practical application of learning from a speci�c academic program in a pre-planned out-of-class situation equivalent in time to at least 1 academic credit, paid or unpaid, requiring structured re�ection and/or an end product,supervised and evaluated by faculty, �eld person, or cooperating professional directing the learning activity.Writing in the Disciplines: Institutional commitment, manifest through an organized approach, to signi�cant student participation in writingembedded in courses at all levels and in all divisions of the curriculum. To accomplish signi�cant writing over time and at increasing levels ofsophistication, it often includes writing experiences in many different disciplines, varied forms of writing for varied audiences, and iterativewriting processes.This data is rolled over from last year.
First-year Experiences

Service Learning
Senior Capstone or Culminating Academic Experiences
Writing in the Disciplines
Undergraduate Research/Creative Projects
Learning Communities
181.) Areas in which all or most students are required to complete some course work prior to graduation: (check as many as apply)
CDS E3 This data is rolled over from last year.
Arts/�ne arts
Computer literacy
English (including composition)
Foreign languages
History
Humanities
Mathematics
Philosophy
Sciences (biological or physical)
Social science
182.) Minor requirements:
This data is rolled over from last year.
Minor is required of all for graduation
Minor is required of some for graduation
Minor is not required for graduation
No Answer
183.) General education/core curriculum is required:
This data is rolled over from last year.
Yes
No
No Answer

184.) Cooperative education programs offered (check as many as apply)
This data is rolled over from last year.
Agriculture
Art
Business
Computer Science
Education
Engineering
Health Professions
Home Economics
Humanities
Natural Science
Social/Behavioral Science
Technologies
Vocational Arts
Other:
185.) Teacher certi�cations offered (check as many as apply)
This data is rolled over from last year.
Early childhood
Elementary
Middle/Junior High
Secondary
Special Education
Vo-tech
Adult Education
Bilingual/bicultural
186.) Specify number of speci�c subject areas in which you offer teacher certi�cation:
This data is rolled over from last year.
51
187.) Quali�ed undergraduate students may take graduate-level classes at your school:
This data is rolled over from last year.
Yes
No
No Answer
188.) Check pre-professional programs that are designed speci�cally as preparation for graduate study (check as many as offered):
This data is rolled over from last year.
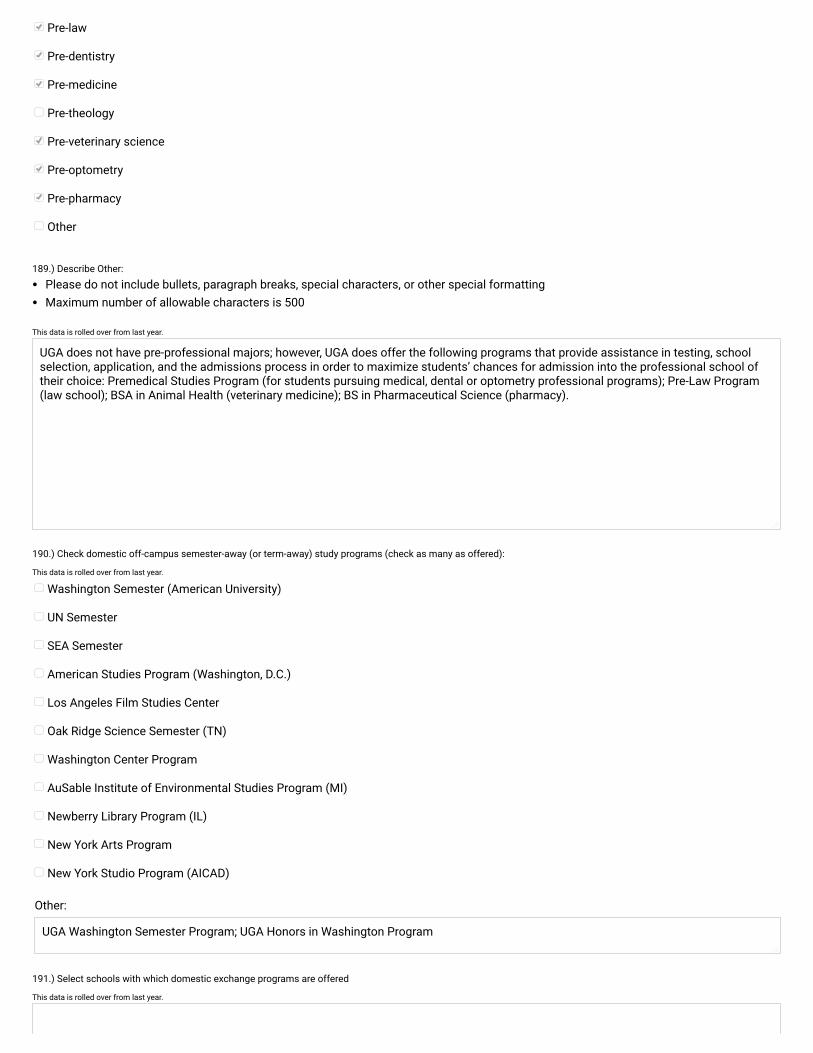
Pre-law
Pre-dentistry
Pre-medicine
Pre-theology
Pre-veterinary science
Pre-optometry
Pre-pharmacy
Other
189.) Describe Other:
Please do not include bullets, paragraph breaks, special characters, or other special formatting Maximum number of allowable characters is 500
This data is rolled over from last year.
UGA does not have pre-professional majors; however, UGA does offer the following programs that provide assistance in testing, school selection, application, and the admissions process in order to maximize students’ chances for admission into the professional school of their choice: Premedical Studies Program (for students pursuing medical, dental or optometry professional programs); Pre-Law Program (law school); BSA in Animal Health (veterinary medicine); BS in Pharmaceutical Science (pharmacy).
190.) Check domestic off-campus semester-away (or term-away) study programs (check as many as offered):
This data is rolled over from last year.
Washington Semester (American University)
UN Semester
SEA Semester
American Studies Program (Washington, D.C.)
Los Angeles Film Studies Center
Oak Ridge Science Semester (TN)
Washington Center Program
AuSable Institute of Environmental Studies Program (MI)
Newberry Library Program (IL)
New York Arts Program
New York Studio Program (AICAD)
Other:
UGA Washington Semester Program; UGA Honors in Washington Program
191.) Select schools with which domestic exchange programs are offered
This data is rolled over from last year.

192.) Select countries in which study abroad is offered.
This data is rolled over from last year.
Argentina, Australia, Austria, Belgium, Bermuda, Brazil, Chile, China, Costa Rica, Croatia, Czech Republic, Ecuador, Fiji, France, Gambia, The, Germany, Ghana, Greece, Hong Kong, India, Indonesia, Ireland, Italy, Japan, Morocco, Netherlands, New Zealand, Panama, Peru, Romania, Russia, Rwanda, Senegal, Singapore, South Africa, South Korea, Spain, Sweden, Switzerland, Taiwan, Tanzania, Thailand, United Kingdom, Uruguay, Vietnam
Combined Degree Programs
193.) List names of combined-degree programs:
This data is rolled over from last year.
AB (Advertising) / MA (Journalism and Mass Communication)
AB (Cognitive Science) / MS (Arti�cial Intelligence)
AB (Communication Studies) / MA (Communication Studies)
AB (Comparative Literature) / MA (Comparative Literature)
AB (Criminal Justice) / MPA (Master of Public Administration)
AB (Ecology) / MS (Conservation Ecology and Sustainable Development)
AB (Economics) / MA (Economics)
AB (English) / BSED (English Education)
AB (English) / MAT (Middle Grades Education)
AB (Entertainment and MEDia Studies) / MA (Journalism and Mass Communication)
AB (French) / BSED (World Language Education)
AB (Geography) / MA (Geography)
AB (German) / BSAE (Agricultural Engineering)
AB (German) / BSED (World Language Education)

AB (German) / MA (German)
AB (History) / BSED (Social Science Education)
AB (History) / MAT (Middle Grades Education)
AB (Interdisciplinary Studies) / MS (Financial Planning, Housing and Consumer Economics)
AB (International Affairs) / MA (Political Science and International Affairs)
AB (International Affairs) / MPA (Master of Public Administration)
AB (Journalism) / MA (Journalism and Mass Communication)
AB (Latin American and Caribbean Studies) / MA (Nonpro�t Management and Leadership)
AB (Linguistics) / MA (Linguistics)
AB (Music) / MA (Journalism and Mass Communication)
AB (Music) / MA (Nonpro�t Management and Leadership)
AB (Political Science) / MA (Political Science and International Affairs)
AB (Political Science) / MPA (Master of Public Administration)
AB (Public Relations) / MA (Journalism and Mass Communication)
AB (Sociology) / MA (Nonpro�t Management and Leadership)
AB (Sociology) / MA (Sociology)
AB (Sociology) / MPA (Master of Public Administration)
AB (Sociology) / MS (Financial Planning, Housing and Consumer Economics)
AB (Spanish) / BSED (World Language Education)
AB (Theatre) / MA (Nonpro�t Management and Leadership)
AB (Women’s Studies) / MA (Communication Studies)
BBA (Accounting) / MACC (Accounting)
BBA (Economics) / MA (Economics)
BBA (Finance) / MACC (Accounting)
BBA (Management Information Systems) / MACC (Accounting)
BLA (Landscape Architecture) / MLA (Landscape Architecture)
BMUS (Music Performance) / MM (Music)
BS (Atmospheric Sciences ) / MS (Geography)

BS (Biochemistry and Molecular Biology) / MS (Comparative BioMedical Sciences)
BS (Biology) / BSED (Science Education)
BS (Biology) / MAT (Science Education)
BS (Biology) / MS (Financial Planning, Housing and Consumer Economics)
BS (Computer Science) / MS (Arti�cial Intelligence)
BS (Computer Science) / MS (Computer Science)
BS (Ecology) / MS (Comparative BioMedical Sciences)
BS (Ecology) / MS (Ecology)
BS (Genetics) / MS (Genetics)
BS (Geography) / MS (Geography)
BS (Math) / BSED (Math Education)
BS (Mathematics) / MA (Mathematics)
BS (Microbiology) / MPH (Master of Public Health)
BS (Microbiology) / MS (Microbiology)
BS (Pharmaceutical Sciences) / MS (Pharmacy)
BS (Psychology) / MA (Nonpro�t Management and Leadership)
BS (Psychology) / MS (Applied Behavior Analysis)
BS (Psychology) / MS (Financial Planning, Housing and Consumer Economics)
BS (Statistics) / MA (Educational Psychology)
BSA (Agribusiness) / MAB (Agribusiness)
BSA (Agribusiness) / MS (Agricultural and Applied Economics)
BSA (Agribusiness) / MS (Environmental Economics)
BSA (Agricultural and Applied Economics ) / MAB (Agribusiness)
BSA (Agricultural and Applied Economics ) / MS (Agricultural and Applied Economics)
BSA (Agricultural and Applied Economics ) / MS (Environmental Economics)
BSA (Agricultural Education) / MAEE (Agricultural and Environmental Education)
BSA (Agriscience and Environmental Systems) / MPPPM (Plant Protection and Pest Management)
BSA (Agriscience and Environmental Systems) / MS (Plant Breeding, Genetics and Genomics)

BSA (Avian Biology) / MS (Poultry Science)
BSA (Biological Science) / MS (Poultry Science)
BSA (Horticulture) / MPPPM (Plant Protection and Pest Management)
BSA (Horticulture) / MS (Horticulture)
BSA / DVM (Veterinary Medicine)
BSAE (Agricultural Engineering) / MBA (Master of Business Administration)
BSAE (Agricultural Engineering) / MS (Agricultural Engineering)
BSBCHE (Biochemical Engineering) / MBA (Master of Business Administration)
BSBCHE (Biochemical Engineering) / MS (Biochemical Engineering)
BSBE (Biological Engineering) / AB (German)
BSBE (Biological Engineering) / MBA (Master of Business Administration)
BSBE (Biological Engineering) / MS (Biological Engineering)
BSCE (Civil Engineering) / AB (German)
BSCE (Civil Engineering) / MBA (Master of Business Administration)
BSCE (Civil Engineering) / MS (Engineering)
BSCE (Computer Systems Engineering) / MS (Engineering)
BSCSE (Computer Systems Engineering) / AB (German)
BSCSE (Computer Systems Engineering) / MBA (Master of Business Administration)
BSED (Early Childhood Education) / MED (Early Childhood Education)
BSED (English Education) / MED (English Education)
BSED (Environmental Economics and Management) / MAB (Agribusiness)
BSED (Environmental Economics and Management) / MS (Agricultural and Applied Economics)
BSED (Environmental Economics and Management) / MS (Environmental Economics)
BSED (Social Studies Education) / MED (Social Studies Education)
BSEE (Electrical & Electronic Engineering) / AB (German)
BSEE (Electrical and Electronic Engineering) / MBA (Master of Business Administration)
BSEE (Electrical and Electronics Engineering) / MS (Engineering)
BSENVE (Environmental Engineering) / MBA (Master of Business Administration)

BSENVE (Environmental Engineering) / MS (Environmental Engineering)
BSES (Biological Engineering) / BSEH (Environmental Health Science)
BSES (Entomology) / MS (Entomology)
BSFCS (Consumer Economics) / MS (Financial Planning, Housing and Consumer Economics)
BSFCS (Consumer Foods ) / MS (Foods and Nutrition)
BSFCS (Consumer Journalism) / MS (Financial Planning, Housing and Consumer Economics)
BSFCS (Dietetics) / MS (Foods and Nutrition)
BSFCS (Family and Consumer Sciences Education) / MAT (Workforce Education)
BSFCS (Family and Consumer Sciences Education) / MS (Financial Planning, Housing and Consumer Economics)
BSFCS (Fashion Merchandising) / MS (Textiles, Merchandising and Interiors)
BSFCS (Financial Planning) / MS (Financial Planning, Housing and Consumer Economics)
BSFCS (Human Development and Family Science) / MAT (Special Education)
BSFCS (Human Development and Family Science) / MS (Financial Planning, Housing and Consumer Economics)
BSFCS (Human Development and Family Science) / MS (Human Development and Family Science)
BSFCS (Nutritional Sciences) / MS (Foods and Nutrition)
BSME (Mechanical Engineering) / AB (German)
BSME (Mechanical Engineering) / MBA (Master of Business Administration)
BSME (Mechanical Engineering) / MS (Engineering)
BSW (Social Work) / MA (Nonpro�t Management and Leadership)
LLM (Master of Laws) / MBA (Master of Business Administration)
MAT (World Language Education) / MA (German)
MBA (Master of Business Administration) / JD (Juris Doctor)
MBA (Master of Business Administration) / MPH (Master of Public Health)
MBA (Master of Business Administration) / PharmD (Doctor of Pharmacy)
MPA (Master of Public Administration) / JD (Juris Doctor)
MPH (Master of Public Health) / DVM (Veterinary Medicine)
MPH (Master of Public Health) / JD (Juris Doctor)
MPH (Master of Public Health) / PharmD (Doctor of Pharmacy)

MPH (Master of Public Health) / PhD (Health Promotion and Behavior)
MS (Kinesiology) / JD (Juris Doctor)
MSW (Master of Social Work) / JD (Juris Doctor)
MSW (Master of Social Work) / MPH (Master of Public Health)
PhD / DVM (Veterinary Medicine)
Consortiums
194.) List names of consortia:
This data is rolled over from last year.
Southern Regional Education Board Consortium (SREB)
Academic Common Market
Oak Ridge Associated Universities
Georgia Library Learning Online (GALILEO)
University Corporation for Atmospheric Research
Atlanta Regional Council on Higher Education (ARCHE)
Alliance for the Arts in Research Universities (a2ru)
Ecosystem Impacts of Oil and Gas to the Gulf (ECOGIG)
TransAtlantic Precision Agriculture Consortium (TAPAC)
Consortium for Overseas Student Teaching (COST)
Schistosomiasis Consortium for Operational Research and Evaluation (SCORE)
Consortium Institute for Management and Business Analysis (CIMBA)
Wood Quality Consortium
Consortium for Internet Imaging and Database Systems (CIIDS)
Georgia Sustainable Agriculture Consortium
Student Activities
195.) Fraternities / Sororities
This data is rolled over from last year.
Number of social fraternities on campus:
36
Number of fraternities with chapter houses:

26
Number of social sororities on campus:
28
Number of sororities with chapter houses:
18
196.) Other Student Characteristics: Please provide the percentages of �rst-time, �rst-year (freshman) degree-seeking students and all degree-seeking undergraduatesenrolled in Fall 2017 who �t the following categories.
CDS F1
First-time, First-year Students (Freshman), Fall2017 Undergraduates Fall 2017
% who are from out of state (exclude international/nonresidentaliens) 14 11
% of men who join fraternities 20
% of women who join sororities 31
% who live in college-owned, operated or a�liated housing 98 33
% who live off campus or commute 2 67
% of students age 25 and older 0 3
Average age of full-time students 18 20
Average age of students (full- and part-time) 18 20
197.) Activities Offered: Identify the programs available at your institution by checking the box next to each program name.
CDS F2 This data is rolled over from last year.
Campus Ministries
Choral groups
Concert band
Dance
Drama/theater
International Student Organization
Jazz band
Literary magazine
Marching band
Model UN

Music ensembles
Musical theater
Opera
Pep band
Radio station
Student government
Student newspaper
Student-run �lm society
Symphony orchestra
Television station
Yearbook
198.) Total number of registered organizations:
This data is rolled over from last year.
817
Student Publications
199.) List the names of student-produced newspapers, magazines, and web-only journalism publications that are at least partially funded by your institution:
This data is rolled over from last year.
Red and Black
Athletics
200.) Sports Information Director and Department website:
This data is rolled over from last year.
Athletic Department Web address:
http://www.georgiadogs.com
Athletic Director name:
Greg McGarity
Athletic Director phone:
706-542-9036
Athletic Director email:
201.) Collegiate athletic association that your school belongs to during the 2017–2018 academic year.
This data is rolled over from last year.
NCAA I
NCAA II
NCAA III

NAIA
None of the above
No Answer
202.) FOR THIS GRID:
Intercollegiate sports are those recognized by either the NCAA or NAIA. Athletic scholarships are only available to NCAA Division I and IIand NAIA sports.Intramural sports are competitive sports played at your institution among other students at your institution.Club sports are not governed by the NCAA or NAIA, may have separate championships, and/or may have intercollegiate contests. For thissurvey, athletic scholarships may not be reported for club sports.
Men's Sports and ScholarshipsThis data is rolled over from last year.

Intercollegiate NCAA or NAIA Scholarships Available? Intramural Club (intercollegiate)
Archery
Badminton
Baseball
Basketball
Bowling
Cheerleading
Crew (Rowing) Heavyweight
Crew (Rowing) Lightweight
Cross-country
Curling
Equestrian
Fencing
Field Hockey
Figure Skating
Football
Golf
Gymnastics
Ice Hockey
Lacrosse
Lightweight Football
Martial Arts
Racquetball
Ri�e
Rodeo
Rugby

Sailing
Skiing: Alpine
Skiing: Nordic
Soccer
Softball
Squash
Swimming and Diving
Synchronized Swimming
Team Handball
Tennis
Track and Field (indoor)
Track and Field (outdoor)
Ultimate Frisbee
Volleyball
Water Polo
Water Skiing
Wrestling
203.) Women's Sports and Scholarships
This data is rolled over from last year.

Intercollegiate NCAA or NAIA Scholarships Available? Intramural Club (intercollegiate)
Archery
Badminton
Baseball
Basketball
Bowling
Cheerleading
Crew (Rowing) Heavyweight
Crew (Rowing) Lightweight
Cross-country
Curling
Equestrian
Fencing
Field Hockey
Figure Skating
Football
Golf
Gymnastics
Ice Hockey
Lacrosse
Lightweight Football
Martial Arts
Racquetball
Ri�e
Rodeo
Rugby

Sailing
Skiing: Alpine
Skiing: Nordic
Soccer
Softball
Squash
Swimming and Diving
Synchronized Swimming
Team Handball
Tennis
Track and Field (indoor)
Track and Field (outdoor)
Ultimate Frisbee
Volleyball
Water Polo
Water Skiing
Wrestling
Honor Societies
204.) List names of honor societies:
This data is rolled over from last year.
Abeneefoo Kuo Honor Society
Alpha Psi Omega
Alpha Epsilon Delta
Alpha Psi Omega
Beta Alpha Psi
Blue Key Honor Society
Dean William Tate Society

Kapa Delta Pi
National Society of Collegiate Scholars
Omicron Delta Kappa
Order of Omega
Phi Kappa Phi
Phi Sigma Pi National Co-Ed Honor Fraternity
Pi Sigma Alpha
Psi Chi Honor Society
Sigma Alpha Lambda
Sigma Delta Pi
Sigma Iota Rho
Sigma Phi Omega
Triota
Xi Sigma Pi
Alpha Lambda Delta
Eta Sigma Phi
Golden Key International Honor Society
Phi Alpha Theta
Phi Upsilon Omicron
Sigma Alpha Lambda
Tau Sigma
Tate Leadership Scholars Program
Honors Program Student Council (HPSC)
Phi Alpha
Religious Student Organizations
205.) List names of religious organizations:
This data is rolled over from last year.
Adventist Christian Fellowship

Alpha Omega
Bahai Association at the University of GA
Baptist Collegiate Ministry
Campus Connection
Chi Alpha Christian Fellowship
Christian Legal Society
Christian Students UGA
Christus Victor Lutheran Church and Student Center
Athens Church Student Organization
CRU/Campus Crusade for Christ
Christian Pharmacists Fellowship International
Georgia Christian Student Center
Greek Intervarsity/USA - UGA Chapter
Hillel at UGA
Chabad Jewish Student Group
Disciples on Campus
Korean Christian Meeting
Jewish Law Students Association
Life on Life Campus Ministries
Chinese Student Christian Fellowship
Muslim Student Association
Navigators
Presbyterian Student Center
Reformed University Fellowship
Ratio Christi
Grace Athens Students
Wesley Foundation
Bethel Campus Fellowship

Catholic Student Association of UGA
Higher Learning Society @ UGA (HLS)
Orthodox Christian Fellowship
Nichiren Buddhist Association at UGA
Beta Upsilon Chi - Brothers Under Christ
Christian Campus Fellowship
Collegetown Gospel Choir
Collegiate Bible Fellowship
The Field
I Am Enough: Mind Body and Soul (IAE / I Am Enough)
International Justice Mission
Pagan Student Association
Cornerstone Church Athens (CCASO)
Daughters of the Throne
Delight Ministries at UGA
Divine Youth Association
Followers of Christ
Latter-day Saints Student Association
S.W.A.T. Ministries
Sigma Alpha Omega
Sikh Student Association
WattyCollege (The Great Exchange)
Young Life
Christian Medical and Dental Association (CMDA)
Christians United for Israel (CUFI)
Korea Campus Crusade for Christ (KCCC)
Men of Purpose (MOP)
Orthodox Christian Campus Ministries (OCCM)

Salvation Army Service Society at UGA (SASS)
Secular Student Alliance at UGA (SSA)
Serving Others Unconditional Love (S.O.U.L.)
Simple Charity (SC)
Together in Christ
Valor at the University of Georgia (Valor)
Asian American Christian Fellowship
Beech College Ministry
Campus Prayer
Christian Grads Fellowship - UGA
HydroLove at UGA
Lambda Theta Alpha latin Sorority, Incorporated
Serving Hearts & Diversity
Seven Thunders
Ethnic Student Organizations
206.) List names of ethnic organizations.
This data is rolled over from last year.
African Student Union
Arab Cultural Association
Asian American Student Association
Brazilian Student Association at UGA
Caribbean Student Association
Chinese Culture and Language Society
Fillipino Student Association
Hispanic Student Association
Indian Cultural Exchange
Indian Student Association
Persian Student Union

Korean Undergraduate Student Association
Russian Club
Students for Latin@ Empowerment
Taiwanese Student Association at UGA
Turkish Student Association
Pakistani Student Association at UGA
Champa & Chameli
Bangladeshi Students Association @ UGA
Black Affairs Council
Black Male Leadership Society
Capoeira Maculele Athens
Georgia Daze Minority Recruitment Program
German Student Organization
Indonesian Student Organization @ UGA
Korean Student Association
Latinos Invested in the Students of Tomorrow
Manna Project International
Multiracial Student Organization
Thai Student Association
Vietnamese Student Association @ UGA
For the Girls
National Council of Negro Women at the University of Georgia
Sri Lankan Student Association at UGA
African American Choral Ensemble (AACE)
Association of Black Social Workers at the University of Georgia (ABSW)
Association of Latino Professionals for America (ALPFA)
Association of Minority Public Health Professional Scholars (AMPPS)
Black Educational Support Team (BEST)

Black Law Student Association (BLSA)
Black Theatrical Ensemble (BTE)
Brown SUGA
Chinese Student Christian Fellowship (cscf-athens)
Dawgs for Israel at UGA (DFI)
Delta Phi Lambda Sorority Alpha Chapter (DPhiL)
Grain de Sel Togo Inc (GDS)
Hispanic Law Students Association (HLSA)
Israel Public Affairs Committee UGA (UGAIPAC)
Korean Badminton Club (KBC)
Korean Language Society (KLS)
Kpop Dance Club (KDC)
Liberty in North Korea at UGA (LiNK at UGA)
Minorities in Agriculture, Natural Resources and Related Sciences (MANRRS)
Minorities in Tech (MiT)
Minority Student Science Association (M.S.S.A.)
Multicultural Business Student Association at UGA (MBSA UGA)
Multicultural Services and Programs (MSP)
The National Association for the Advancement of Colored People at UGA (NAACP)
National Association of Black Accountants (NABA)
National Association of Black Journalists (NABJ)
Native American Student Association (NASA)
Reinvent
Sigma Delta Pi (SDP)
Sikh Student Association (SSA)
Society of Hispanic Professional Engineers (SHPE)
The Undergraduate Black Student Law Association (UBSLA)
Abeneefoo Kuo Honor Society

ARISE Interest Group
Asian American Christian Fellowship
Bengali Student Association at the UGA
Beta Chi Theta National Fraternity, Inc.
Black Lives Matter @ UGA
BOLD Modeling Agency
BuildOn at UGA
Chabad Jewish Student Group
Classic City Bhangra
Coexist UGA
Cornerstone Church Athens
Counseling Psychology Student Association
Falun Dafa Club at UGA
Francophone Students Association
Georgia Dolls
Graduate and Professional Scholars
Japanese Conversation Club
Japanese Culture Club
Lambda Theta Alpha Latin Sorority, Incorporated
Lambda Theta Phi Latin Fraternity, Inc.
Muslim Student Association
Providing Outreach and Inspiration through Sisterhood and Education
Salsa Club at UGA
Sikh Student Association
Tipi Raisers @ UGA
Women for Diversity in Business
Other Student Organizations
207.) List names of other organizations:

This data is rolled over from last year.
https://uga.campuslabs.com/engage/organizations
Popular Cultural and Campus Events
208.) List names of popular campus events:
This data is rolled over from last year.
Dance Marathon
Relay for Life
Dawgs After Dark
Martin Luther King, Jr. Freedom Breakfast and Day of Service
Performing Arts Center Concerts
Georgia Museum of Art Events
University Theatre
Second Thursday Concert Series
State Botanical Garden Events
International Street Festival
Intercollegiate Athletic Events
Welcome Week Activities
University Union Concerts and Lectures
Spotlight on the Arts
Mary Frances Early Lecture
Charter Lecture Series
Louise McBee Lecture
Miss UGA Pageant
UGA Homecoming
IMPACT - Alternative Spring Break
Student Alumni Association Events
40 Under 40
Rite of Sankofa
Lunar New Year Celebration

Unity Ball
Nocha Latina
India Night
Thank a Donor Day
Healthy Dawg Fest
D.A.W.G. Days
Dawgs Ditch the Dumpster - Move Out Day
Hunker Down with Housing - Move In Day
International Graduation Ceremony
Dawg Trot 5K
International Coffee Hour
Bulldog 100
Founders Day
Dawg Camp
Return to the Arch
Student Background
209.) Religious preference: Estimated religious preference percentage of fall 2017 enrolled undergraduate students.
Catholic
Protestant
Jewish
Muslim
Hindu
Buddhist
Mormon
1 %
20 %
2 %
5 %
1 %
0 %

Claim no religious preference
Don't know
Institution Religious a�liation: (Question 10)
Other (De�ne Below)
All other
210.) 'Other' Religious Preference:
211.) Overlap schools: List up to �ve institutions that generally have the biggest overlaps (in terms of number of applicants) with your institution's applicant pool. Please usethe alphabetical listing of colleges and universities on the left hand side of the grid. Select up to �ve institutions, then use the right arrow to move those schools to Overlapcolumn. To remove a school from the right side of the grid, click on its name and hit the left arrow to move them back.
This data is rolled over from last year.
Georgia Institute of Technology (GA), University of Alabama (AL), University of North Carolina--Chapel Hill (NC), University of South Carolina (SC), University of Texas--Austin (TX)
Housing
212.) Institution offers housing:
This data is rolled over from last year.
Yes
No
No Answer
213.) Please check all types of college-owned, -operated, or -a�liated housing available for the 2017-2018 undergraduates at your institution and specify the percentages ofstudents living in each type.
Exclude students not living in these housing types from percentages.When calculating percentages, institutional housing should only be counted in one category.
CDS F4 This data is rolled over from last year.
Coed dorms
1 %
3 %
60 %
%
%
7 %

48
Women's dorms
3
Men's dorms
Sorority housing
11
Fraternity housing
6
Apartments for married students
5
Apartment for single students
16
Special housing for disabled students
1
Special housing for international students
1
Cooperative housing
Theme housing
6
Wellness housing
Other housing options
3
214.) Percentage of college-owned, operated or a�liated housing units that are:
This data is rolled over from last year.
Singles
Doubles
Triples/Suites
4 %
48 %

Apartments
Other
215.) How many college-owned, -operated or -a�liated housing buildings does your institution have?
This data is rolled over from last year.
94
216.) Average percentage of students on campus during weekends:
This data is rolled over from last year.
217.) Are students required to live in school-owned, -operated, or -a�liated housing?
This data is rolled over from last year.
Yes No No Answer
Freshman year
Sophomore year
Junior year
Senior year
218.) Campus housing is available for all unmarried students regardless of year:
This data is rolled over from last year.
Yes
No
No Answer
219.) School provides assistance in locating off-campus housing if on-campus housing is not available:
This data is rolled over from last year.
Yes
No
No Answer
Facilities
Computers/Facilities/Services offered during the 2017-2018 academic year.220.) Computer equipment/network access for student use is provided in: (check all that apply)
This data is rolled over from last year.
Computer Center/Labs
Residence Halls
10 %
38 %
%
75 %

Library
Student Center
221.) What percent of college-owned, -operated, or -a�liated housing units (rooms, apartments, houses) are currently set up for high speed internet access?
This data is rolled over from last year.
222.) If your institution currently utilizes a learning management system(s) for undergraduate students, which of the following functions can all undergraduate studentscurrently perform using this/these system(s)? (Please check all that apply.)
This data is rolled over from last year.
Access all courses in which they are currently enrolled from a single interface
Utilize a mobile app for portable display and use
Grant family members access to account
Access o�cial or uno�cial transcripts
Determine extent of progress toward achieving degree requirements
Register for courses
Submit assignments
Submit tuition payments
Apply for �nancial aid
223.) Which of the following functions can undergraduate students currently perform online? (Please check all that apply.)
This data is rolled over from last year.
Complete and submit course evaluation forms
Reserve library materials
Receive instant alerts from campus-wide emergency alert system
Report emergencies to authorities
Secure on-campus housing
Pre-order food or take-out using meal plan credits
224.) Does your institution currently offer any online bachelor's degree programs, including but not limited to degree completion programs?
An online bachelor's degree program is a program for which all required coursework for program completion is able to be completed viadistance education courses that incorporate Internet-based learning technologies. Distance education courses are courses that deliverinstruction to students who are separated from the instructor, and support regular and substantive interaction between the students andthe instructor synchronously or asynchronously. Note that the requirements for coming to campus for orientation, testing, or academicsupport services do not exclude a program from being classi�ed as an online bachelor's degree program.
This data is rolled over from last year.
Yes
No
No Answer
225.) What percentage of your institution's bachelor degree programs are online bachelor's degree programs?
This data is rolled over from last year.
100 %
1 %

226.) Does your institution offer any individual distance education courses that grant credit toward a bachelor's degree?
Distance education courses are courses that deliver instruction to students who are separated from the instructor, and support regular andsubstantive interaction between the students and the instructor synchronously or asynchronously. Note that requirements for coming tocampus for orientation, testing, or academic support services do not exclude a course from being classi�ed as a distance educationcourse.
This data is rolled over from last year.
Yes
No
No Answer
227.) School has a library on campus:
This data is rolled over from last year.
Yes
No
No Answer
228.) School is a member of library consortium(s):
This data is rolled over from last year.
Yes
No
No Answer
229.) List additional library facilities/collections separated by commas and semi-colons as appropriate. Do not include bullets, paragraph breaks, special characters, or otherspecial formatting.
This data is rolled over from last year.
Richard B. Russell Building Special Collections Libraries, which includes Hargrett Rare Book and Manuscript Library, Walter J. Brown Media Archives and Peabody Awards Collection, and the Richard B. Russell Library for Political Research and Studies; Zell B. Miller Learning Center, Law Library, Science Library, Digital Library of Georgia, Curriculum Materials Library and the Owens Environmental Design Library.
230.) List museums and other special academic buildings/equipment on campus, specifying type separated by commas and semi-colons as appropriate. Do not includebullets, paragraph breaks, special characters, or other special formatting.
This data is rolled over from last year.
GA Museum of Art,GA Museum of Nat Hist,Miller Learning Center,Milledge Hall Acad Rrse Cntr,Performing Arts Cntr,Ramsey Cntr,State Botanical Garden, Lake Herrick Forest,Butts-Mehre Heritage Hall,Collegiate Tennis Hall of Fame, Founders Mem. Garden,Complex Carbohydrate Rsrch Cntr, Animal Hlth Rsch Cntr,Russell Special Collections Libraries,Lamar Dodd Sch of Art,Health Sciences Campus,Science Learning Center,Terry College Business Learning Community, Vet Med Learning Cntr.
Regulations

Regulations/rules in effect during the 2017-2018 academic year.231.) All undergraduate students may have cars on campus:
This data is rolled over from last year.
Yes
No
No Answer
232.) Percentage of all undergraduate students who have cars on campus:
233.) Alcohol is permitted on campus to students of legal age:
This data is rolled over from last year.
Yes
No
No Answer
234.) Which among the below options best describes your institution’s campus carry policy? If your institution has no policy, select the option that best re�ects the defaultregulations in accordance with state and local laws:
Banned: Students may not possess handguns anywhere on campusHighly Restricted: Eligible students may only possess handguns on campus in one or a few designated areas (e.g. cars, residence halls)Concealed Carry: Eligible students may be in control of handguns across most or all of campus on condition these handguns are hiddenfrom viewOpen Carry: Eligible students may be in control of handguns across most or all of campus, without a condition these handguns are hiddenfrom view
This data is rolled over from last year.
Banned
Highly Restricted
Concealed Carry
Open Carry
No Answer
Student Employment/Internships
NOTE: Do not include Work-Study in this section.235.) Institutional employment is available:
This data is rolled over from last year.
Yes
No
No Answer
236.) Percentage of full-time undergraduates who work on campus during the 2017-2018 academic year:
237.) Average amount undergraduates may expect to earn per year from part-time on-campus work:
50 %
14 %

238.) Part-time off-campus employment opportunities for undergraduates are:
This data is rolled over from last year.
Excellent
Fair
Good
Poor
No Answer
239.) Freshmen are discouraged from working during �rst term:
This data is rolled over from last year.
Yes
No
No Answer
240.) Does your college have a formal internship program that helps students �nd internship opportunities?
Yes
No
No Answer
241.) What was the compensation breakdown among students who graduated with a bachelor's degree during the 2017 academic year and had an internship?
Paid:
Unpaid:
Unknown:
Programs/Services for Students with Learning Disabilities
Programs/Services for Students with Learning Disabilities offered during the 2017-2018 academic year242.) Check one type that describes your school's LD Program:
Structured/Proactive/Comprehensive program:Program has separate admissions process and charges fees. Services go well beyond those that are legally mandated and the student isprovided with a more structured environment. Low staff/student ratios. Compulsory student attendance. An advisor/advocate is madeavailable to students.Self-directed/decentralized services:There is no separate admissions process and eligibility for services must be established by the provision of disability documentation thatmeets institutional standards. Services may be coordinated through the Disability Services o�ce and are based on need as speci�ed by thedocumentation. Other o�ces throughout the campus may also provide services and some services offered are not mandated by laws.Students' progress is not monitored.Compliance:Most of the services and accommodations that are provided to students with learning disabilities are those required by law. This type ofprogram can meet the needs of independent students, aware of their needs and able to develop and coordinate their own support systems.
4640$
%
%
%

This data is rolled over from last year.
Structured/Proactive/Comprehensive program
Self-directed/decentralized services
Compliance
No Answer
243.) Are LD program services available to students that have not self-identi�ed during the application process?
This data is rolled over from last year.
Yes
No
No Answer
244.) LD services are available to the following students:
This data is rolled over from last year.
Freshmen
Sophomores
Juniors
Seniors
245.) Please select counseling services that are offered to LD students:
This data is rolled over from last year.
Academic
Psychological
Student support groups
Vocational
246.) Is there a limit as to how many times per academic year a student may use each service?
Yes No No Answer
Academic
Psychological
Student support groups
Vocational
247.) If so, how many times per academic year may a student use these services?
This data is rolled over from last year.
Academic
25
Psychological
Student Support Groups

Vocational
248.) Please select services that are offered to LD students:
This data is rolled over from last year.
Diagnostic Testing Service
Early Syllabus
Exam on tape or computer
Extended Time for Tests
Learning Center
Note-taking Services
Oral Tests
Other Special Classes
Other testing accommodations
Priority registration
Priority seating
Proofreading services
Readers
Reading Machines
Remedial English
Remedial Math
Remedial Reading
Special bookstore section
Substitution of courses
Take home exam
Tape Recorders
Texts on tape
Tutors
Typist/Scribe
Untimed Tests
Videotaped Classes
Waiver of foreign language degree requirement
Waiver of math degree requirement
Other:
With proper documentation, DRC will assist students in petitioning for class substitution

249.) Is there an advisor/advocate from the LD program available to students?
This data is rolled over from last year.
Yes
No
No Answer
250.) Is individual tutoring available?
This data is rolled over from last year.
Yes
No
No Answer
251.) How often is individual tutoring available?
This data is rolled over from last year.
As needed
Daily
Weekly
Twice per month
Monthly
No Answer
252.) Other tutorial options that are available to LD students. Check all that are available by setting:
This data is rolled over from last year.
Individual Group
Time management
Organizational skills
Learning Strategies
Content area
Writing labs
Math labs
Study skills
253.) Are single rooms available to students with speci�c disabilities?
This data is rolled over from last year.
Yes
No
No Answer
254.) URL for LD Program/Unit:
This data is rolled over from last year.

http://www.drc.uga.edu
255.) Person to contact for additional information on LD program:
This data is rolled over from last year.
Name:
Dr. Peter Bertot
Title:
Senior Coordinator, Intake
Phone:
706-542-8719
Email:
International Applicant Info
International Applicant Information for the 2017- 2018 academic year.256.) Indicate test requirements for undergraduate international applicants whose native language is not English.
This data is rolled over from last year.
Require Require for some Recommend Consider ifsubmitted No Answer
TOEFL (Paper)
TOEFL (Internet-based)
Michigan Test
IELTS
SAT
SAT Subject
ACT
257.) TOEFL and/or IELTS may be submitted in place of SAT or ACT
This data is rolled over from last year.
Yes
No
No Answer
258.) Minimum Required Test Scores
This data is rolled over from last year.
TOEFL (Paper)
550
TOEFL (Internet-based)

80
Michigan test
IELTS
6.5
259.) Average score of admitted students:
This data is rolled over from last year.
TOEFL Paper:
TOEFL Internet-based:
Michigan Test:
IELTS:
260.) If SAT/ACT/SAT Subject Tests are required, check correct statement:
This data is rolled over from last year.
SAT/ACT/SAT Subject Tests may replace TOEFL/IELTS/Michigan Test
TOEFL/IELTS/Michigan Test also must be taken
No Answer
261.) Advanced deposit (in addition to tuition/room deposits required of all students) is required of international applicants:
This data is rolled over from last year.
Yes
No
No Answer
262.) Preapplication form is required of international applicants:
This data is rolled over from last year.
Yes
No
No Answer
263.) Separate application form is required of international applicants:
This data is rolled over from last year.
Yes
No
No Answer
264.) Application closing date for international applicants:

This data is rolled over from last year.
Date or Rolling Basis Beginning Date
Fall 01/01
Winter
Spring 09/01
Summer 01/01
265.) Provide the number of degree-seeking, �rst-time, �rst-year (freshman) nonresident alien students who applied, were admitted, and enrolled in fall 2017.
Applicants
1219
Admitted applicants
411
Enrolled
70
266.) Do you offer conditional admission to international applicants?
This data is rolled over from last year.
Yes
No
No Answer
267.) Are international students eligible to apply for early decision or early action?
This data is rolled over from last year.
Yes, both early decision or early action
Early decision only
Early action only
No
No Answer
268.) If your institution actively recruits international students, please check all that apply:
This data is rolled over from last year.
Overseas visits to local or international secondary schools
Overseas public college fairs
Agents
Social media / other Web-based approaches
Other:

269.) If your institution conducts off-campus admissions interviews with international students, please check all that apply
This data is rolled over from last year.
Skype or other Web-based video interview
Phone
In-country visits
In-country alumni interviews
270.) Number of foreign countries represented by degree-seeking undergraduate nonresident aliens (Fall 2017):
98
271.) List the six countries most represented by degree-seeking undergraduate nonresident aliens during the 2017-2018 academic year, and the percentage of degree-seekingundergraduate nonresident aliens who come from each country:
Countries Percent
1. China 51
2. Republic of Korea 12
3. India 8
4. United Kingdom 3
5. Japan 2
6. Canada 2
272.) Special services offered for international students: (check all that apply)
This data is rolled over from last year.
English lab
International student center
Special counselors/advisors
ESL program/classes
Host family program
Housing offered during all school holidays
Dining hall services offered to international students during all school holidays
Special orientation (1-6 days)
Special orientation (1-2 weeks)
Special orientation (2+ weeks)
Support in local set-up (e.g., bank account, cell phone, etc.)
273.) Is any portion of the undergraduate admissions website aimed at prospective international students translated into languages other than English?
This data is rolled over from last year.

Yes
No
No Answer
274.) How many languages?
This data is rolled over from last year.
275.) Please list the languages:
This data is rolled over from last year.
276.) International student contact:
This data is rolled over from last year.
Name:
Robin Catmur
Title:
Director, Immigration Services
Phone:
(706) 542-2900
Email:
URL for additional international applicant information:
https://www.admissions.uga.edu/prospective-students/international
Honors College
277.) Does you institution house an honors college?
This data is rolled over from last year.
Yes
No
No Answer
278.) Does your institution offer an honors program?
This data is rolled over from last year.
Yes

No
No Answer
279.) Provide the number of students enrolled in the following as of October 15th, 2017:
Honors college:
Honors program:
2497
Guidance Facilities
280.) Check remedial learning services offered: (check all that apply)
This data is rolled over from last year.
Math
Reading
Study skills
Writing
281.) Check additional services offered: (check all that apply)
This data is rolled over from last year.
Day care
Health insurance
Health service
Nonremedial tutoring
Placement service
Women's Center
282.) Check counseling services offered: (check all that apply)
This data is rolled over from last year.
Academic
Birth control
Career
International students
Military
Minority student
Older student
Personal
Psychological
Religious
Veteran student

283.) Check services available in career placement center: (check all that apply)
This data is rolled over from last year.
Alumni network
Career/job search classes
Co-op education
Interest inventory
International student internship / job placement assistance
Internships
Interview training
On-campus job interviews
Resume assistance
284.) Check special programs offered for physically disabled students: (check all that apply)
This data is rolled over from last year.
Adaptive equipment
Braille services
Interpreters for hearing-impaired
Note-taking services
Reader services
Special housing
Special transportation
Talking books
Tape recorders
Tutors
285.) Check term that best describes accessibility of campus to physically disabled students:
This data is rolled over from last year.
Fully
Partially
Mostly
Not at all
No Answer
286.) Check campus safety and security services offered:
This data is rolled over from last year.
24-hour emergency telephones
24-hour foot and vehicle patrols
Controlled dormitory access (key, security card, etc)
Late night transport/escort service
Lighted pathways/sidewalks

Student patrols
Firms That Hire Graduates
287.) List names of �rms that have hired graduates within the past 5 years.
This data is rolled over from last year.
22squared
Accenture PLC
A�ac
ALDI
All Risks, Ltd
Altria
Amazon.com, Inc.
American International Group, Inc.
Aon plc
Apple
AT&T
Bank of America
Barrow County School District
Capgemini
Caterpillar Inc.
CBRE Group, Inc.
Centers for Disease Control and Prevention
Cherokee County School District
Chick-�l-A, Inc.
Children's Healthcare of Atlanta
Citigroup Inc.
City Year
Clarke County School District
Cobb County School District

Cox Enterprises
Crowe Horwath LLP
CVS / Pharmacy
DeKalb County School District
Deloitte
Delta Air Lines, Inc.
Emory Healthcare
Emory University
Ernst & Young
ESPN
E-Trade Financial Corporation
First Data Corporation
FTI Consulting, Inc.
Fulton County School District
General Motors Company
Georgia-Paci�c LLC
Gwinnett County School District
IBM
Insight Global
Jackson & Coker
JPMorgan Chase & Co.
Kimberly-Clark Corporation
Knowledge is Power Program
KPMG US LLP
Kroger
Liberty Mutual Group
Macy’s, Inc.

Manhattan Associates
Marriott International, Inc.
Meltwater Group
Microsoft Corporation
Newell Brands
Nolan Transportation Group, Inc.
Northwestern Mutual
Oconee County School District
PricewaterhouseCoopers
Protiviti Inc.
PulteGroup, Inc.
RaceTrac Petroleum, Inc.
Rite Aid Pharmacy
State Farm Insurance
SunTrust Banks, Inc.
SunTrust Robinson Humphrey Inc
Target Corporation
Teach for America
TEKSystems
Textron
The Coca-Cola Company
The Home Depot
The University of Georgia
The Vanguard Group
The Walt Disney World Resort
The Wesley Foundation
Triage Consulting Group
Turner Broadcasting System

UBS Group AG
United Parcel Service
United States Air Force
United States Army
USDA
Walgreens
Walmart
Wells Fargo & Company
WestRock Company
Zurich Insurance Company Ltd
Environment/Transportation
Please report on the 2017-2018 academic year.288.) Select the region from which the majority of U.S. students come:
This data is rolled over from last year.
New England (CT, ME, MA, NH, RI, VT)
Middle Atlantic (NJ, NY, PA)
East North Central (IL, IN, MI, OH, WI)
West North Central (IA, KS, MN, MO, NE, ND, SD)
South Atlantic (DE, DC, FL, GA, MD, NC, SC, VA, WV)
East South Central (AL, KY, MS, TN)
West South Central (AR, LA, OK, TX)
Mountain (AZ, CO, ID, MT, NV, NM, UT, WY)
Paci�c (AK, CA, HI, OR, WA)
No Answer
289.) Percentage of U.S. students who come from most popular region:
290.) Campus size (acres):
This data is rolled over from last year.
767
291.) Check one:
This data is rolled over from last year.
Campus is within one mile of city/town
95 %

Campus is more than one mile from city/town
No Answer
292.)
This data is rolled over from last year.
City/town where school is located:
Athens
Population:
123912
Major city closest to school:
Atlanta
Population:
5789700
Distance from campus (miles):
70
City where nearest international or other major airport used by your students is located:
Atlanta
Distance of airport from campus (miles):
80
City/town where nearest other airport used by your students is located:
Athens
Distance of airport from campus (miles):
3
City/town where passenger train service (e.g., Amtrak) used by your students is located:
Atlanta
Distance of station from campus (miles):
75
City/town where passenger bus service (e.g., Greyhound, Trailways) used by your students is located:
Athens
Distance of station from campus (miles):
1
293.) Public transportation (municipal bus/trolley, subway, commuter rail) serves campus:
This data is rolled over from last year.
Yes
No
No Answer

Social Media
Please provide the main link, if any, for the presence on each of the following sites that your institution identi�es as its primary handle:294.)
This data is rolled over from last year.
Facebook:
https://www.facebook.com/universityofga/
Twitter:
http://twitter.com/universityofga
LinkedIn:
https://www.linkedin.com/school/university-of-georgia
Assessment
The following section contains a brief analysis of ranking data your school submitted on this year's Main statistical survey. All �agged data(identi�ed by the red asterisk *) must be addressed in order to submit your survey. To acknowledge that the �agged data is in fact correct,please select the con�rmation checkbox associated with item in question. Once every �agged assessment item has been either con�rmedor corrected, please proceed to the veri�cation section.Making Data Changes – If you notice an incorrect current year value please go back into the survey and correct the data point. The questionnumbers are listed for your reference. Changing last year’s data must be done through your data collector. Please contact them with theupdated information and a brief description as to why it needs changing. We will analyze the requested changes on a case by case basis andget back to you.Below is a list of some terminology you may encounter:Large Change - For the questions(s) indicated, the data submitted for the current year are signi�cantly larger or smaller than the datasupplied for the previous year. If the data supplied are correct as entered, please check the box. If the data is incorrect, please go back intothe survey and supply new data.Missing - No information has been submitted for this indicator. If the question does not apply to your institution, or if you cannot supply thedata requested, please check the box. If you can supply the missing data, please go back into the survey and enter the new data. If you wishto add in missing previous year data, please contact your data collector with that information.High Value - The data submitted are signi�cantly higher than the norm. Please either correct the �gure or verify that the data are correct assubmitted.295.) Enrollment (Questions 26 - 33):
Current Year: Last Year:
Undergraduate: 28848 27951
Graduate: 8758 8623
Total: 37606 36574
296.) Six-Year Graduation Rates: Total (Questions 36 , 37 , 41):
Fall 2011: 85
Fall 2010: 85
Fall 2009: 85
Fall 2008: 85
297.) Income-based Six-Year Graduation Rates (Questions 36, 37):

2011 Cohort: 2010 Cohort:
Federal Pell Grant: 80 81
Stafford Loan: 80 77
No Loan: 88 87
298.) First-year (Freshman) Retention Rates (Question 42 , 43):
Fall 2016: 96
Fall 2015: 95
Fall 2014: 95
Fall 2013: 94
299.) First-year (Freshman) Acceptance Rate (Question 45):
Current Year: Last Year:
Applicants: 24165 22694
Accepted Applicants: 13052 12232
Rate: 54 53.9
300.) Percent submitting SAT/ACT scores (Question 68, 70):
Current Year: Last Year:
SAT: 68 74
ACT: 74 72
301.) SAT Evidence-Based Reading and Writing - 25th/75th Percentile (Question 71):
Current Year: Last Year:
25th Percentile: 610 570
75th Percentile: 690 670
302.) SAT Math - 25th/75th Percentile (Question 71):
Current Year: Last Year:
25th Percentile: 590 570
75th Percentile: 680 670
303.) ACT Composite - 25th/75th Percentile (Question 73):
Current Year: Last Year:
25th Percentile: 26 26
75th Percentile: 31 31
304.) Average SAT/ACT Scores (Question 77):
Current Year: Last Year:
SAT Evidence-Based Reading and Writing: 651 626
SAT Math: 637 632
ACT Composite: 29 29
305.) All students who provided SAT/ACT scores were included, regardless if considered for admissions (Question 78):

Current Year:
Yes
306.) SAT/ACT scores included the following groups of students (Question 79, 80):
Current Year: Last Year:
All International Students: Yes Yes
All Minority Students: Yes Yes
All Student Athletes: Yes Yes
All Legacy & Children of Alumni: Yes Yes
All Special Admission Arrangements: Yes Yes
All Students Who Began Studies in the Summer: Yes Yes
307.) High school class standing (Question 81):
Current Year: Last Year:
% in Top 10 54 55
% in Top 25 90 91
% in Top 50 99 99
% in Bottom 50 1 1
% Sumitting 61 66
308.) Best Colleges for Veterans (Questions 126 - 128):
Current Year:
Total Military Enrollment: 122
G.I. Bill Certi�ed: Yes
Yellow Ribbon Participant: Yes
309.) Alumni Giving (Question 153 , 155):
Current Year: Last Year:
Alumni of Record: 231178 229221
Alumni Donors: 31022 31480
Alumni Giving Rate: 13.4 13.7
310.) Instructional Faculty (Questions 156 , 157):
Current Year: Last Year:
Full Time: 2028 2012
Part Time: 279 256
Total: 2307 2268
311.) Percentage of full-time equivalent faculty that is full-time (Questions 156 , 157):
Current Year: Last Year:
95.6 95.9

312.) Instructional Full-Time Faculty with Doctorate or Terminal Degree (Questions 156 , 157):
Current Year: Last Year:
Number: 1913 1905
Percent: 94.3 94.7
313.) Student to faculty ratio (Questions 158 , 159):
Current Year: Last Year:
17 18
314.) Full-time Instructional Faculty Compensation (Questions 160 , 161):
Current Year: Last Year:
# of Faculty: 1735 1741
Salary + Fringe Bene�ts: 252398595 245250043
Average Faculty Compensation: 138850 134214
The Average Faculty Compensation the Current Year represents a large change compared to the value entered for Last Year. Either update the Current Year value, contactyour Data Collector to update Last Year's value, or con�rm that this is correct. *
I con�rm that the Current and Last Year's Average faculty compensation are correct
315.) Part-time Instructional Faculty Compensation (Questions 162):
Current Year:
# of Part-time Faculty: 268
# of Graduate Teaching Assistants: 935
Average Part-time Faculty Compensation: 23857.2
Average Graduate Teaching Assistant Compensation 17250.7
316.) Total number of undergraduate class sections (Question 163):
Current Year: Last Year:
4271 4172
317.) Percent of undergraduate class sections (Question 163):
Current Year: Last Year:
2-9 7.6 9.7
10-19 38.2 35.8
20-29 24.6 26.3
30-39 11 10.5
40-49 7.6 6.6
50-99 5.9 6
100+ 5.2 4.9
Veri�cation
317.)

The data veri�cation is the �nal opportunity you have to make changes to your statistical data before it is published in U.S. News productsand/or distributed by U.S. News, or used in the Best Colleges ranking calculations. Please review this survey carefully, paying particularattention to any blank �elds on your survey. A blank �eld may indicate that data were not submitted or that the response submitted did notpass our system error checks.If all data are accurate and no changes are needed, please select the veri�cation check box, �ll out the identi�cation information and hit the‘Submit Survey’ button.If you have any questions about your veri�cation or this procedure, please contact your data collector.On behalf of U.S. News and its many readers, thank you for the time and effort you have given to supply and verify this Information.
I verify that, to the best of my knowledge, the information on this survey is accurate, and accurately describes my institution.
317.) Identi�cation:
Name:
Title:
Date:
Related Documents