STATEWIDE PERSONAL MOBILITY NEEDS FOR OKLAHOMA 2018‐2028 Prepared for: Oklahoma Transit Association Prepared by: Dilip Mistry, Ph.D. Del Peterson Jill Hough, Ph.D. Small Urban and Rural Transit Center Upper Great Plains Transportation Institute North Dakota State University, Fargo

Welcome message from author
This document is posted to help you gain knowledge. Please leave a comment to let me know what you think about it! Share it to your friends and learn new things together.
Transcript
STATEWIDE PERSONAL MOBILITY NEEDS FOR OKLAHOMA 2018‐2028
Prepared for:
Oklahoma Transit Association
Prepared by:
Dilip Mistry, Ph.D. Del Peterson Jill Hough, Ph.D.
Small Urban and Rural Transit Center Upper Great Plains Transportation Institute North Dakota State University, Fargo
Acknowledgements
This research was funded by the Oklahoma Transit Association. It was conducted by the Small
Urban and Rural Transit Center, a program of the Upper Great Plains Transportation Institute at
North Dakota State University.
The authors acknowledge the guidance provided by Ted J. Rieck, General Manager of Tulsa
Transit and Mark Nestlen, Executive Director of Oklahoma Transit Association. Thanks also to
the transit agencies across the state for providing input.
North Dakota State University does not discriminate on the basis of age, color, disability, gender
expression/identity, genetic information, marital status, national origin, public assistance
status, sex, sexual orientation, status as a U.S. veteran, race or religion. Direct inquiries to the
Vice President for Equity, Diversity and Global Outreach, 205 Old Main, (701) 231‐7708
iii
ABSTRACT
This study was conducted to provide the Oklahoma Transit Association and state policy makers
with information that will allow them to plan for mobility challenges and address coming
greater mobility needs stemming from population growth and changes in the state’s
demographics. In this study, we constructed a demographic profile of the state of Oklahoma,
developed a mobility needs index, described the existing levels of transit service within the
state, identified base levels of required transit service and gaps in existing service, and
developed recommendations for meeting mobility needs. We also estimated the level of
funding needed to maintain the current level of service and determined the level of funding
needed to expand the level of service to meet projected needs. Transit providers in Oklahoma
were surveyed to gather information about the existing services, how well the services are
meeting current needs, and the issues and challenges facing the transit providers. Target levels
of transit service were identified, and the funding needed to reach the targets, including funds
for the increased operating expenses and vehicle purchases were estimated. Projections were
also made based on the expected population growth. Recommendations were made regarding
service expansion, staffing, and additional vehicles.
iv
EXECUTIVE SUMMARY
This study focuses on local and regional passenger transportation in the state of Oklahoma. It
was conducted to provide the Oklahoma Transit Association and state policy makers with
information about the changing demographics and mobility needs of the state. Further, the
study identifies gaps that are likely to exist soon because of population growth and changing
demographics. Finally, the study addresses vehicles that will be needed to meet the current
shortcomings and those that will result from projected demographic changes.
The results may be helpful in determining programmatic and funding needs for personal
mobility and to assist in determining funding priorities for state funds and federal funds
controlled by the state. In addition, local and state agencies may use the data that has been
collected and analyzed to plan for future service needs.
Oklahoma has 33 transit agencies that offer a range of services, broadly categorized into fixed‐
route or demand‐response service. Transit agency service areas, (the geographic areas served
by individual agencies) also vary, but most are defined along political boundaries and serve an
entire city or county, a portion of a county, or multiple counties. In 2017, there were 5 urban
transit systems, 19 rural transit systems, and 10 tribal transit systems. In general, urban transit
systems tend to operate scheduled, fixed‐route services, while rural and tribal areas are more
likely to operate demand‐response, or dial‐a‐ride type service. In addition, 4 counties in
Oklahoma have no public transportation service at all. Most of these are in North Oklahoma
along the Kansas border and is located on the Colorado border.
v
Oklahoma transit systems operated 1,474 active fleet vehicles in 2017 which is 138 more
vehicles than in 2016. The Oklahoma rural transit system significantly increased the number of
ADA compliant fleet vehicles for demand response (DR) operations in 2017 which is important
for transporting individuals with disabilities. The urban and tribal systems also increased their
ADA fleet vehicles for demand‐response operations from the previous year. However, these
systems didn’t increase their ADA fleet vehicles for fixed‐route transit services. The average age
of buses operated by Oklahoma transit systems is approximately 10 years. This is critical
information because, according to Federal Transit Administration (FTA), the minimum service
life of transit buses is 12 years (Laver, et al. 2007). Therefore, many of the in the Oklahoma
transit fleet vehicles will need to be replaced soon.
Demographics Projected population growth and demographic trends impact the needs for mobility services
across the state. The estimated statewide population climbed to 3,930,864 in 2017, a 4.8%
increase from the 2010 census. Previously, the population grew 8.7% from 2000 to 2010. The
population is projected to increase to 4,322,825 by 2030 which is a 15.23% increase from the
2010 census figures. The greatest population growth occurred in the central part of the state
from 2010 to 2017. Significant population growth is expected mostly in Logan, Oklahoma,
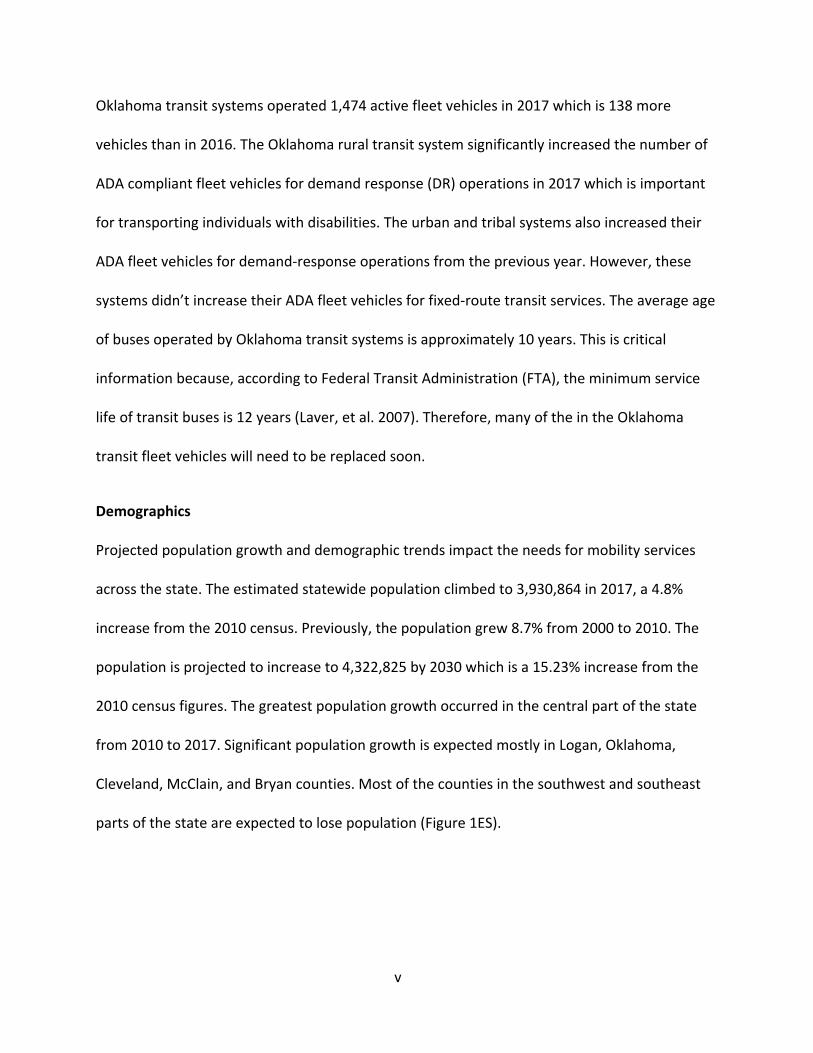
Cleveland, McClain, and Bryan counties. Most of the counties in the southwest and southeast
parts of the state are expected to lose population (Figure 1ES).
vi
Figure 1ES. Projected Population Growth from 2017 to 2030
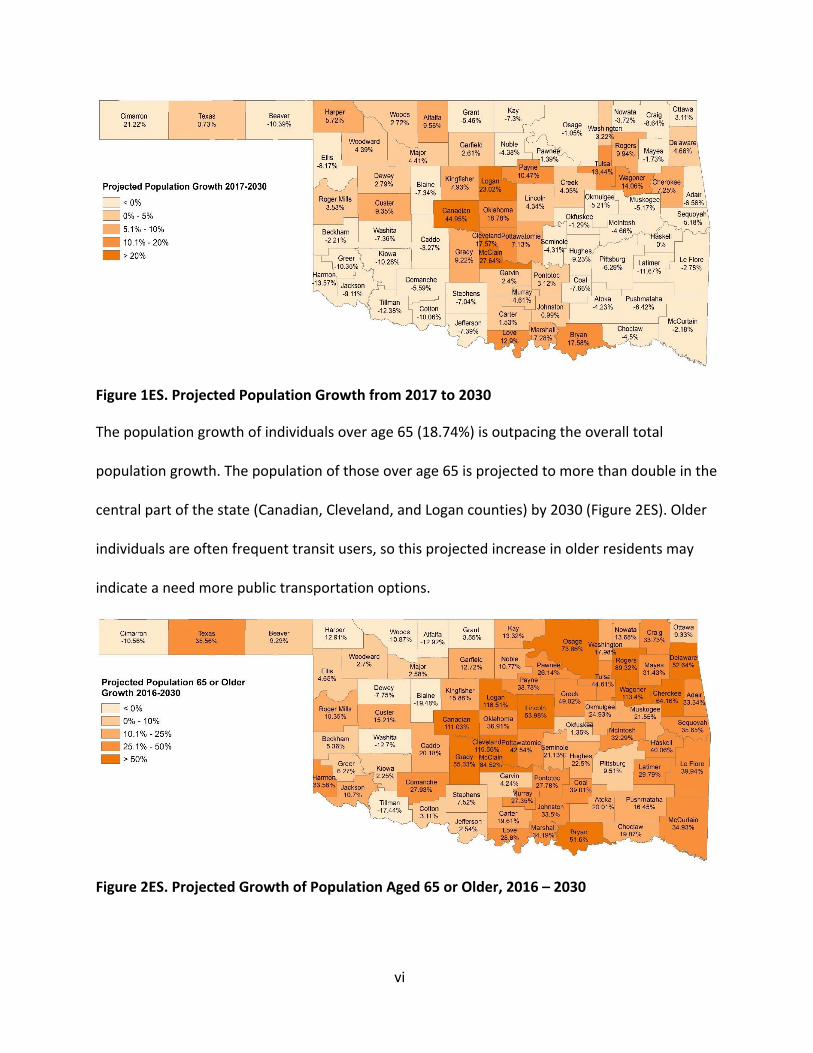
The population growth of individuals over age 65 (18.74%) is outpacing the overall total
population growth. The population of those over age 65 is projected to more than double in the
central part of the state (Canadian, Cleveland, and Logan counties) by 2030 (Figure 2ES). Older
individuals are often frequent transit users, so this projected increase in older residents may
indicate a need more public transportation options.
Figure 2ES. Projected Growth of Population Aged 65 or Older, 2016 – 2030
vii
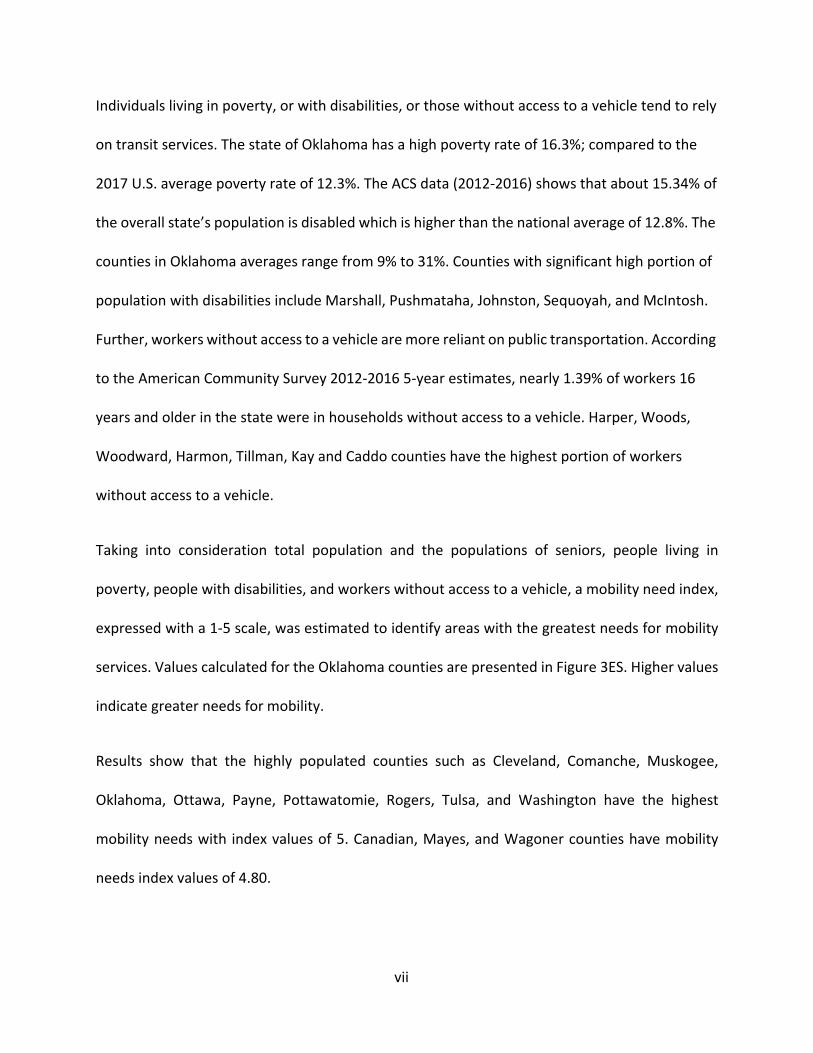
Individuals living in poverty, or with disabilities, or those without access to a vehicle tend to rely
on transit services. The state of Oklahoma has a high poverty rate of 16.3%; compared to the
2017 U.S. average poverty rate of 12.3%. The ACS data (2012‐2016) shows that about 15.34% of
the overall state’s population is disabled which is higher than the national average of 12.8%. The
counties in Oklahoma averages range from 9% to 31%. Counties with significant high portion of
population with disabilities include Marshall, Pushmataha, Johnston, Sequoyah, and McIntosh.
Further, workers without access to a vehicle are more reliant on public transportation. According
to the American Community Survey 2012‐2016 5‐year estimates, nearly 1.39% of workers 16
years and older in the state were in households without access to a vehicle. Harper, Woods,
Woodward, Harmon, Tillman, Kay and Caddo counties have the highest portion of workers
without access to a vehicle.
Taking into consideration total population and the populations of seniors, people living in
poverty, people with disabilities, and workers without access to a vehicle, a mobility need index,
expressed with a 1‐5 scale, was estimated to identify areas with the greatest needs for mobility
services. Values calculated for the Oklahoma counties are presented in Figure 3ES. Higher values
indicate greater needs for mobility.
Results show that the highly populated counties such as Cleveland, Comanche, Muskogee,
Oklahoma, Ottawa, Payne, Pottawatomie, Rogers, Tulsa, and Washington have the highest
mobility needs with index values of 5. Canadian, Mayes, and Wagoner counties have mobility
needs index values of 4.80.
viii
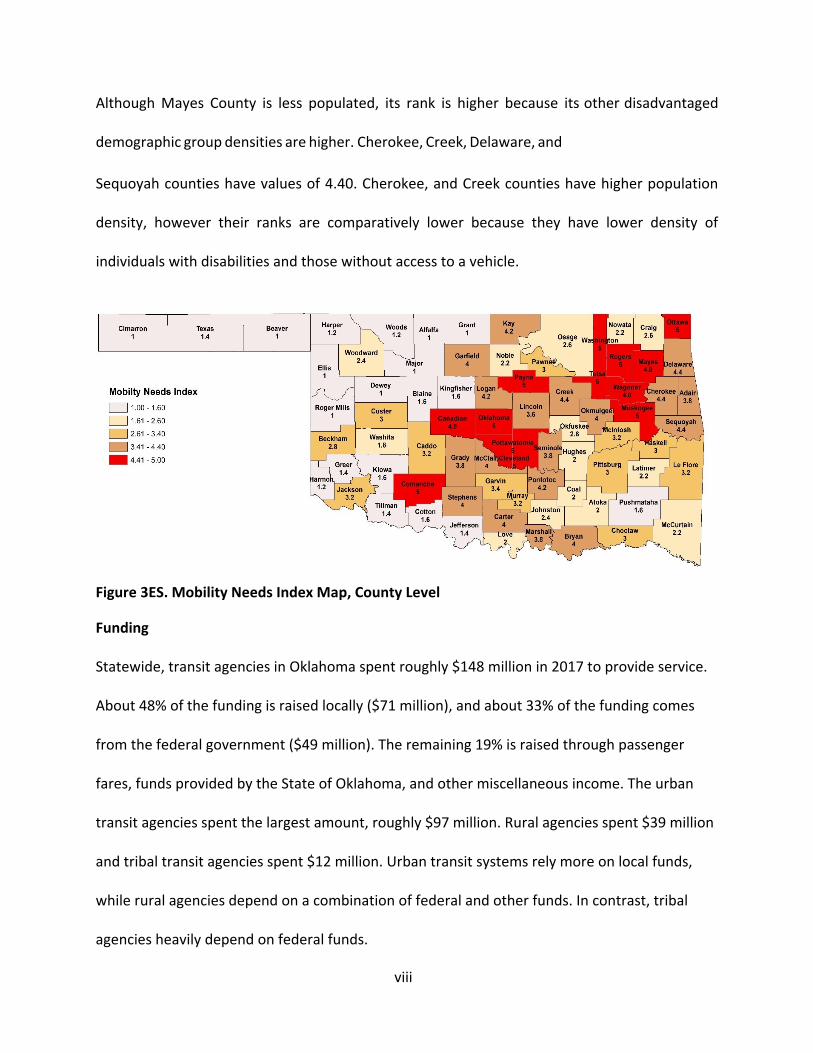
Although Mayes County is less populated, its rank is higher because its other disadvantaged
demographic group densities are higher. Cherokee, Creek, Delaware, and
Sequoyah counties have values of 4.40. Cherokee, and Creek counties have higher population
density, however their ranks are comparatively lower because they have lower density of
individuals with disabilities and those without access to a vehicle.
Figure 3ES. Mobility Needs Index Map, County Level
Funding
Statewide, transit agencies in Oklahoma spent roughly $148 million in 2017 to provide service.
About 48% of the funding is raised locally ($71 million), and about 33% of the funding comes
from the federal government ($49 million). The remaining 19% is raised through passenger
fares, funds provided by the State of Oklahoma, and other miscellaneous income. The urban
transit agencies spent the largest amount, roughly $97 million. Rural agencies spent $39 million
and tribal transit agencies spent $12 million. Urban transit systems rely more on local funds,
while rural agencies depend on a combination of federal and other funds. In contrast, tribal
agencies heavily depend on federal funds.
ix
Transit Agency Needs
While the much of the National Transit Data was being analyzed, surveys were sent to each of
the transit agencies to gather additional information about existing transit services. Participants
were asked if they thought overall transit needs were being met, about trip purposes, the need
for the agency to provide additional trips, adequacy of facilities, administrative and vehicle
storage, the need for vehicles, and if they believed the overall needs were being met.
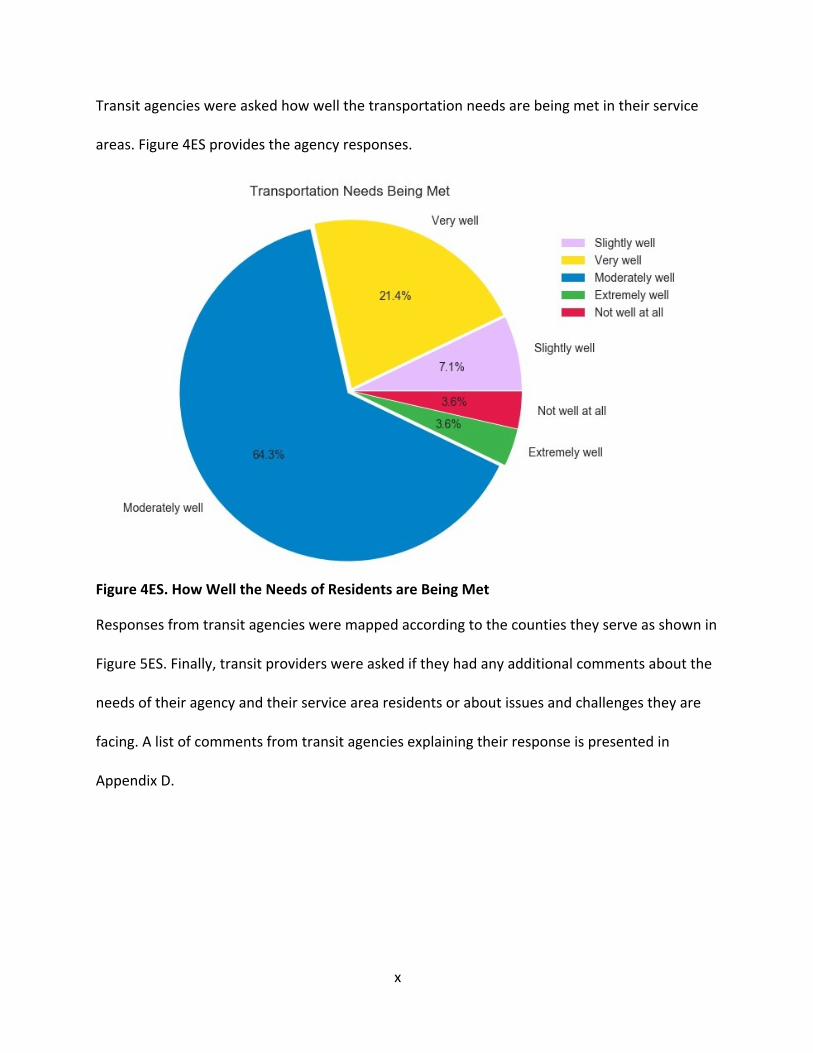
Transit agencies were asked how well the overall transportation needs of their service area
residents were being met. Most transit agencies said the needs of residents in their service
areas needs are being met moderately well (Figures 4ES and 5ES). Washita Valley Transit
agency indicated that the needs of their service area residents are not being met at all.
Southern Oklahoma Rural Transit System and Tulsa Transit indicated that the needs of their
clients are being met slightly well. Some respondents indicated a need for improved facilities;
however, estimates for improving the facilities is beyond the scope of this study.
Transit agencies across the state provide trips for various purposes. The largest shares are
medical trips, followed by dialysis trips. About 64% of the responding transit agencies had a
major need for more trips for medical purposes, 54% for dialysis, and 46% for both employment
and veteran transportation services trips. The survey results also indicated that about 54% of
the responding agencies had minor needs for more service for education/job training trips and
46% needed more service for social/recreation trips. With the changing demographics, it is
anticipated that more medical trips will continue to be needed in the future.
x
Transit agencies were asked how well the transportation needs are being met in their service
areas. Figure 4ES provides the agency responses.
Figure 4ES. How Well the Needs of Residents are Being Met
Responses from transit agencies were mapped according to the counties they serve as shown in
Figure 5ES. Finally, transit providers were asked if they had any additional comments about the
needs of their agency and their service area residents or about issues and challenges they are
facing. A list of comments from transit agencies explaining their response is presented in
Appendix D.
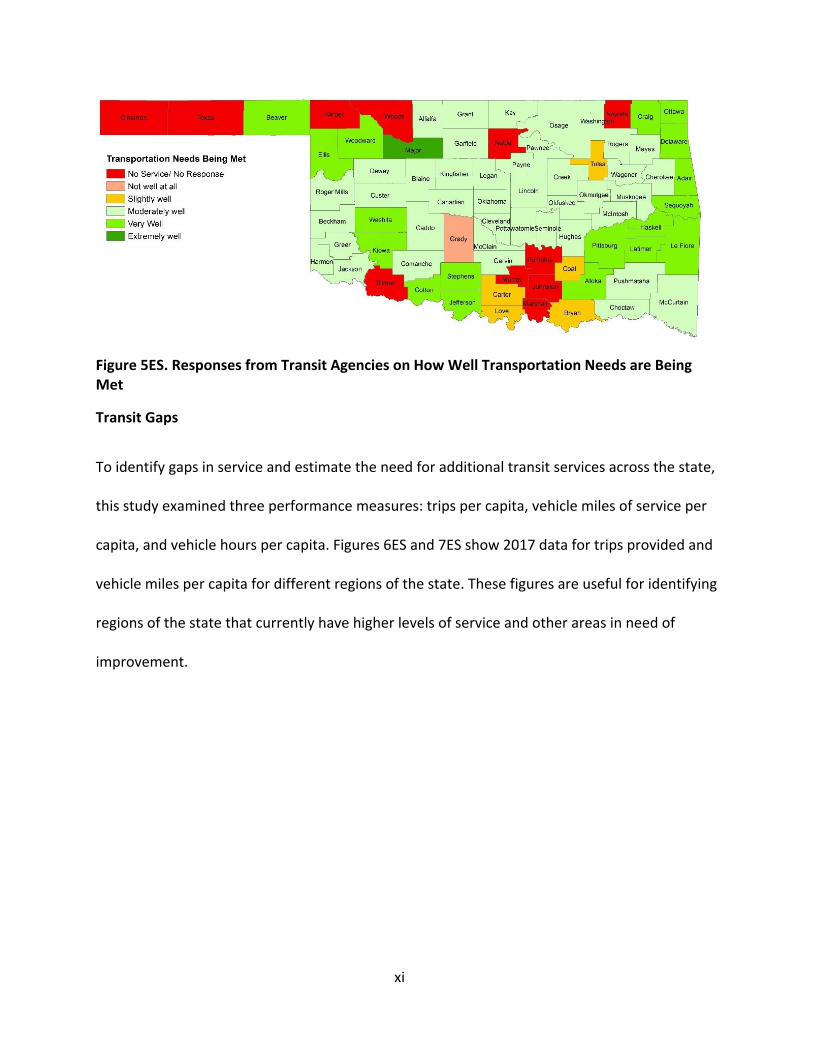
xi
Figure 5ES. Responses from Transit Agencies on How Well Transportation Needs are Being Met
Transit Gaps
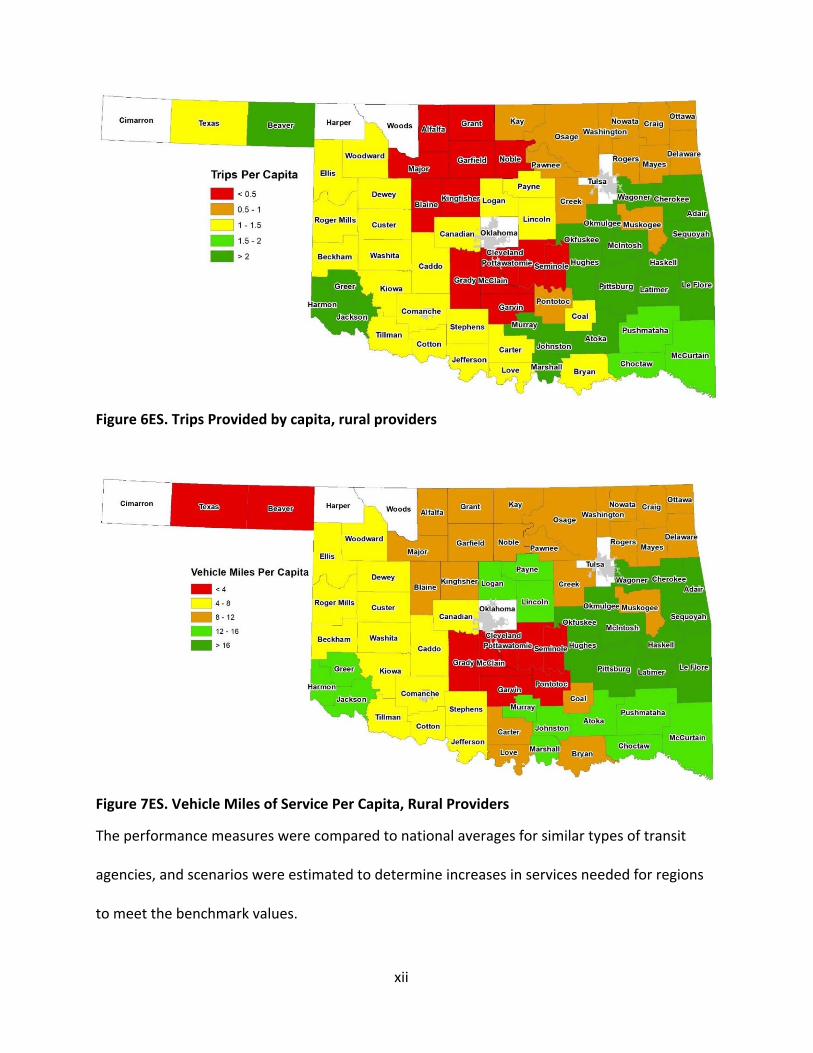
To identify gaps in service and estimate the need for additional transit services across the state,
this study examined three performance measures: trips per capita, vehicle miles of service per
capita, and vehicle hours per capita. Figures 6ES and 7ES show 2017 data for trips provided and
vehicle miles per capita for different regions of the state. These figures are useful for identifying
regions of the state that currently have higher levels of service and other areas in need of
improvement.
xii
Figure 6ES. Trips Provided by capita, rural providers
Figure 7ES. Vehicle Miles of Service Per Capita, Rural Providers
The performance measures were compared to national averages for similar types of transit
agencies, and scenarios were estimated to determine increases in services needed for regions
to meet the benchmark values.
xiii
These scenarios also considered the impact of population growth statewide. Three scenarios
were analyzed to determine needed increases in service and the funding required to provide
that service. Scenario 1 requires that each region meets at least one of the three benchmark
values. Scenario 2 adds requirements that transit services increase at a rate equal to or greater
than population growth. Scenario 3 includes the requirements of Scenario 2 and requires that
each region must meet at least two of the three benchmarks.
Scenario 2 is the least costly scenario that meets the most basic transit needs.
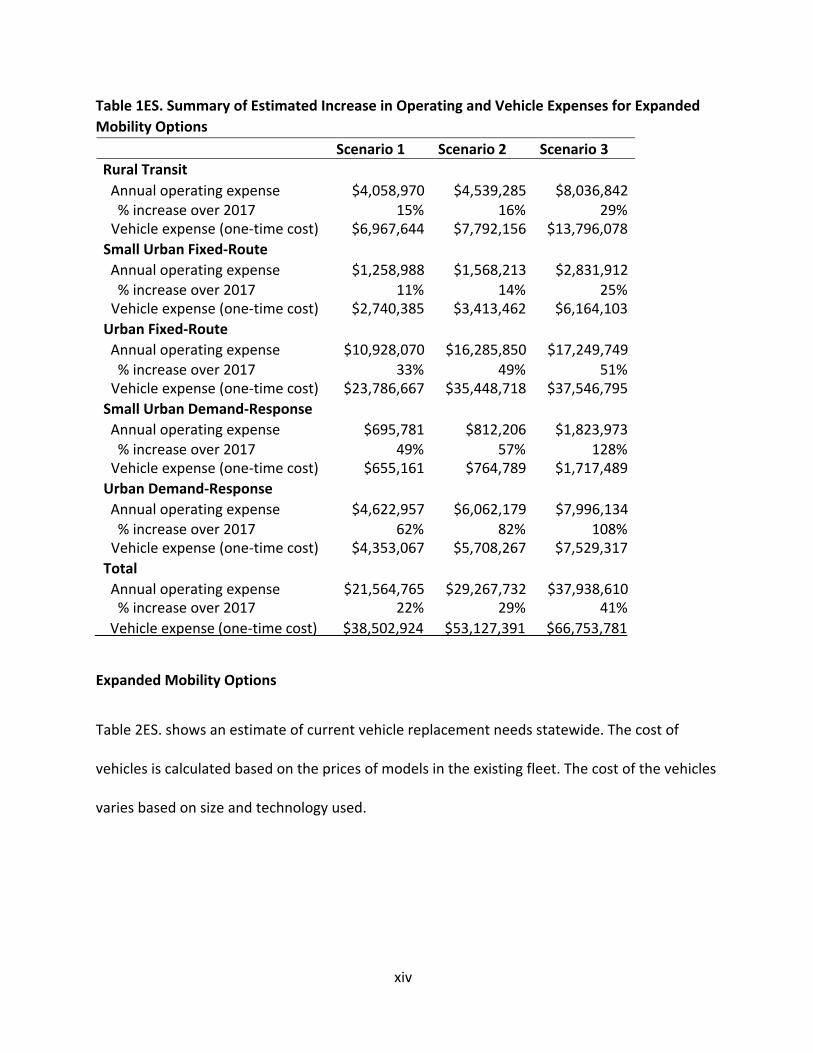
Table 1ES provides a summary of the increased operating and new‐vehicle expenses estimated
in each scenario. These estimates are total increased expenses without consideration of
funding source. The estimated vehicle expenses are one‐time costs needed to increase fleet
sizes across the state to allow for improved service levels. However, these vehicles will need to
be replaced periodically, increasing annual capital expenditures. In addition, there currently are
a significant number of vehicles in the state that have surpassed their useful life and are in need
of replacement.
xiv
Table 1ES. Summary of Estimated Increase in Operating and Vehicle Expenses for Expanded
Mobility Options
Scenario 1 Scenario 2 Scenario 3
Rural Transit
Annual operating expense $4,058,970 $4,539,285 $8,036,842 % increase over 2017 15% 16% 29% Vehicle expense (one‐time cost) $6,967,644 $7,792,156 $13,796,078
Small Urban Fixed‐Route Annual operating expense $1,258,988 $1,568,213 $2,831,912 % increase over 2017 11% 14% 25% Vehicle expense (one‐time cost) $2,740,385 $3,413,462 $6,164,103
Urban Fixed‐Route Annual operating expense $10,928,070 $16,285,850 $17,249,749 % increase over 2017 33% 49% 51% Vehicle expense (one‐time cost) $23,786,667 $35,448,718 $37,546,795
Small Urban Demand‐Response Annual operating expense $695,781 $812,206 $1,823,973 % increase over 2017 49% 57% 128% Vehicle expense (one‐time cost) $655,161 $764,789 $1,717,489
Urban Demand‐Response Annual operating expense $4,622,957 $6,062,179 $7,996,134 % increase over 2017 62% 82% 108% Vehicle expense (one‐time cost) $4,353,067 $5,708,267 $7,529,317
Total Annual operating expense $21,564,765 $29,267,732 $37,938,610 % increase over 2017 22% 29% 41%
Vehicle expense (one‐time cost) $38,502,924 $53,127,391 $66,753,781
Expanded Mobility Options
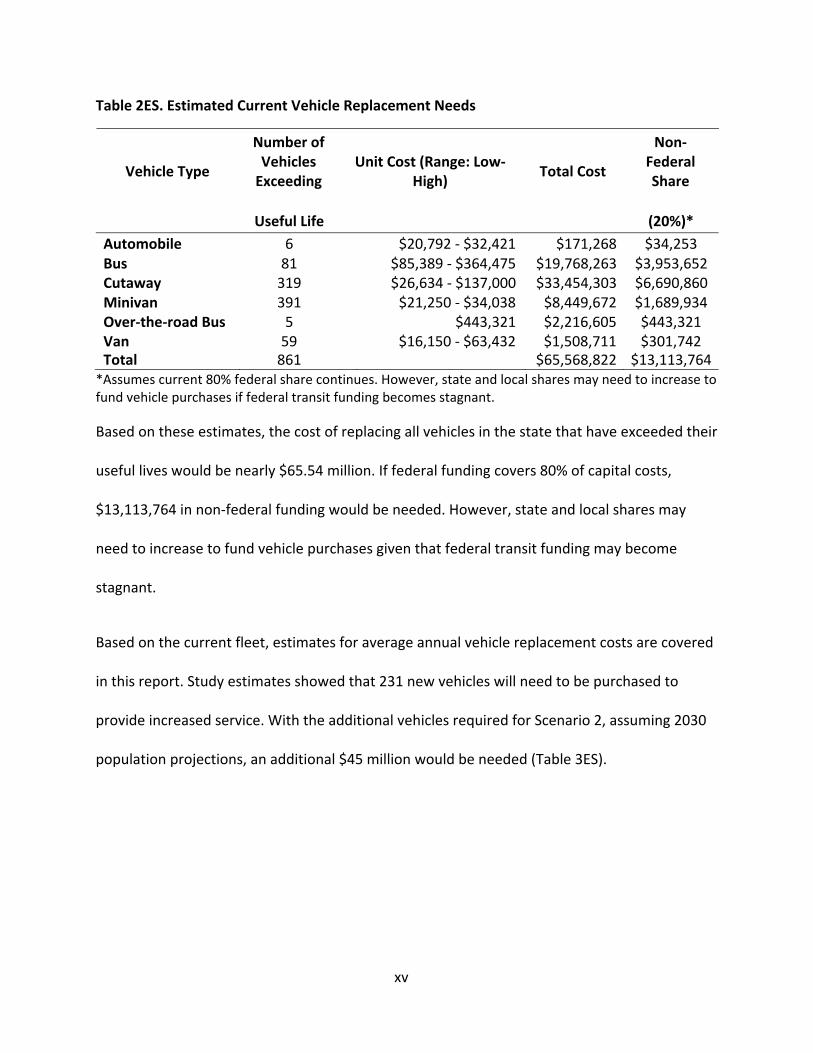
Table 2ES. shows an estimate of current vehicle replacement needs statewide. The cost of
vehicles is calculated based on the prices of models in the existing fleet. The cost of the vehicles
varies based on size and technology used.
xv
Table 2ES. Estimated Current Vehicle Replacement Needs
Vehicle Type
Number of Vehicles Exceeding
Unit Cost (Range: Low‐
High)
Total Cost
Non‐ Federal Share
Useful Life (20%)*
Automobile 6 $20,792 ‐ $32,421 $171,268 $34,253 Bus 81 $85,389 ‐ $364,475 $19,768,263 $3,953,652 Cutaway 319 $26,634 ‐ $137,000 $33,454,303 $6,690,860 Minivan 391 $21,250 ‐ $34,038 $8,449,672 $1,689,934 Over‐the‐road Bus 5 $443,321 $2,216,605 $443,321 Van 59 $16,150 ‐ $63,432 $1,508,711 $301,742 Total 861 $65,568,822 $13,113,764
*Assumes current 80% federal share continues. However, state and local shares may need to increase to fund vehicle purchases if federal transit funding becomes stagnant.
Based on these estimates, the cost of replacing all vehicles in the state that have exceeded their
useful lives would be nearly $65.54 million. If federal funding covers 80% of capital costs,
$13,113,764 in non‐federal funding would be needed. However, state and local shares may
need to increase to fund vehicle purchases given that federal transit funding may become
stagnant.
Based on the current fleet, estimates for average annual vehicle replacement costs are covered
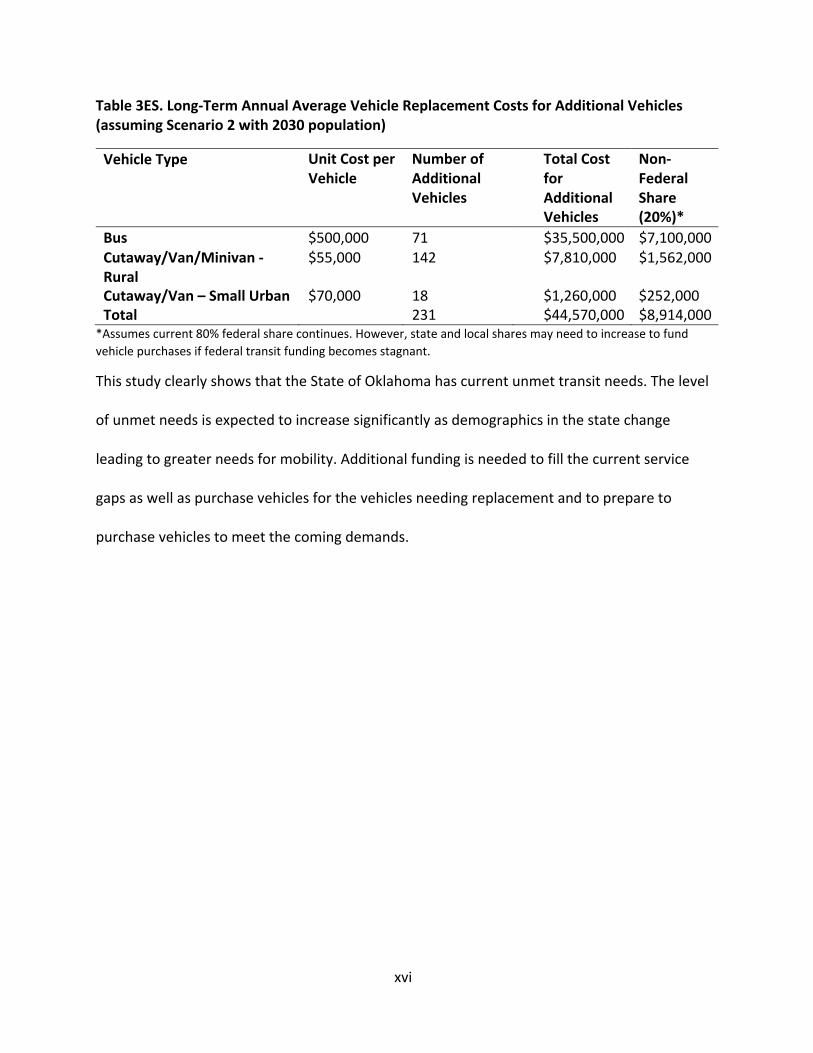
in this report. Study estimates showed that 231 new vehicles will need to be purchased to
provide increased service. With the additional vehicles required for Scenario 2, assuming 2030
population projections, an additional $45 million would be needed (Table 3ES).
xvi
Table 3ES. Long‐Term Annual Average Vehicle Replacement Costs for Additional Vehicles (assuming Scenario 2 with 2030 population)
Vehicle Type Unit Cost per Vehicle
Number of Additional Vehicles
Total Cost for Additional
Non‐ Federal Share
Vehicles (20%)*
Bus $500,000 71 $35,500,000 $7,100,000 Cutaway/Van/Minivan ‐ $55,000 142 $7,810,000 $1,562,000 Rural Cutaway/Van – Small Urban
$70,000
18
$1,260,000
$252,000 Total 231 $44,570,000 $8,914,000
*Assumes current 80% federal share continues. However, state and local shares may need to increase to fund
vehicle purchases if federal transit funding becomes stagnant.
This study clearly shows that the State of Oklahoma has current unmet transit needs. The level
of unmet needs is expected to increase significantly as demographics in the state change
leading to greater needs for mobility. Additional funding is needed to fill the current service
gaps as well as purchase vehicles for the vehicles needing replacement and to prepare to
purchase vehicles to meet the coming demands.
xvii
TABLE OF CONTENTS
Chapter 1 INTRODUCTION .............................................................................................................. 1
Chapter 2 POPULATION GROWTH AND DEMOGRAPHIC PROFILES ................................................ 1
2.1 County Level Population Estimates ....................................................................................... 1
2.2 Population Growth Estimates ............................................................................................... 2
2.3 Projected Population Growth Estimates ............................................................................... 3
2.4 Key Demographic Groups ...................................................................................................... 5
2.5 Population Aged 65 or Older ................................................................................................. 6
2.6 Population below the Poverty Level ..................................................................................... 9
2.7 Population with a Disability ................................................................................................. 11
2.8 Workers without Access to a Vehicle .................................................................................. 13
2.9 Population Densities by Demographic Group ..................................................................... 15
2.10 City‐Level Population and Demographic Data .................................................................. 17
Chapter 3 MOBILITY NEEDS INDEX ............................................................................................... 21
Chapter 4 SURVEY METHODOLOGY AND ADMINISTRATION ....................................................... 24
Chapter 5 EXISTING LEVELS OF TRANSIT SERVICE ........................................................................ 27
5.1 Data from the National Transit Database ........................................................................... 27
5.2 Oklahoma’s Transit Network ............................................................................................... 44
5.3 Transit Operations in Oklahoma ......................................................................................... 45
5.4 Sources of Funding .............................................................................................................. 50
5.6 Urban Transit System and Funding ..................................................................................... 52
5.7 Rural Transit System and Funding ....................................................................................... 53
5.8 Tribal Transit System and Funding ...................................................................................... 56
5.9 Sources of Transit Funds ‐ Federal Funding ........................................................................ 58
5.10 Transit Ridership in Oklahoma .......................................................................................... 60
5.11 Transit Service Hours ......................................................................................................... 62
5.12 Transit Revenue Vehicle Miles .......................................................................................... 63
5.13 Survey of Transit Providers ............................................................................................... 65
5.13.1 Types of Service Provided ........................................................................................... 65
5.13.2 Span of Service ........................................................................................................... 68
5.13.3 ADA Complementary Paratransit ............................................................................... 70
xviii
5.13.4 Advance Reservation Time ......................................................................................... 73
5.13.5 Fares ........................................................................................................................... 75
5.13.6 Rider Characteristics ................................................................................................... 76
5.13.7 Trip Purposes .............................................................................................................. 77
Chapter 6 TRANSIT NEEDS ............................................................................................................ 79
6.1 Transit Agency Needs .......................................................................................................... 79
6.1.1 Facilities ........................................................................................................................ 79
6.1.2 Capacity to Serve Demand ........................................................................................... 85
6.1.3 Need for New Services.................................................................................................. 88
6.1.4 Staffing Needs ............................................................................................................... 89
6.1.5 Overall Service .............................................................................................................. 93
Chapter 7 FUNDING NEEDS TO REDUCE CURRENT SERVICE GAPS. .............................................. 95
7.1 Current Service Levels ......................................................................................................... 95
7.2 Estimated Increases in Services to Reduce Gaps .............................................................. 102
7.3 Estimating Expenses to Achieve Expanded Service Levels ................................................ 107
7.4 Funding Needs for Vehicle Replacement .......................................................................... 111
Chapter 8 CONCLUSIONS AND RECOMMENDATIONS ................................................................ 126
8.1 Funding Increases Necessary for Expanding Services ....................................................... 126
8.2 Staffing Needs ................................................................................................................... 128
8.3 Vehicle Needs .................................................................................................................... 129
8.4 Conclusions ........................................................................................................................ 129
References .................................................................................................................................. 130
APENDIX A: OKLAHOMA RURAL COMMUNITY TRANSIT SYSTEMS ............................................. 132
APENDIX B: TRANSIT AGENCY INFORMATION ............................................................................ 134
APENDIX C: OKLAHOMA TRANSPORTATION ASSET INFORMATION ........................................... 180
APPENDIX D: COMMENTS FROM TRANSIT AGENCIES ................................................................ 188
APPENDIX E: SURVEY FOR NEEDS ASSESSMENT STUDY FOR OKLAHOMA TRANSIT AGENCIES . 196
xix
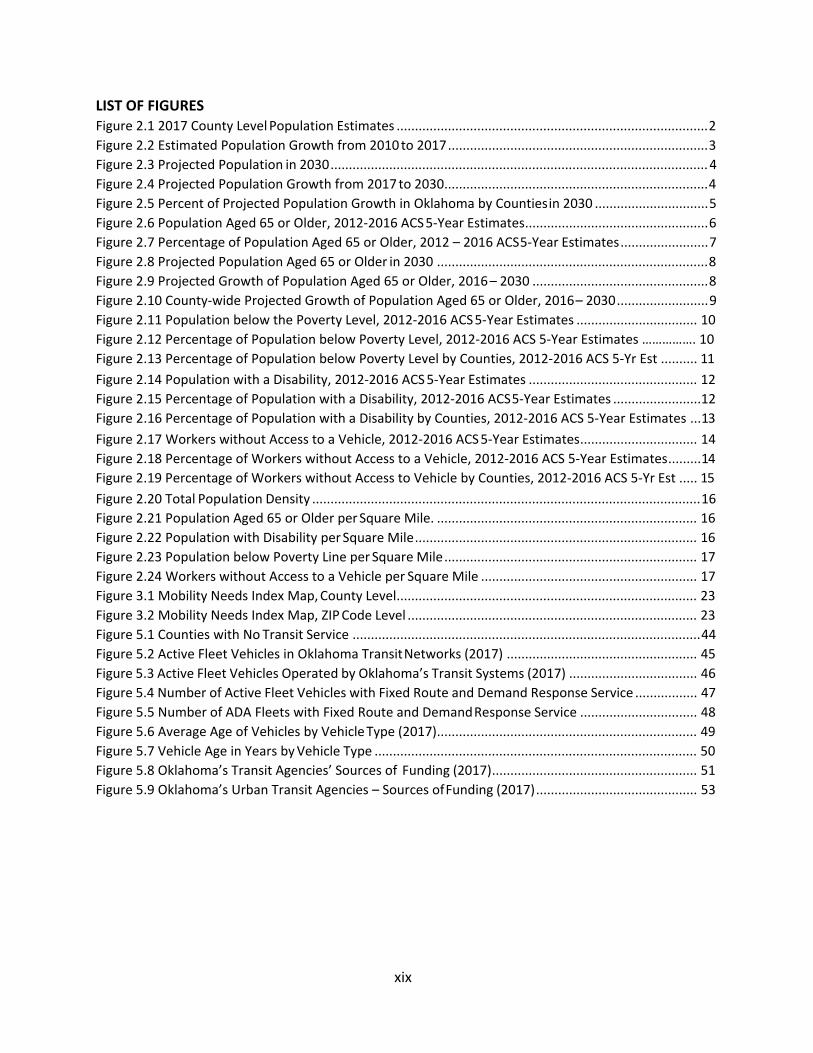
LIST OF FIGURES Figure 2.1 2017 County Level Population Estimates ..................................................................................... 2
Figure 2.2 Estimated Population Growth from 2010 to 2017 ....................................................................... 3
Figure 2.3 Projected Population in 2030 ....................................................................................................... 4
Figure 2.4 Projected Population Growth from 2017 to 2030 ........................................................................ 4
Figure 2.5 Percent of Projected Population Growth in Oklahoma by Counties in 2030 ............................... 5
Figure 2.6 Population Aged 65 or Older, 2012‐2016 ACS 5‐Year Estimates .................................................. 6
Figure 2.7 Percentage of Population Aged 65 or Older, 2012 – 2016 ACS 5‐Year Estimates ........................ 7
Figure 2.8 Projected Population Aged 65 or Older in 2030 .......................................................................... 8
Figure 2.9 Projected Growth of Population Aged 65 or Older, 2016 – 2030 ................................................ 8
Figure 2.10 County‐wide Projected Growth of Population Aged 65 or Older, 2016 – 2030 ......................... 9
Figure 2.11 Population below the Poverty Level, 2012‐2016 ACS 5‐Year Estimates ................................. 10
Figure 2.12 Percentage of Population below Poverty Level, 2012‐2016 ACS 5‐Year Estimates ……………. 10
Figure 2.13 Percentage of Population below Poverty Level by Counties, 2012‐2016 ACS 5‐Yr Est .......... 11
Figure 2.14 Population with a Disability, 2012‐2016 ACS 5‐Year Estimates .............................................. 12
Figure 2.15 Percentage of Population with a Disability, 2012‐2016 ACS 5‐Year Estimates ........................12
Figure 2.16 Percentage of Population with a Disability by Counties, 2012‐2016 ACS 5‐Year Estimates ... 13
Figure 2.17 Workers without Access to a Vehicle, 2012‐2016 ACS 5‐Year Estimates ................................ 14
Figure 2.18 Percentage of Workers without Access to a Vehicle, 2012‐2016 ACS 5‐Year Estimates ......... 14
Figure 2.19 Percentage of Workers without Access to Vehicle by Counties, 2012‐2016 ACS 5‐Yr Est ..... 15
Figure 2.20 Total Population Density .......................................................................................................... 16
Figure 2.21 Population Aged 65 or Older per Square Mile. ....................................................................... 16
Figure 2.22 Population with Disability per Square Mile ............................................................................. 16
Figure 2.23 Population below Poverty Line per Square Mile ..................................................................... 17
Figure 2.24 Workers without Access to a Vehicle per Square Mile ........................................................... 17
Figure 3.1 Mobility Needs Index Map, County Level .................................................................................. 23
Figure 3.2 Mobility Needs Index Map, ZIP Code Level ............................................................................... 23
Figure 5.1 Counties with No Transit Service ............................................................................................... 44
Figure 5.2 Active Fleet Vehicles in Oklahoma Transit Networks (2017) .................................................... 45
Figure 5.3 Active Fleet Vehicles Operated by Oklahoma’s Transit Systems (2017) ................................... 46
Figure 5.4 Number of Active Fleet Vehicles with Fixed Route and Demand Response Service ................. 47
Figure 5.5 Number of ADA Fleets with Fixed Route and Demand Response Service ................................ 48
Figure 5.6 Average Age of Vehicles by Vehicle Type (2017) ....................................................................... 49
Figure 5.7 Vehicle Age in Years by Vehicle Type ........................................................................................ 50
Figure 5.8 Oklahoma’s Transit Agencies’ Sources of Funding (2017) ........................................................ 51
Figure 5.9 Oklahoma’s Urban Transit Agencies – Sources of Funding (2017) ............................................ 53
xx
Figure 5.10 Oklahoma’s Rural Transit Agencies – Sources of Funding (2017) ........................................... 55
Figure 5.11 Oklahoma’s Tribal Transit Agencies – Sources of Funding (2017) ........................................... 57
Figure 5.12 FTA Funding Allocation to Oklahoma, 1998‐2018 ................................................................... 58
Figure 5.13 FTA Funding Allocation to Oklahoma (All Programs), 1998‐2018 ........................................... 59
Figure 5.14 FTA Funding Allocated to Urban Transit Systems in Oklahoma, 1998‐2018 ............................ 59
Figure 5.15 FTA Funding Allocated to Rural Transit Systems in Oklahoma, 1998‐2018 .............................. 60
Figure 5.16 Total Transit Riders in Oklahoma, 2010‐2017 ......................................................................... 61
Figure 5.17 Agency‐wide Transit Riders in Oklahoma, 2010‐2017 ............................................................ 61
Figure 5.18 Total Hours of Transit Service Operated in Oklahoma, 2010‐2017 ......................................... 62
Figure 5.19 Agency‐wide Hours of Transit Service Operated in Oklahoma, 2010‐2017 ............................ 63
Figure 5.20 Total Revenue Vehicle Miles of Transit Service in Oklahoma, 2010‐2017 ............................... 64
Figure 5.21 Agency‐wide Revenue Vehicle Miles of Transit Service in Oklahoma, 2010‐2017 ................... 64
Figure 5.22 Type of Transportation Services Provided by the Transit Agencies ........................................ 66
Figure 5.23 Type of Service Provided by the Transit Agencies ................................................................... 67
Figure 5.24 Areas with Transit Service Days per Week .............................................................................. 68
Figure 5.25 Percentage of Transit Agencies Serve Areas with Service Days per Week ...............................69
Figure 5.26 Areas with Service Hours per Service Day ............................................................................... 69
Figure 5.27 Percentage of Transit Agencies Serve Areas with Service Hours per Service Day ...................70
Figure 5.28 ADA Paratransit Service Area by the Transit Agencies ............................................................ 72
Figure 5.29 Minimum Advance Reserve Time for Demand‐Response or Comp. Paratransit .................... 75
Figure 5.30 Transit Trip Purposes Reported by Transit Agencies ............................................................... 78
Figure 6.1 Adequacy of Facilities for Needs (Passenger) ........................................................................... 80
Figure 6.2 Adequacy of Facilities for Needs (Administrative) .................................................................... 81
Figure 6.3 Adequacy of Facilities for Needs (Vehicle Storage) ................................................................... 82
Figure 6.4 Adequacy of Facilities for Needs (Maintenance)....................................................................... 83
Figure 6.5 Percentage of Demand‐Response Transit Trip Requests Turned Down ‐Lack of Capacity ........ 87
Figure 6.6 Types of Services Needed, Responses from Transit Agencies ................................................... 88
Figure 6.7 Need for More Service for Specific Types of Trips, Responses from Transit Agencies 89 Figure
6.8 Staffing Capabilities of Transit Agencies .............................................................................................. 90
Figure 6.9 How Well the Needs of Residents are Being Met ..................................................................... 93
Figure 6.10 Responses from Transit Agencies on How Well Transportation Needs are Being Met
..................................................................................................................................... 94
Figure 7.1 Trips Per Capita, Rural Providers ............................................................................................. 101
Figure 7.2 Vehicle Miles of Service Per Capita, Rural Providers ............................................................... 101
Figure 7.3 Vehicle Hours of Service Per Capita, Rural Providers .............................................................. 102
Figure 7.4 Predicted Retired Year of Revenue Vehicles in Oklahoma State. ........................................... 113
Figure 7.5 Predicted Retired Year of Buses in Oklahoma State ............................................................... 114
Figure 7.6 Predicted Retired Year for Cutaway Vehicles in Oklahoma State ........................................... 114
Figure 7.7 Predicted Retired Year for Minivans in Oklahoma State ......................................................... 115
xxi
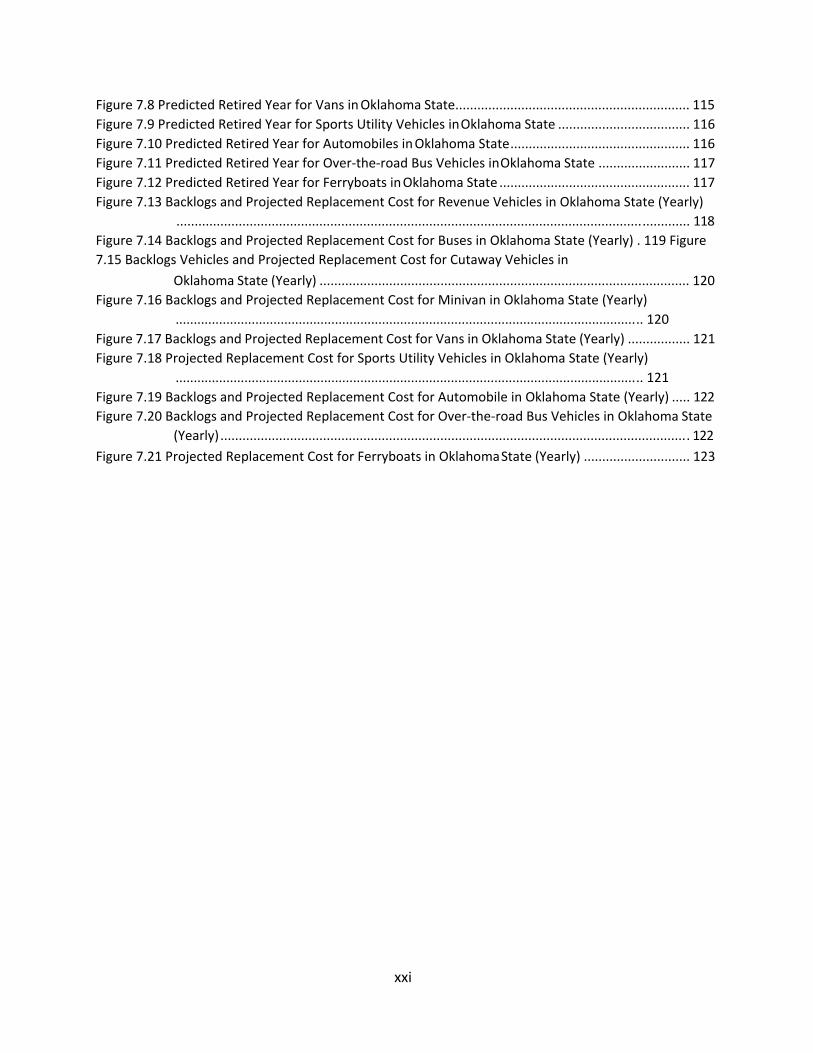
Figure 7.8 Predicted Retired Year for Vans in Oklahoma State................................................................ 115
Figure 7.9 Predicted Retired Year for Sports Utility Vehicles in Oklahoma State .................................... 116
Figure 7.10 Predicted Retired Year for Automobiles in Oklahoma State ................................................. 116
Figure 7.11 Predicted Retired Year for Over‐the‐road Bus Vehicles in Oklahoma State ......................... 117
Figure 7.12 Predicted Retired Year for Ferryboats in Oklahoma State .................................................... 117
Figure 7.13 Backlogs and Projected Replacement Cost for Revenue Vehicles in Oklahoma State (Yearly)
............................................................................................................................................ 118
Figure 7.14 Backlogs and Projected Replacement Cost for Buses in Oklahoma State (Yearly) . 119 Figure
7.15 Backlogs Vehicles and Projected Replacement Cost for Cutaway Vehicles in
Oklahoma State (Yearly) ..................................................................................................... 120
Figure 7.16 Backlogs and Projected Replacement Cost for Minivan in Oklahoma State (Yearly)
................................................................................................................................. 120
Figure 7.17 Backlogs and Projected Replacement Cost for Vans in Oklahoma State (Yearly) ................. 121
Figure 7.18 Projected Replacement Cost for Sports Utility Vehicles in Oklahoma State (Yearly)
................................................................................................................................. 121
Figure 7.19 Backlogs and Projected Replacement Cost for Automobile in Oklahoma State (Yearly) ..... 122
Figure 7.20 Backlogs and Projected Replacement Cost for Over‐the‐road Bus Vehicles in Oklahoma State
(Yearly) ................................................................................................................................ 122
Figure 7.21 Projected Replacement Cost for Ferryboats in Oklahoma State (Yearly) ............................. 123
xxii
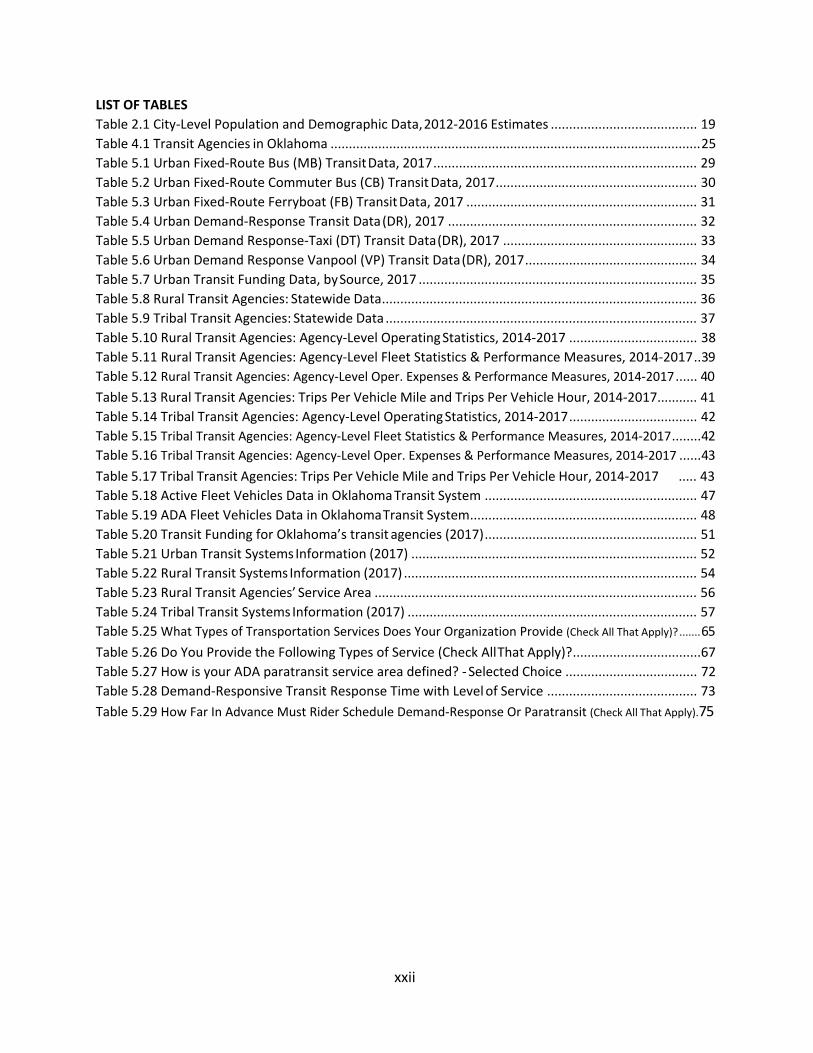
LIST OF TABLES
Table 2.1 City‐Level Population and Demographic Data, 2012‐2016 Estimates ........................................ 19
Table 4.1 Transit Agencies in Oklahoma ..................................................................................................... 25
Table 5.1 Urban Fixed‐Route Bus (MB) Transit Data, 2017 ........................................................................ 29
Table 5.2 Urban Fixed‐Route Commuter Bus (CB) Transit Data, 2017 ....................................................... 30
Table 5.3 Urban Fixed‐Route Ferryboat (FB) Transit Data, 2017 ............................................................... 31
Table 5.4 Urban Demand‐Response Transit Data (DR), 2017 .................................................................... 32
Table 5.5 Urban Demand Response‐Taxi (DT) Transit Data (DR), 2017 ..................................................... 33
Table 5.6 Urban Demand Response Vanpool (VP) Transit Data (DR), 2017 ............................................... 34
Table 5.7 Urban Transit Funding Data, by Source, 2017 ............................................................................ 35
Table 5.8 Rural Transit Agencies: Statewide Data ...................................................................................... 36
Table 5.9 Tribal Transit Agencies: Statewide Data ..................................................................................... 37
Table 5.10 Rural Transit Agencies: Agency‐Level Operating Statistics, 2014‐2017 ................................... 38
Table 5.11 Rural Transit Agencies: Agency‐Level Fleet Statistics & Performance Measures, 2014‐2017 .. 39
Table 5.12 Rural Transit Agencies: Agency‐Level Oper. Expenses & Performance Measures, 2014‐2017 ...... 40
Table 5.13 Rural Transit Agencies: Trips Per Vehicle Mile and Trips Per Vehicle Hour, 2014‐2017........... 41
Table 5.14 Tribal Transit Agencies: Agency‐Level Operating Statistics, 2014‐2017 ................................... 42
Table 5.15 Tribal Transit Agencies: Agency‐Level Fleet Statistics & Performance Measures, 2014‐2017 ........ 42
Table 5.16 Tribal Transit Agencies: Agency‐Level Oper. Expenses & Performance Measures, 2014‐2017 ...... 43
Table 5.17 Tribal Transit Agencies: Trips Per Vehicle Mile and Trips Per Vehicle Hour, 2014‐2017 ..... 43
Table 5.18 Active Fleet Vehicles Data in Oklahoma Transit System .......................................................... 47
Table 5.19 ADA Fleet Vehicles Data in Oklahoma Transit System .............................................................. 48
Table 5.20 Transit Funding for Oklahoma’s transit agencies (2017) .......................................................... 51
Table 5.21 Urban Transit Systems Information (2017) .............................................................................. 52
Table 5.22 Rural Transit Systems Information (2017) ................................................................................ 54
Table 5.23 Rural Transit Agencies’ Service Area ........................................................................................ 56
Table 5.24 Tribal Transit Systems Information (2017) ............................................................................... 57
Table 5.25 What Types of Transportation Services Does Your Organization Provide (Check All That Apply)? ....... 65
Table 5.26 Do You Provide the Following Types of Service (Check All That Apply)? ...................................67
Table 5.27 How is your ADA paratransit service area defined? ‐ Selected Choice .................................... 72
Table 5.28 Demand‐Responsive Transit Response Time with Level of Service ......................................... 73
Table 5.29 How Far In Advance Must Rider Schedule Demand‐Response Or Paratransit (Check All That Apply).75
xxiii
Table 5.30 Percentage of Riders that are Older Adults, People with Disabilities, or Youth for Traditional
Fixed‐Route Systems .............................................................................................................. 76
Table 5.31 Percentage of Riders that are Older Adults, People with Disabilities, or Youth for Demand‐
Response for the General Public Systems .............................................................................. 77
Table 6.1 Needed Facility Upgrades ............................................................................................................ 84
Table 6.2 Percentage of Demand‐Response Transit Trip Requests Turned Down Because of Lack of
Capacity ..................................................................................................................................... 87
Table 6.3 Staffing Needs ............................................................................................................................. 91
Table 7.1 Regional Transit Service Areas and Population Data .................................................................. 97
Table 7.2 Transit Service Data by Provider .................................................................................................. 99
Table 7.3 Rural, Small Urban, and Urban Transit Service Benchmarks: National Averages ..................... 104
Table 7.4 Increase in Vehicle Miles Needed in Each Scenario ................................................................. 106
Table 7.5 Estimated Increases in Operating and Vehicle Expenses to Satisfy Expanded Service Levels . 109
Table 7.6 Minimum Service‐Life in FTA’s Five Service‐life categories ...................................................... 111
Table 7.7 FTA’s Minimum Retirement Age Versus Predictive Retirement Age by Vehicle Category ...... 112
Table 7.8 Estimated Current Vehicle Replacement Needs ....................................................................... 123
Table 7.9 Long‐Term Annual Average Vehicle Replacement Costs .......................................................... 125
Table 7.10 Long‐Term Annual Average Vehicle Replacement Costs for Additional Vehicles (assuming
Scenario 2 with 2030 population) .......................................................................................... 125
Table C. 1 Oklahoma Urban Transportation Asset Information ............................................................... 180
Table C. 2 Oklahoma Rural Transportation Asset Information ................................................................ 181
Table C. 3 Oklahoma Tribal Transportation Asset Information ................................................................ 185
Table D. 1 Comments on How Well Transportation Needs of Service Area Residents are Being Met ... 188
Table D. 2 Challenges to Providing New Services ..................................................................................... 191
Table D. 3 Staffing Needs ......................................................................................................................... 193
Table D. 4 Additional Comments from Transit Agencies .......................................................................... 195
1
Chapter 1 INTRODUCTION
The Oklahoma Transit Association (OTA) identified the potential need for increased mobility among the residents of Oklahoma. This study examines existing data within the National Transit Database, U.S. Census Data, and survey responses from the transit providers to better understand current and future mobility needs of Oklahoma residents.
This study offers Oklahoma policy makers research‐based‐ information and analysis regarding the mobility gaps within the state. Given the projected population growth and changes in demographics, the mobility gaps will increase without action to reduce the gaps. The objective of this study is to identify the financial needs of the state transit providers. The specific objectives are the following:
1. Construct a demographic profile of the state of Oklahoma
2. Develop a mobility needs index
3. Describe existing levels of transit service across the state
4. Identify base levels of required transit service and gaps in existing service
5. Develop recommendations for meeting mobility needs
This report is organized in the following way. Chapter 2 contains the population growth and demographic profiles. This data was used to construct the mobility needs index which is provided in Chapter 3. The survey methodology for the transit providers is contained in Chapter 4. The existing levels of transit services with data from the National Transit Database are presented and further examined in Chapter 5 based upon rural, urban, and tribal service population size. Chapter 6 covers transit needs. The funding needs to reduce the current service gaps in covered in Chapter 7. Finally, the conclusions and recommendations are presented in Chapter 8.
2
Chapter 2 POPULATION GROWTH AND DEMOGRAPHIC PROFILES Understanding the distribution of different demographic population groups is an important part of planning public transit services across the state. Population demographics, such as age distribution, people with disabilities, individuals with low income, and those without vehicle access, may relate to the use of transit service. However, some demographic groups may demonstrate greater propensity to use transit services than others depending on the population density (Felsburg Holt & Ullevig 2015).
2.1 County Level Population Estimates According to the U.S. Census Bureau, the 2010 population was 3,751,351, which breaks down to 2,485,029 urban and 230,466 rural. The 2017 census showed a population of 3,930,864, a 4.8% increase from the 2010 census. Previously, the population grew 8.7% from 2000 to 2010. The population is projected to increase to 4,322,825 which is a 15.23% increase from the 2010 census estimates. Figure 2.1 shows the 2017 population estimates by county level. Oklahoma County has the highest population at 787,958, and Cimarron County has the lowest population at 2,154.
Figure 2.1 2017 County Level Population Estimates
3
2.2 Population Growth Estimates
The greatest population growth occurred in the central part of the state from 2010 to 2017 as shown in Figure 2.2. Population in Canadian County is estimated to increase 20.28%; the least populated, Cimarron County decreased 12.72% from 2010 to 2017. Significant population growth is expected mostly in the counties of Logan, Oklahoma, Cleveland, McClain, and Bryan. Most of the counties in the southwest and southeast parts of the state are expected to lose population.
Figure 2.2 Estimated Population Growth from 2010 to 2017
4
2.3 Projected Population Growth Estimates
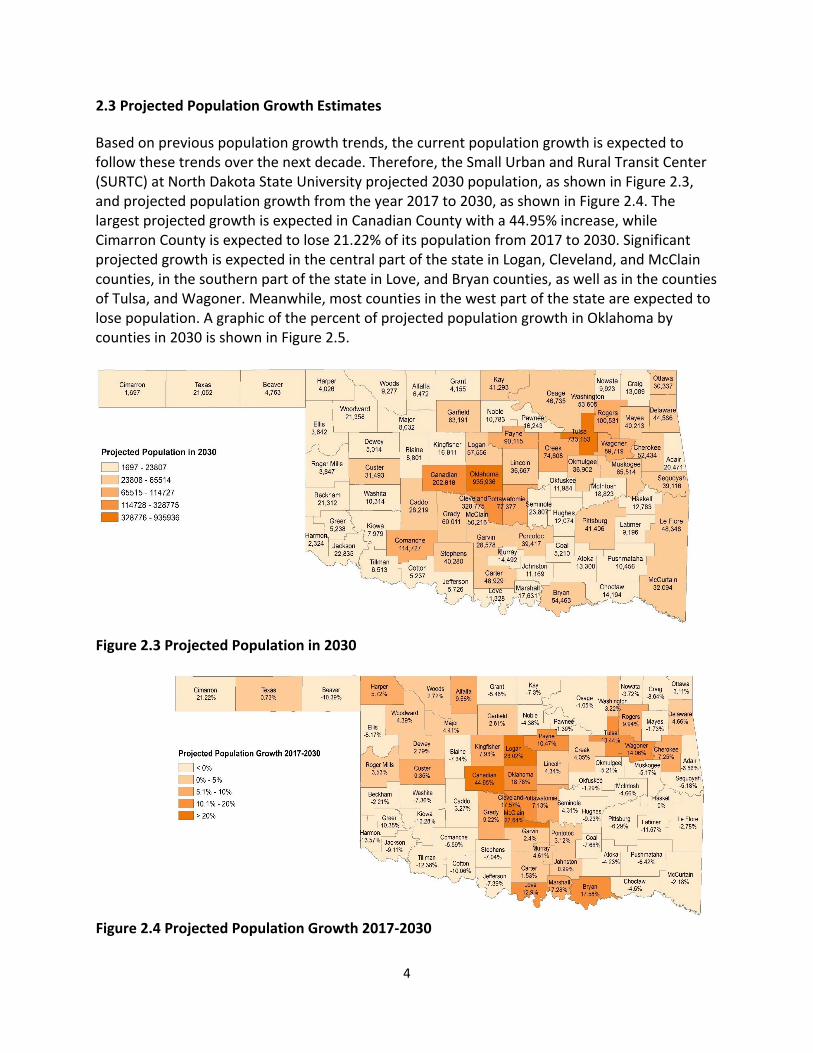
Based on previous population growth trends, the current population growth is expected to follow these trends over the next decade. Therefore, the Small Urban and Rural Transit Center (SURTC) at North Dakota State University projected 2030 population, as shown in Figure 2.3, and projected population growth from the year 2017 to 2030, as shown in Figure 2.4. The largest projected growth is expected in Canadian County with a 44.95% increase, while Cimarron County is expected to lose 21.22% of its population from 2017 to 2030. Significant projected growth is expected in the central part of the state in Logan, Cleveland, and McClain counties, in the southern part of the state in Love, and Bryan counties, as well as in the counties of Tulsa, and Wagoner. Meanwhile, most counties in the west part of the state are expected to lose population. A graphic of the percent of projected population growth in Oklahoma by counties in 2030 is shown in Figure 2.5.
Figure 2.3 Projected Population in 2030
Figure 2.4 Projected Population Growth 2017‐2030
5
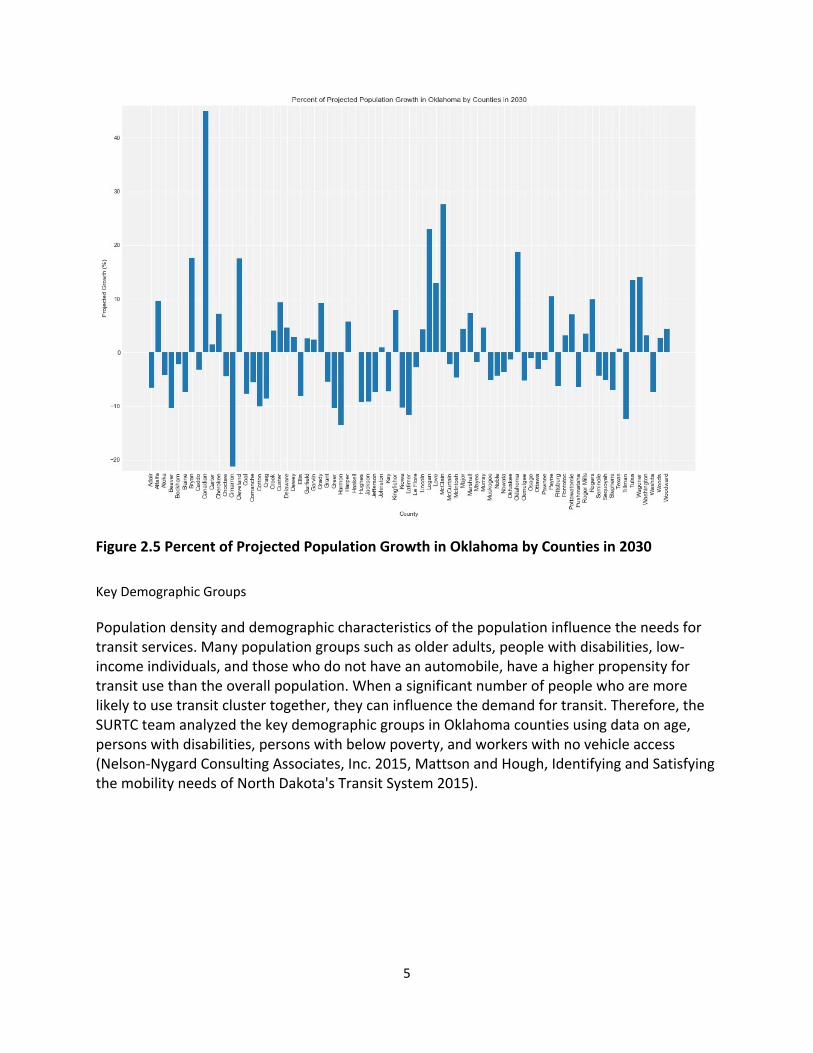
Figure 2.5 Percent of Projected Population Growth in Oklahoma by Counties in 2030
Key Demographic Groups
Population density and demographic characteristics of the population influence the needs for transit services. Many population groups such as older adults, people with disabilities, low‐ income individuals, and those who do not have an automobile, have a higher propensity for transit use than the overall population. When a significant number of people who are more likely to use transit cluster together, they can influence the demand for transit. Therefore, the SURTC team analyzed the key demographic groups in Oklahoma counties using data on age, persons with disabilities, persons with below poverty, and workers with no vehicle access (Nelson‐Nygard Consulting Associates, Inc. 2015, Mattson and Hough, Identifying and Satisfying the mobility needs of North Dakota's Transit System 2015).
6
2.4 Population Aged 65 or Older
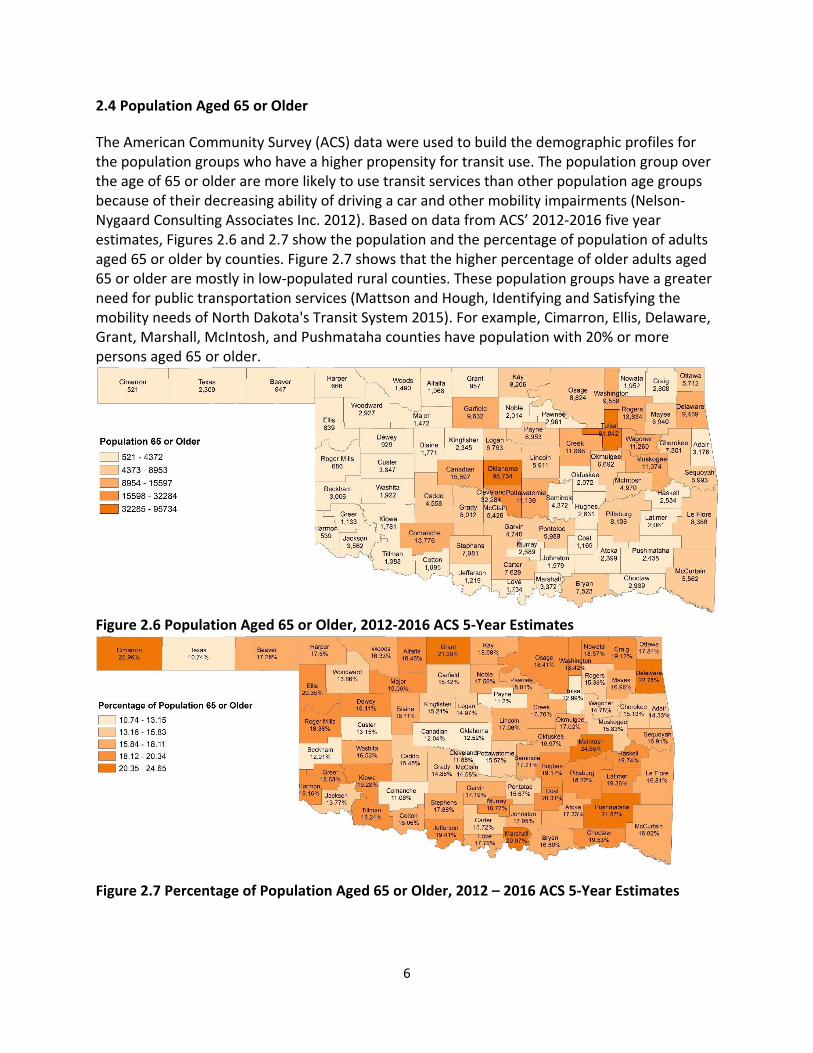
The American Community Survey (ACS) data were used to build the demographic profiles for the population groups who have a higher propensity for transit use. The population group over the age of 65 or older are more likely to use transit services than other population age groups because of their decreasing ability of driving a car and other mobility impairments (Nelson‐ Nygaard Consulting Associates Inc. 2012). Based on data from ACS’ 2012‐2016 five year estimates, Figures 2.6 and 2.7 show the population and the percentage of population of adults aged 65 or older by counties. Figure 2.7 shows that the higher percentage of older adults aged 65 or older are mostly in low‐populated rural counties. These population groups have a greater need for public transportation services (Mattson and Hough, Identifying and Satisfying the mobility needs of North Dakota's Transit System 2015). For example, Cimarron, Ellis, Delaware, Grant, Marshall, McIntosh, and Pushmataha counties have population with 20% or more persons aged 65 or older.
Figure 2.6 Population Aged 65 or Older, 2012‐2016 ACS 5‐Year Estimates
Figure 2.7 Percentage of Population Aged 65 or Older, 2012 – 2016 ACS 5‐Year Estimates
7
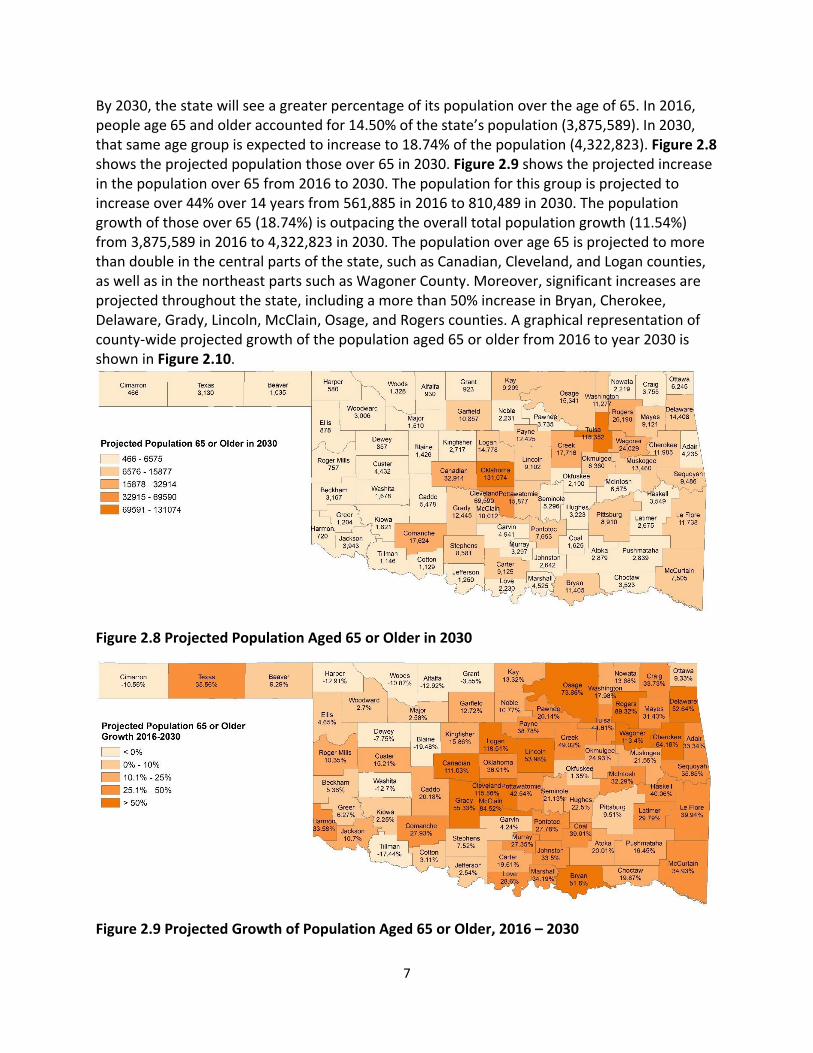
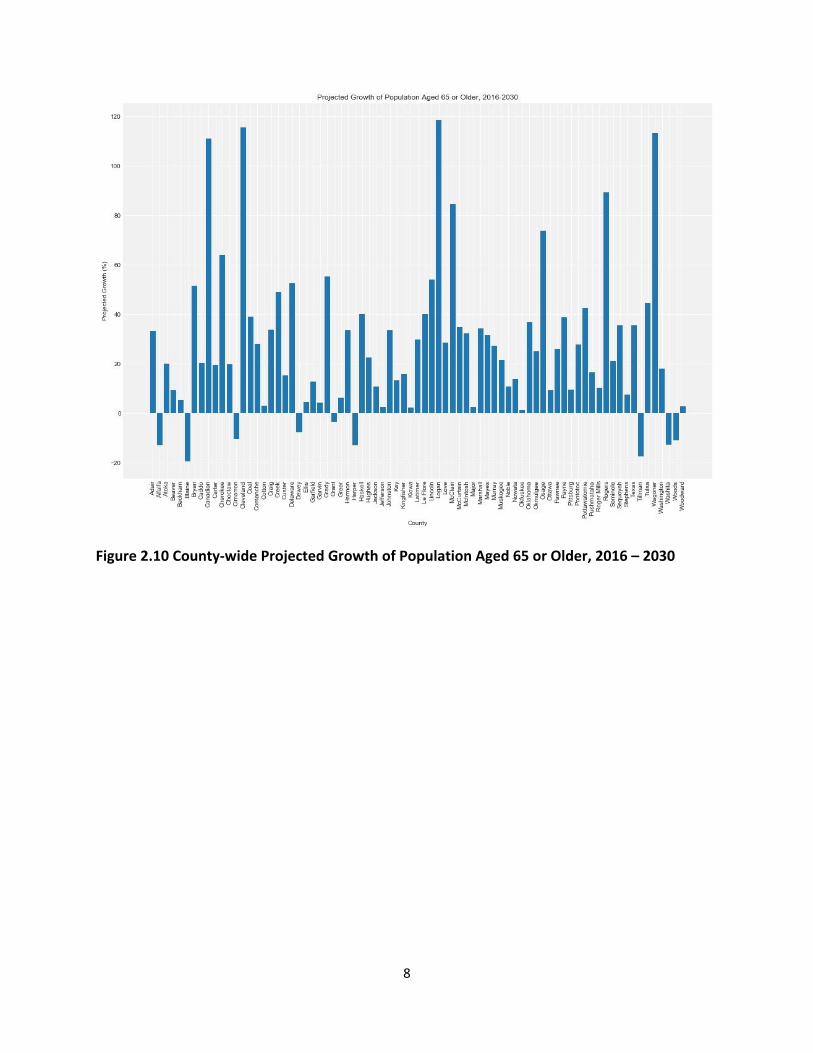
By 2030, the state will see a greater percentage of its population over the age of 65. In 2016, people age 65 and older accounted for 14.50% of the state’s population (3,875,589). In 2030, that same age group is expected to increase to 18.74% of the population (4,322,823). Figure 2.8 shows the projected population those over 65 in 2030. Figure 2.9 shows the projected increase in the population over 65 from 2016 to 2030. The population for this group is projected to increase over 44% over 14 years from 561,885 in 2016 to 810,489 in 2030. The population growth of those over 65 (18.74%) is outpacing the overall total population growth (11.54%) from 3,875,589 in 2016 to 4,322,823 in 2030. The population over age 65 is projected to more than double in the central parts of the state, such as Canadian, Cleveland, and Logan counties, as well as in the northeast parts such as Wagoner County. Moreover, significant increases are projected throughout the state, including a more than 50% increase in Bryan, Cherokee, Delaware, Grady, Lincoln, McClain, Osage, and Rogers counties. A graphical representation of county‐wide projected growth of the population aged 65 or older from 2016 to year 2030 is shown in Figure 2.10.
Figure 2.8 Projected Population Aged 65 or Older in 2030
Figure 2.9 Projected Growth of Population Aged 65 or Older, 2016 – 2030
8
Figure 2.10 County‐wide Projected Growth of Population Aged 65 or Older, 2016 – 2030
9
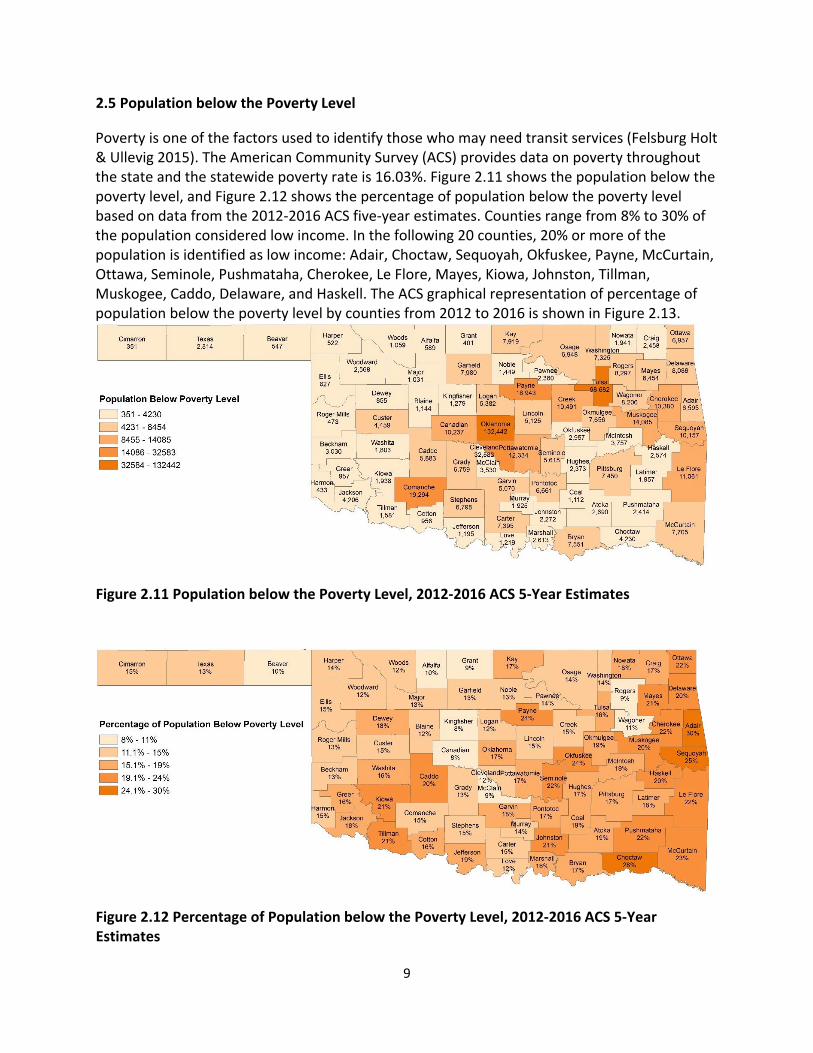
2.5 Population below the Poverty Level
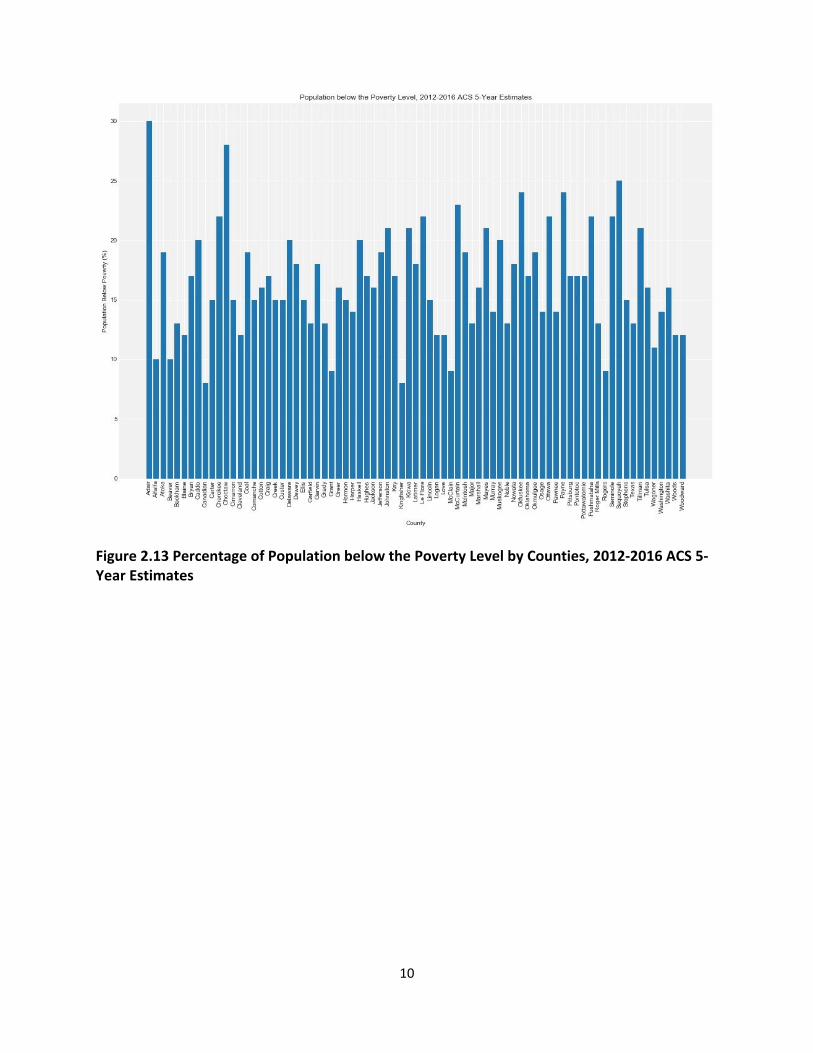
Poverty is one of the factors used to identify those who may need transit services (Felsburg Holt & Ullevig 2015). The American Community Survey (ACS) provides data on poverty throughout the state and the statewide poverty rate is 16.03%. Figure 2.11 shows the population below the poverty level, and Figure 2.12 shows the percentage of population below the poverty level based on data from the 2012‐2016 ACS five‐year estimates. Counties range from 8% to 30% of the population considered low income. In the following 20 counties, 20% or more of the population is identified as low income: Adair, Choctaw, Sequoyah, Okfuskee, Payne, McCurtain, Ottawa, Seminole, Pushmataha, Cherokee, Le Flore, Mayes, Kiowa, Johnston, Tillman, Muskogee, Caddo, Delaware, and Haskell. The ACS graphical representation of percentage of population below the poverty level by counties from 2012 to 2016 is shown in Figure 2.13.
Figure 2.11 Population below the Poverty Level, 2012‐2016 ACS 5‐Year Estimates
Figure 2.12 Percentage of Population below the Poverty Level, 2012‐2016 ACS 5‐Year Estimates
10
Figure 2.13 Percentage of Population below the Poverty Level by Counties, 2012‐2016 ACS 5‐ Year Estimates
11
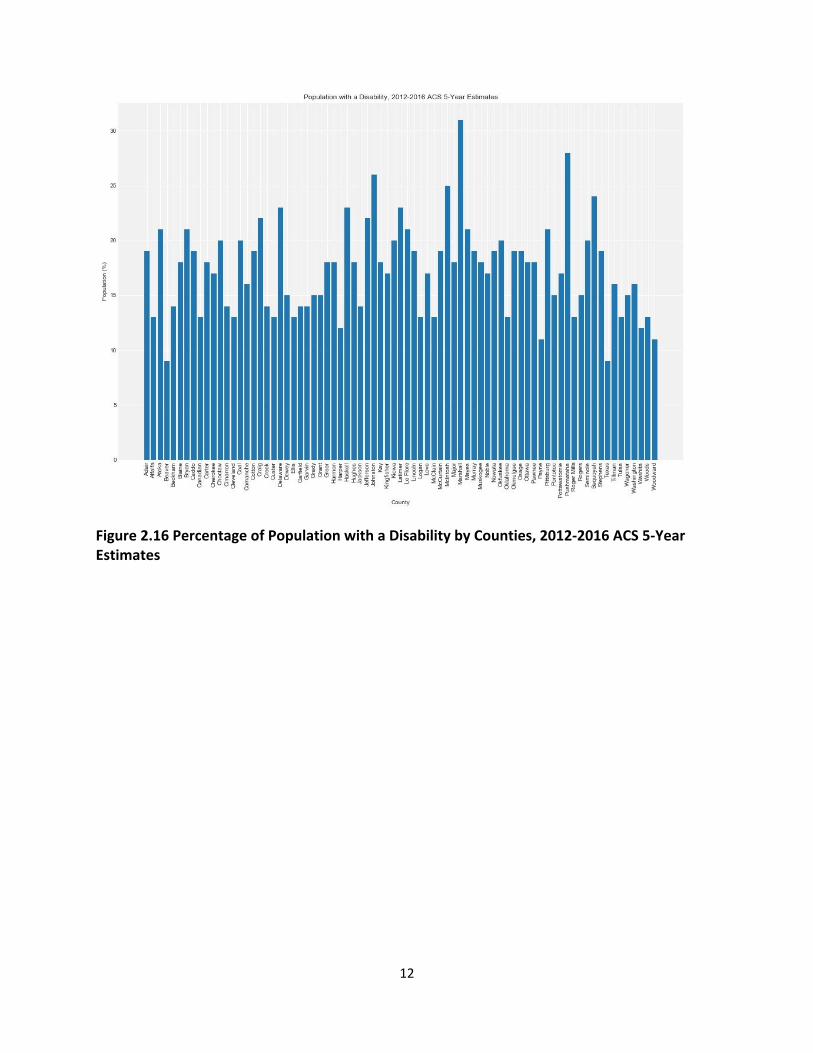
2.6 Population with a Disability
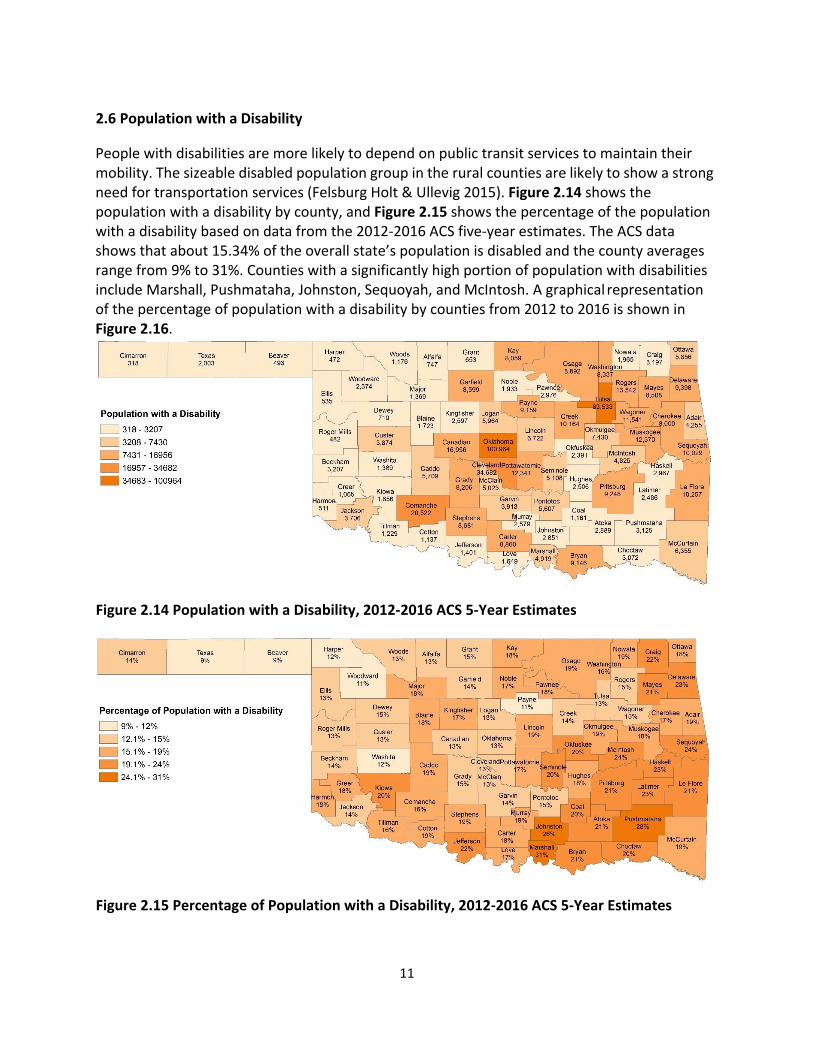
People with disabilities are more likely to depend on public transit services to maintain their mobility. The sizeable disabled population group in the rural counties are likely to show a strong need for transportation services (Felsburg Holt & Ullevig 2015). Figure 2.14 shows the population with a disability by county, and Figure 2.15 shows the percentage of the population with a disability based on data from the 2012‐2016 ACS five‐year estimates. The ACS data shows that about 15.34% of the overall state’s population is disabled and the county averages range from 9% to 31%. Counties with a significantly high portion of population with disabilities include Marshall, Pushmataha, Johnston, Sequoyah, and McIntosh. A graphical representation of the percentage of population with a disability by counties from 2012 to 2016 is shown in Figure 2.16.
Figure 2.14 Population with a Disability, 2012‐2016 ACS 5‐Year Estimates
Figure 2.15 Percentage of Population with a Disability, 2012‐2016 ACS 5‐Year Estimates
12
Figure 2.16 Percentage of Population with a Disability by Counties, 2012‐2016 ACS 5‐Year Estimates
13
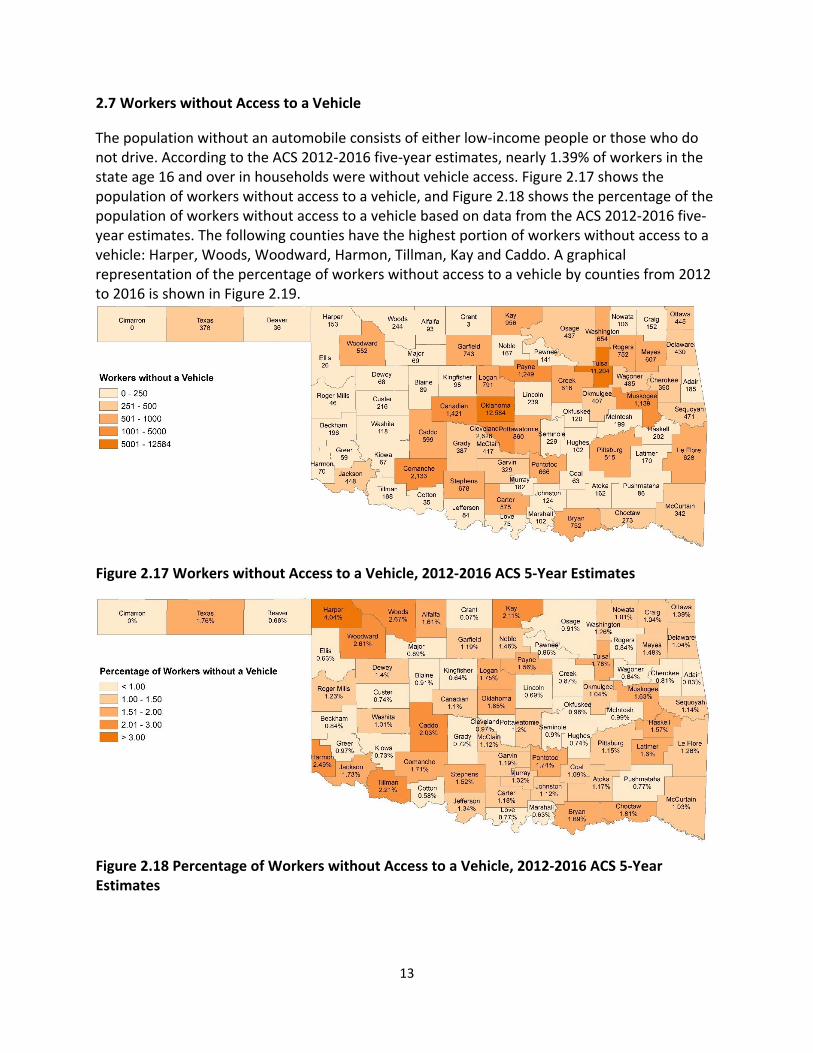
2.7 Workers without Access to a Vehicle
The population without an automobile consists of either low‐income people or those who do not drive. According to the ACS 2012‐2016 five‐year estimates, nearly 1.39% of workers in the state age 16 and over in households were without vehicle access. Figure 2.17 shows the population of workers without access to a vehicle, and Figure 2.18 shows the percentage of the population of workers without access to a vehicle based on data from the ACS 2012‐2016 five‐ year estimates. The following counties have the highest portion of workers without access to a vehicle: Harper, Woods, Woodward, Harmon, Tillman, Kay and Caddo. A graphical representation of the percentage of workers without access to a vehicle by counties from 2012 to 2016 is shown in Figure 2.19.
Figure 2.17 Workers without Access to a Vehicle, 2012‐2016 ACS 5‐Year Estimates
Figure 2.18 Percentage of Workers without Access to a Vehicle, 2012‐2016 ACS 5‐Year Estimates
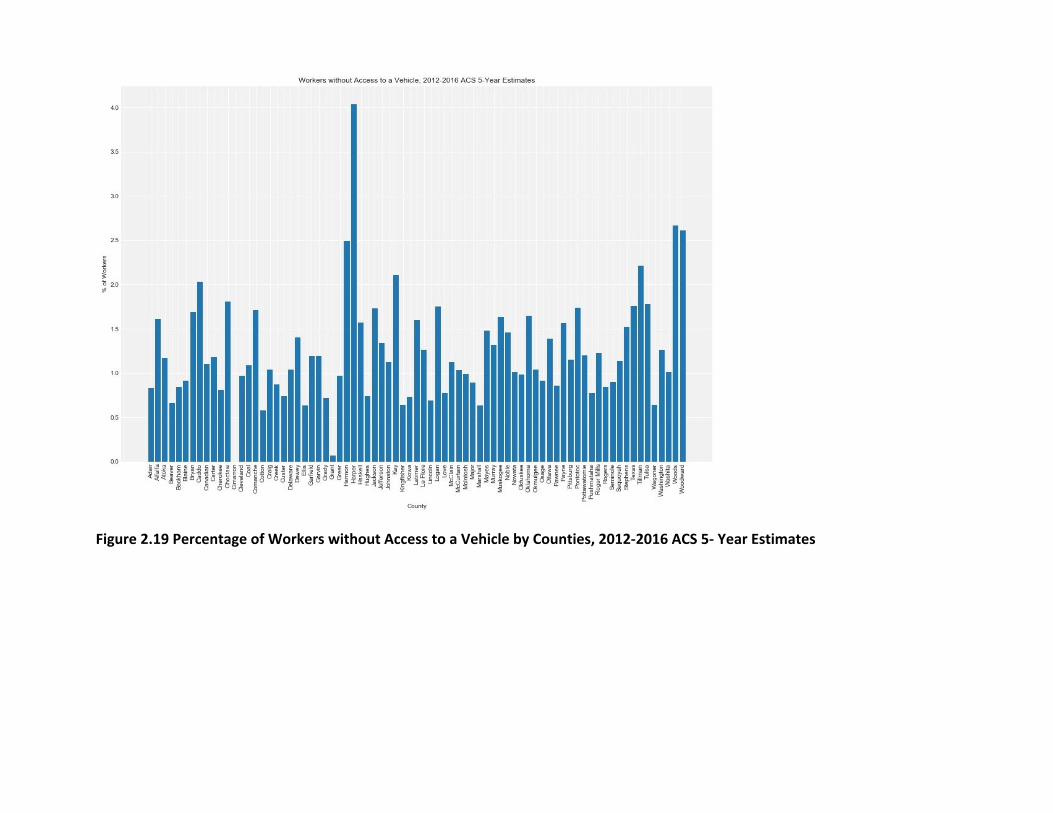
Figure 2.19 Percentage of Workers without Access to a Vehicle by Counties, 2012‐2016 ACS 5‐ Year Estimates
2.8 Population Densities by Demographic Group
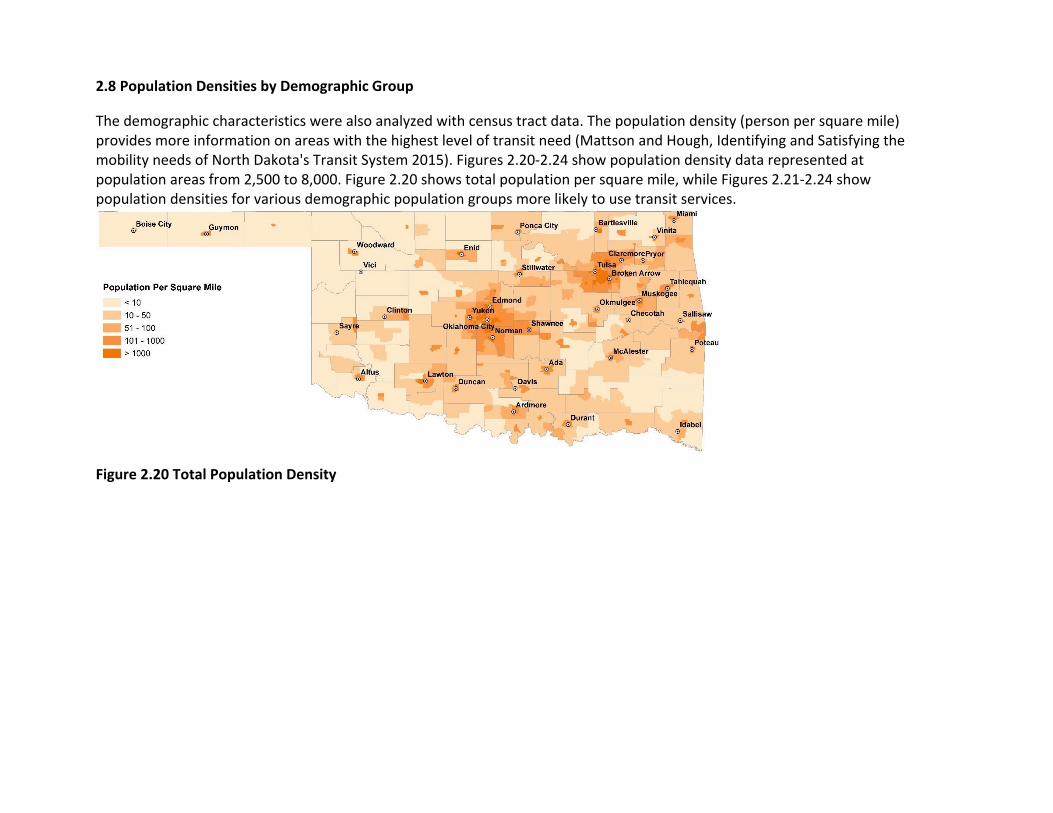
The demographic characteristics were also analyzed with census tract data. The population density (person per square mile) provides more information on areas with the highest level of transit need (Mattson and Hough, Identifying and Satisfying the mobility needs of North Dakota's Transit System 2015). Figures 2.20‐2.24 show population density data represented at population areas from 2,500 to 8,000. Figure 2.20 shows total population per square mile, while Figures 2.21‐2.24 show population densities for various demographic population groups more likely to use transit services.
Figure 2.20 Total Population Density
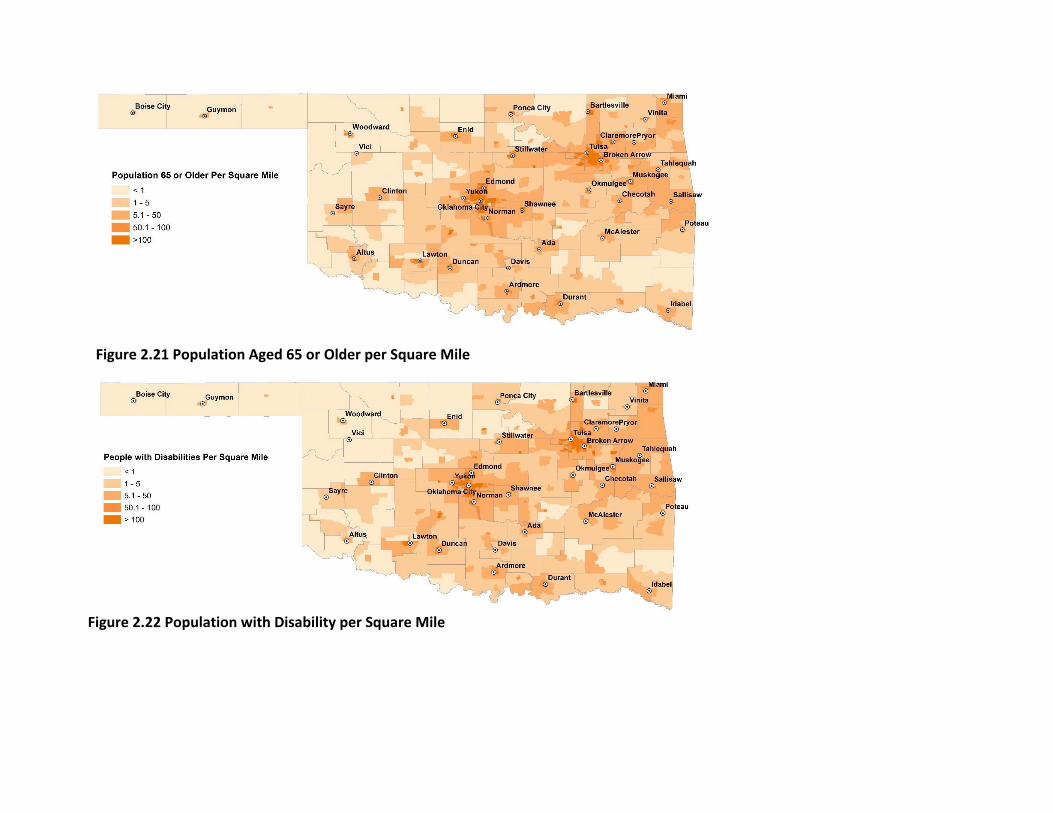
Figure 2.21 Population Aged 65 or Older per Square Mile
Figure 2.22 Population with Disability per Square Mile
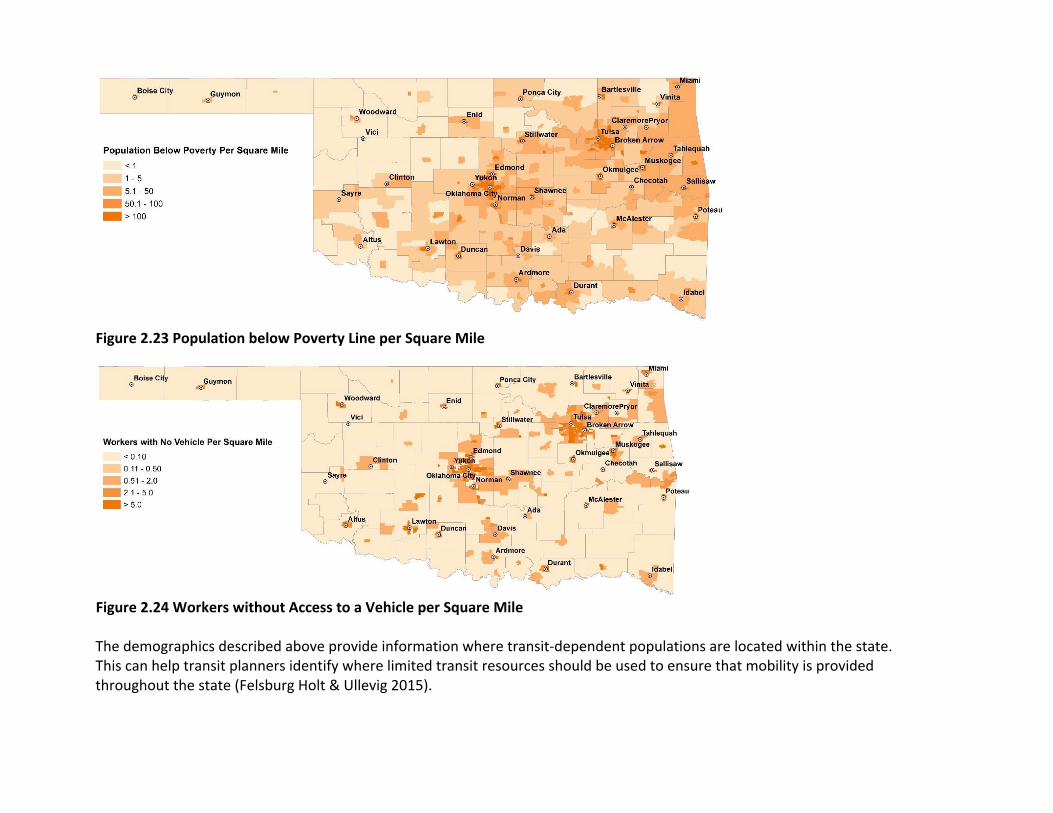
Figure 2.23 Population below Poverty Line per Square Mile
Figure 2.24 Workers without Access to a Vehicle per Square Mile The demographics described above provide information where transit‐dependent populations are located within the state. This can help transit planners identify where limited transit resources should be used to ensure that mobility is provided throughout the state (Felsburg Holt & Ullevig 2015).
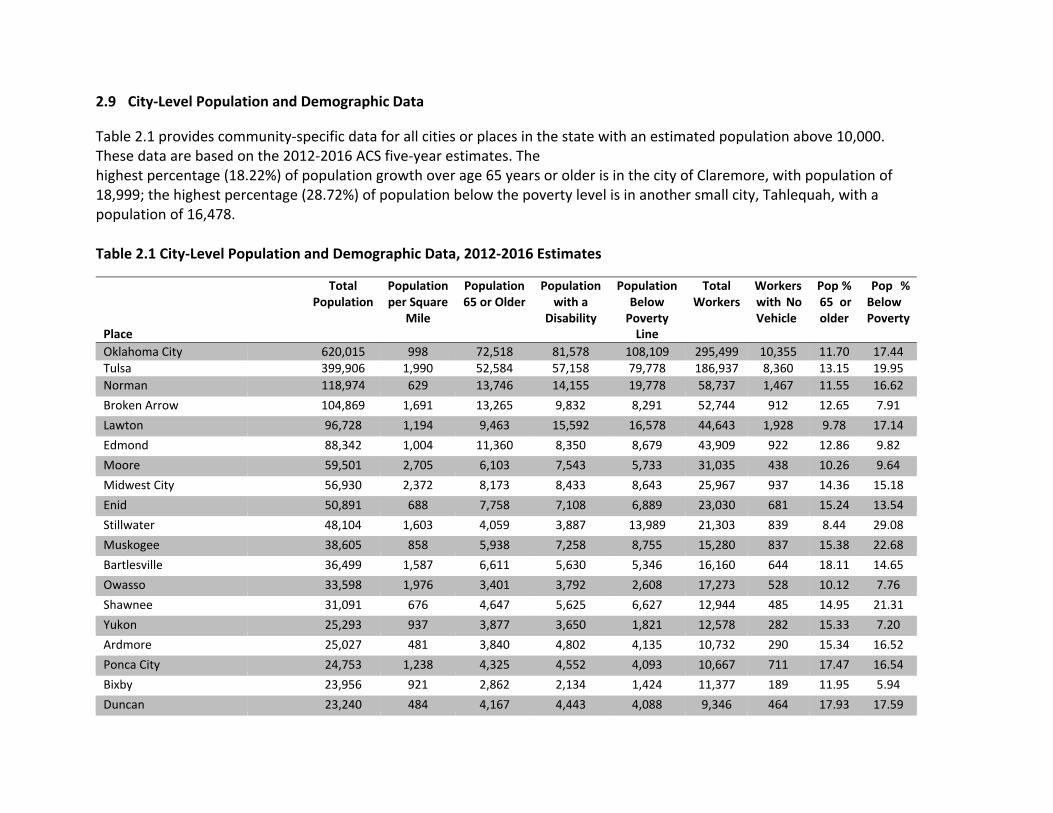
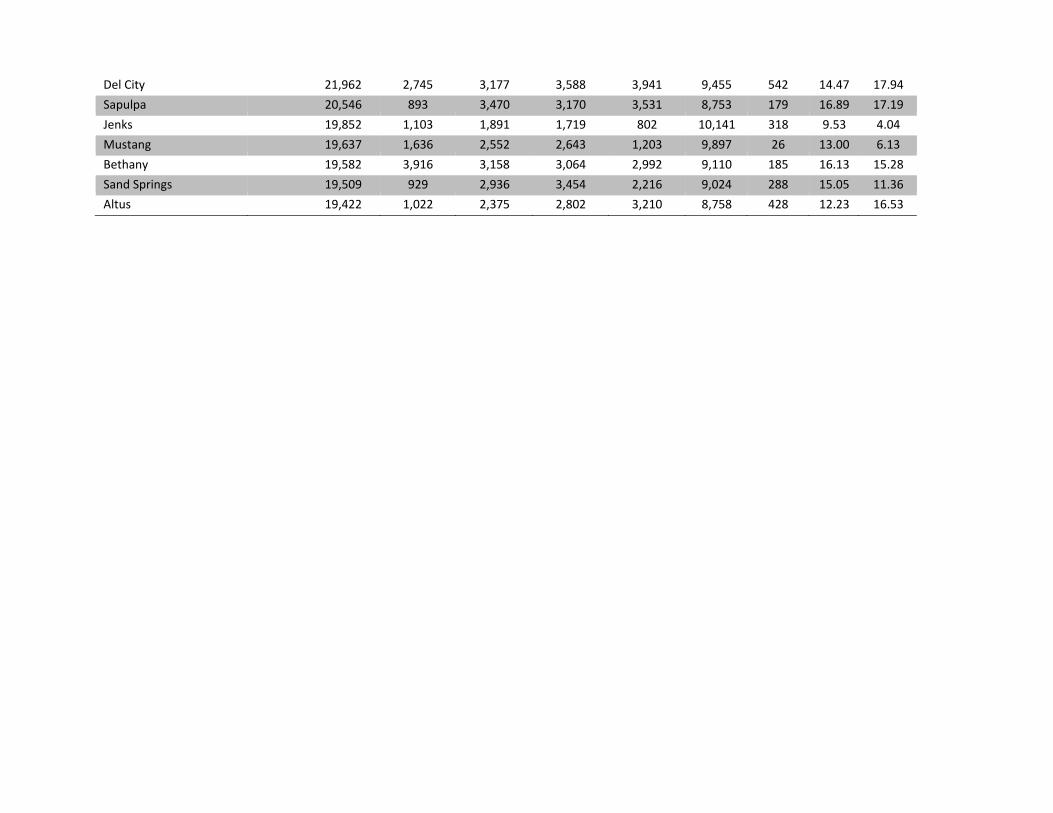
2.9 City‐Level Population and Demographic Data
Table 2.1 provides community‐specific data for all cities or places in the state with an estimated population above 10,000. These data are based on the 2012‐2016 ACS five‐year estimates. The highest percentage (18.22%) of population growth over age 65 years or older is in the city of Claremore, with population of 18,999; the highest percentage (28.72%) of population below the poverty level is in another small city, Tahlequah, with a population of 16,478.
Table 2.1 City‐Level Population and Demographic Data, 2012‐2016 Estimates
Place
Total Population
Population per Square
Mile
Population 65 or Older
Population with a
Disability
Population Below Poverty Line
Total Workers
Workers with No Vehicle
Pop % 65 or older
Pop % Below Poverty
Oklahoma City 620,015 998 72,518 81,578 108,109 295,499 10,355 11.70 17.44 Tulsa 399,906 1,990 52,584 57,158 79,778 186,937 8,360 13.15 19.95
Norman 118,974 629 13,746 14,155 19,778 58,737 1,467 11.55 16.62
Broken Arrow 104,869 1,691 13,265 9,832 8,291 52,744 912 12.65 7.91
Lawton 96,728 1,194 9,463 15,592 16,578 44,643 1,928 9.78 17.14
Edmond 88,342 1,004 11,360 8,350 8,679 43,909 922 12.86 9.82
Moore 59,501 2,705 6,103 7,543 5,733 31,035 438 10.26 9.64
Midwest City 56,930 2,372 8,173 8,433 8,643 25,967 937 14.36 15.18
Enid 50,891 688 7,758 7,108 6,889 23,030 681 15.24 13.54
Stillwater 48,104 1,603 4,059 3,887 13,989 21,303 839 8.44 29.08
Muskogee 38,605 858 5,938 7,258 8,755 15,280 837 15.38 22.68
Bartlesville 36,499 1,587 6,611 5,630 5,346 16,160 644 18.11 14.65
Owasso 33,598 1,976 3,401 3,792 2,608 17,273 528 10.12 7.76
Shawnee 31,091 676 4,647 5,625 6,627 12,944 485 14.95 21.31
Yukon 25,293 937 3,877 3,650 1,821 12,578 282 15.33 7.20
Ardmore 25,027 481 3,840 4,802 4,135 10,732 290 15.34 16.52
Ponca City 24,753 1,238 4,325 4,552 4,093 10,667 711 17.47 16.54
Bixby 23,956 921 2,862 2,134 1,424 11,377 189 11.95 5.94
Duncan 23,240 484 4,167 4,443 4,088 9,346 464 17.93 17.59
Del City 21,962 2,745 3,177 3,588 3,941 9,455 542 14.47 17.94
Sapulpa 20,546 893 3,470 3,170 3,531 8,753 179 16.89 17.19
Jenks 19,852 1,103 1,891 1,719 802 10,141 318 9.53 4.04
Mustang 19,637 1,636 2,552 2,643 1,203 9,897 26 13.00 6.13
Bethany 19,582 3,916 3,158 3,064 2,992 9,110 185 16.13 15.28
Sand Springs 19,509 929 2,936 3,454 2,216 9,024 288 15.05 11.36
Altus 19,422 1,022 2,375 2,802 3,210 8,758 428 12.23 16.53
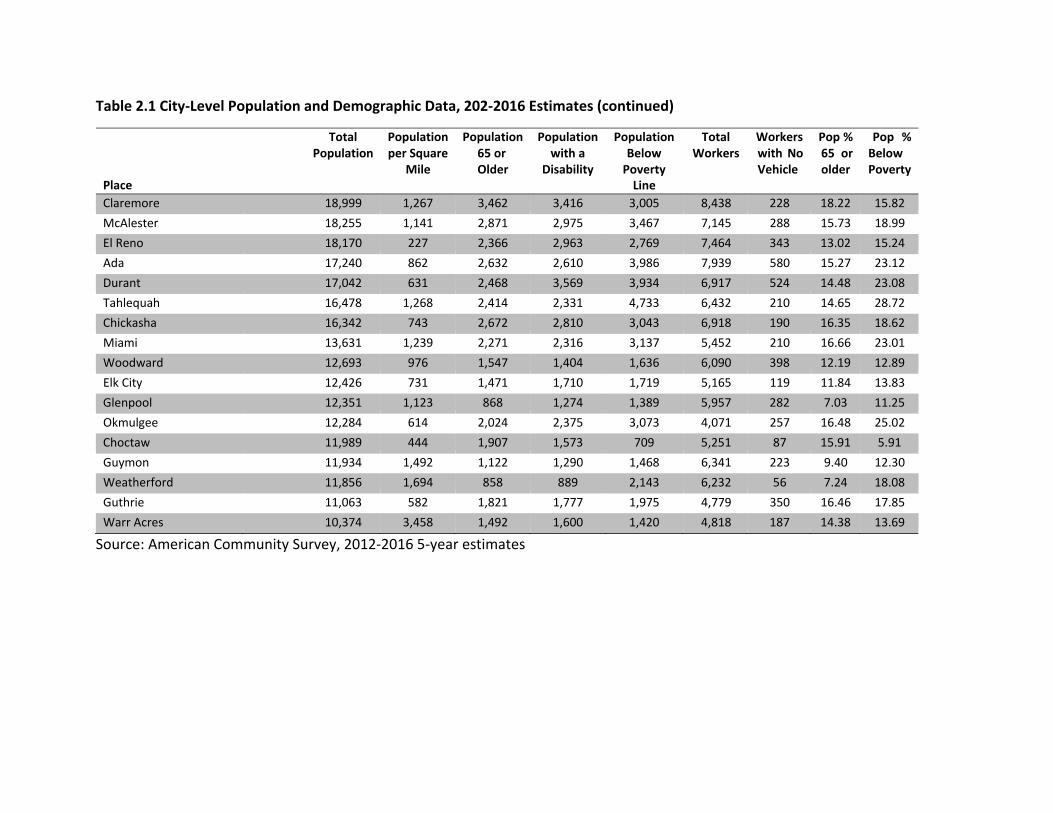
Table 2.1 City‐Level Population and Demographic Data, 202‐2016 Estimates (continued)
Place
Total Population
Population per Square
Mile
Population 65 or Older
Population with a
Disability
Population Below Poverty Line
Total Workers
Workers with No Vehicle
Pop % 65 or older
Pop % Below Poverty
Claremore 18,999 1,267 3,462 3,416 3,005 8,438 228 18.22 15.82
McAlester 18,255 1,141 2,871 2,975 3,467 7,145 288 15.73 18.99
El Reno 18,170 227 2,366 2,963 2,769 7,464 343 13.02 15.24
Ada 17,240 862 2,632 2,610 3,986 7,939 580 15.27 23.12
Durant 17,042 631 2,468 3,569 3,934 6,917 524 14.48 23.08
Tahlequah 16,478 1,268 2,414 2,331 4,733 6,432 210 14.65 28.72
Chickasha 16,342 743 2,672 2,810 3,043 6,918 190 16.35 18.62
Miami 13,631 1,239 2,271 2,316 3,137 5,452 210 16.66 23.01
Woodward 12,693 976 1,547 1,404 1,636 6,090 398 12.19 12.89
Elk City 12,426 731 1,471 1,710 1,719 5,165 119 11.84 13.83
Glenpool 12,351 1,123 868 1,274 1,389 5,957 282 7.03 11.25
Okmulgee 12,284 614 2,024 2,375 3,073 4,071 257 16.48 25.02
Choctaw 11,989 444 1,907 1,573 709 5,251 87 15.91 5.91
Guymon 11,934 1,492 1,122 1,290 1,468 6,341 223 9.40 12.30
Weatherford 11,856 1,694 858 889 2,143 6,232 56 7.24 18.08
Guthrie 11,063 582 1,821 1,777 1,975 4,779 350 16.46 17.85
Warr Acres 10,374 3,458 1,492 1,600 1,420 4,818 187 14.38 13.69
Source: American Community Survey, 2012‐2016 5‐year estimates
21
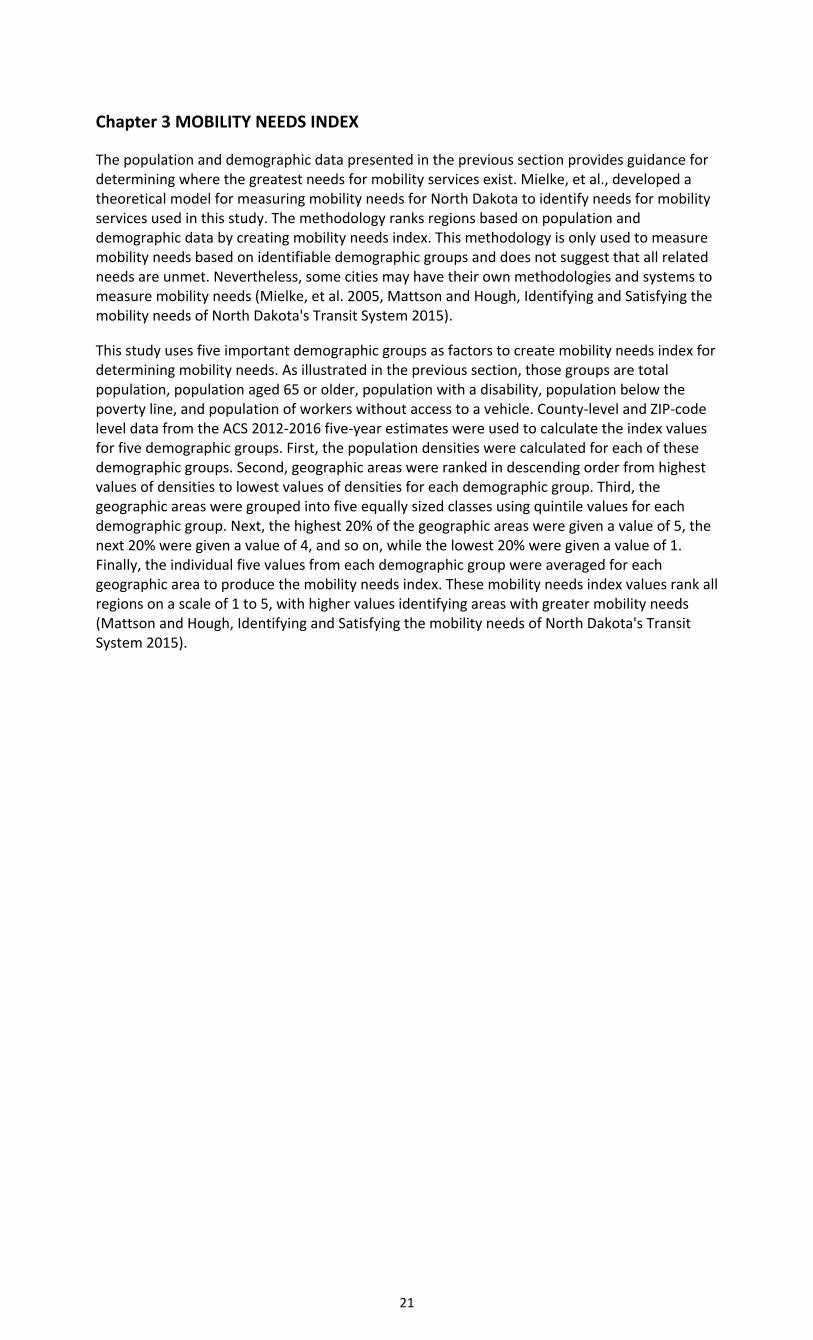
Chapter 3 MOBILITY NEEDS INDEX
The population and demographic data presented in the previous section provides guidance for determining where the greatest needs for mobility services exist. Mielke, et al., developed a theoretical model for measuring mobility needs for North Dakota to identify needs for mobility services used in this study. The methodology ranks regions based on population and demographic data by creating mobility needs index. This methodology is only used to measure mobility needs based on identifiable demographic groups and does not suggest that all related needs are unmet. Nevertheless, some cities may have their own methodologies and systems to measure mobility needs (Mielke, et al. 2005, Mattson and Hough, Identifying and Satisfying the mobility needs of North Dakota's Transit System 2015).
This study uses five important demographic groups as factors to create mobility needs index for determining mobility needs. As illustrated in the previous section, those groups are total population, population aged 65 or older, population with a disability, population below the poverty line, and population of workers without access to a vehicle. County‐level and ZIP‐code level data from the ACS 2012‐2016 five‐year estimates were used to calculate the index values for five demographic groups. First, the population densities were calculated for each of these demographic groups. Second, geographic areas were ranked in descending order from highest values of densities to lowest values of densities for each demographic group. Third, the geographic areas were grouped into five equally sized classes using quintile values for each demographic group. Next, the highest 20% of the geographic areas were given a value of 5, the next 20% were given a value of 4, and so on, while the lowest 20% were given a value of 1. Finally, the individual five values from each demographic group were averaged for each geographic area to produce the mobility needs index. These mobility needs index values rank all regions on a scale of 1 to 5, with higher values identifying areas with greater mobility needs (Mattson and Hough, Identifying and Satisfying the mobility needs of North Dakota's Transit System 2015).
22
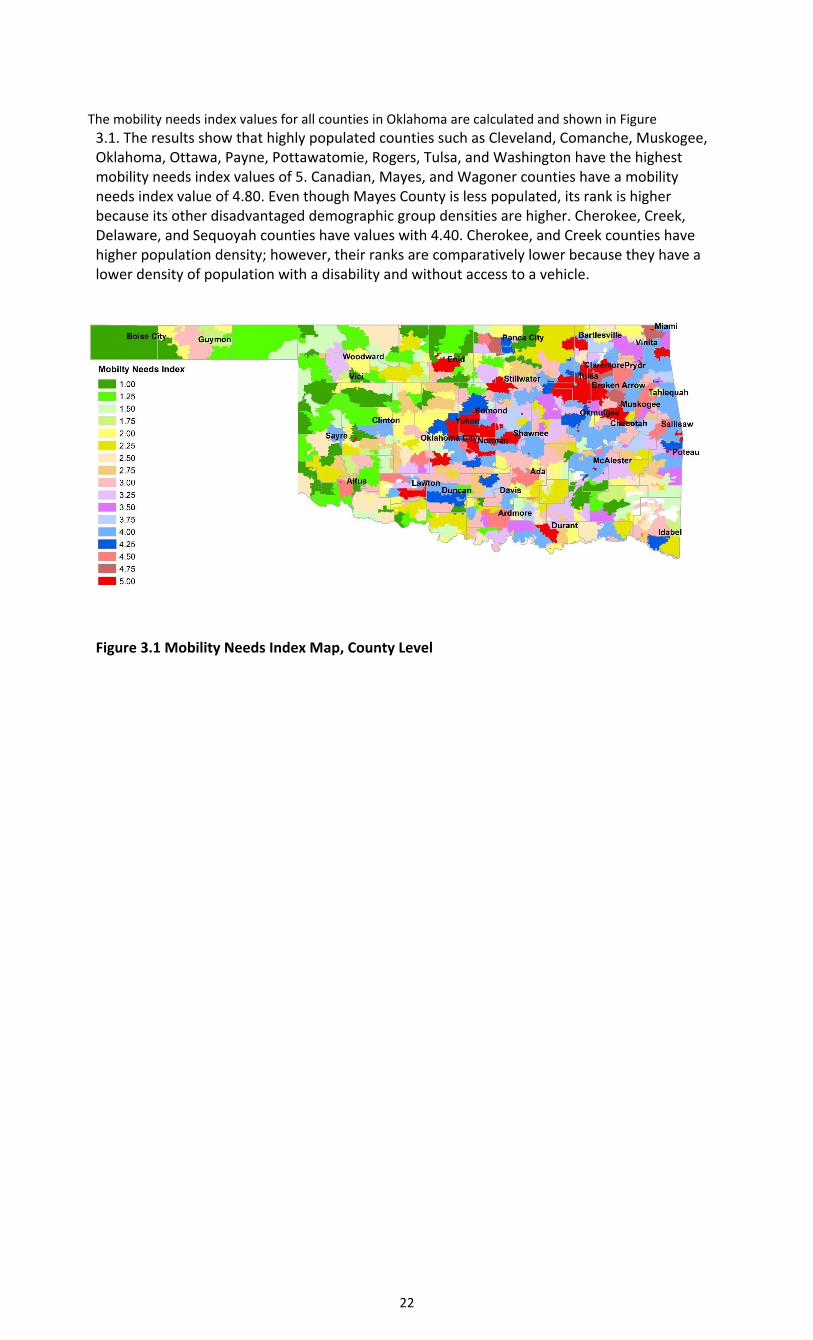
The mobility needs index values for all counties in Oklahoma are calculated and shown in Figure
3.1. The results show that highly populated counties such as Cleveland, Comanche, Muskogee, Oklahoma, Ottawa, Payne, Pottawatomie, Rogers, Tulsa, and Washington have the highest mobility needs index values of 5. Canadian, Mayes, and Wagoner counties have a mobility needs index value of 4.80. Even though Mayes County is less populated, its rank is higher because its other disadvantaged demographic group densities are higher. Cherokee, Creek, Delaware, and Sequoyah counties have values with 4.40. Cherokee, and Creek counties have higher population density; however, their ranks are comparatively lower because they have a lower density of population with a disability and without access to a vehicle.
Figure 3.1 Mobility Needs Index Map, County Level
23
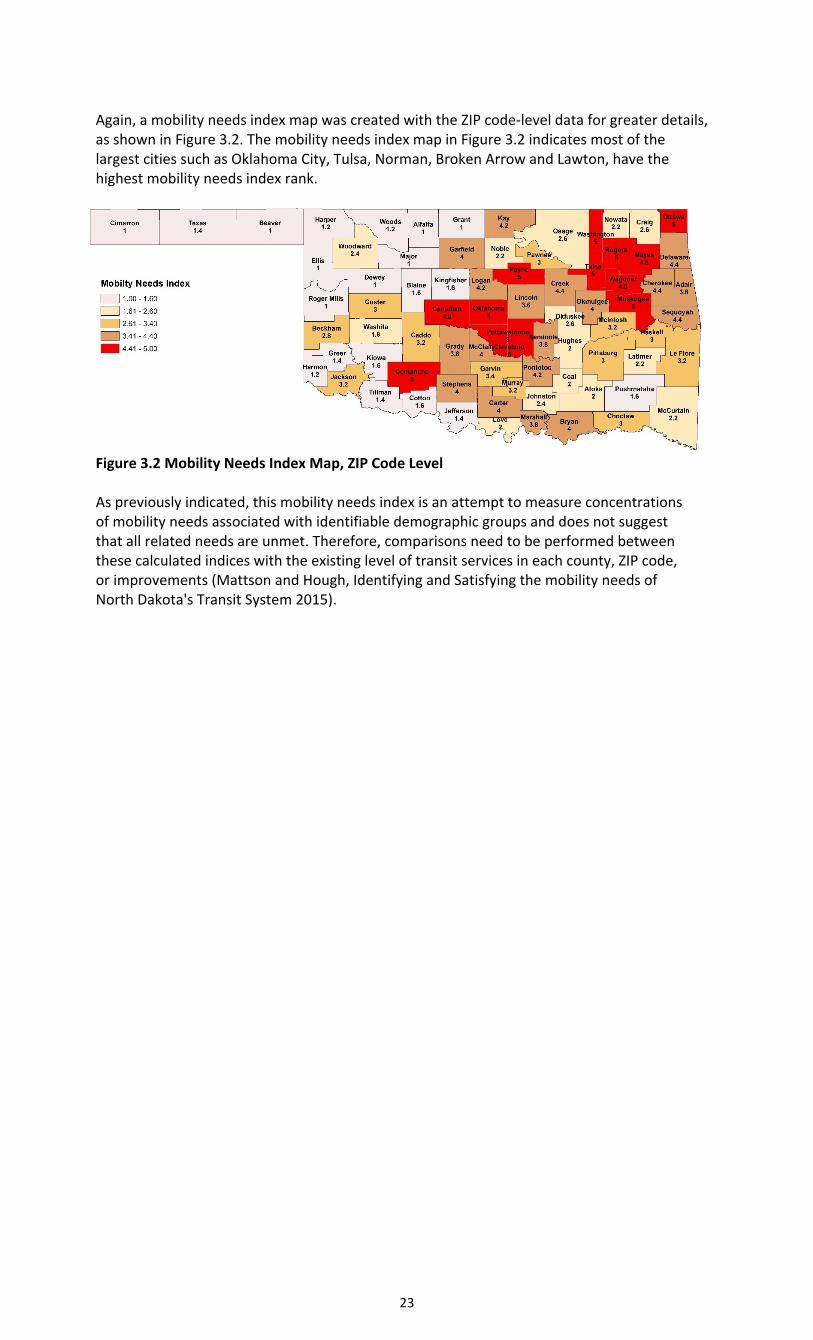
Again, a mobility needs index map was created with the ZIP code‐level data for greater details, as shown in Figure 3.2. The mobility needs index map in Figure 3.2 indicates most of the largest cities such as Oklahoma City, Tulsa, Norman, Broken Arrow and Lawton, have the highest mobility needs index rank.
Figure 3.2 Mobility Needs Index Map, ZIP Code Level As previously indicated, this mobility needs index is an attempt to measure concentrations of mobility needs associated with identifiable demographic groups and does not suggest that all related needs are unmet. Therefore, comparisons need to be performed between these calculated indices with the existing level of transit services in each county, ZIP code, or improvements (Mattson and Hough, Identifying and Satisfying the mobility needs of North Dakota's Transit System 2015).
24
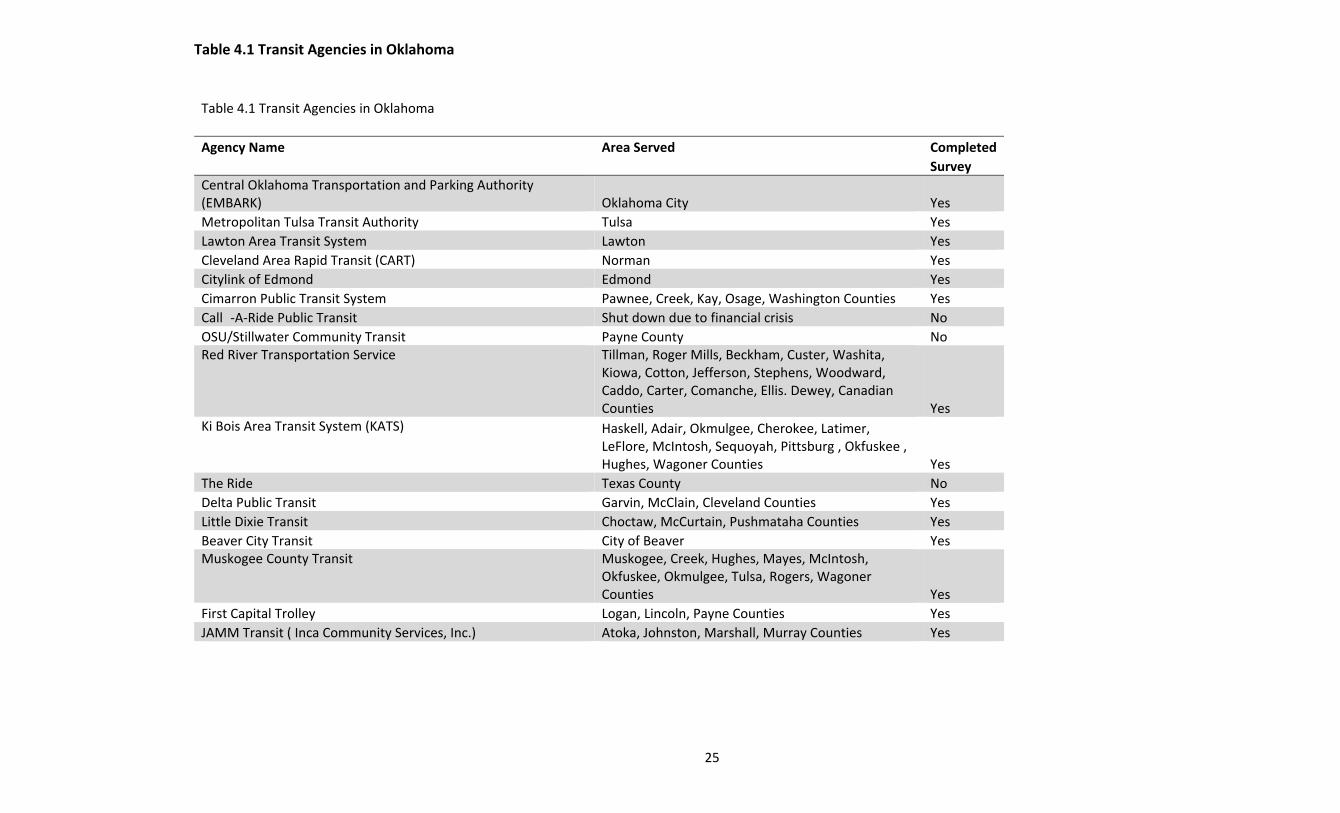
Chapter 4 SURVEY METHODOLOGY AND ADMINISTRATION A survey for needs assessment was conducted with every transit agency in the state of Oklahoma in November of 2018. The survey was designed to collect information on current levels of service, needed facility upgrades, need for new services, challenges to providing new services, staffing capabilities, and other issues. The survey was conducted online and distributed via email to 34 agencies, of which 28 responded. A complete list of transit agencies is shown in Table 4.1, along with information on areas served and whether the agency completed the survey.
25
Table 4.1 Transit Agencies in Oklahoma
Table 4.1 Transit Agencies in Oklahoma
Agency Name Area Served Completed
Survey
Central Oklahoma Transportation and Parking Authority (EMBARK) Oklahoma City Yes
Metropolitan Tulsa Transit Authority Tulsa Yes
Lawton Area Transit System Lawton Yes
Cleveland Area Rapid Transit (CART) Norman Yes
Citylink of Edmond Edmond Yes
Cimarron Public Transit System Pawnee, Creek, Kay, Osage, Washington Counties Yes
Call ‐A‐Ride Public Transit Shut down due to financial crisis No
OSU/Stillwater Community Transit Payne County No Red River Transportation Service Tillman, Roger Mills, Beckham, Custer, Washita,
Kiowa, Cotton, Jefferson, Stephens, Woodward, Caddo, Carter, Comanche, Ellis. Dewey, Canadian Counties Yes
Ki Bois Area Transit System (KATS) Haskell, Adair, Okmulgee, Cherokee, Latimer, LeFlore, McIntosh, Sequoyah, Pittsburg , Okfuskee , Hughes, Wagoner Counties Yes
The Ride Texas County No
Delta Public Transit Garvin, McClain, Cleveland Counties Yes
Little Dixie Transit Choctaw, McCurtain, Pushmataha Counties Yes
Beaver City Transit City of Beaver Yes Muskogee County Transit Muskogee, Creek, Hughes, Mayes, McIntosh,
Okfuskee, Okmulgee, Tulsa, Rogers, Wagoner Counties Yes
First Capital Trolley Logan, Lincoln, Payne Counties Yes
JAMM Transit ( Inca Community Services, Inc.) Atoka, Johnston, Marshall, Murray Counties Yes
26
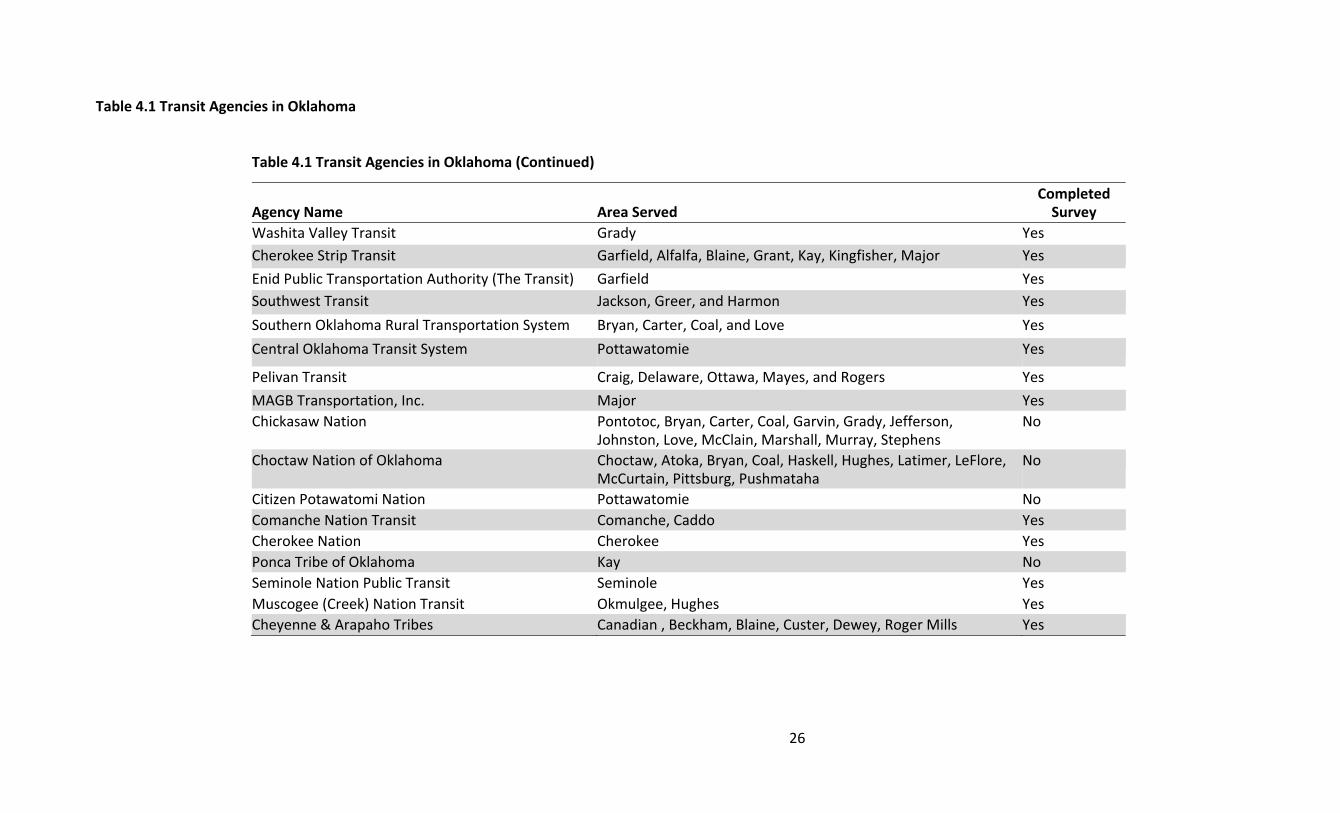
Table 4.1 Transit Agencies in Oklahoma
Table 4.1 Transit Agencies in Oklahoma (Continued)
Agency Name
Area Served
Completed Survey
Washita Valley Transit Grady Yes
Cherokee Strip Transit Garfield, Alfalfa, Blaine, Grant, Kay, Kingfisher, Major Yes
Enid Public Transportation Authority (The Transit) Garfield Yes
Southwest Transit Jackson, Greer, and Harmon Yes
Southern Oklahoma Rural Transportation System Bryan, Carter, Coal, and Love Yes
Central Oklahoma Transit System Pottawatomie Yes
Pelivan Transit Craig, Delaware, Ottawa, Mayes, and Rogers Yes
MAGB Transportation, Inc. Major Yes
Chickasaw Nation Pontotoc, Bryan, Carter, Coal, Garvin, Grady, Jefferson, Johnston, Love, McClain, Marshall, Murray, Stephens
No
Choctaw Nation of Oklahoma Choctaw, Atoka, Bryan, Coal, Haskell, Hughes, Latimer, LeFlore, McCurtain, Pittsburg, Pushmataha
No
Citizen Potawatomi Nation Pottawatomie No
Comanche Nation Transit Comanche, Caddo Yes
Cherokee Nation Cherokee Yes
Ponca Tribe of Oklahoma Kay No
Seminole Nation Public Transit Seminole Yes
Muscogee (Creek) Nation Transit Okmulgee, Hughes Yes
Cheyenne & Arapaho Tribes Canadian , Beckham, Blaine, Custer, Dewey, Roger Mills Yes
Chapter 5 EXISTING LEVELS OF TRANSIT SERVICE Existing levels of transit services will be important to analyze for the state’s transportation network and will be needed to address the mobility needs of the increasing transit disadvantaged population. Therefore, transit data from the National Transit Database (NTD) were analyzed to see the existing levels of transit service. Various performance measures, such as ridership, vehicle revenue miles, vehicle revenue hours, trips, operating expenses, funding, and some important vehicle service information were analyzed.
5.1 Data from the National Transit Database
Data from transit providers receiving funding from Federal Transit Administration are available from NTD. The most recent data available at the time of this report is for 2017. Oklahoma has five urban transit providers: Central Oklahoma Transportation and Parking Authority, Metropolitan Tulsa Transit Authority, The Lawton Area Transit System, Cleveland Area Rapid Transit, and City of Edmond. The Central Oklahoma Transportation and Parking Authority has fixed‐route bus, ferryboat, demand response transit, and demand response taxi services, all of which serves a population of 650,221 in the Oklahoma City area. Metropolitan Tulsa Transit Authority has fixed‐route bus and demand response transit service serving a population of 508,170 in the Tulsa area. Cleveland Area Rapid Transit has fixed‐route bus, and demand response transit service serving a population of 96,782 in the Norman area. The Lawton Area Transit System has fixed‐route bus and demand response transit services serving a population of 70,177 in the Lawton area. The City of Edmond has fixed‐route bus, fixed‐route commuter bus, and demand response transit service serving a population of 89,065 in the Edmond area. Oklahoma has also 19 rural and 10 tribal transit providers. Operating, financial, and fleet statistics for fixed‐route bus, commuter bus, ferryboat, and demand‐response services from these transit agencies were obtained from the NTD for 2014‐2017. Data from 2017 for fixed‐ route bus, fixed‐route commuter bus, fixed‐route ferryboat, demand‐response transit and demand‐response taxi systems are shown in tables 5.1, 5.2, 5.3, 5.4, and 5.5, respectively. The total operating and capital funding data for urban transit systems, by source for 2017, are presented in Table 5.6.
27

Table 5.1 Urban Fixed Route Bus (MB) Transit Data, 2017
Service Data
Central Okla. Transportation and Parking Authority
Metropolitan Tulsa Transit Authority
Cleveland Area Rapid Transit
The Lawton Area Transit System
City of Edmond
Unlinked Passenger Trips 3,129,122 2,807,351 1,228,265 383,920 178,322 Passenger Miles Traveled 16,131,154 14,905,684 N/A N/A N/A Vehicle Revenue Miles 2,888,502 2,808,122 536,038 605,332 136,640 Vehicle Revenue Hours 188,630 189,719 39,627 39,076 11,349 Capital Operating Expense 21,000,002 15037537 2,866,959 2,425,439 1,182,827
Fleet Data
Vehicle Available for Maximum Service 53 60 27 15 4 Average Fleet Age (years) 8.5 7.8 9.3 11.9 6
Performance Measures Unlinked Passenger Trips per Revenue Mile 1.08 1.00 2.29 0.63 1.31 Unlinked Passenger Trips per Revenue Hour 16.59 14.80 31.00 9.82 15.71 Unlinked Passenger Trips per Total Vehicles 59,040 46,789 45,491 25,595 44,581 Vehicle Revenue Miles per Total Vehicles 54,500 46,802 19,853 40,355 34,160 Vehicle Revenue Hours per Total Vehicles 3,559 3,162 1,468 2,605 2,837 Passenger Miles per Vehicle Revenue Mile 5.58 5.31 0.00 0.00 0.00 Operating Cost per Trip 6.71 5.36 2.33 6.32 6.63 Operating Cost per Vehicle Revenue Mile 7.27 5.36 5.35 4.01 8.66 Operating Cost per Vehicle Revenue Hour 111.33 79.26 72.35 62.07 104.22 Farebox Recovery Ratio 11.76% 16.87% 65.72% 12.98% 0.00%
Source: National Transit Database
29
Table 5.2 Urban Fixed‐Route Commuter Bus (CB) Transit Data, 2017
City of Edmond
Service Data
Unlinked Passenger Trips 61882 Vehicle Revenue Miles 92373 Vehicle Revenue Hours 4,592 Total Operating Expense 478594
Fleet Data Vehicles Available for Maximum Service 3 Average Fleet Age (years) 7
Performance Measures
Unlinked Passenger Trips per Revenue Mile 0.67 Unlinked Passenger Trips per Revenue Hour 13.48 Unlinked Passenger Trips per Total Vehicles 20,627 Vehicle Revenue Miles per Total Vehicles 30,791 Vehicle Revenue Hours per Total Vehicles 1,531 Operating Cost per Trip 7.73 Operating Cost per Vehicle Revenue Mile 5.18 Operating Cost per Vehicle Revenue Hour 104.22 Farebox Recovery Ratio 0.00%
Source: National Transit Database
30
Table 5.3 Urban Fixed‐Route Ferryboat (FB) Transit Data, 2017
Central Oklahoma Transportation and Parking
Authority
Service Data
Unlinked Passenger Trips 13,356 Vehicle Revenue Miles 4,259 Vehicle Revenue Hours 1,046 Passenger Miles Traveled 30,343 Total Operating Expense 775,127
Fleet Data Vehicles Available for Maximum Service 3 Average Fleet Age (years) 9.3
Performance Measures
Unlinked Passenger Trips per Revenue Mile 3.14 Unlinked Passenger Trips per Revenue Hour 12.77 Unlinked Passenger Trips per Total Vehicles 6,678 Vehicle Revenue Miles per Total Vehicles 2,130 Vehicle Revenue Hours per Total Vehicles 523 Passenger Miles per Vehicle Revenue Mile 7.12 Operating Cost per Trip 58.04 Operating Cost per Vehicle Revenue Mile 182.00 Operating Cost per Vehicle Revenue Hour 741.04 Farebox Recovery Ratio 4.38%
Source: National Transit Database
31
Table 5.4 Urban Demand‐Response Transit Data (DR), 2017
Central Oklahoma Transportation and Parking Authority
Metropolitan Tulsa Transit Authority
Cleveland Area Rapid Transit
The Lawton Area Transit
System
City of Edmond
Fleet Data
32
Service Data
Unlinked Passenger Trips 54,371 119,029 37,766 13,525 8,534 Passenger Miles Traveled Vehicle Revenue Miles
557,789
988,420
226,601
79,264
37,697
Vehicle Revenue Hours 31,151 56,153 20,438 6,104 2,883 Total Operating Expense 2,906,634 4,058,115 1,412,084 173,334 300,446
Vehicles Available for Maximum Service 17 33 10 6 2 Average Fleet Age (years) 2.5 5.5 4.2 6.0 4.1
Performance Measures Unlinked Passenger Trips per Revenue Mile 0.10 0.12 0.17 0.17 0.23 Unlinked Passenger Trips per Revenue Hour 1.75 2.12 1.85 2.22 2.96 Unlinked Passenger Trips per Total Vehicles 3,198 3,607 3,777 2,254 4,267 Vehicle Revenue Miles per Total Vehicles 32,811 29,952 22,660 13,211 18,849 Vehicle Revenue Hours per Total Vehicles 1,832 1,702 2,044 1,017 1,442 Passenger Miles per Vehicle Revenue Mile 0.89 0.00 0.00 0.00 0.00 Operating Cost per Trip 53.46 34.09 37.39 12.82 35.21 Operating Cost per Vehicle Revenue Mile 5.21 4.11 6.23 2.19 7.97 Operating Cost per Vehicle Revenue Hour 93.31 72.27 69.09 28.40 104.21 Farebox Recovery Ratio 6.93% 9.10% 4.60% 24.10% 0.00%
Source: National Transit Database
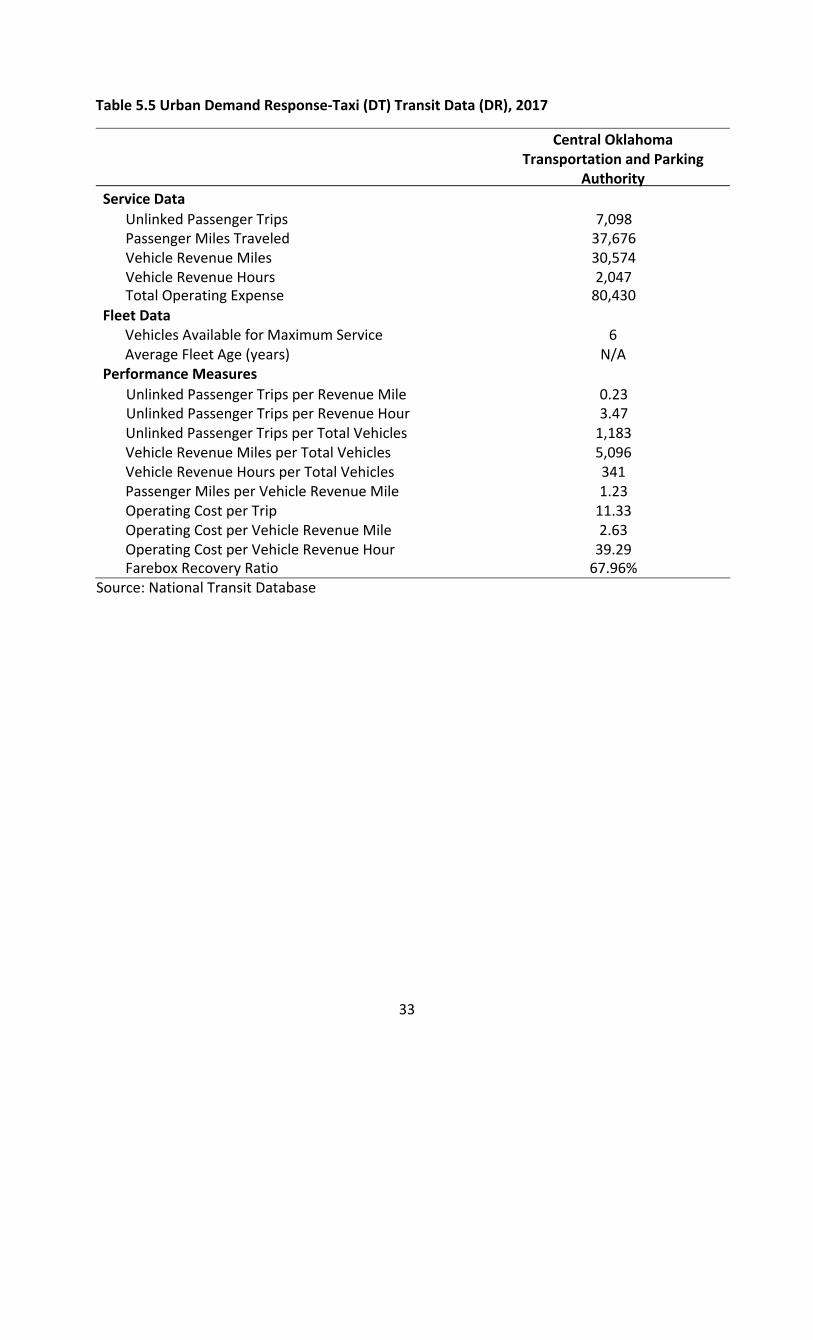
Table 5.5 Urban Demand Response‐Taxi (DT) Transit Data (DR), 2017
Central Oklahoma Transportation and Parking
Authority
Service Data
Unlinked Passenger Trips 7,098 Passenger Miles Traveled 37,676 Vehicle Revenue Miles 30,574 Vehicle Revenue Hours 2,047 Total Operating Expense 80,430
Fleet Data Vehicles Available for Maximum Service 6 Average Fleet Age (years) N/A
Performance Measures
Unlinked Passenger Trips per Revenue Mile 0.23 Unlinked Passenger Trips per Revenue Hour 3.47 Unlinked Passenger Trips per Total Vehicles 1,183 Vehicle Revenue Miles per Total Vehicles 5,096 Vehicle Revenue Hours per Total Vehicles 341 Passenger Miles per Vehicle Revenue Mile 1.23 Operating Cost per Trip 11.33 Operating Cost per Vehicle Revenue Mile 2.63 Operating Cost per Vehicle Revenue Hour 39.29 Farebox Recovery Ratio 67.96%
Source: National Transit Database
33
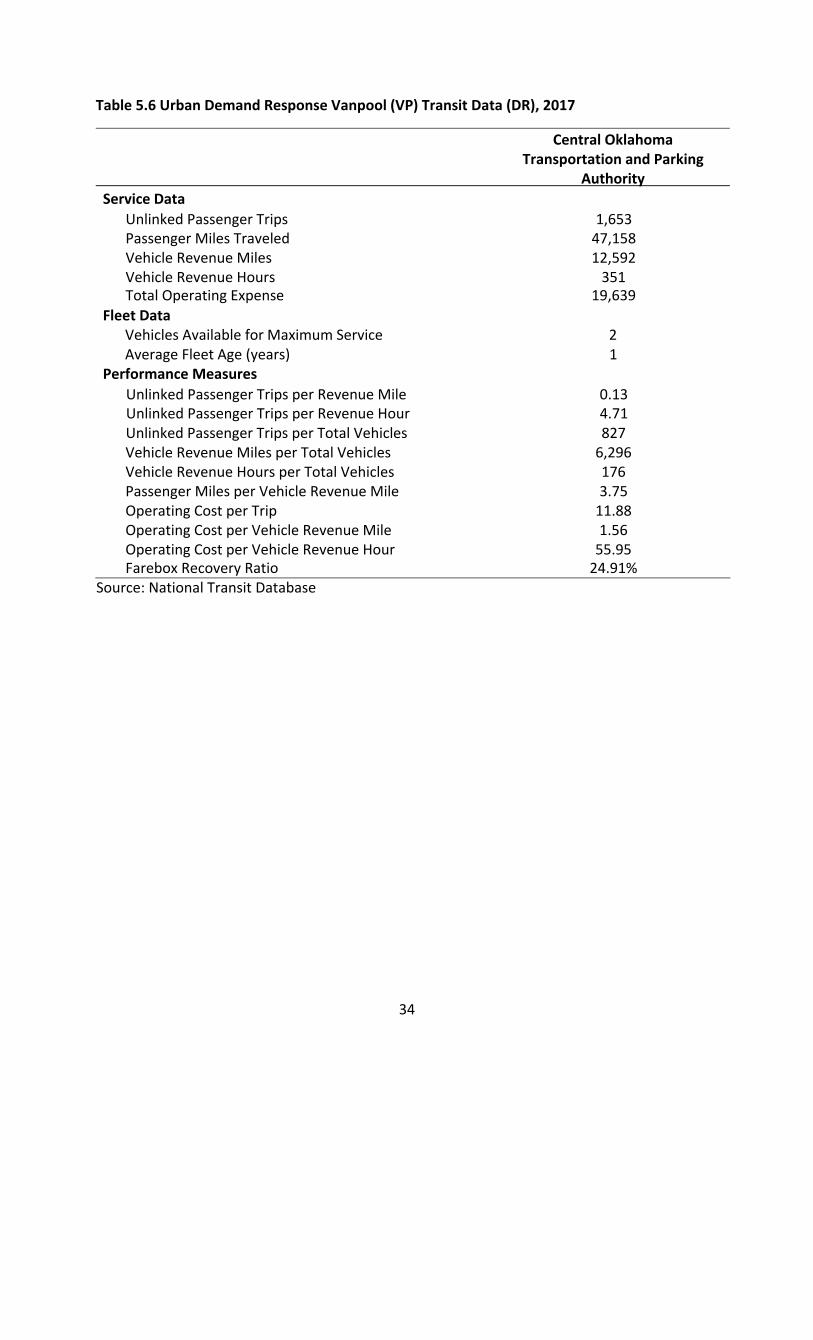
Table 5.6 Urban Demand Response Vanpool (VP) Transit Data (DR), 2017
Central Oklahoma Transportation and Parking
Authority
Service Data
Unlinked Passenger Trips 1,653 Passenger Miles Traveled 47,158 Vehicle Revenue Miles 12,592 Vehicle Revenue Hours 351 Total Operating Expense 19,639
Fleet Data Vehicles Available for Maximum Service 2 Average Fleet Age (years) 1
Performance Measures
Unlinked Passenger Trips per Revenue Mile 0.13 Unlinked Passenger Trips per Revenue Hour 4.71 Unlinked Passenger Trips per Total Vehicles 827 Vehicle Revenue Miles per Total Vehicles 6,296 Vehicle Revenue Hours per Total Vehicles 176 Passenger Miles per Vehicle Revenue Mile 3.75 Operating Cost per Trip 11.88 Operating Cost per Vehicle Revenue Mile 1.56 Operating Cost per Vehicle Revenue Hour 55.95 Farebox Recovery Ratio 24.91%
Source: National Transit Database
34
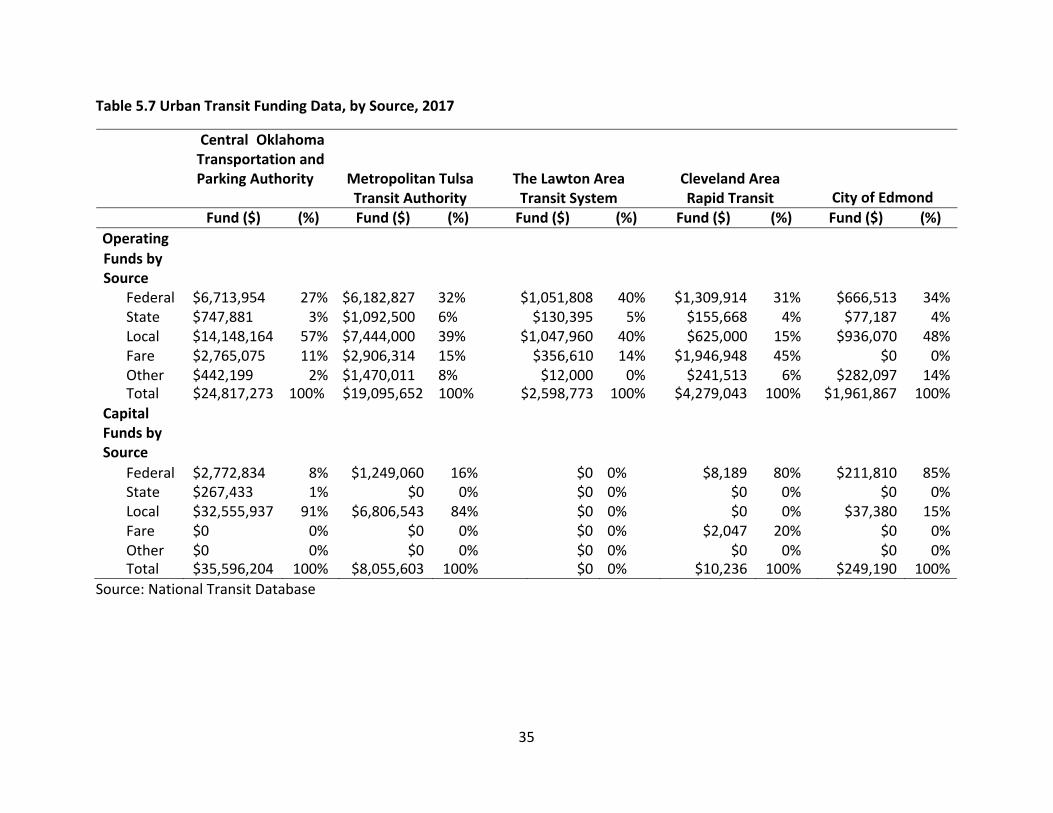
Table 5.7 Urban Transit Funding Data, by Source, 2017
Central Oklahoma Transportation and Parking Authority
Metropolitan Tulsa Transit Authority
The Lawton Area Transit System
Cleveland Area Rapid Transit
City of Edmond Fund ($) (%) Fund ($) (%) Fund ($) (%) Fund ($) (%) Fund ($) (%)
Operating
Funds by
Source
Federal $6,713,954 27% $6,182,827 32% $1,051,808 40% $1,309,914 31% $666,513 34% State $747,881 3% $1,092,500 6% $130,395 5% $155,668 4% $77,187 4% Local $14,148,164 57% $7,444,000 39% $1,047,960 40% $625,000 15% $936,070 48% Fare $2,765,075 11% $2,906,314 15% $356,610 14% $1,946,948 45% $0 0% Other $442,199 2% $1,470,011 8% $12,000 0% $241,513 6% $282,097 14% Total $24,817,273 100% $19,095,652 100% $2,598,773 100% $4,279,043 100% $1,961,867 100%
Capital Funds by Source
Federal $2,772,834 8% $1,249,060 16% $0 0% $8,189 80% $211,810 85% State $267,433 1% $0 0% $0 0% $0 0% $0 0% Local $32,555,937 91% $6,806,543 84% $0 0% $0 0% $37,380 15% Fare $0 0% $0 0% $0 0% $2,047 20% $0 0% Other $0 0% $0 0% $0 0% $0 0% $0 0% Total $35,596,204 100% $8,055,603 100% $0 0% $10,236 100% $249,190 100%
Source: National Transit Database
35
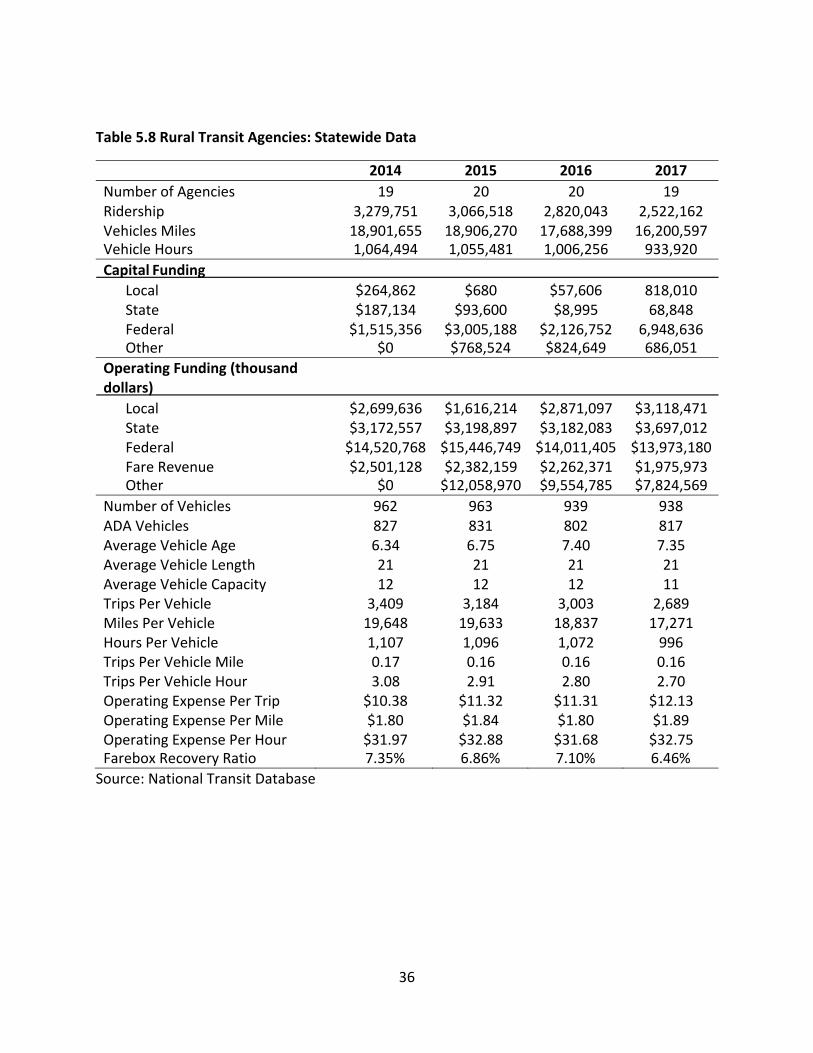
36
Table 5.8 Rural Transit Agencies: Statewide Data
2014 2015 2016 2017
Number of Agencies 19 20 20 19 Ridership 3,279,751 3,066,518 2,820,043 2,522,162 Vehicles Miles 18,901,655 18,906,270 17,688,399 16,200,597 Vehicle Hours 1,064,494 1,055,481 1,006,256 933,920
Capital Funding Local $264,862 $680 $57,606 818,010 State $187,134 $93,600 $8,995 68,848 Federal $1,515,356 $3,005,188 $2,126,752 6,948,636 Other $0 $768,524 $824,649 686,051
Operating Funding (thousand dollars)
Local $2,699,636 $1,616,214 $2,871,097 $3,118,471 State $3,172,557 $3,198,897 $3,182,083 $3,697,012 Federal $14,520,768 $15,446,749 $14,011,405 $13,973,180 Fare Revenue $2,501,128 $2,382,159 $2,262,371 $1,975,973 Other $0 $12,058,970 $9,554,785 $7,824,569
Number of Vehicles 962 963 939 938 ADA Vehicles 827 831 802 817 Average Vehicle Age 6.34 6.75 7.40 7.35 Average Vehicle Length 21 21 21 21 Average Vehicle Capacity 12 12 12 11 Trips Per Vehicle 3,409 3,184 3,003 2,689 Miles Per Vehicle 19,648 19,633 18,837 17,271 Hours Per Vehicle 1,107 1,096 1,072 996 Trips Per Vehicle Mile 0.17 0.16 0.16 0.16 Trips Per Vehicle Hour 3.08 2.91 2.80 2.70 Operating Expense Per Trip $10.38 $11.32 $11.31 $12.13 Operating Expense Per Mile $1.80 $1.84 $1.80 $1.89 Operating Expense Per Hour $31.97 $32.88 $31.68 $32.75 Farebox Recovery Ratio 7.35% 6.86% 7.10% 6.46%
Source: National Transit Database
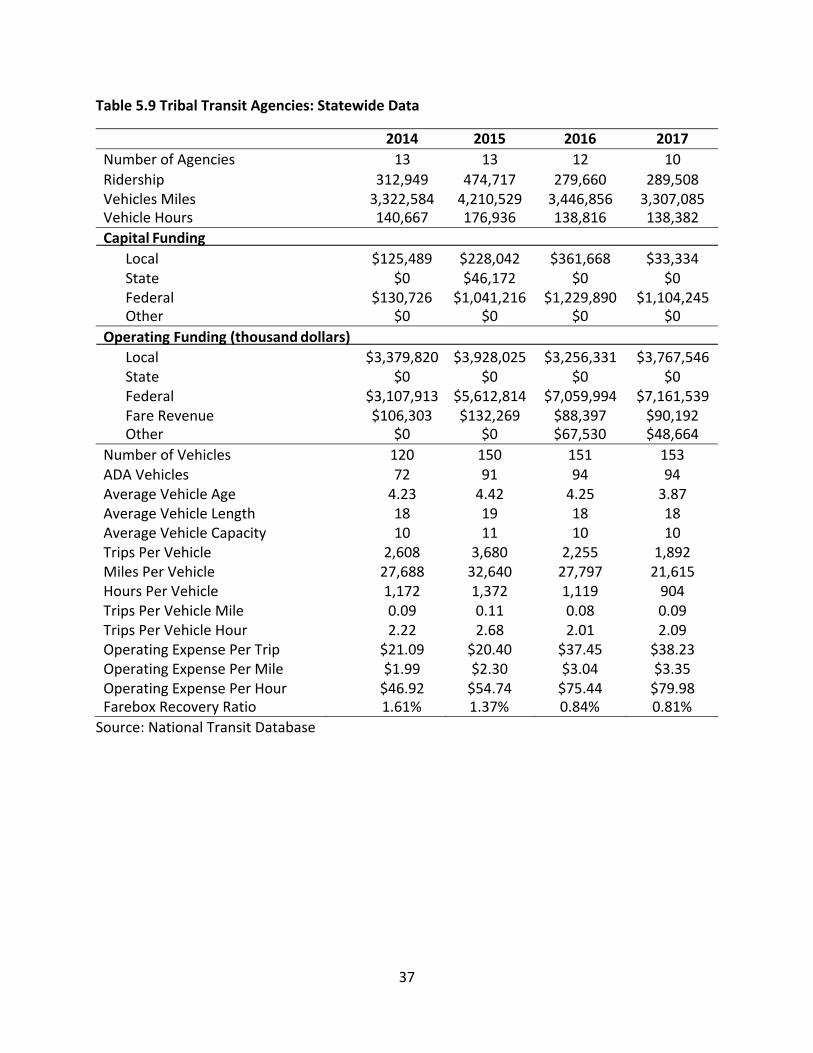
37
Table 5.9 Tribal Transit Agencies: Statewide Data
2014 2015 2016 2017
Number of Agencies 13 13 12 10
Ridership 312,949 474,717 279,660 289,508 Vehicles Miles 3,322,584 4,210,529 3,446,856 3,307,085 Vehicle Hours 140,667 176,936 138,816 138,382
Capital Funding Local $125,489 $228,042 $361,668 $33,334 State $0 $46,172 $0 $0 Federal $130,726 $1,041,216 $1,229,890 $1,104,245 Other $0 $0 $0 $0
Operating Funding (thousand dollars) Local $3,379,820 $3,928,025 $3,256,331 $3,767,546 State $0 $0 $0 $0 Federal $3,107,913 $5,612,814 $7,059,994 $7,161,539 Fare Revenue $106,303 $132,269 $88,397 $90,192 Other $0 $0 $67,530 $48,664
Number of Vehicles 120 150 151 153 ADA Vehicles 72 91 94 94 Average Vehicle Age 4.23 4.42 4.25 3.87 Average Vehicle Length 18 19 18 18 Average Vehicle Capacity 10 11 10 10 Trips Per Vehicle 2,608 3,680 2,255 1,892 Miles Per Vehicle 27,688 32,640 27,797 21,615 Hours Per Vehicle 1,172 1,372 1,119 904 Trips Per Vehicle Mile 0.09 0.11 0.08 0.09 Trips Per Vehicle Hour 2.22 2.68 2.01 2.09 Operating Expense Per Trip $21.09 $20.40 $37.45 $38.23 Operating Expense Per Mile $1.99 $2.30 $3.04 $3.35 Operating Expense Per Hour $46.92 $54.74 $75.44 $79.98 Farebox Recovery Ratio 1.61% 1.37% 0.84% 0.81%
Source: National Transit Database
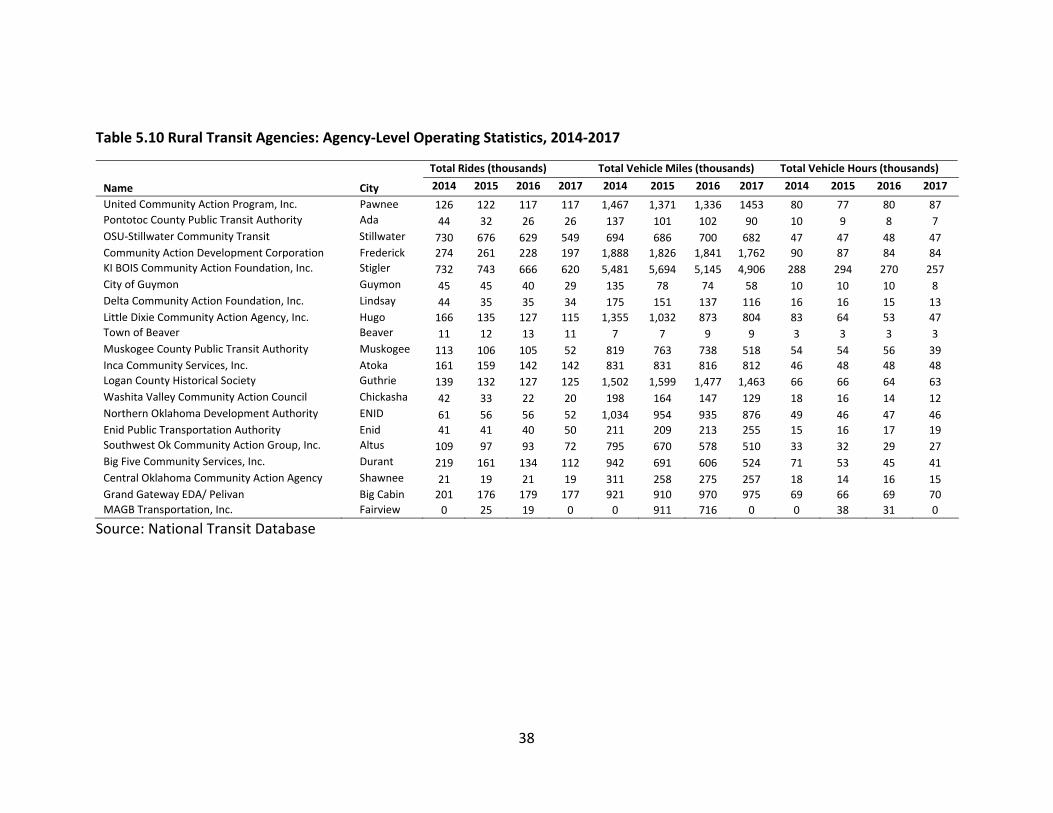
38
Table 5.10 Rural Transit Agencies: Agency‐Level Operating Statistics, 2014‐2017
Total Rides (thousands) Total Vehicle Miles (thousands) Total Vehicle Hours (thousands)
Name City 2014 2015 2016 2017 2014 2015 2016 2017 2014 2015 2016 2017
United Community Action Program, Inc. Pawnee 126 122 117 117 1,467 1,371 1,336 1453 80 77 80 87
Pontotoc County Public Transit Authority Ada 44 32 26 26 137 101 102 90 10 9 8 7
OSU‐Stillwater Community Transit Stillwater 730 676 629 549 694 686 700 682 47 47 48 47
Community Action Development Corporation Frederick 274 261 228 197 1,888 1,826 1,841 1,762 90 87 84 84 KI BOIS Community Action Foundation, Inc. Stigler 732 743 666 620 5,481 5,694 5,145 4,906 288 294 270 257
City of Guymon Guymon 45 45 40 29 135 78 74 58 10 10 10 8
Delta Community Action Foundation, Inc. Lindsay 44 35 35 34 175 151 137 116 16 16 15 13
Little Dixie Community Action Agency, Inc. Hugo 166 135 127 115 1,355 1,032 873 804 83 64 53 47 Town of Beaver Beaver 11 12 13 11 7 7 9 9 3 3 3 3
Muskogee County Public Transit Authority Muskogee 113 106 105 52 819 763 738 518 54 54 56 39 Inca Community Services, Inc. Atoka 161 159 142 142 831 831 816 812 46 48 48 48 Logan County Historical Society Guthrie 139 132 127 125 1,502 1,599 1,477 1,463 66 66 64 63
Washita Valley Community Action Council Chickasha 42 33 22 20 198 164 147 129 18 16 14 12
Northern Oklahoma Development Authority ENID 61 56 56 52 1,034 954 935 876 49 46 47 46
Enid Public Transportation Authority Enid 41 41 40 50 211 209 213 255 15 16 17 19 Southwest Ok Community Action Group, Inc. Altus 109 97 93 72 795 670 578 510 33 32 29 27
Big Five Community Services, Inc. Durant 219 161 134 112 942 691 606 524 71 53 45 41
Central Oklahoma Community Action Agency Shawnee 21 19 21 19 311 258 275 257 18 14 16 15
Grand Gateway EDA/ Pelivan Big Cabin 201 176 179 177 921 910 970 975 69 66 69 70 MAGB Transportation, Inc. Fairview 0 25 19 0 0 911 716 0 0 38 31 0
Source: National Transit Database
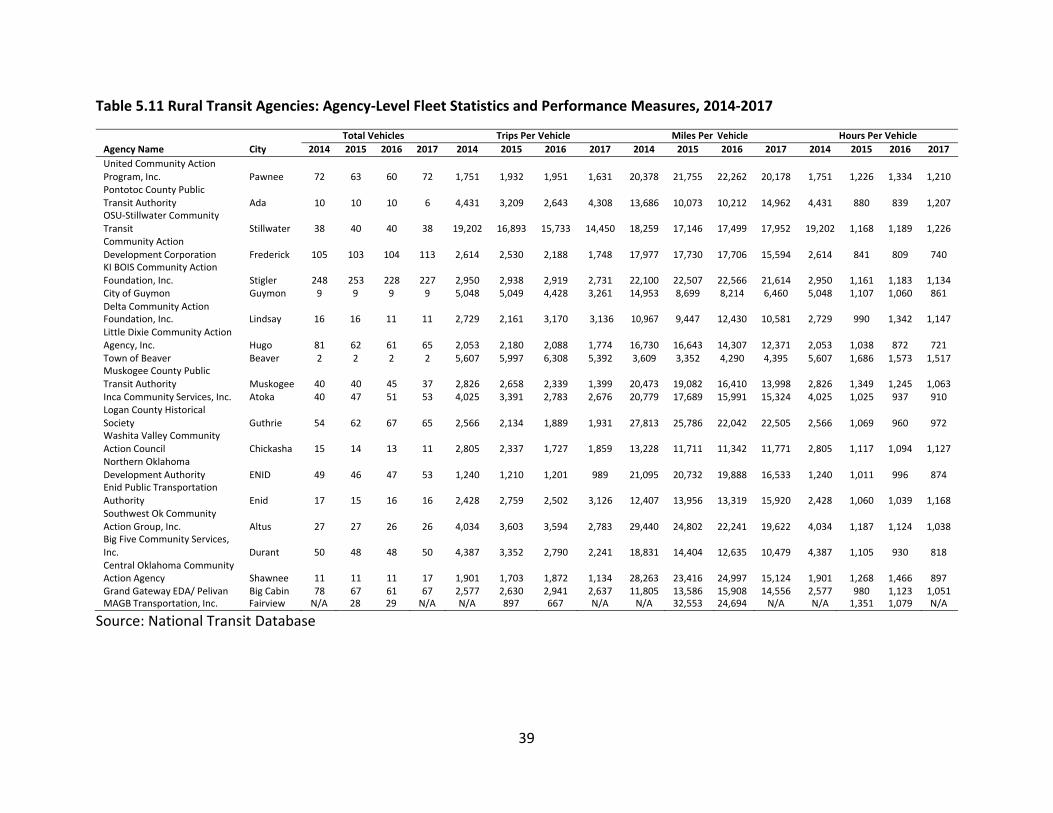
39
Table 5.11 Rural Transit Agencies: Agency‐Level Fleet Statistics and Performance Measures, 2014‐2017
Total Vehicles Trips Per Vehicle Miles Per Vehicle Hours Per Vehicle
Agency Name City 2014 2015 2016 2017 2014 2015 2016 2017 2014 2015 2016 2017 2014 2015 2016 2017
United Community Action
Program, Inc. Pawnee 72 63 60 72 1,751 1,932 1,951 1,631 20,378 21,755 22,262 20,178 1,751 1,226 1,334 1,210 Pontotoc County Public
Transit Authority Ada OSU‐Stillwater Community
10 10 10 6 4,431 3,209 2,643 4,308 13,686 10,073 10,212 14,962 4,431 880 839 1,207
Transit Stillwater 38 40 40 38 19,202 16,893 15,733 14,450 18,259 17,146 17,499 17,952 19,202 1,168 1,189 1,226 Community Action
Development Corporation Frederick KI BOIS Community Action
105 103 104 113 2,614 2,530 2,188 1,748 17,977 17,730 17,706 15,594 2,614 841 809 740
Foundation, Inc. Stigler 248 253 228 227 2,950 2,938 2,919 2,731 22,100 22,507 22,566 21,614 2,950 1,161 1,183 1,134 City of Guymon Guymon 9 9 9 9 5,048 5,049 4,428 3,261 14,953 8,699 8,214 6,460 5,048 1,107 1,060 861 Delta Community Action Foundation, Inc. Lindsay
16
16 11
11
2,729 2,161
3,170
3,136 10,967
9,447
12,430
10,581 2,729
990 1,342
1,147 Little Dixie Community Action
Agency, Inc. Hugo 81 62 61 65 2,053 2,180 2,088 1,774 16,730 16,643 14,307 12,371 2,053 1,038 872 721 Town of Beaver Beaver Muskogee County Public
2 2 2 2 5,607 5,997 6,308 5,392 3,609 3,352 4,290 4,395 5,607 1,686 1,573 1,517
Transit Authority Muskogee 40 40 45 37 2,826 2,658 2,339 1,399 20,473 19,082 16,410 13,998 2,826 1,349 1,245 1,063 Inca Community Services, Inc. Atoka 40 47 51 53 4,025 3,391 2,783 2,676 20,779 17,689 15,991 15,324 4,025 1,025 937 910 Logan County Historical
Society Guthrie Washita Valley Community
54 62 67 65 2,566 2,134 1,889 1,931 27,813 25,786 22,042 22,505 2,566 1,069 960 972
Action Council Chickasha 15 14 13 11 2,805 2,337 1,727 1,859 13,228 11,711 11,342 11,771 2,805 1,117 1,094 1,127 Northern Oklahoma
Development Authority ENID Enid Public Transportation
49 46 47 53 1,240 1,210 1,201 989 21,095 20,732 19,888 16,533 1,240 1,011 996 874
Authority Enid 17 15 16 16 2,428 2,759 2,502 3,126 12,407 13,956 13,319 15,920 2,428 1,060 1,039 1,168 Southwest Ok Community
Action Group, Inc. Altus Big Five Community Services,
27 27 26 26 4,034 3,603 3,594 2,783 29,440 24,802 22,241 19,622 4,034 1,187 1,124 1,038
Inc. Durant 50 48 48 50 4,387 3,352 2,790 2,241 18,831 14,404 12,635 10,479 4,387 1,105 930 818 Central Oklahoma Community
Action Agency Shawnee 11 11 11 17 1,901 1,703 1,872 1,134 28,263 23,416 24,997 15,124 1,901 1,268 1,466 897 Grand Gateway EDA/ Pelivan Big Cabin 78 67 61 67 2,577 2,630 2,941 2,637 11,805 13,586 15,908 14,556 2,577 980 1,123 1,051 MAGB Transportation, Inc. Fairview N/A 28 29 N/A N/A 897 667 N/A N/A 32,553 24,694 N/A N/A 1,351 1,079 N/A
Source: National Transit Database
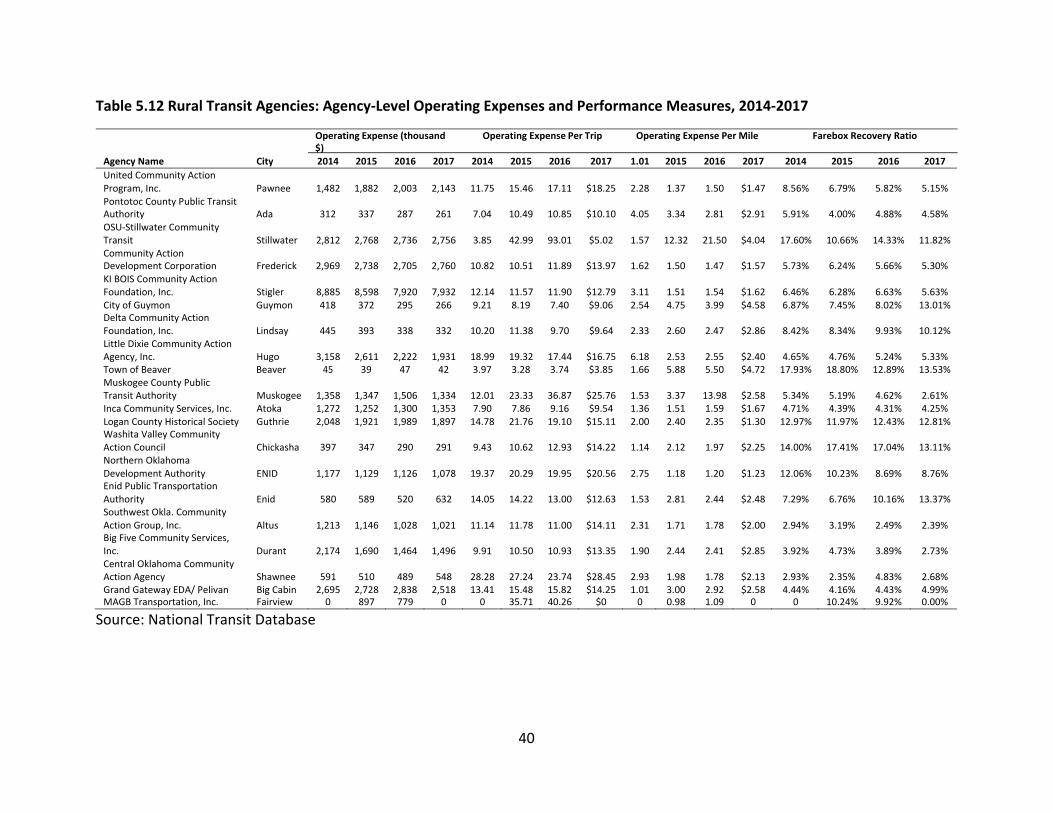
40
Table 5.12 Rural Transit Agencies: Agency‐Level Operating Expenses and Performance Measures, 2014‐2017
Operating Expense (thousand Operating Expense Per Trip Operating Expense Per Mile Farebox Recovery Ratio $)
Agency Name City 2014 2015 2016 2017 2014 2015 2016 2017 1.01 2015 2016 2017 2014 2015 2016 2017
United Community Action
Program, Inc. Pawnee 1,482 1,882 2,003 2,143 11.75 15.46 17.11 $18.25 2.28 1.37 1.50 $1.47 8.56% 6.79% 5.82% 5.15% Pontotoc County Public Transit Authority
Ada
312
337
287
261
7.04
10.49
10.85
$10.10
4.05
3.34
2.81
$2.91
5.91%
4.00%
4.88%
4.58% OSU‐Stillwater Community
Transit Stillwater 2,812 2,768 2,736 2,756 3.85 42.99 93.01 $5.02 1.57 12.32 21.50 $4.04 17.60% 10.66% 14.33% 11.82% Community Action Development Corporation
Frederick
2,969
2,738
2,705
2,760
10.82
10.51
11.89
$13.97
1.62
1.50
1.47
$1.57
5.73%
6.24%
5.66%
5.30% KI BOIS Community Action
Foundation, Inc. Stigler 8,885 8,598 7,920 7,932 12.14 11.57 11.90 $12.79 3.11 1.51 1.54 $1.62 6.46% 6.28% 6.63% 5.63% City of Guymon Delta Community Action
Guymon 418 372 295 266 9.21 8.19 7.40 $9.06 2.54 4.75 3.99 $4.58 6.87% 7.45% 8.02% 13.01%
Foundation, Inc. Lindsay 445 393 338 332 10.20 11.38 9.70 $9.64 2.33 2.60 2.47 $2.86 8.42% 8.34% 9.93% 10.12% Little Dixie Community Action
Agency, Inc. Hugo 3,158 2,611 2,222 1,931 18.99 19.32 17.44 $16.75 6.18 2.53 2.55 $2.40 4.65% 4.76% 5.24% 5.33% Town of Beaver Beaver 45 39 47 42 3.97 3.28 3.74 $3.85 1.66 5.88 5.50 $4.72 17.93% 18.80% 12.89% 13.53% Muskogee County Public
Transit Authority Muskogee 1,358 1,347 1,506 1,334 12.01 23.33 36.87 $25.76 1.53 3.37 13.98 $2.58 5.34% 5.19% 4.62% 2.61% Inca Community Services, Inc. Atoka 1,272 1,252 1,300 1,353 7.90 7.86 9.16 $9.54 1.36 1.51 1.59 $1.67 4.71% 4.39% 4.31% 4.25% Logan County Historical Society Washita Valley Community
Guthrie 2,048 1,921 1,989 1,897 14.78 21.76 19.10 $15.11 2.00 2.40 2.35 $1.30 12.97% 11.97% 12.43% 12.81%
Action Council Chickasha 397 347 290 291 9.43 10.62 12.93 $14.22 1.14 2.12 1.97 $2.25 14.00% 17.41% 17.04% 13.11% Northern Oklahoma
Development Authority Enid Public Transportation
ENID 1,177 1,129 1,126 1,078 19.37 20.29 19.95 $20.56 2.75 1.18 1.20 $1.23 12.06% 10.23% 8.69% 8.76%
Authority Enid 580 589 520 632 14.05 14.22 13.00 $12.63 1.53 2.81 2.44 $2.48 7.29% 6.76% 10.16% 13.37% Southwest Okla. Community
Action Group, Inc. Big Five Community Services,
Altus 1,213 1,146 1,028 1,021 11.14 11.78 11.00 $14.11 2.31 1.71 1.78 $2.00 2.94% 3.19% 2.49% 2.39%
Inc. Durant 2,174 1,690 1,464 1,496 9.91 10.50 10.93 $13.35 1.90 2.44 2.41 $2.85 3.92% 4.73% 3.89% 2.73% Central Oklahoma Community
Action Agency Shawnee 591 510 489 548 28.28 27.24 23.74 $28.45 2.93 1.98 1.78 $2.13 2.93% 2.35% 4.83% 2.68% Grand Gateway EDA/ Pelivan Big Cabin 2,695 2,728 2,838 2,518 13.41 15.48 15.82 $14.25 1.01 3.00 2.92 $2.58 4.44% 4.16% 4.43% 4.99% MAGB Transportation, Inc. Fairview 0 897 779 0 0 35.71 40.26 $0 0 0.98 1.09 0 0 10.24% 9.92% 0.00%
Source: National Transit Database
41
Table 5.13 Rural Transit Agencies: Trips Per Vehicle Mile and Trips Per Vehicle Hour, 2014‐2017
Trips Per Vehicle Mile Trips Per Vehicle Hour Agency Name City 2014 2015 2016 2017 2014 2015 2016 2017
United Community Action Program, Inc. Pawnee 0.09 0.09 0.09 0.08 1.58 1.58 1.46 1.35 Pontotoc County Public Transit Authority Ada 0.32 0.32 0.26 0.29 4.62 3.65 3.15 3.57 OSU‐Stillwater Community Transit Stillwater 1.05 0.99 0.90 0.80 15.60 14.47 13.23 11.79 Community Action Development Corporation Frederick 0.15 0.14 0.12 0.11 3.04 3.01 2.70 2.36 KI BOIS Community Action Foundation, Inc. Stigler 0.13 0.13 0.13 0.13 2.54 2.53 2.47 2.41 City of Guymon Guymon 0.34 0.58 0.54 0.50 4.61 4.56 4.18 3.79 Delta Community Action Foundation, Inc. Lindsay 0.25 0.23 0.26 0.30 2.68 2.18 2.36 2.73 Little Dixie Community Action Agency, Inc. Hugo 0.12 0.13 0.15 0.14 2.00 2.10 2.40 2.46 Town of Beaver Beaver 1.55 1.79 1.47 1.23 3.73 3.56 4.01 3.55 Muskogee County Public Transit Authority Muskogee 0.14 0.14 0.14 0.10 2.07 1.97 1.88 1.32 Inca Community Services, Inc. Atoka 0.19 0.19 0.17 0.17 3.50 3.31 2.97 2.94 Logan County Historical Society Guthrie 0.09 0.08 0.09 0.09 2.11 2.00 1.97 1.99 Washita Valley Community Action Council Chickasha 0.21 0.20 0.15 0.16 2.37 2.09 1.58 1.65 Northern Oklahoma Development Authority ENID 0.06 0.06 0.06 0.06 1.24 1.20 1.21 1.13 Enid Public Transportation Authority Enid 0.20 0.20 0.19 0.20 2.76 2.60 2.41 2.68 Southwest Oklahoma Community Action Group, Inc. Altus 0.14 0.15 0.16 0.14 3.32 3.04 3.20 2.68 Big Five Community Services, Inc. Durant 0.23 0.23 0.22 0.21 3.10 3.03 3.00 2.74 Central Oklahoma Community Action Agency Shawnee 0.07 0.07 0.07 0.07 1.18 1.34 1.28 1.26 Grand Gateway EDA/ Pelivan Big Cabin 0.22 0.19 0.18 0.18 2.91 2.68 2.62 2.51 MAGB Transportation, Inc. Fairview 0 0.03 0.03 0 0 0.66 0.62 0
Source: National Transit Database
42
Table 5.14 Tribal Transit Agencies: Agency‐Level Operating Statistics, 2014‐2017
Name City Total Rides Total Vehicle Miles Total Vehicle Hours
(thousands) (thousands) (thousands)
2014 2015 2016 2017 2014 2015 2016 2017 2014 2015 2016 2017
Chickasaw Nation Ada 45 45 46 54 766 796 840 830 36 35 38 37 Choctaw Nation of Oklahoma Hugo 26 34 43 43 810 815 951 917 22 18 22 24 Citizen Potawatomi Nation Shawnee 26 27 26 29 213 220 224 204 12 14 16 15 Comanche Nation Lawton 24 27 28 27 217 237 254 188 18 11 12 13 Cherokee Nation Tahlequah ‐ 109 ‐ ‐ ‐ 771 ‐ ‐ ‐ 43 ‐ ‐ Ponca Tribe of Oklahoma Ponca City 93 113 10 10 157 129 81 99 9 12 2 3 Seminole Nation Public Transit Wewoka 35 29 25 26 367 285 264 286 11 10 9 11 Kiowa Tribe Carnegie 6 12 8 8 151 282 76 71 7 8 2 2 Muscogee (Creek) Nation Okmulgee 36 56 66 66 283 358 441 403 12 16 23 21 United Keetoowah Band of Cherokee Indians Tahlequah 12 17 20 18 75 81 79 92 2 3 5 6 Cheyenne & Arapaho Tribes Concho 8 6 7 9 253 233 238 218 8 8 9 7 Delaware Nation Anadarko 1 ‐ ‐ ‐ 31 2 ‐ ‐ 4 ‐ ‐ ‐
Source: National Transit Database
Table 5.15 Tribal Transit Agencies: Agency‐Level Fleet Statistics and Performance Measures, 2014‐2017
Agency Name City Total Vehicles Trips Per Vehicle Miles Per Vehicle Hours Per Vehicle
2014 2015 2016 2017 2014 2015 2016 2017 2014 2015 2016 2017 2014 2015 2016 2017
Chickasaw Nation Ada 28 30 29 33 1,591 1,511 1,595 1,622 27,356 26,531 28,978 25,148 1,271 1,163 1,310 1,136 Choctaw Nation of Oklahoma Hugo 24 18 22 40 1,095 1,869 1,961 1,073 33,762 45,273 43,211 22,934 903 976 1,005 610 Citizen Potawatomi Nation Shawnee 8 7 7 7 3,205 3,818 3,685 4,122 26,589 31,493 32,001 29,089 1,524 1,959 2,276 2,122 Comanche Nation Lawton 12 9 9 13 2,035 3,015 3,078 2,091 18,046 26,327 28,222 14,439 1,470 1,220 1,343 974 Cherokee Nation Tahlequah 0 9 0 0 0 12,126 0 0 0 85,714 0 0 0 4,757 0 0 Ponca Tribe of Oklahoma Ponca City 7 6 6 6 13,350 18,750 1,720 1,650 22,473 21,437 13,529 16,425 1,332 2,072 384 462 Seminole Nation Public Transit Wewoka 5 5 5 7 6,935 5,767 4,976 3,719 73,403 56,976 52,854 40,913 2,290 1,960 1,889 1,503 Kiowa Tribe Carnegie 6 6 6 6 1,049 2,046 1,385 1,343 25,128 47,058 12,596 11,834 1,173 1,336 302 271 Muscogee (Creek) Nation Okmulgee 18 26 26 23 2,017 2,135 2,531 2,886 15,697 13,787 16,943 17,516 651 625 874 922 United Keetoowah Band of
Cherokee Indians in Oklahoma Tahlequah 4 5 8 7 3,029 3,402 2,506 2,515 18,715 16,276 9,845 13,111 597 546 638 846 Cheyenne & Arapaho Tribes Concho 6 6 6 11 1,336 1,069 1,234 821 42,226 38,879 39,589 19,811 1,303 1,255 1,550 631 Delaware Nation Anadarko 2 2 ‐ ‐ 600 104 ‐ ‐ 15,600 959 ‐ ‐ 1,920 108 ‐ ‐
Source: National Transit Database
43
Table 5.16 Tribal Transit Agencies: Agency‐Level Operating Expenses and Performance Measures, 2014‐2017
Agency Name City Operating Expense (thousand $) Operating Expense Per Trip ($) Operating Expense Per Mile ($) Farebox Recovery Ratio
2014 2015 2016 2017 2014 2015 2016 2017 2014 2015 2016 2017 2014 2015 2016 2017
Chickasaw Nation Choctaw Nation of
Ada 1,897 2,117 2,498 3,265 42.60 46.70 54.03 60.99 2.48 2.66 2.97 3.93 0.00% 0.00% 0.13% 0.09%
Oklahoma Hugo 1,032 1,215 1,304 1,769 39.26 36.12 30.23 41.21 1.27 1.49 1.37 1.93 0.00% 0.00% 0.00% 0.00% Citizen Potawatomi Nation Shawnee 480 448 498 532 18.71 16.75 19.31 18.44 2.26 2.03 2.22 2.61 0.00% 0.00% 0.00% 0.00% Comanche Nation Lawton 836 820 860 1,052 34.22 30.23 31.05 38.71 3.86 3.46 3.39 5.61 4.55% 5.34% 5.65% 4.67% Cherokee Nation Tahlequah ‐ 933 1,025 ‐ ‐ 8.55 ‐ ‐ ‐ 1.21 ‐ ‐ ‐ 5.46% 0.00% 0.00% Ponca Tribe of Oklahoma Ponca City 318 235 296 324 3.40 2.09 28.72 32.69 2.02 1.82 3.65 3.28 1.44% 4.09% 2.56% 4.07% Seminole Nation of Oklahoma
Wewoka
599
462
445
423
17.29
16.03
17.89
16.26
1.63
1.62
1.68
1.48
0.00%
0.00%
0.00%
0.00% Kiowa Tribe of Oklahoma Carnegie 129 327 121 124 20.56 26.64 14.59 15.45 0.86 1.16 1.60 1.75 6.37% 0.00% 0.00% 0.00% Muscogee (Creek) Nation Okmulgee 511 1,719 1,837 1,257 14.09 30.97 27.91 18.93 1.81 4.80 4.17 3.12 7.17% 0.00% 0.00% 0.00% United Keetoowah Band of Cherokee Indians in
Oklahoma Tahlequah 243 179 214 242 20.01 10.54 10.67 13.75 3.24 2.20 2.72 2.64 3.55% 11.05% 10.68% 8.58% Cheyenne and Arapaho
Tribes Concho 476 418 406 427 59.42 65.24 54.91 47.23 1.88 1.79 1.71 1.96 1.62% 1.75% 1.51% 0.96% Delaware Nation Anadarko 78 5 ‐ ‐ 64.64 24.20 ‐ ‐ 2.49 2.61 ‐ ‐ 3.09% 14.11% 0.00% 0.00%
Source: National Transit Database
Table 5.17 Tribal Transit Agencies: Trips Per Vehicle Mile and Trips Per Vehicle Hour, 2014‐2017
Trips Per Vehicle Mile Trips Per Vehicle Hour Agency Name City 2014 2015 2016 2017 2014 2015 2016 2017
Chickasaw Nation Ada 0.06 0.06 0.06 0.06 1.25 1.30 1.22 1.43 Choctaw Nation of Oklahoma Hugo 0.03 0.04 0.05 0.05 1.21 1.92 1.95 1.76 Citizen Potawatomi Nation Shawnee 0.12 0.12 0.12 0.14 2.10 1.95 1.62 1.94 Comanche Nation Lawton 0.11 0.11 0.11 0.14 1.38 2.47 2.29 2.15 Cherokee Nation Tahlequah ‐ 0.14 ‐ ‐ ‐ 2.55 ‐ ‐ Ponca Tribe of Oklahoma Ponca City 0.59 0.87 0.13 0.10 10.02 9.05 4.48 3.57 Seminole Nation Public Transit Wewoka 0.09 0.10 0.09 0.09 3.03 2.94 2.63 2.48 Kiowa Tribe Carnegie 0.04 0.04 0.11 0.11 0.89 1.53 4.58 4.96 Muscogee (Creek) Nation Okmulgee 0.13 0.15 0.15 0.16 3.10 3.42 2.90 3.13 United Keetoowah Band of Cherokee Indians in Oklahoma Tahlequah 0.16 0.21 0.25 0.19 5.07 6.23 3.93 2.97 Cheyenne & Arapaho Tribes Concho 0.03 0.03 0.03 0.04 1.03 0.85 0.80 1.30 Delaware Nation Anadarko 0.04 0.11 ‐ ‐ 0.31 0.96 ‐ ‐
Source: National Transit Database
44
5.2 Oklahoma’s Transit Network
Oklahoma currently has 33 transit agencies that offer a range of services, broadly categorized into fixed route or demand response service. Transit agency service areas, or the locations their service travels, also vary, although most are defined along political lines and serve an entire city or county, a portion of a county, or multiple counties. In 2017 there were five urban transit systems, 19 rural transit systems, and 10 tribal transit systems in Oklahoma. In 2018, Pontotoc County's Call‐A‐Ride transportation service shut down transit services due to a financial crisis. In general, urban transit systems tend to operate scheduled, fixed route services, while rural and tribal areas are more likely to operate demand response, or dial‐a‐ride type service. In addition, four Oklahoma counties have no public transportation service at all. Most of these are located in north Oklahoma along the Kansas border, and one is located along the Colorado border (See Figure 5.1).
Figure 5.1 Counties with No Transit Service
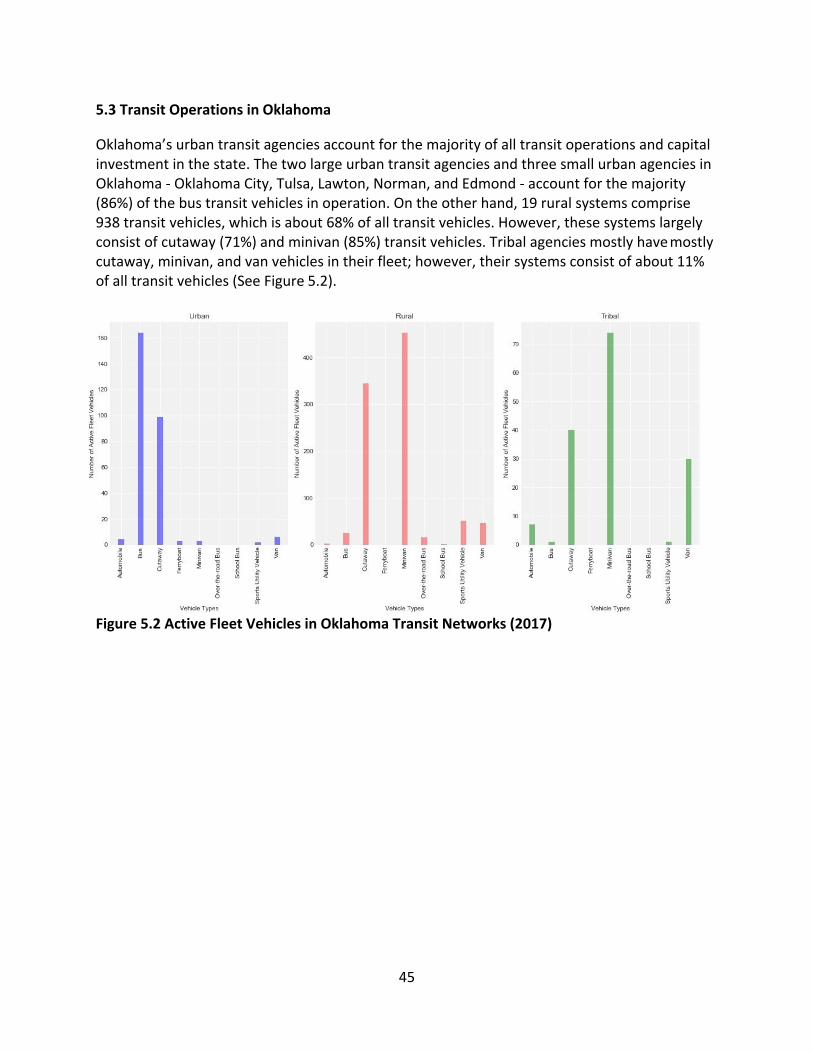
45
5.3 Transit Operations in Oklahoma
Oklahoma’s urban transit agencies account for the majority of all transit operations and capital investment in the state. The two large urban transit agencies and three small urban agencies in Oklahoma ‐ Oklahoma City, Tulsa, Lawton, Norman, and Edmond ‐ account for the majority (86%) of the bus transit vehicles in operation. On the other hand, 19 rural systems comprise 938 transit vehicles, which is about 68% of all transit vehicles. However, these systems largely consist of cutaway (71%) and minivan (85%) transit vehicles. Tribal agencies mostly have mostly cutaway, minivan, and van vehicles in their fleet; however, their systems consist of about 11% of all transit vehicles (See Figure 5.2).
Figure 5.2 Active Fleet Vehicles in Oklahoma Transit Networks (2017)
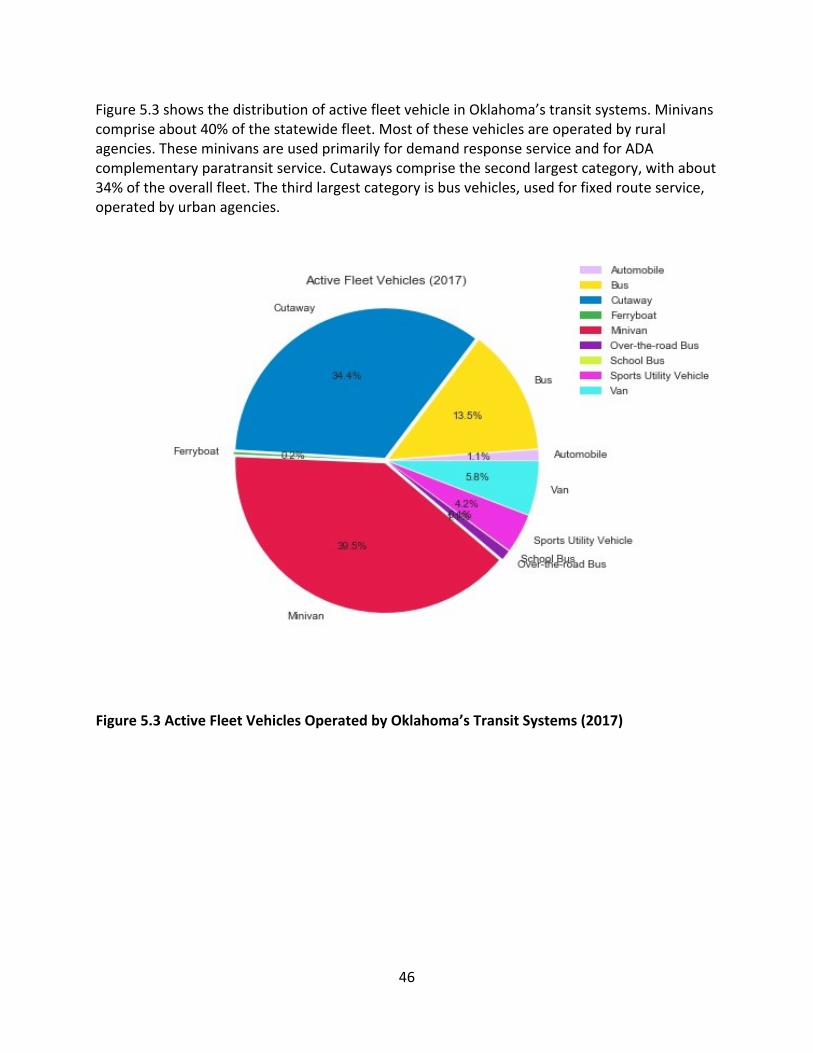
46
Figure 5.3 shows the distribution of active fleet vehicle in Oklahoma’s transit systems. Minivans comprise about 40% of the statewide fleet. Most of these vehicles are operated by rural agencies. These minivans are used primarily for demand response service and for ADA complementary paratransit service. Cutaways comprise the second largest category, with about 34% of the overall fleet. The third largest category is bus vehicles, used for fixed route service, operated by urban agencies.
Figure 5.3 Active Fleet Vehicles Operated by Oklahoma’s Transit Systems (2017)
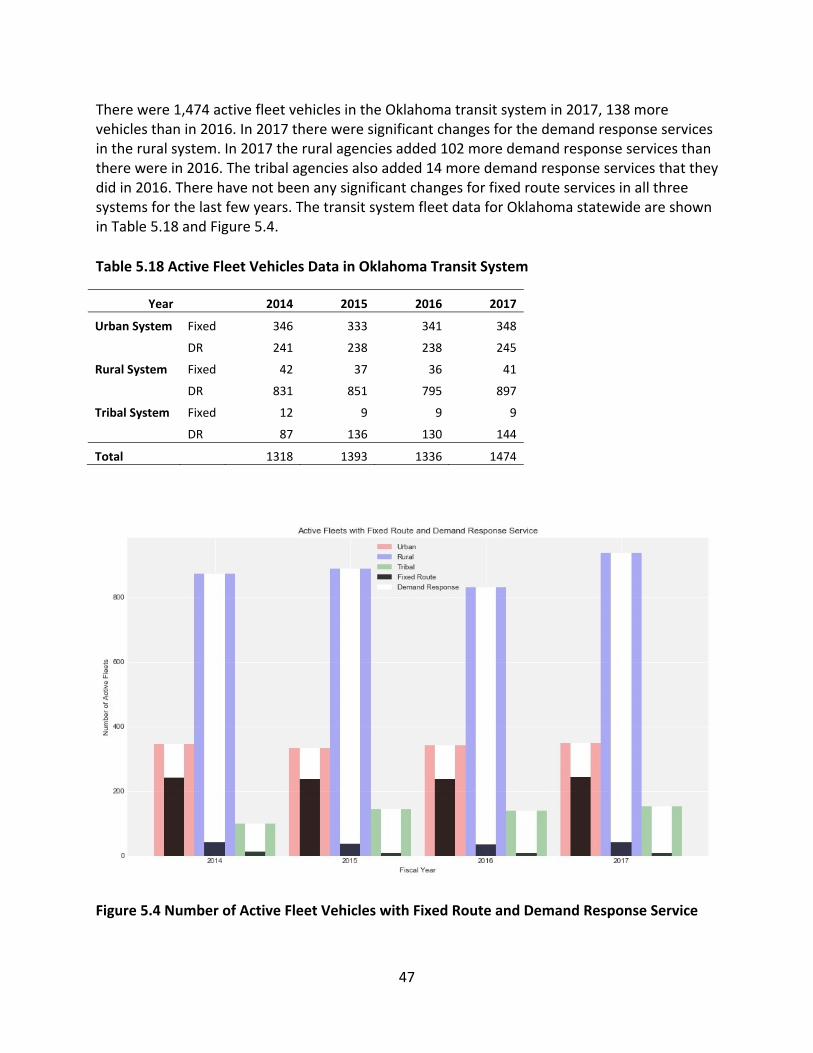
47
There were 1,474 active fleet vehicles in the Oklahoma transit system in 2017, 138 more vehicles than in 2016. In 2017 there were significant changes for the demand response services in the rural system. In 2017 the rural agencies added 102 more demand response services than there were in 2016. The tribal agencies also added 14 more demand response services that they did in 2016. There have not been any significant changes for fixed route services in all three systems for the last few years. The transit system fleet data for Oklahoma statewide are shown in Table 5.18 and Figure 5.4.
Table 5.18 Active Fleet Vehicles Data in Oklahoma Transit System
Year 2014 2015 2016 2017
Urban System Fixed 346 333 341 348
DR 241 238 238 245
Rural System Fixed 42 37 36 41
DR 831 851 795 897
Tribal System Fixed 12 9 9 9
DR 87 136 130 144
Total 1318 1393 1336 1474
Figure 5.4 Number of Active Fleet Vehicles with Fixed Route and Demand Response Service
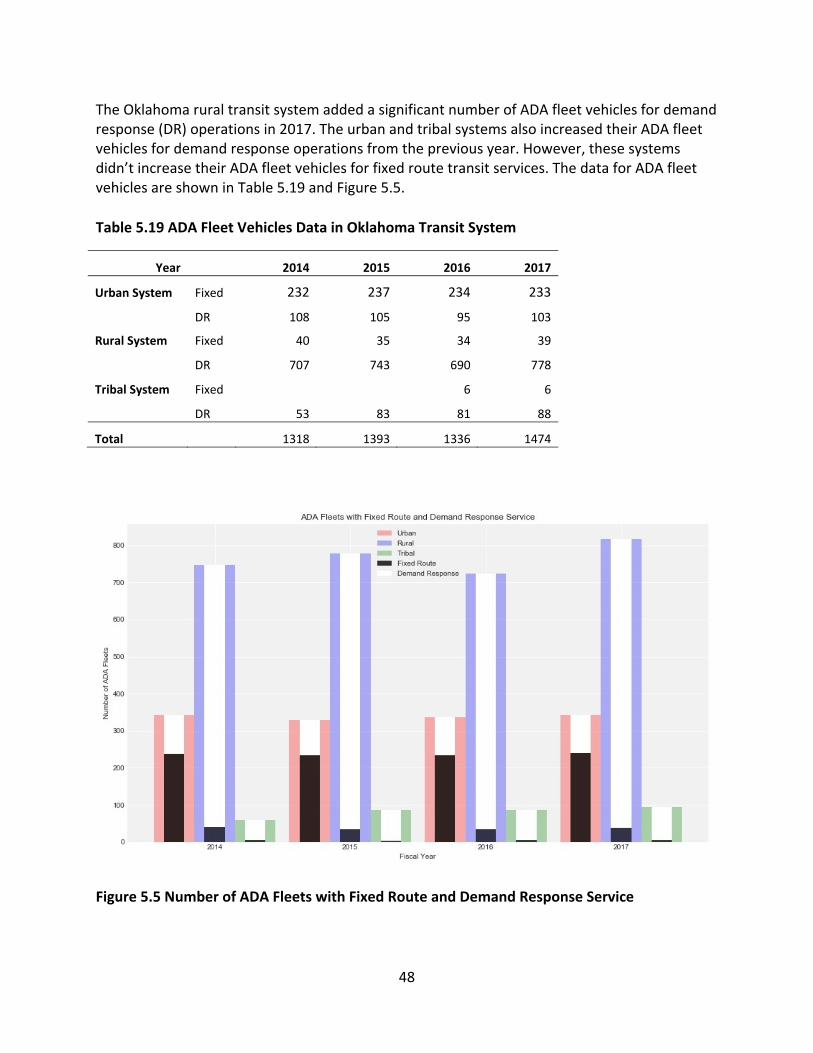
48
The Oklahoma rural transit system added a significant number of ADA fleet vehicles for demand response (DR) operations in 2017. The urban and tribal systems also increased their ADA fleet vehicles for demand response operations from the previous year. However, these systems didn’t increase their ADA fleet vehicles for fixed route transit services. The data for ADA fleet vehicles are shown in Table 5.19 and Figure 5.5.
Table 5.19 ADA Fleet Vehicles Data in Oklahoma Transit System
Year 2014 2015 2016 2017
Urban System Fixed 232 237 234 233
DR 108 105 95 103
Rural System Fixed 40 35 34 39
DR 707 743 690 778
Tribal System Fixed 6 6
DR 53 83 81 88
Total 1318 1393 1336 1474
Figure 5.5 Number of ADA Fleets with Fixed Route and Demand Response Service
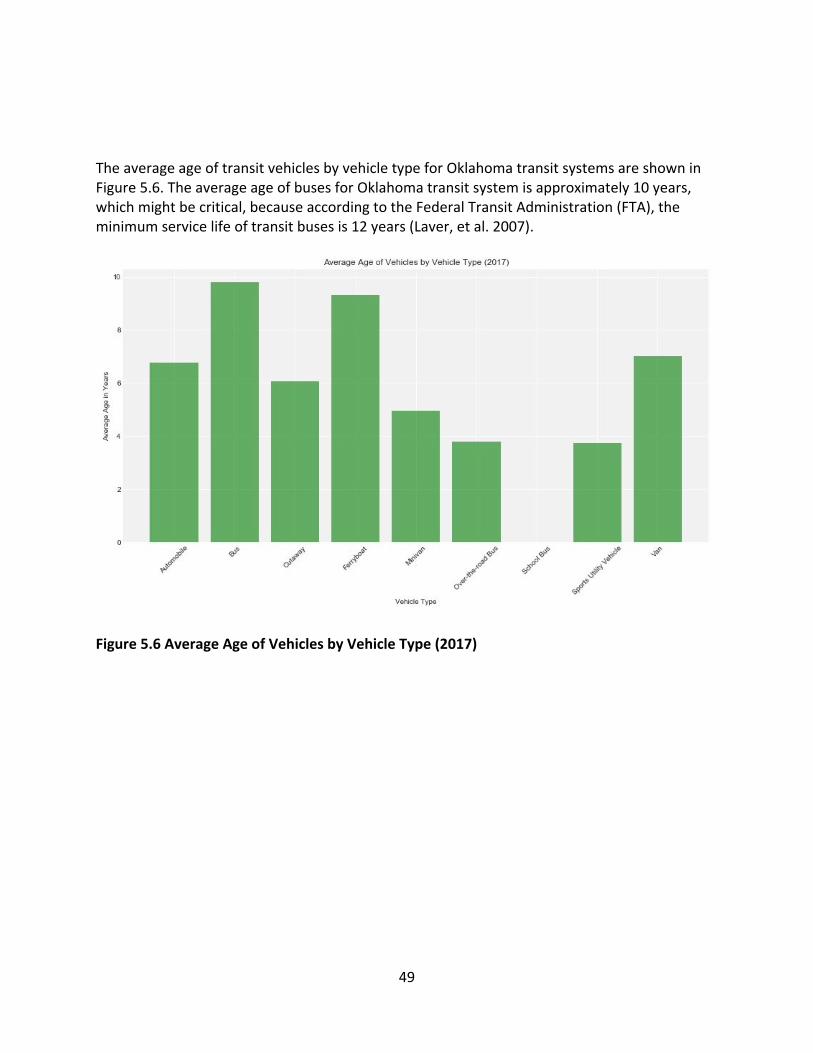
49
The average age of transit vehicles by vehicle type for Oklahoma transit systems are shown in Figure 5.6. The average age of buses for Oklahoma transit system is approximately 10 years, which might be critical, because according to the Federal Transit Administration (FTA), the minimum service life of transit buses is 12 years (Laver, et al. 2007).
Figure 5.6 Average Age of Vehicles by Vehicle Type (2017)
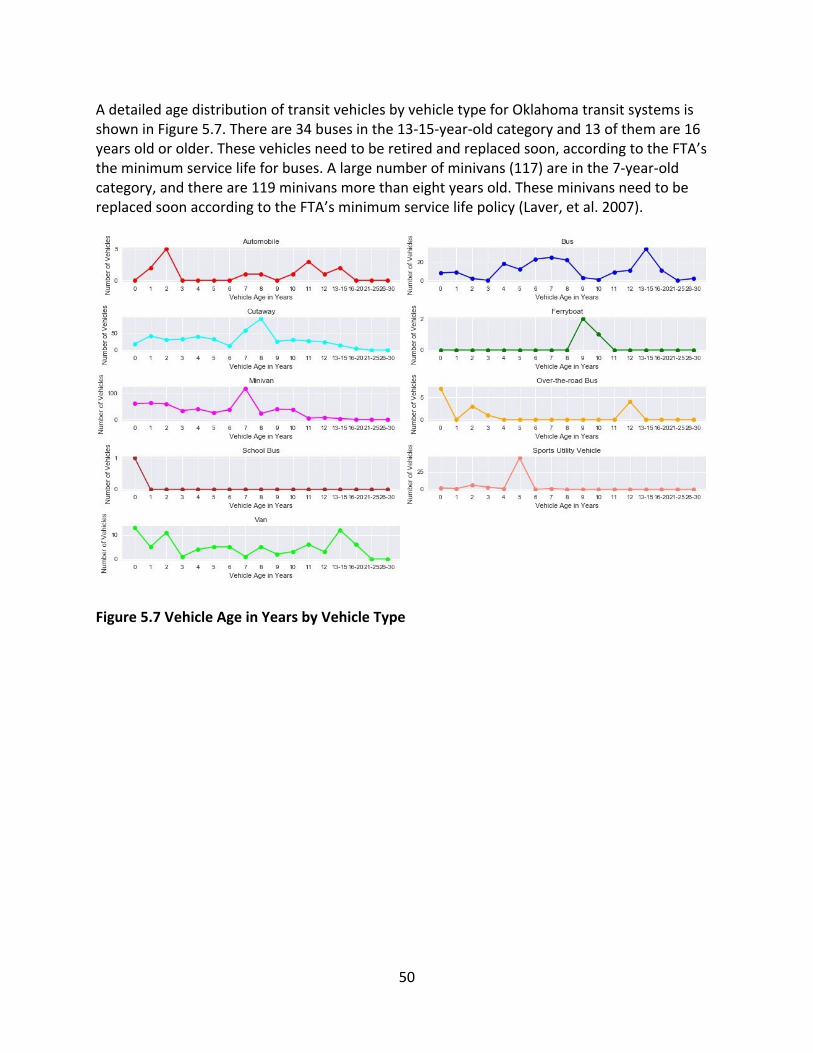
50
A detailed age distribution of transit vehicles by vehicle type for Oklahoma transit systems is shown in Figure 5.7. There are 34 buses in the 13‐15‐year‐old category and 13 of them are 16 years old or older. These vehicles need to be retired and replaced soon, according to the FTA’s the minimum service life for buses. A large number of minivans (117) are in the 7‐year‐old category, and there are 119 minivans more than eight years old. These minivans need to be replaced soon according to the FTA’s minimum service life policy (Laver, et al. 2007).
Figure 5.7 Vehicle Age in Years by Vehicle Type
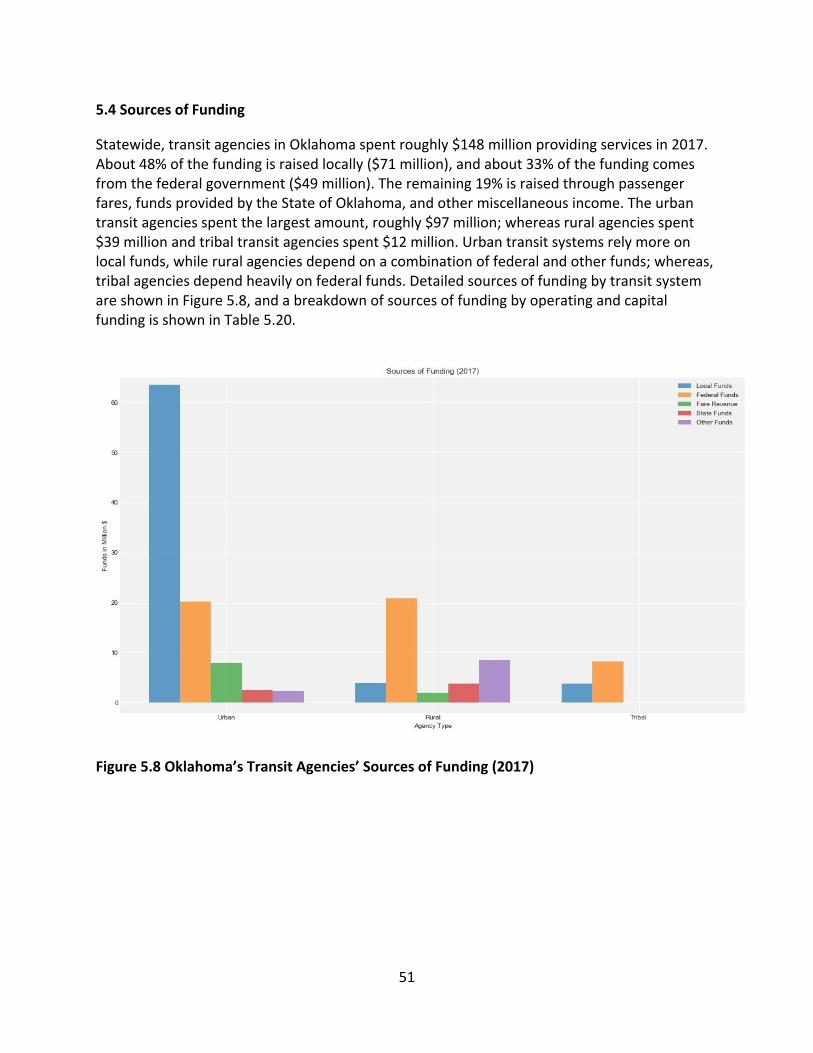
51
5.4 Sources of Funding
Statewide, transit agencies in Oklahoma spent roughly $148 million providing services in 2017. About 48% of the funding is raised locally ($71 million), and about 33% of the funding comes from the federal government ($49 million). The remaining 19% is raised through passenger fares, funds provided by the State of Oklahoma, and other miscellaneous income. The urban transit agencies spent the largest amount, roughly $97 million; whereas rural agencies spent $39 million and tribal transit agencies spent $12 million. Urban transit systems rely more on local funds, while rural agencies depend on a combination of federal and other funds; whereas, tribal agencies depend heavily on federal funds. Detailed sources of funding by transit system are shown in Figure 5.8, and a breakdown of sources of funding by operating and capital funding is shown in Table 5.20.
Figure 5.8 Oklahoma’s Transit Agencies’ Sources of Funding (2017)
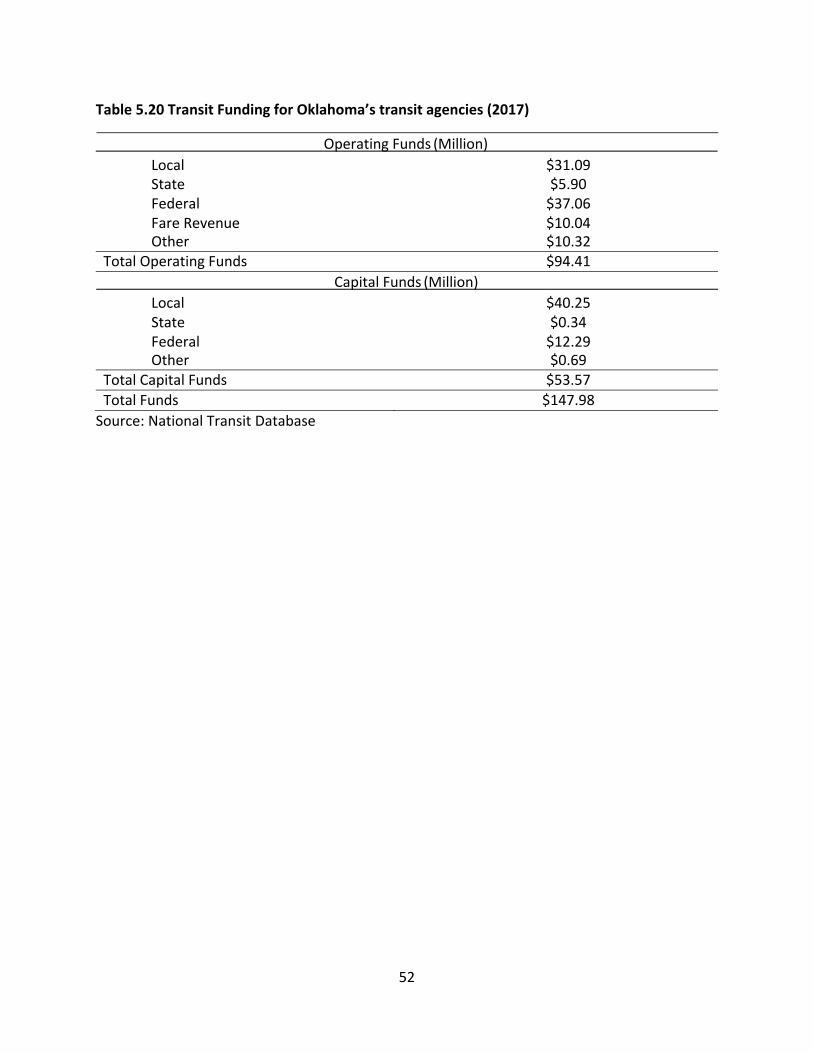
52
Table 5.20 Transit Funding for Oklahoma’s transit agencies (2017)
Operating Funds (Million)
Local $31.09 State $5.90 Federal $37.06 Fare Revenue $10.04 Other $10.32
Total Operating Funds $94.41
Capital Funds (Million)
Local $40.25 State $0.34 Federal $12.29 Other $0.69
Total Capital Funds $53.57
Total Funds $147.98
Source: National Transit Database
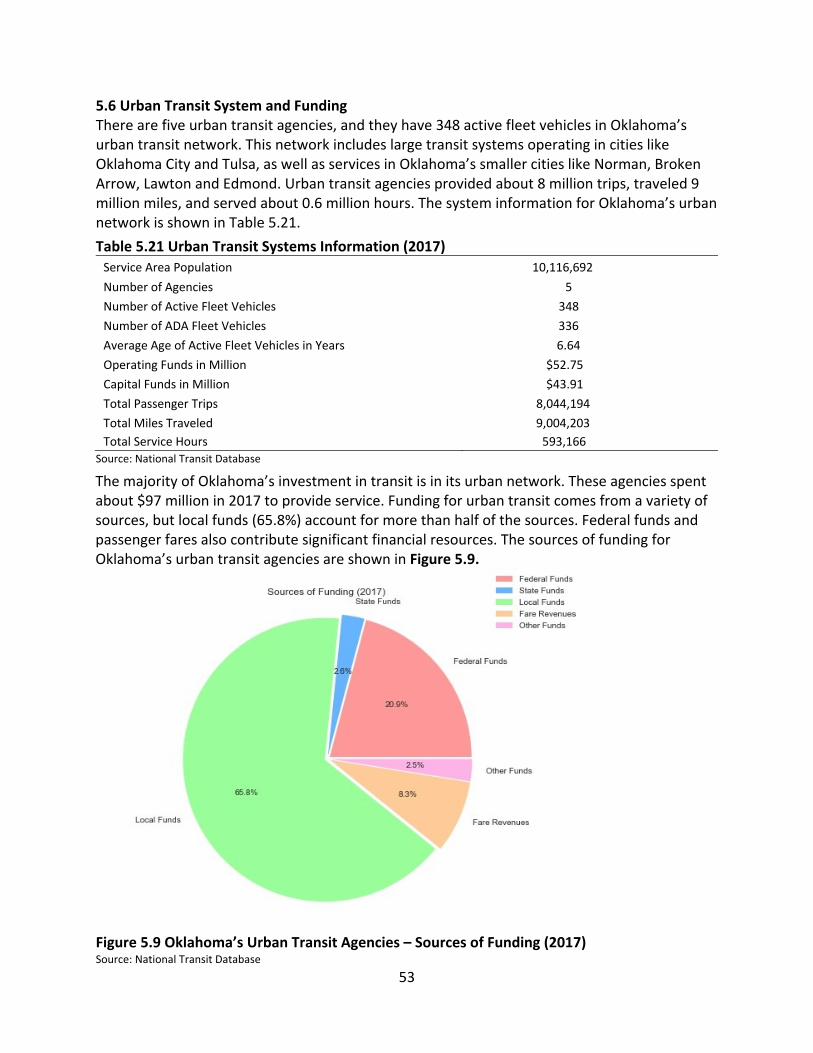
53
5.6 Urban Transit System and Funding There are five urban transit agencies, and they have 348 active fleet vehicles in Oklahoma’s urban transit network. This network includes large transit systems operating in cities like Oklahoma City and Tulsa, as well as services in Oklahoma’s smaller cities like Norman, Broken Arrow, Lawton and Edmond. Urban transit agencies provided about 8 million trips, traveled 9 million miles, and served about 0.6 million hours. The system information for Oklahoma’s urban network is shown in Table 5.21.
Table 5.21 Urban Transit Systems Information (2017)
Service Area Population 10,116,692
Number of Agencies 5
Number of Active Fleet Vehicles 348
Number of ADA Fleet Vehicles 336
Average Age of Active Fleet Vehicles in Years 6.64
Operating Funds in Million $52.75
Capital Funds in Million $43.91
Total Passenger Trips 8,044,194
Total Miles Traveled 9,004,203
Total Service Hours 593,166
Source: National Transit Database
The majority of Oklahoma’s investment in transit is in its urban network. These agencies spent about $97 million in 2017 to provide service. Funding for urban transit comes from a variety of sources, but local funds (65.8%) account for more than half of the sources. Federal funds and passenger fares also contribute significant financial resources. The sources of funding for Oklahoma’s urban transit agencies are shown in Figure 5.9.
Figure 5.9 Oklahoma’s Urban Transit Agencies – Sources of Funding (2017) Source: National Transit Database
54
5.7 Rural Transit System and Funding
Oklahoma’s 19 rural transit agencies spent about $39 million in 2017 to provide service. Rural services operated 938 active fleet vehicles in 52 counties (see Table 5.23) and provided about 2.5 million trips in 2017. Rural transit systems served 0.9 million hours and traveled about 16 million miles (See Table 5.22). Table 5.22 Rural Transit Systems Information (2017) Number of Agencies 19
Number of Active Fleet Vehicles 938 Number of ADA Fleet Vehicles 817 Average Age of Active Fleet Vehicles in Years 7.34 Number of Counties Served 52 Operating Funds in Million $30.59 Capital Funds in Million $8.5 Total Passenger Trips 2,522,162 Total Miles Traveled 16,200,597 Total Service Hours 933,920
Source: National Transit Database
About half of the existing funding for rural agencies comes from federal funding (46.2%). Local funds, state funds, passenger fares, and funds raised from other sources are also important resources for rural agencies. The sources of funding for rural transit systems are shown in Figure 5.10.
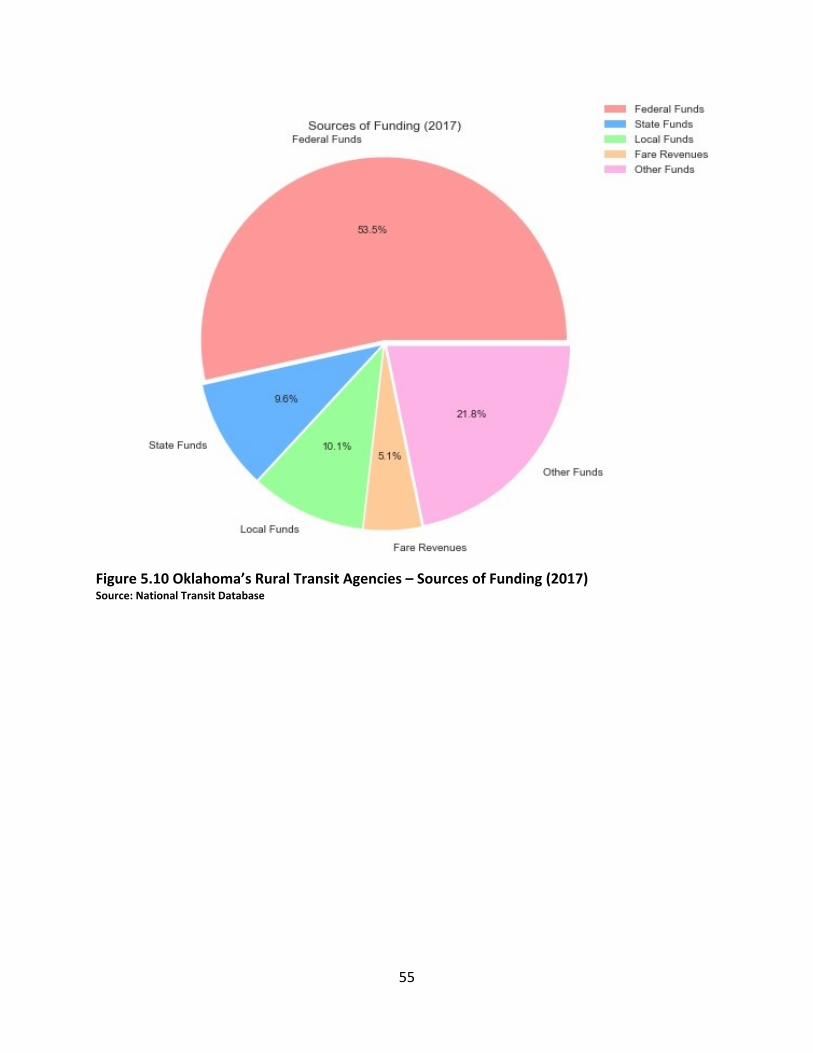
55
Figure 5.10 Oklahoma’s Rural Transit Agencies – Sources of Funding (2017) Source: National Transit Database
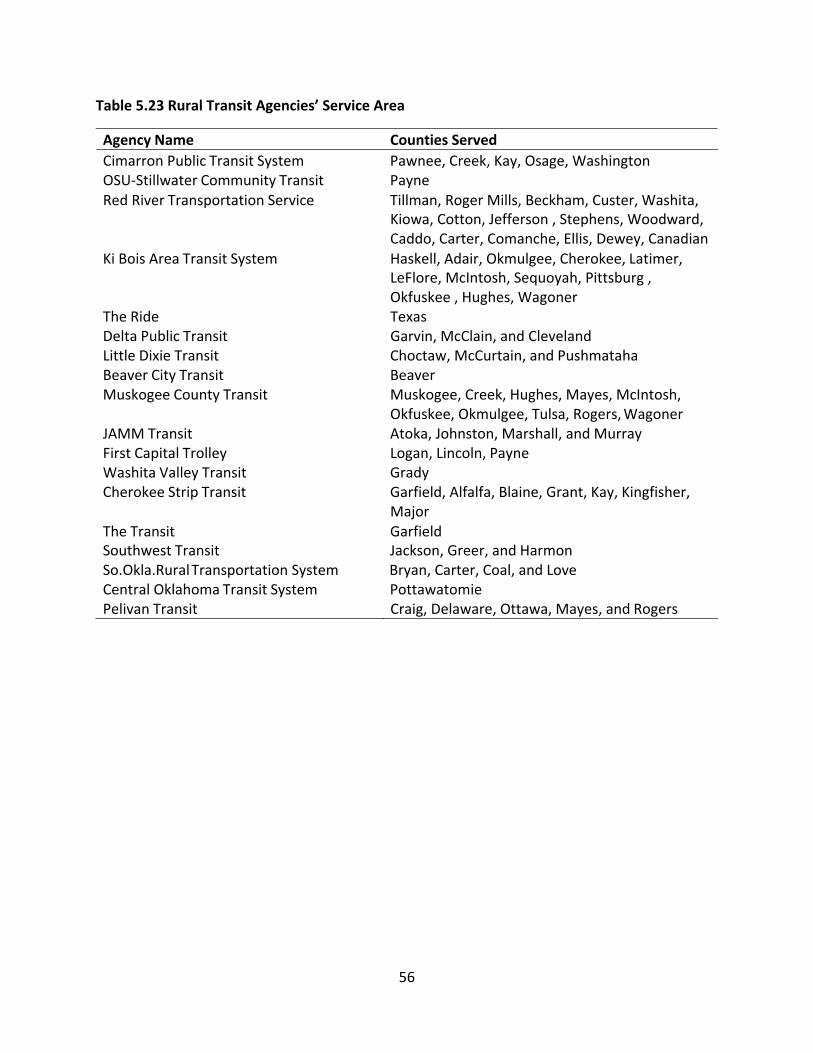
56
Table 5.23 Rural Transit Agencies’ Service Area
Agency Name Counties Served
Cimarron Public Transit System Pawnee, Creek, Kay, Osage, Washington OSU‐Stillwater Community Transit Payne Red River Transportation Service Tillman, Roger Mills, Beckham, Custer, Washita,
Kiowa, Cotton, Jefferson , Stephens, Woodward, Caddo, Carter, Comanche, Ellis, Dewey, Canadian
Ki Bois Area Transit System Haskell, Adair, Okmulgee, Cherokee, Latimer, LeFlore, McIntosh, Sequoyah, Pittsburg , Okfuskee , Hughes, Wagoner
The Ride Texas Delta Public Transit Garvin, McClain, and Cleveland Little Dixie Transit Choctaw, McCurtain, and Pushmataha Beaver City Transit Beaver Muskogee County Transit Muskogee, Creek, Hughes, Mayes, McIntosh,
Okfuskee, Okmulgee, Tulsa, Rogers, Wagoner JAMM Transit Atoka, Johnston, Marshall, and Murray First Capital Trolley Logan, Lincoln, Payne Washita Valley Transit Grady Cherokee Strip Transit Garfield, Alfalfa, Blaine, Grant, Kay, Kingfisher,
Major The Transit Garfield Southwest Transit Jackson, Greer, and Harmon So.Okla.Rural Transportation System Bryan, Carter, Coal, and Love Central Oklahoma Transit System Pottawatomie Pelivan Transit Craig, Delaware, Ottawa, Mayes, and Rogers
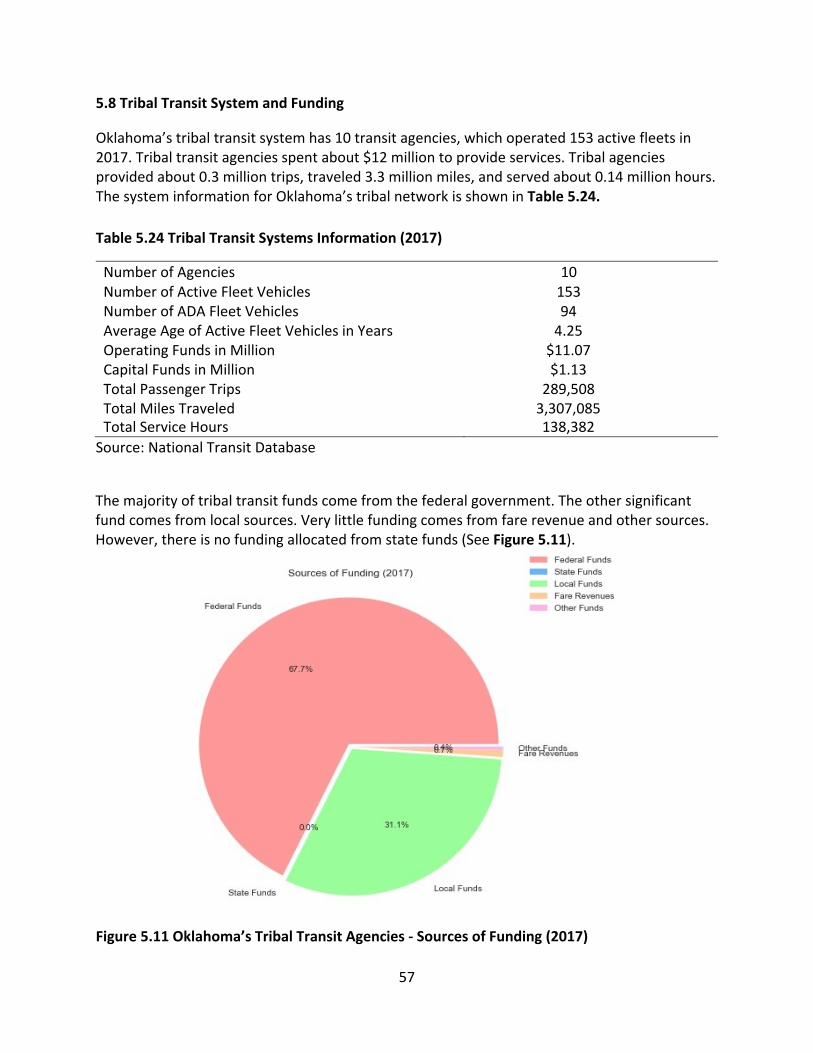
57
5.8 Tribal Transit System and Funding
Oklahoma’s tribal transit system has 10 transit agencies, which operated 153 active fleets in 2017. Tribal transit agencies spent about $12 million to provide services. Tribal agencies provided about 0.3 million trips, traveled 3.3 million miles, and served about 0.14 million hours. The system information for Oklahoma’s tribal network is shown in Table 5.24.
Table 5.24 Tribal Transit Systems Information (2017)
Number of Agencies 10 Number of Active Fleet Vehicles 153 Number of ADA Fleet Vehicles 94 Average Age of Active Fleet Vehicles in Years 4.25 Operating Funds in Million $11.07 Capital Funds in Million $1.13 Total Passenger Trips 289,508 Total Miles Traveled 3,307,085 Total Service Hours 138,382
Source: National Transit Database
The majority of tribal transit funds come from the federal government. The other significant fund comes from local sources. Very little funding comes from fare revenue and other sources. However, there is no funding allocated from state funds (See Figure 5.11).
Figure 5.11 Oklahoma’s Tribal Transit Agencies ‐ Sources of Funding (2017)
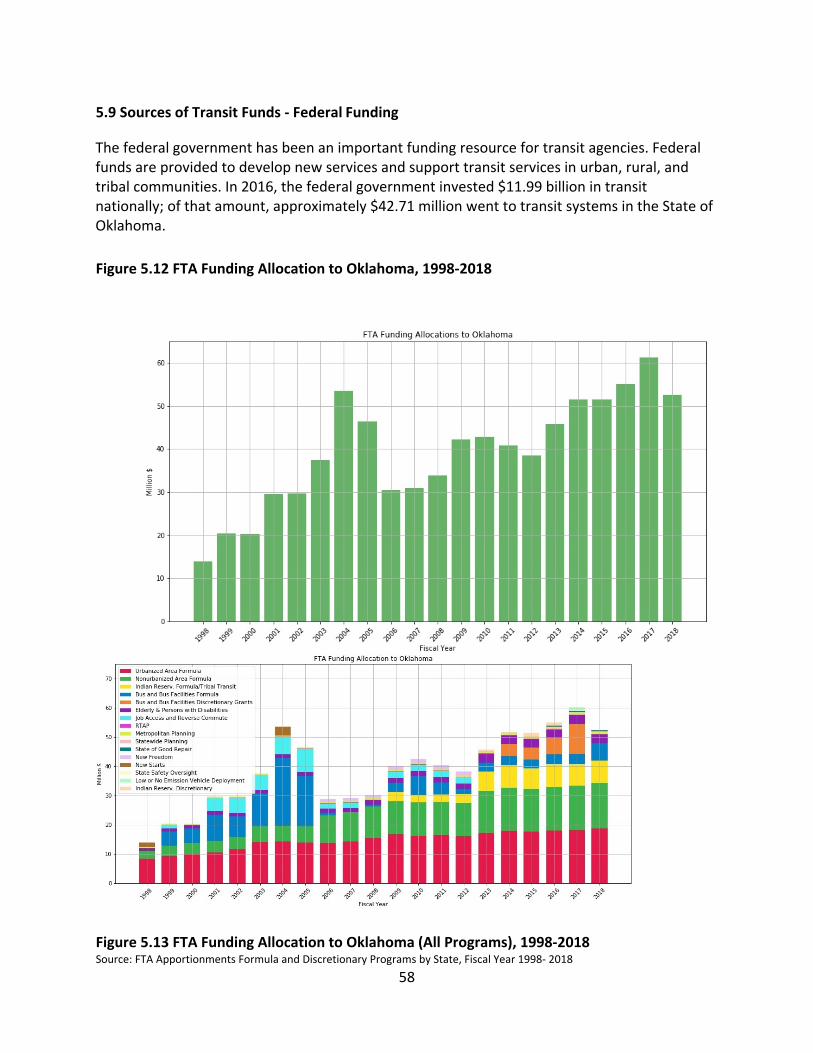
58
5.9 Sources of Transit Funds ‐ Federal Funding
The federal government has been an important funding resource for transit agencies. Federal funds are provided to develop new services and support transit services in urban, rural, and tribal communities. In 2016, the federal government invested $11.99 billion in transit nationally; of that amount, approximately $42.71 million went to transit systems in the State of Oklahoma.
Figure 5.12 FTA Funding Allocation to Oklahoma, 1998‐2018
Figure 5.13 FTA Funding Allocation to Oklahoma (All Programs), 1998‐2018 Source: FTA Apportionments Formula and Discretionary Programs by State, Fiscal Year 1998‐ 2018
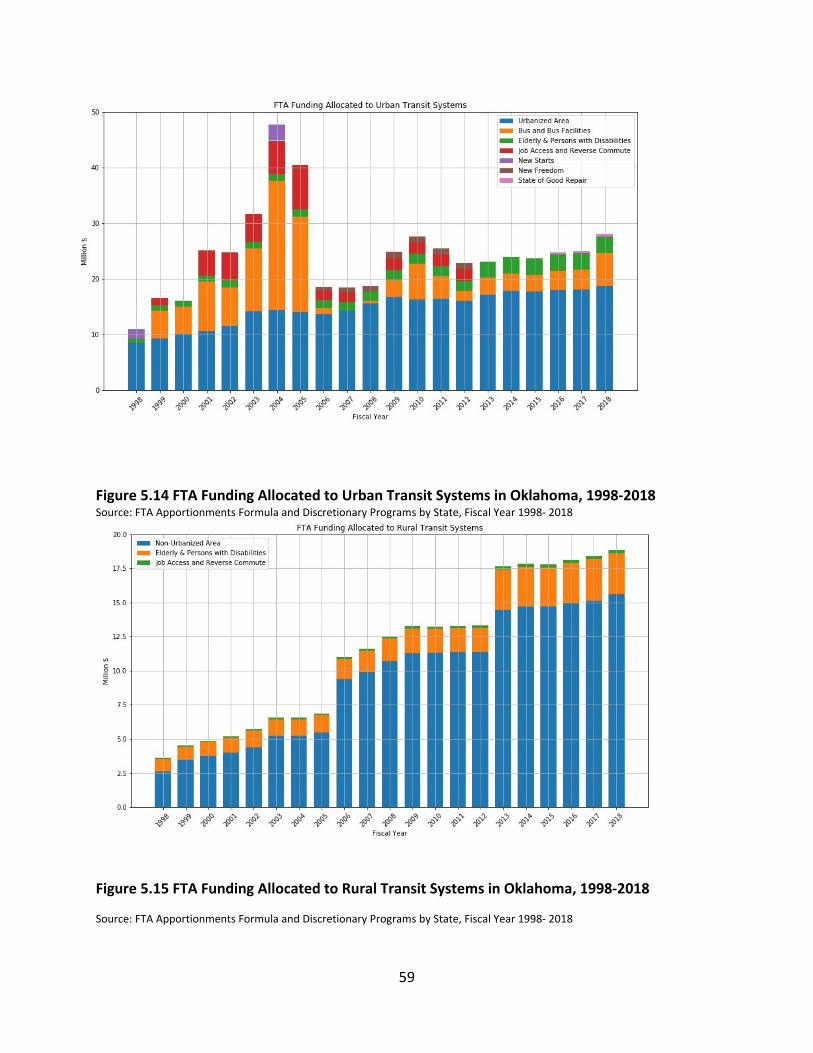
59
Figure 5.14 FTA Funding Allocated to Urban Transit Systems in Oklahoma, 1998‐2018 Source: FTA Apportionments Formula and Discretionary Programs by State, Fiscal Year 1998‐ 2018
Figure 5.15 FTA Funding Allocated to Rural Transit Systems in Oklahoma, 1998‐2018
Source: FTA Apportionments Formula and Discretionary Programs by State, Fiscal Year 1998‐ 2018
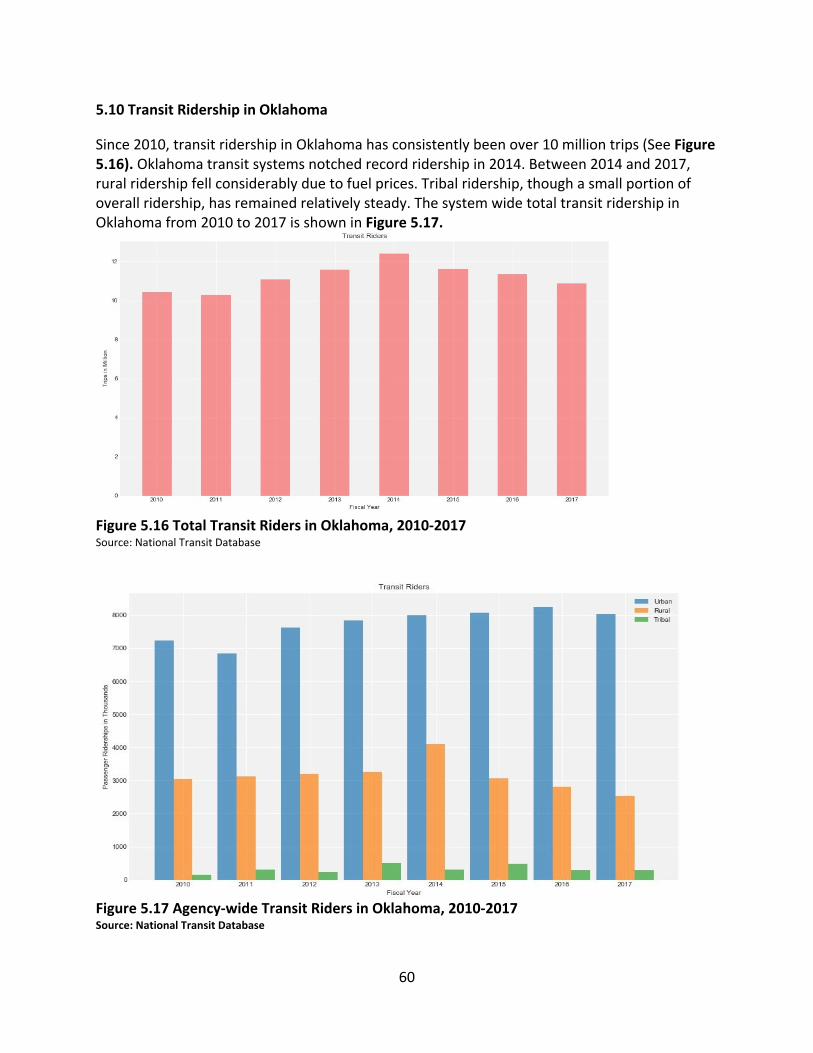
60
5.10 Transit Ridership in Oklahoma
Since 2010, transit ridership in Oklahoma has consistently been over 10 million trips (See Figure 5.16). Oklahoma transit systems notched record ridership in 2014. Between 2014 and 2017, rural ridership fell considerably due to fuel prices. Tribal ridership, though a small portion of overall ridership, has remained relatively steady. The system wide total transit ridership in Oklahoma from 2010 to 2017 is shown in Figure 5.17.
Figure 5.16 Total Transit Riders in Oklahoma, 2010‐2017 Source: National Transit Database
Figure 5.17 Agency‐wide Transit Riders in Oklahoma, 2010‐2017 Source: National Transit Database
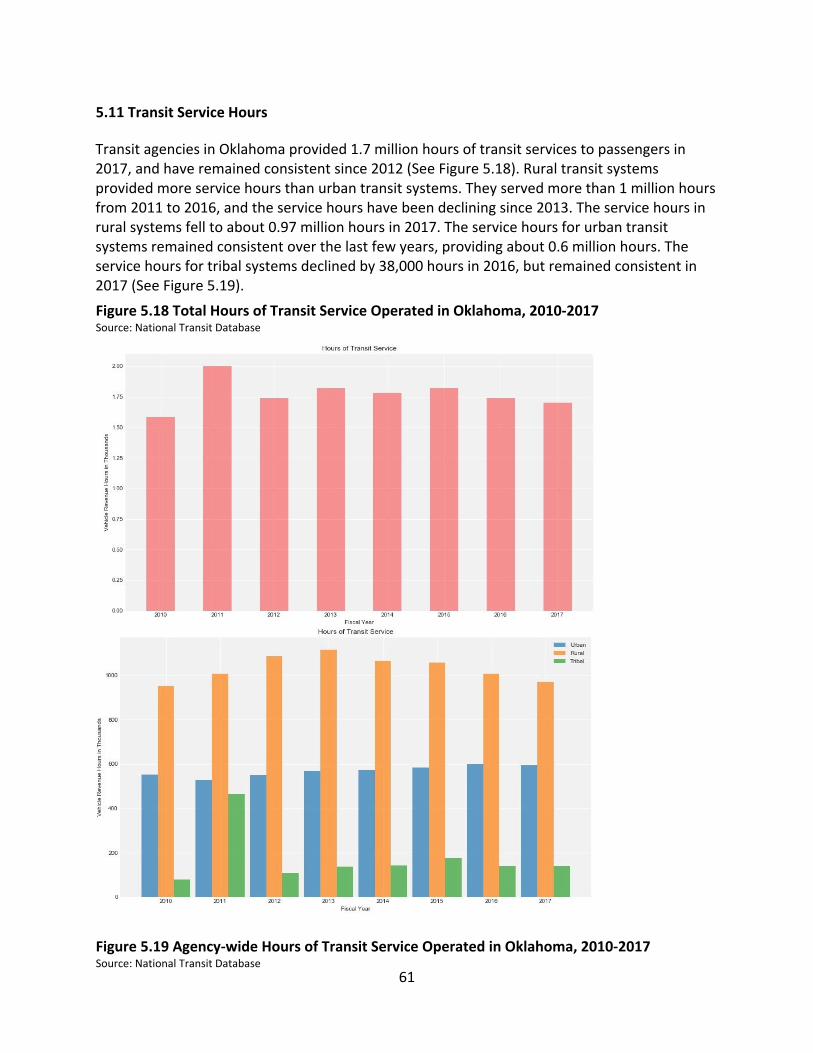
61
5.11 Transit Service Hours
Transit agencies in Oklahoma provided 1.7 million hours of transit services to passengers in 2017, and have remained consistent since 2012 (See Figure 5.18). Rural transit systems provided more service hours than urban transit systems. They served more than 1 million hours from 2011 to 2016, and the service hours have been declining since 2013. The service hours in rural systems fell to about 0.97 million hours in 2017. The service hours for urban transit systems remained consistent over the last few years, providing about 0.6 million hours. The service hours for tribal systems declined by 38,000 hours in 2016, but remained consistent in 2017 (See Figure 5.19).
Figure 5.18 Total Hours of Transit Service Operated in Oklahoma, 2010‐2017 Source: National Transit Database
Figure 5.19 Agency‐wide Hours of Transit Service Operated in Oklahoma, 2010‐2017 Source: National Transit Database
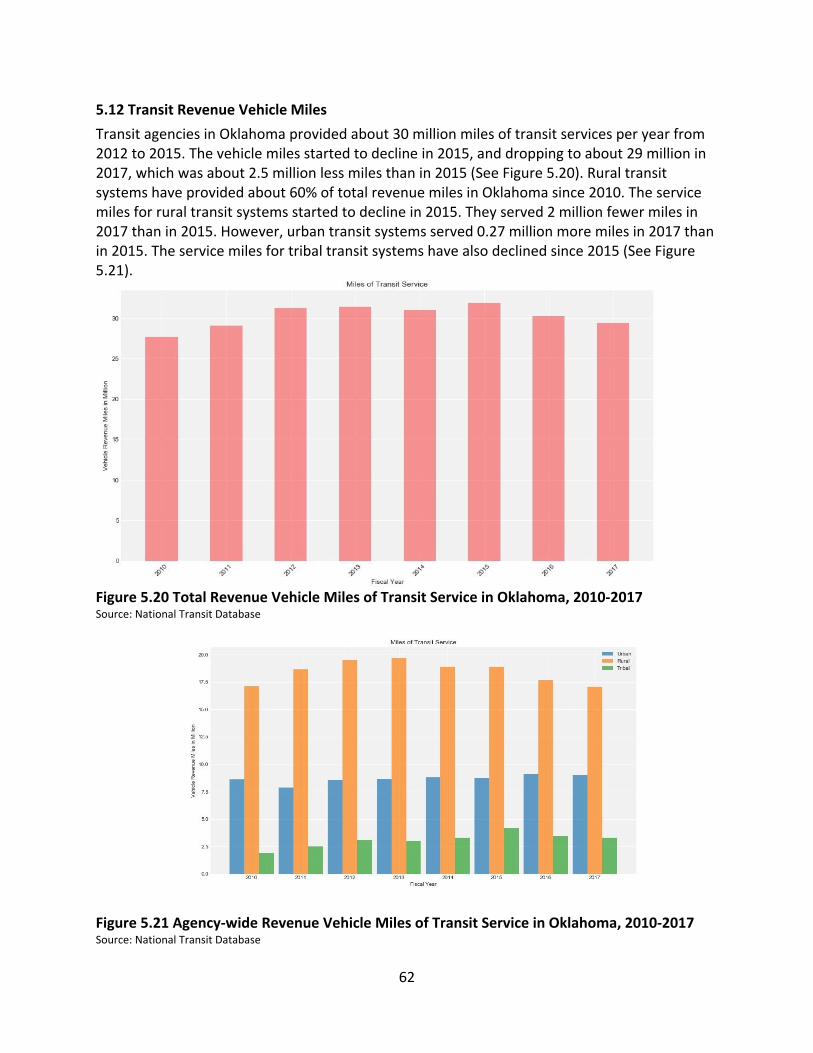
62
5.12 Transit Revenue Vehicle Miles
Transit agencies in Oklahoma provided about 30 million miles of transit services per year from 2012 to 2015. The vehicle miles started to decline in 2015, and dropping to about 29 million in 2017, which was about 2.5 million less miles than in 2015 (See Figure 5.20). Rural transit systems have provided about 60% of total revenue miles in Oklahoma since 2010. The service miles for rural transit systems started to decline in 2015. They served 2 million fewer miles in 2017 than in 2015. However, urban transit systems served 0.27 million more miles in 2017 than in 2015. The service miles for tribal transit systems have also declined since 2015 (See Figure 5.21).
Figure 5.20 Total Revenue Vehicle Miles of Transit Service in Oklahoma, 2010‐2017 Source: National Transit Database
Figure 5.21 Agency‐wide Revenue Vehicle Miles of Transit Service in Oklahoma, 2010‐2017 Source: National Transit Database
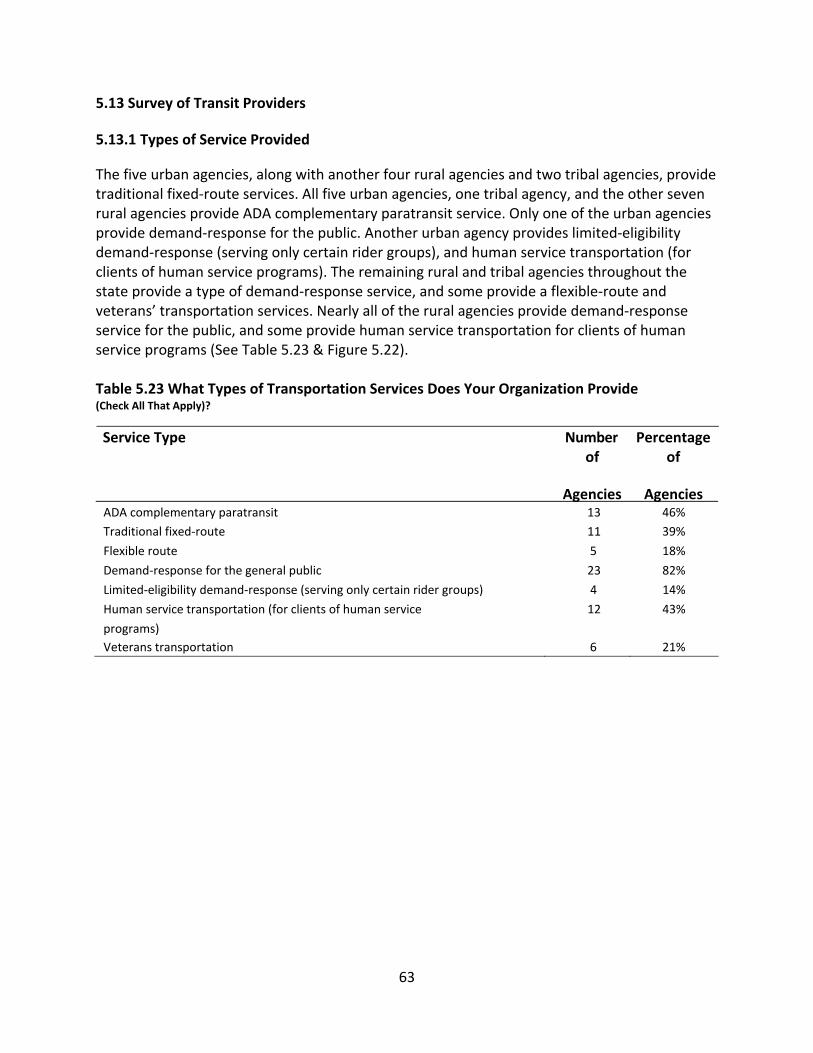
63
5.13 Survey of Transit Providers
5.13.1 Types of Service Provided
The five urban agencies, along with another four rural agencies and two tribal agencies, provide traditional fixed‐route services. All five urban agencies, one tribal agency, and the other seven rural agencies provide ADA complementary paratransit service. Only one of the urban agencies provide demand‐response for the public. Another urban agency provides limited‐eligibility demand‐response (serving only certain rider groups), and human service transportation (for clients of human service programs). The remaining rural and tribal agencies throughout the state provide a type of demand‐response service, and some provide a flexible‐route and veterans’ transportation services. Nearly all of the rural agencies provide demand‐response service for the public, and some provide human service transportation for clients of human service programs (See Table 5.23 & Figure 5.22). Table 5.23 What Types of Transportation Services Does Your Organization Provide (Check All That Apply)?
Service Type Number of
Percentage of
Agencies Agencies ADA complementary paratransit 13 46%
Traditional fixed‐route 11 39%
Flexible route 5 18%
Demand‐response for the general public 23 82%
Limited‐eligibility demand‐response (serving only certain rider groups) 4 14%
Human service transportation (for clients of human service 12 43%
programs)
Veterans transportation 6 21%
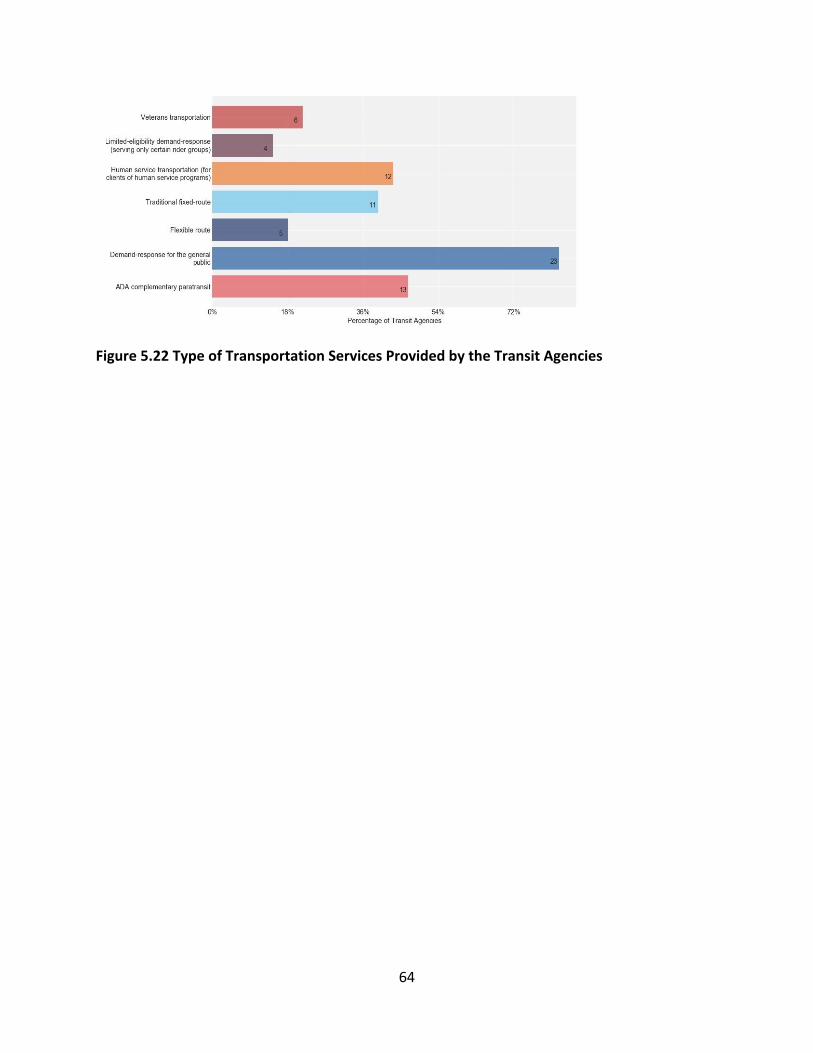
64
Figure 5.22 Type of Transportation Services Provided by the Transit Agencies
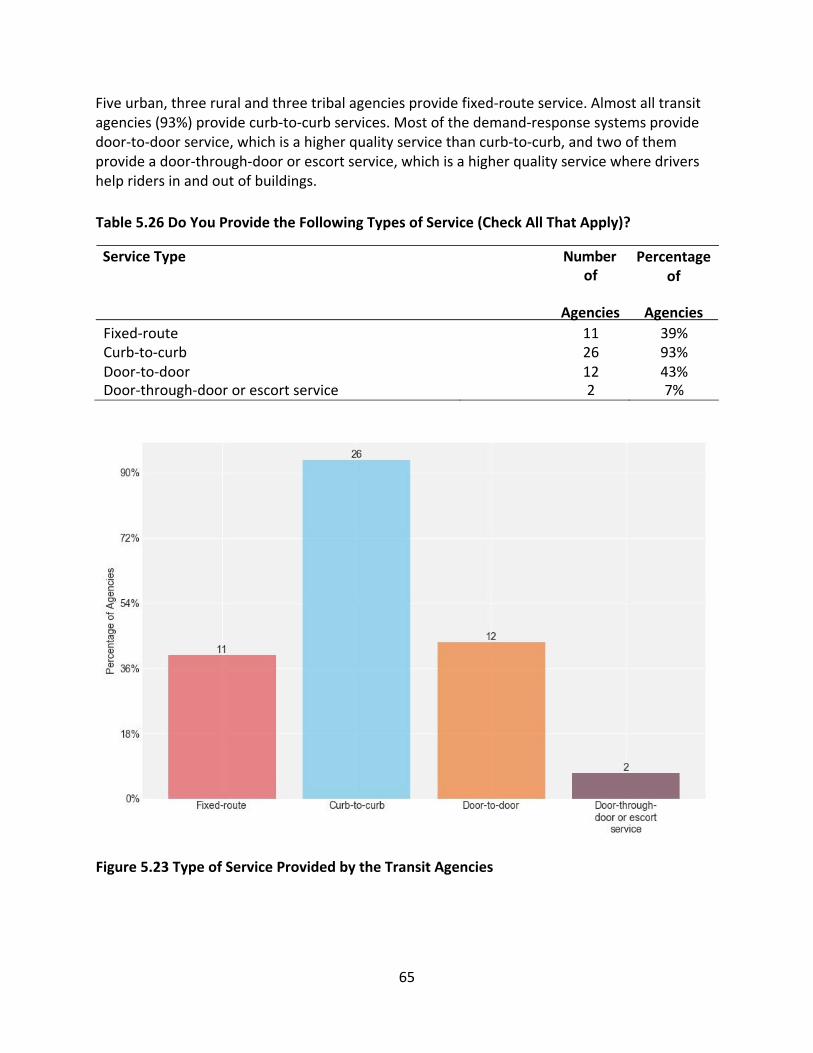
65
Five urban, three rural and three tribal agencies provide fixed‐route service. Almost all transit agencies (93%) provide curb‐to‐curb services. Most of the demand‐response systems provide door‐to‐door service, which is a higher quality service than curb‐to‐curb, and two of them provide a door‐through‐door or escort service, which is a higher quality service where drivers help riders in and out of buildings.
Table 5.26 Do You Provide the Following Types of Service (Check All That Apply)?
Service Type Number of
Percentage of
Agencies Agencies
Fixed‐route 11 39% Curb‐to‐curb 26 93% Door‐to‐door 12 43% Door‐through‐door or escort service 2 7%
Figure 5.23 Type of Service Provided by the Transit Agencies
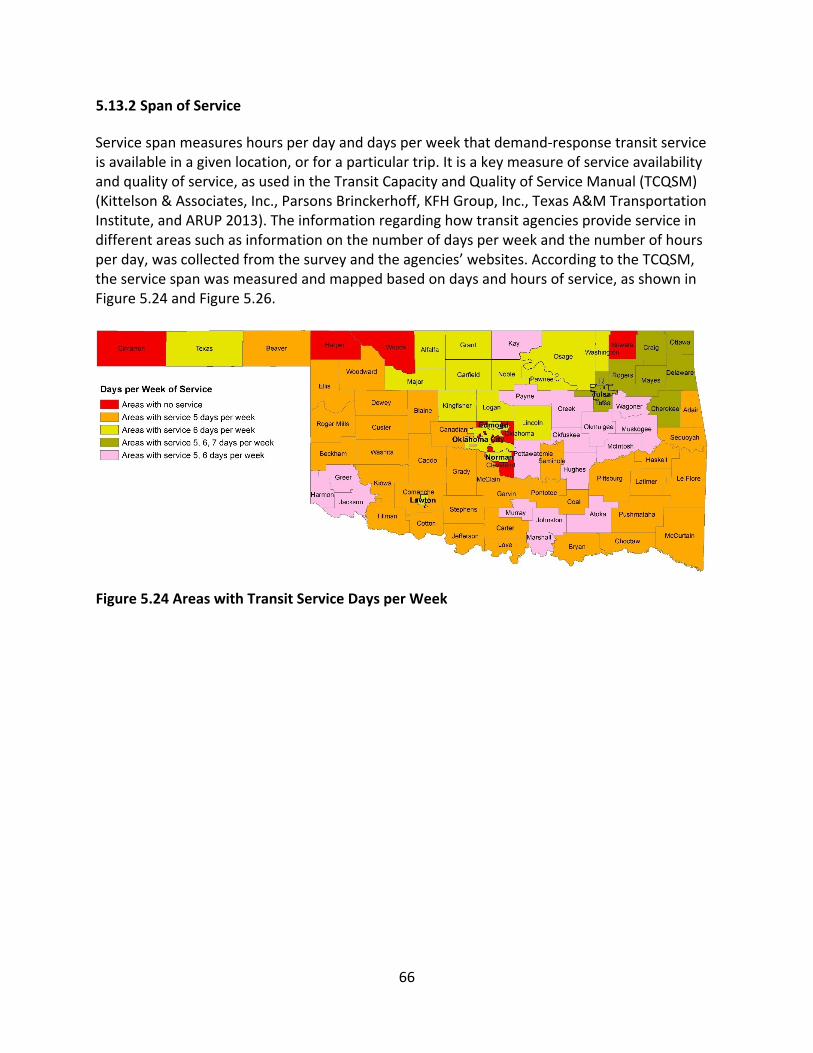
66
5.13.2 Span of Service
Service span measures hours per day and days per week that demand‐response transit service is available in a given location, or for a particular trip. It is a key measure of service availability and quality of service, as used in the Transit Capacity and Quality of Service Manual (TCQSM) (Kittelson & Associates, Inc., Parsons Brinckerhoff, KFH Group, Inc., Texas A&M Transportation Institute, and ARUP 2013). The information regarding how transit agencies provide service in different areas such as information on the number of days per week and the number of hours per day, was collected from the survey and the agencies’ websites. According to the TCQSM, the service span was measured and mapped based on days and hours of service, as shown in Figure 5.24 and Figure 5.26.
Figure 5.24 Areas with Transit Service Days per Week
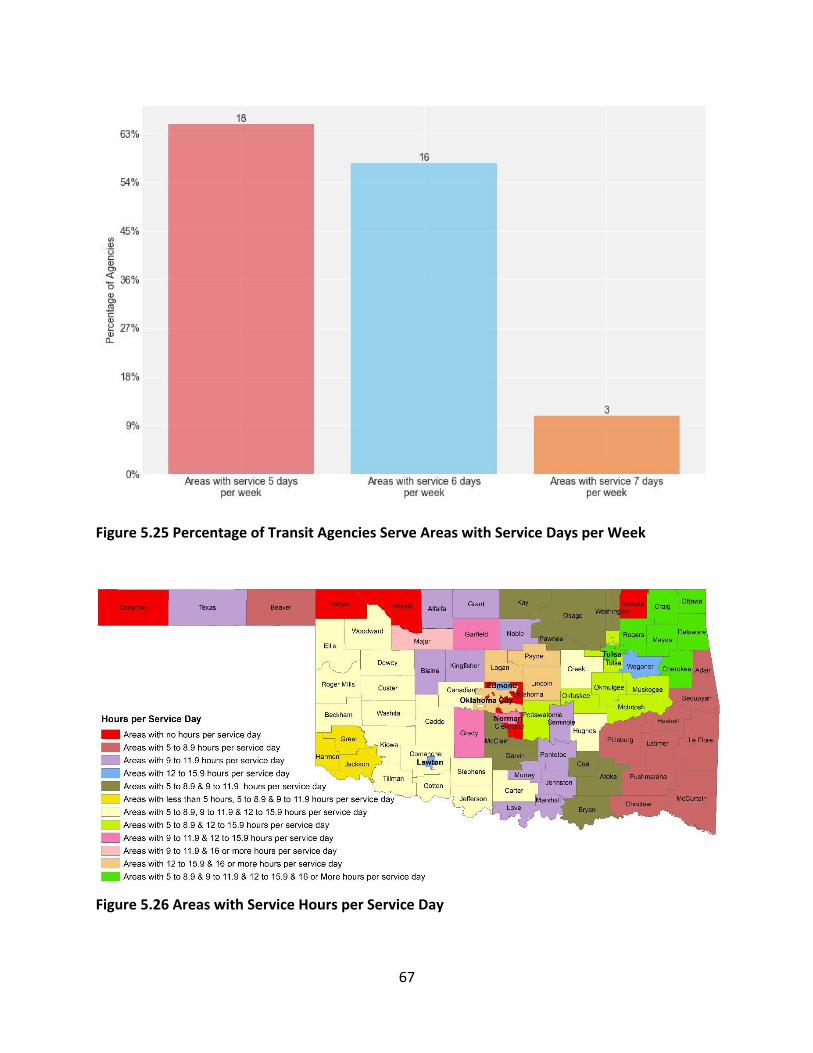
67
Figure 5.25 Percentage of Transit Agencies Serve Areas with Service Days per Week
Figure 5.26 Areas with Service Hours per Service Day
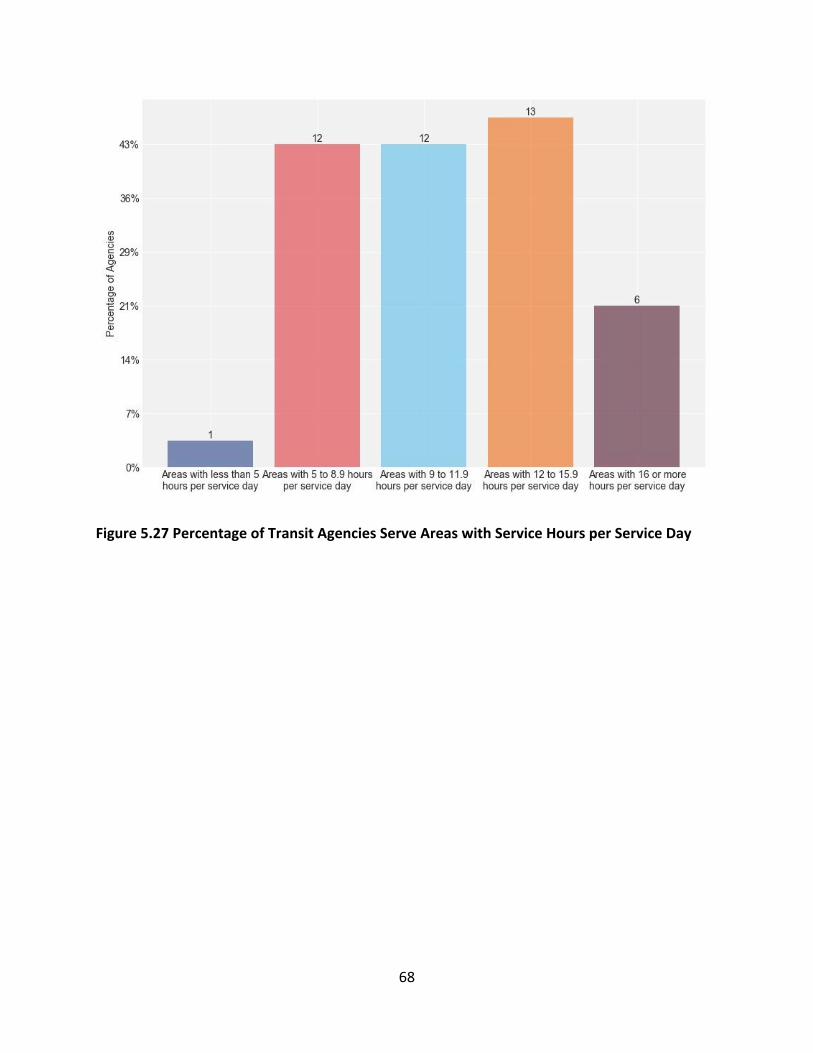
68
Figure 5.27 Percentage of Transit Agencies Serve Areas with Service Hours per Service Day
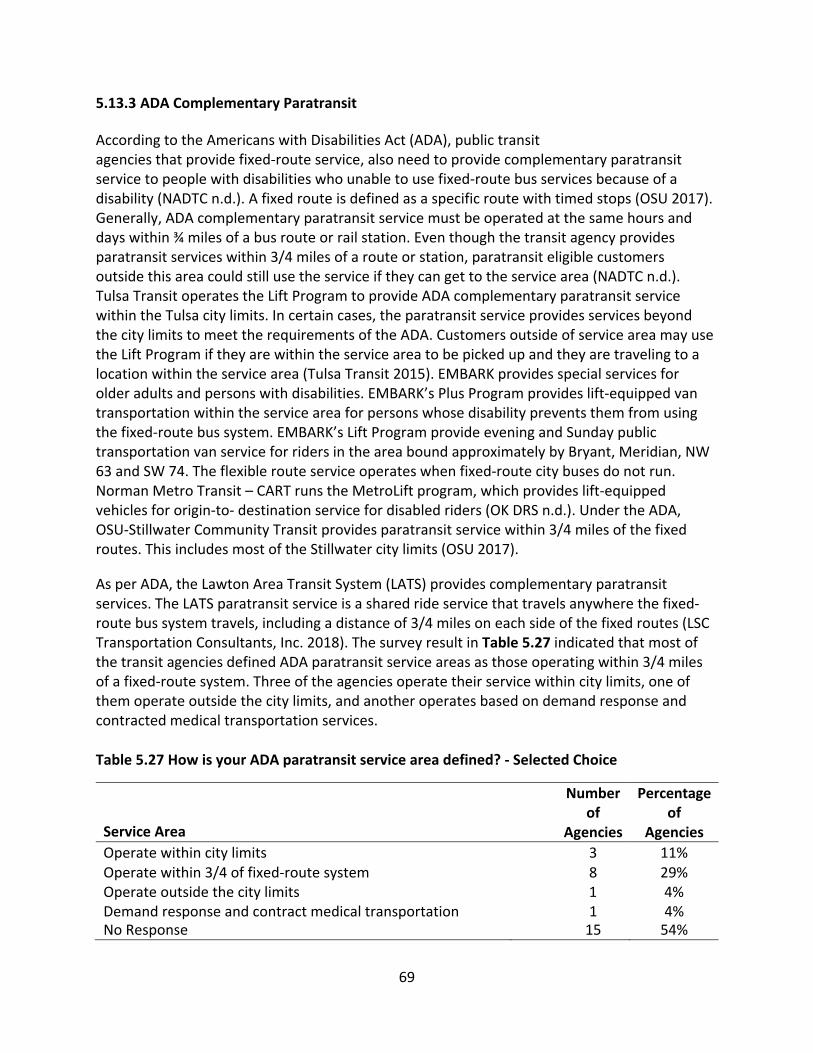
69
5.13.3 ADA Complementary Paratransit
According to the Americans with Disabilities Act (ADA), public transit agencies that provide fixed‐route service, also need to provide complementary paratransit service to people with disabilities who unable to use fixed‐route bus services because of a disability (NADTC n.d.). A fixed route is defined as a specific route with timed stops (OSU 2017). Generally, ADA complementary paratransit service must be operated at the same hours and days within ¾ miles of a bus route or rail station. Even though the transit agency provides paratransit services within 3/4 miles of a route or station, paratransit eligible customers outside this area could still use the service if they can get to the service area (NADTC n.d.). Tulsa Transit operates the Lift Program to provide ADA complementary paratransit service within the Tulsa city limits. In certain cases, the paratransit service provides services beyond the city limits to meet the requirements of the ADA. Customers outside of service area may use the Lift Program if they are within the service area to be picked up and they are traveling to a location within the service area (Tulsa Transit 2015). EMBARK provides special services for older adults and persons with disabilities. EMBARK’s Plus Program provides lift‐equipped van transportation within the service area for persons whose disability prevents them from using the fixed‐route bus system. EMBARK’s Lift Program provide evening and Sunday public transportation van service for riders in the area bound approximately by Bryant, Meridian, NW 63 and SW 74. The flexible route service operates when fixed‐route city buses do not run. Norman Metro Transit – CART runs the MetroLift program, which provides lift‐equipped vehicles for origin‐to‐ destination service for disabled riders (OK DRS n.d.). Under the ADA, OSU‐Stillwater Community Transit provides paratransit service within 3/4 miles of the fixed routes. This includes most of the Stillwater city limits (OSU 2017).
As per ADA, the Lawton Area Transit System (LATS) provides complementary paratransit services. The LATS paratransit service is a shared ride service that travels anywhere the fixed‐ route bus system travels, including a distance of 3/4 miles on each side of the fixed routes (LSC Transportation Consultants, Inc. 2018). The survey result in Table 5.27 indicated that most of the transit agencies defined ADA paratransit service areas as those operating within 3/4 miles of a fixed‐route system. Three of the agencies operate their service within city limits, one of them operate outside the city limits, and another operates based on demand response and contracted medical transportation services. Table 5.27 How is your ADA paratransit service area defined? ‐ Selected Choice
Service Area
Number of
Agencies
Percentage of
Agencies
Operate within city limits 3 11% Operate within 3/4 of fixed‐route system 8 29% Operate outside the city limits 1 4% Demand response and contract medical transportation 1 4% No Response 15 54%
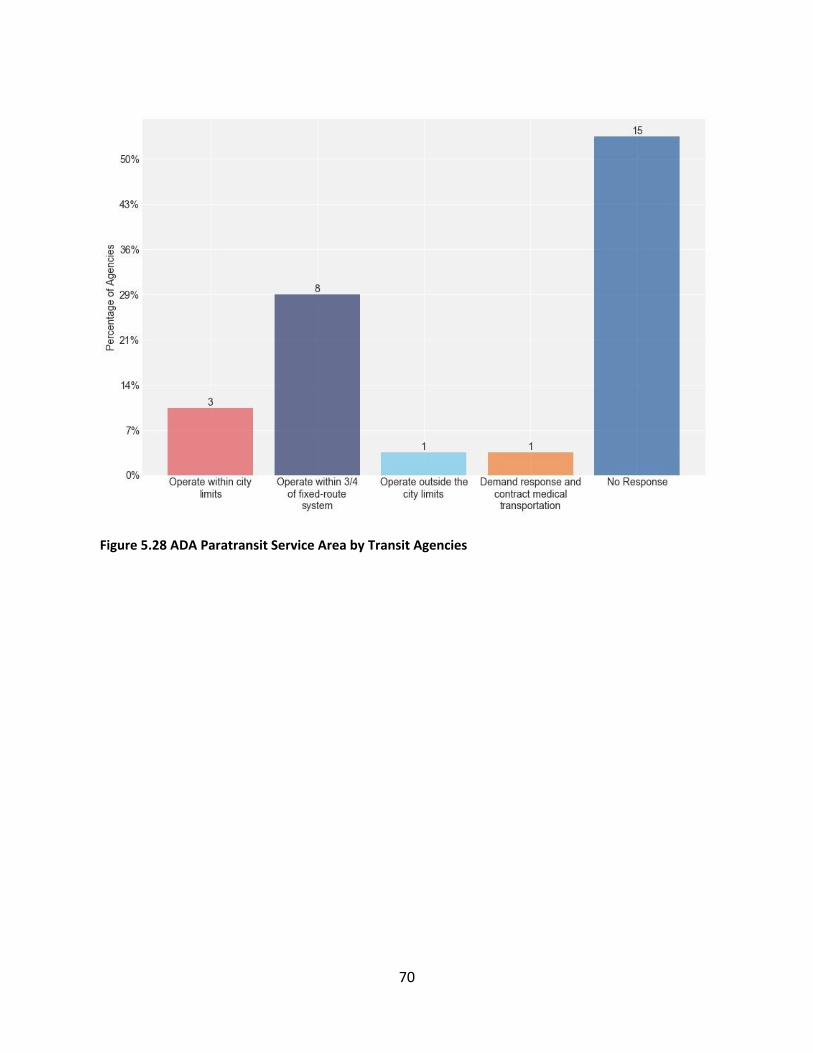
70
Figure 5.28 ADA Paratransit Service Area by Transit Agencies
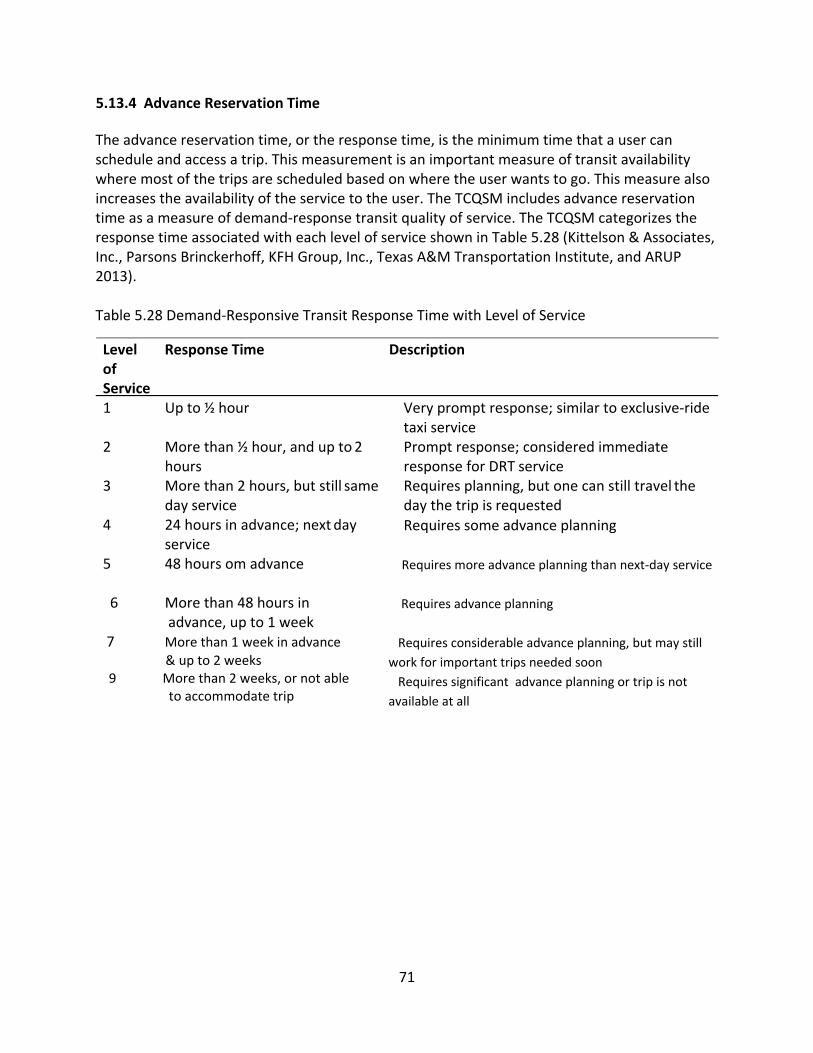
71
5.13.4 Advance Reservation Time
The advance reservation time, or the response time, is the minimum time that a user can schedule and access a trip. This measurement is an important measure of transit availability where most of the trips are scheduled based on where the user wants to go. This measure also increases the availability of the service to the user. The TCQSM includes advance reservation time as a measure of demand‐response transit quality of service. The TCQSM categorizes the response time associated with each level of service shown in Table 5.28 (Kittelson & Associates, Inc., Parsons Brinckerhoff, KFH Group, Inc., Texas A&M Transportation Institute, and ARUP 2013). Table 5.28 Demand‐Responsive Transit Response Time with Level of Service
Level of
Response Time Description
Service 1 Up to ½ hour Very prompt response; similar to exclusive‐ride
taxi service 2 More than ½ hour, and up to 2
hours 3 More than 2 hours, but still same
day service 4 24 hours in advance; next day
service 5 48 hours om advance
6 More than 48 hours in . advance, up to 1 week 7 More than 1 week in advance .
. & up to 2 weeks 9 More than 2 weeks, or not able . to accommodate trip
Prompt response; considered immediate response for DRT service Requires planning, but one can still travel the day the trip is requested
Requires some advance planning
Requires more advance planning than next‐day service
Requires advance planning
Requires considerable advance planning, but may still
work for important trips needed soon
Requires significant advance planning or trip is not
available at all
72
The reservations for Cleveland Area Rapid Transit (CART) may be made up to two weeks in advance but no later than the day before the scheduled trip. CART suggests customers to schedule a trip before noon the day before they would like to travel. CART also requires at least 24 hours in advance schedule all secondary zone rides (CART n.d.). Tulsa Paratransit (the LIFT) requires seven calendar days in advance for reservations (Tulsa Transit 2015). EMBARK Plus does not provide same‐day reservations; however, it makes every effort to schedule a trip for the time requested. In the event the specified time requested is not available, it may offer an alternate time within one hour before or after the requested time. Trip reservations are accepted from one to seven days in advance of the desired travel date (EMBARK 2018). First Capital Trolley allows reservation to be made seven days in advance, but no later than the previous day before 4:00 p.m. (First Capital Trolley 2015). SoonerRide requires at least three business days before making a reservation for any medical appointment (SoonerRide 2010). A reservation for OSU‐Stillwater Community Transit (the RAMP) may be made up to 14 days in advance, but no later than the previous day before 4:30 p.m. (OSU 2017). LATS Paratransit accepts trip reservations no less than 24 hours and no more than 14 days prior to the requested time (LSC Transportation Consultants, Inc. 2018).
The survey result shown in Table 5.29 indicated that most of the transit agencies require at least 24 hours in advance to reserve a demand response trip. One of the tribal agencies requires more than one week in advance for reserving a trip.
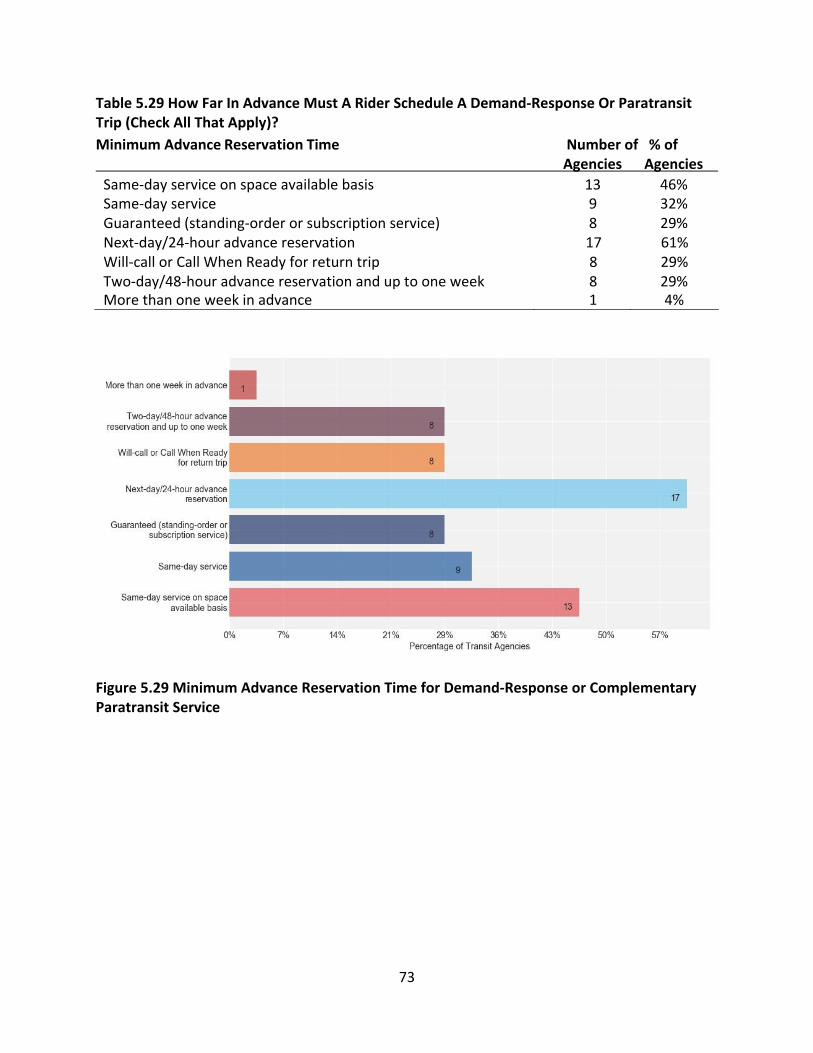
73
Table 5.29 How Far In Advance Must A Rider Schedule A Demand‐Response Or Paratransit Trip (Check All That Apply)?
Minimum Advance Reservation Time Number of % of Agencies Agencies
Same‐day service on space available basis 13 46% Same‐day service 9 32% Guaranteed (standing‐order or subscription service) 8 29% Next‐day/24‐hour advance reservation 17 61% Will‐call or Call When Ready for return trip 8 29% Two‐day/48‐hour advance reservation and up to one week 8 29% More than one week in advance 1 4%
Figure 5.29 Minimum Advance Reservation Time for Demand‐Response or Complementary Paratransit Service
74
5.13.5 Fares
Information on fares was collected for fixed‐route and demand‐response providers for both in‐ town and longer‐distance trips. Many rural transit agencies charge a round‐trip fare. These fares were divided by two to calculate a one‐way fare. Many demand‐response providers charge the same rate for senior citizens, youth, and the public; however, some providers charge reduced fares for senior citizens, disabled persons, and youth (Mattson and Hough, Identifying and Satisfying the mobility needs of North Dakota's Transit System 2015).
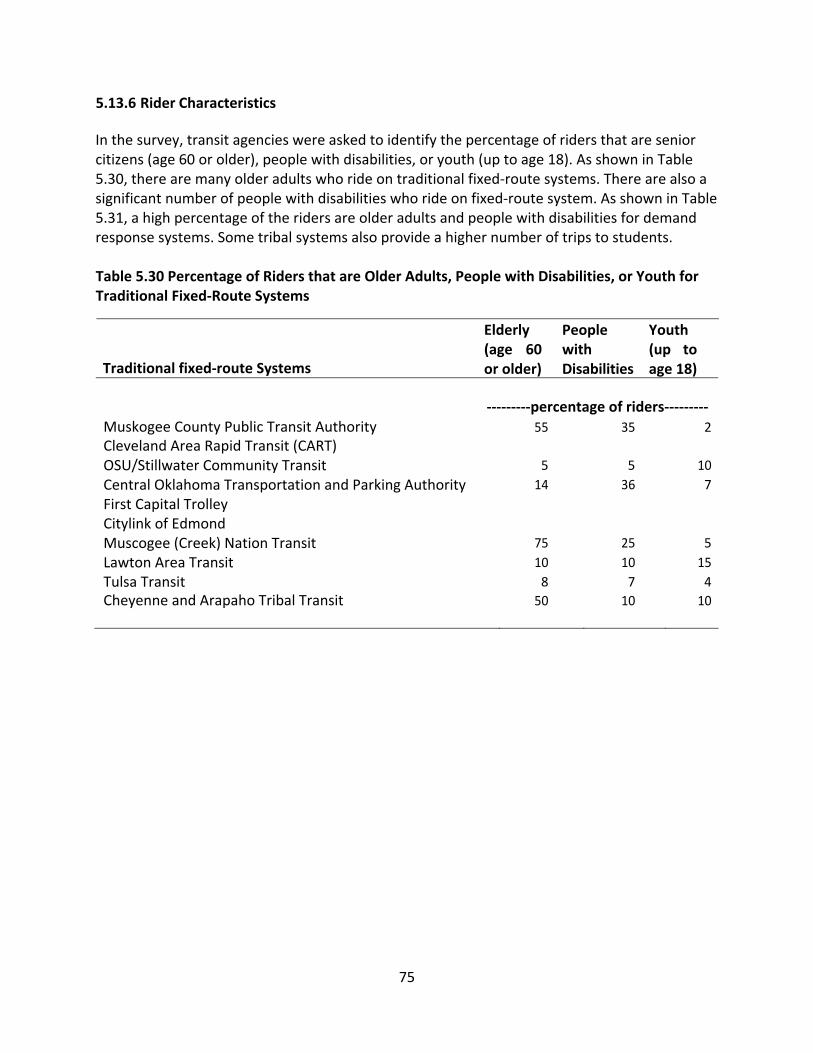
75
5.13.6 Rider Characteristics
In the survey, transit agencies were asked to identify the percentage of riders that are senior citizens (age 60 or older), people with disabilities, or youth (up to age 18). As shown in Table 5.30, there are many older adults who ride on traditional fixed‐route systems. There are also a significant number of people with disabilities who ride on fixed‐route system. As shown in Table 5.31, a high percentage of the riders are older adults and people with disabilities for demand response systems. Some tribal systems also provide a higher number of trips to students. Table 5.30 Percentage of Riders that are Older Adults, People with Disabilities, or Youth for Traditional Fixed‐Route Systems
Traditional fixed‐route Systems
Elderly (age 60 or older)
People with Disabilities
Youth (up to age 18)
‐‐‐‐‐‐‐‐‐percentage of riders‐‐‐‐‐‐‐‐‐
Muskogee County Public Transit Authority 55 35 2
Cleveland Area Rapid Transit (CART)
OSU/Stillwater Community Transit 5 5 10
Central Oklahoma Transportation and Parking Authority 14 36 7
First Capital Trolley
Citylink of Edmond
Muscogee (Creek) Nation Transit 75 25 5
Lawton Area Transit 10 10 15
Tulsa Transit 8 7 4
Cheyenne and Arapaho Tribal Transit 50 10 10
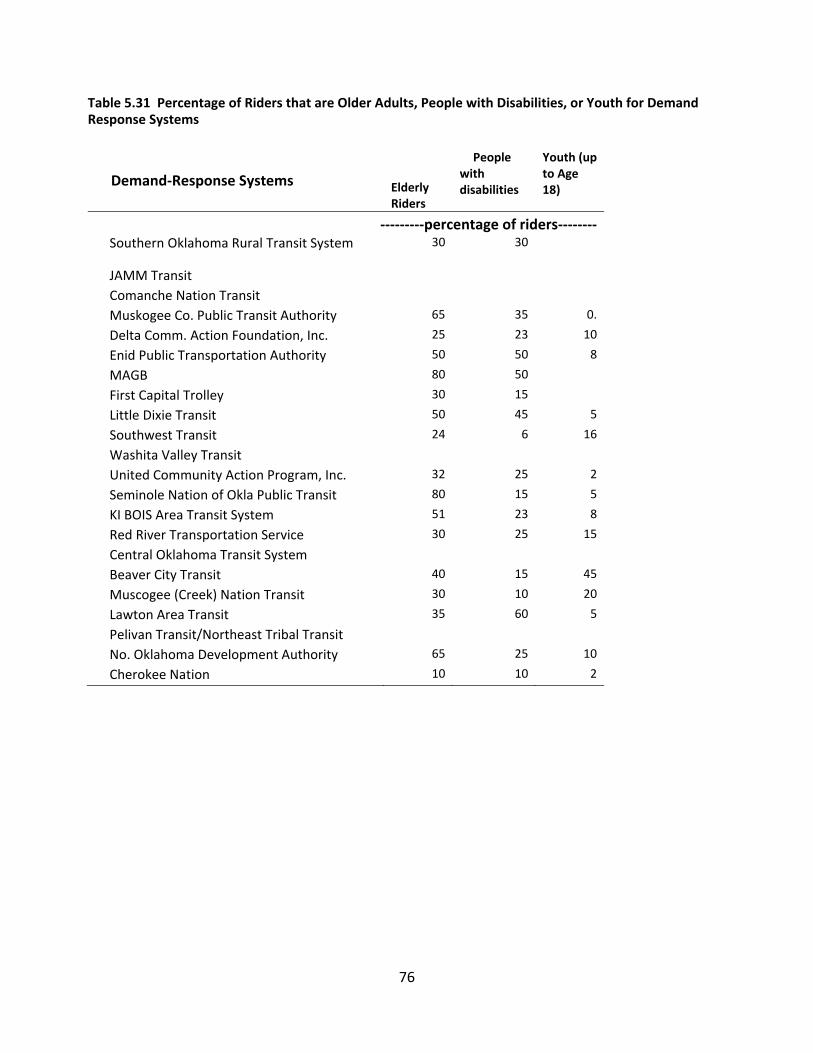
76
Table 5.31 Percentage of Riders that are Older Adults, People with Disabilities, or Youth for Demand Response Systems
Demand‐Response Systems Elderly Riders
People with disabilities
Youth (up to Age 18)
‐‐‐‐‐‐‐‐‐percentage of riders‐‐‐‐‐‐‐‐ Southern Oklahoma Rural Transit System 30 30
JAMM Transit
Comanche Nation Transit
Muskogee Co. Public Transit Authority 65 35 0.
Delta Comm. Action Foundation, Inc. 25 23 10
Enid Public Transportation Authority 50 50 8
MAGB 80 50
First Capital Trolley 30 15
Little Dixie Transit 50 45 5
Southwest Transit 24 6 16
Washita Valley Transit
United Community Action Program, Inc. 32 25 2
Seminole Nation of Okla Public Transit 80 15 5
KI BOIS Area Transit System 51 23 8
Red River Transportation Service 30 25 15
Central Oklahoma Transit System
Beaver City Transit 40 15 45
Muscogee (Creek) Nation Transit 30 10 20
Lawton Area Transit 35 60 5
Pelivan Transit/Northeast Tribal Transit
No. Oklahoma Development Authority 65 25 10
Cherokee Nation 10 10 2
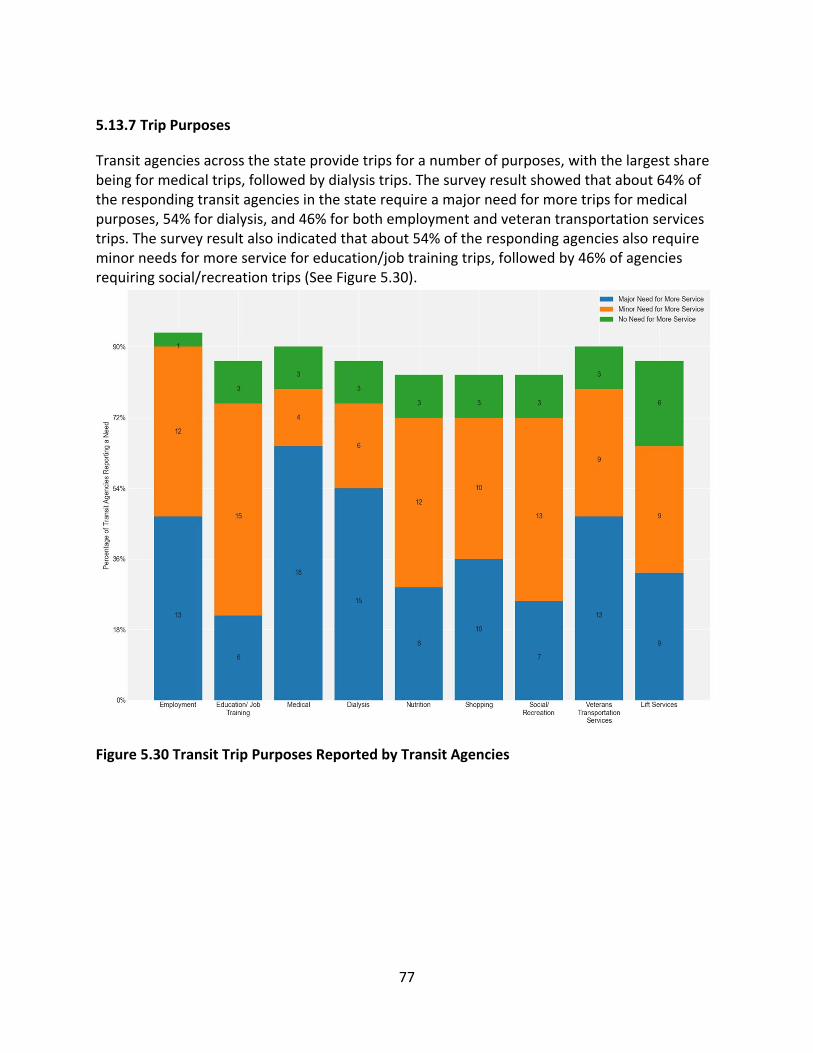
77
5.13.7 Trip Purposes
Transit agencies across the state provide trips for a number of purposes, with the largest share being for medical trips, followed by dialysis trips. The survey result showed that about 64% of the responding transit agencies in the state require a major need for more trips for medical purposes, 54% for dialysis, and 46% for both employment and veteran transportation services trips. The survey result also indicated that about 54% of the responding agencies also require minor needs for more service for education/job training trips, followed by 46% of agencies requiring social/recreation trips (See Figure 5.30).
Figure 5.30 Transit Trip Purposes Reported by Transit Agencies
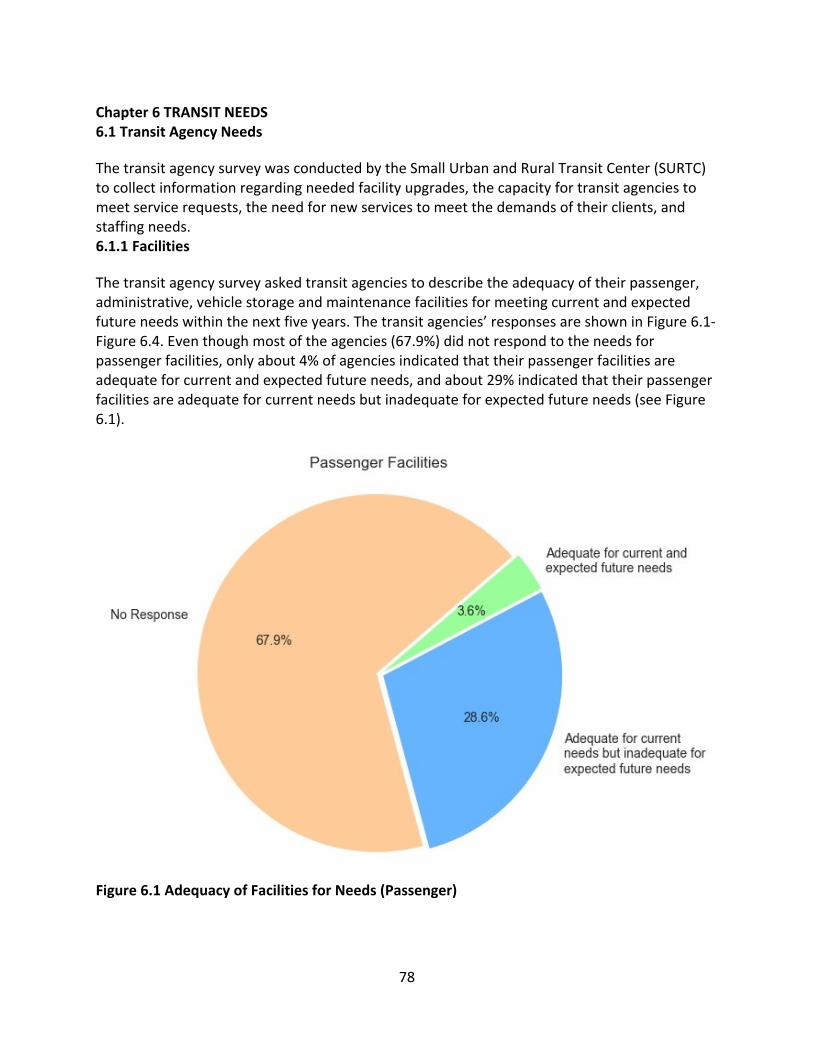
78
Chapter 6 TRANSIT NEEDS 6.1 Transit Agency Needs
The transit agency survey was conducted by the Small Urban and Rural Transit Center (SURTC) to collect information regarding needed facility upgrades, the capacity for transit agencies to meet service requests, the need for new services to meet the demands of their clients, and staffing needs. 6.1.1 Facilities
The transit agency survey asked transit agencies to describe the adequacy of their passenger, administrative, vehicle storage and maintenance facilities for meeting current and expected future needs within the next five years. The transit agencies’ responses are shown in Figure 6.1‐ Figure 6.4. Even though most of the agencies (67.9%) did not respond to the needs for passenger facilities, only about 4% of agencies indicated that their passenger facilities are adequate for current and expected future needs, and about 29% indicated that their passenger facilities are adequate for current needs but inadequate for expected future needs (see Figure 6.1).
Figure 6.1 Adequacy of Facilities for Needs (Passenger)
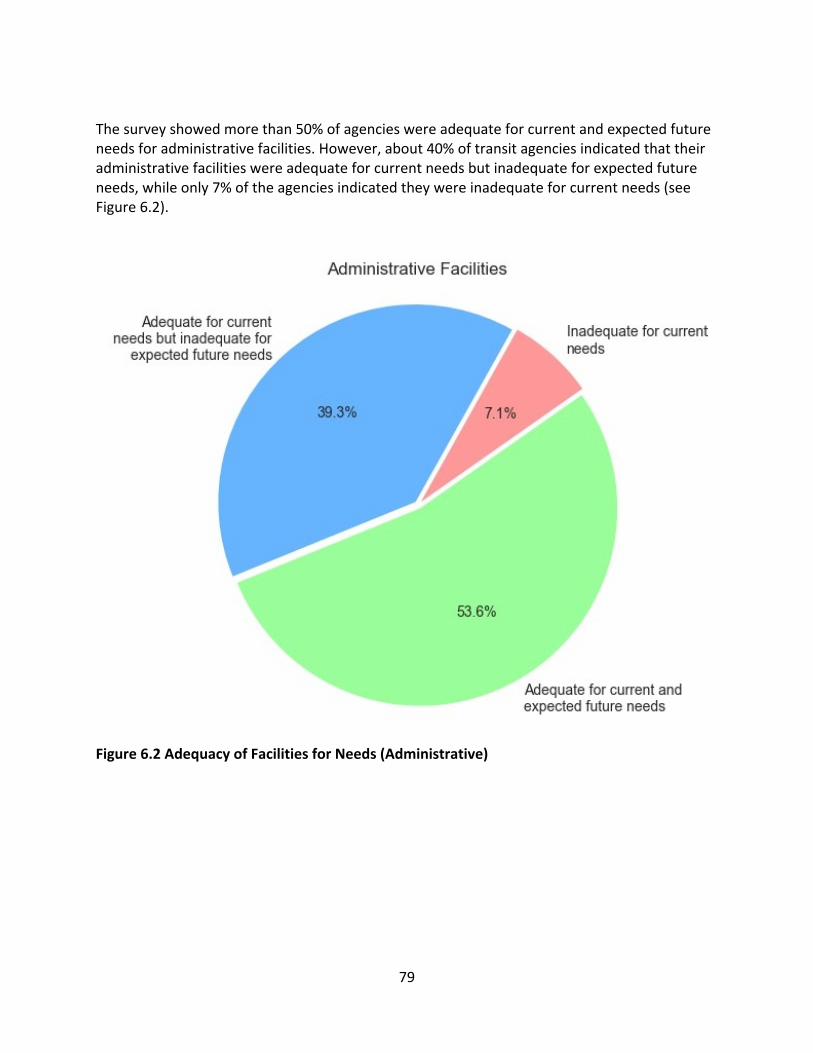
79
The survey showed more than 50% of agencies were adequate for current and expected future needs for administrative facilities. However, about 40% of transit agencies indicated that their administrative facilities were adequate for current needs but inadequate for expected future needs, while only 7% of the agencies indicated they were inadequate for current needs (see Figure 6.2).
Figure 6.2 Adequacy of Facilities for Needs (Administrative)
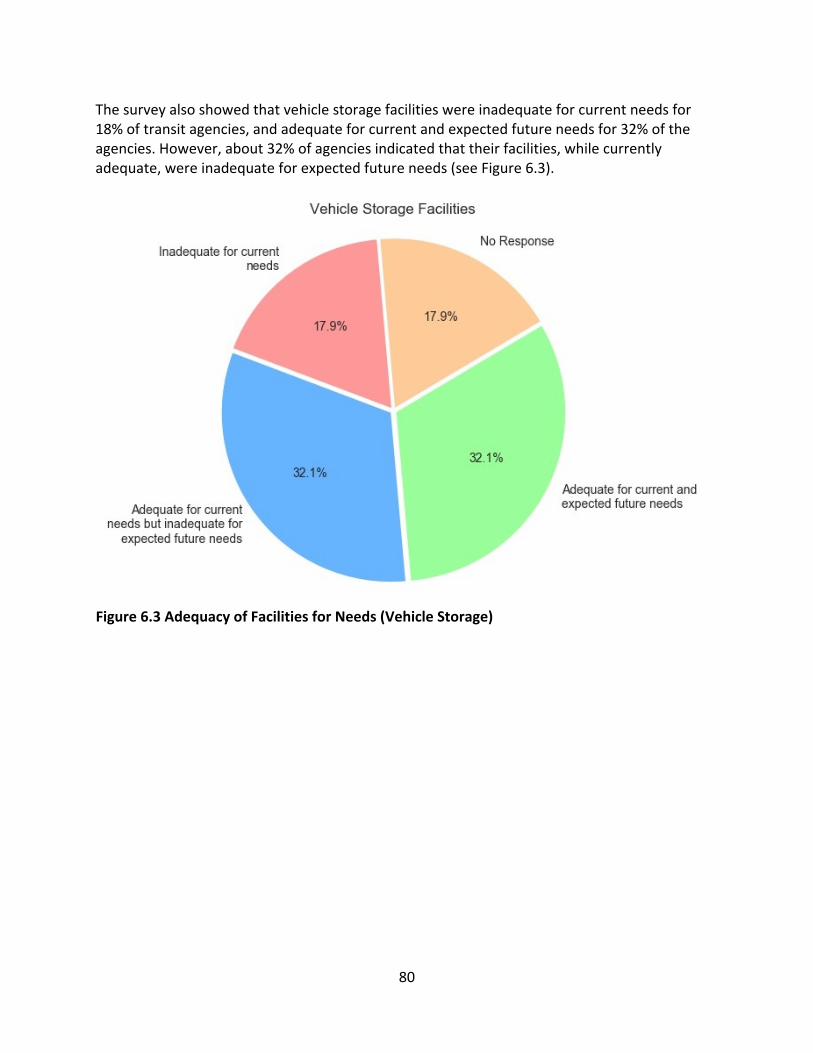
80
The survey also showed that vehicle storage facilities were inadequate for current needs for 18% of transit agencies, and adequate for current and expected future needs for 32% of the agencies. However, about 32% of agencies indicated that their facilities, while currently adequate, were inadequate for expected future needs (see Figure 6.3).
Figure 6.3 Adequacy of Facilities for Needs (Vehicle Storage)
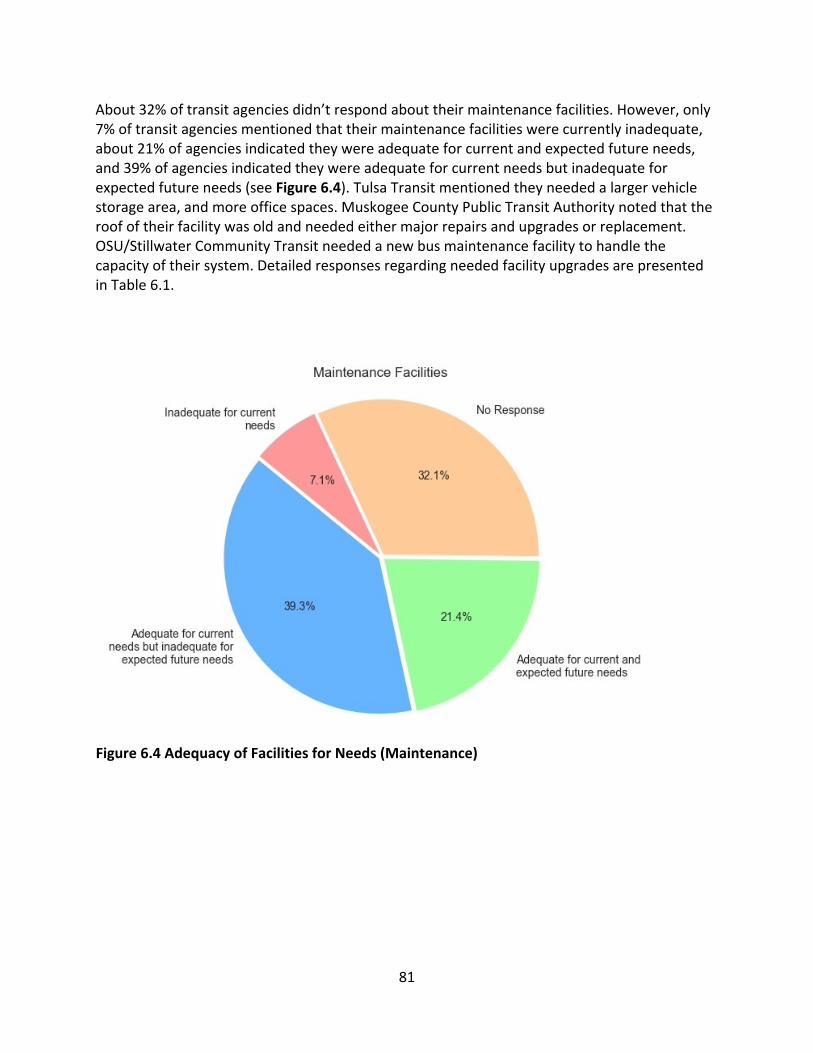
81
About 32% of transit agencies didn’t respond about their maintenance facilities. However, only 7% of transit agencies mentioned that their maintenance facilities were currently inadequate, about 21% of agencies indicated they were adequate for current and expected future needs, and 39% of agencies indicated they were adequate for current needs but inadequate for expected future needs (see Figure 6.4). Tulsa Transit mentioned they needed a larger vehicle storage area, and more office spaces. Muskogee County Public Transit Authority noted that the roof of their facility was old and needed either major repairs and upgrades or replacement. OSU/Stillwater Community Transit needed a new bus maintenance facility to handle the capacity of their system. Detailed responses regarding needed facility upgrades are presented in Table 6.1.
Figure 6.4 Adequacy of Facilities for Needs (Maintenance)
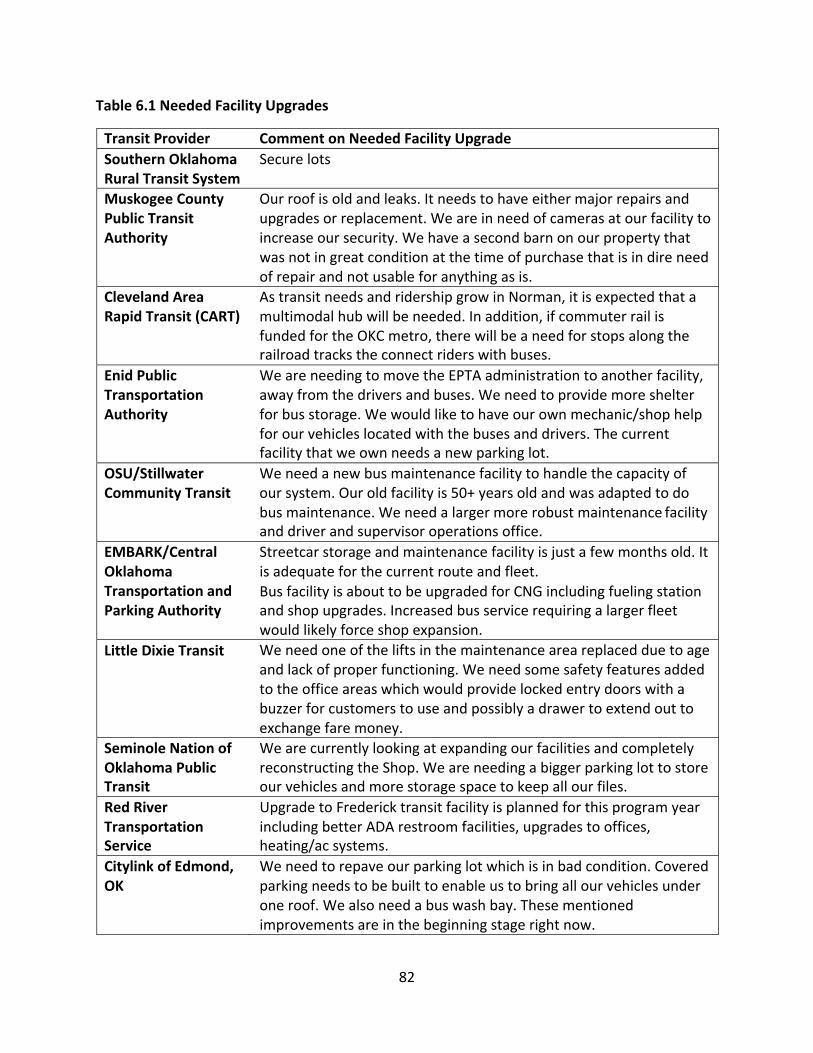
82
Table 6.1 Needed Facility Upgrades
Transit Provider Comment on Needed Facility Upgrade
Southern Oklahoma Rural Transit System
Secure lots
Muskogee County Public Transit Authority
Our roof is old and leaks. It needs to have either major repairs and upgrades or replacement. We are in need of cameras at our facility to increase our security. We have a second barn on our property that was not in great condition at the time of purchase that is in dire need of repair and not usable for anything as is.
Cleveland Area Rapid Transit (CART)
As transit needs and ridership grow in Norman, it is expected that a multimodal hub will be needed. In addition, if commuter rail is funded for the OKC metro, there will be a need for stops along the railroad tracks the connect riders with buses.
Enid Public Transportation Authority
We are needing to move the EPTA administration to another facility, away from the drivers and buses. We need to provide more shelter for bus storage. We would like to have our own mechanic/shop help for our vehicles located with the buses and drivers. The current facility that we own needs a new parking lot.
OSU/Stillwater Community Transit
We need a new bus maintenance facility to handle the capacity of our system. Our old facility is 50+ years old and was adapted to do bus maintenance. We need a larger more robust maintenance facility and driver and supervisor operations office.
EMBARK/Central Oklahoma Transportation and Parking Authority
Streetcar storage and maintenance facility is just a few months old. It is adequate for the current route and fleet. Bus facility is about to be upgraded for CNG including fueling station and shop upgrades. Increased bus service requiring a larger fleet would likely force shop expansion.
Little Dixie Transit We need one of the lifts in the maintenance area replaced due to age and lack of proper functioning. We need some safety features added to the office areas which would provide locked entry doors with a buzzer for customers to use and possibly a drawer to extend out to exchange fare money.
Seminole Nation of Oklahoma Public Transit
We are currently looking at expanding our facilities and completely reconstructing the Shop. We are needing a bigger parking lot to store our vehicles and more storage space to keep all our files.
Red River Transportation Service
Upgrade to Frederick transit facility is planned for this program year including better ADA restroom facilities, upgrades to offices, heating/ac systems.
Citylink of Edmond, OK
We need to repave our parking lot which is in bad condition. Covered parking needs to be built to enable us to bring all our vehicles under one roof. We also need a bus wash bay. These mentioned improvements are in the beginning stage right now.
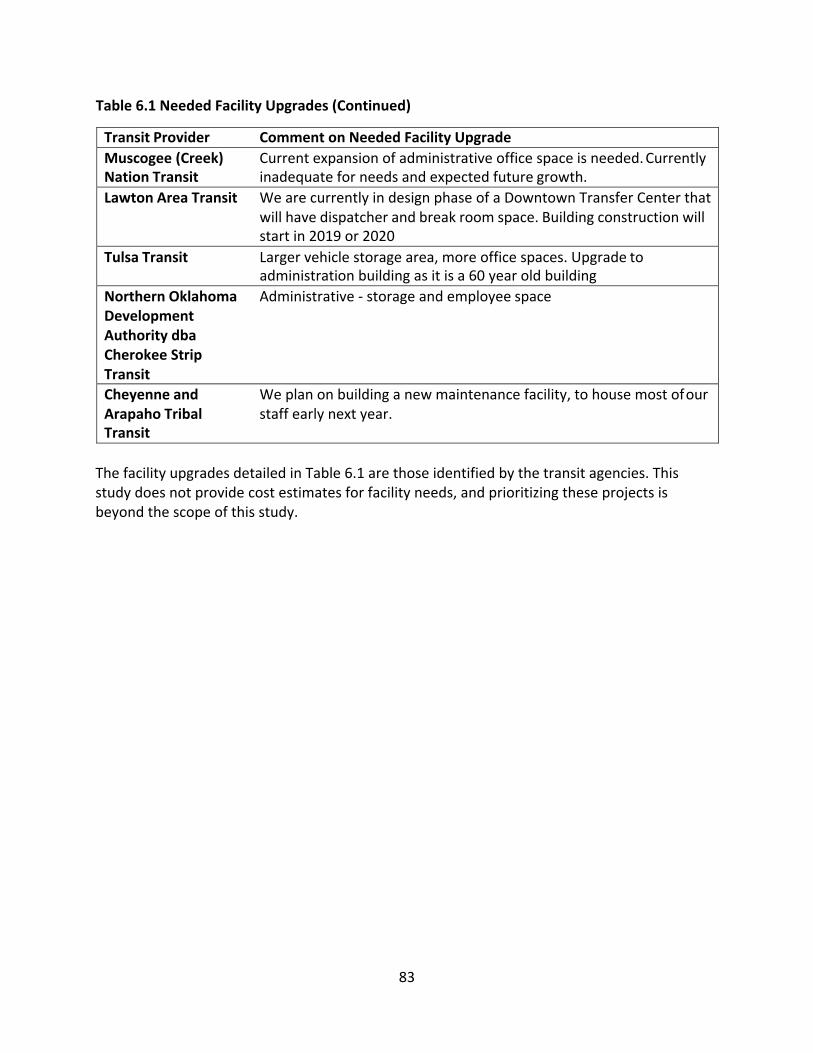
83
Table 6.1 Needed Facility Upgrades (Continued)
Transit Provider Comment on Needed Facility Upgrade
Muscogee (Creek) Current expansion of administrative office space is needed. Currently Nation Transit inadequate for needs and expected future growth.
Lawton Area Transit We are currently in design phase of a Downtown Transfer Center that will have dispatcher and break room space. Building construction will start in 2019 or 2020
Tulsa Transit Larger vehicle storage area, more office spaces. Upgrade to administration building as it is a 60 year old building
Northern Oklahoma Administrative ‐ storage and employee space Development Authority dba Cherokee Strip Transit
Cheyenne and We plan on building a new maintenance facility, to house most of our Arapaho Tribal staff early next year. Transit
The facility upgrades detailed in Table 6.1 are those identified by the transit agencies. This study does not provide cost estimates for facility needs, and prioritizing these projects is beyond the scope of this study.
84
6.1.2 Capacity to Serve Demand
Sometimes transit providers turn down a rider’s trip requests due to space or time unavailability on the vehicle at the rider’s requested time. If space is not available at the requested time, the transit provider tries to find a different time for the trip, but if the rider cannot adjust the trip time, then the trip is turned down and the rider is unable to use the service. If riders are not able to schedule a trip when they wish to travel, then the service will be considered less reliable (Mattson and Hough, Identifying and Satisfying the mobility needs of North Dakota's Transit System 2015). Many demand‐response providers may turn down trips during periods of unusual demand when they are unexpectedly short on vehicles and drivers. If trip turn‐downs happen more frequently, it indicates insufficient capacity to meet the demand. In this case, it may be required to add more vehicles, drivers or additional service hours and adjust driver schedules to provide more capacity during periods of demand (Mattson and Hough, Identifying and Satisfying the mobility needs of North Dakota's Transit System 2015). The TCQSM third edition measures quality of service for trips turned down using the following ranges for percentage: 0%‐1%, >1%‐3%, >3%‐5%, >5%‐10%, and >10%. At the highest quality of service (0%‐1%), a rider would experience essentially no trip turn‐downs which is very reliable service. At each subsequent service level, riders will experience some trip turn‐downs. At the fourth level, with more than 5% and up to 10% of trip requests turned down, riders may stop relying on the demand response service for important trips. At the lowest service level, with more than 10% of trips turned down, riders may not rely on the service and may stop riding demand response transit if another option for transportation is available (Kittelson & Associates, Inc., Parsons Brinckerhoff, KFH Group, Inc., Texas A&M Transportation Institute, and ARUP 2013).
The survey collected information from demand‐response providers regarding how often they have to turn down trips because of lack of capacity, as shown in Table 6.2 and Figure 6.5. Ten of the 28 responding agencies (36%) reported they turned down 0%‐1% of trips, two providers (7%) turned down 1%‐3% of trips, and three providers (11%) turned down 3%‐5% of trips. However, five providers reported turning down 5% or more of trips requested. Muskogee County Public Transit Authority, Enid Public Transportation Authority, and Central Oklahoma Transit System turned down 5%‐10% of trip requests. Southern Oklahoma Rural Transit System, and Washita Valley Transit reported turning down more than 10% of trip requests. This high rate of trips turn‐downs indicates a need for increased capacity through some combination of increased vehicles, more drivers, and additional service hours.
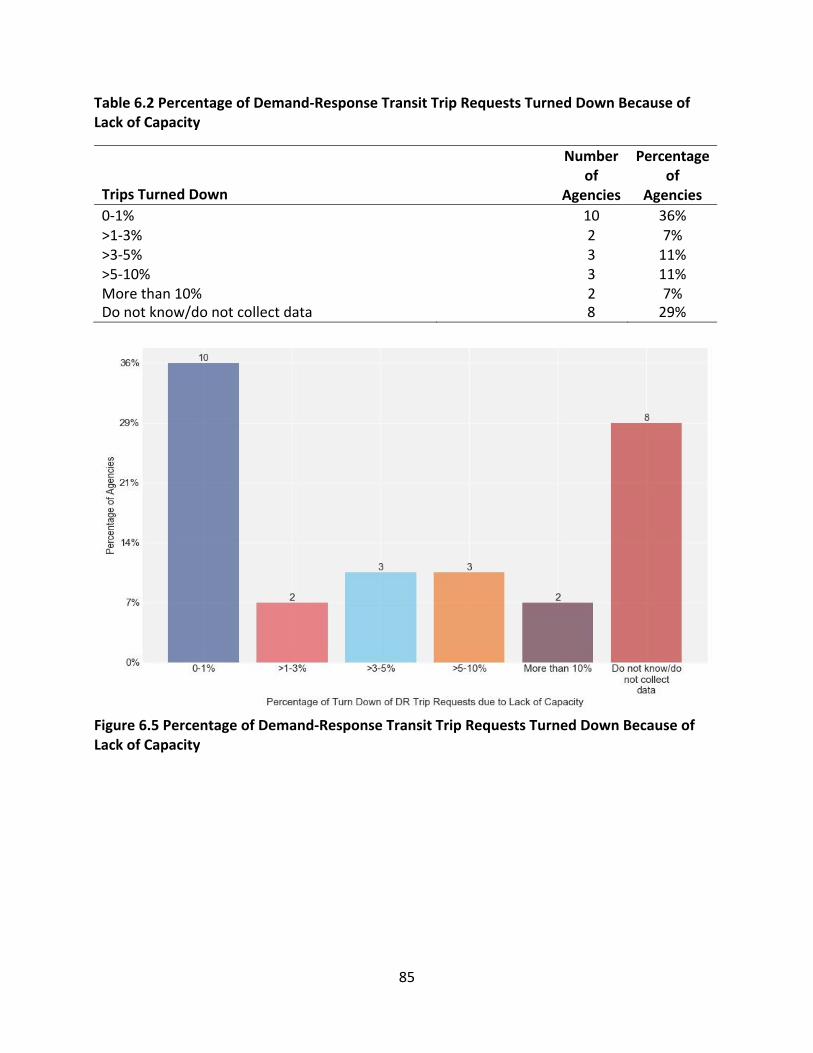
85
Table 6.2 Percentage of Demand‐Response Transit Trip Requests Turned Down Because of Lack of Capacity
Trips Turned Down
Number of
Agencies
Percentage of
Agencies
0‐1% 10 36% >1‐3% 2 7% >3‐5% 3 11% >5‐10% 3 11% More than 10% 2 7% Do not know/do not collect data 8 29%
Figure 6.5 Percentage of Demand‐Response Transit Trip Requests Turned Down Because of Lack of Capacity
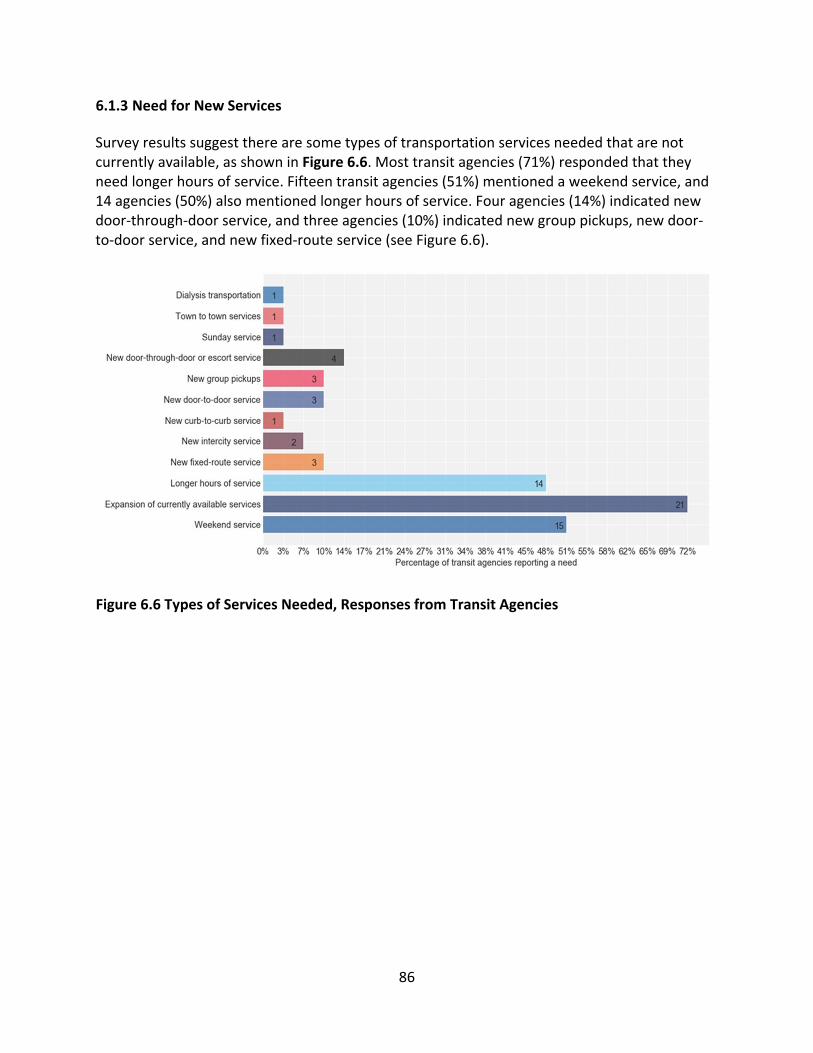
86
6.1.3 Need for New Services
Survey results suggest there are some types of transportation services needed that are not currently available, as shown in Figure 6.6. Most transit agencies (71%) responded that they need longer hours of service. Fifteen transit agencies (51%) mentioned a weekend service, and 14 agencies (50%) also mentioned longer hours of service. Four agencies (14%) indicated new door‐through‐door service, and three agencies (10%) indicated new group pickups, new door‐ to‐door service, and new fixed‐route service (see Figure 6.6).
Figure 6.6 Types of Services Needed, Responses from Transit Agencies
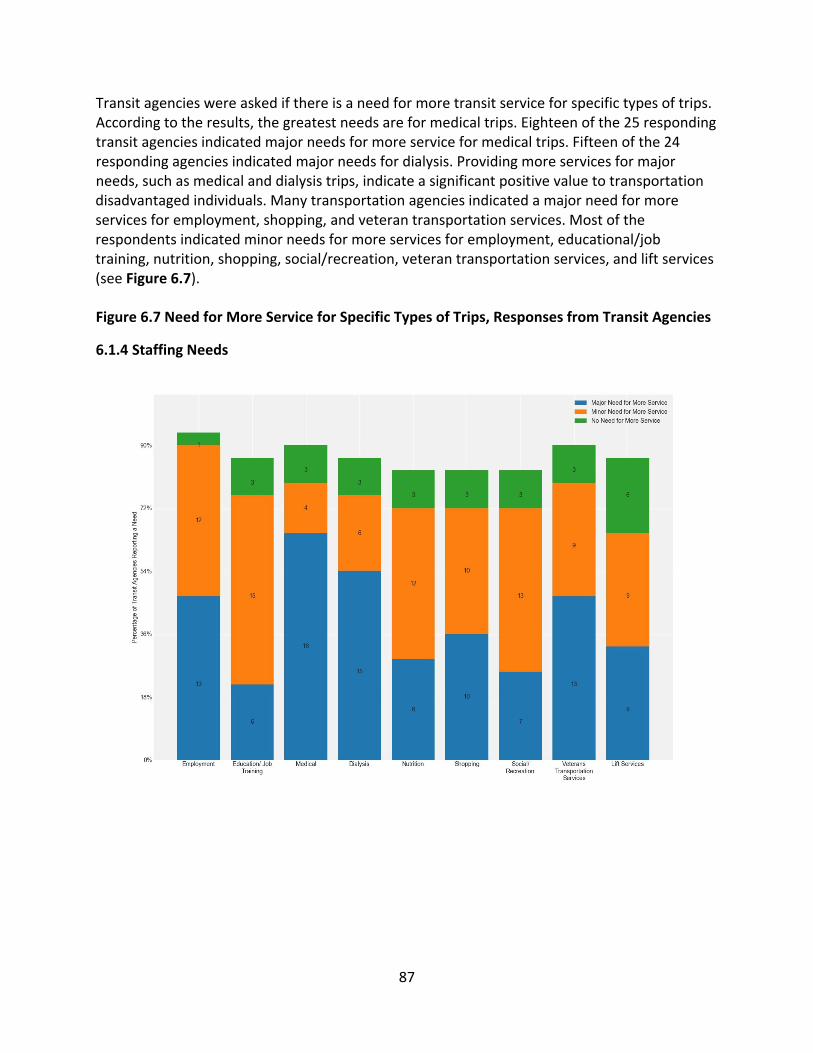
87
Transit agencies were asked if there is a need for more transit service for specific types of trips. According to the results, the greatest needs are for medical trips. Eighteen of the 25 responding transit agencies indicated major needs for more service for medical trips. Fifteen of the 24 responding agencies indicated major needs for dialysis. Providing more services for major needs, such as medical and dialysis trips, indicate a significant positive value to transportation disadvantaged individuals. Many transportation agencies indicated a major need for more services for employment, shopping, and veteran transportation services. Most of the respondents indicated minor needs for more services for employment, educational/job training, nutrition, shopping, social/recreation, veteran transportation services, and lift services (see Figure 6.7).
Figure 6.7 Need for More Service for Specific Types of Trips, Responses from Transit Agencies
6.1.4 Staffing Needs
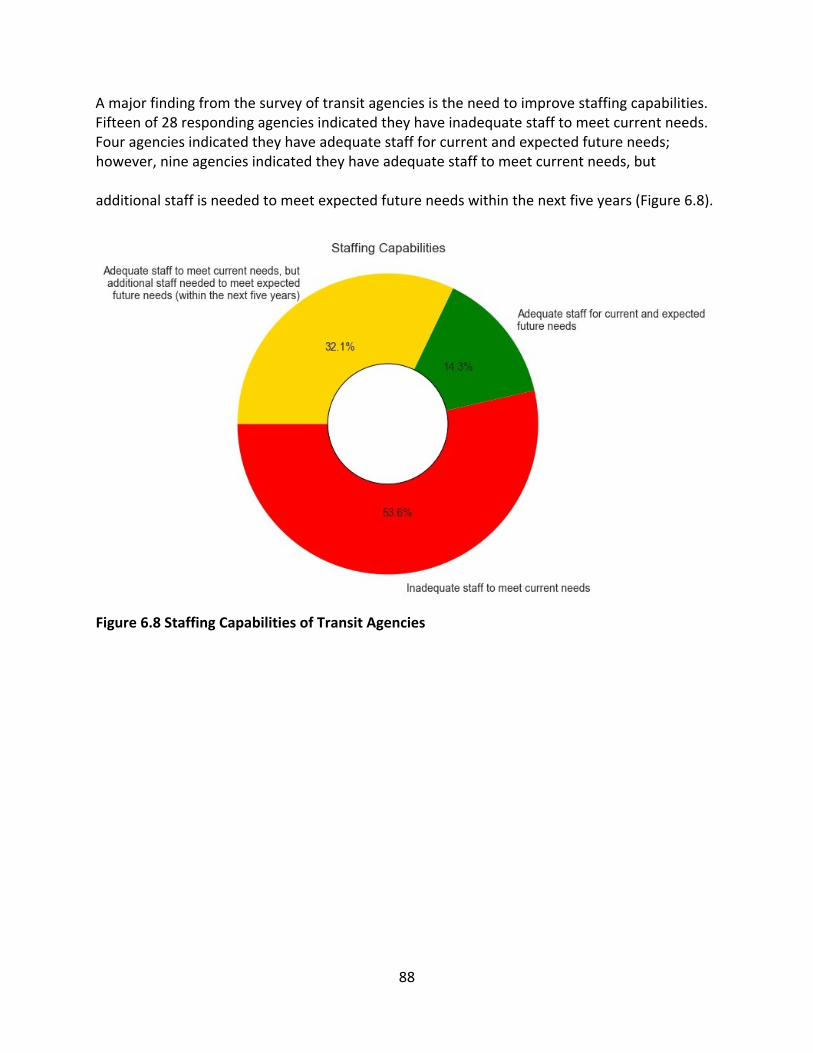
88
A major finding from the survey of transit agencies is the need to improve staffing capabilities. Fifteen of 28 responding agencies indicated they have inadequate staff to meet current needs. Four agencies indicated they have adequate staff for current and expected future needs; however, nine agencies indicated they have adequate staff to meet current needs, but
additional staff is needed to meet expected future needs within the next five years (Figure 6.8).
Figure 6.8 Staffing Capabilities of Transit Agencies
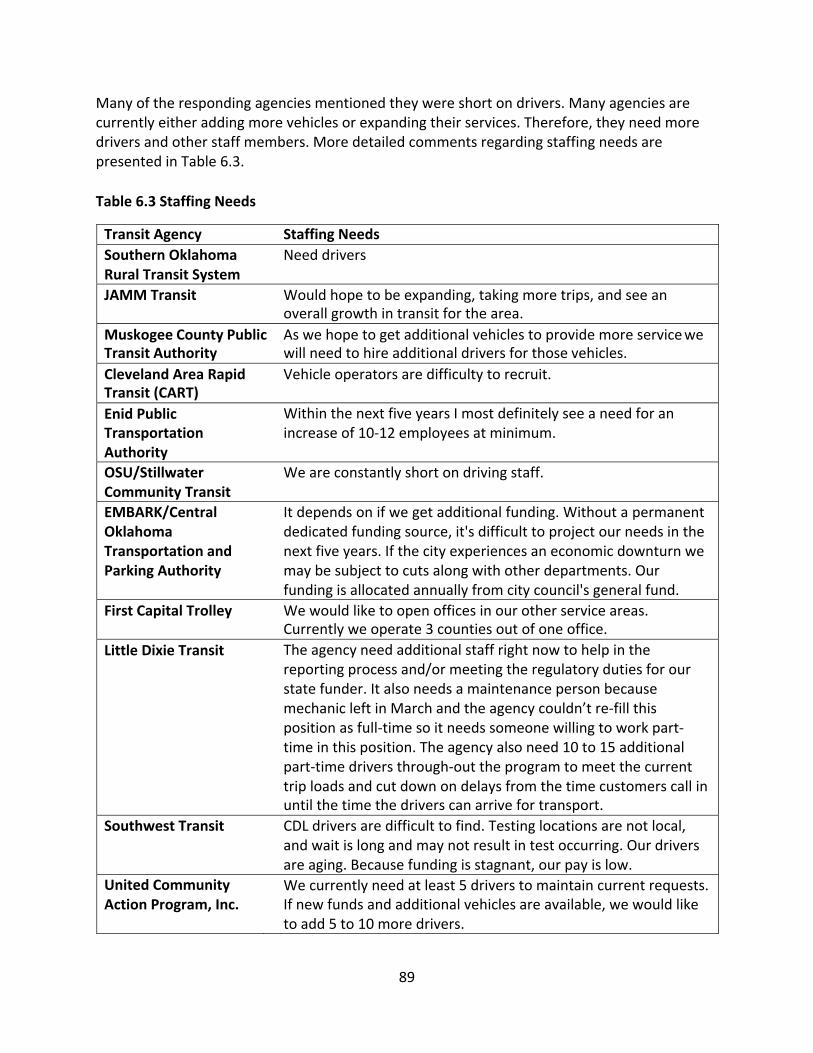
89
Many of the responding agencies mentioned they were short on drivers. Many agencies are currently either adding more vehicles or expanding their services. Therefore, they need more drivers and other staff members. More detailed comments regarding staffing needs are presented in Table 6.3.
Table 6.3 Staffing Needs
Transit Agency Staffing Needs
Southern Oklahoma Rural Transit System
Need drivers
JAMM Transit Would hope to be expanding, taking more trips, and see an overall growth in transit for the area.
Muskogee County Public As we hope to get additional vehicles to provide more service we Transit Authority will need to hire additional drivers for those vehicles.
Cleveland Area Rapid Transit (CART)
Vehicle operators are difficulty to recruit.
Enid Public Transportation Authority
Within the next five years I most definitely see a need for an increase of 10‐12 employees at minimum.
OSU/Stillwater Community Transit
We are constantly short on driving staff.
EMBARK/Central Oklahoma Transportation and Parking Authority
It depends on if we get additional funding. Without a permanent dedicated funding source, it's difficult to project our needs in the next five years. If the city experiences an economic downturn we may be subject to cuts along with other departments. Our funding is allocated annually from city council's general fund.
First Capital Trolley We would like to open offices in our other service areas. Currently we operate 3 counties out of one office.
Little Dixie Transit The agency need additional staff right now to help in the reporting process and/or meeting the regulatory duties for our state funder. It also needs a maintenance person because mechanic left in March and the agency couldn’t re‐fill this position as full‐time so it needs someone willing to work part‐ time in this position. The agency also need 10 to 15 additional part‐time drivers through‐out the program to meet the current trip loads and cut down on delays from the time customers call in until the time the drivers can arrive for transport.
Southwest Transit CDL drivers are difficult to find. Testing locations are not local, and wait is long and may not result in test occurring. Our drivers are aging. Because funding is stagnant, our pay is low.
United Community Action Program, Inc.
We currently need at least 5 drivers to maintain current requests. If new funds and additional vehicles are available, we would like to add 5 to 10 more drivers.
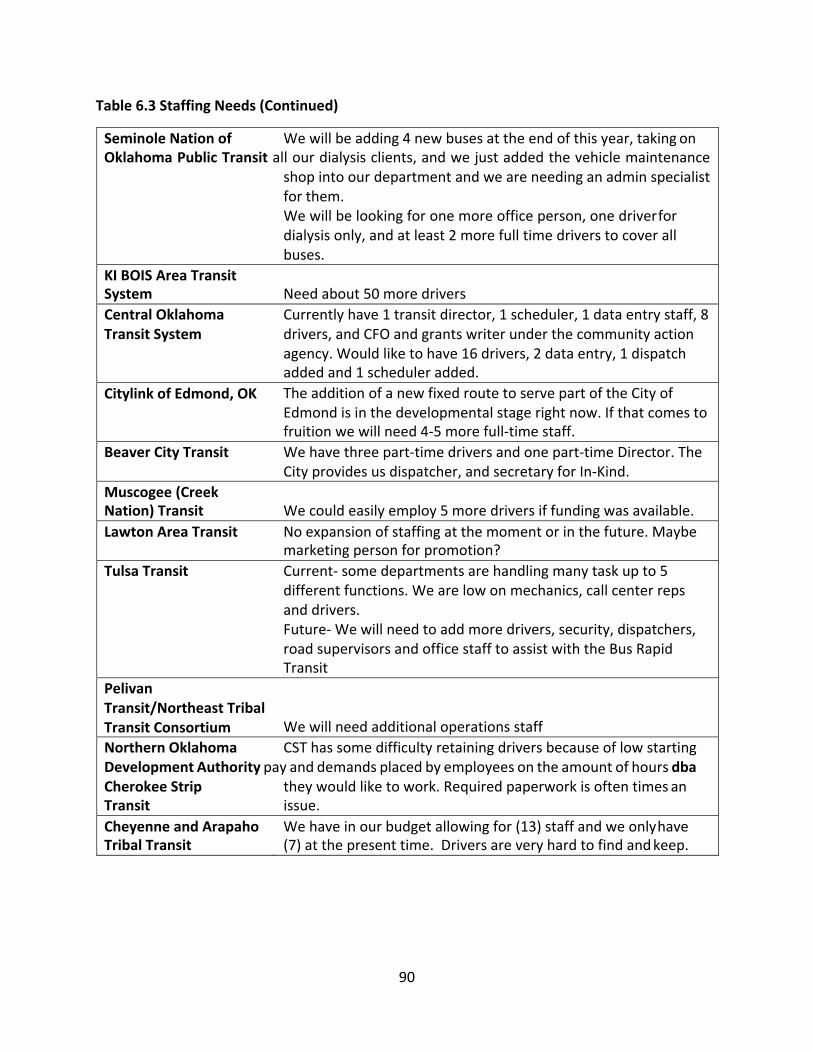
90
Table 6.3 Staffing Needs (Continued)
Seminole Nation of We will be adding 4 new buses at the end of this year, taking on Oklahoma Public Transit all our dialysis clients, and we just added the vehicle maintenance
shop into our department and we are needing an admin specialist for them. We will be looking for one more office person, one driver for dialysis only, and at least 2 more full time drivers to cover all buses.
KI BOIS Area Transit System
Need about 50 more drivers
Central Oklahoma Transit System
Currently have 1 transit director, 1 scheduler, 1 data entry staff, 8 drivers, and CFO and grants writer under the community action agency. Would like to have 16 drivers, 2 data entry, 1 dispatch added and 1 scheduler added.
Citylink of Edmond, OK The addition of a new fixed route to serve part of the City of Edmond is in the developmental stage right now. If that comes to fruition we will need 4‐5 more full‐time staff.
Beaver City Transit We have three part‐time drivers and one part‐time Director. The City provides us dispatcher, and secretary for In‐Kind.
Muscogee (Creek Nation) Transit
We could easily employ 5 more drivers if funding was available.
Lawton Area Transit No expansion of staffing at the moment or in the future. Maybe marketing person for promotion?
Tulsa Transit Current‐ some departments are handling many task up to 5 different functions. We are low on mechanics, call center reps and drivers. Future‐ We will need to add more drivers, security, dispatchers, road supervisors and office staff to assist with the Bus Rapid Transit
Pelivan Transit/Northeast Tribal Transit Consortium
We will need additional operations staff
Northern Oklahoma CST has some difficulty retaining drivers because of low starting Development Authority pay and demands placed by employees on the amount of hours dba Cherokee Strip they would like to work. Required paperwork is often times an Transit issue.
Cheyenne and Arapaho Tribal Transit
We have in our budget allowing for (13) staff and we only have (7) at the present time. Drivers are very hard to find and keep.
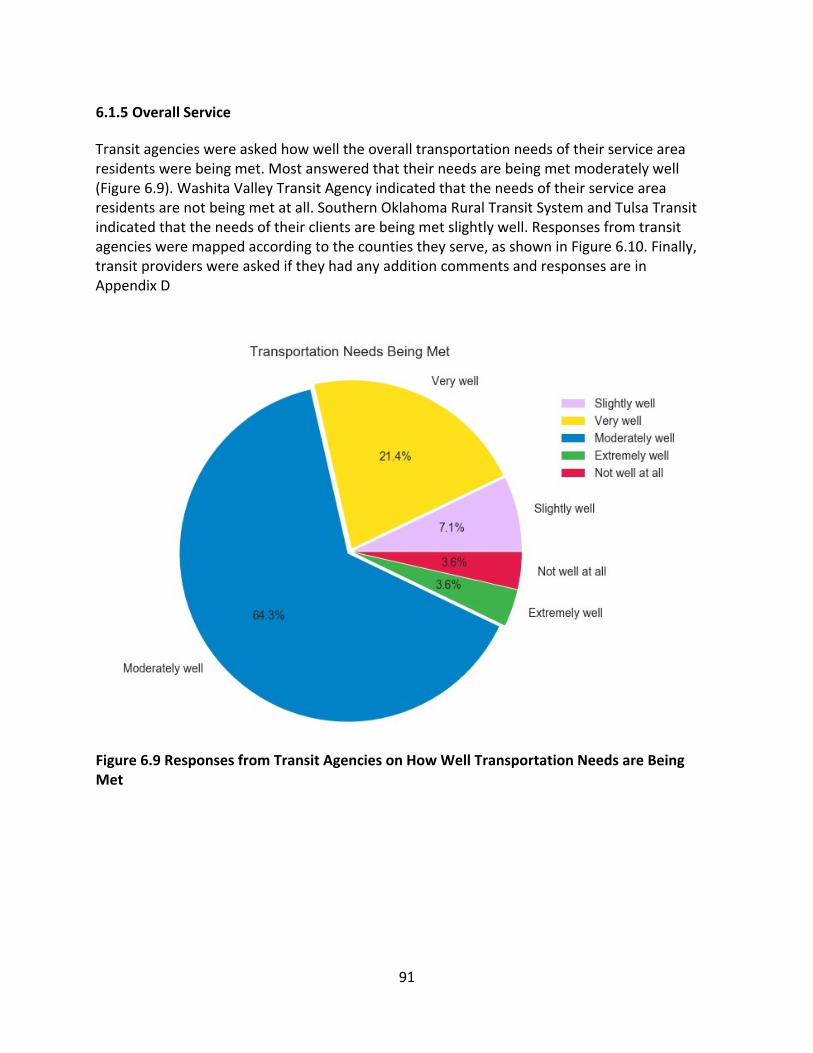
91
6.1.5 Overall Service
Transit agencies were asked how well the overall transportation needs of their service area residents were being met. Most answered that their needs are being met moderately well (Figure 6.9). Washita Valley Transit Agency indicated that the needs of their service area residents are not being met at all. Southern Oklahoma Rural Transit System and Tulsa Transit indicated that the needs of their clients are being met slightly well. Responses from transit agencies were mapped according to the counties they serve, as shown in Figure 6.10. Finally, transit providers were asked if they had any addition comments and responses are in Appendix D
Figure 6.9 Responses from Transit Agencies on How Well Transportation Needs are Being Met
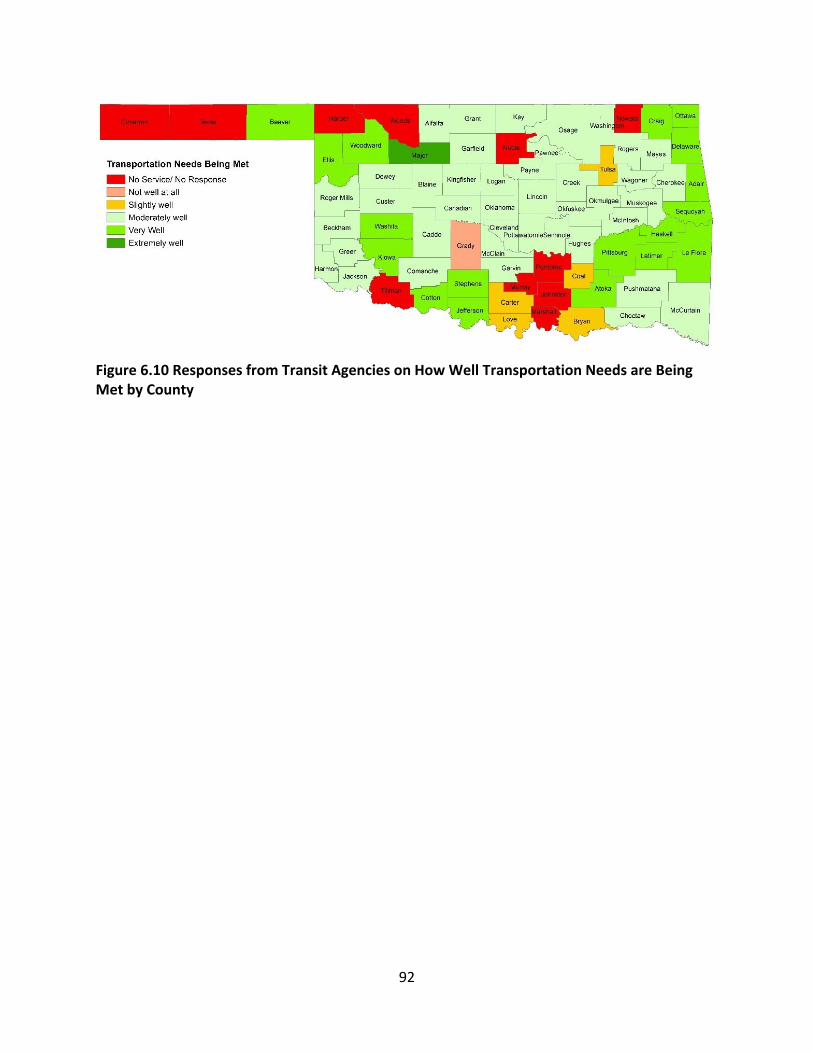
92
Figure 6.10 Responses from Transit Agencies on How Well Transportation Needs are Being Met by County
93
Chapter 7 FUNDING NEEDS TO REDUCE CURRENT SERVICE GAPS
7.1 Current Service Levels
To evaluate service levels in Oklahoma, the state was divided into 34 regions, including two urban areas (Oklahoma City and Tulsa), four small urban areas (Norman, Lawton, Edmond, and Stillwater), and 28 regions, including 18 rural and 10 tribal areas consisting of one or multiple counties. Regions were determined based on the current service boundaries of the state’s transit providers. County‐level data are not available for each provider because many serve multiple counties and do not report data at the county level. Table 7.1 shows a description of these regions, the transit agency serving each, along with current and projected populations. Reliable population projections were not available for tribal providers. Table 7.2 provides total and per capita service data for each region for trips provided, vehicle revenue miles, vehicle revenue hours, and the number of vehicles in service. For both small urban and urban areas, the demand‐response and fixed‐route data are separated. Oklahoma City area demand‐ response service includes EMBARK’s complementary paratransit service in addition to services from RSVP and Community Action.
The per capita data presented in Table 7.2 and Figure 7.1. Figure 7.2 and Figure 7.3 illustrate the level of service provided, adjusted for population. Trips per capita is a measure of transit service consumed while vehicle miles and hours per capita is a measure of transit service supplied, adjusted for population. The number of active vehicles per 1,000 people, as seen in Table 7.2, shows the availability of transit vehicles and the ability of transit providers to meet demand. Vehicles per capita should not be compared between urban and rural settings because this measure does not consider differences in vehicle capacity, which leads to urban providers appearing to have a low number of vehicles per capita, but fixed‐route systems in these areas operate high‐capacity vehicles.
94
As expected, trips provided per capita is highest for fixed‐route service in small urban and urban areas. Among rural providers, trips per capita are highest in southeastern, and southwestern Oklahoma, as well as Beaver County, and lowest in the central and north central regions of the state (Figure 7.1). The amount of service provided, as measured by vehicle miles and/or hours per capita, follows a similar pattern with southeastern and southwestern Oklahoma being highest; while, as opposed to trips per capita, Texas and Beaver counties in the northwest region of the state have low vehicle miles per capita (Figure 7.2). This is due to single county service regions in northwest Oklahoma that do not drive as many miles to provide service compared to with multi‐county service providers in nearly all other parts of the state
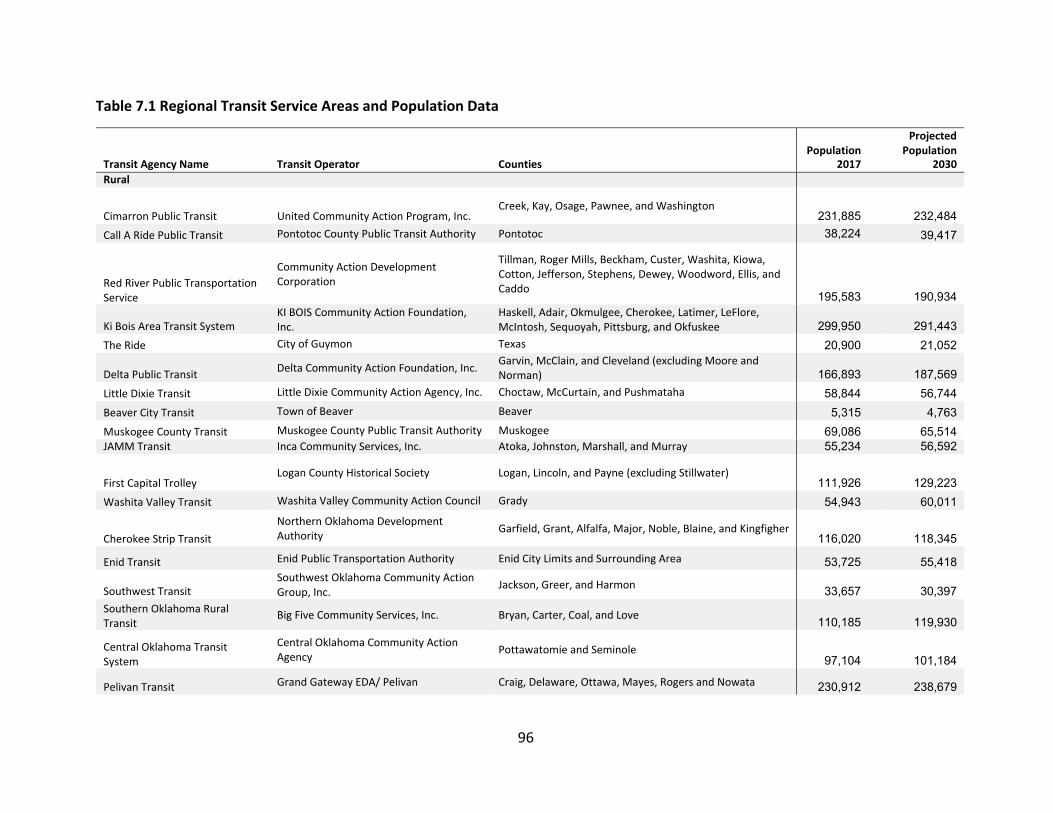
96
Table 7.1 Regional Transit Service Areas and Population Data
Transit Agency Name
Transit Operator
Counties
Population 2017
Projected Population
2030
Rural
Cimarron Public Transit
United Community Action Program, Inc.
Creek, Kay, Osage, Pawnee, and Washington 231,885
232,484
Call A Ride Public Transit Pontotoc County Public Transit Authority Pontotoc 38,224 39,417
Red River Public Transportation Service
Community Action Development Corporation
Tillman, Roger Mills, Beckham, Custer, Washita, Kiowa, Cotton, Jefferson, Stephens, Dewey, Woodword, Ellis, and Caddo
195,583
190,934 Ki Bois Area Transit System
KI BOIS Community Action Foundation, Inc.
Haskell, Adair, Okmulgee, Cherokee, Latimer, LeFlore, McIntosh, Sequoyah, Pittsburg, and Okfuskee
299,950
291,443
The Ride City of Guymon Texas 20,900 21,052 Delta Public Transit
Delta Community Action Foundation, Inc. Garvin, McClain, and Cleveland (excluding Moore and Norman)
166,893
187,569
Little Dixie Transit Little Dixie Community Action Agency, Inc. Choctaw, McCurtain, and Pushmataha 58,844 56,744
Beaver City Transit Town of Beaver Beaver 5,315 4,763
Muskogee County Transit Muskogee County Public Transit Authority Muskogee 69,086 65,514 JAMM Transit Inca Community Services, Inc. Atoka, Johnston, Marshall, and Murray 55,234 56,592
First Capital Trolley
Logan County Historical Society
Logan, Lincoln, and Payne (excluding Stillwater) 111,926
129,223
Washita Valley Transit Washita Valley Community Action Council Grady 54,943 60,011
Cherokee Strip Transit
Northern Oklahoma Development Authority
Garfield, Grant, Alfalfa, Major, Noble, Blaine, and Kingfigher 116,020
118,345
Enid Transit Enid Public Transportation Authority Enid City Limits and Surrounding Area 53,725 55,418 Southwest Transit
Southwest Oklahoma Community Action Group, Inc.
Jackson, Greer, and Harmon
33,657
30,397
Southern Oklahoma Rural Transit
Big Five Community Services, Inc. Bryan, Carter, Coal, and Love
110,185
119,930
Central Oklahoma Transit System
Central Oklahoma Community Action Agency
Pottawatomie and Seminole 97,104
101,184
Pelivan Transit Grand Gateway EDA/ Pelivan Craig, Delaware, Ottawa, Mayes, Rogers and Nowata
230,912
238,679
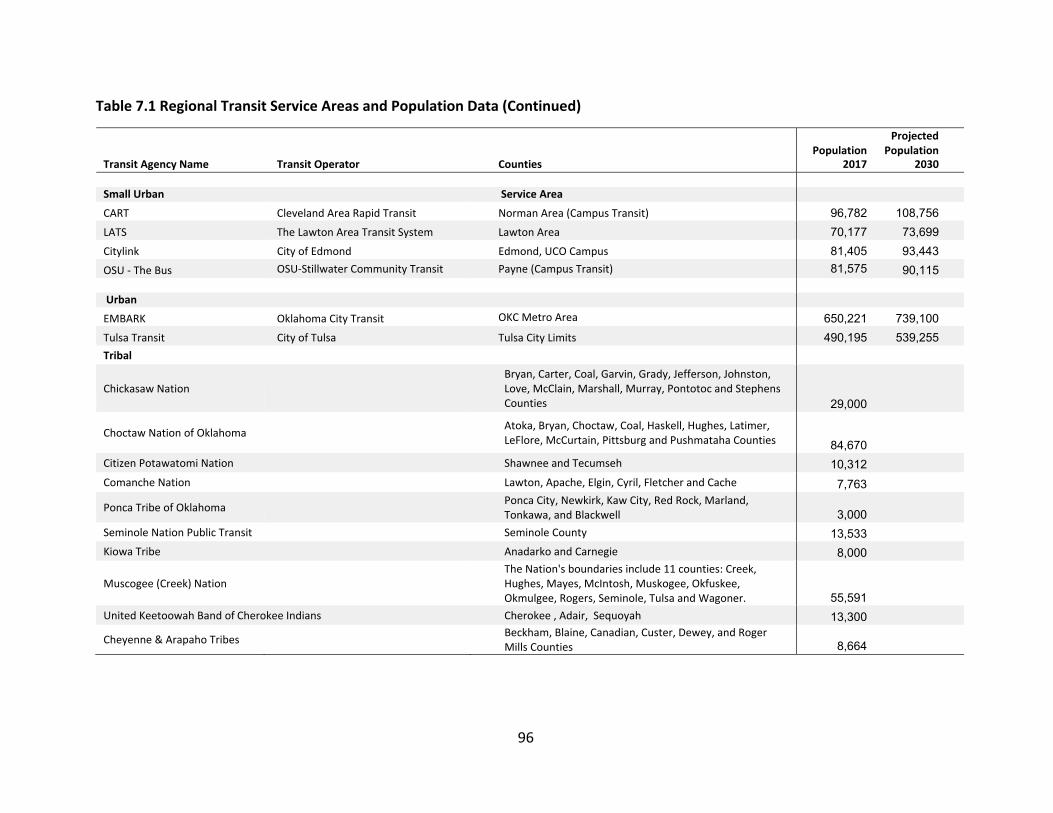
96
Table 7.1 Regional Transit Service Areas and Population Data (Continued)
Transit Agency Name
Transit Operator
Counties
Population 2017
Projected Population
2030
Small Urban Service Area
CART Cleveland Area Rapid Transit Norman Area (Campus Transit) 96,782 108,756
LATS The Lawton Area Transit System Lawton Area 70,177 73,699
Citylink City of Edmond Edmond, UCO Campus 81,405 93,443
OSU ‐ The Bus OSU‐Stillwater Community Transit Payne (Campus Transit) 81,575 90,115
Urban
EMBARK Oklahoma City Transit OKC Metro Area 650,221 739,100
Tulsa Transit City of Tulsa Tulsa City Limits 490,195 539,255
Tribal
Chickasaw Nation
Bryan, Carter, Coal, Garvin, Grady, Jefferson, Johnston, Love, McClain, Marshall, Murray, Pontotoc and Stephens Counties
29,000
Choctaw Nation of Oklahoma
Atoka, Bryan, Choctaw, Coal, Haskell, Hughes, Latimer, LeFlore, McCurtain, Pittsburg and Pushmataha Counties
84,670
Citizen Potawatomi Nation Shawnee and Tecumseh 10,312
Comanche Nation Lawton, Apache, Elgin, Cyril, Fletcher and Cache 7,763
Ponca Tribe of Oklahoma Ponca City, Newkirk, Kaw City, Red Rock, Marland,
Tonkawa, and Blackwell
3,000
Seminole Nation Public Transit Seminole County 13,533
Kiowa Tribe Anadarko and Carnegie 8,000 Muscogee (Creek) Nation
The Nation's boundaries include 11 counties: Creek, Hughes, Mayes, McIntosh, Muskogee, Okfuskee, Okmulgee, Rogers, Seminole, Tulsa and Wagoner.
55,591
United Keetoowah Band of Cherokee Indians Cherokee , Adair, Sequoyah 13,300
Cheyenne & Arapaho Tribes Beckham, Blaine, Canadian, Custer, Dewey, and Roger
Mills Counties
8,664
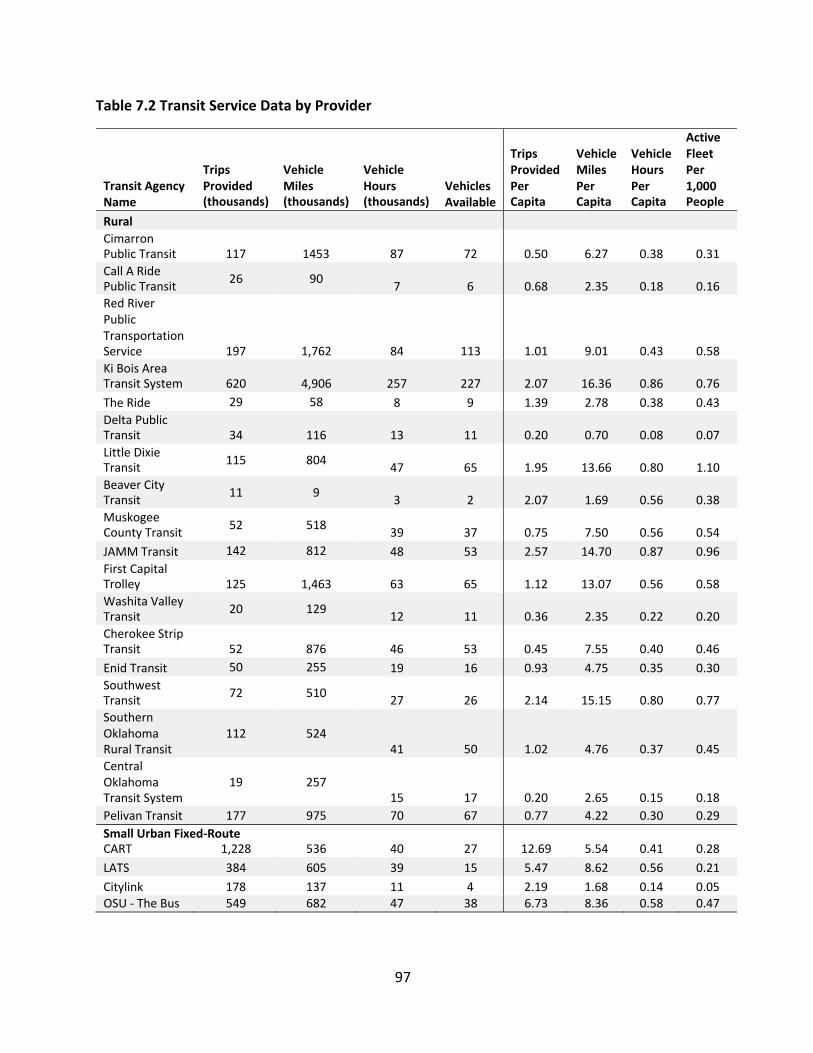
97
Table 7.2 Transit Service Data by Provider
Transit Agency Name
Trips Provided (thousands)
Vehicle Miles (thousands)
Vehicle Hours (thousands)
Vehicles Available
Trips Provided Per Capita
Vehicle Miles Per Capita
Vehicle Hours Per Capita
Active Fleet Per 1,000 People
Rural
Cimarron Public Transit
117
1453
87
72
0.50
6.27
0.38
0.31
Call A Ride Public Transit
26 90
7
6
0.68
2.35
0.18
0.16
Red River Public Transportation Service
197
1,762
84
113
1.01
9.01
0.43
0.58
Ki Bois Area Transit System
620
4,906
257
227
2.07
16.36
0.86
0.76
The Ride 29 58 8 9 1.39 2.78 0.38 0.43
Delta Public Transit
34
116
13
11
0.20
0.70
0.08
0.07
Little Dixie Transit
115 804
47
65
1.95 13.66
0.80
1.10
Beaver City Transit
11 9
3
2
2.07
1.69
0.56
0.38
Muskogee County Transit
52 518
39
37
0.75
7.50
0.56
0.54
JAMM Transit 142 812 48 53 2.57 14.70 0.87 0.96
First Capital Trolley
125
1,463
63
65
1.12
13.07
0.56
0.58
Washita Valley Transit
20 129
12
11
0.36
2.35
0.22
0.20
Cherokee Strip Transit
52
876
46
53
0.45
7.55
0.40
0.46
Enid Transit 50 255 19 16 0.93 4.75 0.35 0.30
Southwest Transit
72 510
27
26
2.14 15.15
0.80
0.77
Southern Oklahoma Rural Transit
112
524
41
50
1.02
4.76
0.37
0.45
Central Oklahoma Transit System
19
257
15
17
0.20
2.65
0.15
0.18
Pelivan Transit 177 975 70 67 0.77 4.22 0.30 0.29
Small Urban Fixed‐Route CART 1,228
536
40
27
12.69
5.54
0.41
0.28
LATS 384 605 39 15 5.47 8.62 0.56 0.21
Citylink 178 137 11 4 2.19 1.68 0.14 0.05 OSU ‐ The Bus 549 682 47 38 6.73 8.36 0.58 0.47
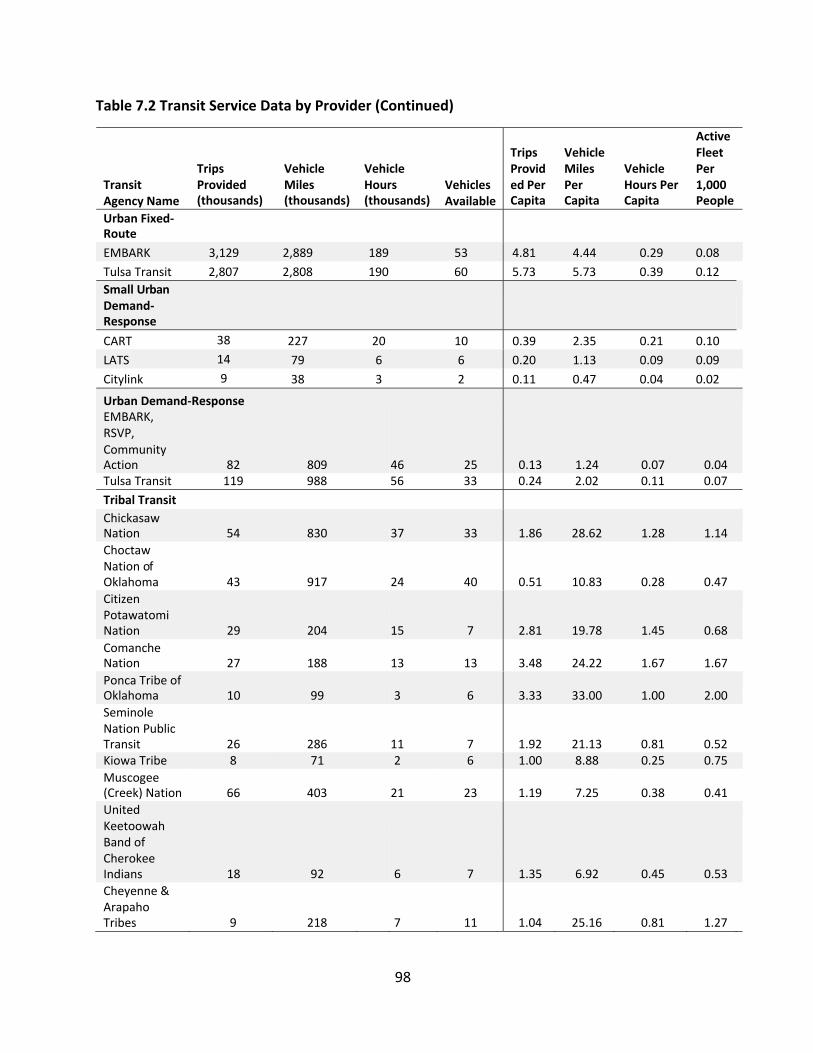
98
Table 7.2 Transit Service Data by Provider (Continued)
Transit Agency Name
Trips Provided (thousands)
Vehicle Miles (thousands)
Vehicle Hours (thousands)
Vehicles Available
Trips Provid ed Per Capita
Vehicle Miles Per Capita
Vehicle Hours Per Capita
Active Fleet Per 1,000 People
Urban Fixed‐ Route
EMBARK 3,129 2,889 189 53 4.81 4.44 0.29 0.08
Tulsa Transit 2,807 2,808 190 60 5.73 5.73 0.39 0.12
Small Urban Demand‐ Response
CART 38 227 20 10 0.39 2.35 0.21 0.10
LATS 14 79 6 6 0.20 1.13 0.09 0.09
Citylink 9 38 3 2 0.11 0.47 0.04 0.02
Urban Demand‐Response EMBARK, RSVP, Community Action 82
809
46
25
0.13
1.24
0.07
0.04
Tulsa Transit 119 988 56 33 0.24 2.02 0.11 0.07
Tribal Transit
Chickasaw Nation 54
830
37
33
1.86
28.62
1.28
1.14
Choctaw Nation of Oklahoma
43
917
24
40
0.51
10.83
0.28
0.47
Citizen Potawatomi Nation
29
204
15
7
2.81
19.78
1.45
0.68
Comanche Nation
27
188
13
13
3.48
24.22
1.67
1.67
Ponca Tribe of Oklahoma
10
99
3
6
3.33
33.00
1.00
2.00
Seminole Nation Public Transit
26
286
11
7
1.92
21.13
0.81
0.52
Kiowa Tribe 8 71 2 6 1.00 8.88 0.25 0.75
Muscogee (Creek) Nation
66
403
21
23
1.19
7.25
0.38
0.41
United Keetoowah Band of Cherokee Indians
18
92
6
7
1.35
6.92
0.45
0.53
Cheyenne & Arapaho Tribes
9
218
7
11
1.04
25.16
0.81
1.27
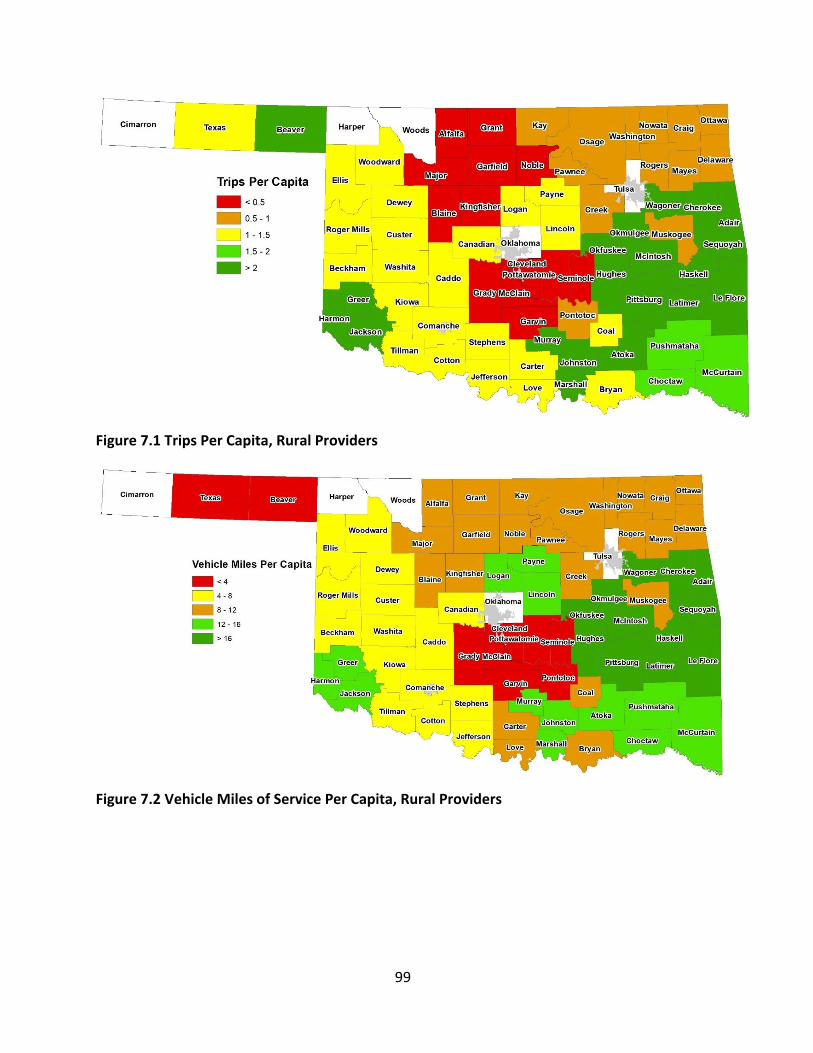
99
Figure 7.1 Trips Per Capita, Rural Providers
Figure 7.2 Vehicle Miles of Service Per Capita, Rural Providers
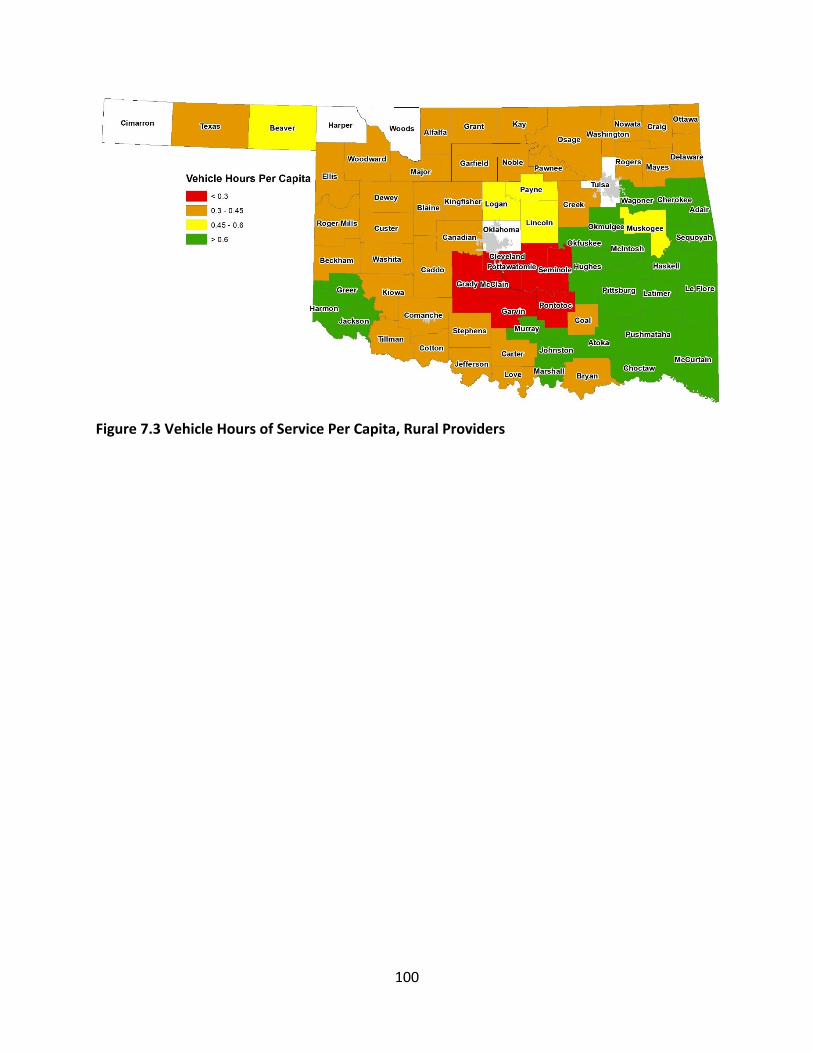
100
Figure 7.3 Vehicle Hours of Service Per Capita, Rural Providers
101
7.2 Estimated Increases in Services to Reduce Gaps
Per capita service levels provide information about how well transit providers are meeting the needs of their communities. Comparing service levels with benchmarks and target levels helps identify where increases in service levels are necessary. A previous analysis conducted by SURTC in 2005 (Mielke, et al. 2005) and 2015 (Mattson and Hough, Identifying and Satisfying the mobility needs of North Dakota's Transit System 2015) for the North Dakota Department of Transportation (NDDOT) used 7.0 and 8.5 vehicle miles per capita as target levels for a high level of service.
In Oklahoma, NTD data from 2017 show that the average number of vehicle miles per capita in rural areas is 8.0, suggesting similar levels as those found in North Dakota. However, there is significant variability among Oklahoma transit providers with vehicle miles per capita, ranging from approximately 2 to 16 among rural providers. Nine of the 18 rural providers shown in Table 6.2 had fewer than 5.0 vehicle miles of service per capita in 2017, and 12 had less than 8.0 vehicle miles of service per capita, showing there are numerous areas in the state not currently meeting this target level of service.
Vehicle miles of service per capita is a useful service level measure, but can be difficult to gauge against a defined target level. Generally, a higher number indicates more frequent service within a defined coverage area, but a high value can be due to sparsely populated areas that require very long trips. Due to these long travel distances, providing adequate service often requires more miles driven per capita. Densely populated areas usually allow for shorter travel distances while providing similar levels of service with fewer vehicle miles. Also, communities with a large number of older adults, higher poverty rates, and other transportation‐ disadvantaged citizens usually provide more miles of service per capita. Nonetheless, a low level of vehicle miles per capita suggests that mobility needs are not being adequately met by existing transit service and that additional service may be justified.
Because there is no single measure that accurately defines the sufficiency of transit service for a given location, this study utilizes three different measures and establishes benchmarks for each: trips per capita, vehicle miles per capita, and vehicle hours per capita.
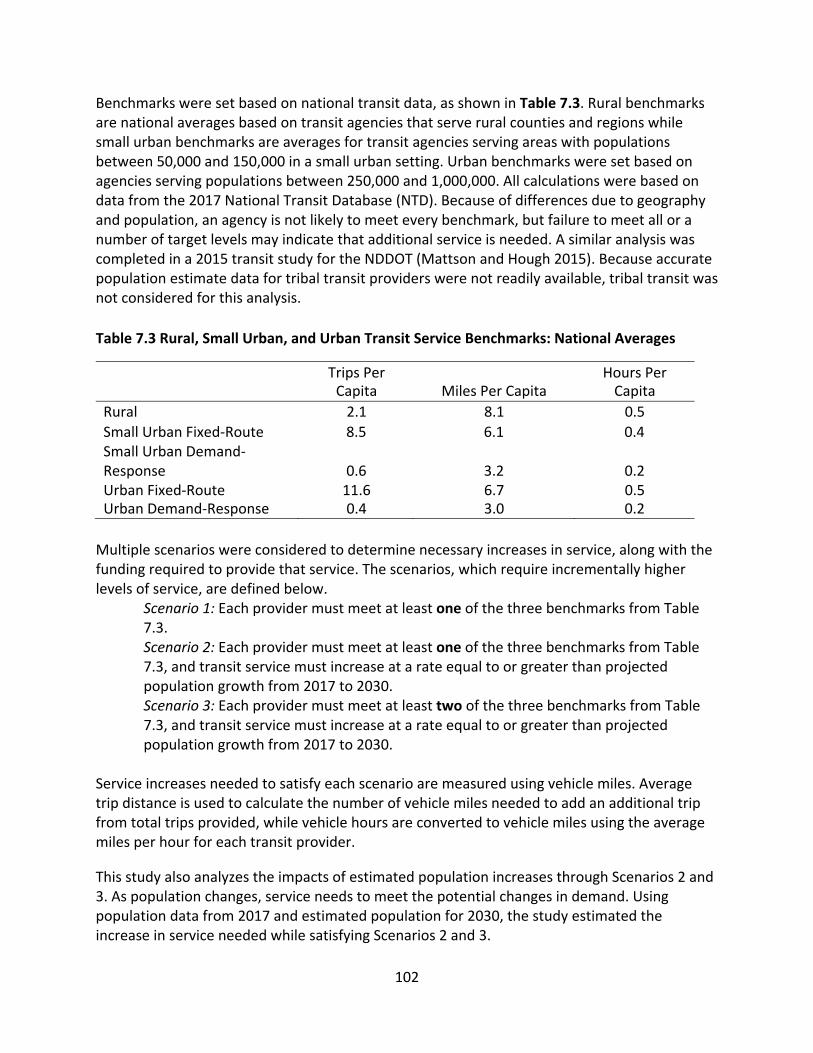
102
Benchmarks were set based on national transit data, as shown in Table 7.3. Rural benchmarks are national averages based on transit agencies that serve rural counties and regions while small urban benchmarks are averages for transit agencies serving areas with populations between 50,000 and 150,000 in a small urban setting. Urban benchmarks were set based on agencies serving populations between 250,000 and 1,000,000. All calculations were based on data from the 2017 National Transit Database (NTD). Because of differences due to geography and population, an agency is not likely to meet every benchmark, but failure to meet all or a number of target levels may indicate that additional service is needed. A similar analysis was completed in a 2015 transit study for the NDDOT (Mattson and Hough 2015). Because accurate population estimate data for tribal transit providers were not readily available, tribal transit was not considered for this analysis.
Table 7.3 Rural, Small Urban, and Urban Transit Service Benchmarks: National Averages
Trips Per Capita
Miles Per Capita
Hours Per Capita
Rural 2.1 8.1 0.5
Small Urban Fixed‐Route 8.5 6.1 0.4 Small Urban Demand‐
Response 0.6 3.2 0.2 Urban Fixed‐Route 11.6 6.7 0.5 Urban Demand‐Response 0.4 3.0 0.2
Multiple scenarios were considered to determine necessary increases in service, along with the funding required to provide that service. The scenarios, which require incrementally higher levels of service, are defined below.
Scenario 1: Each provider must meet at least one of the three benchmarks from Table 7.3. Scenario 2: Each provider must meet at least one of the three benchmarks from Table 7.3, and transit service must increase at a rate equal to or greater than projected population growth from 2017 to 2030. Scenario 3: Each provider must meet at least two of the three benchmarks from Table 7.3, and transit service must increase at a rate equal to or greater than projected population growth from 2017 to 2030.
Service increases needed to satisfy each scenario are measured using vehicle miles. Average trip distance is used to calculate the number of vehicle miles needed to add an additional trip from total trips provided, while vehicle hours are converted to vehicle miles using the average miles per hour for each transit provider.
This study also analyzes the impacts of estimated population increases through Scenarios 2 and 3. As population changes, service needs to meet the potential changes in demand. Using population data from 2017 and estimated population for 2030, the study estimated the increase in service needed while satisfying Scenarios 2 and 3.
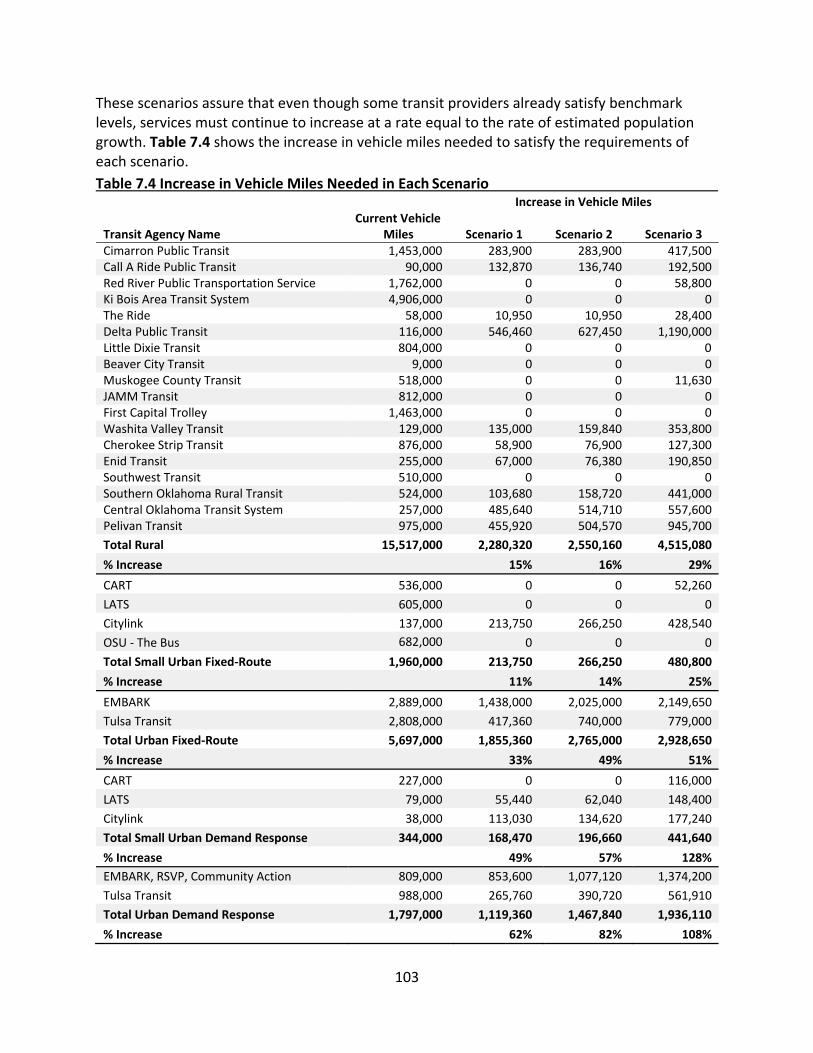
103
These scenarios assure that even though some transit providers already satisfy benchmark levels, services must continue to increase at a rate equal to the rate of estimated population growth. Table 7.4 shows the increase in vehicle miles needed to satisfy the requirements of each scenario.
Table 7.4 Increase in Vehicle Miles Needed in Each Scenario Increase in Vehicle Miles
Current Vehicle Transit Agency Name Miles Scenario 1 Scenario 2 Scenario 3 Cimarron Public Transit 1,453,000 283,900 283,900 417,500 Call A Ride Public Transit 90,000 132,870 136,740 192,500 Red River Public Transportation Service 1,762,000 0 0 58,800 Ki Bois Area Transit System 4,906,000 0 0 0 The Ride 58,000 10,950 10,950 28,400 Delta Public Transit 116,000 546,460 627,450 1,190,000 Little Dixie Transit 804,000 0 0 0 Beaver City Transit 9,000 0 0 0 Muskogee County Transit 518,000 0 0 11,630 JAMM Transit 812,000 0 0 0 First Capital Trolley 1,463,000 0 0 0 Washita Valley Transit 129,000 135,000 159,840 353,800 Cherokee Strip Transit 876,000 58,900 76,900 127,300 Enid Transit 255,000 67,000 76,380 190,850 Southwest Transit 510,000 0 0 0 Southern Oklahoma Rural Transit 524,000 103,680 158,720 441,000 Central Oklahoma Transit System 257,000 485,640 514,710 557,600 Pelivan Transit 975,000 455,920 504,570 945,700
Total Rural 15,517,000 2,280,320 2,550,160 4,515,080
% Increase 15% 16% 29%
CART 536,000 0 0 52,260
LATS 605,000 0 0 0
Citylink 137,000 213,750 266,250 428,540
OSU ‐ The Bus 682,000 0 0 0
Total Small Urban Fixed‐Route 1,960,000 213,750 266,250 480,800
% Increase 11% 14% 25%
EMBARK 2,889,000 1,438,000 2,025,000 2,149,650
Tulsa Transit 2,808,000 417,360 740,000 779,000
Total Urban Fixed‐Route 5,697,000 1,855,360 2,765,000 2,928,650
% Increase 33% 49% 51%
CART 227,000 0 0 116,000
LATS 79,000 55,440 62,040 148,400
Citylink 38,000 113,030 134,620 177,240
Total Small Urban Demand Response 344,000 168,470 196,660 441,640
% Increase 49% 57% 128%
EMBARK, RSVP, Community Action 809,000 853,600 1,077,120 1,374,200
Tulsa Transit 988,000 265,760 390,720 561,910
Total Urban Demand Response 1,797,000 1,119,360 1,467,840 1,936,110
% Increase 62% 82% 108%
104
Under Scenario 1, Delta Public Transit, the Central Oklahoma Transit System, and Pelivin Transit require the largest increase in service among rural providers, while EMBARK and Citylink require the largest increases among urban and small urban providers, respectively. Subsequent scenarios providing higher level of service and considering population increases amplifies the need for increased service in Cimarron Public Transit, Washita Valley Transit, Enid Transit, and Southern Oklahoma Rural Transit among rural providers. Subsequent scenarios also highlight the need for expanded service, once again, for EMBARK, Citylink, and Tulsa Transit in urban and small urban settings.
105
7.3 Estimating Expenses to Achieve Expanded Service Levels
Cost estimates for expanding service levels were estimated first by assuming current costs and then by assuming a 20% increase in costs. The increased costs reflect the need for transit agencies to raise staff wages which would allow them to attract and retain skilled staff needed to maintain and increase service levels. Within small urban and rural transit agencies, labor costs typically account for 70% of total costs (Mattson and Ripplinger 2011). Therefore, increasing wages would have a significant impact on total operating costs. Considering this increased labor cost along with possible increases in other operating costs, the effects on funding needs following a 20% operating cost increase was analyzed.
2017 NTD data show the average operating expense per mile for rural transit in Oklahoma was $1.78. A 20% increase would raise operation costs to $2.14 per mile. Based on average 2017 NTD data for small urban and urban agencies, current operating costs were assumed to be $5.89 per mile for fixed‐route transit and $4.13 per mile for demand‐response service. The number of vehicles needed to expand service levels is uncertain, as there is likely some excess capacity already available. However, it is assumed that a new vehicle is required for every additional 18,000 miles of service for both rural, small urban, and urban demand‐ response transit and for every 39,000 miles for total fixed‐route service, which are the approximate averages for miles driven per vehicle per year. The cost of new vehicles is assumed to be $55,000 for rural agencies, assuming a mix of cutaways, vans, and minivans; $500,000 for urban fixed‐route buses; $70,000 for urban demand‐response vehicles. (Actual costs will vary based on size and kinds of technology used.)
The increased funding necessary to operate these expanded service levels is shown in Table 7.5. All expenses are expressed in 2017 dollars.
106
Table 7.5 Estimated Increases in Operating and Vehicle Expenses to Satisfy Expanded Service Levels
Scenario 1 Scenario 2 Scenario 3
Rural Transit Increase in Vehicle Miles
2,280,320
2,550,160
4,515,080
Number of Vehicles Needed to Provide New Service 127 142 251
Cost of New Vehicles $6,967,644 $7,792,156 $13,796,078
Operating Expense to Provide Additional Miles with Current Operating Costs
$4,058,970
$4,539,285
$8,036,842
Operating Expense to Provide Additional Miles with 20% Increase in Operating Costs
$4,879,885
$5,457,342
$9,662,271
Total Expenses with 2017 Operating Costs $11,026,614 $12,331,440 $21,832,920
Total Expenses with 20% Increase in Operating Costs $11,847,529 $13,249,498 $23,458,349
Small Urban Fixed‐Route Transit Scenario 1 Scenario 2 Scenario 3
Increase in Vehicle Miles 213,750 266,250 480,800
Number of Vehicles Needed to Provide New Service 5 7 12 Cost of New Vehicles $2,740,385 $3,413,462 $6,164,103
Operating Expense to Provide Additional Miles with Current Operating Costs
$1,258,988
$1,568,213
$2,831,912
Operating Expense to Provide Additional Miles with 20% Increase in Operating Costs
$1,511,213
$1,882,388
$3,399,256
Total Expenses with 2017 Operating Costs $3,999,372 $4,981,674 $8,996,015
Total Expenses with 20% Increase in Operating Costs $4,251,597 $5,295,849 $9,563,359
Urban Fixed‐Route Transit
Increase in Vehicle Miles 1,855,360 2,765,000 2,928,650 Number of Vehicles Needed to Provide New Service 48 71 75
Cost of New Vehicles $23,786,667 $35,448,718 $37,546,795
Operating Expense to Provide Additional Miles with Current Operating Costs
$10,928,070
$16,285,850
$17,249,749
Operating Expense to Provide Additional Miles with 20% Increase in Operating Costs
$13,117,395
$19,548,550
$20,705,556
Total Expenses with 2017 Operating Costs $34,714,737 $51,734,568 $54,796,543
Total Expenses with 20% Increase in Operating Costs $36,904,062 $54,997,268 $58,252,350
Small Urban Demand‐Response Transit
Increase in Vehicle Miles 168,470 196,660 441,640
Number of Vehicles Needed to Provide New Service 9 11 25
Cost of New Vehicles $655,161 $764,789 $1,717,489
Operating Expense to Provide Additional Miles with Current Operating Costs
$695,781
$812,206
$1,823,973
Operating Expense to Provide Additional Miles with 20% Increase in Operating Costs
$835,611
$975,434
$2,190,534
Total Expenses with 2007 Operating Costs $1,350,942 $1,576,995 $3,541,462
Total Expenses with 20% Increase in Operating Costs $1,490,772 $1,740,222 $3,908,023
107
Table 7.5 Estimated Increases in Operating and Vehicle Expenses to Satisfy Expanded Service
Levels (Continued)
Scenario 1 Scenario 2 Scenario 3
Urban Demand‐Response Transit
Increase in Vehicle Miles 1,119,360 1,467,840 1,936,110
Number of Vehicles Needed to Provide New Service 62 82 108
Cost of New Vehicles $4,353,067 $5,708,267 $7,529,317
Operating Expense to Provide Additional Miles with Current Operating Costs
$4,622,957
$6,062,179
$7,996,134
Operating Expense to Provide Additional Miles with 20% Increase in Operating Costs
$5,552,026
$7,280,486
$9,603,106
Total Expenses with 2017 Operating Costs $8,976,023 $11,770,446 $15,525,451
Total Expenses with 20% Increase in Operating Costs $9,905,092 $12,988,753 $17,132,422
Statewide Expenses with 2017 Operating Costs $60,067,689 $82,395,123 $104,692,391
Statewide Expenses with 20% Increase in Operating Costs
$64,399,053
$88,271,590
$112,314,503
108
7.4 Funding Needs for Vehicle Replacement
The vehicle expenses estimated in the previous section are one‐time expenses needed to increase fleet sizes across the state to allow for improved service levels. However, these vehicles will need to be replaced periodically, increasing annual capital expenditures. In addition, there are currently several vehicles in the state that have surpassed their useful lives and in need of replacement.
The Federal Transit Administration (FTA) has defined a minimum service life for different categories of buses and vans. The minimum service life indicates the number of years or miles that transit vehicles purchased with federal funds must be in service before they can be retired without financial penalty. This minimum service life requirement is shown in Table 7.6. These requirements have become perceived as the actual useful life of these vehicles (Laver, et al. 2007).
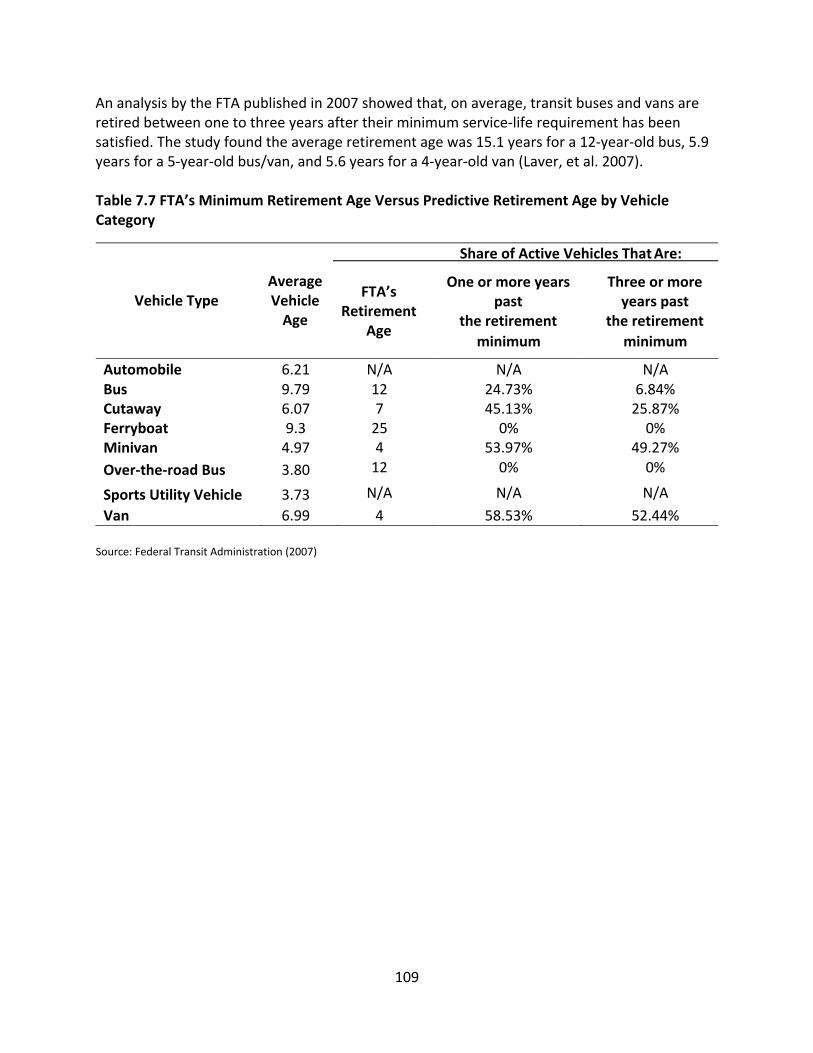
109
An analysis by the FTA published in 2007 showed that, on average, transit buses and vans are retired between one to three years after their minimum service‐life requirement has been satisfied. The study found the average retirement age was 15.1 years for a 12‐year‐old bus, 5.9 years for a 5‐year‐old bus/van, and 5.6 years for a 4‐year‐old van (Laver, et al. 2007). Table 7.7 FTA’s Minimum Retirement Age Versus Predictive Retirement Age by Vehicle Category
Share of Active Vehicles That Are:
Vehicle Type
Average Vehicle Age
FTA’s Retirement
Age
One or more years past
the retirement
Three or more years past
the retirement
Source: Federal Transit Administration (2007)
minimum minimum
Automobile 6.21 N/A N/A N/A Bus 9.79 12 24.73% 6.84% Cutaway 6.07 7 45.13% 25.87% Ferryboat 9.3 25 0% 0% Minivan 4.97 4 53.97% 49.27%
Over‐the‐road Bus 3.80 12 0% 0%
Sports Utility Vehicle 3.73 N/A N/A N/A
Van 6.99 4 58.53% 52.44%
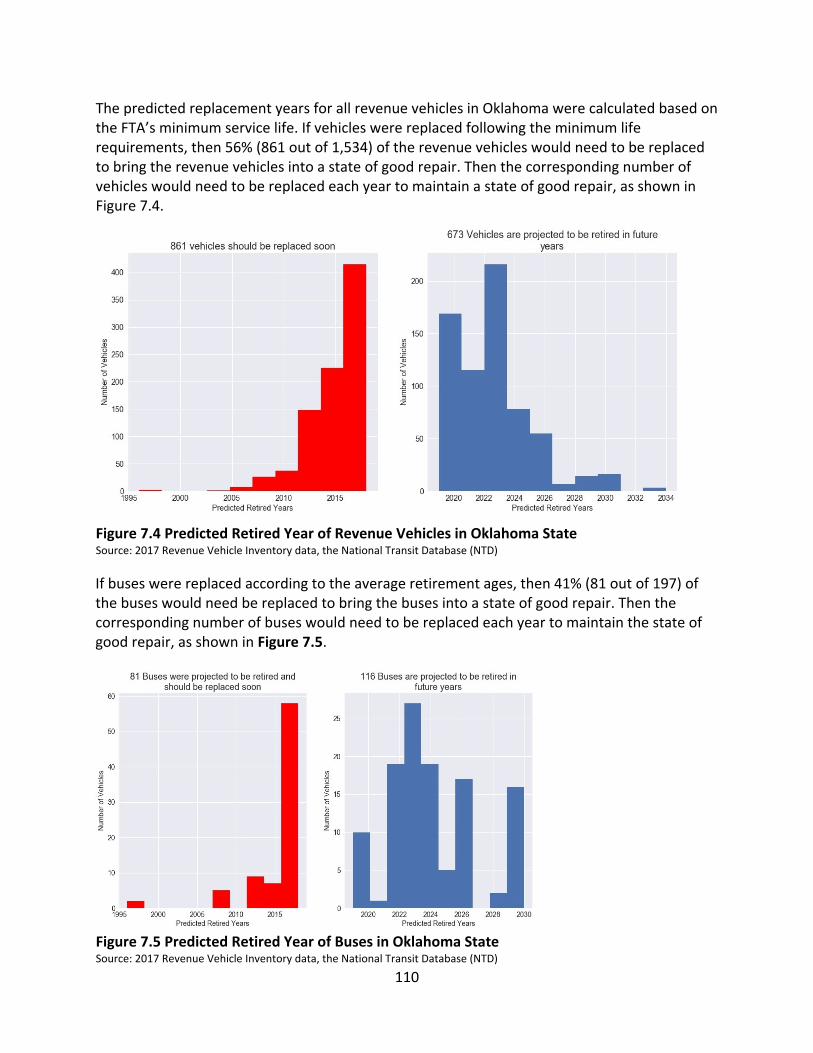
110
The predicted replacement years for all revenue vehicles in Oklahoma were calculated based on the FTA’s minimum service life. If vehicles were replaced following the minimum life requirements, then 56% (861 out of 1,534) of the revenue vehicles would need to be replaced to bring the revenue vehicles into a state of good repair. Then the corresponding number of vehicles would need to be replaced each year to maintain a state of good repair, as shown in Figure 7.4.
Figure 7.4 Predicted Retired Year of Revenue Vehicles in Oklahoma State Source: 2017 Revenue Vehicle Inventory data, the National Transit Database (NTD)
If buses were replaced according to the average retirement ages, then 41% (81 out of 197) of the buses would need be replaced to bring the buses into a state of good repair. Then the corresponding number of buses would need to be replaced each year to maintain the state of good repair, as shown in Figure 7.5.
Figure 7.5 Predicted Retired Year of Buses in Oklahoma State Source: 2017 Revenue Vehicle Inventory data, the National Transit Database (NTD)
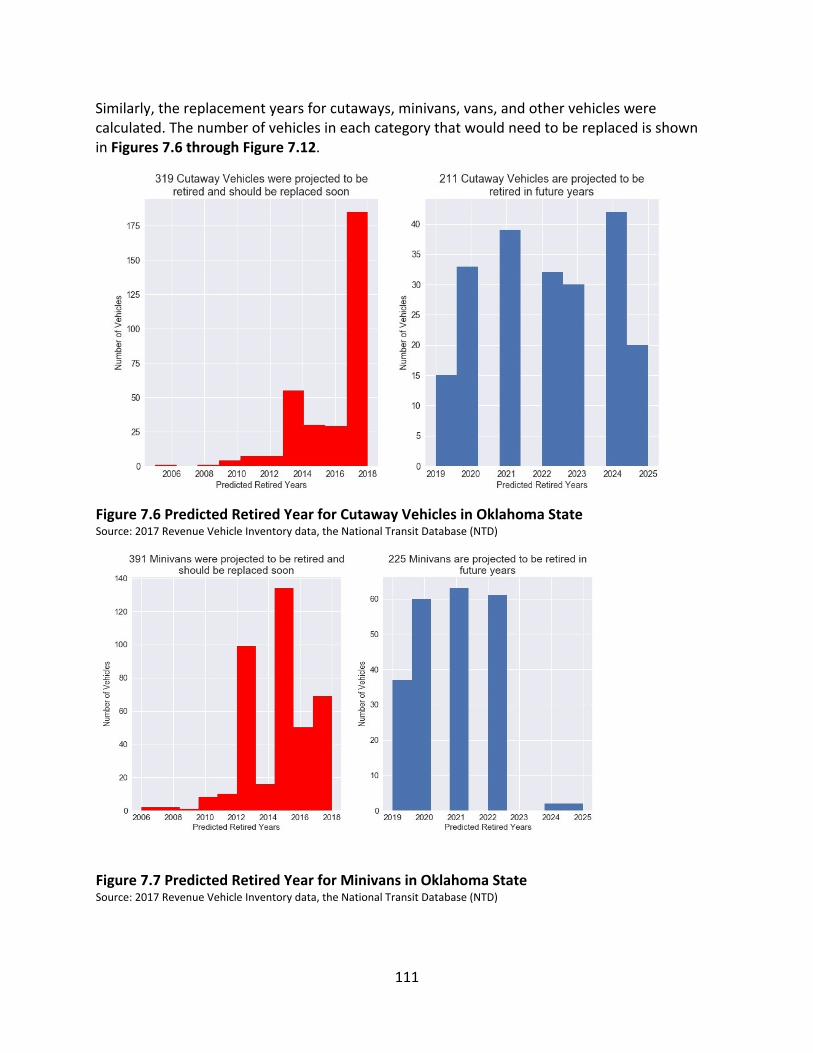
111
Similarly, the replacement years for cutaways, minivans, vans, and other vehicles were calculated. The number of vehicles in each category that would need to be replaced is shown in Figures 7.6 through Figure 7.12.
Figure 7.6 Predicted Retired Year for Cutaway Vehicles in Oklahoma State Source: 2017 Revenue Vehicle Inventory data, the National Transit Database (NTD)
Figure 7.7 Predicted Retired Year for Minivans in Oklahoma State Source: 2017 Revenue Vehicle Inventory data, the National Transit Database (NTD)
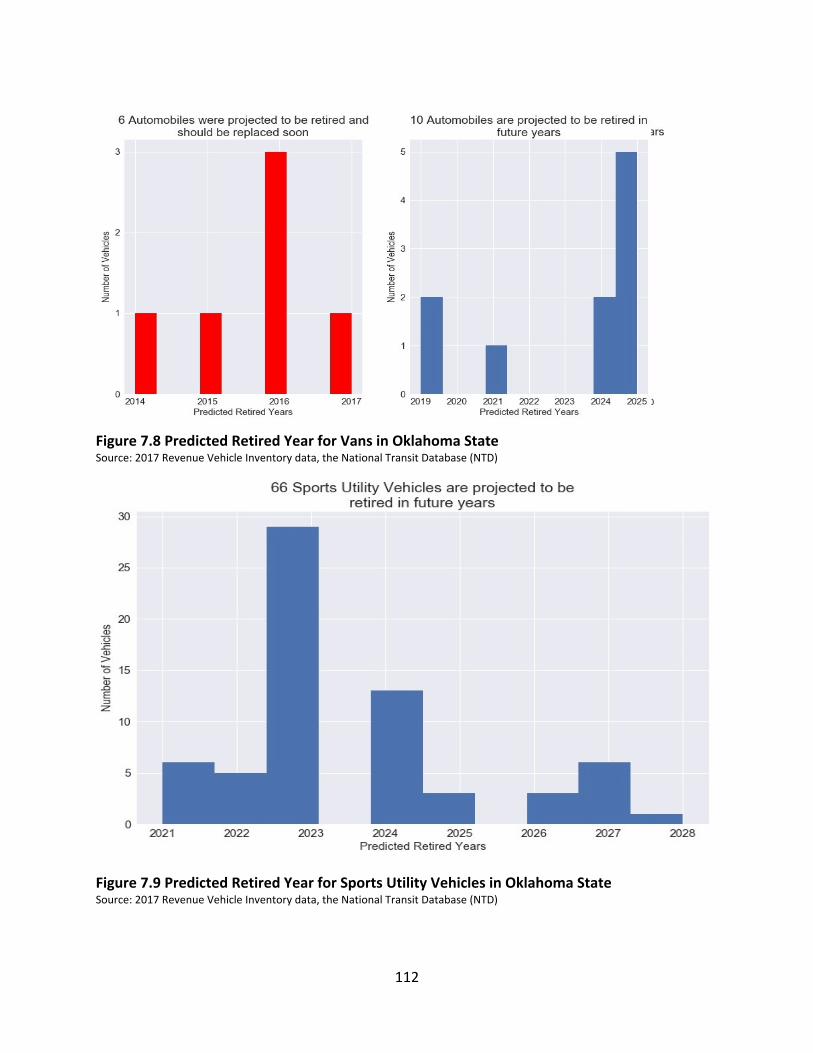
112
Figure 7.8 Predicted Retired Year for Vans in Oklahoma State Source: 2017 Revenue Vehicle Inventory data, the National Transit Database (NTD)
Figure 7.9 Predicted Retired Year for Sports Utility Vehicles in Oklahoma State Source: 2017 Revenue Vehicle Inventory data, the National Transit Database (NTD)
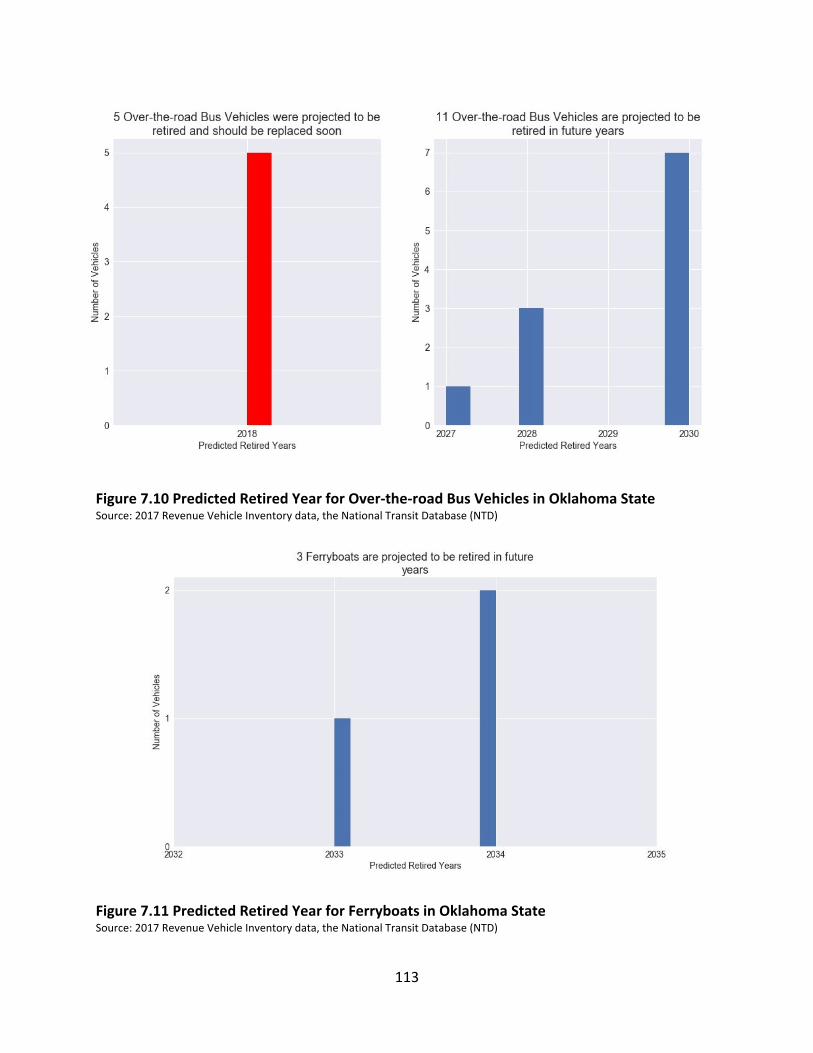
113
Figure 7.10 Predicted Retired Year for Over‐the‐road Bus Vehicles in Oklahoma State Source: 2017 Revenue Vehicle Inventory data, the National Transit Database (NTD)
Figure 7.11 Predicted Retired Year for Ferryboats in Oklahoma State Source: 2017 Revenue Vehicle Inventory data, the National Transit Database (NTD)
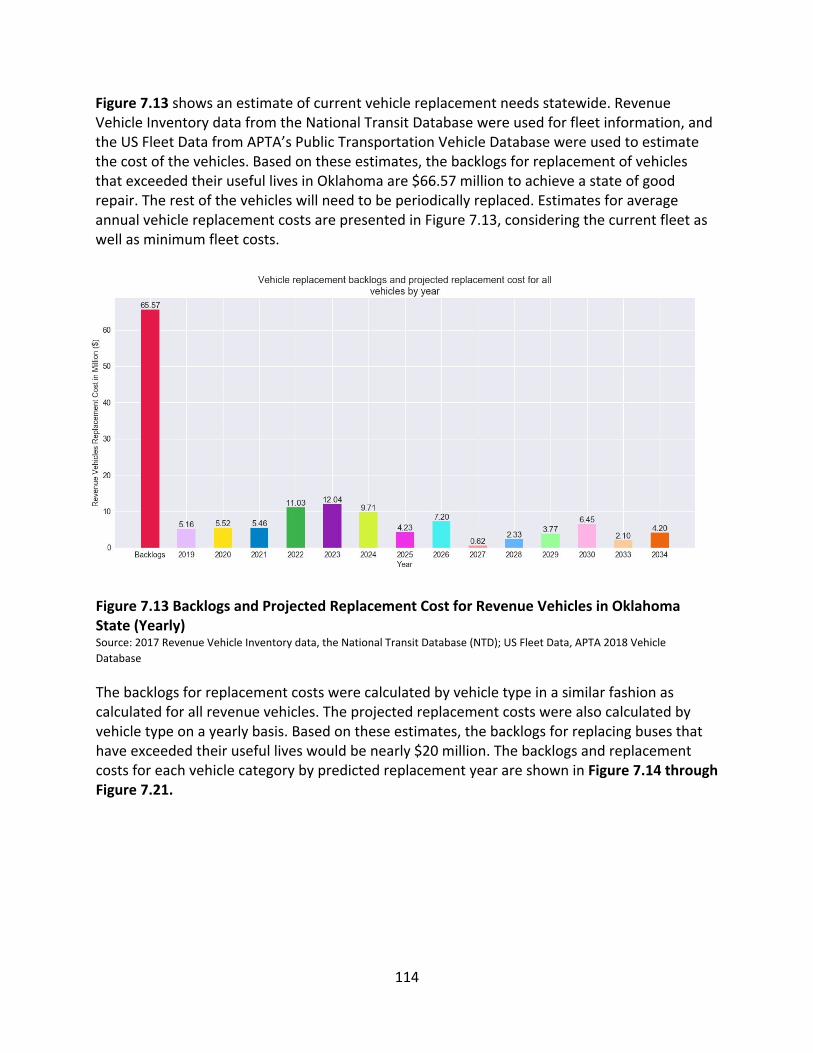
114
Figure 7.13 shows an estimate of current vehicle replacement needs statewide. Revenue Vehicle Inventory data from the National Transit Database were used for fleet information, and the US Fleet Data from APTA’s Public Transportation Vehicle Database were used to estimate the cost of the vehicles. Based on these estimates, the backlogs for replacement of vehicles that exceeded their useful lives in Oklahoma are $66.57 million to achieve a state of good repair. The rest of the vehicles will need to be periodically replaced. Estimates for average annual vehicle replacement costs are presented in Figure 7.13, considering the current fleet as well as minimum fleet costs.
Figure 7.13 Backlogs and Projected Replacement Cost for Revenue Vehicles in Oklahoma State (Yearly) Source: 2017 Revenue Vehicle Inventory data, the National Transit Database (NTD); US Fleet Data, APTA 2018 Vehicle
Database
The backlogs for replacement costs were calculated by vehicle type in a similar fashion as calculated for all revenue vehicles. The projected replacement costs were also calculated by vehicle type on a yearly basis. Based on these estimates, the backlogs for replacing buses that have exceeded their useful lives would be nearly $20 million. The backlogs and replacement costs for each vehicle category by predicted replacement year are shown in Figure 7.14 through Figure 7.21.
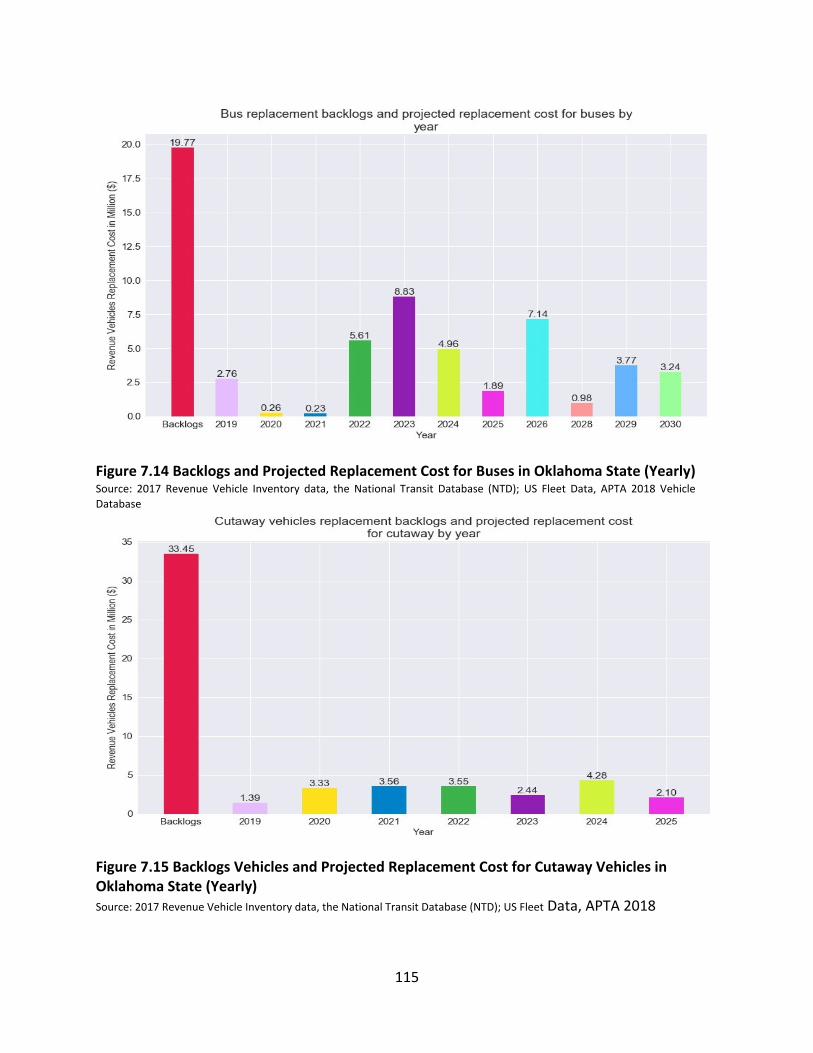
115
Figure 7.14 Backlogs and Projected Replacement Cost for Buses in Oklahoma State (Yearly) Source: 2017 Revenue Vehicle Inventory data, the National Transit Database (NTD); US Fleet Data, APTA 2018 Vehicle
Database
Figure 7.15 Backlogs Vehicles and Projected Replacement Cost for Cutaway Vehicles in Oklahoma State (Yearly) Source: 2017 Revenue Vehicle Inventory data, the National Transit Database (NTD); US Fleet Data, APTA 2018
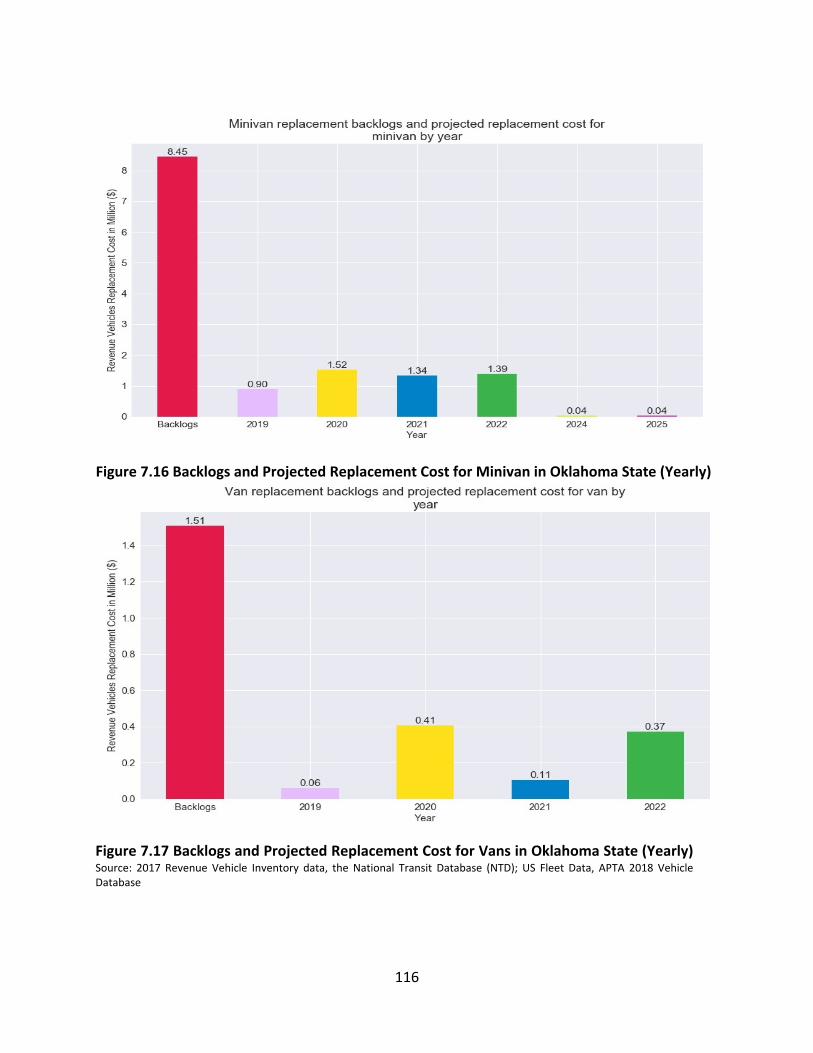
116
Figure 7.16 Backlogs and Projected Replacement Cost for Minivan in Oklahoma State (Yearly)
Figure 7.17 Backlogs and Projected Replacement Cost for Vans in Oklahoma State (Yearly) Source: 2017 Revenue Vehicle Inventory data, the National Transit Database (NTD); US Fleet Data, APTA 2018 Vehicle Database
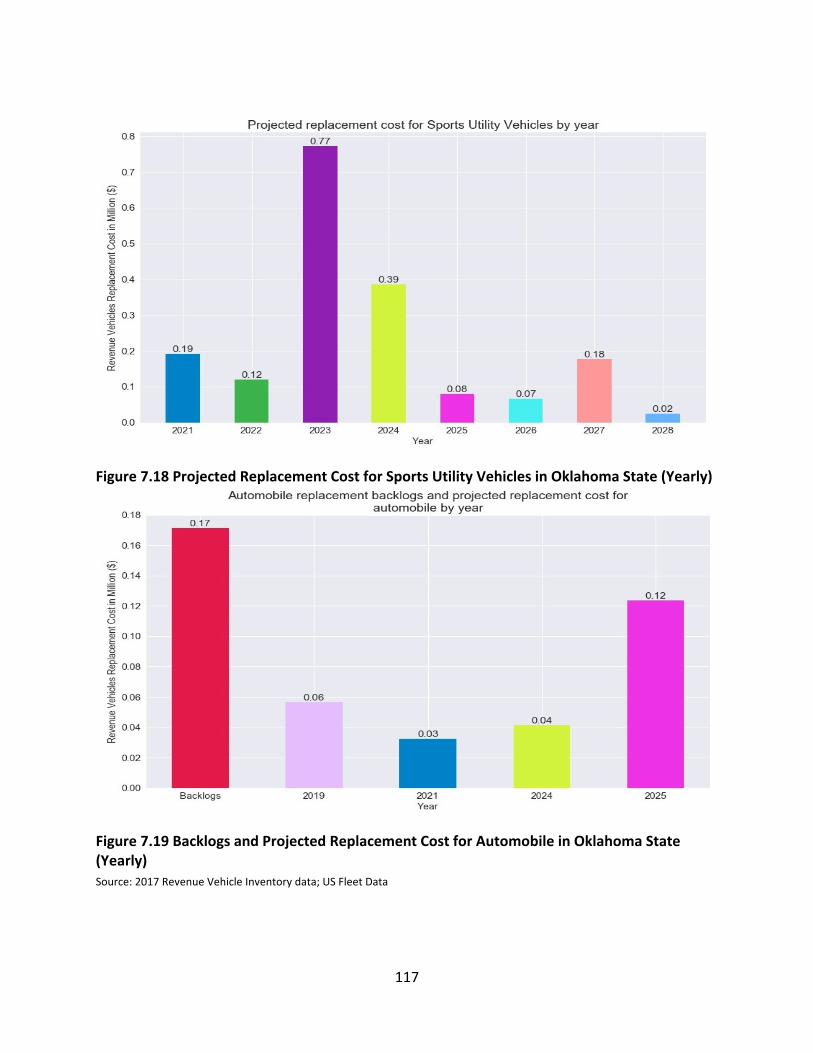
117
Figure 7.18 Projected Replacement Cost for Sports Utility Vehicles in Oklahoma State (Yearly)
Figure 7.19 Backlogs and Projected Replacement Cost for Automobile in Oklahoma State (Yearly) Source: 2017 Revenue Vehicle Inventory data; US Fleet Data
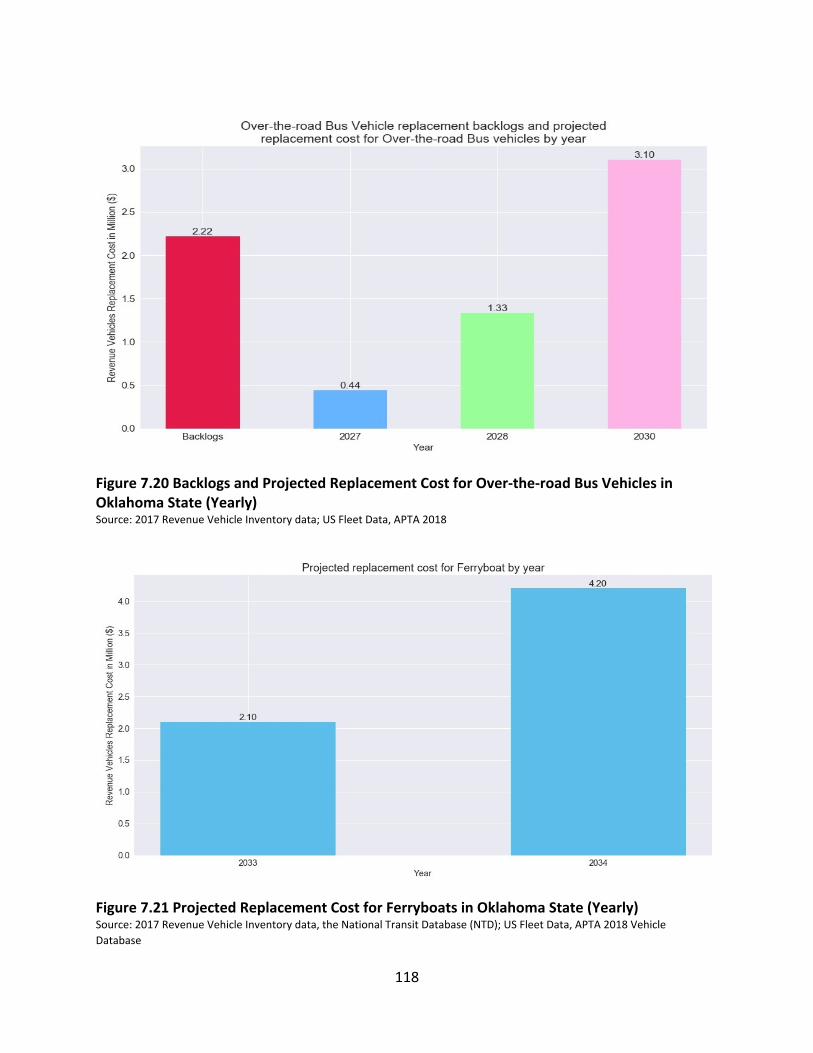
118
Figure 7.20 Backlogs and Projected Replacement Cost for Over‐the‐road Bus Vehicles in Oklahoma State (Yearly) Source: 2017 Revenue Vehicle Inventory data; US Fleet Data, APTA 2018
Figure 7.21 Projected Replacement Cost for Ferryboats in Oklahoma State (Yearly) Source: 2017 Revenue Vehicle Inventory data, the National Transit Database (NTD); US Fleet Data, APTA 2018 Vehicle
Database
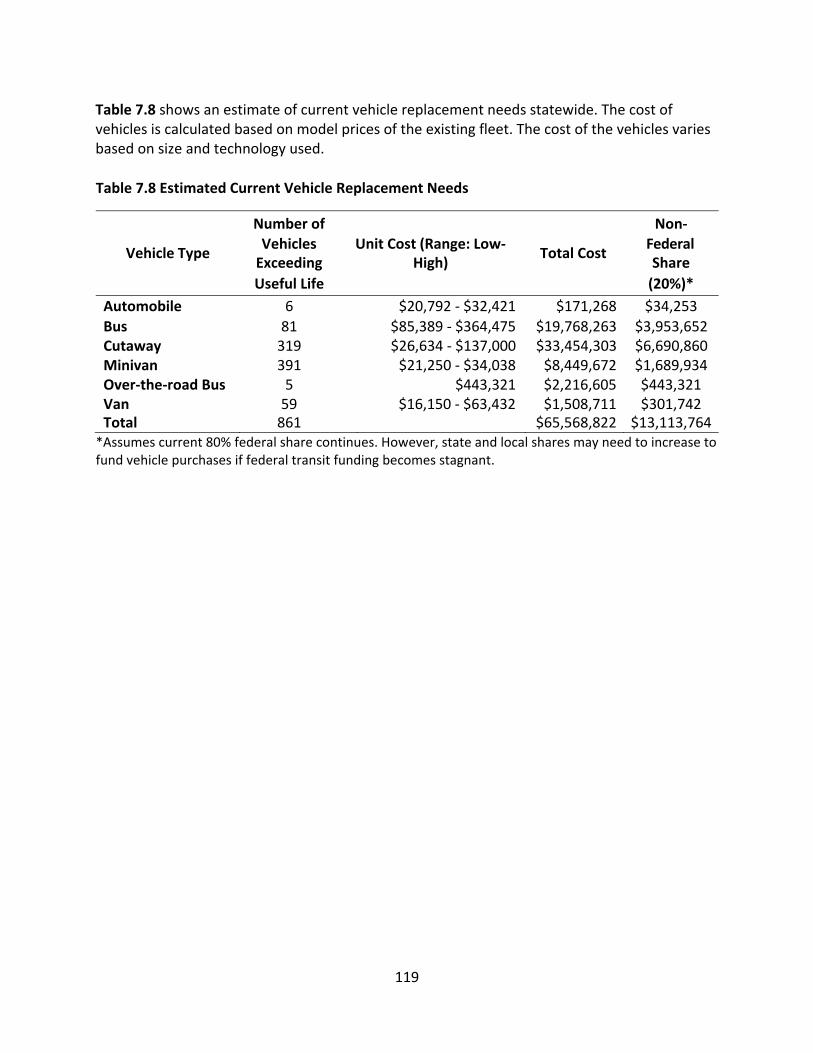
119
Table 7.8 shows an estimate of current vehicle replacement needs statewide. The cost of vehicles is calculated based on model prices of the existing fleet. The cost of the vehicles varies based on size and technology used. Table 7.8 Estimated Current Vehicle Replacement Needs
Number of Non‐
Vehicle Type Vehicles Unit Cost (Range: Low‐
Total Cost Federal
Exceeding High) Share
Useful Life (20%)*
Automobile 6 $20,792 ‐ $32,421 $171,268 $34,253
Bus 81 $85,389 ‐ $364,475 $19,768,263 $3,953,652 Cutaway 319 $26,634 ‐ $137,000 $33,454,303 $6,690,860 Minivan 391 $21,250 ‐ $34,038 $8,449,672 $1,689,934 Over‐the‐road Bus 5 $443,321 $2,216,605 $443,321 Van 59 $16,150 ‐ $63,432 $1,508,711 $301,742 Total 861 $65,568,822 $13,113,764
*Assumes current 80% federal share continues. However, state and local shares may need to increase to fund vehicle purchases if federal transit funding becomes stagnant.
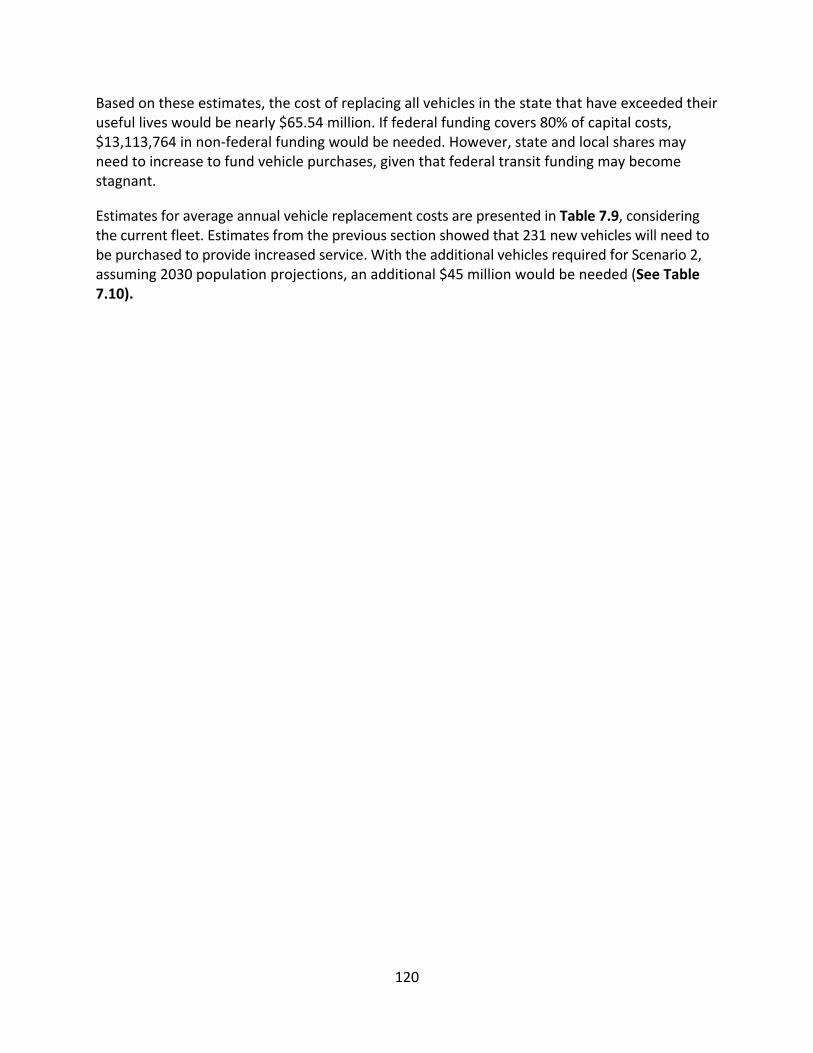
120
Based on these estimates, the cost of replacing all vehicles in the state that have exceeded their useful lives would be nearly $65.54 million. If federal funding covers 80% of capital costs, $13,113,764 in non‐federal funding would be needed. However, state and local shares may need to increase to fund vehicle purchases, given that federal transit funding may become stagnant.
Estimates for average annual vehicle replacement costs are presented in Table 7.9, considering the current fleet. Estimates from the previous section showed that 231 new vehicles will need to be purchased to provide increased service. With the additional vehicles required for Scenario 2, assuming 2030 population projections, an additional $45 million would be needed (See Table 7.10).
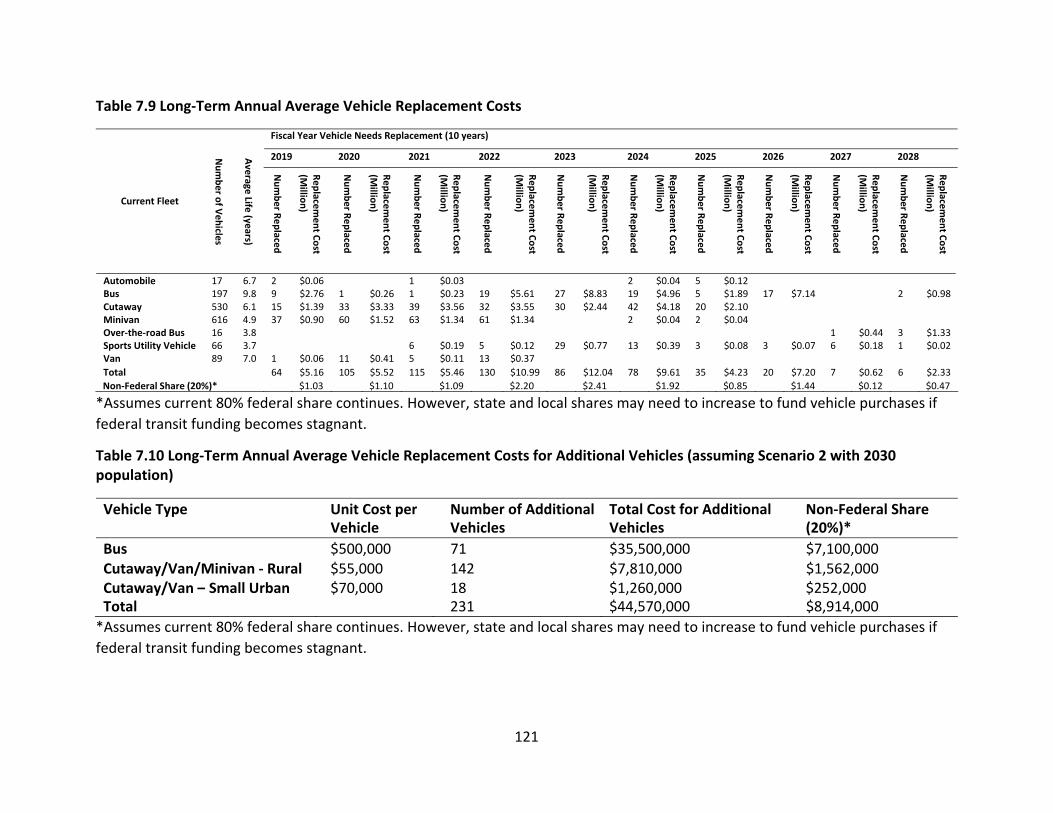
Table 7.9 Long‐Term Annual Average Vehicle Replacement Costs
Fiscal Year Vehicle Needs Replacement (10 years)
2019 2020 2021 2022 2023 2024 2025 2026 2027 2028
Current Fleet
Automobile 17 6.7 2 $0.06 1 $0.03 2 $0.04 5 $0.12
Bus 197 9.8 9 $2.76 1 $0.26 1 $0.23 19 $5.61 27 $8.83 19 $4.96 5 $1.89 17 $7.14 2 $0.98 Cutaway 530 6.1 15 $1.39 33 $3.33 39 $3.56 32 $3.55 30 $2.44 42 $4.18 20 $2.10
Minivan 616 4.9 37 $0.90 60 $1.52 63 $1.34 61 $1.34 2 $0.04 2 $0.04
Over‐the‐road Bus 16 3.8 1 $0.44 3 $1.33 Sports Utility Vehicle 66 3.7 6 $0.19 5 $0.12 29 $0.77 13 $0.39 3 $0.08 3 $0.07 6 $0.18 1 $0.02 Van 89 7.0 1 $0.06 11 $0.41 5 $0.11 13 $0.37
Total 64 $5.16 105 $5.52 115 $5.46 130 $10.99 86 $12.04 78 $9.61 35 $4.23 20 $7.20 7 $0.62 6 $2.33
Non‐Federal Share (20%)* $1.03 $1.10 $1.09 $2.20 $2.41 $1.92 $0.85 $1.44 $0.12 $0.47
*Assumes current 80% federal share continues. However, state and local shares may need to increase to fund vehicle purchases if
federal transit funding becomes stagnant.
Table 7.10 Long‐Term Annual Average Vehicle Replacement Costs for Additional Vehicles (assuming Scenario 2 with 2030 population)
Vehicle Type Unit Cost per Vehicle
Number of Additional Vehicles
Total Cost for Additional Vehicles
Non‐Federal Share (20%)*
Bus $500,000 71 $35,500,000 $7,100,000 Cutaway/Van/Minivan ‐ Rural $55,000 142 $7,810,000 $1,562,000 Cutaway/Van – Small Urban $70,000 18 $1,260,000 $252,000 Total 231 $44,570,000 $8,914,000
*Assumes current 80% federal share continues. However, state and local shares may need to increase to fund vehicle purchases if
federal transit funding becomes stagnant.
121
Replace
ment C
ost
(Millio
n)
Number R
eplace
d
Replace
ment C
ost
(Millio
n)
Number R
eplace
d
Replace
ment C
ost
(Millio
n)
Number R
eplace
d
Replace
ment C
ost
(Millio
n)
Number R
eplace
d
Replace
ment C
ost
(Millio
n)
Number R
eplace
d
Replace
ment C
ost
(Millio
n)
Number R
eplace
d
Replace
ment C
ost
(Millio
n)
Number R
eplace
d
Replace
ment C
ost
(Millio
n)
Number R
eplace
d
Replace
ment C
ost
(Millio
n)
Number R
eplace
d
Replace
ment C
ost
(Millio
n)
Number R
eplace
d
Average
Life (ye
ars)
Number o
f Vehicle
s
123
Chapter 8 CONCLUSIONS AND RECOMMENDATIONS
8.1 Funding Increases Necessary for Expanding Services
Table 8.1 shows a summary of the increased operating and new vehicle expenses estimated in each of the scenarios. Estimates use both current and a 20% increase in current operating costs. The increased costs were considered based on the need for transit agencies to increase staff wages which would allow them to attract and retain qualified staff needed to maintain and increase service levels. Future increases in other operating costs were also included within the 20% increase. Note that operating expenses are ongoing annual expenses, while vehicle purchases are one‐time costs. If all additional services are added in the first year, the needed revenue for the year would equal the new operating costs plus the cost of new vehicles. However, in following years, the revenue increase is increased only enough to cover increased operating costs.
Scenario 2 is the lowest cost scenario that meets both benchmark values and ensures transit services will grow at a rate equal to or greater than population growth through 2030. Justification can also be made for Scenario 3, because there are needs for additional services statewide. It is recommended that funding needs consider increased operating costs, which would allow for increases in wages along with other operating costs. It is also recommended that 2030 population estimates are considered (Scenarios 2 and 3) to allow transit agencies to meet demand from increased population growth during the coming years. Note that the estimates in Table 8.1 are total required revenues that do not consider specific funding sources, but are assumed to include a combination of federal, state, and local funds.
More complete, accurate estimates could be obtained if specific planning was conducted for each transit system in the state. However, without that level of analysis and detail, the calculated estimates presented in this research provide useful guidelines for increased transit service throughout the state along with the proposed funding levels necessary to meet the mobility needs of the state’s population.
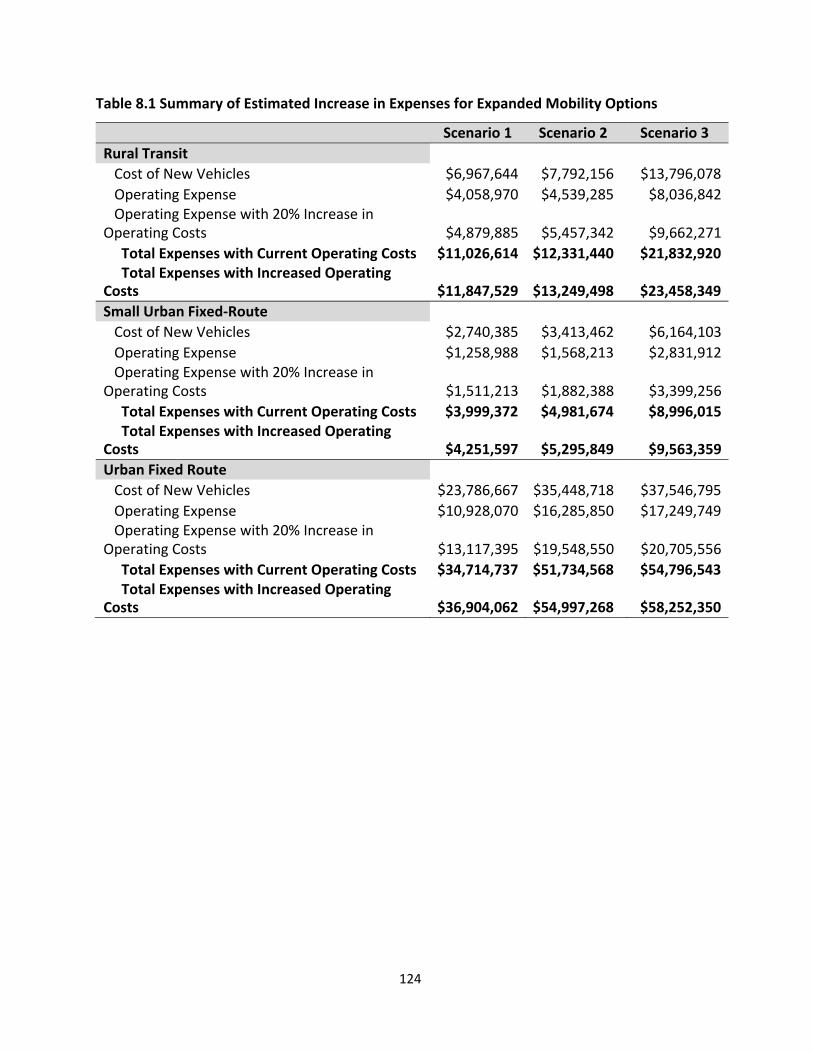
124
Table 8.1 Summary of Estimated Increase in Expenses for Expanded Mobility Options
Scenario 1 Scenario 2 Scenario 3
Rural Transit
Cost of New Vehicles $6,967,644 $7,792,156 $13,796,078
Operating Expense $4,058,970 $4,539,285 $8,036,842 Operating Expense with 20% Increase in
Operating Costs
$4,879,885
$5,457,342
$9,662,271
Total Expenses with Current Operating Costs $11,026,614 $12,331,440 $21,832,920 Total Expenses with Increased Operating
Costs
$11,847,529
$13,249,498
$23,458,349
Small Urban Fixed‐Route
Cost of New Vehicles $2,740,385 $3,413,462 $6,164,103
Operating Expense $1,258,988 $1,568,213 $2,831,912 Operating Expense with 20% Increase in
Operating Costs
$1,511,213
$1,882,388
$3,399,256
Total Expenses with Current Operating Costs $3,999,372 $4,981,674 $8,996,015 Total Expenses with Increased Operating
Costs
$4,251,597
$5,295,849
$9,563,359
Urban Fixed Route
Cost of New Vehicles $23,786,667 $35,448,718 $37,546,795
Operating Expense $10,928,070 $16,285,850 $17,249,749 Operating Expense with 20% Increase in
Operating Costs
$13,117,395
$19,548,550
$20,705,556
Total Expenses with Current Operating Costs $34,714,737 $51,734,568 $54,796,543 Total Expenses with Increased Operating
Costs
$36,904,062
$54,997,268
$58,252,350
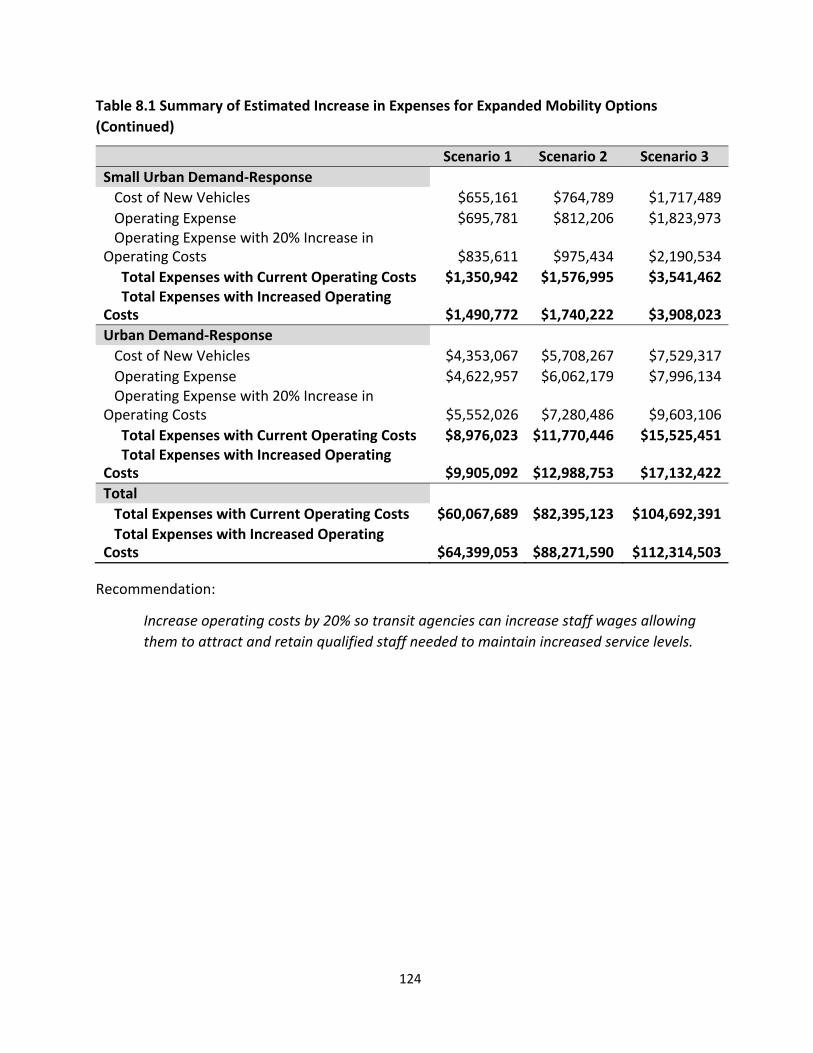
124
Table 8.1 Summary of Estimated Increase in Expenses for Expanded Mobility Options
(Continued)
Scenario 1 Scenario 2 Scenario 3
Small Urban Demand‐Response
Cost of New Vehicles $655,161 $764,789 $1,717,489
Operating Expense $695,781 $812,206 $1,823,973 Operating Expense with 20% Increase in
Operating Costs
$835,611
$975,434
$2,190,534
Total Expenses with Current Operating Costs $1,350,942 $1,576,995 $3,541,462 Total Expenses with Increased Operating
Costs
$1,490,772
$1,740,222
$3,908,023
Urban Demand‐Response
Cost of New Vehicles $4,353,067 $5,708,267 $7,529,317
Operating Expense $4,622,957 $6,062,179 $7,996,134 Operating Expense with 20% Increase in
Operating Costs
$5,552,026
$7,280,486
$9,603,106
Total Expenses with Current Operating Costs $8,976,023 $11,770,446 $15,525,451 Total Expenses with Increased Operating
Costs
$9,905,092
$12,988,753
$17,132,422
Total
Total Expenses with Current Operating Costs $60,067,689 $82,395,123 $104,692,391
Total Expenses with Increased Operating Costs
$64,399,053
$88,271,590
$112,314,503
Recommendation:
Increase operating costs by 20% so transit agencies can increase staff wages allowing
them to attract and retain qualified staff needed to maintain increased service levels.
125
8.2 Staffing Needs
A major finding from the study is the need to improve staffing capabilities. About half of the transit agencies reported having inadequate staff to meet current needs, and about one‐third of the agencies indicated additional staff is needed to meet expected needs within the next five years. Many agencies across the state mentioned they were short of drivers and have difficulty in finding enough qualified staff, especially CDL drivers. Retaining a qualified staff to maintain current levels of service and then to increase service to desired levels will require more funding for salaries and benefits. Wages for drivers and other staff will need to increase.
Recommendation:
Increase operating funding for employee wages.
8.3 Vehicle Needs
Meeting the demand for increased service will require an increase in the number of vehicles in operation. Many agencies mentioned a need for more vehicles. The number of new vehicles and the corresponding costs needed for each of the expansion scenarios were detailed in Table 7.5. Vehicle replacement needs were estimated in Tables 7.8‐7.9.
Recommendation:
Increase funding for vehicles to provide transit agencies the capacity to increase service levels and meet the growing demand.
8.4 Conclusions
Finally, there are needs for transit facility improvements throughout the state of Oklahoma. Developing cost estimates for facilities, including upgrades and new facilities, were beyond the scope of this study. It is recommended that the Oklahoma Department of Transportation review the needs for vehicle storage or maintenance facilities to help identify which transit projects have the greatest need and then develop a strategy to meet these needs.
126
References
CART. n.d. "CARTaccess Booklet." The University of Oklahoma. Accessed 2018.
http://ou.edu/content/dam/CART/Documents/CARTaccess%20Booklet%204‐2016.pdf.
EMBARK. 2018. "PLUS Paratransit Service Guide."
http://2ww.embarkok.com/assets/files/service%20documents/EMBARK%20Plus_ADA%
20Service%20Guide_Temp2018.pdf.
Felsburg Holt & Ullevig. 2015. Statewide Transit Plan. Division of Transit and Rail, Colorado
Department of Transportation.
First Capital Trolley. 2015. "Paratransit Services Guide: Under the Americans With Disabilities
Act of 1990 (ADA)." First Capital Trolley. January.
https://www.firstcapitaltrolley.com/images/ParatransitUserGuideJanuaryNEW.pdf.
Kittelson & Associates, Inc., Parsons Brinckerhoff, KFH Group, Inc., Texas A&M Transportation
Institute, and ARUP. 2013. Transit Capacity and Quality of Service Manual (TCQSM).
TCRP Report 165, Transit Cooperative Research Program, Washington, DC:
Transportation Research Board.
Laver, Richard, Donald Schneck, Douglas Skorupski, Stephen Brady, Laura Cham, and INC. Booz
Allen Hamilton. 2007. Useful Life of Transit Buses and Vans. Federal Transit
Administration, U.S. Department of Transportation.
LSC Transportation Consultants, Inc. 2018. Lawton Area Transit Service Bus Routes Study. Final
Report, LSC Transportation Consultants, Inc., Lawton Metropolitan Planning
Organization.
Mattson, Jeremy, and David Ripplinger. 2011. Marginal Cost Pricing and Subsidy of Transit in
Small Urban Areas. Fargo: Upper Great Plains Transportation Institute, North Dakota
State University.
Mattson, Jeremy, and Jill Hough. 2015. Identifying and Satisfying the mobility needs of North
Dakota's Transit System. Prepared for: North Dakota Department of Transportation,
Small Urban and Rural Transit Center, Upper Great Plains Transportation Institute,
UGPTI Department Publication No. 280.
Mielke, Jon, Jim Miller, David Ripplinger, Del Peterson, and Jill Hough. 2005. "Personal Mobility
in North Dakota: Trends, Gaps, and Recommended Enhancements." UGPTI Department
Publication (Upper Great Plains Transportation Institute) No. 165.
NADTC. n.d. What is ADA complementary paratransit? National Aging and Disability
Transportation Center. Accessed October 2018.
https://www.nadtc.org/about/transportation‐aging‐disability/ada‐and‐paratransit/.
127
Nelson‐Nygaard Consulting Associates Inc. 2012. Charlottesville Transit Study: Market Demand
Analysis. In association with Kimley‐Horn and Associates, Travesky & Associates, Ltd.,
Charlottesville Area Transit.
Nelson‐Nygard Consulting Associates, Inc. 2015. Master Plan: State of the System Report.
Parsons Brinckerhoff.
OK DRS. n.d. "Empower Oklahomans with Disabilities. Chapter 15: Transportation." Oklahoma
Department of Rehabilitation Services. Accessed October 2018.
http://www.okdrs.org/guide/Ch15.
OSU. 2017. "Paratransit Services Guide: Under the Americans With Disabilities Act of 1990
(ADA)." OSU‐Stillwater Community Transit. June.
https://parking.okstate.edu/sites/default/files/Paratransit/TheRAMP‐
ParatransitServicesGuide.pdf.
SoonerRide. 2010. "How to Access SoonerRide: Non‐Emergency Transportation for SoonerCare
Members." https://www.okhca.org/client/pdf/soonerride.pdf.
Tulsa Transit. 2015. "Tulsa Transit: The LIFT." A Guide to Paratransit Services: Under the
Americans With Disabilities Act of 1990 (ADA). http://tulsatransit.org/wp‐
content/uploads/2012/01/A‐GUIDE‐TO‐PARATRANSIT‐SERVICES‐11‐01‐15.pdf.
1
STATEWIDE PERSONAL MOBILITY NEEDS FOR OKLAHOMA (appendix)
Prepared for:
Oklahoma Transit Association
Prepared by:
Dilip Mistry, Ph.D. Del Peterson Jill Hough, Ph.D.
Small Urban and Rural Transit Center Upper Great Plains Transportation Institute North Dakota State University, Fargo
1
APPENDIX A: OKLAHOMA RURAL COMMUNITY TRANSIT SYSTEMS TOWN OF BEAVER Beaver City Transit
PONTOTOC COUNTY PUBLIC TRANSIT AUTHORITY Call‐A‐Ride Public Transit
CENTRAL OKLAHOMA COMMUNITY ACTION AGENCY Central Oklahoma Transit System
NORTHERN OKLAHOMA DEVELOPMENT AUTHORITY Cherokee Strip Transit
UNITED COMMUNITY ACTION PROGRAM, INC. Cimarron Public Transit System
DELTA COMMUNITY ACTION FOUNDATION, INC. Delta Public Transit
ENID PUBLIC TRANSPORTATION AUTHORITY The Transit
LOGAN COUNTY HISTORICAL SOCIETY, INC. First Capital Trolley
CITY OF GUYMON The Ride
INCA COMMUNITY SERVICES JAMM Transit
KI BOIS COMMUNITY ACTION FOUNDATION, INC. Ki Bois Area Transit System
LITTLE DIXIE COMMUNITY ACTION AGENCY, INC. Little Dixie Transit
MUSKOGEE COUNTY PUBLIC TRANSIT AUTHORITY Muskogee County Transit
DEPARTMENT OF PARKING AND TRANSIT SERVICES OSU–STILLWATER COMMUNITY TRANSIT OSU/Stillwater Community Transit
2
GRAND GATEWAY ECONOMIC DEVELOPMENT ASSOCIATION, INC. – Pelivan Transit COMMUNITY ACTION DEVELOPMENT CORPORATION Red River Transportation Service
BIG FIVE COMMUNITY SERVICES, INC. Southern Oklahoma Rural Transportation System
SOUTHWEST OKLAHOMA COMMUNITY ACTION GROUP, INC. Southwest Transit
WASHITA VALLEY COMMUNITY ACTION COUNCIL Washita Valley Transit
3
APPENDIX B: TRANSIT AGENCY INFORMATION
This appendix provides detailed responses from transit agencies regarding their current
facilities, needed facility upgrades, additional services needed, challenges to providing
additional services, staffing needs, comments about how well they are meeting the needs
of their service area residents, and other comments. Also provided is each agency’s most
recent service data and calculated vehicle replacement costs yearly.
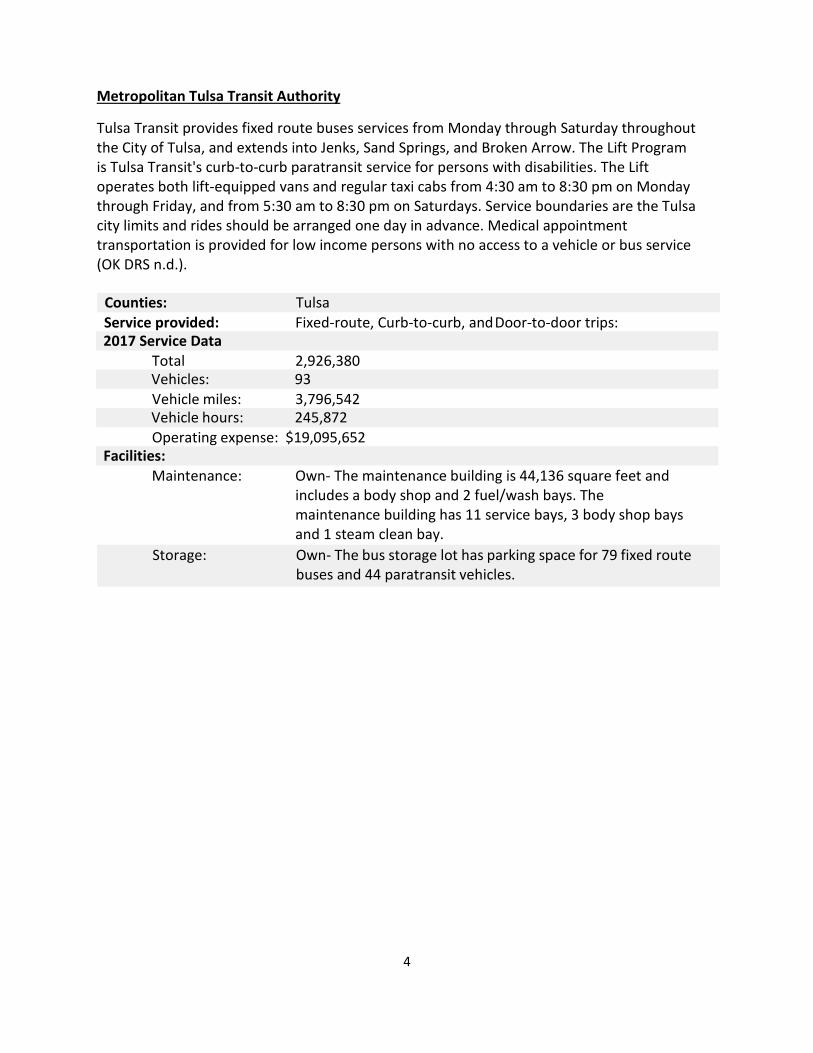
4
Metropolitan Tulsa Transit Authority
Tulsa Transit provides fixed route buses services from Monday through Saturday throughout the City of Tulsa, and extends into Jenks, Sand Springs, and Broken Arrow. The Lift Program is Tulsa Transit's curb‐to‐curb paratransit service for persons with disabilities. The Lift operates both lift‐equipped vans and regular taxi cabs from 4:30 am to 8:30 pm on Monday through Friday, and from 5:30 am to 8:30 pm on Saturdays. Service boundaries are the Tulsa city limits and rides should be arranged one day in advance. Medical appointment transportation is provided for low income persons with no access to a vehicle or bus service (OK DRS n.d.).
Counties: Tulsa Service provided: Fixed‐route, Curb‐to‐curb, and Door‐to‐door trips:
Total 2,926,380
Vehicle miles: 3,796,542
Operating expense: $19,095,652
Maintenance: Own‐ The maintenance building is 44,136 square feet and includes a body shop and 2 fuel/wash bays. The maintenance building has 11 service bays, 3 body shop bays and 1 steam clean bay.
Storage: Own‐ The bus storage lot has parking space for 79 fixed route buses and 44 paratransit vehicles.
2017 Service Data
Vehicles: 93
Vehicle hours: 245,872
Facilities:
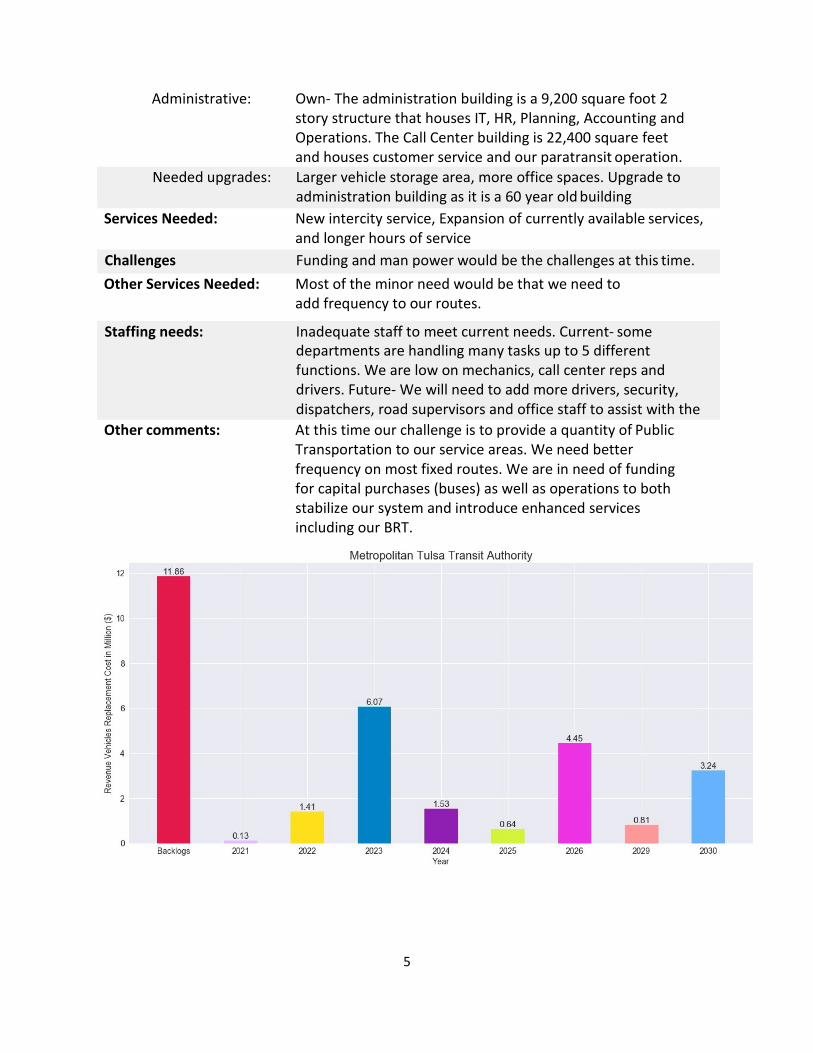
5
Administrative: Own‐ The administration building is a 9,200 square foot 2 story structure that houses IT, HR, Planning, Accounting and Operations. The Call Center building is 22,400 square feet and houses customer service and our paratransit operation.
Needed upgrades: Larger vehicle storage area, more office spaces. Upgrade to administration building as it is a 60 year old building
Services Needed: New intercity service, Expansion of currently available services, and longer hours of service
Challenges Funding and man power would be the challenges at this time. Other Services Needed: Most of the minor need would be that we need to
add frequency to our routes.
Staffing needs: Inadequate staff to meet current needs. Current‐ some departments are handling many tasks up to 5 different functions. We are low on mechanics, call center reps and drivers. Future‐ We will need to add more drivers, security, dispatchers, road supervisors and office staff to assist with the
Other comments: At this time our challenge is to provide a quantity of Public Transportation to our service areas. We need better frequency on most fixed routes. We are in need of funding for capital purchases (buses) as well as operations to both stabilize our system and introduce enhanced services including our BRT.
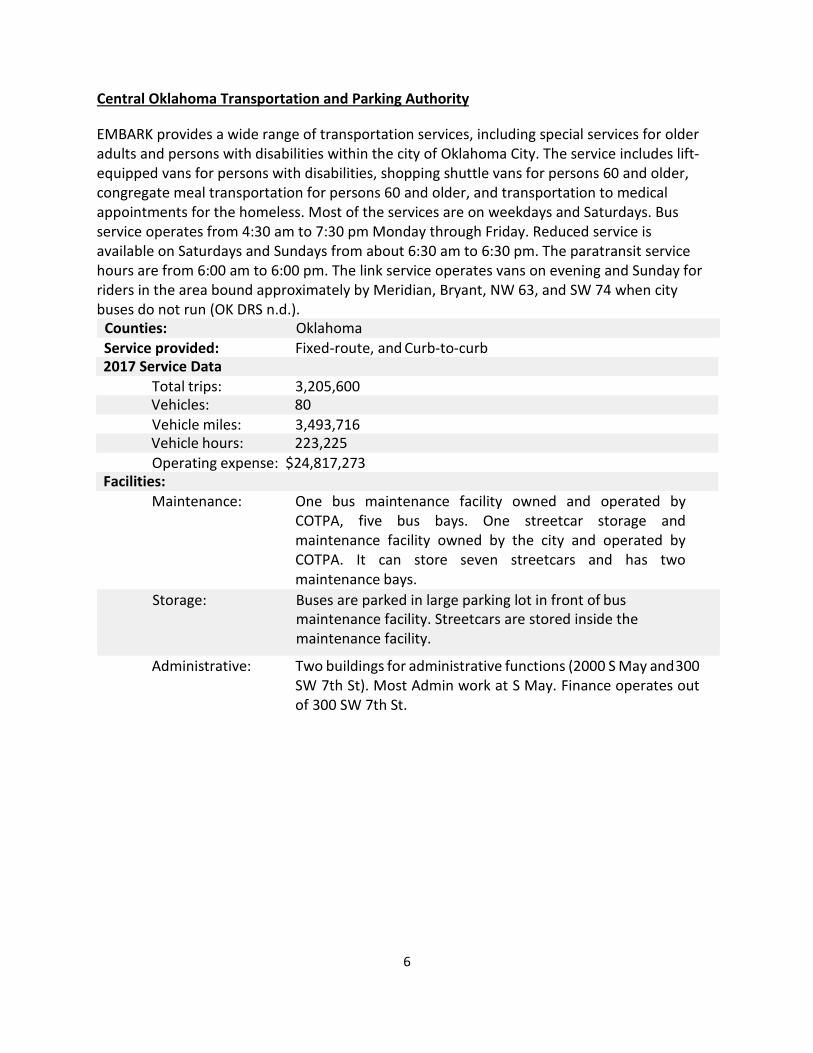
6
Central Oklahoma Transportation and Parking Authority
EMBARK provides a wide range of transportation services, including special services for older adults and persons with disabilities within the city of Oklahoma City. The service includes lift‐ equipped vans for persons with disabilities, shopping shuttle vans for persons 60 and older, congregate meal transportation for persons 60 and older, and transportation to medical appointments for the homeless. Most of the services are on weekdays and Saturdays. Bus service operates from 4:30 am to 7:30 pm Monday through Friday. Reduced service is available on Saturdays and Sundays from about 6:30 am to 6:30 pm. The paratransit service hours are from 6:00 am to 6:00 pm. The link service operates vans on evening and Sunday for riders in the area bound approximately by Meridian, Bryant, NW 63, and SW 74 when city buses do not run (OK DRS n.d.).
Counties: Oklahoma Service provided: Fixed‐route, and Curb‐to‐curb
Total trips: 3,205,600
Vehicle miles: 3,493,716
Operating expense: $24,817,273
Maintenance: One bus maintenance facility owned and operated by COTPA, five bus bays. One streetcar storage and maintenance facility owned by the city and operated by COTPA. It can store seven streetcars and has two maintenance bays.
Storage: Buses are parked in large parking lot in front of bus maintenance facility. Streetcars are stored inside the maintenance facility.
Administrative: Two buildings for administrative functions (2000 S May and 300 SW 7th St). Most Admin work at S May. Finance operates out of 300 SW 7th St.
2017 Service Data
Vehicles: 80
Vehicle hours: 223,225
Facilities:
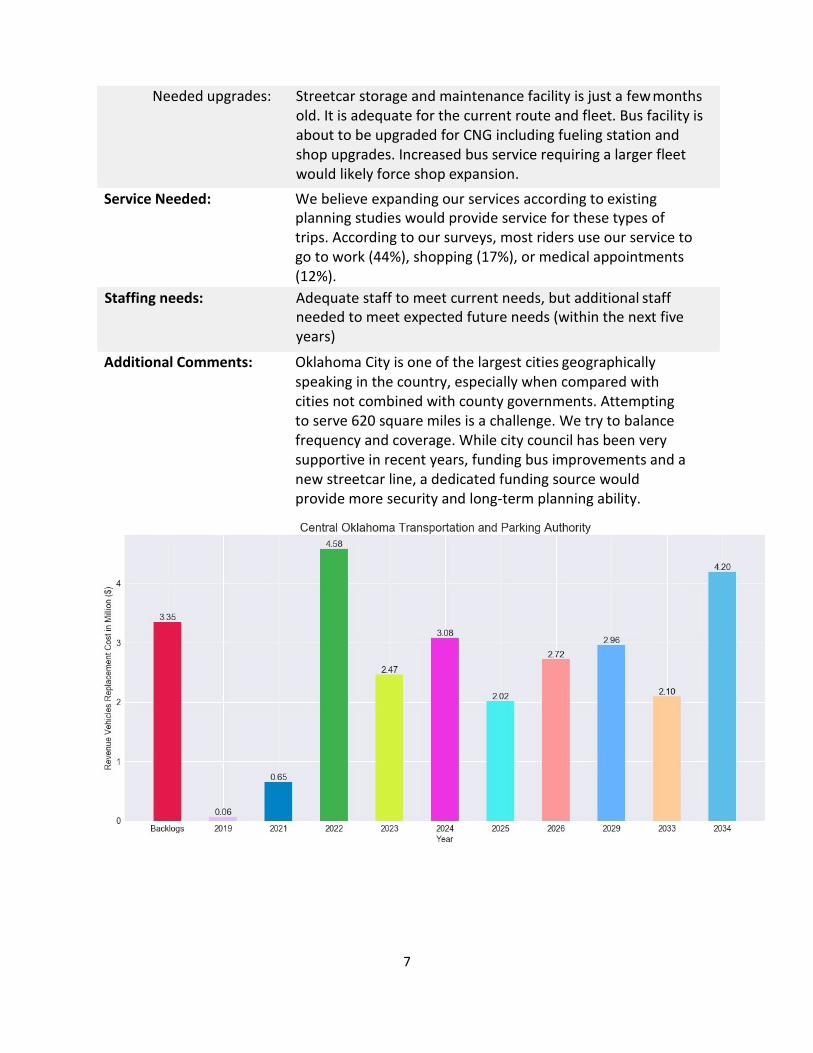
7
Needed upgrades: Streetcar storage and maintenance facility is just a few months old. It is adequate for the current route and fleet. Bus facility is about to be upgraded for CNG including fueling station and shop upgrades. Increased bus service requiring a larger fleet would likely force shop expansion.
Service Needed: We believe expanding our services according to existing planning studies would provide service for these types of trips. According to our surveys, most riders use our service to go to work (44%), shopping (17%), or medical appointments (12%).
Staffing needs: Adequate staff to meet current needs, but additional staff needed to meet expected future needs (within the next five years)
Additional Comments: Oklahoma City is one of the largest cities geographically speaking in the country, especially when compared with cities not combined with county governments. Attempting to serve 620 square miles is a challenge. We try to balance frequency and coverage. While city council has been very supportive in recent years, funding bus improvements and a new streetcar line, a dedicated funding source would provide more security and long‐term planning ability.
8
The Lawton Area Transit System
LATS provides fixed route bus transportation, para‐transit, and charter bus options. The fixed route system operates from 6:00 am to 7:00 pm on Monday through Friday and 9:00 am to 6:00 pm on Saturdays. The paratransit service travels anywhere that the fixed route bus system travels, including a distance of 3/4 miles on each side of the fixed routes. Paratransit trips are available from 6:00 am to 7:00 pm Monday through Friday, and 9:00 am to 6:00 pm on Saturdays.
Counties: Lawton Service provided: Fixed‐route, Curb‐to‐curb, and Door‐to‐door
Total trips: 397,445
Vehicle miles: 684,596
Operating expense: $2,598,773
Maintenance: Currently we have one maintenance building with 3 bays and one wash bay. All vehicles can be maintained with our current facility
Storage: We store our buses outside. There are enough spaces for all our vehicles with spares.
Administrative: We have one administrative building which houses all staff dispatchers and supervisors as well as a driver's break room and a conference/training room.
Needed upgrades: We are currently in design phase of a Downtown Transfer Center that will have dispatcher and break room space. Building construction will start in 2019 or 2020
Service Needed: New fixed‐route service, and expansion of currently available services
Challenges: Funding Staffing needs: Adequate staff for current and expected future needs. No
expansion of staffing at the moment or in the future. Maybe marketing person for promotion?
Other Comments: I would like to get more on‐demand service to are areas we currently don't service. When we do our new Downtown Transfer Center we will have new more efficient routes.
2017 Service Data
Vehicles: 21
Vehicle hours: 45,180
Facilities:
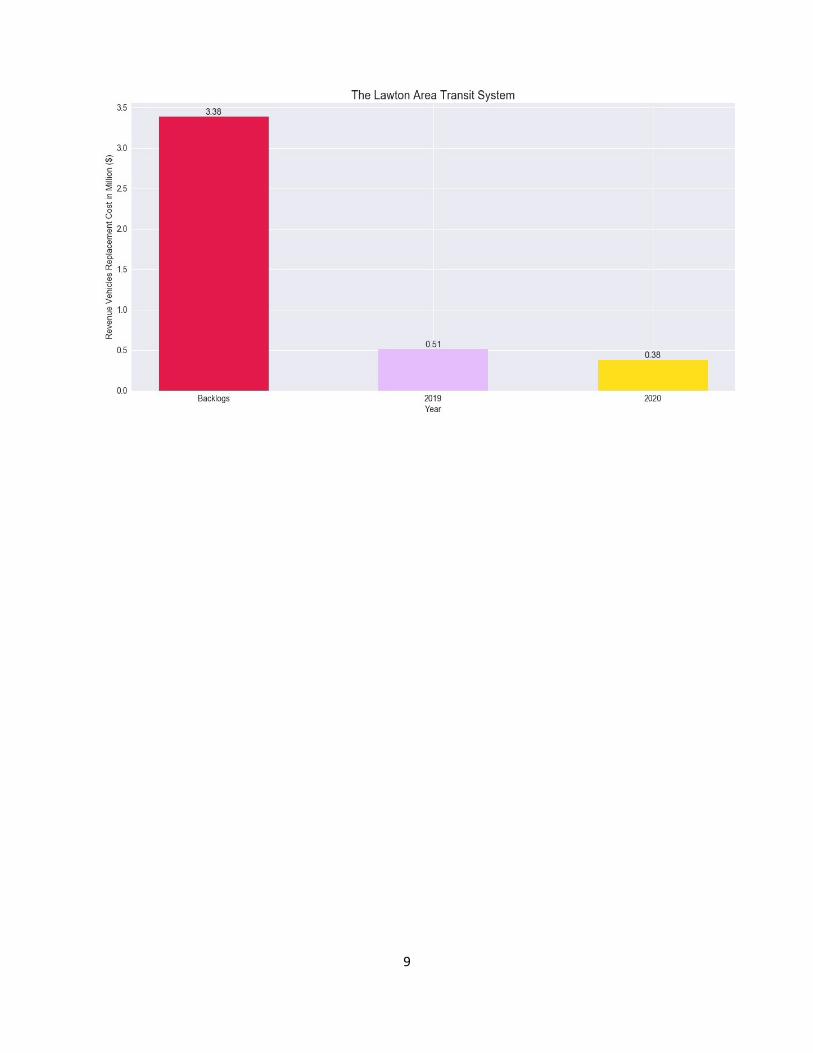
9
10
Cleveland Area Rapid Transit
CART provides services to five city routes, three campus routes, and a route connecting Norman to Oklahoma City. The system's fleet consists of replica trolleys, paratransit vans, and city transit coaches. All CART vehicles are lift‐equipped and provide origin‐to‐destination service for disabled riders. The service hours are seven days a week from 8:30 am to 4:00 pm (OK DRS n.d.).
Counties: Norman Service provided: Fixed‐route, and Curb‐to‐curb
Total trips: 1,266,031
Vehicle miles: 762,639
Operating expense: $4,279,043
Maintenance: CART's maintenance facility is connected to its administrative building. OU's fleet services department maintains all OU vehicles, including CART buses. The maintenance facility is approximately 18,456 square feet and has 5 bays for buses.
2017 Service Data
Vehicles: 27
Vehicle hours: 60,065
Facilities:
Storage: CART's vehicles are stored on a parking lot designed for buses outside the administrative/maintenance building. CART is able to store about 40 vehicles in this lot.
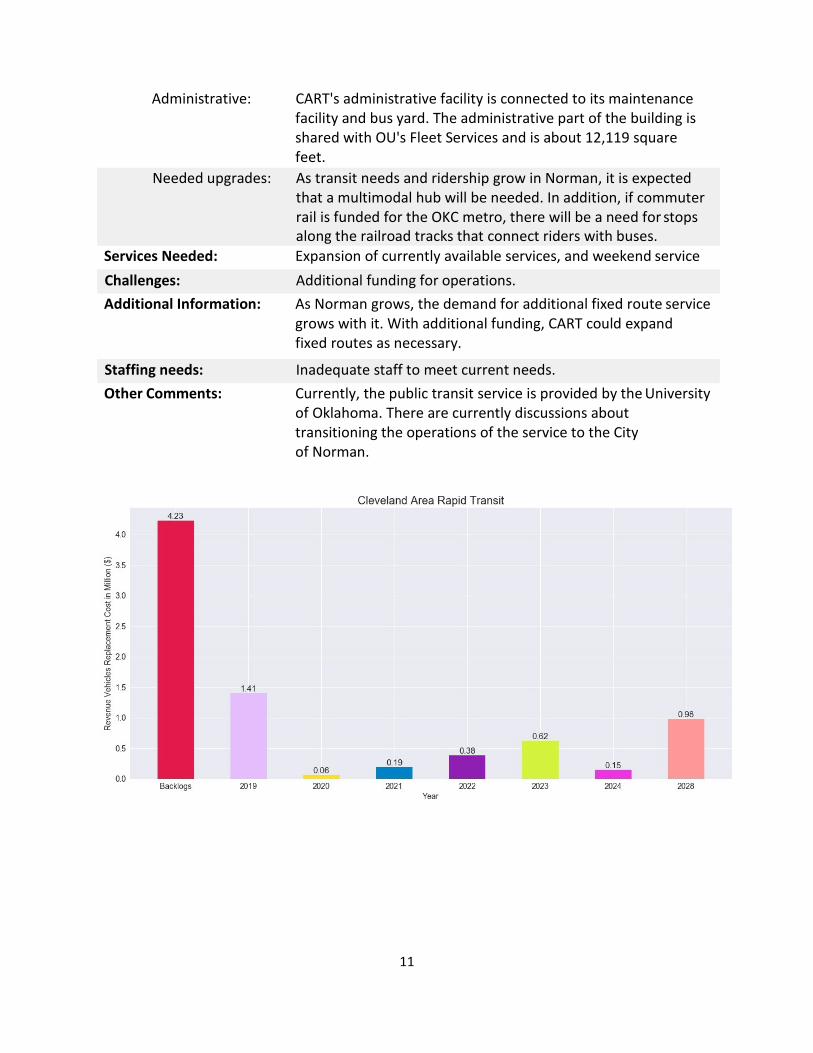
11
Administrative: CART's administrative facility is connected to its maintenance facility and bus yard. The administrative part of the building is shared with OU's Fleet Services and is about 12,119 square feet.
Needed upgrades: As transit needs and ridership grow in Norman, it is expected that a multimodal hub will be needed. In addition, if commuter rail is funded for the OKC metro, there will be a need for stops along the railroad tracks that connect riders with buses.
Services Needed: Expansion of currently available services, and weekend service
Challenges: Additional funding for operations. Additional Information: As Norman grows, the demand for additional fixed route service
grows with it. With additional funding, CART could expand fixed routes as necessary.
Staffing needs: Inadequate staff to meet current needs. Other Comments: Currently, the public transit service is provided by the University
of Oklahoma. There are currently discussions about transitioning the operations of the service to the City of Norman.
12
City of Edmond
Citylink Access Paratransit (CAP) provides curb‐to‐curb service to residents with disabilities within the city‐limits of Edmond in a wheelchair‐accessible bus for free. The CAP hours of service are 8:00 am to 5:00 pm Monday through Saturday. However, customers need to call at least 48 hours prior to pick up to ensure availability (OK DRS n.d.).
Counties: Edmond Service provided: Fixed‐route, and Curb‐to‐curb
Total trips: 248,738
Vehicle miles: 266,710
Operating expense: $1,961,867
Maintenance: We lease a facility from the City of Edmond. It houses maintenance, all our administrative offices and bus storage.
Storage: Our facility has covered storage for ~ 60% of our fleet. Administrative: All of administrative functions and staff are houses in the
same facility as maintenance and fleet storage. Needed upgrades: We need to repave our parking lot which is in bad condition.
Covered parking needs to be built to enable us to bring all our vehicles under a roof. We also need a bus wash bay. These mentioned improvements are in the beginning stage right now.
Services Needed: New fixed‐route service, expansion of currently available services, and longer hours of service
Challenges: As with everything else it comes down to available funds. Staffing needs: Adequate staff to meet current needs, but additional staff
needed to meet expected future needs (within the next five years). The addition of a new fixed route to serve part of the City of Edmond is in the developmental stage right now. If that comes to fruition we will need 4‐5 more full‐time staff.
Other Comments: There are parts of the city that we do not serve that need it. We also need to extend the hours of service on some routes to make them more useful for employment purposes. Our funding is adequate for what we presently have, but will need to increase in the next few years if we increase service. It is difficult to find bus operators, so if/when the new route begins that will be a challenge getting 4‐5 new operators at once.
2017 Service Data
Vehicles: 9
Vehicle hours: 18,824
Facilities:
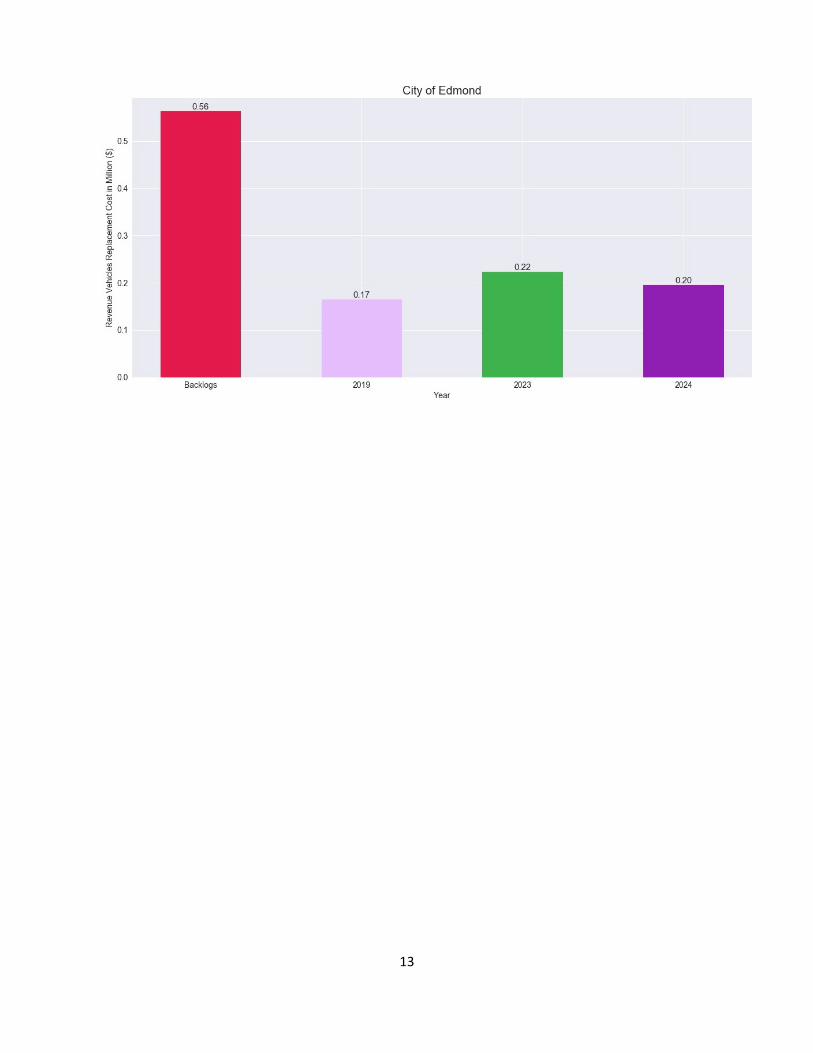
13
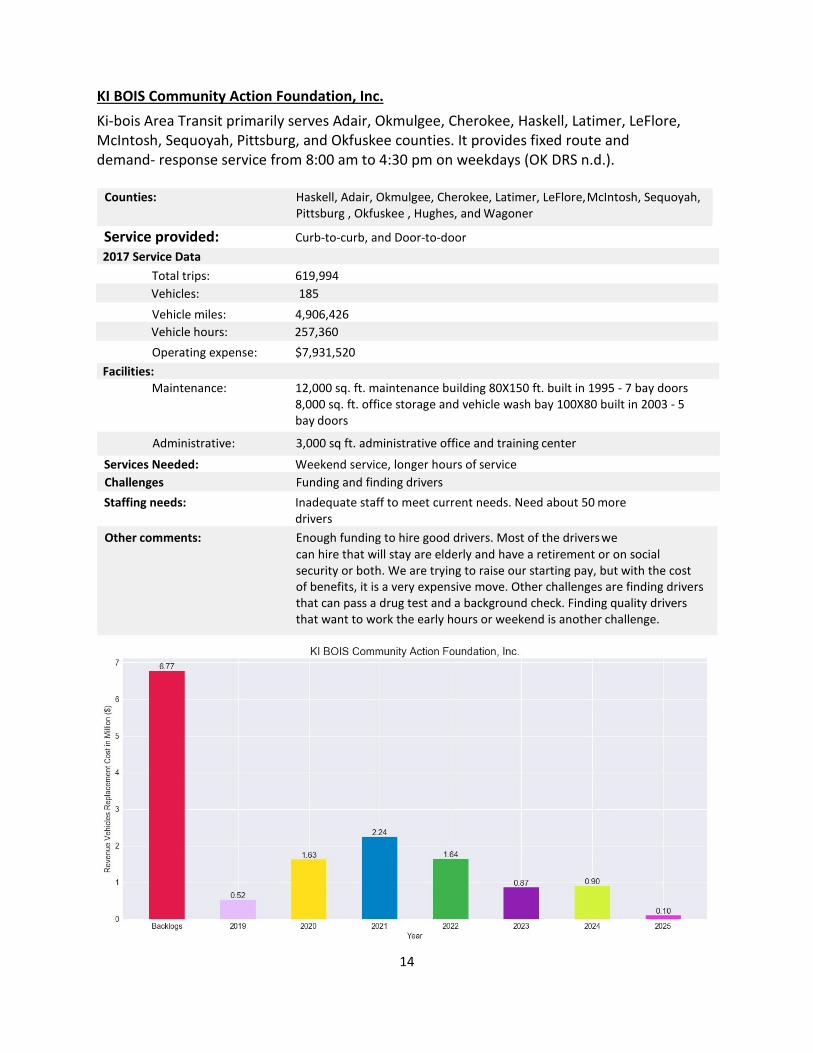
14
KI BOIS Community Action Foundation, Inc. Ki‐bois Area Transit primarily serves Adair, Okmulgee, Cherokee, Haskell, Latimer, LeFlore, McIntosh, Sequoyah, Pittsburg, and Okfuskee counties. It provides fixed route and demand‐ response service from 8:00 am to 4:30 pm on weekdays (OK DRS n.d.).
Counties: Haskell, Adair, Okmulgee, Cherokee, Latimer, LeFlore, McIntosh, Sequoyah, Pittsburg , Okfuskee , Hughes, and Wagoner
Service provided: Curb‐to‐curb, and Door‐to‐door 2017 Service Data
Total trips: 619,994
Vehicle miles: 4,906,426
Operating expense: $7,931,520 Facilities:
Maintenance: 12,000 sq. ft. maintenance building 80X150 ft. built in 1995 ‐ 7 bay doors 8,000 sq. ft. office storage and vehicle wash bay 100X80 built in 2003 ‐ 5 bay doors
Administrative: 3,000 sq ft. administrative office and training center
Services Needed: Weekend service, longer hours of service Challenges Funding and finding drivers Staffing needs: Inadequate staff to meet current needs. Need about 50 more
drivers Other comments: Enough funding to hire good drivers. Most of the drivers we
can hire that will stay are elderly and have a retirement or on social security or both. We are trying to raise our starting pay, but with the cost of benefits, it is a very expensive move. Other challenges are finding drivers that can pass a drug test and a background check. Finding quality drivers that want to work the early hours or weekend is another challenge.
Vehicles: 185
Vehicle hours: 257,360
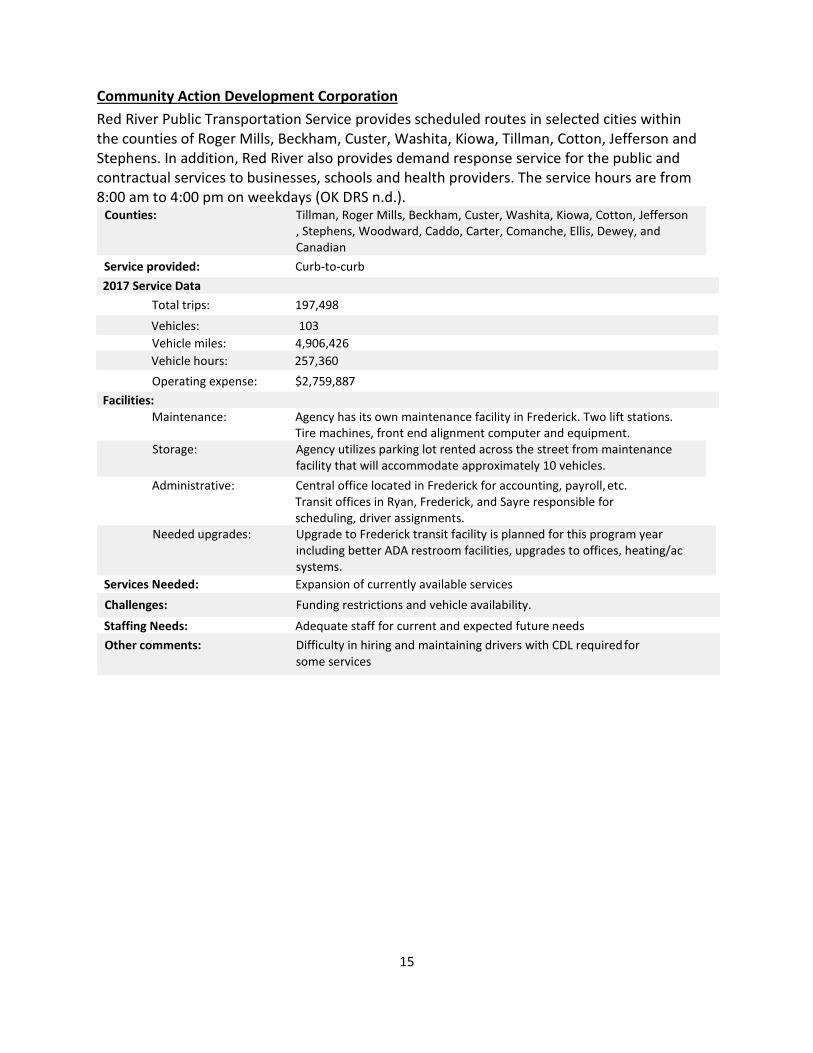
15
Community Action Development Corporation Red River Public Transportation Service provides scheduled routes in selected cities within the counties of Roger Mills, Beckham, Custer, Washita, Kiowa, Tillman, Cotton, Jefferson and Stephens. In addition, Red River also provides demand response service for the public and contractual services to businesses, schools and health providers. The service hours are from 8:00 am to 4:00 pm on weekdays (OK DRS n.d.).
Counties: Tillman, Roger Mills, Beckham, Custer, Washita, Kiowa, Cotton, Jefferson , Stephens, Woodward, Caddo, Carter, Comanche, Ellis, Dewey, and Canadian
Service provided: Curb‐to‐curb 2017 Service Data
Total trips: 197,498
Vehicle miles: 4,906,426
Operating expense: $2,759,887 Facilities:
Maintenance: Agency has its own maintenance facility in Frederick. Two lift stations. Tire machines, front end alignment computer and equipment.
Storage: Agency utilizes parking lot rented across the street from maintenance facility that will accommodate approximately 10 vehicles.
Administrative: Central office located in Frederick for accounting, payroll, etc. Transit offices in Ryan, Frederick, and Sayre responsible for scheduling, driver assignments.
Needed upgrades: Upgrade to Frederick transit facility is planned for this program year including better ADA restroom facilities, upgrades to offices, heating/ac systems.
Services Needed: Expansion of currently available services Challenges: Funding restrictions and vehicle availability.
Staffing Needs: Adequate staff for current and expected future needs Other comments: Difficulty in hiring and maintaining drivers with CDL required for
some services
Vehicles: 103
Vehicle hours: 257,360
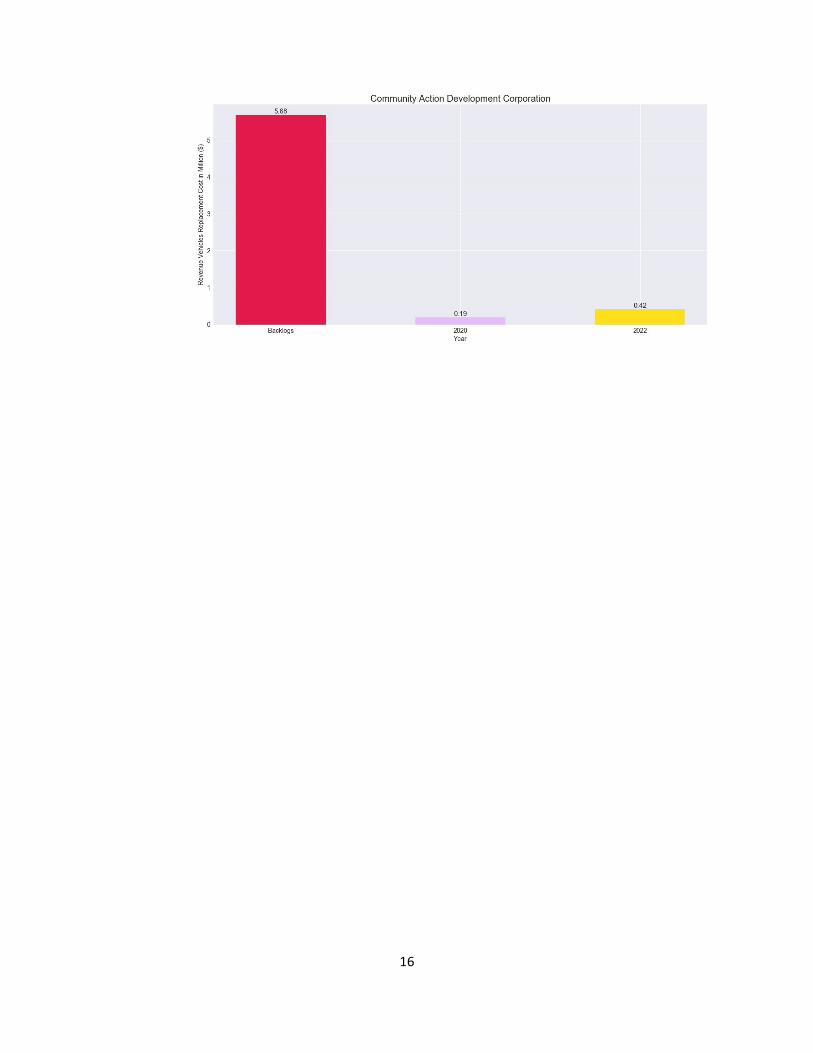
16
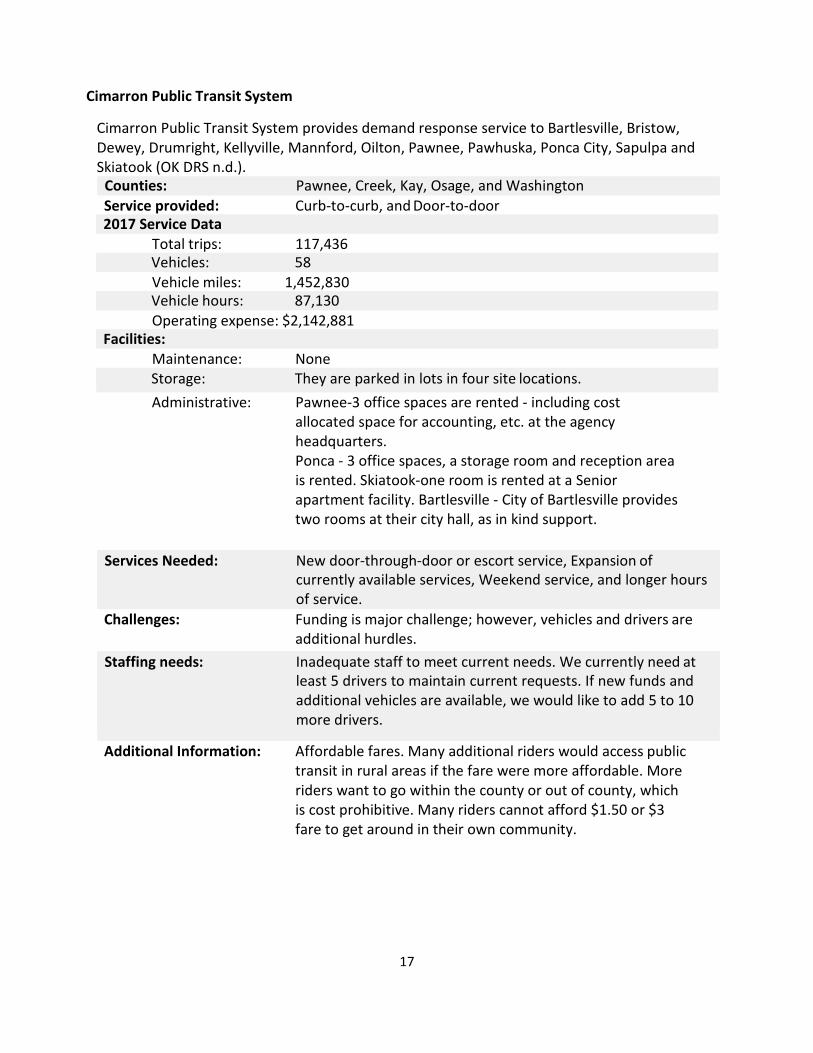
17
Cimarron Public Transit System
Cimarron Public Transit System provides demand response service to Bartlesville, Bristow, Dewey, Drumright, Kellyville, Mannford, Oilton, Pawnee, Pawhuska, Ponca City, Sapulpa and Skiatook (OK DRS n.d.).
Counties: Pawnee, Creek, Kay, Osage, and Washington Service provided: Curb‐to‐curb, and Door‐to‐door
Total trips: 117,436
Vehicle miles: 1,452,830
Operating expense: $2,142,881
Maintenance: None
Administrative: Pawnee‐3 office spaces are rented ‐ including cost allocated space for accounting, etc. at the agency headquarters. Ponca ‐ 3 office spaces, a storage room and reception area is rented. Skiatook‐one room is rented at a Senior apartment facility. Bartlesville ‐ City of Bartlesville provides two rooms at their city hall, as in kind support.
Services Needed: New door‐through‐door or escort service, Expansion of
currently available services, Weekend service, and longer hours of service.
Challenges: Funding is major challenge; however, vehicles and drivers are additional hurdles.
Staffing needs: Inadequate staff to meet current needs. We currently need at least 5 drivers to maintain current requests. If new funds and additional vehicles are available, we would like to add 5 to 10 more drivers.
Additional Information: Affordable fares. Many additional riders would access public transit in rural areas if the fare were more affordable. More riders want to go within the county or out of county, which is cost prohibitive. Many riders cannot afford $1.50 or $3 fare to get around in their own community.
2017 Service Data
Vehicles: 58
Vehicle hours: 87,130
Facilities:
Storage: They are parked in lots in four site locations.
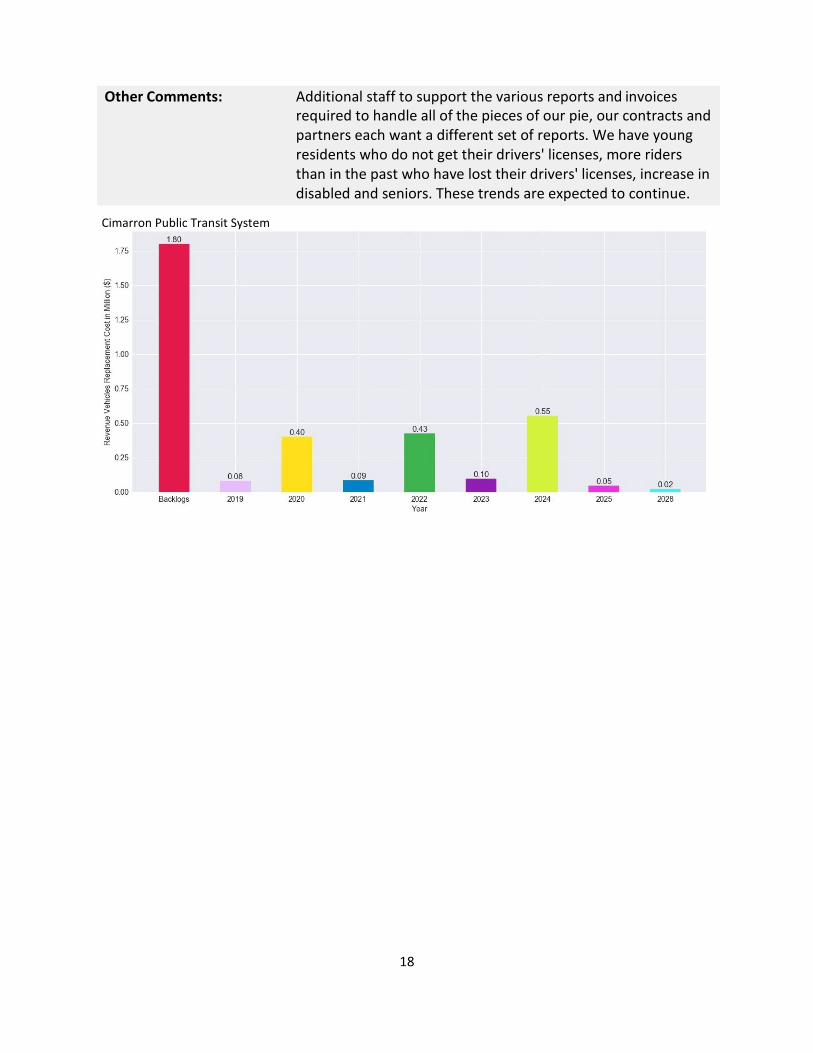
18
Other Comments: Additional staff to support the various reports and invoices required to handle all of the pieces of our pie, our contracts and partners each want a different set of reports. We have young residents who do not get their drivers' licenses, more riders than in the past who have lost their drivers' licenses, increase in disabled and seniors. These trends are expected to continue.
Cimarron Public Transit System
19
Little Dixie Community Action Agency, Inc.
Little Dixie Transit operates a public transportation system in the Southeast Oklahoma counties of McCurtain, Choctaw and Pushmataha. Little Dixie Transit's public transportation services are demand responsive and serve the communities of Hugo, Idabel, Antlers, Broken Bow, and Clayton. It operates two intercity routes to Oklahoma City and Dallas upon request by advance reservations. The Dallas route operates seven days a week and takes clients to Dallas/Fort Worth International Airport, Love Field, or Amtrak. The service hours are from 6:00 am to 6:00 pm daily (OK DRS n.d.).
Counties: Choctaw, McCurtain, and Pushmataha Service provided: Curb‐to‐curb, and Door‐to‐door
2017 Service Data Total trips: 115,330 Vehicles: 55 Vehicle miles: 804,094 Vehicle hours: 46,867 Operating expense: $1,931,453
Facilities: Maintenance: 6 bay garage that we own through purchase with FTA capital
funds and we provided the local match. This facility also includes office areas for 5 staff, document storage room and two restrooms.
Storage: We have fenced lots at three of our five properties. Administrative: Our administrative office is housed with the maintenance
facility. The front part of this building is for offices. Needed upgrades: We need one of the lifts in the maintenance area replaced due to
age and lack of proper functioning. We need some safety features added to the office areas which would provide locked entry doors with a buzzer for customers to use and possibly a drawer to extend out to exchange fare money.
Services Needed: Expansion of currently available services, and weekend service
Challenges: We do not have adequate funding for the current services which prevents us from extending and/or adding additional services.
Staffing needs: Inadequate staff to meet current needs. The agency needs additional staff right now to help in the reporting process and/or meeting the regulatory duties for our state funder. The agency also needs a maintenance person because my mechanic left in March and we cannot re‐fill this position as full‐time so I need someone willing to work part‐time in this position. They need 10 to 15 additional part‐time drivers through‐out the program to meet the current trip loads and cut down on delays from the time customers call in until the time the drivers can arrive for transport.
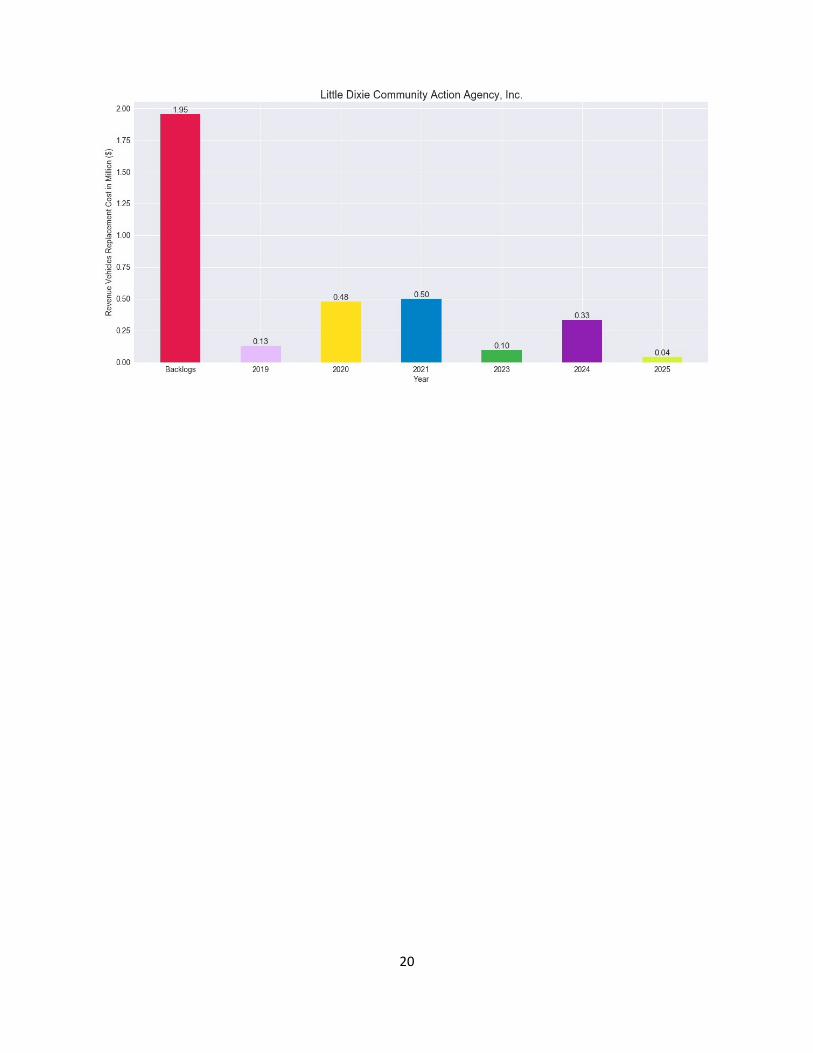
20
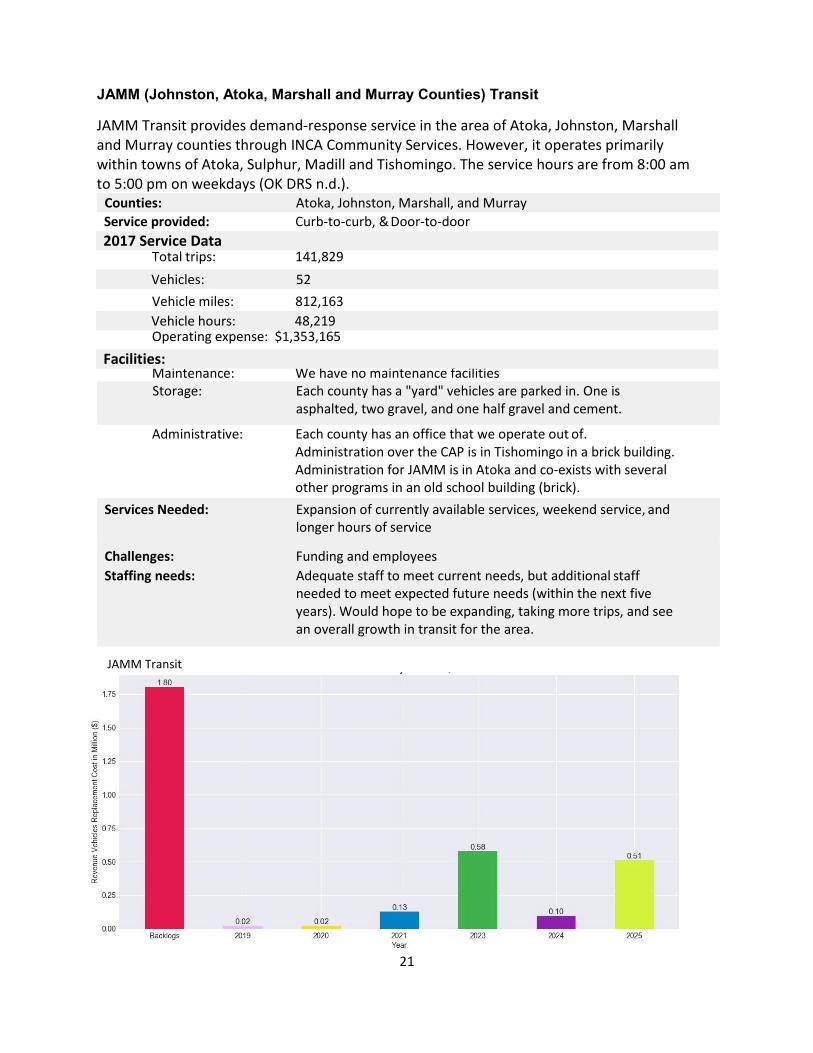
21
JAMM (Johnston, Atoka, Marshall and Murray Counties) Transit
JAMM Transit provides demand‐response service in the area of Atoka, Johnston, Marshall and Murray counties through INCA Community Services. However, it operates primarily within towns of Atoka, Sulphur, Madill and Tishomingo. The service hours are from 8:00 am to 5:00 pm on weekdays (OK DRS n.d.).
Counties: Atoka, Johnston, Marshall, and Murray Service provided: Curb‐to‐curb, & Door‐to‐door
Total trips: 141,829
Vehicle miles: 812,163
Operating expense: $1,353,165
Maintenance: We have no maintenance facilities Storage: Each county has a "yard" vehicles are parked in. One is
asphalted, two gravel, and one half gravel and cement.
Administrative: Each county has an office that we operate out of. Administration over the CAP is in Tishomingo in a brick building. Administration for JAMM is in Atoka and co‐exists with several other programs in an old school building (brick).
Services Needed: Expansion of currently available services, weekend service, and longer hours of service
Challenges: Funding and employees Staffing needs: Adequate staff to meet current needs, but additional staff
needed to meet expected future needs (within the next five years). Would hope to be expanding, taking more trips, and see an overall growth in transit for the area.
JAMM Transit
2017 Service Data
Vehicles: 52
Vehicle hours: 48,219
Facilities:
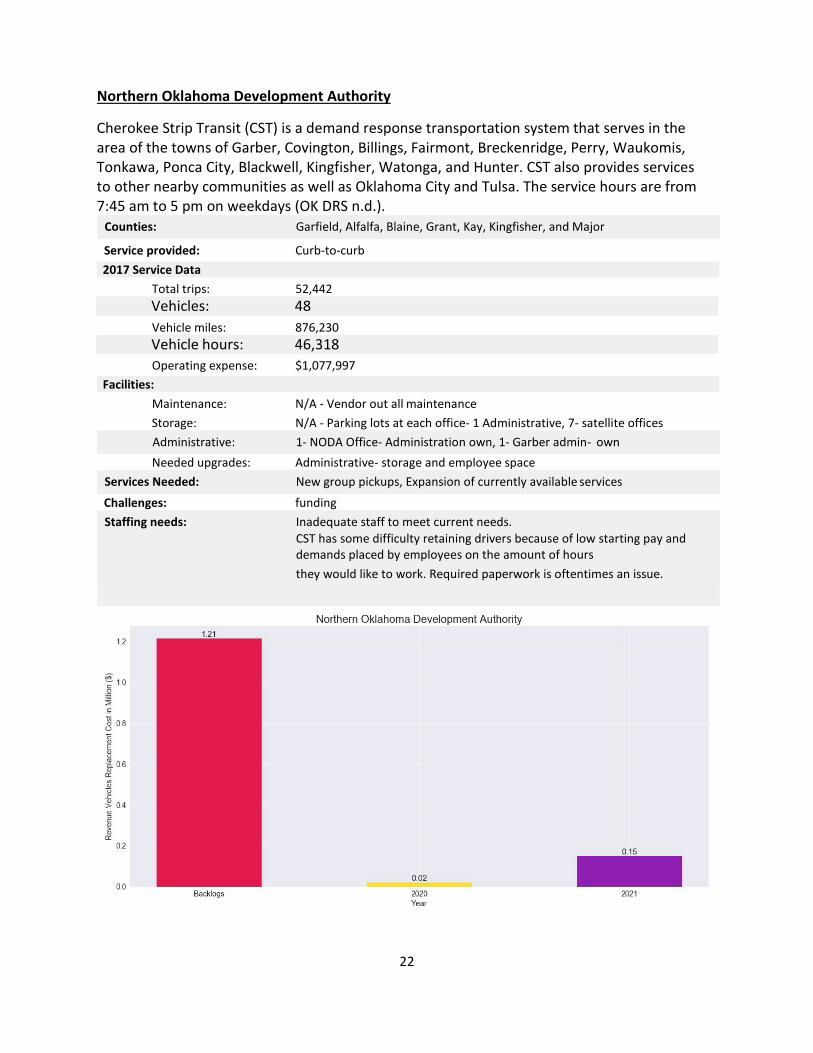
22
Northern Oklahoma Development Authority
Cherokee Strip Transit (CST) is a demand response transportation system that serves in the area of the towns of Garber, Covington, Billings, Fairmont, Breckenridge, Perry, Waukomis, Tonkawa, Ponca City, Blackwell, Kingfisher, Watonga, and Hunter. CST also provides services to other nearby communities as well as Oklahoma City and Tulsa. The service hours are from 7:45 am to 5 pm on weekdays (OK DRS n.d.).
Counties: Garfield, Alfalfa, Blaine, Grant, Kay, Kingfisher, and Major
Service provided: Curb‐to‐curb 2017 Service Data
Total trips: 52,442
Vehicle miles: 876,230
Operating expense: $1,077,997 Facilities:
Maintenance: N/A ‐ Vendor out all maintenance Storage: N/A ‐ Parking lots at each office‐ 1 Administrative, 7‐ satellite offices Administrative: 1‐ NODA Office‐ Administration own, 1‐ Garber admin‐ own Needed upgrades: Administrative‐ storage and employee space
Services Needed: New group pickups, Expansion of currently available services
Challenges: funding Staffing needs: Inadequate staff to meet current needs.
CST has some difficulty retaining drivers because of low starting pay and demands placed by employees on the amount of hours they would like to work. Required paperwork is oftentimes an issue.
Vehicles: 48
Vehicle hours: 46,318
23
Logan County Historical Society
First Capitol Trolley provides fixed route and demand‐response service in the Guthrie area. It provides service between Guthrie and Langston University daily. It also provides on‐campus shuttle service at Oklahoma State University and a campus to shopping shuttle (OK DRS n.d.). Services operate for Langston Shuttle Monday through Friday from 2:36 pm until 8:18 pm. Services operate for the Historic shuttle Saturdays at noon and 2:00 pm.
Counties: Logan, Lincoln, and Payne Service provided: Fixed‐route, Curb‐to‐curb, and Door‐to‐door 2017 Service Data
Total trips: 125,490 Vehicles: 38 Vehicle miles: 1,462,805 Vehicle hours: 63,210 Operating expense: $1,896,506
Facilities: Maintenance: All of our maintenance is outsourced. We have a facility to clean
vehicles and do light preventative maintenance such as wiper blades, headlights, etc.
Storage: FCT is located on 7 acres. Our vehicle storage and administrative facilities are all located on that property. Shop Space Metal Building 4,920 Square Feet Cleaning Bay Metal Building Insulated 1,500 Square Feet Public Parking Spaces Asphalt 19 parking spaces including 2 handicapped spaces 5,890 Square Feet Employee/Company Vehicle Parking Asphalt 46 Covered parking space, 4 Non‐covered spaces 28,718 Square Feet South Awning Concrete/ Asphalt 6 space 1,200 Square Feet East Awning Asphalt 8 spaces 1,600 Square Feet East Bus Awning Asphalt 4 spaces 1,600 Square Feet Middle Awning Asphalt 16 spaces 3,360 Square Feet West Awning Asphalt 12 spaces 2,400 Square Feet.
Administrative: FCT is located on 7 acres. Our vehicle storage and administrative facilities are all located on that property. Office Space Metal Building 2150 Square Feet.
Services Needed: Expansion of currently available services, and longer hours of service
Challenges: 4 or so years ago we had extended hours and Sunday Service in Logan County. When we had a budget shortfall our services had to be decreased. The lack of on call services in Lincoln County is due to funding. Without an increased dedicated funding source it is very challenging to begin something you may have to cut the next year.
Staffing needs: Inadequate staff to meet current needs. We would like to open offices in our other service areas. Currently we operate 3 counties out of one office.
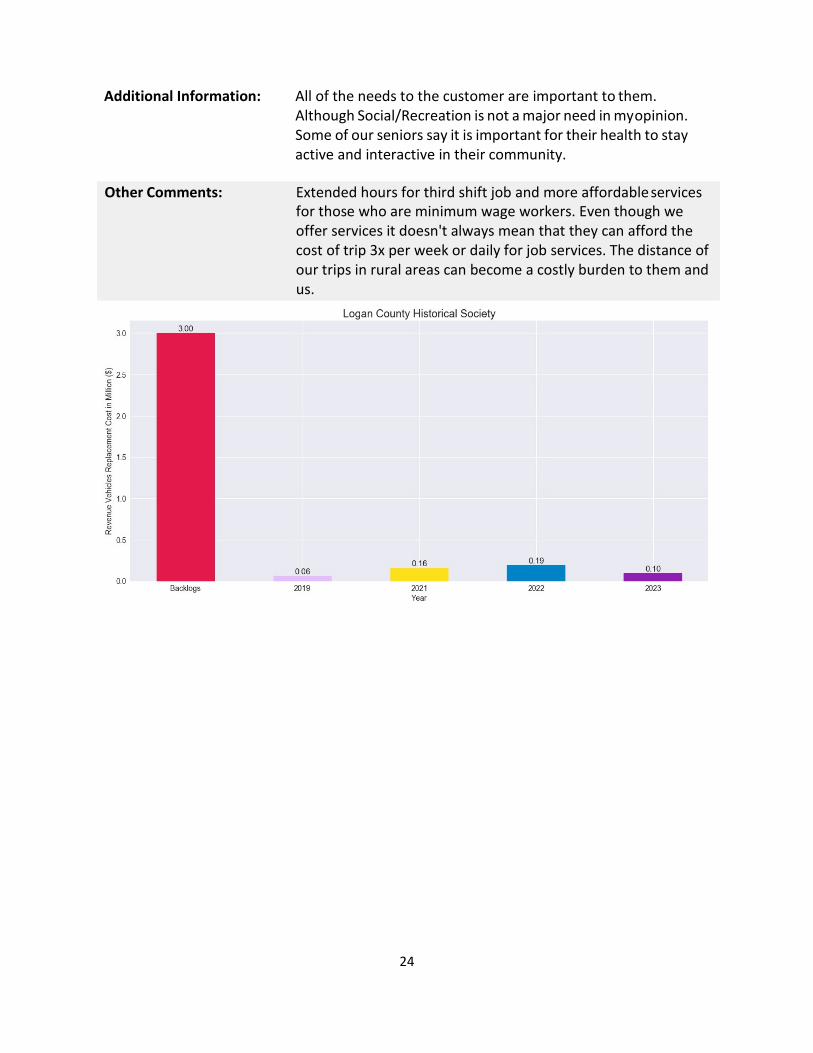
24
Additional Information: All of the needs to the customer are important to them. Although Social/Recreation is not a major need in my opinion. Some of our seniors say it is important for their health to stay active and interactive in their community.
Other Comments: Extended hours for third shift job and more affordable services for those who are minimum wage workers. Even though we offer services it doesn't always mean that they can afford the cost of trip 3x per week or daily for job services. The distance of our trips in rural areas can become a costly burden to them and us.
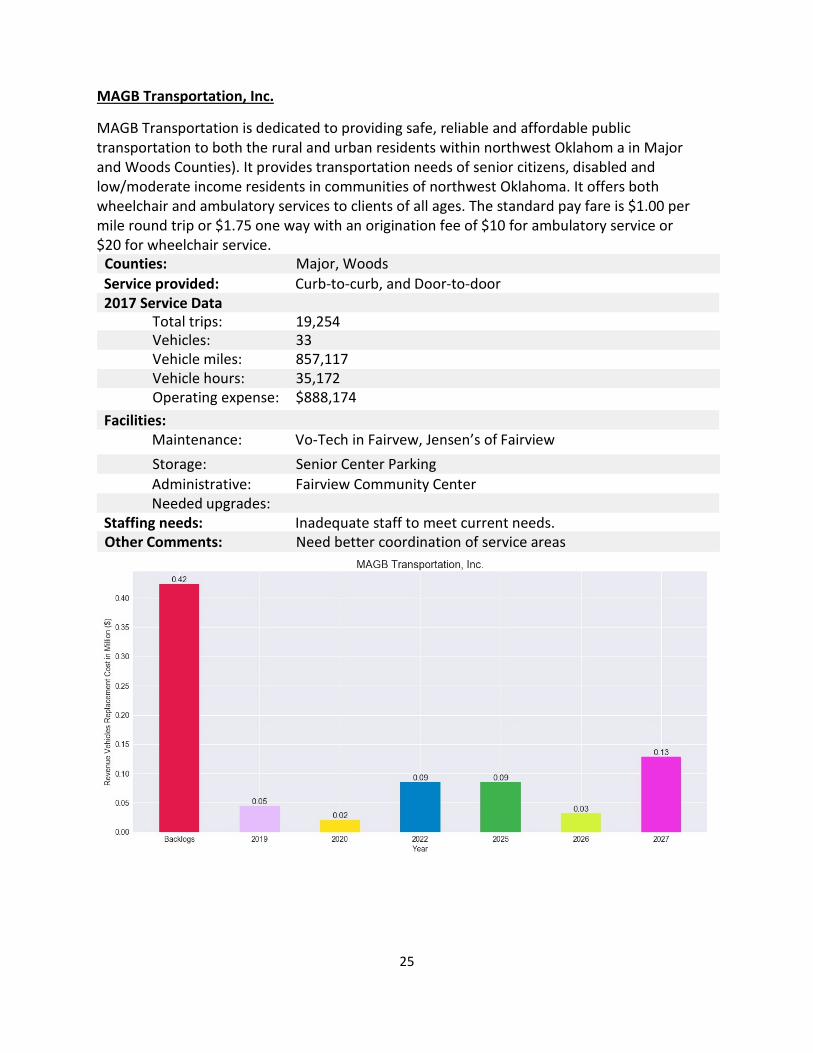
25
MAGB Transportation, Inc.
MAGB Transportation is dedicated to providing safe, reliable and affordable public transportation to both the rural and urban residents within northwest Oklahom a in Major and Woods Counties). It provides transportation needs of senior citizens, disabled and low/moderate income residents in communities of northwest Oklahoma. It offers both wheelchair and ambulatory services to clients of all ages. The standard pay fare is $1.00 per mile round trip or $1.75 one way with an origination fee of $10 for ambulatory service or $20 for wheelchair service.
Counties: Major, Woods Service provided: Curb‐to‐curb, and Door‐to‐door
2017 Service Data Total trips: 19,254 Vehicles: 33 Vehicle miles: 857,117 Vehicle hours: 35,172 Operating expense: $888,174
Facilities: Maintenance: Vo‐Tech in Fairvew, Jensen’s of Fairview
Storage: Senior Center Parking Administrative: Fairview Community Center
Needed upgrades: Staffing needs: Inadequate staff to meet current needs. Other Comments: Need better coordination of service areas
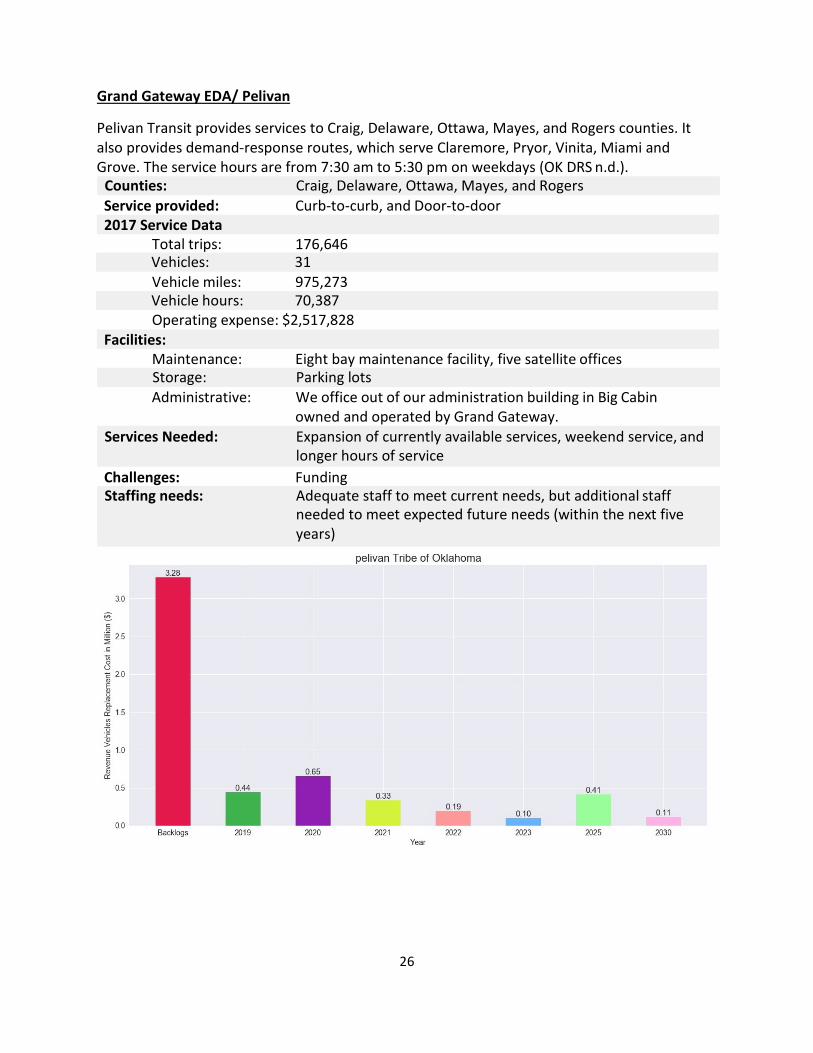
26
Grand Gateway EDA/ Pelivan
Pelivan Transit provides services to Craig, Delaware, Ottawa, Mayes, and Rogers counties. It also provides demand‐response routes, which serve Claremore, Pryor, Vinita, Miami and Grove. The service hours are from 7:30 am to 5:30 pm on weekdays (OK DRS n.d.).
Counties: Craig, Delaware, Ottawa, Mayes, and Rogers Service provided: Curb‐to‐curb, and Door‐to‐door 2017 Service Data
Total trips: 176,646
Vehicle miles: 975,273
Operating expense: $2,517,828 Facilities:
Maintenance: Eight bay maintenance facility, five satellite offices Storage: Parking lots Administrative: We office out of our administration building in Big Cabin
owned and operated by Grand Gateway. Services Needed: Expansion of currently available services, weekend service, and
longer hours of service Challenges: Funding Staffing needs: Adequate staff to meet current needs, but additional staff
needed to meet expected future needs (within the next five years)
Vehicles: 31
Vehicle hours: 70,387
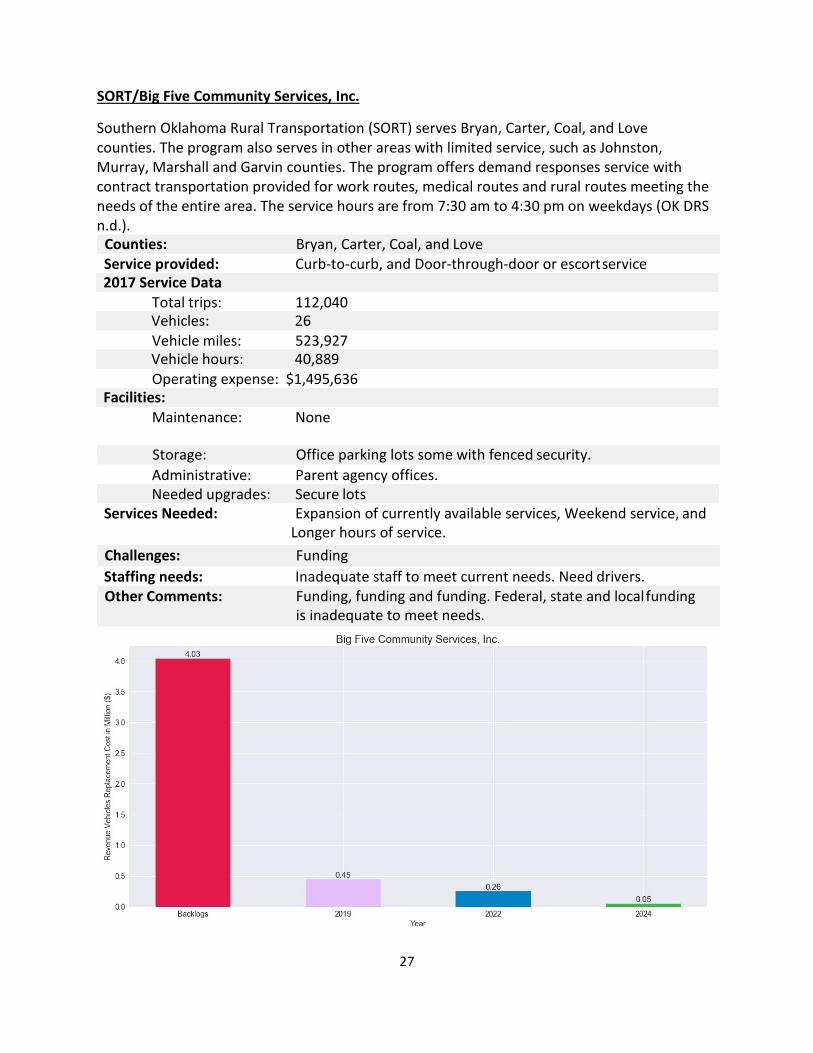
27
SORT/Big Five Community Services, Inc.
Southern Oklahoma Rural Transportation (SORT) serves Bryan, Carter, Coal, and Love counties. The program also serves in other areas with limited service, such as Johnston, Murray, Marshall and Garvin counties. The program offers demand responses service with contract transportation provided for work routes, medical routes and rural routes meeting the needs of the entire area. The service hours are from 7:30 am to 4:30 pm on weekdays (OK DRS n.d.).
Counties: Bryan, Carter, Coal, and Love Service provided: Curb‐to‐curb, and Door‐through‐door or escort service
Total trips: 112,040
Vehicle miles: 523,927
Operating expense: $1,495,636
Maintenance: None
Storage: Office parking lots some with fenced security. Administrative: Parent agency offices. Needed upgrades: Secure lots
Services Needed: Expansion of currently available services, Weekend service, and Longer hours of service.
Challenges: Funding Staffing needs: Inadequate staff to meet current needs. Need drivers. Other Comments: Funding, funding and funding. Federal, state and local funding
is inadequate to meet needs.
2017 Service Data
Vehicles: 26
Vehicle hours: 40,889
Facilities:
28
Southwest Oklahoma Community Action Group, Inc.
Southwest Transit operates in Altus, Hollis, Mangum, and Granite Oklahoma serving counties of Greer, Harmon and Jackson. It provides demand‐response and limited scheduled route services in those communities. It provides service from Altus to Eldorado from Monday through Friday and between Altus and Lawton three times per week. The program also provides transportation services to three local day cares, six Head Start centers, one sheltered workshop, six nutrition sites, numerous work routes under the Road to Work‐Oklahoma program. The regular service hours are from 8:00 am to 5:00 pm on weekdays (OK DRS n.d.).
Counties: Jackson, Greer, and Harmon Service provided: Curb‐to‐curb 2017 Service Data
Total trips: 72,364
Vehicle miles: 510,182
Operating expense: $1,020,884 Facilities:
Maintenance: Operations facility in Altus with parking, offices for dispatch, and garage area for minor maintenance (4000 sq ft). Most maintenance performed by area vendors. Wash bay and parking facility also located on this property (5425 sq ft).
Storage: Vehicle storage in Hollis and Granite, Oklahoma. Vehicle storage is part of facility listed above for Altus. Agency owned. (737 sq ft ea)
Administrative: Bookkeeping and administrative functions housed in Altus at agency central office (7807 sq ft total size for all purposes). This facility is leased from City of Altus at no cost to agency or program. Program uses office at Hollis Meal Site, Mangum Meal Site, and Granite Meal Site. These facilities are all leased from cities by agency. No cost to program.
Services Needed: Weekend service, and Longer hours of service Challenges: Money and staffing. Additional Information: General public is available Monday ‐ Friday from 8:30 to 5:00.
People working evenings and weekends cannot rely on availability. NEMT service is provided for Saturdays and holidays as needed and 1 work contract on Saturdays as needed. Expanding services would require more funding and more local match.
Staffing needs: Inadequate staff to meet current needs. CDL drivers are difficult to find. Testing locations are not local, and wait is long and may not result in test occurring. Our drivers are aging. Because funding is stagnant, our pay is low.
Vehicles: 26
Vehicle hours: 26,995
72,364
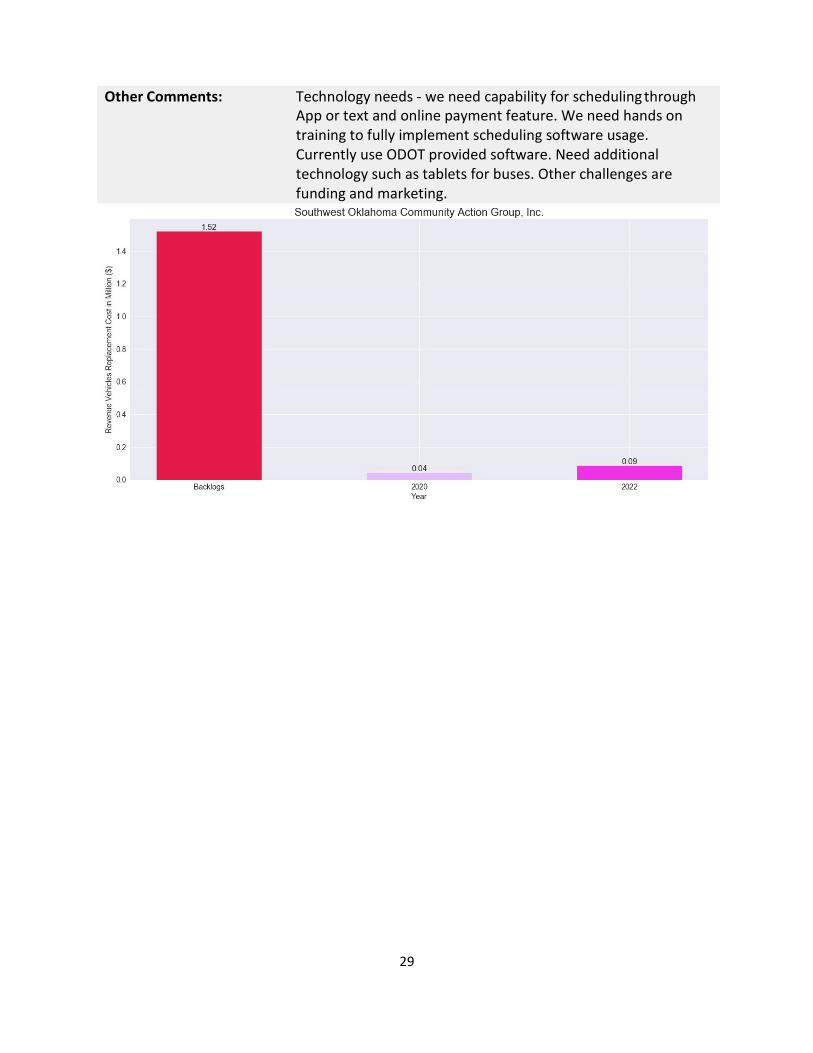
29
Other Comments: Technology needs ‐ we need capability for scheduling through App or text and online payment feature. We need hands on training to fully implement scheduling software usage. Currently use ODOT provided software. Need additional technology such as tablets for buses. Other challenges are funding and marketing.
30
Muskogee County Public Transit Authority
It operates demand‐response services, and the routes include trips into Muskogee from towns around the county, with daily trips to senior nutrition sites. Accessible service is available for those not able to ride in taxi cabs. Taxi service runs 24 hours a day, with half‐price tickets for eligible persons. Regular service is from 8:00 am to 4:30 pm on weekdays (OK DRS n.d.).
Counties: Muskogee, Creek, Hughes, Mayes, McIntosh, Okfuskee, Okmulgee, Tulsa, Rogers, and Wagoner
Service provided: Fixed‐route, and Curb‐to‐curb 2017 Service Data
Total trips: 51,779
Vehicle miles: 517,911
Operating expense: $1,333,900 Facilities:
Maintenance: We have a large facility that we own. This facility houses our administration and all facets of our business. We are able to park our entire fleet (40) inside the garage and we have a maintenance man who maintains the grounds and minor issues with the building as well as, doing oil changes on most of our vehicles and minor mechanical work. I am not certain of the exact size of our facility but I would estimate total square footage to be 10,000 to 15,000 sq ft.
Storage: All of our vehicles are parked inside the garage, except the 2 that are used for outer County routes and they are parked at the drivers’ property where the route begins each morning.
Administrative: All administrative functions, offices, board room, training room, dispatch etc are housed in one building. 9 offices, large board room, Kitchen/breakroom, 4 bathrooms and 2 storage rooms.
Needed upgrades: Our roof is old and leaks. It needs to have either major repairs and upgrades or replacement. We are in need of cameras at our facility to increase our security. We have a second barn on our property that was not in great condition at the time of purchase that is in dire need of repair and not usable for anything as is.
Services Needed: New curb‐to‐curb service, New door‐to‐door service, New group pickups, Expansion of currently available services, and weekend service
Challenges: We need money to purchase vehicles to run longer hours and more routes.
Vehicles: 25
Vehicle hours: 39,341
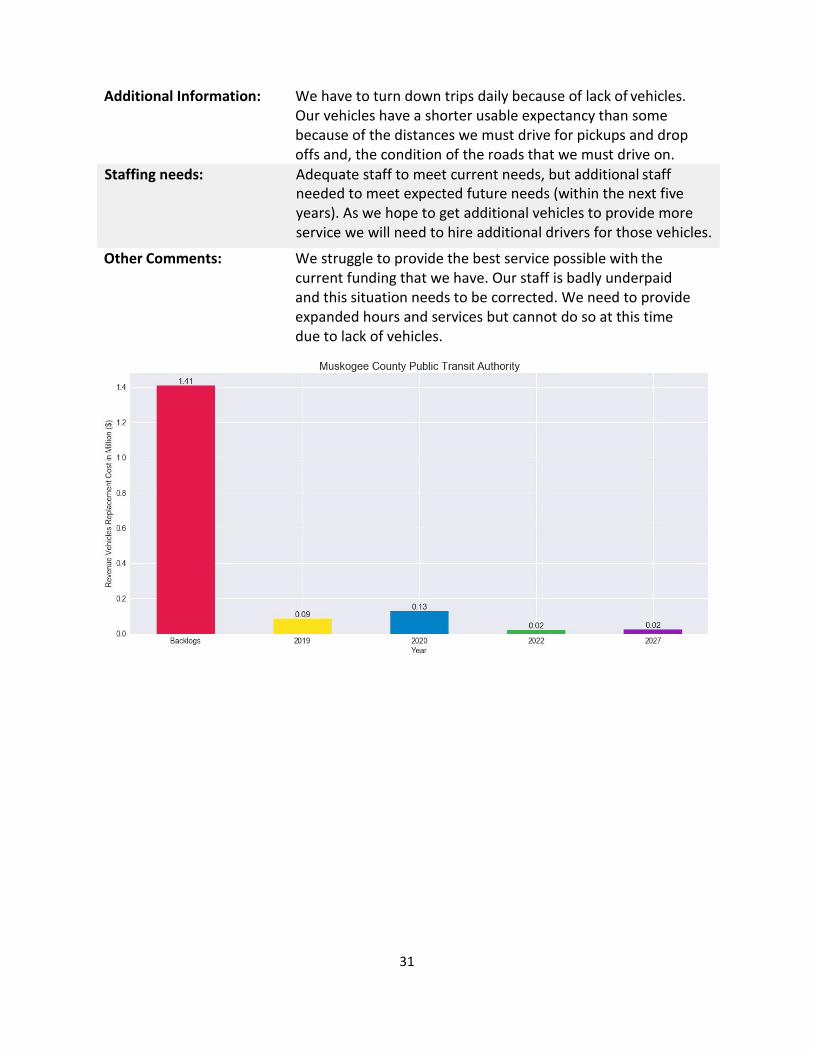
31
Additional Information: We have to turn down trips daily because of lack of vehicles. Our vehicles have a shorter usable expectancy than some because of the distances we must drive for pickups and drop offs and, the condition of the roads that we must drive on.
Staffing needs: Adequate staff to meet current needs, but additional staff needed to meet expected future needs (within the next five years). As we hope to get additional vehicles to provide more service we will need to hire additional drivers for those vehicles.
Other Comments: We struggle to provide the best service possible with the current funding that we have. Our staff is badly underpaid and this situation needs to be corrected. We need to provide expanded hours and services but cannot do so at this time due to lack of vehicles.
32
OSU‐Stillwater Community Transit
The OSU‐Stillwater community transit serves in the area within the city limits of the City of Stillwater. The system provides four on campus routes which provide service from student housing to various building locations on‐campus and six off campus routes that provide service to the community with routes extending out from a central starting point on campus to route locations in the Stillwater community. The service hours are from 6:30 am to 10:30 pm (OK DRS n.d.).
Counties: Payne Service provided: Fixed‐route, Curb‐to‐curb, and Door‐to‐
Total trips: 549,101
Vehicle miles: 682,171
Operating expense: $2,755,672
Maintenance: We own our maintenance facility. The capacity does not meet our needs with only 2 bus maintenance bays for 35 buses.
Storage: We own our vehicle storage lot. It is open with no covered parking but we do have the capacity needed.
Administrative: We have a great multimodal facility for administrative offices and dispatch but our operations office is a temporary building located on our storage lot and CNG fuel station.
Needed upgrades: We need a new bus maintenance facility to handle the capacity of our system. Our old facility is 50+ years old and was adapted to do bus maintenance. We need a larger more robust maintenance facility and driver and supervisor operations office.
Services Needed: Weekend service Challenges: Funding Additional Information: The community need is for weekend service. Staffing needs: Inadequate staff to meet current needs. We are constantly
short on driving staff.
2017 Service Data
Vehicles: 20
Vehicle hours: 46,582
Facilities:
door
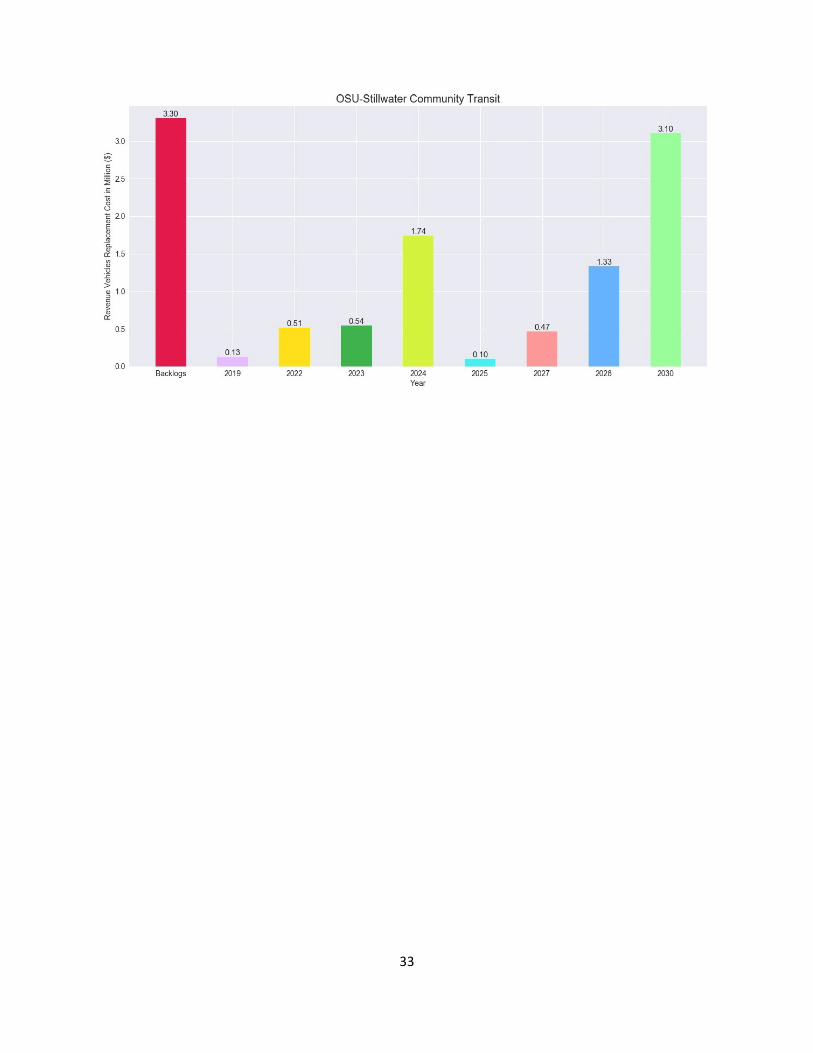
33
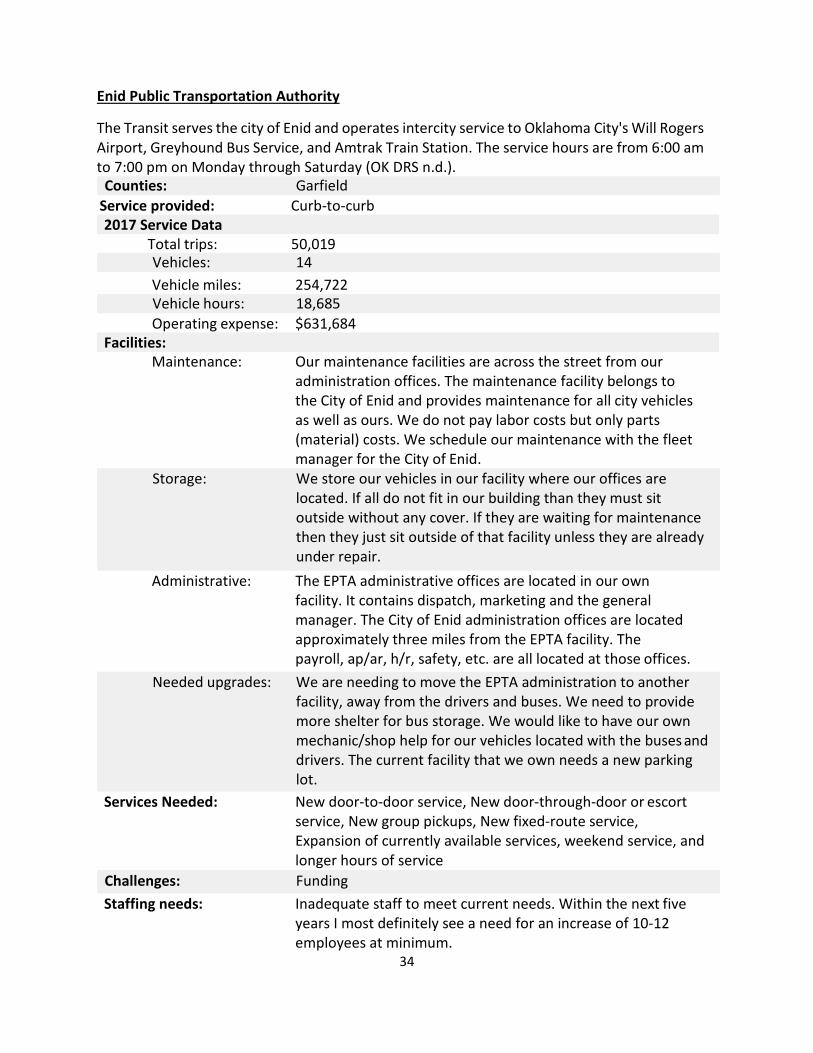
34
Enid Public Transportation Authority
The Transit serves the city of Enid and operates intercity service to Oklahoma City's Will Rogers Airport, Greyhound Bus Service, and Amtrak Train Station. The service hours are from 6:00 am to 7:00 pm on Monday through Saturday (OK DRS n.d.).
Counties: Garfield Service provided: Curb‐to‐curb 2017 Service Data
Total trips: 50,019 Vehicles: 14 Vehicle miles: 254,722 Vehicle hours: 18,685 Operating expense: $631,684
Facilities: Maintenance: Our maintenance facilities are across the street from our
administration offices. The maintenance facility belongs to the City of Enid and provides maintenance for all city vehicles as well as ours. We do not pay labor costs but only parts (material) costs. We schedule our maintenance with the fleet manager for the City of Enid.
Storage: We store our vehicles in our facility where our offices are located. If all do not fit in our building than they must sit outside without any cover. If they are waiting for maintenance then they just sit outside of that facility unless they are already under repair.
Administrative: The EPTA administrative offices are located in our own facility. It contains dispatch, marketing and the general manager. The City of Enid administration offices are located approximately three miles from the EPTA facility. The payroll, ap/ar, h/r, safety, etc. are all located at those offices.
Needed upgrades: We are needing to move the EPTA administration to another facility, away from the drivers and buses. We need to provide more shelter for bus storage. We would like to have our own mechanic/shop help for our vehicles located with the buses and drivers. The current facility that we own needs a new parking lot.
Services Needed: New door‐to‐door service, New door‐through‐door or escort service, New group pickups, New fixed‐route service, Expansion of currently available services, weekend service, and longer hours of service
Challenges: Funding Staffing needs: Inadequate staff to meet current needs. Within the next five
years I most definitely see a need for an increase of 10‐12 employees at minimum.
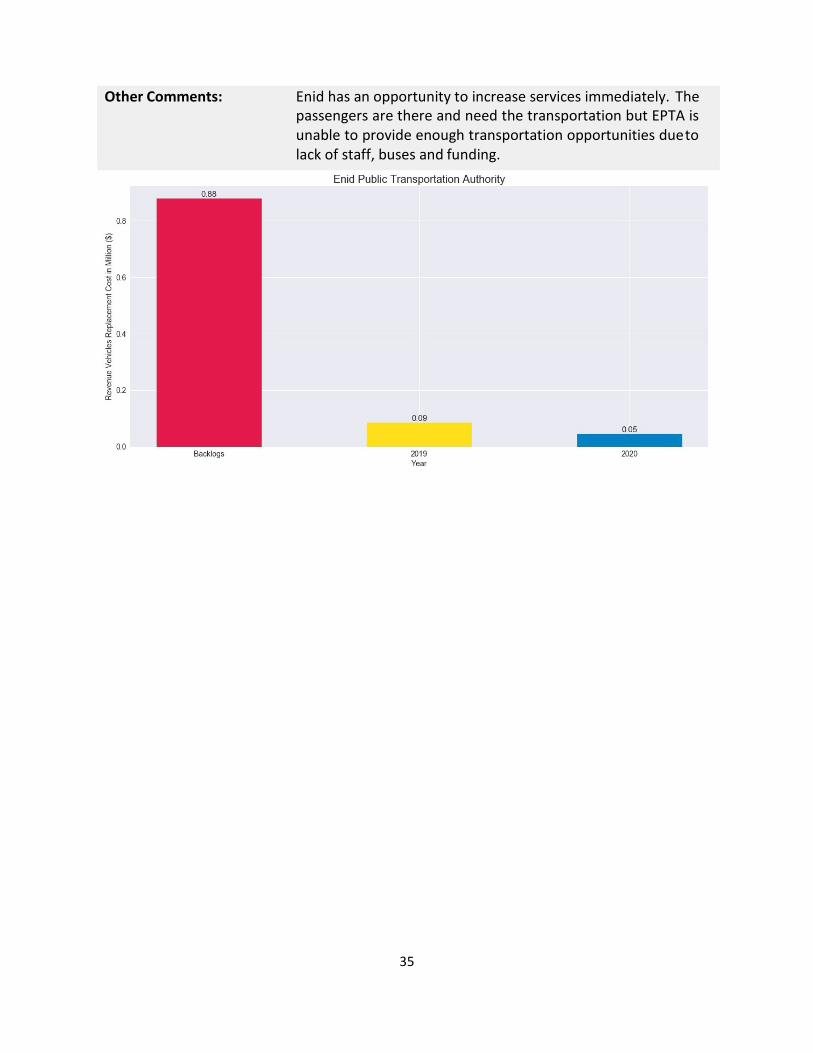
35
Other Comments: Enid has an opportunity to increase services immediately. The passengers are there and need the transportation but EPTA is unable to provide enough transportation opportunities due to lack of staff, buses and funding.
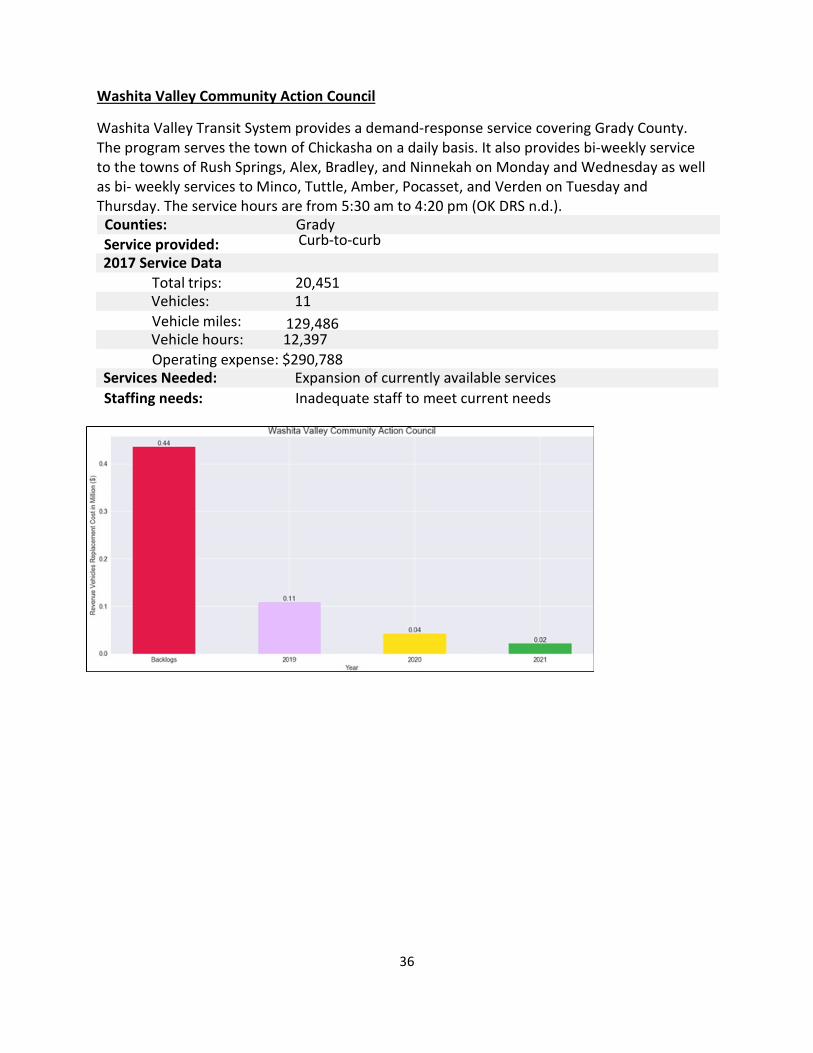
36
Washita Valley Community Action Council
Washita Valley Transit System provides a demand‐response service covering Grady County. The program serves the town of Chickasha on a daily basis. It also provides bi‐weekly service to the towns of Rush Springs, Alex, Bradley, and Ninnekah on Monday and Wednesday as well as bi‐ weekly services to Minco, Tuttle, Amber, Pocasset, and Verden on Tuesday and Thursday. The service hours are from 5:30 am to 4:20 pm (OK DRS n.d.).
Counties: Grady Service provided: Curb‐to‐curb
Total trips: 20,451
Vehicle miles:
Operating expense: $290,788
Staffing needs: Inadequate staff to meet current needs
2017 Service Data
Vehicles: 11
Vehicle hours: 12,397
Services Needed: Expansion of currently available services
129,486
37
Central Oklahoma Community Action Agency Central Oklahoma Transit System provides service to communities in the city limits of Shawnee, and Oklahoma. The service hours are 7:45 am to 5:00 pm on weekdays (OK DRS n.d.).
Counties: Pottawatomie Service provided: Curb‐to‐curb, and Door‐to‐door
2017 Service Data Total trips: 19,273
Vehicle miles: 257,116
Operating expense: $548,322 Facilities:
Maintenance: The current maintenance facilities we use are locally owned within our community. We do not own any.
Storage: We rent the storage for our vehicles. For parking only. can park only up to 15 vehicles
Administrative: We also do not own the administrative offices. We are part of a Community Action Agency so there are several different programs that share in the space and rent of the building.
Needed upgrades: Services Needed: New door‐through‐door or escort service, Expansion of
currently available services, Weekend service, and Longer hours of service Challenges: Funding always funding
Staffing needs: Adequate staff to meet current needs, but additional staff needed to meet expected future needs (within the next five years). Currently have 1 transit director, 1 scheduler, 1 data entry staff, 8 drivers, and CFO and grants writer under the community action agency. would like to have 16 drivers, 2 data entry, 1 dispatch added and 1 scheduler added.
Other Comments: If our funding was met where we could not only pay for more employees and buy more vehicles. We could expand very easily. the need is definitely here.
Vehicles: 10
Vehicle hours: 15,245
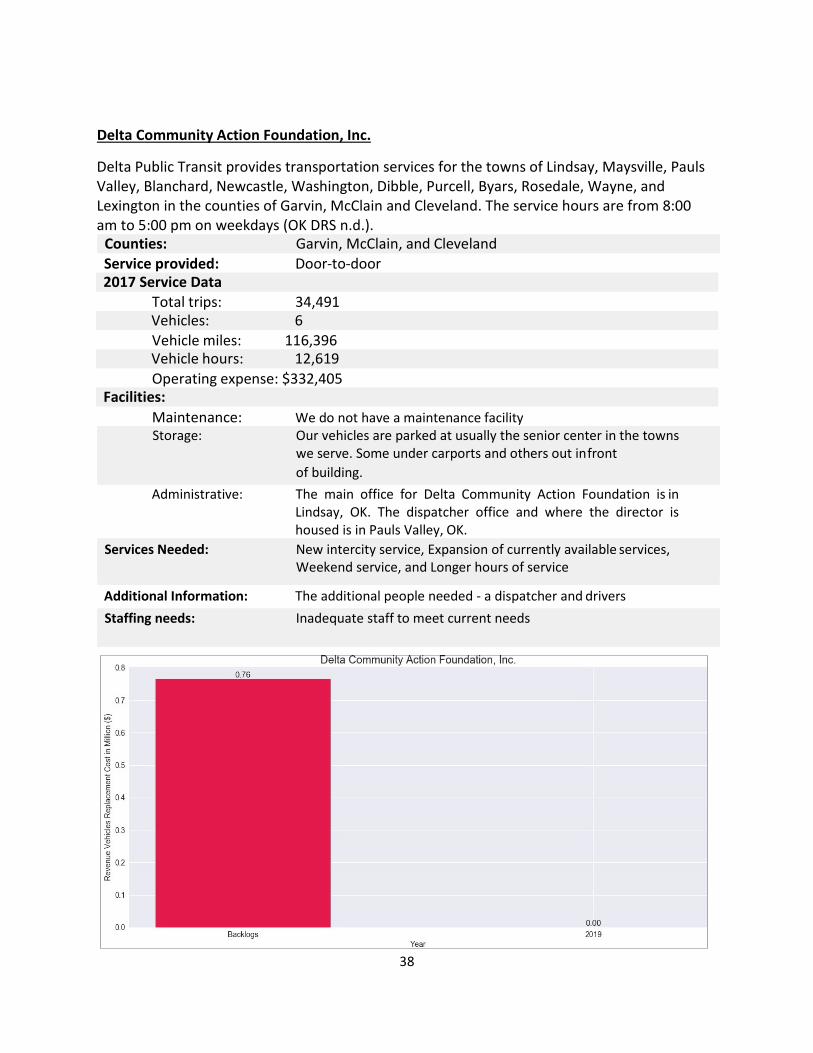
38
Delta Community Action Foundation, Inc.
Delta Public Transit provides transportation services for the towns of Lindsay, Maysville, Pauls Valley, Blanchard, Newcastle, Washington, Dibble, Purcell, Byars, Rosedale, Wayne, and Lexington in the counties of Garvin, McClain and Cleveland. The service hours are from 8:00 am to 5:00 pm on weekdays (OK DRS n.d.).
Counties: Garvin, McClain, and Cleveland Service provided: Door‐to‐door
Total trips: 34,491
Vehicle miles: 116,396
Operating expense: $332,405
Maintenance: We do not have a maintenance facility Storage: Our vehicles are parked at usually the senior center in the towns
we serve. Some under carports and others out in front of building.
Administrative: The main office for Delta Community Action Foundation is in Lindsay, OK. The dispatcher office and where the director is housed is in Pauls Valley, OK.
Services Needed: New intercity service, Expansion of currently available services, Weekend service, and Longer hours of service
Additional Information: The additional people needed ‐ a dispatcher and drivers Staffing needs: Inadequate staff to meet current needs
2017 Service Data
Vehicles: 6
Vehicle hours: 12,619
Facilities:
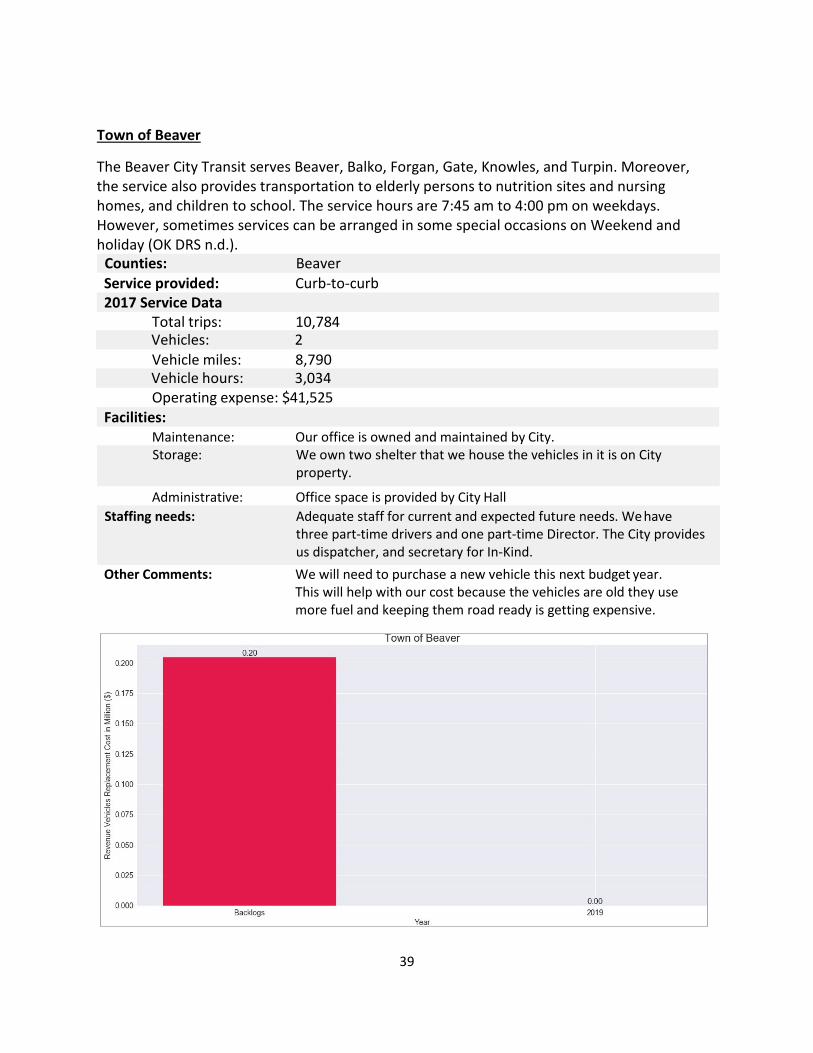
39
Town of Beaver
The Beaver City Transit serves Beaver, Balko, Forgan, Gate, Knowles, and Turpin. Moreover, the service also provides transportation to elderly persons to nutrition sites and nursing homes, and children to school. The service hours are 7:45 am to 4:00 pm on weekdays. However, sometimes services can be arranged in some special occasions on Weekend and holiday (OK DRS n.d.).
Counties: Beaver Service provided: Curb‐to‐curb
2017 Service Data Total trips: 10,784
Vehicle miles: 8,790
Operating expense: $41,525 Facilities:
Maintenance: Our office is owned and maintained by City. Storage: We own two shelter that we house the vehicles in it is on City
property.
Administrative: Office space is provided by City Hall Staffing needs: Adequate staff for current and expected future needs. We have
three part‐time drivers and one part‐time Director. The City provides us dispatcher, and secretary for In‐Kind.
Other Comments: We will need to purchase a new vehicle this next budget year. This will help with our cost because the vehicles are old they use more fuel and keeping them road ready is getting expensive.
Vehicles: 2
Vehicle hours: 3,034
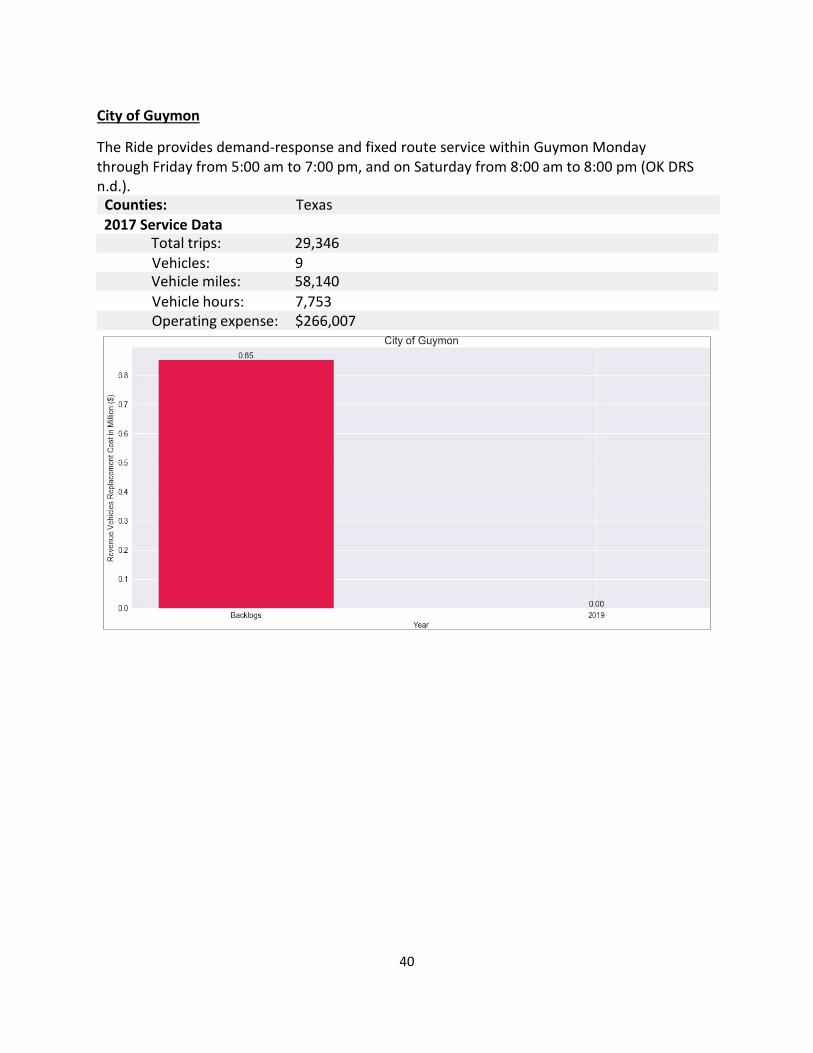
40
City of Guymon
The Ride provides demand‐response and fixed route service within Guymon Monday through Friday from 5:00 am to 7:00 pm, and on Saturday from 8:00 am to 8:00 pm (OK DRS n.d.).
Counties: Texas 2017 Service Data
Vehicles: 9
Vehicle hours: 7,753 Operating expense: $266,007
Total trips: 29,346
Vehicle miles: 58,140
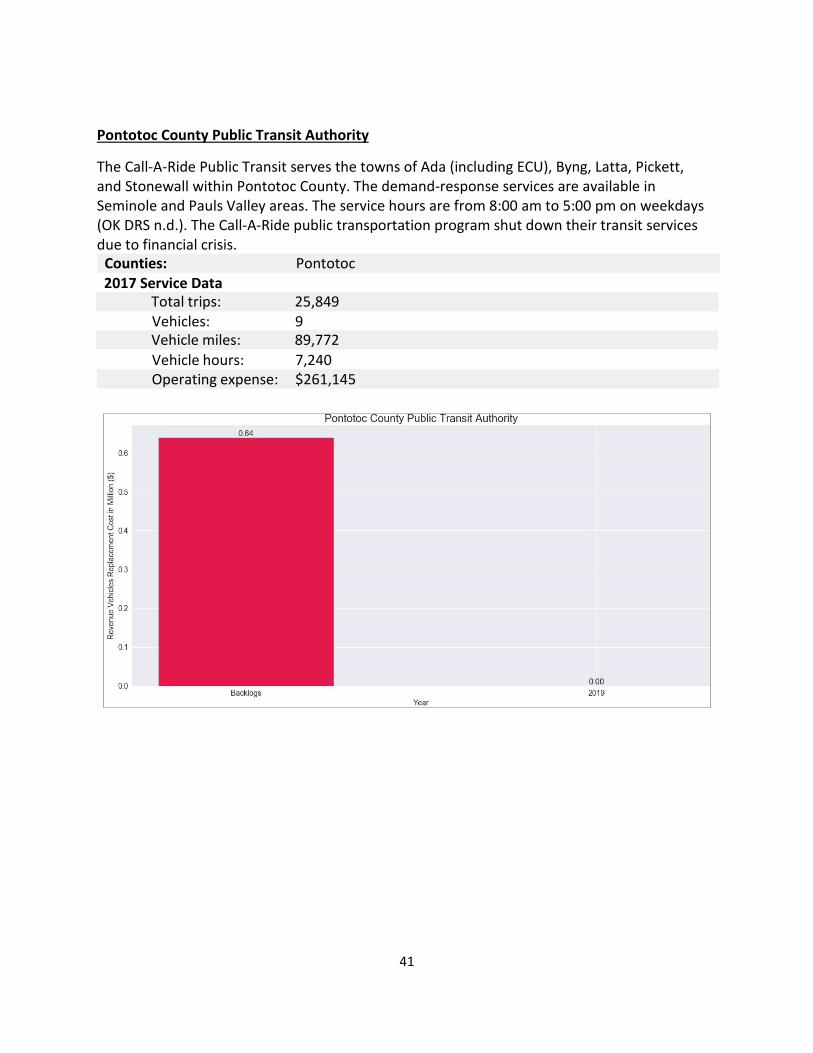
41
Pontotoc County Public Transit Authority
The Call‐A‐Ride Public Transit serves the towns of Ada (including ECU), Byng, Latta, Pickett, and Stonewall within Pontotoc County. The demand‐response services are available in Seminole and Pauls Valley areas. The service hours are from 8:00 am to 5:00 pm on weekdays (OK DRS n.d.). The Call‐A‐Ride public transportation program shut down their transit services due to financial crisis.
Counties: Pontotoc 2017 Service Data
Vehicles: 9
Vehicle hours: 7,240 Operating expense: $261,145
Total trips: 25,849
Vehicle miles: 89,772
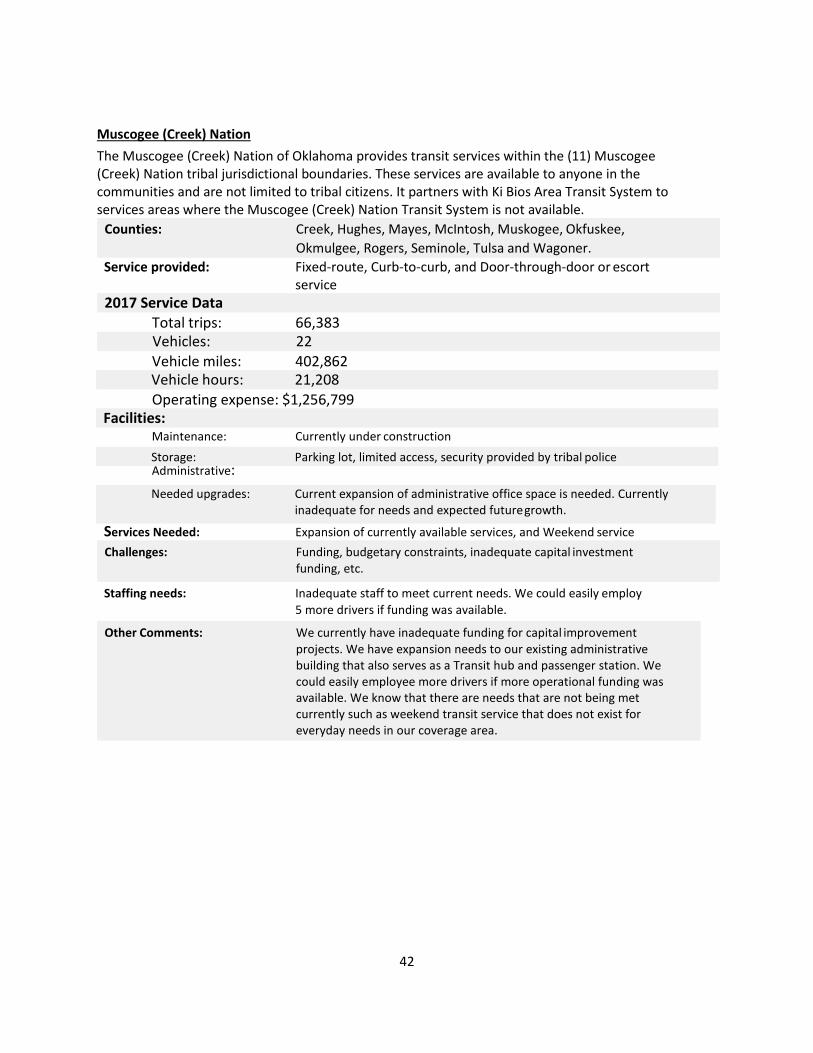
42
Muscogee (Creek) Nation The Muscogee (Creek) Nation of Oklahoma provides transit services within the (11) Muscogee (Creek) Nation tribal jurisdictional boundaries. These services are available to anyone in the communities and are not limited to tribal citizens. It partners with Ki Bios Area Transit System to services areas where the Muscogee (Creek) Nation Transit System is not available.
Counties: Creek, Hughes, Mayes, McIntosh, Muskogee, Okfuskee, Okmulgee, Rogers, Seminole, Tulsa and Wagoner.
Service provided: Fixed‐route, Curb‐to‐curb, and Door‐through‐door or escort service
2017 Service Data Total trips: 66,383 Vehicles: 22 Vehicle miles: 402,862
Operating expense: $1,256,799
Maintenance: Currently under construction
Administrative:
Services Needed: Expansion of currently available services, and Weekend service Challenges: Funding, budgetary constraints, inadequate capital investment
funding, etc. Staffing needs: Inadequate staff to meet current needs. We could easily employ
5 more drivers if funding was available.
Other Comments: We currently have inadequate funding for capital improvement projects. We have expansion needs to our existing administrative building that also serves as a Transit hub and passenger station. We could easily employee more drivers if more operational funding was available. We know that there are needs that are not being met currently such as weekend transit service that does not exist for everyday needs in our coverage area.
Vehicle hours: 21,208
Facilities:
Storage: Parking lot, limited access, security provided by tribal police
Needed upgrades: Current expansion of administrative office space is needed. Currently inadequate for needs and expected future growth.
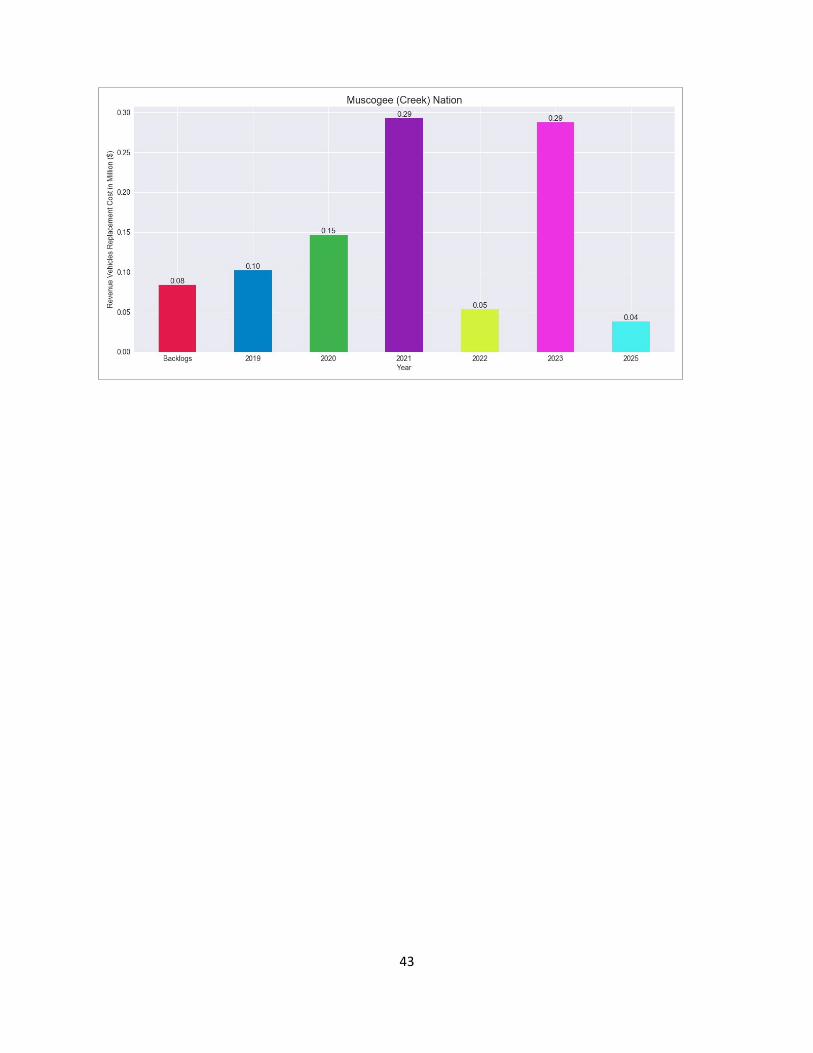
43
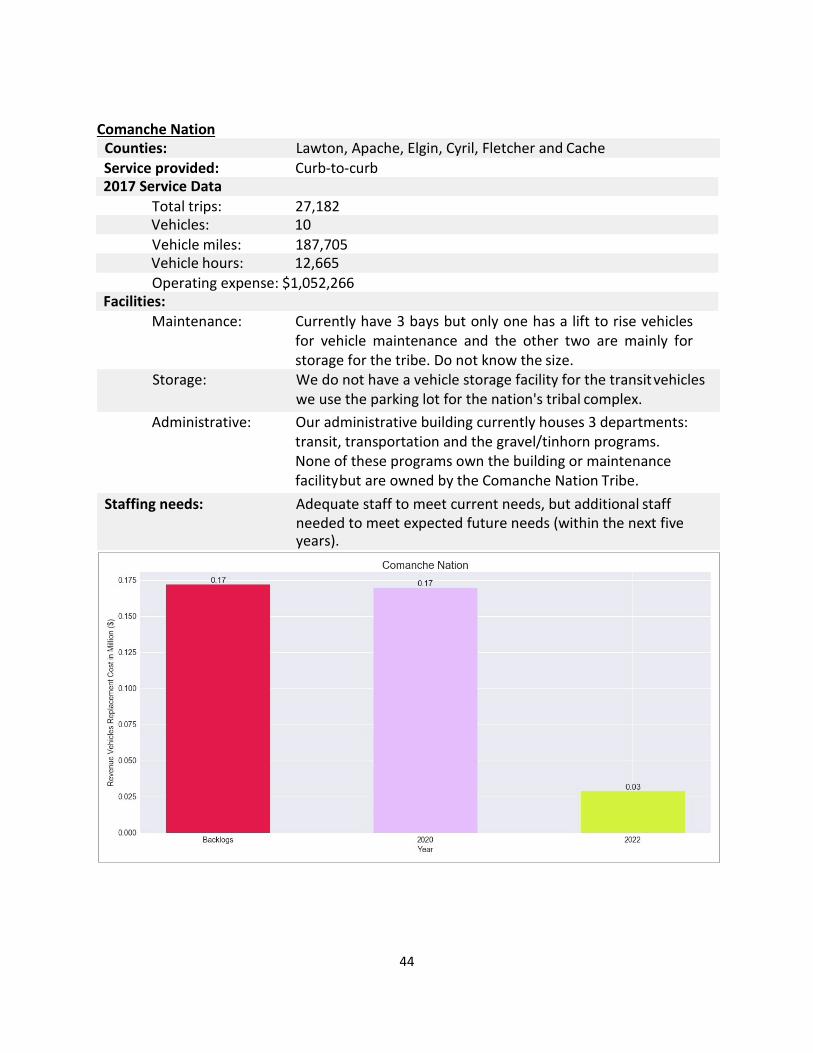
44
Comanche Nation
Counties: Lawton, Apache, Elgin, Cyril, Fletcher and Cache Service provided: Curb‐to‐curb
Total trips: 27,182
Vehicle miles: 187,705
Operating expense: $1,052,266
Maintenance: Currently have 3 bays but only one has a lift to rise vehicles for vehicle maintenance and the other two are mainly for storage for the tribe. Do not know the size.
Storage: We do not have a vehicle storage facility for the transit vehicles we use the parking lot for the nation's tribal complex.
Administrative: Our administrative building currently houses 3 departments: transit, transportation and the gravel/tinhorn programs. None of these programs own the building or maintenance facility but are owned by the Comanche Nation Tribe.
Staffing needs: Adequate staff to meet current needs, but additional staff needed to meet expected future needs (within the next five years).
2017 Service Data
Vehicles: 10
Vehicle hours: 12,665
Facilities:
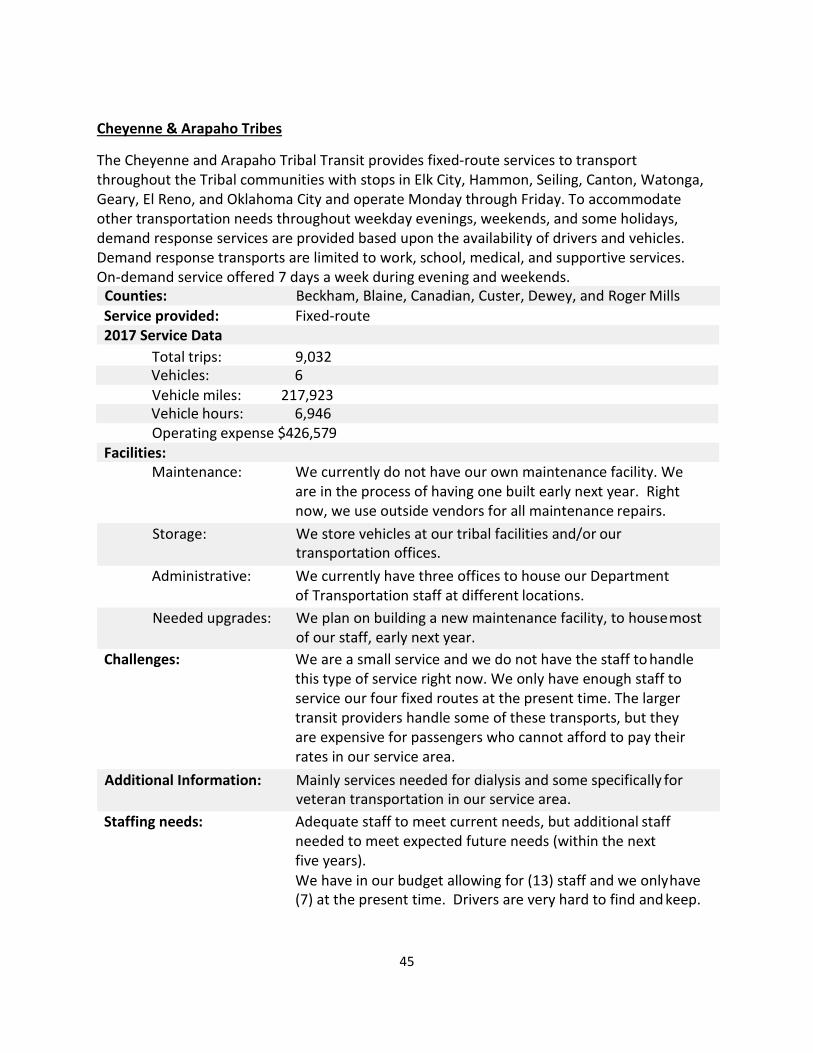
45
Cheyenne & Arapaho Tribes
The Cheyenne and Arapaho Tribal Transit provides fixed‐route services to transport throughout the Tribal communities with stops in Elk City, Hammon, Seiling, Canton, Watonga, Geary, El Reno, and Oklahoma City and operate Monday through Friday. To accommodate other transportation needs throughout weekday evenings, weekends, and some holidays, demand response services are provided based upon the availability of drivers and vehicles. Demand response transports are limited to work, school, medical, and supportive services. On‐demand service offered 7 days a week during evening and weekends.
Counties: Beckham, Blaine, Canadian, Custer, Dewey, and Roger Mills Service provided: Fixed‐route
2017 Service Data Total trips: 9,032
Vehicle miles: 217,923
Operating expense $426,579 Facilities:
Maintenance: We currently do not have our own maintenance facility. We are in the process of having one built early next year. Right now, we use outside vendors for all maintenance repairs.
Storage: We store vehicles at our tribal facilities and/or our transportation offices.
Administrative: We currently have three offices to house our Department of Transportation staff at different locations.
Needed upgrades: We plan on building a new maintenance facility, to house most of our staff, early next year.
Challenges: We are a small service and we do not have the staff to handle this type of service right now. We only have enough staff to service our four fixed routes at the present time. The larger transit providers handle some of these transports, but they are expensive for passengers who cannot afford to pay their rates in our service area.
Additional Information: Mainly services needed for dialysis and some specifically for veteran transportation in our service area.
Staffing needs: Adequate staff to meet current needs, but additional staff needed to meet expected future needs (within the next five years). We have in our budget allowing for (13) staff and we only have (7) at the present time. Drivers are very hard to find and keep.
Vehicles: 6
Vehicle hours: 6,946
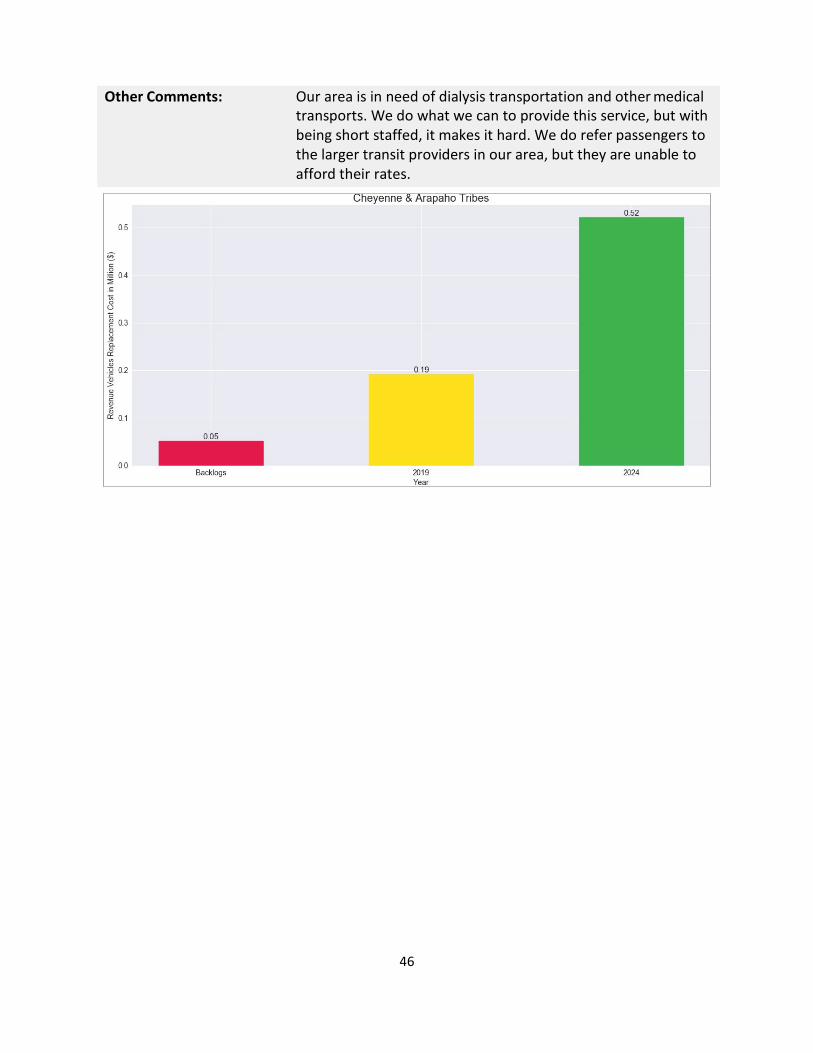
46
Other Comments: Our area is in need of dialysis transportation and other medical transports. We do what we can to provide this service, but with being short staffed, it makes it hard. We do refer passengers to the larger transit providers in our area, but they are unable to afford their rates.
47
Seminole Nation Public Transit
The Seminole Nation Public Transit is a demand response service available to all citizens of Seminole County. The public transit provides service by transporting customers promptly and safely to their destinations. The service hours are open from 8 am to 3 pm, Monday through Friday except on holidays. Same day requests are not permitted; a 24‐hour notice is required for all ride requests.
Counties: Seminole Service provided: Curb‐to‐curb
2017 Service Data Total trips: 26,035
Vehicle miles: 286,390
Operating expense $423,284 Facilities:
Maintenance: For our vehicles we use an in‐house Maintenance shop located on the same premise. If there is a major issue that needs to be addressed then the vehicle is sent out by the Maintenance shop.
Storage: All vehicles are stored in a gated parking lot on the premises. Administrative: All logs, pre‐trip, post‐trip, records etc. are kept and filed on site
for 7 years before we turn them over to our records department.
Needed upgrades: We are currently looking at expanding our facilities and completely reconstructing the Shop. We are needing a bigger parking lot to store our vehicles and more storage space to keep all our files.
Services Needed: New door‐to‐door service, New door‐through‐door or escort service, Expansion of currently available services, Weekend service, and Longer hours of service
Challenges: Getting our council members to all agree on expanding. Staffing needs: Adequate staff to meet current needs, but additional staff
needed to meet expected future needs (within the next five years). We will be adding 4 new buses at the end of this year, taking on all our dialysis clients, and we just added the vehicle maintenance shop into our department and we are needing an admin specialist for them.
Other Comments: In the coming up years we will be justifying adding the shop and dialysis into our department so we will be needing funding for that.
Vehicles: 5
Vehicle hours: 10,519
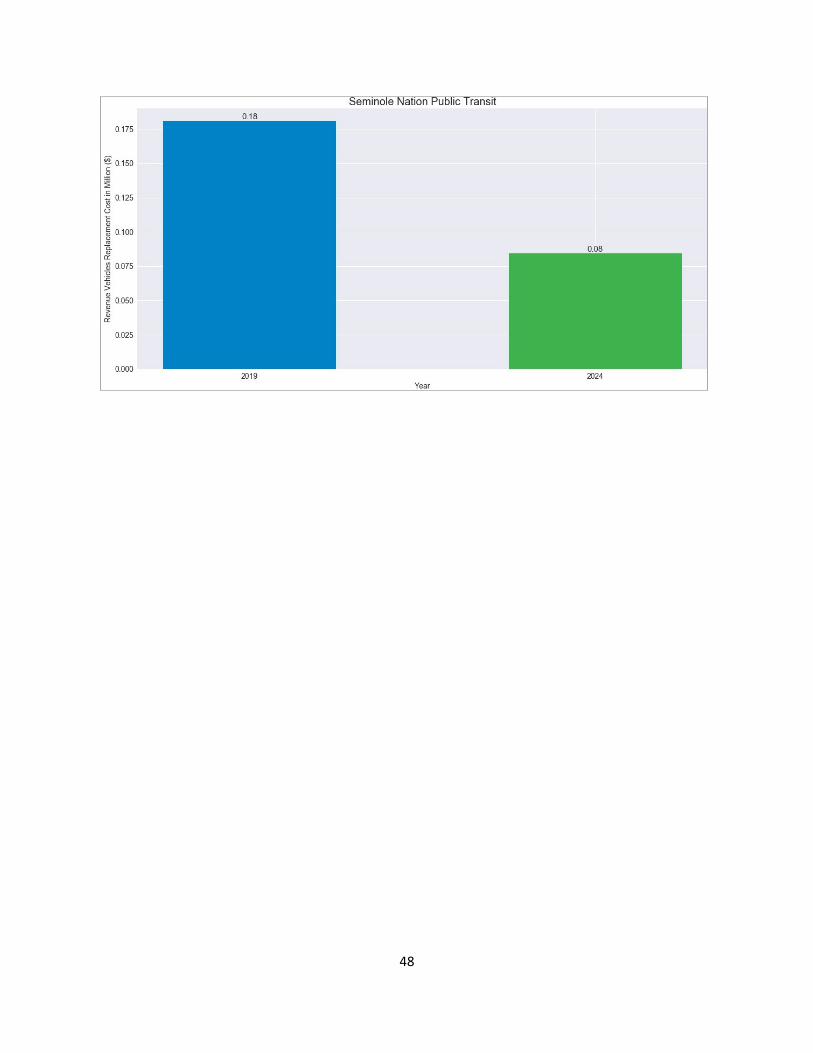
48
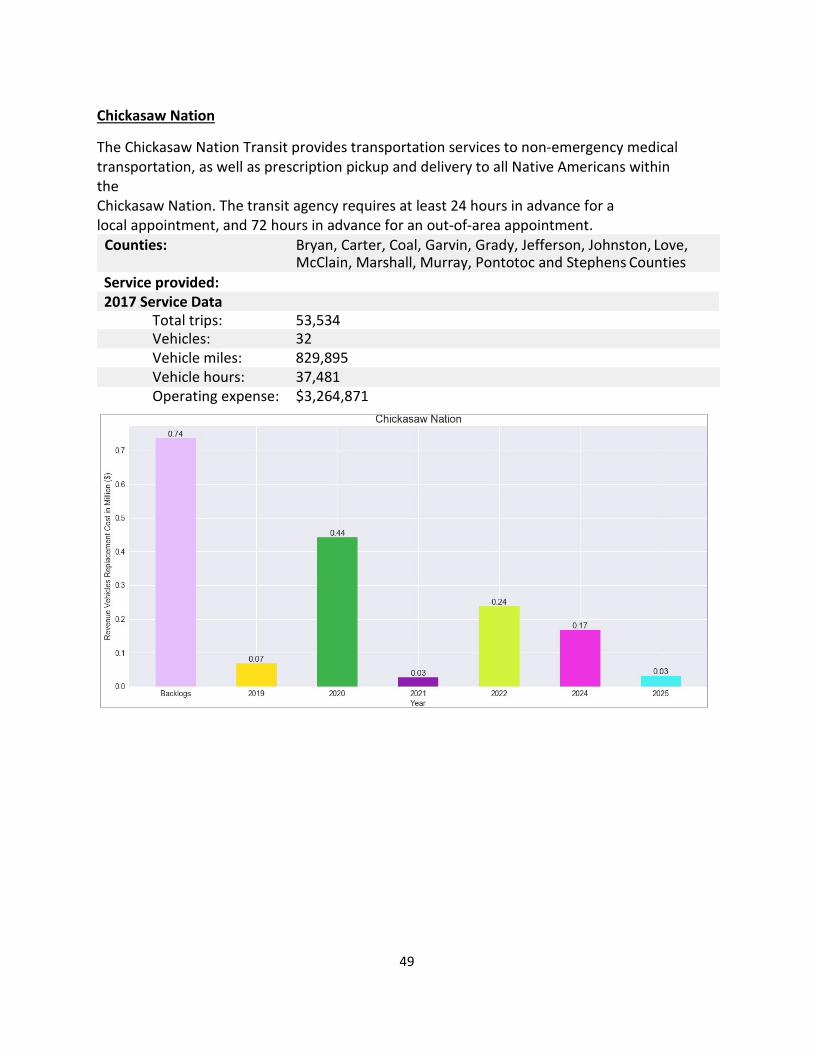
49
Chickasaw Nation
The Chickasaw Nation Transit provides transportation services to non‐emergency medical transportation, as well as prescription pickup and delivery to all Native Americans within the Chickasaw Nation. The transit agency requires at least 24 hours in advance for a local appointment, and 72 hours in advance for an out‐of‐area appointment.
Counties: Bryan, Carter, Coal, Garvin, Grady, Jefferson, Johnston, Love, McClain, Marshall, Murray, Pontotoc and Stephens Counties
Service provided: 2017 Service Data
Total trips: 53,534 Vehicles: 32 Vehicle miles: 829,895 Vehicle hours: 37,481 Operating expense: $3,264,871
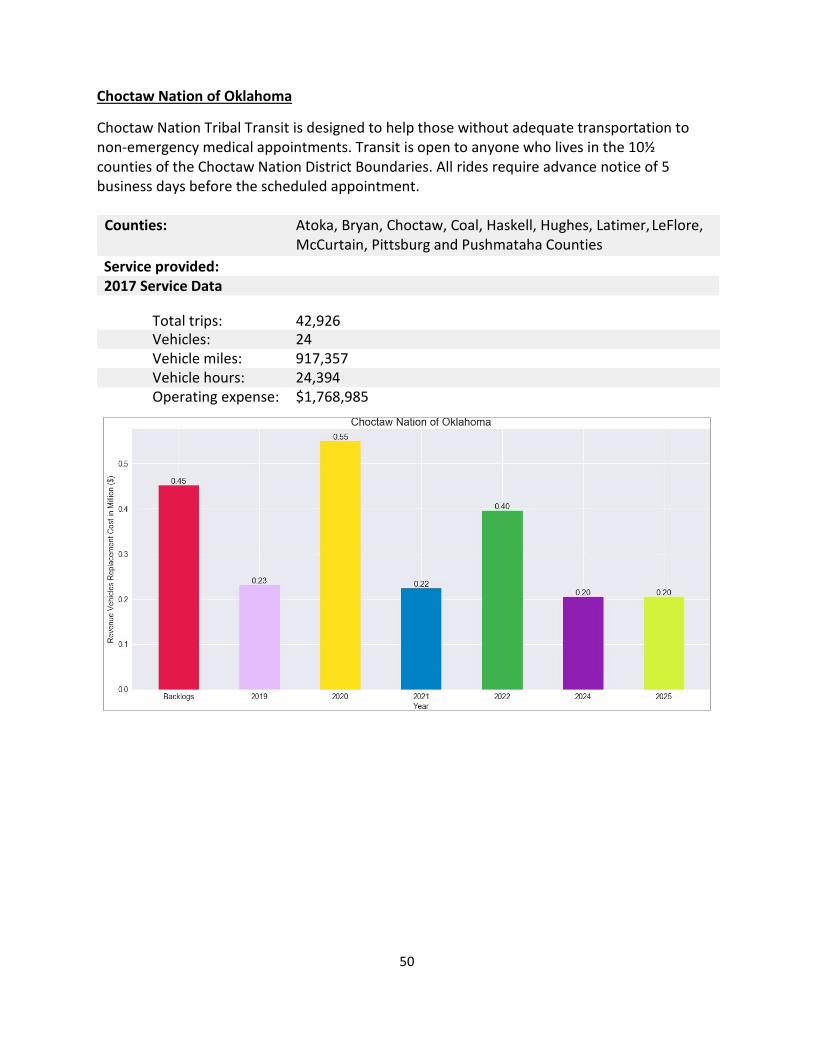
50
Choctaw Nation of Oklahoma
Choctaw Nation Tribal Transit is designed to help those without adequate transportation to non‐emergency medical appointments. Transit is open to anyone who lives in the 10½ counties of the Choctaw Nation District Boundaries. All rides require advance notice of 5 business days before the scheduled appointment.
Counties: Atoka, Bryan, Choctaw, Coal, Haskell, Hughes, Latimer, LeFlore, McCurtain, Pittsburg and Pushmataha Counties
Service provided: 2017 Service Data
Total trips: 42,926 Vehicles: 24 Vehicle miles: 917,357 Vehicle hours: 24,394 Operating expense: $1,768,985
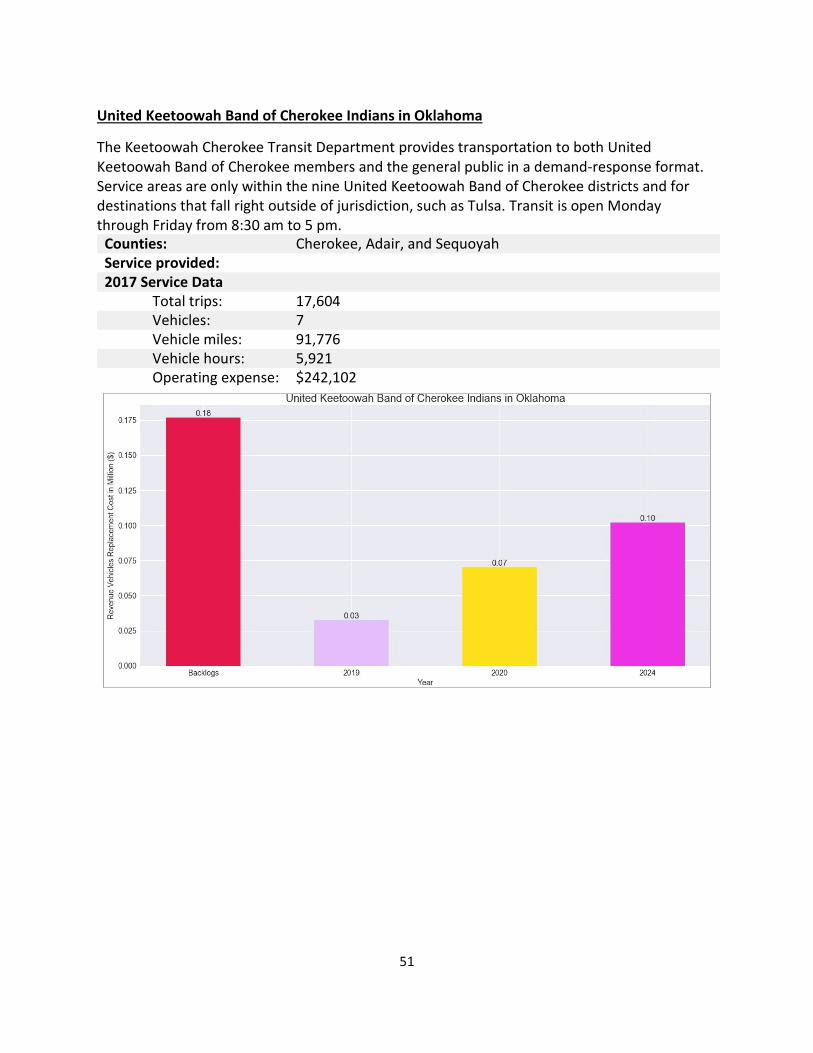
51
United Keetoowah Band of Cherokee Indians in Oklahoma
The Keetoowah Cherokee Transit Department provides transportation to both United Keetoowah Band of Cherokee members and the general public in a demand‐response format. Service areas are only within the nine United Keetoowah Band of Cherokee districts and for destinations that fall right outside of jurisdiction, such as Tulsa. Transit is open Monday through Friday from 8:30 am to 5 pm.
Counties: Cherokee, Adair, and Sequoyah Service provided: 2017 Service Data
Total trips: 17,604 Vehicles: 7 Vehicle miles: 91,776 Vehicle hours: 5,921 Operating expense: $242,102
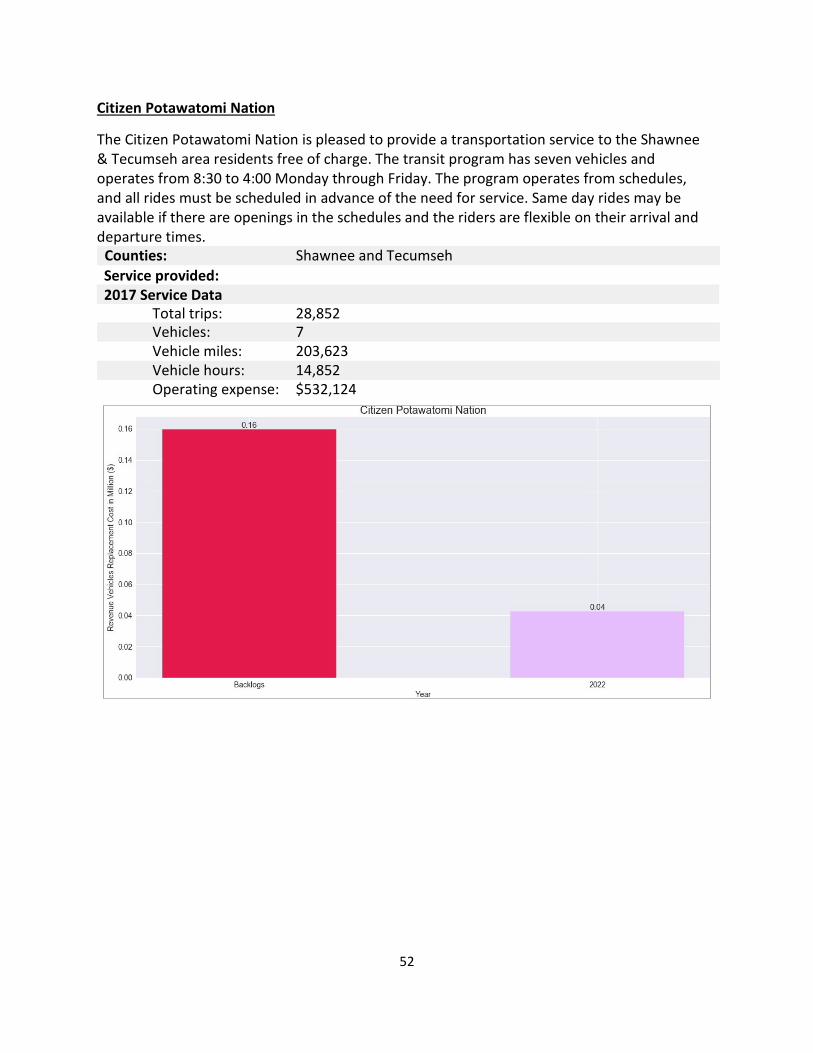
52
Citizen Potawatomi Nation
The Citizen Potawatomi Nation is pleased to provide a transportation service to the Shawnee & Tecumseh area residents free of charge. The transit program has seven vehicles and operates from 8:30 to 4:00 Monday through Friday. The program operates from schedules, and all rides must be scheduled in advance of the need for service. Same day rides may be available if there are openings in the schedules and the riders are flexible on their arrival and departure times.
Counties: Shawnee and Tecumseh Service provided:
2017 Service Data Total trips: 28,852 Vehicles: 7 Vehicle miles: 203,623 Vehicle hours: 14,852 Operating expense: $532,124
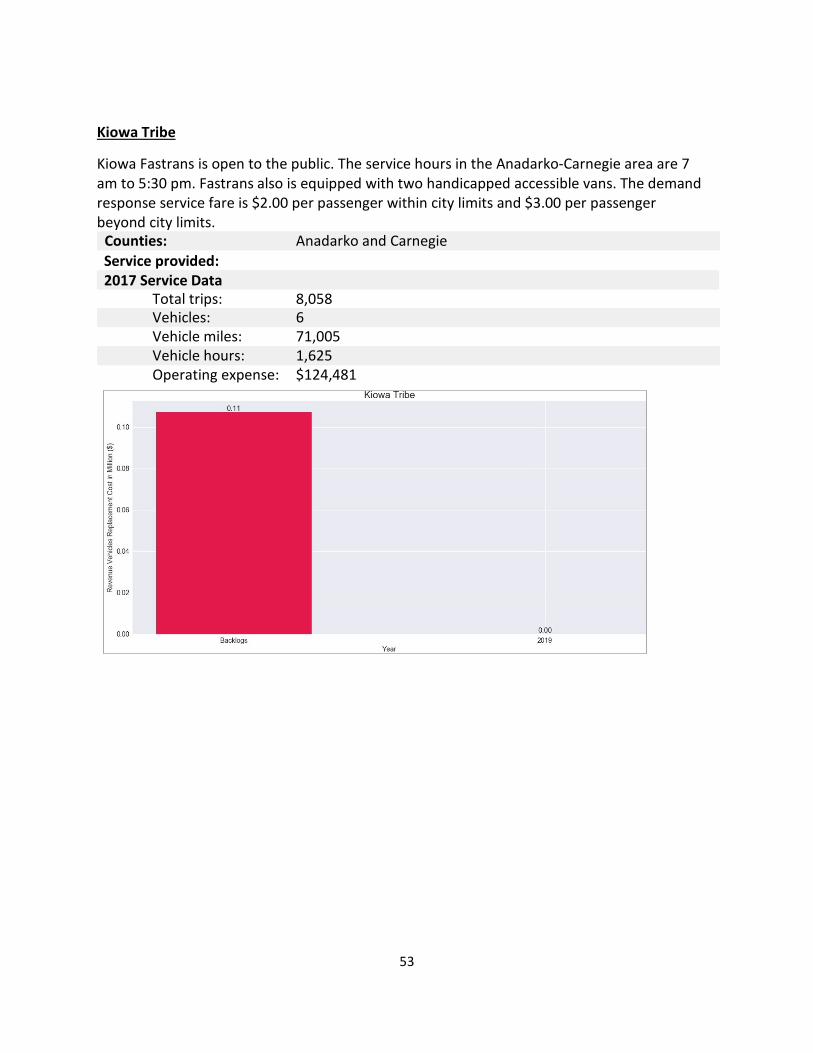
53
Kiowa Tribe
Kiowa Fastrans is open to the public. The service hours in the Anadarko‐Carnegie area are 7 am to 5:30 pm. Fastrans also is equipped with two handicapped accessible vans. The demand response service fare is $2.00 per passenger within city limits and $3.00 per passenger beyond city limits.
Counties: Anadarko and Carnegie Service provided:
2017 Service Data Total trips: 8,058 Vehicles: 6 Vehicle miles: 71,005 Vehicle hours: 1,625 Operating expense: $124,481
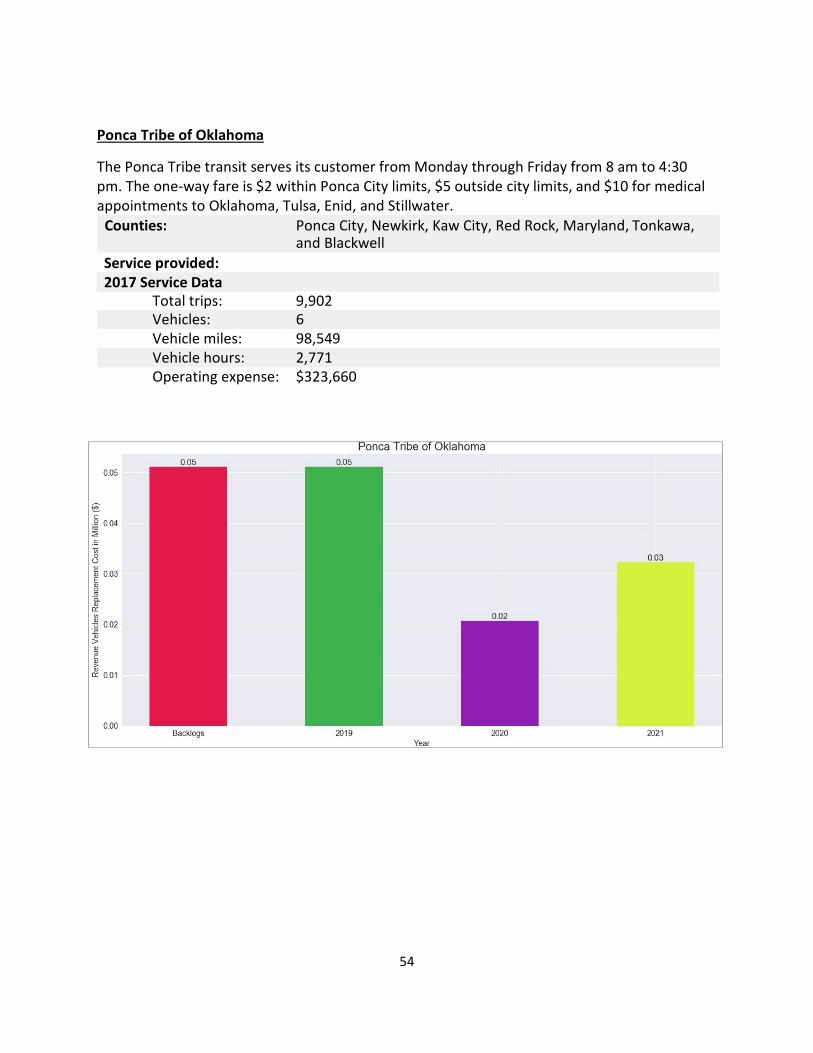
54
Ponca Tribe of Oklahoma
The Ponca Tribe transit serves its customer from Monday through Friday from 8 am to 4:30 pm. The one‐way fare is $2 within Ponca City limits, $5 outside city limits, and $10 for medical appointments to Oklahoma, Tulsa, Enid, and Stillwater.
Counties: Ponca City, Newkirk, Kaw City, Red Rock, Maryland, Tonkawa, and Blackwell
Service provided: 2017 Service Data
Total trips: 9,902 Vehicles: 6 Vehicle miles: 98,549 Vehicle hours: 2,771 Operating expense: $323,660
55
APPENDIX C:
OKLAHOMA TRANSIT ASSET INFORMATION
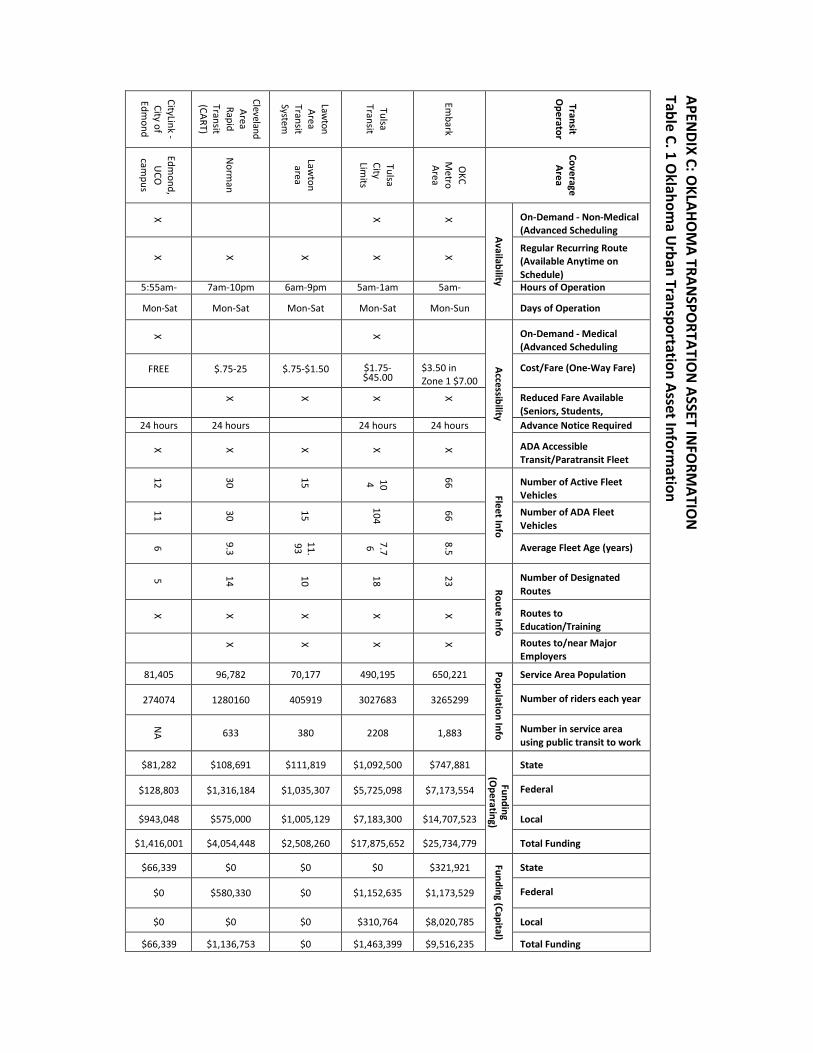
CityLink ‐
City of Edm
ond
Cleveland Area Rapid
Transit (CART)
Lawton
Area Transit System
Tulsa
Transit
Em
bark
Transit O
perator
Edm
ond, U
CO
campus
Norm
an
Law
ton area
Tulsa City Lim
its
O
KC M
etro Area
Coverage Area
X
X
X
Availability
On‐Demand ‐ Non‐Medical (Advanced Scheduling
X
X
X
X
X
Regular Recurring Route (Available Anytime on Schedule)
5:55am‐ 7am‐10pm 6am‐9pm 5am‐1am 5am‐ Hours of Operation
Mon‐Sat Mon‐Sat Mon‐Sat Mon‐Sat Mon‐Sun Days of Operation
X
X
Accessibility
On‐Demand ‐ Medical (Advanced Scheduling
FREE $.75‐25 $.75‐$1.50 $1.75‐ $45.00
$3.50 in Zone 1 $7.00
Cost/Fare (One‐Way Fare)
X
X
X
X Reduced Fare Available
(Seniors, Students, 24 hours 24 hours 24 hours 24 hours Advance Notice Required
X
X
X
X
X ADA Accessible
Transit/Paratransit Fleet 12
30
15
10 4
66
Fleet Info
Number of Active Fleet Vehicles
11
30
15
104
66 Number of ADA Fleet
Vehicles 6
9.3
11. 93
7.7 6
8.5 Average Fleet Age (years)
5
14
10
18
23 Route Info
Number of Designated Routes
X
X
X
X
X Routes to
Education/Training
X
X
X
X Routes to/near Major
Employers
81,405 96,782 70,177 490,195 650,221 Population Info
Service Area Population
274074 1280160 405919 3027683 3265299 Number of riders each year
N
A
633
380
2208
1,883 Number in service area
using public transit to work
$81,282 $108,691 $111,819 $1,092,500 $747,881
Funding (O
perating)
State
$128,803 $1,316,184 $1,035,307 $5,725,098 $7,173,554 Federal
$943,048 $575,000 $1,005,129 $7,183,300 $14,707,523 Local
$1,416,001 $4,054,448 $2,508,260 $17,875,652 $25,734,779 Total Funding
$66,339 $0 $0 $0 $321,921 Funding (Capital)
State
$0 $580,330 $0 $1,152,635 $1,173,529 Federal
$0 $0 $0 $310,764 $8,020,785 Local
$66,339 $1,136,753 $0 $1,463,399 $9,516,235 Total Funding
APENDIX C: O
KLAHOM
A TRANSPO
RTATION
ASSET INFO
RMATIO
N
Table C. 1 Oklahom
a Urban Transportation Asset Inform
ation
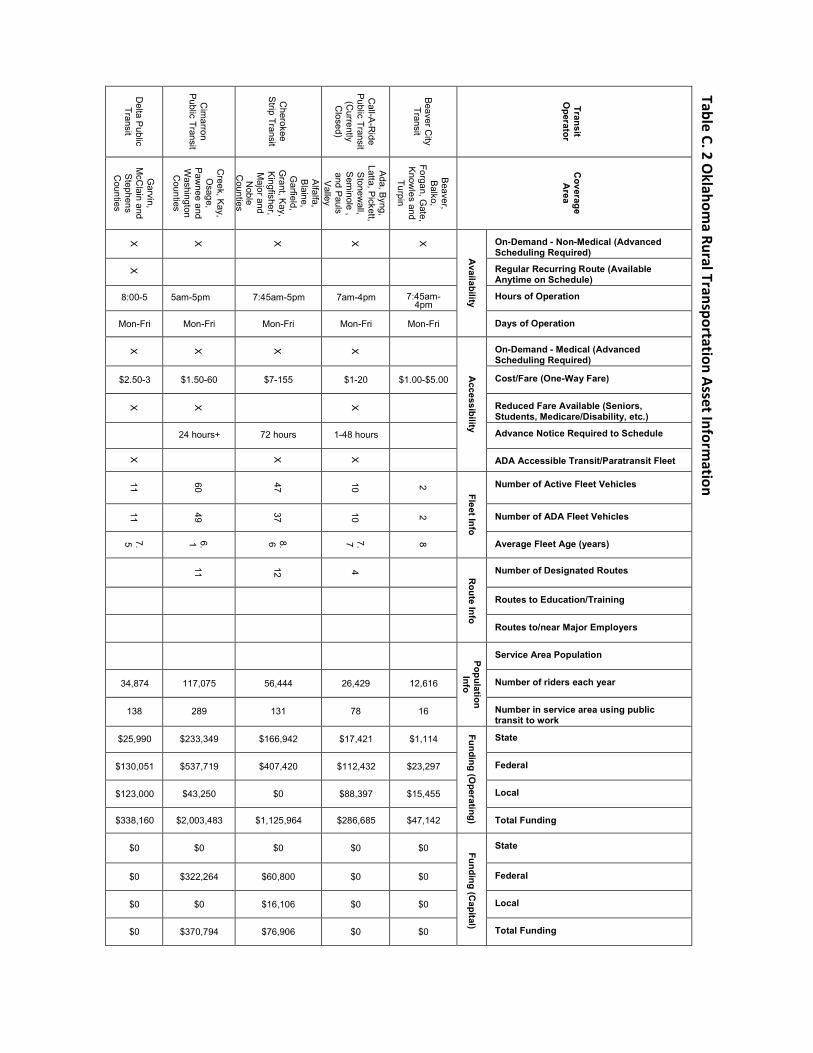
D
elta Public
Transit
C
imarron
Public Transit
Cherokee
Strip Transit
C
all-A-R
ide P
ublic Transit (C
urrently C
losed)
B
eaver City
Transit
Transit O
perator
Garvin,
McC
lain and S
tephens C
ounties
Creek, K
ay, O
sage, P
awnee and
Washington C
ounties
Alfalfa,
Blaine,
Garfield,
Grant, K
ay, K
ingfisher, M
ajor and N
oble C
ounties
Ada, B
yng, Latta, P
ickett, S
tonewall,
Sem
inole , and P
auls V
alley
Beaver,
Balko,
Forgan, Gate,
Know
les and Turpin
Coverage A
rea
X
X
X
X
X
Availability
On-Demand - Non-Medical (Advanced Scheduling Required)
X
Regular Recurring Route (Available Anytime on Schedule)
8:00-5 5am-5pm 7:45am-5pm 7am-4pm 7:45am- 4pm
Hours of Operation
Mon-Fri Mon-Fri Mon-Fri Mon-Fri Mon-Fri Days of Operation
X
X
X
X
A
ccessibility On-Demand - Medical (Advanced Scheduling Required)
$2.50-3 $1.50-60 $7-155 $1-20 $1.00-$5.00 Cost/Fare (One-Way Fare)
X
X
X
Reduced Fare Available (Seniors, Students, Medicare/Disability, etc.)
24 hours+ 72 hours 1-48 hours
Advance Notice Required to Schedule
X
X
X
ADA Accessible Transit/Paratransit Fleet
11
60
47
10
2 Fleet Info
Number of Active Fleet Vehicles
11
49
37
10
2 Number of ADA Fleet Vehicles
7. 5
6. 1
8. 6
7. 7
8 Average Fleet Age (years)
11
12
4
Route Info
Number of Designated Routes
Routes to Education/Training
Routes to/near Major Employers
Population Info
Service Area Population
34,874 117,075 56,444 26,429 12,616 Number of riders each year
138 289 131 78 16 Number in service area using public transit to work
$25,990 $233,349 $166,942 $17,421 $1,114
Funding (Operating)
State
$130,051 $537,719 $407,420 $112,432 $23,297 Federal
$123,000 $43,250 $0 $88,397 $15,455 Local
$338,160 $2,003,483 $1,125,964 $286,685 $47,142 Total Funding
$0 $0 $0 $0 $0 Funding (Capital)
State
$0 $322,264 $60,800 $0 $0 Federal
$0 $0 $16,106 $0 $0 Local
$0 $370,794 $76,906 $0 $0 Total Funding
Table C. 2 Oklahom
a Rural Transportation Asset Information
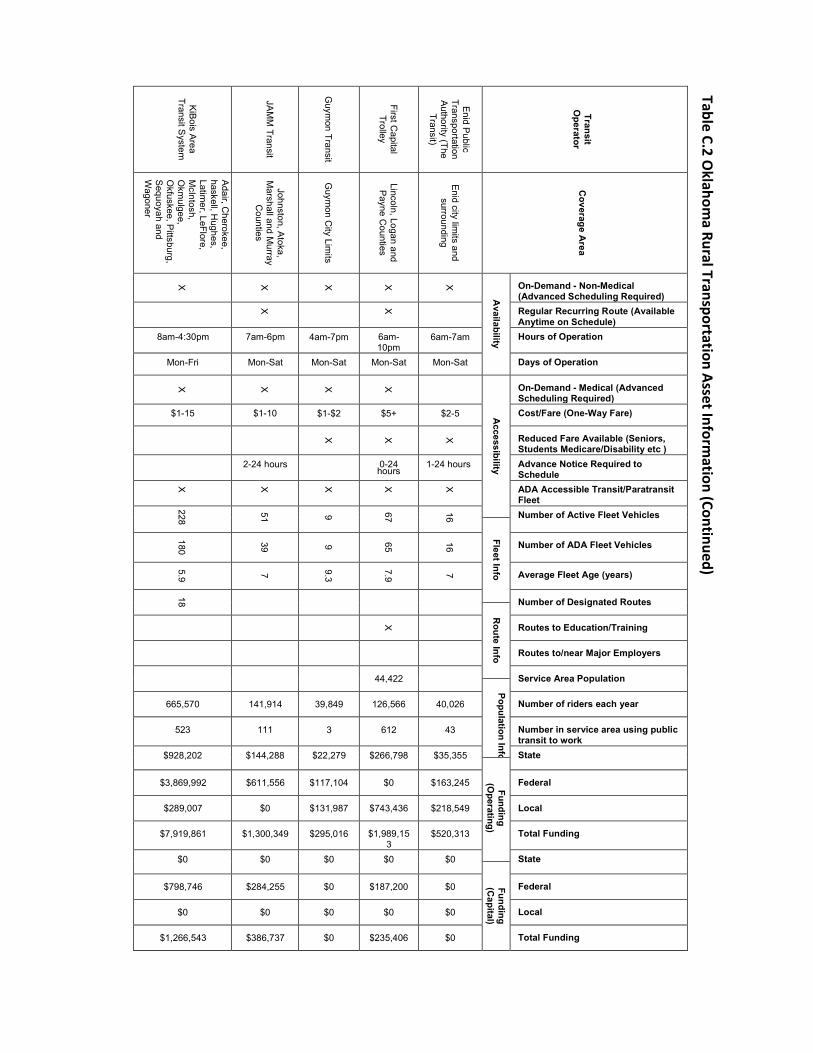
KiB
ois Area
Transit System
JA
MM
Transit
G
uymon Transit
First C
apital Trolley
E
nid Public
Transportation A
uthority (The Transit)
Transit
Operator
Adair, C
herokee, haskell, H
ughes, Latim
er, LeFlore, M
cIntosh, O
kmulgee,
Okfuskee, P
ittsburg, S
equoyah and W
agoner
Johnston, A
toka, M
arshall and Murray
Counties
G
uymon C
ity Limits
Lincoln, Logan and
Payne C
ounties
Enid city lim
its and surrounding
C
overage Area
X
X
X
X
X
Availability
On-Demand - Non-Medical (Advanced Scheduling Required)
X
X Regular Recurring Route (Available
Anytime on Schedule) 8am-4:30pm 7am-6pm 4am-7pm 6am-
10pm 6am-7am Hours of Operation
Mon-Fri Mon-Sat Mon-Sat Mon-Sat Mon-Sat Days of Operation
X
X
X
X
Accessibility
On-Demand - Medical (Advanced Scheduling Required)
$1-15 $1-10 $1-$2 $5+ $2-5 Cost/Fare (One-Way Fare)
X
X
X
Reduced Fare Available (Seniors, Students Medicare/Disability etc )
2-24 hours 0-24 hours
1-24 hours Advance Notice Required to Schedule X
X
X
X
X ADA Accessible Transit/Paratransit
Fleet 228
51
9
67
16 Number of Active Fleet Vehicles
Fleet Info
180
39
9
65
16 Number of ADA Fleet Vehicles
5.9
7
9.3
7.9
7 Average Fleet Age (years)
18
Number of Designated Routes
Route Info
X
Routes to Education/Training
Routes to/near Major Employers
44,422
Service Area Population
Population Info
665,570 141,914 39,849 126,566 40,026 Number of riders each year
523 111 3 612 43 Number in service area using public transit to work
$928,202 $144,288 $22,279 $266,798 $35,355 State
Funding (O
perating)
$3,869,992 $611,556 $117,104 $0 $163,245 Federal
$289,007 $0 $131,987 $743,436 $218,549 Local
$7,919,861 $1,300,349 $295,016 $1,989,15 3
$520,313 Total Funding
$0 $0 $0 $0 $0 State
Funding (C
apital)
$798,746 $284,255 $0 $187,200 $0 Federal
$0 $0 $0 $0 $0 Local
$1,266,543 $386,737 $0 $235,406 $0 Total Funding
Table C.2 Oklahom
a Rural Transportation Asset Information (Continued)
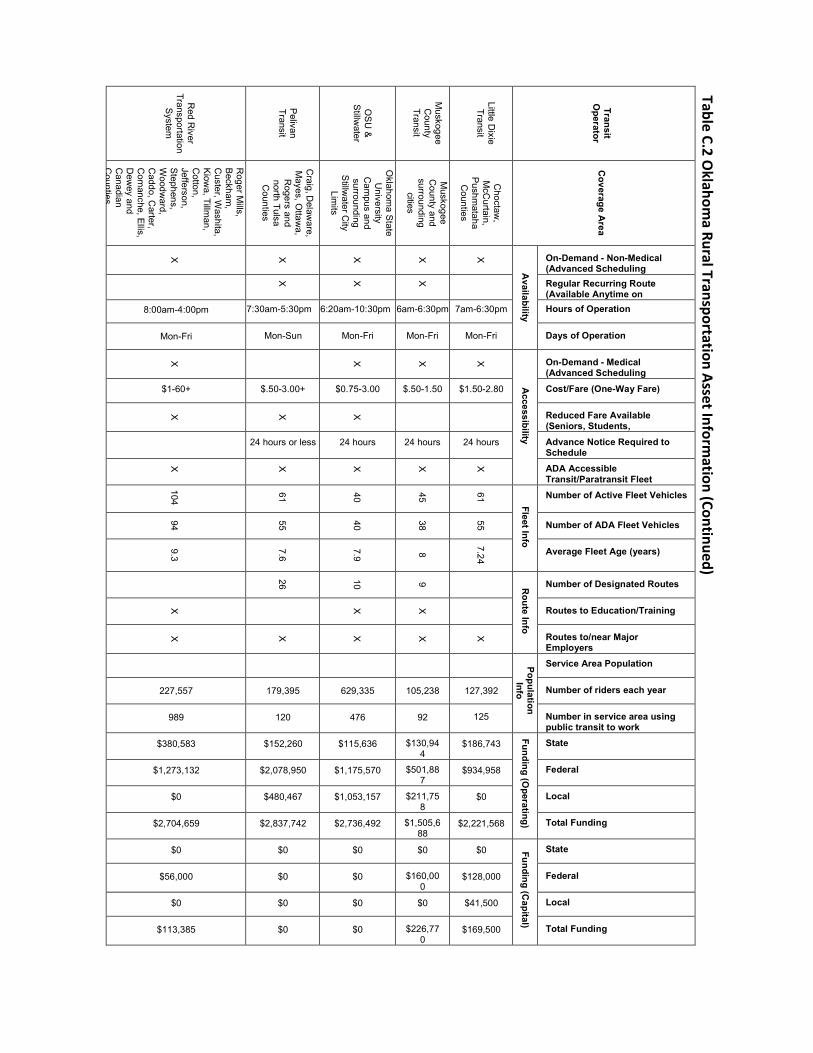
R
ed River
Transportation S
ystem
Pelivan
Transit
OS
U &
S
tillwater
Muskogee C
ounty Transit
Little D
ixie Transit
Transit
Operator
Roger M
ills, B
eckham,
Custer, W
ashita, K
iowa, Tillm
an, C
otton, Jefferson, S
tephens, W
oodward,
Caddo, C
arter, C
omanche, E
llis, D
ewey and
Canadian
Counties
Craig, D
elaware,
Mayes, O
ttawa,
Rogers and
north Tulsa C
ounties
Oklahom
a State
University
Cam
pus and surrounding
Stillw
ater City
Limits
Muskogee
County and
surrounding cities
Choctaw
, M
cCurtain,
Pushm
ataha C
ounties
C
overage Area
X
X
X
X
X
Availability
On-Demand - Non-Medical (Advanced Scheduling
X
X
X Regular Recurring Route
(Available Anytime on 8:00am-4:00pm 7:30am-5:30pm 6:20am-10:30pm 6am-6:30pm 7am-6:30pm Hours of Operation
Mon-Fri Mon-Sun Mon-Fri Mon-Fri Mon-Fri Days of Operation
X
X
X
X
Accessibility
On-Demand - Medical (Advanced Scheduling
$1-60+ $.50-3.00+ $0.75-3.00 $.50-1.50 $1.50-2.80 Cost/Fare (One-Way Fare)
X
X
X
Reduced Fare Available (Seniors, Students,
24 hours or less 24 hours 24 hours 24 hours Advance Notice Required to Schedule
X
X
X
X
X
ADA Accessible Transit/Paratransit Fleet 104
61
40
45
61 Fleet Info
Number of Active Fleet Vehicles
94
55
40
38
55 Number of ADA Fleet Vehicles
9.3
7.6
7.9
8
7.24
Average Fleet Age (years)
26
10
9
Route Info
Number of Designated Routes
X
X
X
Routes to Education/Training
X
X
X
X
X
Routes to/near Major Employers
Population Info
Service Area Population
227,557 179,395 629,335 105,238 127,392 Number of riders each year
989 120 476 92 125 Number in service area using public transit to work
$380,583 $152,260 $115,636 $130,94 4
$186,743
Funding (Operating)
State
$1,273,132 $2,078,950 $1,175,570 $501,88 7
$934,958 Federal
$0 $480,467 $1,053,157 $211,75 8
$0 Local
$2,704,659 $2,837,742 $2,736,492 $1,505,6 88
$2,221,568 Total Funding
$0 $0 $0 $0 $0 Funding (Capital)
State
$56,000 $0 $0 $160,00 0
$128,000 Federal
$0 $0 $0 $0 $41,500 Local
$113,385 $0 $0 $226,77 0
$169,500 Total Funding
Table C.2 Oklahom
a Rural Transportation Asset Information (Continued)
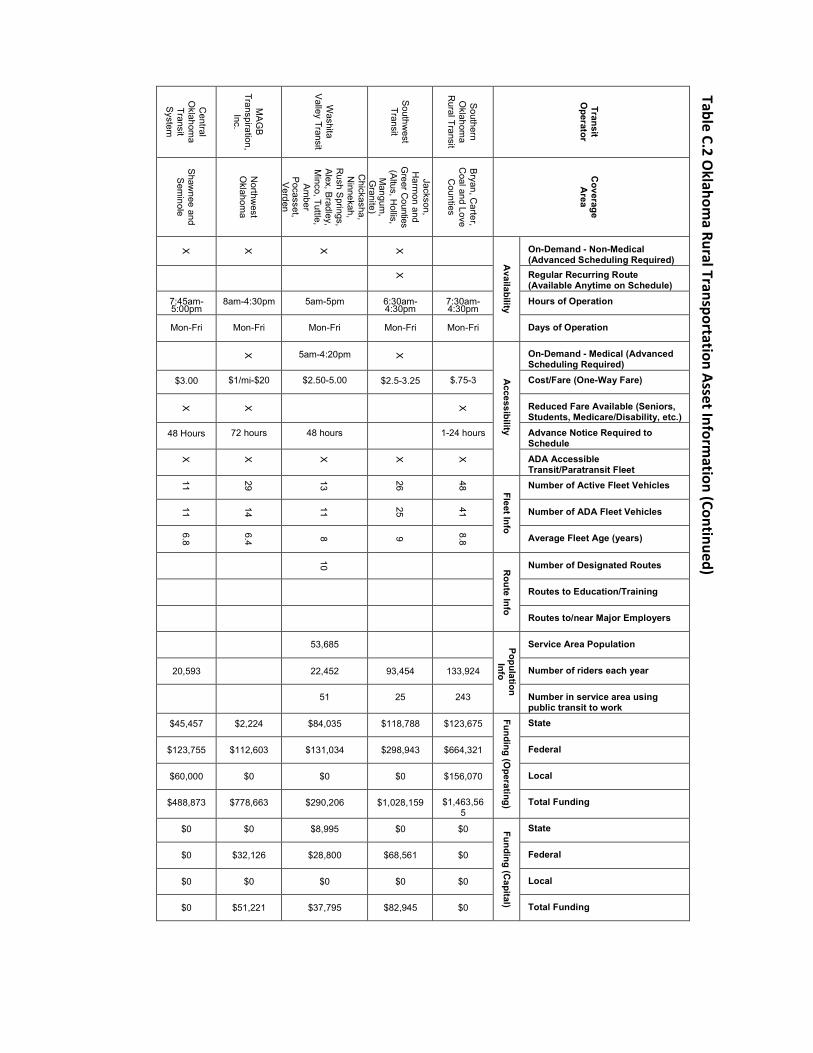
Central
Oklahom
a Transit S
ystem
M
AG
B
Transpiration, Inc.
Washita
Valley Transit
Southw
est Transit
S
outhern O
klahoma
Rural Transit
Transit
Operator
S
hawnee and
Sem
inole
Northw
est O
klahoma
Chickasha,
Ninnekah,
Rush S
prings, A
lex, Bradley,
Minco, Tuttle,
Am
ber P
ocasset, V
erden
Jackson, H
armon and
Greer C
ounties (A
ltus, Hollis,
Mangum
, G
ranite)
B
ryan, Carter,
Coal and Love C
ounties
C
overage A
rea
X
X
X
X
Availability
On-Demand - Non-Medical (Advanced Scheduling Required)
X
Regular Recurring Route (Available Anytime on Schedule)
7:45am- 5:00pm
8am-4:30pm 5am-5pm 6:30am- 4:30pm
7:30am- 4:30pm
Hours of Operation
Mon-Fri Mon-Fri Mon-Fri Mon-Fri Mon-Fri Days of Operation
X
5am-4:20pm
X
Accessibility
On-Demand - Medical (Advanced Scheduling Required)
$3.00 $1/mi-$20 $2.50-5.00 $2.5-3.25 $.75-3 Cost/Fare (One-Way Fare)
X
X
X
Reduced Fare Available (Seniors, Students, Medicare/Disability, etc.)
48 Hours 72 hours 48 hours 1-24 hours Advance Notice Required to Schedule
X
X
X
X
X
ADA Accessible Transit/Paratransit Fleet 11
29
13
26
48 Fleet Info
Number of Active Fleet Vehicles
11
14
11
25
41 Number of ADA Fleet Vehicles
6.8
6.4
8
9
8.8 Average Fleet Age (years)
10
Route Info
Number of Designated Routes
Routes to Education/Training
Routes to/near Major Employers
53,685
Population Info
Service Area Population
20,593
22,452 93,454 133,924 Number of riders each year
51 25 243 Number in service area using
public transit to work $45,457 $2,224 $84,035 $118,788 $123,675
Funding (Operating)
State
$123,755 $112,603 $131,034 $298,943 $664,321 Federal
$60,000 $0 $0 $0 $156,070 Local
$488,873 $778,663 $290,206 $1,028,159 $1,463,56 5
Total Funding
$0 $0 $8,995 $0 $0 Funding (Capital)
State
$0 $32,126 $28,800 $68,561 $0 Federal
$0 $0 $0 $0 $0 Local
$0 $51,221 $37,795 $82,945 $0 Total Funding
Table C.2 Oklahom
a Rural Transportation Asset Information (Continued)
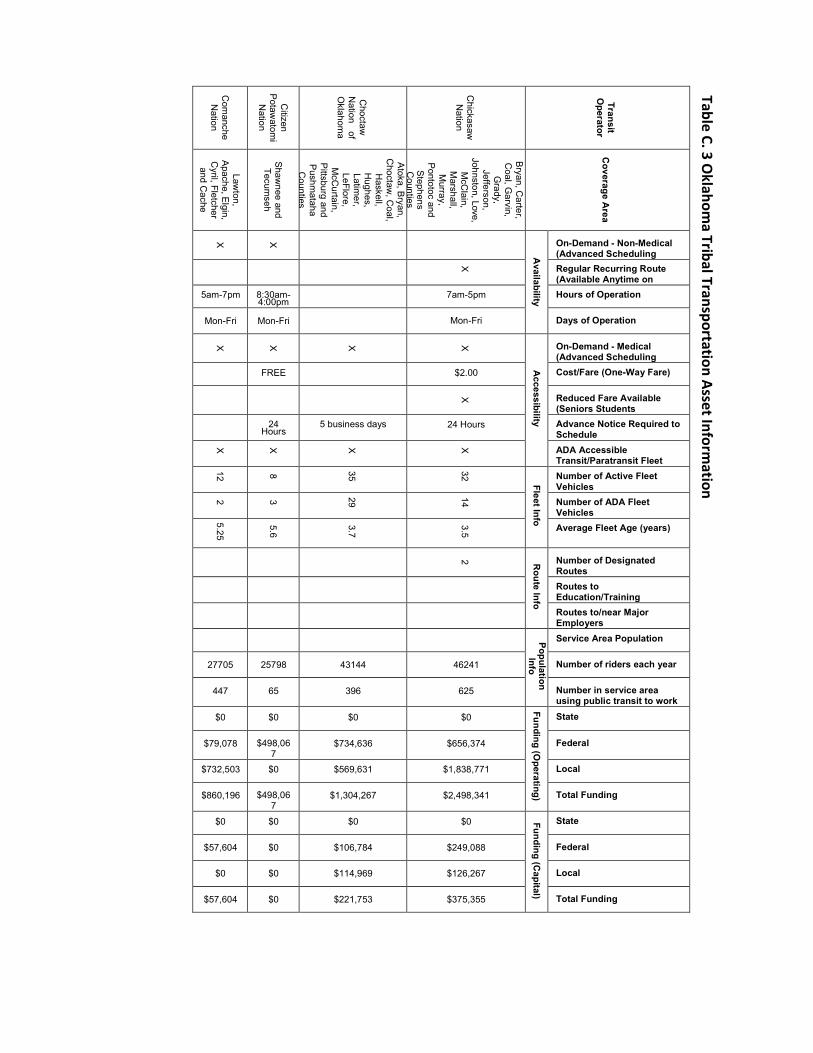
C
omanche
Nation
Citizen
Potaw
atomi
Nation
C
hoctaw
Nation
of O
klahoma
C
hickasaw
Nation
Transit
Operator
Lawton,
Apache, E
lgin, C
yril, Fletcher and C
ache
S
hawnee and
Tecumseh
Atoka, B
ryan, C
hoctaw, C
oal, H
askell, H
ughes, Latim
er, LeFlore,
McC
urtain, P
ittsburg and P
ushmataha
Counties
Bryan, C
arter, C
oal, Garvin,
Grady,
Jefferson, Johnston, Love,
McC
lain, M
arshall, M
urray, P
ontotoc and S
tephens C
ounties
C
overage Area
X
X
Availability
On-Demand - Non-Medical (Advanced Scheduling
X Regular Recurring Route
(Available Anytime on 5am-7pm 8:30am-
4:00pm 7am-5pm Hours of Operation
Mon-Fri Mon-Fri
Mon-Fri Days of Operation
X
X
X
X
Accessibility
On-Demand - Medical (Advanced Scheduling
FREE $2.00 Cost/Fare (One-Way Fare)
X
Reduced Fare Available (Seniors Students
24 Hours
5 business days 24 Hours Advance Notice Required to Schedule
X
X
X
X
ADA Accessible Transit/Paratransit Fleet 12
8
35
32 Fleet Info
Number of Active Fleet Vehicles
2
3
29
14 Number of ADA Fleet Vehicles 5.25
5.6
3.7
3.5
Average Fleet Age (years)
2 R
oute Info
Number of Designated Routes
Routes to Education/Training
Routes to/near Major Employers
Population Info
Service Area Population
27705 25798 43144 46241 Number of riders each year
447 65 396 625 Number in service area using public transit to work
$0 $0 $0 $0
Funding (Operating)
State
$79,078 $498,06 7
$734,636 $656,374 Federal
$732,503 $0 $569,631 $1,838,771 Local
$860,196 $498,06 7
$1,304,267 $2,498,341 Total Funding
$0 $0 $0 $0 Funding (Capital)
State
$57,604 $0 $106,784 $249,088 Federal
$0 $0 $114,969 $126,267 Local
$57,604 $0 $221,753 $375,355 Total Funding
Table C. 3 Oklahom
a Tribal Transportation Asset Information
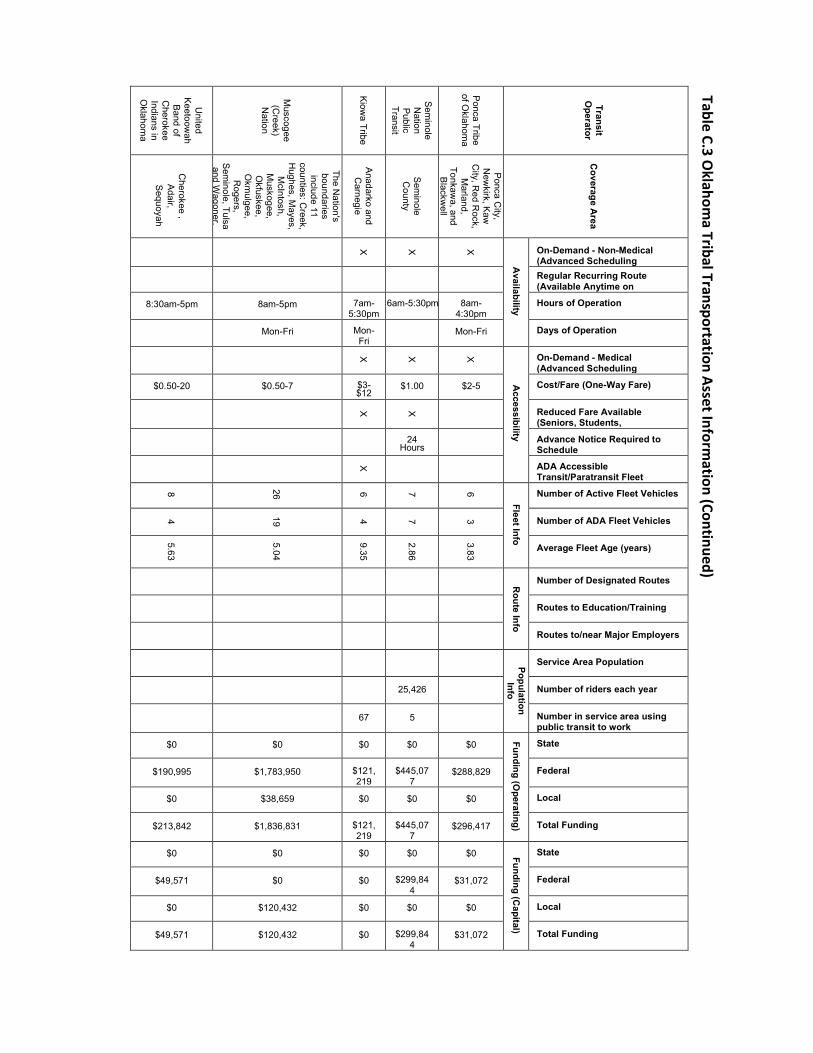
Sequoyah
United
Keetoow
ah B
and of C
herokee Indians in O
klahoma
M
uscogee (C
reek) N
ation
K
iowa Tribe
Sem
inole N
ation P
ublic Transit
Ponca Tribe
of Oklahom
a
Transit O
perator
C
herokee , A
dair,
The Nation's
boundaries include 11
counties: Creek,
Hughes, M
ayes, M
cIntosh, M
uskogee, O
kfuskee, O
kmulgee,
Rogers,
Sem
inole, Tulsa and W
agoner.
A
nadarko and C
arnegie
S
eminole
County
Ponca C
ity, N
ewkirk, K
aw
City, R
ed Rock,
Marland,
Tonkawa, and
Blackw
ell
C
overage Area
X
X
X
Availability
On-Demand - Non-Medical (Advanced Scheduling
Regular Recurring Route (Available Anytime on
8:30am-5pm 8am-5pm 7am- 5:30pm
6am-5:30pm 8am- 4:30pm
Hours of Operation
Mon-Fri Mon-
Fri
Mon-Fri Days of Operation
X
X
X
Accessibility
On-Demand - Medical (Advanced Scheduling
$0.50-20 $0.50-7 $3- $12
$1.00 $2-5 Cost/Fare (One-Way Fare)
X
X
Reduced Fare Available (Seniors, Students,
24 Hours
Advance Notice Required to Schedule
X
ADA Accessible
Transit/Paratransit Fleet 8
26
6
7
6
Fleet Info
Number of Active Fleet Vehicles
4
19
4
7
3 Number of ADA Fleet Vehicles
5.63
5.04
9.35
2.86
3.83
Average Fleet Age (years)
Route Info
Number of Designated Routes
Routes to Education/Training
Routes to/near Major Employers
Population Info
Service Area Population
25,426
Number of riders each year
67 5
Number in service area using public transit to work
$0 $0 $0 $0 $0 Funding (Operating)
State
$190,995 $1,783,950 $121, 219
$445,07 7
$288,829 Federal
$0 $38,659 $0 $0 $0 Local
$213,842 $1,836,831 $121, 219
$445,07 7
$296,417 Total Funding
$0 $0 $0 $0 $0 Funding (Capital)
State
$49,571 $0 $0 $299,84 4
$31,072 Federal
$0 $120,432 $0 $0 $0 Local
$49,571 $120,432 $0 $299,84 4
$31,072 Total Funding
Table C.3 Oklahom
a Tribal Transportation Asset Information (Continued)
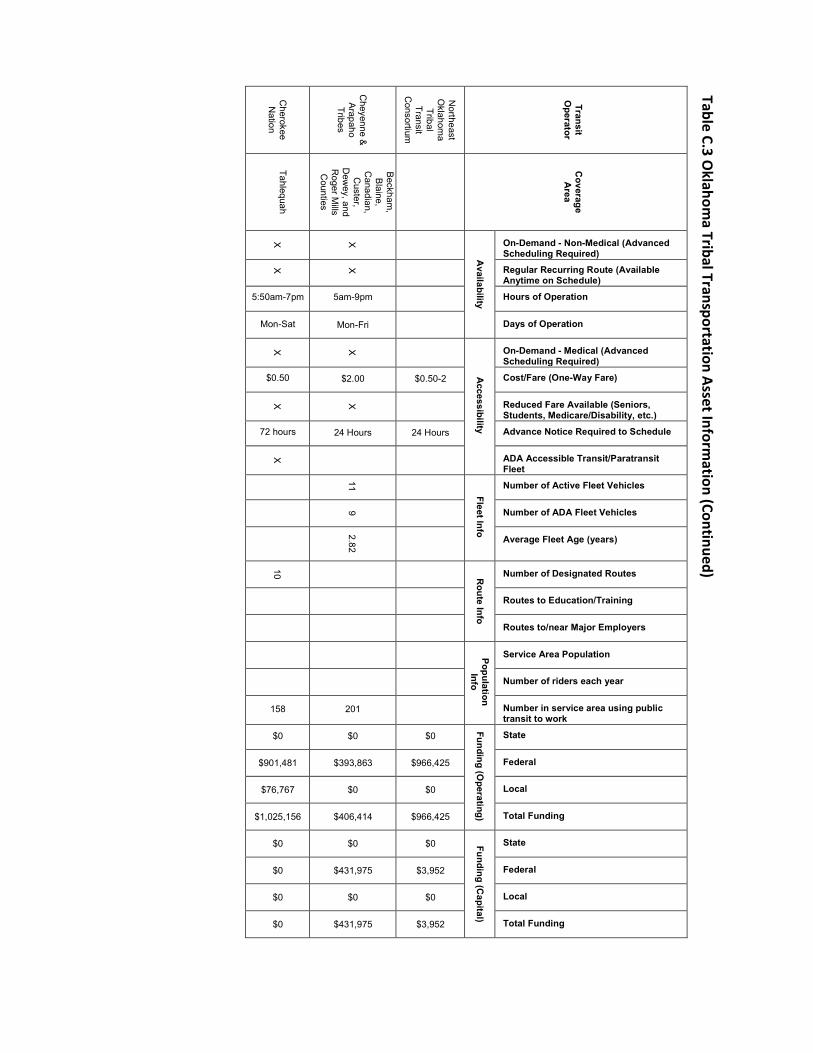
Cherokee N
ation
C
heyenne &
Arapaho Tribes
Northeast
Oklahom
a Tribal Transit
Consortium
Transit
Operator
Tahlequah
Beckham
, B
laine, C
anadian, C
uster, D
ewey, and
Roger M
ills C
ounties
C
overage A
rea
X
X
Availability
On-Demand - Non-Medical (Advanced Scheduling Required)
X
X
Regular Recurring Route (Available Anytime on Schedule)
5:50am-7pm 5am-9pm Hours of Operation
Mon-Sat Mon-Fri
Days of Operation
X
X
A
ccessibility
On-Demand - Medical (Advanced Scheduling Required)
$0.50 $2.00 $0.50-2 Cost/Fare (One-Way Fare)
X
X
Reduced Fare Available (Seniors, Students, Medicare/Disability, etc.)
72 hours 24 Hours 24 Hours Advance Notice Required to Schedule
X
ADA Accessible Transit/Paratransit Fleet
11
Fleet Info
Number of Active Fleet Vehicles
9
Number of ADA Fleet Vehicles
2.82
Average Fleet Age (years)
10
Route Info
Number of Designated Routes
Routes to Education/Training
Routes to/near Major Employers
Population Info
Service Area Population
Number of riders each year
158 201
Number in service area using public transit to work
$0 $0 $0
Funding (Operating)
State
$901,481 $393,863 $966,425 Federal
$76,767 $0 $0 Local
$1,025,156 $406,414 $966,425 Total Funding
$0 $0 $0 Funding (Capital)
State
$0 $431,975 $3,952 Federal
$0 $0 $0 Local
$0 $431,975 $3,952 Total Funding
Table C.3 Oklahom
a Tribal Transportation Asset Information (Continued)
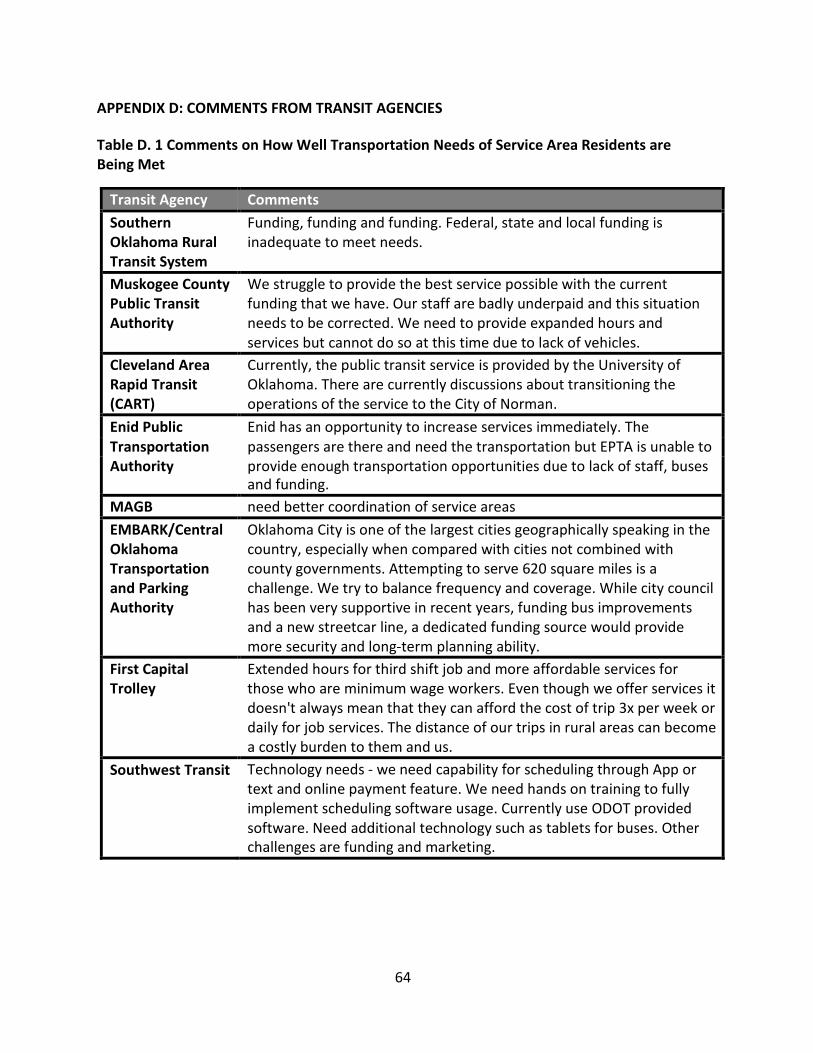
64
APPENDIX D: COMMENTS FROM TRANSIT AGENCIES
Table D. 1 Comments on How Well Transportation Needs of Service Area Residents are Being Met
Transit Agency Comments Southern Oklahoma Rural Transit System
Funding, funding and funding. Federal, state and local funding is inadequate to meet needs.
Muskogee County Public Transit Authority
We struggle to provide the best service possible with the current funding that we have. Our staff are badly underpaid and this situation needs to be corrected. We need to provide expanded hours and services but cannot do so at this time due to lack of vehicles.
Cleveland Area Rapid Transit (CART)
Currently, the public transit service is provided by the University of Oklahoma. There are currently discussions about transitioning the operations of the service to the City of Norman.
Enid Public Enid has an opportunity to increase services immediately. The Transportation passengers are there and need the transportation but EPTA is unable to Authority provide enough transportation opportunities due to lack of staff, buses
and funding. MAGB need better coordination of service areas EMBARK/Central Oklahoma Transportation and Parking Authority
Oklahoma City is one of the largest cities geographically speaking in the country, especially when compared with cities not combined with county governments. Attempting to serve 620 square miles is a challenge. We try to balance frequency and coverage. While city council has been very supportive in recent years, funding bus improvements and a new streetcar line, a dedicated funding source would provide more security and long‐term planning ability.
First Capital Trolley
Extended hours for third shift job and more affordable services for those who are minimum wage workers. Even though we offer services it doesn't always mean that they can afford the cost of trip 3x per week or daily for job services. The distance of our trips in rural areas can become a costly burden to them and us.
Southwest Transit Technology needs ‐ we need capability for scheduling through App or text and online payment feature. We need hands on training to fully implement scheduling software usage. Currently use ODOT provided software. Need additional technology such as tablets for buses. Other challenges are funding and marketing.
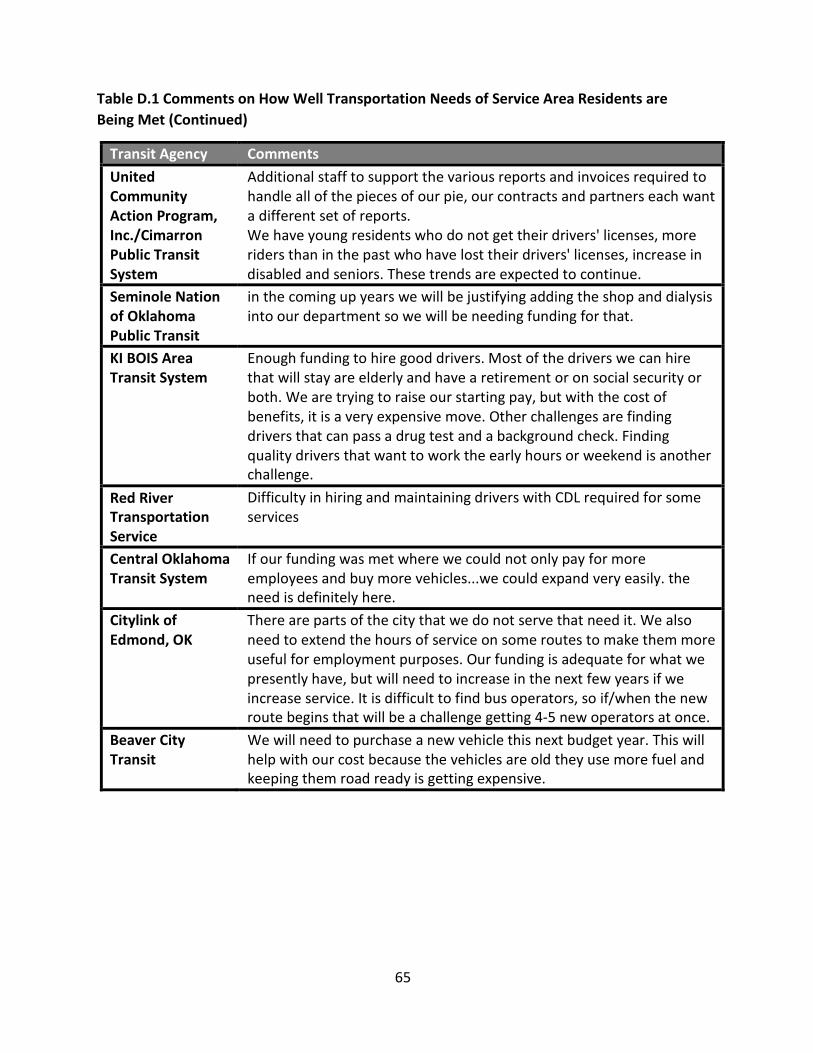
65
Table D.1 Comments on How Well Transportation Needs of Service Area Residents are Being Met (Continued)
Transit Agency Comments United Community Action Program, Inc./Cimarron Public Transit System
Additional staff to support the various reports and invoices required to handle all of the pieces of our pie, our contracts and partners each want a different set of reports. We have young residents who do not get their drivers' licenses, more riders than in the past who have lost their drivers' licenses, increase in disabled and seniors. These trends are expected to continue.
Seminole Nation of Oklahoma Public Transit
in the coming up years we will be justifying adding the shop and dialysis into our department so we will be needing funding for that.
KI BOIS Area Transit System
Enough funding to hire good drivers. Most of the drivers we can hire that will stay are elderly and have a retirement or on social security or both. We are trying to raise our starting pay, but with the cost of benefits, it is a very expensive move. Other challenges are finding drivers that can pass a drug test and a background check. Finding quality drivers that want to work the early hours or weekend is another challenge.
Red River Transportation Service
Difficulty in hiring and maintaining drivers with CDL required for some services
Central Oklahoma Transit System
If our funding was met where we could not only pay for more employees and buy more vehicles...we could expand very easily. the need is definitely here.
Citylink of Edmond, OK
There are parts of the city that we do not serve that need it. We also need to extend the hours of service on some routes to make them more useful for employment purposes. Our funding is adequate for what we presently have, but will need to increase in the next few years if we increase service. It is difficult to find bus operators, so if/when the new route begins that will be a challenge getting 4‐5 new operators at once.
Beaver City Transit
We will need to purchase a new vehicle this next budget year. This will help with our cost because the vehicles are old they use more fuel and keeping them road ready is getting expensive.
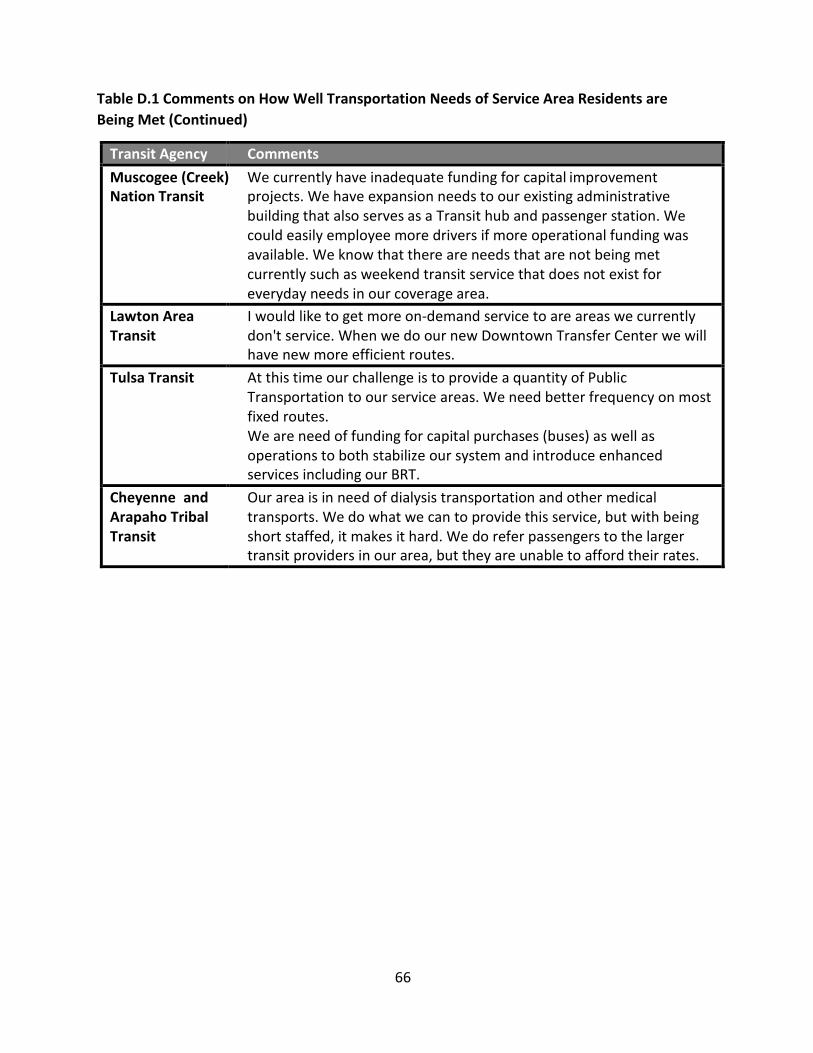
66
Table D.1 Comments on How Well Transportation Needs of Service Area Residents are Being Met (Continued)
Transit Agency Comments Muscogee (Creek) We currently have inadequate funding for capital improvement Nation Transit projects. We have expansion needs to our existing administrative
building that also serves as a Transit hub and passenger station. We could easily employee more drivers if more operational funding was available. We know that there are needs that are not being met currently such as weekend transit service that does not exist for everyday needs in our coverage area.
Lawton Area Transit
I would like to get more on‐demand service to are areas we currently don't service. When we do our new Downtown Transfer Center we will have new more efficient routes.
Tulsa Transit At this time our challenge is to provide a quantity of Public Transportation to our service areas. We need better frequency on most fixed routes. We are need of funding for capital purchases (buses) as well as operations to both stabilize our system and introduce enhanced services including our BRT.
Cheyenne and Arapaho Tribal Transit
Our area is in need of dialysis transportation and other medical transports. We do what we can to provide this service, but with being short staffed, it makes it hard. We do refer passengers to the larger transit providers in our area, but they are unable to afford their rates.
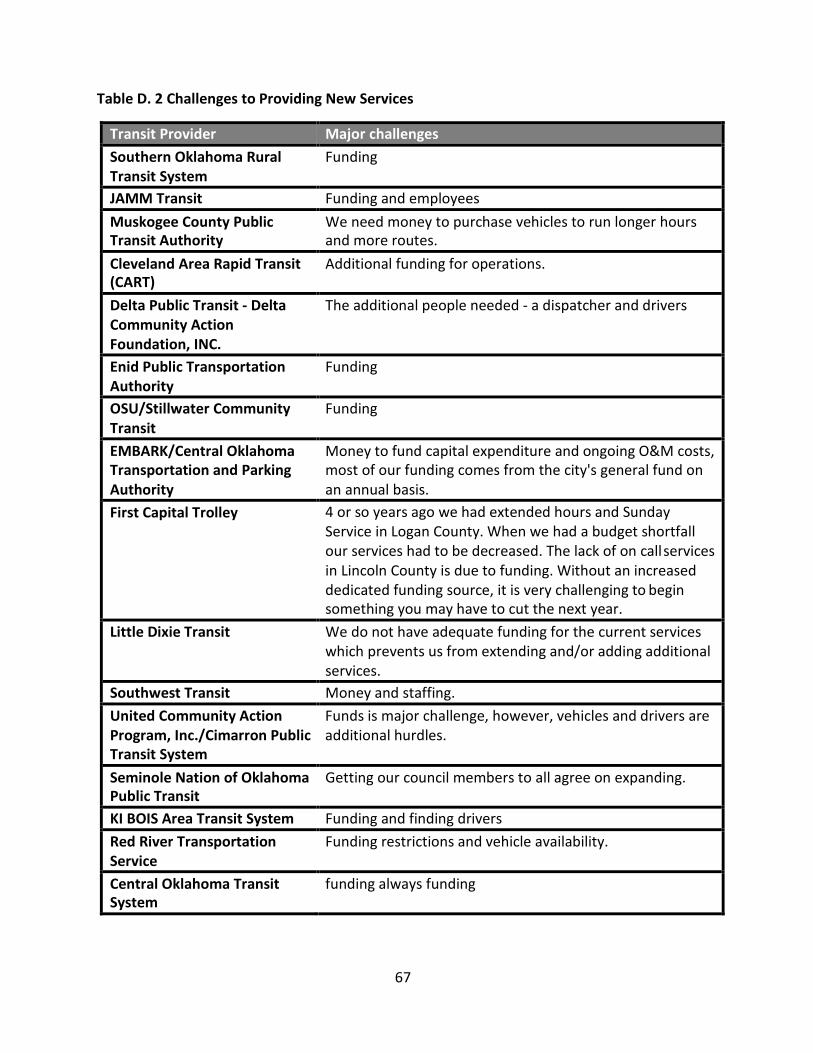
67
Table D. 2 Challenges to Providing New Services
Transit Provider Major challenges Southern Oklahoma Rural Transit System
Funding
JAMM Transit Funding and employees Muskogee County Public Transit Authority
We need money to purchase vehicles to run longer hours and more routes.
Cleveland Area Rapid Transit (CART)
Additional funding for operations.
Delta Public Transit ‐ Delta Community Action Foundation, INC.
The additional people needed ‐ a dispatcher and drivers
Enid Public Transportation Authority
Funding
OSU/Stillwater Community Transit
Funding
EMBARK/Central Oklahoma Transportation and Parking Authority
Money to fund capital expenditure and ongoing O&M costs, most of our funding comes from the city's general fund on an annual basis.
First Capital Trolley 4 or so years ago we had extended hours and Sunday Service in Logan County. When we had a budget shortfall our services had to be decreased. The lack of on call services in Lincoln County is due to funding. Without an increased dedicated funding source, it is very challenging to begin something you may have to cut the next year.
Little Dixie Transit We do not have adequate funding for the current services which prevents us from extending and/or adding additional services.
Southwest Transit Money and staffing. United Community Action Program, Inc./Cimarron Public Transit System
Funds is major challenge, however, vehicles and drivers are additional hurdles.
Seminole Nation of Oklahoma Public Transit
Getting our council members to all agree on expanding.
KI BOIS Area Transit System Funding and finding drivers Red River Transportation Service
Funding restrictions and vehicle availability.
Central Oklahoma Transit System
funding always funding
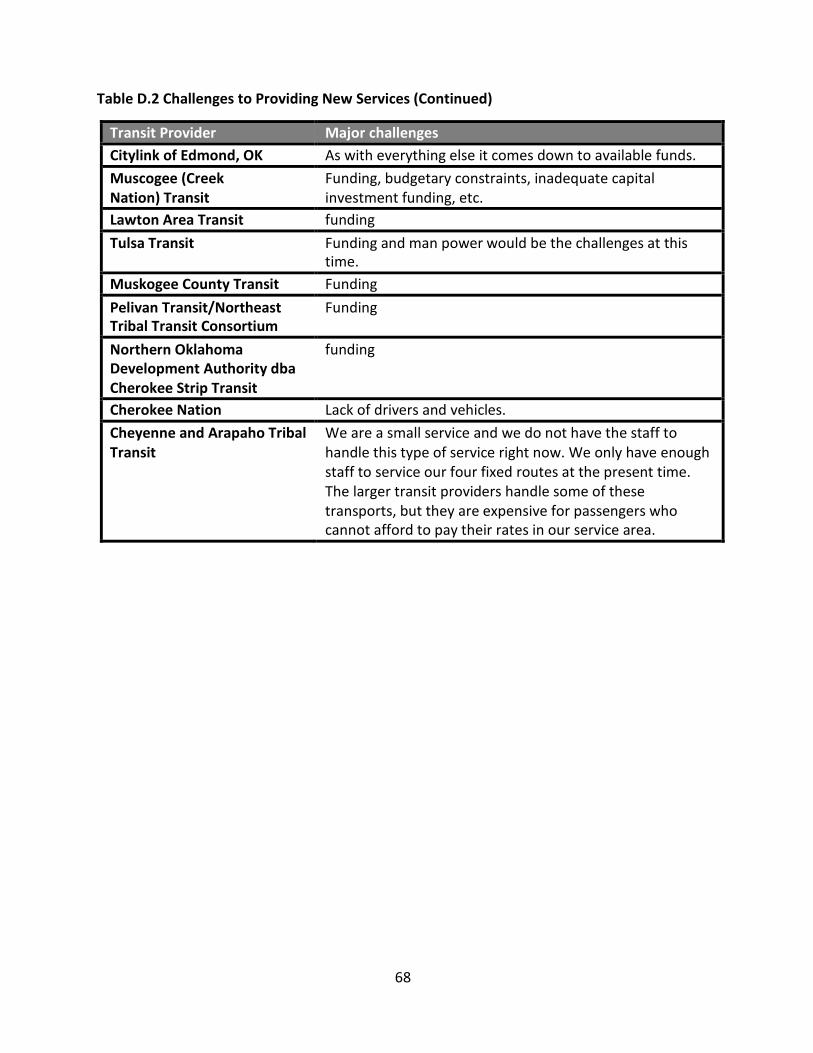
68
Table D.2 Challenges to Providing New Services (Continued)
Transit Provider Major challenges Citylink of Edmond, OK As with everything else it comes down to available funds. Muscogee (Creek Nation) Transit
Funding, budgetary constraints, inadequate capital investment funding, etc.
Lawton Area Transit funding Tulsa Transit Funding and man power would be the challenges at this
time. Muskogee County Transit Funding Pelivan Transit/Northeast Tribal Transit Consortium
Funding
Northern Oklahoma Development Authority dba Cherokee Strip Transit
funding
Cherokee Nation Lack of drivers and vehicles. Cheyenne and Arapaho Tribal Transit
We are a small service and we do not have the staff to handle this type of service right now. We only have enough staff to service our four fixed routes at the present time. The larger transit providers handle some of these transports, but they are expensive for passengers who cannot afford to pay their rates in our service area.
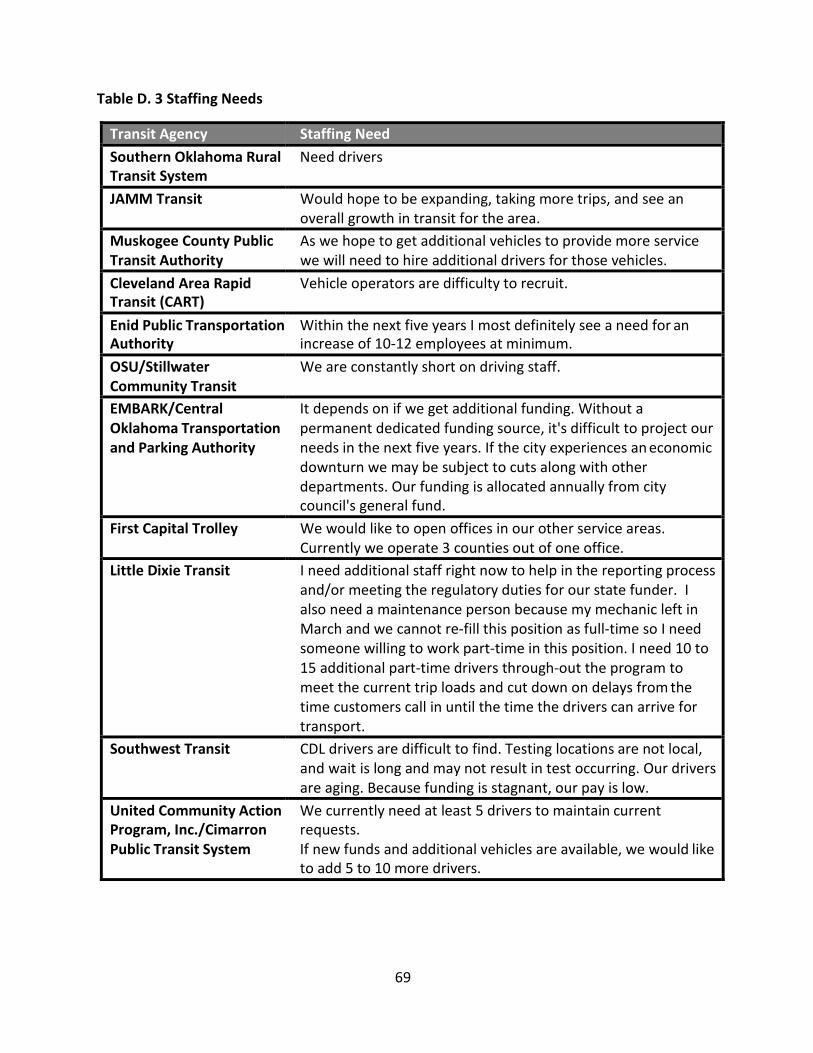
69
Table D. 3 Staffing Needs
Transit Agency Staffing Need Southern Oklahoma Rural Need drivers Transit System JAMM Transit Would hope to be expanding, taking more trips, and see an
overall growth in transit for the area. Muskogee County Public Transit Authority
As we hope to get additional vehicles to provide more service we will need to hire additional drivers for those vehicles.
Cleveland Area Rapid Transit (CART)
Vehicle operators are difficulty to recruit.
Enid Public Transportation Within the next five years I most definitely see a need for an Authority increase of 10‐12 employees at minimum. OSU/Stillwater Community Transit
We are constantly short on driving staff.
EMBARK/Central It depends on if we get additional funding. Without a Oklahoma Transportation permanent dedicated funding source, it's difficult to project our and Parking Authority needs in the next five years. If the city experiences an economic
downturn we may be subject to cuts along with other departments. Our funding is allocated annually from city council's general fund.
First Capital Trolley We would like to open offices in our other service areas. Currently we operate 3 counties out of one office.
Little Dixie Transit I need additional staff right now to help in the reporting process and/or meeting the regulatory duties for our state funder. I also need a maintenance person because my mechanic left in March and we cannot re‐fill this position as full‐time so I need someone willing to work part‐time in this position. I need 10 to 15 additional part‐time drivers through‐out the program to meet the current trip loads and cut down on delays from the time customers call in until the time the drivers can arrive for transport.
Southwest Transit CDL drivers are difficult to find. Testing locations are not local, and wait is long and may not result in test occurring. Our drivers are aging. Because funding is stagnant, our pay is low.
United Community Action We currently need at least 5 drivers to maintain current Program, Inc./Cimarron requests. Public Transit System If new funds and additional vehicles are available, we would like
to add 5 to 10 more drivers.
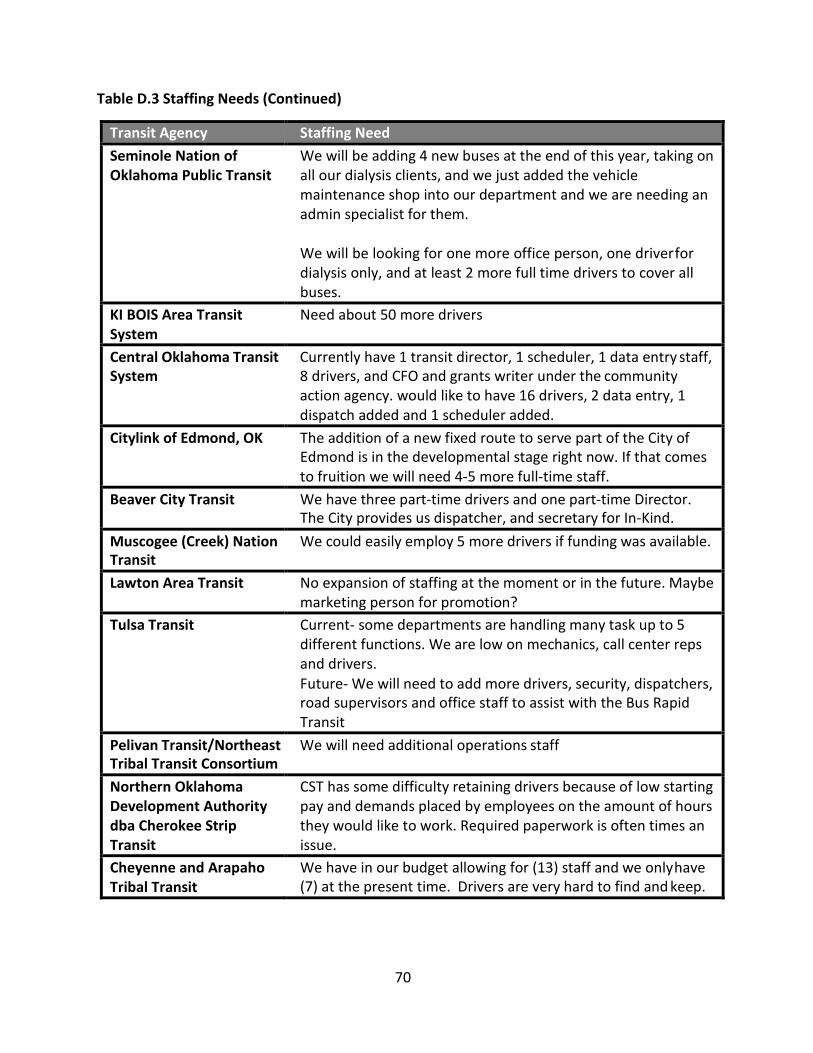
70
Table D.3 Staffing Needs (Continued)
Transit Agency Staffing Need Seminole Nation of Oklahoma Public Transit
We will be adding 4 new buses at the end of this year, taking on all our dialysis clients, and we just added the vehicle maintenance shop into our department and we are needing an admin specialist for them.
We will be looking for one more office person, one driver for dialysis only, and at least 2 more full time drivers to cover all buses.
KI BOIS Area Transit System
Need about 50 more drivers
Central Oklahoma Transit Currently have 1 transit director, 1 scheduler, 1 data entry staff, System 8 drivers, and CFO and grants writer under the community
action agency. would like to have 16 drivers, 2 data entry, 1 dispatch added and 1 scheduler added.
Citylink of Edmond, OK The addition of a new fixed route to serve part of the City of Edmond is in the developmental stage right now. If that comes to fruition we will need 4‐5 more full‐time staff.
Beaver City Transit We have three part‐time drivers and one part‐time Director. The City provides us dispatcher, and secretary for In‐Kind.
Muscogee (Creek) Nation Transit
We could easily employ 5 more drivers if funding was available.
Lawton Area Transit No expansion of staffing at the moment or in the future. Maybe marketing person for promotion?
Tulsa Transit Current‐ some departments are handling many task up to 5 different functions. We are low on mechanics, call center reps and drivers. Future‐ We will need to add more drivers, security, dispatchers, road supervisors and office staff to assist with the Bus Rapid Transit
Pelivan Transit/Northeast We will need additional operations staff Tribal Transit Consortium Northern Oklahoma Development Authority dba Cherokee Strip Transit
CST has some difficulty retaining drivers because of low starting pay and demands placed by employees on the amount of hours they would like to work. Required paperwork is often times an issue.
Cheyenne and Arapaho Tribal Transit
We have in our budget allowing for (13) staff and we only have (7) at the present time. Drivers are very hard to find and keep.
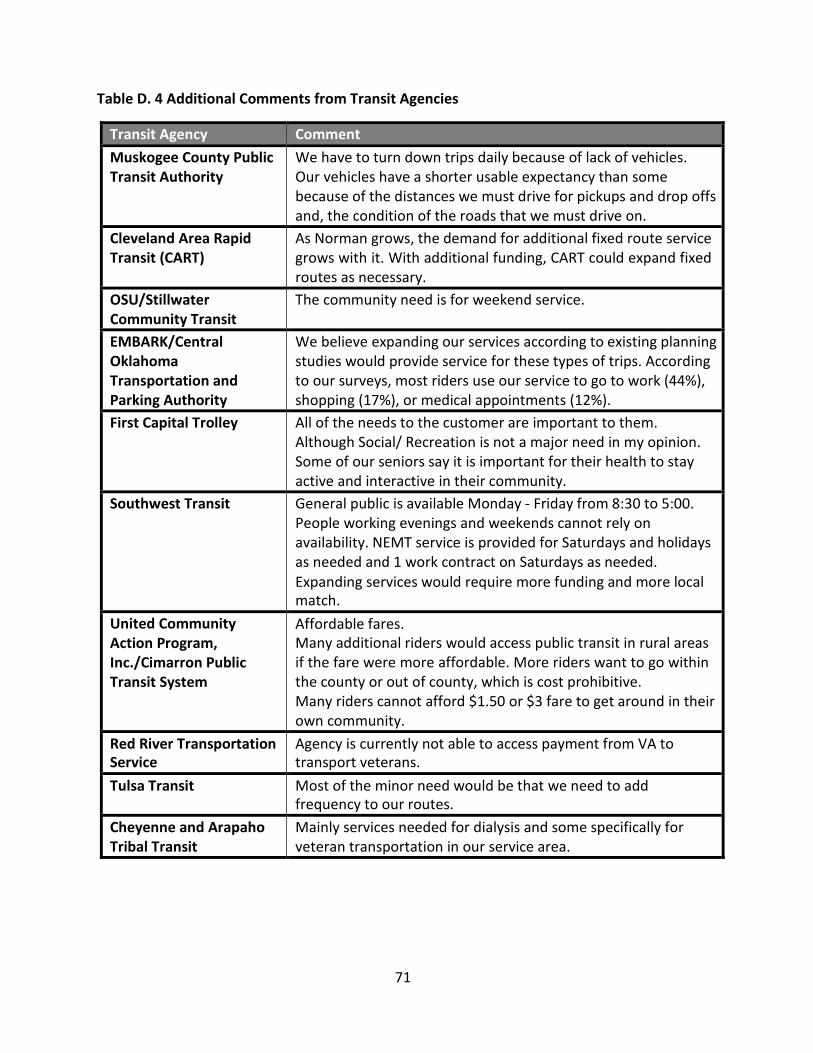
71
Table D. 4 Additional Comments from Transit Agencies
Transit Agency Comment Muskogee County Public Transit Authority
We have to turn down trips daily because of lack of vehicles. Our vehicles have a shorter usable expectancy than some because of the distances we must drive for pickups and drop offs and, the condition of the roads that we must drive on.
Cleveland Area Rapid Transit (CART)
As Norman grows, the demand for additional fixed route service grows with it. With additional funding, CART could expand fixed routes as necessary.
OSU/Stillwater Community Transit
The community need is for weekend service.
EMBARK/Central Oklahoma Transportation and Parking Authority
We believe expanding our services according to existing planning studies would provide service for these types of trips. According to our surveys, most riders use our service to go to work (44%), shopping (17%), or medical appointments (12%).
First Capital Trolley All of the needs to the customer are important to them. Although Social/ Recreation is not a major need in my opinion. Some of our seniors say it is important for their health to stay active and interactive in their community.
Southwest Transit General public is available Monday ‐ Friday from 8:30 to 5:00. People working evenings and weekends cannot rely on availability. NEMT service is provided for Saturdays and holidays as needed and 1 work contract on Saturdays as needed. Expanding services would require more funding and more local match.
United Community Action Program, Inc./Cimarron Public Transit System
Affordable fares. Many additional riders would access public transit in rural areas if the fare were more affordable. More riders want to go within the county or out of county, which is cost prohibitive. Many riders cannot afford $1.50 or $3 fare to get around in their own community.
Red River Transportation Service
Agency is currently not able to access payment from VA to transport veterans.
Tulsa Transit Most of the minor need would be that we need to add frequency to our routes.
Cheyenne and Arapaho Tribal Transit
Mainly services needed for dialysis and some specifically for veteran transportation in our service area.
72
APPENDIX E: SURVEY FOR NEEDS ASSESSMENT STUDY FOR OKLAHOMA TRANSIT AGENCIES
The following cover letter for needs assessment survey was sent to all transit agencies in Oklahoma State: Greetings,
This is the survey that Mark Nestlen, Executive Director of the Oklahoma Transit Association (OTA) mentioned to you in a previous email. My name is Jill Hough. I am the director of the Small Urban and Rural Transit Center and an associate professor of transportation at North Dakota State University. The Center is conducting a mobility needs assessment for OTA and your response to this survey is needed to gather data to supplement our existing data sources, e.g., Census Data, to complete our analysis.
By completing the survey, you will provide information so that we can better assess the mobility needs in Oklahoma and identify the gaps in service. In the study, we will look at current levels of service as well as what would be needed if services were to be increased/expanded based on projected demographic trends.
Your information will be combined with information from others taking part in the study, and we will write about the combined information that we have gathered. You will not be identified in these written materials.
Thank you for your taking part in this survey. We appreciate receiving your response by November 1. Please click this link to go to the survey.
Sincerely,
Jill Jill Hough, Ph.D. Associate Professor of Transportation Director ‐ Small Urban and Rural Transit Center North Dakota State University Fargo, ND 58108 Phone: 701‐793‐1364 [email protected] www.surtc.org / www.ugpti.org
73
Oklahoma Transit Agencies Survey
Start of Block: Service info
Q1 Organization name:
_
Q2 Person completing survey: o Name: (1) o Title: (2) o City: (3) o Email: (4) o Phone: (5)
Q3 What types of transportation services does your organization provide (check all that apply)?
Traditional fixed-route (1)
Flexible route (2)
ADA complementary paratransit (3) Demand-response for the general public (4) Limited-eligibility demand-response (serving only certain rider groups) (5) Human service transportation (for clients of human service programs) (6) Veterans transportation (7)
Q4 Do you provide the following types of service (check all that apply)?
Fixed-route (1)
Curb-to-curb (2)
Door-to-door (3)
Door-through-door or escort service (4) None of the above (5)
Page Break
74
Q6 How many days per week do you provide service? Check all that apply if the number of service days differs in your service region.
Areas with service 7 days per week (1) Areas with service 6 days per week (2) Areas with service 5 days per week (3) Areas with service 4 days per week (4) Areas with service 3 days per week (5) Areas with service 2 days per week (6) Areas with service 1 day per week (7) Areas with service less than weekly (8)
Q7 How many hours per service day do you provide service? Check all that apply if the number of hours differs in your service region.
Areas with 16 or more hours per service day (1) Areas with 12 to 15.9 hours per service day (2) Areas with 9 to 11.9 hours per service day (3) Areas with 5 to 8.9 hours per service day (4) Areas with less than 5 hours per service day (5)
Q8 How is your ADA paratransit service area defined? o Operate within 3/4 of fixed-route system (1) o Operate within some other distance of the fixed-route system, please indicate distance: (2) o Operate within city limits (3) o Other, please describe your service area: (4)
End of Block: Service info
Start of Block: Demand-response
Q9 Who is eligible to use your demand-response or paratransit service (check all that apply)?
General public (1)
People with disabilities (2) Senior citizens (3) Other, please specify: (4)
Display This Question:
If What types of transportation services does your organization provide (check all that apply)? = ADA complementary paratransit
75
Q10 If you provide multiple types of demand-response service with different eligibility requirements, please explain:
_
_
_
_
_
Q11 How far in advance must a rider schedule a demand-response or paratransit trip (check all that apply)?
Guaranteed (standing-order or subscription service) (1) Same-day service (2) Same-day service on space available basis (3) Will-call or Call When Ready for return trip (4) Next-day/24-hour advance reservation (5) Two-day/48-hour advance reservation and up to one week (6) More than one week in advance (7)
Q12 Is the minimum advance reservation time the same for all areas that your organization serves?
o Yes (1) o No, please explain: (2)
76
Q13 Please specify the approximate percentage of demand-response trip requests you have to turn down due to lack of capacity.
o 0-1% (1) o >1-3% (2) o >3-5% (3) o >5-10% (4) o More than 10% (5) o Do not know/do not collect data (6)
End of Block: Demand-response Start of Block: Needs
Q15 Estimate the percentage of riders that belong to the following groups. Leave blank if no estimate available.
Q14 For fixed-route service: o Elderly (%) (1) o People with disabilities (%) (2)
o Youth (up to age 18) (%) (3)
Q16 For demand-response service: o Elderly (%) (1) o People with disabilities (%) (2)
o Youth (up to age 18) (%) (3)
Page Break
77
Q17 Please describe the facilities you currently use for maintenance, vehicle storage, and administrative functions. Indicate if you own facilities for these purposes and the size and capacity of these facilities.
Q18 Maintenance facilities:
_
_
_
_
_
Q19 Vehicle storage:
_
_
_
_
_
Q20 Administrative:
_
_
_
_
78
Q21 Describe the adequacy of your facilities for meeting current and expected future needs (within the next five years).
Inadequate for current needs
(1)
Adequate for current needs but inadequate for expected
future needs (2)
Adequate for current and
expected future needs (3)
Not
applicable (4)
Maintenance facilities (1) o o o o
Vehicle storage facilities (2)
Administrative facilities (3)
Passenger
facilities (4)
Q22 If facility upgrades are currently needed or expected to be needed, please explain the types of upgrades needed:
_
_
_
_
_
Page Break
o o o o o o o o
o o o o
79
Q23 Are there any types of transportation services needed by your service area residents that are not currently available?
o Yes (1) o No (2) o Not sure (3)
Q24 Please identify the types of services needed (check all that apply).
New curb-to-curb service (1) New door-to-door service (2) New door-through-door or escort service (3) New group pickups (4) New fixed-route service (5) New intercity service (6) Expansion of currently available services (7) Weekend service (8) Longer hours of service (9)
Other, please explain: (10)
80
Q25 What is the main challenge or barrier to providing these additional services?
_
_
_
_
_
Q26 Is there a need for more service for any of these types of trips? Major need for more
service (1) Minor need for more
service (2) No need for
more service (3)
Employment (1)
o o o
Education/job training (2)
Medical (3)
o o o
Dialysis (4) o o o
Nutrition (5) o o o
Shopping (6) o o o
Social/recreation (7) o o o
Veterans transportation services (8)
o o o
Lift services (9)
o o o
o o o
81
Q27 Provide any additional information or describe other types of services needed:
_
_
_
_
_
Q28 Describe your staffing capabilities: o Inadequate staff to meet current needs (1) o Adequate staff to meet current needs, but additional staff needed to meet expected future needs (within the next five years) (2) o Adequate staff for current and expected future needs (3)
Q29 Describe current or expected future staffing needs (within the next five years):
_
_
_
_
_
Q30 What is your starting wage rate for vehicle operators?
_
82
Q31 Overall, how well are the transportation needs of your service area residents being met? o Extremely well (1) o Very well (2) o Moderately well (3) o Slightly well (4) o Not well at all (5)
Q32 Please provide any additional comments about the needs of your agency and your service area residents, the issues or challenges you are facing, funding levels, etc.:
_
_
_
_
_
End of Block: Needs
Related Documents