FINANCIAL PLAN 2018-2022

Welcome message from author
This document is posted to help you gain knowledge. Please leave a comment to let me know what you think about it! Share it to your friends and learn new things together.
Transcript
FINANCIAL PLAN 2018-2022
The Government Finance Officers Association (GFOA) of the United States and Canada
presented a Distinguished Budget Presentation Award to the City of Surrey, British
Columbia for its annual budget for the fiscal year beginning January 1, 2017.
In order to receive this award, a governmental unit must publish a budget document
that meets program criteria as a policy document, as an operations guide, as a financial
plan, and as a communications device.
This award is valid for a period of one year only. We believe our current budget
continues to conform to program requirements, and we are submitting it to GFOA to
determine its eligibility for another award.
CITY OF SURREY
TABLE OF CONTENTS
the future lives here. 2018-2022 Financial Plan
PAGE #
EXECUTIVE OVERVIEW
Reader’s Guide .......................................................................................................... 1
Message from the General Manager, Finance ....................................................... 3
Approved Supplemental Funding Requests ........................................................... 8
Budget Summary ...................................................................................................... 9
Sustainability Charter ............................................................................................ 10
Financial Planning Process ..................................................................................... 17
COMMUNITY PROFILE
Surrey’s History ....................................................................................................... 21
Population and Growth Statistics .......................................................................... 26
Business and Industry ............................................................................................ 29
Taxes, Utilities and Assessments .......................................................................... 34
Educational Services ............................................................................................... 36
Health and Safety Services .................................................................................... 38
ORGANIZATIONAL PROFILE
City Government and Administration ................................................................... 41
Organizational Objectives ...................................................................................... 44
Organizational Governance .................................................................................... 48
Integrated Planning Model ..................................................................................... 53
City of Surrey Corporate Functions ....................................................................... 54
Staffing Complement Summary ............................................................................ 55
FINANCIAL OVERVIEW
Economic Overview ................................................................................................ 59
Major Revenue Sources ......................................................................................... 66
Source and Application of Funds .......................................................................... 72
Overview of Fund Structure ................................................................................... 74
Consolidated Financial Summary .......................................................................... 76
GENERAL OPERATING FUND
Overview .................................................................................................................. 89
Financial Summary ................................................................................................. 90
Mayor, Council and Grants ......................................................................... 98
City Manager ............................................................................................. 110
Corporate Services .................................................................................... 122
Engineering Services ................................................................................ 137
Finance ....................................................................................................... 151
Fire .............................................................................................................. 165
Investment and Intergovernmental Relations ......................................... 179
Parks, Recreation and Culture .................................................................. 190
Planning and Development ...................................................................... 211
RCMP .......................................................................................................... 226
Surrey Public Library ................................................................................ 240
TABLE OF CONTENTS
the future lives here. 2018-2022 Financial Plan
PAGE #
UTILITIES OPERATING FUND
Overview ................................................................................................................ 250
Financial Summary ............................................................................................... 251
Drainage Utility .......................................................................................... 253
Parking Utility ............................................................................................. 265
Roads and Traffic Safety Utility ................................................................ 275
Sewer Utility ............................................................................................... 287
Solid Waste Utility ..................................................................................... 298
Surrey City Energy Utility .......................................................................... 308
Water Utility ................................................................................................ 318
CAPITAL PROGRAM
Contribution and Expenditure Overview ............................................................. 330
Capital Planning Process ...................................................................................... 335
Ranked Capital Projects ........................................................................................ 338
2018 Capital Program ............................................................................................ 348
Five Year Capital Program .................................................................................... 350
General Corporate ...................................................................................... 353
Engineering Services ................................................................................. 354
Parks, Recreation and Culture ................................................................... 355
Protective Services ..................................................................................... 357
Drainage Services ...................................................................................... 358
Sewer Services ........................................................................................... 359
Water Services ........................................................................................... 360
GLOSSARY OF TERMINOLOGY ..................................................................................... 363
EXECUTIVE OVERVIEW
READER’S GUIDE
the future lives here. 2018-2022 Financial Plan
This Reader’s Guide provides the reader with an executive overview of the 2018 - 2022
Financial Plan and introduces the content and layout of each of the major sections of the
document.
The primary function of the Financial Plan is to provide detailed information about the
City of Surrey’s funding requirements over the next five years. Furthermore, it serves
the following functions:
As a policy document, which outlines the financial policies that guide the
development of the Financial Plan and articulates financial priorities and issues;
As an operations guide, which helps staff identify financial and staffing resource
requirements, manage day-to-day operations, and provides performance
measurements and policy information; and
As a communication device, which provides readers with a comprehensive look at
the services provided by City departments and the costs attributed to those services.
The 2018 - 2022 Financial Plan is divided into eight major sections:
1. EXECUTIVE OVERVIEW ………………………………………………….……. Page 1
This section provides the reader with a brief overview of the document along with
Surrey’s strategic goals, short-term issues and priorities, and financial planning
process.
2. COMMUNITY PROFILE ………………………………………………...……… Page 21
This section provides the reader with a brief overview of the City of Surrey, its
history, as well as some of the services available to citizens and businesses.
3. ORGANIZATIONAL PROFILE …………………………………………….…… Page 41
This section provides the reader with a brief overview of the organizational
structure of the City of Surrey and of the City’s policies, plans and strategy
documents.
4. FINANCIAL OVERVIEW …………………………………………...…………… Page 59
This section provides the reader with a brief overview of economic conditions
affecting the City of Surrey along with the City’s major revenue sources, fund
structure, consolidated financial summary, and the Consolidated Financial Plan
Bylaw.
5. GENERAL OPERATING FUND ………………………………………..…….… Page 89
This section contains information about the general operating fund, the financial
summary, and the General Operating Bylaw. It also contains subsections providing
information for each departmental operations.
- 1 -
READER’S GUIDE
the future lives here. 2018-2022 Financial Plan
6. UTILITIES OPERATING FUND ……………..………………………………… Page 250
This section contains information about the various utility operating funds the City
operates and contains subsections providing information for each and their
respective operating bylaws.
7. CAPITAL PROGRAM …………………………………………………………… Page 330
This section provides the reader with an overview of capital contributions
available, along with the types of capital expenditures and the capital planning
process. An overview of the ranked capital projects is also included along with the
full Five Year Capital Plan and the Capital Financial Plan Bylaw.
8. GLOSSARY ……………………………………………………………………… Page 363
This section provides the reader with an alphabetical list of terms used in the
Financial Plan along with their definition.
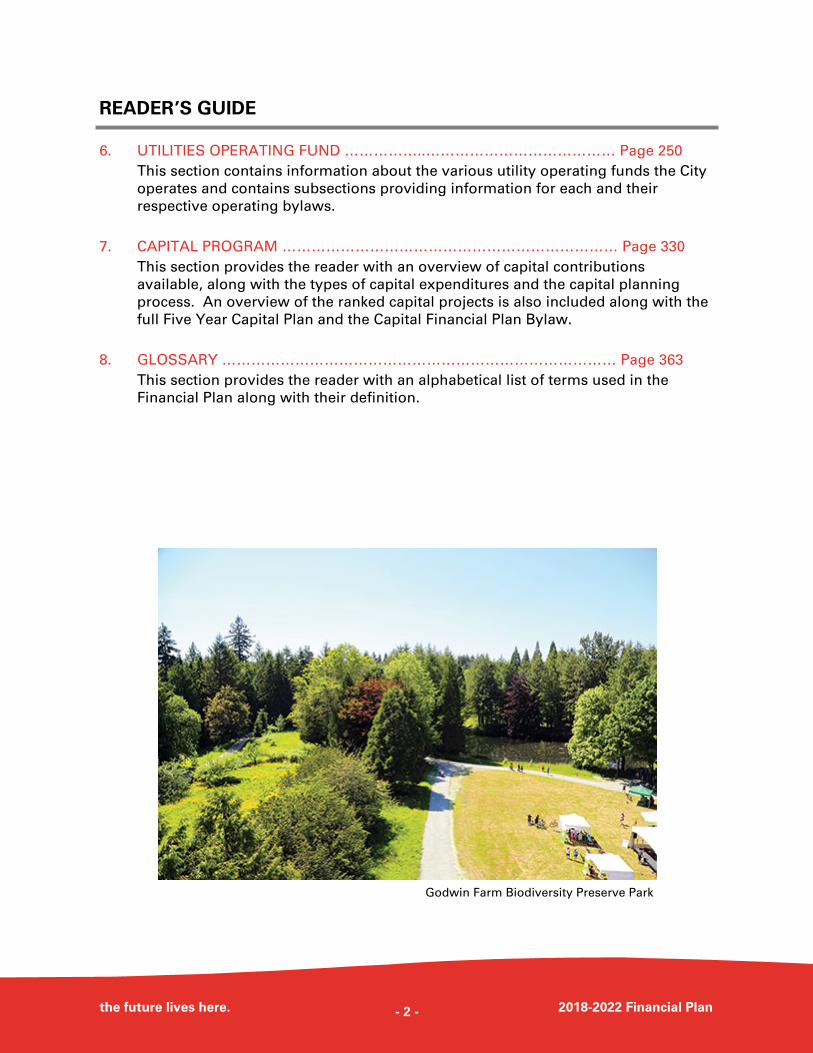
Godwin Farm Biodiversity Preserve Park
- 2 -
EXECUTIVE OVERVIEW
MESSAGE FROM THE GENERAL MANAGER, FINANCE
the future lives here. 2018-2022 Financial Plan
To the Mayor and Council,
City of Surrey
I am pleased to submit the 2018 - 2022 Financial Plan for
the City of Surrey.
The Community Charter requires that Council adopt a Five
Year Financial Plan each year prior to the adoption of the
annual Property Tax Bylaw. The 2018 - 2022 Financial Plan
reinforces the 2018 - 2022 Financial Plan Bylaws, which
received final adoption on December 18, 2017.
The goal of the Five Year Financial Plan is to outline the
financing of initiatives associated with the City’s major
plans including the Sustainability Charter 2.0, the Official Community Plan, the
Transportation Strategic Plan, the Parks, Recreation and Culture Strategic Plan, and the
Surrey Public Library Strategic Plan, as well as Council’s key priorities. Funding these
initiatives helps the City to meet the needs of its citizens.
1.0 OVERVIEW
The 2018 - 2022 Financial Plan presents a Five Year Consolidated Financial Plan, which
includes forecasts of all revenues and expenditures related to the City’s operating and
capital obligations over the next five years.
The document also includes detailed information about the City’s plans for upcoming
years. This supporting information provides departments with their expenditure
authority. Please note that in conjunction with known information, estimates and
projections have been used for the years 2019 through 2022. These projections will be
updated annually prior to Council’s review and approval of the Financial Plan for that
year.
2.0 GENERAL OPERATING FINANCIAL PLAN—ISSUES AND PRIORITIES
Council has directed that the 2018 Financial Plan include the following:
A property tax increase equivalent to $93.00 for an average single family dwelling to
support general expenditure increases, that predominately relates to increased public
safety resourcing and expenditures, that will be applicable to all property
classifications;
A 3.9% across the board net fee increase;
Applicable salary and benefits increases, along with associated in-range salary
adjustments;
The full year impact of the 12 RCMP members and appropriate support staff
approved in 2017;
Kam Grewal
General Manager, Finance
- 3 -
MESSAGE FROM THE GENERAL MANAGER, FINANCE
the future lives here. 2018-2022 Financial Plan
Addition of 12 new RCMP member positions along with the appropriate support
staff;
The full year impact of the 3 Bylaw Officers approved in 2017;
Addition of 4 new Bylaw and Public Safety Officer positions;
Addition of 4 new Fire Fighter positions for a full year with another 4 added in the
second half of the year;
Operating funding for new operating costs related to Parks and Cultural programs;
Additional capital contributions as well as internal borrowing for capital projects;
Continued support for Council’s key priorities such as Cultural Grants, Social Well
Being, Surrey City Energy, Sustainability and Crime Reduction; and
Allowances for third party contract increases, inventory increases and inflation.
These additions will allow staff to address the City’s service priorities and meet Council’s
goals.
The following additional on-going revenues were identified for 2018 and have been
included in this plan:
Tax revenues related to new growth; and
Other City initiatives that generate new revenues.
3.0 DRAINAGE UTILITY FINANCIAL PLAN—ISSUES AND PRIORITIES
The Drainage Utility supports storm water management and environment protection.
This utility is structured to be self-sustaining. Projected funding requirements are met
by a corresponding increase in the drainage parcel tax.
The Drainage Utility’s funding requirements are affected by storm water management
requirements; lowland drainage dyking and flood control program; contractual labour
and energy cost increases; and environmental management.
These funding requirements will continue to be addressed through increases in the
drainage parcel tax over the next several years. For 2018, the drainage parcel tax will be
$223 ($221 in 2017) for residential/farm, and $409 ($359 in 2017) for commercial/
industrial properties.
- 4 -
MESSAGE FROM THE GENERAL MANAGER, FINANCE
the future lives here. 2018-2022 Financial Plan
4.0 PARKING UTILITY FINANCIAL PLAN—ISSUES AND PRIORITIES
The City’s first below ground parking structure became operational in 2014. Revenue
generated from parking rates will cover part of the on-going operating and maintenance
costs of this new facility as well as contribute to the debt financing costs. The
management of the parkade has been contracted out, which will ensure a clean and safe
facility. Parking rates will remain unchanged for 2018 at $75.00 per month for general
parking, $130 per month for reserved parking and $1.50 per hour for general public use.
5.0 ROADS & TRAFFIC UTILITY FINANCIAL PLAN—ISSUES AND PRIORITIES
In 2007, Council approved a Local Roads and Traffic Safety Levy to fund maintenance of
the City's local roadway pavement and additional safety-related road needs, such as
pedestrian crossings, sidewalks, and traffic calming. The Levy was established in 2008
and was set using the equivalent of a 1% property tax increase in each of the next four
years. In 2012, the levy was expanded to support the City’s portion of road and traffic
needs beyond the local and collector roads. In line with the plan that encompassed the
expanded vision, the 2018 levy will increase by an equivalent 1% property tax of
approximately $19.00 for an average assessed single family dwelling and $108.00 for an
average assessed business.
The Local Roads and Traffic Safety Levy is a key factor in the City’s ability to meet the
key objectives of the Transportation Policy, which include traffic safety, transportation
system maintenance and rehabilitation as well as network management, operations and
ensuring sustainable funding. The 2018 - 2022 Financial Plan includes similar increases
in future years to ensure funding is available to meet these transportation objectives.
6.0 SEWER UTILITY FINANCIAL PLAN—ISSUES AND PRIORITIES
The Sewer Utility is a self-sustaining fund. Any projected funding requirements are met
by a corresponding increase in user fees. Over the last two decades, the City has been
moving towards a ‘user-pay’ approach for sewer usage, with the eventual aim of retiring
the ‘flat rate’ system.
The Sewer Utility’s funding requirements are affected by the following factors:
Greater Vancouver Sewer and Drainage District’s (GVS&DD) projected increases;
Contractual labour increases; and
Capital replacement needs for our aging infrastructure.
These funding requirements will be addressed through modest increases in the sewer
rates over the next several years. For 2018, the average metered single family dwelling
will pay $312 ($285 in 2017) for sanitary sewer.
- 5 -
MESSAGE FROM THE GENERAL MANAGER, FINANCE
the future lives here. 2018-2022 Financial Plan
7.0 SOLID WASTE UTILITY FINANCIAL PLAN—ISSUES AND PRIORITIES
The primary goals of the Solid Waste Utility are to achieve an 80% waste diversion from
Surrey residential waste stream and to reduce illegal dumping and related cleanup costs
by 50% by 2020.
As a means of achieving our waste diversion and illegal dumping targets by the year
2020, the City developed a comprehensive work plan that was initiated in 2017 that
includes: increasing education of the City’s existing waste collection programs; new
services to high-rise customers; expanding existing services to curbside (single family)
customers and enhancing enforcement efforts by deploying new surveillance
technologies. These initiatives are contributing to achieving our waste diversion and
illegal dumping targets the year 2020. The solid waste rate will remain unchanged for
2018 at $287.00.
8.0 SURREY CITY ENERGY UTILITY FINANCIAL PLAN—ISSUES AND PRIORITIES
The Surrey City Energy (SCE) Utility has been structured to be a self-sustaining fund that
will supply heating, cooling and hot water to high-density new construction in the City.
Surrey’s first permanent district energy centre will be co-located with West Village Park
and is slated to open in 2018. In July 2014, Council approved the establishment of a
third-party Expert External Rate Review Panel to assist staff and Council in the oversight
of SCE’s rates and rate structure. The Panel conducted a full review of the long-term
financial plan, rate structure, and 2018 rates and has provided a letter of endorsement in
support of the 2018 rates. The 2018 levy will increase by 2.52%, an increase of $19.00 for
a 65m2 (700 square foot) residential dwelling unit that consumes an average of 6.8 MWh/
year of energy. The SCE is currently serving 4 multi-unit high-rise and commercial
buildings, with another 6 buildings expected to connect to the system in 2018.
9.0 WATER UTILITY FINANCIAL PLAN—ISSUES AND PRIORITIES
The Water Utility is a self-sustaining fund; any projected funding requirements are met
by a corresponding increase in user fees. Over the last several years, the City has been
moving towards a fully ‘metered’ approach for recovering the costs of the water utility,
with the eventual aim of retiring the ‘flat rate’ system and having all properties on water
meters.
The Water Utility’s funding requirements are affected by the following factors:
Greater Vancouver Regional District’s (GVRD) projected water rate increases; and
Contractual labour and energy cost increases.
To meet these funding requirements, water rates will increase in 2018 and beyond. The
average metered single family dwelling will pay $427 in 2018 ($414 in 2017) based on an
average yearly consumption of 360 cubic metres.
- 6 -
MESSAGE FROM THE GENERAL MANAGER, FINANCE
the future lives here. 2018-2022 Financial Plan
10.0 GENERAL CAPITAL FINANCIAL PLAN—ISSUES AND PRIORITIES
The City continues to undertake a number of large-scale capital projects to
accommodate and support anticipated business and residential growth. The 2018 - 2022
Financial Plan includes a further $301 million investment over the next five years. The
funding for these projects will be primarily through internal borrowing, although this
approach will be re-evaluated periodically and with consultation with Mayor and
Council. These projects include a new recreation and cultural facility in Clayton, a new
Cloverdale twin ice surface facility, a replacement facility for the arenas in North Surrey,
the second phase of the Surrey Museum expansion, various park additions and
expansions, and a partnership with the YMCA to deliver recreation services in the City
Centre.
The City has ongoing capital requirements of over $18.5 million per year. The City must
also fund minor capital projects including improved parking at various recreation
centres, equipment and security upgrades as well as recreation facility entrance
improvements. Additional details of planned capital projects can be found in the Capital
Program section of this document.
11.0 CONCLUSION
The 2018 - 2022 Financial Plan incorporates Council’s direction in relation to property tax
increases. The City of Surrey continues to have one of the lowest property tax rates in
the Lower Mainland.
I wish to thank all the staff of the City for their dedication and commitment to the
delivery of quality services to Surrey citizens and businesses, while meeting Council’s
financial direction. I also want to acknowledge the efforts of the staff that contributed
directly to the preparation of the 2018 - 2022 Financial Plan.
Respectfully,
Kam Grewal, CPA, CMA
General Manager, Finance
- 7 -
EXECUTIVE OVERVIEW
APPROVED SUPPLEMENTAL FUNDING REQUESTS
the future lives here. 2018-2022 Financial Plan
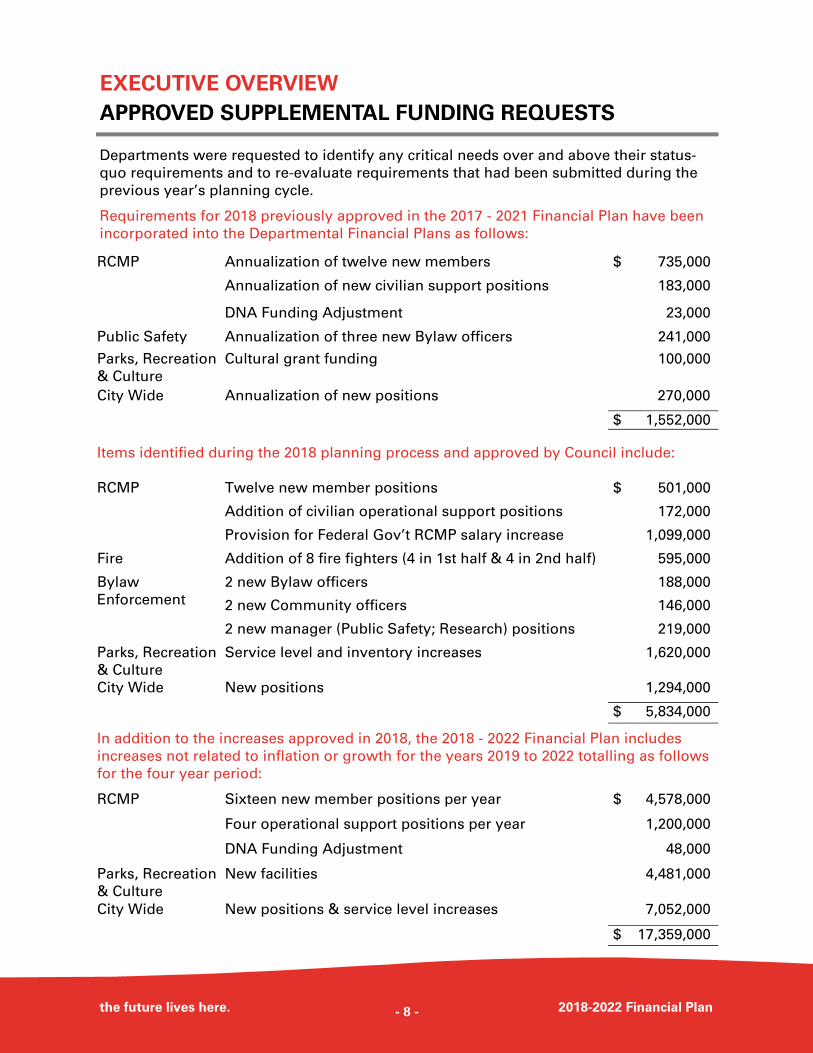
Departments were requested to identify any critical needs over and above their status-
quo requirements and to re-evaluate requirements that had been submitted during the
previous year’s planning cycle.
Requirements for 2018 previously approved in the 2017 - 2021 Financial Plan have been
incorporated into the Departmental Financial Plans as follows:
RCMP Annualization of twelve new members $ 735,000
Annualization of new civilian support positions 183,000
DNA Funding Adjustment 23,000
Public Safety Annualization of three new Bylaw officers 241,000
Cultural grant funding 100,000
City Wide Annualization of new positions 270,000
$ 1,552,000
Items identified during the 2018 planning process and approved by Council include:
RCMP Twelve new member positions $ 501,000
Addition of civilian operational support positions 172,000
Fire Addition of 8 fire fighters (4 in 1st half & 4 in 2nd half) 595,000
2 new Bylaw officers 188,000
2 new Community officers 146,000
2 new manager (Public Safety; Research) positions 219,000
Parks, Recreation
& Culture
Service level and inventory increases 1,620,000
City Wide New positions 1,294,000
$ 5,834,000
In addition to the increases approved in 2018, the 2018 - 2022 Financial Plan includes
increases not related to inflation or growth for the years 2019 to 2022 totalling as follows
for the four year period:
RCMP Sixteen new member positions per year $ 4,578,000
Four operational support positions per year 1,200,000
DNA Funding Adjustment 48,000
Parks, Recreation
& Culture
New facilities 4,481,000
City Wide New positions & service level increases 7,052,000
$ 17,359,000
Bylaw
Enforcement
Parks, Recreation
& Culture
Provision for Federal Gov’t RCMP salary increase 1,099,000
- 8 -
EXECUTIVE OVERVIEW
BUDGET SUMMARY
the future lives here. 2018-2022 Financial Plan
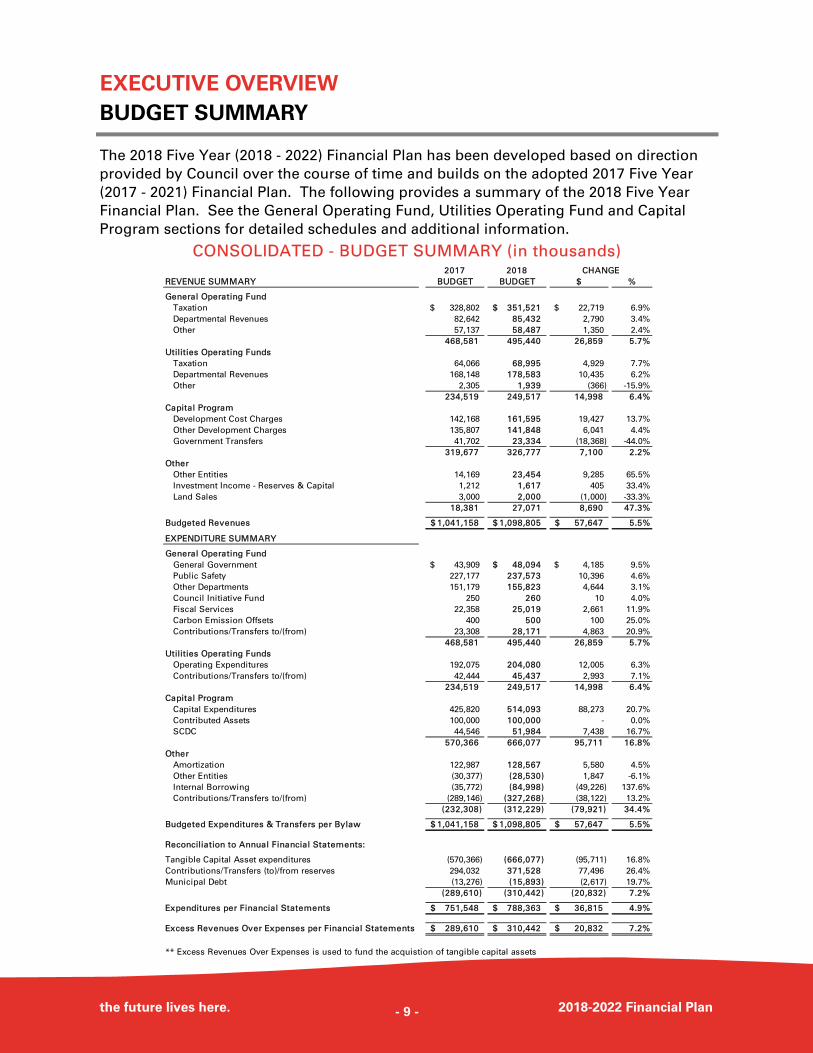
The 2018 Five Year (2018 - 2022) Financial Plan has been developed based on direction
provided by Council over the course of time and builds on the adopted 2017 Five Year
(2017 - 2021) Financial Plan. The following provides a summary of the 2018 Five Year
Financial Plan. See the General Operating Fund, Utilities Operating Fund and Capital
Program sections for detailed schedules and additional information.
CONSOLIDATED - BUDGET SUMMARY (in thousands) 2017 2018
REVENUE SUMMARY BUDGET BUDGET $ %
General Operating Fund
Taxation 328,802$ 351,521$ 22,719$ 6.9%
Departmental Revenues 82,642 85,432 2,790 3.4%
Other 57,137 58,487 1,350 2.4%
468,581 495,440 26,859 5.7%
Utilities Operating Funds
Taxation 64,066 68,995 4,929 7.7%
Departmental Revenues 168,148 178,583 10,435 6.2%
Other 2,305 1,939 (366) -15.9%
234,519 249,517 14,998 6.4%
Capital Program
Development Cost Charges 142,168 161,595 19,427 13.7%
Other Development Charges 135,807 141,848 6,041 4.4%
Government Transfers 41,702 23,334 (18,368) -44.0%
319,677 326,777 7,100 2.2%
Other
Other Entities 14,169 23,454 9,285 65.5%
Investment Income - Reserves & Capital 1,212 1,617 405 33.4%
Land Sales 3,000 2,000 (1,000) -33.3%
18,381 27,071 8,690 47.3%
Budgeted Revenues 1,041,158$ 1,098,805$ 57,647$ 5.5%
EXPENDITURE SUMMARY
General Operating Fund
General Government 43,909$ 48,094$ 4,185$ 9.5%
Public Safety 227,177 237,573 10,396 4.6%
Other Departments 151,179 155,823 4,644 3.1%
Council Initiative Fund 250 260 10 4.0%
Fiscal Services 22,358 25,019 2,661 11.9%
Carbon Emission Offsets 400 500 100 25.0%
Contributions/Transfers to/(from) 23,308 28,171 4,863 20.9%
468,581 495,440 26,859 5.7%
Utilities Operating Funds
Operating Expenditures 192,075 204,080 12,005 6.3%
Contributions/Transfers to/(from) 42,444 45,437 2,993 7.1%
234,519 249,517 14,998 6.4%
Capital Program
Capital Expenditures 425,820 514,093 88,273 20.7%
Contributed Assets 100,000 100,000 - 0.0%
SCDC 44,546 51,984 7,438 16.7%
570,366 666,077 95,711 16.8%
Other
Amortization 122,987 128,567 5,580 4.5%
Other Entities (30,377) (28,530) 1,847 -6.1%
Internal Borrowing (35,772) (84,998) (49,226) 137.6%
Contributions/Transfers to/(from) (289,146) (327,268) (38,122) 13.2%
(232,308) (312,229) (79,921) 34.4%
Budgeted Expenditures & Transfers per Bylaw 1,041,158$ 1,098,805$ 57,647$ 5.5%
Reconciliation to Annual Financial Statements:
Tangible Capital Asset expenditures (570,366) (666,077) (95,711) 16.8%
Contributions/Transfers (to)/from reserves 294,032 371,528 77,496 26.4%
Municipal Debt (13,276) (15,893) (2,617) 19.7%
(289,610) (310,442) (20,832) 7.2%
Expenditures per Financial Statements 751,548$ 788,363$ 36,815$ 4.9%
Excess Revenues Over Expenses per Financial Statements 289,610$ 310,442$ 20,832$ 7.2%
** Excess Revenues Over Expenses is used to fund the acquistion of tangible capital assets
CHANGE
- 9 -
EXECUTIVE OVERVIEW
SUSTAINABILITY CHARTER
the future lives here. 2018-2022 Financial Plan
In 2008, Surrey City Council approved the
Surrey Sustainability Charter as the City’s
overarching policy document.
On May 30, 2016, this policy document
was updated when Council approved the
Sustainability Charter 2.0. It articulates a
refreshed vision statement of a thriving,
green, inclusive city, and is organized
around eight community themes for a
more holistic way of looking at
sustainability and the interconnectedness
of systems in our community. Each
theme includes an overarching goal
statement and a set of desired outcomes
that describe what we envision for Surrey
by the year 2058 (50 years from the
adoption of our original Charter).
Strategic directions are identified under
each of the eight organizing themes, as
priority focus areas for action over the
next few years. Our indicators were
reviewed and updated to ensure they
were the best ones to track progress
towards our goals and desired outcomes,
and will form the basis of monitoring
efforts through the City’s Dashboard.
The updated Charter also outlines
corporate sustainability objectives and
strategies for the City over the coming
five year period, to enhance the City’s
leadership and showcasing of
sustainability and innovation.
The vision, goals and desired outcomes
presented in this Sustainability Charter 2.0
articulate what we want to see for our
whole community, looking ahead over the
next 40 years. Successful implementation
of this ambitious vision needs the support
and involvement of all partners in Surrey
including local businesses, residents and
community groups. With this strong
collaboration and our rich tradition of
community involvement, Surrey will
move forward to become a thriving,
green, inclusive city.
Consequently, the Financial Plan presents
all goals, accomplishments and future
initiatives through these eight community
themes. This presentation highlights the
importance of the Sustainability Charter
2.0 as a living document helping to focus
our short and long-term goals and
objectives.
STRATEGIC DIRECTION FOCUSES ON SUSTAINABILITY
- 10 -
SUSTAINABILITY CHARTER
the future lives here. 2018-2022 Financial Plan
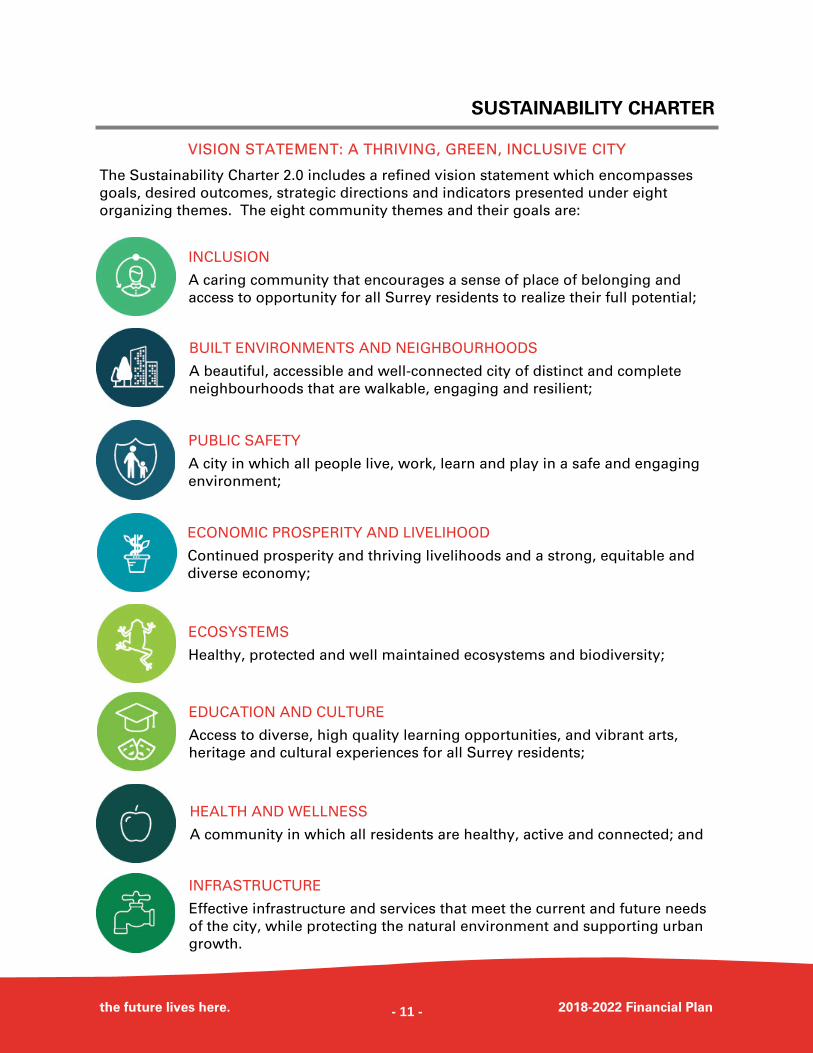
VISION STATEMENT: A THRIVING, GREEN, INCLUSIVE CITY
The Sustainability Charter 2.0 includes a refined vision statement which encompasses
goals, desired outcomes, strategic directions and indicators presented under eight
organizing themes. The eight community themes and their goals are:
INCLUSION
A caring community that encourages a sense of place of belonging and
access to opportunity for all Surrey residents to realize their full potential;
BUILT ENVIRONMENTS AND NEIGHBOURHOODS
A beautiful, accessible and well-connected city of distinct and complete
neighbourhoods that are walkable, engaging and resilient;
PUBLIC SAFETY
A city in which all people live, work, learn and play in a safe and engaging
environment;
ECONOMIC PROSPERITY AND LIVELIHOOD
Continued prosperity and thriving livelihoods and a strong, equitable and
diverse economy;
ECOSYSTEMS
Healthy, protected and well maintained ecosystems and biodiversity;
EDUCATION AND CULTURE
Access to diverse, high quality learning opportunities, and vibrant arts,
heritage and cultural experiences for all Surrey residents;
HEALTH AND WELLNESS
A community in which all residents are healthy, active and connected; and
INFRASTRUCTURE
Effective infrastructure and services that meet the current and future needs
of the city, while protecting the natural environment and supporting urban
growth.
- 11 -
SUSTAINABILITY CHARTER
the future lives here. 2018-2022 Financial Plan
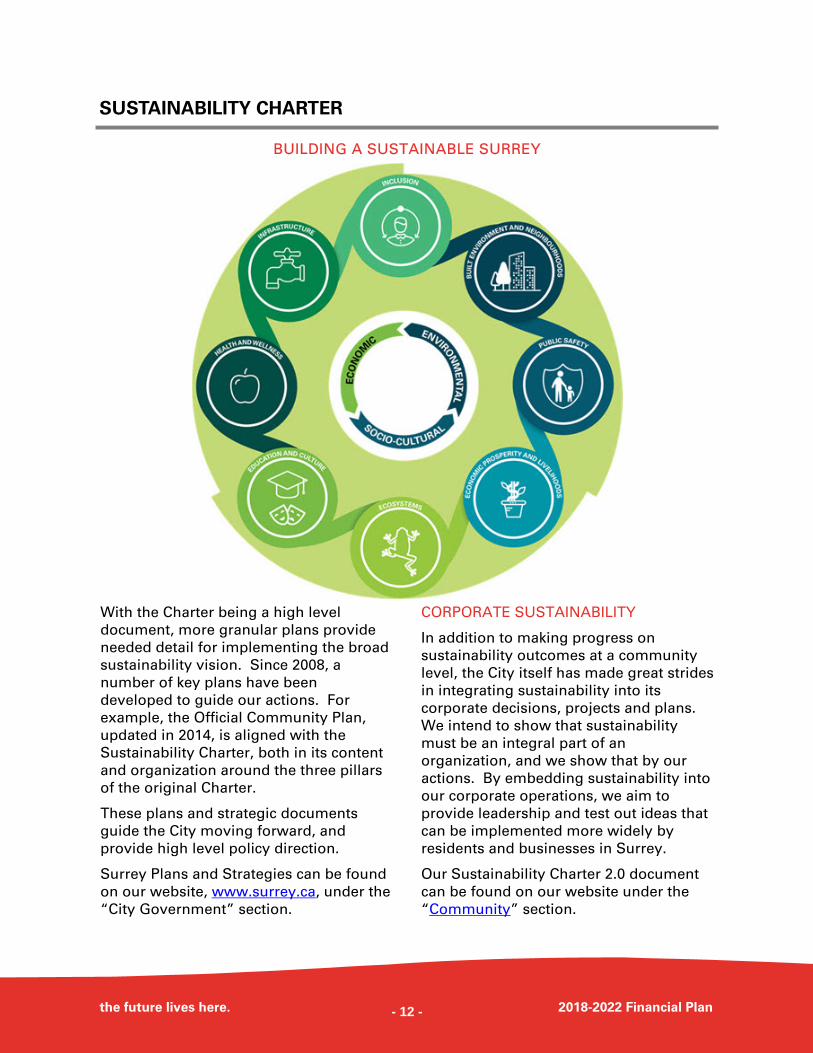
With the Charter being a high level
document, more granular plans provide
needed detail for implementing the broad
sustainability vision. Since 2008, a
number of key plans have been
developed to guide our actions. For
example, the Official Community Plan,
updated in 2014, is aligned with the
Sustainability Charter, both in its content
and organization around the three pillars
of the original Charter.
These plans and strategic documents
guide the City moving forward, and
provide high level policy direction.
Surrey Plans and Strategies can be found
on our website, www.surrey.ca, under the
“City Government” section.
CORPORATE SUSTAINABILITY
In addition to making progress on
sustainability outcomes at a community
level, the City itself has made great strides
in integrating sustainability into its
corporate decisions, projects and plans.
We intend to show that sustainability
must be an integral part of an
organization, and we show that by our
actions. By embedding sustainability into
our corporate operations, we aim to
provide leadership and test out ideas that
can be implemented more widely by
residents and businesses in Surrey.
Our Sustainability Charter 2.0 document
can be found on our website under the
“Community” section.
BUILDING A SUSTAINABLE SURREY
- 12 -
SUSTAINABILITY CHARTER
the future lives here. 2018-2022 Financial Plan
SUSTAINABILITY—WHAT’S BEEN ACCOMPLISHED SINCE 2008
In partnership with a broad range of community stakeholders, the City has made
considerable progress in each of the three pillars of sustainability since the adoption of
the original Charter. Progress has been shared with the community on our
Sustainability Dashboard website, with indicators tracking progress across a number of
sustainability themes, charts and graphs track recent trends on each indicator. The
Dashboard also shows whether Surrey is meeting its sustainability targets. All these
trends are reported to Council on a regular basis in a Sustainability Progress Report.
Here are a few examples of measurable progress made during the past few years:
Surrey residents have better access to green-ways, park paths and cycling trails;
More cultural spaces are available within the city;
Residents have reduced their per capita water consumption;
Residents are diverting more garbage from the landfill;
More social housing units have been created; and
Enrolment continues to rise at Surrey’s post-secondary schools.
Through these actions we are building a more sustainable and resilient city, and
improving residents’ well-being.
SUSTAINABILITY DASHBOARD—KEY PERFORMANCE INDICATORS
The Sustainability Dashboard is currently being updated to include the 2016 Census data
that became available in late 2017. The new dashboard is expected to be available by
mid 2018. The following pages are a summary of the various indicators found on the
dashboard that gauge the progress Surrey is taking to move toward its vision of a better
world.
More information on the Sustainability Dashboard can be found on the City’s website at
www.surrey.ca/dashboard.
- 13 -
SUSTAINABILITY CHARTER
the future lives here. 2018-2022 Financial Plan
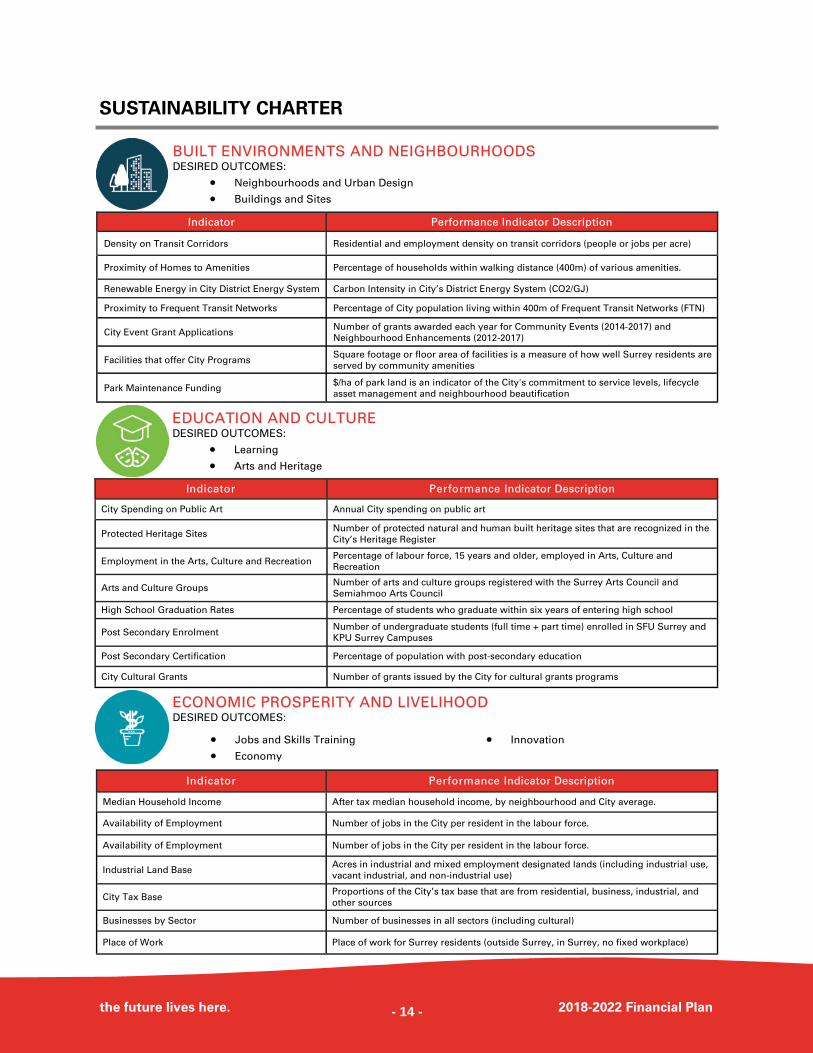
BUILT ENVIRONMENTS AND NEIGHBOURHOODS DESIRED OUTCOMES:
Neighbourhoods and Urban Design
Buildings and Sites
Indicator Performance Indicator Description
Density on Transit Corridors Residential and employment density on transit corridors (people or jobs per acre)
Proximity of Homes to Amenities Percentage of households within walking distance (400m) of various amenities.
Renewable Energy in City District Energy System Carbon Intensity in City’s District Energy System (CO2/GJ)
Proximity to Frequent Transit Networks Percentage of City population living within 400m of Frequent Transit Networks (FTN)
City Event Grant Applications Number of grants awarded each year for Community Events (2014-2017) and
Neighbourhood Enhancements (2012-2017)
Facilities that offer City Programs Square footage or floor area of facilities is a measure of how well Surrey residents are
served by community amenities
Park Maintenance Funding $/ha of park land is an indicator of the City's commitment to service levels, lifecycle
asset management and neighbourhood beautification
EDUCATION AND CULTURE DESIRED OUTCOMES:
Learning
Arts and Heritage
Indicator Performance Indicator Description
City Spending on Public Art Annual City spending on public art
Protected Heritage Sites Number of protected natural and human built heritage sites that are recognized in the
City’s Heritage Register
Employment in the Arts, Culture and Recreation Percentage of labour force, 15 years and older, employed in Arts, Culture and
Recreation
Arts and Culture Groups Number of arts and culture groups registered with the Surrey Arts Council and
Semiahmoo Arts Council
High School Graduation Rates Percentage of students who graduate within six years of entering high school
Post Secondary Enrolment Number of undergraduate students (full time + part time) enrolled in SFU Surrey and
KPU Surrey Campuses
Post Secondary Certification Percentage of population with post-secondary education
City Cultural Grants Number of grants issued by the City for cultural grants programs
ECONOMIC PROSPERITY AND LIVELIHOOD DESIRED OUTCOMES:
Jobs and Skills Training
Economy
Innovation
Indicator Performance Indicator Description
Median Household Income After tax median household income, by neighbourhood and City average.
Availability of Employment Number of jobs in the City per resident in the labour force.
Availability of Employment Number of jobs in the City per resident in the labour force.
Industrial Land Base Acres in industrial and mixed employment designated lands (including industrial use,
vacant industrial, and non-industrial use)
City Tax Base Proportions of the City’s tax base that are from residential, business, industrial, and
other sources
Businesses by Sector Number of businesses in all sectors (including cultural)
Place of Work Place of work for Surrey residents (outside Surrey, in Surrey, no fixed workplace)
- 14 -
SUSTAINABILITY CHARTER
the future lives here. 2018-2022 Financial Plan
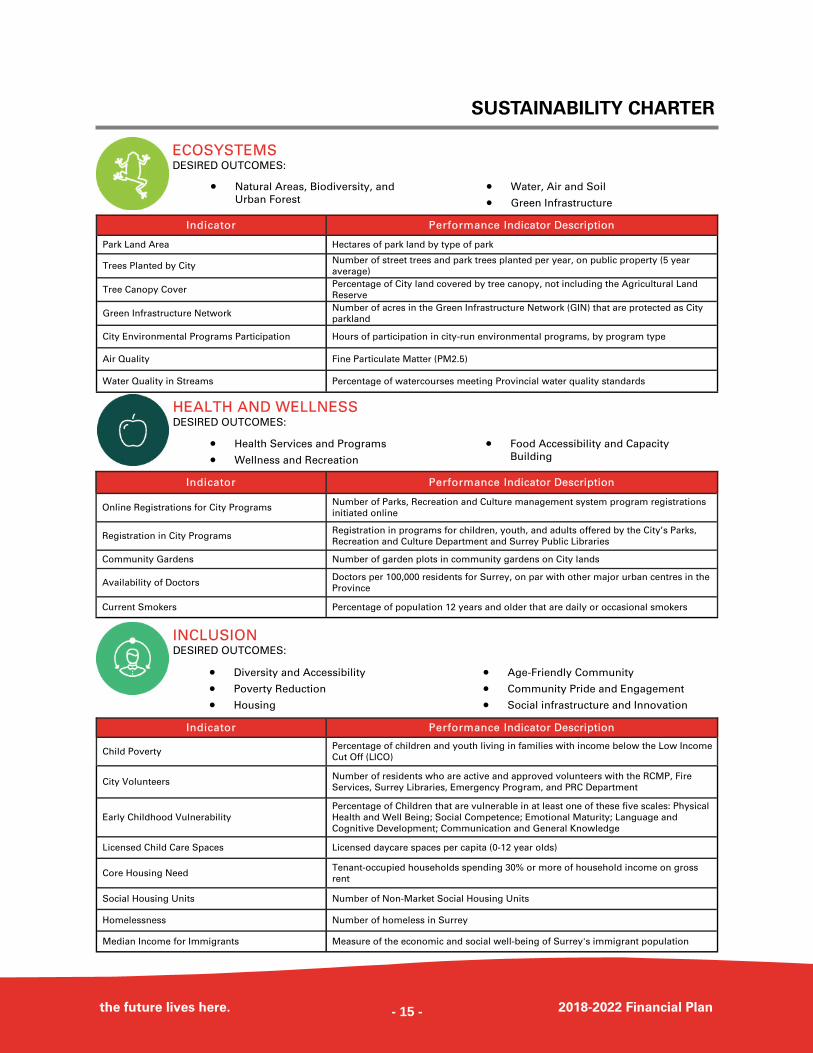
ECOSYSTEMS DESIRED OUTCOMES:
Natural Areas, Biodiversity, and
Urban Forest
Water, Air and Soil
Green Infrastructure
Indicator Performance Indicator Description
Park Land Area Hectares of park land by type of park
Trees Planted by City Number of street trees and park trees planted per year, on public property (5 year
average)
Tree Canopy Cover Percentage of City land covered by tree canopy, not including the Agricultural Land
Reserve
Green Infrastructure Network Number of acres in the Green Infrastructure Network (GIN) that are protected as City
parkland
City Environmental Programs Participation Hours of participation in city-run environmental programs, by program type
Air Quality Fine Particulate Matter (PM2.5)
Water Quality in Streams Percentage of watercourses meeting Provincial water quality standards
Indicator Performance Indicator Description
Online Registrations for City Programs Number of Parks, Recreation and Culture management system program registrations
initiated online
Registration in City Programs Registration in programs for children, youth, and adults offered by the City’s Parks,
Recreation and Culture Department and Surrey Public Libraries
Community Gardens Number of garden plots in community gardens on City lands
Availability of Doctors Doctors per 100,000 residents for Surrey, on par with other major urban centres in the
Province
Current Smokers Percentage of population 12 years and older that are daily or occasional smokers
HEALTH AND WELLNESS DESIRED OUTCOMES:
Health Services and Programs
Wellness and Recreation
Food Accessibility and Capacity
Building
Indicator Performance Indicator Description
Child Poverty Percentage of children and youth living in families with income below the Low Income
Cut Off (LICO)
City Volunteers Number of residents who are active and approved volunteers with the RCMP, Fire
Services, Surrey Libraries, Emergency Program, and PRC Department
Early Childhood Vulnerability
Percentage of Children that are vulnerable in at least one of these five scales: Physical
Health and Well Being; Social Competence; Emotional Maturity; Language and
Cognitive Development; Communication and General Knowledge
Licensed Child Care Spaces Licensed daycare spaces per capita (0-12 year olds)
Core Housing Need Tenant-occupied households spending 30% or more of household income on gross
rent
Social Housing Units Number of Non-Market Social Housing Units
Homelessness Number of homeless in Surrey
Median Income for Immigrants Measure of the economic and social well-being of Surrey's immigrant population
Diversity and Accessibility
Poverty Reduction
Housing
Age-Friendly Community
Community Pride and Engagement
Social infrastructure and Innovation
INCLUSION DESIRED OUTCOMES:
- 15 -
SUSTAINABILITY CHARTER
the future lives here. 2018-2022 Financial Plan
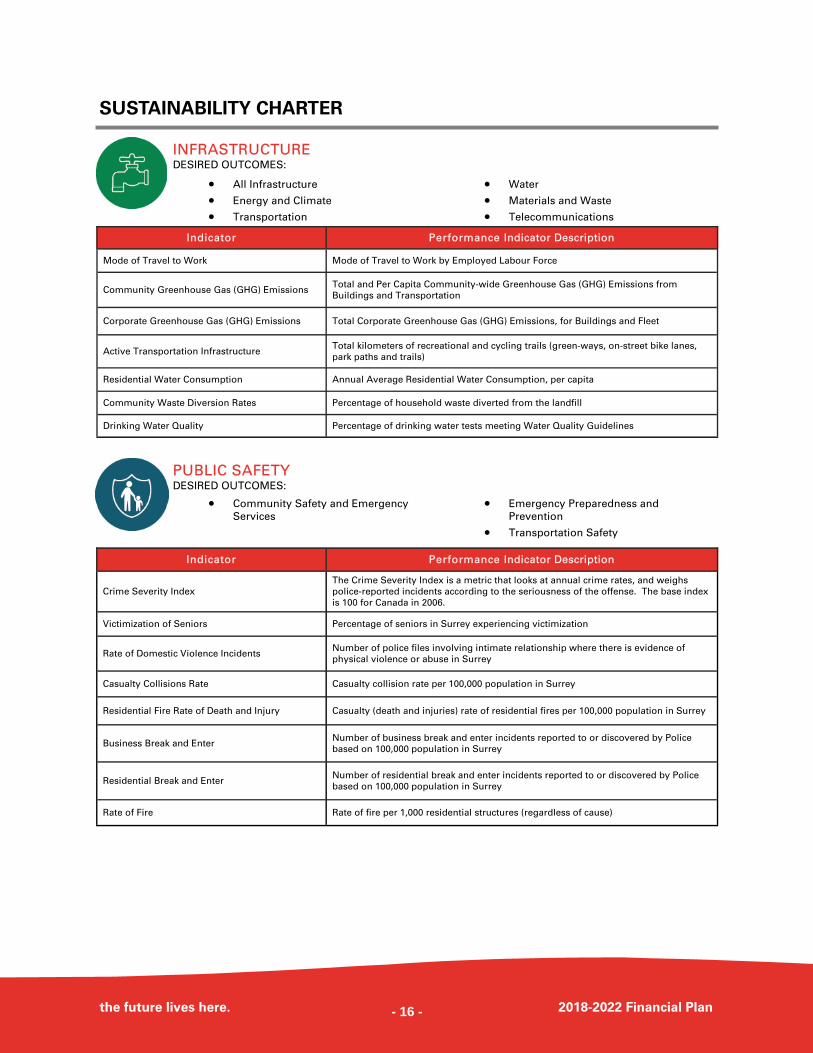
INFRASTRUCTURE DESIRED OUTCOMES:
All Infrastructure
Energy and Climate
Transportation
Water
Materials and Waste
Telecommunications
Indicator Performance Indicator Description
Mode of Travel to Work Mode of Travel to Work by Employed Labour Force
Community Greenhouse Gas (GHG) Emissions Total and Per Capita Community-wide Greenhouse Gas (GHG) Emissions from
Buildings and Transportation
Corporate Greenhouse Gas (GHG) Emissions Total Corporate Greenhouse Gas (GHG) Emissions, for Buildings and Fleet
Active Transportation Infrastructure Total kilometers of recreational and cycling trails (green-ways, on-street bike lanes,
park paths and trails)
Residential Water Consumption Annual Average Residential Water Consumption, per capita
Community Waste Diversion Rates Percentage of household waste diverted from the landfill
Drinking Water Quality Percentage of drinking water tests meeting Water Quality Guidelines
PUBLIC SAFETY DESIRED OUTCOMES:
Community Safety and Emergency
Services
Emergency Preparedness and
Prevention
Transportation Safety
Indicator Performance Indicator Description
Crime Severity Index
The Crime Severity Index is a metric that looks at annual crime rates, and weighs
police-reported incidents according to the seriousness of the offense. The base index
is 100 for Canada in 2006.
Victimization of Seniors Percentage of seniors in Surrey experiencing victimization
Rate of Domestic Violence Incidents Number of police files involving intimate relationship where there is evidence of
physical violence or abuse in Surrey
Casualty Collisions Rate Casualty collision rate per 100,000 population in Surrey
Residential Fire Rate of Death and Injury Casualty (death and injuries) rate of residential fires per 100,000 population in Surrey
Business Break and Enter Number of business break and enter incidents reported to or discovered by Police
based on 100,000 population in Surrey
Residential Break and Enter Number of residential break and enter incidents reported to or discovered by Police
based on 100,000 population in Surrey
Rate of Fire Rate of fire per 1,000 residential structures (regardless of cause)
- 16 -
EXECUTIVE OVERVIEW
FINANCIAL PLANNING PROCESS
the future lives here. 2018-2022 Financial Plan
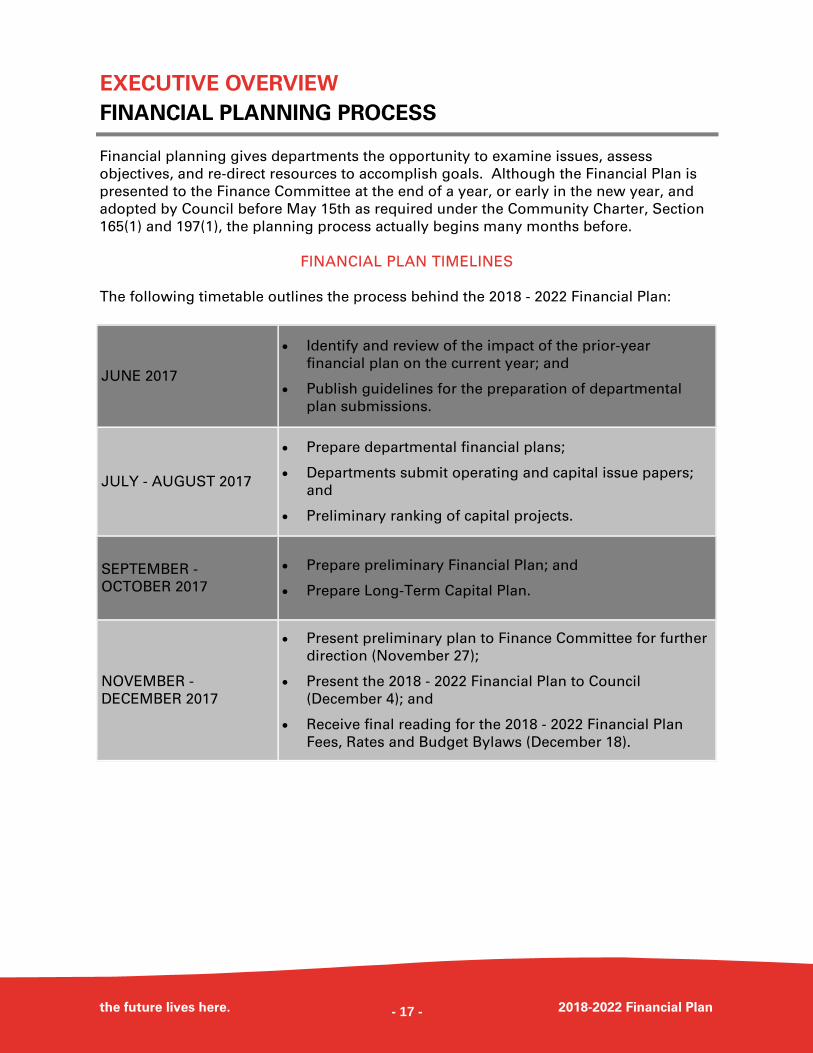
Financial planning gives departments the opportunity to examine issues, assess
objectives, and re-direct resources to accomplish goals. Although the Financial Plan is
presented to the Finance Committee at the end of a year, or early in the new year, and
adopted by Council before May 15th as required under the Community Charter, Section
165(1) and 197(1), the planning process actually begins many months before.
FINANCIAL PLAN TIMELINES
The following timetable outlines the process behind the 2018 - 2022 Financial Plan:
JUNE 2017
Identify and review of the impact of the prior-year
financial plan on the current year; and
Publish guidelines for the preparation of departmental
plan submissions.
JULY - AUGUST 2017
Prepare departmental financial plans;
Departments submit operating and capital issue papers;
and
Preliminary ranking of capital projects.
SEPTEMBER -
OCTOBER 2017
Prepare preliminary Financial Plan; and
Prepare Long-Term Capital Plan.
NOVEMBER -
DECEMBER 2017
Present preliminary plan to Finance Committee for further
direction (November 27);
Present the 2018 - 2022 Financial Plan to Council
(December 4); and
Receive final reading for the 2018 - 2022 Financial Plan
Fees, Rates and Budget Bylaws (December 18).
- 17 -
FINANCIAL PLANNING PROCESS
the future lives here. 2018-2022 Financial Plan
The City uses an accrual basis for
budgeting that reports income when
earned and expenses when incurred,
matching income with their related
expenses.
In addition, the Financial Plan has been
prepared based on the Legislative British
Columbia Community Charter which
differs from the City’s Audited Financial
Statements that are prepared under Public
Sector Accounting Board (PSAB)
guidelines for financial statement
presentation. Those differences include:
Reporting for expenditures, including
all transfers to other funds and
authorities; and
The treatment of capital expenditures,
which differ from the financial
statements where all capital
expenditures are capitalized as assets.
Other Financial Planning policies include:
The Consolidated Financial Plan
includes all components and
represents all revenues and
expenditures that the City intends to
make for the period; and
Appropriated surplus monies
potentially available for appropriation
by individual departments are
included in the respective
departmental financial plans.
Appropriated surplus funds that are
not retained by individual departments
are recorded separately.
FINANCIAL PLANNING PRINCIPLES
This Financial Plan has been prepared
using the Principles of Municipal
Governance as outlined in the Community
Charter, Section 1. The rationale for
incorporating a set of principles into a
decision-making process of public office is
twofold. First, principles provide structure
and commonality in situations where the
interests and objectives of affected parties
differ. Second, explicit reference to
principles makes the political decision
process more comprehensible, which in
turn fosters a greater degree of public
confidence.
The City has developed a set of principles
to guide the financial planning process and
the preparation of operating and capital
plans. Individually, each principle
represents an objective, which is deemed
to have positive consequences for the City
over the long-term. Collectively, these
principles provide a reference for aligning
financial planning objectives with other
City objectives, thereby helping to preserve
the ongoing financial health of the City.
These principles are of two types: those
related to both the Capital and the
Operating Financial Plan and those specific
to the Operating Plan.
BASIS OF BUDGETING AND FINANCIAL PLANNING POLICIES
AMENDMENT TO THE FINANCIAL PLAN AFTER THE FINAL ADOPTION
In certain instances, Financial Plan appropriations may be amended after Council has
adopted the Plan. Any changes made after the Financial Plan Bylaw has been adopted
require a Financial Plan Revision Bylaw.
Changes are tracked during the year and new spending is temporarily funded through
contingencies. At the end of the year, Council adopts a revised Financial Plan Bylaw to
incorporate these changes.
- 18 -
FINANCIAL PLANNING PROCESS
the future lives here. 2018-2022 Financial Plan
Reflect the goals of corporate and
departmental strategic plans.
The departmental strategic and financial
plans should include capital projects and
operating programs which are consistent
with Council-approved strategic plans.
Balance citizens' service expectations with
their ability and willingness to pay.
The departmental strategic and financial
plans should include capital projects and
operating programs which balance the
expectations of citizens for services with
their ability and willingness to pay for
those services.
Provide funding for ongoing maintenance
and asset replacement.
The departmental strategic and financial
plans should incorporate into the cost of
capital projects, the costs associated with
ongoing maintenance and replacement of
investments in facilities, equipment and
infrastructure.
Encourage cost-effective service delivery.
The departmental strategic and financial
plans should support capital projects and
operating programs which deliver cost-
effective services through
entrepreneurship, creativity, and
innovation.
Target total debt service charges to below
five percent of expenditures.
The departmental strategic and financial
plans should strive to keep the annual
cost of total debt servicing below five
percent of the City’s annual expenditures.
Strive to finance capital projects on a
‘pay-as-you-go’ basis.
The Departmental Strategic and Financial
Plans should assume that capital projects
be financed without taking on debt, unless
it is required in support of an exceptional
opportunity.
Charge new development the appropriate
share of new infrastructure costs.
The Departmental Strategic and Financial
Plans should finance through
development cost charges an appropriate
proportion of the cost of new
development related to capital
infrastructure, as determined by Council
Policy.
PRINCIPLES FOR BOTH CAPITAL & OPERATING FINANCIAL PLANNING
Source: City of Surrey Report to Citizens 2017
- 19 -
FINANCIAL PLANNING PROCESS
the future lives here. 2018-2022 Financial Plan
Ensure that current revenues support
current programs.
The Financial Plan should provide that
current programs are funded from current
revenues and that reserves are used only
as a temporary balancing measure. Any
reserves that are used to balance the
Operating Financial Plan should be
subsequently replenished.
Reward cost-effective innovations.
The Financial Plan should reward cost-
saving initiatives through a "save and
invest" philosophy rather than a “spend it
or lose it” approach. This philosophy
allows City departments to reinvest their
savings from innovation.
Maintain appropriate level of reserves as
determined by Council.
The Financial Plan should allocate an
appropriate level of funds to reserves in
order to maintain services throughout
economic cycles. Specifically, the
Financial Plan should:
Provide adequate funding for
unforeseen costs and revenue
reductions;
Provide bridge financing for capital
projects; and
Allow the City to take advantage of
market opportunities.
Council will determine the appropriate
level of these reserves.
PRINCIPLES SPECIFIC TO OPERATING FINANCIAL PLANNING
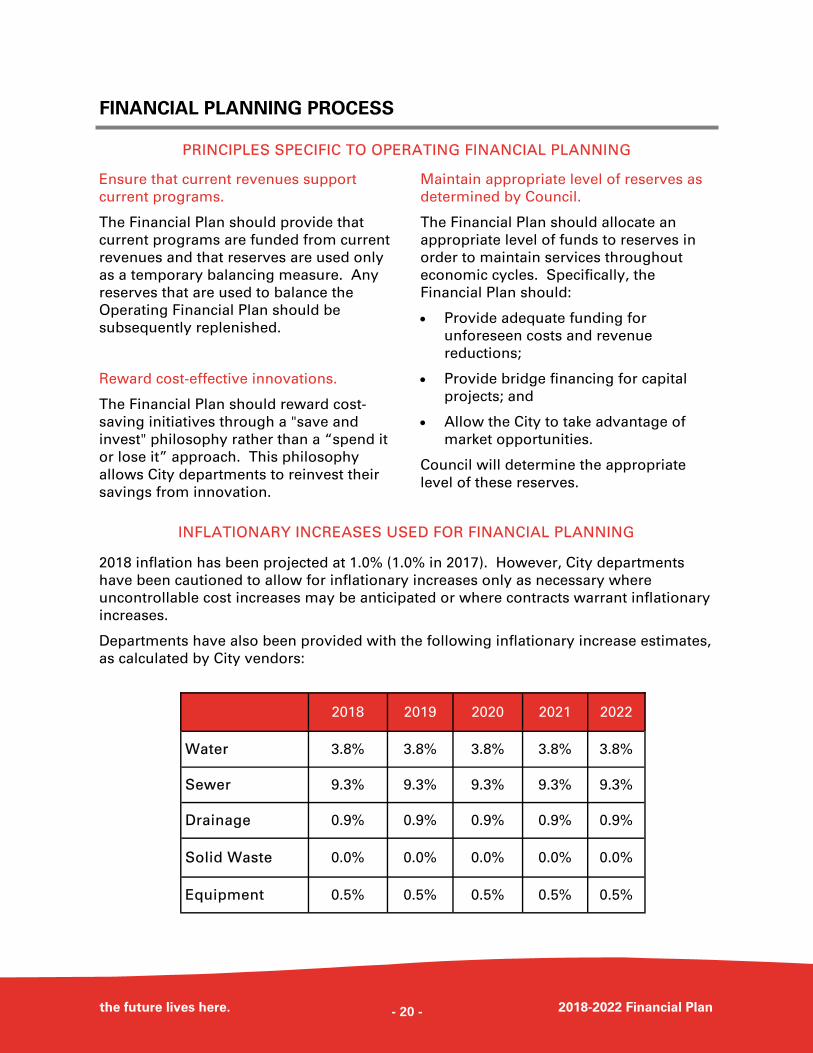
INFLATIONARY INCREASES USED FOR FINANCIAL PLANNING
2018 inflation has been projected at 1.0% (1.0% in 2017). However, City departments
have been cautioned to allow for inflationary increases only as necessary where
uncontrollable cost increases may be anticipated or where contracts warrant inflationary
increases.
Departments have also been provided with the following inflationary increase estimates,
as calculated by City vendors:
2018 2019 2020 2021 2022
Water 3.8% 3.8% 3.8% 3.8% 3.8%
Sewer 9.3% 9.3% 9.3% 9.3% 9.3%
Drainage 0.9% 0.9% 0.9% 0.9% 0.9%
Solid Waste 0.0% 0.0% 0.0% 0.0% 0.0%
Equipment 0.5% 0.5% 0.5% 0.5% 0.5%
- 20 -
COMMUNITY PROFILE
SURREY’S HISTORY
the future lives here. 2018-2022 Financial Plan
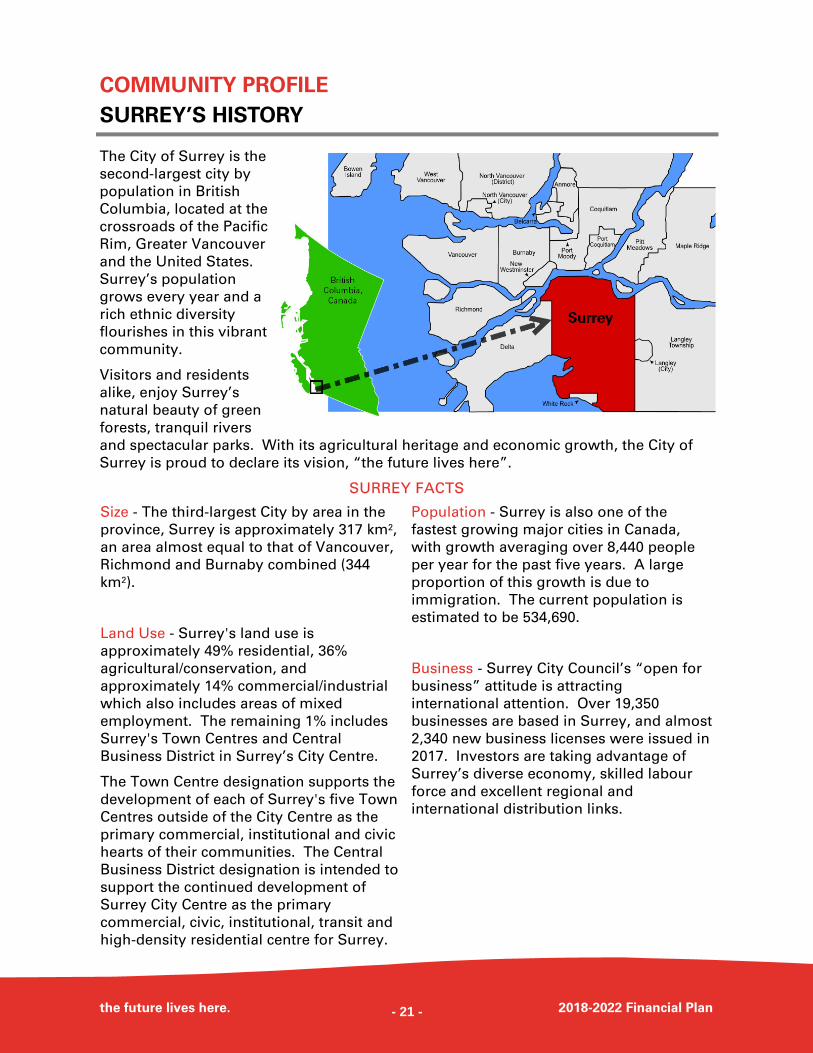
The City of Surrey is the
second-largest city by
population in British
Columbia, located at the
crossroads of the Pacific
Rim, Greater Vancouver
and the United States.
Surrey’s population
grows every year and a
rich ethnic diversity
flourishes in this vibrant
community.
Visitors and residents
alike, enjoy Surrey’s
natural beauty of green
forests, tranquil rivers
and spectacular parks. With its agricultural heritage and economic growth, the City of
Surrey is proud to declare its vision, “the future lives here”.
SURREY FACTS
Size - The third-largest City by area in the
province, Surrey is approximately 317 km2,
an area almost equal to that of Vancouver,
Richmond and Burnaby combined (344
km2).
Land Use - Surrey's land use is
approximately 49% residential, 36%
agricultural/conservation, and
approximately 14% commercial/industrial
which also includes areas of mixed
employment. The remaining 1% includes
Surrey's Town Centres and Central
Business District in Surrey’s City Centre.
The Town Centre designation supports the
development of each of Surrey's five Town
Centres outside of the City Centre as the
primary commercial, institutional and civic
hearts of their communities. The Central
Business District designation is intended to
support the continued development of
Surrey City Centre as the primary
commercial, civic, institutional, transit and
high-density residential centre for Surrey.
Population - Surrey is also one of the
fastest growing major cities in Canada,
with growth averaging over 8,440 people
per year for the past five years. A large
proportion of this growth is due to
immigration. The current population is
estimated to be 534,690.
Business - Surrey City Council’s “open for
business” attitude is attracting
international attention. Over 19,350
businesses are based in Surrey, and almost
2,340 new business licenses were issued in
2017. Investors are taking advantage of
Surrey’s diverse economy, skilled labour
force and excellent regional and
international distribution links.
- 21 -
SURREY’S HISTORY
the future lives here. 2018-2022 Financial Plan
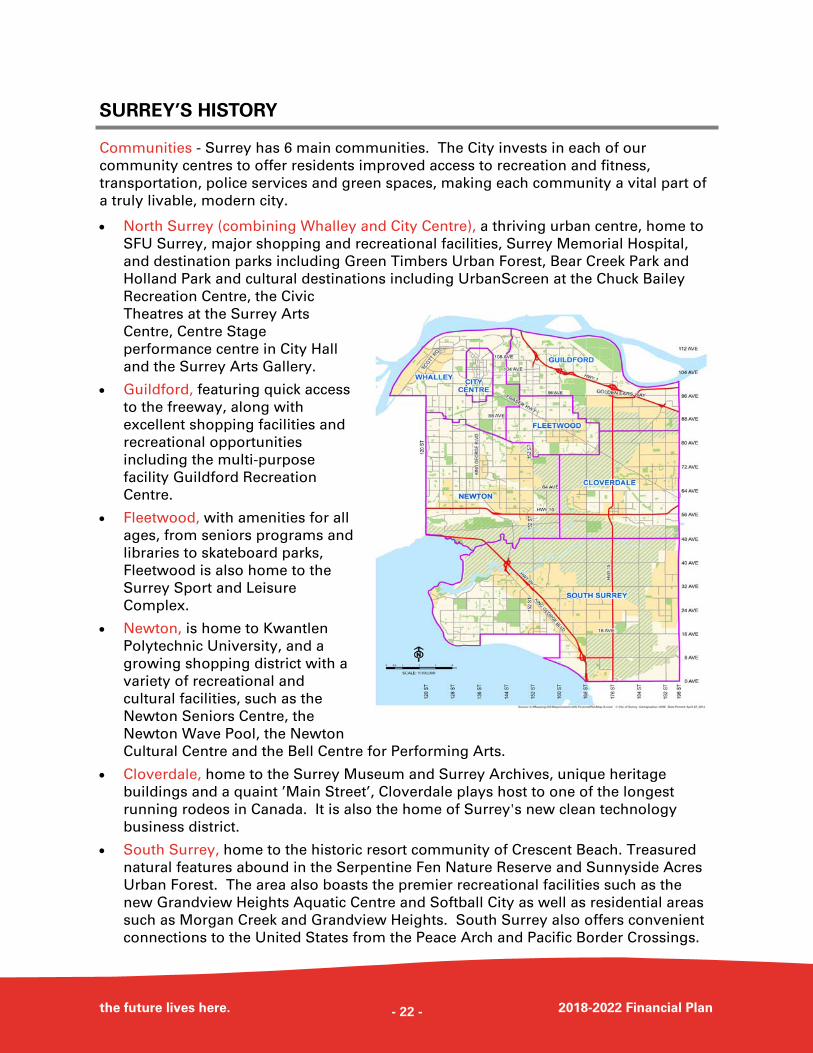
Communities - Surrey has 6 main communities. The City invests in each of our
community centres to offer residents improved access to recreation and fitness,
transportation, police services and green spaces, making each community a vital part of
a truly livable, modern city.
North Surrey (combining Whalley and City Centre), a thriving urban centre, home to
SFU Surrey, major shopping and recreational facilities, Surrey Memorial Hospital,
and destination parks including Green Timbers Urban Forest, Bear Creek Park and
Holland Park and cultural destinations including UrbanScreen at the Chuck Bailey
Recreation Centre, the Civic
Theatres at the Surrey Arts
Centre, Centre Stage
performance centre in City Hall
and the Surrey Arts Gallery.
Guildford, featuring quick access
to the freeway, along with
excellent shopping facilities and
recreational opportunities
including the multi-purpose
facility Guildford Recreation
Centre.
Fleetwood, with amenities for all
ages, from seniors programs and
libraries to skateboard parks,
Fleetwood is also home to the
Surrey Sport and Leisure
Complex.
Newton, is home to Kwantlen
Polytechnic University, and a
growing shopping district with a
variety of recreational and
cultural facilities, such as the
Newton Seniors Centre, the
Newton Wave Pool, the Newton
Cultural Centre and the Bell Centre for Performing Arts.
Cloverdale, home to the Surrey Museum and Surrey Archives, unique heritage
buildings and a quaint ’Main Street’, Cloverdale plays host to one of the longest
running rodeos in Canada. It is also the home of Surrey's new clean technology
business district.
South Surrey, home to the historic resort community of Crescent Beach. Treasured
natural features abound in the Serpentine Fen Nature Reserve and Sunnyside Acres
Urban Forest. The area also boasts the premier recreational facilities such as the
new Grandview Heights Aquatic Centre and Softball City as well as residential areas
such as Morgan Creek and Grandview Heights. South Surrey also offers convenient
connections to the United States from the Peace Arch and Pacific Border Crossings.
- 22 -
SURREY’S HISTORY
the future lives here. 2018-2022 Financial Plan
CITY SERVICES
In 2017, the City of Surrey collected $371 million in taxation revenue. These funds are
used to support City services such as:
15 fire halls and over 386 fire fighters,
of which over 25 are volunteers;
835 RCMP members and 5 community
policing stations, plus a newly
established Surrey Outreach Team
trailer in the 135A Street area;
9 library branches including the state-of
-the-art library built at City Centre;
11 community recreation centres that
include gymnasiums, fitness rooms and
multi-purpose rooms; 6 indoor pools
and 8 outdoor pools; 5 ice arenas
providing 8 sheets of ice; 8 skate parks
including 2 covered youth parks; 6 drop
-in youth lounges and 1 seniors centre
and seniors programming in all
community centres;
Surrey Art Gallery is a contemporary art
museum with exhibit halls, visual arts
studios, TechLab, digital media gallery
and the City’s permanent art collection;
Surrey Civic Theatres including the
Main Stage theatre with a seating
capacity of 402 and Studio Theatre with
a seating capacity of 130 at the Surrey
Arts Centre; and the Centre Stage
performance venue at City Hall with a
seating capacity of 200;
Over 70 public art installations are
distributed across Surrey in civic
facilities and parks including the Urban
Screen venue;
3 community arts facilities including
Newton Cultural Centre, which houses
the Arts Council of Surrey; the Parkway
Studios which houses the Royal
Canadian Theatre Company and
Streetrich Hip Hop Society; and South
Surrey Recreation and Arts Centre
which houses the Semiahmoo Arts
Council;
Surrey Museum hosts a changing,
interactive kids gallery, textile studio,
history exhibits and cultural events.
Civic Archives provides access to local
government records and community
collections including extensive
photographic records; Historic Stewart
Farm includes 8 designated heritage
buildings;
Develop and maintain 7,582 acres of
parkland which include 243 athletic
fields, 16 synthetic turf fields, 3 track
and field complexes, 77 public tennis
courts, 290 kilometres of trails and
paths and 2 large urban forest parks;
Improvements to the various
transportation routes within the City
including road widening, median
beautification, construction of
pedestrian/cycling overpasses and large
scale transportation projects;
Many water, sewer, drainage, and
dyking improvements and upgrades;
and
Transforming Surrey from a suburban
community to a thriving urban
environment with national and
international opportunities for business
and tourism.
- 23 -
SURREY’S HISTORY
the future lives here. 2018-2022 Financial Plan
1879 Surrey incorporated as a district
municipality consisting of 35 property
owners
1881 First Town Hall built at Surrey Centre
1904 Fraser River Railway Bridge from
Brownsville to New Westminster opened
1929 Surrey Leader newspaper first published
1937 Patullo Bridge opened
1940 King George Boulevard (Highway) officially
opened
1948 Surrey Parks Commission established
1962 New Municipal Hall constructed at
Highway 10 and 142 Street
1964 Port Mann Bridge opened
1971 Surrey’s population reaches 96,000
1990 The SkyTrain Expo Line expands from New
Westminster to Surrey
1993 Surrey celebrated becoming a City
1996 Surrey’s population surpassed 300,000
2001 Surrey became the 11th largest City in
Canada and Surrey RCMP celebrated 50
years of service to the City
2005 Surrey citizens elected its first female
Mayor and its first Indo-Canadian
Councillor
2008 Surrey awarded the Cultural Capital of
Canada designation
2009 Surrey adopted a new corporate image
with a new logo—“the future lives here”
2010 Surrey served as an official venue for the
2010 Winter Olympics
2011 First major Canadian City to host an electric
vehicle charging station at City Hall
2012 RCMP “E” Division headquarters was
relocated to the Green Timbers facility
SURREY HISTORY IN BRIEF
1881—First town hall built
1940—King George Highway opens
1990—SkyTrain expands to Surrey
- 24 -
SURREY’S HISTORY
the future lives here. 2018-2022 Financial Plan
2013 The Real Estate Investment Network (REIN)
named Surrey the No. 1 spot for ‘Top British
Columbia Investment Towns’ for the fourth
consecutive year
2014 The new Surrey City Hall officially opened its
doors
The Surrey Fusion Festival was named “Best
Festival” by industry professionals
City Council adopted the Green Surrey
program, launched the “My Surrey App” and
signed a free citywide Wi-Fi agreement
2015 The world class FINA-certified Guildford
Aquatic Centre opens to the public
Surrey named top destination for starting a
small business in Metro Vancouver by
VanCity Credit Union
Surrey becomes first city in the world to
integrate “IBM Watson” technology into its
“MySurrey” mobile app
2016 Grandview Heights Aquatic Centre, the
second FINA-certified aquatic facility, opens
to the public
Surrey's state of the art Operations Centre
opens
Surrey is named one of the Top 7 Intelligent
Communities in the World for the second
consecutive year
In partnership with Metro Vancouver
Regional Parks, Surrey Bend Regional Park
opens to the public
2017 South Surrey Operations Centre completed
construction on time and opened their doors
November 2017
Construction completes at the Surrey Biofuel
Processing Facility; the first closed-loop fully-
integrated organics waste management
system in North America
2014—New City Hall opens its doors
2015— named Top Destination
for Small Business by VanCity
2016— Grandview Heights opens
2017—South Surrey
Operations Centre opens
- 25 -
COMMUNITY PROFILE
POPULATION AND GROWTH STATISTICS
the future lives here. 2018-2022 Financial Plan
Surrey is one of the fastest growing major cities in Canada, with growth averaging over
8,440 people per year for the past five years. A large proportion of this growth is due to
immigration.
Surrey's total population, as of December 2017, is estimated to be 534,690 residents.
This estimate is based on the City's residential building inventory, created using a
combination of data sources that include:
BC Assessment Authority data;
Surrey Building Permit information;
Surrey secondary suite data;
The latest GIS Orthophoto imagery; and
Surrey GIS Cadastre (lot and address) information.
The City's estimates are calibrated to the Census of Canada (including the estimated
Census undercount) every five years as this data is released.
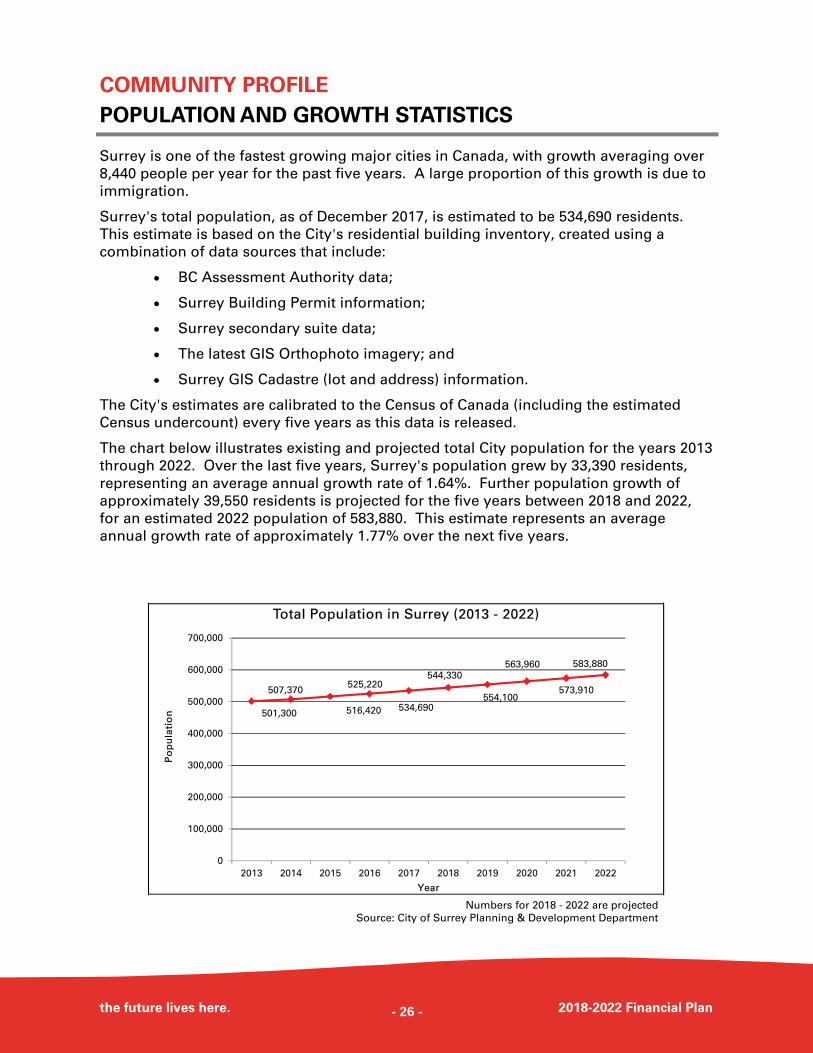
The chart below illustrates existing and projected total City population for the years 2013
through 2022. Over the last five years, Surrey's population grew by 33,390 residents,
representing an average annual growth rate of 1.64%. Further population growth of
approximately 39,550 residents is projected for the five years between 2018 and 2022,
for an estimated 2022 population of 583,880. This estimate represents an average
annual growth rate of approximately 1.77% over the next five years.
501,300
507,370
516,420
525,220
534,690
544,330
554,100
563,960
573,910
583,880
0
100,000
200,000
300,000
400,000
500,000
600,000
700,000
2013 2014 2015 2016 2017 2018 2019 2020 2021 2022
Po
pu
lati
on
Year
Total Population in Surrey (2013 - 2022)
Numbers for 2018 - 2022 are projected
Source: City of Surrey Planning & Development Department
- 26 -
POPULATION AND GROWTH STATISTICS
the future lives here. 2018-2022 Financial Plan
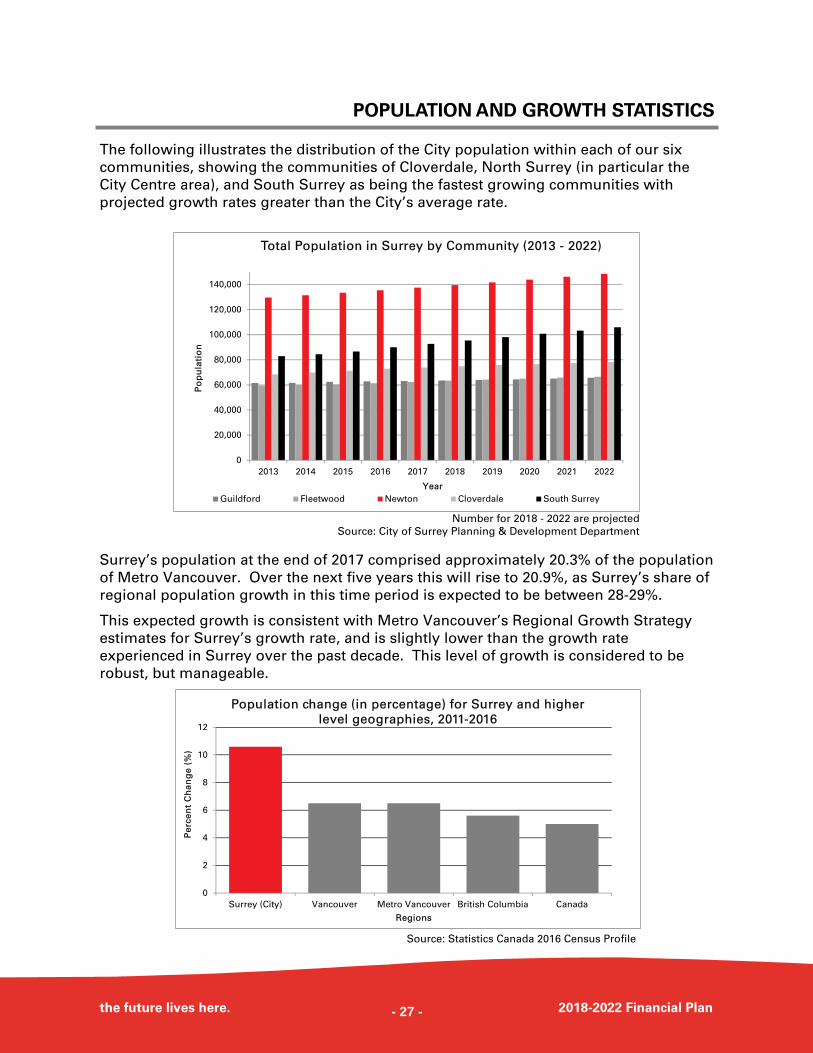
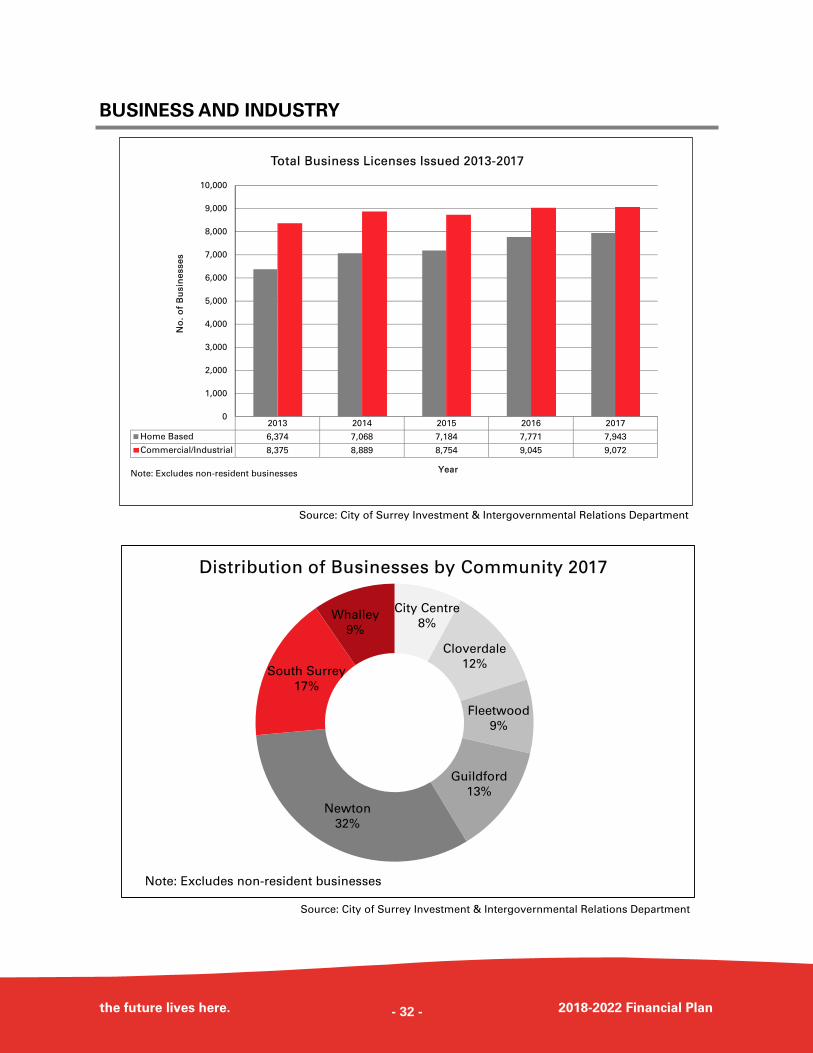
The following illustrates the distribution of the City population within each of our six
communities, showing the communities of Cloverdale, North Surrey (in particular the
City Centre area), and South Surrey as being the fastest growing communities with
projected growth rates greater than the City’s average rate.
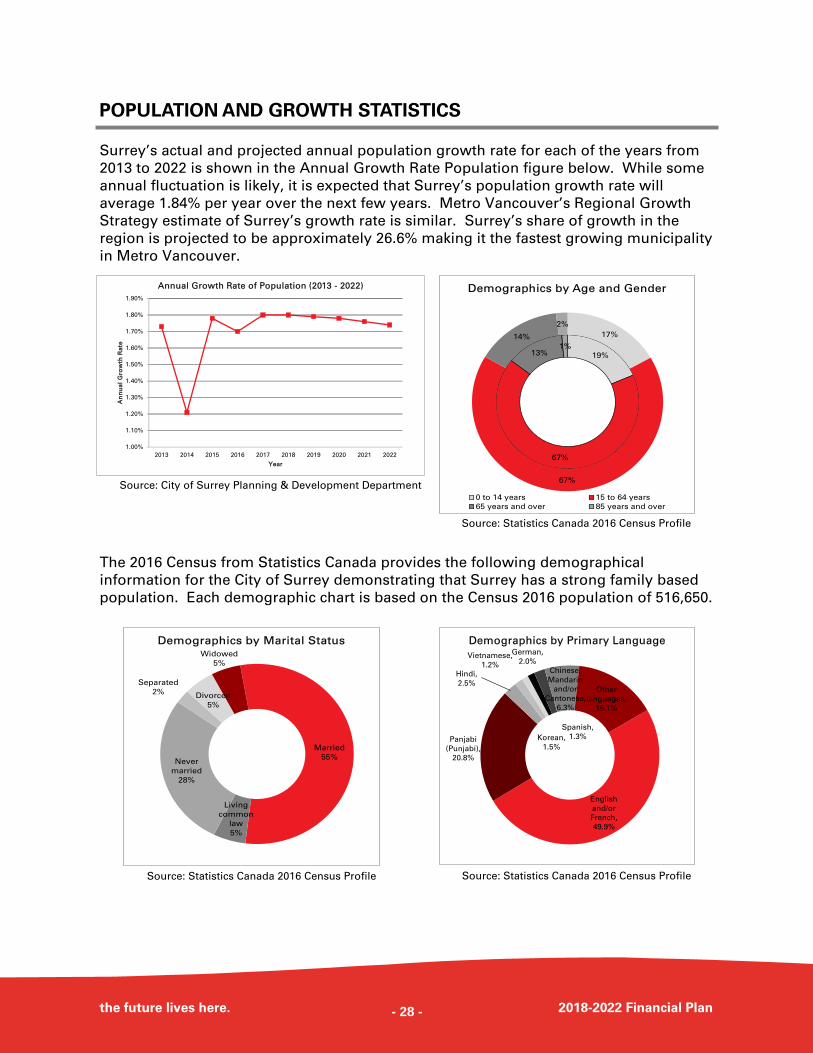
Surrey’s population at the end of 2017 comprised approximately 20.3% of the population
of Metro Vancouver. Over the next five years this will rise to 20.9%, as Surrey’s share of
regional population growth in this time period is expected to be between 28-29%.
This expected growth is consistent with Metro Vancouver’s Regional Growth Strategy
estimates for Surrey’s growth rate, and is slightly lower than the growth rate
experienced in Surrey over the past decade. This level of growth is considered to be
robust, but manageable.
Number for 2018 - 2022 are projected
Source: City of Surrey Planning & Development Department
0
2
4
6
8
10
12
Surrey (City) Vancouver Metro Vancouver British Columbia Canada
Pe
rce
nt
Ch
an
ge
(%
)
Regions
Population change (in percentage) for Surrey and higher
level geographies, 2011-2016
Source: Statistics Canada 2016 Census Profile
0
20,000
40,000
60,000
80,000
100,000
120,000
140,000
2013 2014 2015 2016 2017 2018 2019 2020 2021 2022
Po
pu
lati
on
Year
Total Population in Surrey by Community (2013 - 2022)
Guildford Fleetwood Newton Cloverdale South Surrey
- 27 -
POPULATION AND GROWTH STATISTICS
the future lives here. 2018-2022 Financial Plan
Surrey’s actual and projected annual population growth rate for each of the years from
2013 to 2022 is shown in the Annual Growth Rate Population figure below. While some
annual fluctuation is likely, it is expected that Surrey’s population growth rate will
average 1.84% per year over the next few years. Metro Vancouver’s Regional Growth
Strategy estimate of Surrey’s growth rate is similar. Surrey’s share of growth in the
region is projected to be approximately 26.6% making it the fastest growing municipality
in Metro Vancouver.
The 2016 Census from Statistics Canada provides the following demographical
information for the City of Surrey demonstrating that Surrey has a strong family based
population. Each demographic chart is based on the Census 2016 population of 516,650.
Source: City of Surrey Planning & Development Department
1.00%
1.10%
1.20%
1.30%
1.40%
1.50%
1.60%
1.70%
1.80%
1.90%
2013 2014 2015 2016 2017 2018 2019 2020 2021 2022
An
nu
al
Gro
wth
Ra
te
Year
Annual Growth Rate of Population (2013 - 2022)
19%
67%
13%1%
17%
67%
14%
2%
Demographics by Age and Gender
0 to 14 years 15 to 64 years
65 years and over 85 years and over
Married
55%
Living
common
law
5%
Never
married
28%
Separated
2%Divorced
5%
Widowed
5%
Demographics by Marital Status
English
and/or
French,
49.9%
Panjabi
(Punjabi),
20.8%
Hindi,
2.5%
Korean,
1.5%
Vietnamese,
1.2%
Spanish,
1.3%
German,
2.0%
Chinese,
Mandarin
and/or
Cantonese,
6.3%
Other
languages,
15.1%
Demographics by Primary Language
Source: Statistics Canada 2016 Census Profile
Source: Statistics Canada 2016 Census Profile Source: Statistics Canada 2016 Census Profile
- 28 -
COMMUNITY PROFILE
BUSINESS AND INDUSTRY
the future lives here. 2018-2022 Financial Plan
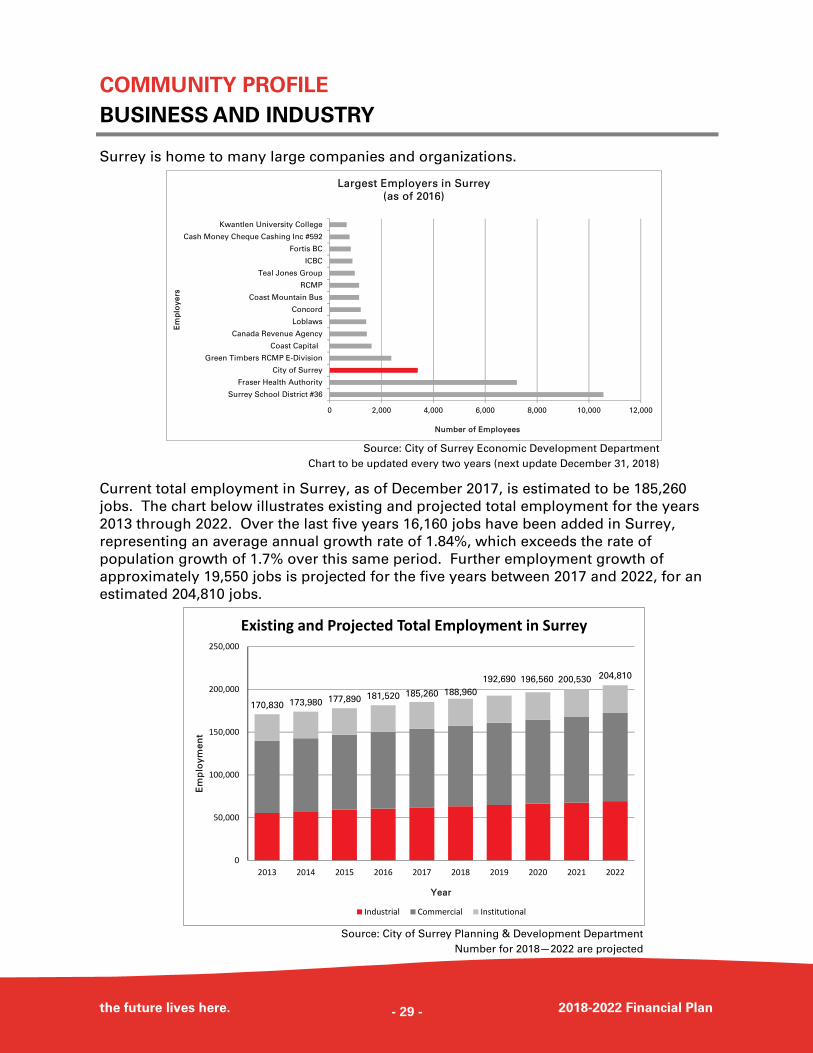
Surrey is home to many large companies and organizations.
Current total employment in Surrey, as of December 2017, is estimated to be 185,260
jobs. The chart below illustrates existing and projected total employment for the years
2013 through 2022. Over the last five years 16,160 jobs have been added in Surrey,
representing an average annual growth rate of 1.84%, which exceeds the rate of
population growth of 1.7% over this same period. Further employment growth of
approximately 19,550 jobs is projected for the five years between 2017 and 2022, for an
estimated 204,810 jobs.
Source: City of Surrey Economic Development Department
Chart to be updated every two years (next update December 31, 2018)
Source: City of Surrey Planning & Development Department
Number for 2018—2022 are projected
170,830 173,980 177,890 181,520 185,260 188,960
192,690 196,560 200,530 204,810
0
50,000
100,000
150,000
200,000
250,000
2013 2014 2015 2016 2017 2018 2019 2020 2021 2022
Em
plo
ym
en
t
Year
Existing and Projected Total Employment in Surrey
Industrial Commercial Institutional
0 2,000 4,000 6,000 8,000 10,000 12,000
Surrey School District #36
Fraser Health Authority
City of Surrey
Green Timbers RCMP E-Division
Coast Capital
Canada Revenue Agency
Loblaws
Concord
Coast Mountain Bus
RCMP
Teal Jones Group
ICBC
Fortis BC
Cash Money Cheque Cashing Inc #592
Kwantlen University College
Number of Employees
Em
plo
ye
rsLargest Employers in Surrey
(as of 2016)
- 29 -
BUSINESS AND INDUSTRY
the future lives here. 2018-2022 Financial Plan
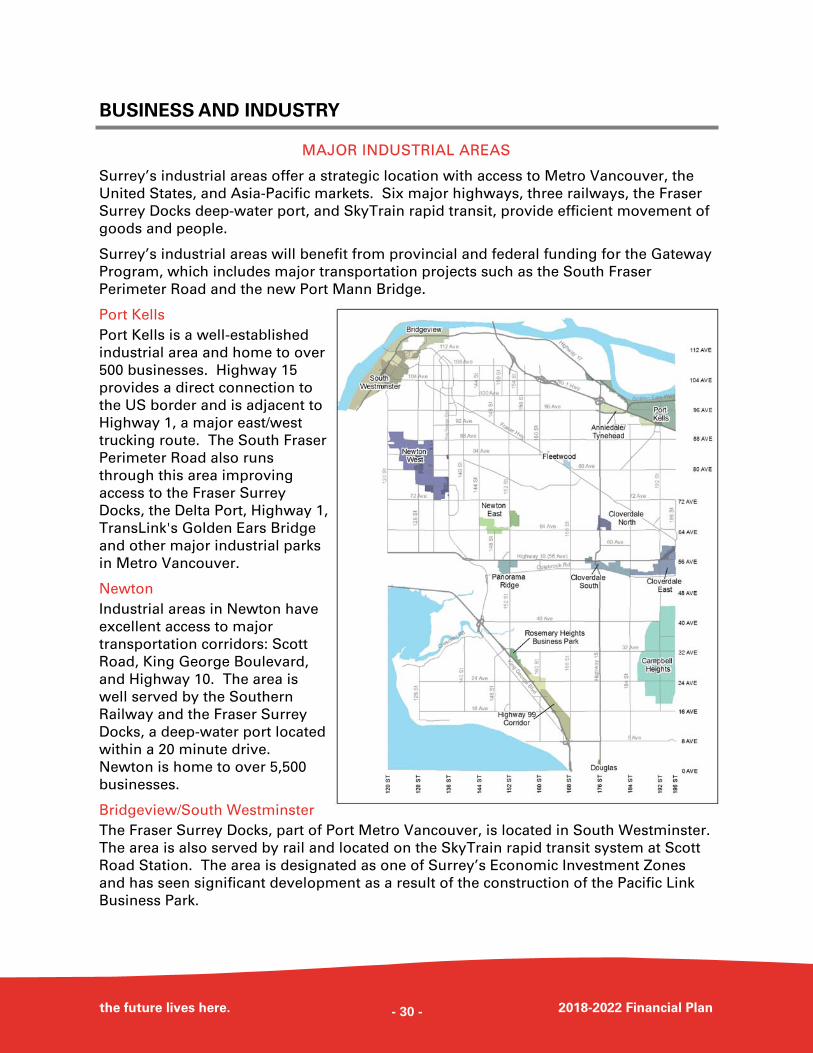
MAJOR INDUSTRIAL AREAS
Surrey’s industrial areas offer a strategic location with access to Metro Vancouver, the
United States, and Asia-Pacific markets. Six major highways, three railways, the Fraser
Surrey Docks deep-water port, and SkyTrain rapid transit, provide efficient movement of
goods and people.
Surrey’s industrial areas will benefit from provincial and federal funding for the Gateway
Program, which includes major transportation projects such as the South Fraser
Perimeter Road and the new Port Mann Bridge.
Port Kells
Port Kells is a well-established
industrial area and home to over
500 businesses. Highway 15
provides a direct connection to
the US border and is adjacent to
Highway 1, a major east/west
trucking route. The South Fraser
Perimeter Road also runs
through this area improving
access to the Fraser Surrey
Docks, the Delta Port, Highway 1,
TransLink's Golden Ears Bridge
and other major industrial parks
in Metro Vancouver.
Newton
Industrial areas in Newton have
excellent access to major
transportation corridors: Scott
Road, King George Boulevard,
and Highway 10. The area is
well served by the Southern
Railway and the Fraser Surrey
Docks, a deep-water port located
within a 20 minute drive.
Newton is home to over 5,500
businesses.
Bridgeview/South Westminster
The Fraser Surrey Docks, part of Port Metro Vancouver, is located in South Westminster.
The area is also served by rail and located on the SkyTrain rapid transit system at Scott
Road Station. The area is designated as one of Surrey’s Economic Investment Zones
and has seen significant development as a result of the construction of the Pacific Link
Business Park.
- 30 -
BUSINESS AND INDUSTRY
the future lives here. 2018-2022 Financial Plan
Cloverdale
Approximately 2,049 businesses are located in three separate industrial areas in
Cloverdale: Cloverdale North, Cloverdale East, and Cloverdale South. The areas have
excellent access to major east/west trucking routes, Highway 10 and Highway 1, as well
as south to the Pacific Highway border crossing to the US via 176th Street. Rail-served
sites are available in East Cloverdale.
Highway 99 Corridor
This prominent gateway has experienced significant commercial and residential
development over the past five years. Zoning along Highway 99 encourages a variety of
uses including industrial, business park, commercial and tourism.
Campbell Heights
The Campbell Heights Business Park is a 1,900 acre high-end business park that is
located within 20 minutes of the Pacific Highway border crossing to the US. Major
east/west trucking routes are accessible via 16 and 32 Avenues. Significant construction
has occurred since the opening of the park with over 5.8 million square feet of office,
commercial, and industrial space built between 2005 and 2015.
Rosemary Heights
Rosemary Heights benefits from excellent exposure along Highway 99 and will benefit
from substantial development along the Highway 99 Corridor to the south. Highway 99
provides access to Vancouver International Airport in 35 minutes and to the Peace Arch
border crossing, to the United States, in 15 minutes.
Douglas
This developing area is located adjacent to the Pacific Highway border crossing, the
second busiest commercial border crossing in Canada. A number of transportation and
warehousing companies are located in the area, as well as the Canada Border Services
Agency.
Source: City of Surrey Report to Citizens 2017
- 31 -
BUSINESS AND INDUSTRY
the future lives here. 2018-2022 Financial Plan
Source: City of Surrey Investment & Intergovernmental Relations Department
2013 2014 2015 2016 2017
Home Based 6,374 7,068 7,184 7,771 7,943
Commercial/Industrial 8,375 8,889 8,754 9,045 9,072
0
1,000
2,000
3,000
4,000
5,000
6,000
7,000
8,000
9,000
10,000N
o.
of
Bu
sin
esse
s
Year
Total Business Licenses Issued 2013-2017
Note: Excludes non-resident businesses
City Centre
8%
Cloverdale
12%
Fleetwood
9%
Guildford
13%
Newton
32%
South Surrey
17%
Whalley
9%
Distribution of Businesses by Community 2017
Note: Excludes non-resident businesses
Source: City of Surrey Investment & Intergovernmental Relations Department
- 32 -
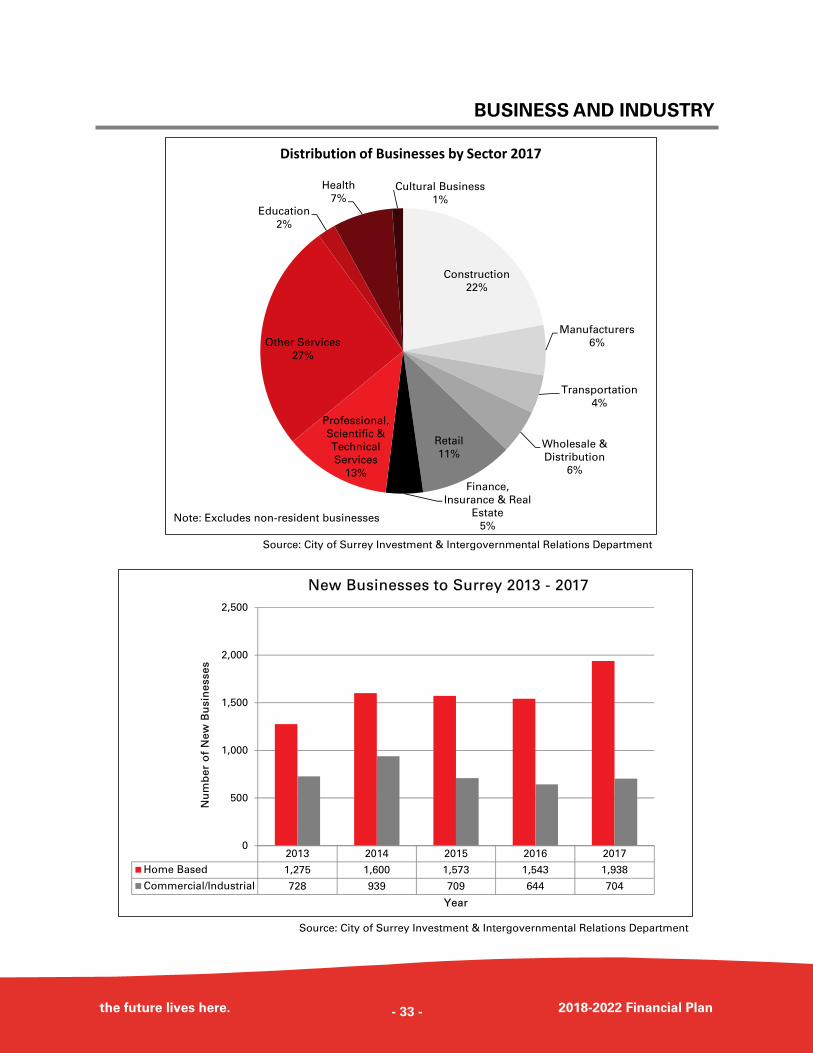
BUSINESS AND INDUSTRY
the future lives here. 2018-2022 Financial Plan
2013 2014 2015 2016 2017
Home Based 1,275 1,600 1,573 1,543 1,938
Commercial/Industrial 728 939 709 644 704
0
500
1,000
1,500
2,000
2,500
Nu
mb
er
of
Ne
w B
usin
esse
s
Year
New Businesses to Surrey 2013 - 2017
Source: City of Surrey Investment & Intergovernmental Relations Department
Construction
22%
Manufacturers
6%
Transportation
4%
Wholesale &
Distribution
6%
Retail
11%
Finance,
Insurance & Real
Estate
5%
Professional,
Scientific &
Technical
Services
13%
Other Services
27%
Education
2%
Health
7%Cultural Business
1%
Distribution of Businesses by Sector 2017
Note: Excludes non-resident businesses
Source: City of Surrey Investment & Intergovernmental Relations Department
- 33 -
COMMUNITY PROFILE
TAXES, UTILITIES AND ASSESSMENTS
the future lives here. 2018-2022 Financial Plan
TAXES
The Property Tax and Utilities section generates property tax and utility bills using the
current tax and utility rates approved by Council and the assessed market values
provided by BC Assessment. Tax rates are based on the use of the property. The
section is also responsible for collecting taxes for other authorities such as the Greater
Vancouver Regional District, the Municipal Finance Authority, BC Assessment, the BC
Ministry of Finance (School Tax), and TransLink. Each taxing authority within the region
sets its own tax rates.
The 2017 tax rates (per $1,000 of assessed value) for the most common uses are as
follows:
Residential $3.46
Business $12.44
Light Industrial $12.21
*2018 tax rates will be available in May 2018.
Surrey property taxes are due on July 2nd each year. Late payments are subject to a 5%
penalty if not paid by July 2nd and a further 5% penalty if not paid by September 2nd.
Property Tax and Utilities Section
City of Surrey
13450 104th Avenue
Surrey, BC V3T 1V8
604-591-4181
UTILITIES
Utility charges for water and sewer are billed on a utility bill, separate from utility
charges for waste collection, which are billed on the Property Tax Notice. In 1998, the
City introduced water metering to all newly constructed residential and commercial
properties. In 2000, a voluntary metering program began, which allowed for previously
built residential properties to have meters installed on request. The majority of single
family homes now have a water meter and all commercial and industrial properties are
metered. Currently, there are over 65,600 water meters installed throughout the City.
This is a giant step towards a full “user pay” system.
Water and sewer utilities for residential properties are classified in two billing categories,
metered and annual.
Metered utility accounts are billed every
four months (three times a year) and are
based on a meter consumption. Payments
are due by the 2nd of the following month
and late payments are subject to a 5%
penalty.
Annual flat rate utility accounts are billed in
late February and are due by April 2nd of
each year. Late payments are subject to a
5% penalty if not paid by April 2nd and a
further 5% penalty if not paid by July 2nd.
- 34 -
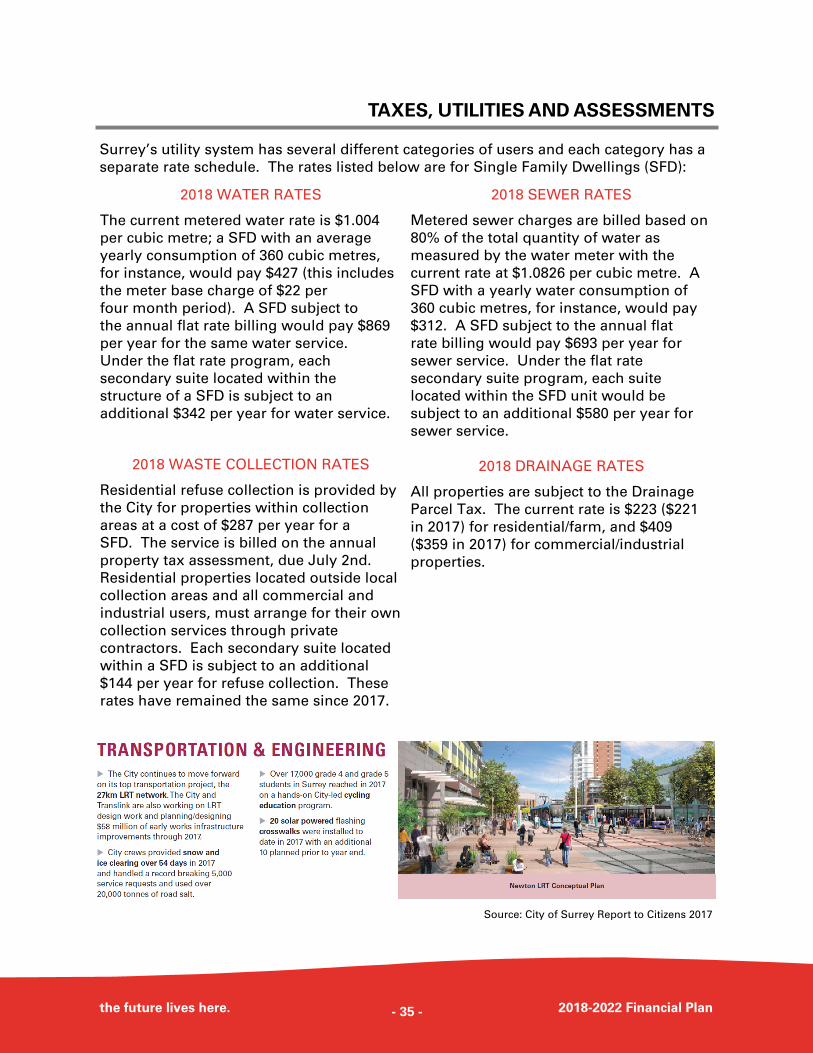
TAXES, UTILITIES AND ASSESSMENTS
the future lives here. 2018-2022 Financial Plan
Surrey’s utility system has several different categories of users and each category has a
separate rate schedule. The rates listed below are for Single Family Dwellings (SFD):
Source: City of Surrey Report to Citizens 2017
2018 WATER RATES
The current metered water rate is $1.004
per cubic metre; a SFD with an average
yearly consumption of 360 cubic metres,
for instance, would pay $427 (this includes
the meter base charge of $22 per
four month period). A SFD subject to
the annual flat rate billing would pay $869
per year for the same water service.
Under the flat rate program, each
secondary suite located within the
structure of a SFD is subject to an
additional $342 per year for water service.
2018 WASTE COLLECTION RATES
Residential refuse collection is provided by
the City for properties within collection
areas at a cost of $287 per year for a
SFD. The service is billed on the annual
property tax assessment, due July 2nd.
Residential properties located outside local
collection areas and all commercial and
industrial users, must arrange for their own
collection services through private
contractors. Each secondary suite located
within a SFD is subject to an additional
$144 per year for refuse collection. These
rates have remained the same since 2017.
2018 SEWER RATES
Metered sewer charges are billed based on
80% of the total quantity of water as
measured by the water meter with the
current rate at $1.0826 per cubic metre. A
SFD with a yearly water consumption of
360 cubic metres, for instance, would pay
$312. A SFD subject to the annual flat
rate billing would pay $693 per year for
sewer service. Under the flat rate
secondary suite program, each suite
located within the SFD unit would be
subject to an additional $580 per year for
sewer service.
2018 DRAINAGE RATES
All properties are subject to the Drainage
Parcel Tax. The current rate is $223 ($221
in 2017) for residential/farm, and $409
($359 in 2017) for commercial/industrial
properties.
- 35 -
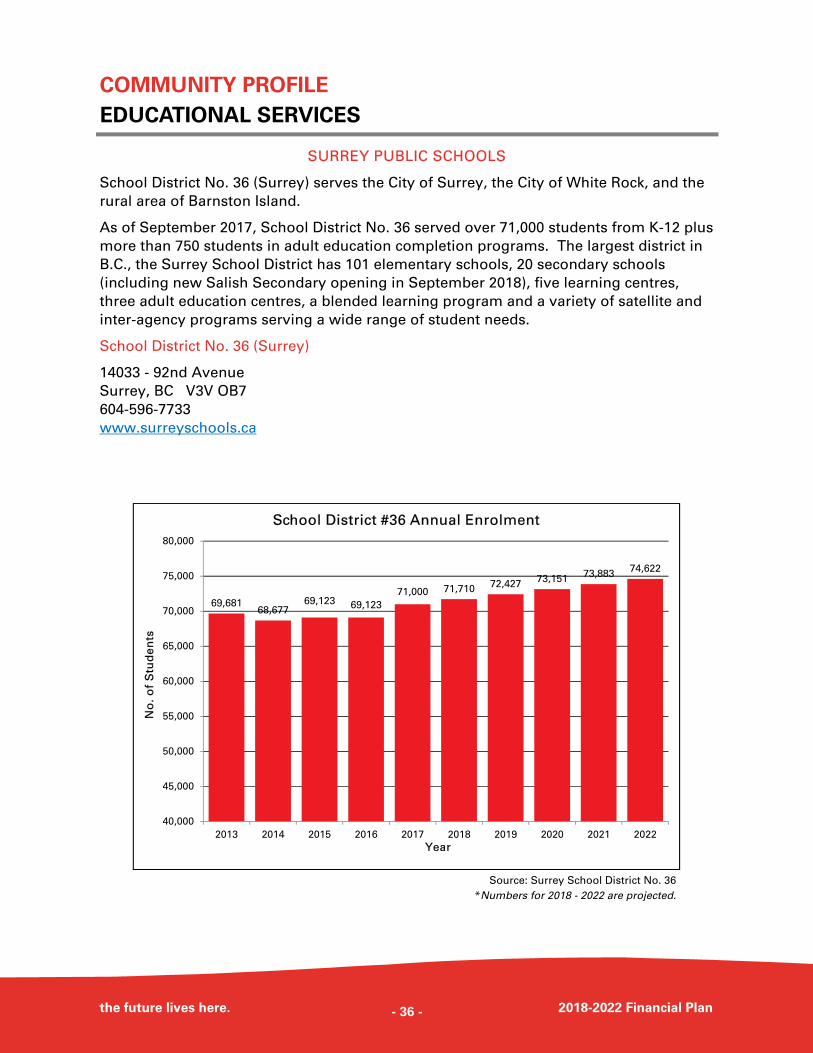
COMMUNITY PROFILE
EDUCATIONAL SERVICES
the future lives here. 2018-2022 Financial Plan
SURREY PUBLIC SCHOOLS
School District No. 36 (Surrey) serves the City of Surrey, the City of White Rock, and the
rural area of Barnston Island.
As of September 2017, School District No. 36 served over 71,000 students from K-12 plus
more than 750 students in adult education completion programs. The largest district in
B.C., the Surrey School District has 101 elementary schools, 20 secondary schools
(including new Salish Secondary opening in September 2018), five learning centres,
three adult education centres, a blended learning program and a variety of satellite and
inter-agency programs serving a wide range of student needs.
School District No. 36 (Surrey)
14033 - 92nd Avenue
Surrey, BC V3V OB7
604-596-7733
www.surreyschools.ca
Source: Surrey School District No. 36
*Numbers for 2018 - 2022 are projected.
69,68168,677
69,123 69,123
71,000 71,71072,427
73,15173,883
74,622
40,000
45,000
50,000
55,000
60,000
65,000
70,000
75,000
80,000
2013 2014 2015 2016 2017 2018 2019 2020 2021 2022
No
. o
f S
tud
en
ts
Year
School District #36 Annual Enrolment
- 36 -
EDUCATIONAL SERVICES
the future lives here. 2018-2022 Financial Plan
POST SECONDARY EDUCATION
Surrey is home to various post-secondary institutions including universities, polytechnic
institutions, and trades and technology training facilities.
The following universities are easily accessed by Surrey residents via transit or by
vehicle:
Kwantlen Polytechnic University
Maintains two of its four campuses in
Surrey. The additional campuses, easily
accessed via transit or vehicle, are located
in Langley and Richmond.
Surrey Campus
12666 - 72nd Avenue
Surrey, BC V3W 2M8
604-599-2000
Cloverdale Campus
5500 - 180th Street
Surrey, BC V3S 4K5
604-599-2000
www.kwantlen.bc.ca
Simon Fraser University (SFU)
Maintains one of its three campuses in
Surrey.
Surrey Campus
#250, 13450 - 102nd Avenue
Surrey, BC V3T 0A3
778-782-7400
www.sfu.ca
University of British Columbia – Point
Grey
2329 West Mall
Vancouver, BC V6T 1Z4
604-822-2211
www.ubc.ca
(Additional campuses located at Robson
Square and Great Northern Way.)
Simon Fraser University – Burnaby
Mountain Campus
8888 University Drive
Burnaby, BC V5A 1S6
778-782-3111
www.sfu.ca
(Additional campus located in Downtown
Vancouver.)
Trinity Western University
7600 Glover Road
Langley, BC V2Y 1Y1
604-888-7511
www.twu.ca
British Columbia Institute of Technology
3700 Willingdon Avenue
Burnaby, BC V5G 3H2
604-434-5734
www.bcit.ca
(BCIT has five main campuses and 9
satellite campuses.)
- 37 -
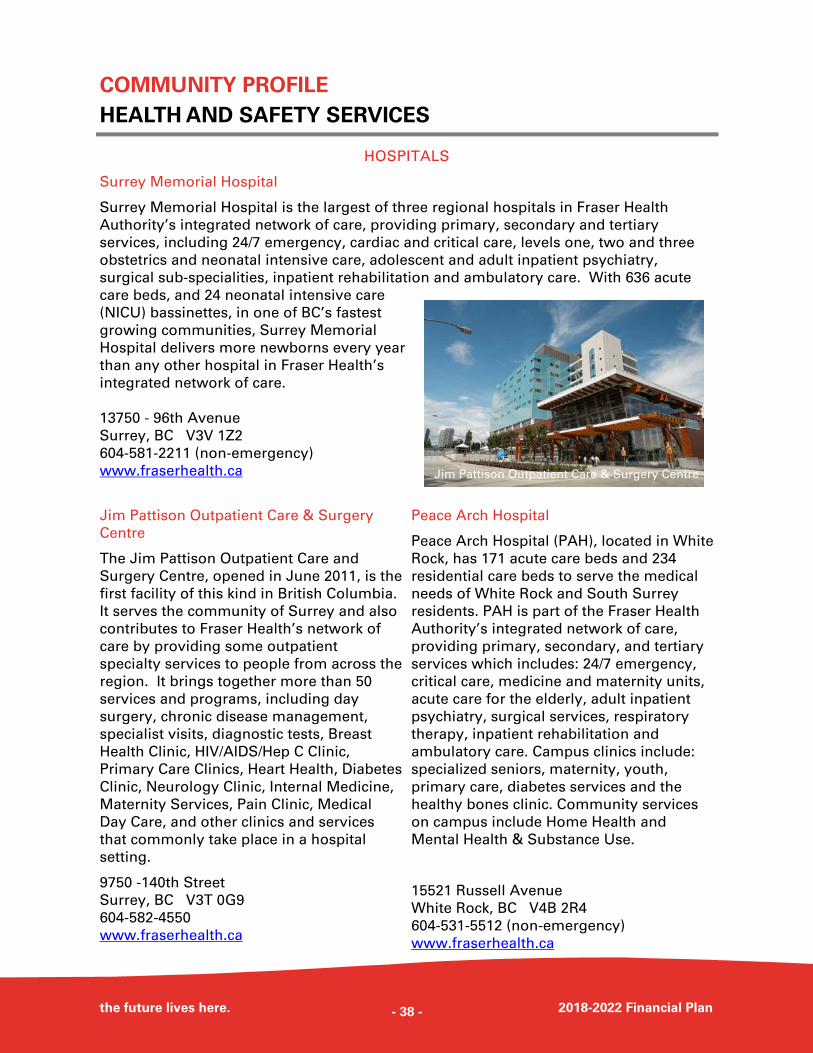
COMMUNITY PROFILE
HEALTH AND SAFETY SERVICES
the future lives here. 2018-2022 Financial Plan
HOSPITALS
Surrey Memorial Hospital
Surrey Memorial Hospital is the largest of three regional hospitals in Fraser Health
Authority’s integrated network of care, providing primary, secondary and tertiary
services, including 24/7 emergency, cardiac and critical care, levels one, two and three
obstetrics and neonatal intensive care, adolescent and adult inpatient psychiatry,
surgical sub-specialities, inpatient rehabilitation and ambulatory care. With 636 acute
care beds, and 24 neonatal intensive care
(NICU) bassinettes, in one of BC’s fastest
growing communities, Surrey Memorial
Hospital delivers more newborns every year
than any other hospital in Fraser Health’s
integrated network of care.
13750 - 96th Avenue
Surrey, BC V3V 1Z2
604-581-2211 (non-emergency)
www.fraserhealth.ca
Jim Pattison Outpatient Care & Surgery
Centre
The Jim Pattison Outpatient Care and
Surgery Centre, opened in June 2011, is the
first facility of this kind in British Columbia.
It serves the community of Surrey and also
contributes to Fraser Health’s network of
care by providing some outpatient
specialty services to people from across the
region. It brings together more than 50
services and programs, including day
surgery, chronic disease management,
specialist visits, diagnostic tests, Breast
Health Clinic, HIV/AIDS/Hep C Clinic,
Primary Care Clinics, Heart Health, Diabetes
Clinic, Neurology Clinic, Internal Medicine,
Maternity Services, Pain Clinic, Medical
Day Care, and other clinics and services
that commonly take place in a hospital
setting.
9750 -140th Street
Surrey, BC V3T 0G9
604-582-4550
www.fraserhealth.ca
Peace Arch Hospital
Peace Arch Hospital (PAH), located in White
Rock, has 171 acute care beds and 234
residential care beds to serve the medical
needs of White Rock and South Surrey
residents. PAH is part of the Fraser Health
Authority’s integrated network of care,
providing primary, secondary, and tertiary
services which includes: 24/7 emergency,
critical care, medicine and maternity units,
acute care for the elderly, adult inpatient
psychiatry, surgical services, respiratory
therapy, inpatient rehabilitation and
ambulatory care. Campus clinics include:
specialized seniors, maternity, youth,
primary care, diabetes services and the
healthy bones clinic. Community services
on campus include Home Health and
Mental Health & Substance Use.
15521 Russell Avenue
White Rock, BC V4B 2R4
604-531-5512 (non-emergency)
www.fraserhealth.ca
Jim Pattison Outpatient Care & Surgery Centre
- 38 -
HEALTH AND SAFETY SERVICES
the future lives here. 2018-2022 Financial Plan
FRASER HEALTH AUTHORITY
The Fraser Health Authority, under the guidance of the provincial Ministry of Health, is
responsible for providing quality health care services to the people of Surrey. This
includes residential care and assisted living, public health, home health, end of life care,
mental health and substance use support, along with specialized programs for children,
women and Aboriginal people. They provide care in 3,350 beds across Surrey in their
hospital, residential care and mental health and substance use programs.
Corporate Office Guildford Public Health Unit
#400, 13450 - 102nd Avenue #100, 10233 - 153rd Street
Surrey, BC V3T 0H1 Surrey, BC V3R 0Z7
604-587-4600 604-587-4750
Toll free 1-877-935-5669 www.fraserhealth.ca
www.fraserhealth.ca
North Surrey Public Health Unit Newton Public Health Unit
#220, 10362 King George Boulevard #200, 7337 - 137th Street
Surrey, BC V3T 2W5 Surrey, BC V3W 1A4
604-587-7900 604-592-2000
www.fraserhealth.ca www.fraserhealth.ca
White Rock/South Surrey Public Health Unit Cloverdale Public Health Unit
15476 Vine Avenue #205 17700 - 56th Avenue
White Rock, BC V4B 5M2 Surrey, BC V3S 1C7
604-542-4000 604-575-5100
www.fraserhealth.ca www.fraserhealth.ca
BC CANCER AGENCY
The Fraser Valley Cancer Centre is one of five full service cancer centres of the BC
Cancer Agency, providing a broad range of services including prevention, treatment,
screening, genetic counselling, and supportive care.
Fraser Valley Cancer Centre
13750 - 96th Avenue
Surrey, BC V3V 1Z2
604-930-2098
Toll free 1-800-523-2885
http://www.bccancer.bc.ca/our-services/centres-clinics/fraser-valley-centre
- 39 -
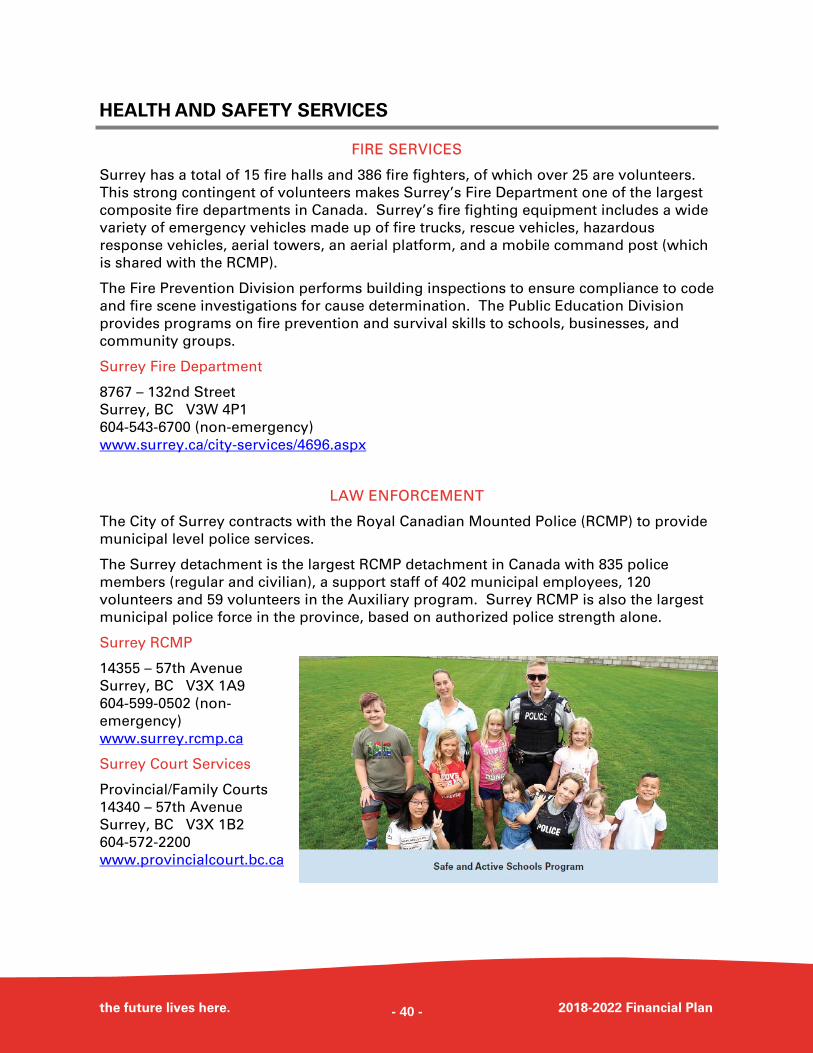
HEALTH AND SAFETY SERVICES
the future lives here. 2018-2022 Financial Plan
FIRE SERVICES
Surrey has a total of 15 fire halls and 386 fire fighters, of which over 25 are volunteers.
This strong contingent of volunteers makes Surrey’s Fire Department one of the largest
composite fire departments in Canada. Surrey’s fire fighting equipment includes a wide
variety of emergency vehicles made up of fire trucks, rescue vehicles, hazardous
response vehicles, aerial towers, an aerial platform, and a mobile command post (which
is shared with the RCMP).
The Fire Prevention Division performs building inspections to ensure compliance to code
and fire scene investigations for cause determination. The Public Education Division
provides programs on fire prevention and survival skills to schools, businesses, and
community groups.
Surrey Fire Department
8767 – 132nd Street
Surrey, BC V3W 4P1
604-543-6700 (non-emergency)
www.surrey.ca/city-services/4696.aspx
LAW ENFORCEMENT
The City of Surrey contracts with the Royal Canadian Mounted Police (RCMP) to provide
municipal level police services.
The Surrey detachment is the largest RCMP detachment in Canada with 835 police
members (regular and civilian), a support staff of 402 municipal employees, 120
volunteers and 59 volunteers in the Auxiliary program. Surrey RCMP is also the largest
municipal police force in the province, based on authorized police strength alone.
Surrey RCMP
14355 – 57th Avenue
Surrey, BC V3X 1A9
604-599-0502 (non-
emergency)
www.surrey.rcmp.ca
Surrey Court Services
Provincial/Family Courts
14340 – 57th Avenue
Surrey, BC V3X 1B2
604-572-2200
www.provincialcourt.bc.ca
- 40 -
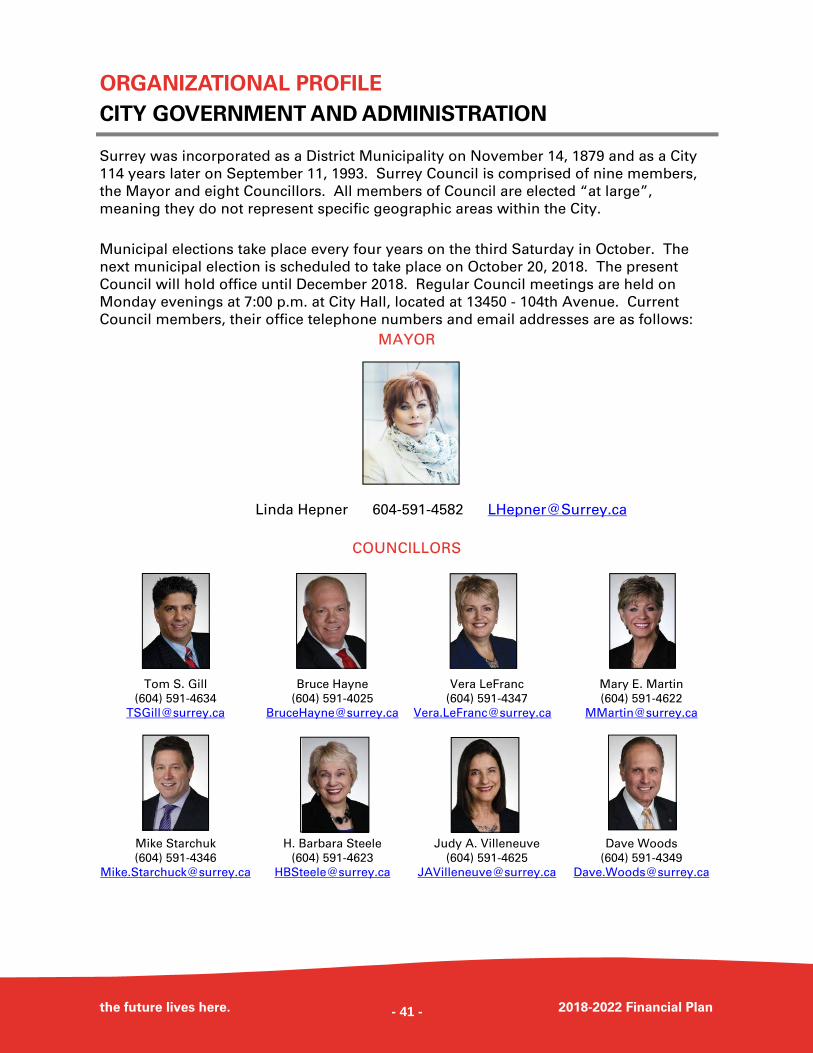
ORGANIZATIONAL PROFILE
CITY GOVERNMENT AND ADMINISTRATION
the future lives here. 2018-2022 Financial Plan
Surrey was incorporated as a District Municipality on November 14, 1879 and as a City
114 years later on September 11, 1993. Surrey Council is comprised of nine members,
the Mayor and eight Councillors. All members of Council are elected “at large”,
meaning they do not represent specific geographic areas within the City.
Municipal elections take place every four years on the third Saturday in October. The
next municipal election is scheduled to take place on October 20, 2018. The present
Council will hold office until December 2018. Regular Council meetings are held on
Monday evenings at 7:00 p.m. at City Hall, located at 13450 - 104th Avenue. Current
Council members, their office telephone numbers and email addresses are as follows:
MAYOR
COUNCILLORS
Linda Hepner 604-591-4582 [email protected]
Tom S. Gill
(604) 591-4634
Bruce Hayne
(604) 591-4025
Vera LeFranc
(604) 591-4347
Mary E. Martin
(604) 591-4622
Mike Starchuk
(604) 591-4346
H. Barbara Steele
(604) 591-4623
Judy A. Villeneuve
(604) 591-4625
Dave Woods
(604) 591-4349
- 41 -
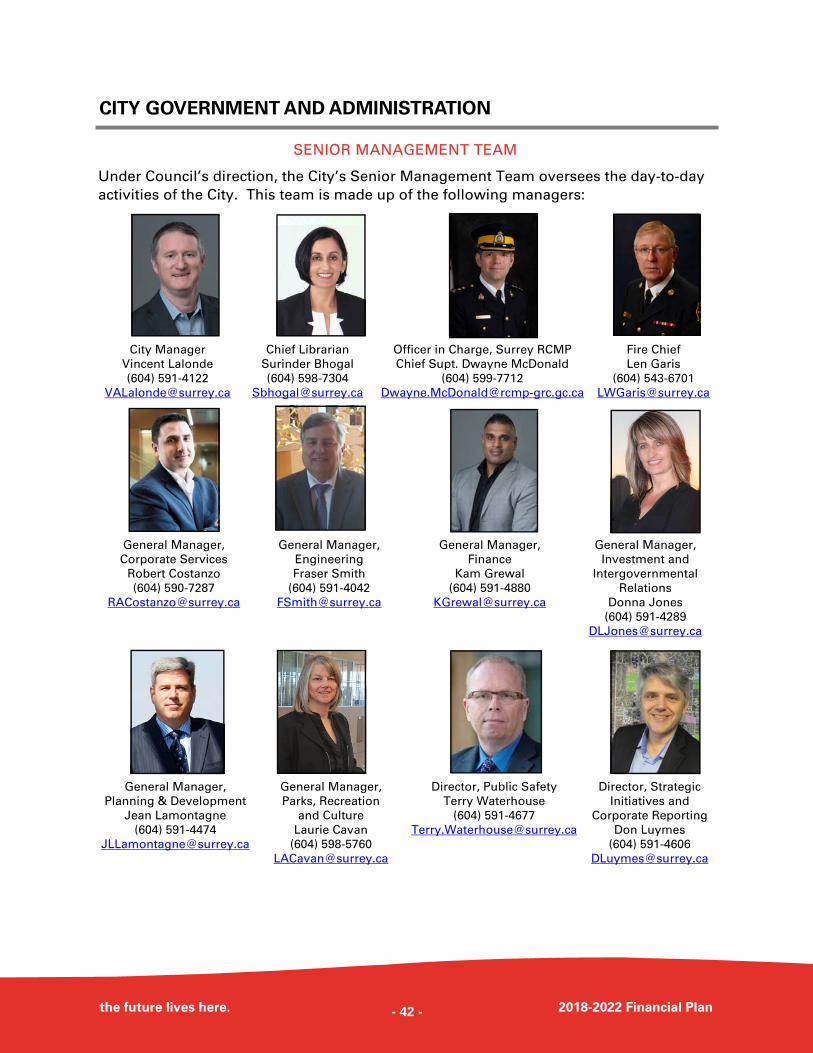
CITY GOVERNMENT AND ADMINISTRATION
the future lives here. 2018-2022 Financial Plan
SENIOR MANAGEMENT TEAM
Under Council’s direction, the City’s Senior Management Team oversees the day-to-day
activities of the City. This team is made up of the following managers:
City Manager
Vincent Lalonde
(604) 591-4122
Chief Librarian
Surinder Bhogal
(604) 598-7304
Fire Chief
Len Garis
(604) 543-6701
Officer in Charge, Surrey RCMP
Chief Supt. Dwayne McDonald
(604) 599-7712
General Manager,
Planning & Development
Jean Lamontagne
(604) 591-4474
Director, Public Safety
Terry Waterhouse
(604) 591-4677
Director, Strategic
Initiatives and
Corporate Reporting
Don Luymes
(604) 591-4606
General Manager,
Parks, Recreation
and Culture
Laurie Cavan
(604) 598-5760
General Manager,
Corporate Services
Robert Costanzo
(604) 590-7287
General Manager,
Engineering
Fraser Smith
(604) 591-4042
General Manager,
Finance
Kam Grewal
(604) 591-4880
General Manager,
Investment and
Intergovernmental
Relations
Donna Jones
(604) 591-4289
- 42 -
CITY GOVERNMENT AND ADMINISTRATION
the future lives here. 2018-2022 Financial Plan
COMMITTEES, BOARDS AND COMMISSIONS
Committees, Boards and Commissions meet to discuss relevant and important issues
that affect the Surrey community. Some groups, such as the Environmental Advisory
Committee, are formed organically, through citizen engagement. Other groups, such as
the Board of Variance, are formed through a provincial mandate. In both cases, the
intention of such groups is to help the City of Surrey operate as a representative,
efficient and transparent local government.
COUNCIL STANDING COMMITTEES
Council Standing Committees are
committees that include only members of
Council as a membership.
Council-In-Committee
Finance Committee
Investment & Innovation Committee
Public Safety Committee
Transportation & Infrastructure
Committee
BOARDS & COMMISSIONS
Boards are legislated committees that each
municipality is required to have, with
volunteers appointed by Council.
Surrey Heritage Advisory Committee
Board of Variance
TASK FORCES
Task Forces are generally short term
committees organized based on current
community needs.
Healthier Communities Partnership
Committee
Mayor’s Task Force Gang Violence
Prevention
COMMITTEES
Select Committees are committees with
generally one Councillor as a chair, and
volunteer members appointed by Council.
Agriculture & Food Security Advisory
Committee
Culture Development Advisory
Committee
Diversity Advisory Committee
Environmental Sustainability Advisory
Committee
Parks, Recreation & Sport Tourism
Committee
Seniors Advisory & Accessibility
Committee
Social Policy Advisory Committee
Audit Committee
STAFF COMMITTEES
Staff Committees do not have a member of
Council sitting on it and are fully organized
by City staff.
Advisory Design Panel
- 43 -
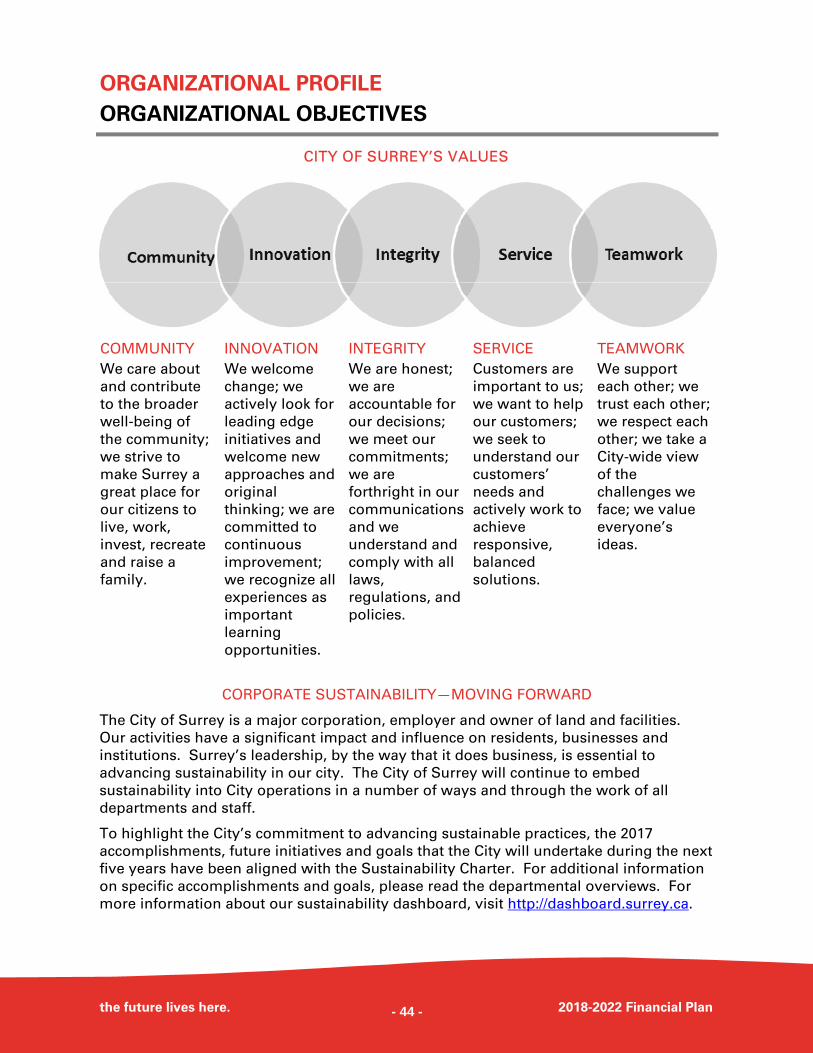
ORGANIZATIONAL PROFILE
ORGANIZATIONAL OBJECTIVES
the future lives here. 2018-2022 Financial Plan
COMMUNITY
We care about
and contribute
to the broader
well-being of
the community;
we strive to
make Surrey a
great place for
our citizens to
live, work,
invest, recreate
and raise a
family.
INNOVATION
We welcome
change; we
actively look for
leading edge
initiatives and
welcome new
approaches and
original
thinking; we are
committed to
continuous
improvement;
we recognize all
experiences as
important
learning
opportunities.
INTEGRITY
We are honest;
we are
accountable for
our decisions;
we meet our
commitments;
we are
forthright in our
communications
and we
understand and
comply with all
laws,
regulations, and
policies.
SERVICE
Customers are
important to us;
we want to help
our customers;
we seek to
understand our
customers’
needs and
actively work to
achieve
responsive,
balanced
solutions.
TEAMWORK
We support
each other; we
trust each other;
we respect each
other; we take a
City-wide view
of the
challenges we
face; we value
everyone’s
ideas.
CITY OF SURREY’S VALUES
CORPORATE SUSTAINABILITY—MOVING FORWARD
The City of Surrey is a major corporation, employer and owner of land and facilities.
Our activities have a significant impact and influence on residents, businesses and
institutions. Surrey’s leadership, by the way that it does business, is essential to
advancing sustainability in our city. The City of Surrey will continue to embed
sustainability into City operations in a number of ways and through the work of all
departments and staff.
To highlight the City’s commitment to advancing sustainable practices, the 2017
accomplishments, future initiatives and goals that the City will undertake during the next
five years have been aligned with the Sustainability Charter. For additional information
on specific accomplishments and goals, please read the departmental overviews. For
more information about our sustainability dashboard, visit http://dashboard.surrey.ca.
- 44 -
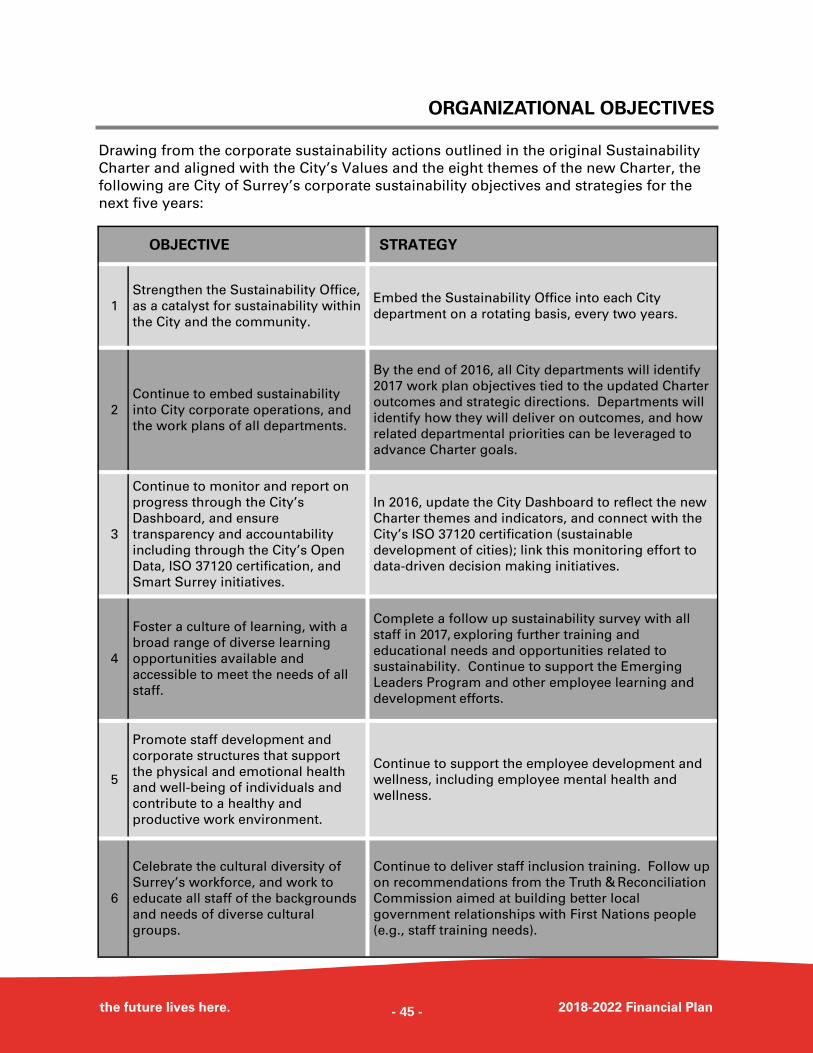
ORGANIZATIONAL OBJECTIVES
the future lives here. 2018-2022 Financial Plan
Drawing from the corporate sustainability actions outlined in the original Sustainability
Charter and aligned with the City’s Values and the eight themes of the new Charter, the
following are City of Surrey’s corporate sustainability objectives and strategies for the
next five years:
OBJECTIVE STRATEGY
1
Strengthen the Sustainability Office,
as a catalyst for sustainability within
the City and the community.
Embed the Sustainability Office into each City
department on a rotating basis, every two years.
2
Continue to embed sustainability
into City corporate operations, and
the work plans of all departments.
By the end of 2016, all City departments will identify
2017 work plan objectives tied to the updated Charter
outcomes and strategic directions. Departments will
identify how they will deliver on outcomes, and how
related departmental priorities can be leveraged to
advance Charter goals.
3
Continue to monitor and report on
progress through the City’s
Dashboard, and ensure
transparency and accountability
including through the City’s Open
Data, ISO 37120 certification, and
Smart Surrey initiatives.
In 2016, update the City Dashboard to reflect the new
Charter themes and indicators, and connect with the
City’s ISO 37120 certification (sustainable
development of cities); link this monitoring effort to
data-driven decision making initiatives.
4
Foster a culture of learning, with a
broad range of diverse learning
opportunities available and
accessible to meet the needs of all
staff.
Complete a follow up sustainability survey with all
staff in 2017, exploring further training and
educational needs and opportunities related to
sustainability. Continue to support the Emerging
Leaders Program and other employee learning and
development efforts.
5
Promote staff development and
corporate structures that support
the physical and emotional health
and well-being of individuals and
contribute to a healthy and
productive work environment.
Continue to support the employee development and
wellness, including employee mental health and
wellness.
6
Celebrate the cultural diversity of
Surrey’s workforce, and work to
educate all staff of the backgrounds
and needs of diverse cultural
groups.
Continue to deliver staff inclusion training. Follow up
on recommendations from the Truth & Reconciliation
Commission aimed at building better local
government relationships with First Nations people
(e.g., staff training needs).
- 45 -
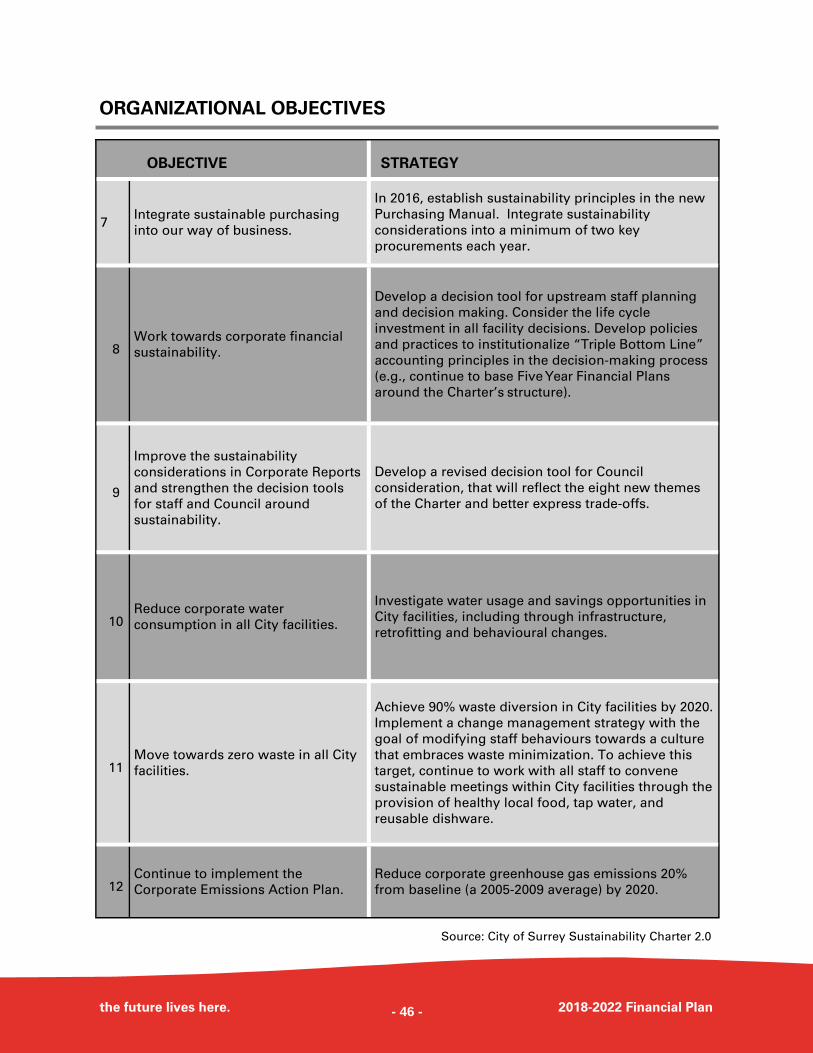
ORGANIZATIONAL OBJECTIVES
the future lives here. 2018-2022 Financial Plan
Source: City of Surrey Sustainability Charter 2.0
OBJECTIVE STRATEGY
7 Integrate sustainable purchasing
into our way of business.
In 2016, establish sustainability principles in the new
Purchasing Manual. Integrate sustainability
considerations into a minimum of two key
procurements each year.
8 Work towards corporate financial
sustainability.
Develop a decision tool for upstream staff planning
and decision making. Consider the life cycle
investment in all facility decisions. Develop policies
and practices to institutionalize “Triple Bottom Line”
accounting principles in the decision-making process
(e.g., continue to base Five Year Financial Plans
around the Charter’s structure).
9
Improve the sustainability
considerations in Corporate Reports
and strengthen the decision tools
for staff and Council around
sustainability.
Develop a revised decision tool for Council
consideration, that will reflect the eight new themes
of the Charter and better express trade-offs.
10 Reduce corporate water
consumption in all City facilities.
Investigate water usage and savings opportunities in
City facilities, including through infrastructure,
retrofitting and behavioural changes.
11 Move towards zero waste in all City
facilities.
Achieve 90% waste diversion in City facilities by 2020.
Implement a change management strategy with the
goal of modifying staff behaviours towards a culture
that embraces waste minimization. To achieve this
target, continue to work with all staff to convene
sustainable meetings within City facilities through the
provision of healthy local food, tap water, and
reusable dishware.
12 Continue to implement the
Corporate Emissions Action Plan.
Reduce corporate greenhouse gas emissions 20%
from baseline (a 2005-2009 average) by 2020.
- 46 -
ORGANIZATIONAL OBJECTIVES
the future lives here. 2018-2022 Financial Plan
DECISION MAKING GUIDEPOSTS
The Community Charter mandates that municipalities develop and report on
organizational objectives and the measures used to determine their progress. Council
has expanded on the broad set of guideposts used in the past and developed specific
measures to support their overall objective. The following section describes the City’s
decision-making guideposts.
1. Developing current and long-range
plans that foster growth and economic
development for Surrey’s culturally-
diverse community while preserving
the City’s rich environment and quality
of life, within the parameters set by
Council in the Official Community
Plan;
2. Enhancing community and individual
well-being by providing Police, Fire,
and Bylaw services that protect
residents and visitors;
3. Developing and implementing long
and short-term Engineering
Infrastructure Service Plans that
respond to growth and meet the
current needs of the City’s citizens and
businesses;
4. Planning and delivering Parks,
Recreation and Culture programs and
Library services that encourage
participation from residents and
visitors of all ages and backgrounds;
5. Providing open and responsive
government through public
consultation, as required by the
Community Charter;
6. Planning for the succession of the
City’s workforce by creating a
challenging, market-competitive,
healthy, and respectful workplace that
attracts and retains qualified
candidates while reflecting the diverse
nature of the City;
7. Fostering co-operative relations with
other governments, community
organizations, and local businesses;
8. Developing programs, policies, and
initiatives that focus on Council’s
specific key objectives; and
9. Protecting the City’s long-term
financial health by managing the City’s
finances while delivering services to
the public within the parameters set
by Council in the Five-Year Financial
Plan.
- 47 -
ORGANIZATIONAL PROFILE
ORGANIZATIONAL GOVERNANCE
the future lives here. 2018-2022 Financial Plan
The purpose of the City of Surrey’s Policy Manual is to describe the policies as adopted
by Council. It guides each General Manager in the operation of their department and
enables staff to make decisions within a common, Council-approved framework. The
Policy Manual guides Council members to make their decisions within existing policy
and assists them when advising the general public on matters brought to their attention.
The Community Charter and the Local Government Act in conjunction with Canadian
public sector accounting standards, form the basis of the City’s Financial Plan and
financial policies. These laws and standards drive financial planning calendar dates,
specify financial planning controls, allow ways to amend the Financial Plan after
adoption, and prescribe appropriate methods for financial planning, accounting, and
reporting.
In addition to Corporate Polices as adopted by Council, there are many corporate
procedures and practices that provide guidance and direction to staff, typically these
documents contain more detailed information compared to corporate polices and also
are designed to be more fluid in nature, being updated based on organizational needs
and workplace changes. The following are some key policies, procedures and practices
utilized by the City:
POLICIES
DEVELOPMENT COST CHARGE AND
CREDIT POLICY
This policy specifies refund and credit
opportunities available to applicants who
have paid all or part of their Development
Cost Charges (DCC), but have chosen to
cancel their building permit.
Opportunities are determined by the
amount of DCC paid as well as the length
of time the permit has been open.
INVESTMENT POLICY
This policy stipulates that the City of
Surrey will invest funds in a manner that
provides an optimal blend of investment
return and security while meeting daily
cash flow demands and complying with
the statutory requirements of the
Community Charter. The policy states
that City funds are to be invested
prudently and that the City’s investment
practices support the three fundamental
objectives of safety, liquidity, and return
on investment.
EXPENSE POLICY
This policy provides guidelines for
employees and other authorized
individuals with respect to travel and
expense reimbursements. It defines
approval authorities, per diem
allowances, ineligible costs, and claim
processing requirements.
MUNICIPAL GRANTS POLICY
This policy specifies that the City will
establish ongoing grants from year to
year, as well as grants for one-time
requests; what types of initiatives/
organizations are generally eligible for
grants; what types of costs, grants can
and cannot cover; and official procedures
for processing grant requests, grant
appeals and late grant applications, as
well as setting the grant budget.
- 48 -
ORGANIZATIONAL GOVERNANCE
the future lives here. 2018-2022 Financial Plan
PUBLIC ART POLICY
The goal of the Public Art Policy is to
ensure a sustainable funding mechanism
that supports the City’s commitment to
spend existing and future funds more
creatively, serve as an act of public trust
and a steward for public art, guide City
staff in implementing the Public Art
Program, and make public art a catalyst
for creativity in Surrey’s diverse
community.
RESERVE AND SURPLUS POLICY
This policy directs the establishment and
maintenance of reserves, unappropriated
surplus, and appropriation of surplus, as
well as the use of reserves and
appropriations of surplus in meeting the
short and long-term financial goals of the
City. The policy states guiding principles,
objectives, criteria, and procedures,
including allowable minimum and
maximum reserve and surplus balances.
TAX EXEMPTION POLICY
This policy provides guidance to Council
in the processing of applications for
exemption from property taxes. Though
the Community Charter states that
exemptions are at the discretion of
Council, this policy establishes principles
which serve as a guide in the evaluation
of applicants.
PROCEDURES AND GUIDELINES
CASH HANDLING PROCEDURE
This policy specifies the requirements
staff must meet when handling tender,
from the initial point of collection through
the reconciliation and the deposit process.
PROCUREMENT PROCEDURE MANUAL
This document details the process that the
City is required to follow when
completing purchases and ensures
applicable Federal, Provincial and
Municipal legislation is followed. It
explains the purchase flow and the
requirements for making purchases on
behalf of the City, including when to
conduct a public competitive solicitation
process.
REPLACEMENT RESERVE FUND
PROCEDURE
The Replacement Reserve Fund guideline
helps to make sufficient reserves available
to replace the City’s extensive inventory
of buildings and equipment.
The City makes annual appropriations to
the Replacement Reserve Fund to provide
necessary funding and reviews the fund,
to ensure that funding levels increase
over time.
TANGIBLE CAPITAL ASSET PROCEDURE
Tangible Capital Assets are non-financial
assets having physical substance that are
acquired, constructed, or developed and
are held for use in the production or
supply of goods and services, have useful
lives extending beyond an accounting
period, are intended to be used on a
continuing basis; and are not intended for
sale in the ordinary course of operations.
The City of Surrey is required to report
tangible capital assets on their financial
statements in accordance with guidelines
set by the Public Sector Accounting Board
(PSAB).
- 49 -
ORGANIZATIONAL GOVERNANCE
the future lives here. 2018-2022 Financial Plan
PLANS & STRATEGIES
AGE FRIENDLY STRATEGY FOR SENIORS
The Surrey Age Friendly Strategy for
Seniors is a city-wide framework for
working together to ensure seniors are
supported and can remain actively
engaged and safe in our community. This
Strategy is based on the World Health
Organization’s work on Global Age
Friendly Cities.
BIODIVERSITY CONSERVATION
STRATEGY
The Biodiversity Conservation Strategy
(BCS), adopted in 2014 as part of
Corporate Report R141, recognizes
Surrey’s biodiversity as a key foundation
of a healthy, livable and sustainable City.
The goal of the Strategy is to preserve,
protect, and enhance Surrey’s biodiversity
for the long-term.
BUILD SURREY PLAN
The Build Surrey plan has been
developed to position the City of Surrey
for a prosperous future. The projects that
have been outlined will accelerate the
transformation of the downtown core,
create BC’s next metropolitan centre and
ensure the ongoing development of major
areas in Surrey.
ECONOMIC DIVERSIFICATION STRATEGY
The Economic Diversification Strategy
identifies Surrey's approach to creating a
strong and resilient economy to support
the 50 year vision outlined in our
Sustainability Charter with a focus on five
priority sectors: health tech, clean tech,
advanced manufacturing, agri-innovation
and the creative economy.
EMPLOYMENT LANDS STRATEGY
The City of Surrey has developed the
Employment Lands Strategy to ensure
that there is an adequate and well-located
supply of employment lands, for the short
and long term. The strategy works
toward attracting and retaining business
investment in the community to keep
Surrey competitive.
OFFICIAL COMMUNITY PLAN
The Official Community Plan (OCP) is a
statement of objectives and policies that
guide City planning decisions. Taking a
comprehensive and long-term
perspective, the Plan provides guidance
for: the physical structure of the City, land
use management, economic and
residential growth, transportation
systems, community development,
provision of City services and amenities,
agricultural land use, environmental
protection, and enhanced social well-
being.
The plans and policies contained in the
OCP are set within the overall framework
of the Sustainability Charter and are
consistent with its principles and goals.
The OCP sets out an overall vision of a
sustainable future for Surrey over the
next 30 years.
The OCP is established under the
authority of the Province’s Local
Government Act and adopted by City
Council as a City bylaw. On an annual
basis, the Official Community Plan is
reviewed to ensure that it contains
relevant information and fully considers
the City’s evolving nature.
- 50 -
ORGANIZATIONAL GOVERNANCE
the future lives here. 2018-2022 Financial Plan
PARKS, RECREATION & CULTURE
STRATEGIC PLAN
The Parks, Recreation & Culture Strategic
Plan is a framework for decision-making
and sets direction for decisions relating to
identifying demands, needs and issues
regarding the delivery of parks, recreation
and culture services to the residents of
Surrey.
PUBLIC SAFETY STRATEGY
Our Public Safety Strategy will make
Surrey a safer city by addressing issues
related to crime, personal safety,
emergencies, disasters, road safety, and
persistent social challenges like
homelessness, mental health and
addictions.
SMART SURREY STRATEGY
The Smart Surrey Strategy guides how
technology and innovation are considered
in decisions made for existing and future
plans, programs and infrastructure.
Using new and existing technologies and
information, it identifies and implements
systems and programs to inform decision
-making, create efficiencies and optimize
our resources leading to cost-savings.
SURREY PUBLIC LIBRARY STRATEGIC
PLAN
The Surrey Public Library Strategic Plan
provides a framework for the delivery of
services, including access to local and
global information and ideas,
encouraging literacy and supporting
lifelong learning for all Surrey residents.
SURREY SPORT TOURISM STRATEGY
The Surrey Sport Tourism Strategy has
been developed to advance the City of
Surrey as a leader in the Sport Tourism
industry, maximizing both economic
benefits and sport development
opportunities.
The Strategy will establish Surrey as a
premier sport tourism destination in the
Pacific Northwest and Canada while
balancing community needs with sport
tourism development.
SUSTAINABILITY CHARTER 2.0
The Sustainability Charter 2.0 is the City
of Surrey's comprehensive framework for
implementing a progressive, long-term 40
year vision for sustainability in Surrey: to
become a thriving, green, inclusive city.
This Charter guides our policy and
decision making, and ensures that social,
environmental and economic factors are
always taken into account. The
Sustainability Charter was updated in
2016 and introduced eight overlapping
themes.
TRANSPORTATION STRATEGIC PLAN
The Transportation Strategic Plan is a
long-range planning document that sets
out the vision, objectives, proposals and
priorities for transportation in Surrey. It
shows how transportation plays a part in
key policy areas such as the environment,
land use, economy, safety and health.
- 51 -
ORGANIZATIONAL GOVERNANCE
the future lives here. 2018-2022 Financial Plan
EXAMPLES OF HOW STRATEGIC PLANS TIE INTO SERVICE DELIVERY PLANS
Surrey’s Financial Plan works in conjunction with the Official Community Plan by
allocating the City’s financial resources in support of Official Community Plan directives.
Similarly all service delivery plans, strategies and programs are driven from strategic
plans. Furthermore, performance measures ensure the City is delivering on its
organizational objectives and aligned to the eight themes of the Sustainability Charter
2.0.
MANAGE GROWTH FOR COMPACT
COMMUNITIES
A compact form of development limits
future growth to planned areas; provides
new opportunities for housing, business,
and mobility; and allows more efficient
use of City utilities, amenities, and
finances.
BUILD A SUSTAINABLE LOCAL
ECONOMY
A strong local economy is necessary for
the fiscal health and functioning of the
City; it helps to provide the tax base
required to support public infrastructure,
amenities, facilities, and services.
BUILD COMPLETE COMMUNITIES
Complete communities have a wide range
of housing choices, as well as
opportunities for employment, business,
investment, recreation, and relaxation.
INCREASE TRANSPORTATION CHOICE
The City will improve its road networks to
allow people and goods to move more
efficiently and to support the
development patterns of businesses,
workplace centres, and neighbourhoods
throughout the City.
PROTECT NATURAL AREAS
The City will preserve, protect, and use
natural areas for park and recreational
purposes.
PROVIDE PARKS AND RECREATIONAL
FACILITIES
The City will provide good quality parks,
open spaces, and recreational facilities for
residents.
PROTECT AGRICULTURE AND
AGRICULTURAL AREAS
The City will protect the viability,
productivity, and sustainability of farming
and farmland.
IMPROVE THE “QUALITY OF
COMMUNITY”
The City will preserve the City’s heritage,
provide community and cultural facilities,
facilitate an adequate supply of rental and
special-needs housing, involve the public
in decision making, and build community
identity and pride.
ENHANCE CITY IMAGE AND CHARACTER
The City seeks to establish an
international reputation as a very
attractive location to live, work, locate a
business, and visit.
ENHANCE CITIZENS’ SAFETY AND WELL-
BEING THROUGH COMMUNITY SAFETY
AND CRIME PREVENTION
The City will reduce opportunities for
crime and nuisance behaviour and
increase citizens’ sense of well-being by
realizing Crime Prevention through
Environmental Design (CPTED) principles.
- 52 -
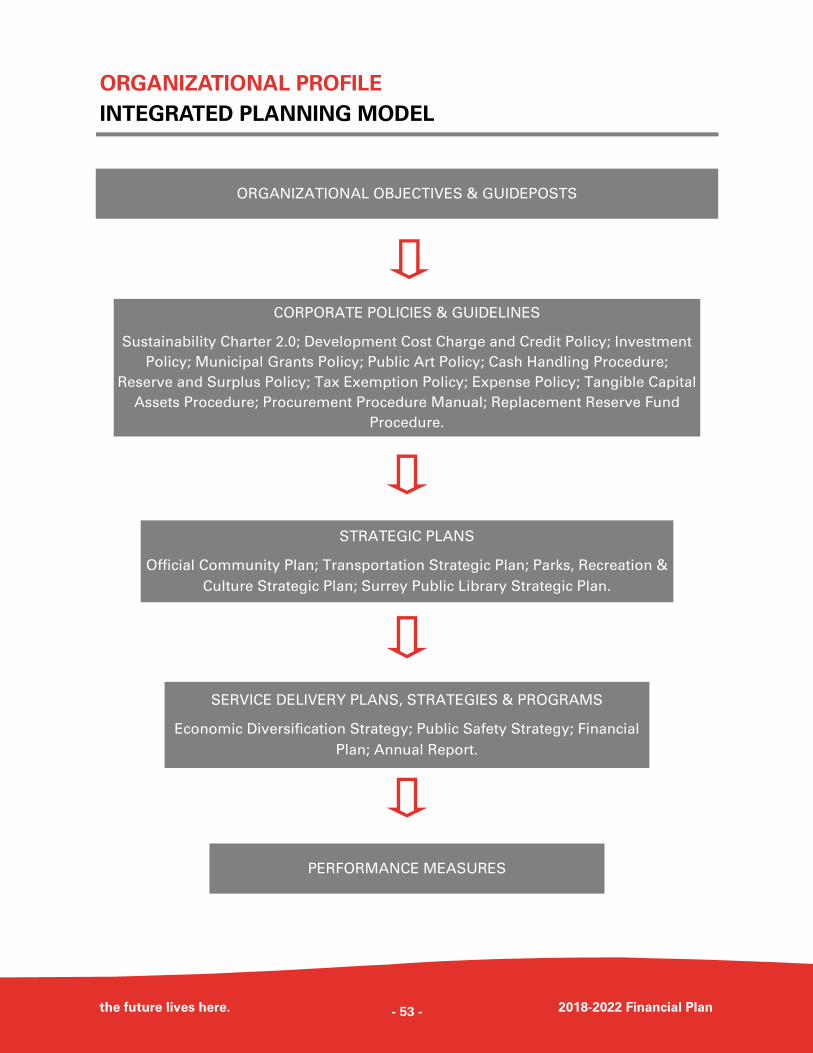
ORGANIZATIONAL PROFILE
INTEGRATED PLANNING MODEL
the future lives here. 2018-2022 Financial Plan
STRATEGIC PLANS
Official Community Plan; Transportation Strategic Plan; Parks, Recreation &
Culture Strategic Plan; Surrey Public Library Strategic Plan.
PERFORMANCE MEASURES
SERVICE DELIVERY PLANS, STRATEGIES & PROGRAMS
Economic Diversification Strategy; Public Safety Strategy; Financial
Plan; Annual Report.
ORGANIZATIONAL OBJECTIVES & GUIDEPOSTS
CORPORATE POLICIES & GUIDELINES
Sustainability Charter 2.0; Development Cost Charge and Credit Policy; Investment
Policy; Municipal Grants Policy; Public Art Policy; Cash Handling Procedure;
Reserve and Surplus Policy; Tax Exemption Policy; Expense Policy; Tangible Capital
Assets Procedure; Procurement Procedure Manual; Replacement Reserve Fund
Procedure.
- 53 -
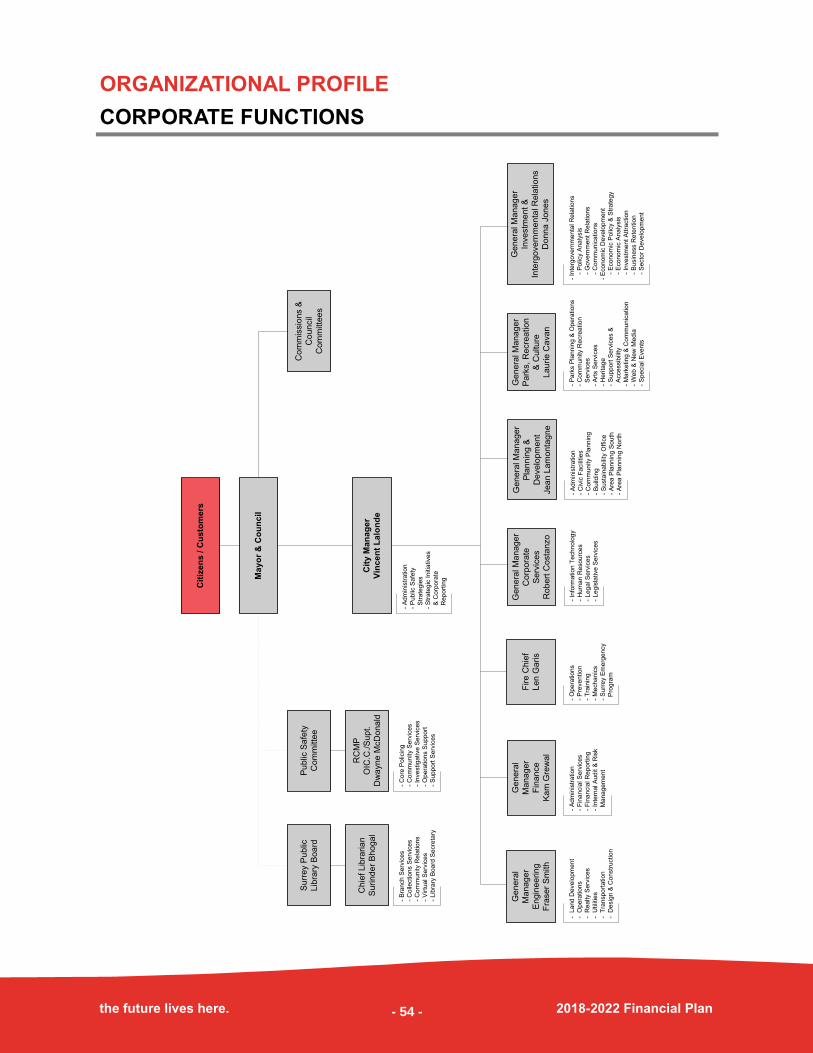
ORGANIZATIONAL PROFILE
CORPORATE FUNCTIONS
the future lives here. 2018-2022 Financial Plan
- A
dm
inis
tra
tio
n
- P
ub
lic S
afe
ty
S
tra
teg
ies
- S
tra
teg
ic In
itia
tive
s
&
Co
rpo
rate
R
ep
ort
ing
- A
dm
inis
tra
tio
n
- C
ivic
Fa
cili
tie
s
- C
om
mu
nity P
lan
nin
g
- B
uild
ing
- S
usta
ina
bili
ty O
ffic
e
- A
rea
Pla
nn
ing
So
uth
- A
rea
Pla
nn
ing
No
rth
- A
dm
inis
tra
tio
n
- F
ina
ncia
l S
erv
ice
s
- F
ina
ncia
l R
ep
ort
ing
- In
tern
al A
ud
it &
Ris
k
M
an
ag
em
en
t
- L
an
d D
eve
lop
me
nt
- O
pe
ratio
ns
- R
ea
lty S
erv
ice
s
- U
tilit
ies
- T
ran
sp
ort
atio
n
- D
esig
n &
Co
nstr
uctio
n
- P
ark
s P
lan
nin
g &
Op
era
tio
ns
- C
om
mu
nity R
ecre
atio
n
S
erv
ice
s
- A
rts S
erv
ice
s
- H
eri
tag
e
- S
up
po
rt S
erv
ice
s &
A
cce
ssib
ility
- M
ark
etin
g &
Co
mm
un
ica
tio
n
- W
eb
& N
ew
Me
dia
- S
pe
cia
l E
ve
nts
- O
pe
ratio
ns
- P
reve
ntio
n
- T
rain
ing
- M
ech
an
ics
- S
urr
ey E
me
rge
ncy
P
rog
ram
Fire C
hie
f
Len G
aris
Genera
l M
an
ager
Pla
nn
ing &
Develo
pm
ent
Jean
Lam
onta
gne
Genera
l
Manage
r
Fin
ance
Kam
Gre
wal
Genera
l
Manage
r
Engin
eering
Fra
ser
Sm
ith
Genera
l M
an
ager
Park
s, R
ecre
ation
& C
ulture
Laurie C
avan
Genera
l M
an
ager
Corp
ora
te
Serv
ices
Rob
ert
Costa
nzo
- In
form
atio
n T
ech
no
log
y
- H
um
an
Re
so
urc
es
- L
eg
al S
erv
ice
s
- L
eg
isla
tive
Se
rvic
es
Cit
y M
an
ag
er
Vin
cen
t L
alo
nd
e
Genera
l M
an
ager
Investm
ent &
Inte
rgovern
men
tal R
ela
tions
Don
na J
ones
- In
terg
ove
rnm
en
tal R
ela
tio
ns
-
Po
licy A
na
lysis
-
Go
ve
rnm
en
t R
ela
tio
ns
-
Co
mm
un
ica
tio
ns
- E
co
no
mic
De
ve
lop
me
nt
-
Eco
no
mic
Po
licy &
Str
ate
gy
-
Eco
no
mic
An
aly
sis
-
In
ve
stm
en
t A
ttra
ctio
n
-
Bu
sin
ess R
ete
ntio
n
-
Se
cto
r D
eve
lop
me
nt
Cit
izen
s / C
usto
mers
Mayo
r &
Co
un
cil
Surr
ey P
ublic
Lib
rary
Boa
rd
Chie
f Lib
rarian
Surind
er
Bhogal
Public
Safe
ty
Com
mitte
e
RC
MP
OIC
.C./S
upt.
Dw
ayn
e M
cD
onald
Com
mis
sio
ns &
Cou
ncil
Com
mitte
es
- B
ran
ch
Se
rvic
es
- C
olle
ctio
ns S
erv
ice
s
- C
om
mu
nity R
ela
tio
ns
- V
irtu
al S
erv
ice
s
- L
ibra
ry B
oa
rd S
ecre
tary
- C
ore
Po
licin
g
- C
om
mu
nity S
erv
ice
s
- In
ve
stig
ative
Se
rvic
es
- O
pe
ratio
ns S
up
po
rt
- S
up
po
rt S
erv
ice
s
- 54 -
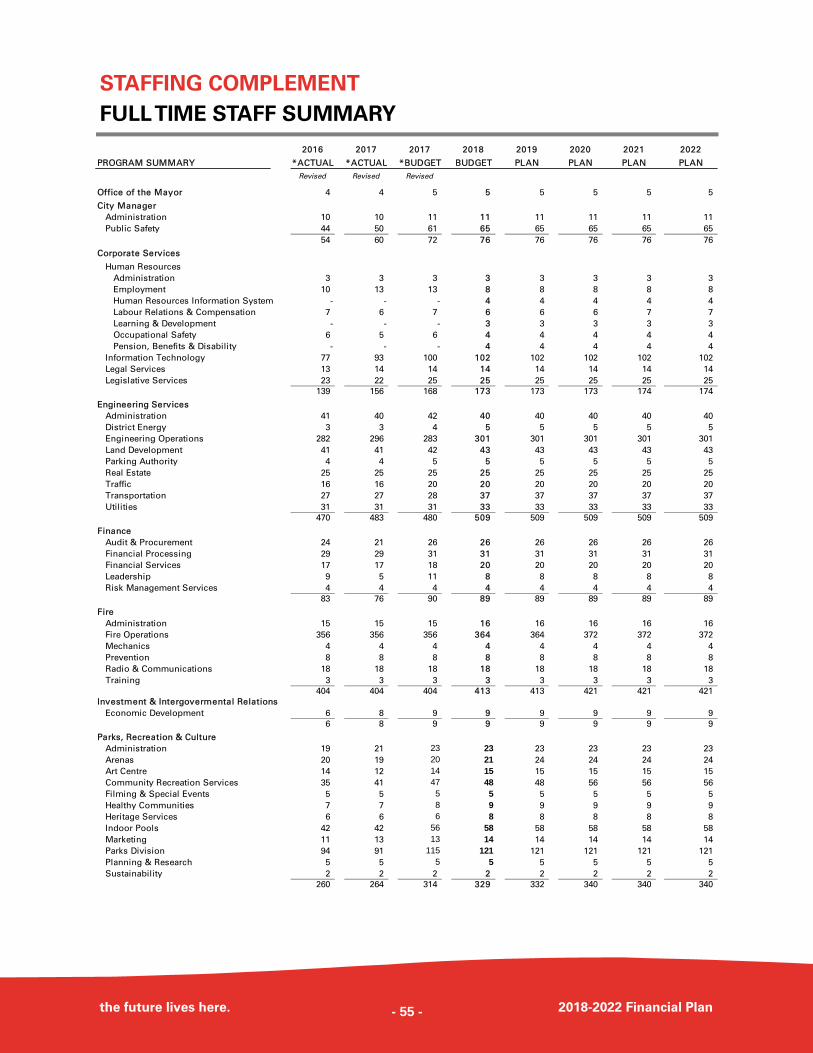
STAFFING COMPLEMENT
FULL TIME STAFF SUMMARY
the future lives here. 2018-2022 Financial Plan
2016 2017 2017 2018 2019 2020 2021 2022
PROGRAM SUMMARY *ACTUAL *ACTUAL *BUDGET BUDGET PLAN PLAN PLAN PLAN
Revised Revised Revised
Office of the Mayor 4 4 5 5 5 5 5 5
City Manager
Administration 10 10 11 11 11 11 11 11
Public Safety 44 50 61 65 65 65 65 65
54 60 72 76 76 76 76 76
Corporate Services
Human Resources
Administration 3 3 3 3 3 3 3 3
Employment 10 13 13 8 8 8 8 8
Human Resources Information System - - - 4 4 4 4 4
Labour Relations & Compensation 7 6 7 6 6 6 7 7
Learning & Development - - - 3 3 3 3 3
Occupational Safety 6 5 6 4 4 4 4 4
Pension, Benefits & Disability - - - 4 4 4 4 4
Information Technology 77 93 100 102 102 102 102 102
Legal Services 13 14 14 14 14 14 14 14
Legislative Services 23 22 25 25 25 25 25 25
139 156 168 173 173 173 174 174
Engineering Services
Administration 41 40 42 40 40 40 40 40
District Energy 3 3 4 5 5 5 5 5
Engineering Operations 282 296 283 301 301 301 301 301
Land Development 41 41 42 43 43 43 43 43
Parking Authority 4 4 5 5 5 5 5 5
Real Estate 25 25 25 25 25 25 25 25
Traffic 16 16 20 20 20 20 20 20
Transportation 27 27 28 37 37 37 37 37
Utilities 31 31 31 33 33 33 33 33
470 483 480 509 509 509 509 509
Finance
Audit & Procurement 24 21 26 26 26 26 26 26
Financial Processing 29 29 31 31 31 31 31 31
Financial Services 17 17 18 20 20 20 20 20
Leadership 9 5 11 8 8 8 8 8
Risk Management Services 4 4 4 4 4 4 4 4
83 76 90 89 89 89 89 89
Fire
Administration 15 15 15 16 16 16 16 16
Fire Operations 356 356 356 364 364 372 372 372
Mechanics 4 4 4 4 4 4 4 4
Prevention 8 8 8 8 8 8 8 8
Radio & Communications 18 18 18 18 18 18 18 18
Training 3 3 3 3 3 3 3 3
404 404 404 413 413 421 421 421
Investment & Intergovermental Relations
Economic Development 6 8 9 9 9 9 9 9
6 8 9 9 9 9 9 9
Parks, Recreation & Culture
Administration 19 21 23 23 23 23 23 23
Arenas 20 19 20 21 24 24 24 24
Art Centre 14 12 14 15 15 15 15 15
Community Recreation Services 35 41 47 48 48 56 56 56
Filming & Special Events 5 5 5 5 5 5 5 5
Healthy Communities 7 7 8 9 9 9 9 9
Heritage Services 6 6 6 8 8 8 8 8
Indoor Pools 42 42 56 58 58 58 58 58
Marketing 11 13 13 14 14 14 14 14
Parks Division 94 91 115 121 121 121 121 121
Planning & Research 5 5 5 5 5 5 5 5
Sustainability 2 2 2 2 2 2 2 2
260 264 314 329 332 340 340 340
- 55 -
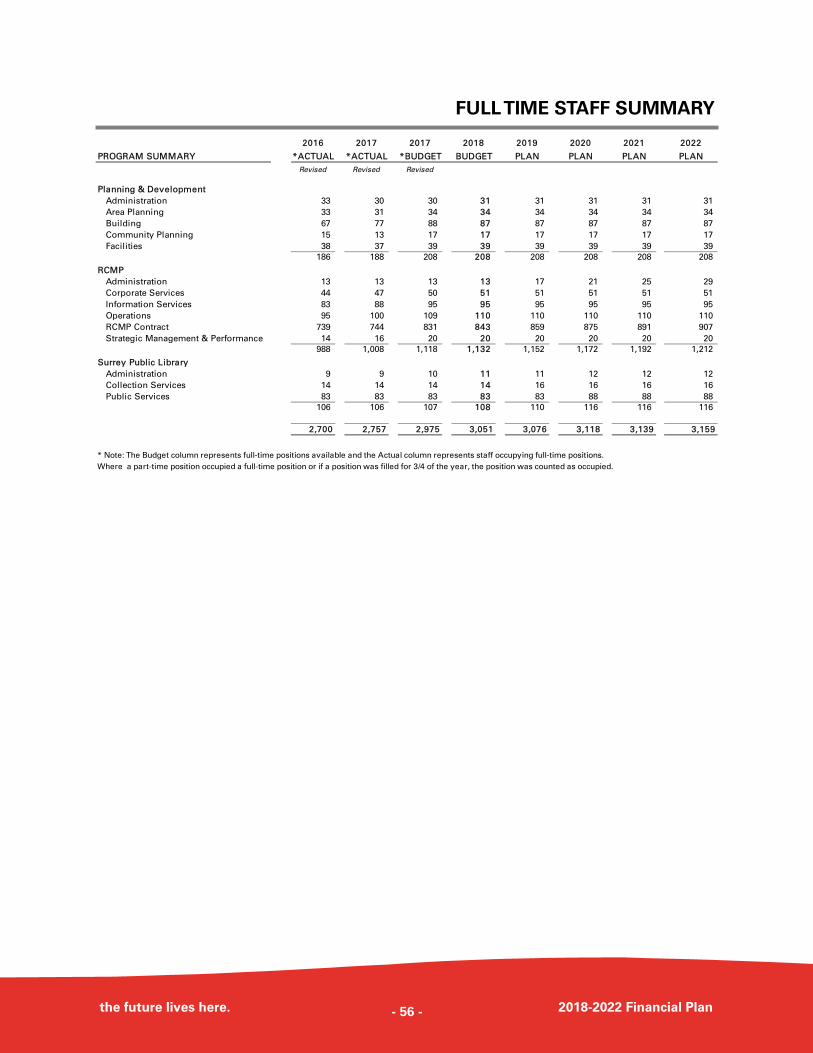
FULL TIME STAFF SUMMARY
the future lives here. 2018-2022 Financial Plan
* Note: The Budget column represents full-time positions available and the Actual column represents staff occupying full-time positions.
Where a part-time position occupied a full-time position or if a position was filled for 3/4 of the year, the position was counted as occupied.
2016 2017 2017 2018 2019 2020 2021 2022
PROGRAM SUMMARY *ACTUAL *ACTUAL *BUDGET BUDGET PLAN PLAN PLAN PLAN
Revised Revised Revised
Planning & Development
Administration 33 30 30 31 31 31 31 31
Area Planning 33 31 34 34 34 34 34 34
Building 67 77 88 87 87 87 87 87
Community Planning 15 13 17 17 17 17 17 17
Facilities 38 37 39 39 39 39 39 39
186 188 208 208 208 208 208 208
RCMP
Administration 13 13 13 13 17 21 25 29
Corporate Services 44 47 50 51 51 51 51 51
Information Services 83 88 95 95 95 95 95 95
Operations 95 100 109 110 110 110 110 110
RCMP Contract 739 744 831 843 859 875 891 907
Strategic Management & Performance 14 16 20 20 20 20 20 20
988 1,008 1,118 1,132 1,152 1,172 1,192 1,212
Surrey Public Library
Administration 9 9 10 11 11 12 12 12
Collection Services 14 14 14 14 16 16 16 16
Public Services 83 83 83 83 83 88 88 88
106 106 107 108 110 116 116 116
2,700 2,757 2,975 3,051 3,076 3,118 3,139 3,159
- 56 -
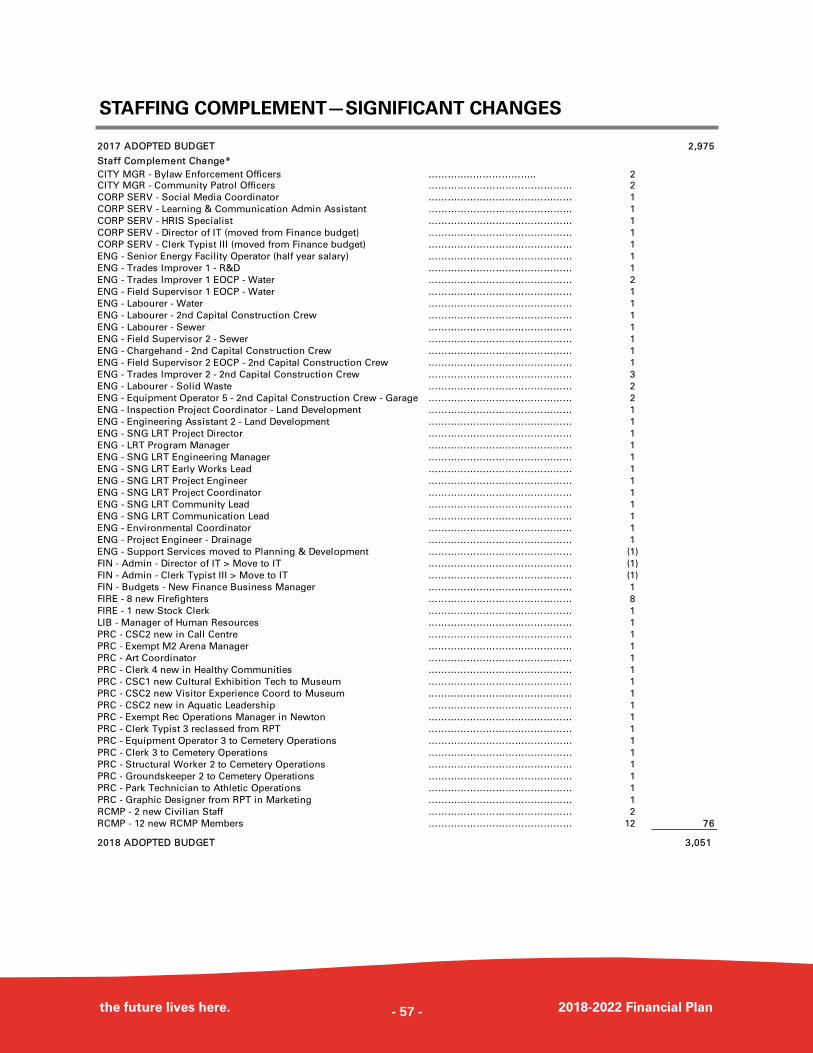
STAFFING COMPLEMENT—SIGNIFICANT CHANGES
the future lives here. 2018-2022 Financial Plan
2017 ADOPTED BUDGET 2,975
Staff Complement Change*
CITY MGR - Bylaw Enforcement Officers …………..……………….. 2 CITY MGR - Community Patrol Officers ……………………………………… 2
CORP SERV - Social Media Coordinator ……………………………………… 1
CORP SERV - Learning & Communication Admin Assistant ……………………………………… 1
CORP SERV - HRIS Specialist ……………………………………… 1
CORP SERV - Director of IT (moved from Finance budget) ……………………………………… 1
CORP SERV - Clerk Typist III (moved from Finance budget) ……………………………………… 1
ENG - Senior Energy Facility Operator (half year salary) ……………………………………… 1
ENG - Trades Improver 1 - R&D ……………………………………… 1
ENG - Trades Improver 1 EOCP - Water ……………………………………… 2
ENG - Field Supervisor 1 EOCP - Water ……………………………………… 1
ENG - Labourer - Water ……………………………………… 1
ENG - Labourer - 2nd Capital Construction Crew ……………………………………… 1
ENG - Labourer - Sewer ……………………………………… 1
ENG - Field Supervisor 2 - Sewer ……………………………………… 1
ENG - Chargehand - 2nd Capital Construction Crew ……………………………………… 1
ENG - Field Supervisor 2 EOCP - 2nd Capital Construction Crew ……………………………………… 1
ENG - Trades Improver 2 - 2nd Capital Construction Crew ……………………………………… 3
ENG - Labourer - Solid Waste ……………………………………… 2
ENG - Equipment Operator 5 - 2nd Capital Construction Crew - Garage ……………………………………… 2
ENG - Inspection Project Coordinator - Land Development ……………………………………… 1
ENG - Engineering Assistant 2 - Land Development ……………………………………… 1
ENG - SNG LRT Project Director ……………………………………… 1
ENG - LRT Program Manager ……………………………………… 1
ENG - SNG LRT Engineering Manager ……………………………………… 1
ENG - SNG LRT Early Works Lead ……………………………………… 1
ENG - SNG LRT Project Engineer ……………………………………… 1
ENG - SNG LRT Project Coordinator ……………………………………… 1
ENG - SNG LRT Community Lead ……………………………………… 1
ENG - SNG LRT Communication Lead ……………………………………… 1
ENG - Environmental Coordinator ……………………………………… 1
ENG - Project Engineer - Drainage ……………………………………… 1
ENG - Support Services moved to Planning & Development ……………………………………… (1)
FIN - Admin - Director of IT > Move to IT ……………………………………… (1)
FIN - Admin - Clerk Typist III > Move to IT ……………………………………… (1)
FIN - Budgets - New Finance Business Manager ……………………………………… 1
FIRE - 8 new Firefighters ……………………………………… 8
FIRE - 1 new Stock Clerk ……………………………………… 1
LIB - Manager of Human Resources ……………………………………… 1
PRC - CSC2 new in Call Centre ……………………………………… 1
PRC - Exempt M2 Arena Manager ……………………………………… 1
PRC - Art Coordinator ……………………………………… 1
PRC - Clerk 4 new in Healthy Communities ……………………………………… 1
PRC - CSC1 new Cultural Exhibition Tech to Museum ……………………………………… 1
PRC - CSC2 new Visitor Experience Coord to Museum ……………………………………… 1
PRC - CSC2 new in Aquatic Leadership ……………………………………… 1
PRC - Exempt Rec Operations Manager in Newton ……………………………………… 1
PRC - Clerk Typist 3 reclassed from RPT ……………………………………… 1
PRC - Equipment Operator 3 to Cemetery Operations ……………………………………… 1
PRC - Clerk 3 to Cemetery Operations ……………………………………… 1
PRC - Structural Worker 2 to Cemetery Operations ……………………………………… 1
PRC - Groundskeeper 2 to Cemetery Operations ……………………………………… 1
PRC - Park Technician to Athletic Operations ……………………………………… 1
PRC - Graphic Designer from RPT in Marketing ……………………………………… 1
RCMP - 2 new Civilian Staff ……………………………………… 2
RCMP - 12 new RCMP Members ……………………………………… 12 76
2018 ADOPTED BUDGET 3,051
- 57 -
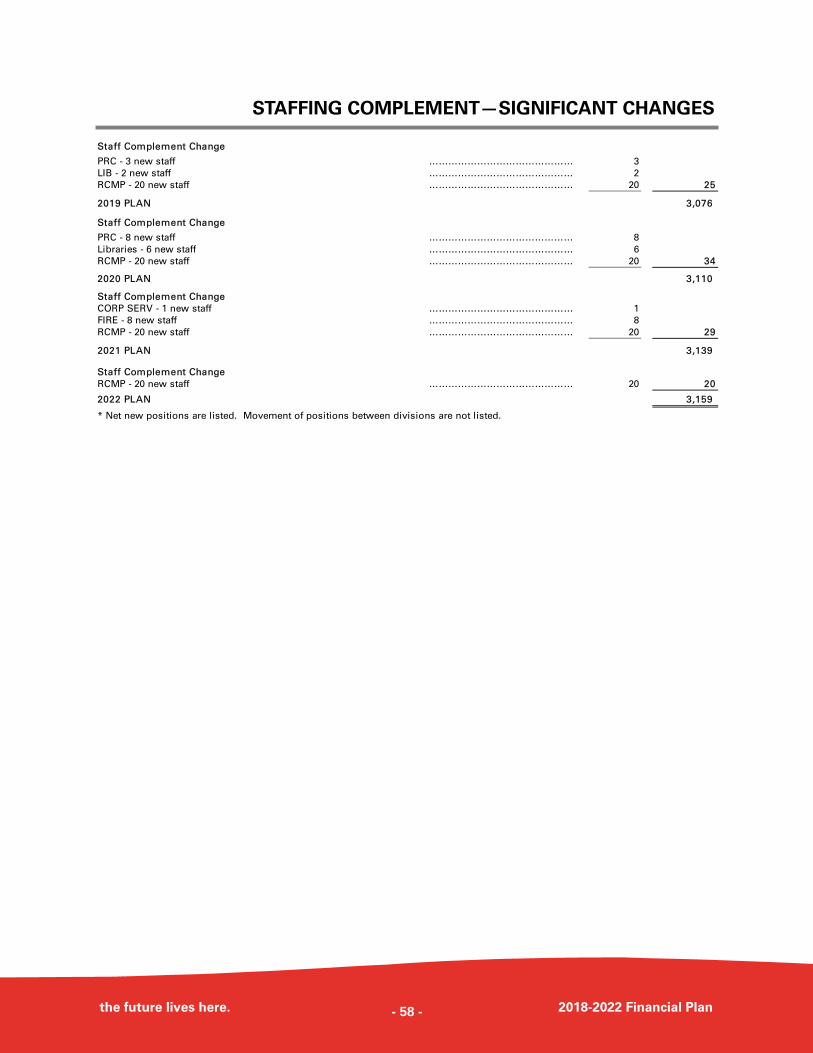
STAFFING COMPLEMENT—SIGNIFICANT CHANGES
the future lives here. 2018-2022 Financial Plan
Staff Complement Change
PRC - 3 new staff ……………………………………… 3
LIB - 2 new staff ……………………………………… 2
RCMP - 20 new staff ……………………………………… 20 25
2019 PLAN 3,076
Staff Complement Change
PRC - 8 new staff ……………………………………… 8
Libraries - 6 new staff ……………………………………… 6
RCMP - 20 new staff ……………………………………… 20 34
2020 PLAN 3,110
Staff Complement Change
CORP SERV - 1 new staff ……………………………………… 1
FIRE - 8 new staff ……………………………………… 8
RCMP - 20 new staff ……………………………………… 20 29
2021 PLAN 3,139
Staff Complement Change
RCMP - 20 new staff ……………………………………… 20 20
2022 PLAN 3,159
* Net new positions are listed. Movement of positions between divisions are not listed.
- 58 -
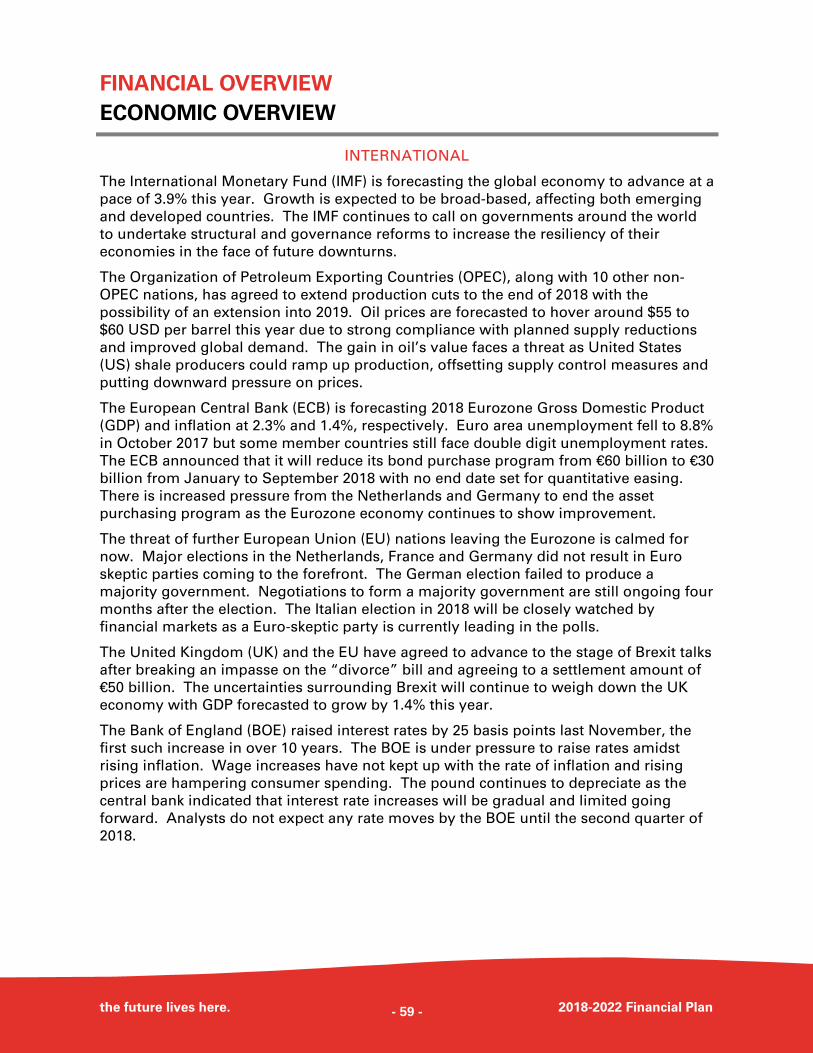
FINANCIAL OVERVIEW ECONOMIC OVERVIEW
the future lives here. 2018-2022 Financial Plan
INTERNATIONAL
The International Monetary Fund (IMF) is forecasting the global economy to advance at a
pace of 3.9% this year. Growth is expected to be broad-based, affecting both emerging
and developed countries. The IMF continues to call on governments around the world
to undertake structural and governance reforms to increase the resiliency of their
economies in the face of future downturns.
The Organization of Petroleum Exporting Countries (OPEC), along with 10 other non-
OPEC nations, has agreed to extend production cuts to the end of 2018 with the
possibility of an extension into 2019. Oil prices are forecasted to hover around $55 to
$60 USD per barrel this year due to strong compliance with planned supply reductions
and improved global demand. The gain in oil’s value faces a threat as United States
(US) shale producers could ramp up production, offsetting supply control measures and
putting downward pressure on prices.
The European Central Bank (ECB) is forecasting 2018 Eurozone Gross Domestic Product
(GDP) and inflation at 2.3% and 1.4%, respectively. Euro area unemployment fell to 8.8%
in October 2017 but some member countries still face double digit unemployment rates.
The ECB announced that it will reduce its bond purchase program from €60 billion to €30
billion from January to September 2018 with no end date set for quantitative easing.
There is increased pressure from the Netherlands and Germany to end the asset
purchasing program as the Eurozone economy continues to show improvement.
The threat of further European Union (EU) nations leaving the Eurozone is calmed for
now. Major elections in the Netherlands, France and Germany did not result in Euro
skeptic parties coming to the forefront. The German election failed to produce a
majority government. Negotiations to form a majority government are still ongoing four
months after the election. The Italian election in 2018 will be closely watched by
financial markets as a Euro-skeptic party is currently leading in the polls.
The United Kingdom (UK) and the EU have agreed to advance to the stage of Brexit talks
after breaking an impasse on the “divorce” bill and agreeing to a settlement amount of
€50 billion. The uncertainties surrounding Brexit will continue to weigh down the UK
economy with GDP forecasted to grow by 1.4% this year.
The Bank of England (BOE) raised interest rates by 25 basis points last November, the
first such increase in over 10 years. The BOE is under pressure to raise rates amidst
rising inflation. Wage increases have not kept up with the rate of inflation and rising
prices are hampering consumer spending. The pound continues to depreciate as the
central bank indicated that interest rate increases will be gradual and limited going
forward. Analysts do not expect any rate moves by the BOE until the second quarter of
2018.
- 59 -
ECONOMIC OVERVIEW
the future lives here. 2018-2022 Financial Plan
The IMF is forecasting the Chinese economy to grow by 6.6% this year. Challenges
facing China include high levels of domestic debt and uneven distribution of wealth
exemplified by a large rural population living in poverty. The retail sector is expected to
post strong growth as income levels rise. Continued global economic growth will
benefit China’s export sectors. China has vowed to defend its interests against US tariffs
on solar panel imports; however, no countervailing tariff has been laid by China thus far.
UNITED STATES
The US Federal Reserve (Fed) is forecasting domestic GDP to grow between 2.2% to
2.6% this year. The unemployment rate is expected to fall around 3.9%. A tightening
labour market will push up wages, increase disposable income, and further fuel US
consumer consumption.
The Fed raised their key interest rate three times last year and is expected to continue its
path of monetary tightening in 2018. The central bank has signalled that three additional
rate increases are possible this year given the strong labour market and strengthening
economy. Increased consumer demand will provide a boost to inflation. If inflation
rises quickly, the Fed may be inclined to increase their key interest rate at a faster pace
than planned. The US dollar will continue to strengthen against other currencies as
interest rates ascend, putting increased pressure on holders of US denominated debt.
Much anticipated tax reform was delivered by the Trump administration in January
2018. The tax code changes cut the corporate rate from 35% to 21% and also lowered
taxes for individuals. The tax cuts are estimated to cost $1.4 trillion over 10 years.
Opponents argue that the reforms disproportionately benefit the rich. Supporters feel
that the overall economy will benefit as multinational corporations will choose to
repatriate profits to the US and increase business investments. As an example, Apple
Inc. announced that it will bring home almost $250 billion in oversees cash which will
result in approximately $38 billion in tax revenues to the government.
Business investment and consumer consumption should see an uptick due to the tax
cuts. Some large corporations have announced that they will share their tax saving with
employees by way of increased wages, benefits or bonus payments. With tax reforms
underway, the Trump administration is expected to turn its attention to infrastructure
spending. The President campaigned on a promise of $1 trillion in infrastructure
spending. It remains to be seen if the administration will provide clarity on its plan
going forward.
Uncertainties persist around the US’ trade policies. Several rounds of North America
Free Trade Agreement (NAFTA) renegotiations were held with no progress made on
contentious issues such as autos, the dispute settlement process and the expiration
clause. The US Trade Representative’s demand for a higher share of US sourced
content in automobiles manufactured in North America was rejected by Mexico and
Canada last November with no counter proposals made to date.
- 60 -
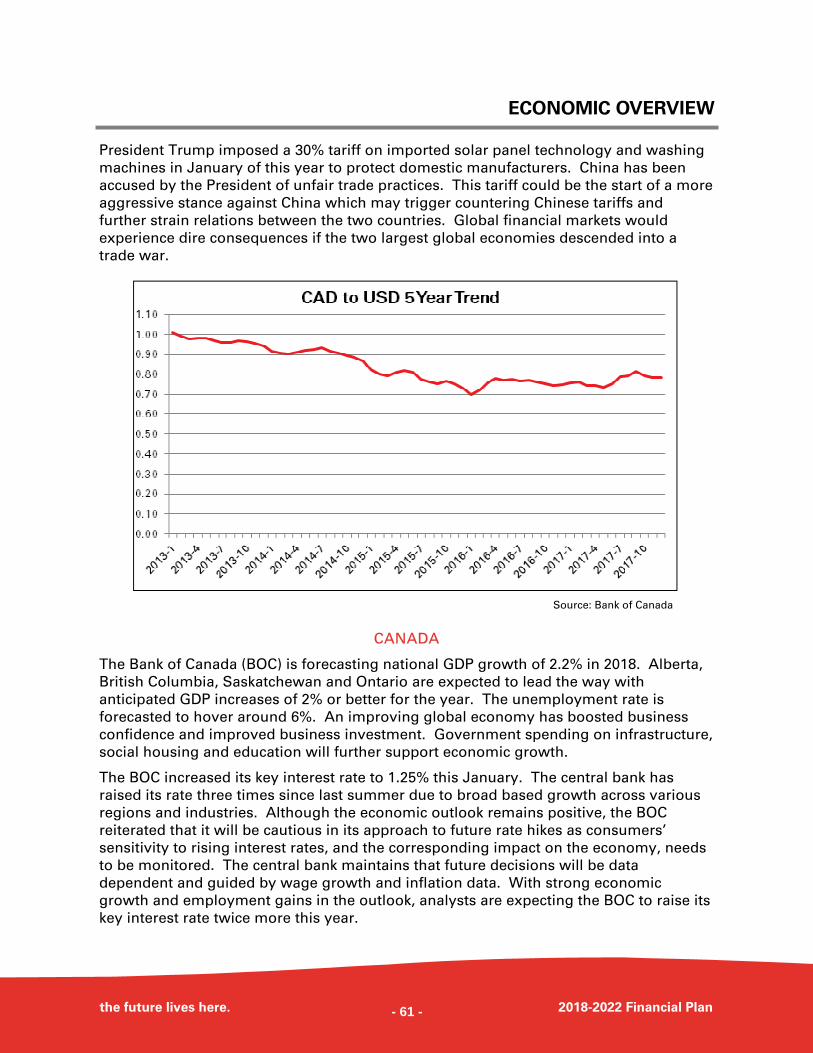
ECONOMIC OVERVIEW
the future lives here. 2018-2022 Financial Plan
President Trump imposed a 30% tariff on imported solar panel technology and washing
machines in January of this year to protect domestic manufacturers. China has been
accused by the President of unfair trade practices. This tariff could be the start of a more
aggressive stance against China which may trigger countering Chinese tariffs and
further strain relations between the two countries. Global financial markets would
experience dire consequences if the two largest global economies descended into a
trade war.
CANADA
The Bank of Canada (BOC) is forecasting national GDP growth of 2.2% in 2018. Alberta,
British Columbia, Saskatchewan and Ontario are expected to lead the way with
anticipated GDP increases of 2% or better for the year. The unemployment rate is
forecasted to hover around 6%. An improving global economy has boosted business
confidence and improved business investment. Government spending on infrastructure,
social housing and education will further support economic growth.
The BOC increased its key interest rate to 1.25% this January. The central bank has
raised its rate three times since last summer due to broad based growth across various
regions and industries. Although the economic outlook remains positive, the BOC
reiterated that it will be cautious in its approach to future rate hikes as consumers’
sensitivity to rising interest rates, and the corresponding impact on the economy, needs
to be monitored. The central bank maintains that future decisions will be data
dependent and guided by wage growth and inflation data. With strong economic
growth and employment gains in the outlook, analysts are expecting the BOC to raise its
key interest rate twice more this year.
Source: Bank of Canada
- 61 -
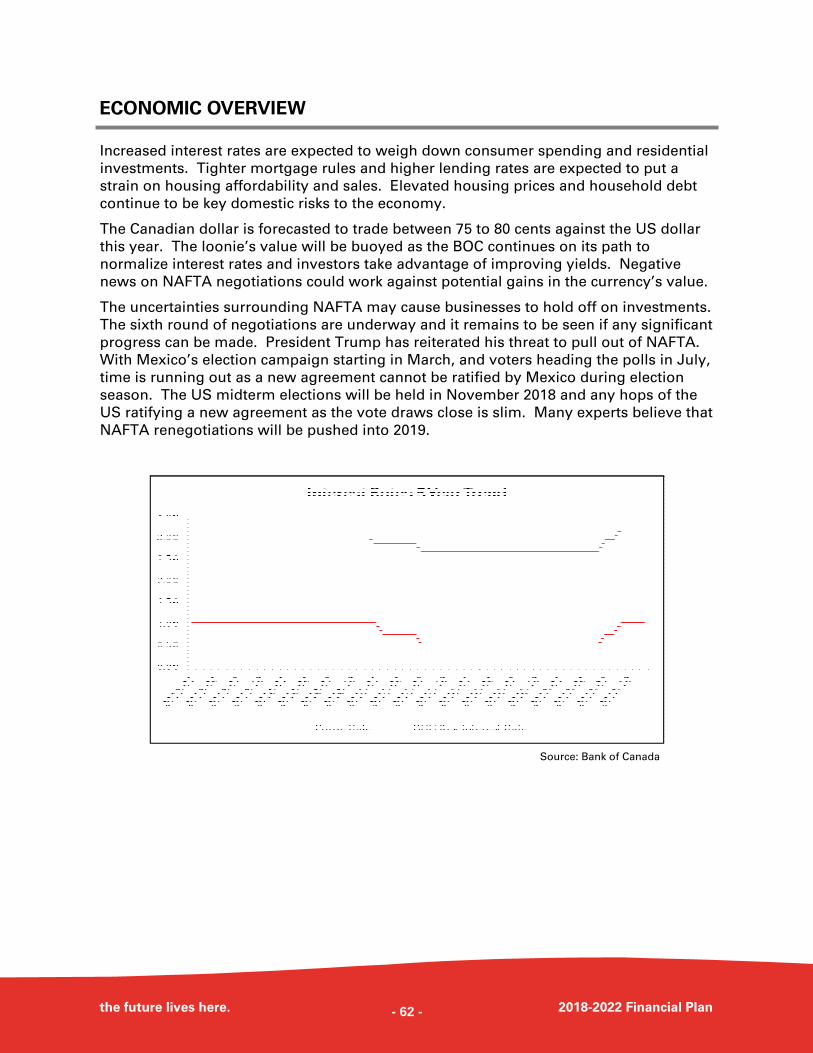
ECONOMIC OVERVIEW
the future lives here. 2018-2022 Financial Plan
Increased interest rates are expected to weigh down consumer spending and residential
investments. Tighter mortgage rules and higher lending rates are expected to put a
strain on housing affordability and sales. Elevated housing prices and household debt
continue to be key domestic risks to the economy.
The Canadian dollar is forecasted to trade between 75 to 80 cents against the US dollar
this year. The loonie’s value will be buoyed as the BOC continues on its path to
normalize interest rates and investors take advantage of improving yields. Negative
news on NAFTA negotiations could work against potential gains in the currency’s value.
The uncertainties surrounding NAFTA may cause businesses to hold off on investments.
The sixth round of negotiations are underway and it remains to be seen if any significant
progress can be made. President Trump has reiterated his threat to pull out of NAFTA.
With Mexico’s election campaign starting in March, and voters heading the polls in July,
time is running out as a new agreement cannot be ratified by Mexico during election
season. The US midterm elections will be held in November 2018 and any hops of the
US ratifying a new agreement as the vote draws close is slim. Many experts believe that
NAFTA renegotiations will be pushed into 2019.
Source: Bank of Canada
- 62 -
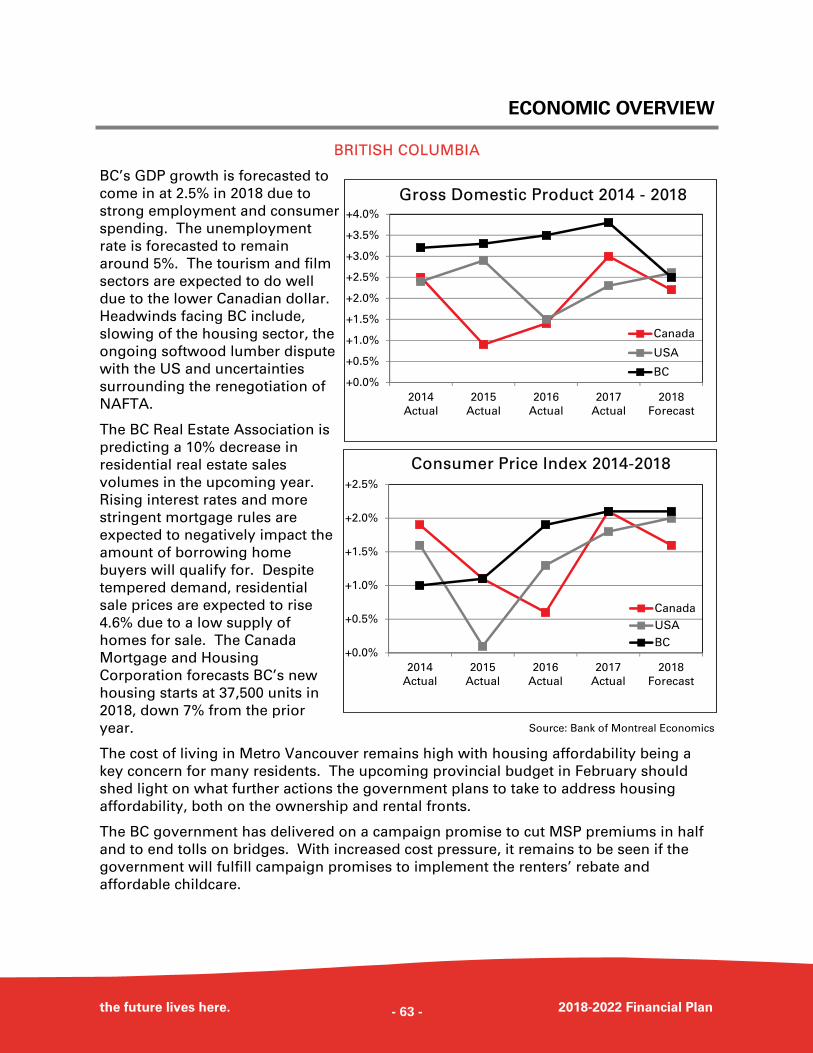
ECONOMIC OVERVIEW
the future lives here. 2018-2022 Financial Plan
BRITISH COLUMBIA
BC’s GDP growth is forecasted to
come in at 2.5% in 2018 due to
strong employment and consumer
spending. The unemployment
rate is forecasted to remain
around 5%. The tourism and film
sectors are expected to do well
due to the lower Canadian dollar.
Headwinds facing BC include,
slowing of the housing sector, the
ongoing softwood lumber dispute
with the US and uncertainties
surrounding the renegotiation of
NAFTA.
The BC Real Estate Association is
predicting a 10% decrease in
residential real estate sales
volumes in the upcoming year.
Rising interest rates and more
stringent mortgage rules are
expected to negatively impact the
amount of borrowing home
buyers will qualify for. Despite
tempered demand, residential
sale prices are expected to rise
4.6% due to a low supply of
homes for sale. The Canada
Mortgage and Housing
Corporation forecasts BC’s new
housing starts at 37,500 units in
2018, down 7% from the prior
year.
The cost of living in Metro Vancouver remains high with housing affordability being a
key concern for many residents. The upcoming provincial budget in February should
shed light on what further actions the government plans to take to address housing
affordability, both on the ownership and rental fronts.
The BC government has delivered on a campaign promise to cut MSP premiums in half
and to end tolls on bridges. With increased cost pressure, it remains to be seen if the
government will fulfill campaign promises to implement the renters’ rebate and
affordable childcare.
Source: Bank of Montreal Economics
+0.0%
+0.5%
+1.0%
+1.5%
+2.0%
+2.5%
+3.0%
+3.5%
+4.0%
2014
Actual
2015
Actual
2016
Actual
2017
Actual
2018
Forecast
Gross Domestic Product 2014 - 2018
Canada
USA
BC
+0.0%
+0.5%
+1.0%
+1.5%
+2.0%
+2.5%
2014
Actual
2015
Actual
2016
Actual
2017
Actual
2018
Forecast
Consumer Price Index 2014-2018
Canada
USA
BC
- 63 -
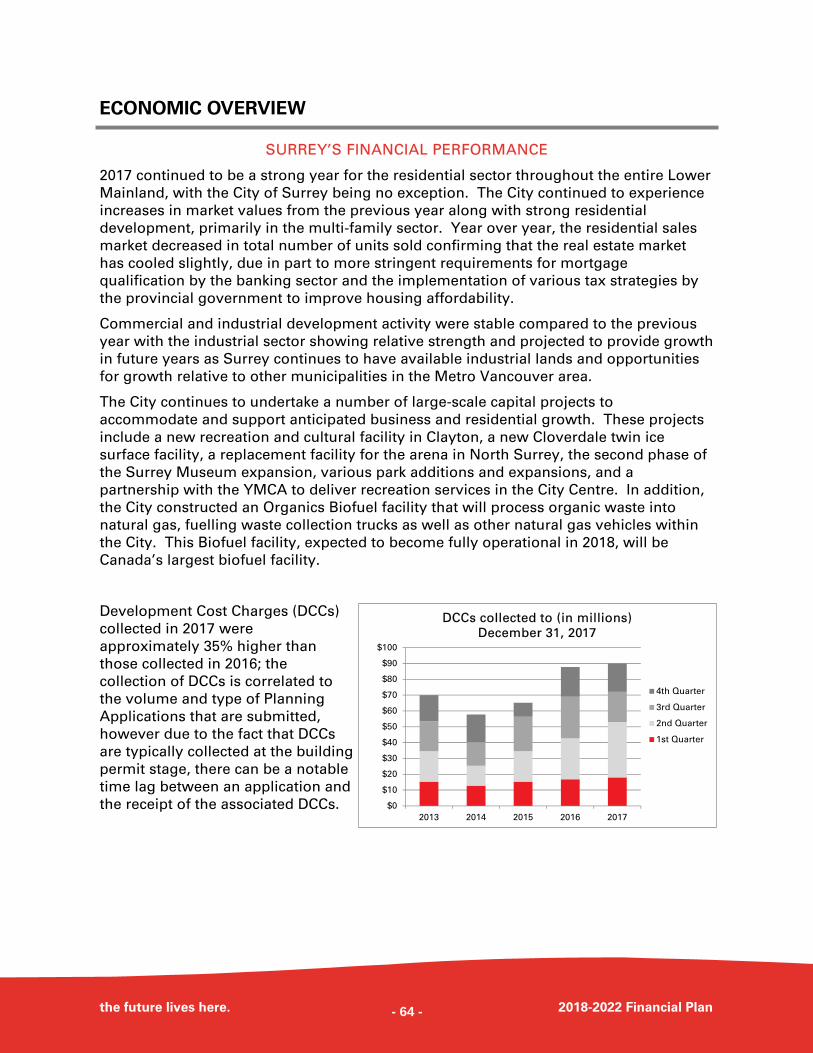
ECONOMIC OVERVIEW
the future lives here. 2018-2022 Financial Plan
SURREY’S FINANCIAL PERFORMANCE
2017 continued to be a strong year for the residential sector throughout the entire Lower
Mainland, with the City of Surrey being no exception. The City continued to experience
increases in market values from the previous year along with strong residential
development, primarily in the multi-family sector. Year over year, the residential sales
market decreased in total number of units sold confirming that the real estate market
has cooled slightly, due in part to more stringent requirements for mortgage
qualification by the banking sector and the implementation of various tax strategies by
the provincial government to improve housing affordability.
Commercial and industrial development activity were stable compared to the previous
year with the industrial sector showing relative strength and projected to provide growth
in future years as Surrey continues to have available industrial lands and opportunities
for growth relative to other municipalities in the Metro Vancouver area.
The City continues to undertake a number of large-scale capital projects to
accommodate and support anticipated business and residential growth. These projects
include a new recreation and cultural facility in Clayton, a new Cloverdale twin ice
surface facility, a replacement facility for the arena in North Surrey, the second phase of
the Surrey Museum expansion, various park additions and expansions, and a
partnership with the YMCA to deliver recreation services in the City Centre. In addition,
the City constructed an Organics Biofuel facility that will process organic waste into
natural gas, fuelling waste collection trucks as well as other natural gas vehicles within
the City. This Biofuel facility, expected to become fully operational in 2018, will be
Canada’s largest biofuel facility.
Development Cost Charges (DCCs)
collected in 2017 were
approximately 35% higher than
those collected in 2016; the
collection of DCCs is correlated to
the volume and type of Planning
Applications that are submitted,
however due to the fact that DCCs
are typically collected at the building
permit stage, there can be a notable
time lag between an application and
the receipt of the associated DCCs. $0
$10
$20
$30
$40
$50
$60
$70
$80
$90
$100
2013 2014 2015 2016 2017
DCCs collected to (in millions)
December 31, 2017
4th Quarter
3rd Quarter
2nd Quarter
1st Quarter
- 64 -
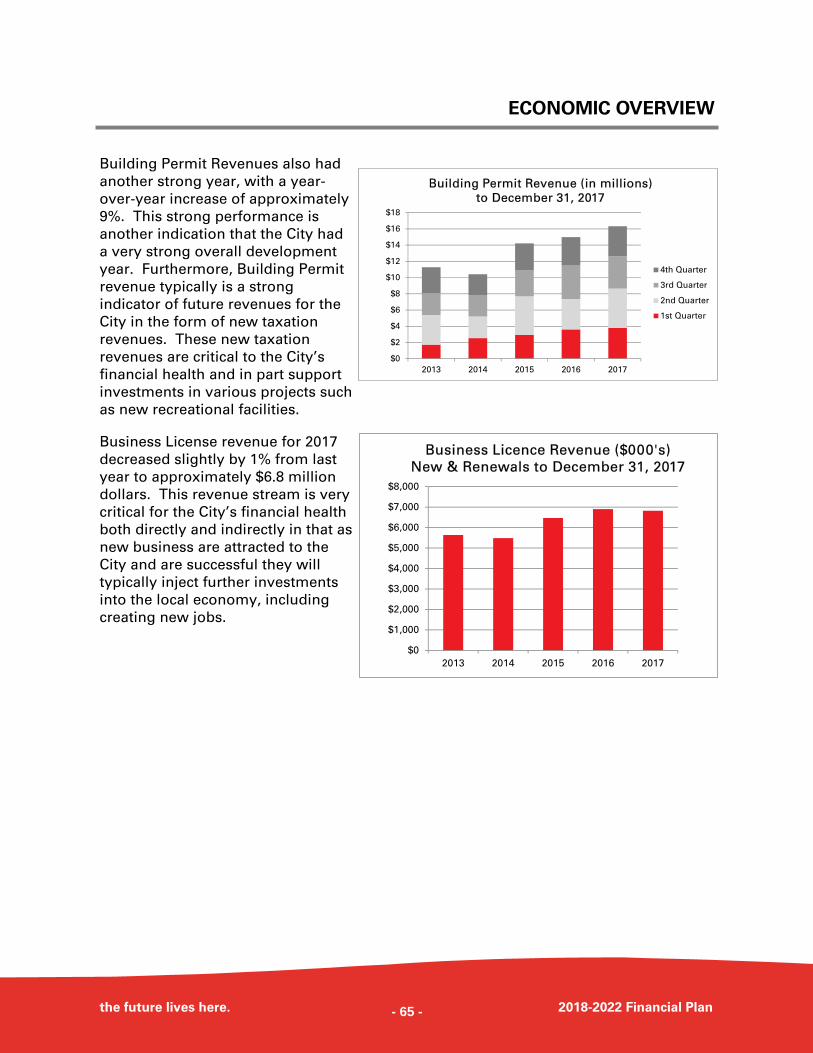
ECONOMIC OVERVIEW
the future lives here. 2018-2022 Financial Plan
Building Permit Revenues also had
another strong year, with a year-
over-year increase of approximately
9%. This strong performance is
another indication that the City had
a very strong overall development
year. Furthermore, Building Permit
revenue typically is a strong
indicator of future revenues for the
City in the form of new taxation
revenues. These new taxation
revenues are critical to the City’s
financial health and in part support
investments in various projects such
as new recreational facilities.
Business License revenue for 2017
decreased slightly by 1% from last
year to approximately $6.8 million
dollars. This revenue stream is very
critical for the City’s financial health
both directly and indirectly in that as
new business are attracted to the
City and are successful they will
typically inject further investments
into the local economy, including
creating new jobs.
$0
$1,000
$2,000
$3,000
$4,000
$5,000
$6,000
$7,000
$8,000
2013 2014 2015 2016 2017
Business Licence Revenue ($000's)
New & Renewals to December 31, 2017
$0
$2
$4
$6
$8
$10
$12
$14
$16
$18
2013 2014 2015 2016 2017
Building Permit Revenue (in millions)
to December 31, 2017
4th Quarter
3rd Quarter
2nd Quarter
1st Quarter
- 65 -
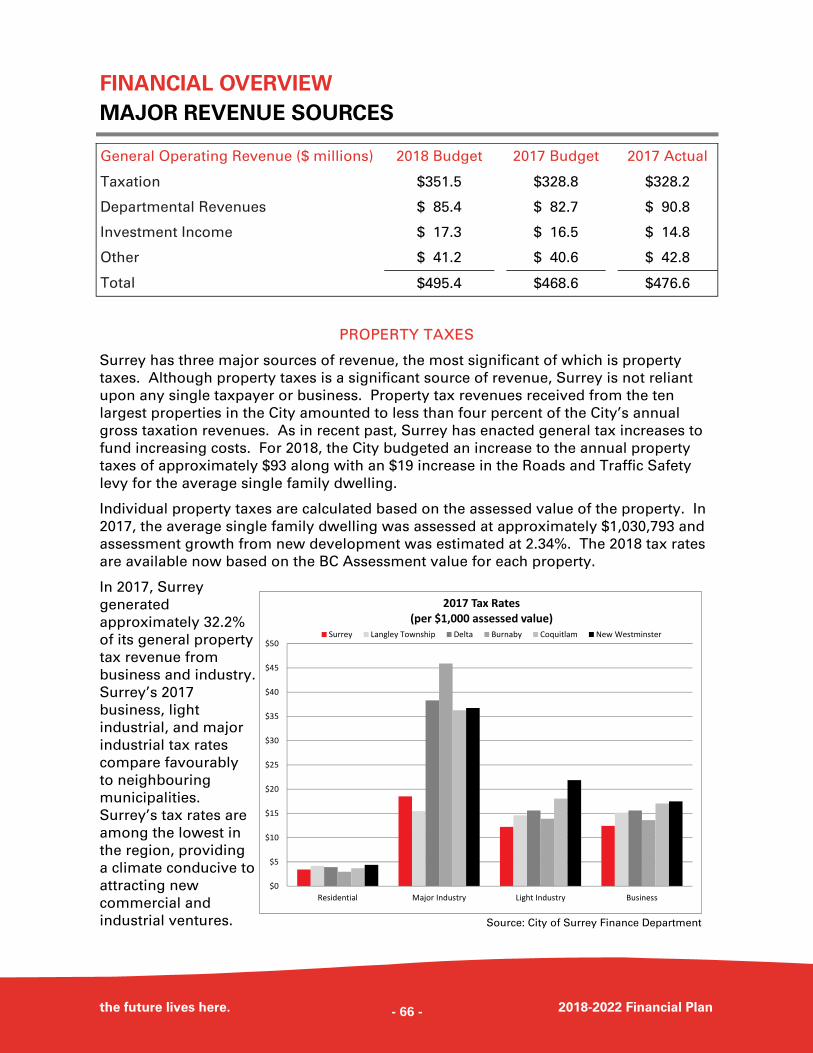
FINANCIAL OVERVIEW MAJOR REVENUE SOURCES
the future lives here. 2018-2022 Financial Plan
PROPERTY TAXES
Surrey has three major sources of revenue, the most significant of which is property
taxes. Although property taxes is a significant source of revenue, Surrey is not reliant
upon any single taxpayer or business. Property tax revenues received from the ten
largest properties in the City amounted to less than four percent of the City’s annual
gross taxation revenues. As in recent past, Surrey has enacted general tax increases to
fund increasing costs. For 2018, the City budgeted an increase to the annual property
taxes of approximately $93 along with an $19 increase in the Roads and Traffic Safety
levy for the average single family dwelling.
Individual property taxes are calculated based on the assessed value of the property. In
2017, the average single family dwelling was assessed at approximately $1,030,793 and
assessment growth from new development was estimated at 2.34%. The 2018 tax rates
are available now based on the BC Assessment value for each property.
In 2017, Surrey
generated
approximately 32.2%
of its general property
tax revenue from
business and industry.
Surrey’s 2017
business, light
industrial, and major
industrial tax rates
compare favourably
to neighbouring
municipalities.
Surrey’s tax rates are
among the lowest in
the region, providing
a climate conducive to
attracting new
commercial and
industrial ventures.
General Operating Revenue ($ millions) 2018 Budget 2017 Budget 2017 Actual
Taxation $351.5 $328.8 $328.2
Departmental Revenues $ 85.4 $ 82.7 $ 90.8
Investment Income $ 17.3 $ 16.5 $ 14.8
Other $ 41.2 $ 40.6 $ 42.8
Total $495.4 $468.6 $476.6
Source: City of Surrey Finance Department
$0
$5
$10
$15
$20
$25
$30
$35
$40
$45
$50
Residential Major Industry Light Industry Business
2017 Tax Rates(per $1,000 assessed value)
Surrey Langley Township Delta Burnaby Coquitlam New Westminster
- 66 -
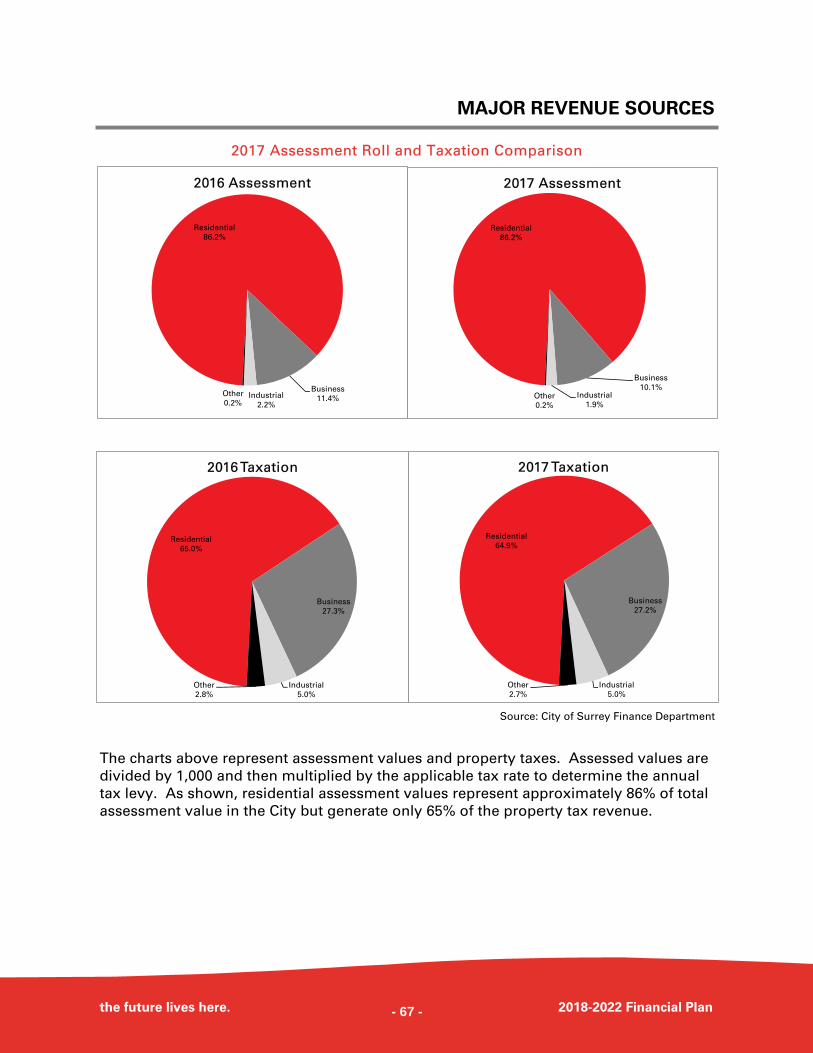
MAJOR REVENUE SOURCES
the future lives here. 2018-2022 Financial Plan
2017 Assessment Roll and Taxation Comparison
The charts above represent assessment values and property taxes. Assessed values are
divided by 1,000 and then multiplied by the applicable tax rate to determine the annual
tax levy. As shown, residential assessment values represent approximately 86% of total
assessment value in the City but generate only 65% of the property tax revenue.
Residential
86.2%
Business
11.4%Industrial
2.2%
Other
0.2%
2016 Assessment
Residential
86.2%
Business
10.1%Industrial
1.9%Other
0.2%
2017 Assessment
Residential
65.0%
Business
27.3%
Industrial
5.0%
Other
2.8%
2016 Taxation
Residential
64.9%
Business
27.2%
Industrial
5.0%
Other
2.7%
2017 Taxation
Source: City of Surrey Finance Department
- 67 -
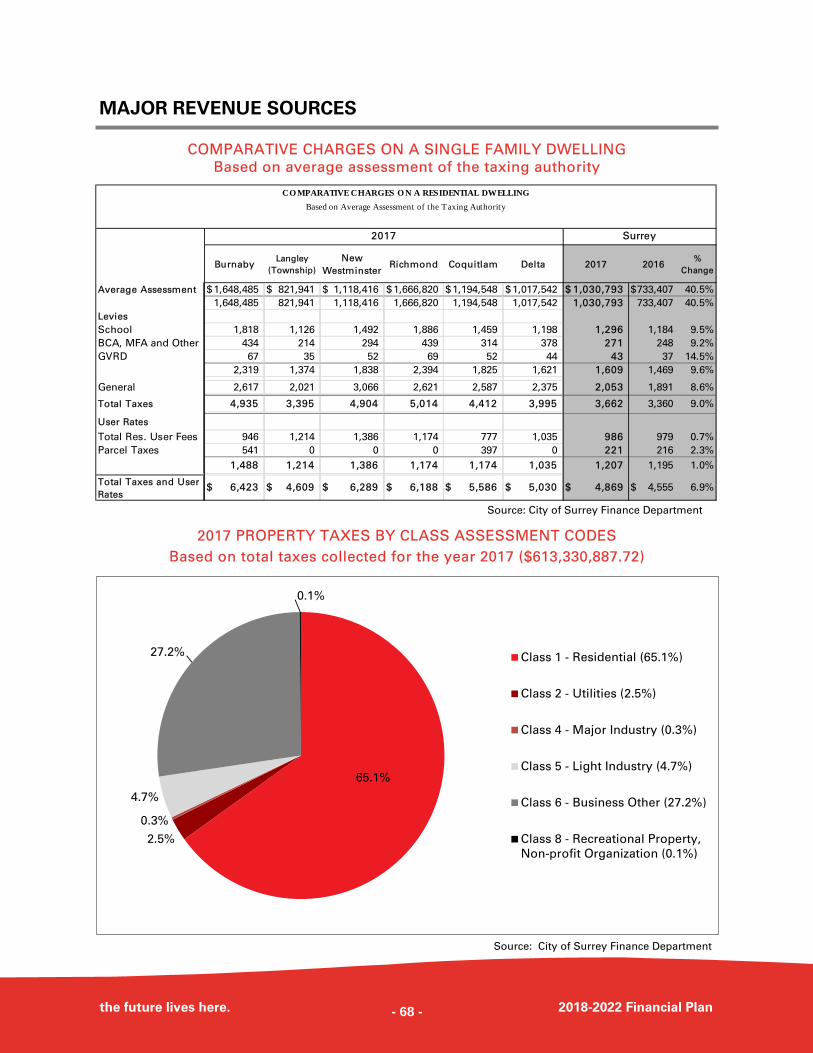
MAJOR REVENUE SOURCES
the future lives here. 2018-2022 Financial Plan
Source: City of Surrey Finance Department
COMPARATIVE CHARGES ON A SINGLE FAMILY DWELLING
Based on average assessment of the taxing authority
2017 PROPERTY TAXES BY CLASS ASSESSMENT CODES
Based on total taxes collected for the year 2017 ($613,330,887.72)
Source: City of Surrey Finance Department
65.1%
2.5%
0.3%
4.7%
27.2%
0.1%
Class 1 - Residential (65.1%)
Class 2 - Utilities (2.5%)
Class 4 - Major Industry (0.3%)
Class 5 - Light Industry (4.7%)
Class 6 - Business Other (27.2%)
Class 8 - Recreational Property,
Non-profit Organization (0.1%)
BurnabyLangley
(Township)
New
WestminsterRichmond Coquitlam Delta 2017 2016
%
Change
Average Assessment 1,648,485 $ 821,941 $ 1,118,416 $ 1,666,820 $ 1,194,548 $ 1,017,542 $ 1,030,793 $ 733,407 $ 40.5%
1,648,485 821,941 1,118,416 1,666,820 1,194,548 1,017,542 1,030,793 733,407 40.5%
Levies
School 1,818 1,126 1,492 1,886 1,459 1,198 1,296 1,184 9.5%
BCA, MFA and Other 434 214 294 439 314 378 271 248 9.2%
GVRD 67 35 52 69 52 44 43 37 14.5%
2,319 1,374 1,838 2,394 1,825 1,621 1,609 1,469 9.6%
General 2,617 2,021 3,066 2,621 2,587 2,375 2,053 1,891 8.6%
Total Taxes 4,935 3,395 4,904 5,014 4,412 3,995 3,662 3,360 9.0%
User Rates
Total Res. User Fees 946 1,214 1,386 1,174 777 1,035 986 979 0.7%
Parcel Taxes 541 0 0 0 397 0 221 216 2.3%
1,488 1,214 1,386 1,174 1,174 1,035 1,207 1,195 1.0%
Total Taxes and User
Rates6,423 $ 4,609 $ 6,289 $ 6,188 $ 5,586 $ 5,030 $ 4,869 $ 4,555 $ 6.9%
CO MPARATIVE CHARGES O N A RESIDENTIAL DWELLING
Based on Average Assessment of the Taxing Authority
2017 Surrey
- 68 -
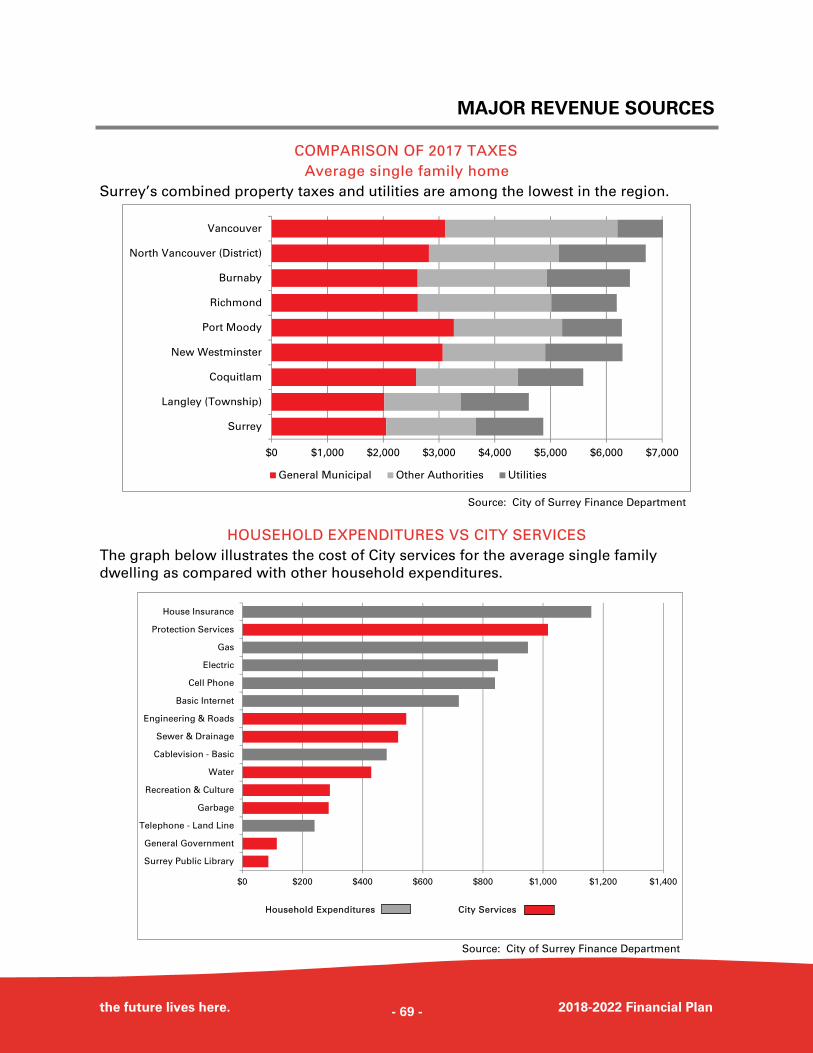
MAJOR REVENUE SOURCES
the future lives here. 2018-2022 Financial Plan
COMPARISON OF 2017 TAXES
Average single family home
Surrey’s combined property taxes and utilities are among the lowest in the region.
HOUSEHOLD EXPENDITURES VS CITY SERVICES
The graph below illustrates the cost of City services for the average single family
dwelling as compared with other household expenditures.
Source: City of Surrey Finance Department
Source: City of Surrey Finance Department
$0 $1,000 $2,000 $3,000 $4,000 $5,000 $6,000 $7,000
Surrey
Langley (Township)
Coquitlam
New Westminster
Port Moody
Richmond
Burnaby
North Vancouver (District)
Vancouver
General Municipal Other Authorities Utilities
$0 $200 $400 $600 $800 $1,000 $1,200 $1,400
Surrey Public Library
General Government
Telephone - Land Line
Garbage
Recreation & Culture
Water
Cablevision - Basic
Sewer & Drainage
Engineering & Roads
Basic Internet
Cell Phone
Electric
Gas
Protection Services
House Insurance
Household Expenditures City Services
- 69 -
MAJOR REVENUE SOURCES
the future lives here. 2018-2022 Financial Plan
DEPARTMENTAL REVENUES
Examples of departmental revenues include items such as:
• User fees - fees from recreation facilities, water, and solid waste removal;
• Provincial revenue - traffic fine sharing, and Surrey Public Library grants;
• Permit fees - fees from building permits, electrical permits, and road closure permits;
• Licence revenue - fees from business licenses; and
• Other fees - fees from enforcing bylaws and the sale of reports and maps.
Council approved an increase equivalent to an $93 increase in taxes on an average
single family dwelling for 2018.
RETURN ON INVESTMENT (INTEREST REVENUE)
In 2017, the City’s investment portfolio achieved a return of 1.95%.
In its purchase of investments, the City is subject to the Community Charter as well as its
own Investment Policy, approved by Council on May 6, 2013. The policy provides a
framework for the City to maximize returns with minimal risk.
The City’s investments are classified as follows:
Money Market Portfolio
Surrey’s Money Market Portfolio is
comprised of investments that will mature
within one year. This portfolio represents
50.1% of the City’s investments. Cash
holdings account for 3.7% of the
investment portfolio.
Intermediate Portfolio
The intermediate portfolio is comprised of
investments with a term greater than one
year and less than two years. This portfolio
represents 17.6% of the City’s investments.
Bond Portfolio
The bond portfolio is comprised of
investments with a term greater than two
years and less than ten years. This
portfolio represents 28.6% of the City’s
investments.
Portfolio Mix
The City’s investment portfolio consists of
securities purchased from Canadian
Schedule 1 Banks (45.2%), Canadian
Provinces and Provincial institutions
(11.5%), British Columbia Credit Unions
(38.7%), Cash Holdings (3.7%), and
Canadian Schedule 2 Banks (0.9%).
- 70 -
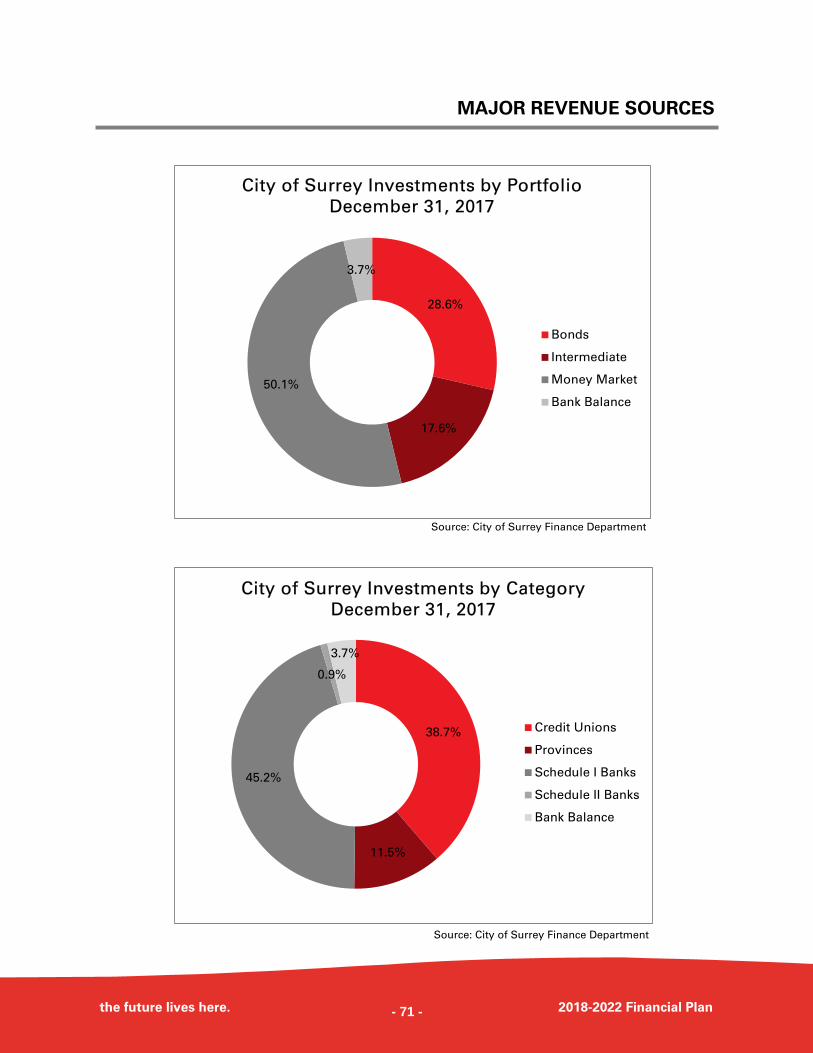
MAJOR REVENUE SOURCES
the future lives here. 2018-2022 Financial Plan
Source: City of Surrey Finance Department
Source: City of Surrey Finance Department
28.6%
17.6%
50.1%
3.7%
City of Surrey Investments by Portfolio
December 31, 2017
Bonds
Intermediate
Money Market
Bank Balance
38.7%
11.5%
45.2%
0.9%
3.7%
City of Surrey Investments by Category
December 31, 2017
Credit Unions
Provinces
Schedule I Banks
Schedule II Banks
Bank Balance
- 71 -
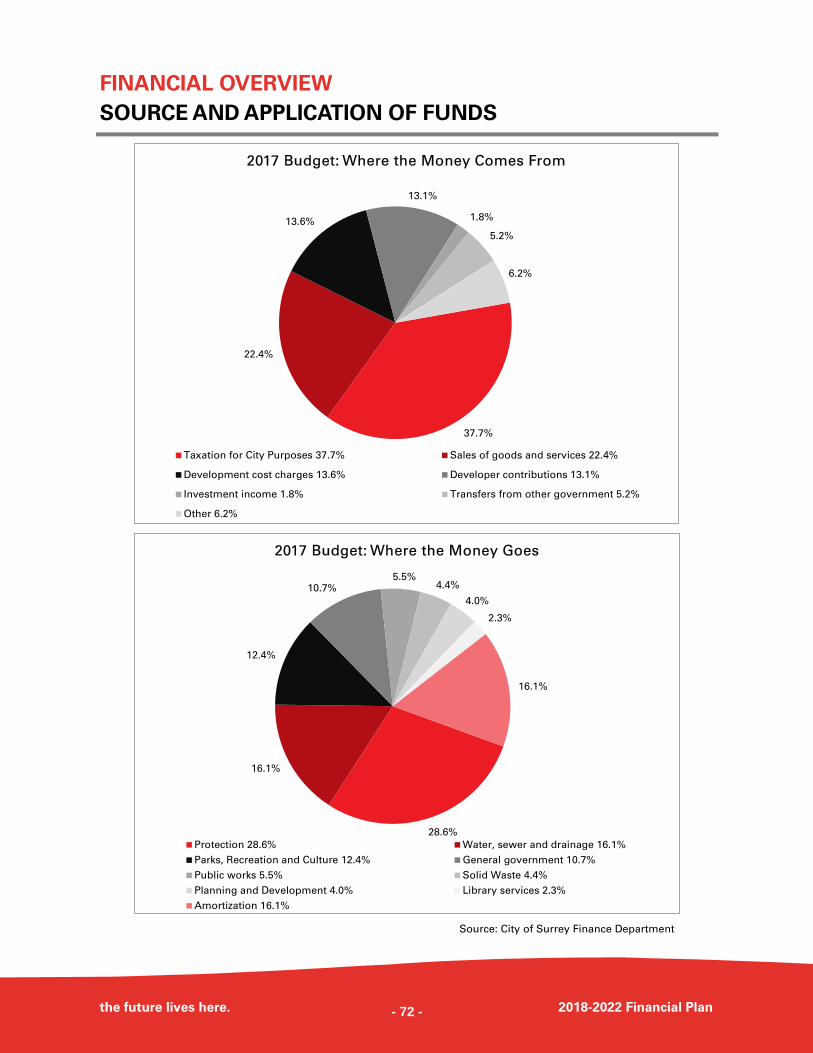
FINANCIAL OVERVIEW SOURCE AND APPLICATION OF FUNDS
the future lives here. 2018-2022 Financial Plan
Source: City of Surrey Finance Department
37.7%
22.4%
13.6%
13.1%
1.8%
5.2%
6.2%
2017 Budget: Where the Money Comes From
Taxation for City Purposes 37.7% Sales of goods and services 22.4%
Development cost charges 13.6% Developer contributions 13.1%
Investment income 1.8% Transfers from other government 5.2%
Other 6.2%
28.6%
16.1%
12.4%
10.7%5.5%
4.4%
4.0%
2.3%
16.1%
2017 Budget: Where the Money Goes
Protection 28.6% Water, sewer and drainage 16.1%
Parks, Recreation and Culture 12.4% General government 10.7%
Public works 5.5% Solid Waste 4.4%
Planning and Development 4.0% Library services 2.3%
Amortization 16.1%
- 72 -
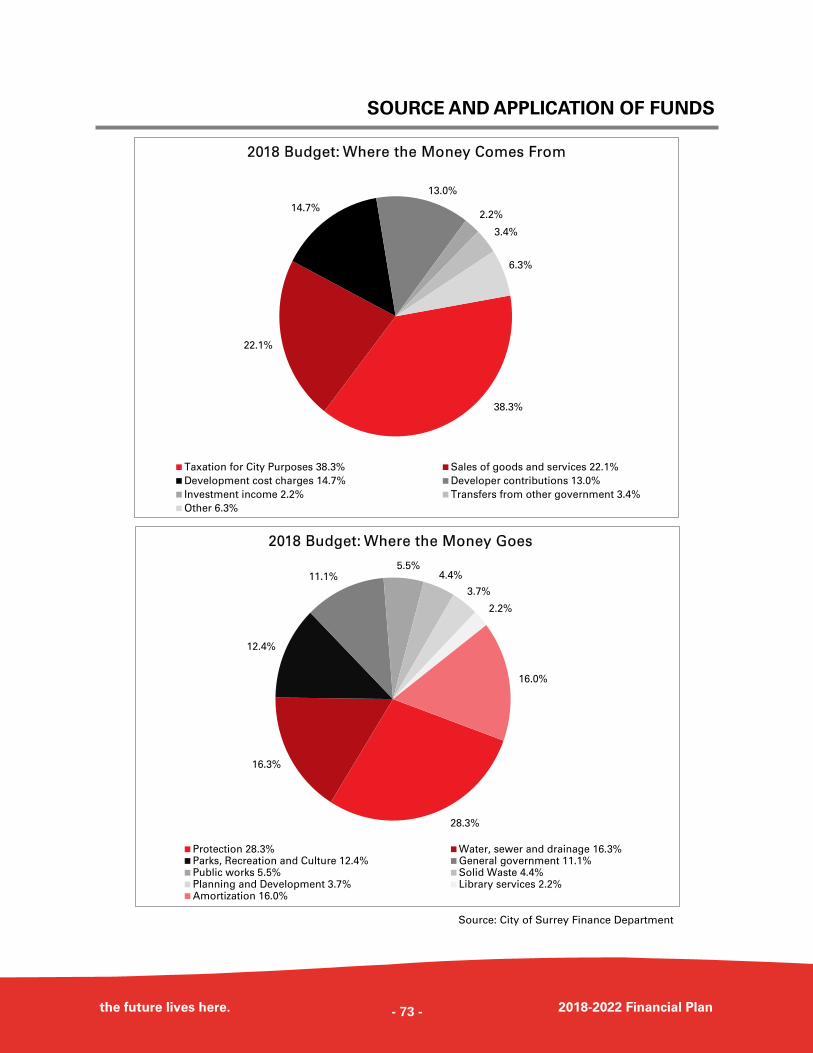
SOURCE AND APPLICATION OF FUNDS
the future lives here. 2018-2022 Financial Plan
Source: City of Surrey Finance Department
38.3%
22.1%
14.7%
13.0%
2.2%
3.4%
6.3%
2018 Budget: Where the Money Comes From
Taxation for City Purposes 38.3% Sales of goods and services 22.1%
Development cost charges 14.7% Developer contributions 13.0%
Investment income 2.2% Transfers from other government 3.4%
Other 6.3%
28.3%
16.3%
12.4%
11.1%5.5%
4.4%
3.7%
2.2%
16.0%
2018 Budget: Where the Money Goes
Protection 28.3% Water, sewer and drainage 16.3%Parks, Recreation and Culture 12.4% General government 11.1%Public works 5.5% Solid Waste 4.4%Planning and Development 3.7% Library services 2.2%Amortization 16.0%
- 73 -
FINANCIAL OVERVIEW OVERVIEW OF FUND STRUCTURE
the future lives here. 2018-2022 Financial Plan
The 2018 - 2022 Financial Plan consolidates the results of the City’s Operating, Capital,
Reserve, and Utility Funds, as well as those of the Surrey City Development Corporation
and the Surrey Homelessness and Housing Society.
OPERATING & CAPITAL FUNDS
Operating and Capital funds include the following:
Operating funds are used to report the operating activities of the City, whereas capital
funds are used to record the acquisition of capital assets, amortization and any related
long-term debt.
RESERVE FUNDS
Under the Community Charter, City Council may use bylaws to establish Reserve Funds
for specified purposes. Money in a special Reserve Fund and the interest earned on it
may only be used for the purpose for which the fund was established. If the amount in a
Reserve Fund is greater than required, City Council may, by bylaw, transfer all or part of
the amount to another Reserve Fund. Surrey currently has the following Reserve Funds:
• Equipment and Building Replacement;
• Municipal Land;
• Parkland Acquisition;
• Capital Acquisition;
• Environmental Stewardship;
• Local Improvement Financing;
• Water Claims;
• Affordable Housing;
• Parking Space;
• Development Cost Charges; and
• Neighbourhood Concept Plan.
TRUST FUNDS
Trust funds contain assets which are to be administered as directed by agreement or
statute for certain beneficiaries. Trusts administered by the City are not included in the
City’s Consolidated Budget.
• General
• Drainage
• Parking
• Roads and Traffic Safety
• Sewer
• Solid Waste
• Surrey City Energy
• Water
- 74 -
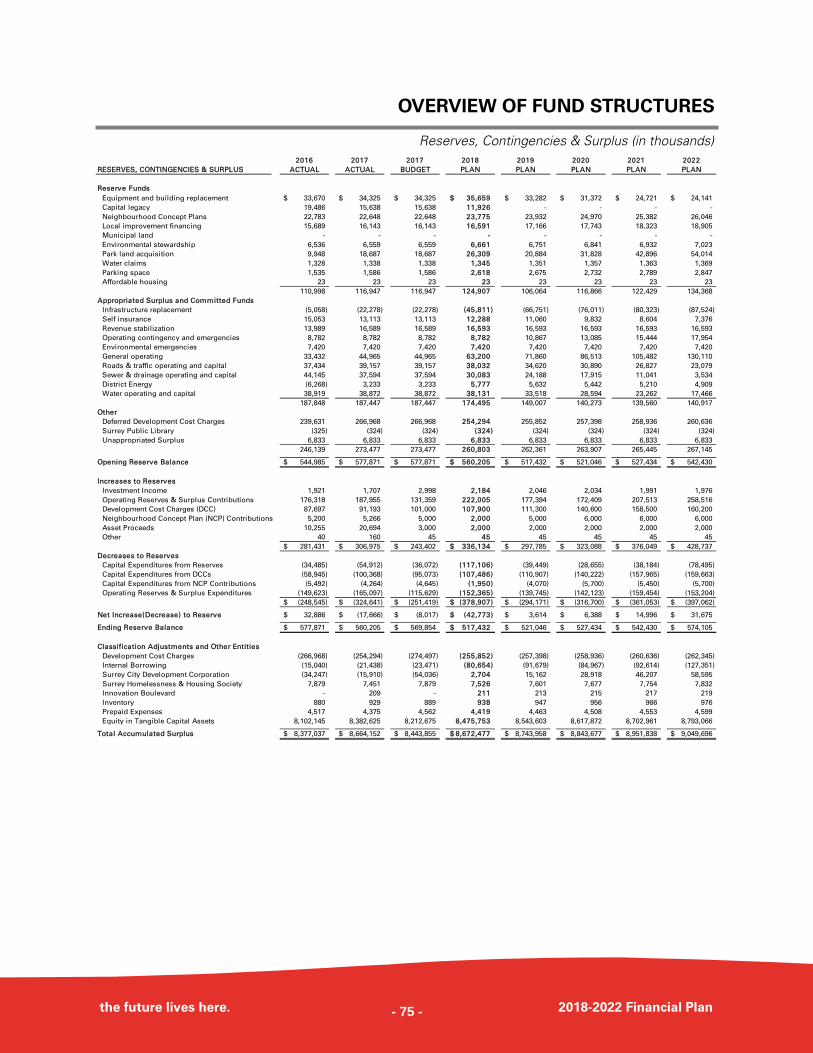
OVERVIEW OF FUND STRUCTURES
the future lives here. 2018-2022 Financial Plan
Reserves, Contingencies & Surplus (in thousands) 2016 2017 2017 2018 2019 2020 2021 2022
RESERVES, CONTINGENCIES & SURPLUS ACTUAL ACTUAL BUDGET PLAN PLAN PLAN PLAN PLAN
Reserve Funds
Equipment and building replacement 33,670$ 34,325$ 34,325$ 35,659$ 33,282$ 31,372$ 24,721$ 24,141$
Capital legacy 19,486 15,638 15,638 11,926 - - - -
Neighbourhood Concept Plans 22,783 22,648 22,648 23,775 23,932 24,970 25,382 26,046
Local improvement financing 15,689 16,143 16,143 16,591 17,166 17,743 18,323 18,905
Municipal land - - - - - - - -
Environmental stewardship 6,536 6,559 6,559 6,661 6,751 6,841 6,932 7,023
Park land acquisition 9,948 18,687 18,687 26,309 20,884 31,828 42,896 54,014
Water claims 1,328 1,338 1,338 1,345 1,351 1,357 1,363 1,369
Parking space 1,535 1,586 1,586 2,618 2,675 2,732 2,789 2,847
Affordable housing 23 23 23 23 23 23 23 23
110,998 116,947 116,947 124,907 106,064 116,866 122,429 134,368
Appropriated Surplus and Committed Funds
Infrastructure replacement (5,058) (22,278) (22,278) (45,811) (66,751) (76,011) (80,323) (87,524)
Self insurance 15,053 13,113 13,113 12,288 11,060 9,832 8,604 7,376
Revenue stabilization 13,989 16,589 16,589 16,593 16,593 16,593 16,593 16,593
Operating contingency and emergencies 8,782 8,782 8,782 8,782 10,867 13,085 15,444 17,954
Environmental emergencies 7,420 7,420 7,420 7,420 7,420 7,420 7,420 7,420
General operating 33,432 44,965 44,965 63,200 71,860 86,513 105,482 130,110
Roads & traffic operating and capital 37,434 39,157 39,157 38,032 34,620 30,890 26,827 23,079
Sewer & drainage operating and capital 44,145 37,594 37,594 30,083 24,188 17,915 11,041 3,534
District Energy (6,268) 3,233 3,233 5,777 5,632 5,442 5,210 4,909
Water operating and capital 38,919 38,872 38,872 38,131 33,518 28,594 23,262 17,466
187,848 187,447 187,447 174,495 149,007 140,273 139,560 140,917
Other
Deferred Development Cost Charges 239,631 266,968 266,968 254,294 255,852 257,398 258,936 260,636
Surrey Public Library (325) (324) (324) (324) (324) (324) (324) (324)
Unappropriated Surplus 6,833 6,833 6,833 6,833 6,833 6,833 6,833 6,833
246,139 273,477 273,477 260,803 262,361 263,907 265,445 267,145
Opening Reserve Balance 544,985$ 577,871$ 577,871$ 560,205$ 517,432$ 521,046$ 527,434$ 542,430$
Increases to Reserves
Investment Income 1,921 1,707 2,998 2,184 2,046 2,034 1,991 1,976
Operating Reserves & Surplus Contributions 176,318 187,955 131,359 222,005 177,394 172,409 207,513 258,516
Development Cost Charges (DCC) 87,697 91,193 101,000 107,900 111,300 140,600 158,500 160,200
Neighbourhood Concept Plan (NCP) Contributions 5,200 5,266 5,000 2,000 5,000 6,000 6,000 6,000
Asset Proceeds 10,255 20,694 3,000 2,000 2,000 2,000 2,000 2,000
Other 40 160 45 45 45 45 45 45
281,431$ 306,975$ 243,402$ 336,134$ 297,785$ 323,088$ 376,049$ 428,737$
Decreases to Reserves
Capital Expenditures from Reserves (34,485) (54,912) (36,072) (117,106) (39,449) (28,655) (38,184) (78,495)
Capital Expenditures from DCCs (58,945) (100,368) (95,073) (107,486) (110,907) (140,222) (157,965) (159,663)
Capital Expenditures from NCP Contributions (5,492) (4,264) (4,645) (1,950) (4,070) (5,700) (5,450) (5,700)
Operating Reserves & Surplus Expenditures (149,623) (165,097) (115,629) (152,365) (139,745) (142,123) (159,454) (153,204)
(248,545)$ (324,641)$ (251,419)$ (378,907)$ (294,171)$ (316,700)$ (361,053)$ (397,062)$
Net Increase(Decrease) to Reserve 32,886$ (17,666)$ (8,017)$ (42,773)$ 3,614$ 6,388$ 14,996$ 31,675$
Ending Reserve Balance 577,871$ 560,205$ 569,854$ 517,432$ 521,046$ 527,434$ 542,430$ 574,105$
Classification Adjustments and Other Entities
Development Cost Charges (266,968) (254,294) (274,497) (255,852) (257,398) (258,936) (260,636) (262,345)
Internal Borrowing (15,040) (21,438) (23,471) (80,654) (91,679) (84,967) (92,614) (127,351)
Surrey City Development Corporation (34,247) (15,910) (54,036) 2,704 15,162 28,918 46,207 58,595
Surrey Homelessness & Housing Society 7,879 7,451 7,879 7,526 7,601 7,677 7,754 7,832
Innovation Boulevard - 209 - 211 213 215 217 219
Inventory 880 929 889 938 947 956 966 976
Prepaid Expenses 4,517 4,375 4,562 4,419 4,463 4,508 4,553 4,599
Equity in Tangible Capital Assets 8,102,145 8,382,625 8,212,675 8,475,753 8,543,603 8,617,872 8,702,961 8,793,066
Total Accumulated Surplus 8,377,037$ 8,664,152$ 8,443,855$ 8,672,477$ 8,743,958$ 8,843,677$ 8,951,838$ 9,049,696$
- 75 -
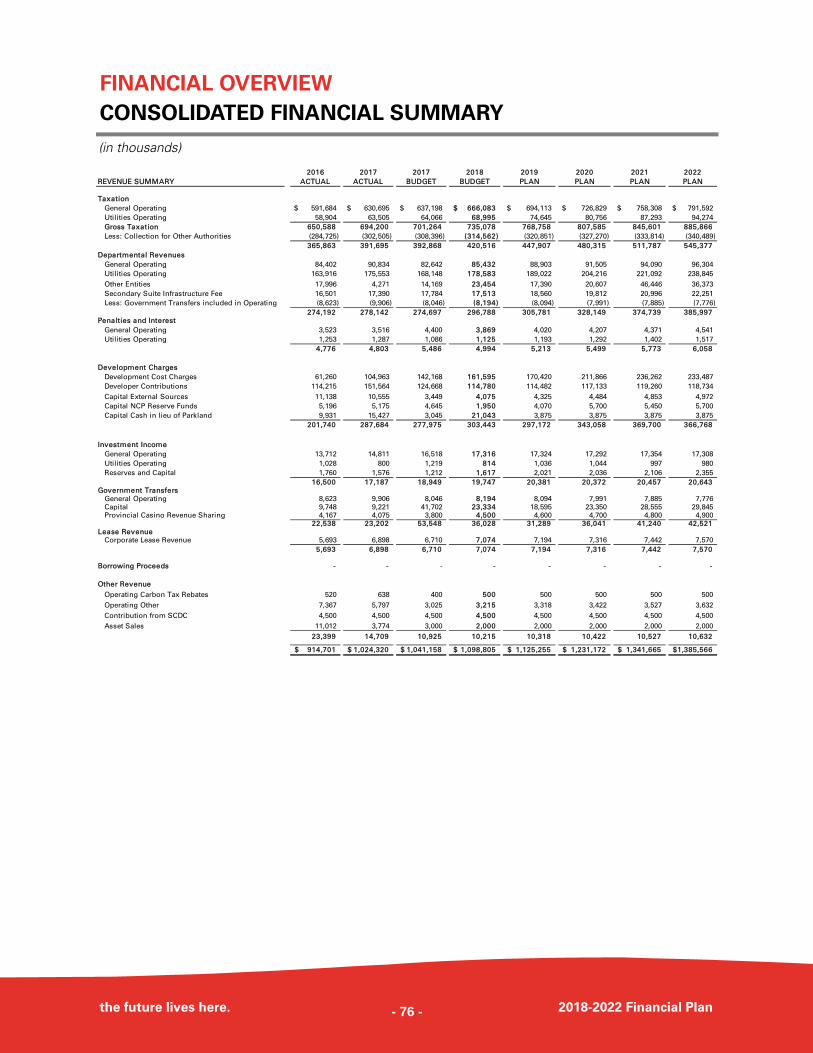
FINANCIAL OVERVIEW CONSOLIDATED FINANCIAL SUMMARY
the future lives here. 2018-2022 Financial Plan
(in thousands)
2016 2017 2017 2018 2019 2020 2021 2022
REVENUE SUMMARY ACTUAL ACTUAL BUDGET BUDGET PLAN PLAN PLAN PLAN
Taxation
General Operating 591,684$ 630,695$ 637,198$ 666,083$ 694,113$ 726,829$ 758,308$ 791,592$
Utilities Operating 58,904 63,505 64,066 68,995 74,645 80,756 87,293 94,274
Gross Taxation 650,588 694,200 701,264 735,078 768,758 807,585 845,601 885,866
Less: Collection for Other Authorities (284,725) (302,505) (308,396) (314,562) (320,851) (327,270) (333,814) (340,489)
365,863 391,695 392,868 420,516 447,907 480,315 511,787 545,377
Departmental Revenues
General Operating 84,402 90,834 82,642 85,432 88,903 91,505 94,090 96,304
Utilities Operating 163,916 175,553 168,148 178,583 189,022 204,216 221,092 238,845
Other Entities 17,996 4,271 14,169 23,454 17,390 20,607 46,446 36,373
Secondary Suite Infrastructure Fee 16,501 17,390 17,784 17,513 18,560 19,812 20,996 22,251
Less: Government Transfers included in Operating (8,623) (9,906) (8,046) (8,194) (8,094) (7,991) (7,885) (7,776)
274,192 278,142 274,697 296,788 305,781 328,149 374,739 385,997 Penalties and Interest
General Operating 3,523 3,516 4,400 3,869 4,020 4,207 4,371 4,541
Utilities Operating 1,253 1,287 1,086 1,125 1,193 1,292 1,402 1,517
4,776 4,803 5,486 4,994 5,213 5,499 5,773 6,058
Development Charges
Development Cost Charges 61,260 104,963 142,168 161,595 170,420 211,866 236,262 233,487
Developer Contributions 114,215 151,564 124,668 114,780 114,482 117,133 119,260 118,734
Capital External Sources 11,138 10,555 3,449 4,075 4,325 4,484 4,853 4,972
Capital NCP Reserve Funds 5,196 5,175 4,645 1,950 4,070 5,700 5,450 5,700
Capital Cash in lieu of Parkland 9,931 15,427 3,045 21,043 3,875 3,875 3,875 3,875
201,740 287,684 277,975 303,443 297,172 343,058 369,700 366,768
Investment Income
General Operating 13,712 14,811 16,518 17,316 17,324 17,292 17,354 17,308
Utilities Operating 1,028 800 1,219 814 1,036 1,044 997 980
Reserves and Capital 1,760 1,576 1,212 1,617 2,021 2,036 2,106 2,355
16,500 17,187 18,949 19,747 20,381 20,372 20,457 20,643 Government Transfers
General Operating 8,623 9,906 8,046 8,194 8,094 7,991 7,885 7,776 Capital 9,748 9,221 41,702 23,334 18,595 23,350 28,555 29,845 Provincial Casino Revenue Sharing 4,167 4,075 3,800 4,500 4,600 4,700 4,800 4,900
22,538 23,202 53,548 36,028 31,289 36,041 41,240 42,521 Lease Revenue Corporate Lease Revenue 5,693 6,898 6,710 7,074 7,194 7,316 7,442 7,570
5,693 6,898 6,710 7,074 7,194 7,316 7,442 7,570
Borrowing Proceeds - - - - - - - -
Other Revenue
Operating Carbon Tax Rebates 520 638 400 500 500 500 500 500
Operating Other 7,367 5,797 3,025 3,215 3,318 3,422 3,527 3,632
Contribution from SCDC 4,500 4,500 4,500 4,500 4,500 4,500 4,500 4,500
Asset Sales 11,012 3,774 3,000 2,000 2,000 2,000 2,000 2,000
23,399 14,709 10,925 10,215 10,318 10,422 10,527 10,632
914,701$ 1,024,320$ 1,041,158$ 1,098,805$ 1,125,255$ 1,231,172$ 1,341,665$ 1,385,566$
- 76 -
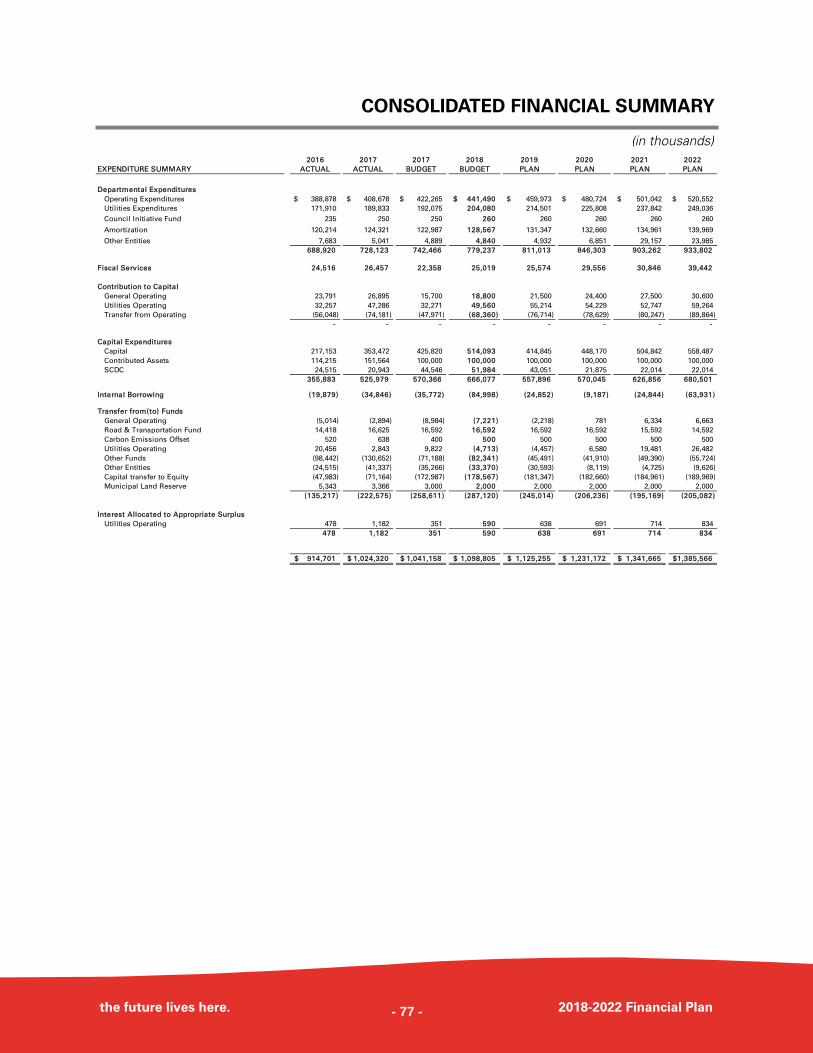
CONSOLIDATED FINANCIAL SUMMARY
the future lives here. 2018-2022 Financial Plan
(in thousands) 2016 2017 2017 2018 2019 2020 2021 2022
EXPENDITURE SUMMARY ACTUAL ACTUAL BUDGET BUDGET PLAN PLAN PLAN PLAN
Departmental Expenditures
Operating Expenditures 388,878$ 408,678$ 422,265$ 441,490$ 459,973$ 480,724$ 501,042$ 520,552$
Utilities Expenditures 171,910 189,833 192,075 204,080 214,501 225,808 237,842 249,036
Council Initiative Fund 235 250 250 260 260 260 260 260
Amortization 120,214 124,321 122,987 128,567 131,347 132,660 134,961 139,969
Other Entities 7,683 5,041 4,889 4,840 4,932 6,851 29,157 23,985
688,920 728,123 742,466 779,237 811,013 846,303 903,262 933,802
Fiscal Services 24,516 26,457 22,358 25,019 25,574 29,556 30,846 39,442
Contribution to Capital
General Operating 23,791 26,895 15,700 18,800 21,500 24,400 27,500 30,600
Utilities Operating 32,257 47,286 32,271 49,560 55,214 54,229 52,747 59,264
Transfer from Operating (56,048) (74,181) (47,971) (68,360) (76,714) (78,629) (80,247) (89,864)
- - - - - - - -
Capital Expenditures
Capital 217,153 353,472 425,820 514,093 414,845 448,170 504,842 558,487
Contributed Assets 114,215 151,564 100,000 100,000 100,000 100,000 100,000 100,000
SCDC 24,515 20,943 44,546 51,984 43,051 21,875 22,014 22,014
355,883 525,979 570,366 666,077 557,896 570,045 626,856 680,501
Internal Borrowing (19,879) (34,846) (35,772) (84,998) (24,852) (9,187) (24,844) (63,931)
Transfer from(to) Funds
General Operating (5,014) (2,894) (8,984) (7,221) (2,218) 781 6,334 6,663
Road & Transportation Fund 14,418 16,625 16,592 16,592 16,592 16,592 15,592 14,592
Carbon Emissions Offset 520 638 400 500 500 500 500 500
Utilities Operating 20,456 2,843 9,822 (4,713) (4,457) 6,580 19,481 26,482
Other Funds (98,442) (130,652) (71,188) (82,341) (45,491) (41,910) (49,390) (55,724)
Other Entities (24,515) (41,337) (35,266) (33,370) (30,593) (8,119) (4,725) (9,626)
Capital transfer to Equity (47,983) (71,164) (172,987) (178,567) (181,347) (182,660) (184,961) (189,969)
Municipal Land Reserve 5,343 3,366 3,000 2,000 2,000 2,000 2,000 2,000
(135,217) (222,575) (258,611) (287,120) (245,014) (206,236) (195,169) (205,082)
Interest Allocated to Appropriate Surplus
Utilities Operating 478 1,182 351 590 638 691 714 834
478 1,182 351 590 638 691 714 834
914,701$ 1,024,320$ 1,041,158$ 1,098,805$ 1,125,255$ 1,231,172$ 1,341,665$ 1,385,566$
- 77 -
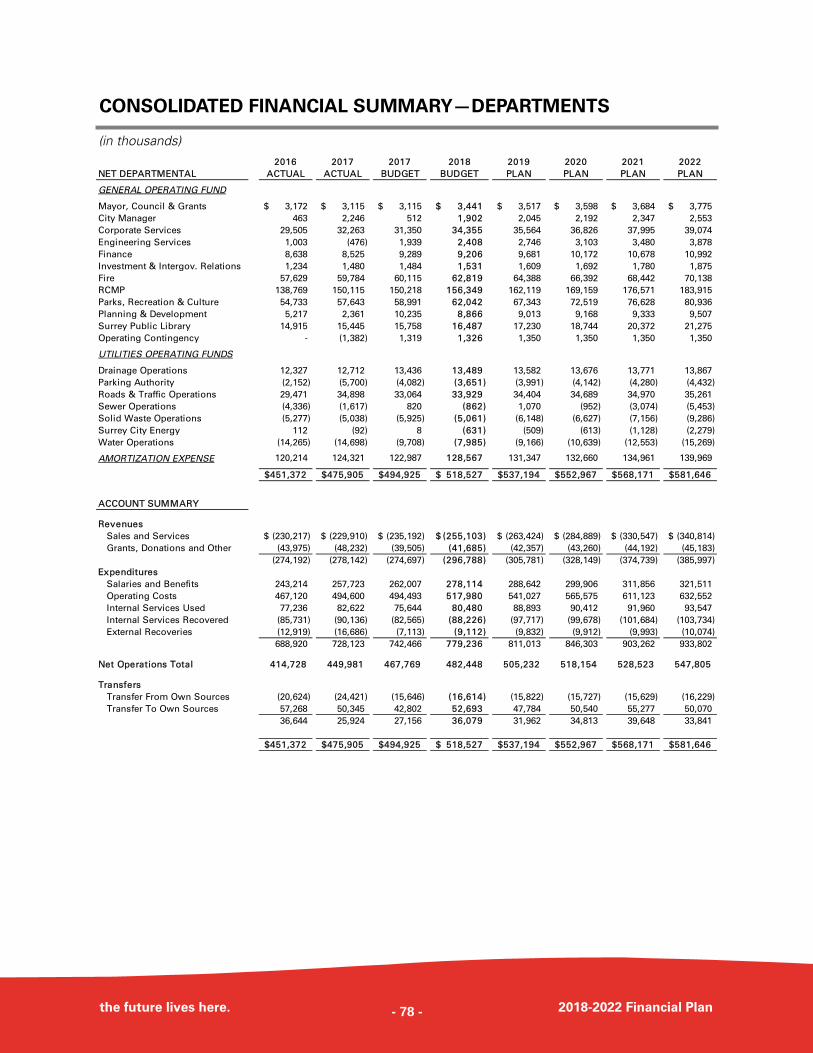
CONSOLIDATED FINANCIAL SUMMARY—DEPARTMENTS
the future lives here. 2018-2022 Financial Plan
(in thousands) 2016 2017 2017 2018 2019 2020 2021 2022
NET DEPARTMENTAL ACTUAL ACTUAL BUDGET BUDGET PLAN PLAN PLAN PLAN
GENERAL OPERATING FUND
Mayor, Council & Grants 3,172$ 3,115$ 3,115$ 3,441$ 3,517$ 3,598$ 3,684$ 3,775$
City Manager 463 2,246 512 1,902 2,045 2,192 2,347 2,553
Corporate Services 29,505 32,263 31,350 34,355 35,564 36,826 37,995 39,074
Engineering Services 1,003 (476) 1,939 2,408 2,746 3,103 3,480 3,878
Finance 8,638 8,525 9,289 9,206 9,681 10,172 10,678 10,992
Investment & Intergov. Relations 1,234 1,480 1,484 1,531 1,609 1,692 1,780 1,875
Fire 57,629 59,784 60,115 62,819 64,388 66,392 68,442 70,138
RCMP 138,769 150,115 150,218 156,349 162,119 169,159 176,571 183,915
Parks, Recreation & Culture 54,733 57,643 58,991 62,042 67,343 72,519 76,628 80,936
Planning & Development 5,217 2,361 10,235 8,866 9,013 9,168 9,333 9,507
Surrey Public Library 14,915 15,445 15,758 16,487 17,230 18,744 20,372 21,275
Operating Contingency - (1,382) 1,319 1,326 1,350 1,350 1,350 1,350
UTILITIES OPERATING FUNDS
Drainage Operations 12,327 12,712 13,436 13,489 13,582 13,676 13,771 13,867
Parking Authority (2,152) (5,700) (4,082) (3,651) (3,991) (4,142) (4,280) (4,432)
Roads & Traffic Operations 29,471 34,898 33,064 33,929 34,404 34,689 34,970 35,261
Sewer Operations (4,336) (1,617) 820 (862) 1,070 (952) (3,074) (5,453)
Solid Waste Operations (5,277) (5,038) (5,925) (5,061) (6,148) (6,627) (7,156) (9,286)
Surrey City Energy 112 (92) 8 (631) (509) (613) (1,128) (2,279)
Water Operations (14,265) (14,698) (9,708) (7,985) (9,166) (10,639) (12,553) (15,269)
AMORTIZATION EXPENSE 120,214 124,321 122,987 128,567 131,347 132,660 134,961 139,969
451,372$ 475,905$ 494,925$ 518,527$ 537,194$ 552,967$ 568,171$ 581,646$
ACCOUNT SUMMARY
Revenues
Sales and Services (230,217)$ (229,910)$ (235,192)$ (255,103)$ (263,424)$ (284,889)$ (330,547)$ (340,814)$
Grants, Donations and Other (43,975) (48,232) (39,505) (41,685) (42,357) (43,260) (44,192) (45,183)
(274,192) (278,142) (274,697) (296,788) (305,781) (328,149) (374,739) (385,997)
Expenditures
Salaries and Benefits 243,214 257,723 262,007 278,114 288,642 299,906 311,856 321,511
Operating Costs 467,120 494,600 494,493 517,980 541,027 565,575 611,123 632,552
Internal Services Used 77,236 82,622 75,644 80,480 88,893 90,412 91,960 93,547
Internal Services Recovered (85,731) (90,136) (82,565) (88,226) (97,717) (99,678) (101,684) (103,734)
External Recoveries (12,919) (16,686) (7,113) (9,112) (9,832) (9,912) (9,993) (10,074)
688,920 728,123 742,466 779,236 811,013 846,303 903,262 933,802
Net Operations Total 414,728 449,981 467,769 482,448 505,232 518,154 528,523 547,805
Transfers
Transfer From Own Sources (20,624) (24,421) (15,646) (16,614) (15,822) (15,727) (15,629) (16,229)
Transfer To Own Sources 57,268 50,345 42,802 52,693 47,784 50,540 55,277 50,070
36,644 25,924 27,156 36,079 31,962 34,813 39,648 33,841
451,372$ 475,905$ 494,925$ 518,527$ 537,194$ 552,967$ 568,171$ 581,646$
- 78 -
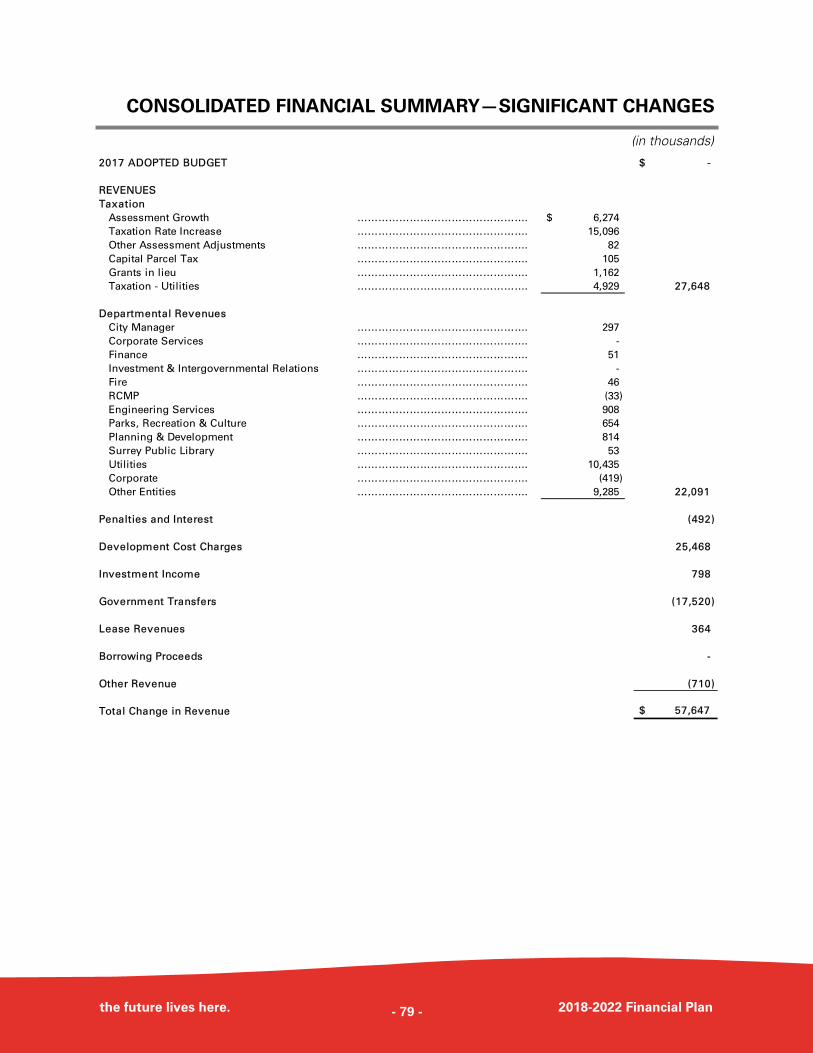
CONSOLIDATED FINANCIAL SUMMARY—SIGNIFICANT CHANGES
the future lives here. 2018-2022 Financial Plan
(in thousands)
2017 ADOPTED BUDGET $ -
REVENUES
Taxation
Assessment Growth …………………………………………. 6,274$
Taxation Rate Increase …………………………………………. 15,096
Other Assessment Adjustments …………………………………………. 82
Capital Parcel Tax …………………………………………. 105
Grants in lieu …………………………………………. 1,162
Taxation - Utilities …………………………………………. 4,929 27,648
Departmental Revenues
City Manager …………………………………………. 297
Corporate Services …………………………………………. -
Finance …………………………………………. 51
Investment & Intergovernmental Relations …………………………………………. -
Fire …………………………………………. 46
RCMP …………………………………………. (33)
Engineering Services …………………………………………. 908
Parks, Recreation & Culture …………………………………………. 654
Planning & Development …………………………………………. 814
Surrey Public Library …………………………………………. 53
Utilities …………………………………………. 10,435
Corporate …………………………………………. (419)
Other Entities …………………………………………. 9,285 22,091
Penalties and Interest (492)
Development Cost Charges 25,468
Investment Income 798
Government Transfers (17,520)
Lease Revenues 364
Borrowing Proceeds -
Other Revenue (710)
Total Change in Revenue $ 57,647
- 79 -

CONSOLIDATED FINANCIAL SUMMARY—SIGNIFICANT CHANGES
the future lives here. 2018-2022 Financial Plan
(in thousands) EXPENDITURES
Departmental Expenditures
Mayor, Council & Grants …………………………………………. 326$
City Manager …………………………………………. 1,687
Corporate Services …………………………………………. 3,705
Finance …………………………………………. (32)
Investment & Intergovernmental Relations …………………………………………. 47
Fire …………………………………………. 2,750
RCMP …………………………………………. 6,098
Engineering Services …………………………………………. 624
Parks, Recreation & Culture …………………………………………. 3,786
Planning & Development …………………………………………. (555)
Surrey Public Library …………………………………………. 782
Utilities …………………………………………. 12,005
Operating Contingency …………………………………………. 7
Council Initiative Fund …………………………………………. 10
Other Entities …………………………………………. (49)
Amortization …………………………………………. 5,580 36,771
Capital Expenditures 95,711
Fiscal Services 2,661
Internal Borrowing (49,226)
Transfers (28,509)
Interest Allocated to Appropriate Surplus 239
Total Change in Expenditures $ 57,647
2018 BUDGET -$
- 80 -
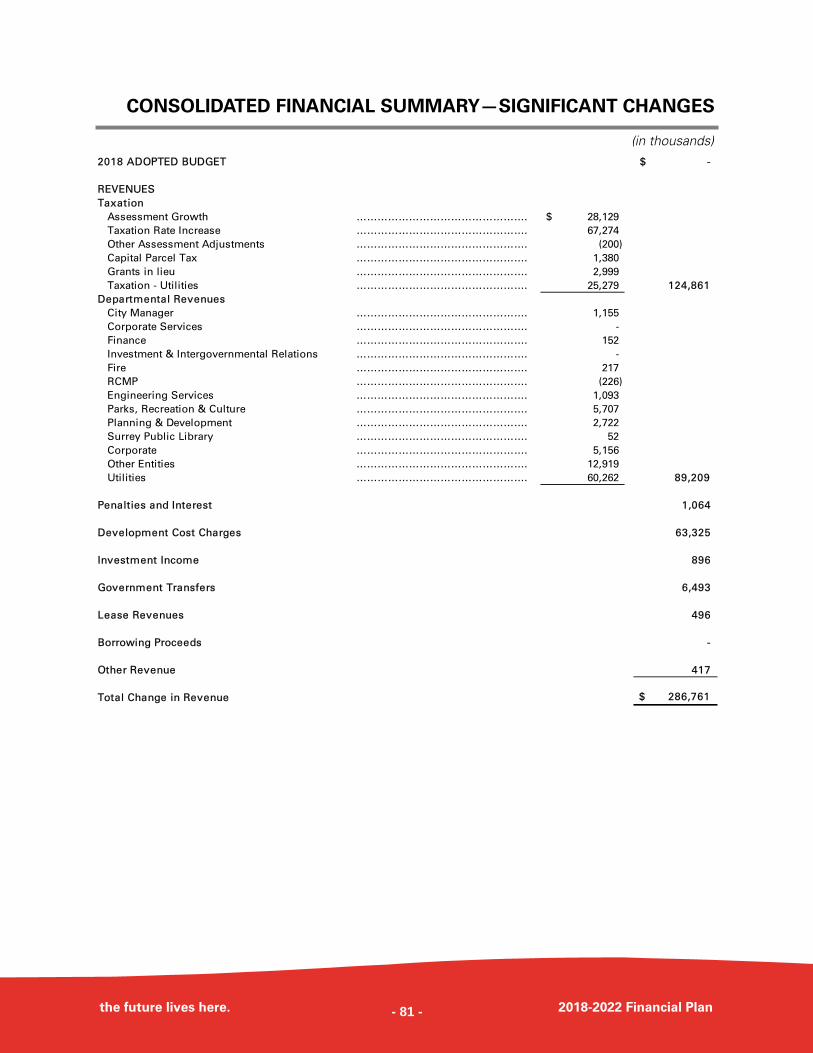
CONSOLIDATED FINANCIAL SUMMARY—SIGNIFICANT CHANGES
the future lives here. 2018-2022 Financial Plan
(in thousands) 2018 ADOPTED BUDGET -$
REVENUES
Taxation
Assessment Growth …………………………………………. 28,129$
Taxation Rate Increase …………………………………………. 67,274
Other Assessment Adjustments …………………………………………. (200)
Capital Parcel Tax …………………………………………. 1,380
Grants in lieu …………………………………………. 2,999
Taxation - Utilities …………………………………………. 25,279 124,861
Departmental Revenues
City Manager …………………………………………. 1,155
Corporate Services …………………………………………. -
Finance …………………………………………. 152
Investment & Intergovernmental Relations …………………………………………. -
Fire …………………………………………. 217
RCMP …………………………………………. (226)
Engineering Services …………………………………………. 1,093
Parks, Recreation & Culture …………………………………………. 5,707
Planning & Development …………………………………………. 2,722
Surrey Public Library …………………………………………. 52
Corporate …………………………………………. 5,156
Other Entities …………………………………………. 12,919
Utilities …………………………………………. 60,262 89,209
Penalties and Interest 1,064
Development Cost Charges 63,325
Investment Income 896
Government Transfers 6,493
Lease Revenues 496
Borrowing Proceeds -
Other Revenue 417
Total Change in Revenue $ 286,761
- 81 -
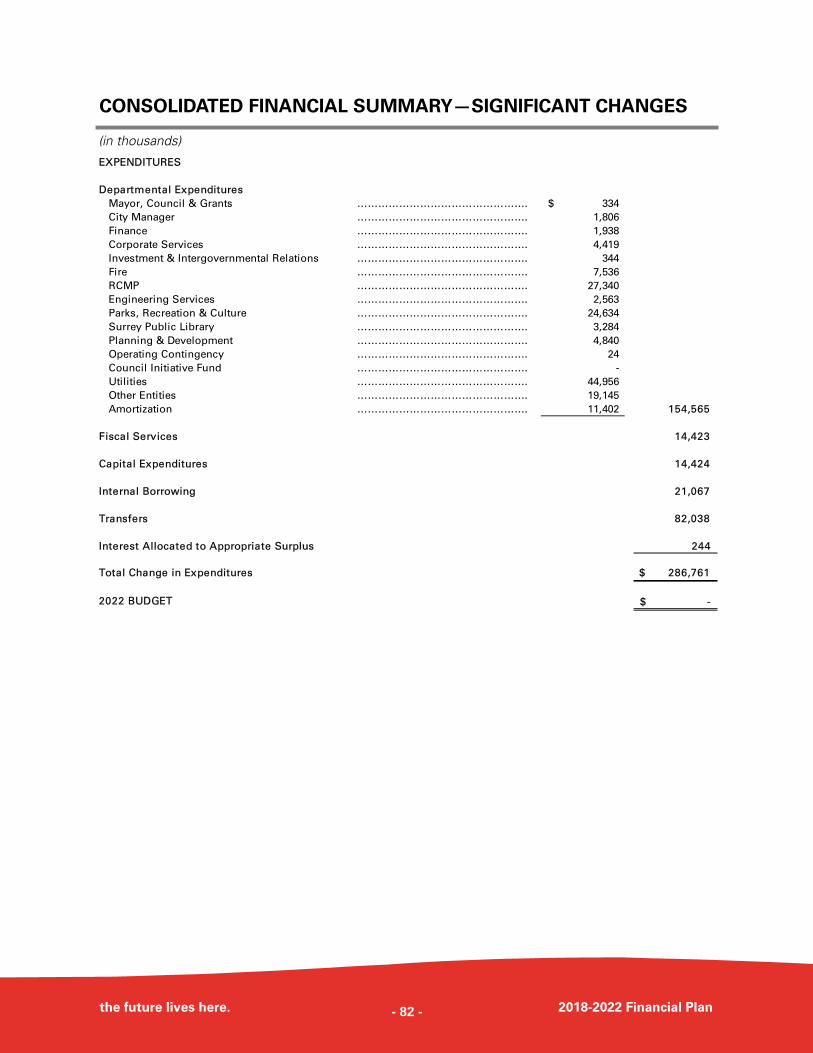
CONSOLIDATED FINANCIAL SUMMARY—SIGNIFICANT CHANGES
the future lives here. 2018-2022 Financial Plan
(in thousands)
EXPENDITURES
Departmental Expenditures
Mayor, Council & Grants …………………………………………. 334$
City Manager …………………………………………. 1,806
Finance …………………………………………. 1,938
Corporate Services …………………………………………. 4,419
Investment & Intergovernmental Relations …………………………………………. 344
Fire …………………………………………. 7,536
RCMP …………………………………………. 27,340
Engineering Services …………………………………………. 2,563
Parks, Recreation & Culture …………………………………………. 24,634
Surrey Public Library …………………………………………. 3,284
Planning & Development …………………………………………. 4,840
Operating Contingency …………………………………………. 24
Council Initiative Fund …………………………………………. -
Utilities …………………………………………. 44,956
Other Entities …………………………………………. 19,145
Amortization …………………………………………. 11,402 154,565
Fiscal Services 14,423
Capital Expenditures 14,424
Internal Borrowing 21,067
Transfers 82,038
Interest Allocated to Appropriate Surplus 244
Total Change in Expenditures $ 286,761
2022 BUDGET -$
- 82 -
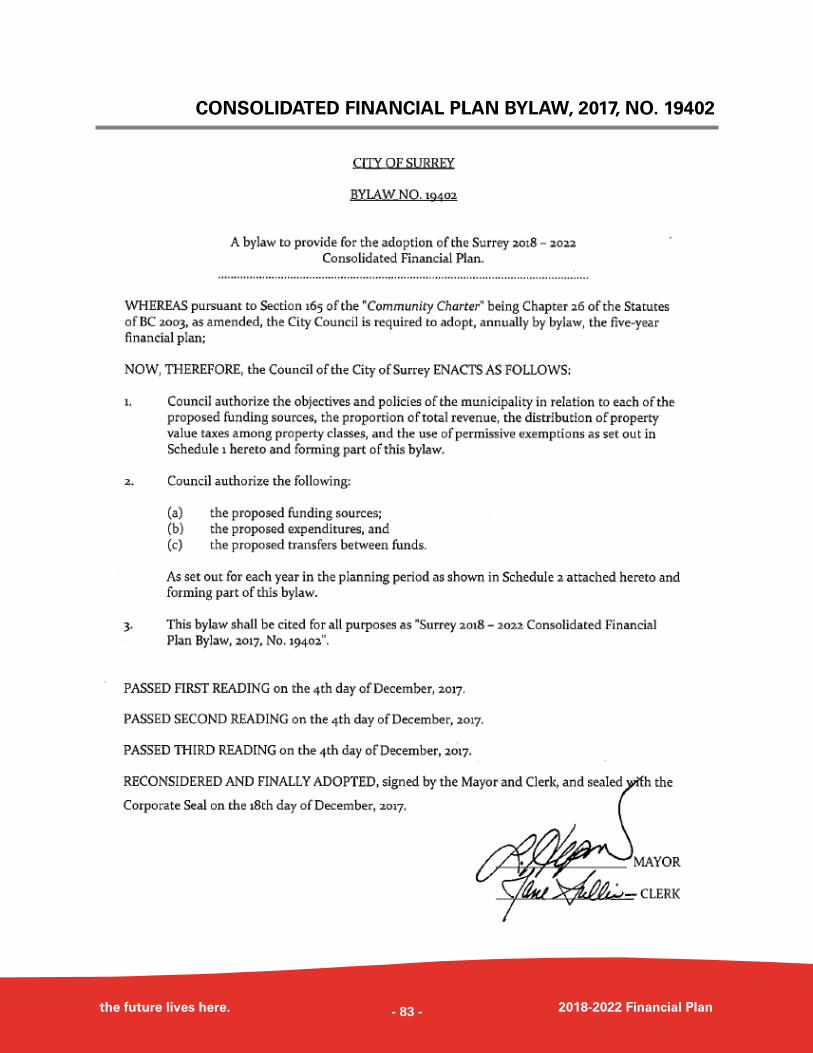
CONSOLIDATED FINANCIAL PLAN BYLAW, 2017, NO. 19402
the future lives here. 2018-2022 Financial Plan - 83 -
CONSOLIDATED FINANCIAL PLAN BYLAW, 2017, NO. 19402
the future lives here. 2018-2022 Financial Plan - 84 -
CONSOLIDATED FINANCIAL PLAN BYLAW, 2017, NO. 19402
the future lives here. 2018-2022 Financial Plan - 85 -
CONSOLIDATED FINANCIAL PLAN BYLAW, 2017, NO. 19402
the future lives here. 2018-2022 Financial Plan - 86 -
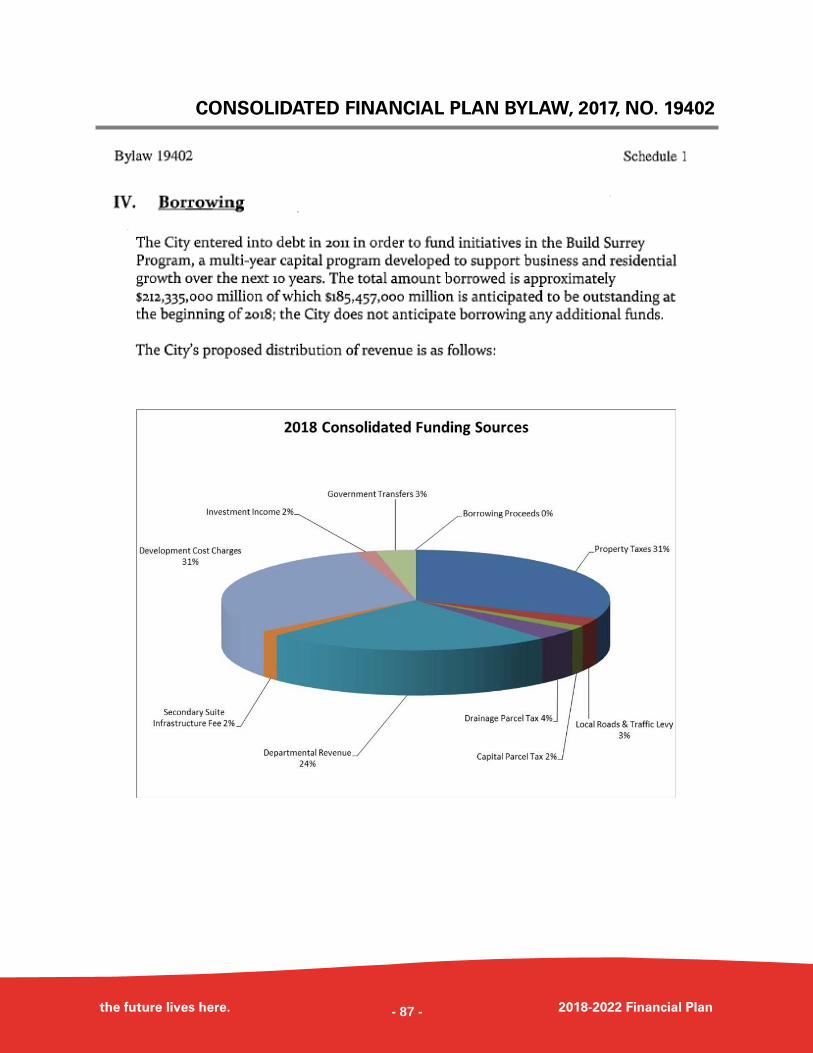
CONSOLIDATED FINANCIAL PLAN BYLAW, 2017, NO. 19402
the future lives here. 2018-2022 Financial Plan - 87 -
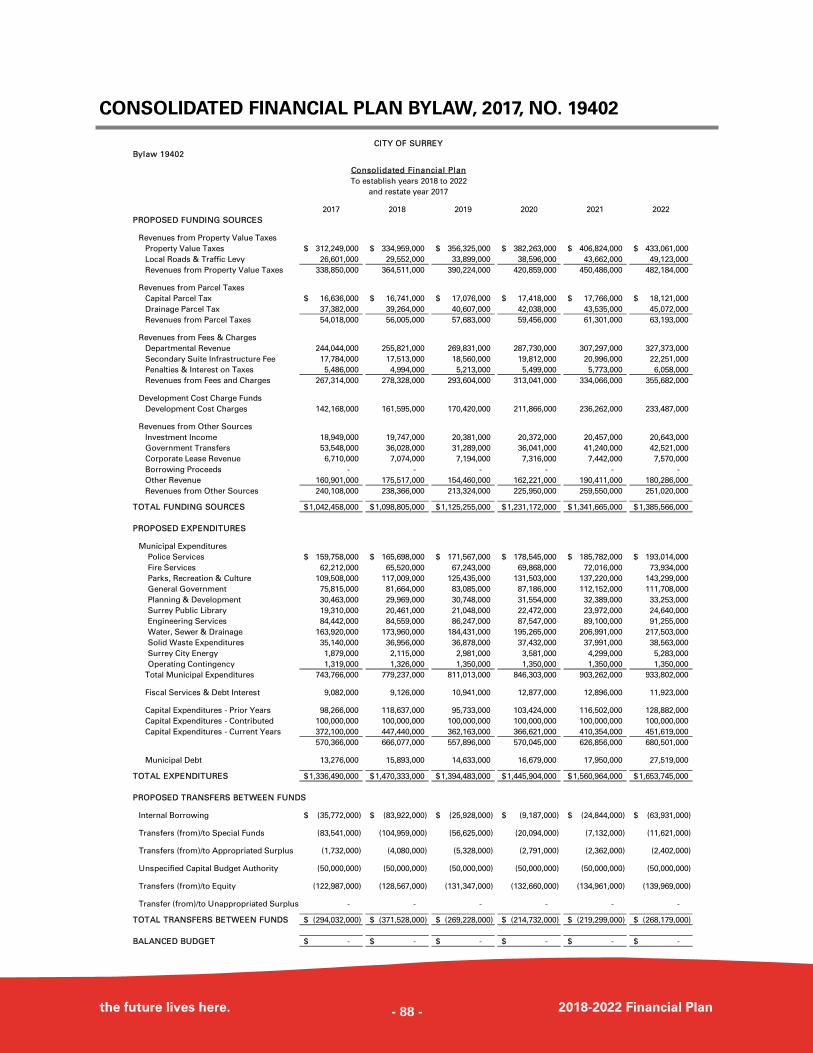
CONSOLIDATED FINANCIAL PLAN BYLAW, 2017, NO. 19402
the future lives here. 2018-2022 Financial Plan
CITY OF SURREY
Bylaw 19402
Consolidated Financial Plan
To establish years 2018 to 2022
and restate year 2017
2017 2018 2019 2020 2021 2022
PROPOSED FUNDING SOURCES
Revenues from Property Value Taxes
Property Value Taxes 312,249,000$ 334,959,000$ 356,325,000$ 382,263,000$ 406,824,000$ 433,061,000$
Local Roads & Traffic Levy 26,601,000 29,552,000 33,899,000 38,596,000 43,662,000 49,123,000
Revenues from Property Value Taxes 338,850,000 364,511,000 390,224,000 420,859,000 450,486,000 482,184,000
Revenues from Parcel Taxes
Capital Parcel Tax 16,636,000$ 16,741,000$ 17,076,000$ 17,418,000$ 17,766,000$ 18,121,000$
Drainage Parcel Tax 37,382,000 39,264,000 40,607,000 42,038,000 43,535,000 45,072,000
Revenues from Parcel Taxes 54,018,000 56,005,000 57,683,000 59,456,000 61,301,000 63,193,000
Revenues from Fees & Charges
Departmental Revenue 244,044,000 255,821,000 269,831,000 287,730,000 307,297,000 327,373,000
Secondary Suite Infrastructure Fee 17,784,000 17,513,000 18,560,000 19,812,000 20,996,000 22,251,000
Penalties & Interest on Taxes 5,486,000 4,994,000 5,213,000 5,499,000 5,773,000 6,058,000
Revenues from Fees and Charges 267,314,000 278,328,000 293,604,000 313,041,000 334,066,000 355,682,000
Development Cost Charge Funds
Development Cost Charges 142,168,000 161,595,000 170,420,000 211,866,000 236,262,000 233,487,000
Revenues from Other Sources
Investment Income 18,949,000 19,747,000 20,381,000 20,372,000 20,457,000 20,643,000
Government Transfers 53,548,000 36,028,000 31,289,000 36,041,000 41,240,000 42,521,000
Corporate Lease Revenue 6,710,000 7,074,000 7,194,000 7,316,000 7,442,000 7,570,000
Borrowing Proceeds - - - - - -
Other Revenue 160,901,000 175,517,000 154,460,000 162,221,000 190,411,000 180,286,000
Revenues from Other Sources 240,108,000 238,366,000 213,324,000 225,950,000 259,550,000 251,020,000
TOTAL FUNDING SOURCES 1,042,458,000$ 1,098,805,000$ 1,125,255,000$ 1,231,172,000$ 1,341,665,000$ 1,385,566,000$
PROPOSED EXPENDITURES
Municipal Expenditures
Police Services 159,758,000$ 165,698,000$ 171,567,000$ 178,545,000$ 185,782,000$ 193,014,000$
Fire Services 62,212,000 65,520,000 67,243,000 69,868,000 72,016,000 73,934,000
Parks, Recreation & Culture 109,508,000 117,009,000 125,435,000 131,503,000 137,220,000 143,299,000
General Government 75,815,000 81,664,000 83,085,000 87,186,000 112,152,000 111,708,000
Planning & Development 30,463,000 29,969,000 30,748,000 31,554,000 32,389,000 33,253,000
Surrey Public Library 19,310,000 20,461,000 21,048,000 22,472,000 23,972,000 24,640,000
Engineering Services 84,442,000 84,559,000 86,247,000 87,547,000 89,100,000 91,255,000
Water, Sewer & Drainage 163,920,000 173,960,000 184,431,000 195,265,000 206,991,000 217,503,000
Solid Waste Expenditures 35,140,000 36,956,000 36,878,000 37,432,000 37,991,000 38,563,000
Surrey City Energy 1,879,000 2,115,000 2,981,000 3,581,000 4,299,000 5,283,000
Operating Contingency 1,319,000 1,326,000 1,350,000 1,350,000 1,350,000 1,350,000
Total Municipal Expenditures 743,766,000 779,237,000 811,013,000 846,303,000 903,262,000 933,802,000
Fiscal Services & Debt Interest 9,082,000 9,126,000 10,941,000 12,877,000 12,896,000 11,923,000
Capital Expenditures - Prior Years 98,266,000 118,637,000 95,733,000 103,424,000 116,502,000 128,882,000
Capital Expenditures - Contributed 100,000,000 100,000,000 100,000,000 100,000,000 100,000,000 100,000,000
Capital Expenditures - Current Years 372,100,000 447,440,000 362,163,000 366,621,000 410,354,000 451,619,000
570,366,000 666,077,000 557,896,000 570,045,000 626,856,000 680,501,000
Municipal Debt 13,276,000 15,893,000 14,633,000 16,679,000 17,950,000 27,519,000
TOTAL EXPENDITURES 1,336,490,000$ 1,470,333,000$ 1,394,483,000$ 1,445,904,000$ 1,560,964,000$ 1,653,745,000$
PROPOSED TRANSFERS BETWEEN FUNDS
Internal Borrowing (35,772,000)$ (83,922,000)$ (25,928,000)$ (9,187,000)$ (24,844,000)$ (63,931,000)$
Transfers (from)/to Special Funds (83,541,000) (104,959,000) (56,625,000) (20,094,000) (7,132,000) (11,621,000)
Transfers (from)/to Appropriated Surplus (1,732,000) (4,080,000) (5,328,000) (2,791,000) (2,362,000) (2,402,000)
Unspecified Capital Budget Authority (50,000,000) (50,000,000) (50,000,000) (50,000,000) (50,000,000) (50,000,000)
Transfers (from)/to Equity (122,987,000) (128,567,000) (131,347,000) (132,660,000) (134,961,000) (139,969,000)
Transfer (from)/to Unappropriated Surplus - - - - - -
TOTAL TRANSFERS BETWEEN FUNDS (294,032,000)$ (371,528,000)$ (269,228,000)$ (214,732,000)$ (219,299,000)$ (268,179,000)$
BALANCED BUDGET -$ -$ -$ -$ -$ -$
- 88 -
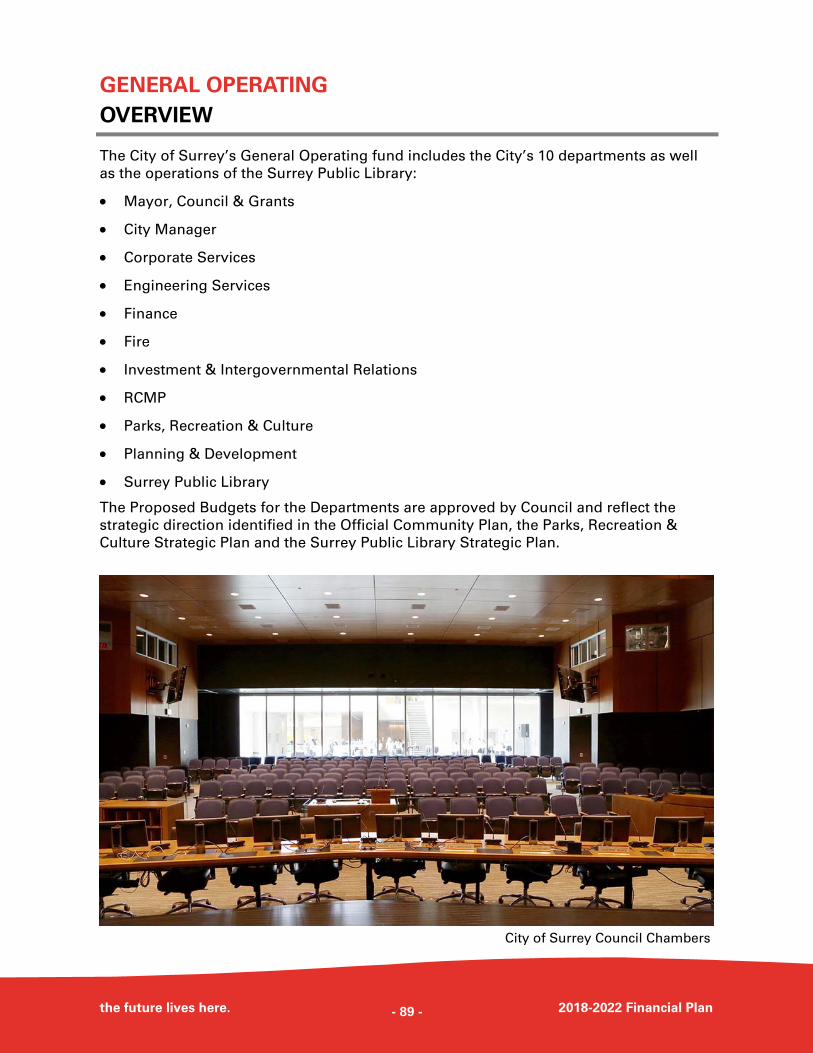
GENERAL OPERATING
OVERVIEW
the future lives here. 2018-2022 Financial Plan
The City of Surrey’s General Operating fund includes the City’s 10 departments as well
as the operations of the Surrey Public Library:
Mayor, Council & Grants
City Manager
Corporate Services
Engineering Services
Finance
Fire
Investment & Intergovernmental Relations
RCMP
Parks, Recreation & Culture
Planning & Development
Surrey Public Library
The Proposed Budgets for the Departments are approved by Council and reflect the
strategic direction identified in the Official Community Plan, the Parks, Recreation &
Culture Strategic Plan and the Surrey Public Library Strategic Plan.
City of Surrey Council Chambers
- 89 -
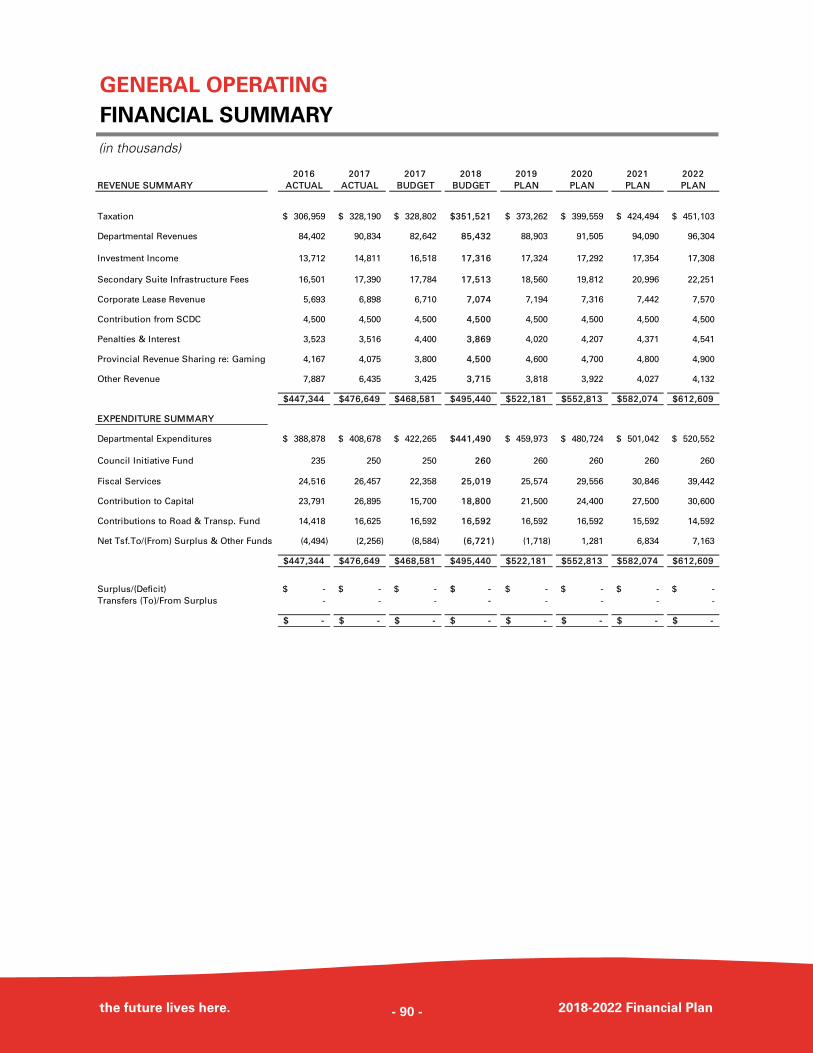
GENERAL OPERATING
FINANCIAL SUMMARY
the future lives here. 2018-2022 Financial Plan
(in thousands)
2016 2017 2017 2018 2019 2020 2021 2022
REVENUE SUMMARY ACTUAL ACTUAL BUDGET BUDGET PLAN PLAN PLAN PLAN
Taxation 306,959$ 328,190$ 328,802$ 351,521$ 373,262$ 399,559$ 424,494$ 451,103$
Departmental Revenues 84,402 90,834 82,642 85,432 88,903 91,505 94,090 96,304
Investment Income 13,712 14,811 16,518 17,316 17,324 17,292 17,354 17,308
Secondary Suite Infrastructure Fees 16,501 17,390 17,784 17,513 18,560 19,812 20,996 22,251
Corporate Lease Revenue 5,693 6,898 6,710 7,074 7,194 7,316 7,442 7,570
Contribution from SCDC 4,500 4,500 4,500 4,500 4,500 4,500 4,500 4,500
Penalties & Interest 3,523 3,516 4,400 3,869 4,020 4,207 4,371 4,541
Provincial Revenue Sharing re: Gaming 4,167 4,075 3,800 4,500 4,600 4,700 4,800 4,900
Other Revenue 7,887 6,435 3,425 3,715 3,818 3,922 4,027 4,132
447,344$ 476,649$ 468,581$ 495,440$ 522,181$ 552,813$ 582,074$ 612,609$
EXPENDITURE SUMMARY
Departmental Expenditures 388,878$ 408,678$ 422,265$ 441,490$ 459,973$ 480,724$ 501,042$ 520,552$
Council Initiative Fund 235 250 250 260 260 260 260 260
Fiscal Services 24,516 26,457 22,358 25,019 25,574 29,556 30,846 39,442
Contribution to Capital 23,791 26,895 15,700 18,800 21,500 24,400 27,500 30,600
Contributions to Road & Transp. Fund 14,418 16,625 16,592 16,592 16,592 16,592 15,592 14,592
Net Tsf.To/(From) Surplus & Other Funds (4,494) (2,256) (8,584) (6,721) (1,718) 1,281 6,834 7,163
447,344$ 476,649$ 468,581$ 495,440$ 522,181$ 552,813$ 582,074$ 612,609$
Surplus/(Deficit) -$ -$ -$ -$ -$ -$ -$ -$
Transfers (To)/From Surplus - - - - - - - -
-$ -$ -$ -$ -$ -$ -$ -$
- 90 -
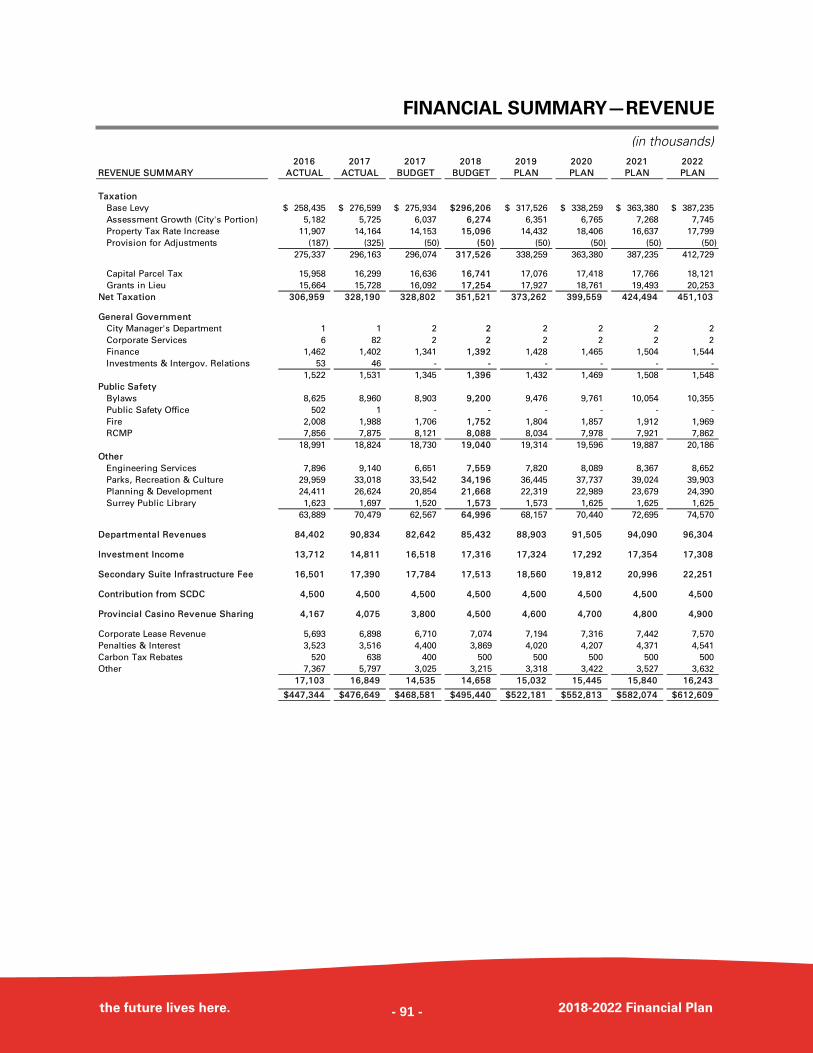
FINANCIAL SUMMARY—REVENUE
the future lives here. 2018-2022 Financial Plan
(in thousands) 2016 2017 2017 2018 2019 2020 2021 2022
REVENUE SUMMARY ACTUAL ACTUAL BUDGET BUDGET PLAN PLAN PLAN PLAN
Taxation
Base Levy 258,435$ 276,599$ 275,934$ 296,206$ 317,526$ 338,259$ 363,380$ 387,235$
Assessment Growth (City's Portion) 5,182 5,725 6,037 6,274 6,351 6,765 7,268 7,745
Property Tax Rate Increase 11,907 14,164 14,153 15,096 14,432 18,406 16,637 17,799
Provision for Adjustments (187) (325) (50) (50) (50) (50) (50) (50)
275,337 296,163 296,074 317,526 338,259 363,380 387,235 412,729
Capital Parcel Tax 15,958 16,299 16,636 16,741 17,076 17,418 17,766 18,121
Grants in Lieu 15,664 15,728 16,092 17,254 17,927 18,761 19,493 20,253
Net Taxation 306,959 328,190 328,802 351,521 373,262 399,559 424,494 451,103
General Government
City Manager's Department 1 1 2 2 2 2 2 2
Corporate Services 6 82 2 2 2 2 2 2
Finance 1,462 1,402 1,341 1,392 1,428 1,465 1,504 1,544
Investments & Intergov. Relations 53 46 - - - - - -
1,522 1,531 1,345 1,396 1,432 1,469 1,508 1,548
Public Safety
Bylaws 8,625 8,960 8,903 9,200 9,476 9,761 10,054 10,355
Public Safety Office 502 1 - - - - - -
Fire 2,008 1,988 1,706 1,752 1,804 1,857 1,912 1,969
RCMP 7,856 7,875 8,121 8,088 8,034 7,978 7,921 7,862
18,991 18,824 18,730 19,040 19,314 19,596 19,887 20,186
Other
Engineering Services 7,896 9,140 6,651 7,559 7,820 8,089 8,367 8,652
Parks, Recreation & Culture 29,959 33,018 33,542 34,196 36,445 37,737 39,024 39,903
Planning & Development 24,411 26,624 20,854 21,668 22,319 22,989 23,679 24,390
Surrey Public Library 1,623 1,697 1,520 1,573 1,573 1,625 1,625 1,625
63,889 70,479 62,567 64,996 68,157 70,440 72,695 74,570
Departmental Revenues 84,402 90,834 82,642 85,432 88,903 91,505 94,090 96,304
Investment Income 13,712 14,811 16,518 17,316 17,324 17,292 17,354 17,308
Secondary Suite Infrastructure Fee 16,501 17,390 17,784 17,513 18,560 19,812 20,996 22,251
Contribution from SCDC 4,500 4,500 4,500 4,500 4,500 4,500 4,500 4,500
Provincial Casino Revenue Sharing 4,167 4,075 3,800 4,500 4,600 4,700 4,800 4,900
Corporate Lease Revenue 5,693 6,898 6,710 7,074 7,194 7,316 7,442 7,570
Penalties & Interest 3,523 3,516 4,400 3,869 4,020 4,207 4,371 4,541
Carbon Tax Rebates 520 638 400 500 500 500 500 500
Other 7,367 5,797 3,025 3,215 3,318 3,422 3,527 3,632
17,103 16,849 14,535 14,658 15,032 15,445 15,840 16,243
447,344$ 476,649$ 468,581$ 495,440$ 522,181$ 552,813$ 582,074$ 612,609$
- 91 -
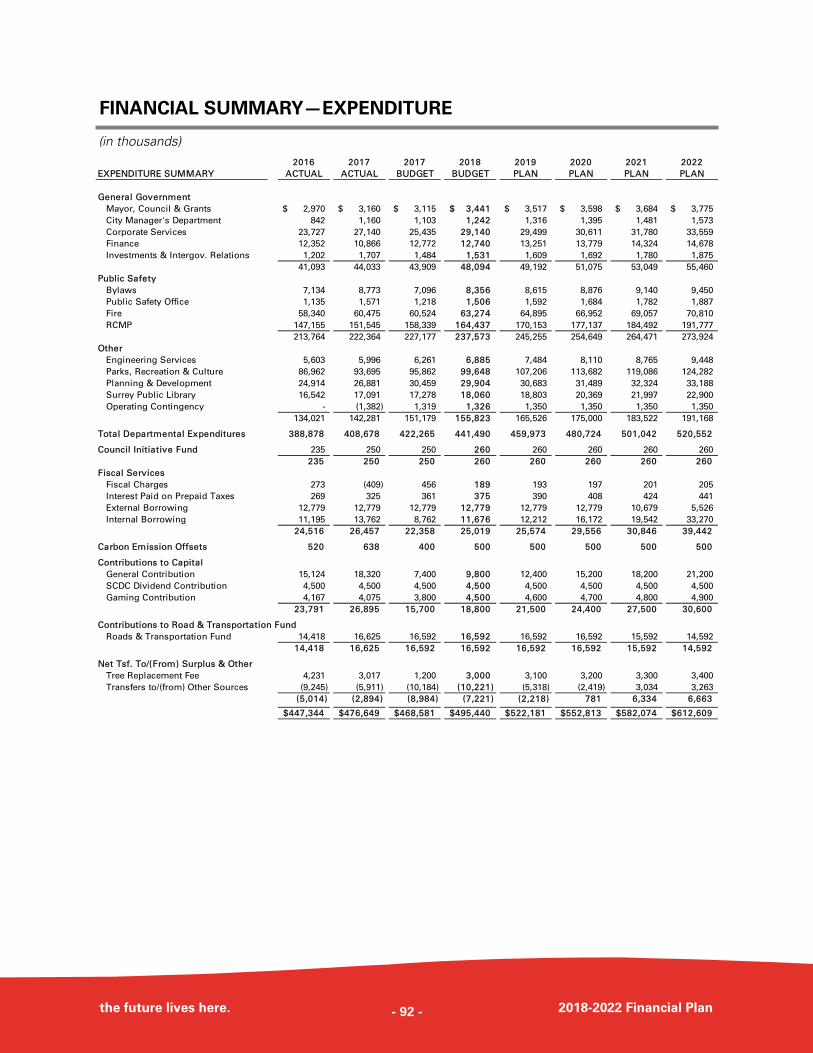
FINANCIAL SUMMARY—EXPENDITURE
the future lives here. 2018-2022 Financial Plan
(in thousands) 2016 2017 2017 2018 2019 2020 2021 2022
EXPENDITURE SUMMARY ACTUAL ACTUAL BUDGET BUDGET PLAN PLAN PLAN PLAN
General Government
Mayor, Council & Grants 2,970$ 3,160$ 3,115$ 3,441$ 3,517$ 3,598$ 3,684$ 3,775$
City Manager's Department 842 1,160 1,103 1,242 1,316 1,395 1,481 1,573
Corporate Services 23,727 27,140 25,435 29,140 29,499 30,611 31,780 33,559
Finance 12,352 10,866 12,772 12,740 13,251 13,779 14,324 14,678
Investments & Intergov. Relations 1,202 1,707 1,484 1,531 1,609 1,692 1,780 1,875
41,093 44,033 43,909 48,094 49,192 51,075 53,049 55,460
Public Safety
Bylaws 7,134 8,773 7,096 8,356 8,615 8,876 9,140 9,450
Public Safety Office 1,135 1,571 1,218 1,506 1,592 1,684 1,782 1,887
Fire 58,340 60,475 60,524 63,274 64,895 66,952 69,057 70,810
RCMP 147,155 151,545 158,339 164,437 170,153 177,137 184,492 191,777
213,764 222,364 227,177 237,573 245,255 254,649 264,471 273,924
Other
Engineering Services 5,603 5,996 6,261 6,885 7,484 8,110 8,765 9,448
Parks, Recreation & Culture 86,962 93,695 95,862 99,648 107,206 113,682 119,086 124,282
Planning & Development 24,914 26,881 30,459 29,904 30,683 31,489 32,324 33,188
Surrey Public Library 16,542 17,091 17,278 18,060 18,803 20,369 21,997 22,900
Operating Contingency - (1,382) 1,319 1,326 1,350 1,350 1,350 1,350
134,021 142,281 151,179 155,823 165,526 175,000 183,522 191,168
Total Departmental Expenditures 388,878 408,678 422,265 441,490 459,973 480,724 501,042 520,552
Council Initiative Fund 235 250 250 260 260 260 260 260
235 250 250 260 260 260 260 260
Fiscal Services
Fiscal Charges 273 (409) 456 189 193 197 201 205
Interest Paid on Prepaid Taxes 269 325 361 375 390 408 424 441
External Borrowing 12,779 12,779 12,779 12,779 12,779 12,779 10,679 5,526
Internal Borrowing 11,195 13,762 8,762 11,676 12,212 16,172 19,542 33,270
24,516 26,457 22,358 25,019 25,574 29,556 30,846 39,442
Carbon Emission Offsets 520 638 400 500 500 500 500 500
Contributions to Capital
General Contribution 15,124 18,320 7,400 9,800 12,400 15,200 18,200 21,200
SCDC Dividend Contribution 4,500 4,500 4,500 4,500 4,500 4,500 4,500 4,500
Gaming Contribution 4,167 4,075 3,800 4,500 4,600 4,700 4,800 4,900
23,791 26,895 15,700 18,800 21,500 24,400 27,500 30,600
Contributions to Road & Transportation Fund
Roads & Transportation Fund 14,418 16,625 16,592 16,592 16,592 16,592 15,592 14,592
14,418 16,625 16,592 16,592 16,592 16,592 15,592 14,592
Net Tsf. To/(From) Surplus & Other
Tree Replacement Fee 4,231 3,017 1,200 3,000 3,100 3,200 3,300 3,400
Transfers to/(from) Other Sources (9,245) (5,911) (10,184) (10,221) (5,318) (2,419) 3,034 3,263
(5,014) (2,894) (8,984) (7,221) (2,218) 781 6,334 6,663
447,344$ 476,649$ 468,581$ 495,440$ 522,181$ 552,813$ 582,074$ 612,609$
- 92 -
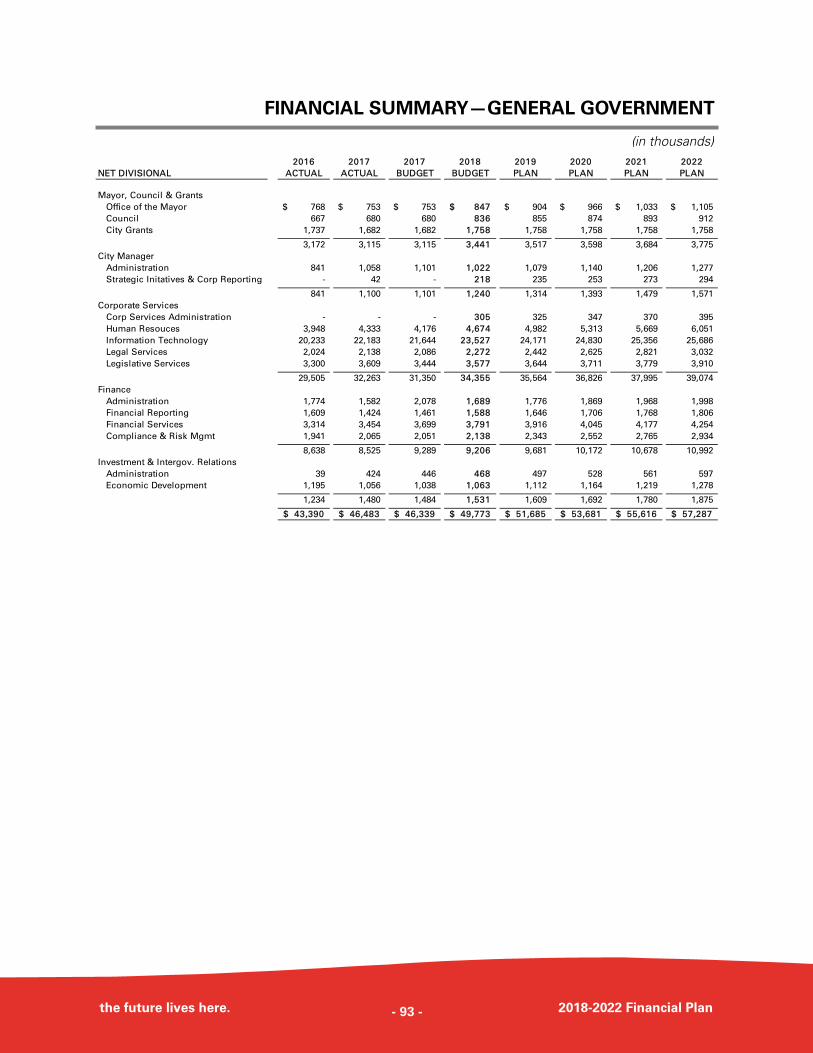
FINANCIAL SUMMARY—GENERAL GOVERNMENT
the future lives here. 2018-2022 Financial Plan
(in thousands) 2016 2017 2017 2018 2019 2020 2021 2022
NET DIVISIONAL ACTUAL ACTUAL BUDGET BUDGET PLAN PLAN PLAN PLAN
Mayor, Council & Grants
Office of the Mayor 768$ 753$ 753$ 847$ 904$ 966$ 1,033$ 1,105$
Council 667 680 680 836 855 874 893 912
City Grants 1,737 1,682 1,682 1,758 1,758 1,758 1,758 1,758
3,172 3,115 3,115 3,441 3,517 3,598 3,684 3,775
City Manager
Administration 841 1,058 1,101 1,022 1,079 1,140 1,206 1,277
Strategic Initatives & Corp Reporting - 42 - 218 235 253 273 294
841 1,100 1,101 1,240 1,314 1,393 1,479 1,571
Corporate Services
Corp Services Administration - - - 305 325 347 370 395
Human Resouces 3,948 4,333 4,176 4,674 4,982 5,313 5,669 6,051
Information Technology 20,233 22,183 21,644 23,527 24,171 24,830 25,356 25,686
Legal Services 2,024 2,138 2,086 2,272 2,442 2,625 2,821 3,032
Legislative Services 3,300 3,609 3,444 3,577 3,644 3,711 3,779 3,910
29,505 32,263 31,350 34,355 35,564 36,826 37,995 39,074
Finance
Administration 1,774 1,582 2,078 1,689 1,776 1,869 1,968 1,998
Financial Reporting 1,609 1,424 1,461 1,588 1,646 1,706 1,768 1,806
Financial Services 3,314 3,454 3,699 3,791 3,916 4,045 4,177 4,254
Compliance & Risk Mgmt 1,941 2,065 2,051 2,138 2,343 2,552 2,765 2,934
8,638 8,525 9,289 9,206 9,681 10,172 10,678 10,992
Investment & Intergov. Relations
Administration 39 424 446 468 497 528 561 597
Economic Development 1,195 1,056 1,038 1,063 1,112 1,164 1,219 1,278
1,234 1,480 1,484 1,531 1,609 1,692 1,780 1,875
43,390$ 46,483$ 46,339$ 49,773$ 51,685$ 53,681$ 55,616$ 57,287$
- 93 -
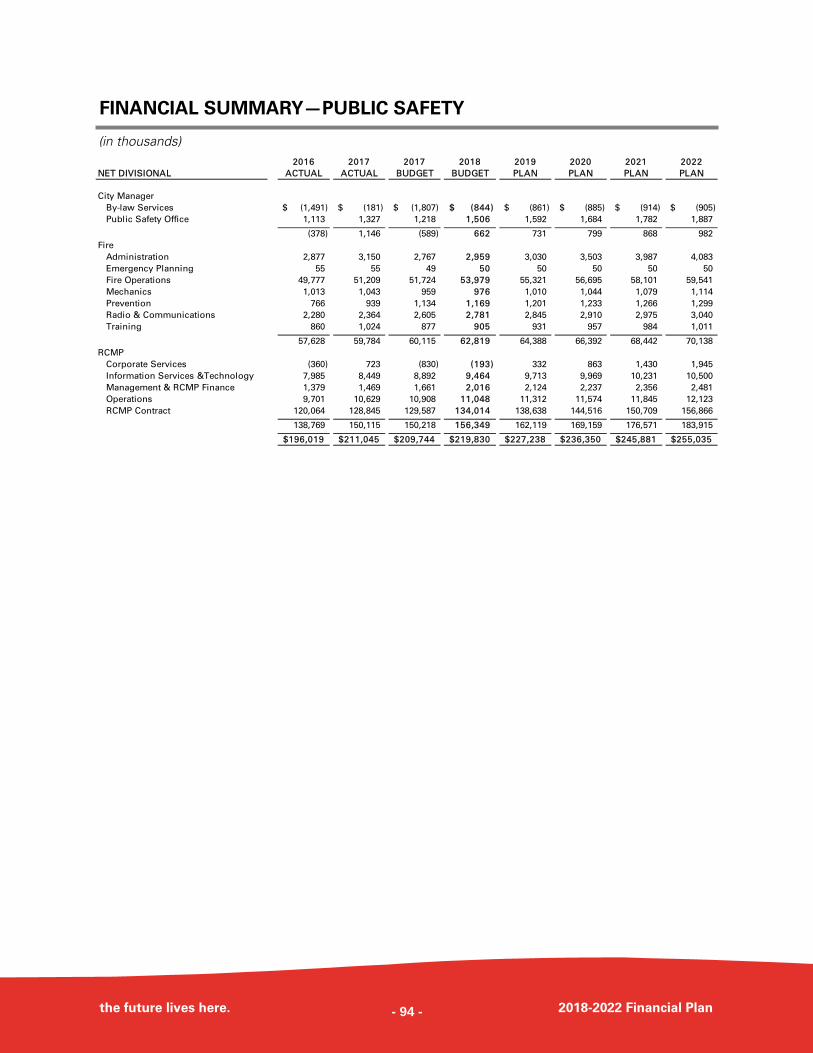
FINANCIAL SUMMARY—PUBLIC SAFETY
the future lives here. 2018-2022 Financial Plan
(in thousands) 2016 2017 2017 2018 2019 2020 2021 2022
NET DIVISIONAL ACTUAL ACTUAL BUDGET BUDGET PLAN PLAN PLAN PLAN
City Manager
By-law Services (1,491)$ (181)$ (1,807)$ (844)$ (861)$ (885)$ (914)$ (905)$
Public Safety Office 1,113 1,327 1,218 1,506 1,592 1,684 1,782 1,887
(378) 1,146 (589) 662 731 799 868 982
Fire
Administration 2,877 3,150 2,767 2,959 3,030 3,503 3,987 4,083
Emergency Planning 55 55 49 50 50 50 50 50
Fire Operations 49,777 51,209 51,724 53,979 55,321 56,695 58,101 59,541
Mechanics 1,013 1,043 959 976 1,010 1,044 1,079 1,114
Prevention 766 939 1,134 1,169 1,201 1,233 1,266 1,299
Radio & Communications 2,280 2,364 2,605 2,781 2,845 2,910 2,975 3,040
Training 860 1,024 877 905 931 957 984 1,011
57,628 59,784 60,115 62,819 64,388 66,392 68,442 70,138
RCMP
Corporate Services (360) 723 (830) (193) 332 863 1,430 1,945
Information Services &Technology 7,985 8,449 8,892 9,464 9,713 9,969 10,231 10,500
Management & RCMP Finance 1,379 1,469 1,661 2,016 2,124 2,237 2,356 2,481
Operations 9,701 10,629 10,908 11,048 11,312 11,574 11,845 12,123
RCMP Contract 120,064 128,845 129,587 134,014 138,638 144,516 150,709 156,866
138,769 150,115 150,218 156,349 162,119 169,159 176,571 183,915
196,019$ 211,045$ 209,744$ 219,830$ 227,238$ 236,350$ 245,881$ 255,035$
- 94 -
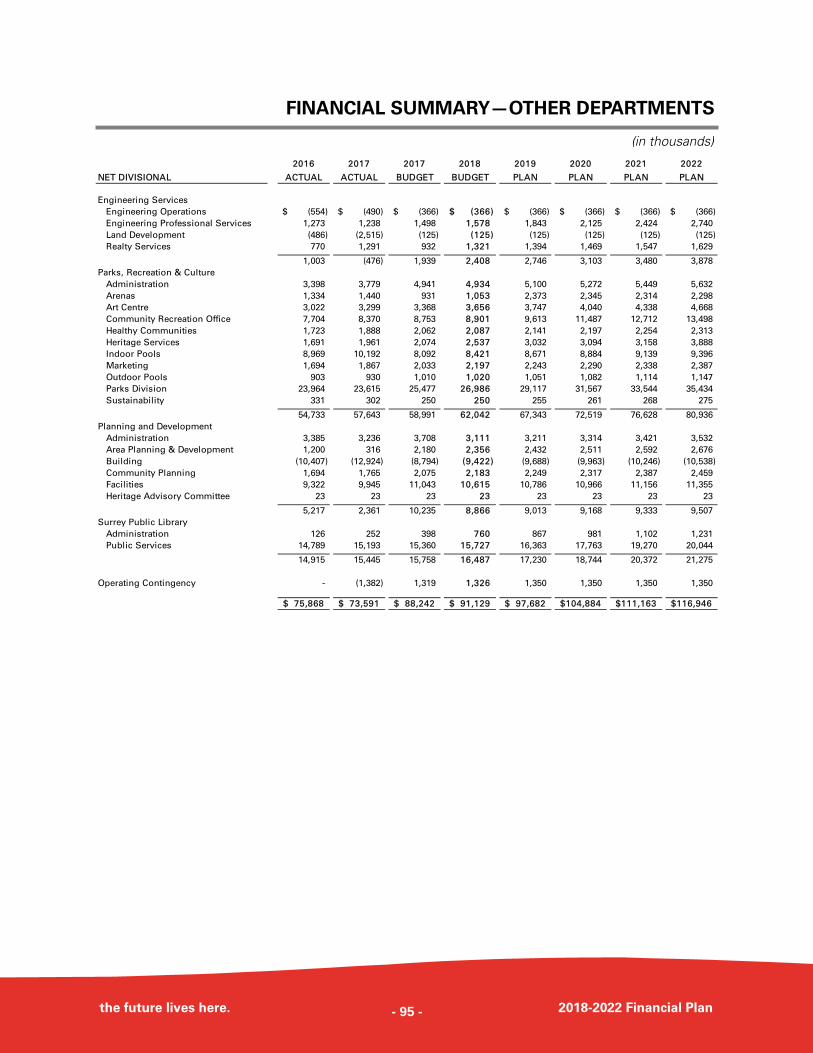
FINANCIAL SUMMARY—OTHER DEPARTMENTS
the future lives here. 2018-2022 Financial Plan
(in thousands)
2016 2017 2017 2018 2019 2020 2021 2022
NET DIVISIONAL ACTUAL ACTUAL BUDGET BUDGET PLAN PLAN PLAN PLAN
Engineering Services
Engineering Operations (554)$ (490)$ (366)$ (366)$ (366)$ (366)$ (366)$ (366)$
Engineering Professional Services 1,273 1,238 1,498 1,578 1,843 2,125 2,424 2,740
Land Development (486) (2,515) (125) (125) (125) (125) (125) (125)
Realty Services 770 1,291 932 1,321 1,394 1,469 1,547 1,629
1,003 (476) 1,939 2,408 2,746 3,103 3,480 3,878
Parks, Recreation & Culture
Administration 3,398 3,779 4,941 4,934 5,100 5,272 5,449 5,632
Arenas 1,334 1,440 931 1,053 2,373 2,345 2,314 2,298
Art Centre 3,022 3,299 3,368 3,656 3,747 4,040 4,338 4,668
Community Recreation Office 7,704 8,370 8,753 8,901 9,613 11,487 12,712 13,498
Healthy Communities 1,723 1,888 2,062 2,087 2,141 2,197 2,254 2,313
Heritage Services 1,691 1,961 2,074 2,537 3,032 3,094 3,158 3,888
Indoor Pools 8,969 10,192 8,092 8,421 8,671 8,884 9,139 9,396
Marketing 1,694 1,867 2,033 2,197 2,243 2,290 2,338 2,387
Outdoor Pools 903 930 1,010 1,020 1,051 1,082 1,114 1,147
Parks Division 23,964 23,615 25,477 26,986 29,117 31,567 33,544 35,434
Sustainability 331 302 250 250 255 261 268 275
54,733 57,643 58,991 62,042 67,343 72,519 76,628 80,936
Planning and Development
Administration 3,385 3,236 3,708 3,111 3,211 3,314 3,421 3,532
Area Planning & Development 1,200 316 2,180 2,356 2,432 2,511 2,592 2,676
Building (10,407) (12,924) (8,794) (9,422) (9,688) (9,963) (10,246) (10,538)
Community Planning 1,694 1,765 2,075 2,183 2,249 2,317 2,387 2,459
Facilities 9,322 9,945 11,043 10,615 10,786 10,966 11,156 11,355
Heritage Advisory Committee 23 23 23 23 23 23 23 23
5,217 2,361 10,235 8,866 9,013 9,168 9,333 9,507
Surrey Public Library
Administration 126 252 398 760 867 981 1,102 1,231
Public Services 14,789 15,193 15,360 15,727 16,363 17,763 19,270 20,044
14,915 15,445 15,758 16,487 17,230 18,744 20,372 21,275
Operating Contingency - (1,382) 1,319 1,326 1,350 1,350 1,350 1,350
75,868$ 73,591$ 88,242$ 91,129$ 97,682$ 104,884$ 111,163$ 116,946$
- 95 -
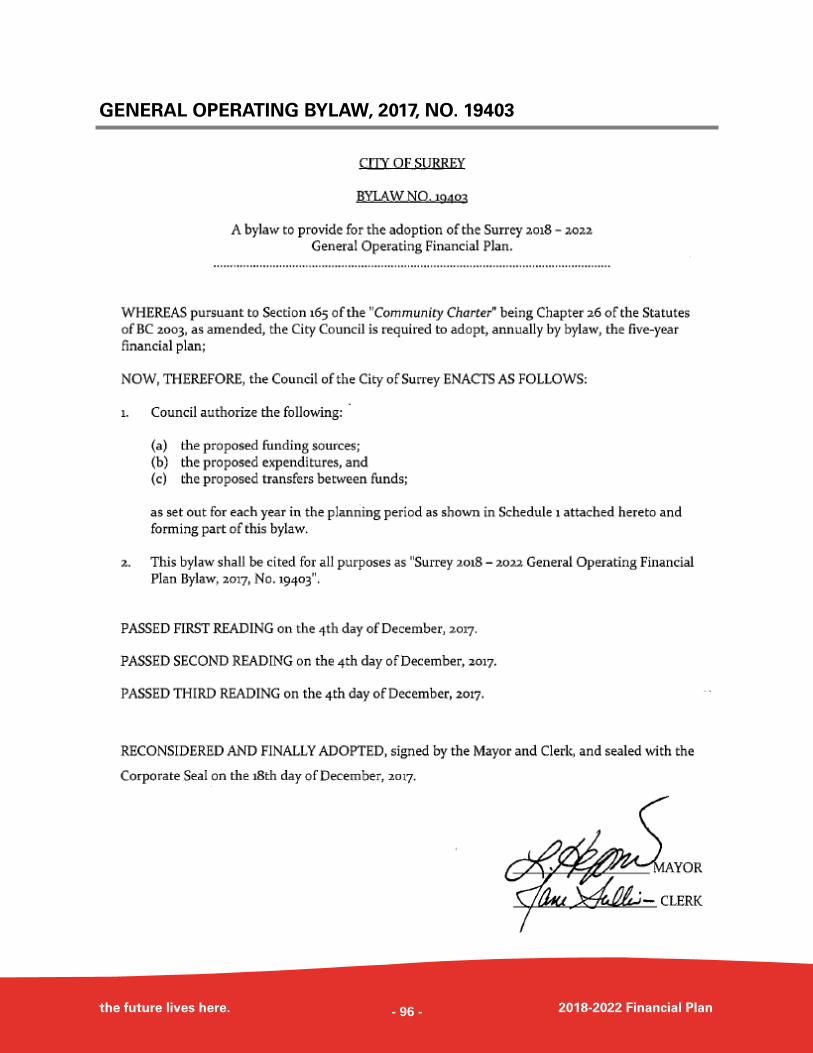
GENERAL OPERATING BYLAW, 2017, NO. 19403
the future lives here. 2018-2022 Financial Plan - 96 -
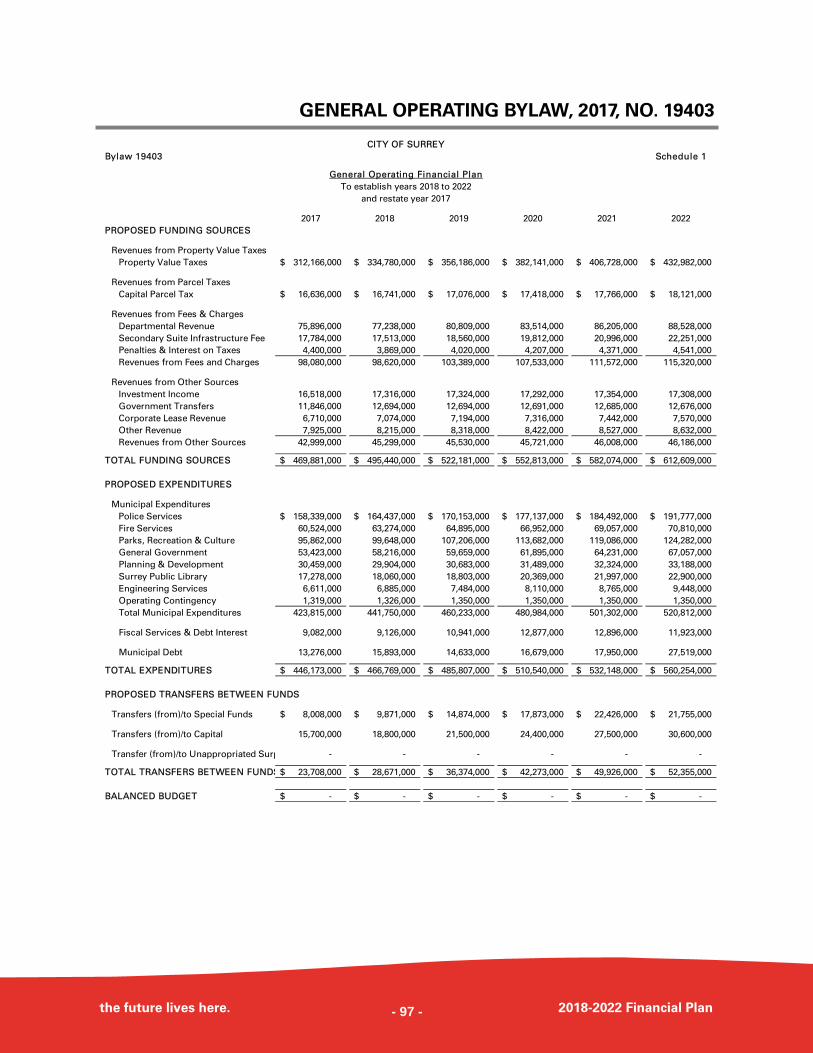
GENERAL OPERATING BYLAW, 2017, NO. 19403
the future lives here. 2018-2022 Financial Plan
CITY OF SURREY
Bylaw 19403 Schedule 1
General Operating Financial Plan
To establish years 2018 to 2022
and restate year 2017
2017 2018 2019 2020 2021 2022
PROPOSED FUNDING SOURCES
Revenues from Property Value Taxes
Property Value Taxes 312,166,000$ 334,780,000$ 356,186,000$ 382,141,000$ 406,728,000$ 432,982,000$
Revenues from Parcel Taxes
Capital Parcel Tax 16,636,000$ 16,741,000$ 17,076,000$ 17,418,000$ 17,766,000$ 18,121,000$
Revenues from Fees & Charges
Departmental Revenue 75,896,000 77,238,000 80,809,000 83,514,000 86,205,000 88,528,000
Secondary Suite Infrastructure Fee 17,784,000 17,513,000 18,560,000 19,812,000 20,996,000 22,251,000
Penalties & Interest on Taxes 4,400,000 3,869,000 4,020,000 4,207,000 4,371,000 4,541,000
Revenues from Fees and Charges 98,080,000 98,620,000 103,389,000 107,533,000 111,572,000 115,320,000
Revenues from Other Sources
Investment Income 16,518,000 17,316,000 17,324,000 17,292,000 17,354,000 17,308,000
Government Transfers 11,846,000 12,694,000 12,694,000 12,691,000 12,685,000 12,676,000
Corporate Lease Revenue 6,710,000 7,074,000 7,194,000 7,316,000 7,442,000 7,570,000
Other Revenue 7,925,000 8,215,000 8,318,000 8,422,000 8,527,000 8,632,000
Revenues from Other Sources 42,999,000 45,299,000 45,530,000 45,721,000 46,008,000 46,186,000
TOTAL FUNDING SOURCES 469,881,000$ 495,440,000$ 522,181,000$ 552,813,000$ 582,074,000$ 612,609,000$
PROPOSED EXPENDITURES
Municipal Expenditures
Police Services 158,339,000$ 164,437,000$ 170,153,000$ 177,137,000$ 184,492,000$ 191,777,000$
Fire Services 60,524,000 63,274,000 64,895,000 66,952,000 69,057,000 70,810,000
Parks, Recreation & Culture 95,862,000 99,648,000 107,206,000 113,682,000 119,086,000 124,282,000
General Government 53,423,000 58,216,000 59,659,000 61,895,000 64,231,000 67,057,000
Planning & Development 30,459,000 29,904,000 30,683,000 31,489,000 32,324,000 33,188,000
Surrey Public Library 17,278,000 18,060,000 18,803,000 20,369,000 21,997,000 22,900,000
Engineering Services 6,611,000 6,885,000 7,484,000 8,110,000 8,765,000 9,448,000
Operating Contingency 1,319,000 1,326,000 1,350,000 1,350,000 1,350,000 1,350,000
Total Municipal Expenditures 423,815,000 441,750,000 460,233,000 480,984,000 501,302,000 520,812,000
Fiscal Services & Debt Interest 9,082,000 9,126,000 10,941,000 12,877,000 12,896,000 11,923,000
Municipal Debt 13,276,000 15,893,000 14,633,000 16,679,000 17,950,000 27,519,000
TOTAL EXPENDITURES 446,173,000$ 466,769,000$ 485,807,000$ 510,540,000$ 532,148,000$ 560,254,000$
PROPOSED TRANSFERS BETWEEN FUNDS
Transfers (from)/to Special Funds 8,008,000$ 9,871,000$ 14,874,000$ 17,873,000$ 22,426,000$ 21,755,000$
Transfers (from)/to Capital 15,700,000 18,800,000 21,500,000 24,400,000 27,500,000 30,600,000
Transfer (from)/to Unappropriated Surp - - - - - -
TOTAL TRANSFERS BETWEEN FUNDS 23,708,000$ 28,671,000$ 36,374,000$ 42,273,000$ 49,926,000$ 52,355,000$
BALANCED BUDGET -$ -$ -$ -$ -$ -$
- 97 -
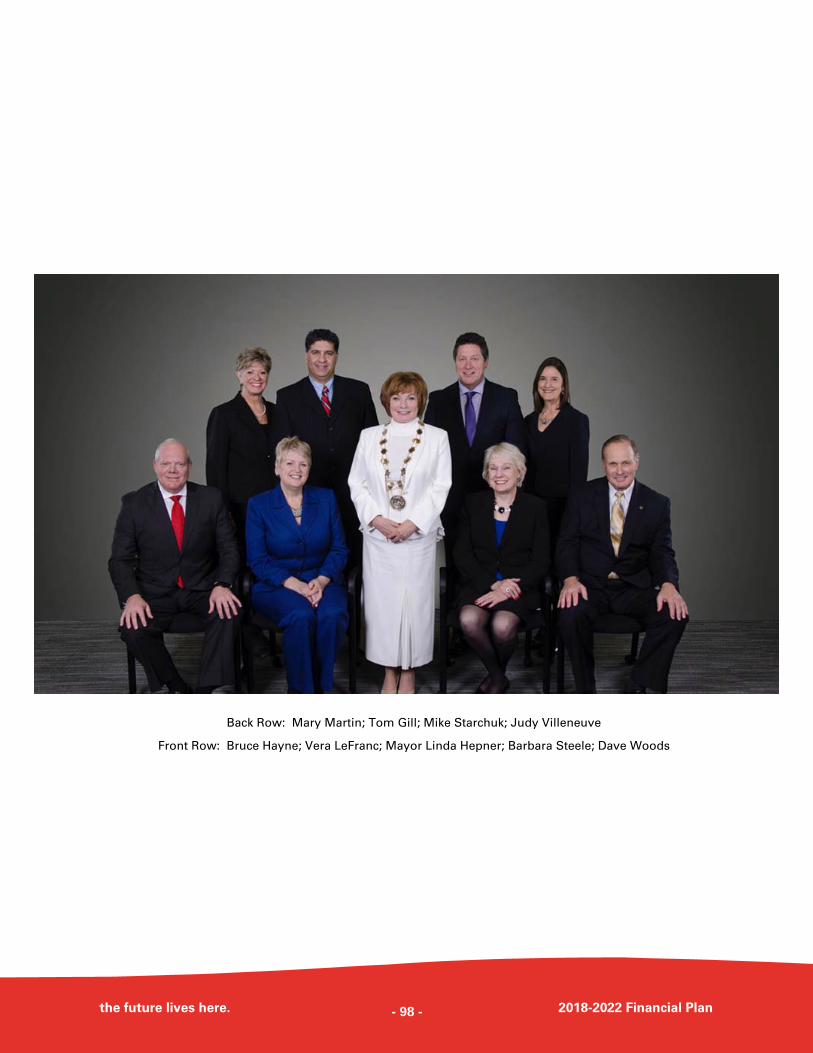
Back Row: Mary Martin; Tom Gill; Mike Starchuk; Judy Villeneuve
Front Row: Bruce Hayne; Vera LeFranc; Mayor Linda Hepner; Barbara Steele; Dave Woods
the future lives here. 2018-2022 Financial Plan - 98 -
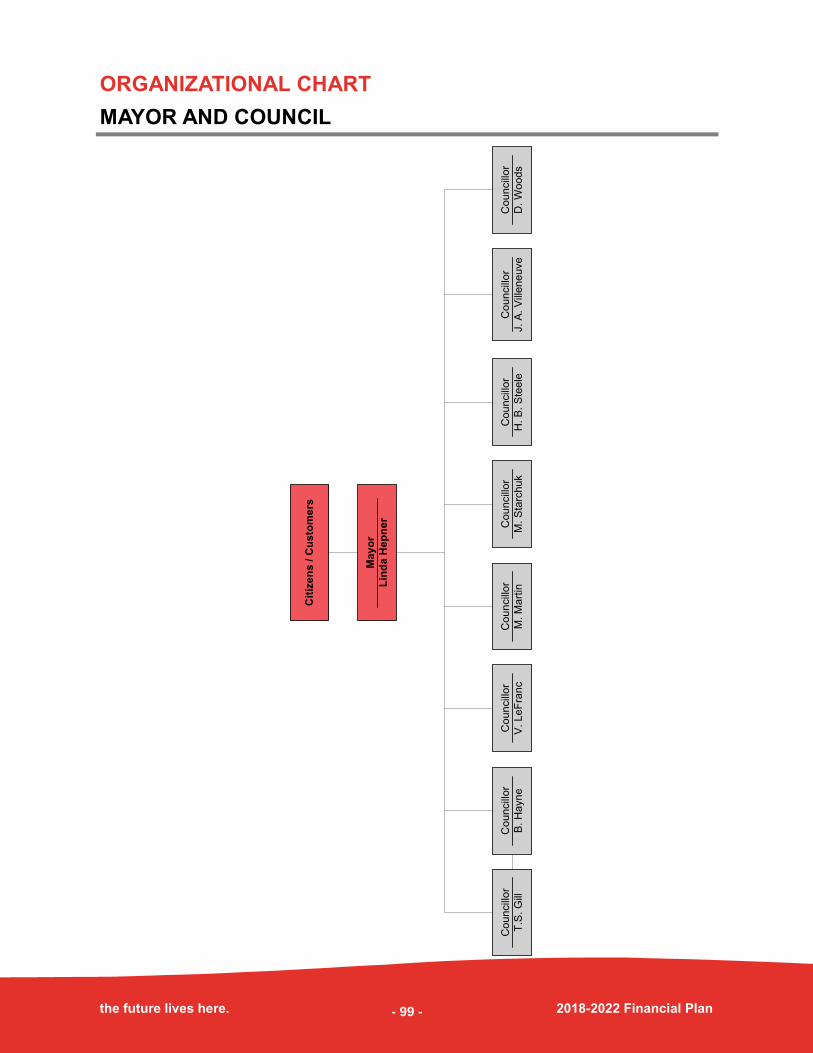
ORGANIZATIONAL CHART
MAYOR AND COUNCIL
the future lives here. 2018-2022 Financial Plan
May
or
Lin
da H
ep
ne
r
Cou
ncill
or
T.S
. G
ill
Cit
izen
s / C
usto
mers
Cou
ncill
or
B. H
ayne
Cou
ncill
or
V. LeF
ranc
Cou
ncill
or
M. M
art
in
Cou
ncill
or
M. S
tarc
hu
k
Cou
ncill
or
H. B
. S
teele
Cou
ncill
or
J. A
. V
ille
neuve
Cou
ncill
or
D. W
ood
s
- 99 -
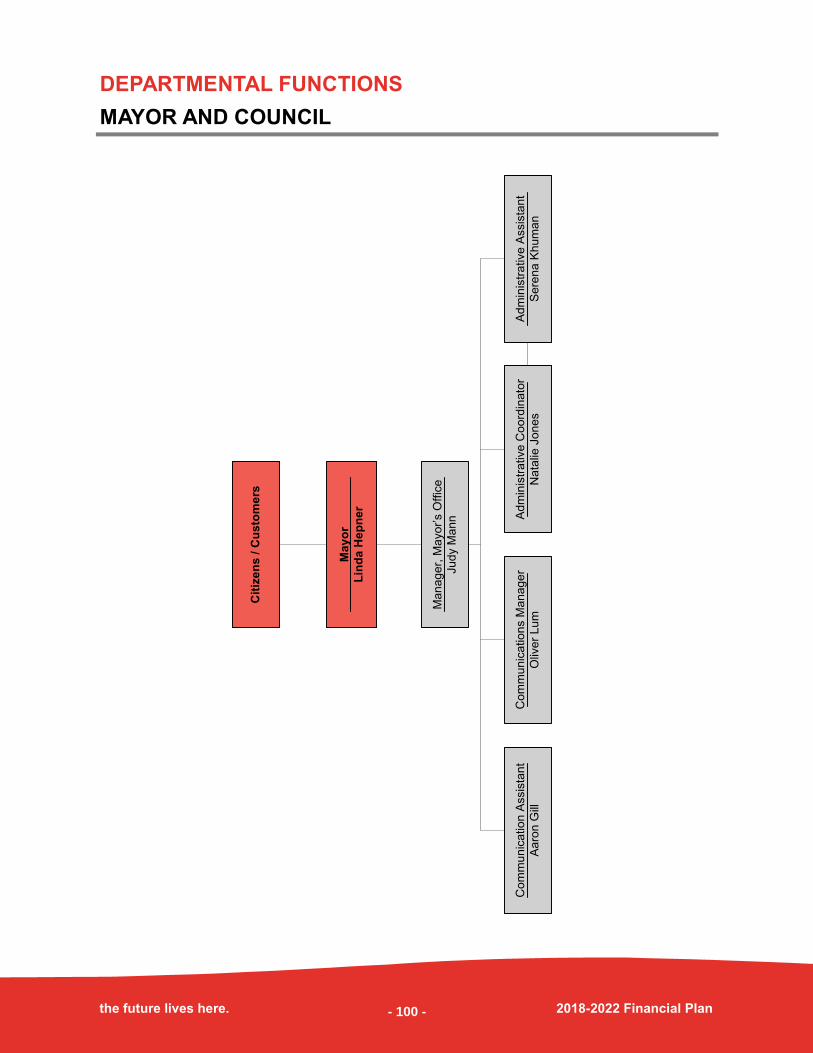
DEPARTMENTAL FUNCTIONS
MAYOR AND COUNCIL
the future lives here. 2018-2022 Financial Plan
Mayo
r
Lin
da H
ep
ner
Cit
izen
s / C
usto
mers
Mana
ger,
Mayor’s O
ffic
e
Judy M
an
n
Com
mu
nic
atio
ns M
anager
Oliv
er
Lum
Adm
inis
trative C
oo
rdin
ato
r
Nata
lie J
ones
Adm
inis
trative A
ssis
tant
Sere
na
Khum
an
Com
mu
nic
atio
n A
ssis
tant
Aaro
n G
ill
- 100 -
DEPARTMENTAL OVERVIEW
MAYOR AND COUNCIL
the future lives here. 2018-2022 Financial Plan
Surrey City Council is comprised of the Mayor and eight Councillors who provide
leadership and vision for the City as the governing body.
Municipal elections are held every four years, with an upcoming election to take place in
October 2018. Council meetings, held two or three times every month, occur on Monday
afternoons and evenings in the Council Chambers at Surrey City Hall.
These meetings provide residents, community groups and businesses with an
opportunity to appear before Council in the form of public delegation to voice concerns
or recommendations and participate in the law-making process.
The most important goals of City Council are to create prosperous, safe, sustainable,
clean, and active communities.
Key initiatives include: Municipal Government responsibilities as outlined in the
Community Charter, the Local Government Act and other provincial statutes as well as
the adoption of bylaws, policies and levying of taxes for these purposes.
Council also has the responsibility to obtain, release and manage City property, assets
and operations as delegated through the City Manager.
Council members are involved at all levels of government, often serving on local,
regional, provincial and federal committees, boards and commissions.
The Mayor has civic authority to establish various committees and may appoint both
Council and civilian members. Once established, committees are primarily deliberative
and bring forth their recommendations to City Council for adoption.
Altogether, there are several standing committees, select committees, boards,
commissions and task forces appointed and steered by Council Members.
As elected officials, the Mayor and City Council use their authority to establish and enact
sustainable policies that aide in promoting the overall growth, development and
operation of Surrey.
- 101 -
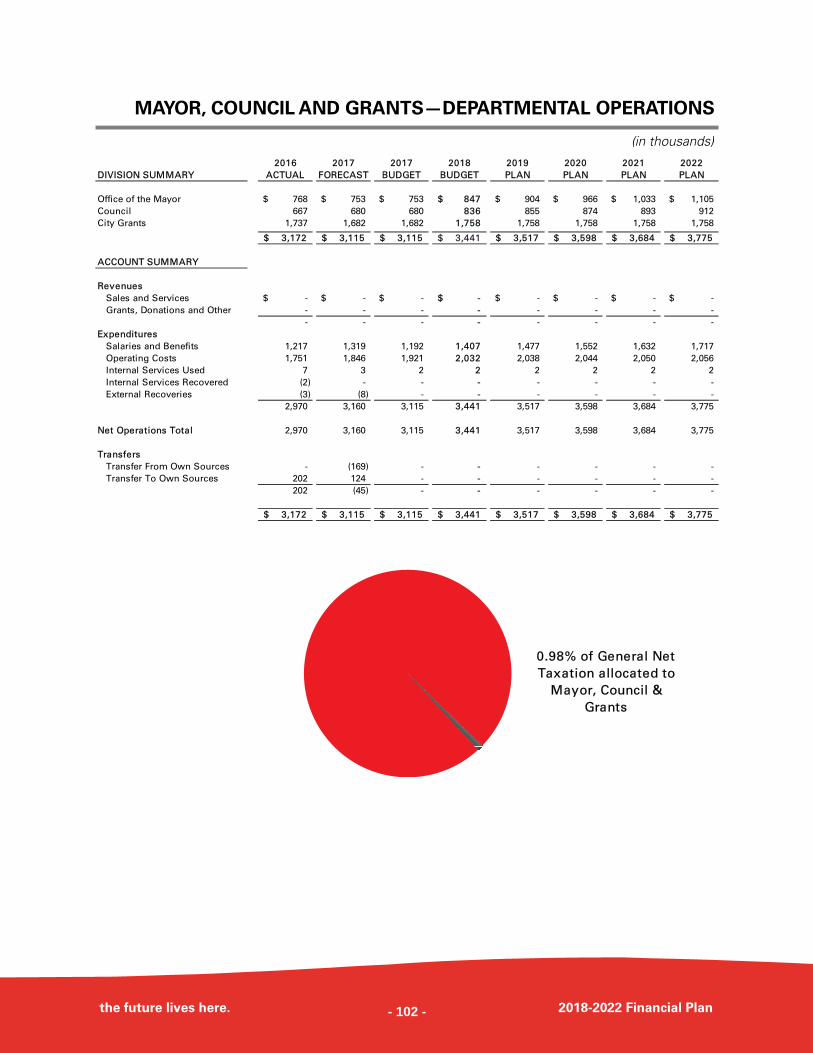
MAYOR, COUNCIL AND GRANTS—DEPARTMENTAL OPERATIONS
the future lives here. 2018-2022 Financial Plan
(in thousands)
2016 2017 2017 2018 2019 2020 2021 2022
DIVISION SUMMARY ACTUAL FORECAST BUDGET BUDGET PLAN PLAN PLAN PLAN
Office of the Mayor 768$ 753$ 753$ 847$ 904$ 966$ 1,033$ 1,105$
Council 667 680 680 836 855 874 893 912
City Grants 1,737 1,682 1,682 1,758 1,758 1,758 1,758 1,758
3,172$ 3,115$ 3,115$ 3,441$ 3,517$ 3,598$ 3,684$ 3,775$
ACCOUNT SUMMARY
Revenues
Sales and Services -$ -$ -$ -$ -$ -$ -$ -$
Grants, Donations and Other - - - - - - - -
- - - - - - - -
Expenditures
Salaries and Benefits 1,217 1,319 1,192 1,407 1,477 1,552 1,632 1,717
Operating Costs 1,751 1,846 1,921 2,032 2,038 2,044 2,050 2,056
Internal Services Used 7 3 2 2 2 2 2 2
Internal Services Recovered (2) - - - - - - -
External Recoveries (3) (8) - - - - - -
2,970 3,160 3,115 3,441 3,517 3,598 3,684 3,775
Net Operations Total 2,970 3,160 3,115 3,441 3,517 3,598 3,684 3,775
Transfers
Transfer From Own Sources - (169) - - - - - -
Transfer To Own Sources 202 124 - - - - - -
202 (45) - - - - - -
3,172$ 3,115$ 3,115$ 3,441$ 3,517$ 3,598$ 3,684$ 3,775$
0.98% of General Net
Taxation allocated to
Mayor, Council &
Grants
- 102 -
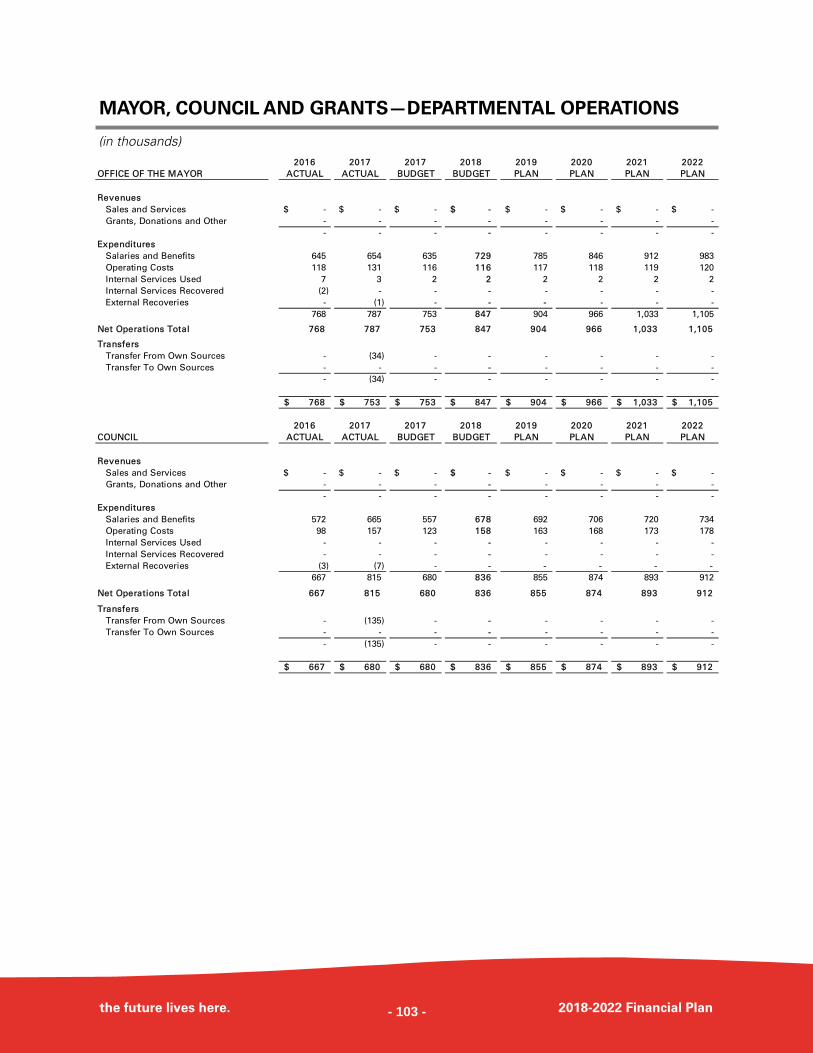
MAYOR, COUNCIL AND GRANTS—DEPARTMENTAL OPERATIONS
the future lives here. 2018-2022 Financial Plan
(in thousands) 2016 2017 2017 2018 2019 2020 2021 2022
OFFICE OF THE MAYOR ACTUAL ACTUAL BUDGET BUDGET PLAN PLAN PLAN PLAN
Revenues
Sales and Services -$ -$ -$ -$ -$ -$ -$ -$
Grants, Donations and Other - - - - - - - -
- - - - - - - -
Expenditures
Salaries and Benefits 645 654 635 729 785 846 912 983
Operating Costs 118 131 116 116 117 118 119 120
Internal Services Used 7 3 2 2 2 2 2 2
Internal Services Recovered (2) - - - - - - -
External Recoveries - (1) - - - - - -
768 787 753 847 904 966 1,033 1,105
Net Operations Total 768 787 753 847 904 966 1,033 1,105
Transfers
Transfer From Own Sources - (34) - - - - - -
Transfer To Own Sources - - - - - - - -
- (34) - - - - - -
768$ 753$ 753$ 847$ 904$ 966$ 1,033$ 1,105$
2016 2017 2017 2018 2019 2020 2021 2022
COUNCIL ACTUAL ACTUAL BUDGET BUDGET PLAN PLAN PLAN PLAN
Revenues
Sales and Services -$ -$ -$ -$ -$ -$ -$ -$
Grants, Donations and Other - - - - - - - -
- - - - - - - -
Expenditures
Salaries and Benefits 572 665 557 678 692 706 720 734
Operating Costs 98 157 123 158 163 168 173 178
Internal Services Used - - - - - - - -
Internal Services Recovered - - - - - - - -
External Recoveries (3) (7) - - - - - -
667 815 680 836 855 874 893 912
Net Operations Total 667 815 680 836 855 874 893 912
Transfers
Transfer From Own Sources - (135) - - - - - -
Transfer To Own Sources - - - - - - - -
- (135) - - - - - -
667$ 680$ 680$ 836$ 855$ 874$ 893$ 912$
- 103 -
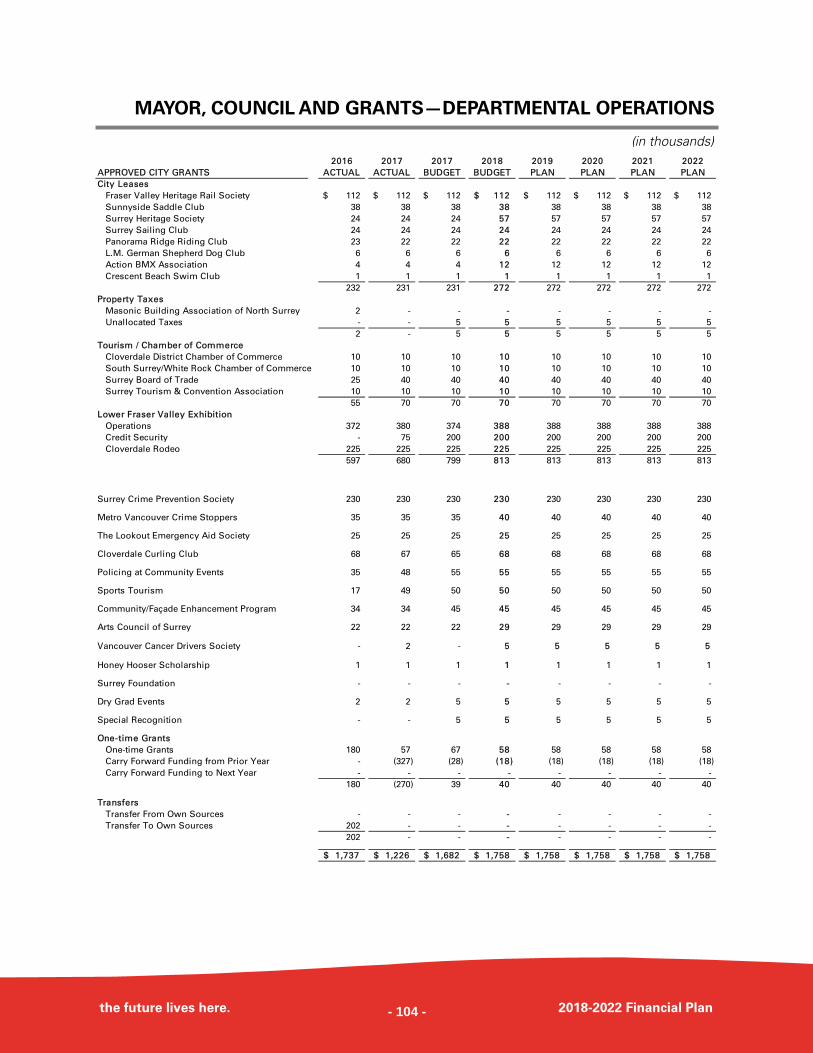
MAYOR, COUNCIL AND GRANTS—DEPARTMENTAL OPERATIONS
the future lives here. 2018-2022 Financial Plan
(in thousands) 2016 2017 2017 2018 2019 2020 2021 2022
APPROVED CITY GRANTS ACTUAL ACTUAL BUDGET BUDGET PLAN PLAN PLAN PLAN
City Leases
Fraser Valley Heritage Rail Society 112$ 112$ 112$ 112$ 112$ 112$ 112$ 112$
Sunnyside Saddle Club 38 38 38 38 38 38 38 38
Surrey Heritage Society 24 24 24 57 57 57 57 57
Surrey Sailing Club 24 24 24 24 24 24 24 24
Panorama Ridge Riding Club 23 22 22 22 22 22 22 22
L.M. German Shepherd Dog Club 6 6 6 6 6 6 6 6
Action BMX Association 4 4 4 12 12 12 12 12
Crescent Beach Swim Club 1 1 1 1 1 1 1 1
232 231 231 272 272 272 272 272
Property Taxes
Masonic Building Association of North Surrey 2 - - - - - - -
Unallocated Taxes - - 5 5 5 5 5 5
2 - 5 5 5 5 5 5
Tourism / Chamber of Commerce
Cloverdale District Chamber of Commerce 10 10 10 10 10 10 10 10
South Surrey/White Rock Chamber of Commerce 10 10 10 10 10 10 10 10
Surrey Board of Trade 25 40 40 40 40 40 40 40
Surrey Tourism & Convention Association 10 10 10 10 10 10 10 10
55 70 70 70 70 70 70 70
Lower Fraser Valley Exhibition
Operations 372 380 374 388 388 388 388 388
Credit Security - 75 200 200 200 200 200 200
Cloverdale Rodeo 225 225 225 225 225 225 225 225
597 680 799 813 813 813 813 813
Surrey Crime Prevention Society 230 230 230 230 230 230 230 230
Metro Vancouver Crime Stoppers 35 35 35 40 40 40 40 40
The Lookout Emergency Aid Society 25 25 25 25 25 25 25 25
Cloverdale Curling Club 68 67 65 68 68 68 68 68
Policing at Community Events 35 48 55 55 55 55 55 55
Sports Tourism 17 49 50 50 50 50 50 50
Community/Façade Enhancement Program 34 34 45 45 45 45 45 45
Arts Council of Surrey 22 22 22 29 29 29 29 29
Vancouver Cancer Drivers Society - 2 - 5 5 5 5 5
Honey Hooser Scholarship 1 1 1 1 1 1 1 1
Surrey Foundation - - - - - - - -
Dry Grad Events 2 2 5 5 5 5 5 5
Special Recognition - - 5 5 5 5 5 5
One-time Grants
One-time Grants 180 57 67 58 58 58 58 58
Carry Forward Funding from Prior Year - (327) (28) (18) (18) (18) (18) (18)
Carry Forward Funding to Next Year - - - - - - - -
180 (270) 39 40 40 40 40 40
Transfers
Transfer From Own Sources - - - - - - - -
Transfer To Own Sources 202 - - - - - - -
202 - - - - - - -
1,737$ 1,226$ 1,682$ 1,758$ 1,758$ 1,758$ 1,758$ 1,758$
- 104 -
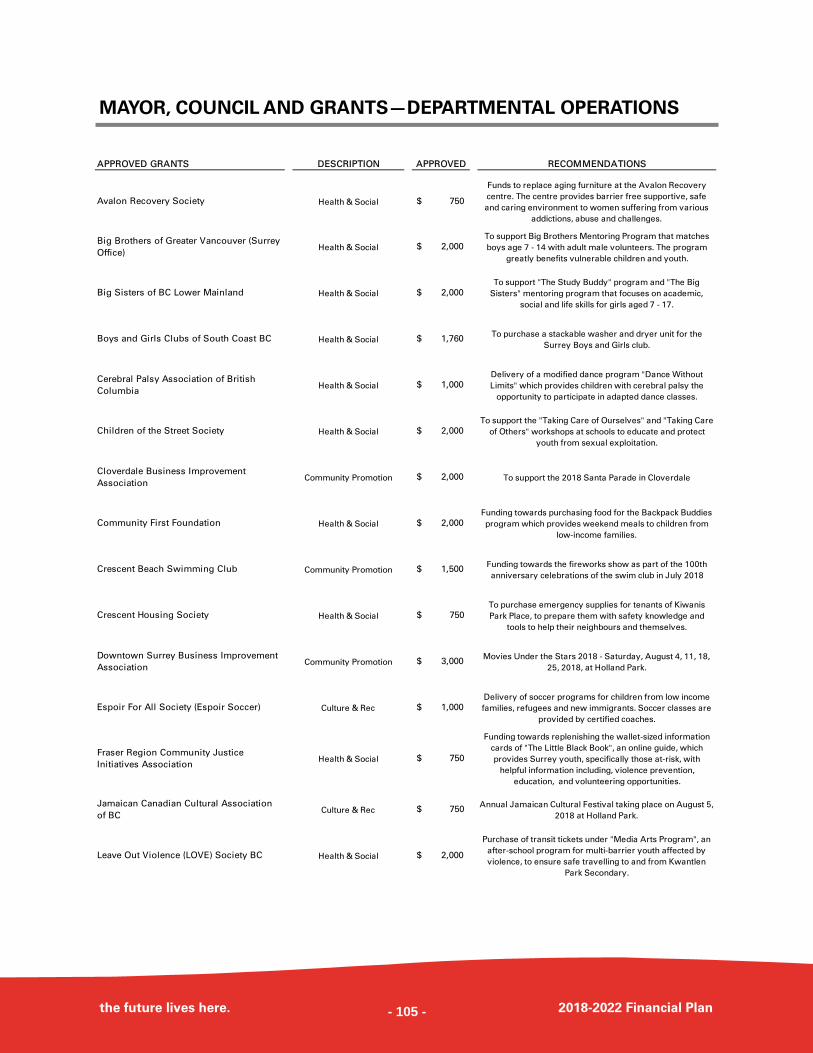
MAYOR, COUNCIL AND GRANTS—DEPARTMENTAL OPERATIONS
the future lives here. 2018-2022 Financial Plan
APPROVED GRANTS DESCRIPTION APPROVED RECOMMENDATIONS
Avalon Recovery Society Health & Social $ 750
Funds to replace aging furniture at the Avalon Recovery
centre. The centre provides barrier free supportive, safe
and caring environment to women suffering from various
addictions, abuse and challenges.
Big Brothers of Greater Vancouver (Surrey
Office)Health & Social $ 2,000
To support Big Brothers Mentoring Program that matches
boys age 7 - 14 with adult male volunteers. The program
greatly benefits vulnerable children and youth.
Big Sisters of BC Lower Mainland Health & Social $ 2,000 To support "The Study Buddy" program and "The Big
Sisters" mentoring program that focuses on academic,
social and life skills for girls aged 7 - 17.
Boys and Girls Clubs of South Coast BC Health & Social $ 1,760 To purchase a stackable washer and dryer unit for the
Surrey Boys and Girls club.
Cerebral Palsy Association of British
ColumbiaHealth & Social $ 1,000
Delivery of a modified dance program "Dance Without
Limits" which provides children with cerebral palsy the
opportunity to participate in adapted dance classes.
Children of the Street Society Health & Social $ 2,000 To support the "Taking Care of Ourselves" and "Taking Care
of Others" workshops at schools to educate and protect
youth from sexual exploitation.
Cloverdale Business Improvement
AssociationCommunity Promotion $ 2,000 To support the 2018 Santa Parade in Cloverdale
Community First Foundation Health & Social $ 2,000 Funding towards purchasing food for the Backpack Buddies
program which provides weekend meals to children from
low-income families.
Crescent Beach Swimming Club Community Promotion $ 1,500 Funding towards the fireworks show as part of the 100th
anniversary celebrations of the swim club in July 2018
Crescent Housing Society Health & Social $ 750 To purchase emergency supplies for tenants of Kiwanis
Park Place, to prepare them with safety knowledge and
tools to help their neighbours and themselves.
Downtown Surrey Business Improvement
AssociationCommunity Promotion $ 3,000
Movies Under the Stars 2018 - Saturday, August 4, 11, 18,
25, 2018, at Holland Park.
Espoir For All Society (Espoir Soccer) Culture & Rec $ 1,000 Delivery of soccer programs for children from low income
families, refugees and new immigrants. Soccer classes are
provided by certified coaches.
Fraser Region Community Justice
Initiatives AssociationHealth & Social $ 750
Funding towards replenishing the wallet-sized information
cards of "The Little Black Book", an online guide, which
provides Surrey youth, specifically those at-risk, with
helpful information including, violence prevention,
education, and volunteering opportunities.
Jamaican Canadian Cultural Association
of BCCulture & Rec $ 750
Annual Jamaican Cultural Festival taking place on August 5,
2018 at Holland Park.
Leave Out Violence (LOVE) Society BC Health & Social $ 2,000
Purchase of transit tickets under "Media Arts Program", an
after-school program for multi-barrier youth affected by
violence, to ensure safe travelling to and from Kwantlen
Park Secondary.
- 105 -
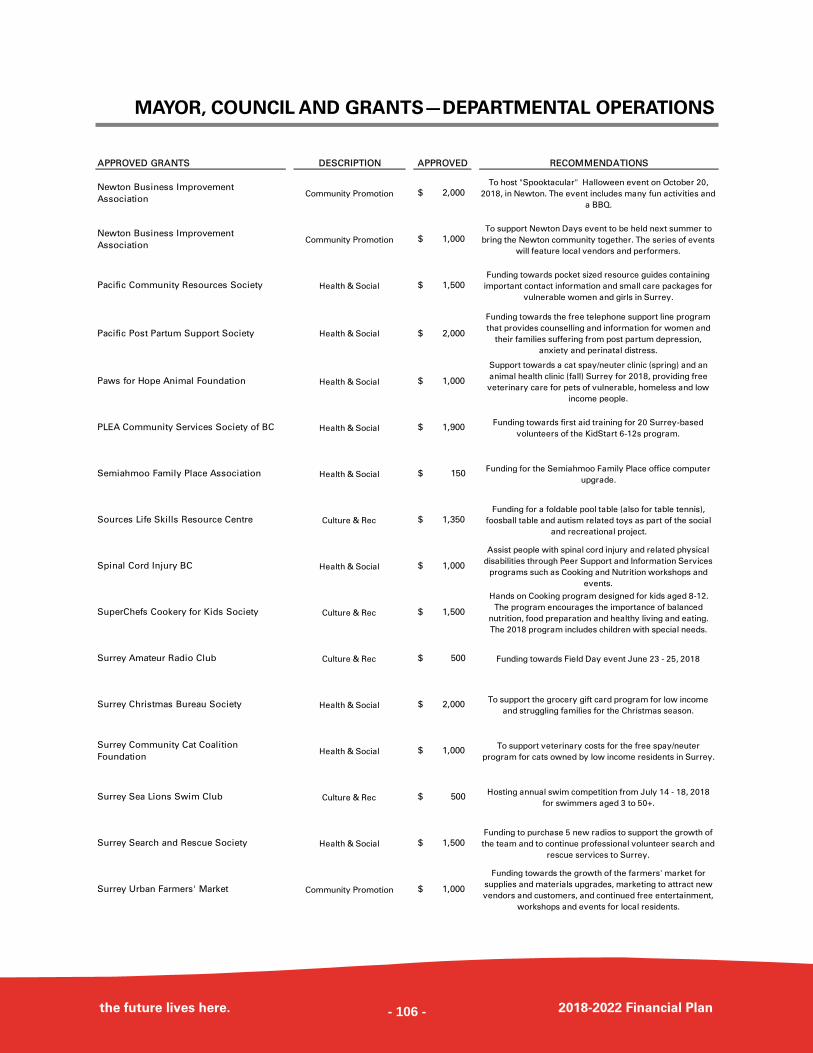
MAYOR, COUNCIL AND GRANTS—DEPARTMENTAL OPERATIONS
the future lives here. 2018-2022 Financial Plan
APPROVED GRANTS DESCRIPTION APPROVED RECOMMENDATIONS
Newton Business Improvement
AssociationCommunity Promotion $ 2,000
To host "Spooktacular" Halloween event on October 20,
2018, in Newton. The event includes many fun activities and
a BBQ.
Newton Business Improvement
AssociationCommunity Promotion $ 1,000
To support Newton Days event to be held next summer to
bring the Newton community together. The series of events
will feature local vendors and performers.
Pacific Community Resources Society Health & Social $ 1,500 Funding towards pocket sized resource guides containing
important contact information and small care packages for
vulnerable women and girls in Surrey.
Pacific Post Partum Support Society Health & Social $ 2,000
Funding towards the free telephone support line program
that provides counselling and information for women and
their families suffering from post partum depression,
anxiety and perinatal distress.
Paws for Hope Animal Foundation Health & Social $ 1,000
Support towards a cat spay/neuter clinic (spring) and an
animal health clinic (fall) Surrey for 2018, providing free
veterinary care for pets of vulnerable, homeless and low
income people.
PLEA Community Services Society of BC Health & Social $ 1,900 Funding towards first aid training for 20 Surrey-based
volunteers of the KidStart 6-12s program.
Semiahmoo Family Place Association Health & Social $ 150 Funding for the Semiahmoo Family Place office computer
upgrade.
Sources Life Skills Resource Centre Culture & Rec $ 1,350 Funding for a foldable pool table (also for table tennis),
foosball table and autism related toys as part of the social
and recreational project.
Spinal Cord Injury BC Health & Social $ 1,000
Assist people with spinal cord injury and related physical
disabilities through Peer Support and Information Services
programs such as Cooking and Nutrition workshops and
events.
SuperChefs Cookery for Kids Society Culture & Rec $ 1,500
Hands on Cooking program designed for kids aged 8-12.
The program encourages the importance of balanced
nutrition, food preparation and healthy living and eating.
The 2018 program includes children with special needs.
Surrey Amateur Radio Club Culture & Rec $ 500 Funding towards Field Day event June 23 - 25, 2018
Surrey Christmas Bureau Society Health & Social $ 2,000 To support the grocery gift card program for low income
and struggling families for the Christmas season.
Surrey Community Cat Coalition
FoundationHealth & Social $ 1,000
To support veterinary costs for the free spay/neuter
program for cats owned by low income residents in Surrey.
Surrey Sea Lions Swim Club Culture & Rec $ 500 Hosting annual swim competition from July 14 - 18, 2018
for swimmers aged 3 to 50+.
Surrey Search and Rescue Society Health & Social $ 1,500 Funding to purchase 5 new radios to support the growth of
the team and to continue professional volunteer search and
rescue services to Surrey.
Surrey Urban Farmers' Market Community Promotion $ 1,000
Funding towards the growth of the farmers' market for
supplies and materials upgrades, marketing to attract new
vendors and customers, and continued free entertainment,
workshops and events for local residents.
- 106 -
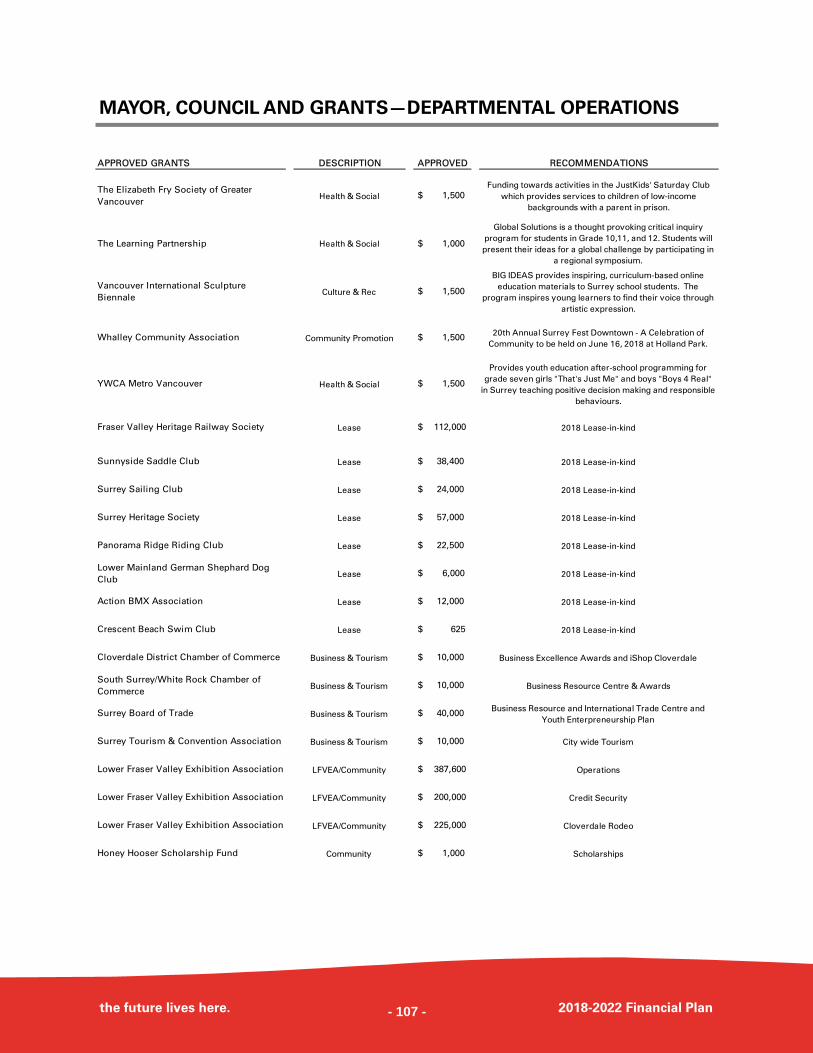
MAYOR, COUNCIL AND GRANTS—DEPARTMENTAL OPERATIONS
the future lives here. 2018-2022 Financial Plan
APPROVED GRANTS DESCRIPTION APPROVED RECOMMENDATIONS
The Elizabeth Fry Society of Greater
VancouverHealth & Social $ 1,500
Funding towards activities in the JustKids' Saturday Club
which provides services to children of low-income
backgrounds with a parent in prison.
The Learning Partnership Health & Social $ 1,000
Global Solutions is a thought provoking critical inquiry
program for students in Grade 10,11, and 12. Students will
present their ideas for a global challenge by participating in
a regional symposium.
Vancouver International Sculpture
BiennaleCulture & Rec $ 1,500
BIG IDEAS provides inspiring, curriculum-based online
education materials to Surrey school students. The
program inspires young learners to find their voice through
artistic expression.
Whalley Community Association Community Promotion $ 1,500 20th Annual Surrey Fest Downtown - A Celebration of
Community to be held on June 16, 2018 at Holland Park.
YWCA Metro Vancouver Health & Social $ 1,500
Provides youth education after-school programming for
grade seven girls "That's Just Me" and boys "Boys 4 Real"
in Surrey teaching positive decision making and responsible
behaviours.
Fraser Valley Heritage Railway Society Lease $ 112,000 2018 Lease-in-kind
Sunnyside Saddle Club Lease $ 38,400 2018 Lease-in-kind
Surrey Sailing Club Lease $ 24,000 2018 Lease-in-kind
Surrey Heritage Society Lease $ 57,000 2018 Lease-in-kind
Panorama Ridge Riding Club Lease $ 22,500 2018 Lease-in-kind
Lower Mainland German Shephard Dog
ClubLease $ 6,000 2018 Lease-in-kind
Action BMX Association Lease $ 12,000 2018 Lease-in-kind
Crescent Beach Swim Club Lease $ 625 2018 Lease-in-kind
Cloverdale District Chamber of Commerce Business & Tourism $ 10,000 Business Excellence Awards and iShop Cloverdale
South Surrey/White Rock Chamber of
CommerceBusiness & Tourism $ 10,000 Business Resource Centre & Awards
Surrey Board of Trade Business & Tourism $ 40,000 Business Resource and International Trade Centre and
Youth Enterpreneurship Plan
Surrey Tourism & Convention Association Business & Tourism $ 10,000 City wide Tourism
Lower Fraser Valley Exhibition Association LFVEA/Community $ 387,600 Operations
Lower Fraser Valley Exhibition Association LFVEA/Community $ 200,000 Credit Security
Lower Fraser Valley Exhibition Association LFVEA/Community $ 225,000 Cloverdale Rodeo
Honey Hooser Scholarship Fund Community $ 1,000 Scholarships
- 107 -
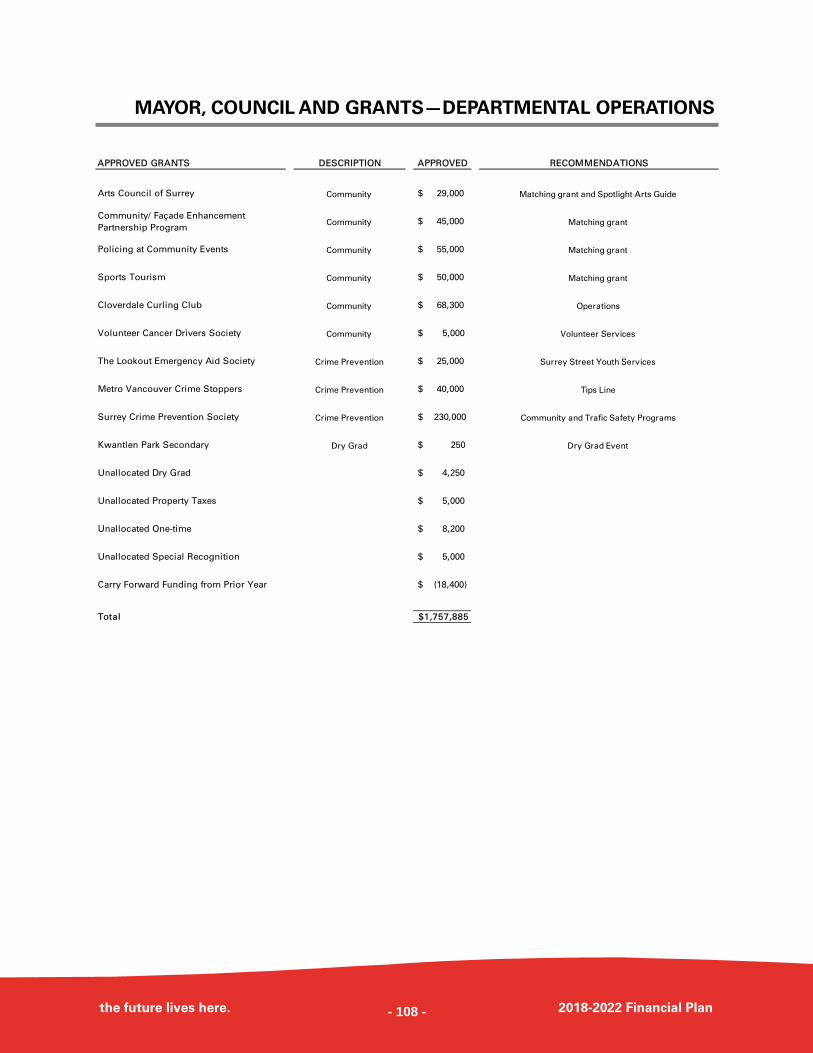
MAYOR, COUNCIL AND GRANTS—DEPARTMENTAL OPERATIONS
the future lives here. 2018-2022 Financial Plan
APPROVED GRANTS DESCRIPTION APPROVED RECOMMENDATIONS
Arts Council of Surrey Community $ 29,000 Matching grant and Spotlight Arts Guide
Community/ Façade Enhancement
Partnership ProgramCommunity $ 45,000 Matching grant
Policing at Community Events Community $ 55,000 Matching grant
Sports Tourism Community $ 50,000 Matching grant
Cloverdale Curling Club Community $ 68,300 Operations
Volunteer Cancer Drivers Society Community $ 5,000 Volunteer Services
The Lookout Emergency Aid Society Crime Prevention $ 25,000 Surrey Street Youth Services
Metro Vancouver Crime Stoppers Crime Prevention $ 40,000 Tips Line
Surrey Crime Prevention Society Crime Prevention $ 230,000 Community and Trafic Safety Programs
Kwantlen Park Secondary Dry Grad $ 250 Dry Grad Event
Unallocated Dry Grad $ 4,250
Unallocated Property Taxes $ 5,000
Unallocated One-time $ 8,200
Unallocated Special Recognition $ 5,000
Carry Forward Funding from Prior Year $ (18,400)
Total 1,757,885$
- 108 -
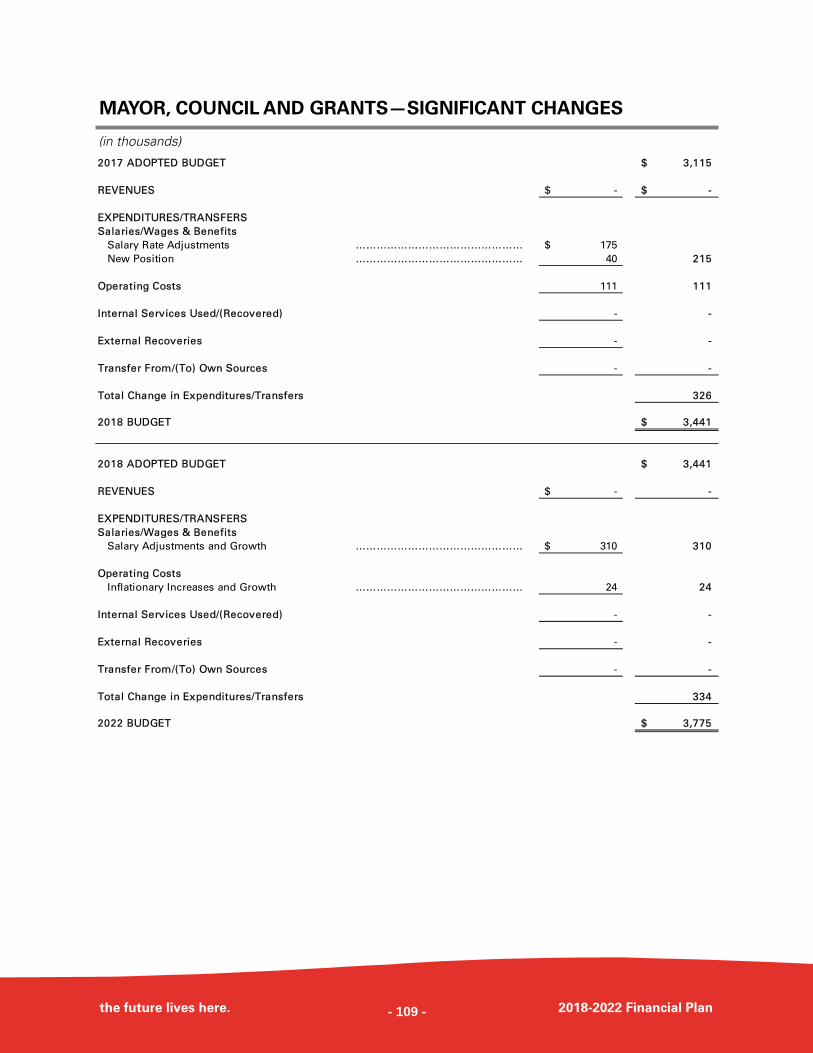
MAYOR, COUNCIL AND GRANTS—SIGNIFICANT CHANGES
(in thousands)
the future lives here. 2018-2022 Financial Plan
2017 ADOPTED BUDGET 3,115$
REVENUES -$ -$
EXPENDITURES/TRANSFERS
Salaries/Wages & Benefits
Salary Rate Adjustments ………………………………………… 175$
New Position ………………………………………… 40 215
Operating Costs 111 111
Internal Services Used/(Recovered) - -
External Recoveries - -
Transfer From/(To) Own Sources - -
Total Change in Expenditures/Transfers 326
2018 BUDGET 3,441$
2018 ADOPTED BUDGET 3,441$
REVENUES -$ -
EXPENDITURES/TRANSFERS
Salaries/Wages & Benefits
Salary Adjustments and Growth ………………………………………… 310$ 310
Operating Costs
Inflationary Increases and Growth ………………………………………… 24 24
Internal Services Used/(Recovered) - -
External Recoveries - -
Transfer From/(To) Own Sources - -
Total Change in Expenditures/Transfers 334
2022 BUDGET 3,775$
- 109 -
- 110 -
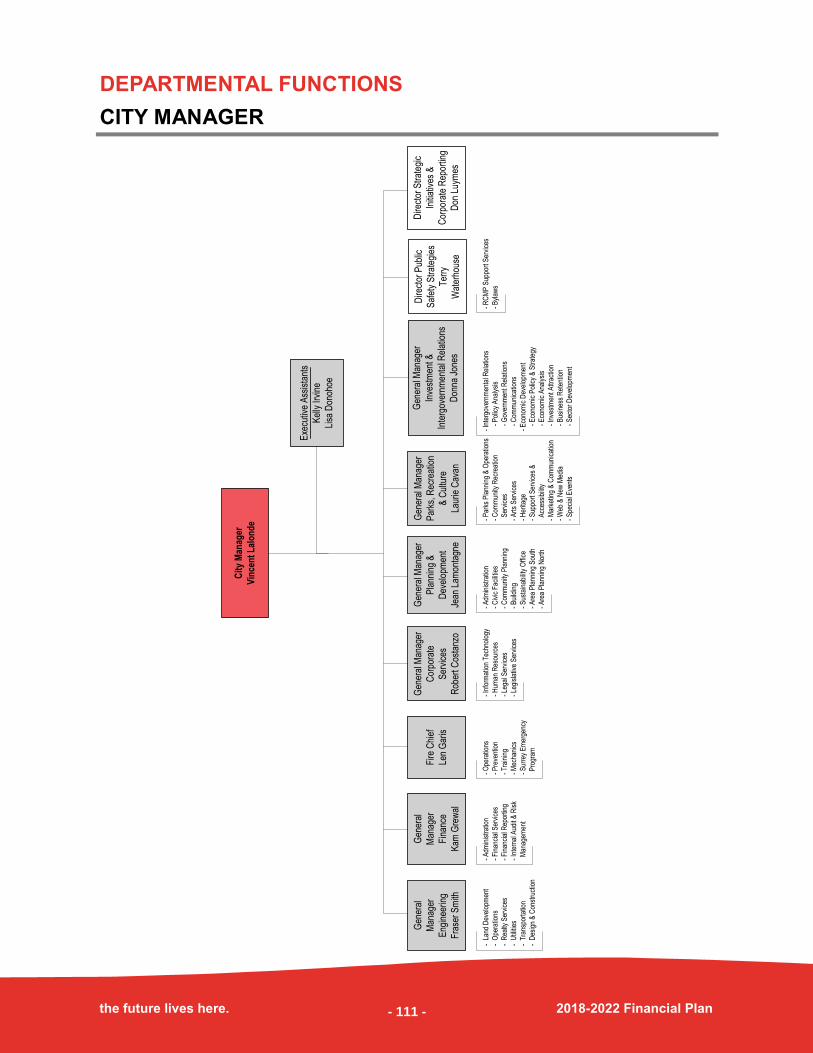
DEPARTMENTAL FUNCTIONS
CITY MANAGER
the future lives here. 2018-2022 Financial Plan
- A
dmin
istr
atio
n
- C
ivic
Fac
ilitie
s
- C
omm
unity
Pla
nnin
g
- B
uild
ing
- S
usta
inab
ility
Offi
ce
- A
rea
Pla
nnin
g S
outh
- A
rea
Pla
nnin
g N
orth
- A
dmin
istr
atio
n
- F
inan
cial
Ser
vice
s
- F
inan
cial
Rep
ortin
g
- In
tern
al A
udit
& R
isk
Man
agem
ent
- L
and
Dev
elop
men
t
- O
pera
tions
- R
ealty
Ser
vice
s
- U
tiliti
es
- T
rans
port
atio
n
- D
esig
n &
Con
stru
ctio
n
- P
arks
Pla
nnin
g &
Ope
ratio
ns
- C
omm
unity
Rec
reat
ion
Ser
vice
s
- A
rts
Ser
vice
s
- H
erita
ge
- S
uppo
rt S
ervi
ces
&
Acc
essi
bilit
y
- M
arke
ting
& C
omm
unic
atio
n
- W
eb &
New
Med
ia
- S
peci
al E
vent
s
- O
pera
tions
- P
reve
ntio
n
- T
rain
ing
- M
echa
nics
- S
urre
y E
mer
genc
y
Pro
gram
Fire
Chi
ef
Len
Gar
is
Gen
eral
Man
ager
Pla
nnin
g &
Dev
elop
men
t
Jean
Lam
onta
gne
Gen
eral
Man
ager
Fin
ance
Kam
Gre
wal
Gen
eral
Man
ager
Eng
inee
ring
Fra
ser
Sm
ith
Gen
eral
Man
ager
Par
ks, R
ecre
atio
n
& C
ultu
re
Laur
ie C
avan
Gen
eral
Man
ager
Cor
pora
te
Ser
vice
s
Rob
ert C
osta
nzo
- In
form
atio
n T
echn
olog
y
- H
uman
Res
ourc
es
- Le
gal S
ervi
ces
- Le
gisl
ativ
e S
ervi
ces
Cit
y M
anag
er
Vin
cen
t L
alo
nd
e
Gen
eral
Man
ager
Inve
stm
ent &
Inte
rgov
ernm
enta
l Rel
atio
ns
Don
na J
ones
- In
terg
over
nmen
tal R
elat
ions
-
Pol
icy
Ana
lysi
s
-
Gov
ernm
ent R
elat
ions
-
Com
mun
icat
ions
- E
cono
mic
Dev
elop
men
t
-
Eco
nom
ic P
olic
y &
Str
ateg
y
-
Eco
nom
ic A
naly
sis
-
Inve
stm
ent A
ttrac
tion
-
Bus
ines
s R
eten
tion
-
Sec
tor
Dev
elop
men
t
Exe
cutiv
e A
ssis
tant
s
Kel
ly Ir
vine
Lisa
Don
ohoe
Dire
ctor
Pub
lic
Saf
ety
Str
ateg
ies
Ter
ry
Wat
erho
use
Dire
ctor
Str
ateg
ic
Initi
ativ
es &
Cor
pora
te R
epor
ting
Don
Luy
mes
- R
CM
P S
uppo
rt S
ervi
ces
- B
ylaw
s
- 111 -
DEPARTMENTAL OVERVIEW
CITY MANAGER
the future lives here. 2018-2022 Financial Plan
MISSION STATEMENT
The mission of the City Manager’s Department is to oversee the achievement by the
City’s administration of City Council’s short and long-term objectives for the City.
KEY PROGRAMS AND SERVICES
The City Manager’s Department:
Provides advice and recommendations to City Council related to policies and
emerging issues;
Assists in guiding the work of the other City departments;
Ensures a coordinated and balanced implementation of Council policy and programs;
Ensures that Council resolutions are addressed in a timely and fulsome manner;
Ensures effective financial management through the monitoring of the annual budget
and the 5 Year Financial Plan and by reviewing the City’s financial performance
throughout the year; and
Council’s priorities and high quality sustainable City services are delivered on a
consistent basis to the City’s residents and businesses.
The City Manager’s Department also has responsibility for the following operational
divisions/sections:
PUBLIC SAFETY
The Public Safety Office is responsible for
developing, implementing, monitoring
and measuring the impact of the Public
Safety Strategy and providing leadership
of RCMP Support Service and Public
Safety Operations, including bylaw
enforcement, animal control, licensing
and corporate security. Public Safety
brings city resources together with its
partners to deliver programs and services
that promote and ensure safety and
wellbeing for citizens.
- 112 -
CITY MANAGER
the future lives here. 2018-2022 Financial Plan
2017 ACCOMPLISHMENTS
STRATEGIC INITIATIVES & CORPORATE REPORTING
The Strategic Initiatives & Corporate Reporting function in the City Manager’s
Department provides coordination of key initiatives that span across multiple
departments, including the “Surrey Excels” program. These strategic initiatives will
evolve as Council’s priorities emerge and are addressed.
This function also ensures consistency and high standards of corporate reporting,
including regular reports to Council as well as periodic reports on organizational
performance.
Completed consultation with diverse communities as part of the implementation of
the Public Safety Strategy.
INCLUSION
BUILT ENVIRONMENT & NEIGHBOURHOODS
Expanded the Community Patrol
Initiative beyond the Newton core,
focusing on responding to community
concerns through community
engagement;
In partnership with the Planning &
Development Department, successfully
advocated for 150 rapid response
transition workforce housing and 250
new supportive modular housing units
in Surrey; and
Worked with the Engineering
Department and the Planning &
Development Department to advance
the Nexus program, which expedites
development projects that are of
strategic significance and which
advance the City’s goals.
- 113 -
CITY MANAGER
the future lives here. 2018-2022 Financial Plan
Partnered with Fraser Health Authority to deliver a series of eight training sessions
for the community to support naloxone interventions in the case of overdoses, and
supported several dialogues on the opioid crisis led by Sources Community
Resource Society and the Vulnerable Women and Girls Group.
Completed the Surrey Excels Tier 1 (city
-wide) Strategy Map through an
intensive process involving senior
management and staff groups from
across all departments. Surrey Excels
is a strategic management tool that
provides a structure for aligning the
City’s goals, objectives and strategies,
and which includes a set of measures
and targets to gauge our progress; and
Set up a Corporate Grants Team to
share resources and information across
departments with the goal of increasing
the City’s success in attracting grant
funding from a variety of sources and
increasing revenues to support City
initiatives.
HEALTH & WELLNESS
CORPORATE SUSTAINABILITY
Implemented 10 new initiatives as part
of the Public Safety Strategy for the City
(e.g. Surrey Outreach Team, Gang
Exiting Pilot and the Clayton Heights
Activity Team);
Completed six public safety roll-out
events across the City with 37 partners
to raise awareness about the strategy
and encourage participation by
community members;
Developed a new model, the Surrey
Outreach Team, for supporting
vulnerable persons and responding to
community concerns in the 135A Street
area through a partnership model that
responds to issues in the area and
transitions people from the street to
housing and other supports. The
Surrey Outreach Team was awarded the
Surrey Board of Trade “Team of the
Year” Award in 2017;
Completed research and development
of a best practices model to support
legalization of cannabis in
municipalities;
Continued enhancing our integrated
service model by increasing the
capacity of Surrey Mobility and
Resilience Team (SMART) to support
vulnerable persons, conducted an
evaluation of the project and finalized
the funding proposal for the Integrated
Services Network in partnership with
the Province; and
Worked with property owners to bring
into compliance 141 abandoned and
nuisance properties.
PUBLIC SAFETY
- 114 -
CITY MANAGER
the future lives here. 2018-2022 Financial Plan
FUTURE INITIATIVES, GOALS & OBJECTIVES
Implement the Mayor’s Action Plan on
Gang Violence which includes five new
initiatives including the Mayor’s Task
Force on Gang Violence Prevention and
the Mayor’s Annual Award for Civic
Responsibility;
Complete implementation of the
Performance Measurement Framework
for public safety initiatives;
Support roll out of the Surrey Excels
process and cascade Tier 2 plans;
Collaborate in the development of the
City dashboard that allows for public
reporting on the Public Safety Strategy;
In partnership with City departments,
develop and implement a regulatory
framework for the legalization of
cannabis;
Expand the capacity of the Public Safety
Office to accelerate implementation of
the initiatives;
Develop a phase two plan to evolve and
augment the Public Safety Strategy with
new initiatives as needs arise;
Expand the Bylaw enforcement team
with four new positions in 2018; and
Conduct review of corporate security
operations once the Corporate Security
Manager is in place.
Further development of the Public Safety Strategy internal objectives: improve
resource efficiency, increase Public Safety support from government, improve
training, enhance technology solutions, improve collaboration, improve evidence
based decision making, and improve communication.
PUBLIC SAFETY
ECONOMIC PROSPERITY & LIVELIHOODS
CORPORATE SUSTAINABILITY
Initiate the “cascading” of the Surrey Excels program to all units of the City, through
the development of more detailed strategy maps at the department, division and
section levels to ensure consistency and alignment across the City.
- 115 -
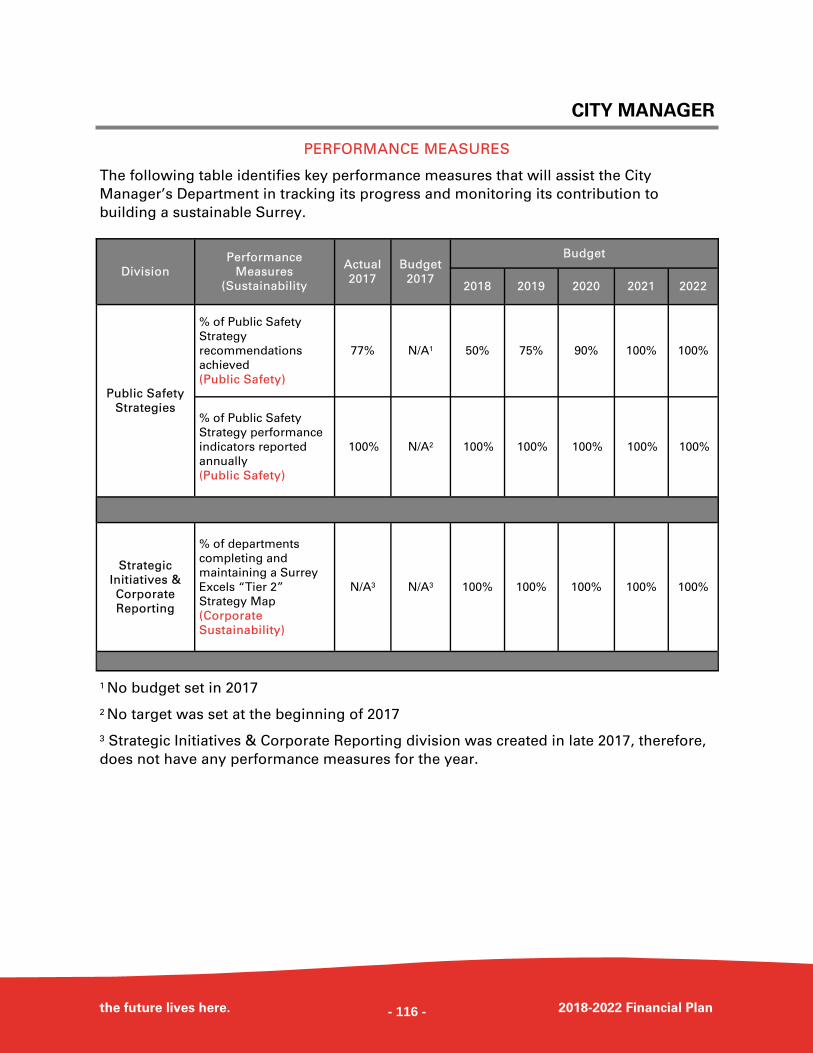
CITY MANAGER
the future lives here. 2018-2022 Financial Plan
PERFORMANCE MEASURES
The following table identifies key performance measures that will assist the City
Manager’s Department in tracking its progress and monitoring its contribution to
building a sustainable Surrey.
1 No budget set in 2017
2 No target was set at the beginning of 2017
3 Strategic Initiatives & Corporate Reporting division was created in late 2017, therefore,
does not have any performance measures for the year.
Division
Performance
Measures
(Sustainability
Actual
2017
Budget
2017
Budget
2018 2019 2020 2021 2022
Public Safety
Strategies
% of Public Safety
Strategy
recommendations
achieved
(Public Safety)
77% N/A1 50% 75% 90% 100% 100%
% of Public Safety
Strategy performance
indicators reported
annually
(Public Safety)
100% N/A2 100% 100% 100% 100% 100%
Strategic
Initiatives &
Corporate
Reporting
% of departments
completing and
maintaining a Surrey
Excels “Tier 2”
Strategy Map
(Corporate
Sustainability)
N/A3 N/A3 100% 100% 100% 100% 100%
- 116 -
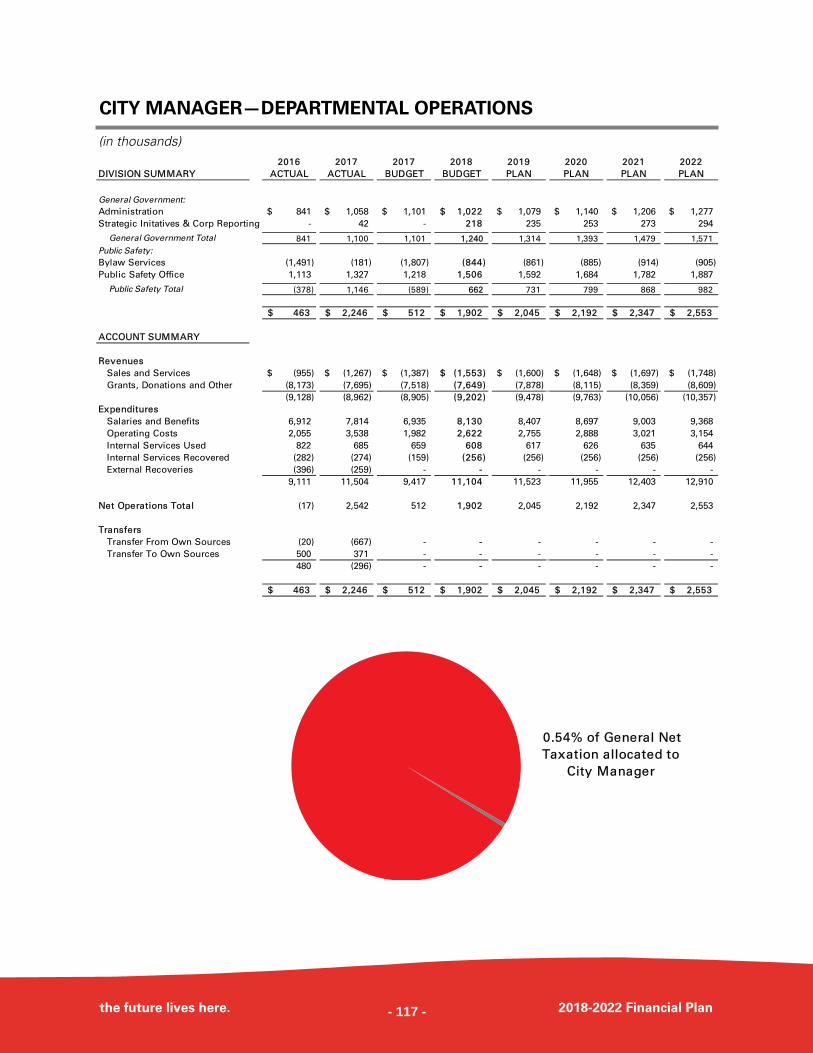
the future lives here. 2018-2022 Financial Plan
CITY MANAGER—DEPARTMENTAL OPERATIONS
(in thousands) 2016 2017 2017 2018 2019 2020 2021 2022
DIVISION SUMMARY ACTUAL ACTUAL BUDGET BUDGET PLAN PLAN PLAN PLAN
General Government:
Administration 841$ 1,058$ 1,101$ 1,022$ 1,079$ 1,140$ 1,206$ 1,277$
Strategic Initatives & Corp Reporting - 42 - 218 235 253 273 294
General Government Total 841 1,100 1,101 1,240 1,314 1,393 1,479 1,571
Public Safety:
Bylaw Services (1,491) (181) (1,807) (844) (861) (885) (914) (905)
Public Safety Office 1,113 1,327 1,218 1,506 1,592 1,684 1,782 1,887
Public Safety Total (378) 1,146 (589) 662 731 799 868 982
463$ 2,246$ 512$ 1,902$ 2,045$ 2,192$ 2,347$ 2,553$
ACCOUNT SUMMARY
Revenues
Sales and Services (955)$ (1,267)$ (1,387)$ (1,553)$ (1,600)$ (1,648)$ (1,697)$ (1,748)$
Grants, Donations and Other (8,173) (7,695) (7,518) (7,649) (7,878) (8,115) (8,359) (8,609)
(9,128) (8,962) (8,905) (9,202) (9,478) (9,763) (10,056) (10,357)
Expenditures
Salaries and Benefits 6,912 7,814 6,935 8,130 8,407 8,697 9,003 9,368
Operating Costs 2,055 3,538 1,982 2,622 2,755 2,888 3,021 3,154
Internal Services Used 822 685 659 608 617 626 635 644
Internal Services Recovered (282) (274) (159) (256) (256) (256) (256) (256)
External Recoveries (396) (259) - - - - - -
9,111 11,504 9,417 11,104 11,523 11,955 12,403 12,910
Net Operations Total (17) 2,542 512 1,902 2,045 2,192 2,347 2,553
Transfers
Transfer From Own Sources (20) (667) - - - - - -
Transfer To Own Sources 500 371 - - - - - -
480 (296) - - - - - -
463$ 2,246$ 512$ 1,902$ 2,045$ 2,192$ 2,347$ 2,553$
0.54% of General Net
Taxation allocated to
City Manager
- 117 -

CITY MANAGER—DEPARTMENTAL OPERATIONS
the future lives here. 2018-2022 Financial Plan
(in thousands) 2016 2017 2017 2018 2019 2020 2021 2022
ADMINISTRATION ACTUAL ACTUAL BUDGET BUDGET PLAN PLAN PLAN PLAN
Revenues
Sales and Services (1)$ (1)$ (2)$ (2)$ (2)$ (2)$ (2)$ (2)$
Grants, Donations and Other - - - - - - - -
(1) (1) (2) (2) (2) (2) (2) (2)
Expenditures
Salaries and Benefits 637 720 757 698 752 810 873 941
Operating Costs 162 339 156 156 159 162 165 168
Internal Services Used 62 28 190 170 170 170 170 170
Internal Services Recovered (17) (28) - - - - - -
External Recoveries (2) - - - - - - -
842 1,059 1,103 1,024 1,081 1,142 1,208 1,279
Net Operations Total 841 1,058 1,101 1,022 1,079 1,140 1,206 1,277
Transfers
Transfer From Own Sources - - - - - - - -
Transfer To Own Sources - - - - - - - -
- - - - - - - -
841$ 1,058$ 1,101$ 1,022$ 1,079$ 1,140$ 1,206$ 1,277$
STRATEGIC INITIATIVES & 2016 2017 2017 2018 2019 2020 2021 2022
CORPORATE REPORTING ACTUAL ACTUAL BUDGET BUDGET PLAN PLAN PLAN PLAN
Revenues
Sales and Services -$ -$ -$ -$ -$ -$ -$ -$
Grants, Donations and Other - - - - - - - -
- - - - - - - -
Expenditures
Salaries and Benefits - 101 - 218 235 253 273 294
Operating Costs - - - - - - - -
Internal Services Used - - - - - - - -
Internal Services Recovered - - - - - - - -
External Recoveries - - - - - - - -
- 101 - 218 235 253 273 294
Net Operations Total - 101 - 218 235 253 273 294
Transfers
Transfer From Own Sources - (59) - - - - - -
Transfer To Own Sources - - - - - - - -
- (59) - - - - - -
-$ 42$ -$ 218$ 235$ 253$ 273$ 294$
- 118 -
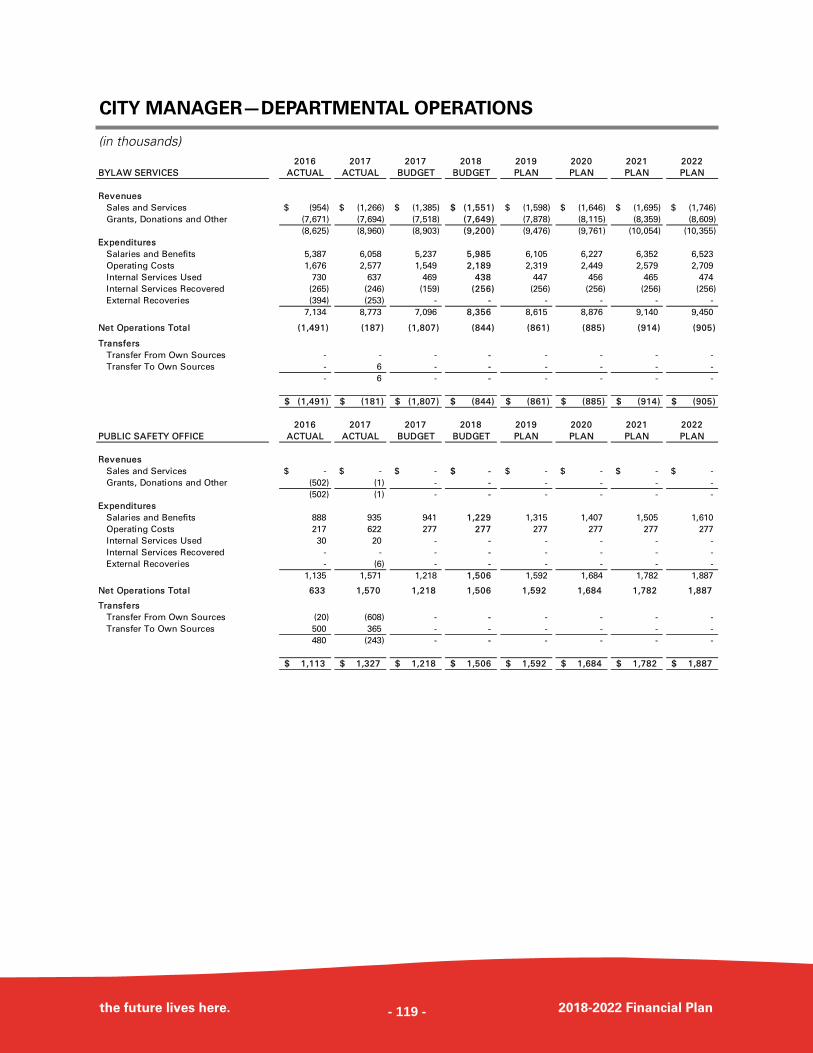
the future lives here. 2018-2022 Financial Plan
CITY MANAGER—DEPARTMENTAL OPERATIONS
(in thousands) 2016 2017 2017 2018 2019 2020 2021 2022
BYLAW SERVICES ACTUAL ACTUAL BUDGET BUDGET PLAN PLAN PLAN PLAN
Revenues
Sales and Services (954)$ (1,266)$ (1,385)$ (1,551)$ (1,598)$ (1,646)$ (1,695)$ (1,746)$
Grants, Donations and Other (7,671) (7,694) (7,518) (7,649) (7,878) (8,115) (8,359) (8,609)
(8,625) (8,960) (8,903) (9,200) (9,476) (9,761) (10,054) (10,355)
Expenditures
Salaries and Benefits 5,387 6,058 5,237 5,985 6,105 6,227 6,352 6,523
Operating Costs 1,676 2,577 1,549 2,189 2,319 2,449 2,579 2,709
Internal Services Used 730 637 469 438 447 456 465 474
Internal Services Recovered (265) (246) (159) (256) (256) (256) (256) (256)
External Recoveries (394) (253) - - - - - -
7,134 8,773 7,096 8,356 8,615 8,876 9,140 9,450
Net Operations Total (1,491) (187) (1,807) (844) (861) (885) (914) (905)
Transfers
Transfer From Own Sources - - - - - - - -
Transfer To Own Sources - 6 - - - - - -
- 6 - - - - - -
(1,491)$ (181)$ (1,807)$ (844)$ (861)$ (885)$ (914)$ (905)$
2016 2017 2017 2018 2019 2020 2021 2022
PUBLIC SAFETY OFFICE ACTUAL ACTUAL BUDGET BUDGET PLAN PLAN PLAN PLAN
Revenues
Sales and Services -$ -$ -$ -$ -$ -$ -$ -$
Grants, Donations and Other (502) (1) - - - - - -
(502) (1) - - - - - -
Expenditures
Salaries and Benefits 888 935 941 1,229 1,315 1,407 1,505 1,610
Operating Costs 217 622 277 277 277 277 277 277
Internal Services Used 30 20 - - - - - -
Internal Services Recovered - - - - - - - -
External Recoveries - (6) - - - - - -
1,135 1,571 1,218 1,506 1,592 1,684 1,782 1,887
Net Operations Total 633 1,570 1,218 1,506 1,592 1,684 1,782 1,887
Transfers
Transfer From Own Sources (20) (608) - - - - - -
Transfer To Own Sources 500 365 - - - - - -
480 (243) - - - - - -
1,113$ 1,327$ 1,218$ 1,506$ 1,592$ 1,684$ 1,782$ 1,887$
- 119 -
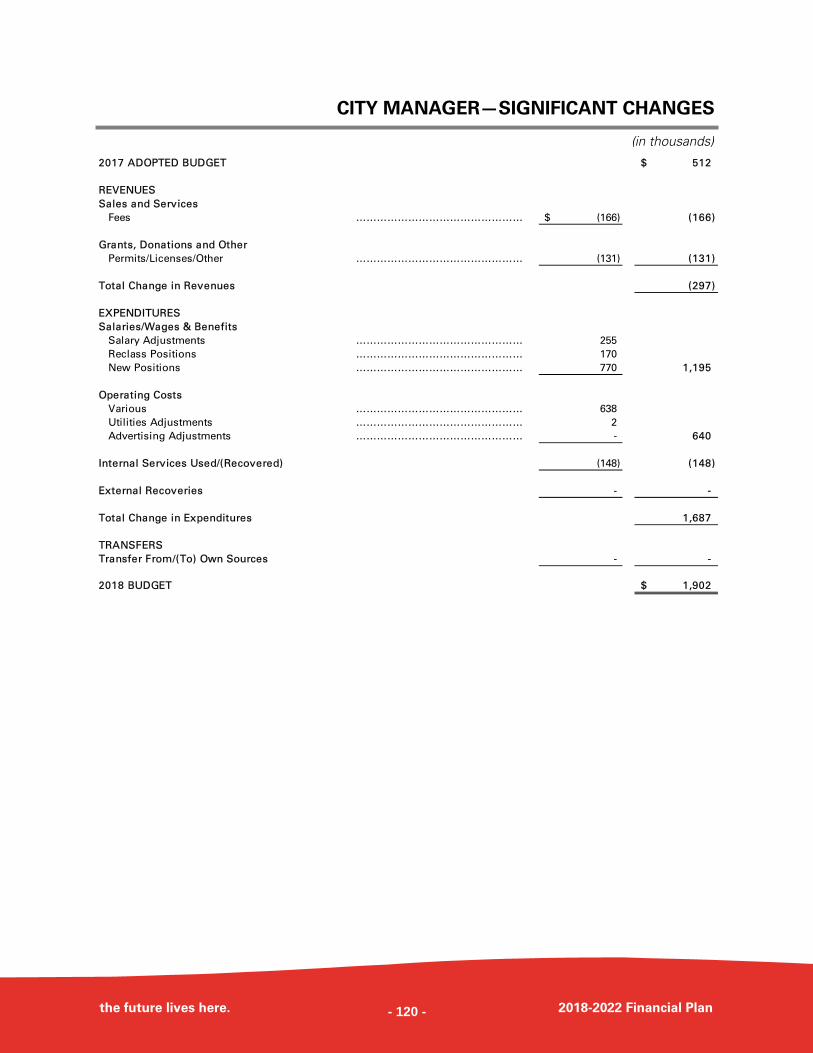
the future lives here. 2018-2022 Financial Plan
CITY MANAGER—SIGNIFICANT CHANGES
(in thousands)
2017 ADOPTED BUDGET 512$
REVENUES
Sales and Services
Fees ………………………………………… (166)$ (166)
Grants, Donations and Other
Permits/Licenses/Other ………………………………………… (131) (131)
Total Change in Revenues (297)
EXPENDITURES
Salaries/Wages & Benefits
Salary Adjustments ………………………………………… 255
Reclass Positions ………………………………………… 170
New Positions ………………………………………… 770 1,195
Operating Costs
Various ………………………………………… 638
Utilities Adjustments ………………………………………… 2
Advertising Adjustments ………………………………………… - 640
Internal Services Used/(Recovered) (148) (148)
External Recoveries - -
Total Change in Expenditures 1,687
TRANSFERS
Transfer From/(To) Own Sources - -
2018 BUDGET 1,902$
- 120 -
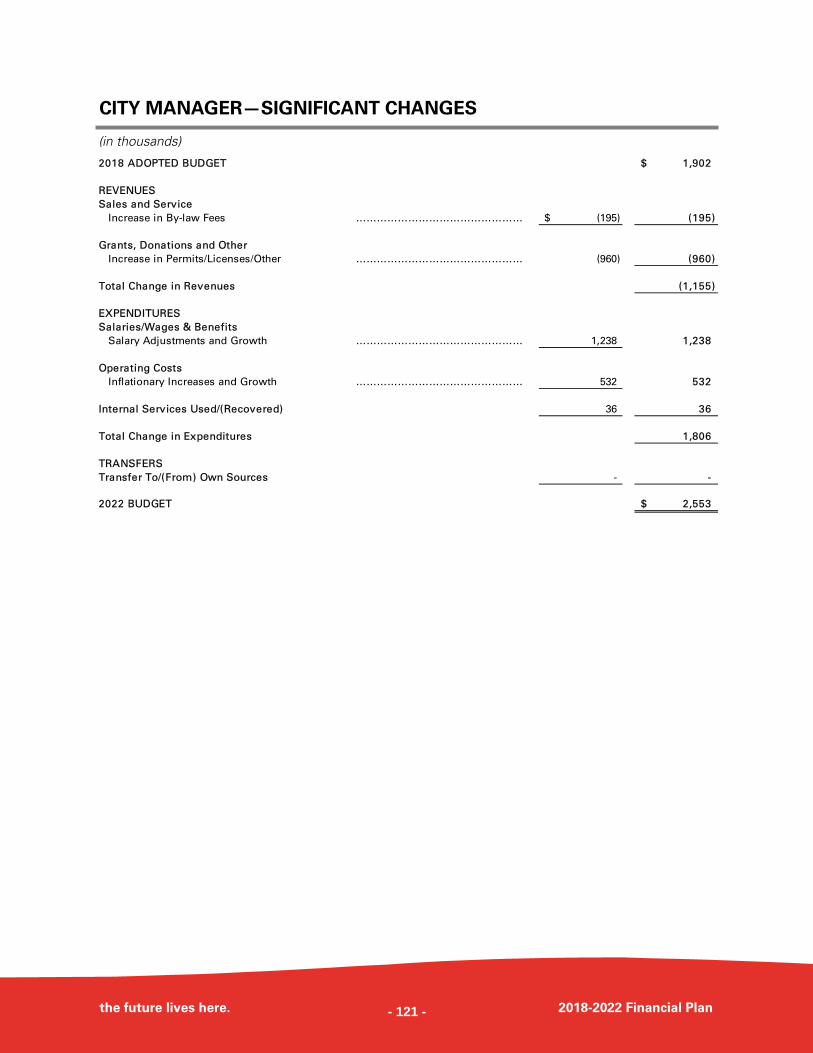
the future lives here. 2018-2022 Financial Plan
CITY MANAGER—SIGNIFICANT CHANGES
(in thousands)
2018 ADOPTED BUDGET 1,902$
REVENUES
Sales and Service
Increase in By-law Fees ………………………………………… (195)$ (195)
Grants, Donations and Other
Increase in Permits/Licenses/Other ………………………………………… (960) (960)
Total Change in Revenues (1,155)
EXPENDITURES
Salaries/Wages & Benefits
Salary Adjustments and Growth ………………………………………… 1,238 1,238
Operating Costs
Inflationary Increases and Growth ………………………………………… 532 532
Internal Services Used/(Recovered) 36 36
Total Change in Expenditures 1,806
TRANSFERS
Transfer To/(From) Own Sources - -
2022 BUDGET 2,553$
- 121 -
- 122 -
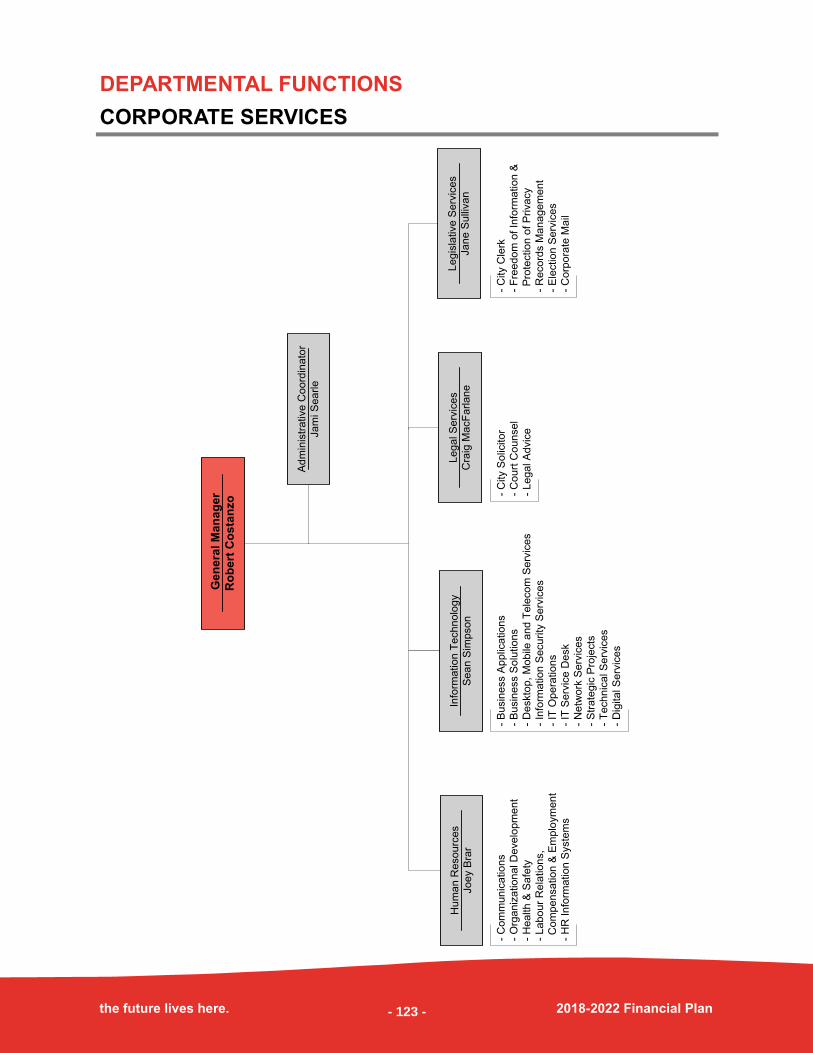
DEPARTMENTAL FUNCTIONS
CORPORATE SERVICES
the future lives here. 2018-2022 Financial Plan
Ge
ne
ral M
an
ag
er
Ro
be
rt C
os
tan
zo
Info
rmation
Techn
olo
gy
Sean
Sim
pson
- C
om
mun
ications
- O
rganiz
atio
nal D
eve
lopm
ent
- H
ealth &
Safe
ty
- Labo
ur
Rela
tion
s,
C
om
pen
sation &
Em
plo
ym
ent
- H
R Info
rmation
Syste
ms
Hum
an R
esourc
es
Joey B
rar
- B
usin
ess A
pplic
ations
- B
usin
ess S
olu
tio
ns
- D
eskto
p, M
ob
ile a
nd T
ele
com
Serv
ices
- In
form
ation
Security
Serv
ices
- IT
Ope
rations
- IT
Serv
ice D
esk
- N
etw
ork
Serv
ices
- S
trate
gic
Pro
jects
- T
echnic
al S
erv
ices
- D
igital S
erv
ices
Leg
al S
erv
ices
Cra
ig M
acF
arlan
e
Leg
isla
tive S
erv
ices
Jane S
ulli
van
- C
ity S
olic
itor
- C
ou
rt C
ounsel
- Le
gal A
dvic
e
- C
ity C
lerk
- F
reed
om
of In
form
ation &
P
rote
ction o
f P
rivacy
- R
eco
rds M
anag
em
ent
- E
lectio
n S
erv
ices
- C
orp
ora
te M
ail
Adm
inis
trative C
oo
rdin
ato
r
Jam
i S
ea
rle
- 123 -
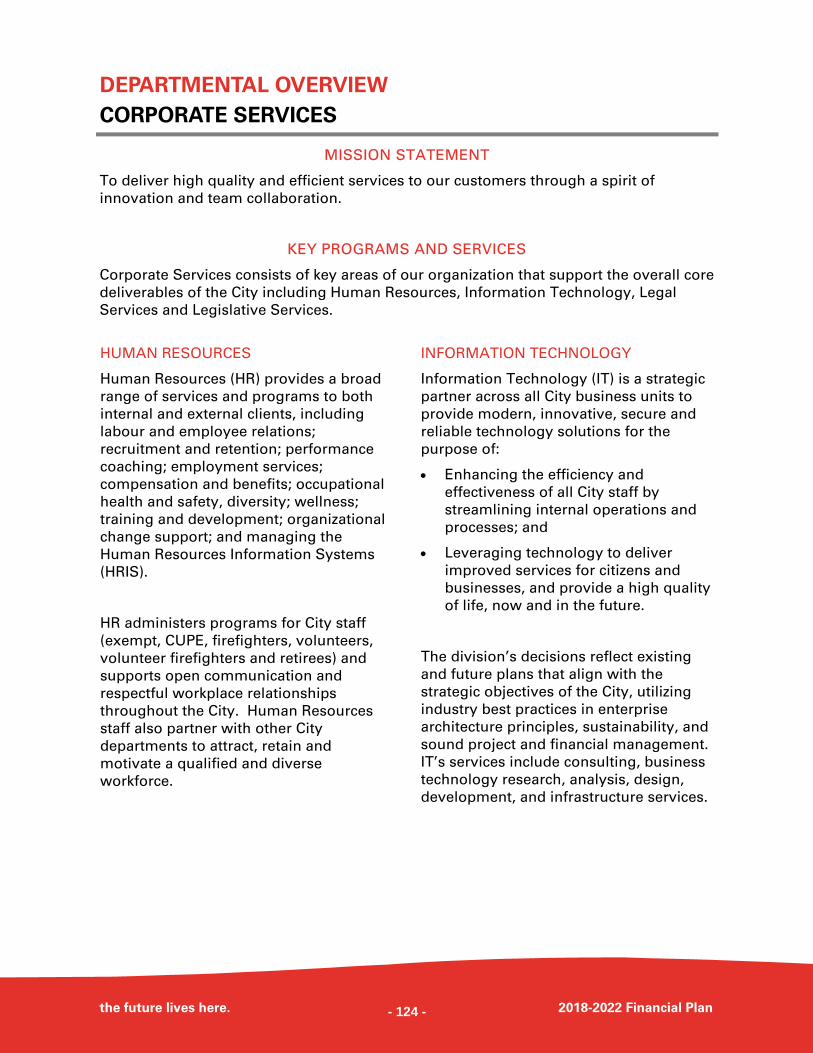
DEPARTMENTAL OVERVIEW
CORPORATE SERVICES
the future lives here. 2018-2022 Financial Plan
MISSION STATEMENT
To deliver high quality and efficient services to our customers through a spirit of
innovation and team collaboration.
KEY PROGRAMS AND SERVICES
Corporate Services consists of key areas of our organization that support the overall core
deliverables of the City including Human Resources, Information Technology, Legal
Services and Legislative Services.
HUMAN RESOURCES
Human Resources (HR) provides a broad
range of services and programs to both
internal and external clients, including
labour and employee relations;
recruitment and retention; performance
coaching; employment services;
compensation and benefits; occupational
health and safety, diversity; wellness;
training and development; organizational
change support; and managing the
Human Resources Information Systems
(HRIS).
HR administers programs for City staff
(exempt, CUPE, firefighters, volunteers,
volunteer firefighters and retirees) and
supports open communication and
respectful workplace relationships
throughout the City. Human Resources
staff also partner with other City
departments to attract, retain and
motivate a qualified and diverse
workforce.
INFORMATION TECHNOLOGY
Information Technology (IT) is a strategic
partner across all City business units to
provide modern, innovative, secure and
reliable technology solutions for the
purpose of:
Enhancing the efficiency and
effectiveness of all City staff by
streamlining internal operations and
processes; and
Leveraging technology to deliver
improved services for citizens and
businesses, and provide a high quality
of life, now and in the future.
The division’s decisions reflect existing
and future plans that align with the
strategic objectives of the City, utilizing
industry best practices in enterprise
architecture principles, sustainability, and
sound project and financial management.
IT’s services include consulting, business
technology research, analysis, design,
development, and infrastructure services.
- 124 -
CORPORATE SERVICES
the future lives here. 2018-2022 Financial Plan
LEGAL SERVICES
Legal Services is responsible for providing
legal services to City Council and all of the
City’s departments. The City’s solicitors
serve as court counsel, provide legal
advice and render legal opinions on a wide
variety of matters along with drafting and
reviewing all forms of legal and legislative
documentation associated with the
business of the City.
LEGISLATIVE SERVICES
Legislative Services is responsible for
ensuring the City conducts business in
accordance with all levels of government
legislation. Legislative Services is also
responsible for carrying out the statutory
responsibilities of the Corporate Officer as
legislated under the Community Charter
and providing direct services to City
Council, City departments and the public.
Administrative support is given to Council
and to the various committees and boards
on which Council members sit. Legislative
Services also coordinators and conducts
the municipal elections every four years to
elect the City’s Mayor and Council.
The division manages the City’s
compliance with legislation, which
includes ongoing management of the
Corporate Records program, the City’s
privacy practices, and responding to
requests for information under the
Freedom of Information and Protection of
Privacy Act (FIPPA).
Staff at Council meeting
- 125 -
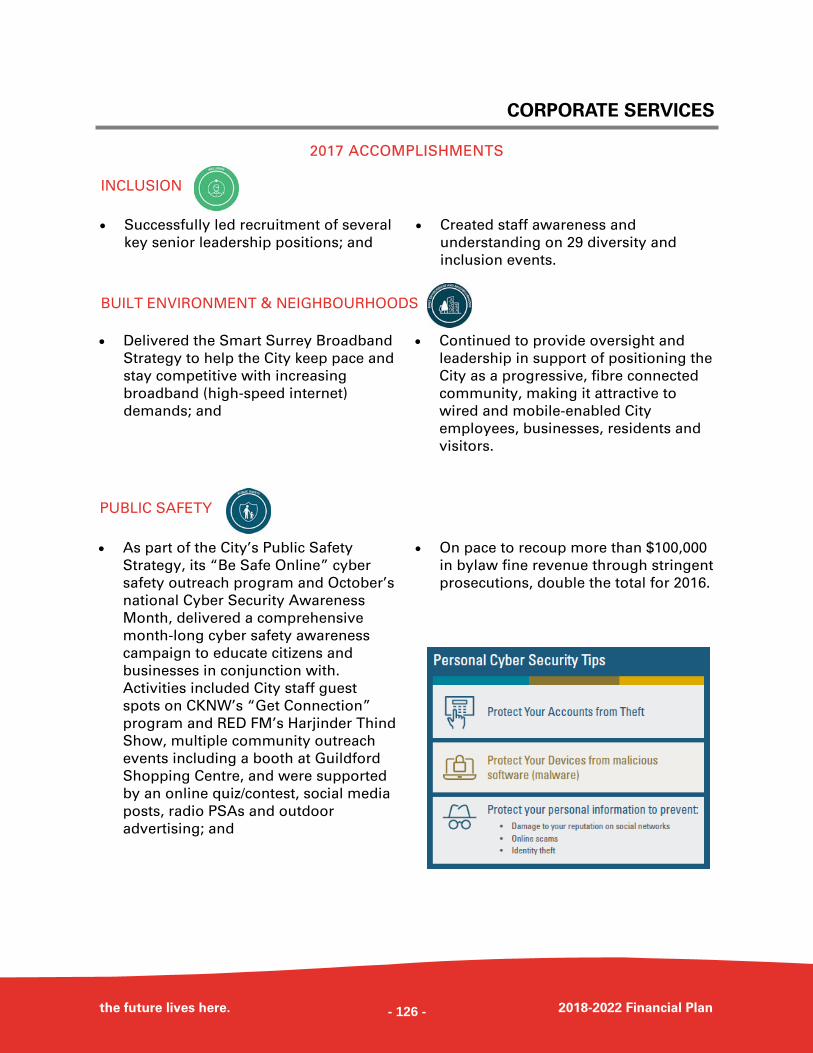
CORPORATE SERVICES
the future lives here. 2018-2022 Financial Plan
2017 ACCOMPLISHMENTS
Successfully led recruitment of several
key senior leadership positions; and
Created staff awareness and
understanding on 29 diversity and
inclusion events.
INCLUSION
PUBLIC SAFETY
As part of the City’s Public Safety
Strategy, its “Be Safe Online” cyber
safety outreach program and October’s
national Cyber Security Awareness
Month, delivered a comprehensive
month-long cyber safety awareness
campaign to educate citizens and
businesses in conjunction with.
Activities included City staff guest
spots on CKNW’s “Get Connection”
program and RED FM’s Harjinder Thind
Show, multiple community outreach
events including a booth at Guildford
Shopping Centre, and were supported
by an online quiz/contest, social media
posts, radio PSAs and outdoor
advertising; and
On pace to recoup more than $100,000
in bylaw fine revenue through stringent
prosecutions, double the total for 2016.
BUILT ENVIRONMENT & NEIGHBOURHOODS
Delivered the Smart Surrey Broadband
Strategy to help the City keep pace and
stay competitive with increasing
broadband (high-speed internet)
demands; and
Continued to provide oversight and
leadership in support of positioning the
City as a progressive, fibre connected
community, making it attractive to
wired and mobile-enabled City
employees, businesses, residents and
visitors.
- 126 -
CORPORATE SERVICES
the future lives here. 2018-2022 Financial Plan
ECOSYSTEMS
Corporate Records, in conjunction with Iron Mountain, securely shredded and
recycled 28,181 pounds of paper, with the following environmental benefits: 236
trees preserved, 70 cubic yards of landfill space conserved, 386 gallons of water
saved, and 31,845 KWH of electricity saved.
ECONOMIC PROSPERITY & LIVELIHOODS
Innovation Boulevard Corporate and
Innovation Boulevard Society created
foundation funding and governance
structure between the City and Simon
Fraser University and is now BC’s first
Health Tech Accelerator to enable and
support biopharmaceutical and health
tech companies;
Awarded 2017 BC’s Top Employer; and
Awarded 2017 Canada’s Top Employer
for Young People.
EDUCATION & CULTURE
Delivered city-wide staff training on fundamental City policies (City Essentials).
INFRASTRUCTURE
Expanded MySurrey Portal which allows customers to quickly, conveniently and
securely access popular Surrey online services from one location and is accessible
anywhere, anytime and from any devices. New 2017 online services include a
parking ticket dispute process, waste cart exchange service, invoice payments
service, and the ability to pay with Interact Online.
CORPORATE SUSTAINABILITY
Introduced several new services
including Electronic Seals and e-
signatures, that have increased staff
productivity and efficiency, streamlined
business processes, increased security,
removed printed paper, eliminated
delivery costs, and positively
transformed customer experience; and
Continued to work with Planning &
Development to terminate the majority
of land use contracts with over 298
Land Use Contract Termination Bylaws
being adopted by Council in 2017.
- 127 -
CORPORATE SERVICES
the future lives here. 2018-2022 Financial Plan
FUTURE INITIATIVES, GOALS & OBJECTIVES
INCLUSION
Formally highlight/celebrate innovative and collaborative staff projects as part of an
annual City Values Recognition Program.
Increase the City’s security of its data and critical infrastructure to protect City
business internally, as well as protecting citizens and businesses, by continuing to
invest in advanced security technology with a goal of being recognized as a centre of
excellence in this field.
PUBLIC SAFETY
ECONOMIC PROSPERITY & LIVELIHOODS
In conjunction with IT, finalize
agreements in order to expand fibre
optic internet access for residents
throughout the City; and
Subject to the approval of BC Utilities
Commission, and in conjunction with
the Engineering Department, finalize
an Operating Agreement with Fortis BC
Energy Inc. which will, among other
things, provide for the payment to the
City of an annual operating fee.
ECOSYSTEMS
Continue to develop the “Digital Mailroom” to more efficiently disperse information
and reduce hard copying inbound and outgoing correspondence wherever practical.
EDUCATION & CULTURE
Deliver focused training in “customer service excellence” to all front-line staff.
HEALTH & WELLNESS
Develop a comprehensive corporate wellness plan, informed by evidence and data,
with the objective of integrating wellness into our culture and everyday work
practices.
- 128 -
CORPORATE SERVICES
the future lives here. 2018-2022 Financial Plan
INFRASTRUCTURE
Work towards submitting an application for the Smart Cities Challenge to win the
$50 million Federal award towards an innovative technology-related infrastructure
project.
CORPORATE SUSTAINABILITY
Promote through the organization an
increased focus on data driven
evidence-based decision making
supported by a new comprehensive
business intelligence, visualization and
reporting system (D3M Project);
Rewrite and update the Council
Procedure Bylaw;
Create an enhanced employee
onboarding experience; and
Continue to advance the Enterprise
Content Management Program to
increase the City’s capabilities
including finding information quickly
and easily, have confidence in the
information found, improve
information sharing and collaboration,
preserve knowledge, meet legal
obligations of Freedom of Information
(FOI) and legal holds, reduce liability
and risk by providing audit trails, and
retention and defensible disposition.
Staff supporting Anti-Bullying on Pink Shirt Day
- 129 -
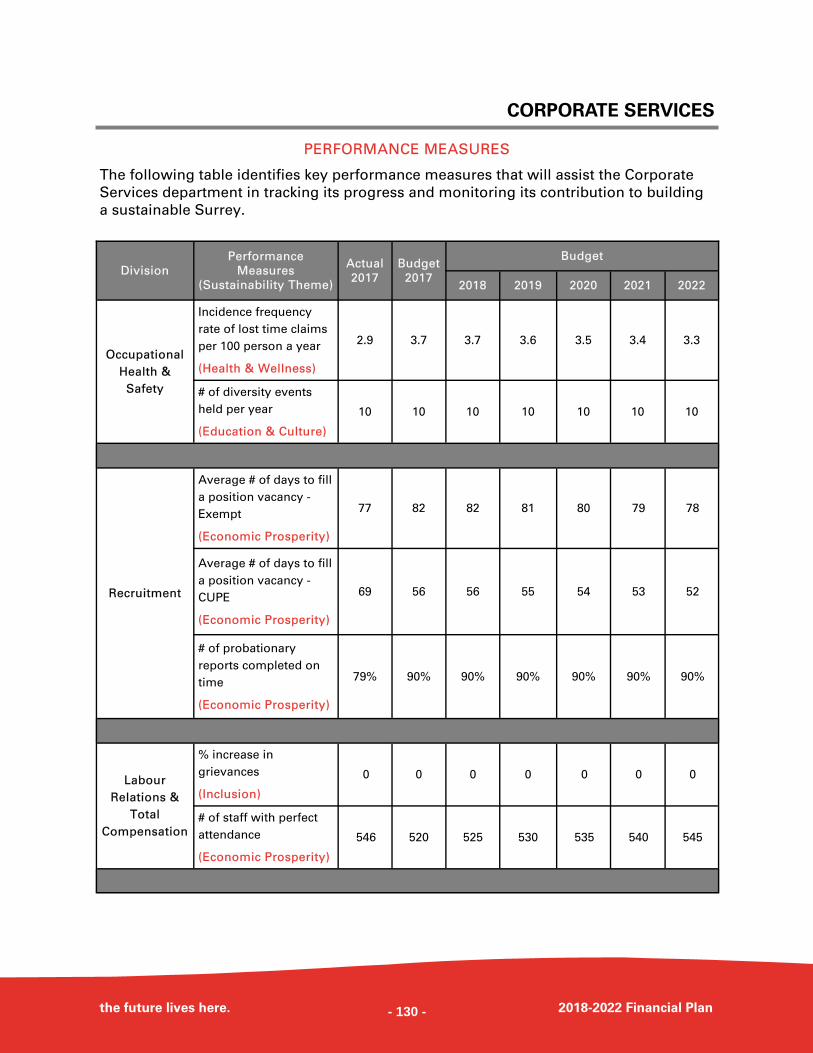
CORPORATE SERVICES
the future lives here. 2018-2022 Financial Plan
PERFORMANCE MEASURES
The following table identifies key performance measures that will assist the Corporate
Services department in tracking its progress and monitoring its contribution to building
a sustainable Surrey.
Division
Performance
Measures
(Sustainability Theme)
Actual
2017
Budget
2017
Budget
2018 2019 2020 2021 2022
Occupational
Health &
Safety
Incidence frequency
rate of lost time claims
per 100 person a year
(Health & Wellness)
2.9 3.7 3.7 3.6 3.5 3.4 3.3
# of diversity events
held per year
(Education & Culture)
10 10 10 10 10 10 10
Recruitment
Average # of days to fill
a position vacancy -
Exempt
(Economic Prosperity)
77 82 82 81 80 79 78
Average # of days to fill
a position vacancy -
CUPE
(Economic Prosperity)
69 56 56 55 54 53 52
# of probationary
reports completed on
time
(Economic Prosperity)
79% 90% 90% 90% 90% 90% 90%
% increase in
grievances
(Inclusion)
0 0 0 0 0 0 0
# of staff with perfect
attendance
(Economic Prosperity)
546 520 525 530 535 540 545
Labour
Relations &
Total
Compensation
- 130 -
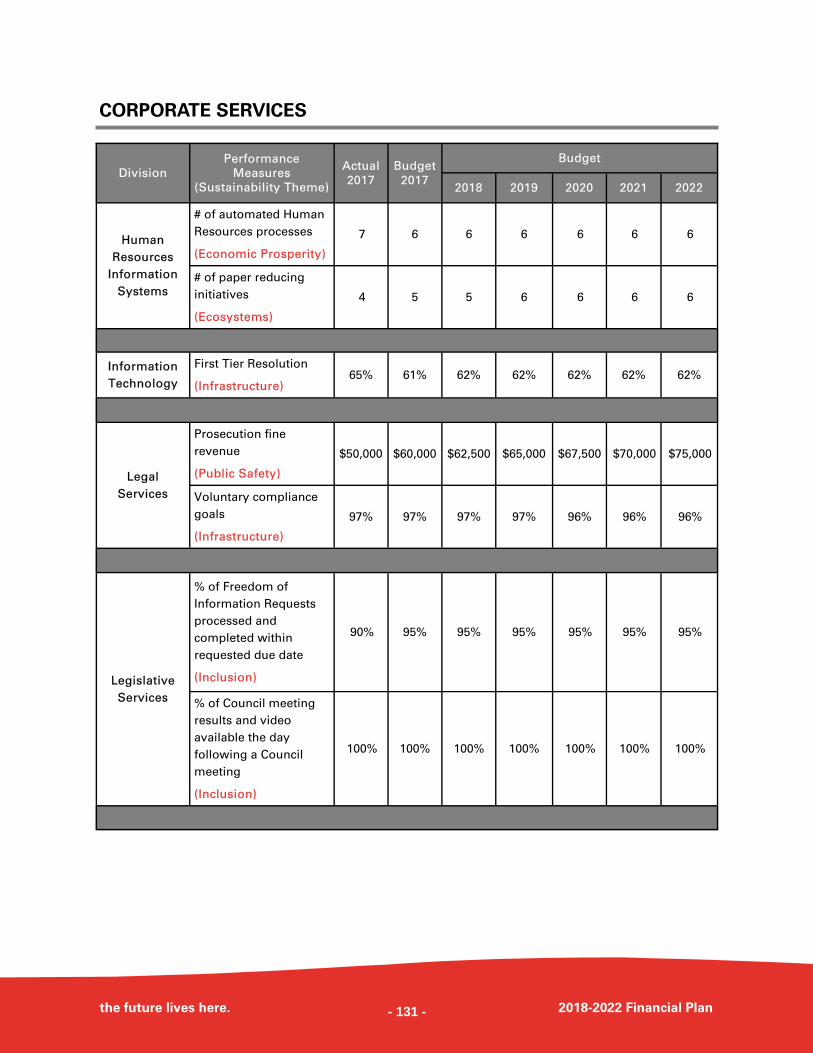
CORPORATE SERVICES
the future lives here. 2018-2022 Financial Plan
Division
Performance
Measures
(Sustainability Theme)
Actual
2017
Budget
2017
Budget
2018 2019 2020 2021 2022
Human
Resources
Information
Systems
# of automated Human
Resources processes
(Economic Prosperity)
7 6 6 6 6 6 6
# of paper reducing
initiatives
(Ecosystems)
4 5 5 6 6 6 6
Information
Technology
First Tier Resolution
(Infrastructure) 65% 61% 62% 62% 62% 62% 62%
Legal
Services
Prosecution fine
revenue
(Public Safety)
$50,000 $60,000 $62,500 $65,000 $67,500 $70,000 $75,000
Voluntary compliance
goals
(Infrastructure)
97% 97% 97% 97% 96% 96% 96%
Legislative
Services
% of Freedom of
Information Requests
processed and
completed within
requested due date
(Inclusion)
90% 95% 95% 95% 95% 95% 95%
% of Council meeting
results and video
available the day
following a Council
meeting
(Inclusion)
100% 100% 100% 100% 100% 100% 100%
- 131 -
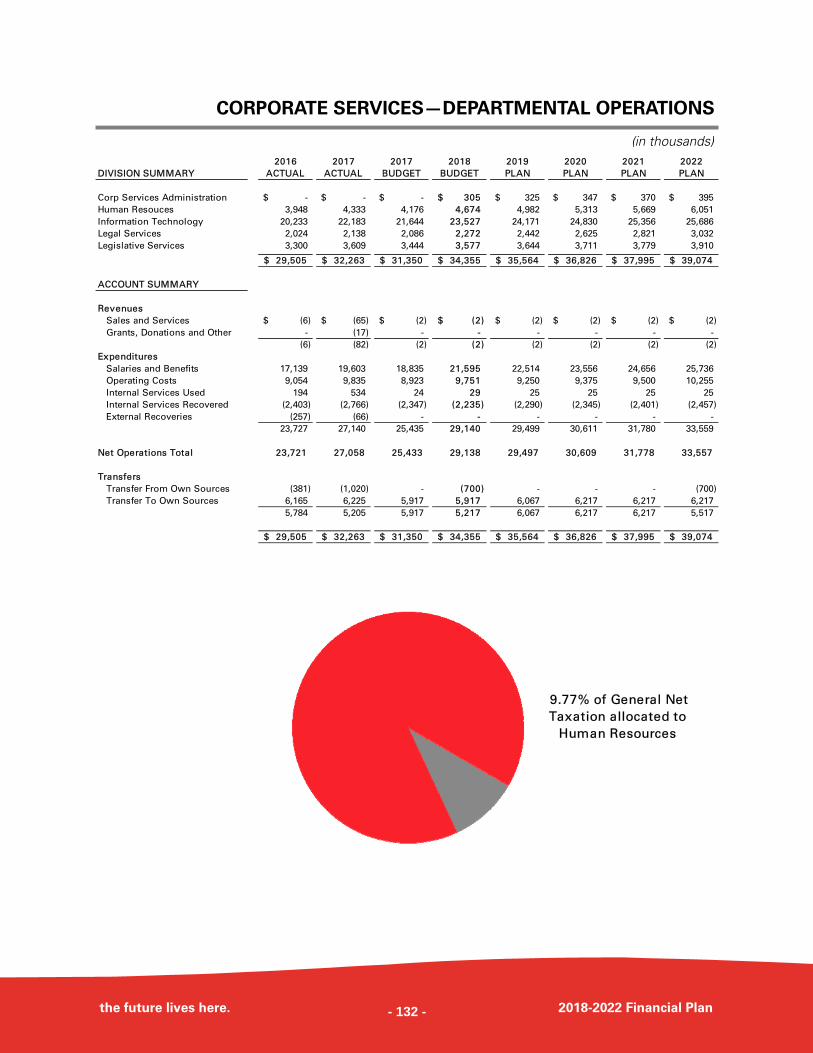
CORPORATE SERVICES—DEPARTMENTAL OPERATIONS
the future lives here. 2018-2022 Financial Plan
(in thousands) 2016 2017 2017 2018 2019 2020 2021 2022
DIVISION SUMMARY ACTUAL ACTUAL BUDGET BUDGET PLAN PLAN PLAN PLAN
Corp Services Administration -$ -$ -$ 305$ 325$ 347$ 370$ 395$
Human Resouces 3,948 4,333 4,176 4,674 4,982 5,313 5,669 6,051
Information Technology 20,233 22,183 21,644 23,527 24,171 24,830 25,356 25,686
Legal Services 2,024 2,138 2,086 2,272 2,442 2,625 2,821 3,032
Legislative Services 3,300 3,609 3,444 3,577 3,644 3,711 3,779 3,910
29,505$ 32,263$ 31,350$ 34,355$ 35,564$ 36,826$ 37,995$ 39,074$
ACCOUNT SUMMARY
Revenues
Sales and Services (6)$ (65)$ (2)$ (2)$ (2)$ (2)$ (2)$ (2)$
Grants, Donations and Other - (17) - - - - - -
(6) (82) (2) (2) (2) (2) (2) (2)
Expenditures
Salaries and Benefits 17,139 19,603 18,835 21,595 22,514 23,556 24,656 25,736
Operating Costs 9,054 9,835 8,923 9,751 9,250 9,375 9,500 10,255
Internal Services Used 194 534 24 29 25 25 25 25
Internal Services Recovered (2,403) (2,766) (2,347) (2,235) (2,290) (2,345) (2,401) (2,457)
External Recoveries (257) (66) - - - - - -
23,727 27,140 25,435 29,140 29,499 30,611 31,780 33,559
Net Operations Total 23,721 27,058 25,433 29,138 29,497 30,609 31,778 33,557
Transfers
Transfer From Own Sources (381) (1,020) - (700) - - - (700)
Transfer To Own Sources 6,165 6,225 5,917 5,917 6,067 6,217 6,217 6,217
5,784 5,205 5,917 5,217 6,067 6,217 6,217 5,517
29,505$ 32,263$ 31,350$ 34,355$ 35,564$ 36,826$ 37,995$ 39,074$
9.77% of General Net
Taxation allocated to
Human Resources
- 132 -
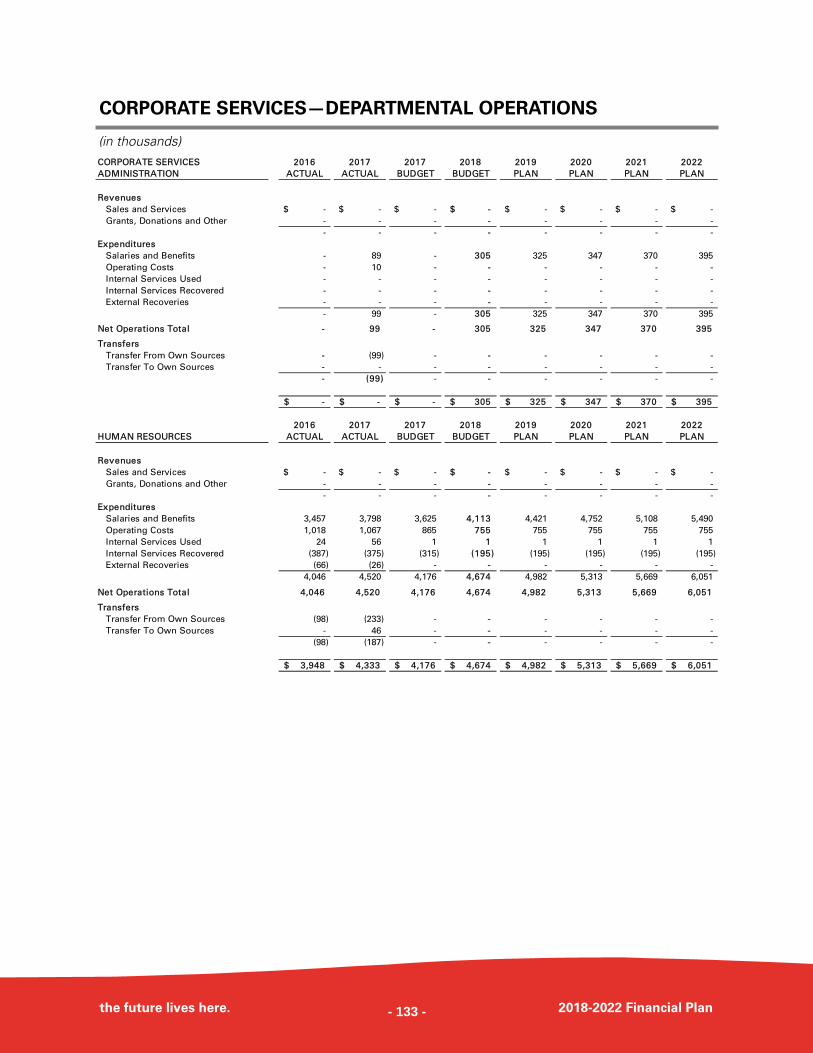
CORPORATE SERVICES—DEPARTMENTAL OPERATIONS
the future lives here. 2018-2022 Financial Plan
(in thousands) CORPORATE SERVICES 2016 2017 2017 2018 2019 2020 2021 2022
ADMINISTRATION ACTUAL ACTUAL BUDGET BUDGET PLAN PLAN PLAN PLAN
Revenues
Sales and Services -$ -$ -$ -$ -$ -$ -$ -$
Grants, Donations and Other - - - - - - - -
- - - - - - - -
Expenditures
Salaries and Benefits - 89 - 305 325 347 370 395
Operating Costs - 10 - - - - - -
Internal Services Used - - - - - - - -
Internal Services Recovered - - - - - - - -
External Recoveries - - - - - - - -
- 99 - 305 325 347 370 395
Net Operations Total - 99 - 305 325 347 370 395
Transfers
Transfer From Own Sources - (99) - - - - - -
Transfer To Own Sources - - - - - - - -
- (99) - - - - - -
-$ -$ -$ 305$ 325$ 347$ 370$ 395$
2016 2017 2017 2018 2019 2020 2021 2022
HUMAN RESOURCES ACTUAL ACTUAL BUDGET BUDGET PLAN PLAN PLAN PLAN
Revenues
Sales and Services -$ -$ -$ -$ -$ -$ -$ -$
Grants, Donations and Other - - - - - - - -
- - - - - - - -
Expenditures
Salaries and Benefits 3,457 3,798 3,625 4,113 4,421 4,752 5,108 5,490
Operating Costs 1,018 1,067 865 755 755 755 755 755
Internal Services Used 24 56 1 1 1 1 1 1
Internal Services Recovered (387) (375) (315) (195) (195) (195) (195) (195)
External Recoveries (66) (26) - - - - - -
4,046 4,520 4,176 4,674 4,982 5,313 5,669 6,051
Net Operations Total 4,046 4,520 4,176 4,674 4,982 5,313 5,669 6,051
Transfers
Transfer From Own Sources (98) (233) - - - - - -
Transfer To Own Sources - 46 - - - - - -
(98) (187) - - - - - -
3,948$ 4,333$ 4,176$ 4,674$ 4,982$ 5,313$ 5,669$ 6,051$
- 133 -
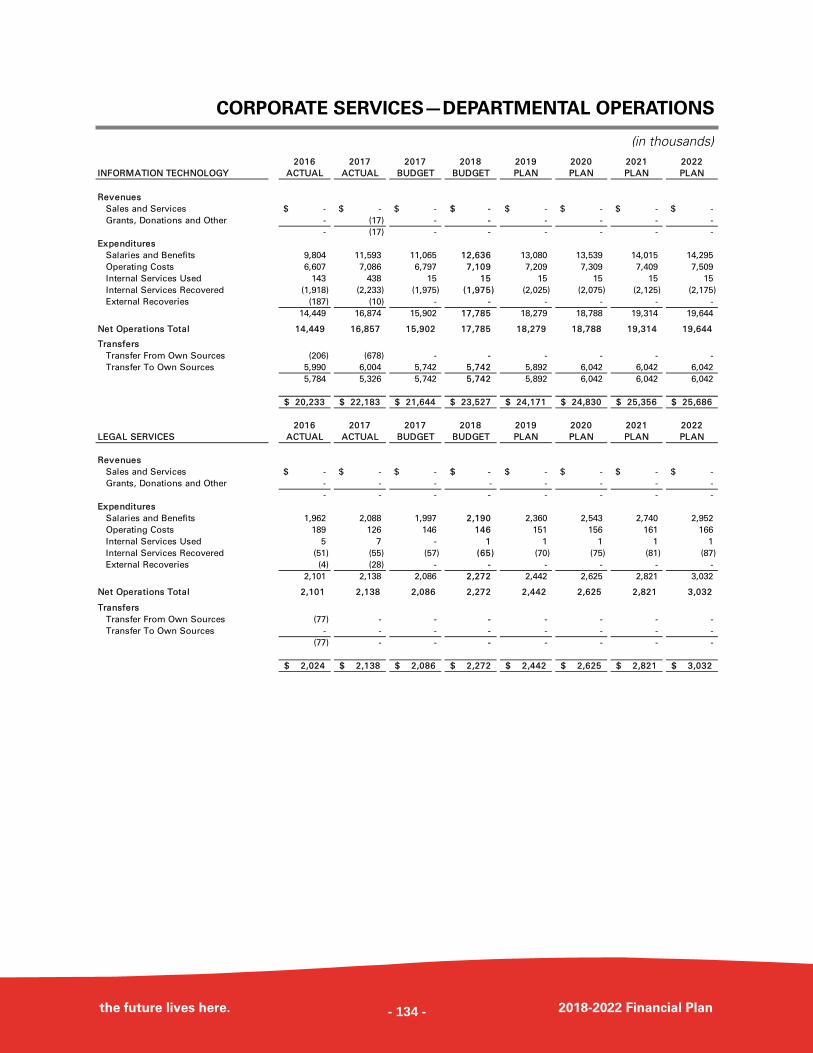
CORPORATE SERVICES—DEPARTMENTAL OPERATIONS
the future lives here. 2018-2022 Financial Plan
(in thousands) 2016 2017 2017 2018 2019 2020 2021 2022
INFORMATION TECHNOLOGY ACTUAL ACTUAL BUDGET BUDGET PLAN PLAN PLAN PLAN
Revenues
Sales and Services -$ -$ -$ -$ -$ -$ -$ -$
Grants, Donations and Other - (17) - - - - - -
- (17) - - - - - -
Expenditures
Salaries and Benefits 9,804 11,593 11,065 12,636 13,080 13,539 14,015 14,295
Operating Costs 6,607 7,086 6,797 7,109 7,209 7,309 7,409 7,509
Internal Services Used 143 438 15 15 15 15 15 15
Internal Services Recovered (1,918) (2,233) (1,975) (1,975) (2,025) (2,075) (2,125) (2,175)
External Recoveries (187) (10) - - - - - -
14,449 16,874 15,902 17,785 18,279 18,788 19,314 19,644
Net Operations Total 14,449 16,857 15,902 17,785 18,279 18,788 19,314 19,644
Transfers
Transfer From Own Sources (206) (678) - - - - - -
Transfer To Own Sources 5,990 6,004 5,742 5,742 5,892 6,042 6,042 6,042
5,784 5,326 5,742 5,742 5,892 6,042 6,042 6,042
20,233$ 22,183$ 21,644$ 23,527$ 24,171$ 24,830$ 25,356$ 25,686$
2016 2017 2017 2018 2019 2020 2021 2022
LEGAL SERVICES ACTUAL ACTUAL BUDGET BUDGET PLAN PLAN PLAN PLAN
Revenues
Sales and Services -$ -$ -$ -$ -$ -$ -$ -$
Grants, Donations and Other - - - - - - - -
- - - - - - - -
Expenditures
Salaries and Benefits 1,962 2,088 1,997 2,190 2,360 2,543 2,740 2,952
Operating Costs 189 126 146 146 151 156 161 166
Internal Services Used 5 7 - 1 1 1 1 1
Internal Services Recovered (51) (55) (57) (65) (70) (75) (81) (87)
External Recoveries (4) (28) - - - - - -
2,101 2,138 2,086 2,272 2,442 2,625 2,821 3,032
Net Operations Total 2,101 2,138 2,086 2,272 2,442 2,625 2,821 3,032
Transfers
Transfer From Own Sources (77) - - - - - - -
Transfer To Own Sources - - - - - - - -
(77) - - - - - - -
2,024$ 2,138$ 2,086$ 2,272$ 2,442$ 2,625$ 2,821$ 3,032$
- 134 -
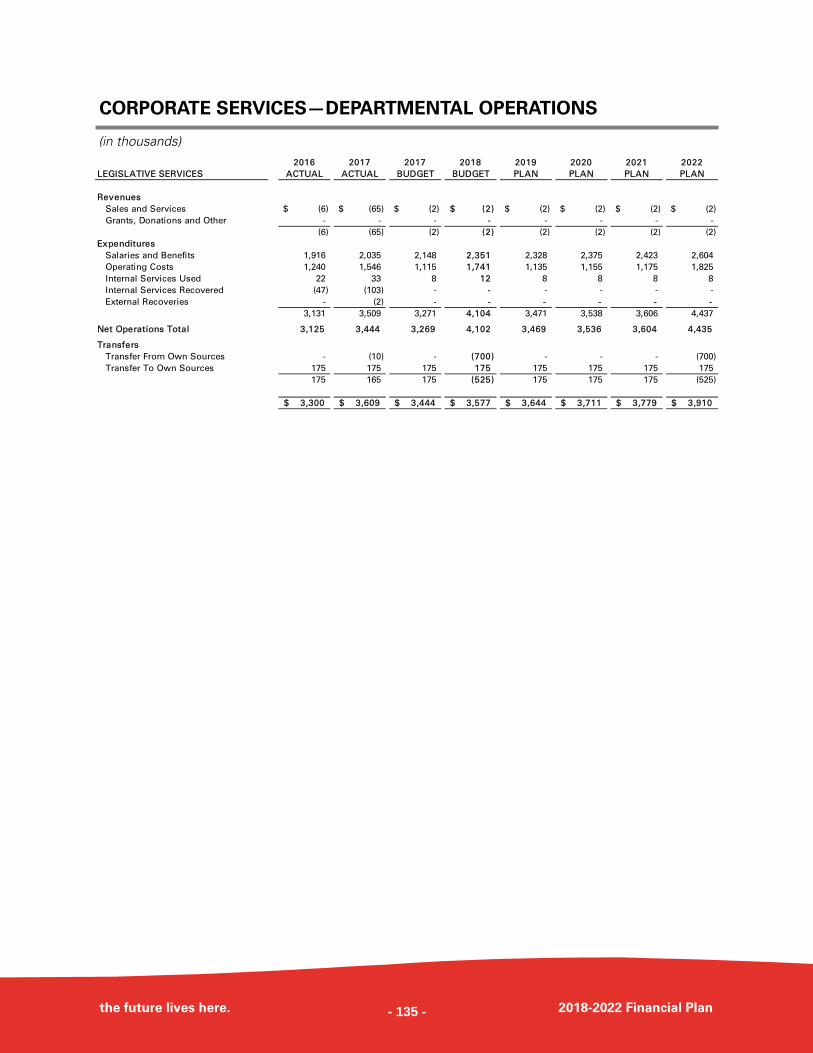
CORPORATE SERVICES—DEPARTMENTAL OPERATIONS
the future lives here. 2018-2022 Financial Plan
(in thousands) 2016 2017 2017 2018 2019 2020 2021 2022
LEGISLATIVE SERVICES ACTUAL ACTUAL BUDGET BUDGET PLAN PLAN PLAN PLAN
Revenues
Sales and Services (6)$ (65)$ (2)$ (2)$ (2)$ (2)$ (2)$ (2)$
Grants, Donations and Other - - - - - - - -
(6) (65) (2) (2) (2) (2) (2) (2)
Expenditures
Salaries and Benefits 1,916 2,035 2,148 2,351 2,328 2,375 2,423 2,604
Operating Costs 1,240 1,546 1,115 1,741 1,135 1,155 1,175 1,825
Internal Services Used 22 33 8 12 8 8 8 8
Internal Services Recovered (47) (103) - - - - - -
External Recoveries - (2) - - - - - -
3,131 3,509 3,271 4,104 3,471 3,538 3,606 4,437
Net Operations Total 3,125 3,444 3,269 4,102 3,469 3,536 3,604 4,435
Transfers
Transfer From Own Sources - (10) - (700) - - - (700)
Transfer To Own Sources 175 175 175 175 175 175 175 175
175 165 175 (525) 175 175 175 (525)
3,300$ 3,609$ 3,444$ 3,577$ 3,644$ 3,711$ 3,779$ 3,910$
- 135 -
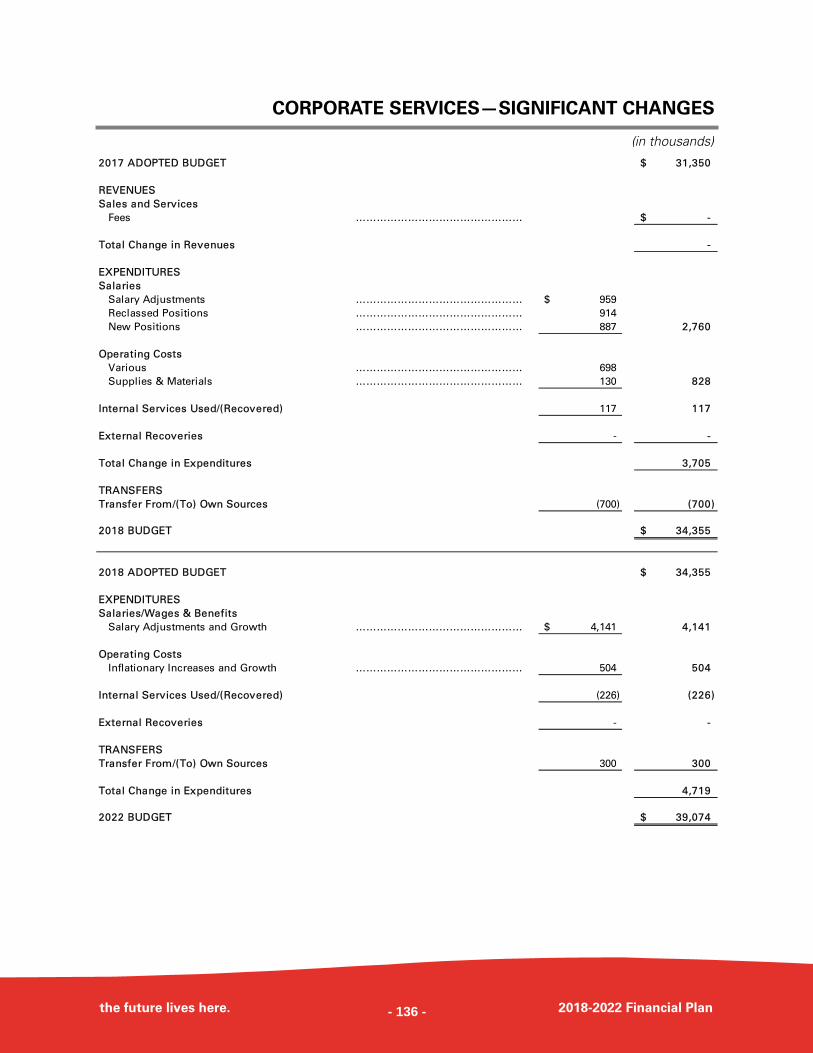
CORPORATE SERVICES—SIGNIFICANT CHANGES
the future lives here. 2018-2022 Financial Plan
(in thousands)
2017 ADOPTED BUDGET 31,350$
REVENUES
Sales and Services
Fees ………………………………………… -$
Total Change in Revenues -
EXPENDITURES
Salaries
Salary Adjustments ………………………………………… 959$
Reclassed Positions ………………………………………… 914
New Positions ………………………………………… 887 2,760
Operating Costs
Various ………………………………………… 698
Supplies & Materials ………………………………………… 130 828
Internal Services Used/(Recovered) 117 117
External Recoveries - -
Total Change in Expenditures 3,705
TRANSFERS
Transfer From/(To) Own Sources (700) (700)
2018 BUDGET 34,355$
2018 ADOPTED BUDGET 34,355$
EXPENDITURES
Salaries/Wages & Benefits
Salary Adjustments and Growth ………………………………………… 4,141$ 4,141
Operating Costs
Inflationary Increases and Growth ………………………………………… 504 504
Internal Services Used/(Recovered) (226) (226)
External Recoveries - -
TRANSFERS
Transfer From/(To) Own Sources 300 300
Total Change in Expenditures 4,719
2022 BUDGET 39,074$
- 136 -
Operations Worksyard
- 137 -
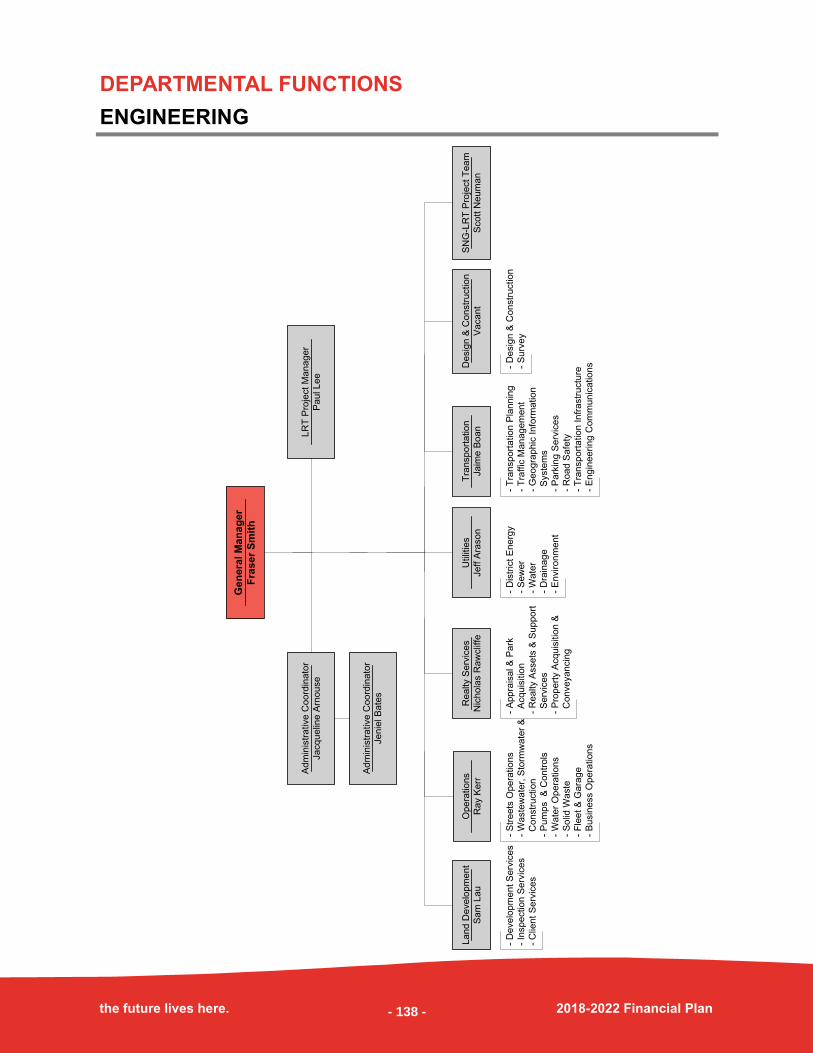
DEPARTMENTAL FUNCTIONS
ENGINEERING
the future lives here. 2018-2022 Financial Plan
- S
tre
ets
Op
era
tio
ns
- W
aste
wa
ter,
Sto
rmw
ate
r &
C
on
str
uctio
n
- P
um
ps
& C
on
tro
ls
- W
ate
r O
pe
ratio
ns
- S
olid
Wa
ste
- F
lee
t &
Ga
rag
e
- B
usin
ess O
pe
ratio
ns
- D
istr
ict
En
erg
y
- S
ew
er
- W
ate
r
- D
rain
ag
e
- E
nviro
nm
en
t
- D
eve
lop
me
nt
Se
rvic
es
- In
sp
ectio
n S
erv
ice
s
- C
lien
t S
erv
ice
s
- A
pp
rais
al &
Pa
rk
A
cq
uis
itio
n
- R
ea
lty A
sse
ts &
Su
pp
ort
S
erv
ice
s
- P
rop
ert
y A
cq
uis
itio
n &
C
on
ve
ya
ncin
g
Ge
ne
ral
Ma
na
ge
r
Fra
se
r S
mit
h
La
nd
De
ve
lop
me
nt
Sa
m L
au
Op
era
tio
ns
Ra
y K
err
Utilit
ies
Je
ff A
raso
n
Tra
nsp
ort
atio
n
Ja
ime
Bo
an
- T
ran
sp
ort
atio
n P
lan
nin
g
- T
raffic
Ma
na
ge
me
nt
- G
eo
gra
ph
ic I
nfo
rma
tio
n
S
yste
ms
- P
ark
ing
Se
rvic
es
- R
oa
d S
afe
ty
- T
ran
sp
ort
atio
n In
fra
str
uctu
re
- E
ng
ine
erin
g C
om
mu
nic
atio
ns
Re
alty S
erv
ice
s
Nic
ho
las R
aw
clif
fe
De
sig
n &
Co
nstr
uctio
n
Va
ca
nt
- D
esig
n &
Co
nstr
uctio
n
- S
urv
ey
Ad
min
istr
ative
Co
ord
ina
tor
Je
nie
l B
ate
s
Ad
min
istr
ative
Co
ord
ina
tor
Ja
cq
ue
line
Arn
ou
se
LR
T P
roje
ct M
an
ag
er
Pa
ul L
ee
SN
G-L
RT
Pro
ject T
ea
m
Sco
tt N
eu
ma
n
- 138 -
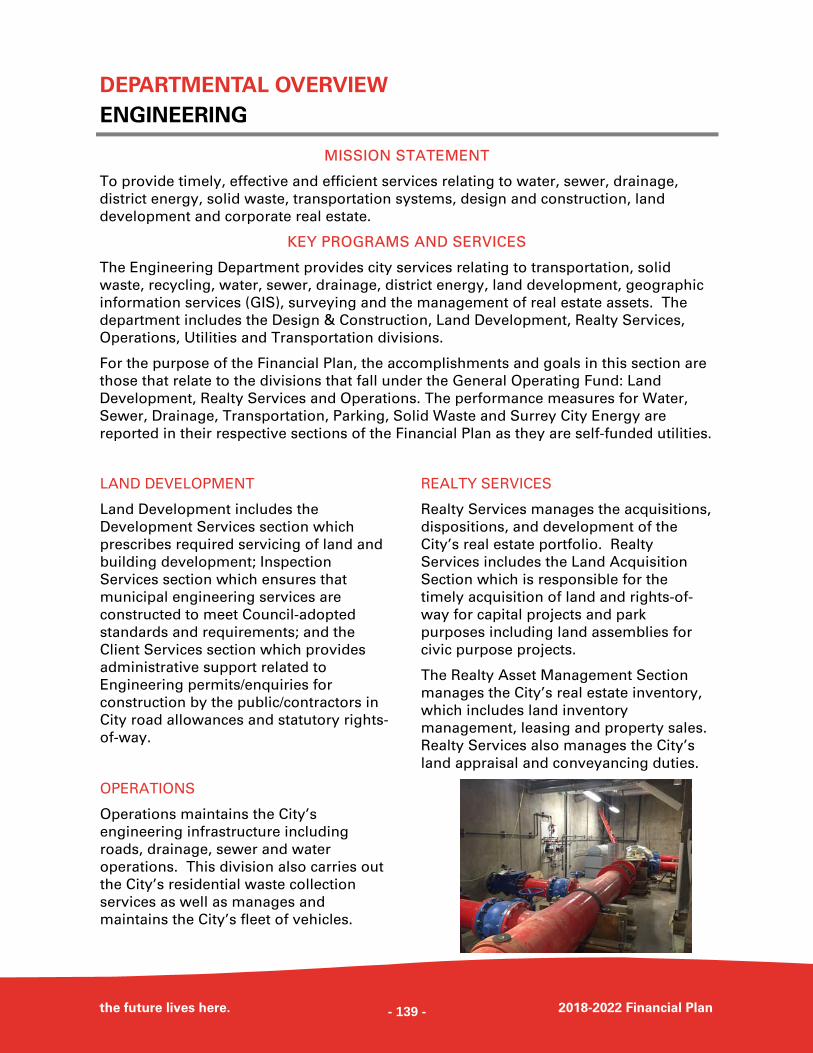
DEPARTMENTAL OVERVIEW
ENGINEERING
the future lives here. 2018-2022 Financial Plan
MISSION STATEMENT
To provide timely, effective and efficient services relating to water, sewer, drainage,
district energy, solid waste, transportation systems, design and construction, land
development and corporate real estate.
KEY PROGRAMS AND SERVICES
The Engineering Department provides city services relating to transportation, solid
waste, recycling, water, sewer, drainage, district energy, land development, geographic
information services (GIS), surveying and the management of real estate assets. The
department includes the Design & Construction, Land Development, Realty Services,
Operations, Utilities and Transportation divisions.
For the purpose of the Financial Plan, the accomplishments and goals in this section are
those that relate to the divisions that fall under the General Operating Fund: Land
Development, Realty Services and Operations. The performance measures for Water,
Sewer, Drainage, Transportation, Parking, Solid Waste and Surrey City Energy are
reported in their respective sections of the Financial Plan as they are self-funded utilities.
LAND DEVELOPMENT
Land Development includes the
Development Services section which
prescribes required servicing of land and
building development; Inspection
Services section which ensures that
municipal engineering services are
constructed to meet Council-adopted
standards and requirements; and the
Client Services section which provides
administrative support related to
Engineering permits/enquiries for
construction by the public/contractors in
City road allowances and statutory rights-
of-way.
OPERATIONS
Operations maintains the City’s
engineering infrastructure including
roads, drainage, sewer and water
operations. This division also carries out
the City’s residential waste collection
services as well as manages and
maintains the City’s fleet of vehicles.
REALTY SERVICES
Realty Services manages the acquisitions,
dispositions, and development of the
City’s real estate portfolio. Realty
Services includes the Land Acquisition
Section which is responsible for the
timely acquisition of land and rights-of-
way for capital projects and park
purposes including land assemblies for
civic purpose projects.
The Realty Asset Management Section
manages the City’s real estate inventory,
which includes land inventory
management, leasing and property sales.
Realty Services also manages the City’s
land appraisal and conveyancing duties.
- 139 -
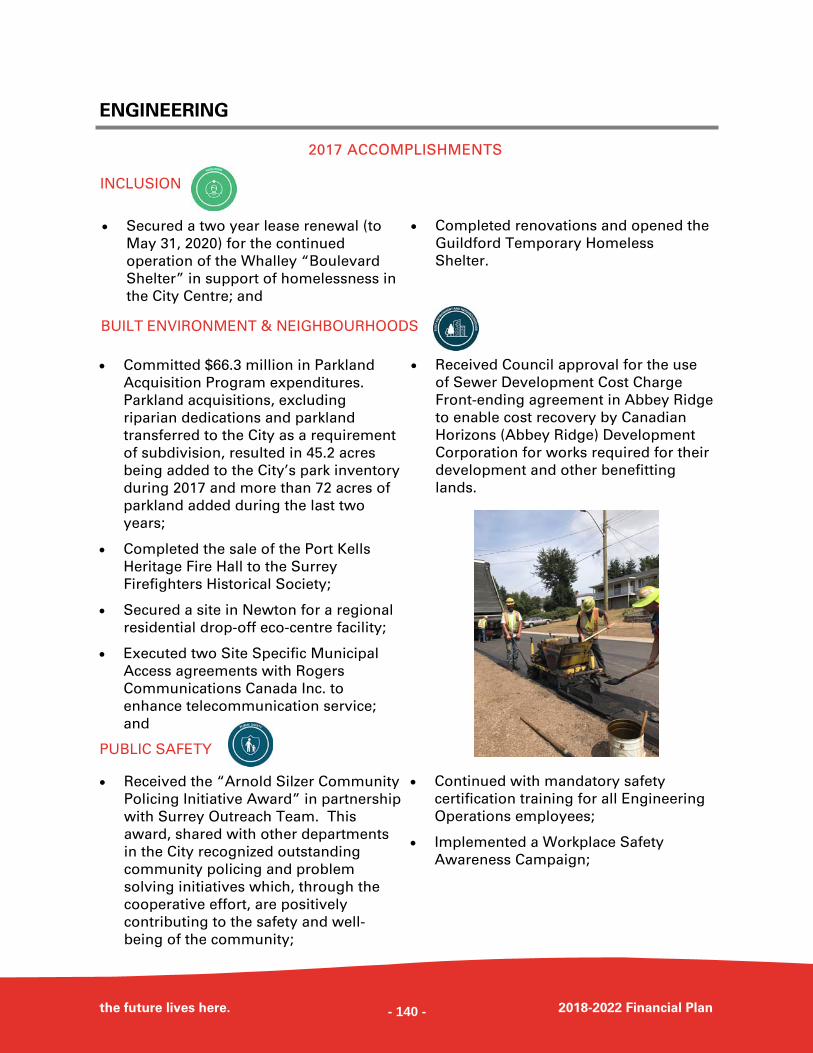
ENGINEERING
the future lives here. 2018-2022 Financial Plan
2017 ACCOMPLISHMENTS
Secured a two year lease renewal (to
May 31, 2020) for the continued
operation of the Whalley “Boulevard
Shelter” in support of homelessness in
the City Centre; and
Completed renovations and opened the
Guildford Temporary Homeless
Shelter.
Committed $66.3 million in Parkland
Acquisition Program expenditures.
Parkland acquisitions, excluding
riparian dedications and parkland
transferred to the City as a requirement
of subdivision, resulted in 45.2 acres
being added to the City’s park inventory
during 2017 and more than 72 acres of
parkland added during the last two
years;
Completed the sale of the Port Kells
Heritage Fire Hall to the Surrey
Firefighters Historical Society;
Secured a site in Newton for a regional
residential drop-off eco-centre facility;
Executed two Site Specific Municipal
Access agreements with Rogers
Communications Canada Inc. to
enhance telecommunication service;
and
Received Council approval for the use
of Sewer Development Cost Charge
Front-ending agreement in Abbey Ridge
to enable cost recovery by Canadian
Horizons (Abbey Ridge) Development
Corporation for works required for their
development and other benefitting
lands.
Received the “Arnold Silzer Community
Policing Initiative Award” in partnership
with Surrey Outreach Team. This
award, shared with other departments
in the City recognized outstanding
community policing and problem
solving initiatives which, through the
cooperative effort, are positively
contributing to the safety and well-
being of the community;
Continued with mandatory safety
certification training for all Engineering
Operations employees;
Implemented a Workplace Safety
Awareness Campaign;
INCLUSION
BUILT ENVIRONMENT & NEIGHBOURHOODS
PUBLIC SAFETY
- 140 -
ENGINEERING
the future lives here. 2018-2022 Financial Plan
Reduced illegal dumping costs by over
42% through implementing various
initiatives;
Increased annual lease and rental
revenues by more than $900,000 over
2016 levels;
Increased, through appraisal review and
negotiation, the cash-in-lieu
contribution of park dedication
payments to the City by more than $6
million over and above the original
amounts tendered as part of
development applications;
Completed 375 appraisal requests. The
Appraisal Section also provided land
valuation estimates for 311 properties
for the proposed DCC budget analysis
for the Parks program;
Registered 507 statutory rights-of-way
for the Land Development division,
including liaison with the development
community, which is on par with Land
Development statutory rights-of-way
registered during 2016;
Successfully integrated the operation of
Dogwood Campground into the City’s
Realty management portfolio;
Enhanced CityWorks counter-related
permit inspection results with
automatic notification to staff;
Expedited the following “Nexus”
projects:
SFU Sustainable Energy and
Environmental Engineering
Building (Servicing Agreement and
Building Permit issued);
Kekinow Native Housing (Servicing
Agreement issued); and
Anthem Properties in City Centre
(reviewing servicing design ahead
of 1st reading).
Piloted the use of surety bond instead
of cash or letter of credit as an alternate
form of security for Servicing
Agreements with two development
files;
Completed final templates for new
Servicing Agreement, Servicing
Agreement Extension, Short-Form
Servicing Agreement, Short-Form
Servicing Agreement Amendment,
Servicing Agreement for School
District, DCC Front-Ending Agreement
and Development Works Agreement;
and
Presented the use of Bluebeam for
Digital Plan Reviews at the 2017
Bluebeam eXtreme Conference in Los
Angeles.
ECONOMIC PROSPERITY & LIVELIHOODS
Developed draft document for a Land
Development Contractor Violation
(CRV) to gather details of an incident,
guide process to determine whether the
incident constitutes a severe or minor
violation, and determine appropriate
actions based on the severity of
violation; and
Solicited input from select contractors
on their safety procedures to establish
certified safety training program(s) for
every contractor working on City roads
or statutory rights-of-way.
- 141 -
ENGINEERING
the future lives here. 2018-2022 Financial Plan
Completed construction of the Surrey
Biofuel facility )operations will
commence December 2017);
Completed the South Surrey Operations
Centre on time and budget in
November of 2017;
Streamlined GIS update of new water
assets or assets that require correct
information with IT in order to have the
right information updated in GIS as
soon as it becomes available;
Through direct contact with residents,
we have doubled our Large Item Pick-
Up participation rates from an average
15% per year to 30%; and
Hosted four Pop Up Junk Drop events
between June and July 2017 with
approximately 1,000 tonnes of waste
and recycle materials collected and 62%
of waste diverted from landfill. In
addition, over 55 tonnes of reusable
materials were recovered by non-profit
agencies working with the City.
FUTURE INITIATIVES, GOALS & OBJECTIVES
Implement Surrey Disaster Debris
Management Plan, in alignment with
the Regional Engineer’s Advisory
Committee adopted resolution, and
integrated the Joint Municipal Regional
Disaster Debris Management
Operational Plan within our emergency
management plans; and
Reduce illegal dumping and associated
costs by 50% over the next 5 years (year
4 of 5).
INFRASTRUCTURE
BUILT ENVIRONMENT & NEIGHBOURHOODS
EDUCATION & CULTURE
Received the “Exceptional Performance
Award in Public Works Journalism” by
the American Public Works Association
in recognition of the City’s exceptional
performance in presenting a positive
image of our community and the public
works profession. This is the first time
a Canadian city has received this
prestigious award;
Received Metro Vancouver Board
approval for new utilities through
Tynehead Regional Park to support
development at 162A Street;
Received the “Award for Community
Celebration” by the Public Works
Association of BC for the City’s Public
Works Week. This award recognizes
the City’s ability to inform the public
about the essential role that public
works plays in the quality for our
community and for promoting public
works as a career choice; and
Presented on how the City of Surrey
uses the Bluebeam software in our
digital review of land development
servicing drawings at the 2017
Bluebeam eXtreme Conference in Los
Angeles.
- 142 -
ENGINEERING
the future lives here. 2018-2022 Financial Plan
Expand Road Weather Information
System (RWIS) achieve City-wide
coverage and initiate data collection to
enable predictive snow and ice road
condition forecasting. In 2018, install
up to seven new RWIS stations
throughout the several micro-climates
in the City. Use RWIS along with the
City’s Automatic Vehicle Location
application and GPS to operational
effectiveness;
Integrate CRV process and finalize
documentation for consistency and
predictability in industry; and
Develop a new City Policy that every
contractor working on City roads or
statutory rights-of-way must be
certified through a safety training
program.
Rapid Pipe Condition Assessment
Program: Utilize innovative sewer
inspection technology to rapidly assess
storm sewer pipe condition and reduce
inspection cost by 30% and improve
efficiencies with sanitary sewer
maintenance programs;
Increase Engineering Operations overall
efficiency by 25% in the next 5 years
(year 3 of 5);
Become the first city in Canada to
achieve zero waste in the next 7 years;
“Right Sizing” Engineering Operations
business unit budgets for 2019 budget
to be better aligned with previous
years’ expenditures and more accurate
projections;
Develop infrastructure layers in GIS for
primary and secondary water source
feeds to pressure zones including
knowledge sharing and transfer from
experienced staff. Future steps will
involve real time system information
through smart sensors;
Implement Surrey Disaster Debris
Management Plan to ensure there is
operational framework to manage large
volumes of debris after an emergency
event;
Roll out new Servicing Agreement,
Servicing Agreement Extension, Short-
Form Servicing Agreement, Short-Form
Servicing Agreement Amendment,
Servicing Agreement for School
District, DCC Front-Ending Agreement
and Development Works Agreement;
Publish DCC Front-Ending Agreement
and Development Works Agreement
manuals;
Continue to work with IT staff to
develop Data-Drive Decision Making
reporting tools; and
Enhance the Online Development
Inquiry webpage beyond current
development and building permit files
to allow contractors and applicants to
view the status and comments of their
counter-related permits.
PUBLIC SAFETY
ECONOMIC PROSPERITY & LIVELIHOODS
- 143 -
ENGINEERING
the future lives here. 2018-2022 Financial Plan
Improve Employee Safety: Reduce
short duration employee absenteeism
due to preventable accidents by 90% in
the next 5 years (year 3 of 5);
Strategic Workforce Planning (1 of 5
year plan): Develop strategy to build a
better workforce for the short and long
term. Apply the three stages of
workforce planning: Know your
business, know your people, and form
workforce plan; and
Employee engagement, networking and
mentoring: Developed strategy to help
employees acquire and improve skills,
knowledge and ability through
mentoring, networking, cross training
and job shadowing. Employee
engagement will also improve work
relationships, attract and retain
personnel, enhance business processes
and procedures, increase efficiency and
improve customer service.
Complete public consultation, rezoning
and commence construction of RDO /
Eco-Centre site for solid waste and
recyclables;
Continue to work in partnership with
TELUS to expeditiously process
requests to deploy the remaining Small
Cells telecommunication infrastructure
on City-owned street light poles and
Fibre-to-the-Premise within City road
allowances;
Issue updates to the Design Criteria
Manual and Supplementary Master
Municipal Construction Documents;
Develop tracking of Land Development
Inspection Services receivables that
occur during construction, e.g.,
collection of asphalt overlay, pavement
cut fees, final work order costs,
garbage/ESC clean-ups, etc.;
Establish a process to upload sewer
videos from land development projects
to COSMOS; and
Develop cross-training opportunities
within divisions and the department to
promote professional and personal
development that may offer different
future service delivery models, e.g.,
staff prepares comments, designs
servicing drawings, administers
construction contract, etc.
HEALTH & WELLNESS
INFRASTRUCTURE
ECOSYSTEMS
Roll out process to accept digital seals/
signatures on Engineering submissions;
Develop AMANDA module for P-15
agreement for habitat replacement on
City land; and
Continue working towards paperless
environment by entering data in
AMANDA and linking with CityWorks so
information is accessible by all staff.
- 144 -
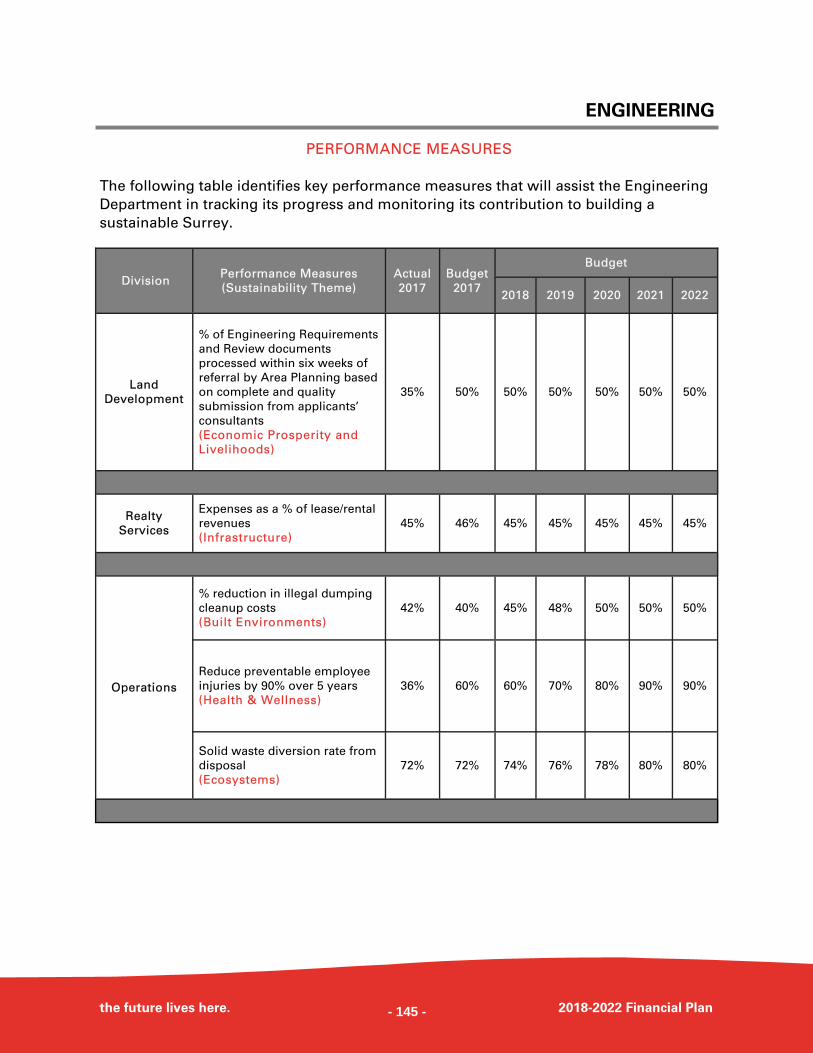
ENGINEERING
the future lives here. 2018-2022 Financial Plan
PERFORMANCE MEASURES
The following table identifies key performance measures that will assist the Engineering
Department in tracking its progress and monitoring its contribution to building a
sustainable Surrey.
Division Performance Measures
(Sustainability Theme)
Actual
2017
Budget
2017
Budget
2018 2019 2020 2021 2022
Land
Development
% of Engineering Requirements
and Review documents
processed within six weeks of
referral by Area Planning based
on complete and quality
submission from applicants’
consultants
(Economic Prosperity and
Livelihoods)
35% 50% 50% 50% 50% 50% 50%
Realty
Services
Expenses as a % of lease/rental
revenues
(Infrastructure) 45% 46% 45% 45% 45% 45% 45%
Operations
% reduction in illegal dumping
cleanup costs
(Built Environments) 42% 40% 45% 48% 50% 50% 50%
Reduce preventable employee
injuries by 90% over 5 years
(Health & Wellness) 36% 60% 60% 70% 80% 90% 90%
Solid waste diversion rate from
disposal
(Ecosystems) 72% 72% 74% 76% 78% 80% 80%
- 145 -
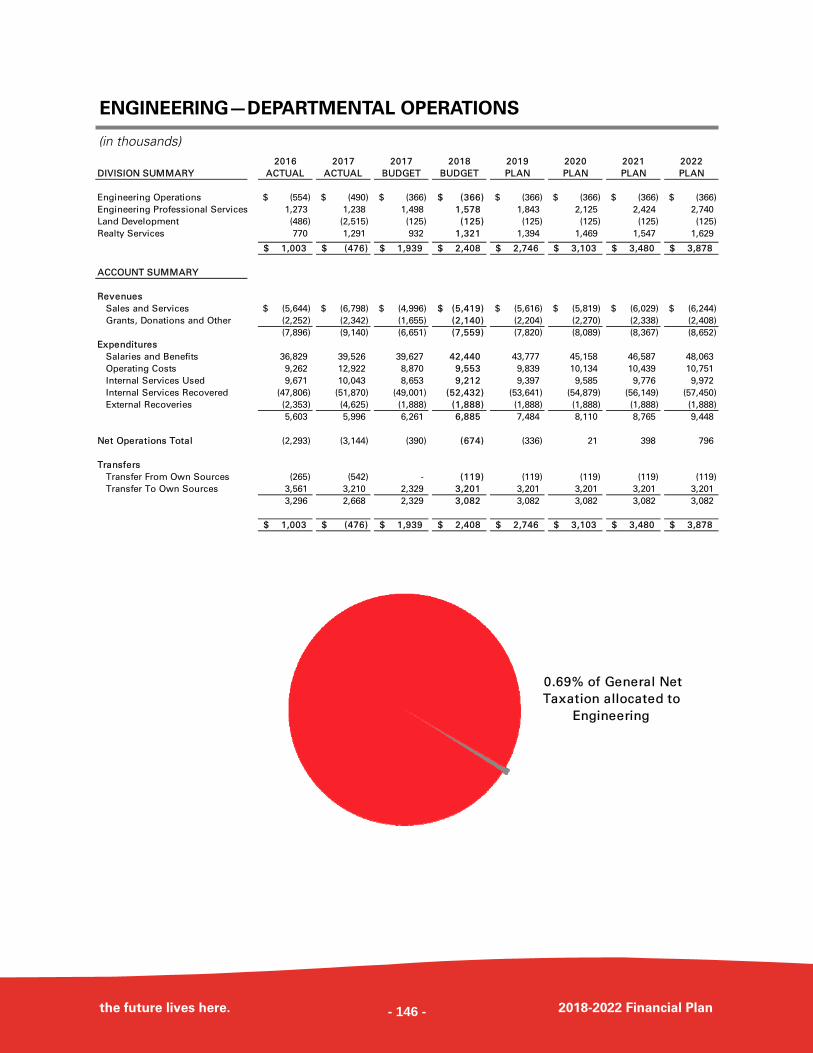
ENGINEERING—DEPARTMENTAL OPERATIONS
the future lives here. 2018-2022 Financial Plan
(in thousands) 2016 2017 2017 2018 2019 2020 2021 2022
DIVISION SUMMARY ACTUAL ACTUAL BUDGET BUDGET PLAN PLAN PLAN PLAN
Engineering Operations (554)$ (490)$ (366)$ (366)$ (366)$ (366)$ (366)$ (366)$
Engineering Professional Services 1,273 1,238 1,498 1,578 1,843 2,125 2,424 2,740
Land Development (486) (2,515) (125) (125) (125) (125) (125) (125)
Realty Services 770 1,291 932 1,321 1,394 1,469 1,547 1,629
1,003$ (476)$ 1,939$ 2,408$ 2,746$ 3,103$ 3,480$ 3,878$
ACCOUNT SUMMARY
Revenues
Sales and Services (5,644)$ (6,798)$ (4,996)$ (5,419)$ (5,616)$ (5,819)$ (6,029)$ (6,244)$
Grants, Donations and Other (2,252) (2,342) (1,655) (2,140) (2,204) (2,270) (2,338) (2,408)
(7,896) (9,140) (6,651) (7,559) (7,820) (8,089) (8,367) (8,652)
Expenditures
Salaries and Benefits 36,829 39,526 39,627 42,440 43,777 45,158 46,587 48,063
Operating Costs 9,262 12,922 8,870 9,553 9,839 10,134 10,439 10,751
Internal Services Used 9,671 10,043 8,653 9,212 9,397 9,585 9,776 9,972
Internal Services Recovered (47,806) (51,870) (49,001) (52,432) (53,641) (54,879) (56,149) (57,450)
External Recoveries (2,353) (4,625) (1,888) (1,888) (1,888) (1,888) (1,888) (1,888)
5,603 5,996 6,261 6,885 7,484 8,110 8,765 9,448
Net Operations Total (2,293) (3,144) (390) (674) (336) 21 398 796
Transfers
Transfer From Own Sources (265) (542) - (119) (119) (119) (119) (119)
Transfer To Own Sources 3,561 3,210 2,329 3,201 3,201 3,201 3,201 3,201
3,296 2,668 2,329 3,082 3,082 3,082 3,082 3,082
1,003$ (476)$ 1,939$ 2,408$ 2,746$ 3,103$ 3,480$ 3,878$
0.69% of General Net
Taxation allocated to
Engineering
- 146 -
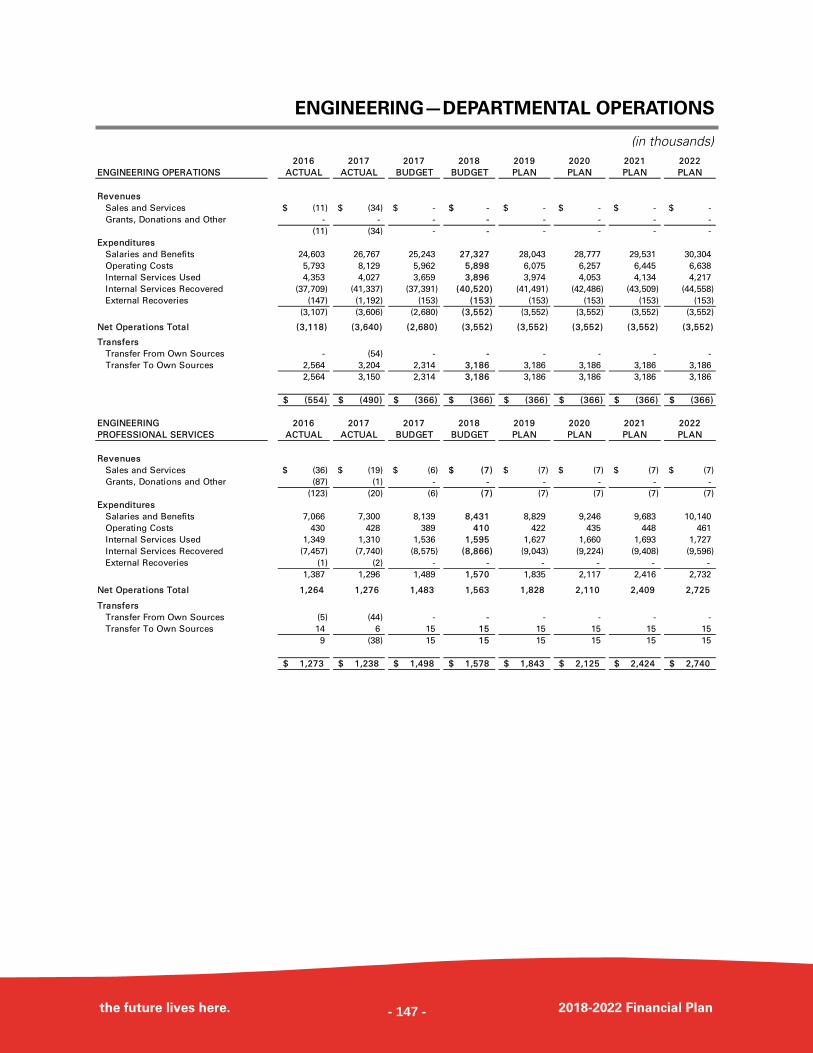
ENGINEERING—DEPARTMENTAL OPERATIONS
the future lives here. 2018-2022 Financial Plan
(in thousands) 2016 2017 2017 2018 2019 2020 2021 2022
ENGINEERING OPERATIONS ACTUAL ACTUAL BUDGET BUDGET PLAN PLAN PLAN PLAN
Revenues
Sales and Services (11)$ (34)$ -$ -$ -$ -$ -$ -$
Grants, Donations and Other - - - - - - - -
(11) (34) - - - - - -
Expenditures
Salaries and Benefits 24,603 26,767 25,243 27,327 28,043 28,777 29,531 30,304
Operating Costs 5,793 8,129 5,962 5,898 6,075 6,257 6,445 6,638
Internal Services Used 4,353 4,027 3,659 3,896 3,974 4,053 4,134 4,217
Internal Services Recovered (37,709) (41,337) (37,391) (40,520) (41,491) (42,486) (43,509) (44,558)
External Recoveries (147) (1,192) (153) (153) (153) (153) (153) (153)
(3,107) (3,606) (2,680) (3,552) (3,552) (3,552) (3,552) (3,552)
Net Operations Total (3,118) (3,640) (2,680) (3,552) (3,552) (3,552) (3,552) (3,552)
Transfers
Transfer From Own Sources - (54) - - - - - -
Transfer To Own Sources 2,564 3,204 2,314 3,186 3,186 3,186 3,186 3,186
2,564 3,150 2,314 3,186 3,186 3,186 3,186 3,186
(554)$ (490)$ (366)$ (366)$ (366)$ (366)$ (366)$ (366)$
ENGINEERING 2016 2017 2017 2018 2019 2020 2021 2022
PROFESSIONAL SERVICES ACTUAL ACTUAL BUDGET BUDGET PLAN PLAN PLAN PLAN
Revenues
Sales and Services (36)$ (19)$ (6)$ (7)$ (7)$ (7)$ (7)$ (7)$
Grants, Donations and Other (87) (1) - - - - - -
(123) (20) (6) (7) (7) (7) (7) (7)
Expenditures
Salaries and Benefits 7,066 7,300 8,139 8,431 8,829 9,246 9,683 10,140
Operating Costs 430 428 389 410 422 435 448 461
Internal Services Used 1,349 1,310 1,536 1,595 1,627 1,660 1,693 1,727
Internal Services Recovered (7,457) (7,740) (8,575) (8,866) (9,043) (9,224) (9,408) (9,596)
External Recoveries (1) (2) - - - - - -
1,387 1,296 1,489 1,570 1,835 2,117 2,416 2,732
Net Operations Total 1,264 1,276 1,483 1,563 1,828 2,110 2,409 2,725
Transfers
Transfer From Own Sources (5) (44) - - - - - -
Transfer To Own Sources 14 6 15 15 15 15 15 15
9 (38) 15 15 15 15 15 15
1,273$ 1,238$ 1,498$ 1,578$ 1,843$ 2,125$ 2,424$ 2,740$
- 147 -
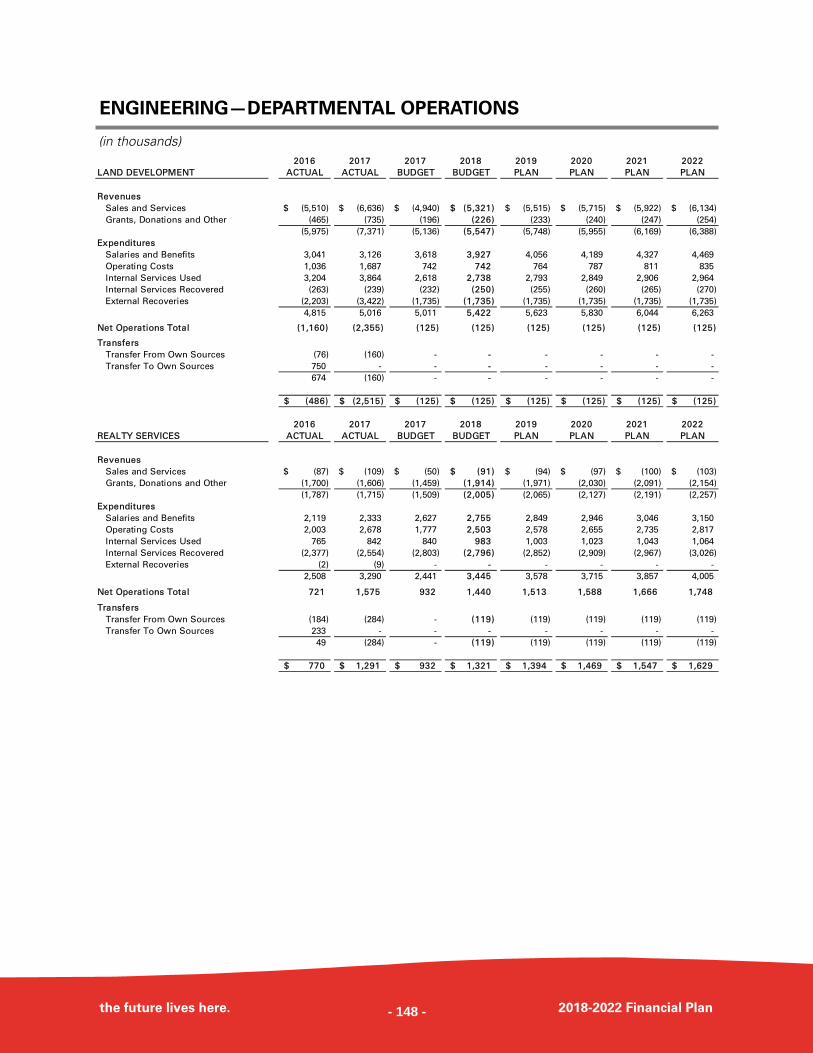
ENGINEERING—DEPARTMENTAL OPERATIONS
the future lives here. 2018-2022 Financial Plan
(in thousands) 2016 2017 2017 2018 2019 2020 2021 2022
LAND DEVELOPMENT ACTUAL ACTUAL BUDGET BUDGET PLAN PLAN PLAN PLAN
Revenues
Sales and Services (5,510)$ (6,636)$ (4,940)$ (5,321)$ (5,515)$ (5,715)$ (5,922)$ (6,134)$
Grants, Donations and Other (465) (735) (196) (226) (233) (240) (247) (254)
(5,975) (7,371) (5,136) (5,547) (5,748) (5,955) (6,169) (6,388)
Expenditures
Salaries and Benefits 3,041 3,126 3,618 3,927 4,056 4,189 4,327 4,469
Operating Costs 1,036 1,687 742 742 764 787 811 835
Internal Services Used 3,204 3,864 2,618 2,738 2,793 2,849 2,906 2,964
Internal Services Recovered (263) (239) (232) (250) (255) (260) (265) (270)
External Recoveries (2,203) (3,422) (1,735) (1,735) (1,735) (1,735) (1,735) (1,735)
4,815 5,016 5,011 5,422 5,623 5,830 6,044 6,263
Net Operations Total (1,160) (2,355) (125) (125) (125) (125) (125) (125)
Transfers
Transfer From Own Sources (76) (160) - - - - - -
Transfer To Own Sources 750 - - - - - - -
674 (160) - - - - - -
(486)$ (2,515)$ (125)$ (125)$ (125)$ (125)$ (125)$ (125)$
2016 2017 2017 2018 2019 2020 2021 2022
REALTY SERVICES ACTUAL ACTUAL BUDGET BUDGET PLAN PLAN PLAN PLAN
Revenues
Sales and Services (87)$ (109)$ (50)$ (91)$ (94)$ (97)$ (100)$ (103)$
Grants, Donations and Other (1,700) (1,606) (1,459) (1,914) (1,971) (2,030) (2,091) (2,154)
(1,787) (1,715) (1,509) (2,005) (2,065) (2,127) (2,191) (2,257)
Expenditures
Salaries and Benefits 2,119 2,333 2,627 2,755 2,849 2,946 3,046 3,150
Operating Costs 2,003 2,678 1,777 2,503 2,578 2,655 2,735 2,817
Internal Services Used 765 842 840 983 1,003 1,023 1,043 1,064
Internal Services Recovered (2,377) (2,554) (2,803) (2,796) (2,852) (2,909) (2,967) (3,026)
External Recoveries (2) (9) - - - - - -
2,508 3,290 2,441 3,445 3,578 3,715 3,857 4,005
Net Operations Total 721 1,575 932 1,440 1,513 1,588 1,666 1,748
Transfers
Transfer From Own Sources (184) (284) - (119) (119) (119) (119) (119)
Transfer To Own Sources 233 - - - - - - -
49 (284) - (119) (119) (119) (119) (119)
770$ 1,291$ 932$ 1,321$ 1,394$ 1,469$ 1,547$ 1,629$
- 148 -
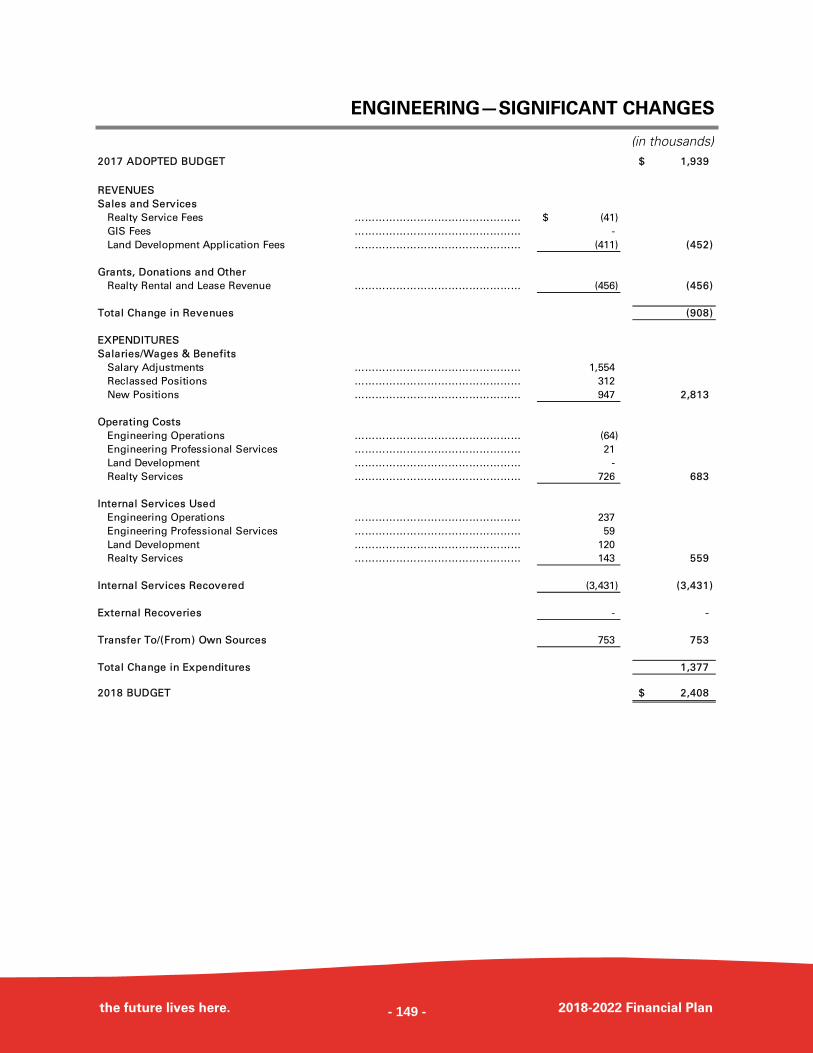
ENGINEERING—SIGNIFICANT CHANGES
the future lives here. 2018-2022 Financial Plan
(in thousands) 2017 ADOPTED BUDGET 1,939$
REVENUES
Sales and Services
Realty Service Fees ………………………………………… (41)$
GIS Fees ………………………………………… -
Land Development Application Fees ………………………………………… (411) (452)
Grants, Donations and Other
Realty Rental and Lease Revenue ………………………………………… (456) (456)
Total Change in Revenues (908)
EXPENDITURES
Salaries/Wages & Benefits
Salary Adjustments ………………………………………… 1,554
Reclassed Positions ………………………………………… 312
New Positions ………………………………………… 947 2,813
Operating Costs
Engineering Operations ………………………………………… (64)
Engineering Professional Services ………………………………………… 21
Land Development ………………………………………… -
Realty Services ………………………………………… 726 683
Internal Services Used
Engineering Operations ………………………………………… 237
Engineering Professional Services ………………………………………… 59
Land Development ………………………………………… 120
Realty Services ………………………………………… 143 559
Internal Services Recovered (3,431) (3,431)
External Recoveries - -
Transfer To/(From) Own Sources 753 753
Total Change in Expenditures 1,377
2018 BUDGET 2,408$
- 149 -
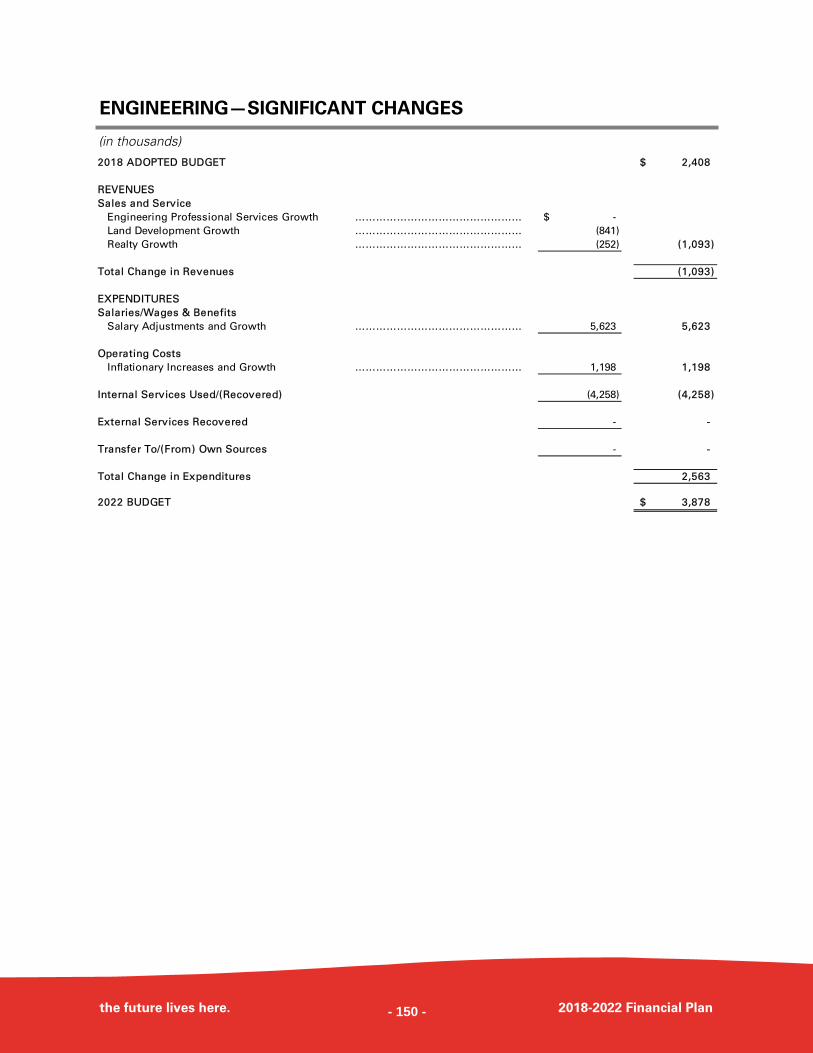
ENGINEERING—SIGNIFICANT CHANGES
the future lives here. 2018-2022 Financial Plan
(in thousands)
2018 ADOPTED BUDGET 2,408$
REVENUES
Sales and Service
Engineering Professional Services Growth ………………………………………… -$
Land Development Growth ………………………………………… (841)
Realty Growth ………………………………………… (252) (1,093)
Total Change in Revenues (1,093)
EXPENDITURES
Salaries/Wages & Benefits
Salary Adjustments and Growth ………………………………………… 5,623 5,623
Operating Costs
Inflationary Increases and Growth ………………………………………… 1,198 1,198
Internal Services Used/(Recovered) (4,258) (4,258)
External Services Recovered - -
Transfer To/(From) Own Sources - -
Total Change in Expenditures 2,563
2022 BUDGET 3,878$
- 150 -
- 151 -
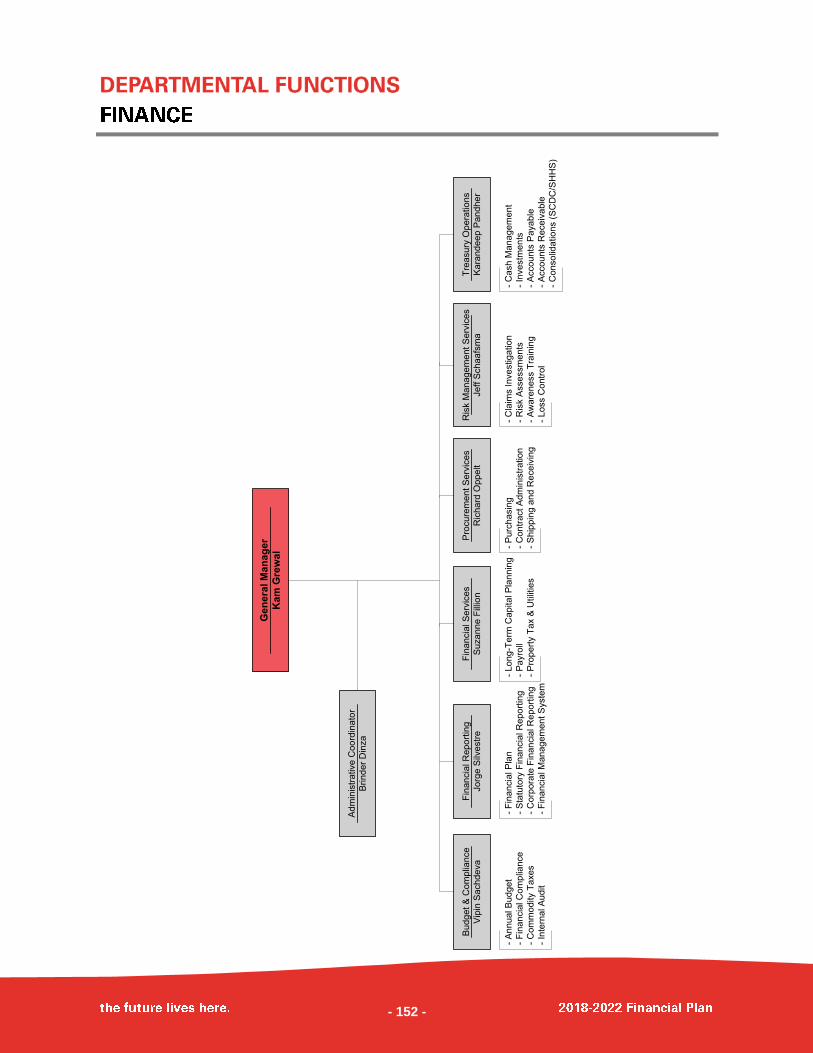
- Long-T
erm
Capital P
lannin
g
- P
ayro
ll
- P
ropert
y T
ax &
Utilit
ies
- A
nnua
l B
udget
- F
inancia
l C
om
plia
nce
- C
om
mo
dity T
axe
s
- In
tern
al A
ud
it
Gen
era
l M
an
ag
er
Ka
m G
rew
al
Budg
et &
Com
plia
nce
Vip
in S
achdeva
- F
inancia
l P
lan
- S
tatu
tory
Fin
ancia
l R
eport
ing
- C
orp
ora
te F
inancia
l R
eport
ing
- F
inancia
l M
anage
ment S
yste
m
Adm
inis
trative C
oord
inato
r
Brind
er
Din
za
Fin
ancia
l R
ep
ort
ing
Jorg
e S
ilvestr
e
Fin
ancia
l S
erv
ice
s
Suzan
ne F
illio
n
Pro
cure
ment S
erv
ices
Ric
hard
Oppelt
Ris
k M
an
agem
en
t S
erv
ices
Jeff S
ch
aafs
ma
- P
urc
hasin
g
- C
ontr
act A
dm
inis
tration
- S
hip
pin
g a
nd R
eceiv
ing
- C
laim
s Inve
stigation
- R
isk A
ssessm
en
ts
- A
ware
ne
ss T
rain
ing
- Loss C
on
trol
Tre
asury
Op
era
tion
s
Kara
nd
eep P
an
dher
- C
ash M
an
agem
en
t
- In
ve
stm
ents
- A
ccou
nts
Paya
ble
- A
ccou
nts
Receiv
able
- C
onso
lidation
s (
SC
DC
/SH
HS
)
- 152 -
DEPARTMENTAL OVERVIEW
FINANCE
the future lives here. 2018-2022 Financial Plan
MISSION STATEMENT
To provide expert advice, services and innovative solutions in the areas of Finance,
Taxation, Risk Management and Audit Services to City departments and citizens,
focusing on the City’s values to provide “An Innovative Team Serving the Community
with Integrity”.
KEY PROGRAMS AND SERVICES
The Finance Department provides financial expertise, risk management, internal audit
services, advice and guidance to support all City operations. The department provides
responsive services and innovative solutions required to streamline City processes,
facilitating gains in efficiencies.
The department leads process improvements and maintains as well as sets financial
practices, policies and standards. The Department’s core services include:
BUDGET & COMPLIANCE
This section prepares the City’s budgets
and various financial reports for the
Senior Management Team and Council to
demonstrate public accountability. The
section also monitors and analysis
expenditure and revenue trends
throughout the fiscal year and assists
other departments in achieving their
financial targets.
FINANCIAL REPORTING
Financial Reporting includes long-term
financial planning, accounting and
statutory financial reporting; responsible
for presenting an annual five-year
financial plan which establishes financial
and programming priorities. The
Financial Reporting section also keeps
management and Council informed about
the City’s financial performance on a
quarterly basis, ensuring the City meets
its annual budget and targeted savings.
FINANCIAL SERVICES
Financial Services includes payroll, long-
term capital planning and taxation. Staff
calculate, levy, and collect property taxes,
water and sewer billing and other
payments, to ensure completeness and
accuracy. Payroll ensures that all staff are
paid correctly on a bi-weekly basis. Surrey City Hall
- 153 -
FINANCE
the future lives here. 2018-2022 Financial Plan
2017 ACCOMPLISHMENTS
PROCUREMENT SERVICES
Procurement Services coordinates the
purchasing of high quality, cost-effective
goods and services, while ensuring all
polices are followed and best practices
implemented. The Procurement Services
section follows applicable legislation and
ensures appropriate public and
competitive processes are applied.
RISK MANAGEMENT SERVICES
Risk Management provides service and
expertise in risk management, insurance,
claims, litigation and loss control. By
incorporating effective Risk Management
practices, the City is able to identify,
manage and reduce the overall cost of
risk.
TREASURY OPERATIONS
Treasury Operations includes Accounts
Payable, Tangible Capital Assets,
Accounts Receivable, Investments, Letters
of Credit and Banking and Payment
processing. Staff monitor cash flow and
invest funds for maximum return while
minimizing risk and adhering to the City’s
Investment Policy. They ensure that
supplier invoices are paid in a timely
manner and also oversee billing and
prompt collection of receivables. This
group is responsible for the City’s
relationship with its financial institution
and credit/debit card payment processor
and also assists City departments in
obtaining securities by way of Letters of
Credit. Treasury Operations oversees the
recording and financial reporting for the
City’s vast inventory of capital assets and
is responsible for consolidation
INCLUSION
Provided superior customer service and expert advice to internal and external
customers along with assistance and financial advice to Surrey associations and non-
profit organizations.
BUILT ENVIRONMENT & NEIGHBOURHOODS
Offered budgeting process training
sessions to new and existing
managers;
Improved utility billing process by
creating new reports to capture
updated client information;
Provided leadership to the Request for
Proposal process that led to the
appointment of the external auditors;
and
Provided recommendations to
improve the City’s contract
management process.
- 154 -
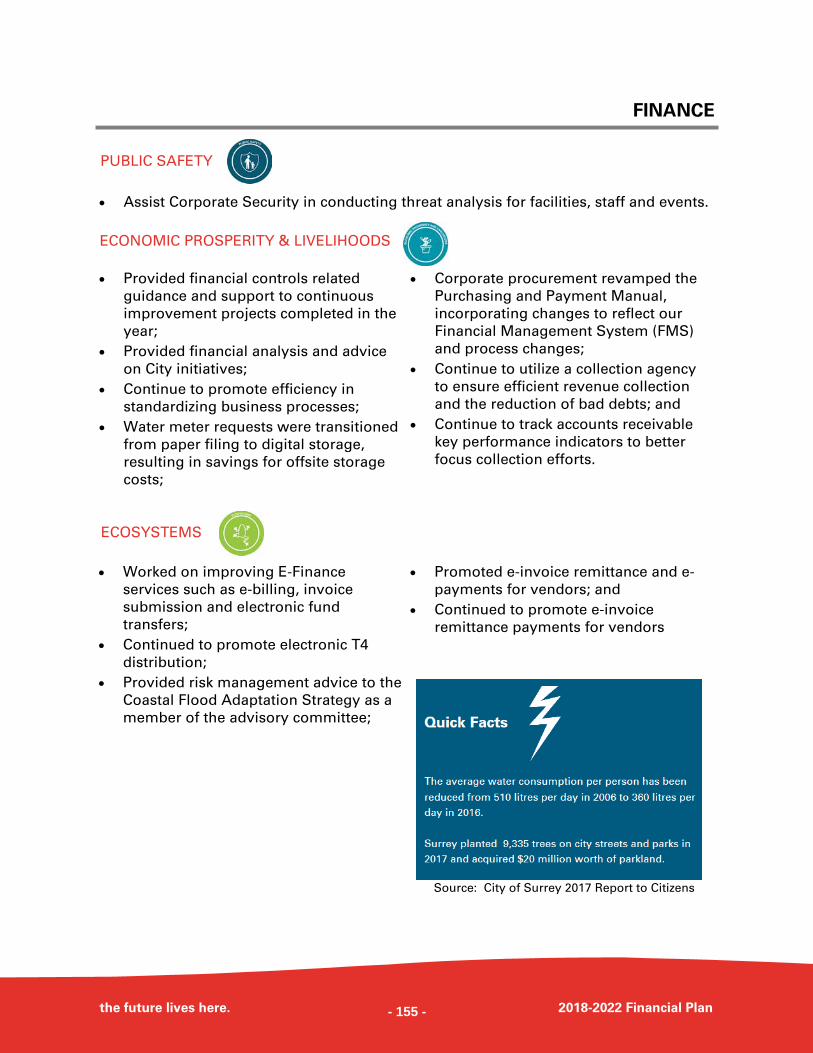
FINANCE
the future lives here. 2018-2022 Financial Plan
Assist Corporate Security in conducting threat analysis for facilities, staff and events.
PUBLIC SAFETY
ECONOMIC PROSPERITY & LIVELIHOODS
Provided financial controls related
guidance and support to continuous
improvement projects completed in the
year;
Provided financial analysis and advice
on City initiatives;
Continue to promote efficiency in
standardizing business processes;
Water meter requests were transitioned
from paper filing to digital storage,
resulting in savings for offsite storage
costs;
Corporate procurement revamped the
Purchasing and Payment Manual,
incorporating changes to reflect our
Financial Management System (FMS)
and process changes;
Continue to utilize a collection agency
to ensure efficient revenue collection
and the reduction of bad debts; and
Continue to track accounts receivable
key performance indicators to better
focus collection efforts.
Source: City of Surrey 2017 Report to Citizens
ECOSYSTEMS
Worked on improving E-Finance
services such as e-billing, invoice
submission and electronic fund
transfers;
Continued to promote electronic T4
distribution;
Provided risk management advice to the
Coastal Flood Adaptation Strategy as a
member of the advisory committee;
Promoted e-invoice remittance and e-
payments for vendors; and
Continued to promote e-invoice
remittance payments for vendors
- 155 -
FINANCE
the future lives here. 2018-2022 Financial Plan
Provided financial analysis and advice
on City initiatives.
HEALTH & WELLNESS
EDUCATION & CULTURE
Continued training key staff on the
financial system offering various
sessions throughout the year, focusing
on different areas of the system;
Updated the Integrated Risk
Management Framework and Risk
Management Policy linking the risk
management strategy to corporate
goals;
Provided corporate training sessions on
best practices related to purchasing
cards (P-Cards) documentation process;
and
Updated the City’s P-Card policy to
provide clarity on usage of cards by City
staff.
INFRASTRUCTURE
Launched a revised and revamped
Purchasing and Payment Manual;
Completed a review of the Contract
Module in our Financial System to
facilitate improved efficiencies and
reporting; and
Ensured that all financial transactions
and reporting met appropriate statutory
requirements.
CORPORATE SUSTAINABILITY
Received the Canadian Award for
Financial Reporting for the 2016 Annual
Report;
Received the Distinguished Budget
Presentation Award for the 2017-2021
Financial Plan;
Received the Popular Annual Financial
Reporting Award for the 2016 Annual
Report Highlights;
Continued to develop the Financial
System, upgrading the processes,
adding increased functionality and
continuing with overall process
efficiencies;
Continued to manage and improve our
total cost of risk;
Improved risk identification and
treatment options and processes;
Simplified, clarified and streamlined the
procurement process at the City of
Surrey; and
Completed evaluation to ensure that all
controls and processes in place are
appropriately calculating and applying
taxes, levies and charges correctly.
Source: City of Surrey 2017 Report to Citizens
- 156 -
FINANCE
the future lives here. 2018-2022 Financial Plan
FUTURE INITIATIVES, GOALS & OBJECTIVES
Implement Online Payments for
Accounts Receivable invoices;
Prepare and post a Request for Proposal
(RFP) for Banking Services;
Perform research and stakeholder
engagement to prepare for a credit and
debit card payment processing Request
for Proposal;
Maximize return on investment
portfolio while adhering to all
governing policies and legislation;
Broaden operating revenue sources to
provide for growth–related needs; and
Assist other departments in obtaining
government grants.
ECONOMIC PROSPERITY & LIVELIHOODS
BUILT ENVIRONMENT & NEIGHBOURHOODS
Continue to explore online payment
capabilities to allow residents to pay for
regular billings; and
Encourage vendors to submit invoices
and make bid submissions via email in
order to minimize paper usage.
ECOSYSTEMS
Continue to promote auto debit as a
payment method for metered utility
clients and explore other electronic
payment options;
Continue to reduce departmental
energy consumption and waste;
Continue to promote financial E-
Services such as e-billing, invoice
submission and electronic fund
transfers;
Encourage staff to make a sustainable
process improvement each year;
Implement a paperless claim system;
Implement an electronic content
management system;
Streamline and eliminate manual
forms;
Continue to reduce the number of
hardcopies printed for various financial
documents, including the Annual
Financial Plan and Financial
Statements;
Include an appropriate sustainability
criteria into our solicitations to facilitate
and promote corporate sustainability
with our external stakeholders;
Continue to educate staff about
environmental issues; and
Continue to encourage vendors to
submit invoices and make bid
submissions electronically in order to
minimize paper usage.
- 157 -
FINANCE
the future lives here. 2018-2022 Financial Plan
Maintain sound purchasing practices
and continue training on the Purchasing
and Process Manual;
Develop an analysis tool that measures
“triple bottom line” accountability;
Continue to manage debt;
Implement Data Driven Decision Making
(D3M) Program which will include
assessing and implementing enhanced
reporting, dash boarding and analytical
abilities to assist business areas in
meeting City objectives;
Review select financial streams to
assess controls and provide
recommendations for improvement;
Perform annual review of current
policies;
Continue with releasing the Annual
Corporate Audit Plan;
Ensure sufficient reserves for
equipment replacement costs; and
Provide continuous departmental
Procurement Awareness Training.
INFRASTRUCTURE
EDUCATION & CULTURE
Improve accuracy and consistency of
departmental information;
Promote education to the public
regarding water meters;
Ensure staff cross training is in place for
critical roles in business units;
Develop video based training material
that is repeatable;
Facilitate staff professional
development and training;
Continue to provide training and
support to City staff on finance related
policies and procedures; and
Attend department managers’ meetings
in various departments to discuss any
finance or internal audit related matter.
CORPORATE SUSTAINABILITY
Maximize return on investment
portfolio while adhering to all
governing policies and legislation;
Prepare and publish financial
statements garnering an unqualified
audit opinion and address all audit
findings;
Conduct special audits as directed by
the Senior Management Team, Audit
Committee and City Manager;
Provide expert internal audit services to
other municipalities;
Take proactive measures to ensure City
systems have accurate and complete
financial information; and
Assess and implement enhanced
reporting, dash boarding and analytical
abilities to enable modernized data
driven decision capabilities to assist
business areas in meeting City
objectives.
- 158 -
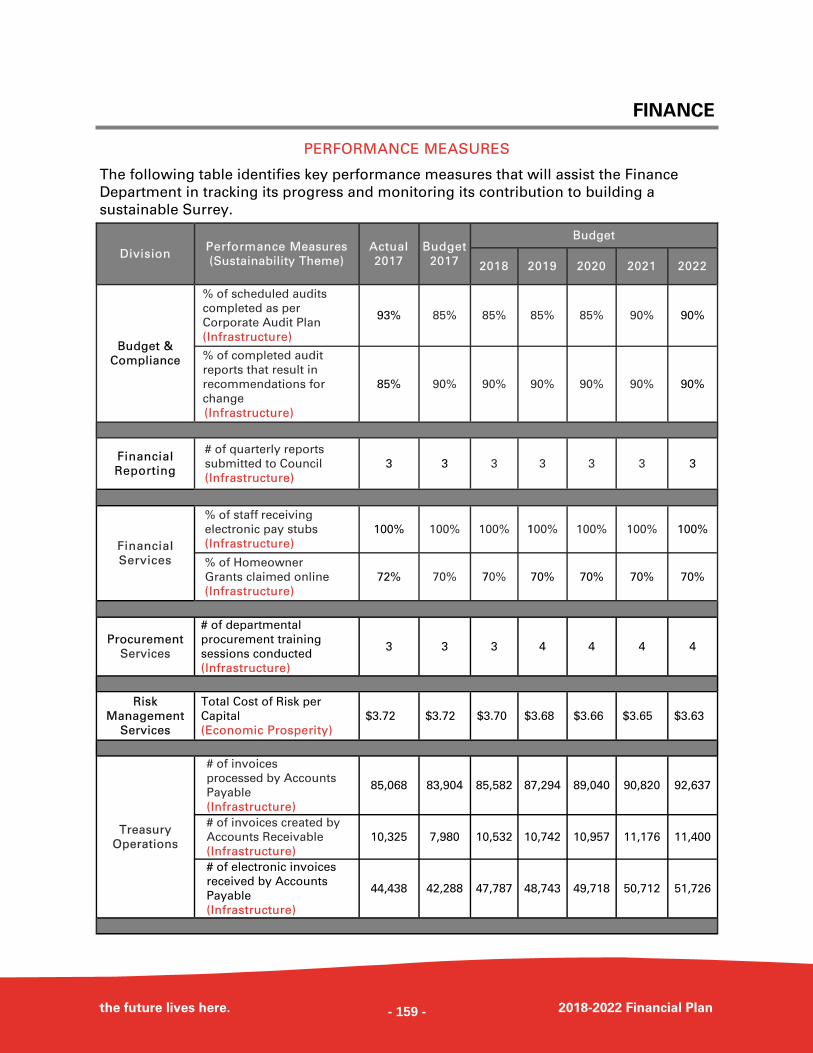
FINANCE
the future lives here. 2018-2022 Financial Plan
PERFORMANCE MEASURES
The following table identifies key performance measures that will assist the Finance
Department in tracking its progress and monitoring its contribution to building a
sustainable Surrey.
Division Performance Measures
(Sustainability Theme)
Actual
2017
Budget
2017
Budget
2018 2019 2020 2021 2022
Budget &
Compliance
% of scheduled audits
completed as per
Corporate Audit Plan
(Infrastructure)
93% 85% 85% 85% 85% 90% 90%
% of completed audit
reports that result in
recommendations for
change
(Infrastructure)
85% 90% 90% 90% 90% 90% 90%
Financial
Reporting
# of quarterly reports
submitted to Council
(Infrastructure)
3 3 3 3 3 3 3
Financial
Services
% of staff receiving
electronic pay stubs
(Infrastructure)
100% 100% 100% 100% 100% 100% 100%
% of Homeowner
Grants claimed online
(Infrastructure)
72% 70% 70% 70% 70% 70% 70%
Procurement
Services
# of departmental
procurement training
sessions conducted
(Infrastructure)
3 3 3 4 4 4 4
Risk
Management
Services
Total Cost of Risk per
Capital
(Economic Prosperity)
$3.72 $3.72 $3.70 $3.68 $3.66 $3.65 $3.63
Treasury
Operations
# of invoices
processed by Accounts
Payable
(Infrastructure)
85,068 83,904 85,582 87,294 89,040 90,820 92,637
# of invoices created by
Accounts Receivable
(Infrastructure)
10,325 7,980 10,532 10,742 10,957 11,176 11,400
# of electronic invoices
received by Accounts
Payable
(Infrastructure)
44,438 42,288 47,787 48,743 49,718 50,712 51,726
- 159 -

FINANCE—DEPARTMENTAL OPERATIONS
the future lives here. 2018-2022 Financial Plan
(in thousands) 2016 2017 2017 2018 2019 2020 2021 2022
DIVISION SUMMARY ACTUAL ACTUAL BUDGET BUDGET PLAN PLAN PLAN PLAN
Administration 1,774$ 1,582$ 2,078$ 1,689$ 1,776$ 1,869$ 1,968$ 1,998$
Financial Reporting 1,609 1,424 1,461 1,588 1,646 1,706 1,768 1,806
Financial Services 3,314 3,454 3,699 3,791 3,916 4,045 4,177 4,254
Compliance & Risk Mgmt 1,941 2,065 2,051 2,138 2,343 2,552 2,765 2,934
8,638$ 8,525$ 9,289$ 9,206$ 9,681$ 10,172$ 10,678$ 10,992$
ACCOUNT SUMMARY
Revenues
Sales and Services (1,369)$ (1,306)$ (1,245)$ (1,294)$ (1,330)$ (1,367)$ (1,406)$ (1,446)$
Grants, Donations and Other (93) (96) (96) (98) (98) (98) (98) (98)
(1,462) (1,402) (1,341) (1,392) (1,428) (1,465) (1,504) (1,544)
Expenditures
Salaries and Benefits 8,315 8,162 9,044 8,977 9,335 9,710 10,102 10,303
Operating Costs 5,135 3,988 5,331 5,366 5,531 5,696 5,861 6,026
Internal Services Used 363 129 146 146 146 146 146 146
Internal Services Recovered (1,074) (1,409) (1,506) (1,506) (1,518) (1,530) (1,542) (1,554)
External Recoveries (387) (4) (243) (243) (243) (243) (243) (243)
12,352 10,866 12,772 12,740 13,251 13,779 14,324 14,678
Net Operations Total 10,890 9,464 11,431 11,348 11,823 12,314 12,820 13,134
Transfers
Transfer From Own Sources (2,701) (1,506) (2,142) (2,142) (2,142) (2,142) (2,142) (2,142)
Transfer To Own Sources 449 567 - - - - - -
(2,252) (939) (2,142) (2,142) (2,142) (2,142) (2,142) (2,142)
8,638$ 8,525$ 9,289$ 9,206$ 9,681$ 10,172$ 10,678$ 10,992$
2.62% of General Net
Taxation allocated to
Finance
- 160 -
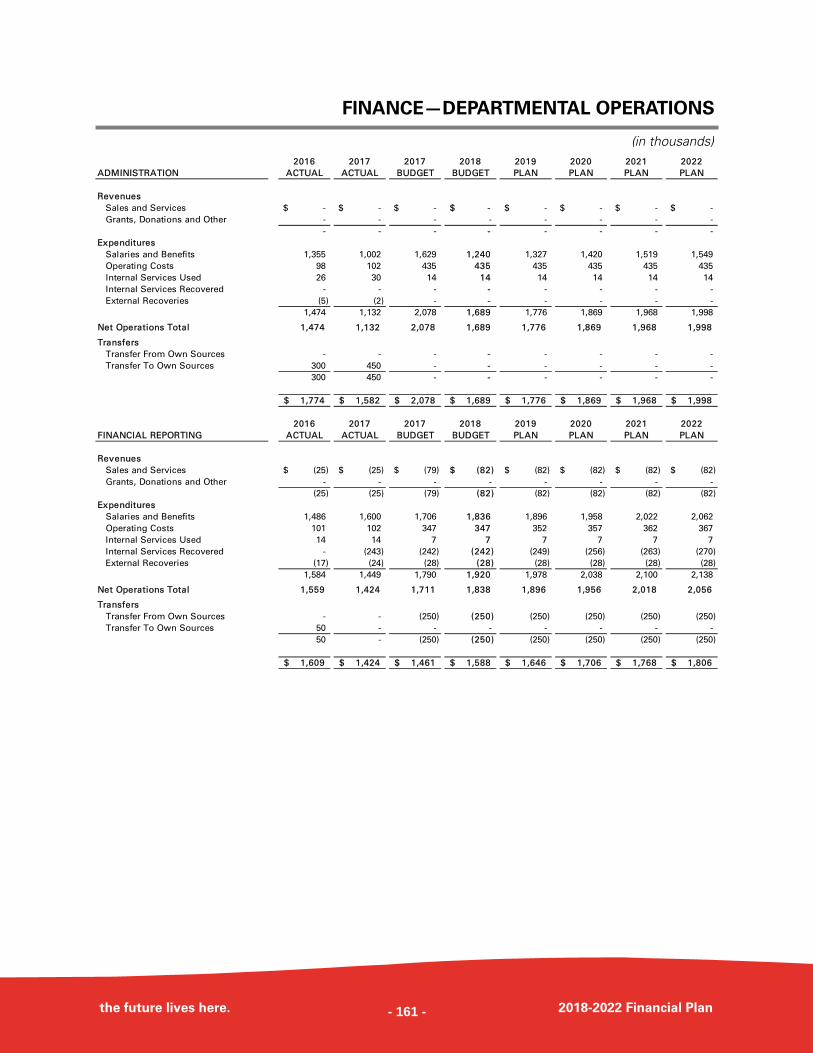
FINANCE—DEPARTMENTAL OPERATIONS
the future lives here. 2018-2022 Financial Plan
(in thousands) 2016 2017 2017 2018 2019 2020 2021 2022
ADMINISTRATION ACTUAL ACTUAL BUDGET BUDGET PLAN PLAN PLAN PLAN
Revenues
Sales and Services -$ -$ -$ -$ -$ -$ -$ -$
Grants, Donations and Other - - - - - - - -
- - - - - - - -
Expenditures
Salaries and Benefits 1,355 1,002 1,629 1,240 1,327 1,420 1,519 1,549
Operating Costs 98 102 435 435 435 435 435 435
Internal Services Used 26 30 14 14 14 14 14 14
Internal Services Recovered - - - - - - - -
External Recoveries (5) (2) - - - - - -
1,474 1,132 2,078 1,689 1,776 1,869 1,968 1,998
Net Operations Total 1,474 1,132 2,078 1,689 1,776 1,869 1,968 1,998
Transfers
Transfer From Own Sources - - - - - - - -
Transfer To Own Sources 300 450 - - - - - -
300 450 - - - - - -
1,774$ 1,582$ 2,078$ 1,689$ 1,776$ 1,869$ 1,968$ 1,998$
2016 2017 2017 2018 2019 2020 2021 2022
FINANCIAL REPORTING ACTUAL ACTUAL BUDGET BUDGET PLAN PLAN PLAN PLAN
Revenues
Sales and Services (25)$ (25)$ (79)$ (82)$ (82)$ (82)$ (82)$ (82)$
Grants, Donations and Other - - - - - - - -
(25) (25) (79) (82) (82) (82) (82) (82)
Expenditures
Salaries and Benefits 1,486 1,600 1,706 1,836 1,896 1,958 2,022 2,062
Operating Costs 101 102 347 347 352 357 362 367
Internal Services Used 14 14 7 7 7 7 7 7
Internal Services Recovered - (243) (242) (242) (249) (256) (263) (270)
External Recoveries (17) (24) (28) (28) (28) (28) (28) (28)
1,584 1,449 1,790 1,920 1,978 2,038 2,100 2,138
Net Operations Total 1,559 1,424 1,711 1,838 1,896 1,956 2,018 2,056
Transfers
Transfer From Own Sources - - (250) (250) (250) (250) (250) (250)
Transfer To Own Sources 50 - - - - - - -
50 - (250) (250) (250) (250) (250) (250)
1,609$ 1,424$ 1,461$ 1,588$ 1,646$ 1,706$ 1,768$ 1,806$
- 161 -
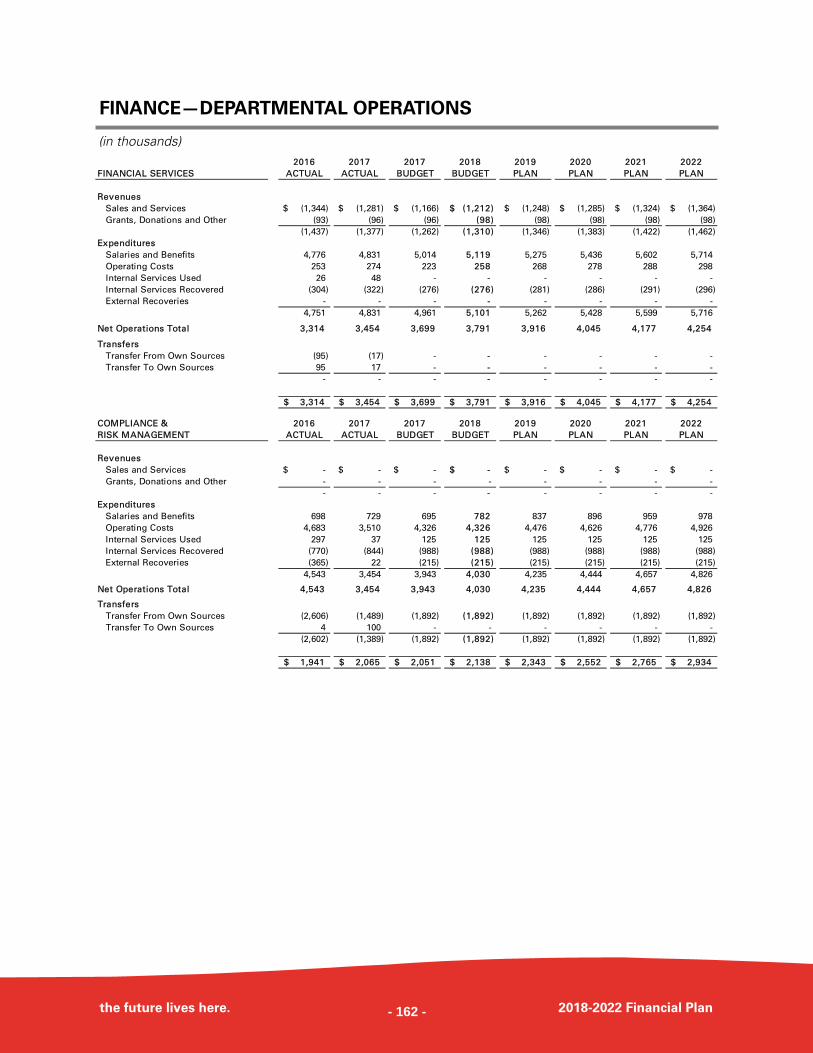
FINANCE—DEPARTMENTAL OPERATIONS
the future lives here. 2018-2022 Financial Plan
(in thousands) 2016 2017 2017 2018 2019 2020 2021 2022
FINANCIAL SERVICES ACTUAL ACTUAL BUDGET BUDGET PLAN PLAN PLAN PLAN
Revenues
Sales and Services (1,344)$ (1,281)$ (1,166)$ (1,212)$ (1,248)$ (1,285)$ (1,324)$ (1,364)$
Grants, Donations and Other (93) (96) (96) (98) (98) (98) (98) (98)
(1,437) (1,377) (1,262) (1,310) (1,346) (1,383) (1,422) (1,462)
Expenditures
Salaries and Benefits 4,776 4,831 5,014 5,119 5,275 5,436 5,602 5,714
Operating Costs 253 274 223 258 268 278 288 298
Internal Services Used 26 48 - - - - - -
Internal Services Recovered (304) (322) (276) (276) (281) (286) (291) (296)
External Recoveries - - - - - - - -
4,751 4,831 4,961 5,101 5,262 5,428 5,599 5,716
Net Operations Total 3,314 3,454 3,699 3,791 3,916 4,045 4,177 4,254
Transfers
Transfer From Own Sources (95) (17) - - - - - -
Transfer To Own Sources 95 17 - - - - - -
- - - - - - - -
3,314$ 3,454$ 3,699$ 3,791$ 3,916$ 4,045$ 4,177$ 4,254$
COMPLIANCE & 2016 2017 2017 2018 2019 2020 2021 2022
RISK MANAGEMENT ACTUAL ACTUAL BUDGET BUDGET PLAN PLAN PLAN PLAN
Revenues
Sales and Services -$ -$ -$ -$ -$ -$ -$ -$
Grants, Donations and Other - - - - - - - -
- - - - - - - -
Expenditures
Salaries and Benefits 698 729 695 782 837 896 959 978
Operating Costs 4,683 3,510 4,326 4,326 4,476 4,626 4,776 4,926
Internal Services Used 297 37 125 125 125 125 125 125
Internal Services Recovered (770) (844) (988) (988) (988) (988) (988) (988)
External Recoveries (365) 22 (215) (215) (215) (215) (215) (215)
4,543 3,454 3,943 4,030 4,235 4,444 4,657 4,826
Net Operations Total 4,543 3,454 3,943 4,030 4,235 4,444 4,657 4,826
Transfers
Transfer From Own Sources (2,606) (1,489) (1,892) (1,892) (1,892) (1,892) (1,892) (1,892)
Transfer To Own Sources 4 100 - - - - - -
(2,602) (1,389) (1,892) (1,892) (1,892) (1,892) (1,892) (1,892)
1,941$ 2,065$ 2,051$ 2,138$ 2,343$ 2,552$ 2,765$ 2,934$
- 162 -
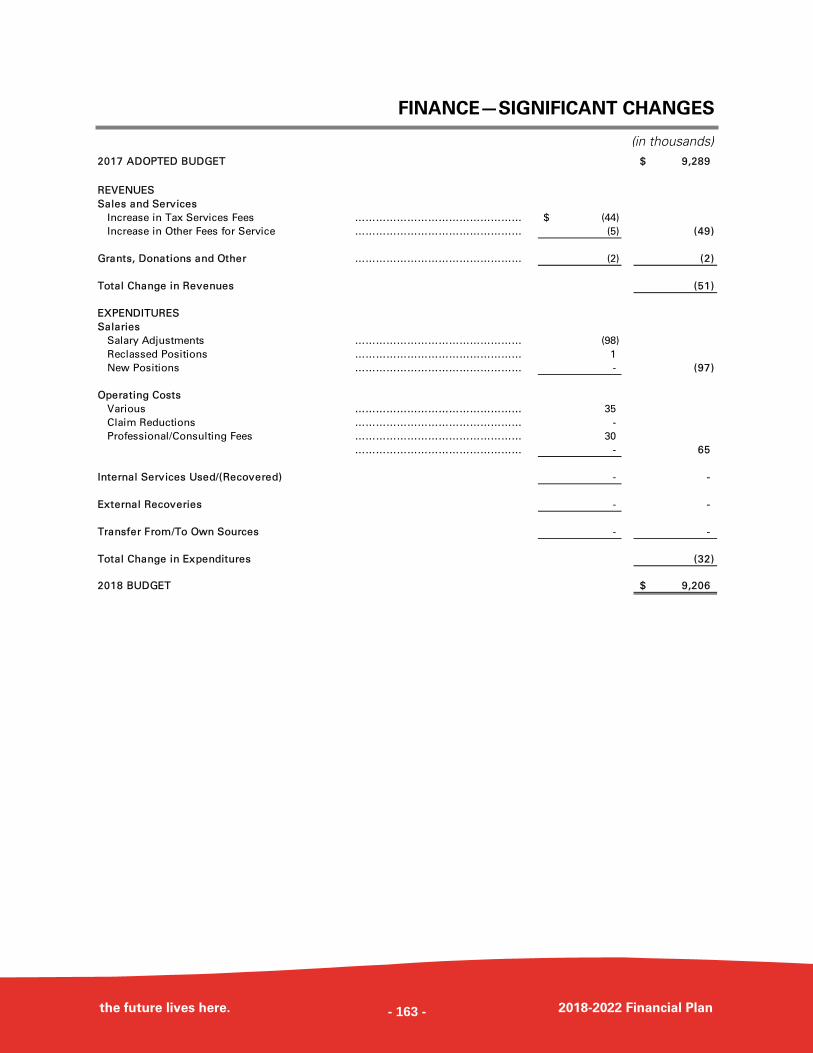
FINANCE—SIGNIFICANT CHANGES
the future lives here. 2018-2022 Financial Plan
(in thousands) 2017 ADOPTED BUDGET 9,289$
REVENUES
Sales and Services
Increase in Tax Services Fees ………………………………………… (44)$
Increase in Other Fees for Service ………………………………………… (5) (49)
Grants, Donations and Other ………………………………………… (2) (2)
Total Change in Revenues (51)
EXPENDITURES
Salaries
Salary Adjustments ………………………………………… (98)
Reclassed Positions ………………………………………… 1
New Positions ………………………………………… - (97)
Operating Costs
Various ………………………………………… 35
Claim Reductions ………………………………………… -
Professional/Consulting Fees ………………………………………… 30
………………………………………… - 65
Internal Services Used/(Recovered) - -
External Recoveries - -
Transfer From/To Own Sources - -
Total Change in Expenditures (32)
2018 BUDGET 9,206$
- 163 -
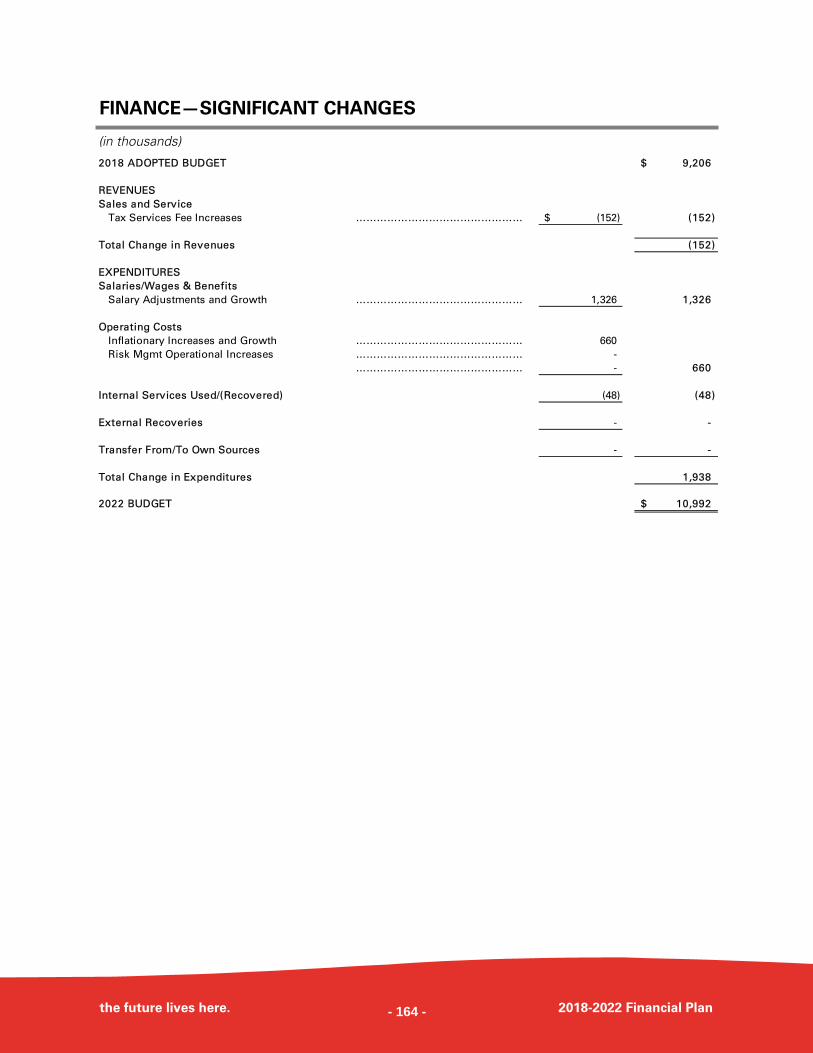
FINANCE—SIGNIFICANT CHANGES
the future lives here. 2018-2022 Financial Plan
(in thousands)
2018 ADOPTED BUDGET 9,206$
REVENUES
Sales and Service
Tax Services Fee Increases ………………………………………… (152)$ (152)
Total Change in Revenues (152)
EXPENDITURES
Salaries/Wages & Benefits
Salary Adjustments and Growth ………………………………………… 1,326 1,326
Operating Costs
Inflationary Increases and Growth ………………………………………… 660
Risk Mgmt Operational Increases ………………………………………… -
………………………………………… - 660
Internal Services Used/(Recovered) (48) (48)
External Recoveries - -
Transfer From/To Own Sources - -
Total Change in Expenditures 1,938
2022 BUDGET 10,992$
- 164 -
- 165 -
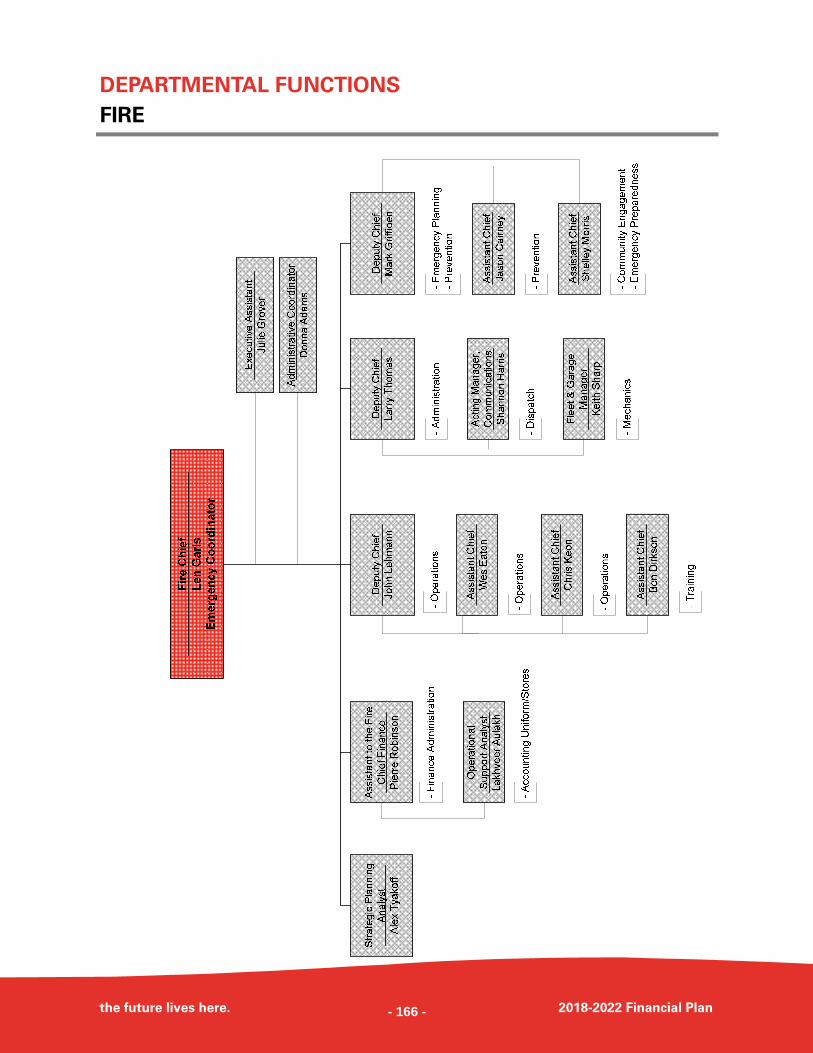
DEPARTMENTAL FUNCTIONS
FIRE
the future lives here. 2018-2022 Financial Plan - 166 -
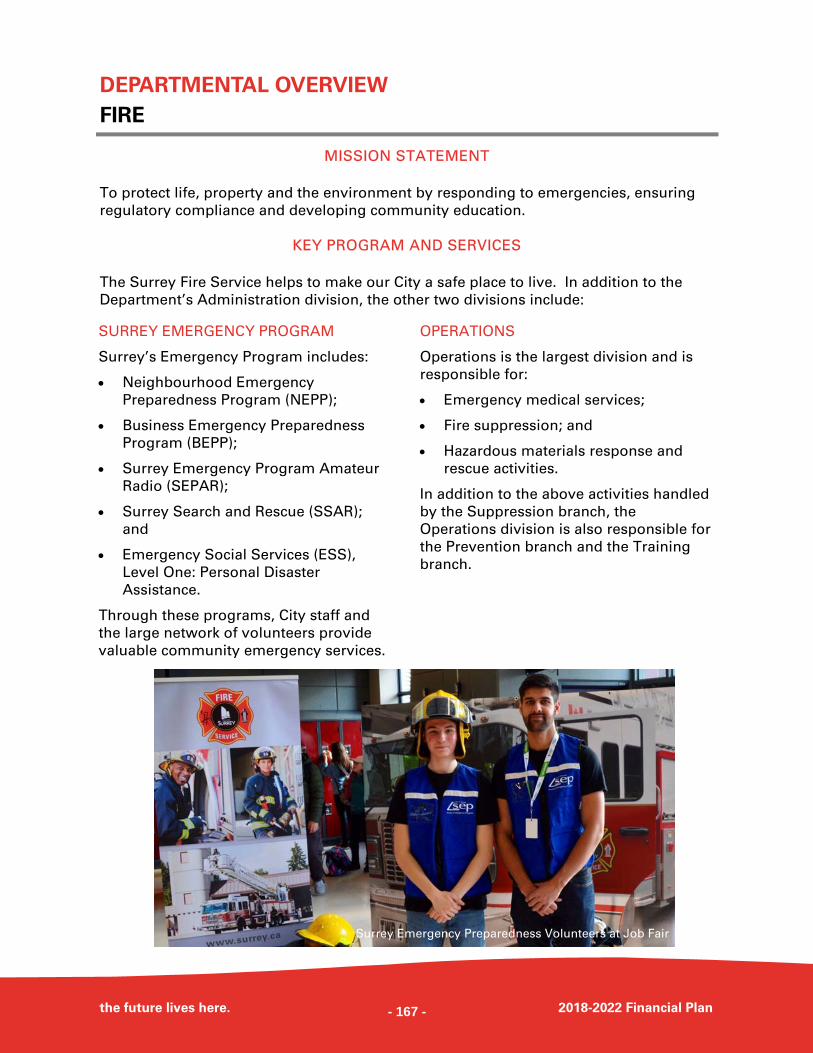
DEPARTMENTAL OVERVIEW
FIRE
the future lives here. 2018-2022 Financial Plan
MISSION STATEMENT
To protect life, property and the environment by responding to emergencies, ensuring
regulatory compliance and developing community education.
KEY PROGRAM AND SERVICES
The Surrey Fire Service helps to make our City a safe place to live. In addition to the
Department’s Administration division, the other two divisions include:
SURREY EMERGENCY PROGRAM
Surrey’s Emergency Program includes:
Neighbourhood Emergency
Preparedness Program (NEPP);
Business Emergency Preparedness
Program (BEPP);
Surrey Emergency Program Amateur
Radio (SEPAR);
Surrey Search and Rescue (SSAR);
and
Emergency Social Services (ESS),
Level One: Personal Disaster
Assistance.
Through these programs, City staff and
the large network of volunteers provide
valuable community emergency services.
OPERATIONS
Operations is the largest division and is
responsible for:
Emergency medical services;
Fire suppression; and
Hazardous materials response and
rescue activities.
In addition to the above activities handled
by the Suppression branch, the
Operations division is also responsible for
the Prevention branch and the Training
branch.
Surrey Emergency Preparedness Volunteers at Job Fair
- 167 -
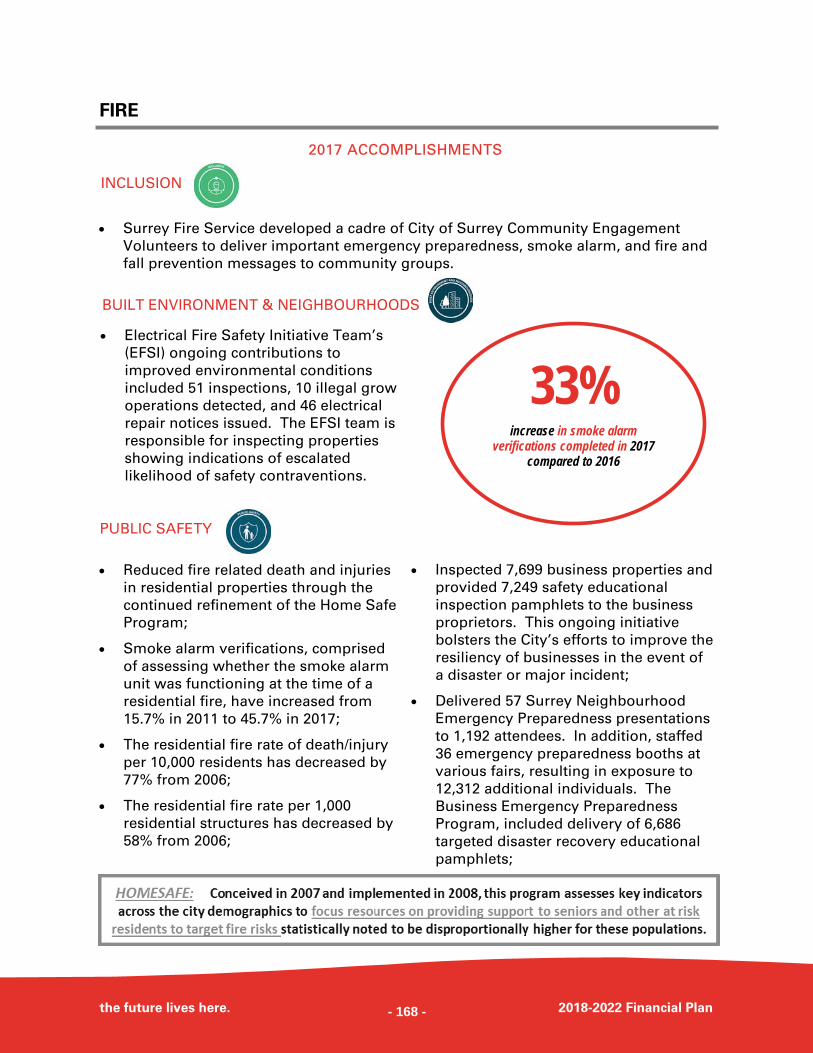
FIRE
the future lives here. 2018-2022 Financial Plan
2017 ACCOMPLISHMENTS
Surrey Fire Service developed a cadre of City of Surrey Community Engagement
Volunteers to deliver important emergency preparedness, smoke alarm, and fire and
fall prevention messages to community groups.
Electrical Fire Safety Initiative Team’s
(EFSI) ongoing contributions to
improved environmental conditions
included 51 inspections, 10 illegal grow
operations detected, and 46 electrical
repair notices issued. The EFSI team is
responsible for inspecting properties
showing indications of escalated
likelihood of safety contraventions.
Reduced fire related death and injuries
in residential properties through the
continued refinement of the Home Safe
Program;
Smoke alarm verifications, comprised
of assessing whether the smoke alarm
unit was functioning at the time of a
residential fire, have increased from
15.7% in 2011 to 45.7% in 2017;
The residential fire rate of death/injury
per 10,000 residents has decreased by
77% from 2006;
The residential fire rate per 1,000
residential structures has decreased by
58% from 2006;
Inspected 7,699 business properties and
provided 7,249 safety educational
inspection pamphlets to the business
proprietors. This ongoing initiative
bolsters the City’s efforts to improve the
resiliency of businesses in the event of
a disaster or major incident;
Delivered 57 Surrey Neighbourhood
Emergency Preparedness presentations
to 1,192 attendees. In addition, staffed
36 emergency preparedness booths at
various fairs, resulting in exposure to
12,312 additional individuals. The
Business Emergency Preparedness
Program, included delivery of 6,686
targeted disaster recovery educational
pamphlets;
INCLUSION
BUILT ENVIRONMENT & NEIGHBOURHOODS
PUBLIC SAFETY
33%
increase in smoke alarm verifications completed in 2017
compared to 2016
- 168 -
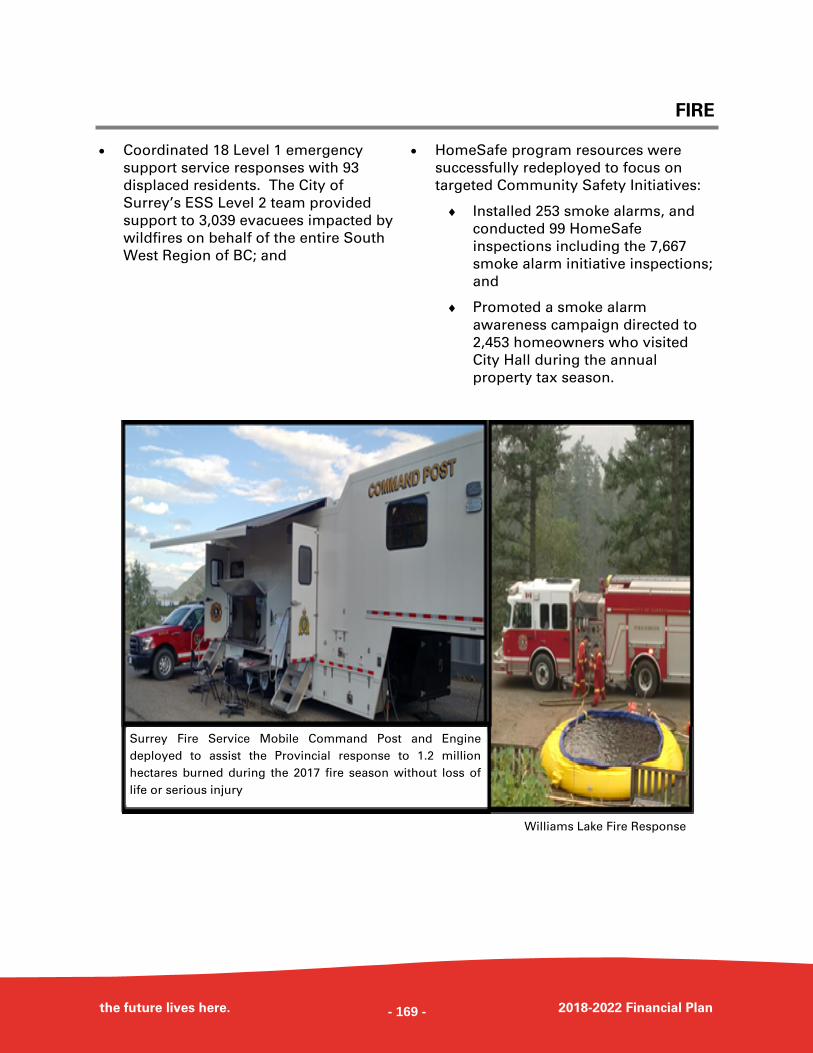
FIRE
the future lives here. 2018-2022 Financial Plan
Coordinated 18 Level 1 emergency
support service responses with 93
displaced residents. The City of
Surrey’s ESS Level 2 team provided
support to 3,039 evacuees impacted by
wildfires on behalf of the entire South
West Region of BC; and
HomeSafe program resources were
successfully redeployed to focus on
targeted Community Safety Initiatives:
Installed 253 smoke alarms, and
conducted 99 HomeSafe
inspections including the 7,667
smoke alarm initiative inspections;
and
Promoted a smoke alarm
awareness campaign directed to
2,453 homeowners who visited
City Hall during the annual
property tax season.
Williams Lake Fire Response
Surrey Fire Service Mobile Command Post and Engine
deployed to assist the Provincial response to 1.2 million
hectares burned during the 2017 fire season without loss of
life or serious injury
- 169 -
FIRE
the future lives here. 2018-2022 Financial Plan
Completed redevelopment of Online
Requests for Information through My
Surrey Portal to increase cost efficiency
of current service model. New
application will be made available for
public use in 2018;
Redesigned internal procedures and
reporting to support the expanded
online invoice payment option; and
Expanded service capacity, by adding a
response Medical Engine Unit at Hall 2,
to cost effectively address the Opioid
Crisis using existing funding for lower
cost per unit vehicles.
Published 11 research articles and/or
papers illustrating the evidence based
decision-making used for strategic
planning and emergency activity; and
Replaced 75% of main cleaning
solutions used at all Fire Halls with safe
and environmentally sustainable
products at no additional cost.
Expanded on cohort check-ins for pilot
program of “Heart Outcomes
Prevention and Evaluation—4” which
leverages first responder presence in
the community to promote, educate and
link cohorts to appropriate medical
channels to improve community health;
and
Continued to refine the Attendance
Management Program that resulted in
achieving a 61% perfect attendance.
ECONOMIC PROSPERITY & LIVELIHOODS
ECOSYSTEMS
HEALTH & WELLNESS
Joint award recipient with the City for the 2017 Innovation Management Finalist
Award by the Institute of Public Administration of Canada with regards to the
Designing Out Crime Campaign.
EDUCATION & CULTURE
- 170 -
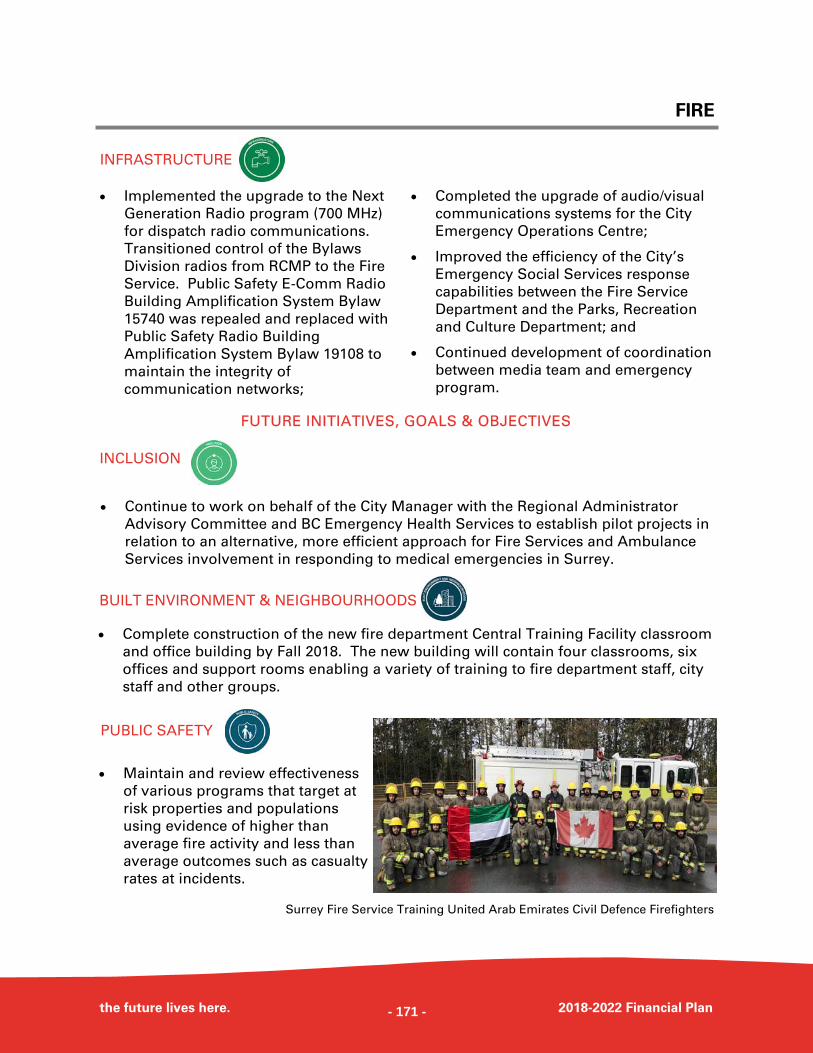
FIRE
the future lives here. 2018-2022 Financial Plan
Implemented the upgrade to the Next
Generation Radio program (700 MHz)
for dispatch radio communications.
Transitioned control of the Bylaws
Division radios from RCMP to the Fire
Service. Public Safety E-Comm Radio
Building Amplification System Bylaw
15740 was repealed and replaced with
Public Safety Radio Building
Amplification System Bylaw 19108 to
maintain the integrity of
communication networks;
Completed the upgrade of audio/visual
communications systems for the City
Emergency Operations Centre;
Improved the efficiency of the City’s
Emergency Social Services response
capabilities between the Fire Service
Department and the Parks, Recreation
and Culture Department; and
Continued development of coordination
between media team and emergency
program.
INFRASTRUCTURE
FUTURE INITIATIVES, GOALS & OBJECTIVES
Continue to work on behalf of the City Manager with the Regional Administrator
Advisory Committee and BC Emergency Health Services to establish pilot projects in
relation to an alternative, more efficient approach for Fire Services and Ambulance
Services involvement in responding to medical emergencies in Surrey.
INCLUSION
Complete construction of the new fire department Central Training Facility classroom
and office building by Fall 2018. The new building will contain four classrooms, six
offices and support rooms enabling a variety of training to fire department staff, city
staff and other groups.
BUILT ENVIRONMENT & NEIGHBOURHOODS
Maintain and review effectiveness
of various programs that target at
risk properties and populations
using evidence of higher than
average fire activity and less than
average outcomes such as casualty
rates at incidents.
PUBLIC SAFETY
Surrey Fire Service Training United Arab Emirates Civil Defence Firefighters
- 171 -
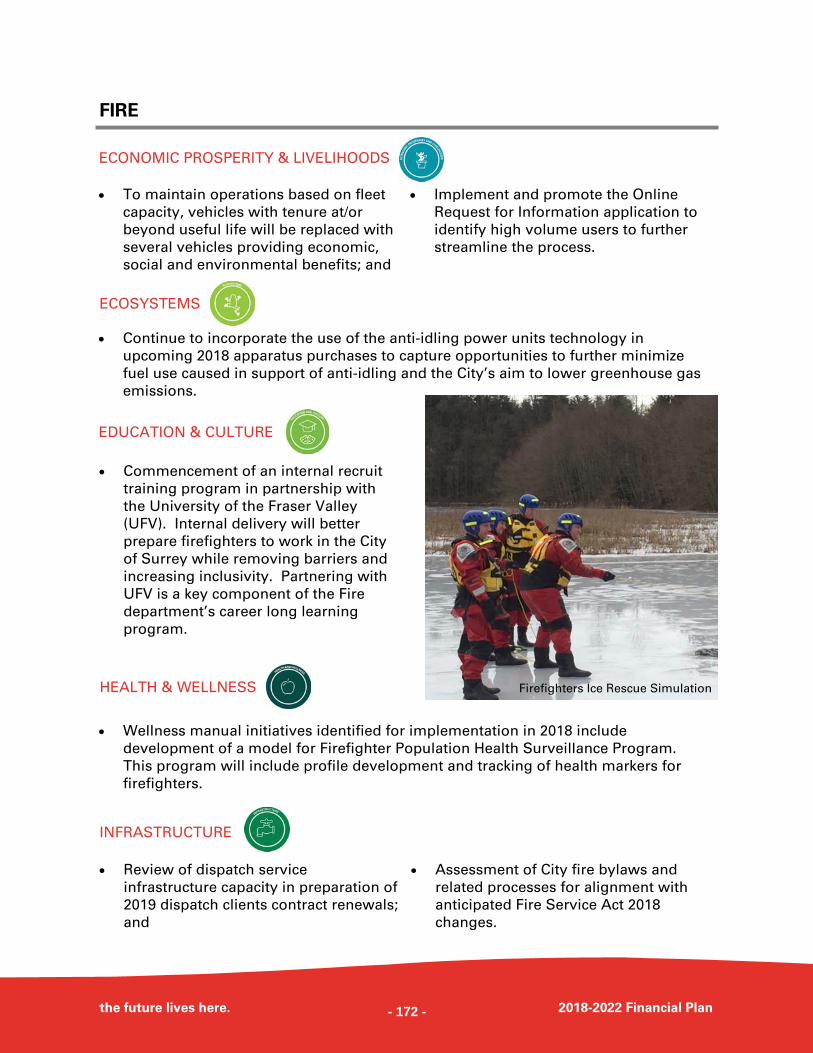
FIRE
the future lives here. 2018-2022 Financial Plan
To maintain operations based on fleet
capacity, vehicles with tenure at/or
beyond useful life will be replaced with
several vehicles providing economic,
social and environmental benefits; and
Implement and promote the Online
Request for Information application to
identify high volume users to further
streamline the process.
ECONOMIC PROSPERITY & LIVELIHOODS
Continue to incorporate the use of the anti-idling power units technology in
upcoming 2018 apparatus purchases to capture opportunities to further minimize
fuel use caused in support of anti-idling and the City’s aim to lower greenhouse gas
emissions.
ECOSYSTEMS
Commencement of an internal recruit
training program in partnership with
the University of the Fraser Valley
(UFV). Internal delivery will better
prepare firefighters to work in the City
of Surrey while removing barriers and
increasing inclusivity. Partnering with
UFV is a key component of the Fire
department’s career long learning
program.
EDUCATION & CULTURE
Firefighters Ice Rescue Simulation HEALTH & WELLNESS
Wellness manual initiatives identified for implementation in 2018 include
development of a model for Firefighter Population Health Surveillance Program.
This program will include profile development and tracking of health markers for
firefighters.
Review of dispatch service
infrastructure capacity in preparation of
2019 dispatch clients contract renewals;
and
Assessment of City fire bylaws and
related processes for alignment with
anticipated Fire Service Act 2018
changes.
INFRASTRUCTURE
- 172 -
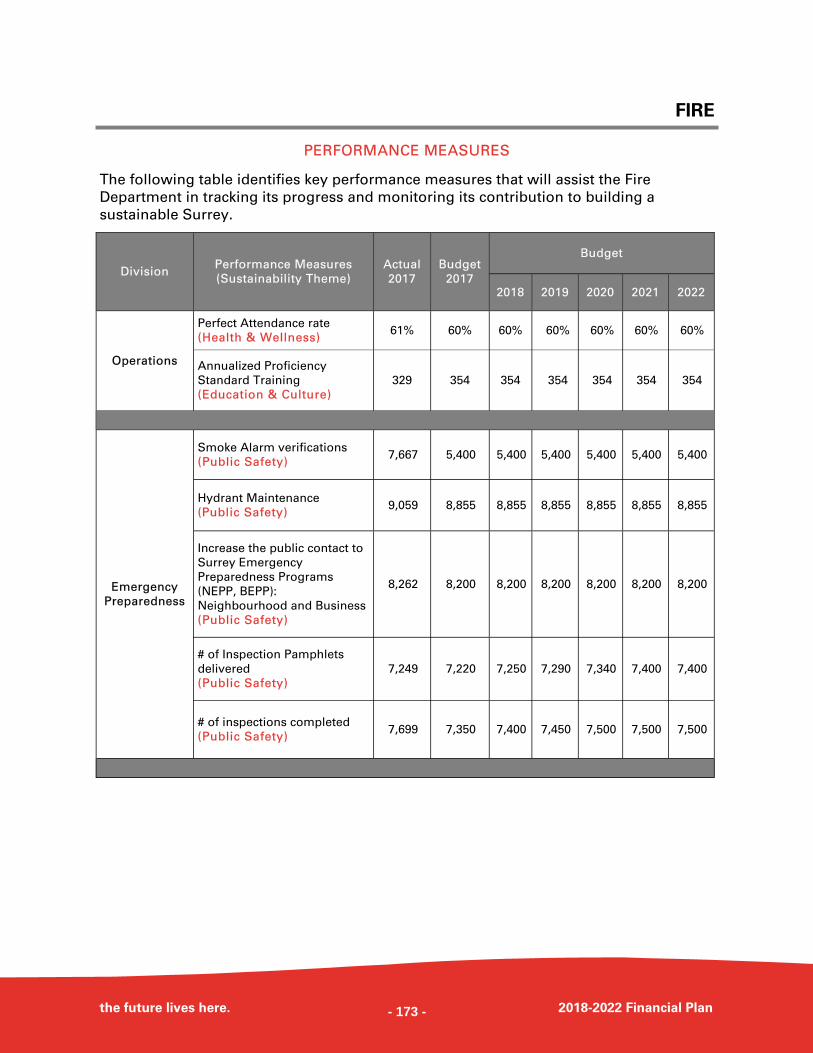
FIRE
the future lives here. 2018-2022 Financial Plan
PERFORMANCE MEASURES
The following table identifies key performance measures that will assist the Fire
Department in tracking its progress and monitoring its contribution to building a
sustainable Surrey.
Division Performance Measures
(Sustainability Theme)
Actual
2017
Budget
2017
Budget
2018 2019 2020 2021 2022
Operations
Perfect Attendance rate
(Health & Wellness) 61% 60% 60% 60% 60% 60% 60%
Annualized Proficiency
Standard Training
(Education & Culture) 329 354 354 354 354 354 354
Smoke Alarm verifications
(Public Safety) 7,667 5,400 5,400 5,400 5,400 5,400 5,400
Hydrant Maintenance
(Public Safety) 9,059 8,855 8,855 8,855 8,855 8,855 8,855
Increase the public contact to
Surrey Emergency
Preparedness Programs
(NEPP, BEPP):
Neighbourhood and Business
(Public Safety)
8,262 8,200 8,200 8,200 8,200 8,200 8,200
# of Inspection Pamphlets
delivered
(Public Safety) 7,249 7,220 7,250 7,290 7,340 7,400 7,400
# of inspections completed
(Public Safety) 7,699 7,350 7,400 7,450 7,500 7,500 7,500
Emergency
Preparedness
- 173 -
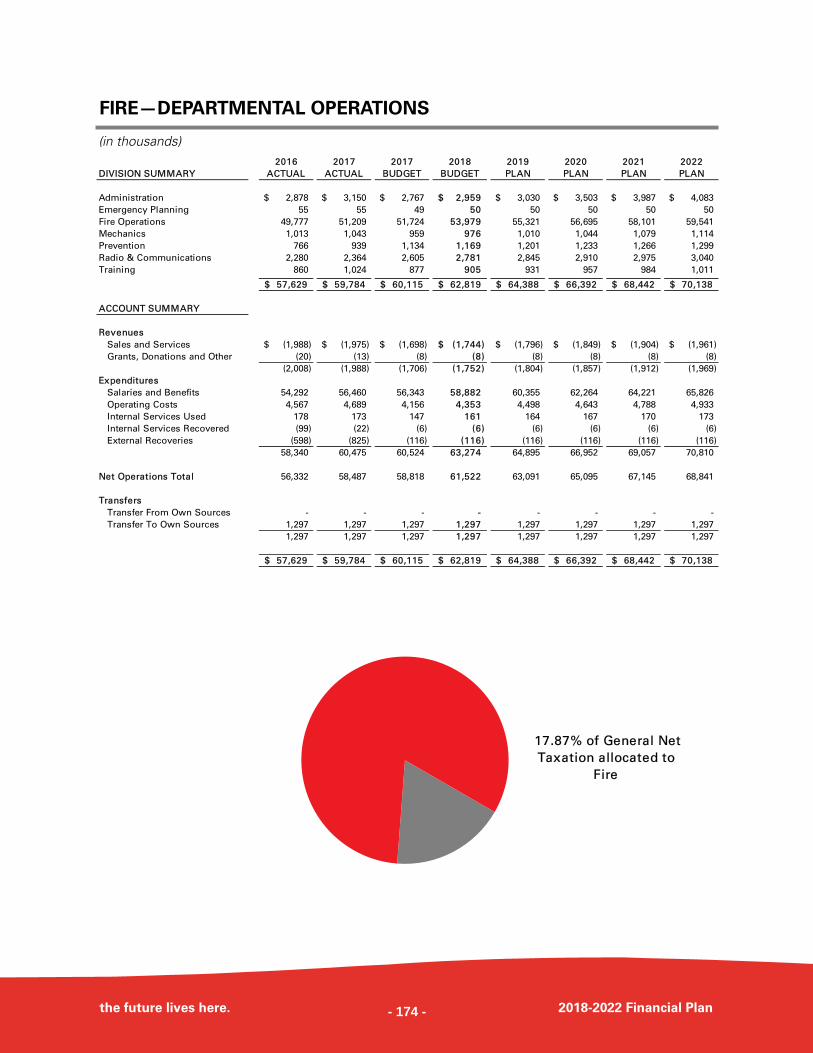
FIRE—DEPARTMENTAL OPERATIONS
the future lives here. 2018-2022 Financial Plan
(in thousands) 2016 2017 2017 2018 2019 2020 2021 2022
DIVISION SUMMARY ACTUAL ACTUAL BUDGET BUDGET PLAN PLAN PLAN PLAN
Administration 2,878$ 3,150$ 2,767$ 2,959$ 3,030$ 3,503$ 3,987$ 4,083$
Emergency Planning 55 55 49 50 50 50 50 50
Fire Operations 49,777 51,209 51,724 53,979 55,321 56,695 58,101 59,541
Mechanics 1,013 1,043 959 976 1,010 1,044 1,079 1,114
Prevention 766 939 1,134 1,169 1,201 1,233 1,266 1,299
Radio & Communications 2,280 2,364 2,605 2,781 2,845 2,910 2,975 3,040
Training 860 1,024 877 905 931 957 984 1,011
57,629$ 59,784$ 60,115$ 62,819$ 64,388$ 66,392$ 68,442$ 70,138$
ACCOUNT SUMMARY
Revenues
Sales and Services (1,988)$ (1,975)$ (1,698)$ (1,744)$ (1,796)$ (1,849)$ (1,904)$ (1,961)$
Grants, Donations and Other (20) (13) (8) (8) (8) (8) (8) (8)
(2,008) (1,988) (1,706) (1,752) (1,804) (1,857) (1,912) (1,969)
Expenditures
Salaries and Benefits 54,292 56,460 56,343 58,882 60,355 62,264 64,221 65,826
Operating Costs 4,567 4,689 4,156 4,353 4,498 4,643 4,788 4,933
Internal Services Used 178 173 147 161 164 167 170 173
Internal Services Recovered (99) (22) (6) (6) (6) (6) (6) (6)
External Recoveries (598) (825) (116) (116) (116) (116) (116) (116)
58,340 60,475 60,524 63,274 64,895 66,952 69,057 70,810
Net Operations Total 56,332 58,487 58,818 61,522 63,091 65,095 67,145 68,841
Transfers
Transfer From Own Sources - - - - - - - -
Transfer To Own Sources 1,297 1,297 1,297 1,297 1,297 1,297 1,297 1,297
1,297 1,297 1,297 1,297 1,297 1,297 1,297 1,297
57,629$ 59,784$ 60,115$ 62,819$ 64,388$ 66,392$ 68,442$ 70,138$
17.87% of General Net
Taxation allocated to
Fire
- 174 -
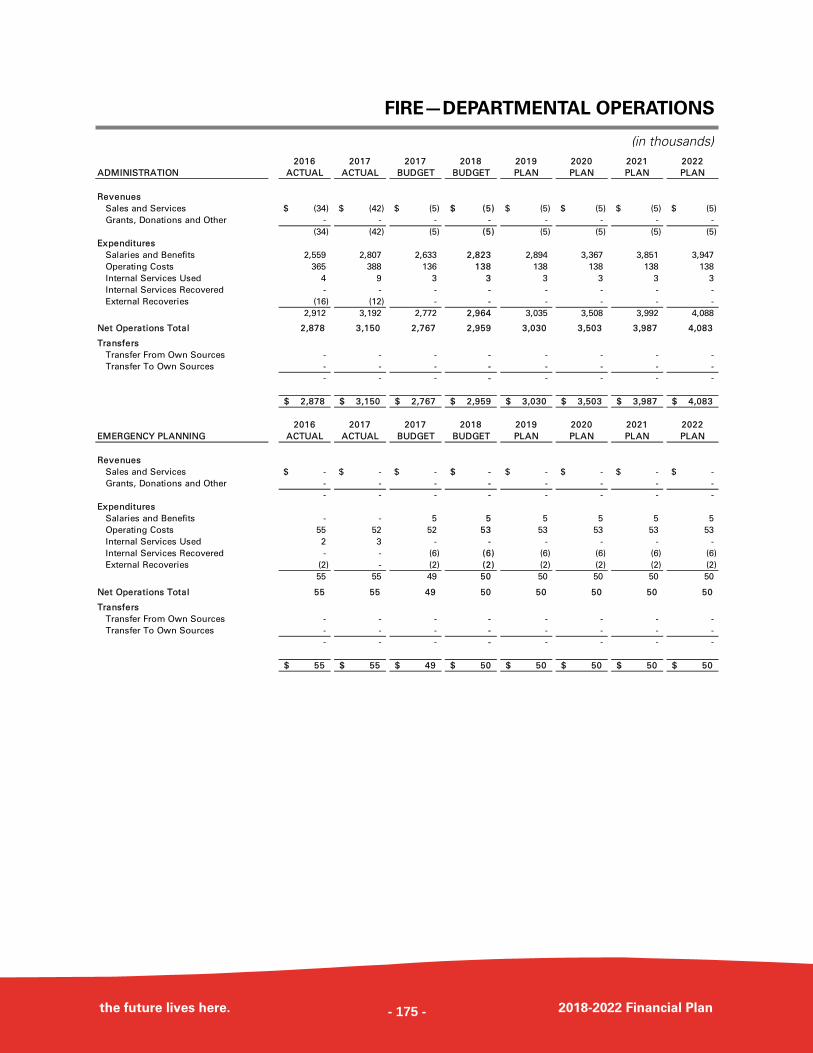
FIRE—DEPARTMENTAL OPERATIONS
the future lives here. 2018-2022 Financial Plan
(in thousands) 2016 2017 2017 2018 2019 2020 2021 2022
ADMINISTRATION ACTUAL ACTUAL BUDGET BUDGET PLAN PLAN PLAN PLAN
Revenues
Sales and Services (34)$ (42)$ (5)$ (5)$ (5)$ (5)$ (5)$ (5)$
Grants, Donations and Other - - - - - - - -
(34) (42) (5) (5) (5) (5) (5) (5)
Expenditures
Salaries and Benefits 2,559 2,807 2,633 2,823 2,894 3,367 3,851 3,947
Operating Costs 365 388 136 138 138 138 138 138
Internal Services Used 4 9 3 3 3 3 3 3
Internal Services Recovered - - - - - - - -
External Recoveries (16) (12) - - - - - -
2,912 3,192 2,772 2,964 3,035 3,508 3,992 4,088
Net Operations Total 2,878 3,150 2,767 2,959 3,030 3,503 3,987 4,083
Transfers
Transfer From Own Sources - - - - - - - -
Transfer To Own Sources - - - - - - - -
- - - - - - - -
2,878$ 3,150$ 2,767$ 2,959$ 3,030$ 3,503$ 3,987$ 4,083$
2016 2017 2017 2018 2019 2020 2021 2022
EMERGENCY PLANNING ACTUAL ACTUAL BUDGET BUDGET PLAN PLAN PLAN PLAN
Revenues
Sales and Services -$ -$ -$ -$ -$ -$ -$ -$
Grants, Donations and Other - - - - - - - -
- - - - - - - -
Expenditures
Salaries and Benefits - - 5 5 5 5 5 5
Operating Costs 55 52 52 53 53 53 53 53
Internal Services Used 2 3 - - - - - -
Internal Services Recovered - - (6) (6) (6) (6) (6) (6)
External Recoveries (2) - (2) (2) (2) (2) (2) (2)
55 55 49 50 50 50 50 50
Net Operations Total 55 55 49 50 50 50 50 50
Transfers
Transfer From Own Sources - - - - - - - -
Transfer To Own Sources - - - - - - - -
- - - - - - - -
55$ 55$ 49$ 50$ 50$ 50$ 50$ 50$
- 175 -
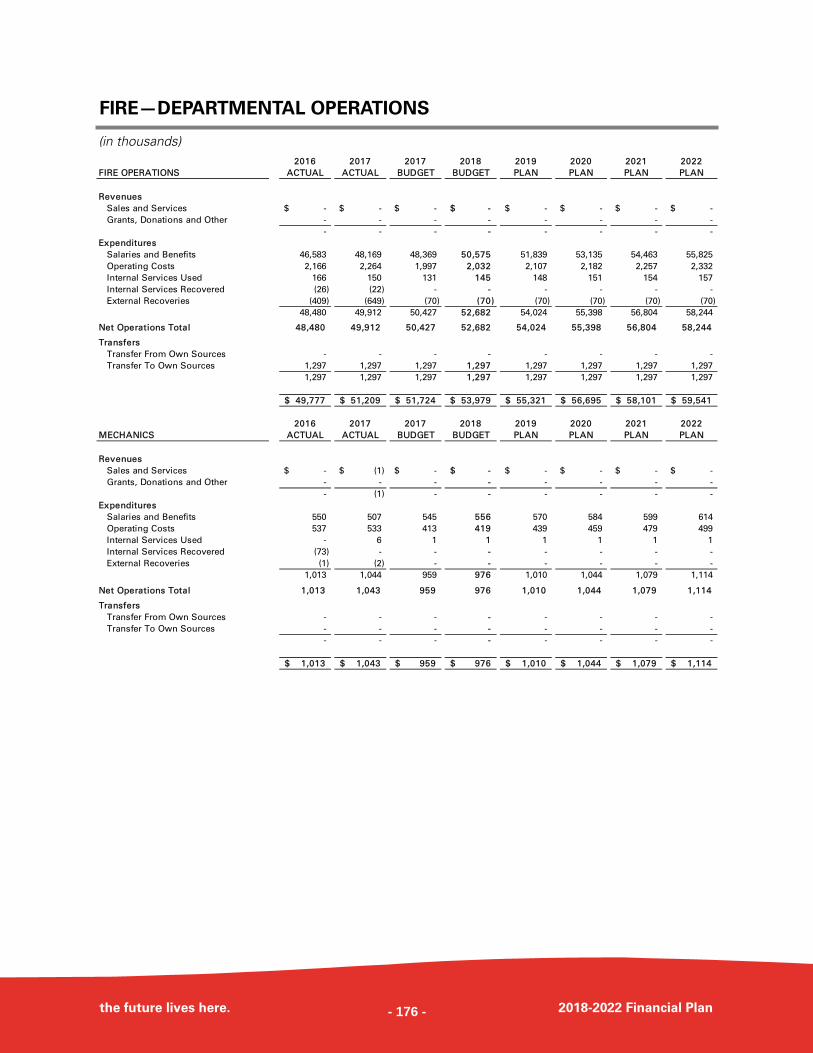
FIRE—DEPARTMENTAL OPERATIONS
the future lives here. 2018-2022 Financial Plan
(in thousands) 2016 2017 2017 2018 2019 2020 2021 2022
FIRE OPERATIONS ACTUAL ACTUAL BUDGET BUDGET PLAN PLAN PLAN PLAN
Revenues
Sales and Services -$ -$ -$ -$ -$ -$ -$ -$
Grants, Donations and Other - - - - - - - -
- - - - - - - -
Expenditures
Salaries and Benefits 46,583 48,169 48,369 50,575 51,839 53,135 54,463 55,825
Operating Costs 2,166 2,264 1,997 2,032 2,107 2,182 2,257 2,332
Internal Services Used 166 150 131 145 148 151 154 157
Internal Services Recovered (26) (22) - - - - - -
External Recoveries (409) (649) (70) (70) (70) (70) (70) (70)
48,480 49,912 50,427 52,682 54,024 55,398 56,804 58,244
Net Operations Total 48,480 49,912 50,427 52,682 54,024 55,398 56,804 58,244
Transfers
Transfer From Own Sources - - - - - - - -
Transfer To Own Sources 1,297 1,297 1,297 1,297 1,297 1,297 1,297 1,297
1,297 1,297 1,297 1,297 1,297 1,297 1,297 1,297
49,777$ 51,209$ 51,724$ 53,979$ 55,321$ 56,695$ 58,101$ 59,541$
2016 2017 2017 2018 2019 2020 2021 2022
MECHANICS ACTUAL ACTUAL BUDGET BUDGET PLAN PLAN PLAN PLAN
Revenues
Sales and Services -$ (1)$ -$ -$ -$ -$ -$ -$
Grants, Donations and Other - - - - - - - -
- (1) - - - - - -
Expenditures
Salaries and Benefits 550 507 545 556 570 584 599 614
Operating Costs 537 533 413 419 439 459 479 499
Internal Services Used - 6 1 1 1 1 1 1
Internal Services Recovered (73) - - - - - - -
External Recoveries (1) (2) - - - - - -
1,013 1,044 959 976 1,010 1,044 1,079 1,114
Net Operations Total 1,013 1,043 959 976 1,010 1,044 1,079 1,114
Transfers
Transfer From Own Sources - - - - - - - -
Transfer To Own Sources - - - - - - - -
- - - - - - - -
1,013$ 1,043$ 959$ 976$ 1,010$ 1,044$ 1,079$ 1,114$
- 176 -
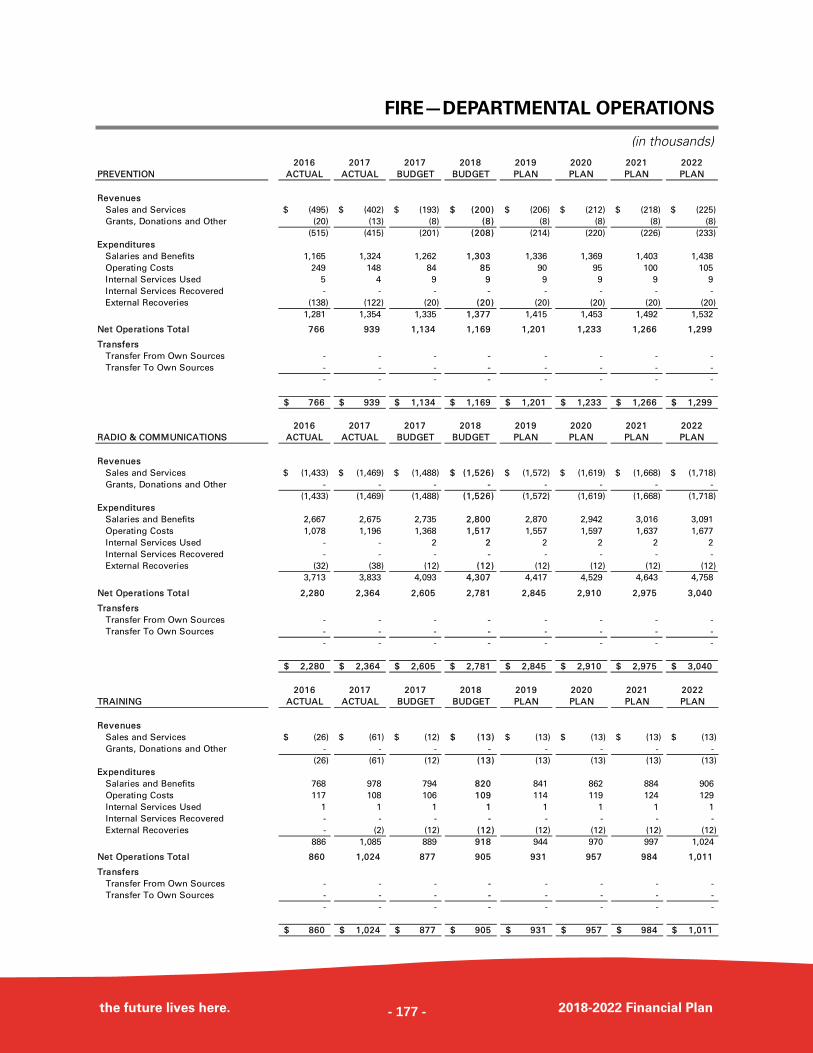
FIRE—DEPARTMENTAL OPERATIONS
the future lives here. 2018-2022 Financial Plan
(in thousands) 2016 2017 2017 2018 2019 2020 2021 2022
PREVENTION ACTUAL ACTUAL BUDGET BUDGET PLAN PLAN PLAN PLAN
Revenues
Sales and Services (495)$ (402)$ (193)$ (200)$ (206)$ (212)$ (218)$ (225)$
Grants, Donations and Other (20) (13) (8) (8) (8) (8) (8) (8)
(515) (415) (201) (208) (214) (220) (226) (233)
Expenditures
Salaries and Benefits 1,165 1,324 1,262 1,303 1,336 1,369 1,403 1,438
Operating Costs 249 148 84 85 90 95 100 105
Internal Services Used 5 4 9 9 9 9 9 9
Internal Services Recovered - - - - - - - -
External Recoveries (138) (122) (20) (20) (20) (20) (20) (20)
1,281 1,354 1,335 1,377 1,415 1,453 1,492 1,532
Net Operations Total 766 939 1,134 1,169 1,201 1,233 1,266 1,299
Transfers
Transfer From Own Sources - - - - - - - -
Transfer To Own Sources - - - - - - - -
- - - - - - - -
766$ 939$ 1,134$ 1,169$ 1,201$ 1,233$ 1,266$ 1,299$
2016 2017 2017 2018 2019 2020 2021 2022
RADIO & COMMUNICATIONS ACTUAL ACTUAL BUDGET BUDGET PLAN PLAN PLAN PLAN
Revenues
Sales and Services (1,433)$ (1,469)$ (1,488)$ (1,526)$ (1,572)$ (1,619)$ (1,668)$ (1,718)$
Grants, Donations and Other - - - - - - - -
(1,433) (1,469) (1,488) (1,526) (1,572) (1,619) (1,668) (1,718)
Expenditures
Salaries and Benefits 2,667 2,675 2,735 2,800 2,870 2,942 3,016 3,091
Operating Costs 1,078 1,196 1,368 1,517 1,557 1,597 1,637 1,677
Internal Services Used - - 2 2 2 2 2 2
Internal Services Recovered - - - - - - - -
External Recoveries (32) (38) (12) (12) (12) (12) (12) (12)
3,713 3,833 4,093 4,307 4,417 4,529 4,643 4,758
Net Operations Total 2,280 2,364 2,605 2,781 2,845 2,910 2,975 3,040
Transfers
Transfer From Own Sources - - - - - - - -
Transfer To Own Sources - - - - - - - -
- - - - - - - -
2,280$ 2,364$ 2,605$ 2,781$ 2,845$ 2,910$ 2,975$ 3,040$
2016 2017 2017 2018 2019 2020 2021 2022
TRAINING ACTUAL ACTUAL BUDGET BUDGET PLAN PLAN PLAN PLAN
Revenues
Sales and Services (26)$ (61)$ (12)$ (13)$ (13)$ (13)$ (13)$ (13)$
Grants, Donations and Other - - - - - - - -
(26) (61) (12) (13) (13) (13) (13) (13)
Expenditures
Salaries and Benefits 768 978 794 820 841 862 884 906
Operating Costs 117 108 106 109 114 119 124 129
Internal Services Used 1 1 1 1 1 1 1 1
Internal Services Recovered - - - - - - - -
External Recoveries - (2) (12) (12) (12) (12) (12) (12)
886 1,085 889 918 944 970 997 1,024
Net Operations Total 860 1,024 877 905 931 957 984 1,011
Transfers
Transfer From Own Sources - - - - - - - -
Transfer To Own Sources - - - - - - - -
- - - - - - - -
860$ 1,024$ 877$ 905$ 931$ 957$ 984$ 1,011$
- 177 -
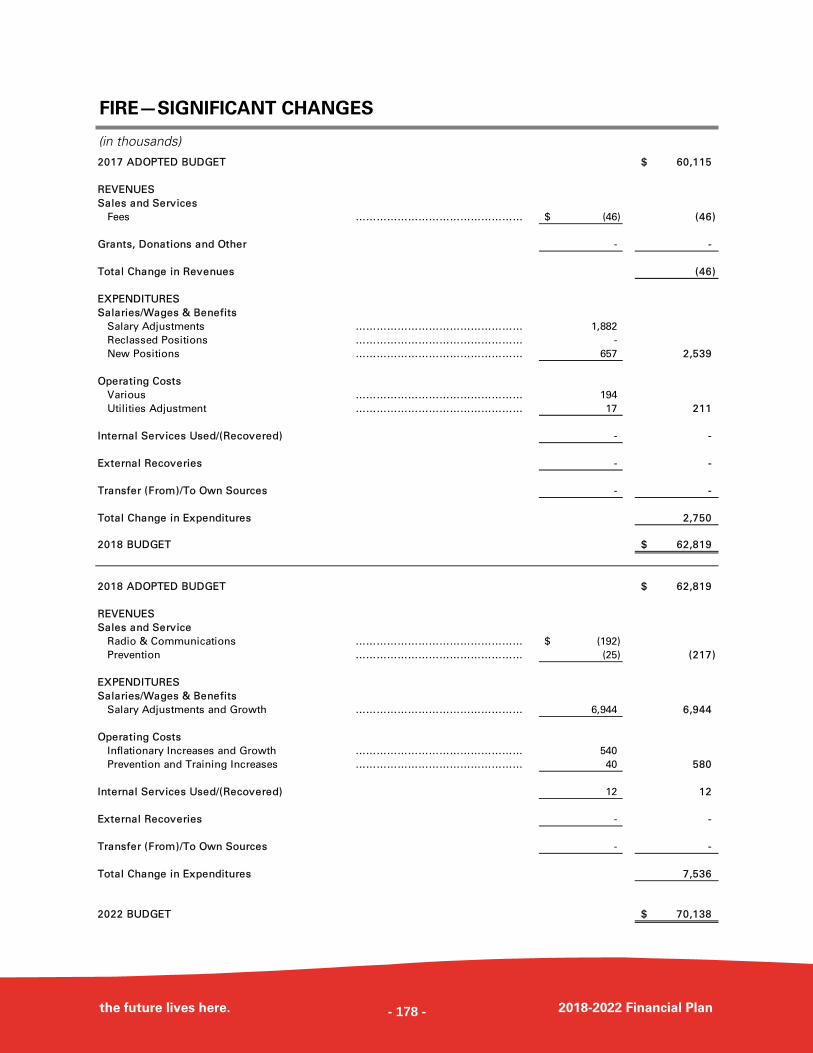
FIRE—SIGNIFICANT CHANGES
the future lives here. 2018-2022 Financial Plan
(in thousands) 2017 ADOPTED BUDGET 60,115$
REVENUES
Sales and Services
Fees ………………………………………… (46)$ (46)
Grants, Donations and Other - -
Total Change in Revenues (46)
EXPENDITURES
Salaries/Wages & Benefits
Salary Adjustments ………………………………………… 1,882
Reclassed Positions ………………………………………… -
New Positions ………………………………………… 657 2,539
Operating Costs
Various ………………………………………… 194
Utilities Adjustment ………………………………………… 17 211
Internal Services Used/(Recovered) - -
External Recoveries - -
Transfer (From)/To Own Sources - -
Total Change in Expenditures 2,750
2018 BUDGET 62,819$
2018 ADOPTED BUDGET 62,819$
REVENUES
Sales and Service
Radio & Communications ………………………………………… (192)$
Prevention ………………………………………… (25) (217)
EXPENDITURES
Salaries/Wages & Benefits
Salary Adjustments and Growth ………………………………………… 6,944 6,944
Operating Costs
Inflationary Increases and Growth ………………………………………… 540
Prevention and Training Increases ………………………………………… 40 580
Internal Services Used/(Recovered) 12 12
External Recoveries - -
Transfer (From)/To Own Sources - -
Total Change in Expenditures 7,536
2022 BUDGET 70,138$
- 178 -
- 179 -
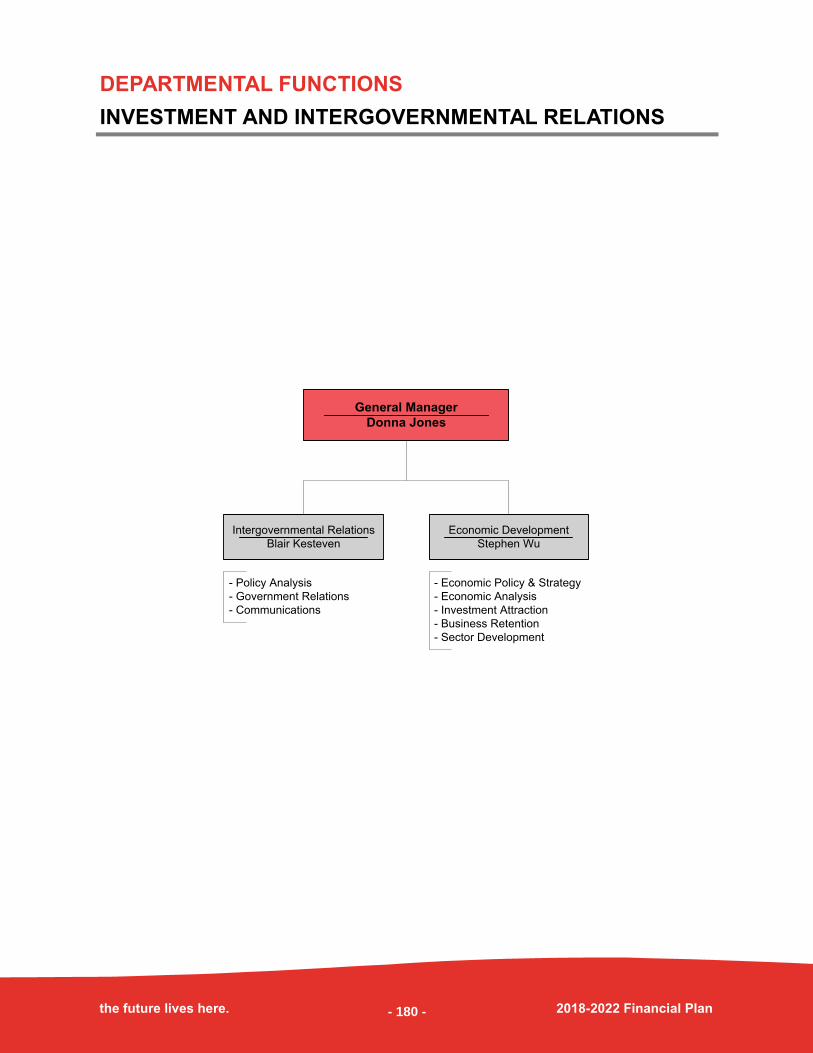
DEPARTMENTAL FUNCTIONS
INVESTMENT AND INTERGOVERNMENTAL RELATIONS
the future lives here. 2018-2022 Financial Plan
General Manager
Donna Jones
Economic Development
Stephen Wu
Intergovernmental Relations
Blair Kesteven
- Economic Policy & Strategy
- Economic Analysis
- Investment Attraction
- Business Retention
- Sector Development
- Policy Analysis
- Government Relations
- Communications
- 180 -
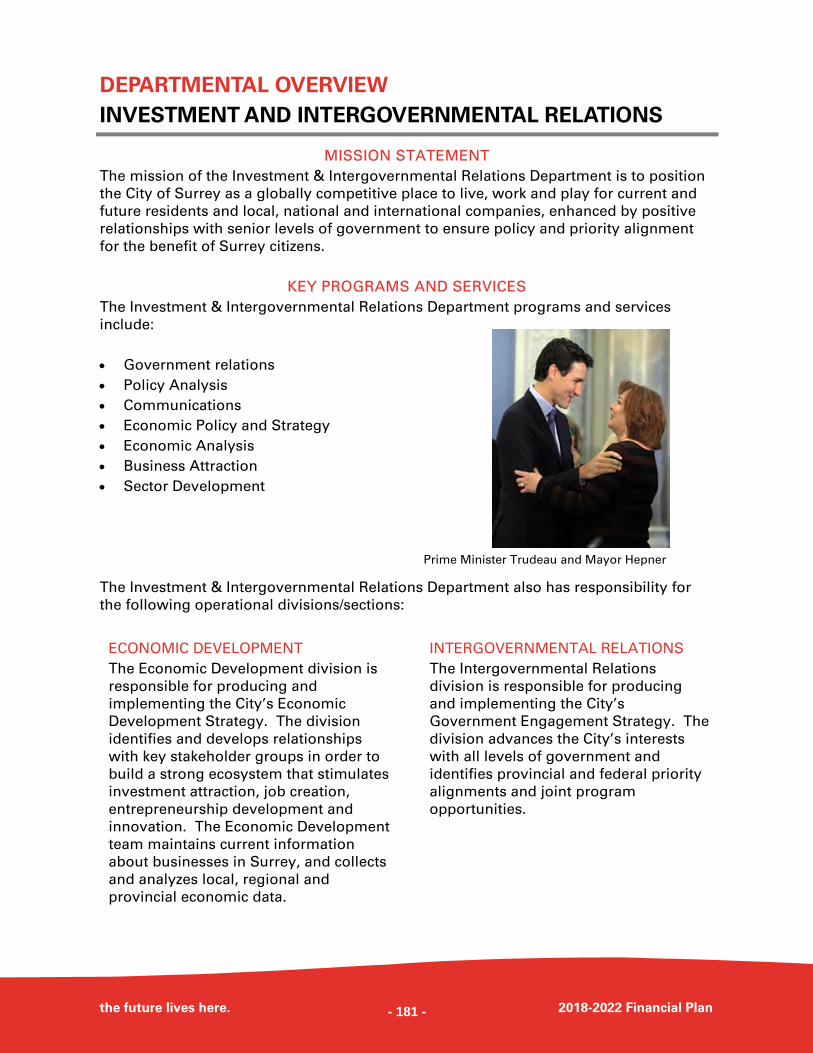
DEPARTMENTAL OVERVIEW
INVESTMENT AND INTERGOVERNMENTAL RELATIONS
the future lives here. 2018-2022 Financial Plan
MISSION STATEMENT
The mission of the Investment & Intergovernmental Relations Department is to position
the City of Surrey as a globally competitive place to live, work and play for current and
future residents and local, national and international companies, enhanced by positive
relationships with senior levels of government to ensure policy and priority alignment
for the benefit of Surrey citizens.
KEY PROGRAMS AND SERVICES
The Investment & Intergovernmental Relations Department programs and services
include:
Government relations
Policy Analysis
Communications
Economic Policy and Strategy
Economic Analysis
Business Attraction
Sector Development
The Investment & Intergovernmental Relations Department also has responsibility for
the following operational divisions/sections:
ECONOMIC DEVELOPMENT
The Economic Development division is
responsible for producing and
implementing the City’s Economic
Development Strategy. The division
identifies and develops relationships
with key stakeholder groups in order to
build a strong ecosystem that stimulates
investment attraction, job creation,
entrepreneurship development and
innovation. The Economic Development
team maintains current information
about businesses in Surrey, and collects
and analyzes local, regional and
provincial economic data.
INTERGOVERNMENTAL RELATIONS
The Intergovernmental Relations
division is responsible for producing
and implementing the City’s
Government Engagement Strategy. The
division advances the City’s interests
with all levels of government and
identifies provincial and federal priority
alignments and joint program
opportunities.
Prime Minister Trudeau and Mayor Hepner
- 181 -
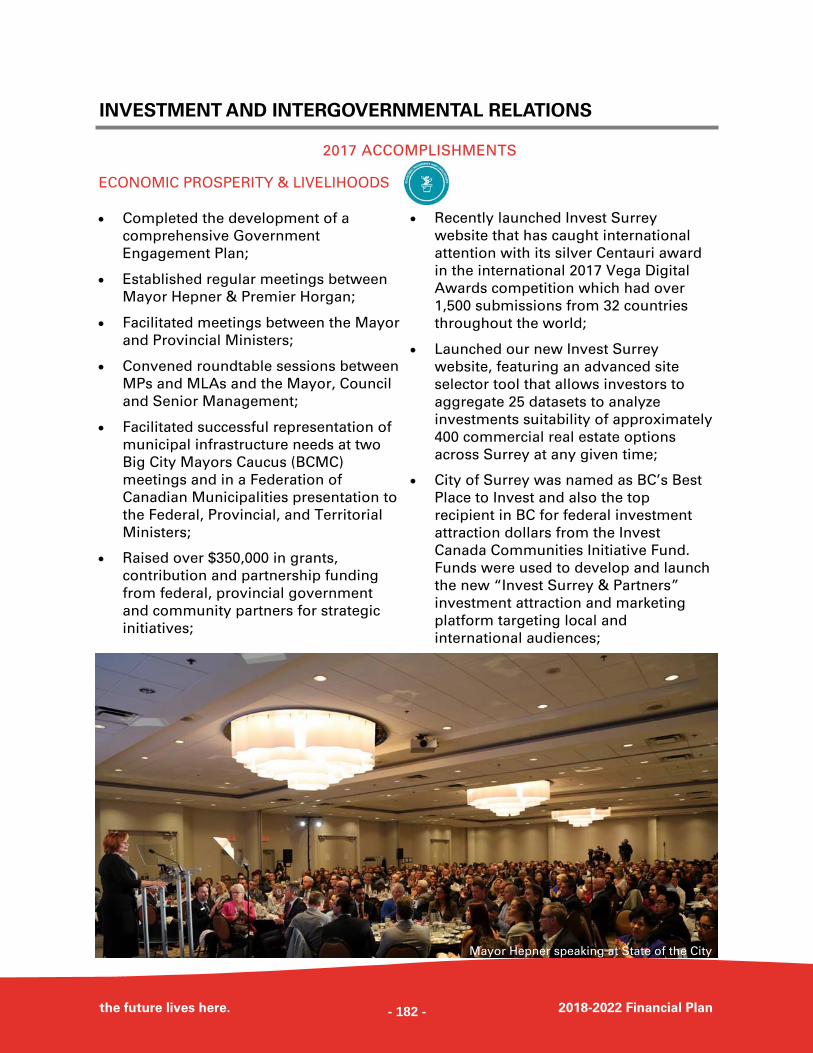
INVESTMENT AND INTERGOVERNMENTAL RELATIONS
the future lives here. 2018-2022 Financial Plan
2017 ACCOMPLISHMENTS
Completed the development of a
comprehensive Government
Engagement Plan;
Established regular meetings between
Mayor Hepner & Premier Horgan;
Facilitated meetings between the Mayor
and Provincial Ministers;
Convened roundtable sessions between
MPs and MLAs and the Mayor, Council
and Senior Management;
Facilitated successful representation of
municipal infrastructure needs at two
Big City Mayors Caucus (BCMC)
meetings and in a Federation of
Canadian Municipalities presentation to
the Federal, Provincial, and Territorial
Ministers;
Raised over $350,000 in grants,
contribution and partnership funding
from federal, provincial government
and community partners for strategic
initiatives;
Recently launched Invest Surrey
website that has caught international
attention with its silver Centauri award
in the international 2017 Vega Digital
Awards competition which had over
1,500 submissions from 32 countries
throughout the world;
Launched our new Invest Surrey
website, featuring an advanced site
selector tool that allows investors to
aggregate 25 datasets to analyze
investments suitability of approximately
400 commercial real estate options
across Surrey at any given time;
City of Surrey was named as BC’s Best
Place to Invest and also the top
recipient in BC for federal investment
attraction dollars from the Invest
Canada Communities Initiative Fund.
Funds were used to develop and launch
the new “Invest Surrey & Partners”
investment attraction and marketing
platform targeting local and
international audiences;
ECONOMIC PROSPERITY & LIVELIHOODS
Mayor Hepner speaking at State of the City
- 182 -
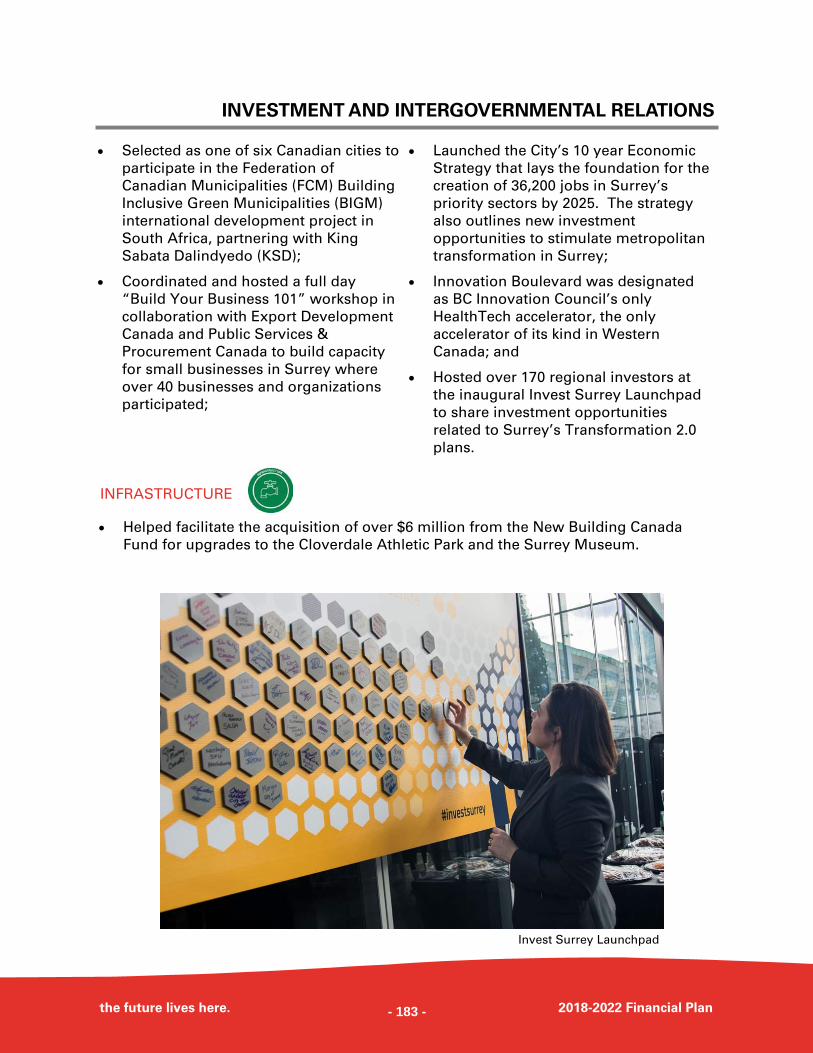
INVESTMENT AND INTERGOVERNMENTAL RELATIONS
the future lives here. 2018-2022 Financial Plan
Selected as one of six Canadian cities to
participate in the Federation of
Canadian Municipalities (FCM) Building
Inclusive Green Municipalities (BIGM)
international development project in
South Africa, partnering with King
Sabata Dalindyedo (KSD);
Coordinated and hosted a full day
“Build Your Business 101” workshop in
collaboration with Export Development
Canada and Public Services &
Procurement Canada to build capacity
for small businesses in Surrey where
over 40 businesses and organizations
participated;
Launched the City’s 10 year Economic
Strategy that lays the foundation for the
creation of 36,200 jobs in Surrey’s
priority sectors by 2025. The strategy
also outlines new investment
opportunities to stimulate metropolitan
transformation in Surrey;
Innovation Boulevard was designated
as BC Innovation Council’s only
HealthTech accelerator, the only
accelerator of its kind in Western
Canada; and
Hosted over 170 regional investors at
the inaugural Invest Surrey Launchpad
to share investment opportunities
related to Surrey’s Transformation 2.0
plans.
INFRASTRUCTURE
Helped facilitate the acquisition of over $6 million from the New Building Canada
Fund for upgrades to the Cloverdale Athletic Park and the Surrey Museum.
Invest Surrey Launchpad
- 183 -
INVESTMENT AND INTERGOVERNMENTAL RELATIONS
the future lives here. 2018-2022 Financial Plan
FUTURE INITIATIVES, GOALS & OBJECTIVES
In partnership with the Public Safety
division, work with the Province to
achieve a funded Integrated Services
Network—a single location for
administrative offices of justice, health
and social services involved in the co-
delivery of programs and services
aimed at reducing crime in Surrey; and
In partnership with Public Safety, Fire,
Statistics Canada and other partners,
design and execute an Opioid
Intervention Demonstration Project.
Continuously update and work with the
Senior Management Team to execute
the Government Engagement Plan;
Assist in the achievement of funding
under Phase 2 of the Federal
Infrastructure Program;
In partnership with Planning &
Development and Bylaws, work with
the Province to create a comprehensive
provincial program framework for
supportive recovery homes;
Conceptualize, plan and execute the
flagship investment attraction event for
Surrey, Invest Surrey Launchpad in Q4
2017, that will highlight investment
opportunities in Surrey to business
leaders from across Canada;
Obtain 2018 Invest Canada Community
Initiative federal funding to further
develop the “Invest Surrey & Partners”
platform collaterals and programming;
Build and execute a City Centre
marketing strategy that facilitates the
attraction of jobs, investment,
entrepreneurship and innovation in the
community beginning with a global
launch at the MIPIM Conference in
France in 2018;
Continuously upgrade and promote the
City’s advanced Site Selector tool for
investor self-serve information
gathering on prospective commercial/
industrial real estate investment
opportunities. This will include town
centre specific reports for public
consumption;
Explore international trade
development and investment attraction
opportunities in Cascadia innovation
corridor and other key global markets.
Aim to increase leads generated
through such endeavours;
Unlock $100,000 in sponsorship
opportunities for businesses to support
events promoting Surrey’s economic
vision;
Finalize the Surrey Investment
Evaluation Matrix System (SIEMS) to
qualify inbound investment leads more
efficiently, enhancing the investor
experience;
Conduct a comprehensive review and
assessment of municipal best practices
related to support for local business
associations, BIAs, and other
community groups including training,
and joint partnership initiatives;
PUBLIC SAFETY
ECONOMIC PROSPERITY & LIVELIHOODS
- 184 -
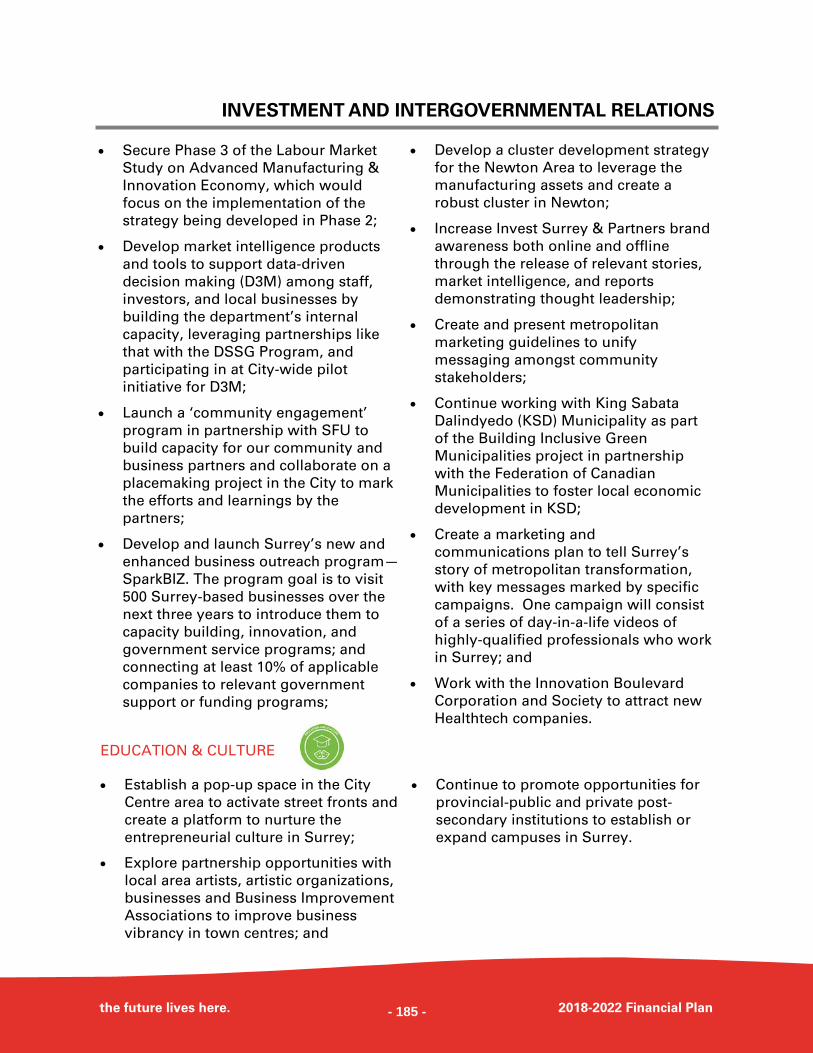
INVESTMENT AND INTERGOVERNMENTAL RELATIONS
the future lives here. 2018-2022 Financial Plan
Establish a pop-up space in the City
Centre area to activate street fronts and
create a platform to nurture the
entrepreneurial culture in Surrey;
Explore partnership opportunities with
local area artists, artistic organizations,
businesses and Business Improvement
Associations to improve business
vibrancy in town centres; and
Continue to promote opportunities for
provincial-public and private post-
secondary institutions to establish or
expand campuses in Surrey.
Secure Phase 3 of the Labour Market
Study on Advanced Manufacturing &
Innovation Economy, which would
focus on the implementation of the
strategy being developed in Phase 2;
Develop market intelligence products
and tools to support data-driven
decision making (D3M) among staff,
investors, and local businesses by
building the department’s internal
capacity, leveraging partnerships like
that with the DSSG Program, and
participating in at City-wide pilot
initiative for D3M;
Launch a ‘community engagement’
program in partnership with SFU to
build capacity for our community and
business partners and collaborate on a
placemaking project in the City to mark
the efforts and learnings by the
partners;
Develop and launch Surrey’s new and
enhanced business outreach program—
SparkBIZ. The program goal is to visit
500 Surrey-based businesses over the
next three years to introduce them to
capacity building, innovation, and
government service programs; and
connecting at least 10% of applicable
companies to relevant government
support or funding programs;
Develop a cluster development strategy
for the Newton Area to leverage the
manufacturing assets and create a
robust cluster in Newton;
Increase Invest Surrey & Partners brand
awareness both online and offline
through the release of relevant stories,
market intelligence, and reports
demonstrating thought leadership;
Create and present metropolitan
marketing guidelines to unify
messaging amongst community
stakeholders;
Continue working with King Sabata
Dalindyedo (KSD) Municipality as part
of the Building Inclusive Green
Municipalities project in partnership
with the Federation of Canadian
Municipalities to foster local economic
development in KSD;
Create a marketing and
communications plan to tell Surrey’s
story of metropolitan transformation,
with key messages marked by specific
campaigns. One campaign will consist
of a series of day-in-a-life videos of
highly-qualified professionals who work
in Surrey; and
Work with the Innovation Boulevard
Corporation and Society to attract new
Healthtech companies.
EDUCATION & CULTURE
- 185 -
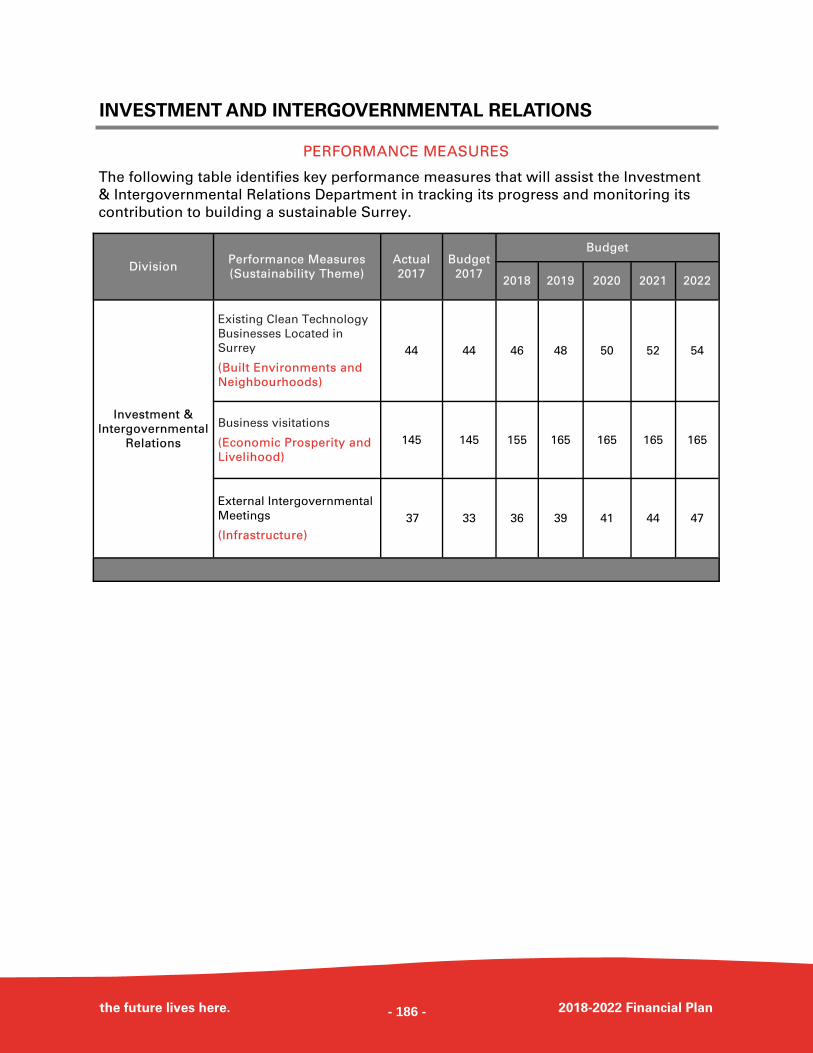
INVESTMENT AND INTERGOVERNMENTAL RELATIONS
the future lives here. 2018-2022 Financial Plan
PERFORMANCE MEASURES
The following table identifies key performance measures that will assist the Investment
& Intergovernmental Relations Department in tracking its progress and monitoring its
contribution to building a sustainable Surrey.
Division Performance Measures
(Sustainability Theme)
Actual
2017
Budget
2017
Budget
2018 2019 2020 2021 2022
Investment &
Intergovernmental
Relations
Existing Clean Technology
Businesses Located in
Surrey
(Built Environments and
Neighbourhoods)
44 44 46 48 50 52 54
External Intergovernmental
Meetings
(Infrastructure)
37 33 36 39 41 44 47
Business visitations
(Economic Prosperity and
Livelihood)
145 145 155 165 165 165 165
- 186 -
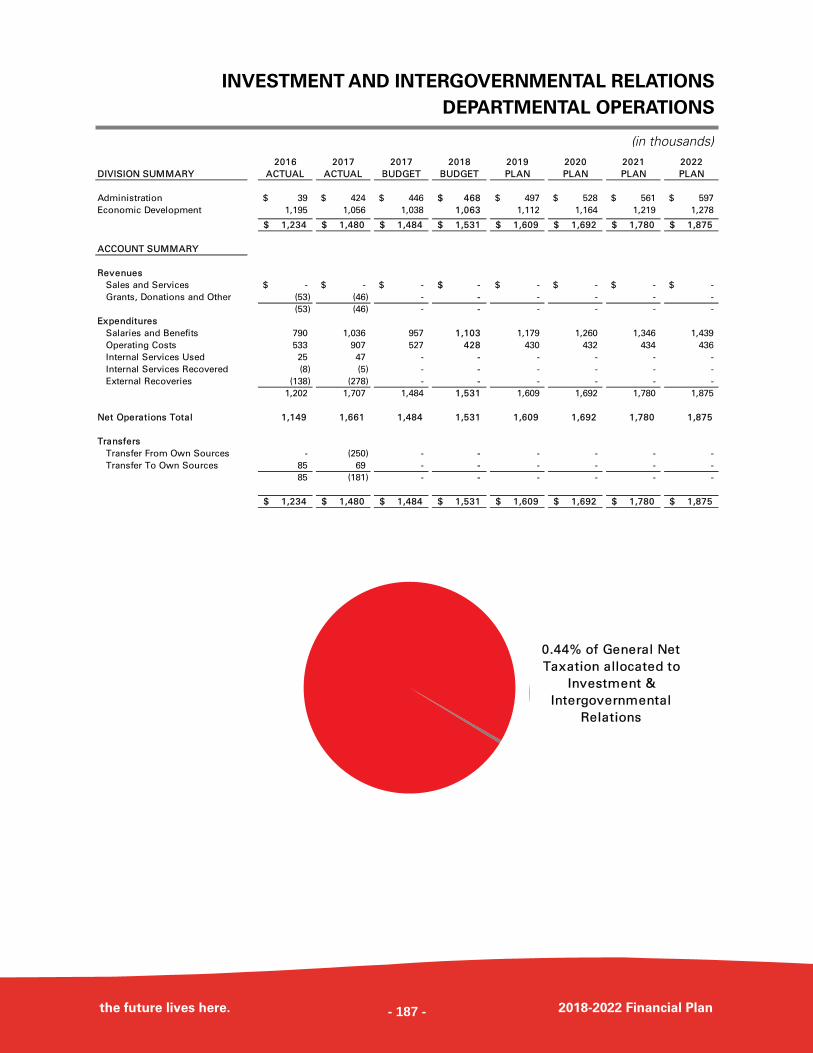
INVESTMENT AND INTERGOVERNMENTAL RELATIONS
DEPARTMENTAL OPERATIONS
the future lives here. 2018-2022 Financial Plan
(in thousands) 2016 2017 2017 2018 2019 2020 2021 2022
DIVISION SUMMARY ACTUAL ACTUAL BUDGET BUDGET PLAN PLAN PLAN PLAN
Administration 39$ 424$ 446$ 468$ 497$ 528$ 561$ 597$
Economic Development 1,195 1,056 1,038 1,063 1,112 1,164 1,219 1,278
1,234$ 1,480$ 1,484$ 1,531$ 1,609$ 1,692$ 1,780$ 1,875$
ACCOUNT SUMMARY
Revenues
Sales and Services -$ -$ -$ -$ -$ -$ -$ -$
Grants, Donations and Other (53) (46) - - - - - -
(53) (46) - - - - - -
Expenditures
Salaries and Benefits 790 1,036 957 1,103 1,179 1,260 1,346 1,439
Operating Costs 533 907 527 428 430 432 434 436
Internal Services Used 25 47 - - - - - -
Internal Services Recovered (8) (5) - - - - - -
External Recoveries (138) (278) - - - - - -
1,202 1,707 1,484 1,531 1,609 1,692 1,780 1,875
Net Operations Total 1,149 1,661 1,484 1,531 1,609 1,692 1,780 1,875
Transfers
Transfer From Own Sources - (250) - - - - - -
Transfer To Own Sources 85 69 - - - - - -
85 (181) - - - - - -
1,234$ 1,480$ 1,484$ 1,531$ 1,609$ 1,692$ 1,780$ 1,875$
0.44% of General Net
Taxation allocated to
Investment &
Intergovernmental
Relations
- 187 -
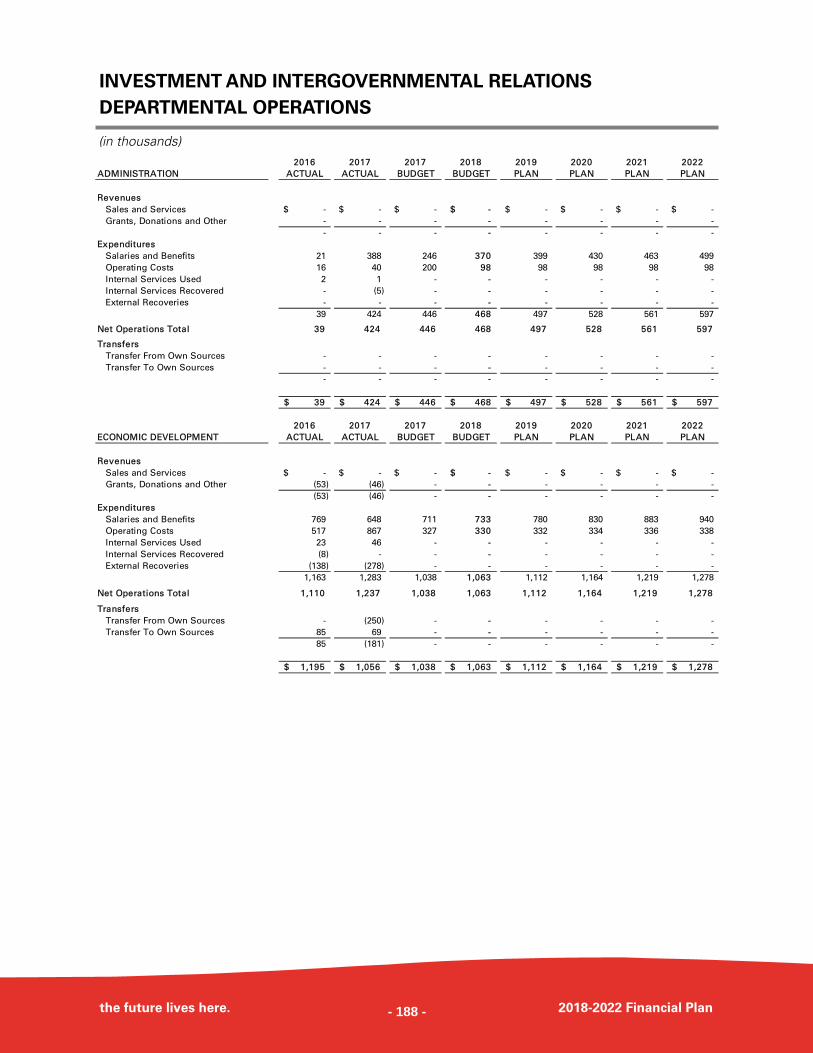
INVESTMENT AND INTERGOVERNMENTAL RELATIONS
DEPARTMENTAL OPERATIONS
the future lives here. 2018-2022 Financial Plan
(in thousands) 2016 2017 2017 2018 2019 2020 2021 2022
ADMINISTRATION ACTUAL ACTUAL BUDGET BUDGET PLAN PLAN PLAN PLAN
Revenues
Sales and Services -$ -$ -$ -$ -$ -$ -$ -$
Grants, Donations and Other - - - - - - - -
- - - - - - - -
Expenditures
Salaries and Benefits 21 388 246 370 399 430 463 499
Operating Costs 16 40 200 98 98 98 98 98
Internal Services Used 2 1 - - - - - -
Internal Services Recovered - (5) - - - - - -
External Recoveries - - - - - - - -
39 424 446 468 497 528 561 597
Net Operations Total 39 424 446 468 497 528 561 597
Transfers
Transfer From Own Sources - - - - - - - -
Transfer To Own Sources - - - - - - - -
- - - - - - - -
39$ 424$ 446$ 468$ 497$ 528$ 561$ 597$
2016 2017 2017 2018 2019 2020 2021 2022
ECONOMIC DEVELOPMENT ACTUAL ACTUAL BUDGET BUDGET PLAN PLAN PLAN PLAN
Revenues
Sales and Services -$ -$ -$ -$ -$ -$ -$ -$
Grants, Donations and Other (53) (46) - - - - - -
(53) (46) - - - - - -
Expenditures
Salaries and Benefits 769 648 711 733 780 830 883 940
Operating Costs 517 867 327 330 332 334 336 338
Internal Services Used 23 46 - - - - - -
Internal Services Recovered (8) - - - - - - -
External Recoveries (138) (278) - - - - - -
1,163 1,283 1,038 1,063 1,112 1,164 1,219 1,278
Net Operations Total 1,110 1,237 1,038 1,063 1,112 1,164 1,219 1,278
Transfers
Transfer From Own Sources - (250) - - - - - -
Transfer To Own Sources 85 69 - - - - - -
85 (181) - - - - - -
1,195$ 1,056$ 1,038$ 1,063$ 1,112$ 1,164$ 1,219$ 1,278$
- 188 -
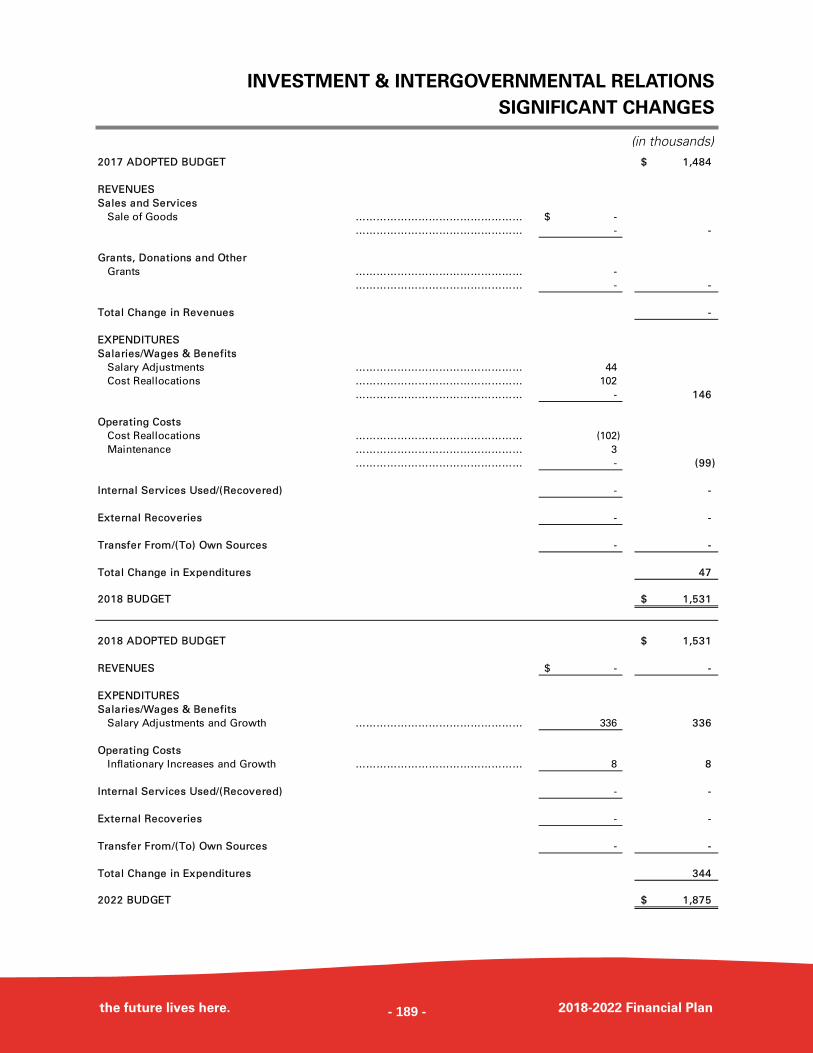
INVESTMENT & INTERGOVERNMENTAL RELATIONS
SIGNIFICANT CHANGES
the future lives here. 2018-2022 Financial Plan
(in thousands) 2017 ADOPTED BUDGET 1,484$
REVENUES
Sales and Services
Sale of Goods ………………………………………… -$
………………………………………… - -
Grants, Donations and Other
Grants ………………………………………… -
………………………………………… - -
Total Change in Revenues -
EXPENDITURES
Salaries/Wages & Benefits
Salary Adjustments ………………………………………… 44
Cost Reallocations ………………………………………… 102
………………………………………… - 146
Operating Costs
Cost Reallocations ………………………………………… (102)
Maintenance ………………………………………… 3
………………………………………… - (99)
Internal Services Used/(Recovered) - -
External Recoveries - -
Transfer From/(To) Own Sources - -
Total Change in Expenditures 47
2018 BUDGET 1,531$
2018 ADOPTED BUDGET 1,531$
REVENUES -$ -
EXPENDITURES
Salaries/Wages & Benefits
Salary Adjustments and Growth ………………………………………… 336 336
Operating Costs
Inflationary Increases and Growth ………………………………………… 8 8
Internal Services Used/(Recovered) - -
External Recoveries - -
Transfer From/(To) Own Sources - -
Total Change in Expenditures 344
2022 BUDGET 1,875$
- 189 -
- 190 -
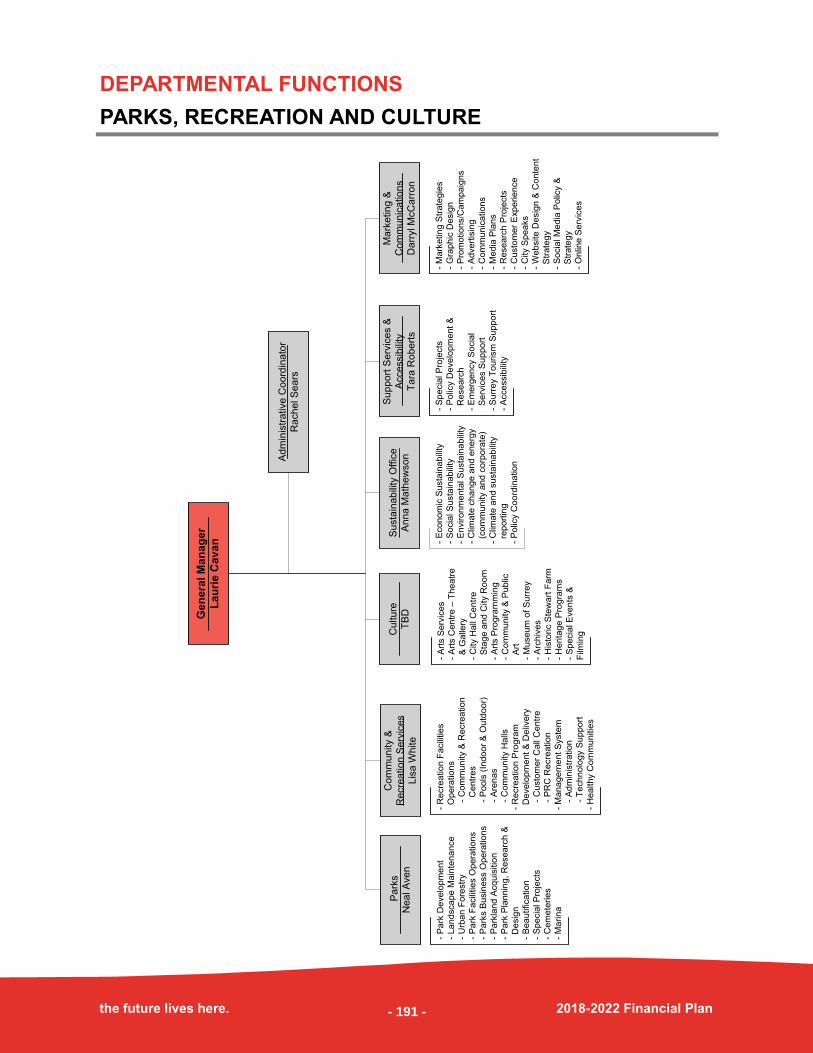
DEPARTMENTAL FUNCTIONS
PARKS, RECREATION AND CULTURE
the future lives here. 2018-2022 Financial Plan
Ge
ne
ral
Ma
na
ge
r
La
uri
e C
av
an
Pa
rks
Ne
al A
ve
n
Co
mm
un
ity &
Re
cre
atio
n S
erv
ice
s
Lis
a W
hite
Cu
ltu
re
TB
D
Ma
rke
tin
g &
Co
mm
un
ica
tio
ns
Da
rryl M
cC
arr
on
Ad
min
istr
ative
Co
ord
ina
tor
Ra
ch
el S
ea
rs
- A
rts S
erv
ice
s
- A
rts C
en
tre
– T
he
atr
e
&
Ga
llery
- C
ity H
all
Ce
ntr
e
S
tag
e a
nd
City R
oo
m
- A
rts P
rog
ram
min
g
- C
om
mu
nity &
Pu
blic
A
rt
- M
use
um
of S
urr
ey
- A
rch
ive
s
- H
isto
ric S
tew
art
Fa
rm
- H
erita
ge
Pro
gra
ms
- S
pe
cia
l E
ve
nts
&
Film
ing
- R
ecre
atio
n F
acili
tie
s
O
pe
ratio
ns
-
Co
mm
un
ity &
Re
cre
atio
n
C
en
tre
s
-
Po
ols
(In
do
or
& O
utd
oo
r)
-
Are
na
s
-
Co
mm
un
ity H
alls
- R
ecre
atio
n P
rog
ram
D
eve
lop
me
nt
& D
eliv
ery
-
Cu
sto
me
r C
all
Ce
ntr
e
-
PR
C R
ecre
atio
n
- M
an
ag
em
en
t S
yste
m
-
Ad
min
istr
atio
n
-
Te
ch
no
log
y S
up
po
rt
- H
ea
lth
y C
om
mu
nitie
s
- P
ark
De
ve
lop
me
nt
- L
an
dsca
pe
Ma
inte
na
nce
- U
rba
n F
ore
str
y
- P
ark
Fa
cili
tie
s O
pe
ratio
ns
- P
ark
s B
usin
ess O
pe
ratio
ns
- P
ark
lan
d A
cq
uis
itio
n
- P
ark
Pla
nn
ing
, R
ese
arc
h &
D
esig
n
- B
ea
utifica
tio
n
- S
pe
cia
l P
roje
cts
- C
em
ete
rie
s
- M
arin
a
- S
pe
cia
l P
roje
cts
- P
olic
y D
eve
lop
me
nt
&
R
ese
arc
h
- E
me
rge
ncy S
ocia
l
S
erv
ice
s S
up
po
rt
- S
urr
ey T
ou
rism
Su
pp
ort
- A
cce
ssib
ility
- M
ark
etin
g S
tra
teg
ies
- G
rap
hic
De
sig
n
- P
rom
otio
ns/C
am
pa
ign
s
- A
dve
rtis
ing
- C
om
mu
nic
atio
ns
- M
ed
ia P
lan
s
- R
ese
arc
h P
roje
cts
- C
usto
me
r E
xp
erie
nce
- C
ity S
pe
aks
- W
eb
site
De
sig
n &
Co
nte
nt
S
tra
teg
y
- S
ocia
l M
ed
ia P
olic
y &
S
tra
teg
y
- O
nlin
e S
erv
ice
s
Su
pp
ort
Se
rvic
es &
Acce
ssib
ility
Ta
ra R
ob
ert
s
Su
sta
ina
bili
ty O
ffic
e
An
na
Ma
the
wso
n
- E
co
no
mic
Su
sta
ina
bili
ty
- S
ocia
l S
usta
ina
bili
ty
- E
nviro
nm
en
tal S
usta
ina
bili
ty
- C
lima
te c
ha
ng
e a
nd
en
erg
y
(c
om
mu
nity a
nd
co
rpo
rate
)
- C
lima
te a
nd
su
sta
ina
bili
ty
re
po
rtin
g
- P
olic
y C
oo
rdin
atio
n
- 191 -
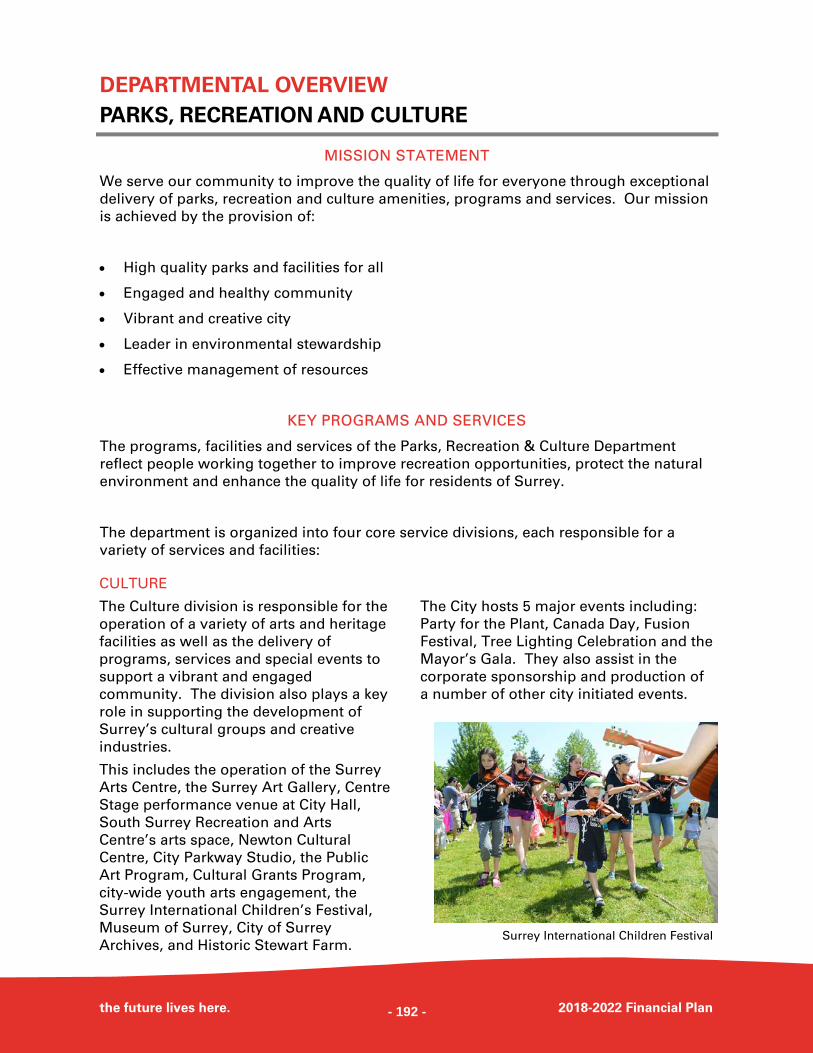
DEPARTMENTAL OVERVIEW
PARKS, RECREATION AND CULTURE
the future lives here. 2018-2022 Financial Plan
MISSION STATEMENT
We serve our community to improve the quality of life for everyone through exceptional
delivery of parks, recreation and culture amenities, programs and services. Our mission
is achieved by the provision of:
High quality parks and facilities for all
Engaged and healthy community
Vibrant and creative city
Leader in environmental stewardship
Effective management of resources
KEY PROGRAMS AND SERVICES
The programs, facilities and services of the Parks, Recreation & Culture Department
reflect people working together to improve recreation opportunities, protect the natural
environment and enhance the quality of life for residents of Surrey.
The department is organized into four core service divisions, each responsible for a
variety of services and facilities:
CULTURE
The Culture division is responsible for the
operation of a variety of arts and heritage
facilities as well as the delivery of
programs, services and special events to
support a vibrant and engaged
community. The division also plays a key
role in supporting the development of
Surrey’s cultural groups and creative
industries.
This includes the operation of the Surrey
Arts Centre, the Surrey Art Gallery, Centre
Stage performance venue at City Hall,
South Surrey Recreation and Arts
Centre’s arts space, Newton Cultural
Centre, City Parkway Studio, the Public
Art Program, Cultural Grants Program,
city-wide youth arts engagement, the
Surrey International Children’s Festival,
Museum of Surrey, City of Surrey
Archives, and Historic Stewart Farm.
The City hosts 5 major events including:
Party for the Plant, Canada Day, Fusion
Festival, Tree Lighting Celebration and the
Mayor’s Gala. They also assist in the
corporate sponsorship and production of
a number of other city initiated events.
Surrey International Children Festival
- 192 -
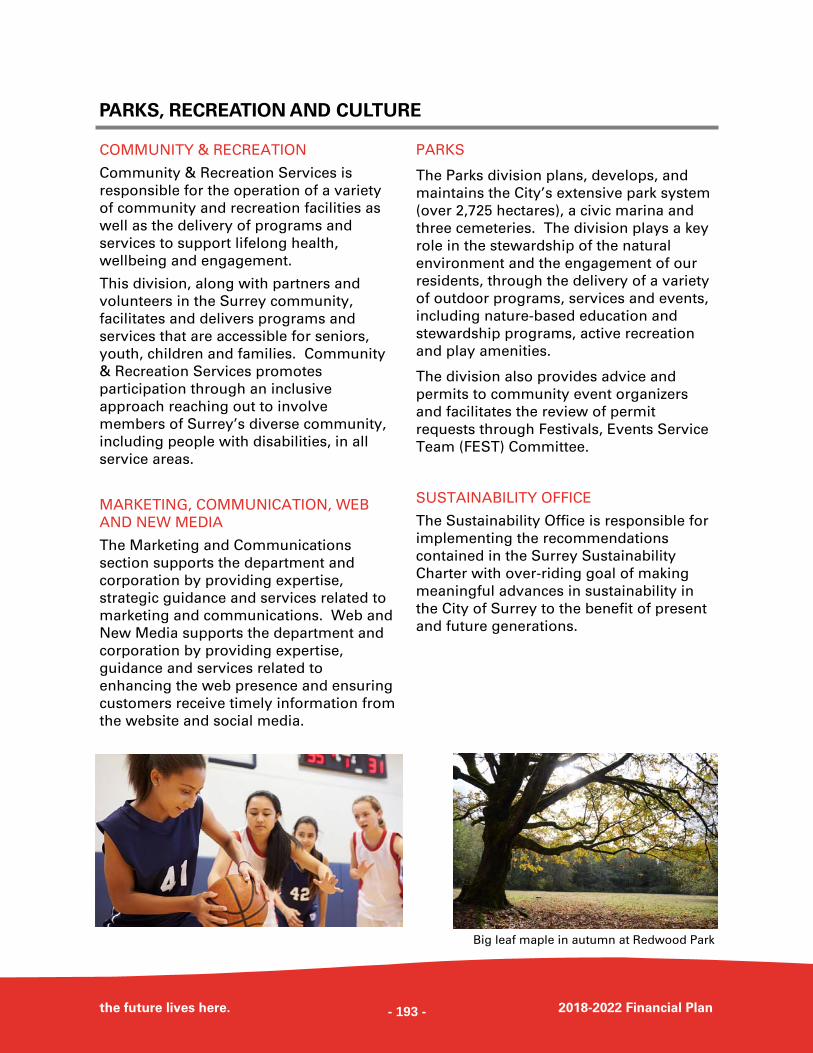
PARKS, RECREATION AND CULTURE
the future lives here. 2018-2022 Financial Plan
COMMUNITY & RECREATION
Community & Recreation Services is
responsible for the operation of a variety
of community and recreation facilities as
well as the delivery of programs and
services to support lifelong health,
wellbeing and engagement.
This division, along with partners and
volunteers in the Surrey community,
facilitates and delivers programs and
services that are accessible for seniors,
youth, children and families. Community
& Recreation Services promotes
participation through an inclusive
approach reaching out to involve
members of Surrey’s diverse community,
including people with disabilities, in all
service areas.
MARKETING, COMMUNICATION, WEB
AND NEW MEDIA
The Marketing and Communications
section supports the department and
corporation by providing expertise,
strategic guidance and services related to
marketing and communications. Web and
New Media supports the department and
corporation by providing expertise,
guidance and services related to
enhancing the web presence and ensuring
customers receive timely information from
the website and social media.
PARKS
The Parks division plans, develops, and
maintains the City’s extensive park system
(over 2,725 hectares), a civic marina and
three cemeteries. The division plays a key
role in the stewardship of the natural
environment and the engagement of our
residents, through the delivery of a variety
of outdoor programs, services and events,
including nature-based education and
stewardship programs, active recreation
and play amenities.
The division also provides advice and
permits to community event organizers
and facilitates the review of permit
requests through Festivals, Events Service
Team (FEST) Committee.
SUSTAINABILITY OFFICE
The Sustainability Office is responsible for
implementing the recommendations
contained in the Surrey Sustainability
Charter with over-riding goal of making
meaningful advances in sustainability in
the City of Surrey to the benefit of present
and future generations.
Big leaf maple in autumn at Redwood Park
- 193 -
PARKS, RECREATION AND CULTURE
the future lives here. 2018-2022 Financial Plan
2017 ACCOMPLISHMENTS
Accessibility and Inclusion supported
over 200 children with 1-1 support in
programs. This support assured that
children could successfully participate
in a variety of programs including
Spring break and Summer camps,
swimming lessons, skating lessons and
other social recreation programs; and
The Settlement Services in Recreation
Centre (SSiRC) program that is offered
in 4 town centres, helped more than
2,500 newcomer clients with much
needed settlement services (in 7
languages) regarding questions about
employment, childcare and education.
In the 2016-2017 school year, 4 Girls
Got Game programs were delivered in
the Guildford and Newton community
with 43 girls participating;
The Premier announced that the
Provincial Government will provide
$500,000 annually to the Wrap Program
to help reduce or end the program
waitlist;
In 2017, 45% of participants in the
WRAParound program were connected
to City of Surrey recreation
opportunities; and
A new pathway for WRAParound youth
to volunteer with the City of Surrey was
created resulting in 23 volunteers.
INCLUSION
PUBLIC SAFETY
BUILT ENVIRONMENT & NEIGHBOURHOODS
In collaboration with volunteers from
the North Surrey Action Team, Chuck
Bailey installed a permanent
community garden next to the facility.
There are currently 14 plots in this
garden;
With Finance, continued to develop a
sustainability implementation fund
granting program for the community,
focused on the Sustainability Charter
2.0 themes; and
Successfully obtained FCM project
funding and launched the Newton
Sustainability in Action pilot planning
process, to develop a neighbourhood
sustainability action plan in
collaboration with the Newton
community.
- 194 -
PARKS, RECREATION AND CULTURE
the future lives here. 2018-2022 Financial Plan
Hosted 62 Provincial events/adventure
races, 9 Regional/Western Canada
events, 4 National events and 4
International events as part of our Sport
Tourism Strategy;
Surrey has had a 632% increase in the
number of film days since 2011 and a
280% increase in the number of film
permits issued since 2010;
Surrey welcomed large productions to
our community, issuing a record
number of 179 film permits for more
than 271 days of filming including titles
such as Deadpool 2, Riverdale, The
Good Doctor, and Skyscraper featuring
Dwayne “The Rock” Johnson; and
Completed ISO 37120 (sustainable cities
and quality of life) re-certification with
support from Engineering.
ECONOMIC PROSPERITY & LIVELIHOODS
There were several new park openings including, Godwin Park Biodiversity Preserve
Park in May, Oak Meadows Park in June, Bose Forest Park and Forsyth Park in
October.
ECOSYSTEMS
EDUCATION & CULTURE
In celebration of Canada’s 150th
anniversary of confederation, the City of
Surrey honoured this historic birthday
by showcasing our national pride and
civic pride with premier concerts,
festivals and community events
throughout our City. These events
include the 7th Annual Party for the
Planet, Canada Day, Surrey
International Children’s Festival and the
10th Annual Fusion Festival;
Historic Stewart Farm in South Surrey
hosted an event featuring the award
winning “Re-enactors” performance
troupe with live music, entertainment,
food, fun and games;
The Surrey Art Gallery hosted a Canada
150 presentation and exhibition
“Canada 150: Art by Surrey Students”,
where over 2,000 Surrey students
participated;
Heritage Services worked with the
Surrey Heritage Advisory Commission
and award-winning author K. Jane Watt
on a Canada 150 book project called
“Surrey: A City of Stories”;
Restoration of the Surrey Centennial
Totem Pole at the Municipal campus
was completed;
Unveiled the Fern Façade at the Newton
Wave Pool;
- 195 -
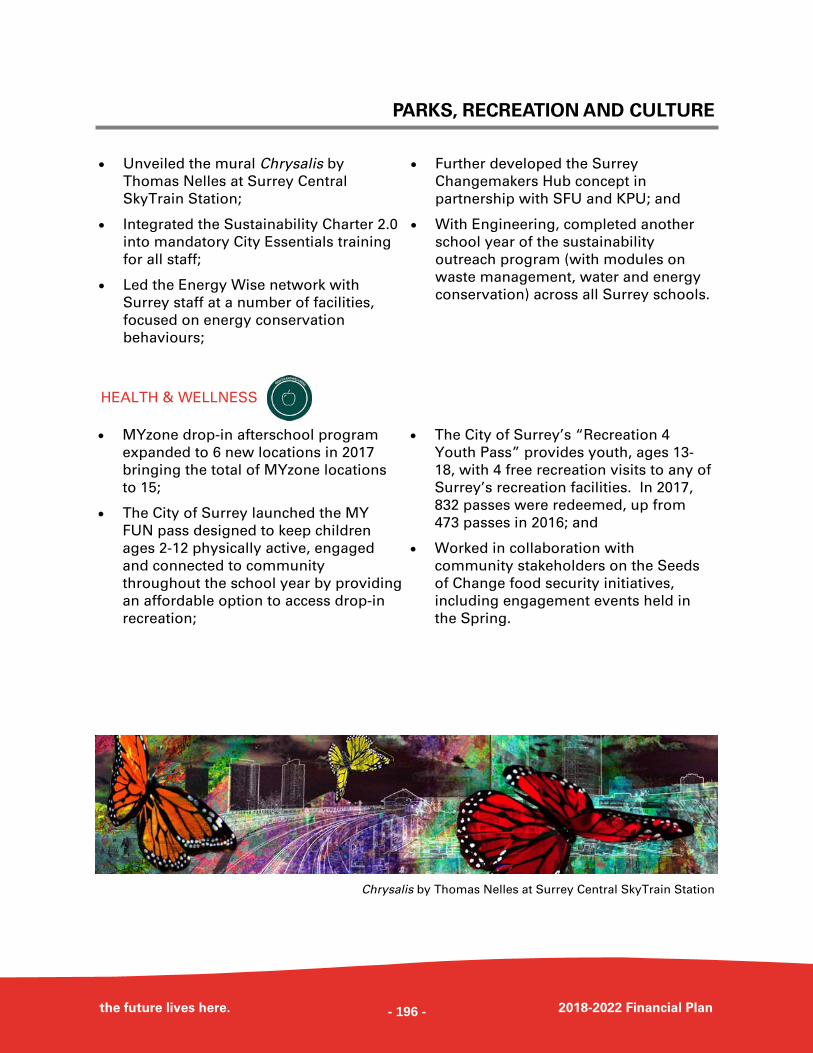
PARKS, RECREATION AND CULTURE
the future lives here. 2018-2022 Financial Plan
Unveiled the mural Chrysalis by
Thomas Nelles at Surrey Central
SkyTrain Station;
Integrated the Sustainability Charter 2.0
into mandatory City Essentials training
for all staff;
Led the Energy Wise network with
Surrey staff at a number of facilities,
focused on energy conservation
behaviours;
Further developed the Surrey
Changemakers Hub concept in
partnership with SFU and KPU; and
With Engineering, completed another
school year of the sustainability
outreach program (with modules on
waste management, water and energy
conservation) across all Surrey schools.
MYzone drop-in afterschool program
expanded to 6 new locations in 2017
bringing the total of MYzone locations
to 15;
The City of Surrey launched the MY
FUN pass designed to keep children
ages 2-12 physically active, engaged
and connected to community
throughout the school year by providing
an affordable option to access drop-in
recreation;
The City of Surrey’s “Recreation 4
Youth Pass” provides youth, ages 13-
18, with 4 free recreation visits to any of
Surrey’s recreation facilities. In 2017,
832 passes were redeemed, up from
473 passes in 2016; and
Worked in collaboration with
community stakeholders on the Seeds
of Change food security initiatives,
including engagement events held in
the Spring.
HEALTH & WELLNESS
Chrysalis by Thomas Nelles at Surrey Central SkyTrain Station
- 196 -
PARKS, RECREATION AND CULTURE
the future lives here. 2018-2022 Financial Plan
City Parkway Studio, operated through
a partnership agreement between the
City, the Royal Canadian Theatre
Company, and Streetrich Hip Hop
Society, opened in Spring 2017;
Planning and initial construction of
Phase II of the Surrey Museum began;
Completed lifecycle replacement of two
water parks, South Surrey Athletic Park
and Cloverdale Athletic Park, and seized
the opportunity to reduce water
consumption while increasing play
value to users;
Completed a dog off-leash park in
Forsyth Park, further advancing the plan
for increasing off-leash spaces across
the City;
Completed lifecycle replacement of
synthetic turf field #1 as well as a new
synthetic turf field at Cloverdale Athletic
Park, extending the life of this field for
the next 15 years;
Completed final design of Cloverdale
and North Surrey Sport & Ice
Complexes;
Participated in the development of the
BC Energy Step Code for better building
energy efficiency;
Supported the City’s efforts to build a
passive house-standard Clayton
community hub building;
Supported the City’s successful
applicants for Municipal Climate
Innovation Program (MCIP) climate-
related project funding, including for the
Coastal Flood Adaptation Strategy;
Successfully obtained a Natural
Resources Canada innovation grant of
$1.3 million for the Clayton Hub
community building;
Formed a partnership with Portland
State University to begin urban heat
mapping of the City, with a view to
future climate adaptation work in this
area;
Reached the final Milestone 5 in the
ICLEI Building Adaptive and Resilience
Communities (BARC) process for
climate adaptation, and Milestone 5 the
FMC Partners for Climate Protection
program for GHG reductions;
Completed all required climate
reporting as part of the commitment to
the Global Covenant of Mayors; and
Obtained partnership funding from
utilities for two new staff positions
focused on energy (for corporate energy
and emissions, and for community
natural gas/renewable natural gas
opportunities).
INFRASTRUCTURE
Girls Got Game program
- 197 -
PARKS, RECREATION AND CULTURE
the future lives here. 2018-2022 Financial Plan
FUTURE INITIATIVES, GOALS & OBJECTIVES
Create a process for accessibility audits and grant requests to be reviewed through
the Rick Hansen Foundation at all recreation facilities, Historic Stewart Farm, Surrey
Archives, Surrey Arts Centre and Don Christian Park.
Roll out the Young Adults Employment Program where youth will gain course work,
certifications, and job skills in the recreation sector through an unpaid internship
where they will be mentored by City of Surrey staff.
INCLUSION
BUILT ENVIRONMENT & NEIGHBOURHOODS
Unveiling of artwork commissioned for
West Village Park and Energy Plant;
Launch of Indigenous public art
initiatives;
Make enhancements to the Private
Development Public Art Program;
Public art commissions for the North
Surrey Ice and Sport Complex,
Cloverdale Ice and Sport Complex,
Clayton Community Centre, South
Surrey Operations Centre and the
Surrey Museum;
Completed the Newton Sustainability in
Action pilot planning process (to
develop a neighbourhood sustainability
action plan in collaboration with the
Newton community) and assess the
applicability of this concept to other
neighbourhoods; and
Bring to Council a proposal for the
sustainability implementation fund
granting program for the community,
focused on the Charter 2.0 themes.
ECONOMIC PROSPERITY & LIVELIHOODS
ECOSYSTEMS
Manage key sensitive ecosystems as
biodiversity preserves including Fergus
Watershed and Godwin Biodiversity
Reserve;
Plant 4,000 shade trees on streets in
parks;
Develop a concept plan for the
Nicomekl riverfront; and
Designate the Charles Richardson
Nature Reserve as a biodiversity
preserve and develop an environmental
management plan for the site.
- 198 -
PARKS, RECREATION AND CULTURE
the future lives here. 2018-2022 Financial Plan
EDUCATION & CULTURE
HEALTH & WELLNESS
Celebration of the 50th Anniversary of
Surrey Arts Centre Main Stage;
Expansion of participatory youth
programs;
Begin strategic business planning to
prepare for Surrey Art Gallery 2.0, the
transition into the Interactive Art
Museum;
Major 2018 exhibitions planned include
a travelling show on Indigenous
contemporary art from India and a
national survey of contemporary textile
art;
Surrey Art Gallery to receive major
grant funding to support youth
programming;
Implementation of recommendations
from the cultural grant review for the
2019 grant cycle;
Program planning and outreach
underway for Clayton Community
Centre arts programs;
Expanded Indigenous programming for
the Surrey International Children’s
Festival including ticketed
performances, daily performances on
community spirit stage and hands on
art making activity led by Indigenous
artists;
Continue to lead the Energy Wise
network with Surrey staff at a number
of facilities, focused on energy
conservation behaviours;
Finalize the Surrey Changemakers Hub
concept in partnership with SFU and
KPU; and
With Engineering, complete another
school year of the sustainability
outreach program (with modules on
waste management, water and energy
conservation) across all Surrey schools.
Launch Active PLAYces Street Play
program;
Continue to support meaningful ways to
involve volunteers in the work of the
department through the servicing of a
range of volunteer opportunities. This
work will include, but is not limited to, a
commitment to the review of
management systems and practices, the
development of resources (i.e. toolkits,
training) and campaigns that
demonstrate the impact of our
community volunteers (i.e. National
Volunteer Week, Volunteer of the
Month);
Develop internal and external
partnerships to support key focus areas
of the Afterschool for All Strategy;
Launch new Peer Mentorship Program
designed to improve services to
children ages 10-14 by offering a
mentorship opportunity that is
developmentally supportive and
captures their interest; and
Continue to work in collaboration with
community stakeholders on the Seeds
of Change food security initiative in
Newton and Guildford.
- 199 -
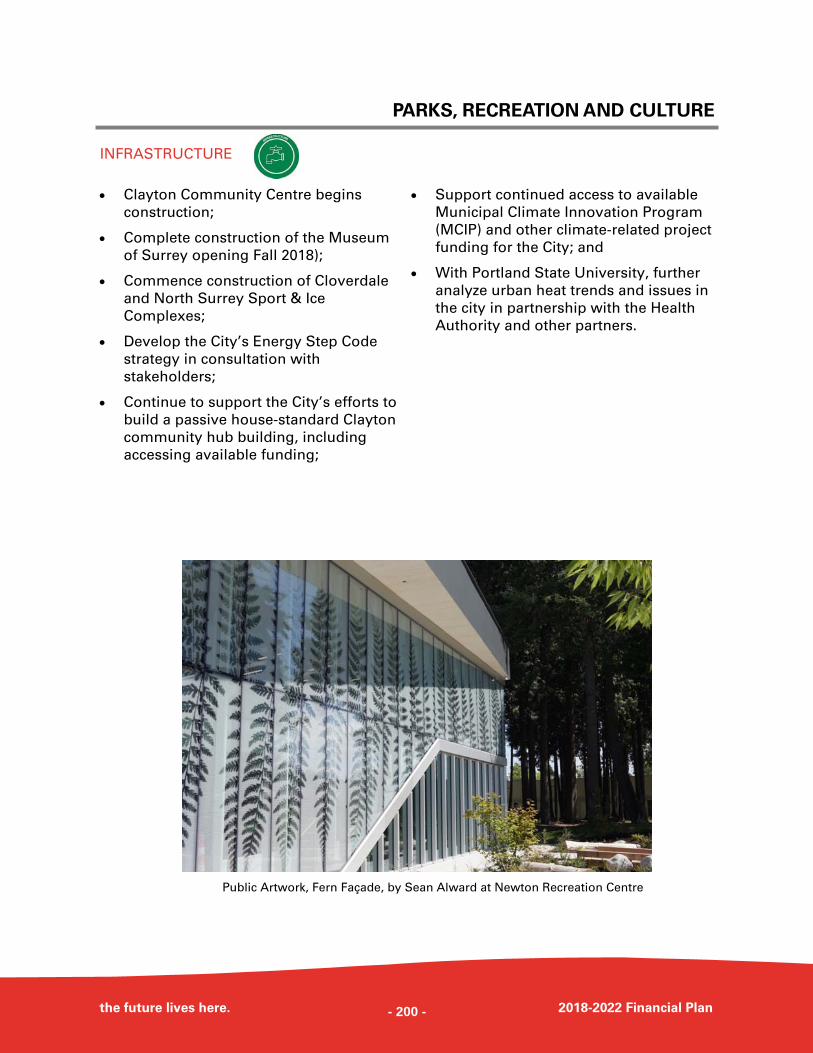
PARKS, RECREATION AND CULTURE
the future lives here. 2018-2022 Financial Plan
Clayton Community Centre begins
construction;
Complete construction of the Museum
of Surrey opening Fall 2018);
Commence construction of Cloverdale
and North Surrey Sport & Ice
Complexes;
Develop the City’s Energy Step Code
strategy in consultation with
stakeholders;
Continue to support the City’s efforts to
build a passive house-standard Clayton
community hub building, including
accessing available funding;
Support continued access to available
Municipal Climate Innovation Program
(MCIP) and other climate-related project
funding for the City; and
With Portland State University, further
analyze urban heat trends and issues in
the city in partnership with the Health
Authority and other partners.
INFRASTRUCTURE
Public Artwork, Fern Façade, by Sean Alward at Newton Recreation Centre
- 200 -
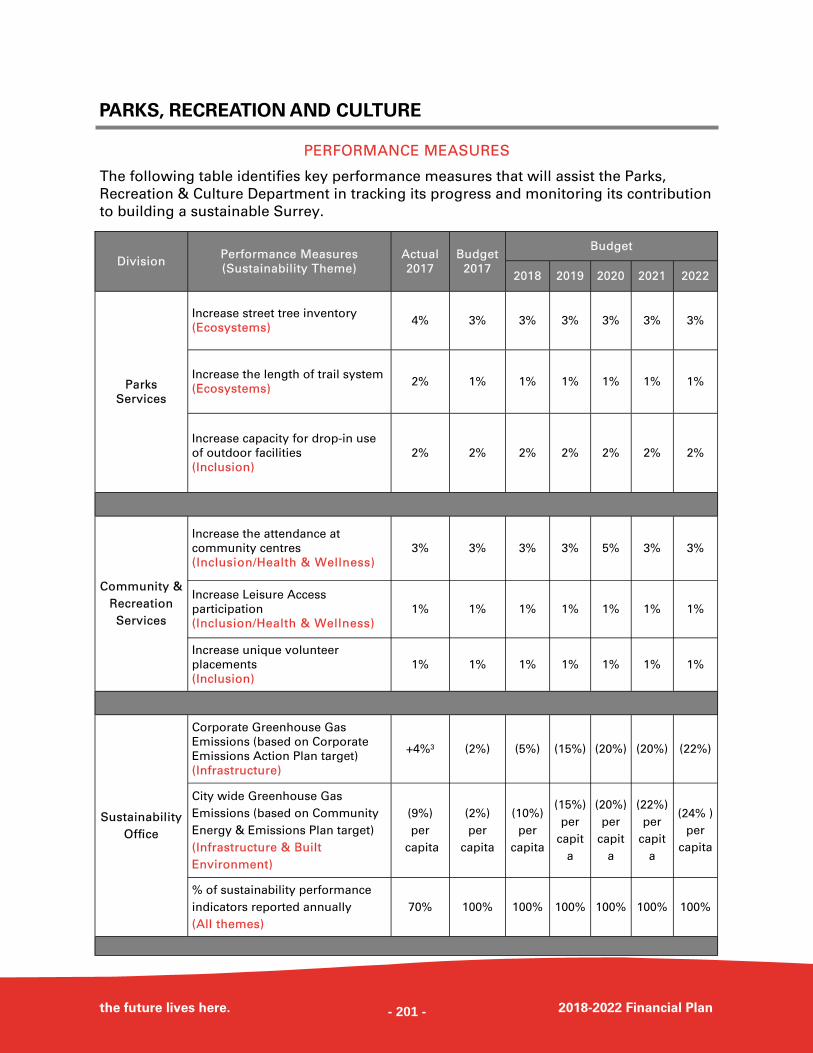
PARKS, RECREATION AND CULTURE
the future lives here. 2018-2022 Financial Plan
PERFORMANCE MEASURES
The following table identifies key performance measures that will assist the Parks,
Recreation & Culture Department in tracking its progress and monitoring its contribution
to building a sustainable Surrey.
Division Performance Measures
(Sustainability Theme)
Actual
2017
Budget
2017
Budget
2018 2019 2020 2021 2022
Parks
Services
Increase street tree inventory
(Ecosystems) 4% 3% 3% 3% 3% 3% 3%
Increase the length of trail system
(Ecosystems) 2% 1% 1% 1% 1% 1% 1%
Increase capacity for drop-in use
of outdoor facilities
(Inclusion)
2% 2% 2% 2% 2% 2% 2%
Community &
Recreation
Services
Increase the attendance at
community centres
(Inclusion/Health & Wellness) 3% 3% 3% 3% 5% 3% 3%
Increase Leisure Access
participation
(Inclusion/Health & Wellness)
1% 1% 1% 1% 1% 1% 1%
Increase unique volunteer
placements
(Inclusion)
1% 1% 1% 1% 1% 1% 1%
Sustainability
Office
Corporate Greenhouse Gas
Emissions (based on Corporate
Emissions Action Plan target)
(Infrastructure)
+4%3 (2%) (5%) (15%) (20%) (20%) (22%)
City wide Greenhouse Gas
Emissions (based on Community
Energy & Emissions Plan target)
(Infrastructure & Built
Environment)
(9%)
per
capita
(2%)
per
capita
(10%)
per
capita
(15%)
per
capit
a
(20%)
per
capit
a
(22%)
per
capit
a
(24% )
per
capita
% of sustainability performance
indicators reported annually
(All themes)
70% 100% 100% 100% 100% 100% 100%
- 201 -
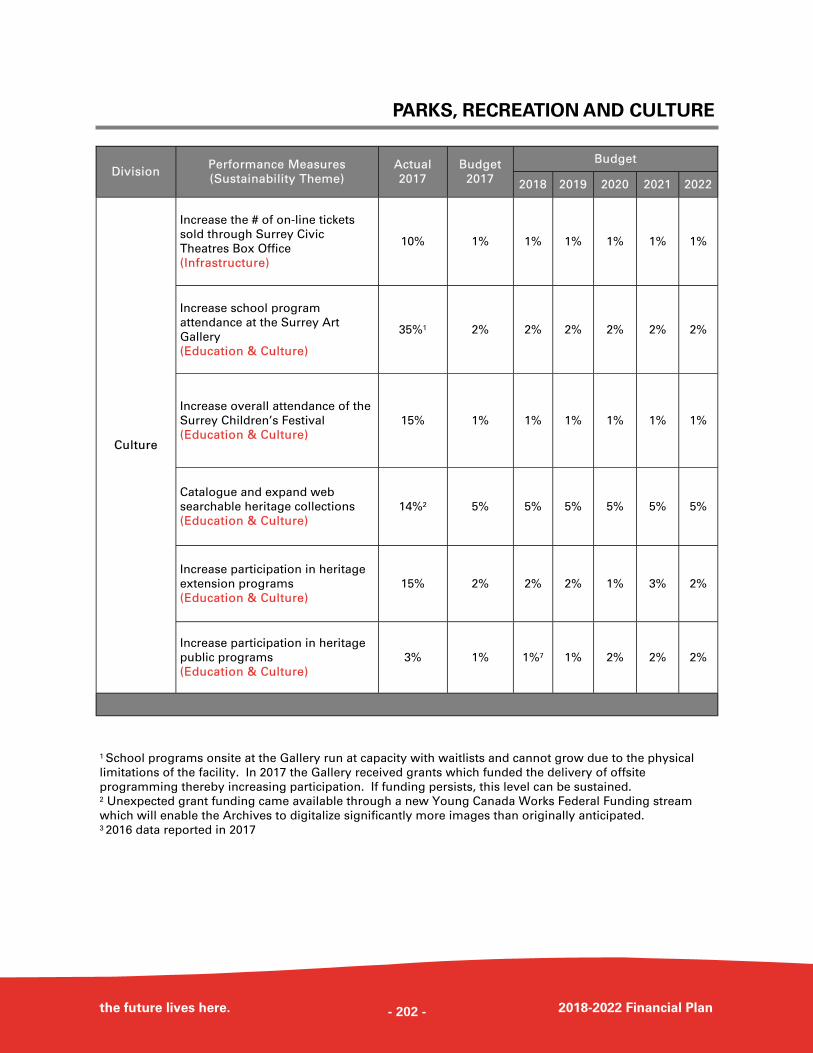
PARKS, RECREATION AND CULTURE
the future lives here. 2018-2022 Financial Plan
1 School programs onsite at the Gallery run at capacity with waitlists and cannot grow due to the physical
limitations of the facility. In 2017 the Gallery received grants which funded the delivery of offsite
programming thereby increasing participation. If funding persists, this level can be sustained. 2 Unexpected grant funding came available through a new Young Canada Works Federal Funding stream
which will enable the Archives to digitalize significantly more images than originally anticipated. 3 2016 data reported in 2017
Division Performance Measures
(Sustainability Theme)
Actual
2017
Budget
2017
Budget
2018 2019 2020 2021 2022
Increase the # of on-line tickets
sold through Surrey Civic
Theatres Box Office
(Infrastructure)
10% 1% 1% 1% 1% 1% 1%
Increase school program
attendance at the Surrey Art
Gallery
(Education & Culture)
35%1 2% 2% 2% 2% 2% 2%
Increase overall attendance of the
Surrey Children’s Festival
(Education & Culture)
15% 1% 1% 1% 1% 1% 1%
Catalogue and expand web
searchable heritage collections
(Education & Culture)
14%2
5%
5%
5%
5%
5%
5%
Increase participation in heritage
extension programs
(Education & Culture)
15% 2% 2% 2% 1% 3% 2%
Increase participation in heritage
public programs
(Education & Culture)
3% 1% 1%7 1% 2% 2% 2%
Culture
- 202 -
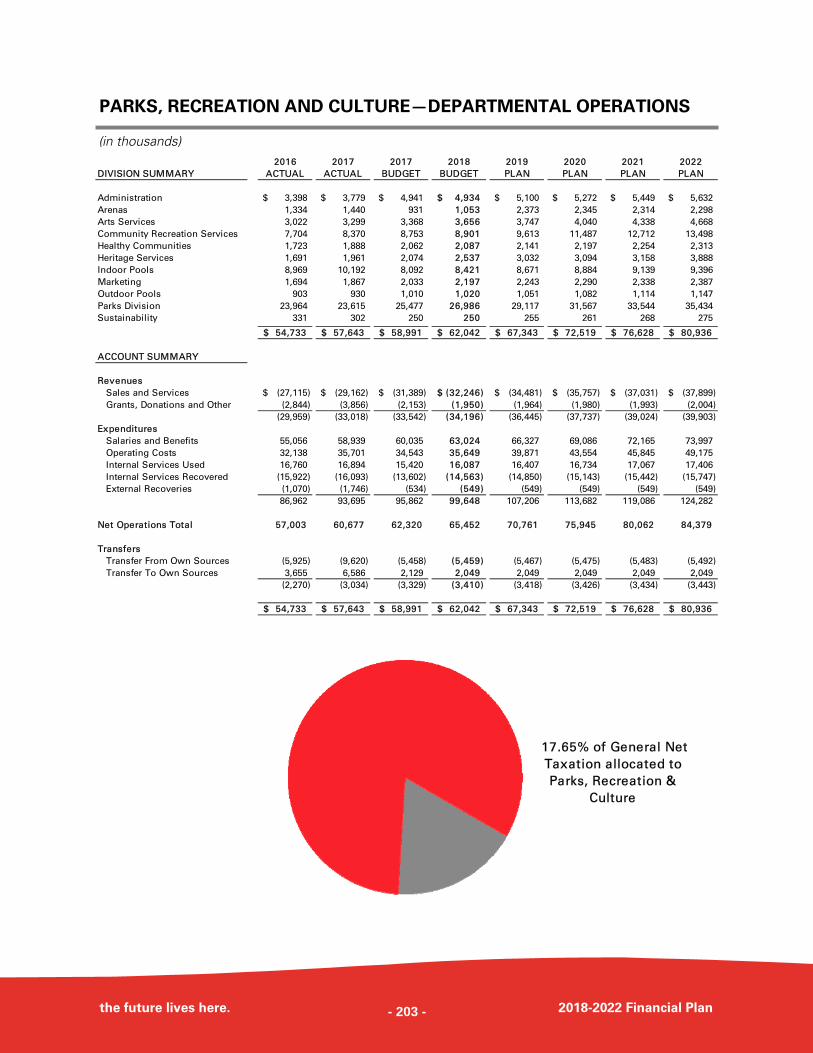
PARKS, RECREATION AND CULTURE—DEPARTMENTAL OPERATIONS
the future lives here. 2018-2022 Financial Plan
(in thousands) 2016 2017 2017 2018 2019 2020 2021 2022
DIVISION SUMMARY ACTUAL ACTUAL BUDGET BUDGET PLAN PLAN PLAN PLAN
Administration 3,398$ 3,779$ 4,941$ 4,934$ 5,100$ 5,272$ 5,449$ 5,632$
Arenas 1,334 1,440 931 1,053 2,373 2,345 2,314 2,298
Arts Services 3,022 3,299 3,368 3,656 3,747 4,040 4,338 4,668
Community Recreation Services 7,704 8,370 8,753 8,901 9,613 11,487 12,712 13,498
Healthy Communities 1,723 1,888 2,062 2,087 2,141 2,197 2,254 2,313
Heritage Services 1,691 1,961 2,074 2,537 3,032 3,094 3,158 3,888
Indoor Pools 8,969 10,192 8,092 8,421 8,671 8,884 9,139 9,396
Marketing 1,694 1,867 2,033 2,197 2,243 2,290 2,338 2,387
Outdoor Pools 903 930 1,010 1,020 1,051 1,082 1,114 1,147
Parks Division 23,964 23,615 25,477 26,986 29,117 31,567 33,544 35,434
Sustainability 331 302 250 250 255 261 268 275
54,733$ 57,643$ 58,991$ 62,042$ 67,343$ 72,519$ 76,628$ 80,936$
ACCOUNT SUMMARY
Revenues
Sales and Services (27,115)$ (29,162)$ (31,389)$ (32,246)$ (34,481)$ (35,757)$ (37,031)$ (37,899)$
Grants, Donations and Other (2,844) (3,856) (2,153) (1,950) (1,964) (1,980) (1,993) (2,004)
(29,959) (33,018) (33,542) (34,196) (36,445) (37,737) (39,024) (39,903)
Expenditures
Salaries and Benefits 55,056 58,939 60,035 63,024 66,327 69,086 72,165 73,997
Operating Costs 32,138 35,701 34,543 35,649 39,871 43,554 45,845 49,175
Internal Services Used 16,760 16,894 15,420 16,087 16,407 16,734 17,067 17,406
Internal Services Recovered (15,922) (16,093) (13,602) (14,563) (14,850) (15,143) (15,442) (15,747)
External Recoveries (1,070) (1,746) (534) (549) (549) (549) (549) (549)
86,962 93,695 95,862 99,648 107,206 113,682 119,086 124,282
Net Operations Total 57,003 60,677 62,320 65,452 70,761 75,945 80,062 84,379
Transfers
Transfer From Own Sources (5,925) (9,620) (5,458) (5,459) (5,467) (5,475) (5,483) (5,492)
Transfer To Own Sources 3,655 6,586 2,129 2,049 2,049 2,049 2,049 2,049
(2,270) (3,034) (3,329) (3,410) (3,418) (3,426) (3,434) (3,443)
54,733$ 57,643$ 58,991$ 62,042$ 67,343$ 72,519$ 76,628$ 80,936$
17.65% of General Net
Taxation allocated to
Parks, Recreation &
Culture
- 203 -
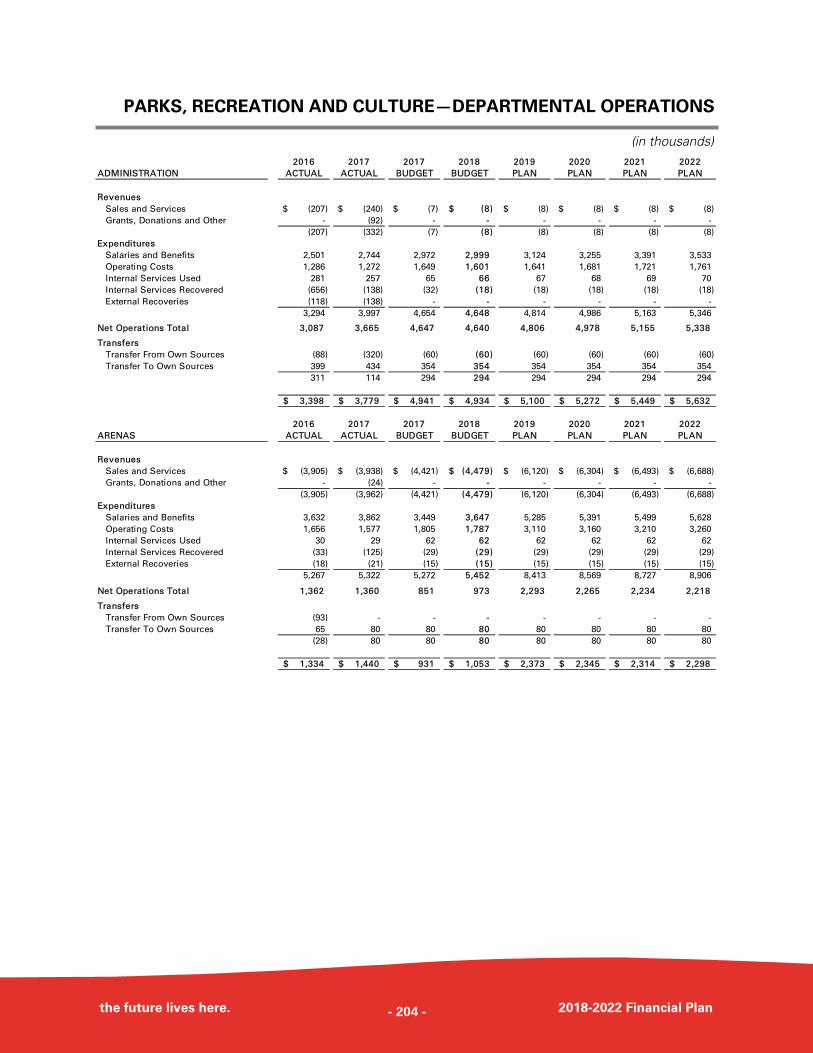
PARKS, RECREATION AND CULTURE—DEPARTMENTAL OPERATIONS
the future lives here. 2018-2022 Financial Plan
(in thousands) 2016 2017 2017 2018 2019 2020 2021 2022
ADMINISTRATION ACTUAL ACTUAL BUDGET BUDGET PLAN PLAN PLAN PLAN
Revenues
Sales and Services (207)$ (240)$ (7)$ (8)$ (8)$ (8)$ (8)$ (8)$
Grants, Donations and Other - (92) - - - - - -
(207) (332) (7) (8) (8) (8) (8) (8)
Expenditures
Salaries and Benefits 2,501 2,744 2,972 2,999 3,124 3,255 3,391 3,533
Operating Costs 1,286 1,272 1,649 1,601 1,641 1,681 1,721 1,761
Internal Services Used 281 257 65 66 67 68 69 70
Internal Services Recovered (656) (138) (32) (18) (18) (18) (18) (18)
External Recoveries (118) (138) - - - - - -
3,294 3,997 4,654 4,648 4,814 4,986 5,163 5,346
Net Operations Total 3,087 3,665 4,647 4,640 4,806 4,978 5,155 5,338
Transfers
Transfer From Own Sources (88) (320) (60) (60) (60) (60) (60) (60)
Transfer To Own Sources 399 434 354 354 354 354 354 354
311 114 294 294 294 294 294 294
3,398$ 3,779$ 4,941$ 4,934$ 5,100$ 5,272$ 5,449$ 5,632$
2016 2017 2017 2018 2019 2020 2021 2022
ARENAS ACTUAL ACTUAL BUDGET BUDGET PLAN PLAN PLAN PLAN
Revenues
Sales and Services (3,905)$ (3,938)$ (4,421)$ (4,479)$ (6,120)$ (6,304)$ (6,493)$ (6,688)$
Grants, Donations and Other - (24) - - - - - -
(3,905) (3,962) (4,421) (4,479) (6,120) (6,304) (6,493) (6,688)
Expenditures
Salaries and Benefits 3,632 3,862 3,449 3,647 5,285 5,391 5,499 5,628
Operating Costs 1,656 1,577 1,805 1,787 3,110 3,160 3,210 3,260
Internal Services Used 30 29 62 62 62 62 62 62
Internal Services Recovered (33) (125) (29) (29) (29) (29) (29) (29)
External Recoveries (18) (21) (15) (15) (15) (15) (15) (15)
5,267 5,322 5,272 5,452 8,413 8,569 8,727 8,906
Net Operations Total 1,362 1,360 851 973 2,293 2,265 2,234 2,218
Transfers
Transfer From Own Sources (93) - - - - - - -
Transfer To Own Sources 65 80 80 80 80 80 80 80
(28) 80 80 80 80 80 80 80
1,334$ 1,440$ 931$ 1,053$ 2,373$ 2,345$ 2,314$ 2,298$
- 204 -
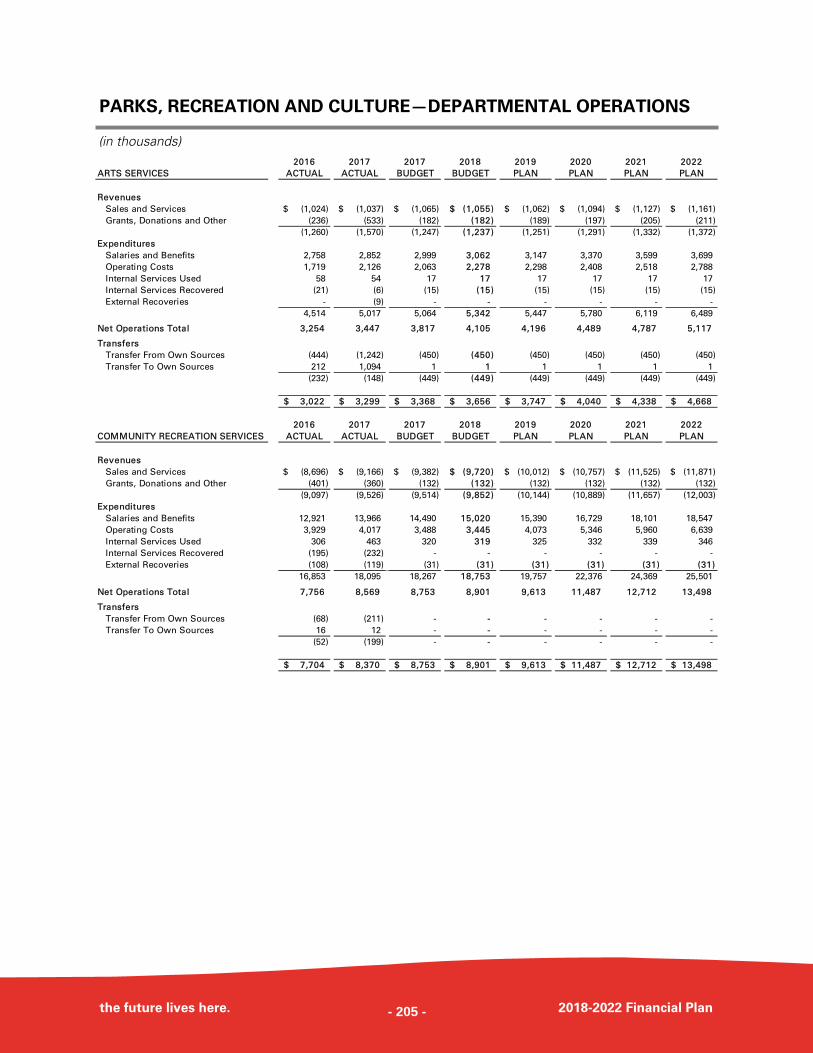
PARKS, RECREATION AND CULTURE—DEPARTMENTAL OPERATIONS
the future lives here. 2018-2022 Financial Plan
(in thousands) 2016 2017 2017 2018 2019 2020 2021 2022
ARTS SERVICES ACTUAL ACTUAL BUDGET BUDGET PLAN PLAN PLAN PLAN
Revenues
Sales and Services (1,024)$ (1,037)$ (1,065)$ (1,055)$ (1,062)$ (1,094)$ (1,127)$ (1,161)$
Grants, Donations and Other (236) (533) (182) (182) (189) (197) (205) (211)
(1,260) (1,570) (1,247) (1,237) (1,251) (1,291) (1,332) (1,372)
Expenditures
Salaries and Benefits 2,758 2,852 2,999 3,062 3,147 3,370 3,599 3,699
Operating Costs 1,719 2,126 2,063 2,278 2,298 2,408 2,518 2,788
Internal Services Used 58 54 17 17 17 17 17 17
Internal Services Recovered (21) (6) (15) (15) (15) (15) (15) (15)
External Recoveries - (9) - - - - - -
4,514 5,017 5,064 5,342 5,447 5,780 6,119 6,489
Net Operations Total 3,254 3,447 3,817 4,105 4,196 4,489 4,787 5,117
Transfers
Transfer From Own Sources (444) (1,242) (450) (450) (450) (450) (450) (450)
Transfer To Own Sources 212 1,094 1 1 1 1 1 1
(232) (148) (449) (449) (449) (449) (449) (449)
3,022$ 3,299$ 3,368$ 3,656$ 3,747$ 4,040$ 4,338$ 4,668$
2016 2017 2017 2018 2019 2020 2021 2022
COMMUNITY RECREATION SERVICES ACTUAL ACTUAL BUDGET BUDGET PLAN PLAN PLAN PLAN
Revenues
Sales and Services (8,696)$ (9,166)$ (9,382)$ (9,720)$ (10,012)$ (10,757)$ (11,525)$ (11,871)$
Grants, Donations and Other (401) (360) (132) (132) (132) (132) (132) (132)
(9,097) (9,526) (9,514) (9,852) (10,144) (10,889) (11,657) (12,003)
Expenditures
Salaries and Benefits 12,921 13,966 14,490 15,020 15,390 16,729 18,101 18,547
Operating Costs 3,929 4,017 3,488 3,445 4,073 5,346 5,960 6,639
Internal Services Used 306 463 320 319 325 332 339 346
Internal Services Recovered (195) (232) - - - - - -
External Recoveries (108) (119) (31) (31) (31) (31) (31) (31)
16,853 18,095 18,267 18,753 19,757 22,376 24,369 25,501
Net Operations Total 7,756 8,569 8,753 8,901 9,613 11,487 12,712 13,498
Transfers
Transfer From Own Sources (68) (211) - - - - - -
Transfer To Own Sources 16 12 - - - - - -
(52) (199) - - - - - -
7,704$ 8,370$ 8,753$ 8,901$ 9,613$ 11,487$ 12,712$ 13,498$
- 205 -
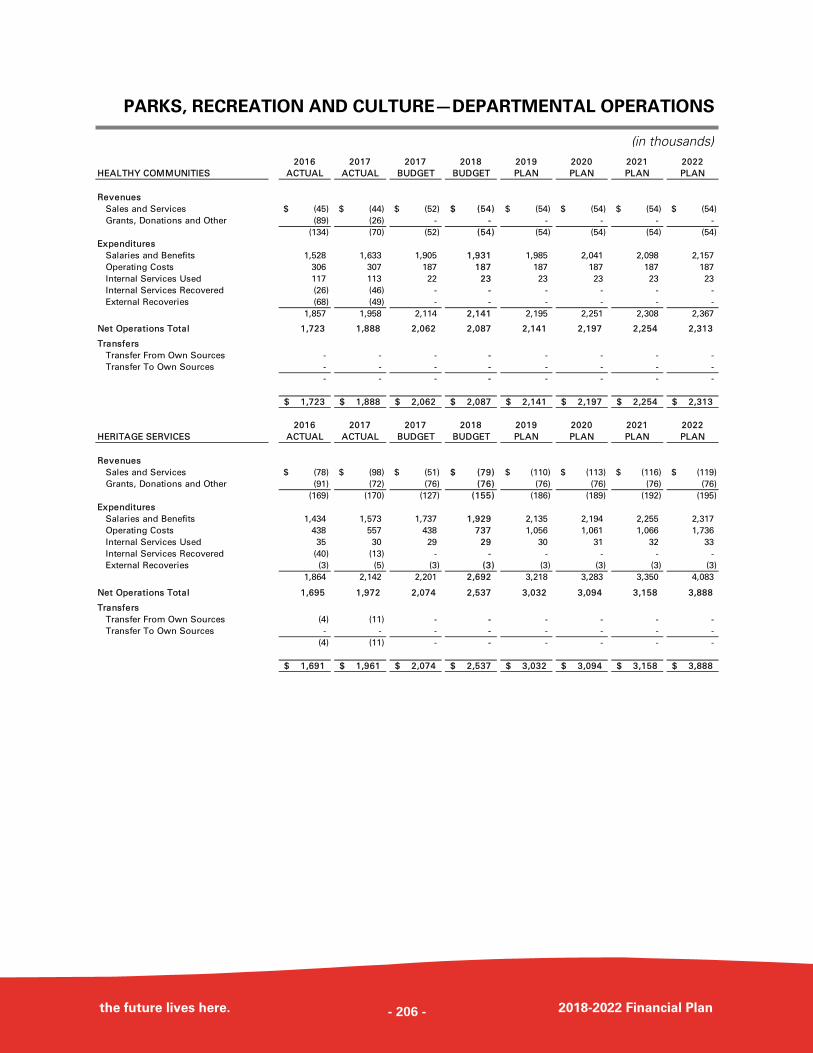
PARKS, RECREATION AND CULTURE—DEPARTMENTAL OPERATIONS
the future lives here. 2018-2022 Financial Plan
(in thousands) 2016 2017 2017 2018 2019 2020 2021 2022
HEALTHY COMMUNITIES ACTUAL ACTUAL BUDGET BUDGET PLAN PLAN PLAN PLAN
Revenues
Sales and Services (45)$ (44)$ (52)$ (54)$ (54)$ (54)$ (54)$ (54)$
Grants, Donations and Other (89) (26) - - - - - -
(134) (70) (52) (54) (54) (54) (54) (54)
Expenditures
Salaries and Benefits 1,528 1,633 1,905 1,931 1,985 2,041 2,098 2,157
Operating Costs 306 307 187 187 187 187 187 187
Internal Services Used 117 113 22 23 23 23 23 23
Internal Services Recovered (26) (46) - - - - - -
External Recoveries (68) (49) - - - - - -
1,857 1,958 2,114 2,141 2,195 2,251 2,308 2,367
Net Operations Total 1,723 1,888 2,062 2,087 2,141 2,197 2,254 2,313
Transfers
Transfer From Own Sources - - - - - - - -
Transfer To Own Sources - - - - - - - -
- - - - - - - -
1,723$ 1,888$ 2,062$ 2,087$ 2,141$ 2,197$ 2,254$ 2,313$
2016 2017 2017 2018 2019 2020 2021 2022
HERITAGE SERVICES ACTUAL ACTUAL BUDGET BUDGET PLAN PLAN PLAN PLAN
Revenues
Sales and Services (78)$ (98)$ (51)$ (79)$ (110)$ (113)$ (116)$ (119)$
Grants, Donations and Other (91) (72) (76) (76) (76) (76) (76) (76)
(169) (170) (127) (155) (186) (189) (192) (195)
Expenditures
Salaries and Benefits 1,434 1,573 1,737 1,929 2,135 2,194 2,255 2,317
Operating Costs 438 557 438 737 1,056 1,061 1,066 1,736
Internal Services Used 35 30 29 29 30 31 32 33
Internal Services Recovered (40) (13) - - - - - -
External Recoveries (3) (5) (3) (3) (3) (3) (3) (3)
1,864 2,142 2,201 2,692 3,218 3,283 3,350 4,083
Net Operations Total 1,695 1,972 2,074 2,537 3,032 3,094 3,158 3,888
Transfers
Transfer From Own Sources (4) (11) - - - - - -
Transfer To Own Sources - - - - - - - -
(4) (11) - - - - - -
1,691$ 1,961$ 2,074$ 2,537$ 3,032$ 3,094$ 3,158$ 3,888$
- 206 -
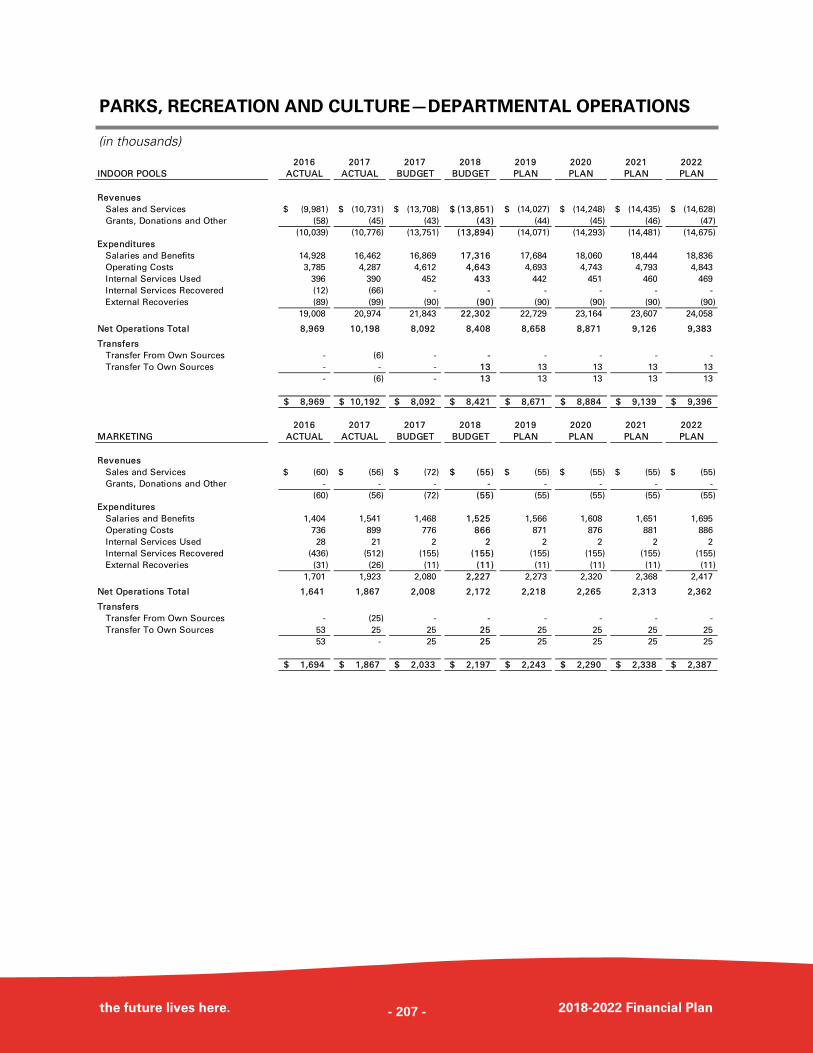
PARKS, RECREATION AND CULTURE—DEPARTMENTAL OPERATIONS
the future lives here. 2018-2022 Financial Plan
(in thousands) 2016 2017 2017 2018 2019 2020 2021 2022
INDOOR POOLS ACTUAL ACTUAL BUDGET BUDGET PLAN PLAN PLAN PLAN
Revenues
Sales and Services (9,981)$ (10,731)$ (13,708)$ (13,851)$ (14,027)$ (14,248)$ (14,435)$ (14,628)$
Grants, Donations and Other (58) (45) (43) (43) (44) (45) (46) (47)
(10,039) (10,776) (13,751) (13,894) (14,071) (14,293) (14,481) (14,675)
Expenditures
Salaries and Benefits 14,928 16,462 16,869 17,316 17,684 18,060 18,444 18,836
Operating Costs 3,785 4,287 4,612 4,643 4,693 4,743 4,793 4,843
Internal Services Used 396 390 452 433 442 451 460 469
Internal Services Recovered (12) (66) - - - - - -
External Recoveries (89) (99) (90) (90) (90) (90) (90) (90)
19,008 20,974 21,843 22,302 22,729 23,164 23,607 24,058
Net Operations Total 8,969 10,198 8,092 8,408 8,658 8,871 9,126 9,383
Transfers
Transfer From Own Sources - (6) - - - - - -
Transfer To Own Sources - - - 13 13 13 13 13
- (6) - 13 13 13 13 13
8,969$ 10,192$ 8,092$ 8,421$ 8,671$ 8,884$ 9,139$ 9,396$
2016 2017 2017 2018 2019 2020 2021 2022
MARKETING ACTUAL ACTUAL BUDGET BUDGET PLAN PLAN PLAN PLAN
Revenues
Sales and Services (60)$ (56)$ (72)$ (55)$ (55)$ (55)$ (55)$ (55)$
Grants, Donations and Other - - - - - - - -
(60) (56) (72) (55) (55) (55) (55) (55)
Expenditures
Salaries and Benefits 1,404 1,541 1,468 1,525 1,566 1,608 1,651 1,695
Operating Costs 736 899 776 866 871 876 881 886
Internal Services Used 28 21 2 2 2 2 2 2
Internal Services Recovered (436) (512) (155) (155) (155) (155) (155) (155)
External Recoveries (31) (26) (11) (11) (11) (11) (11) (11)
1,701 1,923 2,080 2,227 2,273 2,320 2,368 2,417
Net Operations Total 1,641 1,867 2,008 2,172 2,218 2,265 2,313 2,362
Transfers
Transfer From Own Sources - (25) - - - - - -
Transfer To Own Sources 53 25 25 25 25 25 25 25
53 - 25 25 25 25 25 25
1,694$ 1,867$ 2,033$ 2,197$ 2,243$ 2,290$ 2,338$ 2,387$
- 207 -
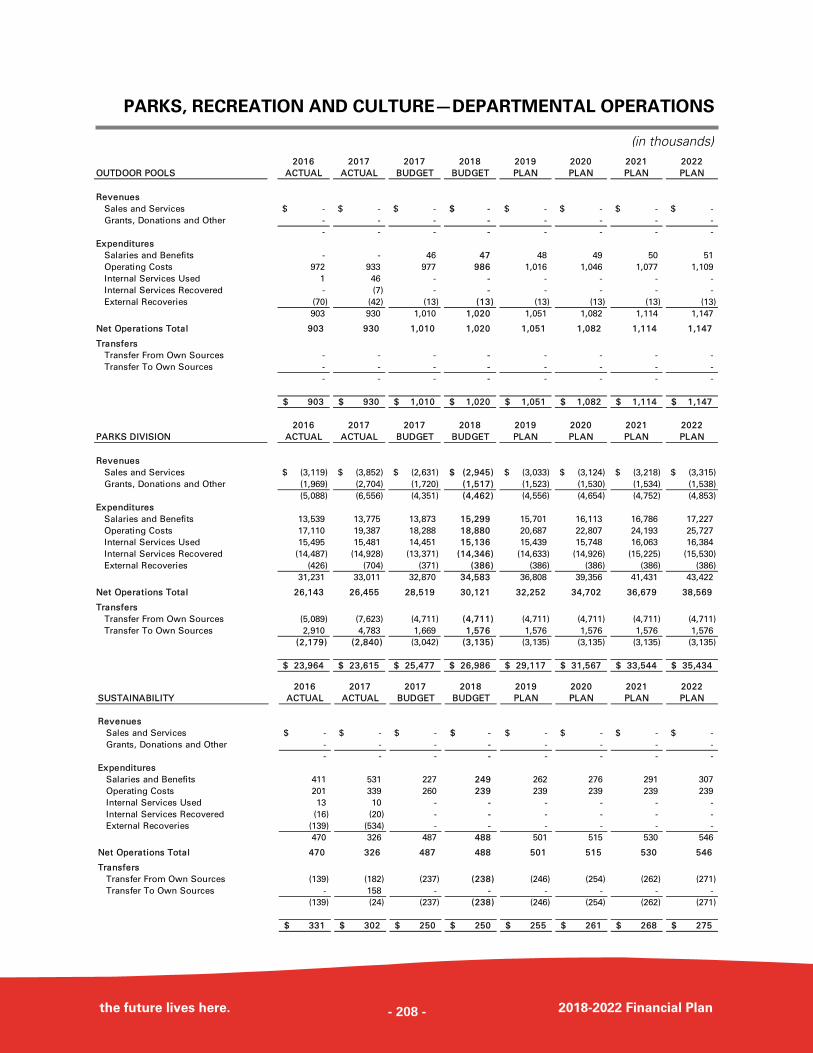
PARKS, RECREATION AND CULTURE—DEPARTMENTAL OPERATIONS
the future lives here. 2018-2022 Financial Plan
(in thousands) 2016 2017 2017 2018 2019 2020 2021 2022
OUTDOOR POOLS ACTUAL ACTUAL BUDGET BUDGET PLAN PLAN PLAN PLAN
Revenues
Sales and Services -$ -$ -$ -$ -$ -$ -$ -$
Grants, Donations and Other - - - - - - - -
- - - - - - - -
Expenditures
Salaries and Benefits - - 46 47 48 49 50 51
Operating Costs 972 933 977 986 1,016 1,046 1,077 1,109
Internal Services Used 1 46 - - - - - -
Internal Services Recovered - (7) - - - - - -
External Recoveries (70) (42) (13) (13) (13) (13) (13) (13)
903 930 1,010 1,020 1,051 1,082 1,114 1,147
Net Operations Total 903 930 1,010 1,020 1,051 1,082 1,114 1,147
Transfers
Transfer From Own Sources - - - - - - - -
Transfer To Own Sources - - - - - - - -
- - - - - - - -
903$ 930$ 1,010$ 1,020$ 1,051$ 1,082$ 1,114$ 1,147$
2016 2017 2017 2018 2019 2020 2021 2022
PARKS DIVISION ACTUAL ACTUAL BUDGET BUDGET PLAN PLAN PLAN PLAN
Revenues
Sales and Services (3,119)$ (3,852)$ (2,631)$ (2,945)$ (3,033)$ (3,124)$ (3,218)$ (3,315)$
Grants, Donations and Other (1,969) (2,704) (1,720) (1,517) (1,523) (1,530) (1,534) (1,538)
(5,088) (6,556) (4,351) (4,462) (4,556) (4,654) (4,752) (4,853)
Expenditures
Salaries and Benefits 13,539 13,775 13,873 15,299 15,701 16,113 16,786 17,227
Operating Costs 17,110 19,387 18,288 18,880 20,687 22,807 24,193 25,727
Internal Services Used 15,495 15,481 14,451 15,136 15,439 15,748 16,063 16,384
Internal Services Recovered (14,487) (14,928) (13,371) (14,346) (14,633) (14,926) (15,225) (15,530)
External Recoveries (426) (704) (371) (386) (386) (386) (386) (386)
31,231 33,011 32,870 34,583 36,808 39,356 41,431 43,422
Net Operations Total 26,143 26,455 28,519 30,121 32,252 34,702 36,679 38,569
Transfers
Transfer From Own Sources (5,089) (7,623) (4,711) (4,711) (4,711) (4,711) (4,711) (4,711)
Transfer To Own Sources 2,910 4,783 1,669 1,576 1,576 1,576 1,576 1,576
(2,179) (2,840) (3,042) (3,135) (3,135) (3,135) (3,135) (3,135)
23,964$ 23,615$ 25,477$ 26,986$ 29,117$ 31,567$ 33,544$ 35,434$
2016 2017 2017 2018 2019 2020 2021 2022
SUSTAINABILITY ACTUAL ACTUAL BUDGET BUDGET PLAN PLAN PLAN PLAN
Revenues
Sales and Services -$ -$ -$ -$ -$ -$ -$ -$
Grants, Donations and Other - - - - - - - -
- - - - - - - -
Expenditures
Salaries and Benefits 411 531 227 249 262 276 291 307
Operating Costs 201 339 260 239 239 239 239 239
Internal Services Used 13 10 - - - - - -
Internal Services Recovered (16) (20) - - - - - -
External Recoveries (139) (534) - - - - - -
470 326 487 488 501 515 530 546
Net Operations Total 470 326 487 488 501 515 530 546
Transfers
Transfer From Own Sources (139) (182) (237) (238) (246) (254) (262) (271)
Transfer To Own Sources - 158 - - - - - -
(139) (24) (237) (238) (246) (254) (262) (271)
331$ 302$ 250$ 250$ 255$ 261$ 268$ 275$
- 208 -
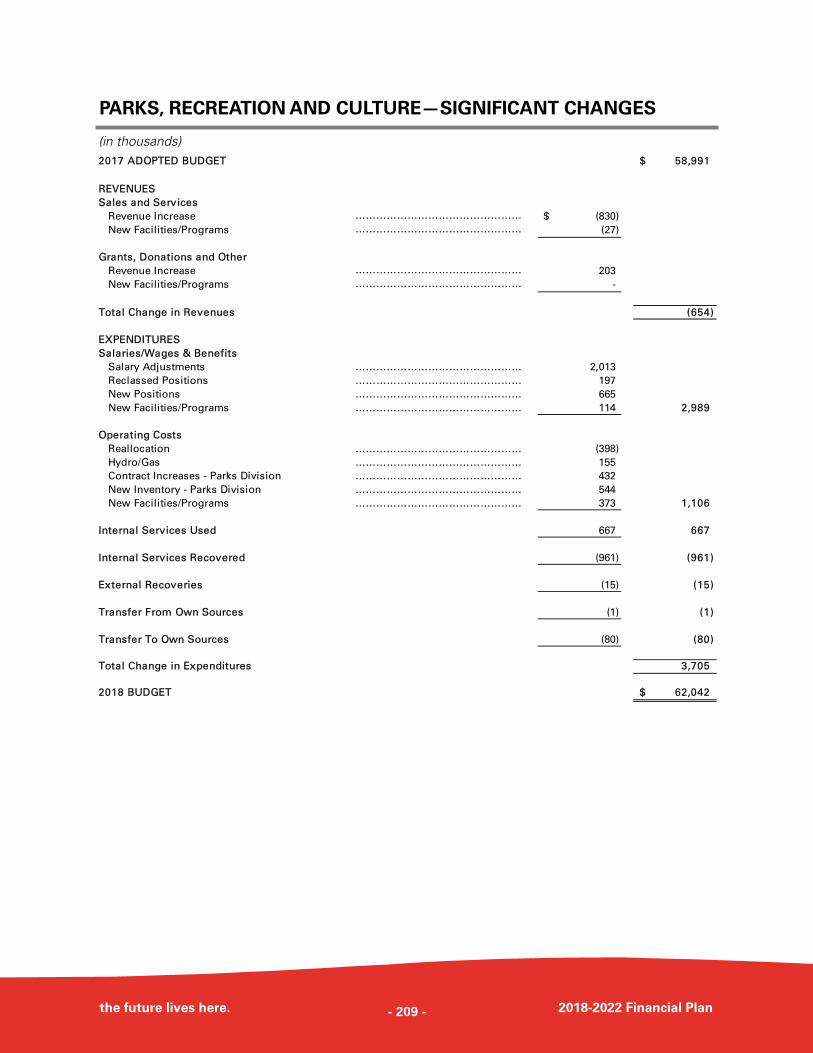
PARKS, RECREATION AND CULTURE—SIGNIFICANT CHANGES
the future lives here. 2018-2022 Financial Plan
(in thousands) 2017 ADOPTED BUDGET 58,991$
REVENUES
Sales and Services
Revenue Increase ………………………………………… (830)$
New Facilities/Programs ………………………………………… (27)
Grants, Donations and Other
Revenue Increase ………………………………………… 203
New Facilities/Programs ………………………………………… -
Total Change in Revenues (654)
EXPENDITURES
Salaries/Wages & Benefits
Salary Adjustments ………………………………………… 2,013
Reclassed Positions ………………………………………… 197
New Positions ………………………………………… 665
New Facilities/Programs ………………………………………… 114 2,989
Operating Costs
Reallocation ………………………………………… (398)
Hydro/Gas ………………………………………… 155
Contract Increases - Parks Division ………………………………………… 432
New Inventory - Parks Division ………………………………………… 544
New Facilities/Programs ………………………………………… 373 1,106
Internal Services Used 667 667
Internal Services Recovered (961) (961)
External Recoveries (15) (15)
Transfer From Own Sources (1) (1)
Transfer To Own Sources (80) (80)
Total Change in Expenditures 3,705
2018 BUDGET 62,042$
- 209 -
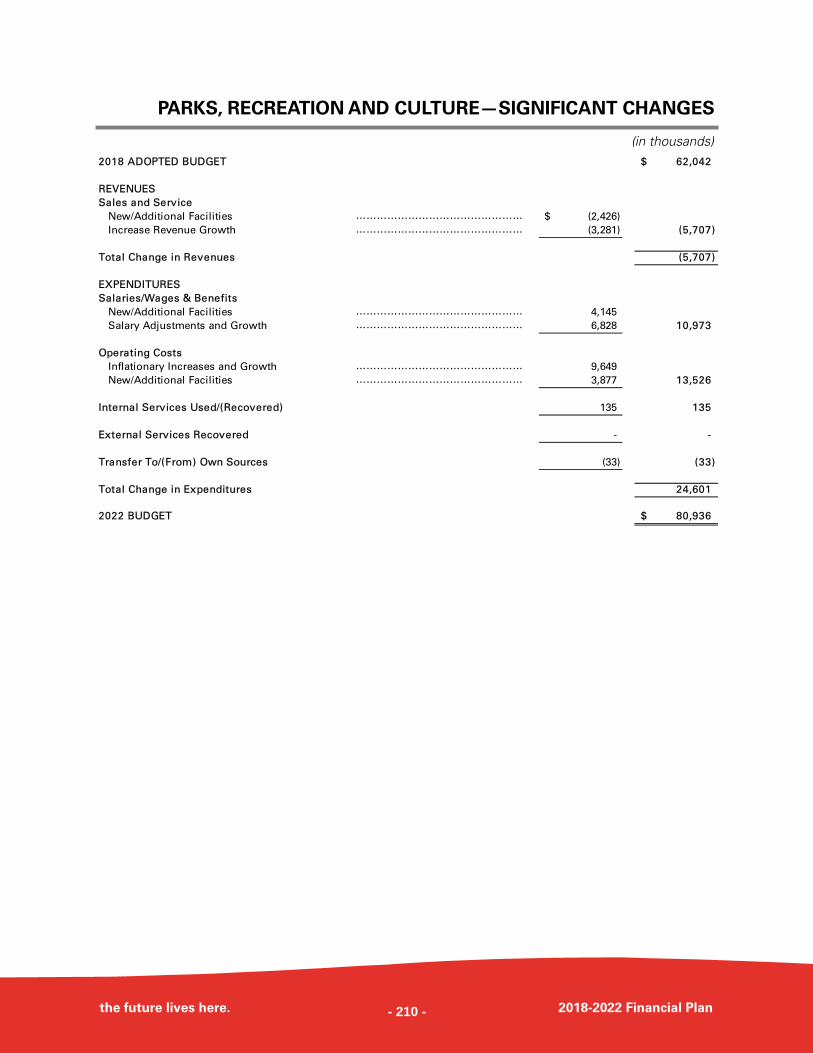
PARKS, RECREATION AND CULTURE—SIGNIFICANT CHANGES
the future lives here. 2018-2022 Financial Plan
(in thousands) 2018 ADOPTED BUDGET 62,042$
REVENUES
Sales and Service
New/Additional Facilities ………………………………………… (2,426)$
Increase Revenue Growth ………………………………………… (3,281) (5,707)
Total Change in Revenues (5,707)
EXPENDITURES
Salaries/Wages & Benefits
New/Additional Facilities ………………………………………… 4,145
Salary Adjustments and Growth ………………………………………… 6,828 10,973
Operating Costs
Inflationary Increases and Growth ………………………………………… 9,649
New/Additional Facilities ………………………………………… 3,877 13,526
Internal Services Used/(Recovered) 135 135
External Services Recovered - -
Transfer To/(From) Own Sources (33) (33)
Total Change in Expenditures 24,601
2022 BUDGET 80,936$
- 210 -

- 211 -
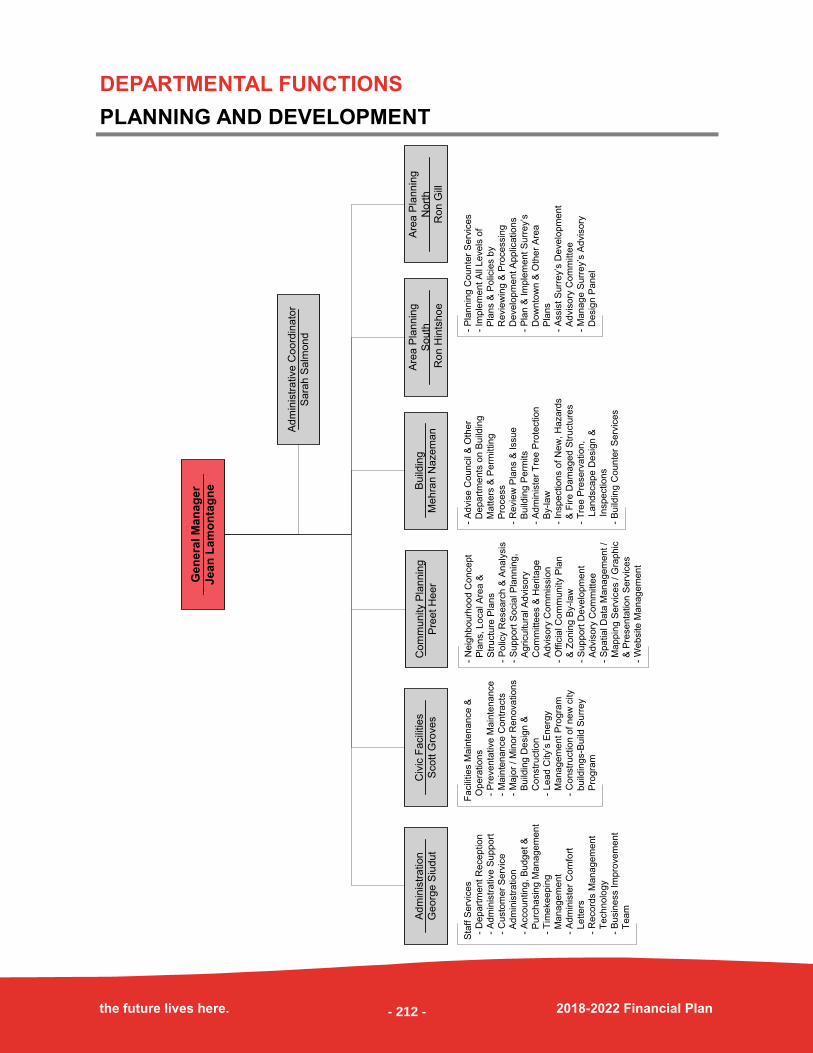
DEPARTMENTAL FUNCTIONS
PLANNING AND DEVELOPMENT
the future lives here. 2018-2022 Financial Plan
- A
dvis
e C
ou
ncil
& O
the
r
D
ep
art
me
nts
on
Bu
ildin
g
M
att
ers
& P
erm
ittin
g
P
roce
ss
- R
evie
w P
lan
s &
Issu
e
B
uild
ing
Pe
rmits
- A
dm
inis
ter
Tre
e P
rote
ctio
n
B
y-la
w
- In
sp
ectio
ns o
f N
ew
, H
aza
rds
&
Fire
Da
ma
ge
d S
tru
ctu
res
- T
ree
Pre
se
rva
tio
n,
L
an
dsca
pe
De
sig
n &
In
sp
ectio
ns
- B
uild
ing
Co
un
ter
Se
rvic
es
- P
lan
nin
g C
ou
nte
r S
erv
ice
s
- Im
ple
me
nt
All
Le
ve
ls o
f
P
lan
s &
Po
licie
s b
y
R
evie
win
g &
Pro
ce
ssin
g
D
eve
lop
me
nt
Ap
plic
atio
ns
- P
lan
& I
mp
lem
en
t S
urr
ey’s
D
ow
nto
wn
& O
the
r A
rea
P
lan
s
- A
ssis
t S
urr
ey’s
De
ve
lop
me
nt
A
dvis
ory
Co
mm
itte
e
- M
an
ag
e S
urr
ey’s
Ad
vis
ory
D
esig
n P
an
el
Fa
cili
tie
s M
ain
ten
an
ce
&
O
pe
ratio
ns
-
Pre
ve
nta
tive
Ma
inte
na
nce
-
Ma
inte
na
nce
Co
ntr
acts
-
Ma
jor
/ M
ino
r R
en
ova
tio
ns
B
uild
ing
De
sig
n &
C
on
str
uctio
n
-
Le
ad
City’s
En
erg
y
M
an
ag
em
en
t P
rog
ram
-
Co
nstr
uctio
n o
f n
ew
city
b
uild
ing
s-B
uild
Su
rre
y
Pro
gra
m
Sta
ff S
erv
ice
s
-
De
pa
rtm
en
t R
ece
ptio
n
-
Ad
min
istr
ative
Su
pp
ort
-
Cu
sto
me
r S
erv
ice
A
dm
inis
tra
tio
n
-
Acco
un
tin
g,
Bu
dg
et
&
P
urc
ha
sin
g M
an
ag
em
en
t
-
Tim
eke
ep
ing
M
an
ag
em
en
t
-
Ad
min
iste
r C
om
fort
L
ett
ers
-
Re
co
rds M
an
ag
em
en
t
T
ech
no
log
y
-
Bu
sin
ess I
mp
rove
me
nt
T
ea
m
Gen
era
l M
an
ag
er
Jea
n L
am
on
tag
ne
Ad
min
istr
ative
Co
ord
ina
tor
Sa
rah
Sa
lmo
nd
- N
eig
hb
ou
rho
od
Co
nce
pt
P
lan
s,
Lo
ca
l A
rea
&
S
tru
ctu
re P
lan
s
- P
olic
y R
ese
arc
h &
An
aly
sis
- S
up
po
rt S
ocia
l P
lan
nin
g,
A
gricu
ltu
ral A
dvis
ory
C
om
mitte
es &
He
rita
ge
A
dvis
ory
Co
mm
issio
n
- O
ffic
ial C
om
mu
nity P
lan
&
Zo
nin
g B
y-la
w
- S
up
po
rt D
eve
lop
me
nt
A
dvis
ory
Co
mm
itte
e
- S
pa
tia
l D
ata
Ma
na
ge
me
nt /
M
ap
pin
g S
erv
ice
s /
Gra
ph
ic
&
Pre
se
nta
tio
n S
erv
ice
s
- W
eb
site
Ma
na
ge
me
nt
Are
a P
lan
nin
g
So
uth
Ro
n H
ints
ho
e
Are
a P
lan
nin
g
No
rth
Ro
n G
ill
Bu
ildin
g
Me
hra
n N
aze
ma
n
Civ
ic F
acili
tie
s
Sco
tt G
rove
sC
om
mu
nity P
lan
nin
g
Pre
et
He
er
Ad
min
istr
atio
n
Ge
org
e S
iud
ut
- 212 -
DEPARTMENTAL OVERVIEW
PLANNING AND DEVELOPMENT
the future lives here. 2018-2022 Financial Plan
MISSION STATEMENT
To provide advice and recommendations to City Council on planning, building and
community development matters and to implement the bylaws, policies and objectives
set by City Council related to growth and development.
KEY PROGRAMS AND SERVICES
The primary functions of the Planning & Development Department are to:
Prepare land use plans, bylaws and policies for consideration by City Council; and
Undertake application reviews and approval processes consistent with Council-
approved plans, bylaws and policies in support of planned, orderly and sustainable
development of the City.
The Department’s mandate is accomplished through activities of the following five
divisions:
AREA PLANNING & DEVELOPMENT,
NORTH & SOUTH
Area Planning & Development
implements Council-adopted bylaws
approved secondary plans, and policies in
relation to the use and development of
land. This work involves receiving and
reviewing applications and making
appropriate recommendations for land
development projects and preparing
reports to Council.
ADMINISTRATION & SPECIAL PROJECTS
Administration & Special Projects
provides general administrative support
services, records management,
budgeting, information technology
deployment and support, Enterprise
Content Management implementation
and customer service.
BUILDING
Building administers Council adopted
bylaws and policies related to building
construction. This work involves
servicing residential and commercial
building plan reviews, performing
building, plumbing and electrical field
review services, and the administration of
the Tree Preservation Bylaw and sign
bylaws. The Building division is also
responsible for providing professional
advice on building construction related
matters to City Council, the Board of
Variance, other City departments and the
public.
CIVIC FACILITIES
Civic Facilities plans, designs and
constructs new facilities, and maintains
and operates the City’s existing building
inventory, which includes redeveloping
and modifying buildings, and
administering an ongoing preventative
maintenance program. The division leads
energy saving initiatives throughout the
City, including lighting and HVAC system
upgrades.
- 213 -
PLANNING AND DEVELOPMENT
the future lives here. 2018-2022 Financial Plan
2017 ACCOMPLISHMENTS
COMMUNITY PLANNING
Community Planning develops land use
plans and policies in support of the
planned and orderly development of the
City. The division administers the Official
Community Plan (OCP), General Land Use
Plans, Neighbourhood Concept Plans
(NCP), Local Area Plans, zoning bylaw
amendments and monitors the City’s
growth management strategies.
Community Planning also supports the
Heritage Advisory Commission,
Environmental Advisory Committee,
Agricultural and Food Security Advisory
Committee and the Social Planning
Advisory Committee. The division
provides graphic and mapping services
for the department and supports the
corporate Geographical Information
Systems (GIS) services.
INCLUSION
Completed All Our Relations Social
Innovation Strategy, Phase 2 of the
Surrey Urban Aboriginal Partnering
Strategy;
Completed the improvements of the
remaining space at the former City Hall
building to accommodate the growth of
the RCMP;
Continued implementation of the
multi—year Local Immigration
Partnership (LIP) including “We are
Surrey” Anti-Racism Campaign, hosted
Citizenship Ceremony, Surrey
Newcomer Youth Leadership
Conference, and Newcomer
Employment Week; and
Implemented Refugee Integration
Strategy.
Initiated Affordable Housing Strategy,
pending approval in December 2017;
Updated City Centre Density Bonus
Policy;
Completed Stage 1 of South Campbell
Heights Plan;
Completed Stage 2 of the Abbey Ridge
Plan;
Completed Downzoning Process
Guidelines;
Initiated Review of Sunnyside Heights
NCP;
Created new Quarter-Acre Residential
Zone (RQ);
With Finance, continued to develop a
sustainability implementation fund
small granting program for the
community, focused on the Charter 2.0
themes;
BUILT ENVIRONMENT & NEIGHBOURHOODS
- 214 -
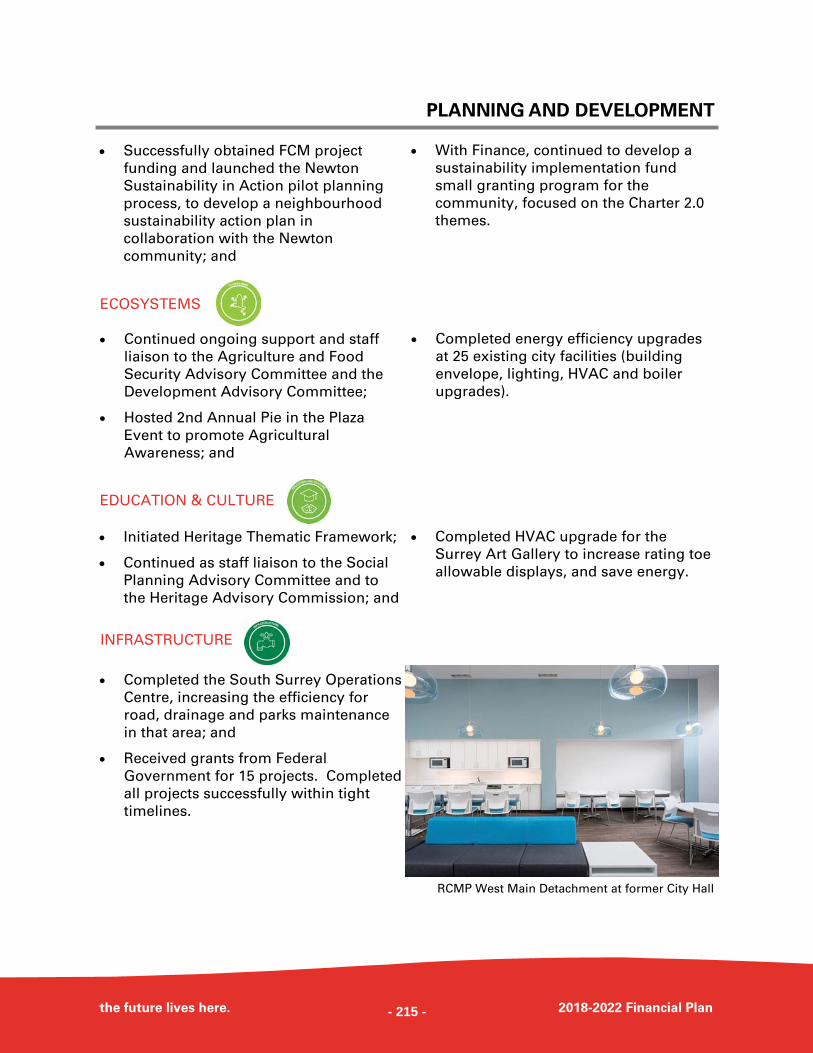
PLANNING AND DEVELOPMENT
the future lives here. 2018-2022 Financial Plan
Continued ongoing support and staff
liaison to the Agriculture and Food
Security Advisory Committee and the
Development Advisory Committee;
Hosted 2nd Annual Pie in the Plaza
Event to promote Agricultural
Awareness; and
Completed energy efficiency upgrades
at 25 existing city facilities (building
envelope, lighting, HVAC and boiler
upgrades).
ECOSYSTEMS
Initiated Heritage Thematic Framework;
Continued as staff liaison to the Social
Planning Advisory Committee and to
the Heritage Advisory Commission; and
Completed HVAC upgrade for the
Surrey Art Gallery to increase rating toe
allowable displays, and save energy.
EDUCATION & CULTURE
Successfully obtained FCM project
funding and launched the Newton
Sustainability in Action pilot planning
process, to develop a neighbourhood
sustainability action plan in
collaboration with the Newton
community; and
With Finance, continued to develop a
sustainability implementation fund
small granting program for the
community, focused on the Charter 2.0
themes.
Completed the South Surrey Operations
Centre, increasing the efficiency for
road, drainage and parks maintenance
in that area; and
Received grants from Federal
Government for 15 projects. Completed
all projects successfully within tight
timelines.
INFRASTRUCTURE
RCMP West Main Detachment at former City Hall
- 215 -
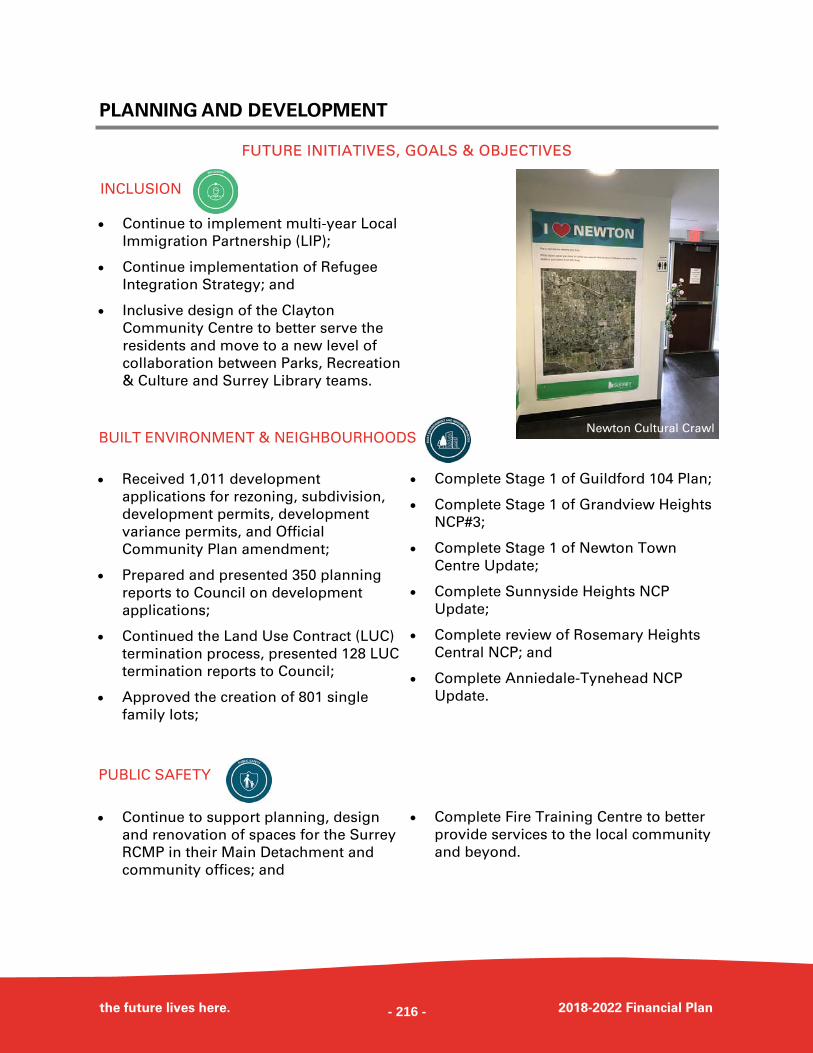
PLANNING AND DEVELOPMENT
the future lives here. 2018-2022 Financial Plan
FUTURE INITIATIVES, GOALS & OBJECTIVES
Continue to implement multi-year Local
Immigration Partnership (LIP);
Continue implementation of Refugee
Integration Strategy; and
Inclusive design of the Clayton
Community Centre to better serve the
residents and move to a new level of
collaboration between Parks, Recreation
& Culture and Surrey Library teams.
Received 1,011 development
applications for rezoning, subdivision,
development permits, development
variance permits, and Official
Community Plan amendment;
Prepared and presented 350 planning
reports to Council on development
applications;
Continued the Land Use Contract (LUC)
termination process, presented 128 LUC
termination reports to Council;
Approved the creation of 801 single
family lots;
Complete Stage 1 of Guildford 104 Plan;
Complete Stage 1 of Grandview Heights
NCP#3;
Complete Stage 1 of Newton Town
Centre Update;
Complete Sunnyside Heights NCP
Update;
Complete review of Rosemary Heights
Central NCP; and
Complete Anniedale-Tynehead NCP
Update.
Continue to support planning, design
and renovation of spaces for the Surrey
RCMP in their Main Detachment and
community offices; and
Complete Fire Training Centre to better
provide services to the local community
and beyond.
INCLUSION
BUILT ENVIRONMENT & NEIGHBOURHOODS
PUBLIC SAFETY
Newton Cultural Crawl
- 216 -
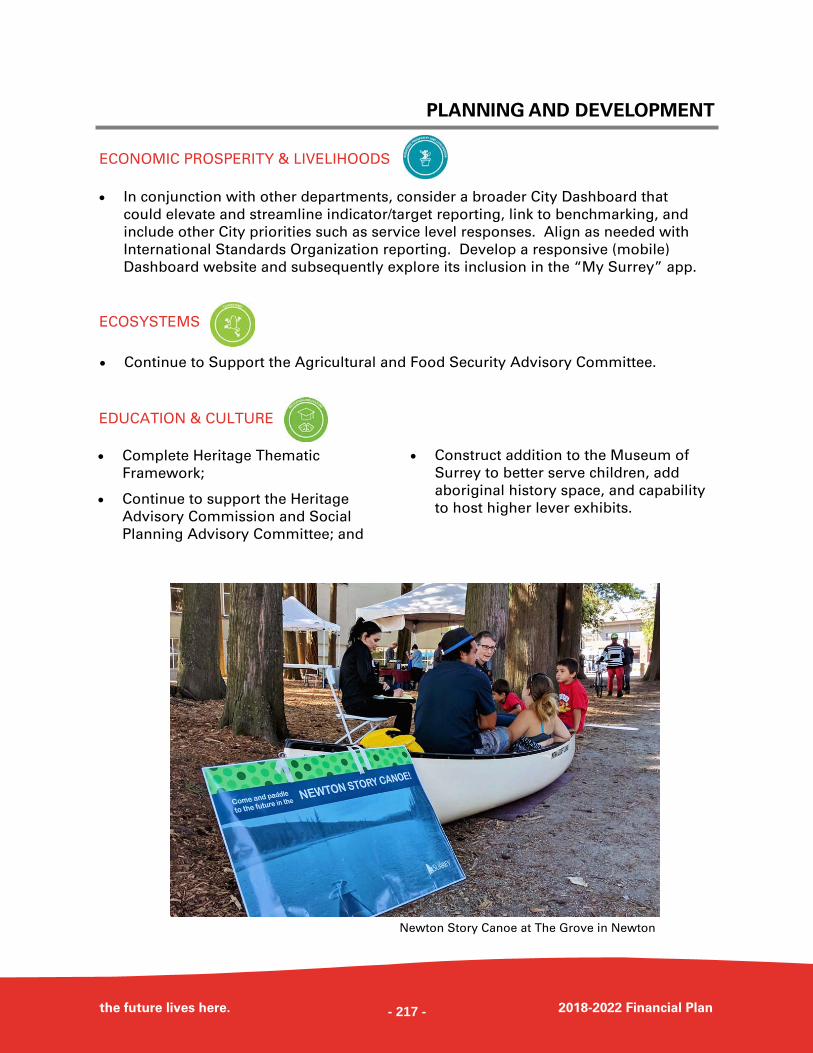
PLANNING AND DEVELOPMENT
the future lives here. 2018-2022 Financial Plan
In conjunction with other departments, consider a broader City Dashboard that
could elevate and streamline indicator/target reporting, link to benchmarking, and
include other City priorities such as service level responses. Align as needed with
International Standards Organization reporting. Develop a responsive (mobile)
Dashboard website and subsequently explore its inclusion in the “My Surrey” app.
Continue to Support the Agricultural and Food Security Advisory Committee.
Complete Heritage Thematic
Framework;
Continue to support the Heritage
Advisory Commission and Social
Planning Advisory Committee; and
Construct addition to the Museum of
Surrey to better serve children, add
aboriginal history space, and capability
to host higher lever exhibits.
ECONOMIC PROSPERITY & LIVELIHOODS
ECOSYSTEMS
EDUCATION & CULTURE
Newton Story Canoe at The Grove in Newton
- 217 -
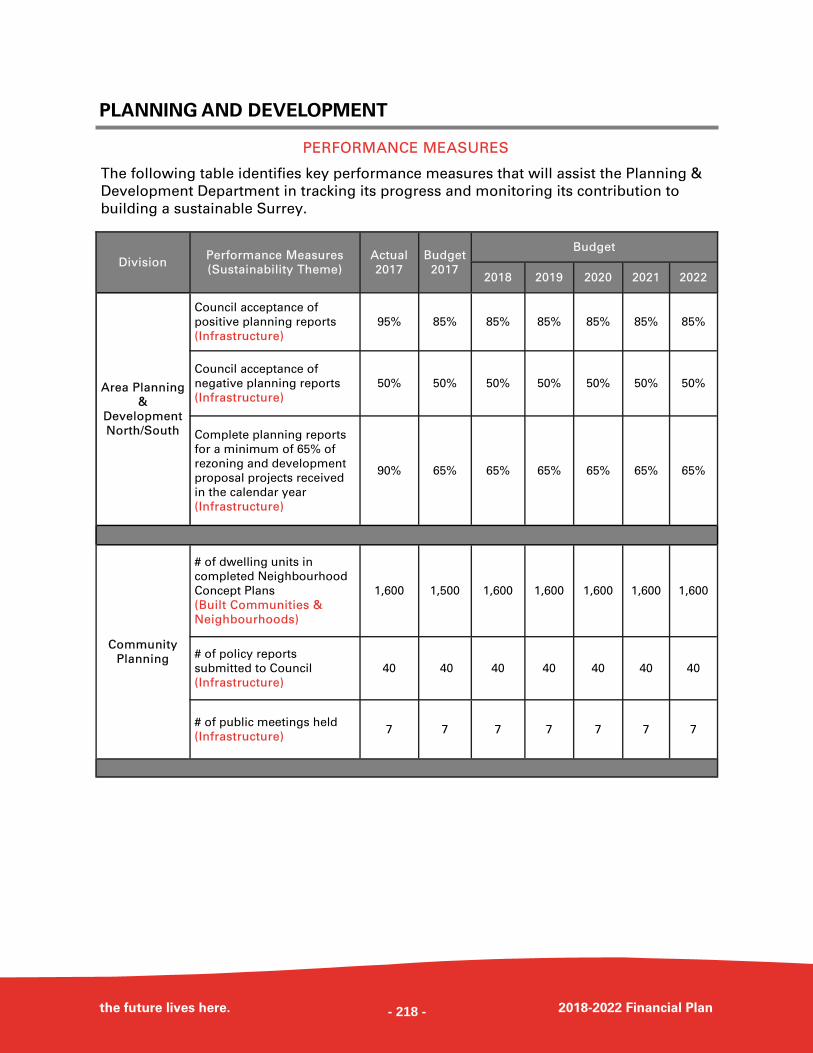
PLANNING AND DEVELOPMENT
the future lives here. 2018-2022 Financial Plan
Division Performance Measures
(Sustainability Theme)
Actual
2017
Budget
2017
Budget
2018 2019 2020 2021 2022
Area Planning
&
Development
North/South
Council acceptance of
positive planning reports
(Infrastructure)
95% 85% 85% 85% 85% 85% 85%
Council acceptance of
negative planning reports
(Infrastructure)
50% 50% 50% 50% 50% 50% 50%
Complete planning reports
for a minimum of 65% of
rezoning and development
proposal projects received
in the calendar year
(Infrastructure)
90% 65% 65% 65% 65% 65% 65%
Community
Planning
# of dwelling units in
completed Neighbourhood
Concept Plans
(Built Communities &
Neighbourhoods)
1,600 1,500 1,600 1,600 1,600 1,600 1,600
# of policy reports
submitted to Council
(Infrastructure)
40 40 40 40 40 40 40
# of public meetings held
(Infrastructure) 7 7 7 7 7 7 7
PERFORMANCE MEASURES
The following table identifies key performance measures that will assist the Planning &
Development Department in tracking its progress and monitoring its contribution to
building a sustainable Surrey.
- 218 -
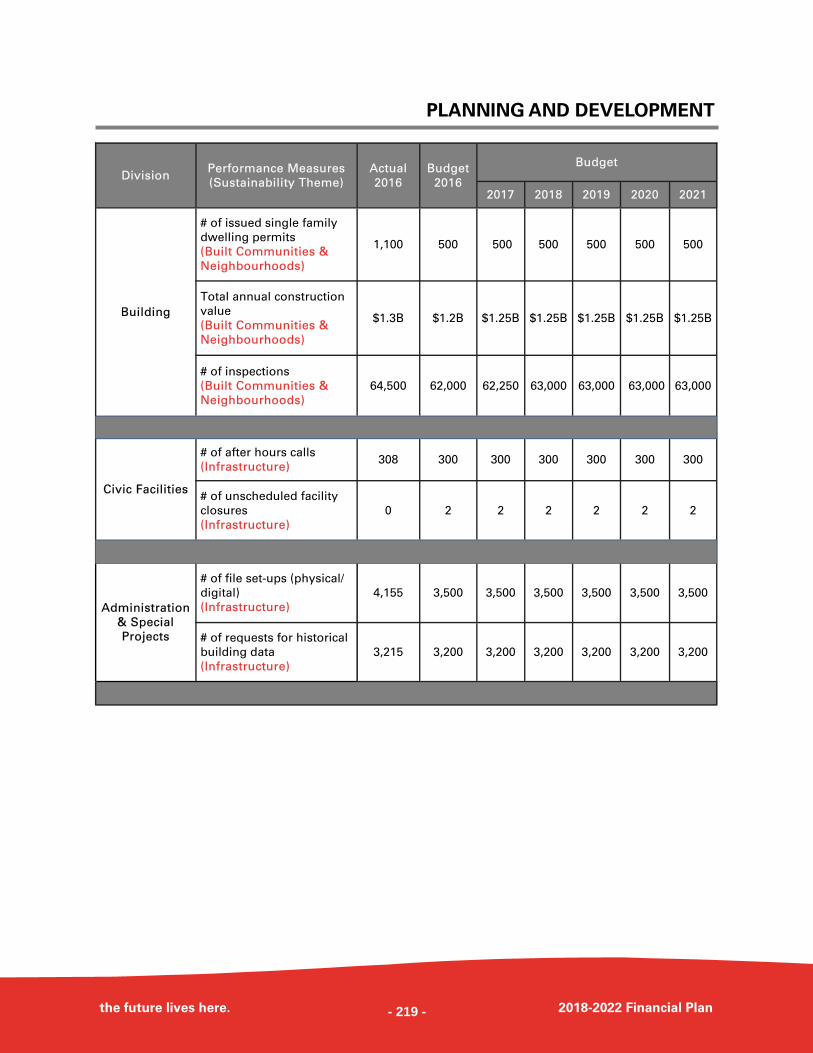
PLANNING AND DEVELOPMENT
the future lives here. 2018-2022 Financial Plan
Division Performance Measures
(Sustainability Theme)
Actual
2016
Budget
2016
Budget
2017 2018 2019 2020 2021
Building
# of issued single family
dwelling permits
(Built Communities &
Neighbourhoods)
1,100 500 500 500 500 500 500
Total annual construction
value
(Built Communities &
Neighbourhoods)
$1.3B $1.2B $1.25B $1.25B $1.25B $1.25B $1.25B
# of inspections
(Built Communities &
Neighbourhoods)
64,500 62,000 62,250 63,000 63,000 63,000 63,000
Civic Facilities
# of after hours calls
(Infrastructure) 308 300 300 300 300 300 300
# of unscheduled facility
closures
(Infrastructure)
0 2 2 2 2 2 2
Administration
& Special
Projects
# of file set-ups (physical/
digital)
(Infrastructure)
4,155 3,500 3,500 3,500 3,500 3,500 3,500
# of requests for historical
building data
(Infrastructure)
3,215 3,200 3,200 3,200 3,200 3,200 3,200
- 219 -
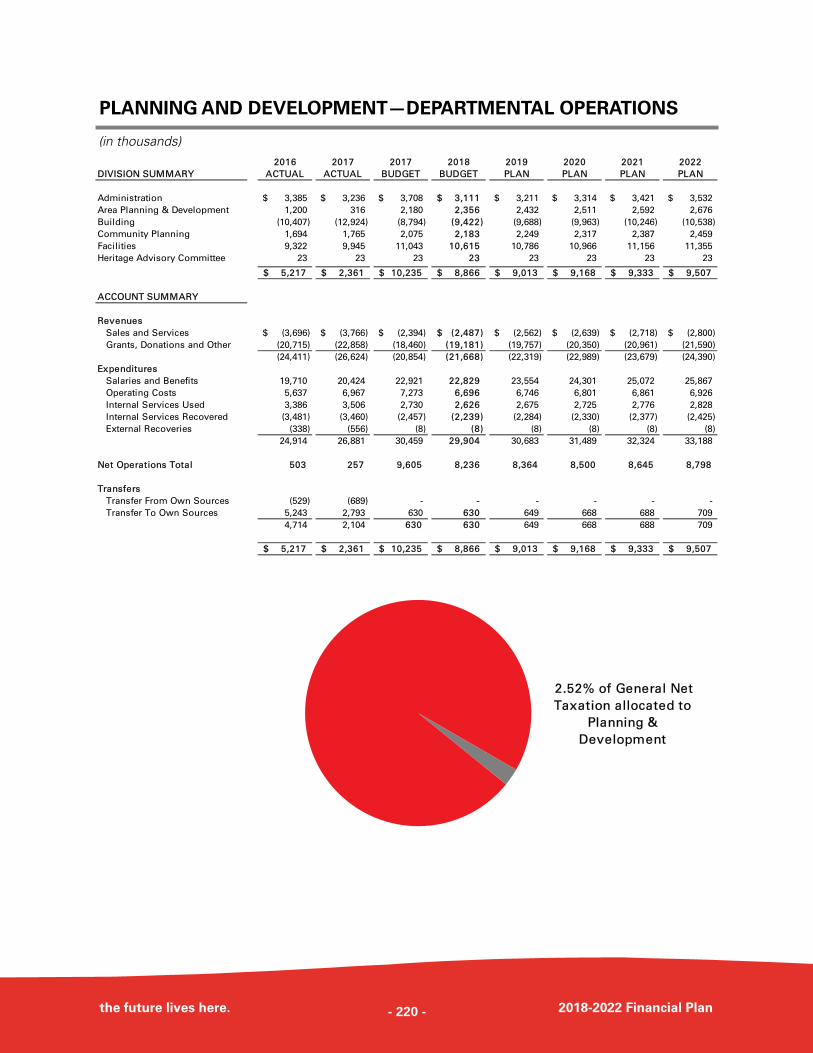
PLANNING AND DEVELOPMENT—DEPARTMENTAL OPERATIONS
the future lives here. 2018-2022 Financial Plan
(in thousands) 2016 2017 2017 2018 2019 2020 2021 2022
DIVISION SUMMARY ACTUAL ACTUAL BUDGET BUDGET PLAN PLAN PLAN PLAN
Administration 3,385$ 3,236$ 3,708$ 3,111$ 3,211$ 3,314$ 3,421$ 3,532$
Area Planning & Development 1,200 316 2,180 2,356 2,432 2,511 2,592 2,676
Building (10,407) (12,924) (8,794) (9,422) (9,688) (9,963) (10,246) (10,538)
Community Planning 1,694 1,765 2,075 2,183 2,249 2,317 2,387 2,459
Facilities 9,322 9,945 11,043 10,615 10,786 10,966 11,156 11,355
Heritage Advisory Committee 23 23 23 23 23 23 23 23
5,217$ 2,361$ 10,235$ 8,866$ 9,013$ 9,168$ 9,333$ 9,507$
ACCOUNT SUMMARY
Revenues
Sales and Services (3,696)$ (3,766)$ (2,394)$ (2,487)$ (2,562)$ (2,639)$ (2,718)$ (2,800)$
Grants, Donations and Other (20,715) (22,858) (18,460) (19,181) (19,757) (20,350) (20,961) (21,590)
(24,411) (26,624) (20,854) (21,668) (22,319) (22,989) (23,679) (24,390)
Expenditures
Salaries and Benefits 19,710 20,424 22,921 22,829 23,554 24,301 25,072 25,867
Operating Costs 5,637 6,967 7,273 6,696 6,746 6,801 6,861 6,926
Internal Services Used 3,386 3,506 2,730 2,626 2,675 2,725 2,776 2,828
Internal Services Recovered (3,481) (3,460) (2,457) (2,239) (2,284) (2,330) (2,377) (2,425)
External Recoveries (338) (556) (8) (8) (8) (8) (8) (8)
24,914 26,881 30,459 29,904 30,683 31,489 32,324 33,188
Net Operations Total 503 257 9,605 8,236 8,364 8,500 8,645 8,798
Transfers
Transfer From Own Sources (529) (689) - - - - - -
Transfer To Own Sources 5,243 2,793 630 630 649 668 688 709
4,714 2,104 630 630 649 668 688 709
5,217$ 2,361$ 10,235$ 8,866$ 9,013$ 9,168$ 9,333$ 9,507$
2.52% of General Net
Taxation allocated to
Planning &
Development
- 220 -

PLANNING AND DEVELOPMENT—DEPARTMENTAL OPERATIONS
the future lives here. 2018-2022 Financial Plan
(in thousands) 2016 2017 2017 2018 2019 2020 2021 2022
ADMINISTRATION ACTUAL ACTUAL BUDGET BUDGET PLAN PLAN PLAN PLAN
Revenues
Sales and Services (180)$ (190)$ (34)$ (35)$ (36)$ (37)$ (38)$ (39)$
Grants, Donations and Other (4) (4) - - - - - -
(184) (194) (34) (35) (36) (37) (38) (39)
Expenditures
Salaries and Benefits 3,038 2,761 3,344 2,807 2,908 3,012 3,120 3,232
Operating Costs 626 595 384 325 325 325 325 325
Internal Services Used 13 79 14 14 14 14 14 14
Internal Services Recovered (5) (6) - - - - - -
External Recoveries - (3) - - - - - -
3,672 3,426 3,742 3,146 3,247 3,351 3,459 3,571
Net Operations Total 3,488 3,232 3,708 3,111 3,211 3,314 3,421 3,532
Transfers
Transfer From Own Sources (107) - - - - - - -
Transfer To Own Sources 4 4 - - - - - -
(103) 4 - - - - - -
3,385$ 3,236$ 3,708$ 3,111$ 3,211$ 3,314$ 3,421$ 3,532$
2016 2017 2017 2018 2019 2020 2021 2022
AREA & PLANNING DEVELOPMENT ACTUAL ACTUAL BUDGET BUDGET PLAN PLAN PLAN PLAN
Revenues
Sales and Services (3,076)$ (3,087)$ (2,045)$ (2,125)$ (2,189)$ (2,255)$ (2,323)$ (2,393)$
Grants, Donations and Other (322) (397) (150) (156) (161) (166) (171) (176)
(3,398) (3,484) (2,195) (2,281) (2,350) (2,421) (2,494) (2,569)
Expenditures
Salaries and Benefits 3,445 3,553 4,170 4,432 4,577 4,727 4,881 5,040
Operating Costs 31 111 66 66 66 66 66 66
Internal Services Used 45 40 139 139 139 139 139 139
Internal Services Recovered - - - - - - - -
External Recoveries - - - - - - - -
3,521 3,704 4,375 4,637 4,782 4,932 5,086 5,245
Net Operations Total 123 220 2,180 2,356 2,432 2,511 2,592 2,676
Transfers
Transfer From Own Sources - - - - - - - -
Transfer To Own Sources 1,077 96 - - - - - -
1,077 96 - - - - - -
1,200$ 316$ 2,180$ 2,356$ 2,432$ 2,511$ 2,592$ 2,676$
- 221 -
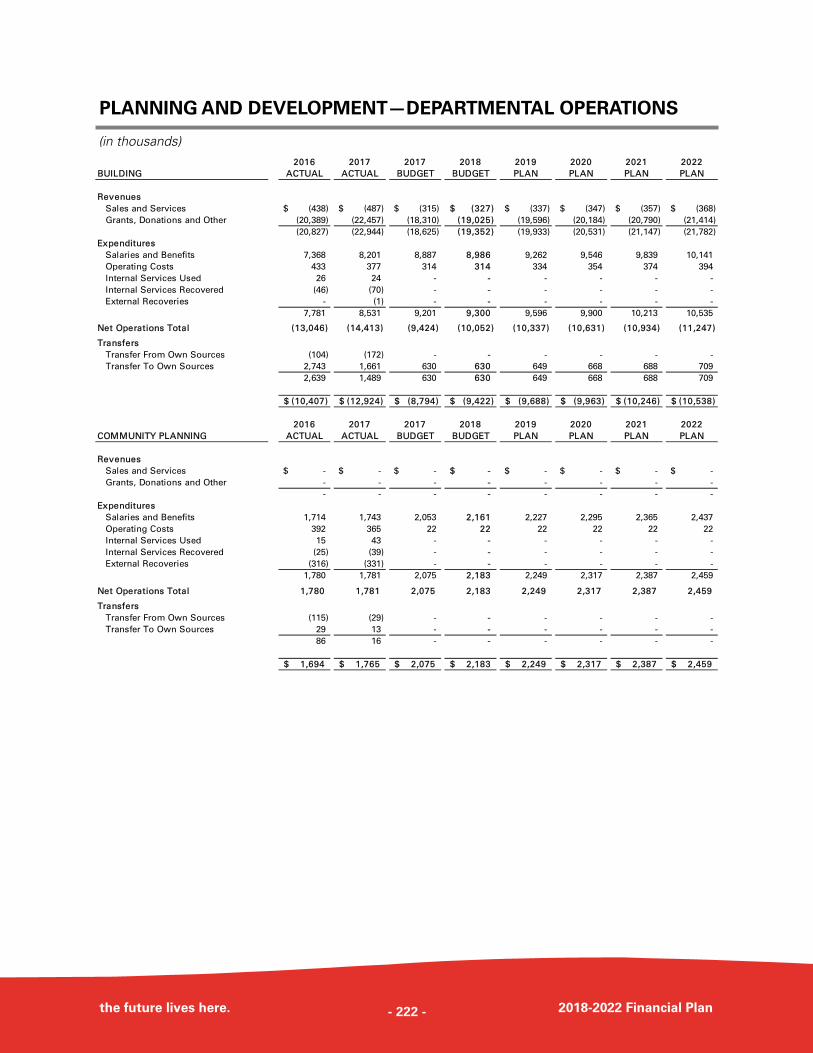
PLANNING AND DEVELOPMENT—DEPARTMENTAL OPERATIONS
the future lives here. 2018-2022 Financial Plan
(in thousands) 2016 2017 2017 2018 2019 2020 2021 2022
BUILDING ACTUAL ACTUAL BUDGET BUDGET PLAN PLAN PLAN PLAN
Revenues
Sales and Services (438)$ (487)$ (315)$ (327)$ (337)$ (347)$ (357)$ (368)$
Grants, Donations and Other (20,389) (22,457) (18,310) (19,025) (19,596) (20,184) (20,790) (21,414)
(20,827) (22,944) (18,625) (19,352) (19,933) (20,531) (21,147) (21,782)
Expenditures
Salaries and Benefits 7,368 8,201 8,887 8,986 9,262 9,546 9,839 10,141
Operating Costs 433 377 314 314 334 354 374 394
Internal Services Used 26 24 - - - - - -
Internal Services Recovered (46) (70) - - - - - -
External Recoveries - (1) - - - - - -
7,781 8,531 9,201 9,300 9,596 9,900 10,213 10,535
Net Operations Total (13,046) (14,413) (9,424) (10,052) (10,337) (10,631) (10,934) (11,247)
Transfers
Transfer From Own Sources (104) (172) - - - - - -
Transfer To Own Sources 2,743 1,661 630 630 649 668 688 709
2,639 1,489 630 630 649 668 688 709
(10,407)$ (12,924)$ (8,794)$ (9,422)$ (9,688)$ (9,963)$ (10,246)$ (10,538)$
2016 2017 2017 2018 2019 2020 2021 2022
COMMUNITY PLANNING ACTUAL ACTUAL BUDGET BUDGET PLAN PLAN PLAN PLAN
Revenues
Sales and Services -$ -$ -$ -$ -$ -$ -$ -$
Grants, Donations and Other - - - - - - - -
- - - - - - - -
Expenditures
Salaries and Benefits 1,714 1,743 2,053 2,161 2,227 2,295 2,365 2,437
Operating Costs 392 365 22 22 22 22 22 22
Internal Services Used 15 43 - - - - - -
Internal Services Recovered (25) (39) - - - - - -
External Recoveries (316) (331) - - - - - -
1,780 1,781 2,075 2,183 2,249 2,317 2,387 2,459
Net Operations Total 1,780 1,781 2,075 2,183 2,249 2,317 2,387 2,459
Transfers
Transfer From Own Sources (115) (29) - - - - - -
Transfer To Own Sources 29 13 - - - - - -
86 16 - - - - - -
1,694$ 1,765$ 2,075$ 2,183$ 2,249$ 2,317$ 2,387$ 2,459$
- 222 -
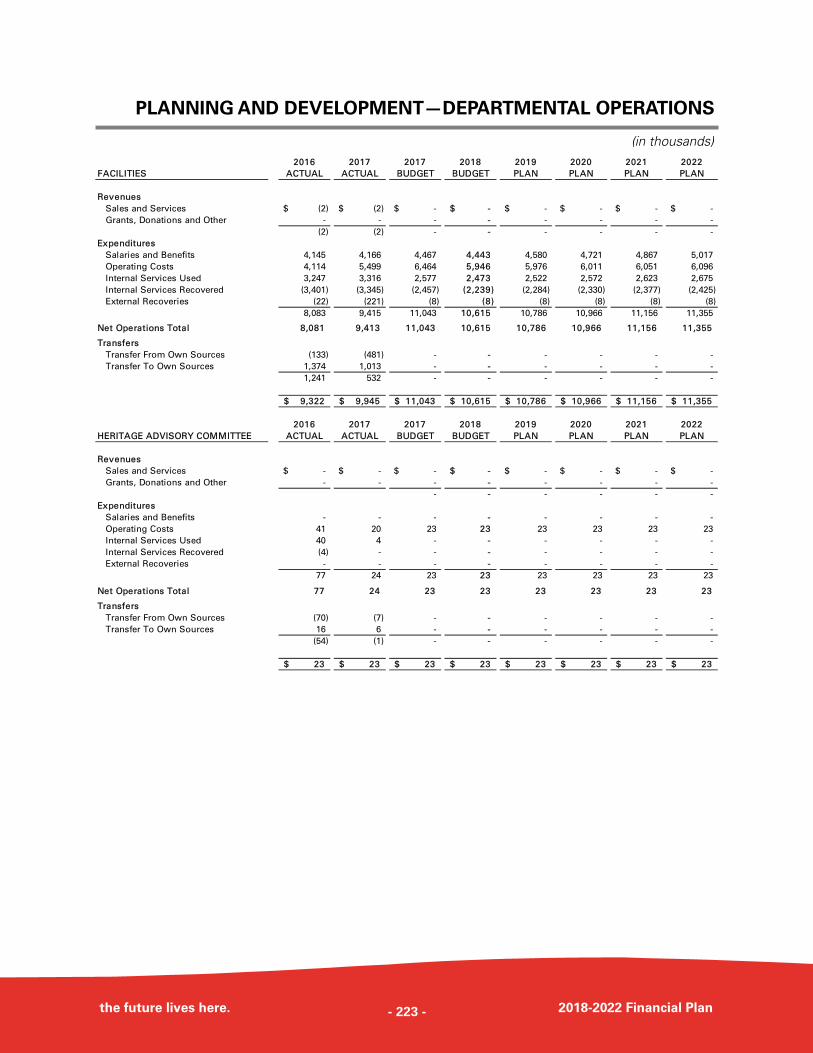
PLANNING AND DEVELOPMENT—DEPARTMENTAL OPERATIONS
the future lives here. 2018-2022 Financial Plan
(in thousands) 2016 2017 2017 2018 2019 2020 2021 2022
FACILITIES ACTUAL ACTUAL BUDGET BUDGET PLAN PLAN PLAN PLAN
Revenues
Sales and Services (2)$ (2)$ -$ -$ -$ -$ -$ -$
Grants, Donations and Other - - - - - - - -
(2) (2) - - - - - -
Expenditures
Salaries and Benefits 4,145 4,166 4,467 4,443 4,580 4,721 4,867 5,017
Operating Costs 4,114 5,499 6,464 5,946 5,976 6,011 6,051 6,096
Internal Services Used 3,247 3,316 2,577 2,473 2,522 2,572 2,623 2,675
Internal Services Recovered (3,401) (3,345) (2,457) (2,239) (2,284) (2,330) (2,377) (2,425)
External Recoveries (22) (221) (8) (8) (8) (8) (8) (8)
8,083 9,415 11,043 10,615 10,786 10,966 11,156 11,355
Net Operations Total 8,081 9,413 11,043 10,615 10,786 10,966 11,156 11,355
Transfers
Transfer From Own Sources (133) (481) - - - - - -
Transfer To Own Sources 1,374 1,013 - - - - - -
1,241 532 - - - - - -
9,322$ 9,945$ 11,043$ 10,615$ 10,786$ 10,966$ 11,156$ 11,355$
2016 2017 2017 2018 2019 2020 2021 2022
HERITAGE ADVISORY COMMITTEE ACTUAL ACTUAL BUDGET BUDGET PLAN PLAN PLAN PLAN
Revenues
Sales and Services -$ -$ -$ -$ -$ -$ -$ -$
Grants, Donations and Other - - - - - - - -
- - - - - -
Expenditures
Salaries and Benefits - - - - - - - -
Operating Costs 41 20 23 23 23 23 23 23
Internal Services Used 40 4 - - - - - -
Internal Services Recovered (4) - - - - - - -
External Recoveries - - - - - - - -
77 24 23 23 23 23 23 23
Net Operations Total 77 24 23 23 23 23 23 23
Transfers
Transfer From Own Sources (70) (7) - - - - - -
Transfer To Own Sources 16 6 - - - - - -
(54) (1) - - - - - -
23$ 23$ 23$ 23$ 23$ 23$ 23$ 23$
- 223 -
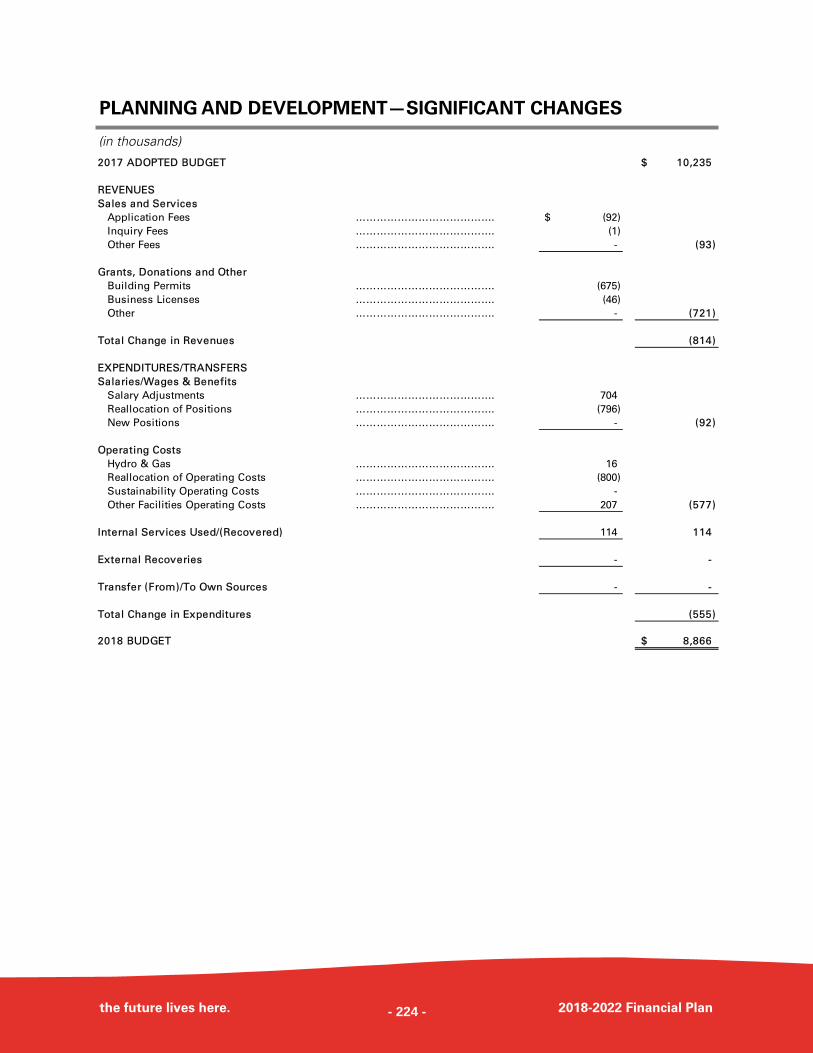
PLANNING AND DEVELOPMENT—SIGNIFICANT CHANGES
the future lives here. 2018-2022 Financial Plan
(in thousands)
2017 ADOPTED BUDGET 10,235$
REVENUES
Sales and Services
Application Fees …………………………………. (92)$
Inquiry Fees …………………………………. (1)
Other Fees …………………………………. - (93)
Grants, Donations and Other
Building Permits …………………………………. (675)
Business Licenses …………………………………. (46)
Other …………………………………. - (721)
Total Change in Revenues (814)
EXPENDITURES/TRANSFERS
Salaries/Wages & Benefits
Salary Adjustments …………………………………. 704
Reallocation of Positions …………………………………. (796)
New Positions …………………………………. - (92)
Operating Costs
Hydro & Gas …………………………………. 16
Reallocation of Operating Costs …………………………………. (800)
Sustainability Operating Costs …………………………………. -
Other Facilities Operating Costs …………………………………. 207 (577)
Internal Services Used/(Recovered) 114 114
External Recoveries - -
Transfer (From)/To Own Sources - -
Total Change in Expenditures (555)
2018 BUDGET 8,866$
- 224 -
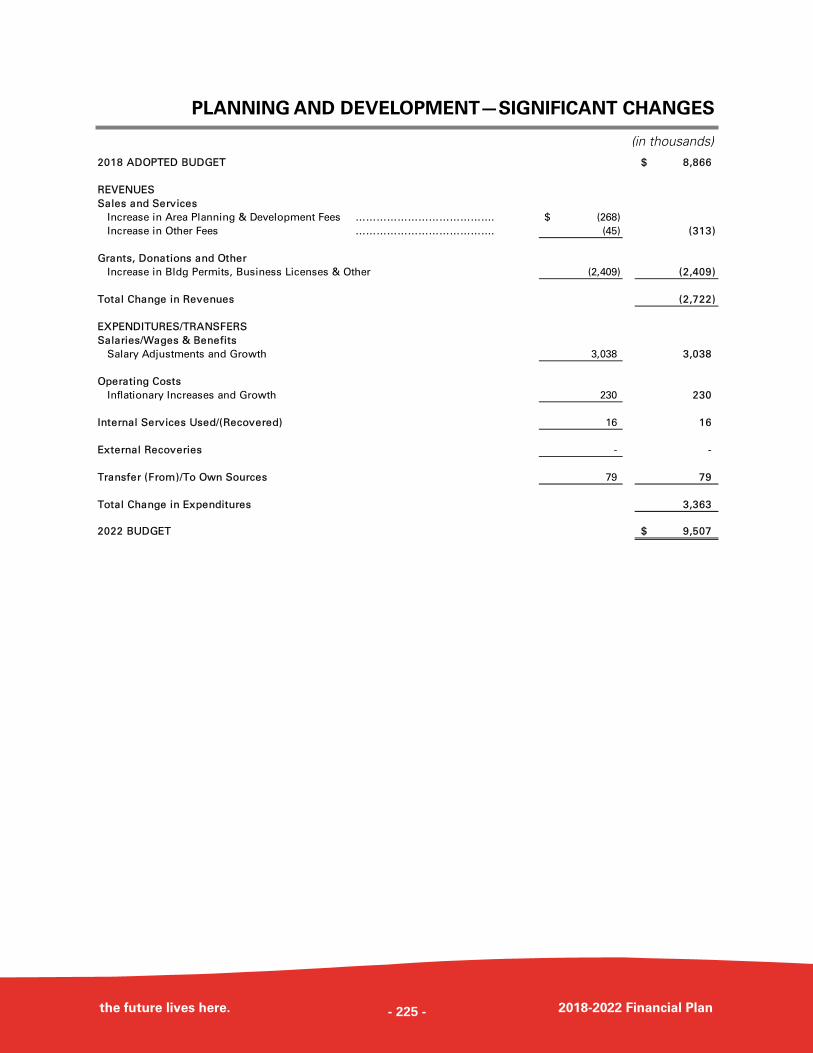
PLANNING AND DEVELOPMENT—SIGNIFICANT CHANGES
the future lives here. 2018-2022 Financial Plan
(in thousands)
2018 ADOPTED BUDGET 8,866$
REVENUES
Sales and Services
Increase in Area Planning & Development Fees …………………………………. (268)$
Increase in Other Fees …………………………………. (45) (313)
Grants, Donations and Other
Increase in Bldg Permits, Business Licenses & Other (2,409) (2,409)
Total Change in Revenues (2,722)
EXPENDITURES/TRANSFERS
Salaries/Wages & Benefits
Salary Adjustments and Growth 3,038 3,038
Operating Costs
Inflationary Increases and Growth 230 230
Internal Services Used/(Recovered) 16 16
External Recoveries - -
Transfer (From)/To Own Sources 79 79
Total Change in Expenditures 3,363
2022 BUDGET 9,507$
- 225 -
- 226 -
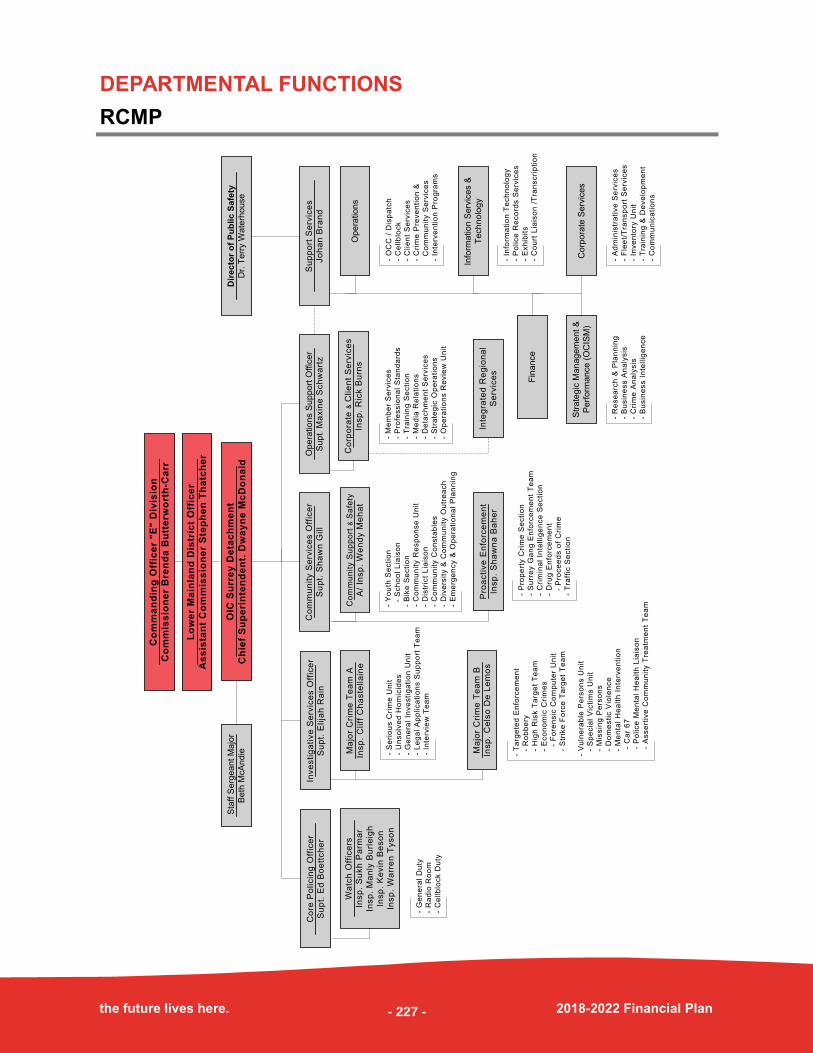
DEPARTMENTAL FUNCTIONS
RCMP
the future lives here. 2018-2022 Financial Plan
Dir
ecto
r o
f P
ub
lic S
afe
ty
Dr.
Terr
y W
ate
rhouse
Co
mm
an
din
g O
ffic
er
"E
" D
ivis
ion
Co
mm
iss
ion
er
Bre
nd
a B
utt
erw
ort
h-C
arr
Lo
we
r M
ain
lan
d D
istr
ict
Off
ice
r
As
sis
tan
t C
om
mis
sio
ne
r S
tep
he
n T
ha
tch
er
OIC
Su
rre
y D
eta
ch
me
nt
Ch
ief
Su
pe
rin
ten
de
nt.
Dw
ay
ne
Mc
Do
na
ld
Inve
sti
ga
tive
Se
rvic
es O
ffic
er
Su
pt.
Elija
h R
ain
Su
pp
ort
Se
rvic
es
Jo
ha
n B
ran
d
Co
mm
un
ity S
erv
ice
s O
ffic
er
Su
pt.
Sh
aw
n G
ill
Co
re P
olicin
g O
ffic
er
Su
pt.
Ed
Bo
ett
ch
er
- G
en
era
l D
uty
- R
ad
io R
oo
m
- C
ellb
lock D
uty
Wa
tch
Off
ice
rs
Insp
. S
ukh
Pa
rma
r
Insp
. M
an
ly B
url
eig
h
Insp
. K
evin
Be
so
n
Insp
. W
arr
en
Tyso
n
- T
arg
ete
d E
nfo
rce
me
nt
-
Ro
bb
ery
-
Hig
h R
isk T
arg
et
Te
am
-
Eco
no
mic
Cri
me
s
- F
ore
nsic
Co
mp
ute
r U
nit
-
Str
ike
Fo
rce
Ta
rge
t T
ea
m
- V
uln
era
ble
Pe
rso
ns U
nit
-
Sp
ecia
l V
icti
ms U
nit
-
Mis
sin
g P
ers
on
s
-
Do
me
sti
c V
iole
nce
-
Me
nta
l H
ea
lth
In
terv
en
tio
n
-
Ca
r 6
7
-
Po
lice
Me
nta
l H
ea
lth
Lia
iso
n
-
Asse
rtiv
e C
om
mu
nit
y T
rea
tme
nt
Te
am
- S
eri
ou
s C
rim
e U
nit
- U
nso
lve
d H
om
icid
es
- G
en
era
l In
ve
sti
ga
tio
n U
nit
- L
eg
al
Ap
plica
tio
ns S
up
po
rt T
ea
m
- In
terv
iew
Te
am
Ma
jor
Cri
me
Te
am
B
Insp
. C
els
o D
e L
em
os
Ma
jor
Cri
me
Te
am
A
Insp
. C
liff
Ch
aste
lla
ine
Sta
ff S
erg
eant M
ajo
r
Beth
McA
ndie
Opera
tions S
up
port
Offic
er
Supt. M
axin
e S
ch
wa
rtz
Co
mm
un
ity S
up
po
rt &
Sa
fety
A/
Insp
. W
en
dy M
eh
at
- P
rop
ert
y C
rim
e S
ecti
on
- S
urr
ey G
an
g E
nfo
rce
me
nt
Te
am
- C
rim
ina
l In
tellig
en
ce
Se
cti
on
- D
rug
En
forc
em
en
t
-
Pro
ce
ed
s o
f C
rim
e
- T
raff
ic S
ecti
on
- Y
ou
th S
ecti
on
-
Sch
oo
l L
iais
on
- B
ike
Se
cti
on
- C
om
mu
nit
y R
esp
on
se
Un
it
- D
istr
ict
Lia
iso
n
- C
om
mu
nit
y C
on
sta
ble
s
- D
ive
rsit
y &
Co
mm
un
ity O
utr
ea
ch
- E
me
rge
ncy &
Op
era
tio
na
l P
lan
nin
g
- O
CC
/ D
isp
atc
h
- C
ellb
lock
- C
lie
nt
Se
rvic
es
- C
rim
e P
reve
nti
on
&
C
om
mu
nit
y S
erv
ice
s
- In
terv
en
tio
n P
rog
ram
s
Opera
tions
Corp
ora
te S
erv
ices
Str
ate
gic
Manage
ment &
Perf
orm
ance (
OC
ISM
)
Info
rmation S
erv
ices &
Technolo
gy
- In
form
ati
on
Te
ch
no
log
y
- P
olice
Re
co
rds S
erv
ice
s
- E
xh
ibit
s
- C
ou
rt L
iais
on
/T
ran
scri
pti
on
- A
dm
inis
tra
tive
Se
rvic
es
- F
lee
t/T
ran
sp
ort
Se
rvic
es
- In
ve
nto
ry U
nit
- T
rain
ing
& D
eve
lop
me
nt
- C
om
mu
nic
ati
on
s
Pro
acti
ve
En
forc
em
en
t
Insp
. S
ha
wn
a B
ah
er
Co
rpo
rate
& C
lie
nt
Se
rvic
es
Insp
. R
ick B
urn
s
Inte
gra
ted
Re
gio
na
l
Se
rvic
es
- M
em
be
r S
erv
ice
s
- P
rofe
ssio
na
l S
tan
da
rds
- T
rain
ing
Se
cti
on
- M
ed
ia R
ela
tio
ns
- D
eta
ch
me
nt
Se
rvic
es
- S
tra
teg
ic O
pe
rati
on
s
- O
pe
rati
on
s R
evie
w U
nit
Fin
ance
- R
ese
arc
h &
Pla
nn
ing
- B
usin
ess A
na
lysis
- C
rim
e A
na
lysis
- B
usin
ess I
nte
llig
en
ce
- 227 -
DEPARTMENTAL OVERVIEW
RCMP
the future lives here. 2018-2022 Financial Plan
MISSION STATEMENT
The Royal Canadian Mounted Police (RCMP) is committed to preserving the peace,
upholding the law and providing quality service in partnership with the communities we
serve.
KEY PROGRAMS AND SERVICES
The RCMP provides policing services to the City of Surrey. The Surrey detachment’s
officers and support staff work with the community to identify and address local crime
and safety concerns. The detachment responds to calls for service, conducts and
participates in criminal investigations, intelligence gathering, and enforcement
operations, and works to reduce the impact of crime on the community through
education and outreach. The Detachment is structured as follows:
CORE POLICING
Core Policing consists primarily of
uniformed general duty members. They
are first responders to emergency and
non-emergency calls for service and also
conduct community patrols and proactive
initiatives. The division also includes
several support units, including the Radio
Room and Cellblock Operations.
INVESTIGATIVE SERVICES
Investigative Services consists primarily
of plainclothes members organized into
specialized sections, such as Serious
Crimes, Unsolved Homicides, General
Investigation support, Robbery and
Economic Crime Units, and also includes
Interview and Target teams. The
Vulnerable Persons Unit also fall under
this division, providing specialized
support with respect to Special Victims,
Child Abuse, Sexual Offences, Missing
Persons, Domestic Violence and Mental
Health.
COMMUNITY SERVICES
Community Services is the home of
proactive enforcement teams and
community safety and service teams
focused on crime reduction and
prevention, including Property Crime,
Gang and Drug Enforcement teams,
uniformed Traffic Enforcement, School
Resource and Youth at Risk units, Bike
Patrol, Special Events and Emergency
Planning, district based Community
Response units and a Diversity and
Outreach unit.
OPERATIONS SUPPORT
Operations Support includes a number of
specialized corporate and client service
units, such as Training Section, Member
Services, Professional Standards,
Strategic Operations, Media Relations,
and the Operations Review Unit.
Detachment Operations and the
Telephone Reporting Team also provide
support to walk-in clientele and calls for
service where police attendance is not
required.
- 228 -
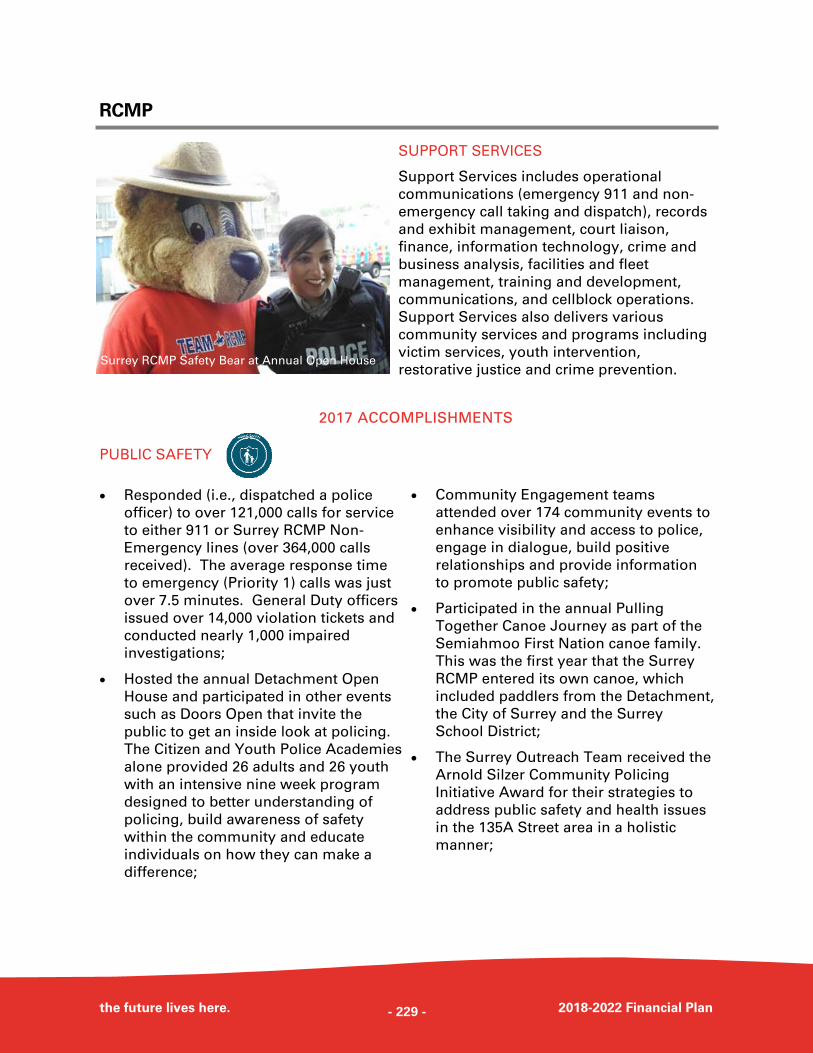
RCMP
the future lives here. 2018-2022 Financial Plan
SUPPORT SERVICES
Support Services includes operational
communications (emergency 911 and non-
emergency call taking and dispatch), records
and exhibit management, court liaison,
finance, information technology, crime and
business analysis, facilities and fleet
management, training and development,
communications, and cellblock operations.
Support Services also delivers various
community services and programs including
victim services, youth intervention,
restorative justice and crime prevention.
2017 ACCOMPLISHMENTS
PUBLIC SAFETY
Responded (i.e., dispatched a police
officer) to over 121,000 calls for service
to either 911 or Surrey RCMP Non-
Emergency lines (over 364,000 calls
received). The average response time
to emergency (Priority 1) calls was just
over 7.5 minutes. General Duty officers
issued over 14,000 violation tickets and
conducted nearly 1,000 impaired
investigations;
Hosted the annual Detachment Open
House and participated in other events
such as Doors Open that invite the
public to get an inside look at policing.
The Citizen and Youth Police Academies
alone provided 26 adults and 26 youth
with an intensive nine week program
designed to better understanding of
policing, build awareness of safety
within the community and educate
individuals on how they can make a
difference;
Community Engagement teams
attended over 174 community events to
enhance visibility and access to police,
engage in dialogue, build positive
relationships and provide information
to promote public safety;
Participated in the annual Pulling
Together Canoe Journey as part of the
Semiahmoo First Nation canoe family.
This was the first year that the Surrey
RCMP entered its own canoe, which
included paddlers from the Detachment,
the City of Surrey and the Surrey
School District;
The Surrey Outreach Team received the
Arnold Silzer Community Policing
Initiative Award for their strategies to
address public safety and health issues
in the 135A Street area in a holistic
manner;
Surrey RCMP Safety Bear at Annual Open House
- 229 -
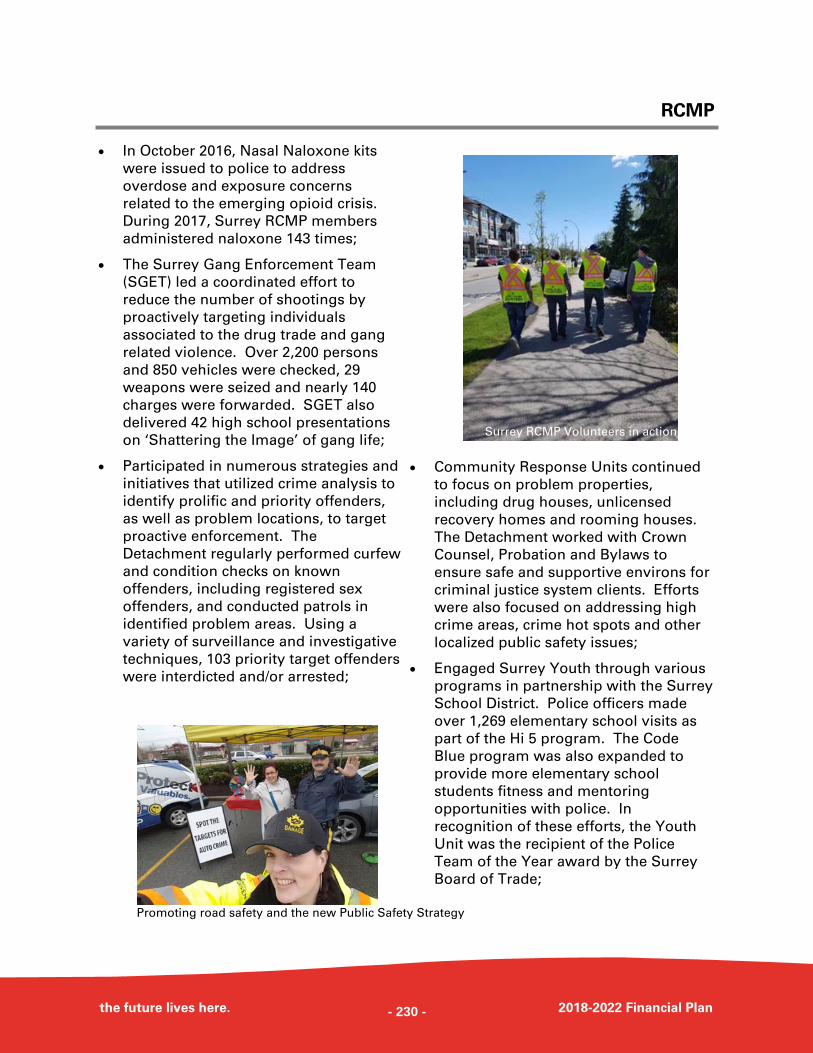
RCMP
the future lives here. 2018-2022 Financial Plan
In October 2016, Nasal Naloxone kits
were issued to police to address
overdose and exposure concerns
related to the emerging opioid crisis.
During 2017, Surrey RCMP members
administered naloxone 143 times;
The Surrey Gang Enforcement Team
(SGET) led a coordinated effort to
reduce the number of shootings by
proactively targeting individuals
associated to the drug trade and gang
related violence. Over 2,200 persons
and 850 vehicles were checked, 29
weapons were seized and nearly 140
charges were forwarded. SGET also
delivered 42 high school presentations
on ‘Shattering the Image’ of gang life;
Participated in numerous strategies and
initiatives that utilized crime analysis to
identify prolific and priority offenders,
as well as problem locations, to target
proactive enforcement. The
Detachment regularly performed curfew
and condition checks on known
offenders, including registered sex
offenders, and conducted patrols in
identified problem areas. Using a
variety of surveillance and investigative
techniques, 103 priority target offenders
were interdicted and/or arrested;
Community Response Units continued
to focus on problem properties,
including drug houses, unlicensed
recovery homes and rooming houses.
The Detachment worked with Crown
Counsel, Probation and Bylaws to
ensure safe and supportive environs for
criminal justice system clients. Efforts
were also focused on addressing high
crime areas, crime hot spots and other
localized public safety issues;
Engaged Surrey Youth through various
programs in partnership with the Surrey
School District. Police officers made
over 1,269 elementary school visits as
part of the Hi 5 program. The Code
Blue program was also expanded to
provide more elementary school
students fitness and mentoring
opportunities with police. In
recognition of these efforts, the Youth
Unit was the recipient of the Police
Team of the Year award by the Surrey
Board of Trade;
Surrey RCMP Volunteers in action
Promoting road safety and the new Public Safety Strategy
- 230 -
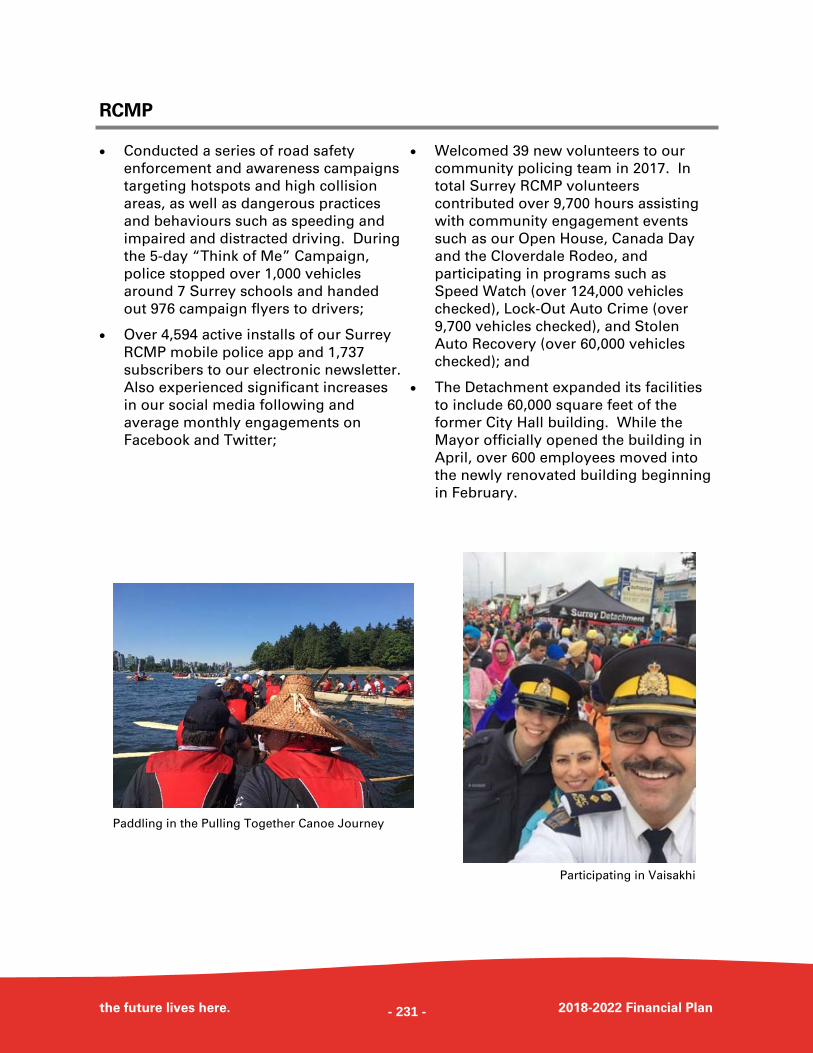
RCMP
the future lives here. 2018-2022 Financial Plan
Conducted a series of road safety
enforcement and awareness campaigns
targeting hotspots and high collision
areas, as well as dangerous practices
and behaviours such as speeding and
impaired and distracted driving. During
the 5-day “Think of Me” Campaign,
police stopped over 1,000 vehicles
around 7 Surrey schools and handed
out 976 campaign flyers to drivers;
Over 4,594 active installs of our Surrey
RCMP mobile police app and 1,737
subscribers to our electronic newsletter.
Also experienced significant increases
in our social media following and
average monthly engagements on
Facebook and Twitter;
Welcomed 39 new volunteers to our
community policing team in 2017. In
total Surrey RCMP volunteers
contributed over 9,700 hours assisting
with community engagement events
such as our Open House, Canada Day
and the Cloverdale Rodeo, and
participating in programs such as
Speed Watch (over 124,000 vehicles
checked), Lock-Out Auto Crime (over
9,700 vehicles checked), and Stolen
Auto Recovery (over 60,000 vehicles
checked); and
The Detachment expanded its facilities
to include 60,000 square feet of the
former City Hall building. While the
Mayor officially opened the building in
April, over 600 employees moved into
the newly renovated building beginning
in February.
Paddling in the Pulling Together Canoe Journey
Participating in Vaisakhi
- 231 -
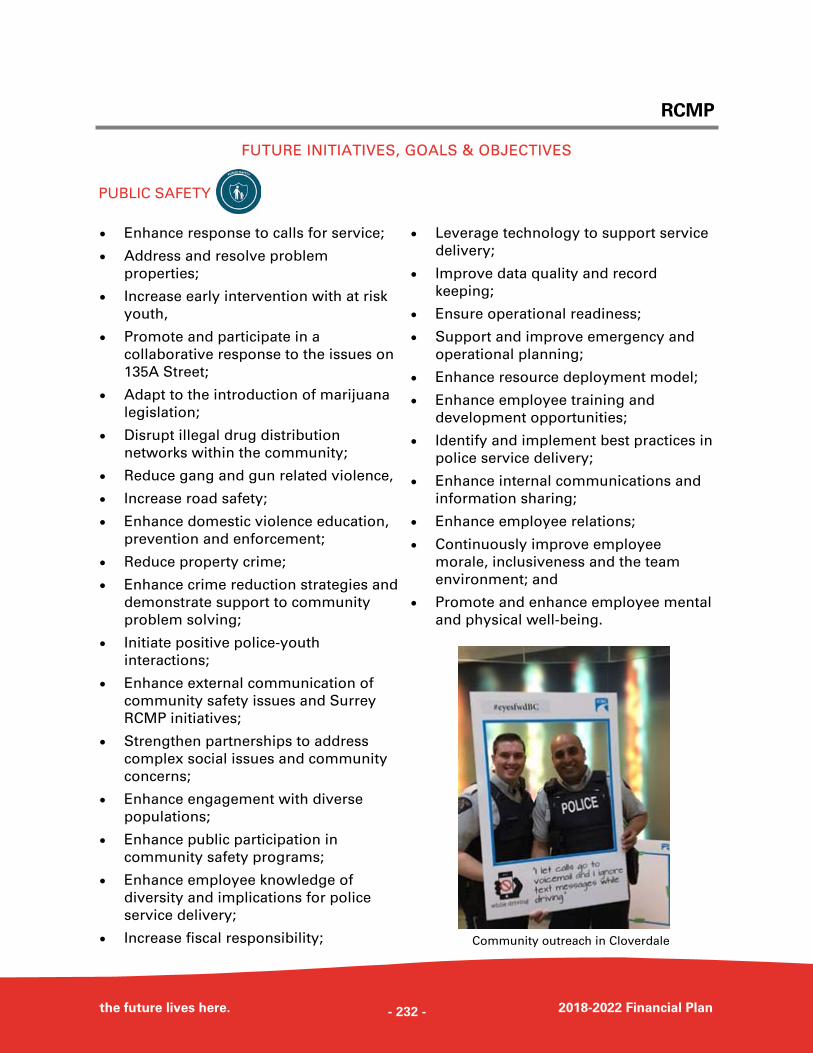
RCMP
the future lives here. 2018-2022 Financial Plan
FUTURE INITIATIVES, GOALS & OBJECTIVES
Enhance response to calls for service;
Address and resolve problem
properties;
Increase early intervention with at risk
youth,
Promote and participate in a
collaborative response to the issues on
135A Street;
Adapt to the introduction of marijuana
legislation;
Disrupt illegal drug distribution
networks within the community;
Reduce gang and gun related violence,
Increase road safety;
Enhance domestic violence education,
prevention and enforcement;
Reduce property crime;
Enhance crime reduction strategies and
demonstrate support to community
problem solving;
Initiate positive police-youth
interactions;
Enhance external communication of
community safety issues and Surrey
RCMP initiatives;
Strengthen partnerships to address
complex social issues and community
concerns;
Enhance engagement with diverse
populations;
Enhance public participation in
community safety programs;
Enhance employee knowledge of
diversity and implications for police
service delivery;
Increase fiscal responsibility;
Leverage technology to support service
delivery;
Improve data quality and record
keeping;
Ensure operational readiness;
Support and improve emergency and
operational planning;
Enhance resource deployment model;
Enhance employee training and
development opportunities;
Identify and implement best practices in
police service delivery;
Enhance internal communications and
information sharing;
Enhance employee relations;
Continuously improve employee
morale, inclusiveness and the team
environment; and
Promote and enhance employee mental
and physical well-being.
PUBLIC SAFETY
Community outreach in Cloverdale
- 232 -
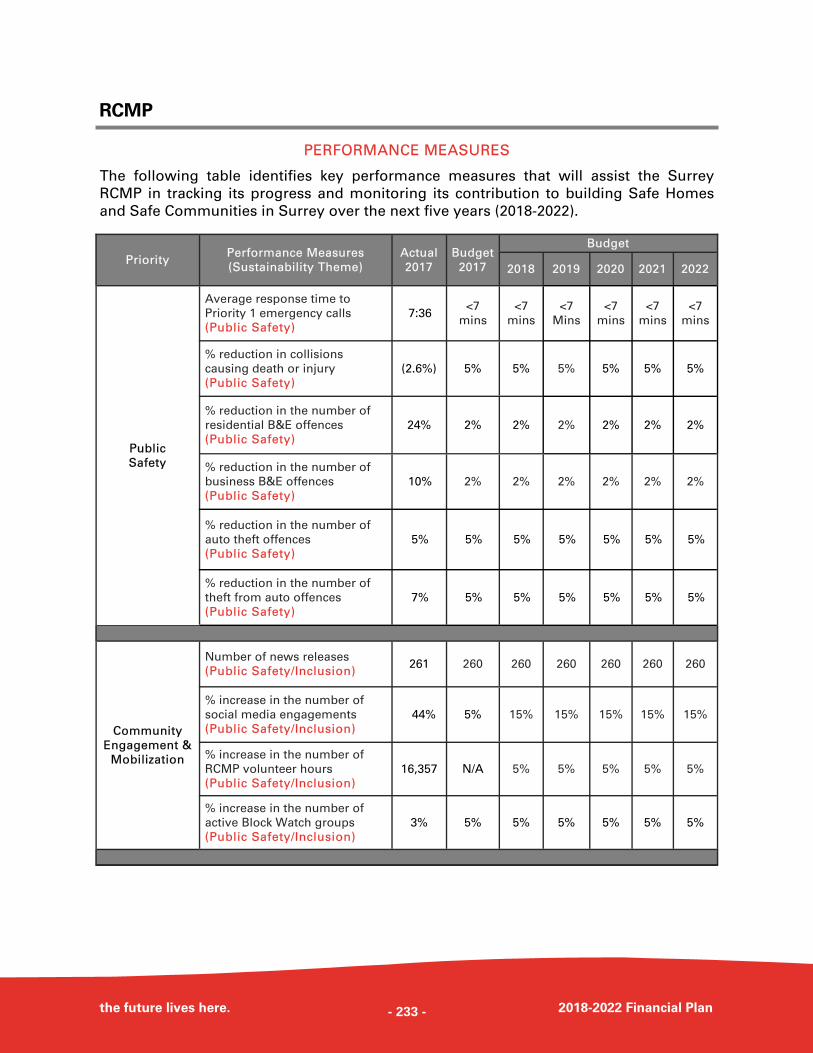
RCMP
the future lives here. 2018-2022 Financial Plan
PERFORMANCE MEASURES
The following table identifies key performance measures that will assist the Surrey
RCMP in tracking its progress and monitoring its contribution to building Safe Homes
and Safe Communities in Surrey over the next five years (2018-2022).
Priority Performance Measures
(Sustainability Theme)
Actual
2017
Budget
2017
Budget
2018 2019 2020 2021 2022
Public
Safety
Average response time to
Priority 1 emergency calls
(Public Safety) 7:36
<7
mins
<7
mins
<7
Mins
<7
mins
<7
mins
<7
mins
% reduction in collisions
causing death or injury
(Public Safety) (2.6%) 5% 5% 5% 5% 5% 5%
% reduction in the number of
residential B&E offences
(Public Safety) 24% 2% 2% 2% 2% 2% 2%
% reduction in the number of
business B&E offences
(Public Safety) 10% 2% 2% 2% 2% 2% 2%
% reduction in the number of
auto theft offences
(Public Safety) 5% 5% 5% 5% 5% 5% 5%
% reduction in the number of
theft from auto offences
(Public Safety) 7% 5% 5% 5% 5% 5% 5%
Community
Engagement &
Mobilization
Number of news releases
(Public Safety/Inclusion) 261 260 260 260 260 260 260
% increase in the number of
social media engagements
(Public Safety/Inclusion) 44% 5% 15% 15% 15% 15% 15%
% increase in the number of
RCMP volunteer hours
(Public Safety/Inclusion) 16,357 N/A 5% 5% 5% 5% 5%
% increase in the number of
active Block Watch groups
(Public Safety/Inclusion) 3% 5% 5% 5% 5% 5% 5%
- 233 -
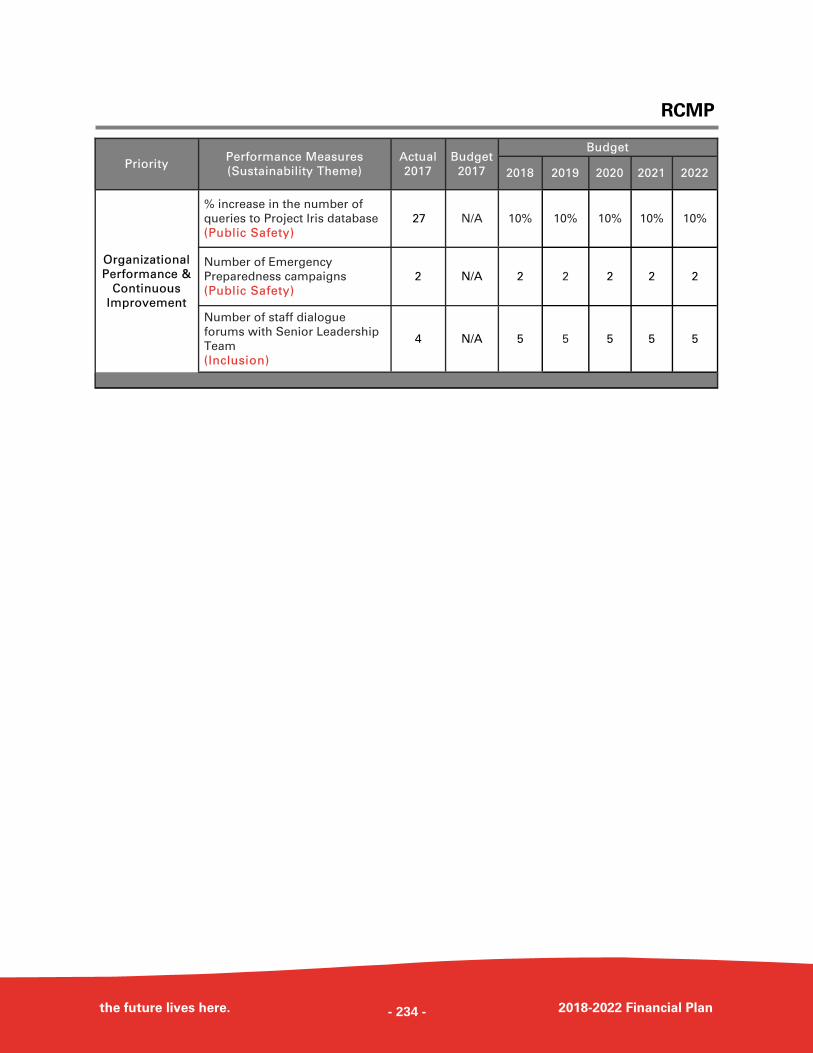
RCMP
the future lives here. 2018-2022 Financial Plan
Priority Performance Measures
(Sustainability Theme)
Actual
2017
Budget
2017
Budget
2018 2019 2020 2021 2022
Organizational
Performance &
Continuous
Improvement
% increase in the number of
queries to Project Iris database
(Public Safety) 27 N/A 10% 10% 10% 10% 10%
Number of Emergency
Preparedness campaigns
(Public Safety) 2 N/A 2 2 2 2 2
Number of staff dialogue
forums with Senior Leadership
Team
(Inclusion)
4 N/A 5 5 5 5 5
- 234 -
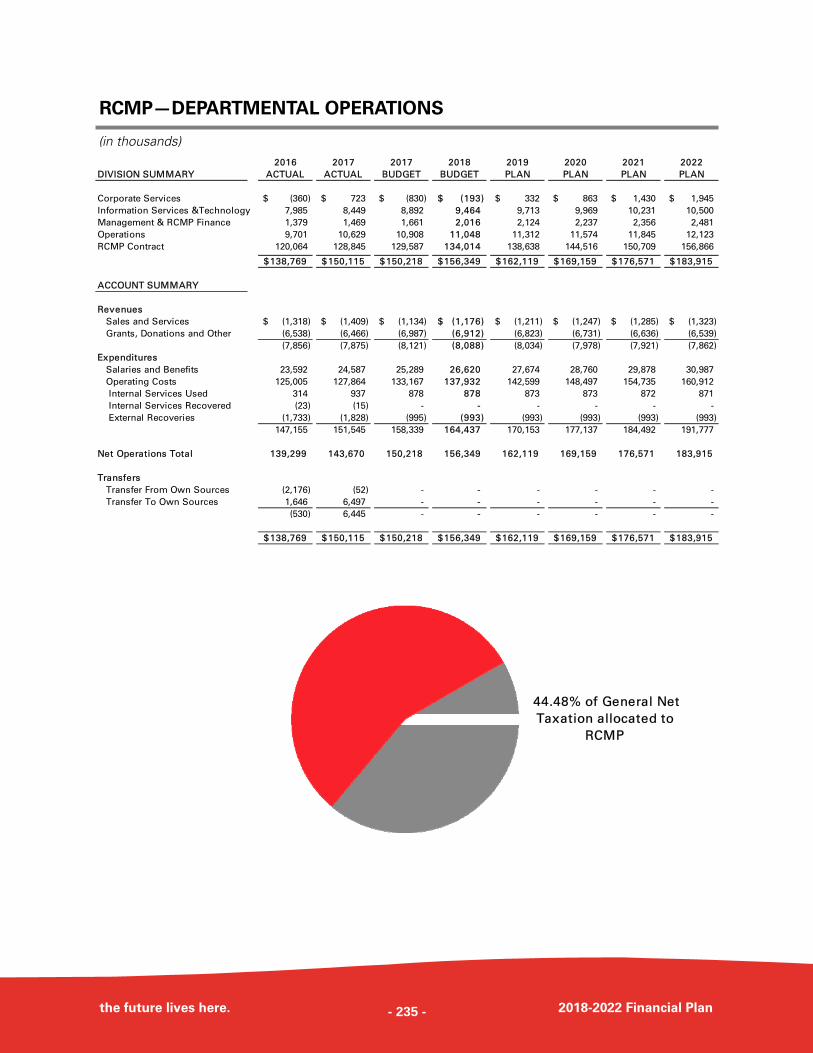
RCMP—DEPARTMENTAL OPERATIONS
the future lives here. 2018-2022 Financial Plan
(in thousands) 2016 2017 2017 2018 2019 2020 2021 2022
DIVISION SUMMARY ACTUAL ACTUAL BUDGET BUDGET PLAN PLAN PLAN PLAN
Corporate Services (360)$ 723$ (830)$ (193)$ 332$ 863$ 1,430$ 1,945$
Information Services &Technology 7,985 8,449 8,892 9,464 9,713 9,969 10,231 10,500
Management & RCMP Finance 1,379 1,469 1,661 2,016 2,124 2,237 2,356 2,481
Operations 9,701 10,629 10,908 11,048 11,312 11,574 11,845 12,123
RCMP Contract 120,064 128,845 129,587 134,014 138,638 144,516 150,709 156,866
138,769$ 150,115$ 150,218$ 156,349$ 162,119$ 169,159$ 176,571$ 183,915$
ACCOUNT SUMMARY
Revenues
Sales and Services (1,318)$ (1,409)$ (1,134)$ (1,176)$ (1,211)$ (1,247)$ (1,285)$ (1,323)$
Grants, Donations and Other (6,538) (6,466) (6,987) (6,912) (6,823) (6,731) (6,636) (6,539)
(7,856) (7,875) (8,121) (8,088) (8,034) (7,978) (7,921) (7,862)
Expenditures
Salaries and Benefits 23,592 24,587 25,289 26,620 27,674 28,760 29,878 30,987
Operating Costs 125,005 127,864 133,167 137,932 142,599 148,497 154,735 160,912
Internal Services Used 314 937 878 878 873 873 872 871
Internal Services Recovered (23) (15) - - - - - -
External Recoveries (1,733) (1,828) (995) (993) (993) (993) (993) (993)
147,155 151,545 158,339 164,437 170,153 177,137 184,492 191,777
Net Operations Total 139,299 143,670 150,218 156,349 162,119 169,159 176,571 183,915
Transfers
Transfer From Own Sources (2,176) (52) - - - - - -
Transfer To Own Sources 1,646 6,497 - - - - - -
(530) 6,445 - - - - - -
138,769$ 150,115$ 150,218$ 156,349$ 162,119$ 169,159$ 176,571$ 183,915$
44.48% of General Net
Taxation allocated to
RCMP
- 235 -
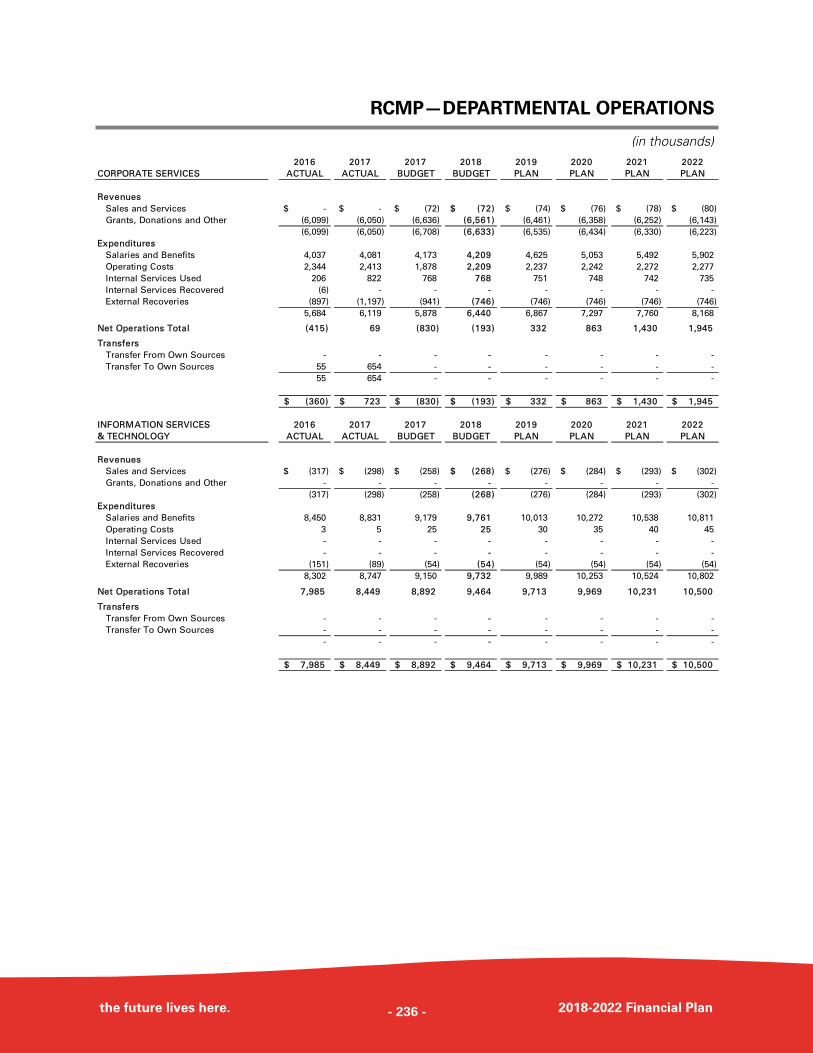
RCMP—DEPARTMENTAL OPERATIONS
the future lives here. 2018-2022 Financial Plan
(in thousands) 2016 2017 2017 2018 2019 2020 2021 2022
CORPORATE SERVICES ACTUAL ACTUAL BUDGET BUDGET PLAN PLAN PLAN PLAN
Revenues
Sales and Services -$ -$ (72)$ (72)$ (74)$ (76)$ (78)$ (80)$
Grants, Donations and Other (6,099) (6,050) (6,636) (6,561) (6,461) (6,358) (6,252) (6,143)
(6,099) (6,050) (6,708) (6,633) (6,535) (6,434) (6,330) (6,223)
Expenditures
Salaries and Benefits 4,037 4,081 4,173 4,209 4,625 5,053 5,492 5,902
Operating Costs 2,344 2,413 1,878 2,209 2,237 2,242 2,272 2,277
Internal Services Used 206 822 768 768 751 748 742 735
Internal Services Recovered (6) - - - - - - -
External Recoveries (897) (1,197) (941) (746) (746) (746) (746) (746)
5,684 6,119 5,878 6,440 6,867 7,297 7,760 8,168
Net Operations Total (415) 69 (830) (193) 332 863 1,430 1,945
Transfers
Transfer From Own Sources - - - - - - - -
Transfer To Own Sources 55 654 - - - - - -
55 654 - - - - - -
(360)$ 723$ (830)$ (193)$ 332$ 863$ 1,430$ 1,945$
INFORMATION SERVICES 2016 2017 2017 2018 2019 2020 2021 2022
& TECHNOLOGY ACTUAL ACTUAL BUDGET BUDGET PLAN PLAN PLAN PLAN
Revenues
Sales and Services (317)$ (298)$ (258)$ (268)$ (276)$ (284)$ (293)$ (302)$
Grants, Donations and Other - - - - - - - -
(317) (298) (258) (268) (276) (284) (293) (302)
Expenditures
Salaries and Benefits 8,450 8,831 9,179 9,761 10,013 10,272 10,538 10,811
Operating Costs 3 5 25 25 30 35 40 45
Internal Services Used - - - - - - - -
Internal Services Recovered - - - - - - - -
External Recoveries (151) (89) (54) (54) (54) (54) (54) (54)
8,302 8,747 9,150 9,732 9,989 10,253 10,524 10,802
Net Operations Total 7,985 8,449 8,892 9,464 9,713 9,969 10,231 10,500
Transfers
Transfer From Own Sources - - - - - - - -
Transfer To Own Sources - - - - - - - -
- - - - - - - -
7,985$ 8,449$ 8,892$ 9,464$ 9,713$ 9,969$ 10,231$ 10,500$
- 236 -
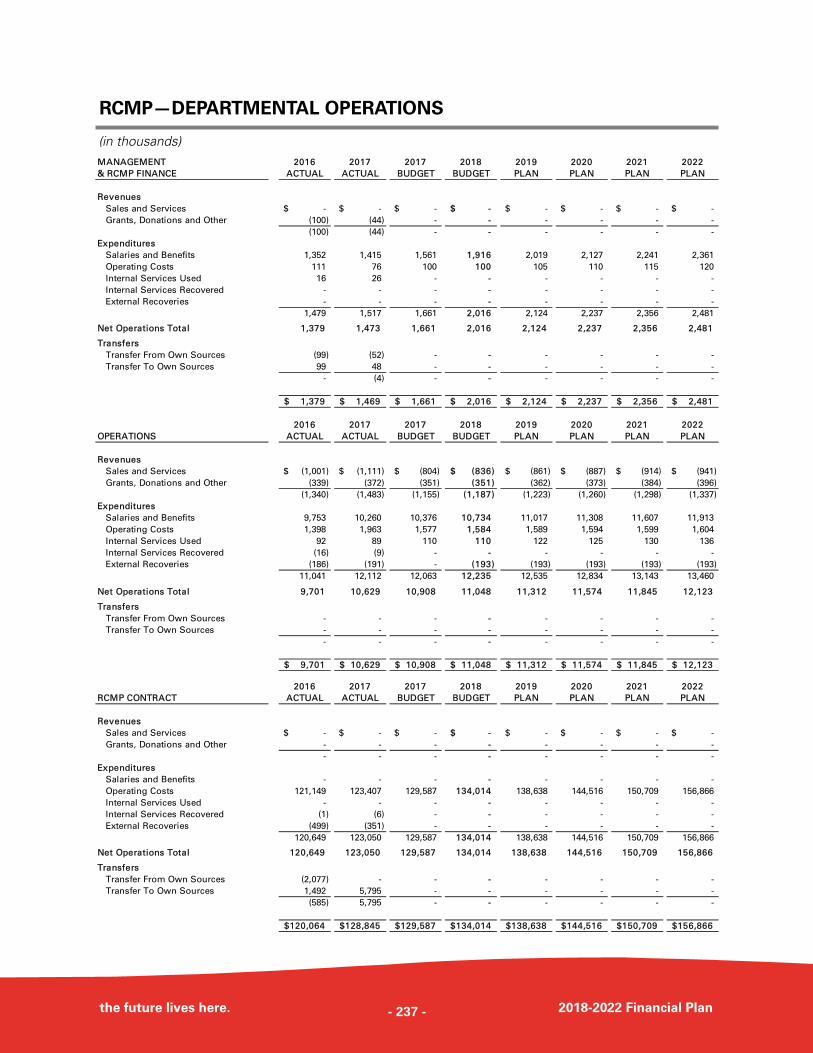
RCMP—DEPARTMENTAL OPERATIONS
the future lives here. 2018-2022 Financial Plan
(in thousands) MANAGEMENT 2016 2017 2017 2018 2019 2020 2021 2022
& RCMP FINANCE ACTUAL ACTUAL BUDGET BUDGET PLAN PLAN PLAN PLAN
Revenues
Sales and Services -$ -$ -$ -$ -$ -$ -$ -$
Grants, Donations and Other (100) (44) - - - - - -
(100) (44) - - - - - -
Expenditures
Salaries and Benefits 1,352 1,415 1,561 1,916 2,019 2,127 2,241 2,361
Operating Costs 111 76 100 100 105 110 115 120
Internal Services Used 16 26 - - - - - -
Internal Services Recovered - - - - - - - -
External Recoveries - - - - - - - -
1,479 1,517 1,661 2,016 2,124 2,237 2,356 2,481
Net Operations Total 1,379 1,473 1,661 2,016 2,124 2,237 2,356 2,481
Transfers
Transfer From Own Sources (99) (52) - - - - - -
Transfer To Own Sources 99 48 - - - - - -
- (4) - - - - - -
1,379$ 1,469$ 1,661$ 2,016$ 2,124$ 2,237$ 2,356$ 2,481$
2016 2017 2017 2018 2019 2020 2021 2022
OPERATIONS ACTUAL ACTUAL BUDGET BUDGET PLAN PLAN PLAN PLAN
Revenues
Sales and Services (1,001)$ (1,111)$ (804)$ (836)$ (861)$ (887)$ (914)$ (941)$
Grants, Donations and Other (339) (372) (351) (351) (362) (373) (384) (396)
(1,340) (1,483) (1,155) (1,187) (1,223) (1,260) (1,298) (1,337)
Expenditures
Salaries and Benefits 9,753 10,260 10,376 10,734 11,017 11,308 11,607 11,913
Operating Costs 1,398 1,963 1,577 1,584 1,589 1,594 1,599 1,604
Internal Services Used 92 89 110 110 122 125 130 136
Internal Services Recovered (16) (9) - - - - - -
External Recoveries (186) (191) - (193) (193) (193) (193) (193)
11,041 12,112 12,063 12,235 12,535 12,834 13,143 13,460
Net Operations Total 9,701 10,629 10,908 11,048 11,312 11,574 11,845 12,123
Transfers
Transfer From Own Sources - - - - - - - -
Transfer To Own Sources - - - - - - - -
- - - - - - - -
9,701$ 10,629$ 10,908$ 11,048$ 11,312$ 11,574$ 11,845$ 12,123$
2016 2017 2017 2018 2019 2020 2021 2022
RCMP CONTRACT ACTUAL ACTUAL BUDGET BUDGET PLAN PLAN PLAN PLAN
Revenues
Sales and Services -$ -$ -$ -$ -$ -$ -$ -$
Grants, Donations and Other - - - - - - - -
- - - - - - - -
Expenditures
Salaries and Benefits - - - - - - - -
Operating Costs 121,149 123,407 129,587 134,014 138,638 144,516 150,709 156,866
Internal Services Used - - - - - - - -
Internal Services Recovered (1) (6) - - - - - -
External Recoveries (499) (351) - - - - - -
120,649 123,050 129,587 134,014 138,638 144,516 150,709 156,866
Net Operations Total 120,649 123,050 129,587 134,014 138,638 144,516 150,709 156,866
Transfers
Transfer From Own Sources (2,077) - - - - - - -
Transfer To Own Sources 1,492 5,795 - - - - - -
(585) 5,795 - - - - - -
120,064$ 128,845$ 129,587$ 134,014$ 138,638$ 144,516$ 150,709$ 156,866$
- 237 -
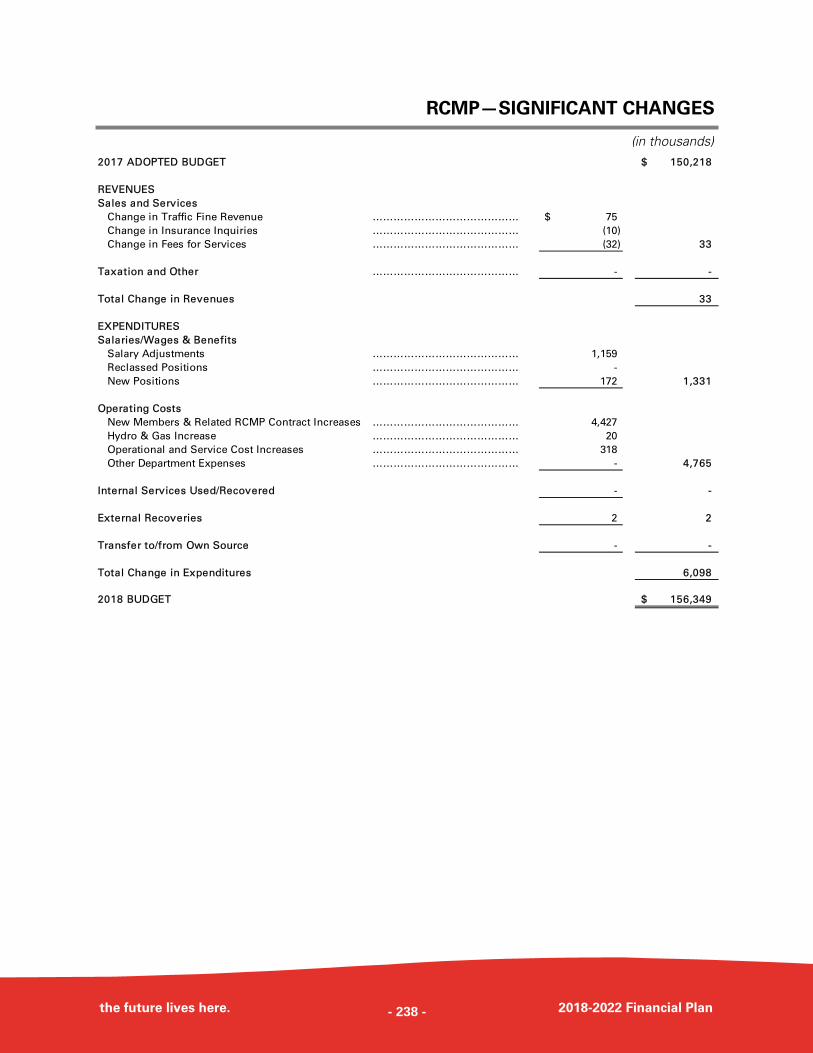
RCMP—SIGNIFICANT CHANGES
the future lives here. 2018-2022 Financial Plan
(in thousands) 2017 ADOPTED BUDGET 150,218$
REVENUES
Sales and Services
Change in Traffic Fine Revenue …………………………………… 75$
Change in Insurance Inquiries …………………………………… (10)
Change in Fees for Services …………………………………… (32) 33
Taxation and Other …………………………………… - -
Total Change in Revenues 33
EXPENDITURES
Salaries/Wages & Benefits
Salary Adjustments …………………………………… 1,159
Reclassed Positions …………………………………… -
New Positions …………………………………… 172 1,331
Operating Costs
New Members & Related RCMP Contract Increases …………………………………… 4,427
Hydro & Gas Increase …………………………………… 20
Operational and Service Cost Increases …………………………………… 318
Other Department Expenses …………………………………… - 4,765
Internal Services Used/Recovered - -
External Recoveries 2 2
Transfer to/from Own Source - -
Total Change in Expenditures 6,098
2018 BUDGET 156,349$
- 238 -
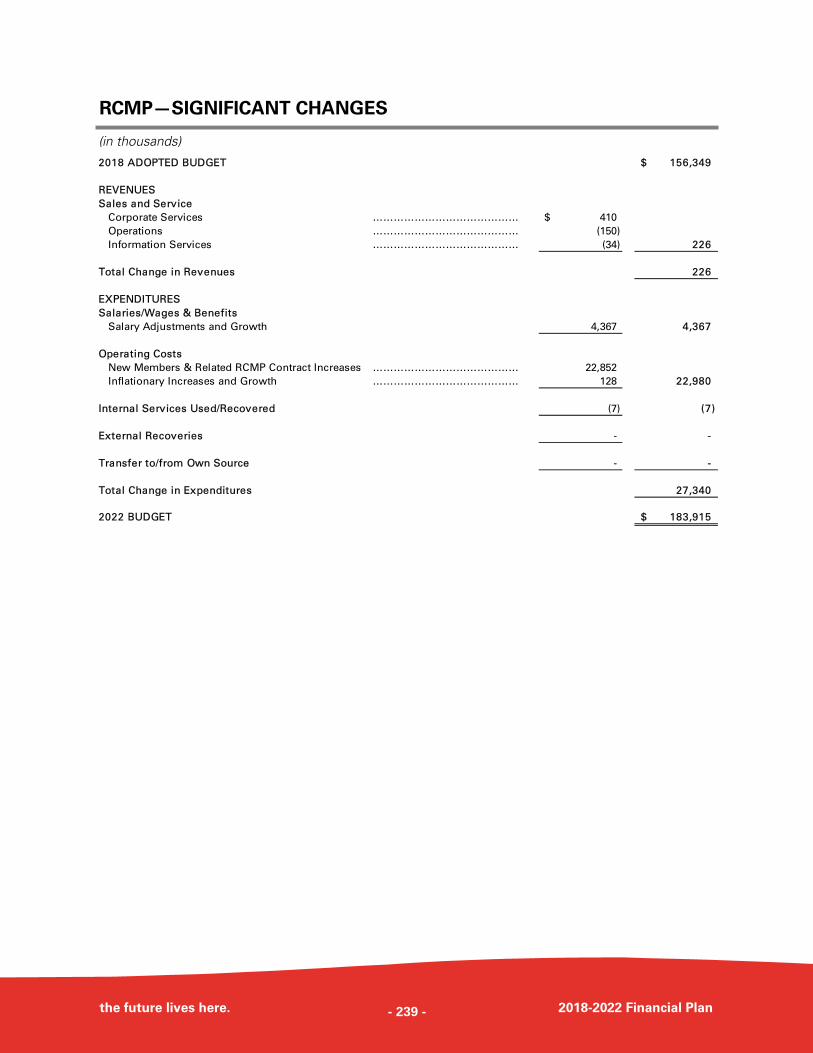
RCMP—SIGNIFICANT CHANGES
the future lives here. 2018-2022 Financial Plan
(in thousands)
2018 ADOPTED BUDGET 156,349$
REVENUES
Sales and Service
Corporate Services …………………………………… 410$
Operations …………………………………… (150)
Information Services …………………………………… (34) 226
Total Change in Revenues 226
EXPENDITURES
Salaries/Wages & Benefits
Salary Adjustments and Growth 4,367 4,367
Operating Costs
New Members & Related RCMP Contract Increases …………………………………… 22,852
Inflationary Increases and Growth …………………………………… 128 22,980
Internal Services Used/Recovered (7) (7)
External Recoveries - -
Transfer to/from Own Source - -
Total Change in Expenditures 27,340
2022 BUDGET 183,915$
- 239 -
- 240 -
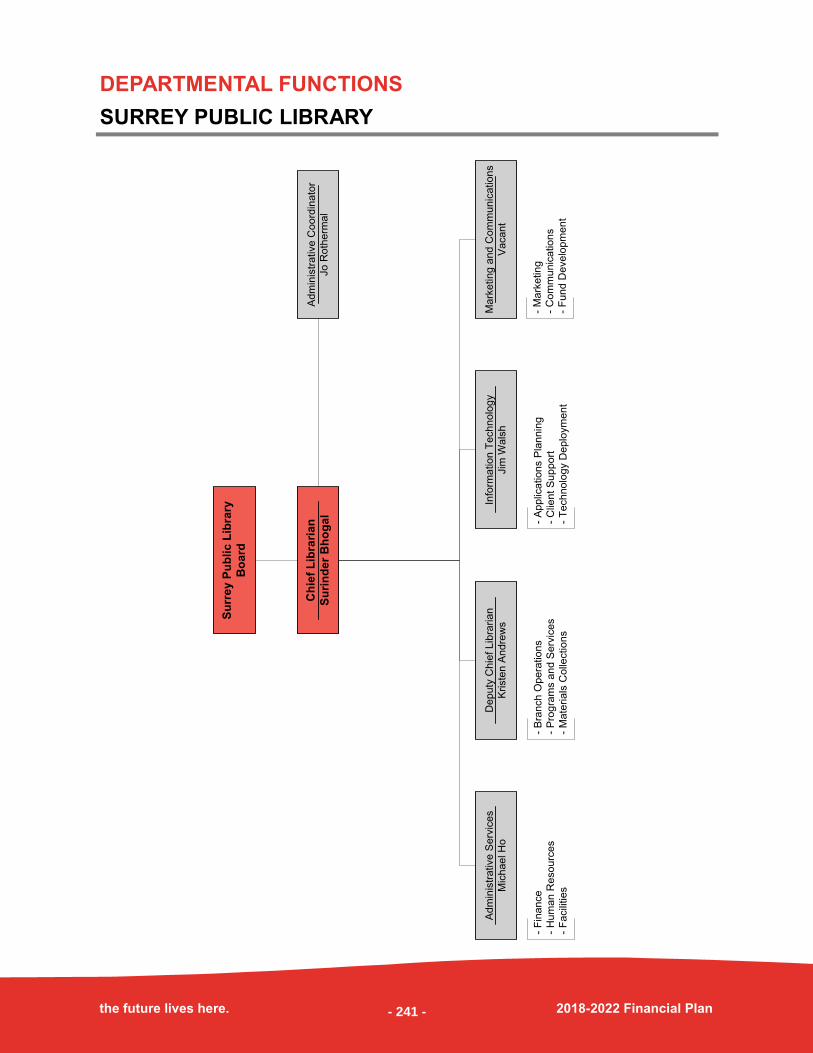
DEPARTMENTAL FUNCTIONS
SURREY PUBLIC LIBRARY
the future lives here. 2018-2022 Financial Plan
- F
inance
- H
um
an
Resourc
es
- F
acili
tie
s
- A
pplic
ations P
lann
ing
- C
lien
t S
up
port
- T
echnolo
gy D
eplo
ym
ent
Ch
ief
Lib
rari
an
Su
rin
de
r B
ho
ga
l
- B
ranch O
pera
tio
ns
- P
rogra
ms a
nd
Serv
ices
- M
ate
rials
Colle
ctio
ns
Info
rmation
Techn
olo
gy
Jim
Wals
h
Adm
inis
trative S
erv
ice
s
Mic
ha
el H
o
Dep
uty
Chie
f Lib
rarian
Kriste
n A
ndre
ws
Su
rre
y P
ub
lic
Lib
rary
Bo
ard
Adm
inis
trative C
oo
rdin
ato
r
Jo R
oth
erm
al
Mark
etin
g a
nd C
om
munic
ation
s
Vacan
t
- M
ark
eting
- C
om
mu
nic
ations
- F
und D
evelo
pm
ent
- 241 -
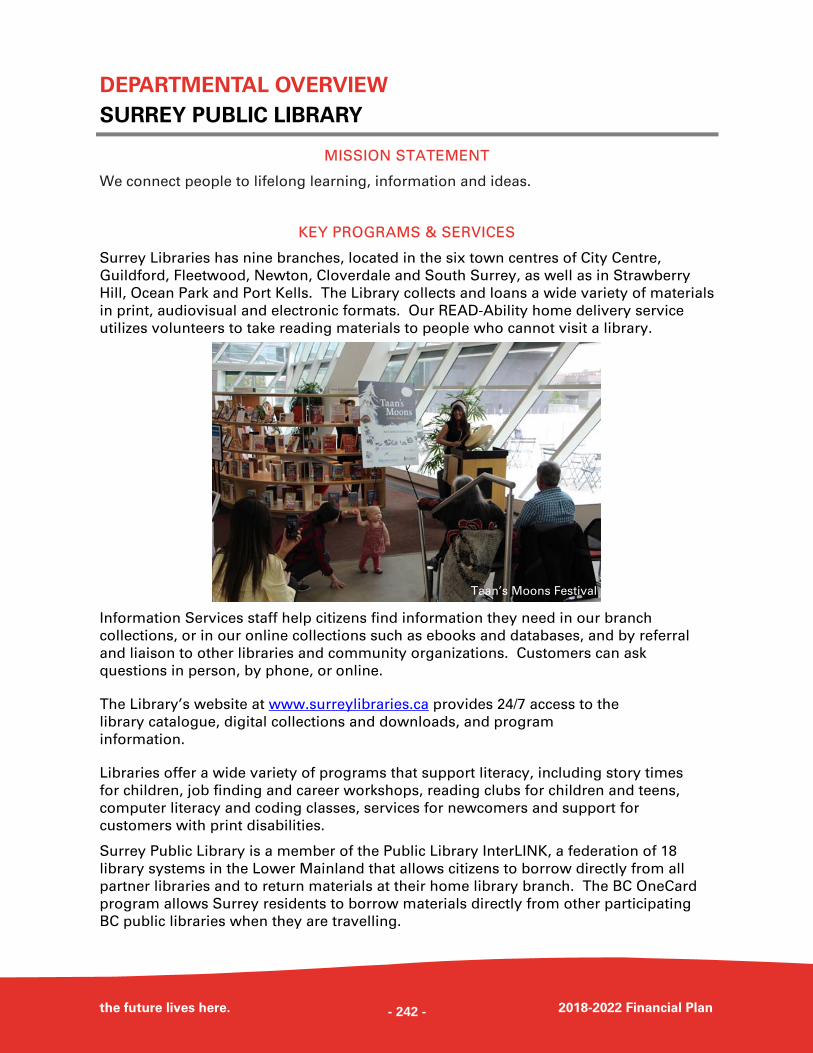
DEPARTMENTAL OVERVIEW
SURREY PUBLIC LIBRARY
the future lives here. 2018-2022 Financial Plan
MISSION STATEMENT
We connect people to lifelong learning, information and ideas.
KEY PROGRAMS & SERVICES
Surrey Libraries has nine branches, located in the six town centres of City Centre,
Guildford, Fleetwood, Newton, Cloverdale and South Surrey, as well as in Strawberry
Hill, Ocean Park and Port Kells. The Library collects and loans a wide variety of materials
in print, audiovisual and electronic formats. Our READ-Ability home delivery service
utilizes volunteers to take reading materials to people who cannot visit a library.
Information Services staff help citizens find information they need in our branch
collections, or in our online collections such as ebooks and databases, and by referral
and liaison to other libraries and community organizations. Customers can ask
questions in person, by phone, or online.
The Library’s website at www.surreylibraries.ca provides 24/7 access to the
library catalogue, digital collections and downloads, and program
information.
Libraries offer a wide variety of programs that support literacy, including story times
for children, job finding and career workshops, reading clubs for children and teens,
computer literacy and coding classes, services for newcomers and support for
customers with print disabilities.
Surrey Public Library is a member of the Public Library InterLINK, a federation of 18
library systems in the Lower Mainland that allows citizens to borrow directly from all
partner libraries and to return materials at their home library branch. The BC OneCard
program allows Surrey residents to borrow materials directly from other participating
BC public libraries when they are travelling.
Taan’s Moons Festival
- 242 -
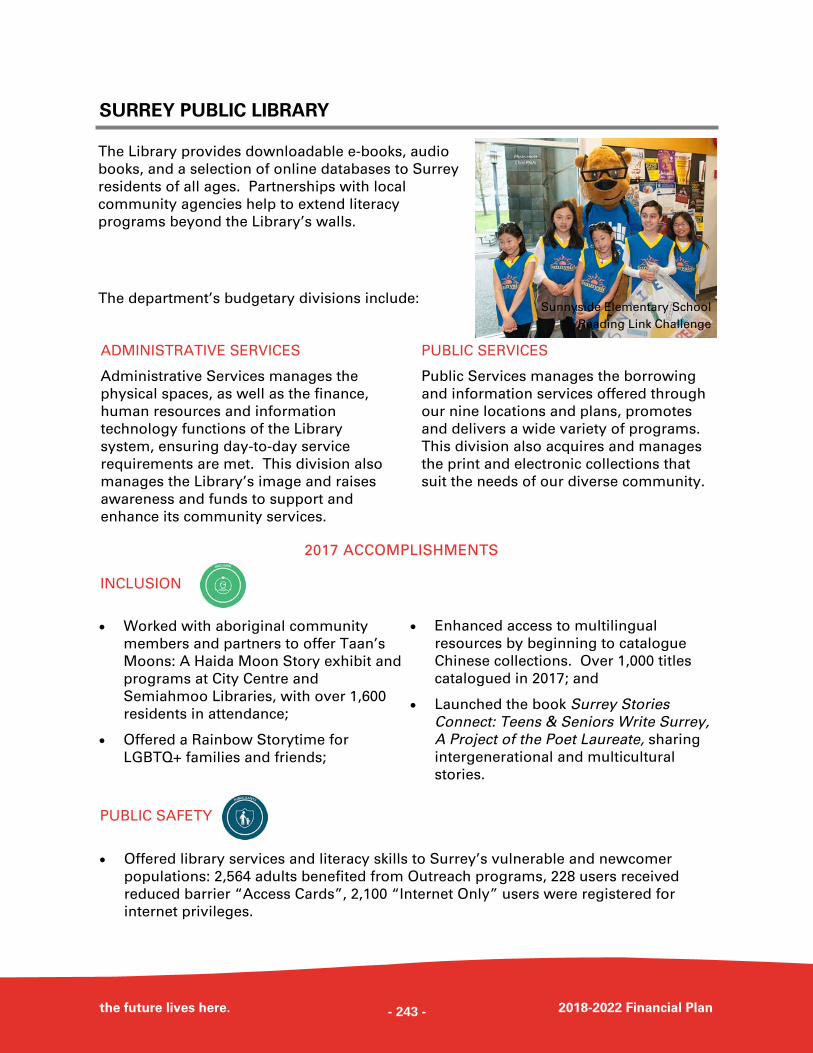
SURREY PUBLIC LIBRARY
the future lives here. 2018-2022 Financial Plan
The Library provides downloadable e-books, audio
books, and a selection of online databases to Surrey
residents of all ages. Partnerships with local
community agencies help to extend literacy
programs beyond the Library’s walls.
The department’s budgetary divisions include:
ADMINISTRATIVE SERVICES
Administrative Services manages the
physical spaces, as well as the finance,
human resources and information
technology functions of the Library
system, ensuring day-to-day service
requirements are met. This division also
manages the Library’s image and raises
awareness and funds to support and
enhance its community services.
PUBLIC SERVICES
Public Services manages the borrowing
and information services offered through
our nine locations and plans, promotes
and delivers a wide variety of programs.
This division also acquires and manages
the print and electronic collections that
suit the needs of our diverse community.
2017 ACCOMPLISHMENTS
Worked with aboriginal community
members and partners to offer Taan’s
Moons: A Haida Moon Story exhibit and
programs at City Centre and
Semiahmoo Libraries, with over 1,600
residents in attendance;
Offered a Rainbow Storytime for
LGBTQ+ families and friends;
Enhanced access to multilingual
resources by beginning to catalogue
Chinese collections. Over 1,000 titles
catalogued in 2017; and
Launched the book Surrey Stories
Connect: Teens & Seniors Write Surrey,
A Project of the Poet Laureate, sharing
intergenerational and multicultural
stories.
Offered library services and literacy skills to Surrey’s vulnerable and newcomer
populations: 2,564 adults benefited from Outreach programs, 228 users received
reduced barrier “Access Cards”, 2,100 “Internet Only” users were registered for
internet privileges.
INCLUSION
PUBLIC SAFETY
Sunnyside Elementary School
Reading Link Challenge
- 243 -
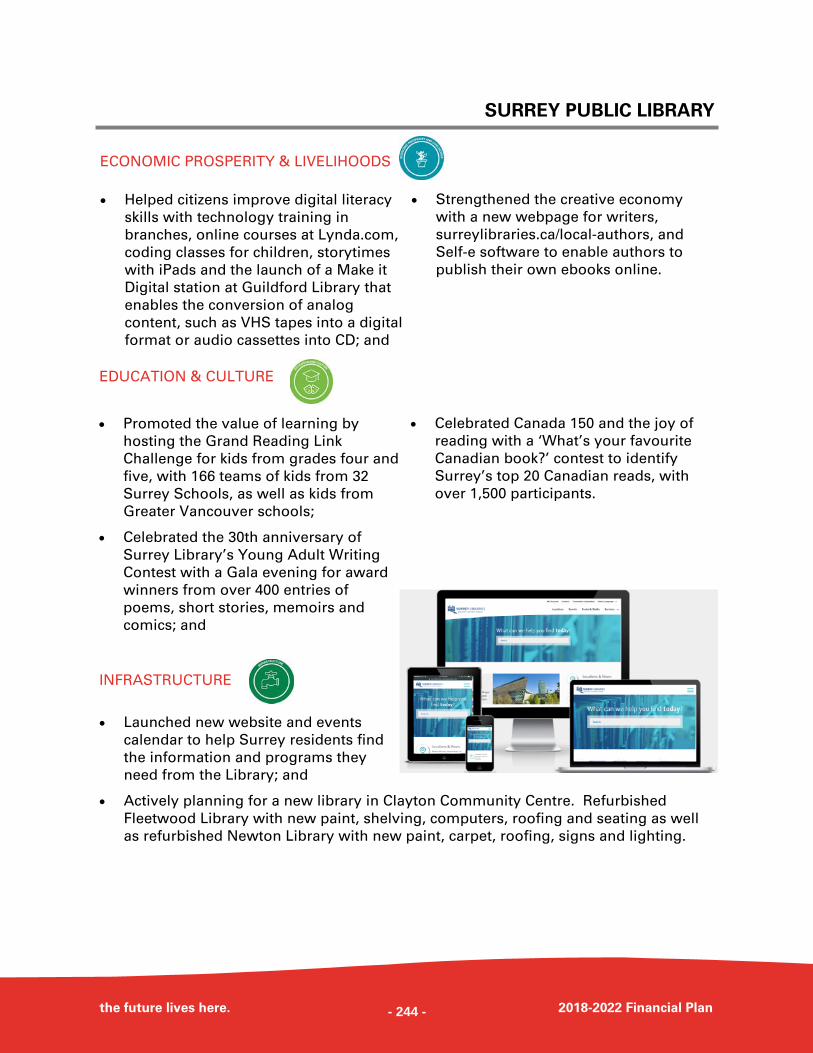
SURREY PUBLIC LIBRARY
the future lives here. 2018-2022 Financial Plan
Helped citizens improve digital literacy
skills with technology training in
branches, online courses at Lynda.com,
coding classes for children, storytimes
with iPads and the launch of a Make it
Digital station at Guildford Library that
enables the conversion of analog
content, such as VHS tapes into a digital
format or audio cassettes into CD; and
Strengthened the creative economy
with a new webpage for writers,
surreylibraries.ca/local-authors, and
Self-e software to enable authors to
publish their own ebooks online.
Promoted the value of learning by
hosting the Grand Reading Link
Challenge for kids from grades four and
five, with 166 teams of kids from 32
Surrey Schools, as well as kids from
Greater Vancouver schools;
Celebrated the 30th anniversary of
Surrey Library’s Young Adult Writing
Contest with a Gala evening for award
winners from over 400 entries of
poems, short stories, memoirs and
comics; and
Celebrated Canada 150 and the joy of
reading with a ‘What’s your favourite
Canadian book?’ contest to identify
Surrey’s top 20 Canadian reads, with
over 1,500 participants.
Launched new website and events
calendar to help Surrey residents find
the information and programs they
need from the Library; and
Actively planning for a new library in Clayton Community Centre. Refurbished
Fleetwood Library with new paint, shelving, computers, roofing and seating as well
as refurbished Newton Library with new paint, carpet, roofing, signs and lighting.
ECONOMIC PROSPERITY & LIVELIHOODS
EDUCATION & CULTURE
INFRASTRUCTURE
- 244 -
SURREY PUBLIC LIBRARY
the future lives here. 2018-2022 Financial Plan
FUTURE INITIATIVES, GOALS & OBJECTIVES
Create action plan for a mobile literacy
van to each underserved areas and
vulnerable citizens;
Host an indigenous author reading
series for children; and
Increase selection of world language
materials.
Continue to serve Surrey’s vulnerable and newcomer populations with current levels
of outreach programming, continued in-library programs of relevance and increased
numbers of Access Cards offered (goal of 5% increase annually).
Improve access to services by adding
opening hours on Family Day and
Sundays; and
Support literacy with programs for
writers and local authors.
Engage with stakeholders to create a
new Strategic Plan for Surrey Libraries;
and
Connect more school aged children to
the Library with grade one tours
initiative in partnership with school
librarians.
Continue planning for a new library in
Clayton Community Centre;
Refurbish Ocean Park Library; and
Renovate Cloverdale Library to be part
of a Heritage Campus with Surrey
Museum and Surrey Archives.
INCLUSION
PUBLIC SAFETY
ECONOMIC PROSPERITY & LIVELIHOODS
EDUCATION & CULTURE
INFRASTRUCTURE
- 245 -
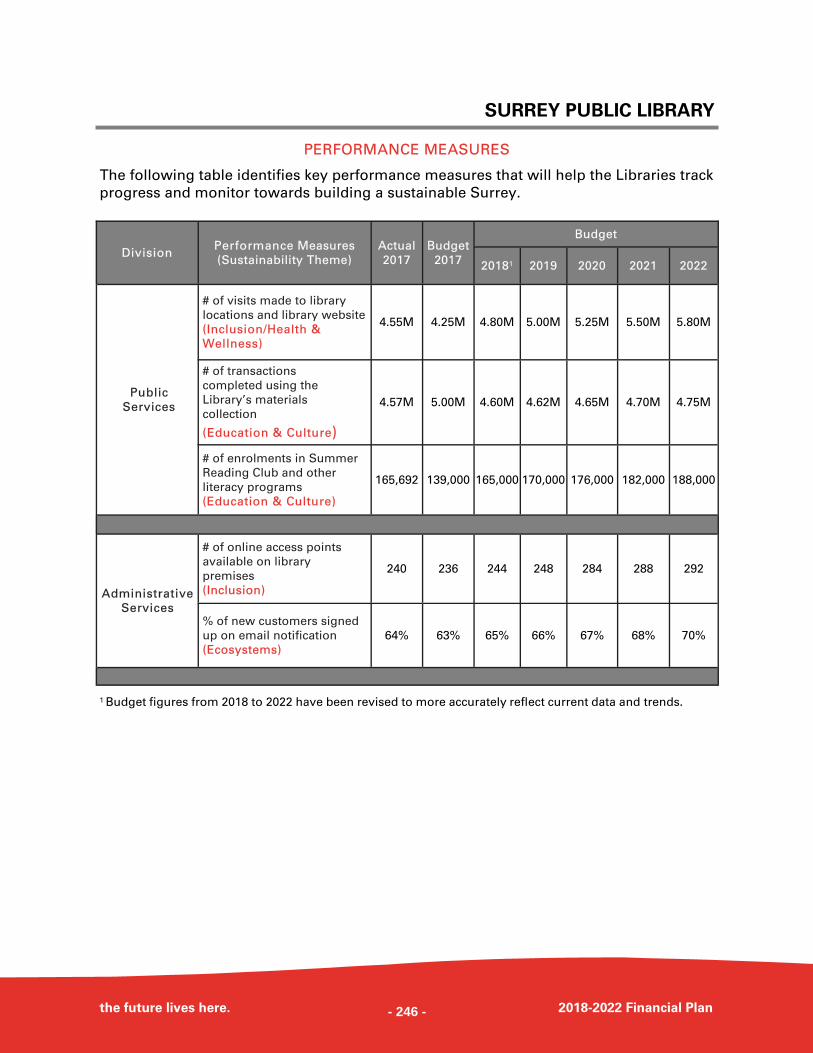
SURREY PUBLIC LIBRARY
the future lives here. 2018-2022 Financial Plan
PERFORMANCE MEASURES
The following table identifies key performance measures that will help the Libraries track
progress and monitor towards building a sustainable Surrey.
1 Budget figures from 2018 to 2022 have been revised to more accurately reflect current data and trends.
Division Performance Measures
(Sustainability Theme)
Actual
2017
Budget
20181 2019 2020 2021 2022
Public
Services
# of visits made to library
locations and library website
(Inclusion/Health &
Wellness)
4.55M 4.80M 5.00M 5.25M 5.50M 5.80M
# of transactions
completed using the
Library’s materials
collection
(Education & Culture)
4.57M 4.60M 4.62M 4.65M 4.70M 4.75M
# of enrolments in Summer
Reading Club and other
literacy programs
(Education & Culture)
165,692 165,000 170,000 176,000 182,000 188,000
Administrative
Services
# of online access points
available on library
premises
(Inclusion)
240 244 248 284 288 292
% of new customers signed
up on email notification
(Ecosystems)
64% 65% 66% 67% 68% 70%
Budget
2017
4.25M
5.00M
139,000
236
63%
- 246 -
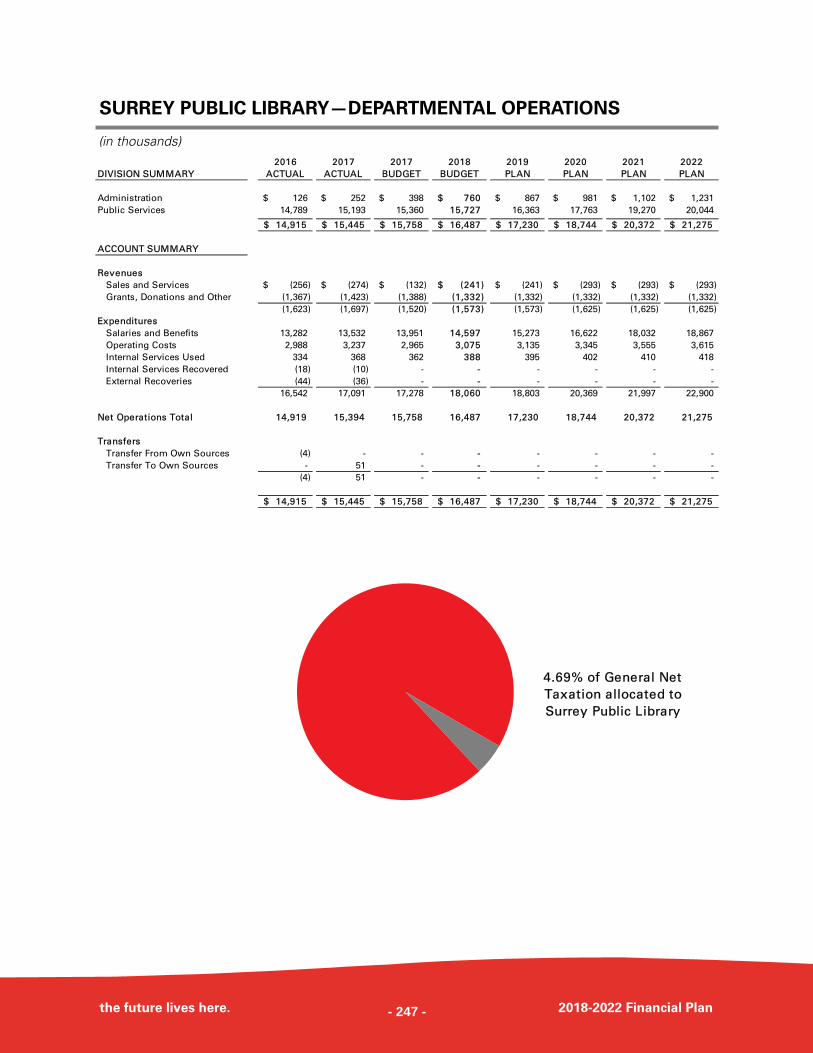
SURREY PUBLIC LIBRARY—DEPARTMENTAL OPERATIONS
the future lives here. 2018-2022 Financial Plan
(in thousands) 2016 2017 2017 2018 2019 2020 2021 2022
DIVISION SUMMARY ACTUAL ACTUAL BUDGET BUDGET PLAN PLAN PLAN PLAN
Administration 126$ 252$ 398$ 760$ 867$ 981$ 1,102$ 1,231$
Public Services 14,789 15,193 15,360 15,727 16,363 17,763 19,270 20,044
14,915$ 15,445$ 15,758$ 16,487$ 17,230$ 18,744$ 20,372$ 21,275$
ACCOUNT SUMMARY
Revenues
Sales and Services (256)$ (274)$ (132)$ (241)$ (241)$ (293)$ (293)$ (293)$
Grants, Donations and Other (1,367) (1,423) (1,388) (1,332) (1,332) (1,332) (1,332) (1,332)
(1,623) (1,697) (1,520) (1,573) (1,573) (1,625) (1,625) (1,625)
Expenditures
Salaries and Benefits 13,282 13,532 13,951 14,597 15,273 16,622 18,032 18,867
Operating Costs 2,988 3,237 2,965 3,075 3,135 3,345 3,555 3,615
Internal Services Used 334 368 362 388 395 402 410 418
Internal Services Recovered (18) (10) - - - - - -
External Recoveries (44) (36) - - - - - -
16,542 17,091 17,278 18,060 18,803 20,369 21,997 22,900
Net Operations Total 14,919 15,394 15,758 16,487 17,230 18,744 20,372 21,275
Transfers
Transfer From Own Sources (4) - - - - - - -
Transfer To Own Sources - 51 - - - - - -
(4) 51 - - - - - -
14,915$ 15,445$ 15,758$ 16,487$ 17,230$ 18,744$ 20,372$ 21,275$
4.69% of General Net
Taxation allocated to
Surrey Public Library
- 247 -
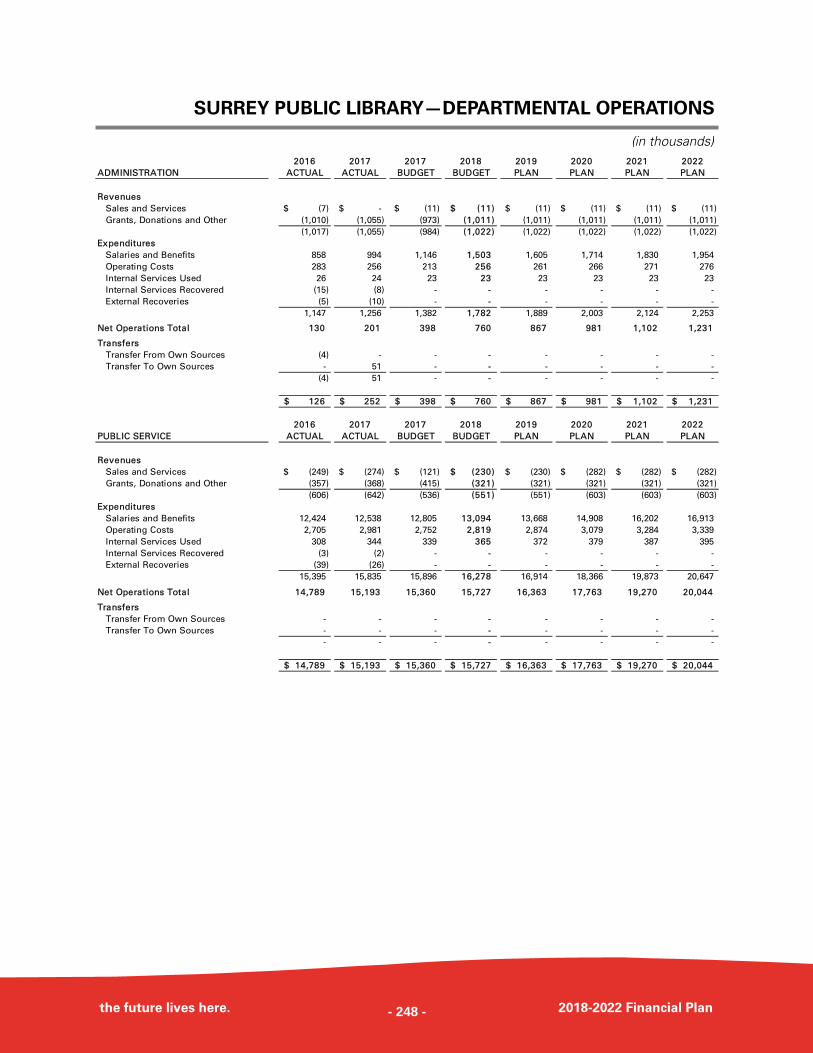
SURREY PUBLIC LIBRARY—DEPARTMENTAL OPERATIONS
the future lives here. 2018-2022 Financial Plan
(in thousands) 2016 2017 2017 2018 2019 2020 2021 2022
ADMINISTRATION ACTUAL ACTUAL BUDGET BUDGET PLAN PLAN PLAN PLAN
Revenues
Sales and Services (7)$ -$ (11)$ (11)$ (11)$ (11)$ (11)$ (11)$
Grants, Donations and Other (1,010) (1,055) (973) (1,011) (1,011) (1,011) (1,011) (1,011)
(1,017) (1,055) (984) (1,022) (1,022) (1,022) (1,022) (1,022)
Expenditures
Salaries and Benefits 858 994 1,146 1,503 1,605 1,714 1,830 1,954
Operating Costs 283 256 213 256 261 266 271 276
Internal Services Used 26 24 23 23 23 23 23 23
Internal Services Recovered (15) (8) - - - - - -
External Recoveries (5) (10) - - - - - -
1,147 1,256 1,382 1,782 1,889 2,003 2,124 2,253
Net Operations Total 130 201 398 760 867 981 1,102 1,231
Transfers
Transfer From Own Sources (4) - - - - - - -
Transfer To Own Sources - 51 - - - - - -
(4) 51 - - - - - -
126$ 252$ 398$ 760$ 867$ 981$ 1,102$ 1,231$
2016 2017 2017 2018 2019 2020 2021 2022
PUBLIC SERVICE ACTUAL ACTUAL BUDGET BUDGET PLAN PLAN PLAN PLAN
Revenues
Sales and Services (249)$ (274)$ (121)$ (230)$ (230)$ (282)$ (282)$ (282)$
Grants, Donations and Other (357) (368) (415) (321) (321) (321) (321) (321)
(606) (642) (536) (551) (551) (603) (603) (603)
Expenditures
Salaries and Benefits 12,424 12,538 12,805 13,094 13,668 14,908 16,202 16,913
Operating Costs 2,705 2,981 2,752 2,819 2,874 3,079 3,284 3,339
Internal Services Used 308 344 339 365 372 379 387 395
Internal Services Recovered (3) (2) - - - - - -
External Recoveries (39) (26) - - - - - -
15,395 15,835 15,896 16,278 16,914 18,366 19,873 20,647
Net Operations Total 14,789 15,193 15,360 15,727 16,363 17,763 19,270 20,044
Transfers
Transfer From Own Sources - - - - - - - -
Transfer To Own Sources - - - - - - - -
- - - - - - - -
14,789$ 15,193$ 15,360$ 15,727$ 16,363$ 17,763$ 19,270$ 20,044$
- 248 -
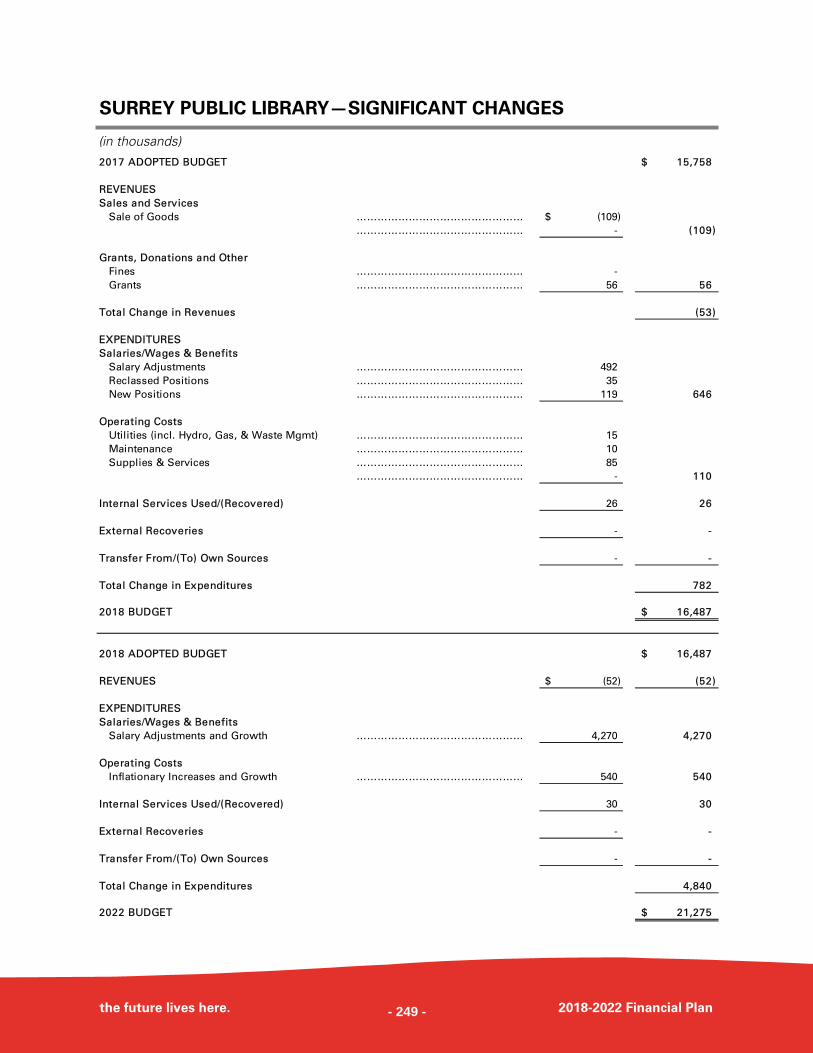
SURREY PUBLIC LIBRARY—SIGNIFICANT CHANGES
the future lives here. 2018-2022 Financial Plan
(in thousands) 2017 ADOPTED BUDGET 15,758$
REVENUES
Sales and Services
Sale of Goods ………………………………………… (109)$
………………………………………… - (109)
Grants, Donations and Other
Fines ………………………………………… -
Grants ………………………………………… 56 56
Total Change in Revenues (53)
EXPENDITURES
Salaries/Wages & Benefits
Salary Adjustments ………………………………………… 492
Reclassed Positions ………………………………………… 35
New Positions ………………………………………… 119 646
Operating Costs
Utilities (incl. Hydro, Gas, & Waste Mgmt) ………………………………………… 15
Maintenance ………………………………………… 10
Supplies & Services ………………………………………… 85
………………………………………… - 110
Internal Services Used/(Recovered) 26 26
External Recoveries - -
Transfer From/(To) Own Sources - -
Total Change in Expenditures 782
2018 BUDGET 16,487$
2018 ADOPTED BUDGET 16,487$
REVENUES (52)$ (52)
EXPENDITURES
Salaries/Wages & Benefits
Salary Adjustments and Growth ………………………………………… 4,270 4,270
Operating Costs
Inflationary Increases and Growth ………………………………………… 540 540
Internal Services Used/(Recovered) 30 30
External Recoveries - -
Transfer From/(To) Own Sources - -
Total Change in Expenditures 4,840
2022 BUDGET 21,275$
- 249 -
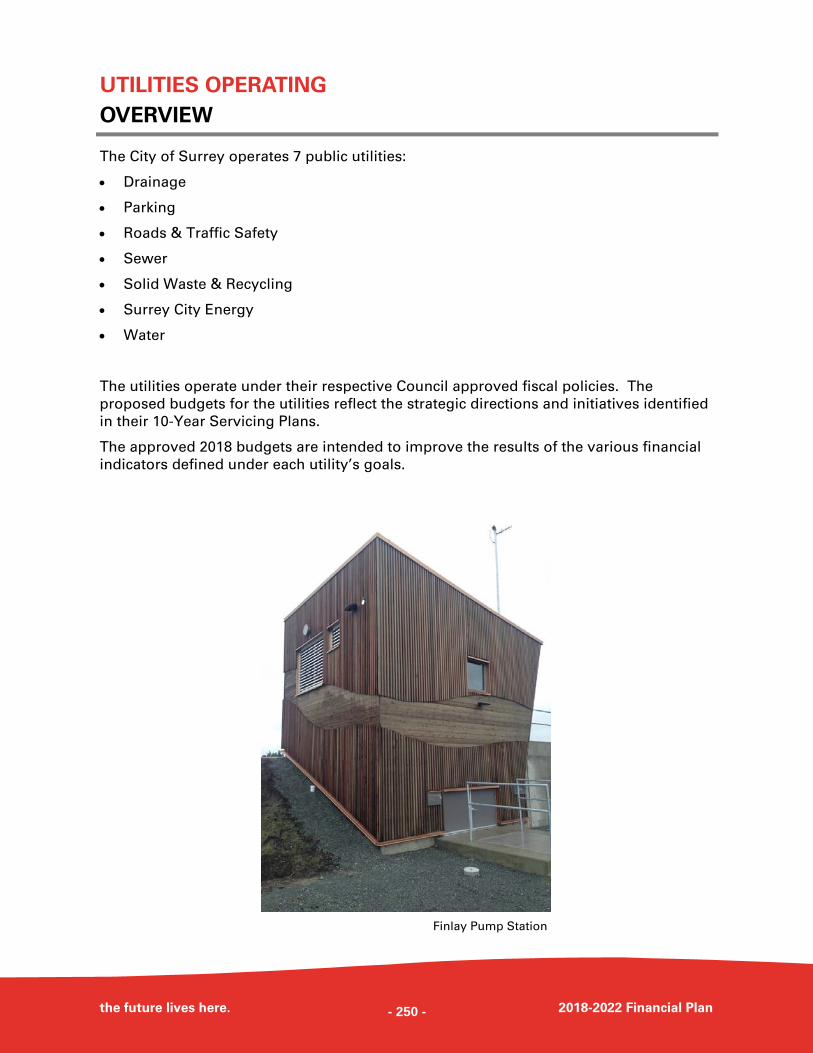
UTILITIES OPERATING
OVERVIEW
the future lives here. 2018-2022 Financial Plan
The City of Surrey operates 7 public utilities:
Drainage
Parking
Roads & Traffic Safety
Sewer
Solid Waste & Recycling
Surrey City Energy
Water
The utilities operate under their respective Council approved fiscal policies. The
proposed budgets for the utilities reflect the strategic directions and initiatives identified
in their 10-Year Servicing Plans.
The approved 2018 budgets are intended to improve the results of the various financial
indicators defined under each utility’s goals.
Finlay Pump Station
- 250 -
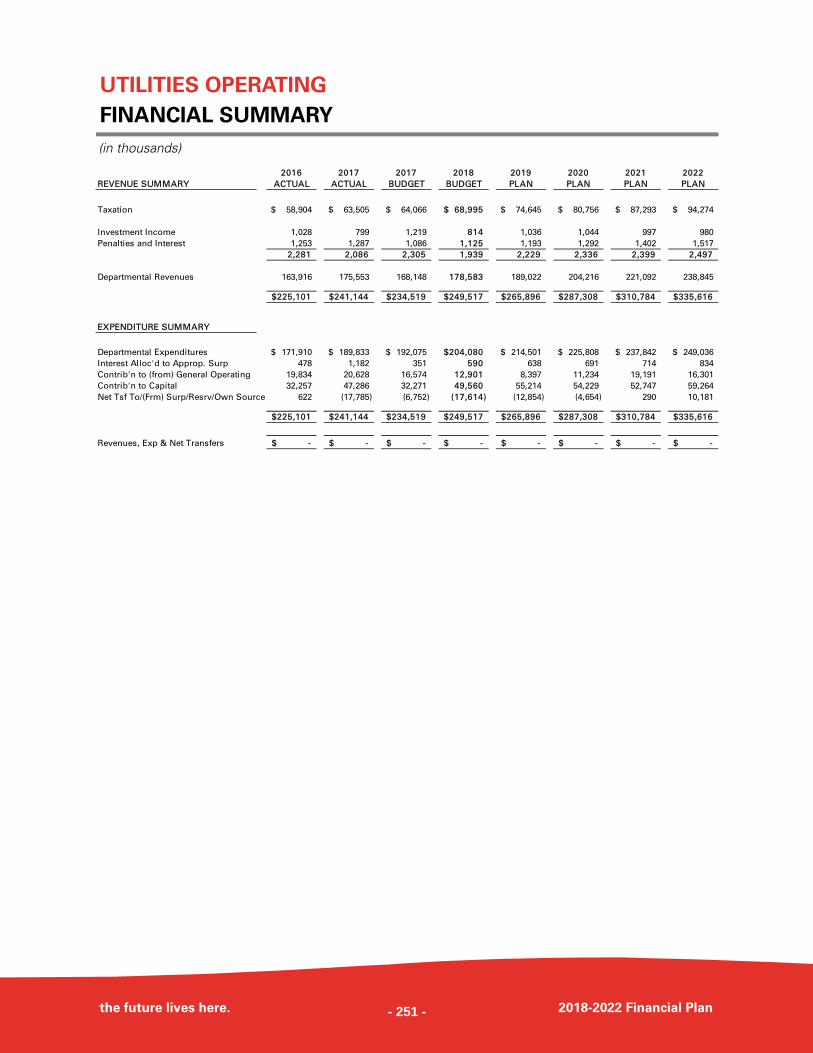
UTILITIES OPERATING
FINANCIAL SUMMARY
the future lives here. 2018-2022 Financial Plan
(in thousands)
2016 2017 2017 2018 2019 2020 2021 2022
REVENUE SUMMARY ACTUAL ACTUAL BUDGET BUDGET PLAN PLAN PLAN PLAN
Taxation 58,904$ 63,505$ 64,066$ 68,995$ 74,645$ 80,756$ 87,293$ 94,274$
Investment Income 1,028 799 1,219 814 1,036 1,044 997 980
Penalties and Interest 1,253 1,287 1,086 1,125 1,193 1,292 1,402 1,517
2,281 2,086 2,305 1,939 2,229 2,336 2,399 2,497
Departmental Revenues 163,916 175,553 168,148 178,583 189,022 204,216 221,092 238,845
225,101$ 241,144$ 234,519$ 249,517$ 265,896$ 287,308$ 310,784$ 335,616$
EXPENDITURE SUMMARY
Departmental Expenditures 171,910$ 189,833$ 192,075$ 204,080$ 214,501$ 225,808$ 237,842$ 249,036$
Interest Alloc'd to Approp. Surp 478 1,182 351 590 638 691 714 834
Contrib'n to (from) General Operating 19,834 20,628 16,574 12,901 8,397 11,234 19,191 16,301
Contrib'n to Capital 32,257 47,286 32,271 49,560 55,214 54,229 52,747 59,264
Net Tsf To/(Frm) Surp/Resrv/Own Source 622 (17,785) (6,752) (17,614) (12,854) (4,654) 290 10,181
225,101$ 241,144$ 234,519$ 249,517$ 265,896$ 287,308$ 310,784$ 335,616$
Revenues, Exp & Net Transfers -$ -$ -$ -$ -$ -$ -$ -$
- 251 -
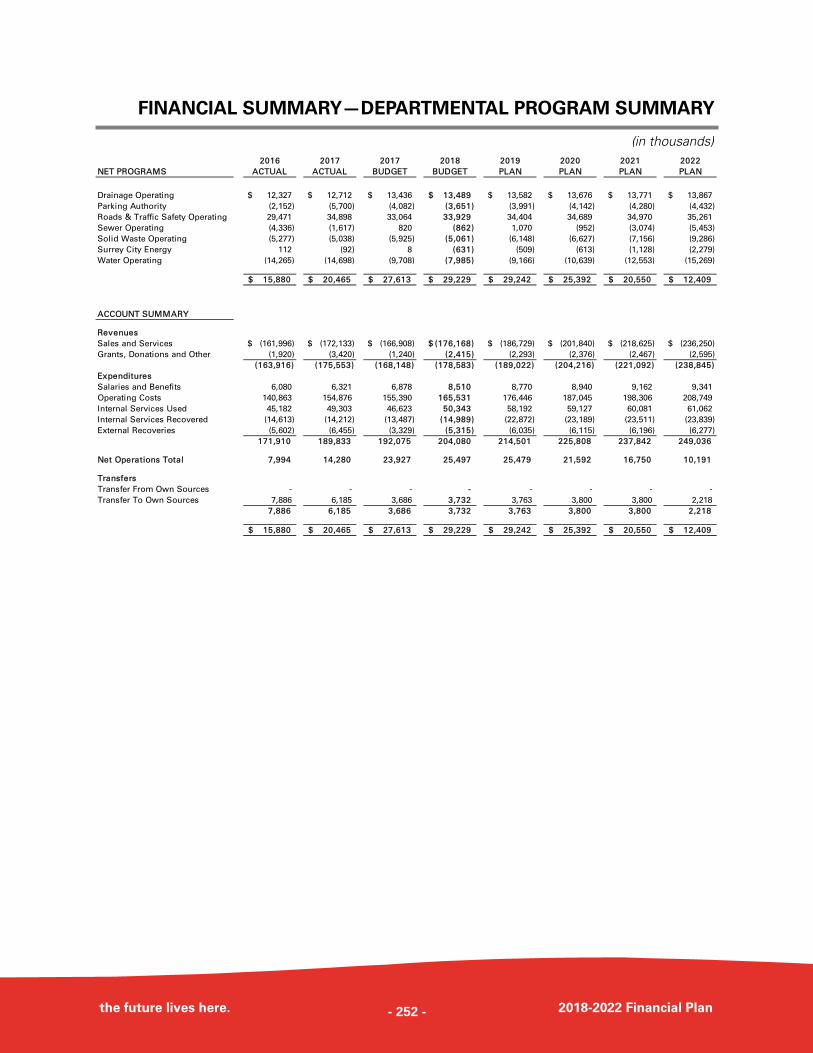
FINANCIAL SUMMARY—DEPARTMENTAL PROGRAM SUMMARY
the future lives here. 2018-2022 Financial Plan
(in thousands) 2016 2017 2017 2018 2019 2020 2021 2022
NET PROGRAMS ACTUAL ACTUAL BUDGET BUDGET PLAN PLAN PLAN PLAN
Drainage Operating 12,327$ 12,712$ 13,436$ 13,489$ 13,582$ 13,676$ 13,771$ 13,867$
Parking Authority (2,152) (5,700) (4,082) (3,651) (3,991) (4,142) (4,280) (4,432)
Roads & Traffic Safety Operating 29,471 34,898 33,064 33,929 34,404 34,689 34,970 35,261
Sewer Operating (4,336) (1,617) 820 (862) 1,070 (952) (3,074) (5,453)
Solid Waste Operating (5,277) (5,038) (5,925) (5,061) (6,148) (6,627) (7,156) (9,286)
Surrey City Energy 112 (92) 8 (631) (509) (613) (1,128) (2,279)
Water Operating (14,265) (14,698) (9,708) (7,985) (9,166) (10,639) (12,553) (15,269)
15,880$ 20,465$ 27,613$ 29,229$ 29,242$ 25,392$ 20,550$ 12,409$
ACCOUNT SUMMARY
Revenues
Sales and Services (161,996)$ (172,133)$ (166,908)$ (176,168)$ (186,729)$ (201,840)$ (218,625)$ (236,250)$
Grants, Donations and Other (1,920) (3,420) (1,240) (2,415) (2,293) (2,376) (2,467) (2,595)
(163,916) (175,553) (168,148) (178,583) (189,022) (204,216) (221,092) (238,845)
Expenditures
Salaries and Benefits 6,080 6,321 6,878 8,510 8,770 8,940 9,162 9,341
Operating Costs 140,863 154,876 155,390 165,531 176,446 187,045 198,306 208,749
Internal Services Used 45,182 49,303 46,623 50,343 58,192 59,127 60,081 61,062
Internal Services Recovered (14,613) (14,212) (13,487) (14,989) (22,872) (23,189) (23,511) (23,839)
External Recoveries (5,602) (6,455) (3,329) (5,315) (6,035) (6,115) (6,196) (6,277)
171,910 189,833 192,075 204,080 214,501 225,808 237,842 249,036
Net Operations Total 7,994 14,280 23,927 25,497 25,479 21,592 16,750 10,191
Transfers
Transfer From Own Sources - - - - - - - -
Transfer To Own Sources 7,886 6,185 3,686 3,732 3,763 3,800 3,800 2,218
7,886 6,185 3,686 3,732 3,763 3,800 3,800 2,218
15,880$ 20,465$ 27,613$ 29,229$ 29,242$ 25,392$ 20,550$ 12,409$
- 252 -
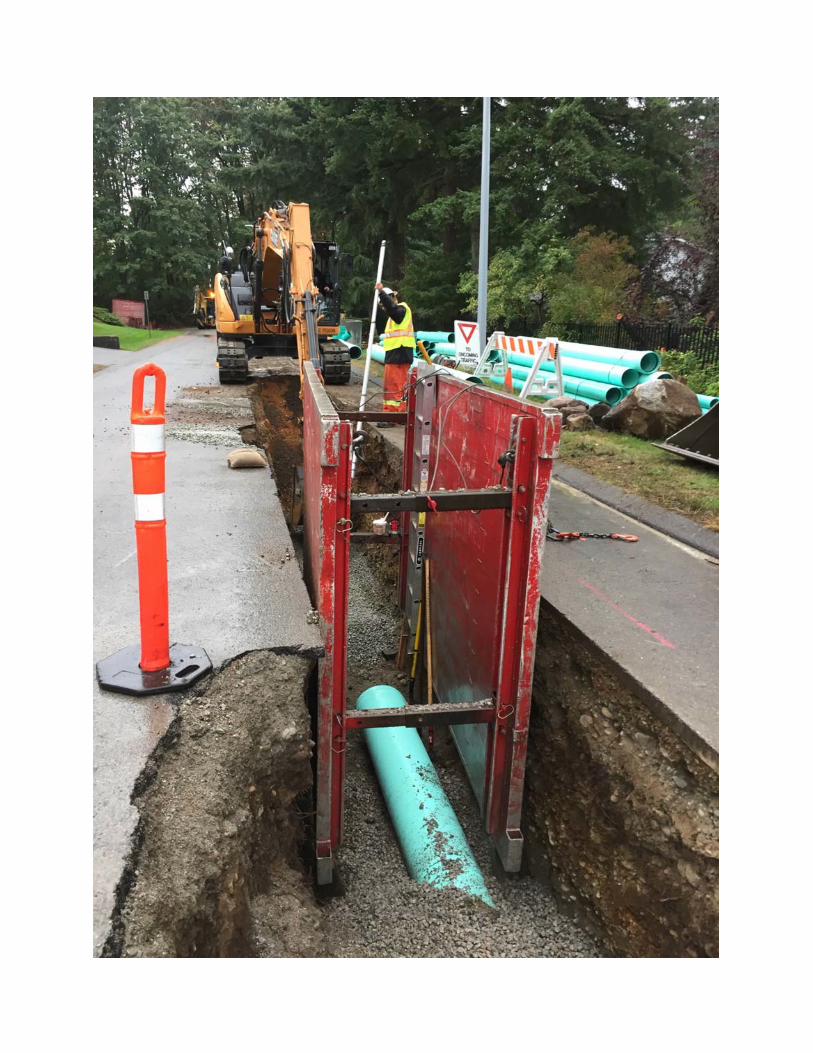
- 253 -
UTILITY OVERVIEW
DRAINAGE
the future lives here. 2018-2022 Financial Plan
MISSION STATEMENT
To provide engineering services for the City’s drainage and environmental systems to
support the building of a healthy, sustainable community.
KEY PROGRAMS AND SERVICES
The Drainage Utility’s primary responsibility is to manage the City’s stormwater runoff
and flood protection in partnership with the Operations Division.
The Utility also plans, designs and constructs drainage infrastructure; implements
erosion and sediment control measures; manages soil deposition and extraction;
controls coastal and lowland flooding; and undertakes initiatives in support of the
region’s Integrated Liquid Waste Resource Management Plan.
Due to the intrinsic link between drainage systems and natural watercourses, the
Drainage Utility also funds environmental works related to stream corridors, water
quality, contaminated sites, terrestrial habitat and biodiversity.
Some of the key programs administered by the Utility include:
Salmon Habitat Restoration Program (“SHaRP”);
Boundary Bay Ambient Monitoring Program;
Integrated Storm Water Management Plans;
Coastal Flood Adaptation Strategy;
Biodiversity Conservation Strategy;
Safe and cost effective drainage services; and
Adaptive plans based on evidence-based monitoring.
2017 ACCOMPLISHMENTS
Hosted over 20 public and stakeholder
engagements regarding the
development of the Coastal Flood
Adaptation Strategy;
Completed the 2017 SHaRP program;
and
Presented Surrey’s work on sea level
rise and climate change at numerous
conferences and workshops.
INCLUSION
- 254 -
DRAINAGE
the future lives here. 2018-2022 Financial Plan
Actively participated in the Fraser Basin Council Regional Flood Strategy Phase 2
which included assisting with four different expert panels.
Incorporated native vegetation into the 2016 Design and Construction projects.
Implemented the third year of Water
Quality Monitoring for Adaptive
Management Framework and the
seventh year of the Boundary Bay
Assessment and Monitoring Program;
and
Participated in ongoing environmental
stewardship by overseeing and
managing the P-15 Habitat replacement
program.
Developed three
interactive histories of Crescent Beach,
agriculture and transportation related to
coastal flood protection and sea level
rise; and
Continued research on salmonid
spawner presence and young
salmonids in watercourse with limited
documentation to support Surrey’s
Watercourse Classification mapping
updates.
Developed criteria for Sensitive
Ecosystem Development Permit Areas;
Completed the development of
servicing strategies for the Abbey Ridge
Local Area Plan area and the City Centre
Neighbourhood Concept Plan area; and
Implemented recommendations from
various Integrated Stormwater
Management Plans throughout the City.
BUILT ENVIRONMENT & NEIGHBOURHOODS
PUBLIC SAFETY
ECONOMIC PROSPERITY & LIVELIHOODS
ECOSYSTEMS
EDUCATION & CULTURE
- 255 -
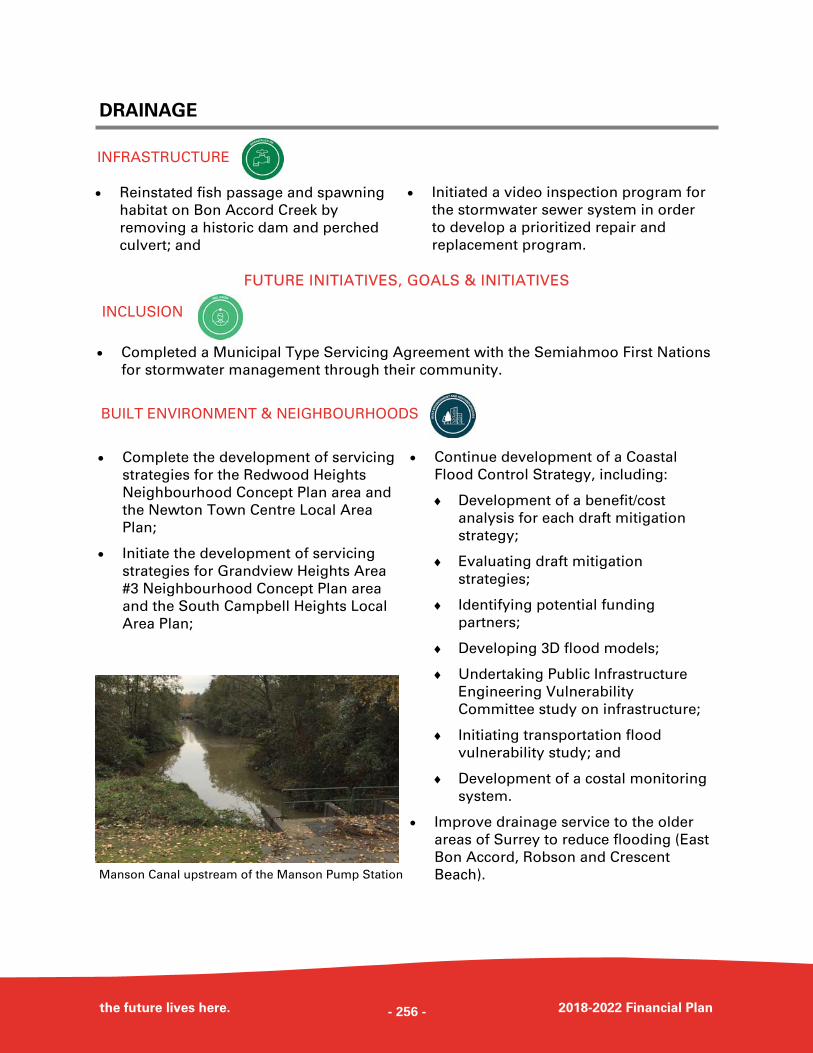
DRAINAGE
the future lives here. 2018-2022 Financial Plan
Complete the development of servicing
strategies for the Redwood Heights
Neighbourhood Concept Plan area and
the Newton Town Centre Local Area
Plan;
Initiate the development of servicing
strategies for Grandview Heights Area
#3 Neighbourhood Concept Plan area
and the South Campbell Heights Local
Area Plan;
Continue development of a Coastal
Flood Control Strategy, including:
Development of a benefit/cost
analysis for each draft mitigation
strategy;
Evaluating draft mitigation
strategies;
Identifying potential funding
partners;
Developing 3D flood models;
Undertaking Public Infrastructure
Engineering Vulnerability
Committee study on infrastructure;
Initiating transportation flood
vulnerability study; and
Development of a costal monitoring
system.
Improve drainage service to the older
areas of Surrey to reduce flooding (East
Bon Accord, Robson and Crescent
Beach).
Completed a Municipal Type Servicing Agreement with the Semiahmoo First Nations
for stormwater management through their community.
FUTURE INITIATIVES, GOALS & INITIATIVES
Reinstated fish passage and spawning
habitat on Bon Accord Creek by
removing a historic dam and perched
culvert; and
Initiated a video inspection program for
the stormwater sewer system in order
to develop a prioritized repair and
replacement program.
INFRASTRUCTURE
INCLUSION
BUILT ENVIRONMENT & NEIGHBOURHOODS
Manson Canal upstream of the Manson Pump Station
- 256 -
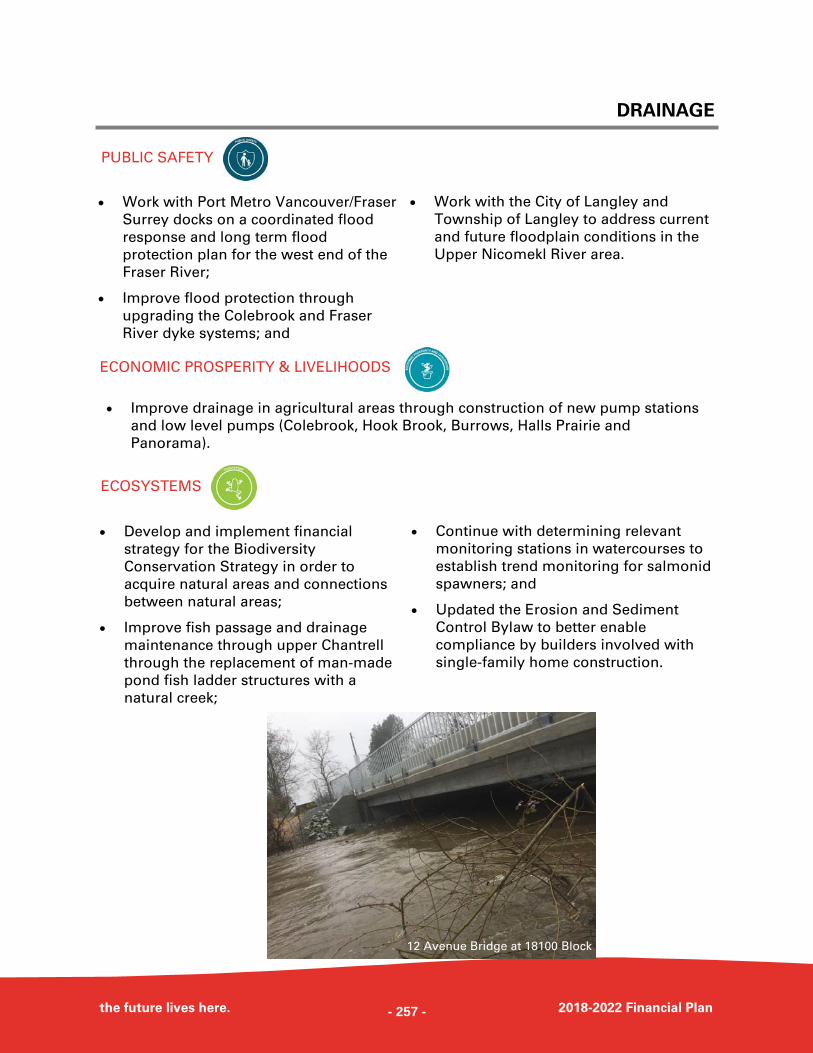
DRAINAGE
the future lives here. 2018-2022 Financial Plan
Develop and implement financial
strategy for the Biodiversity
Conservation Strategy in order to
acquire natural areas and connections
between natural areas;
Improve fish passage and drainage
maintenance through upper Chantrell
through the replacement of man-made
pond fish ladder structures with a
natural creek;
Continue with determining relevant
monitoring stations in watercourses to
establish trend monitoring for salmonid
spawners; and
Updated the Erosion and Sediment
Control Bylaw to better enable
compliance by builders involved with
single-family home construction.
Work with Port Metro Vancouver/Fraser
Surrey docks on a coordinated flood
response and long term flood
protection plan for the west end of the
Fraser River;
Improve flood protection through
upgrading the Colebrook and Fraser
River dyke systems; and
Work with the City of Langley and
Township of Langley to address current
and future floodplain conditions in the
Upper Nicomekl River area.
Improve drainage in agricultural areas through construction of new pump stations
and low level pumps (Colebrook, Hook Brook, Burrows, Halls Prairie and
Panorama).
PUBLIC SAFETY
ECONOMIC PROSPERITY & LIVELIHOODS
ECOSYSTEMS
12 Avenue Bridge at 18100 Block
- 257 -
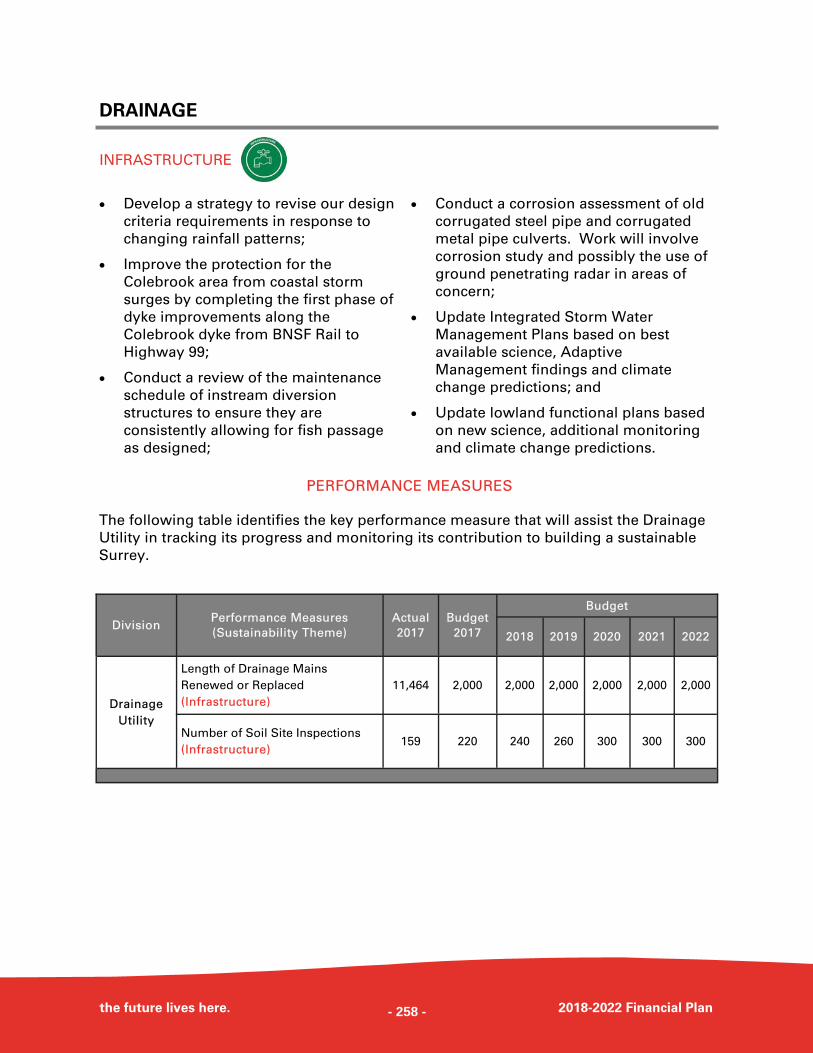
DRAINAGE
the future lives here. 2018-2022 Financial Plan
The following table identifies the key performance measure that will assist the Drainage
Utility in tracking its progress and monitoring its contribution to building a sustainable
Surrey.
PERFORMANCE MEASURES
Division Performance Measures
(Sustainability Theme)
Actual
2017
Budget
2018 2019 2020 2021 2022
Drainage
Utility
Length of Drainage Mains
Renewed or Replaced
(Infrastructure)
11,464 2,000 2,000 2,000 2,000 2,000 2,000
Number of Soil Site Inspections
(Infrastructure) 159 220 240 260 300 300 300
Budget
2017
Develop a strategy to revise our design
criteria requirements in response to
changing rainfall patterns;
Improve the protection for the
Colebrook area from coastal storm
surges by completing the first phase of
dyke improvements along the
Colebrook dyke from BNSF Rail to
Highway 99;
Conduct a review of the maintenance
schedule of instream diversion
structures to ensure they are
consistently allowing for fish passage
as designed;
Conduct a corrosion assessment of old
corrugated steel pipe and corrugated
metal pipe culverts. Work will involve
corrosion study and possibly the use of
ground penetrating radar in areas of
concern;
Update Integrated Storm Water
Management Plans based on best
available science, Adaptive
Management findings and climate
change predictions; and
Update lowland functional plans based
on new science, additional monitoring
and climate change predictions.
INFRASTRUCTURE
- 258 -
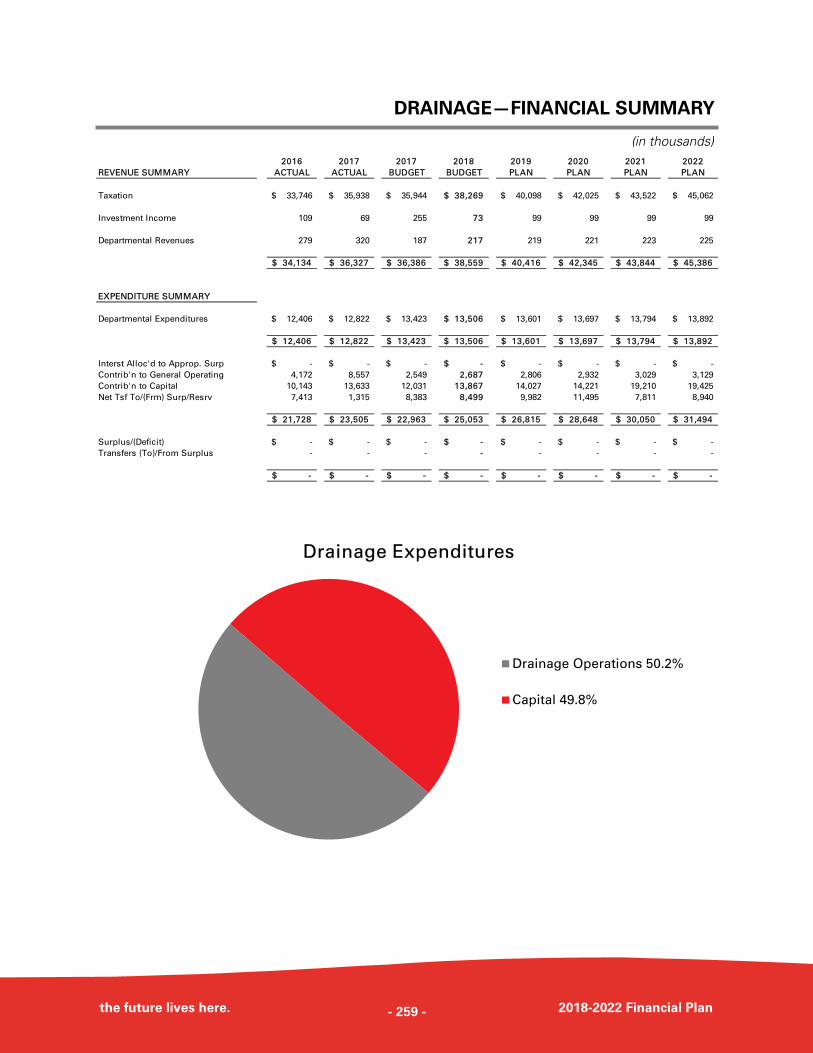
DRAINAGE—FINANCIAL SUMMARY
the future lives here. 2018-2022 Financial Plan
(in thousands)
Drainage Expenditures
Drainage Operations 50.2%
Capital 49.8%
2016 2017 2017 2018 2019 2020 2021 2022
REVENUE SUMMARY ACTUAL ACTUAL BUDGET BUDGET PLAN PLAN PLAN PLAN
Taxation 33,746$ 35,938$ 35,944$ 38,269$ 40,098$ 42,025$ 43,522$ 45,062$
Investment Income 109 69 255 73 99 99 99 99
Departmental Revenues 279 320 187 217 219 221 223 225
34,134$ 36,327$ 36,386$ 38,559$ 40,416$ 42,345$ 43,844$ 45,386$
EXPENDITURE SUMMARY
Departmental Expenditures 12,406$ 12,822$ 13,423$ 13,506$ 13,601$ 13,697$ 13,794$ 13,892$
12,406$ 12,822$ 13,423$ 13,506$ 13,601$ 13,697$ 13,794$ 13,892$
Interst Alloc'd to Approp. Surp -$ -$ -$ -$ -$ -$ -$ -$
Contrib'n to General Operating 4,172 8,557 2,549 2,687 2,806 2,932 3,029 3,129
Contrib'n to Capital 10,143 13,633 12,031 13,867 14,027 14,221 19,210 19,425
Net Tsf To/(Frm) Surp/Resrv 7,413 1,315 8,383 8,499 9,982 11,495 7,811 8,940
21,728$ 23,505$ 22,963$ 25,053$ 26,815$ 28,648$ 30,050$ 31,494$
Surplus/(Deficit) -$ -$ -$ -$ -$ -$ -$ -$
Transfers (To)/From Surplus - - - - - - - -
-$ -$ -$ -$ -$ -$ -$ -$
- 259 -
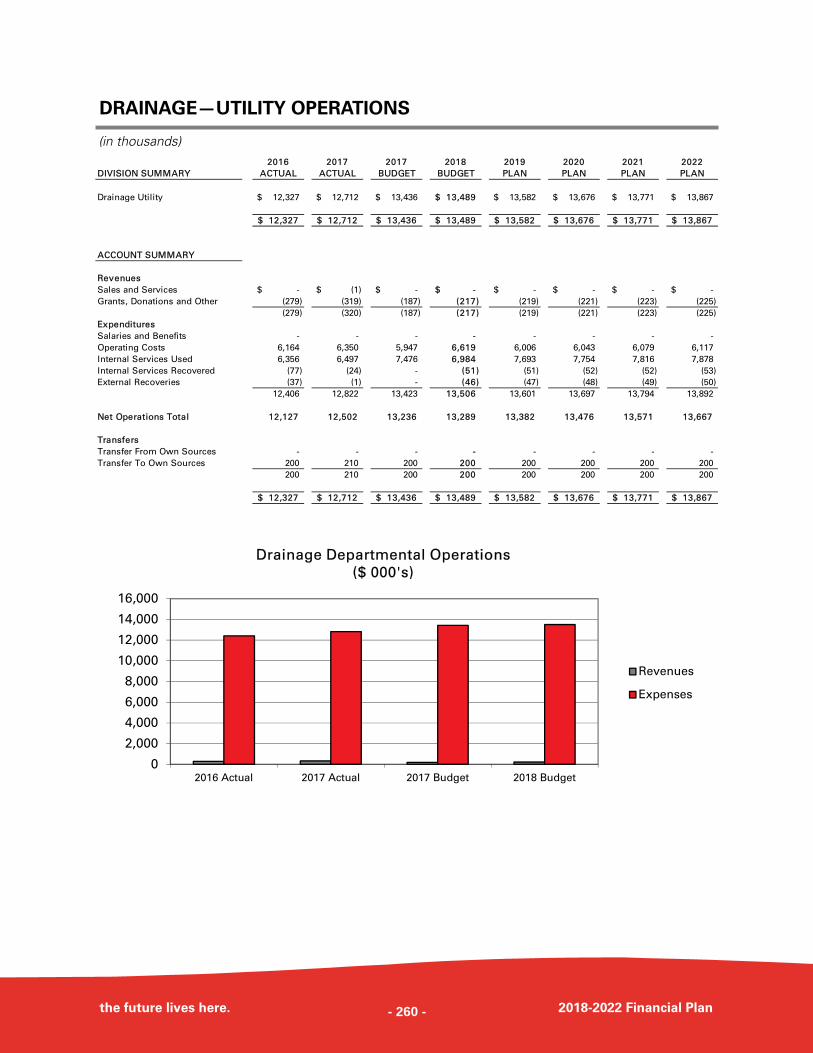
DRAINAGE—UTILITY OPERATIONS
the future lives here. 2018-2022 Financial Plan
(in thousands)
0
2,000
4,000
6,000
8,000
10,000
12,000
14,000
16,000
2016 Actual 2017 Actual 2017 Budget 2018 Budget
Drainage Departmental Operations
($ 000's)
Revenues
Expenses
2016 2017 2017 2018 2019 2020 2021 2022
DIVISION SUMMARY ACTUAL ACTUAL BUDGET BUDGET PLAN PLAN PLAN PLAN
Drainage Utility 12,327$ 12,712$ 13,436$ 13,489$ 13,582$ 13,676$ 13,771$ 13,867$
12,327$ 12,712$ 13,436$ 13,489$ 13,582$ 13,676$ 13,771$ 13,867$
ACCOUNT SUMMARY
Revenues
Sales and Services -$ (1)$ -$ -$ -$ -$ -$ -$
Grants, Donations and Other (279) (319) (187) (217) (219) (221) (223) (225)
(279) (320) (187) (217) (219) (221) (223) (225)
Expenditures
Salaries and Benefits - - - - - - - -
Operating Costs 6,164 6,350 5,947 6,619 6,006 6,043 6,079 6,117
Internal Services Used 6,356 6,497 7,476 6,984 7,693 7,754 7,816 7,878
Internal Services Recovered (77) (24) - (51) (51) (52) (52) (53)
External Recoveries (37) (1) - (46) (47) (48) (49) (50)
12,406 12,822 13,423 13,506 13,601 13,697 13,794 13,892
Net Operations Total 12,127 12,502 13,236 13,289 13,382 13,476 13,571 13,667
Transfers
Transfer From Own Sources - - - - - - - -
Transfer To Own Sources 200 210 200 200 200 200 200 200
200 210 200 200 200 200 200 200
12,327$ 12,712$ 13,436$ 13,489$ 13,582$ 13,676$ 13,771$ 13,867$
- 260 -
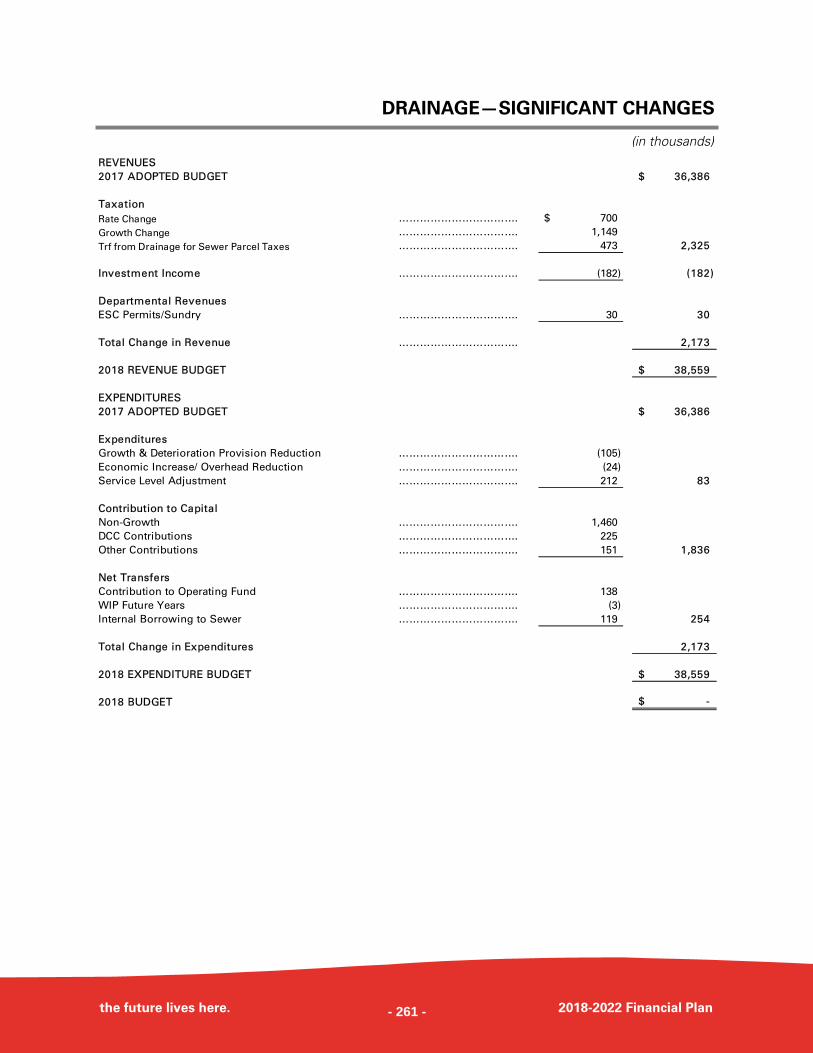
DRAINAGE—SIGNIFICANT CHANGES
the future lives here. 2018-2022 Financial Plan
(in thousands)
REVENUES
2017 ADOPTED BUDGET 36,386$
Taxation
Rate Change ……………………………. 700$
Growth Change ……………………………. 1,149
Trf from Drainage for Sewer Parcel Taxes ……………………………. 473 2,325
Investment Income ……………………………. (182) (182)
Departmental Revenues
ESC Permits/Sundry ……………………………. 30 30
Total Change in Revenue ……………………………. 2,173
2018 REVENUE BUDGET 38,559$
EXPENDITURES
2017 ADOPTED BUDGET 36,386$
Expenditures
Growth & Deterioration Provision Reduction ……………………………. (105)
Economic Increase/ Overhead Reduction ……………………………. (24)
Service Level Adjustment ……………………………. 212 83
Contribution to Capital
Non-Growth ……………………………. 1,460
DCC Contributions ……………………………. 225
Other Contributions ……………………………. 151 1,836
Net Transfers
Contribution to Operating Fund ……………………………. 138
WIP Future Years ……………………………. (3)
Internal Borrowing to Sewer ……………………………. 119 254
Total Change in Expenditures 2,173
2018 EXPENDITURE BUDGET 38,559$
2018 BUDGET -$
- 261 -
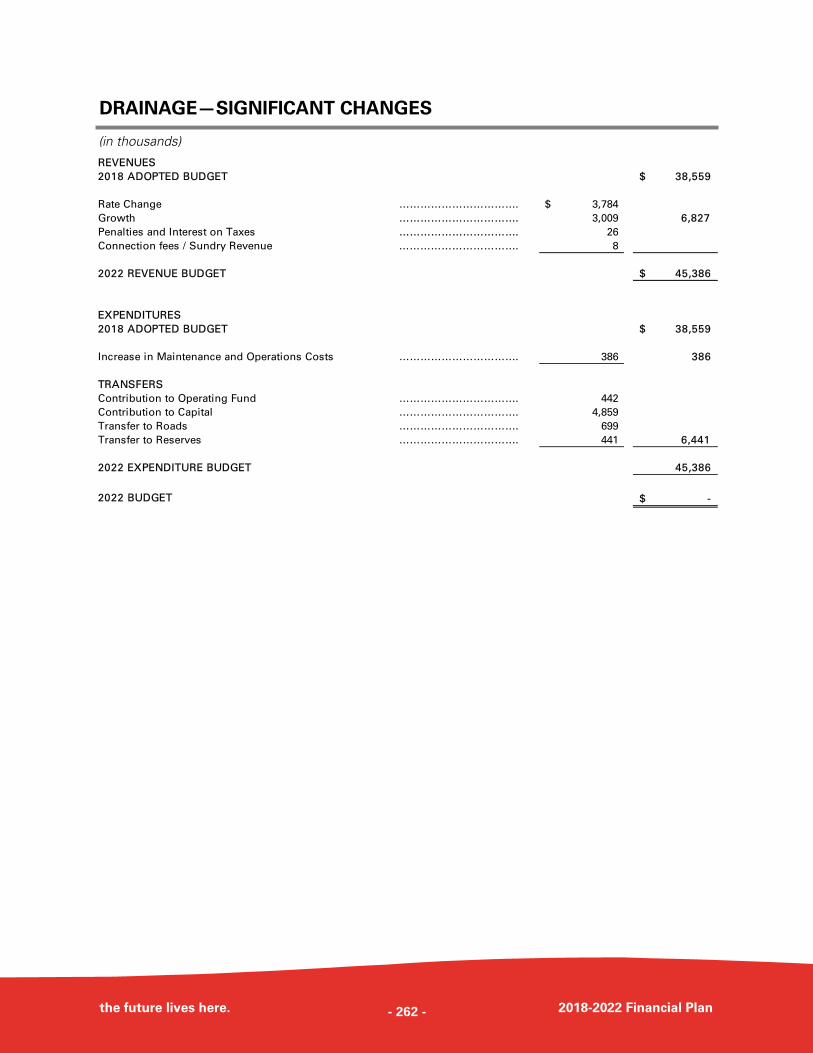
DRAINAGE—SIGNIFICANT CHANGES
the future lives here. 2018-2022 Financial Plan
(in thousands)
REVENUES
2018 ADOPTED BUDGET 38,559$
Rate Change ……………………………. 3,784$
Growth ……………………………. 3,009 6,827
Penalties and Interest on Taxes ……………………………. 26
Connection fees / Sundry Revenue ……………………………. 8
2022 REVENUE BUDGET 45,386$
EXPENDITURES
2018 ADOPTED BUDGET 38,559$
Increase in Maintenance and Operations Costs ……………………………. 386 386
TRANSFERS
Contribution to Operating Fund ……………………………. 442
Contribution to Capital ……………………………. 4,859
Transfer to Roads ……………………………. 699
Transfer to Reserves ……………………………. 441 6,441
2022 EXPENDITURE BUDGET 45,386
2022 BUDGET -$
- 262 -
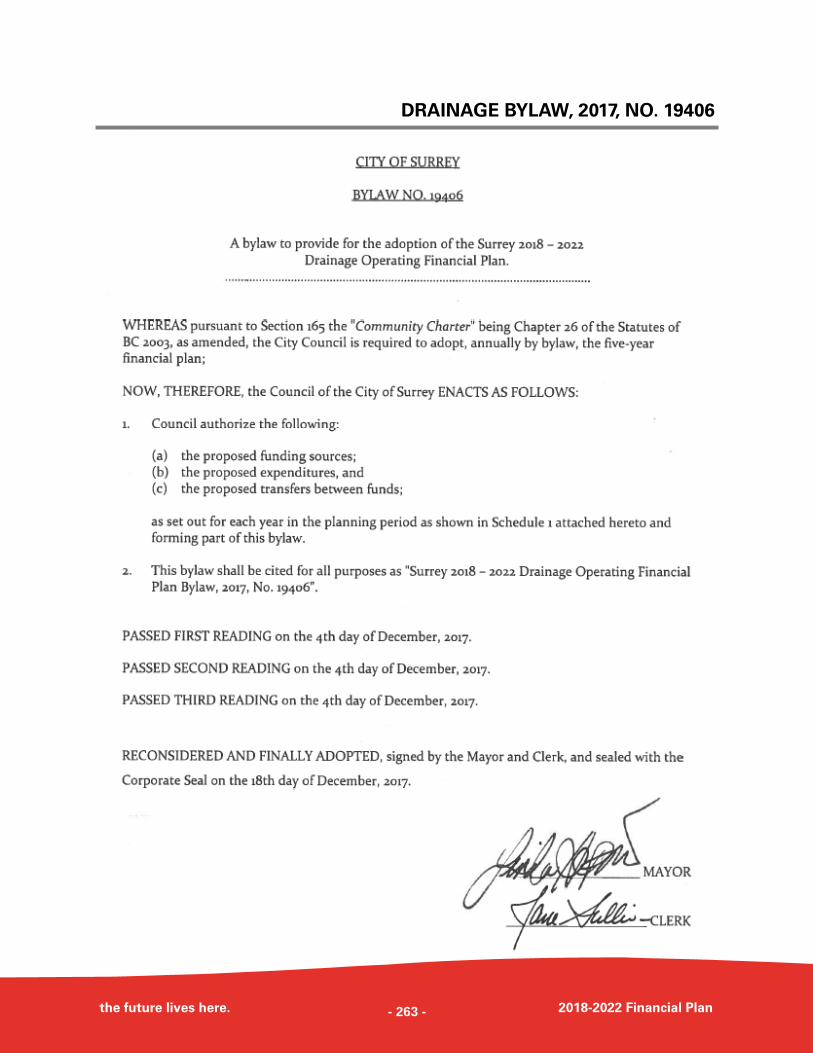
DRAINAGE BYLAW, 2017, NO. 19406
the future lives here. 2018-2022 Financial Plan - 263 -
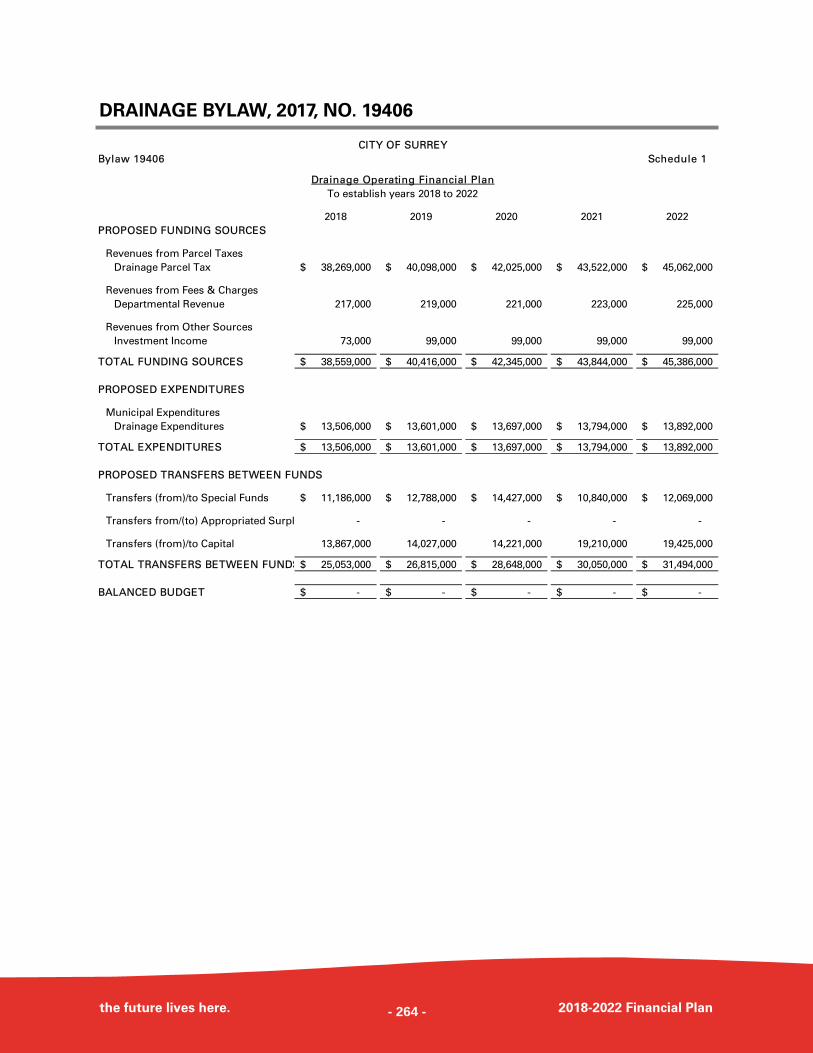
DRAINAGE BYLAW, 2017, NO. 19406
the future lives here. 2018-2022 Financial Plan
CITY OF SURREY
Bylaw 19406 Schedule 1
Drainage Operating Financial Plan
To establish years 2018 to 2022
2018 2019 2020 2021 2022
PROPOSED FUNDING SOURCES
Revenues from Parcel Taxes
Drainage Parcel Tax 38,269,000$ 40,098,000$ 42,025,000$ 43,522,000$ 45,062,000$
Revenues from Fees & Charges
Departmental Revenue 217,000 219,000 221,000 223,000 225,000
Revenues from Other Sources
Investment Income 73,000 99,000 99,000 99,000 99,000
TOTAL FUNDING SOURCES 38,559,000$ 40,416,000$ 42,345,000$ 43,844,000$ 45,386,000$
PROPOSED EXPENDITURES
Municipal Expenditures
Drainage Expenditures 13,506,000$ 13,601,000$ 13,697,000$ 13,794,000$ 13,892,000$
TOTAL EXPENDITURES 13,506,000$ 13,601,000$ 13,697,000$ 13,794,000$ 13,892,000$
PROPOSED TRANSFERS BETWEEN FUNDS
Transfers (from)/to Special Funds 11,186,000$ 12,788,000$ 14,427,000$ 10,840,000$ 12,069,000$
Transfers from/(to) Appropriated Surpl - - - - -
Transfers (from)/to Capital 13,867,000 14,027,000 14,221,000 19,210,000 19,425,000
TOTAL TRANSFERS BETWEEN FUNDS 25,053,000$ 26,815,000$ 28,648,000$ 30,050,000$ 31,494,000$
BALANCED BUDGET -$ -$ -$ -$ -$
- 264 -
- 265 -
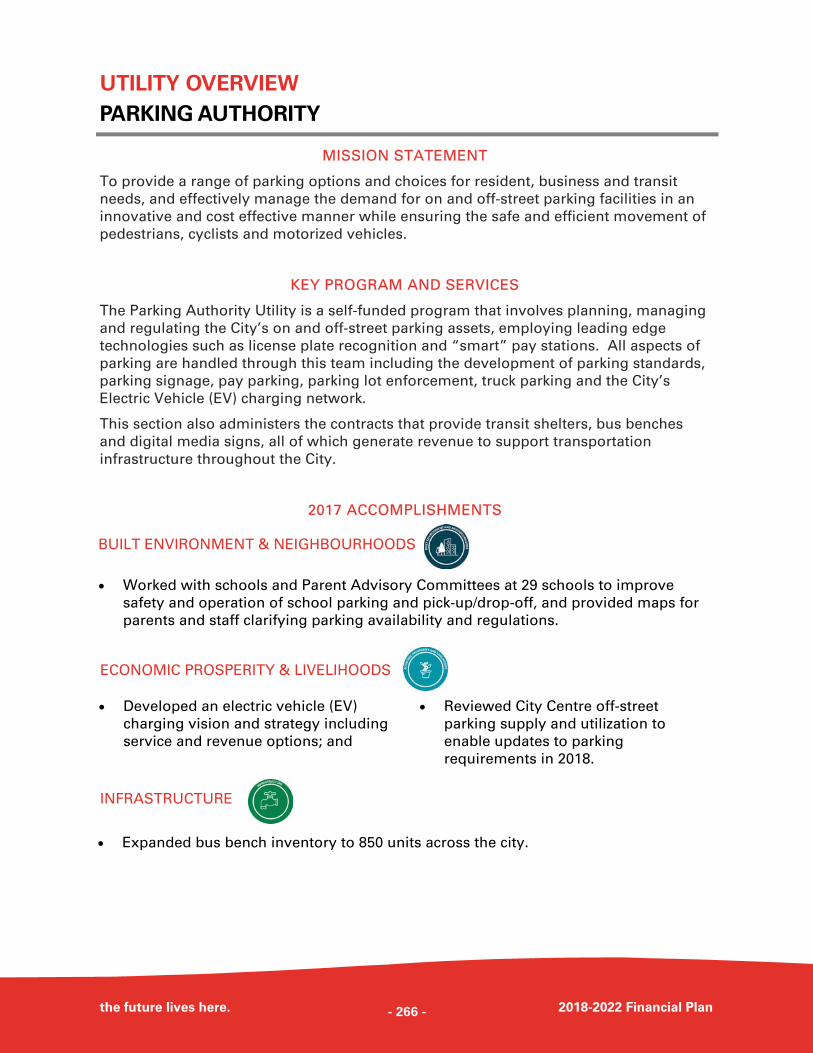
UTILITY OVERVIEW
PARKING AUTHORITY
the future lives here. 2018-2022 Financial Plan
MISSION STATEMENT
To provide a range of parking options and choices for resident, business and transit
needs, and effectively manage the demand for on and off-street parking facilities in an
innovative and cost effective manner while ensuring the safe and efficient movement of
pedestrians, cyclists and motorized vehicles.
KEY PROGRAM AND SERVICES
The Parking Authority Utility is a self-funded program that involves planning, managing
and regulating the City’s on and off-street parking assets, employing leading edge
technologies such as license plate recognition and “smart” pay stations. All aspects of
parking are handled through this team including the development of parking standards,
parking signage, pay parking, parking lot enforcement, truck parking and the City’s
Electric Vehicle (EV) charging network.
This section also administers the contracts that provide transit shelters, bus benches
and digital media signs, all of which generate revenue to support transportation
infrastructure throughout the City.
2017 ACCOMPLISHMENTS
Developed an electric vehicle (EV)
charging vision and strategy including
service and revenue options; and
Reviewed City Centre off-street
parking supply and utilization to
enable updates to parking
requirements in 2018.
ECONOMIC PROSPERITY & LIVELIHOODS
Worked with schools and Parent Advisory Committees at 29 schools to improve
safety and operation of school parking and pick-up/drop-off, and provided maps for
parents and staff clarifying parking availability and regulations.
BUILT ENVIRONMENT & NEIGHBOURHOODS
Expanded bus bench inventory to 850 units across the city.
INFRASTRUCTURE
- 266 -
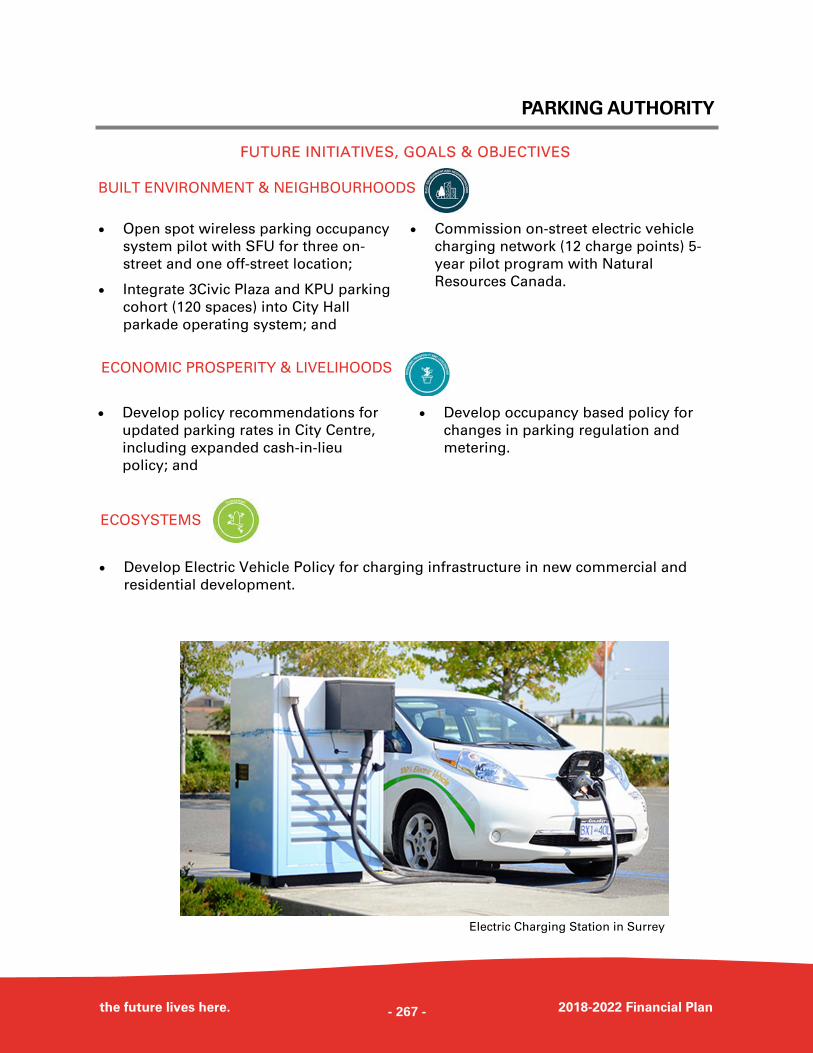
PARKING AUTHORITY
the future lives here. 2018-2022 Financial Plan
FUTURE INITIATIVES, GOALS & OBJECTIVES
Develop policy recommendations for
updated parking rates in City Centre,
including expanded cash-in-lieu
policy; and
Develop occupancy based policy for
changes in parking regulation and
metering.
Open spot wireless parking occupancy
system pilot with SFU for three on-
street and one off-street location;
Integrate 3Civic Plaza and KPU parking
cohort (120 spaces) into City Hall
parkade operating system; and
Commission on-street electric vehicle
charging network (12 charge points) 5-
year pilot program with Natural
Resources Canada.
BUILT ENVIRONMENT & NEIGHBOURHOODS
ECONOMIC PROSPERITY & LIVELIHOODS
ECOSYSTEMS
Develop Electric Vehicle Policy for charging infrastructure in new commercial and
residential development.
Electric Charging Station in Surrey
- 267 -
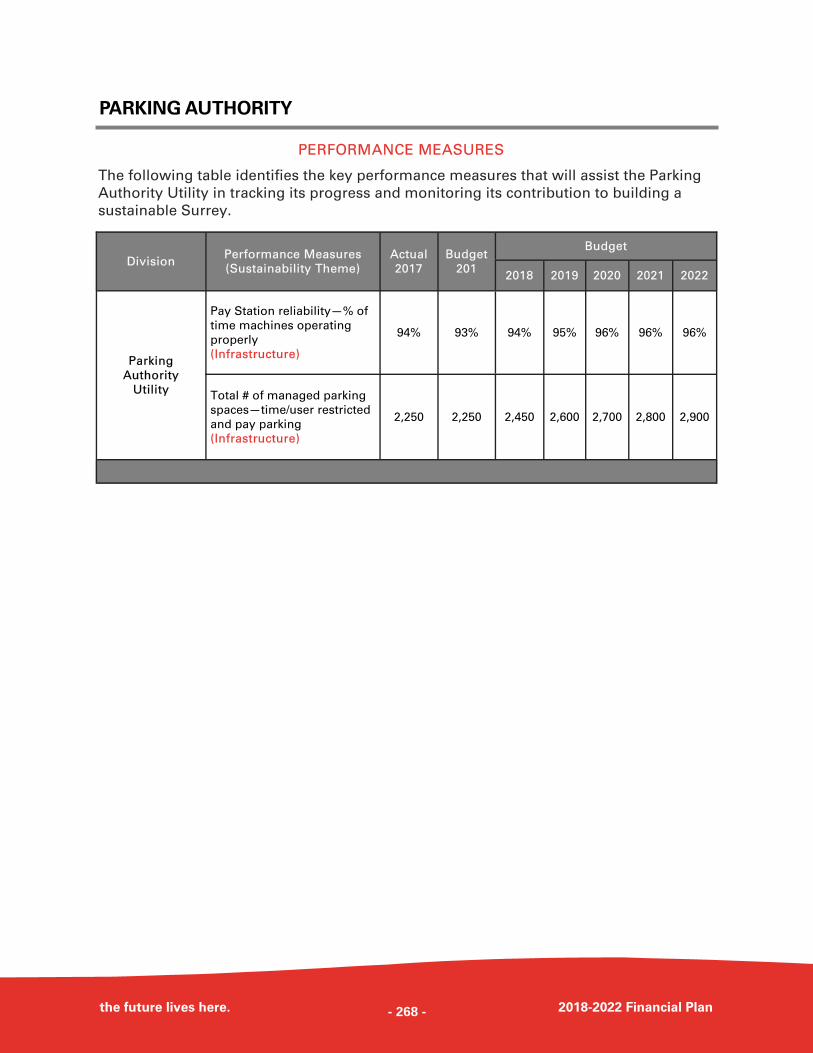
PARKING AUTHORITY
the future lives here. 2018-2022 Financial Plan
PERFORMANCE MEASURES
The following table identifies the key performance measures that will assist the Parking
Authority Utility in tracking its progress and monitoring its contribution to building a
sustainable Surrey.
Division Actual
2017
Budget
2018 2019 2020 2021 2022
Parking
Authority
Utility
Pay Station reliability—% of
time machines operating
properly
(Infrastructure)
94% 94% 95% 96% 96% 96%
Total # of managed parking
spaces—time/user restricted
and pay parking
(Infrastructure)
2,250 2,450 2,600 2,700 2,800 2,900
Performance Measures
(Sustainability Theme)
Budget
201
93%
2,250
- 268 -
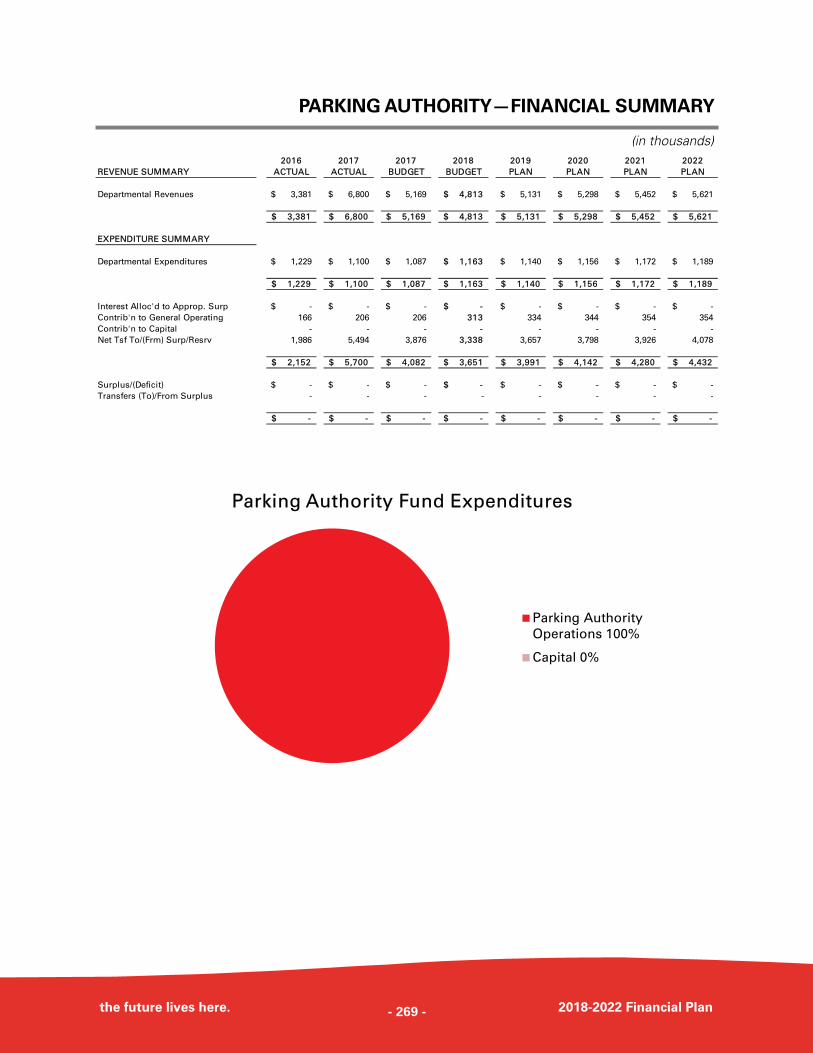
PARKING AUTHORITY—FINANCIAL SUMMARY
the future lives here. 2018-2022 Financial Plan
(in thousands)
Parking Authority Fund Expenditures
Parking Authority
Operations 100%
Capital 0%
2016 2017 2017 2018 2019 2020 2021 2022
REVENUE SUMMARY ACTUAL ACTUAL BUDGET BUDGET PLAN PLAN PLAN PLAN
Departmental Revenues 3,381$ 6,800$ 5,169$ 4,813$ 5,131$ 5,298$ 5,452$ 5,621$
3,381$ 6,800$ 5,169$ 4,813$ 5,131$ 5,298$ 5,452$ 5,621$
EXPENDITURE SUMMARY
Departmental Expenditures 1,229$ 1,100$ 1,087$ 1,163$ 1,140$ 1,156$ 1,172$ 1,189$
1,229$ 1,100$ 1,087$ 1,163$ 1,140$ 1,156$ 1,172$ 1,189$
Interest Alloc'd to Approp. Surp -$ -$ -$ -$ -$ -$ -$ -$
Contrib'n to General Operating 166 206 206 313 334 344 354 354
Contrib'n to Capital - - - - - - - -
Net Tsf To/(Frm) Surp/Resrv 1,986 5,494 3,876 3,338 3,657 3,798 3,926 4,078
2,152$ 5,700$ 4,082$ 3,651$ 3,991$ 4,142$ 4,280$ 4,432$
Surplus/(Deficit) -$ -$ -$ -$ -$ -$ -$ -$
Transfers (To)/From Surplus - - - - - - - -
-$ -$ -$ -$ -$ -$ -$ -$
- 269 -
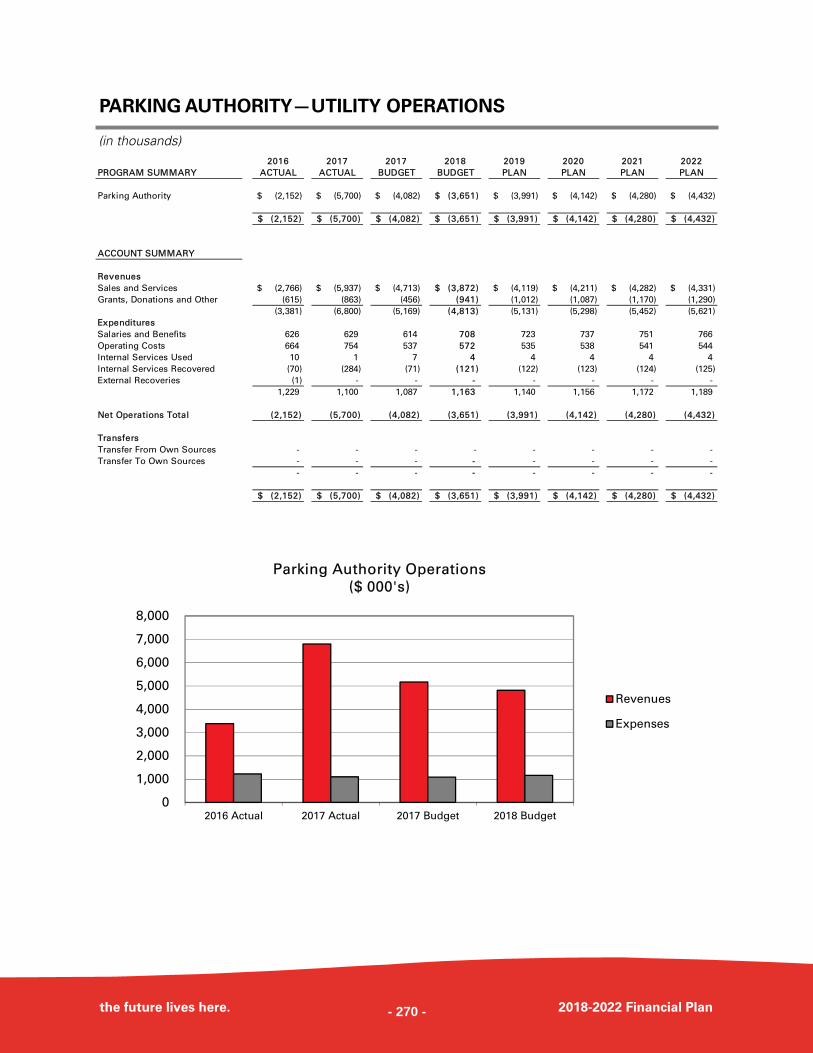
PARKING AUTHORITY—UTILITY OPERATIONS
the future lives here. 2018-2022 Financial Plan
(in thousands)
0
1,000
2,000
3,000
4,000
5,000
6,000
7,000
8,000
2016 Actual 2017 Actual 2017 Budget 2018 Budget
Parking Authority Operations
($ 000's)
Revenues
Expenses
2016 2017 2017 2018 2019 2020 2021 2022
PROGRAM SUMMARY ACTUAL ACTUAL BUDGET BUDGET PLAN PLAN PLAN PLAN
Parking Authority (2,152)$ (5,700)$ (4,082)$ (3,651)$ (3,991)$ (4,142)$ (4,280)$ (4,432)$
(2,152)$ (5,700)$ (4,082)$ (3,651)$ (3,991)$ (4,142)$ (4,280)$ (4,432)$
ACCOUNT SUMMARY
Revenues
Sales and Services (2,766)$ (5,937)$ (4,713)$ (3,872)$ (4,119)$ (4,211)$ (4,282)$ (4,331)$
Grants, Donations and Other (615) (863) (456) (941) (1,012) (1,087) (1,170) (1,290)
(3,381) (6,800) (5,169) (4,813) (5,131) (5,298) (5,452) (5,621)
Expenditures
Salaries and Benefits 626 629 614 708 723 737 751 766
Operating Costs 664 754 537 572 535 538 541 544
Internal Services Used 10 1 7 4 4 4 4 4
Internal Services Recovered (70) (284) (71) (121) (122) (123) (124) (125)
External Recoveries (1) - - - - - - -
1,229 1,100 1,087 1,163 1,140 1,156 1,172 1,189
Net Operations Total (2,152) (5,700) (4,082) (3,651) (3,991) (4,142) (4,280) (4,432)
Transfers
Transfer From Own Sources - - - - - - - -
Transfer To Own Sources - - - - - - - -
- - - - - - - -
(2,152)$ (5,700)$ (4,082)$ (3,651)$ (3,991)$ (4,142)$ (4,280)$ (4,432)$
- 270 -
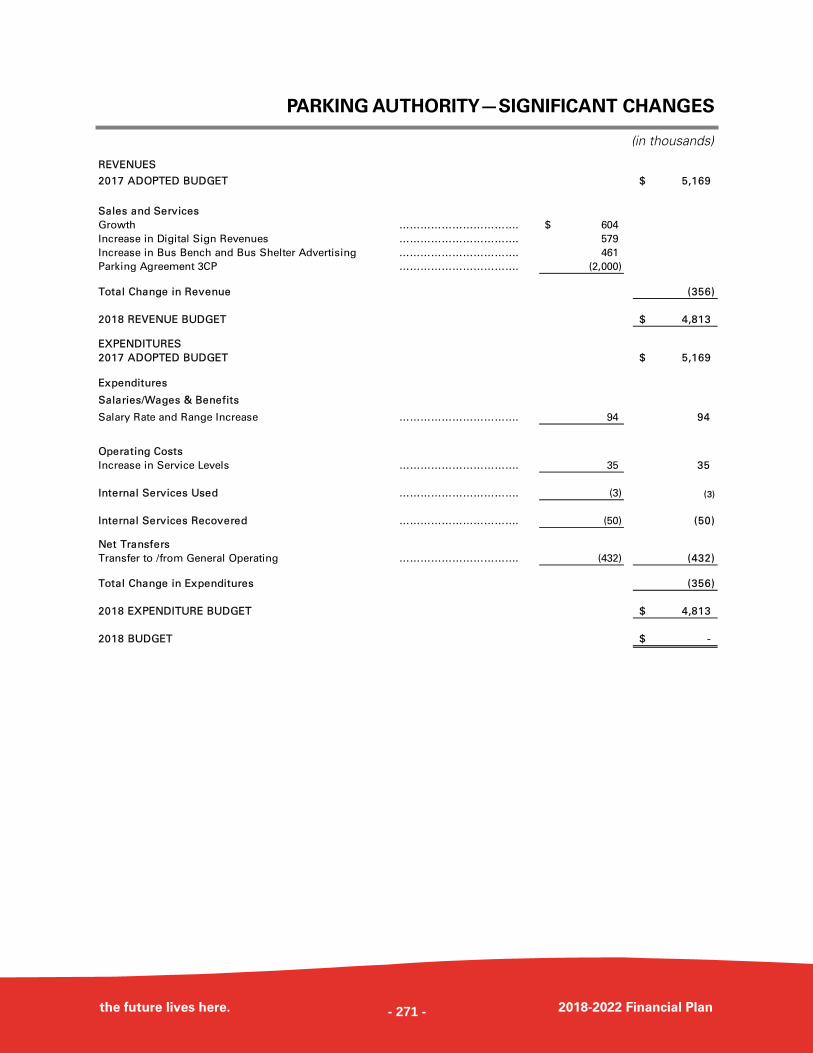
PARKING AUTHORITY—SIGNIFICANT CHANGES
the future lives here. 2018-2022 Financial Plan
(in thousands)
REVENUES
2017 ADOPTED BUDGET 5,169$
Sales and Services
Growth ……………………………. 604$
Increase in Digital Sign Revenues ……………………………. 579
Increase in Bus Bench and Bus Shelter Advertising ……………………………. 461
Parking Agreement 3CP ……………………………. (2,000)
Total Change in Revenue (356)
2018 REVENUE BUDGET 4,813$
EXPENDITURES
2017 ADOPTED BUDGET 5,169$
Expenditures
Salaries/Wages & Benefits
Salary Rate and Range Increase ……………………………. 94 94
Operating Costs
Increase in Service Levels ……………………………. 35 35
Internal Services Used ……………………………. (3) (3)
Internal Services Recovered ……………………………. (50) (50)
Net Transfers
Transfer to /from General Operating ……………………………. (432) (432)
Total Change in Expenditures (356)
2018 EXPENDITURE BUDGET 4,813$
2018 BUDGET -$
- 271 -
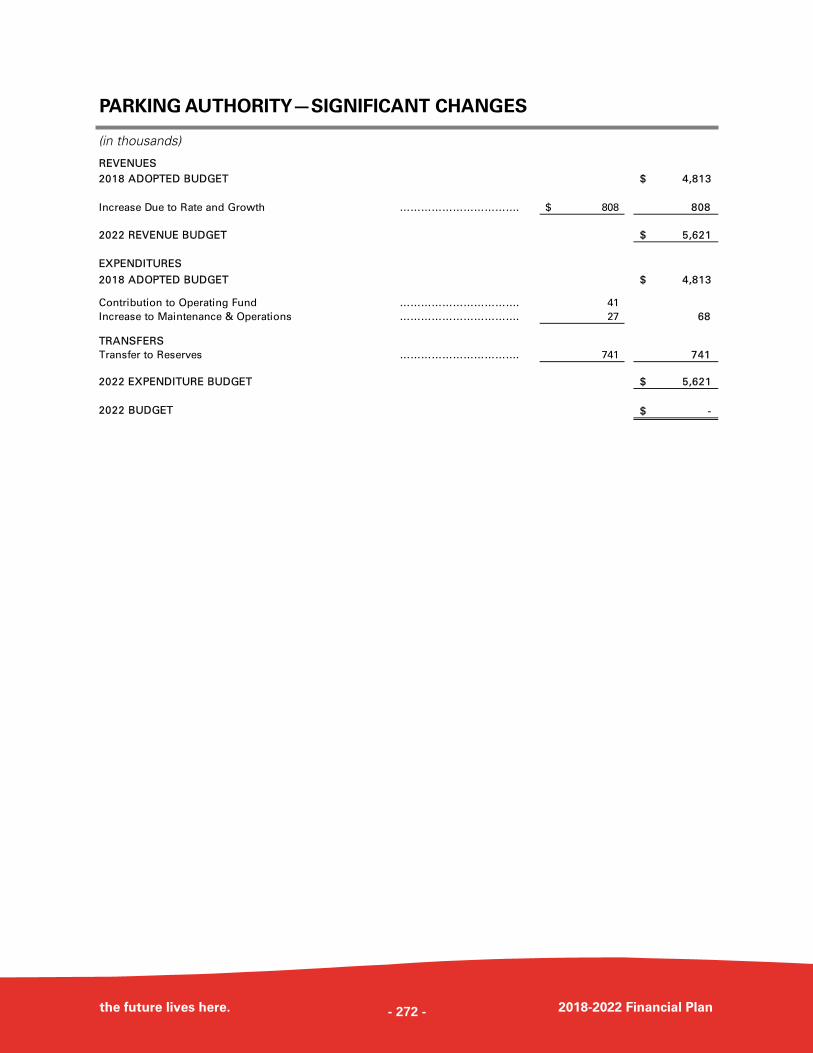
PARKING AUTHORITY—SIGNIFICANT CHANGES
the future lives here. 2018-2022 Financial Plan
(in thousands)
REVENUES
2018 ADOPTED BUDGET 4,813$
Increase Due to Rate and Growth ……………………………. 808$ 808
2022 REVENUE BUDGET 5,621$
EXPENDITURES
2018 ADOPTED BUDGET 4,813$
Contribution to Operating Fund ……………………………. 41
Increase to Maintenance & Operations ……………………………. 27 68
TRANSFERS
Transfer to Reserves ……………………………. 741 741
2022 EXPENDITURE BUDGET 5,621$
2022 BUDGET -$
- 272 -
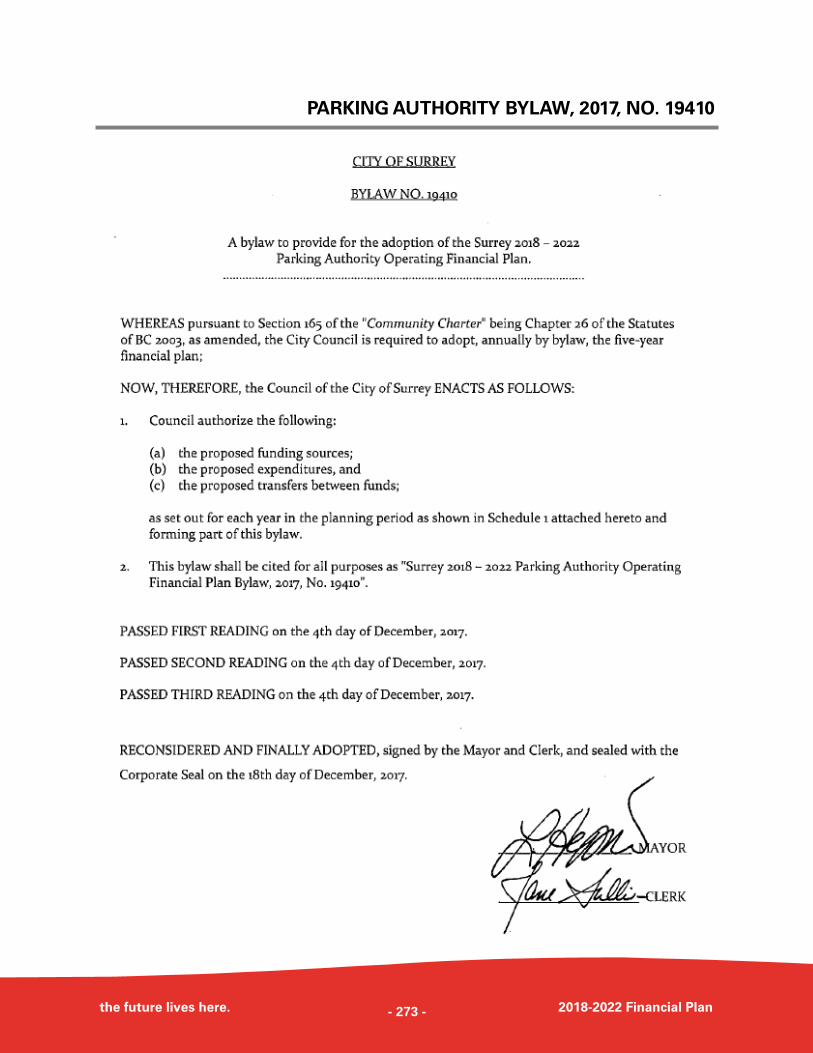
PARKING AUTHORITY BYLAW, 2017, NO. 19410
the future lives here. 2018-2022 Financial Plan - 273 -
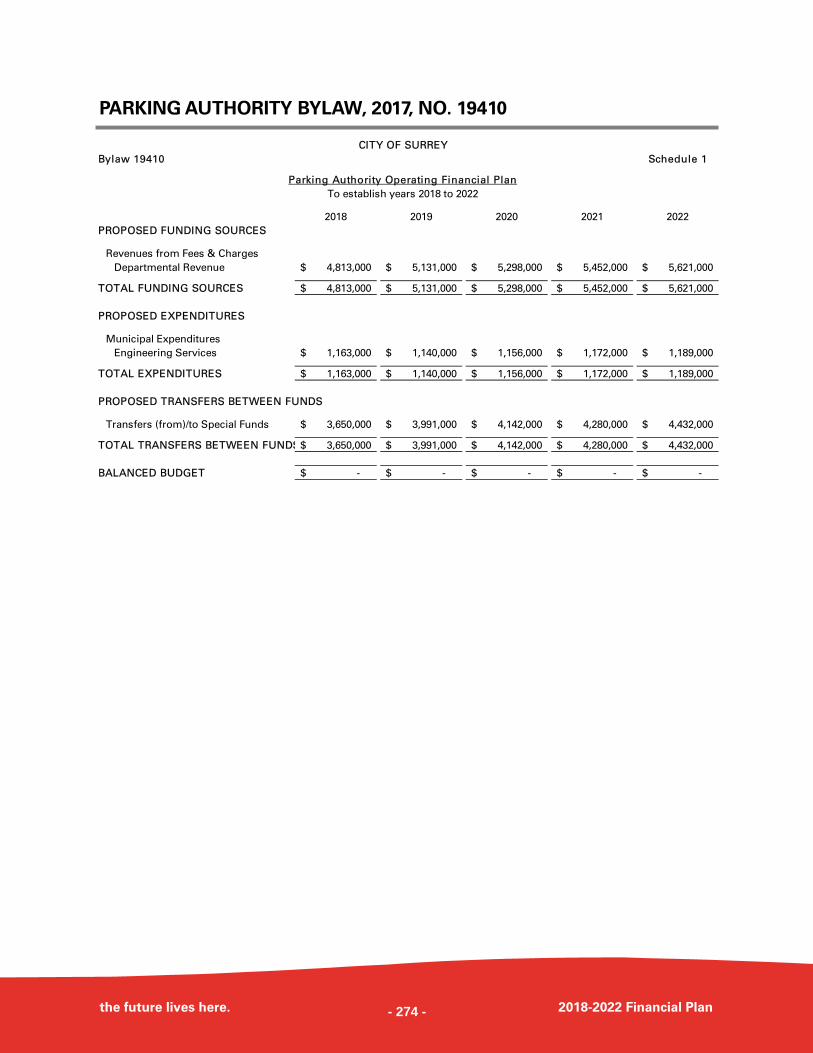
PARKING AUTHORITY BYLAW, 2017, NO. 19410
the future lives here. 2018-2022 Financial Plan
CITY OF SURREY
Bylaw 19410 Schedule 1
Parking Authority Operating Financial Plan
To establish years 2018 to 2022
2018 2019 2020 2021 2022
PROPOSED FUNDING SOURCES
Revenues from Fees & Charges
Departmental Revenue 4,813,000$ 5,131,000$ 5,298,000$ 5,452,000$ 5,621,000$
TOTAL FUNDING SOURCES 4,813,000$ 5,131,000$ 5,298,000$ 5,452,000$ 5,621,000$
PROPOSED EXPENDITURES
Municipal Expenditures
Engineering Services 1,163,000$ 1,140,000$ 1,156,000$ 1,172,000$ 1,189,000$
TOTAL EXPENDITURES 1,163,000$ 1,140,000$ 1,156,000$ 1,172,000$ 1,189,000$
PROPOSED TRANSFERS BETWEEN FUNDS
Transfers (from)/to Special Funds 3,650,000$ 3,991,000$ 4,142,000$ 4,280,000$ 4,432,000$
TOTAL TRANSFERS BETWEEN FUNDS 3,650,000$ 3,991,000$ 4,142,000$ 4,280,000$ 4,432,000$
BALANCED BUDGET -$ -$ -$ -$ -$
- 274 -
- 275 -
UTILITY OVERVIEW
ROADS AND TRAFFIC SAFETY
the future lives here. 2018-2022 Financial Plan
MISSION STATEMENT
To improve the quality of life for those living, working or recreating in Surrey by
enabling their multi-modal mobility needs in a safe and efficient manner, while
protecting the environment.
KEY PROGRAMS AND SERVICES
The Roads & Traffic Safety Utility services are delivered through the work of three
Engineering Department divisions: the Transportation division, which plans for current
and future transportation needs and ensures the safe and efficient operation of the
system; the Design & Construction division, which designs and builds new infrastructure
in an environmentally sound and sustainable manner; and the Operations division,
which ensures maintenance of the road infrastructure.
The Transportation Strategic Plan provides the overarching direction for this Utility with
daughter plans for walking, cycling and the upcoming Safe Mobility Plan. This Utility
deals with roadway services ranging from winter maintenance, sweeping and road
repaving to planning and delivering infrastructure in support of transit, walking, cycling
and automobiles to improving traffic flow through intelligent transportation systems,
like our Traffic Management Centre.
2017 ACCOMPLISHMENTS
Planned implementation strategy for pedestrian and cyclist access to Light Rail
Transit (LRT) stations.
Worked with RCMP on collision data
and analysis sharing to enable more
collaboration in improving road safety;
Initiated work towards a new program,
Data Driven Approach to Crime and
Traffic Safety, that reduces crime and
traffic collisions;
Initiated a pilot to assess pavement
markings and other treatments to
improve driver awareness at schools;
Constructed $4.2 million of
transportation and mobility
improvements under the Safe and
Active Schools program;
Implemented safety improvements at
the top 10 collision intersections; and
Worked with RCMP, external agencies
and stakeholders in developing a draft
Safe Mobility Plan to be launched in
Spring 2018.
INCLUSION
PUBLIC SAFETY
- 276 -
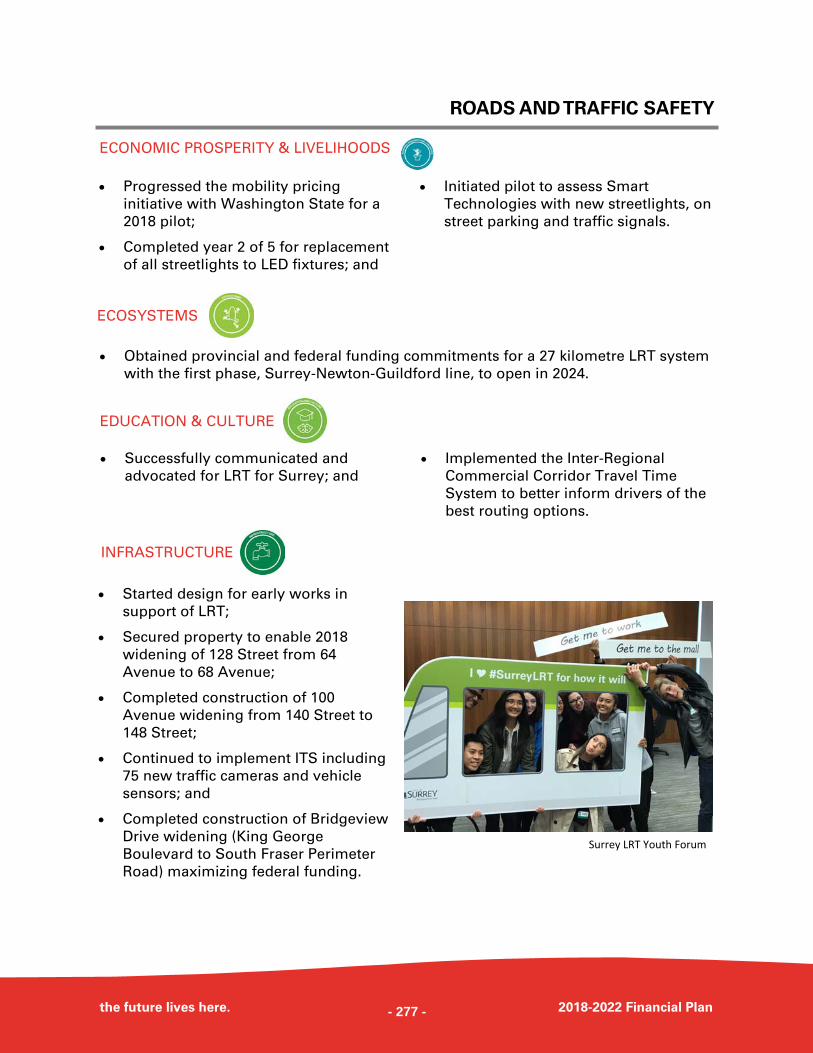
ROADS AND TRAFFIC SAFETY
the future lives here. 2018-2022 Financial Plan
Progressed the mobility pricing
initiative with Washington State for a
2018 pilot;
Completed year 2 of 5 for replacement
of all streetlights to LED fixtures; and
Initiated pilot to assess Smart
Technologies with new streetlights, on
street parking and traffic signals.
Obtained provincial and federal funding commitments for a 27 kilometre LRT system
with the first phase, Surrey-Newton-Guildford line, to open in 2024.
Successfully communicated and
advocated for LRT for Surrey; and
Implemented the Inter-Regional
Commercial Corridor Travel Time
System to better inform drivers of the
best routing options.
Started design for early works in
support of LRT;
Secured property to enable 2018
widening of 128 Street from 64
Avenue to 68 Avenue;
Completed construction of 100
Avenue widening from 140 Street to
148 Street;
Continued to implement ITS including
75 new traffic cameras and vehicle
sensors; and
Completed construction of Bridgeview
Drive widening (King George
Boulevard to South Fraser Perimeter
Road) maximizing federal funding.
ECONOMIC PROSPERITY & LIVELIHOODS
ECOSYSTEMS
EDUCATION & CULTURE
INFRASTRUCTURE
Surrey LRT Youth Forum
- 277 -
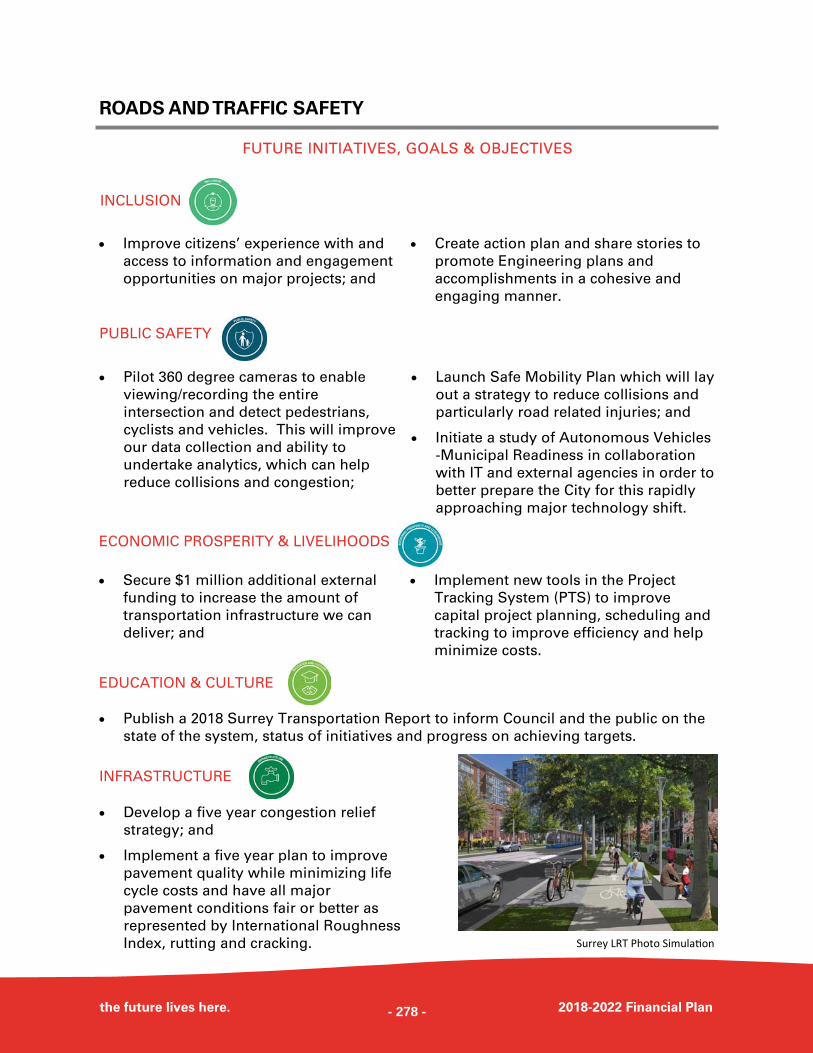
ROADS AND TRAFFIC SAFETY
the future lives here. 2018-2022 Financial Plan
FUTURE INITIATIVES, GOALS & OBJECTIVES
Improve citizens’ experience with and
access to information and engagement
opportunities on major projects; and
Create action plan and share stories to
promote Engineering plans and
accomplishments in a cohesive and
engaging manner.
Pilot 360 degree cameras to enable
viewing/recording the entire
intersection and detect pedestrians,
cyclists and vehicles. This will improve
our data collection and ability to
undertake analytics, which can help
reduce collisions and congestion;
Launch Safe Mobility Plan which will lay
out a strategy to reduce collisions and
particularly road related injuries; and
Initiate a study of Autonomous Vehicles
-Municipal Readiness in collaboration
with IT and external agencies in order to
better prepare the City for this rapidly
approaching major technology shift.
Secure $1 million additional external
funding to increase the amount of
transportation infrastructure we can
deliver; and
Implement new tools in the Project
Tracking System (PTS) to improve
capital project planning, scheduling and
tracking to improve efficiency and help
minimize costs.
Publish a 2018 Surrey Transportation Report to inform Council and the public on the
state of the system, status of initiatives and progress on achieving targets.
INCLUSION
PUBLIC SAFETY
ECONOMIC PROSPERITY & LIVELIHOODS
EDUCATION & CULTURE
Surrey LRT Photo Simula on
Develop a five year congestion relief
strategy; and
Implement a five year plan to improve
pavement quality while minimizing life
cycle costs and have all major
pavement conditions fair or better as
represented by International Roughness
Index, rutting and cracking.
INFRASTRUCTURE
- 278 -
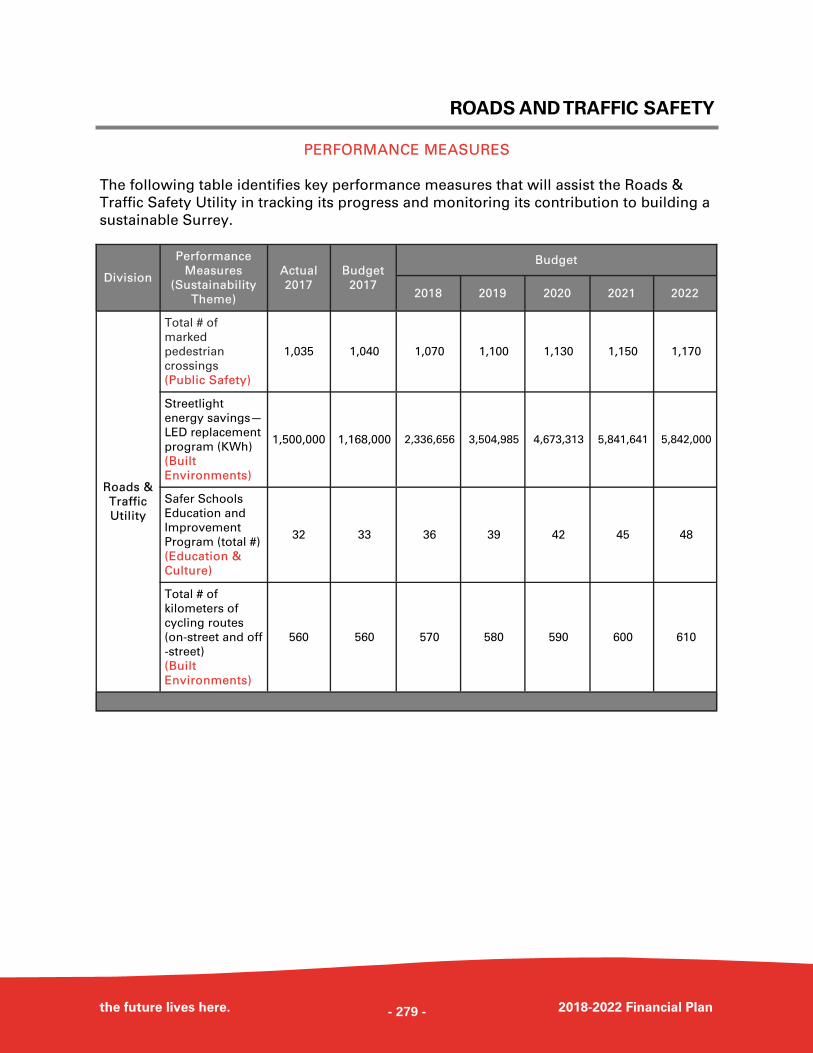
ROADS AND TRAFFIC SAFETY
the future lives here. 2018-2022 Financial Plan
PERFORMANCE MEASURES
The following table identifies key performance measures that will assist the Roads &
Traffic Safety Utility in tracking its progress and monitoring its contribution to building a
sustainable Surrey.
Division
Performance
Measures
(Sustainability
Theme)
Budget
2018 2019 2020 2021 2022
Roads &
Traffic
Utility
Total # of
marked
pedestrian
crossings
(Public Safety)
1,035 1,070 1,100 1,130 1,150 1,170
Streetlight
energy savings—
LED replacement
program (KWh)
(Built
Environments)
1,500,000 2,336,656 3,504,985 4,673,313 5,841,641 5,842,000
Safer Schools
Education and
Improvement
Program (total #)
(Education &
Culture)
32 36 39 42 45 48
Total # of
kilometers of
cycling routes
(on-street and off
-street)
(Built
Environments)
560 570 580 590 600 610
Actual
2017
Budget
2017
1,040
1,168,000
33
560
- 279 -
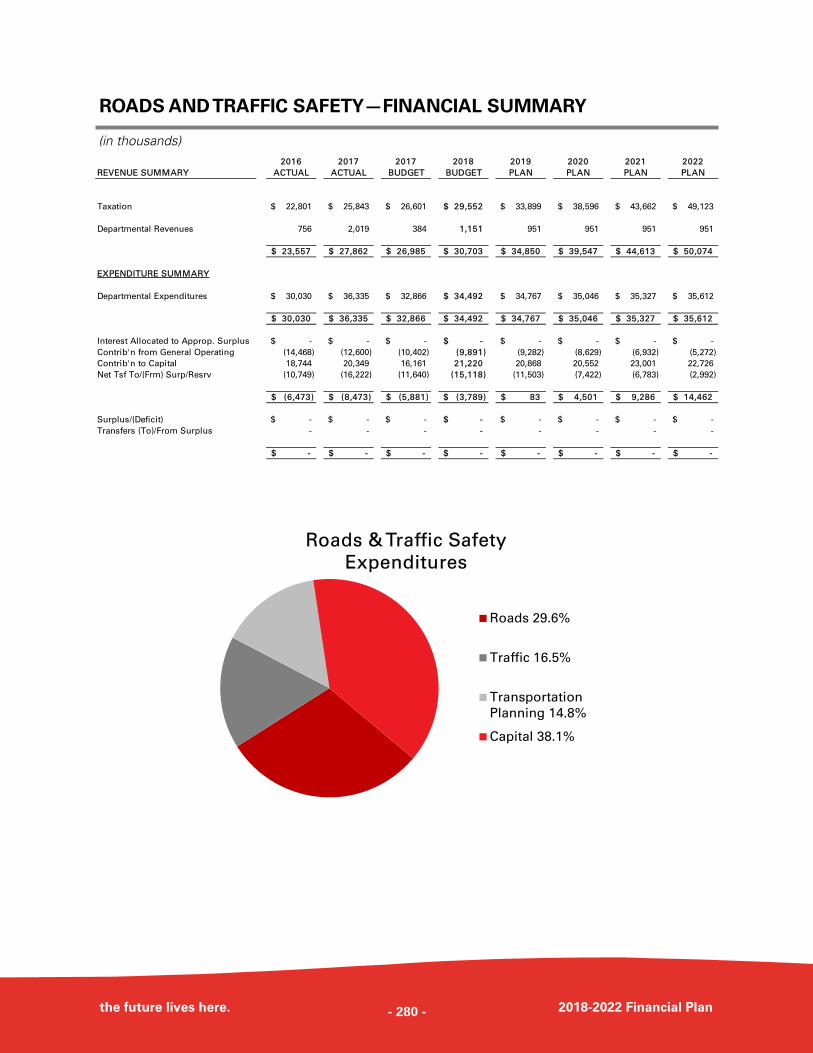
ROADS AND TRAFFIC SAFETY—FINANCIAL SUMMARY
the future lives here. 2018-2022 Financial Plan
(in thousands)
Roads & Traffic Safety
Expenditures
Roads 29.6%
Traffic 16.5%
Transportation
Planning 14.8%
Capital 38.1%
2016 2017 2017 2018 2019 2020 2021 2022
REVENUE SUMMARY ACTUAL ACTUAL BUDGET BUDGET PLAN PLAN PLAN PLAN
Taxation 22,801$ 25,843$ 26,601$ 29,552$ 33,899$ 38,596$ 43,662$ 49,123$
Departmental Revenues 756 2,019 384 1,151 951 951 951 951
23,557$ 27,862$ 26,985$ 30,703$ 34,850$ 39,547$ 44,613$ 50,074$
EXPENDITURE SUMMARY
Departmental Expenditures 30,030$ 36,335$ 32,866$ 34,492$ 34,767$ 35,046$ 35,327$ 35,612$
30,030$ 36,335$ 32,866$ 34,492$ 34,767$ 35,046$ 35,327$ 35,612$
Interest Allocated to Approp. Surplus -$ -$ -$ -$ -$ -$ -$ -$
Contrib'n from General Operating (14,468) (12,600) (10,402) (9,891) (9,282) (8,629) (6,932) (5,272)
Contrib'n to Capital 18,744 20,349 16,161 21,220 20,868 20,552 23,001 22,726
Net Tsf To/(Frm) Surp/Resrv (10,749) (16,222) (11,640) (15,118) (11,503) (7,422) (6,783) (2,992)
(6,473)$ (8,473)$ (5,881)$ (3,789)$ 83$ 4,501$ 9,286$ 14,462$
Surplus/(Deficit) -$ -$ -$ -$ -$ -$ -$ -$
Transfers (To)/From Surplus - - - - - - - -
-$ -$ -$ -$ -$ -$ -$ -$
- 280 -
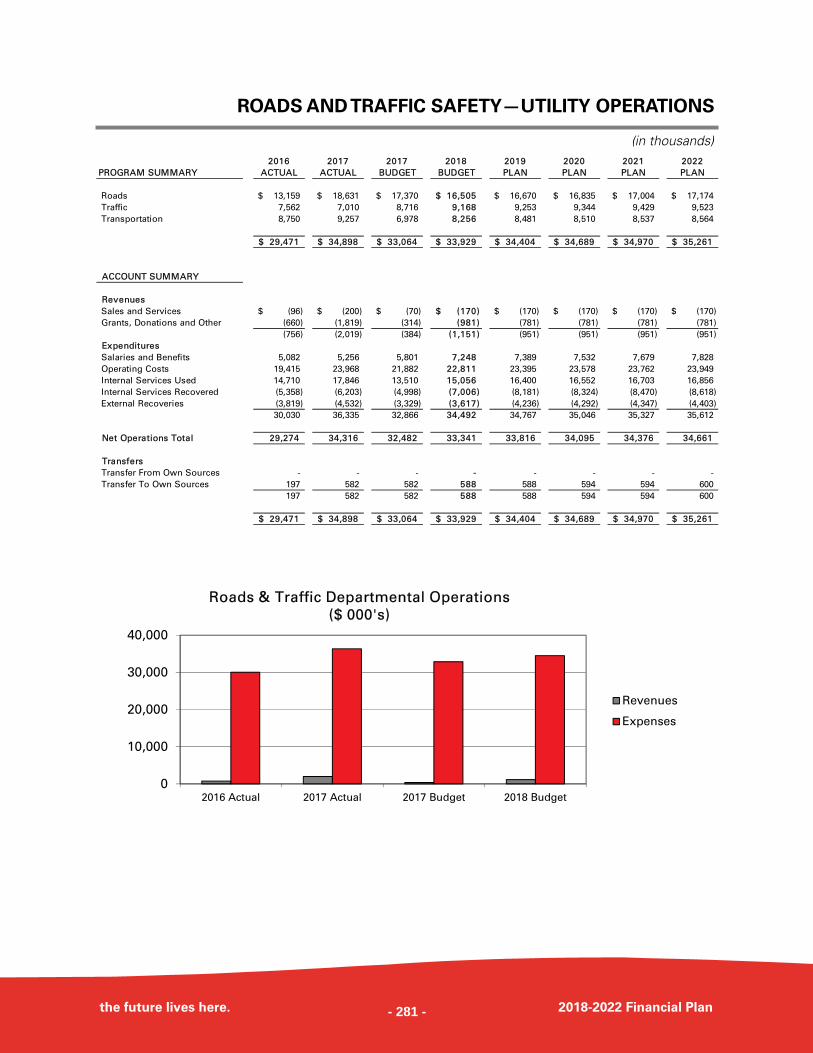
ROADS AND TRAFFIC SAFETY—UTILITY OPERATIONS
the future lives here. 2018-2022 Financial Plan
(in thousands)
0
10,000
20,000
30,000
40,000
2016 Actual 2017 Actual 2017 Budget 2018 Budget
Roads & Traffic Departmental Operations
($ 000's)
Revenues
Expenses
2016 2017 2017 2018 2019 2020 2021 2022
PROGRAM SUMMARY ACTUAL ACTUAL BUDGET BUDGET PLAN PLAN PLAN PLAN
Roads 13,159$ 18,631$ 17,370$ 16,505$ 16,670$ 16,835$ 17,004$ 17,174$
Traffic 7,562 7,010 8,716 9,168 9,253 9,344 9,429 9,523
Transportation 8,750 9,257 6,978 8,256 8,481 8,510 8,537 8,564
29,471$ 34,898$ 33,064$ 33,929$ 34,404$ 34,689$ 34,970$ 35,261$
ACCOUNT SUMMARY
Revenues
Sales and Services (96)$ (200)$ (70)$ (170)$ (170)$ (170)$ (170)$ (170)$
Grants, Donations and Other (660) (1,819) (314) (981) (781) (781) (781) (781)
(756) (2,019) (384) (1,151) (951) (951) (951) (951)
Expenditures
Salaries and Benefits 5,082 5,256 5,801 7,248 7,389 7,532 7,679 7,828
Operating Costs 19,415 23,968 21,882 22,811 23,395 23,578 23,762 23,949
Internal Services Used 14,710 17,846 13,510 15,056 16,400 16,552 16,703 16,856
Internal Services Recovered (5,358) (6,203) (4,998) (7,006) (8,181) (8,324) (8,470) (8,618)
External Recoveries (3,819) (4,532) (3,329) (3,617) (4,236) (4,292) (4,347) (4,403)
30,030 36,335 32,866 34,492 34,767 35,046 35,327 35,612
Net Operations Total 29,274 34,316 32,482 33,341 33,816 34,095 34,376 34,661
Transfers
Transfer From Own Sources - - - - - - - -
Transfer To Own Sources 197 582 582 588 588 594 594 600
197 582 582 588 588 594 594 600
29,471$ 34,898$ 33,064$ 33,929$ 34,404$ 34,689$ 34,970$ 35,261$
- 281 -
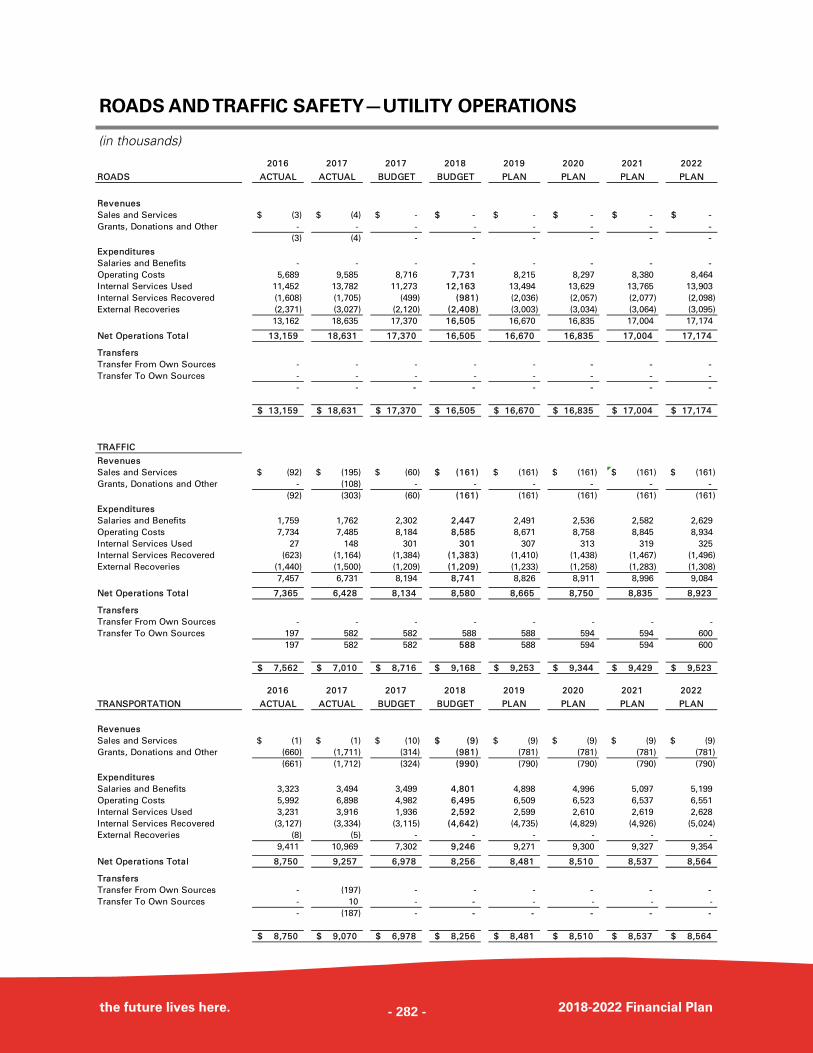
ROADS AND TRAFFIC SAFETY—UTILITY OPERATIONS
the future lives here. 2018-2022 Financial Plan
(in thousands)
2016 2017 2017 2018 2019 2020 2021 2022
ROADS ACTUAL ACTUAL BUDGET BUDGET PLAN PLAN PLAN PLAN
Revenues
Sales and Services (3)$ (4)$ -$ -$ -$ -$ -$ -$
Grants, Donations and Other - - - - - - - -
(3) (4) - - - - - -
Expenditures
Salaries and Benefits - - - - - - - -
Operating Costs 5,689 9,585 8,716 7,731 8,215 8,297 8,380 8,464
Internal Services Used 11,452 13,782 11,273 12,163 13,494 13,629 13,765 13,903
Internal Services Recovered (1,608) (1,705) (499) (981) (2,036) (2,057) (2,077) (2,098)
External Recoveries (2,371) (3,027) (2,120) (2,408) (3,003) (3,034) (3,064) (3,095)
13,162 18,635 17,370 16,505 16,670 16,835 17,004 17,174
Net Operations Total 13,159 18,631 17,370 16,505 16,670 16,835 17,004 17,174
Transfers
Transfer From Own Sources - - - - - - - -
Transfer To Own Sources - - - - - - - -
- - - - - - - -
13,159$ 18,631$ 17,370$ 16,505$ 16,670$ 16,835$ 17,004$ 17,174$
TRAFFIC
Revenues
Sales and Services (92)$ (195)$ (60)$ (161)$ (161)$ (161)$ (161)$ (161)$
Grants, Donations and Other - (108) - - - - - -
(92) (303) (60) (161) (161) (161) (161) (161)
Expenditures
Salaries and Benefits 1,759 1,762 2,302 2,447 2,491 2,536 2,582 2,629
Operating Costs 7,734 7,485 8,184 8,585 8,671 8,758 8,845 8,934
Internal Services Used 27 148 301 301 307 313 319 325
Internal Services Recovered (623) (1,164) (1,384) (1,383) (1,410) (1,438) (1,467) (1,496)
External Recoveries (1,440) (1,500) (1,209) (1,209) (1,233) (1,258) (1,283) (1,308)
7,457 6,731 8,194 8,741 8,826 8,911 8,996 9,084
Net Operations Total 7,365 6,428 8,134 8,580 8,665 8,750 8,835 8,923
Transfers
Transfer From Own Sources - - - - - - - -
Transfer To Own Sources 197 582 582 588 588 594 594 600
197 582 582 588 588 594 594 600
7,562$ 7,010$ 8,716$ 9,168$ 9,253$ 9,344$ 9,429$ 9,523$
2016 2017 2017 2018 2019 2020 2021 2022
TRANSPORTATION ACTUAL ACTUAL BUDGET BUDGET PLAN PLAN PLAN PLAN
Revenues
Sales and Services (1)$ (1)$ (10)$ (9)$ (9)$ (9)$ (9)$ (9)$
Grants, Donations and Other (660) (1,711) (314) (981) (781) (781) (781) (781)
(661) (1,712) (324) (990) (790) (790) (790) (790)
Expenditures
Salaries and Benefits 3,323 3,494 3,499 4,801 4,898 4,996 5,097 5,199
Operating Costs 5,992 6,898 4,982 6,495 6,509 6,523 6,537 6,551
Internal Services Used 3,231 3,916 1,936 2,592 2,599 2,610 2,619 2,628
Internal Services Recovered (3,127) (3,334) (3,115) (4,642) (4,735) (4,829) (4,926) (5,024)
External Recoveries (8) (5) - - - - - -
9,411 10,969 7,302 9,246 9,271 9,300 9,327 9,354
Net Operations Total 8,750 9,257 6,978 8,256 8,481 8,510 8,537 8,564
Transfers
Transfer From Own Sources - (197) - - - - - -
Transfer To Own Sources - 10 - - - - - -
- (187) - - - - - -
8,750$ 9,070$ 6,978$ 8,256$ 8,481$ 8,510$ 8,537$ 8,564$
- 282 -
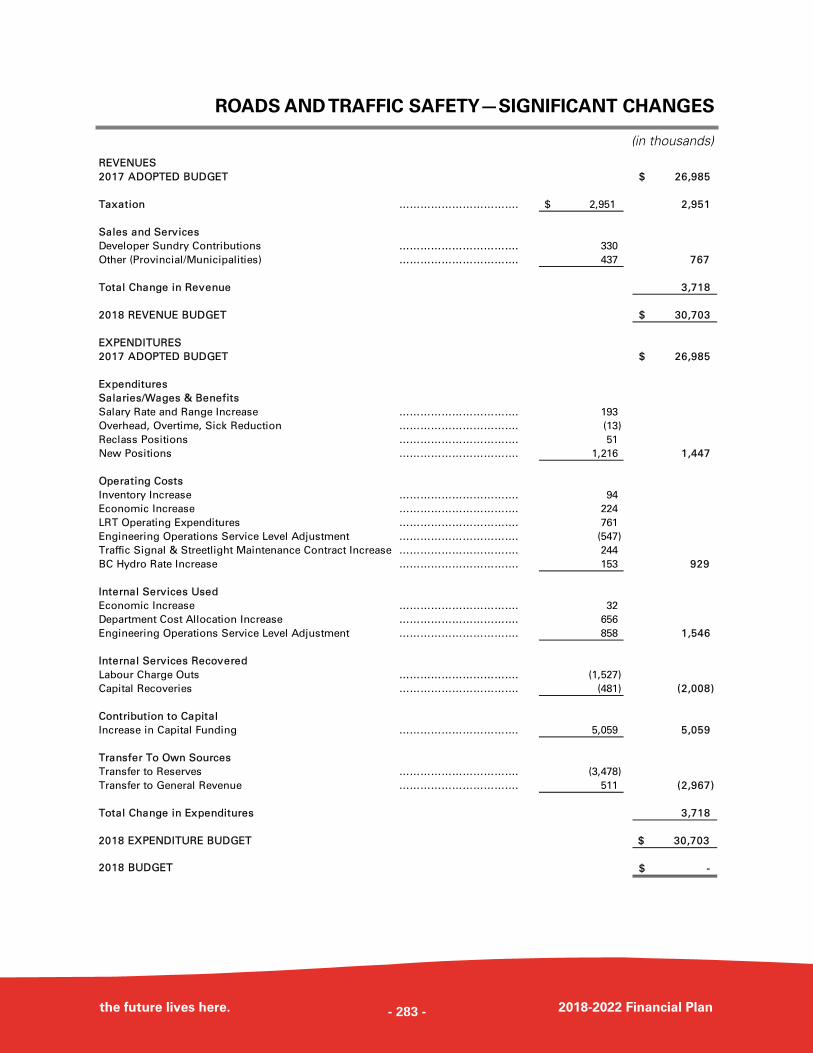
ROADS AND TRAFFIC SAFETY—SIGNIFICANT CHANGES
the future lives here. 2018-2022 Financial Plan
(in thousands)
REVENUES
2017 ADOPTED BUDGET 26,985$
Taxation ……………………………. $ 2,951 2,951
Sales and Services
Developer Sundry Contributions ……………………………. 330
Other (Provincial/Municipalities) ……………………………. 437 767
Total Change in Revenue 3,718
2018 REVENUE BUDGET 30,703$
EXPENDITURES
2017 ADOPTED BUDGET 26,985$
Expenditures
Salaries/Wages & Benefits
Salary Rate and Range Increase ……………………………. 193
Overhead, Overtime, Sick Reduction ……………………………. (13)
Reclass Positions ……………………………. 51
New Positions ……………………………. 1,216 1,447
Operating Costs
Inventory Increase ……………………………. 94
Economic Increase ……………………………. 224
LRT Operating Expenditures ……………………………. 761
Engineering Operations Service Level Adjustment ……………………………. (547)
Traffic Signal & Streetlight Maintenance Contract Increase ……………………………. 244
BC Hydro Rate Increase ……………………………. 153 929
Internal Services Used
Economic Increase ……………………………. 32
Department Cost Allocation Increase ……………………………. 656
Engineering Operations Service Level Adjustment ……………………………. 858 1,546
Internal Services Recovered
Labour Charge Outs ……………………………. (1,527)
Capital Recoveries ……………………………. (481) (2,008)
Contribution to Capital
Increase in Capital Funding ……………………………. 5,059 5,059
Transfer To Own Sources
Transfer to Reserves ……………………………. (3,478)
Transfer to General Revenue ……………………………. 511 (2,967)
Total Change in Expenditures 3,718
2018 EXPENDITURE BUDGET $ 30,703
2018 BUDGET -$
- 283 -
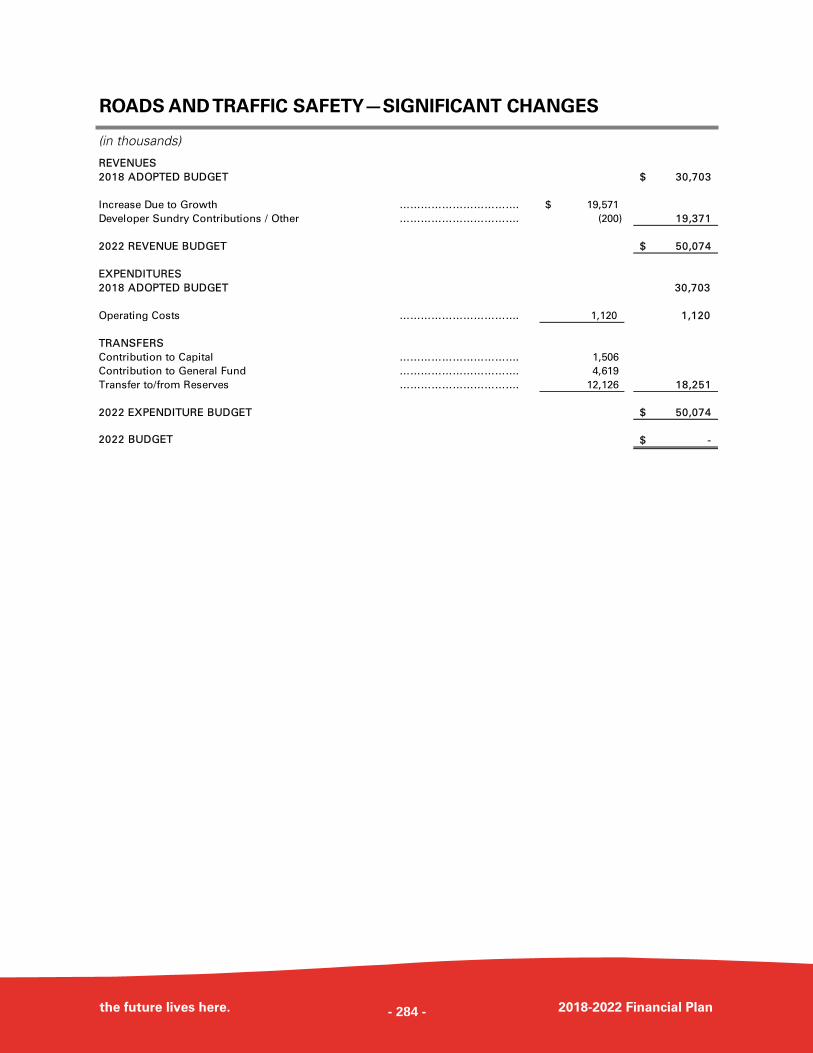
ROADS AND TRAFFIC SAFETY—SIGNIFICANT CHANGES
the future lives here. 2018-2022 Financial Plan
(in thousands)
REVENUES
2018 ADOPTED BUDGET 30,703$
Increase Due to Growth ……………………………. 19,571$
Developer Sundry Contributions / Other ……………………………. (200) 19,371
2022 REVENUE BUDGET 50,074$
EXPENDITURES
2018 ADOPTED BUDGET 30,703
Operating Costs ……………………………. 1,120 1,120
TRANSFERS
Contribution to Capital ……………………………. 1,506
Contribution to General Fund ……………………………. 4,619
Transfer to/from Reserves ……………………………. 12,126 18,251
2022 EXPENDITURE BUDGET 50,074$
2022 BUDGET -$
- 284 -

ROADS AND TRAFFIC SAFETY BYLAW, 2017, NO. 19404
the future lives here. 2018-2022 Financial Plan - 285 -
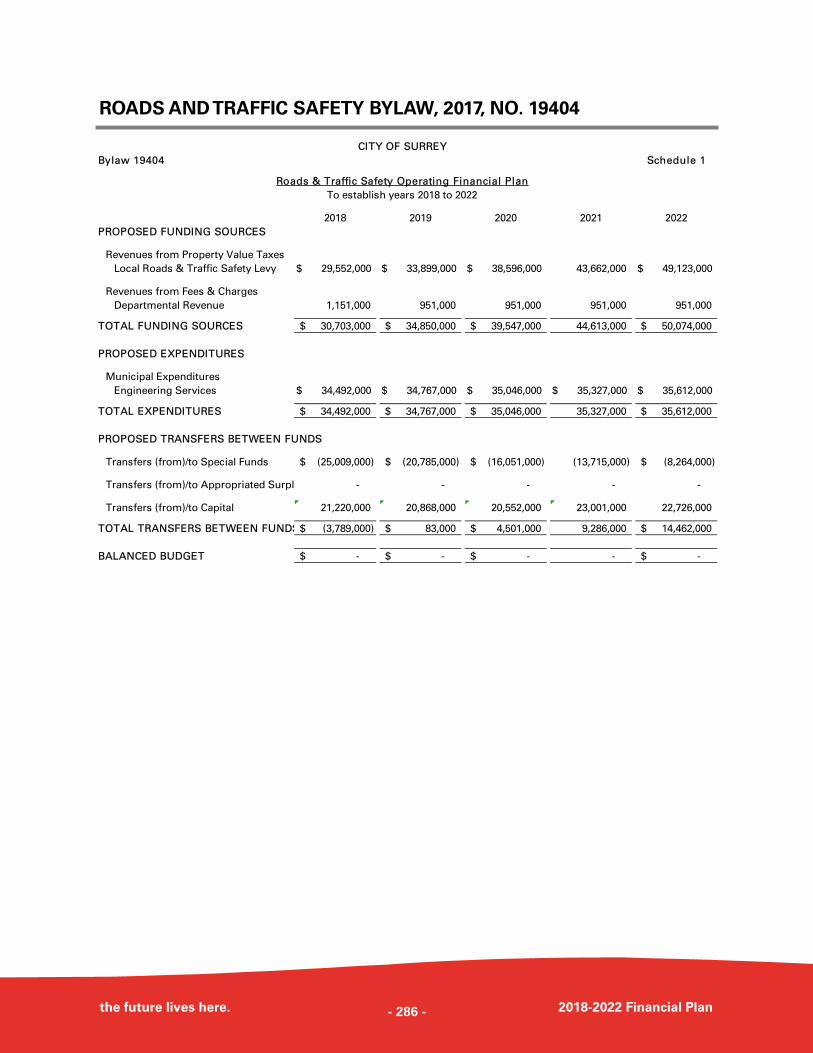
ROADS AND TRAFFIC SAFETY BYLAW, 2017, NO. 19404
the future lives here. 2018-2022 Financial Plan
CITY OF SURREY
Bylaw 19404 Schedule 1
Roads & Traffic Safety Operating Financial Plan
To establish years 2018 to 2022
2018 2019 2020 2021 2022
PROPOSED FUNDING SOURCES
Revenues from Property Value Taxes
Local Roads & Traffic Safety Levy 29,552,000 $ 33,899,000 $ 38,596,000 $ 43,662,000 49,123,000 $
Revenues from Fees & Charges
Departmental Revenue 1,151,000 951,000 951,000 951,000 951,000
TOTAL FUNDING SOURCES 30,703,000$ 34,850,000$ 39,547,000$ 44,613,000 50,074,000$
PROPOSED EXPENDITURES
Municipal Expenditures
Engineering Services 34,492,000 $ 34,767,000 $ 35,046,000 $ 35,327,000 $ 35,612,000 $
TOTAL EXPENDITURES 34,492,000$ 34,767,000$ 35,046,000$ 35,327,000 35,612,000$
PROPOSED TRANSFERS BETWEEN FUNDS
Transfers (from)/to Special Funds (25,009,000)$ (20,785,000)$ (16,051,000)$ (13,715,000) (8,264,000)$
Transfers (from)/to Appropriated Surpl - - - - -
Transfers (from)/to Capital 21,220,000 20,868,000 20,552,000 23,001,000 22,726,000
TOTAL TRANSFERS BETWEEN FUNDS (3,789,000)$ 83,000$ 4,501,000$ 9,286,000 14,462,000$
BALANCED BUDGET -$ -$ -$ - -$
- 286 -
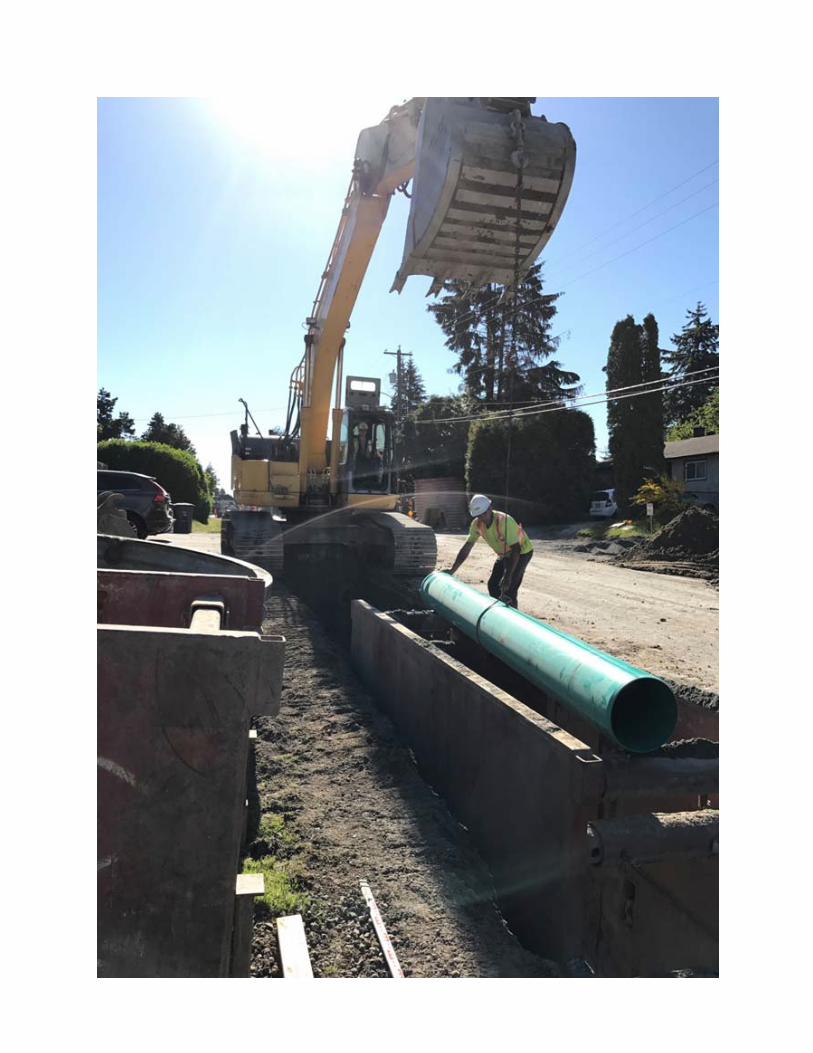
- 287 -
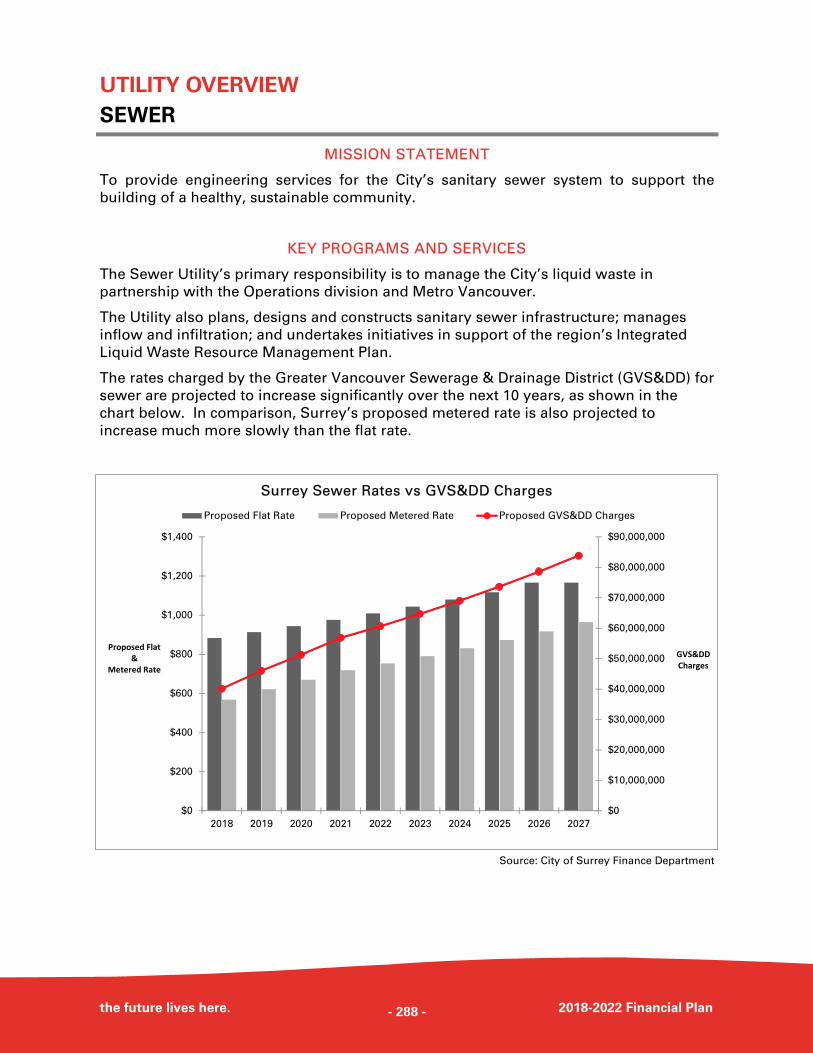
UTILITY OVERVIEW
SEWER
the future lives here. 2018-2022 Financial Plan
MISSION STATEMENT
To provide engineering services for the City’s sanitary sewer system to support the
building of a healthy, sustainable community.
KEY PROGRAMS AND SERVICES
The Sewer Utility’s primary responsibility is to manage the City’s liquid waste in
partnership with the Operations division and Metro Vancouver.
The Utility also plans, designs and constructs sanitary sewer infrastructure; manages
inflow and infiltration; and undertakes initiatives in support of the region’s Integrated
Liquid Waste Resource Management Plan.
The rates charged by the Greater Vancouver Sewerage & Drainage District (GVS&DD) for
sewer are projected to increase significantly over the next 10 years, as shown in the
chart below. In comparison, Surrey’s proposed metered rate is also projected to
increase much more slowly than the flat rate.
Source: City of Surrey Finance Department
$0
$10,000,000
$20,000,000
$30,000,000
$40,000,000
$50,000,000
$60,000,000
$70,000,000
$80,000,000
$90,000,000
$0
$200
$400
$600
$800
$1,000
$1,200
$1,400
2018 2019 2020 2021 2022 2023 2024 2025 2026 2027
Surrey Sewer Rates vs GVS&DD Charges
Proposed Flat Rate Proposed Metered Rate Proposed GVS&DD Charges
Proposed Flat &
Metered Rate
GVS&DD Charges
- 288 -
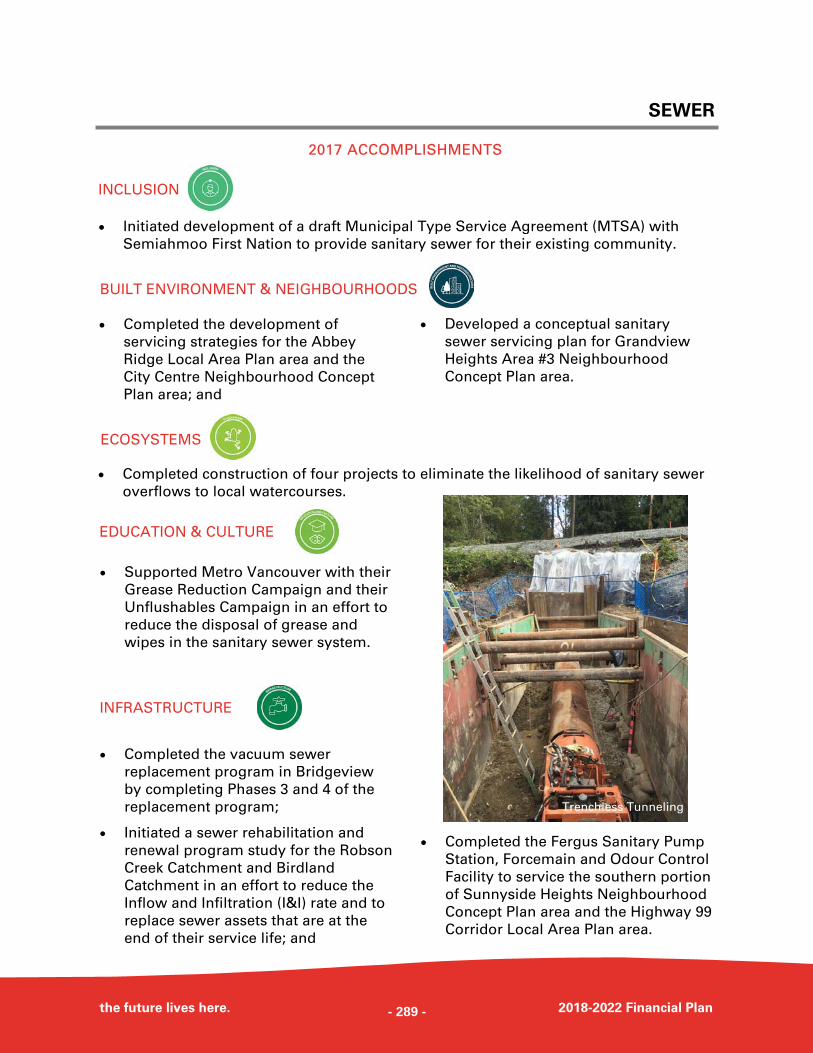
SEWER
the future lives here. 2018-2022 Financial Plan
2017 ACCOMPLISHMENTS
Completed the development of
servicing strategies for the Abbey
Ridge Local Area Plan area and the
City Centre Neighbourhood Concept
Plan area; and
Developed a conceptual sanitary
sewer servicing plan for Grandview
Heights Area #3 Neighbourhood
Concept Plan area.
Completed construction of four projects to eliminate the likelihood of sanitary sewer
overflows to local watercourses.
Supported Metro Vancouver with their
Grease Reduction Campaign and their
Unflushables Campaign in an effort to
reduce the disposal of grease and
wipes in the sanitary sewer system.
Completed the vacuum sewer
replacement program in Bridgeview
by completing Phases 3 and 4 of the
replacement program;
Initiated a sewer rehabilitation and
renewal program study for the Robson
Creek Catchment and Birdland
Catchment in an effort to reduce the
Inflow and Infiltration (I&I) rate and to
replace sewer assets that are at the
end of their service life; and
Completed the Fergus Sanitary Pump
Station, Forcemain and Odour Control
Facility to service the southern portion
of Sunnyside Heights Neighbourhood
Concept Plan area and the Highway 99
Corridor Local Area Plan area.
BUILT ENVIRONMENT & NEIGHBOURHOODS
ECOSYSTEMS
EDUCATION & CULTURE
INFRASTRUCTURE
INCLUSION
Initiated development of a draft Municipal Type Service Agreement (MTSA) with
Semiahmoo First Nation to provide sanitary sewer for their existing community.
Trenchless Tunneling
- 289 -
SEWER
the future lives here. 2018-2022 Financial Plan
FUTURE INITIATIVES, GOALS & INITIATIVES
Complete the development of servicing
strategies for the Redwood Heights
Neighbourhood Concept Plan area and
the Newton Town Centre Local Area
Plan;
Initiate the development of servicing
strategies for Grandview Heights Area
#3 Neighbourhood Concept Plan area
and the South Campbell Heights Local
Area Plan; and
Mitigate odour concerns by
constructing two odour control facilities
in South Surrey. Support Metro
Vancouver in their development of an
air management system in North
Surrey.
Continue sewer rehabilitation and cross connection investigation in an effort to
reduce the I&I rate by completing the Robson Creek Catchment and Birdland
Catchment Rehabilitation and Renewal program studies.
Complete a MTSA with the Semiahmoo First Nations to provide sanitary sewer for
their existing community.
Develop and implement an education campaign for residents to advise them of I&I
and actions they can take to reduce and I&I.
INCLUSION
BUILT ENVIRONMENT & NEIGHBOURHOODS
ECOSYSTEMS
EDUCATION & CULTURE
Complete the replacement of aging
sewer mains along routes adjacent to
Light Rail Transit (LRT);
Complete the design of Grandview
Heights Sanitary Pump Station and
Forcemain; and
Complete the Campbell Heights twin
forecemain.
INFRASTRUCTURE
- 290 -
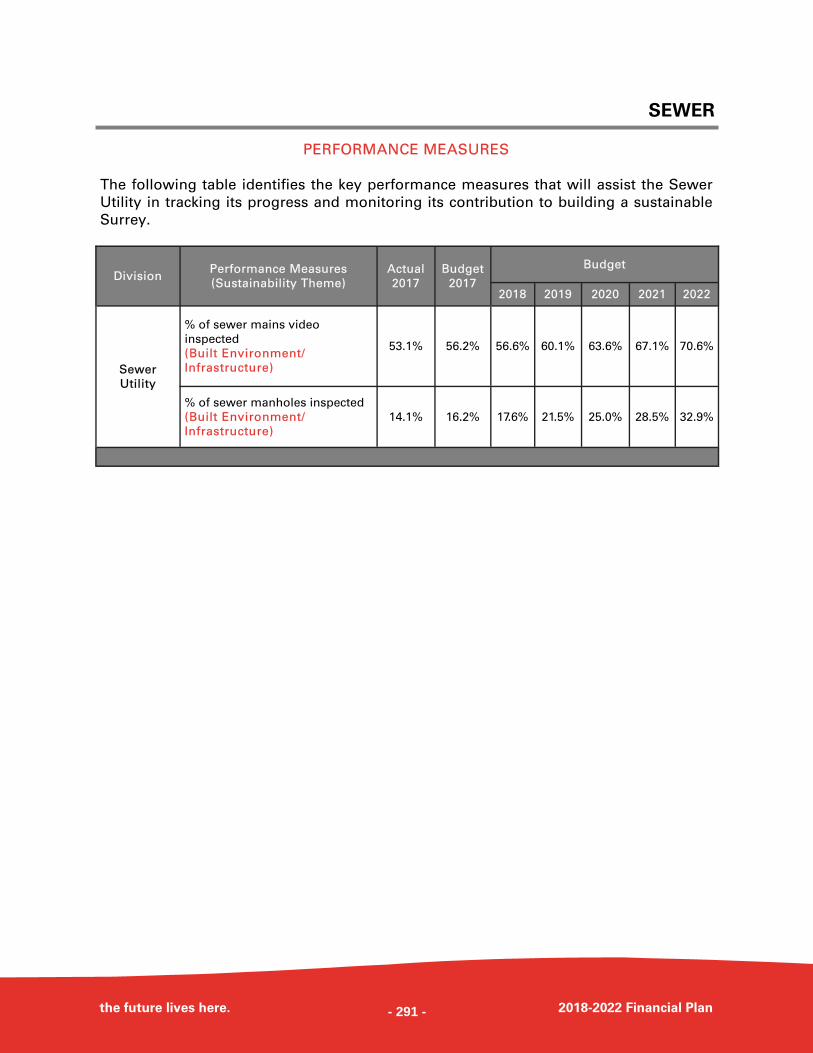
SEWER
the future lives here. 2018-2022 Financial Plan
Performance Measures
(Sustainability Theme)
Actual
2017
Budget
2018 2019 2020 2021 2022
Sewer
Utility
% of sewer mains video
inspected
(Built Environment/
Infrastructure) 53.1% 56.6% 60.1% 63.6% 67.1% 70.6%
% of sewer manholes inspected
(Built Environment/
Infrastructure) 14.1% 17.6% 21.5% 25.0% 28.5% 32.9%
Division Budget
2017
56.2%
16.2%
PERFORMANCE MEASURES
The following table identifies the key performance measures that will assist the Sewer
Utility in tracking its progress and monitoring its contribution to building a sustainable
Surrey.
- 291 -
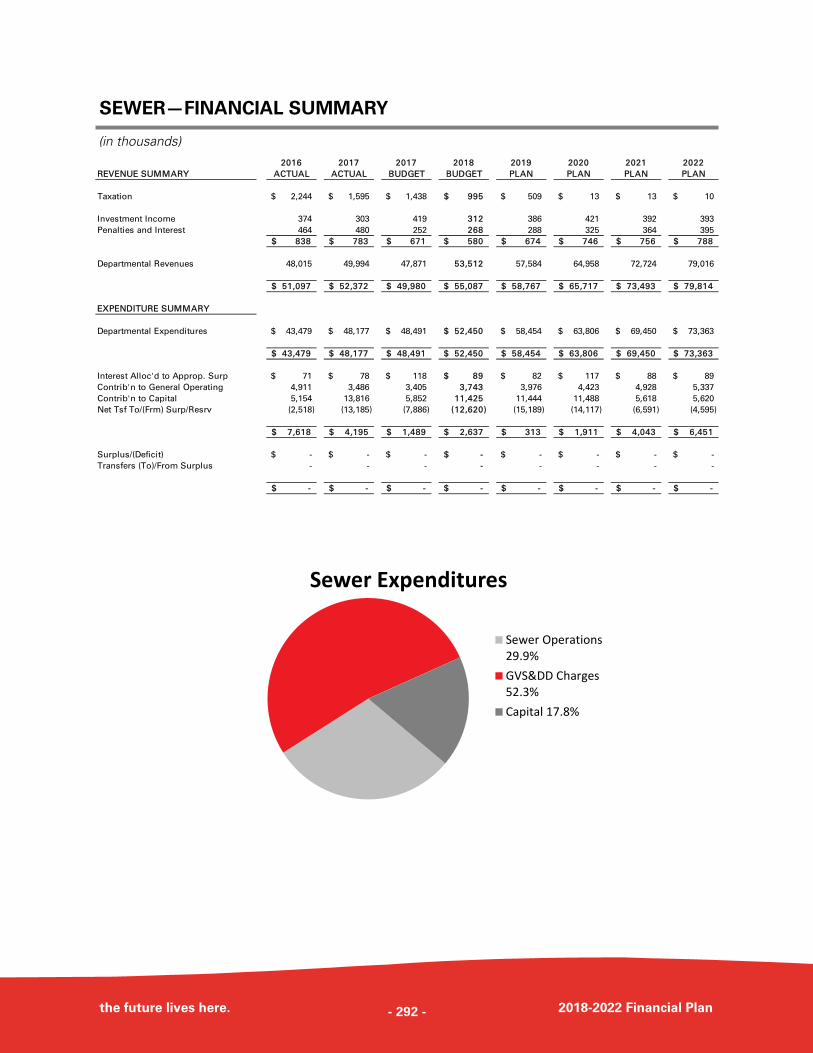
SEWER—FINANCIAL SUMMARY
the future lives here. 2018-2022 Financial Plan
(in thousands) 2016 2017 2017 2018 2019 2020 2021 2022
REVENUE SUMMARY ACTUAL ACTUAL BUDGET BUDGET PLAN PLAN PLAN PLAN
Taxation 2,244$ 1,595$ 1,438$ 995$ 509$ 13$ 13$ 10$
Investment Income 374 303 419 312 386 421 392 393
Penalties and Interest 464 480 252 268 288 325 364 395
838$ 783$ 671$ 580$ 674$ 746$ 756$ 788$
Departmental Revenues 48,015 49,994 47,871 53,512 57,584 64,958 72,724 79,016
51,097$ 52,372$ 49,980$ 55,087$ 58,767$ 65,717$ 73,493$ 79,814$
EXPENDITURE SUMMARY
Departmental Expenditures 43,479$ 48,177$ 48,491$ 52,450$ 58,454$ 63,806$ 69,450$ 73,363$
43,479$ 48,177$ 48,491$ 52,450$ 58,454$ 63,806$ 69,450$ 73,363$
Interest Alloc'd to Approp. Surp 71$ 78$ 118$ 89$ 82$ 117$ 88$ 89$
Contrib'n to General Operating 4,911 3,486 3,405 3,743 3,976 4,423 4,928 5,337
Contrib'n to Capital 5,154 13,816 5,852 11,425 11,444 11,488 5,618 5,620
Net Tsf To/(Frm) Surp/Resrv (2,518) (13,185) (7,886) (12,620) (15,189) (14,117) (6,591) (4,595)
7,618$ 4,195$ 1,489$ 2,637$ 313$ 1,911$ 4,043$ 6,451$
Surplus/(Deficit) -$ -$ -$ -$ -$ -$ -$ -$
Transfers (To)/From Surplus - - - - - - - -
-$ -$ -$ -$ -$ -$ -$ -$
Sewer Expenditures
Sewer Operations29.9%
GVS&DD Charges52.3%
Capital 17.8%
- 292 -
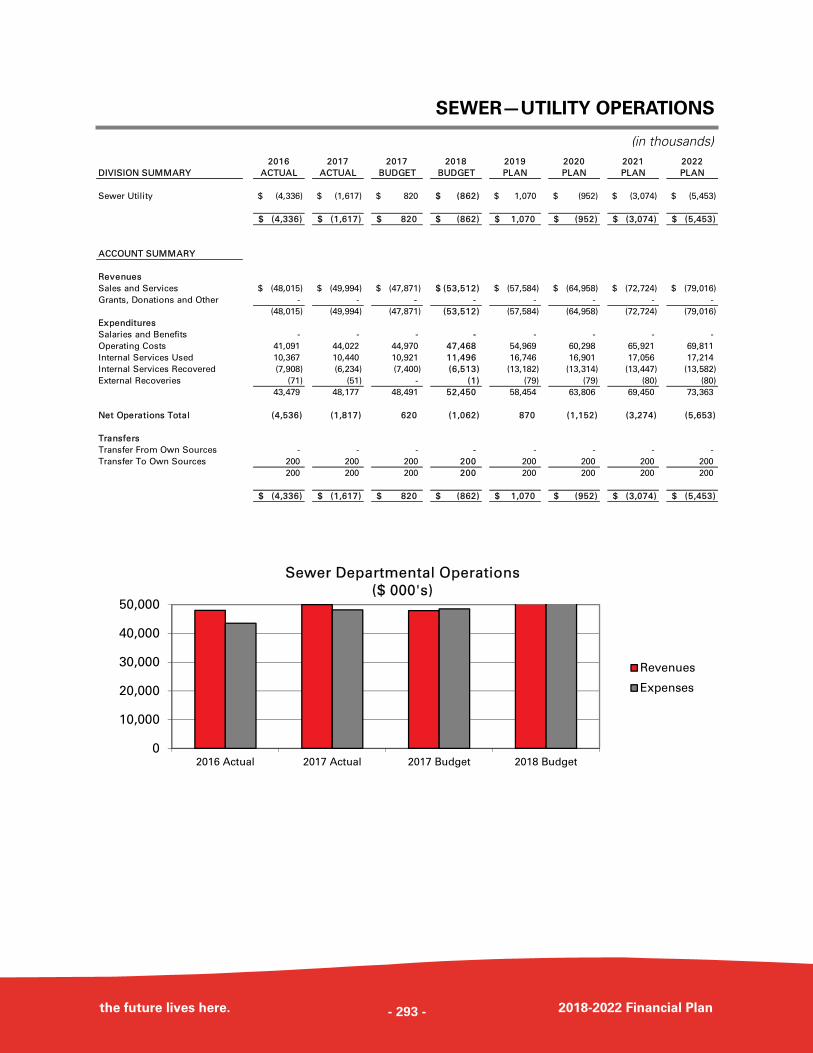
SEWER—UTILITY OPERATIONS
the future lives here. 2018-2022 Financial Plan
(in thousands) 2016 2017 2017 2018 2019 2020 2021 2022
DIVISION SUMMARY ACTUAL ACTUAL BUDGET BUDGET PLAN PLAN PLAN PLAN
Sewer Utility (4,336)$ (1,617)$ 820$ (862)$ 1,070$ (952)$ (3,074)$ (5,453)$
(4,336)$ (1,617)$ 820$ (862)$ 1,070$ (952)$ (3,074)$ (5,453)$
ACCOUNT SUMMARY
Revenues
Sales and Services (48,015)$ (49,994)$ (47,871)$ (53,512)$ (57,584)$ (64,958)$ (72,724)$ (79,016)$
Grants, Donations and Other - - - - - - - -
(48,015) (49,994) (47,871) (53,512) (57,584) (64,958) (72,724) (79,016)
Expenditures
Salaries and Benefits - - - - - - - -
Operating Costs 41,091 44,022 44,970 47,468 54,969 60,298 65,921 69,811
Internal Services Used 10,367 10,440 10,921 11,496 16,746 16,901 17,056 17,214
Internal Services Recovered (7,908) (6,234) (7,400) (6,513) (13,182) (13,314) (13,447) (13,582)
External Recoveries (71) (51) - (1) (79) (79) (80) (80)
43,479 48,177 48,491 52,450 58,454 63,806 69,450 73,363
Net Operations Total (4,536) (1,817) 620 (1,062) 870 (1,152) (3,274) (5,653)
Transfers
Transfer From Own Sources - - - - - - - -
Transfer To Own Sources 200 200 200 200 200 200 200 200
200 200 200 200 200 200 200 200
(4,336)$ (1,617)$ 820$ (862)$ 1,070$ (952)$ (3,074)$ (5,453)$
0
10,000
20,000
30,000
40,000
50,000
2016 Actual 2017 Actual 2017 Budget 2018 Budget
Sewer Departmental Operations
($ 000's)
Revenues
Expenses
- 293 -
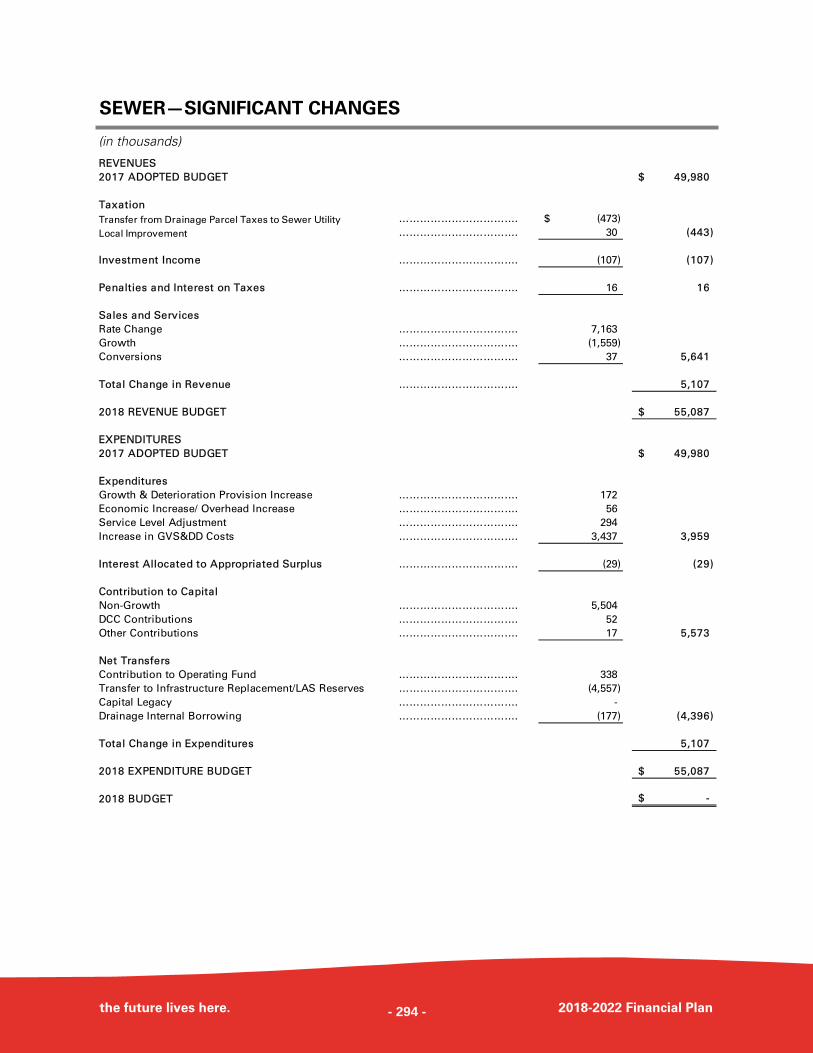
SEWER—SIGNIFICANT CHANGES
the future lives here. 2018-2022 Financial Plan
(in thousands)
REVENUES
2017 ADOPTED BUDGET 49,980$
Taxation
Transfer from Drainage Parcel Taxes to Sewer Utility ……………………………. (473)$
Local Improvement ……………………………. 30 (443)
Investment Income ……………………………. (107) (107)
Penalties and Interest on Taxes ……………………………. 16 16
Sales and Services
Rate Change ……………………………. 7,163
Growth ……………………………. (1,559)
Conversions ……………………………. 37 5,641
Total Change in Revenue ……………………………. 5,107
2018 REVENUE BUDGET 55,087$
EXPENDITURES
2017 ADOPTED BUDGET 49,980$
Expenditures
Growth & Deterioration Provision Increase ……………………………. 172
Economic Increase/ Overhead Increase ……………………………. 56
Service Level Adjustment ……………………………. 294
Increase in GVS&DD Costs ……………………………. 3,437 3,959
Interest Allocated to Appropriated Surplus ……………………………. (29) (29)
Contribution to Capital
Non-Growth ……………………………. 5,504
DCC Contributions ……………………………. 52
Other Contributions ……………………………. 17 5,573
Net Transfers
Contribution to Operating Fund ……………………………. 338
Transfer to Infrastructure Replacement/LAS Reserves ……………………………. (4,557)
Capital Legacy ……………………………. -
Drainage Internal Borrowing ……………………………. (177) (4,396)
Total Change in Expenditures 5,107
2018 EXPENDITURE BUDGET 55,087$
2018 BUDGET -$
- 294 -
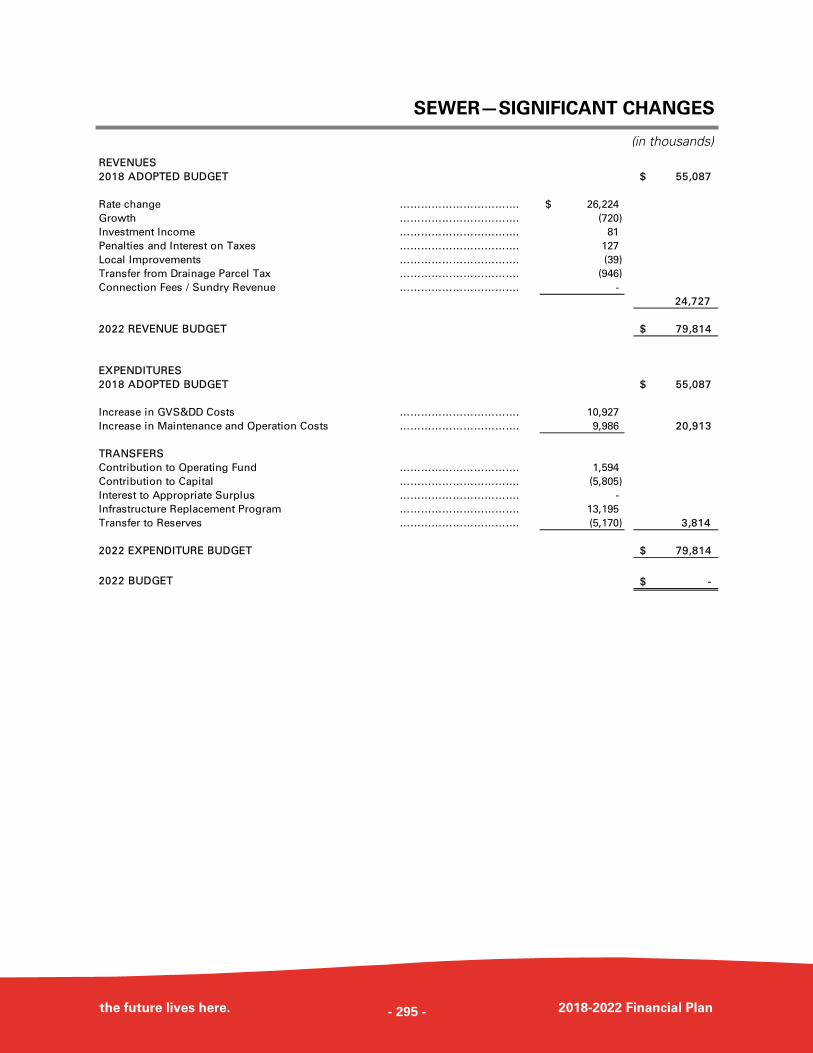
SEWER—SIGNIFICANT CHANGES
the future lives here. 2018-2022 Financial Plan
(in thousands)
REVENUES
2018 ADOPTED BUDGET 55,087$
Rate change ……………………………. 26,224$
Growth ……………………………. (720)
Investment Income ……………………………. 81
Penalties and Interest on Taxes ……………………………. 127
Local Improvements ……………………………. (39)
Transfer from Drainage Parcel Tax ……………………………. (946)
Connection Fees / Sundry Revenue ……………………………. -
24,727
2022 REVENUE BUDGET 79,814$
EXPENDITURES
2018 ADOPTED BUDGET 55,087$
Increase in GVS&DD Costs ……………………………. 10,927
Increase in Maintenance and Operation Costs ……………………………. 9,986 20,913
TRANSFERS
Contribution to Operating Fund ……………………………. 1,594
Contribution to Capital ……………………………. (5,805)
Interest to Appropriate Surplus ……………………………. -
Infrastructure Replacement Program ……………………………. 13,195
Transfer to Reserves ……………………………. (5,170) 3,814
2022 EXPENDITURE BUDGET 79,814$
2022 BUDGET -$
- 295 -
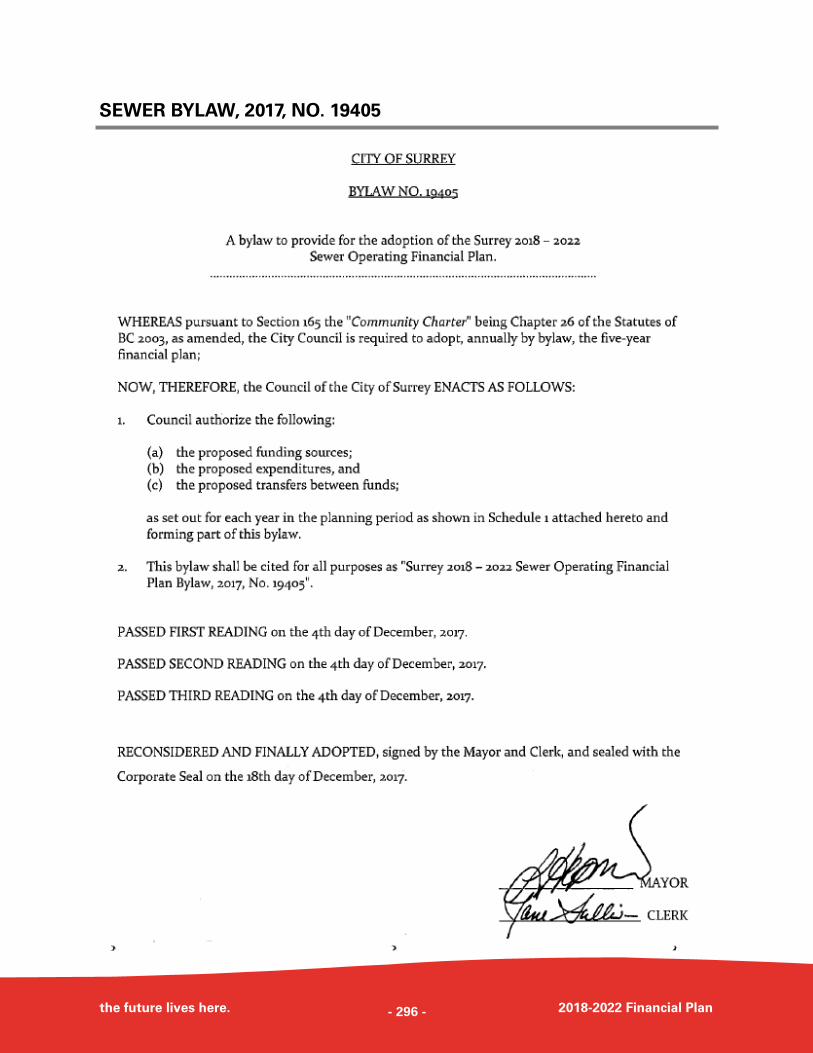
SEWER BYLAW, 2017, NO. 19405
the future lives here. 2018-2022 Financial Plan - 296 -
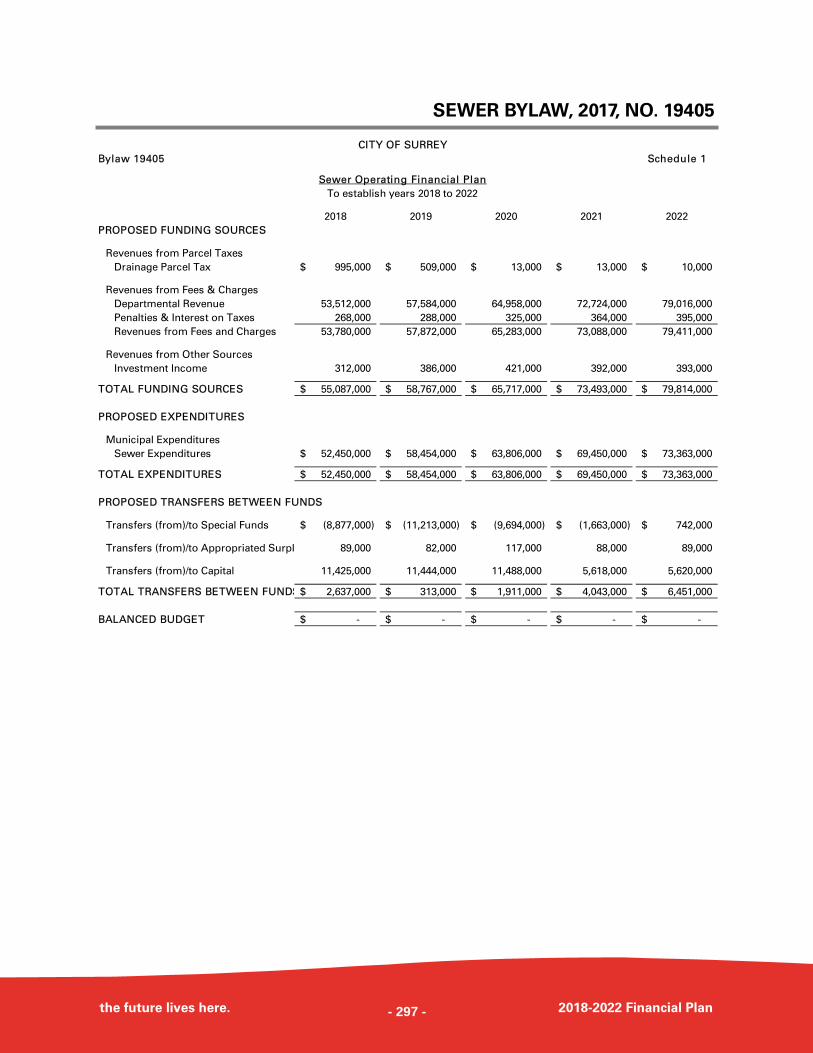
SEWER BYLAW, 2017, NO. 19405
the future lives here. 2018-2022 Financial Plan
CITY OF SURREY
Bylaw 19405 Schedule 1
Sewer Operating Financial Plan
To establish years 2018 to 2022
2018 2019 2020 2021 2022
PROPOSED FUNDING SOURCES
Revenues from Parcel Taxes
Drainage Parcel Tax 995,000$ 509,000$ 13,000$ 13,000$ 10,000$
Revenues from Fees & Charges
Departmental Revenue 53,512,000 57,584,000 64,958,000 72,724,000 79,016,000
Penalties & Interest on Taxes 268,000 288,000 325,000 364,000 395,000
Revenues from Fees and Charges 53,780,000 57,872,000 65,283,000 73,088,000 79,411,000
Revenues from Other Sources
Investment Income 312,000 386,000 421,000 392,000 393,000
TOTAL FUNDING SOURCES 55,087,000$ 58,767,000$ 65,717,000$ 73,493,000$ 79,814,000$
PROPOSED EXPENDITURES
Municipal Expenditures
Sewer Expenditures 52,450,000$ 58,454,000$ 63,806,000$ 69,450,000$ 73,363,000$
TOTAL EXPENDITURES 52,450,000$ 58,454,000$ 63,806,000$ 69,450,000$ 73,363,000$
PROPOSED TRANSFERS BETWEEN FUNDS
Transfers (from)/to Special Funds (8,877,000)$ (11,213,000)$ (9,694,000)$ (1,663,000)$ 742,000$
Transfers (from)/to Appropriated Surpl 89,000 82,000 117,000 88,000 89,000
Transfers (from)/to Capital 11,425,000 11,444,000 11,488,000 5,618,000 5,620,000
TOTAL TRANSFERS BETWEEN FUNDS 2,637,000$ 313,000$ 1,911,000$ 4,043,000$ 6,451,000$
BALANCED BUDGET -$ -$ -$ -$ -$
- 297 -
- 298 -
UTILITY OVERVIEW
SOLID WASTE
the future lives here. 2018-2022 Financial Plan
MISSION STATEMENT
To provide a leadership role in municipal waste management through the application of
innovative and sustainable solutions that ensures environmental, economic and social
benefits to the City of Surrey’s residents.
KEY PROGRAMS AND SERVICES
The Solid Waste Utility provides weekly residential curbside organic waste collection
with alternating bi-weekly garbage and recycling services via a fully-automated cart-
based collection system that is carried out using a Compressed Natural Gas waste
collection fleet. Waste collection services are provided to approximately 104,000 single-
family households and 28,500 secondary suites. Additionally, 34,500 residences from
apartment buildings are provided centralized recycling service, while approximately 50%
of these households additionally receive weekly organic waste collection services.
In addition to waste collection services, in 2017, Surrey became the first municipality in
North America to operate a fully integrated waste management solution. The City
processes the organic waste it collects at curbside into a renewable natural gas that is
used to fuel the fleet that collects this waste at curbside. The remaining materials are
composted into a nutrient rich soil and fertilizer that is used by local food growers and
landscapers, creating a closed-loop system.
2017 ACCOMPLISHMENTS
The Surrey Outreach Team, in partnership with Engineering Operations staff,
received the Arnold Silzer Community Policing Initiative Award. This award, shared
with other departments in the City, recognized outstanding community policing and
problem-solving initiatives which, through the cooperative effort, area positively
contributing to the safety and well-being of the community.
Reduced illegal dumping costs by over
42% through implementing various
initiatives;
Received a performance bonus from
Multi Materials BC in the amount of
$123,000 for collecting above the
average volume of recyclable material
per household; and
Delivered curbside waste collection
services to the City’s customers in 2017
with no utility rate increase.
PUBLIC SAFETY
ECONOMIC PROSPERITY & LIVELIHOODS
- 299 -
SOLID WASTE
the future lives here. 2018-2022 Financial Plan
Completed construction of the Surrey
Biofuel facility (operations
commenced December 2017);
Hosted four Pop Up Junk Drop events
between June and July 2017 with
approximately 1,000 tonnes of waste
and recycled materials collected and
62% of this waste diverted from
landfill. In addition, over 55 tonnes of
reusable materials were recovered by
non-profit agencies working with the
City;
Made significant strides towards
managing illegal dumping by reducing
the number of incidents by 30%;
Through direct contact with residents,
we have doubled our Large Item Pick
Up participation rates from an average
15% a year to 30%;
Secured property and Greater
Vancouver Sewerage & Drainage
District Board approval for the Surrey
Residential Drop Off (RDO) / Eco-
Centre;
Developed and implemented a Waste
and Recyclable Materials Bylaw to
increase waste diversion;
Developed and implemented a
customer self-service portal (or app)
for enhanced services for cart
purchases and exchanges, and large
item pickup requests; and
Piloted increasing the number of large
items from 4 to 8 and additional
categories of items (e.g., electronics,
small appliances and tires) to reduce
impacts on illegal dumping.
FUTURE INITIATIVES, GOALS & OBJECTIVES
Reduce illegal dumping and associated
costs by 50% over the next 5 years
(Year 4 of 5).
Implement the Surrey Disaster Debris
Management Plan to ensure there is
operational framework to manage large
volumes of debris after an emergency
event;
Become the first city in Canada to
achieve zero waste in the next seven
years; and
Execute a contract extension with
Waste Connections of Canada with
enhanced services.
INFRASTRUCTURE
PUBLIC SAFETY
ECONOMIC PROSPERITY & LIVELIHOODS
- 300 -
SOLID WASTE
the future lives here. 2018-2022 Financial Plan
PERFORMANCE MEASURES
The following table identifies key performance measures that will assist the Solid Waste
Utility in tracking its progress and monitoring its contribution to building a sustainable
Surrey.
Division Actual
2017
Budget
2018 2019 2020 2021 2022
Solid
Waste
Utility
Kitchen Waste Program
total # of residences to
date
(Environmental)
104,000 105,500 107,000 108,500 110,000 111,500
Solid waste diversion
rate from disposal
(Environmental/Socio-
Cultural)
72% 74% 76% 78% 80% 80%
Performance Measures
(Sustainability Theme)
Budget
2017
103,700
72%
Increase our customer waste diversion to over 80% in the next three years:
72% diversion target achieved in 2017; and
Focus in 2018 will be to reach 74% diversion.
Reduce recycling contamination to
achieve a goal of having the lowest
amount of non-targeted packaging and
printed paper material for a single-
stream curbside program in BC; and
Complete public consultation, rezoning
and commence construction of RDO /
Eco-Centre site.
ECOSYSTEMS
INFRASTRUCTURE
- 301 -
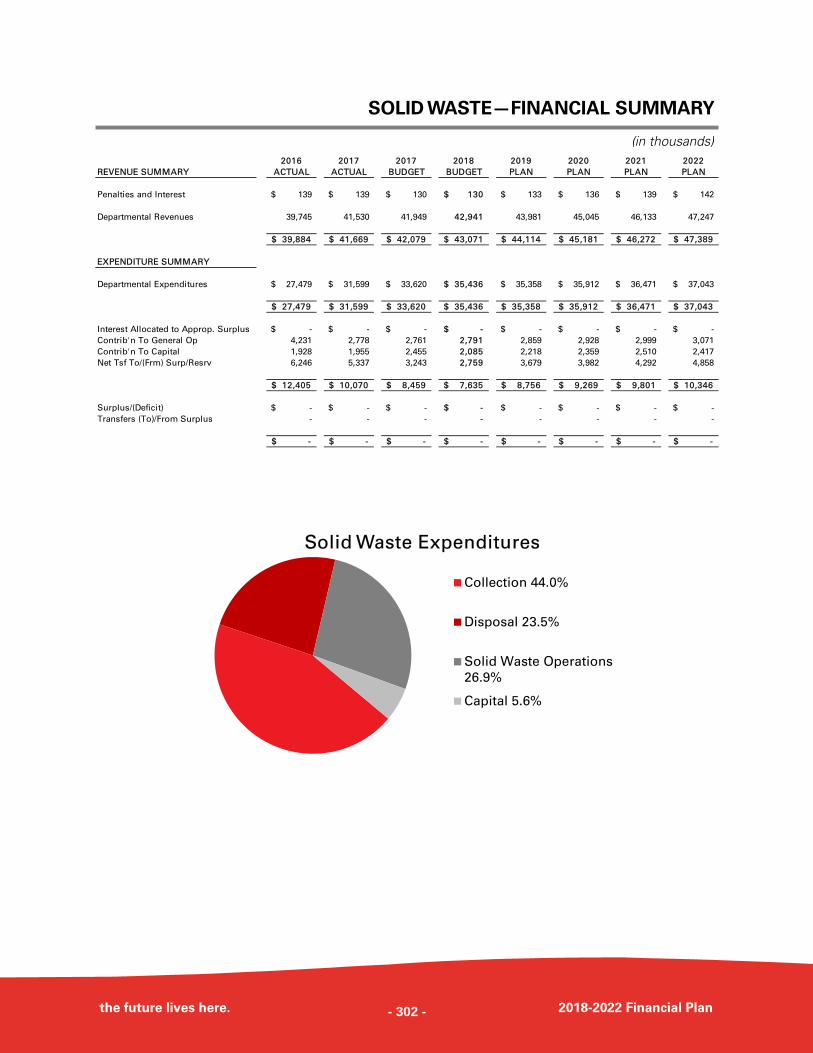
SOLID WASTE—FINANCIAL SUMMARY
the future lives here. 2018-2022 Financial Plan
(in thousands) 2016 2017 2017 2018 2019 2020 2021 2022
REVENUE SUMMARY ACTUAL ACTUAL BUDGET BUDGET PLAN PLAN PLAN PLAN
Penalties and Interest 139$ 139$ 130$ 130$ 133$ 136$ 139$ 142$
Departmental Revenues 39,745 41,530 41,949 42,941 43,981 45,045 46,133 47,247
39,884$ 41,669$ 42,079$ 43,071$ 44,114$ 45,181$ 46,272$ 47,389$
EXPENDITURE SUMMARY
Departmental Expenditures 27,479$ 31,599$ 33,620$ 35,436$ 35,358$ 35,912$ 36,471$ 37,043$
27,479$ 31,599$ 33,620$ 35,436$ 35,358$ 35,912$ 36,471$ 37,043$
Interest Allocated to Approp. Surplus -$ -$ -$ -$ -$ -$ -$ -$
Contrib'n To General Op 4,231 2,778 2,761 2,791 2,859 2,928 2,999 3,071
Contrib'n To Capital 1,928 1,955 2,455 2,085 2,218 2,359 2,510 2,417
Net Tsf To/(Frm) Surp/Resrv 6,246 5,337 3,243 2,759 3,679 3,982 4,292 4,858
12,405$ 10,070$ 8,459$ 7,635$ 8,756$ 9,269$ 9,801$ 10,346$
Surplus/(Deficit) -$ -$ -$ -$ -$ -$ -$ -$
Transfers (To)/From Surplus - - - - - - - -
-$ -$ -$ -$ -$ -$ -$ -$
Solid Waste Expenditures
Collection 44.0%
Disposal 23.5%
Solid Waste Operations
26.9%
Capital 5.6%
- 302 -
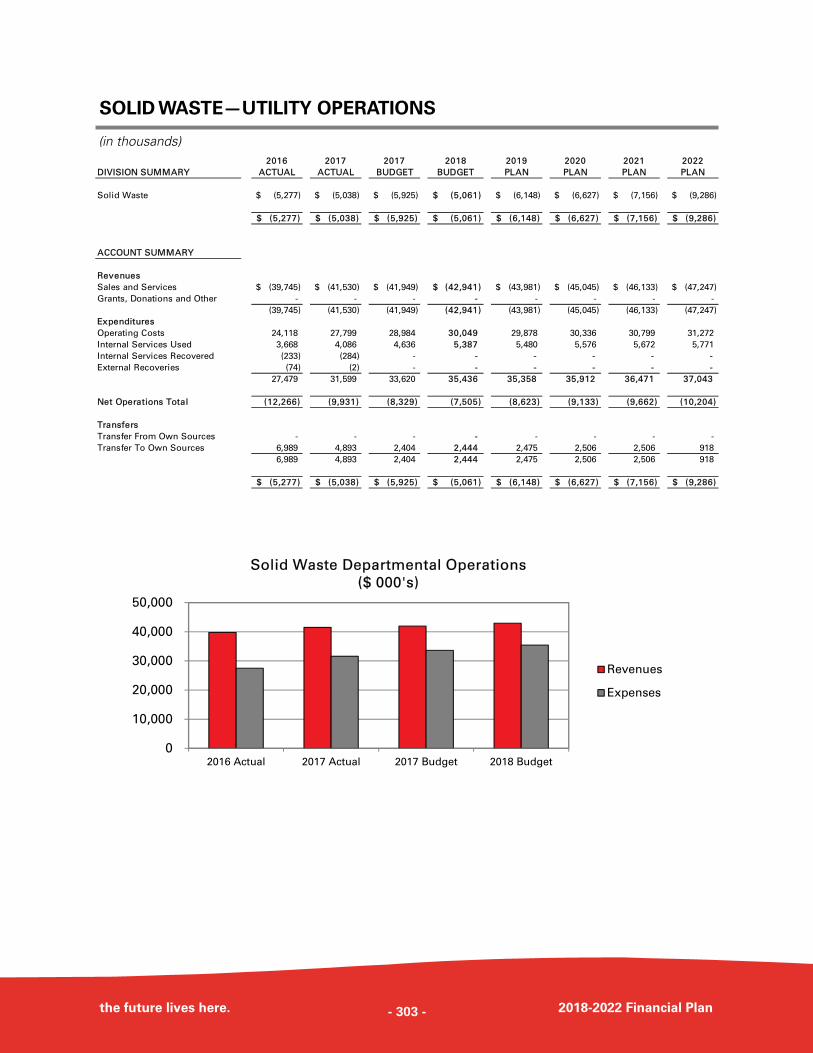
SOLID WASTE—UTILITY OPERATIONS
the future lives here. 2018-2022 Financial Plan
(in thousands)
0
10,000
20,000
30,000
40,000
50,000
2016 Actual 2017 Actual 2017 Budget 2018 Budget
Solid Waste Departmental Operations
($ 000's)
Revenues
Expenses
2016 2017 2017 2018 2019 2020 2021 2022
DIVISION SUMMARY ACTUAL ACTUAL BUDGET BUDGET PLAN PLAN PLAN PLAN
Solid Waste (5,277)$ (5,038)$ (5,925)$ (5,061)$ (6,148)$ (6,627)$ (7,156)$ (9,286)$
(5,277)$ (5,038)$ (5,925)$ (5,061)$ (6,148)$ (6,627)$ (7,156)$ (9,286)$
ACCOUNT SUMMARY
Revenues
Sales and Services (39,745)$ (41,530)$ (41,949)$ (42,941)$ (43,981)$ (45,045)$ (46,133)$ (47,247)$
Grants, Donations and Other - - - - - - - -
(39,745) (41,530) (41,949) (42,941) (43,981) (45,045) (46,133) (47,247)
Expenditures
Operating Costs 24,118 27,799 28,984 30,049 29,878 30,336 30,799 31,272
Internal Services Used 3,668 4,086 4,636 5,387 5,480 5,576 5,672 5,771
Internal Services Recovered (233) (284) - - - - - -
External Recoveries (74) (2) - - - - - -
27,479 31,599 33,620 35,436 35,358 35,912 36,471 37,043
Net Operations Total (12,266) (9,931) (8,329) (7,505) (8,623) (9,133) (9,662) (10,204)
Transfers
Transfer From Own Sources - - - - - - - -
Transfer To Own Sources 6,989 4,893 2,404 2,444 2,475 2,506 2,506 918
6,989 4,893 2,404 2,444 2,475 2,506 2,506 918
(5,277)$ (5,038)$ (5,925)$ (5,061)$ (6,148)$ (6,627)$ (7,156)$ (9,286)$
- 303 -
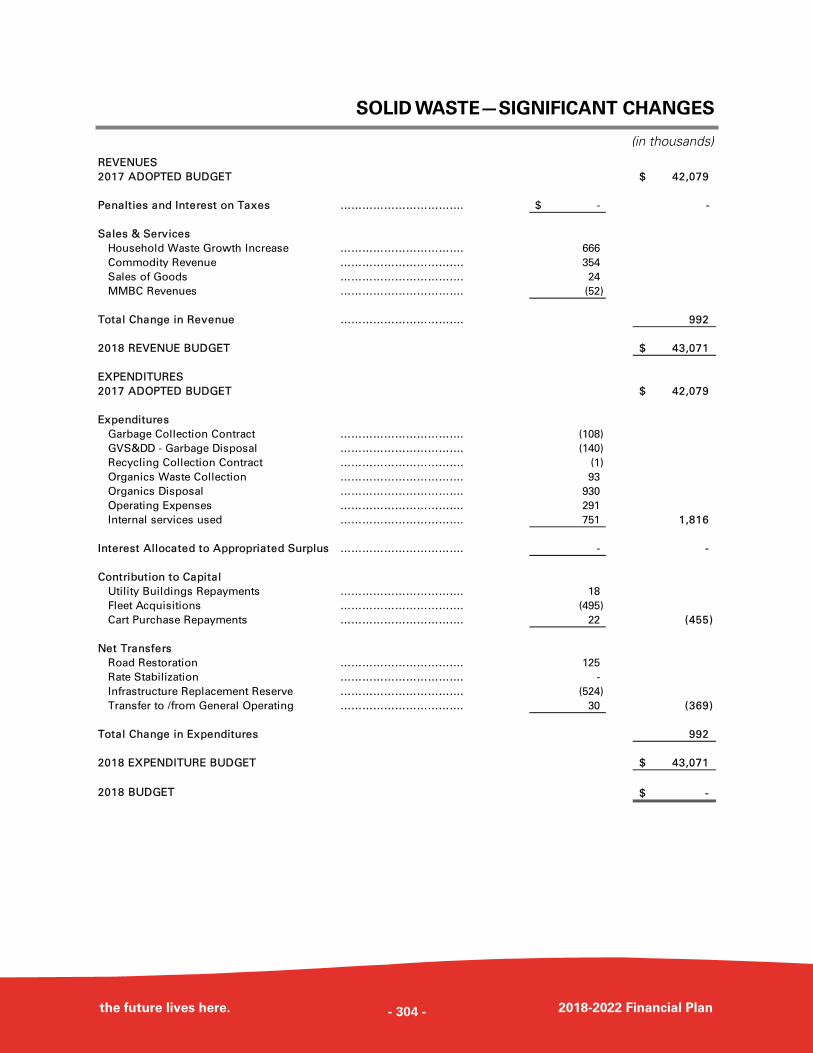
SOLID WASTE—SIGNIFICANT CHANGES
the future lives here. 2018-2022 Financial Plan
(in thousands)
REVENUES
2017 ADOPTED BUDGET 42,079$
Penalties and Interest on Taxes ……………………………. -$ -
Sales & Services
Household Waste Growth Increase ……………………………. 666
Commodity Revenue ……………………………. 354
Sales of Goods ……………………………. 24
MMBC Revenues ……………………………. (52)
Total Change in Revenue ……………………………. 992
2018 REVENUE BUDGET 43,071$
EXPENDITURES
2017 ADOPTED BUDGET 42,079$
Expenditures
Garbage Collection Contract ……………………………. (108)
GVS&DD - Garbage Disposal ……………………………. (140)
Recycling Collection Contract ……………………………. (1)
Organics Waste Collection ……………………………. 93
Organics Disposal ……………………………. 930
Operating Expenses ……………………………. 291
Internal services used ……………………………. 751 1,816
Interest Allocated to Appropriated Surplus ……………………………. - -
Contribution to Capital
Utility Buildings Repayments ……………………………. 18
Fleet Acquisitions ……………………………. (495)
Cart Purchase Repayments ……………………………. 22 (455)
Net Transfers
Road Restoration ……………………………. 125
Rate Stabilization ……………………………. -
Infrastructure Replacement Reserve ……………………………. (524)
Transfer to /from General Operating ……………………………. 30 (369)
Total Change in Expenditures 992
2018 EXPENDITURE BUDGET 43,071$
2018 BUDGET -$
- 304 -
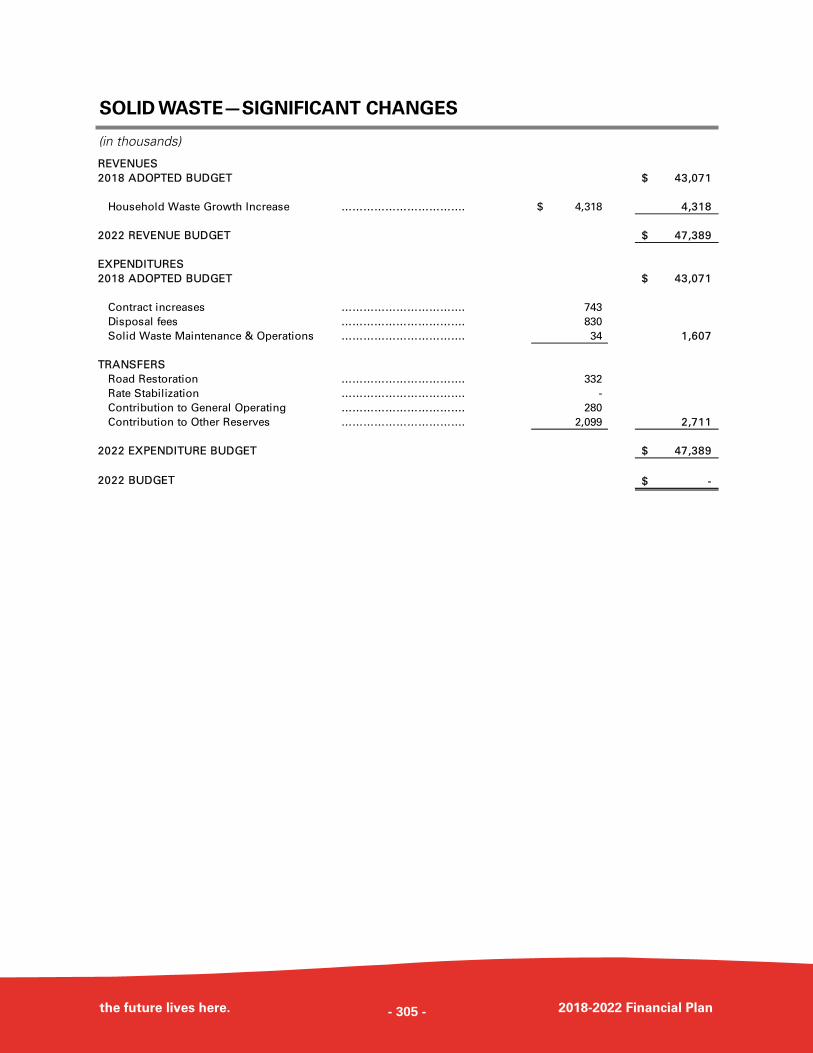
SOLID WASTE—SIGNIFICANT CHANGES
the future lives here. 2018-2022 Financial Plan
(in thousands)
REVENUES
2018 ADOPTED BUDGET 43,071$
Household Waste Growth Increase ……………………………. 4,318$ 4,318
2022 REVENUE BUDGET 47,389$
EXPENDITURES
2018 ADOPTED BUDGET 43,071$
Contract increases ……………………………. 743
Disposal fees ……………………………. 830
Solid Waste Maintenance & Operations ……………………………. 34 1,607
TRANSFERS
Road Restoration ……………………………. 332
Rate Stabilization ……………………………. -
Contribution to General Operating ……………………………. 280
Contribution to Other Reserves ……………………………. 2,099 2,711
2022 EXPENDITURE BUDGET 47,389$
2022 BUDGET -$
- 305 -
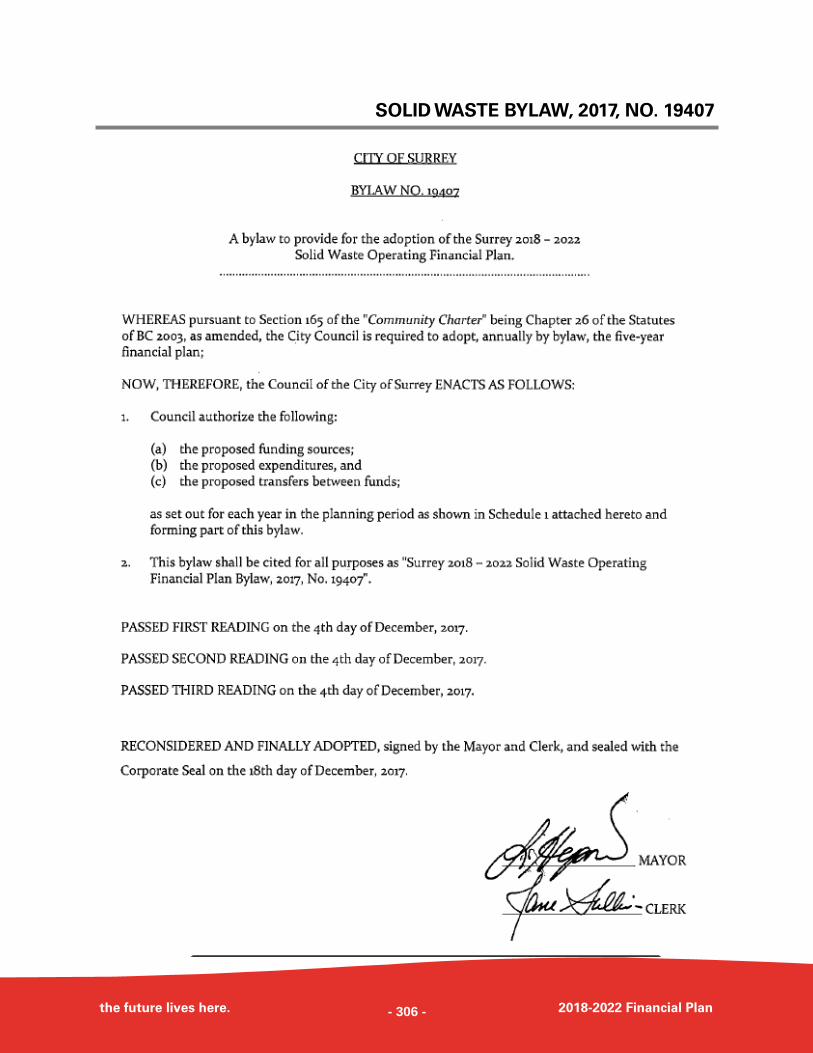
SOLID WASTE BYLAW, 2017, NO. 19407
the future lives here. 2018-2022 Financial Plan - 306 -
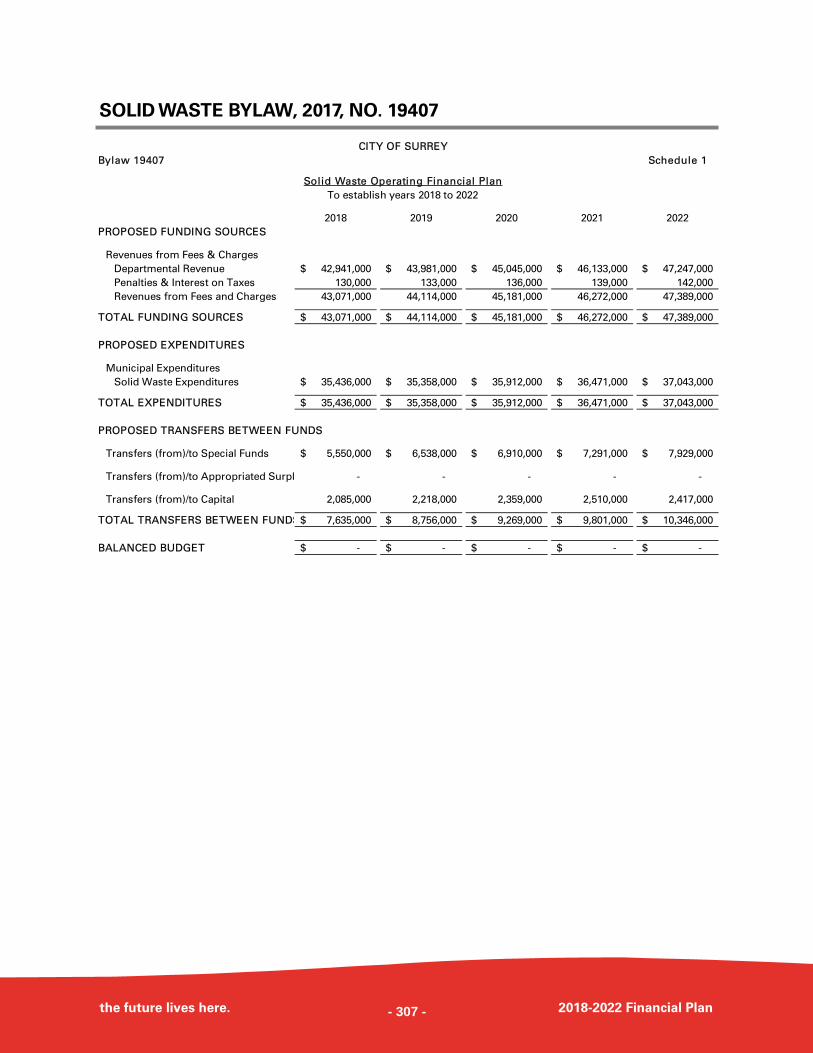
SOLID WASTE BYLAW, 2017, NO. 19407
the future lives here. 2018-2022 Financial Plan
CITY OF SURREY
Bylaw 19407 Schedule 1
Solid Waste Operating Financial Plan
To establish years 2018 to 2022
2018 2019 2020 2021 2022
PROPOSED FUNDING SOURCES
Revenues from Fees & Charges
Departmental Revenue 42,941,000$ 43,981,000$ 45,045,000$ 46,133,000$ 47,247,000$
Penalties & Interest on Taxes 130,000 133,000 136,000 139,000 142,000
Revenues from Fees and Charges 43,071,000 44,114,000 45,181,000 46,272,000 47,389,000
TOTAL FUNDING SOURCES 43,071,000$ 44,114,000$ 45,181,000$ 46,272,000$ 47,389,000$
PROPOSED EXPENDITURES
Municipal Expenditures
Solid Waste Expenditures 35,436,000$ 35,358,000$ 35,912,000$ 36,471,000$ 37,043,000$
TOTAL EXPENDITURES 35,436,000$ 35,358,000$ 35,912,000$ 36,471,000$ 37,043,000$
PROPOSED TRANSFERS BETWEEN FUNDS
Transfers (from)/to Special Funds 5,550,000$ 6,538,000$ 6,910,000$ 7,291,000$ 7,929,000$
Transfers (from)/to Appropriated Surpl - - - - -
Transfers (from)/to Capital 2,085,000 2,218,000 2,359,000 2,510,000 2,417,000
TOTAL TRANSFERS BETWEEN FUNDS 7,635,000$ 8,756,000$ 9,269,000$ 9,801,000$ 10,346,000$
BALANCED BUDGET -$ -$ -$ -$ -$
- 307 -
- 308 -
UTILITY OVERVIEW
SURREY CITY ENERGY
the future lives here. 2018-2022 Financial Plan
MISSION STATEMENT
To deploy district energy systems in Surrey that provide exceptional service at
competitive rates while achieving neighbourhood scale greenhouse gas emission
reductions and minimizing vulnerability to energy price fluctuations.
KEY PROGRAMS AND SERVICES
Surrey City Energy’s primary responsibility is to provide the planning, development and
operations of community energy systems that will provide thermal energy to new and
existing developments throughout the City Centre area.
This Utility is focused on developing a thermal energy grid in City Centre, consisting of
buried pre-insulated steel pipes that will distribute heat in the form of hot water to
buildings for use in space heating and domestic hot water.
Small scale energy plants will be strategically located to serve early customers in several
different locations. As these systems grow over time, they will inter-connect and form
one large integrated system. At first, the individual systems will rely primarily on
high efficiency natural gas boilers; however, once the integrated system reaches a
larger size, efficiencies of scale will provide the opportunity to introduce various
renewable energy supply alternatives such as biomass, waste heat recovery and solar
thermal energy.
Surrey City Energy will be recovering all costs from future energy rates. Rates will be
adjusted from time to time, but will generally not exceed the rates charged by BC Hydro.
By consuming significantly less electricity and natural gas, as compared to the
conventional alternatives, Surrey City Energy will be able to insulate its customers from
the expected future increases in the cost of these commodities, in addition to reducing
community carbon emissions from buildings.
2017 ACCOMPLISHMENTS
Completed a comprehensive updated
to the utility rate model and obtained
the endorsement of the Expert
External Rate Review Panel for the
proposed 2018 rates; and
Obtained $175,000 of grant funding
from the Federation of Canadian
Municipalities to completed the Low-
Carbon District Energy Strategy.
ECONOMIC PROSPERITY & LIVELIHOODS
- 309 -
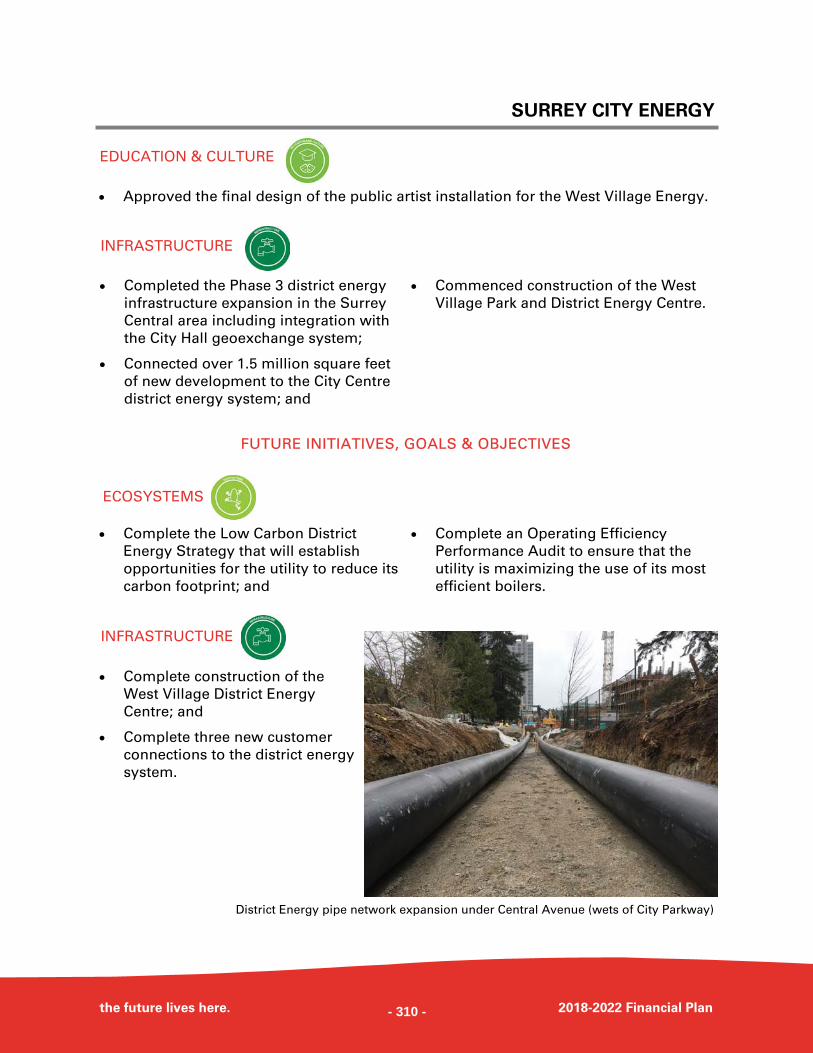
SURREY CITY ENERGY
the future lives here. 2018-2022 Financial Plan
Approved the final design of the public artist installation for the West Village Energy.
Completed the Phase 3 district energy
infrastructure expansion in the Surrey
Central area including integration with
the City Hall geoexchange system;
Connected over 1.5 million square feet
of new development to the City Centre
district energy system; and
Commenced construction of the West
Village Park and District Energy Centre.
FUTURE INITIATIVES, GOALS & OBJECTIVES
Complete the Low Carbon District
Energy Strategy that will establish
opportunities for the utility to reduce its
carbon footprint; and
Complete an Operating Efficiency
Performance Audit to ensure that the
utility is maximizing the use of its most
efficient boilers.
Complete construction of the
West Village District Energy
Centre; and
Complete three new customer
connections to the district energy
system.
EDUCATION & CULTURE
INFRASTRUCTURE
ECOSYSTEMS
INFRASTRUCTURE
District Energy pipe network expansion under Central Avenue (wets of City Parkway)
- 310 -
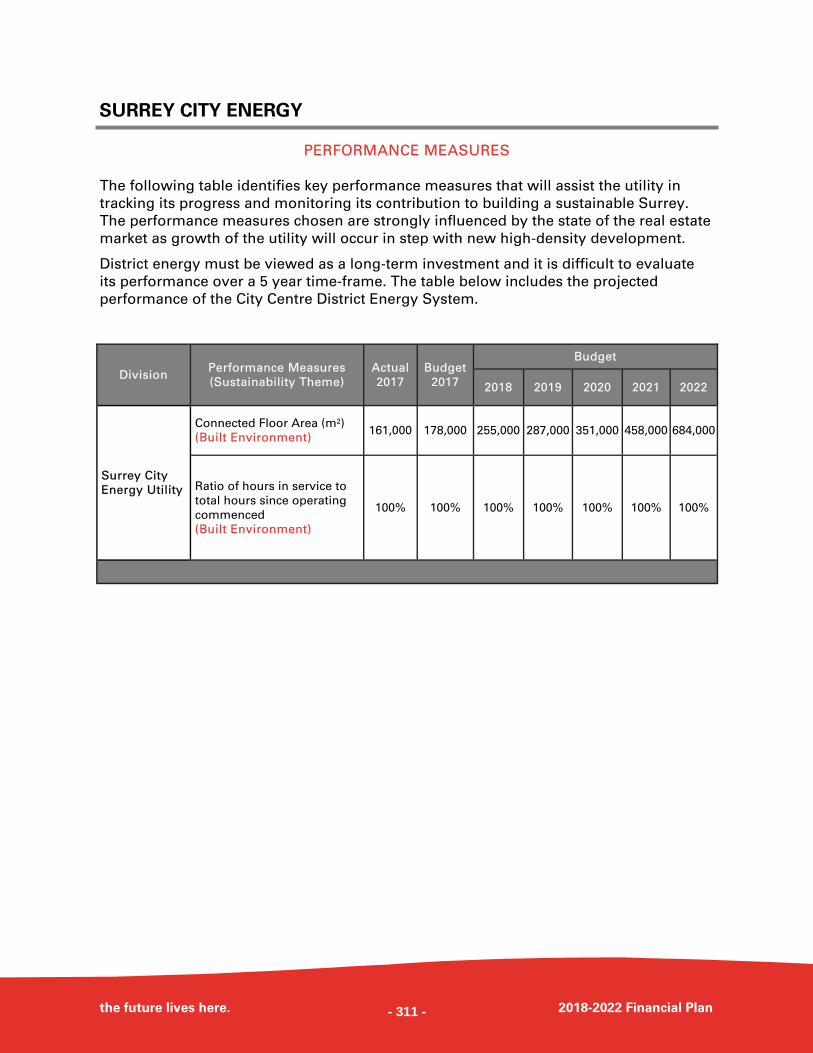
SURREY CITY ENERGY
the future lives here. 2018-2022 Financial Plan
PERFORMANCE MEASURES
The following table identifies key performance measures that will assist the utility in
tracking its progress and monitoring its contribution to building a sustainable Surrey.
The performance measures chosen are strongly influenced by the state of the real estate
market as growth of the utility will occur in step with new high-density development.
District energy must be viewed as a long-term investment and it is difficult to evaluate
its performance over a 5 year time-frame. The table below includes the projected
performance of the City Centre District Energy System.
Division Performance Measures
(Sustainability Theme)
Actual
2017
Budget
2017
Budget
2018 2019 2020 2021 2022
Surrey City
Energy Utility
Connected Floor Area (m2)
(Built Environment) 161,000 178,000 255,000 287,000 351,000 458,000 684,000
Ratio of hours in service to
total hours since operating
commenced
(Built Environment)
100% 100% 100% 100% 100% 100% 100%
- 311 -
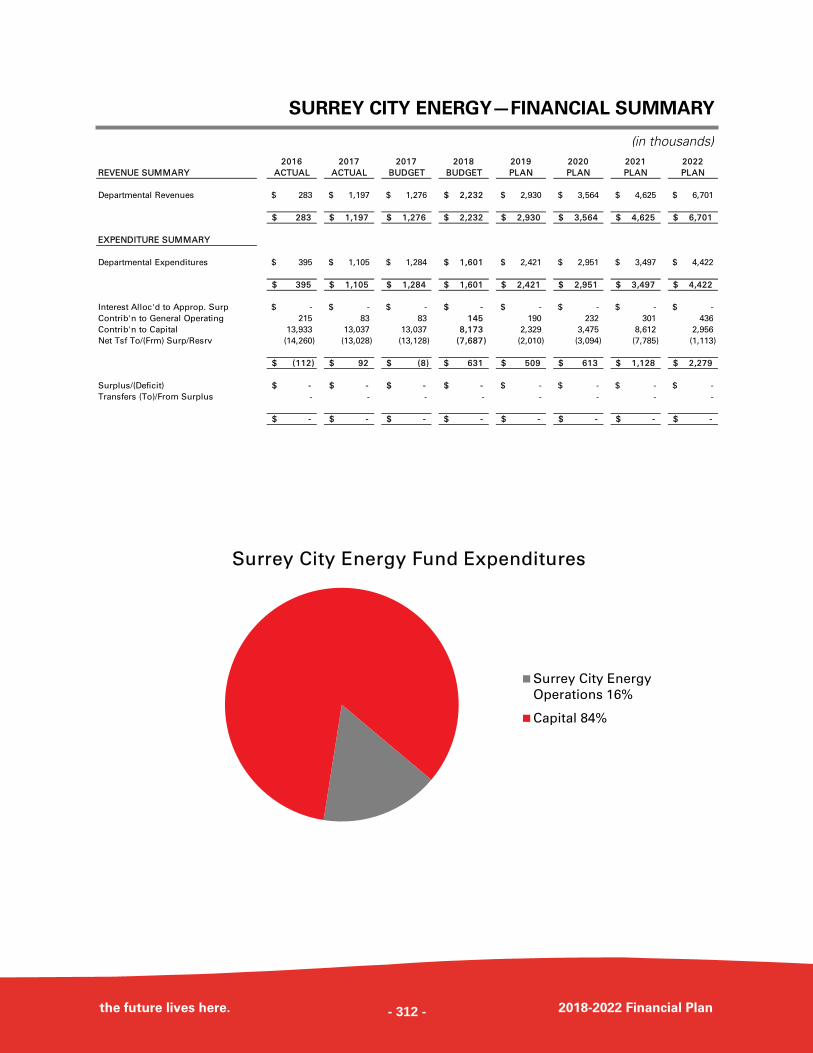
SURREY CITY ENERGY—FINANCIAL SUMMARY
the future lives here. 2018-2022 Financial Plan
(in thousands)
Surrey City Energy Fund Expenditures
Surrey City Energy
Operations 16%
Capital 84%
2016 2017 2017 2018 2019 2020 2021 2022
REVENUE SUMMARY ACTUAL ACTUAL BUDGET BUDGET PLAN PLAN PLAN PLAN
Departmental Revenues 283$ 1,197$ 1,276$ 2,232$ 2,930$ 3,564$ 4,625$ 6,701$
283$ 1,197$ 1,276$ 2,232$ 2,930$ 3,564$ 4,625$ 6,701$
EXPENDITURE SUMMARY
Departmental Expenditures 395$ 1,105$ 1,284$ 1,601$ 2,421$ 2,951$ 3,497$ 4,422$
395$ 1,105$ 1,284$ 1,601$ 2,421$ 2,951$ 3,497$ 4,422$
Interest Alloc'd to Approp. Surp -$ -$ -$ -$ -$ -$ -$ -$
Contrib'n to General Operating 215 83 83 145 190 232 301 436
Contrib'n to Capital 13,933 13,037 13,037 8,173 2,329 3,475 8,612 2,956
Net Tsf To/(Frm) Surp/Resrv (14,260) (13,028) (13,128) (7,687) (2,010) (3,094) (7,785) (1,113)
(112)$ 92$ (8)$ 631$ 509$ 613$ 1,128$ 2,279$
Surplus/(Deficit) -$ -$ -$ -$ -$ -$ -$ -$
Transfers (To)/From Surplus - - - - - - - -
-$ -$ -$ -$ -$ -$ -$ -$
- 312 -
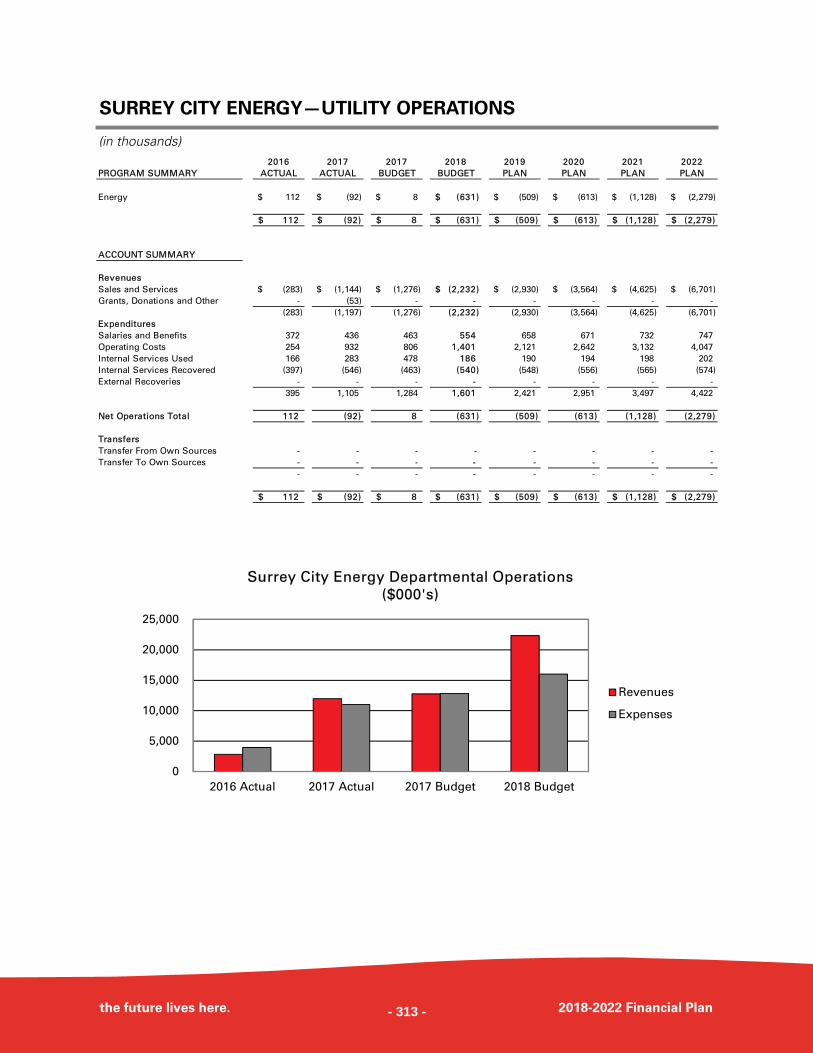
SURREY CITY ENERGY—UTILITY OPERATIONS
the future lives here. 2018-2022 Financial Plan
(in thousands)
0
5,000
10,000
15,000
20,000
25,000
2016 Actual 2017 Actual 2017 Budget 2018 Budget
Surrey City Energy Departmental Operations
($000's)
Revenues
Expenses
2016 2017 2017 2018 2019 2020 2021 2022
PROGRAM SUMMARY ACTUAL ACTUAL BUDGET BUDGET PLAN PLAN PLAN PLAN
Energy 112$ (92)$ 8$ (631)$ (509)$ (613)$ (1,128)$ (2,279)$
112$ (92)$ 8$ (631)$ (509)$ (613)$ (1,128)$ (2,279)$
ACCOUNT SUMMARY
Revenues
Sales and Services (283)$ (1,144)$ (1,276)$ (2,232)$ (2,930)$ (3,564)$ (4,625)$ (6,701)$
Grants, Donations and Other - (53) - - - - - -
(283) (1,197) (1,276) (2,232) (2,930) (3,564) (4,625) (6,701)
Expenditures
Salaries and Benefits 372 436 463 554 658 671 732 747
Operating Costs 254 932 806 1,401 2,121 2,642 3,132 4,047
Internal Services Used 166 283 478 186 190 194 198 202
Internal Services Recovered (397) (546) (463) (540) (548) (556) (565) (574)
External Recoveries - - - - - - - -
395 1,105 1,284 1,601 2,421 2,951 3,497 4,422
Net Operations Total 112 (92) 8 (631) (509) (613) (1,128) (2,279)
Transfers
Transfer From Own Sources - - - - - - - -
Transfer To Own Sources - - - - - - - -
- - - - - - - -
112$ (92)$ 8$ (631)$ (509)$ (613)$ (1,128)$ (2,279)$
- 313 -
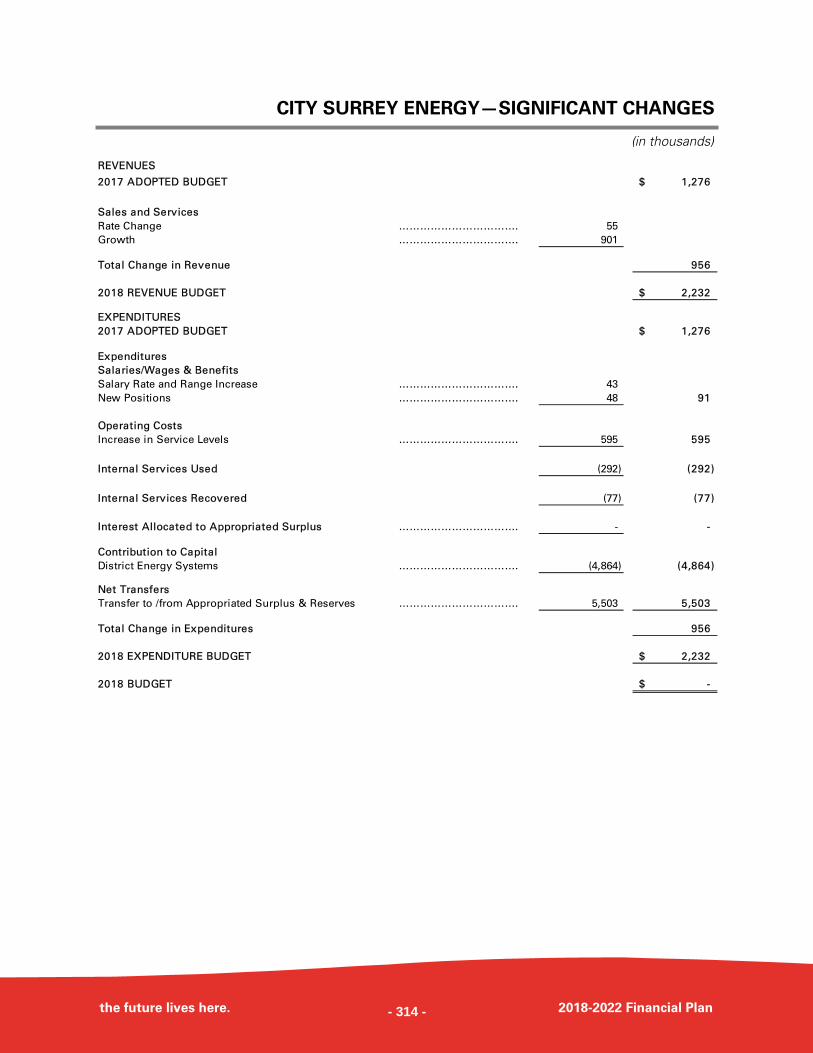
CITY SURREY ENERGY—SIGNIFICANT CHANGES
the future lives here. 2018-2022 Financial Plan
(in thousands)
REVENUES
2017 ADOPTED BUDGET 1,276$
Sales and Services
Rate Change ……………………………. 55
Growth ……………………………. 901
Total Change in Revenue 956
2018 REVENUE BUDGET 2,232$
EXPENDITURES
2017 ADOPTED BUDGET 1,276$
Expenditures
Salaries/Wages & Benefits
Salary Rate and Range Increase ……………………………. 43
New Positions ……………………………. 48 91
Operating Costs
Increase in Service Levels ……………………………. 595 595
Internal Services Used (292) (292)
Internal Services Recovered (77) (77)
Interest Allocated to Appropriated Surplus ……………………………. - -
Contribution to Capital
District Energy Systems ……………………………. (4,864) (4,864)
Net Transfers
Transfer to /from Appropriated Surplus & Reserves ……………………………. 5,503 5,503
Total Change in Expenditures 956
2018 EXPENDITURE BUDGET 2,232$
2018 BUDGET -$
- 314 -
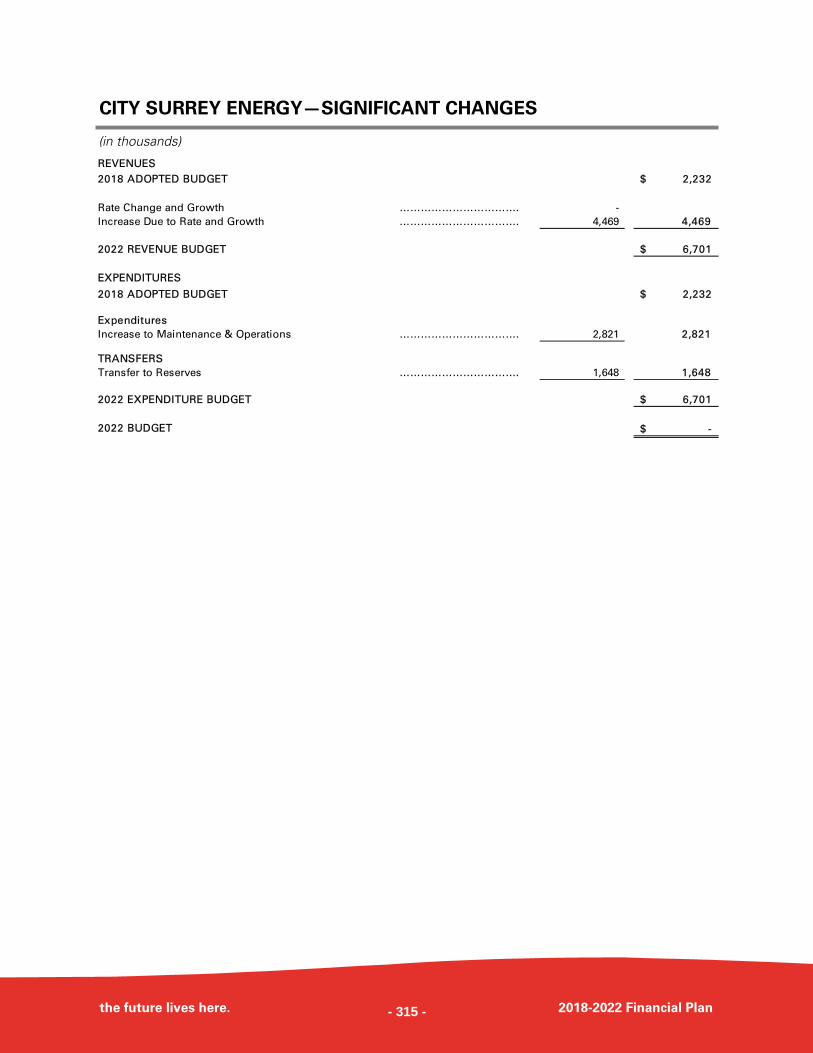
CITY SURREY ENERGY—SIGNIFICANT CHANGES
the future lives here. 2018-2022 Financial Plan
(in thousands)
REVENUES
2018 ADOPTED BUDGET 2,232$
Rate Change and Growth ……………………………. -
Increase Due to Rate and Growth ……………………………. 4,469 4,469
2022 REVENUE BUDGET 6,701$
EXPENDITURES
2018 ADOPTED BUDGET 2,232$
Expenditures
Increase to Maintenance & Operations ……………………………. 2,821 2,821
TRANSFERS
Transfer to Reserves ……………………………. 1,648 1,648
2022 EXPENDITURE BUDGET 6,701$
2022 BUDGET -$
- 315 -
DISTRICT ENERGY BYLAW, 2017, NO. 19409
the future lives here. 2018-2022 Financial Plan - 316 -
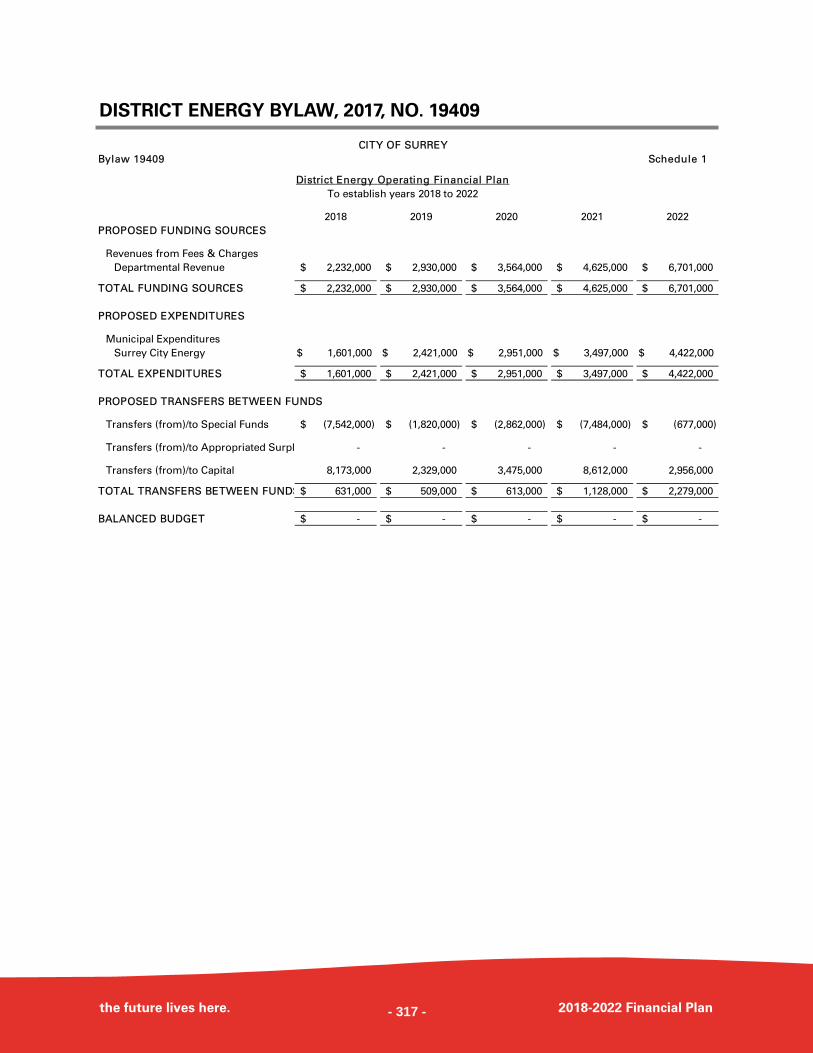
DISTRICT ENERGY BYLAW, 2017, NO. 19409
the future lives here. 2018-2022 Financial Plan
CITY OF SURREY
Bylaw 19409 Schedule 1
District Energy Operating Financial Plan
To establish years 2018 to 2022
2018 2019 2020 2021 2022
PROPOSED FUNDING SOURCES
Revenues from Fees & Charges
Departmental Revenue 2,232,000$ 2,930,000$ 3,564,000$ 4,625,000$ 6,701,000$
TOTAL FUNDING SOURCES 2,232,000$ 2,930,000$ 3,564,000$ 4,625,000$ 6,701,000$
PROPOSED EXPENDITURES
Municipal Expenditures
Surrey City Energy 1,601,000 $ 2,421,000 $ 2,951,000 $ 3,497,000 $ 4,422,000 $
TOTAL EXPENDITURES 1,601,000$ 2,421,000$ 2,951,000$ 3,497,000$ 4,422,000$
PROPOSED TRANSFERS BETWEEN FUNDS
Transfers (from)/to Special Funds (7,542,000)$ (1,820,000)$ (2,862,000)$ (7,484,000)$ (677,000)$
Transfers (from)/to Appropriated Surpl - - - - -
Transfers (from)/to Capital 8,173,000 2,329,000 3,475,000 8,612,000 2,956,000
TOTAL TRANSFERS BETWEEN FUNDS 631,000$ 509,000$ 613,000$ 1,128,000$ 2,279,000$
BALANCED BUDGET -$ -$ -$ -$ -$
- 317 -
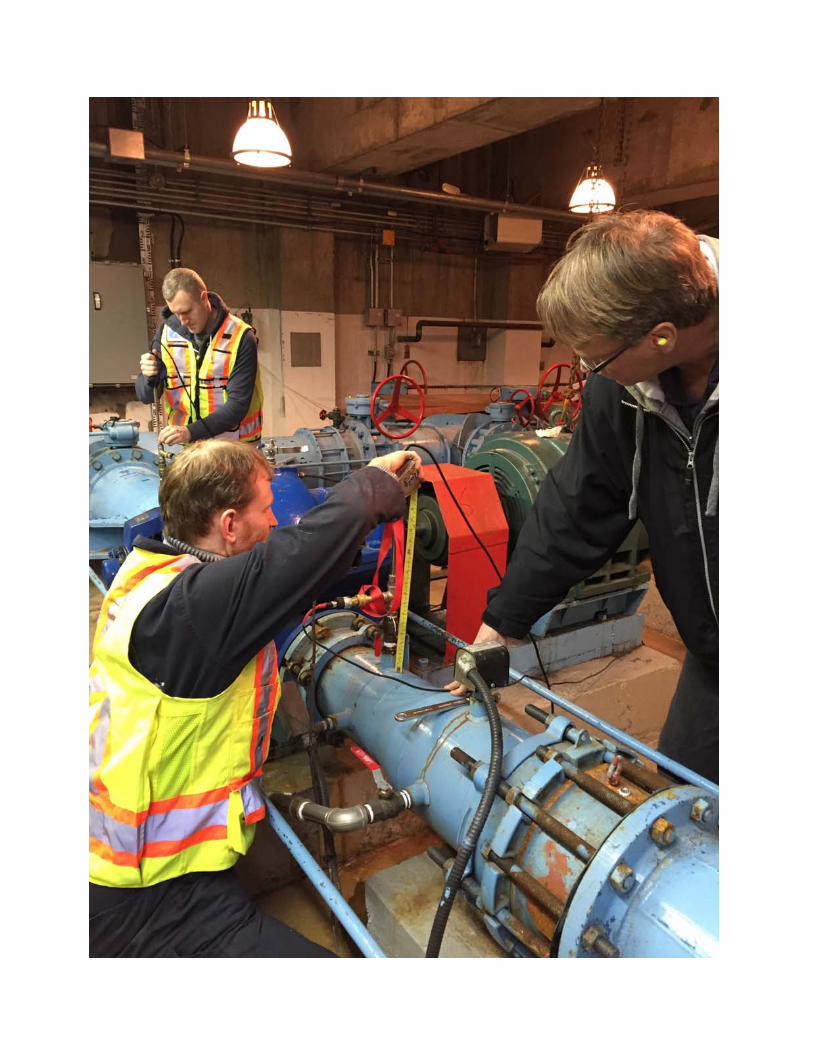
- 318 -
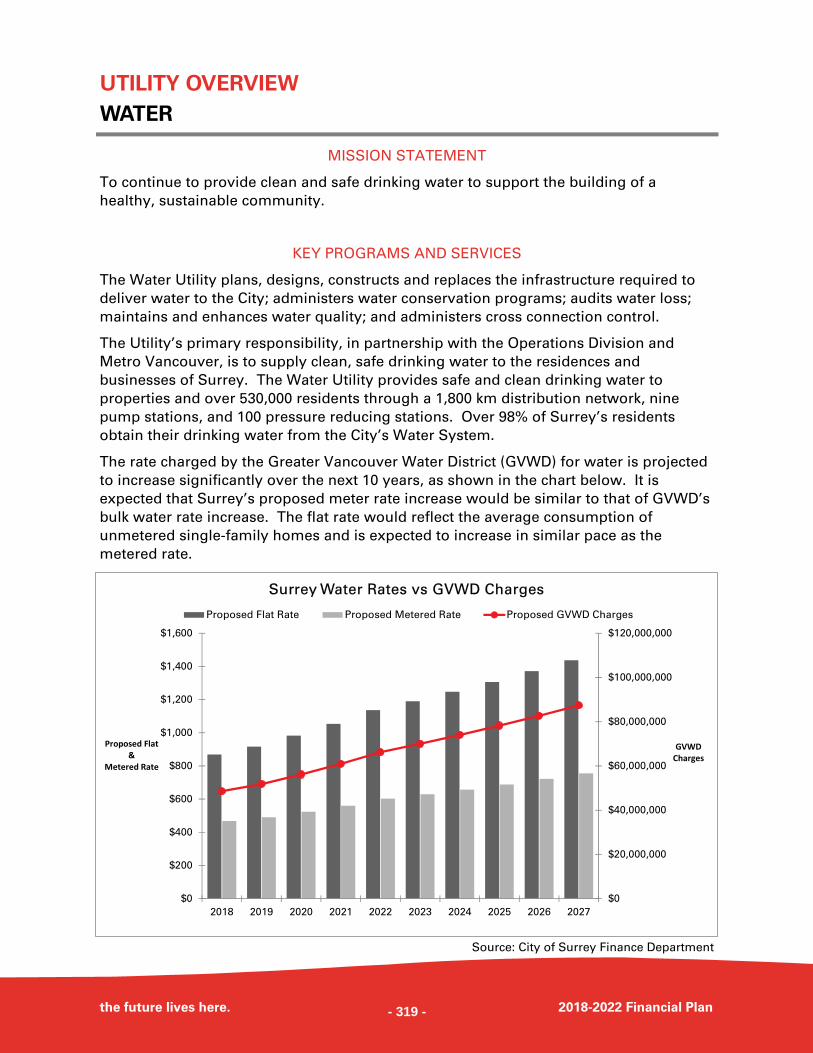
UTILITY OVERVIEW
WATER
the future lives here. 2018-2022 Financial Plan
MISSION STATEMENT
To continue to provide clean and safe drinking water to support the building of a
healthy, sustainable community.
KEY PROGRAMS AND SERVICES
The Water Utility plans, designs, constructs and replaces the infrastructure required to
deliver water to the City; administers water conservation programs; audits water loss;
maintains and enhances water quality; and administers cross connection control.
The Utility’s primary responsibility, in partnership with the Operations Division and
Metro Vancouver, is to supply clean, safe drinking water to the residences and
businesses of Surrey. The Water Utility provides safe and clean drinking water to
properties and over 530,000 residents through a 1,800 km distribution network, nine
pump stations, and 100 pressure reducing stations. Over 98% of Surrey’s residents
obtain their drinking water from the City’s Water System.
The rate charged by the Greater Vancouver Water District (GVWD) for water is projected
to increase significantly over the next 10 years, as shown in the chart below. It is
expected that Surrey’s proposed meter rate increase would be similar to that of GVWD’s
bulk water rate increase. The flat rate would reflect the average consumption of
unmetered single-family homes and is expected to increase in similar pace as the
metered rate.
Source: City of Surrey Finance Department
$0
$20,000,000
$40,000,000
$60,000,000
$80,000,000
$100,000,000
$120,000,000
$0
$200
$400
$600
$800
$1,000
$1,200
$1,400
$1,600
2018 2019 2020 2021 2022 2023 2024 2025 2026 2027
Surrey Water Rates vs GVWD Charges
Proposed Flat Rate Proposed Metered Rate Proposed GVWD Charges
GVWD Charges
Proposed Flat &
Metered Rate
- 319 -
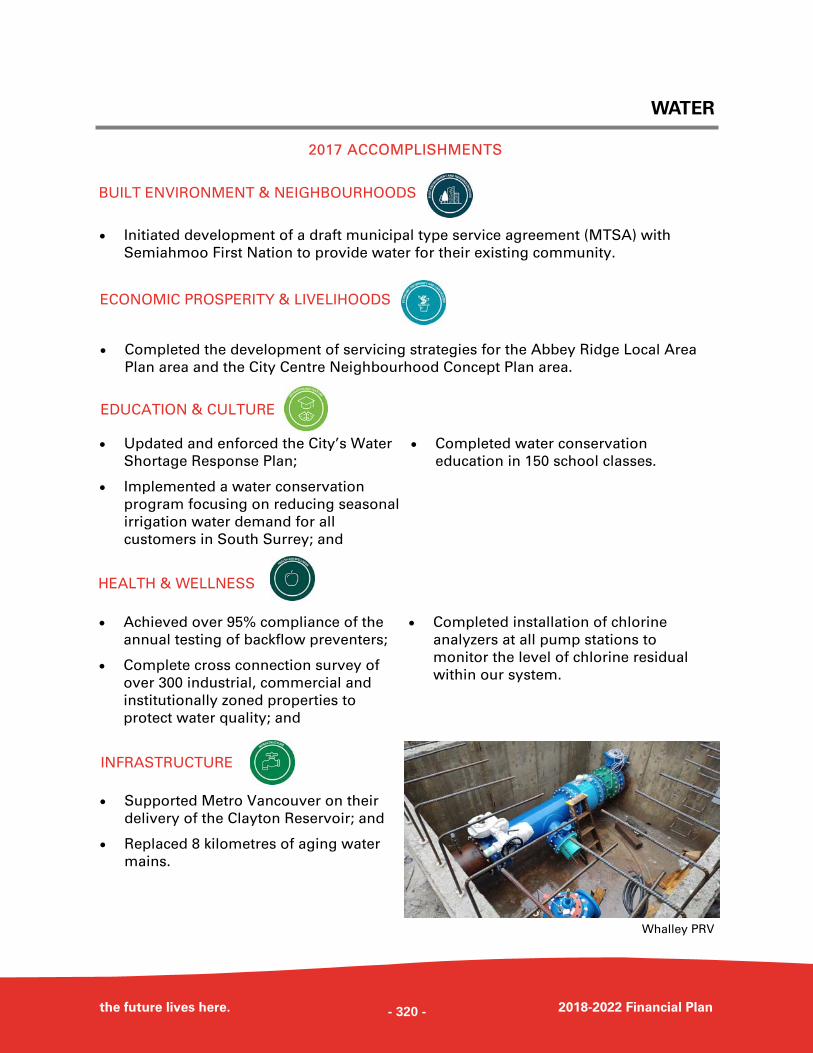
WATER
the future lives here. 2018-2022 Financial Plan
2017 ACCOMPLISHMENTS
Initiated development of a draft municipal type service agreement (MTSA) with
Semiahmoo First Nation to provide water for their existing community.
Updated and enforced the City’s Water
Shortage Response Plan;
Implemented a water conservation
program focusing on reducing seasonal
irrigation water demand for all
customers in South Surrey; and
Completed water conservation
education in 150 school classes.
Achieved over 95% compliance of the
annual testing of backflow preventers;
Complete cross connection survey of
over 300 industrial, commercial and
institutionally zoned properties to
protect water quality; and
Completed installation of chlorine
analyzers at all pump stations to
monitor the level of chlorine residual
within our system.
Supported Metro Vancouver on their
delivery of the Clayton Reservoir; and
Replaced 8 kilometres of aging water
mains.
Completed the development of servicing strategies for the Abbey Ridge Local Area
Plan area and the City Centre Neighbourhood Concept Plan area.
BUILT ENVIRONMENT & NEIGHBOURHOODS
ECONOMIC PROSPERITY & LIVELIHOODS
EDUCATION & CULTURE
HEALTH & WELLNESS
INFRASTRUCTURE
Whalley PRV
- 320 -
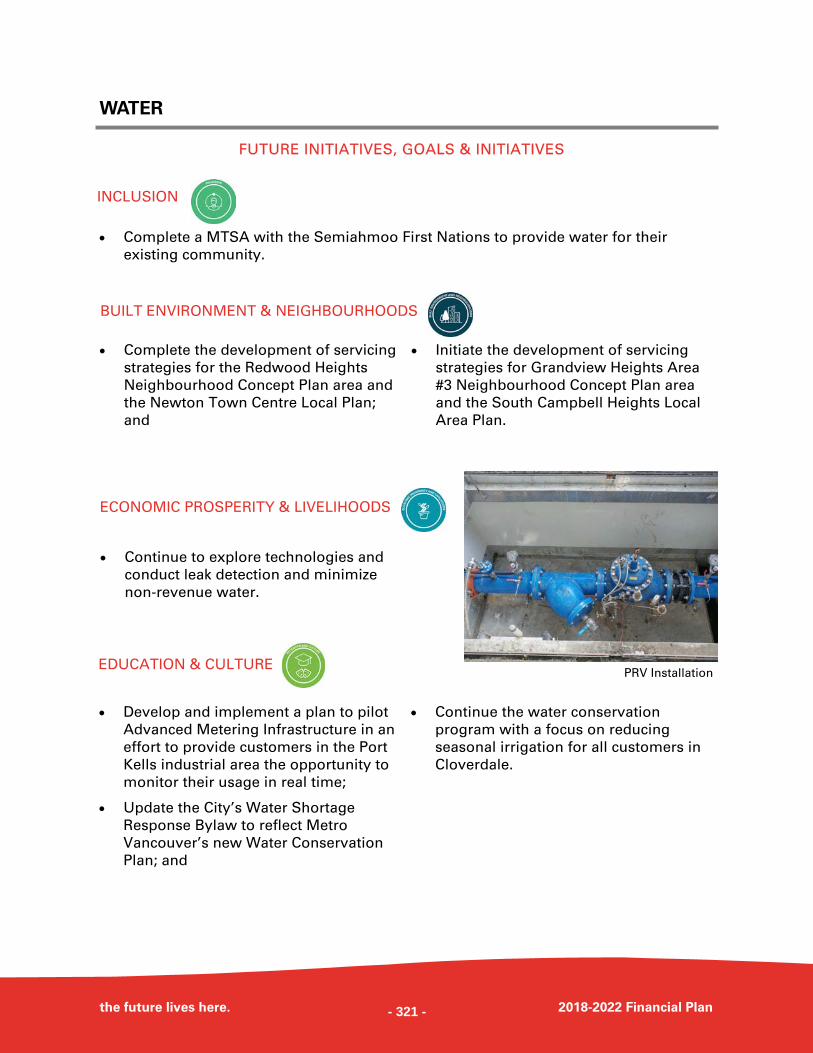
WATER
the future lives here. 2018-2022 Financial Plan
Develop and implement a plan to pilot
Advanced Metering Infrastructure in an
effort to provide customers in the Port
Kells industrial area the opportunity to
monitor their usage in real time;
Update the City’s Water Shortage
Response Bylaw to reflect Metro
Vancouver’s new Water Conservation
Plan; and
Continue the water conservation
program with a focus on reducing
seasonal irrigation for all customers in
Cloverdale.
FUTURE INITIATIVES, GOALS & INITIATIVES
Complete a MTSA with the Semiahmoo First Nations to provide water for their
existing community.
Complete the development of servicing
strategies for the Redwood Heights
Neighbourhood Concept Plan area and
the Newton Town Centre Local Plan;
and
Initiate the development of servicing
strategies for Grandview Heights Area
#3 Neighbourhood Concept Plan area
and the South Campbell Heights Local
Area Plan.
INCLUSION
BUILT ENVIRONMENT & NEIGHBOURHOODS
EDUCATION & CULTURE
Continue to explore technologies and
conduct leak detection and minimize
non-revenue water.
ECONOMIC PROSPERITY & LIVELIHOODS
PRV Installation
- 321 -
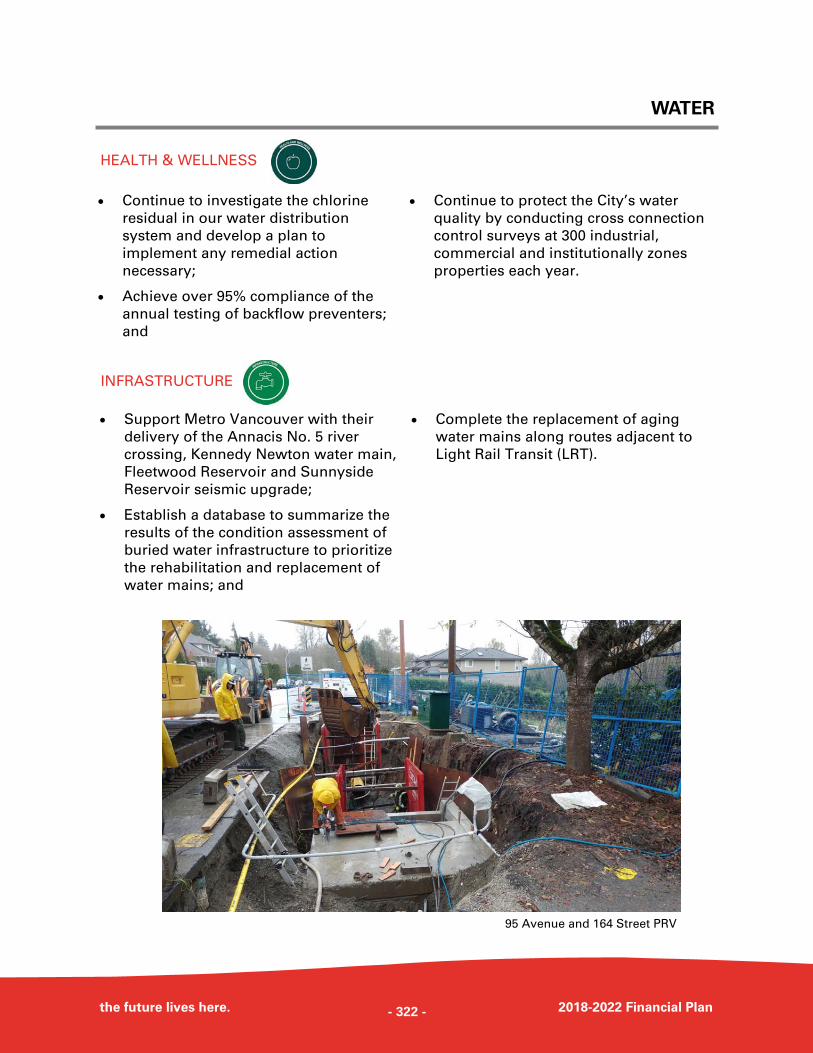
WATER
the future lives here. 2018-2022 Financial Plan
Support Metro Vancouver with their
delivery of the Annacis No. 5 river
crossing, Kennedy Newton water main,
Fleetwood Reservoir and Sunnyside
Reservoir seismic upgrade;
Establish a database to summarize the
results of the condition assessment of
buried water infrastructure to prioritize
the rehabilitation and replacement of
water mains; and
Complete the replacement of aging
water mains along routes adjacent to
Light Rail Transit (LRT).
INFRASTRUCTURE
Continue to investigate the chlorine
residual in our water distribution
system and develop a plan to
implement any remedial action
necessary;
Achieve over 95% compliance of the
annual testing of backflow preventers;
and
Continue to protect the City’s water
quality by conducting cross connection
control surveys at 300 industrial,
commercial and institutionally zones
properties each year.
HEALTH & WELLNESS
95 Avenue and 164 Street PRV
- 322 -
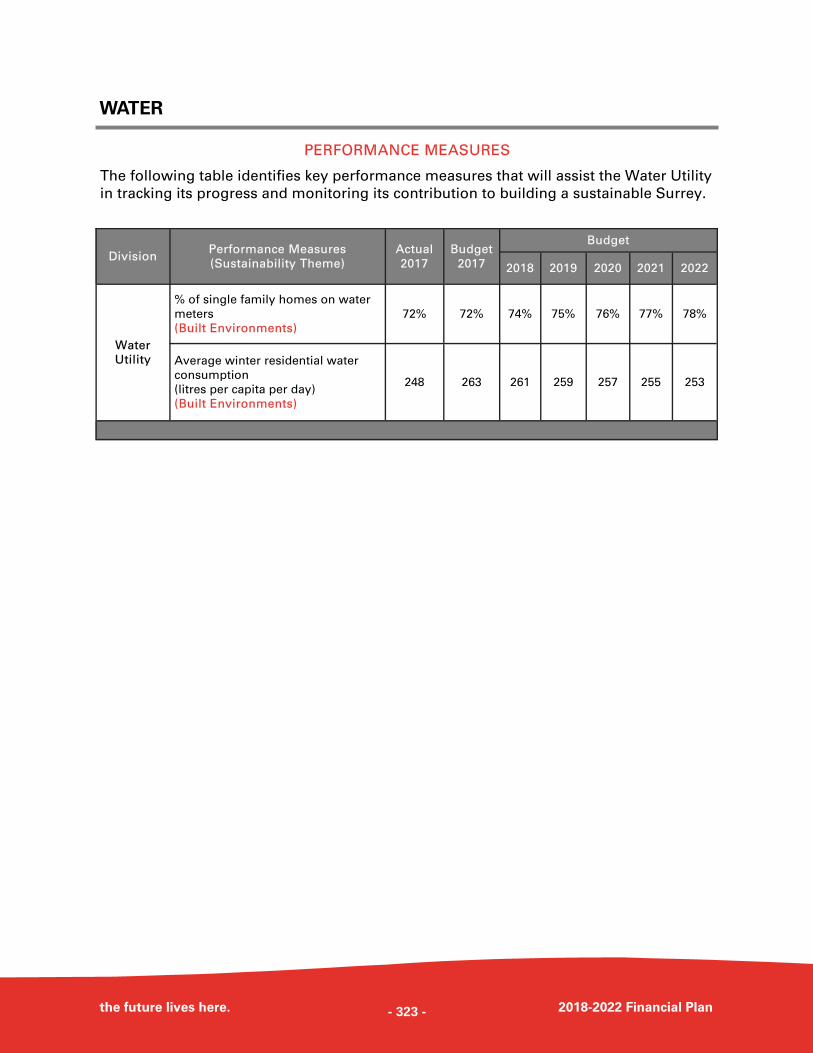
WATER
the future lives here. 2018-2022 Financial Plan
PERFORMANCE MEASURES
The following table identifies key performance measures that will assist the Water Utility
in tracking its progress and monitoring its contribution to building a sustainable Surrey.
Performance Measures
(Sustainability Theme)
Budget
2017
Budget
2018 2019 2020 2021 2022
Water
Utility
% of single family homes on water
meters
(Built Environments)
72% 74% 75% 76% 77% 78%
Average winter residential water
consumption
(litres per capita per day)
(Built Environments)
263 261 259 257 255 253
Division Actual
2017
72%
248
- 323 -
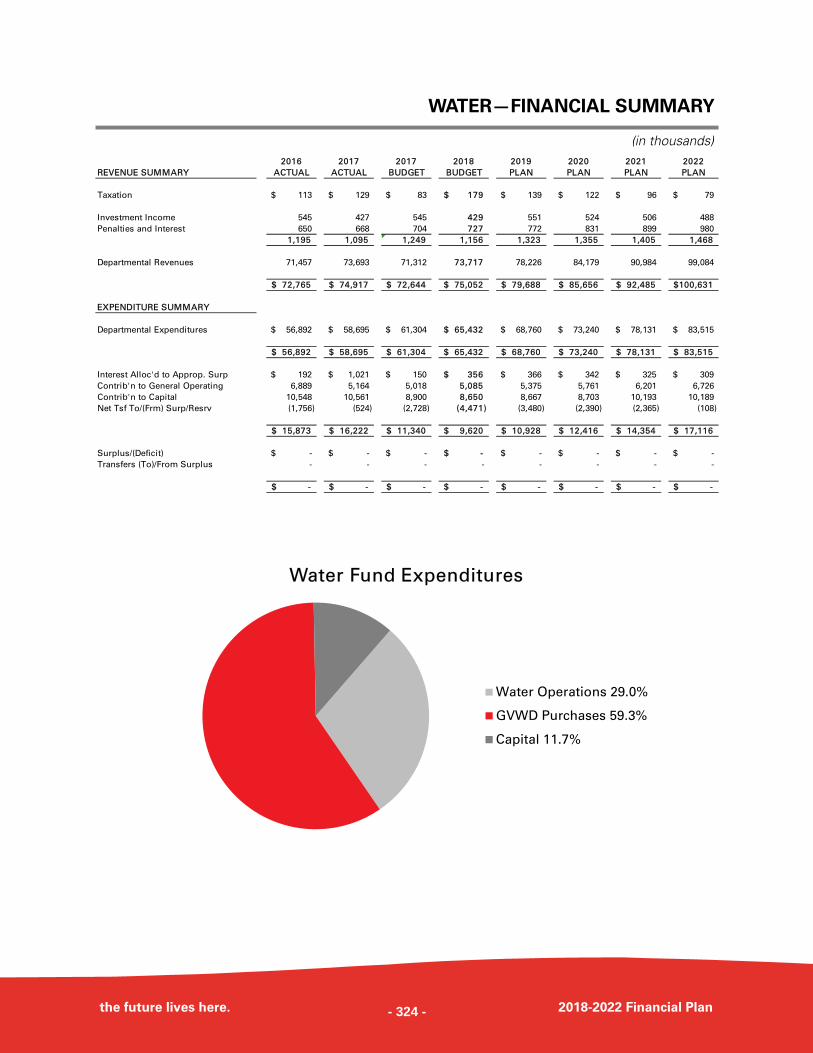
WATER—FINANCIAL SUMMARY
the future lives here. 2018-2022 Financial Plan
(in thousands) 2016 2017 2017 2018 2019 2020 2021 2022
REVENUE SUMMARY ACTUAL ACTUAL BUDGET BUDGET PLAN PLAN PLAN PLAN
Taxation 113$ 129$ 83$ 179$ 139$ 122$ 96$ 79$
Investment Income 545 427 545 429 551 524 506 488
Penalties and Interest 650 668 704 727 772 831 899 980
1,195 1,095 1,249 1,156 1,323 1,355 1,405 1,468
Departmental Revenues 71,457 73,693 71,312 73,717 78,226 84,179 90,984 99,084
72,765$ 74,917$ 72,644$ 75,052$ 79,688$ 85,656$ 92,485$ 100,631$
EXPENDITURE SUMMARY
Departmental Expenditures 56,892$ 58,695$ 61,304$ 65,432$ 68,760$ 73,240$ 78,131$ 83,515$
56,892$ 58,695$ 61,304$ 65,432$ 68,760$ 73,240$ 78,131$ 83,515$
Interest Alloc'd to Approp. Surp 192$ 1,021$ 150$ 356$ 366$ 342$ 325$ 309$
Contrib'n to General Operating 6,889 5,164 5,018 5,085 5,375 5,761 6,201 6,726
Contrib'n to Capital 10,548 10,561 8,900 8,650 8,667 8,703 10,193 10,189
Net Tsf To/(Frm) Surp/Resrv (1,756) (524) (2,728) (4,471) (3,480) (2,390) (2,365) (108)
15,873$ 16,222$ 11,340$ 9,620$ 10,928$ 12,416$ 14,354$ 17,116$
Surplus/(Deficit) -$ -$ -$ -$ -$ -$ -$ -$
Transfers (To)/From Surplus - - - - - - - -
-$ -$ -$ -$ -$ -$ -$ -$
Water Fund Expenditures
Water Operations 29.0%
GVWD Purchases 59.3%
Capital 11.7%
- 324 -
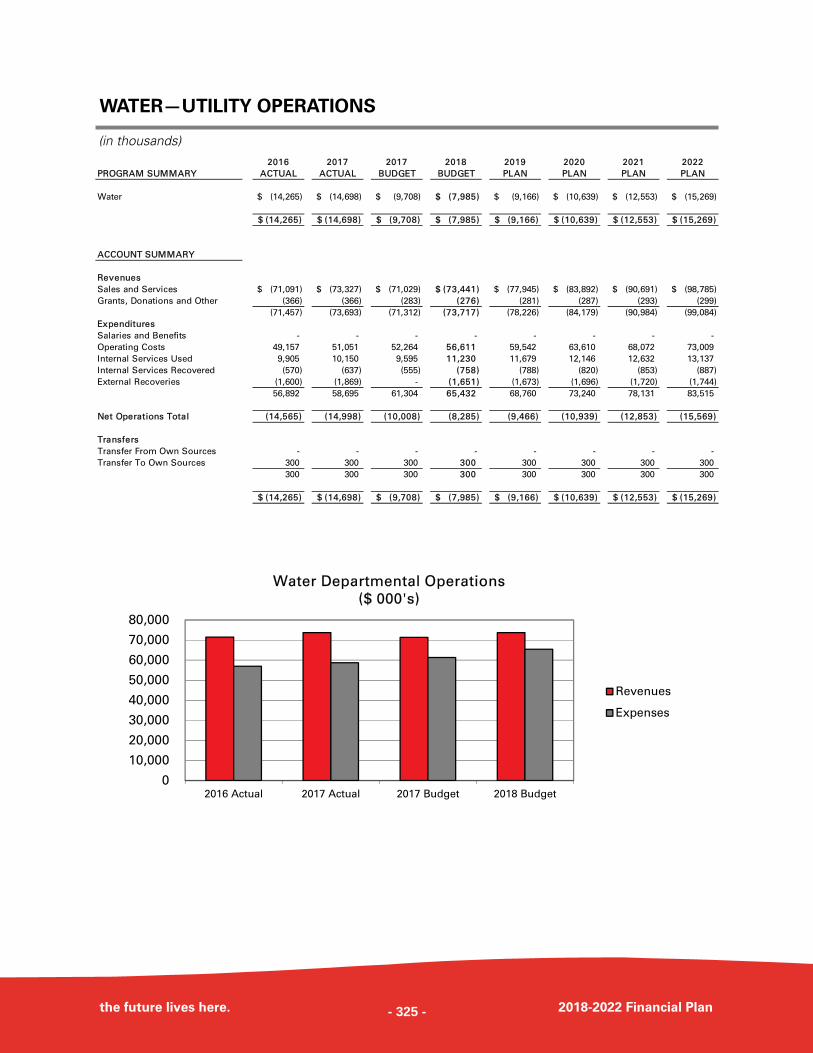
WATER—UTILITY OPERATIONS
the future lives here. 2018-2022 Financial Plan
(in thousands) 2016 2017 2017 2018 2019 2020 2021 2022
PROGRAM SUMMARY ACTUAL ACTUAL BUDGET BUDGET PLAN PLAN PLAN PLAN
Water (14,265)$ (14,698)$ (9,708)$ (7,985)$ (9,166)$ (10,639)$ (12,553)$ (15,269)$
(14,265)$ (14,698)$ (9,708)$ (7,985)$ (9,166)$ (10,639)$ (12,553)$ (15,269)$
ACCOUNT SUMMARY
Revenues
Sales and Services (71,091)$ (73,327)$ (71,029)$ (73,441)$ (77,945)$ (83,892)$ (90,691)$ (98,785)$
Grants, Donations and Other (366) (366) (283) (276) (281) (287) (293) (299)
(71,457) (73,693) (71,312) (73,717) (78,226) (84,179) (90,984) (99,084)
Expenditures
Salaries and Benefits - - - - - - - -
Operating Costs 49,157 51,051 52,264 56,611 59,542 63,610 68,072 73,009
Internal Services Used 9,905 10,150 9,595 11,230 11,679 12,146 12,632 13,137
Internal Services Recovered (570) (637) (555) (758) (788) (820) (853) (887)
External Recoveries (1,600) (1,869) - (1,651) (1,673) (1,696) (1,720) (1,744)
56,892 58,695 61,304 65,432 68,760 73,240 78,131 83,515
Net Operations Total (14,565) (14,998) (10,008) (8,285) (9,466) (10,939) (12,853) (15,569)
Transfers
Transfer From Own Sources - - - - - - - -
Transfer To Own Sources 300 300 300 300 300 300 300 300
300 300 300 300 300 300 300 300
(14,265)$ (14,698)$ (9,708)$ (7,985)$ (9,166)$ (10,639)$ (12,553)$ (15,269)$
0
10,000
20,000
30,000
40,000
50,000
60,000
70,000
80,000
2016 Actual 2017 Actual 2017 Budget 2018 Budget
Water Departmental Operations
($ 000's)
Revenues
Expenses
- 325 -
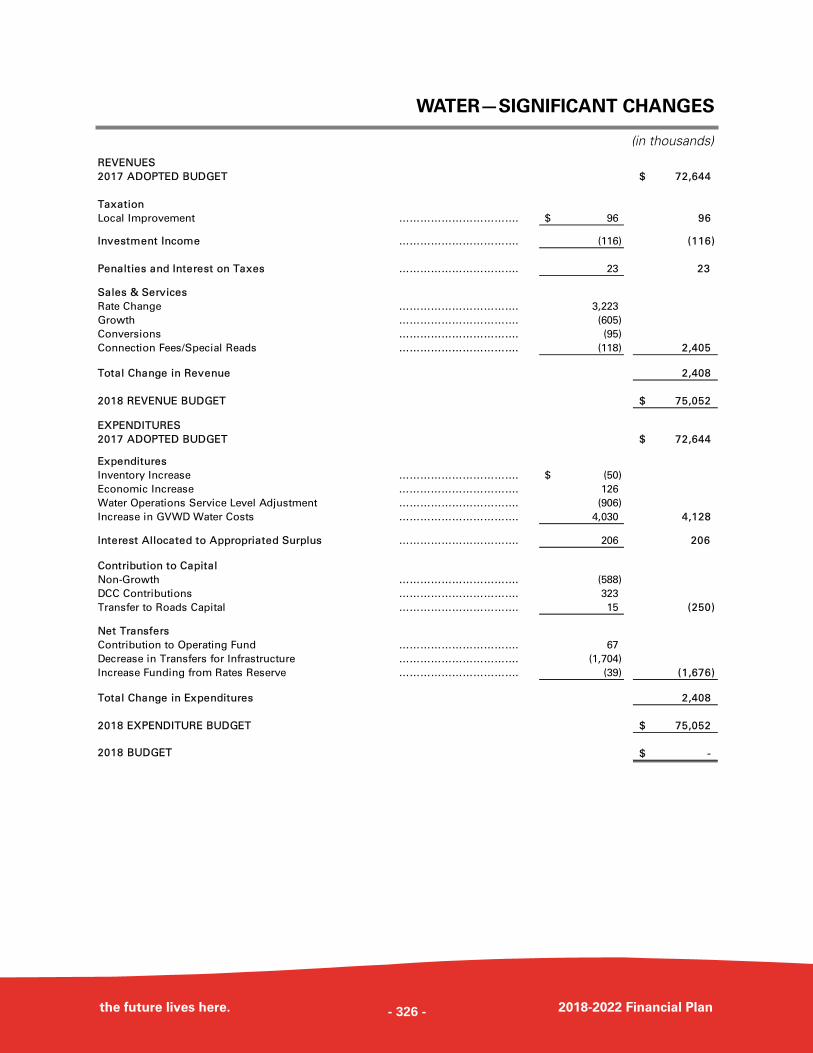
WATER—SIGNIFICANT CHANGES
the future lives here. 2018-2022 Financial Plan
(in thousands)
REVENUES
2017 ADOPTED BUDGET 72,644$
Taxation
Local Improvement ……………………………. 96$ 96
Investment Income ……………………………. (116) (116)
Penalties and Interest on Taxes ……………………………. 23 23
Sales & Services
Rate Change ……………………………. 3,223
Growth ……………………………. (605)
Conversions ……………………………. (95)
Connection Fees/Special Reads ……………………………. (118) 2,405
Total Change in Revenue 2,408
2018 REVENUE BUDGET 75,052$
EXPENDITURES
2017 ADOPTED BUDGET 72,644$
Expenditures
Inventory Increase ……………………………. (50)$
Economic Increase ……………………………. 126
Water Operations Service Level Adjustment ……………………………. (906)
Increase in GVWD Water Costs ……………………………. 4,030 4,128
Interest Allocated to Appropriated Surplus ……………………………. 206 206
Contribution to Capital
Non-Growth ……………………………. (588)
DCC Contributions ……………………………. 323
Transfer to Roads Capital ……………………………. 15 (250)
Net Transfers
Contribution to Operating Fund ……………………………. 67
Decrease in Transfers for Infrastructure ……………………………. (1,704)
Increase Funding from Rates Reserve ……………………………. (39) (1,676)
Total Change in Expenditures 2,408
2018 EXPENDITURE BUDGET 75,052$
2018 BUDGET -$
- 326 -
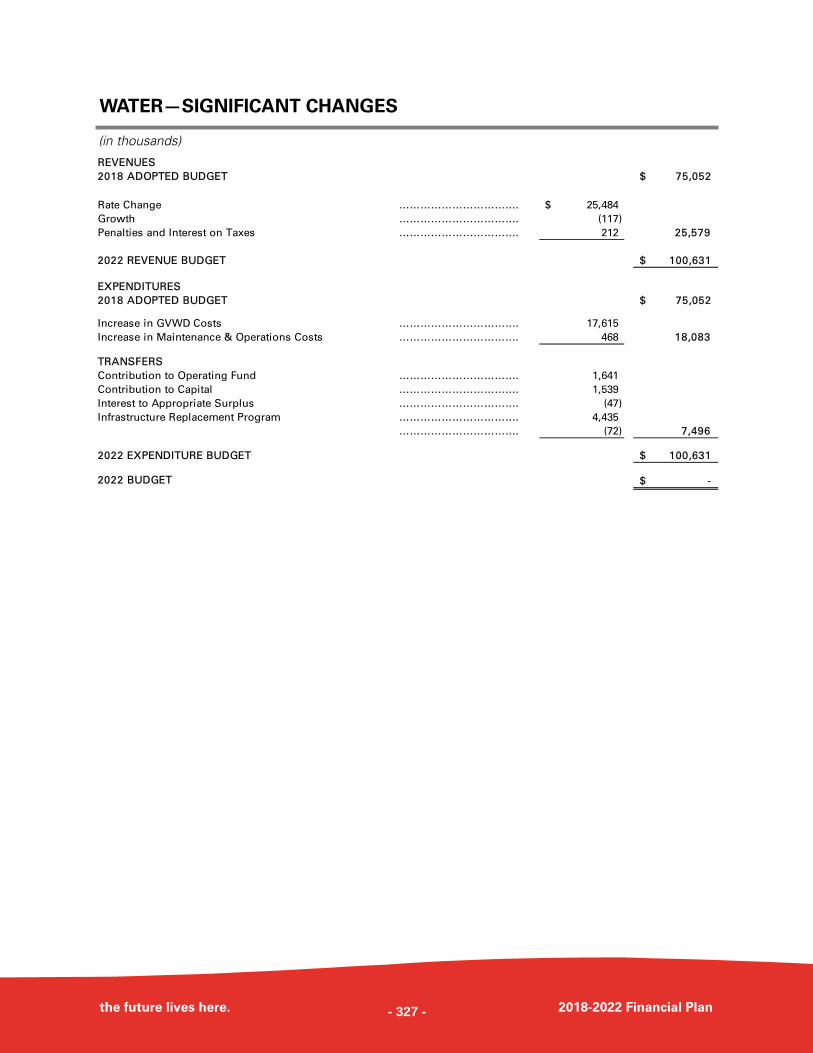
WATER—SIGNIFICANT CHANGES
the future lives here. 2018-2022 Financial Plan
(in thousands)
REVENUES
2018 ADOPTED BUDGET 75,052$
Rate Change ……………………………. 25,484$
Growth ……………………………. (117)
Penalties and Interest on Taxes ……………………………. 212 25,579
2022 REVENUE BUDGET 100,631$
EXPENDITURES
2018 ADOPTED BUDGET 75,052$
Increase in GVWD Costs ……………………………. 17,615
Increase in Maintenance & Operations Costs ……………………………. 468 18,083
TRANSFERS
Contribution to Operating Fund ……………………………. 1,641
Contribution to Capital ……………………………. 1,539
Interest to Appropriate Surplus ……………………………. (47)
Infrastructure Replacement Program ……………………………. 4,435
……………………………. (72) 7,496
2022 EXPENDITURE BUDGET 100,631$
2022 BUDGET -$
- 327 -
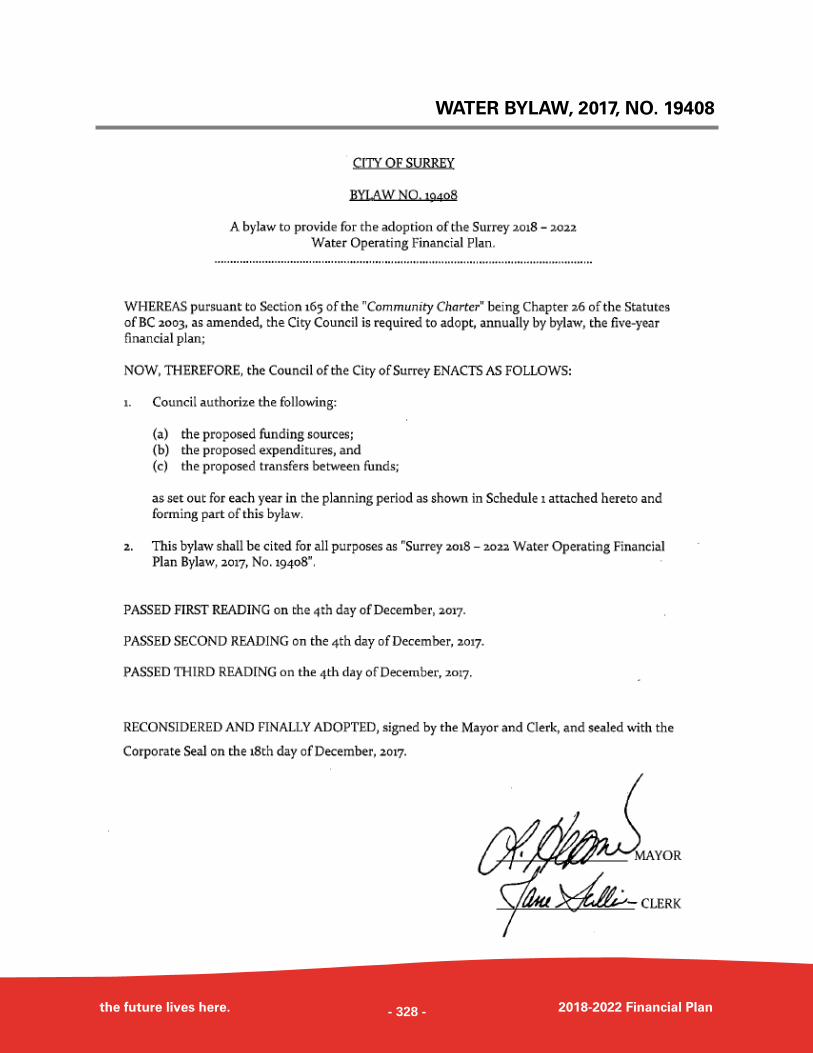
WATER BYLAW, 2017, NO. 19408
the future lives here. 2018-2022 Financial Plan - 328 -
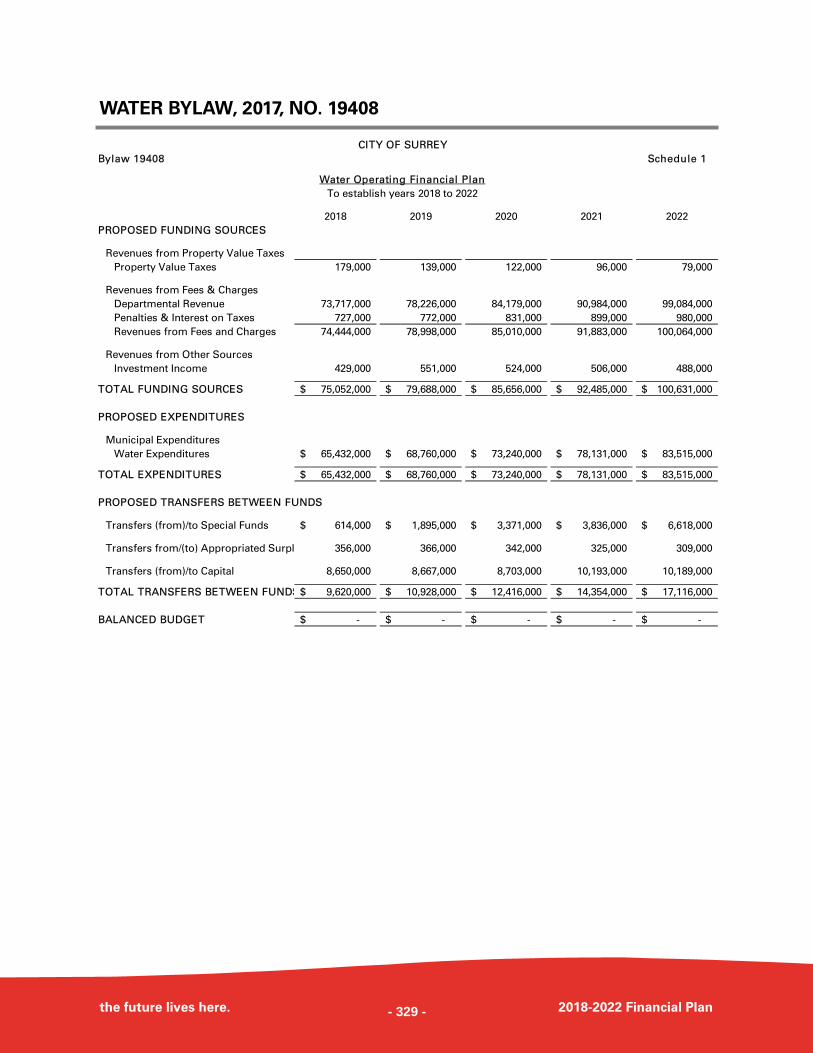
WATER BYLAW, 2017, NO. 19408
the future lives here. 2018-2022 Financial Plan
CITY OF SURREY
Bylaw 19408 Schedule 1
Water Operating Financial Plan
To establish years 2018 to 2022
2018 2019 2020 2021 2022
PROPOSED FUNDING SOURCES
Revenues from Property Value Taxes
Property Value Taxes 179,000 139,000 122,000 96,000 79,000
Revenues from Fees & Charges
Departmental Revenue 73,717,000 78,226,000 84,179,000 90,984,000 99,084,000
Penalties & Interest on Taxes 727,000 772,000 831,000 899,000 980,000
Revenues from Fees and Charges 74,444,000 78,998,000 85,010,000 91,883,000 100,064,000
Revenues from Other Sources
Investment Income 429,000 551,000 524,000 506,000 488,000
TOTAL FUNDING SOURCES 75,052,000$ 79,688,000$ 85,656,000$ 92,485,000$ 100,631,000$
PROPOSED EXPENDITURES
Municipal Expenditures
Water Expenditures 65,432,000$ 68,760,000$ 73,240,000$ 78,131,000$ 83,515,000$
TOTAL EXPENDITURES 65,432,000$ 68,760,000$ 73,240,000$ 78,131,000$ 83,515,000$
PROPOSED TRANSFERS BETWEEN FUNDS
Transfers (from)/to Special Funds 614,000$ 1,895,000$ 3,371,000$ 3,836,000$ 6,618,000$
Transfers from/(to) Appropriated Surpl 356,000 366,000 342,000 325,000 309,000
Transfers (from)/to Capital 8,650,000 8,667,000 8,703,000 10,193,000 10,189,000
TOTAL TRANSFERS BETWEEN FUNDS 9,620,000$ 10,928,000$ 12,416,000$ 14,354,000$ 17,116,000$
BALANCED BUDGET -$ -$ -$ -$ -$
- 329 -
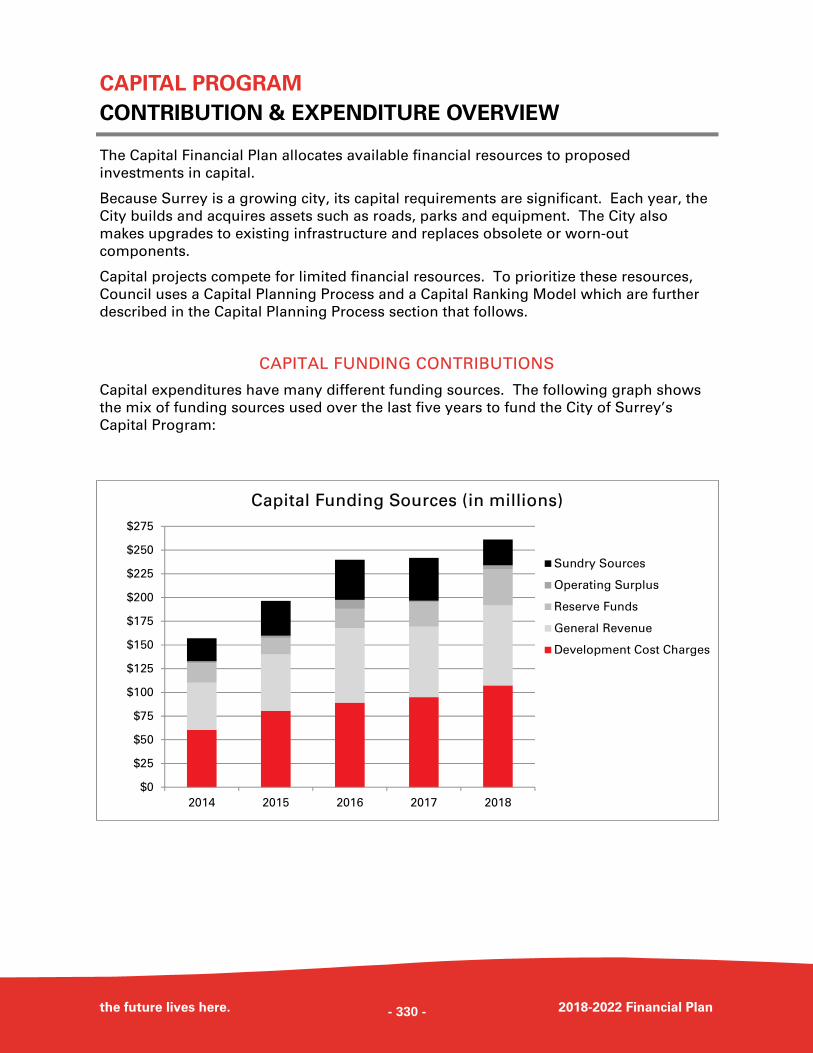
CAPITAL PROGRAM
CONTRIBUTION & EXPENDITURE OVERVIEW
the future lives here. 2018-2022 Financial Plan
The Capital Financial Plan allocates available financial resources to proposed
investments in capital.
Because Surrey is a growing city, its capital requirements are significant. Each year, the
City builds and acquires assets such as roads, parks and equipment. The City also
makes upgrades to existing infrastructure and replaces obsolete or worn-out
components.
Capital projects compete for limited financial resources. To prioritize these resources,
Council uses a Capital Planning Process and a Capital Ranking Model which are further
described in the Capital Planning Process section that follows.
CAPITAL FUNDING CONTRIBUTIONS
Capital expenditures have many different funding sources. The following graph shows
the mix of funding sources used over the last five years to fund the City of Surrey’s
Capital Program:
$0
$25
$50
$75
$100
$125
$150
$175
$200
$225
$250
$275
2014 2015 2016 2017 2018
Capital Funding Sources (in millions)
Sundry Sources
Operating Surplus
Reserve Funds
General Revenue
Development Cost Charges
- 330 -
CONTRIBUTION & EXPENDITURE OVERVIEW
the future lives here. 2018-2022 Financial Plan
NON-DISCRETIONARY CONTRIBUTIONS
Non-discretionary contributions to the capital program include those statutory reserve
funds that are restrictive in their intended use. These include the following:
Development Cost Charges (Section 933 of the Local Government Act);
Neighbourhood Concept Plan (NCP) Contributions; and
Cash-in-Lieu of Parkland (Section 936 of the Local Government Act).
DISCRETIONARY CONTRIBUTIONS
Discretionary contributions include appropriations of operating surplus, contributions
from operating financial plans, or less restrictive statutory reserve funds.
The City requires developers to contribute
to its future growth. They must pay
Development Cost Charges (DCC) in order
to develop land. In some instances, they
are also required to contribute to NCPs.
When the City collects these
contributions, it deposits them into a
statutory reserve fund until the money
can be spent.
Contributions collected in a given year
can be included as a funding source in the
next year’s Capital Financial Plan. Each
contribution can only be used for the
purpose for which it was collected. For
instance, water DCC’s can only be spent
on a growth-related water project.
Operating Appropriated Surplus
Non-statutory reserves within operating
funds are appropriations of surplus or
unappropriated surplus revenues which
City Council can, by simple majority vote,
use for any capital or operating purpose.
Examples of these appropriations include
the following:
Operating Contingency;
Innovation Fund; and
Utility Rate Stabilization Reserve.
Development applicants must contribute
either a portion of their land or a cash
equivalent for park land. When the City
collects cash-in-lieu, it deposits the funds
in a statutory reserve fund and may only
use it to purchase parkland.
Contributions collected in a given year
can be included as funding sources in the
next year’s Capital Financial Plan.
- 331 -
the future lives here. 2018-2022 Financial Plan
CONTRIBUTION & EXPENDITURE OVERVIEW
OTHER CONTRIBUTIONS
Other contributions in nature are usually from sources external to the City which include
the following:
Other Statutory Reserve Funds
The Community Charter allows for the
establishment of less restrictive statutory
reserve funds. Two examples of these
types of reserve funds are the Municipal
Land Reserve and the Vehicles and
Equipment Replacement
Reserve. Legislation requires that
proceeds from the sale of parkland be
deposited into a statutory reserve fund
and can only be used to purchase
parkland. All other proceeds from land
sales are deposited into the Municipal
Land Reserve as per Bylaw 6474.
Once the funds have been deposited, they
may be used without restriction as long as
the planned expenditures are authorized
by Council and meet with the intended
purpose set out in the bylaw. The City is
also permitted to appropriate, from
general operating funds, to a Capital
Works Reserve Fund for the purpose of
replacing machinery and equipment to
maintain City property.
External Resources
External or sundry funding sources are
contributions to capital projects from
individuals or external organizations,
including senior governments.
These contributions vary from year to
year in accordance with changes in
government grant programs and
opportunities for private sector
partnerships.
Some projects are dependent on these
contributions to proceed.
Borrowing
Long-term borrowing limits for
municipalities within the Province of BC
are determined by the criteria established
under Section 174 of the Community
Charter ([SBC 2003] Chapter 26). These
borrowing limits are based on a
municipality’s ability to service their debt.
Debt servicing limits are based on 25% of
the following:
The annual revenue for the previous
year; less
The annual debt servicing costs
including contingent liabilities.
The City of Surrey’s gross borrowing
capacity is $1.60 billion. Outstanding
consolidated external borrowing at
December 31, 2017 was $267,219,000. Of
this external borrowing, $185,457,000
relates to City debt through the Municipal
Finance Authority of British Columbia
(MFABC). The City’s cash re-payments of
MFABC principal are held in a sinking
fund administered by MFABC. The
sinking fund earns interest, known as
actuarial earnings, through an investment
program managed by MFABC. In addition
to the cash re-payments, the actuarial
earnings on the sinking fund are also
applied as a reduction to the outstanding
loan balance.
- 332 -
CONTRIBUTION & EXPENDITURE OVERVIEW
the future lives here. 2018-2022 Financial Plan
CAPITAL EXPENDITURES
The capital program includes statutory and asset maintenance as well as new projects.
MFABC cash principal/interest payments
and budgeted actuarial earnings over the
next five years (2018 - 2022) will be
$63,898,609 and $7,772,528 respectively.
Section 177 of the Community Charter
allows municipalities to undertake short-
term (up to five years) borrowing to pay
for capital projects. Total short-term debt
outstanding must not exceed $50
multiplied by the municipal population, as
certified by the Minister of Municipal
Affairs and Housing. The City’s short-
term capital borrowing capacity for 2018
is $26.7 million.
Section 177 of the Community Charter
also allows municipalities to borrow
money to pay for their current
expenditures. Temporary borrowing
must not exceed total unpaid taxes levied
during the current year. Surrey’s
temporary borrowing capacity for 2018 is
approximately $694 million. The City’s
authorized temporary borrowing limit for
2018 is $20 million.
The City uses several approaches to
finance capital works: “pay as you go”,
internal loans, and external debt.
Surrey continues to use a “pay as you go”
approach to finance a majority of its
capital works projects. The “pay as you
go” approach employed by Surrey has
two significant benefits, namely it:
Preserves flexibility for the City by
allowing it to avoid fixed debt costs
and interest charges; and
Is particularly appropriate in a growing
municipality where development can
be funded through developer
contributions and an increased tax
base.
The City has undertaken a significant
capital program to meet the needs of our
growing community. In order to fund the
capital projects under this program, the
City has borrowed both internally and
externally.
Statutory and Asset Maintenance
Statutory and asset maintenance
constitute the largest part of the capital
program.
They are the ‘base’ expenditures required
to preserve previous investments, replace
old or worn-out assets, and service
growth.
These expenditures are funded by
ongoing capital sources such as:
Contributions from operating revenue;
DCCs; and
Sundry sources.
- 333 -
the future lives here. 2018-2022 Financial Plan
CONTRIBUTION & EXPENDITURE OVERVIEW
Preservation of Previous Investments in Capital
Replacement of Worn-out or Obsolete Assets
Meeting the Demands of Growth
New Projects
Aging capital assets require more
maintenance and upkeep. Major
maintenance is designed to restore assets
to the state they were in when the original
investment was made. The need to
maintain assets often receives less
attention than the need for new facilities.
However, timely maintenance work is
important. Consider, for example, the
City’s extensive network of roads. Timely
road repaving allows the City to avoid
large scale rehabilitation work. Delaying
repaving merely defers an even larger
fiscal problem to future years.
Contributions from operating are
normally required to pay for this
maintenance work.
The City can save costs in the long run by
replacing aged assets instead of repairing
or maintaining them, as newer assets are
often more technologically-advanced and
energy efficient. Statutory Reserve Funds
are used to pay for the replacement of
worn-out or obsolete assets.
They are established and replenished by
transferring funds from general revenue.
When management decides an asset
needs to be replaced, it seeks budget
authority through the current year's
budget process.
Each year the City’s population increases
as more people choose to call Surrey their
home. This increase results in heightened
demand on the City’s financial resources
to pay for facilities and other capital
infrastructure that meets the City’s
standards and is acceptable to residents.
Libraries, recreation centres, and fire halls
typically cost several million dollars and
cannot be funded in the same way as
statutory and asset maintenance projects.
There are always more potential projects
than there is available funding.
Many proposed projects compete for the
City’s limited resources. The City’s capital
planning process helps to prioritize new
projects.
Surrey'stotalpopulation,asof
December2017,isestimatedat
534,690residents.
- 334 -
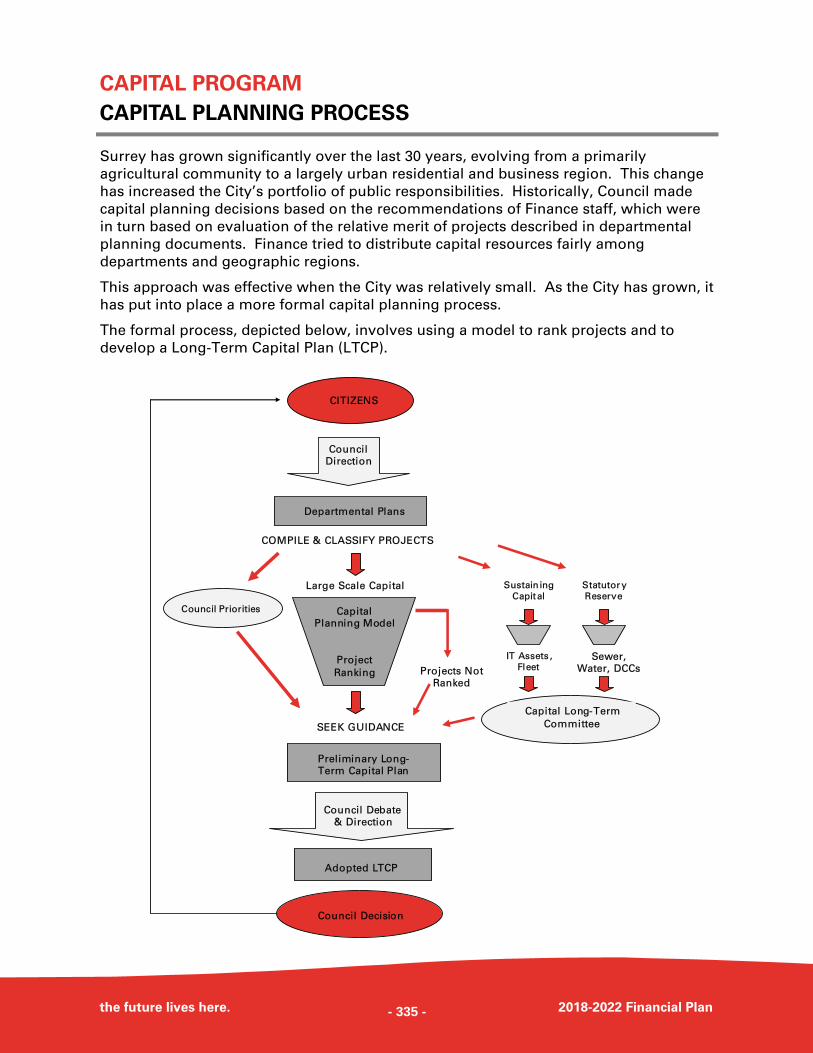
CAPITAL PROGRAM
CAPITAL PLANNING PROCESS
the future lives here. 2018-2022 Financial Plan
Surrey has grown significantly over the last 30 years, evolving from a primarily
agricultural community to a largely urban residential and business region. This change
has increased the City’s portfolio of public responsibilities. Historically, Council made
capital planning decisions based on the recommendations of Finance staff, which were
in turn based on evaluation of the relative merit of projects described in departmental
planning documents. Finance tried to distribute capital resources fairly among
departments and geographic regions.
This approach was effective when the City was relatively small. As the City has grown, it
has put into place a more formal capital planning process.
The formal process, depicted below, involves using a model to rank projects and to
develop a Long-Term Capital Plan (LTCP).
COMPILE & CLASSIFY PROJECTS
Large Scale Capital
SEEK GUIDANCE
CITIZENS
Capital
Planning Model
Project
Ranking
Preliminary Long-
Term Capital Plan
Council
Direction
Departmental Plans
Council Debate
& Direction
Adopted LTCP
Council Decision
Council Priorities
Projects Not
Ranked
Sustain ing
Capital
IT Assets ,
Fleet
Statutor y
Reserve
Sewer,
Water, DCCs
Capital Long-Term
Committee
- 335 -
the future lives here. 2018-2022 Financial Plan
CAPITAL PLANNING PROCESS
CAPITAL RANKING MODEL
The City’s Capital Ranking Model separates projects into four categories:
COUNCIL PRIORITIES
Projects that Council deems to be high priority.
SUSTAINING CAPITAL
Small-scale projects designed to maintain the City’s existing infrastructure, such as
investments in information technology, building renovations and the purchase of
furniture and equipment.
CAPITAL FROM STATUTORY RESERVE FUNDS
Improvements to and expansions of sewer, water, and road systems funded by DCCs.
LARGE SCALE CAPITAL
A selection of proposed large scale capital projects. The model uses six criteria:
Purpose;
Consistency with Master Plans;
Technical feasibility;
Economic benefit;
Social and environmental quality; and
Availability of funding.
- 336 -
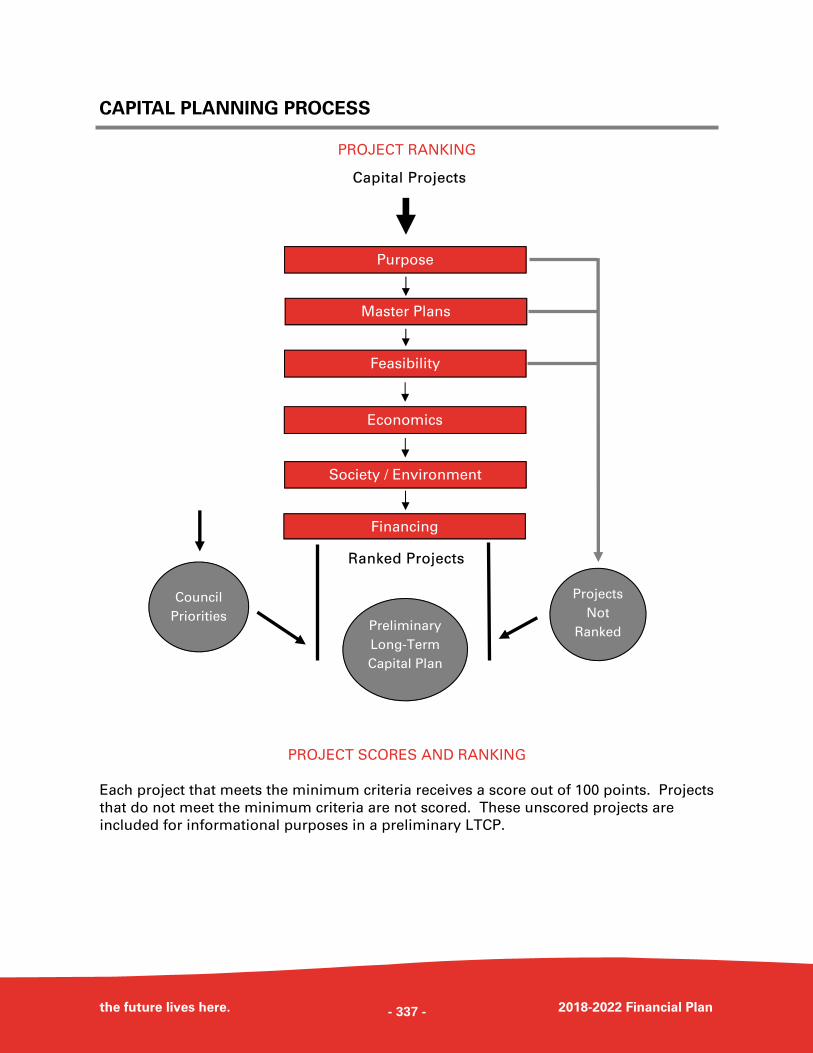
the future lives here. 2018-2022 Financial Plan
CAPITAL PLANNING PROCESS
PROJECT RANKING
Ranked Projects
PROJECT SCORES AND RANKING
Each project that meets the minimum criteria receives a score out of 100 points. Projects
that do not meet the minimum criteria are not scored. These unscored projects are
included for informational purposes in a preliminary LTCP.
Master Plans
Feasibility
Purpose
Economics
Society / Environment
Financing
Projects
Not
Ranked
Council
Priorities Preliminary
Long-Term
Capital Plan
Capital Projects
- 337 -
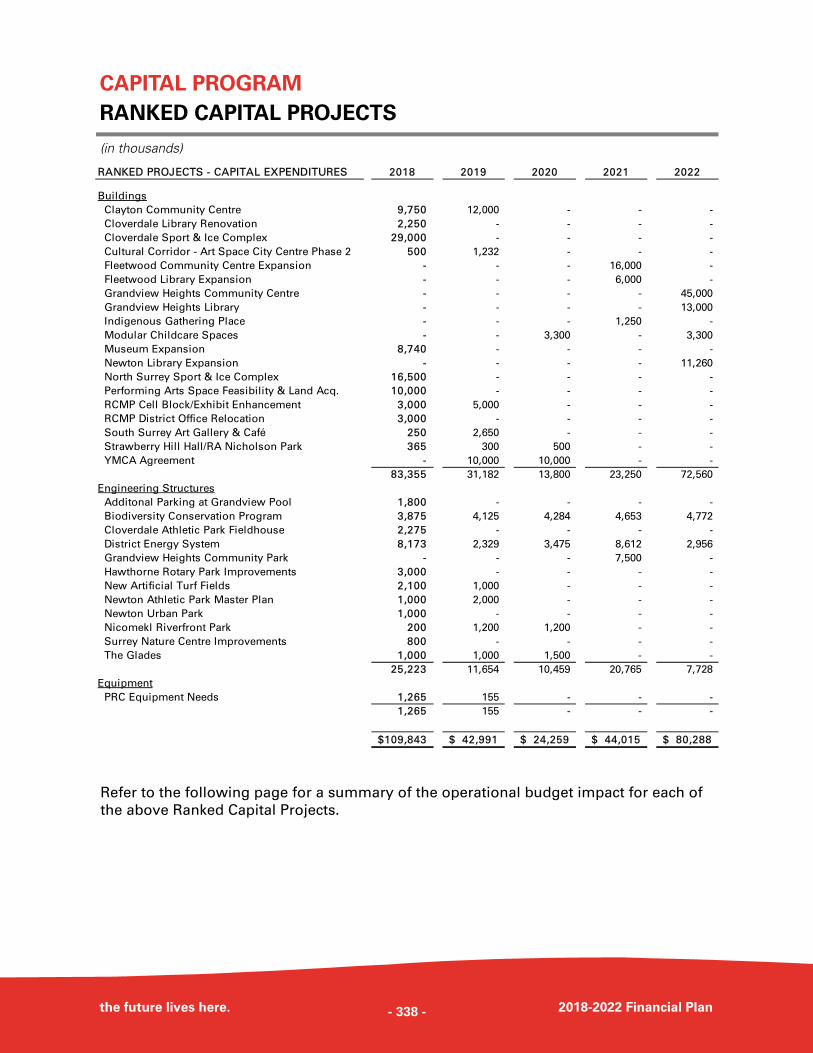
CAPITAL PROGRAM
RANKED CAPITAL PROJECTS
the future lives here. 2018-2022 Financial Plan
(in thousands)
Refer to the following page for a summary of the operational budget impact for each of
the above Ranked Capital Projects.
RANKED PROJECTS - CAPITAL EXPENDITURES 2018 2019 2020 2021 2022
Buildings
Clayton Community Centre 9,750 12,000 - - -
Cloverdale Library Renovation 2,250 - - - -
Cloverdale Sport & Ice Complex 29,000 - - - -
Cultural Corridor - Art Space City Centre Phase 2 500 1,232 - - -
Fleetwood Community Centre Expansion - - - 16,000 -
Fleetwood Library Expansion - - - 6,000 -
Grandview Heights Community Centre - - - - 45,000
Grandview Heights Library - - - - 13,000
Indigenous Gathering Place - - - 1,250 -
Modular Childcare Spaces - - 3,300 - 3,300
Museum Expansion 8,740 - - - -
Newton Library Expansion - - - - 11,260
North Surrey Sport & Ice Complex 16,500 - - - -
Performing Arts Space Feasibility & Land Acq. 10,000 - - - -
RCMP Cell Block/Exhibit Enhancement 3,000 5,000 - - -
RCMP District Office Relocation 3,000 - - - -
South Surrey Art Gallery & Café 250 2,650 - - -
Strawberry Hill Hall/RA Nicholson Park 365 300 500 - -
YMCA Agreement - 10,000 10,000 - -
83,355 31,182 13,800 23,250 72,560
Engineering Structures
Additonal Parking at Grandview Pool 1,800 - - - -
Biodiversity Conservation Program 3,875 4,125 4,284 4,653 4,772
Cloverdale Athletic Park Fieldhouse 2,275 - - - -
District Energy System 8,173 2,329 3,475 8,612 2,956
Grandview Heights Community Park - - - 7,500 -
Hawthorne Rotary Park Improvements 3,000 - - - -
New Artificial Turf Fields 2,100 1,000 - - -
Newton Athletic Park Master Plan 1,000 2,000 - - -
Newton Urban Park 1,000 - - - -
Nicomekl Riverfront Park 200 1,200 1,200 - -
Surrey Nature Centre Improvements 800 - - - -
The Glades 1,000 1,000 1,500 - -
25,223 11,654 10,459 20,765 7,728
Equipment
PRC Equipment Needs 1,265 155 - - -
1,265 155 - - -
109,843$ 42,991$ 24,259$ 44,015$ 80,288$
- 338 -
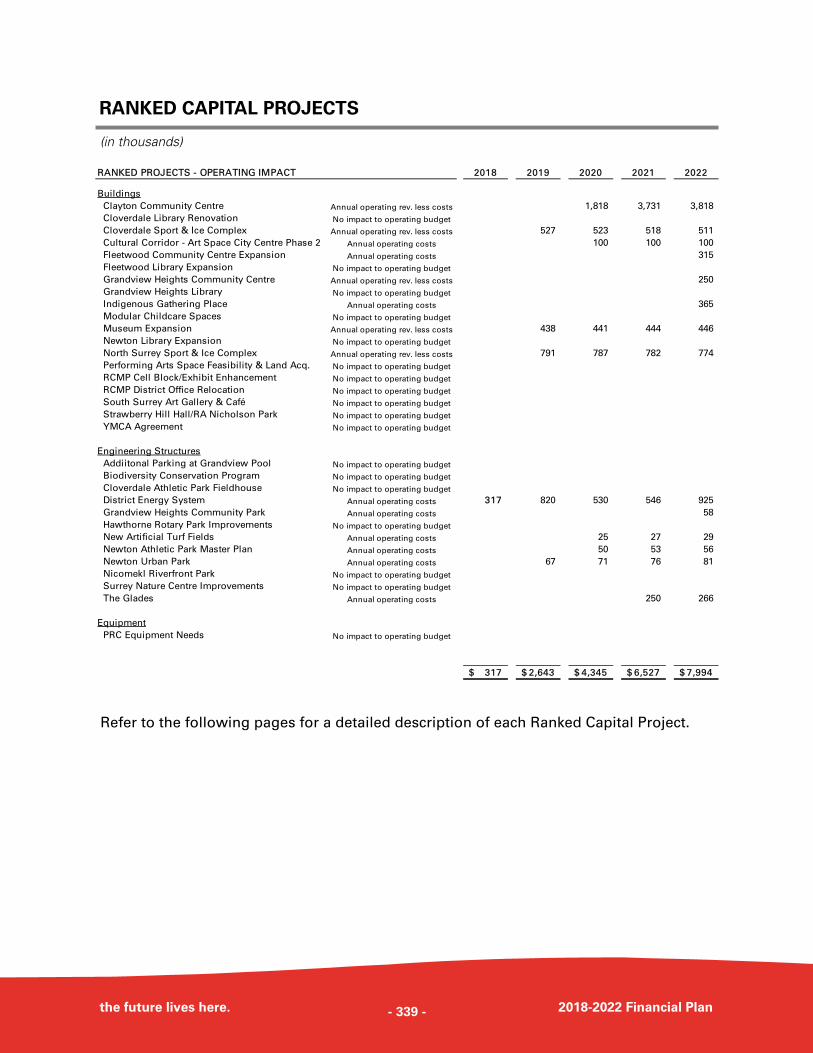
RANKED CAPITAL PROJECTS
the future lives here. 2018-2022 Financial Plan
(in thousands)
Refer to the following pages for a detailed description of each Ranked Capital Project.
RANKED PROJECTS - OPERATING IMPACT 2018 2019 2020 2021 2022
Buildings
Clayton Community Centre Annual operating rev. less costs 1,818 3,731 3,818
Cloverdale Library Renovation No impact to operating budget
Cloverdale Sport & Ice Complex Annual operating rev. less costs 527 523 518 511
Cultural Corridor - Art Space City Centre Phase 2 Annual operating costs 100 100 100
Fleetwood Community Centre Expansion Annual operating costs 315
Fleetwood Library Expansion No impact to operating budget
Grandview Heights Community Centre Annual operating rev. less costs 250
Grandview Heights Library No impact to operating budget
Indigenous Gathering Place Annual operating costs 365
Modular Childcare Spaces No impact to operating budget
Museum Expansion Annual operating rev. less costs 438 441 444 446
Newton Library Expansion No impact to operating budget
North Surrey Sport & Ice Complex Annual operating rev. less costs 791 787 782 774
Performing Arts Space Feasibility & Land Acq. No impact to operating budget
RCMP Cell Block/Exhibit Enhancement No impact to operating budget
RCMP District Office Relocation No impact to operating budget
South Surrey Art Gallery & Café No impact to operating budget
Strawberry Hill Hall/RA Nicholson Park No impact to operating budget
YMCA Agreement No impact to operating budget
Engineering Structures
Addiitonal Parking at Grandview Pool No impact to operating budget
Biodiversity Conservation Program No impact to operating budget
Cloverdale Athletic Park Fieldhouse No impact to operating budget
District Energy System Annual operating costs 317 820 530 546 925
Grandview Heights Community Park Annual operating costs 58
Hawthorne Rotary Park Improvements No impact to operating budget
New Artificial Turf Fields Annual operating costs 25 27 29
Newton Athletic Park Master Plan Annual operating costs 50 53 56
Newton Urban Park Annual operating costs 67 71 76 81
Nicomekl Riverfront Park No impact to operating budget
Surrey Nature Centre Improvements No impact to operating budget
The Glades Annual operating costs 250 266
Equipment
PRC Equipment Needs No impact to operating budget
317$ 2,643$ 4,345$ 6,527$ 7,994$
- 339 -
the future lives here. 2018-2022 Financial Plan
RANKED CAPITAL PROJECTS
The following section provides a description of the 2018 ranked projects that were
approved by Council during the budget process.
BUILDINGS
CLAYTON RECREATION & CULTURE FACILITY
In consideration of the growth in East Clayton and the development expected over the
next few years in West Clayton, the new Clayton Community Centre will include visual
and performing arts components, a library and associated circulation management
spaces, a gymnasium, fitness and weight rooms, preschool/daycare facilities, child
minding space, youth gathering space, staff spaces and supporting infrastructure and
spaces. Detailed design is currently in progress and construction is expected to begin in
2018. The total project budget is expected to be $42 million.
CLOVERDALE LIBRARY RENOVATION
The Museum of Surrey will be expanding and revamping the layout of the entrances and
parking, including the entrance to the Cloverdale Library. In order to realign operations
to the new entrance, reorganization of the functions and spaces (both staff and public)
within the library are required. Interior renovations will add dramatic improvements in
layout and workflow adjacencies, resulting in further opportunities for collaboration with
the museum and enhanced services for the public.
CLOVERDALE TWIN ICE SURFACE
Due to additional demand for ice sports, there is a need for a new twin sheet arena in the
Cloverdale area. The new arena complex will be designed to be efficient and welcoming
as it serves the community and the region for ice hockey, figure skating, public lessons
and skating sessions, as well as dry floor summer use. This facility will have 2 regulation
size ice sheets, multipurpose rooms, community meeting spaces, food service,
additional dressing rooms and room for further expansion. It is expected that this multi-
year project will cost $35 million to complete and will open in the Winter of 2019.
CULTURAL CORRIDOR—ART SPACE CITY CENTRE PHASE 2
The Cultural Corridor is comprised of cultural opportunities generally following King
George Boulevard, from City Centre to South Surrey. Phase 1 delivered approximately
2,500 square feet of a 7,500 square foot building in the City Centre as art space that is
operated by the Royal Canadian Theatre Company and Streetrich Hip Hop Society. The
proposal for Phase 2 is to develop additional art space and realize a Creative Hub in City
Centre that will house multiple cultural organizations. Additional art and cultural
opportunities along the Cultural Corridor will engage the artistic community in creating
positive destinations for local residents and visitors.
- 340 -
the future lives here. 2018-2022 Financial Plan
RANKED CAPITAL PROJECTS
FLEETWOOD COMMUNITY CENTRE EXPANSION
The City is investing in an expansion to the Fleetwood Community Centre. New
amenities will include studios and rehearsal space to support programming in
performing and visual arts, new community and recreation amenities and space for
community groups.
FLEETWOOD LIBRARY EXPANSION
The Fleetwood Library expansion will include a silent study room, digital learning
classroom, more space for individual, group study and computer access, a larger
children’s area and a dedicated youth space. Details and timelines are still to be
finalized and the library expansion may be coordinated with an overall expansion to the
current Fleetwood Community Centre.
GRANDVIEW HEIGHTS COMMUNITY CENTRE
Grandview Heights, like Clayton, will be the focus of ongoing development which will
result in continued population growth. To address this growth, a new Community
Centre will be developed near the Grandview Heights Aquatic Centre to provide facilities
and services for recreation and sport, wellness, arts and library services. This new
centre, coupled with the development of a new athletic park, will create a new social,
cultural and recreational hub for the residents of the broader Grandview Heights
community.
GRANDVIEW HEIGHTS LIBRARY
A brand new library to serve the growing population in the Grandview Heights area,
ideally co-located with the existing Grandview Heights Aquatic Centre and a new
community centre.
INDIGENOUS GATHERING PLACE
Indigenous gathering places provide opportunity for people to engage in traditional and
contemporary Indigenous cultural activities such as craftwork, celebration, activism and
collaboration. Spaces like this build community, provide deeper understanding, foster
creative learning and promote Indigenous cultures. The collaborative development of
Indigenous spaces will provide First Nations with employment and entrepreneurial
opportunities.
- 341 -
the future lives here. 2018-2022 Financial Plan
RANKED CAPITAL PROJECTS
MODULAR CHILDCARE SPACES
The City will invest in the development of new childcare spaces through exploration of
building type, modular or traditional, based on construction costs. The City will apply
for upcoming provincial government major capital grants to add to the existing budget.
The goal is to provide childcare for children ages 0-12, with the potential to have a non-
profit organization be a part of the service delivery. The City will circulate a request for
proposals for the design and construction of a modular child care facility and the
location to be explored with the School District or at a recreation site. Currently staff are
researching the costs for modular build and the maximum number of childcare spaces
that can be created within this budget.
MUSEUM EXPANSION
The Museum expansion will address the Museum of Surrey’s functional needs for
gallery, program and work space. The design phase began in 2016, construction started
in 2017 and is expected to be complete in Fall 2018. Included in this expansion will be a
2,500 sf flexible Feature Gallery for local, national and international exhibitions and
programs, a dynamic atrium for community events, and back of house areas including
additional collections storage, a fabrication workshop and office space. In addition, the
Kids Explore Zone will be expanded from 800 sf to 2,000 sf to engage young families in
Surrey in interactive and exciting ways. Additional work has been funded to compliment
the museum expansion, some through Federal Grants. This includes the addition of an
Indigenous Hall, relocation and restoration of the 1881 Town Hall and 1891 Anniedale
School to the site (interiors completed in early 2019), and other campus improvements.
The entire project is anticipated to cost $14.7 million, with $4.74 million coming from the
Federal Government.
NEWTON LIBRARY EXPANSION
The Newton Library expansion will include a silent study room, digital learning
classroom, more space for individual, group study and computer, a larger children’s
area and a dedicated youth space. Details and timelines are still to be studied further as
the existing location may not be a viable option.
NORTH SURREY ARENA REPLACMEENT
The existing North Surrey Arena contains 2 sheets of ice; one of the sheets was built in
1966 and is at the end of its useful life. To ensure that the users of that arena are not
displaced due to a facility failure, it has been necessary to plan and build the
replacement of the 2 sheets prior to closing the existing arena. An additional sheet of
sheet of ice is also being added to meet the growing demand for ice sports and dry floor
use in the City, resulting in a 3 sheet sports complex in South Westminster. The facility
will also include program space, multipurpose and community meeting spaces, food
services and room for further expansion. It is anticipated that the multi-year budget
requirement for this project will be $52 million and will open in the Fall of 2019.
- 342 -
the future lives here. 2018-2022 Financial Plan
RANKED CAPITAL PROJECTS
PERFORMING ARTS CENTRE
To further complement the existing Surrey Arts Centre’s 400 seat theatre and City Hall’s
Centre Stage 200 seat theatre, a new performing arts space is planned in the City. Given
the City’s growth and large geographic area, there is demand for an additional
performing arts space. The initial investment of $10.8 million will support critical land
acquisitions when identified.
RCMP CELL BLOCK/EXHIBIT ENHANCEMENT
The Surrey RCMP Detachment Cellblock and Exhibits areas are rapidly reaching
maximum capacity. Expansion in both areas is required to meet the current and future
operational needs of the Surrey RCMP Detachment. The City has engaged the services of
an architectural firm for the purposes of a feasibility study, needs analysis and high level
costing. DGBK Architects are providing design options to accommodate future growth
projections in the Cellblock and Exhibits areas over the next 10-15 years. It is anticipated
that the design for this expansion will take place in 2018, followed by a 2019
construction start.
RCMP DISTRICT OFFICE RELOCATION
The current District Three (“Newton”) and District Four (“Cloverdale”) Community Police
Offices are leased spaces. The City’s Realty Department is currently negotiating a new
lease for the Newton office and exploring options for the relocation of the Cloverdale
office. This funding will provide for leasehold improvements and relocation expenses.
SOUTH SURREY ART GALLERY AND CAFE
The Surrey Cultural Plan recommends the development of additional gallery space in the
City. An artist-run contemporary gallery and café is proposed to be operated within an
arts organization in the South Surrey area. The Gallery will provide exhibition space, a
collaborative area, and a café to foster the development of the arts community and build
community engagement related to the arts. The space may be integrated into a mixed
use development.
STRAWBERRY HILL HALL/RA NICHOLSON PARK
The Strawberry Hill Hall/RA Nicholson Park project is a combined Parks & Recreation
Services project to renovate Strawberry Hill Hall to accommodate daycare space while
also expanding RA Nicholson Park and providing more outdoor recreation opportunities
for residents in Newton. Strawberry Hill Hall is a heritage listed building and its
renovation and long term retention will be a great benefit.
- 343 -
the future lives here. 2018-2022 Financial Plan
RANKED CAPITAL PROJECTS
YMCA AGREEMENT
The City will contribute to the development of a new YMCA in City Centre. The facility
will include a new pool, fitness centre and community amenities to replace the aging
North Surrey Recreation Centre.
ENGINEERING STRUCTURES
ADDITIONAL PARKING AT GRANDVIEW POOL
The design for the additional parking lot at Grandview Pool is underway, including a
master drainage plan for the Grandview Heights Campus that plans for future facilities in
the precinct.
BIODIVERSITY CONSERVATION PROGRAM
The rollout of the Biodiversity Conservation Program continues as a major component
of the City’s management plans, include the acquisition of land. A funding strategy for
the acquisition program is still in development with implementation anticipated in 2018.
Dedicated staffing is also anticipated in 2018 that will oversee the program’s highest
priority projects.
CLOVERDALE ATHLETIC PARK FIELDHOUSE
The City has been successful in receiving a Federal Grant, allowing the City to Partner
with the Surrey United Soccer Club to construct a new fieldhouse at the Cloverdale
Athletic Park. Design is underway for the fieldhouse, which will include washrooms,
change rooms, community space and office space for Surrey United. The fieldhouse will
further enhance Cloverdale Athletic Park as a sports tournament destination.
DISTRICT ENERGY SYSTEM
Further phases of the district energy network expansion are planned for 2018 to extend
the network east across King George Blvd in order to provide service to the Anthem
Developments project at 102 Ave between King George Blvd and Whalley Blvd. Surrey
City Energy will continue to expand this network in order to add new customers to the
system in step with new development in the City Centre area. District Energy
infrastructure costs are fully recovered from future customers through their rate
structure.
GRANDVIEW HEIGHTS COMMUNITY PARK
Grandview Heights Community Park will be a significant new park in the growing
Grandview Heights neighbourhood. It will build off the existing Grandview Heights
Aquatic Centre and be a focal point for active sports and amenities for residents in the
area. Public consultation will determine many of the final elements but it is expected to
include sports fields, water spray park, a dog off-leash park, sports courts and more.
- 344 -
the future lives here. 2018-2022 Financial Plan
RANKED CAPITAL PROJECTS
HAWTHORNE ROTARY PARK IMPROVEMENTS
Public Consultation is underway to develop the Hawthorne Rotary Park Master Plan.
Proposed improvements will include biodiversity and environmental enhancements,
improved access to the park, new walking trails, a new water park, a destination scale
playground, new washroom building, and new fenced off leash dog area.
NEW ARTIFICIAL TURF FIELDS
Continuing the City’s investment in artificial turf maximizes usage of the City’s sports
fields and lowers operating costs. Funding in 2018 will complete the new artificial turf
field at Cloverdale Athletic Park and also fund upgraded turf surfaces at Tamanawis Park
for field hockey and South Surrey Athletic Park for the Soccer Nationals Tournament.
Total project costs are $4.3 million and these costs are recovered through user fees of
the artificial turf fields. An additional artificial turf field is planned for 2019.
NEWTON ATHLETIC PARK MASTER PLAN
The Newton Athletic Park project is the continued development of the park to create a
regional sport tournament destination as well as a complete destination park for the
rapidly growing community of Newton. Remaining projects include: renovations to the
existing fieldhouse to improve its tournament hosting facilities; development of a
covered artificial practice field; and a new field house on the north end of the park to
provide improved facilities for seniors and sport user groups.
NEWTON URBAN PARK
The Newton Urban Park project will create a central urban park for the Newton Town
Centre including festival and public event spaces. It will encourage and develop place
making opportunities through public art and urban design elements. The multi-year
budget for this project is $3 million.
NICOMEKL RIVERFRONT PARK
The City is achieving a complete park system along the south bank of the Nicomekl River
including three large park sites. A master plan is being developed that will create a
continuous path network through the park system along with opportunities for a boat
launch and other activities along the Nicomekl River. This project is expected to cost
$2.6 million over the next three years.
SURREY NATURE CENTRE IMPROVEMENTS
The Surrey Nature Centre project includes improvements to the parking, entrance area
and outdoor spaces at the Surrey Nature Centre in order to improve its performance and
ability to host large school groups.
- 345 -
the future lives here. 2018-2022 Financial Plan
RANKED CAPITAL PROJECTS
THE GLADES
The City has acquired the 5 acre property to the south of The Glades Park. An update to
the park master plan is completed with parking areas, garden pavilion, new horticultural
areas, events lawn and maintenance area. These improvements will allow the park to
open more frequently and remove parking from the busy 172 Street at the front of the
park. In 2017, the City developed a new parking area. Funding in 2018 and 2019 is
required to complete the master plan. This multi-year project is expected to be $4
million.
EQUIPMENT
PRC EQUIPMENT NEEDS
Items included in the recreation equipment needs request include additional fitness
equipment for the North Surrey Arena & Sport Complex and a new accessible bus. In
addition, preschool programs across the City continue with their equipment upgrading,
along with improvements to facility entrances to ensure a welcoming and consistent
experience for our customers. Improvements also need to be completed for the Main
Stage theatre, gallery signage and equipment at the Surrey Arts Centre.
- 346 -
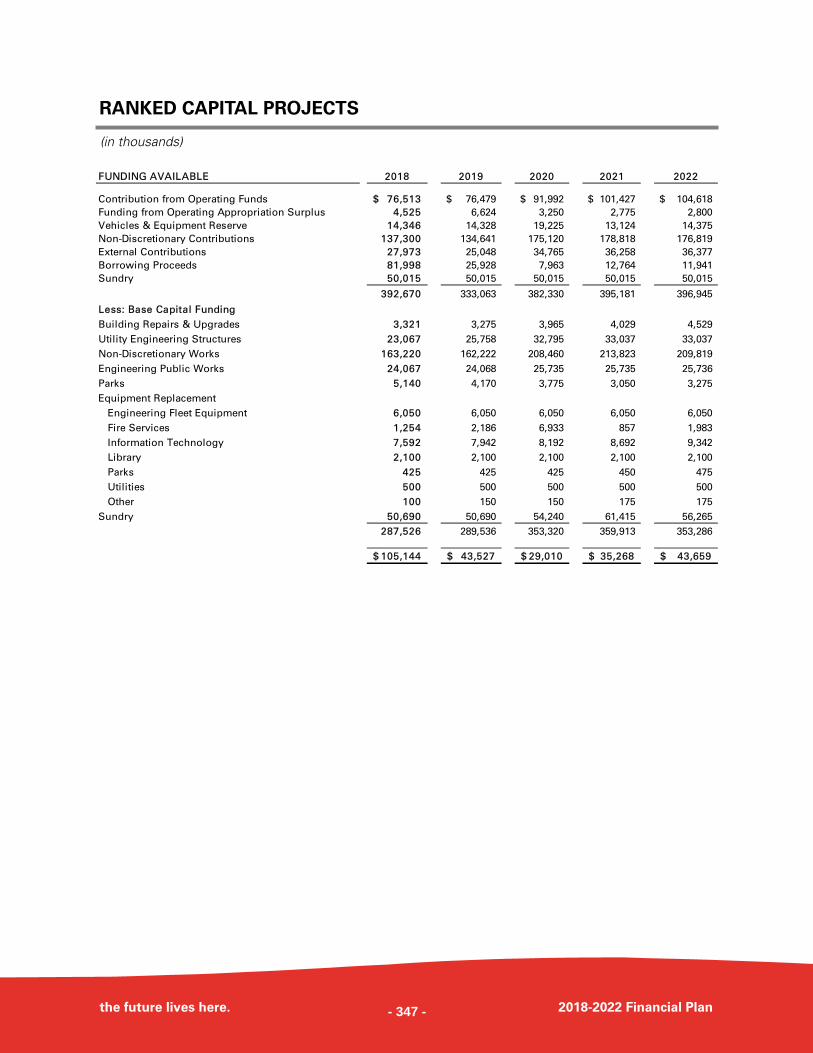
RANKED CAPITAL PROJECTS
the future lives here. 2018-2022 Financial Plan
(in thousands)
FUNDING AVAILABLE 2018 2019 2020 2021 2022
Contribution from Operating Funds 76,513$ 76,479$ 91,992$ 101,427$ 104,618$
Funding from Operating Appropriation Surplus 4,525 6,624 3,250 2,775 2,800
Vehicles & Equipment Reserve 14,346 14,328 19,225 13,124 14,375
Non-Discretionary Contributions 137,300 134,641 175,120 178,818 176,819
External Contributions 27,973 25,048 34,765 36,258 36,377
Borrowing Proceeds 81,998 25,928 7,963 12,764 11,941
Sundry 50,015 50,015 50,015 50,015 50,015
392,670 333,063 382,330 395,181 396,945
Less: Base Capital Funding
Building Repairs & Upgrades 3,321 3,275 3,965 4,029 4,529
Utility Engineering Structures 23,067 25,758 32,795 33,037 33,037
Non-Discretionary Works 163,220 162,222 208,460 213,823 209,819
Engineering Public Works 24,067 24,068 25,735 25,735 25,736
Parks 5,140 4,170 3,775 3,050 3,275
Equipment Replacement
Engineering Fleet Equipment 6,050 6,050 6,050 6,050 6,050
Fire Services 1,254 2,186 6,933 857 1,983
Information Technology 7,592 7,942 8,192 8,692 9,342
Library 2,100 2,100 2,100 2,100 2,100
Parks 425 425 425 450 475
Utilities 500 500 500 500 500
Other 100 150 150 175 175
Sundry 50,690 50,690 54,240 61,415 56,265
287,526 289,536 353,320 359,913 353,286
105,144$ 43,527$ 29,010$ 35,268$ 43,659$
- 347 -
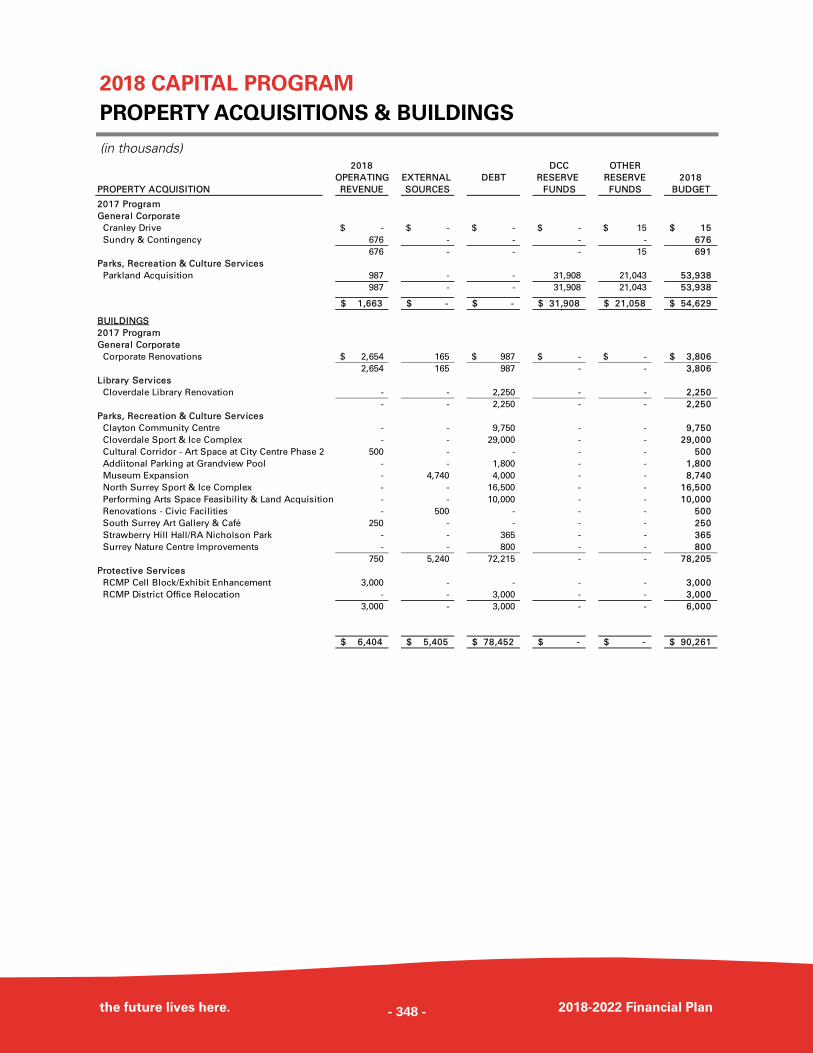
2018 CAPITAL PROGRAM
PROPERTY ACQUISITIONS & BUILDINGS
the future lives here. 2018-2022 Financial Plan
(in thousands) 2018 DCC OTHER
OPERATING EXTERNAL DEBT RESERVE RESERVE 2018
PROPERTY ACQUISITION REVENUE SOURCES FUNDS FUNDS BUDGET
2017 Program
General Corporate
Cranley Drive -$ -$ -$ -$ 15$ 15$
Sundry & Contingency 676 - - - - 676
676 - - - 15 691
Parks, Recreation & Culture Services
Parkland Acquisition 987 - - 31,908 21,043 53,938
987 - - 31,908 21,043 53,938
1,663$ -$ -$ 31,908$ 21,058$ 54,629$ ,
BUILDINGS
2017 Program
General Corporate
Corporate Renovations 2,654$ 165 987$ -$ -$ 3,806$
2,654 165 987 - - 3,806
Library Services
Cloverdale Library Renovation - - 2,250 - - 2,250
- - 2,250 - - 2,250
Parks, Recreation & Culture Services
Clayton Community Centre - - 9,750 - - 9,750
Cloverdale Sport & Ice Complex - - 29,000 - - 29,000
Cultural Corridor - Art Space at City Centre Phase 2 500 - - - - 500
Addiitonal Parking at Grandview Pool - - 1,800 - - 1,800
Museum Expansion - 4,740 4,000 - - 8,740
North Surrey Sport & Ice Complex - - 16,500 - - 16,500
Performing Arts Space Feasibility & Land Acquisition - - 10,000 - - 10,000
Renovations - Civic Facilities - 500 - - - 500
South Surrey Art Gallery & Café 250 - - - - 250
Strawberry Hill Hall/RA Nicholson Park - - 365 - - 365
Surrey Nature Centre Improvements - - 800 - - 800
750 5,240 72,215 - - 78,205
Protective Services
RCMP Cell Block/Exhibit Enhancement 3,000 - - - - 3,000
RCMP District Office Relocation - - 3,000 - - 3,000
3,000 - 3,000 - - 6,000
6,404$ 5,405$ 78,452$ -$ -$ 90,261$
- 348 -
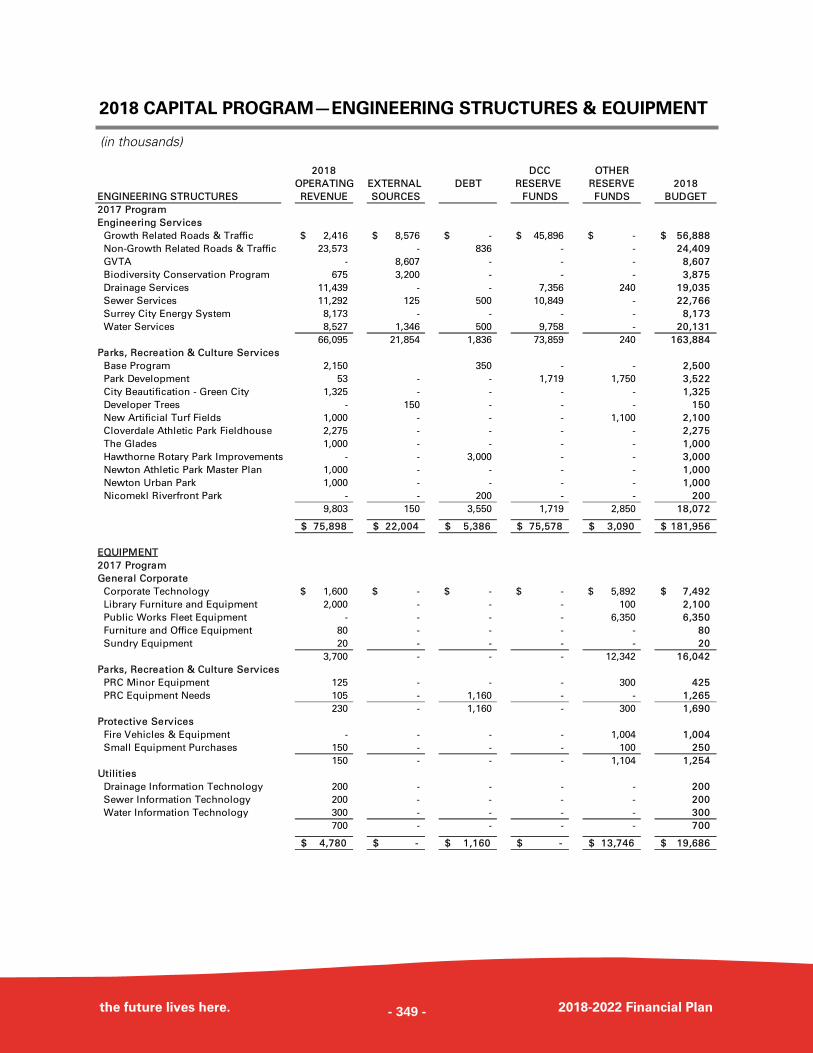
the future lives here. 2018-2022 Financial Plan
2018 CAPITAL PROGRAM—ENGINEERING STRUCTURES & EQUIPMENT
(in thousands)
2018 DCC OTHER
OPERATING EXTERNAL DEBT RESERVE RESERVE 2018
ENGINEERING STRUCTURES REVENUE SOURCES FUNDS FUNDS BUDGET
2017 Program
Engineering Services
Growth Related Roads & Traffic 2,416$ 8,576$ -$ 45,896$ -$ 56,888$
Non-Growth Related Roads & Traffic 23,573 - 836 - - 24,409
GVTA - 8,607 - - - 8,607
Biodiversity Conservation Program 675 3,200 - - - 3,875
Drainage Services 11,439 - - 7,356 240 19,035
Sewer Services 11,292 125 500 10,849 - 22,766
Surrey City Energy System 8,173 - - - - 8,173
Water Services 8,527 1,346 500 9,758 - 20,131
66,095 21,854 1,836 73,859 240 163,884
Parks, Recreation & Culture Services
Base Program 2,150 350 - - 2,500
Park Development 53 - - 1,719 1,750 3,522
City Beautification - Green City 1,325 - - - - 1,325
Developer Trees - 150 - - - 150
New Artificial Turf Fields 1,000 - - - 1,100 2,100
Cloverdale Athletic Park Fieldhouse 2,275 - - - - 2,275
The Glades 1,000 - - - - 1,000
Hawthorne Rotary Park Improvements - - 3,000 - - 3,000
Newton Athletic Park Master Plan 1,000 - - - - 1,000
Newton Urban Park 1,000 - - - - 1,000
Nicomekl Riverfront Park - - 200 - - 200
9,803 150 3,550 1,719 2,850 18,072
75,898$ 22,004$ 5,386$ 75,578$ 3,090$ 181,956$
EQUIPMENT
2017 Program
General Corporate
Corporate Technology 1,600$ -$ -$ -$ 5,892$ 7,492$
Library Furniture and Equipment 2,000 - - - 100 2,100
Public Works Fleet Equipment - - - - 6,350 6,350
Furniture and Office Equipment 80 - - - - 80
Sundry Equipment 20 - - - - 20
3,700 - - - 12,342 16,042
Parks, Recreation & Culture Services
PRC Minor Equipment 125 - - - 300 425
PRC Equipment Needs 105 - 1,160 - - 1,265
230 - 1,160 - 300 1,690
Protective Services
Fire Vehicles & Equipment - - - - 1,004 1,004
Small Equipment Purchases 150 - - - 100 250
150 - - - 1,104 1,254
Utilities
Drainage Information Technology 200 - - - - 200
Sewer Information Technology 200 - - - - 200
Water Information Technology 300 - - - - 300
700 - - - - 700
4,780$ -$ 1,160$ -$ 13,746$ 19,686$
- 349 -
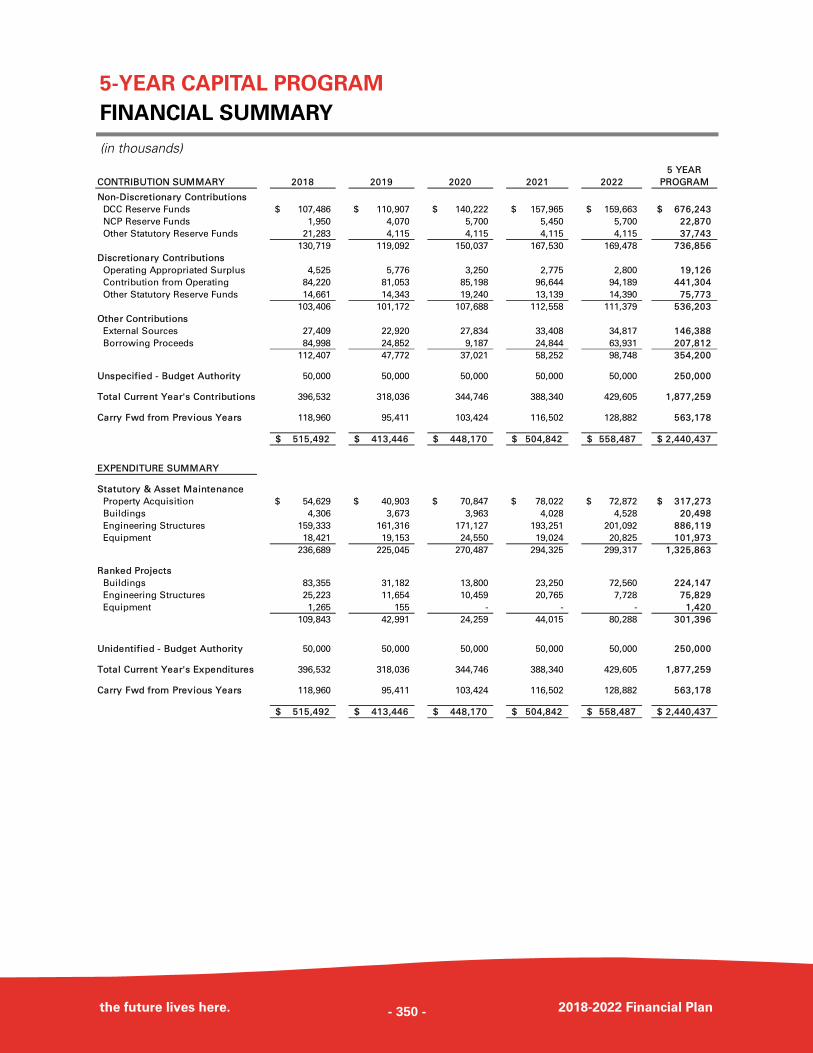
5-YEAR CAPITAL PROGRAM
FINANCIAL SUMMARY
the future lives here. 2018-2022 Financial Plan
(in thousands) 5 YEAR
CONTRIBUTION SUMMARY 2018 2019 2020 2021 2022 PROGRAM
Non-Discretionary Contributions
DCC Reserve Funds 107,486$ 110,907$ 140,222$ 157,965$ 159,663$ 676,243$
NCP Reserve Funds 1,950 4,070 5,700 5,450 5,700 22,870
Other Statutory Reserve Funds 21,283 4,115 4,115 4,115 4,115 37,743
130,719 119,092 150,037 167,530 169,478 736,856
Discretionary Contributions
Operating Appropriated Surplus 4,525 5,776 3,250 2,775 2,800 19,126
Contribution from Operating 84,220 81,053 85,198 96,644 94,189 441,304
Other Statutory Reserve Funds 14,661 14,343 19,240 13,139 14,390 75,773
103,406 101,172 107,688 112,558 111,379 536,203
Other Contributions
External Sources 27,409 22,920 27,834 33,408 34,817 146,388
Borrowing Proceeds 84,998 24,852 9,187 24,844 63,931 207,812
112,407 47,772 37,021 58,252 98,748 354,200
Unspecified - Budget Authority 50,000 50,000 50,000 50,000 50,000 250,000
Total Current Year's Contributions 396,532 318,036 344,746 388,340 429,605 1,877,259
Carry Fwd from Previous Years 118,960 95,411 103,424 116,502 128,882 563,178
515,492$ 413,446$ 448,170$ 504,842$ 558,487$ 2,440,437$
EXPENDITURE SUMMARY
Statutory & Asset Maintenance
Property Acquisition 54,629$ 40,903$ 70,847$ 78,022$ 72,872$ 317,273$
Buildings 4,306 3,673 3,963 4,028 4,528 20,498
Engineering Structures 159,333 161,316 171,127 193,251 201,092 886,119
Equipment 18,421 19,153 24,550 19,024 20,825 101,973
236,689 225,045 270,487 294,325 299,317 1,325,863
Ranked Projects
Buildings 83,355 31,182 13,800 23,250 72,560 224,147
Engineering Structures 25,223 11,654 10,459 20,765 7,728 75,829
Equipment 1,265 155 - - - 1,420
109,843 42,991 24,259 44,015 80,288 301,396
Unidentified - Budget Authority 50,000 50,000 50,000 50,000 50,000 250,000
Total Current Year's Expenditures 396,532 318,036 344,746 388,340 429,605 1,877,259
Carry Fwd from Previous Years 118,960 95,411 103,424 116,502 128,882 563,178
515,492$ 413,446$ 448,170$ 504,842$ 558,487$ 2,440,437$
- 350 -
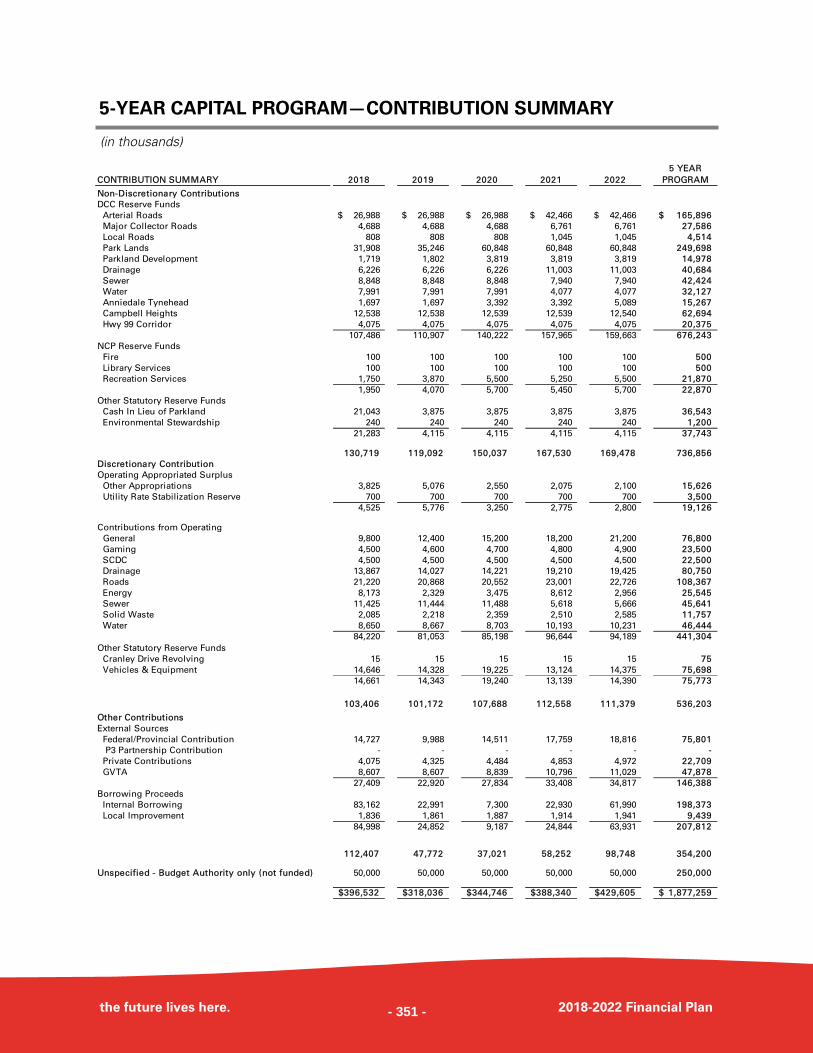
the future lives here. 2018-2022 Financial Plan
5-YEAR CAPITAL PROGRAM—CONTRIBUTION SUMMARY
(in thousands)
5 YEAR
CONTRIBUTION SUMMARY 2018 2019 2020 2021 2022 PROGRAM
Non-Discretionary Contributions
DCC Reserve Funds
Arterial Roads 26,988$ 26,988$ 26,988$ 42,466$ 42,466$ 165,896$
Major Collector Roads 4,688 4,688 4,688 6,761 6,761 27,586
Local Roads 808 808 808 1,045 1,045 4,514
Park Lands 31,908 35,246 60,848 60,848 60,848 249,698
Parkland Development 1,719 1,802 3,819 3,819 3,819 14,978
Drainage 6,226 6,226 6,226 11,003 11,003 40,684
Sewer 8,848 8,848 8,848 7,940 7,940 42,424
Water 7,991 7,991 7,991 4,077 4,077 32,127
Anniedale Tynehead 1,697 1,697 3,392 3,392 5,089 15,267
Campbell Heights 12,538 12,538 12,539 12,539 12,540 62,694
Hwy 99 Corridor 4,075 4,075 4,075 4,075 4,075 20,375
107,486 110,907 140,222 157,965 159,663 676,243
NCP Reserve Funds
Fire 100 100 100 100 100 500
Library Services 100 100 100 100 100 500
Recreation Services 1,750 3,870 5,500 5,250 5,500 21,870
1,950 4,070 5,700 5,450 5,700 22,870
Other Statutory Reserve Funds
Cash In Lieu of Parkland 21,043 3,875 3,875 3,875 3,875 36,543
Environmental Stewardship 240 240 240 240 240 1,200
21,283 4,115 4,115 4,115 4,115 37,743
130,719 119,092 150,037 167,530 169,478 736,856
Discretionary Contribution
Operating Appropriated Surplus
Other Appropriations 3,825 5,076 2,550 2,075 2,100 15,626
Utility Rate Stabilization Reserve 700 700 700 700 700 3,500
4,525 5,776 3,250 2,775 2,800 19,126
Contributions from Operating
General 9,800 12,400 15,200 18,200 21,200 76,800
Gaming 4,500 4,600 4,700 4,800 4,900 23,500
SCDC 4,500 4,500 4,500 4,500 4,500 22,500
Drainage 13,867 14,027 14,221 19,210 19,425 80,750
Roads 21,220 20,868 20,552 23,001 22,726 108,367
Energy 8,173 2,329 3,475 8,612 2,956 25,545
Sewer 11,425 11,444 11,488 5,618 5,666 45,641
Solid Waste 2,085 2,218 2,359 2,510 2,585 11,757
Water 8,650 8,667 8,703 10,193 10,231 46,444
84,220 81,053 85,198 96,644 94,189 441,304
Other Statutory Reserve Funds
Cranley Drive Revolving 15 15 15 15 15 75
Vehicles & Equipment 14,646 14,328 19,225 13,124 14,375 75,698
14,661 14,343 19,240 13,139 14,390 75,773
103,406 101,172 107,688 112,558 111,379 536,203
Other Contributions
External Sources
Federal/Provincial Contribution 14,727 9,988 14,511 17,759 18,816 75,801
P3 Partnership Contribution - - - - - -
Private Contributions 4,075 4,325 4,484 4,853 4,972 22,709
GVTA 8,607 8,607 8,839 10,796 11,029 47,878
27,409 22,920 27,834 33,408 34,817 146,388
Borrowing Proceeds
Internal Borrowing 83,162 22,991 7,300 22,930 61,990 198,373
Local Improvement 1,836 1,861 1,887 1,914 1,941 9,439
84,998 24,852 9,187 24,844 63,931 207,812
112,407 47,772 37,021 58,252 98,748 354,200
Unspecified - Budget Authority only (not funded) 50,000 50,000 50,000 50,000 50,000 250,000
396,532$ 318,036$ 344,746$ 388,340$ 429,605$ 1,877,259$
- 351 -
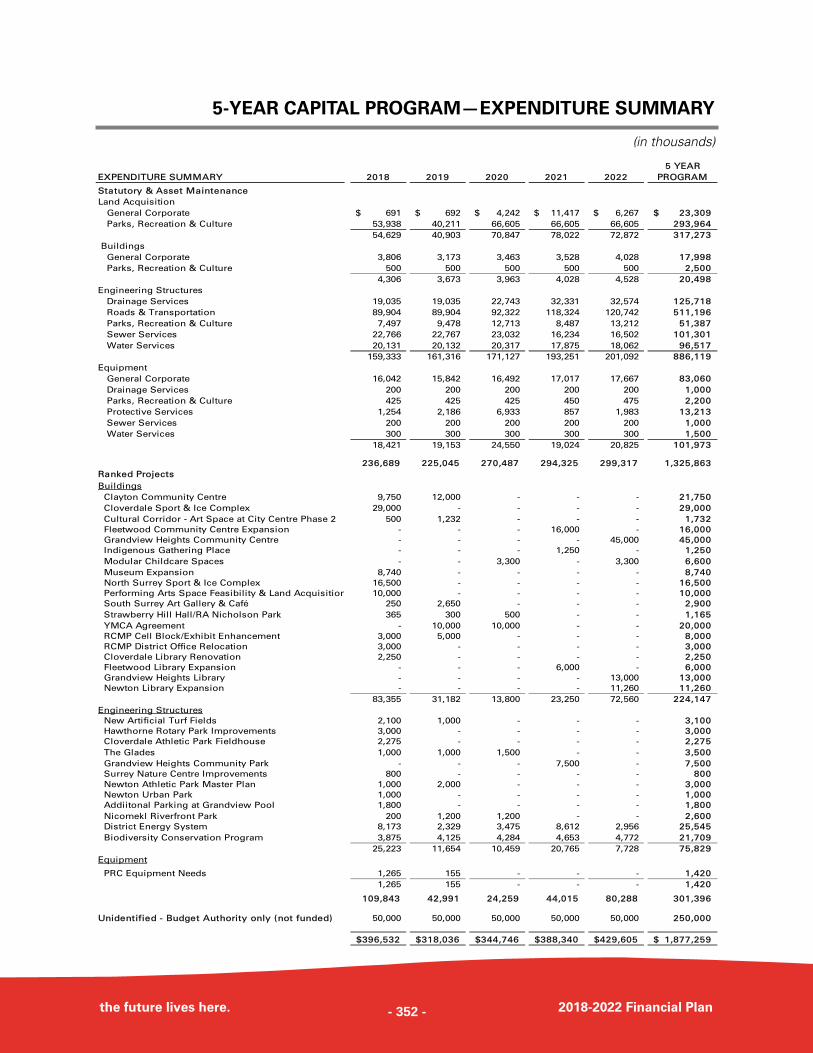
the future lives here. 2018-2022 Financial Plan
5-YEAR CAPITAL PROGRAM—EXPENDITURE SUMMARY
(in thousands)
EXPENDITURE SUMMARY 2018 2019 2020 2021 2022
5 YEAR
PROGRAM
Statutory & Asset Maintenance
Land Acquisition
General Corporate 691$ 692$ 4,242$ 11,417$ 6,267$ 23,309$
Parks, Recreation & Culture 53,938 40,211 66,605 66,605 66,605 293,964
54,629 40,903 70,847 78,022 72,872 317,273
Buildings
General Corporate 3,806 3,173 3,463 3,528 4,028 17,998
Parks, Recreation & Culture 500 500 500 500 500 2,500
4,306 3,673 3,963 4,028 4,528 20,498
Engineering Structures
Drainage Services 19,035 19,035 22,743 32,331 32,574 125,718
Roads & Transportation 89,904 89,904 92,322 118,324 120,742 511,196
Parks, Recreation & Culture 7,497 9,478 12,713 8,487 13,212 51,387
Sewer Services 22,766 22,767 23,032 16,234 16,502 101,301
Water Services 20,131 20,132 20,317 17,875 18,062 96,517
159,333 161,316 171,127 193,251 201,092 886,119
Equipment
General Corporate 16,042 15,842 16,492 17,017 17,667 83,060
Drainage Services 200 200 200 200 200 1,000
Parks, Recreation & Culture 425 425 425 450 475 2,200
Protective Services 1,254 2,186 6,933 857 1,983 13,213
Sewer Services 200 200 200 200 200 1,000
Water Services 300 300 300 300 300 1,500
18,421 19,153 24,550 19,024 20,825 101,973
236,689 225,045 270,487 294,325 299,317 1,325,863
Ranked Projects
Buildings
Clayton Community Centre 9,750 12,000 - - - 21,750
Cloverdale Sport & Ice Complex 29,000 - - - - 29,000
Cultural Corridor - Art Space at City Centre Phase 2 500 1,232 - - - 1,732
Fleetwood Community Centre Expansion - - - 16,000 - 16,000
Grandview Heights Community Centre - - - - 45,000 45,000
Indigenous Gathering Place - - - 1,250 - 1,250
Modular Childcare Spaces - - 3,300 - 3,300 6,600
Museum Expansion 8,740 - - - - 8,740
North Surrey Sport & Ice Complex 16,500 - - - - 16,500
Performing Arts Space Feasibility & Land Acquisition 10,000 - - - - 10,000
South Surrey Art Gallery & Café 250 2,650 - - - 2,900
Strawberry Hill Hall/RA Nicholson Park 365 300 500 - - 1,165
YMCA Agreement - 10,000 10,000 - - 20,000
RCMP Cell Block/Exhibit Enhancement 3,000 5,000 - - - 8,000
RCMP District Office Relocation 3,000 - - - - 3,000
Cloverdale Library Renovation 2,250 - - - - 2,250
Fleetwood Library Expansion - - - 6,000 - 6,000
Grandview Heights Library - - - - 13,000 13,000
Newton Library Expansion - - - - 11,260 11,260
83,355 31,182 13,800 23,250 72,560 224,147
Engineering Structures
New Artificial Turf Fields 2,100 1,000 - - - 3,100
Hawthorne Rotary Park Improvements 3,000 - - - - 3,000
Cloverdale Athletic Park Fieldhouse 2,275 - - - - 2,275
The Glades 1,000 1,000 1,500 - - 3,500
Grandview Heights Community Park - - - 7,500 - 7,500
Surrey Nature Centre Improvements 800 - - - - 800
Newton Athletic Park Master Plan 1,000 2,000 - - - 3,000
Newton Urban Park 1,000 - - - - 1,000
Addiitonal Parking at Grandview Pool 1,800 - - - - 1,800
Nicomekl Riverfront Park 200 1,200 1,200 - - 2,600
District Energy System 8,173 2,329 3,475 8,612 2,956 25,545
Biodiversity Conservation Program 3,875 4,125 4,284 4,653 4,772 21,709
25,223 11,654 10,459 20,765 7,728 75,829
Equipment
PRC Equipment Needs 1,265 155 - - - 1,420
1,265 155 - - - 1,420
109,843 42,991 24,259 44,015 80,288 301,396
Unidentified - Budget Authority only (not funded) 50,000 50,000 50,000 50,000 50,000 250,000
396,532$ 318,036$ 344,746$ 388,340$ 429,605$ 1,877,259$
- 352 -
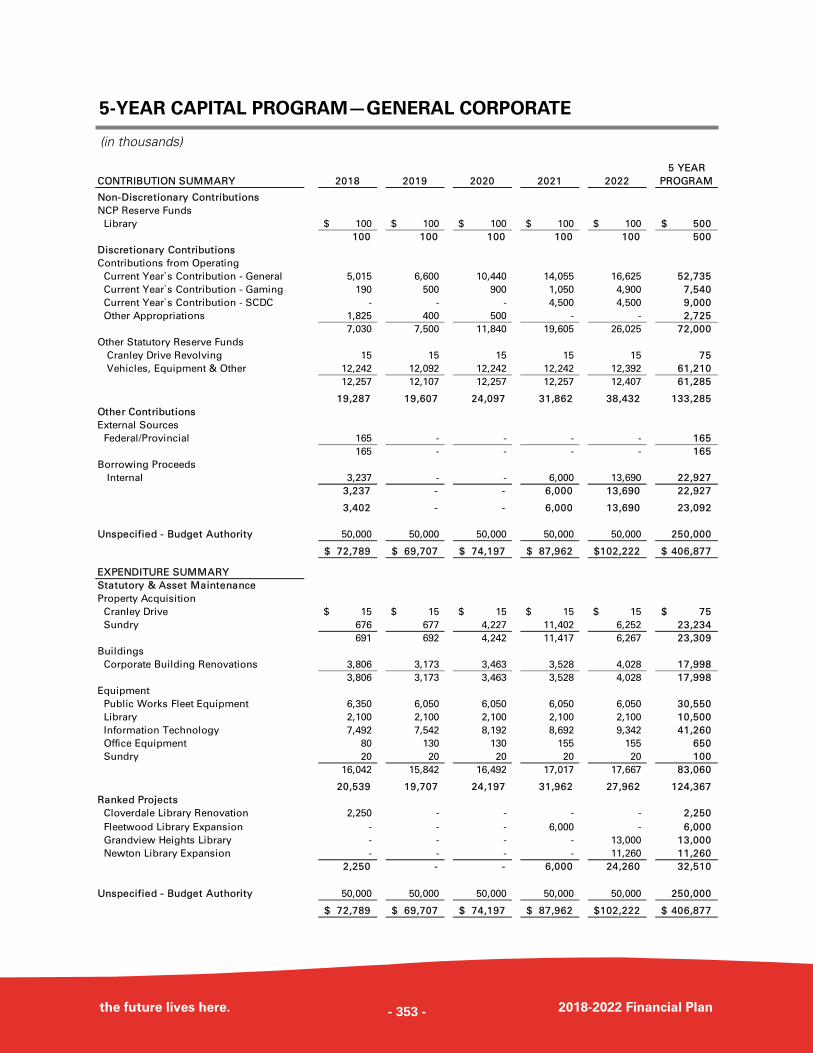
the future lives here. 2018-2022 Financial Plan
5-YEAR CAPITAL PROGRAM—GENERAL CORPORATE
(in thousands)
5 YEAR
CONTRIBUTION SUMMARY 2018 2019 2020 2021 2022 PROGRAM
Non-Discretionary Contributions
NCP Reserve Funds
Library 100$ 100$ 100$ 100$ 100$ 500$
100 100 100 100 100 500
Discretionary Contributions
Contributions from Operating
Current Year`s Contribution - General 5,015 6,600 10,440 14,055 16,625 52,735
Current Year`s Contribution - Gaming 190 500 900 1,050 4,900 7,540
Current Year`s Contribution - SCDC - - - 4,500 4,500 9,000
Other Appropriations 1,825 400 500 - - 2,725
7,030 7,500 11,840 19,605 26,025 72,000
Other Statutory Reserve Funds
Cranley Drive Revolving 15 15 15 15 15 75
Vehicles, Equipment & Other 12,242 12,092 12,242 12,242 12,392 61,210
12,257 12,107 12,257 12,257 12,407 61,285
19,287 19,607 24,097 31,862 38,432 133,285
Other Contributions
External Sources
Federal/Provincial 165 - - - - 165
165 - - - - 165
Borrowing Proceeds
Internal 3,237 - - 6,000 13,690 22,927
3,237 - - 6,000 13,690 22,927
3,402 - - 6,000 13,690 23,092
Unspecified - Budget Authority 50,000 50,000 50,000 50,000 50,000 250,000
72,789$ 69,707$ 74,197$ 87,962$ 102,222$ 406,877$
EXPENDITURE SUMMARY
Statutory & Asset Maintenance
Property Acquisition
Cranley Drive 15$ 15$ 15$ 15$ 15$ 75$
Sundry 676 677 4,227 11,402 6,252 23,234
691 692 4,242 11,417 6,267 23,309
Buildings
Corporate Building Renovations 3,806 3,173 3,463 3,528 4,028 17,998
3,806 3,173 3,463 3,528 4,028 17,998
Equipment
Public Works Fleet Equipment 6,350 6,050 6,050 6,050 6,050 30,550
Library 2,100 2,100 2,100 2,100 2,100 10,500
Information Technology 7,492 7,542 8,192 8,692 9,342 41,260
Office Equipment 80 130 130 155 155 650
Sundry 20 20 20 20 20 100
16,042 15,842 16,492 17,017 17,667 83,060
20,539 19,707 24,197 31,962 27,962 124,367
Ranked Projects
Cloverdale Library Renovation 2,250 - - - - 2,250
Fleetwood Library Expansion - - - 6,000 - 6,000
Grandview Heights Library - - - - 13,000 13,000
Newton Library Expansion - - - - 11,260 11,260
2,250 - - 6,000 24,260 32,510
Unspecified - Budget Authority 50,000 50,000 50,000 50,000 50,000 250,000
72,789$ 69,707$ 74,197$ 87,962$ 102,222$ 406,877$
- 353 -
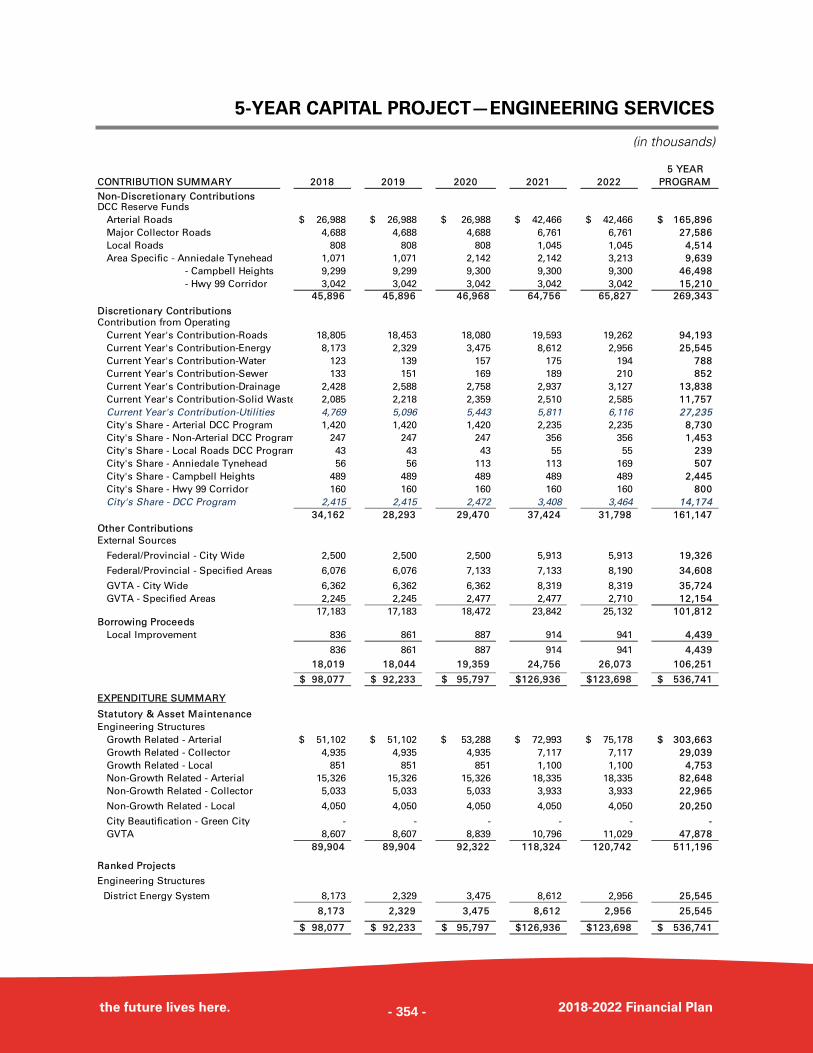
the future lives here. 2018-2022 Financial Plan
5-YEAR CAPITAL PROJECT—ENGINEERING SERVICES
(in thousands)
5 YEAR
CONTRIBUTION SUMMARY 2018 2019 2020 2021 2022 PROGRAM
Non-Discretionary ContributionsDCC Reserve Funds
Arterial Roads 26,988$ 26,988$ 26,988$ 42,466$ 42,466$ 165,896$
Major Collector Roads 4,688 4,688 4,688 6,761 6,761 27,586
Local Roads 808 808 808 1,045 1,045 4,514
Area Specific - Anniedale Tynehead 1,071 1,071 2,142 2,142 3,213 9,639
- Campbell Heights 9,299 9,299 9,300 9,300 9,300 46,498
- Hwy 99 Corridor 3,042 3,042 3,042 3,042 3,042 15,210
45,896 45,896 46,968 64,756 65,827 269,343
Discretionary ContributionsContribution from Operating
Current Year's Contribution-Roads 18,805 18,453 18,080 19,593 19,262 94,193
Current Year's Contribution-Energy 8,173 2,329 3,475 8,612 2,956 25,545
Current Year's Contribution-Water 123 139 157 175 194 788
Current Year's Contribution-Sewer 133 151 169 189 210 852
Current Year's Contribution-Drainage 2,428 2,588 2,758 2,937 3,127 13,838
Current Year's Contribution-Solid Waste 2,085 2,218 2,359 2,510 2,585 11,757
Current Year's Contribution-Utilities 4,769 5,096 5,443 5,811 6,116 27,235
City's Share - Arterial DCC Program 1,420 1,420 1,420 2,235 2,235 8,730
City's Share - Non-Arterial DCC Program 247 247 247 356 356 1,453
City's Share - Local Roads DCC Program 43 43 43 55 55 239
City's Share - Anniedale Tynehead 56 56 113 113 169 507
City's Share - Campbell Heights 489 489 489 489 489 2,445
City's Share - Hwy 99 Corridor 160 160 160 160 160 800
City's Share - DCC Program 2,415 2,415 2,472 3,408 3,464 14,174
34,162 28,293 29,470 37,424 31,798 161,147
Other Contributions
External Sources
Federal/Provincial - City Wide 2,500 2,500 2,500 5,913 5,913 19,326
Federal/Provincial - Specified Areas 6,076 6,076 7,133 7,133 8,190 34,608
GVTA - City Wide 6,362 6,362 6,362 8,319 8,319 35,724
GVTA - Specified Areas 2,245 2,245 2,477 2,477 2,710 12,154
17,183 17,183 18,472 23,842 25,132 101,812 Borrowing Proceeds
Local Improvement 836 861 887 914 941 4,439
836 861 887 914 941 4,439
18,019 18,044 19,359 24,756 26,073 106,251
98,077$ 92,233$ 95,797$ 126,936$ 123,698$ 536,741$
EXPENDITURE SUMMARY
Statutory & Asset Maintenance
Engineering Structures
Growth Related - Arterial 51,102$ 51,102$ 53,288$ 72,993$ 75,178$ 303,663$
Growth Related - Collector 4,935 4,935 4,935 7,117 7,117 29,039
Growth Related - Local 851 851 851 1,100 1,100 4,753
Non-Growth Related - Arterial 15,326 15,326 15,326 18,335 18,335 82,648
Non-Growth Related - Collector 5,033 5,033 5,033 3,933 3,933 22,965
Non-Growth Related - Local 4,050 4,050 4,050 4,050 4,050 20,250
City Beautification - Green City - - - - - -
GVTA 8,607 8,607 8,839 10,796 11,029 47,878
89,904 89,904 92,322 118,324 120,742 511,196
Ranked Projects
Engineering Structures
District Energy System 8,173 2,329 3,475 8,612 2,956 25,545
8,173 2,329 3,475 8,612 2,956 25,545
98,077$ 92,233$ 95,797$ 126,936$ 123,698$ 536,741$
- 354 -
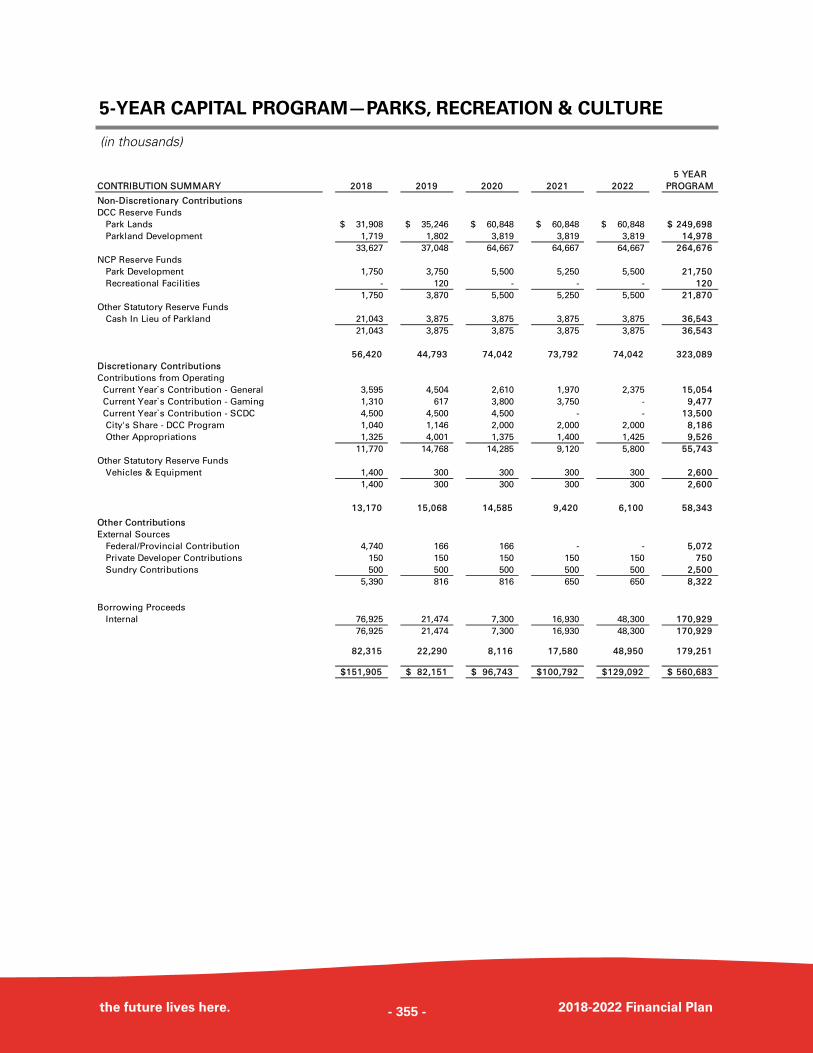
the future lives here. 2018-2022 Financial Plan
5-YEAR CAPITAL PROGRAM—PARKS, RECREATION & CULTURE
(in thousands)
5 YEAR
CONTRIBUTION SUMMARY 2018 2019 2020 2021 2022 PROGRAM
Non-Discretionary Contributions
DCC Reserve Funds
Park Lands 31,908$ 35,246$ 60,848$ 60,848$ 60,848$ 249,698$
Parkland Development 1,719 1,802 3,819 3,819 3,819 14,978
33,627 37,048 64,667 64,667 64,667 264,676
NCP Reserve Funds
Park Development 1,750 3,750 5,500 5,250 5,500 21,750
Recreational Facilities - 120 - - - 120
1,750 3,870 5,500 5,250 5,500 21,870
Other Statutory Reserve Funds
Cash In Lieu of Parkland 21,043 3,875 3,875 3,875 3,875 36,543
21,043 3,875 3,875 3,875 3,875 36,543
56,420 44,793 74,042 73,792 74,042 323,089
Discretionary Contributions
Contributions from Operating
Current Year`s Contribution - General 3,595 4,504 2,610 1,970 2,375 15,054
Current Year`s Contribution - Gaming 1,310 617 3,800 3,750 - 9,477
Current Year`s Contribution - SCDC 4,500 4,500 4,500 - - 13,500
City's Share - DCC Program 1,040 1,146 2,000 2,000 2,000 8,186
Other Appropriations 1,325 4,001 1,375 1,400 1,425 9,526
11,770 14,768 14,285 9,120 5,800 55,743
Other Statutory Reserve Funds
Vehicles & Equipment 1,400 300 300 300 300 2,600
1,400 300 300 300 300 2,600
13,170 15,068 14,585 9,420 6,100 58,343
Other Contributions
External Sources
Federal/Provincial Contribution 4,740 166 166 - - 5,072
Private Developer Contributions 150 150 150 150 150 750
Sundry Contributions 500 500 500 500 500 2,500
5,390 816 816 650 650 8,322
Borrowing Proceeds
Internal 76,925 21,474 7,300 16,930 48,300 170,929
76,925 21,474 7,300 16,930 48,300 170,929
82,315 22,290 8,116 17,580 48,950 179,251
151,905$ 82,151$ 96,743$ 100,792$ 129,092$ 560,683$
- 355 -
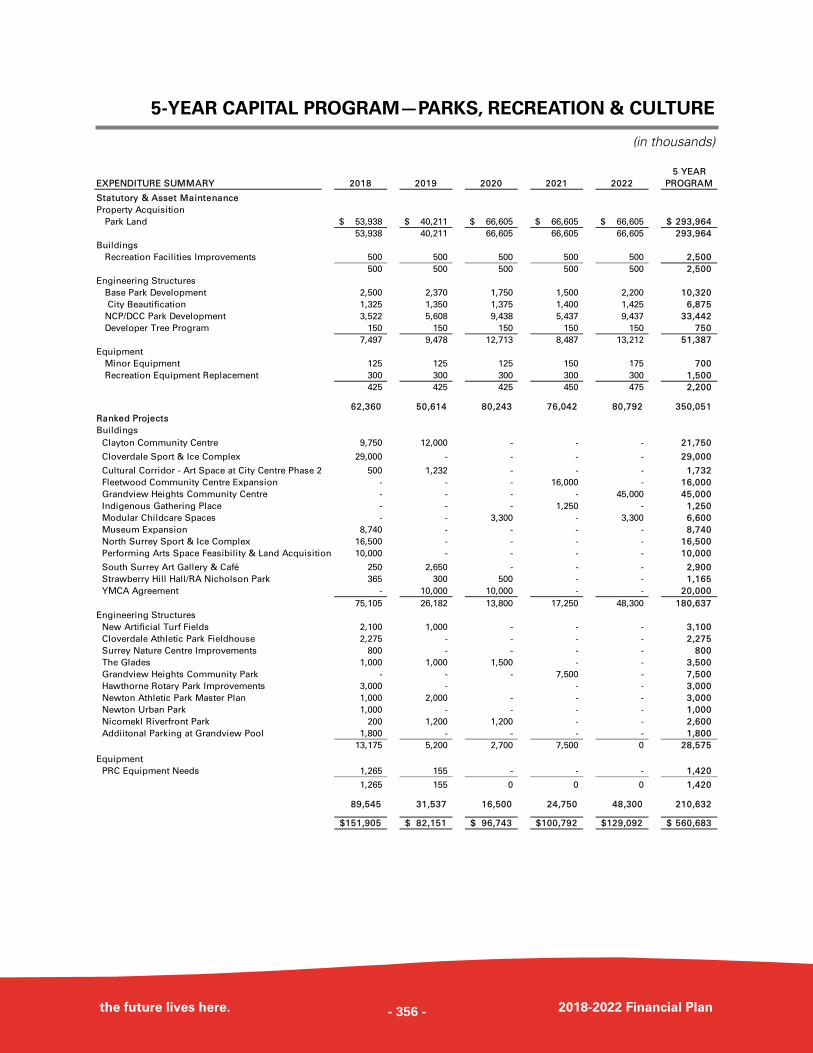
the future lives here. 2018-2022 Financial Plan
5-YEAR CAPITAL PROGRAM—PARKS, RECREATION & CULTURE
(in thousands)
5 YEAR
EXPENDITURE SUMMARY 2018 2019 2020 2021 2022 PROGRAM
Statutory & Asset Maintenance
Property Acquisition
Park Land 53,938$ 40,211$ 66,605$ 66,605$ 66,605$ 293,964$
53,938 40,211 66,605 66,605 66,605 293,964
Buildings
Recreation Facilities Improvements 500 500 500 500 500 2,500
500 500 500 500 500 2,500
Engineering Structures
Base Park Development 2,500 2,370 1,750 1,500 2,200 10,320
City Beautification 1,325 1,350 1,375 1,400 1,425 6,875
NCP/DCC Park Development 3,522 5,608 9,438 5,437 9,437 33,442
Developer Tree Program 150 150 150 150 150 750
7,497 9,478 12,713 8,487 13,212 51,387
Equipment
Minor Equipment 125 125 125 150 175 700
Recreation Equipment Replacement 300 300 300 300 300 1,500
425 425 425 450 475 2,200
62,360 50,614 80,243 76,042 80,792 350,051
Ranked Projects
Buildings
Clayton Community Centre 9,750 12,000 - - - 21,750
Cloverdale Sport & Ice Complex 29,000 - - - - 29,000
Cultural Corridor - Art Space at City Centre Phase 2 500 1,232 - - - 1,732
Fleetwood Community Centre Expansion - - - 16,000 - 16,000
Grandview Heights Community Centre - - - - 45,000 45,000
Indigenous Gathering Place - - - 1,250 - 1,250
Modular Childcare Spaces - - 3,300 - 3,300 6,600
Museum Expansion 8,740 - - - - 8,740
North Surrey Sport & Ice Complex 16,500 - - - - 16,500
Performing Arts Space Feasibility & Land Acquisition 10,000 - - - - 10,000
South Surrey Art Gallery & Café 250 2,650 - - - 2,900
Strawberry Hill Hall/RA Nicholson Park 365 300 500 - - 1,165
YMCA Agreement - 10,000 10,000 - - 20,000
75,105 26,182 13,800 17,250 48,300 180,637
Engineering Structures
New Artificial Turf Fields 2,100 1,000 - - - 3,100
Cloverdale Athletic Park Fieldhouse 2,275 - - - - 2,275
Surrey Nature Centre Improvements 800 - - - - 800
The Glades 1,000 1,000 1,500 - - 3,500
Grandview Heights Community Park - - - 7,500 - 7,500
Hawthorne Rotary Park Improvements 3,000 - - - 3,000
Newton Athletic Park Master Plan 1,000 2,000 - - - 3,000
Newton Urban Park 1,000 - - - - 1,000
Nicomekl Riverfront Park 200 1,200 1,200 - - 2,600
Addiitonal Parking at Grandview Pool 1,800 - - - - 1,800
13,175 5,200 2,700 7,500 0 28,575
Equipment
PRC Equipment Needs 1,265 155 - - - 1,420
1,265 155 0 0 0 1,420
89,545 31,537 16,500 24,750 48,300 210,632
151,905$ 82,151$ 96,743$ 100,792$ 129,092$ 560,683$
- 356 -
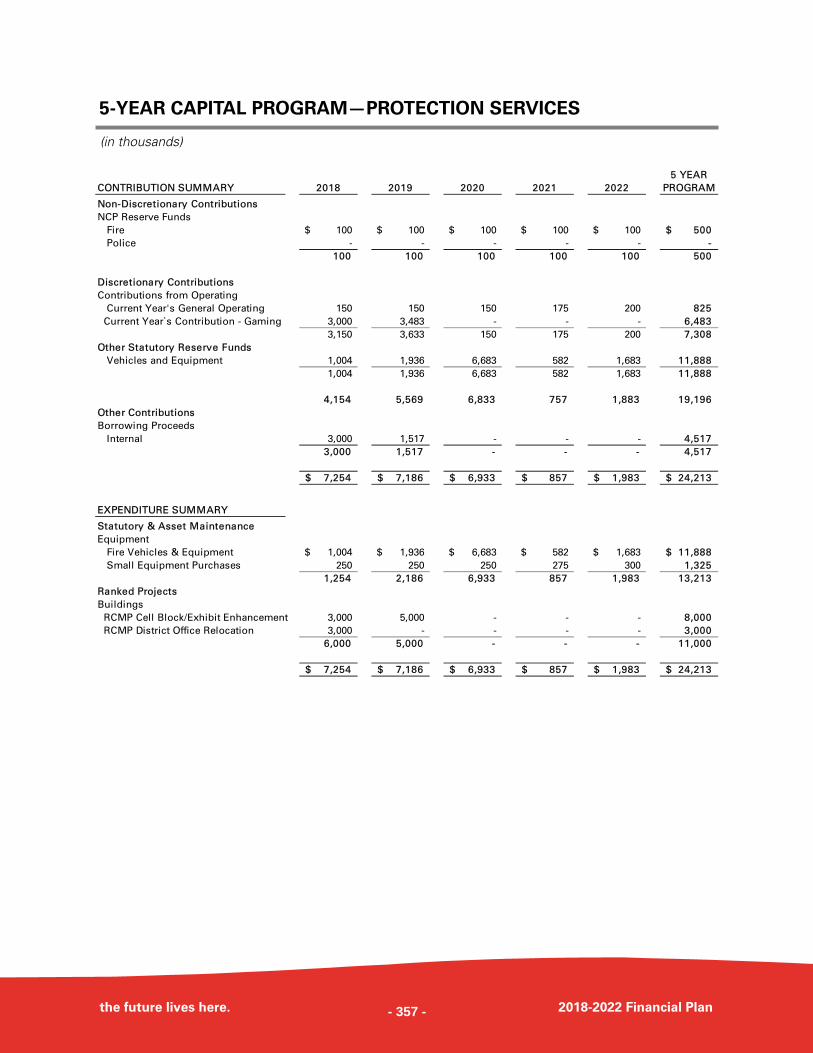
the future lives here. 2018-2022 Financial Plan
5-YEAR CAPITAL PROGRAM—PROTECTION SERVICES
(in thousands)
5 YEAR
CONTRIBUTION SUMMARY 2018 2019 2020 2021 2022 PROGRAM
Non-Discretionary Contributions
NCP Reserve Funds
Fire 100$ 100$ 100$ 100$ 100$ 500$
Police - - - - - -
100 100 100 100 100 500
Discretionary Contributions
Contributions from Operating
Current Year's General Operating 150 150 150 175 200 825
Current Year`s Contribution - Gaming 3,000 3,483 - - - 6,483
3,150 3,633 150 175 200 7,308
Other Statutory Reserve Funds
Vehicles and Equipment 1,004 1,936 6,683 582 1,683 11,888
1,004 1,936 6,683 582 1,683 11,888
4,154 5,569 6,833 757 1,883 19,196
Other Contributions
Borrowing Proceeds
Internal 3,000 1,517 - - - 4,517
3,000 1,517 - - - 4,517
7,254$ 7,186$ 6,933$ 857$ 1,983$ 24,213$
EXPENDITURE SUMMARY
Statutory & Asset Maintenance
Equipment
Fire Vehicles & Equipment 1,004$ 1,936$ 6,683$ 582$ 1,683$ 11,888$
Small Equipment Purchases 250 250 250 275 300 1,325
1,254 2,186 6,933 857 1,983 13,213
Ranked Projects
Buildings
RCMP Cell Block/Exhibit Enhancement 3,000 5,000 - - - 8,000
RCMP District Office Relocation 3,000 - - - - 3,000
6,000 5,000 - - - 11,000
7,254$ 7,186$ 6,933$ 857$ 1,983$ 24,213$
- 357 -
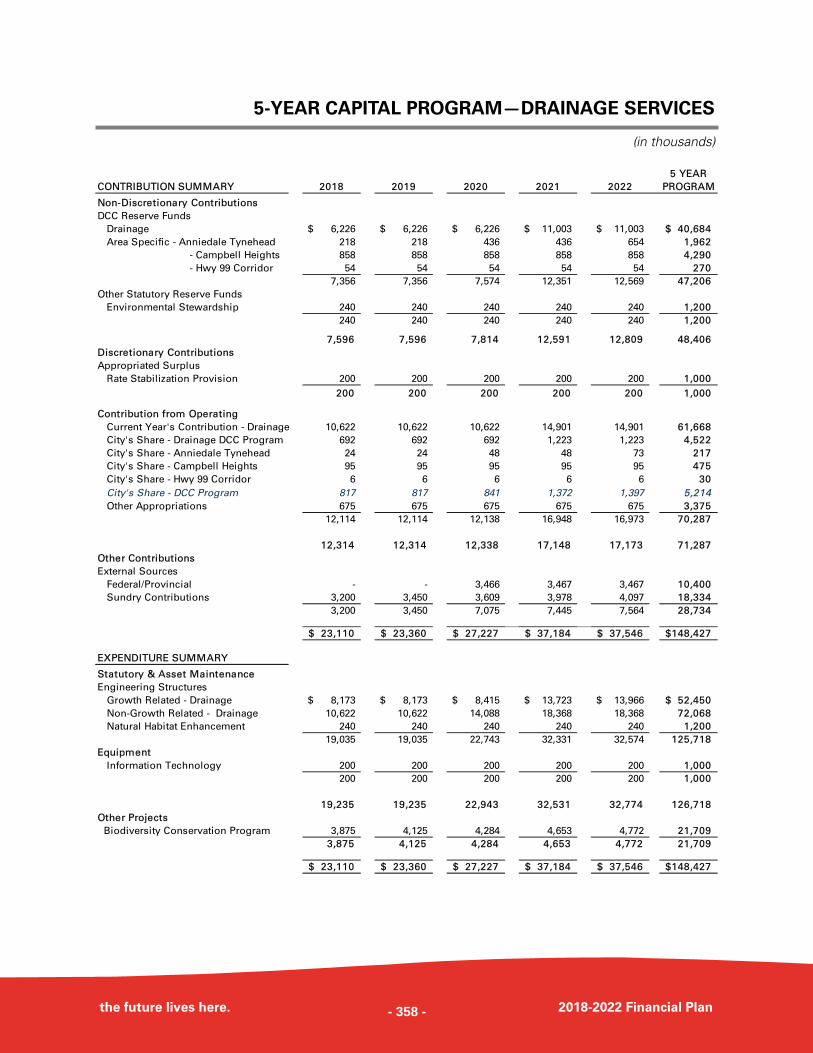
the future lives here. 2018-2022 Financial Plan
5-YEAR CAPITAL PROGRAM—DRAINAGE SERVICES
(in thousands)
5 YEAR
CONTRIBUTION SUMMARY 2018 2019 2020 2021 2022 PROGRAM
Non-Discretionary Contributions
DCC Reserve Funds
Drainage 6,226$ 6,226$ 6,226$ 11,003$ 11,003$ 40,684$
Area Specific - Anniedale Tynehead 218 218 436 436 654 1,962
- Campbell Heights 858 858 858 858 858 4,290
- Hwy 99 Corridor 54 54 54 54 54 270
7,356 7,356 7,574 12,351 12,569 47,206
Other Statutory Reserve Funds
Environmental Stewardship 240 240 240 240 240 1,200
240 240 240 240 240 1,200
7,596 7,596 7,814 12,591 12,809 48,406
Discretionary Contributions
Appropriated Surplus
Rate Stabilization Provision 200 200 200 200 200 1,000
200 200 200 200 200 1,000
Contribution from Operating
Current Year's Contribution - Drainage 10,622 10,622 10,622 14,901 14,901 61,668
City's Share - Drainage DCC Program 692 692 692 1,223 1,223 4,522
City's Share - Anniedale Tynehead 24 24 48 48 73 217
City's Share - Campbell Heights 95 95 95 95 95 475
City's Share - Hwy 99 Corridor 6 6 6 6 6 30
City's Share - DCC Program 817 817 841 1,372 1,397 5,214
Other Appropriations 675 675 675 675 675 3,375
12,114 12,114 12,138 16,948 16,973 70,287
12,314 12,314 12,338 17,148 17,173 71,287
Other Contributions
External Sources
Federal/Provincial - - 3,466 3,467 3,467 10,400
Sundry Contributions 3,200 3,450 3,609 3,978 4,097 18,334
3,200 3,450 7,075 7,445 7,564 28,734
23,110$ 23,360$ 27,227$ 37,184$ 37,546$ 148,427$
EXPENDITURE SUMMARY
Statutory & Asset Maintenance
Engineering Structures
Growth Related - Drainage 8,173$ 8,173$ 8,415$ 13,723$ 13,966$ 52,450$
Non-Growth Related - Drainage 10,622 10,622 14,088 18,368 18,368 72,068
Natural Habitat Enhancement 240 240 240 240 240 1,200
19,035 19,035 22,743 32,331 32,574 125,718
Equipment
Information Technology 200 200 200 200 200 1,000
200 200 200 200 200 1,000
19,235 19,235 22,943 32,531 32,774 126,718
Other Projects
Biodiversity Conservation Program 3,875 4,125 4,284 4,653 4,772 21,709
3,875 4,125 4,284 4,653 4,772 21,709
23,110$ 23,360$ 27,227$ 37,184$ 37,546$ 148,427$
- 358 -
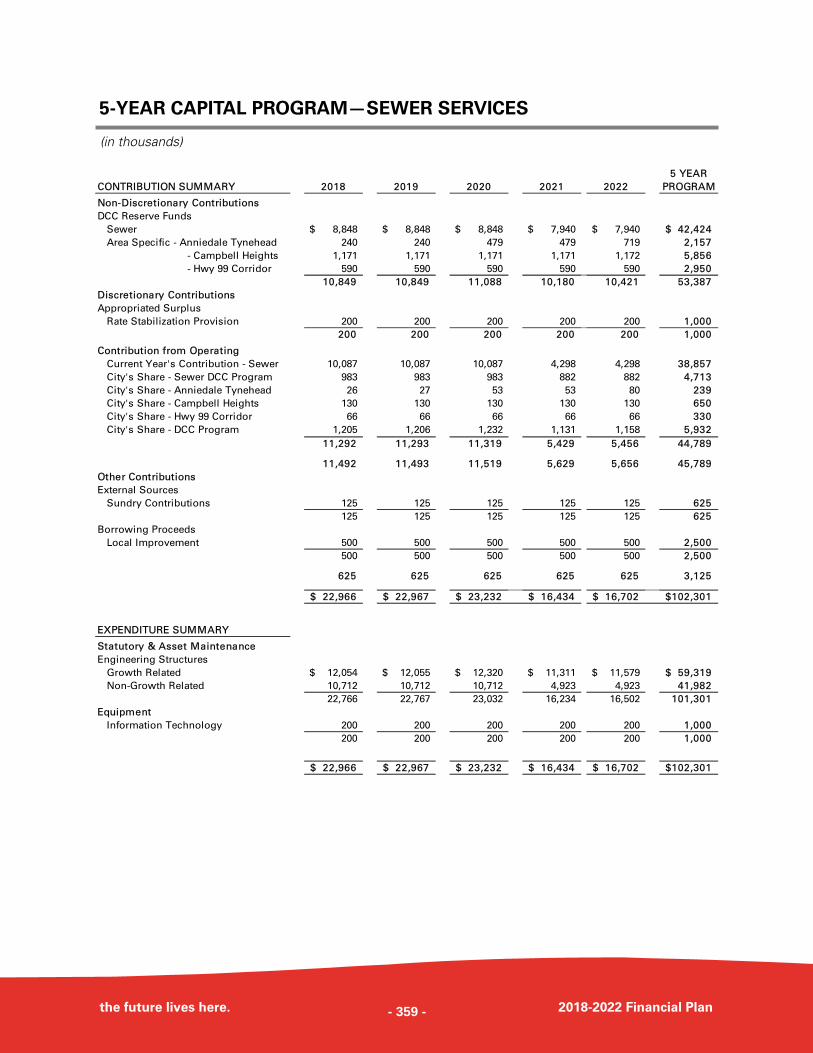
the future lives here. 2018-2022 Financial Plan
5-YEAR CAPITAL PROGRAM—SEWER SERVICES
(in thousands)
5 YEAR
CONTRIBUTION SUMMARY 2018 2019 2020 2021 2022 PROGRAM
Non-Discretionary Contributions
DCC Reserve Funds
Sewer 8,848$ 8,848$ 8,848$ 7,940$ 7,940$ 42,424$
Area Specific - Anniedale Tynehead 240 240 479 479 719 2,157
- Campbell Heights 1,171 1,171 1,171 1,171 1,172 5,856
- Hwy 99 Corridor 590 590 590 590 590 2,950
10,849 10,849 11,088 10,180 10,421 53,387
Discretionary Contributions
Appropriated Surplus
Rate Stabilization Provision 200 200 200 200 200 1,000
200 200 200 200 200 1,000
Contribution from Operating
Current Year's Contribution - Sewer 10,087 10,087 10,087 4,298 4,298 38,857
City's Share - Sewer DCC Program 983 983 983 882 882 4,713
City's Share - Anniedale Tynehead 26 27 53 53 80 239
City's Share - Campbell Heights 130 130 130 130 130 650
City's Share - Hwy 99 Corridor 66 66 66 66 66 330
City's Share - DCC Program 1,205 1,206 1,232 1,131 1,158 5,932
11,292 11,293 11,319 5,429 5,456 44,789
11,492 11,493 11,519 5,629 5,656 45,789
Other Contributions
External Sources
Sundry Contributions 125 125 125 125 125 625
125 125 125 125 125 625
Borrowing Proceeds
Local Improvement 500 500 500 500 500 2,500
500 500 500 500 500 2,500
625 625 625 625 625 3,125
22,966$ 22,967$ 23,232$ 16,434$ 16,702$ 102,301$
EXPENDITURE SUMMARY
Statutory & Asset Maintenance
Engineering Structures
Growth Related 12,054$ 12,055$ 12,320$ 11,311$ 11,579$ 59,319$
Non-Growth Related 10,712 10,712 10,712 4,923 4,923 41,982
22,766 22,767 23,032 16,234 16,502 101,301
Equipment
Information Technology 200 200 200 200 200 1,000
200 200 200 200 200 1,000
22,966$ 22,967$ 23,232$ 16,434$ 16,702$ 102,301$
- 359 -
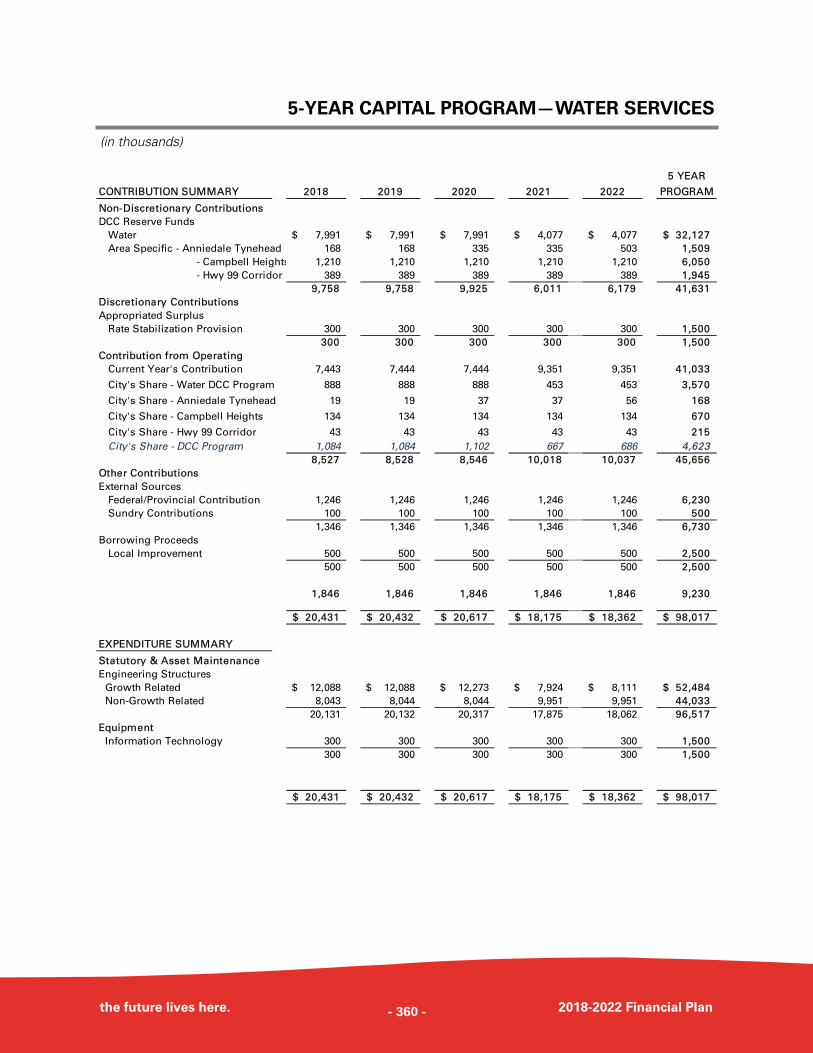
the future lives here. 2018-2022 Financial Plan
5-YEAR CAPITAL PROGRAM—WATER SERVICES
(in thousands)
5 YEAR
CONTRIBUTION SUMMARY 2018 2019 2020 2021 2022 PROGRAM
Non-Discretionary Contributions
DCC Reserve Funds
Water 7,991$ 7,991$ 7,991$ 4,077$ 4,077$ 32,127$
Area Specific - Anniedale Tynehead 168 168 335 335 503 1,509
- Campbell Heights 1,210 1,210 1,210 1,210 1,210 6,050
- Hwy 99 Corridor 389 389 389 389 389 1,945
9,758 9,758 9,925 6,011 6,179 41,631
Discretionary Contributions
Appropriated Surplus
Rate Stabilization Provision 300 300 300 300 300 1,500
300 300 300 300 300 1,500
Contribution from Operating
Current Year's Contribution 7,443 7,444 7,444 9,351 9,351 41,033
City's Share - Water DCC Program 888 888 888 453 453 3,570
City's Share - Anniedale Tynehead 19 19 37 37 56 168
City's Share - Campbell Heights 134 134 134 134 134 670
City's Share - Hwy 99 Corridor 43 43 43 43 43 215
City's Share - DCC Program 1,084 1,084 1,102 667 686 4,623
8,527 8,528 8,546 10,018 10,037 45,656
Other Contributions
External Sources
Federal/Provincial Contribution 1,246 1,246 1,246 1,246 1,246 6,230
Sundry Contributions 100 100 100 100 100 500
1,346 1,346 1,346 1,346 1,346 6,730
Borrowing Proceeds
Local Improvement 500 500 500 500 500 2,500
500 500 500 500 500 2,500
1,846 1,846 1,846 1,846 1,846 9,230
20,431$ 20,432$ 20,617$ 18,175$ 18,362$ 98,017$
EXPENDITURE SUMMARY
Statutory & Asset Maintenance
Engineering Structures
Growth Related 12,088$ 12,088$ 12,273$ 7,924$ 8,111$ 52,484$
Non-Growth Related 8,043 8,044 8,044 9,951 9,951 44,033
20,131 20,132 20,317 17,875 18,062 96,517
Equipment
Information Technology 300 300 300 300 300 1,500
300 300 300 300 300 1,500
20,431$ 20,432$ 20,617$ 18,175$ 18,362$ 98,017$
- 360 -
the future lives here. 2018-2022 Financial Plan
CAPITAL FINANCIAL PLAN BYLAW, 2017, NO. 19411
- 361 -
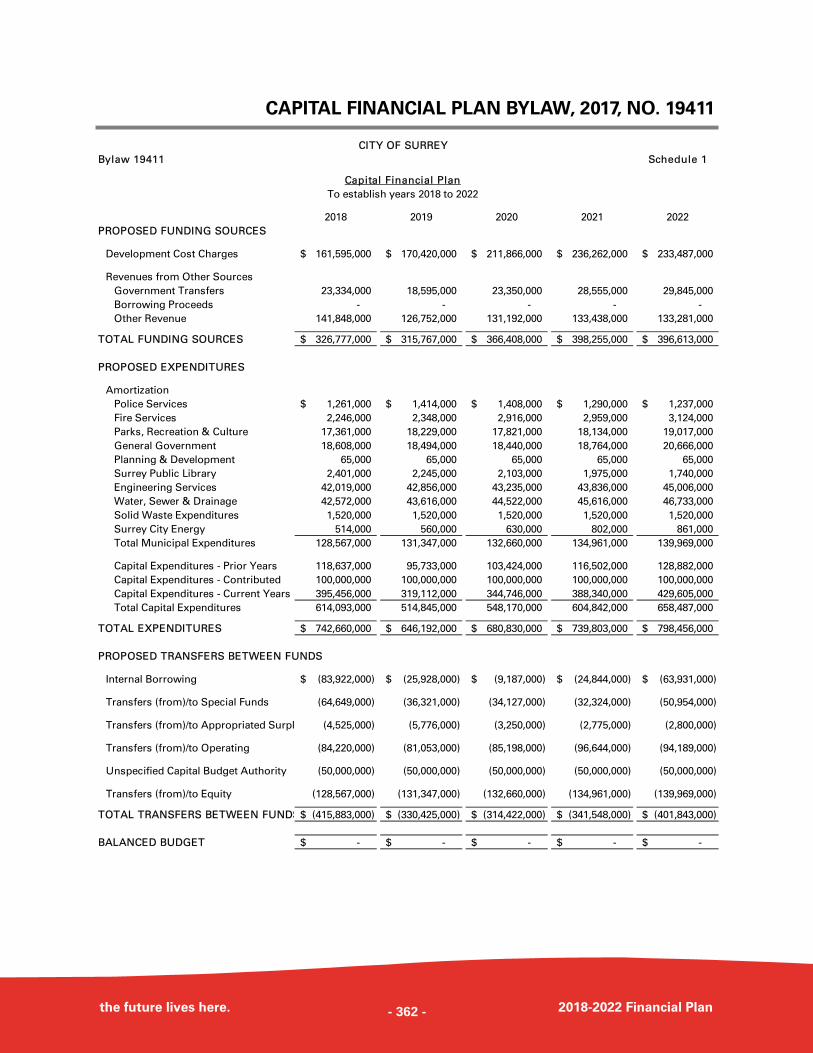
the future lives here. 2018-2022 Financial Plan
CAPITAL FINANCIAL PLAN BYLAW, 2017, NO. 19411
CITY OF SURREY
Bylaw 19411 Schedule 1
Capital Financial Plan
To establish years 2018 to 2022
2018 2019 2020 2021 2022
PROPOSED FUNDING SOURCES
Development Cost Charges 161,595,000$ 170,420,000$ 211,866,000$ 236,262,000$ 233,487,000$
Revenues from Other Sources
Government Transfers 23,334,000 18,595,000 23,350,000 28,555,000 29,845,000
Borrowing Proceeds - - - - -
Other Revenue 141,848,000 126,752,000 131,192,000 133,438,000 133,281,000
TOTAL FUNDING SOURCES 326,777,000$ 315,767,000$ 366,408,000$ 398,255,000$ 396,613,000$
PROPOSED EXPENDITURES
Amortization
Police Services 1,261,000$ 1,414,000$ 1,408,000$ 1,290,000$ 1,237,000$
Fire Services 2,246,000 2,348,000 2,916,000 2,959,000 3,124,000
Parks, Recreation & Culture 17,361,000 18,229,000 17,821,000 18,134,000 19,017,000
General Government 18,608,000 18,494,000 18,440,000 18,764,000 20,666,000
Planning & Development 65,000 65,000 65,000 65,000 65,000
Surrey Public Library 2,401,000 2,245,000 2,103,000 1,975,000 1,740,000
Engineering Services 42,019,000 42,856,000 43,235,000 43,836,000 45,006,000
Water, Sewer & Drainage 42,572,000 43,616,000 44,522,000 45,616,000 46,733,000
Solid Waste Expenditures 1,520,000 1,520,000 1,520,000 1,520,000 1,520,000
Surrey City Energy 514,000 560,000 630,000 802,000 861,000
Total Municipal Expenditures 128,567,000 131,347,000 132,660,000 134,961,000 139,969,000
Capital Expenditures - Prior Years 118,637,000 95,733,000 103,424,000 116,502,000 128,882,000
Capital Expenditures - Contributed 100,000,000 100,000,000 100,000,000 100,000,000 100,000,000
Capital Expenditures - Current Years 395,456,000 319,112,000 344,746,000 388,340,000 429,605,000
Total Capital Expenditures 614,093,000 514,845,000 548,170,000 604,842,000 658,487,000
TOTAL EXPENDITURES 742,660,000$ 646,192,000$ 680,830,000$ 739,803,000$ 798,456,000$
PROPOSED TRANSFERS BETWEEN FUNDS
Internal Borrowing (83,922,000)$ (25,928,000)$ (9,187,000)$ (24,844,000)$ (63,931,000)$
Transfers (from)/to Special Funds (64,649,000) (36,321,000) (34,127,000) (32,324,000) (50,954,000)
Transfers (from)/to Appropriated Surpl (4,525,000) (5,776,000) (3,250,000) (2,775,000) (2,800,000)
Transfers (from)/to Operating (84,220,000) (81,053,000) (85,198,000) (96,644,000) (94,189,000)
Unspecified Capital Budget Authority (50,000,000) (50,000,000) (50,000,000) (50,000,000) (50,000,000)
Transfers (from)/to Equity (128,567,000) (131,347,000) (132,660,000) (134,961,000) (139,969,000)
TOTAL TRANSFERS BETWEEN FUNDS (415,883,000)$ (330,425,000)$ (314,422,000)$ (341,548,000)$ (401,843,000)$
BALANCED BUDGET -$ -$ -$ -$ -$
- 362 -
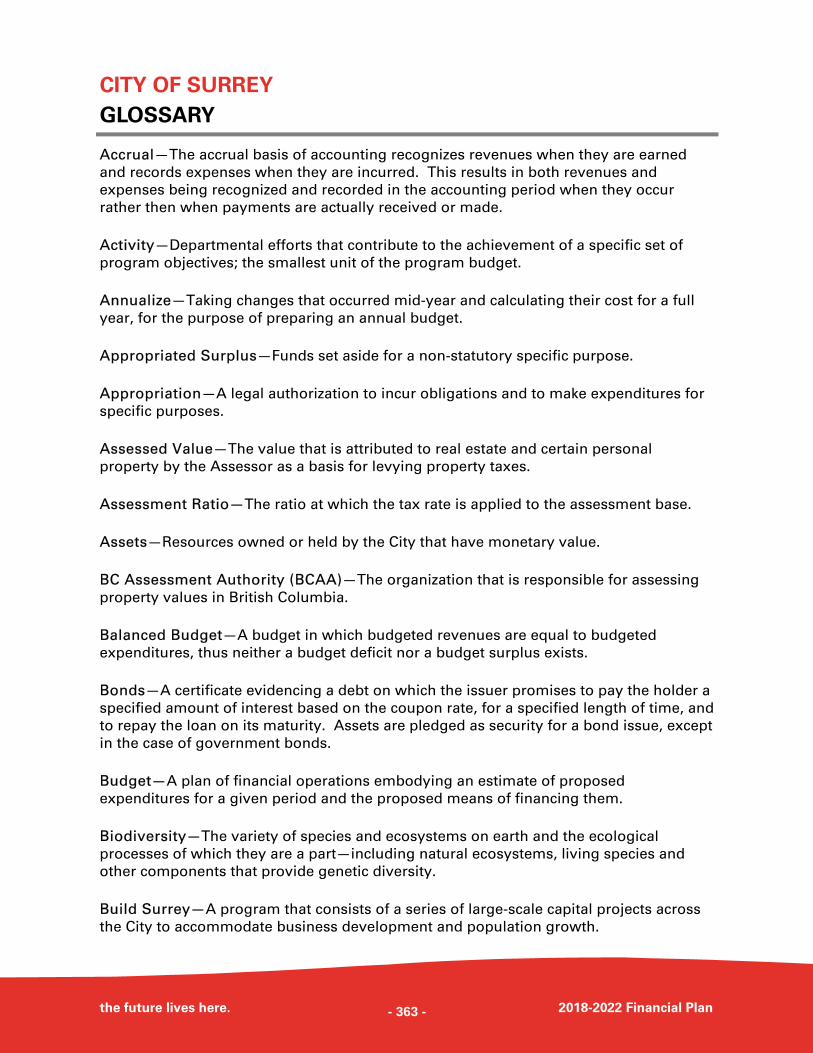
CITY OF SURREY
GLOSSARY
the future lives here. 2018-2022 Financial Plan
Accrual—The accrual basis of accounting recognizes revenues when they are earned
and records expenses when they are incurred. This results in both revenues and
expenses being recognized and recorded in the accounting period when they occur
rather then when payments are actually received or made.
Activity—Departmental efforts that contribute to the achievement of a specific set of
program objectives; the smallest unit of the program budget.
Annualize—Taking changes that occurred mid-year and calculating their cost for a full
year, for the purpose of preparing an annual budget.
Appropriated Surplus—Funds set aside for a non-statutory specific purpose.
Appropriation—A legal authorization to incur obligations and to make expenditures for
specific purposes.
Assessed Value—The value that is attributed to real estate and certain personal
property by the Assessor as a basis for levying property taxes.
Assessment Ratio—The ratio at which the tax rate is applied to the assessment base.
Assets—Resources owned or held by the City that have monetary value.
BC Assessment Authority (BCAA)—The organization that is responsible for assessing
property values in British Columbia.
Balanced Budget—A budget in which budgeted revenues are equal to budgeted
expenditures, thus neither a budget deficit nor a budget surplus exists.
Bonds—A certificate evidencing a debt on which the issuer promises to pay the holder a
specified amount of interest based on the coupon rate, for a specified length of time, and
to repay the loan on its maturity. Assets are pledged as security for a bond issue, except
in the case of government bonds.
Budget—A plan of financial operations embodying an estimate of proposed
expenditures for a given period and the proposed means of financing them.
Biodiversity—The variety of species and ecosystems on earth and the ecological
processes of which they are a part—including natural ecosystems, living species and
other components that provide genetic diversity.
Build Surrey—A program that consists of a series of large-scale capital projects across
the City to accommodate business development and population growth.
- 363 -
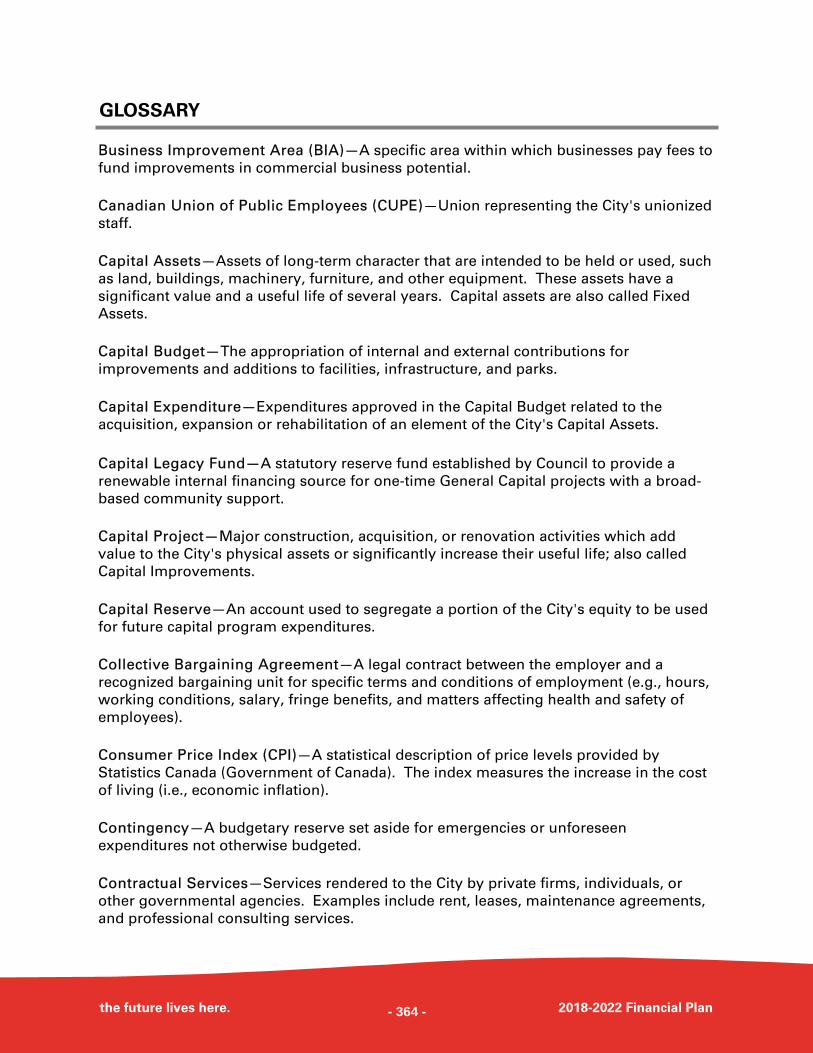
GLOSSARY
the future lives here. 2018-2022 Financial Plan
Business Improvement Area (BIA)—A specific area within which businesses pay fees to
fund improvements in commercial business potential.
Canadian Union of Public Employees (CUPE)—Union representing the City's unionized
staff.
Capital Assets—Assets of long-term character that are intended to be held or used, such
as land, buildings, machinery, furniture, and other equipment. These assets have a
significant value and a useful life of several years. Capital assets are also called Fixed
Assets.
Capital Budget—The appropriation of internal and external contributions for
improvements and additions to facilities, infrastructure, and parks.
Capital Expenditure—Expenditures approved in the Capital Budget related to the
acquisition, expansion or rehabilitation of an element of the City's Capital Assets.
Capital Legacy Fund—A statutory reserve fund established by Council to provide a
renewable internal financing source for one-time General Capital projects with a broad-
based community support.
Capital Project—Major construction, acquisition, or renovation activities which add
value to the City's physical assets or significantly increase their useful life; also called
Capital Improvements.
Capital Reserve—An account used to segregate a portion of the City's equity to be used
for future capital program expenditures.
Collective Bargaining Agreement—A legal contract between the employer and a
recognized bargaining unit for specific terms and conditions of employment (e.g., hours,
working conditions, salary, fringe benefits, and matters affecting health and safety of
employees).
Consumer Price Index (CPI)—A statistical description of price levels provided by
Statistics Canada (Government of Canada). The index measures the increase in the cost
of living (i.e., economic inflation).
Contingency—A budgetary reserve set aside for emergencies or unforeseen
expenditures not otherwise budgeted.
Contractual Services—Services rendered to the City by private firms, individuals, or
other governmental agencies. Examples include rent, leases, maintenance agreements,
and professional consulting services.
- 364 -
GLOSSARY
the future lives here. 2018-2022 Financial Plan
Debt Service—The cost of paying principal and interest on borrowed money according
to a payment schedule.
Deficit—The excess of an entity's liabilities over its assets or the excess of expenditures
over revenues during a single accounting period.
Department—The basic organizational unit of the City, which is functionally unique in its
delivery of services.
Depreciation—Expiration in the service life of Capital Assets attributable to wear and
tear, deterioration, exposure to elements, inadequacy, or obsolescence. It is also known
as amortization.
Development Cost Charges (DCC)—Fees and charges contributed by developers to
support development and growth in the City.
Expenditure—Costs incurred (whether paid or unpaid) for the purpose of acquiring an
asset, service or settling a loss.
External Recoveries—Funds received from other organizations for services provided by
the City and its departments.
Fiscal Year—A twelve-month period designated as the operating year for accounting
and budgeting purposes in an organization.
Full-time equivalent (FTE)—A term expressing the amount of time for which a position
has been budgeted in relation to the amount of time a regular full-time employee
normally works in a year. Most full-time employees (1.00 FTE) are paid either 1,820 or
1,950 hours in a year, depending on their staffing position requirements.
Fund—A fiscal entity with segregated revenues and expenditures, and a specific
purpose or activity.
Gross Domestic Product (GDP)—GDP is the final value of the goods and services
produced within the geographic boundaries of a country during a specified period of
time, normally a year. GDP growth rate is an important indicator of the economic
performance of a country. GDP data was provided by Statistics Canada.
Generally Accepted Accounting Principles (GAAP)—The standards, conventions, and
rules prescribed for the recording of financial transactions and the preparation of
financial statements.
Government Finance Officers Association (GFOA)—GFOA, founded in 1906,
represents public finance officials throughout the United States and Canada.
- 365 -
GLOSSARY
the future lives here. 2018-2022 Financial Plan
Goal—A general, timeless statement of broad direction, purpose , or intent (see
Objective).
Grants—A contribution by a City or other organization to support a particular function,
or endeavour. Grants can be either operational or capital.
Guidepost—See goal.
Greater Vancouver Regional District (GVRD)—GVRD represents a federation of 21
municipalities, one Electoral Area and one Treaty First Nation that collaboratively plans
for and delivers regional-scale services. Its core services are drinking water, wastewater
treatment and solid waste management. They also regulates air quality, plan for urban
growth, manage a regional park system and provide for affordable housing. The regional
district is governed by a Board of Directors of elected officials from each local authority.
As of 2017, the GVRD officially changed their name to Metro Vancouver Reginal District
(MVRD).
Greater Vancouver Sewer & Drainage District (GVS&DD)—GVS & DD is an
organization of member municipalities for the planning and delivery of sanitary sewer
and drainage services.
Greater Vancouver Transit Authority (GVTA)—GVTA is the preceding agency to
Translink, who is the statutory authority responsible for the regional transportation
network of Metro Vancouver, including public transport, major roads and bridges.
Greater Vancouver Water District (GVWD)—GVWD is an organization of member
municipalities for planning and delivery of water services.
Infrastructure—Large-scale, physical assets required for the operation of a society (i.e.,
streets, water, sewer, public buildings, and parks).
Internal Services Recovered—Recovery from one department to another for services
rendered, such as data processing or insurance funded from a control pool. See internal
services used.
Internal Services Used—Charge from one department to another for services rendered.
See internal services recovered.
Long Term Capital Plan (LTCP)—LTCP is the process of budgeting resources for the
future of the City of Surrey’s various long term plans.
Levy—To impose taxes to fund City services.
Long-term Debt—Debt with a maturity of more than one year after the date of issuance.
- 366 -
GLOSSARY
the future lives here. 2018-2022 Financial Plan
Materials and Supplies—Expendable goods necessary to conduct departmental
operations.
Metro Vancouver Regional District (MVRD)—Formally the Greater Vancouver Regional
District, see the glossary definition for Greater Vancouver Regional District (GVRD).
Neighbourhood Concept Plan (NCP)—Part of the City's Official Community Plan, and is
a conceptual framework for proposed development of a neighborhood. It identifies a
pattern of land uses, densities, services and infrastructure.
Objective—Something to be accomplished in specific, well-defined, and measurable
terms and that is achievable within a specific time frame. See goal.
Obligations—Amounts that the City may be legally required to pay. They include not
only actual liabilities, but also encumbrances.
Official Community Plan (OCP)—The City’s primary and governing document under
Bylaw, 2013, No. 18020, that outlines the community’s objectives and the corresponding
policies and maps to guide decisions on planning, land use management, and
development within the area covered by the plan (usually an entire municipality or parts
of a regional district).
Operating Expenditures—The cost of personnel, materials and equipment associated
with the City’s day-to-day operation.
Operating Revenues—Funds that the City receives as income to pay for its day-to-day
operation, including taxes, fees from specific services, interest earnings, and grant
revenues.
Public-Private Partnership (P3)—Public-Private Partnership or P3, is a contractual
arrangement between a public agency (federal, provincial or local) and a private sector
entity. Through this agreement, the skills and assets of each sector (public and private)
are shared in delivering a service or facility for the use of the general public. In addition
to the sharing of resources, each party shares in the risks and rewards potential in the
delivery of the service and/or facility.
Program—A group of related activities performed by one or more organizational units
for the purpose of accomplishing a function for which the City is responsible.
Program Revenue—Revenues earned by a program, including fees for services, license
and permit fees, and fines.
- 367 -
GLOSSARY
the future lives here. 2018-2022 Financial Plan
Public Sector Accounting Board (PSAB)—Sets accounting standards for the public
sector. PSAB serves the public interests by setting standards and guidance with respect
to the reporting of financial and other information.
Riparian Corridor—The habitat immediately adjacent to a river, stream, lake or other
natural body of water.
Royal Canadian Mounted Police (RCMP)—RCMP is the Canadian national police
service and an agency of the Ministry of Public Safety Canada. The RCMP is unique in
the world since it is a national, federal, provincial and municipal policing body. They
provide a total federal policing service to all Canadians and policing services under
contract to the three territories, eight provinces (except Ontario and Quebec), more than
150 municipalities, more than 600 Aboriginal communities and three international
airports.
Revenue—Sources of income used by the City to finance its operations.
South Fraser Perimeter Road (SFPR) —Capital roads project undertaken by the City.
Tax Levy—The total amount to be raised through general property taxes.
Taxes—Compulsory charges levied by the City for the purpose of financing services
performed for the common benefit of its citizens.
Transfers To/From Own Sources—Amounts transferred to/from one fund to another
fund or to/from deferred revenue or reserve accounts.
Triple Bottom Line (TBL) Accounting—While traditional accounting focuses on finding
the least-cost solution in support of decision making, TBL requires that financial costs be
balanced against social and environmental benefits and impacts, i.e., the full costs of a
decision are considered. For example, when considering energy investments, the cost of
investment into new infrastructure will be considered against long-term savings,
reduced greenhouse gas and environmental impacts and access to lower cost energy
for residents.
- 368 -
Related Documents