Phase Three: Sutton Elementary School Closing the Achievement Gap Diagnostic 2018-2019 Phase Three: Closing the Achievement Gap Diagnostic Sutton Elementary School Danna Johnson 2060 Lewis Lane Owensboro, Kentucky, 42301 United States of America Last Modified: 12/27/2018 Status: Open Powered by AdvancED eProve

Welcome message from author
This document is posted to help you gain knowledge. Please leave a comment to let me know what you think about it! Share it to your friends and learn new things together.
Transcript

Phase Three: Sutton Elementary School Closing the Achievement GapDiagnostic 2018-2019
Phase Three: Closing the Achievement Gap Diagnostic
Sutton Elementary School Danna Johnson
2060 Lewis Lane Owensboro, Kentucky, 42301
United States of America
Last Modified: 12/27/2018 Status: Open
Powered by AdvancED eProve

Phase Three: Closing the Achievement Gap Diagnostic Report - Generated on 01/29/2019
Sutton Elementary School
TABLE OF CONTENTS
I. Achievement Gap Group Identification .................................................................................................. 3 II. Achievement Gap Analysis ................................................................................................................... 4 III. Planning the Work ................................................................................................................................ 6 ATTACHMENT SUMMARY....................................................................................................................... 7
Powered by AdvancED eProve
Page 2 of 7

Phase Three: Closing the Achievement Gap Diagnostic Report - Generated on 01/29/2019
Sutton Elementary School
Phase Three: Closing the Achievement Gap Diagnostic
I. Achievement Gap Group Identification
Schools should use a variety of measures and analysis to conduct its annual GAP report pursuant to KRS 158.649. Complete the Achievement Gap Group spreadsheet and attach it. Please see attached Sutton Elementary School Spreadsheet
ATTACHMENTS Please be sure to upload the files in the Attachments section at the end of the diagnostic.
Powered by AdvancED eProve
Page 3 of 7

Phase Three: Closing the Achievement Gap Diagnostic Report - Generated on 01/29/2019
Sutton Elementary School
II. Achievement Gap Analysis
A. Describe the school's climate and culture as they relate to its gap population. Sutton Elementary School completes data analysis on student achievement throughout the school year. Data Action Team meetings occur in September, February and May analyzing assessment data. Data boards are created during the analysis and students are targeted for specific interventions in reading and math that score below the 40th% in MAP. Interventions include researched based reading programs, KCM numeracy interventions, Leveled Literacy Interventions, computer-based literacy and numeracy programs, ESS services through the daytime waiver program, and after-school services. Student progress in interventions is reviewed during our monthly response to intervention meetings with teachers. At those meetings, the team determines to continue interventions or create a new plan based on student progress.
B. Analyzing gap trends and using specific data from the previous two academic years, which gaps has the school successfully closed and which ones persist? Use the work steps below to answer. After analyzing achievement within gap groups in the areas of reading and math, all gap groups perform below the overall score of all students in the areas of reading and math. However, in analyzing our gap group achievements it should be noted that Sutton's gap groups do perform higher than the state's gap groups in the areas of reading and math. In looking at the trend data there are some years where specific gap groups were not reported due to the number of students tested were below ten. However, free and reduced students and students with disabilities data did indicate a drop in achievement from 2017-2018 in the area of reading. Analysis of data indicated transciency within the fourth-grade group and the specific areas of identification is for students with disabilities in reading.
C. Based upon the analysis of the gap data, identify the gap groups and content areas where the school has shown improvement. Based upon analysis, the students with disabilities have shown improvement in the area of math from 2016 to 2018. In 2016, 45% of students with disabilities were scoring proficient or distinguished compared to 47% of students scored proficient or distinguished in 2018.
D. Based upon the analysis of the gap data, identify the gap groups and content areas where the school has lacked progression or regressed. Based upon the analysis, students in the areas of free and reduced lunch and disabilities are scoring significantly below the student group in the area of reading. The free and reduced lunch group scored 46% proficient and distinguished, students with disabilities scored 23.6% proficient and distinguished compared to our overall group which was 66.2% proficient or distinguished in reading.
E. Describe in detail the school's professional development plan and extended school services plan as related to its achievement gaps. (Note: Schools that missed any gap target the previous school year need documentation of superintendent approval of PD and ESS plans as related to achievement gaps. Schools missing the same target two consecutive years will be reported to the local board and the Commissioner of Education, and their school improvement plans will be subject to review and approval by KDE).
Sutton Elementary School completes data analysis on student achievement throughout the school year. Data Action Team meetings occur in September, February and May analyzing assessment data. Data boards after-school during the analysis and students are targeted for specific interventions in reading and math that score below the 40th% in MAP. Interventions include researched based reading programs, KCM numeracy interventions, Leveled Literacy Interventions,
Powered by AdvancED eProve
Page 4 of 7
Phase Three: Closing the Achievement Gap Diagnostic Report - Generated on 01/29/2019
Sutton Elementary School
computer-based literacy and numeracy programs, ESS services through the daytime waiver program, and after-school services. Student progress in interventions is reviewed during our monthly response to intervention meetings with teachers. At those meetings, the team determines to continue interventions or create a new plan based on student progress. This year, kindergarten and first grade teachers are receiving professional development in guided reading instruction with Jan Richardson. Third, fourth and fifth grade teachers are using Wit and Wisdom and are receiving on going professional development throughout the school year. Currently, our district is participated in the Striving Readers' grant which literacy teachers are participating in literacy based professional development. Teachers also participate in job embedded professional development through professional learning community groups.
ATTACHMENTS Please be sure to upload the files in the Attachments section at the end of the diagnostic.
F. Describe the processes, practices and/or conditions that have prevented the school from closing existing and persistent achievement gaps. After analyzing data, all special education teachers that teach resource reading will use Read Well, by Sopris West to teach the foundations of reading. In third, fourth and fifth grades, a new reading program, Wit and Wisdom has been implemented in all literacy classrooms. Transciency and cap size classrooms among students continues to be a problem in third, fourth and fifth grade classrooms. Currently, there are 26 new students and all classrooms in these grade levels are at cap size or higher making it difficult to meet the educational needs of all students.
G. Describe the process used to involve teachers, leaders, and other stakeholders in the continuous improvement and planning process as it relates to closing the achievement gap. List the names and roles of strategic partners involved. All stakeholders are involved in continuous improvement and the planning process as it relates to student achievement. All teachers serve within the response to interventions committee and all teachers participate in Sutton Action Teams: Leadership, Culture, Academics and Student Leadership. Teams meet in vertical team planning in the areas of ELA, math, science and arts and humanities. These teams meet monthly and report back to the faculty as it relates to student achievement. Tiffany Hoffman, Crystal Richards, Mary Booth, Rachael Roberts, Susan Bratcher, Vanessa Gentry, Casey Wallace, Amy Schertzinger, Margaret Douglas, Dita Neely, Melissa Riney, Mandy Walker, Tiffany Smith, Beth Worth, Jaime Quattrocchi, Gina Davis, Victoria Coleman, Carrie Colbert, Jennifer Settle, Monica Huff, Blake Roberts, Vic Harrison, Kim Kingsley, Jamie Self, Krista Thompson, Jennifer Thurman, Lore' North, Jennifer Wells, Sarah Hagan, Melody Hayden, Michelle Whitmer, Renee Guinn, Karen Poe and Amber Bryant.
Powered by AdvancED eProve
Page 5 of 7

Phase Three: Closing the Achievement Gap Diagnostic Report - Generated on 01/29/2019
Sutton Elementary School
III. Planning the Work
Gap Goals List all measurable goals for each identified gap population and content area for the current school year. This percentage should be based on trend data identified in Section II and based on data such as universal screeners, classroom data, ACT, and Response to Intervention (RTI). Content areas should never be combined into a single goal (i.e., Combined reading and math should always be separated into two goals – one for reading and one for math – in order to explicitly focus on strategies and activities tailored to the goal).
Goal 3: Increase the average combined reading and math proficiency ratings for all students in the consolidated gap group from 48.5% in 2018 to 65% by 2022. Objective 1: During the 2018-2019 school year, increase the percentage of gap students scoring proficient or better in reading form 37.6% to 45%. Objective 2: During the 2018-2019 school year, increase the percentage of gap students scoring proficient or better in math from 59.4% to 65%. Please see attachment for strategies and activities
ATTACHMENTS Please be sure to upload the files in the Attachments section at the end of the diagnostic.
Closing the Gap Step 1: Download the Closing the Achievement Gap Summary spreadsheet. Step 2: Complete your findings and answers. Step 3: Upload the Completed Closing the Achievement Gap Plan Summary spreadsheet.
Please see attachment
ATTACHMENTS Please be sure to upload the files in the Attachments section at the end of the diagnostic.
Powered by AdvancED eProve
Page 6 of 7

Phase Three: Closing the Achievement Gap Diagnostic Report - Generated on 01/29/2019
Sutton Elementary School
ATTACHMENT SUMMARY Attachment Name Description Item(s)
Goals for the Gap Groups in Reading andMath
Gap goals III
Sutton Elementary School Gap GroupIdentification Summary Sheet 2018-2019
This is a summary of the gap groups identified at Sutton. III
Powered by AdvancED eProve
Page 7 of 7
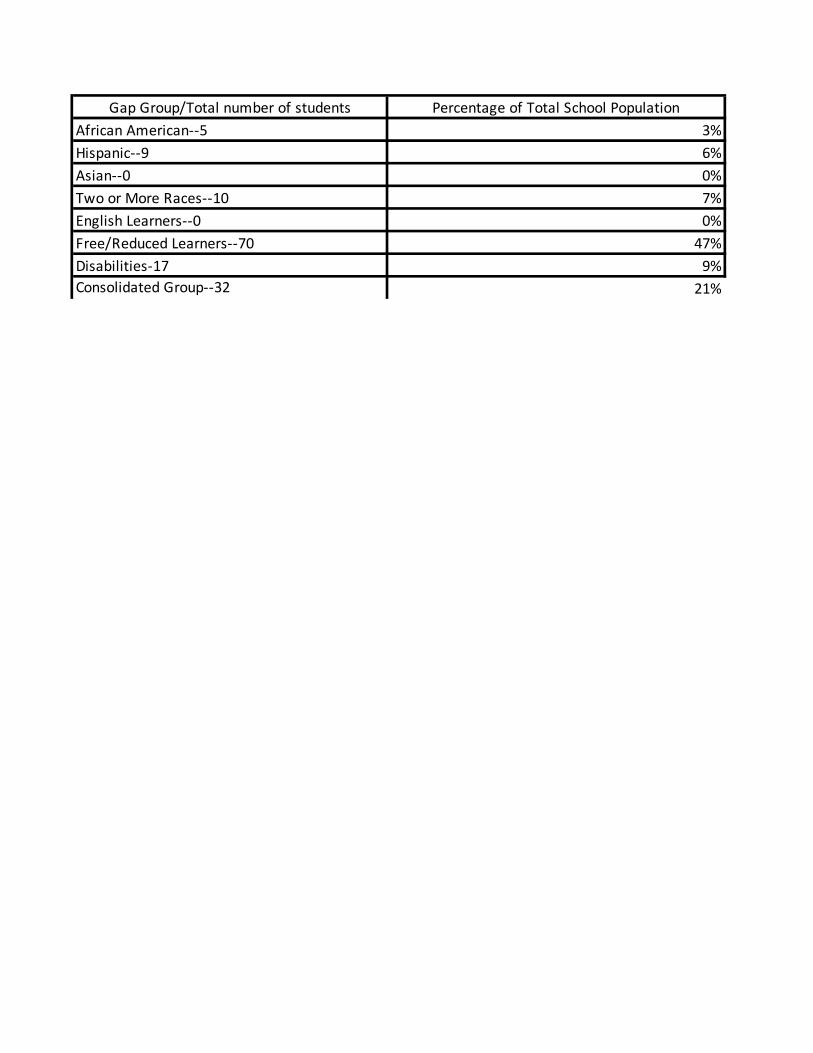
Gap Group/Total number of students Percentage of Total School Population African American--5 3% Hispanic--9 6% Asian--0 0% Two or More Races--10 7% English Learners--0 0% Free/Reduced Learners--70 47% Disabilities-17 9% Consolidated Group--32 21%

Comprehensive Improvement Plan for Schools
Rationale School improvement efforts focus on student needs through a collaborative process involving all stakeholders to establish and address priority needs, district funding, and closing achievement
gaps between identified subgroups of students. Additionally, schools build upon their capacity for high-quality planning by making connections between academic resources and available
funding to address targeted needs.
Operational definitions of each area within the plan Goal: Long-term three to five year target based on Kentucky Board of Education required goals. Schools may supplement with individual or district goals.
Objective: Short-term target to be attained by the end of the current school year.
Strategy: Research-based approach based on the 6 Key Core Work Processes designed to systematically address the process, practice or condition that the district will focus its efforts upon in
order to reach its goals/objectives.
Activity: The actionable steps used to deploy the chosen strategy.
Key Core Work Processes: A series of processes that involve the majority of an organization’s workforce and relate to its core competencies. These are the factors that determine an
organization’s success and help it prioritize areas for growth.
Measure of Success: the criteria that you believe shows the impact of our work. The measures may be quantifiable or qualitative, but they are observable in some way. Without data on what is
being accomplished by our deliberate actions, we have little or no foundation for decision-making or improvement.
Progress Monitoring: is used to assess the plan performance, to quantify a rate of improvement based on goals and objectives, and to evaluate the effectiveness of the plan.
Guidelines for Building an Improvement Plan ● There are 6 required District Goals: Proficiency, Separate Academic Indicator, Achievement Gap Closure, Graduation rate, Growth, and Transition readiness.
● There are 5 required school-level goals:
For elementary/middle school: Proficiency, Separate Academic Indicator, Gap, Growth, and Transition readiness.
For high school: Proficiency, Separate Academic Indicator, Gap, Graduation rate, and Transition readiness.
● There can be multiple objectives for each goal.
● There can be multiple strategies for each objective.
● There can be multiple activities for each strategy.

1: Proficiency Goal Goal 1: Increase the percentage of students scoring proficient or better in combined reading and mathematics from 66.2% in 2018 to 80% by 2022.
Which Strategy will the district use to address this goal? (The
Strategy can be based upon the six Key Core Work Processes listed below or another research-based approach. Provide
justification and/or attach evidence for why the strategy was
chosen.)
● KCWP 1: Design and Deploy Standards
● KCWP 2: Design and Deliver Instruction
● KCWP 3: Design and Deliver Assessment Literacy
● KCWP 4: Review, Analyze and Apply Data
● KCWP 5: Design, Align and Deliver Support
● KCWP 6: Establishing Learning Culture and Environment
Which Activities will the district deploy based on the strategy or strategies
chosen? (The links to the Key Core Work Processes activity bank below may be a helpful resource. Provide a brief explanation or justification for
the activity.
● KCWP1: Design and Deploy Standards Classroom Activities
● KCWP2: Design and Deliver Instruction Classroom Activities
● KCWP3: Design and Deliver Assessment Literacy
Classroom Activities
● KCWP4: Review, Analyze and Apply Data Classroom Activities
● KCWP5: Design, Align and Deliver Support Classroom Activities
● KCWP6: Establishing Learning Culture and Environment
Classroom Activities
In the following chart, identify the timeline for the activity or
activities, the person(s) responsible for ensuring the fidelity
of the activity or activities, and necessary funding to execute
the activity or activities.
Objective Strategy Activities to Deploy Strategy Measure of Success Progress Monitoring Date & Notes Funding
Objective 1: During the 2018-
2019 school year, increase the
percentage of students
scoring proficient or better in
reading from 66.2% to 70%.
● KCWP 1: Design and
Deploy Standards
● Curricular alignment reviews
will be an ongoing action of the
grade level and vertical
planning process
● Grade level teachers will meet
with the curriculum facilitator,
assistant principal and principal
will meet on a bimonthly basis
to curriculum map Kentucky
Common Core Reading
Standards, analyze student
achievement through MAP data
and create learning paths using
EdGenuity and NWEA
Descartes to meet the
individual needs of students in
literacy.
● Vertical content teams will
meet on a monthly basis to
identify instructional gaps,
including planning for
introduction and mastery of
standards.
August 2018
Monthly Team Meetings
PLC Meetings Data Action Teams in
September and February
$3,000.00 Sutton
Title I Monies

● Teachers will provided with
ongoing, job embedded
collaborative professional
development on a weekly,
monthly and quarterly basis:
1. PD days in the school
calendar.
2. PLC meetings on a
monthly basis.
3. Data Action Days in
September and February.
August 2018
Monthly Team Meetings
PLC Meetings Data Action Teams in
September and February
$3,000.00 Sutton
Title I Monies
● KCWP 5: Design, Align ● On a weekly basis, identify August 2018 $0.00 and Deliver Support
●
academic data and non-
cognitive data (attendance
behavior, home problems and
health issues) of all students at
Sutton and engage in solutions
to help decrease barriers to
learning in identified students.
The master schedule will be
●
scrutinized for the most
effective use of time to support
literacy and math instruction
for all grade levels.
The guidance counselor will
August 2018 $0.00
provide weekly instruction to
all students in helping them to
develop the ability to make
good choices and leadership
abilities through The Leader in
Me using the character
education program: Core
Essentials.
August 2018 $42,000.00 SBDM
Allocations
● The Family Resource Center
Director will provide support to
students and families that
carries to learning through the
Back Pack Feeder Program,
Dental Health Clinic, Noon
August 2018 $36,000.00 FRYSC

●
Optimist Vision Support, Alma
Randolph, Building Stronger
Families, Sunrise Services,
River Valley Behavioral Health
and Good Fellows Club.
The curriculum facilitator will
provide job embedded pd, meet
bi weekly with teachers,
analyze students achievement
data and assist teachers in
developing instructional
strategies to meet the needs of
diverse learners.
August 2018 $65,000.00 Title II
and District Funding
● KCWP 2: Design and
Deliver Instruction
● Classroom teachers will
implement effective student
grouping methods to address
differentiated reading
instruction based on diagnosed
student level needs from the
beginning of the year, mid-
year, and end of the year data.
August 2018 $0.00
● Teachers will use the following
literacy resources to support
literacy instruction: Kentucky
Common Core Standards,
EdGenuity, Guided Reading
with Jan Richardson, Phonics
Instruction with Michael
Haggerty, Accelerated Reading
Program, Wit and Wisdom,
Fountas and Pinnell Phonics,
Open Court Phonics, Kentucky
Reading Support Coach,
Scholastic Read Aloud
materials, Lucy Calkins
Writing Curriculum, Striving
August 2018 $18,000.00 District
Reading Initiative
Monies

● KCWP 6: Establishing
Learning Culture and
Environment
Readers Grant, Professional
Development
● The district gifted and talented
specialist will work with
students identified in gifted and
talented areas and the primary
talent pool to meet the
individual needs of students.
● Ensure that technology
instructional needs are met,
equipment updated and
equipment is being used
throughout the building( iPads,
Chromebooks, I Macs,
Proximas, Smart Boards, etc.)
The following web based
programs are used to integrate
elementary curriculum:
Learning A to Z, Eureka Math,
Raz Kids, Edgenuity, Star
Literacy, DIBELS, Footsteps to
Brilliance, Accelerated Reader,
Moby Max, SumDog, Zearn,
Dream Box, and Brain Pop.
● Personalized Learning for
students-Sutton Elementary
will provide personalized
learning to all students
though development of
learning, teaching,
leadership and management
and community engagement.
August 2018
August 2018
August 2018
$6,800.00 District
Funding
$13,000.00
designated
technology SBDM
allocations
$1,000.00 SBDM
monies

● 1. Teachers will work with
student to take full
ownership of their learning.
● 2.Sutton Elementary
teachers will engage in high
quality teaching practices
that engage, motivate,
explain and challenge
students to take ownership of
their learning.
● 3. Sutton Elementary will
foster a culture of leadership
that will enable teachers to
facilitate change in Sutton.
Leadership opportunities
will include the following:
Data Team, Leader in Me
Lighthouse Team,
Leadership Action Teams,
Academic Committee,
Student Conduct Action
Teams, Academic
Committee, Student Conduct
Team, Scheduling Team and
Facilities and Resources
Team.
● 4. Sutton students will begin
to learn to take ownership of
their career and college
readiness goals through the
Leader in Me, Sutton
Leadership Day, Career Day,
and visiting colleges in our
region. Students will also
have the opportunity to have
leadership roles within the
school and classroom.
● Encourage teaching staff to
participate in the TELL
August 2018 $0.00

Survey, encourage families
to complete FRC/Title I
Needs Assessment Surveys,
and develop surveys for
students, and community
members to participate in.
The Leadership and data
teams will analyze the
results and communicate
those results to stakeholders.
● The Sutton staff and
Lighthouse Teams will
identify first steps in creating
a welcoming environment
for students, their families
and the community.
August 2018 $0.00
● Grade Level Information
Meetings: At the beginning
of the school year, parents
will have the opportunity to
meet with grade level
teachers and learn about
grade level expectations and
the Kentucky Core
Standards. Parents will also
learn about the support
services offered through the
Family Resource Center and
guidance office.
August 2018 $250.00 Title I
Monies
● The Family Resource
Director will plan monthly
parent meetings and
activities to encourage
parents to be active partners
in their child’s education: AR Night, Harvest Hustle,
All Pro Dads, Storybook
August 2018 $3,500.00 FRYSC
and Sutton SBDM
monies

Christmas, Literacy Night,
and Math Nights.
● Student Agenda books and
homework folders will
bridge communication with
school and parents.
August 2018 $1, 600.00 Title I
and Title I Parent
Involvement Monies

Objective 2:
During the 2018-2019 school
year, increase the percentage
of students scoring proficient
or better in math from 66.2%
to 70%.
● KCWP 3: Design and
Deliver Assessment
Literacy
● Grade level and vertical
teams will analyze
curriculum, MAP data, and
K-Prep data to identify
learning gaps in the areas of
literacy and make necessary
adjustments to the
curriculum.
● Vertical Literacy Team will
analyze Sutton’s writing
policy and program to
determine if plans should be
revised or updated.
● Analyze student
achievement by gap groups
according to state, district
and school assessments in
the area of literacy.
● Analyzing and making
ongoing modifications to
instruction based on
formative and summative
data. through this analysis
teachers will develop
intervention strategies that
are research based and will
meet the needs of individual
students.
August 2018
Monthly Vertical Team Planning
Meetings
August 2018
August 2018
Monthly Vertical Team Planning
August 2018
$0.00
$0.00
$3,000.00 Title I
Monies
$1,000.00 Title I
Monies

● KCWP 1: Design and
Deploy Standards
● KCWP 5: Design, Align
and Deliver Support
● Curricular alignment reviews
will be ongoing action of the
grade level and vertical
planning process.
● Grade level teachers will
meet with the curriculum
facilitator and principal on a
bimonthly basis to
curriculum map Kentucky
Common Core Reading
standards, analyze student
achievement through MAP
data and creating learning
paths using Edgenuity and
NWEA Descartes to meet
the individual needs of
students in literacy.
● Vertical content teams will
meet on a monthly basis to
identify instructional gaps,
including planning for
introduction an mastery of
standards.
August 2018
Monthly Team Meetings
PLC Meetings
Data Action Teams in September and
February
August 2018
August 2018
$3,000.00 Sutton
Title I Monies
$0.00
$0.00
● Teachers will be provided
with ongoing, job embedded
collaborative professional
development on a weekly,
monthly, and quarterly basis:
1. PD days in the school
calendar
2. PLC meeting days on a
monthly basis
August 2018
Monthly Team Meetings
PLC Meetings
PLC Meetings
Data Action Teams in September and
February
$5,000.00 Title I
Monies
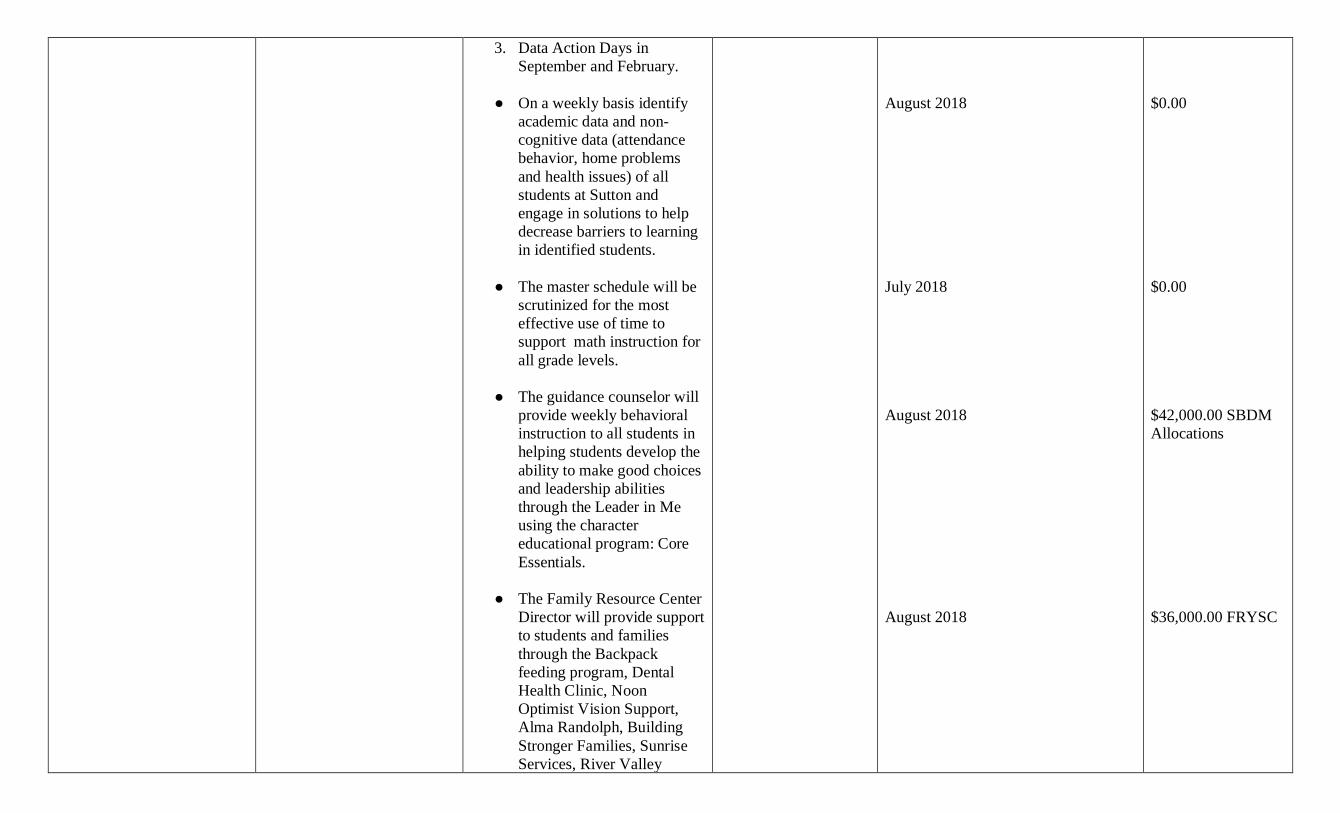
3. Data Action Days in
September and February.
● On a weekly basis identify
academic data and non-
cognitive data (attendance
behavior, home problems
and health issues) of all
students at Sutton and
engage in solutions to help
decrease barriers to learning
in identified students.
August 2018 $0.00
● The master schedule will be
scrutinized for the most
effective use of time to
support math instruction for
all grade levels.
● The guidance counselor will
July 2018 $0.00
provide weekly behavioral
instruction to all students in
helping students develop the
ability to make good choices
and leadership abilities
through the Leader in Me
using the character
educational program: Core
Essentials.
● The Family Resource Center
August 2018 $42,000.00 SBDM
Allocations
Director will provide support
to students and families
through the Backpack
feeding program, Dental
Health Clinic, Noon
Optimist Vision Support,
Alma Randolph, Building
Stronger Families, Sunrise
Services, River Valley
August 2018 $36,000.00 FRYSC
Behavioral Health and
Goodfellows Club.
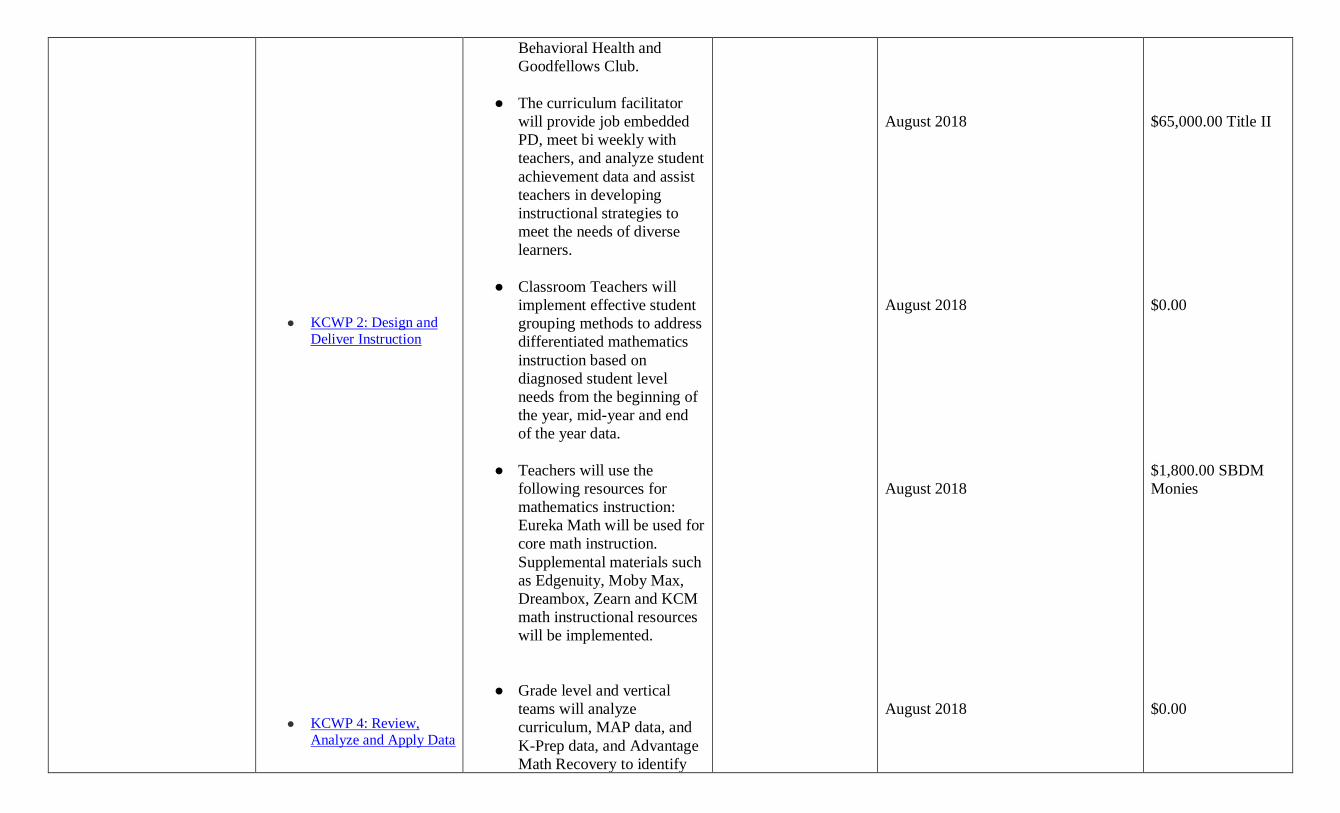
● The curriculum facilitator
will provide job embedded
PD, meet bi weekly with
teachers, and analyze student
achievement data and assist
teachers in developing
instructional strategies to
meet the needs of diverse
learners.
● Classroom Teachers will
August 2018 $65,000.00 Title II
● KCWP 2: Design and
Deliver Instruction
implement effective student
grouping methods to address
differentiated mathematics
instruction based on
diagnosed student level
needs from the beginning of
the year, mid-year and end
of the year data.
● Teachers will use the
August 2018 $0.00
$1,800.00 SBDM
following resources for
mathematics instruction:
Eureka Math will be used for
core math instruction.
Supplemental materials such
as Edgenuity, Moby Max,
Dreambox, Zearn and KCM
math instructional resources
will be implemented.
August 2018 Monies
● Grade level and vertical
● KCWP 4: Review,
Analyze and Apply Data
teams will analyze
curriculum, MAP data, and
K-Prep data, and Advantage
Math Recovery to identify
August 2018 $0.00
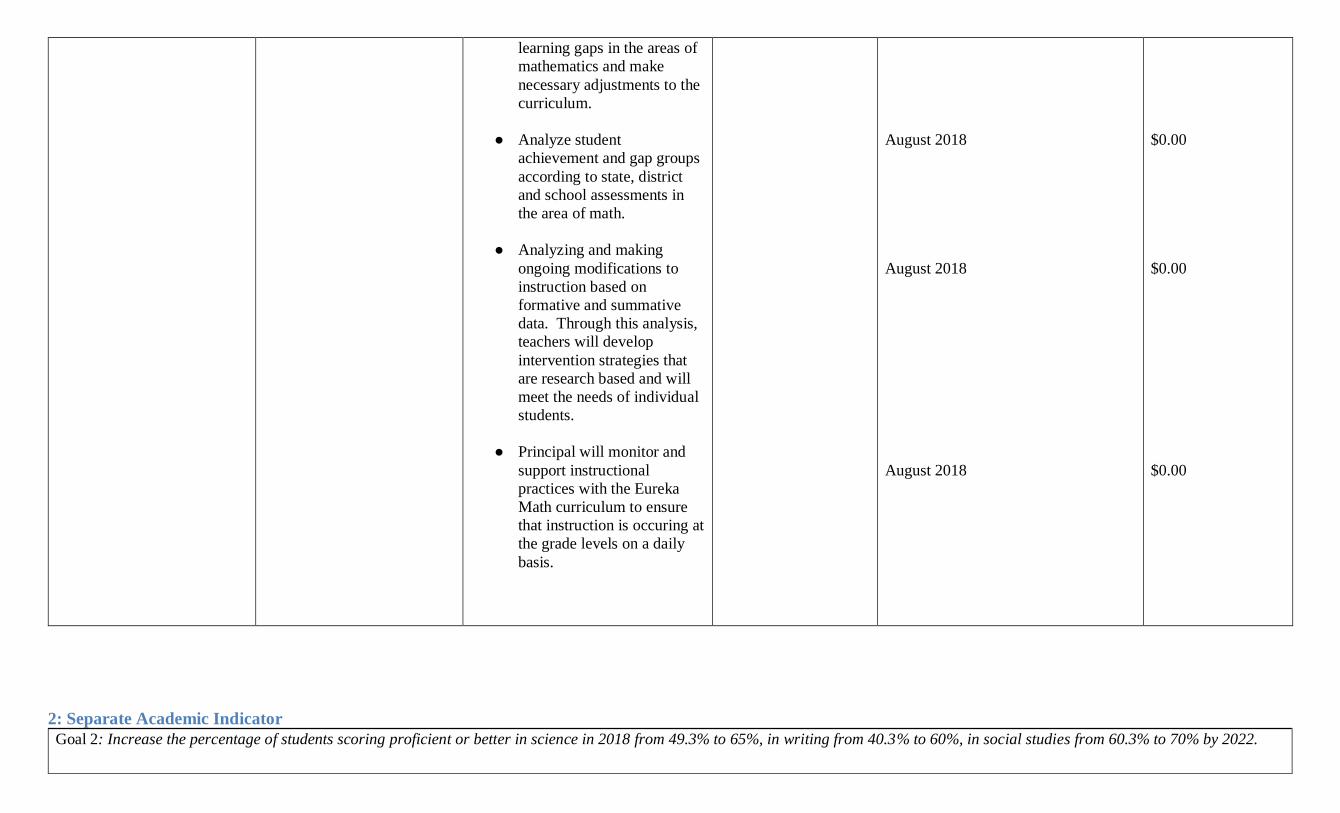
learning gaps in the areas of
mathematics and make
necessary adjustments to the
curriculum.
● Analyze student
achievement and gap groups
according to state, district
and school assessments in
the area of math.
● Analyzing and making
August 2018 $0.00
ongoing modifications to
instruction based on
formative and summative
data. Through this analysis,
teachers will develop
intervention strategies that
are research based and will
meet the needs of individual
students.
● Principal will monitor and
August 2018 $0.00
support instructional
practices with the Eureka
Math curriculum to ensure
that instruction is occuring at
the grade levels on a daily
basis.
August 2018 $0.00
2: Separate Academic Indicator
Goal 2: Increase the percentage of students scoring proficient or better in science in 2018 from 49.3% to 65%, in writing from 40.3% to 60%, in social studies from 60.3% to 70% by 2022.

Which Strategy will the district use to address this goal? (The Strategy can be based upon the six Key Core Work Processes
listed below or another research-based approach. Provide
justification and/or attach evidence for why the strategy was
chosen.)
● KCWP 1: Design and Deploy Standards
● KCWP 2: Design and Deliver Instruction
● KCWP 3: Design and Deliver Assessment Literacy
● KCWP 4: Review, Analyze and Apply Data
● KCWP 5: Design, Align and Deliver Support
● KCWP 6: Establishing Learning Culture and Environment
Which Activities will the district deploy based on the strategy or strategies
chosen? (The links to the Key Core Work Processes activity bank below
may be a helpful resource. Provide a brief explanation or justification for
the activity.
● KCWP1: Design and Deploy Standards Classroom Activities
● KCWP2: Design and Deliver Instruction Classroom Activities
● KCWP3: Design and Deliver Assessment Literacy
Classroom Activities
● KCWP4: Review, Analyze and Apply Data Classroom Activities
● KCWP5: Design, Align and Deliver Support Classroom Activities
● KCWP6: Establishing Learning Culture and Environment
Classroom Activities
In the following chart, identify the timeline for the activity or
activities, the person(s) responsible for ensuring the fidelity
of the activity or activities, and necessary funding to execute
the activity or activities.
Objective Strategy Activities to Deploy Strategy Measure of Success Progress Monitoring Date & Notes Funding
Objective 1: During the 2018-
2019 school year, increase the
percentage of students
scoring proficient or better in
science from 49.3% to 55%.
● KCWP 1: Design and
Deploy Standards ● Curricular alignment reviews
will be on ongoing action of
the grade level and the
vertical planning process.
● Vertical content teams will
meet on a bi monthly basis to
identify instructional gaps
including planning for
introduction and mastery of
standards.
● Teachers will be provided
with ongoing, job embedded
collaborative professional
development during the
school year.
● The curriculum facilitator
will provide job embedded
pd with teachers, analyze
student achievement data
and assist teachers in
developing instructional
strategies to meet the needs
of diverse learners.
August 2018
Monthly Team meetings
PLC Meetings, Data Action Teams in
September and February
August 2018
August 2018
August 2018
$3,000.00 SBDM
Monies
$0.00
$0.00
$0.00

Objective 2: During the 2018-
2019 school year, increase the
percentage of students
scoring proficient in writing
from 40.3% to 45%.
● KCWP 2: Design and
Deliver Instruction
● Teachers will use the
following resources to
support science instruction :
Kentucky Common Core
Standards, Owensboro
Public Schools Science
Continuum.
August 2018 $0.00
● KCWP 1: Design and
Deploy Standards ● Curricular alignment reviews
will be on ongoing action of
the grade level and the
vertical planning process.
● Vertical content teams will
meet on a bi monthly basis to
identify instructional gaps
including planning for
introduction and mastery of
standards.
August 2018 $3,000.00 SBDM
Monies
● Teachers will be provided
with ongoing, job embedded
collaborative professional
development during the
school year.
August 2018 $0.00
● The curriculum facilitator
will provide job embedded
pd with teachers, analyze
student achievement data
and assist teachers in
developing instructional
strategies to meet the needs
of diverse learners.
August 2018 $0.00

● KCWP 2: Design and
Deliver Instruction Teachers will use the following
resources to support science
instruction : Kentucky Common
Core Standards, Owensboro Public
Schools Writing Continuum and the
Sutton Elementary Writing Policy
August 2018 $0.00
Objective 3: During the 2018-
2019 school year, increase the
percentage of students
scoring proficient in social
studies 60.3% to 65%.
● KCWP 1: Design and
Deploy Standards ● Curricular alignment reviews
will be on ongoing action of
the grade level and the
vertical planning process.
● Vertical content teams will
meet on a bi monthly basis to
identify instructional gaps
including planning for
introduction and mastery of
standards
● Teachers will be provided
with ongoing, job embedded
collaborative professional
development during the
school year.
● The curriculum facilitator
will provide job embedded
pd with teachers, analyze
student achievement data
and assist teachers in
developing instructional
strategies to meet the needs
of diverse learners.
August 2018
August 2018
August 2018
August 2018
$3,000.00 SBDM
Monies
$0.00
$0.00
$0.00

● KCWP 2: Design and
Deliver Instruction Teachers will use the following
resources to support science
instruction : Kentucky Common
Core Standards, Owensboro Public
Schools Social Studies Continuum,
August 2018 $0.00

3: Gap
Goal 3: Increase the average combined reading and math proficiency ratings for all students in the consolidated gap group from 48.5% in 2018 to 65% by 2022.
Which Strategy will the district use to address this goal? (The
Strategy can be based upon the six Key Core Work Processes
listed below or another research-based approach. Provide justification and/or attach evidence for why the strategy was
chosen.)
● KCWP 1: Design and Deploy Standards
● KCWP 2: Design and Deliver Instruction
● KCWP 3: Design and Deliver Assessment Literacy
● KCWP 4: Review, Analyze and Apply Data
● KCWP 5: Design, Align and Deliver Support
● KCWP 6: Establishing Learning Culture and Environment
Which Activities will the district deploy based on the strategy or strategies
chosen? (The links to the Key Core Work Processes activity bank below
may be a helpful resource. Provide a brief explanation or justification for the activity.
● KCWP1: Design and Deploy Standards Classroom Activities
● KCWP2: Design and Deliver Instruction Classroom Activities
● KCWP3: Design and Deliver Assessment Literacy
Classroom Activities
● KCWP4: Review, Analyze and Apply Data Classroom Activities
● KCWP5: Design, Align and Deliver Support Classroom Activities
● KCWP6: Establishing Learning Culture and Environment
Classroom Activities
In the following chart, identify the timeline for the activity or
activities, the person(s) responsible for ensuring the fidelity
of the activity or activities, and necessary funding to execute
the activity or activities.
Objective Strategy Activities to Deploy Strategy Measure of Success Progress Monitoring Date & Notes Funding
Objective 1: During the 2018-
2019 school year, increase the
percentage of gap students
scoring proficient or better in
reading form 37.6% to 45%.
● KCWP 4: Review,
Analyze and Apply Data ● The Sutton Intervention
Team will monitor student
progress in researched based
interventions using grade
level benchmarks according
to the Dynamic Indicators of
Basic Early Literacy Skills,
BAS, and DRA and make
decisions about student
progress among the tiers of
Response to Interventions.
● ESS funds will be used to
support students achieving
below grade level standards
in various reading
assessments.
● The reading intervention
specialist provided by the
Read to Achieve grant will
work with students in
Kindergarten through third
August 2018 Monthly RTI Team
Meetings
August 2018
August 2018
$15,000.00 SBDM
Monies
$14,500.00 ESS
Funds
$48,000.00 Read to
Achieve Grant

grade who are below grade
level benchmarks within the
area of literacy. The reading
specialist will use researched
based intervention programs,
specifically Leveled Literacy
Intervention and progress
monitor students on a bi
weekly basis.
● Regular classroom and
special education teachers
will design, develop and
implement instruction for
students identified with
disabilities based on
collaborative instructional
strategies and efforts.
August 2018 $85,000.00 IDEA
Monies
● Analyze student
achievement by gap groups
according to state, district
and school assessments in
the area of literacy.
August 2018 $0.00
● Analyzing and making
ongoing modifications to
instruction based on
formative and summative
data. Through this analysis,
teachers will develop
intervention strategies that
are research based and will
need meet the needs of
individual students.
August 2018 $0.00
● Students that are performing
below grade level in
kindergarten and first grade
will be targeted for
August 2018 $14,500.00 ESS
Funds

additional literacy
instruction through the ESS
Daytime Waiver Program
and students in second
through fifth grade who are
scoring below grade level
benchmarks in literacy will
be targeted for after school
ESS literacy instruction.
Objective 2: During the 2018-
2019 school year, increase the
percentage of gap students
scoring proficient or better in
math from 59.4% to 65%.
● KCWP 4: Review,
Analyze and Apply Data ● The Sutton Intervention
Team will monitor student
progress in researched based
interventions using grade
level benchmarks according
to the Dynamic Indicators of
Basic Early Mathematical
Skills, and make decisions
about student progress
among the tiers of Response
to Interventions.
August 2018 $15,000.00 SBDM
Monies
● ESS funds will be used to
support students achieving
below grade level standards
in various math assessments.
August 2018 $17,000.00 ESS
Funds
● The math intervention
specialist provided by the
Kentucky Center of
Mathematics grant will work
with students in
Kindergarten through third
grade who are below grade
level benchmarks within the
August 2018 $50,000.00
Kentucky Center of
Mathematics Grant

area of mathematics. The
math specialist will work
with students using
researched based
interventions in the areas of
number and operations in
base ten, operations and
algebraic thinking,
measurement and data, and
geometry.
● Regular classroom and
special education teachers
will design, develop and
implement instruction for
students identified with
disabilities based on
collaborative instructional
strategies and efforts.
August 2018 $85,000.00 IDEA
Monies
● Analyze student
achievement by gap groups
according to state, district
and school assessments in
the area of mathematics.
August 2018 $0.00
● Analyzing and making
ongoing modifications to
instruction based on
formative and summative
data. Through this analysis,
teachers will develop
intervention strategies that
are research based and will
need meet the needs of
individual students.
August 2018 $0.00
● Students that are performing
below grade level
benchmarks in mathematics
August 2018 $14,500.00 ESS
Funds

will be targeted for after
school ESS math instruction.

4: Graduation rate
Goal 4 (State your Graduation Rate goal):
Which Strategy will the district use to address this goal? (The
Strategy can be based upon the six Key Core Work Processes
listed below or another research-based approach. Provide justification and/or attach evidence for why the strategy was
chosen.)
● KCWP 1: Design and Deploy Standards
● KCWP 2: Design and Deliver Instruction
● KCWP 3: Design and Deliver Assessment Literacy
● KCWP 4: Review, Analyze and Apply Data
● KCWP 5: Design, Align and Deliver Support
● KCWP 6: Establishing Learning Culture and Environment
Which Activities will the district deploy based on the strategy or strategies
chosen? (The links to the Key Core Work Processes activity bank below
may be a helpful resource. Provide a brief explanation or justification for the activity.
● KCWP1: Design and Deploy Standards Classroom Activities
● KCWP2: Design and Deliver Instruction Classroom Activities
● KCWP3: Design and Deliver Assessment Literacy
Classroom Activities
● KCWP4: Review, Analyze and Apply Data Classroom Activities
● KCWP5: Design, Align and Deliver Support Classroom Activities
● KCWP6: Establishing Learning Culture and Environment
Classroom Activities
In the following chart, identify the timeline for the activity or
activities, the person(s) responsible for ensuring the fidelity
of the activity or activities, and necessary funding to execute
the activity or activities.
Objective Strategy Activities to Deploy Strategy Measure of Success Progress Monitoring Date & Notes Funding
Objective 1
Objective 2
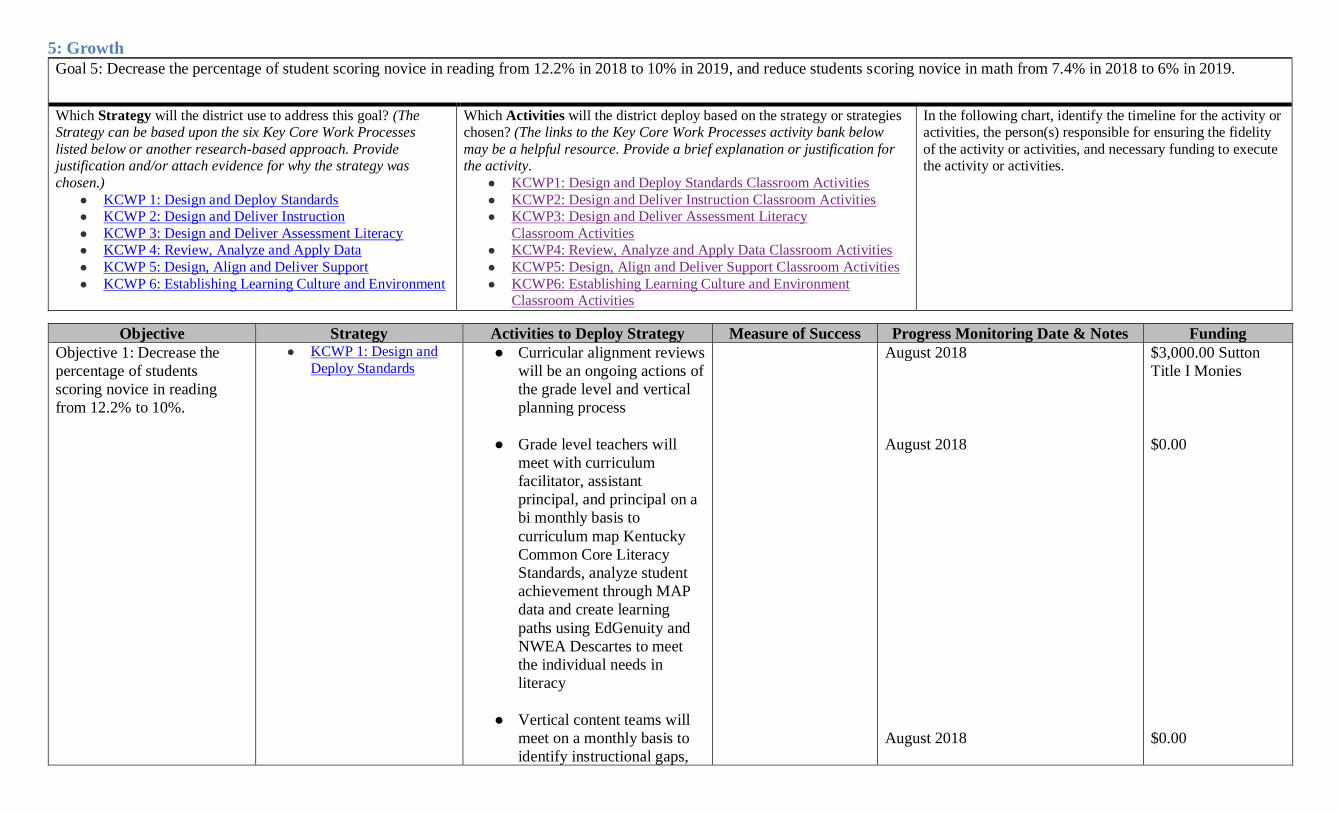
5: Growth
Goal 5: Decrease the percentage of student scoring novice in reading from 12.2% in 2018 to 10% in 2019, and reduce students scoring novice in math from 7.4% in 2018 to 6% in 2019.
Which Strategy will the district use to address this goal? (The
Strategy can be based upon the six Key Core Work Processes
listed below or another research-based approach. Provide justification and/or attach evidence for why the strategy was
chosen.)
● KCWP 1: Design and Deploy Standards
● KCWP 2: Design and Deliver Instruction
● KCWP 3: Design and Deliver Assessment Literacy
● KCWP 4: Review, Analyze and Apply Data
● KCWP 5: Design, Align and Deliver Support
● KCWP 6: Establishing Learning Culture and Environment
Which Activities will the district deploy based on the strategy or strategies
chosen? (The links to the Key Core Work Processes activity bank below
may be a helpful resource. Provide a brief explanation or justification for the activity.
● KCWP1: Design and Deploy Standards Classroom Activities
● KCWP2: Design and Deliver Instruction Classroom Activities
● KCWP3: Design and Deliver Assessment Literacy
Classroom Activities
● KCWP4: Review, Analyze and Apply Data Classroom Activities
● KCWP5: Design, Align and Deliver Support Classroom Activities
● KCWP6: Establishing Learning Culture and Environment
Classroom Activities
In the following chart, identify the timeline for the activity or
activities, the person(s) responsible for ensuring the fidelity
of the activity or activities, and necessary funding to execute
the activity or activities.
Objective Strategy Activities to Deploy Strategy Measure of Success Progress Monitoring Date & Notes Funding
Objective 1: Decrease the
percentage of students
scoring novice in reading
from 12.2% to 10%.
● KCWP 1: Design and
Deploy Standards ● Curricular alignment reviews
will be an ongoing actions of
the grade level and vertical
planning process
August 2018 $3,000.00 Sutton
Title I Monies
● Grade level teachers will
meet with curriculum
facilitator, assistant
principal, and principal on a
bi monthly basis to
curriculum map Kentucky
Common Core Literacy
Standards, analyze student
achievement through MAP
data and create learning
paths using EdGenuity and
NWEA Descartes to meet
the individual needs in
literacy
● Vertical content teams will
August 2018 $0.00
meet on a monthly basis to
identify instructional gaps,
August 2018 $0.00
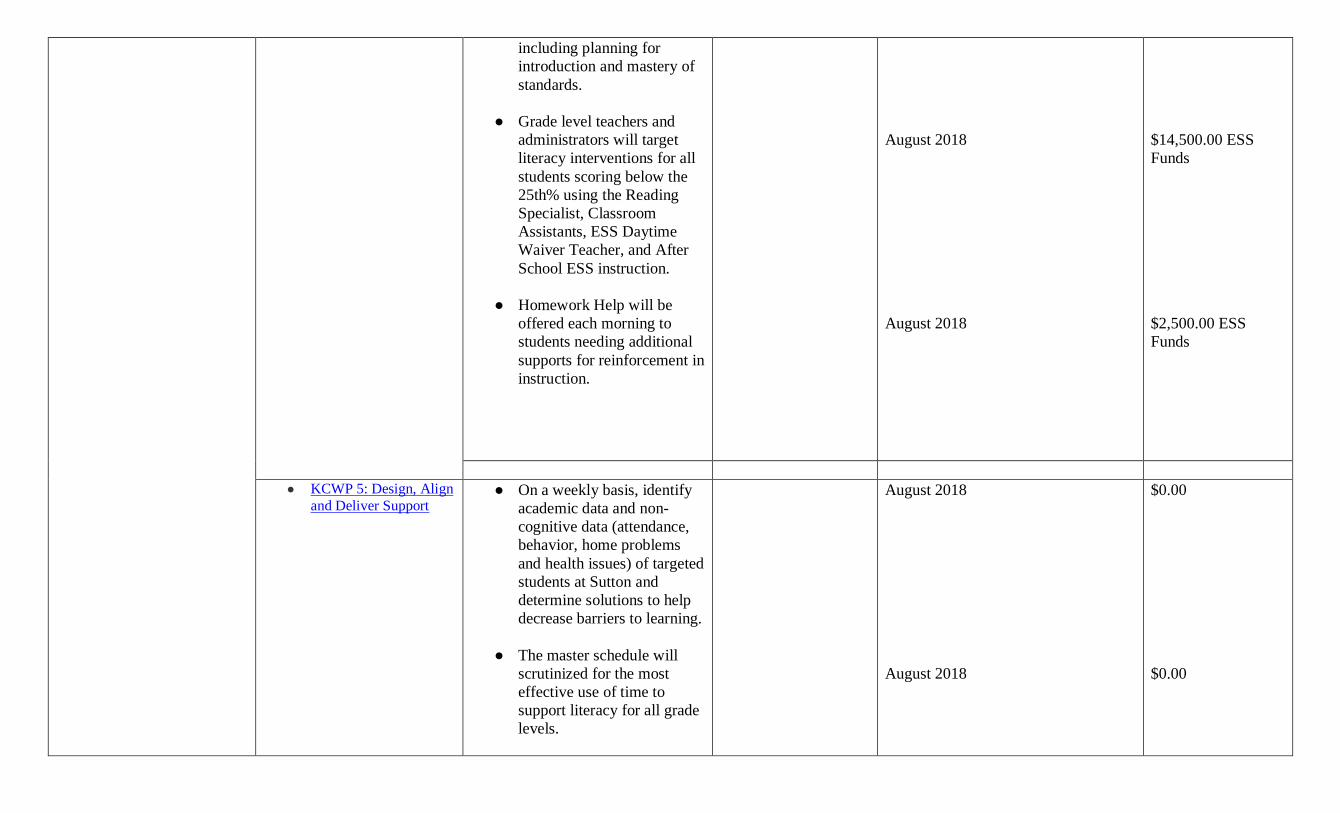
including planning for
introduction and mastery of
standards.
● Grade level teachers and
administrators will target
literacy interventions for all
students scoring below the
25th% using the Reading
Specialist, Classroom
Assistants, ESS Daytime
Waiver Teacher, and After
School ESS instruction.
● Homework Help will be
offered each morning to
students needing additional
supports for reinforcement in
instruction.
August 2018
August 2018
$14,500.00 ESS
Funds
$2,500.00 ESS
Funds
● KCWP 5: Design, Align
and Deliver Support ● On a weekly basis, identify
academic data and non-
cognitive data (attendance,
behavior, home problems
and health issues) of targeted
students at Sutton and
determine solutions to help
decrease barriers to learning.
● The master schedule will
August 2018 $0.00
scrutinized for the most
effective use of time to
support literacy for all grade
levels.
August 2018 $0.00

● KCWP 2: Design and ● Classroom teacher will August 2018 $0.00 Deliver Instruction implement effective student
grouping methods to address
differentiated literacy
instruction based on
diagnosed student level
needs form the beginning of
the year, mid year and end of
the year data.
● Teacher will use the
following literacy resources
to support literacy
instruction: Kentucky
Common Core Standards,
Edgenuity, Accelerated
Reading, Novel Ties,
Reading Naturally, Marie
Carbo Reading Fluency,
Leveled Literacy Instruction,
Weekly Informational
Reading Magazines, Guided
Reading with Jan
Richardson, Fountas and
Pinnell Phonics, Michael
Haggerty Phonics
Continuum, Open Court
Phonics, Kentucky Reading
Support Coach, Scholastic
Read Aloud Instructional
materials, Lucy Calkins
Writing, On Demand
Writing Strategies, and Wit
and Wisdom Reading
August 2018 $18,000.00 District
Reading Initiative
Monies
● KCWP 6: Establishing Program. Learning Culture and ● Personalized Learning for all August 2018 $1,000.00 SBDM Environment
students: Sutton Elementary
will provide personalized
learning for through the
Monies
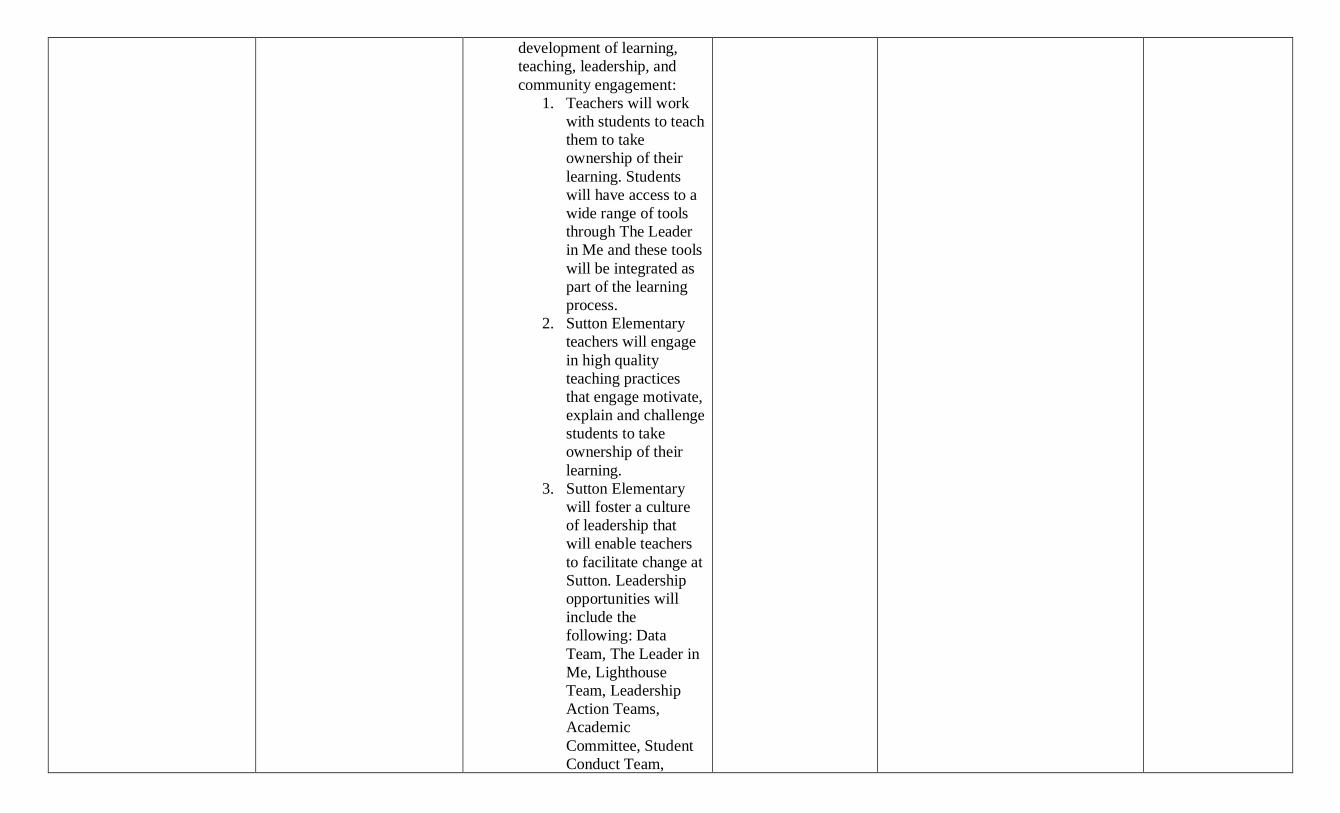
development of learning,
teaching, leadership, and
community engagement:
1. Teachers will work
with students to teach
them to take
ownership of their
learning. Students
will have access to a
wide range of tools
through The Leader
in Me and these tools
will be integrated as
part of the learning
process.
2. Sutton Elementary
teachers will engage
in high quality
teaching practices
that engage motivate,
explain and challenge
students to take
ownership of their
learning.
3. Sutton Elementary
will foster a culture
of leadership that
will enable teachers
to facilitate change at
Sutton. Leadership
opportunities will
include the
following: Data
Team, The Leader in
Me, Lighthouse
Team, Leadership
Action Teams,
Academic
Committee, Student
Conduct Team,

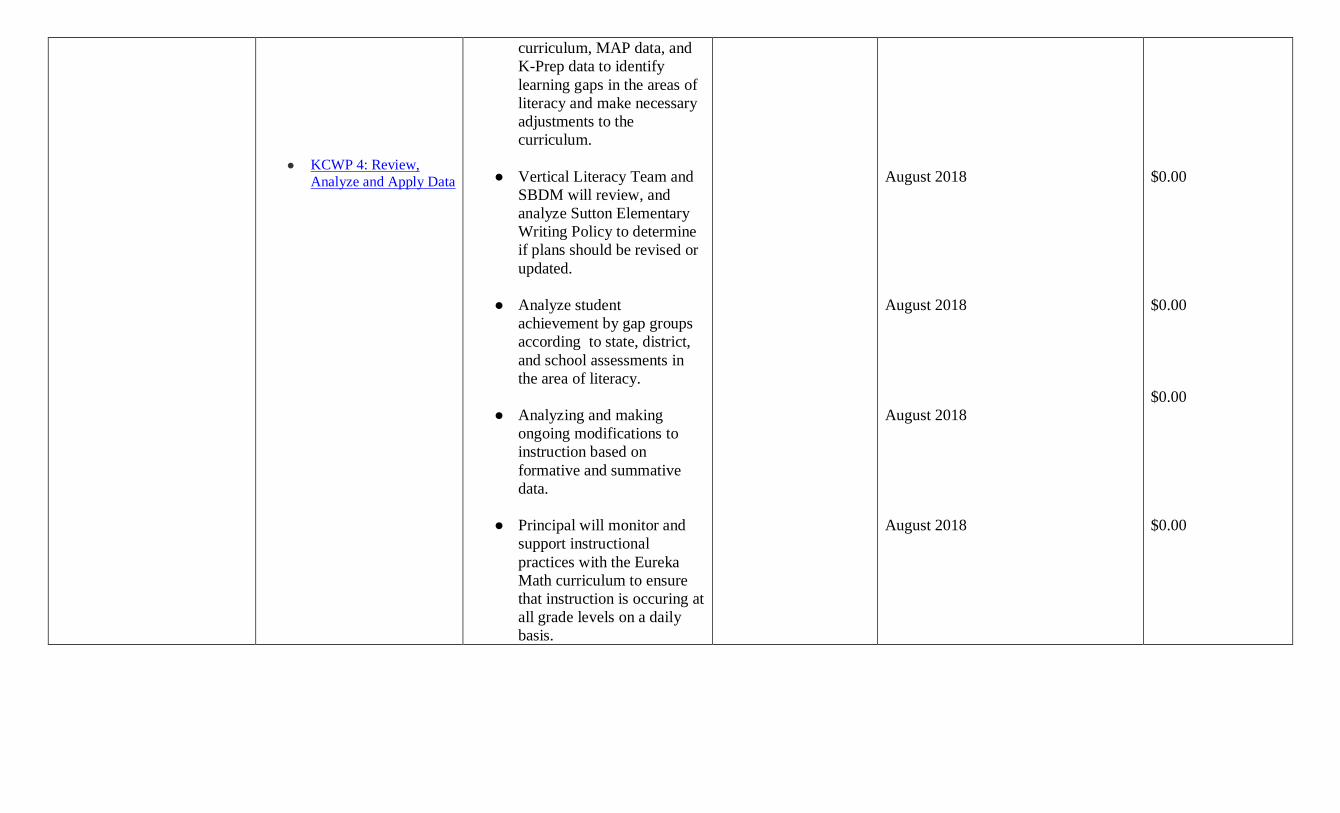
● KCWP 4: Review,
Analyze and Apply Data
Scheduling Team,
and Facilities and
Resources Team.
● Grade level and vertical
teams will analyze
curriculum, MAP data, and
K-Prep data to identify
learning gaps in the areas of
literacy and make necessary
adjustments to the
curriculum.
August 2018 $0.00
● Vertical Literacy Team and
SBDM will review, and
analyze Sutton Elementary
Writing Policy to determine
if plans should be revised or
updated.
August 2018 $0.00
● Analyze student
achievement by gap groups
according to state, district,
and school assessments in
the area of literacy.
August 2018 $0.00
● Analyzing and making
ongoing modifications to
instruction based on
formative and summative
data.
August 2018 $0.00
● Principal will monitor and
support instructional
practices with the literacy
programs and curriculum to
ensure that instruction is
occurring at all grade levels
on a daily basis.
August 2018 $0.00

Objective 2: Decrease the
percentage of students
scoring novice in math from
7.4% to 6%.
● KCWP 1: Design and
Deploy Standards ● Curricular alignment reviews
will be an ongoing actions of
the grade level and vertical
planning process
August 2018 $3,000.00 Sutton
Title I Monies
● Grade level teachers will
meet with curriculum
facilitator, assistant
principal, and principal on a
bi monthly basis to
curriculum map Kentucky
Common Core Mathematics
Standards, analyze student
achievement through MAP
data and create learning
paths using EdGenuity and
NWEA Descartes to meet
the individual needs in
mathematics
August 2018 $0.00
● Vertical content teams will
meet on a monthly basis to
identify instructional gaps,
including planning for
introduction and mastery of
standards.
● Grade level teachers and
August 2018 $0.00
administrators will target
math interventions for all
students scoring below the
25th% using the Math
Specialist, Classroom
Assistants, and After School
ESS instruction.
● Homework Help will be
August 2018 $14,500.00 ESS
Funds
offered each morning to
students needing additional
August 2018 $2,500.00

supports for reinforcement in
instruction.
● KCWP 5: Design, Align
and Deliver Support ● On a weekly basis, identify
academic data and non-
cognitive data (attendance,
behavior, home problems
and health issues) of targeted
students at Sutton and
determine solutions to help
decrease barriers to learning.
● The master schedule will
scrutinized for the most
effective use of time to
support math instruction for
all grade levels.
August 2018
August 2018
$0.00
$0.00
● KCWP 2: Design and
Deliver Instruction ● Classroom teacher will
implement effective student
grouping methods to address
differentiated mathematics
instruction based on
diagnosed student level
needs form the beginning of
the year, mid year and end of
the year data.
August 2018 $0.00
● Teacher will use the
following math resources to
support math instruction:
Kentucky Common Core
Standards, Eureka Math
Program, Kentucky Center
of Mathematics instructional
resources, Edgenuity, Zearn,
Sum Dog and Dreambox.
August 2018 $1,800.00 SBDM
Monies

● KCWP 6: Establishing
Learning Culture and
Environment
● Personalized Learning for all
students: Sutton Elementary
will provide personalized
learning for through the
development of learning,
teaching, leadership, and
community engagement:
August 2018 $1,000.00
1. Teachers will work with
students to teach them to
take ownership of their
learning. Students will have
access to a wide range of
tools through The Leader in
Me and these tools will be
integrated as part of the
learning process.
2. Sutton Elementary teachers
will engage in high quality
teaching practices that
engage motivate, explain and
challenge students to take
ownership of their learning.
3. Sutton Elementary will
foster a culture of leadership
that will enable teachers to
facilitate change at Sutton.
Leadership opportunities
will include the following:
Data Team, The Leader in
Me, Lighthouse Team,
Leadership Action Teams,
Academic Committee,
Student Conduct Team,
Scheduling Team, and
Facilities and Resources
Team.
4. Grade level and vertical
teams will analyze
● KCWP 4: Review,
curriculum, MAP data, and
K-Prep data to identify
learning gaps in the areas of
literacy and make necessary
adjustments to the
curriculum.
Analyze and Apply Data ● Vertical Literacy Team and
SBDM will review, and
analyze Sutton Elementary
Writing Policy to determine
if plans should be revised or
updated.
August 2018 $0.00
● Analyze student
achievement by gap groups
according to state, district,
and school assessments in
the area of literacy.
August 2018 $0.00
● Analyzing and making
ongoing modifications to
instruction based on
formative and summative
data.
August 2018
$0.00
● Principal will monitor and
support instructional
practices with the Eureka
Math curriculum to ensure
that instruction is occuring at
all grade levels on a daily
basis.
August 2018 $0.00
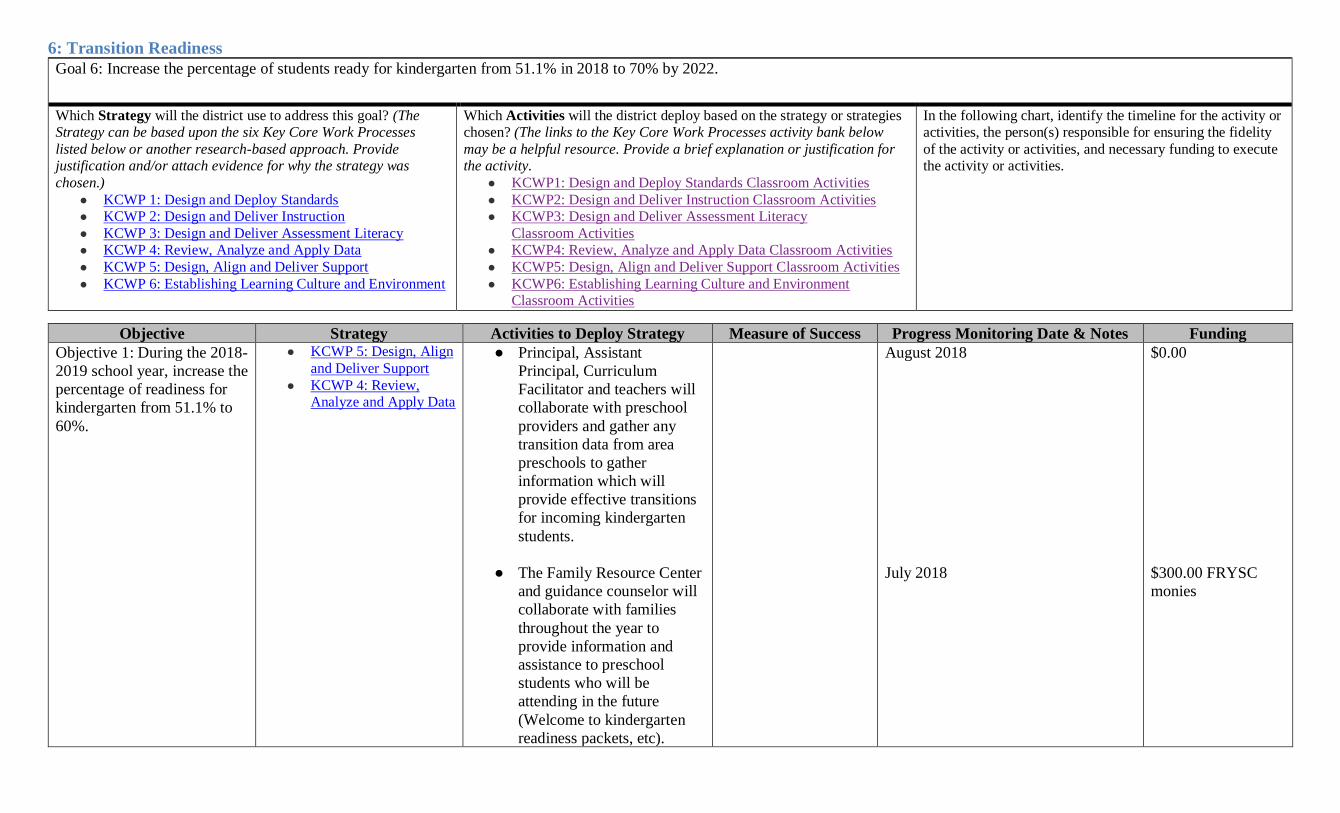
6: Transition Readiness
Goal 6: Increase the percentage of students ready for kindergarten from 51.1% in 2018 to 70% by 2022.
Which Strategy will the district use to address this goal? (The
Strategy can be based upon the six Key Core Work Processes
listed below or another research-based approach. Provide justification and/or attach evidence for why the strategy was
chosen.)
● KCWP 1: Design and Deploy Standards
● KCWP 2: Design and Deliver Instruction
● KCWP 3: Design and Deliver Assessment Literacy
● KCWP 4: Review, Analyze and Apply Data
● KCWP 5: Design, Align and Deliver Support
● KCWP 6: Establishing Learning Culture and Environment
Which Activities will the district deploy based on the strategy or strategies
chosen? (The links to the Key Core Work Processes activity bank below
may be a helpful resource. Provide a brief explanation or justification for the activity.
● KCWP1: Design and Deploy Standards Classroom Activities
● KCWP2: Design and Deliver Instruction Classroom Activities
● KCWP3: Design and Deliver Assessment Literacy
Classroom Activities
● KCWP4: Review, Analyze and Apply Data Classroom Activities
● KCWP5: Design, Align and Deliver Support Classroom Activities
● KCWP6: Establishing Learning Culture and Environment
Classroom Activities
In the following chart, identify the timeline for the activity or
activities, the person(s) responsible for ensuring the fidelity
of the activity or activities, and necessary funding to execute
the activity or activities.
Objective Strategy Activities to Deploy Strategy Measure of Success Progress Monitoring Date & Notes Funding
Objective 1: During the 2018-
2019 school year, increase the
percentage of readiness for
kindergarten from 51.1% to
60%.
●
●
KCWP 5: Design, Align
and Deliver Support
KCWP 4: Review,
Analyze and Apply Data
● Principal, Assistant
Principal, Curriculum
Facilitator and teachers will
collaborate with preschool
providers and gather any
transition data from area
preschools to gather
information which will
provide effective transitions
for incoming kindergarten
students.
August 2018 $0.00
● The Family Resource Center
and guidance counselor will
collaborate with families
throughout the year to
provide information and
assistance to preschool
students who will be
attending in the future
(Welcome to kindergarten
readiness packets, etc).
July 2018 $300.00 FRYSC
monies

● Assess all kindergarten
students with the common
statewide Brigance Screener
at the beginning of the
school year to determine
kindergarten readiness and
analyze the data to develop
instruction for kindergarten
students.
August 2018 $0.00

7: Other (optional)
Goal 7 (State your goal):
Which Strategy will the district use to address this goal? (The
Strategy can be based upon the six Key Core Work Processes
listed below or another research-based approach. Provide justification and/or attach evidence for why the strategy was
chosen.)
● KCWP 1: Design and Deploy Standards
● KCWP 2: Design and Deliver Instruction
● KCWP 3: Design and Deliver Assessment Literacy
● KCWP 4: Review, Analyze and Apply Data
● KCWP 5: Design, Align and Deliver Support
● KCWP 6: Establishing Learning Culture and Environment
Which Activities will the district deploy based on the strategy or strategies
chosen? (The links to the Key Core Work Processes activity bank below
may be a helpful resource. Provide a brief explanation or justification for the activity.
● KCWP1: Design and Deploy Standards Classroom Activities
● KCWP2: Design and Deliver Instruction Classroom Activities
● KCWP3: Design and Deliver Assessment Literacy
Classroom Activities
● KCWP4: Review, Analyze and Apply Data Classroom Activities
● KCWP5: Design, Align and Deliver Support Classroom Activities
● KCWP6: Establishing Learning Culture and Environment
Classroom Activities
In the following chart, identify the timeline for the activity or
activities, the person(s) responsible for ensuring the fidelity
of the activity or activities, and necessary funding to execute
the activity or activities.
Objective Strategy Activities to Deploy Strategy Measure of Success Progress Monitoring Date & Notes Funding
Objective 1
Objective 2
Related Documents