2017 Water & Sewerage Sector Private Participation in Infrastructure (PPI)

Welcome message from author
This document is posted to help you gain knowledge. Please leave a comment to let me know what you think about it! Share it to your friends and learn new things together.
Transcript

2017 Water & Sewerage SectorPrivate Participation in Infrastructure (PPI)

2017 WATER & SEWERAGE SECTOR • ii
Acknowledgement & DisclaimerThis report was written by a team comprising Deblina Saha (Task Team Leader), Alex Shao and Iuliia Zemlytska, with copy editing by Luba Vangelova and design by Victoria Adams-Kotsch. The team is very grateful for the support and guidance received from Jordan Schwartz (Director, IPG Group), Abha Joshi-Ghani (Senior Adviser, IPG Group) and Towfiqua Hoque (Head of Infrastructure Finance and PPPs, Singapore). The team is thankful to Darwin Marcelo (Senior Infrastructure Economist, IPG Group) and Victoria Delmon (Senior Infrastructure Lawyer, Water Global Practice) for providing valu-able comments which helped shape the report. Cover photo © Andrés De León Creative Commons CC BY NC 2.0. Page iv photo © YaYapas Creative Commons CC BY 2.0.
This report describes Private Participation in Infrastructure (PPI) as indicated in the Private Participa-tion in Infrastructure Database. The database records investment information for infrastructure proj-ects in low- and middle-income countries globally.
The PPI Database represents the best efforts of a research team to compile publicly available informa-tion, and should not be seen as a fully comprehensive resource. Some projects—particularly those involving local and small-scale operators—tend to be omitted because they are usually not reported by major news sources, databases, government websites, and other sources used by the PPI Projects database staff.
2017 WATER & SEWERAGE SECTOR • iii
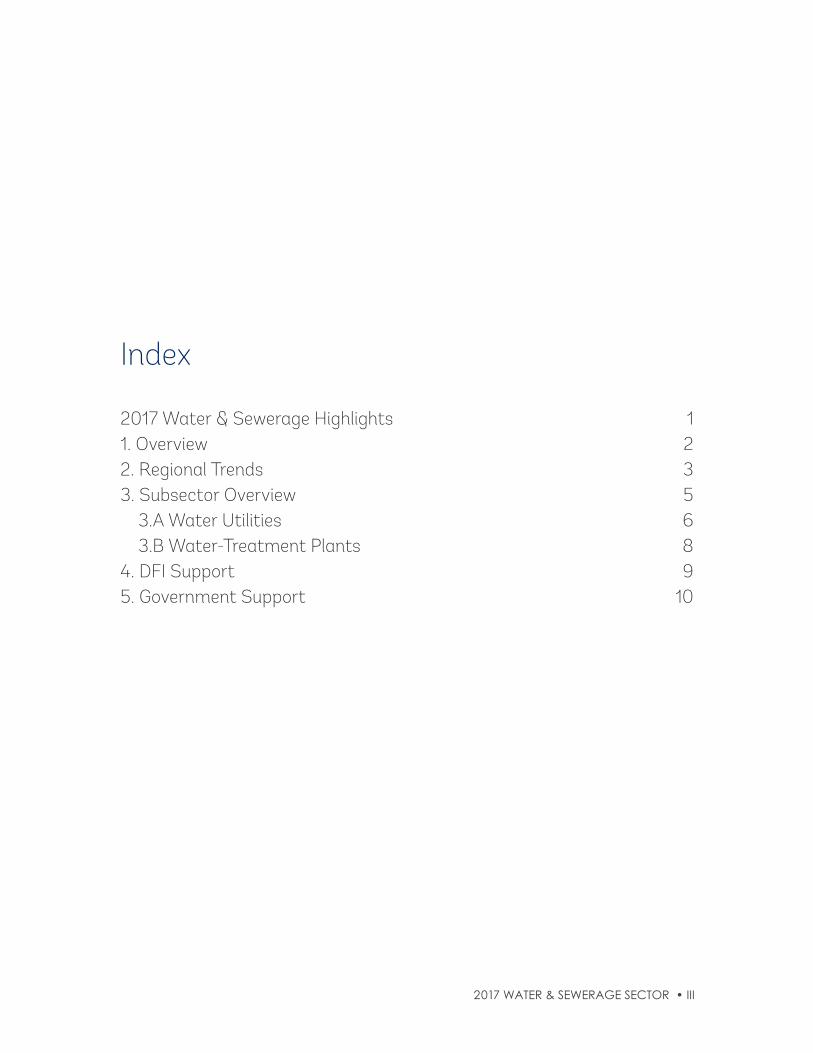
Index
2017 Water & Sewerage Highlights 11. Overview 22. Regional Trends 33. Subsector Overview 5
3.A Water Utilities 6 3.B Water-Treatment Plants 84. DFI Support 95. Government Support 10
2017 HALF YEAR UPDATE • iv

2017 WATER & SEWERAGE SECTOR • 1
2017 Water & Sewerage Highlights
• Declining water and sewerage investments in 2017. The 2017 sectoral investment level at US$1.9 billion across 30 projects, not only represents a slight decline (seven percent) com-pared to the 2016 levels but is also 55 percent lower than the five-year average of US$4.2 bil-lion. In 2017, water and sewerage was the only sector to report a decline in investment levels.
• Lower investments in Latin America and Caribbean (LAC) only partially offset by in-creasing investments in East Asia and Pacific (EAP). LAC investments in the water and sewerage sector have been historically dominated by Brazil. As investment in Brazil has decreased from its peak (US$4.8 billion in 2012 to US$219 million in 2017), the region has also seen a sharp decline. Other key players, such as Mexico and Peru, did not record any investments in 2016 or 2017. On the brighter side, East Asia and Pacific (EAP), which accounted for 83 percent of PPI investment in the water and sewerage sector in 2017, has been receiving increased investments since 2013. Most of the EAP investments in 2017 were dominated by China (in line with previous years’ trends), and there was one project in Indonesia.
• Majority of water utility projects were brownfield while majority of treatment plants were greenfield. Over the past 10 years, US$22.0 billion was invested in the water utility subsector- of which two thirds went to brownfield projects. Inclination of the private inves-tors towards brownfield water utilities can be explained by the fact that these have some revenue track record established and hence lower risk perception. On the other hand, 84 percent of treatment plant projects were greenfield. Treatment facilities have to be built from scratch as regulators and residents are slowly realizing the health and environmental benefits accruing from improved sanitation, which partially explains the predominance of greenfield investments. Also, most of the treatment-plant projects are taking place in China, where there has been a strong policy focus on water-pollution prevention (the Water Ten Plan).
• Unlike other sectors, majority of water and sewerage projects are municipal projects. Over the previous 10 years, an average of 77 percent of contracts were granted at the local and municipal levels, whereas for other sectors, a majority of contracts were granted at the national level. In 2017, 22 of 30 projects were contracted by local or municipal governments.
• In 2017, water and sewerage was the sector with the highest proportion of projects receiving government support. Twenty out of 30 projects received government support, including 17 projects in China that were backed by revenue subsidies and three projects (in Brazil, India and Indonesia) receiving capital-subsidy allocations. Similarly, from 2012 to 2017, 70 percent of projects received government support.

2017 WATER & SEWERAGE SECTOR • 2
1. OverviewIn 2017, 30 projects in the water and sewerage sector received a total of US$1.9 billion in investment—a decline of seven percent from 2016 levels. This not only marks the second-lowest level of investment in the previous 10 years (after the US$1.2 billion recorded in 2011), but is also 55 percent lower than the five-year average investment level of US$4.2 billion.
The investment peak of US$6.0 billion in 2012 (Figure 1) was due to a substantial amount of invest-ment (US$5.4 billion) in LAC. A second peak in 2015 was the result of US$3.1 billion worth of invest-ment in LAC and a US$1.2-billion investment in Russia. The declining levels of sectoral investments in recent years are largely explained by the muted investments in these regions.
The PPI investment commitment in this sector in 2017 accounted for only two percent of the total PPI investment, compared to 3.8 percent over the previous five years, and three percent over the previous 10 years.
On the brighter side, 2017 marked a 21-percent increase in investments in water-treatment plants, which accounted for 84 percent of sectoral investments (US$1.6 billion out of US$1.9 billion). It is also 50-percent higher than the average investment in water-treatment plants in the previous five years. China accounted for four-fifths of investments in water-treatment projects, with the majority of these being greenfield projects.
FIGURE 1 Investment Commitments with Private Participation in the Water and Sewerage Sector in Emerging Market and Developing Economies (EMDEs), 2007–2017
Source: PPI Database, World Bank, as of April 2018
Total Investment Number of Projects
2,000
3,000
4,000
5,000
6,000
7,000
1,000
0
2016 US$ Billion No. of projects
-10
10
50
30
70
110
90
130
150
2007 2008 2009 2010 2011 2013 2016 20172014 20152012
3%
97%
Water & Sewerage
Other Sectors

2017 WATER & SEWERAGE SECTOR • 3
On the other hand, the water-utility subsector received the lowest level of investment of the previous 10 years; this was the primary cause for the drop in sectoral investments in recent years. There were only three water-utility projects, with a total worth of US$291 million.
Interestingly, the water sector saw a large percentage of contracts granted at the local or municipal levels. Over the previous 10 years, an average of 77 percent of contracts were granted at the local and municipal levels, whereas for other sectors, a majority of contracts were granted at the national level. In 2017, 22 of 30 projects were contracted by local or municipal governments. Twenty-one of these projects were in China; they amounted to US$1.06 billion, and 20 of them were treatment plants. Of the four projects that were contracted by state or provincial governments, three were from China and amounted to US$365 million. Brazil had one project (worth US3.4 million) contracted by a local or municipal government, and one project (worth US$215 million) by a state or provincial government. There were also individual projects seen in India, Indonesia and Rwanda that were commissioned by the national government.
2. Regional Trends In 2017, US$1.6 billion, or 83 percent of the PPI investment in the water sector, was in EAP. This region has been receiving an increasing share of sectoral investments over the previous five years, as investments in LAC continue to decline (Figure 2). Of the 25 projects recorded in EAP, 24 were in China, and one water-treatment plant worth US$157 million was in Indonesia. The average water-sector project size in EAP quadrupled over the previous five years, increasing from US$16 million in 2014 to US$31 million in 2015, and increasing again to US$64 million in 2016 and 2017.
LAC—Brazil in particular—contributed US$219 million to the overall sector investment, with two brownfield water-utility projects. However, this was the lowest level of investment in the previous 10 years and represented only seven percent of the five-year average annual investment in the region.
ECA—specifically Georgia—attracted US$25 million for a sewerage-treatment-plant project. This is much lower than ECA’s 2016 investment levels of US$200 million, and its average investment of US$237 million over the previous 10 years.
Authority 2008 2009 2010 2011 2012 2013 2014 2015 2016 201710-year total
Local/ Municipal
57 36 16 27 34 22 31 43 31 22 319
National 9 4 8 4 4 1 3 4 1 3 41
State/ Provincial
6 6 3 4 6 7 3 4 1 4 44
Not Available 2 2 3 1 1 8
Total Projects 72 46 27 37 46 33 37 52 33 30 413
TABLE 1: NUMBER OF PROJECTS GRANTED BY DIFFERENT GOVERNMENT LEVELS FROM 2008 TO 2017 AND THE 10-YEAR TOTAL

2017 WATER & SEWERAGE SECTOR • 4
A US$24-million sewerage-treatment-plant project in India was the only investment in South Asia (SAR). A potable-water-treatment-plant project in Rwanda in Sub-Saharan Africa (SSA), which re-ceived a US$60-million investment in 2017, was double the size of the region’s 10-year and five-year investment averages.
Brazil, China and Mexico attracted the most private investment in the water and sewerage sector in the last 10 years (Table 2). In 2017, Brazil and China received US$219 million and US$1.4 billion respectively, collectively accounting for 86 percent of the total investment in the sector.
Brazil still has stark inequalities in terms of access to water and sanitation between the country’s regions, as well as between rural and urban communities. The National Water and Sanitation Plan (PlanSab) promotes the country’s vision of achieving 99-percent coverage for a safely managed water supply and
FIGURE 2 Private Participation in Water and Sewerage Projects by Region, 2012–2017
1,500
3,000
2,500
3,500
3,000
4,000
5,000
4,500
1,000
500
0
2016 US$ million
EAP
ECA
LAC
MENA
SAR
SSA
Private Investment in the Sector in the previous five years
16%
7%
73%
2%1%
1%
EAP trend line
LAC trend line
201720162012 20152013 2014
Country10-year Average
(US$ mil.)10-year Average
country shareInvestment in 2017
(US$ mil.)2017 Country
Share
Brazil $1,309 38% $219 11%
China $775 22% $1426 75%
Mexico $457 13% $0 0%
Other countries $936 27% $266 14%
TABLE 2: TOP THREE COUNTRIES WITH PRIVATE INVESTMENT IN THE WATER AND SEWERAGE SECTOR AND THEIR GLOBAL SHARE
2017 WATER & SEWERAGE SECTOR • 5
92-percent access to safely managed sanitation services by 2033. In line with this policy priority, since 2007 there has been a continued financing flow (either by domestic public transfers or repayable financ-ing) by the national government into local service providers in the sector. With the help of a national infrastructure PAC (Programme for Growth Acceleration) and subsidized long-term financing by the Brazilian Development Bank (BNDES), the country managed to increase private-sector participation. However, recent political and economic crises have significantly affected investment levels.
In the meantime, China has set out to combat water pollution. With more than 20 percent of the world’s population residing in China, and rapid industrialization and urbanization, the country is facing serious water-security risks. Since 2015 China has been showing a strong commitment to im-prove water-resources management. A new environmental-protection law was issued, followed by a policy that promotes outsourcing of industrial-waste treatment to third parties. Finally, more stringent regulations of the Water Pollution Prevention & Control Action Plan (the Water Ten Plan) and new wastewater-discharge standards created demand for technology solutions, attracting foreign players to the market. Additionally, the government committed to increasing investment in wastewater-treatment plants by 35 percent before 2020. With wastewater treatment being one of China’s key environmental goals, the country became one of the largest subsector markets in the world, where foreign investors can leverage their technological expertise and generous government support.
Amidst continuous water challenges, Mexico has been reliant on two main instruments to channel financial resources to infrastructure: Banobras (Banco Nacional de Obras y Servicios Públicos), a Mexi-can development bank specializing in infrastructure, and Fonadin, a government-owned trust with a mission of making infrastructure projects bankable. Fonadin supports PPPs in infrastructure projects; facilitates the inflow of private-sector funds into infrastructure; takes risks the market is unwilling to take; increases interest for private investors in projects with low yields by high social impact; and pro-vides competitive long-term financing. One of the programs run by Fonadin is PROMAGUA (Water Operators Modernization Programme), which aims to attract the private sector into water and sewerage projects. These initiatives have been helpful in attracting PPI investments to Mexico, though in 2017 there was no water and sewerage sector investment in Mexico.
3. Subsector OverviewThe PPI database classifies water and sewerage projects as water-utility projects (mostly performing water-distribution and sewage-collection functions) or water-treatment projects (treating and storing potable water, or processing wastewater).
Until 2011, water-treatment projects garnered a higher share of water-and-sewerage-sector investments. From 2012 to 2015, water-utility projects overtook treatment projects, as investments in LAC shot up (Figure 3). Interestingly, LAC, led by Brazil, received more investments in water-utility projects, where-as investment in EAP, driven by China, was focused more on treatment-plant projects. Increasing in-vestment in China is the reason for the spike in treatment-project investments in both 2017 and 2016.

2017 WATER & SEWERAGE SECTOR • 6
3.A WATER UTILITIESThe water-utility subsector attracted US$291 million for three projects in 2017—two brownfield proj-ects in Brazil (worth a total of US$219 million) and one greenfield build-operate-transfer (BOT) proj-ect in China (worth US$72 million).
From 2007 to 2017, there were 138 projects, accounting for US$22.0 billion worth of PPI invest-ments, in the water-utility subsector. Figure 4 provides the regional- and country-wise breakdown of these investments.
FIGURE 3 Private Participation in Water and Sewerage Projects by Sub-Sector, 2007–2017
2007–2017
40%
60%
50%
80%
90%
100%
70%
40%
30%
60%
20%
10%
0%2007 2008 2009 2010 2011 2012 2013 2014 2015 2016 2017
Treatment Plant Water Utility

2017 WATER & SEWERAGE SECTOR • 7
Of the US$22.0 billion invested in the subsector, two thirds (US$14.8 billion) went to brownfield projects, while US$5.3 billion went to greenfield projects. From 2007 to 2017, investments in brown-field projects were recorded in nine1 countries, with Brazil accounting for more than three-fourths of all water-utility investments (Figure 5). On the other hand, greenfield projects primarily took place in Russia, Jordan, Mexico and Peru (Figure 6).
1 Investment amounts were not available for Indonesia and Thailand.
FIGURE 4 Investment Commitments in Water-Utility Projects with Private Participation in EMDEs, by Region and Country* (2007–2017)
Source: PPI Database, World Bank, as of April 2018
LAC
SAR
MEN
A
ECA
EAP
Brazil
Mex
ico
Peru
China
Philippines
Russia
Georgia
Jordan
India
* Countries with investment levels less than US$200 million are not shown.

2017 WATER & SEWERAGE SECTOR • 8
3.B WATER-TREATMENT PLANTSIn contrast to declining water-utility investments, water-treatment investments increased by 20 percent, from US$1.3 billion in 2016 to US$1.6 billion in 2017. This is more than 50 percent higher than the five-year subsector average of US$1.1 billion. Twenty-three of the 27 water-treatment projects in 2017 took place in China. The remaining four projects took place in Indonesia, Georgia, India and Rwanda.
From 2007 to 2017, a total of US$14.7 billion was invested across 349 projects in the water-treatment subsector. Eighty-four percent (US$12.3 billion) of the total investment was invested in greenfield projects, and the remaining US$2.0 billion was invested in brownfield projects. During the same pe-riod, 15 countries received investments in greenfield water-treatment projects (Figure 7), and six coun-tries received investments in brownfield water-treatment projects (Figure 8).
40%
FIGURE 5 Investment Commitments in Brownfield Water-Utility Projects with Private Participation, in US$ millions (2007 – 2017)
FIGURE 6 Investment Commitments in Greenfield Water-Utility Projects with Private Participation, in US$ millions (2007 – 2017)
Source: PPI Database, World Bank, as of April 2018
Brazil $11,442
78%
Other $3,321
22%
Mexico $1,377 | 9%
China $1,073 | 7%
Others (6) $871 | 6%
Mexico $1,001
19%
Peru $857 16%
Other $1,209
22%Russia $1,215
23%
Jordan $1,064
20%
China $555 | 10%
Philippines $489 | 9%
India $20 | 0.4%
Brazil $146 | 3%
FIGURE 7 Investment Commitments in Greenfield Water-Treatment Projects with Private Participation, in US$ millions (2007 – 2017)
FIGURE 8 Investment Commitments in Brownfield Water-Treatment Projects with Private Participation, in US$ millions (2007 – 2017)
Source: PPI Database, World Bank, as of April 2018
China $1,242
Others $41
India $85
Brazil $422
Jordan $233China
$4,994
Egypt $523
Peru $373
Others, $1,152
Brazil $1,301
Mexico $2,195
Algeria $1,764

2017 WATER & SEWERAGE SECTOR • 9
It is interesting to note that most (two-thirds) of the investments in water utilities were in brownfield projects, whereas most (84 percent) of the treatment-plant investments were in greenfield projects. Al-though providing universal access to water-supply services remains a serious challenge in a number of EMDEs, there are quite a few water-supply systems already in place. When considering water-utility in-vestments, the private sector has a natural bias towards participating in brownfield projects, as existing facilities with established track records may invoke a perception of lower risks. However, as regulators and residents are slowly realizing the health and environmental benefits accruing from improved sanita-tion, demand for wastewater and sewerage treatment is also increasing. At the same time, significantly smaller proportions of residents in EMDEs are connected to wastewater-treatment services, compared to those that have a water supply. Treatment facilities often have to be built from scratch, which par-tially explains the predominance of greenfield investments. Also, most of the treatment-plant projects are taking place in China, where there has been a strong policy focus on water-pollution prevention (the Water Ten Plan).
4. DFI SupportIn 2017, only three (or 10 percent) of the 30 water and sewerage projects received DFI support, where-as a third of all PPI projects received DFI support that year. All three of the projects received financing from multilateral institutions, as shown in Table 3.
The water sector has always attracted the least amount of DFI support. Even during the previous five-year period (2012 to 2016), only 10 of 201 projects received multilateral support, and only one project received bilateral support. Hence, only five percent of all water and sewerage projects received DFI support. Although in 2017 there has been an improvement in the proportion of water and sewerage projects receiving DFI support (10 percent), there remains a significant scope for greater DFI involve-ment in the sector. As governments have been playing a primary role in providing water and sewerage services, especially in developing and emerging markets, DFI support can become a critical factor for boosting private-sector investment. Among developing countries, projects in Brazil and Mexico have been able to attract private investment, because tariff rates are sufficiently high for the private sector to recoup its investment; energy prices are stable; and legal guarantees are in place to ensure that the contract is not going to be unilaterally renegotiated. In addition to financing projects, DFIs can play an important role in helping developing countries create a legal, regulatory, institutional environment
Region Country Project NameMultilateral
Investment (US$ mil.)Total investment
(US$ mil.)
EAP China Wastewater treatmeant and water supply project by Penyao Environmental Protection Ltd.
IFC (100) 172
ECA Georgia Gardabani Wastewater Treat-ment Plant & Water Supply Infrastructure Rehabilitation
EIB (25) 25
SSA Rwanda Kigali Bulk Water Supply Plant AfDB (19) 60
TABLE 3: PROJECTS WITH DFI SUPPORT IN 2017

2017 WATER & SEWERAGE SECTOR • 10
conducive for private investment in the sector, as well as help structure projects in a way that is both economically viable and attractive to the private sector.
5. Government SupportGovernment support is tracked as either direct or indirect support. Direct government support includes government liabilities that directly cover project costs, either in cash or in kind, and are certain to occur. Indirect government support takes place either through contingent liabilities or government policies that support investment.
In 2017, 20 of 30 projects received government support, including 17 projects in China backed by a government-revenue subsidy, and three projects in Brazil, India and Indonesia that received capital subsidies. The same project in Indonesia also received indirect support, through a viability-gap-funding guarantee.
From 2012 to 2017, 70 percent of projects received government support. The only exceptions were 2015 and 2016, when the number of projects with government support was significantly lower (29 percent). As can be seen in Figure 9, in the last five years, a majority of projects receiving government support (more than 70 percent each year) were in China.
FIGURE 9 Direct and indirect
* Viability Gap Funding guarantee
Source: PPI Database, World Bank, as of April 2018
50%
80%
90%
100%
70%
40%
30%
60%
20% 8
12
16
20
24
28
32
36
40
10% 4
0% 02012
23
7
12
2013
9
14
9
2014
11
13
13
2015
36
15
1
2016
24
8
1
2017
9
20
1
Revenue Subsidy
Capital Subsidy
Others*
Government support types
in 2017
17
31
Direct Indirect No Support China (both direct & indirect)
8
17
8
2118
20

About the Private Participation in Infrastructure Projects Database
The Private Participation in Infrastructure Database is a product of the World Bank Group’s Infrastruc-ture, PPPs and Guarantees team. Its purpose is to identify and disseminate information on private par-ticipation in infrastructure projects in low- and middle-income countries. The database highlights the contractual arrangements used to attract private investment, the sources and destination of investment flows, and information on the main investors. The site currently provides information on more than 8,000 infrastructure projects dating from 1984 to 2017. It contains over 50 fields per project record, including country, financial closure year, infrastructure services provided, type of private participation, technology, capacity, project location, contract duration, private sponsors, debt providers, and develop-ment bank support.
For more information, please visit: ppi.worldbank.org
About the World Bank Group
The World Bank Group plays a key role in the global effort to end extreme poverty and boost shared prosperity. It consists of five institutions: The World Bank, including the International Bank for Recon-struction and Development (IBRD) and the International Development Association (IDA); the Inter-national Finance Corporation (IFC); the Multilateral Investment Guarantee Agency (MIGA); and the International Centre for Settlement of Investment Disputes (ICSID). Working together in more than 100 countries, these institutions provide financing, advice, and other solutions that enable countries to address the most urgent challenges of development.
For more information, please visit: www.worldbank.org

2018
ppi.worldbank.org worldbank.org/ppp @WBG_PPP
Related Documents