The Municipality of Brighton 2017 Wastnvater Annual Report am IC! PIL 1SF 3niciwi rON 2017 WASTEWATER POLLUTION CONTROL PLANT ANNUAL REPORT Environmental Compliance Approval No 6166-AJJTGW March. 2018

Welcome message from author
This document is posted to help you gain knowledge. Please leave a comment to let me know what you think about it! Share it to your friends and learn new things together.
Transcript
The Municipality of Brighton2017 Wastnvater Annual Report
_________
amIC!PIL 1SF
3niciwi rON
2017 WASTEWATER POLLUTION CONTROLPLANT ANNUAL REPORT
Environmental Compliance Approval No 6166-AJJTGW
March. 2018


The Municipality of Brighton2017 Wastnvater Annual Report
TABLE OF CONTENTS
1.0 INTRODUCTION
2.0 WASTEWATER FLOWS
2.1 Flow Interpretation
2.2 Raw sewage quality
3.0 WASTEWATER EFFLUENT QUALITY
4.0 CONSTRUCTED WETLAND EFFLUENT QUALITY
5.0 OVERVIEW OF SUCCESS AND ADEQUACY OF WORKS
6.0 OPERATING PROBLEMS AND CORRECTIVE ACTIONS
7.0 SUMMARY OF MAINTENANCE
8.0 EFFLUENT QUALiTY ASSURANCE AND CONTROL
9.0 SUMMARY OF CALIBRATION AND MAINTENANCE ON MONITORING EQUIPMENT
10.0 EFFORTS AND RESULTS TO MEET EFFLUENT OBJECTIVES
11.0 AMMONIUM NITROGEN
11,1 Total Phosphorus
11,2 CBOD and Suspended Solids
12.0 BIOSOLIDS MANAGEMENT
13.0 SUMMARY OF COMPLAINTS
14.0 SUMMARY OF BY-PASSES, SPILLS AND ABNORMAL DISCHARGES
15.0 SUMMARY OF SEWER WORK COMPLETED
16.0 RAINBOW TROUT TOXICITY TESTING

The Municipality of Brighton 32017 Wastovater Annual Report
List of Tables
Table I — Monthly Wastewater Flows to WPCPTable II — Monthly Raw Influent to WPCPTable III - Monthly Average Waste Stabilization Pond Effluent QualityTable IV — Monthly Average Waste Stabilization Pond Effluent LoadTable V - Monthly Average Constructed Wetland Effluent QualityTable VI - Overall Efficiency of WPCP Sewage Works SystemTable VII — Summary of Operating Problems and Corrective ActionsTable VIII— Summary of MaintenanceTable IX — Dates of Equipment Calibration
List of Appendices
Appendix A — Notice of Modifications — Submitted to MOECC Under LOF Process — 2017

The Municipality of Brighton 42017 Wastewater Annual Report
1.0 INTRODUCTION
The Municipality of Brighton is pleased to present its Annual Performance Report forwastewater treatment for the operating period of January ito December 31, 2017.
Brighton’s Water Pollution Control Plant (WPCP) services a population of approximately6,500 people or 3,263 homes and businesses, as well as Presquile Provincial Park. TheWPCP is classified as a Class 1 treatment facility that operates under amendedEnvironmental Compliance Approval (ECA) Number 6166-AJJTGW, issued by the OntarioMinistry of the Environment and Climate Change (MOECC) March 20, 2017.
This report has been prepared in accordance with Section 10.5 of the ECA. This ECAincludes Limited Operational Flexibility (LOF) provisions to allow expedited changes tothe treatment operation, subject to final MOECC approvals and conditions.
The WPCP is located at 100 County Road 64. Wastewater collected from the servicedarea of the Municipality passes through four treatment components at the WPCP, in theorder listed below:
1) A 0.7-hectare aerated cell (Lagoon #1) with two mechanical surface aerators,and two aspirating aerators.
2) A chemical mixing chamber where ferric chloride is added.3) A 5.44-hectare waste stabilization pond (Lagoon #2) with three baffles.4) A two-celled constructed wetland having a total surface area of 6.2 hectares.
The effluent from the constructed wetland is discharged continuously into a naturalwetland that borders Presqu’ile Bay, which is located off the northeast shore of LakeOntario.
2.0 WASTEWATER FLOWS
The ECA stipulates that the rated flow capacity of the WPCP is a yearly average of 4,600m3/day. The average flow for 2017 was 4,040 m3/day, which represents 87.8% of therated flow capacity. The highest average flows occurred in May at a flow of 8,384 m3/day.The lowest average flows occurred in September at 2,088 m3/day.
It should be stressed that 2017 was a wet year for precipitation, particularly during springthough to early summer. More importantly though, was water levels in Lake Ontario. InMay and June, 2017 water levels in Lake Ontario peaked at record levels. This high lakelevel caused the groundwater level along the lake shore area to rise in a similar fashionand undoubtedly greatly increased flows into basement weeping tiles, causing a verylarge increase in sump pump flows being discharged to the sanitary sewer system. Aswefl, the high ground water would increase the amount of water pressure bearing on theburied sewer system, increasing the infiltration into the sewer system through cracks inmanholes and pipe joints.

Tim Municipality of Brighton 52017 Wastewater Annual Report
These increases in sewage flows in 2017 were almost entirely clean groundwater orrainwater. Flows in the sewer system dropped significantly, beginning in August, as lakelevels receded. According to the Monthly Water Level Bulletin (http:I/www.tidesmarees.gc.ca/C&A/bulletin-eng.html), water levels in Lake Ontario peaked in May andJune 2017, with a decline of approximately one metre over the summer and fall. Sewageflows also decreased steadily during the same period and sewage flows returned toaverage flow levels (3,000 m3/day or less) by August. Average sewage flows remainedbelow 3,000 m3/day for the balance of the year (other than November when averagesewage flows increased with wet weather to approximately 3,700 m3/day).
It is unlikely that water levels will return to record levels in Lake Ontario and thus averagesewage flows are also expected to remain below 3,000 m3/day, especially when combinedwith ongoing leak repairs in the sewer system.
The maximum daily flow for the year was 18,052 m3 on May 6, 2017. The lowest dailyflow was 1,580 m3 on September 20, 2017. There were no exceedances of the ratedflow capacity of the WPCP in 2017, even though we had record high water levels in LakeOntario, which caused extra high flows to the WPCP due to infiltration from Lake Ontario.Table I, below, summarizes sewage flows in 2017.
Table I — Monthly Wastewater Flows to WPCP
Total Flow Avg. Flow Percent of the ratedMonth (m3) (m3/day) capacity (%)January 112,226 3,620 79%February 92,753 3,313 72%March 118,181 3,812 83%April 163,513 5,450 118%May 259,905 8,384 182%June 182,965 6,099 133%July 129,650 4,182 91%August 83,585 2,696 59%September 62,627 2,088 45%October 76,107 2,455 53%November 110,777 3,693 80%December 83,197 2,684 58%
Annual 1,475,486 4,040 87.8°Io
2.1 Flow Interpretation
The variations in the flow of wastewater received at the WPCP are caused by infiltrationand inflow to the collection system, as a result of local precipitation events, fluctuationsin groundwater elevations and snow melt.
The Municipality of Brighton 62017 Wastewater Annual Report
In 2015, 2016, and 2017 sewer repair work was completed by Sewer Technologies whichhas reduced infiltration. Due to extreme conditions in 2017, (very high precipitation andvery high lake levels), flows were greatly increased above normal. It is likely averagesewage flows would have been significantly higher if sewer repairs had not beencompleted.
2.2 Raw Sewage Quality
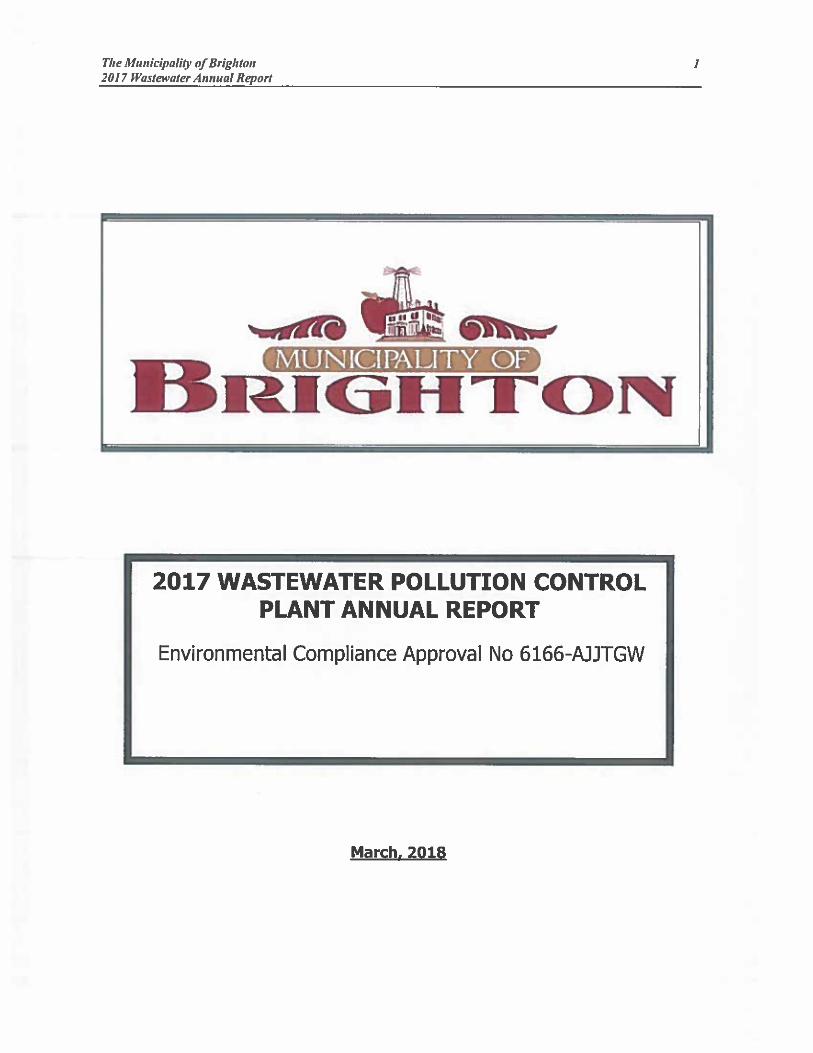
As per the ECA, raw sewage samples are to be collected and analyzed for selectparameters once per month. However, for 2017, raw sewage samples were collectedweekly as part of an intensive study of the WPCP to better assess ammonia.
Table II as follows summarizes raw wastewater quality for 2017. For all months, resultsfor all samples collected within a month were averaged to determine raw sewage qualityvalues provided in Table II.
TABLE II- MONTHLY RAW INFLUENT TO WPCP
TOTALTKN AMMONIAYEAR CBOD5 TSS PHOSPHOROUS NITROGEN
Raw Raw RawRaw Sewage Raw Sewage2017 Sewage Sewage (mg/L) (mg/L) Sewage(mg/L) (mg/L) (mg/L)
January 98.1 106.0 3.52 31.0 27.7February 99.8 127.3 3.67 33.3 24.7
March 99.5 140.5 3.01 24.6 17.1April 58.5 124.3 2.67 24.6 18.8
May 30.5 97.0 2.18 19.6 15.2June 60.4 141.5 3.47 31.6 25.2July 58.9 147.3 3.47 32.8 26.7
August 20.2 48.6 1.59 15.3 13.9September 29.6 69.0 2.07 19.4 15.1
October 23.0 40.8 1.62 14.9 12.9November 23.0 97.8 1.62 27.7 10.6December 97.1 217.6 5.9 42.4 12.9
Yearly83.8 142.2 4.3 36.5 29.9Average
The Municipality of Brighton 72017 Wastewater A,,nual Report
3.0 WASTEWATER EFFLUENT QUAlITY
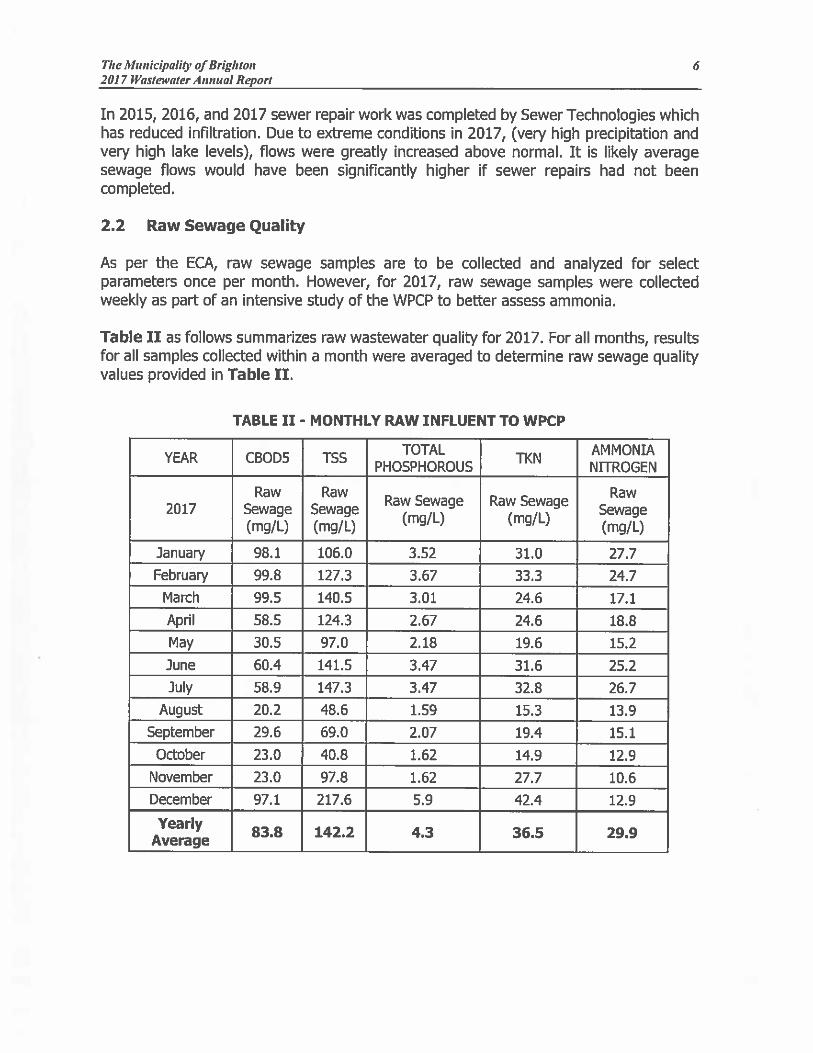
Section 7 of the ECA lists monthly average limits for the levels of four parameters in theeffluent from the waste stabilization pond. The parameters are: five-day carbonaceousbiochemical oxygen demand (CBOD5), total suspended solids (TSS), total phosphorus(TP), and ammonia plus ammonium nitrogen (ammonia).
Section 9 of the ECA outlines the frequency that the parameters must be tested for andlists an additional six parameters that must be tested: total Kjeldahl nitrogen, nitratenitrogen, nitrite nitrogen, temperature and E. Coli.
In 2017, the effluent quality met the limits for the parameters tested, except for ammonianitrogen from July to October inclusive and December (Table HI).
Table III — Monthly Average Waste Stabilization Pond Effluent Quality
Parameter CBODS TSS TP Ammonia Nitrogen E. Coli pH(mg/L) (mg/L) (mg/L) (mg/L) (du/100
mL)Effluent Limit 30 40 1.0 (May-Oct 14 mg/I) No Limit 6.0-(mg/L) Nov-Apr 17 mg/I) Specified 9.5
January 13.0 18.8 0.34 16.6 900 7.5February 4.3 12.5 0.23 14.7 360 7.5
March 4.0 10.5 0.26 13.1 160 7.7April 3.0 12.5 0.29 11.5 3700 7.9May 2.6 12.4 0.31 8.4 5300 7.9June 2.0 6.5 0.18 12.6 80 7.8July 1.8 4.0 0.18 14.6 60 7.9
August 1.0 3.2 0.21 18.9 24 7.8September 1.3 3.0 0.26 22.0 60 7.9
October 1.2 3.4 0.21 24.2 10 7.9November 1.5 6.0 0.22 16.9 1880 7.8December 2.0 5.8 0.27 18.7 20 7.7
Section 7 of the ECA also lists effluent loading limits for CBOD5, TSS, TP and AmmoniaNitrogen. The effluent from the waste stabilization pond met the effluent loading limitsfor all required parameters other than ammonia limits highlighted below in Table IV.
Tim Municipality of Brighton 82017 Wastewater Annual Report
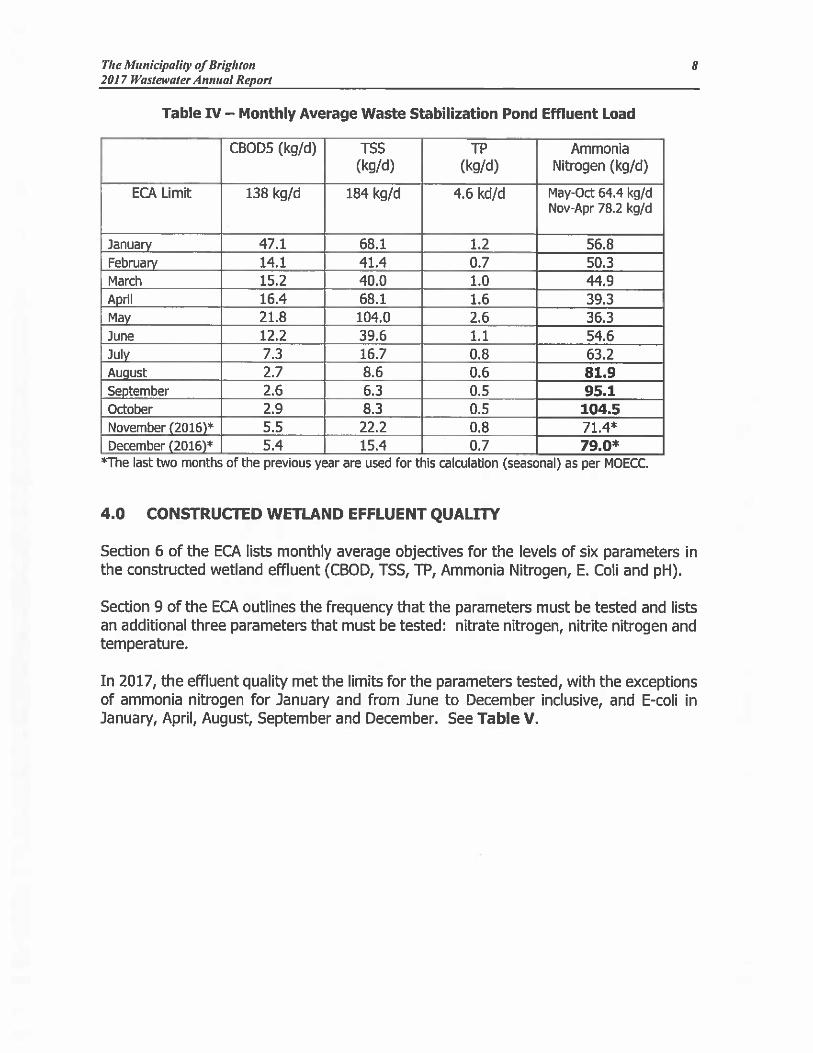
Table IV — Monthly Average Waste Stabilization Pond Effluent Load
CBOD5 (kg/d) TSS TP Ammonia(kg/d) (kg/d) Nitrogen (kg/d)
ECA Limit 138 kg/d 184 kg/d 4.6 kd/d May-Oct 64.4 kg/dNov-Apr 78.2 kg/d
January 47.1 68.1 1.2 56.8February 14.1 41.4 0.7 50.3March 15.2 40.0 1.0 44.9Apr11 16.4 68.1 1.6 39.3May 21.8 104.0 2.6 36.3June 12.2 39.6 1.1 54.6July 7.3 16.7 0.8 63.2August 2.7 8.6 0.6 81.9September 2.6 6.3 0.5 95.1October 2.9 8.3 0.5 104.5November (2016)* 5.5 22.2 0.8 71.4*December (2016)* 5.4 15.4 0.7 79.0*
*The last two months of the previous year are used for this calculation (seasonal) as per MOECC.
4.0 CONSTRUCTED WETLAND EFFLUENT QUALITY
Section 6 of the ECA lists monthly average objectives for the levels of six parameters inthe constructed wetland effluent (CBOD, TSS, TP, Ammonia Nitrogen, E. Coli and pH).
Section 9 of the ECA outlines the frequency that the parameters must be tested and listsan additional three parameters that must be tested: nitrate nitrogen, nitrite nitrogen andtemperature.
In 2017, the effluent quality met the limits for the parameters tested, with the exceptionsof ammonia nitrogen for January and from June to December inclusive, and E-coli inJanuary, April, August, September and December. See Table V.

The Municipality of Brighton 92017 WastnvaterA,,,,,,al Report
Table V — Monthly Average Constructed Wetland Effluent Quality Objectives
Parameter CBODS TSS TP Ammonia E. Coli ph(mg/L) (mg/L) (mgfL) Nitrogen (mg/L) (cfu/200
mL)Effluent Objective 15 15 0.8 (May-Oct 10 mg/I) 200 6.0-
(mg/L) Nov-Apr 15 mg/I) 9.5January 3.6 6.2 0.16 18.0 400 7.8February 2.0 4.0 0.12 14.7 20 7.7March 2.0 3.3 0.09 13.1 14 7.8April 2.8 4.6 0.16 10.1 40 7.8May 1.6 5 0.52 6.5 380 7.8June 1.5 5.8 0.47 11.9 200 7.9July 1.8 4.0 0.26 12.4 100 7.7August 1.2 4.0 0.29 16.9 254 7.6September 2.3 3.9 0.44 20.0 1200 7.6October 1.2 5.0 0.30 21.3 140 7.6November 1.5 3.0 0.10 16.4 120 7.9December 1.0 5.0 0.15 17.5 2500 7.8
5.0 OVERVIEW OF SUCCESS AND ADEQUACY OF WORKS
For the most part, the WPCP is successfully treating the effluent for the key effluentparameters with the exception of ammonia nitrogen. As per Table III, there wereexceedances of ammonia nitrogen for five of the twelve months in 2017.
Table VI summarizes overall treatment efficiency of the lagoon system, based on effluentquality from the wetland portion of the treatment works compared to the raw sewagequality.
Table VI— Overall Efficiency of WPCP Sewage Works System
Date CBOD5 (%) TSS (%) P (%) AmmoniaNitrogen (°k)
January 96.3 94.2 95.5 35.3February 98.0 96.9 95.6 40.6March 97.8 97.7 97.0 23.6April 95.3 96.3 99.8 46.5May 94.8 94.8 76.1 57.2June 97.5 95.9 86.4 52.7July 97.0 97.3 92.4 53.3August 94.1 91.8 81.6September 92.4 94.4 79.0October 94.8 87.7 81.3November 93.5 96.9 93.7December 99.0 97.7 97.5Average 95.7% 95.1% 89.7% 8.3%
* Indicates a production of Ammonia Nitrogen
The Municipality of Brighton 102017 Wastewater Annual Report
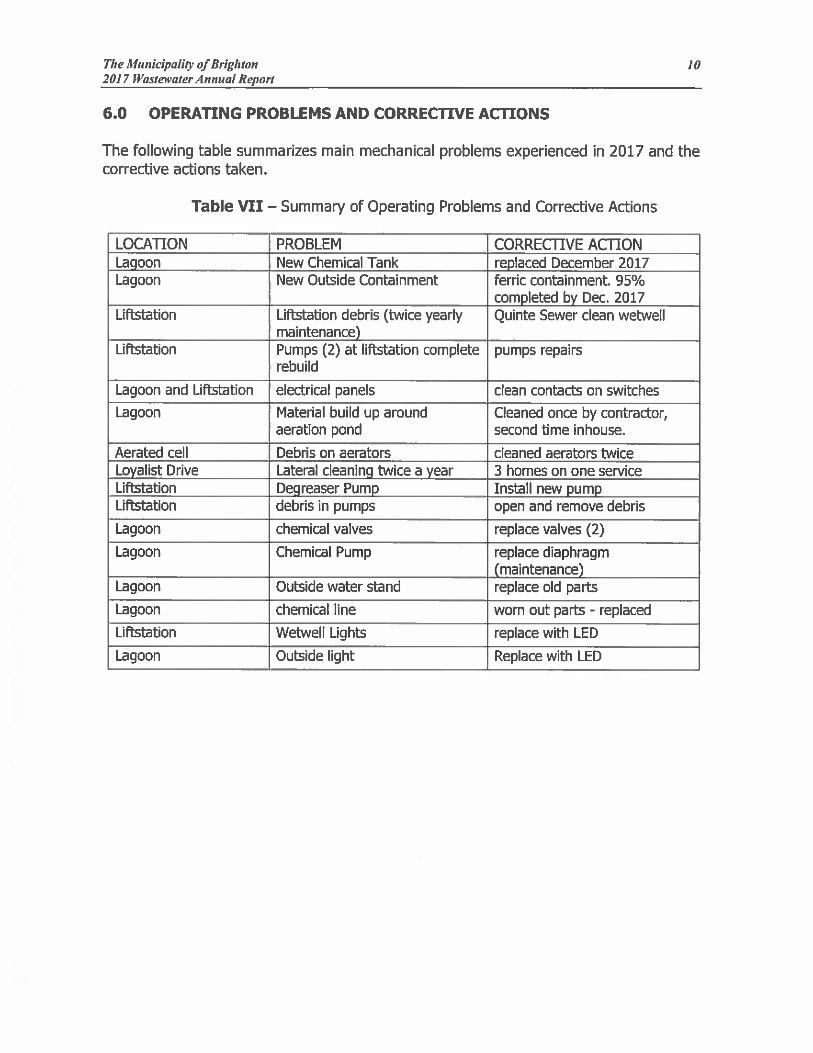
6.0 OPERATING PROBLEMS AND CORRECTIVE ACTIONS
The following table summarizes main mechanical problems experienced in 2017 and the
corrective actions taken.
Table WI — Summary of Operating Problems and Corrective Actions
LOCATION PROBLEM CORRECTIVE ACTIONLagoon New Chemical Tank replaced December 2017Lagoon New Outside Containment ferric containment. 95%
completed by Dec. 2017Liftstation Liftstation debris (twice yearly Quinte Sewer clean wetwell
maintenance)Liftstation Pumps (2) at liftstation complete pumps repairs
rebuild
Lagoon and Liftstation electrical panels clean contacts on switches
Lagoon Material build up around Cleaned once by contractor,aeration pond second time inhouse.
Aerated cell Debris on aerators cleaned aerators twiceLoyalist Drive Lateral cleaning twice a year 3 homes on one serviceLiftstation Degreaser Pump Install new pumpLiftstation debris in pumps open and remove debris
Lagoon chemical valves replace valves (2)
Lagoon Chemical Pump replace diaphragm
( maintenance)Lagoon Outside water stand replace old parts
Lagoon chemical line worn out parts - replaced
Liftstation Wetwell Lights replace with LED
Lagoon Outside light Replace with LED

The Municipality ofBrighton2017 Wastewater Annual Report
7.0 SUMMARY OF MAINTENANCE
11
The following is an abbreviated summary of normal maintenance completed at the lagoonsystem and sewage pumping stations.
Table VIII — Summary of Maintenance
DATE NAME OF EQUIPMENT ACTIONMAINTAINED
Weekly pH meter! DO Calibration (in-house)
Quarterly Flash mixer! Grease/check oilAerators/Pumps
February yearly maint. or Chemical Pump 1&2/ flush Flushed and clean,when required quarterly replace DiaphragmsApril Yearly Constructed wetland Trapping of muskratsApril yearly OCMIII, MultiRanger, Calibration
Siemens Magmeter, LUT400Spring wetland levels Water levels loweredSpring, summer and fall Aerators Removed debrisSummer Constructed wetland Water levels raisedSpring ferric system cleaned Flushed lines, clean
pumpsNovember wetland levels Water levels raisedSpring and Fall Constructed wetland Trapping of muskrats
8.0 EFFLUENT QUALITY ASSURANCE AND CONTROL
Wastewater exiting the aerationChloride is the coagulant usedsettling of other substances andhours a day, seven days a week.operator.
pond passes through a chemical dosing chamber. Ferricto precipitate soluble phosphorus. It also aids in theodour control. The dosing system operates twenty-fourThe system is checked and logged daily by a wastewater
Samples are collected by a trained wastewater operator, following the applicable MOECCguidelines. All collected wastewater samples are sent weekly to an accredited laboratoryfor analysis. The results of the water samples are analyzed weekly by Brighton staff. Aresult showing non-compliance with the required wastewater quality stated in the ECA isreported to the MOECC, as required by the ECA.

The Municipality of Brighton 122017 Wastewater Annual Report
9.0 SUMMARY OF CALIBRATION AND MAINTENANCE ON MONITORINGEQUIPMENT
Table IX — Dates of Equipment Calibration
DATE OF CAUBRATION EQUIPMENT COMPANY PERFORMINGOr Maintenance CALIBRATED/Maint. CAUBRRATION/Maint.April 2017 Yearly Flow monitors! Mag Meters Franklin/MeasureMaxDecember 2017 Yearly DO meter! DR2800/ Hach TechnidanWeekly Do/pH meters In-house
10.0 EFFORTS AND RESULTS TO MEET EFFLUENT OBJECTIVES
In May of 2015, Brighton retained the engineering and wastewater operations firm ofGSS Engineering Consultants Ltd. (GSS) to assist with operation of the lagoon system.
With the assistance of GSS, the Municipality of Brighton has implemented a number ofinterim efforts under the LOF process of the ECA to potentially improve performance ofthe lagoon treatment system.
Four aerators are provided in the aerated cell. Total aerator power is approximately 60kW. While total energy available in the aerated cell is relatively low (3.3 W/m3 based ontotal volume of 18,000 m3), all four (4) aerators, when running together, will suspend asignificant amount of solids in the aerated cell. MOECC design guidelines recommendsmixing energy of 15-25 W/m3 to fully suspend mixed liquor, suspended solids.
In the early spring of 2016, the aerators were equipped with simple timers to allow allthe aerators to operate at the same time and then turn off. The intent was to allowperiods of settling during the aerator “off” period, to slowly build volatile suspended solids(VSS) in the aerated cell to achieve nifrification.
However, simple on/off operation of the aerators was not successful in increasing VSSlevels in the aerated cell. It was then proposed to combine the on/off aerator operationwith manual “decanting” of the top layer of effluent from the aerated cell when theaerators were off. This would assumedly retain solids within the aerated cell and allowVSS to build to levels that would support nitrification.
A Notice of Modification (Notification Number 7) for trial decanting, combined with on/offaeration, was submitted to MOECC in August, 2017. This notice is included in AppendixA.
This modification was approved under the LOF conditions of the current ECA. The decanttrial started on September 25, 2017. After approximately 8 weeks of trial, the manualdecant process was terminated on November 29, 2017. At that time, the aerators were
The Municipality of Brighton 132017 Wastewater Annual Report
returned to their normal on/off cycle program. The following summarizes the results ofthe decant trial.
Method
Based on preliminary evaluations, the simplest method to achieve manual decanting wasto:
- Manually turn off all aerators at approximately 7 am- Wait one half to one hour to allow settling of solids in the aerated cell- Manually lift the first 6 inch stop log to release the first “batch” of clear decant- After approximately 1 additional hour, manually remove the 2 stop log to release a
second batch of clear decant- Overall, such draining of decant lowered water levels in the aeration cell by
approximately 12 inches (300 mm).- At approximately 2 pm, reinstall both stop logs and then turn on all aerators. The
aerated cell would slowly refill- Allow aerators to run from 2 pm to approximately 7 am. Then repeat the decant
process.
The operators completed regular measurement of dissolved oxygen in the aerated cell.Generally, the 6 hour decant period (8 am to 2 pm) resulted in falling dissolved oxygenlevels in the aerated cell, but oxygen levels normally did not fall below 1 mg/I. Once theaerators were restarted, there was sometimes a temporary, further sag in oxygen levelsbefore oxygen levels rebounded to 4 to 6 mg/I.
Normally, once the aerated cell was decanted for 6 hours, the remaining storage depthof approximately 12 inches (300 mm) was sufficient to store the incoming sewage flowuntil the next morning, without overtopping the stop logs.
Results — Retention of VSS and Removal of Ammonia
Decanting, as noted above, began in late September 2017. The hoped-for result wouldbe that VSS in the aerated cell would increase to at least 400 mg/I and potentially as highas 600 mg/I. Levels of VSS this high would provide the total mass of VSS in the aeratedcell necessary to achieve nitrification.
However, higher levels of VSS were not achieved. VSS levels in the aerated cell, whenfully mixed using the available aerators, normally remained below 200 mg/I. Also, noadditional removal of ammonia was achieved. While levels of ammonia in the aeratedcell typically reduced 5O% from levels in the incoming raw sewage, no additional removalof ammonia was achieved by the decanting process compared to the normal aerationprocess in the aeration cell.
The Municipality of Brighton 142017 IVastewater Annual Report
Overall, ammonia levels in the aerated cell effluent remained high (normally greater than14 mg/I) throughout the decant trial period. There was some formation of nitrite andnitrate in the cell (evidence of some nitrification) but Levels of nitrate remained low(typically below 1 mg/I) and were not appreciably higher than levels of nitrate formationseen before the decant trial. Table 1 also shows average levels of nibite and nitrate inthe aerated cell.
To assist development of nitrifying bacteria in the aerated cell, loads of activated sludgefrom the Frankfort sewage plant were imported weekly and discharged into the aeratedcell. Sludge was imported between September 27 and October 25, 2017. The Frankfordsewage plant is an activated sludge plant that provides nitrification.
As above, however, formation of nitrite/nitrates, and a buildup of VSS, did not occur atsignificant levels. Seeding with nitrifying sludge did not appear to improve ammoniaremoval.
Other Results
Other than ammonia, decanting appeared to improve the quality of effluent beingdischarged from the aeration cell to the large downstream lagoon (facultative lagoon). Akey benefit was that relatively high clarity effluent, with few solids, was discharged to thedownstream facultative lagoon.
Average values of solids in the aerated cell decant in October, 2017, were 55 mg/I.However, this is based on an average of 5 weekly samples. Four of the samples had solidslevels between 20 and 28 mg/I. However, the 5tfr sample (October 18) had an outliervalue of 180 mg/I which significantly affected the monthly average value. For November2017, the average value of decant solids was 39 mg/I.
These levels of suspended soLids (55 and 39 mg/I) were much lower than previous monthswhere decanting was not practiced. Values of suspended solids in the aerated cell effluentfor the months of January, 2017 to September, 2017 averaged 135 mg/I.
BOD appeared to be further reduced in the aerated cell during the decanting trials. Valuesof CROD in the decant were 11 mg/I in October and 13 mg/I in November. Compared toaverage values of incoming raw sewage BOD (average values of 76 mg/I in October andNovember) removal of BOD in the aeration cell was approximately 84%.An initial concern with the decant trial was whether effective dosing of ferric chloride tothe “slug” release of decant could be achieved. Ferric chloride is added to the aeratedcell effluent to remove phosphorus. During this trial, the operators would manually turnup the ferric pumps just before the stop logs were removed, and then turn down thepumps once the logs were reinstalled in the afternoon.

Tue Municipality of Brighton IS2017 Wastewater Anizual Report
However, phosphorus levels at the compliance point (discharge from the lagoon) werevery low and averaged 0.21 and 0.22 mg/I, respectively, for October and November,2017. Therefore, the initial concern of ferric dosing proved not to be a problem.
Overall, effluent quality from the lagoon was excellent in 2017 (other than ammonia) andapproached or exceeded tertiary quality levels for CBOD, Suspended Solids and TotalPhosphorous for numerous months.
While high flows very likely diluted pollutants in the treated effluent during 2017, sewageflows had returned to more normal levels by the time the decant trial began (i.e. lessthan 3,000 m3/day during September, October and just under 3,700 m3/day forNovember of 2017).
Summary
The decant process did not achieve the main objective of building VSS levels in theaerated cell and treating ammonia. While limited nitrification occurs in the aerated cell(based on observed but low levels of nitrite and nitrate), it would appear that the availablebacterial mass is not sufficient to allow a long enough “sludge age” to develop whichwould support significant populations of nitrifying bacteria.
Import of nitrifying sludge from the nearby Frankford STP did not significantly improvethe level of nitrification in the aerated cell.
While significant reduction of ammonia was not achieved, it is recommended that anautomatic decant system for the aeration cell, in concert with on/off blower operation,be seriously considered for the following reasons:
- The decanting process significantly reduced the sludge solids discharged to thedownstream facultative lagoon. This would significantly reduce sludge accumulationin the lagoon.
- Reducing sludge loads to the lagoon should improve lagoon effluent quality.
- Reduction of sludge loadings would defer the very expensive and disruptive processto remove sludge from the lagoon.
Reduced suspended solids in the decant may allow ferric dosing levels to bedecreased, as the ferric may become more available (i.e. used more efficiently) forphosphorus removal. This would result in chemical cost savings.
- Decanting appears to improve BOD removal in the aerated cell. Combined with lessCBOD, less sludge, and potentially less phosphorus levels in the lagoon, the chanceof disruptive algae blooms in the lagoon may reduce.

The Municipality of Brighton 162017 Wastewater Annual Report
- While lagoon effluent results were excellent for much of 2017 (other than ammonia),the decanting process did not appear to effect effluent quality in the lagoon. Rather,it appeared that decanting from the aerated cell improved the quality of lagooneffluent for CBOD, TSS and TP.
If an automatic decant system was installed, it would simplify the decanting procedure.Multiple decants each day (say four times per day) would avoid any overflow of mixed,aerated effluent (containing high levels of solids) to the downstream lagoon.
If an automatic decanting system was installed, the existing timer system for the aeratorswould likely suffice. The only upgrade that could be considered is automatic, higherdosing of ferric chloride during the decant periods.
11.0 Ammonium Nitrogen
Removal of ammonia nitrogen has been a lang-standing issue for the Brighton WPCP.LOF provisions under previously issued Notices were undertaken largely to improveremoval of ammonia nitrogen in the lagoon system.
In 2017, efforts to improve ammonia removal focused on operation of the aerators ontimers in conjunction with manual decanting of the aerated cell. These measures wereintended to build levels of VSS and increase sludge age in the aerated cell to promotedevelopment of nitrifying bacteria.
Efforts to reduce ammonia have continued at the same time a Class EA was beingcompleted to determine the best long term treatment alternative. Previous testing byEnviro Sim (2016) indicated that the raw sewage is treatable (for significant ammoniaremoval) if proper treatment, with an established mass of nitrifying bacteria, is available.
11.1 Total Phosphorus
As per Table III, there was no exceedance of the TP limit of 1.0 mg/I in 2017.
Jar testing of the coagulant dosage was completed during the first three months of 2017to optimize dosing levels of ferric chloride under cold water conditions.
Levels of TP in wetland effluent remained below the Objective level of 0.8 mg/I for allmonths.
11.2 CBOD and Suspended Solids
Levels of CBOD and Suspended solids remained below the compliance limit and objectivelimits far all months in 2017.

The Municipality of Brighton 172017 Wastnvater Annual Report
12.0 BIOSOLIDS MANAGEMENT
No sludge was removed during 2017.
13.0 SUMMARY OF COMPLAINTS
The Municipality received no complaints in 2017
14.0 SUMMARY OF BY-PASSES, SPILLS AND ABNORMAL DISCHARGES
There were no sewage by-passes, spills or abnormal discharges during this reportingperiod.
15.0 SUMMARY OF SEWER WORK COMPLETED
Between 2010 and 2017, the Municipality completed significant maintenance of thesanitary sewer system. This work included flushing and TV inspection and progressed tomajor repairs of sewers and manholes to reduce infiltration.
At the end of 2014, Sewer Technologies completed a priority sewer repair list with themost important problems rated at 5, and the least important problems rated at 1. Therepair work has been carried out in 2015, 2016, 2017 and will continue into 2018.
In seven years, the Municipality has spent approximately $700,000 on the collectionsystem infrastructure. As noted, average flows have been reduced by approximately 500cubic meter per day.
This lower flow has increased the remaining treatment capacity, potential reducedpollutant loadings on the environment, reduced run time of pumping equipment andreduced energy usage for pumping raw sewage.
In 2018, the Municipality plans to invest a further $150,000 on flushing, CCTV and repairs,after which all of the Municipality’s sewer will have been completed. Smoke testing is alsoplanned to find direct inflow sources such as sump pumps and down spouts etc.
The Municipality of Brighton 182017 Wastinvater Annual Report
16.0 RAINBOW TROUT TOXICITY TESTING
Since spring of 2015, Brighton has submitted quarterly samples of final effluent from theconstructed wetlands to a toxicity laboratory in Guelph, Ontario (Aquatox Testing andConsulting Ltd.) for LC 50 testing using young rainbow trout.
All tests completed in 2017 had zero mortalities. Sampling and testing have been donein accordance with Environment Canada requirements.
Prepared by:
Keith Lee, Wastewater ORO Jeff Graham, P. Eng.Municipality of Brighton GSS Engineering Consultants Ltd

APPENDIX A
NOTICE OF MODIFICATIONSSUBMItTED TO MOECC UNDER LOF PROCESS — 2017
The Municipality of Brighton2017 Wastewater Annual Report
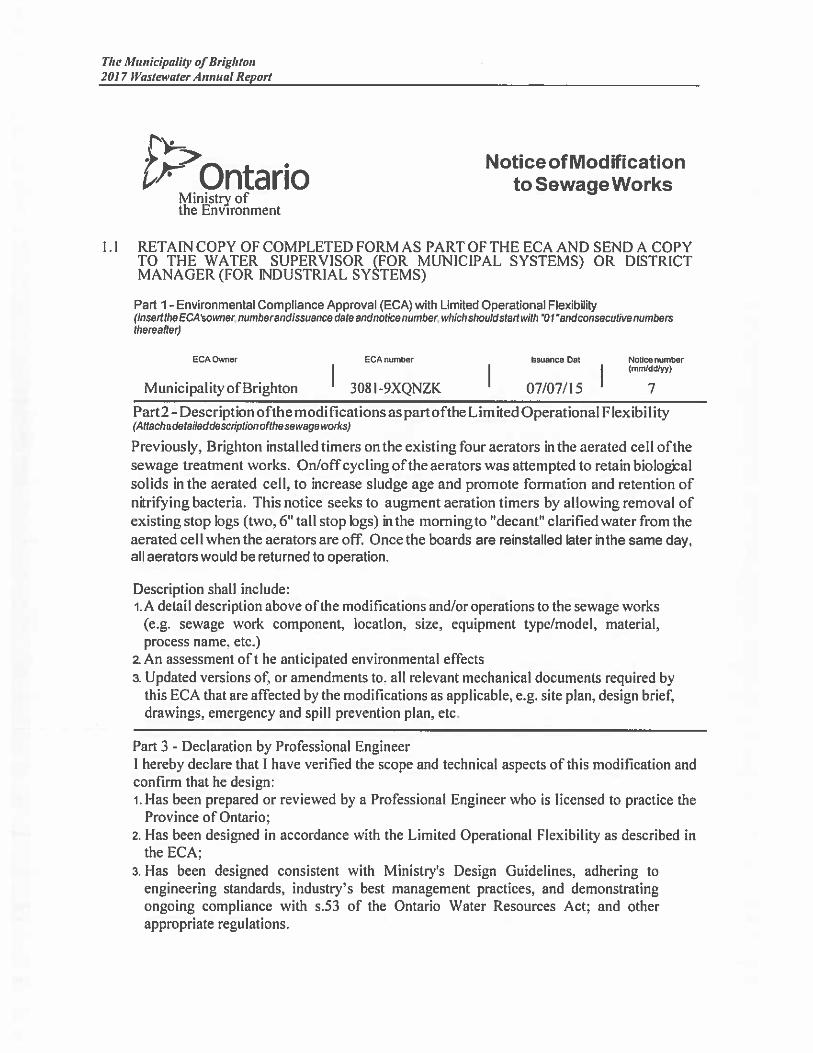
NoticeofModification,,‘Ir Ontario to Sewage WorksMinistry ofthe Environment
1.1 RETAIN COPY OF COMPLETED FORM AS PART OF THE ECA AND SEND A COPYTO THE WATER SUPERVISOR (FOR MUNICIPAL SYSTEMS) OR DISTRICTMANAGER (FOR INDUSTRIAL SYSTEMS)
Pad 1—Environmental Compliance Approval (ECA) with Limited Operational Flexibility(lnsefltheECAsowner. numberandissuance date andnotice number. which sho uld staftwith VI “andconsecutive numbersthereafter)
ECA Owner ECA number bsuance Dat Notice number(mmlddlyy)
Municipality ofBrighton 3081 -9XQNZK 07/07/15 7
Part2 - Description ofthemodifications as partofthe Limited Operational Flexibility(Attach a detaileddescflption ofthesewageworks
Previously, Brighton installed timers on the existing four aerators in the aerated cell ofthesewage treatment works. On/off cycling of the aerators was attempted to retain biologzalsolids in the aerated cell, to increase sludge age and promote formation and retention ofnitrifying bacteria. This notice seeks to augment aeration timers by allowing removal ofexisting stop logs (two, 6” tall stop logs) hi the morningto “decant” clarifledwater from theaerated cell when the aerators are off. Once the boards are reinstalled later inthe same day,all aerators would be returned to operation.
Description shall include:l.A detail description above ofthe modifications and/or operations to the sewage works
(e.g. sewage work component, location, size, equipment type/model, material,process name. etc.)
a An assessment oft he anticipated environmental effectsa Updated versions of, or amendments to. all relevant mechanical documents required by
this ECA that are affected by the modifications as applicable, e.g. site plan, design brief,drawings, emergency and spill prevention plan, etc.
Part 3 - Declaration by Professional EngineerI hereby declare that I have verified the scope and technical aspects of this modification andconfirm that he design:1. Has been prepared or reviewed by a Professional Engineer who is licensed to practice the
Province of Ontario:2. Has been designed in accordance with the Limited Operational Flexibility as described in
the ECA:3. Has been designed consistent with Ministry’s Design Guidelines, adhering to
engineering standards, industry’s best management practices, and demonstratingongoing compliance with s.53 of the Ontario Water Resources Act; and otherappropriate regulations.
The Municipality of Brighton2017 Wastewater Annual Report
- offl3p mfl.EnaSignature
Name at Employer
GS ednp Consdants Ltd
Owner representauves tile (PtThq
CAO
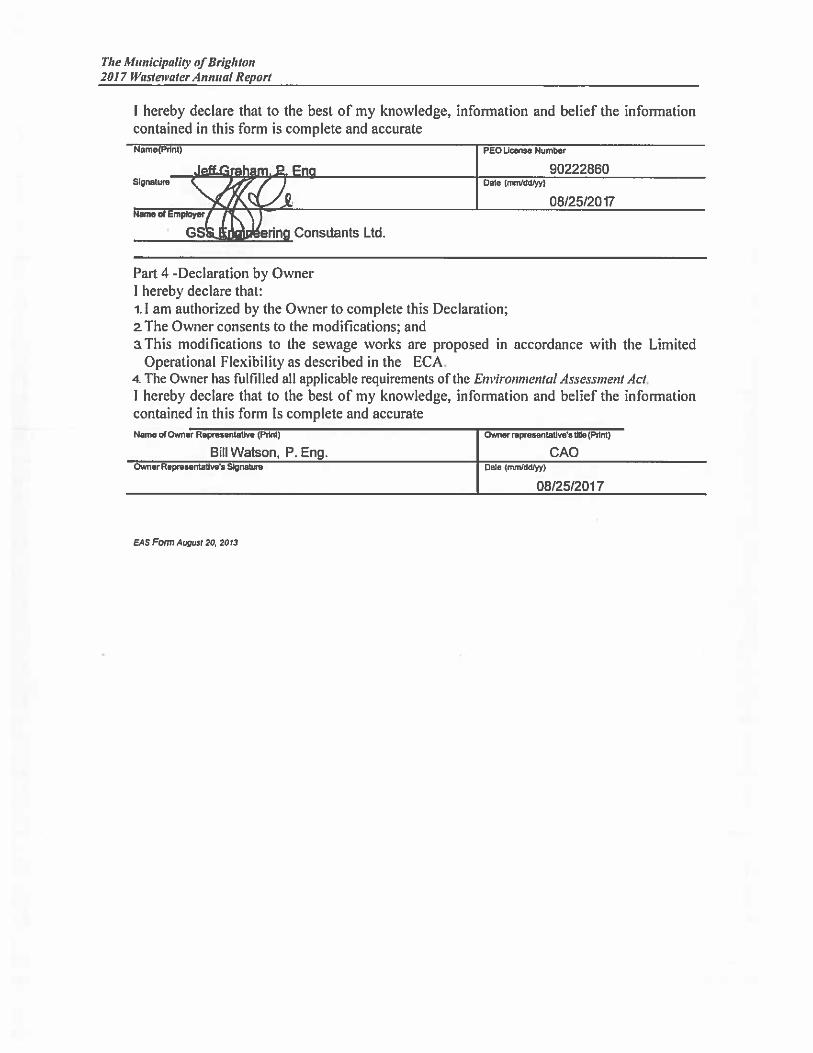
I hereby declare that to the best of my knowledge, information and belief the informationcontained in this form is complete and accurateName{Pdnt) PEO Ucense Number
90222860Date (nnvdd*)
08/25/2017
Part 4 -Declaration by OwnerI hereby declare that:1.! am authorized by the Owner to complete this Declaration;a The Owner consents to the modifications; anda This modifications to the sewage works are proposed in accordance with the Limited
Operational Flexibility as described in the ECA.4. The Owner has fulfilled all applicable requirements of the Environmental Assessment Act,I hereby declare that to the best of my knowledge, information and belief the informationcontained in this form Is complete and accurateName at Owner Rapreseiitaltve (Prig)
Bill Watson, P. Eng.OwnerRsentaOvesSignL.o
08/25/2017
EAS Fonn August 20 2013
Related Documents