Prod John De Ta John De Ta John Dee John Deere netwrap with TamaTec+™ technology Giving you MORE than ever, for LESS. logy Product Name Width Roll Length John Deere CoverEdge TamaTec+ 51 in. (130 cm) 12,100 ft. (3,700 m) John Deere CoverEdge TamaTec+ 67 in. (170 cm) 9,000 ft. (2,750 m) John Deere Edge to Edge TamaTec+ 48 in. (123 cm) 13,200 ft. (4,025 m) John Deere Edge to Edge TamaTec+ 64 in. (163 cm) 9,700 ft. (2,950 m) available at your local John Deere Dealer ASK YOUR JOHN DEERE DEALER ABOUT NEW WRAP! Tama USA Inc. Toll Free: 1-800-225-8946 Website: www.tama-usa.com 2017 U.S. forage statistics more than 15,000 thousand tons 10,000 to 15,000 thousand tons 5,000 to 10,000 thousand tons 2,000 to 5,000 thousand tons 0 to 2,000 thousand tons Total forage production Total forage production is represented by the total of alfalfa, other hay, silage and greenchop production. 2017 national forage review States that provided data to NASS were divided into the following regions: • Southwest: Arizona, California, Nevada, New Mexico, Oklahoma, Texas • East: Kentucky, New York, Ohio, Pennsylvania • Northwest: Colorado, Idaho, Montana, Oregon, Utah, Washington, Wyoming • Midwest: Illinois, Iowa, Kansas, Michigan, Minnesota, Missouri, Nebraska, North Dakota, South Dakota, Wisconsin For market reports updated monthly, visit www.progressiveforage.com/news/hay-market-reports Alfalfa hay market trends (dollars per ton) Total corn silage production Total other hay production Total alfalfa hay production Total greenchop production more than 5,000 thousand tons 3,000 to 5,000 thousand tons 1,000 to 3,000 thousand tons 100 to 1,000 thousand tons 0 to 100 thousand tons more than 5,000 thousand tons 2,000 to 5,000 thousand tons 1,000 to 2,000 thousand tons 500 to 1,000 thousand tons 0 to 500 thousand tons more than 10,000 thousand tons 5,000 to 10,000 thousand tons 1,000 to 5,000 thousand tons 500 to 1,000 thousand tons 0 to 500 thousand tons more than 5,000 thousand tons 2,000 to 5,000 thousand tons 1,000 to 2,000 thousand tons 500 to 1,000 thousand tons 0 to 500 thousand tons Midwest (average) Northwest (average) $149 $166 $203 $127 Southwest (average) East (average) May Apr July June Sept Aug Nov Dec Oct Dec 2016 Mar Feb Jan 2017 $100 $120 $140 $160 $180 $200 $220 2017 Top 10 states Sorghum silage State ranking State Acreage (in thousand acres) State Yield (tons/acre) State Production (in thousand tons) 1 Kansas 85 Missouri 19.0 Kansas 1,105 2 Texas 65 Oklahoma 18.0 Texas 975 3 South Dakota 37 Arkansas 16.0 South Dakota 407 4 Colorado 25 Colorado 15.0 Colorado 375 5 Nebraska 22 Texas 15.0 Nebraska 220 6 New Mexico 17 Georgia 13.0 Oklahoma 216 7 Oklahoma 12 Kansas 13.0 New Mexico 187 8 Georgia 8 Illinois 12.0 Georgia 104 9 Missouri 5 Louisiana 12.0 Missouri 95 10 North Carolina 4 New Mexico 11.0 North Carolina 40 Source: USDA National Ag Statistics Service 2017 annual Crop Production report, Jan. 2018 Prices With U.S. average hay prices ending 2016 at 70-month lows, presumably there was nowhere to go but up. However, it took until spring for prices to thaw out. Significant revisions in final USDA 2016 alfalfa and hay acreage estimates, along with an 11 percent acreage reduction in new alfalfa seedings, did nothing to boost prices as the new year began. A pickup in buyer interest in early February also failed to spring life into hay markets, and alfalfa hay prices continued lower in January and February 2018. Alfalfa hay prices started to improve in March, with U.S. averages rising about $31 per ton between January and May to reach $157 per ton, before plateauing in June and settling in a narrow range through November. In contrast, 2017 average prices for other hay peaked in April at $131 per ton and then settled back to prices similar to the end of 2016. As the harvest season ended and the 2017 hay crop was tucked away in sheds and stacks, growing-season factors took a back seat to domestic and foreign demand in driving hay prices. The October 2017 U.S. average price paid to alfalfa hay producers at the farm level was $152 per ton, up $3 from September and $17 more than a year earlier. The October 2017 U.S. average price for other hay moved off a 12-month low and was estimated at $118 per ton, up $5 per ton from September. Weather and drought Widespread winter precipitation improved moisture conditions in many hay- producing areas throughout the U.S., providing optimism for the 2017 growing season. The USDA’s World Agricultural Outlook Board reported about 24 percent of U.S. hay acreage was located in areas experiencing drought at the end of 2016 and that dropped to about 19 to 20 percent in January and February 2018. California’s drought area had shrunk substantially, but Oklahoma, Missouri and Colorado showed a growing presence of drought. Spring also revealed signs of significant alfalfa winterkill losses in southern South Dakota, central Minnesota and southwestern Wisconsin. Fields most affected were older fields and/or those where a late fall cutting was taken. Excessive moisture levels were also causing grower challenges elsewhere. In California, common leaf spot was evident in alfalfa fields in early spring. Late August and early September threw more curveballs at hay growers, with hurricanes hitting the Gulf Coast and Southeast, fire and smoke impacting haying activity and hay quality in the Northwest, and the drought lingering in the Northern Plains. Officials in the Northern Plains prepared a hay lottery, with livestock producers from Montana, North Dakota and South Dakota eligible to receive emergency hay. The nationwide percentage of hay area facing drought was up slightly by October, and the situation worsened during the final quarter of 2017, to 30 percent of U.S. hay-producing acreage as 2018 began. Exports 2017 continued a three-year run in which alfalfa hay exports rose from the year before. By November, 2017 alfalfa hay export sales topped 2.4 million metric tons (MT) and were just short of a new record annual high, with one month still to go on the export calendar. China was the wild card, and was frequently the top destination for U.S. alfalfa hay each month. Through the first 11 months of the year, China had purchased about 44 percent of all U.S. alfalfa exports. Japan was the second-leading market, and Saudi Arabia, nearing its goal of eliminating domestic hay production due to limits on water usage, continued expanded alfalfa production and exports from Arizona. Despite an unfavorable exchange rate and strong domestic harvest, Japan remained the leading foreign market for other hay. In very short supply of straws and timothy, South Korea was also a leading purchaser of other hay during the year. Production and inventories Notable changes in acres and tonnage produced unfolded across all forage products in 2017. • All dry hay: 2017 production was estimated at 131 million tons, down 3 percent from the revised 2016 total. Area harvested was estimated at 53.8 million acres, up 1 percent from 2016. The average yield, at 2.44 tons per acre, was down 0.08 ton from the previous year. • Alfalfa and alfalfa mixtures: Production in 2017 was estimated at 55.1 million tons, down 5 percent from the 2016 total. Harvested area, at 16.6 million acres, was 2 percent below the previous year. Average yield was estimated at 3.32 tons per acre, down 0.13 ton from 2016. • Other hay: Production in 2017 totaled 76.4 million tons, down less than 1 percent from the revised 2016 total. Harvested area, at 37.2 million acres, was up 2 percent from the previous year. Average yield was estimated at 2.05 tons per acre, down 0.05 ton from the previous year’s revised record high. • Total forage: In 2017, 17 states were included in the USDA forage estimation program, which measures annual production of forage crops. Haylage and greenchop production was converted to 13 percent moisture and combined with dry hay production to derive the total forage production. The 17-state total for all forage production was 86.7 million tons. Of this total, 44 million tons were produced from alfalfa and alfalfa mixtures. The total 2017 all haylage and greenchop production for the 17 states was 30.5 million tons, of which 20 million tons were from alfalfa and alfalfa mixtures. • Corn silage: Production was estimated at 128.4 million tons for 2017, up 2 percent from 2016 and up slightly from the previous high set in 2014. Area harvested for silage was estimated at 6.43 million acres, up 4 percent from a year ago and the most acreage devoted to corn silage since 2012. Average yield was estimated at 19.9 tons per acre, down 0.4 ton from 2016 and the lowest average since 2013. • Sorghum silage: Production was estimated at 3.77 million tons, down 10 percent from 2016 and the smallest harvest since 2011. Area harvested for silage was estimated at 284,000 acres, down 5 percent from the previous year and also the smallest harvested area since 2011. Silage yield averaged 13.3 tons per acre, down 0.7 tons per acre from 2016. One footnote: Data for Arizona, the fourth-largest sorghum silage-producing state in 2015, was discontinued for 2016-17. • New seedings of alfalfa and alfalfa mixtures: At 2.21 million acres, acreage newly seeded to alfalfa in 2017 were down about 3 percent (58,000 acres) from 2016 and the lowest acreage devoted to new seeding since USDA started releasing estimates two decades ago. New alfalfa seeding routinely surpassed 3 million acres per year between 1997 and 2006.

Welcome message from author
This document is posted to help you gain knowledge. Please leave a comment to let me know what you think about it! Share it to your friends and learn new things together.
Transcript

John Deere netwrap with TamaTec+™ technologyGiving you MORE than ever, for LESS.
• MORE footage – LESS cost per bale• MORE bales per roll – LESS downtime• MORE baling productivity
P.O. Box 506, Highway 61-151 South, Dubuque, IOWA 52004-0506Phone: (563) 583-3035 Fax: (563) 583-3531 TOLL FREE: 1-800-225-8946Email: [email protected] www.ambraco.com
Product Name Width Roll Length
John Deere CoverEdge TamaTec+ 51 in. (130 cm) 12,100 ft. (3,700 m)
John Deere CoverEdge TamaTec+ 67 in. (170 cm) 9,000 ft. (2,750 m)
John Deere Edge to Edge TamaTec+ 48 in. (123 cm) 13,200 ft. (4,025 m)
John Deere Edge to Edge TamaTec+ 64 in. (163 cm) 9,700 ft. (2,950 m)
available at your local John Deere Dealer
ASK YOUR JOHN DEERE DEALER ABOUT NEW WRAP!
Tama USA Inc.Toll Free: 1-800-225-8946Website: www.tama-usa.com
2017 U.S. forage statistics
more than 15,000 thousand tons
10,000 to 15,000 thousand tons
5,000 to 10,000 thousand tons
2,000 to 5,000 thousand tons
0 to 2,000 thousand tons
Total forage production
Total forage production is represented by the total of alfalfa, other hay, silage and greenchop production.
2017 national forage review
States that provided data to NASS were divided into the following regions:• Southwest: Arizona, California, Nevada, New Mexico, Oklahoma, Texas• East: Kentucky, New York, Ohio, Pennsylvania• Northwest: Colorado, Idaho, Montana, Oregon, Utah, Washington, Wyoming• Midwest: Illinois, Iowa, Kansas, Michigan, Minnesota, Missouri, Nebraska, North Dakota, South Dakota, Wisconsin
For market reports updated monthly, visit www.progressiveforage.com/news/hay-market-reports
Alfalfa hay market trends (dollars per ton)Total corn silage production
Total other hay production
Total alfalfa hay production
Total greenchop production
more than 5,000 thousand tons3,000 to 5,000 thousand tons1,000 to 3,000 thousand tons100 to 1,000 thousand tons0 to 100 thousand tons
more than 5,000 thousand tons2,000 to 5,000 thousand tons1,000 to 2,000 thousand tons500 to 1,000 thousand tons0 to 500 thousand tons
more than 10,000 thousand tons5,000 to 10,000 thousand tons1,000 to 5,000 thousand tons500 to 1,000 thousand tons0 to 500 thousand tons
more than 5,000 thousand tons2,000 to 5,000 thousand tons1,000 to 2,000 thousand tons500 to 1,000 thousand tons0 to 500 thousand tons
Midwest(average)
Northwest(average)
$149
$166
$203
$127
Southwest (average)
East (average)
MayApr JulyJune SeptAug Nov DecOctDec2016
MarFebJan2017
$100
$120
$140
$160
$180
$200
$220
2017 Top 10 statesSorghum silage
State ranking
StateAcreage
(in thousand acres)
StateYield
(tons/acre)State
Production (in thousand
tons)
1 Kansas 85 Missouri 19.0 Kansas 1,105
2 Texas 65 Oklahoma 18.0 Texas 975
3 South Dakota 37 Arkansas 16.0 South Dakota 407
4 Colorado 25 Colorado 15.0 Colorado 375
5 Nebraska 22 Texas 15.0 Nebraska 220
6 New Mexico 17 Georgia 13.0 Oklahoma 216
7 Oklahoma 12 Kansas 13.0 New Mexico 187
8 Georgia 8 Illinois 12.0 Georgia 104
9 Missouri 5 Louisiana 12.0 Missouri 95
10 North Carolina 4 New Mexico 11.0 North Carolina 40
Source: USDA National Ag Statistics Service 2017 annual Crop Production report, Jan. 2018
PricesWith U.S. average hay prices ending 2016 at 70-month lows, presumably there
was nowhere to go but up. However, it took until spring for prices to thaw out.Significant revisions in final USDA 2016 alfalfa and hay acreage estimates, along
with an 11 percent acreage reduction in new alfalfa seedings, did nothing to boost prices as the new year began. A pickup in buyer interest in early February also failed to spring life into hay markets, and alfalfa hay prices continued lower in January and February 2018.
Alfalfa hay prices started to improve in March, with U.S. averages rising about $31 per ton between January and May to reach $157 per ton, before plateauing in June and settling in a narrow range through November.
In contrast, 2017 average prices for other hay peaked in April at $131 per ton and then settled back to prices similar to the end of 2016.
As the harvest season ended and the 2017 hay crop was tucked away in sheds and stacks, growing-season factors took a back seat to domestic and foreign demand in driving hay prices. The October 2017 U.S. average price paid to alfalfa hay producers at the farm level was $152 per ton, up $3 from September and $17 more than a year earlier. The October 2017 U.S. average price for other hay moved off a 12-month low and was estimated at $118 per ton, up $5 per ton from September.
Weather and droughtWidespread winter precipitation improved moisture conditions in many hay-
producing areas throughout the U.S., providing optimism for the 2017 growing season.
The USDA’s World Agricultural Outlook Board reported about 24 percent of U.S. hay acreage was located in areas experiencing drought at the end of 2016 and that dropped to about 19 to 20 percent in January and February 2018. California’s drought area had shrunk substantially, but Oklahoma, Missouri and Colorado showed a growing presence of drought.
Spring also revealed signs of significant alfalfa winterkill losses in southern South Dakota, central Minnesota and southwestern Wisconsin. Fields most affected were older fields and/or those where a late fall cutting was taken.
Excessive moisture levels were also causing grower challenges elsewhere. In California, common leaf spot was evident in alfalfa fields in early spring. Late August and early September threw more curveballs at hay growers, with hurricanes hitting the Gulf Coast and Southeast, fire and smoke impacting haying activity and hay quality in the Northwest, and the drought lingering in the Northern Plains. Officials in the Northern Plains prepared a hay lottery, with livestock producers from Montana, North Dakota and South Dakota eligible to receive emergency hay.
The nationwide percentage of hay area facing drought was up slightly by October, and the situation worsened during the final quarter of 2017, to 30 percent of U.S. hay-producing acreage as 2018 began.
Exports2017 continued a three-year run in which alfalfa hay exports rose from the year
before. By November, 2017 alfalfa hay export sales topped 2.4 million metric tons (MT) and were just short of a new record annual high, with one month still to go on the export calendar.
China was the wild card, and was frequently the top destination for U.S. alfalfa hay each month. Through the first 11 months of the year, China had purchased about 44 percent of all U.S. alfalfa exports. Japan was the second-leading market, and Saudi Arabia, nearing its goal of eliminating domestic hay production due to limits on water usage, continued expanded alfalfa production and exports from Arizona.
Despite an unfavorable exchange rate and strong domestic harvest, Japan remained the leading foreign market for other hay. In very short supply of straws and timothy, South Korea was also a leading purchaser of other hay during the year.
Production and inventoriesNotable changes in acres and tonnage produced unfolded across all forage
products in 2017.
• All dry hay: 2017 production was estimated at 131 million tons, down 3 percent from the revised 2016 total. Area harvested was estimated at 53.8 million acres, up 1 percent from 2016. The average yield, at 2.44 tons per acre, was down 0.08 ton from the previous year.
• Alfalfa and alfalfa mixtures: Production in 2017 was estimated at 55.1 million tons, down 5 percent from the 2016 total. Harvested area, at 16.6 million acres, was 2 percent below the previous year. Average yield was estimated at 3.32 tons per acre, down 0.13 ton from 2016.
• Other hay: Production in 2017 totaled 76.4 million tons, down less than 1 percent from the revised 2016 total. Harvested area, at 37.2 million acres, was up 2 percent from the previous year. Average yield was estimated at 2.05 tons per acre, down 0.05 ton from the previous year’s revised record high.
• Total forage: In 2017, 17 states were included in the USDA forage estimation program, which measures annual production of forage crops. Haylage and greenchop production was converted to 13 percent moisture and combined with dry hay production to derive the total forage production.
The 17-state total for all forage production was 86.7 million tons. Of this total, 44 million tons were produced from alfalfa and alfalfa mixtures. The total 2017 all haylage and greenchop production for the 17 states was 30.5 million tons, of which 20 million tons were from alfalfa and alfalfa mixtures.
• Corn silage: Production was estimated at 128.4 million tons for 2017, up 2 percent from 2016 and up slightly from the previous high set in 2014. Area harvested for silage was estimated at 6.43 million acres, up 4 percent from a year ago and the most acreage devoted to corn silage since 2012. Average yield was estimated at 19.9 tons per acre, down 0.4 ton from 2016 and the lowest average since 2013.
• Sorghum silage: Production was estimated at 3.77 million tons, down 10 percent from 2016 and the smallest harvest since 2011. Area harvested for silage was estimated at 284,000 acres, down 5 percent from the previous year and also the smallest harvested area since 2011. Silage yield averaged 13.3 tons per acre, down 0.7 tons per acre from 2016. One footnote: Data for Arizona, the fourth-largest sorghum silage-producing state in 2015, was discontinued for 2016-17.
• New seedings of alfalfa and alfalfa mixtures: At 2.21 million acres, acreage newly seeded to alfalfa in 2017 were down about 3 percent (58,000 acres) from 2016 and the lowest acreage devoted to new seeding since USDA started releasing estimates two decades ago. New alfalfa seeding routinely surpassed 3 million acres per year between 1997 and 2006.
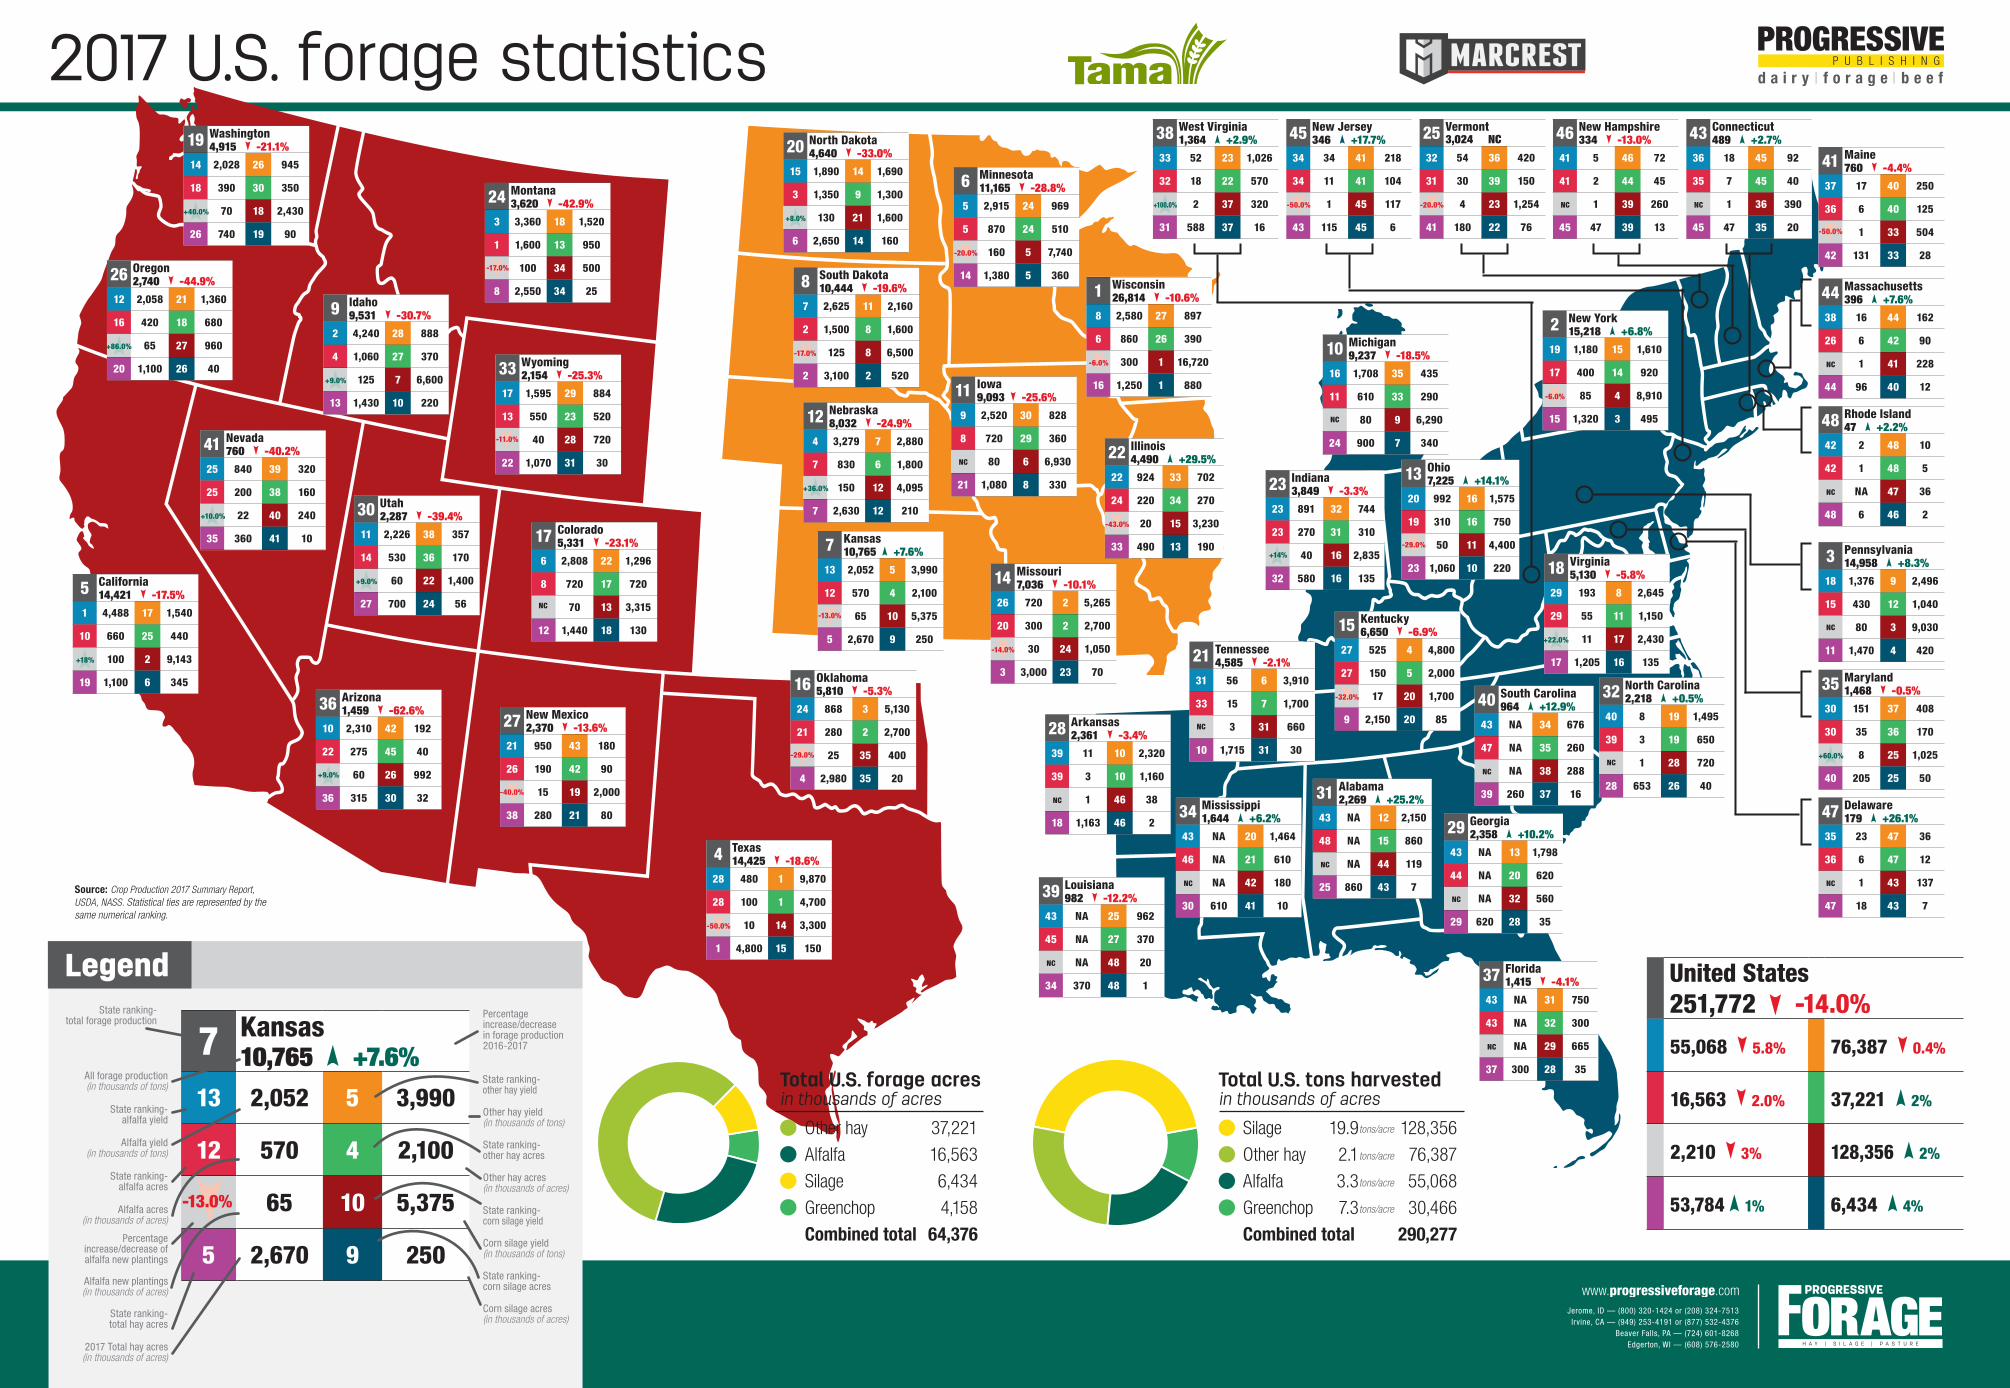
2017 U.S. forage statistics
State ranking- total forage production
Legend
Jerome, ID — (800) 320-1424 or (208) 324-7513 Irvine, CA — (949) 253-4191 or (877) 532-4376
Beaver Falls, PA — (724) 601-8268Edgerton, WI — (608) 576-2580
United States251,772 -14.0%
55,068 5.8% 76,387 0.4%
16,563 2.0% 37,221 2%
2,210 3% 128,356 2%
53,784 1% 6,434 4%
7 Kansas10,765 +7.6%
13 2,052 5 3,990
12 570 4 2,100
65 10 5,375
5 2,670 9 250
-13.0%
Source: Crop Production 2017 Summary Report, USDA, NASS. Statistical ties are represented by the same numerical ranking.
Total U.S. forage acresin thousands of acres in thousands of acres
Total U.S. tons harvestedAll forage production(in thousands of tons)
State ranking- alfalfa yield
State ranking-alfalfa acres
Percentage increase/decrease of alfalfa new plantings
State ranking-total hay acres
Alfalfa yield (in thousands of tons)
Alfalfa acres(in thousands of acres)
Alfalfa new plantings(in thousands of acres)
2017 Total hay acres(in thousands of acres)
Percentage increase/decrease in forage production 2016-2017
State ranking-other hay yield
State ranking-corn silage yield
Other hay yield(in thousands of tons)
Other hay acres(in thousands of acres)
Corn silage acres(in thousands of acres)
Corn silage yield(in thousands of tons)
State ranking-other hay acres
State ranking-corn silage acres
41 Nevada760 -40.2%
25 840 39 320
25 200 38 160
22 40 240
35 360 41 10
+10.0%
4 Texas14,425 -18.6%
28 480 1 9,870
28 100 1 4,700
10 14 3,300
1 4,800 15 150
-50.0%
25 Vermont3,024 NC
32 54 36 420
31 30 39 150
4 23 1,254
41 180 22 76
-20.0%
38 West Virginia1,364 +2.9%
33 52 23 1,026
32 18 22 570
2 37 320
31 588 37 16
+100.0%
45 New Jersey346 +17.7%
34 34 41 218
34 11 41 104
1 45 117
43 115 45 6
-50.0%
46 New Hampshire334 -13.0%
41 5 46 72
41 2 44 45
1 39 260
45 47 39 13
NC
41 Maine760 -4.4%
37 17 40 250
36 6 40 125
1 33 504
42 131 33 28
3 Pennsylvania14,958 +8.3%
18 1,376 9 2,496
15 430 12 1,040
80 3 9,030
11 1,470 4 420
47 Delaware179 +26.1%
35 23 47 36
36 6 47 12
1 43 137
47 18 43 7
NC
18 Virginia5,130 -5.8%
29 193 8 2,645
29 55 11 1,150
11 17 2,430
17 1,205 16 135
+22.0%15 Kentucky
6,650 -6.9%27 525 4 4,800
27 150 5 2,000
17 20 1,700
9 2,150 20 85
-32.0%
39 Louisiana982 -12.2%
43 NA 25 962
45 NA 27 370
NA 48 20
34 370 48 1
NC
28 Arkansas2,361 -3.4%
39 11 10 2,320
39 3 10 1,160
1 46 38
18 1,163 46 2
NC
8 South Dakota10,444 -19.6%
7 2,625 11 2,160
2 1,500 8 1,600
125 8 6,500
2 3,100 2 520
-17.0%
30 Utah2,287 -39.4%
11 2,226 38 357
14 530 36 170
60 22 1,400
27 700 24 56
+9.0%
33 Wyoming2,154 -25.3%
17 1,595 29 884
13 550 23 520
40 28 720
22 1,070 31 30
24 Montana3,620 -42.9%
3 3,360 18 1,520
1 1,600 13 950
100 34 500
8 2,550 34 25
9 Idaho9,531 -30.7%
2 4,240 28 888
4 1,060 27 370
125 7 6,600
13 1,430 10 220
+9.0%
26 Oregon2,740 -44.9%
12 2,058 21 1,360
16 420 18 680
65 27 960
20 1,100 26 40
+86.0%
5 California14,421 -17.5%
1 4,488 17 1,540
10 660 25 440
100 2 9,143
19 1,100 6 345
+18%
17 Colorado5,331 -23.1%
6 2,808 22 1,296
8 720 17 720
70 13 3,315
12 1,440 18 130
2 New York15,218 +6.8%
19 1,180 15 1,610
17 400 14 920
85 4 8,910
15 1,320 3 495
-6.0%
43 Connecticut489 +2.7%
36 18 45 92
35 7 45 40
1 36 390
45 47 35 20
NC
44 Massachusetts396 +7.6%
38 16 44 162
26 6 42 90
1 41 228
44 96 40 12
NC
48 Rhode Island47 +2.2%
42 2 48 10
42 1 48 5
NA 47 36
48 6 46 2
NC
35 Maryland1,468 -0.5%
30 151 37 408
30 35 36 170
8 25 1,025
40 205 25 50
+60.0%
32 North Carolina2,218 +0.5%
40 8 19 1,495
39 3 19 650
1 28 720
28 653 26 40
34 Mississippi1,644 +6.2%
43 NA 20 1,464
46 NA 21 610
NA 42 180
30 610 41 10
NC
22 Illinois4,490 +29.5%
22 924 33 702
24 220 34 270
20 15 3,230
33 490 13 190
-43.0%
31 Alabama2,269 +25.2%
43 NA 12 2,150
48 NA 15 860
NA 44 119
25 860 43 7
NC
29 Georgia2,358 +10.2%
43 NA 13 1,798
44 NA 20 620
NA 32 560
29 620 28 35
NC
40 South Carolina964 +12.9%
43 NA 34 676
47 NA 35 260
NA 38 288
39 260 37 16
NC
37 Florida1,415 -4.1%
43 NA 31 750
43 NA 32 300
NA 29 665
37 300 28 35
NC
13 Ohio7,225 +14.1%
20 992 16 1,575
19 310 16 750
50 11 4,400
23 1,060 10 220
-29.0%
10 Michigan9,237 -18.5%
16 1,708 35 435
11 610 33 290
80 9 6,290
24 900 7 340
1 Wisconsin26,814 -10.6%
8 2,580 27 897
6 860 26 390
300 1 16,720
16 1,250 1 880
-6.0%
14 Missouri7,036 -10.1%
26 720 2 5,265
20 300 2 2,700
30 24 1,050
3 3,000 23 70
-14.0%
6 Minnesota11,165 -28.8%
5 2,915 24 969
5 870 24 510
160 5 7,740
14 1,380 5 360
-20.0%
12 Nebraska8,032 -24.9%
4 3,279 7 2,880
7 830 6 1,800
150 12 4,095
7 2,630 12 210
+36.0%
20 North Dakota4,640 -33.0%
15 1,890 14 1,690
3 1,350 9 1,300
130 21 1,600
6 2,650 14 160
+8.0%
19 Washington4,915 -21.1%
14 2,028 26 945
18 390 30 350
70 18 2,430
26 740 19 90
+40.0%
Other hay 37,221
Alfalfa 16,563
Silage 6,434
Greenchop 4,158
Combined total 64,376
Silage 19.9 128,356
Other hay 2.1 76,387
Alfalfa 3.3 55,068
Greenchop 7.3 30,466
Combined total 290,277
tons/acre
tons/acre
tons/acre
tons/acre
-17.0%
-11.0%
NC
36 Arizona1,459 -62.6%
10 2,310 42 192
22 275 45 40
60 26 992
36 315 30 32
+9.0%
27 New Mexico2,370 -13.6%
21 950 43 180
26 190 42 90
15 19 2,000
38 280 21 80
-40.0%
7 Kansas10,765 +7.6%
13 2,052 5 3,990
12 570 4 2,100
65 10 5,375
5 2,670 9 250
-13.0%
16 Oklahoma5,810 -5.3%
24 868 3 5,130
21 280 2 2,700
25 35 400
4 2,980 35 20
-29.0%
11 Iowa9,093 -25.6%
9 2,520 30 828
8 720 29 360
80 6 6,930
21 1,080 8 330
NC
-50.0%
NC
23 Indiana3,849 -3.3%
23 891 32 744
23 270 31 310
40 16 2,835
32 580 16 135
+14%
21 Tennessee4,585 -2.1%
31 56 6 3,910
33 15 7 1,700
3 31 660
10 1,715 31 30
NC
NC
NC
Related Documents