No portion of this document may be reproduced, scanned into an electronic system, distributed, publicly displayed or used as the basis of derivative works without attributing Bloomberg Finance L.P. and the Business Council for Sustainable Energy. For more information on terms of use, please contact [email protected]. Copyright and Disclaimer notice on the last page applies throughout. Developed in partnership with the Business Council for Sustainable Energy. GET THE FACTS www.bcse.org 2017 Sustainable Energy In America FACTBOOK

Welcome message from author
This document is posted to help you gain knowledge. Please leave a comment to let me know what you think about it! Share it to your friends and learn new things together.
Transcript

No portion of this document may be reproduced, scanned into an electronic system, distributed, publicly displayed or used as the basis of derivative works without attributing Bloomberg Finance L.P. and the Business Council for Sustainable Energy. For more information on terms of use, please contact [email protected]. Copyright and Disclaimer notice on the last page applies throughout. Developed in partnership with the Business Council for Sustainable Energy.
GET THE FACTS www.bcse.org
2017
Sustainable Energy In America FACTBOOK

1 © Bloomberg Finance L.P. 2017. Developed in partnership with The Business Council for Sustainable Energy.
About the Factbook (1 of 4): What is it and what’s new
• Aims to augment existing, reputable sources of information on US energy
• Focuses on renewables, efficiency, natural gas
• Fills important data gaps in certain areas (eg, investment flows by sector, contribution of distributed energy)
• Contains data through the end of 2016 wherever possible
• Employs Bloomberg New Energy Finance data in most cases, augmented by EIA, FERC, ACEEE, LBNL, and other
sources where necessary
• Contains the very latest information on new energy technology costs
• Has been graciously underwritten by the Business Council for Sustainable Energy
• Is in its fifth edition (first published in January 2013)
What is it?
• Format: This year’s edition of the Factbook (this document) consists of Powerpoint slides showing updated charts. For
those looking for more context on any sector, the 2014 edition can continue to serve as a reference. The emphasis of
this 2017 edition is to capture new developments that occurred in the past year.
• Updated analysis: Most charts have been extended by one year to capture the latest data.
• 2016 developments: The text in the slides highlights major changes that occurred over the past year.
• New coverage: This report contains data shown for the first time in the Factbook, including transmission investment,
PURPA-driven solar build, battery pricing, natural gas exports, energy spending, biofuel blending and electric vehicle
model availability.
What’s new?

2 © Bloomberg Finance L.P. 2017. Developed in partnership with The Business Council for Sustainable Energy.
OT
HE
R
CL
EA
N
EN
ER
GY
(no
t co
vere
d
in t
his
rep
ort
)
SU
STA
INA
BL
E
EN
ER
GY
(as
de
fin
ed
in
th
is
rep
ort
)
RENEWABLE
ENERGY
FOSSIL-
FIRED /
NUCLEAR
POWER
DISTRIBUTED POWER,
STORAGE, EFFICIENCY
TRANSPORT
• Solar
• Wind
• Geothermal
• Hydro
• Biomass
• Biogas
• Waste-to-energy
• Natural gas
• CCS
• Small-scale renewables
• CHP and WHP
• Fuel cells
• Storage
• Smart grid / demand response
• Building efficiency
• Industrial efficiency (aluminum)
• Direct use applications for natural gas
• Electric vehicles
(including hybrids)
• Natural gas vehicles
• Wave / tidal • Nuclear
• Lighting
• Industrial efficiency (other industries)
About the Factbook (2 of 4): Understanding terminology for this report

3 © Bloomberg Finance L.P. 2017. Developed in partnership with The Business Council for Sustainable Energy.
Roadmap
Sustainable energy: the new normal
Falling costs to consumers
2016: achieving new highs
Wrap-up

2016: achieving new highs

5 © Bloomberg Finance L.P. 2017. Developed in partnership with The Business Council for Sustainable Energy.
Source: US Energy Information Administration (EIA), Bureau of Economic Analysis, Bloomberg Terminal
Notes: Values for 2016 energy consumption are projected, accounting for seasonality, based on latest monthly values from EIA (data available through October 2016). GDP is real and chained (2009 dollars); annual growth rate for GDP
for 2016 is based on consensus of economic forecasts gathered on the Bloomberg Terminal as of January 2017.
● Energy productivity continues to rise: in 2016, GDP rose 1.6% while total primary energy consumption fell by 0.2%.
0.9
1.0
1.1
1.2
1.3
1.4
1.5
1.6
1.7
1.8
1.9
199
0
199
2
199
4
199
6
199
8
200
0
200
2
200
4
200
6
200
8
201
0
201
2
201
4
201
6
GDP (indexed)
Primary energy consumption (indexed)
US energy overview: The economy is more energy productive than ever
6 © Bloomberg Finance L.P. 2017. Developed in partnership with The Business Council for Sustainable Energy.
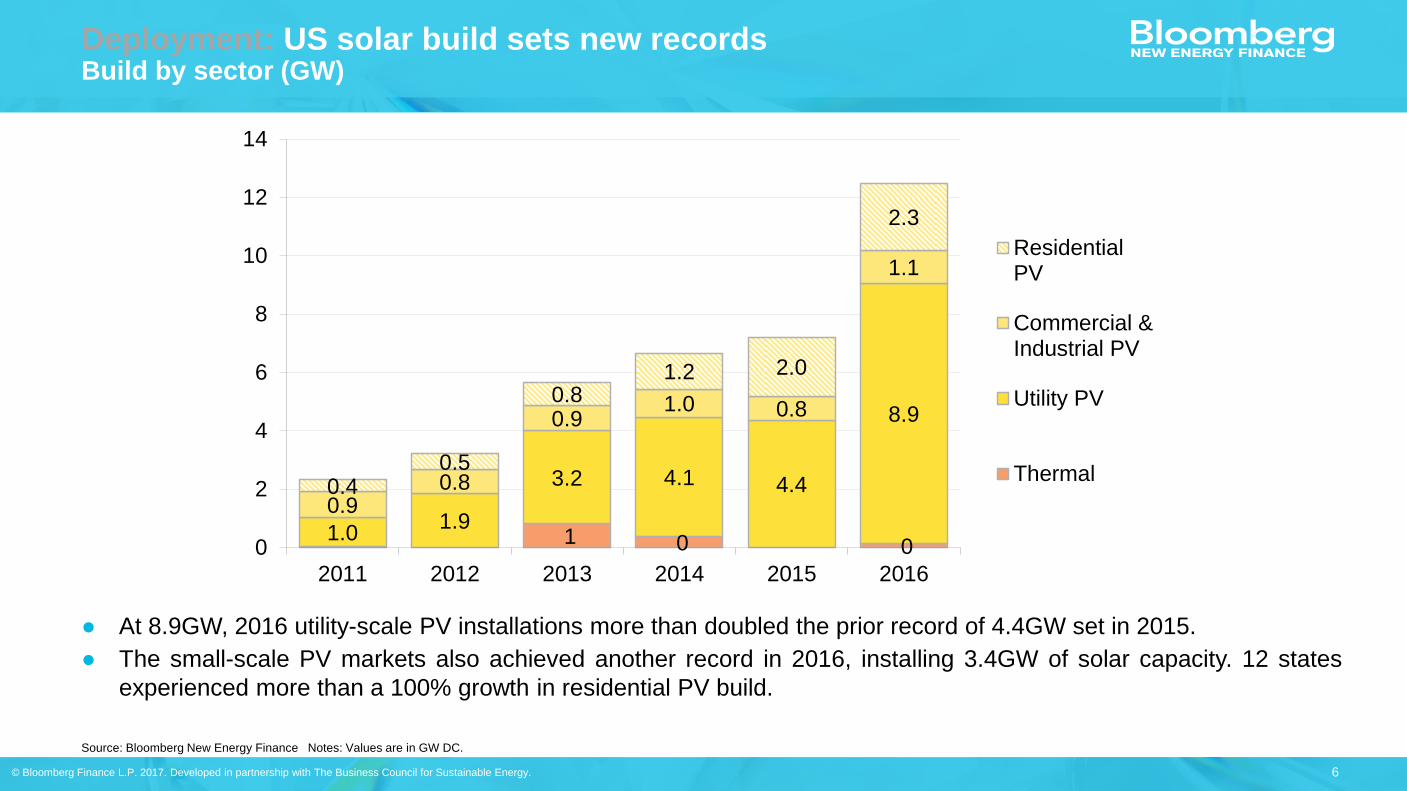
Deployment: US solar build sets new records Build by sector (GW)
● At 8.9GW, 2016 utility-scale PV installations more than doubled the prior record of 4.4GW set in 2015.
● The small-scale PV markets also achieved another record in 2016, installing 3.4GW of solar capacity. 12 states
experienced more than a 100% growth in residential PV build.
Source: Bloomberg New Energy Finance Notes: Values are in GW DC.
1 0 0 1.0
1.9
3.2 4.1 4.4
8.9
0.90.8
0.91.0 0.8
1.1
0.40.5
0.81.2 2.0
2.3
0
2
4
6
8
10
12
14
2011 2012 2013 2014 2015 2016
ResidentialPV
Commercial &Industrial PV
Utility PV
Thermal

7 © Bloomberg Finance L.P. 2017. Developed in partnership with The Business Council for Sustainable Energy.
Deployment: US becomes a natural gas net exporter Exports and imports of natural gas (Bcfd)
Source: Bloomberg New Energy Finance, EIA Note: data is through October 2016.
● Exports to Mexico have been growing steadily.
● 2016 marked the opening of two trains at the Sabine Pass LNG export terminal, which, combined with a
decrease in imports, made the US a net LNG exporter.
-10
-8
-6
-4
-2
0
2
4
6
8
2011 2012 2013 2014 2015 2016LNG imports LNG exports Imports from Canada Exports to Mexico Exports to Canada Net exports

8 © Bloomberg Finance L.P. 2017. Developed in partnership with The Business Council for Sustainable Energy.
Deployment: US non-hydropower energy storage picks up steam Commissioned and announced capacity (MW)
Incremental Cumulative
Source: Bloomberg New Energy Finance Notes: Does not include pumped hydropower, underground compressed air energy storage, or flooded lead-acid batteries. Minimum project size for inclusion in this analysis is 100kW or
100kWh.
● Energy storage is gaining momentum: the US installed a record 199MW in 2016, bringing the total to 814MW.
● And more is on the way: 4,085MW have been announced to date.
1 - - - 6 - - 0 0 -22
44 6 7 19 24
2 16 45
8 5 10 7 22 6 47
14
132
35 34 2
129
-
500
1,000
1,500
2,000
2,500
3,000
3,500
4,000
4,500
0
100
200
300
400
500
600
700
800
Q1 Q3 Q1 Q3 Q1 Q3 Q1 Q3 Q1 Q3 Q1 Q3 Q1 Q3 Q1 Q3
2009 2010 2011 2012 2013 2014 2015 2016
1 - 4
752
43 25
85 42
19 40
12 16 7
320
-
55
2 22
0 5
51 24 16
302
233
171 129
399
69 80 94
12
4,085
-
500
1,000
1,500
2,000
2,500
3,000
3,500
4,000
4,500
0
100
200
300
400
500
600
700
800
Q1 Q3 Q1 Q3 Q1 Q3 Q1 Q3 Q1 Q3 Q1 Q3 Q1 Q3 Q1 Q3
2009 2010 2011 2012 2013 2014 2015 2016
Incremental Cumulative Commissioned Announced

Sustainable energy: the new normal

10 © Bloomberg Finance L.P. 2017. Developed in partnership with The Business Council for Sustainable Energy.
Global context: Total new investment in clean energy by country or region ($bn)
Source: Bloomberg New Energy Finance Notes: For definition of clean energy, see slide in Section 2.2 of this report titled “Finance: US clean energy investment (1 of 2) – total new investment, all asset classes ($bn)” . AMER is
Americas; APAC is Asia-Pacific; EMEA is Europe, Middle East, and Africa. Investment figures are nominal.
10 17 35 47 44 35 47 63 53 45 52 63 593 911
17 26 3945
49 63 6792
11988
62
88
130
183205 207
276
317
291269
315
349
287
0
50
100
150
200
250
300
350
400
2004 2005 2006 2007 2008 2009 2010 2011 2012 2013 2014 2015 2016
Other EMEA
Other APAC
Other AMER
Europe
Brazil
India
China
United States
● The US has invested $507bn into clean energy technologies in just the last 10 years, and remains the second-
largest destination globally for clean energy investment.
● Investment, on average, has grown significantly since the early 2000s, despite precipitous drops in costs.

11 © Bloomberg Finance L.P. 2017. Developed in partnership with The Business Council for Sustainable Energy.
Deployment: US coal power plant retirements completed and announced by year (GW)
Source: Bloomberg New Energy Finance, EIA
Notes: ‘Retirements’ does not include conversions from coal to natural gas or biomass; includes retirements or announced retirements reported to the EIA through end-November 2016.
● 2016 saw another 7.2GW of coal-fired power plants drop offline, after 2015 marked the largest single year of coal
retirements ever (at just under 15GW). Since 2011, the coal fleet has shrunk 12% from its peak size of 308GW.
● This does not account for coal plants that are mothballed or on standby – ie, not generating.
1 1 1 1 3
9
6 4
15
7 5
3 2 0
2
4
6
8
10
12
14
16
19
90
19
91
19
92
19
93
19
94
19
95
19
96
19
97
19
98
19
99
20
00
20
01
20
02
20
03
20
04
20
05
20
06
20
07
20
08
20
09
20
10
20
11
20
12
20
13
20
14
20
15
20
16
20
17
20
18
20
19
20
20
EIA retired EIA announced
12 © Bloomberg Finance L.P. 2017. Developed in partnership with The Business Council for Sustainable Energy.
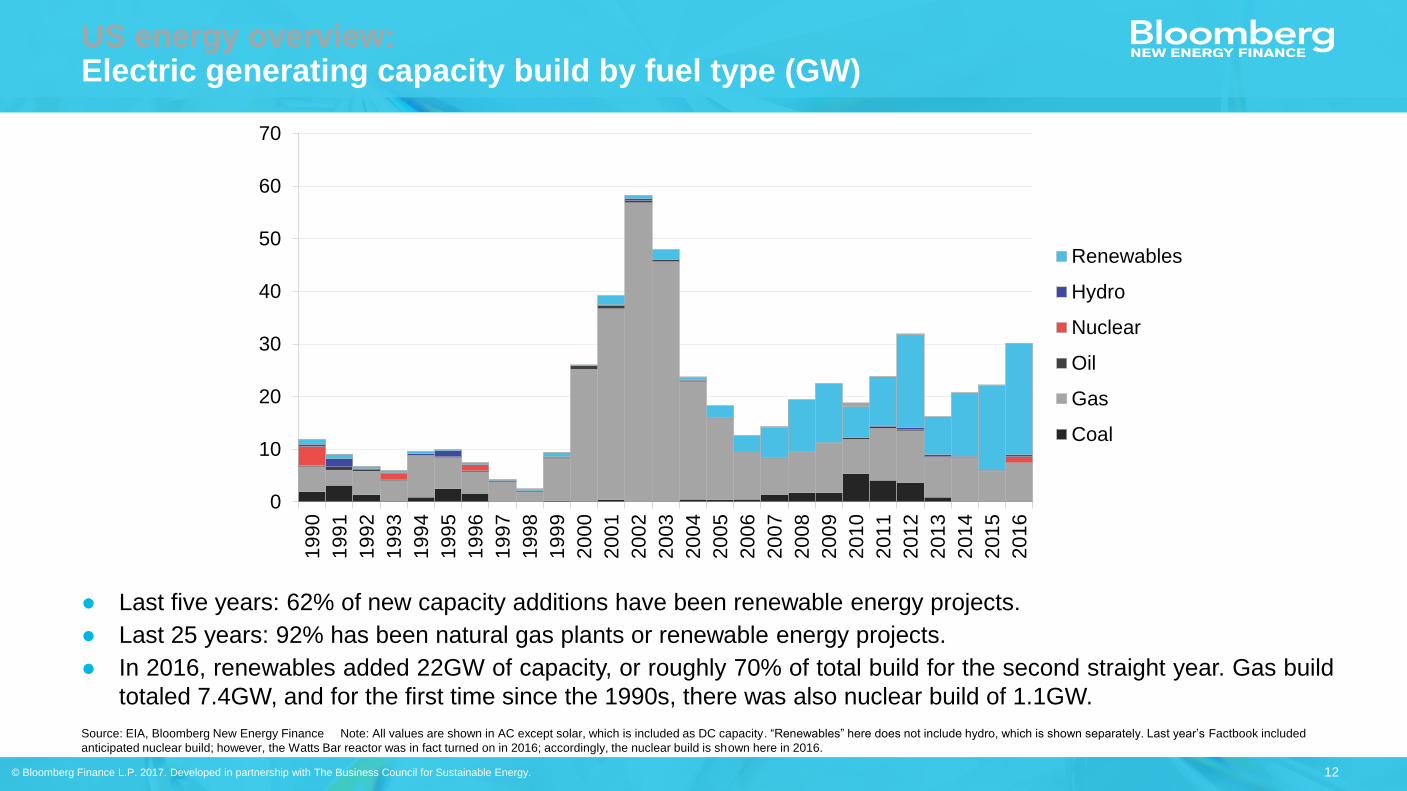
● Last five years: 62% of new capacity additions have been renewable energy projects.
● Last 25 years: 92% has been natural gas plants or renewable energy projects.
● In 2016, renewables added 22GW of capacity, or roughly 70% of total build for the second straight year. Gas build
totaled 7.4GW, and for the first time since the 1990s, there was also nuclear build of 1.1GW.
Source: EIA, Bloomberg New Energy Finance Note: All values are shown in AC except solar, which is included as DC capacity. “Renewables” here does not include hydro, which is shown separately. Last year’s Factbook included
anticipated nuclear build; however, the Watts Bar reactor was in fact turned on in 2016; accordingly, the nuclear build is shown here in 2016.
US energy overview: Electric generating capacity build by fuel type (GW)
0
10
20
30
40
50
60
70
19
90
19
91
19
92
19
93
19
94
19
95
19
96
19
97
19
98
19
99
20
00
20
01
20
02
20
03
20
04
20
05
20
06
20
07
20
08
20
09
20
10
20
11
20
12
20
13
20
14
20
15
20
16
Renewables
Hydro
Nuclear
Oil
Gas
Coal

13 © Bloomberg Finance L.P. 2017. Developed in partnership with The Business Council for Sustainable Energy.
241 249 269 255313
271 264 253 244 259
105 126144 167
194218 254 290 309
360346
375413 422
507 490517
544 553
619
0
100
200
300
400
500
600
700
200
7
200
8
200
9
2010
201
1
2012
201
3
2014
201
5
2016
Otherrenewables
Hydropower
US energy overview: Renewable energy generation by technology
Source: Bloomberg New Energy Finance, EIA
Notes: Values for 2016 are projected, accounting for seasonality, based on latest monthly values from EIA (data available through November 2016). Includes net energy consumption by pumped hydropower storage facilities.
Totals may not sum due to rounding. Beginning in 2014, numbers include estimated generation from distributed solar; generation from other distributed resources is not included.
US renewable generation by technology
(including hydropower) (TWh)
US non-hydropower renewable generation by
technology (TWh)
34 55 74 95120141
168182191224
11
11
24
929
39
56
5655
5456
5758
61
6464
63
1515
1515
1516
16
1616
17
105126
144167
194218
254
290309
360
0
50
100
150
200
250
300
350
400
2007
2008
2009
201
0
201
1
201
2
201
3
201
4
201
5
201
6
Geothermal
Biomass, biogas,waste-to-energy
Solar
Wind
● Renewable generation surged in 2016, increasing 12% over 2015 levels. Hydropower remains the largest
single source of renewable generation (42%), but wind (36%) is catching up quickly.
● Non-hydro renewable generation has more than tripled over the past ten years.

14 © Bloomberg Finance L.P. 2017. Developed in partnership with The Business Council for Sustainable Energy.
49% 48% 44% 45% 42%37% 39% 39%
33% 30%
19% 20%20% 20%
19%19% 19% 19%
19%20%
22% 22% 24% 24%25%
31% 28% 28%33%
34%
8% 9% 11% 10% 13% 12% 13% 13% 14% 15%
0%
20%
40%
60%
80%
100%
200
7
200
8
200
9
201
0
201
1
201
2
201
3
201
4
201
5
201
6
Renewables(including hydro)
Natural gas
Nuclear
Oil
Coal
US energy overview: Electricity generation mix
Source: EIA Notes: Values for 2016 are projected, accounting for seasonality, based on latest monthly values from EIA (data available through November 2016). In chart at left, contribution from ‘Other’ is not shown; the amount is
minimal and consists of miscellaneous technologies including hydrogen and non-renewable waste. The hydropower portion of ‘Renewables’ includes negative generation from pumped storage.
● Natural gas has eclipsed coal as the largest contributor to the US electricity mix, hitting 34% in 2016. Coal sank to
second place, providing 30% of the mix – its lowest share on record.
● Since 2007: coal’s share plummeted from 49% to 30%, while natural gas’s grew from 22% to 34% and renewables
from 8% to 15%.

15 © Bloomberg Finance L.P. 2017. Developed in partnership with The Business Council for Sustainable Energy.
Deployment: US natural gas production and gas-directed rig count
Production (Bcfd) Number of rigs
Source: Bloomberg New Energy Finance, EIA, Baker Hughes. Data up through the latest comprehensive numbers available (October 2016).
0
200
400
600
800
1,000
1,200
1,400
1,600
1,800
0
10
20
30
40
50
60
70
80
90
2006 2007 2008 2009 2010 2011 2012 2013 2014 2015 2016
Shale Other lower 48 Rigs
● US natural gas production held steady despite rig counts falling 48% year-on-year.
● Producers are selectively drilling in productive ‘sweet spots’ and turning to an inventory of drilled but
uncompleted wells (DUCs) to cost-effectively extract gas, and the industry has made technological
improvements in efficiencies.

16 © Bloomberg Finance L.P. 2017. Developed in partnership with The Business Council for Sustainable Energy.
Deployment: US natural gas demand by end use (Bcfd)
● 2016 demand represented a 21% increase from 2008 levels, and a slight year-on-year rise from 2015.
● The power sector drove domestic demand growth, jumping 7% compared to 2015.
● Pipeline exports to Mexico have nearly quadrupled since 2008, and the US started exporting liquefied natural
gas (LNG) this past year.
Source: Bloomberg New Energy Finance, EIA Note: Values for 2016 are projected based upon the latest available data (October 2016).
18.2 16.9 18.7 19.1 19.8 20.3 20.9 20.6 20.9
8.68.5
8.5 8.6 7.9 9.0 9.5 8.8 7.8
13.413.1
13.1 12.9 11.413.4 13.9
12.610.6
18.218.8
20.2 20.7 24.922.4
22.2 26.428.4
0.4
1.0 0.9 0.9 1.41.7 1.8
2.02.9 3.7
0.0
10.0
20.0
30.0
40.0
50.0
60.0
70.0
80.0
2008 2009 2010 2011 2012 2013 2014 2015 2016
Industrial Commercial Residential Power LNG exports Mexico exports
58.1 61.362.7
65.6 66.968.6 71.3
59.5
71.7
17 © Bloomberg Finance L.P. 2017. Developed in partnership with The Business Council for Sustainable Energy.
Source: Bloomberg New Energy Finance, EIA, EPA
Notes: ‘Sinks’ refer to forests and green areas which absorb carbon dioxide. Values may differ from last year’s, due to recalculations and revisions published by the EPA, primarily to methane emissions. Values for 2016 are
projected, accounting for seasonality, based on latest monthly values from EIA (data available through October 2016). ‘Obama’s target’ refers to a pledge made in Copenhagen climate talks in 2009. The target shown here assumes
17% reduction by 2020 on 2005 levels of total GHG emissions, but the actual language of the announcement left vague whether the reductions applied to economy-wide emissions or just emissions of certain sectors. Data for total
GHG emissions comes from EPA’s Inventory of US Greenhouse Gas Emissions and Sinks (1990-2014), published April 2016. Data for CO2 emissions from the energy sector comes from the EIA’s Monthly Energy Review.
4,000
4,500
5,000
5,500
6,000
6,500
7,000
7,500
8,000
1990
1992
1994
1996
1998
2000
2002
2004
2006
2008
2010
2012
2014
2016
2018
2020
GHG emissions from energy sector, 1990-2016e
Total GHG emissions,1990
Obama's target, 2020
Total (gross) GHG emissions,2005-2016e
0
500
1,000
1,500
2,000
2,500
3,000
1990
1992
1994
1996
1998
2000
2002
2004
2006
2008
2010
2012
2014
2016
2018
2020
GHG emissions from power sector only
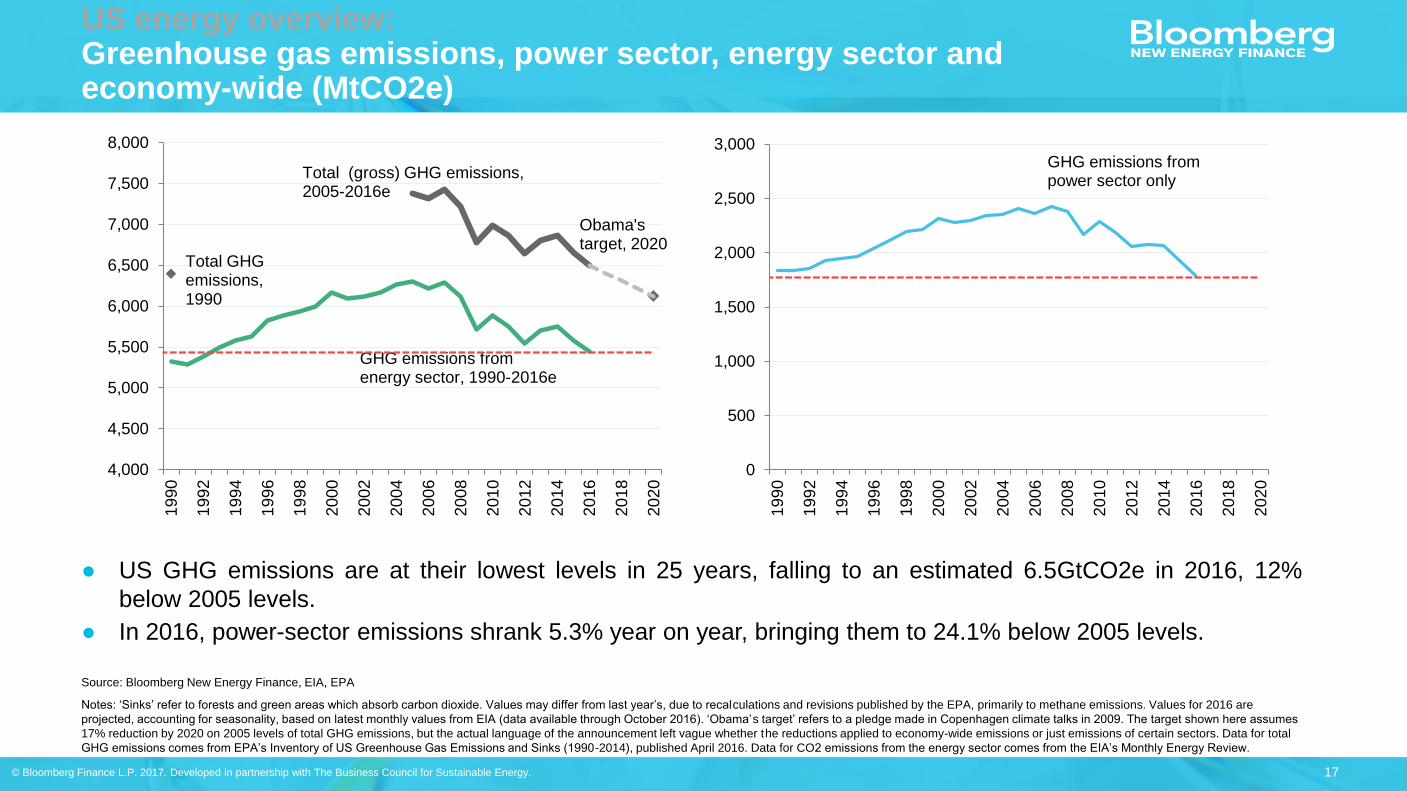
US energy overview: Greenhouse gas emissions, power sector, energy sector and economy-wide (MtCO2e)
● US GHG emissions are at their lowest levels in 25 years, falling to an estimated 6.5GtCO2e in 2016, 12%
below 2005 levels.
● In 2016, power-sector emissions shrank 5.3% year on year, bringing them to 24.1% below 2005 levels.

Falling costs for consumers

19 © Bloomberg Finance L.P. 2017. Developed in partnership with The Business Council for Sustainable Energy.
Economics: Price of solar modules and experience curve (2015$/W as function of global cumulative capacity)
Source: Bloomberg New Energy Finance, Paul Maycock Notes: The precise learning rate depends on the end-point chosen, but we believe $0.41/W to be slightly below the experience curve at the end of 2016. Figures in real 2015
dollars.
Cost (2015 $/W)
0.1
1
10
100
1 10 100 1,000 10,000 100,000 1,000,000
Historical prices (Maycock) Chinese c-Si module price Experience curve
1976
1985
2003
1976
1985
2008
Cumulative capacity (MW)
2015
2016(estimate)
● PV module prices have fallen 26.5%, on average, for every doubling of installed capacity
● At the end of 2016, the global average module price was $0.41/W, down 90% from 2008 levels ($3.88/W).
● Global oversupply will likely depress prices further in 2017.

20 © Bloomberg Finance L.P. 2017. Developed in partnership with The Business Council for Sustainable Energy.
Economics: US levelized cost of electricity (unsubsidized across power generation technologies, H2 2016 ($/MWh)
Source: Bloomberg New Energy Finance, EIA
0 50 100 150 200 250
Combined cycle gas
Wind - onshore
Coal
PV - tracking
PV - no tracking
CHP
Nuclear
Solar thermal - trough
H2 2016 benchmark H1 2016 benchmark
● On a levelized cost basis, renewables are competitive with coal and natural gas-fired power.
● The unsubsidized LCOE for wind came in as low as $37/MWh in Texas, the cheapest of all technologies
assessed. Solar PV can be built for as low as $50/MWh, again in Texas and the Southwest.
● Natural gas is cheaper to build than coal across most of the country.

21 © Bloomberg Finance L.P. 2017. Developed in partnership with The Business Council for Sustainable Energy.
Economics: Average 2015-H1 2016 offtake prices for wind and solar PPAs by signing date ($/MWh)
Source: Bloomberg New Energy Finance, FERC EQR
● Lower levelized costs translate into lower offtake prices: prices paid for solar and wind have fallen dramatically
since 2008-2010.
<200MW
<600MW
<845MW

22 © Bloomberg Finance L.P. 2017. Developed in partnership with The Business Council for Sustainable Energy.
-20% -20% -7% -10% -35% -22%
1,000
800
642 599
540
350 273
2010 2011 2012 2013 2014 2015 2016
Source: Bloomberg New Energy Finance
Economics: Lithium-ion battery pack prices, 2010-2016 ($/kWh)
● The costs of energy storage are also declining, with lithium-ion battery prices down 73% since 2010.
● Falling costs for battery packs are making battery electric vehicles competitive with traditional combustion engines,
when accounting for purchasing incentives.

23 © Bloomberg Finance L.P. 2017. Developed in partnership with The Business Council for Sustainable Energy.
Source: Bloomberg New Energy Finance, EIA, Bloomberg Terminal Notes: Wholesale prices are taken from proxy power hubs in each ISO and are updated through end-2016. The retail power prices shown here are not exact retail rates,
but weighted averages across all rate classes by state, as published by EIA 826. Retail prices are updated through end-November 2016. All prices are in real 2016 dollars.
0
20
40
60
80
100
120
140
160
180
200
200
6
200
7
200
8
200
9
201
0
201
1
201
2
201
3
201
4
2015
201
6
New York
NewEnglandCalifornia
PJM
MISO
ERCOT
Northwest
Florida
Southwest
Southeast
US energy overview: Retail power prices (2016 $/MWh)
● Retail prices declined at an average of 2.2% across the country in 2016. New York and Texas (ERCOT) saw
decreases of 5.6% and 6.2%, respectively.
● Since 2005, US average retail prices have risen only 1.4% in real terms. Prices are down 7% from their 2008
peak.

24 © Bloomberg Finance L.P. 2017. Developed in partnership with The Business Council for Sustainable Energy.
Source: Bloomberg New Energy Finance, EIA Notes: 2016 values are annualized, accounting for seasonality, using data through October 2016. All prices are in real 2016 dollars.
US energy overview: Retail natural gas prices by segment (2016 $/Mcf)
● Prices for natural gas delivered to commercial consumers are at their lowest levels since 1977.
0
2
4
6
8
10
12
14
16
18
20
1975 1980 1985 1990 1995 2000 2005 2010 2015
Industrial
Commercial
Residential

25 © Bloomberg Finance L.P. 2017. Developed in partnership with The Business Council for Sustainable Energy.
Source: Bureau of Economic Analysis, Bloomberg New Energy Finance Notes: Values for the fourth quarter of 2016 are preliminary.
Electricity and natural gas as a share of total
consumption expenditure
Total energy goods and services as a share of total
consumption expenditure
US energy overview: Energy as share of total US personal consumption expenditure
● Americans are dedicating less of their household spending to energy than at any other time on record: energy consumption
as a share of total consumption expenditures averaged 3.9% in 2016, the first year in which this measure came in below 4%
since at least 1959.
● Consumption costs for natural gas and electricity reflect a similar trend: natural gas represented under 0.4% of total
spending, and electricity came in at 1.4%, both the lowest totals on record.
0%
2%
4%
6%
8%
10%
1960 65 70 75 80 85 90 95 2000 05 10 15
0.0%
0.5%
1.0%
1.5%
2.0%
2.5%
1960 65 70 75 80 85 90 95 2000 05 10 15
Electricity
Natural gas

Wrap-up
27 © Bloomberg Finance L.P. 2017. Developed in partnership with The Business Council for Sustainable Energy.
Wrap-up
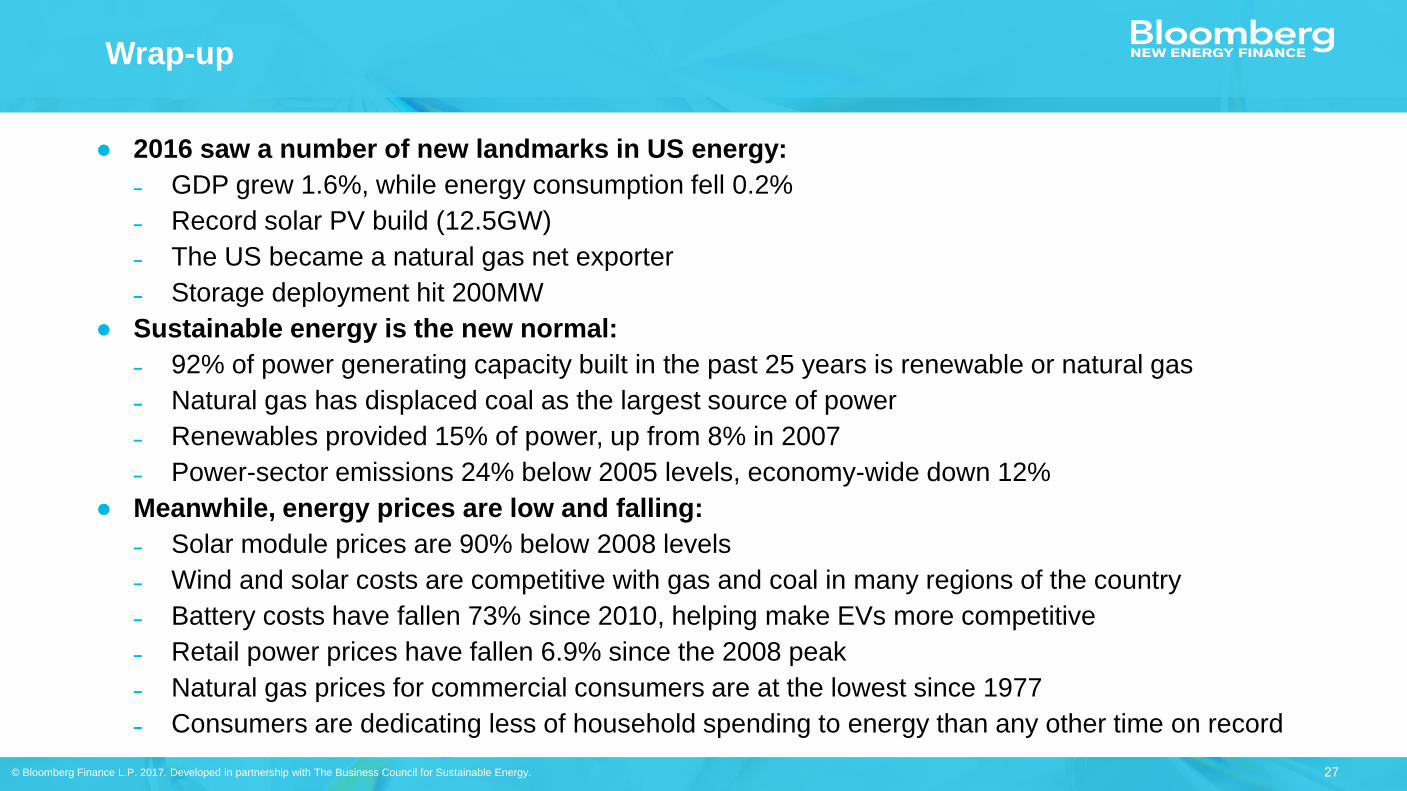
● 2016 saw a number of new landmarks in US energy:
˗ GDP grew 1.6%, while energy consumption fell 0.2%
˗ Record solar PV build (12.5GW)
˗ The US became a natural gas net exporter
˗ Storage deployment hit 200MW
● Sustainable energy is the new normal:
˗ 92% of power generating capacity built in the past 25 years is renewable or natural gas
˗ Natural gas has displaced coal as the largest source of power
˗ Renewables provided 15% of power, up from 8% in 2007
˗ Power-sector emissions 24% below 2005 levels, economy-wide down 12%
● Meanwhile, energy prices are low and falling:
˗ Solar module prices are 90% below 2008 levels
˗ Wind and solar costs are competitive with gas and coal in many regions of the country
˗ Battery costs have fallen 73% since 2010, helping make EVs more competitive
˗ Retail power prices have fallen 6.9% since the 2008 peak
˗ Natural gas prices for commercial consumers are at the lowest since 1977
˗ Consumers are dedicating less of household spending to energy than any other time on record
28 © Bloomberg Finance L.P. 2017. Developed in partnership with The Business Council for Sustainable Energy.
This publication is the copyright of Bloomberg New Energy Finance. Developed in partnership with The Business Council for Sustainable Energy. No
portion of this document may be photocopied, reproduced, scanned into an electronic system or transmitted, forwarded or distributed in any way without
attributing Bloomberg New Energy Finance and The Business Council for Sustainable Energy.
The information contained in this publication is derived from carefully selected sources we believe are reasonable. We do not guarantee its accuracy or
completeness and nothing in this document shall be construed to be a representation of such a guarantee. Any opinions expressed reflect the current
judgment of the author of the relevant article or features, and does not necessarily reflect the opinion of Bloomberg New Energy Finance, Bloomberg
Finance L.P., Bloomberg L.P. or any of their affiliates ("Bloomberg"). The opinions presented are subject to change without notice. Bloomberg accepts no
responsibility for any liability arising from use of this document or its contents. Nothing herein shall constitute or be construed as an offering of financial
instruments, or as investment advice or recommendations by Bloomberg of an investment strategy or whether or not to "buy," "sell" or "hold" an
investment.
Copyright and disclaimer

Subscription-based news, data and analysis to support your decisions in
clean energy, power and water and the carbon markets
MARKETS Renewable Energy
Energy Smart Technologies
Advanced Transport
Gas
Carbon and RECs
SERVICES Americas Service
Asia Pacific Service
EMEA Service
Applied Research
Events and Workshops
Contributors:
Ethan Zindler
Colleen Regan
Rachel Jiang
Economics and Policy: Richard Chatterton,
Abraham Louw, Stephen Munro, Dan Shurey
Natural Gas: Anastacia Dialynas, Jacob
Fericy
Renewable Energy: Meredith Annex, Hugh
Bromley, Amy Grace, Kyle Harrison, Lela
Jgerenaia, Vertis McMillan, Alex Morgan, Dean
Robertson, Nathan Serota, Ben Vickers
Energy Smart Technologies and
Transportation: Claire Curry, Logan Goldie-
Scot, Colin McKerracher, Thomas Rowlands-
Rees, Aleksandra Rybczynska, Yayoi Sekine,
Nikolas Soulopoulos, James Sprinz, Alejandro
Zamorano-Cadavid
Related Documents