Welcome message from author
This document is posted to help you gain knowledge. Please leave a comment to let me know what you think about it! Share it to your friends and learn new things together.
Transcript


Citation:
Eberhard, R., Thorburn, P., Rolfe, J., Taylor, B., Ronan, M., Weber, T., Flint, N., Kroon, F., Brodie, J., Waterhouse, J., Silburn, M., Bartley, R., Davis, A., Wilkinson, S., Lewis, S., Star, M., Poggio, M., Windle, J., Marshall, N., Hill, R., Maclean, K., Lyons, P., Robinson, C., Adame, F., Selles, A., Griffiths, M., Gunn, J., McCosker, K., 2017. Scientific Consensus Statement 2017: A synthesis of the science of land-based water quality impacts on the Great Barrier Reef, Chapter 4: Management options and their effectiveness. State of Queensland, 2017.
© State of Queensland, 2017
The Queensland Government supports and encourages the dissemination and exchange of its information. The copyright in this publication is licensed under a Creative Commons Attribution 3.0 Australia (CC BY) licence. Under this licence you are free, without having to seek our permission, to use this publication in accordance with the licence terms. You must keep intact the copyright notice and attribute the State of Queensland as the source of this publication. For more information on this licence, visit creativecommons.org/licenses/by/3.0/au/deed.en.
This document was prepared by a panel of scientists with expertise in Great Barrier Reef water quality. This document does not represent government policy.

2017 Scientific Consensus Statement—Chapter 4
Contents
Executive summary .......................................................................................................................................... 1
Introduction ............................................................................................................................................. 16 Synthesis process ................................................................................................................................ 16 Scope and limitations .......................................................................................................................... 16 The questions this chapter seeks to answer ....................................................................................... 16 Chapter structure ................................................................................................................................ 17
Wicked problems—tackling complexity in the Great Barrier Reef ............................................................ 17 Why the Great Barrier Reef is a wicked problem ................................................................................ 17 General principles for addressing wicked problems ........................................................................... 18
Values at risk ............................................................................................................................................ 18 Environmental ..................................................................................................................................... 18 Economics ........................................................................................................................................... 19 Community values ............................................................................................................................... 21 Indigenous values ................................................................................................................................ 22 Conclusions ......................................................................................................................................... 24
Management goals and targets ................................................................................................................ 26 Reef Water Quality Protection Plan targets ........................................................................................ 26 Progress against targets ...................................................................................................................... 28 Catchment condition targets .............................................................................................................. 29
End-of-catchment load reduction targets ...................................................................................... 29 Expected outcomes of meeting Reef Water Quality Protection Plan targets ..................................... 31
What is success? ............................................................................................................................. 31 What does success mean for the Great Barrier Reef? .................................................................... 33
The Great Barrier Reef governance system .............................................................................................. 33 Great Barrier Reef water quality programs ......................................................................................... 35
Partnerships .................................................................................................................................... 35 Planning .......................................................................................................................................... 36 Education and incentives ................................................................................................................ 37 Regulation ....................................................................................................................................... 38 Market instruments ........................................................................................................................ 38 Monitoring, evaluation and reporting ............................................................................................ 39
Issues beyond current programs ......................................................................................................... 39 Climate change ............................................................................................................................... 40 Impact assessment and management of major infrastructure projects ........................................ 40 Policy alignment .............................................................................................................................. 40
Conclusions ......................................................................................................................................... 41
Agricultural practice change ..................................................................................................................... 45 Effectiveness of agricultural practice change...................................................................................... 45
Sediments ....................................................................................................................................... 45 Nutrients ......................................................................................................................................... 52
Management options and their effectiveness iii

2017 Scientific Consensus Statement—Chapter 4
Pesticides ........................................................................................................................................ 64 Conclusion....................................................................................................................................... 71
Economic dimensions of agricultural practice change ........................................................................ 75 The costs of improving water quality at the farm level .................................................................. 75 Factors influencing adoption .......................................................................................................... 81 Assessing overall cost effectiveness of management practices ..................................................... 82 Mechanisms to achieve change ...................................................................................................... 88 Prioritisation ................................................................................................................................... 88 Conclusion....................................................................................................................................... 89
Social dimensions of agricultural practice change .............................................................................. 92 Understanding adoption ................................................................................................................. 92 Characteristics of the practice and ‘best practice’.......................................................................... 93 Awareness of the problem.............................................................................................................. 93 Working with diversity among landholders .................................................................................... 94 Values, motivations and goals ........................................................................................................ 94 Primary income source ................................................................................................................... 95 Personal reputation and ‘cultural capital’ ...................................................................................... 95 Joint decision-making and social learning ...................................................................................... 95 Information, intermediaries and advice networks ......................................................................... 96 Participation in practice improvement or conservation programs ................................................ 96 Conclusion....................................................................................................................................... 97
Prioritising investments in agricultural practice change ................................................................... 101
The effectiveness of other land management practices in improving water quality ............................... 102 Urban ................................................................................................................................................ 102
Urbanisation risks ......................................................................................................................... 102 Managing the risks of urban areas ............................................................................................... 103 Future research and data needs ................................................................................................... 109 Conclusions ................................................................................................................................... 110
Ports .................................................................................................................................................. 112 Factors influencing port water ...................................................................................................... 112 Conclusion..................................................................................................................................... 114
Wetlands and treatment systems ..................................................................................................... 116 Wetlands and coastal ecosystems ................................................................................................ 116 Treatment systems ....................................................................................................................... 120 Reinstatement of wetland function (‘system repair’) ................................................................... 121 Conclusion..................................................................................................................................... 123
Land use change ................................................................................................................................ 126 Other pollutants ................................................................................................................................ 127
Marine debris ................................................................................................................................ 127 Sewage treatment plants .............................................................................................................. 127
Reference list ......................................................................................................................................... 129
Management options and their effectiveness iv
2017 Scientific Consensus Statement—Chapter 4
Acronyms, units and definitions
Acronyms
APSIM = Agricultural production systems sIMulator model BMPs = Best management practices as defined by the Reef Water Quality Risk Frameworks (Australian and Queensland governments, 2013a). Where industry programs are specifically referred to these are described as ‘industry best management practices’. DIN = dissolved inorganic nitrogen ICTs = information and communications technologies ISO = International Organization for Standardization NRM = natural resource management PN = particulate nitrogen PP = particulate phosphorus PSII herbicides = photosystem II inhibiting herbicides TN = total nitrogen TSS = total suspended sediment1
Units
$/t = dollars per tonne g/m2/yr = grams per square metre per year gN/m3/d = grams of nitrogen per cubic metre per day gP/m3/d = grams of phosphorus per cubic metre per day ha = hectares kg/ha = kilograms per hectare kgN/ha = kilograms of nitrogen per hectare kgN/ha/yr = kg of nitrogen per hectare per year kgP/ha = kilograms of phosphorus per hectare kgP/ha/yr = kg of phosphorus per hectare per year km = kilometres km2 = square kilometres m = metres m3/yr = per annual cubic metre ML/d = megalitre per day mm/yr = millimetres per year t/ha = tonnes per hectare
1 TSS is also often referred to as total suspended solids.
Management options and their effectiveness iii

2017 Scientific Consensus Statement—Chapter 4
Definitions
Economic surplus measures: technical measures to estimate the benefits associated with commercial, recreation, amenity and non-use benefits.
Marginal Abatement Cost Curves: the extra cost per unit of pollutant reduction achieved ordered from lowest to highest.
Non-use values: These are values that people hold for protecting the reef and can include aspects such as wanting their children to visit the reef and have it exist in good condition.
Opportunity cost: the net cost or the amount that has to be given up for another option.
Management options and their effectiveness iv

2017 Scientific Consensus Statement—Chapter 4
Acknowledgements
This chapter was led by Eberhard Consulting with contributions from several representatives from Alluvium Consulting, the Australian Institute of Marine Science (AIMS), Central Queensland University (CQU), the Commonwealth Scientific and Industrial Research Organisation (CSIRO), Earth Environmental, Griffith University, James Cook University (JCU), Queensland Department of Agriculture and Fisheries, Department of Environment and Heritage Protection (DEHP), Queensland Department of Natural Resources and Mines (DNRM) and the Queensland Department of Science, Information Technology and Innovation (DSITI).
Unlike the other chapters in the Scientific Consensus Statement, this chapter presents discrete components that were led by the lead authors identified below.
• Overall chapter coordination and lead author– Rachel Eberhard • Agricultural practice change – water quality – Peter Thorburn • Agricultural practice change – economic dimensions – John Rolfe • Agricultural practice change – social dimensions – Bruce Taylor • Wetlands and treatment systems – Mike Ronan • Urban – Tony Weber and John Gunn • Values and governance – Rachel Eberhard
We would like to thank Richard Margerum (University of Oregon), Karen Vella (Queensland University of Technology) and Allan Dale (JCU) for the advice and review on the governance section of this chapter.
We acknowledge the advice and recommendations on the drafts of the social dimensions section from Ruth Nettle (University of Melbourne), John Pickering (Behaviour Innovation), Sharyn Rundle-Thiele (Griffith University) and Jeanette Durante (DSITI).
We also acknowledge the contribution of Stuart Whitten (CSIRO) on the economic dimensions section and that of Andrew O’Neill (Healthy Land and Water) on the urban section.
We thank David Toms (DEHP) and Neil Saintalin (Macquarie University) for their evaluations and comments on the wetlands and treatment systems section.
The chapter was prepared with the support of funding from the Office of the Great Barrier Reef within the Queensland Department of Environment and Heritage Protection and from the Department of the Environment and Energy and significant in-kind support from the authors’ organisations.
Management options and their effectiveness iv


2017 Scientific Consensus Statement—Chapter 4
Executive summary
This chapter seeks to answer the following questions:
1. What are the values of the Great Barrier Reef? 2. How effective are better agricultural practices in improving water quality? 3. How can we improve the uptake of better agricultural practices? 4. What water quality improvement can non-agricultural land uses contribute? 5. How can Great Barrier Reef water quality improvement programs be improved?
Each section summarises the currently available peer reviewed literature and comments on implications for management and research gaps.
This chapter has a wider scope than previous Scientific Consensus Statements, including, for the first time, the social and governance dimensions of management and the management of non-agricultural land uses. These new sections are constrained by a lack of Great Barrier Reef–specific data and information. The relevance of information from other locations must be carefully considered. In comparison, the agricultural practice change and economics sections provide an update on material compiled as part of the 2013 Scientific Consensus Statement.
This report has been confined to peer reviewed literature, which is generally published in books and journals or major reports. There is additional evidence in grey literature, such as project and program reports, that has not been included here. Each section of this chapter has been compiled by a writing team and then revised following a series of review processes.
The values of the Great Barrier Reef
Evidence of the environmental, economic, social and cultural values of the Great Barrier Reef includes:
• The environmental values of the Great Barrier Reef are recognised as globally significant (outstanding universal value) in its World Heritage listing and nationally as a Matter of national environmental significance under the Environment Protection and Biodiversity Conservation Act 1999.
• The declining condition of the environmental values of the Great Barrier Reef is widely reported. Regional Water Quality Improvement Plans summarise information on regional coastal and marine assets.
• The annual direct economic contribution of the Great Barrier Reef is estimated at $2.9 billion in the Great Barrier Reef regions and $6.4B in Australia overall, driven largely by tourism. The economic value of agricultural production in Great Barrier Reef catchments is about half that.
• ‘Non-use’ economic values are likely to be at least as great as these estimates, if not greater. The Great Barrier Reef holds important cultural values for residents, tourists, commercial fishers, tourism operators and Australians more broadly (particularly aesthetic, heritage, lifestyle and biodiversity values). The broader Australian community perceives the Great Barrier Reef to be a significant contributor to national identity. In many cases, people rate these values higher than economic values.
• Public debates about water quality impacts on the Great Barrier Reef need to recognise the social benefits people obtain from the Great Barrier Reef (not only benefits to ecological and economic values) and the reciprocal benefits to the reef of good stewardship.
• Recognising Indigenous roles and values in water quality management offers multiple benefits to Indigenous communities and management agencies. Current water quality planning efforts fail to realise these benefits.
Management options and their effectiveness 1

2017 Scientific Consensus Statement—Chapter 4
Key knowledge gaps include:
• understanding the social, cultural and economic impacts of declining water quality and environmental values on communities and industries
• incorporating and valuing the benefits to reef condition (and human wellbeing) that arise from stewardship actions
• how to effectively harness the strong values that the community places on the Great Barrier Reef to support more effective management
• improving Indigenous engagement in Great Barrier Reef water quality planning and programs.
Management goals and targets
Reef Water Quality Protection Plan targets
The Reef Water Quality Protection Plan (2013) includes land and catchment management targets to address improved agricultural management practices and the protection of natural wetlands and riparian areas. These targets are based on the understanding of the link between land condition, management practice standards and water quality outcomes.
The management practice and land condition targets to be achieved by 2018 are:
• 90% of sugarcane, horticulture, cropping and grazing lands are managed using best management practice systems (soil, nutrient and pesticides) in priority areas
• minimum 70% late dry season ground cover on grazing lands • the extent of riparian vegetation is increased • no net loss of the extent, and an improvement in the ecological processes and
environmental values, of natural wetlands.
The water quality targets to be achieved by 2018 include:
• at least a 50% reduction in anthropogenic end-of-catchment dissolved inorganic nitrogen loads in priority areas
• at least a 20% reduction in anthropogenic end-of-catchment loads of sediment and particulate nutrients in priority areas
• at least a 60% reduction in end-of-catchment pesticide loads in priority areas. The pesticides referred to are the photosystem II inhibiting herbicides hexazinone, ametryn, atrazine, diuron and tebuthiuron.
The annual Reef Report Card reports progress against the plan targets, with the most recent being Report Card 2016 for the 2014-2015 year (Australian and Queensland governments, 2016). Most of the indicators are reported annually, except for the wetland and riparian extent indicators which are reported every four years (most recently in 2014).
Progress against targets
Best management practices are defined in Water Quality Risk Frameworks for each major agricultural industry (Australian and Queensland governments, 2013a; Australian and Queensland governments, 2013b). These frameworks identify the management practices with greatest potential influence on off-farm water quality, and articulate a reasonable best practice level which can be expected to result in a moderate-low water quality risk. The metrics used to describe progress towards best management practice systems refer to the degree of adoption of practices relating to major pollutant categories.
Management options and their effectiveness 2

2017 Scientific Consensus Statement—Chapter 4
Overall progress towards land management targets from 2009 and 2015 is summarised below:
• Graziers manage 31.1 million ha of land and over 100,000 km of streambank in the Great Barrier Reef catchments. Best management practices including improved pasture streambank and/or gully management had been adopted over 32% of this area as at June 2015. Approximately 28% of grazing land is managed using best management practice systems for reducing erosion risk from pastures (8.8 million ha), 54% for practices relating to streambank erosion (60,000 km of streambanks) and 25% for practices relating to gully erosion (7.6 million ha). However, against the Great Barrier Reef target of 90% adoption of best management practices this scored ‘D’ (poor on a scale from ‘E’ very poor to ‘A’ very good).
• Sugarcane growers operate 3777 enterprises on 400,000 ha in the Great Barrier Reef. Between 2008 and 2015, 32% of this area implemented best management practices for sediment, nutrients and/or pesticides. Approximately 32% of cane land has adopted best management practices for pesticides (139,000 ha), 16% for nutrient management (69,000 ha) and 23% for soil (101,000 ha). With a target of 90% best management practices uptake, this scored ‘D’ (poor).
• Higher rates of adoption were achieved in horticulture (47% of the area, scored as ‘C’) and grains (57% of the area, scored as ‘C’), although there is less comprehensive data for these industries.
While the rates of adoption appear to have slowed in recent years, this is partly a consequence of a change to more focused targets. As the understanding of water quality risk has improved, more robust measurement frameworks have been adopted (Australian and Queensland governments, 2013a; Australian and Queensland governments, 2013b).
In terms of catchment condition targets, the late dry season ground cover in 2013-2014 was reported as ‘A’ or very good (73%) (Australian and Queensland governments, 2015). In 2014-2015 it was also ‘A’ or very good (77%) (Australian and Queensland governments, 2016) although there were significant areas of low ground cover in the Burdekin and Fitzroy regions that were drought declared in both years. This indicator appears to be on track to meet the Reef Water Quality Protection Plan target, although it may decline if low rainfall conditions continue to prevail.
Wetland loss and riparian extent are reported as part of the Paddock to Reef Integrated Monitoring, Modelling and Reporting Program every four years. In Report Card 2014 (Australian and Queensland governments, 2015), all regions reported very good or good progress, and across the whole Great Barrier Reef catchment it was estimated that there was <0.1% net loss in the extent of natural wetlands between 2009 and 2013. The results for riparian extent were more variable across regions (from good to poor), with losses up to 0.7% (poor) in the Fitzroy and Burnett Mary regions. The overall score for the Great Barrier Reef catchment was moderate (0.4% loss).
Modelled estimates of end-of-catchment pollutant loads are used to assess the water quality benefits of the adoption of best management practices (Waters et al., 2014). In practice, there is a lag between the adoption of new practices and the achievement of water quality benefits. Modelled estimates of the load reductions achieved by the adoption of best management practices facilitated through Great Barrier Reef programs between 2008 and 2016 (Figure i) include:
• an 18% reduction in dissolved inorganic nitrogen against a target of 50% by 2018, score ‘E’ very poor
• a 12% reduction in suspended sediment against a target of 20%, score ‘C’ moderate • a 34% reduction in pesticides against a target of 60%, score ‘C’ moderate.
The rate of progress towards these targets is slowing, although this comparison is confounded by the progressive refinement of risk frameworks, better reporting and modelling improvements.
Management options and their effectiveness 3

2017 Scientific Consensus Statement—Chapter 4
As illustrated in Chapter 1 (Schaffelke et al., 2017), the overall condition of the inshore marine environment (water quality, seagrass and coral) remains poor and has not changed greatly since Report Card 2011. Marine water quality generally remained in ‘D’ condition in 2015, but some areas have improved to ‘C’ due to lower rainfall and river discharges.
Figure i. Progress towards Reef Water Quality Protection Plan targets (Australian and Queensland governments, 2016).
Expected outcomes of meeting water quality targets
The management of terrestrial pollutant discharge to the Great Barrier Reef implicitly assumes that the impacts of increased loads of nutrients, sediments and pesticides would be reversed if the loads were reduced. Successful restoration has been observed, for example, nutrient management for seagrass in Tampa, Florida. However, there are well-documented cases of eutrophied (nutrient-enriched) marine systems, dominated by algae, where reductions in nutrient loading have not returned the systems to their original ecological status. This may be attributed to the influence of other factors or the relaxation of controls and management efforts. The issues of reversibility, time lags and phase change in coral reef systems are currently the subject of research.
In the Great Barrier Reef, water quality targets are being set on the basis of offshore coral and seagrass ecological requirements. It is assumed that reductions in pollutant loading to the Great Barrier Reef, to the extent of the new targets, will also achieve a restoration of coral (cover, diversity and community structure) and seagrass (cover, biomass, spatial extent, community structure) to a significant degree. This restoration will then also benefit ‘downstream’ species that are dependent on good coral or seagrass status, for example dugongs. A complicating factor is, of course, that other stressors besides pollution are also impacting corals and seagrass of the Great Barrier Reef. The most prominent and important of these other stressors is climate change. As climate change impacts accelerate (e.g. coral bleaching), even highly effective pollution management is unlikely to restore coral and seagrass to restoration objectives.
Great Barrier Reef governance
Great Barrier Reef governance is a ‘wicked’ policy problem requiring adaptive, participatory and transdisciplinary approaches.
• Adaptive approaches recommend the use of modelling, mapping and other tools to build system understanding, encourage experimentation, tailor solutions to regional variations and rigorously evaluate outcomes.
Management options and their effectiveness 4

2017 Scientific Consensus Statement—Chapter 4
• Participatory approaches can bring more knowledge to the debate about solutions, garner support, coordinate effort and reveal value conflicts.
• Transdisciplinary approaches recommend using natural and social sciences and stakeholder knowledge to test and evaluate innovative solutions together.
Research insights about the governance of Great Barrier Reef water quality include:
• Climate change, major development projects and poorly aligned and coordinated policies represent critical risks to Great Barrier Reef health.
• Intergovernmental coordination affects all aspects of program design and delivery. Policy alignment (across governments and across related policy areas within government) provides unambiguous policy signals to stakeholders and enables greater impact.
• Researchers have called for the new Reef 2050 Long-Term Sustainability Plan, as the overarching intergovernmental document, to have a stronger mandate, clearer strategies and greater financial commitment.
• Modelling of water quality outcomes is well established as a decision support and reporting tool in the Great Barrier Reef. More use of scenarios and forecasting could help water quality programs anticipate future challenges.
• A greater focus on experimentation and evaluation of on-ground works and program delivery would strengthen the adaptive capacity of Great Barrier Reef programs.
• Participation and collaboration are features of Great Barrier Reef policy, planning and implementation. Collaboration between natural resource management organisations and industry peak bodies has facilitated coordinated program delivery. Regional capacity is, however, fragile, with changes to national and state natural resource management programs, capacity and funding commitments.
• Smart regulation (using multiple pathways to influence behaviours, such as industry standards, supply chains and financial systems) has potential to harness industry innovation for multiple outcomes.
• There has been little investment in social and institutional research and a lack of systematic evaluation of delivery processes and governance systems.
Implications for management include:
• Many policy areas influence water quality in the Great Barrier Reef, and perverse impacts may negate the benefits of water quality programs. Significant risks in other policy areas should be addressed by:
o advocating for greenhouse gas emissions reductions and developing a strategic approach to climate adaptation in the Great Barrier Reef catchments
o strengthening cumulative impact assessment of projects with risks to the Great Barrier Reef
o influencing related policy areas such agricultural intensification and coastal development that may increase risks to the Great Barrier Reef.
• Mechanisms to strengthen and maintain intergovernmental coordination is critical for effective reef programs. The new Reef 2050 Long-Term Sustainability Plan, as the overarching intergovernmental document, needs a stronger mandate, clearer strategies and greater financial commitment.
• Sustain and encourage productive collaborations at local, regional and policy levels to access a wider knowledge base, share resources and risk, enable innovation and tailor programs to local contexts. Collaborative processes at different scales need to be effectively linked to share learnings and align effort.
• Strengthen the regional and catchment- and property-scale delivery network by investing in core natural resource management activities (partnerships, planning, community
Management options and their effectiveness 5
2017 Scientific Consensus Statement—Chapter 4
engagement, etc.). Support collaboration efforts with longer term funding tied to locally identified and measured program outcomes.
• Encourage experimentation and innovation by scientists working with local stakeholders to develop, test and evaluate potential solutions.
• Develop stronger alignment between reef programs, wetlands management and other regional planning and management activities such as land-use planning, development assessment and floodplain management.
• Monitor, evaluate and report on the health of the wider governance system, delivery processes and program effectiveness. Incorporate learnings from social research and international case studies into formal Great Barrier Reef policy review cycles.
Key knowledge gaps include:
• understanding of the efficacy and transferability of governance and policy mechanisms and delivery arrangements from comparable international problem contexts such as the United States, the European Union and New Zealand
• a foundation of social research, including understanding of behavioural change and systematic evaluation of program delivery arrangements to provide clear feedback to policy, programs and Great Barrier Reef stakeholders
• ‘smart regulation’ (using multiple pathways to influence behaviours, such as industry standards, supply chains and financial systems) options to influence agricultural practices through unconventional pathways and how to work collaboratively with growers, supply chain participants and industry groups to design, test and evaluate the effectiveness of these instruments
• monitoring, evaluation and reporting of the effectiveness of Great Barrier Reef governance arrangements (including policy alignment) and how to establish clear feedback mechanisms to policy and programs.
The effectiveness of agricultural practices in improving water quality
New research has confirmed existing knowledge about the efficacy of many agricultural management practices in reducing water quality impacts, improving confidence in the Water Quality Risk Frameworks used to monitor and evaluate progress against targets. New knowledge that has emerged since the last Scientific Consensus Statement (2013) includes:
• Sediment from gullies and streambank erosion is now recognised as more significant than previously thought and requires greater focus.
• Enhanced efficiency fertilisers can increase nitrogen use efficiency in sugarcane, although further work is required to establish the extent to which their use reduces nitrogen losses.
• Better climate forecasting may help to reduce nitrogen losses. • Tailoring nitrogen recommendations to site-specific conditions is desirable but requires
decision support systems that model the behaviour of fertilisers, including enhanced efficiency fertilisers, under variable soil, climate and management factors.
To reduce sediment loss in grazing lands:
• established practices include: — maintaining ground cover and forage biomass at the end of the dry season — setting appropriate stocking rates — excluding stock from riparian and frontage country and from rilled, scalded and gullied
areas — locating and constructing linear features (roads, tracks, fences, firebreaks and water
points) to minimise erosion risk
Management options and their effectiveness 6

2017 Scientific Consensus Statement—Chapter 4
— targeting hotspots of sediment loss. • insights from new research include:
— increased confidence that reducing stocking rates will improve ground cover and water quality from hillslopes
— increased confidence that cover provided by invasive grass species is less effective in helping productivity and soil infiltration capacity than perennials
— the importance of sediments from gully and streambank sources is clearer, and sediments from these sources can contain high concentrations of bioavailable nutrients
— increased confidence that maintaining land condition on hillslopes above gullies helps reduce gully erosion
— effective remediation of gullies requires substantial actions such as excluding stock, and engineering (e.g. check dams) or bioengineering (slope battering, seed, mulch, gypsum and fertiliser) approaches
— the effectiveness of managing streambank erosion for water quality has still not been demonstrated in Great Barrier Reef catchments.
To reduce sediment loss in agricultural cropping lands, research supports existing practices including:
• reducing or eliminating tillage and maximising soil cover (via crop residue retention and grassed inter-rows)
• adopting controlled traffic, opportunity cropping and contour embankments • increasing irrigation application efficiency to minimise run-off, deep drainage and
denitrification from the farm.
To reduce nutrient exports from agricultural lands, established practices include:
• reducing erosion to reduce particulate nutrient losses • minimising the nutrient surpluses, that is, the difference between inputs and crop off-take,
especially for nitrogen • practices such as splitting applications, changing the timing of fertiliser applications to avoid
irrigation or the chance of rainfall, and burying fertiliser • targeting hotspots where nutrient surpluses are high (and hence nutrient use efficiency is
low).
New insights to reducing nutrient exports from agricultural lands include:
• increased confidence that lower nutrient (nitrogen) application rates (to industry best management practices rates) reduce nutrient losses from fields without reducing yield
• enhanced efficiency fertilisers can increase nitrogen use efficiency in sugarcane, which should reduce nitrogen losses if nitrogen application rates are reduced. However, there are only early indications that these fertilisers reduce nitrogen losses. Enhanced efficiency fertilisers need to be targeted according to season, soil and fertiliser technology types
• early indications that seasonal climate forecasting can help with optimising nitrogen fertiliser applications to sugarcane
• a current focus on aligning production goals to block or productivity zone yield potential in the Six Easy Steps framework for sugarcane fertiliser management. However, the sugarcane nitrogen requirement in the framework is also spatially and temporally variable. Development of site-specific nitrogen recommendations needs to account for variability in the sugarcane nitrogen requirement as well as yield target.
Management options and their effectiveness 7

2017 Scientific Consensus Statement—Chapter 4
To reduce pesticides exports, established agricultural practices include:
• reducing the amount applied, for example banded spraying and adopting integrated pest and/or weed management
• minimising run-off and sediment loss from the farm • maximising the time between application and likely run-off events • choosing products with rapid degradation rates (e.g. some ‘knockdown’ herbicides).
New insights to reducing pesticide loss from agricultural lands include:
• increased confidence that reducing pesticide applications (e.g. through banded spraying) reduces pesticide losses from fields
• increased confidence that avoiding run-off for three weeks after application substantially reduces pesticide losses
• practices for managing losses also apply to the newly released chemicals • transport of most pesticides in current use is more dominant in the dissolved phase than
previously thought, placing greater emphasis on the management of run-off. More pesticides are lost in deep drainage that previously thought, although the amount is very small
• integrated weed management in sugarcane has demonstrated the successful use of shorter lived herbicides and/or lower application rates
• frameworks to help choose pesticide products (balancing toxicity and run-off potential to reduce risk) are starting to be developed.
Established irrigation practices that reduce water quality risks include:
• increasing irrigation efficiency (i.e. reducing over-application of irrigation), which reduces nutrient and pesticide losses
• delaying irrigation after nitrogen or pesticide applications, which reduces losses.
New insights into the effectiveness of irrigation practices in reducing water quality risks include:
• clearer indications (through modelling) that highly efficient irrigation systems reduce nutrient losses
• increased confidence that avoiding irrigation after nitrogen or pesticide applications substantially reduces losses.
Key knowledge gaps include:
• the effectiveness, costs and suitability of management techniques to address erosion features in gullies and riparian areas, including physical works and grazing management, in priority areas of Great Barrier Reef grazing lands
• the processes, time frames and water quality effectiveness of recovery in land condition following improved grazing practices in areas of high erosion rates, in low vegetation cover and biomass, and in fine-textured and sodic soils
• development and application of decision support tools that use a combination of forage budgeting, forage condition assessment and climate forecasts to set stocking rates across the grazing industry
• assessment of the soil loss benefits of different pasture species and systems, including improved pastured and reduced stocking rates on native pastures
• understanding of the effectiveness of nutrient management practices in Great Barrier Reef cropping lands, including:
Management options and their effectiveness 8

2017 Scientific Consensus Statement—Chapter 4
— the water quality benefits of adopting enhanced efficiency fertilisers and the best management of these fertilisers under different soil and climatic conditions
— the potential for novel interventions (e.g. incorporating climate forecasting into nutrient management decisions) to help farmers reduce nitrogen applications
— improving site-specific recommendations for nitrogen application in sugarcane, nitrogen supply from organic sources and optimising the management of enhanced efficiency fertilisers using the Agricultural Production Systems sIMulator model (APSIM).
• decision support systems to tailor site-specific fertiliser recommendations, including for enhanced efficiency fertilisers
• verification of the potential for improved irrigation management and water use efficiency to reduce nutrient losses, including deep drainage as well as run-off, and the efficacy of tail water dams/recycle pits for pollutant trapping in irrigated areas in the Lower Burdekin
• the efficacy of various practices for managing nitrogen losses through deep drainage (e.g. irrigation scheduling, timing of fertiliser applications) need to be better defined and tested
• the contribution of organic sources of nutrients (e.g. nitrogen from legumes, nitrogen and phosphorus from mill mud) to nutrient losses (both dissolved and particulate). If the contribution is significant, methods to manage those losses (e.g. better managing supplementary fertiliser in these situations) need to be developed
• the magnitude and, possibly, management of nutrient losses from grains production areas • understanding of nutrient losses from, or nutrient management in, fertilised grazing lands • the relationship between phosphorus surpluses, soil phosphorus concentrations and
phosphorus lost to the environment in both particulate and dissolved forms • the relative and additive toxicity of new herbicide products (knockdowns and residuals) • understanding of the run-off potential and half-lives of more pesticide products to enable a
more comprehensive risk assessment framework and guidance on product choice.
The social and economic dimensions of agricultural practice change
Social dimensions
Established knowledge about the social dimensions of changing agricultural practices includes:
• The adoption of a new practice is dependent upon landholders’ expectations that the practice will allow them to better achieve their own goals. This decision is based on subjective perceptions and is sensitive to timing, local conditions and the personal, family and business circumstances of individual farmers or industry sectors.
• The perceived benefits of adopting a new practice may be focused on profitability, but may also include social recognition, ease of management, meeting family goals or a reduction in regulatory risk. Landholders with strong profitability goals engage more with productivity best management practices, while those with environmental or stewardship goals engage with vegetation or riparian best management practices. Best management practice programs may unintentionally exclude some landholders because of the scope of implied or expressed benefits of the program.
• Different groups of landholders can be identified based on their adoption behaviours, goals, attitudes, norms and socio-economic characteristics. These groups trust different information sources and are more likely to work with some organisations or entities over others. Understanding the character or diversity of these attributes within the landholder target group improves participation and uptake.
• Even if farmers are aware of broader environmental problems or value biodiversity, this does not always translate to recognition or acceptance of management issues on their own properties.
Management options and their effectiveness 9

2017 Scientific Consensus Statement—Chapter 4
Research insights specific to the social dimensions of agricultural practice change in the Great Barrier Reef include:
• Conflicting messages about reef health, blaming farmers and overemphasising science to the exclusion of local or industry knowledge contributes to low acceptance of environmental responsibility.
• Social barriers to participating in Great Barrier Reef best management practices programs include perceptions of working with government; scheme complexity; lack of social recognition; and practice changes that disrupt relationships with peers, harvesting cooperatives, contractors and suppliers. Designing delivery programs that recognise and leverage these social and cultural preferences improves participation.
• Where local industry, farmers, scientists and natural resource management managers work collaboratively to design and evaluate new interventions (e.g. local technical assessment panels or monitoring outcomes of actions at paddock or sub-catchment scales), these processes of joint learning build trust in decisions and in the data, which underpins support for future action.
• Participation in Great Barrier Reef financial incentive programs will be improved by flexibility to tailor contracts and delivery to producers’ circumstances and by working through local, trusted intermediaries (e.g. extension officers).
The general implications of these findings include:
• Regional bodies, governments and industry groups need to be explicit and specific about the target audience for program delivery or intervention and in doing so recognise the goals and circumstances of those landholders, which will vary between and within sectors and regions, and, based on these assessments, they need to set realistic targets for engagement and uptake and select appropriate engagement models.
• Governments and regional bodies continue to work inclusively and collaboratively with landholders and their organisations in the design and delivery of practice improvement programs and look to expand partners to include new actors (public and private) who are a source of information that influence farmer decisions about management practices.
• All parties engaged in program delivery work to maintain a conducive or enabling adoption environment that supports knowledge exchange between farmers, scientists and others (rather than knowledge transfer); that addresses perceptions of risk associated with the practice itself and participation; provides trusted and diverse advisory services; and delivers adequate financial, cultural or social rewards for land managers.
The recent interest in the use of social marketing, community-based social marketing and improving communication practices as an adjunct to good engagement practices needs to be evaluated. Decision support tools for farmers and extension officers can provide sophisticated support and real-time feedback on crop production and environmental outcomes, but barriers to uptake (including privacy and data-sharing issues) need to be overcome for these benefits to be fully realised.
Key knowledge gaps include:
• understanding how extension, information and advice provision impacting on practice decisions is collectively governed and coordinated in the Great Barrier Reef catchments, including public, private and non-government organisation sources
• understanding how practice improvement for water quality benefits can be encouraged through the broader social and economic networks that influence management (suppliers, contractors, buyers, family members and peers)
• understanding the likely effects of emerging digital technologies (sensing, information and communication technologies and big data analytics) in enhancing extension strategies;
Management options and their effectiveness 10

2017 Scientific Consensus Statement—Chapter 4
farmer decision-making, monitoring and improvement at different scales (farm to program) and the social and institutional requirements for data sharing
• understanding the efficacy of current behaviour change programs that seek to influence grower behaviour at farm and whole-of-industry level.
Economic dimensions
There is now a large body of work that estimates the benefits, costs, adoption drivers and mechanism design relevant to the Great Barrier Reef. Overall, recent economic analysis using a combination of modelling and evaluation data shows that:
• There are large variations in the costs to improve water quality across regions, programs and industries.
• The total costs of meeting water quality targets are very high (much higher than previously considered). As water quality targets are approached, the costs of additional actions rise sharply.
• Analysis of reef funding programs shows marked variations in cost effectiveness of both management changes and programs.
• Prioritisation can improve the efficiency and effectiveness of practice-change investments. • Different mixes of policy mechanisms may be required.
In terms of the costs to farmers of changing management practices for water quality benefits:
• While some farm management changes can be at low (or negative cost), most involve capital investment and/or trade-offs in production and long time frames until benefits are received.
• The cost of management changes and the benefits to the landholder and Great Barrier Reef water quality vary widely, resulting in large differences in the cost effectiveness of actions.
• Risk preferences, transaction costs and other barriers such as complexity are also key drivers for landholder adoption behaviour.
Economic analysis can contribute to more efficient prioritisation of investment and mechanism design:
• A simple focus on individual sources of pollutants, actions or regions is unlikely to be efficient as the cost effectiveness of management practice change varies across industries, regions and farms.
• Prioritisation should consider: — environmental (Great Barrier Reef coastal and marine ecosystem health), social and
economic benefits — risks of practice change to landholders and industries — impacts of weather and markets — performance of past and current investments, delivery models and delivery partners — time lags to implementation, end-of-catchment pollutant reductions and benefits to
Great Barrier Reef health. • There needs to be some method of assessing the relative benefits and risks of focusing on
protecting reef assets in good health versus repairing degraded areas.
Recent work by Star et al. (2017) demonstrates a more holistic prioritisation process that accounts for marine risk, practice change, adoption rates, costs, time lags and uncertainties. The analysis highlights that for all parameters there are a range of relatively low-cost options that can be prioritised, and that no individual action or catchment is preferred across all the prioritisation criteria.
Management options and their effectiveness 11

2017 Scientific Consensus Statement—Chapter 4
Key knowledge gaps include:
• improving approaches to estimate overall costs, including modelling constraints and underlying assumptions
• understanding farmer motivation to change and incorporation of costs and risks associated with weather and markets
• development of prioritisation approaches to take account of the benefits that can be gained and cost effectiveness
• more cost-effective solutions for catchments where targets cannot be reached or can only be reached at very high costs
• determining the optimal suite of incentives, regulation and market mechanisms to effect change.
The effectiveness of other land management practices in improving water quality
For the first time, this Scientific Consensus Statement has included non-agricultural land uses. The science of agricultural land management for Great Barrier Reef water quality has developed over the last 15 years of intensive research effort. Our knowledge about the effectiveness of management practices for water quality improvement across other land uses is much less than in grazing and agriculture. Where there is limited information available from the Great Barrier Reef region, care must be taken in interpreting research from other areas (particularly outside the tropics and subtropics).
Urban
Established water quality management practices in urban areas include stormwater quality management such as vegetated treatment systems, integrated water cycle management, and wastewater management approaches. The integration of water cycle management approaches is critical to improving water quality.
Water quality monitoring in Mackay and Townsville indicates high variability of stormwater quality. Some information and guidance is available for the Great Barrier Reef through local governments. Water Quality Improvement Plans have highlighted the opportunities for specific management actions. There are capacity-building programs for stormwater quality management currently underway in the Great Barrier Reef.
Key knowledge gaps include:
• Great Barrier Reef–specific performance measures for urban water quality management practices
• understanding of the applicability of measures from other parts of Australia • design modification of specific practices, particularly vegetated treatment systems, for the
Great Barrier Reef • further development of integrated approaches to water cycle management • understanding of the capacity of agencies and utilities to adopt improved management
practices for urban areas of the Great Barrier Reef.
Implications for management:
• All elements of the water cycle and how they work together should be assessed as part of urban water quality management for the Great Barrier Reef.
Management options and their effectiveness 12

2017 Scientific Consensus Statement—Chapter 4
• While run-off from urban areas is a relatively minor contribution to catchment loads in the Great Barrier Reef, urban run-off contributes high loads per area and can be locally significant, especially in developing urban areas. Proximity to the inner lagoon means that impacts may be substantial.
• Reducing the impervious surface area of new greenfield developments has potential to improve water quality through hydrological management for the benefit of waterways within and downstream of urban areas.
Ports
Ports impact water quality through a range of direct and indirect impacts, including run-off and discharge from port facilities and portside activities, shipping movements, construction, capital and maintenance dredging and land reclamation. Water quality monitoring in Queensland ports is variable, and public reporting of results is currently limited.
Key knowledge gaps include:
• understanding of the impacts of ports, particularly in estuaries • managing the impacts of land-based disposal of dredge material • improved water quality monitoring, assessment and reporting in Great Barrier Reef ports.
Wetlands and treatment systems
Natural and modified estuarine and freshwater wetlands have many values, including protection from wave action and storms and reducing the impacts of floods, as well as providing important habitat. Wetlands can absorb and transform pollutants and nutrients in catchment run-off, but the capacity of wetlands to improve water quality for the reef is limited by the size and type of wetland (open water, vegetated, etc.), residence time, wetland location and condition, rainfall and hydrological connectivity. The capacity of wetlands to improve water quality is highest when hydrologic loads are low to intermediate, such as during early and late wet season, in smaller sub-catchments, or in the dry season, as well as in irrigated areas where flows are supplemented.
While wetlands can filter catchment run-off, when poor quality enters wetlands, it can affect the provision of values and services from the wetlands and have consequences for wider reef health. The consideration of natural wetlands and treatment systems in relation to water quality improvement needs to be framed within the context of the broader landscape and be part of an overall integrated pollutant management process.
Natural and constructed wetlands can remove nitrogen and phosphorus from the water through denitrification, sediment accumulation and plant growth:
• In the Great Barrier Reef, the capacity of wetlands to mitigate nutrient export from the basin is likely to be variable across catchments and wetland types.
• Highly variable flows, especially during extreme drought or flood events, will strongly influence the ability of wetlands to mitigate nutrient exports. Nutrient uptake may be higher at the beginning and end of the wet season.
• Nutrients are removed primarily through denitrification, storage in soils and vegetation. However, input of excess nutrients can damage wetlands functions and threaten their values.
• The range of treatment systems available for nutrient removal has expanded and proven to be effective overseas. For example, globally, wetlands have been found to remove nitrogen at a median rate of 93 g/m2/yr and phosphorus at a rate of 1.2 g/m2/yr, with a removal efficiency of 39% and 46% respectively.
Management options and their effectiveness 13

2017 Scientific Consensus Statement—Chapter 4
Natural and constructed wetlands can facilitate sedimentation by trapping sediment and the carbon and nutrients associated with it:
• Intertidal wetlands in the Great Barrier Reef, especially mangroves, can trap sediment from the water that floods them.
• Excess sediment can be detrimental to wetlands and, in some cases, can destroy them. • At the landscape level, wetlands can make a substantial contribution to reducing sediment
loads to the marine environment in many regions.
Pesticides are being transported as run-off to wetlands of the Great Barrier Reef:
• Natural and constructed wetlands can trap pesticides and accelerate their decomposition. • In some areas of the Great Barrier Reef, wetlands are accumulating high levels of pesticides.
This can damage wetland functions and threaten their values.
Implications for Great Barrier Reef management include:
• Wetland conservation and restoration can complement on-farm practices to reduce nutrient, sediment and pesticide run-off to the Great Barrier Reef.
• Wetlands in the Great Barrier Reef catchment occupy a relatively small area; however, they contribute to the biodiversity, carbon, nutrient and sediment storage of the region.
• While wetlands have the capacity to contribute to water quality improvement in the Great Barrier Reef, it is important to understand that these pollutants can also have significant negative impacts on wetlands, which are part of the broader reef ecosystem.
• Engineered treatment systems can be effective in reducing the concentration of pollutants such as sediment, nutrients and pesticides. Treatment systems include technologies such as constructed wetlands, denitrifying bioreactors, floating wetlands, high-efficiency sedimentation basins and algae nutrient removal.
Key knowledge gaps include:
• the capacity of different types of wetlands to improve water quality, including in relation to seasonal variations, floods and droughts
• the response and tolerance of different wetland types to sediment, nutrient and pesticide pollution and thresholds that could degrade the wetland
• the contribution wetlands make to water quality of the Great Barrier Reef at the landscape level and their effectiveness in different locations and under different hydrological regimes
• evaluating the effectiveness, efficiency and costs of using different types of treatment systems to address sediment, nutrients and pesticides in different locations in the Great Barrier Reef
• the decomposition rates of pesticides in wetlands • the effects of pesticides on flora and fauna of wetlands.
Land-use change
Recent Queensland Government and Australian government documents have identified potential areas for expansion and intensification of agriculture in the Great Barrier Reef. Any shift from grazing to fertilised cropping will increase the discharge of dissolved inorganic nitrogen to the Great Barrier Reef.
Management options and their effectiveness 14

2017 Scientific Consensus Statement—Chapter 4
Urban expansion is also expected along the Great Barrier Reef coast, with population growth and inward migration to the region. Expanding urban areas will increase the urban water quality footprint in the Great Barrier Reef.
Expected land-use change and its associated water quality impacts should be incorporated into water quality planning, management strategies and catchment modelling of water quality outcomes. Impacts can be minimised by adoption of best practice systems from the outset. Options for land-use change or land retirement to achieve water quality benefits have not been fully explored and should be reviewed, considering costs, benefits, other trade-offs and policy instruments.
Other pollutants
As well as sediment, nutrients and pesticides, a range of other pollutants are of growing significance in the Great Barrier Reef and elsewhere. These are derived from a range of sources including agriculture, urban, industrial, transport and waste facilities, which complicates management efforts.
The Great Barrier Reef has widespread contamination with marine debris from shipping, fishing and industrial and urban sources. Current proposals to ban single-use plastic bags and for container deposit schemes are promising first steps to reduce marine debris, but more significant change is required.
Monitoring of water sensitive urban design structures in the Great Barrier Reef has shown that effluent discharges include a wide range of pollutants such as pharmaceuticals and personal care products (as well as nutrients). Comprehensive information about Great Barrier Reef sewage treatment plants and their discharges is not readily available.
Key knowledge gaps for other contaminants in the Great Barrier Reef include:
• monitoring of marine debris and evaluating the effectiveness of the schemes to reduce marine debris
• understanding of current and potential future risk of pollutants in sewage treatment plant effluent discharges, with the projected increase in population and urban growth along the Great Barrier Reef coast, by: — developing an inventory of sewage treatment plants and their treatment levels in the
Great Barrier Reef catchment — quantifying the volume they discharge — determining a full inventory of pollutants (based on Australian and international
studies) being discharged by a range of representative sewage treatment plants.
Management options and their effectiveness 15

2017 Scientific Consensus Statement—Chapter 4
Introduction
Synthesis process Unlike the other chapters in the Scientific Consensus Statement, this chapter presents discrete sections that were led by the lead authors identified in the acknowledgements section. Each section was drafted by a writing team and then revised following a series of review processes:
1. review by co-authors 2. review by relevant scientific peers 3. policy review by the Office of the Great Barrier Reef (Queensland Department of
Environment and Heritage Protection) 4. chapter reviews by the Independent Science Panel for the Reef Water Quality Protection
Plan 5. formal review by independent scientists of international standing.
In addition, early findings were presented and discussed at the Great Barrier Reef Synthesis Workshop: Science, Policy and Management held in Townsville 9–11 November 2016. Some sections were also reviewed by other Great Barrier Reef groups and networks, for example the Great Barrier Reef Wetlands Network.
Scope and limitations This chapter has a wider scope than previous Scientific Consensus Statements. For the first time, the Scientific Consensus Statement has included social and governance dimensions of management and consideration of non-agricultural land uses, including urban and industrial and ports, as well as wetlands and treatment systems and consideration of land-use change. The new sections provide an initial synthesis of relevant information but are generally constrained by a lack of Great Barrier Reef–specific data and information, and the relevance of information from other locations must be carefully considered. In comparison, the agricultural practice change and economics sections provide an update on material compiled as part of the 2013 Scientific Consensus Statement.
Note that the social, economic and governance dimensions outlined in this chapter relate primarily to agricultural practice change, where the focus of policy effort has been for the last 10 years.
It is also worth noting that this report has been confined to peer reviewed literature, which is generally published in books and journals or major reports. This literature usually lags behind current practice and research by at least a year, usually several. There is substantial additional evidence that exists in grey literature, that is, project and program reports that do not meet the criteria for inclusion here.
The questions this chapter seeks to answer This chapter seeks to answer the following questions:
1. What are the values of the Great Barrier Reef? 2. How effective are better agricultural practices in improving water quality? 3. How can we improve the uptake of better agricultural practices? 4. What water quality improvement can other land uses contribute? 5. How can Great Barrier Reef programs be improved?
Each section summarises the currently available peer reviewed literature as evidence to answer these questions and comments on implications for management and research gaps.
Management options and their effectiveness 16

2017 Scientific Consensus Statement—Chapter 4
Chapter structure In keeping with the risk management framework presented in the Introduction (Chapter 1, Schaffelke et al., 2017) this chapter addresses the ways that water quality risks to the Great Barrier Reef can be managed. General principles for tackling wicked problems—including adaptive, participatory and transdisciplinary approaches—are introduced in section 2. Section 3 describes the values at risk in the Great Barrier Reef, including environmental, economic, community and Indigenous values. Progress against water quality and practice change targets is documented in section 4. Research that relates to the effectiveness of Great Barrier Reef governance is reported in section 5, including water quality planning, programs and partnerships. Significant issues that are not addressed under current water quality policy initiatives are highlighted in section 5.2.
Section 6 discusses the effectiveness of agricultural practice change in achieving reduced sediment, nutrient and pesticide run-off. The economic and social dimensions of facilitating the adoption of agricultural practices for water quality benefits are discussed in sections 6.2 and 6.3 respectively. This section also includes an example of applying a more integrated approach to prioritising investments in practice change
Section 7 discusses the effectiveness of actions to reduce water quality impacts from other land uses, including urban (section 7.1) and ports (section 7.2). The potential for wetlands and treatment systems to contribute to improving Great Barrier Reef water quality are reported in section 7.3 and the potential for land-use change in section 7.4. Finally, a short section describes actions to reduce the impact of other contaminants not covered in the prior sections (section 7.5).
Wicked problems—tackling complexity in the Great Barrier Reef
Why the Great Barrier Reef is a wicked problem Policy research has used the concept of ‘wicked problems’ to describe complex and policy issues that are resistant to solution because of their inherent complexity and conflicting stakeholder values (Churchman, 1967; Rittel and Webber, 1973). Wicked problems have many interdependencies that arise from their complexity and resulting uncertainty, so interventions may lead to unforeseen consequences. Social and institutional complexity are key elements of wicked problems, which are often characterised by chronic policy failure (Australian Public Service, 2007).
Characteristics of the Great Barrier Reef that indicate its status as a ‘wicked’ problem include the following:
1. The Great Barrier Reef is a very complex system operating at multiple scales, including individual enterprises, agricultural industries, regional communities, diverse catchments and marine assets in a changing climate.
2. Stakeholders view the Great Barrier Reef water quality issue in different ways: as an environmental catastrophe, an economic risk, a property rights or local development issue.
3. The science is contested, particularly in relation to the source of water quality issues (for example, see Lankester et al., 2009).
4. The water quality issue involves many discrete elements, but is itself only part of a suite of issues affecting the health of the Great Barrier Reef.
5. Improving agricultural run-off involves behavioural change, yet farming enterprises have individual goals and many other drivers for management decisions, including productivity, profitability, business, economic and social dimensions (refer section 6.2 and section 6.3).
Management options and their effectiveness 17

2017 Scientific Consensus Statement—Chapter 4
6. Water quality was first identified as a critical policy issue in the 1980s. Substantial public investment and three iterations of bilateral planning have failed to achieve demonstrable water quality improvements.
General principles for addressing wicked problems Adaptive, participatory and transdisciplinary approaches are widely recommended to deal with the uncertainty of wicked problems (Duckett et al., 2016; Head and Alford, 2015; Head and Xiang, 2016). A more prescriptive policy approach is unlikely to be successful because of complex and uncertain science, the likelihood of unintended consequences and the inability to resolve competing values and interests (Everingham J.A. et al., 2016).
Adaptive approaches allow programs to respond to new learnings and changing contexts. Modelling, forecasting and scenario-building are tools that help to build a system understanding that allows programs to develop and test ideas before they are applied more widely. Tailoring solutions to regional variations, experimentation and responding opportunistically to changes are also considered adaptive (Duckett et al., 2016).
Participatory approaches are recommended for wicked problems for two reasons. First, stakeholders bring important local knowledge to contribute to understanding the issue and developing and testing responses tailored to local contexts (Margerum, 2011). Second, participatory processes can reveal, and potentially resolve, value and interest conflicts that contribute to the issue. From a policy perspective, participatory processes are likely to increase stakeholder commitment, align and coordinate multiple management efforts, develop more effective solutions and share resources (Australian Public Service, 2007). Ineffective processes, however, can alienate stakeholders, entrench or polarise positions and result in conflict or stalemates.
Transdisciplinary approaches involve deliberations across different scientific fields (e.g. human and natural sciences) as well as engaging stakeholders who bring other knowledge and perspectives. Innovation solutions are more likely to emerge when participatory and transdisciplinary approaches are employed. Wicked problems require ongoing experimentation, closely coupled with rigorous monitoring and evaluation to understand how the system responds to different interventions.
Wicked problems call for a wider engagement of stakeholders, approaches to understand complex systems, a preparedness to trial new approaches but rigorously evaluate their performance, and sustained engagement with an evolving problem set. This requires new forms of leadership that are collaborative and flexible. Institutional structures and arrangements that support these practices require flexible resourcing, collaborative decision-making and more sophisticated approaches to performance evaluation and management (Head and Alford, 2015; Lane and Robinson, 2009; Peterson et al., 2010).
Values at risk
Environmental The Great Barrier Reef is recognised nationally and internationally for its environmental values. The Great Barrier Reef Marine Park was enacted in 1975 and the area listed as World Heritage in 1981. Under the Environment Protection and Biodiversity Conservation Act 1999 (EPBC Act) the Great Barrier Reef is included as a matter of national environmental significance on the grounds of seven matters:
• world heritage property • the Great Barrier Reef Marine Park • national heritage places
Management options and their effectiveness 18

2017 Scientific Consensus Statement—Chapter 4
• Commonwealth marine areas • listed migratory species • listed threatened species and ecological communities • wetlands of international importance
(GBRMPA, 2014a).
The Great Barrier Reef World Heritage Area covers 348,000 km2 and includes some 600 continental islands, 300 coral cays and 150 mangrove islands. It is inscribed on the World Heritage List because of its natural Outstanding Universal Value: ‘Outstanding universal value is defined as cultural and/or natural significance which is so exceptional as to transcend national boundaries and to be of common importance for present and future generations of all humanity’ (UNESCO Intergovernmental Committee for the Protection of the World Cultural and Natural Heritage, 2012, p.11).
The Great Barrier Reef was listed as having outstanding universal value in relation to four criteria:
• representation of the major stages of the Earth’s evolutionary history • ecological and biological processes • natural beauty and natural phenomena • habitats for the conservation of biodiversity.
These values are considered interconnected and present throughout the extent of the Great Barrier Reef World Heritage Area.
Further details about the environmental values of the Great Barrier Reef can be found in the Great Barrier Reef Outlook Report (GBRMPA, 2014a), the Great Barrier Reef Regional Strategic Assessment (GBRMPA, 2014b; QDSDIP, 2013) and the Final Report of the Great Barrier Reef Water Science Taskforce (GBRWST, 2016). In addition, all six natural resource management regions bordering the Great Barrier Reef have recently updated Water Quality Improvement Plans, each of which includes a detailed description and condition assessment of regional coastal and marine ecosystems (Burnett Mary NRM Group, 2015; Cape York NRM and South Cape York Catchments, 2016; Fitzroy Basin Association, 2015; Folkers et al., 2014; NQ Dry Tropics, 2016; Terrain NRM, 2015). Water Quality Improvement Plans have also identified the environmental values (natural and cultural) and water quality objectives to guide the regulation of activities under the Environmental Protection Act 1994 (once scheduled under the Environmental Protection (Water) Policy 2009). The process is supported by extensive community consultation.
Economics The Great Barrier Reef supports a large economic base. The most visible are the direct commercial services to the tourism, fishing, recreation and other industries located in the Great Barrier Reef catchment. Deloitte Access Economics (2017) estimated the economic contribution of the reef as $6.4 billion in value added and almost 69,000 full-time equivalent jobs across tourism, recreation, fishing and scientific research and reef management sectors to the Australian economy, including $2.9B and over 24,000 jobs to the economy of the Great Barrier Reef regions. Tourism was the dominant sector, accounting for 89% of the value-added impact and 92% of jobs supported. Parallel to this, agriculture is the dominant land use in the adjacent catchments, generating approximately $3.7 billion per year of production and employing up to 35,000 people (GBRWST, 2016).
Economic analysis requires some assessment of the benefits provided by the Great Barrier Reef or benefits resulting from additional protection measures, so that these can be compared to the costs of additional protection. The gross values of commercial activity are not appropriate for this purpose; instead, a surplus or benefits measure akin to the profits generated within each industry is
Management options and their effectiveness 19

2017 Scientific Consensus Statement—Chapter 4
more appropriate. Surplus measures can be calculated for each industry and summed to provide benefit values generated by the Great Barrier Reef. Changes in benefit values from poorer or better conditions in reef health can also be estimated. The economic surpluses arising from better protection (e.g. changes in industry profits) can then be compared to the costs of achieving that protection.
The Great Barrier Reef has additional economic benefits beyond direct commercial activity, such as ecosystem services, but these are difficult to measure because not all values (e.g. wanting your children to visit the reef) are traded in markets and therefore do not have a clear benefit. Several studies have previously used specialist non-market valuation techniques to value recreation (e.g. Kragt et al., 2009; Prayaga et al., 2010; Rolfe and Gregg, 2012; Stoeckl et al., 2011), indirect values (e.g. shore protection) (e.g. Oxford Economics, 2009) and non-use (protection) values for the reef (e.g. Rolfe and Windle, 2012; Stoeckl et al., 2011). The available evidence indicates that the additional economic values are at least equal if not larger than the value-added commercial benefits (Oxford Economics, 2009).
There have been four important additions to knowledge of the economic value of the Great Barrier Reef since the 2013 Scientific Consensus Statement, in addition to the synthesis of knowledge provided by Thomas and Brodie (2014). The first was the material provided by Deloitte Access Economics (2017), which clarified that the value-added and employment contribution of the Great Barrier Reef was almost twice as large as the agricultural sector in the Great Barrier Reef catchments. The second has been the Social and Economic Long-Term Monitoring Program (SELTMP, 2017), which has been capturing some of the dimensions of human involvement with the reef. For example, Marshall et al. (2014) show that about 86% of local residents living adjacent to the reef had visited the reef in the previous 12 months; the reef was a drawcard for tourists to visit north Queensland; and that 25% of coastal residents were dependent on the reef for at least some of their household income. The third has been the contribution of Rolfe and Windle (2015), who added to their previous estimates of protection values for the Great Barrier Reef held by Australian, Queensland and regional populations to show that values were higher for scenarios with greater certainty of protection for the reef. The fourth has been the work by Stoeckl et al. (2014) to assess values in an ecosystem service framework, where they estimated that the collective monetary value of the broad range of services provided by the Great Barrier Reef is likely to be between $15 and $20 billion Australian dollars per year.
The various economic benefits generated by the reef are potential losses if it deteriorates or if services are no longer available. Some estimates are focused on valuing changes in condition. For example, Prayaga et al. (2010) estimated that a 25% reduction in fish catch rates in the southern Great Barrier Reef would lower the value of recreational fishing trips by at least $7.74/trip, and a 25% increase in fish catch rates would increase values by at least $28.00/trip. Rolfe and Gregg (2012) estimated the value of beach visits in the Great Barrier Reef at $35.00/person/visit, with each 1% decline in water quality reducing visit values by $1.30/recreation trip. Rolfe and Windle (2012) estimated that Australian households would be willing to pay $21.68/household/year for five years to protect each additional 1% of the Great Barrier Reef.
However, value estimates of benefits have rarely been used in policy settings to justify public investment. Reasons include the sparsity of value estimates, the difficulties of relating changes in condition to marginal changes in value estimates and the limited understanding of how specific policy initiatives will translate to changes in reef condition. One priority for future work is to link changes in Great Barrier Reef condition with economic impacts and economic values, particularly at the regional level, so that the consequences of losses and gains in condition are clearer and the benefits of improved protection can be compared to the costs involved. A second priority is to improve economic value estimates, and a third is to make economic values more accessible for
Management options and their effectiveness 20

2017 Scientific Consensus Statement—Chapter 4
decision-makers at local and regional levels so that it is easier to estimate values for water quality improvements.
In summary, several studies have valued benefits and ecosystem services provided by the Great Barrier Reef, but these are not systematically consistent or useful for policymakers. Research priorities are to find more useful ways of providing values; making values more spatially relevant, particularly at the catchment and sub-catchment level; linking values with changes in water quality; and mapping values against ecosystem services. These are essential to support cost–benefit analysis for guiding management options in the Great Barrier Reef.
Community values As well as its extraordinary environmental values and the ~$6 billion contribution it generates each year (Deloitte Access Economics, 2017), the Great Barrier Reef is important to the maintenance of people’s livelihoods and wellbeing (Marshall et al., 2016). Some 86% of local residents living adjacent to the reef visited the Great Barrier Reef in 2013, representing nearly 1 million visitor days (SELTMP, 2017). Commercial fishers spent 70,000 effort days on the Great Barrier Reef, and tourism operators effectively spent 150,000 days. Tourists spent over 52 million days in 2013 enjoying the reef. In total, the Great Barrier Reef received an estimated 53.3 million days of use in 2013, with 98% of use comprising tourism visitation (SELTMP, 2017).
The Social and Economic Long-Term Monitoring Program (SELTMP, 2017) provides Great Barrier Reef social data about:
1. what people are doing within the Great Barrier Reef 2. how people are dependent on the Great Barrier Reef 3. the level of wellbeing that people derive from the Great Barrier Reef 4. contextual information including how people perceive, experience, value, understand and
relate to the Great Barrier Reef.
Key results from the SELTMP (2017) in 2013 show that the Great Barrier Reef provides a very high level of wellbeing to 80% of residents, 93% of tourism operators and 88% of commercial fisheries. Some 92% of tourists agreed with the statement ‘it means a lot to me that I have been to the Great Barrier Reef’.
The Great Barrier Reef is an integral part of Australian culture (SELTMP, 2017). Identity, pride, place, aesthetic appeal, biodiversity, lifestyle, seafood, heritage and agency were all found to be important cultural values for residents, other Australians, tourists, commercial fishers and tourism operators. People highly valued the aesthetic qualities of the Great Barrier Reef, its heritage opportunities, lifestyle and biodiversity (Marshall et al., 2016). The Great Barrier Reef also provides seafood that is particularly valued by Indigenous people and other residents (SELTMP, 2017). For 41% of residents, 76% of tourism operators and 65% of commercial fishers, the Great Barrier Reef was a main reason to live in the Great Barrier Reef region. The wider Australian community rated the role of the Great Barrier Reef in their identity even more highly than residents of the region. Domestic tourists, residents, Indigenous residents and tourism operators rated their agreement with the following statement when surveyed as ‘high’: ‘I feel proud that the Great Barrier Reef is a World Heritage Area.’ Indigenous residents, commercial fishers and tourism operators stated that they would be particularly affected if the condition of the Great Barrier Reef declined (SELTMP, 2017).
Economic values within the Great Barrier Reef region are not necessarily the most highly rated. Commercial fishers and tourism operators (both financially dependent on the Great Barrier Reef) rated aesthetic and biodiversity values more highly than economic values (Marshall et al., 2016). In a related study, Bohnet and Kinjun (2009) found that people living within the Great Barrier Reef region’s Tully River catchment valued water as more than just an economic good. In the Mackay region, Dutra et al. (2016) found that stakeholders valued environmental goals as the most
Management options and their effectiveness 21
2017 Scientific Consensus Statement—Chapter 4
important for the region’s coastal environment, specifically: (i) reducing the direct impacts of infrastructure and development, and (ii) reducing the influx of pollutants and minimising human-induced changes in water flow regimes. Commercial fishers and high school students within the region identified increasing compliance and stakeholder engagement as highly important for the maintenance of coastal values (Dutra et al., 2016).
Other research has found that the level of wellbeing in the region is directly related to environmental quality. For example, Larson (2009) found that water quality was of ‘high importance’ to the wellbeing of people within the Tully and Murray catchments (then Cardwell Shire). Larson et al. (2015) found that most respondents in that catchment area were dissatisfied with the benefits they received from industry. They also found that the absence of visible rubbish and the presence of healthy reef fish, coral cover, mangroves and iconic marine species were more important to respondents’ perceptions of ‘quality of life’ than the jobs and incomes associated with industry.
This information is important for Great Barrier Reef managers who recognise the need to minimise social-cultural impacts of ecosystem decline in the Great Barrier Reef, while maximising conservation goals. Social-cultural impacts are typically ‘invisible’; and are not widely recognised or accounted for in environmental decision-making (Turner et al., 2008). However, these impacts can significantly influence community vitality, and the social values associated with these impacts can be harnessed to support Great Barrier Reef management.
Indigenous values Indigenous peoples’ values and interests in Great Barrier Reef water quality are based on their cultural, historical and economic relationship to their traditional land and sea country (Smyth, 1995). At least 42 Traditional Owner groups have rights and interests in water quality planning and improvement across the Great Barrier Reef and its catchments (Dale et al., 2016a). Indigenous peoples contribute to managing for improved water quality in the Great Barrier Reef in many important ways.
Indigenous values associated with ‘freshwater country’ can contribute towards an ‘early warning system’ for social and ecological health of the Great Barrier Reef. Indigenous peoples’ worldview underpins many ‘relational values’, that is, the relationships or linkages between humans and nature. Thus, they are often aware of the impacts of declining water quality on animal and plant species and on particular places (Bark et al., 2016; Chan et al., 2016). Indigenous groups in the Great Barrier Reef catchments are observing increased seasonal sediment load in their rivers as well as changing availability of fresh- and saltwater fish (McIntyre-Tamwoy et al., 2013). These linkages are nurtured through, for example: (i) the collection of seasonal aquatic plant and animal species for the purposes of health and medicine, subsistence and art; (ii) knowledge of seasonal change (Bohnet and Kinjun, 2009; Cullen-Unsworth and Maclean, 2015); and (iii) stewardship of water places, such as wetlands, that may contain healing waters, important totem species and/or archaeological sites (Bark et al., 2015). Protection of sacred sites, including through cultural practices within the Great Barrier Reef Marine Park, have been associated with the health of particular species and places (Smyth, 1995).
Engaging with Indigenous values enables a more holistic approach to water quality. The Reef 2050 Long-Term Sustainability Plan (Australian Government, 2015a) supports Traditional Owner engagement in water quality improvement, with the aim to build on the success of Traditional Use of Marine Resource Agreements and existing community efforts to utilise water quality planning as a pathway to strengthen co-management of their traditional lands (Maclean and Robinson, 2011; Tsatsaros, 2013). Support for Indigenous peoples’ institutions—through the provision of resources and activities to strengthen language, culture, kinship connections, country-based livelihoods, Indigenous governance and strategic leadership—are critical ingredients in effective water co-management (Hill et al., 2014; Maclean et al., 2015a; Pert et al., 2015). Delivery of these ingredients
Management options and their effectiveness 22
2017 Scientific Consensus Statement—Chapter 4
requires: (i) strong local Indigenous organisations with governance, technical and on-ground capacities; (ii) effective partnership frameworks with government and non-government organisations; and (iii) support for information and knowledge generation activities targeted to Indigenous audiences (Dale et al., 2016a).
Recognition of Indigenous responsibility to care for Great Barrier Reef catchments offers the potential to establish Indigenous enterprises that promote water quality, while preserving cultural values (Nursey-Bray, 2009; Nursey-Bray and Rist, 2009; Nursey-Bray et al., 2009). Some Great Barrier Reef coastal Indigenous groups have expressed interest in small-scale mariculture, lobster fishing and cultural ecotourism, as well as a greater role in managing land and sea country (Smyth, 1995; Nursey-Bray, 2009). Maintaining healthy aquatic ecosystems, through ranger programs, also creates Indigenous employment opportunities (Maclean and Robinson, 2011; Smyth, 1995) and contributes to the broader goals of self-determination and economic independence (Hibbard et al., 2008; Smyth, 1995).
Using Indigenous values to guide management approaches to improve water quality may also improve the health and wellbeing of Indigenous people. Sacred sites and ecosystems can be negatively impacted by poor water quality, and the physical, spiritual and mental wellbeing of the Traditional Owners of those places can be adversely affected because of their connections and obligations to prevent decline in the values in these areas (Maclean et al., 2013; Parlee and Berkes 2005). Poor water quality can also result in a reduction in health and abundance of fish and turtles that are used to supplement Indigenous peoples’ diets (Bohnet and Kinjun, 2009; Maclean and Robinson, 2011) or are totems; it can also impact living ancestral beings such as the Rainbow Serpent who is believed to still travel the country via rivers and is responsible for the natural flow of fresh water in some Great Barrier Reef catchments regions (e.g. Maclean and TBYB Inc., 2015).
Engaging with Indigenous values and roles enables approaches that support governments to meet their obligations towards Indigenous peoples according to the national water quality standards. The National Water Quality Management Strategy notes requirements for stakeholder engagement (Australian and New Zealand Environment Conservation Council, 1994) including planning mechanisms developed in consultation and cooperation with Indigenous peoples. Collaborative planning and follow-up that respects Indigenous law, custom and traditional knowledge have been identified as mechanisms to engage Indigenous values in water quality planning efforts (Collings, 2012).
Bringing together Indigenous knowledge and scientific knowledge can contribute to the co-production of innovations for better management. Aboriginal lore is connected to Indigenous values and traditional ecological knowledge. It is used by Traditional Owners, in conjunction with scientific knowledge, to inform Indigenous management of those areas of freshwater country to which the Traditional Owners still have access (e.g. Maclean et al., 2015b; Robinson et al., 2015). Stakeholder engagement processes within existing water quality planning efforts can disempower Indigenous people and result in inadequate consideration and inclusion of Indigenous water values (Bohnet, 2015; Bohnet and Kinjun, 2009; Hill et al., 2015). Knowledge asymmetry, such as differing levels and types of knowledge, is a key issue in engaging with Indigenous communities, where knowledge acquisition rights are often associated with age, gender and customary law; and where historical and colonial processes have frequently prevented the sharing and transmission of Indigenous knowledge (Hill et al., 2015; Tengö et al., 2017). Maps, pictures and plans can be useful knowledge-sharing mechanisms to support negotiation among Indigenous groups and to negotiate between Indigenous and non-Indigenous worldviews (Maclean and TBYB Inc., 2015; Robinson et al., 2015; Zurba and Berkes, 2014).
Management options and their effectiveness 23

2017 Scientific Consensus Statement—Chapter 4
Conclusions The Great Barrier Reef is recognised nationally as a matter of National Environmental Significance and internationally as a World Heritage Area for its Outstanding Universal Value. Several recent reports document the values and declining condition of the Great Barrier Reef, and regional Water Quality Improvement Plans summarise information on regional coastal and marine assets.
Deloitte Access Economics (2017) estimated the economic contribution of the reef as $6.4billion per year and over 64,000 full-time equivalent jobs, predominantly in tourism, with impacts in the Great Barrier Reef region estimated at $2.9B in value added and over 24,000 jobs. Agriculture is the dominant land use in the Great Barrier Reef catchments, generating approximately $3.7 billion per year of production and employing up to 35,000 people (GBRWST, 2016). Additional, non-use economic values are likely to be at least as much as the value-added commercial benefits (Oxford Economics, 2009). Several studies have attempted to estimate these values in different ways. Further research to better understand the economic impacts of declining water quality and environmental values is needed.
The Social and Economic Long-Term Monitoring Program provides social data on the Great Barrier Reef. Results show that the Great Barrier Reef is important to the maintenance of people’s livelihoods and wellbeing (Marshall et al., 2016). An estimated 53.3 million days of use were spent in the Great Barrier Reef in 2013, mostly related to tourism (SELTMP, 2017). The Great Barrier Reef provides a very high level of wellbeing and is an integral part of Australian culture (SELTMP, 2017), including identity, pride, place, aesthetic appeal, biodiversity, lifestyle, seafood, heritage and agency for local residents, other Australians, tourists, commercial fishers and tourism operators (SELTMP, 2017). A number of studies have shown that environmental values are rated as high or higher as economic values, and that the level of wellbeing in the region is directly related to environmental quality (Bohnet and Kinjun, 2009; Dutra et al., 2016; Marshall et al., 2016). The social and cultural impacts of declining environmental condition are not widely recognised but can be significant (Turner et al., 2008).
Recognising Indigenous roles and values in water quality management can contribute to ‘early warning’ monitoring services; provide additional evidence for designing management interventions; build management capacity with associated economic, health and wellbeing benefits; and help governments demonstrate accountability for Indigenous engagement. Stakeholder engagement processes within existing water quality planning efforts can disempower Indigenous people and result in inadequate consideration and inclusion of Indigenous water values (Bohnet, 2015; Bohnet and Kinjun, 2009; Hill et al., 2015).
Management options and their effectiveness 24

2017 Scientific Consensus Statement—Chapter 4
Table 1. Overview of established knowledge about the environmental, economic, community and Indigenous values of the Great Barrier Reef and insights from recent research.
Established knowledge and understanding
GBR-specific information or insights Contentious, unresolved or unknown areas (for further research)
Environmental values
• The Outstanding Universal Value of the GBR is recognised internationally through World Heritage listing, and a Matter of National Environmental Significance.
• Several recent reports document the values and declining condition of the GBR, and regional Water Quality Improvement Plans summarise information on regional coastal and marine assets.
Economic values • The GBR supports a very significant tourism industry, and agriculture dominates the GBR catchments.
• The direct economic contribution of the GBR is estimated at $6.4 billion annually, driven largely by tourism. The economic value of agricultural production in GBR catchments is about half this.
• ‘Non-use’ economic values are likely to be at least as great as this, if not greater.
• Further research to better understand the economic impacts of declining water quality and environmental values is needed.
Community and Indigenous values
• People’s perception of their physical and mental wellbeing is directly related to environmental quality, including water quality and healthy reefs.
• The GBR holds important cultural values for residents, tourists, commercial fishers, tourism operators and Australians more broadly (particularly aesthetic, heritage, lifestyle and biodiversity values). The broader Australian community perceives the GBR to be a significant contributor to national identity. In many cases people rate these values higher than economic values.
• Public debates about water quality impacts on the GBR and its values need to recognise and engage with the social benefits people obtain from the GBR (not only benefits of action to ecological and economic values).
• Recognising Indigenous roles and values in water quality management can contribute to ‘early warning’ monitoring services; provide additional evidence for designing management interventions; build management capacity with associated economic, health and wellbeing benefits; and help governments demonstrate accountability for Indigenous engagement.
• Social and cultural impacts of declining environmental condition are not widely recognised but can be significant.
• Stakeholder engagement processes within existing water quality planning efforts can disempower Indigenous people and result in inadequate consideration and inclusion of Indigenous water values.
Management options and their effectiveness 25

2017 Scientific Consensus Statement—Chapter 4
Management goals and targets
Reef Water Quality Protection Plan targets
Management practice and catchment condition targets Reef Water Quality Protection Plan 2013 includes land and catchment management targets to address improved agricultural management practices and the protection of natural wetlands and riparian areas. These targets are based on the conceptual understanding of the link between land condition, management practice standards and water quality outcomes.
As described further in section 6, management practices are classified using the Paddock to Reef Water Quality Risk Framework which attempts to describe what constitutes ‘best practice management’. This has progressed from the ABCD framework described in the 2013 Scientific Consensus Statement to become much more specific about the detail of individual practices, which is essential for more accurate monitoring, evaluation and reporting.
The Reef Water Quality Protection Plan management practice and land condition targets to be achieved by 2018 are:
• 90% of sugarcane, horticulture, cropping and grazing lands are managed using best management practice systems (soil, nutrient and pesticides) in priority areas
• minimum 70% late dry season ground cover on grazing lands • extent of riparian vegetation is increased • no net loss of the extent, and an improvement in the ecological processes and environmental
values, of natural wetlands.
The Reef 2050 Long-Term Sustainability Plan (Reef 2050) also adopts these targets (Water Quality Target 2), with a refined version of the wetland target (Ecosystem Health 3 Target):
• There is no net loss of the extent, and a net improvement in the condition, of natural wetlands and riparian vegetation that contribute to Reef resilience and ecosystem health.
The following target is also included for non-agricultural land uses (Water Quality Target 3):
• By 2020, Reef-wide and locally relevant water quality targets are in place for urban, industrial, aquaculture and port activities and monitoring shows a stable or improving trend.
End-of-catchment load reduction targets Water quality targets have been an important part of the framework for driving Great Barrier Reef water quality improvement over the last decade. Reef Water Quality Protection Plan 2013 sets targets designed to achieve the overarching goal of ensuring that ‘by 2020 the quality of water entering the lagoon from broadscale land use has no detrimental impact on the health and resilience on the Great Barrier Reef’. The Reef Water Quality Protection Plan 2013 targets to be achieved by 2018 include:
• at least a 50% reduction in anthropogenic end-of-catchment dissolved inorganic nitrogen loads in priority areas
• at least a 20% reduction in anthropogenic end-of-catchment loads of sediment and particulate nutrients in priority areas
Management options and their effectiveness 26
2017 Scientific Consensus Statement—Chapter 4
• at least a 60% reduction in end-of-catchment pesticide loads in priority areas. The pesticides referred to are the photosystem II inhibiting herbicides (PSII herbicides) hexazinone, ametryn, atrazine, diuron and tebuthiuron.
The Reef Water Quality Protection Plan 2013 targets built on the Reef Water Quality Protection Plan 2009 targets, which were primarily drawn from best available data and expert opinion at the time. These water quality targets quantify the amount of improvement to be achieved for water quality parameters, but they are not linked to the environmental values of the coastal and marine environments and hence are not necessarily ecologically relevant or based on natural physical processes (e.g. natural erosion rates).
Reef 2050 builds on the Reef Water Quality Protection Plan 2013 targets; the extended Reef 2050 targets are in italics:
• at least a 50% reduction in anthropogenic end-of-catchment dissolved inorganic nitrogen loads in priority areas, on the way to achieving up to an 80% reduction in nitrogen in priority areas by 2025
• at least a 20% reduction in anthropogenic end-of-catchment loads of sediment in priority areas, on the way to achieving up to a 50% reduction in priority areas by 2025
• at least a 20% reduction in anthropogenic end-of-catchment loads of particulate nutrients in priority areas
• at least a 60% reduction in end-of-catchment pesticide loads in priority areas.
In addition, the Queensland Government announced an election commitment in 2015 that adopted and extended these targets as follows:
• reduce nitrogen run-off by up to 80% in key catchments such as the Wet Tropics and the Burdekin by 2025
• reduce total suspended sediment run-off by up to 50% in key catchments such as the Wet Tropics and the Burdekin by 2025.
While the Reef Water Quality Protection Plan targets refer to reductions in ‘anthropogenic end-of-catchment’ loads and define the pollutants as ‘dissolved inorganic nitrogen’ and ‘sediment and particulate nutrients’, the Reef 2050 long-term targets and the Queensland Government targets as they currently stand are less specific, using the term ‘up to’ and referring only to ‘nitrogen’ and ‘sediment’, and thus lend themselves to mixed interpretations. Both sets of targets refer to ‘priority areas’ or ‘key catchments’, which also requires further definition.
The development of basin-specific targets was progressed through each of the recently completed regional Water Quality Improvement Plans (Burnett Mary Regional Group, 2015; Cape York NRM and South Cape York Catchments, 2016; Fitzroy Basin Association, 2015; Folkers et al., 2014; NQ Dry Tropics, 2016; Terrain NRM, 2015); however, consistent methodology was not employed for all regions as they were completed at different times (from 2014 to 2016). Ecologically relevant targets were defined for basins in the Wet Tropics (Brodie et al., 2014), Burdekin (Brodie et al., 2016), Fitzroy (Brodie et al., 2015) and Burnett Mary regions (Brodie and Lewis, 2014). A set of ecologically relevant, basin-specific end-of-catchment load reduction targets are currently being developed to support the Reef Water Quality Protection Plan update using Source Catchment and eReefs modelling scenarios and the latest knowledge of ecological thresholds and impacts for sediments, nutrients and pesticides.
Management options and their effectiveness 27

2017 Scientific Consensus Statement—Chapter 4
Progress against targets The annual Reef Report Card reports progress against the Reef Water Quality Protection Plan targets, with the most recent being Report Card 2016 for the 2014-2015 data (Australian and Queensland governments, 2016). Most of the indicators are reporting annually, except for the wetland and riparian extent indicators which are reported every four years (the last report was in 2014).
Best management practices targets are defined in Water Quality Risk Frameworks for each major agricultural industry (Australian and Queensland governments, 2013a). These frameworks identify the management practices with greatest potential influence on off-farm water quality, and articulate a reasonable best practice level which can be expected to result in a moderate-low water quality risk The levels described for each practice, where relevant, are:
• high risk (superseded or outdated practices) • moderate risk (a minimum standard) • moderate-low risk (best practice) • lowest risk (innovative practices expected to result in further water quality benefits, but
where commercial feasibility is not well understood).
The metrics used to describe progress towards best management practice systems refer to the degree of adoption of practices relating to major pollutant categories.
For the cropping industries (sugarcane, horticulture and grains), metrics refer to the adoption of practices that minimise the off-farm loss of soil, nutrients and pesticides. For the grazing industry, metrics refer to the adoption of practices that minimise soil loss through pasture (hillslope), streambank and gully erosion processes. Farm land estimated to be in the two lowest risk categories (best practice and innovative practices) is included in the area reported under best management practice systems.
Overall progress towards land management targets from 2009 and 2015 is summarised below:
• Graziers manage 31.1 million ha of land and over 100,000 km of streambank in the Great Barrier Reef catchments. Best management practices including improved pasture streambank and/or gully management have been adopted over 32% of this area as at June 2015. Approximately 28% of grazing land is managed using best management practice systems for reducing erosion risk from pastures (8.8 million ha), 54% for practices relating to streambank erosion (60,000 km of streambanks) and 25% for practices relating to gully erosion (7.6 million ha). However, against the Great Barrier Reef target of 90% adoption of best management practices this scored ‘D’ (poor on a scale from ‘E’ very poor to ‘A’ very good.
• Sugarcane growers operate 3,777 enterprises on 400,000 ha in the Great Barrier Reef. Between 2008 and 2015, 32% of this area implemented best management practices for sediment, nutrients and/or pesticides. Approximately 32% of sugarcane land has adopted best management practices for pesticides (139,000 ha), 16% for nutrient management (69,000 ha) and 23% for soil (101,000 ha). With a target of 90% best management practices uptake, this scored ‘D’ (poor).
• Higher rates of adoption were achieved in horticulture (47% of the area, scored as ‘C’) and grains (57% of the area, scored as ‘C’), although there is less comprehensive data for these industries.
While the rates of adoption appear to have slowed in recent years, this is partly a consequence of a change to more focused targets. As the understanding of water quality risk has improved, more
Management options and their effectiveness 28

2017 Scientific Consensus Statement—Chapter 4
robust measurement frameworks have been adopted (Australian and Queensland governments, 2013a; Australian and Queensland governments, 2013b).
Catchment condition targets Ground cover consists of the non-woody plant cover near the soil surface and all litter, including woody litter. Ground cover is measured and reported annually as part of the Paddock to Reef program using satellite imagery and the fractional vegetation cover method described by Scarth et al. (2010). The method measures the proportion of green cover, non-green cover and bare ground using reflectance information from late dry season Landsat 5 Thematic Mapper (TM), Landsat 7 Enhanced Thematic Mapper (ETM+) and Landsat 8 Operational Land Imager (OLI) satellite imagery. These data are calibrated using field observations. The spatial resolution of Landsat imagery is approximately 30 m. Total ground cover is given by summing the green and non-green cover fractions (Queensland Government, 2009). It is important to note that averaging ground cover across the whole Great Barrier Reef and then within each natural resource management region can mask localised areas of lower cover, particularly where there is a strong rainfall gradient. The mean ground cover reported is therefore only indicative of general levels of cover within the reporting area; it is important to consider the spatial distribution of cover when accounting for its impact on sediment generation.
The late dry season ground cover in 2013-2014 for the Great Barrier Reef catchment was reported as very good (73%) (Australian and Queensland governments, 2015), and in 2014-2015 it was also ‘A’ or very good (77%) (Australian and Queensland governments, 2016); however, there were significant areas of low ground cover in the Burdekin and Fitzroy regions that were drought declared in both years. While there is some regional variation, all regions met the target of a minimum of 70% late dry season ground cover in these two years, apart from the Burdekin, which was 69%. This indicator is on track to meet the Reef Water Quality Protection Plan target of a minimum of 70% late dry season ground cover by 2018; however, it is possible that this will decline if the relatively low rainfall recorded in the region over the last three years continues.
Wetland loss and riparian extent are reported as part of the Paddock to Reef program every four years. In Report Card 2014 (Australian and Queensland governments, 2015), all regions reported very good or good progress, and across the whole Great Barrier Reef catchment it was estimated that there was <0.1% net loss (‘good’) in the extent of natural wetlands between 2009 and 2013. The results for riparian extent were more variable across regions (from good to poor) with losses up to 0.7% (poor) in the Fitzroy and Burnett Mary regions. The overall score for the Great Barrier Reef catchment was moderate (0.4% loss).
End-of-catchment load reduction targets Measurement of progress towards the end-of-catchment load reduction targets uses the Source Catchment modelling and accounts for inter-annual variability in catchments to portray trends in water quality due to improved management practices, as distinct from natural variability in loads due to climatic factors. The load targets are modelled over the hydrological period 1986-2014 using management practice improvements starting in 2008 and calibrated using measured loads at end-of-catchment sites from 2005 to 2014 (see McCloskey et al., 2017a; McCloskey et al., 2017b).
Modelled estimates of end-of-catchment pollutant loads are used to assess the benefits of the adoption of best management practices (Waters et al., 2014). In practice, there is a lag between the adoption of new practices and the achievement of water quality benefits. While soil erosion might respond quite rapidly to practice changes that improve ground cover, for example, it takes much longer for restored riparian vegetation to establish and become effective or for sediment that has accumulated in rivers to be flushed. Modelled estimates of the load reductions achieved by the
Management options and their effectiveness 29

2017 Scientific Consensus Statement—Chapter 4
adoption of best management practices facilitated through reef water quality programs in 2008-2016 (Figure 1) include:
• an 18% reduction in DIN against a target of 50% by 2018, score ‘E’ very poor • a 12% reduction in suspended sediment against a target of 20%, score ‘C’ moderate • a 34% reduction in pesticides against a target of 60%, score ‘C’ moderate.
The rate of progress towards these targets is also slowing, although this comparison is confounded by the progressive refinement of risk frameworks, better reporting and modelling improvements. A comparison of the rate of reduction in loads of sediment, nutrients and pesticides between the periods 2009-2013 and 2013-2015 (Figure 1) shows:
• sediment: 10% reduction from 2009 to 2013, i.e. 2%/yr • dissolved inorganic nitrogen: 17% reduction from 2009 to 2013, i.e. 3.5%/yr • pesticides: 28% reduction from 2009 to 2013, i.e. 5.5% /yr.
As illustrated in Chapter 1 (Schaffelke et al., 2017), the overall condition of the inshore marine environment (water quality, seagrass and coral) remains poor and has not changed greatly since Report Card 2011. Marine water quality generally remained in ‘D’ condition in 2015, but some areas have improved to ‘C’ due to lower rainfall and river discharges. It must be understood that the methods used to assess water quality during this period (remote sensing of chlorophyll a and total suspended solids) are unreliable in some conditions, particularly in the shallow and often highly turbid coastal and inshore areas of the Great Barrier Reef (Waterhouse and Brodie, 2015). Thus, our understanding of the true state of water quality is very limited, temporally and spatially (see Chapter 1).
Given the estimated investment of around $700 million over that period (Brodie and Pearson, 2016), progress towards the Reef Water Quality Protection Plan targets and the overall goal of ensuring that ‘by 2020 the quality of water entering the reef from broad-scale land use has no detrimental impact on the health and resilience of the Great Barrier Reef’ (Australian and Queensland governments, 2013b) appears to be slow, albeit against the massive scale of the Great Barrier Reef catchment. Modelling has also shown that even complete adoption of existing industry best management practices is not expected to achieve sediment and nutrient targets (Thorburn and Wilkinson, 2013; Waters et al., 2014).
Figure 1. Progress towards Reef Water Quality Protection Plan targets (Australian and Queensland governments, 2016).
Management options and their effectiveness 30

2017 Scientific Consensus Statement—Chapter 4
This situation was highlighted by the Great Barrier Reef Water Science Taskforce Report (GBRWST, 2016), that used Figure 2 to show progress to date and highlighted ‘the poor outcome of continued business-as-usual as per current investment, and an indicative steep trajectory that will be needed to meet water quality targets’. This was reiterated by Tarte et al. (2017) p.14 who stated that:
... as the Great Barrier Reef Water Science Taskforce Report and the 2015 Report Card assessment clearly show, progress with water quality load targets is not ‘on-track’ and it is highly likely that most 2018 targets will not be met. Consequently, if the 2018 targets are not met, it will be extremely challenging to meet the 2025 targets, particularly for DIN [dissolved inorganic nitrogen], which is the highest target to achieve (up to 80%), but has the worst performance to date.
Figure 2. Nitrogen and sediment load reductions required to meet 2025 targets. Reproduced from GBRWST, (2016).
Expected outcomes of meeting Reef Water Quality Protection Plan targets
What is success? The management of terrestrial pollutant discharge to the Great Barrier Reef implicitly assumes that the impacts of increased loads of nutrients, sediments and pesticides would be reversed if the loads were reduced. There is an implicit aim that if loadings are reduced enough, the continuing decline of species and ecosystems impacted by pollution can be reversed and hopefully system restoration may be achieved. Such restoration has been observed after, for example, nutrient management in Tampa, Florida when seagrass meadows were restored to near their pre-pollution condition (Greening et al., 2014). In the Great Barrier Reef case the restoration possibilities are complicated by
Management options and their effectiveness 31

2017 Scientific Consensus Statement—Chapter 4
the reality of multiple stressors, particularly those associated with climate change. Water quality management alone, even if very successful, is unlikely to be sufficient to reverse the decline in coral cover in the Great Barrier Reef if minimal or no action is taken on climate change globally.
Ecologically relevant targets for pollutant load reductions are currently being defined for the 35 basins of the Great Barrier Reef catchment (Brodie et al., 2017a). These targets incorporate an ecological endpoint in the Great Barrier Reef (e.g. Brodie et al., 2016) and, using modelling, a sufficient reduction is made such that the ecological endpoints are achieved. Hence these targets, if achieved, should lead (all other stressors being ignored) to reversal of decline and restoration as discussed above.
In nutrient-enriched conditions there are well-documented cases of eutrophied marine systems, dominated by algae, where reductions in nutrient loading have not returned the systems to their original ecological status (Duarte et al., 2009; Lotze et al., 2011; McCracken et al., 2017) or where only partial recovery was observed (Elliot et al., 2016; Borja et al., 2010). This may be attributed to the range of other factors in the system that have dramatically changed during the period of increased nutrient loading, such as human population increases, increased carbon dioxide in the atmosphere, changed catchment hydrology and discharge volumes, global temperature increases and fish stock losses. Alternatively, the management regime that enabled the nutrient loading reductions may have weakened or been repealed in the case of legal solutions. In Moreton Bay, nitrogen reductions have not reduced algal growth as the system is possibly phosphorus (P) limited (Wulff et al., 2011) although increased growth of one species has been observed (nitrogen (N2)-fixing Lyngbya majuscule).
In coral reef systems the issues of reversibility, time lags and phase change have been the subject of much recent research (Bruno et al., 2009; Elmhirst et al., 2009; Hughes T.P. et al., 2010; Mumby et al., 2007; Norström et al., 2009). However, further research is required on ecosystem responses to changing water quality, particularly in combination with other stressors such as climate change, to quantify the likely time lags of the response of the Great Barrier Reef ecosystems and the nature and trajectory of the response.
Successful examples in tropical seagrass/coral reef settings of management of terrestrial discharges such that ecosystem restoration occurred include:
1. Tampa Bay, Florida (Greening et al., 2014) where, following citizen demands for action, reduction in wastewater nutrient loading of approximately 90% in the late 1970s lowered external total nitrogen (TN) loading by more than 50% within three years. Continuing nutrient management actions from public and private sectors were associated with a steadily declining TN load rate despite an increase of more than 1 million people living within the Tampa Bay metropolitan area. Following recovery from an extreme weather event in 1997–1998, water clarity increased significantly and seagrass is expanding at a rate significantly different than before the event. Key elements supporting the nutrient management strategy and concomitant ecosystem recovery in Tampa Bay include: 1) active community involvement, including agreement about quantifiable restoration goals; 2) regulatory and voluntary reduction in nutrient loadings from point, atmospheric, and nonpoint sources; 3) long-term water quality and seagrass extent monitoring; and 4) a commitment from public and private sectors to work together to attain restoration goals.
2. Kaneohe Bay, Oahu, Hawaii (e.g. Stimson, 2015; Bahr et al., 2015). Sewage discharges into Kaneohe Bay, Hawaii increased from the end of the Second World War to 1978, due to increasing population and urbanisation, up to 20 ML/d in 1977. This chronic discharge into the lagoon introduced high levels of inorganic nitrogen and inorganic phosphate, and southern lagoon waters became increasingly rich in phytoplankton. Reefs closest to the outfall become overgrown by filter-feeding organisms, such as sponges, tube-worms and barnacles. Reefs in the centre of the Bay
Management options and their effectiveness 32

2017 Scientific Consensus Statement—Chapter 4
further from the outfalls were overgrown by the indigenous green algae Dictyosphaeria cavernosa. After diversion of the outfalls into the ocean in 1978, in-water nutrient levels reduced, phyto- and zooplankton populations declined and D. cavernosa abundance declined to 25% of previous levels. At the same time, increases in the abundance and distribution of coral species were reported, and the reefs slowly recovered. A drastic decline in previously dominant D. cavernosa occurred in 2006, attributed to a gradual return to a coral-dominated state following relocation of the sewage outfall in 1978 that eliminated the sewage nutrient inputs that drove the initial phase shift to macroalgae in the 1970s.
What does success mean for the Great Barrier Reef? Pollutant load reduction targets have recently been set for the 35 Great Barrier Reef basins (Brodie et al., 2017a). These targets are qualitatively different than previous Reef Water Quality Protection Plan targets (Australian and Queensland governments, 2013b) in that they attempt to quantitatively estimate load targets that, if met, would ensure an ecological endpoint for the Great Barrier Reef is achieved. In this way they are more similar to the recent Water Quality Improvement Plans targets for the Wet Tropics (Brodie et al., 2014) and Burdekin (Brodie et al., 2016) regions which also, where possible, were set to reach an offshore ecological endpoint. Thus, the scientific underpinnings of these basin-scale targets is to achieve a restoration outcome for specific Great Barrier Reef ecosystems, in particular, in this case, coral and seagrass status. This can be compared to the case studies referred to above where (i) seagrass was restored in Tampa Bay after an 80% reduction in total nitrogen loading, and (ii) coral recovery occurred (albeit after a time lag of 30 years) in Kaneohe Bay after sewage effluent loading was largely eliminated by diversion to oceanic waters. However, there are no known examples of improved ecological health following reduced diffuse sediment and particulate nutrient loading. The successful examples mentioned above all involved reducing dissolved inorganic nutrient loadings (DIN and dissolved inorganic phosphate (DIP)) from sewage treatment plants; from fertiliser use; or from industrial discharges (Kroon et al., 2014).
In essence, it is assumed that reductions in pollutant loading to the Great Barrier Reef, to the extent of the new targets, will also achieve a restoration of coral (cover, diversity and community structure) and seagrass (cover, biomass, spatial extent and community structure) to a significant degree. This restoration will then also benefit ‘downstream’ species that are dependent on good coral or seagrass status, for example dugongs. A complicating factor is, of course, that other stressors besides pollution are also impacting corals and seagrass of the Great Barrier Reef. The most prominent and important of these other stressors is climate change. As climate change impacts accelerate (e.g. coral bleaching), even highly effective pollution management may not restore coral and seagrass to projected restoration objectives.
The Great Barrier Reef governance system
Governance refers to the wide variety of decision-making processes leading to various environmental, social and economic outcomes within society. The processes include the decisions involved in policy development and implementation, including policy instruments such as regulation, cooperation and market approaches. Governance, however, refers to more than ‘government’ as it includes the diverse suite of public, private and civil society decisions that interact with government and lead to various outcomes (Kooiman, 2003; Rhodes, 2007). Governance occurs as a result of the interaction of multiple decision-making centres operating at different levels (Ostrom, 2010).
The Great Barrier Reef is subject to multiple interacting threats, including coastal development, water quality, fishing and climate change (Brodie and Pearson, 2016; Brodie and Waterhouse, 2012) (refer Chapter 1). The Great Barrier Reef World Heritage Area is jointly managed by Australian and Queensland governments through the Great Barrier Reef Marine Park Act 1975 and the Queensland Marine Parks Act 2004 respectively.
Management options and their effectiveness 33

2017 Scientific Consensus Statement—Chapter 4
The Great Barrier Reef was listed as a World Heritage site in 1981 for its outstanding universal value. The World Heritage Convention imposes binding obligations on Australia (Wulf, 2004) and these obligations are supported through the Environment Protection and Biodiversity Conservation Act 1999 and the Great Barrier Reef Marine Park Act 1975. The Queensland Government retains primary responsibility for land and water management and administers this through the Environment Protection Act 1994, the Water Act 2000, the Vegetation Management Act 1999, the Planning Act 2016 and other legislation. Local governments also play a significant role in planning, sewage treatment, local environmental restoration and community engagement activities. There are 26 different Acts and Regulations relevant to the Great Barrier Reef World Heritage Area, administered by 12 Australian and Queensland government departments (Jacobs, 2014). For a summary of the main legislative instruments refer to Jacobs (2014) (www.environment.gov.au/marine/gbr/publications/independent-review).
The Great Barrier Reef Marine Park enjoys stringent legal protection (Baxter, 2006) and the 2003 rezoning of the Park (Great Barrier Reef Marine Park Zoning Plan 2003 (Commonwealth)) was widely hailed as world’s best practice in marine spatial planning and management (Baxter, 2006; Day and Dobbs, 2013). However, given the contemporary importance of water quality impacts from land management activities, the successful management of the reef involves managing catchment risks as well as direct use impacts.
The governance system of the Great Barrier Reef is complicated by the overlapping jurisdictions of Australian and Queensland governments across the catchment/marine interface and the intersection with the governance efforts of local government, industries, conservation interests, the Indigenous community and others (Fraser et al., 2017). The sheer scale of the Great Barrier Reef catchment; the variety of landscapes, land uses and stakeholder interests; as well as major external drivers such as climate change and world economic conditions complicate water quality management (Day and Dobbs, 2013; Evans et al., 2014).
Like other complex governance systems, Great Barrier Reef governance comprises a mix of hierarchical rules administered by governments (policy, legislation and regulation), delivery and market mechanisms and networks of interacting parties at a wide range of scales (Agrawal and Lemos, 2007; Powell and DiMaggio, 1991). The main policy initiatives employed by Australian and Queensland governments to manage water quality impacts on the Great Barrier Reef include:
1. the bilateral Reef Water Quality Protection Plan (established in 2003, revised in 2009 and 2013), which focuses on actions to improve water quality, and the 2015 Reef 2050, which has a broader remit to coordinate actions to maintain the health of the reef
2. the Reef Trust, an Australian Government initiative to resource projects to support the implementation of Reef 2050
3. Regional Water Quality Improvement Plans developed by regional natural resource management groups across the six natural resource management regions (c. 2008 and revised c. 2016)
4. property planning and management systems, including industry-led voluntary best management practices programs, such as Smartcane and Grazing BMP
5. specific property requirements under land and water management regulations, including the Great Barrier Reef Protection Amendment Act 2009 (Qld). However, note the current discussion paper (Queensland Government, 2017) seeking comment on proposed changes to reef regulation, including setting minimum practice standards for all key industries, setting catchment load limits and developing a water quality offsets framework.
The Australian and Queensland governments have made substantial investments in positive incentives (education, extension, grants and market mechanisms) for improved agricultural
Management options and their effectiveness 34

2017 Scientific Consensus Statement—Chapter 4
practices, largely delivered through natural resource management and agricultural industry organisations.
While these formal reef-related initiatives form the core of reef water quality actions by government, many policy areas influence water quality outcomes in the Great Barrier Reef. Dale et al. (2016b) identified some 40 decision-making systems (or governance areas) that include policy, planning and management efforts that influence the reef at different scales, including:
• international (e.g. United Nations Framework Convention on Climate Change; World Heritage Convention)
• national (e.g. Northern Australia Development agenda, natural resource management programs, major project impact assessment, shipping)
• state (e.g. vegetation, water quantity and quality planning and management, coastal planning, ports)
• regional (e.g. land-use planning, regional natural resource management) • local (e.g. local government planning).
Many of these governance areas are not specifically focused on the reef but may make significant contributions to the health of the reef. For example, Australian economic development or trade policies may involve the development of supply chains and pricing systems that can be significant drivers of farmer behaviour (Vella, 2004).
The overall Great Barrier Reef governance system thus involves a wide range of governance areas and their associated decision-making processes that operate at multiple scales, across different time frames and through diverse delivery mechanisms. Decisions made in a wide variety of policy areas collectively contribute to the health of the Great Barrier Reef catchments and reef lagoon.
Great Barrier Reef water quality programs The governance of water quality management in the Great Barrier Reef has adopted many of the strategies recommended for wicked problems. Yet implementation of more adaptive, collaborative and transdisciplinary approaches alongside traditional hierarchical top-down or centralised approaches to governing is challenging. In line with international experience, challenges arise both from the hybrid nature of governance arrangements (top-down and collaborative) and the dynamic context where political changes at both state and federal levels and a variety of internal and external shocks (e.g. mining boom, coral bleaching) disrupt policies and programs (Eberhard et al., 2017a; Fleischman et al., 2014). The following section reports and summarises the findings of peer reviewed literature about Great Barrier Reef governance. These are presented in categories that relate to partnerships, planning, implementation and monitoring and evaluation.
Partnerships The concept of partnership or collaboration implies some degree of shared decision-making, moving beyond cooperation and coordination to genuine collaboration (Keast et al., 2007). In the Great Barrier Reef, partnerships have emerged in different forms at different levels, including local delivery arrangements, regional planning and regional Great Barrier Reef report cards (Eberhard et al., 2013; Robinson et al., 2009; Vella and Dale, 2014) and stakeholder engagement in policy decisions.
Partnerships can take a long time to establish, build trust and negotiate their collective role. For example, the Fitzroy Partnership for River Health took two years to build trust, agree on objectives and negotiate governance arrangements and resourcing (Eberhard et al., 2013). Partnerships promise ‘collaborative advantage’ (Huxham, 2003) through cost efficiencies, enabling democratic deliberation, knowledge sharing and learning, flexible operations, shared resources, risks and responsibilities (Ansell and Gash, 2008). Indeed, this model underpins community-based natural resource management (Armitage, 2005; Kellert et al., 2010) as a model of organisational
Management options and their effectiveness 35

2017 Scientific Consensus Statement—Chapter 4
collaboration that has evolved through scaling up local action groups and networks (Campbell, 2016; Head et al., 2016).
The Reef Alliance has emerged as a formal collaboration between regional natural resource management groups, agricultural industry peak bodies and the conservation sector and has been highly influential in policy development, design and implementation in the last decade. An evaluation of Reef Rescue (Eberhard, 2011) found that the Reef Alliance made a significant contribution to the success of Reef Rescue by:
• facilitating broad stakeholder support and establishing delivery pathways • brokering a collaborative and evolving design that bridged reef-wide, regional and industry
interests • testing, refining and aligning regional delivery processes • providing flexibility to address contingencies and a reef-wide forum for delivery agents.
Collaboration at the policy scale is more challenging, with limited authority, two-step decision-making (where participants need to refer decisions back to their organisations) and accountability challenges (Robinson et al., 2011). While the nature and degree of collaboration between policymakers and stakeholders has varied over time with different governments, these forums have worked to improve the credibility and legitimacy of knowledge used for policy decisions. Informal stakeholder alliances have also been adept at influencing political decisions through timely advocacy of policy options (Robinson et al., 2010). Vella and Forester (2017) have documented the experiences of ‘activist planners’ in building collaborations to overcome barriers to action in the Great Barrier Reef. In Australia, the United States and Europe, governments have embraced greater dialogue with stakeholders, yet firmly retain decision-making authority over water policy issues (Eberhard et al., 2017a).
Planning Water quality planning in the Great Barrier Reef occurs at two primary scales: at the reef-wide level through the Reef Water Quality Protection Plan and through regional-scale Water Quality Improvement Plans. This approach is consistent with new regionalism, where integrated planning is increasingly decentralised and regions become the scale that engages government, industry and the community (Peterson et al., 2010). First developed in 2006-2008 and recently updated (2015-2016), the Water Quality Improvement Plans have used robust biophysical modelling and economic analysis to guide investment priorities (Burnett Mary NRM Group, 2015; Cape York NRM and South Cape York Catchments, 2016; Fitzroy Basin Association, 2015; Folkers et al., 2014; NQ Dry Tropics, 2016; Terrain NRM, 2015). Yet Water Quality Improvement Plan implementation is not directly resourced; rather, Water Quality Improvement Plan priorities ‘inform’ Great Barrier Reef policy, and government investments in water quality programs are generally consistent with the Water Quality Improvement Plans (Eberhard et al., 2017b). However, programmatic investments are typically highly constrained by programmatic specifications (Eberhard et al., 2017b) that may limit local experimentation.
At the Great Barrier Reef level, Dale et al. (2016b) found that the Reef Water Quality Protection Plan and Reef 2050 provided a strong bilateral approach to policy targets and agreement on strategy, although implementation remains challenging and current investments are widely acknowledged to be unlikely to achieve water quality targets (Thorburn and Wilkinson, 2013 Waters et al., 2014). Reef 2050 has been critiqued as having inadequate strategies and investment to address the pressure facing the reef (Australian Academy of Science, 2014; Brodie et al., 2017b; Kroon et al., 2016) and weak stakeholder engagement processes beyond key stakeholder organisations (Dale et al., 2016b).
Management options and their effectiveness 36

2017 Scientific Consensus Statement—Chapter 4
Knowledge
The development of water quality plans at regional or Great Barrier Reef scales involves substantial technical and scientific challenges to prioritise pollutants, understand the water quality risks of different agricultural practices and account for time lags and uncertainty in freshwater and marine ecosystem responses and an evolving knowledge base (Brodie and Waterhouse, 2012).
Incorporating local knowledge into science-based plans raises issues of uncertainty and bias, timing and brokerage (Kroon et al., 2009; Taylor B. et al., 2010). Using water quality science and local farmer knowledge to develop tailored plans is a demanding process that requires careful facilitation by trusted agents (Robinson et al., 2014). In some of the earlier Water Quality Improvement Plans, scenarios have been a useful technique to build a community vision that accepts and responds to uncertainty about future changes, including economic growth, climate change and other drivers of local development (Bohensky et al., 2011; Hill et al., 2015; Pert et al., 2010). This is a gap in the most recent Water Quality Improvement Plans.
Participation and engagement
Community engagement in water quality planning can build trust and social resilience as well as contributing local knowledge, growing commitment and tailoring plans to local contexts (Bohensky et al., 2010; Bohnet and Smith, 2007; Bohnet and Kinjun, 2009; Dutra et al., 2016; Hill et al., 2015; Lebel et al., 2006). For governments, local community engagement can also demonstrate accountability and justice (Lebel et al., 2006).
However, community engagement is not without its challenges. Great Barrier Reef science, policy and governance arrangements have been the subject of prolonged and contested debates (Taylor B. et al., 2010; Taylor, 2010). The relative importance of science, local knowledge and values is often ambiguous in the design of engagement processes, which can lack clear pathways for resolving conflicts (Bohnet, 2015; Taylor B. et al., 2010). Engagement of Traditional Owners in water quality planning and programs has been inconsistent and has lacked supporting capacity building and engagement frameworks (Dale et al., 2016a).
Participation of farmers in water quality planning and programs is frequently mediated by local institutions, for example grower groups. The role of water quality plans themselves is ambiguous, and indeed collaborative planning efforts in the Great Barrier Reef have informed investments in both positive incentives such as grants as well as regulations (Eberhard et al., 2017b). For growers, as well as their representative organisations, participation in Great Barrier Reef water quality planning, partnerships and program delivery represents both a risk and an opportunity (Taylor B. et al., 2010). The growing role of agricultural peak bodies in cooperative Great Barrier Reef program delivery challenges traditional models of agricultural advocacy and has raised issues of representational legitimacy (i.e. who speaks for farmers’ interests in reef issues?) (Taylor and Lawrence, 2012).
Education and incentives To date, government investments in reef water quality programs have mostly used voluntary approaches to improving agricultural practices through grants, education, extension and, more recently, market-based incentives. More broadly there is a general trend in Australia, and internationally, of agricultural extension services shifting from the public to the private sector (Campbell, 2016; Marsh and Pannell, 2000).
Sustained investment in reef programs has enabled substantial delivery capacity and experience to be built. The Paddock to Reef Water Quality Risk Framework (Australian and Queensland governments, 2013a) has provided a valuable tool for linking industry best management practice programs, water quality grants and reporting metrics (Eberhard, 2011; Vella and Dale, 2014). The
Management options and their effectiveness 37

2017 Scientific Consensus Statement—Chapter 4
social and economic dimensions of agricultural practice change are discussed further in sections 6.2 and 6.3.
While reef programs have demonstrated substantial progress in engaging growers (Australian and Queensland governments, 2016; Eberhard, 2011), changes to natural resource management programs since 2008 have impacted the capacity of regional natural resource management groups to deliver those programs. Reductions in core funding and more competitive funding models in national natural resource management programs have increased uncertainty, reduced the mandate of regional plans and weakened bilateral arrangements (Campbell, 2016; Robins and Kanowski, 2011; Vella and Sipe, 2014; Vella et al., 2015). These issues have been mirrored in reef water quality regions, where Great Barrier Reef programs dominate natural resource management organisational budgets. Periodic review of reef investment priorities also impacts on regional capacity, staffing levels and community relations (Dale et al., 2013; Tennent and Lockie, 2013). The fragility of the national natural resource management model and funding uncertainty directly impacts the human and institutional capacity of organisations delivering reef water quality programs.
Regulation Effectively regulating agricultural run-off is challenged by the regulator’s capacity to measure performance at the scale of management (attribution) and the capacity to assess cumulative effects (Gardner and Waschka, 2012). Legislation and regulation, such as the European Union Nitrates Directive, has achieved water quality improvements in European countries (Kroon et al., 2014; Kroon et al., 2016).
The Queensland Government’s Great Barrier Reef Protection Amendment Act 2009 provides a risk-based approach to regulating practice in larger scale enterprises in the grazing and sugarcane industries in priority catchments. However, changing levels of government commitment to compliance have reduced the potential effectiveness of these regulations (Eberhard et al., 2017b). Reef regulations are currently under review by the Queensland Government (2017). A review of pesticide regulation in relation to the Great Barrier Reef found that the response by Australia’s national pesticide regulator has been ‘ad hoc, case-by-case, very slow and ineffective’ (King et al., 2013).
Additional regulatory mechanisms could be used to support water quality improvement in the Great Barrier Reef, including local and Queensland government planning instruments, and vegetation and water resource management legislation. The potential perverse impacts of other policies—such as agricultural intensification, drought relief and water resource development—are also important.
Good policy practice suggests a mix of regulatory instruments and close engagement with the agricultural community to ensure regulations achieve desired outcomes (Cherry et al., 2008; Connor et al., 2009; Stark and Richards, 2008; Van Grinsven et al., 2012). Simple regulatory responses are unlikely to be effective on their own. ‘Smart regulation’ uses a suite of policy measures including unconventional pathways that can influence behaviour, such as international standards, trading partners and supply chains, commercial institutions and financial markets, peer pressure, industry self-regulation and internal environmental management systems (Gunningham, 2009). Nonetheless, regulation, or threat of regulation, remains a strong motivator of environmental performance (Henriques and Sadorsky, 1996).
Market instruments There is a growing interest in Australia and internationally in the use of market-based instruments to address environmental issues in an efficient way (Rolfe and Windle, 2011a). There are two basic types of market instruments applied to water quality: (i) price-based mechanisms such as auction or tender systems to allocate public funds for environmental services, and (ii) quantity-based
Management options and their effectiveness 38

2017 Scientific Consensus Statement—Chapter 4
mechanisms such as cap and trade or offset programs (Rolfe and Windle, 2011b). Market mechanisms can reveal the opportunity costs of water quality improvements, as well as promising flexibility and efficiency. Rolfe and Windle (2011b) analysed the results of four water quality tenders in the Great Barrier Reef and found that there are very large variations in the costs of water quality outcomes between sectors, catchments, pollutant types and actions. This information is an important outcome of the process and can help improve the effectiveness of public investments in market and non-market mechanisms. Greiner (2015a) interviewed participants in the 2008 Lower Burdekin Water Quality Tender and found that improved land management actions had persisted post the tender, and that the tender increased the adoption of additional water quality–related actions and increased knowledge about water quality impacts by participants (including those who were not successful in in the tender process).
Monitoring, evaluation and reporting Great Barrier Reef programs have been supported by substantial investment in monitoring, modelling and reporting, which provides public accountability and assessment of outcomes (e.g. Australian and Queensland governments, 2016; GBRMPA, 2014b; Waters et al., 2014). Water quality and practice change targets have provided clear, measurable objectives for assessing management effectiveness (Day, 2008; Eberhard, 2011; Eberhard et al., 2017b). Clear targets and program specificity strengthen performance accountability, but can also constrain the capacity to experiment and innovate, as is recommended for tackling wicked problems. However, despite the substantial investment in monitoring to date (refer progress against targets, section 4), there is a lack of systematic evaluation of planning and governance performance in the Great Barrier Reef (Dale et al., 2016b; Vella et al., 2015) and this undermines the potential to learn about the effectiveness of program delivery systems and pathways.
Evidence of the contribution of collaborative governance to environmental outcomes is generally limited to in-depth case studies (Ansell and Gash, 2008; Margerum, 2011). In a meta-analysis of 47 case studies from North America and Western Europe, Newig and Fritsch (2009) found that while collaboration influenced the standard of decisions and level of outputs, it did not necessarily deliver improved environmental outcomes. In a paired study of 20 estuaries in the USA, Lubell (2005) found that collaborative groups with strong procedures and practices can enhance stakeholder trust and support for collaborative policy efforts. Scott (2015) examined 357 watersheds in the USA and found that collaborative watershed groups improved water chemistry and in-stream habitat conditions. Biddle and Koontz (2014) also found empirical evidence that collaborative processes have a measurable, beneficial effect on environmental outcomes in a paired study of 26 American watershed partnerships. Setting specific pollutant goals using logic models was significantly related to environmental outcomes, and key process factors included sustained collaboration, information sharing and collective documentation.
Issues beyond current programs Since 2003, reef water quality programs have focused on accelerating the uptake of agricultural practices with lower water quality risks, informed by the results of modelling and monitoring that have been used to prioritise catchments and sub-catchments, agricultural industries and specific land management practices. However, the context for Great Barrier Reef water quality programs continues to evolve. The scope and priorities of water quality programs require ongoing review and need to respond to emerging climate change impacts, new knowledge and broader economic and political changes.
In a recent paper, Morrison (2017) has documented the impact of multiple changes to the Great Barrier Reef governance system over the last 12 years. Against a backdrop of the resources boom, budget deficits and reduced core agency resourcing, a series of changes have both centralised decision-making authority and accommodated industry interests. While the structural complexity of
Management options and their effectiveness 39
2017 Scientific Consensus Statement—Chapter 4
the Great Barrier Reef system has been maintained (generally considered to confer resilience to the governance system) the overall impact has been a reduced authority and capacity to achieve conservation goals for the Great Barrier Reef.
The following section highlights three areas (climate change, major projects and policy alignment) that sit outside the current scope of formal reef water quality programs but have a very significant influence on water quality and the health of the Great Barrier Reef.
Climate change The Great Barrier Reef Outlook Report 2014 (GBRMPA, 2014a) defines climate change impacts as the single largest threat to the Great Barrier Reef ecosystem. From 2018, ocean temperature increases are expected to cause coral bleaching events twice per decade, and 2035 has been used as a critical climate change timeline within regional planning (Terrain NRM, 2015). Better water quality improves the resilience of the Great Barrier Reef ecosystem to cyclone damage, crown-of-thorns starfish outbreaks and the impacts of increased temperature and ocean acidification, but there is an increasing urgency to address both Great Barrier Reef water quality and global greenhouse emissions to sustain the reef (Brodie and Pearson, 2016; Brodie and Waterhouse, 2012). Dale et al. (2016b) found that greenhouse gas emissions management is ‘routinely ignored in consideration of Great Barrier Reef–specific governance, despite the potential for most reef-related governance subdomains (areas) to be overwhelmed by far bigger risks emerging from the potential failure in international and national action on emissions’. Without effective action on greenhouse gas emissions, the Great Barrier Reef will experience major changes, including widespread coral mortality, in the decades ahead (Pandolfi and Greenstein, 2007; Pandolfi et al., 2003).
Climate change will also impact agricultural industries, regional communities and coastal development. While government agencies at all levels have developed climate adaptation strategies, most are short-term, incremental adaptation measures, without a coherent framework to facilitate alignment between those strategies (Fidelman et al., 2013).
Impact assessment and management of major infrastructure projects The recent mining boom in Queensland highlighted the potential for other industries (coal and coal seam gas) to significantly impact the Great Barrier Reef. The planned expansion of major ports at Cairns, Townsville, Abbott Point, Hay Point and Gladstone would generate approximately 150 million tonnes of sediment over a 10-year period, an amount that would be both impractical and prohibitively expensive to offset (Brodie, 2014). While changes to government policy have since constrained the proposals for new port developments, existing ports continue to expand to meet demand, and pressure to add new ports is likely to return in the future. Major infrastructure projects like these undergo environmental assessment by the Australian and Queensland governments, but environmental impact statement requirements have been critiqued for lack of rigour and standardisation (Sheaves et al., 2015). Cumulative impact assessment, which seeks to understand the impact of multiple stressors, is required as part of an environmental impact statement but is neither well understood nor adequately assessed (Day, 2008). Several authors have called for independent, transparent and scientific review of environmental impact statement documentation and monitoring design (Grech et al., 2013; Grech et al., 2016; Hughes T.P. et al., 2015; Jacobs, 2014; Sheaves et al., 2015). Fraser et al. (2017) highlight how the limits of jurisdictional responsibility constrain management decisions (e.g. the impact of management decisions outside the Great Barrier Reef World Heritage Area) and the policy gaps around cumulative impact assessments.
Policy alignment Given the complexity and scale of the Great Barrier Reef, a wide suite of policy settings impact on agricultural industries, regional and coastal development and hence on the health of the Great Barrier Reef. In a risk analysis of Great Barrier Reef governance systems, Dale et al. (2016b)
Management options and their effectiveness 40
2017 Scientific Consensus Statement—Chapter 4
highlighted the need for policy alignment across multiple and competing policy areas to support Great Barrier Reef programs.
Policy alignment is required between levels of government as well as between related policy areas administered by the same government. The degree of reef policy coordination and alignment between Australian and Queensland governments has varied over time. Co-investment in reef monitoring and reporting programs is an example of good bilateral arrangements (Eberhard et al., 2017b).
While Reef 2050 provides a critical integrative mechanism for broader policy alignment between Australian and Queensland governments, there is a suite of policy areas that are not closely aligned or coordinated with reef policy at the regional or catchment scale, including regional land-use planning, ports planning, property planning, floodplain management and Traditional Sea Country management. Local government, which has significant relevant functions at the local scale, has had only limited engagement in formal reef policy (Dale et al., 2016b). In addition to climate change and major infrastructure project risks, described above, additional pressures on the reef can arise from increased vegetation clearing, changing land use such as proposals to expand agricultural production across northern Australia, and the lack of economic valuation of ecosystem services. With a strengthened mandate, investment and the scientific foundations of Reef 2050 could provide an effective mechanism to facilitate wider policy alignment (Dale et al., 2016b).
Conclusions The governance of the Great Barrier Reef water quality is a wicked policy problem, requiring a commitment to adaptive, participatory and transdisciplinary approaches. Governments have adopted many of these strategies in the Great Barrier Reef, yet there are tensions between traditional top-down policy approaches and more collaborative arrangements. The peer reviewed literature on Great Barrier Reef governance highlights where current programs can be strengthened, and the risks such as climate change, major development projects and unaligned policy need to be managed. Indeed, a framework for ongoing monitoring of the health of the wider governance system affecting Great Barrier Reef outcomes has been established (Dale et al., 2016b).
Adaptive approaches recommend the use of modelling and other tools to build system understanding, encourage experimentation and evaluation and tailor solutions to regional contexts. Participatory approaches can bring more knowledge to the debate about solutions, garner support, coordinate effort and reveal value and issue conflicts. Transdisciplinary approaches recommend using natural and social sciences and stakeholder knowledge to test and evaluate innovative solutions at local and catchment scales.
Monitoring and modelling of the natural systems is a strength of Great Barrier Reef programs. There has been little investment in social and institutional research, however, and a lack of systematic evaluation of delivery processes and governance systems. Current arrangements have not effectively supported a culture of innovation for reef water quality. Modelling of water quality outcomes is well established as a decision support and reporting tool in the Great Barrier Reef. More use of scenarios and forecasting could help water quality programs anticipate future challenges. A greater focus on experimentation and evaluation of on-ground works and program delivery would strengthen the adaptive capacity of Great Barrier Reef programs.
Participation and collaboration are features of Great Barrier Reef policy, planning and implementation. Coordinated program delivery by the alliance of natural resource management organisations and industry bodies is impressive. Regional capacity is, however, fragile, with changes to the natural resource management programs. Smart regulation could harness industry innovation for multiple outcomes.
Management options and their effectiveness 41
2017 Scientific Consensus Statement—Chapter 4
Water quality programs have focused almost exclusively on agricultural practices to date, yet climate change is the greatest risk to the health of the Great Barrier Reef. Reef water quality needs a wider policy scope to address emerging risks and greater policy alignment. Areas for further research and implications for management are summarised in Table 2 and 3.
Management options and their effectiveness 42

2017 Scientific Consensus Statement—Chapter 4
Table 2. Synthesis of established knowledge, new information and areas of further research relating to the governance of Great Barrier Reef water quality.
Established knowledge and understanding
GBR-specific information or insights Contentious, unresolved or unknown areas (for further research)
Over-arching
• GBR governance is a ‘wicked’ policy problem requiring adaptive, participatory and transdisciplinary approaches.
• Adaptive approaches recommend the use of modelling and other tools to build system understanding, encourage experimentation and evaluation and tailor solutions to regional variations.
• Participatory approaches can bring more knowledge to the debate about solutions, garner support, coordinate effort and reveal value conflicts.
• Transdisciplinary approaches recommend using natural and social sciences and stakeholder knowledge to test and evaluate innovative solutions.
• Modelling of water quality outcomes is well established as a decision support and reporting tool in the GBR. More use of scenarios and forecasting could help water quality programs anticipate future challenges. A greater focus on experimentation and evaluation of on-ground works and program delivery would strengthen the adaptive capacity of GBR programs.
• Participation and collaboration are features of GBR policy, planning and implementation. Collaboration between natural resource management organisations and industry peak bodies has facilitated coordinated program delivery. Regional capacity is, however, fragile, with changes to the natural resource management programs. Smart regulation has potential to harness industry innovation for multiple outcomes.
• Monitoring and modelling of the natural systems is a strength of GBR programs. There has been little investment in social and institutional research, however, and a lack of systematic evaluation of delivery processes and governance systems. Current arrangements have not effectively supported a culture of innovation for reef water quality.
• Understanding the efficacy and transferability of governance and policy mechanisms and delivery arrangements from comparable international problem contexts such as the US, the EU and NZ.
• A foundation of social research, including understanding of behavioural change and systematic evaluation of program delivery arrangements to provide clear feedback to policy, programs and GBR stakeholders.
• ‘Smart regulation’ options to influence agricultural practices through unconventional pathways such as standards, supply chains, commercial institutions and how to work collaboratively with growers, supply chain participants and industry groups to design, test and evaluate the effectiveness of these instruments.
• Monitoring, evaluation and reporting on the effectiveness of GBR governance arrangements (including policy alignment) and establishment of clear feedback mechanisms to policy, programs and delivery arrangements.
Management options and their effectiveness 43

2017 Scientific Consensus Statement—Chapter 4
Table 3. Implications and management considerations for the governance of Great Barrier Reef water quality.
Implications/considerations for management
Critical risks Address the significant risks from other policy arenas by:
• advocating for greenhouse gas emissions reductions and developing a strategic approach to climate adaptation in the GBR catchments
• strengthening cumulative impact assessment of major projects with risks to the GBR • influencing related policy areas such agricultural intensification and coastal development that may increase risks to the GBR.
Intergovernmental coordination
Intergovernmental coordination is critical for effective reef programs. Policy alignment (across governments and within government across related policy areas) provides unambiguous policy signals to stakeholders and enables greater impact. The new Reef 2050 Long-Term Sustainability Plan, as the overarching intergovernmental document, needs a stronger mandate, clearer strategies and greater financial commitment.
Collaboration Sustain and encourage productive collaborations at local, regional and policy levels to access a wider knowledge base, share resources and risk, enable innovation and tailor programs to local contexts. Collaborative processes at different scales need to be effectively linked to share learnings and align effort.
Regional delivery capacity
Strengthen the regional-, catchment- and property-scale delivery network by investing in core natural resource management activities (partnerships, planning, community engagement, etc.). Support collaboration efforts with longer term funding tied to locally identified and measured program outcomes.
Innovation Encourage experimentation and innovation by scientists working with local stakeholders to develop, test and evaluate potential new solutions.
Regional alignment Develop stronger alignment between reef programs and other regional planning and management activities such as land-use planning, development assessment and floodplain management.
Adaptive governance
Monitor, evaluate and report on the health of the wider governance system, delivery processes and program effectiveness. Incorporate learnings from social research and international case studies into formal GBR policy review cycles.
Management options and their effectiveness 44

Scientific Consensus Statement 2017—Chapter 4
Agricultural practice change
Effectiveness of agricultural practice change The iconic Great Barrier Reef marine ecosystems are interconnected with freshwater wetlands and the wider landscape of the Great Barrier Reef catchments. The impacts of poor water quality on both marine and freshwater ecosystems can have far-reaching impacts such as on the food chain; nutrient cycling; and species distribution, abundance, population size, growth and reproduction (Chapter 1). Agricultural lands are significant sources of pollutants discharged from Great Barrier Reef catchments (Chapter 2, Bartley et al., 2017), so it is important that the relationships between land management and pollutant exports is understood.
Since the 2013 Scientific Consensus Statement, there has been new research published on the water quality outcomes of agricultural management practices on farms. Much of this research has been undertaken in two major programs: the Paddock to Reef Integrated Monitoring, Modelling and Reporting Program (Paddock to Reef) and the Reef Rescue Water Quality Research and Development Program. The Paddock to Reef program also included substantial modelling of management practice effectiveness that has provided some new insights. There has also been research undertaken outside these programs that contributed new insights, including substantial reviews on nitrogen use efficiency in sugarcane and pesticides in Great Barrier Reef catchments, as well as individual research projects.
In this section, we examine the potential for management interventions to reduce pollutant discharges from agricultural lands in Great Barrier Reef catchments. The management of the three major pollutants— sediments, nutrients and pesticides—is reviewed. For sediments, the focus is on erosion in grazing lands as the primary source of sediments. However, erosion in cropped lands is also considered. For nutrients and pesticides, the focus is sugarcane, grains, horticulture and cotton production as it is in these production systems that most nutrients and pesticides are applied. However, pesticides management in grazing lands is also considered. Many of the general principles for managing exports of these pollutants are well understood, and we state these principles at the start of each section. We then expand on the process underpinning the control of pollutant exports and the evidence on practices that are effective in reducing these exports. Recent research has reinforced conclusions about the efficacy of many practices for managing pollutant discharges from agricultural lands. This previous knowledge is the basis for the Water Quality Risk Frameworks used in the Paddock to Reef program (Australian and Queensland governments, 2013a). Thus, we have increased confidence in the efficacy of these practices and the frameworks on which they are based. As well, there have been some new practices identified that, with further development and testing, could help manage pollutant discharges.
Sediments Sediments are generated through the process of erosion, whereby soil particles are removed from the landscape in water. The soil can be surface soil from hillslopes or subsoil from scalds, gullies or streambanks. The soil particles can be mobilised by run-off or, in the case of streambank erosion, stream flow. Erosion is a naturally occurring geomorphological phenomenon that is exacerbated by grazing (Bartley et al., 2010; Bartley et al., 2014; Thorburn and Wilkinson, 2013) and cropping (Carroll et al., 1997; Hughes A.O. et al., 2009; Murphy et al., 2013), although grazing lands provide three-quarters of the fine sediment delivered to the Great Barrier Reef (Chapter 2). Approaches to reducing sediment exports focus on reducing both the exposure of the soil, gully or streambanks to erosive forces as well as slowing and reducing surface run-off.
Management options and their effectiveness 45

Scientific Consensus Statement 2017—Chapter 4
General principles
Management practices reduce erosion of fine sediment by:
• Maintaining the groundcover and forage biomass of vegetation, including through droughts, to protect the soil surface from rain splash and rill erosion (Freebairn et al., 1996; Rosewell, 1993; Bartley et al., 2010; Silburn et al., 2011; DNRM, 2016) as well as gully incision (Prosser and Slade, 1994). Cover and biomass also reduce overland run-off in smaller events (McIvor et al., 1995) through increasing evapotranspiration and slowing run-off, thereby reducing sediment transport capacity. In grazing land, ground cover and biomass are ideally managed by setting stocking rates based on consumption at 10–30% of available forage. In the long term, such management results in better land condition (capacity to produce forage) than if grazing pressure is heavier. Improving grazing land management can reduce erosion within approximately five years (Hawdon et al., 2008; Bartley et al., 2010), although the response will continue to develop over a longer period (e.g. several decades) in areas where pasture composition is now dominated by Indian couch (Wilkinson et al., 2013; Bartley et al., 2014). In highly degraded landscapes, pasture management on its own is unlikely to reduce rates of erosion from gullies in the time frames required under the Reef Water Quality Protection Plan (i.e. <10 years) (Bartley et al., 2014). In cropped lands, groundcover is managed by reduced tillage, avoiding bare fallows by retaining crop residues after harvest, selecting crops that provide good ground cover where possible and maintaining a high crop frequency and/or planting fallow crops, depending on the cropping system.
• Improving soil condition to reduce run-off. In grazing land, this involves reducing forage utilisation (i.e. grazing pressure) and retaining vegetation diversity (Ash et al., 2011; Dawes-Gromadzki, 2005; Roth, 2004). Some tree cover can also enhance run-off infiltration (Ellis et al., 2006; Leguédois et al., 2008). In cropping land, improving soil condition involves reducing tillage and using controlled traffic farming to prevent soil compaction in the crop row, avoiding bare fallow periods and maintaining or increasing soil organic matter (Freebairn et al., 1996; Tullberg et al., 2007; Murphy et al., 2013; DNRM, 2016).
• Redistributing the pressure of agricultural activities away from areas vulnerable to erosion. In grazing lands, this involves fencing and additional water points to separate soil types with preferred pasture (Chilcott et al., 2003; Gordon and Nelson, 2007), riparian or frontage country (Hunt et al., 2007) and gullied areas. It also involves remediating rilled and scalded areas (Bartley et al., 2010), and gullied areas (Thorburn and Wilkinson, 2013). In cropping areas, redistributing agricultural activities would involve avoiding use of steep land, using contour banks to retain run-off (Murphy et al., 2013) and using buffer strips around riparian areas and drainage lines (McKergow et al., 2004).
Grazing lands
Hillslope erosion
Field studies investigating changes to land management have shown it is possible to reduce sediment concentrations in hillslope run-off, and to reduce run-off volumes from early wet season events, by improved grazing land management within approximately five years (Hawdon et al., 2008; Bartley et al., 2010). Run-off volumes can be more than 30% higher from degraded catchments relative to those in good condition, with differences occurring especially at rainfall totals <50 mm per day (Wilkinson et al., 2013). Improvements have been more rapid (reducing run-off coefficients by 25% over three years) when cattle were excluded completely and where pastures were dominated by more resilient tussock grasses (Connolly et al., 1997; Wilkinson et al., 2014). In areas of the catchment with low erosion rates, responses are difficult to detect over short timescales (less than five years) (O’Reagain et al., 2005). As well, significant recovery of moisture storage function, with
Management options and their effectiveness 46

Scientific Consensus Statement 2017—Chapter 4
subsequent reductions in run-off, is likely to take several decades in areas where pasture composition is now dominated by Indian couch, an introduced grass species that is less effective in reducing sediment loss than native species (Wilkinson et al., 2013; Bartley et al., 2014).
Studies in the Burdekin and adjacent Fitzroy catchments have found that increasing ground cover generally increases the amount of rainfall required to initiate run-off (Bartley et al., 2010; Connolly et al., 1997) and reduces peak discharges (Ciesiolka, 1987). Extrapolation of such data using water balance modelling suggests that the most effective revegetation strategy, in terms of run-off reduction (but not necessarily catchment sediment yield), was to increase cover levels modestly across the whole catchment rather than to revegetate small areas intensively (Connolly et al., 1997). To change or reduce run-off at the hillslope scale, average cover needs to be >75% and biomass >2000 kg/ha (Ciesiolka, 1987; Roth, 2004).
Reducing run-off and sediment yields from degraded areas at the catchment scale will take a lot longer (>10 years) because of the time lags associated with soil and pasture recovery (Colloff et al., 2010) and the geomorphic changes required to reduce the rates of channel erosion. In the semi-arid Concho River (~10,000 km2) in the United States, an 80-year flow record has shown that annual streamflow has decreased by ~70% and stormflow (which is generated in large events) declined between 1960 and 2005. This change was attributed to a decline in grazing animal numbers over the latter half of the century resulting in improved soil infiltrability due to improved ground condition (Wilcox et al., 2008).
In grazing lands of Great Barrier Reef catchments, the principles of land management for reducing run-off and sediment loss include (i) reducing forage utilisation (which is heavily influenced by stocking rates) to increase ground cover, and (ii) redistributing grazing pressure away from areas vulnerable to erosion such as gullies and streambanks (McIvor, 2010; Thorburn and Wilkinson, 2013; Hunt et al., 2014). Several studies have found that levels of livestock forage utilisation of 25–30% (of maximum annual biomass) are required to ensure that the pasture productivity and erosion control functions of rangeland vegetation are sustained (Ash et al., 2011). More recently Wilkinson et al. (2014) determined that animal equivalent stocking rates were inversely correlated with historical cover levels, with low-cover properties having typically two to four times the stocking rates of high-cover properties. High-cover properties also had a much higher proportion of 3P (palatable, productive, perennial) grasses than the medium- and low-cover sites, irrespective of soil type. Land condition assessments were consistently higher and less variable on the high-cover sites. The study also found that while forage productivity and hydrologic function are related to historical cover levels over decades, grazing management in the shorter term must consider more than just ground cover. For example, the widespread dominance of the exotic grass Indian couch in degrading pastures can give rise to high cover but low productivity and poor soil infiltration capacity.
Despite the strong evidence that reduced stocking rates will improve ground cover and water quality from hillslopes, the marginal economics of many grazing enterprises often prevent the adoption of these principles, and long-term profitability and sustainability are frequently compromised in favour of short-term income (Landsberg et al., 1998; O’Reagain et al., 2011; Ash et al., 2015; Rolfe et al., 2016). There needs to be more research into the relationship between ground cover and management practice (Barbi et al., 2015).
It is unlikely, however, that pasture management alone will be sufficient to reduce sediment yields to ecologically sustainable levels for the Great Barrier Reef due to increased contribution of sediment sources from channel (gully and streambank) sources. This was demonstrated by a 10-year study (2002-2011) on a property in the Burdekin catchment that investigated the role of reduced stocking rates and rotational wet season resting on hillslope and catchment run-off and sediment yields. During this study, average ground cover increased from ~35% to ~80%, and hillslope and catchment sediment concentrations did decline with the increased ground cover, yet catchment sediment yields
Management options and their effectiveness 47

Scientific Consensus Statement 2017—Chapter 4
increased proportionally to annual run-off due to the contribution of sub-surface (scald, gully and bank) erosion (Bartley et al., 2014). Similarly, the Ord River Catchment Regeneration Project in Western Australia involved reducing cattle numbers and remedial works to re-establish pasture in areas where serious erosion was identified (Fitzgerald, 1976). After almost 30 years, the project has had no measurable effect on the sedimentation rate in Lake Argyle, which is downstream of the restored area (Wasson et al., 2002). This is because the scheme invested a lot of money into hillslope rehabilitation yet gully erosion was the main form of erosion, and therefore sediment yields did not decline (Wasson et al., 2002). These studies suggest that more than 10 years will be required to restore healthy eco-hydrological function to these previously degraded and low-productivity rangelands. Even longer timescales will be needed to meet current targets for water quality.
Gully erosion
With the increased evidence of the contribution of channel (gully and streambank) sources to end-of-catchment fine sediment and particulate nutrient yields (see reviews in Chapter 2), there has been an increased investment in gully remediation trials in recent years.
The causes of gully erosion in northern Australia have not been fully resolved. However, recent research suggests that, like southern Australia, gully erosion was either initiated, or accelerated, when mining and cattle were introduced into these catchments (Shellberg et al., 2010; Shellberg et al., 2012; Shellberg et al., 2016). In general, however, the processes, spatial patterns and management of gully erosion remain poorly understood relative to those of hillslope surface erosion.
Despite these knowledge limitations, several studies in recent years have trialled a range of remediation options for reducing soil loss from gully erosion. Wilkinson et al. (2013) demonstrated that gully check dams (constructed of sticks wired together) and controlling livestock access are effective ways to trap fine sediment on the gully bed, initiate revegetation of the gully bed and walls and reduce gully sediment yield. For this method to be effective, the remediation design must be appropriately scaled to the run-off volumes. A companion study by Wilkinson et al. (2014) determined that the soil and vegetation condition of the hillslope above the gully was important for reducing run-off into hillslope drainage line gullies. Soil infiltration capacity of high-cover sites was measured to be four times that of low-cover sites for both Chromosol and Sodosol soils, indicating that high-cover sites could absorb and retain more water in the root zone of the soil profile for supporting forage production and reduce the amount of run-off fuelling channel erosion downslope.
Studies by Brooks et al. (2016a) investigated (i) the influence of grazing exclusion, (ii) the contribution of bioavailable nutrients, and (iii) the effectiveness of engineering works to support revegetation and control erosion of large gullies in alluvial soil. In summary, this study found that:
• Grazing pressure was not a strong predictor of short-term large-scale gully erosion detectable by aerial LiDAR (light detection and ranging) remote sensing. This does not suggest that land use is and was not a key driver in initiating gullies and driving gully condition. However, once gullies are established, the soil properties and drainage area are stronger drivers of gully growth, particularly for large alluvial gullies.
• Since vegetation colonisation onto very active surfaces of deep, well-developed gully complexes appears to be minimal in the short term, it is unlikely that significant reductions in gully surface erosion and slumping from direct rainfall will result from cattle exclusion and vegetation response.
• Vegetation improvements in the uneroded upslope catchments of alluvial gullies can promote infiltration, reduce run-off and slow head scarp retreat rates in the long term. There were significant reductions in large-scale erosion following three to four years of cattle exclusion.
Management options and their effectiveness 48

Scientific Consensus Statement 2017—Chapter 4
• This study also showed that as gully systems erode back into the alluvium they contribute nutrient-rich sediments, largely from terrace features, to stream systems. This reinforces the importance of all fine sediment sources as contributors of bioavailable nutrients.
• Bioengineering (slope battering, seed, mulch, gypsum and fertiliser) reduces erosion rates on alluvial gullies by 90% compared to untreated control sites after four years.
• Battering walls of alluvial gully sequences, without any soil treatment, increased erosion rates above the untreated control and background rates.
• Several cautions are given with this study, including the need to understand the base level lowering processes near any bioengineering works, as these will be the long-term influence on the success of remediation.
The Paddock to Reef Water Quality Risk Framework for Grazing (Australian and Queensland governments, 2013a) now includes explicit targeting of gully and streambank erosion as a means to reduce the water quality risk from grazing land management. The key metric being used to prioritise suitable projects for gully and streambank erosion control programs is cost effectiveness (Wilkinson et al., 2015a; Wilkinson et al., 2015b; Bartley et al., 2015). Using the cost effectiveness metric favours low-cost, low-intervention erosion control activities to revegetate these erosion features and return the eco-hydrological function of grazing landscapes, wherever they are effective at controlling erosion. Larger, more interventionist, high-cost and high-risk remediation projects are regarded as cost-effective where gully erosion is more rapid (producing more sediment per hectare), or where low-cost measures would not be effective due to unstable soils, for example. Brooks et al. (2016b) argue that earth works and other engineering activities can be cost-effective and will be necessary to reduce sediment yields delivered to the Great Barrier Reef within target time frames. Achieving sediment reduction targets from gullied catchments will require selection and design of erosion control activities that are appropriate to each site or environmental setting.
Streambank erosion
There has been considerable improvement in our knowledge of the effectiveness of improved hillslope and gully remediation over the last three to four years. However, our understanding of the degree of alteration of bank erosion with the introduction of agriculture, and the success of methods for remediating bank erosion sites, is limited.
Streambank erosion is the common term used to describe the erosion of the channel boundary in river systems (Bartley et al., 2015). Bank erosion is a natural process that occurs even in densely forested systems (Rozo et al., 2014) and is integral to the functioning of river ecosystems (Pusey and Arthington, 2003). However, changes to land use, vegetation and climate in recent centuries have resulted in bank erosion rates that are higher than natural background levels in many parts of the world (Hooke, 1980).
There are no known published studies on the effectiveness of reinstating riparian zones on the erosion, sediment loss or water quality in the Great Barrier Reef catchments. A review of studies from around the world suggests that in ~40% of studies there was no reduction in sediment yields, improvement in water quality or reduced erosion following riparian remediation (Bartley et al., 2015). In fact, for some studies, particularly those that only ran for short time frames (~3 years), there was an increase in sediment yield following remediation (e.g. Marsh et al., 2004). This highlights the importance of preventing erosion, as once systems have changed, it is very difficult in many situations to reduce erosion rates. Where there was quantitative evidence for improved water quality and riparian condition following remediation, the response time was quite variable, ranging between two and 18 years (Bartley et al., 2015).
There are ~300,000 km of stream lines draining to the Great Barrier Reef (Bartley et al., 2015). The channel types, and associated erosion processes, vary enormously. Despite this large variability,
Management options and their effectiveness 49

Scientific Consensus Statement 2017—Chapter 4
there are some general principles that apply to riparian management and bank erosion control that will improve the likely success of riparian investments (Bartley et al., 2015). These include:
• Stream size: Larger streams tend to erode more quickly than smaller streams as they produce more sediment per unit length of stream, but smaller streams are more prone to damage by cattle as they can trample banks.
• Vegetation: Mean bank erosion rates are lower on sites with good riparian vegetation compared to sites without vegetation (Bartley et al., 2008). A combination of woody and grass species is likely to offer the greatest benefit in terms of bank stabilisation (Simon and Collison, 2002).
• Channel confinement: Confined or bedrock controlled channels are less likely to have high bank erosion compared to alluvial reaches. Many rivers in the Great Barrier Reef catchments have relatively inactive and rarely inundated floodplains (Amos et al., 2009) and therefore the bench features that sit within the channel are most active in terms of lateral (channel) erosion (Brooks et al., 2014).
• Bank material: Bank erosion rate is strongly related to the grain size and the percentage of silt and clay in the banks (Nanson and Hickin, 1986; Brooks et al., 2014).
• Stream power: This is considered an important influence over bank erosion rates due to its direct impact on channel form (Knighton, 1999; Thompson and Croke, 2013) as well as the more indirect influence on riparian vegetation (Bendix, 1999). However, Brooks et al. (2014) found that in-channel deposition was a more significant driver of bank erosion than stream power in Queensland rivers.
Cropped lands
Cropping is generally associated with higher rates of sediment loss per hectare than grazing, and this has also been observed in the Great Barrier Reef region (Prove et al., 1995; Carroll et al., 1997; Hughes A.O. et al., 2009; Murphy et al., 2013). Great Barrier Reef catchments management systems that reduce or eliminate tillage and maximise soil cover (through crop rotations and the retention of crop residues) reduce soil loss in a wide variety of cropping systems (Thorburn, 1992; Sallaway et al., 1990; Prove et al., 1995; Carroll et al., 1997; Rohde et al., 2013a; Rohde et al., 2013b; DNRM, 2016). As well as these practices, controlled traffic is effective in reducing run-off and soil loss in sugarcane farming (Masters et al., 2013; DNRM, 2016) and row cropping (Tullberg et al., 2007; Silburn et al., 2013a). Contour embankments are essential for reducing soil loss from cropping lands in large storms (Murphy et al., 2013). In addition, fallows with low surface cover represent a major erosion hazard, and greater than 30% soil cover should be maintained during fallows through retention of crop residues and/or planting cover crops to manage erosion. Maintaining surface cover is also important in perennial horticultural crops (DNRM, 2016). Retaining crop residues and/or planting cover crops will increase soil organic matter, which increases the strength of soil aggregate and increases infiltration (Freebairn et al., 1996). Sediment deposition rates indicate that maintaining ground cover is also a factor in reducing sediment yields, with sediment yields under reduced tillage and increased soil cover being less than half the sediment yield of traditional practices (Hughes A.O. et al., 2009). Clear examples of the efficacy of these practices come from several studies in Great Barrier Reef catchments. In the central highlands area, when zero tillage resulted in high soil cover, erosion rates were 75% lower than from traditional cropping practices (Carroll et al., 1997; DNRM, 2016).
Areas for targeted management
From the above sections, it is clear that most erosion processes can be effectively managed at the paddock scale. Targeting practice improvement first to areas of the Great Barrier Reef catchments which have higher sediment contribution rates can be expected to reduce sediment loads more than non-targeted practice improvements (Lu et al., 2004). The regional-scale gradients in sediment
Management options and their effectiveness 50

Scientific Consensus Statement 2017—Chapter 4
contribution rate result from variations in erosion rates across grazing and cropping lands that are independent of management practices and are associated with gradients in the environmental drivers of erosion, including rainfall and topography. Other factors causing locally higher sediment contribution include cropping (described above), and fine-textured soils such as basalt-derived Vertisols in the Fitzroy catchment (Smith et al., 2008; Packett et al., 2009). Gullied areas inherently deliver several times more sediment per hectare than non-gullied areas, and streambanks are also areas of locally intense erosion which can provide larger reductions in sediment loads per hectare of treatment. Hotspot areas of hillslope erosion will also be priorities for efficiently reducing sediment loads where they are well connected to river outlets. The rates of contribution to Great Barrier Reef sediment loads are lower for areas upstream of large impoundments, which trap most fine sediment delivered from upstream areas (Lewis et al., 2013).
Prospects for reducing run-off and sediment exports
Grazing lands
At a global level, fewer than five rivers have demonstrated a reduction in end-of-river sediment loads to coastal waters in response to improved land management (Walling and Fang, 2003; Zhang and Wen, 2004; Wang et al., 2007; Wang et al., 2011; Kroon et al., 2014). Where reductions have occurred, the financial investments into catchment restoration have been substantial (Kroon et al., 2014). For example, a study by Garbrecht and Starks (2009) showed a reduction in sediment yields over a long (~60 year) period due to the combined effects of activities such as conservation tillage, terracing of cropland, gully shaping, grade control structures, channel stabilisation, sediment trapping by water impoundments and road surfacing in catchments ranging between 49 km2 and 826 km2. Kuhnle et al. (2008) measured reductions of about 60% in fine and total sediment concentrations over a nine-year period from a 21.3 km2 catchment dominated by channel erosion, after highly erodible cultivated land was reduced from 26% to 8% of the catchment. This was attributed to reduced run-off from crop land and reduced channel transport capacity. These studies were conducted in headwater catchments, and a reduction in sediment yields to coastal waters was not measured.
More broadly, the water quality change following improved land management practice has been hampered in long-term studies by (i) inappropriate targeting of the critical source/pathway of the sediment, (ii) the dominance of channel rather than surface soil erosion, and (iv) time lags, historical legacies and variable climate within the monitoring periods (Tomer and Locke, 2011). Some of the difficulties in measuring and identifying a response in sediment yield to land management change are also due to the lack of long-term, well-managed, statistically robust datasets (Richardson et al., 2008).
The high variability of run-off and sediment yield in many of the Great Barrier Reef catchments will make it difficult to link changes in catchment management to end-of-catchment sediment yields. Statistical modelling suggests that with current monitoring programs it will take at least 50 years to detect an average 20% reduction in suspended sediment loads with reasonable (80%) confidence (Darnell et al., 2012). The role of sediment storage in large catchments can also make linking land management changes and sediment response challenging (Walling et al., 2011). For example, the Coon Creek (USA) work by Trimble (1981; 1983) suggests that even after the implementation of soil conservation measures in the 1930s, which reduced gross erosion by ~25%, the sediment yield at the basin outlet changed very little. This was due to increased efficiency of sediment transfer through the channel system (via reduced deposition) and the remobilisation of sediment that had accumulated in the valley during the preceding period of accelerated erosion.
In summary, due to the costs and challenges with long-term monitoring, there are very few studies anywhere in the world that have demonstrated a reduction in run-off and fine sediment delivery to
Management options and their effectiveness 51

Scientific Consensus Statement 2017—Chapter 4
marine ecosystems following improved land management (Kroon et al., 2014). For restoration to be effective, and reduce the delivery of the ecologically threatening sediment, it must target the primary erosion process, and associated monitoring needs to be conducted at a range of spatial scales (plot, sub-catchment, basin) to allow detection of potential water quality improvements in response to the restoration. It is likely that increasing cover levels across the whole catchment will help reduce run-off and prevent or reduce further hillslope and channel erosion. However, once gullies are well established, specific remediation measures will be required. Depending on the scale and effectiveness of restoration measures, detecting reductions in end-of-river sediment loads may take years to decades using current monitoring programs (Darnell et al., 2012).
Cropped lands
Unlike for grazing lands, the means to control run-off and erosion from cropped lands is well understood. The efficacy of the management practices outlined above has been demonstrated in many studies across the range of crops grown in Great Barrier Reef catchments (Rohde et al., 2013a; Rohde et al., 2013b; DNRM, 2016).
Further research
• The water quality effectiveness and the costs and suitability to land holders of specific grazing practices need to be verified using local investigations within priority, highly eroding areas of Great Barrier Reef grazing lands. Practices that are priorities for further study include riparian grazing management, reducing or removing grazing pressure from gullied areas and remediation of gullies and other erosion features using physical works.
• There have been many more studies of grazing land degradation than of land condition improvement, and yet the latter is the objective for reducing sediment losses as well as for enhancing pasture productivity. More local studies are required of the processes, time frames and water quality effectiveness of recovery in land condition following improved grazing practices, including soil and vegetation properties and water and pollutant fluxes. Priority areas for such studies would be areas of high erosion rates, low vegetation cover and biomass and fine-textured and sodic soils.
• Systematic methods need to be developed for ensuring that tools for applying forage budgeting, forage condition assessment and climate forecasts are available across the grazing industry. These methods then need to be applied to determine stocking rates. Anecdotal information indicates that most graziers do not currently use quantitative methods for setting stocking rates.
• Pasture improvement is a common practice, but there is very little evidence about the soil loss benefits relative to reduced utilisation of native pastures or information on the soil loss under different pasture species being used.
Nutrients Many nutrients are critical for plant growth and, hence, for crop and pasture production. However, only two, nitrogen and phosphorus, have been identified to date as having major ecological impacts on Great Barrier Reef ecosystems (Chapter 1). Both are influenced by agricultural management practices. Therefore, this section focuses on nitrogen and phosphorus.
Nutrients exist in particulate and dissolved form. There are similarities, but also differences in the management outcomes for these two forms, which will be considered.
Management options and their effectiveness 52

Scientific Consensus Statement 2017—Chapter 4
General principles
• Inputs of nitrogen into cropping systems can have several fates: uptake by crops and removal from the field (e.g. in harvested products or burnt crop residues), storage in the soils in both mineral and organic (the clear majority) forms and losses to the environment (Figure 3). At steady state, soil storage is not significant (Janssen and De Willigen, 2006) so the difference between nitrogen inputs and nitrogen removal from the field, that is, the nitrogen surplus, is an indicator of environmental losses over the long term (Buczko et al., 2010; Sieling and Kage, 2006; Thorburn et al., 2013a). Surplus nitrogen can be lost to the environment through various pathways, including leaching, run-off, soil erosion and atmospheric losses (denitrification and volatilisation). The partitioning of these losses will depend on the climate, soil type and management (Thorburn and Wilkinson, 2013). Climate and soil type also affect processes that determine the nitrogen surplus, such as crop size (and hence nitrogen removal) and soil nitrogen cycling. Linking nitrogen surpluses to a particular loss pathway—for example, run-off or deep drainage—will be problematic (Buczko and Kuchenbuch, 2010). However, as a first principle, we expect changes in nitrogen surpluses to be reflected in relative changes in nitrogen losses in all pathways. Nitrogen surpluses (and nitrogen application rates) have been correlated with nitrogen loads (in dissolved inorganic and particulate forms) to the Great Barrier Reef at the regional scale (Thorburn and Wilkinson, 2013; Thorburn et al., 2013a). Lower nitrogen surpluses (and lower nitrogen application rates) result in lower nitrogen losses from fields (Webster et al., 2012; Armour et al., 2013a; Armour et al., 2013b; Rohde et al., 2013a, Rohde et al., 2013b; Donaldson et al., 2015). These principles imply there are two strategies for reducing nitrogen losses: (i) reducing input of nitrogen from fertiliser or other sources, or (ii) increasing production and hence removal of nitrogen from the field.
• The general principles for phosphorus are like those for nitrogen. Phosphorus inputs into cropping systems can be removed from the field (e.g. in harvested products or burnt crop residues), stored in the soils and lost to the environment. And, as for nitrogen, at steady state, soil storage is not significant (Janssen and De Willigen, 2006) so the difference between phosphorus inputs and crop phosphorus uptake, that is, the phosphorus surplus, may be an indicator of environmental losses over the long term. However, because phosphorus is bound to the soil, the soil acts as a finite phosphorus sink and the assumption of steady-state soil phosphorus is less applicable than it is to nitrogen. For example, decades of over-application of phosphorus fertiliser to sugarcane crops has resulted in positive phosphorus surpluses and substantial increases in soil phosphorus concentrations in some regions (Bloesch et al., 1997). High soil phosphorus concentrations themselves are a fundamental driver of phosphorus losses to the environment (Moody, 2011).
• Plants take up nutrients gradually as they grow. However, fertiliser is often applied one or two times during a crop’s growth, typically relatively early in the growing season and well in advance of crop nutrient demand. Thus, at the time of application there is more nutrient in the soil than can be taken up by the plant, and the excess nutrient increases the risk of nutrients being lost to the environment. Synchronising the supply of nutrients to crops’ requirements is one potential strategy to increase crop nutrient uptake and reduce nutrient losses (Bell and Moody, 2014). This strategy will be more beneficial for nitrogen than for other nutrients as nitrogen is often in the mobile form, nitrate. Synchronising the supply of nitrogen to crops’ requirements can be achieved by applying a small amount of nitrogen at regular intervals, for example, through fertigation (application of nutrient with irrigation) of irrigated horticultural crops (Armour et al., 2013a; Armour et al., 2013b). Improved synchrony may also be achieved by applying enhanced efficiency fertilisers, which use various mechanisms to either slow the release of nitrogen or reduce nitrate concentrations in soil (Verburg et al., 2014). Using enhanced efficiency fertilisers is a more practical method
Management options and their effectiveness 53
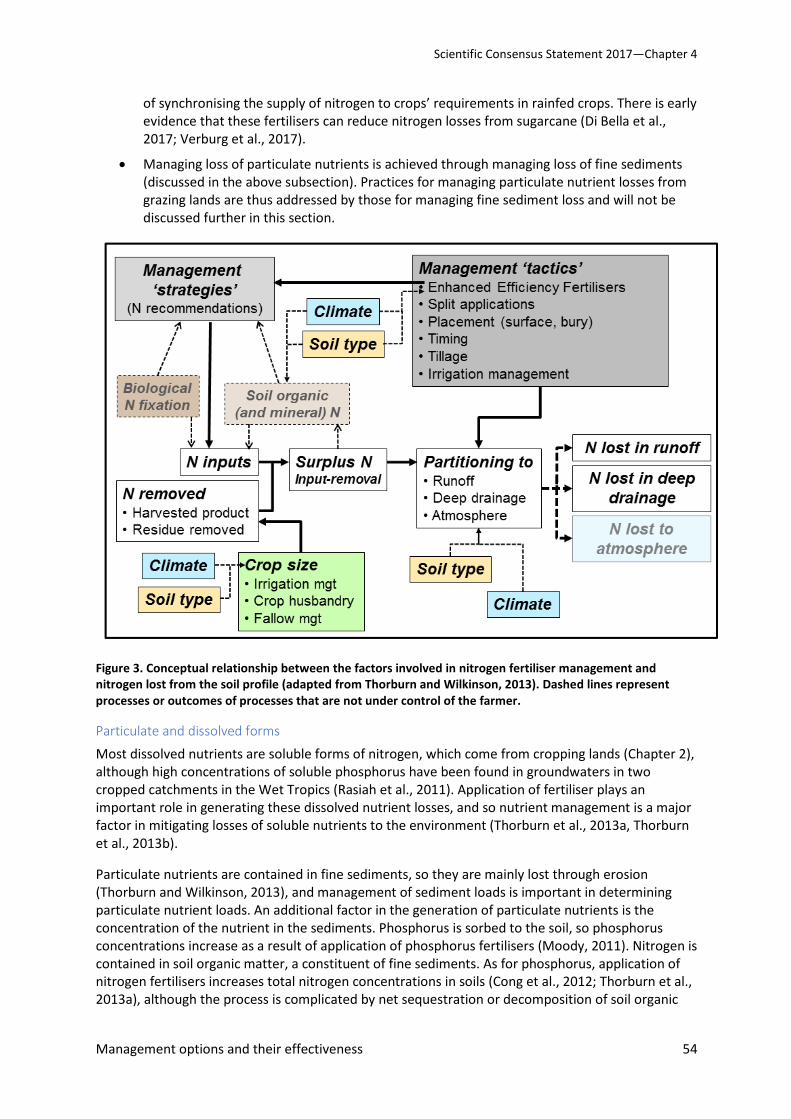
Scientific Consensus Statement 2017—Chapter 4
of synchronising the supply of nitrogen to crops’ requirements in rainfed crops. There is early evidence that these fertilisers can reduce nitrogen losses from sugarcane (Di Bella et al., 2017; Verburg et al., 2017).
• Managing loss of particulate nutrients is achieved through managing loss of fine sediments (discussed in the above subsection). Practices for managing particulate nutrient losses from grazing lands are thus addressed by those for managing fine sediment loss and will not be discussed further in this section.
Figure 3. Conceptual relationship between the factors involved in nitrogen fertiliser management and nitrogen lost from the soil profile (adapted from Thorburn and Wilkinson, 2013). Dashed lines represent processes or outcomes of processes that are not under control of the farmer.
Particulate and dissolved forms
Most dissolved nutrients are soluble forms of nitrogen, which come from cropping lands (Chapter 2), although high concentrations of soluble phosphorus have been found in groundwaters in two cropped catchments in the Wet Tropics (Rasiah et al., 2011). Application of fertiliser plays an important role in generating these dissolved nutrient losses, and so nutrient management is a major factor in mitigating losses of soluble nutrients to the environment (Thorburn et al., 2013a, Thorburn et al., 2013b).
Particulate nutrients are contained in fine sediments, so they are mainly lost through erosion (Thorburn and Wilkinson, 2013), and management of sediment loads is important in determining particulate nutrient loads. An additional factor in the generation of particulate nutrients is the concentration of the nutrient in the sediments. Phosphorus is sorbed to the soil, so phosphorus concentrations increase as a result of application of phosphorus fertilisers (Moody, 2011). Nitrogen is contained in soil organic matter, a constituent of fine sediments. As for phosphorus, application of nitrogen fertilisers increases total nitrogen concentrations in soils (Cong et al., 2012; Thorburn et al., 2013a), although the process is complicated by net sequestration or decomposition of soil organic
Management options and their effectiveness 54

Scientific Consensus Statement 2017—Chapter 4
matter. Thus, management of nutrient application can potentially affect generation of particulate nutrients.
The principles for managing nutrients to reduce their losses from Great Barrier Reef catchments apply to dissolved and particulate nutrients in fertilised crops and pastures. The concepts have generally been developed and tested in the context of managing losses of dissolved nutrients from crops because of (i) the widespread use of fertiliser in crop production, and (ii) common adoption of erosion reducing measures in cropped lands.
Nutrient applications, surpluses and losses
Nitrogen
As described above, nutrient surpluses are the difference between the amount of nutrients applied to a field and those removed from the field in harvested product, burnt crop residues or in other losses (Figure 3). For crops that receive nitrogen fertiliser applications at or above best management practice rates, nitrogen surpluses are significantly (r2 = 0.83, ρ < 0.001, Figure 4) correlated with nitrogen fertiliser applications (Thorburn and Wilkinson, 2013). At lower application rates, where nitrogen limits crop growth, we would expect surpluses to be relatively small and possibly less dependent on nitrogen fertiliser inputs (Thorburn et al., 2013a).
Nitrogen surpluses and nitrogen fertiliser (Figure 4) application rates are correlated with nitrogen losses (in both dissolved and particulate forms) from Great Barrier Reef catchments (Thorburn and Wilkinson, 2013; Thorburn et al., 2013a). The relationships in the Great Barrier Reef are similar to those in catchments in Europe and the United States (Thorburn et al., 2013a). The correlation at catchment scale implies that reducing nitrogen fertiliser applications to crops will reduce nitrogen losses. There is clear experimental evidence supporting this implication for losses via both run-off and deep drainage (Prove et al., 1997; Webster et al., 2012; Armour et al., 2013a; Armour et al., 2013b; Rohde et al., 2013a; Rohde et al., 2013b; Donaldson et al., 2015; DNRM, 2016; Nachimuthu et al., 2017a); at the field scale, lower nitrogen fertiliser results in lower nitrogen losses in run-off (Figure 5) and deep drainage (Figure 6). These results suggest that (i) nitrogen surpluses and/or nitrogen fertiliser application rates are an indicator of risk of nitrogen losses, and (ii) reducing nitrogen fertiliser application in excess of crop requirements is a primary way of managing nitrogen losses.
Figure 4. Mean annual export of dissolved inorganic nitrogen (DIN) as a function of estimated annual nitrogen fertiliser applications for Great Barrier Reef regions (circles) and 17 catchments in Europe (diamonds). The line is the regression (R2 = 0.83) excluding the circled European data. (After Thorburn et al., 2013a.)
Management options and their effectiveness 55

Scientific Consensus Statement 2017—Chapter 4
Figure 5. Dissolved inorganic nitrogen (DIN) lost in run-off under different nitrogen fertiliser applications resulting from two different management systems, ‘B Class’ and ‘C Class’, in four sugarcane ratoon crops (1R = 1st ratoon, etc.). (Data from Rohde et al., 2013a; Rohde et al., 2013b.)
Figure 6. Dissolved inorganic nitrogen (DIN) lost in deep drainage below the root zone of bananas at different nitrogen fertiliser applications. (Data from Armour et al., 2013b).
Fertiliser is not the only source of nutrient inputs to crops, and it is necessary to consider the effects of these other sources on nutrient losses (Figure 3). One of these sources is biological fixation of nitrogen in legumes. Legumes often obtain most their nitrogen via biological fixation (Peoples et al., 2009) and so where legumes are grown in a cropping system the fixed nitrogen needs to be considered as a nitrogen input. If grain is harvested from the legumes, the impact of legumes on nitrogen balances of cropping systems is small, as much of the nitrogen in legumes is in the grain (Bell et al., 1998). However, when legumes are grown as ley crops they contain substantial amounts of nitrogen (e.g. 300 kg/ha; Schroeder et al., 2014) and increase nitrogen surpluses in cropping systems. This is particularly relevant to sugarcane production in Great Barrier Reef catchments where legumes (either ley or grain crops) have been widely promoted as fallow crops to overcome
Management options and their effectiveness 56

Scientific Consensus Statement 2017—Chapter 4
soil health declines found in sugarcane monocultures (Garside and Bell, 2011). Increased nitrogen losses in run-off have been found in sugarcane crops grown after ley legume crops (DNRM, 2016).
Nitrogen inputs from ley legumes are taken up by subsequent sugarcane crops and so lessen the amount of fertiliser nitrogen needed by these crops. The effect is greatest in sugarcane plant crops, but may last for one (Bell et al., 2010) or more (Park et al., 2010) ratoon crops, depending on soil and environmental factors. Thus, balancing nitrogen inputs from legumes with lower nitrogen fertiliser applications is one strategy for minimising nitrogen surpluses in, and nitrogen losses from, sugarcane crops following ley legumes. Nitrogen fertiliser recommendations for sugarcane recognise the contribution of nitrogen from fallow legumes, advising an equivalent reduction in nitrogen applied to plant crops (Schroeder et al., 2014). However, there are situations where nitrogen from legumes appears to be lost to the environment before it can be taken up by crops (Bell et al., 2010) creating the uncertainty about productivity of crops following legumes if nitrogen fertiliser applications are reduced. While balancing legume nitrogen inputs with reduced nitrogen fertiliser applications is important for reducing nitrogen losses from cropping systems, legumes in cropping systems may have other detrimental impacts on nitrogen losses. Decomposing legume residues are often mineralising on or very near the soil surface. Following a rainfall event, they are thus potentially more prone to losses in run-off than fertiliser nitrogen applied below the soil surface (Nachimuthu et al., 2017b). The appropriate management of fallows (harvesting, incorporation, etc.) to reduce nitrogen losses while ensuring crop availability remains a research gap.
Sugarcane production is not the only cropping system in the Great Barrier Reef catchments where legumes are grown. In grain production systems, legume grain crops are often grown in rotation with cereals. Legume crops in these production systems may have only a small impact on nitrogen surpluses and, hence, on water quality (Thorburn and Wilkinson, 2013). This is because little or no nitrogen fertiliser is applied to either the legume or cereal grain crops in these systems, since their nitrogen requirements are largely met through legume nitrogen fixation (e.g. Huth et al., 2010), and much of the fixed nitrogen from legumes is removed from the field in harvested grain. However, substantial amounts of DIN were measured in run-off from a sorghum crop in central Queensland (Murphy et al., 2013). The reasons for the high loss of DIN from this site, and how representative these results are of the general situation in grains production areas, are unclear.
Mill mud is another potential source of nutrients in sugarcane production areas. It is a by-product of sugarcane milling that mainly consists of ground sugarcane stalks and leaves, soil and lime added during clarification of juice. Nitrogen concentrations in mill mud are low (e.g. approximately 1.5% on a dry weight basis: Barry et al., 1998). However, while mill mud is ‘collected’ over all harvested sugarcane crops, it is traditionally disposed of on only a small proportion (e.g. 5%) of the harvested area (Barry et al., 1998). Thus, the constituents of mill mud are effectively concentrated in that small area, and the same small areas (generally near the mills) receive regular repeat applications. This creates a situation where approximately 400 kgN/ha may commonly be applied in mill mud, considerably greater than the recommended application rates for a sugarcane crop (Wood et al., 2003; Schroeder et al., 2014). Unless fertiliser nitrogen is reduced by an equivalent amount, which cannot be achieved in a single sugarcane crop, mill mud managed in this manner potentially exacerbates losses of nitrogen to the environment. A simulation study (Thorburn et al., 2008) illustrates the potential problem: reductions in nitrogen fertiliser after application of 130 wet t/ha of mill mud could only offset half the nitrogen applied in mill mud. However, there is little direct information on the impact of mill mud on nutrient losses, or its management. In the one study published to date (a rainfall simulator experiment in the Herbert region), nitrogen losses in run-off were higher where mill mud was incorporated into the soil compared with fertiliser (DNRM, 2016). The water quality impact of disposing of mill mud on farmers’ fields is likely to be lessened if it is disposed of over greater areas, so reducing the loadings of nitrogen on an area basis. Systems have been developed in the Mackay region to do this (Markley and Refalo, 2011). The recommendations
Management options and their effectiveness 57

Scientific Consensus Statement 2017—Chapter 4
to farmers on how to adjust their nitrogen fertiliser applications following mill mud are poorly developed, in part because of uncertainties in predicting the mineralisation of organic nitrogen forms in mill mud in response to environmental conditions, making it more likely that mill mud applications increase nitrogen losses.
Lastly, irrigation water can contain substantial amounts of nitrogen. This mainly occurs in parts of the Burdekin region, where irrigation is sourced from groundwater which has high concentrations of inorganic nitrogen and irrigation applications are high. In these circumstances nitrogen applications can be appreciable, for example up to 150 kgN/ha (Thorburn et al., 2011a), and so needs to be accounted for in determining nitrogen fertiliser requirements (Schroeder et al., 2014).
Phosphorus
In Great Barrier Reef catchments, phosphorus surpluses are generally lower than nitrogen surpluses. In horticultural crops, phosphorus surpluses are 40–70 kg/ha per crop in many crops (Moody and Aitken, 1996), although higher surpluses (i.e. greater than 100 kg/ha per crop) have been found in specific experiments in bananas (Prove et al., 1997). Surpluses tend to be lower in some tree crops, for example less than 10 kg/ha per crop in mango and coffee (Moody and Aitken, 1997) and sugarcane (Bloesch et al., 1997; Prove et al., 1997). Although these phosphorus surpluses in sugarcane are small, they have still resulted in a substantial build-up of phosphorus in soils over decades in some regions (Bloesch et al., 1997). This build-up may mean that sugarcane crop yields do not respond to additions of phosphorus fertiliser and little phosphorus needs to be applied to sugarcane crops. Soil testing is an effective way of determining phosphorus needs in sugarcane and is a recommended practice (Wood et al., 2003).
Mill mud contains phosphorus, and approximately 250 kgP/ha may be applied to sugarcane crops in mill mud (Barry et al., 1998). As with nitrogen, this amount of phosphorus is considerably above recommended application rates for a sugarcane crop (Wood et al., 2003) and cannot be offset by reduced phosphorus fertiliser in a single crop. As mill mud is often applied onto the soil or trash blanket, it is often more vulnerable to erosive losses during run-off events than phosphorus fertiliser applications made in bands applied well below the soil surface. As with nitrogen, disposing of mill mud over greater areas, so reducing the loadings of phosphorus on an area basis, will reduce the over-application of phosphorus from this source.
Few studies on the management of nutrient run-off or deep drainage from cropped lands in Great Barrier Reef catchments consider phosphorus. In one that did (Prove et al., 1997), there was an interaction between cultivation and phosphorus fertiliser inputs: phosphorus losses were lower in crops with no phosphorus applied compared with those where 31 kgP/ha was applied. Losses were also lower with conventional cultivation than with minimum tillage in the fertilised crops. A more recent study (Nachimuthu et al., 2017a) found lower total and soluble phosphorus losses in run-off from vegetable production with ‘improved practice’ (reduced phosphorus fertiliser application and grass-covered inter-rows) compared with conventional practice. Other studies considering phosphorus focus on practices to control run-off and erosion (Agnew et al., 2011; Masters et al., 2008; Murphy et al., 2013; DNRM, 2016) rather than the relationship between the phosphorus fertiliser applications and phosphorus losses. Because of the direct linkage between extractable soil phosphorus and dissolved phosphorus concentration in the soil solution (Moody, 2011) and run-off (Burkitt et al., 2010), the high extractable phosphorus status of many sugarcane soils (Bloesch et al., 1997) is likely to result in concentrations of dissolved phosphorus in run-off being higher than background concentrations in unfertilised soils. Enhanced extractable soil phosphorus status has also been shown to be associated with dissolved phosphorus enrichment of groundwater in the wet tropics (Rasiah et al., 2011).
Other practices to reduce nutrient losses
Management options and their effectiveness 58

Scientific Consensus Statement 2017—Chapter 4
Enhanced efficiency fertilisers
Plants take up nutrients gradually as they grow, but fertiliser is often applied one or two times early in the crops’ growth. Thus, at the time of application there is more nutrient in the soil than can be taken up by the plant, and the excess nutrient increases the risk of nutrients being lost to the environment. This risk is seen in experiments: dissolved inorganic nitrogen concentrations in run-off water and deep drainage are greatest immediately after nitrogen fertiliser application then decline through time (Stewart et al., 2006; Thorburn et al., 2011b; Webster et al., 2012; Armour et al., 2013a; Armour et al., 2013b; Rohde et al., 2013a; Rohde et al., 2013b; Donaldson et al., 2015). Synchronising the supply of nutrients to better match crop requirements is one potential pathway to increase crop nutrient uptake and reduce nutrient losses (Bell and Moody, 2014; Bell et al., 2016).
Nitrogen can be in the soil in several forms. Nitrate is the most mobile form, hence the most susceptible to being lost from the soil when converted to gasses (through the process of denitrification), leached or in run-off. Nitrogen in fertiliser, while often not in the form of nitrate, generally gets converted to nitrate when applied to the soil. There has been considerable interest within agriculture worldwide to develop fertiliser formulations that delay the formation or release of nitrate in the soil (Verburg et al., 2014). These fertilisers are referred to as enhanced efficiency fertilisers. The aim of applying enhanced efficiency fertilisers is to better align nitrate availability in the soil with crop needs, thereby reducing the chance of nitrogen stress limiting yield and potentially increasing nitrogen use efficiency (crop yield relative to nitrogen fertiliser applied). Also, lower soil nitrate concentrations at times of run-off or leaching will reduce nitrogen losses (Bell et al., 2016). There are two broad modes of action within enhanced efficiency fertilisers (Verburg et al., 2014): delaying (i) the conversion of ammonium to nitrate (nitrification inhibitors), or (ii) the release of nitrogen from fertiliser granules (controlled-release products, such as coated urea).
There has long been interest in the potential of enhanced efficiency fertilisers to increase nitrogen use efficiency in many cropping systems (e.g. Chen et al., 2008), including sugarcane grown in Great Barrier Reef catchments (Wood et al., 2010). The increased cost of enhanced efficiency fertilisers relative to conventional fertiliser has been a barrier to their use by farmers. However, increased use by farmers is resulting in reduced costs (J Armour, pers. comm., March 2017). In sugarcane production, much of the focus has been on reducing losses of nitrogen to the atmosphere through ammonium volatilisation or denitrification (Verburg et al., 2014). More recently, most work has focused on the potential of enhanced efficiency fertilisers to increase sugarcane yields and/or nitrogen use efficiency (the ratio of crop yield to nitrogen fertiliser applied). While some trials showed significant yield benefits of enhanced efficiency fertilisers (Di Bella et al., 2013; Di Bella et al., 2014) others did not (Salter et al., 2013). Similar variability has been found in other studies reported in the non-peer reviewed literature (as reviewed by Verburg et al., 2014; Verburg et al., 2016). The variability in these results is perhaps to be expected. As mentioned above, there are different modes of action among enhanced efficiency fertilisers. As well, enhanced efficiency fertilisers are often blended (in varying proportions) with conventional fertilisers. Thus, there is variability in the release patterns of the fertilisers (enhanced efficiency alone or mixed with conventional) applied in these experiments (Bell et al., 2016). In addition, the processes that slow the production of nitrate with nitrification inhibitors or release of fertiliser from controlled-release products are affected by the soil environment (Verburg et al., 2014; Verburg et al., 2016; Zhao and Verburg, 2015). Given the variability in the soil environment through space (e.g. different soils or regions) and time (through the season) it is likely that the degree of synchronisation between nitrogen release and crop uptake will vary.
Loss of undegraded fertiliser urea has recently been identified as a potentially significant (and previously overlooked) form of dissolved nitrogen lost from Great Barrier Reef cropping lands (Rohde et al., 2013a; Rohde et al., 2013b; Davis et al., 2016). This highlights that understanding applied
Management options and their effectiveness 59

Scientific Consensus Statement 2017—Chapter 4
fertiliser nitrogen transformation dynamics is critical in future research, particularly when dealing with enhanced efficiency fertilisers (where rapid fertiliser urea transformation is typically inhibited).
While many studies have focused on the potential of enhanced efficiency fertilisers to increase sugarcane yields and/or nitrogen use efficiency, few are yet to measure the water quality benefits of enhanced efficiency fertilisers. The variability in yield benefits described above has been seen in a simulation study of yields and nitrogen losses from controlled-release fertiliser applied to sugarcane growing on a brown Dermosol soil at Tully (Verburg et al., 2017). In that study, controlled-release fertiliser reduced average nitrogen losses compared with conventional fertilisers, although there was substantial variability in the magnitude of the reduction in the different years simulated. An important result from this study was that reduced nitrogen losses could occur when yield increases were small or absent. A similar result was found in a short-term pot experiment, where controlled-release fertiliser reduced leaching of nitrogen but did not increase plant biomass or nitrogen uptake (Di Bella et al., 2017). These two studies suggest that enhanced efficiency fertilisers may have a role to play in reducing nitrogen losses from sugarcane cropping systems in Great Barrier Reef catchments. However, a substantial experimental verification will be required before the extent of the benefits is confirmed and the management of enhanced efficiency fertilisers (e.g. matching product to environment) is optimised.
Split applications
Another way of synchronising the supply of nitrogen to match a crop’s requirements can be achieved by applying frequent but small amounts of nitrogen to a field at many times during the growing season. This is commonly practised where nitrogen (and other nutrients) are applied in conjunction with irrigation (called fertigation), although it can also be achieved by ‘splitting’ fertiliser when applied more conventionally. Fertigation is common in irrigated horticultural crops. In Great Barrier Reef catchments, closely matching the amount of nitrogen applied to banana crops through fertigation has been shown to reduce nitrogen losses (Armour et al., 2013a; Armour et al., 2013b; DNRM, 2016). Splitting nitrogen applications to sugarcane in the Tully region was predicted to reduce nitrogen losses, especially in years of above average rainfall (Thorburn et al., 2011c).
Burying nitrogen fertiliser
Fertiliser lying on the soil surface can easily be washed off the field when run-off occurs. This has led to recommendations to bury nitrogen fertiliser to reduce nitrogen losses soon after nitrogen applications. The efficacy of burying fertiliser for reducing nitrogen in run-off over some weeks following fertiliser application has been confirmed in rainfall simulator studies (Cowie et al., 2012; DNRM, 2016).
While the relatively short-term benefits of burying nitrogen fertiliser on run-off losses are clear, what are less clear are the benefits of burying nitrogen fertiliser over the whole crop (as opposed to the first few weeks after fertiliser application). Burying nitrogen fertiliser has given higher losses of nitrogen in run-off over a whole sugarcane crop (Prove et al., 1997; Webster et al., 2012). The whole-crop results potentially came about because nitrogen was lost from the surface-applied nitrogen through volatilisation, which did not happen with the buried nitrogen (Prove et al., 1997), with the result that the net input of nitrogen to the soil was greater with buried nitrogen (Thorburn and Wilkinson, 2013). Thus, it may be necessary to reduce nitrogen fertiliser rates when burying fertiliser to achieve long-term water quality benefits. This analysis illustrates the systems nature of nutrient management in cropping systems and the potential for unexpected outcomes as the dominant nitrogen loss pathway changes because of management interventions.
Management options and their effectiveness 60

Scientific Consensus Statement 2017—Chapter 4
Reducing run-off and/or sediment loss
Run-off water contains both dissolved and particulate nutrients. Thus, practices that reduce run-off and/or sediment loss will reduce losses of nutrients via this pathway. In Great Barrier Reef catchments, management systems that reduce or eliminate tillage, reduce soil compaction (e.g. controlled traffic) and maximise cropping opportunities and soil cover (by crop residue retention) reduce nutrient losses in a wide variety of cropping systems, including grain (Thomas G.A. et al., 1990), cotton (Silburn and Hunter, 2009) and sugarcane (Agnew et al., 2011; Masters et al., 2008; DNRM, 2016). Contour embankments are essential for reducing loss of sediments and associated particulate nutrients from cropping lands in large storms, particularly in rainfed cropping (Murphy et al., 2013). These principles also apply to reducing nutrient losses from fallows in cropping systems (DNRM, 2016).
However, for dissolved nutrients, particularly nitrate, reducing losses through run-off may increase losses through another pathway, that is, leaching or denitrification (Thorburn and Wilkinson, 2013). This situation is exemplified by the discussion above on burying nitrogen fertiliser. Given that nitrate can move from groundwater to streams in the Great Barrier Reef (Rasiah et al., 2013) and denitrification produces the potent greenhouse gas nitrous oxide (Thorburn et al., 2010), simply changing the pathway by which nutrients are lost to the environment rather than reducing the total loss of nutrients is an undesirable outcome.
Irrigation management
Crops grown under irrigation may have greater nutrient losses relative to rainfed crops through several mechanisms. Higher yields of irrigated crops are often associated with larger fertiliser applications, increasing the chance of nutrient losses (Randall et al., 2008). Additionally, application of irrigation water itself can exacerbate nutrient loss processes (Kruse et al., 1990; Randall et al., 2008), especially when applied in large amounts via systems that have low application efficiencies (e.g. furrow irrigation) and hence substantial run-off and/or deep drainage (McHugh et al., 2008; Thorburn et al., 2011b).
Despite the importance of irrigation in the production of horticultural, sugarcane and cotton crops, there are few studies on the effect of irrigation management on nutrient losses in Great Barrier Reef catchments. In sugarcane, dissolved nitrogen losses in run-off from irrigated crops (Thorburn et al., 2011b; Agnew et al., 2011; DNRM, 2016) are generally not substantially different from those found in rainfed crops (Prove et al., 1997; Masters et al., 2008; Webster et al., 2012; Rohde et al., 2013a; Rohde et al., 2013b; DNRM, 2016). Thus, irrigation itself is not necessarily associated with increased nitrogen run-off losses in sugarcane. Even though nitrogen losses from irrigated and rainfed crops are similar, there is scope to reduce nutrient losses through increasing irrigation efficiency, that is, managing irrigation to reduce water losses through run-off or deep drainage. In the Burdekin region, adoption of highly efficient irrigation was predicted to meet regional water quality goals (NQ Dry Tropics, 2016), illustrating the potential water quality benefits coming from irrigation management.
One way to increase irrigation efficiency is to match irrigation applications as closely as possible to crop water requirements. In a simulation study of furrow-irrigated sugarcane in the Burdekin region, reducing total application of irrigation water from approximately 4000 to approximately 2000 mm/yr was predicted to reduce nitrogen losses by run-off or deep drainage by approximately 5–50% (depending on the soil type) without reducing crop yields (Thorburn et al., 2011b). Further reductions in irrigation applications further reduced losses but also reduced yields. Interestingly, in this study nitrogen losses (and yield) were mainly affected by the total amount of irrigation water applied to the crop and not frequency of irrigation or the amount applied per irrigation (although the variations in these were kept within practical limits). It would be valuable to verify these results experimentally.
Management options and their effectiveness 61

Scientific Consensus Statement 2017—Chapter 4
However, there are inherent limitations to the efficiencies that can be achieved in different irrigations systems (Webster et al., 2013). Thus, maximising irrigation efficiency and minimising nutrient losses may require moving from irrigation systems with low efficiency (i.e. furrow irrigation) to those with high efficiency (e.g. drip irrigation or overhead low-pressure irrigation). With high-efficiency irrigation systems, there is the potential to have very little run-off of irrigation water (Stork et al., 2009; Bhattarai and Midmore, 2015), a process that is responsible for transporting most nitrogen from furrow-irrigated fields (Thorburn et al., 2011b; DNRM, 2016). Sub-surface drip irrigation reduced losses of nitrogen and phosphorus by an order of magnitude compared with furrow-irrigated cotton (McHugh et al., 2008), although yields were reduced at very low water applications. In sugarcane, overhead low-pressure irrigation also reduced nitrogen losses compared with furrow irrigation (Attard et al., 2013). Drip irrigation and similar high-efficiency systems (e.g. microjet) are common in horticultural crops (Stork et al., 2009; Armour et al., 2013a; Armour et al., 2013b). They are less common in sugarcane production in Great Barrier Reef catchments; however, there is increasing evidence that sugarcane can be produced successfully under drip irrigation (Attard and O’Donnell, 2013; Thompson et al., 2016c).
On many furrow-irrigated farms, irrigation tail water can be collected in small dams and subsequently used for irrigation (Thorburn et al., 2011b; Cotton Australia, www.cottonaustralia.com.au/cotton-growers/mybmp; Shannon and McShane, 2013), reducing the potential for off-farm losses of nutrients (and other chemicals). It has been estimated that the infrastructure exists to capture irrigation tail water in 30% (Davis et al., 2013) to 70% (Shannon and McShane, 2013) of the farmed area in the Burdekin Haughton Water Supply Scheme (i.e. the southern Burdekin irrigation area). High concentrations of pesticides have been found in creeks draining the southern Burdekin Haughton Water Supply Scheme area (Davis et al., 2013), suggesting a substantial release of tail water from farms in that region. This result could be due to either small dam size relative to the volume of run-off water or water being flushed from the dams during large rainfall events, moving nutrients (and sediments and other chemicals) off farms, reducing the efficiency with which dams keep nutrients on farms. Shannon and McShane (2013) found that the size of on-farm dams (recycling pits) was well matched to the volumes of irrigation tail water produced, suggesting flushing of dams during large rainfall events the more likely cause. However, the frequency with which water is flushed out of dams and into local water courses is not known. Capturing and recycling of all tail water and some rainfall run-off is considered minimum standard practice in irrigated cotton and grains in central Queensland (e.g. Cotton Australia, www.cottonaustralia.com.au/cotton-growers/mybmp) and irrigated sugarcane in the Burdekin region (NQ Dry Tropics, 2016). More information is required on the efficacy of capturing tail water, and the pollutants contained in that water, in irrigated areas in the Lower Burdekin.
Development in fertiliser recommendations
Where fertiliser recommendations influence farmer behaviour, they directly affect the nutrient application to, and hence potentially losses of nutrients from, cropped lands (Figure 5). In general, fertiliser recommendations aim to estimate nutrient needs of a crop compared with the likely supply of the nutrient from the soil, with the difference being made up by the application of fertiliser. The nutrient needs are the product of the crop’s yield potential or the farmer’s yield goal (in t/ha) and the amount of nutrient required to achieve that yield (kg nutrient/t of yield). Supply of the nutrient from the soil can account for soil nutrient stores and, in the case of nutrients that cycle through soil organic matter (particularly nitrogen), mineralisation (the release of nutrients from decomposing organic matter). Given the threat to the Great Barrier Reef posed by nitrogen exports, together with the large amount of nitrogen fertiliser applied to sugarcane across the Great Barrier Reef catchments, the focus on fertiliser recommendations over the past five years has been on nitrogen recommendations in sugarcane (Bell, 2014).
Management options and their effectiveness 62

Scientific Consensus Statement 2017—Chapter 4
The current recommendation system supported by the sugarcane industry, known as ‘Six Easy Steps’, reflects this general form described above: (i) The target yield is the ‘district yield potential’, which is defined as 120% of the ‘estimated highest average annual district yield’; (ii) The nitrogen requirement of sugarcane is 1.4 kg/t, for yields up to 100 t/ha, plus 1 kg/t for yields over 100 t/ha; (iii) A range of factors account for supply of nitrogen from mineralisation of a range of organic sources (soil organic matter, crop residues, etc.). The district yield potential is seldom achieved (Schroeder et al., 2010), and there have been calls to revise the yield goal to something more closely aligned to yields farmers typically achieve, that is, the block (or productivity zone) yield potential (Bell and Moody, 2014; Bramley et al., 2017). This suggestion reflects the spatial (i.e. block to block) variability of the productive capacity of fields. While aligning production goals to block or productivity zone yield potential is an attractive concept, determining production goals at finer scales may be difficult. Year-to-year sugarcane yield variability can be greater at fine scales (e.g. a block) than large scales (Schroeder et al., 2010) making identification of yield potential uncertain.
Regardless of the scale being considered, a problem with selecting a yield target for sugarcane is the high variability between years. One reason for the variability is the substantial seasonal climate variability experienced in sugarcane-producing regions (Everingham Y.L. et al., 2007). Developing ways to account for yield variation may better match nitrogen applications to crop productive potential and hence reduce nitrogen surpluses. For example, seasonal climate forecasting may allow the impacts of climate variability on crop nitrogen responses to be better factored into fertiliser rate decisions (Skocaj et al., 2013; Thorburn et al., 2011c).
While there has been debate over the yield goal aspect of the Six Easy Steps system, the other aspects have received less attention. However, the arguments for yield potential being spatially and temporally variable will apply to the sugarcane nitrogen requirement (Thorburn et al., 2014) and soil nitrogen mineralisation (Meier et al., 2003). The temporal variability is caused by both year-to-year changes in management and climate. Ignoring the variability in these aspects of Six Easy Steps could lead to unintended outcomes, such as reduced production where yield goals are reduced in situations where the sugarcane nitrogen requirement is higher than that assumed in Six Easy Steps. Further, the current values of the sugarcane nitrogen requirement in the Six Easy Steps system come from simulations of sugarcane in a single region (the Herbert district) using an early version (1.6, c.f. the current release 7.8) of the APSIM-Sugarcane model (Keating et al., 1997). There have been substantial changes to the science of the model over the versions (Holzworth et al., 2014). Thus, there is a clear case to revisit the sugarcane nitrogen requirement in Six Easy Steps, aiming to develop more site-specific values using contemporary versions of the model (Thorburn et al., 2014).
Although there are clear opportunities for better developing the Six Easy Steps system, the temporal and spatial complexity of soil, climatic and management factors (Figure 3) that drive both variability in sugarcane nitrogen requirements and the variable behaviour of enhanced efficiency fertilisers are unlikely to be well captured by traditional (static) nitrogen recommendation systems. Decision support systems based on cropping systems models will need to be harnessed to fully optimise nitrogen fertiliser management decisions (Thorburn et al., 2014). The use of model-based decision support systems to optimise nitrogen fertiliser management decisions is reasonably common in other cropping systems in Australia and overseas.
Prospects for reducing nutrient exports from cropped lands
Previous studies have predicted that universal adoption of best management practices would not meet Great Barrier Reef water quality improvement targets for dissolved inorganic nitrogen (Thorburn and Wilkinson, 2013; Waters et al., 2014). Thus, meeting receiving water nitrogen targets may require the adoption of practices that farmers may not be motivated to adopt under other circumstances, unless adoption of some other technological intervention (e.g. enhanced efficiency fertiliser, climate forecasting) provides sufficient water quality benefits.
Management options and their effectiveness 63

Scientific Consensus Statement 2017—Chapter 4
This situation is not unique to the Great Barrier Reef catchments. In other countries, it is only where external forces have impacted on agriculture that significant reductions in agricultural pollution to coastal ecosystems have been achieved (Kroon et al., 2014). These forces have included legislation and regulation (e.g. China, Denmark) and broader socio-economic drivers (e.g. decline of agriculture in Eastern Europe). These experiences indicate that targeted regulatory policy approaches can greatly enhance the protection of downstream aquatic ecosystems from land-based pollution (Kroon et al., 2016).
Further research
While we have some knowledge on how to reduce nutrient exports from cropped lands in Great Barrier Reef catchments, there are still knowledge gaps about the effectiveness of some management practices. Further research on the following topics is necessary to have a better understanding of the extent to which we can reduce nutrient exports from cropped lands.
1. It is important to directly assess the water quality benefits of adopting enhanced efficiency fertiliser. The optimum management of these fertilisers under contrasting soil and climatic conditions also needs to be determined.
2. The potential for novel interventions (e.g. incorporating climate forecasting into nutrient management decisions) to help farmers reduce nitrogen applications to, and hence nitrogen losses from, crops needs to be assessed.
3. Work to make nutrient recommendations more site specific should be broadened to include the site-specific nature of the nitrogen requirement of sugarcane and nitrogen supply from organic sources. There is a clear case to revisit the sugarcane nitrogen requirement using contemporary versions of the APSIM model. Optimising management of enhanced efficiency fertilisers should be included in this work.
4. Decision support systems based on cropping systems models will underpin more site-specific nitrogen fertiliser management decisions, including management of enhanced efficiency fertilisers that are unlikely to be captured in traditional (static) nitrogen recommendation systems.
5. The potential for improved irrigation management and water use efficiency to reduce losses of nutrients from fields needs to be further empirically verified. This work should consider losses through deep drainage as well as run-off. More information is required on the efficacy of tail water, and the pollutants contained in that water, in irrigated areas in the Lower Burdekin.
6. The efficacy of various practices for managing nitrogen losses through deep drainage (e.g. irrigation scheduling, timing of fertiliser applications) needs to be better defined and tested.
7. More information is still needed on the contribution of organic sources of nutrients (e.g. nitrogen from legumes, nitrogen and phosphorus from mill mud) to nutrient losses (both dissolved and particulate). If the contribution is significant, methods to manage those losses (e.g. better managing supplementary fertiliser in these situations) need to be developed.
8. More information is still needed about the magnitude and, possibly, management of nutrient losses from grains production areas.
9. There is little information on nutrient losses from, or nutrient management in, fertilised grazing lands.
10. The relationship between phosphorus surpluses, soil phosphorus concentrations and phosphorus lost to the environment in both particulate and dissolved forms needs to be determined.
Pesticides Pesticides include insecticides, herbicides and fungicides (and other compounds). Under the Reef Water Quality Protection Plan (Australian and Queensland governments, 2013a), the priority has been on managing selected PSII herbicides, that is, ametryn, atrazine, diuron, hexazinone and
Management options and their effectiveness 64

Scientific Consensus Statement 2017—Chapter 4
tebuthiuron. Other pesticides (PSII and other modes of action) which are possible alternatives to the priority PSII herbicides, either knockdowns or soil residuals, are increasingly of concern. More of them are being detected in monitoring programs (Chapter 2), and their relative and additive toxicity are still uncertain in many cases (Davis et al., 2014), although progress is being made (Smith et al., 2016a; Smith et al., 2016b). Some insecticides are also being detected in stream loads (e.g. imidacloprid; Wallace et al., 2016) and may require stewardship and effective management practices.
Pesticides have a wide range of chemical properties that affect their behaviour and fate in the environment. These properties affect their persistence in various compartments (soil, water bodies, etc.), their propensity to be washed off plants and crop residues and lost via leaching and run-off, and their transport in either sediment (as an adsorbed phase) or water (dissolved phase). While management practices typically focus on reducing pesticide loads in run-off (leading to exposure, or export from fields) there is a need to manage overall detrimental impacts by considering toxicity as well as exposure. Pesticides typically decay after application, and their rate of dissipation has a strong effect on their temporal risk profile, compared with other non-degrading pollutants (e.g. heavy metals).
Since the previous Scientific Consensus Statement (Brodie et al., 2013) there has been major progress in understanding the fate and behaviour of pesticides in the Great Barrier Reef (Devlin et al., 2015; Lewis et al., 2016). There have been advances in understanding, for both the priority PSII and alternative herbicides, of pesticide properties (e.g. soil and water half-lives and partitioning); modelling of pesticides; farm-scale run-off from different industries, including direct comparisons estimating run-off losses and toxic loads; the combined toxicity of mixtures; and farm economics of implementing herbicide best management practices. A major advance has been in the understanding of effects of the choice of product, through direct comparisons of a range of widely used herbicides in their relative run-off potential, their dissipation in soil and of their toxicology (Lewis et al., 2013; Smith et al., 2016a; Smith et al., 2016b). These studies have generally reinforced the previous principles of management of pesticides (Thorburn et al., 2013a; Thorburn et al., 2013b; Table 1) and their applicability to a broader range of products.
General principles
Management practices that have been shown to be effective in reducing run-off losses of pesticides in Great Barrier Reef catchments include (Thorburn et al., 2013a; Thorburn et al., 2013b; Devlin et al., 2015; Lewis et al., 2016):
1. reducing the amount of pesticide applied, through precision application practices such as banded/shielded spray applications and spot spray technology (e.g. WeedSeeker®)
2. timing pesticide applications to avoid risk of run-off from rainfall or irrigation within several weeks of the application
3. choosing products with shorter persistence, greater efficacy (lower application rates), lower mobility and lower toxicity
4. reducing run-off and soil erosion through retaining cover, controlled traffic, increased crop frequency and irrigation water management.
The success of most of these principles has been widely demonstrated (Table 4). For example, losses of residual herbicides have been reduced by 90% by using banded spraying on irrigated sugarcane paddocks (Davis and Pradolin, 2016; Oliver et al., 2014; Silburn et al., 2013b) and by at least 50–60% in rainfed systems (Devlin et al., 2015; Davis and Pradolin, 2016; Masters et al., 2013; Nachimuthu et al., 2016).
Given the direct relationship between the amount of pesticide on an area and the run-off losses from that area (discussed below), reducing applications of pesticides to fields will also reduce losses
Management options and their effectiveness 65

Scientific Consensus Statement 2017—Chapter 4
(Rohde et al., 2013a; Rohde et al., 2013b; Masters et al., 2013; Silburn et al., 2013b; Davis, 2013; DNRM, 2016). Pesticide applications can be reduced through practices such as band spraying of residual herbicides, employing shielded sprayers, substituting less toxic knockdown herbicides for residual products and adopting integrated weed management, which aims to strategically manage the weed seed bank rather than rely on prophylactic or precautionary spraying.
Mechanisms of off-field transport
Pesticides exist in two forms in soils, either in the soil solution or sorbed onto the soil particles. Thus, they can be transported in both run-off (dissolved pesticides) and with sediment (sorbed pesticides). The relative proportions in the dissolved and sorbed phases (i.e. partitioning) is an important parameter for understanding how to reduce pesticide exports from fields. In addition, most pesticides break down with time following application. The time taken to break down (commonly characterised by the half-life of a pesticide) is another important parameter governing pesticide mobility.
Recent research has shown that most herbicides in current use are generally transported, both off-field and in-stream, in greater proportions in the dissolved phase than in the particulate phase (i.e. with sediments) (Davis et al., 2012; Packett, 2014). For example, for PSII and some other residual herbicides (e.g. diuron, simazine) more than 70% were found to be transported in the dissolved phase. In rainfall simulator experiments, herbicides were mainly (>90%) transported in the dissolved phase, except for AMPA, diuron, glyphosate, imazapic and pendimethalin, which were transported partially in sediment (Packett, 2014; Melland et al., 2016). Even so, 60–80% of glyphosate applied to bare soil was transported in the water phase under simulated rainfall conditions (Melland et al., 2016) and the loads (as a percentage of applied active ingredient) in irrigation tail water were in a range similar to herbicides that are generally considered more mobile (atrazine, metribuzin, 2,4-D) (Davis and Pradolin, 2016). The higher transport in the dissolved phase of some of these pesticides means that controlling run-off (as opposed to sediment loss) will be more important in controlling pesticides than previously thought. It also means that greater qualities of pesticides will potentially be leached below the root zone than previously thought, although the concentrations of pesticides in deep drainage (Rohde et al., 2013a) and groundwater (Shaw et al., 2012; Masters et al., 2014) are generally much lower than in run-off.
Other pesticides, including some insecticides and fungicides, may have greater affinity for binding to sediments but most have not been studied in the Great Barrier Reef. For example, paraquat is so tightly sorbed that it has not been found in run-off water even when sampled directly at the edge of field soon after application (Davis et al., 2013; Davis and Pradolin, 2016).
Integrated weed management
A critical step in reducing the amount of pesticide applied is effective strategic weed control over the longer term. This approach is termed ‘integrated weed management’ and it requires planned and timely management of many operations over many crop cycles to reduce the weed seed burden over time. Fundamental principles of integrated weed management include suppression of weeds through high levels of crop residues and crop competition and diligent weed control during fallow phases to avoid regeneration of the weed seed bank. Case studies have illustrated the effectiveness of integrated weed management in sugarcane crops. In the Burdekin region (Davis, 2013), a farmer was able to change entirely to shorter lived knockdown herbicides in ratoon stages of the crop cycle and thus reduce the risk of herbicide loss from the field. In the Wet Tropics (Armour et al., 2013a; Armour et al., 2013b) a farmer was able to use shorter lived herbicides or low application rates of regulated herbicides. This change was particularly important during November–March, when heavy and prolonged rain was likely and the risk of herbicide movement from the field was high. Nachimuthu et al. (2016) found that using knockdown herbicides and an inter-row soybean mulch instead of residual herbicides, resulted in adequate weed control in the plant cane crop and a
Management options and their effectiveness 66

Scientific Consensus Statement 2017—Chapter 4
complete absence of residual herbicides detected in run-off. The same strategy in the first ratoon crop resulted in poor weed control; additional herbicide applications were necessary at a later stage of the crop. The authors considered that the trash layer in the ratoon crop was not thick enough for long enough to provide weed control, but it did cause interactions between the herbicide and the trash that had negative effects on weed control.
Green-cane trash blanketing in sugarcane is widely considered an efficient practice to manage weeds in sugarcane production. However, little information exists on the optimal thickness of a green-cane trash blanket for weed control or the optimal timing of the herbicide applications in this situation. Fillols (2012) showed that, in comparison to bare soil, trash at all levels reduced weed coverage and contributed to additional yield and profitability. In particular, increasing the level of trash led to improved management of broadleaf weeds and grasses, and strategies involving early pre-emergent herbicides were more efficient.
Reducing overall usage and use of precision application
There is a logical relationship between the amount of pesticide on a field at the time of a run-off event and the amount transported in run-off (Leonard et al., 1979; Silburn and Kennedy, 2007; Thorburn et al., 2013a; Melland et al., 2016). Therefore, management practices that reduce the amount of product applied—by applying at a lower rate, banded or precision application (e.g. spotspray/WeedSeeker®)—have repeatedly been demonstrated in catchment, irrigation and rainfall simulation studies to provide a nearly proportional reduction in run-off losses (Table 4, Figure 7). For example, field experiments in Great Barrier Reef catchments using banded spraying have shown 90% reductions in losses of residual herbicides on irrigated sugarcane paddocks (Davis and Pradolin, 2016; Oliver et al., 2014) and at least 50–60% reductions in rainfed systems (Devlin et al., 2015; Masters et al., 2013; Nachimuthu et al., 2016).
Figure7. Schematic of herbicide run-off concentration related to increasing rates of coverage on paddocks (yellow cells represent areas where herbicide was applied) (Melland et al., 2016).
Timing of application
It has long been known that loads and concentrations of pesticides in run-off are greatest soon after application and decline with time (Wauchope, 1978; Leonard et al., 1979). This behaviour is characteristic of constituents that are decaying at the site of application (e.g. soil, crop residues). If no run-off occurs within the first three weeks after application, large losses are typically avoided.
Management options and their effectiveness 67

Scientific Consensus Statement 2017—Chapter 4
Field studies in Great Barrier Reef catchments have consistently supported this result, in sugarcane, grain cropping and for woody weed control in grazing (Table 4). For example, herbicide run-off loads from sugarcane fields were up to 90% lower when diuron was applied earlier (September) compared to later application (December), even though the early application was at twice the rate (Figure 8). The decline in run-off losses with time after application was revealed yet again in the field experiments in sugarcane at Bundaberg (Nachimuthu et al., 2016). They also revealed interactions with soil and trash management practices and trade-offs between improved water quality and productivity. The response of pesticide run-off to sugarcane trash cover and other forms of crop residue covers has been mixed (Thorburn et al., 2013b), with some studies reporting reduced pesticide run-off with surface cover (e.g. Cowie et al., 2012; Silburn et al., 2002) and others reporting an increase (e.g. Shipitalo et al., 2008; Masters et al., 2013). Interception of pesticides on the crop residues can cause increased run-off losses at shorter times after application, particularly if no small falls of rain occur to wash the pesticide into the soil and the soil has low infiltration capacity (e.g. the soil is moist).
Figure 8. Diuron concentrations in run-off events occurring at different times after application. Data from two sites have been combined to give a wide range in times until run-off occurred (Armour et al., 2013b).
Choice of product
Choice of product is a complicated area of herbicide management because to achieve improved water quality, the alternative product needs to be equally or more effective in weed control, be no more prone to run-off losses and/or be no more toxic than the current product (Davis et al., 2014). All the above requirements are currently subject to uncertainties. Major progress has been made in understanding the relative run-off risk and relative toxicity of older and emerging herbicides, but these are still works in progress (Lewis et al., 2013; Devlin et al., 2015; Smith et al., 2016a; Smith et al., 2016b). Most of the older, soil residual (e.g. PSII and other) herbicides have somewhat similar physicochemical properties and application rates and similar high susceptibility to loss in run-off (e.g. Cowie et al., 2012; Melland et al., 2016; Silburn et al., 2013b; Silburn et al., 2013c). The products that are less prone to losses through run-off include those applied at lower rates (e.g. imazapic, isoxaflutole and fluroxypyr), those with greater soil sorption (e.g. paraquat, pendimethalin) and those with shorter half-lives (e.g. glyphosate and 2,4-D), as illustrated by modelling using generic properties (Shaw et al., 2011). Experience in grain and oilseed cropping in the United States has also found that replacing soil residual herbicides with knockdown herbicides (e.g. in glyphosate-resistant crops) resulted in less herbicide run-off and less toxic loads, in both monitoring (Shipitalo et al., 2008) and modelling (Wauchope et al., 2002a).
Management options and their effectiveness 68

Scientific Consensus Statement 2017—Chapter 4
A series of rainfall simulation trials (Cowie et al., 2012; Lewis et al., 2013; Melland et al., 2016; Silburn et al., 2013b; Silburn et al., 2013c) on a variety of herbicides (older residuals, alternative residuals and knockdowns) at two days after application (before half-life differences emerge) showed that run-off loads of the older and alternative residual herbicides and 2,4-D were reasonably similar and high. Herbicides applied at much lower rates (e.g. fluroxypyr, imazapic, isoxaflutole) had lower run-off loads. Glyphosate run-off loads were generally lower, and for pendimethalin were considerably lower, than for residuals applied at similar rates. Results varied depending on site conditions (e.g. soil type and cover) and hydrology. This is still a work in progress. An overarching framework for explaining the differences quantitatively is yet to be found, particularly for soils or field conditions with contrasting hydrology.
The results also demonstrated that glyphosate sprayed on the soil is still reasonably prone to run-off even though its soil sorption is greater than many soil residual herbicides (Devlin et al., 2015). Melland et al. (2016) found sediment–water partition coefficients of glyphosate in run-off were lower than the Footprint soil sorption value and percentages in the dissolved phase in run-off were 60% and 82%, on sandy clay loam and medium clay, respectively. While sorption may increase somewhat with time after application (Silburn and Kennedy, 2007; Wauchope et al., 2002b), sorption does not appear large enough to prevent glyphosate transport in run-off in the water phase, whereas sorption was more effective in limiting run-off loads for pendimethalin. Glyphosate has been a cornerstone of industry transitions towards minimum tillage agriculture and lower dependence on residual PSII herbicides. However, it is being detected frequently at catchment scales since its recent addition to Great Barrier Reef monitoring programs (Wallace et al., 2016), and greater knowledge of its environmental behaviour is needed. Weed resistance to glyphosate (and to other herbicides) is also driving large changes in weed control practices and will continue to do so in future.
Lewis et al. (2013) have attempted to develop a risk assessment framework based on (i) run-off loads of herbicides under simulated rainfall (Silburn et al., 2013b; Silburn et al., 2013c; Melland et al., 2016), (ii) herbicide dissipation rates in soil (Shaw et al., 2013) and (iii) the relative toxicity of herbicides to aquatic plants (Poggio et al., 2014; Smith et al., 2016a; Smith et al., 2016b). When toxicity and run-off potential are combined, most herbicides had less risk than diuron, although ametryn had a higher risk. The reduced risks relative to diuron are reinforced if rainfall occurred 30 days after application rather than at two days. While this analysis is preliminary and requires completion of current studies on toxicity and further direct comparisons of run-off potential and half-lives for more products, it does illustrate a way forward in providing useful advice on product choice.
Managing run-off and sediment loss
Given that pesticides are transported in run-off (in their dissolved phase) or attached to sediments (their sorbed phase), reducing run-off and sediment losses can contribute to managing pesticide exports from fields. Practices that reduce run-off and sediment movement, such as retention of crop residues and controlled traffic, are well established (Freebairn et al., 1996) and their effectiveness in reducing pesticide losses have been confirmed in many studies in the Great Barrier Reef (Cowie et al., 2012; Cowie et al., 2013; Masters et al., 2013; Rohde et al., 2013a; Rohde et al., 2013b; Silburn et al., 2002; Silburn et al., 2013a).
On irrigated farms, tail water capture and recycling provide useful control of paddock run-off during dry times (Davis, 2013; DeBose et al., 2014). Tail water recycling is widely practised on irrigated cotton farms (Connolly et al., 1999; Connolly et al., 2001) and on a significant proportion of sugarcane farms in the Burdekin River irrigation area (Shannon and McShane, 2013).
Management options and their effectiveness 69

Scientific Consensus Statement 2017—Chapter 4
Table 4. Management practice for pesticides, relative effectiveness and supporting studies (studies since previous consensus statement in bold).
Management practice Effectiveness Example results References (and any negative outcomes)
Integrated weed management (effective early control in fallows and early crop stages)
Large reduction in overall application of residual herbicides throughout crop cycle
Sugarcane trash can be effective in suppressing weeds.
Good weed control (including use of residual herbicides) in fallow and plant sugarcane resulted in use of knockdowns only in ratoon crops, in Wet Tropics and Burdekin.
Armour et al. (2013a, 2013b), Davis (2013)
Fillols (2012)
Pesticide choice (application rate, half-life, sorption, relative run-off, toxicity)
Strong in principle, indicative only for relative run-off
‘Old’ residual PSII herbicides typically have higher application rates and high and somewhat similar run-off losses. Glyphosate and 2,4-D run-off losses can be equal to or less than those of PSII herbicides.
Cowie et al. (2012), Lewis et al. (2013), Melland et al. (2016), Shaw et al. (2011), Shipitalo et al. (2008), Silburn et al. (2013c), Wauchope at al. (2002a)
Reduce usage (amount, banding, precision/spot spray)
Strong evidence, linear 1:1 reduction in run-off loads with reduced usage under rainfall, 90% reduction in run-off loads for banding on the bed in furrow irrigation
Banded application of diuron reduced run-off loads by 50% from run-off plots in sugarcane at Mackay; peak event mean concentration was reduced by a factor of five (Donaldson et al., 2015).
Amount: Leonard et al. (1979), Silburn and Kennedy (2007)
Banding: Donaldson et al. (2015), Davis and Pradolin (2016), Masters et al. (2013), Nachimuthu et al. (2016), Oliver and Kookana (2006), Oliver et al. (2014), Rohde et al. (2013b), Silburn et al. (2013a)
Spot spray: Silburn et al. (2013b), Melland et al. (2016)
Timing (application at least three weeks before first large run-off event)
Strong evidence, potentially order of magnitude reduction. However, application in practice is limited by the need to forecast rainfall.
Run-off loads of 5–10% of applied pesticides occur when rainfall or irrigation occur within two–five days after application, accounting for 80% of annual load.
Tebuthiuron requires a longer delay due to its longer half-life (in the order of 100 days).
Rattray et al. (2007), Armour et al. (2013a, 2013b), Davis (2013), Davis et al. (2013), Rohde et al. (2013a, 2013b), Masters et al. (2013), Murphy et al. (2013), Nachimuthu et al. (2013, 2016)
Thornton and Elledge (2016)
Soil management practices that reduce run-off and sediment movement (retention of crop residues, controlled traffic, etc.)
Retaining cover and controlled traffic are synergistic. Managing sediment is more effective for pesticides with greater sorption.
On average, 15% reduction in run-off with wide-row spacing (controlled traffic) in sugarcane at Mackay Whitsunday (Rohde et al., 2013a; Rohde et al., 2013b).
Cowie et al. (2012), Cowie et al. (2013), Masters et al. (2013), Nachimuthu et al. (2016*), Rohde et al. (2013a, 2013b), Silburn et al. (2002, 2013a)
* greater run-off from trash than bare
Water/irrigation management Tail water recycling provides useful control of paddock run-off during dry times.
Tail water capture is widely practised on irrigated cotton farms.
Sub-surface irrigation generates less run-off and lower contaminant loads than furrow irrigation.
Connolly et al. (1999, 2001), Davis (2013), DeBose et al. (2014)
McHugh et al. (2008)
Management options and their effectiveness 70

Scientific Consensus Statement 2017—Chapter 4
Areas for targeted management
Pesticide concentrations decrease substantially, that is, by an order of magnitude (Davis et al., 2013), between fields and nearby receiving water bodies, potentially due to considerable dilution that takes place over relatively short distances. This result suggests that it might be important to target management action to fields closer to receiving water bodies. It is clear that management action should target times of the year when potential for dilution is low. Pesticide risk modelling suggests concentrations generated by irrigation in the dry season, when dilution from rainfall run-off is absent, posed considerable ecological risk to aquatic ecosystems (Davis et al., 2013).
There is potential for breakdown and/or losses of pesticides in streams, rivers and wetlands, although there is little information on these degradation processes for the Great Barrier Reef. However, pesticides are often considered more persistent in water than in soil (e.g. average atrazine half-life in water is 100 days c.f. 30 days in soils). In the areas with greatest generation rates of herbicides, that is, the Wet Tropics and Mackay Whitsunday regions, transit times in streams and rivers may be short, so that the pesticide load delivered to the Great Barrier Reef may be similar to that entering the stream. At the scale of community drainage schemes in the Wet Tropics, where inflows are large and transit times are low, Brodie et al. (2014) considered that minimal trapping of soluble, poorly sorbed herbicides is likely. Thus, it is not clear to what extent there should be a spatial prioritisation for pesticide management. Further study of herbicide breakdown during in-stream transport is needed to determine the potential for prioritising management spatially.
A study comparing pesticide risk indicators with measured pesticide data from fruit tree crops determined that simple risk indicators (e.g. the Pesticide Impact Rating Index or Environmental Potential Risk Indicator for Pesticides systems) can be good predictors or a first-tier risk assessment of pesticide transport to neighbouring water bodies (Oliver et al., 2016). Such tools may be useful for spatially targeting management to areas of higher usage of more persistent or more toxic pesticides.
Further research
• A range of herbicides are possible alternatives to the current priority PSII herbicides, either knockdowns or soil residuals. These newer products are increasingly being detected, yet their relative and additive toxicity are still uncertain in many cases. Some insecticides (e.g. imidacloprid) and the herbicide glyphosate are also being detected in stream loads at a significant frequency. More information is needed on these products.
• The risk posed by pesticides is a combination of their toxicity, propensity to move off fields and the speed at which they break down after application. Attempts have been made to develop risk assessment frameworks based on these factors. However, further direct comparisons of run-off potential and half-lives for more products are required to provide a more complete assessment of risk and provide advice on product choice.
• Export of herbicides from fields is affected by site conditions (e.g. soil type and cover) and hydrology. More understanding on these factors will allow development of an overarching quantitative framework explaining the differences in exports under different field conditions.
• Further study of herbicide breakdown during in-stream transport is required.
Conclusion Since the last Scientific Consensus Statement, new information has been gained on the water quality outcomes of agricultural management practices on farms. This research has reinforced previous conclusions about the efficacy of many established practices for managing pollutant discharges from agricultural lands (Table 5), and thus increased confidence in the Water Quality Risk Frameworks used in the monitoring and evaluation of Reef Water Quality Protection Plan investments into practice change that reflect these previous conclusions (Australian and Queensland governments, 2013a).
Management options and their effectiveness 71

Scientific Consensus Statement 2017—Chapter 4
As well, new insights have come from recent research (Table 5). In some cases, there are early indications of practices that, with further development and testing, could help manage pollutant exports from agricultural lands. The importance of sediments from gully and streambank sources is clearer and requires greater focus on managing sediment from these sources. Enhanced efficiency fertilisers can increase nitrogen use efficiency in sugarcane, although further work is required to establish the extent to which their use reduces nitrogen exports. Climate forecasting may too have a role to play in reducing nitrogen exports. However, the challenge in making nitrogen recommendations more site specific is likely to require the development of decision support systems based on comprehensive cropping systems models that can integrate the temporal and spatial complexity of soil, climatic and management factors that drive both variability in sugarcane nitrogen requirements and the variable behaviour of enhanced efficiency fertilisers.
Management options and their effectiveness 72

Scientific Consensus Statement 2017—Chapter 4
Table 5. Overview of established knowledge about the management of pollutant exports from agricultural lands, and insights from recent research.
Pollutant Established practices New insights
Sediments Grazing lands
• Maintain adequate ground cover and forage biomass at the end of the dry season to enhance soil condition and infiltration and reduce sediment loss from hillslopes and gullies.
• Set appropriate stocking rates for ground cover goals. • Exclude stock from riparian and frontage country and from rilled,
scalded and gullied areas to maintain and increase ground cover in these areas.
• Locate and construct linear features (roads, tracks, fences, firebreaks, and water points) to minimise their risk of initiating erosion.
• Target hotspots of sediment loss.
Grazing lands
• We have increased confidence that reduced stocking rates will improve ground cover and water quality from hillslopes.
• We have increased confidence that cover provided by invasive grass species is less effective in helping productivity and soil infiltration capacity than are perennials.
• The importance of sediments from gully and streambank sources is clearer. And sediments from these sources can contain high concentrations of bioavailable nutrients.
• We have increased confidence that maintaining land condition on hillslopes above gullies helps reduce gully erosion.
• Effective remediation of gullies requires substantial actions such as excluding stock and engineering (e.g. check dams) or bioengineering (slope battering, seed, mulch, gypsum and fertiliser) approaches.
• Effectiveness of managing streambank erosion has still not been demonstrated in GBR catchments.
Cropping lands
• Reduce or eliminate tillage and maximise soil cover (via crop residue retention and grassed inter-rows).
• Adopt controlled traffic, opportunity cropping and contour embankments.
• Increase irrigation application efficiency to minimise run-off from the farm.
Cropping lands
No change in our understanding
Management options and their effectiveness 73

Scientific Consensus Statement 2017—Chapter 4
Pollutant Established practices New insights
Nutrients • Reduce erosion to reduce particulate nutrient losses. • Minimise the nutrient surpluses, that is, the difference between
inputs and crop off-take, especially for nitrogen. • Practices such as splitting, timing of fertiliser applications to avoid
irrigation or the chance of rainfall, and burying fertiliser also help manage the risk.
• Target hotspots where nutrient surpluses are high (and hence nutrient use efficiency is low).
• We have increased confidence that lower nutrient (nitrogen) application rates (to industry best management practice rates) reduces nutrient losses from fields, without reducing yield.
• Enhanced efficiency fertilisers can increase nitrogen use efficiency in sugarcane, which should reduce nitrogen losses if nitrogen application rates are reduced. However, there are only early indications that these fertilisers reduce nitrogen exports.
• There are early indications that seasonal climate forecasting can play a role in optimising nitrogen fertiliser applications to sugarcane.
• The cane nitrogen requirement in the Six Easy Steps framework is likely to be spatially and temporally variable. Development of site-specific nitrogen recommendations needs to account for the variability.
Pesticides • Reduce the amount applied through, for example, banded spraying and adopting integrated pest and/or weed management.
• Minimise run-off and sediment loss from the farm. • Maximise the time between application and likely run-off events. • Choose products with rapid degradation rates (e.g. some knockdown
herbicides).
• We have increased confidence that reduced pesticide applications (e.g. through banded spraying) reduces pesticide losses from fields.
• We have increased confidence that avoiding run-off for three weeks after application substantially reduces pesticide losses.
• Practices for managing losses also apply to the newly released chemicals. • Transport of most pesticides in current use is more dominantly in the
dissolved phase than previously thought, placing greater emphasis on management of run-off. More pesticides will be lost in deep drainage than previously thought, although the amount is very small.
• Integrated weed management has been demonstrated in sugarcane to aid use of shorter lived herbicides and/or low application rates.
• Frameworks are starting to be developed to aid choice of product, through balancing toxicity and run-off potential to reduce risk.
Irrigation • Increasing irrigation efficiency (i.e. reducing over-application of irrigation) reduces nutrient and pesticide losses.
• Delaying irrigation after nitrogen or pesticide applications reduces losses.
• There are clearer indications (through modelling) that highly efficient irrigation systems reduce nutrient losses.
• We have increased confidence that avoiding irrigation after nitrogen or pesticide applications substantially reduces losses.
Management options and their effectiveness 74

Scientific Consensus Statement 2017—Chapter 4
Economic dimensions of agricultural practice change An understanding of economic issues is essential for identifying the costs of protection of the Great Barrier Reef where improvements in protection and in the mechanisms that are used can be made. In this section of the chapter, six key aspects of economic analysis are considered:
• the economic benefits provided by the Great Barrier Reef and how and where these might be at risk (refer section 3)
• the costs of improving water quality at the farm level • economic barriers to practice change • combining all actions by cost effectiveness into a supply function • selection of mechanisms to achieve change • prioritisation of actions and projects to achieve pollutant reductions.
The following terms are used in this section and are defined here for clarification:
• non-use values: values that people hold for protecting the reef; they can include aspects such as wanting their children to visit the reef and having it exist in good condition
• economic surplus measures: technical measures to estimate the benefits associated with commercial, recreation, amenity and non-use benefits
• opportunity cost: the net cost or the amount that has to be given up for another option • marginal abatement cost curves: the extra cost per unit of pollutant reduction achieved ordered
from lowest to highest.
The costs of improving water quality at the farm level The most visible economic analyses have been estimates of the costs of change, including the Alluvium (2016) report that $8.2 billion would be required to meet the water quality improvement targets for the Great Barrier Reef. These estimates were built on studies assessing, at the farm level, the economic trade-offs of changing management practices to reduce pollutant generation and export to the reef. In agriculture, improved management practices will typically involve private costs to make the changes. Some management changes, such as reducing overgrazing or lowering excessive fertiliser applications, generate win–win outcomes for both landholders and the environment (MacLeod and McIvor, 2006; Rolfe and Gregg, 2015). In these cases, financial performance is improved by increasing production, lowering costs or both. In many cases, though, landholders require some capital investment (e.g. fences, machinery) to be able to achieve these management changes and subsequent benefits. In other cases, where landholders are already close to optimum production, reductions in pollutants can only be achieved by reducing production, moving to different production systems or specific mitigation strategies, all of which come at some cost to landholders. In some marginal lands where profitability is low and emissions are high, lower cost solutions may be to change land uses or remove land from agriculture completely.
Many private costs of practice change in agriculture are unknown or not easily seen, even to farmers, in part because of the complexity and variability of farming systems and interactions with environmental factors (e.g. some farmers will over-fertilise in case a wet season occurs and they cannot access the paddock again). Economic analysis and economic modelling are required to estimate the impacts of management changes on farm production, profits and costs. The costs of improving water quality through changed agricultural management practices vary substantially across producers, agricultural sectors, and catchments (Rolfe et al., 2011; Rolfe and Windle, 2011b; van Grieken et al., 2014a; Star et al., 2015a; Star et al., 2015b; Beher et al., 2016). Private and public costs and benefits vary with climate, markets and agronomic responses, so that assessing costs requires either case study analysis of specific management changes or modelling of how costs will vary across variations expected in key parameters.
Management options and their effectiveness 75

Scientific Consensus Statement 2017—Chapter 4
To take account of key differences, most farm-level studies have focused on specific industry sectors (e.g. grazing, sugarcane, bananas) within specified regions (e.g. natural resource management regions), and may also be focused by management action, rainfall zone and soil/land types. In some industry analysis, management actions are grouped for convenience from D (dated, traditional) and C (current) to B (better management) and A (aspirational best practice) and have been updated since the last Scientific Consensus Statement; this allows the analysis to consider the costs of change in management systems rather than focus on itemised practices (Harvey et al., 2016a). The management classes correspond to the water quality risks associated with each group of practices. Similarly, in the grazing sector, it has been useful to focus on summary measures of land condition from the Grazing Land Management Framework (Chilcott et al., 2005), which ranges from D (degraded) and C (poor) through to B (good) and A (very good); this allows the analysis to identify the costs of improving land condition from one class to another. Some analyses in grazing (e.g. Alluvium, 2016) have focused on changes in management actions, assuming that changes will flow through to equivalent improvements in land condition.
Grazing
Previous analysis (e.g. Ash et al., 1995; MacLeod et al., 2004; MacLeod and McIvor, 2006; O’Reagain et al., 2011) identified that there are net economic benefits to the grazing industry of maintaining natural resources in good condition. In the long term (>15 years), higher pasture productivity from maintaining resource condition is more profitable than continuous heavy stocking and subsequent declines in land condition. Research has also identified that there are long-term economic benefits from reducing utilisation rates during droughts to maintain the resource base (Landsberg et al., 1998; O’Reagain et al., 2011). This means that where overgrazing is occurring, there should be both private benefits and public benefits from reducing stocking rates, noting that the benefits occur into the future. There was also substantial evidence that economic trade-offs vary across different land types and pasture utilisation (stocking) rates (Mcleod and McIvor, 2006; Star et al., 2013a).
More recent economic analysis of the grazing sector has been embedded in wider studies focused on prioritisation (e.g. Star et al., 2013a or broader assessments of costs (e.g. Alluvium, 2016). Star et al. (2013a) modelled the costs of improving land condition in four grazing land types in the Fitzroy Basin across the A, B, C land conditions, finding that while there were net private costs of all improvement options, the costs of making sediment reductions varied by more than 100 times between options. The cost of reducing sediment emissions varied from a low of $4.00/t for the Silver-leafed Ironbark on duplex soils land type in poor condition to a high of $421.00/t for the Brigalow-Blackbutt land type in very good condition. The opportunity costs were normally lower to improve land from C condition than from B condition. Higher costs are driven by limited interactions between grazing pressures and sediment movement, typically on more fertile soils on flatter lands, together with larger losses in production when stocking is reduced.
Assessing costs of sediment reduction in the grazing sector is complicated by variations in pollution sources and strategies adopted; significant sources include gullies, streambanks and D-condition land (refer to Chapter 2; Bartley et al., 2017) where remediation and costs tend to be very site specific. Wilkinson et al. (2015a) estimated that treatment costs for a targeted set of gullies across Great Barrier Reef catchments ranged between $500/km and $9000/km of gully, translating to costs between $81/t and $217/t of sediment reduction. In a preliminary study, Rust and Star (2016) reported that the costs of remediating gully erosion in the Fitzroy Basin ranged between $94/m3/yr and $867/m3/yr of sediment reduction.
Economic analysis has been included in the Water Quality Improvement Plans for each natural resource management region. While some studies (e.g. Folkers et al., 2014) have only provided overall costs, others have provided detailed analysis underpinning the cost estimates. For example, Pannell et al. (2014) estimated the incentive payments for grazing managers in the Burnett Mary
Management options and their effectiveness 76

Scientific Consensus Statement 2017—Chapter 4
Water Quality Improvement Plan to adopt beneficial management practices across small, medium and large farm sizes and low, medium and high land productivity classes, drawing on the bioeconomic modelling work published by Star et al. ( 2013a). The required incentive payments ranged from $10/ha/yr to $160/ha/yr and were highest for small farms compared to medium and larger farms. Costs were also higher for practice changes that had up-front costs and very high non-profit barriers (such as increased management complexity). Star et al. (2015b) used bioeconomic modelling to analyse the costs of management changes in the grazing and grains industries as a part of the Fitzroy Water Quality Improvement Plan. For sediment reductions, the cost varied significantly over 191 neighbourhood catchments from $18.83/t to $9779/t, with the very large costs occurring in sub-catchments where changing management had limited effect but involved large production losses and the rates of delivery to end-of-catchment were low.
Alluvium (2016) assembled costs from various studies to predict the costs of reducing pollutants by catchment, industry and practice change. For fine sediments, which largely relates to grazing catchments, the cost per tonne of fine sediment reduction was estimated to range from $3/t (moving grazing land management in the Burdekin from D to C class) to $2130/t (remediating 26–50% of gullies in the Fitzroy catchment) (Table 6).
Table 6. Cost effectiveness results for sediment reductions resulting from different management actions in different catchments (Alluvium, 2016)
Description Catchment Cost effectiveness $/t
Land Management - Burdekin - Grazing D to C Burdekin $3
Land Management - Wet Tropics - Grazing D to C Wet Tropics $10
Land Management - Mackay - Grazing D to C Mackay $19
Land Management - Fitzroy - Grazing D to C Fitzroy $21
Streambank - Herbert River 5% Wet Tropics $26
Streambank - Herbert River 6% to 10% Wet Tropics $53
Land Management - BURNETT MARY- Grazing C to B Burnett Mary $58
Land Management - Wet Tropics - Grazing B to A Wet Tropics $61
Land Management - Wet Tropics - Grazing C to B Wet Tropics $67
Land Management - Mackay - Grazing C to B Mackay $67
Gully - Burdekin 10% - Treatment 2 Burdekin $140
Land Management - Burdekin - Grazing C to B Burdekin $158
Streambank - Tully River 5% Wet Tropics $358
Streambank - Tully River 6% to 10% Wet Tropics $569
Land Management - Fitzroy - Grazing C to B Fitzroy $581
Land Repair - Fitzroy 5% D class grazing to conservation Fitzroy $836
Land Repair - Fitzroy 6% to 10% D class grazing to conservation Fitzroy $836
Land Repair - Fitzroy 11% to 20% D class grazing to conservation Fitzroy $836
Gully - Fitzroy 10% - Treatment 2 Fitzroy $1,210
Gully - Fitzroy 11% to 25% - Treatment 2 Fitzroy $1,370
Land Management - Fitzroy - Grazing B to A Fitzroy $1,700
Gully - Fitzroy 26% to 50% - Treatment 2 Fitzroy $2,130
Management options and their effectiveness 77

Scientific Consensus Statement 2017—Chapter 4
In a different approach, Beher et al. (2016) estimated costs of sediment reduction from an analysis of funded projects in the Fitzroy and Mackay Whitsunday regions covering both sugarcane and grazing sectors. Costs of reducing sediment were estimated to range from $9/t to $71,000/t. The difference in values between studies may be in part because of different treatment of costs; Pannell et al. (2014) included both opportunity costs (net impact on business) and incentive costs (funds required to engage farmers) of land management; Star et al. (2015a) included only opportunity costs of land condition; Beher et al. (2016) included public and private investment as well as the value of in-kind contributions.
In general, the results from various case studies and modelling confirm that while sediment reductions can be achieved at low cost with some practice changes in some catchments, there are large variations in costs, and remediation actions are very expensive. There are several priorities for future work. First, more robust costing studies are needed for many actions, particularly for gully and streambank remediation where the links to land management are poorly understood. Second, better information is needed about adoption success and practice efficiency success, which are underpinning assumptions for cost estimates. Third, effort is needed to reconcile some of the large variations in cost estimates and to provide some measure of confidence around cost estimates. Fourth, there needs to be more effort to incorporate time lags in adoption, effectiveness and transmission into costing analysis.
Sugarcane
Previous economic analysis of sugarcane operations (Roebeling et al., 2009; van Grieken et al., 2013a; van Grieken et al., 2013b) showed that the trade-offs from moving to better management practices can vary from strongly positive to strongly negative. Van Grieken et al. (2013a) showed that improving management actions can generate some positive returns to cane farmers in the Tully-Murray catchments, with improved landholder profits predicted for 10% and 20% end-of-river reductions in DIN. However, improving water quality by more than 30% was predicted to lead to a reduction in regional income (due to reduced cane production) and a decrease in regional employment (due to the adoption of less labour-intensive management classes and/or taking sugarcane land out of production).
Bioeconomic modelling was also used by van Grieken et al. (2013b) for the Tully and Pioneer catchments, showing that:
• Changes to higher management classes involve significant capital costs, and several years of operations are required before the change generates positive values.
• The positive net returns to farmers of moving to Class B means that landholders have large enough private net benefits to do this without being regulated—although the study did not incorporate all transaction costs or risk preferences.
• Only modest improvements in water quality can be generated by farmers moving to recommended management actions; larger improvements will require changes that involve net private costs to farmers.
• There is large variation in abatement costs, such that even prioritising by catchment is likely to be too large a scale for regulations to achieve cost-effective improvements to water quality relative to more flexible voluntary mechanisms.
More recent contributions to economic analysis have been made in several areas, including summary reviews of the economics of practice changes (Smith et al., 2014; Collier et al., 2015), evaluation of improved management practices (van Grieken et al., 2014a; Harvey et al., 2016a; Smith, 2015), pesticides (Poggio et al., 2014) and evaluation of case studies (Thompson et al., 2016a; Thompson et al., 2016b; Thompson et al., 2016c).
Management options and their effectiveness 78

Scientific Consensus Statement 2017—Chapter 4
Harvey et al. (2016a) note that most recent economic studies have focused on nitrogen application rates rather than other practices such as tillage and water management, with more recent studies looking at the economics of nitrogen replacement and nitrogen use efficiency strategies. Several specific trials and case studies have been evaluated by the Queensland Department of Agriculture and Fisheries, considering offsetting changes in costs and productivity (see publications.qld.gov.au/dataset/best-management-practices-for-sugarcane). There was some (but not conclusive) evidence from trials in the Burdekin that use of enhanced efficiency nitrogen fertilisers instead of urea could be at least cost neutral (Thompson et al., 2016a), and similar results showing that banding mill mud may generate positive returns in some cases (Thompson et al., 2016b). However, the high capital costs made low-cost drip irrigation in the Burdekin generally unprofitable, even though it reduces management costs and increases yields (Thompson et al., 2016c).
Van Grieken et al. (2014b) provided a detailed analysis of the cost effectiveness of changes in different management practices in the sugar industry and identified that there were large variations in returns to growers from practice change (farm gross margins) between regions but more limited variations within regions and across farm sizes. Actions that reduced nitrogen inputs were identified as having the largest environmental benefits; many of the strategies such as the use of Six Easy Steps were identified as being financially beneficial, although the returns (and financial attractiveness) vary between regions, the combinations of management practices used on farms and the existing level of each practice group (A, B, C, D framework). Across the three regions analysed, it was generally (but not always) cost effective for farmers to move from C-level practices to B-level practices, but not cost-effective to move from B-level to A-level practices.
Harvey et al. (2016a) identified that the use of Six Easy Steps outperformed nitrogen-replacement options on production and gross margin analysis in selected studies but that widespread adoption of Six Easy Steps would only deliver modest reductions in DIN of between 15% and 30%. Pesticide efficiency could be improved with specialised spraying equipment, but costs do not make this economically viable under current conditions. Harvey et al. (2016a) identified several priorities for future economic analysis, including matching site-specific yields to nutrient management, alternative forms of nutrient management and the use of fallow crops, mill mud and irrigation systems to reduce nitrogen losses. There has also been attention on the economics of practice change. Van Grieken et al. (2014a) analysed the economics of improving sugarcane management practices in the Burnett Mary region, finding that it was generally profitable to move from D- to C- or B-class practices, not profitable to move to A-class practices and sometimes profitable to move from C- to B-class practices. The net annualised equivalent benefits of the latter ranged from -$72/ha/yr to $161/ha/yr, depending on soil type and farm size. Alluvium (2016) generated their estimates of costs of meeting targets by estimating the costs of practice change across catchments and pollutants. For reductions in DIN, estimates ranged from $597/t/yr for Cane D to C practice change in the Mackay area to $62,500/t/yr for one of the irrigation practice changes in the Burdekin (noting that sediment and dissolved inorganic nitrogen reduction targets could not be fully met in the Wet Tropics) (Table 7).
Management options and their effectiveness 79

Scientific Consensus Statement 2017—Chapter 4
Table 7. Alluvium (2016) cost effectiveness results for DIN reductions resulting from different management actions in different catchments.
Description Catchment Cost Effectiveness $/t
Land Management - Mackay - Cane D to C Mackay $597
Land Management - Burnett Mary - Cane D to C Burnett Mary $1,770
Land Management - Wet Tropics - Cane C to B Wet Tropics $4,930
Land Management - Wet Tropics - Cane D to C Wet Tropics $5,570
Land Repair - Mackay 6% to 10% D class cane to conservation Mackay $6,280
Land Repair - Mackay 11% to 20% D class cane to conservation Mackay $6,290
Irrigation - Burdekin - 20% - Level 2 Burdekin $12,300
Land Repair - Wet Tropics 11% to 30% D class cane to conservation Wet Tropics $14,500
Land Repair - Wet Tropics 10% D class cane to conservation Wet Tropics $14,500
Land Repair - Wet Tropics 31% to 50% D class cane to conservation Wet Tropics $14,500
Land Management - Mackay - Cane C to B Mackay $24,700
Irrigation - Burdekin – 21% to 50% - Level 2 Burdekin $32,700
Irrigation - Burdekin – 71% to 100% - Level 2 Burdekin $41,600
Irrigation - Burdekin – 51% to 70% - Level 2 Burdekin $62,500
Rolfe et al. (2017 used a different approach, similar to Beher et al. (2016), of analysing grant programs to estimate the actual costs of making pollutant reductions. Unlike Beher et al. (2016), only the publicly funded component of programs was included and allowances were made for multiple pollutants. Costs were estimated to range from less than $1/t to $14,500/t for sediment, from less than $1/kg to $3,800/kg for DIN, and from $12/kg to $128,000/kg for pesticides. The ranges are much larger than the modelling approaches, largely because the modelling focuses on expected costs for an average farm in an average year, whereas the program analysis captures the heterogeneity across farms and years.
In general, the results from both case study analyses and bioeconomic modelling confirm that while adoption of better management practices in sugarcane is sometimes profitable, there are large variations in net costs and benefits within and across regions, and that private incentives to improve management practices are unlikely to deliver major reductions in pollutant delivery. Priorities for future research include more robust costing studies for different nutrient management and nitrogen loss options; the relationship between costs, adoption success and practice efficiency; and analysis to reconcile some of the large variations in cost estimates.
Other industries
Economic analysis outside of the key grazing and sugarcane sectors remains very limited. Previous analysis (e.g. Strahan and Hoffman, 2009; Rolfe and Windle, 2011b) had identified that some advanced management practices can have both financial and environmental benefits, but that returns vary with a number of factors.
Harvey et al. (2016b) review the economics of adopting best management practices in the banana industry, with the latter showing in a case study that adoption led to an annual improvement in farm
Management options and their effectiveness 80
Scientific Consensus Statement 2017—Chapter 4
profit of $30,543/yr, mostly due to reduced operating costs. This reduction was offset by capital requirements of $196,016, implying that it will take 10 years to break even at a 10% discount rate.
Star et al. (2015b) analysed the costs of management changes in the grain industries as a part of the Fitzroy Water Quality Improvement Plan, focusing on the installation of contour banks to limit sediment mobilisation. It was identified to be more cost effective to address sediment losses in cropping lands than reducing sediments from grazing, at least in the shorter term.
Factors influencing adoption A key question that arises is why landholders are not already adopting the practices that are identified as generating net benefits to them. Understanding the drivers for landholders to change management practices is an essential part of reducing agricultural impacts on water quality. Landholders do not simply follow short-term profit signals; they make land management decisions according to a complex mix of drivers, including historical patterns, their ability to adapt to changed conditions and their personal characteristics and circumstances. Economic causes of low adoption in grazing systems have been previously canvassed by MacLeod and McIvor (2006), Greiner et al. (2009), Greiner and Gregg (2011) and Star et al. (2013a).
More recent contributions to understanding slow rates of adoption come from Rolfe and Gregg (2015) and Gregg and Rolfe (2016). Rolfe and Gregg (2015) reported that adoption drivers and attitudes to risk vary across different groupings of landholders, and the outcomes of management changes in terms of relative advantage, cost, environmental improvement and risks appeal to those different groups of landholders in positive and negative ways, making it difficult to apply broadscale and generic engagement and adoption mechanisms.
Star et al. (2015c) show that returns from practice change in grazing in central Queensland are very sensitive to the application of different 20-year rainfall patterns, indicating that perceptions of future profits and trade-offs may depend on expectations and attitudes to weather events. Gregg and Rolfe (2016) show from experiments with beef producers in central Queensland about land condition and financial returns that there are variations in the way that producers consider information and make choices.
There have also been some recent studies that have examined adoption drivers for best management practices in the sugar industry. These include studies that identify factors that influence farmer decisions (Akbar et al., 2014; Collier et al., 2015). Landholder and non-financial factors that have been identified as important in Great Barrier Reef catchments include:
• Best management practices may not align with farmer objectives and outlooks or stage of life.
• Farmers may not trust the information provided.
• Attitudes to risk may limit trials and adoption of new practices.
• Farmers may not have all the skills required for some best management practices.
• Innovations and programs may require farmers to invest considerable time and effort.
• There may not be peer group support for adoption of practices.
Additional research has provided understanding about the importance of transaction costs and lag effects. Coggan et al. (2015) show that the private transaction costs of sugarcane farmers to participate in Reef Rescue schemes for improving water quality in the Great Barrier Reef were large and important, averaging $389 per farm. Pannell et al. (2014), in their analysis of grazing costs for the Burnett Mary region, modelled the annual incentive needed to address high non-profit barriers (e.g. preferences for traditional farming systems) at $75/ha.
Management options and their effectiveness 81

Scientific Consensus Statement 2017—Chapter 4
A key issue that has not received much attention is the subsequent effects on adoption from particular projects and interventions. Effects could be positive, where an initial pilot trial stimulates further adoption across the farm and neighbouring farms, or negative, when farmers begin to want public funds and programs to support any management improvement. The limited evidence to date suggests there are positive effects. Greiner (2015a) performed a retrospective evaluation of a water quality tender conducted on the Burdekin, finding a high persistence of investments and actions and substantial evidence that projects stimulated further actions, where farmers went on to make subsequent water quality investments and improvements.
Assessing overall cost effectiveness of management practices An emerging trend in recent years has been attempts to develop more systematic understandings of the costs of improving water quality. Some of the drivers for this include criticisms of the cost effectiveness of past investments (Queensland Audit Office, 2015) and increased focus on prioritisation and actions that will deliver change (Great Barrier Reef Water Science Taskforce, 2016). The approaches can be summarised into three broad groups.
1. Development of marginal abatement cost curves which order groups of potential actions by increasing cost per tonnage reduction. These provide a de facto supply curve of potential improvements to water quality, where increasing amounts of improvement can be matched to additional costs. Initial versions of marginal abatement cost curves were provided by van Grieken et al. (2014b) for sugarcane in the Wet Tropics, Burdekin and Mackay Whitsunday areas; by Pannell et al. (2014) for grazing in the Burnett Mary region; and by Star et al. (2015b) for grazing and dryland cropping in the Fitzroy Basin. More comprehensive marginal abatement cost curves have been provided by Whitten et al. (2015) for sugarcane in the Great Barrier Reef and Star et al. (2015a) for grazing in the Burdekin and Fitzroy basins, summarised by the Department of Environment and Heritage Protection (DEHP, 2016). An example of a supply curve for one group of actions (shifting grazing landholders from C to B management) is shown in Figure 9 below, demonstrating that costs per tonne of sediment reduced for these actions vary from less than $10/t to almost $1000/t for average grazing enterprises across sub-catchment areas.
Figure 9. Cumulative cost of shifting landholders from C to B management in Burdekin and Fitzroy catchments (DEHP, 2016, p. 19).
A similar example for the costs of reducing DIN is shown in Figure 10, where the initial costs are negative, reflecting the large private benefits associated with those actions. This figure highlights the range in costs per tonne (y-axis) from less than $10/t to $1,000/t, and the x-axis shows the cumulative amount of sediment that can be achieved.
Management options and their effectiveness 82

Scientific Consensus Statement 2017—Chapter 4
Figure 10. Adjusted DIN abatement annualised equivalent benefit costs by sub-catchment and farm size (Burdekin and Wet Tropics) (DEHP 2016, p. 8). This figure shows the range of management actions as little squares across the x-axis, which are the amount of tonnes per year that are reduced. Management practices below the line indicate these are of benefit to the landholder to adopt.
Management options and their effectiveness 83

Scientific Consensus Statement 2017—Chapter 4
2. Analysis of the costs of meeting water quality targets to help improve targeting and budgeting at regional scales. This builds on earlier efforts to identify the varying cost effectiveness of actions (Rolfe et al., 2011; Rolfe and Windle, 2011b). Rolfe and Windle (2016) analyse variations in cost effectiveness across funding programs for the Great Barrier Reef; Beher et al. (2016) analyse variations in funding sugarcane and grazing projects; Rolfe et al. (2017) analyse variations between funded sugarcane projects within programs. The latter analysis (Figure 11) showed that variations in cost effectiveness could be found across each of the four sugarcane regions (Burnett Mary, Mackay Whitsunday, Burdekin and Wet Tropics). From the analysis, the following benchmarks (maximum prices to be paid) were recommended:
i. sediment: $45/t ii. Nitrogen (DIN): $41/kg
iii. PSII pesticide: $1,100/kg
Figure 11. Cost effectiveness of DIN reductions by region (Rolfe et al., 2017, p. 22). This figure shows the number of projects along the x-axis with the different catchments in the different colours. The variance in cost is reflected on the y-axis.
$0
$200
$400
$600
$800
$1,000
$1,200
$1,400
$1,600
$1,800
1 5 9 13 17 21 25 29 33 37 41 45 49 53 57 61 65 69 73 77 81 85 89 93 97 101
105
109
Cost
($/k
g) D
IN re
duct
ion
projects
DIN
WT (n=45) BURD (n=111) MW (n=32) BMRG (n=6)
BMRGAvg cost
$38.52/kgMW
Avg cost: $1.22/kg1st 50% = $0.49/kg2nd 50% = $8.02/kg
WTAvg cost: $8.32/kg1st 50% = $4.07/kg2nd 50% = $75.28/kg
BURDAvg cost: $12.88/kg1st 50% = $6.25/kg2nd 50% = $207/kg
Management options and their effectiveness 84

Scientific Consensus Statement 2017—Chapter 4
3. Estimates of the total costs involved in meeting required water quality targets across the Great Barrier Reef. Alluvium (2016) provides an estimate of the costs of undertaking management actions to meet 2025 water quality targets across the Great Barrier Reef across seven policy solution sets: land management practice change, improved irrigation practices, gully remediation, streambank repair, wetland construction, changes to land use (including conversion to conservation uses) and improvements in urban stormwater management. Cost estimates were largely extrapolated from previous work (e.g. Whitten et al., 2015; Star et al., 2015a) and modelled to match potential management changes. Several assumptions underpinned the extrapolation and analysis because of gaps in primary data; Alluvium caution that the outcomes should not be treated as precise estimates. Williams et al. (2016) in their review of the Alluvium study noted that the analysis included some very expensive, high-risk actions that were unlikely to be practical or affordable, and that additional research, development and innovation are likely to expand the range of cost-effective abatement actions.
The overall cost of meeting the 2025 water quality targets was estimated by Alluvium (2016) at $8.2 billion, but this includes $7.8 billion for achieving the fine sediment targets, particularly for gully erosion in the Fitzroy (Figure 12). The cost of achieving the targets for DIN was estimated at $0.4 billion but only 75% of the DIN target and 80% of the fine sediment target in the Wet Tropics could be reached with the solutions considered in the analysis (Figure 14). Consistent with the analysis of program funding by Whitten et al. (2015), Beher et al. (2016) and Rolfe et al. (2017) there are large variations and rapidly increasing costs as higher and higher levels of reduction are sought. Examples of the marginal average cost curves for sediments and DIN are provided in Figures 12 and 13 below.
Management options and their effectiveness 85

Scientific Consensus Statement 2017—Chapter 4
Figure 12. Estimated marginal average cost curves of achieving fine sediment targets for each region in aggregate (excluding Cape York) by 2025. (Alluvium, 2016) This figure highlights that the cumulative tonnes reduced can be achieved for a lower cost until approximately 1,750,000 t (x-axis). To achieve the last 500,000 t, the costs per tonne (y-axis) increase from approximately $1,000/t to $20,000t.
Management options and their effectiveness 86

Scientific Consensus Statement 2017—Chapter 4
Figure 13. Estimated marginal average cost curves of achieving DIN targets for each region in aggregate including uncertainty (excluding Cape York) by 2025. (Alluvium, 2016, p. 74)
Management options and their effectiveness 87

Scientific Consensus Statement 2017—Chapter 4
Mechanisms to achieve change Several different mechanisms are available to achieve practice change, which can be summarised into information and persuasion mechanisms, extension, incentives, property rights (including land retirement), market-based instruments, and regulation. Historically most programs have focused on relatively simple grant programs, which are positive incentive mechanisms, although these have also included (i) elements of information and persuasion mechanisms through communication and stakeholder engagement, and (ii) education mechanisms through extension elements (GBRWST, 2016).
Previous evidence has shown that grant programs have not been particularly efficient. Rolfe and Windle (2011b) identified that the costs of pollutant reductions can vary by more than 100 times between different projects, and Rolfe and Windle (2011b) and Star et al. (2013a) demonstrated that a simple focus on management actions that achieve the largest reductions is not efficient, and that selection mechanisms should compare additional benefits to project costs.
There has been some focus on improving mechanism design, through greater adoption of market-based instruments such as reverse auctions, stewardship payments, temporary land retirement and trading systems (GBRWST, 2016). For example, Smart et al. (2016) explored the potential for a tradeable permit scheme to be introduced for nitrogen run-off in sugarcane regions. Other examples include the application of reverse tenders to improve nitrogen use efficiency in the Wet Tropics and Burdekin regions (e.g. www.environment.gov.au/marine/gbr/reef-trust/reef-trust-tender) and improvements in selection processes through the Water Quality Improvement Plans.
Kroon et al. (2016) conclude that the mix of mechanisms that have been applied to reduce land-based pollution are unlikely to be sufficient to achieve change in the desired time frames. They argue that standard approaches to incremental mechanism change and adoption improvement are not achieving the necessary scale of change, and that transformational change is required in at least some parts of the Great Barrier Reef catchments and industries.
Prioritisation There has been more interest in prioritising actions and investments to address water quality in the Great Barrier Reef (GBRWST, 2016), driven in part by economic evidence about variations in cost effectiveness and the challenges in meeting water quality targets. Beher et al. (2016) found that funding mechanisms that included information about costs and benefits were up to four times more efficient than historic approaches to analysing funding. Rolfe et al. (2017) found from an analysis of Reef Program grants to sugarcane growers in 2013-2014 and 2014-2015 that the best 50% of projects generated 90.1% of direct sediment reductions, 95.6% of direct DIN reductions and 89.7% of direct pesticide reductions and concluded that cost efficiency could be at least doubled with better prioritisation and project selection methods.
A striking feature in the prioritisation debate has been the diversity of approaches taken. The Water Quality Improvement Plans developed by each natural resource management group are focused on improving prioritisation, but these exhibit some variation in both economic and biophysical factors included in the prioritisation. Although most economic analyses (Star et al., 2013a; Star et al., 2015b; Parks and Roberts, 2014 Roberts et al., 2016; Whitten et al., 2015; Alluvium 2016; Beverley et al., 2016; Beher et al., 2016; Rolfe et al., 2016b) have prioritised by comparing the benefits achieved to the costs, the components included in both benefits and costs have varied. For example, most have estimated benefits in terms of end-of-catchment pollutant reduction rather than benefits to reef assets; Rolfe et al. (2017) have more rigorously disaggregated costs between pollutants than the other studies; Alluvium (2016), Beher et al. (2016) and Beverley et al. (2016) have used more inclusive (but different) estimates of costs than other studies; Star et al. (2015a) and Alluvium (2016) have accounted for adoption success and practice efficiency success, and Star et al. (2015b) have accounted for lag effects in prioritisation.
Management options and their effectiveness 88

Scientific Consensus Statement 2017—Chapter 4
Most economic approaches to prioritisation have focused on cost effectiveness as the key measure; however, some studies such as Whitten et al. (2015) and Alluvium (2016) have identified that program and project selection may be ordered by other factors. Great Barrier Reef Water Science Taskforce (GBRWST, 2016) and Alluvium (2016) identified that priorities may be ordered to a large extent by mechanism design or by the interaction between mechanism design and private net costs, as shown in the Figure 14 below.
Figure 14. Mix of tools required. (GBRWST, 2016, p. 46)
Conclusion Economics can be used to identify the trade-offs involved in efforts to improve water quality and prevent further damage to the reef. There is now a large body of work that provides estimates of benefits, costs, adoption drivers and mechanism designs relevant to the Great Barrier Reef. Of importance is the very large variation in costs of actions to improve water quality. This has the potential to create inefficiencies, if target setting and funding efforts are focused on actions that achieve little return for large investments.
There have been several economic studies that identify commercial and community benefits of the reef. The values are for purposes such as tourism, recreation, fishing and other non-use benefits such as ensuring the reef is in good health for future generations. The diversity in values allows the opportunity for improved spatial linkages between community benefits and where the pollutant loads are entering the reef.
There has been a significant increase in understanding of the farm-level trade-offs and economic implications regarding management changes under the new Water Quality Risk Frameworks. These studies highlight the complexity and variance in costs and the pollutant reductions that subsequently occur. In part, the variance in costs is due to the implications of both weather and climate risk along with individual landholder motivations, which can provide insights into the low adoption rates of some management practices.
Management options and their effectiveness 89

Scientific Consensus Statement 2017—Chapter 4
The low level of adoption of key management practices has resulted in a broader suite of mechanisms (incentives, extension, market-based instruments) being implemented. To date there has been limited understanding of the long-term impacts of incentives, the on-ground change driven by extension or the outcomes of market-based instruments on adoption levels. Limited information also exists regarding the influences these mechanisms together have on overall adoption levels. This presents difficulty in understanding the costs to achieve the target pollutant load reductions.
The large potential for misallocation of resources, together with slow rates of adoption and improvement, means that key areas for policy focus should be on prioritisation and mechanism design. To date, economic analysis has had limited roles in these areas, but improved analysis and modelling should facilitate the interface between economics and other disciplines.
There has been an increase in the overall body of economic analysis, which has provided a number of case study insights into changed management practices and the community benefits of improvements in reef health. However, these case studies have been at best ad hoc and driven through different funding sources, explaining the difference in approaches between studies. To allow more strategic outcomes and ensured continuity between approaches a more comprehensive overall economic strategy is required. The current state of knowledge about the economic dimensions of agricultural practice change and implications for management is summarised in Table 8.
Management options and their effectiveness 90

Scientific Consensus Statement 2017—Chapter 4
Table 8. Overview of established knowledge about the economic dimensions of agricultural practice and insights from recent research. Category Established knowledge and understanding
(based on previous Scientific Consensus Statement findings)
New information or insights Contentious, unresolved or unknown areas (for further research)
Overarching • There are a range of different benefits to communities from protecting the GBR, including benefits for tourism, recreation users and biodiversity values.
• Natural capital is important. • Costs of farm management changes to
reduce pollutant generation vary widely; some management improvements generate net financial returns to growers.
• There are large variations in costs across regions, programs and industries.
• Risk preferences, transaction costs and other barriers such as complexity are also key drivers for landholder adoption.
• Total costs of meeting targets are very high. • Improving prioritisation is critical. • Different mixes of mechanisms may be required.
• Cost estimates remain variable, and there are some very high costs of change.
• Prioritisation needs to be developed to take account of the benefits that can be gained and cost effectiveness.
• How to select and package the best combinations of policy mechanisms is unclear.
Costs for farmers to make management changes
• Additional research since 2013 continues to show that cost of management changes can vary widely; together with variations in benefits both to the landholder and reduction in pollutants this underpins large differences in cost-effective actions
• While some farm management changes can be at low (or negative cost), most involve capital investment and/or trade-offs in production, and long time frames until benefits are received.
• Analysis of reef funding programs shows marked variations in cost effectiveness of both management changes and programs.
• There are variations in cost estimates between approaches to be resolved.
• Costs are very dependent on assumptions about weather and markets.
• Cost estimates seem to be a poor guide to what it takes to motivate all farmers to change.
Cost of meeting targets
• Not previously considered • Recent work has focused more on assembling cost estimates across practices, industries and regions to generate marginal abatement curves and estimates of total costs to reach targets:
— Evidence shows that cost curves rise sharply as additional actions to achieve targets have to be undertaken.
— The costs of achieving the water quality targets are now understood to be much higher than previously considered.
• Estimates are sensitive to a number of underlying assumptions and modelling constraints.
• In some catchments, targets cannot be reached or can only be reached at very high costs. Cost-effective solutions need to be found.
Prioritisation • Most focus on prioritisation was within programs, rather than at a higher level.
• Landholder risks from practice change and variations in weather and markets, together with time lags to pollutant reductions, are important to consider. Benefits of projects are highly likely to be reduced when these are present.
• Cost effectiveness of management practice change varies across industries, regions and farms; a simple focus on individual sources of pollutants, actions or regions is unlikely to be efficient.
• Project selection that takes into account environmental and economic benefits could improve cost effectiveness of grant programs by up to four times.
• Heterogeneity in both impacts and costs needs to be considered. • Prioritisation should be assessed in terms of effect on reef health, not
end-of-catchment pollutant reductions. • Time lags (to (i) when actions become effective, (ii) when pollutant
reductions occur at end-of-catchment, and (iii) when GBR assets are benefited) should be included in assessments.
• There needs to be some method of assessing the relative benefits and risks of focusing on protecting reef assets in good health versus repairing degraded areas.
Implications/considerations for management
• Selecting and prioritising programs and projects is complex and requires evaluation of the additional environmental and economic benefits gained against the costs involved. • The benefits of project and program implementation should ideally be assessed in terms of the costs of improvements in GBR health that are likely to be achieved and at the very least, the costs of achieving
reductions in pollution. • The selection of policy mechanisms should take account of economic considerations and the changes in farm management that can be achieved.
Management options and their effectiveness 91

Scientific Consensus Statement 2017—Chapter 4
Social dimensions of agricultural practice change This section of the report aims to summarise the main body of evidence related to the social dimensions of farmers’ (and other rural landholders’) adoption of management practices to improve environmental outcomes from primary production. It primarily focuses on studies from the last 10 years conducted in catchments adjacent to the Great Barrier Reef that have key primary production industries such as sugarcane and grazing. It also considers the factors that influence farmers’ decisions to participate in programs or initiatives designed to promote specific agricultural practices to improve environmental outcomes, including reducing impacts of diffuse water quality. The next section of the report considers the influence of the broader institutional, policy and governance arrangements on Great Barrier Reef water quality outcomes.
Understanding adoption In recent decades, research into the social dimensions of voluntary practice change on Australian farms (Cary et al., 2002; Lockie et al., 2002; Pannell et al., 2006; Vanclay, 2004) has considered practices to improve productivity or profitability of farming business, ameliorate the effects of land degradation, reduce off-site environmental impacts and improve biodiversity conservation on rural landholdings. Major reviews of adoption practice among Australian farmers identify a central theme: that adoption of a new practice depends on a landholder’s ‘expectation that it will allow them to better achieve their goals’ (Pannell et al., 2006, p. 1408). The literature also emphasises that adoption decisions are based on subjective perceptions or expectations rather than on objective ‘truths’ about the efficacy of a given technique being promoted by one group or another. These perceptions depend on three broad sets of issues: (i) the process of learning and experience to inform the decision, (ii) the personal characteristics and circumstances of the landholder in their broader social environment, and (iii) the characteristics of the practice itself (Pannell et al., 2006).
Considering these sets of issues above, a land manager’s or farmer’s decision to trial or adopt a new practice can be influenced by a diverse combination of factors, including but not limited to their awareness of the practice or the problem it is intended to address; their own land management and/or production goals; their own experience, attitudes and beliefs about benefits of the proposed change (or otherwise); the source of advice about the practice; their financial resources; shared views among peers about ‘good farming’; and broader community expectations and debates. In this way, adoption is highly contextual and sensitive to timing; local conditions; the personal, family and business circumstances of individual farmers; and the broader industry context. Farm production decisions are also complex and greatly influenced by context. Decisions about the use of chemicals, for instance, require farmers to consider regulatory and technical requirements, while assessing potential weather-related risks and their own production requirements (Kealley and Milford, 2013). Labelling landholders as either ‘innovators’ or ‘laggards’ is also inaccurate and unhelpful since adoption is specific to a technology or practice, and because these labels can socially alienate landholders from the very information or networks that change agents are relying on (Emtage et al., 2007; Pannell et al., 2006; Vanclay, 2004). The issue of working with diversity is discussed further below.
In this section, we draw on examples from research done in Great Barrier Reef catchments to illustrate several of the issues above. We note that in the case of Great Barrier Reef water quality–related practice change, adoption decisions and related learning processes will often be in the context of government-sponsored information and incentive programs that seek to accelerate adoption of specific practices (e.g. riparian fencing or nutrient budgeting) among farmers. As such, decisions about participation in these broader programs and adoption of specific practices can be intertwined.
Management options and their effectiveness 92

Scientific Consensus Statement 2017—Chapter 4
Characteristics of the practice and ‘best practice’ Issues related to the ‘characteristics of the practice’ have strong economic and technical efficacy dimensions which are addressed in other sections of this chapter (see sections on agricultural management practice effectiveness, section 6.1). However, when considering the characteristics of specific practices or technologies, two broad categories stand out: relative advantage and trialability (Pannell et al., 2006). Over time, relative advantage is considered the decisive factor in influencing the extent of adoption of a given practice (Pannell et al., 2006). Relative advantage refers to the expected additional benefit a producer gains from replacement of an existing practice with a new or modified practice. These gains may not only be financial benefits related to improved production, but may include social recognition, ease of management, meeting family goals or a reduction in the likelihood of government regulation being imposed. Trialability refers to how easy it is to move from non-adoption to adoption via a learning phase, where practices can be tried at a small scale, thereby reducing uncertainty, managing for risk and developing skills for broader implementation (Pannell et al., 2006).
It is also worth noting, in general terms, that the idea of ‘best’ or ‘recommended’ farming practices for productivity or environmental improvement has come under some criticism due to its often prescriptive nature that ignores the diversity of farming systems and farmers’ individual contexts (described further below). The practice or suite of management changes being promoted may also contrast significantly with previously trusted advice from the same sources (such as government extension officers) or fail to build on recent changes made to farm management by the producer (Vanclay, 2004; Stanley et al., 2006). Some studies in the international literature suggest the need, instead, to seek a best-fit outcome between desired or promoted practices and those individual contexts. This thinking is also extending to the broader design and operation of extension advisory services (see for instance Birner et al., 2009).
Awareness of the problem Due to differences among individuals’ information-seeking behaviour (e.g. sources, networks, capacity) there can be significant lag times or differences (years) in the rate at which awareness of an issue or practice reaches landholders, despite the presence of extension activities (Gibbs et al., 1987, cited in Pannell et al., 2006). Differences in awareness and knowledge of a problem and its causes are clear in a study of adoption of riparian management practices by graziers in the upper Burdekin rangelands (Lankester et al., 2009). This showed that awareness and knowledge varied among land managers and between land managers, scientists and extension officers. These differences concerned (i) the location and source of sediments leaving their properties, (ii) the main cause of the erosion damage (e.g. weeds, pigs, cattle movement), (iii) the consequences for downstream impacts, and (iv) the efficacy of proposed riparian management practices (e.g. fencing, spelling) to reduce that damage or improve production outcomes (Lankester et al., 2009).
While some graziers believed ‘erosion, caused by compaction of the soil during cattle movement, to be the main impact on riparian areas from cattle grazing’, others questioned how much of the problem of sediments in waterways was due to grazing practices compared with natural rainfall and flood events. In addition, some graziers were sceptical or uncertain about the credibility of scientific findings that demonstrated a link between management and environmental damage, thereby questioning how much control or influence they had over the situation (Lankester et al., 2009, p. 98). Broader public messaging seemed to add to this uncertainty, where land managers hear reports about the Great Barrier Reef being of world-class standing and then other reports that describe the Great Barrier Reef in crisis (Lankester et al., 2009). Landholders in the Wet Tropics region also recognise and accept that declining environmental quality of natural assets in their region occurs; however, they do not generally see these problems evident on, or traceable to, their own property (Emtage and Herbohn, 2012a; Taylor and van Grieken, 2015; Taylor, 2010). This is consistent with other earlier studies that have highlighted how many Australian landholders do not see their own activities as directly contributing to environmental degradation, despite awareness of broader problems (Lawrence et al., 2004).
Management options and their effectiveness 93

Scientific Consensus Statement 2017—Chapter 4
In some instances, these perceptions of landholders about environmental harm may be influenced by providing property or location-specific information that clearly shows the management–impact relationship in a way that can practically inform a management response by the landholder. This strategy of property-specific information provision is more effective where landholders actively participate in the gathering or validation of that information through their own observations and experience and where the information can be accommodated within existing property-level plans. However, rather than a lack of information, low levels of acceptance of the off-site impacts of agricultural production can have more to do with concerns over the potential implications (financial, reputational and political) of the implied responsibility for fixing the stated problem. These tensions between concerns about evidence and responsibility were clearly evident in the early stages of debates about Great Barrier Reef water quality improvement between governments and industries and can resurface as new data, goals or issues are introduced (Taylor, 2010; Taylor B. et al., 2012). Addressing the ambiguity for landholders and industries around what happens next, who pays and what help is available for addressing the problem needs to be done in parallel with attempts to address gaps about the evidence to convince landholders of impacts (Taylor et al., 2012).
Working with diversity among landholders Studies have highlighted the diversity that exists between land managers based on the relationship between their adoption of natural resource management practices, management values, attitudes and norms, socio-economic characteristics, and worldviews (Emtage et al., 2007; Nettle and Lamb, 2010; Morrison et al., 2012; Price and Leviston, 2014). Based on these kinds of relationships, five types of rural landholders in the Wet Tropics have been identified: concerned but unengaged, production oriented, multiple objective, well connected and progressive, disconnected and conservative (Emtage and Herbohn, 2012a). Categorising these differences, using a market segmentation approach, can assist with designing communication and engagement strategies to promote improved management practices (Emtage and Herbohn, 2012a; Price and Leviston, 2014). This is because these different subgroups of rural landholders place different importance and trust in certain sources of information, communication, behaviours and propensity to work with some types of organisations over others (discussed below) (Emtage and Herbohn, 2012a; Emtage and Herbohn, 2012b). For example, as noted above, care must be taken as it is difficult to ‘describe segments in a way that acknowledges difference without implying “good” or “bad” management’ (Waters et al., 2009, p. 47).
Values, motivations and goals While farmers’ values do not always influence adoption decisions directly, understanding values is most useful in the context of how they influence perceptions about a specific practice (Emtage et al., 2007). This is particularly the case in situations where landholders lack specific or detailed information about the practice (Pannell et al., 2006). Correspondingly, a number of studies have shown that conservation-focused programs in the Wet Tropics, for instance, are more likely to attract participants with pro-environmental values and thereby generate conservation outcomes (Moon et al., 2012). While the natural environment and biodiversity values form an important and intrinsic motivation for many graziers, this does not necessarily translate into a working knowledge of biodiversity condition or the threats that some grazing management practices can present to biodiversity conservation (Greiner, 2015b; Greiner, 2016).
Significant differences have been identified between adoption-related behaviours of primary producers and the motivations of rural landholders who own and manage land for different purposes, that is, with different management regimes or goals (Emtage and Herbohn, 2012b), with differences between farmers and non-farming rural landholders (Pannell et al., 2006). The goals of rural landholders in the Wet Tropics, for instance, fall into the broad divisions of economic (build business), environmental (improve environment) and social (family and lifestyle) factors (Emtage and Herbohn, 2012a, p. 359). In addition to differences between landholders within a region, Greiner and Gregg (2011) found graziers’ primary motivations vary between regions. However, they
Management options and their effectiveness 94

Scientific Consensus Statement 2017—Chapter 4
also found a strong stewardship ethic (incorporating personal and family concern with care for the land) to be more pervasive among graziers than were other financial, economic or social objectives (Greiner and Gregg, 2011).
Adoption is strongly influenced by the goals of landholders or farmers (Pannell et al., 2006). Landholders with strong enterprise profitability goals were found to have greater engagement with enterprise-related best management practices, while landholders with management goals about improving environmental condition had greater adoption of vegetation or riparian management practices (Emtage and Herbohn, 2012b). Congruence between environmental and production goals, particularly a view that good production encapsulates responsible environmental management, was associated with those riparian practices more readily adopted among graziers (Lankester et al., 2009). Because some producers have multiple goals for their enterprise, profit-only focused practice improvement programs in cropping and grazing industries may inadvertently exclude producers who have environmental goals (Schirmer et al., 2012). A recent study in one cane-growing catchment in Queensland shows that while farmers can hold both productivist and conservationist identities, the latter is often latent in their decision-making and can be activated in engagement processes and supported to improve best management practices uptake (Willmott et al., 2016). For example, graziers in northern Australia (Burdekin, Northern Gulf, Northern Territory) with stronger financial motives have required higher stewardship payments for practices such as total exclusion of cattle from sensitive areas (Greiner, 2015b; Greiner, 2016; Greiner et al., 2009). These findings do not imply that program design should favour one motivational posture over another, only that certain program designs will more successfully engage some landholders and not others and that governments and industries need to make informed choices about the narratives and instruments they use to engage specific groups of landholders.
Primary income source Knowing the main source of income for farming households has been found to help predict landholders’ decisions to participate in programs to conserve native vegetation on their properties. Moon and Cocklin (2011, p. 493) found that Queensland landholders who derived their main income source from agricultural production ‘were more likely to participate in short-term programs that offered large financial incentives that applied to <25% of their property, [whereas] nonproduction landholders were more likely to participate in long-term programs that were voluntary or offered small financial incentives that applied to >75% of their property’. Grazing property owners who derived their main income from beef production were influenced most by the likely economic benefits to be gained by adoption of riparian management practices. Property owners who derived most of their income from sources other than grazing were more likely to be influenced by the environmental management benefits of riparian management (Lankester et al., 2009).
Personal reputation and ‘cultural capital’ The reputational standing of farmers, or their ‘cultural capital’ in their farming community, is another key influence on adoption and participation (Burton et al., 2008). This has been reported by farmers reflecting on their decision to apply (or not) for financial assistance for water quality improvement in grazing and cane. For example, some beef producers in the Burdekin rangelands reported a loss of pride in receiving handouts and concern about how others see their riparian management as important considerations (Lankester et al., 2009). In these instances, while financial incentives may be justified, peer-based or broader social incentives may be more effective in encouraging participation (Greiner et al., 2009). Sugarcane growers have also claimed that water quality incentive programs fail to recognise more progressive growers and instead target or reward, in their view, poorer performers (Taylor and van Grieken, 2015).
Joint decision-making and social learning Decision-making in farming businesses is rarely made by an individual in isolation. Advisors are often involved in the decision-making process (Pannell et al., 2006). Relationships with peers and other
Management options and their effectiveness 95

Scientific Consensus Statement 2017—Chapter 4
producers create shared norms of good practice and provide opportunities to see and hear what others are doing (Lankester et al., 2009). Family members are also highly influential when decisions are being made as well as providing the labour required to do the work (Lankester et al., 2009). These influences were observed in grazing land managers’ approaches to riparian management in the Burdekin (Lankester et al., 2009). Relationships with extension officers or other advisors who provide opportunities for practical learning had a strong positive influence (Lankester et al., 2009). Furthermore, these relationships contribute to developing a two-way understanding of management practices (Lankester et al., 2009, p. 99). Establishing local technical assessment panels and other mechanisms to share knowledge between regional bodies, industry extension staff, scientists and landholders improved outcomes of water quality grants schemes and promoted joint learning (Robinson et al., 2014). Similarly, collaborative water quality monitoring activities in the Herbert catchment to assess nitrogen losses from cane blocks, with links to targeted extension activities, has reportedly built the capacity of farmers, extension officers, scientists and others to understand the run-off problem in detail at the local level and provide the information to develop and trial appropriate farm-level management responses (Di Bella et al., 2016).
Information, intermediaries and advice networks Information about new practices is obtained from a widening range of sources, and farming advice networks are becoming more complex (Phillipson et al., 2016; Blackstock et al., 2010). Recent case studies that examine delivery and uptake of precision-farming technologies in Australian agriculture also point to the importance of improving coordination and collaboration among public, private and other agricultural advisory services and between public research and commercial providers for improving adoption outcomes in these complex innovation settings (Eastwood et al., 2017).
Practices such as nutrient budgeting to reduce pollutant loads and improve on-farm productivity are information intensive. Growers’ trust of information sources is critical to their adoption of these types of practices and participation in practice change schemes (Emtage and Herbohn 2012b; Taylor and van Grieken, 2015; Osmond et al., 2015). Growers place different importance or value on the advice they receive from different sources, including private advisors or service providers, government or groups seen to be working with government such as regional natural resource management bodies (Taylor and van Grieken, 2015). One study found that for sugarcane growers in the Great Barrier Reef catchments, the gathering of information about a proposed practice change constituted a significant part of the private transaction costs of adoption (Coggan et al., 2015). Local engagement practitioners and supportive extension arrangements provided by regional natural resource management bodies help to bridge the administrative world of government-sponsored natural resource management and the everyday lives of land managers (Darbas et al., 2009). A local, trusted connection between landholders and extension practitioners is key to influencing practice change (Emtage and Herbohn, 2012b; Taylor and van Grieken, 2015). These relationships are also critical to enabling farmer participation in programs where the motives of distant governments are not fully trusted. In these cases, locally trusted intermediaries serve to buffer the risk of participation perceived by producers (Taylor and van Grieken, 2015).
Participation in practice improvement or conservation programs In the context of Great Barrier Reef water quality, practice change is largely sought by encouraging farmer or land manager participation through a scheme or program designed for that purpose. Gaining farmer participation in these programs is often problematic due to the complexity of scheme design and implementation, the program rules or the often conflicting goals of policymakers and farmers (Taylor and van Grieken, 2015). The propensity of landholders to participate in different types of programs is influenced by their personal circumstances (e.g. income, education, health) as well as differences in their norms (especially their beliefs about how an individual is expected to act) and their attitudes (Moon and Cocklin, 2011; Greiner, 2015b; Greiner, 2016). A lack of available capital restricted sugarcane growers’ participation in grants for nutrient management that required up-front cost-sharing conditions to be met, as did concerns about the potential for lost farm
Management options and their effectiveness 96

Scientific Consensus Statement 2017—Chapter 4
productivity (Taylor and van Grieken, 2015). Other risks of participating that were reported included the source of funds; trust in and goal-orientation of government funding agencies; deeper concerns about government interference in their farm business; lack of social recognition for participants; and changes to their farming systems (e.g. row spaces) that would disrupt relationships or processes with their harvesting cooperatives, contractors and suppliers (Taylor and van Grieken, 2015). In grazing, Greiner and Gregg (2011) argue that the financial focus of conservation programs has crowded out stewardship-focused motivations and, combined with land manager cynicism about the involvement of government, has reduced participation in regions such as the Burdekin. In the Mackay Whitsunday region, land managers with higher socio-demographic status were found to be more likely to participate in natural resource management–related schemes (Morrison et al., 2012).
A recent review of the literature on factors that influence the effectiveness of financial incentives on long-term, natural resource management–related behaviour change (i.e. beyond farmers’ initial decision to participate) identified both practice-level characteristics and features of program-level design and implementation as important (Swann and Richards, 2016). These factors include that ongoing maintenance of the practice is affordable and relatively simple (or financially supported), whether structural or land-use change is required and whether resulting environmental benefits are highly observable. Furthermore, elements such as landholder involvement in planning, design and evaluation of programs; extension support that builds relationships and trust; flexibility in application of the practice; and appropriate contract length improve the effectiveness of financial incentives in supporting longer term changes in farming behaviours (Swann and Richards, 2016). Greiner also notes that complementary regulation and/or information are important in promoting participation in these type of programs, as they set minimum expectations from which voluntary measures can be built (Greiner, 2015b; Greiner, 2016). There is also recent industry-commissioned research on best management practice programs, such as Smartcane BMP, that show progress in grower participation in these programs and change in attitudes towards the environment and practice (Kealley and Quirk, 2016). This work highlights a diverse suite of reasons for why growers participate or not; these are consistent with the findings of other research presented here, including the activation of farmers’ intrinsic motivations (e.g. profitability or stewardship); external pressures or signals (e.g. market benefits or regulatory emphasis); demonstrating leadership within the sector; and the design of communication, engagement and practice change programs including well-resourced regional facilitators (Kealley and Quirk, 2016).
Conclusion As discussed at the outset of this section, the material presented here on the social dimensions of practice change in agriculture has drawn on studies related directly to environmental improvement programs targeted at primary industries and landholders in the Great Barrier Reef catchments. In addition, there is a modest but insightful body of international evidence on the social and institutional dimensions of managing diffuse water quality impacts from farming lands. Indeed, many of the local studies presented above draw on this international scholarship. Despite some significant cultural, political and production system differences, there are a number of persistent themes related to voluntary practice adoption across the Great Barrier Reef catchments and from similar problem and program contexts in the United States, Europe and the United Kingdom. These themes focus around (i) the importance of understanding and engaging with the diverse goals and circumstances of landholders and across sectors and regions, (ii) the importance of working inclusively and collaboratively with landholders and their organisations in the design and delivery of practice improvement programs, (iii) the importance of creating a conducive or enabling adoption environment that supports knowledge exchange, addresses perceptions of risk and provides trusted advisory services and adequate financial or other rewards, and (iv) the importance of recognising the multiple sources (peer, public and private) of information that influences farmer decisions about new practices. Blackstock et al. (2010) provide a useful and succinct review of these broader conditions, and Osmond et al. (2015) examine the specific dynamics of nutrient management planning on United States farms, mirroring many of these broader considerations.
Management options and their effectiveness 97

Scientific Consensus Statement 2017—Chapter 4
There is currently interest among some stakeholders about the contribution that approaches such as social marketing, community-based social marketing and improving communication practices might make to the uptake of water quality improvement programs by primary producers in the Great Barrier Reef region or to best management practice adoption in agriculture and grazing more broadly. Several reviews that are yet to be published have been conducted of these approaches in recent months. The cane industry is also currently partnering with behavioural scientists in the development of a population-level (whole of industry) behavioural change program to increase best management practice uptake in that industry, focusing on strategies that recognise and promote desired grower behaviours (Pickering and Hong, 2016). It will be important to follow and evaluate the efficacy of these projects as they progress, to assess their contribution to the practice and knowledge of delivering water quality improvement outcomes in the Great Barrier Reef catchments.
In recent decades, rural research and development providers have encouraged the widespread use of decision support systems on farms and by extension officers including, for instance, in sugarcane production (Jakku and Thorburn, 2010). These technologies seek to assist producers by improving their capacity to model or predict productivity outcomes from different input or management scenarios (e.g. fertiliser use, water use or stocking rates) and incorporate other variables such as seasonal weather forecasts to help manage uncertainty. While the extent of uptake and ongoing use of these technologies has been considerably less than anticipated, a new generation of digital information and communication technologies utilising connections between smart devices, data platforms and remote and in-field sensing is creating renewed interest about how farmers could utilise these technologies for productivity and environmental improvements. The potential for these technologies to provide real-time location-specific feedback on environmental or crop response to different management strategies has the potential to improve farmer, program and policy learning outcomes. There are, however, several current barriers that have been identified around farmer acceptance of these technologies, including, but not limited to, how data are shared or accessed between different users (advisors, industry groups, government and private sector), how privacy is protected and how benefits are shared (Jakku et al., 2016; Wolfert et al., 2017).
Management options and their effectiveness 98

Scientific Consensus Statement 2017—Chapter 4
Table 9. Overview of established knowledge about the social dimensions of agricultural practice and insights from recent research.
Established knowledge and understanding GBR-specific information or insights Contentious, unresolved or unknown areas (for further research)
Management practice change
• Adoption of a new practice is dependent upon landholders’ expectations that the practice will allow them to better achieve their own goals. This decision is based on subjective perceptions and is sensitive to timing, local conditions and the personal, family and business circumstances of individual farmers or industry sectors.
• Perceived benefits of adopting a new practice may be focused on profitability but may also include social recognition, ease of management, meeting family goals or a reduction in regulatory risk. Landholders with strong profitability goals engage more with productivity best management practices, and those with environmental or stewardship goals engage with vegetation or riparian best management practices. Best management practice programs may unintentionally exclude some landholders because of the scope of implied or expressed benefits of the program.
• Different groups of landholders can be identified based on their adoption behaviours, goals, attitudes, norms and socio-economic characteristics. These groups trust different information sources and are more likely to work with some organisations or entities over others. Understanding the character or diversity of these attributes within the landholder target group improves participation and uptake.
• Even if farmers are aware of broader environmental problems or value biodiversity, this does not always translate to recognition or acceptance of management issues on their own properties.
• Conflicting messages about reef health, blaming and over-privileging of scientific knowledge contributes to low acceptance of environmental responsibility.
• Social barriers to participating in GBR best management practice programs include perceptions of working with government; scheme complexity; lack of social recognition; and practice changes that disrupt relationships with peers, harvesting cooperatives, contractors and suppliers. Designing delivery programs that recognise and leverage these social and cultural preferences improves participation.
• Where local industry, farmers, scientists and natural resource managers work collaboratively to design and evaluate new interventions (e.g. local technical assessment panels or monitoring outcomes of actions at paddock or sub-catchment scales), these processes of joint learning improve the building of trust in decisions and in the data, which underpin support for future action.
• Participation in GBR financial incentive programs will be improved by flexibility to tailor contracts and delivery to producers’ circumstances and by working through local, trusted intermediaries (e.g. extension officers).
• We require an improved understanding of how extension, information and advice provision impacting on practice decisions is collectively governed and coordinated in the GBR catchments, including public, private and non-government sources.
• Look beyond the farm to increase understanding of how practice improvement for water quality benefits can be encouraged through the broader social and economic networks that influence management (suppliers, contractors, buyers, family members and peers).
• Assess the enabling and disruptive potential of emerging digital technologies (sensing, information and communication technologies and big data analytics) in enhancing extension strategies, farmer decision-making, monitoring and improvement at different scales (farm to program) and the social and institutional requirements for required data sharing. Evaluate the efficacy of and learn from current behaviour change programs that seek to influence grower behaviour at farm and whole-of-industry level.
Management options and their effectiveness 99

Scientific Consensus Statement 2017—Chapter 4
Implications/considerations for management
In addition to the implications implied in the key findings above, general implications that are broadly applicable include:
• Regional bodies, governments and industry groups should be explicit and specific about the target audience for program delivery or intervention and, in doing so, recognise the particular goals and circumstances of landholders, which will vary between and within sectors and regions. Based on these assessments, set realistic targets for engagement and uptake and select appropriate engagement models.
• Governments and regional bodies should continue to work inclusively and collaboratively with landholders and their organisations in the design and delivery of practice improvement programs and look to expand partnerships to include new participants (public and private) who are a source of information that influences farmer decisions about management practices.
• All parties involved in on-ground delivery should work to maintain a conducive or enabling adoption environment that supports knowledge exchange between farmers, scientists and others (rather than knowledge transfer); that addresses perceptions of risk associated with the practice itself and participation; and that provides trusted and diverse advisory services and adequate financial, cultural or social rewards for land managers.
Management options and their effectiveness 100

Scientific Consensus Statement 2017—Chapter 4
Prioritising investments in agricultural practice change Prioritisation in relation to water quality issues in the Great Barrier Reef is the process of identifying which actions can achieve the largest environmental benefits at lowest cost and greatest certainty. Star et al. (2017) have integrated existing spatial datasets to identify where there is scope to achieve the most cost-effective water quality outcomes (informed by Chapter 3) and how that relates to the basin-specific assessment of the likelihood of exposure of pollutants to marine ecosystems (determined in Chapter 3: Waterhouse et al., 2017) and outlined above) (Figure 15). The results assess all 47 management units of the Great Barrier Reef catchment to identify the most cost-effective actions and areas for management efforts, also highlighting where there is further scope for improvement.
Figure 15. Four main steps considered in the prioritisation approach of Star et al. (2017).
The analysis involves summarising data in four key steps.
The first step is to identify the Expected pollutant reduction across the different management changes for the three pollutants by the 47 management and the different industries involved (grazing and sugarcane). For ease of analysis, these are estimated in terms of potential changes at end of catchment (transmission losses are factored in):
Expected pollutant reduction = Pollutant reduction (on-farm)*transmission rate
1
The second step is to calculate an effectiveness index, which is an integration of the expected management practice adoption, weather risk influence and paddock-scale time lags, and multiply this by estimated reductions to predict what proportion of potential changes on-farm will lead to pollutant reductions at end of catchment:
Effectiveness Index = Practice adoption rate*Weather risk*Time lags 2(a)
Pollutant load reduced = Expected pollutant reduction*Effectiveness Index 2(b)
The third step is to weight the predicted pollutant load reduction according to the estimated amount of marine exposure (i.e. the area of coral and seagrass in the area of highest exposure):
Pollutant reduction weighted for marine exposure = Expected benefits for reducing marine exposure x Pollutant load reduced
3
The fourth step is to compare the pollutant load reduction weighted for marine protection against the cost of the action:
•Options to improve water quality
•Unit pollutant reductions
What can be done
•Extent of adoption•Time lags•Climate interruptions•Transmission losses
Effectiveness of actions
•Identify threats by river plume areas
•Predict the resulting improvement in marine resources
Marine risk
• Reduction weighted by marine risk
• Cost of options
Trade-offs to consider
Management options and their effectiveness 101

Scientific Consensus Statement 2017—Chapter 4
Cost per tonne pollutant reduction weighted for marine exposure = Pollutant reduction weighted for marine protection / cost
4
The approach allows the relative benefits of each group of actions to be estimated in turn so that they can be ‘stacked’ in different ways. The measure (cost per tonne pollutant weighted for marine exposure) provide a measure of cost effectiveness that can be used to rank projects in order of priority.
The assessment includes grazing and sugarcane (excluding grains, horticulture and bananas) and uses the grazing and sugarcane management Paddock to Reef Water Quality Risk Frameworks (Australian and Queensland governments, 2013a) to determine the effectiveness of different management actions. The pollutant reductions or water quality benefits have been estimated using catchment modelling and are weighted by importance based on the associated marine Likelihood of Exposure Indexes from Chapter 3 (the latter assessed through a combination of eReefs modelling outputs, remote sensing analysis and monitoring data linked to basin end-of-catchment loads). The approach also considers landholder participation and adoption (based on existing uptake), climate variability as a risk to on-ground works, time lags to achieve benefits (greater in grazing lands, but differ by land productivity) and the costs of management change. A number of data limitations have been identified in this assessment; therefore, several assumptions are required to complete the analysis. The Cape York and Burnett Mary regions generally have fewer data than the other natural resource management regions for all input data.
The results highlight the wide range of costs and the opportunity to target investments. The more cost-effective options initially come from managing hillslope erosion in grazing lands and from various sugarcane management changes, compared to the gully and streambank approaches, which have higher costs and longer time frames for recovery. The analysis highlights that for all parameters there is a range of relatively low-cost options that can be prioritised, although these may not necessarily align well with the areas of highest marine exposure. The results of the integrated prioritisation are useful for assessing investment priorities beyond the initial assessment of relative risks to Great Barrier Reef ecosystems; however, uncertainties in the heterogeneity of the adoption, climate and cost estimates of specific practices, and the need to make assumptions in the datasets to extrapolate the data to a basin scale, remain an issue.
The effectiveness of other land management practices in improving water quality
This section provides additional information about the management of water quality sources from non-agricultural land uses—urban, ports and wetlands—as well as information on land-use change and other contaminants.
Urban
Urbanisation risks
The urban context in the Great Barrier Reef
The urbanised areas within the Great Barrier Reef are a very small part of the overall area of the catchment, occupying <1% (0.57%) of the total catchment area flowing to the reef (Waters et al., 2014).
Urban centres in the Great Barrier Reef catchment are all located in coastal areas and include Cairns, Townsville, Mackay, Rockhampton, Gladstone and Bundaberg. It is estimated that approximately 65% of the total population in the Great Barrier Reef catchment lives in coastal areas (GBRMPA, 2009). While small in area, these urban centres are key business and government centres and provide critical tourism infrastructure.
Management options and their effectiveness 102

Scientific Consensus Statement 2017—Chapter 4
The growth in these centres has varied considerably, but future urban growth is predicted at approximately 6000 dwellings over 10 years covering an area of nearly 3500 ha for Cairns, Townsville, Mackay and Rockhampton alone (Alluvium, 2016).
Key urban risks to downstream water quality
Urbanisation of an area leads to significant alterations in the natural hydrologic cycle (Duncan et al., 2014) with major increases in flow frequency, volume and intensity. These changes in hydrology result in significant increases in pollutant loads, even when the concentrations of some constituents are less than those of the pre-development land use. Changes in hydrology can be significant; Codner et al. (1988) found that the conversion of a rural area to urban land uses within a small catchment in the Australian Capital Territory resulted in the average stream flow increasing sixfold, and peak flows from a one-year annual recurrence interval storm increased tenfold. This is caused by improvement in drainage efficiency, otherwise known as ‘effective impervious area’ (the proportion of hard surfaces directly connected to stormwater drainage) whereby small increases in urbanisation have a significant impact on run-off, water quality and stream health (Walsh et al., 2005).
The overall results of these changes are larger run-off volumes and flow rates, with lower baseflows, and increased pollutant exports during rainfall events. The key pollutants of concern from urban run-off include nitrogen, phosphorous, sediments (both during the construction phase and when fully developed) and heavy metals.
In addition to the generation of polluted run-off in urban areas, the generation of wastewater means that there is always an abundance of water in urban catchment areas, which is greater than the inflows of potable water needed to supply them (Weber and Ramilo, 2012). This wastewater is collected through centralised infrastructure and treated at various levels prior to discharge, sometimes to land, but mostly directly to waterways and the Great Barrier Reef lagoon.
In the Great Barrier Reef catchment, urban areas are estimated to contribute 3.8% of the nutrient loads (from both diffuse and point sources of dissolved inorganic nitrogen), when their areal coverage is 0.57% (Waters et al., 2014). Drainage systems are also very effective at delivering these pollutants directly to the inshore lagoon, so that urban areas can be the dominant contributor to inshore waterways in their vicinity (Gunn and Manning, 2010).
Delivery pathways of urban risks
Urban pollutants are delivered to the Great Barrier Reef lagoon in a range of pathways, including direct discharge, processing (decay and enrichment) within waterways prior to release and further processing once within the lagoon. Of note is that these pathways can be transitory in nature, in that there may be very elevated pollutant loads during the construction phase of new urban areas, or they may only be related to episodic or ambient conditions (Gunn and Manning, 2010). The management approach therefore needs to be cognisant of these pathways in order to develop the most effective methods of improving downstream water quality.
Managing the risks of urban areas
Total water cycle management
Implementation of risk management practices in urban areas needs to consider a whole-of-water-cycle approach (BMT WBM and Bligh Tanner, 2012). This type of approach aims to consider the synergistic effects of all elements of the water cycle, so that rainwater, stormwater run-off, wastewater releases and potable water supply are all considered together, and management practices that maximise the effectiveness of restoring a more natural hydrologic cycle are used (Figure 16).
Management options and their effectiveness 103

Scientific Consensus Statement 2017—Chapter 4
Figure 16. Integrated water cycle management practices. (Weber and Ramilo, 2012)
The focus of integrated water cycle management is to ensure that the urban environment is provided with a range of water supplies that are fit for purpose for their end use. This ensures that discharges of pollutants are minimised by the capture and reuse of water back into the urban area. The effectiveness of these management practices has been thoroughly evaluated in a number of projects (BMT WBM and Bligh Tanner, 2012; Cook et al., 2012; Coombes et al., 2002); however, their broadscale application to the urban areas within the Great Barrier Reef region are limited (Gunn and Manning, 2010).
Substantial effort on the assessment of stormwater best management practices has been conducted through several agencies, most particularly through the former Cooperative Research Centre for Catchment Hydrology (Duncan, 1999; Persson et al., 1999), the Institute for Sustainable Water Resources (Fletcher et al., 2004) and the Facility for Advancing Water Biofiltration (Bratieres et al., 2008). More recently, the Cooperative Research Centre for Water Sensitive Cities has focused on not just the performance of on-ground treatments but also on investigations of the methods and barriers to improving the transition to a water sensitive city (Brown et al., 2009). In addition, the effectiveness of point source and total water cycle management approaches has been investigated by the Urban Water Security Research Alliance (Lane and Lant, 2012; Hall, 2012) and the Water Recycling Centre of Excellence (http://www.australianwaterrecycling.com.au).
Effectiveness of management practices
Stormwater management
The management of urban stormwater has been refined over the last 30 years as the principles of water sensitive urban design became embedded in industry. Water sensitive urban design is very similar to integrated water cycle management, though much of the research in recent years has been focused on stormwater to help improve our understanding of performance of on-ground systems. The challenge with this is that the research was largely confined to Brisbane and Melbourne (Fletcher et al., 2002; Hatt et al., 2009). Many stormwater treatment measures have
Management options and their effectiveness 104

Scientific Consensus Statement 2017—Chapter 4
been implemented in the Great Barrier Reef and there are significant investments in capacity building (Gunn, 2015) but performance measurement is largely confined to modelling (Wong et al., 2002). There is a strong need to verify the performance of treatment measures in the urban centres of the tropical Great Barrier Reef.
Stormwater management performance measures reported here are largely dependent on those research efforts noted above. While not definitive in the Great Barrier Reef context, these results provide a good indication of likely performance in that environment.
Wetlands
Somes and Wong (1997) and Persson et al. (1999) evaluated a range of wetlands and completed fundamental research into the performance of vegetated and unvegetated systems. This showed that the performance of wetlands was strongly correlated to their hydraulic effectiveness. Design curves were produced that showed that, across Australia, wetlands in tropical environments needed to be significantly larger than those in temperate environments to achieve the same performance. For tropical systems, wetlands would need to be in the order of 10% of the upstream impervious area to achieve design criteria (Fletcher et al., 2004, based on 1800 mm/yr run-off).
Note that the use of wetlands and treatment systems in the wider catchment is discussed further in section 7.3.
Vegetated swales
The use of vegetated swales was a very strong focus of initial applications of water sensitive urban design (Lloyd et al., 2002). Subsequent field trials showed that they were very effective in subtropical environments for reductions in TSS and TP (total phosphorus but less so for total nitrogen (TN) (Fletcher et al., 2002).
Biofilters
In terms of efficacy, biofiltration systems, also called bioretention systems and raingardens, are more effective per unit area than wetlands or other vegetated treatment systems (Hatt et al., 2009). They have been extensively applied within a range of tropical and subtropical systems, and ongoing evaluation of field-based systems continues to show their effectiveness at removing TSS, TN and TP (Bratieres et al., 2008). They have also been demonstrated to be highly effective at removal of heavy metals, though excessive accumulation of pollutants can lead to breakthrough (Hatt et al., 2011). Their application within dry tropical climates has been noted as problematic due to vegetation loss during the dry season (Townsville City Council, 2017). Modifications to the design of systems with saturated zones promoting ongoing watering of vegetation through dry periods has alleviated this somewhat (Glaister et al., 2014). These saturated zones have also been demonstrated as highly effective in promoting denitrification due to soil moisture retention in between rainfall events. A diagram of the typical configuration of these systems is shown in Figure 17 below.
Management options and their effectiveness 105

Scientific Consensus Statement 2017—Chapter 4
Figure 17. Typical saturated zone biofilter configuration (Townsville City Council, 2017)
The primary removal processes are associated with wetting and drying of the filter media (Parker et al., 2009), biofilm growth and plant uptake (Hatt et al., 2009).
Rainwater and stormwater harvesting
Given the surplus of water in our urban environments, we need to consider ways of reducing discharged water volumes. One of the ways this can be accomplished is by capturing and reusing rainwater and stormwater. There has been considerable research regarding the role of rainwater harvesting in alternate water supplies (see Coombes et al., 2002; Maheepala et al., 2013) and work completed as part of the Institute for Sustainable Water Research and the Cooperative Research Centre for Water Sensitive Cities has been able to demonstrate the importance of stormwater harvesting as a method to reduce hydrologic impact and the pollutants associated with stormwater run-off (Mitchell et al., 2007). The overall effectiveness of harvesting and reuse programs is strongly governed by demand (Weber and Ramilo, 2012), and maximising the use of harvested water will lead to significant reductions in downstream hydrologic and water quality impacts.
Infiltration
Another method to ‘lose’ water out of the stormwater drainage system is to infiltrate it into shallow groundwater systems. Infiltration treatment systems are usually designed in a very similar way to biofiltration systems in that there is a filtration component consisting of a soil media that also supports vegetation. The filtered water then is allowed to infiltrate into the sub-surface soils and shallow groundwater. This ensures that the water quality is sufficient prior to entering the groundwater and promotes a return to a more natural hydrologic cycle (Walsh et al., 2005). The ability to infiltrate water will be largely dependent on the underlying soil and hydrogeological setting.
Retention and detention
A different approach to urban stormwater management has been proposed in Allen et al. (2004), whereby the overall management of stormwater for both water quantity (hydrology and flooding) and quality is considered in an integrated framework. This looks at the effectiveness of retaining water on-site for reuse through rainwater harvesting and infiltration. The aim is to maintain a ‘regime-in-balance’ approach that considers the capacity of existing infrastructure and reduces
Management options and their effectiveness 106

Scientific Consensus Statement 2017—Chapter 4
impacts from future development. While not specifically focused on water quality, the impacts in mitigating downstream hydrologic change would mean that overall reductions in stormwater run-off would reduce pollutant loads, in addition to lowering stream energy during run-off events, reducing bed and bank erosion and restoring baseflows (McIntosh et al., 2013).
Aquifer storage and recovery
The use of aquifer storage and recovery has been well developed in South Australia (van Roon, 2007) and has seen some limited application in other states. To date, this is not widely used in Queensland. However, where shallow aquifers are available, the ability to capture, treat and store stormwater run-off could achieve similar benefits to stormwater-harvesting schemes. Further research on the suitability of aquifers in the urban areas of reef catchments would assist in the implementation of this approach.
Erosion and sediment control
The proper management of the construction phase of development is an essential component of managing future urban growth. There are limited data on the effectiveness of erosion and sediment control measures in the Great Barrier Reef catchments, and unless there are specific development approval conditions or significant compliance breaches, water quality monitoring associated with urban development erosion and sediment control measures is generally not undertaken (Gunn, 2015). In lieu of specific monitoring data, erosion and sediment control efficacy was modelled for developing areas for the Townsville Water Quality Improvement Plan and compared to other land uses, including for mature urban with and without water sensitive urban design measures in place (see Figure 18 below).
Figure 18. Relative loads of unmitigated and mitigated urban construction phase relative to existing land-use loads. (Gunn and Manning, 2010)
As illustrated above (Figure 18), the potential sediment generation rate for developing urban areas (the five scenarios on the left with different levels of erosion and sediment control [ESC] measures)
Management options and their effectiveness 107

Scientific Consensus Statement 2017—Chapter 4
is significantly higher than for other land uses (shown on the right). A number of studies examining the performance of high-efficiency sediment basins (Auckland Regional Council, 1999) suggest that these may be effective in removing up to 99% of fine sediment, although this has not been verified for Great Barrier Reef catchments.
Non-vegetated treatment systems and proprietary products
Other treatment measures exist where vegetation is not the primary form of treatment. These include trash racks, below-ground gross pollutant traps, cartridge and media filtration systems. Typically, these were first developed for sediment and gross pollutants, but newer treatment systems using dedicated media for water filtration have shown promise in reducing nutrients such as nitrogen and phosphorus (Drapper and Hornbuckle, 2015). In addition, floating treatment wetlands have also shown some promise (Nichols et al., 2016) for sediment and nutrient removal; however, as with any treatment device, their operation in tropical run-off regimes needs to be verified. Wicks et al. (2011) provided evidence of operation of an engineered treatment system in the Wet Tropics with removals of nitrogen and phosphorus reported; this also demonstrated overall export of dissolved inorganic nitrogen.
Non-structural measures
The Cooperative Research Centre for Water Sensitive Cities researched the importance of institutional capacity to move towards more water sensitive outcomes (Brown et al., 2009). Morison and Brown (2011) found that there were generally gaps between the stated objectives of local governments around water sensitive urban design and their capacity to deliver it. Leadership support can help facilitate adoption (Taylor A.C. et al., 2012). Current initiatives are underway to increase the capacity of local government in the Great Barrier Reef region to implement best practice stormwater management and erosion and sediment control (Gunn, 2015).
Taylor and Wong (2002) studied the efficacy of a range of educational and regulatory approaches for stormwater pollution and, in some cases, demonstrated measurable water quality improvements were possible, especially for litter management, though these needed to be maintained over the long term and there are risks of short-term improvements being lost over time.
Wastewater management
Nutrient reduction
There has been a large investment across Queensland in the improvement of wastewater management within sewage treatment plants (STPs) for nutrient reduction (Gunn and Manning, 2010), largely focused on nitrogen reduction. Further investigation on the status of existing treatment plant performance for urban centres would be to determine the potential for any additional improvements or if the limit of feasible nutrient reduction with existing technology has been reached.
Recycling
The Australian Water Recycling Centre of Excellence has produced a large body of work focusing on improving the understanding of the role, resources and performance of a range of water recycling approaches. Wastewater recycling, whereby the nutrients contained in the water are placed back into the landscape through land application to agriculture, can have significant benefits in reducing downstream nutrient loads, though the pathways through connections in shallow groundwater systems need to be better understood (Pitt et al., 2015). As for stormwater management, the ability to lose water from the urban water cycle through recycling can have significant benefits in reducing potable water demand; however, the direct linkage to improvements in water quality are less clear.
Management options and their effectiveness 108

Scientific Consensus Statement 2017—Chapter 4
Potable water management
Demand reduction
Fielding et al., 2012 demonstrated that focusing on the reduction in potable drinking water demand through efficient appliances and hardware can lead to reductions in wastewater volumes and may also be very effective in reducing energy requirements for water management (Hussey and Pittock, 2012). Reduction in wastewater loads should have a positive effect on downstream water quality.
Alternate water sources
A process that delivers water that is fit for its end use is a fundamental principle of integrated water cycle management (Weber and Ramilo, 2012). The use of alternative sources of water such as those highlighted above (harvested rainwater, stormwater and recycled wastewater) provides opportunities to reduce the overall demand on potable water supplies. The challenge with the surplus of water through these alternate sources is to ensure that they are fit for the end use, but also that demand management is still used so that these sources are not overused as fail-safe or backup supplies. Without management of demand, it may be that only minimal reductions in downstream pollutant loads may occur as the pollutants captured through harvesting and recycling schemes are placed back onto the landscape ready to be washed off by future run-off events.
Integration of water cycle management practices
As noted in the introduction to this section, the integrated water cycle management approach can help deliver multiple benefits for hydrology, potable water demand, wastewater reduction and water quality. The Living Waterways approach (Water by Design, 2014) provides a framework for integrating new urban developments within a basin-scale assessment of urban catchments that allows the loads and flows from existing and new urban areas to be considered (BMT WBM and Bligh Tanner, 2012).
One of the challenges in ensuring this integration is the management of competing water sources for the same water demand (Weber and Ramilo, 2012). A good example of this is the use of harvested stormwater or recycled water for irrigating sportsgrounds or parks. Both sources of water would be fit for this end use, but if stormwater harvesting is used, then there would be only minimal other demands for recycled wastewater, such that the environmental benefit could be realised of only one of these alternate water sources, not both. Ensuring that both the end use and environmental benefit is considered, in addition to the costs of implementing both, is necessary to ensure efficient overall delivery of the maximum benefits.
Flooding is another area which is not often well integrated into integrated water cycle management, but large-scale flood schemes where retention and detention are considered at the source and regional scales may also provide opportunities to integrate water quality and stormwater harvesting approaches. The approaches in Allen et al. (2004) offer a viable integration method for all elements of the water cycle, including flooding.
Future research and data needs The use of management practices for urban water management has been increasing across the reef catchments; however, there is a strong need to undertake further scientific research around the effectiveness of those practices in the range of tropical climates present in the area. A focus on the ability of these treatments to deal with the changes in extremes because of climate change is also necessary, as more intense rainfalls may limit the functionality of some treatments, and longer dry periods may affect the plant survival of vegetated treatment systems (Townsville City Council, 2017).
Asset management and institutional capacity to deliver the range of approaches are also areas that would benefit from further work (Gunn, 2015).
Management options and their effectiveness 109
Scientific Consensus Statement 2017—Chapter 4
The integration of all water cycle elements in a coordinated way (across agencies and utilities) is improving, but there are not any dedicated efforts in this space and it is largely implemented through existing networks and connections such as the Reef Urban Stormwater Management Improvement Group.
Conclusions The management of the impact of urban environments in the reef catchments is an important part of the future of the reef itself, both because of the high potential of urban spaces to efficiently deliver pollutants directly to nearshore receiving environments, but also because of their role in supporting tourism, social amenity and economic growth within regional Queensland. The sustainable delivery of future urban growth, while also focusing on the impacts from existing urban areas should therefore continue to be a focus of future management efforts within the reef. The state of knowledge and implications for the management of urban water quality in the Great Barrier Reef are summarised in Tables 10 and 11.
Management options and their effectiveness 110

Scientific Consensus Statement 2017—Chapter 4
Table 10. Overview of knowledge about urban water quality management in the Great Barrier Reef
Established knowledge and understanding
GBR-specific information or insights Contentious, unresolved or unknown areas (for further research)
Overarching • Stormwater quality management • Integrated water cycle management • Effectiveness of some vegetated
treatment systems • Evaluation of performance of
treatment systems under climate change
• Wastewater management approaches
• Some information and guidance are available for reef catchments through particular local governments and Water Quality Improvement Plans.
• Capacity-building programs are currently underway.
• Lack of GBR-specific measured performance • Further work on integration of all water cycle
elements • Understanding of the capacity of agencies and
utilities to support delivery of management practice changes
Factors influencing urban water quality
• Construction phase management (erosion and sediment control)
• Imperviousness connection • Rainfall intensity
• Monitoring undertaken in Mackay and Townsville indicates high variability of stormwater quality.
• Applicability of monitoring and scientific assessments from other areas of Australia to the GBR
Water quality management
• A range of techniques are available across stormwater, wastewater, rainwater and potable water.
• Integration of water cycle management is critical.
• Water Quality Improvement Plans have highlighted the opportunities for specific management actions.
• The adoption of specific management practices, especially associated with vegetated treatment systems, has required significant modifications of design approaches from other states. This still has not been fully explored in the various reef catchment regions.
Table 11. Implications and management considerations for the management of urban contributions to Great Barrier Reef water quality
Implications/considerations for management
Whole-of-water-cycle approaches
• Consideration of all elements of the water cycle and how they can be synergistic should be undertaken in any assessment of future urban water quality management.
Existing urban areas
• The existing urban areas within the reef catchment are contributing high areal pollutant loads; while these are not significant in terms of overall reef catchment loads, the economic importance and proximity of these urban areas to the inner lagoon means that the impacts of the pollutant loads may be substantial.
Hydrology management
• There is a strong need to properly consider the role of hydrologic management to reduce water quality impacts from increased imperviousness during urbanisation of greenfield areas and in the management of stream health for waterways within and downstream of urban areas.
Management options and their effectiveness 111

Scientific Consensus Statement 2017—Chapter 4
Ports There are 20 operational ports along the Queensland coastline (DTMR, 2016), including 13 ports within or near the Great Barrier Reef World Heritage Area (GBRMPA, 2014a). Queensland ports are managed by port authorities that are owned by the Queensland Government and operate within Environmental Management Systems (EMS) developed to comply with International Organization for Standardization (ISO) 14001:2004. The Queensland Government’s Sustainable Ports Development Act 2015 provides for the protection of the Great Barrier Reef World Heritage Area through managing port-related development in and adjacent to the area. The Act identifies priority ports located along the Great Barrier Reef coast as follows:
• Port of Abbot Point (managed by North Queensland Bulk Ports Corporation Limited) • Port of Gladstone (Gladstone Ports Corporation Limited) • The ports of Hay Point and Mackay (North Queensland Bulk Ports Corporation Limited) • Port of Townsville (Port of Townsville Limited).
These ports, the Port of Weipa and the Port of Brisbane, are the largest in Queensland (Grech et al., 2013).
Factors influencing port water In addition to the water quality impacts associated with any coastal waters in Queensland, water quality in industrial ports can be influenced by factors including discharge and run-off from portside industries and port activities. These may include ship movements, berthing, loading and unloading; wharf or industrial construction; maintenance dredging, capital dredging; and land reclamation (Flint et al., 2015).
Shipping movements, propeller wash from large ships and berthing at wharves can resuspend benthic sediments (Grech et al., 2013), and water quality contamination at wharves can occur through spills and wash down when loading and unloading freight (GPC, 2014). These activities are regulated through environmental authorities under the Queensland Environment Protection Act 1994. Shipping activities can result in pollution from ships (e.g. oil, sewage, garbage) and the discharge of high-risk ballast water (i.e. salt water from ports and coastal waters outside Australia’s territorial sea); both actions are prohibited under Australian and Queensland government legislation. Discharge of ballast water also carries a biosecurity risk of the introduction of marine pests. Antifoulant coatings are another potential source of water pollution that is prevalent in ports. Following restrictions on tributyltin use due to its universal toxicity to marine organisms, copper-based biocides have become the predominant antifouling agent. However, the use of copper is now also being restricted or regulated in some areas due to its potential for toxic effects (Dafforn et al., 2011).
Dredging is an important port maintenance requirement for safe transportation activities. Ports conduct maintenance dredging of channels and berths to fulfil their operational obligations under the Queensland Transport Infrastructure Act 1994. In large ports, maintenance dredging may be conducted annually. As an example of dredge volumes, in the decade from 2004 to 2013, maintenance dredging in the Port of Gladstone averaged 164,000 m3/yr. In addition, larger capital dredging projects may be undertaken to increase port access; for example, the recent Western Basin Dredging and Disposal Project in the Port of Gladstone dredged 22.5 million m3 (Flint et al., 2015). Dredging can cause direct physical damage to inshore marine habitats (e.g. seagrasses), and increased rates of localised turbidity, sedimentation and deposition can also indirectly alter habitats (Erftemeijer and Lewis, 2006). The release of any pollutants that are bound to fine sediments can increase the bioavailable toxicants to organisms in the area (Lohrer and Wetz, 2003; Erftemeijer et al., 2012).
Management options and their effectiveness 112
Scientific Consensus Statement 2017—Chapter 4
Disposal of dredge material also affects water quality, with impacts depending on the quantity of material, the method of disposal, the proximity to sensitive ecosystems and the potential for dispersal (Erftemeijer and Lewis, 2006). The recently introduced Queensland Government’s Sustainable Ports Development Act 2015 prohibits sea disposal of capital dredge material in the Great Barrier Reef World Heritage Area. Some attention has been given to the impacts of sea disposal of dredge material in the Australian scientific literature (e.g. Grech et al., 2013; Brodie, 2014), but research into the effects of land disposal of dredge material is lacking. Land-based disposal may become more frequent following the introduction of the Act, and the implications of this for the coastal environment need to be better understood.
Water quality management in ports
Many ports are located in estuaries, which are particularly complex ecosystems to monitor and evaluate, making it difficult to differentiate between effects of industrial and natural processes (Hallett et al., 2016a). Environmental management in Queensland ports is complex and primarily the responsibility of the Queensland Government (SEWPaC, 2013). As ports cross jurisdictional boundaries, local governments and the Australian Government also have some responsibility for port governance activities in Queensland. A range of international agreements and Australian and Queensland government legislation relates to managing water quality, and matters that may be affected by water quality, in Queensland ports. Hallett et al. (2016b) reviewed Australian approaches to monitoring and assessing estuarine conditions, including those in key ports such as Gladstone.
The Australian Government’s role relates to matters in the national interest, the protection of matters of national environmental significance and international maritime issues such as sea dumping and ballast water. Water quality objectives and environmental values, scheduled under the Queensland Environment Protection (Water) Policy 2009 define locally relevant values and objectives for some Queensland regions. Where water quality objectives and environmental values are in place, they also apply to ports operating within the specified region.
Several levels of legislation apply to ship-based pollution of marine and coastal environments. The Queensland Transport Operations (Marine Pollution) Act 1995 aims to protect marine and coastal environments from ship-based pollution including discharges of oil, noxious liquids, sewage and garbage from ships operating in Queensland coastal waters and pilotage areas. The Protection of the Sea (Prevention from Pollution from Ships) Act 1983 is administered by the Australian Maritime Safety Authority and implements the International Convention for the Prevention of Pollution from Ships in Australian waters. Publicly available records of prosecutions for ship-sourced pollution are maintained by the Australian Maritime Safety Authority. Ballast water management is now legislated under the Australian Biosecurity Act 2015.
Port activities in and near the Great Barrier Reef have increased in the last 20 years, and there are proposals for additional port expansions, primarily driven by resource sector growth. The effects of port activities can be significant but tend to be localised, unlike other human impacts such as overland run-off. While the recent and future increase in port expansions poses a possible threat to the ecological integrity of the Great Barrier Reef, it is recognised that ‘to date port developments have not resulted in any significant, widespread deterioration of the Region’ (GBRMPA, 2014a, p. 205). Australian ports are considered to be generally well managed, although planning and environmental monitoring could be improved (GBRMPA, 2014a).
Monitoring and assessment
Monitoring and assessment programs for water quality in Queensland ports vary between regions. Coordinated ambient monitoring programs operate only in some ports, and public reporting of port water quality is variable. Hallett et al. (2016b) note that while monitoring and reporting programs in Queensland generally meet international best practice criteria, there is scope for better coordination
Management options and their effectiveness 113
Scientific Consensus Statement 2017—Chapter 4
and standardisation. There is a case for considering the establishment of a minimum standard for long-term far-field water quality monitoring and assessment in large ports that are within, or near, the Great Barrier Reef. One of the most extensive port water quality monitoring programs in Queensland is the Port Curtis Integrated Monitoring Program Inc., comprising industries and organisations operating in or near the Port of Gladstone (Flint et al., 2015). The program undertakes ambient far-field water and sediment quality monitoring in Port Curtis and reference sites. The Independent Review of the Port of Gladstone noted that the public release of the program’s monitoring data would improve public confidence in the program (SEWPaC, 2013, Finding 15). More comprehensive assessments of environmental conditions are provided by the Gladstone Healthy Harbour Partnership Report Cards (ghhp.org.au/report-cards), which incorporate Port Curtis Integrated Monitoring Program data on water and sediment quality, together with a range of other measures.
Conclusion Ports impact water quality through a range of direct and indirect impacts including run-off and discharge from port facilities and portside activities, shipping movements, construction, capital and maintenance dredging and land reclamation. Water quality monitoring in Queensland ports is variable, and public reporting of results is currently limited. Understanding the impacts of ports is particularly difficult in estuaries. The impacts of land-based disposal of dredge material requires further research. Improved water quality monitoring, assessment and reporting in Great Barrier Reef ports is needed. The state of knowledge and implications for the management of port water quality in the Great Barrier Reef is summarised in Table 12.
Management options and their effectiveness 114

Scientific Consensus Statement 2017—Chapter 4
Table 12. Overview of knowledge, areas of further research and implications for the management of water quality in Great Barrier Reef ports.
Established knowledge and understanding GBR-specific information or insights Contentious, unresolved or unknown areas (for further research)
Overarching • Queensland ports are managed by port authorities owned by the Queensland Government.
• Queensland ports operate under Environmental Management Systems (EMS) developed to comply with ISO 14001:2004.
• Thirteen13 ports are location within or near the GBR •
Factors influencing port water quality
• Water quality in industrial ports can be influenced by discharge and run-off from portside industries, port activities and other impacts associated with all coastal waters.
• Port activities that may affect water quality include ship movements, berthing, loading and unloading; wharf or industrial construction; maintenance dredging and capital dredging; and land reclamation.
• • In ports located within estuaries, in particular, it can at times be difficult to differentiate port-related water quality impacts from catchment/terrestrial impacts.
• The potential effects of land-based disposal of dredge material is an area requiring further research.
Water quality management
• Environmental management in ports is complex and primarily the responsibility of the Queensland Government.
• Local governments and the Australian Government also have responsibility for some specific port governance activities in Queensland.
• The Queensland Government’s Sustainable Ports Development Act 2015 provides for the protection of the Great Barrier Reef World Heritage Area through managing port-related development in and adjacent to the area.
• A range of international agreements and Australian Government and Queensland Government legislation relates to managing water quality, and matters that it may affect, in GBR ports.
•
Monitoring and assessment
• The level of monitoring and assessment of water quality varies between ports.
• • Some ports are less well monitored than others, and public reporting of results is currently limited.
Implications/considerations for management
There is a case for considering the establishment of a minimum standard for long-term far-field water quality monitoring and assessment in large ports that are within, or near, the Great Barrier Reef. An example of an established port water quality monitoring program is the Port Curtis Integrated Monitoring Program Inc., which undertakes ambient far-field water and sediment quality monitoring in and around the Port of Gladstone. Results are incorporated into the Gladstone Healthy Harbour Partnership Report Cards.
Management options and their effectiveness 115

Scientific Consensus Statement 2017—Chapter 4
Wetlands and treatment systems
Wetlands and coastal ecosystems
Potential for improving water quality
This section outlines the potential role that Nntural and modified estuarine and freshwater wetlands2 in the catchments of the Great Barrier Reef can have in improving water quality entering the Great Barrier Reef lagoon. However, it is important to understand that these pollutants can also have significant negative impacts on wetlands themselves (these are considered in Chapter 1: Schaffelke et al., 2017).
While wetlands represent a relatively small area of the landscape, they contribute to biodiversity, carbon sequestration and improvement of water quality of the Great Barrier Reef (Conolly et al., 2012; Arthington et al., 2014; Tran and Dargusch, 2016; Mitsch, 2016). The potential capacity of wetlands to improve water quality for the Great Barrier Reef is influenced by the size and type of wetland (open water, vegetated, etc.), residence time, wetland location and condition and hydrological connectivity.
The role of wetlands in nutrient processing in tropical and subtropical wetlands of the Great Barrier Reef catchment has not been adequately assessed and remains a key knowledge gap. Most studies on the role of wetlands for improving water quality have been conducted in temperate locations and in the tropical Everglades, Florida (e.g. Mitsch, 2016). While much of the information presented here is drawn from studies in other locations, the general principles should be applicable to Great Barrier Reef catchments. However, the wetlands in the Great Barrier Reef region, like other tropical wetlands, experience high flow variability (Jardine et al., 2015; Davis et al., 2017), and consideration should be given to the variability of flows across the Great Barrier Reef catchments when assessing potential treatment efficacy, for example the very high flows during flood conditions in the Wet Tropics and the irrigated cropping areas in the Lower Burdekin.
There are several aspects of wetlands that contribute to improving water quality, including denitrification and the capacity to store and absorb nutrients; these are outlined further below. Around the world, there is general consensus that wetlands are crucial for improving water quality at the landscape level (Verhoeven et al., 2006; Mitsch et al., 2001; Mitsch, 2016). In recognition of the potential role of wetlands to improve water quality, the Swedish government will protect and restore 1574 wetlands to reduce nitrogen and phosphorus run-off into the Baltic Sea (EU Water Framework Directive, 2016). In the United States, it has been found that a wetland area of 3–7% of the catchment can remove 20–50% of the nitrogen from the Mississippi Basin and the tropical Everglades in Florida (Mitsch et al., 2001; Mitsch and Day, 2006; Mitsch, 2016). Wetland restoration is an increasingly used approach for improving water quality at the basin scale. Riverine and palustrine wetlands restored by the Department of Agriculture in the United States have improved water quality and delivered additional ecosystem services, such as carbon sequestration (Marton et al., 2014).
Nutrients
Natural and modified natural wetlands can remove nitrogen and phosphorus from water that flows through them (Land et al., 2016). In a review of over 200 wetlands with a variety of hydrological and rainfall characteristics, 58 of them in equatorial locations, Land et al. (2016) demonstrated that wetlands can remove nitrogen at a median rate of 93 g/m2/yr and phosphorus at a rate of 1.2 g/m2/yr, a removal efficiency of 39% and 46% respectively. In South East Queensland, mangroves
2 Freshwater wetlands include lacustrine, palustrine, riverine and subterranean wetlands (refer Chapter 1 definitions)
Management options and their effectiveness 116
Scientific Consensus Statement 2017—Chapter 4
can function as a sink for nitrous oxides (NOx) and soluble reactive phosphate (SRP) with removal rates of 16 g/m2/yr and 6 g/m2/yr respectively. This is a net efficiency of up to 28% for NOx and 51% for SRP (Adame et al., 2010a; Adame et al., 2012a). Thus, at a local scale, wetlands can be considered important for decreasing nutrient loads based on three lines of evidence:
1. Denitrification is common in wetlands: The conversion of nitrite to nitrogen gas by denitrifying bacteria is usually high in sediment where oxygen concentrations are low and organic carbon is high, conditions that prevail in most wetlands (Mitsch and Gosselink, 2016; Bryant et al., 2008). The role of wetlands in denitrification in Great Barrier Reef catchments is currently being investigated under an Advance Queensland Research Fellowship ‘Cost-effective restoration of wetlands that protect the Great Barrier Reef’ involving the Australian Rivers Institute, Griffith University and the Queensland Department of Environment and Heritage Protection.
2. Wetlands soil can store nutrients and carbon: Anoxic conditions and high sedimentation rates in wetlands results in the storage of carbon and nutrients for decades, centuries or even millennia (Adame and Fry, 2016; Wooller et al., 2007. In the Great Barrier Reef catchments, riverine and intertidal wetlands retain and accrete terrestrially derived sediment and the carbon and nutrients associated with it (Adame et al., 2012b). While the capacity of a wetland to store phosphorus is usually limited at chemical saturation levels, nitrogen can be continually taken and stored for decades (Craft, 1996). Recent and ongoing research in the Great Barrier Reef catchments has shown that particulate nutrients can become bioavailable and more mobile under the action of microorganisms, both in freshwater and saline environments. The bioavailability of particulate nutrients depends on multiple factors including land use and soil type source, particle size and erosion type (surface versus sub-surface) (Burton et al., 2015; Garzon-Garcia et al., 2016). This process is likely to occur within the wetland environment and would most likely vary in importance with wetland type.
3. Wetlands are highly productive: In the tropical floodplains of Australia, algae, macrophytes, grasses, sedges, shrubs and trees absorb nutrients from the water to support their high production. While microalgae is consumed rapidly (Jardine et al., 2012), macrophytes can store nutrients for months or years and large trees for decades or even centuries.
These functions depend on several factors, and in the Great Barrier Reef catchments residence time is a major limiting factor in the capacity of wetlands to process nutrients under flood conditions. During large floods, nutrients are rapidly mobilised through the river channels into the coastal zone and marine environments (Davis et al., 2017). Wetlands may provide little protection from the large amounts of nutrients discharged into the Great Barrier Reef lagoons during these flood events (McJannet et al., 2012). The exceptions to this could be small sub-catchments, where the ratio of wetlands to other land uses allows processing to occur, or in deltaic systems, where large areas of wetlands and floodplain are flooded for long enough to process the nutrients before they are exported to the Great Barrier Reef lagoon.
While nutrients, pesticides and sediments will impact on freshwater and estuarine systems during low- and medium-flow events, these wetlands also have the potential to ameliorate these pollutants in line with the characteristics, location and extent of the wetlands (see chapters 1 and 3). Additionally, pollutant removal during the low- to medium-flow events means they are no longer in the catchment to be remobilised during high-flow events.
In areas such as the Lower Burdekin, irrigation has resulted in continuous flows through irrigation channels and into creeks and other wetlands systems. In these irrigated systems residence time is high and vegetation (much of it exotic) is often extensive, leading to increased potential to improve water quality. High-flow events in the Lower Burdekin may still result in removal of nutrients
Management options and their effectiveness 117

Scientific Consensus Statement 2017—Chapter 4
through natural wetlands as the flat topography contributes to increasing residence time (refer Chapter 3).
Thus, many wetlands in the Great Barrier Reef catchments are likely to act as sinks of nutrients and carbon in the long term. Variations across hydro-morphological settings, hydrological connectivity (groundwater and surface water), wetland type and position in the landscape need to be assessed to understand their role within the whole landscape and throughout the year (Mitsch and Gosslink, 2000; Noe and Hupp, 2009). Highest nitrogen and phosphorus removal occurs at temperatures above 15°C; at low to medium hydrologic loading rates, that is, low volumes of water in high surface area of wetlands; where vegetation is dense; and when nutrient concentrations are less than 25 kgN/ha/yr and 10 kgP/ha/yr with relatively constant rates of flow (Holmes et al., 1996; Adame et al., 2010a; Land et al., 2016; Verhoeven et al., 2006; Mulholland et al., 2008). For example, in subtropical Queensland, nutrient uptake of mangroves was highest during wet periods in sites where nutrient loads were intermediate (Adame et al., 2010a).
Restored wetlands can also have a role in improving the quality of the water that flows through them (Land et al., 2016). Restored wetlands can rapidly accumulate phosphorus in the soil at a rate of 10–60 kg/ha/yr, mostly due to chemical adsorption and precipitation in the soil (Craft, 1996). Chemical accumulation of phosphorus decreases after 10 years of restoration, but accumulation of phosphorus as organic material will continue many decades after restoration (Craft, 1996). The nitrogen accumulated in restored wetlands can reach 60 kg/ha/yr, mostly as soil accumulation of organic matter (Craft, 1996). Other wetlands will take longer to start acting as nutrient sinks. In restored agricultural land, wetlands can act as sources of phosphorus and will not retain nitrogen in the first years after restoration, probably due to the flushing of accumulated nutrients in the soil, and the legacy of past nutrient enrichment and hydrological modifications (Mitsch et al., 2015; Land et al., 2016). Restored wetlands might act as a source of methane and nitrous oxide; however, emissions are usually lower compared to agricultural fields (Morse et al., 2012).
Sediments
Some wetlands can improve water quality by retaining suspended sediments from the water that enters them (Johnston, 2009; Noe and Hupp, 2009; Erskine et al., 2017). Mangroves, saltmarshes and seagrass in the Great Barrier Reef can retain sediment derived from the land (Adame et al., 2012b); for example, mangroves at Middle Creek, Cairns, have been shown to trap up to 80% of the sediment entering the forest during tides (Furukawa et al., 1997). Wetlands can be partly characterised by the dominant vegetation that grows in them, that is, grasses, sedges, shrubs or trees. This vegetation has the capacity to slow down water flow and promote sedimentation or trapping (Coops et al., 1996; Aquatic Ecosystem Task Group, 2012; WetlandInfo, 2016). Some of the sediment trapped by a wetland can be resuspended, but some will be stored for years or even centuries (Noe et al., 2016).
A recent study in the Northern Territory showed that sediment fluxes were low because of low soil erosion rates and because upstream floodplains and downstream wetlands trap and store sediment (Erskine et al., 2017). Floodplain wetlands of Chesapeake Bay in the United States can retain up to 24% of nitrogen and 59% of phosphorus as sediment that otherwise would have been exported into the Chesapeake Bay (Noe and Hupp, 2009). Rivers surrounded by riparian vegetation in subtropical Queensland had 50-200 times less sediment loads compared to those without vegetation (Olley et al., 2015).
The capacity of wetlands to trap sediment is related to the degree of hydrological connection, water flow velocity, geomorphology, plant composition, sediment characteristics and structure complexity (Adame et al., 2010b; Lovelock et al., 2014). In South East Queensland, fringe mangroves were more efficient than marshes and cyanobacterial mats in retaining land-sourced sediment (Adame et al., 2010a; Adame et al., 2010b). Floodplain wetlands with large areas and longer inundation periods retain a greater proportion of riverine loads compared to smaller wetlands that are infrequently
Management options and their effectiveness 118
Scientific Consensus Statement 2017—Chapter 4
inundated (Noe and Hupp, 2009). Thus, as for nutrients, wetlands that are frequently flooded and are hydrologically connected have the highest capacity of retaining sediments, with the highest sediment retention rates during episodes of low to medium flows.
It should be noted that where freshwater wetlands are within closed depressions, sediment retention can only be temporary as the wetlands will cease to exist or become reduced in extent if they become filled with sediment.
Pesticides
Pesticides are leached from agricultural land in the Great Barrier Reef catchment into rivers and also transported as run-off into wetlands, including after the first large rainfall event of the season (Lewis et al., 2009; O’Brien et al., 2016; Davis et al., 2014; Davis et al., 2017; Devlin et al., 2015). Wetlands can accumulate pesticides; for example, wetlands close to agricultural lands accumulate atrazine, acetochlor and trifluralin (Belden et al., 2012). In tropical latitudes, studies are minimal, but pesticides have been found in surface water, groundwater and wetlands, especially coastal freshwater wetlands, within the Great Barrier Reef catchment (Devlin et al., 2015). A range of pesticides have been detected in intertidal wetlands at Bowling Green Bay (Shaw et al., 2012), and PSII pesticides have been detected in the Mackay Whitsunday and Burnett Mary regions (Devlin et al., 2015). An indirect measurement of pesticide transport (glomalin-protein) that binds and transports potentially toxic elements (Gonzales-Chavez et al., 2004) has shown that pesticides are deposited in intertidal wetlands of the reef (Adame et al., 2012b).
Pesticides can be retained and processed in wetlands through four main processes: physical retention through absorption and precipitation, chemical retention through reduction and hydrolysis, biological retention through plant absorption and biogeochemical retention through microbial degradation (Vymzal and Březinová, 2015). In the Lower Burdekin, at the Barratta Creek complex, concentrations of atrazine, diuron and imidacloprid are highest after sugarcane harvest and decrease as the waters move through a large area of wetlands (O’Brien et al., 2016).
Many wetlands support high plant biomass, soils rich in organic carbon, and anaerobic conditions, making them efficient at accumulating, concentrating and decomposing pesticides (Poissante et al., 2008; Elsayed et al., 2015). It is possible that in tropical wetlands, pesticides decompose 5–10 times faster than in wetlands in temperate regions, probably due to higher volatilisation (Laabs et al., 2002) and higher microbial activity in tropical locations. In the Great Barrier Reef catchment, the half-life of pesticides is likely to be higher when pesticides are in contact with sediments compared to when they are transported only in water (Mercurio et al., 2015). The capacity of wetlands to accumulate and decompose pesticides is influenced by a range of factors, such as pesticide type and concentration and soil characteristics.
Knowledge gaps
In the Great Barrier Reef region, the capacity of wetlands to process pesticides, sediments and nutrients is highly dependent on the large variability in flows between wet and dry seasons. In Australia, studies have mainly focused on the river channel, and there is limited research regarding the role that coastal floodplains have in improving water quality from agricultural run-off. Additionally, remnant floodplain wetlands, although relatively small in area, contribute disproportionally to regional biodiversity and to carbon and nutrient processing within the coastal zone and should be considered priority areas for research, conservation and restoration (Tockner and Stanford, 2002; Douglas et al., 2005).
Another significant knowledge gap is the impact of poor water quality on wetland processes and the provision of ecosystem services to the broader reef ecosystem. Excessive nutrients can degrade wetlands irreversibly (Verhoenven et al., 2006). Understanding the tolerances of Great Barrier Reef wetlands to poor water quality and the impact on ecosystem services is key.
Management options and their effectiveness 119

Scientific Consensus Statement 2017—Chapter 4
Treatment systems3 While most effort in water quality improvement needs to be focused on reducing the release of pollutants to the environments, there may also be a need to improve water quality through the effective capture and treatment of those pollutants that are released to the environment from farming practices (GBRWST, 2016). While treatment systems have the potential to improve water quality, most have not been tested in Great Barrier Reef catchments but show promise in specific locations. As with natural wetland systems, careful consideration needs to be made with respect to catchment hydrology, residence time, rainfall patterns and other factors. Further testing of treatment systems within the catchments of the Great Barrier Reef is needed.
Engineered treatment systems can be effective in reducing the concentration of pollutants such as sediment, nutrients and pesticides from diffuse sources. Treatment systems include technologies such as constructed wetlands, denitrifying bioreactors, floating wetlands, high-efficiency sedimentation basins and algae nutrient/chemical removal. These systems have been widely used overseas for urban stormwater management and agriculture. Some treatment technologies have been trialled and tested in Queensland (Schipper et al., 2010; Robson, 2015; Tournebize et al., 2016; Nichols et al., 2016; Neveux et al., 2016). Treatment systems can be important for improving water quality in Great Barrier Reef catchments as a complement to on-farm management practices and ecosystem repair.
Constructed wetlands are an established technology that can remove sediment, nitrogen and pesticides from agricultural land (Tournebize et al., 2016). A review of 47 studies from 35 constructed wetlands—including tropical locations in Brazil, Colombia and Suriname and subtropical locations in South Africa and Australia (New South Wales)—demonstrated that constructed wetlands are efficient at mitigating non-point-source agricultural run-off and drainage (Vymazal and Březinová, 2015). Average reduction efficiencies range from 20% to 90% for pesticides and from 40% to 90% for nitrate, depending on hydraulic residence time and microbiological activities (Tournebize et al., 2016). Removal efficiencies are highly variable across both pesticide types and systems for a particular pesticide (Vymazal and Březinová, 2015).
Constructed wetlands can be designed in a variety of configurations: horizontal surface flow, sub-surface flow and vertical flow. Modelling can be used to ensure that designs are suitable for wet and dry tropic conditions. Nitrate-nitrogen reduction is greater in wetlands near the bottom of catchments where flow regimes tend to be steadier than they are at the top of catchments, where they tend to be flashier (Tanner, 2013). However, other factors need to be considered when designing a constructed wetland, such as the selection of critical source areas and equitable spread of costs between landowners, as well as biodiversity outcomes (Tanner, 2013).
‘Denitrifying bioreactors’ is an overarching term that encompasses denitrification beds and denitrification walls constructed of wood chips or other solid carbon sources that promote the denitrification of nitrates in water by denitrifying bacteria under anoxic conditions (Schipper et al., 2010). Bioreactor beds are used where flows are piped or contained within a channel. Denitrification walls are used to intercept groundwater at the edge of fields prior to groundwater entering waterways. These bioreactors have been found to be a relatively low-cost method for nitrogen reduction in farming systems in the United States (Christianson et al., 2013). Nitrate removal rates vary depending on influent nitrate concentrations, temperature, hydraulic residence time and bed age and material (Addy et al., 2016; Christianson and Schipper, 2016). Nitrate removal rates in walls
3 Treatment systems are engineered landscape features used to treat pollutants in surface and groundwater. They comprise various technologies, including constructed treatment wetlands. Multiple treatment systems combine to form a treatment train.
Management options and their effectiveness 120

Scientific Consensus Statement 2017—Chapter 4
are lower (0.01–3.6 gN/m3/d) than in beds (2–22 gN/m3/d), but walls tend to have lower influent nitrate concentrations moving more slowly with groundwater (Addy et al., 2016). Percentage removal depends on the size of bioreactor chosen relative to the influent nitrate concentrations. Bioreactor beds and walls can reduce nitrate loads over long time spans (estimated >20 years; Long et al., 2011; Schmidt and Clarke, 2012). In addition to reducing nitrates, bioreactors can also degrade atrazine and, potentially, other herbicides (Camilo, 2016). Bioreactor walls require limited land and can be integrated with agricultural operations. This technology has yet to be trialled extensively in Queensland.
Floating treatment wetlands consist of wetland vegetation planted on a floating substrate. The plants and bacteria associated with the roots of the plants enhance sedimentation and removal of nutrients from the water column. Floating wetlands can be installed in existing ponds or channels and may be applicable for nutrient or sediment removal in agricultural or urban settings in particular circumstances in the Great Barrier Reef. Floating wetlands have been applied to wastewater lagoons and stormwater systems in South East Queensland (Nichols et al., 2016), showing overall pollution removal of 80% of TSS, 53% of total phosphorus and 17% of total nitrogen (Nichols et al., 2016). Floating treatment wetlands are more efficient than conventional retention ponds and can achieve 40% reduction in TSS and nitrogen (Borne et al., 2013).
High-efficiency sedimentation basins use chemical coagulants to increase the effectiveness and rate of sediment removal in ponds, including removal of colloidal material and adsorbed nutrients and pesticides. Trials and modelling of this technology of construction site stormwater in Queensland have shown that high efficient sedimentation basins can remove 77-92% of suspended sediment, a rate that is 2 to 4 times more effective than traditional batch treatment sediment basins (Robson, 2015). The coagulant dosing units can be moved and potentially provide a flexible system for use within existing farm ponds or permanent or temporary sediment ponds.
Algae treatment systems are circulating treatment ponds that convert nitrogen into macroalgae biomass. The algae is removed from the system and used for animal feed (where it can stop methane production from herbivores) or fertiliser or is processed into high value products. In Queensland, controlled experiments achieved nutrient removal rates of 0.5 gN/m2/d and 0.11 gP/m2/d, with reductions of 62% of nitrogen, 75% of phosphorus and 57% of chemical oxygen demand (Neveux et al., 2016). A feasibility study in the Lower Burdekin showed that to treat most of a farm's run-off, approximately 0.2% of the farm area would be required to be converted to a treatment system, and it could remove approximately 34% of the DIN. To remove 86% of the nitrogen, a high rate algal pond equivalent to 0.4% of the farm area would be required (Rickert and McShane, 2015). Combined treatment units for multiple farms should be considered (Rickert and McShane, 2015). The process is in use for aquaculture wastewater in Queensland at a cost of $30/kgN removal (Lawson, 2016). Microalgae can also be used to remediate organic pollutants (Chekroun et al., 2014) and heavy metals from aquatic systems (Rai and Tripathi, 2007; Zeraatkar et al., 2016).
Alluvium’s (2016) report Costs of achieving the water quality targets for the Great Barrier Reef examined two treatment systems: constructed wetlands and recycle pits. It was recommended that the construction of wetlands could assist in achieving the Reef 2050 goals, particularly in sugarcane-growing areas, but would require large areas (Alluvium, 2016). The use of treatment systems to remove pollutants from agricultural activities and stormwater is increasing worldwide and, with appropriate technology selection, design and placement, has the potential to become a cost-effective best practice management in Great Barrier Reef catchments.
Reinstatement of wetland function (‘system repair’) Wetland maintenance and restoration can successfully enhance biodiversity and ecosystem service provision (Meli et al., 2014). While wetland restoration is possible, it must not replace wetland
Management options and their effectiveness 121

Scientific Consensus Statement 2017—Chapter 4
protection and conservation (Maron et al., 2012), as the natural state of the wetland is not likely to be recovered (Hobbs et al., 2009). It may also be less expensive to retain and maintain functioning of current wetlands, including assurance that pollutant loads are minimised, than to restore wetlands (Verhoeven et al., 2006). Restored wetlands may become alternate ecosystems with different plant assemblages and biogeochemical functions compared to their natural counterparts (Moreno-Mateos et al., 2012). Tropical wetlands are more likely to be successfully restored compared to those in cold climates; large (>100 ha) and hydrologically connected wetlands are also more likely to be successfully restored (Moreno-Mateos et al., 2012).
The Queensland Government shares responsibility for the management of wetlands with the Australian Government, local governments, landholders and the wider community. These responsibilities are formalised in laws passed by the Queensland and Australian governments and through international obligations and management agreements such as Ramsar. A range of laws, policies and programs administered by different government agencies operate to manage the different wetlands in the Great Barrier Reef and catchments (WetlandInfo, 2016.
There are examples of successful system repair throughout the world. Restored marshes of Spartina arteniflora in the United States were comparable to natural ones after 5–15 years of restoration (Craft et al., 2002). The recovery of the above-ground biomass is generally fast, but in some locations soil characteristics might take decades or even centuries to recover (Craft et al., 2002). Mangrove forests can also be successfully restored in tropical locations (Zaldivar-Jimenez et al., 2010, but the success of the restoration is a function of land-use history and salinity (McKee and Faulkner, 2000). Wetlands can be restored for various purposes. Some restoration goals are compatible, for example biodiversity and carbon storage (Adame et al., 2015), but some might not be, such as biodiversity and water quality improvement (Verhoeven et al., 2006). Clarity on the goal of the restoration is essential (WetlandCare Australia, 2008).
Systems repair should be focused on recovering wetlands in accordance with specific targets and outcomes, with measurable goals (Ruiz-Jaen and Aide, 2005; Hobbs et al., 2009; WetlandCare Australia, 2008). Restoration projects should also include the possible consequences of climate change. For instance, in the Great Barrier Reef catchment, many coastal floodplain wetlands could experience saltwater intrusions and stronger floods; wetlands further up the catchment will experience longer droughts (CSIRO and BOM, 2015; Alongi, 2015). Successful systems repair requires knowledge of the hydrology, biogeochemistry and ecology of wetlands (Zedler, 2000) across the Great Barrier Reef catchment and over long-term timescales.
Monitoring, maintenance and evaluation of effectiveness are not features of many repair and revitalisation projects and where they are underway, it will take some time for outcomes to be known (Sheaves et al., 2014). Critical to determining appropriate and integrated management interventions is a fundamental understanding of the parts of a catchment: its wetlands, how they function and the ecosystem services they provide (Department of Environment, Water, Heritage and the Arts, 2008).
Wetlands need to be maintained to ensure proper functioning. Maintenance issues include the accumulation of sediment, plant debris, litter or oils; infestation of weeds; pigs, mosquitos and other pest problems; algal blooms; and scouring. Management tools that integrate with the day-to-day management of different industries have significant advantages in this regard (DEEDI, 2011).
Since many weeds are transported during flood events, a key focus of wetland maintenance is the eradication of noxious or nuisance species (DEEDI, 2011). Large areas of weed matting have been observed in lagoons in the Great Barrier Reef catchments. The growth of the weed mats is facilitated by nutrients washed into the lagoons during rainfall events. During extreme flooding events, there is a risk that weed mats will be flushed into the Great Barrier Reef lagoon, carrying nutrients, sediments and pesticides with them and thereby directly impacting reef water quality. The risk of
Management options and their effectiveness 122

Scientific Consensus Statement 2017—Chapter 4
this type of pollutant dumping into the Great Barrier Reef is likely to be exacerbated by a greater frequency of extreme flood events predicted because of climate change.
Conclusion
Natural and modified estuarine and freshwater wetlands play numerous roles across terrestrial, coastal and marine environments. They can provide protection from wave action and storms, reduce the impacts of floods and support habitat for many species that live on the Great Barrier Reef. Wetlands can absorb and transform pollutants and nutrients in catchment run-off, which is a key pressure on the Great Barrier Reef. However, the capacity of wetlands to improve water quality for the Great Barrier Reef is limited by the size and type of wetland (open water, vegetated, etc.), residence time, wetland location and condition and hydrological connectivity. The capacity of wetlands to improve water quality is highest when hydrologic loads are low to intermediate, such as during early and late wet season, in smaller sub-catchments or in the dry season as well as in irrigated areas where flows are supplemented (Figure 19).
Figure 19. Potential role of natural wetlands and treatment systems in water quality improvement.
Very few large catchments in the Great Barrier Reef have a large area of wetlands relative to the catchment size. There are, however, quite a few sub-catchment areas in the Great Barrier Reef where the area of wetlands is high relative to the catchment size. During low flow events, pollutants may be removed through natural wetlands and treatment systems, meaning they are not available for mobilisation during high-flow events. Some wetlands or treatment systems may capture first-flush events, even in high-flow events, if a bypass system is in place. Deltas usually have slower flows even during high-flow events (because of the flat landscape) and operate more like slow flow systems. In irrigated systems, pollutants are constantly removed by wetlands and are not as available in high-flow events for movement.
While acting to filter catchment run-off, poor quality water entering wetlands can affect the provision of values and services from the wetlands and have consequences for wider reef health. The consideration of natural wetlands and treatment systems in relation to water quality improvement needs to be framed within the context of the broader landscape and be part of an overall integrated pollutant management process. The state of knowledge and implications for the management of wetlands and treatment systems to improve water quality in the Great Barrier Reef are summarised in Table 13.
Management options and their effectiveness 123

Scientific Consensus Statement 2017—Chapter 4
Table 123. Overview of established knowledge about the wetlands, treatment systems and Great Barrier Reef water quality and insights from recent research.
Established knowledge and understanding (based on previous Scientific Consensus Statement findings)
New information or insights Contentious, unresolved or unknown areas (for further research)
Overarching • Natural and constructed wetlands can improve water quality.
• The capacity of wetlands to improve water quality is variable and strongly associated with the flooding and drying episodes dictated by inter- and intra- annual variations.
• Several aspects of wetlands contribute to their capacity to improve water quality, including the size and type of wetland (open water, vegetated, etc.), residence time, wetland location and condition and hydrological connectivity.
• Poor water quality can affect wetlands and irreversibly damage wetlands and the services they provide.
• Treatment systems have the potential to improve water quality as part of an overall pollution management system.
• Capacity of different types of wetlands to improve water quality
• Seasonal variations in nutrient, carbon and sediment uptake by wetlands
• Thresholds of change of wetlands due to poor water quality
• Contribution at the landscape level of wetlands to improve water quality of the GBR and their effectiveness in different locations and under different hydrological regimes
• Effectiveness, efficiency and costs of using different types of treatment systems in different locations
Nutrients
• Natural and constructed wetlands can remove nitrogen and phosphorus from the water through denitrification, sediment accumulation and plant growth.
• The capacity of wetlands to mitigate nutrient export from the basin is variable across catchments and wetland types.
• Globally wetlands have been found to remove N at a median rate of 93 g/m-2/yr.-1 and P at a rate of 1.2/g/m-
2/yr.-1 with a removal efficiency of 39% and 46% respectively.
• Nutrients are removed primarily through denitrification, storage in soils and vegetation and adsorption.
• Temporal variability of hydrological flows, especially during extreme drought or flood events, will strongly influence the ability of wetlands to mitigate nutrient exports. Nutrient uptake may be higher at the beginning and end of the wet season.
• Excess nutrients can irreversibly damage wetlands.
• Capacity of freshwater wetlands, such as Melaleuca forest and marshes, to uptake nutrients; partitioning within the different components of the ecosystem, for example, soils, vegetation and biota
• Seasonal variability of nutrient uptake in wetlands, especially during drought and flood events, and other hydrological epochs
• Nutrient thresholds that could cause irreversible degradation in wetlands
• Effects of particulate nutrients on wetland processes and water quality improvement function
• Effectiveness and efficiency of treatment systems for nutrient removal under different land uses
Management options and their effectiveness 124

Scientific Consensus Statement 2017—Chapter 4
• The range of treatment systems for nutrient removal has expanded overseas and proven to be effective.
Sediment • Natural and constructed wetlands facilitate sedimentation by trapping sediment and the carbon and nutrients associated with it.
• Intertidal wetlands in the GBR, especially mangroves, can trap sediment from the water that floods them.
• Excess sediment can be detrimental to wetlands and. in some cases, can destroy them.
• Wetlands contribute substantially at the landscape level to decrease sediment loads to the marine environment in many regions.
• Capacity of freshwater wetlands, such as Melaleuca forest and marshes, to accrete sediment
• Effects of increased sediment loads in freshwater wetlands
• Impacts of different sediment types on the function of wetlands
Pesticides • Natural and constructed wetlands could trap pesticides and accelerate their decomposition.
• Pesticides are being transported as run-off to wetlands of the GBR.
• Wetlands are accumulating high levels of pesticides in some areas of the GBR catchments.
• Decomposition rates of pesticides in wetlands • Effects of pesticides on flora and fauna of
wetlands
Implications/considerations for management
Categories if required
• Wetland conservation and restoration could complement on-farm practices to reduce nutrient, sediment and pesticide run-off to the GBR. • Wetlands in the GBR catchment occupy a relatively small area; however, they contribute to the biodiversity, carbon, nutrient and sediment storage of
the region. • While wetlands have the capacity to contribute to water quality improvement in the GBR, it is important to understand that these pollutants can also
have significant negative impacts on wetlands.
• Engineered treatment systems can be effective in reducing the concentration of pollutants such as sediment, nutrients and pesticides. Treatment systems include technologies such as constructed wetlands, denitrifying bioreactors, floating wetlands, high-efficiency sedimentation basins and algae nutrient removal.
Management options and their effectiveness 125

Scientific Consensus Statement 2017—Chapter 4
Land use change Plans to expand and intensify agriculture, particularly cropping, are a feature of current planning in northern Australia (see, for example Australian Government, 2015b). In Queensland, the Agricultural Land Audit (QDAFF, 2013) identified large areas of land in the Great Barrier Reef catchment as suitable, in principle, for conversion from rangeland grazing to sugarcane cultivation. Changing land use from grazing to fertilised cropping will lead to increased discharge of DIN to the Great Barrier Reef no matter what fertiliser use management standards are in place (Thomas et al., in press). In addition, population numbers are predicted to increase in the larger regional centres, which is likely to increase STP discharges of DIN and DIP to the Great Barrier Reef. For example, in the NQ Dry Tropics NRM region, urban expansion is occurring around the main regional centre of Townsville and may occur at new major mine sites. In addition to urban expansion there also continues to be aspirations to expand agricultural development in the Lower Burdekin (cropping and aquaculture), Don (horticulture), Upper Burdekin (Pentland), Belyando and Suttor (via water harvesting) and Bowen (Urannah and Collinsville) areas (NQ Dry Tropics, 2016; Marsden Jacobs Associates, 2013; QDAFF, 2013). There are opportunities to allocate additional water from the Burdekin Dam, although there are substantial environmental constraints to downstream development including rising water tables, saltwater intrusion and pollutant run-off (QDAFF, 2013; Australian Government, 2015b).
In the Wet Tropics NRM region, population is expected to grow by 1.5% per year over the next 20 years (QDAFF, 2013). The increase (largely due to net migration) is expected to be accommodated in coastal corridors north and south of Cairns (Queensland Department of Infrastructure and Planning, 2009). Further development in coastal areas can also disturb potential acid sulfate soils. However, the State Planning Policy 2016 (DILGP, 2016a) and State Planning Policy State Interest Guideline Water Quality 2016 (DILGP, 2016b) provide guidance to coastal local governments to manage these risks.
The Queensland Agricultural Land Audit (QDAFF, 2013) identified the potential to significantly expand sugarcane and other crops, including 206,908 ha of A class land as a potential new irrigation district in the upper Herbert catchment. All other regions of the Great Barrier Reef Catchment have potential for expansion and intensification of agriculture (cropping and grazing) with likely implications for DIN (and in some cases suspended sediment) export to the Great Barrier Reef. Expansion of cropping (mainly banana crops) is already occurring near Lakeland in Cape York, and further expansions are planned (Cape York Natural Resource Management and South Cape York Catchments, 2016). In the Burnett-Mary region, horticultural areas have expanded following the construction of the Paradise Dam (Burnett Mary Regional Group, 2015).
The potential benefits of retiring some agricultural lands to restore hydrological function and reduce water quality impacts in areas of high risk and high sensitivity have been flagged by a number of authors (Kroon et al., 2016; Brodie et al., 2016; Eberhard et al., 2017b; Waterhouse et al., 2016). Kroon et al. (2016) detail where this has been used internationally, including riparian buffers, floodplain and wetland restoration and reforestation of agricultural lands. Alluvium (2016) explored the costs of land retirement from cane and grazing enterprises, while recognising that the trade-offs and policy mechanisms have not been fully explored (Butler et al., 2013).
In summary, existing and proposed agricultural expansion and intensification across the Great Barrier Reef is likely to result in increases in the discharge of DIN from fertiliser use in cropping lands. Impacts can be minimised by adoption of best practice systems from the outset. Options for land use change or land retirement to achieve water quality benefits have not been fully explored.
Management options and their effectiveness 126

Scientific Consensus Statement 2017—Chapter 4
Other pollutants Pollutants other than sediment, nutrients and pesticides are derived from a range of diffuse and point sources including agriculture (intensive animal production), manufacturing and industrial, mining, rural and urban residential, transport and communication, waste treatment and disposal, ports/marine harbour, coastal/marine tourism, military areas, and shipping (Kroon et al., 2016). This makes management for most of these pollutants, but not all, a complex issue.
Marine debris Beach clean-ups along the coastline of the Great Barrier Reef—and more recently tows for marine debris, including plastics—have shown that contamination of the Great Barrier Reef and Torres Strait coastal and marine ecosystems is widespread.
Similar to international studies (GESAMP, 2015; United Nations Environment Programme, 2009), source attribution shows that marine debris in the Great Barrier Reef and Torres Strait regions is likely derived from both marine and land-based sources, including (unintentional) discard from shipping and fishing and land disposal via industrial and urban discharges and river run-off (Haynes, 1997; Hardesty et al., 2014; Hardesty et al., 2017; Griffin, 2008).
Recommendations for national policy, management and research are outlined in two recent initiatives:
• The recent Senate Inquiry into the threat of marine plastic pollution in Australia (The Senate Environment and Communications References Committee, 2016) has made recommendations to the Australian Government.
• The Federal Threat abatement plan for the impacts of marine debris on vertebrate marine life (Department of the Environment, Water, Heritage and the Arts, 2009) is currently being updated and finalised.
The Queensland Government recently requested input into proposals to reduce marine debris, including deposit schemes and the banning of free plastic bags in shops. Given that consumer items can make up a large proportion of marine debris along the Great Barrier Reef coast (Australian Marine Debris Initiative, 2016), these proposals should reduce marine debris.
While such schemes may be effective in reducing marine debris, ultimately there is a need for preventative measures to be taken against the plastic producers, including the plastic and packaging industries, as well as against consumers. In addition, there is a research need to monitor marine debris and examine the effectiveness of the proposed schemes to reduce marine debris, including container deposit schemes and the banning of single-use plastic bags.
Sewage treatment plants Monitoring on sewage treatment plants (STPs) located in the Great Barrier Reef catchment shows that effluent discharge includes a range of pollutants, including pharmaceuticals and personal care products (Kroon et al., 2015). Based on results from Australian and international studies, it is likely that a much larger number of pollutants are present in STP discharges (Kroon et al., 2013).
While STPs are highly regulated, for Great Barrier Reef water quality purposes there is no clear picture on (i) how many discharge into waterways connected to the Great Barrier Reef, (ii) what volume they discharge, and (iii) what treatment level these STPs are (primary, secondary, tertiary, etc.). This precludes an effective assessment of the number and concentration of pollutants present in STP discharge, including their potential risk to Great Barrier Reef coastal and marine ecosystems.
The Queensland Government did not meet its own target of upgrading all coastal sewage treatment plants that discharge into the marine environment to the most stringent treatment standards (i.e.
Management options and their effectiveness 127

Scientific Consensus Statement 2017—Chapter 4
tertiary treatment) by 2010 (GBRMPA, 2014a). This target is currently not mentioned in either relevant regulation (DEHP, 2015) or guidelines (DEHP, 2012) despite projected annual population growth of ≥1.6% up to 2036 (GBRMPA, 2014a).
Hence, with the projected increase in population and urban growth along the Great Barrier Reef coast, there is a need to improve our understanding of current and potential future risk of pollutants present in sewage treatment plant effluent discharges.
Research priorities are to determine potential risk to Great Barrier Reef coastal and marine ecosystems from pollutants in STP discharge, by (i) developing an inventory of STPs and their treatment levels in the Great Barrier Reef catchment, (ii) quantifying the volume they discharge, and (iii) determining a full inventory of pollutants (based on Australian and international studies) being discharged by a range of representative STPs.
Management options and their effectiveness 128

Scientific Consensus Statement 2017—Chapter 4
Reference list
Adame, M.F., Fry, B., 2016. Source and stability of soil carbon in mangrove and freshwater wetlands of the Mexican Pacific coast. Wetlands Ecology and Management 24, 129-137. doi:10.1007/s11273-015-9475-6.
Adame, M.F., Neil, D., Wright, S.F., Lovelock, C.E., 2010a. Sedimentation within and among mangrove forests along a gradient of geomorphological settings. Estuarine, Coastal and Shelf Science 86, 21-30. doi:10.1016/j.ecss.2009.10.013.
Adame, M.F., Virdis, B., Lovelock, C.E., 2010b. Effect of geomorphological setting and rainfall on nutrient exchange in mangroves during tidal inundation. Marine and Freshwater Research 61, 1197-1206. doi:10.1071/MF10013.
Adame, M.F., Wright, S.F., Grinham, A., Lobb, K., Reymond, C.E., Lovelock, C.E., 2012a. Terrestrial–marine connectivity: Patterns of terrestrial soil carbon deposition in coastal sediments determined by analysis of glomalin related soil protein. Limnology and Oceanography 57, 1492-1502. doi:10.4319/lo.2012.57.5.1492.
Adame, M.F., Reef, R., Herrera-Silveira, J.A., Lovelock, C.E., 2012b. Sensitivity of dissolved organic carbon exchange and sediment bacteria to water quality in mangrove forests. Hydrobiologia 691, 239-253. doi: 10.1007/s10750-012-1071-7.
Adame, M.F., Hermoso, V., Perhans, K., Lovelock, C.E., Herrera-Silveira, J.A., 2015. Selecting cost-effective areas for restoration of ecosystem services. Conservation Biology 29, 493-502. doi: 10.1111/cobi.12391.
Addy, K., Gold, A.J., Christianson, L.E., David, M.B., Schipper, L.A., Ratigan, N.A., 2016. Denitrifying bioreactors for nitrate removal: a meta-analysis. Journal of Environmental Quality 45, 873-881. doi:10.2134/jeq2015.07.0399.
Agnew, J.R. Rohde, K., Bush, A., 2011. Impact of sugarcane farming practices on water quality in the Mackay region. Proceedings of the Australian Society of Sugar Cane Technologists, 33, 9 pp.
Agrawal, A., Lemos, M.C., 2007. A Greener Revolution in the Making?: Environmental Governance in the 21st Century. Environment: Science and Policy for Sustainable Development 49, 36-45.
Akbar, D., Rolfe, J., Greer, L., Smith, P., Marshall, N., 2014. Factors affecting adoption of land management practices that have water quality benefits: evolution of scenarios for cane farming in GBR catchments. Report to the Reef Rescue Research and Development Program. Centre for Environmental Management CQ University Australia, Rockhampton 53 pp.
Allen, M.D., Argue, J.R., Geiger, W.F., Johnston, L., Pezzaniti, D., Scott, P.G., 2004. Water sensitive urban design: Basic procedures for ‘source control’ pf stormwater – A handbook for Australian practice, Urban Water Resources Centre, University of South Australian, Adelaide, South Australia, in collaboration with the Stormwater Industry Association and Australian Water Association.
Alluvium, 2016. Costs of achieving the water quality targets for the GBR by Alluvium Consulting Australia for Department of Environment and Heritage Protection, Brisbane. www.openchannels.org/sites/default/files/literature/Costs%20of%20achieving%20the%20water%20quality%20targets%20for%20the%20Great%20Barrier%20Reef.pdf
Alongi, D.M., 2015. The impact of climate change on mangrove forests. Current Climate Change Report 1, 30-39. doi: 10.1007/s40641-015-0002-x.
Amos, K.J., Croke, J.C., Timmers, H., Owens, P.N., Thompson, C., 2009. The application of caesium-137 measurements to investigate floodplain deposition in a large semi-arid catchment in Queensland, Australia: a low-fallout environment. Earth Surface Processes and Landforms 34, 515-529.
Ansell, C., Gash, A., 2008. Collaborative governance in theory and practice. Journal of Public Administration Research and Theory 18, 543-571.
Management options and their effectiveness 129

Scientific Consensus Statement 2017—Chapter 4
Aquatic Ecosystems Task Group (2012). Aquatic Ecosystems Toolkit. Module 1: Aquatic Ecosystems Toolkit Guidance Paper. Australian Government Department of Sustainability, Environment, Water, Population and Communities, Canberra.
Armitage, D., 2005. Adaptive capacity and community-based natural resource management. Environmental management 35, 703-715.
Armour, J., Davis, A., Masters, B., Mortimore, C., Whitten, M., 2013a. Paddock Scale Water Quality Monitoring of Sugarcane and Banana Management Practices: Final Technical Report 2010-2013 Wet Seasons, Wet Tropics Region. Queensland Department of Natural Resources and Mines, Centre for Tropical Water & Aquatic Ecosystem Research and Queensland Department of Agriculture, Fisheries and Forestry for Terrain Natural Resource Management, Australia.
Armour, J.D., Nelson, P.N.N., Daniells, J.W.W., Rasiah, V., Inman-Bamber, N.G.G., 2013b. Nitrogen leaching from the root zone of sugarcane and bananas in the humid tropics of Australia. Agriculture, Ecosystems and Environment 180 68-78.
Arthington, A.H., Godfrey, P.C., Pearson, R.G., Karim, F., Wallace, J., 2015. Biodiversity values of remnant freshwater floodplain lagoons in agricultural catchments: evidence for fish of the Wet Tropics bioregion, northern Australia. Aquatic Conservation: Marine and Freshwater Ecosystems 25, 336-352.
Ash, A., McIvor, J., Corfield, P., Winter, W., 1995. How land condition alters plant-animal relationships in Australia's tropical rangelands. Agriculture Ecosystems & Environment 56, 77-92.
Ash, A.J., Corfield, J.P., McIvor, J.G., Ksiksi, T.S., 2011. Grazing Management in Tropical Savannas: Utilization and Rest Strategies to Manipulate Rangeland Condition. Rangeland Ecology and Management 64(3), 223-239. 10.2111/rem-d-09-00111.1.
Ash, A., Hunt, L., McDonald, C., Scanlan, J., Bell, L., Cowley, R., Watson, I., McIvor, J., MacLeod, N., 2015. Boosting the productivity and profitability of northern Australian beef enterprises: Exploring innovation options using simulation modelling and systems analysis. Agricultural Systems 139, 50-65.
Attard S., O’Donnell, D., 2013. Drip irrigation on sugarcane in the Burdekin region. Paddock Case Study, Sugarcane, Reef Water Quality Protection Plan. www.reefplan.qld.gov.au/measuring-success/case-studies/case-studies-sugarcane/drip-irrigation/.
Attard S.J., Inman-Bamber, N.G., Hesp, C. 2013. Use of overhead irrigation in the lower Burdekin uses less water and does not penalise yield. Proceedings of Australian Society of Sugar Cane Technologists 31, 230-239.
Auckland Regional Council, 1999. Erosion and Sediment Control Guidelines for Land Disturbing Activities in the Auckland Region. Technical Publication No. 90, Auckland Regional Council.
Australian Academy of Science, 2014. Response to the draft Reef 2050 long-term sustainability plan. Australian Academy of Science, Canberra.
Australian and New Zealand Environment Conservation Council, 1994. National Water Quality Management Strategy: Australian Water Quality Guidelines for Fresh and Marine Waters. Policies and Principles. Online: www.environment.gov.au/water/publications/quality/nwqms-policies-principles.html. Australian and New Zealand Environment & Conservation Council.
Australian and Queensland governments, 2013a. Reef Water Quality Protection Plan Paddock to Reef Program Water Quality Risk Frameworks. Australian and Queensland governments, Brisbane, Australia.
Australian and Queensland governments, 2013b. Reef Water Quality Protection Plan 2013: Securing the health and resilience of the Great Barrier Reef World Heritage Area and adjacent catchments. Queensland Government, Brisbane, Australia, 36 pp. www.reefplan.qld.gov.au/resources/assets/reef-plan-2013.pdf
Australian and Queensland governments, 2015. Great Barrier Reef Report Card 2014 Reef Water Quality Protection Plan. Queensland Government, Brisbane, Australia, 176 pp. www.reefplan.qld.gov.au/measuring-success/report-cards/2014/assets/gbr-2014report-card-detailed-results.pdf
Management options and their effectiveness 130

Scientific Consensus Statement 2017—Chapter 4
Australian and Queensland governments, 2016. Great Barrier Reef Report Card 2015 Reef Water Quality Protection Plan. Queensland Government, Brisbane, Australia, 150 pp. www.reefplan.qld.gov.au/measuring-success/report-cards/2015/assets/gbr-2015report-card-detailed-results.pdf
Australian Government, 2015a. Great Barrier Reef 2050 Long-term Sustainability Plan. (Reef 2050 Plan) Canberra, Australia: Australian Government, 111 pp. www.environment.gov.au/system/files/resources/d98b3e53-146b-4b9c-a84a-2a22454b9a83/files/reef-2050-long-term-sustainability-plan.pdf
Australian Government, 2015b. Our north, our future: White paper on developing Northern Australia. Australian Government, Canberra, Australia, 200 pp. northernaustralia.gov.au/files/files/NAWP-FullReport.pdf
Australian Marine Debris Initiative, 2016. Australian Marine Debris Database, Australian Marine Debris Initiative, Queensland. http://www.tangaroablue.org/database.html
Australian Public Service, 2007. Tackling wicked problems. A public policy perspective. Australian Government, Canberra, ACT, 11 pp. www.apsc.gov.au/publications-and-media/archive/publications-archive/tackling-wicked-problems
Bahr, K.D., Jokiel, P.L., Toonen, R.J., 2015. The unnatural history of Kāne‘ohe Bay: coral reef resilience in the face of centuries of anthropogenic impacts. PeerJ, 3, e950.
Barbi, E., Denham, R., Star, M., 2015. Do improved grazing management practices lead to increased levels of ground cover? Journal of Rural Extension and Innovation Systems 11, 114-121.
Bark, R.H., Barber, M., Jackson, S., Maclean, K., Pollino, C., Moggridge, B., 2015. Operationalising the ecosystem services approach in water planning: a case study of indigenous cultural values from the Murray–Darling Basin, Australia. International Journal of Biodiversity Science, Ecosystem Services & Management 11(3), 239-249. dx.doi.org/10.1080/21513732.2014.983549.
Bark, R.H., Robinson, C.J., Flessa, K.W., 2016. Tracking cultural ecosystem services: water chasing the Colorado River restoration pulse flow, Ecological Economics 127, 165-172.
Barry, G., Price, A., Lynch, P., 1998. Some implications of the recycling of sugar industry by-products. Proceedings of Australian Society of Sugar Cane Technologists 20, 52–55.
Bartley, R., Keen, R.J., Hawdon, A.A., Hairsine, P.B., Disher, M.G., Kinsey-Henderson, A.E., 2008. Bank erosion and channel width change in a tropical catchment. Earth Surface Processes and Landforms 33, 2174-2200.
Bartley, R., Corfield, J.P., Abbott, B.N., Hawdon, A.A., Wilkinson, S.N., Nelson, B., 2010. Impacts of improved grazing land management on sediment yields, Part I: hillslope processes. Journal of Hydrology 389, 237-248.
Bartley, R., Corfield, J.P., Hawdon, A.A., Kinsey-Henderson, A.E., Abbott, B.N., Wilkinson, S.N., Keen, R.J., 2014. Can changes to pasture management reduce run-off and sediment loss to the Great Barrier Reef? The results of a 10-year study in the Burdekin catchment, Australia. The Rangeland Journal 36, 67-84.
Bartley, R., Henderson, A. Wilkinson, S., Whitten, S., Rutherfurd, I., 2015. Stream Bank Management in the Great Barrier Reef Catchments: A Handbook. Report to the Department of Environment. CSIRO Land and Water, Australia.
Bartley, R., Waters, D., Turner, R., Kroon, F., Wilkinson, S., Garzon-Garcia, A., Kuhnert, P., Lewis, S., Smith, R., Bainbridge, Z., Olley, J., Brooks, A., Burton, J., Brodie, J., Waterhouse, J., 2017. Scientific Consensus Statement 2017: A synthesis of the science of land-based water quality impacts on the Great Barrier Reef, Chapter 2: Sources of sediment, nutrients, pesticides and other pollutants to the Great Barrier Reef. State of Queensland, 2017.
Baxter, T., 2006. Legal Protection for the Great Barrier Reef World Heritage Area. Macquarie Journal of International and Comparative Environmental Law 3, 67-82.
Management options and their effectiveness 131

Scientific Consensus Statement 2017—Chapter 4
Beher, J., Possingham, H., Hoobin, S., Dougall, C., and Klein, C., 2016. Prioritising catchment management projects to improve marine water quality. Environmental Science and Policy 59, 35-43. doi:10.1016/j.envsci.2016.02.005.
Belden, J.B., Hanson, B.R., McMurry, S.T., Smith L.M., Haukos, D.A., 2012. Assessment of the Effects of Farming and Conservation Programs on Pesticide Deposition in High Plains Wetlands. Environmental Science and Technology 46, 3424-3432. doi: 10.1021/es300316q.
Bell, M. J., 2014. A review of nitrogen use efficiency in sugarcane, Sugar Research Australia, Brisbane. 344 pp. elibrary.sugarresearch.com.au/bitstream/handle/11079/14733/A%20review%20of%20nitrogen%20use%20efficiency%20in%20sugarcane.pdf;jsessionid=833D2D451BBE695D8BE14633CC95304B?sequence=1
Bell, M.J., Moody, P., 2014. Fertiliser N use in the sugarcane industry - an overview and future opportunities, in: Bell, M.J. (Ed.), A Review of Nitrogen Use Efficiency in Sugarcane. SRA Research Report. Sugar Research Australia, Brisbane, pp. 305-320.
Bell, M.J., Garside, A.L., Cunningham, G., Halpin, N., Berthelsen, J., Richards, C., 1998. Grain legumes in sugarcane farming systems. Proceedings of Australian Society of Sugar Cane Technologists 20, 97-103.
Bell, M., Garside, A.L., Halpin, N., 2010. Interactions between rotation breaks, tillage and N management on sugarcane grown at Bundaberg and Ingham. Proceedings of the Australian Society of Sugar Cane Technologists 32, 119–139.
Bell, M., Schaffelke, B., Moody, P., Waters, D., Silburn, M., 2016. Tracking nitrogen from the paddock to the reef—a case study from the Great Barrier Reef. Proceedings of the International Nitrogen Initiative Conference, Melbourne, Australia.
Bendix, J., 1999. Stream power influence on southern Californian riparian vegetation. Journal of Vegetation Science 10, 243–252.
Beverley, C., Roberts, A., Doole, G., Park, G., Bennett, F., 2016. Assessing the net benefits of achieving water quality targets using a bio-economic model. Environmental Modelling and Software 85, 229-245.
Bhattarai, S.P., Midmore, D.J., 2015. Advanced drip and optimised furrow irrigation to minimise sediment, nutrient and pesticide losses to the environment through deep drainage and run-off from sugarcane and banana industries in northern Queensland. Report to the Reef Rescue Water Quality Research & Development Program. Reef and Rainforest Research Centre Limited, Cairns, 41 pp.
Biddle, J.C., Koontz, T.M., 2014. Goal specificity: A proxy measure for improvements in environmental outcomes in collaborative governance. Journal of Environmental Management 145, 268-276.
Birner, R., Davis, K., Pender, J., Nkonya, E., Anandajayasekeram, P., Ekboir, J., Mbabu, A., Spielman, D.J., Horna, D., Benin, S., Cohen, C., 2009. From Best Practice to Best Fit: A Framework for Designing and Analyzing Pluralistic Agricultural Advisory Services Worldwide. The Journal of Agricultural Education and Extension 15(4), 341-355.
Blackstock, K.L., Ingram, J., Burton, R., Brown, K.M., Slee, B. 2010. Understanding and influencing behaviour change by farmers to improve water quality. Science of the Total Environment 408, 5631-5638.
Bloesch, P.M., Rayment, G.E., Pulsford, J.S., 1997. Regional total phosphorus budgets for sugar production in Queensland. Proceedings of the Australian Society of Sugar Cane Technologists, 19, 213-220.
BMT WBM and Bligh Tanner, 2012. Total Water Cycle Management Plan. Prepared for Moreton Bay Regional Council, Caboolture, 240 pp. www.moretonbay.qld.gov.au/uploadedFiles/moretonbay/development/planning/Total-Water-Cycle-Detailed-Plan.pdf
Bohensky, E., Stone-Jovicich, S., Larson, S., Marshall, N., 2010. Chapter 2, Adaptive capacity in theory and reality: implications for governance in the Great Barrier Reef region, IN Armitage, D and Plummer, R., (eds) Adaptive capacity and environmental governance. Springer, Berlin pp. 23-41. link.springer.com/chapter/10.1007%2F978-3-642-12194-4_2#page-1
Management options and their effectiveness 132

Scientific Consensus Statement 2017—Chapter 4
Bohensky, E., Butler, J.R., Costanza, R., Bohnet, I., Delisle, A., Fabricius, K., Gooch, M., Kubiszewski, I., Lukacs, G., Pert, P., 2011. Future makers or future takers? A scenario analysis of climate change and the Great Barrier Reef. Global Environmental Change 21, 876-893.
Bohnet, I.C., 2015. Lessons Learned from Public Participation in Water Quality Improvement Planning: A Study from Australia. Society & Natural Resources 28(2), 180-196.
Bohnet, I.C., Kinjun, C., 2009. Community uses and values of water informing water quality improvement planning: a study from the Great Barrier GBR region, Australia. Marine and Freshwater Research 60 (11), 1176-1182. doi: 10.1071/MF08329
Bohnet, I., Smith, D.M., 2007. Planning future landscapes in the Wet Tropics of Australia: a social–ecological framework. Landscape and Urban Planning 80, 137-152.
Borja, Á., Dauer, D.M., Elliott, M., Simenstad, C.A. 2010. Medium-and long-term recovery of estuarine and coastal ecosystems: patterns, rates and restoration effectiveness. Estuaries and Coasts 33(6), 1249-1260.
Borne, K.E., Fassman, E.A., Tanner, C.C., 2013. Floating treatment wetland retrofit to improve stormwater pond performance for suspended solids, copper and zinc. Ecological Engineering 54, 173-182. doi: 10.1016/j.ecoleng.2013.01.031
Bramley, R., Ouzman J., Gobbett D., 2017. Is district yield potential an appropriate concept for fertilizer decision making? Proceedings of Australian Society of Sugar Cane Technologists 39, 67-76. www.assct.com.au/media//pdfs/members/67%20Ag%2007%20Bramley%20et%20al.pdf
Bratieres, K., Fletcher, T.D., Deletic, A., Zinger, Y., 2008. Nutrient and sediment removal by stormwater biofilters: A large-scale design optimisation study, Water Research 42, 3930–3940.
Brodie, J., 2014. Dredging the Great Barrier Reef: Use and misuse of science. Estuarine, Coastal and Shelf Science 142, 1-3.
Brodie J., Lewis S. 2014. Ecologically relevant targets for pollutant discharge from the drainage basins of the Burnett Mary Region, Great Barrier Reef. TropWATER Report No. 14/32, Centre for Tropical Water & Aquatic Ecosystem Research (TropWATER), James Cook University, Townsville, 41 pp.
Brodie, J., Pearson, R.G., 2016. Ecosystem health of the Great Barrier Reef: Time for effective management action based on evidence. Estuarine, Coastal and Shelf Science 183, 438-451.
Brodie, J., Waterhouse, J., 2012. A critical review of environmental management of the ‘not so Great’ Barrier Reef. Estuarine, Coastal and Shelf Science 104-105, 1-22.
Brodie, J., Waterhouse, J., Schaffelke, B., Kroon, F., Thorburn, P., Rolfe, J., Johnson, J., Fabricius, K., Lewis, S., Devilin, M., Warne, M. St J., McKenzie, L., 2013. 2013 Scientific Consensus Statement: Land use impacts on the Great Barrier Reef water quality and ecosystem condition. Reef Water Quality Plan Secretariat, QLD. www.reefplan.qld.gov.au/about/assets/scientific-consensus-statement-2013.pdf.
Brodie, J., Waterhouse, J., Lewis, S., Basnett, A., Davis, A., Alexander, F., Ginders, M., 2014. Comparative effectiveness of community drainage schemes and EVTAs in trapping PSII Herbicides from sugarcane farms Stage 1 Report. ACTFR Report Number 10/14. Australian Centre for Tropical Freshwater Research, James Cook University, Townsville.
Brodie, J., Lewis, S., Wooldridge, S., Bainbridge, Z., Waterhouse, J., Honchin, C., 2015. Ecologically relevant targets for pollutant discharge from the drainage basins of the Fitzroy Region, Great Barrier Reef. Prepared for the Fitzroy Basin Association. Tropwater Report No. 15/66, Centre for Tropical Water & Aquatic Ecosystem Research (TropWATER), James Cook University, Townsville, 53 pp.
Brodie, J., Lewis, S., Wooldridge, S., Bainbridge, Z., Waterhouse, J. Honchin, C., 2016. Ecologically relevant targets for pollutant discharge from the drainage basins of the Burdekin Region, Great Barrier Reef. TropWATER Report No. 15/44, Centre for Tropical Water & Aqua c Ecosystem Research (TropWATER), James Cook University, Townsville.
Management options and their effectiveness 133

Scientific Consensus Statement 2017—Chapter 4
Brodie, J., Baird, M., Waterhouse, J., Mongin, M., Skerratt, J., Robillot, C., Smith, R., Mann, M., Warne, M., 2017a. Development of basin specific ecologically relevant pollutant load reduction targets for the Great Barrier Reef. Published by the State of Queensland, Brisbane, Australia. 62 pp.
Brodie, J.E., Lewis, S.E., Collier, C.J., Wooldridge, S., Bainbridge, Z.T., Waterhouse, J., Rasheed, M.A., Honchin, C., Holmes, G., Fabricius, K., 2017b. Setting ecologically relevant targets for river pollutant loads to meet marine water quality requirements for the Great Barrier Reef, Australia: a preliminary methodology and analysis. Ocean & Coastal Management 143, 136-147.
Brooks, A., Olley, J., Iwashita, F., Spencer, J., McMahon, J., Curwen, G., Saxton, N.E., Gibson, S., 2014. Reducing sediment pollution in Queensland Rivers: towards the development of a method to quantify and prioritise bank erosion in Queensland Rivers based on field evidence from the Upper Brisbane, O'Connell and Normanby Rivers, Final report to Queensland State Government, Department of Science Information Technology Innovation and the Arts, Griffith University, 76 pp.
Brooks, A., Curwen, G., Spencer, J., Shellberg, J., Garzon-Garcia, A., Burton, J., Iwashita, F., 2016a. Reducing sediment sources to the Reef: managing alluvial gully erosion, Report to the National Environmental Science Programme. Reef and Rainforest Research Centre Limited, Cairns (Project 1.7), 418 pp. nesptropical.edu.au/wp-content/uploads/2016/06/NESP-TWQ-1.7-FINAL-REPORT-COMPLETE-10-06-16.pdf
Brooks, A., Spencer, J., Curwen, G., 2016b. A cost effective method for targeting gully rehabilitation effort in high priority GBR sub-catchments (Eds.), 8th Australian Stream Management Conference, Blue Mountains.
Brown, R., Farrelly, M., Keath, N., 2009. Practitioner Perceptions of Social and Institutional Barriers to Advancing a Diverse Water Source Approach in Australia. International Journal of Water Resources Development 25, 15–28.
Bruno, J.F., Sweatman, H., Precht, W.F., Selig, E.R., Schutte, V.G., 2009. Assessing evidence of phase shifts from coral to macroalgal dominance on coral reefs. Ecology 90(6), 1478-1484.
Bryant, K.L., Wilson, P.R., Biggs, A.J.W., Brough, D.M., Burgess, J.W., 2008. Soil Indicators of Queensland Wetlands: Statewide assessment and methodology. Department of Natural Resources and Water, Brisbane, 100 pp. wetlandinfo.ehp.qld.gov.au/resources/static/pdf/ecology/soils/soils-report/01047-soil-indicators-qld-wetlands-lowres.pdf
Buczko, U., Kuchenbuch, R.O., 2010. Environmental indicators to assess the risk of diffuse nitrogen losses from agriculture. Journal of Environmental Management, 45, 1201-1222.
Buczko, U., Kuchenbuch, R.O., Lennartz, B., 2010. Assessment of the predictive quality of simple indicator approaches for nitrate leaching from agricultural fields. Journal of Environmental Management 91, 1305-1315.
Burkitt, L.L., Dougherty, W.J., Carlson, S.M., Donaghy, D.J., 2010. Effect of variable soil phosphorus on phosphorus concentrations in simulated surface run-off under intensive dairy pastures. Soil Research 48, 231-237.
Burnett Mary NRM Group, 2015. Water Quality Improvement Plan for the Burnett Mary 2015, Burnett-Mary Regional Group, Bundaberg, Australia. 171 pp. www.bmrg.org.au/resources/publications/water-quality-improvement-plans/
Burton, Rob J.F., Kuczera, C., Schwarz, G., 2008. Exploring Farmers' Cultural Resistance to Voluntary Agri-environmental Schemes. Sociologia Ruralis 48(1), 16-37. doi: 10.1111/j.1467-9523.2008.00452.x.
Burton, J., Moody, P., DeHayr, R., Chen, C., Lewis, S., Olley, J., 2015. Sources of bioavailable particulate nutrients: Phase 1 (RP128G), Department of Science, Information Technology and Innovation, Brisbane, Australia, 34 pp. publications.qld.gov.au/dataset/35b3d675-af86-47f3-965a-32834f7f6bec/resource/dbb8a587-ef94-45fe-90bf-f4640be44c47/download/sourcesofbioavailableparticulatenutrientsphase1rp128gfinal.pdf
Management options and their effectiveness 134

Scientific Consensus Statement 2017—Chapter 4
Butler, J.R., Wong, G.Y., Metcalfe, D.J., Honzák, M., Pert, P.L., Rao, N., van Grieken, M.E., Lawson, T., Bruce, C., Kroon, F.J., 2013. An analysis of trade-offs between multiple ecosystem services and stakeholders linked to land use and water quality management in the Great Barrier Reef, Australia. Agriculture, Ecosystems & Environment 180, 176-191.
Camilo, B.K., 2016. Bioreactor reduces atrazine and nitrate in tile drain waters. Ecological Engineering 86, 269–278. doi: 10.1016/j.ecoleng.2015.09.072
Campbell, A., 2016. Two step forward, one back. The ongoing failure to capture synergies in natural resource management (Australia), in: Esau, C., Young, M. (Eds.), Transformational Change in Environmental and Natural Resource Management. Guidelines for policy excellence. Taylor and Francise, Abingdon, United Kingdome, pp. 80-94.
Cape York NRM and South Cape York Catchments, 2016. Eastern Cape York Water Quality Improvement Plan. Cape York Natural Resource Management and South Cape York Catchments, Cooktown, Queensland, Australia, 151pp. maps.capeyorknrm.com.au/sites/default/files/downloads/Eastern%20Cape%20York%20WQIP%20DRAFT%20R.pdf
Carroll, C., Halpin, M., Burger, P., Bell, K., Sallaway, M.M., Yule, D.F., 1997. The effect of crop type, crop rotation, and tillage practice on run-off and soil loss on a Vertisol in central Queensland. Australian Journal of Soil Research 35, 925–939.
Cary, J., Webb, T., Barr, N., 2002. Understanding landholders' capacity to change to sustainable practices. Bureau of Rural Sciences, Canberra.
Chan, K.M.A., Balvanera, P., Benessaiah, K., Chapman M., Díaz, S., Gómez-Baggethun, E.,.Gould, R., Hannahs, N., Jax, K., Klain, S., Luck, G.W., Martín-López, B., Muraca, B., Norton, B., Ott, K., Pascual, U., Satterfield, T., Tadaki, M., Taggart, J., Turner, N., 2016. Opinion: Why protect nature? Rethinking values and the environment. Proceedings of the National Academy of Sciences 113(6), 1462-1465.
Chekroun, K. B., Sánchez, E., Baghou, M., 2014. The role of algae in bioremediation of organic pollutants. International Research Journal of Public and Environmental Health 1, 19-32.
Chen, D., Li, Y., Grace, P., Mosier, A.R., 2008. N2O emissions from agricultural lands: a synthesis of simulation approaches. Plant Soil 309, 169–189.
Cherry, K., Shepherd, M., Withers, P., Mooney, S., 2008. Assessing the effectiveness of actions to mitigate nutrient loss from agriculture: A review of methods. Science of the Total Environment 406, 1-23.
Chilcott, C.R., McCallum, B.S., Quirk, M.F., Paton, C.J., 2003. Grazing Land Management Education Package Workshop Notes – Burdekin. Meat and Livestock Australia Limited, Sydney, Australia.
Chilcott, C.R., Sandral, C.J., Aisthorpe, J.L., Paton, C.J., McCallum, B.S., 2005. Grazing Land Management - Fitzroy Basin Version Workshop Notes. Meat and Livestock Australia, North Sydney, NSW.
Christianson, L.E., Schipper, L.A., 2016. Moving Denitrifying Bioreactors beyond Proof of Concept: Introduction to the Special Section. Journal of Environmental Quality 45, 757-761. doi:10.2134/jeq2016.01.0013
Christianson, L., Tyndall, J., Helmers, M., 2013. Financial comparison of seven nitrate reduction strategies for Midwestern agricultural drainage. Water Resources and Economics 2-3, 30-56. doi:10.1016/j.wre.2013.09.001
Churchman, C.W., 1967. Wicked problems. Management Science 14, B141-B142.
Ciesiolka, C., 1987. Catchment Management in the Nogoa Watershed. Australian Water Resources Council, Canberra, 204 pp.
Codner G.P., Laurenson E.M., Mein R.G., 1988. Hydrologic Effects of Urbanization: A Case Study. In Hydrology and Water Resources Symposium.
Coggan, A., van Grieken, M., Boullier, A., Jardi, X., 2015. Private transaction costs of participation in water quality improvement programs for Australia's Great Barrier Reef: Extent, causes and policy implications. Australian Journal of Agricultural and Resource Economics 59, 499-527.
Management options and their effectiveness 135

Scientific Consensus Statement 2017—Chapter 4
Collier, A., Poggio, M., Holligan, E., 2015. The impact of sugarcane growing practices on farm profitability and the environment – a literature review, Submitted to Sugar Research Australia (SRA) as part of SRA Project 2014/15, Department of Agriculture and Fisheries (DAF) Queensland, 30 pp. publications.qld.gov.au/dataset/05fe1bbd-1933-4205-851b-a469f915327e/resource/4abe46b7-0338-47f3-b685-f982fce9bc34/download/the-impact-of-sugarcane-growing-practices-on-farm-profitability-and-the-environment--a-literatur.pdf
Collings, N., 2012. Indigenous cultural & spiritual values in water quality planning. Online: webarchive.nla.gov.au/gov/20130904193600/http://www.environment.gov.au/water/publications/quality/water-quality-planning-indigenous.html. Department of Sustainability, Environment, Water, Population and Communities, Canberra.
Colloff, M.J., Pullen, K.R., Cunningham, S.A., 2010. Restoration of an ecosystem function to revegetation communities: the role of invertebrate macropores in enhancing soil water infiltration. Restoration Ecology 18(1), 65–72, doi: 10.1111/j.1526-100X.2010.00667.x.
Cong, R.H., Wang, X.J., Xu, M.G., Zhang, W.J., Xie, L.J., Yang, X.Y., Huang, S.M., Wang, B.R., 2012. Dynamics of soil carbon to nitrogen ratio changes under long-term fertilizer addition in wheat-corn double cropping systems of China. European Journal of Soil Science 63, 341–350.
Connolly, R.D., Ciesiolka, C.A.A., Silburn, D.M., Carroll, C., 1997. Distributed parameter hydrology model (Answers) applied to a range of catchment scales using rainfall simulator data. IV Evaluating pasture catchment hydrology. Journal of Hydrology 201(1-4), 311-328.
Connolly, R.D., Carroll, C., Frances, J., Silburn, D.M., Simpson, B., Freebairn, D.M., 1999. A simulation study of erosion in the Emerald Irrigation Area. Australian Journal of Soil Research 37, 479-494. 10.1071/SR05195
Connolly, R.D., Kennedy, I.R., Silburn, D.M., Simpson, B., Freebairn, D.M., 2001. Simulating endosulfan transport in run-off from cotton farms in Australia with the GLEAMS model. Journal of Environmental Quality 30, 702-713.
Connolly, N., Kahler, C., Mackay, S., Fry, S., Cameron, R., 2012. Variations in wetland condition across Land Zones in the lower Burdekin. Aquatic weed distribution determined by underlying differences in water and salinity regimes. A report prepared for NQ Dry Tropics NRM. Department of Environment and Heritage Protection, Queensland.
Connor, J.D., MacDonald, D.H., Morrison, M., Cast, A., 2009. Evaluating policy options for managing diffuse source water quality in Lake Taupo, New Zealand. The Environmentalist 29, 348-359.
Cook, S., Kukulies, T., 2017. The economic impact of Banana Best Management Practice adoption for growers in the Wet Tropics: RP140B Case Study Three, Department of Agriculture and Fisheries (DAF), Queensland, 4 pp. publications.qld.gov.au/dataset/862d67fd-9069-44ec-9e73-7354e6f20a64/resource/9ab24ddf-3d94-41f8-bbb7-881fbf975e76/download/rp140b-3rd-case-study.pdf
Cook, S., Sharma, A., Gurung, T. R., Chong, M. C., Umapathi, S., Gardner, T., Carlin, G., Palmer A., 2012. Performance of Cluster Scale Rainwater Harvesting Systems: Analysis of Residential and Commercial Development Case Studies. Urban Water Security Research Alliance Technical Report No. 68, 64 pp. www.urbanwateralliance.org.au/publications/UWSRA-tr68.pdf
Coombes, P., Kuczera, G., Kalma, J., Argue, J., 2002. An evaluation of the benefits of source control measures at the regional scale. Urban Water 4, 307–320.
Coops, H., Geilen, N., Verheij, H.J., Boeters, R., van der Velde, G., 1996. Interactions between waves, bank erosion and emergent vegetation: an experimental study in a wave tank. Aquatic Botany 53, 187–198.
Cowie, B., Shaw, M., Di Bella, L., Benson, A., Nash, M., Davison, L., Tang, W., 2012. Runoff loss of herbicides applied to cane trash and bare soil: a rainfall simulation study. In Proceedings of the International Society for Sugar Cane Technology and Agronomy Workshop, Townsville, Australia, September 2012.
Management options and their effectiveness 136

Scientific Consensus Statement 2017—Chapter 4
Cowie, B., Davison, L., Tang, W., 2013. Rainfall Simulation Program 2010 – 2013. Final report to Paddock to Reef Integrated Monitoring, Modelling and Reporting (Paddock to Reef) Program. Prepared by Department of Natural Resources and Mines.
Craft, C.B., 1996. Dynamics of nitrogen and phosphorus retention during wetland ecosystem succession. Wetlands Ecology and Management 4, 177-187.
Craft, C.B., Broome, S., Campbell, C., 2002. Fifteen years of vegetation and soil development after brackish-water marsh creation. Restoration Ecology 10, 248-258.
CSIRO and BOM, 2015. Climate Change in Australia Information for Australia’s Natural Resource Management Regions: Technical Report, CSIRO and Bureau of Meteorology, Australia.
Cullen-Unsworth, L., Maclean, K., 2015. 'We now have a name for some of the big changes happening on our Bubu [country]'. The role of Indigenous knowledge for the management of cultural landscapes in a changing climate. A case study of the Kuku Nyungkal people from the Queensland Wet Tropics, Australia. In Harvey, D., Perry, J., (eds). The Future of Heritage as Climates Change. Loss, Adaptation and Creativity, pp. 95-110. Routledge.
Dafforn, K.A., Lewis, J.A., Johnston, E.L., 2011. Antifouling strategies: History and regulation, ecological impacts and mitigation. Marine Pollution Bulletin 62, 453-465.
Dale, A., McKee, J., Vella, K., Potts, R., 2013. Carbon, biodiversity and regional natural resource planning: towards high impact next generation plans. Australian Planner 50, 328-339.
Dale, A., George, M., Hill, R., Fraser, D., 2016a. Traditional Owners and Sea Country in the Southern Great Barrier Reef – Which Way Forward? Report to the National Environmental Science Programme. Reef and Rainforest Research Centre Limited, Cairns, Australia, p. 50. Online; nesptropical.edu.au/wp-content/uploads/2016/05/NESP-TWQ-3.9-FINAL-REPORT.pdf. Report to the National Environmental Science Program. GBR and Rainforest Research Centre Ltd.
Dale, A., Vella, K., Pressey, R.L., Brodie, J., Gooch, M., Potts, R., Eberhard, R., 2016b. Risk analysis of the governance system affecting outcomes in the Great Barrier Reef. Global Environmental Change 183, 712-721.
Darbas, T., Smith, T.F., Jakku, E., 2009. Seeing engagement practitioners as deliberative hinges to improve landholder engagement. IN Lane, M.B., Robinson, C., Taylor, B., (eds) Contested Country: Local and Regional Natural Resources Management in Australia, CSIRO Publishing, Collingwood.
Darnell, R., Henderson, B., Kroon, F.J., Kuhnert, P., 2012. Statistical power of detecting trends in total suspended sediment loads to the Great Barrier Reef. Marine Pollution Bulletin 65(4-9), 203-209, 10.1016/j.marpolbul.2012.04.002.
Davis, A., 2013. Runoff and deep drainage in sugarcane farming. Paddock Scale Water Quality Monitoring of Sugarcane Management Practices, Summary report, 2010-2013 Wet Seasons. Lower Burdekin Region. Department of Natural Resources and Mines, Queensland Government and Tropical Water & Aquatic Ecosystem Research (TropWATER) Publication, James Cook University.
Davis, A.M., Pradolin J., 2016. Precision herbicide application technologies to decrease herbicide losses in furrow irrigation outflows in a Northeastern Australian cropping system. Journal of Agricultural and Food Chemistry 64, 4021-4028.
Davis, A.M., Lewis, S.E., Bainbridge, Z.T., Glendenning, L., Turner, R., Brodie, J.E., 2012. Dynamics of herbicide transport and partitioning under event flow conditions in the lower Burdekin region, Australia. Marine Pollution Bulletin 65, 182-193.
Davis, A.M., Thorburn, P.J., Lewis, S.E., Bainbridge, Z.T., Attard, S.J., Milla, R., Brodie, J., 2013. Herbicide run-off dynamics of furrow irrigated sugarcane farms and associated drainage systems on the Burdekin River Floodplain, north-eastern Australia. Agriculture, Ecosystems and Environment 80, 123-135 doi:10.1016/j.agee.2011.06.019.
Management options and their effectiveness 137
Scientific Consensus Statement 2017—Chapter 4
Davis, A., Lewis, S., Brodie, J., Benson, A., 2014. The potential benefits of herbicide regulation: A cautionary note for the GBR catchment area. Science of the Total Environment 490, 81-92. doi: 10.1016/j.scitotenv.2014.04.005
Davis, A.M., Tink, M., Rohde, K., Brodie, J.E., 2016. Urea contributions to dissolved ‘organic’ nitrogen losses from intensive, fertilised agriculture. Agriculture, Ecosystems and Environment 223, 190-196.
Davis, A.M., Pearson, R.G., Brodie, J.E., Butler, B., 2017. Review and conceptual models of agricultural impacts and water quality in waterways of the Great Barrier Reef Catchment area. Marine and Freshwater Research 68, 1-19. doi: 10.1071/MF15301_AC
Dawes-Gromadzki, T., 2005. Bugs beneath the surface: the functional significance of soil macro-invertebrates to landscape health in Australia's tropical savannas. Insect Science 12(4), 307–312.
Day, J., 2008. The need and practice of monitoring, evaluating and adapting marine planning and management—lessons from the Great Barrier Reef. Marine Policy 32, 823-831.
Day, J.C., Dobbs, K., 2013. Effective governance of a large and complex cross-jurisdictional marine protected area: Australia's Great Barrier Reef. Marine Policy 41, 14-24.
DeBose, J., Coppo, C., McIntyre, R., Nelson, P., Karim, F., Davis, A., Brodie, J., 2014. Effectiveness of vegetated systems in managing contaminated run-off from sugarcane and banana farms to protect off-farm aquatic ecosystems, particularly the Great Barrier Reef. TropWATER report 14/10.
DEEDI (Department of Employment, Economic Development and Innovation), 2011. Wetland Management Handbook: Farm Management Systems (FMS) guidelines for managing wetlands in intensive agriculture, Queensland Wetlands Program, Brisbane. www.wetlandinfo.ehp.qld.gov.au.
DEHP (Department of Environment and Heritage Protection), 2012. Wastewater release to Queensland waters. Queensland Government, Department of Environment and Heritage Protection, Brisbane, Australia.
DEHP (Department of Environment and Heritage Protection), 2015. Environmental Protection Act 1994. ed. Queensland Government Queensland Government, Department of Environment and Heritage Protection, Brisbane, Australia, 830 pp.
DEHP (Department of Environment and Heritage Protection), 2016. Marginal abatement cost curves for sugar cane and grazing in the Great Barrier Reef catchments. Department of Environment and Heritage Protection, Queensland Government. Brisbane, Australia.
Deloitte Access Economics, 2017. At what price? The economic, social and icon value of the Great Barrier Reef, Great Barrier Reef Foundation, Brisbane. 92 pp. file:///C:/Users/rolfej/Downloads/deloitte-au-economics-great-barrier-reef-230617.pdf
Devlin, M. Lewis, S. Davis, A. Smith, R. Negri, A. Thompson, M. Poggio, M., 2015. Advancing our understanding of the source, management, transport and impacts of pesticides on the GBR 2011-2015. A report for the Queensland Department of Environment and Heritage Protection. Tropical Water & Aquatic Ecosystem Research (TropWATER) Publication, James Cook University, Cairns, 134 pp.
DEWHA (Department of the Environment, Water, Heritage and the Arts), 2008. National Framework and Guidance for Describing the Ecological Character of Australia’s Ramsar Wetlands. Module 2 of the National Guidelines for Ramsar Wetlands— Implementing the Ramsar Convention in Australia. Australian Government Department of the Environment, Water, Heritage and the Arts, Canberra.
DEWHA (Department of the Environment, Water, Heritage and the Arts), 2009. Threat Abatement Plan for the impacts of marine debris on vertebrate marine life. Australian Government Department of the Environment, Water, Heritage and the Arts, Canberra.
Di Bella, L.P., Stacey, S.P., Benson, A., Royle, A., Holzberger, G., 2013. An assessment of controlled release fertiliser in the Herbert cane growing region. Proceedings of the Australian Society of Sugar Cane Technologists 35, 784–788.
Management options and their effectiveness 138
Scientific Consensus Statement 2017—Chapter 4
Di Bella, L.P., Stacey, S.P., Moody, P., Benson, A., Dowie, J., Sluggett, R., 2014. An assessment of controlled release fertilisers in the Australian sugar industry. Proceedings of the Australian Society of Sugar Cane Technologists 36, 121-131.
Di Bella, L, O'Brien, D., Nash, M., Wegscheidl, C., 2016. The Use of Targeted Extension Strategies to Improve Water Quality Outcomes in the Herbert Sugar Cane Industry. Proceedings of the Australian Society of Sugar Cane Technologists 38, 170-179.
Di Bella, L.P., Armour, J.D., Moody, P., Royle, M., Ibanez, M., Le Bris, M., (2017). The assessment of enhanced efficiency fertilisers (EEFs) in a glasshouse experiment to investigate nitrogen loss pathways, in sugarcane. Proceedings of Australian Society of Sugar Cane Technologists, 39.
DILGP (Department of Infrastructure, Local Government and Planning), 2016a. State Planning Policy 2016. Queensland Government, Brisbane, 92 pp. www.dilgp.qld.gov.au/resources/policy/state-planning/spp-april-2016.pdf
DILGP (Department of Infrastructure, Local Government and Planning), 2016b. State Planning Policy - State Interest - Guideline Water Quality 2016. Queensland Government, Brisbane, 28 pp. www.dilgp.qld.gov.au/resources/guideline/spp/spp-guideline-water-quality.pdf
DNRM (Department of Natural Resources and Mines), 2016. Key technical information from paddock monitoring activities under the DNRM Paddock to Reef Program. A synopsis of key findings for consideration for the Scientific Consensus Statement 2017, Queensland Department of Natural Resources and Mines, Brisbane, Queensland.
Donaldson, S., Robins, S., Chataway, R., 2015. Paddock-Scale Water Quality Monitoring of Sugarcane Management Practices 2013-2014 Summary report, Mackay-Whitsunday Region. Department of Natural Resources and Mines.
Douglas, M.M., Bunn, S.E., Davies, P.M., 2005. River and wetlands food webs in Australia’s wet-tropics: general principles and implications for management. Marine and Freshwater Research 56, 329-342. doi:10.1071/MF04084
Drapper, D., Hornbuckle, A., 2015. Field Evaluation of a Stormwater Treatment Train with Pit Baskets and Filter Media Cartridges in Southeast Queensland. Water 7, 4496–4510.
DTMR (Queensland Department of Transport and Main Roads), 2016. Business and industry transport sectors, Ports. Online resource available at: www.tmr.qld.gov.au/business-industry/Transport-sectors/Ports.aspx. Accessed December 2016.
Duarte, C.M., Conley, D.J., Carstensen, J., Sánchez-Camacho, M., 2009. Return to Neverland: shifting baselines affect eutrophication restoration targets. Estuaries and Coasts, 32(1), 29-36.
Duckett, D., Feliciano, D., Martin-Ortega, J., Munoz-Rojas, J., 2016. Tackling wicked environmental problems: The discourse and its influence on praxis in Scotland. Landscape and Urban Planning 154, 44-66.
Duncan, H.P., 1999. Urban Stormwater Quality – A statistical overview, Report 99/3. CRC for Catchment Hydrology, Monash University, Melbourne.
Duncan, H.P., Fletcher, T.D., Vietz, G., Urrutiaguer, M., 2014. The feasibility of maintaining ecologically and geomorphically important elements of the natural flow regime in the context of a superabundance of flow. Melbourne Waterway Research-Practice Partnership Technical Report. 14.5.
Dutra, L.X. C., Dichmont, C.M., van Putten, I.E., Thebaud, O., Deng, R.A., Pascual, R., Playford, J., 2016. How important is the coast? A survey of coastal objectives in an Australian regional city. Marine Policy 71, 229-241. doi: 10.1016/j.marpol.2016.05.020
Eastwood, C., Klerkx, L., Nettle, R., 2017. Dynamics and distribution of public and private research and extension roles for technological innovation and diffusion: Case studies of the implementation and adaptation of precision farming technologies. Journal of Rural Studies 49, 1-12.
Eberhard, R., 2011. Caring for our Country - Reef Rescue as a program delivery model for natural resource management. Eberhard Consulting, Brisbane.
Management options and their effectiveness 139

Scientific Consensus Statement 2017—Chapter 4
Eberhard, R., Johnston, N., Everingham, J.A., 2013. A collaborative approach to address the cumulative impacts of mine-water discharge: Negotiating a cross-sectoral waterway partnership in the Bowen Basin, Australia. Resources Policy 38, 678-687.
Eberhard, R., Margerum, R.D., Vella, K., Mayere, S., Taylor, B., 2017a. The practice of water policy governance networks: an international comparative case study analysis. Society and Natural Resources 30, 453 - 470.
Eberhard, R., Brodie, J., Waterhouse, J., 2017b. Managing water quality for the Great Barrier Reef, in: Hart, B., Doolan, J., (eds.). Decision Making in Water Resources Policy and Management: An Australian Perspective. Elsevier, Collingwood, Australia.
Elliott, M., Mander, L., Mazik, K., Simenstad, C., Valesini, F., Whitfield, A., Wolanski, E., 2016. Ecoengineering with ecohydrology: successes and failures in estuarine restoration. Estuarine, Coastal and Shelf Science, 176, 12-35.
Ellis, T.W., Leguédois, S., Hairsine, P.B., Tongway, D.J., 2006. Capture of overland flow by a tree belt on a pastured hillslope in south-eastern Australia. Australian Journal of Soil Research 44, 117-125. doi: 110.071/SR05130
Elmhirst, T., Connolly, S.R., Hughes, T.P., 2009. Connectivity, regime shifts and the resilience of coral reefs. Coral Reefs, 28(4), 949-957.
Elsayed, O.F., Maillard, E., Vuilleumier, S., Millet, M., Imfeld, G., 2015. Degradation of chloroacetanilide herbicides and bacterial community composition in lab-scale wetlands. Science of the Total Environment 520, 222-231. doi:10.1016/j.scitotenv.2015.03.061
Emtage, N., Herbohn, J., 2012a. Implications of landholders' management goals, use of information and trust of others for the adoption of recommended practices in the Wet Tropics region of Australia. Landscape and Urban Planning 107(4), 351-360.
Emtage, N., Herbohn, J., 2012b. Assessing rural landholders diversity in the Wet Tropics region of Queensland, Australia in relation to natural resource management programs: A market segmentation approach. Agricultural Systems 110, 107-118.
Emtage, N., Herbohn, J., Harrison, S., 2007. Landholder profiling and typologies for natural resource-management policy and program support: Potential and constraints. Environmental Management 40(3), 481-492.
Erftemeijer, P.L.A., Lewis, R.R., 2006. Environmental impacts of dredging on seagrasses: A review. Marine Pollution Bulletin 52, 1553-1572.
Erftemeijer, P.L.A., Riegl, B., Hoeksema, B.W., Todd, P.A., 2012. Environmental impacts of dredging and other sediment disturbances on corals: A review. Marine Pollution Bulletin 64, 1737-1765.
Erskine, W.D., Saynor, M.J., Boyden, J.M., Evans, K.G., 2017. Sediment fluxes and sinks for Magela Creek, Northern Territory, Australia. Marine and Freshwater Research, 8 pp. doi:10.1071/MF16107
EU Water Framework Directive, 2016. No. 3, Special Report Combating eutrophication in the Baltic Sea: further and more effective action needed. Office of the European Union. www.eca.europa.eu/en/Pages/DocItem.aspx?did=35757
Evans, L.S., Ban, N.C., Schoon, M., Nenadovic, M., 2014. Keeping the ‘Great’ in the Great Barrier Reef: large-scale governance of the Great Barrier Reef Marine Park. International Journal of the Commons 8, 396-427.
Everingham, J.A., Collins, N., Cavaye, J., Rifkin, W., Vink, S., Baumgartl, T., Rodriguez, D., 2016. Energy from the foodbowl: Associated land-use conflicts, risks and wicked problems. Landscape and Urban Planning 154, 68-80.
Everingham, Y.L., Inman-Bamber, N.G., Thorburn, P.J., McNeill, T.J., 2007. A bayesian modelling approach for improving long lead sugarcane yield forecasts. Australian Journal of Agricultural Research 58, 87-94.
Management options and their effectiveness 140

Scientific Consensus Statement 2017—Chapter 4
Fidelman, P.I., Leitch, A.M., Nelson, D.R., 2013. Unpacking multilevel adaptation to climate change in the Great Barrier Reef, Australia. Global Environmental Change 23, 800-812.
Fielding, K., Spinks, A., Russell, S., Mankad, A., McCrae, R., Gardner, J., 2012. Water demand management: Interventions to reduce household water use. Urban Water Security Research Alliance Technical Report. No. 94, 56 pp. www.urbanwateralliance.org.au/publications/UWSRA-tr94.pdf
Fillols, E., 2012. Weedicide properties of trash blankets and timing of application of pre-emergent herbicides on trash. Proceedings of Australian Society of Sugar Cane Technologists, 34, 1-17.
Fitzgerald, K., 1976. Management and regeneration of degraded catchments and eroded pastoral lands with particular reference to range reseeding, Conservation in Arid and Semi-arid zones, FAO Conservation Guide. Food and Agricultural Organisation of the United Nations, Rome, pp. 41-60.
Fitzroy Basin Association 2015. Fitzroy Water Quality Improvement Plan. riverhealth.org.au/projects/fba-wqip/.
Fleischman, F., Ban, N., Evans, L., Epstein, G., Garcia-Lopez, G., Villamayor-Tomas, S., 2014. Governing large-scale social-ecological systems: Lessons from five cases. International Journal of the Commons 8(2), 428-456. doi:http://doi.org/10.18352/ijc.416
Fletcher, T.D., Peljo, L., Fielding, J., Wong, T.H., Weber, T., 2002. The performance of vegetated swales for urban stormwater pollution control. IN Global Solutions for Urban Drainage Ninth International Conference on Urban Drainage (9ICUD) Portland, Oregon, September 8-13, 2002, 16 pp.
Fletcher, T.D., Duncan, H.P., Poelsma, P., Lloyd, S., 2004. Stormwater Flow and Quality, and the Effectiveness of Non-Proprietary Stormwater Treatment Measures: A Review and Gap Analysis. CRC for Catchment Hydrology and Institute for Sustainable Water Research, Monash University.
Flint, N., Jackson, E., Wilson, S., Verlis, K., and Rolfe, J., 2015. Synthesis of water quality influences in ports of the Fitzroy region, Queensland. A report to the Fitzroy Basin Association. CQ University Australia, North Rockhampton, Queensland. riverhealth.org.au/wp-content/uploads/2016/02/Ports-23_10_2015.pdf
Folkers, A., Rohde, K., Delaney, K., Flett, I., 2014. Mackay Whitsunday Water Quality Improvement Plan 2014-2021. Reef Catchments and Australian Government. reefcatchments.com.au/files/2015/06/WATER-QUALITY-IMPROVEMENT-PLAN-MACKAY-WHITSUNDAY-ISAAC-2014-2021_DRAFT.pdf
Fraser, K.A., Adams, V.M., Pressey, R.L., Pandolfi, J.M., 2017. Purpose, policy, and practice: Intent and reality for on-ground management and outcomes of the Great Barrier Reef Marine Park. Marine Policy 81, 301-311.
Freebairn, D.M., Loch, R.J., Silburn, D.M., 1996. Soil erosion and soil conservation for vertisols. Developments in Soil Science 24, 303-362.
Furukawa, K., Wolanski, E., Mueller, H., 1997. Currents and sediment transport in mangrove forests. Estuarine Coastal and Shelf Science 44, 301–310.
Garbrecht, J.D. Starks, P.J., 2009. Watershed sediment yield reduction through soil conservation in a West-Central Oklahoma watershed. Ecohydrology 2(3), 313-320, doi: 10.1002/eco.55.
Gardner, A., Waschka, M., 2012. Using regulation to tackle the challenge of diffuse water pollution and its impact on the Great Barrier Reef: the challenge of managing diffuse source pollution from agriculture: GBR case study and Queensland's reef protection legislation: an analysis. Australasian Journal of Natural Resources Law and Policy 15(2), 109-147.
Garside A.L., Bell M.J., 2011. Growth and yield responses to amendments to the sugarcane monoculture: effect of crop, pasture and bare fallow breaks and soil fumigation on plant and ratoon crops. Crop and Pasture Science 62, 396–412.
Garzon-Garcia, A., Burton, J., Brooks, A., 2016. Bioavailable nutrients and organics in alluvial gully sediment. Department of Science, Information Technology and Innovation, Brisbane, pp. 59. publications.qld.gov.au/dataset/22535c14-fd32-43ae-9425-ac71be51b15d/resource/17fb3a56-1814-40da-9688-3587cc8660ec/download/bioavailable-nutrients-organics-gully-sediment.pdf
Management options and their effectiveness 141
Scientific Consensus Statement 2017—Chapter 4
GBRMPA (Great Barrier Reef Marine Park Authority), 2009. Great Barrier Reef Outlook Report 2009. Commonwealth of Australia, Townsville.
GBRMPA (Great Barrier Reef Marine Park Authority), 2014a. Great Barrier Reef Outlook Report 2014, Commonwealth of Australia, Townsville.
GBRMPA (Great Barrier Reef Marine Park Authority), 2014b. Great Barrier Reef Region Strategic Assessment, Commonwealth of Australia, Townsville.
GBRWST (Great Barrier Reef Water Science Taskforce), 2016. Great Barrier Reef Water Science Taskforce Final Report May 2016. Office of the Great Barrier Reef, Department of Environment and Heritage Protection, Brisbane.
GESAMP, 2015. Sources, fate and effects of microplastics in the marine environment: a global assessment. ed Kershaw P.J. (IMO/FAO/UNESCO-IOC/UNIDO/WMO/IAEA/UN/UNEP/UNDP) Joint Group of Experts on the Scientific Aspects of Marine Environmental Protection, London, U.K., 96 pp.
Glaister, B., Fletcher, T., Cook, P., Hatt, B., 2014. Co-optimisation of phosphorus and nitrogen removal in stormwater biofilters: the role of filter media, vegetation and saturated zone. Water Science and Technology 69, 1961-1969. doi:10.2166/wst.2014.117
Gonzalez-Chavez, M.C., Carrillo-Gonzalez, R., Wright, S.F., Nichols, K.A., 2004. The role of glomalin, a protein produced by arbuscular mycorrhizal fungi, in sequestering potentially toxic elements. Environmental Pollution 130 (3), 317-323.
Gordon, I.J., Nelson, B., 2007. Reef Safe Beef: Environmentally sensitive livestock management for the grazing lands of the Great Barrier Reef catchments. In: Swain, D.L., Charmley, E., Steel, J.W. & Coffey, S.G. (eds) Redesigning Animal Agriculture; the Challenge of the 21st Century. pp. 171-184. CABI Publishing, Wallingford, UK.
GPC (Gladstone Port Corporation), 2014. Long term monitoring and management plan for permit under the Environment Protection (Sea Dumping) Act 1981 to dispose of dredge material at sea. Maintenance dredging. Gladstone Ports Corporation, Gladstone, Queensland.
Grech, A., Bos, M., Brodie, J., Coles, R., Dale, A., Gilbert, R., Hamann, M., Marsh, H., Neil, K., Pressey, R.L., Rasheed, M.A., Sheaves, M., Smith, A., 2013. Guiding principles for the improved governance of port and shipping impacts on the Great Barrier Reef. Marine Pollution Bulletin 75, 8-20.
Grech, A., Pressey, R.L., Day, J.C., 2016. Coal, Cumulative Impacts, and the Great Barrier Reef. Conservation Letters 9, 200-207.
Greening, H., Janicki, A., Sherwood, E.T., Pribble, R., Johansson, J.O.R., 2014. Ecosystem responses to long-term nutrient management in an urban estuary: Tampa Bay, Florida, USA. Estuarine, Coastal and Shelf Science, 151, A1-A16.
Gregg, D., Rolfe, J.,2016. Using experiments to improve understanding of limits to decision making in Grazing Land Management. Land Use Policy 54, 508-521.
Greiner, R., 2015a. Ex-post evaluation of an environmental auction: Legacy of the 2008 Lower Burdekin Water Quality Tender. Report to the National Environmental Science Program. Reef and Rainforest Research Centre Limited, Cairns, Australia, 46 pp.
Greiner, R., 2015b. Motivations and attitudes influence farmers' willingness to participate in biodiversity conservation contracts. Agricultural Systems 137, 154-165.
Greiner, R., 2016. Factors influencing farmers’ participation in contractual biodiversity conservation: a choice experiment with northern Australian pastoralists. Australian Journal of Agricultural and Resource Economics 60 (1), 1-21.
Greiner, R., Gregg, D., 2011. Farmers’ intrinsic motivations, barriers to the adoption of conservation practices and effectiveness of policy instruments: Empirical evidence from northern Australia. Land Use Policy 28(1), 257-265.
Management options and their effectiveness 142

Scientific Consensus Statement 2017—Chapter 4
Greiner, R., Patterson, L., Miller, O., 2009. Motivations, risk perceptions and adoption of conservation practices by farmers. Agricultural Systems 99(2-3), 86-104.
Griffin, D., 2008. Pilot investigation of the origins and pathways of marine debris found in the northern Australian marine environment. CSIRO, Hobart, Australia, 42 pp.
Gunn, J., 2015. Fitzroy Region Urban Scoping Report, prepared for the Fitzroy Basin Water Quality Improvement Plan. Earth Environmental, Mackay, Queensland.
Gunn, J., Manning, C., 2010. Black Ross (Townsville) Water Quality Improvement Plan: Improving Water Quality from Creek to Coral, Townsville City Council - Creek to Coral, Townsville. 106 pp.
Gunningham, N., 2009. Environment law, regulation and governance: Shifting architectures. Journal of Environmental Law 21, 179-212.
Hall, M.R., 2012. Extended Cost-Effectiveness of Water Supply Options: Case Study of the Total Water Cycle Management Plan for Moreton Bay Regional Council. Urban Water Security Research Alliance Technical Report No. 88, 55 pp. www.urbanwateralliance.org.au/publications/UWSRA-tr88.pdf
Hallett, C.S., Valesini, F. and Elliot, M., 2016b. A review of Australian approaches for monitoring, assessing and reporting estuarine conditions: I. International context and evaluation criteria. Environmental Science & Policy 66, 260-269.
Hallett, C.S., Valesini, F., Scanes, P., Crawford, C., Gillanders, B.M., Pope, A., Udy, J., Fortune, J., Townsend, S., Barton, J., Ye, Q., Ross, D.J., Martin, K., Glasby, T. and Maxwell, P., 2016a. A review of Australian approaches for monitoring, assessing and reporting estuarine conditions: II. State and Territory programs. Environmental Science & Policy 66, 270-281.
Hardesty, B.D., Wilcox, C., Lawson, T.J, Van Der Velde, T., Lansdell, M., 2014. Understanding the effects of marine debris on wildlife. CSIRO, Hobart, Australia, 364 pp.
Hardesty, B.D., Lawson, T., Velde, T., Lansdell, M., Wilcox, C., 2017. Estimating quantities and sources of marine debris at a continental scale. Frontiers in Ecology and the Environment 15, 18-25.
Harvey, S., Poggio, M., Thompson, M., Holligan, E., 2016a. Understanding the economics of improved management practices and systems on sugarcane farms. Department of Agriculture and Fisheries (DAF) Queensland.
Harvey, S., Cook, S., Poggio, M., 2016b. Economic assessment of best management practices for banana growing, Report to the Department of Environment and Heritage Protection through funding from the Reef Water Quality Science Program, RP140B Initial synthesis report. Department of Agriculture and Fisheries (DAF), Queensland.
Hatt, B., Fletcher, T., Deletic, A., 2009. Hydrologic and pollutant removal performance of stormwater biofiltration systems at the field scale. Journal of Hydrology 365, 310–321.
Hatt, B.E., Steinel, A., Deletic, A., Fletcher, T.D., 2011. Retention of heavy metals by stormwater filtration systems: breakthrough analysis. Water Science Technology 64, 1913.
Hawdon, A., Keen, R.J., Post, D.A., Wilkinson, S.N., 2008. Hydrological recovery of rangeland following cattle exclusion. In: J. Schmidt, T. Cochrane, C. Phillips, S. Elliott, T. Davies and L. Basher (Eds), Sediment Dynamics in Changing Environments IAHS Publ. 325, Christchurch New Zealand, pp. 532-539.
Haynes D., 1997. Marine debris on continental islands and sand cays in the far northern section of the Great Barrier Reef Marine Park, Australia. Marine Pollution Bulletin 34(4), 276-279.
Head, B.W., Alford, J., 2015. Wicked problems: implications for public policy and management. Administration & Society 47, 711–739.
Head, B.W., Xiang, W.-N., 2016. Why is an APT approach to wicked problems important? Landscape and Urban Planning, 154, 4-7.
Head, B.W., Ross, H., Bellamy, J., 2016. Managing wicked natural resource problems: The collaborative challenge at regional scales in Australia. Landscape and Urban Planning 154, 81-92.
Management options and their effectiveness 143

Scientific Consensus Statement 2017—Chapter 4
Henriques, I., Sadorsky, P., 1996. The determinants of an environmentally responsive firm: An empirical approach. Journal of Environmental Economics and Management 30, 381-395.
Hibbard, M., Lane, M.B., Rasmussen, K., 2008. The Split Personality of Planning: Indigenous Peoples and Planning for Land and Resource Management. Journal of Planning Literature 23 (2), 136-151.
Hill, R., Pert, P.L, Maclean, K., Bauman,T., Bock, E., Dale, A.P., Flynn, M., Joyce, A., McDermott, S., Mundraby, V., Rist, P., Rampton, B., Schmider, J., Talbot, L.D., Tawake, L., 2014. Indigenous peoples and biodiversity protection in wet tropics country: from co-management to collaborative governance. Volume 1 interim policy-relevant findings. Cairns, 46 pp. www.nerptropical.edu.au/publication/project-121-technical-report-indigenous-peoples-and-biodiversity-protection-wet-tropics.
Hill, R., Davies, J., Bohnet, I., Robinson, C., Maclean, K., Pert, P., 2015. Collaboration mobilises institutions with scale-dependent comparative advantage in landscape-scale biodiversity conservation. Environmental Science & Policy 51, 267-277. doi.org/10.1016/j.envsci.2015.04.014
Hobbs, R.J., Higgs, E., Harris, J.A., 2009. Novel ecosystems: implications for conservation and restoration. Trends in Ecology & Evolution 24, 599-605. doi:10.1016/j.tree.2009.05.012
Holmes, R.M., Jones, J.B., Fisher, S.G., Grimm, N.B.,1996. Denitrification in a nitrogen-limited stream ecosystem. Biogeochemistry 33, 125-146. doi: 10.1007/BF02181035
Holzworth, D.P., Huth, N.I., deVoil, P.G., Zurcher, E.J., Herrmann, N.I., McLean, G., Chenu, K., van Oosterom, E., Snow, V.O., Murphy, C., Moore, A.D., Brown, H.E., Whish, J.P.M., Verrall, S., Fainges, J., Bell, L., Peake, A.S., Poulton, P.L., Hochman, Z., Thorburn, P.J., Gaydon, D.S., Dalgliesh, N.P., Rodriguez, D., Cox, H., Chapman, S., Doherty, A., Teixeira, E., Sharp, J., Cichota, R., Vogeler, I., Li, F.Y., Wang, E., Hammer, G.L., Robertson, M.J., Dimes, J., Whitbread, A.M., Hunt, J., van Rees, H., McClelland, T., Carberry, P.S., Hargreaves, J.N.G., MacLeod, N., McDonald, C., Harsdorf, J., Wedgwood, S., Keating, B.A., 2014. APSIM - Evolution towards a new generation of agricultural systems simulation. Environmental Modelling and Software 62, 327-350.
Hooke, J.M., 1980. Magnitude and distribution of rates of river bank erosion. Earth Surface Processes and Landforms 5(2), 143-157.
Hughes, A.O., Olley, J.M., Croke, J.C., McKergow, L.A., 2009. Sediment source changes over the last 250 years in a dry-tropical catchment, central Queensland, Australia. Geomorphology 104(3-4), 262-275.
Hughes, T.P., Graham, N.A., Jackson, J.B., Mumby, P.J., Steneck, R.S., 2010. Rising to the challenge of sustaining coral reef resilience. Trends in Ecology & Evolution 25, 633-642.
Hughes, T.P., Day, J.C., Brodie, J., 2015. Securing the future of the Great Barrier Reef. Nature Climate Change 5, 508-511. doi:10.1038/nclimate2604
Hunt, L.P., Petty, S., Cowley, R., Fisher, A., Ash, A.J., MacDonald, N., 2007. Factors affecting the management of cattle grazing distribution in northern Australia: preliminary observations on the effect of paddock size and water points. The Rangeland Journal 29(2), 169-179.
Hunt, L.P., McIvor, J.G., Grice, A.C., Bray, S.G., 2014. Principles and guidelines for managing cattle grazing in the grazing lands of northern Australia: stocking rates, pasture resting, prescribed fire, paddock size and water points - a review. The Rangeland Journal 36(2), 105-119, 10.1071/rj13070.
Hussey, K., Pittock, J., 2012. The Energy–Water Nexus: Managing the Links between Energy and Water for a Sustainable Future. Ecology and Society 17, 31. doi.org/10.5751/ES-04641-170131.
Huth, N.I., Thorburn, P.J., Radford, B.J., Thornton, C.M., 2010. Impacts of fertilisers and legumes on N2O and CO2 emissions from soils in subtropical agricultural systems: A simulation study. Agriculture Ecosystem and Environment 136, 351–357. doi:10.1016/j.agee.2009.12.016
Huxham, C., 2003. Theorizing collaboration practice. Public Management Review 5, 401-423.
Jacobs, 2014. Institutional and legal mechanisms that provide coordinated planning, protection and management of the Great Barrier Reef World Heritage Area. Jacobs, Brisbane, Australia. www.environment.gov.au/marine/gbr/publications/independent-review
Management options and their effectiveness 144

Scientific Consensus Statement 2017—Chapter 4
Jakku, E., Thorburn, P.J., 2010. A conceptual framework for guiding the participatory development of agricultural decision support systems. Agricultural Systems 103, 675–682.
Jakku, E., Taylor, B., Fleming, A., Thorburn, P.J., 2016. Big Data, Trust and Collaboration: Exploring the socio-technical enabling conditions for big data in the grains industry. CSIRO Technical Report, June 2016. doi: 10.13140/RG.2.2.26854.22089.
Janssen, B.H., De Willigen, P., 2006. Ideal and saturated soil fertility as bench marks in nutrient management. 1. Outline of the framework. Agriculture, Ecosystems and Environment 116, 132–146.
Jardine, T.D., Hunt, R.J., Faggotter, S.J., Valdez, D., Burford, M.A., Bunn, S.E., 2012. Carbon from periphyton supports fish biomass in waterholes of a wet-dry tropical river. River Research Applications 29, 560-573. doi: 10.1002/rra.2554
Jardine, T.D., Bond, N.R., Burford, M.A., Kennard, M.J., Ward, D.P., Bayliss, P., Davies, P. M., Douglas, M.M., Hamilton, S.K., Melack, J.M., Naiman, R.J., Pettit, N.E., Pusey, B.J., Warfe, D.M., Bunn, S.E., 2015. Flood rhythm and ecosystem responses in tropical riverscapes. Ecology 96, 684–692.
Johnston, C.A., 2009. Sediment and nutrient retention by freshwater wetlands: effects on surface water quality. Reviews in Environmental Control 21, 491-565. doi: 10.1080/10643389109388425.
Kealley, M.J., Milford, B.J., 2013. Case Study: Preserving the use of Diuron for sugarcane production in catchments adjacent to the Great Barrier GBR. Proceedings of the International Society of Sugar Cane Technologists 28, 377-389.
Kealley, M.J., Quirk, M.F., 2016. Smartcane BMP – understanding drivers and building momentum for best management practice uptake in the Queensland sugarcane industry. Proceedings of the International Society of Sugar Cane Technologists 29, 1-9.
Keast, R., Brown, K., Mandell, M.P., 2007. Getting the right mix: unpacking integration meanings and strategies. International Public Management Journal 10, 9-33.
Keating, B.A., Verburg, K., Huth, N.I., Robertson, M.J., 1997. Nitrogen management in intensive agriculture: sugarcane in Australia. In: Keating, B.A., Wilson, J.R. (Eds.), Intensive Sugarcane Production: Meeting the Challenges Beyond 2000. CAB International, Wallingford, UK, 221 pp.
Kellert, S.R., Mehta, J.N., Ebbin, S.A., 2010. Community Natural Resource Management: Promise, Rhetoric, and Reality. Society and Natural Resources 13, 705-715.
King, J., Alexander, F., Brodie, J., 2013. Regulation of pesticides in Australia: The Great Barrier Reef as a case study for evaluating effectiveness. Agriculture, Ecosystems & Environment 180, 54-67.
Knighton, A.D., 1999. Downstream variation in stream power. Geomorphology 29, 293–306.
Kooiman, J., 2003. Governing as governance. Sage, London. 264 pp.
Kragt, M.E., Roebeling, P.C., Ruijs, A., 2009. Effects of Great Barrier Reef degradation on recreational reef-trip demand: a contingent behaviour approach. The Australian Journal of Agricultural and Resource Economics 53, 213-229.
Kroon, F.J., Robinson, C.J., Dale, A.P., 2009. Integrating knowledge to inform water quality planning in the Tully–Murray basin, Australia. Marine and Freshwater Research 60, 1183-1183.
Kroon F., Turner, R., Smith, R., Warne, M., Hunter H., Bartley, R., Wilkinson, S., Lewis, S., Waters, D., Carrol, C., 2013. 2013 Scientific Consensus Statement. Chapter 4: Sources of sediment, nutrients, pesticides and other pollutants in the Great Barrier Reef catchment. Reef Water Quality Protection Plan Secretariat, Brisbane, Australia, 42 pp.
Kroon, F.J., Schaffelke, B., Bartley, R., 2014. Informing policy to protect coastal coral reefs: Insight from a global review of reducing agricultural pollution to coastal ecosystems. Marine Pollution Bulletin 85(1), 33-41, doi.org/10.1016/j.marpolbul.2014.06.003.
Kroon, F., Berry, K., Brinkman, D., Davis, A., King, O., Kookana, R., Lewis, S., Leusch, F., Makarynskyy, O., Melvin, S., 2015. Identification, impacts, and prioritisation of emerging contaminants present in the
Management options and their effectiveness 145

Scientific Consensus Statement 2017—Chapter 4
GBR and Torres Strait marine environments (Final Report Project 1.10. Report to the National Environmental Science Programme). Reef and Rainforest Research Centre Limited, Cairns, 138 pp.
Kroon, F., Thorburn, P., Schaffelke, B., Whitten, S., 2016. Towards protecting the Great Barrier Reef from land-based pollution. Global Change Biology 22, 1985-2002. doi:10.1111/gcb.13262
Kruse, E.G., Bucks, D.A., Von Bernuth, R.D. 1990 Comparison of Irrigation Systems. In: Stewart, B.A., Nielsen, D.A., Irrigation of Agricultural Crops. No 30 in the Agronomy Series American Society of Agronomy 475-508.
Kuhnle, R.A., Bingner, R.L., Alonso, C.V., Wilson, C.G., Simon, A., 2008. Conservation practice effects on sediment load in the Goodwin Creek Experimental Watershed. Journal Soil Water Conservation 63(6), 496-503. doi:10.2489/jswc.63.6.496
Laabs, V., Amelung, W., Pinto, A., Zech, W., 2002. Fate of pesticides in tropical soils of Brazil under Field Conditions. Journal of Environmental Quality 31, 256-268. doi:10.2134/jeq2002.2560
Land, M., Graneli, W., Grimvall, A., Hoffmann, C.C., Mitsch, W.J., Tonderski, K.S., Verhoeven, J.T.A., 2016. How effective are created or restored wetlands for nitrogen and phosphorus removal? A systematic review. Environmental Evidence 5, 9. doi:10.1186/s13750-016-0060-0
Landsberg, R.G., Ash, A.J., Shepherd, R.K., McKeon, G.M., 1998. Learning from history to survive in the future: management evolution on Trafalgar Station, North-East Queensland. The Rangeland Journal 20(1), 104-118. dx.doi.org/10.1071/RJ9980104.
Lane, J.L., Lant, P.A., 2012. Using Life Cycle Assessment to Inform Total Water Cycle Management Planning – an Investigation for the Caboolture Catchment. Urban Water Security Research Alliance Technical Report No. 85, 38 pp.
Lane, M.B., Robinson, C.J., 2009. Institutional complexity and environmental management: the challenge of integration and the promise of large-scale collaboration. Australian Journal of Environmental Management 16, 27-35.
Lankester, A., Valentine, P., Cottrell, A., 2009. ‘The sweeter country’: social dimensions to riparian management in the Burdekin rangelands, Queensland. Australasian Journal of Environmental Management 16(2), 94-102.
Larson, S., 2009. Communicating Stakeholder Priorities in the Great Barrier Reef Region. Society & Natural Resources 22, 7, 650-664, doi: 10.1080/08941920801992102
Larson, S., Stoeckl, N., Farr, M., Esparon, M., 2015. The role the Great Barrier Reef plays in resident wellbeing and implications for its management. Ambio 44(3), 166-177. doi:10.1007/s13280-014-0554-3
Lawrence, G., Richards, C.A., Cheshire, L., 2004. The environmental enigma: why do producers professing stewardship continue to practice poor natural resource management? Journal of Environmental Policy and Planning 6(3-4), 251-270.
Lawson, A., 2016. Bioremediation using freshwater algae. Treatment System in Coastal Catchments Forum, July 2016. MDB Energy Ltd.
Lebel, L., Anderies, J.M., Campbell, B., Folke, C., Hatfield-Dodds, S., Hughes, T.P., Wilson, J., 2006. Governance and the capacity to manage resilience in regional social-ecological systems. Ecology and Society 11, 19. www.ecologyandsociety.org/vol11/iss1/art19/
Leguédois, S., Ellis, T.W., Hairsine, P.B., Tongway, D.J., 2008. Sediment trapping by a tree belt: processes and consequences for sediment delivery. Hydrological Processes 22, 3523-3534.
Leonard R.A., Langdale, G.W., Fleming, W.G., 1979. Herbicide run-off from upland piedmont watersheds—data implications for modeling pesticide transport. Journal of Environmental Quality 8, 223–229.
Lewis, S.E., Brodie, J.E., Bainbridge, Z.T., Rohde, K.W., Davis, A.M., Masters, B.L., Maughan, M., Devlin, M.J., Mueller, J.F., Schaffelke, B., 2009. Herbicides: A new threat to the Great Barrier Reef. Environmental Pollution 157, 2470-2484. doi:10.1016/j.envpol.2009.03.006
Management options and their effectiveness 146

Scientific Consensus Statement 2017—Chapter 4
Lewis, S.E., Silburn, D.M., Shaw, M., Davis, A., O’Brien, D.S., Oliver, D., Brodie, J.E., Andersen, J.S., Kookana, R., Fillols, E., Smith, R., Rojas-Ponce, S., McHugh, J., Baillie, C., 2013. Pesticides in the sugarcane industry: an evaluation of improved management practices. Report to the Reef Rescue Water Quality Research & Development Program. Reef and Rainforest Research Centre Limited, Cairns, 28 pp.
Lewis, S., Silburn, D.M., Shaw, M., Kookana, R., 2016. Pesticide behaviour, fate and effects in the tropics: a review of current knowledge. Journal Agricultural and Food Chemistry 64, 3917−3924.
Lloyd, S.D., Wong, T.H.F., Porter, B., 2002. The planning and construction of an urban stormwater management scheme. Water Science and Technology, 45(7), 1–10.
Lockie, S., Lawrence, G., Dale, A., Taylor, B., 2002. 'Capacity for Change': Testing a Model for the Inclusion of Social Indicators in Australia's National Land and Water Resources Audit. Journal of Environmental Planning and Management 45(6), 813 - 826.
Lohrer, A.M. and Wetz, J.J., 2003. Dredging-induced nutrient release from sediments to the water column in a southeastern saltmarsh tidal creek. Marine Pollution Bulletin 46, 1156-1163.
Long, L.M., Schipper, L.A., Bruesewitz, D.A., 2011. Long-term nitrate removal in a denitrification wall. Agriculture, Ecosystems and Environment 140, 514–520.
Lotze, H.K., Coll, M., Magera, A.M., Ward-Paige, C., Airoldi, L., 2011. Recovery of marine animal populations and ecosystems. Trends in Ecology & Evolution, 26(11), 595-605.
Lovelock, C.E., Adame, M.F., Bennion, V., Hayes, M., O’Mara, J., Reef, R., Santini, N., 2014. Contemporary rates of carbon sequestration through vertical accretion of sediments in mangrove forests and saltmarshes of South East Queensland, Australia. Estuaries and Coasts 37, 763-771. doi:10.1007/s12237-013-9702-4
Lu, H., Moran, C.J., Prosser, I.P., DeRose, R., 2004. Investment prioritization based on broadscale spatial budgeting to meet downstream targets for suspended sediment loads. Water Resources Research 40(6), 16 pp: onlinelibrary.wiley.com/doi/10.1029/2003WR002966/pdf.
Lubell, M., 2005. Do watershed partnerships enhance beliefs conducive to collective action? In. Sabatier, P.A., Lubell, M., Vedlitz, A., Focht, W., Trachtenberg, Z., Matlock, M., (Eds.), Swimming upstream: Collaborative approaches to watershed management Cambridge, MA, MIT Press, pp. 201–232.
Maclean, K., Robinson, C.J., 2011. Aboriginal knowledge partnerships for water planning and assessment in the Wet Tropics region. Brisbane. www.csiro.au/Organisation-Structure/Divisions/Ecosystem-Sciences/Aboriginal-Knowledge-Partnerships-Report.aspx
Maclean, K., TBYB Inc., 2015. Crossing cultural boundaries: Integrating Indigenous water knowledge into water governance through co-research in the Queensland Wet Tropics, Australia. Geoforum 59, 142-152.
Maclean, K., Ross, H., Cuthill, M., Rist, P., 2013. Healthy country, healthy people: An Australian Aboriginal organisation's adaptive governance to enhance its social-ecological system. Geoforum 45, 96-107.
Maclean, K., Hill, R., Pert, P.L., 2015a. Desktop review of co-management pathways in Cape York Peninsula. An assessment of support for structures, processes and results that enable Aboriginal Peoples and their partners to work towards co-management of country www.nerptropical.edu.au/sites/default/files/publications/files/NERP-TE-PROJECT-12.1-FINAL-REPORT-COMPLETE.pdf
Maclean, K., Robinson, C.J., Natcher, D.C., 2015b. Consensus Building or Constructive Conflict? Aboriginal Discursive Strategies to Enhance Participation in Natural Resource Management in Australia and Canada. Society & Natural Resources 8, 197-211.
MacLeod, N.D., McIvor, J.G., 2006. Reconciling economic and ecological conflicts for sustained management of grazing lands. Ecological Economics 56, 386-401.
MacLeod, N.D, Ash, A.J., McIvor, J.G., 2004. An economic assessment of the impact of grazing land condition on livestock performance in tropical woodlands. The Rangeland Journal 26, 49-71.
Management options and their effectiveness 147

Scientific Consensus Statement 2017—Chapter 4
Maheepala, S., Coultas, E., Neumann, L., Sharma, A., 2013. Quantification of Regional Scale Water Quantity and Quality Implications of Rainwater Tanks in South East Queensland. Urban Water Security Research Alliance Technical Report No. 104.
Margerum, R.D., 2011. Beyond Consensus: Improving collaborative planning and management. MIT Press, Cambridge, MA., 416 pp.
Markley, J., Refalo, B., 2011. Reducing the environmental impact and optimising nutrient requirements for mill mud applications in cane farming operations. Proceedings of the Australian Society of Sugar Cane Technologists 33, 11 pp. www.assct.com.au/media/pdfs/Ag%2015%20Markley%20and%20Refalo.pdf
Maron, M., Hobbs, R.J., Moilanen, A., Matthews, J.W., Christie, K., Gardner, T.A., Keith, D.A., Lindenmayer, D.B., McAlpine, C.A., 2012. Faustian bargains? Restoration realities in the context of biodiversity offset policies. Biological Conservation 155, 141-148. doi: 0.1016/j.biocon.2012.06.003
Marsden Jacobs Associates, 2013. Draft report on the economic and social impacts of protecting environmental values in Great Barrier Reef catchment waterways and the reef lagoon. Report prepared for Queensland Department of Environment and Heritage Protection. Marsden Jacobs Associates, Brisbane, 325 pp. www.ehp.qld.gov.au/water/policy/pdf/draft-protecting-ev-gbr-catchment.pdf
Marsh, S.P., Pannell, D., 2000. Agricultural extension policy in Australia: the good, the bad and the misguided. Australian Journal of Agricultural and Resource Economics 44, 605-627.
Marsh, N., Rutherfurd, I.D., Bunn, S.E., 2004. How does riparian vegetation affect suspended sediment in a southeast Queensland stream? CRC Catchment Hydrology, Melbourne, 43 pp. www.ewater.org.au/archive/crcch/archive/pubs/pdfs/technical200413.pdf
Marshall, N.A. Bohensky, E., Curnock, M., Goldberg, J., Gooch, M., Nicotra, B., Pert, P.L., Scherl, L., Stone-Jovicich, S., Tobin, R.C., 2014. The Social and Economic Long Term Monitoring Program for the Great Barrier Reef. Final Report. Report to the National Environmental Research Program. Reef and Rainforest Research Centre Limited, Cairns, 28 pp.
Marshall N.A, Bohensky E, Curnock M, Goldberg J, Gooch M, Nicotra, B., Pert P., Scherl, L.M., Stone-Jovicich, S., Tobin, R.C., 2016. Advances in Monitoring the Human Dimension of Natural Resource Systems: A Showcase from the Great Barrier Reef. Environmental Research Letters 11, 114020. doi:10.1088/1748-9326/11/11/114020
Marton, J.M., Fennessy, S.M., Craft, C.B., 2014 USDA conservation practices increase carbon storage and water quality improvement functions: An example from Ohio. Restoration Ecology 22, 117-124. doi: 10.1111/rec.12033
Masters, B., Rohde, K., Gurner, N., Higham, W., Drewry, J., 2008. Sediment, nutrient and herbicide in run-off from cane farming practices in the Mackay Whitsunday region: a field-based rainfall simulation study of management practices. Queensland Department of Natural Resources and Water for the Mackay Whitsunday Natural Resource Management Group, Mackay.
Masters, B., Rohde, K., Gurner, N., Reid, D., 2013. Reducing the risk of herbicide run-off in sugarcane through controlled traffic and early-banded application. Agriculture, Ecosystems & Environment 180, 29–39.
Masters, B., Mortimore, C. Armour, J., Silburn, D.M., 2014. Pesticides in groundwater of the Tully-Murray and Johnstone catchments: 2012/2013 Report, Wet Tropics Region. Queensland Department of Natural Resources and Mines.
McCloskey G.L, Waters, D., Baheerathan, R., Darr, S., Dougall, C., Ellis, R., Fentie, B., Hateley, L., 2017a. Modelling reductions of pollutant loads due to improved management practices in the Great Barrier Reef catchments: updated methodology and results – Technical Report for Reef Report Card 2014, Queensland Department of Natural Resources and Mines, Brisbane, Queensland.
McCloskey G.L, Waters, D., Baheerathan, R., Darr, S., Dougall, C., Ellis, R., Fentie, B., Hateley, L., 2017b. Modelling reductions of pollutant loads due to improved management practices in the Great Barrier Reef catchments: updated methodology and results – Technical Report for Reef Report Card 2015, Queensland Department of Natural Resources and Mines, Brisbane, Queensland.
Management options and their effectiveness 148
Scientific Consensus Statement 2017—Chapter 4
McCrackin, M.L., Jones, H.P., Jones, P.C., Moreno-Mateos, D., 2017. Recovery of lakes and coastal marine ecosystems from eutrophication: A global meta-analysis. Limnology and Oceanography, 62(2), 507-518.
McHugh, A.D., Bhattarai, S., Lotz, G., Midmore, D.J., 2008. Effects of subsurface drip irrigation rates and furrow irrigation for cotton grown on a vertisol on offsite movement of sediments, nutrients and pesticides. Agronomy for Sustainable Development 28, 507–519.
McIntosh, B.S., Aryal, S., Ashbolt, S., Sheldon, F., Maheepala, S., Gardner, T., Chowdhury, R., Gardiner, R., Hartcher, M., Pagendam, D., Hodgson, G., Hodgen, M., Pelzer, L., 2013. Urbanisation and Stormwater Management in South East Queensland – Synthesis and Recommendations. Urban Water Security Research Alliance Technical Report No. 106, 59pp. www.urbanwateralliance.org.au/publications/UWSRA-tr106.pdf
McIntyre-Tamwoy, S., Fuary, M., Buhrich, A., 2013. Understanding climate, adapting to change: Indigenous cultural values and climate change impacts in North Queensland. Local Environment 18, 91-109. doi: 10.1080/13549839.2012.716415
McIvor, J., 2010. Sustainable management of tropical grazing lands - having our cake and eating it too, CSIRO, Brisbane, Australia, 65 pp.
McIvor, J.G., Williams, J., Gardener, C.J., 1995. Pasture management influences run-off and soil movement in the semi-arid tropics. Australian Journal of Experimental Agriculture 35, 55-65.
McJannet, D., Wallace, J., Keen, R., Hawdon, A., Kemei, J., 2012. The filtering capacity of a tropical riverine wetland: II. Sediment and nutrient balances. Hydrological Processes 26, 53-72. doi:10.1002/hyp.8111
McKee, K.L., Faulkner, P.L., 2000. Restoration of biogeochemical function in mangrove forests. Restoration Ecology, 8, 247–59.
McKergow, L.A., Prosser, I.P., Grayson, R.B., Heiner, D., 2004. Performance of grass and rainforest riparian buffers in the wet tropics, Far North Queensland 2. Water Quality. Australian Journal Soil Research 42, 485-498.
Meier, E.A., Thorburn P.J., Goodson M.A., Wegener M.K., Basford K.E., 2003. Management of sugarcane crop residues for nitrogen supply in the Australian wet tropics. In Soil Management for Sustainability, Proceedings of the 16th Triennial Conference of the International Soil Tillage Research Organisation. International Soil Tillage Research Organisation: The University of Queensland, Brisbane, Australia, pp. 737-742 (published on CD ISBN 0-646-42496-3).
Meli, P., Benayas, J.M.R., Balvanera, P., Martinez Ramos, M., 2014. Restoration enhances wetland biodiversity and ecosystem service supply, but results are context-dependent: A meta-analysis. PLoS ONE 9:e93507. doi:10.1371/journal.pone.0093507.
Melland, A.R., Silburn, D.M., McHugh, A.D., Fillols, E., Rojas-Ponce, S., Baillie, C., Lewis, S., 2016. Spot spraying reduces herbicide concentrations in run-off. Journal of Agricultural and Food Chemistry 64, 4009−4020. doi:10.1021/acs.jafc.5b03688.
Mercurio, P., Mueller, J.F., Eaglesham, G., Flores, F., Negri, A.P., 2015. Herbicide Persistence in Seawater Simulation Experiments. PLoS ONE 10. doi:10.1371/journal.pone.0136391
Mitchell, V.G, Deletic, A., Fletcher, T.D., Hatt, B.E., McCarthy, D.T., 2007. Achieving multiple benefits from stormwater harvesting. Water Science Technology 55(4), 135-144.
Mitsch, W.J., 2016. Restoring the greater Florida Everglades, once and for all. Ecological Engineering 93, A1-A3. doi: 10.1016/j.ecoleng.2016.02.016
Mitsch, W.J., Day, J.W., 2006. Restoration of wetlands in the Mississippi-Ohio-Missouri (MOM) River Basin: Experience and needed research. Ecological Engineering 26, 55-69. doi:10.1016/j.ecoleng.2005.09.005
Mitsch, W.J., Gosselink, J.G., 2000. The value of wetlands: importance of scale and landscape setting. Ecological Economics 35, 25–33. Special issue, the values of wetlands: landscapes and institutional perspectives.
Mitsch, W.J., Gosselink, J.G., 2016. Wetlands. 5th Ed. Wiley & Sons, NJ, USA, 736 pp.
Management options and their effectiveness 149

Scientific Consensus Statement 2017—Chapter 4
Mitsch, W.J., Day, J.W. Jr, Gilliam, W., Groffman, P.M., Hey, D.L., Randall, G.W., Wang, N., 2001. Reducing nitrogen loading to the Gulf of Mexico from the Mississipi River Basin: Strategies to counter a persistent ecological problem. BioScience 51, 373-388. doi: 10.1641/0006-3568(2001)051[0373:RNLTTG]2.0.CO;2
Mitsch, W.J., Zhang, L., Marois, D., Song, K., 2015. Protecting the Florida Everglades wetlands with wetlands: Can stormwater phosphorus be reduced to oligotrophic conditions? Ecological Engineering 80, 8-19.
Moody, P.W., 2011. Environmental risk indicators for soil phosphorus status. Soil Research 49, 247–252.
Moody, P.W., Aitken, R.L., 1997. Fertiliser management in tropical horticulture: Is it sustainable. In: Stephenson, R.A., Winks, C.W. (Eds), Challenges for Horticulture in the Tropics: Proceedings of the 3rd Australian Society of Horticultural Science and the 1st Australian Macadamia Society Research Conference on the Challenges for Horticulture in the Tropics. Australian Society of Horticultural Science, Burnie, pp. 109-115.
Moon, K., Cocklin, C., 2011. Participation in biodiversity conservation: motivations and barriers of Australian landholders. Journal of Rural Studies 27(3), 331-342.
Moon, K., Marshall, N., Cocklin, C., 2012. Personal circumstances and social characteristics as determinants of landholder participation in biodiversity conservation programs. Journal of Environmental Management 113, 292-300.
Moreno-Mateos, D., Power, M.E., Comin, F.A., Yockteng, R., 2012. Structural and functional loss in restored wetland ecosystems. PLoS Biology 10: e1001247. doi:10.1371/journal.pbio.1001247
Morison, P., Brown, R., 2011. Understanding the nature of publics and local policy commitment to Water Sensitive Urban Design. Landscape Urban Plan 99, 83–92.
Morrison, M., Durante, J., Greig, J., Ward, J., Oczkowski, E., 2012. Segmenting landholders for improving the targeting of natural resource management expenditures. Journal of Environmental Planning and Management 55(1), 17-37.
Morrison, T.H., 2017. Evolving polycentric governance of the Great Barrier Reef. Proceedings of the National Academy of Sciences of the United States of America 114(15), E3013–E3021. doi:10.1073/pnas.1620830114.
Morse, J.L., Ardon, M., Bernhardt, E.S., 2012. Greenhouse gas fluxes in southeastern US coastal plain wetlands under contrasting land uses. Ecological Applications 22, 264-280.
Mulholland, P.J., Helton, A.M., Poole, G.C., Hall, R.O., Hamilton, S.K., Peterson, B.J., Tank, J.L., Ashkenas, L.R., Cooper, L.W., Dahm, C.N., Dodds, W.K., Findlay, S.E., Gregory, S.V., Grimm, N.B., Johnson, S.L., McDowell, W.H., Meyer, J.L., Valett, H.M., Webster, J.R., Arango, C.P., Beaulieu, J.J., Bernot, M.J., Burgin, A.J., Crenshaw, C.L., Johnson, L.T., Niederlehner, B.R., O’Brien, J.M., Potter, J.D., Sheibley, R.W., Sobota, D.J., Thomas, S.M., 2008. Stream denitrification across biomes and its response to anthropogenic nitrate loading. Nature 452, 202-205. doi:10.1038/nature06686
Mumby, P.J., Hastings, A., Edwards, H.J., 2007. Thresholds and the resilience of Caribbean coral reefs. Nature, 450(7166), 98-101.
Murphy, T., Dougall, C., Burger, P., Carroll C., 2013. Runoff water quality from dryland cropping on Vertisols in Central Queensland, Australia. Agriculture, Ecosystems and Environment 180(1), 21-28, doi:10.1016/j.agee.2011.07.023.
Nachimuthu, G., Halpin, N., Bell, M., 2013. Paddock scale water quality monitoring of vegetable-sugarcane and legume-sugarcane farming systems: Summary report 2010-2013 Burnett Mary region. Paddock to Reef Program summary report. 14 pp.
Nachimuthu, G., Halpin, N.V., Bell, M.J., 2016. Effect of sugarcane cropping systems on herbicide losses in surface run-off. Science of the Total Environment 557–558, 773–784.
Nachimuthu, G., Bell, M.J., Halpin, N.V., 2017a. Impact of practice change on run-off water quality and vegetable yield—An on-farm case study. Agriculture 7(3), 30. doi:10.3390/agriculture7030030.
Management options and their effectiveness 150

Scientific Consensus Statement 2017—Chapter 4
Nachimuthu, G., Bell, M.J., Halpin, N.V., 2017b. Nitrogen losses in terrestrial hydrological pathways in sugarcane cropping systems of Australia. Journal of Soil and Water Conservation 72, 32A-35A.
Nanson, G.C., Hickin, E.J., 1986. A statistical analysis of bank erosion and channel migration in western Canada. Geological Society of America Bulletin, 97, 497-504.
Nettle, R., Lamb, G., 2010. Water security: how can extension work with farming worldviews? Extension Farming Systems Journal 6(1), 11-21.
Neveux, N., Magnusson, M., Mata, L., Whelan, A., De Nys, R., Paul, N.A., 2016. The treatment of municipal wastewater by the macroalga Oedogonium sp. and its potential for the production of biocrude. Algal Research 13, 284–292. doi:10.1016/j.algal.2015.12.010
Newig, J., Fritsch, O., 2009. Environmental governance: participatory, multi-level and effective? Environmental Policy and Governance 19, 197-214.
Nichols, P., Lucke, T., Drapper, D., Walker, C., 2016. Performance evaluation of a Floating Treatment Wetland in an urban catchment. Water 8(6), 244. doi:10.3390/w8060244
Noe, G.B., Hupp, C.R., 2009. Retention of riverine sediment and nutrient loads by coastal plain floodplains. Ecosystems 12, 728–746
Noe, G.B., Hupp, C.R., Bernhardt, C.E., 2016. Contemporary deposition and long-term accumulation of sediments and nutrients by tidal freshwater forested wetlands impacted by sea level rise. Estuaries and Coasts 39(4), 1006-1019. doi:10.1007/s12237-016-0066-4
Norström, A.V., Nyström, M., Lokrantz, J., Folke, C., 2009. Alternative states on coral reefs: beyond coral–macroalgal phase shifts. Marine Ecology Progress Series, 376, 295-306.
NQ Dry Tropics, 2016. Burdekin Region Water Quality Improvement Plan 2016, NQ Dry Tropics, Townsville. http://www.nqdrytropics.com.au/wqip2016/
Nursey-Bray, M., 2009. A Guugu Yimmithir Bam Wii: Ngawiya and Girrbithi: Hunting, planning and management along the Great Barrier Reef, Australia. Geoforum 40(3), 442-453.
Nursey-Bray, M., Rist, P., 2009. Co-management and protected area management: Achieving effective management of a contested site, lessons from the Great Barrier Reef World Heritage Area (GBRWHA). Marine Policy 33, 118-127.
Nursey-Bray, M., Wallis, A., Rist, P., 2009. Having a yarn: The importance of appropriate engagement and participation in the development of Indigenous driven environmental policy, Queensland, Australia. Indigenous Policy Journal 20(3), 20 pp. http://www.indigenouspolicy.org/index.php/ipj/article/view/72
O'Brien, D., Lewis, S., Davis, A., Gallen, C., Smith, R., Turner, R., Warne, M., Turner, S., Caswell, S., Mueller, J.F., Brodie, J., 2016. Spatial and temporal variability in pesticide exposure downstream of a heavily irrigated cropping area: application of different monitoring techniques. Journal of Agricultural and Food Chemistry 64, 3975-3989. doi: 10.1021/acs.jafc.5b04710
Oliver, D.P., Kookana, R.S., 2006. On-farm management practices to minimise off-site movement of pesticides from furrow irrigation. Pest Management Science 62, 899–911.
Oliver, D.P., Anderson, J.S., Davis, A., Lewis, S., Brodie, J., Kookana, R., 2014. Banded applications are highly effective in minimising herbicide migration from furrow-irrigated sugar cane. Science of the Total Environment 466–467, 841–848.
Oliver, D.P., Kookana, R.S., Anderson, J.S. Umali, B., 2016. Field evaluation of two risk indicators for predicting likelihood of pesticide transport to surface water from two orchards. Science of the Total Environment 571, 819-825.
Olley, J., Burton, J., Hermoso, V., Smolders, K., McMahon, J., Thomson, B., Watkinson, A., 2015. Remnant riparian vegetation, sediment and nutrient loads, and river rehabilitation in subtropical Australia. Hydrological Processes 29, 2290-2300. doi:10.1002/hyp.10369
Management options and their effectiveness 151

Scientific Consensus Statement 2017—Chapter 4
O'Reagain, P.J., Brodie, J., Fraser, G., Bushell, J.J., Holloway, C.H., Faithful, J.W., Haynes, D., 2005. Nutrient loss and water quality under extensive grazing in the upper Burdekin river catchment, North Queensland. Marine Pollution Bulletin 51, 37-50.
O'Reagain, P., Bushell, J., Holmes, B., 2011. Managing for rainfall variability: long-term profitability of different grazing strategies in a northern Australian tropical savanna. Animal Production Science 51, 210-224. doi: 10.1071/an10106.
Osmond, D.L., Hoag, D.L.K., Luloff, A.E., Meals, D.W., Neas, K., 2015. Farmers’ Use of Nutrient Management: Lessons from Watershed Case Studies. Journal of Environmental Quality 44, 382-390.
Ostrom, E. (2010). Beyond markets and states: polycentric governance of complex economic systems. Transnational Corporations Review, 2(2), 1-12.
Oxford Economics, 2009. Valuing the effects of Great Barrier Reef bleaching, Great Barrier Reef Foundation, Australia, 101 pp. www.oxfordeconomics.com/Media/Default/economic-impact/sustainability-and-climate-change/gbrfoxford.pdf
Packett, R., 2014. Project RRRD038 Pesticide dynamics in the Great Barrier Reef catchment and lagoon: management practices (grazing, bananas and grain) and risk assessments. Dissolved and particulate herbicide transport in central Great Barrier Reef catchments (Subproject 3). Report to the Reef Rescue Water Quality Research & Development Program. Reef and Rainforest Research Centre Limited, Cairns, 29 pp.
Packett, R., Dougall, C., Rhode. K., Noble, R., 2009. Agricultural lands are hot-spots for annual run-off polluting the southern Great Barrier Reef lagoon. Marine Pollution Bulletin 58, 976-986.
Pandolfi, J., Greenstein, B., 2007. Chapter 22 - Using the past to understand the future: Paleoecology of coral reefs. Commonwealth of Australia, pp. 717-744. In Johnston, J., Marshall, P., (Eds). Climate Change and the Great Barrier Reef A Vulnerability Assessment. www.gbrmpa.gov.au/__data/assets/pdf_file/0019/5437/chpt-22-pandolfi-et-al-2007.pdf
Pandolfi, J.M., Bradbury, R.H., Sala, E., Hughes, T.P., Bjorndal, K.A., Cooke, R.G., McArdle, D., McClenachan, L., Newman, M.J., Paredes, G., 2003. Global trajectories of the long-term decline of coral reef ecosystems. Science 301, 955-958.
Pannell, D. J., Marshall, G., R., N., Barr, Curtis, A., Vanclay, F., Wilkinson, R., 2006. Understanding and promoting adoption of conservation practices by rural landholders. Australian Journal of Experimental Agriculture 46(11), 1407-1424.
Pannell, D., Roberts, A. Park, G., 2014. Economic analysis of grazing systems for water quality improvement in the Burnett Mary catchment. Report provided for the Water Quality Improvement Plan for the Burnett Mary 2015.
Park, G., Roberts, A., 2014. Wet Tropics WQIP – INFFER Assessment. Final Report (draft) to Terrain NRM for the Wet Tropics Water Quality Improvement Plan, version 25th July 2014. Natural Decisions, http://www.naturaldecisions.com.au/
Park, S.E., Webster, A.J., Horan, H.L., James, A.T., Thorburn, P.J., 2010. A legume rotation crop lessens the need for nitrogen fertiliser throughout the sugarcane cropping cycle. Field Crop Research 119, 331–341. doi:10.1016/j.fcr.2010.08.001
Parker, N., Gardner, T., Goonetilleke, A., Egodawatta, P.K., Giglio, D., 2009. Effectiveness of WSUD in the ‘real world’. In Proceedings of The 6th International Water Sensitive Urban Design Conference and the 3rd Hydropolis: Towards Water Sensitive Cities and Citizens, Perth, Western Australia.
Parlee, B., Berkes, P., 2005. Health of the Land, Health of the People: A Case Study on Gwich’in Berry Harvesting in Northern Canada. EcoHealth 2, 127-137.
Peoples, M.B., Brockwell, J., Herridge, D.E., Rochester, I.J., Alves, B.R., Urquiaga, S., Boddey, R.M., Dakora, E.D., Bhattarai, S., Maskey, S.L., Sampet, C., Rerkasem,B., Khan, D.F., Hauggaard-Nielsen, H., Jensen, E.S., 2009. Review article. The contributions of nitrogen-fixing crop legumes to the productivity of agricultural systems. Symbiosis 48, 1-17.
Management options and their effectiveness 152

Scientific Consensus Statement 2017—Chapter 4
Persson, J., Somes, N.L.G., Wong, T.H.F., 1999. Hydraulics efficiency of constructed wetlands and ponds. Water Science and Technology 40, 291–300.
Pert, P.L., Hill, R., Williams, K.J., Harding, E.K., O'Malley, T., Grace, R.a., Dale, A.P., Bohnet, I., Butler, J.R.L.A., 2010. Scenarios for Community-based Approaches to Biodiversity Conservation: a case study from the Wet Tropics, Queensland, Australia. Australian Geographer 41, 285-306.
Pert, P.L., Hill, R., Maclean, K., Dale, A., Rist, P., Schmider, J., Talbot, L., Tawake, L., 2015. Mapping cultural ecosystem services with Rainforest Aboriginal peoples: integrating biocultural diversity, governance and social variation. Ecosystem Services 13, 41-56.
Peterson, A., Walker, M., Maher, M., Hoverman, S., Eberhard, R., 2010. New Regionalism and Planning for Water Quality Improvement in the Great Barrier Reef, Australia. Geographical Research 48, 297-313.
Phillipson, J., Proctor, A., Emery, S.B. and Lowe, P., 2016. Performing inter-professional expertise in rural advisory networks. Land Use Policy, 54, pp.321-330.
Pickering, J.A., Hong, J., 2016. Project Cane Changer: Milestone 3 Report. Behaviour Innovation, Brisbane, Australia.
Pitt, T., Cox, J., Phograt, V., Fleming, N., Grant, C., 2015. Methods to increase the use of recycled wastewater in irrigation by overcoming the constraint of soil salinity. Australian Water Recycling Centre of Excellence. 138 pp.
Poggio, M., Smith, M., van Grieken, M.E., Shaw, M., 2014. The Economics of Adopting Pesticide Management Practices Leading to Water Quality Improvement on Sugarcane Farms. Report to the Department of Environment and Heritage Protection through funding from the Reef Water Quality Science Program. RP62C Technical Report. Department of Agriculture, Fisheries and Forestry (DAFF) Queensland, 54 pp. era.daf.qld.gov.au/4492/1/fin-synth-rep-econ-pest-mgment-sc-farms.pdf
Poissant, L., Beauvais, C., Lafrance, P., Deblois, C., 2008. Pesticides in fluvial wetlands catchments under intensive agricultural activities. Science of the Total Environment 404, 182-195. doi:10.1016/j.scitotenv.2008.05.030
Powell, W.W., DiMaggio, P.J., 1991. The new institutionalism in organizational analysis. University of Chicago Press, Chicago, IL, 486 pp.
Prayaga, P., Rolfe, J.C. and Stoekl, N., 2010. The value of recreational fishing in the Great Barrier Reef, Australia: A pooled revealed preference and contingent behaviour model. Marine Policy 34, 244-251.
Price, J. C., Leviston, Z., 2014. Predicting pro-environmental agricultural practices: The social, psychological and contextual influences on land management. Journal of Rural Studies 34, 65-78.
Prosser, I.P., Slade, C.J., 1994. Gully formation and the role of valley-floor vegetation, southeastern Australia. Geology 22, 1127-1130.
Prove, B.G., Doogan, V.J., Truong, P.N.V., 1995. Nature and magnitude of soil erosion in sugarcane land on the wet tropical coast of north-eastern Queensland. Australian Journal of Experimental Agriculture 35(64), 1-9.
Prove, B., Moody, P., Reghenzani, J., 1997. DAQ3S Nutrient balances and transport from agricultural and rainforest lands. A case study in the Johnstone River Catchment. Final Report. Queensland Department of Natural Resources and BSES, Queensland, 31 pp.
Pusey, B.J., Arthington, A.H., 2003. Importance of the riparian zone to the conservation and management of freshwater fish: a review. Marine and Freshwater Research 54(1), 1-16.
QDAFF (Queensland Department of Agriculture, Fisheries and Forestry), 2013. Queensland Agricultural Land Audit. Queensland Government, Brisbane, Australia. www.daf.qld.gov.au/environment/ag-land-audit
QDIP (Queensland Department of Infrastructure and Planning), 2009. Far North Queensland regional plan 2009–2031. Queensland Government, Cairns, 188pp. www.dilgp.qld.gov.au/resources/plan/far-north-queensland/fnq-regional-plan-2009-31.pdf
Management options and their effectiveness 153

Scientific Consensus Statement 2017—Chapter 4
QDSDIP (Queensland Department of State Development, Infrastructure and Planning), 2013. Great Barrier Reef Coastal Zone Strategic Assessment. Strategic Assessment Report, State of Queensland, Brisbane.
Queensland Audit Office, 2015. Managing Water Quality in Great Barrier Reef catchments, Report 20 2014 – 2015, The State of Queensland, Brisbane, 101 pp. www.qao.qld.gov.au/sites/all/libraries/pdf.js/web/viewer.html?file=https%3A%2F%2Fwww.qao.qld.gov.au%2Fsites%2Fqao%2Ffiles%2Freports%2Frtp_managing_water_quality_in_great_barrier_reef_catchments.pdf
Queensland Government, 2009. Paddock to Reef Program, Catchment Indicators. http://www.reefplan.qld.gov.au/measuring-success/methods/catchment-indicators/groundcover
Queensland Government, 2017. Enhancing regulations to ensure clean water for a healthy Great Barrier Reef and a prosperous Queensland. Discussion paper. Queensland Government, Brisbane, Australia.
Queensland Environment Protection (Water) Policy 2009 (https://www.legislation.qld.gov.au/LEGISLTN/CURRENT/E/EnvProWateP09.pdf),
Rai, P.K., Tripathi, B.D., 2007. Heavy metals removal using nuisance cyanobacteria Microcystis in continuous culture experiment: an eco-sustainable technology. Environmental Science 4, 53–59. doi:10.1080/15693430601164956
Randall, G., Delgado, J.A., Schepers, J.S., 2008. Nitrogen management to protect water resources. In: Schepers, J.S., Raun, W.R. (Eds.), Nitrogen in Agricultural Systems. Agronomy Monograph 49. The American. Society of Agronomy. Madison, WI, pp. 911-945.
Rasiah, V., Moody, P.W., Armour, J.D., 2011. Soluble phosphate in fluctuating groundwater under cropping in the north-eastern wet tropics of Australia. Soil Research 49, 329–342.
Rasiah, V., Armour, J.D., Nelson, P.N., 2013. Nitrate in shallow fluctuating groundwater under sugarcane: Quantifying the lateral export quantities to surface waters. Agriculture, Ecosystems and Environment 180, 103–110. doi:10.1016/j.agee.2012.07.002
Rattray, D.J., Standley, J., Silburn, D.M., Freebairn, D.M., Spann, K.P., 2007. Atrazine degradation and transport in run-off on a Black Vertosol. Australian Journal of Soil Research 45(8), 598-607.
Rhodes, R.A.W., 2007. Understanding governance: Ten years on. Organization Studies 28, 1243-1264.
Richardson, C.W., Bucks, D.A., Sadler, E.J., 2008. The Conservation Effects Assessment Project benchmark watersheds: Synthesis of preliminary findings. Journal of Soil and Water Conservation 63, 590-604.
Rickert, A., Mcshane, T., 2015. Remediation of Agricultural Irrigation Runoff Using High Rate Algal Ponds. Burdekin-Bowen Integrated Floodplain Management Advisory Committee (BBIFMAC) Ayr, December 2015.
Rittel, H.W.J., Webber, M.M., 1973. Dilemmas in a General Theory of Planning. Policy Sciences 4, 155-169.
Roberts, A., Park, G., Dickson, M., 2016. Burdekin WQIP – INFFER Assessment. Final Report prepared for NQ Dry Tropics, Townsville as part of the Burdekin Water Quality Improvement Plan 2016. Natural Decisions, Newstead.
Robins, L., Kanowski, P., 2011. ‘Crying for our Country’: eight ways in which ‘Caring for our Country’ has undermined Australia's regional model for natural resource management. Australasian Journal of Environmental Management, 18, 88-108.
Robinson, C.J., Taylor, B.M., Pearson, L., O'Donohue, M., Harman, B., 2009. A SMART assessment of water quality partnership needs in Great Barrier Reef catchments. Australasian Journal of Environmental Management 16, 84-93.
Robinson, C.J., Eberhard, R., Wallington, T., Lane, M., 2010. Using knowledge to make collaborative policy-level decisions in Australia’s Great Barrier Reef. CSIRO Water for a Healthy Country Technical Report, Australia. www.clw.csiro.au/publications/waterforahealthycountry/2010/wfhc-GBR-collaborative-decisions.pdf
Management options and their effectiveness 154

Scientific Consensus Statement 2017—Chapter 4
Robinson, C.J., Margerum, R.D., Koontz, T.M., Moseley, C., Lurie, S., 2011. Policy-Level Collaboratives for Environmental Management at the Regional Scale: Lessons and Challenges From Australia and the United States. Society & Natural Resources 24, 849-859.
Robinson, C.J., Taylor, B., Vella, K., Wallington, T.J., 2014. Working knowledge for collaborative water governance. International Journal of Water Governance 1, 1-18. doi:10.7564/13-IJWG4.
Robinson, C., Maclean, K., Hill, R., Bock, E., Rist, P., 2015. Participatory mapping to negotiate indigenous knowledge used to assess environmental risk. Sustainability Science 1-12. doi:10.1007/s11625-015-0292-x.
Robson, K., 2015. An assessment of the performance of current best practice sediment basins vs. high efficiency sediment basins based on modelling and field studies. 2015 Stormwater Queensland Conference, Toowoomba 15-16 July, 2015.
Roebeling, P.C., van Grieken, M.E., Webster, A.J., Biggs, J.S. and Thorburn, P.J. 2009. Cost-effective water quality improvement in linked terrestrial and marine ecosystems: a spatial environmental-economic modelling approach. Marine and Freshwater Research, 60, 1150-1158.
Rohde K, McDuffie K., Agnew J., 2013a. Paddock to Sub-catchment Scale Water Quality Monitoring of Sugarcane Management Practices. Final Report 2009/10 to 2011/12 Wet Seasons, Mackay Whitsunday Region. Department of Natural Resources and Mines, Queensland Government for Reef Catchments (Mackay Whitsunday Isaac) Limited, Australia.
Rohde, K., McDuffie, K., Agnew, J., 2013b. Paddock to Sub-catchment Scale Water Quality Monitoring of Sugarcane Management Practices. Interim Report 2012/13 Wet Season, Mackay Whitsunday Region. Department of Natural Resources and Mines, Queensland Government for Reef Catchments (Mackay Whitsunday Isaac) Limited, Australia.
Rolfe, J., Gregg, D., 2012. Valuing Beach Recreation Across a Regional Area: The Great Barrier Reef in Australia, Ocean and Coastal Management 69, 282 -290.
Rolfe, J., Gregg, D., 2015. Factors affecting adoption of improved management practices in the pastoral industry in Great Barrier Reef catchments. Journal of Environmental Management 157, 182-193. doi.org/10.1016/j.jenvman.2015.03.014
Rolfe, J., Windle, J., 2011a. Assessing community values for reducing agricultural emissions to improve water quality and protect coral health in the Great Barrier Reef. Water Resources Research 47, 12 doi:10.1029/2010WR010355
Rolfe, J, Windle, J., 2011b. Using auction mechanisms to reveal costs for water quality improvements in Great Barrier Reef catchments in Australia. Agricultural Water Management 98, 493-501.
Rolfe, J., Windle, J., 2012. Testing benefit transfer of reef protection values between local case studies: The Great Barrier Reef in Australia. Ecological Economics 81, 60-69. http://dx.doi.org/10.1016/j.ecolecon.2012.05.006
Rolfe, J., Windle, J., 2015. Do respondents adjust their expected utility in the presence of an outcome certainty attribute in a choice experiment? Environmental and Resource Economics 60, 125-142.
Rolfe, J., Windle, J., 2016. Benchmarking costs of improving agricultural water management in GBR catchments. Report to the National Environmental Science Programme. Reef and Rainforest Research Centre Limited, Cairns. 55 pp.
Rolfe J., Greiner R., Windle J., Hailu A., 2011. Testing for allocation efficiencies in water quality tenders across catchments, industries and pollutants: A north Queensland case study. Australian Journal of Agricultural and Resource Economics 55(4), 518-536.
Rolfe, J.W., Larard, A.E., English, B.H., Hegarty, E.S., McGrath, T.B., Gobius, N.R., De Faveri, J., Srhoj, J.R., Digby, M.J., Musgrove, R.J, 2016. Rangeland profitability in the northern Gulf region of Queensland: understanding beef business complexity and the subsequent impact on land resource management and environmental outcomes. The Rangeland Journal 38, 261–272.
Management options and their effectiveness 155

Scientific Consensus Statement 2017—Chapter 4
Rolfe, J., Windle, J., McCosker, K., Northey, A. and Gregg, D., 2017. Costs of improving agricultural water management in GBR catchments: Analysis of Paddock to Reef sugarcane grants. Report to the National Environmental Science Programme. Reef and Rainforest Research Centre, Cairns. 28 pp.
Rosewell, C.J., 1993. SOILOSS - A program to assist in the selection of management practises to reduce erosion. Technical Handbook No. 11. Soil Conservation Service of NSW, Sydney.
Roth, C., 2004. A framework relating soil surface condition to infiltration and sediment and nutrient mobilisation in grazed rangelands of north-eastern Queensland. Earth Surface Processes and Landforms 29, 1093-1104.
Rozo, M.G., Nogueira, A.C.R., Castro, C.S., 2014. Remote sensing-based analysis of the planform changes in the Upper Amazon River over the period 1986-2006. Journal of South American Earth Sciences 51, 28-44, 10.1016/j.jsames.2013.12.004.
Ruiz-Jaen, M.C., Aide, T.M., 2005. Restoration success: How is it being measured? Restoration Ecology 13, 569-577. doi: 10.1111/j.1526-100X.2005.00072.x
Rust, S., Star, M., 2016. The Cost Effectiveness of Remediating Erosion Gullies in the Fitzroy Basin, paper presented at the 60th Annual Conference of the Australian Agricultural and Resource Economics Society, Canberra.
Sallaway, M.M., Yule, D.F., Mayer, D., Burger, P.W., 1990. Effects of surface management on the hydrology of a vertisol in semi-arid Australia. Soil and Tillage Research 15, 227–245.
Salter, B., Brieffies, T., Wang, W., Reeves, S., 2013. Sugarcane yield response to nitrogen rates and a nitrification inhibitor following soybean and bare fallow. Proceedings of the Australian Society of Sugar Cane Technologists 35, xx-xx.
Scarth, P., Roder, A., Schmidt, M., 2010. Tracking grazing pressure and climate interaction – the role of Landsat fractional cover in time series analysis in Proceedings of the 15th Australasian Remote Sensing and Photogrammetry Conference, Alice Springs, Australia, September 2010.
Schaffelke, B., Collier, C., Kroon, F., Lough, J., McKenzie, L., Ronan, M., Uthicke, S., Brodie, J., 2017. Reef Plan Scientific Consensus Statement 2017. Scientific Consensus Statement 2017: A synthesis of the science of land-based water quality impacts on the Great Barrier Reef, Chapter 1: The condition of coastal and marine ecosystems of the Great Barrier Reef and their responses to water quality and disturbances. State of Queensland, 2017.
Schipper, L. A., Robertson, W.D., Gold A.J., Jaynes, D.B., Cameron, S.C., 2010. Denitrifying bioreactors—An approach for reducing nitrate loads to receiving waters. Ecological Engineering 36, 1532–1543. doi:10.1016/j.ecoleng.2010.04.008
Schirmer, J., Dovers, S., Clayton, H., 2012. Informing conservation policy design through an examination of landholder preferences: a case study of scattered tree conservation in Australia. Biological Conservation 153, 51-63.
Schmidt, C.A., Clark, M.W., 2012. Efficacy of a denitrification wall to treat continuously high nitrate loads. Ecological Engineering 42, 203–211. doi:10.1016/j.ecoleng.2012.02.006
Schroeder, B.L., Wood, A., Sefton, M., Hurney, A.P., Skocaj, D.M., Stainley, T., Moody, P.W., 2010. District yield potential: an appropriate basis for nitrogen guidelines for sugarcane production. Proceedings of Australian Society of Sugar Cane Technologists 32, 193–209.
Schroeder B.L, Salter B., Moody, P.W., Skocaj, D.M., Thorburn, P.J., 2014. Evolving nature of nitrogen management in the Australian sugar industry. In Bell, M.J., (ed.) A review of nitrogen use efficiency in sugarcane. pp. 14-86. SRA Research Report. Brisbane, Sugar Research Australia.
Scott, T., 2015. Does Collaboration Make Any Difference? Linking Collaborative Governance to Environmental Outcomes. Journal of Policy Analysis and Management 34, 537–566. doi:10.1002/pam.21836
SELTMP (Social and Economic Long-Term Monitoring Program), 2017. www seltmp.eatlas.org.au/seltmp.
Management options and their effectiveness 156

Scientific Consensus Statement 2017—Chapter 4
SEWPaC (Department of Sustainability, Environment, Water, Population and Communities), 2013. Independent Review of the Port of Gladstone: Report on Findings. Australian Government, Canberra, 123 pp. www.environment.gov.au/system/files/resources/ae7cbcf9-2963-47d7-9029-3aa1a065db51/files/gladstone-review-initial-report.pdf
Shannon, E.L., McShane, T.J., 2013. Options for tailwater capture and reuse in the Barratta Creek catchment (A scoping study). Report funded through the Wetland Management in Agricultural Production Systems Programme. QWP Phase 11 2012-2013. 24 pp. www.canegrowersburdekin.files.wordpress.com/2013/12/scoping-study-final-report-19-nov-13.pdf .
Shaw, M., Silburn, D.M., Thornton, C., Robinson, B., McClymont, D., 2011. Modelling pesticide run-off from paddocks in the Great Barrier Reef with HowLeaky. MODSIM 2011, Perth WA.
Shaw, M.S., Silburn, D.S., Lenahan, M., Harris, M., 2012. Pesticides in groundwater in the Lower Burdekin floodplain. Brisbane: Department of Environment and Resource Management, Queensland Government.
Shaw M., Silburn D.M., Rojas-Ponce, S., Lewis, S., Davis, A., 2013. Herbicide degradation on Queensland cropping soils and crop residue. Half-lives measured in a controlled environment. Department of Natural Resources and Mines, Regional Science, South Region and TropWater, James Cook University. Report to the Reef Rescue Water Quality Research & Development Program. Reef and Rainforest Research Centre Limited, Cairns.
Sheaves, M., Brookes, J., Coles, R., Freckelton, M., Groves, P., Johnston, R., Winberg, P., 2014. Repair and revitalisation of Australia’s tropical estuaries and coastal wetlands: opportunities and constraints for the reinstatement of lost function and productivity. Marine Policy 47,23–38. doi:10.1016/j.marpol.2014.01.024
Sheaves, M., Coles, R., Dale, P., Grech, A., Pressey, R.L., Waltham, N.J., 2015. Enhancing the Value and Validity of EIA: Serious Science to Protect Australia's Great Barrier Reef. Conservation Letters 9, 377–383.
Shellberg, J., Brooks, A., Spencer, J., 2010. Land-use change from indigenous management to cattle grazing initiates the gullying of alluvial soils in northern Australia. Proceedings of the 19th World Congress of Soil Science: Soil solutions for a changing world, Brisbane, Australia, 1-6 August 2010. Symposium 4.3.1 Impacts of land use change in unsustainable ecosystems, 59-62 pp.
Shellberg, J.G., Brooks, A.P., Spencer, J., Ward, D., 2012. The hydrogeomorphic influences on alluvial gully erosion along the Mitchell River fluvial megafan. Hydrological Processes 27, 1086-1104.
Shellberg, J.G., Spencer, J., Brooks, A.P., Pietsch, T.J., 2016. Degradation of the Mitchell River fluvial megafan by alluvial gully erosion increased by post-European land use change, Queensland, Australia. Geomorphology 266, 105-120. doi.org/10.1016/j.geomorph.2016.04.021.
Shipitalo, M.J., Malone, R.W., Owens, L.B., 2008. Impact of glyphosate-tolerant soybean and glufosinate-tolerant corn production on herbicide losses in surface run-off. Journal of Environmental Quality 37, 401–408.
Sieling, K., Kage, H., 2006. N balance as an indicator of N leaching in an oilseed rape–winter wheat–winter barley rotation. Agriculture, Ecosystems and Environment 115, 261–269.
Silburn, D.M., Hunter, H.M., 2009. Management practices for control of run-off losses from cotton furrows under storm rainfall. III. Cover and wheel traffic effects on nutrients (N and P) in run-off from a black Vertisol. Australian Journal of Soil Research 47, 221–233.
Silburn, D.M., Kennedy, I.R., 2007. Rain simulation to estimate pesticide transport in run-off. In: Kennedy, I.R., Soloman, K.R., Gee, S.J., Crossan, A.N., Wang, S., Sanchez-Bayo, F. (eds), Rational Environmental Management of Agrochemicals: Risk Assessment, Monitoring and Remedial Action. ACS Symposium Series No. 966. American Chemical Society, pp. 120–135.
Silburn, D.M., Simpson, B.W., Hargreaves, P.A., 2002. Management practices for control of run-off losses from cotton furrows under storm rainfall. II. Transport of pesticides in run-off. Australian Journal of Soil Research 40, 21–44.
Management options and their effectiveness 157

Scientific Consensus Statement 2017—Chapter 4
Silburn, D.M., Carroll, C., Ciesiolka, C.A.A., deVoil, R.C., Burger, P., 2011. Hillslope run-off and erosion on duplex soils in grazing lands in semi-arid central Queensland. I. Influences of cover, slope, and soil. Soil Research 49(2), 105-117.
Silburn, D.M., Foley, J.L., deVoil, R.C., 2013a. Managing run-off of herbicides under rainfall and furrow irrigation with wheel traffic and banded spraying. Agriculture, Ecosystems and Environment 180, 40– 53.
Silburn, D.M., Rojas-Ponce, S., Fillols, E., Olsen, D., McHugh, J., Baillie, C., Lewis, S., Davis, A., 2013b. Precision application (band spray) of herbicides on sugarcane in the Burdekin region. Case Study, Reef Water Quality Protection Plan Secretariat. Department of Natural Resources and Mines, BSES, NCEA-USQ, TropWATER James Cook University.
Silburn, D.M., Rojas-Ponce, S., Fillols, E., Olsen, D., McHugh, J., Baillie, C., 2013c. Comparing residual versus knockdown herbicides in sugarcane in Mackay Whitsunday. Case Study, Reef Water Quality Protection Plan Secretariat, viewed 17-may-2013, www.reefplan.qld.gov.au/measuring-success/case-studies/case-studies-sugarcane/comparing-run-off-loss.aspx. Department of Natural Resources and Mines, BSES, NCEA-USQ, TropWATER, James Cook University.
Simon, A., Collison, A.J.C., 2002. Quantifying the mechanical and hydrologic effects of riparian vegetation on streambank stability. Earth Surface Processes and Landforms 27, 527-546.
Skocaj, D.M., Everingham, Y.L., Schroeder, B.L., 2013. Nitrogen management guidelines for sugarcane production in Australia: Can these be modified for wet tropical conditions using seasonal climate forecasting? Science Reviews 1(1), 51–71.
Smart, J.B., Hasan, S., Volders, A., Curwen, G., Fleming, C., Burford, M., 2016. A tradable permit scheme for cost-effective reduction of nitrogen run-off in the sugarcane catchments of the Great Barrier Reef. Report to the National Environmental Science Programme. Reef and Rainforest Research Centre Limited, Cairns, 75 pp. http://nesptropical.edu.au/wp-content/uploads/2016/04/NESP-TWQ-2.2-FINAL-REPORT.pdf
Smith, J., Douglas, G.B., Radke, L.C., Palmer, M., Brooke, B.P., 2008. Fitzroy River Basin, Queensland, Australia. III. Identification of sediment sources in the coastal zone. Environmental Chemistry 5(3), 231-242.
Smith, M., 2015. Evaluating management class transitions between sugarcane production systems within the Burdekin Dry Tropics region. Final Report prepared for NQ Dry Tropics, Townsville as part of the Burdekin Water Quality Improvement Plan 2016.
Smith, M., Poggio, M. J., Thompson, M., Collier, A., 2014. The Economics of Pesticide Management Practices on Sugarcane Farms: Final Synthesis Report. Department of Agriculture, Fisheries and Forestry (QDAFF), Queensland.
Smith, R.A., Warne M. St J., Mengersen, K., Turner, R.D.R., 2016a. An improved method for calculating toxicity-based pollutant loads: Part 1. Method development. Integrated Environmental Assessment and Management 13(4), 746-753. doi: 10.1002/ieam.1854.
Smith, R.A., Warne, M. St J., Mengersen, K., Turner, R.D.R., 2016b. An improved method for calculating toxicity-based pollutant loads: Part 2. Application to contaminants discharged to the Great Barrier Reef, Queensland, Australia. Integrated Environmental Assessment and Management 13(4), 754-764 doi:10.1002/ieam.1860 Published online 4 Dec 2016.
Smyth, D., 1995. Chapter 8, Caring for sea country – accommodating indigenous peoples' interests in marine protected areas. In Gubbay, S., (ed.) Marine protected areas Marine Protected Areas: Principles and techniques for management. Springer Netherlands, pp. 149-173
Somes, N., Wong, T., 1997. Designing outlet characteristics for optimal wetland performance. Water Science & Technology, 36, 235–240.
Stanley, J., Clouston, B., Baker, R., 2006. Understanding Land Manager Constraints to the Adoption of Changed Practices or Technological Innovations: Working Paper No. 1 from the Project “Impediments to the Uptake of Market Based Instruments”. Department of Natural Resources, Mines and Water, State of
Management options and their effectiveness 158

Scientific Consensus Statement 2017—Chapter 4
Queensland. www.csu.edu.au/__data/assets/pdf_file/0009/754344/WP1Understanding-land-manager-constraints.pdf
Star, M., Rolfe, J., Donaghy, P., Beutel, T., Whish, G. and Abbott, B., 2013a. Targeting resource investments to achieve sediment reduction and improved Great Barrier Reef health, Agriculture, Ecosystems and the Environment 180: 148-156. doi:org/10.1016/j.agee.2012.03.016
Star, M., Rolfe, J., Whish, G., & East, M., 2013b. Predicting economic costs of improving grazing management in the Herbert, Burdekin and Fitzroy Catchments. RRRD39 - Component Two: Integrated assessment of BMP cost effectiveness and decision tool for regions and landholders. Report to the Reef Rescue Water Quality Research & Development Program. Reef and Rainforest Research Centre Limited, Cairns.
Star, M., East, M., Beutel, T., Rust, S., Northey, A., McCoser, K., Ellis, R., Darr, S., Rolfe J., 2015a. Understanding the cost of policy mechanisms for sediment reductions, for rangelands grazing in the Burdekin and Fitzroy Basin – Report to the Office of the Great Barrier Reef, Department of Environment and Heritage Protection.
Star, M., Beutel, T., Scrobback, P., Rolfe, J., McCosker, K., Ellis, R., 2015b. Prioritisation of neighbourhood catchments in the Fitzroy Basin. Report to Fitzroy Basin Association for the Fitzroy Water Quality Improvement Plan.
Star, M., Rolfe, J., Long, P., Whish, G., Donaghy, P., 2015c. Improved grazing management practices in the catchments of the Great Barrier Reef, Australia: does climate variability influence their adoption by landholders? The Rangeland Journal 37 (5), 507-515.
Star, M., Rolfe, J., Pringle, M., Shaw, M., McCosker, K., Ellis, R., Waters, D., Tindal, D., Turner, R., 2017. Targeting for pollutant reductions in the Great Barrier Reef management units. Central Queensland University Rockhampton, Australia.
Stark, C.H., Richards, K.G., 2008. The continuing challenge of nitrogen loss to the environment: Environmental consequences and mitigation strategies. Dynamic Soil, Dynamic Plant 2, 41-55.
Stewart, L.K., Charlesworth, P.B., Bristow, K.L., Thorburn, P.J., 2006. Estimating deep drainage and nitrate leaching from the root zone under sugarcane using APSIM-SWIM. Agricultural Water Management 81, 315–334. doi:10.1016/j.agwat.2005.05.002
Stimson, J., 2015. Long-Term Record of Nutrient Concentrations in Kāneohe Bay, Oahu, Hawaii, and Its Relevance to Onset and End of a Phase Shift Involving an Indigenous Alga, Dictyosphaeria cavernosa 1. Pacific Science, 69(3), 319-339.
Stoeckl, N., Hicks, C.C., Mills, M., Fabricius, K., Esparon, M., Kroon, F., Kaur, K. and Costanza, R., 2011. The economic value of ecosystem services in the Great Barrier Reef: Our state of knowledge. Annals of the New York Academy of Sciences 1219(1), 113-133.
Stoeckl, N., Farr, M., Larson, S., Adams, V.M., Kubiszewski, I., Esparon, M. and Costanza, R., 2014. A new approach to the problem of overlapping values: A case study in Australia׳ s Great Barrier Reef. Ecosystem Services, 10, pp.61-78. Stork, P.R, Lyons, D.J., Bell, M.J., 2009. Losses of nitrogen in surface run-off from a plantation horticulture farm in coastal Queensland, Australia. Australian Journal of Soil Research 47, 565–573.
Strahan, R., Hoffman, A., 2009. Estimating the economic implications for broad acre cropping farms in the Fitzroy Basin catchments of adoption of best management practices. Department of Employment, Economic Development and Innovation, Queensland, Australia.
Swann, E., Richards, R., 2016. What factors influence the effectiveness of financial incentives on long-term natural resource management practice change? Evidence Base 2, 1-17.
Tanner, C.C., 2013, Bottoms or Tops? – Optimising location of wetlands in catchments to maximise efficiency. National Institute of Water and Atmospheric Research (NIWA), Hamilton, New Zealand, 7 pp. www.massey.ac.nz/~flrc/workshops/13/Manuscripts/Paper_Tanner_2013.pdf
Management options and their effectiveness 159

Scientific Consensus Statement 2017—Chapter 4
Tarte, D., Hart, B., Hughes, T., Hussey, K., 2017. Reef 2050 Long-Term Sustainability Plan Progress on Implementation. Review by Great Barrier Reef Independent Review Group. February 2017. Great Barrier Reef Independent Review Group, Australia. https://independent.academia.edu/DiTarte
Taylor A.C., Wong, T.H., 2002. Non-structural stormwater quality: best management practices: a literature review of their value and life-cycle costs. CRC for Catchment Hydrology, Monash University.
Taylor, A., Cocklin, C., Brown, R., 2012. Fostering environmental champions: A process to build their capacity to drive change. Journal of Environmental Management 98, 84–97.
Taylor, B. M., 2010. Between argument and coercion: Social coordination in rural environmental governance. Journal of Rural Studies 26(4), 383-393.
Taylor, B.M., Lawrence, G.A., 2012. Agri-political Organisations in Environmental Governance: Representing Farmer Interests in Regional Partnerships. Journal of Environmental Policy & Planning 14, 337-359.
Taylor, B. M., van Grieken, M., 2015. Local institutions and farmer participation in agri-environmental schemes. Journal of Rural Studies 37, 10-19.
Taylor, B., Wallington, T., Robinson, C.J., 2012. Uncertainty and ambiguity in environmental governance: water quality in the Great Barrier Reef. Risk and Social Theory in Environmental Management. CSIRO Publishing, Melbourne, pp. 161-174.
Tengö, M., Hill, R., Malmer, P., Raymond, C.M., Spierenburg, M., Danielsen, F., Elmqvist, T., Folke, C., 2017. Weaving knowledge systems in IPBES, CBD and beyond – lessons learned for sustainability. Current Opinion in Environmental Sustainability 26-27, 17-25.
Tennent, R., Lockie, S., 2013. Vale Landcare: the rise and decline of community-based natural resource management in rural Australia. Journal of Environmental Planning and Management 56, 572-587.
Terrain NRM, 2015. Wet Tropics Water Quality Improvement Plan 2015-2020. Terrain NRM, Innisfail. www.terrain.org.au/Projects/Water-Quality-Improvement-Plan
The Senate Environment and Communications References Committee, 2016. The threat of marine plastic pollution in Australia. Australian Government, Canberra, Australia, 165 pp. www.aph.gov.au/Parliamentary_Business/Committees/Senate/Environment_and_Communications/Marine_plastics/Report
Thomas, C., Brodie, J., 2014. Valuation of environmental benefits derived from the Wet Tropics region, Great Barrier Reef. Report No. 14/29, TropWATER, James Cook University, Townsville.
Thomas, C.R., Alvarez-Romero, J., Davis, A.M., Lewis, S.E., Brodie, J.E., Pressey, R., in press. Export coefficient model of potential water quality impacts of sugarcane expansion in the Great Barrier Reef, Centre for Tropical Water & Aquatic Ecosystem Research (TropWATER), James Cook University, Townsville, 42 pp.
Thomas, G.A., Standley, J., Hunter, H.M., Blight, G.W., Webb, A.A., 1990. Tillage and crop residue management affect Vertisol properties and grain sorghum growth over seven years in the semiarid sub-tropics. 3. Crop growth, water use and nutrient balance. Soil Tillage Research 18, 367-388.
Thompson, C., Croke, J., 2013. Geomorphic effects, flood power, and channel competence of a catastrophic flood in confined and unconfined reaches of the upper Lockyer valley, southeast Queensland, Australia. Geomorphology 197, 156–169.
Thompson, M., Dowie, J., Wright, C., 2016a. Fertilising with enhanced efficiency nitrogen – representative economic analysis, Burdekin region. Department of Agriculture and Fisheries (DAF), Queensland, 37 pp. publications.qld.gov.au/dataset/05fe1bbd-1933-4205-851b-a469f915327e/resource/e15a2103-614d-45ac-8159-32a0d13336ec/download/eef-representative-report.pdf
Thompson, M., McDonnell, P., Dowie, J., 2016b. Banding mill by-products – representative economic analysis, Burdekin region. Department of Agriculture and Fisheries (DAF), Queensland, 25 pp. publications.qld.gov.au/dataset/05fe1bbd-1933-4205-851b-a469f915327e/resource/6f9dccb8-8aa2-459c-80dd-fbae84e6fdc9/download/mud-representative-report.pdf
Management options and their effectiveness 160

Scientific Consensus Statement 2017—Chapter 4
Thompson, M., Shannon, E., McDonnell, P., 2016c. Low-cost drip irrigation – representative economic analysis, Burdekin region. Department of Agriculture and Fisheries (DAF), Queensland, 19 pp. https://publications.qld.gov.au/dataset/05fe1bbd-1933-4205-851b-a469f915327e/resource/34419984-4dbc-4270-9e8b-ae58cdf5caf4/download/drip-representative-report.pdf
Thorburn, P.J., 1992. Structural and hydrological changes in a Vertisol under different fallow management techniques. Soil Tillage Research 23, 341-359.
Thorburn, P.J., Wilkinson, S.N., 2013. Conceptual frameworks for estimating the water quality benefits of improved agricultural management practices in large catchments. Agriculture, Ecosystems and Environment 180, 192-209.
Thorburn, P.J., Park, S.E., Bloesch, P., Webster, A.J., Horan, H.L., Biggs, I.M., Biggs, J.S., 2008. Potential impacts of mill mud on nitrogen fertiliser requirements for sugarcane production. Proceedings of Australian Society of Sugar Cane Technologists 30, 367–368.
Thorburn, P.J., Biggs, J.S., Collins, K., Probert, M.E., 2010. Using the APSIM model to estimate nitrous oxide emissions from diverse Australian sugarcane production systems. Agriculture, Ecosystems and Environment 136, 343–350.
Thorburn, P.J., Webster, A.J., Biggs, J.S., Biggs, I.M., 2011a. Meeting global environmental challenges of sugarcane production through an innovative nitrogen fertiliser management system. Plant Soil 339, 51-67.
Thorburn, P.J., Biggs, J.S., Attard, S.J., Kemei, J., 2011b. Environmental impacts of fully irrigated sugarcane production: Nitrogen lost through run-off and leaching. Agriculture, Ecosystems and Environment 144, 1-12.
Thorburn, P.J., Jakku, E., Webster, A.J., Everingham, Y.L., 2011c. Agricultural decision support systems facilitating co-learning: a case study on environmental impacts of sugarcane production. International Journal of Agricultural Sustainability 9, 322-333.
Thorburn, P. J., & Wilkinson, S. N. (2013). Conceptual frameworks for estimating the water quality benefits of improved agricultural management practices in large catchments. Agriculture, Ecosystems & Environment, 180(2013), 192-209.
Thorburn, P.J., Wilkinson, S.N., Silburn, D.M., 2013a. Water quality in agricultural lands draining to the Great Barrier Reef: Causes, management and priorities. Agriculture, Ecosystems and Environment 180, 4– 20.
Thorburn, P., Rolfe, J., Wilkinson, S., Silburn, M., Blake, J., Gongora, M., Windle, J., VanderGragt, M., Wegscheidl, C., Ronan, M., Carroll, C., 2013b. The water quality and economic benefits of agricultural management practices. Chapter 5, in: 2013 Scientific Consensus Statement. Land use impacts on Great Barrier Reef water quality and ecosystem condition. The State of Queensland 2013. Published by the Reef Water Quality Protection Plan Secretariat, July 2013. pp. 47.
Thorburn, P.J., Biggs, J.S., Meier, E.A., Empson, M., Palmer, J., Verburg, K., Skocaj, D.M., 2014. Increasing nitrogen use efficiency in Australian sugarcane crops: Insights from simulation modelling. In: A review of nitrogen use efficiency in sugarcane. SRA Research Report, Sugar Research Australia: Brisbane, pp. 183-228.
Thornton, C. M., Elledge, A.E., 2016. Tebuthiuron movement via leaching and run-off from grazed Vertisol and Alfisol soils of the Brigalow Belt Bioregion of Central Queensland, Australia. Journal of Agricultural and Food Chemistry 64, 3949-3959. 10.1021/acs.jafc.5b05393
Tockner, K., Standford, J.A, 2002. River floodplains: present state and future trends. Environmental Conservation 29, 308-330. doi:10.1017/S037689290200022X
Tomer, M.D., Locke, M.A., 2011. The challenge of documenting water quality benefits of conservation practices: a review of USDA-ARS's conservation effects assessment project watershed studies. Water Science and Technology 64(1), 300-310, 10.2166/wst.2011.555.
Management options and their effectiveness 161

Scientific Consensus Statement 2017—Chapter 4
Tournebize, J., Chaumonta, C., Mander, Ü., 2016. Implications for constructed wetlands to mitigate nitrate and pesticide pollution in agricultural drained watersheds. Ecological Engineering 11, pp. doi: 10.1016/j.ecoleng.2016.02.014
Townsville City Council, 2017. WSUD in the Townsville Coastal Dry Tropics. Townsville City Council, 6 pp. www.townsville.qld.gov.au/__data/assets/pdf_file/0010/12214/WSUD-in-the-Townsville-Coastal-Dry-Tropics-V3.pdf
Tran, D.B., Dargusch, P., 2016. Melaleuca forests in Australia have globally significant carbon stocks. Forest Ecology and Management 375, 230-237. doi:10.1016/j.foreco.2016.05.028
Trimble, S.W., 1981. Changes in sediment storage in the Coon Creek basin, Driftless Area, Wisconsin, 1853-1977. Science 214, 181-183.
Trimble, S.W., 1983. A Sediment Budget for Coon Creek Basin in the Driftless Area, Wisconsin, 1853-1977. American Journal of Science 283(5), 454-474.
Tsatsaros, J.H., 2013. Refining water quality objectives and monitoring in the community based approach. James Cook University, Townsville, Australia. PhD thesis. http://researchonline.jcu.edu.au/39909/1/39909-tsatsaros-2013-thesis.pdf
Tullberg, J.N., Yule, D.F., McGarry, D., 2007. Controlled traffic farming - From research to adoption in Australia. Soil Tillage Research 97, 272–281.
Turner, N.J., Gregory, R., Brooks, C., Failing, L., Satterfield, T., 2008. From Invisibility to Transparency: Identifying the Implications. Ecology and Society 13(2), 7. www.ecologyandsociety.org/vol13/iss2/art7/
UNESCO Intergovernmental Committee for the Protection of the World Cultural and Natural Heritage, 2012. Operational guidelines for the implementation of the World Heritage Convention. UNESCO, Paris, France, 175 pp. whc.unesco.org/en/guidelines/
United Nations Environment Programme, 2009. Marine Litter: A Global Challenge. UNEP, Nairobi, Kenya, 234 pp. euroshore.com/sites/euroshore.com/files/documents/unep_marine_litter.pdf
van Grieken, M., Thomas, C., Roebeling, P., Thorburn, P., 2013a. Integrating economic drivers of social change into agricultural water quality improvement strategies. Agriculture, Ecosystems and Environment 180, 166-175.
van Grieken, M., Lynam, T., Coggan, A., Whitten, S., Kroon, F., 2013b Cost effectiveness of design-based water quality improvement regulations in the Great Barrier Reef. Agriculture, Ecosystems and Environment 180, 157-165.
van Grieken, M.E., Pannell, D., Roberts, A., 2014a. Economic Analysis of Farming Systems for Water Quality Improvement in the Burnett Mary Catchment. A report prepared for the Burnett Mary Regional Group in cooperation with Natural Decisions. CSIRO Water for a Healthy Country Flagship. Brisbane.
van Grieken, M., Poggio, M., Smith, M., Taylor, B., Thorburn, P., Biggs, J., Whitten, S., Faure, C., Boullier, A., 2014b. Cost-effectiveness of management activities for water quality improvement in sugarcane farming. Report to the Reef Rescue Water Quality Research & Development Program. Reef and Rainforest Research Centre Limited, Cairns, 85 pp.
van Grinsven, H., Ten Berge, H., Dalgaard, T., Fraters, B., Durand, P., Hart, A., Hofman, G., Jacobsen, B.H., Lalor, S.T., Lesschen, J., 2012. Management, regulation and environmental impacts of nitrogen fertilization in Northwestern Europe under the Nitrates Directive: a benchmark study. Biogeosciences 9, 5143-5160.
van Roon, M., 2007. Water localisation and reclamation: Steps towards low impact urban design and development. Journal of Environmental Management 83(4), 437–447.
Vanclay, F., 2004. Social principles for agricultural extension to assist in the promotion of natural resource management. Animal Production Science 44 (3), 213-222.
Management options and their effectiveness 162

Scientific Consensus Statement 2017—Chapter 4
Vella, K., 2004. Assessing institutional progress towards sustainability, School of Geography, Planning and Architecture. University of Queensland, Brisbane, Australia, 520 pp.
Vella, K., Dale, A., 2014. An approach for adaptive and integrated agricultural planning to deal with uncertainty in a Great Barrier Reef Catchment. Australian Planner 51, 243-259.
Vella, K., Forester, J., 2017. Creating spaces for action: Lessons from front line planners in the Great Barrier Reef. In: Sipe, N., Vella, K. (Eds.), Australian Handbook of Urban and Regional Planning. Routledge, New York.
Vella, K., Sipe, N., 2014. The evolving landscape of natural resource planning and governance in Australia, Association of Collegiate Schools of Planning Conference, Philadelphia, Pennsylvania.
Vella, K., Sipe, N., Dale, A., Taylor, B., 2015. Not Learning from the Past: Adaptive Governance Challenges for Australian Natural Resource Management. Geographical Research 53, 379–392.
Verburg, K., Harvey, T.G., Muster, T.H., Brennan McKellar, L.E., Thorburn, P.J., Biggs, J.S., Di Bella, L.P., Wang, W.J., 2014. Use of enhanced efficiency fertilisers to increase fertiliser nitrogen use efficiency in sugarcane, in: Bell, M.J. (Ed.), A Review of Nitrogen Use Efficiency in Sugarcane. SRA Research Report. Sugar Research Australia, Brisbane, pp. 229–295.
Verburg, K., Zhao, Z., Biggs, J.S., Thorburn, P.J., 2016. Controlled release fertilisers—lessons from a review and early results characterising release, synchrony and nitrogen losses. Proceedings of Australian Society of Sugar Cane Technologists 38, 159-169.
Verburg, K., Zhao, Z., Biggs, J.S., Thorburn, P.J., in press, 2017. Potential production and environmental benefits from controlled release fertilisers – Lessons from a simulation analysis. Proceedings of Australian Society of Sugar Cane Technologists, 39.
Verhoeven, J.T.A., Arheimer, B., Yin, C., Hefting, M.M., 2006. Regional and global concerns over wetlands and water quality. Trends in Ecology and Evolution 21, 96-103. doi:10.1016/j.tree.2005.11.015
Vymazal, J., Březinová, T., 2015. The use of constructed wetlands for removal of pesticides from agricultural run-off and drainage: A review. Environment International 75, 11–20. doi:0.1016/j.envint.2014.10.026
Wallace, R., Huggins, R., King, O., Gardiner, R., Thomson, B., Orr, D.N., Ferguson, B., Taylor, C., Severino, Z., Smith, R.A., Warne, M., Turner, R.D.R., Mann, R.M., 2016. Total suspended solids, nutrient and pesticide loads (2014–2015) for rivers that discharge to the Great Barrier Reef – Great Barrier Reef Catchment Loads Monitoring Program. Department of Science, Information Technology and Innovation. Brisbane. doi:10.13140/RG.2.2.17851.62240
Walling, D.E., Fang, D., 2003. Recent trends in the suspended sediment loads of the world's rivers. Global and Planetary Change 39, 111-126.
Walling, D.E., Wilkinson, S.N., Horowitz, A.J., 2011. Catchment Erosion, Sediment Delivery, and Sediment Quality. In: P. Wilderer (ed.), Treatise on Water Science. Oxford: Academic Press, pp. 305-338.
Walsh, C., Fletcher, T., Ladson, A., 2005. Stream restoration in urban catchments through redesigning stormwater systems: looking to the catchment to save the stream. Journal of the North American Benthological Society 33, 690–705.
Wang, H.J., Yang, Z.S., Saito, Y., Liu, J.P., Sun, X.X., Wang, Y., 2007. Stepwise decreases of the Huanghe (Yellow River) sediment load (1950-2005): Impacts of climate change and human activities. Global and Planetary Change 57(3-4), 331-354. doi:10.1016/j.gloplacha.2007.01.003.
Wang, H.J., Saito, Y., Zhang, Y., Bi, N.S., Sun, X.X., Yang, Z.S., 2011. Recent changes of sediment flux to the western Pacific Ocean from major rivers in East and Southeast Asia. Earth-Science Reviews 108(1-2), 80-100. doi:10.1016/j.earscirev.2011.06.003.
Wasson, R.J., Caitcheon, G., Murray, A.S., McCulloch, M., Quade, J., 2002. Sourcing Sediment Using Multiple Tracers in the Catchment of Lake Argyle, Northwestern Australia. Environmental Management 29, 634-646.
Management options and their effectiveness 163

Scientific Consensus Statement 2017—Chapter 4
Water by Design, 2014. Living Waterways. Healthy Waterways Limited, Brisbane. http://hlw.org.au/u/lib/mob/20141010171640_5607a66ccaf6956d9/2014_livingwaterwaysbooklet-28mb.pdf
Waterhouse, J., Brodie, J., 2015. Recent findings of an assessment of remote sensing data for water quality measurement in the Great Barrier Reef: Supporting information for the GBR Water Quality Improvement Plans. Report to Cape York NRM, NQ Dry Tropics and Fitzroy Basin Association. TropWATER Report 2015, Townsville, Australia.
Waterhouse, J., Brodie, J., Lewis, S., & Audas, D.-M. (2016). Land-sea connectivity, ecohydrology and holistic management of the Great Barrier Reef and its catchments: time for a change. Ecohydrology & Hydrobiology, 16(1), 45-57.
Waterhouse, J., Brodie, J., Tracey, D., Smith, R., Vandergragt, M., Collier, C., Petus, C., Baird, M., Kroon, F., Mann, R., Sutcliffe, T., Adame, F., 2017. Scientific Consensus Statement 2017: A synthesis of the science of land-based water quality impacts on the Great Barrier Reef, Chapter 3: The risk from anthropogenic pollutants to Great Barrier Reef coastal and marine ecosystems. State of Queensland, 2017.
Waters, D.K., Carroll, C., Ellis, R., Hateley, L., McCloskey, G.L., Packett, R., Dougall, C., Fentie, B., 2014. Modelling Reductions of Pollutant Loads Due to Improved Management Practices in the Great Barrier Reef Catchments - Whole of GBR. Technical Report, Volume 1. Queensland department of Natural Resources and Mines, Toowoomba, Australia, 120 pp.
Waters, W., Thomson, D., and Nettle, R., 2009. Derived attitudinal farmer segments: A method for understanding and working with the diversity of Australian dairy farmers. Extension Farming Systems Journal, 5(2), 47-59.
Wauchope, R.D., 1978. The pesticide content of surface water draining from agricultural fields—a review. Journal of Environmental Quality 7, 459–472.
Wauchope, R.D., Estes, T.L., Allen, R., Baker, J.L., Hornsby, A.G., Jones, R.L., Richards, R.P., Gustafson, D.I., 2002a. Predicted impact of transgenic, herbicide tolerant corn on drinking water quality in vulnerable watersheds of the mid-western USA. Pest Management Science 58, 146–160.
Wauchope, R.D., Yeh, S., Linders, J.B., Kloskowski, R., Tanaka, K., Rubin, B., Katayama, A., Kordel, W., Gerstl, Z., Lane, M., Unsworth, J.B., 2002b. Pesticide soil sorption parameters: theory, measurement, uses, limitations and reliability. Pest Management Science 58, 419–445.
Weber, T.R., Ramilo, N.J., 2012. Integrated water cycle management - dealing with dilemmas. In WSUD 2012: Water sensitive urban design; Building the water sensitive community; 7th international conference on water sensitive urban design, Melbourne, Australia, 2012, 331-337.
Webster, A.J., Bartley, R., Armour, J.D., Brodie, J.E., Thorburn, P.J., 2012. Reducing dissolved inorganic nitrogen in surface run-off water from sugarcane production systems. Marine Pollution Bulletin 65, 128–35. doi:10.1016/j.marpolbul.2012.02.023
Webster, T., Poulton, P., Yeates, S., Cocks, B., Hornbuckle, J., Gentle, J., McKellar, L., Mayberry, D., Jones, A., Wixon, A., 2013. Agricultural productivity in the Flinders and Gilbert catchment. A technical report to the Australian Government from the CSIRO Flinders and Gilbert Agricultural Resource assessment, part of the North Queensland Irrigated Agricultural Strategy. CSIRO Water for a Healthy Country and Sustainable Agriculture flagships, Australia.
WetlandCare Australia, 2008. Wetland Rehabilitation Guidelines for the Great Barrier Reef catchment. Compiled for Department of the Environment, Water, Heritage and the Arts.
WetlandInfo 2016. Great Barrier Reef contributing catchments — facts and maps, WetlandInfo, Department of Environment and Heritage Protection, Queensland. wetlandinfo.ehp.qld.gov.au/wetlands/facts-maps/study-area-great-barrier-reef/
Management options and their effectiveness 164

Scientific Consensus Statement 2017—Chapter 4
Whitten, S.M., Kandulu, J., Coggan, A., Marinoni, O., 2015. Marginal abatement cost curves for sugar cane in the Great Barrier Reef, Report Prepared for the Queensland Government by CSIRO Land and Water, 23 pp.
Wicks, M., Vigar, N., Hannah, M., 2011. Nutrients and Solids Removal by an Engineered Treatment Train, Water 38, 6.
Wilcox, B.P., Huang, Y., Walker, J.W., 2008. Long-term trends in streamflow from semiarid rangelands: uncovering drivers of change. Global Change Biology 14, 1676-1689.
Wilkinson, S.N., Kinsey-Henderson, A.E., Hawdon, A., Ellis, T.W., Nicholas, M., 2013. Gully erosion and its response to grazing practices in the Upper Burdekin catchment. CSIRO Water for a Healthy Country Flagship, Australia, A report to NQ Dry Tropics for the Paddock to Reef program, 94 pp. www.publications.csiro.au/rpr/download?pid=csiro:EP132482&dsid=DS10
Wilkinson, S.N., Bastin, G., Stokes, C.J., Hawdon, A.A., Chewings, V.H., Kinsey-Henderson, A.E., Nicholas, D.M., Abbott, B.N., McKellar, K., Kemei, J., 2014. Improving grazing management practices to enhance ground cover and reduce sediment loads, Report to the Reef Rescue Water Quality Research & Development Program. Reef and Rainforest Research Centre Limited, Cairns, 97 pp. www.reefrescueresearch.com.au/images/Final_Research_Outcomes_Reports/RRRD032_Research_Outcomes_Report_FINAL-COMPLETE.pdf
Wilkinson, S.N., Bartley, R., Hairsine, P.B., Bui, E.N., Gregory, L., Henderson, A.E., 2015a. Managing gully erosion as an efficient approach to improving water quality in the Great Barrier Reef lagoon. Report to the Department of the Environment. CSIRO Land and Water, Australia, 53 pp. www.publications.csiro.au/rpr/download?pid=csiro:EP1410201&dsid=DS6
Wilkinson, S.N., Hawdon, A.A., Hairsine, P.B., Austin, J., 2015b. Gully Toolbox: A technical guide for the Reef Trust Gully Erosion Control Programme 2015-16, CSIRO, Report to the Department of the Environment (Reef Program), 46 pp. www.environment.gov.au/system/files/pages/d597f340-04b3-4dfa-86eb-5672003d4a5b/files/grant-gully-toolbox.pdf
Williams, C., Morton, E., Whitten, S., Smale, R., Grafton, Q., Rolfe, J., Richardson, S., Woollett, G., 2016. Costs of achieving the water quality targets for the Great Barrier Reef: External peer review, Queensland Government, Brisbane, 9 pp. www.ehp.qld.gov.au/assets/documents/reef/external-review-report.pdf
Willmott, T., Taiminen, H.M., Rundle-Thiele, S., 2016. Engaging farmers to adopt best management practices: A dual interest framework exploratory study (Abstract). Australian and New Zealand Marketing Academy Conference. Proceedings 5-7 December 2016. University of Canterbury, Christchurch, New Zealand, p. 47. www.mang.canterbury.ac.nz/ANZMAC/ANZMAC%20proceedings%202016.pdf
Wolfert, S., Ge, L. Verdouw, C and Bogaardt, M., 2017 Big Data in Smart Farming – A review. Agricultural Systems 153, 69-80.
Wong T.H., Fletcher T.D., Duncan H.P., Coleman J.R., Jenkins G.A., 2002. A Model for Urban Stormwater Improvement: Conceptualization. In Strecker, E.W. (ed) Global Solutions for Urban Drainage: Extended abstracts of the Ninth International Conference on Urban Drainage, 1-14.
Wood, A., Schroeder, B.L., Stewart, R., 2003. The development of site-specific nutrient management guidelines for sustainable sugarcane production. Proceedings of Australian Society of Sugar Cane Technologists 25, 12 pp.
Wood, A.W., Schroeder, B.L., Dwyer, R., 2010. Opportunities for improving the efficiency of use of nitrogen fertiliser in the Australian sugar industry. Proceedings of the Australian Society of Sugar Cane Technologists 32, 221-233.
Wooller, M.J., Morgan, R., Fowell, S., Behling, H., Fogel, M., 2007. A multiproxy peat record of Holocene mangrove palaeoecology from Twin Cays Belize. The Holocene 17, 1129-1139.
Wulf, P., 2004. Diffuse land-based pollution and the Great Barrier Reef world heritage area: The commonwealth's responsibilities and implications for the Queensland sugar industry. Environmental and Planning Law Journal 21, 424-444.
Management options and their effectiveness 165

Scientific Consensus Statement 2017—Chapter 4
Wulff, F., Eyre, B.D., Johnstone, R., 2011. Nitrogen versus phosphorus limitation in a subtropical coastal embayment (Moreton Bay; Australia): Implications for management. Ecological Modelling 222, 120-130.
Zaldivar-Jimenez, M.A., Herrera-Silveira, J.A., Teutli-Hernandez, C., Comin, F.A., Andrade, J.L., Coronado Molina, C., Perez Ceballos, R., 2010. Conceptual Framework for Mangrove Restoration in the Yucatán Peninsula. Restoration Ecology 28, 333-342. doi:10.3368/er.28.3.333
Zedler, J.B., 2000. Progress in wetland restoration ecology. Trends in Ecology and Evolution 15, 402-407. doi:10.1016/S0169-5347(00)01959-5
Zeraatkar, A. K., Ahmadzadeh, H., Talebi, A.F., Moheimani, N.R, McHenry, M.P., 2016. Potential use of algae for heavy metal bioremediation, a critical review. Journal of Environmental Management 181, 817-831. doi:10.1016/j.jenvman.2016.06.059
Zhang, X.B., Wen, A.B., 2004. Current changes of sediment yields in the upper Yangtze River and its two biggest tributaries, China. Global and Planetary Change 41, 221-227.
Zhao, Z, Verburg, K., 2015. Modelling nitrogen uptake by sugarcane crops to inform synchrony of N supply from controlled release fertiliser. In ‘MODSIM2015, 21st International Congress on Modelling and Simulation’, Gold Coast, December 2015, 420–426. www.mssanz.org.au/modsim2015/B3/zhao.pdf
Zurba, M., Berkes, F., 2014. Caring for country through participatory art: creating a boundary object for communicating Indigenous knowledge and values. Local Environment 19(8), 821-836.
Management options and their effectiveness 166
Related Documents