1 14 March 2018 Prudential plc 2017 Full Year Results

Welcome message from author
This document is posted to help you gain knowledge. Please leave a comment to let me know what you think about it! Share it to your friends and learn new things together.
Transcript

1
14 March 2018
Prudential plc 2017 Full Year Results
2017 FULL YEAR RESULTS 2
This document may contain ‘forward-looking statements’ with respect to certain of Prudential's plans and its goals and expectations relating to its future financial condition, performance, results, strategy and objectives. Statements that are not historical facts, including statements about Prudential’s beliefs and expectations and including, without limitation, statements containing the words ‘may’, ‘will’, ‘should’, ‘continue’, ‘aims’, ‘estimates’, ‘projects’, ‘believes’, ‘intends’, ‘expects’, ‘plans’, ‘seeks’ and ‘anticipates’, and words of similar meaning, are forward-looking statements. These statements are based on plans, estimates and projections as at the time they are made, and therefore undue reliance should not be placed on them. By their nature, all forward-looking statements involve risk and uncertainty. A number of important factors could cause Prudential's actual future financial condition or performance or other indicated results to differ materially from those indicated in any forward-looking statement. Such factors include, but are not limited to, the timing, costs and successful implementation of the demerger described herein; the future trading value of the shares of Prudential plc and the trading value and liquidity of the shares of the to-be-listed M&G Prudential business following such demerger; future market conditions, including fluctuations in interest rates and exchange rates the potential for a sustained low-interest rate environment, and the performance of financial markets generally; the policies and actions of regulatory authorities, including, for example, new government initiatives; the political, legal and economic effects of the UK’s decision to leave the European Union; the impact of continuing designation as a Global Systemically Important Insurer or ‘G-SII’; the impact of competition, economic uncertainty, inflation and deflation; the effect on Prudential’s business and results from, in particular, mortality and morbidity trends, lapse rates and policy renewal rates; the timing, impact and other uncertainties of future acquisitions or combinations within relevant industries; the impact of internal projects and other strategic actions failing to meet their objectives; disruption to the availability, confidentiality or integrity of Prudential’s IT systems (or those of its suppliers); the impact of changes in capital, solvency standards, accounting standards or relevant regulatory frameworks, and tax and other legislation and regulations in the jurisdictions in which Prudential and its affiliates operate; and the impact of legal and regulatory actions, investigations and disputes. These and other important factors may, for example, result in changes to assumptions used for determining results of operations or re-estimations of reserves for future policy benefits. Further discussion of these and other important factors that could cause Prudential's actual future financial condition or performance or other indicated results to differ, possibly materially, from those anticipated in Prudential's forward-looking statements can be found under the ‘Risk Factors’ heading in Prudential’s Full Year 2017 Results Regulatory News Release and the ‘Risk Factors’ heading in its most recent Annual Report and the ‘Risk Factors’ heading of Prudential's most recent annual report on Form 20-F filed with the U.S. Securities and Exchange Commission, as well as under the ‘Risk Factors’ heading of any subsequent Prudential Half Year Financial Report. Prudential's most recent Annual Report, Form 20-F and any subsequent Half Year Financial Report are available on its website at www.prudential.co.uk.
Any forward-looking statements contained in this document speak only as of the date on which they are made. Prudential expressly disclaims any obligation to update any of the forward-looking statements contained in this document or any other forward-looking statements it may make, whether as a result of future events, new information or otherwise except as required pursuant to the UK Prospectus Rules, the UK Listing Rules, the UK Disclosure and Transparency Rules, the Hong Kong Listing Rules, the SGX-ST listing rules or other applicable laws and regulations.

2017 FULL YEAR RESULTS 3
Mike Wells, Group CEO
Headline Results & Strategic Update
Agenda
Mark FitzPatrick, Group CFO
FY17 Financial Performance
Mike Wells, Group CEO
Wrap-Up
Paul Manduca, Group Chairman
Introduction

2017 FULL YEAR RESULTS 4
Mike Wells, Group CEO
Headline Results & Strategic Update
Agenda
Mark FitzPatrick, Group CFO
FY17 Financial Performance
Mike Wells, Group CEO
Wrap-Up
Paul Manduca, Group Chairman
Introduction
2017 FULL YEAR RESULTS 5
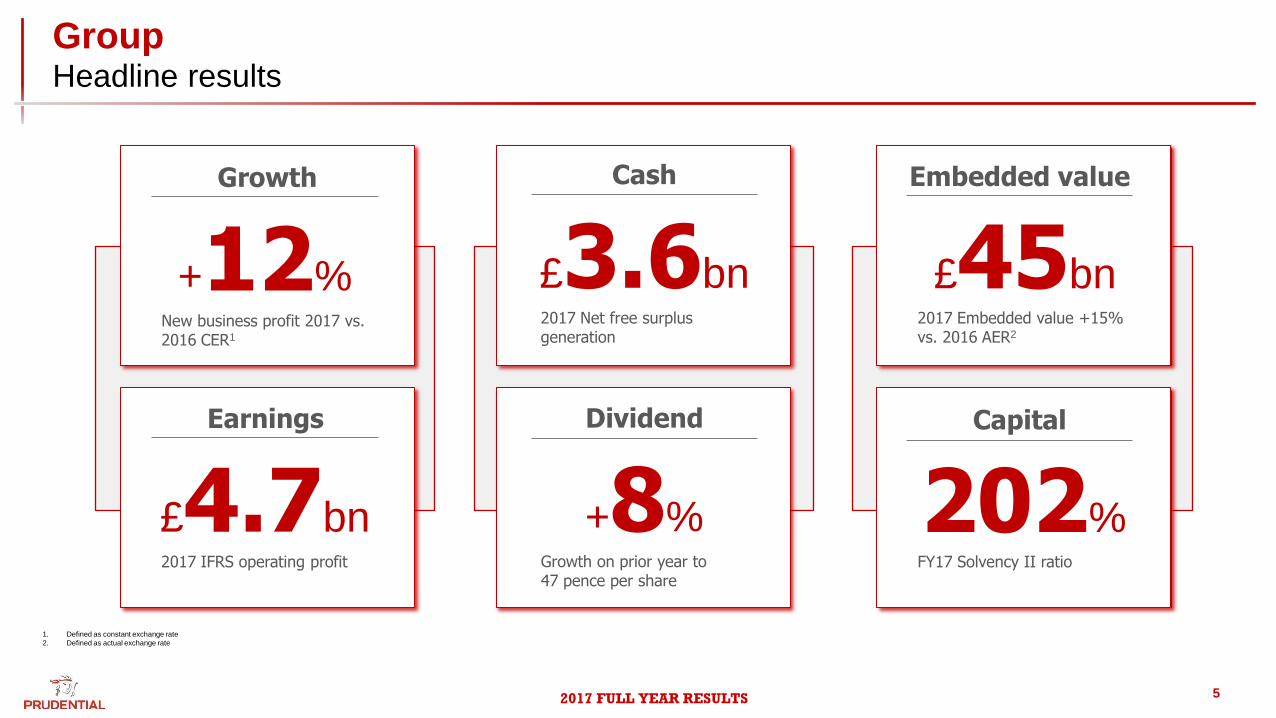
Group Headline results
1. Defined as constant exchange rate
2. Defined as actual exchange rate
Capital
202% FY17 Solvency II ratio
Embedded value
2017 Embedded value +15% vs. 2016 AER2
£45bn
Earnings
£4.7bn 2017 IFRS operating profit
Growth
+12% New business profit 2017 vs. 2016 CER1
Cash
2017 Net free surplus generation
£3.6bn
Dividend
Growth on prior year to 47 pence per share
+8%
2017 FULL YEAR RESULTS 6
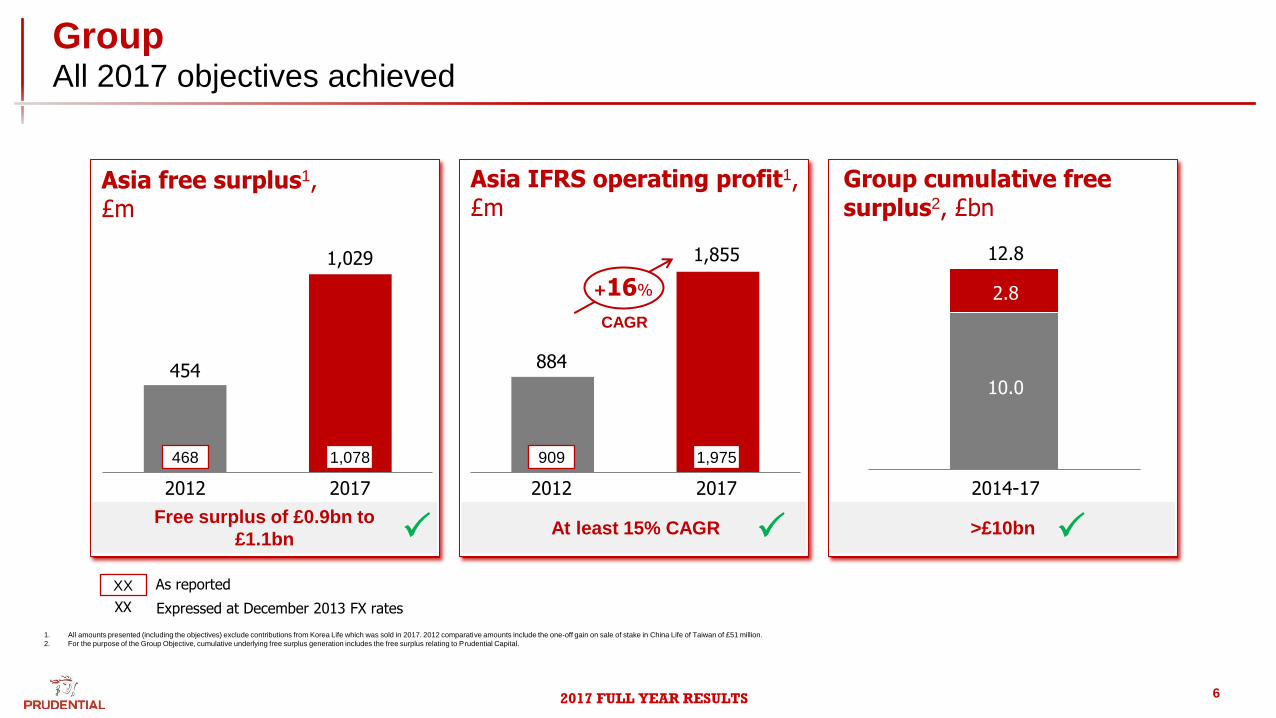
Group All 2017 objectives achieved
2017
Asia free surplus1, £m
454
1,029
2012
468 1,078
2012 2017
Asia IFRS operating profit1, £m
884
1,855
909 1,975
2014-17
Group cumulative free surplus2, £bn
12.8
10.0
XX
XX
As reported
Expressed at December 2013 FX rates
2.8
CAGR
+16%
1. All amounts presented (including the objectives) exclude contributions from Korea Life which was sold in 2017. 2012 comparative amounts include the one-off gain on sale of stake in China Life of Taiwan of £51 million.
2. For the purpose of the Group Objective, cumulative underlying free surplus generation includes the free surplus relating to Prudential Capital.
At least 15% CAGR >£10bn P P P Free surplus of £0.9bn to
£1.1bn
2017 FULL YEAR RESULTS 7
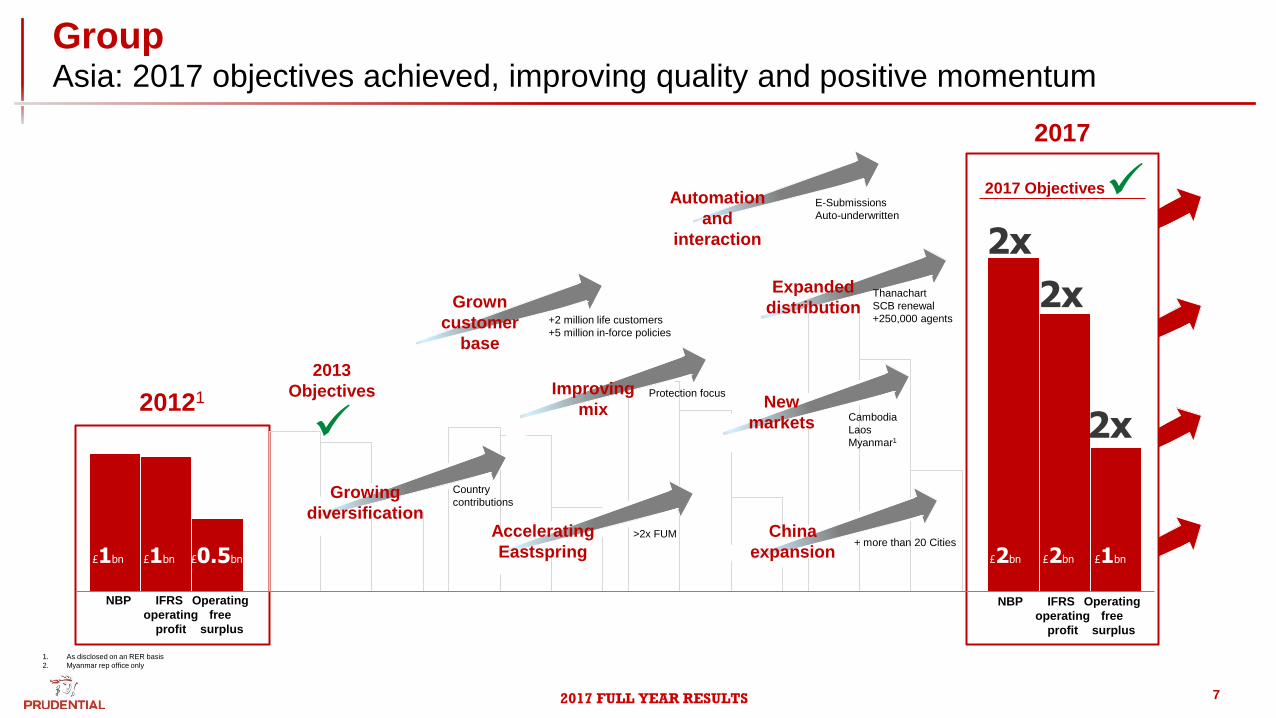
20121
2017
2x
2x
NBP IFRS
operating
profit
2x
Operating
free
surplus
Expanded
distribution Grown
customer
base
2013
Objectives
£1bn £1bn £0.5bn £2bn £2bn £1bn
Automation
and
interaction
Improving
mix
Growing
diversification Accelerating
Eastspring
China
expansion
New
markets
2017 Objectives
>2x FUM + more than 20 Cities
Cambodia
Laos
Myanmar1
Thanachart
SCB renewal
+250,000 agents
E-Submissions
Auto-underwritten
+2 million life customers
+5 million in-force policies
Protection focus
Country
contributions
NBP IFRS
operating
profit
Operating
free
surplus
1. As disclosed on an RER basis
2. Myanmar rep office only
Group Asia: 2017 objectives achieved, improving quality and positive momentum
2017 FULL YEAR RESULTS 8
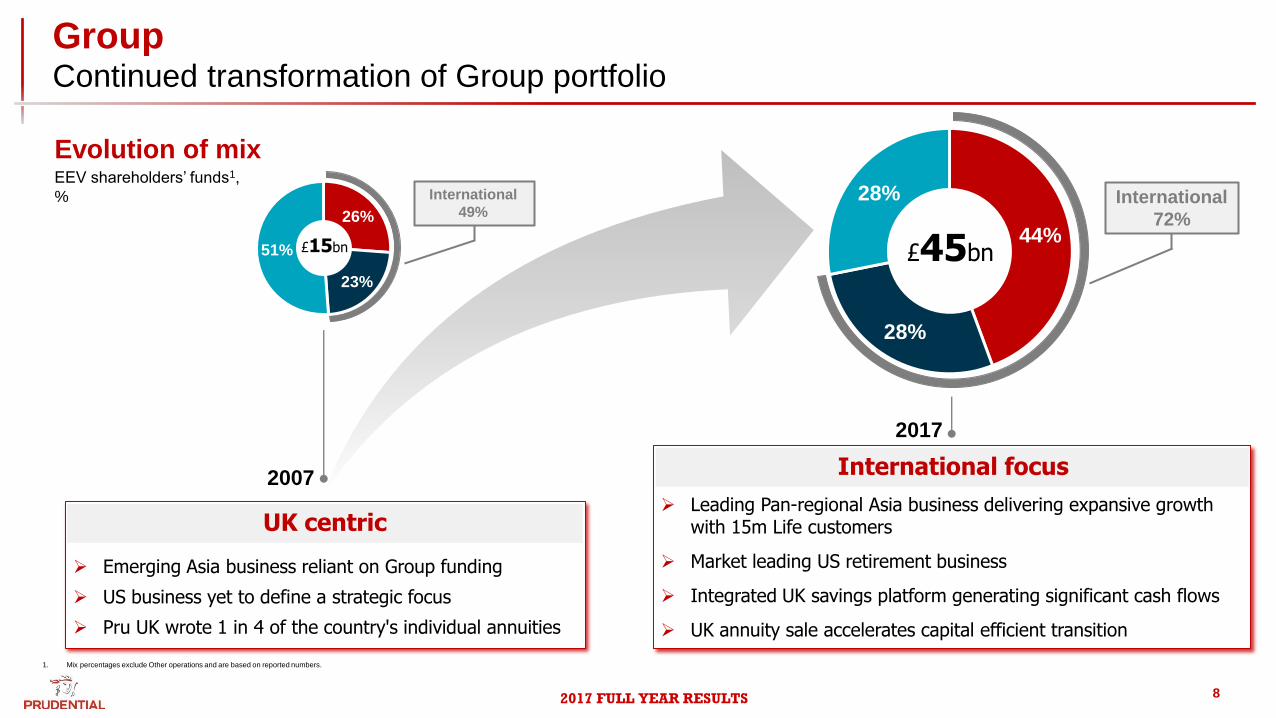
Group Continued transformation of Group portfolio
2007
2017
Evolution of mix
26%
23%
51% 44%
28%
28%
1. Mix percentages exclude Other operations and are based on reported numbers.
Leading Pan-regional Asia business delivering expansive growth with 15m Life customers
Market leading US retirement business
Integrated UK savings platform generating significant cash flows
UK annuity sale accelerates capital efficient transition
Emerging Asia business reliant on Group funding
US business yet to define a strategic focus
Pru UK wrote 1 in 4 of the country's individual annuities
£45bn £15bn
International
72%
International
49%
EEV shareholders’ funds1,
%
UK centric
International focus
2017 FULL YEAR RESULTS 9
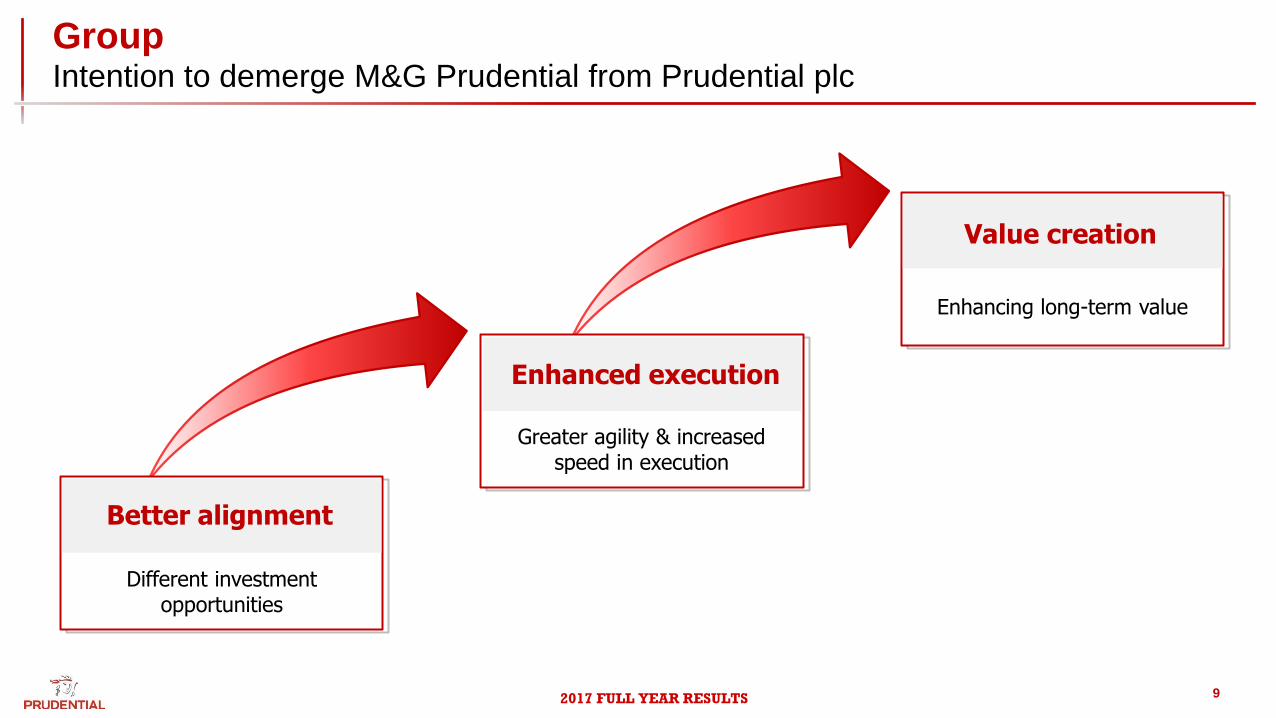
Group Intention to demerge M&G Prudential from Prudential plc
Value creation
Better alignment
Enhanced execution
Different investment opportunities
Greater agility & increased speed in execution
Enhancing long-term value
2017 FULL YEAR RESULTS 10
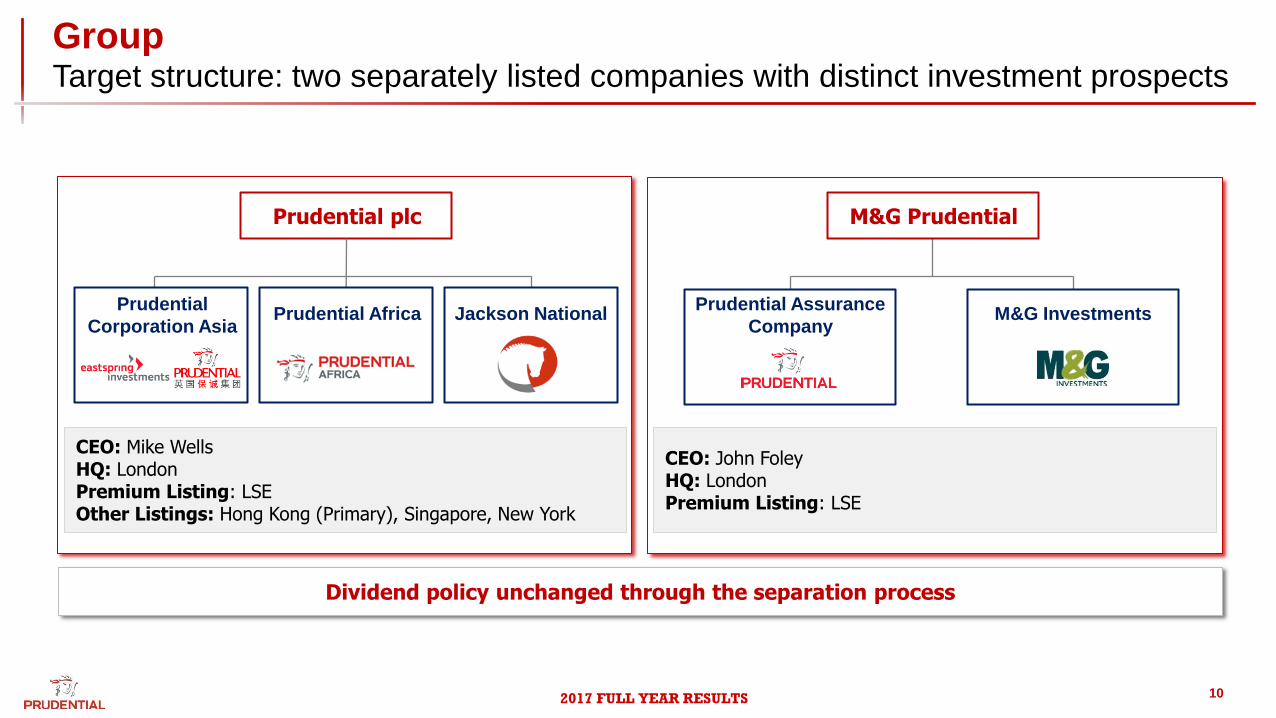
Group Target structure: two separately listed companies with distinct investment prospects
Dividend policy unchanged through the separation process
Prudential plc
Prudential
Corporation Asia Jackson National
Prudential Assurance
Company M&G Investments
CEO: Mike Wells HQ: London Premium Listing: LSE Other Listings: Hong Kong (Primary), Singapore, New York
CEO: John Foley HQ: London Premium Listing: LSE
Prudential Africa
M&G Prudential
2017 FULL YEAR RESULTS 11
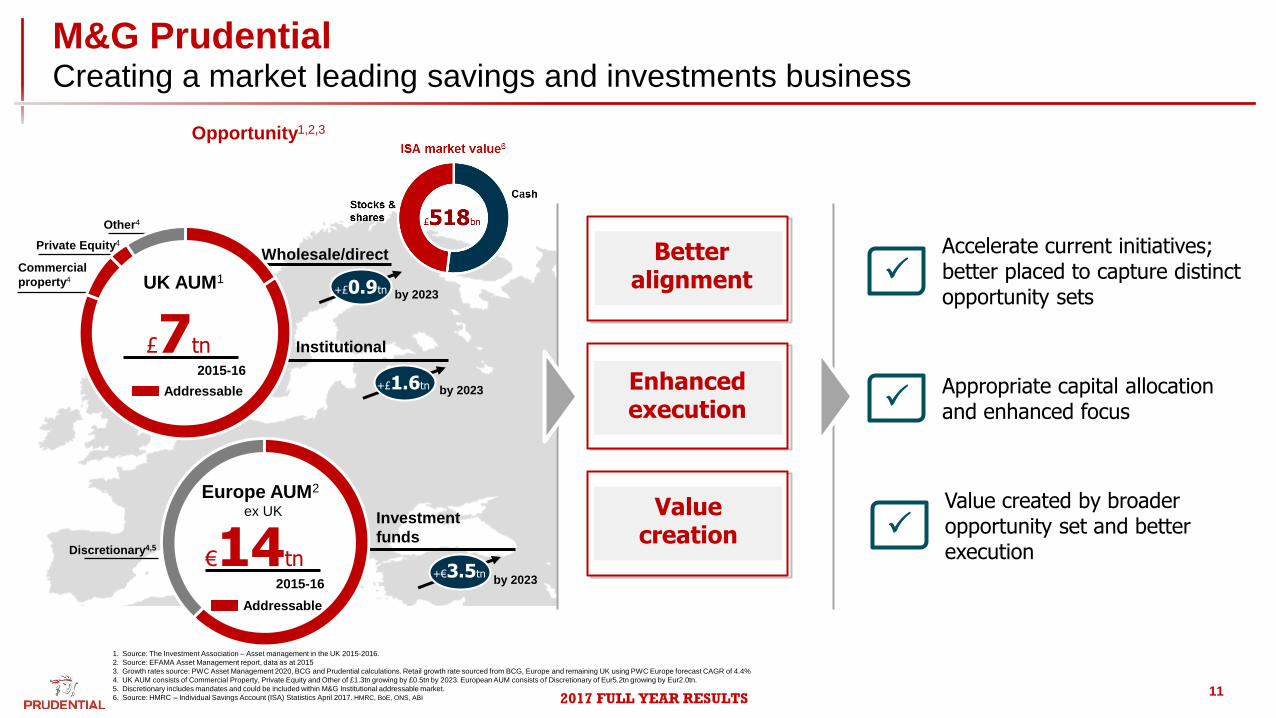
M&G Prudential Creating a market leading savings and investments business
Appropriate capital allocation and enhanced focus
Accelerate current initiatives; better placed to capture distinct opportunity sets
Value created by broader opportunity set and better execution
P
P
P
Better alignment
Value creation
Enhanced execution
Other4
Private Equity4
Commercial
property4
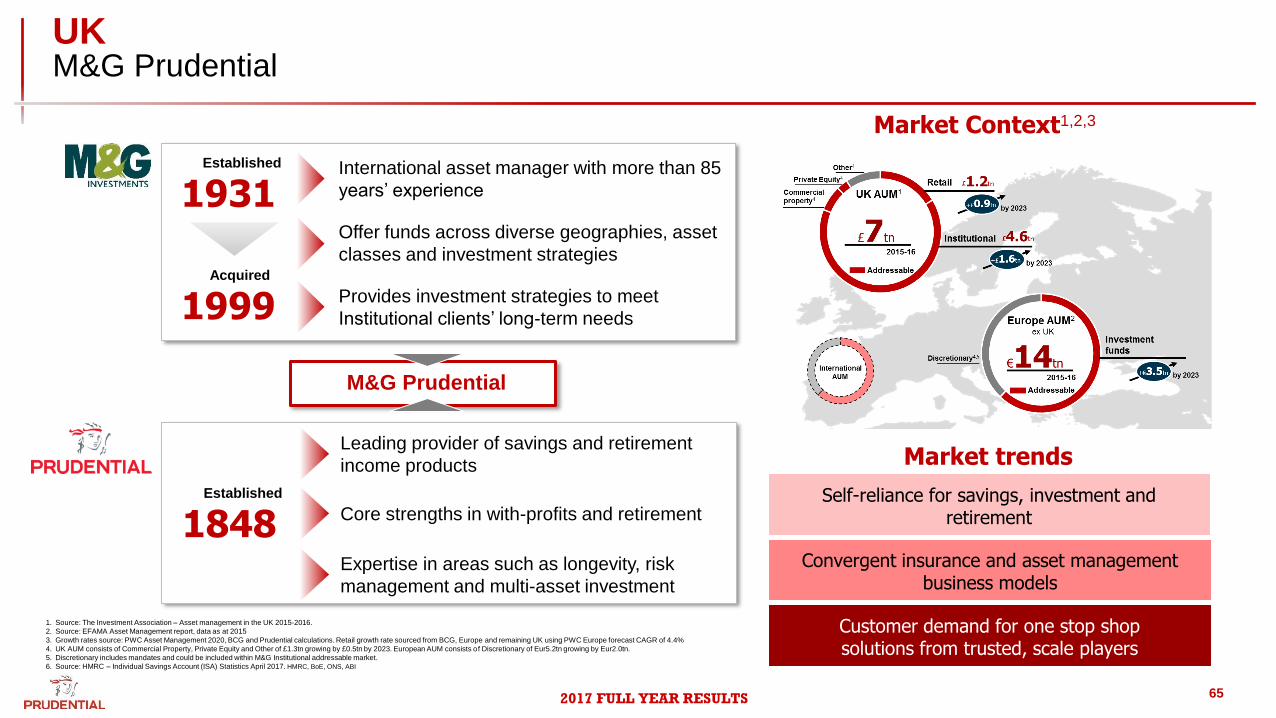
£7tn
UK AUM1
2015-16
Wholesale/direct
Institutional
Addressable
by 2023 +£0.9tn
by 2023 +£1.6tn
€14tn 2015-16
Europe AUM2 ex UK
Addressable
Discretionary4,5
Investment
funds
by 2023 +€3.5tn
1. Source: The Investment Association – Asset management in the UK 2015-2016.
2. Source: EFAMA Asset Management report, data as at 2015
3. Growth rates source: PWC Asset Management 2020, BCG and Prudential calculations. Retail growth rate sourced from BCG, Europe and remaining UK using PWC Europe forecast CAGR of 4.4%
4. UK AUM consists of Commercial Property, Private Equity and Other of £1.3tn growing by £0.5tn by 2023. European AUM consists of Discretionary of Eur5.2tn growing by Eur2.0tn.
5. Discretionary includes mandates and could be included within M&G Institutional addressable market.
6. Source: HMRC – Individual Savings Account (ISA) Statistics April 2017. HMRC, BoE, ONS, ABI
Opportunity1,2,3
2017 FULL YEAR RESULTS 12
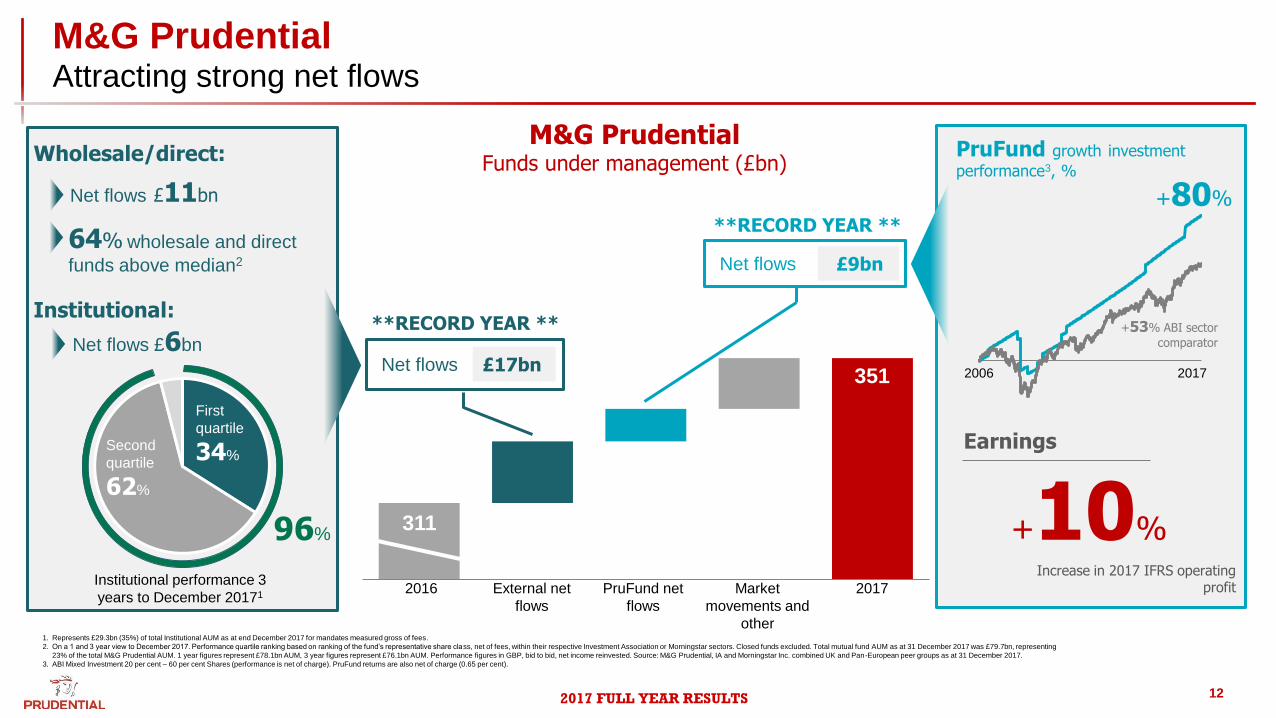
M&G Prudential Attracting strong net flows
2016 2017 External net
flows
Market
movements and
other
M&G Prudential Funds under management (£bn)
335bn
Net flows £11bn
Institutional:
Net flows
Net flows
£17bn 351
311
PruFund net
flows
**RECORD YEAR **
**RECORD YEAR **
£9bn
Institutional performance 3
years to December 20171
First
quartile
34% Second
quartile
62%
96%
Earnings
+10% Increase in 2017 IFRS operating
profit
PruFund growth investment
performance3, %
+80%
+53% ABI sector
comparator
2006 2017
1. Represents £29.3bn (35%) of total Institutional AUM as at end December 2017 for mandates measured gross of fees.
2. On a 1 and 3 year view to December 2017. Performance quartile ranking based on ranking of the fund’s representative share class, net of fees, within their respective Investment Association or Morningstar sectors. Closed funds excluded. Total mutual fund AUM as at 31 December 2017 was £79.7bn, representing
23% of the total M&G Prudential AUM. 1 year figures represent £78.1bn AUM, 3 year figures represent £76.1bn AUM. Performance figures in GBP, bid to bid, net income reinvested. Source: M&G Prudential, IA and Morningstar Inc. combined UK and Pan-European peer groups as at 31 December 2017.
3. ABI Mixed Investment 20 per cent – 60 per cent Shares (performance is net of charge). PruFund returns are also net of charge (0.65 per cent).
64% wholesale and direct
funds above median2
Wholesale/direct:
Net flows £6bn
2017 FULL YEAR RESULTS 13
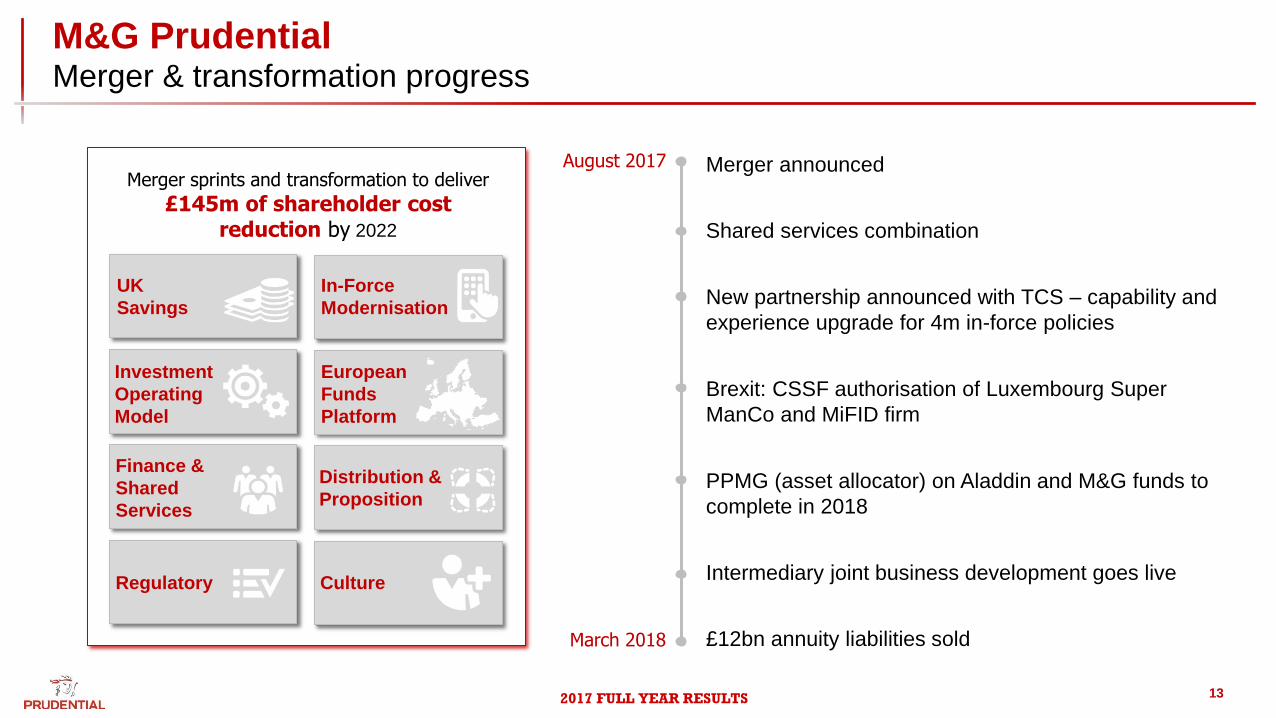
M&G Prudential Merger & transformation progress
Merger announced
Shared services combination
New partnership announced with TCS – capability and
experience upgrade for 4m in-force policies
Brexit: CSSF authorisation of Luxembourg Super
ManCo and MiFID firm
PPMG (asset allocator) on Aladdin and M&G funds to
complete in 2018
Intermediary joint business development goes live
£12bn annuity liabilities sold
August 2017
March 2018
Merger sprints and transformation to deliver
£145m of shareholder cost reduction by 2022
UK
Savings
Investment
Operating
Model
Finance &
Shared
Services
Regulatory
In-Force
Modernisation
European
Funds
Platform
Distribution &
Proposition
Culture
2017 FULL YEAR RESULTS 14
7.9
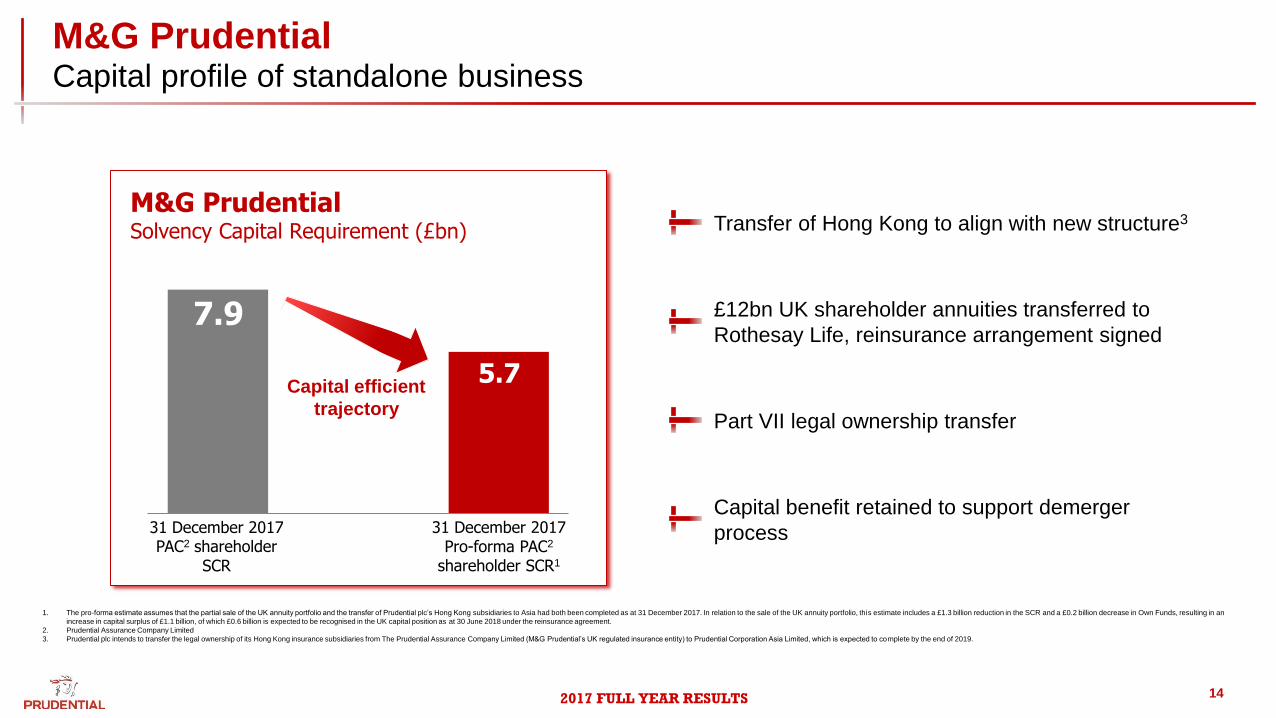
M&G Prudential Capital profile of standalone business
M&G Prudential Solvency Capital Requirement (£bn)
31 December 2017 PAC2 shareholder
SCR
31 December 2017 Pro-forma PAC2
shareholder SCR1
5.7
Part VII legal ownership transfer
Capital benefit retained to support demerger
process
Transfer of Hong Kong to align with new structure3
£12bn UK shareholder annuities transferred to
Rothesay Life, reinsurance arrangement signed
Capital efficient
trajectory
1. The pro-forma estimate assumes that the partial sale of the UK annuity portfolio and the transfer of Prudential plc’s Hong Kong subsidiaries to Asia had both been completed as at 31 December 2017. In relation to the sale of the UK annuity portfolio, this estimate includes a £1.3 billion reduction in the SCR and a £0.2 billion decrease in Own Funds, resulting in an
increase in capital surplus of £1.1 billion, of which £0.6 billion is expected to be recognised in the UK capital position as at 30 June 2018 under the reinsurance agreement.
2. Prudential Assurance Company Limited
3. Prudential plc intends to transfer the legal ownership of its Hong Kong insurance subsidiaries from The Prudential Assurance Company Limited (M&G Prudential’s UK regulated insurance entity) to Prudential Corporation Asia Limited, which is expected to complete by the end of 2019.
2017 FULL YEAR RESULTS 15
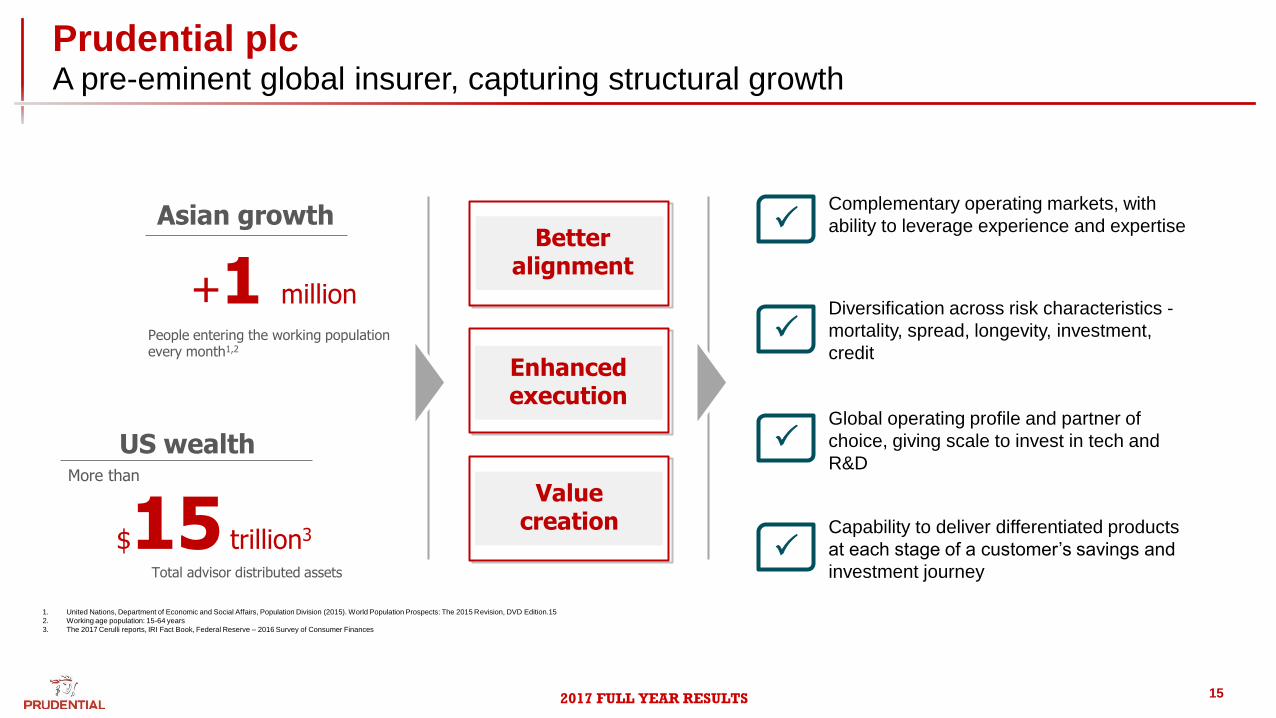
Prudential plc A pre-eminent global insurer, capturing structural growth
Capability to deliver differentiated products
at each stage of a customer’s savings and
investment journey
Global operating profile and partner of
choice, giving scale to invest in tech and
R&D
Complementary operating markets, with
ability to leverage experience and expertise
Diversification across risk characteristics -
mortality, spread, longevity, investment,
credit
P
P
P
P
Better alignment
Value creation
Enhanced execution
Asian growth
+1 million
People entering the working population every month1,2
US wealth
$15 trillion3
Total advisor distributed assets
1. United Nations, Department of Economic and Social Affairs, Population Division (2015). World Population Prospects: The 2015 Revision, DVD Edition.15
2. Working age population: 15-64 years
3. The 2017 Cerulli reports, IRI Fact Book, Federal Reserve – 2016 Survey of Consumer Finances
More than
2017 FULL YEAR RESULTS
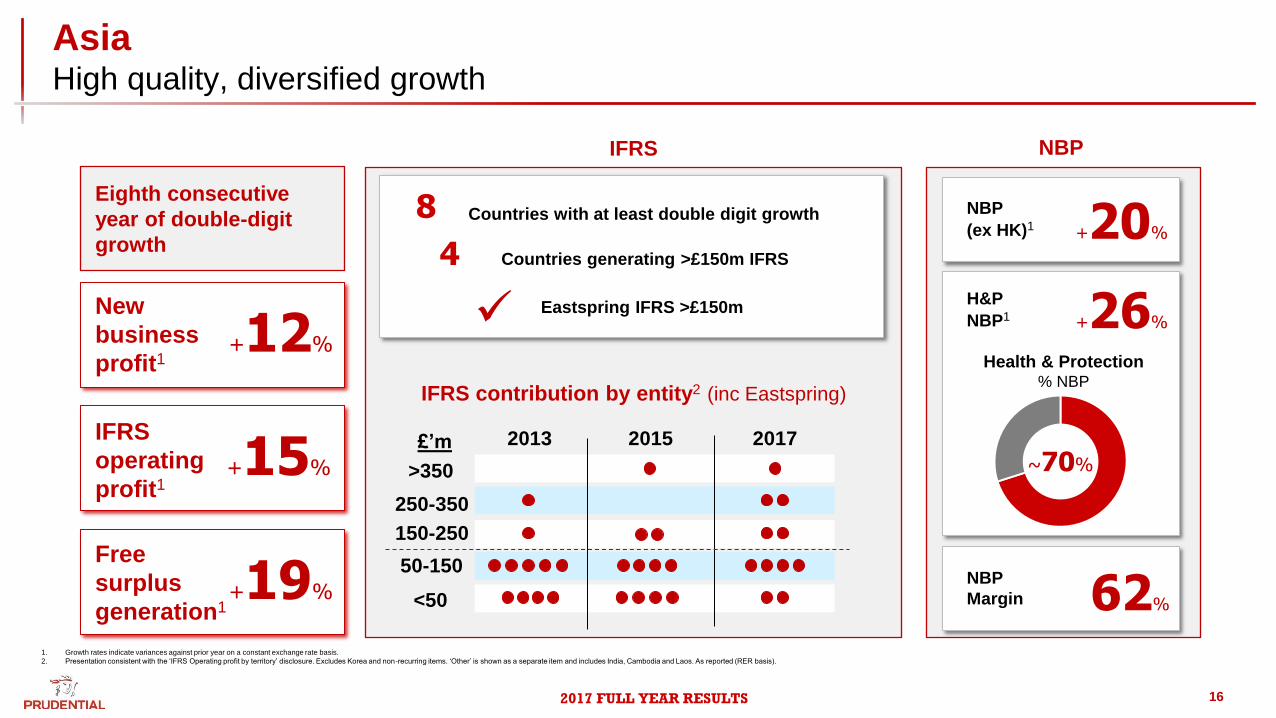
Asia High quality, diversified growth
16
1. Growth rates indicate variances against prior year on a constant exchange rate basis.
2. Presentation consistent with the ‘IFRS Operating profit by territory’ disclosure. Excludes Korea and non-recurring items. ‘Other’ is shown as a separate item and includes India, Cambodia and Laos. As reported (RER basis).
Eighth consecutive
year of double-digit
growth
+26%
H&P
NBP1
NBP
Health & Protection % NBP
~70%
NBP
(ex HK)1
New
business
profit1 +12%
IFRS
operating
profit1 +15%
Free
surplus
generation1 +19%
Countries with at least double digit growth 8
Countries generating >£150m IFRS
IFRS
2013 2015 2017
<50
50-150
150-250
250-350
>350
IFRS contribution by entity2 (inc Eastspring)
£’m
Eastspring IFRS >£150m
4
NBP
Margin 62%
+20%
2017 FULL YEAR RESULTS 17
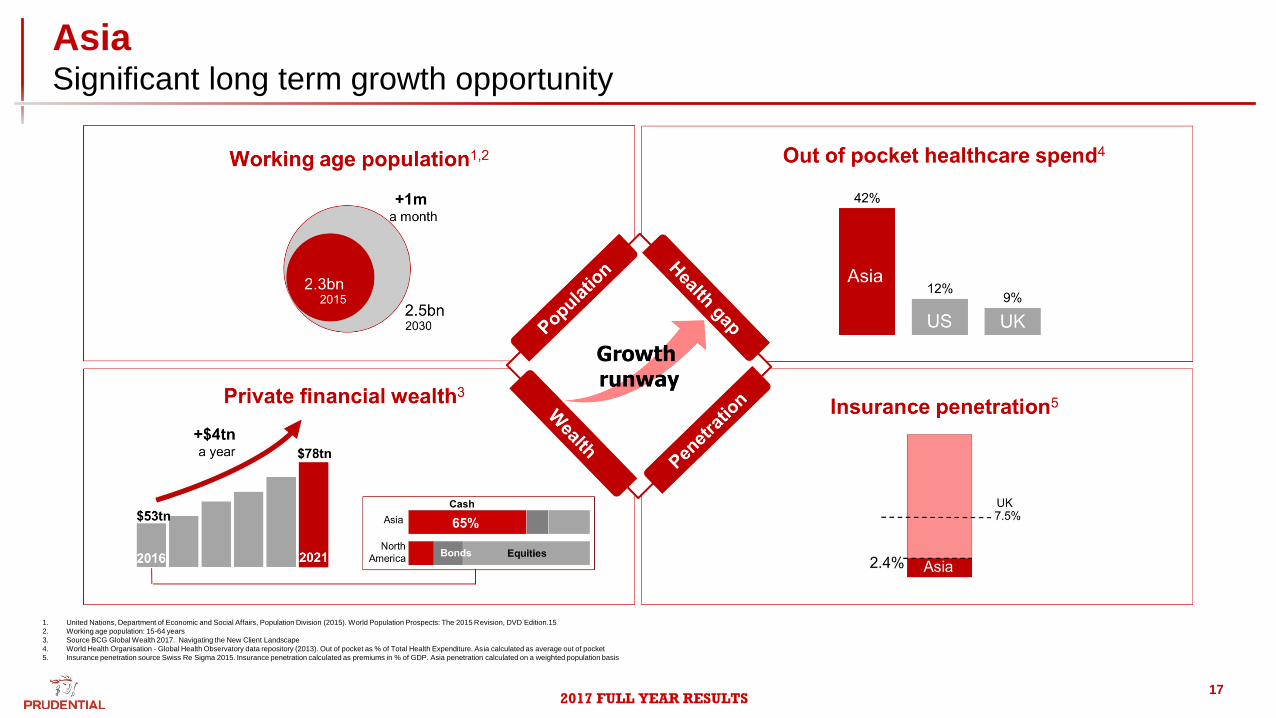
Asia Significant long term growth opportunity
1. United Nations, Department of Economic and Social Affairs, Population Division (2015). World Population Prospects: The 2015 Revision, DVD Edition.15
2. Working age population: 15-64 years
3. Source BCG Global Wealth 2017. Navigating the New Client Landscape
4. World Health Organisation - Global Health Observatory data repository (2013). Out of pocket as % of Total Health Expenditure. Asia calculated as average out of pocket
5. Insurance penetration source Swiss Re Sigma 2015. Insurance penetration calculated as premiums in % of GDP. Asia penetration calculated on a weighted population basis
2017 FULL YEAR RESULTS 18
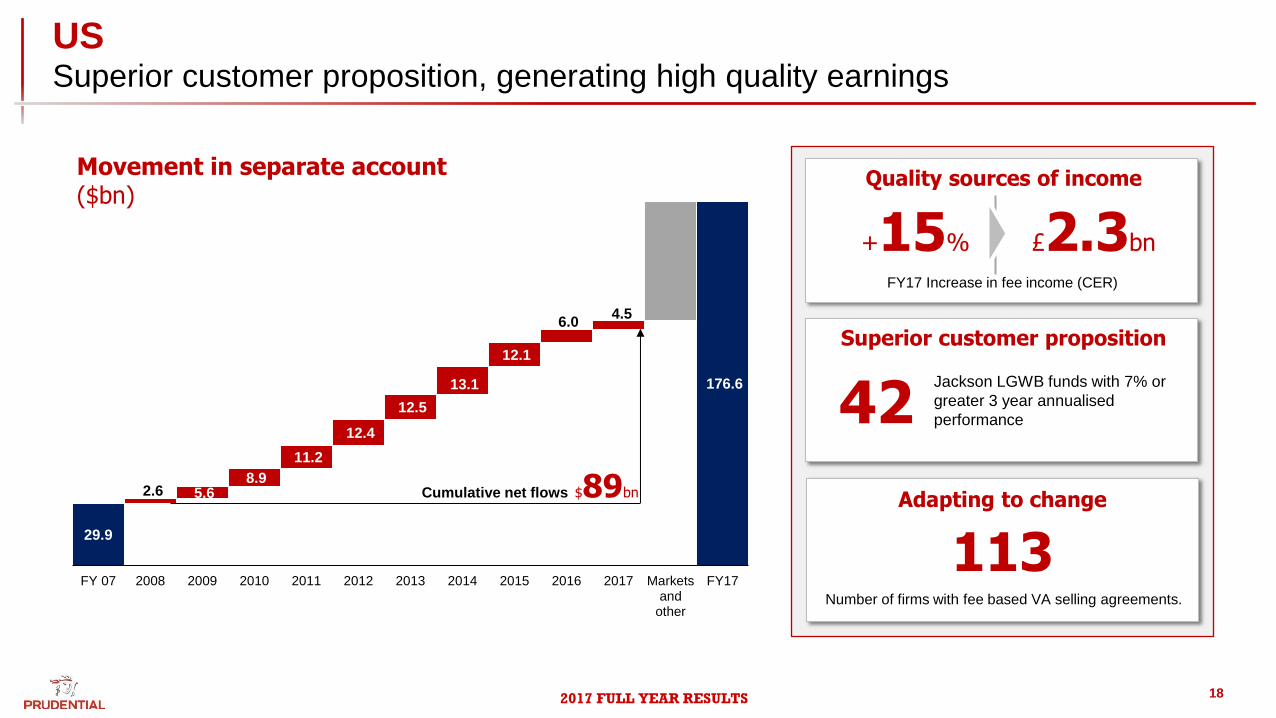
US Superior customer proposition, generating high quality earnings
29.9
176.6
2.6 5.6 8.9
11.2
12.4
12.5
13.1
12.1
6.0 4.5
FY 07 2008 2009 2010 2011 2012 2013 2014 2015 2016 2017 Marketsand
other
FY17
$89bn Cumulative net flows
Movement in separate account ($bn)
Superior customer proposition
Quality sources of income
Adapting to change
Number of firms with fee based VA selling agreements.
113
+15% £2.3bn
FY17 Increase in fee income (CER)
Jackson LGWB funds with 7% or
greater 3 year annualised
performance 42
2017 FULL YEAR RESULTS 19
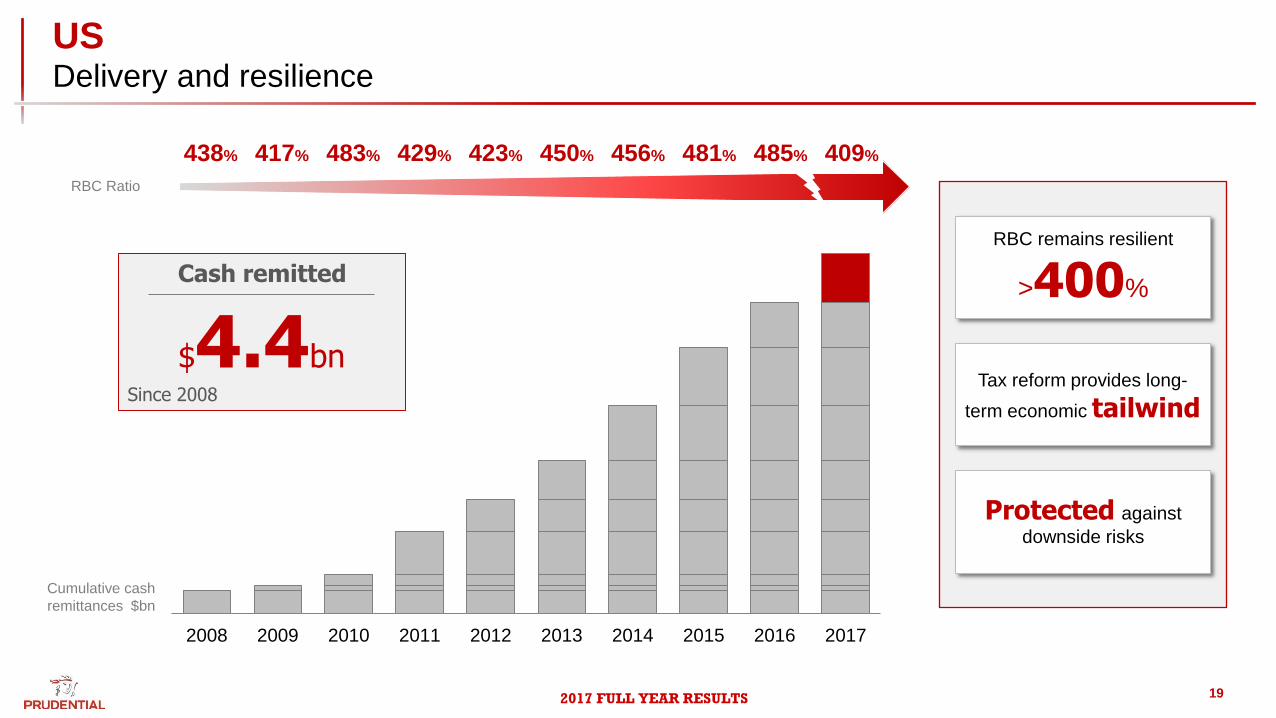
US Delivery and resilience
438% 417% 483% 429% 423% 450% 456% 481% 485% 409%
RBC Ratio
2008 2009 2010 2011 2012 2013 2014 2015 2016 2017
RBC remains resilient
>400%
Tax reform provides long-
term economic tailwind
Protected against
downside risks
Cumulative cash
remittances $bn
Cash remitted
$4.4bn Since 2008
2017 FULL YEAR RESULTS
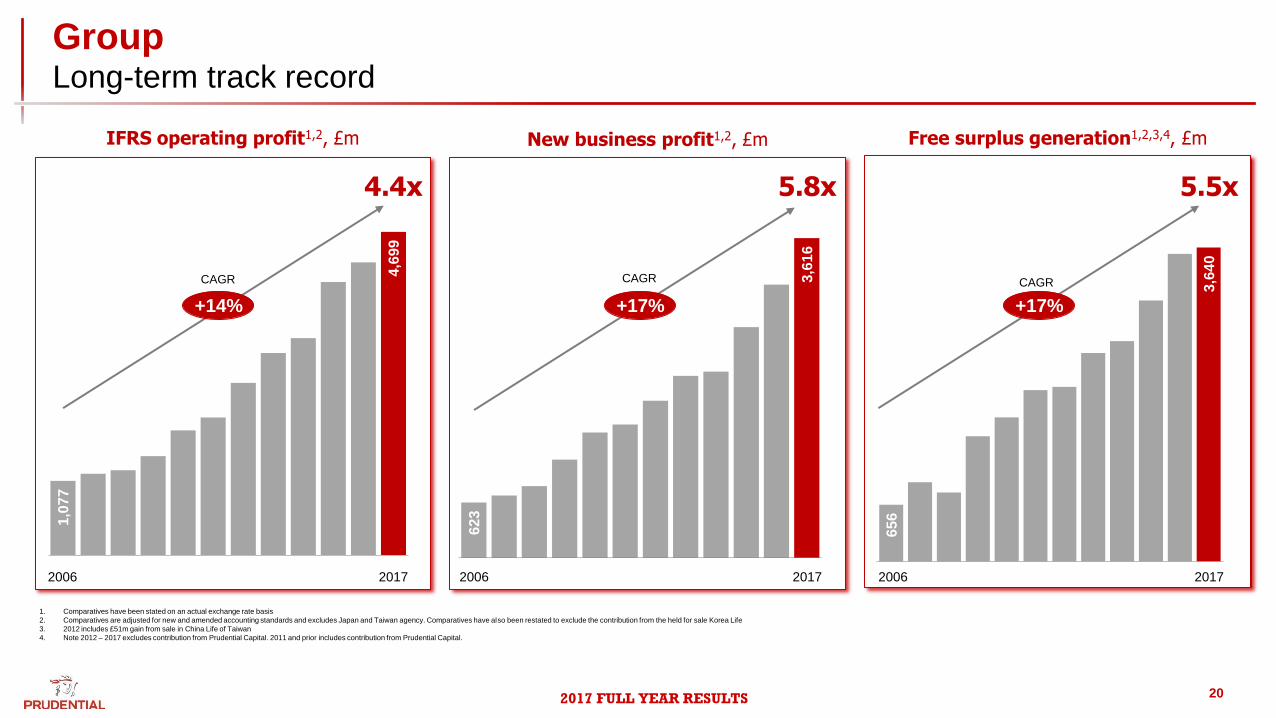
Group Long-term track record
20
1,0
77
4,6
99
2006 2007 2008 2009 2010 2011 2012 2013 2014 2015 2016 2017
IFRS operating profit1,2, £m
+14%
4.4x
623
3,6
16
2006 2007 2008 2009 2010 2011 2012 2013 2014 2015 2016 2017
656
3,6
40
2006 2007 2008 2009 2010 2011 2012 2013 2014 2015 2016 2017
New business profit1,2, £m Free surplus generation1,2,3,4, £m
1. Comparatives have been stated on an actual exchange rate basis
2. Comparatives are adjusted for new and amended accounting standards and excludes Japan and Taiwan agency. Comparatives have also been restated to exclude the contribution from the held for sale Korea Life
3. 2012 includes £51m gain from sale in China Life of Taiwan
4. Note 2012 – 2017 excludes contribution from Prudential Capital. 2011 and prior includes contribution from Prudential Capital.
CAGR
5.8x 5.5x
2006 2017 2006 2017 2006 2017
+17% +17%
CAGR CAGR
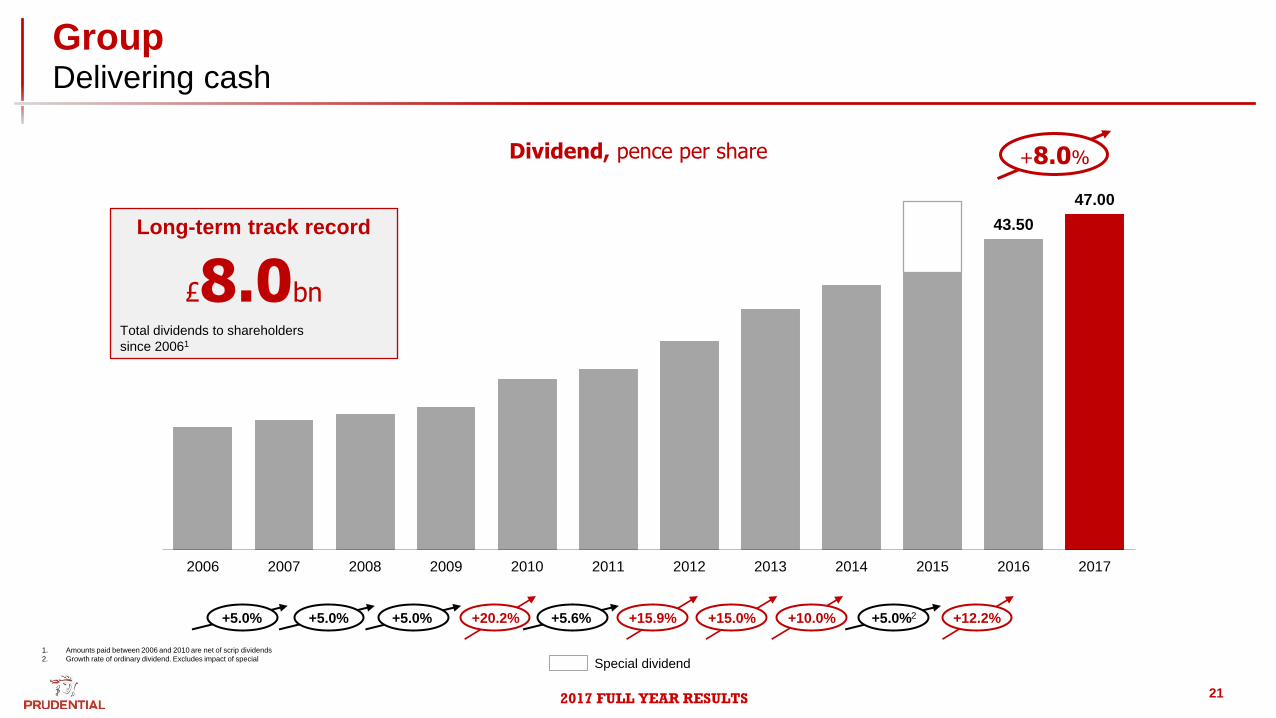
2017 FULL YEAR RESULTS 21
Group Delivering cash
43.50
47.00
2006 2007 2008 2009 2010 2011 2012 2013 2014 2015 2016 2017
Dividend, pence per share
1. Amounts paid between 2006 and 2010 are net of scrip dividends
2. Growth rate of ordinary dividend. Excludes impact of special
+5.0% +5.0% +5.0% +20.2% +15.9% +15.0% +10.0% +5.0%2 +12.2% +5.6%
Special dividend
£8.0bn
Total dividends to shareholders
since 20061
Long-term track record
+8.0%

2017 FULL YEAR RESULTS 22
Mike Wells, Group CEO
Headline Results & Strategic Update
Agenda
Mark FitzPatrick, Group CFO
FY17 Financial Performance
Mike Wells, Group CEO
Wrap-Up
Paul Manduca, Group Chairman
Introduction
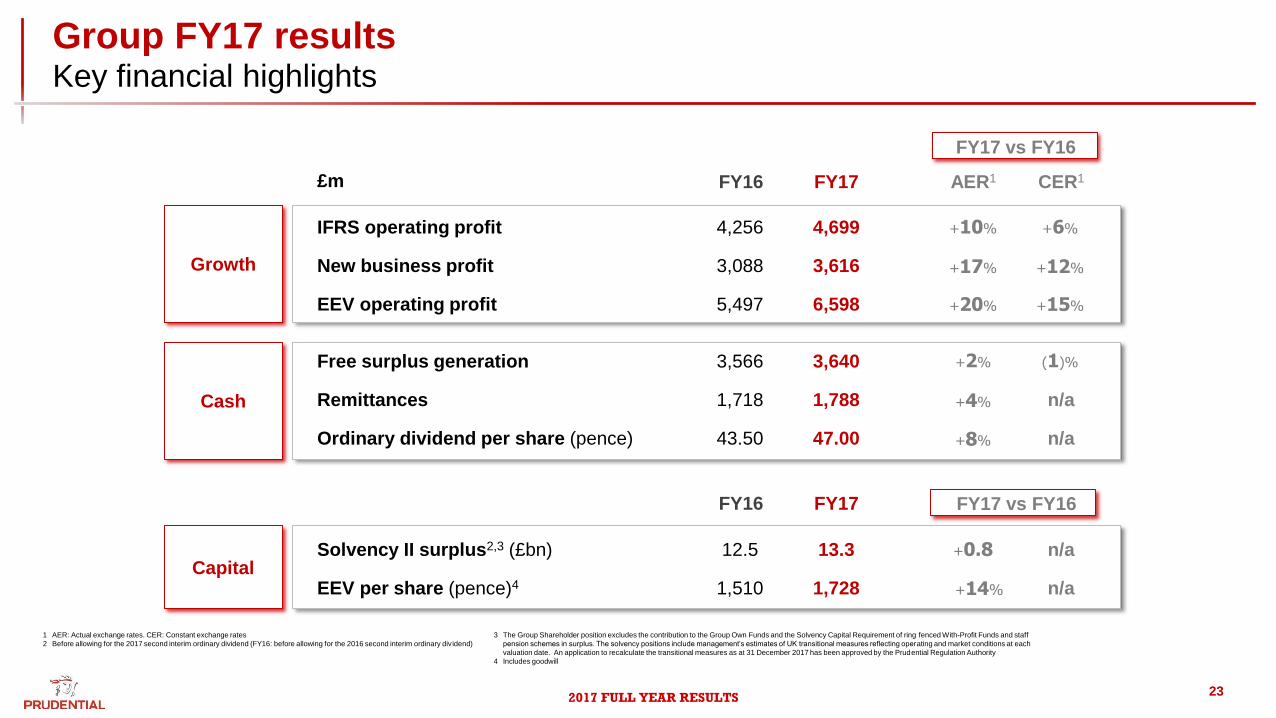
2017 FULL YEAR RESULTS 23
Group FY17 results Key financial highlights
+20% EEV operating profit
AER1 FY17
3,640
4,699
FY16
3,566
4,256
£m
IFRS operating profit
1,788 1,718
47.00 43.50
13.3 12.5
1,728 1,510
Remittances
Free surplus generation
Ordinary dividend per share (pence)
Solvency II surplus2,3 (£bn)
EEV per share (pence)4
New business profit 3,616 3,088
6,598 5,497
Growth
Cash
Capital
CER1
n/a
n/a
n/a
n/a
+12%
+6%
(1)%
+10%
+2%
+14%
+8%
+15%
+17%
+4%
FY17 FY16
+0.8
FY17 vs FY16
FY17 vs FY16
1 AER: Actual exchange rates. CER: Constant exchange rates
2 Before allowing for the 2017 second interim ordinary dividend (FY16: before allowing for the 2016 second interim ordinary dividend)
3 The Group Shareholder position excludes the contribution to the Group Own Funds and the Solvency Capital Requirement of ring fenced With-Profit Funds and staff
pension schemes in surplus. The solvency positions include management’s estimates of UK transitional measures reflecting operating and market conditions at each
valuation date. An application to recalculate the transitional measures as at 31 December 2017 has been approved by the Prudential Regulation Authority
4 Includes goodwill
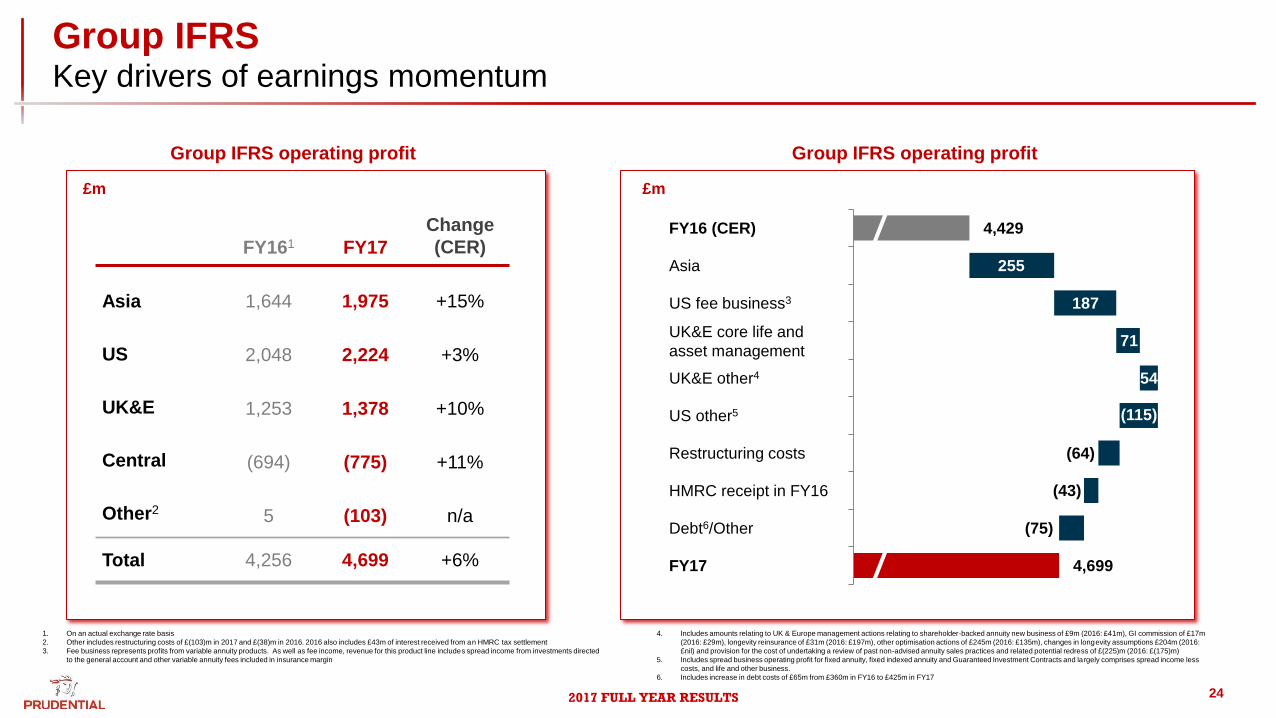
2017 FULL YEAR RESULTS 24
Group IFRS Key drivers of earnings momentum
Change
(CER)
+3%
+15%
+10%
Asia
US
UK&E
+6%
FY17
1,378
4,699
2,224
1,975
+11% Central (775)
Group IFRS operating profit Group IFRS operating profit
Total
FY161
1,253
4,256
2,048
1,644
(694)
Other2 n/a (103) 5
1. On an actual exchange rate basis
2. Other includes restructuring costs of £(103)m in 2017 and £(38)m in 2016. 2016 also includes £43m of interest received from an HMRC tax settlement
3. Fee business represents profits from variable annuity products. As well as fee income, revenue for this product line includes spread income from investments directed
to the general account and other variable annuity fees included in insurance margin
£m
FY16 (CER)
Asia
US fee business3
UK&E core life and
asset management
UK&E other4
HMRC receipt in FY16
FY17
Debt6/Other
4,429
(64)
71
54
(115)
4,699
(43)
255
US other5
Restructuring costs
187
(75)
£m
4. Includes amounts relating to UK & Europe management actions relating to shareholder-backed annuity new business of £9m (2016: £41m), GI commission of £17m
(2016: £29m), longevity reinsurance of £31m (2016: £197m), other optimisation actions of £245m (2016: £135m), changes in longevity assumptions £204m (2016:
£nil) and provision for the cost of undertaking a review of past non-advised annuity sales practices and related potential redress of £(225)m (2016: £(175)m)
5. Includes spread business operating profit for fixed annuity, fixed indexed annuity and Guaranteed Investment Contracts and largely comprises spread income less
costs, and life and other business.
6. Includes increase in debt costs of £65m from £360m in FY16 to £425m in FY17
2017 FULL YEAR RESULTS
• Malaysia
• Vietnam
25
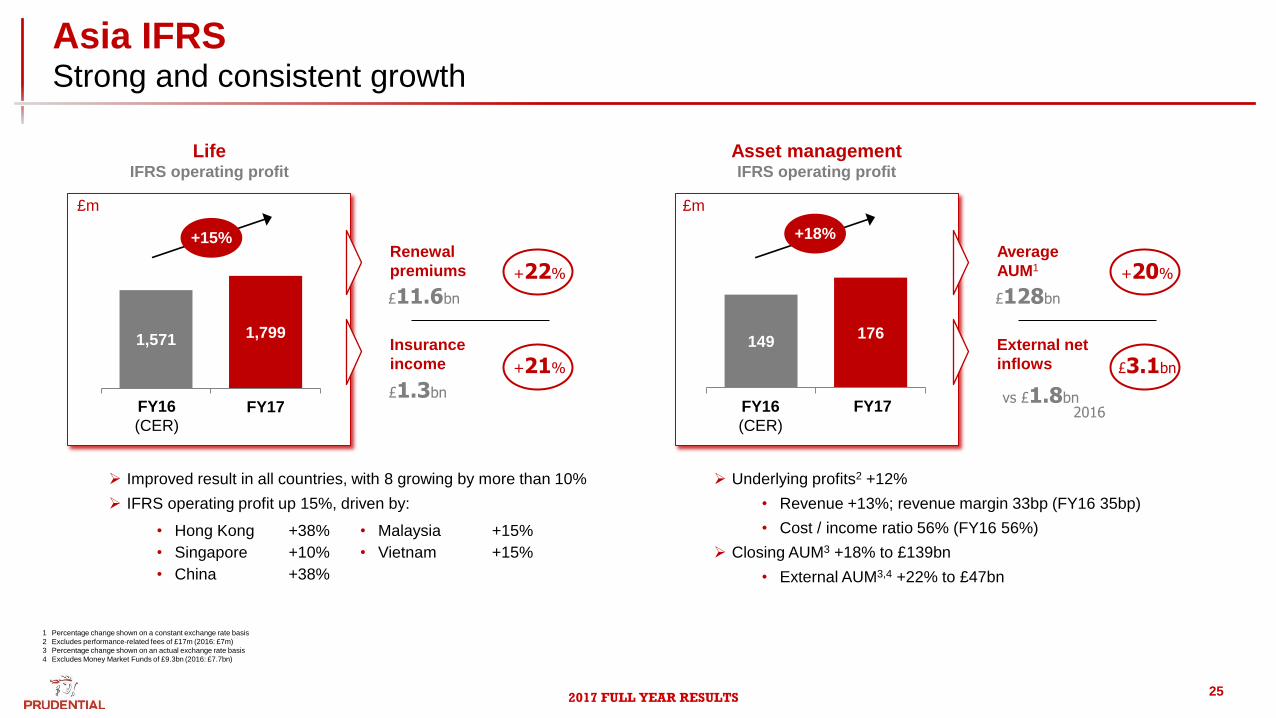
Asia IFRS Strong and consistent growth
Life IFRS operating profit
1,571 1,799
FY16
(CER) FY17
+15%
Asset management IFRS operating profit
149 176
FY17
+18%
Underlying profits2 +12%
• Revenue +13%; revenue margin 33bp (FY16 35bp)
• Cost / income ratio 56% (FY16 56%)
Closing AUM3 +18% to £139bn
• External AUM3,4 +22% to £47bn
£m £m
Renewal
premiums
Insurance
income
£11.6bn
+22%
£1.3bn
+21%
+38%
+10%
+38%
FY16
(CER)
Average
AUM1
External net
inflows
£128bn
+20%
£3.1bn
1 Percentage change shown on a constant exchange rate basis
2 Excludes performance-related fees of £17m (2016: £7m)
3 Percentage change shown on an actual exchange rate basis
4 Excludes Money Market Funds of £9.3bn (2016: £7.7bn)
+15%
+15%
Improved result in all countries, with 8 growing by more than 10%
IFRS operating profit up 15%, driven by:
• Hong Kong
• Singapore
• China
vs £1.8bn 2016
2017 FULL YEAR RESULTS 26
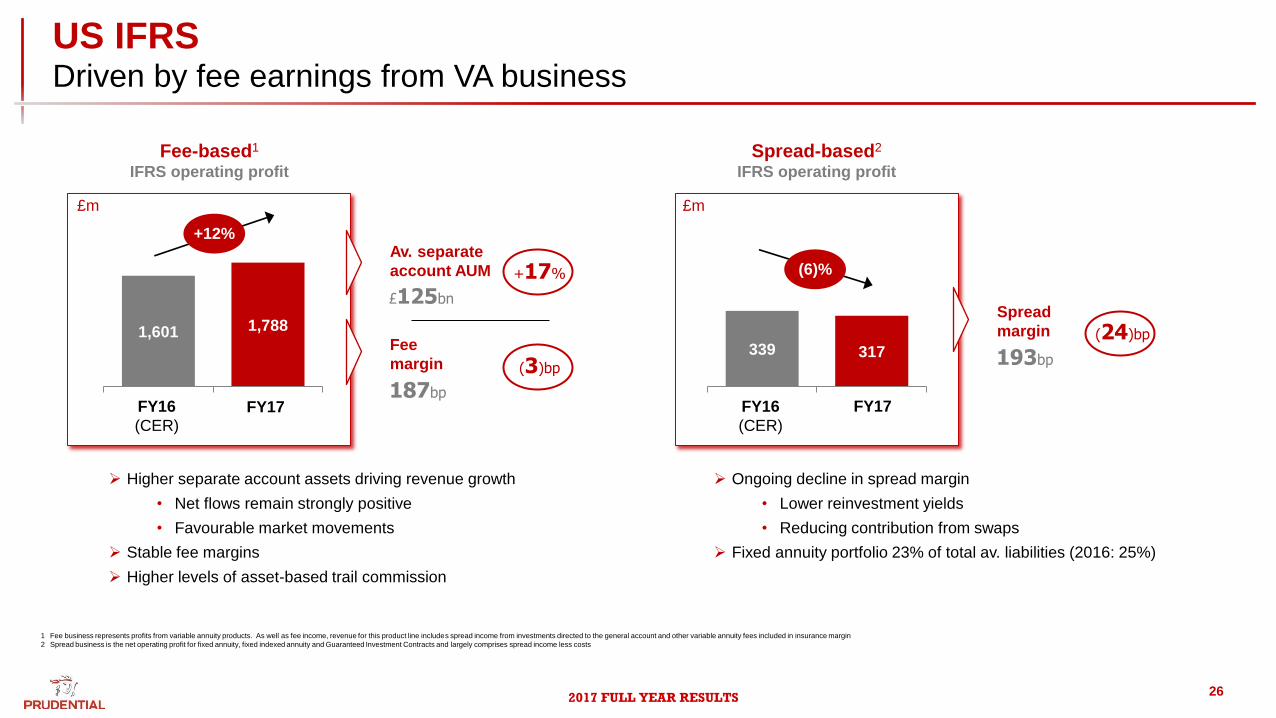
US IFRS Driven by fee earnings from VA business
Fee-based1
IFRS operating profit
FY16
(CER) FY17
Spread-based2
IFRS operating profit
FY17
(6)%
Higher separate account assets driving revenue growth
• Net flows remain strongly positive
• Favourable market movements
Stable fee margins
Higher levels of asset-based trail commission
Ongoing decline in spread margin
• Lower reinvestment yields
• Reducing contribution from swaps
Fixed annuity portfolio 23% of total av. liabilities (2016: 25%)
£m £m
Av. separate
account AUM
Fee
margin
£125bn
187bp FY16
(CER)
Spread
margin
193bp
1,601 1,788
+12%
339 317
+17%
(3)bp
(24)bp
1 Fee business represents profits from variable annuity products. As well as fee income, revenue for this product line includes spread income from investments directed to the general account and other variable annuity fees included in insurance margin
2 Spread business is the net operating profit for fixed annuity, fixed indexed annuity and Guaranteed Investment Contracts and largely comprises spread income less costs
2017 FULL YEAR RESULTS 27
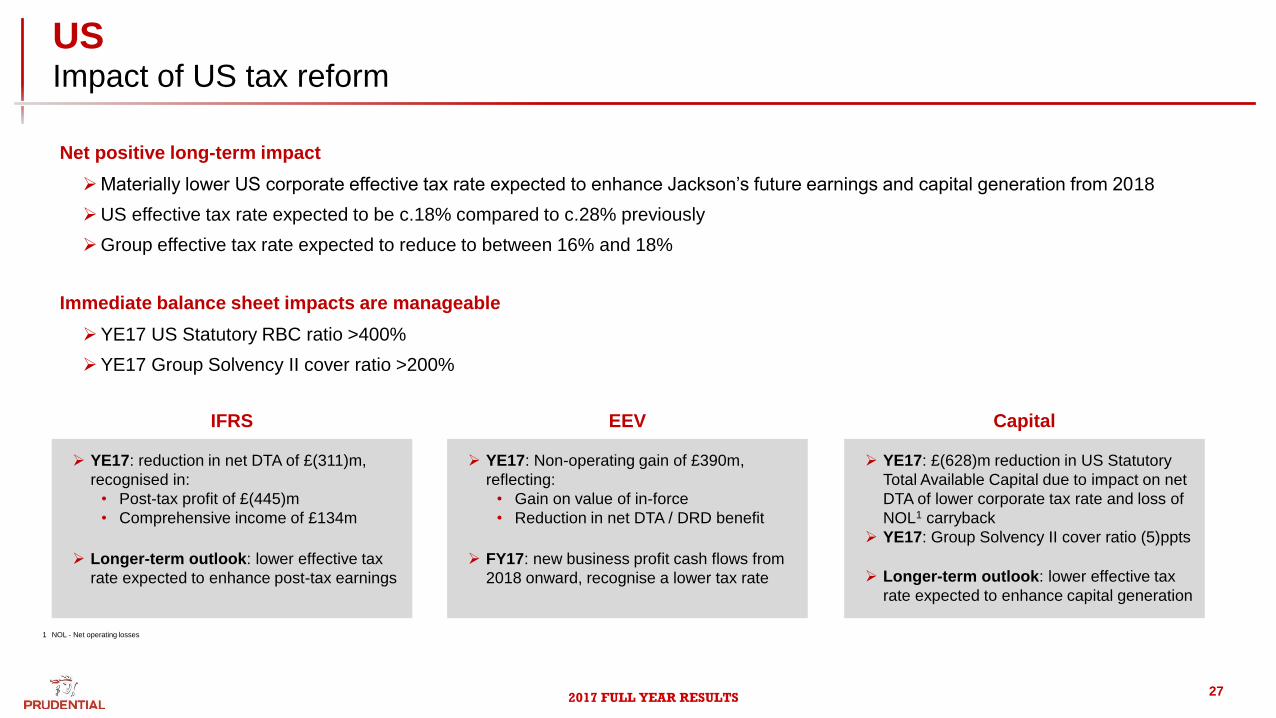
US Impact of US tax reform
Net positive long-term impact
IFRS EEV Capital
YE17: reduction in net DTA of £(311)m,
recognised in:
• Post-tax profit of £(445)m
• Comprehensive income of £134m
Longer-term outlook: lower effective tax
rate expected to enhance post-tax earnings
FY17: new business profit cash flows from
2018 onward, recognise a lower tax rate Longer-term outlook: lower effective tax
rate expected to enhance capital generation
YE17: Non-operating gain of £390m,
reflecting:
• Gain on value of in-force
• Reduction in net DTA / DRD benefit
YE17: £(628)m reduction in US Statutory
Total Available Capital due to impact on net
DTA of lower corporate tax rate and loss of
NOL1 carryback
YE17: Group Solvency II cover ratio (5)ppts
Materially lower US corporate effective tax rate expected to enhance Jackson’s future earnings and capital generation from 2018
US effective tax rate expected to be c.18% compared to c.28% previously
Group effective tax rate expected to reduce to between 16% and 18%
Immediate balance sheet impacts are manageable
YE17 US Statutory RBC ratio >400%
YE17 Group Solvency II cover ratio >200%
1 NOL - Net operating losses
2017 FULL YEAR RESULTS
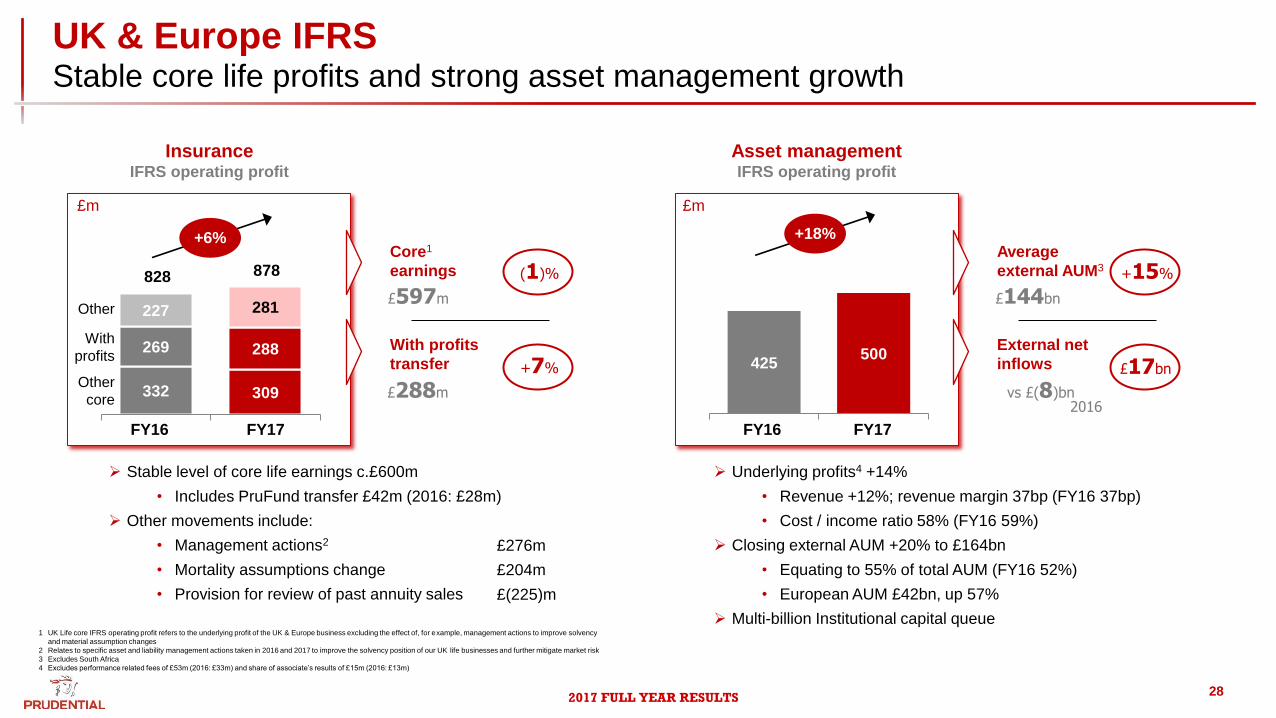
Asset management IFRS operating profit
FY17
+18%
Underlying profits4 +14%
• Revenue +12%; revenue margin 37bp (FY16 37bp)
• Cost / income ratio 58% (FY16 59%)
Closing external AUM +20% to £164bn
• Equating to 55% of total AUM (FY16 52%)
• European AUM £42bn, up 57%
Multi-billion Institutional capital queue
£m
FY16
Average
external AUM3
External net
inflows
£144bn
vs £(8)bn
+15%
£17bn
Insurance IFRS operating profit
FY16 FY17
+6%
Stable level of core life earnings c.£600m
• Includes PruFund transfer £42m (2016: £28m)
Other movements include:
• Management actions2
• Mortality assumptions change
• Provision for review of past annuity sales
£m
Core1
earnings
With profits
transfer
£597m
£288m
28
UK & Europe IFRS Stable core life profits and strong asset management growth
332 309
269 288
227 281
425 500
828 878
Other
core
With
profits
Other
(1)%
+7%
£276m
£204m
£(225)m
2016
1 UK Life core IFRS operating profit refers to the underlying profit of the UK & Europe business excluding the effect of, for example, management actions to improve solvency
and material assumption changes
2 Relates to specific asset and liability management actions taken in 2016 and 2017 to improve the solvency position of our UK life businesses and further mitigate market risk
3 Excludes South Africa
4 Excludes performance related fees of £53m (2016: £33m) and share of associate’s results of £15m (2016: £13m)
2017 FULL YEAR RESULTS 29
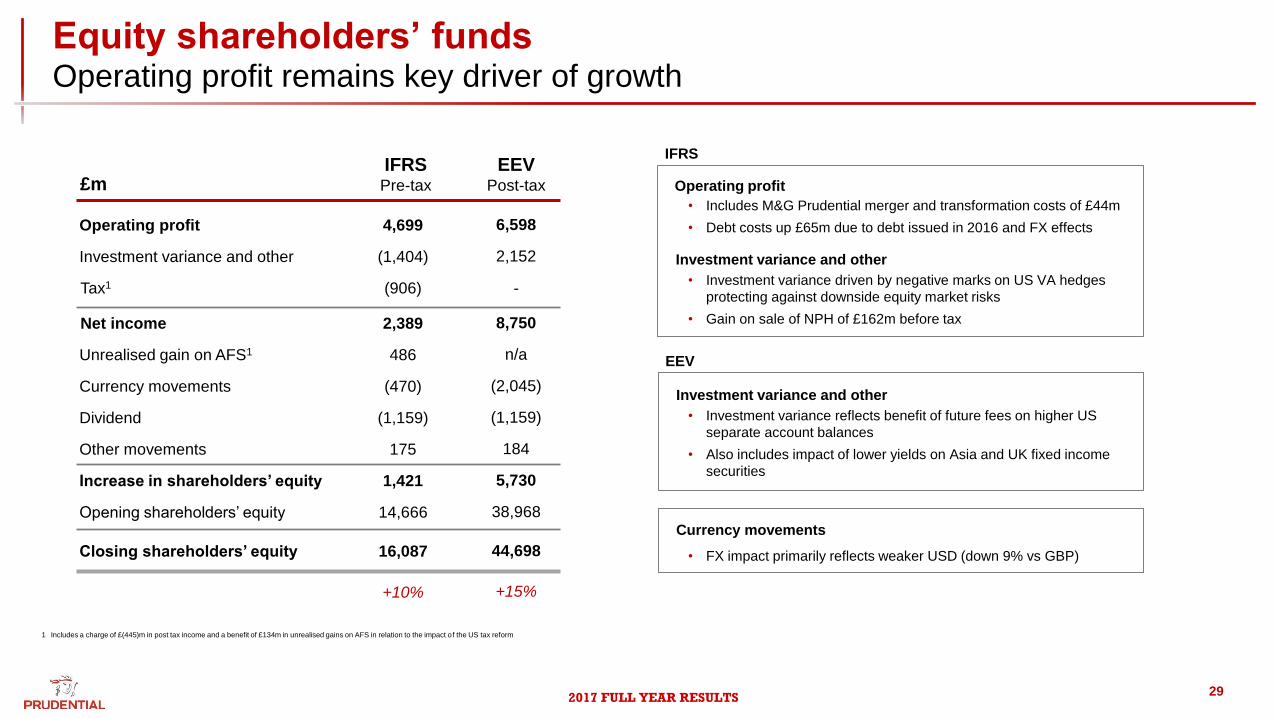
Equity shareholders’ funds Operating profit remains key driver of growth
Operating profit
Investment variance and other
Unrealised gain on AFS1
Currency movements
Dividend
Increase in shareholders’ equity
Opening shareholders’ equity
Other movements
£m
4,699
(906)
2,389
486
(1,404)
Closing shareholders’ equity
Tax1
Net income
Operating profit
• Includes M&G Prudential merger and transformation costs of £44m
• Debt costs up £65m due to debt issued in 2016 and FX effects
Investment variance and other
• Investment variance driven by negative marks on US VA hedges
protecting against downside equity market risks
• Gain on sale of NPH of £162m before tax
Currency movements
• FX impact primarily reflects weaker USD (down 9% vs GBP)
(470)
(1,159)
175
1,421
14,666
16,087
1 Includes a charge of £(445)m in post tax income and a benefit of £134m in unrealised gains on AFS in relation to the impact of the US tax reform
+10%
6,598
8,750
n/a
2,152
(2,045)
(1,159)
184
5,730
38,968
44,698
+15%
IFRS Pre-tax
EEV Post-tax
-
IFRS
Investment variance and other
• Investment variance reflects benefit of future fees on higher US
separate account balances
• Also includes impact of lower yields on Asia and UK fixed income
securities
EEV
2017 FULL YEAR RESULTS
+9%
30
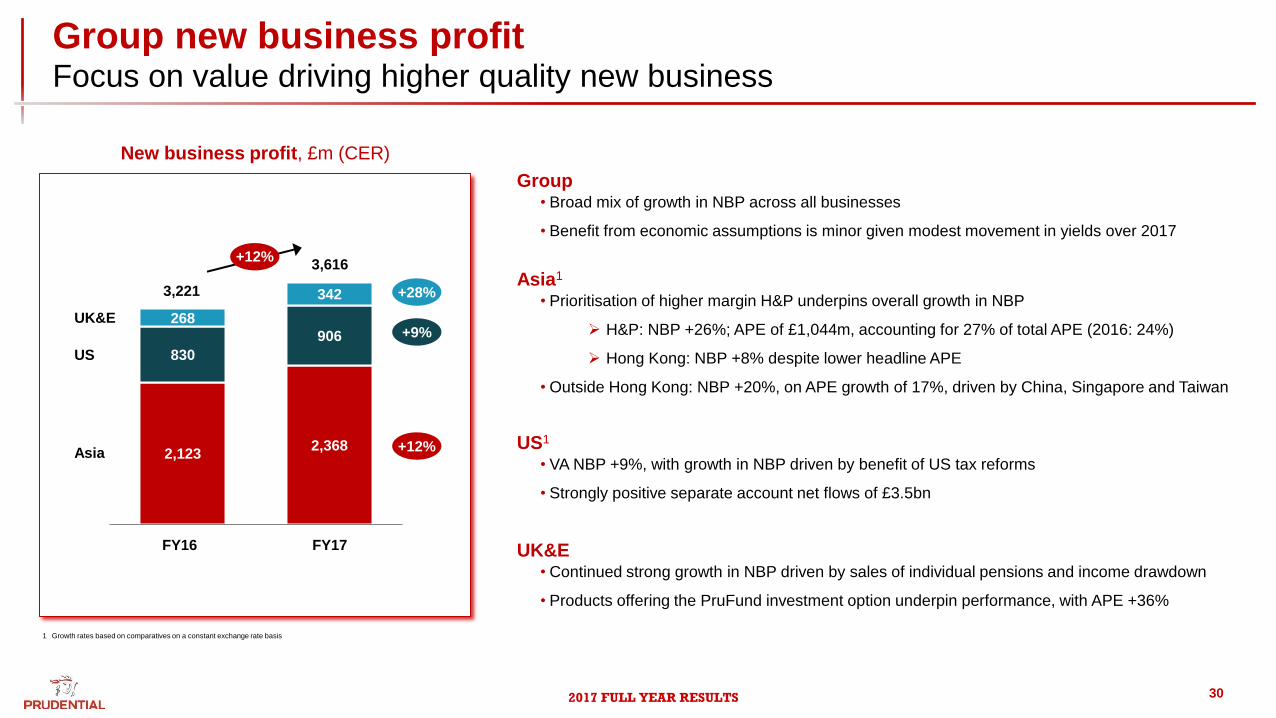
Group new business profit Focus on value driving higher quality new business
2,123 2,368
830
906
268
342 3,221
3,616
FY16
Asia
US
UK&E
+12%
New business profit, £m (CER)
• Broad mix of growth in NBP across all businesses
• Benefit from economic assumptions is minor given modest movement in yields over 2017
Group
FY17
+28%
+12%
• Prioritisation of higher margin H&P underpins overall growth in NBP
H&P: NBP +26%; APE of £1,044m, accounting for 27% of total APE (2016: 24%)
Hong Kong: NBP +8% despite lower headline APE
• Outside Hong Kong: NBP +20%, on APE growth of 17%, driven by China, Singapore and Taiwan
Asia1
• VA NBP +9%, with growth in NBP driven by benefit of US tax reforms
• Strongly positive separate account net flows of £3.5bn
US1
• Continued strong growth in NBP driven by sales of individual pensions and income drawdown
• Products offering the PruFund investment option underpin performance, with APE +36%
UK&E
1 Growth rates based on comparatives on a constant exchange rate basis
2017 FULL YEAR RESULTS 31
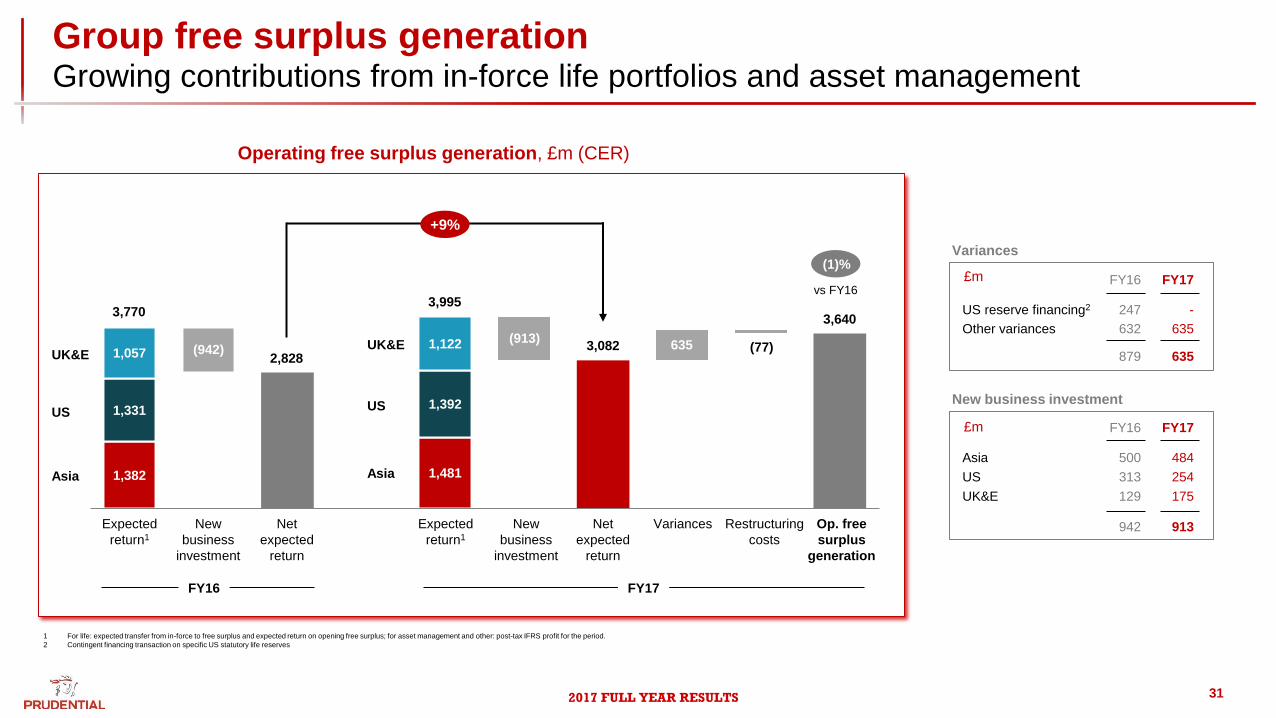
Group free surplus generation Growing contributions from in-force life portfolios and asset management
1 For life: expected transfer from in-force to free surplus and expected return on opening free surplus; for asset management and other: post-tax IFRS profit for the period.
2 Contingent financing transaction on specific US statutory life reserves
1,382
2,828
1,481
1,331 1,392
1,057 1,122
3,770
Expected
return1
3,082 (77) (913)
Variances
3,640
Asia
US
UK&E
(1)%
Operating free surplus generation, £m (CER)
US reserve financing2
Other variances 632
247
879
Variances
635
-
635
FY16 FY17
Asia
US 313
500
129
New business investment
254
484
175
FY16 FY17
UK&E
942 913
vs FY16
(942) 2,828
3,995
635
+9%
Op. free
surplus
generation
Restructuring
costs
New
business
investment
Net
expected
return
Expected
return1
New
business
investment
Net
expected
return
FY16 FY17
Asia
US
UK&E
£m
£m
2017 FULL YEAR RESULTS
Movement in life free surplus, £m
32
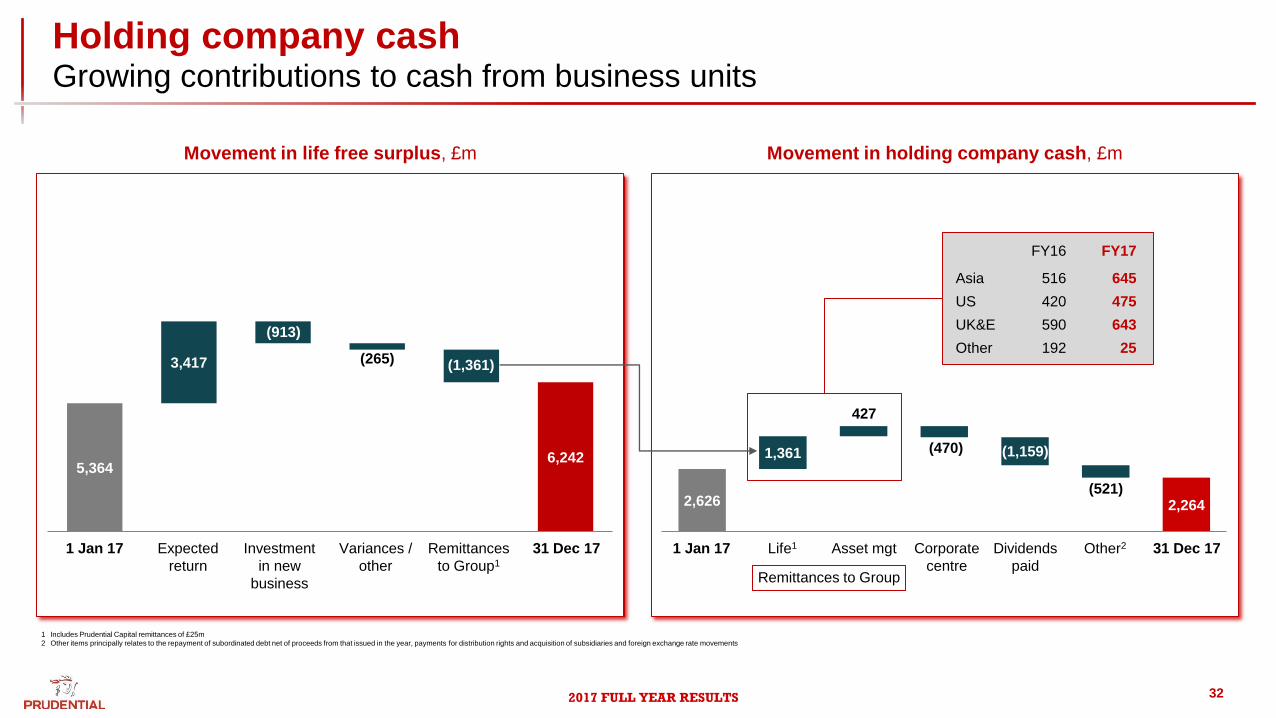
Holding company cash Growing contributions to cash from business units
5,364 6,242
3,417
2,626 2,264
1,361
1 Jan 17 Expected
return
1 Jan 17 Investment
in new
business
Variances /
other
Remittances
to Group1
31 Dec 17 31 Dec 17 Life1
Remittances to Group
Asset mgt Corporate
centre
Dividends
paid
Other2
(913)
(265) (1,361)
427
(470) (1,159)
(521)
Asia
US
UK&E
Other
516
420
590
192
645
475
643
25
FY16 FY17
Movement in holding company cash, £m
1 Includes Prudential Capital remittances of £25m
2 Other items principally relates to the repayment of subordinated debt net of proceeds from that issued in the year, payments for distribution rights and acquisition of subsidiaries and foreign exchange rate movements
2017 FULL YEAR RESULTS 33
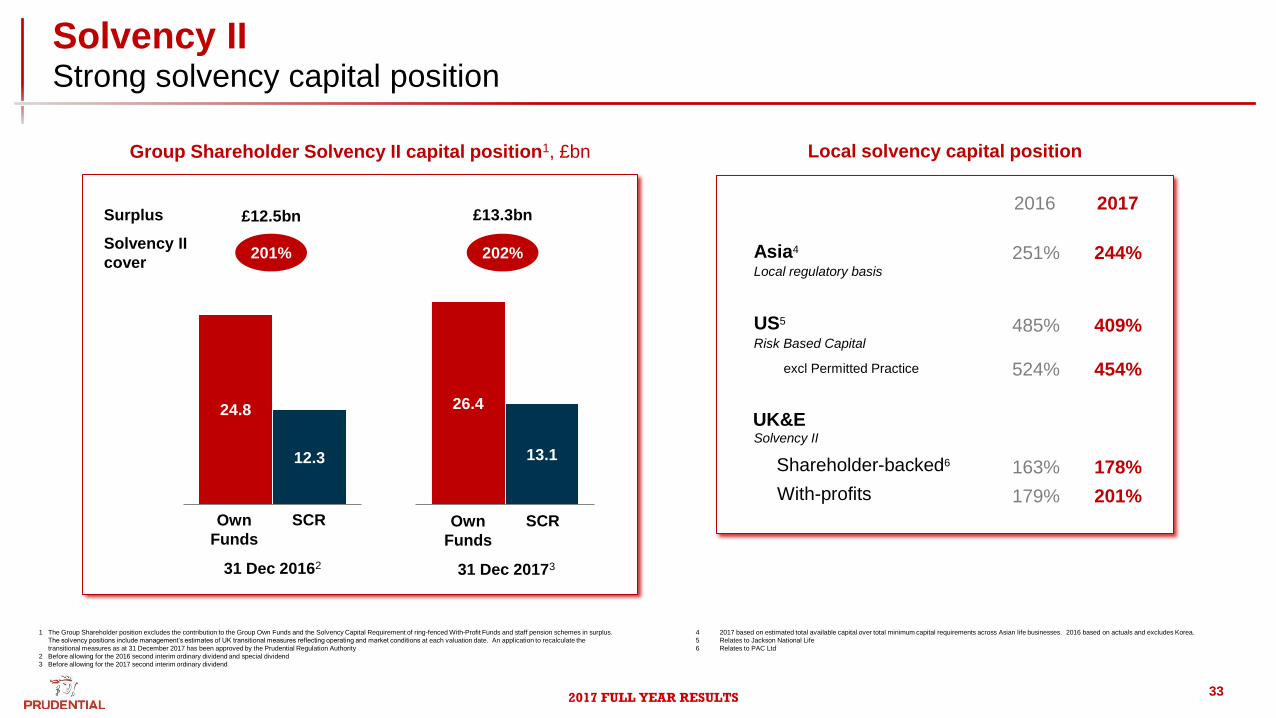
Solvency II Strong solvency capital position
24.8
12.3
Group Shareholder Solvency II capital position1, £bn
1 The Group Shareholder position excludes the contribution to the Group Own Funds and the Solvency Capital Requirement of ring-fenced With-Profit Funds and staff pension schemes in surplus.
The solvency positions include management’s estimates of UK transitional measures reflecting operating and market conditions at each valuation date. An application to recalculate the
transitional measures as at 31 December 2017 has been approved by the Prudential Regulation Authority
2 Before allowing for the 2016 second interim ordinary dividend and special dividend
3 Before allowing for the 2017 second interim ordinary dividend
26.4
13.1
Surplus
Solvency II
cover 202%
Own
Funds
SCR
31 Dec 20173
£13.3bn
Local solvency capital position
Asia4
UK&E
US5
2016 2017
Local regulatory basis
Risk Based Capital
Solvency II
485% 409%
Shareholder-backed6 163% 178%
With-profits 179% 201%
201%
£12.5bn
Own
Funds
SCR
31 Dec 20162
251% 244%
excl Permitted Practice 524% 454%
4 2017 based on estimated total available capital over total minimum capital requirements across Asian life businesses. 2016 based on actuals and excludes Korea.
5 Relates to Jackson National Life
6 Relates to PAC Ltd
2017 FULL YEAR RESULTS 34
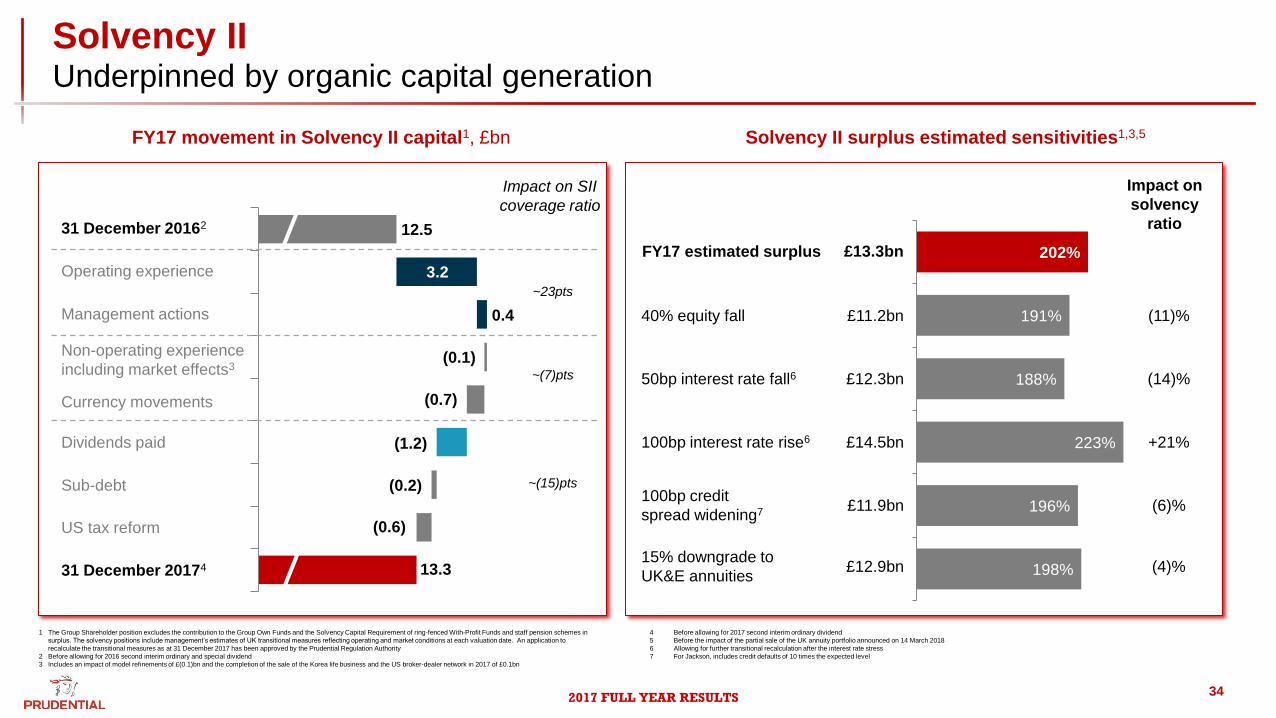
Solvency II Underpinned by organic capital generation
1 The Group Shareholder position excludes the contribution to the Group Own Funds and the Solvency Capital Requirement of ring-fenced With-Profit Funds and staff pension schemes in
surplus. The solvency positions include management’s estimates of UK transitional measures reflecting operating and market conditions at each valuation date. An application to
recalculate the transitional measures as at 31 December 2017 has been approved by the Prudential Regulation Authority
2 Before allowing for 2016 second interim ordinary and special dividend
3 Includes an impact of model refinements of £(0.1)bn and the completion of the sale of the Korea life business and the US broker-dealer network in 2017 of £0.1bn
FY17 movement in Solvency II capital1, £bn Solvency II surplus estimated sensitivities1,3,5
40% equity fall
100bp interest rate rise6
50bp interest rate fall6
FY17 estimated surplus
£11.2bn
£12.3bn
£14.5bn
£13.3bn 202%
191%
188%
223%
196%
198%
100bp credit
spread widening7 £11.9bn
(11)%
(14)%
+21%
(6)%
Impact on
solvency
ratio
15% downgrade to
UK&E annuities £12.9bn (4)%
12.5
13.3
US tax reform
31 December 20162
Operating experience
Currency movements
Dividends paid
Non-operating experience
including market effects3
31 December 20174
Sub-debt
3.2
(0.2)
(0.6)
(0.1)
(0.7)
Management actions 0.4
(1.2)
Impact on SII
coverage ratio
~23pts
~(7)pts
~(15)pts
4 Before allowing for 2017 second interim ordinary dividend
5 Before the impact of the partial sale of the UK annuity portfolio announced on 14 March 2018
6 Allowing for further transitional recalculation after the interest rate stress
7 For Jackson, includes credit defaults of 10 times the expected level
2017 FULL YEAR RESULTS 35
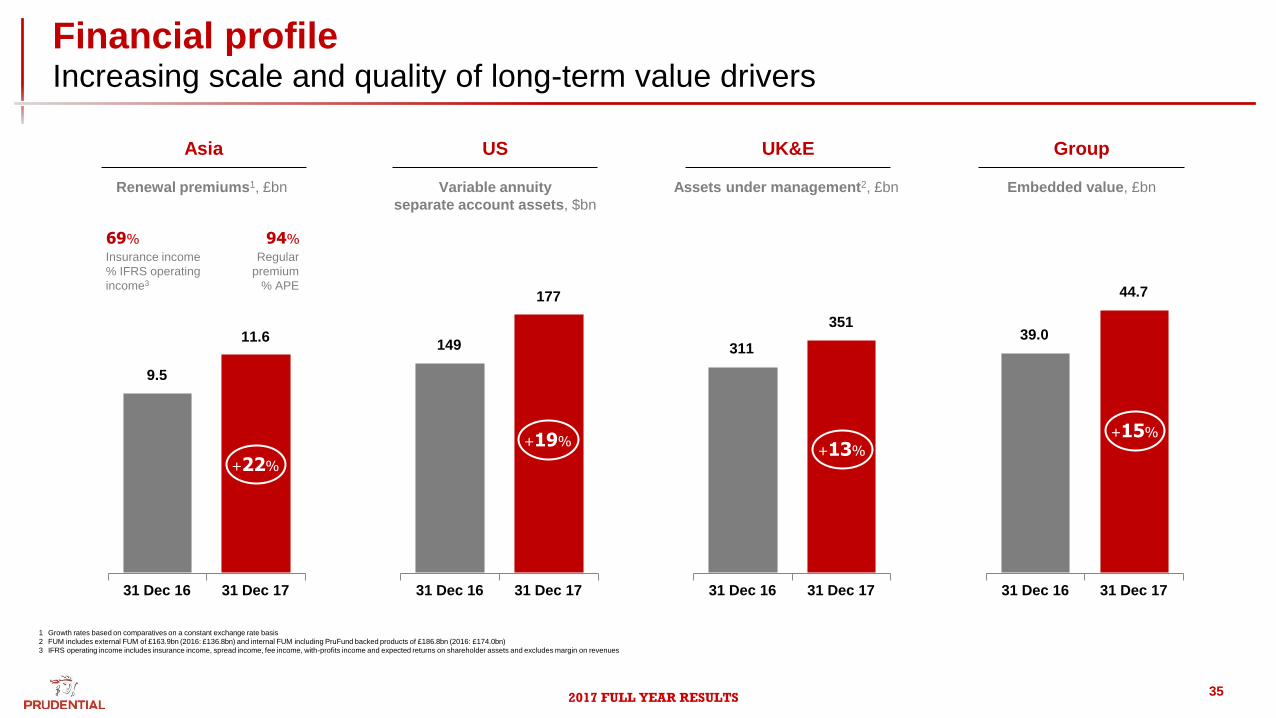
Financial profile Increasing scale and quality of long-term value drivers
31 Dec 17 31 Dec 16 31 Dec 17 31 Dec 16 31 Dec 17 31 Dec 16 31 Dec 17 31 Dec 16
Asia US UK&E Group
9.5
11.6 149
177
311
351 39.0
44.7
Renewal premiums1, £bn Variable annuity
separate account assets, $bn
Assets under management2, £bn Embedded value, £bn
+22%
+19% +15%
+13%
94%
Regular
premium
% APE
69%
Insurance income
% IFRS operating
income3
1 Growth rates based on comparatives on a constant exchange rate basis
2 FUM includes external FUM of £163.9bn (2016: £136.8bn) and internal FUM including PruFund backed products of £186.8bn (2016: £174.0bn)
3 IFRS operating income includes insurance income, spread income, fee income, with-profits income and expected returns on shareholder assets and excludes margin on revenues
2017 FULL YEAR RESULTS 36
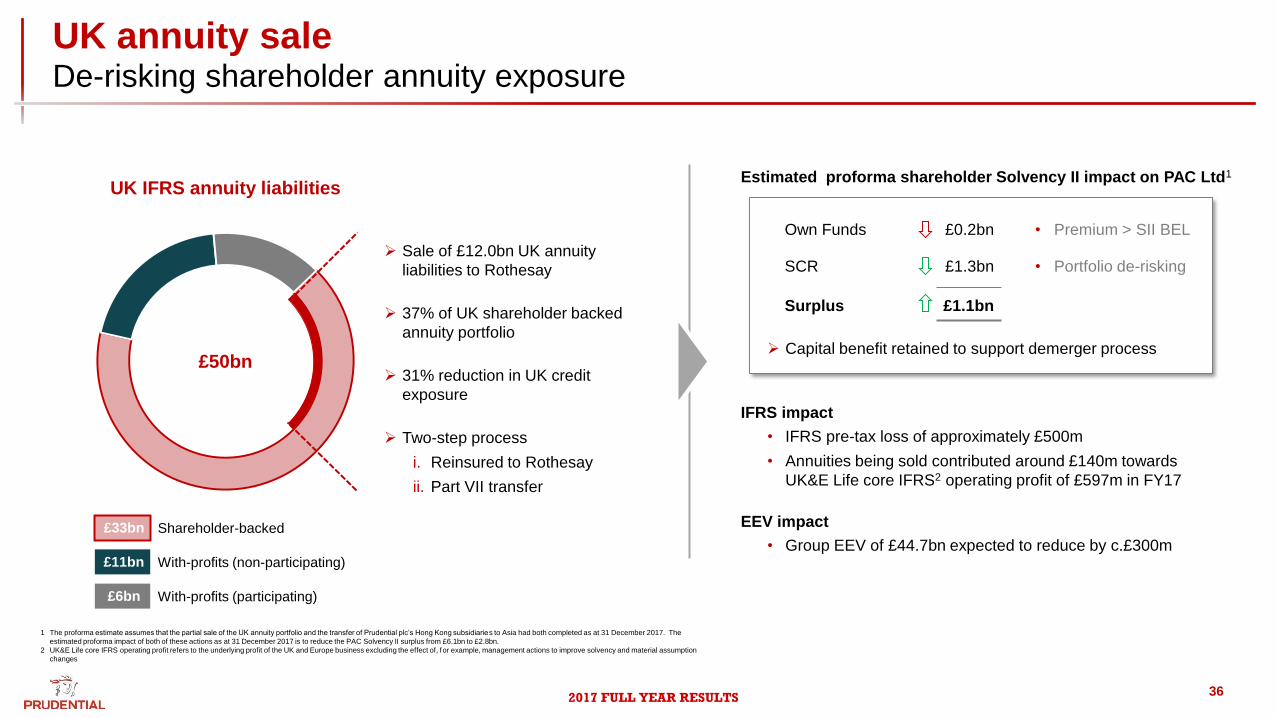
UK annuity sale De-risking shareholder annuity exposure
UK IFRS annuity liabilities Estimated proforma shareholder Solvency II impact on PAC Ltd1
1 The proforma estimate assumes that the partial sale of the UK annuity portfolio and the transfer of Prudential plc’s Hong Kong subsidiaries to Asia had both completed as at 31 December 2017. The
estimated proforma impact of both of these actions as at 31 December 2017 is to reduce the PAC Solvency II surplus from £6.1bn to £2.8bn.
2 UK&E Life core IFRS operating profit refers to the underlying profit of the UK and Europe business excluding the effect of, for example, management actions to improve solvency and material assumption
changes
Sale of £12.0bn UK annuity
liabilities to Rothesay
37% of UK shareholder backed
annuity portfolio
31% reduction in UK credit
exposure
Two-step process
i. Reinsured to Rothesay
ii. Part VII transfer
Shareholder-backed
With-profits (non-participating)
With-profits (participating)
Own Funds
SCR
Surplus
IFRS impact
• IFRS pre-tax loss of approximately £500m
• Annuities being sold contributed around £140m towards
UK&E Life core IFRS2 operating profit of £597m in FY17
EEV impact
• Group EEV of £44.7bn expected to reduce by c.£300m
£0.2bn
£1.3bn
£1.1bn
£50bn
£33bn
£11bn
£6bn
• Premium > SII BEL
• Portfolio de-risking
Capital benefit retained to support demerger process
2017 FULL YEAR RESULTS 37
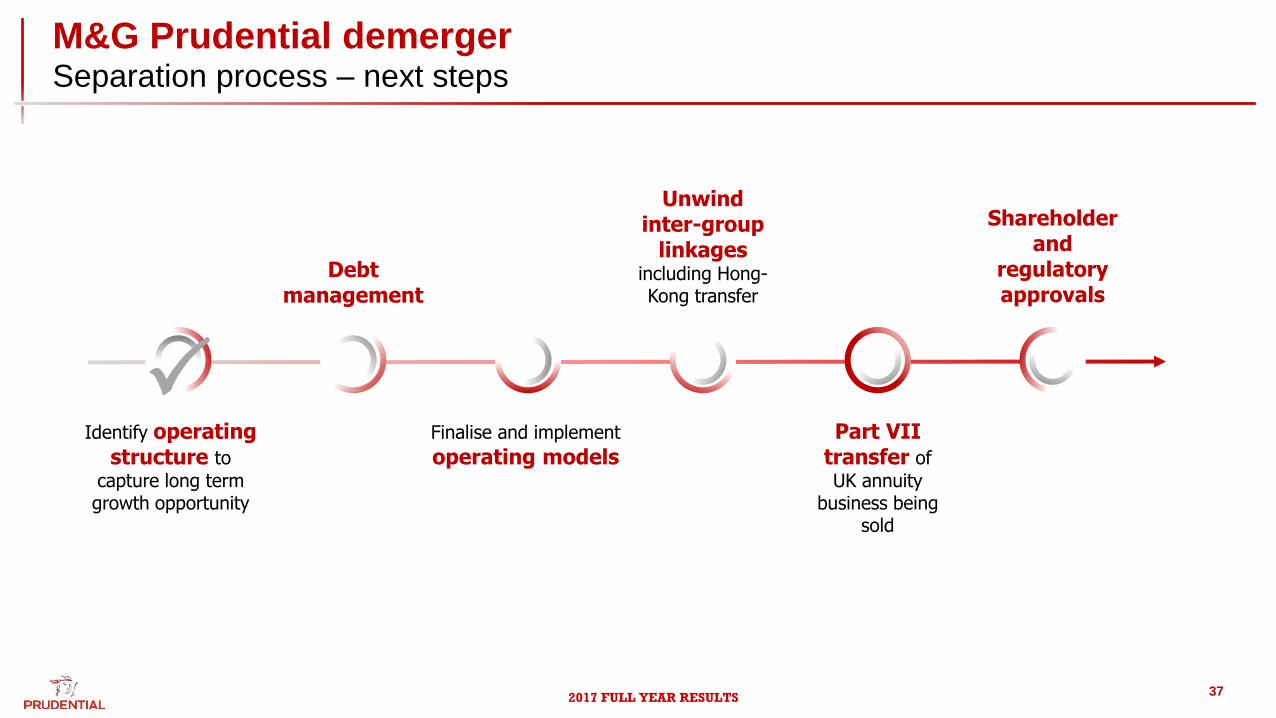
M&G Prudential demerger Separation process – next steps
Debt management
Finalise and implement operating models
Unwind inter-group
linkages including Hong-Kong transfer
Part VII transfer of
UK annuity business being
sold
Shareholder and
regulatory approvals
Identify operating structure to
capture long term growth opportunity
P
2017 FULL YEAR RESULTS 38
FY17 results Summary
Sustained momentum in earnings drivers underpins positive outlook
Well capitalised with defensive balance sheet
8% increase in 2017 full year ordinary dividend
Demerging M&G Prudential from a position of financial strength
Continued delivery of growth and cash

2017 FULL YEAR RESULTS 39
Mike Wells, Group CEO
Headline Results & Strategic Update
Agenda
Mark FitzPatrick, Group CFO
FY17 Financial Performance
Mike Wells, Group CEO
Wrap-Up
Paul Manduca, Group Chairman
Introduction
2017 FULL YEAR RESULTS 40
Group Wrap-up
Adapting structure to maximise the opportunity for our businesses
Asia growth is broad based and high quality
US continues to deliver, outperforming the peer group
UK&E strong performance, underpinning rationale for capital efficient strategy

2017 FULL YEAR RESULTS 41
14 - 15 November 2018
2018 Investor Conference, Singapore
42
US
Jackson National
Appendix
2017 Full Year Results
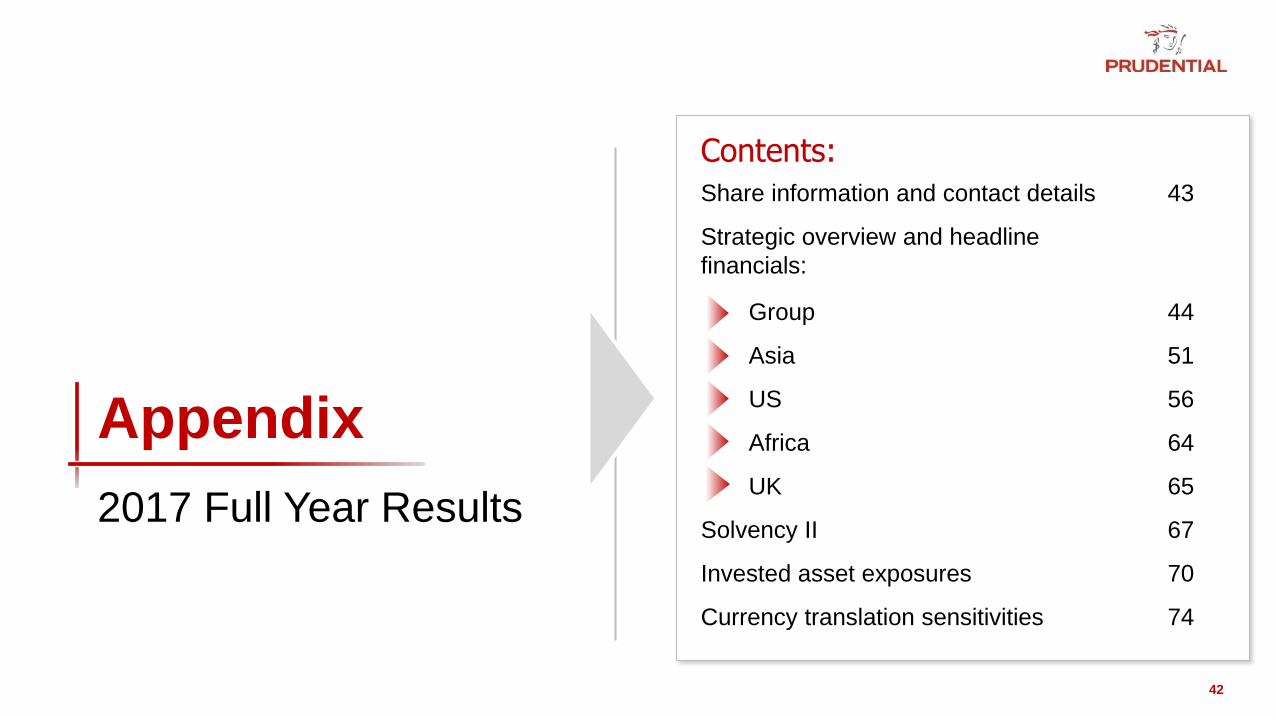
Contents:
Share information and contact details 43
Strategic overview and headline
financials:
Group 44
Asia 51
US 56
Africa 64
UK 65
Solvency II 67
Invested asset exposures 70
Currency translation sensitivities 74
2017 FULL YEAR RESULTS
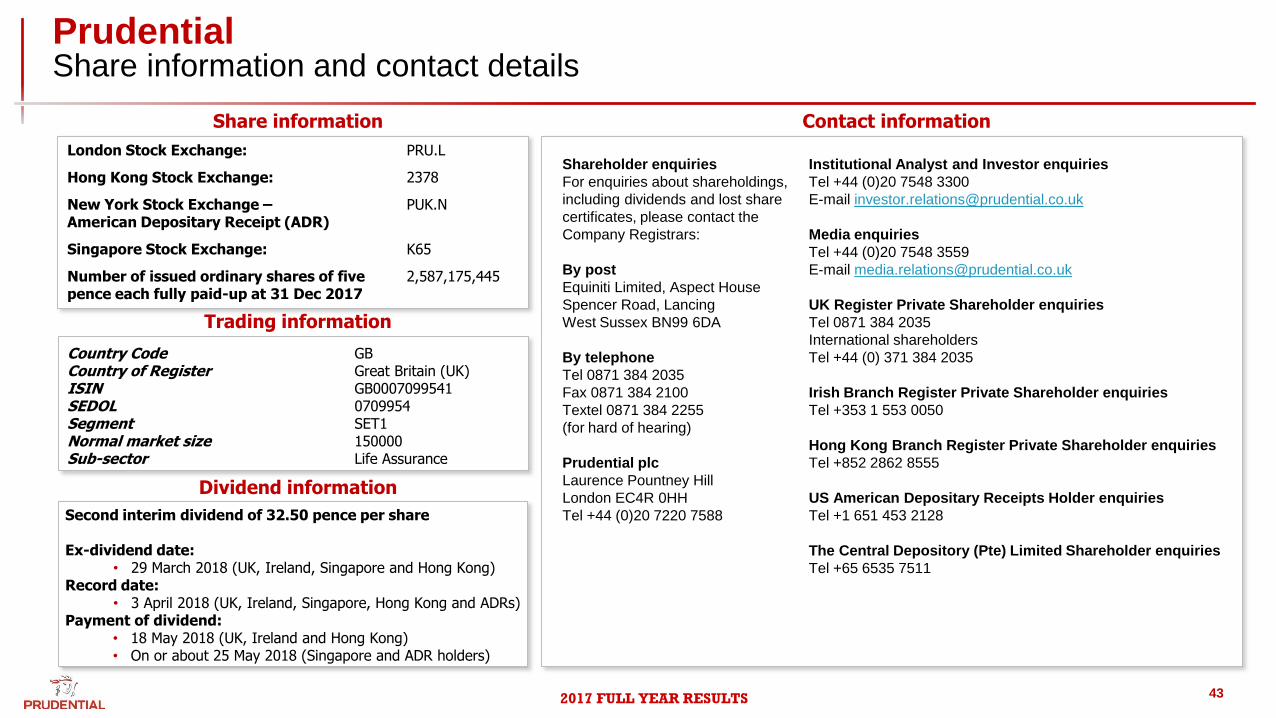
Prudential Share information and contact details
43
Country Code GB Country of Register Great Britain (UK) ISIN GB0007099541 SEDOL 0709954 Segment SET1 Normal market size 150000 Sub-sector Life Assurance
Shareholder enquiries
For enquiries about shareholdings,
including dividends and lost share
certificates, please contact the
Company Registrars:
By post
Equiniti Limited, Aspect House
Spencer Road, Lancing
West Sussex BN99 6DA
By telephone
Tel 0871 384 2035
Fax 0871 384 2100
Textel 0871 384 2255
(for hard of hearing)
Prudential plc
Laurence Pountney Hill
London EC4R 0HH
Tel +44 (0)20 7220 7588
Institutional Analyst and Investor enquiries
Tel +44 (0)20 7548 3300
E-mail [email protected]
Media enquiries
Tel +44 (0)20 7548 3559
E-mail [email protected]
UK Register Private Shareholder enquiries
Tel 0871 384 2035
International shareholders
Tel +44 (0) 371 384 2035
Irish Branch Register Private Shareholder enquiries
Tel +353 1 553 0050
Hong Kong Branch Register Private Shareholder enquiries
Tel +852 2862 8555
US American Depositary Receipts Holder enquiries
Tel +1 651 453 2128
The Central Depository (Pte) Limited Shareholder enquiries
Tel +65 6535 7511
Contact information Share information
Trading information
London Stock Exchange: PRU.L
Hong Kong Stock Exchange: 2378
New York Stock Exchange – American Depositary Receipt (ADR)
PUK.N
Singapore Stock Exchange: K65
Number of issued ordinary shares of five pence each fully paid-up at 31 Dec 2017
2,587,175,445
Dividend information
Second interim dividend of 32.50 pence per share Ex-dividend date:
• 29 March 2018 (UK, Ireland, Singapore and Hong Kong) Record date:
• 3 April 2018 (UK, Ireland, Singapore, Hong Kong and ADRs) Payment of dividend:
• 18 May 2018 (UK, Ireland and Hong Kong) • On or about 25 May 2018 (Singapore and ADR holders)
2017 FULL YEAR RESULTS
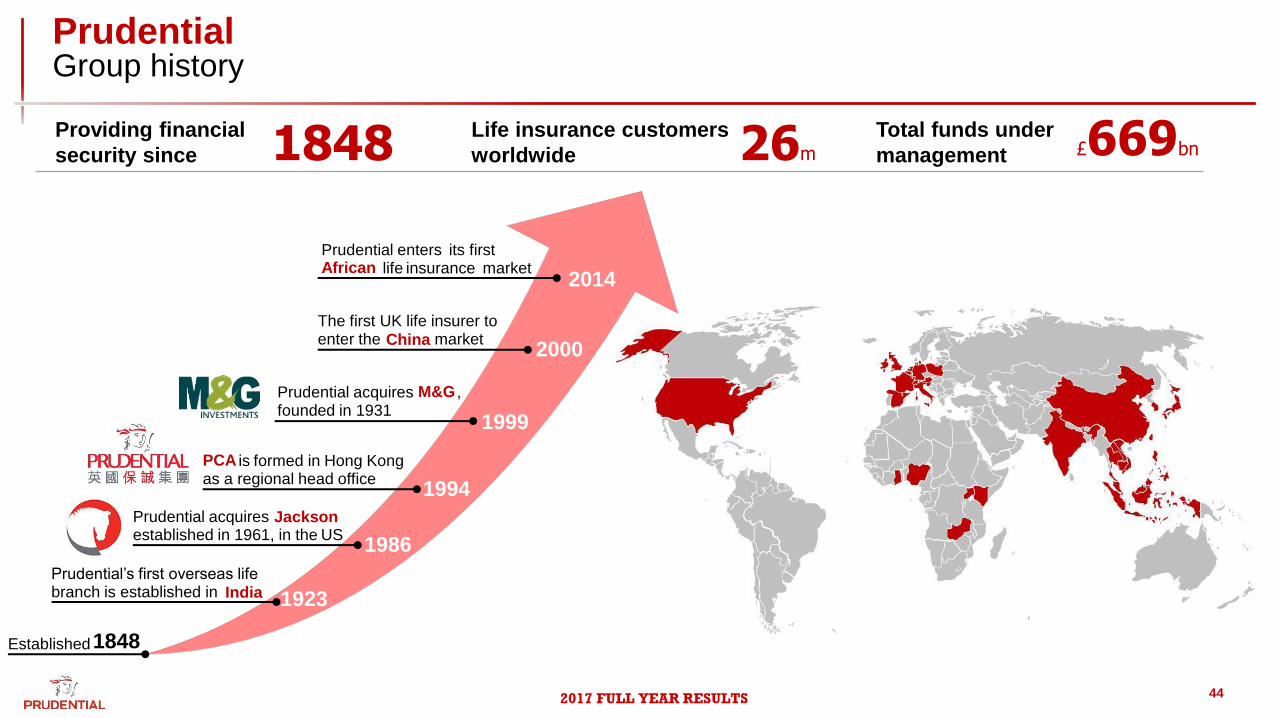
Prudential Group history
44
Total funds under
management 26m £669bn Providing financial
security since
Life insurance customers
worldwide 1848
1848
Prudential’s first overseas life branch is established in India
1986
1999
2000
2014
1923
Prudential acquires Jackson established in 1961, in the US
Prudential acquires M&G , founded in 1931
The first UK life insurer to enter the China market
1994
PCA is formed in Hong Kong as a regional head office
Prudential enters its first African life insurance market
Established
2017 FULL YEAR RESULTS
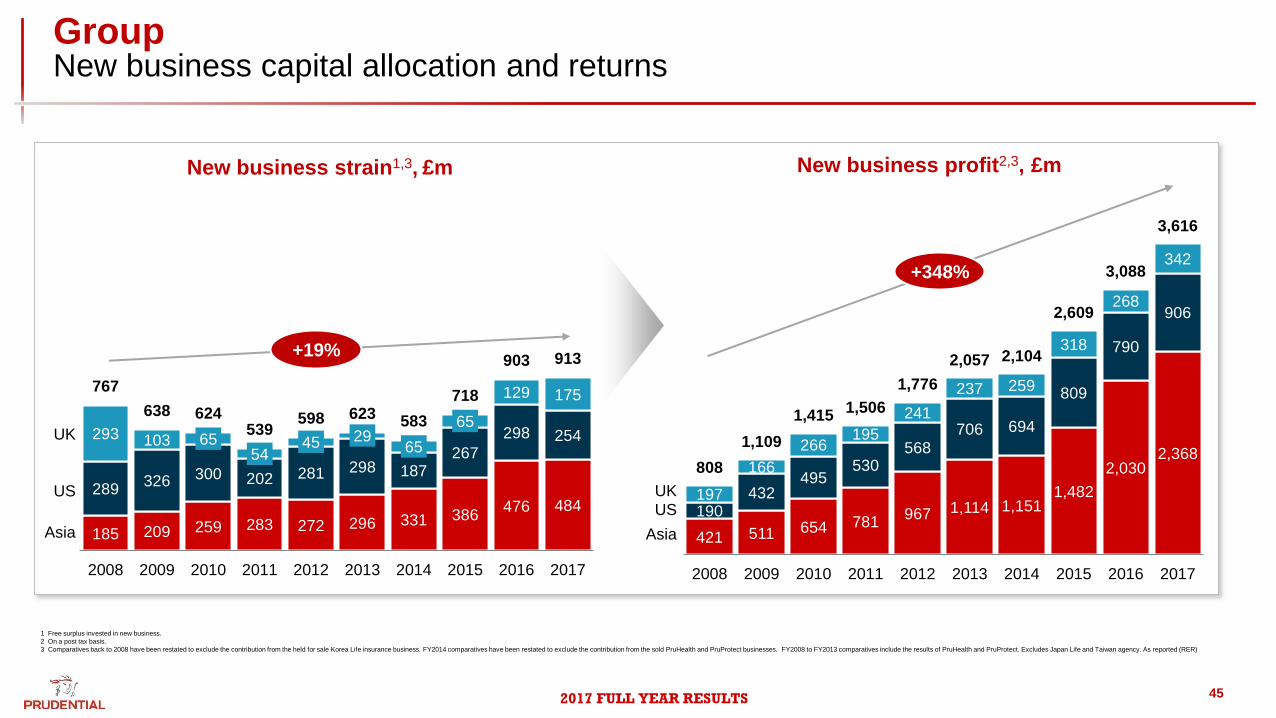
Group New business capital allocation and returns
45
421 511 654 781 967 1,114 1,151
1,482
2,030 2,368
190 432
495 530
568 706 694
809
790
906
197
166
266 195
241
237 259
318
268
342
808
1,109
1,415 1,506
1,776
2,057 2,104
2,609
3,088
3,616
2008 2009 2010 2011 2012 2013 2014 2015 2016 2017
185 209 259 283 272 296 331 386 476 484
289 326 300 202 281 298 187
267
298 254 293 103 65 54
45 29 65
65
129 175 767
638 624 539
598 623 583
718
903 913
2008 2009 2010 2011 2012 2013 2014 2015 2016 2017
Asia
US
UK
+19%
Asia
US
UK
+348%
New business strain1,3, £m New business profit2,3, £m
1 Free surplus invested in new business.
2 On a post tax basis.
3 Comparatives back to 2008 have been restated to exclude the contribution from the held for sale Korea Life insurance business. FY2014 comparatives have been restated to exclude the contribution from the sold PruHealth and PruProtect businesses. FY2008 to FY2013 comparatives include the results of PruHealth and PruProtect. Excludes Japan Life and Taiwan agency. As reported (RER)
2017 FULL YEAR RESULTS 46
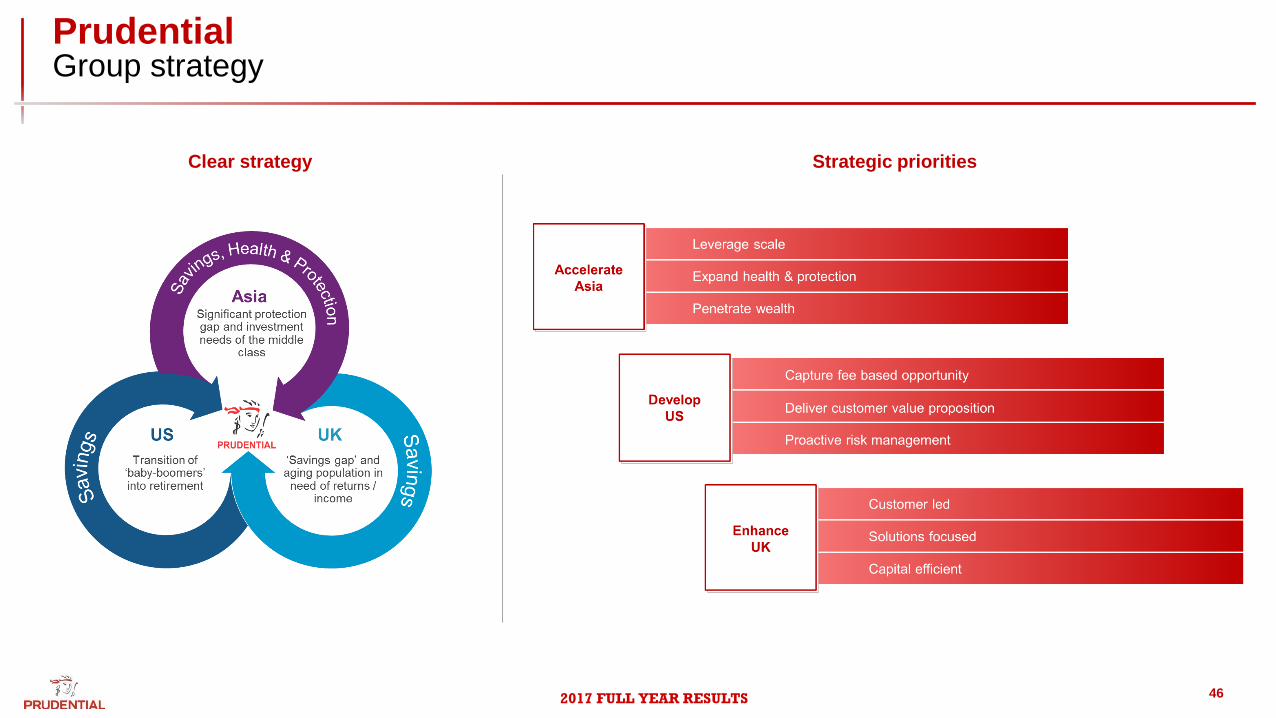
Clear strategy Strategic priorities
Prudential Group strategy
2017 FULL YEAR RESULTS
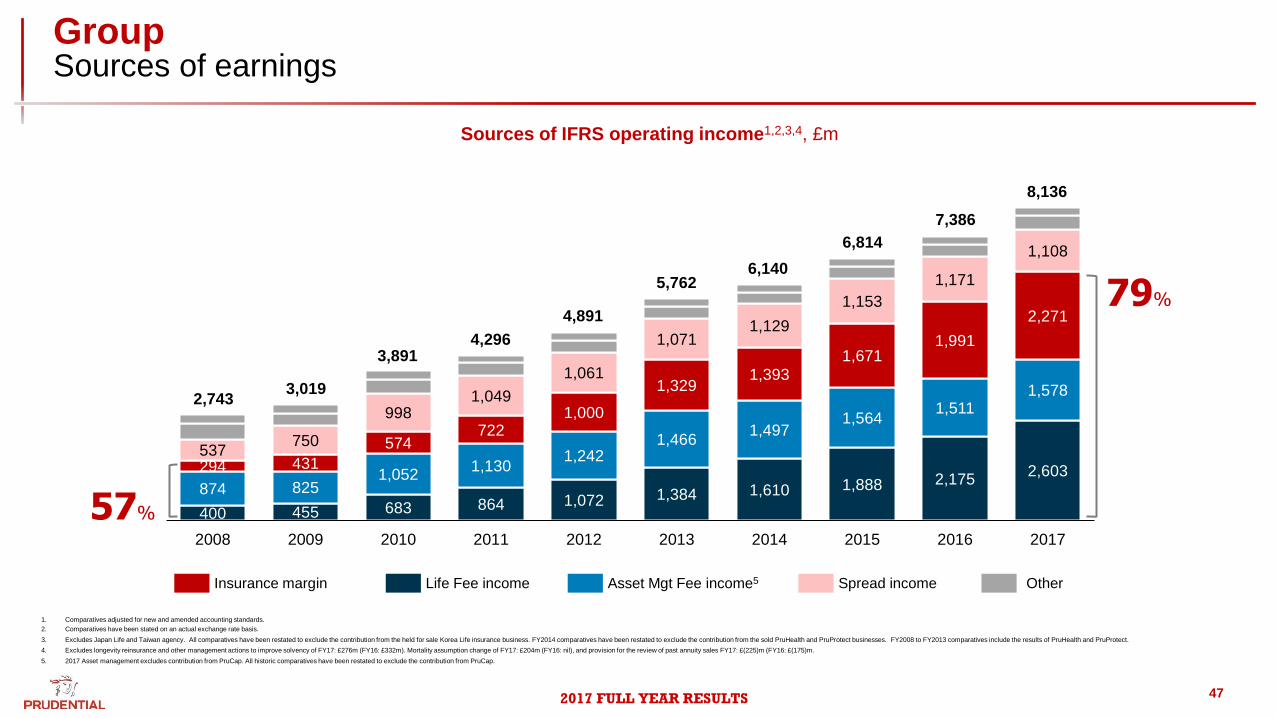
Group Sources of earnings
47
400 455 683 864 1,072 1,384 1,610 1,888 2,175 2,603
874 825 1,052
1,130 1,242
1,466 1,497
1,564 1,511
1,578
294 431
574 722
1,000
1,329 1,393
1,671 1,991
2,271
537 750
998 1,049
1,061
1,071 1,129
1,153
1,171
1,108
2008 2009 2010 2011 2012 2013 2014 2015 2016 2017
57%
Asset Mgt Fee income5 Spread income Insurance margin Life Fee income Other
6,140 5,762
4,891
4,296 3,891
3,019 2,743
1. Comparatives adjusted for new and amended accounting standards.
2. Comparatives have been stated on an actual exchange rate basis.
3. Excludes Japan Life and Taiwan agency. All comparatives have been restated to exclude the contribution from the held for sale Korea Life insurance business. FY2014 comparatives have been restated to exclude the contribution from the sold PruHealth and PruProtect businesses. FY2008 to FY2013 comparatives include the results of PruHealth and PruProtect.
4. Excludes longevity reinsurance and other management actions to improve solvency of FY17: £276m (FY16: £332m). Mortality assumption change of FY17: £204m (FY16: nil), and provision for the review of past annuity sales FY17: £(225)m (FY16: £(175)m.
5. 2017 Asset management excludes contribution from PruCap. All historic comparatives have been restated to exclude the contribution from PruCap.
79%
6,814
Sources of IFRS operating income1,2,3,4, £m
7,386
8,136
2017 FULL YEAR RESULTS
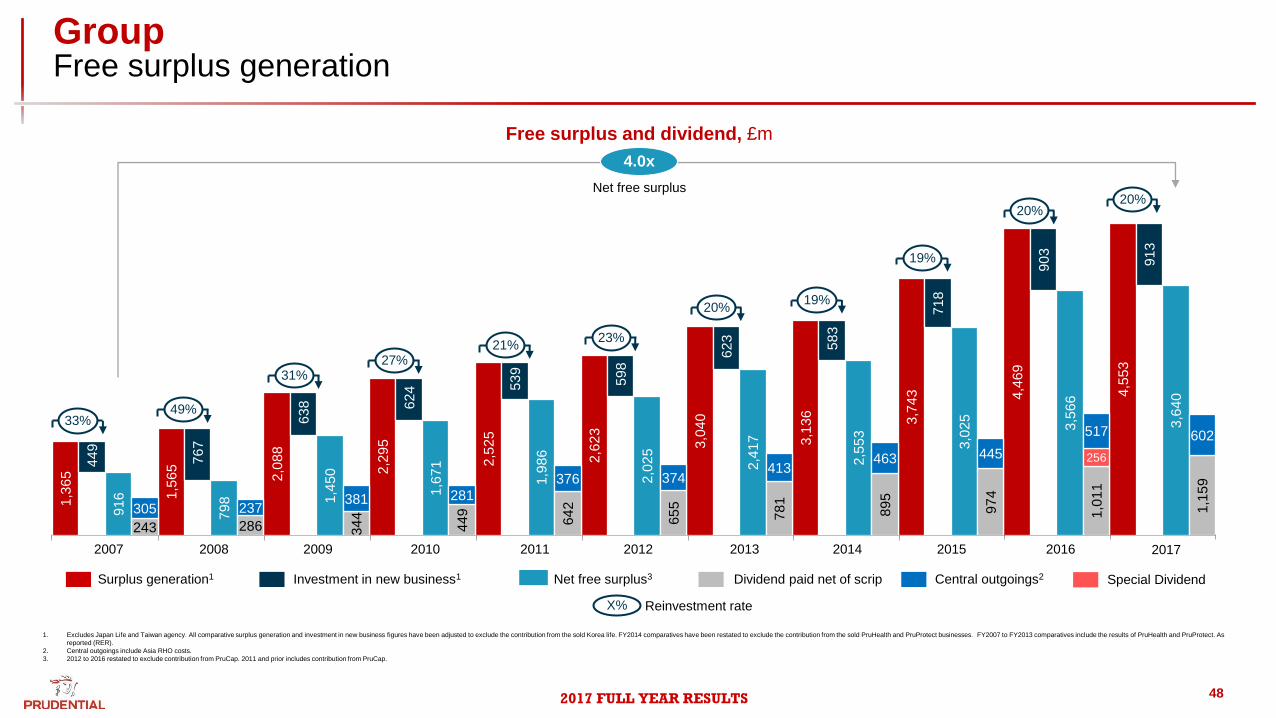
Group Free surplus generation
48
1,3
65
1,5
65
2,0
88
2,2
95
2,5
25
2,6
23
3,0
40
3,1
36
3,7
43
4,4
69
4,5
53
44
9
76
7
63
8
62
4
53
9
59
8 6
23
58
3
71
8
90
3
91
3
91
6
79
8
1,4
50
1,6
71
1,9
86
2,0
25
2,4
17
2,5
53
3,0
25
3,5
66
3,6
40
243 286 34
4
44
9
64
2
65
5
78
1
89
5
97
4
1,0
11
1,1
59
256
305 237 381 281
376 374 413
463 445
517 602
1. Excludes Japan Life and Taiwan agency. All comparative surplus generation and investment in new business figures have been adjusted to exclude the contribution from the sold Korea life. FY2014 comparatives have been restated to exclude the contribution from the sold PruHealth and PruProtect businesses. FY2007 to FY2013 comparatives include the results of PruHealth and PruProtect. As
reported (RER).
2. Central outgoings include Asia RHO costs.
3. 2012 to 2016 restated to exclude contribution from PruCap. 2011 and prior includes contribution from PruCap.
Surplus generation1 Net free surplus3 Dividend paid net of scrip Central outgoings2 Investment in new business1
4.0x
Free surplus and dividend, £m
2008 2009 2010 2012 2011 2013 2014 2015
Net free surplus
2016
Special Dividend
2007
33% 49%
31% 27%
21% 23%
20% 19%
19%
20%
X% Reinvestment rate
2017
20%
2017 FULL YEAR RESULTS
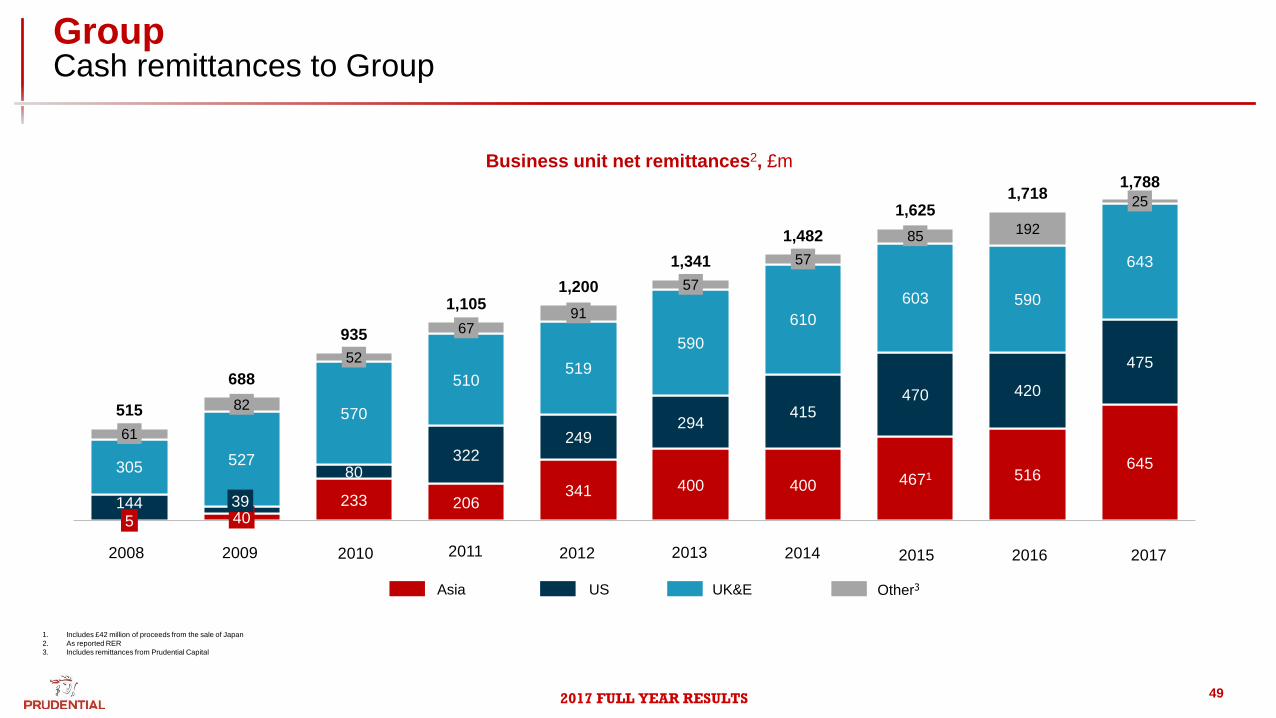
Group Cash remittances to Group
49
1. Includes £42 million of proceeds from the sale of Japan
2. As reported RER
3. Includes remittances from Prudential Capital
Business unit net remittances2, £m
2014 2013 2012 2011 2010 2009 2008 2015 2016
Asia US UK&E Other3
5 40 233 206
341 400 400 4671 516 645
144 39
80 322
249 294
415 470 420
475
305 527
570
510 519
590
610
603 590
643
61
82
52
67 91
57
57
85 192
25
515
688
935
1,105 1,200
1,341
1,482
1,625 1,718
1,788
2017
2017 FULL YEAR RESULTS
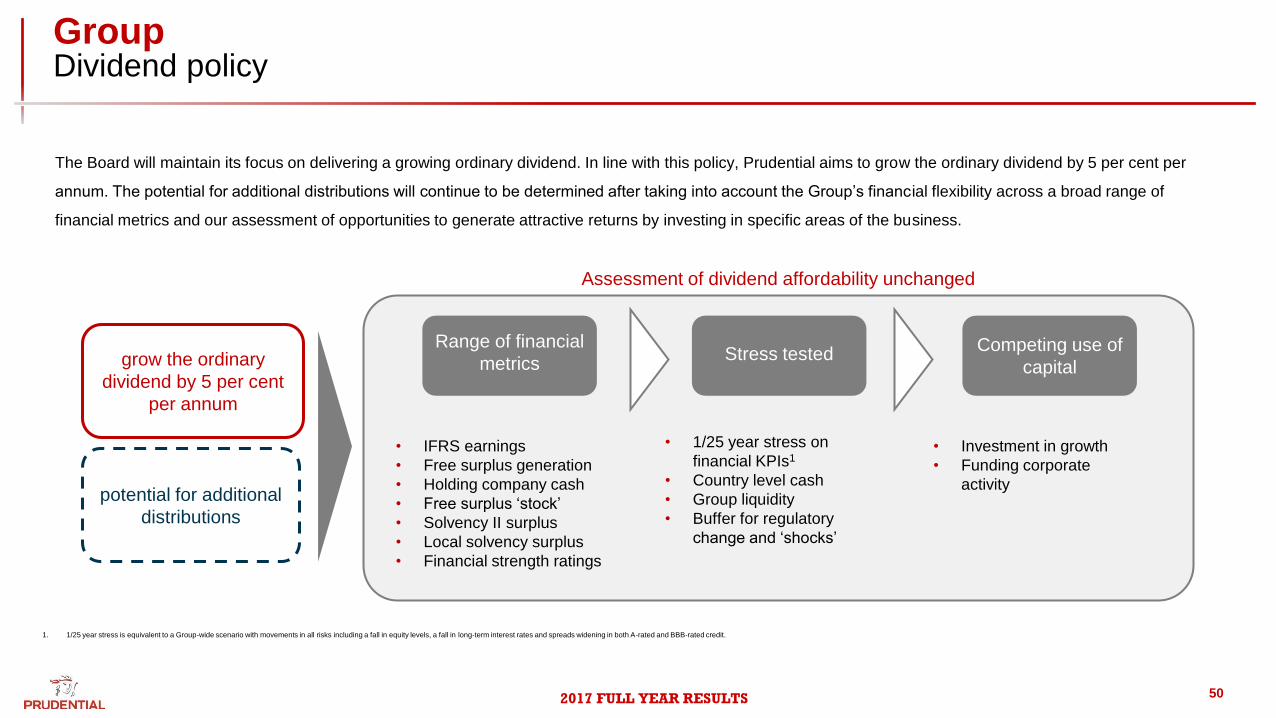
Group Dividend policy
50
grow the ordinary
dividend by 5 per cent
per annum
potential for additional
distributions
Assessment of dividend affordability unchanged
• IFRS earnings
• Free surplus generation
• Holding company cash
• Free surplus ‘stock’
• Solvency II surplus
• Local solvency surplus
• Financial strength ratings
• 1/25 year stress on
financial KPIs1
• Country level cash
• Group liquidity
• Buffer for regulatory
change and ‘shocks’
• Investment in growth
• Funding corporate
activity
Range of financial
metrics Stress tested
Competing use of
capital
1. 1/25 year stress is equivalent to a Group-wide scenario with movements in all risks including a fall in equity levels, a fall in long-term interest rates and spreads widening in both A-rated and BBB-rated credit.
The Board will maintain its focus on delivering a growing ordinary dividend. In line with this policy, Prudential aims to grow the ordinary dividend by 5 per cent per
annum. The potential for additional distributions will continue to be determined after taking into account the Group’s financial flexibility across a broad range of
financial metrics and our assessment of opportunities to generate attractive returns by investing in specific areas of the business.
2017 FULL YEAR RESULTS
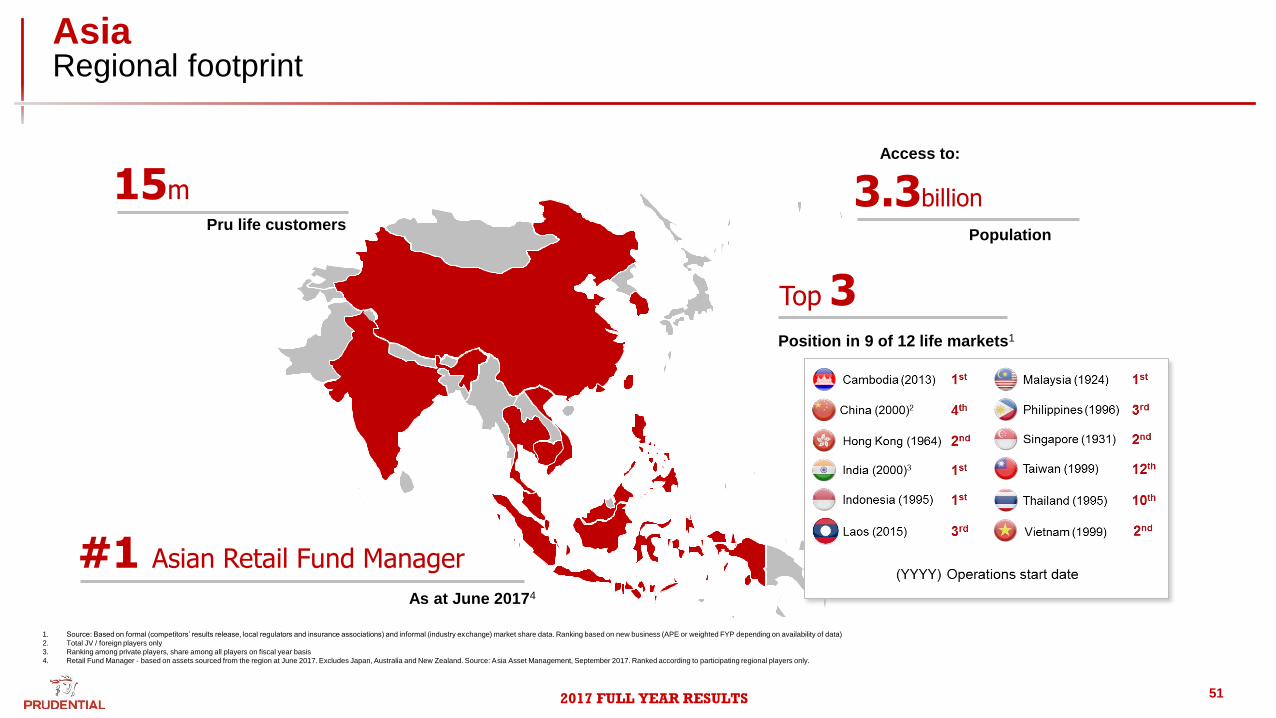
Asia Regional footprint
51
3.3billion
Population
Access to:
15m Pru life customers
Top 3 Position in 9 of 12 life markets1
#1 Asian Retail Fund Manager
As at June 20174
1. Source: Based on formal (competitors’ results release, local regulators and insurance associations) and informal (industry exchange) market share data. Ranking based on new business (APE or weighted FYP depending on availability of data)
2. Total JV / foreign players only
3. Ranking among private players, share among all players on fiscal year basis
4. Retail Fund Manager - based on assets sourced from the region at June 2017. Excludes Japan, Australia and New Zealand. Source: Asia Asset Management, September 2017. Ranked according to participating regional players only.
2017 FULL YEAR RESULTS 52
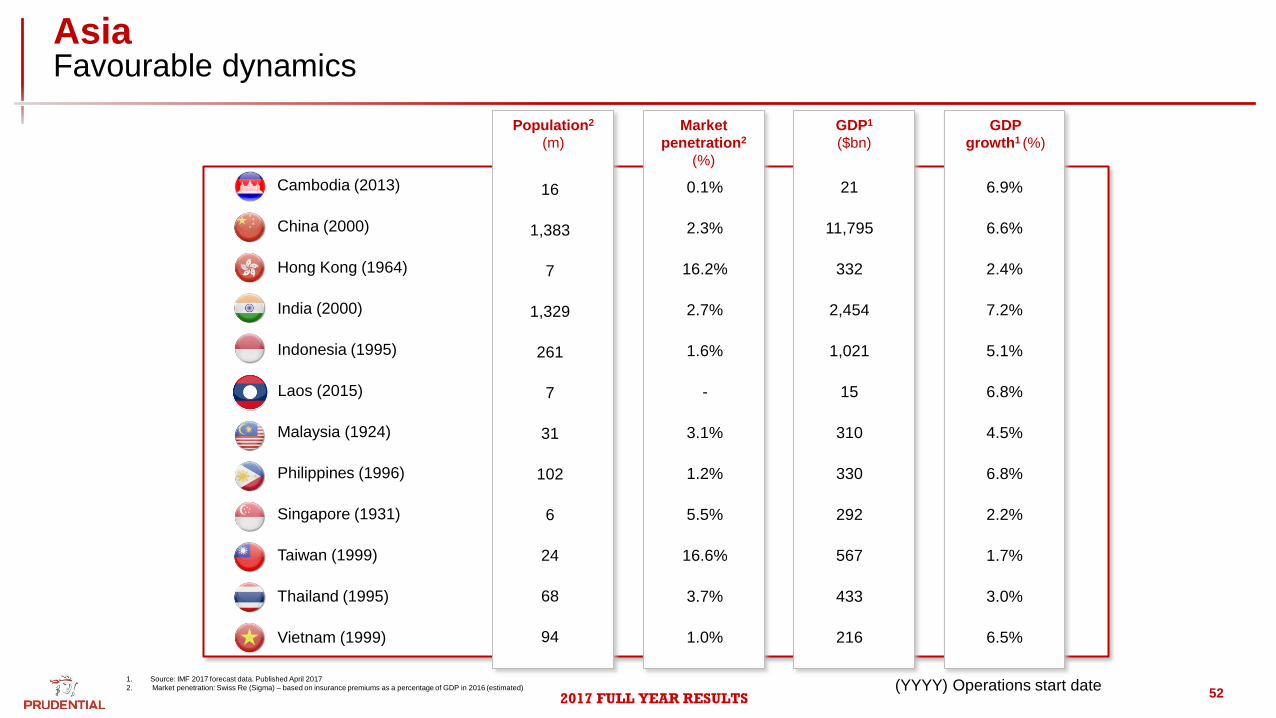
1. Source: IMF 2017 forecast data. Published April 2017
2. Market penetration: Swiss Re (Sigma) – based on insurance premiums as a percentage of GDP in 2016 (estimated)
GDP
growth1 (%)
GDP1
($bn)
Population2
(m)
Market
penetration2
(%)
1,021 5.1% Indonesia (1995) 261 1.6%
330 6.8% Philippines (1996) 102 1.2%
332 2.4% Hong Kong (1964) 7 16.2%
3.0% 433 Thailand (1995) 68 3.7%
2,454 7.2% India (2000) 1,329 2.7%
11,795 6.6% China (2000) 1,383 2.3%
567 1.7% Taiwan (1999) 24 16.6%
21 6.9% Cambodia (2013) 16 0.1%
216 6.5% Vietnam (1999) 94 1.0%
310 4.5% Malaysia (1924) 31 3.1%
292 2.2% Singapore (1931) 6 5.5%
Laos (2015) 7 - 15 6.8%
(YYYY) Operations start date
Asia Favourable dynamics
2017 FULL YEAR RESULTS
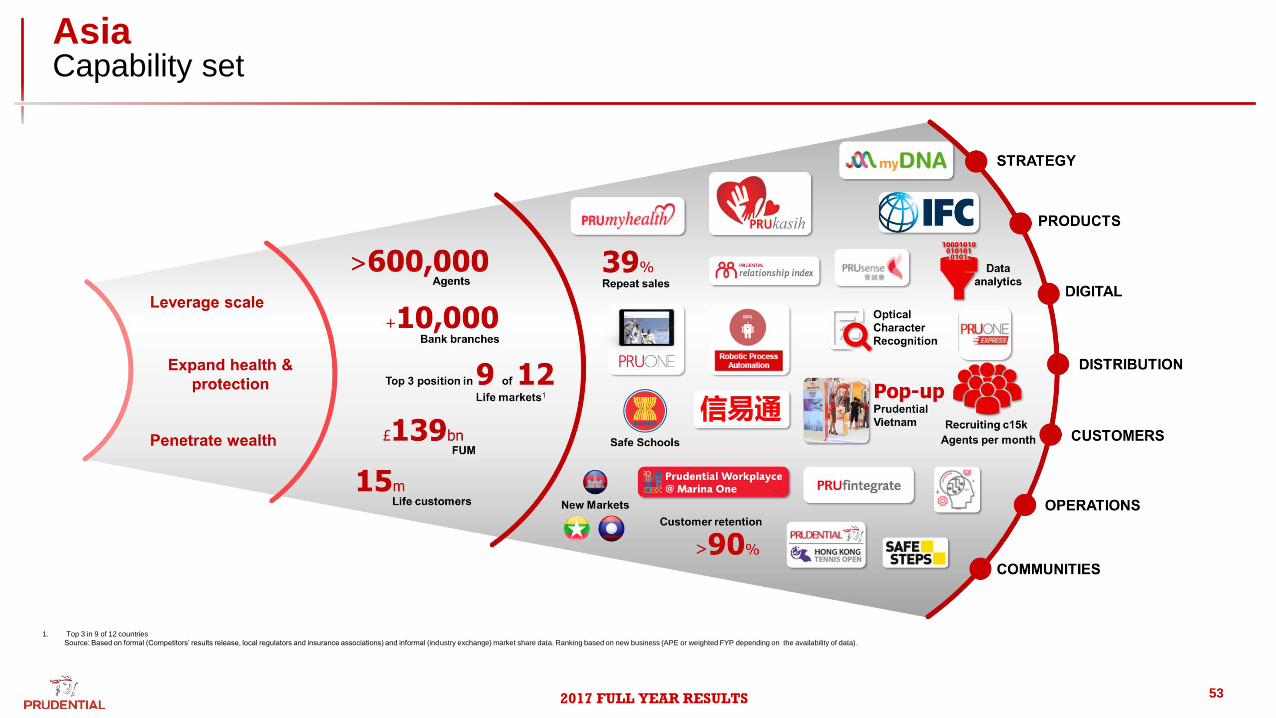
Asia Capability set
53
1. Top 3 in 9 of 12 countries
Source: Based on formal (Competitors’ results release, local regulators and insurance associations) and informal (industry exchange) market share data. Ranking based on new business (APE or weighted FYP depending on the availability of data).
2017 FULL YEAR RESULTS
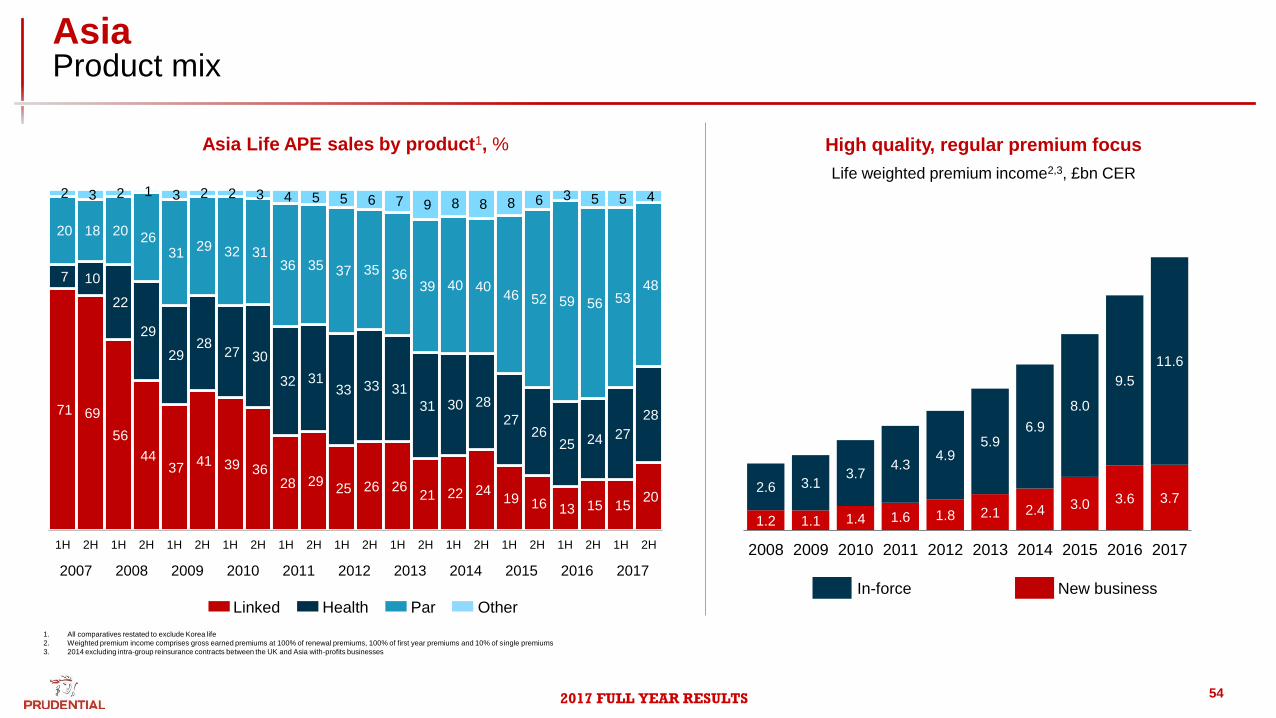
Asia Product mix
54
71 69
56
44 37
41 39 36 28 29
25 26 26 21 22 24
19 16 13 15 15 20
7 10
22
29
29 28
27 30
32 31 33 33 31
31 30 28
27 26
25 24 27
28
20 18 20 26
31 29 32 31
36 35 37 35 36 39 40 40
46 52 59 56 53 48
2 3 2 1 3 2 2 3 4 5 5 6 7 9 8 8 8 6 3 5 5 4
1H 2H 1H 2H 1H 2H 1H 2H 1H 2H 1H 2H 1H 2H 1H 2H 1H 2H 1H 2H 1H 2H
Linked Health Par Other
Asia Life APE sales by product1, % High quality, regular premium focus
83%
In-force New business
Life weighted premium income2,3, £bn CER
1.2 1.1 1.4 1.6 1.8 2.1 2.4 3.0 3.6 3.7 2.6 3.1
3.7 4.3
4.9 5.9
6.9
8.0
9.5
11.6
2008 2009 2010 2011 2012 2013 2014 2015 2016 2017
2007 2008 2009 2010 2011 2012 2013 2014 2015 2016 2017
1. All comparatives restated to exclude Korea life
2. Weighted premium income comprises gross earned premiums at 100% of renewal premiums, 100% of first year premiums and 10% of single premiums
3. 2014 excluding intra-group reinsurance contracts between the UK and Asia with-profits businesses
2017 FULL YEAR RESULTS
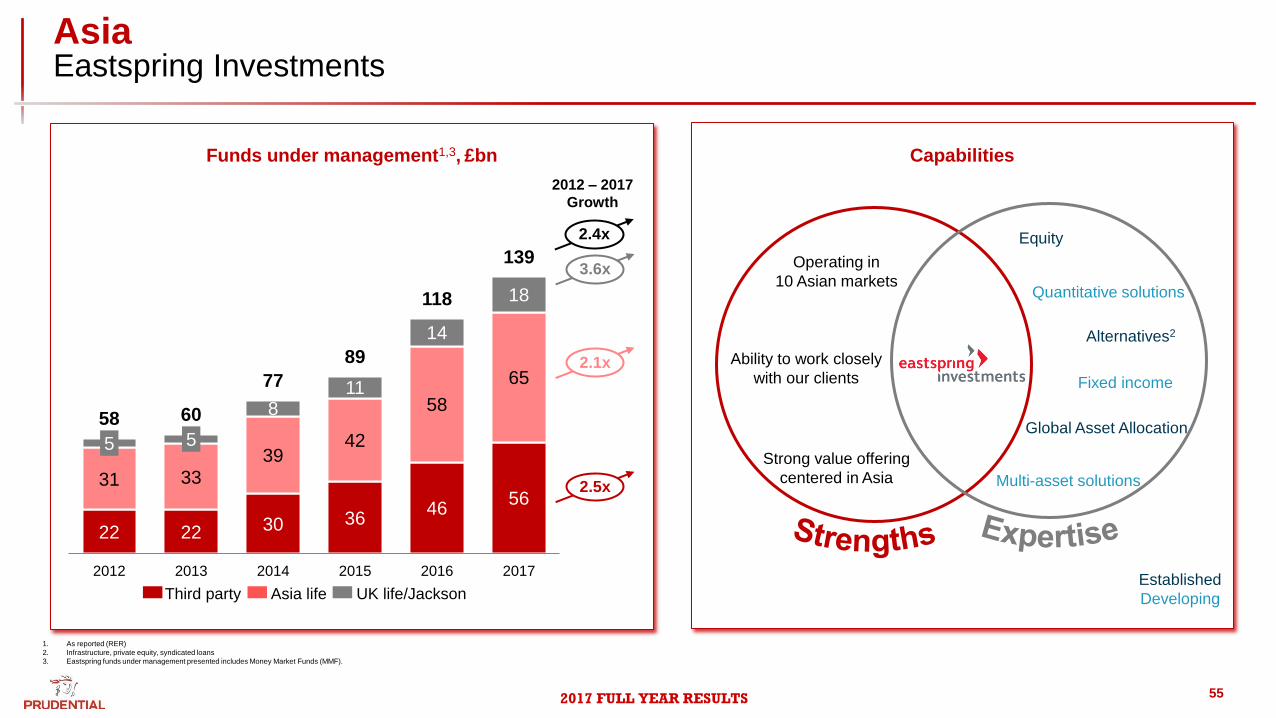
Asia Eastspring Investments
55
22 22 30 36 46
56 31 33
39 42
58
65
5 5
8 11
14
18
58 60
77
89
118
139
2012 2013 2014 2015 2016 2017
Third party Asia life UK life/Jackson
2.5x
2.1x
3.6x
2.4x
2012 – 2017
Growth
Funds under management1,3, £bn
1. As reported (RER)
2. Infrastructure, private equity, syndicated loans
3. Eastspring funds under management presented includes Money Market Funds (MMF).
Equity
Fixed income
Global Asset Allocation
Quantitative solutions
Alternatives2
Multi-asset solutions
Ability to work closely
with our clients
Operating in
10 Asian markets
Strong value offering
centered in Asia
Established
Developing
Capabilities
2017 FULL YEAR RESULTS
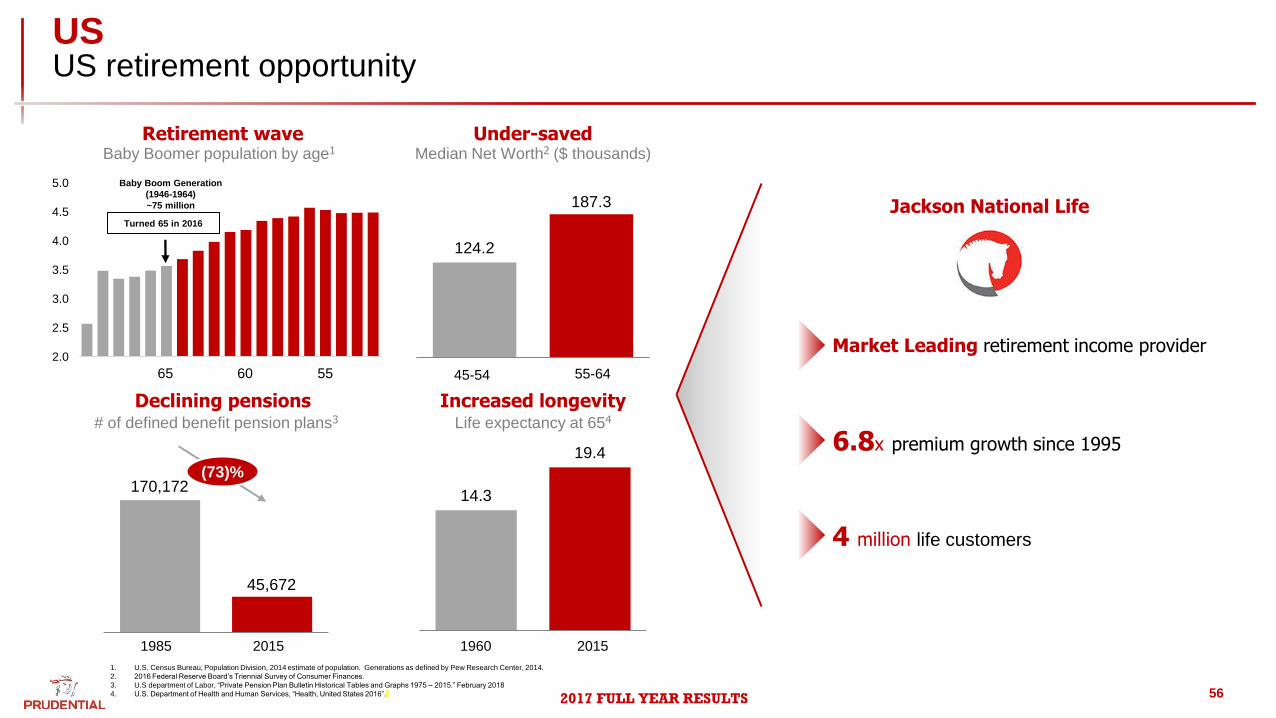
US US retirement opportunity
56
Retirement wave Under-saved
Declining pensions Increased longevity
124.2
187.3
14.3
19.4
Baby Boomer population by age1 Median Net Worth2 ($ thousands)
Life expectancy at 654
1985 2015 2015 1960
55-64
(73)%
4 million life customers
6.8x premium growth since 1995
Market Leading retirement income provider
# of defined benefit pension plans3
170,172
45,672
Jackson National Life
2.0
2.5
3.0
3.5
4.0
4.5
5.0 Baby Boom Generation
(1946-1964)
~75 million
Turned 65 in 2016
65 60 55 45-54
1. U.S. Census Bureau, Population Division, 2014 estimate of population. Generations as defined by Pew Research Center, 2014.
2. 2016 Federal Reserve Board’s Triennial Survey of Consumer Finances.
3. U.S department of Labor, “Private Pension Plan Bulletin Historical Tables and Graphs 1975 – 2015.” February 2018
4. U.S. Department of Health and Human Services, “Health, United States 2016”.
2017 FULL YEAR RESULTS
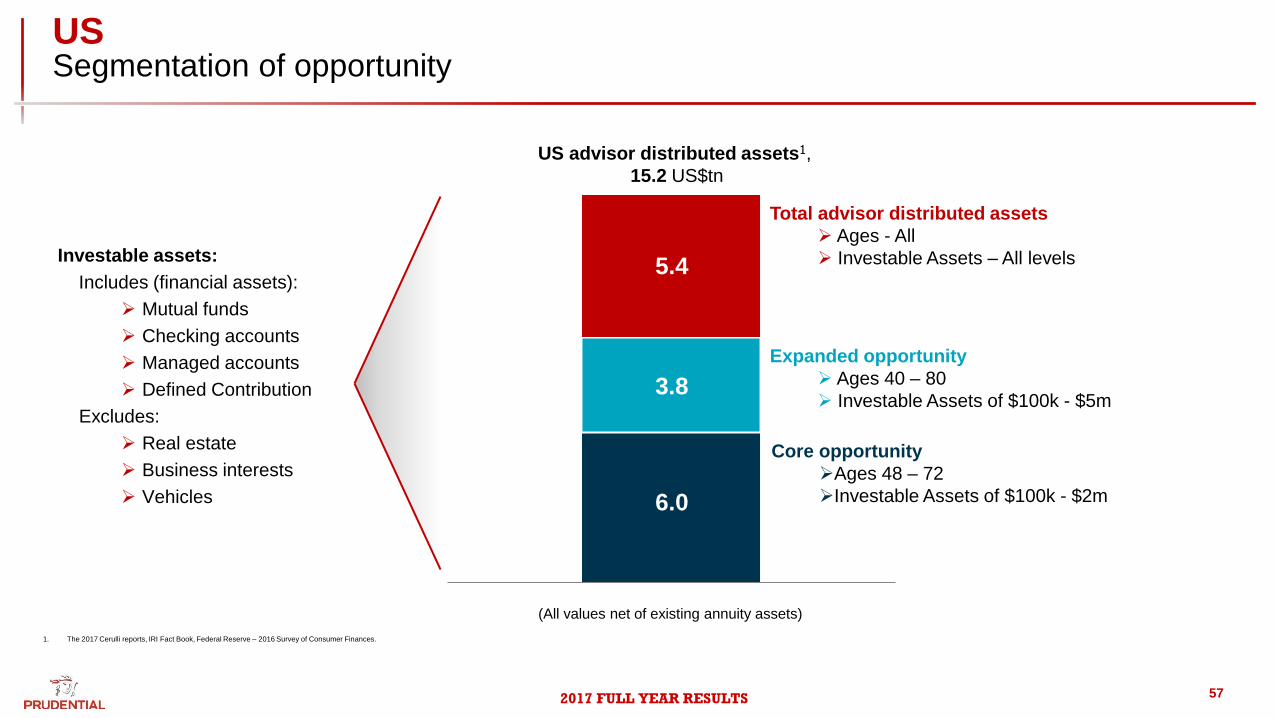
US Segmentation of opportunity
57
Investable assets:
Includes (financial assets):
Mutual funds
Checking accounts
Managed accounts
Defined Contribution
Excludes:
Real estate
Business interests
Vehicles
1. The 2017 Cerulli reports, IRI Fact Book, Federal Reserve – 2016 Survey of Consumer Finances.
(All values net of existing annuity assets)
Total advisor distributed assets
Ages - All
Investable Assets – All levels
Expanded opportunity
Ages 40 – 80
Investable Assets of $100k - $5m
Core opportunity
Ages 48 – 72
Investable Assets of $100k - $2m
3.8
6.0
US advisor distributed assets1,
15.2 US$tn
5.4
2017 FULL YEAR RESULTS
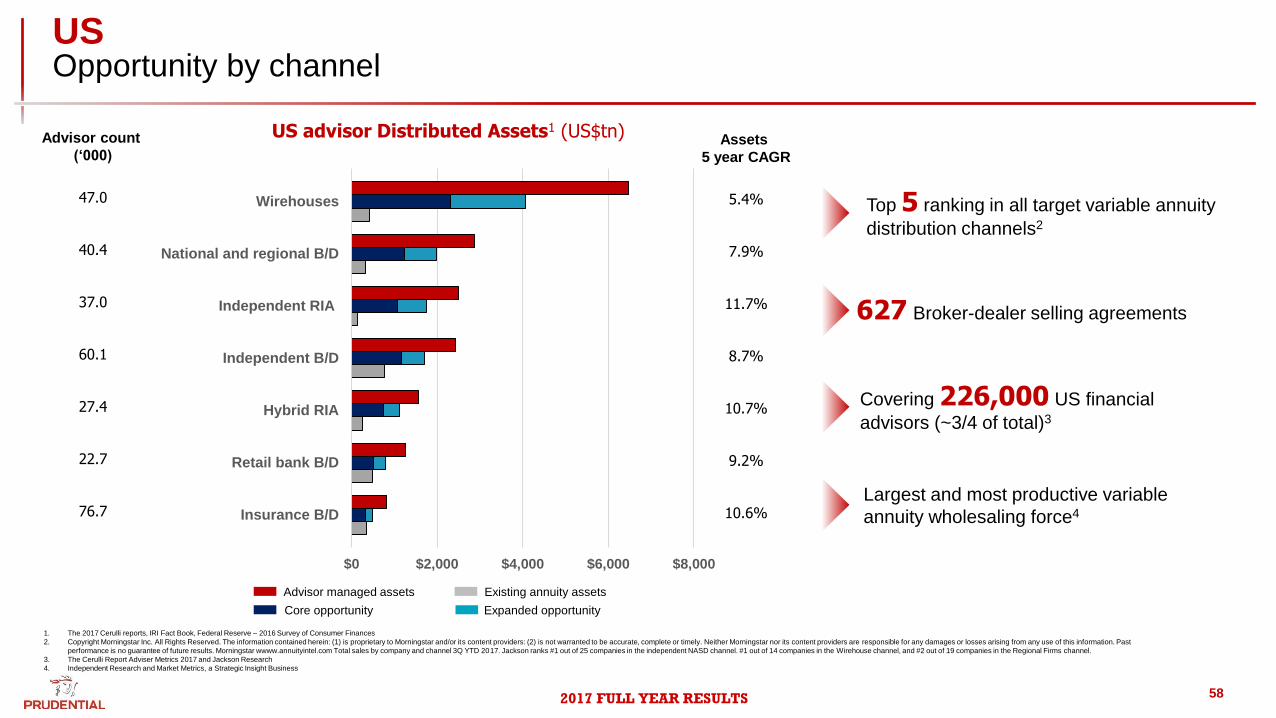
$0 $2,000 $4,000 $6,000 $8,000
Insurance B/D
Retail bank B/D
Hybrid RIA
Independent B/D
Independent RIA
National and regional B/D
Wirehouses
US Opportunity by channel
58
627 Broker-dealer selling agreements
US advisor Distributed Assets1 (US$tn) Advisor count
(‘000)
47.0
40.4
37.0
60.1
27.4
22.7
76.7
Assets
5 year CAGR
5.4%
7.9%
11.7%
8.7%
10.7%
9.2%
10.6%
1. The 2017 Cerulli reports, IRI Fact Book, Federal Reserve – 2016 Survey of Consumer Finances
2. Copyright Morningstar Inc. All Rights Reserved. The information contained herein: (1) is proprietary to Morningstar and/or its content providers: (2) is not warranted to be accurate, complete or timely. Neither Morningstar nor its content providers are responsible for any damages or losses arising from any use of this information. Past
performance is no guarantee of future results. Morningstar wwww.annuityintel.com Total sales by company and channel 3Q YTD 2017. Jackson ranks #1 out of 25 companies in the independent NASD channel. #1 out of 14 companies in the Wirehouse channel, and #2 out of 19 companies in the Regional Firms channel.
3. The Cerulli Report Adviser Metrics 2017 and Jackson Research
4. Independent Research and Market Metrics, a Strategic Insight Business
Top 5 ranking in all target variable annuity
distribution channels2
Covering 226,000 US financial
advisors (~3/4 of total)3
Largest and most productive variable
annuity wholesaling force4
Advisor managed assets
Core opportunity
Existing annuity assets
Expanded opportunity
2017 FULL YEAR RESULTS
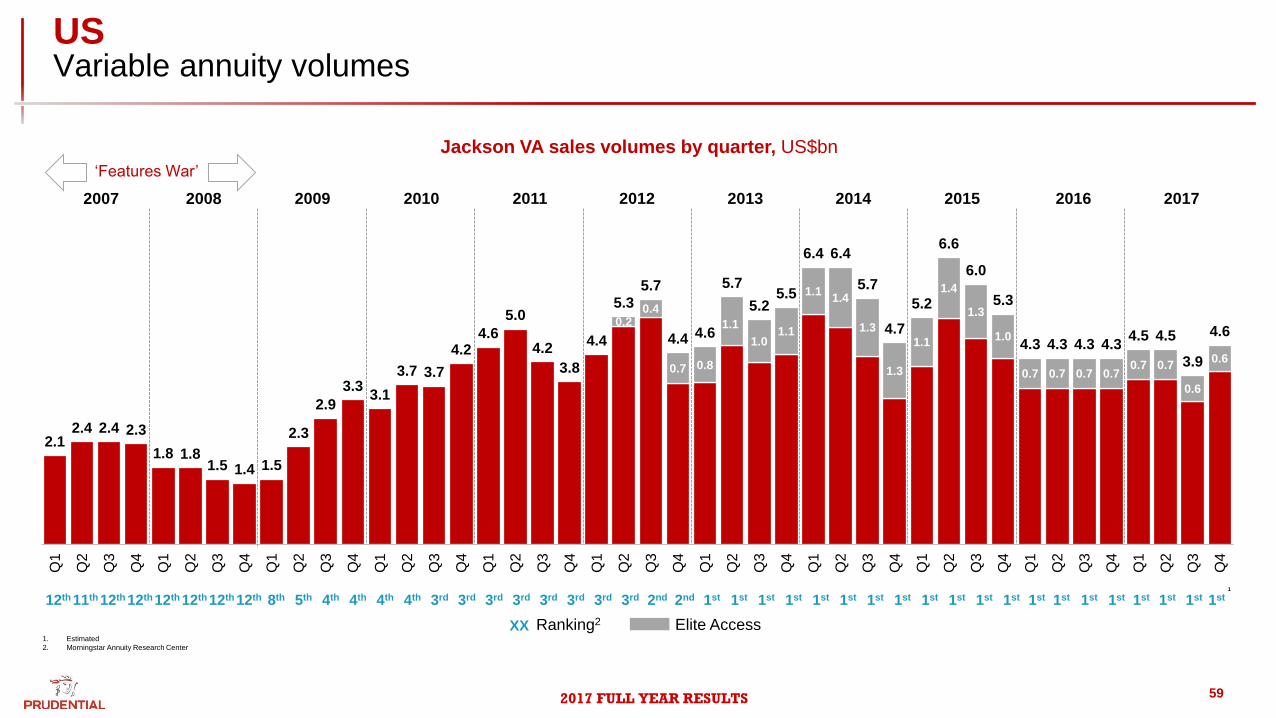
US Variable annuity volumes
59
0.2 0.4
0.7 0.8
1.1
1.0 1.1
1.1 1.4
1.3
1.3
1.1
1.4
1.3
1.0
0.7 0.7 0.7 0.7 0.7 0.7
0.6
0.6
2.1 2.4 2.4 2.3
1.8 1.8 1.5 1.4 1.5
2.3
2.9
3.3 3.1
3.7 3.7
4.2 4.6
5.0
4.2
3.8
4.4
5.3 5.7
4.4 4.6
5.7
5.2 5.5
6.4 6.4
5.7
4.7
5.2
6.6
6.0
5.3
4.3 4.3 4.3 4.3 4.5 4.5
3.9
4.6
Q1
Q2
Q3
Q4
Q1
Q2
Q3
Q4
Q1
Q2
Q3
Q4
Q1
Q2
Q3
Q4
Q1
Q2
Q3
Q4
Q1
Q2
Q3
Q4
Q1
Q2
Q3
Q4
Q1
Q2
Q3
Q4
Q1
Q2
Q3
Q4
Q1
Q2
Q3
Q4
Q1
Q2
Q3
Q4
1. Estimated
2. Morningstar Annuity Research Center
Ranking2 Elite Access
‘Features War’
1
2013 2014 2015 2016 2012 2011 2010 2008 2009 2007
Jackson VA sales volumes by quarter, US$bn
2017
12th 11th 12th 12th 12th 12th 12th 12th 8th 5th 4th 4th 4th 4th 3rd 3rd 3rd 3rd 3rd 3rd 3rd 3rd 2nd 2nd 1st 1st 1st 1st 1st 1st 1st 1st 1st 1st 1st 1st 1st 1st 1st 1st 1st 1st
XX
1st 1st
2017 FULL YEAR RESULTS 60
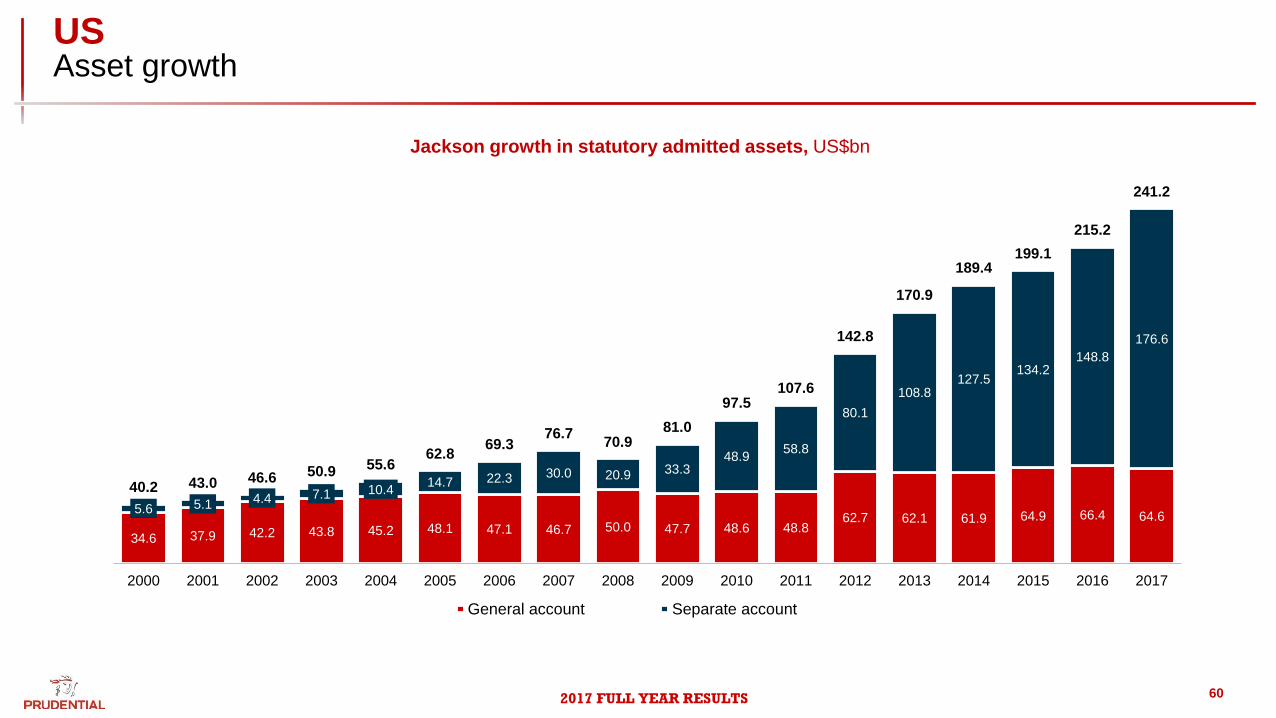
34.6 37.9 42.2 43.8 45.2 48.1 47.1 46.7 50.0 47.7 48.6 48.8 62.7 62.1 61.9 64.9 66.4 64.6
5.6 5.1 4.4 7.1 10.4 14.7 22.3 30.0 20.9 33.3
48.9 58.8
80.1
108.8 127.5
134.2 148.8
176.6
40.2 43.0 46.6 50.9 55.6 62.8
69.3 76.7
70.9 81.0
97.5 107.6
142.8
170.9
189.4 199.1
215.2
241.2
2000 2001 2002 2003 2004 2005 2006 2007 2008 2009 2010 2011 2012 2013 2014 2015 2016 2017
General account Separate account
Jackson growth in statutory admitted assets, US$bn
US Asset growth
2017 FULL YEAR RESULTS
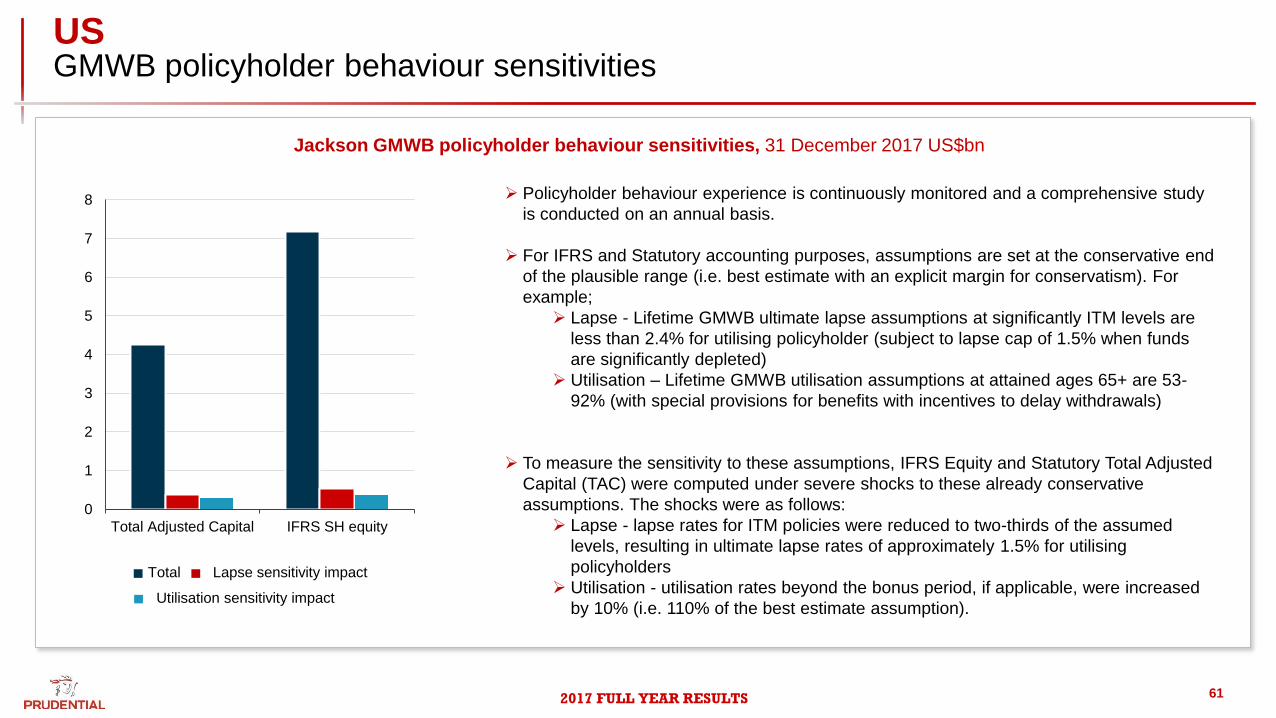
US GMWB policyholder behaviour sensitivities
61
Jackson GMWB policyholder behaviour sensitivities, 31 December 2017 US$bn
0
1
2
3
4
5
6
7
8
Total Adjusted Capital IFRS SH equity
Total Lapse sensitivity impact
Utilisation sensitivity impact
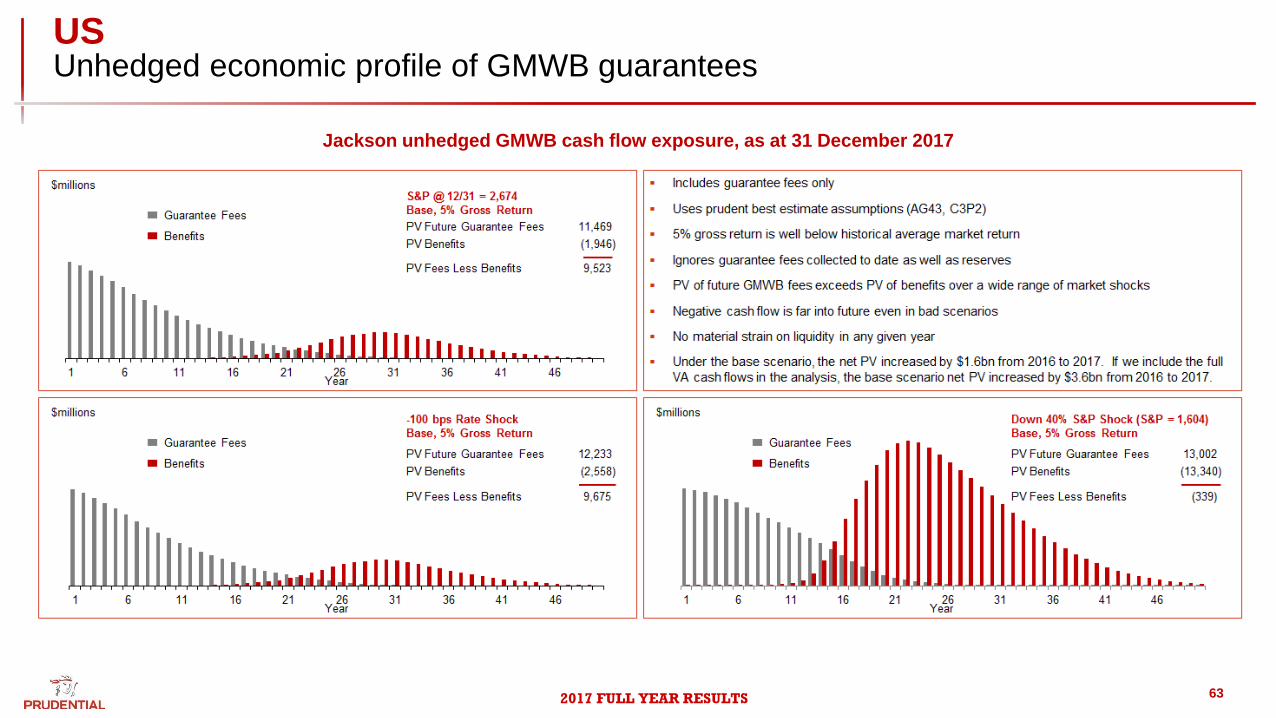
Policyholder behaviour experience is continuously monitored and a comprehensive study
is conducted on an annual basis.
For IFRS and Statutory accounting purposes, assumptions are set at the conservative end
of the plausible range (i.e. best estimate with an explicit margin for conservatism). For
example;
Lapse - Lifetime GMWB ultimate lapse assumptions at significantly ITM levels are
less than 2.4% for utilising policyholder (subject to lapse cap of 1.5% when funds
are significantly depleted)
Utilisation – Lifetime GMWB utilisation assumptions at attained ages 65+ are 53-
92% (with special provisions for benefits with incentives to delay withdrawals)
To measure the sensitivity to these assumptions, IFRS Equity and Statutory Total Adjusted
Capital (TAC) were computed under severe shocks to these already conservative
assumptions. The shocks were as follows:
Lapse - lapse rates for ITM policies were reduced to two-thirds of the assumed
levels, resulting in ultimate lapse rates of approximately 1.5% for utilising
policyholders
Utilisation - utilisation rates beyond the bonus period, if applicable, were increased
by 10% (i.e. 110% of the best estimate assumption).
2017 FULL YEAR RESULTS
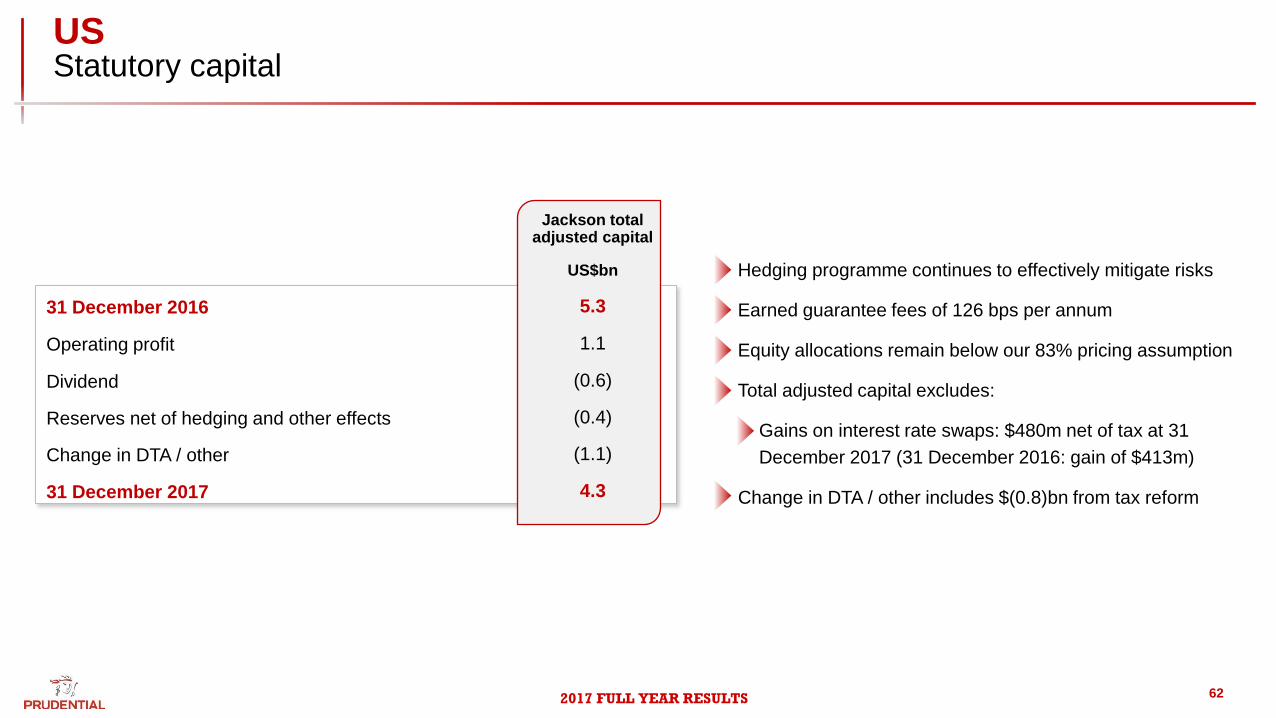
US Statutory capital
62
Hedging programme continues to effectively mitigate risks
Earned guarantee fees of 126 bps per annum
Equity allocations remain below our 83% pricing assumption
Total adjusted capital excludes:
Gains on interest rate swaps: $480m net of tax at 31
December 2017 (31 December 2016: gain of $413m)
Change in DTA / other includes $(0.8)bn from tax reform
Jackson total adjusted capital
US$bn
31 December 2016 5.3
Operating profit 1.1
Dividend (0.6)
Reserves net of hedging and other effects (0.4)
Change in DTA / other (1.1)
31 December 2017 4.3
2017 FULL YEAR RESULTS
US Unhedged economic profile of GMWB guarantees
63
Jackson unhedged GMWB cash flow exposure, as at 31 December 2017
2017 FULL YEAR RESULTS
Africa Regional footprint
64
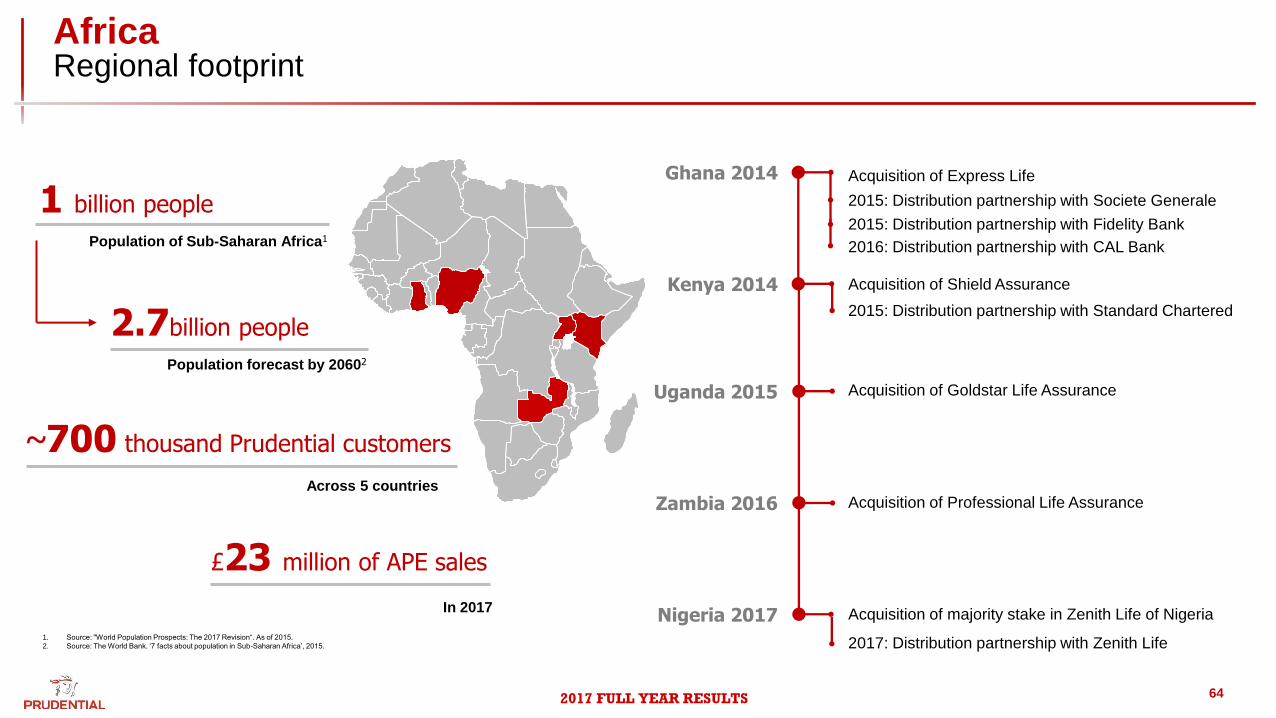
1 billion people
Population of Sub-Saharan Africa1
2.7billion people
Population forecast by 20602
Ghana 2014
Kenya 2014
Uganda 2015
Zambia 2016
Nigeria 2017
2015: Distribution partnership with Societe Generale
2015: Distribution partnership with Standard Chartered
Acquisition of majority stake in Zenith Life of Nigeria
Acquisition of Professional Life Assurance
Acquisition of Goldstar Life Assurance
Acquisition of Shield Assurance
2015: Distribution partnership with Fidelity Bank
Acquisition of Express Life
~700 thousand Prudential customers
Across 5 countries
1. Source: "World Population Prospects: The 2017 Revision“. As of 2015.
2. Source: The World Bank. ‘7 facts about population in Sub-Saharan Africa’, 2015.
£23 million of APE sales
In 2017
2016: Distribution partnership with CAL Bank
2017: Distribution partnership with Zenith Life
2017 FULL YEAR RESULTS
UK M&G Prudential
65
Market Context1,2,3
1848 Established
Leading provider of savings and retirement
income products
Core strengths in with-profits and retirement
Expertise in areas such as longevity, risk
management and multi-asset investment
1931 Established
1999 Acquired
International asset manager with more than 85
years’ experience
Offer funds across diverse geographies, asset
classes and investment strategies
Provides investment strategies to meet
Institutional clients’ long-term needs
Market trends
Convergent insurance and asset management business models
Self-reliance for savings, investment and retirement
Customer demand for one stop shop solutions from trusted, scale players
M&G Prudential
1. Source: The Investment Association – Asset management in the UK 2015-2016.
2. Source: EFAMA Asset Management report, data as at 2015
3. Growth rates source: PWC Asset Management 2020, BCG and Prudential calculations. Retail growth rate sourced from BCG, Europe and remaining UK using PWC Europe forecast CAGR of 4.4%
4. UK AUM consists of Commercial Property, Private Equity and Other of £1.3tn growing by £0.5tn by 2023. European AUM consists of Discretionary of Eur5.2tn growing by Eur2.0tn.
5. Discretionary includes mandates and could be included within M&G Institutional addressable market.
6. Source: HMRC – Individual Savings Account (ISA) Statistics April 2017. HMRC, BoE, ONS, ABI
2017 FULL YEAR RESULTS
UK Distribution mix
66
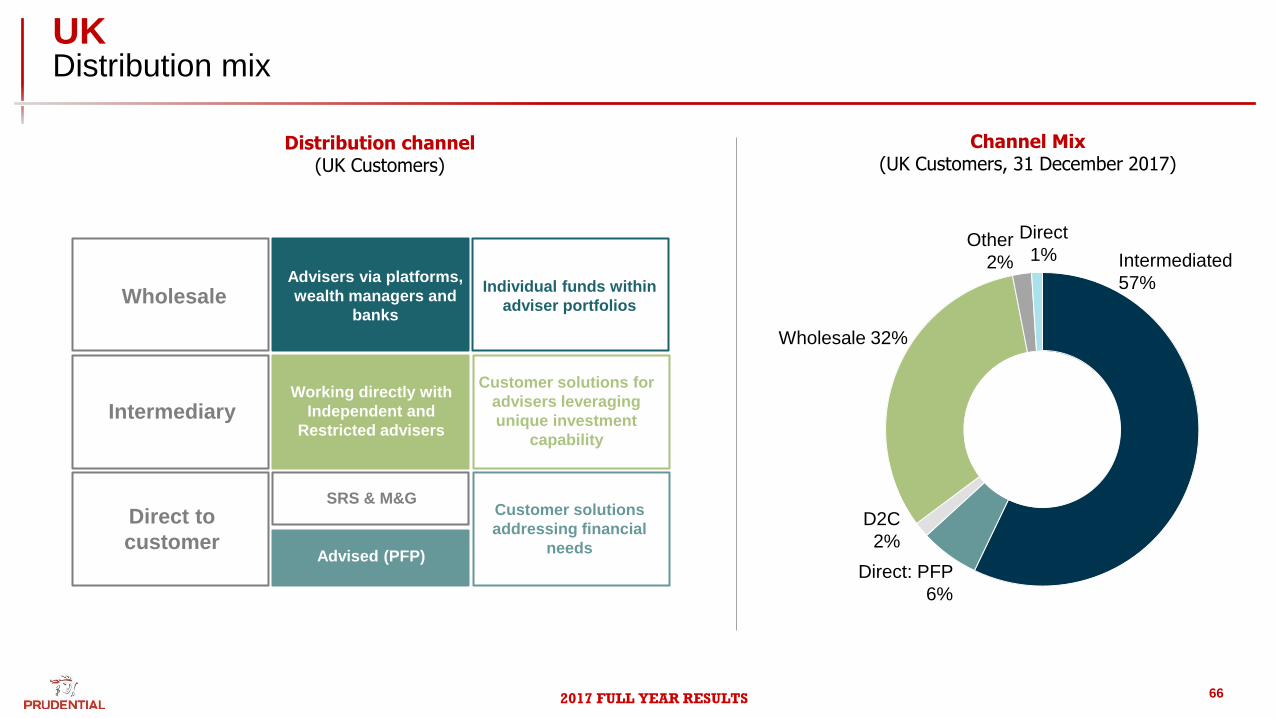
Wholesale
Intermediary
Direct to
customer
Advisers via platforms,
wealth managers and
banks
SRS & M&G
Working directly with
Independent and
Restricted advisers
Individual funds within
adviser portfolios
Customer solutions for
advisers leveraging
unique investment
capability
Customer solutions
addressing financial
needs Advised (PFP)
Other
2%
Direct: PFP
6%
Intermediated
57%
Wholesale 32%
Distribution channel (UK Customers)
Channel Mix (UK Customers, 31 December 2017)
D2C
2%
Direct
1%
2017 FULL YEAR RESULTS
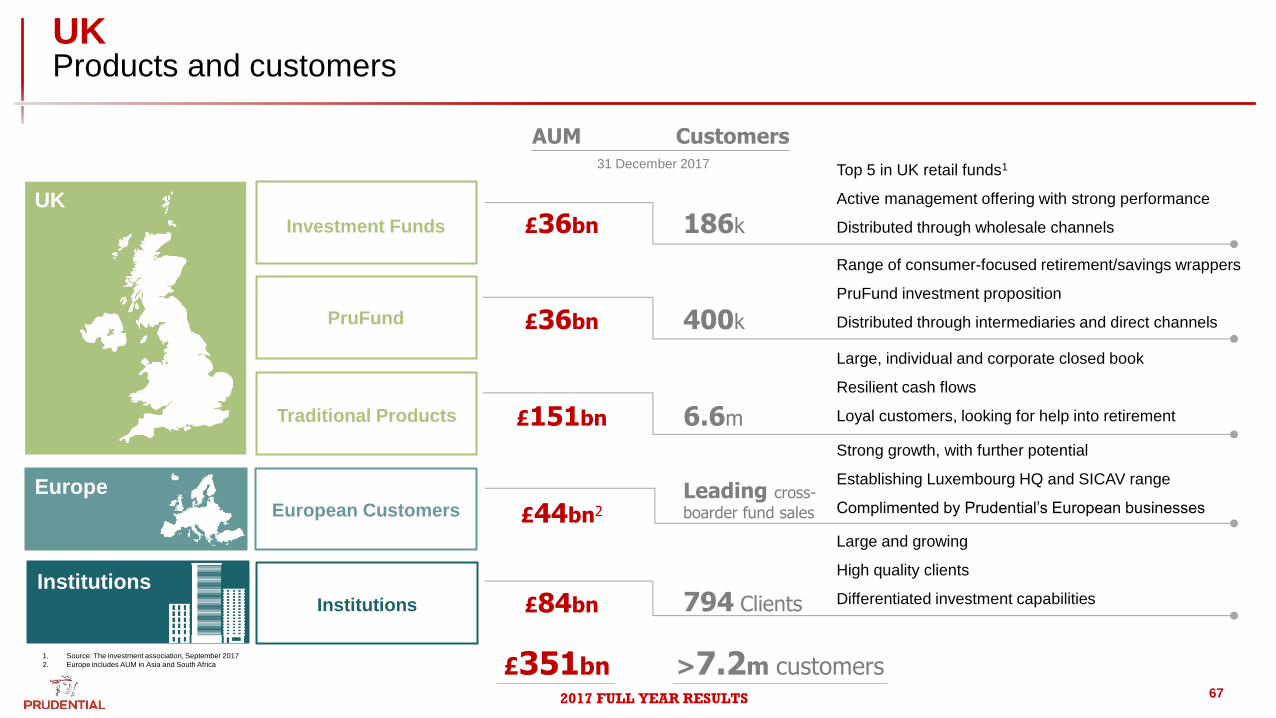
UK Products and customers
67
Investment Funds
PruFund
Traditional Products
European Customers
Institutions
31 December 2017
AUM Customers
£36bn
£36bn
£151bn
£44bn2
£84bn
186k
400k
6.6m
794 Clients
Top 5 in UK retail funds1
Active management offering with strong performance
Distributed through wholesale channels
Range of consumer-focused retirement/savings wrappers
PruFund investment proposition
Distributed through intermediaries and direct channels
Large, individual and corporate closed book
Resilient cash flows
Loyal customers, looking for help into retirement
Strong growth, with further potential
Establishing Luxembourg HQ and SICAV range
Complimented by Prudential’s European businesses
Large and growing
High quality clients
Differentiated investment capabilities
UK
Europe
Institutions
1. Source: The investment association, September 2017
2. Europe includes AUM in Asia and South Africa £351bn
Leading cross-
boarder fund sales
>7.2m customers
2017 FULL YEAR RESULTS
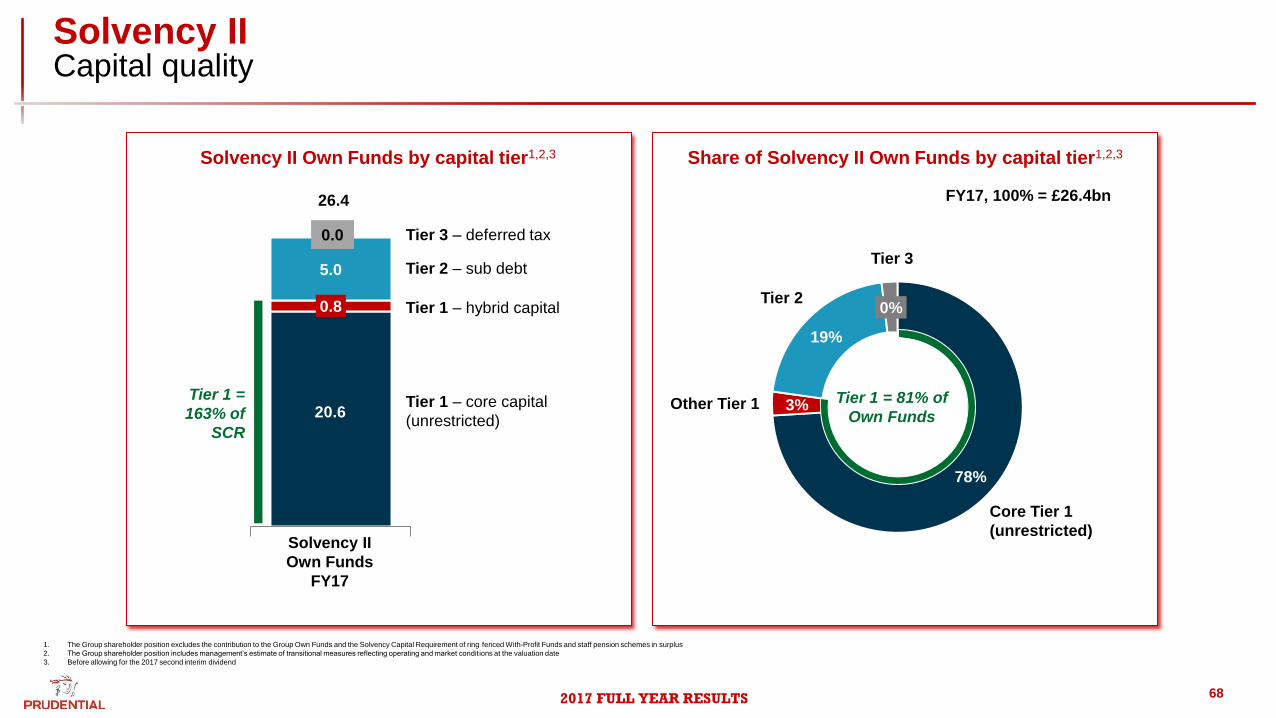
Solvency II Capital quality
68
Solvency II Own Funds by capital tier1,2,3
0.8
5.0
Solvency II
Own Funds
FY17
Tier 1 – core capital
(unrestricted)
Tier 1 – hybrid capital
Tier 2 – sub debt
Tier 3 – deferred tax
20.6
26.4
78%
3%
19%
0%
Core Tier 1
(unrestricted)
Other Tier 1
Tier 2
Tier 3
Tier 1 = 81% of
Own Funds
Tier 1 =
163% of
SCR
Share of Solvency II Own Funds by capital tier1,2,3
FY17, 100% = £26.4bn
1. The Group shareholder position excludes the contribution to the Group Own Funds and the Solvency Capital Requirement of ring fenced With-Profit Funds and staff pension schemes in surplus
2. The Group shareholder position includes management’s estimate of transitional measures reflecting operating and market condit ions at the valuation date
3. Before allowing for the 2017 second interim dividend
0.0
2017 FULL YEAR RESULTS
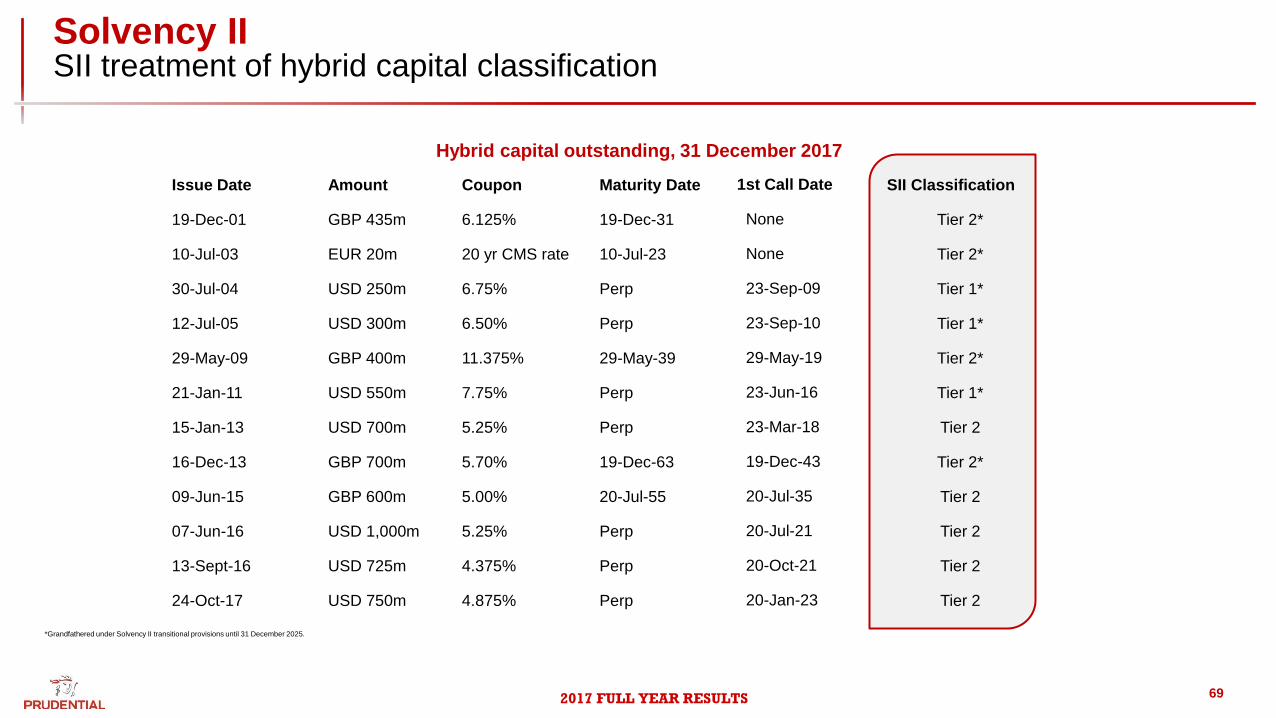
Solvency II SII treatment of hybrid capital classification
69
Issue Date Amount Coupon Maturity Date 1st Call Date SII Classification
19-Dec-01 GBP 435m 6.125% 19-Dec-31 None Tier 2*
10-Jul-03 EUR 20m 20 yr CMS rate 10-Jul-23 None Tier 2*
30-Jul-04 USD 250m 6.75% Perp 23-Sep-09 Tier 1*
12-Jul-05 USD 300m 6.50% Perp 23-Sep-10 Tier 1*
29-May-09 GBP 400m 11.375% 29-May-39 29-May-19 Tier 2*
21-Jan-11 USD 550m 7.75% Perp 23-Jun-16 Tier 1*
15-Jan-13 USD 700m 5.25% Perp 23-Mar-18 Tier 2
16-Dec-13 GBP 700m 5.70% 19-Dec-63 19-Dec-43 Tier 2*
09-Jun-15 GBP 600m 5.00% 20-Jul-55 20-Jul-35 Tier 2
07-Jun-16 USD 1,000m 5.25% Perp 20-Jul-21 Tier 2
13-Sept-16 USD 725m 4.375% Perp 20-Oct-21 Tier 2
24-Oct-17 USD 750m 4.875% Perp 20-Jan-23 Tier 2
*Grandfathered under Solvency II transitional provisions until 31 December 2025.
Hybrid capital outstanding, 31 December 2017
2017 FULL YEAR RESULTS
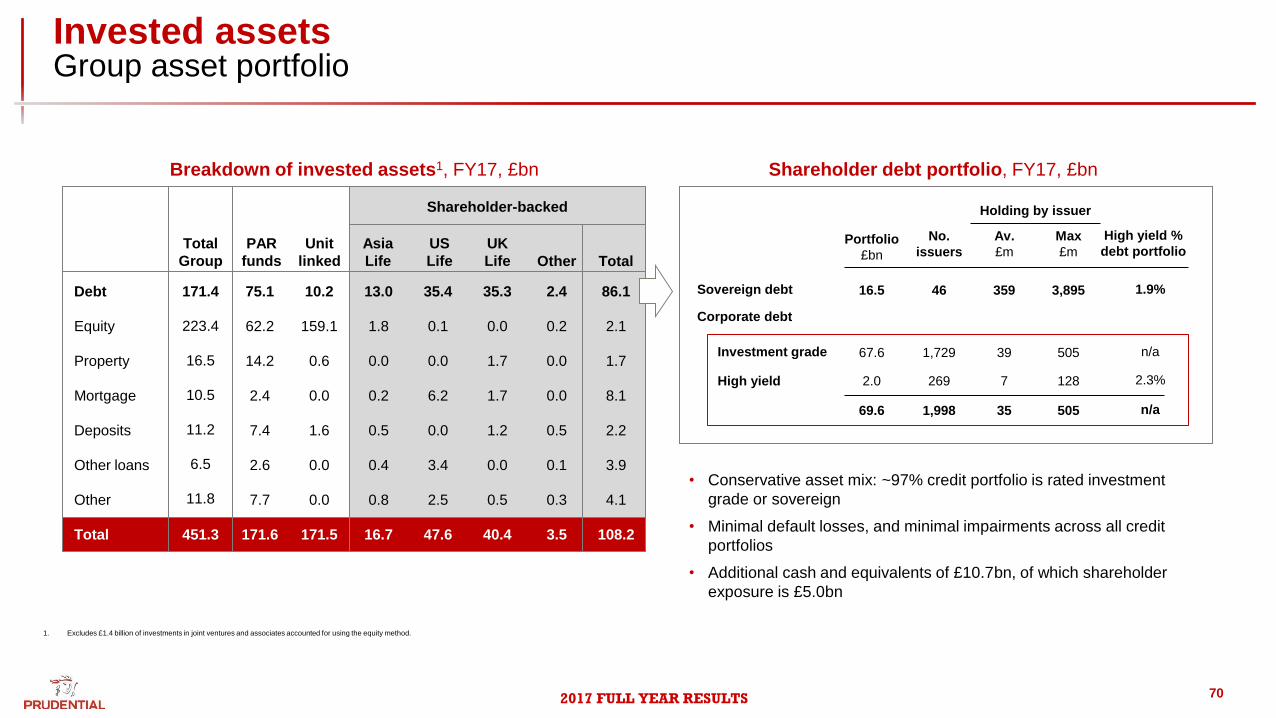
Invested assets Group asset portfolio
70
1. Excludes £1.4 billion of investments in joint ventures and associates accounted for using the equity method.
Breakdown of invested assets1, FY17, £bn
Asia
Life
US
Life
UK
Life Other Total
Total
Group
PAR
funds
Unit
linked
Debt
Equity
Property
Mortgage
Other loans
Deposits
Other
Total
171.4
223.4
16.5
10.5
11.2
6.5
11.8
451.3
75.1
62.2
14.2
2.4
7.4
2.6
7.7
171.6
10.2
159.1
0.6
0.0
1.6
0.0
0.0
171.5
13.0
1.8
0.0
0.2
0.5
0.4
0.8
16.7
35.4
0.1
0.0
6.2
0.0
3.4
2.5
47.6
35.3
0.0
1.7
1.7
1.2
0.0
0.5
40.4
2.4
0.2
0.0
0.0
0.5
0.1
0.3
3.5
86.1
2.1
1.7
8.1
2.2
3.9
4.1
108.2
Shareholder-backed
Shareholder debt portfolio, FY17, £bn
• Conservative asset mix: ~97% credit portfolio is rated investment
grade or sovereign
• Minimal default losses, and minimal impairments across all credit
portfolios
• Additional cash and equivalents of £10.7bn, of which shareholder
exposure is £5.0bn
Portfolio
£bn
Investment grade
High yield
No.
issuers
Holding by issuer
Max
£m
High yield %
debt portfolio
67.6
2.0
1,729 39 505
7 128 269
n/a
2.3%
Sovereign debt 16.5 46 359 3,895 1.9%
Corporate debt
69.6 35 505 1,998 n/a
Av.
£m
2017 FULL YEAR RESULTS
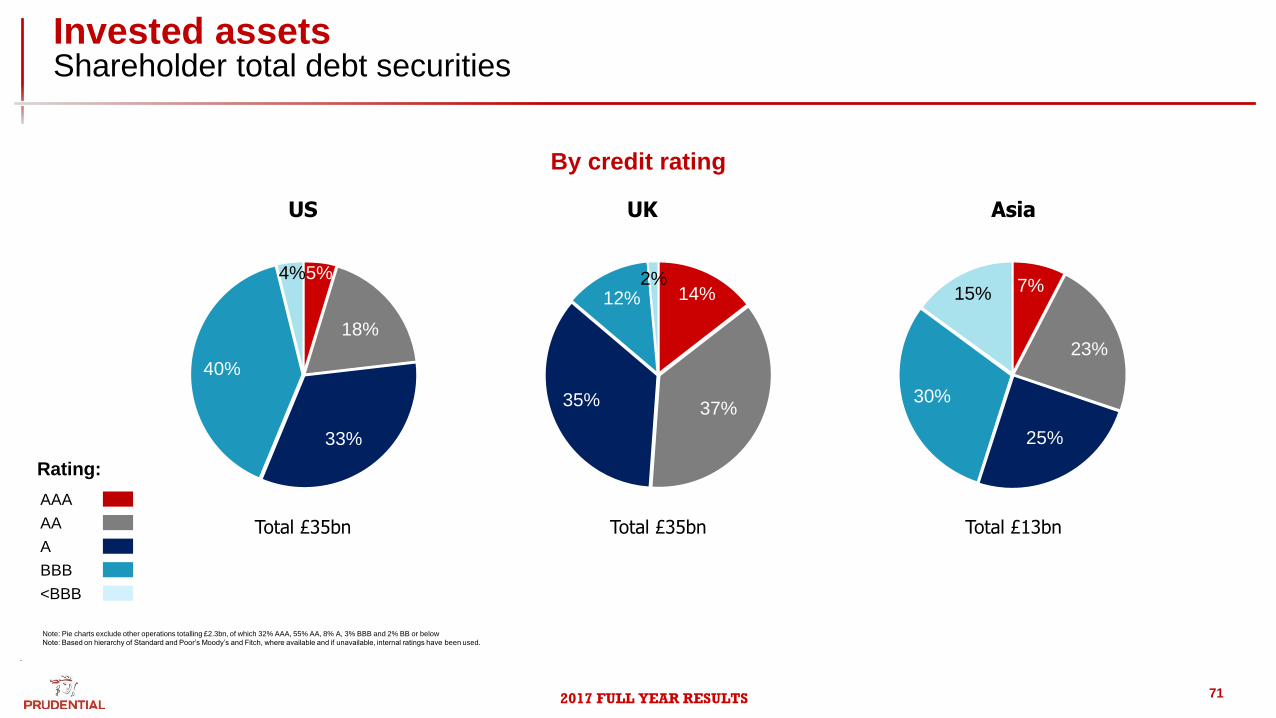
Invested assets Shareholder total debt securities
71
.
Note: Pie charts exclude other operations totalling £2.3bn, of which 32% AAA, 55% AA, 8% A, 3% BBB and 2% BB or below
Note: Based on hierarchy of Standard and Poor’s Moody’s and Fitch, where available and if unavailable, internal ratings have been used.
By credit rating
5%
18%
33%
40%
4%
Rating:
AAA
AA
A
BBB
<BBB
14%
37% 35%
12% 2% 7%
23%
25%
30%
15%
Total £35bn Total £35bn Total £13bn
US UK Asia
2017 FULL YEAR RESULTS
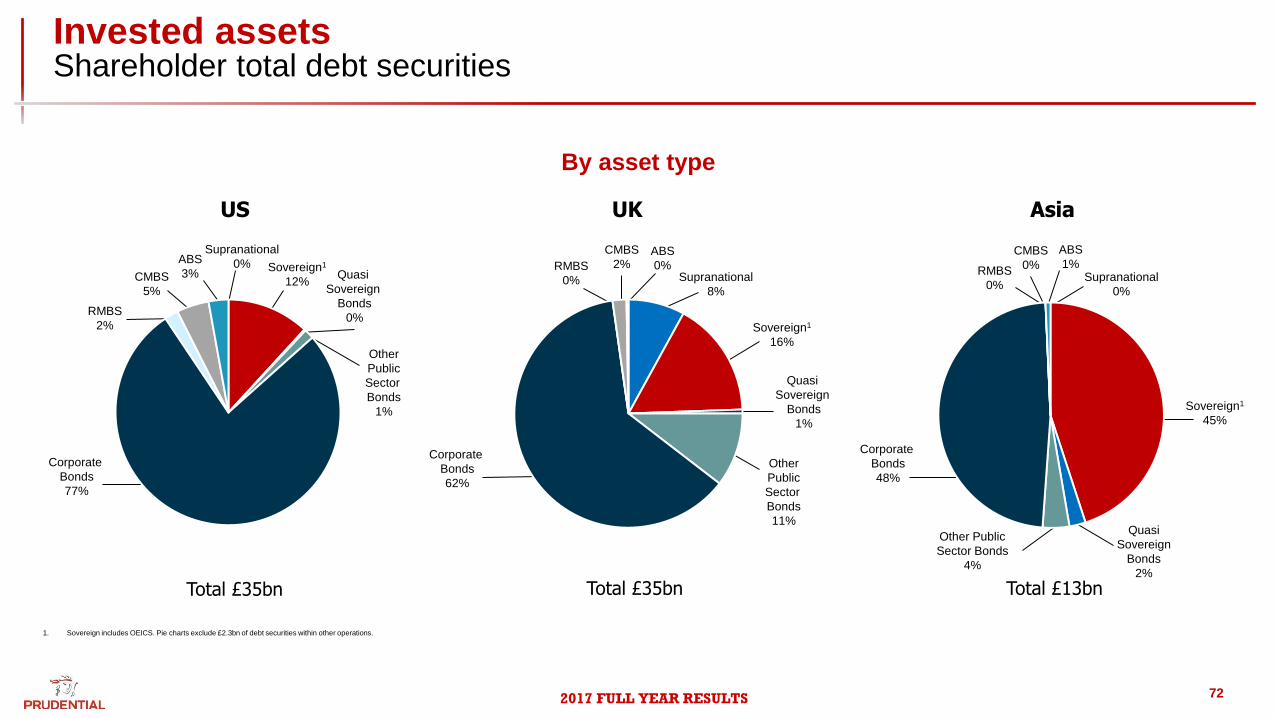
Invested assets Shareholder total debt securities
72
1. Sovereign includes OEICS. Pie charts exclude £2.3bn of debt securities within other operations.
By asset type
Total £35bn Total £35bn Total £13bn
Corporate
Bonds
77%
RMBS
2%
CMBS
5%
ABS
3%
Supranational
0% Sovereign1
12% Quasi
Sovereign
Bonds
0%
Other
Public
Sector
Bonds
1%
Corporate
Bonds
62%
RMBS
0%
CMBS
2% ABS
0% Supranational
8%
Sovereign1
16%
Quasi
Sovereign
Bonds
1%
Other
Public
Sector
Bonds
11%
Corporate
Bonds
48%
RMBS
0%
CMBS
0%
ABS
1% Supranational
0%
Sovereign1
45%
Quasi
Sovereign
Bonds
2%
Other Public
Sector Bonds
4%
US UK Asia
2017 FULL YEAR RESULTS
Other
2%
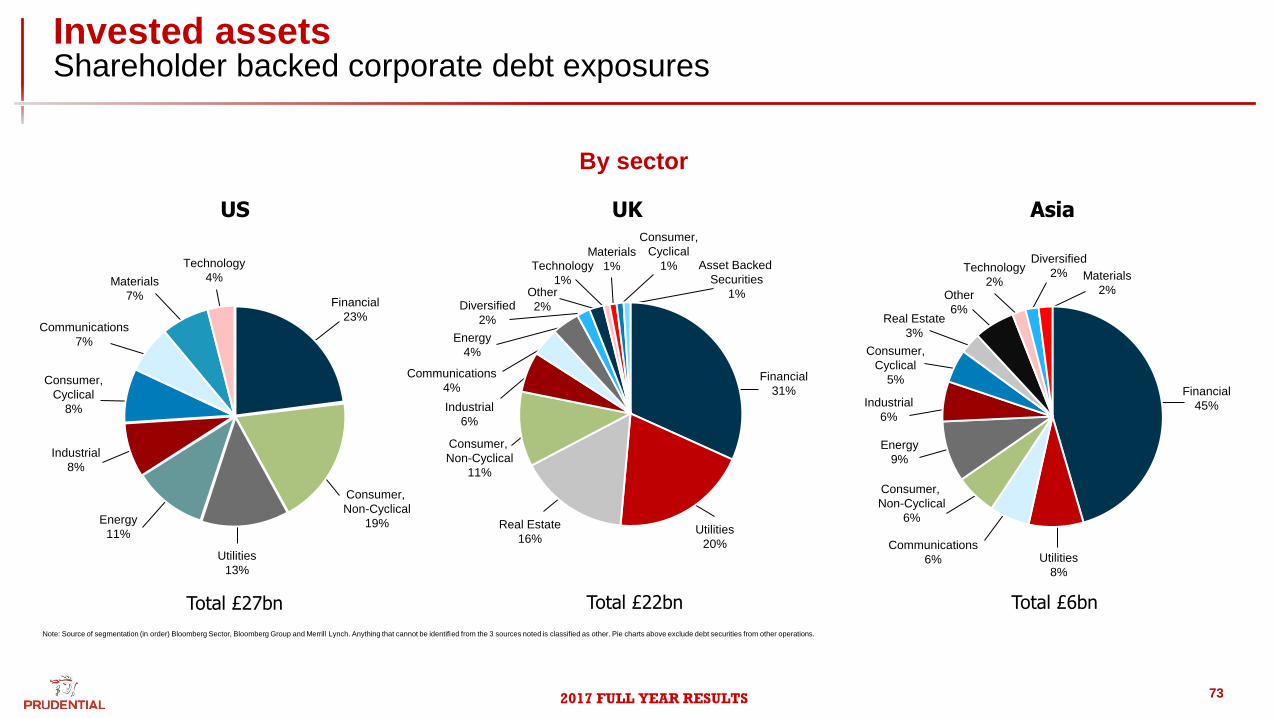
Invested assets Shareholder backed corporate debt exposures
73
Note: Source of segmentation (in order) Bloomberg Sector, Bloomberg Group and Merrill Lynch. Anything that cannot be identified from the 3 sources noted is classified as other. Pie charts above exclude debt securities from other operations.
By sector
Energy
11%
Industrial
8%
Consumer,
Cyclical
8%
Communications
7%
Materials
7%
Technology
4%
Financial
23%
Consumer,
Non-Cyclical
19%
Utilities
13%
Real Estate
16%
Energy
4%
Technology
1%
Materials
1%
Consumer,
Cyclical
1%
Financial
31%
Asset Backed
Securities
1%
Utilities
20%
Diversified
2%
Communications
4%
Industrial
6%
Consumer,
Non-Cyclical
11%
Real Estate
3%
Energy
9%
Other
6%
Technology
2% Materials
2%
Consumer,
Cyclical
5% Financial
45%
Utilities
8%
Diversified
2%
Communications
6%
Industrial
6%
Consumer,
Non-Cyclical
6%
US UK Asia
Total £27bn Total £22bn Total £6bn
2017 FULL YEAR RESULTS
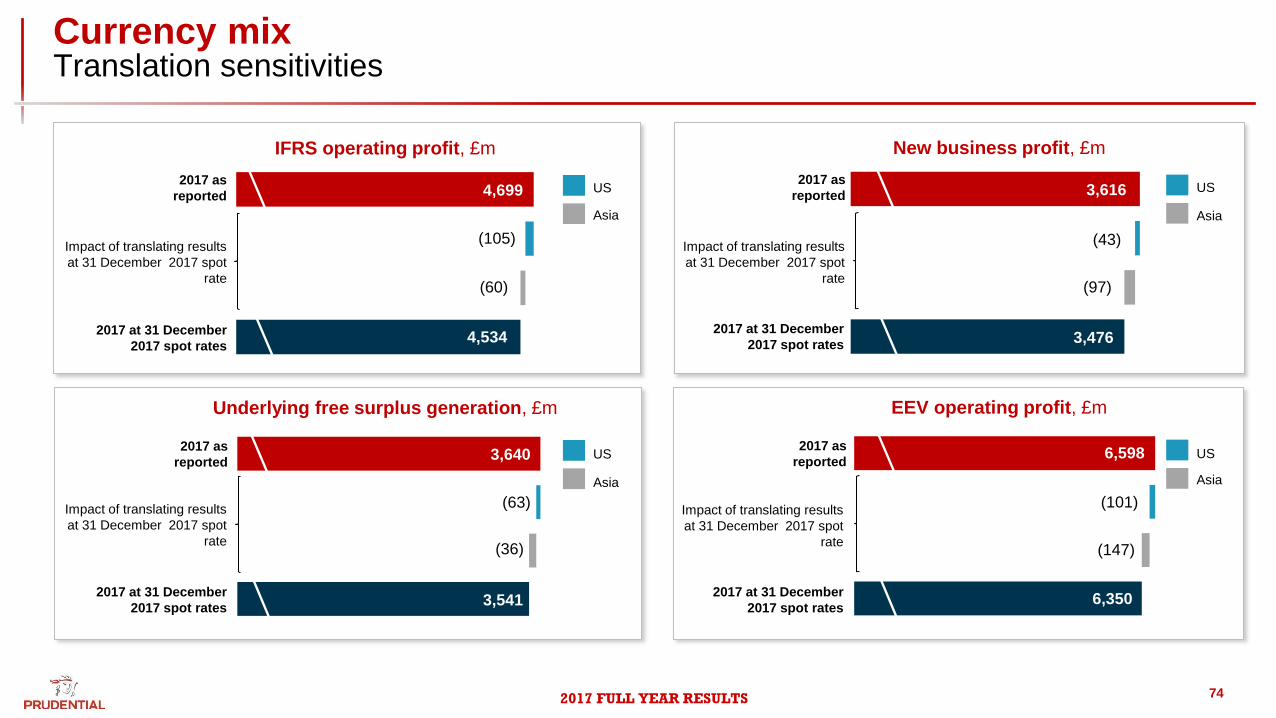
Currency mix Translation sensitivities
74
2017 as
reported
2017 at 31 December
2017 spot rates 4,534
4,699
(105)
(60)
Impact of translating results
at 31 December 2017 spot
rate
2017 as
reported
3,541
3,640
(36)
(63)
Asia
US
Asia
US
IFRS operating profit, £m
Underlying free surplus generation, £m
2017 as
reported
3,476
3,616
(97)
(43)
2017 as
reported
6,350
6,598
(101)
(147)
Asia
US
Asia
US
New business profit, £m
EEV operating profit, £m
2017 at 31 December
2017 spot rates
2017 at 31 December
2017 spot rates
2017 at 31 December
2017 spot rates
Impact of translating results
at 31 December 2017 spot
rate
Impact of translating results
at 31 December 2017 spot
rate
Impact of translating results
at 31 December 2017 spot
rate
Related Documents


