COST OF CYBER CRIME STUDY 2017 INSIGHTS ON THE SECURITY INVESTMENTS THAT MAKE A DIFFERENCE Independently conducted by Ponemon Institute LLC and jointly developed by Accenture

Welcome message from author
This document is posted to help you gain knowledge. Please leave a comment to let me know what you think about it! Share it to your friends and learn new things together.
Transcript
COST OF CYBER CRIME STUDY
2017
INSIGHTS ON THE SECURITY INVESTMENTS THAT MAKE A DIFFERENCE
Independently conducted by Ponemon Institute LLC and jointly developed by Accenture
2 > 2017 COST OF CYBER CRIME STUDY
$11.7M
22.7% 130 27.4%
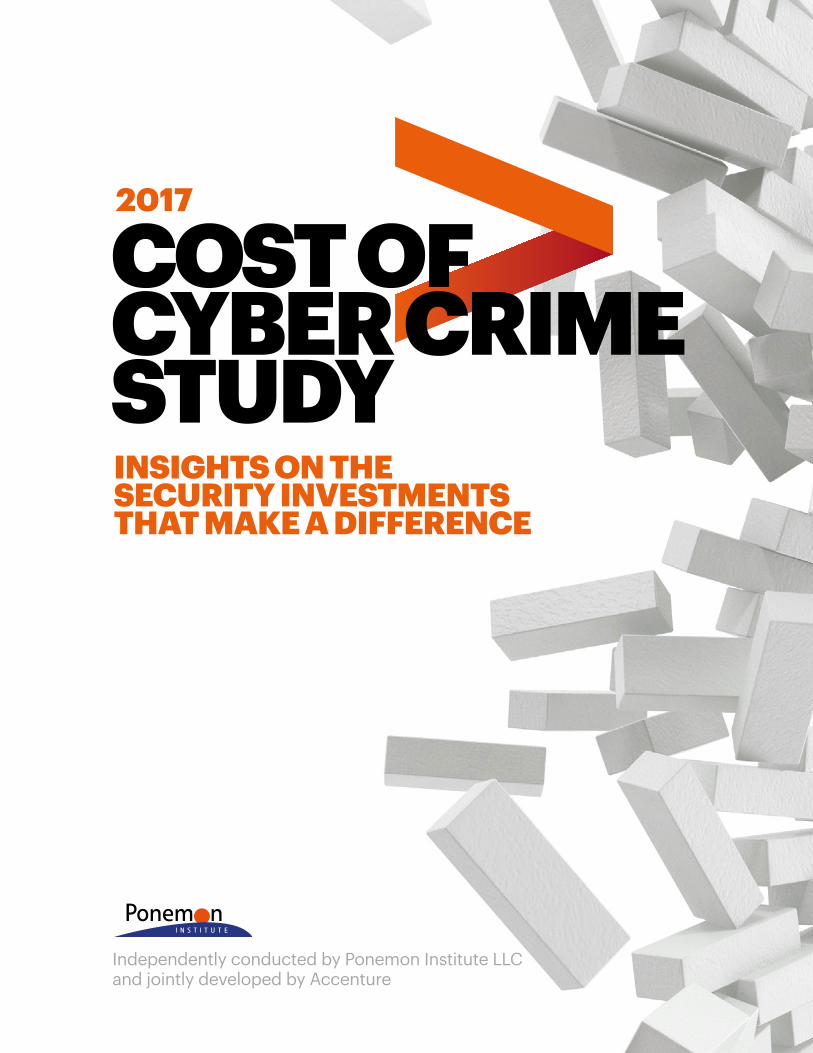
Average annualized cost of cybersecurity (USD)
Percentage increase in cost of cybersecurity in a year
Average number of security breaches each year
Percentage increase in average annual number of security breaches
EXECUTIVE SUMMARY
> 3 2017 COST OF CYBER CRIME STUDY
Over the last two years, the accelerating cost of cyber crime means that it is now 23 percent more than last year and is costing organizations, on average, US$11.7 million. Whether managing incidents themselves or spending to recover from the disruption to the business and customers, organizations are investing on an unprecedented scale—but current spending priorities show that much of this is misdirected toward security capabilities that fail to deliver the greatest efficiency and effectiveness. A better understanding of the cost of cyber crime could help executives bridge the gap between their own defenses and the escalating creativity—and numbers—of threat actors. Alongside the increased cost of cyber crime—which runs into an average of more than US$17 million for organizations in industries like Financial Services and Utilities and Energy—attackers are getting smarter. Criminals are evolving new business models, such as ransomware-as-a-service, which mean that attackers are finding it easier to scale cyber crime globally.
PRIORITIZING BREAKTHROUGH INVESTMENTS

4 > 2017 COST OF CYBER CRIME STUDY
With cyber attacks on the rise, successful breaches per company each year has risen more than 27 percent, from an average of 102 to 130. Ransomware attacks alone have doubled in frequency, from 13 percent to 27 percent, with incidents like WannaCry and Petya affecting thousands of targets and disrupting public services and large corporations across the world. One of the most significant data breaches in recent years has been the successful theft of 143 million customer records from Equifax—a consumer credit reporting agency—a cyber crime with devastating consequences due to the type of personally identifiable information stolen and knock-on effect on the credit markets. Information theft of this type remains the most expensive consequence of a cyber crime. Among the organizations we studied, information loss represents the largest cost component with a rise from 35 percent in 2015 to 43 percent in 2017. It is this threat landscape that demands organizations re-examine their investment priorities to keep pace with these more sophisticated and highly motivated attacks.
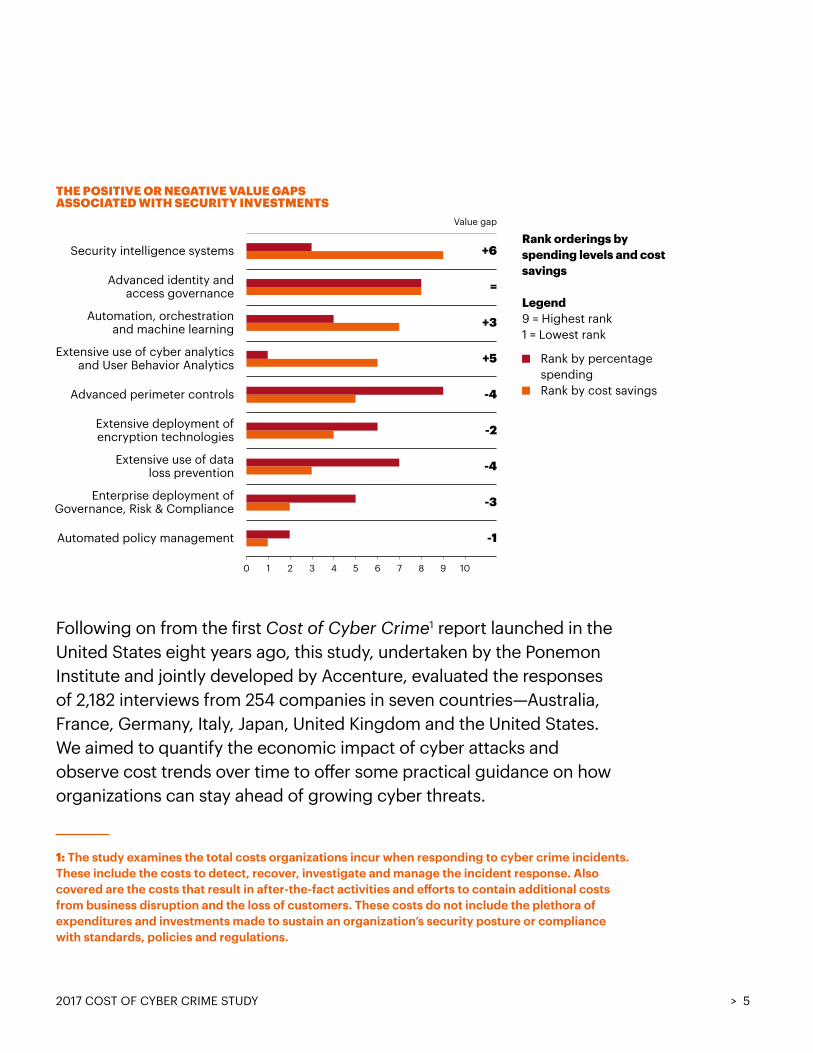
To better understand the effectiveness of investment decisions, we analyzed nine security technologies across two dimensions: the percentage spending level between them and their value in terms of cost-savings to the business. The findings illustrate that many organizations may be spending too much on the wrong technologies. Five of the nine security technologies had a negative value gap where the percentage spending level is higher than the relative value to the business. Of the remaining four technologies, three had a significant positive value gap and one was in balance. So, while maintaining the status quo on advanced identity and access governance, the opportunity exists to evaluate potential over-spend in areas which have a negative value gap and rebalance these funds by investing in the breakthrough innovations which deliver positive value.
EXECUTIVE SUMMARY
> 5 2017 COST OF CYBER CRIME STUDY
Following on from the first Cost of Cyber Crime1 report launched in the United States eight years ago, this study, undertaken by the Ponemon Institute and jointly developed by Accenture, evaluated the responses of 2,182 interviews from 254 companies in seven countries—Australia, France, Germany, Italy, Japan, United Kingdom and the United States. We aimed to quantify the economic impact of cyber attacks and observe cost trends over time to offer some practical guidance on how organizations can stay ahead of growing cyber threats.
1: The study examines the total costs organizations incur when responding to cyber crime incidents. These include the costs to detect, recover, investigate and manage the incident response. Also covered are the costs that result in after-the-fact activities and efforts to contain additional costs from business disruption and the loss of customers. These costs do not include the plethora of expenditures and investments made to sustain an organization’s security posture or compliance with standards, policies and regulations.
Rank orderings by spending levels and cost savings
Legend 9 = Highest rank 1 = Lowest rank
Rank by percentage spending Rank by cost savings
FY2013 FY2014 FY2015 FY2016 FY2017
$14M
12M
10M
8M
6M
4M
2M
0
$7.2M $7.6M $7.7M
$9.5M
$11.7M
0 1 2 3 4 5 6 7 8 9 10
Security intelligence systems
Extensive use of cyber analyticsand User Behavior Analytics
Advanced perimeter controls
Automation, orchestrationand machine learning
Enterprise deployment ofGovernance, Risk & Compliance
Advanced identity andaccess governance
Automated policy management
+6
-1
Extensive deployment ofencryption technologies
Extensive use of dataloss prevention
Value gap
-3
-4
-2
-4
+5
=
+3
THE POSITIVE OR NEGATIVE VALUE GAPS ASSOCIATED WITH SECURITY INVESTMENTS
6 > 2017 COST OF CYBER CRIME STUDY
HIGHLIGHTS FROM THE FINDINGS INCLUDE:
Security intelligence systems (67 percent) and advanced identity and access governance (63 percent) are the top two most widely deployed enabling security technologies across the enterprise. They also deliver the highest positive value gap with organizational cost savings of US$2.8 million and US$2.4 million respectively. As the threat landscape constantly evolves, these investments should be monitored closely so that spend is at an appropriate level and maintains effective outcomes. Aside from systems and governance, other investments show a lack of balance. Of the nine security technologies evaluated, the highest percentage spend was on advanced perimeter controls. Yet, the cost savings associated with technologies in this area were only fifth in the overall ranking with a negative value gap of minus 4. Clearly, an opportunity exists here to assess spending levels and potentially reallocate investments to higher-value security technologies.
Spending on governance, risk and compliance (GRC) technologies is not a fast-track to increased security. Enterprise-wide deployment of GRC technology and automated policy management showed the lowest effectiveness in reducing cyber crime costs (9 percent and 7 percent respectively) out of nine enabling security technologies. So, while compliance technology is important, organizations must spend to a level that is appropriate to achieve the required capability and effectiveness, enabling them to free up funds for breakthrough innovations.
EXECUTIVE SUMMARY
Organizations need to better balance investments in security technologies.
Compliance technology is important but don’t bet the business on it.
> 7 2017 COST OF CYBER CRIME STUDY
Innovations are generating the highest returns on investment, yet investment in them is low. For example, two enabling security technology areas identified as “Extensive use of cyber analytics and User Behavior Analytics (UBA)” and “Automation, orchestration and machine learning” were the lowest ranked technologies for enterprise-wide deployment (32 percent and 28 percent respectively) and yet they provide the third and fourth highest cost savings for security technologies. By balancing investments from less rewarding technologies into these breakthrough innovation areas, organizations could improve the effectiveness of their security programs.
RECOMMENDATIONS
The foundation of a strong and effective security program is to identify and “harden” the higher-value assets. These are the “crown jewels” of a business—the assets most critical to operations, subject to the most stringent regulatory penalties, and the source of important trade secrets and market differentiation. Hardening these assets makes it as difficult and costly as possible for adversaries to achieve their goals, and limits the damage they can cause if they do obtain access.
Organizations need to grasp the innovation opportunity.
$2.8Mcost savings from security intelligence systems and most positive value gap
8 > 2017 COST OF CYBER CRIME STUDY
By taking the following three steps, organizations can further improve the effectiveness of their cybersecurity efforts to fend off and reduce the impact of cyber crime:
Invest in the “brilliant basics” such as security intelligence and advanced access management and yet recognize the need to innovate to stay ahead of the hackers.
Organizations should not rely on compliance alone to enhance their security profile but undertake extreme pressure testing to identify vulnerabilities more rigorously than even the most highly motivated attacker.
Balance spend on new technologies, specifically analytics and artificial intelligence, to enhance program effectiveness and scale value.
Organizations need to recognize that spending alone does not always equate to value. Beyond prevention and remediation, if security fails, companies face unexpected costs from not being able to run their businesses efficiently to compete in the digital economy. Knowing which assets must be protected, and what the consequences will be for the business if protection fails, requires an intelligent security strategy that builds resilience from the inside out and an industry-specific strategy that protects the entire value chain. As this research shows, making wise security investments can help to make a difference.
EXECUTIVE SUMMARY
Build cyber-security on a strong foundation
1 >
2 > Undertake extreme pressure testing
Invest in breakthrough innovation
3 >
> 9 2017 COST OF CYBER CRIME STUDY
$2.4 million average cost of malware attack spend and the top cost to companies
50 days average time to resolve a malicious insiders attack
23 daysaverage time to resolve a ransomware attack
10 > 2017 COST OF CYBER CRIME STUDY
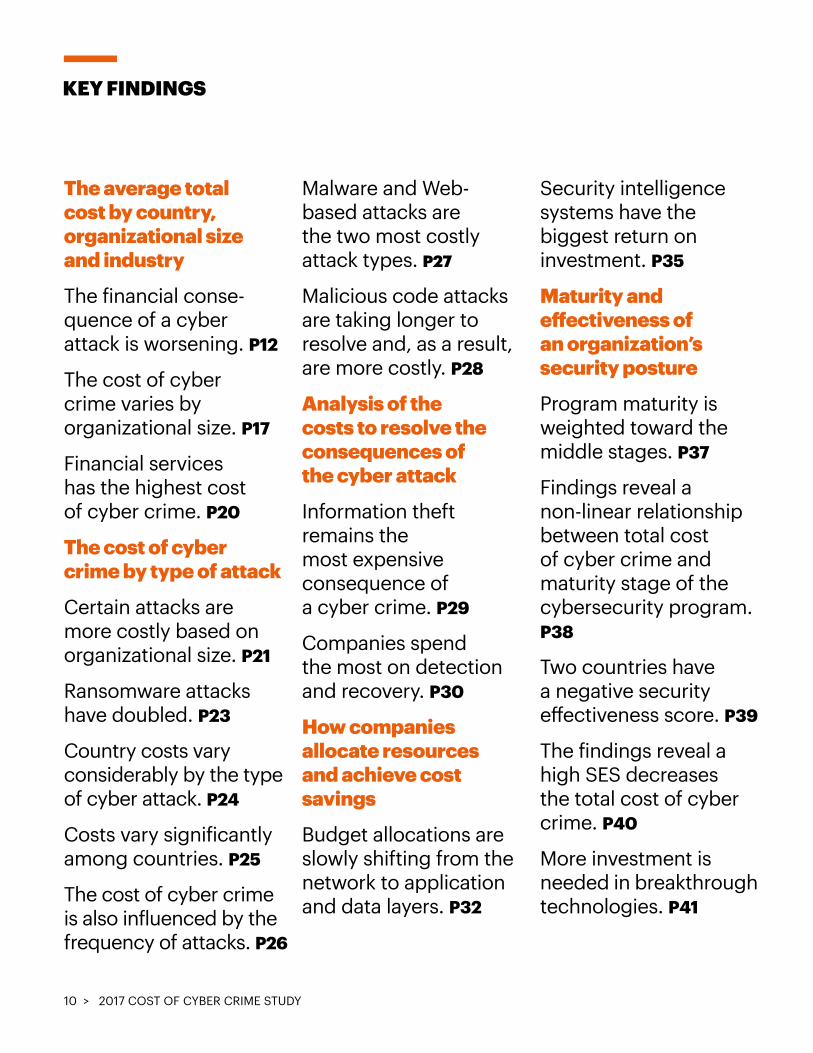
The average total cost by country, organizational size and industry
The financial conse-quence of a cyber attack is worsening. P12
The cost of cyber crime varies by organizational size. P17
Financial services has the highest cost of cyber crime. P20
The cost of cyber crime by type of attack
Certain attacks are more costly based on organizational size. P21
Ransomware attacks have doubled. P23
Country costs vary considerably by the type of cyber attack. P24
Costs vary significantly among countries. P25
The cost of cyber crime is also influenced by the frequency of attacks. P26
Malware and Web-based attacks are the two most costly attack types. P27
Malicious code attacks are taking longer to resolve and, as a result, are more costly. P28
Analysis of the costs to resolve the consequences of the cyber attack
Information theft remains the most expensive consequence of a cyber crime. P29
Companies spend the most on detection and recovery. P30
How companies allocate resources and achieve cost savings
Budget allocations are slowly shifting from the network to application and data layers. P32
Security intelligence systems have the biggest return on investment. P35
Maturity and effectiveness of an organization’s security posture
Program maturity is weighted toward the middle stages. P37
Findings reveal a non-linear relationship between total cost of cyber crime and maturity stage of the cybersecurity program.P38
Two countries have a negative security effectiveness score. P39
The findings reveal a high SES decreases the total cost of cyber crime. P40
More investment is needed in breakthrough technologies. P41
KEY FINDINGS
> 11 2017 COST OF CYBER CRIME STUDY
The cost of cyber crime varies by country, organizational size, industry, type of cyber attack and maturity and effectiveness of an organization’s security posture. In addition to presenting the range of costs according to these variables, we also analyzed the average expenditures and allocation of resources to resolve the cyber attack. Topics covered in this report include:
• Average total cost by country, organizational size and industry
• The cost of cyber crime by type of cyber attack• Analysis of the costs to resolve the consequences
of the cyber attack• How companies allocate resources and achieve
cost savings• Maturity and effectiveness of an organization’s
security posture
12 > 2017 COST OF CYBER CRIME STUDY
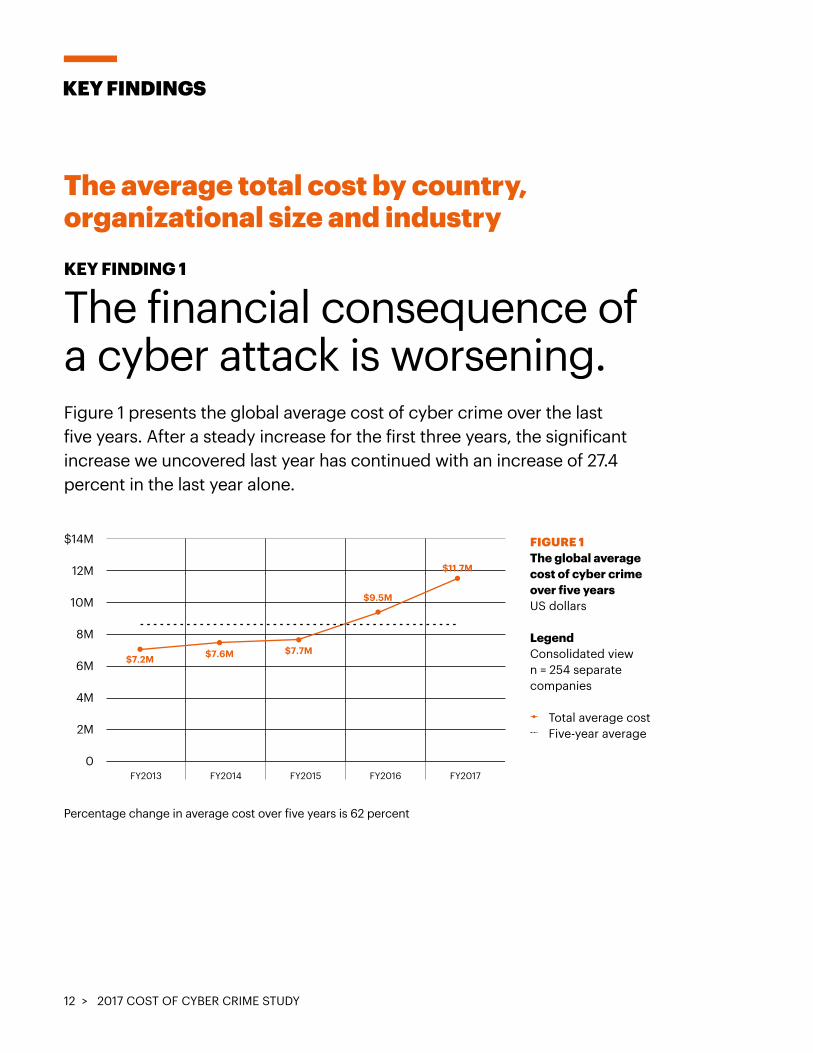
The average total cost by country, organizational size and industryKEY FINDING 1
The financial consequence of a cyber attack is worsening.Figure 1 presents the global average cost of cyber crime over the last five years. After a steady increase for the first three years, the significant increase we uncovered last year has continued with an increase of 27.4 percent in the last year alone.
Percentage change in average cost over five years is 62 percent
KEY FINDINGS
FIGURE 1 The global average cost of cyber crime over five years US dollars
LegendConsolidated view n = 254 separate companies
Total average cost Five-year average
FY2013 FY2014 FY2015 FY2016 FY2017
$14M
12M
10M
8M
6M
4M
2M
0
$7.2M $7.6M $7.7M
$9.5M
$11.7M
0 1 2 3 4 5 6 7 8 9 10
Security intelligence systems
Extensive use of cyber analyticsand User Behavior Analytics
Advanced perimeter controls
Automation, orchestrationand machine learning
Enterprise deployment ofGovernance, Risk & Compliance
Advanced identity andaccess governance
Automated policy management
+6
-1
Extensive deployment ofencryption technologies
Extensive use of dataloss prevention
Value gap
-3
-4
-2
-4
+5
=
+3
$0 5 10 15 20 25
United States
Germany
Japan
United Kingdom
*France
*Italy
Australia
21.22$17.36
11.157.84
10.458.39
8.747.21
7.907.90
6.736.73
5.414.30
> 13 2017 COST OF CYBER CRIME STUDY
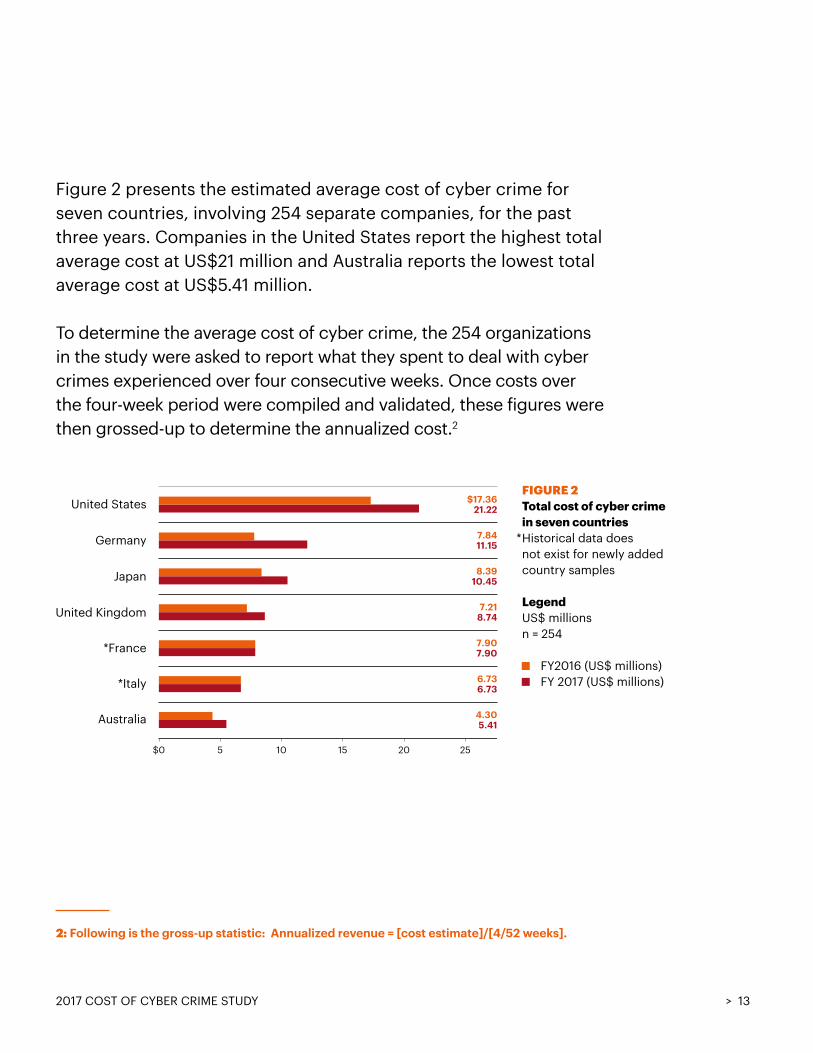
Figure 2 presents the estimated average cost of cyber crime for seven countries, involving 254 separate companies, for the past three years. Companies in the United States report the highest total average cost at US$21 million and Australia reports the lowest total average cost at US$5.41 million.
To determine the average cost of cyber crime, the 254 organizations in the study were asked to report what they spent to deal with cyber crimes experienced over four consecutive weeks. Once costs over the four-week period were compiled and validated, these figures were then grossed-up to determine the annualized cost.2
*
2: Following is the gross-up statistic: Annualized revenue = [cost estimate]/[4/52 weeks].
FIGURE 2 Total cost of cyber crime in seven countriesHistorical data does not exist for newly added country samples
LegendUS$ millions n = 254
FY2016 (US$ millions) FY 2017 (US$ millions)
$0 5 10 15 20 25
United States
Germany
Japan
United Kingdom
*France
*Italy
Australia
21.22$17.36
11.157.84
10.458.39
8.747.21
7.907.90
6.736.73
5.414.30
14 > 2017 COST OF CYBER CRIME STUDY
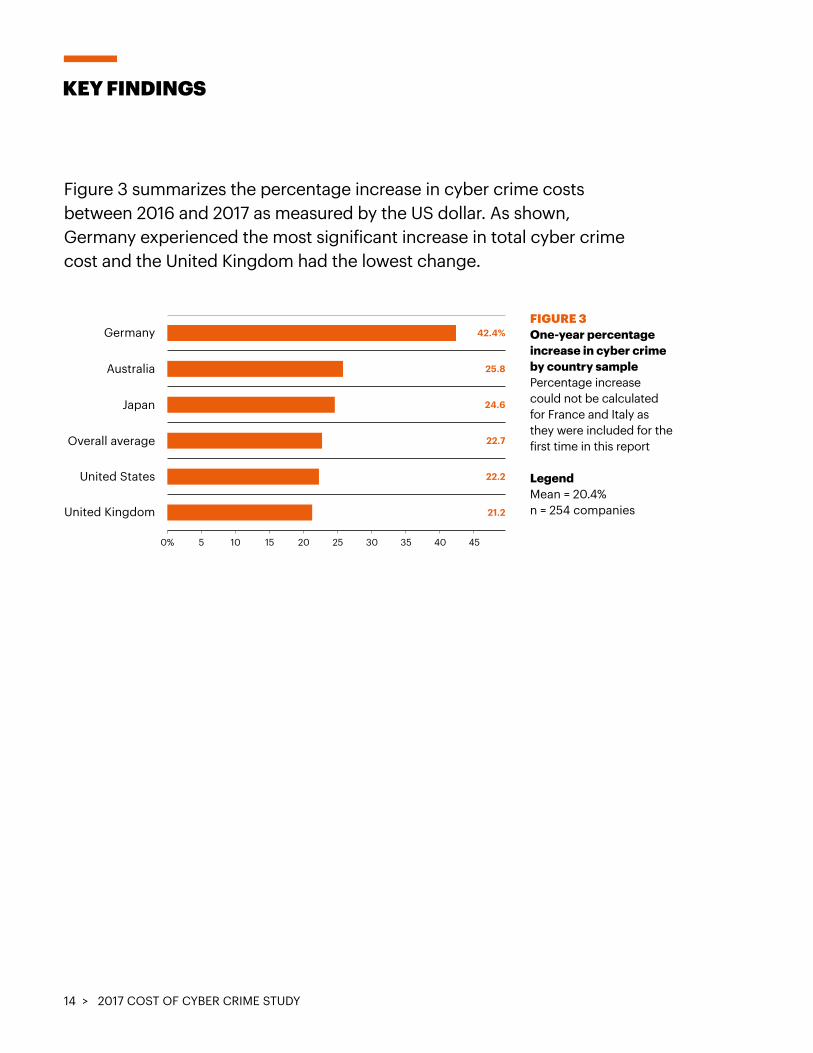
Figure 3 summarizes the percentage increase in cyber crime costs between 2016 and 2017 as measured by the US dollar. As shown, Germany experienced the most significant increase in total cyber crime cost and the United Kingdom had the lowest change.
KEY FINDINGS
FIGURE 3 One-year percentage increase in cyber crime by country samplePercentage increase could not be calculated for France and Italy as they were included for the first time in this report
LegendMean = 20.4%n = 254 companies
3530252015105
$90M
80M
70M
60M
50M
40M
30M
20M
10M
01 28 56 84 112 140 168 196 224 254
$77.1M
$0 5 10 15 20 25
United States
Germany
Japan
United Kingdom
*France
*Italy
Australia
Germany
Australia
Japan
Overall average
United States
United Kingdom
17.36
42.4%
25.8
24.6
22.7
22.2
21.2
$15.65
7.848.44
8.397.66
7.216.58
7.907.90
6.736.73
4.304.17
45400%
3530252015105
$90M
80M
70M
60M
50M
40M
30M
20M
10M
01 28 56 84 112 140 168 196 224 254
$77.1M
$0 5 10 15 20 25
United States
Germany
Japan
United Kingdom
*France
*Italy
Australia
Germany
Australia
Japan
Overall average
United States
United Kingdom
21.22
35%
22.8
21.9
20.4
20
19
$15.65
11.158.44
10.457.86
8.746.58
7.907.90
6.736.73
5.414.17
400%
> 15 2017 COST OF CYBER CRIME STUDY
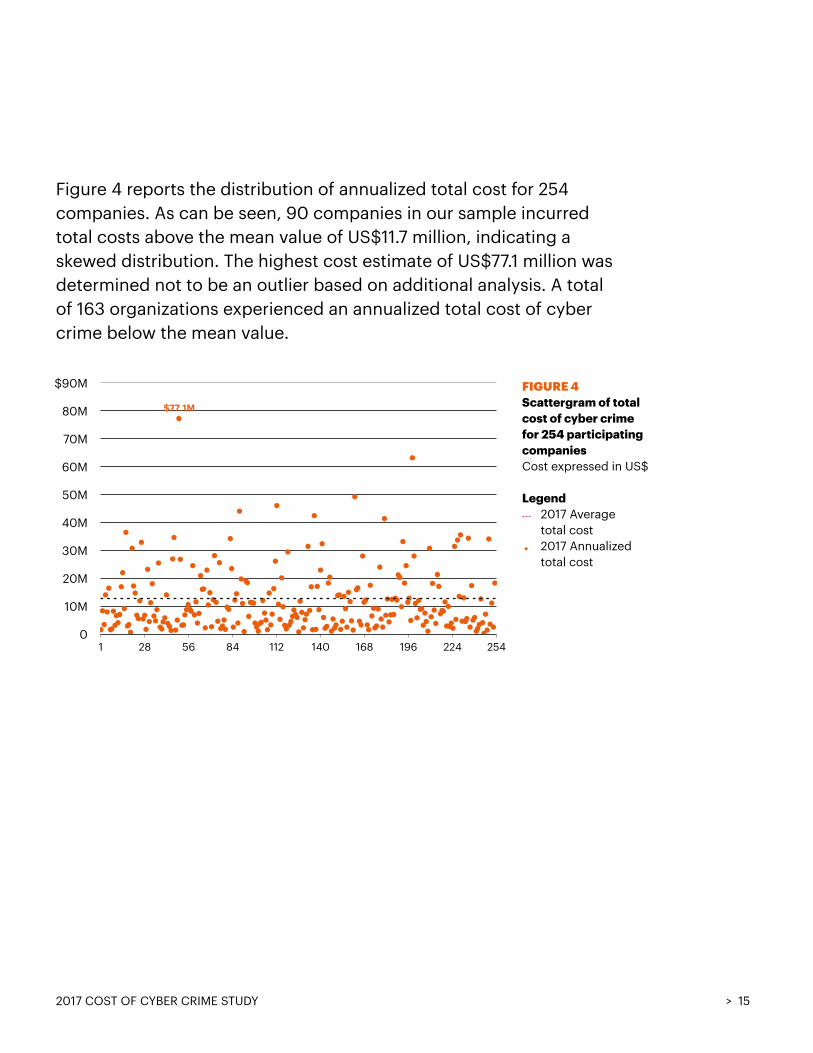
Figure 4 reports the distribution of annualized total cost for 254 companies. As can be seen, 90 companies in our sample incurred total costs above the mean value of US$11.7 million, indicating a skewed distribution. The highest cost estimate of US$77.1 million was determined not to be an outlier based on additional analysis. A total of 163 organizations experienced an annualized total cost of cyber crime below the mean value.
FIGURE 4 Scattergram of total cost of cyber crime for 254 participating companiesCost expressed in US$
Legend 2017 Average total cost 2017 Annualized total cost
3530252015105
$90M
80M
70M
60M
50M
40M
30M
20M
10M
01 28 56 84 112 140 168 196 224 254
$77.1M
$0 5 10 15 20 25
United States
Germany
Japan
United Kingdom
*France
*Italy
Australia
Germany
Australia
Japan
Overall average
United States
United Kingdom
21.22
35%
22.8
21.9
20.4
20
19
$15.65
11.158.44
10.457.86
8.746.58
7.907.90
6.736.73
5.414.17
400%
16 > 2017 COST OF CYBER CRIME STUDY
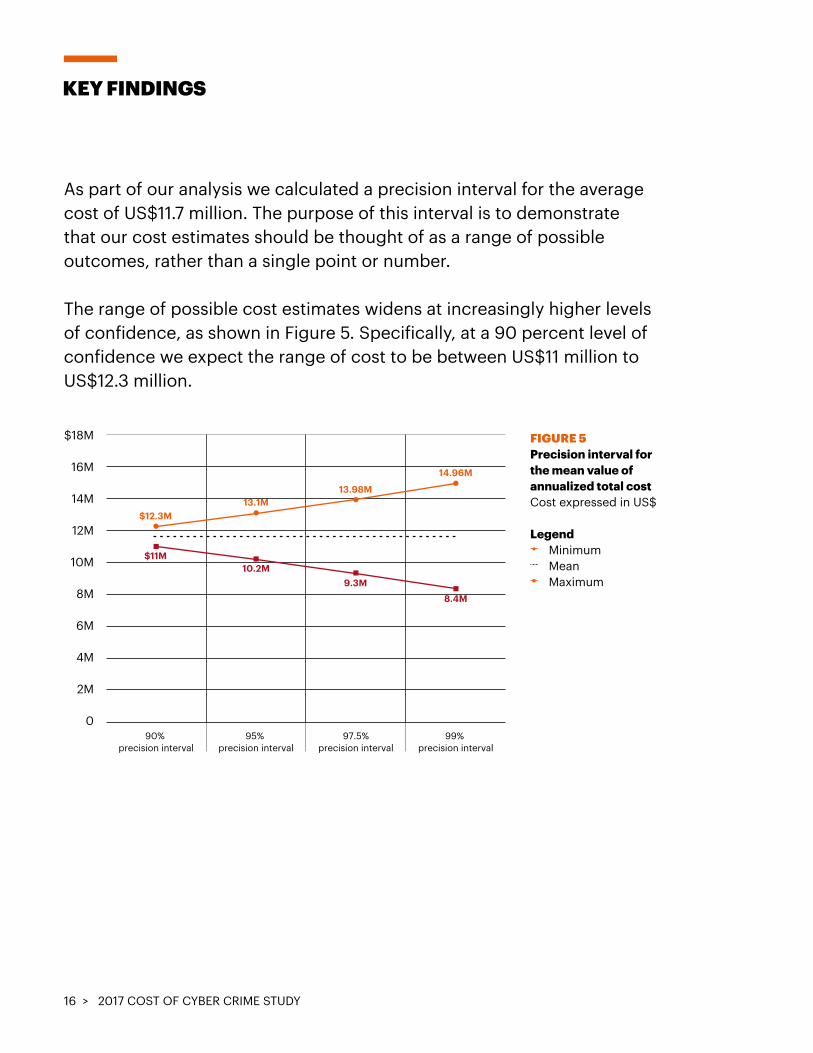
As part of our analysis we calculated a precision interval for the average cost of US$11.7 million. The purpose of this interval is to demonstrate that our cost estimates should be thought of as a range of possible outcomes, rather than a single point or number.
The range of possible cost estimates widens at increasingly higher levels of confidence, as shown in Figure 5. Specifically, at a 90 percent level of confidence we expect the range of cost to be between US$11 million to US$12.3 million.
KEY FINDINGS
FIGURE 5 Precision interval for the mean value of annualized total costCost expressed in US$
Legend Minimum Mean Maximum
$90M
80M
70M
60M
50M
40M
30M
20M
10M
0Ascending order by the number of enterprise seats (size)
90% precision interval
95% precision interval
97.5%precision interval
99% precision interval
$12.3M13.1M
13.98M
14.96M
$11M10.2M
9.3M8.4M
$18M
16M
14M
12M
10M
8M
6M
4M
2M
0
$90M
80M
70M
60M
50M
40M
30M
20M
10M
0Ascending order by the number of enterprise seats (size)
90% precision interval
95% precision interval
97.5%precision interval
99% precision interval
$12.3M13.1M
13.98M
14.96M
$11M10.2M
9.3M8.4M
$18M
16M
14M
12M
10M
8M
6M
4M
2M
0
> 17 2017 COST OF CYBER CRIME STUDY
KEY FINDING 2
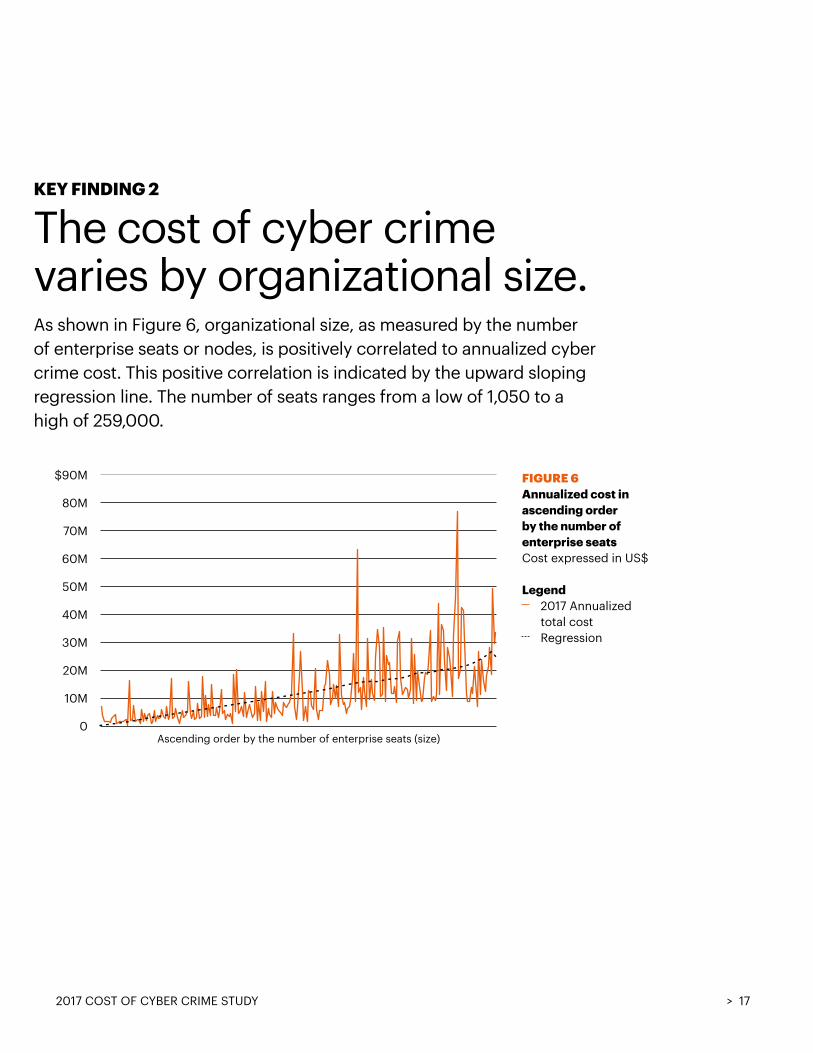
The cost of cyber crime varies by organizational size.As shown in Figure 6, organizational size, as measured by the number of enterprise seats or nodes, is positively correlated to annualized cyber crime cost. This positive correlation is indicated by the upward sloping regression line. The number of seats ranges from a low of 1,050 to a high of 259,000.
FIGURE 6 Annualized cost in ascending order by the number of enterprise seatsCost expressed in US$
Legend 2017 Annualized total cost Regression
$90M
80M
70M
60M
50M
40M
30M
20M
10M
0Ascending order by the number of enterprise seats (size)
90% precision interval
95% precision interval
97.5%precision interval
99% precision interval
$12.3M13.1M
13.98M
14.96M
$11M10.2M
9.3M8.4M
$18M
16M
14M
12M
10M
8M
6M
4M
2M
0
18 > 2017 COST OF CYBER CRIME STUDY
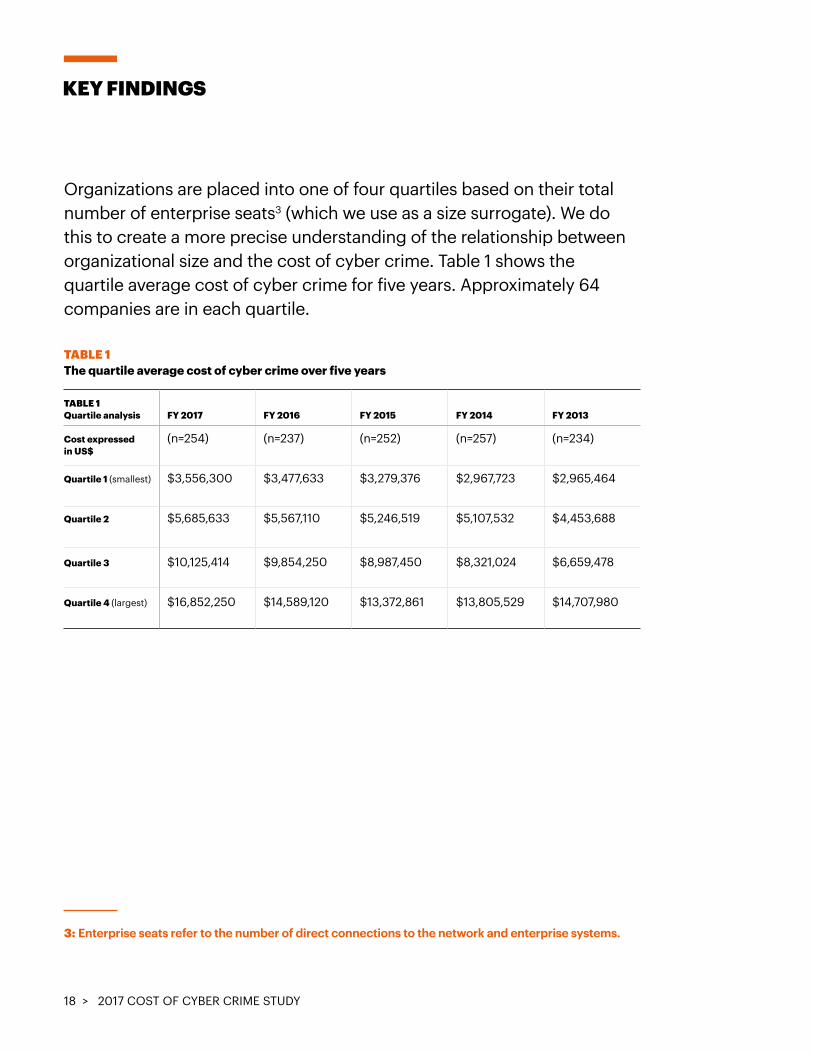
Organizations are placed into one of four quartiles based on their total number of enterprise seats3 (which we use as a size surrogate). We do this to create a more precise understanding of the relationship between organizational size and the cost of cyber crime. Table 1 shows the quartile average cost of cyber crime for five years. Approximately 64 companies are in each quartile.
TABLE 1 The quartile average cost of cyber crime over five years
KEY FINDINGS
3: Enterprise seats refer to the number of direct connections to the network and enterprise systems.
TABLE 1 Quartile analysis FY 2017 FY 2016 FY 2015 FY 2014 FY 2013
Cost expressed in US$
(n=254) (n=237) (n=252) (n=257) (n=234)
Quartile 1 (smallest) $3,556,300 $3,477,633 $3,279,376 $2,967,723 $2,965,464
Quartile 2 $5,685,633 $5,567,110 $5,246,519 $5,107,532 $4,453,688
Quartile 3 $10,125,414 $9,854,250 $8,987,450 $8,321,024 $6,659,478
Quartile 4 (largest) $16,852,250 $14,589,120 $13,372,861 $13,805,529 $14,707,980
> 19 2017 COST OF CYBER CRIME STUDY
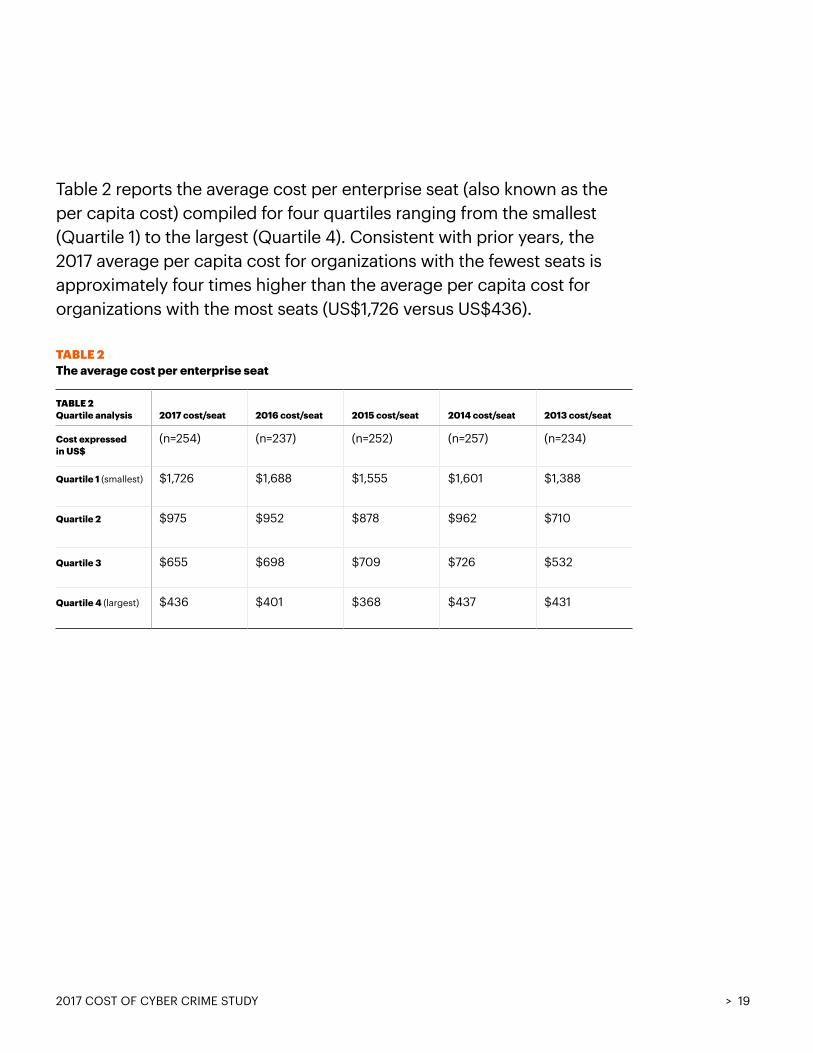
Table 2 reports the average cost per enterprise seat (also known as the per capita cost) compiled for four quartiles ranging from the smallest (Quartile 1) to the largest (Quartile 4). Consistent with prior years, the 2017 average per capita cost for organizations with the fewest seats is approximately four times higher than the average per capita cost for organizations with the most seats (US$1,726 versus US$436).
TABLE 2 The average cost per enterprise seat
TABLE 2 Quartile analysis 2017 cost/seat 2016 cost/seat 2015 cost/seat 2014 cost/seat 2013 cost/seat
Cost expressed in US$
(n=254) (n=237) (n=252) (n=257) (n=234)
Quartile 1 (smallest) $1,726 $1,688 $1,555 $1,601 $1,388
Quartile 2 $975 $952 $878 $962 $710
Quartile 3 $655 $698 $709 $726 $532
Quartile 4 (largest) $436 $401 $368 $437 $431
20 > 2017 COST OF CYBER CRIME STUDY
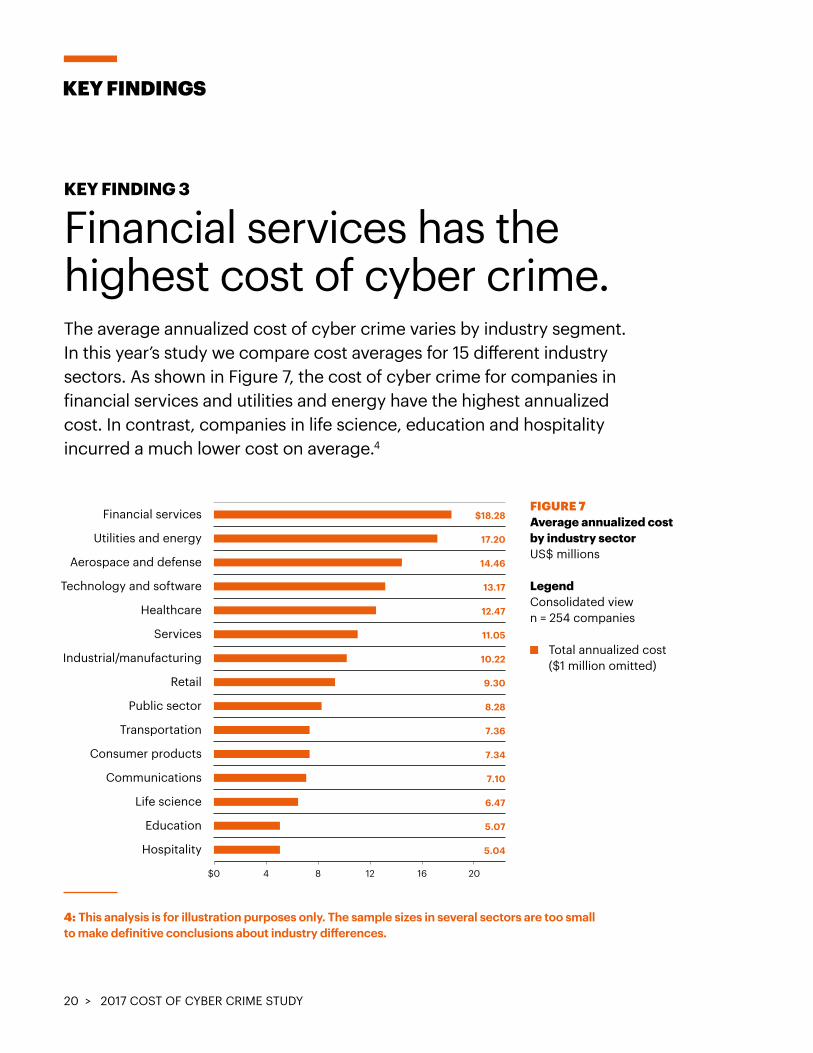
KEY FINDING 3
Financial services has the highest cost of cyber crime.The average annualized cost of cyber crime varies by industry segment. In this year’s study we compare cost averages for 15 different industry sectors. As shown in Figure 7, the cost of cyber crime for companies in financial services and utilities and energy have the highest annualized cost. In contrast, companies in life science, education and hospitality incurred a much lower cost on average.4
KEY FINDINGS
4: This analysis is for illustration purposes only. The sample sizes in several sectors are too small to make definitive conclusions about industry differences.
FIGURE 7 Average annualized cost by industry sector US$ millions
LegendConsolidated view n = 254 companies
Total annualized cost ($1 million omitted)
161284
Financial services
Utilities and energy
Aerospace and defense
Technology and software
Healthcare
Services
Industrial/manufacturing
Retail
Public sector
Transportation
Consumer products
Communications
Life science
Education
Hospitality
$18.28
17.20
14.46
13.17
12.47
11.05
10.22
9.30
8.28
7.36
7.34
7.10
6.47
5.07
5.04
20$0
30252010 155
Malware
Web-based attacks
Denial of services
Malicious insiders
Malicious code
Phishing andsocial engineering
Stolen devices
Ransomware
Botnets
19/23%
15/20
16/10
14/9
13/9
9/13
7/8
5/5
2/4
4535 400%
> 21 2017 COST OF CYBER CRIME STUDY
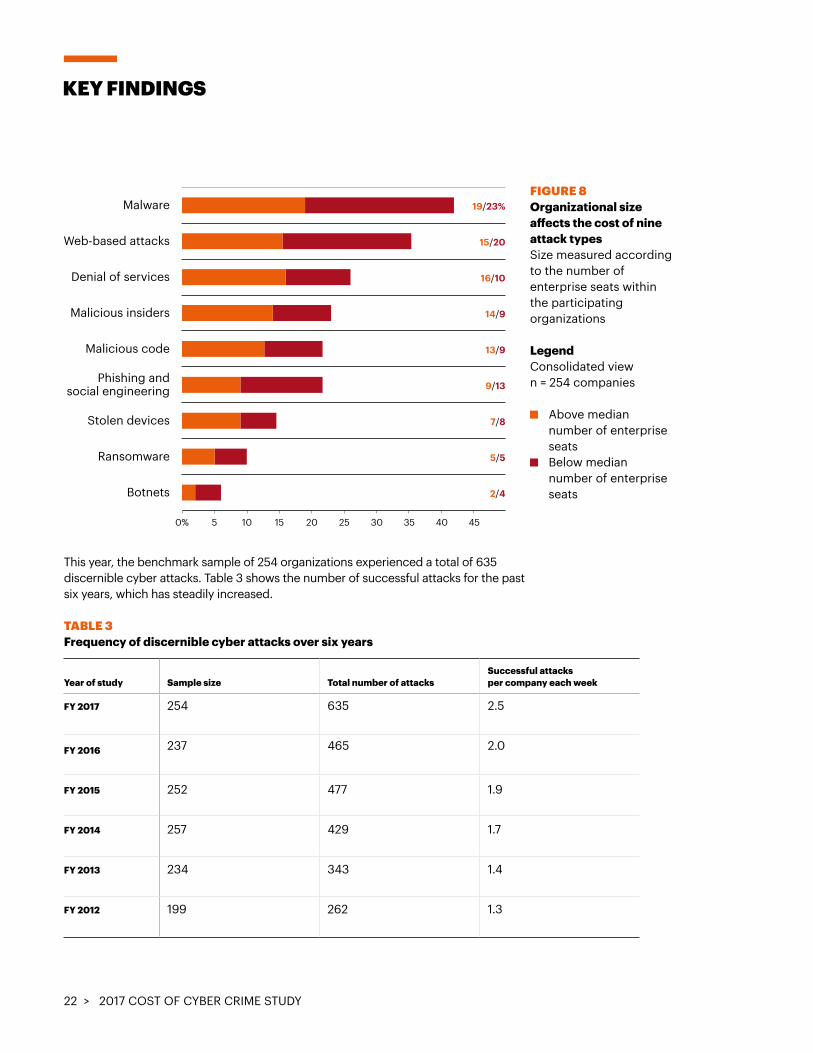
The cost of cyber crime by type of attackKEY FINDING 4
Certain attacks are more costly based on organizational size.The study focuses on nine different attack vectors as the source of the cyber crime. In Figure 8, we compare smaller and larger-sized organizations based on the sample median of 8,560 seats.
Smaller organizations (below the median) experience a higher proportion of cyber crime costs relating to malware, Web-based attacks, phishing and social engineering attacks and stolen devices. In contrast, larger organizations (above the median) experience a higher proportion of costs relating to denial of services, malicious insiders and malicious code.
In the context of this research, malicious insiders include employees, temporary employees, contractors and, possibly other business partners. We also distinguish viruses from malware. Viruses reside on the endpoint and as yet have not infiltrated the network but malware has infiltrated the network. Malicious code attacks the application layer and includes SQL attack.
22 > 2017 COST OF CYBER CRIME STUDY
This year, the benchmark sample of 254 organizations experienced a total of 635 discernible cyber attacks. Table 3 shows the number of successful attacks for the past six years, which has steadily increased.
TABLE 3 Frequency of discernible cyber attacks over six years
KEY FINDINGS
FIGURE 8 Organizational size affects the cost of nine attack typesSize measured according to the number of enterprise seats within the participating organizations LegendConsolidated view n = 254 companies
Above median number of enterprise seats Below median number of enterprise seats
161284
Financial services
Utilities and energy
Aerospace and defense
Technology and software
Healthcare
Services
Industrial/manufacturing
Retail
Public sector
Transportation
Consumer products
Communications
Life science
Education
Hospitality
$18.28
17.20
14.46
13.17
12.47
11.05
10.22
9.30
8.28
7.36
7.34
7.10
6.47
5.07
5.04
20$0
30252010 155
Malware
Web-based attacks
Denial of services
Malicious insiders
Malicious code
Phishing andsocial engineering
Stolen devices
Ransomware
Botnets
19/23%
15/20
16/10
14/9
13/9
9/13
7/8
5/5
2/4
4535 400%
Year of study Sample size Total number of attacks
Successful attacks per company each week
FY 2017 254 635 2.5
FY 2016 237 465 2.0
FY 2015 252 477 1.9
FY 2014 257 429 1.7
FY 2013 234 343 1.4
FY 2012 199 262 1.3
> 232017 COST OF CYBER CRIME STUDY
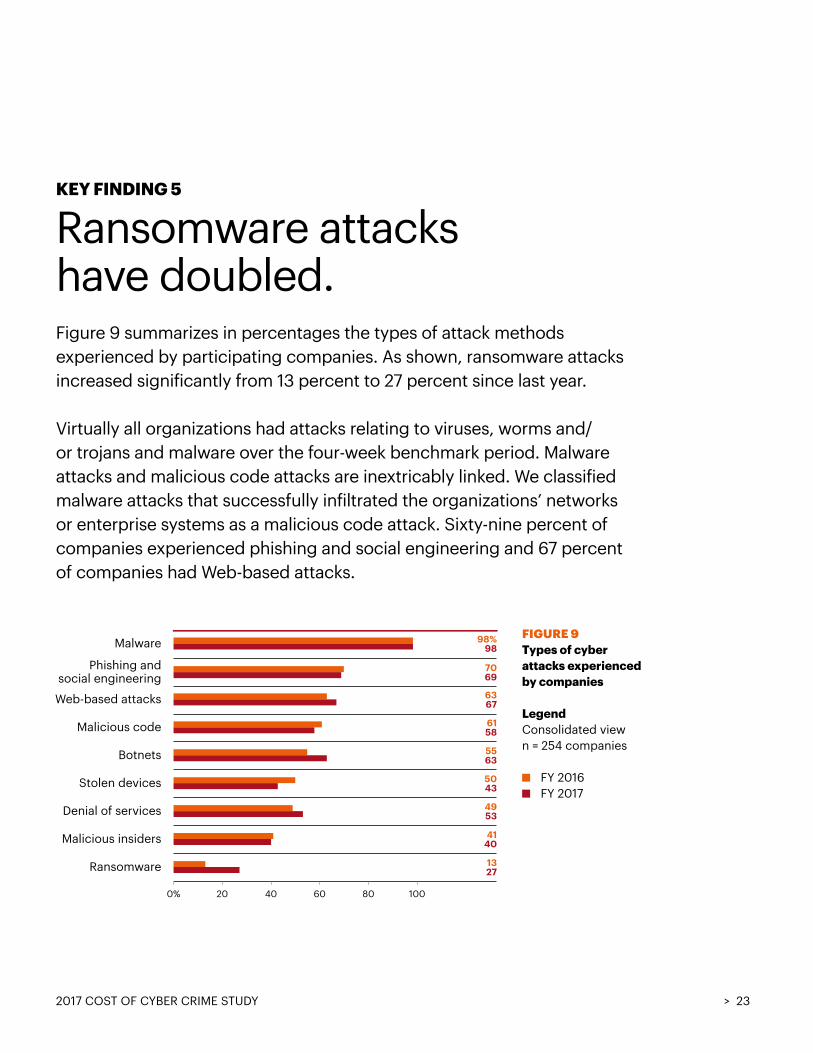
KEY FINDING 5
Ransomware attacks have doubled.Figure 9 summarizes in percentages the types of attack methods experienced by participating companies. As shown, ransomware attacks increased significantly from 13 percent to 27 percent since last year.
Virtually all organizations had attacks relating to viruses, worms and/or trojans and malware over the four-week benchmark period. Malware attacks and malicious code attacks are inextricably linked. We classified malware attacks that successfully infiltrated the organizations’ networks or enterprise systems as a malicious code attack. Sixty-nine percent of companies experienced phishing and social engineering and 67 percent of companies had Web-based attacks.
FIGURE 9 Types of cyber attacks experienced by companies
LegendConsolidated view n = 254 companies
FY 2016FY 2017
1008040 60200%
Malware 98%98
Phishing andsocial engineering
7069
Web-based attacks 6367
Malicious code 6158
Botnets 5563
Stolen devices 5043
Denial of services 4953
Malicious insiders 4140
Ransomware 1327
24 > 2017 COST OF CYBER CRIME STUDY
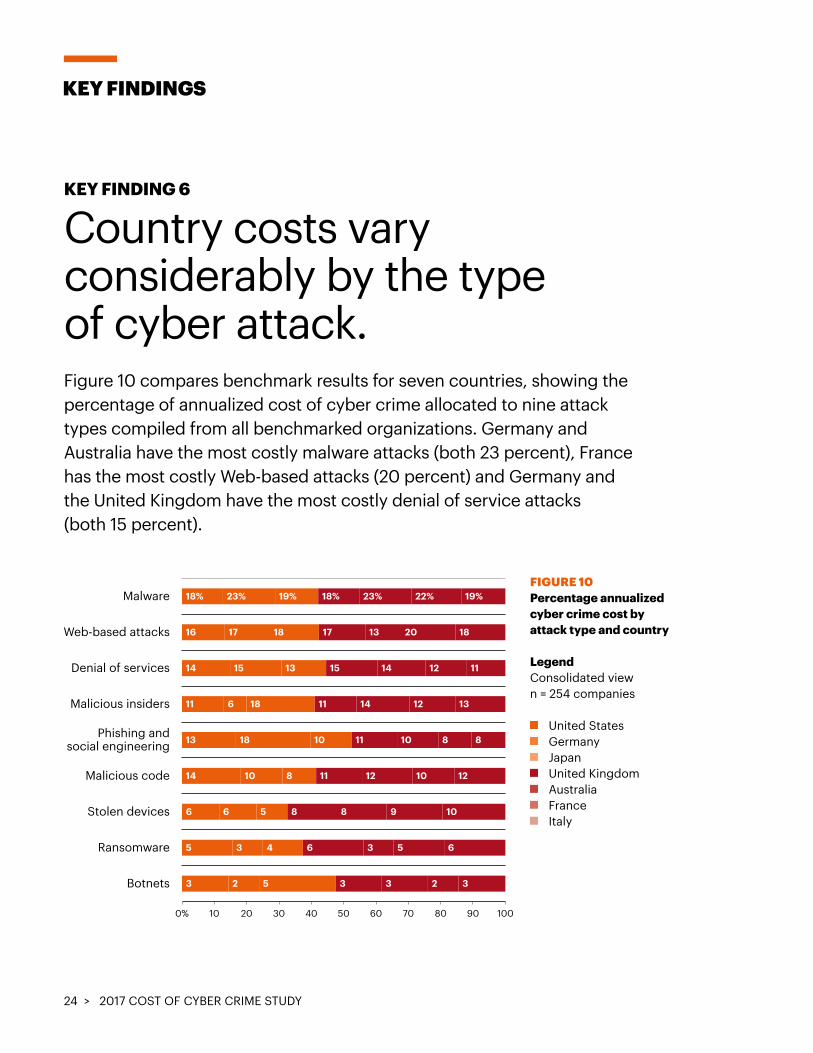
KEY FINDING 6
Country costs vary considerably by the type of cyber attack.Figure 10 compares benchmark results for seven countries, showing the percentage of annualized cost of cyber crime allocated to nine attack types compiled from all benchmarked organizations. Germany and Australia have the most costly malware attacks (both 23 percent), France has the most costly Web-based attacks (20 percent) and Germany and the United Kingdom have the most costly denial of service attacks(both 15 percent).
KEY FINDINGS
FIGURE 10Percentage annualized cyber crime cost by attack type and country
LegendConsolidated view n = 254 companies
United States Germany Japan
United Kingdom Australia France Italy
70605030 402010
Malware 18% 23% 19% 18% 23% 22% 19%
16 17 18 17 13 20 18
14 15 13 15 14 12 11
11 6 18 11 14 12 13
13 18 10 11 10 8 8
14 10 8 11 12 10 12
6 6 5 8 8 9 10
5 3 4 6 3 5 6
3 2 5 3 3 2 3
Web-based attacks
Denial of services
Malicious insiders
Malicious code
Phishing andsocial engineering
Stolen devices
Ransomware
Botnets
10080 900%
30252010 155
Malware
Web-based attacks
Denial of services
Malicious insiders
Malicious code
Phishing andsocial engineering
Stolen devices
Ransomware
Botnets
98%98
7069
6367
6158
5563
5043
4953
4140
3112
4535 400%
> 25 2017 COST OF CYBER CRIME STUDY
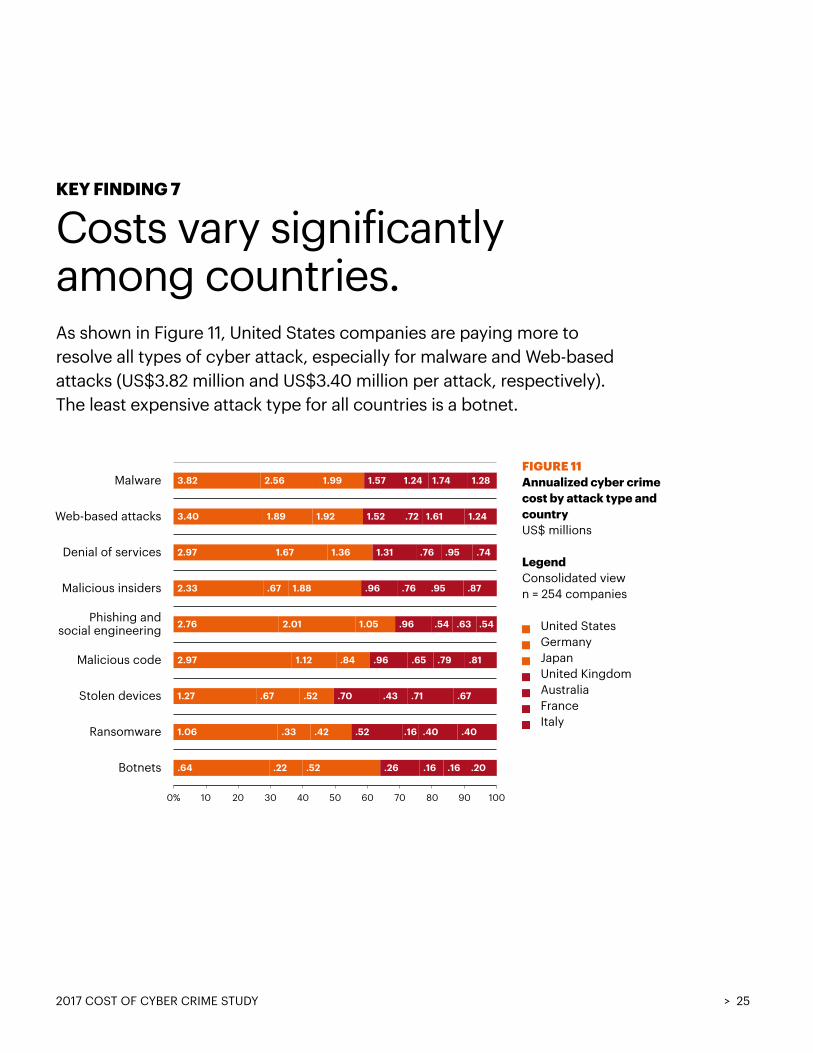
KEY FINDING 7
Costs vary significantly among countries. As shown in Figure 11, United States companies are paying more to resolve all types of cyber attack, especially for malware and Web-basedattacks (US$3.82 million and US$3.40 million per attack, respectively). The least expensive attack type for all countries is a botnet.
FIGURE 11Annualized cyber crime cost by attack type and countryUS$ millions
LegendConsolidated view n = 254 companies
United States Germany Japan United Kingdom Australia France Italy
70605030 402010
Malware
Web-based attacks
Denial of services
Malicious insiders
Malicious code
Phishing andsocial engineering
Stolen devices
Ransomware
Botnets
10080 900%
3.82 2.56 1.99 1.57 1.24 1.74 1.28
3.40 1.89 1.92 1.52 .72 1.61 1.24
2.97 1.67 1.36 1.31 .76 .95 .74
2.33 .67 1.88 .96 .76 .95 .87
2.76 2.01 1.05 .96 .54 .63 .54
2.97 1.12 .84 .96 .65 .79 .81
1.27 .67 .52 .70 .43 .71 .67
1.06 .33 .42 .52 .16 .40 .40
.64 .22 .52 .26 .16 .16 .20
8040
Malware
Web-based attacks
Denial of services
Malicious insiders
Malicious code
Phishing andsocial engineering
Stolen devices
Ransomware
Botnets
200120 160$0
$167,890173,516
133,45329,450
92,336112,419
95,821105,900
78,99388,496
88,14583,450
31,87029,883
5,1106,001
995950
26 > 2017 COST OF CYBER CRIME STUDY
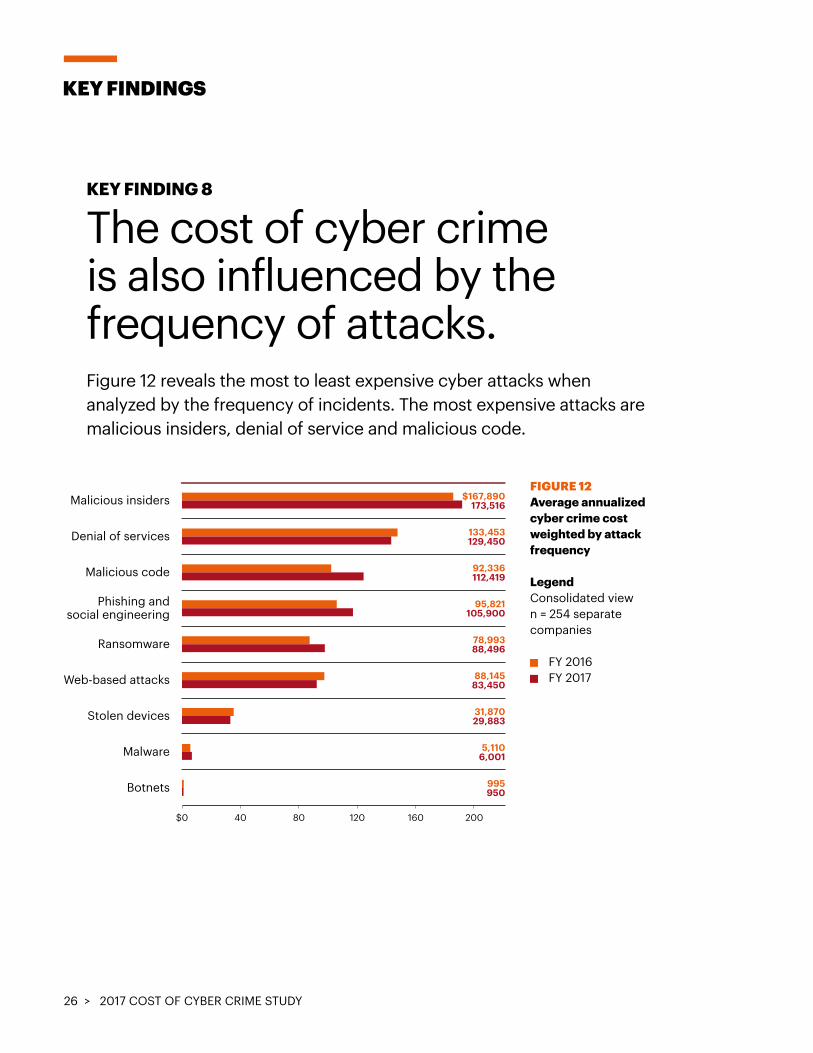
KEY FINDING 8
The cost of cyber crime is also influenced by the frequency of attacks. Figure 12 reveals the most to least expensive cyber attacks when analyzed by the frequency of incidents. The most expensive attacks are malicious insiders, denial of service and malicious code.
KEY FINDINGS
FIGURE 12Average annualized cyber crime cost weighted by attack frequency
LegendConsolidated view n = 254 separate companies
FY 2016 FY 2017
70605030 402010
Malware
Web-based attacks
Denial of services
Malicious insiders
Malicious code
Phishing andsocial engineering
Stolen devices
Ransomware
Botnets
10080 900%
3.82 2.56 1.99 1.57 1.24 1.74 1.28
3.40 1.89 1.92 1.52 .72 1.61 1.24
2.97 1.67 1.36 1.31 .76 .95 .74
2.33 .67 1.88 .96 .76 .95 .87
2.76 2.01 1.05 .96 .54 .63 .54
2.97 1.12 .84 .96 .65 .79 .81
1.27 .67 .52 .70 .43 .71 .67
1.06 .33 .42 .52 .16 .40 .40
.64 .22 .52 .26 .16 .16 .20
8040
Malware
Web-based attacks
Denial of services
Malicious insiders
Malicious code
Phishing andsocial engineering
Stolen devices
Ransomware
Botnets
200120 160$0
$167,890173,516
133,453129,450
92,336112,419
95,821105,900
78,99388,496
88,14583,450
31,87029,883
5,1106,001
995950
$2,364,806
2,014,142
1,565,435
1,415,217
1,298,978
1,282,324
865,985
532,914
350,012
2M1M 3M$0M
Ransomware
Malicious code
Web-based attacks
Malware
Denial of services
Malicious insiders
Stolen devices
Phishing &social engineering
Botnets
> 27 2017 COST OF CYBER CRIME STUDY
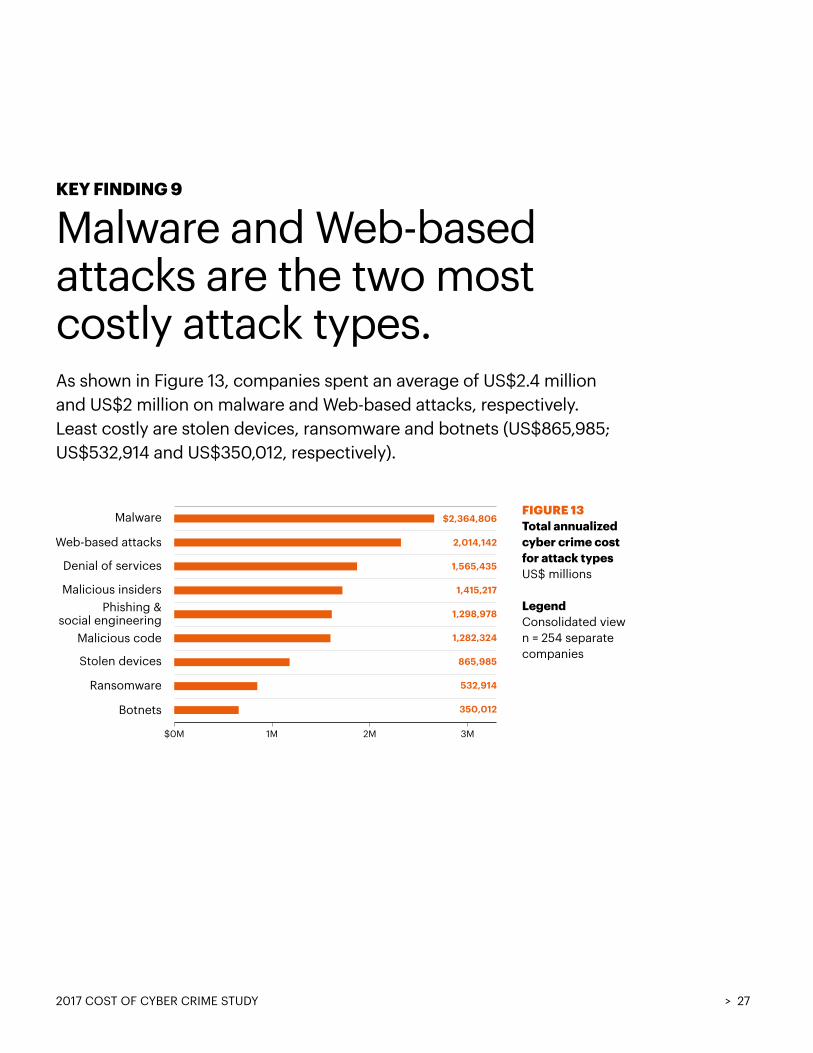
KEY FINDING 9
Malware and Web-based attacks are the two most costly attack types.As shown in Figure 13, companies spent an average of US$2.4 million and US$2 million on malware and Web-based attacks, respectively. Least costly are stolen devices, ransomware and botnets (US$865,985; US$532,914 and US$350,012, respectively).
FIGURE 13Total annualized cyber crime cost for attack typesUS$ millions
LegendConsolidated view n = 254 separate companies
$2,364,806
2,014,142
1,565,435
1,415,217
1,298,978
1,282,324
865,985
532,914
350,012
2M1M 3M$0M
Ransomware
Malicious code
Web-based attacks
Malware
Denial of services
Malicious insiders
Stolen devices
Phishing &social engineering
Botnets
28 > 2017 COST OF CYBER CRIME STUDY
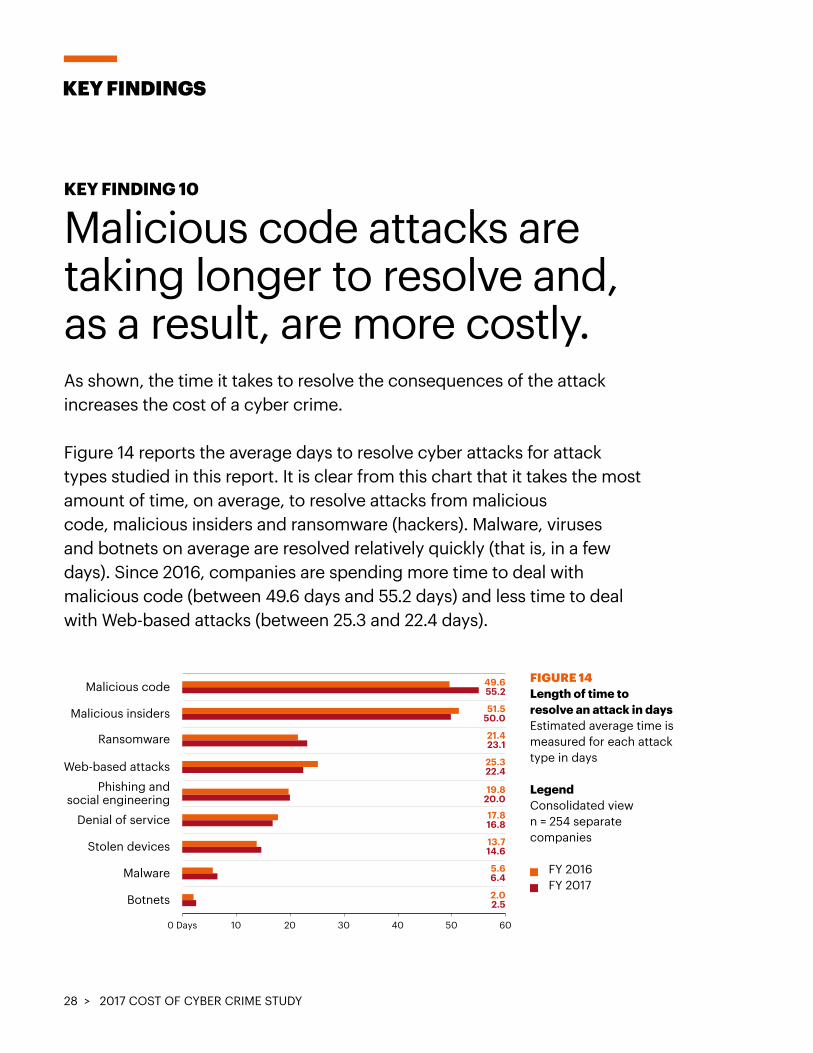
KEY FINDING 10
Malicious code attacks are taking longer to resolve and, as a result, are more costly. As shown, the time it takes to resolve the consequences of the attack increases the cost of a cyber crime.
Figure 14 reports the average days to resolve cyber attacks for attack types studied in this report. It is clear from this chart that it takes the most amount of time, on average, to resolve attacks from malicious code, malicious insiders and ransomware (hackers). Malware, viruses and botnets on average are resolved relatively quickly (that is, in a few days). Since 2016, companies are spending more time to deal with malicious code (between 49.6 days and 55.2 days) and less time to deal with Web-based attacks (between 25.3 and 22.4 days).
KEY FINDINGS
FIGURE 14Length of time to resolve an attack in days Estimated average time is measured for each attack type in days
LegendConsolidated view n = 254 separatecompanies
FY 2016 FY 2017
2010 604030 500 Days
Malicious code 49.655.2
Malicious insiders 51.550.0
Ransomware 21.423.1
Web-based attacks 25.322.4
Phishing andsocial engineering
19.820.0
Denial of service 17.816.8
Stolen devices 13.714.6
Malware 5.66.4
Botnets 2.02.5
50%
40
30
20
10
0Business
disruptionInformation
lossOthercosts
Revenueloss
Equipmentdamages
39% 36 33 35 39 43 21 20 21 4 4 3 2 1 0
> 29 2017 COST OF CYBER CRIME STUDY
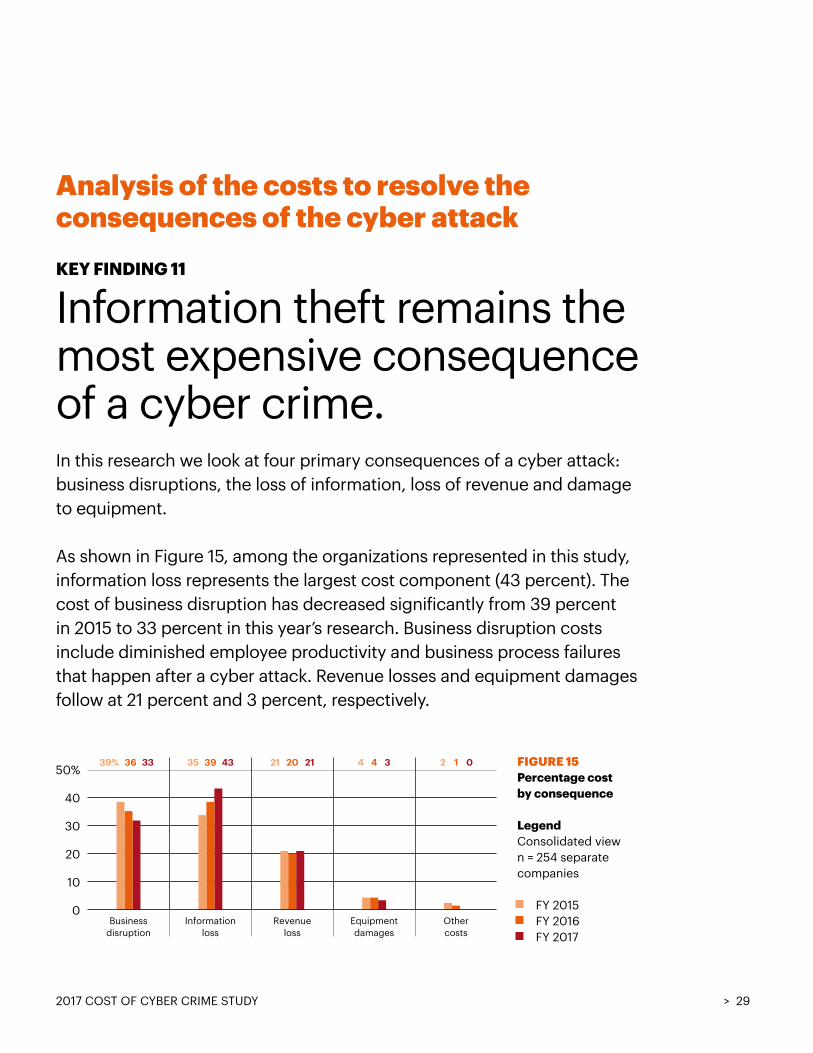
Analysis of the costs to resolve the consequences of the cyber attackKEY FINDING 11
Information theft remains the most expensive consequence of a cyber crime.In this research we look at four primary consequences of a cyber attack: business disruptions, the loss of information, loss of revenue and damage to equipment.
As shown in Figure 15, among the organizations represented in this study, information loss represents the largest cost component (43 percent). The cost of business disruption has decreased significantly from 39 percent in 2015 to 33 percent in this year’s research. Business disruption costs include diminished employee productivity and business process failures that happen after a cyber attack. Revenue losses and equipment damages follow at 21 percent and 3 percent, respectively.
FIGURE 15Percentage cost by consequence
LegendConsolidated view n = 254 separate companies
FY 2015 FY 2016 FY 2017
50%
40
30
20
10
0Business
disruptionInformation
lossOthercosts
Revenueloss
Equipmentdamages
39% 36 33 35 39 43 21 20 21 4 4 3 2 1 0
30 > 2017 COST OF CYBER CRIME STUDY
KEY FINDINGS
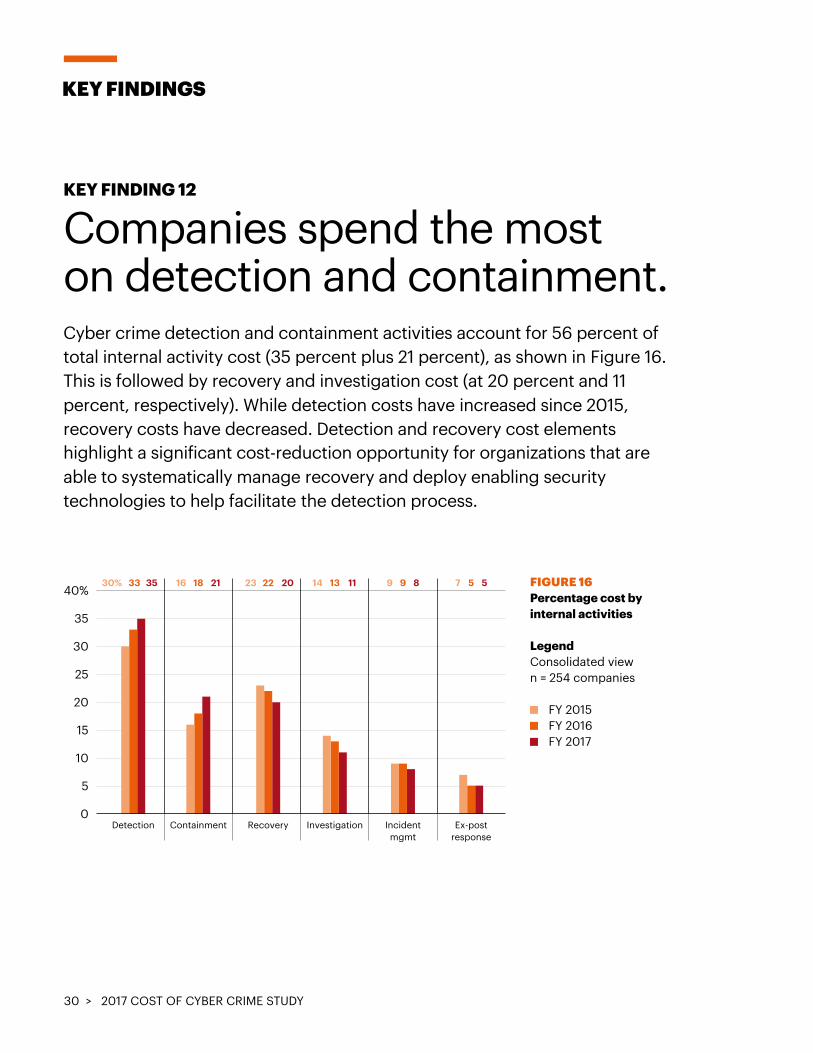
KEY FINDING 12
Companies spend the most on detection and containment. Cyber crime detection and containment activities account for 56 percent of total internal activity cost (35 percent plus 21 percent), as shown in Figure 16. This is followed by recovery and investigation cost (at 20 percent and 11 percent, respectively). While detection costs have increased since 2015, recovery costs have decreased. Detection and recovery cost elements highlight a significant cost-reduction opportunity for organizations that are able to systematically manage recovery and deploy enabling security technologies to help facilitate the detection process.
FIGURE 16Percentage cost by internal activities
LegendConsolidated view n = 254 companies
FY 2015FY 2016FY 2017
40%
35
30
25
20
15
10
5
0Recovery
23 22
Detection
30% 33 35
Containment
16 18 21 20
Investigation
14 13 11
Incidentmgmt
9 9 8
Ex-postresponse
7 5 5
35
40%
30
25
20
15
10
5
0Directlabor
23 24 26
Cashoutlay
17 19 20
Indirectlabor
15 15 17
Overhead
9 8 6
Other
2 1 0
Productionloss
34% 33 31
40%
35
30
25
20
15
10
5
0Recovery
23 22
Detection
30% 33 35
Containment
16 18 21 20
Investigation
14 13 11
Incidentmgmt
9 9 8
Ex-postresponse
7 5 5
35
40%
30
25
20
15
10
5
0Directlabor
23 24 26
Cashoutlay
17 19 20
Indirectlabor
15 15 17
Overhead
9 8 6
Other
2 1 0
Productionloss
34% 33 31
> 312017 COST OF CYBER CRIME STUDY
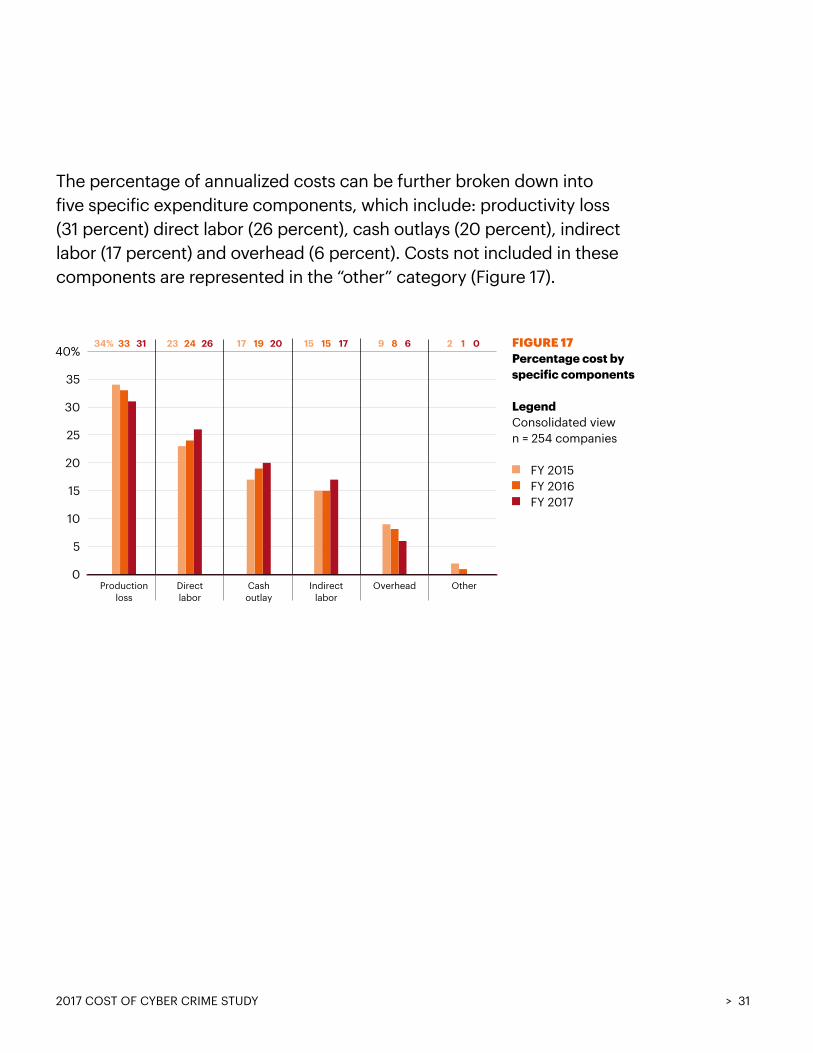
The percentage of annualized costs can be further broken down into five specific expenditure components, which include: productivity loss (31 percent) direct labor (26 percent), cash outlays (20 percent), indirect labor (17 percent) and overhead (6 percent). Costs not included in thesecomponents are represented in the “other” category (Figure 17).
FIGURE 17Percentage cost by specific components
LegendConsolidated view n = 254 companies
FY 2015FY 2016FY 2017
40%
35
30
25
20
15
10
5
0Recovery
23 22
Detection
30% 33 35
Containment
16 18 21 20
Investigation
14 13 11
Incidentmgmt
9 9 8
Ex-postresponse
7 5 5
35
40%
30
25
20
15
10
5
0Directlabor
23 24 26
Cashoutlay
17 19 20
Indirectlabor
15 15 17
Overhead
9 8 6
Other
2 1 0
Productionloss
34% 33 31
32 > 2017 COST OF CYBER CRIME STUDY
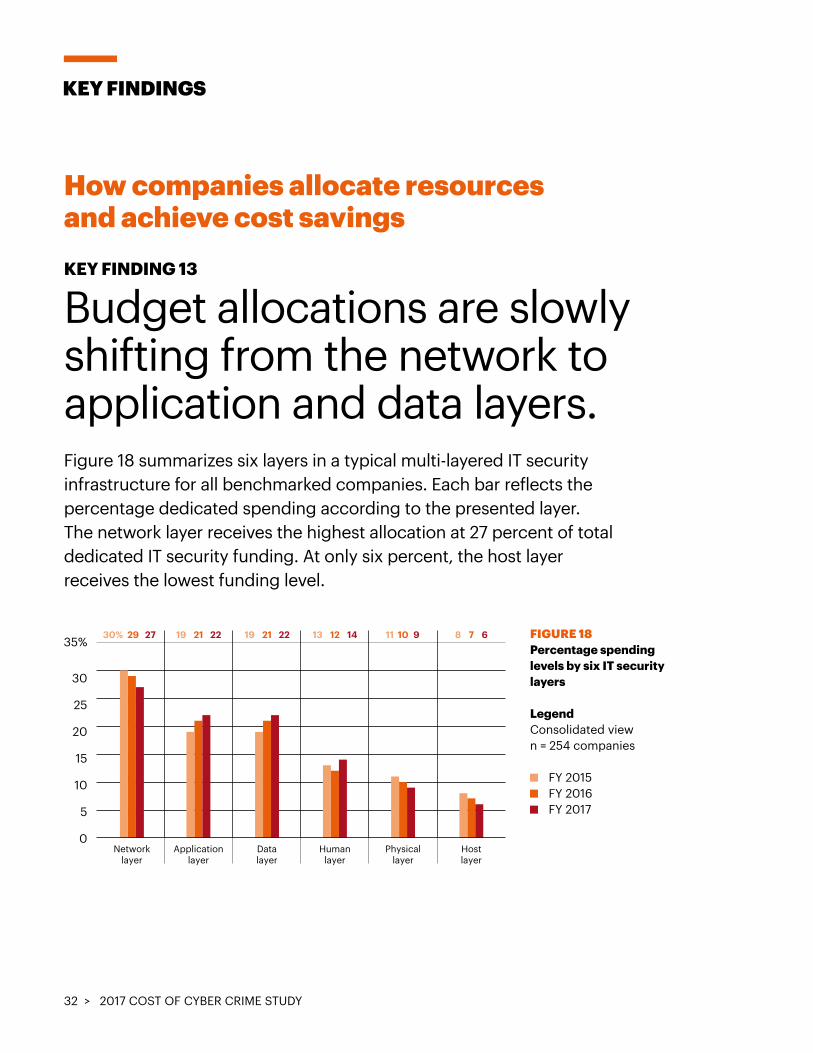
How companies allocate resources and achieve cost savingsKEY FINDING 13
Budget allocations are slowly shifting from the network to application and data layers. Figure 18 summarizes six layers in a typical multi-layered IT security infrastructure for all benchmarked companies. Each bar reflects the percentage dedicated spending according to the presented layer. The network layer receives the highest allocation at 27 percent of total dedicated IT security funding. At only six percent, the host layer receives the lowest funding level.
KEY FINDINGS
FIGURE 18Percentage spending levels by six IT security layers
LegendConsolidated view n = 254 companies
FY 2015FY 2016FY 2017
30
35%
25
20
15
10
5
0
29
Networklayer
30% 27 21
Applicationlayer
19 22 21
Datalayer
19 22 12
Humanlayer
13 14 10
Physicallayer
11 9 7
Hostlayer
8 6
Security intelligence systems
Extensive use of cyber analyticsand User Behavior Analytics
Advanced perimeter controls
Automation, orchestrationand machine learning
Enterprise deployment ofGovernance, Risk & Compliance
Advanced identity andaccess governance
Automated policy management
Extensive deployment ofencryption technologies
Extensive use of dataloss prevention
0% 70605040302010
67%
63
58
55
52
46
34
32
28
> 332017 COST OF CYBER CRIME STUDY
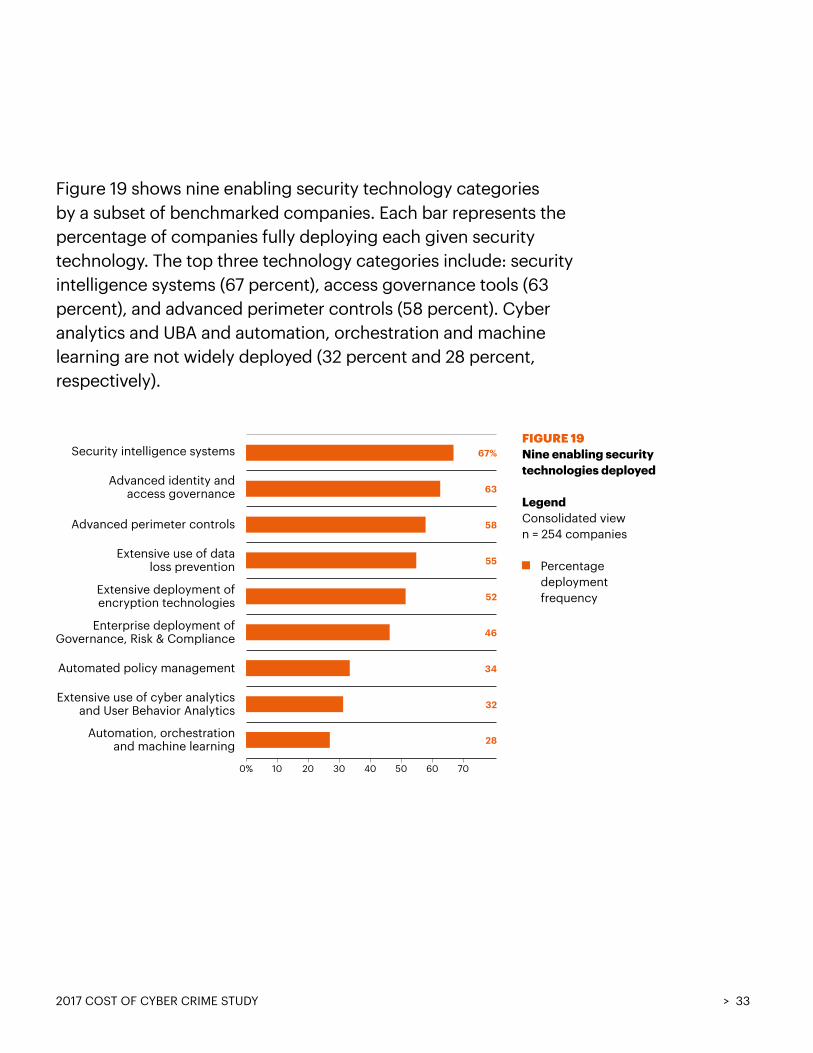
Figure 19 shows nine enabling security technology categoriesby a subset of benchmarked companies. Each bar represents the percentage of companies fully deploying each given security technology. The top three technology categories include: security intelligence systems (67 percent), access governance tools (63 percent), and advanced perimeter controls (58 percent). Cyber analytics and UBA and automation, orchestration and machine learning are not widely deployed (32 percent and 28 percent, respectively).
FIGURE 19Nine enabling security technologies deployed
LegendConsolidated view n = 254 companies
Percentage deployment frequency
Security intelligence systems
Extensive use of cyber analyticsand User Behavior Analytics
Advanced perimeter controls
Automation, orchestrationand machine learning
Enterprise deployment ofGovernance, Risk & Compliance
Advanced identity andaccess governance
Automated policy management
Extensive deployment ofencryption technologies
Extensive use of dataloss prevention
0% 70605040302010
67%
63
58
55
52
46
34
32
28
34 > 2017 COST OF CYBER CRIME STUDY
KEY FINDINGS
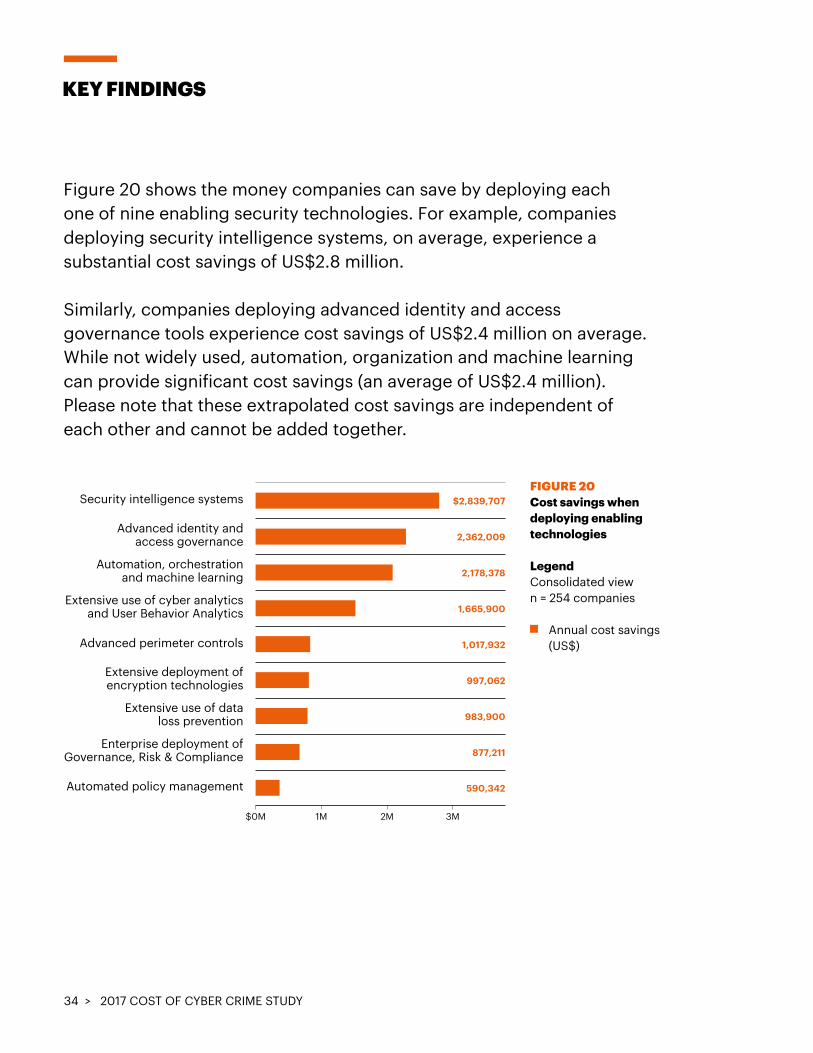
Figure 20 shows the money companies can save by deploying eachone of nine enabling security technologies. For example, companies deploying security intelligence systems, on average, experience a substantial cost savings of US$2.8 million.
Similarly, companies deploying advanced identity and access governance tools experience cost savings of US$2.4 million on average. While not widely used, automation, organization and machine learning can provide significant cost savings (an average of US$2.4 million). Please note that these extrapolated cost savings are independent of each other and cannot be added together.
FIGURE 20Cost savings when deploying enabling technologies
LegendConsolidated view n = 254 companies
Annual cost savings (US$)
Security intelligence systems
Extensive use of cyber analyticsand User Behavior Analytics
Advanced perimeter controls
Automation, orchestrationand machine learning
Enterprise deployment ofGovernance, Risk & Compliance
Advanced identity andaccess governance
Automated policy management
Extensive deployment ofencryption technologies
Extensive use of dataloss prevention
$0M 3M2M1M
$2,839,707
2,362,009
2,178,378
1,665,900
1,017,932
997,062
983,900
877,211
590,342
> 352017 COST OF CYBER CRIME STUDY
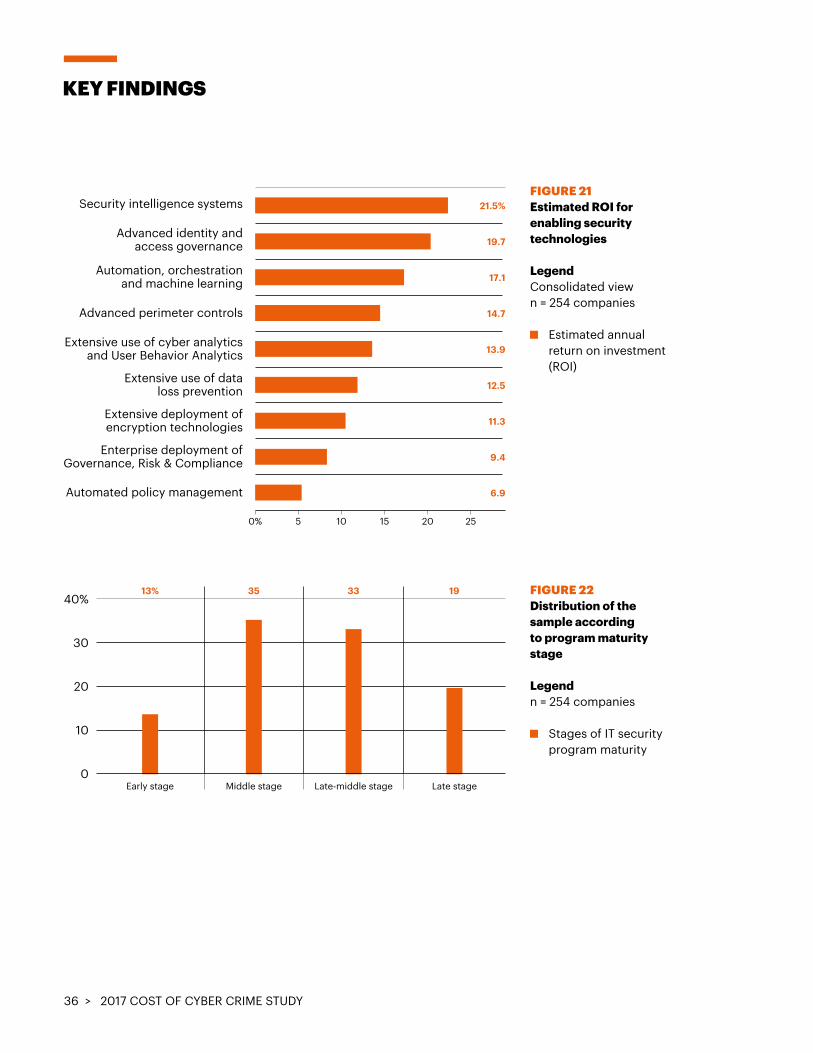
KEY FINDING 14
Security intelligence systems have the biggest return on investment.Figure 21 summarizes the estimated return on investment (ROI) realized by companies for each one of the nine categories of enabling security technologies.5 At 21.5 percent, companies deploying security intelligence systems, on average, experience a substantially higher ROI than all other technology categories in this study.
Also significant are the estimated ROI results for companies that utilize advanced identity and access governance and automation, orchestration and machine learning technologies (19.7 percent and 17.1 percent, respectively). The estimated average ROI for all nine categories of enabling security technologies is 14.1 percent.
5: The return on investment calculated for each security technology category is defined as: (1) gains from the investment divided by (2) cost of investment (minus any residual value). We estimate a three-year life for all technology categories presented. Hence, investments are simply amortized over three years. The gains are the net present value of cost savings expected over the investment life. From this amount, we subtract conservative estimates for operations and maintenance cost each year. The net present value used the prime plus 2 percent discount rate per year. We also assume no (zero) residual value.
36 > 2017 COST OF CYBER CRIME STUDY
KEY FINDINGS
FIGURE 21Estimated ROI for enabling security technologies
LegendConsolidated view n = 254 companies
Estimated annual return on investment
(ROI)
FIGURE 22Distribution of the sample according to program maturity stage
Legendn = 254 companies
Stages of IT security program maturity
Security intelligence systems
Extensive use of cyber analyticsand User Behavior Analytics
Advanced perimeter controls
Automation, orchestrationand machine learning
Enterprise deployment ofGovernance, Risk & Compliance
Advanced identity andaccess governance
Automated policy management
Extensive deployment ofencryption technologies
Extensive use of dataloss prevention
0% 20 2515105
21.5%
19.7
17.1
14.7
13.9
12.5
11.3
9.4
6.9
Early stage
13%
Middle stage
35
Late-middle stage
33
Late stage
1940%
30
20
10
0
> 37 2017 COST OF CYBER CRIME STUDY
Maturity and effectiveness of an organization’s security postureKEY FINDING 15
Program maturity is weighted toward the middle stages.Figure 22 reports the distribution of our global sample of 254 companies according one of four maturity stages of the cybersecurityprogram, defined as follows:
• Early stage—many cybersecurity program activities have not as yet been planned or deployed
• Middle stage—cybersecurity program activities are planned and defined but only partially deployed
• Late-middle stage—many cybersecurity program activities are deployed across the enterprise
• Mature stage—most cybersecurity program activities are deployed across the enterprise
As can be seen, 35 percent of the sample is located in the middle stage. Only 13 percent of the sample is located in the early stage. Another 19 percent is located in the late stage.
38 > 2017 COST OF CYBER CRIME STUDY
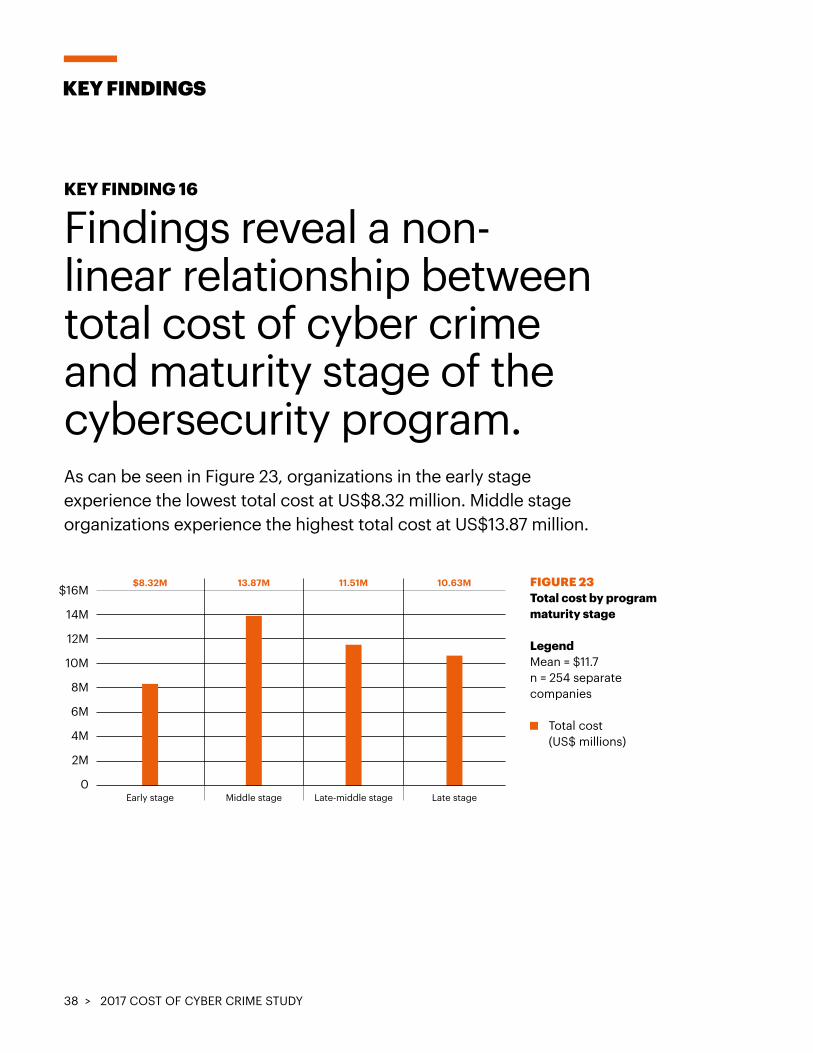
KEY FINDING 16
Findings reveal a non-linear relationship between total cost of cyber crime and maturity stage of the cybersecurity program.As can be seen in Figure 23, organizations in the early stage experience the lowest total cost at US$8.32 million. Middle stage organizations experience the highest total cost at US$13.87 million.
KEY FINDINGS
FIGURE 23 Total cost by program maturity stage
LegendMean = $11.7n = 254 separate companies
Total cost (US$ millions)
0Early stage Middle stage Late-middle stage Late stage
12M
14M
$16M
10M
8M
6M
4M
2M
$8.32M 13.87M 11.51M 10.63M
> 39 2017 COST OF CYBER CRIME STUDY
KEY FINDING 17
Two countries have a negative security effectiveness score.To better understand how security practises affect the total cost of cyber crime, we split the sample according to each company’s security posture, which is measured by the Security Effectiveness Score (SES). Ponemon Institute developed this proprietary benchmarking methodology more than 10 years ago. The SES score is derived from rating numerous security practises, including the deployment of enabling security technologies.
This method has been validated from more than 50 independent studies conducted for more than a decade. The SES provides a range of +2 (most favorable) to -2 (least favorable) with a theoretical mean of zero. Hence, a score greater than zero is viewed as net favorable and a score less than zero is net unfavorable. A high favorable score (such as +1 or above) indicates that the organization’s investment in people and technologies is both effective in achieving its security mission and is efficient in utilizing limited resources.
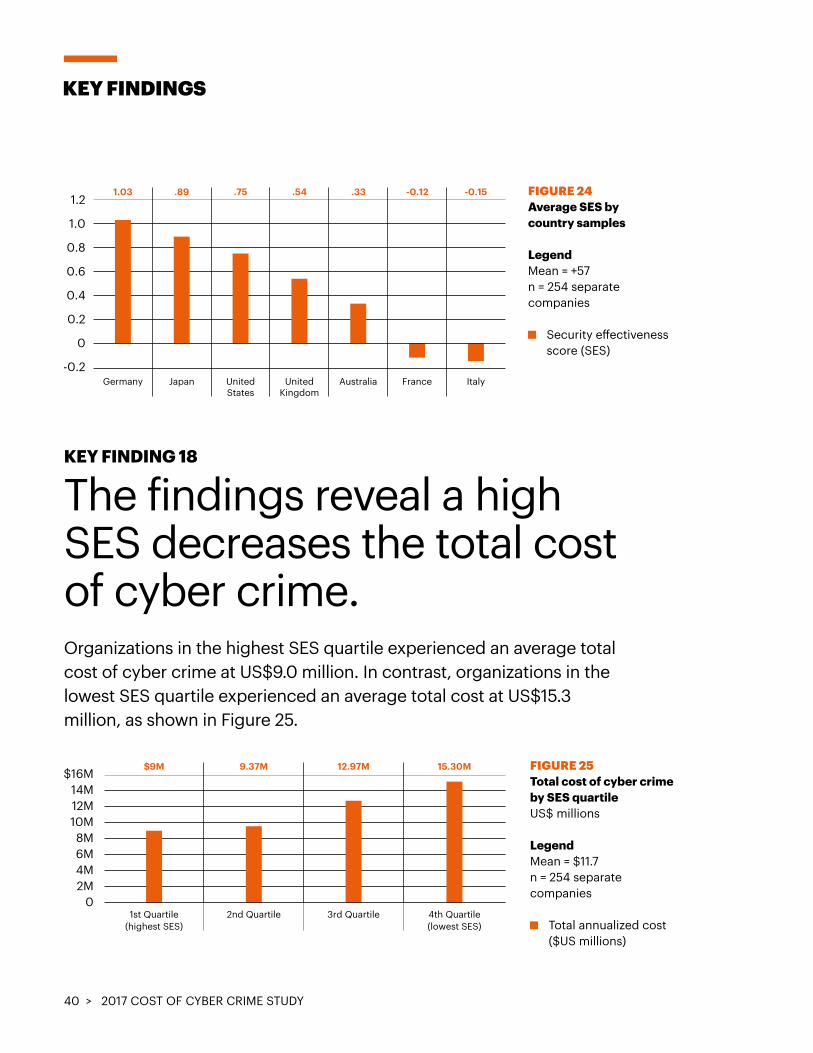
It is our belief that companies with a high SES are more cyber resilient and will have methods that will lessen the cost impact of cyber crimes. The mean SES for all 254 companies in our global sample is +.57. The highest SES was +1.76 and the lowest SES was -1.61. Figure 24 shows the mean SES by country sample. Germany achieved the highest overall SES at +1.03. In contrast, Italy had the lowest SES at -0.15. net favorable and a score less than zero is net unfavorable.
40 > 2017 COST OF CYBER CRIME STUDY
KEY FINDING 18
The findings reveal a high SES decreases the total cost of cyber crime.Organizations in the highest SES quartile experienced an average total cost of cyber crime at US$9.0 million. In contrast, organizations in the lowest SES quartile experienced an average total cost at US$15.3million, as shown in Figure 25.
KEY FINDINGS
FIGURE 24 Average SES by country samples
LegendMean = +57n = 254 separate companies
Security effectiveness score (SES)
FIGURE 25 Total cost of cyber crime by SES quartileUS$ millions
LegendMean = $11.7n = 254 separate companies
Total annualized cost ($US millions)
-0.2
1.2
1.0
0.8
0.6
0.4
0.2
0
Italy
-0.15
France
-0.12
Australia
.33
UnitedKingdom
.54
UnitedStates
.75
Japan
.89
Germany
1.03
$16M14M12M10M8M6M4M2M
01st Quartile
(highest SES)
$9M
2nd Quartile
9.37M
3rd Quartile
12.97M
4th Quartile(lowest SES)
15.30M
> 41 2017 COST OF CYBER CRIME STUDY
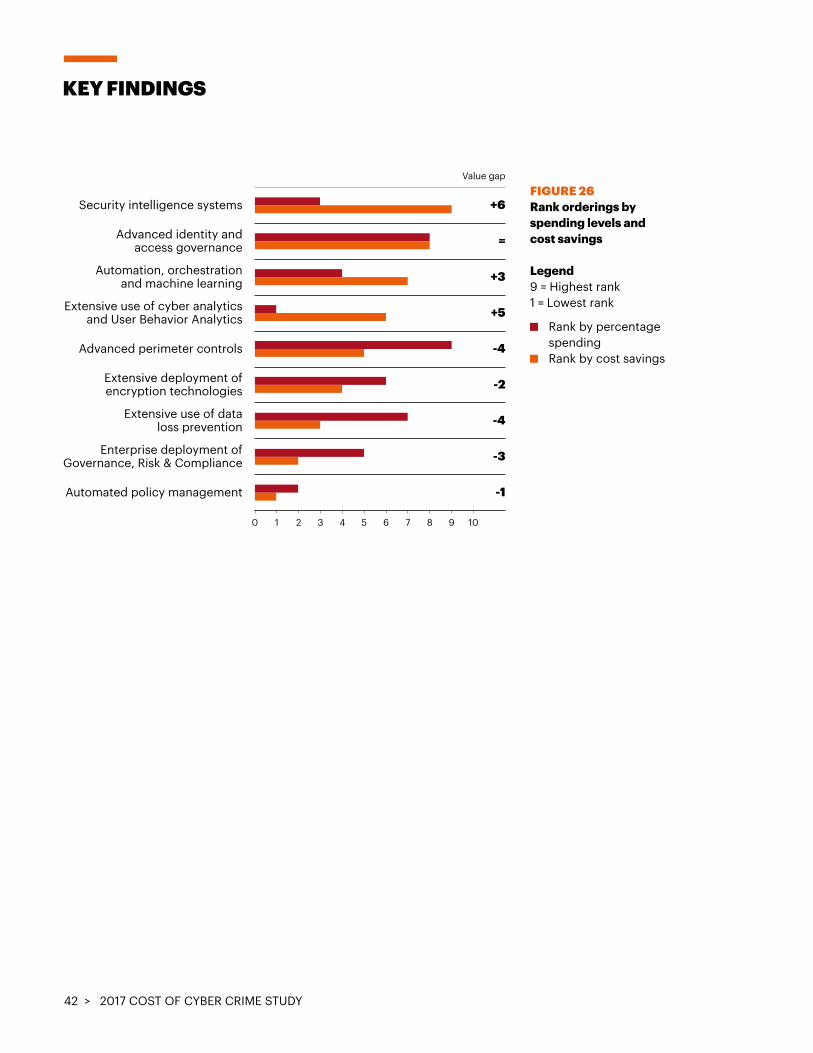
KEY FINDING 19
More investment is needed in breakthrough technologies.Figure 26 presents the results of two independent rankings. The first ranking shows the order of nine (9) enabling security technologies as defined above. As shown, security intelligence systems provide the greatest cost savings, thus earning a rank equal to 9. In contrast, automated policy management provides the lowest savings, with a rank equal to 1.
The second ranking shows the order of enabling security technologies based on the percentage spending level during FY 2017. Here, security intelligence systems has a rank of 3 (third from the bottom). In terms of spending level, advanced perimeter controls has the highest rank of 9, but only a rank of 5 with respect to cost savings. Hence, differences or value gaps between these two rankings suggest possible inefficiencies in the allocation of resources on security solutions.
42 > 2017 COST OF CYBER CRIME STUDY
KEY FINDINGS
FIGURE 26 Rank orderings by spending levels and cost savings
Legend 9 = Highest rank 1 = Lowest rank
Rank by percentage spending
Rank by cost savings
FY2013 FY2014 FY2015 FY2016 FY2017
$14M
12M
10M
8M
6M
4M
2M
0
$7.2M $7.6M $7.7M
$9.5M
$11.7M
0 1 2 3 4 5 6 7 8 9 10
Security intelligence systems
Extensive use of cyber analyticsand User Behavior Analytics
Advanced perimeter controls
Automation, orchestrationand machine learning
Enterprise deployment ofGovernance, Risk & Compliance
Advanced identity andaccess governance
Automated policy management
+6
-1
Extensive deployment ofencryption technologies
Extensive use of dataloss prevention
Value gap
-3
-4
-2
-4
+5
=
+3
> 43 2017 COST OF CYBER CRIME STUDY
COST OF CYBER CRIMEFrequently Asked Questions
What types of cyber attacks are included in this research? For purposes of this study, we define cyber attacks as criminal activity conducted through the organization’s IT infrastructure via the internal or external networks or the Internet. Cyber attacks also include attacks against industrial controls. A successful cyber attack is one that results in the infiltration of a company’s core networks or enterprise systems. It does not include the plethora of attacks stopped by a company’s firewall defenses.
How does benchmark research differ from survey research?The unit of analysis in the 2017 Cost of Cyber Crime Study is the organization. In survey research, the unit of analysis is the individual. In our experience, a traditional survey approach does not capture the necessary details required to extrapolate cyber crime costs. We conduct field-based research that involves interviewing senior-level personnel about their organizations’ actual cyber crime incidents.
How do you collect the data? In our 2017 study, our researchers collected in-depth qualitative data through 2,182 separate interviews conducted over a 10-month period in 254 companies in seven countries: the United States, the United Kingdom, Germany, France, Italy, Australia and Japan. In each of the 254 participating organizations, we spoke with IT, compliance and information security practitioners who are knowledgeable about the cyber attacks experienced by the company and the costs associated with resolving the cyber crime incidents. For privacy purposes we did not collect organization-specific information.
ABOUT THE RESEARCH
44 > 2017 COST OF CYBER CRIME STUDY
How do you calculate the cost? To determine the average cost of cyber crime, organizations were asked to report what they spent to deal with cyber crimes over four consecutive weeks. Once the costs over the four-week period were compiled and validated, these figures were then grossed-up to determine the annualized cost. These are costs to detect, recover, investigate and manage the incident response. Also covered are the costs that result in after-the-fact activities and efforts to reduce business disruption and the loss of customers. These costs do not include expenditures and investments made to sustain an organization’s security posture or compliance with standards, policies and regulations.
Are you tracking the same organizations each year? For consistency purposes, our benchmark sample consists of only larger-sized organizations (that is, a minimum of approximately 1,000 enterprise seats).6 Each annual study involves a different sample of companies. In short, we do not track the same sample of companies over time. To be consistent, we recruit and match companies with similar characteristics such as the company’s industry, headcount, geographic footprint and size of data breach.
ABOUT THE RESEARCH
6: Enterprise seats refer to the number of direct connections to the network and enterprise systems.
> 45 2017 COST OF CYBER CRIME STUDY
FrameworkThe purpose of this research is to provide guidance on what a successful cyber attack can cost an organization. Our 2017 Cost of Cyber Crime Study is unique in addressing the core systems and business process-related activities that drive a range of expenditures associated with a company’s response to cyber crime. Cost figures have been converted into United States dollars for comparative purposes.7
In this study, we define a successful attack as one that results in the infiltration of a company’s core networks or enterprise systems. It does not include the plethora of attacks stopped by a company’s firewall defenses.
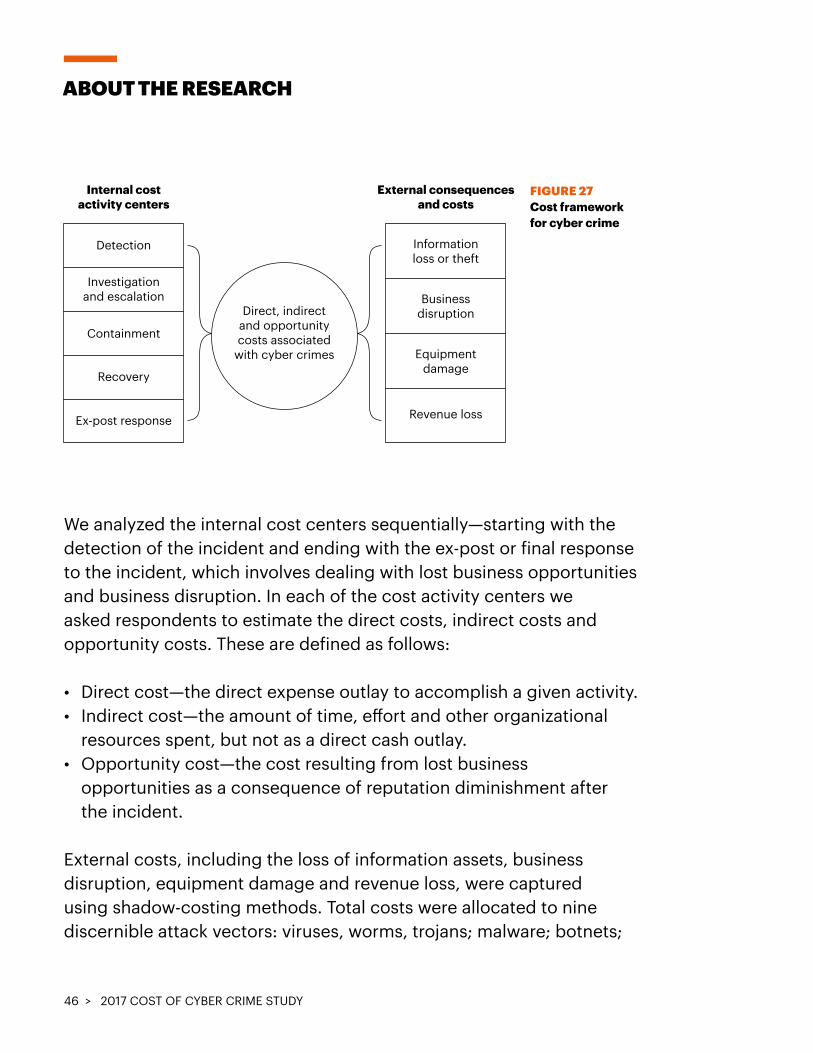
Figure 27 presents the activity-based costing framework used to calculate the average cost of cyber crime. Our benchmark methods attempt to elicit the actual experiences and consequences of cyber attacks. Based on interviews with a variety of senior-level individuals in each organization we classify the costs according to two different cost streams:
• The costs related to dealing with the cyber crime or what we refer to as the internal cost activity centers.
• The costs related to the consequences of the cyber attack or what we refer to as the external consequences of the cyber attack.
7: The Wall Street Journal’s August 16, 2017 currency conversion rates.
46 > 2017 COST OF CYBER CRIME STUDY
We analyzed the internal cost centers sequentially—starting with the detection of the incident and ending with the ex-post or final response to the incident, which involves dealing with lost business opportunities and business disruption. In each of the cost activity centers we asked respondents to estimate the direct costs, indirect costs and opportunity costs. These are defined as follows:
• Direct cost—the direct expense outlay to accomplish a given activity.• Indirect cost—the amount of time, effort and other organizational
resources spent, but not as a direct cash outlay.• Opportunity cost—the cost resulting from lost business
opportunities as a consequence of reputation diminishment after the incident.
External costs, including the loss of information assets, business disruption, equipment damage and revenue loss, were captured using shadow-costing methods. Total costs were allocated to nine discernible attack vectors: viruses, worms, trojans; malware; botnets;
ABOUT THE RESEARCH
FIGURE 27 Cost framework for cyber crime
Internal costactivity centers
Detection
Revenue loss
External consequencesand costs
Businessdisruption
Informationloss or theft
Equipmentdamage
Investigationand escalation
Containment
Recovery
Direct, indirectand opportunity costs associated
with cyber crimes
Ex-post response
> 47 2017 COST OF CYBER CRIME STUDY
Web-based attacks; phishing and social engineering; malicious insiders; stolen or damaged devices; malicious code (including SQL injection); and denial of services.8 This study addresses the core process-related activities that drive a range of expenditures associated with a company’s cyber attack. The five internal cost activity centers in our framework include:9
Activities that enable an organization to reasonably detect and possibly deter cyber attacks or advanced threats. This includes allocated (overhead) costs of certain enabling technologies that enhance mitigation or early detection. Activities necessary to thoroughly uncover the source, scope, and magnitude of one or more incidents. The escalation activity also includes the steps taken to organize an initial management response. Activities that focus on stopping or lessening the severity of cyber attacks or advanced threats. These include shutting down high-risk attack vectors such as insecure applications or endpoints.
8: We acknowledge that these nine attack categories are not mutually independent and they do not represent an exhaustive list. Classification of a given attack was made by the researcher and derived from the facts collected during the benchmarking process. 9: Internal costs are extrapolated using labor (time) as a surrogate for direct and indirect costs. This is also used to allocate an overhead component for fixed costs such as multi-year investments in technologies.
Detection
Investigation and escalation
Containment
48 > 2017 COST OF CYBER CRIME STUDY
Activities associated with repairing and remediating the organization’s systems and core business processes. These include the restoration of damaged information assets and other IT (data center) assets.
Activities to help the organization minimize potential future attacks. These include containing costs from business disruption and information loss as well as adding new enabling technologies and control systems.
In addition to the above process-related activities, organizations often experience external consequences or costs associated with the aftermath of successful attacks—which are defined as attacks that infiltrate the organization’s network or enterprise systems. Accordingly, our research shows that four general cost activities associated with these external consequences are as follows:
Loss or theft of sensitive and confidential information as a result of a cyber attack. Such information includes trade secrets, intellectual properties (including source code), customer information and employee records. This cost category also includes the cost of data breach notification in the event that personal information is wrongfully acquired.
ABOUT THE RESEARCH
Recovery
Ex-post response
Cost of information loss or theft
> 49 2017 COST OF CYBER CRIME STUDY
The economic impact of downtime or unplanned outages that prevent the organization from meeting its data processing requirements.
The cost to remediate equipment and other IT assets as a result of cyber attacks to information resources and critical infrastructure.
The loss of customers (churn) and other stakeholders because of system delays or shutdowns as a result of a cyber attack. To extrapolate this cost, we use a shadow costing method that relies on the “lifetime value” of an average customer as defined for each participating organization.
BenchmarkingThe cost of cyber crime benchmark instrument is designed to collect descriptive information from IT, information security and other key individuals about the actual costs incurred either directly or indirectly as a result of cyber attacks actually detected. Our cost method does not require subjects to provide actual accounting results, but instead relies on estimation and extrapolation from interview data over a four-week period.
Cost of business disruption
Cost of equipment damage
Lost revenue
50 > 2017 COST OF CYBER CRIME STUDY
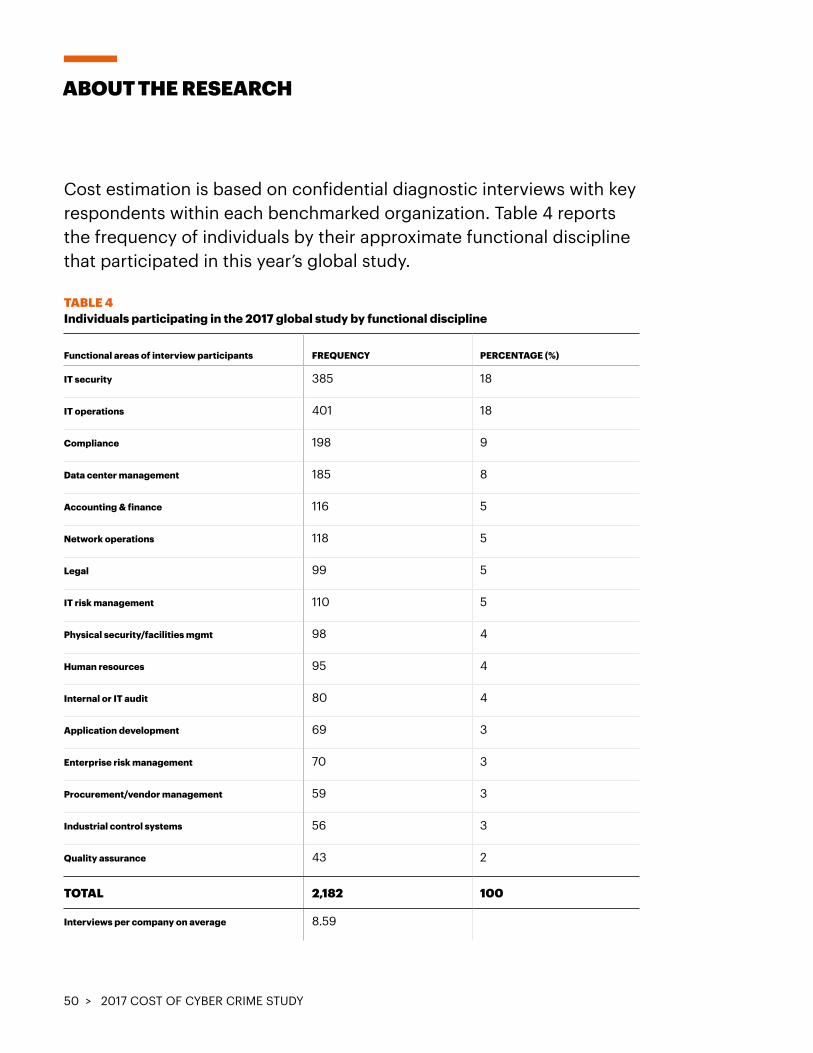
Cost estimation is based on confidential diagnostic interviews with key respondents within each benchmarked organization. Table 4 reports the frequency of individuals by their approximate functional discipline that participated in this year’s global study.
TABLE 4 Individuals participating in the 2017 global study by functional discipline
ABOUT THE RESEARCH
Functional areas of interview participants FREQUENCY PERCENTAGE (%)
IT security 385 18
IT operations 401 18
Compliance 198 9
Data center management 185 8
Accounting & finance 116 5
Network operations 118 5
Legal 99 5
IT risk management 110 5
Physical security/facilities mgmt 98 4
Human resources 95 4
Internal or IT audit 80 4
Application development 69 3
Enterprise risk management 70 3
Procurement/vendor management 59 3
Industrial control systems 56 3
Quality assurance 43 2
TOTAL 2,182 100
Interviews per company on average 8.59
> 51 2017 COST OF CYBER CRIME STUDY
Data collection methods did not include actual accounting information, but instead relied upon numerical estimation based on the knowledge and experience of each participant. Within each category, cost estimation was a two-stage process. First, the benchmark instrument required individuals to rate direct cost estimates for each cost category by marking a range variable defined in the following number-line format.
The numerical value obtained from the number line, rather than a point estimate for each presented cost category, preserved confidentiality and ensured a higher response rate. The benchmark instrument also required practitioners to provide a second estimate for indirect and opportunity costs, separately.
Cost estimates were then compiled for each organization based on the relative magnitude of these costs in comparison to a direct cost within a given category. Finally, we administered general interview questions to obtain additional facts, including estimated revenue losses as a result of the cyber crime.
The size and scope of survey items was limited to known cost categories that cut across different industry sectors. In our experience, a survey focusing on process yields a higher response rate and better quality of results. We also used a paper instrument, rather than an electronic survey, to provide greater assurances of confidentiality.
To maintain complete confidentiality, the survey instrument did not capture company-specific information of any kind. Subject materials contained no tracking codes or other methods that could link responses to participating companies.
We carefully limited items to only those cost activities we considered crucial to the measurement of cyber crime cost to keep the benchmark
52 > 2017 COST OF CYBER CRIME STUDY
instrument to a manageable size. Based on discussions with learned experts, the final set of items focused on a finite set of direct or indirect cost activities. After collecting benchmark information, each instrument was examined carefully for consistency and completeness. In this study, a few companies were rejected because of incomplete, inconsistent or blank responses.
Field research was conducted over several months, concluding in August 2017. To maintain consistency for all benchmark companies, information was collected about the organizations’ cyber crime experience was limited to four consecutive weeks. This time frame was not necessarily the same time period as other organizations in this study. The extrapolated direct, indirect and opportunity costs of cyber crime were annualized by dividing the total cost collected over four weeks (ratio = 4/52 weeks).
SampleThe recruitment of the annual study started with a personalized letter and a follow-up telephone call to 1,701 contacts for possible participation and 254 organizations permitted Ponemon Institute to perform the benchmark analysis.
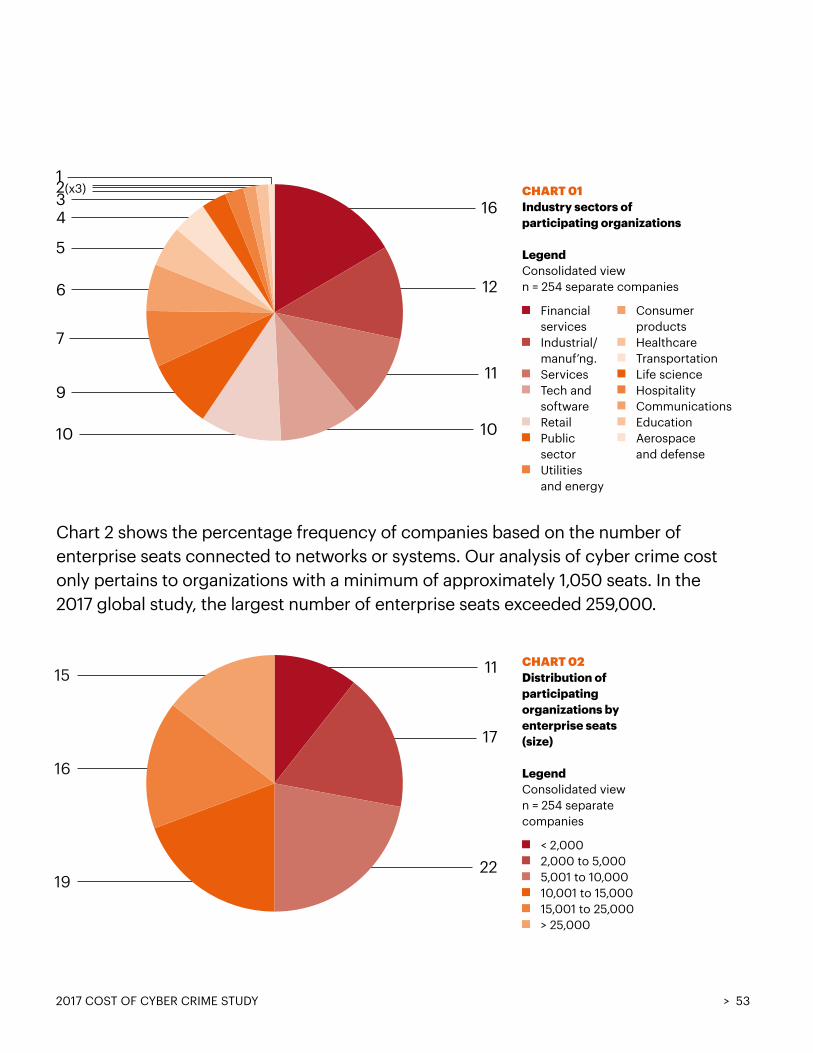
Chart 1 summarizes the current (FY 2017) sample of participating companies based on 15 primary industry classifications. As can be seen, financial services (16 percent) represent the largest segment. This includes retail banking, insurance, brokerage and credit card companies. The second and third largest segments include industrial (12 percent) and services (11 percent).
ABOUT THE RESEARCH
> 53 2017 COST OF CYBER CRIME STUDY
Chart 2 shows the percentage frequency of companies based on the number of enterprise seats connected to networks or systems. Our analysis of cyber crime cost only pertains to organizations with a minimum of approximately 1,050 seats. In the 2017 global study, the largest number of enterprise seats exceeded 259,000.
16
12
11
1010
9
7
6
5
432(x3)1
11
17
2219
16
15
CHART 01 Industry sectors of participating organizations
Legend Consolidated view n = 254 separate companies
Financial services Industrial/ manuf’ng. Services Tech and software Retail Public sector Utilities and energy
Consumer products Healthcare Transportation Life science Hospitality Communications Education Aerospace and defense
CHART 02 Distribution of participating organizations by enterprise seats (size)
Legend Consolidated view n = 254 separate companies
< 2,000 2,000 to 5,000 5,001 to 10,000 10,001 to 15,000 15,001 to 25,000 > 25,000
54 > 2017 COST OF CYBER CRIME STUDY
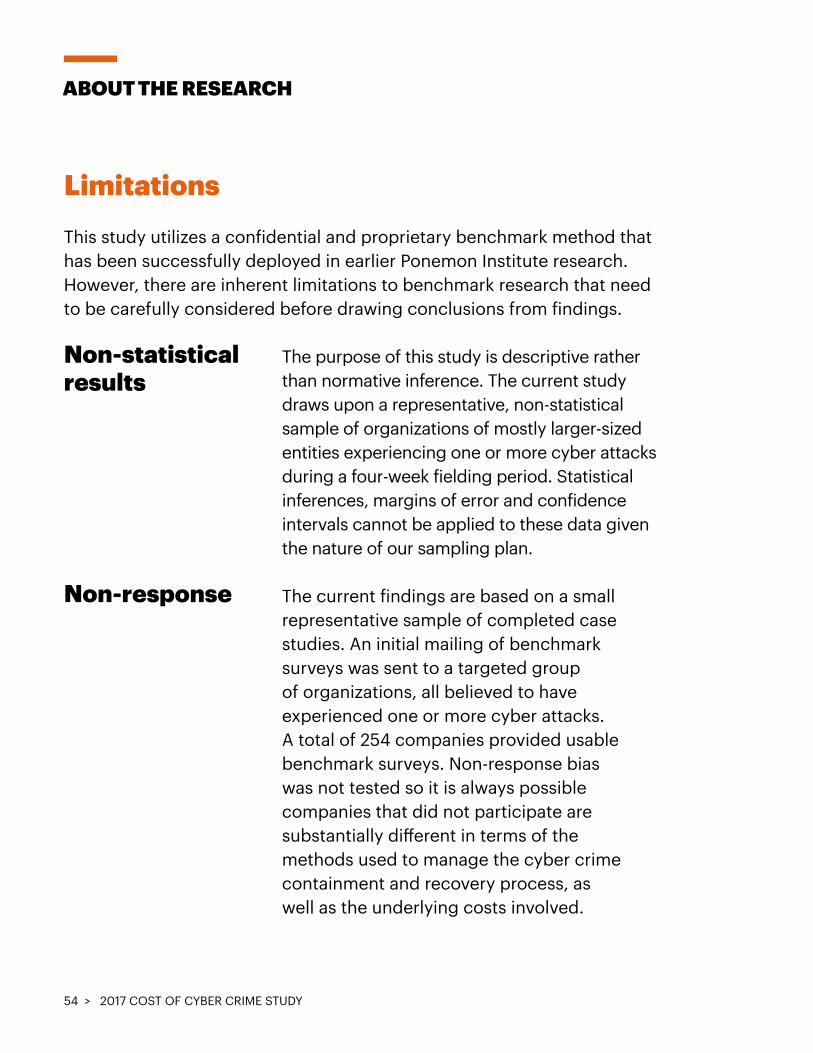
LimitationsThis study utilizes a confidential and proprietary benchmark method that has been successfully deployed in earlier Ponemon Institute research. However, there are inherent limitations to benchmark research that need to be carefully considered before drawing conclusions from findings.
The purpose of this study is descriptive rather than normative inference. The current study draws upon a representative, non-statistical sample of organizations of mostly larger-sized entities experiencing one or more cyber attacks during a four-week fielding period. Statistical inferences, margins of error and confidence intervals cannot be applied to these data given the nature of our sampling plan.
The current findings are based on a small representative sample of completed case studies. An initial mailing of benchmark surveys was sent to a targeted group of organizations, all believed to have experienced one or more cyber attacks. A total of 254 companies provided usable benchmark surveys. Non-response bias was not tested so it is always possible companies that did not participate are substantially different in terms of the methods used to manage the cyber crime containment and recovery process, as well as the underlying costs involved.
ABOUT THE RESEARCH
Non-statistical results
Non-response
> 55 2017 COST OF CYBER CRIME STUDY
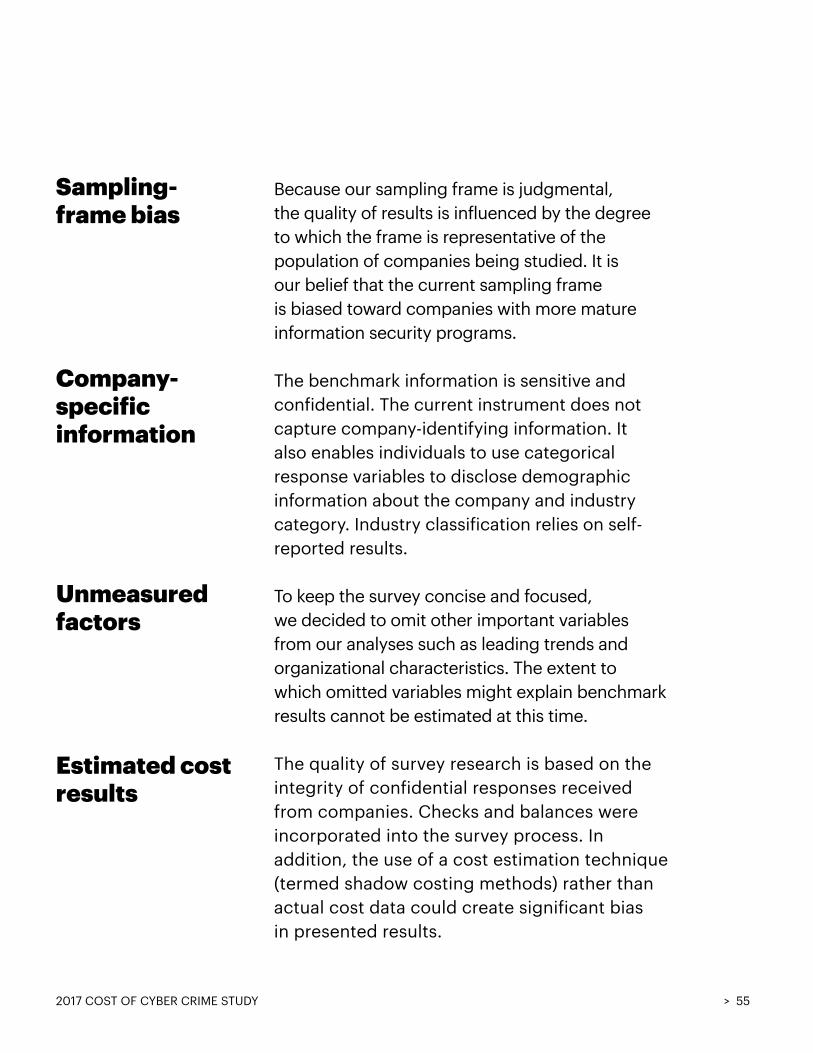
Because our sampling frame is judgmental, the quality of results is influenced by the degree to which the frame is representative of the population of companies being studied. It is our belief that the current sampling frame is biased toward companies with more mature information security programs.
The benchmark information is sensitive and confidential. The current instrument does not capture company-identifying information. It also enables individuals to use categorical response variables to disclose demographic information about the company and industry category. Industry classification relies on self-reported results.
To keep the survey concise and focused, we decided to omit other important variables from our analyses such as leading trends and organizational characteristics. The extent to which omitted variables might explain benchmark results cannot be estimated at this time.
The quality of survey research is based on the integrity of confidential responses received from companies. Checks and balances were incorporated into the survey process. In addition, the use of a cost estimation technique (termed shadow costing methods) rather than actual cost data could create significant bias in presented results.
Sampling- frame bias
Company- specific information
Unmeasured factors
Estimated cost results
CONTACT USKevin Richards [email protected]
Ryan LaSalle [email protected]
Matt Devost [email protected]
Floris van den Dool [email protected]
Josh Kennedy-White [email protected]
Ponemon Institute LLC Attn: Research Department 2308 US 31 North Traverse City, Michigan 49629 USA 1.800.887.3118 [email protected]
ABOUT ACCENTUREAccenture is a leading global professional services company, providing a broad range of services and solutions in strategy, consulting, digital, technology and operations. Combining unmatched experience and specialized skills across more than 40 industries and all business functions—underpinned by the world’s largest delivery network—Accenture works at the intersection of business and technology to help clients improve their performance and create sustainable value for their stakeholders. With approximately 411,000 people serving clients in more than 120 countries, Accenture drives innovation to improve the way the world works and lives. Visit us at www.accenture.com
ABOUT ACCENTURE SECURITYAccenture Security helps organizations build resilience from the inside out, so they can confidently focus on innovation and growth. Leveraging its global network of cybersecurity labs, deep industry understanding across client value chains and services that span the security lifecycle, Accenture protects organization’s valuable assets, end-to-end. With services that include strategy and risk management, cyber defense, digital identity, application security and managed security, Accenture enables businesses around the world to defend against known sophisticated threats, and the unknown. Follow us @AccentureSecure on Twitter or visit the Accenture Security blog.
ABOUT PONEMON INSTITUTEAdvancing Responsible Information Management
Ponemon Institute is dedicated to independent research and education that advances responsible information and privacy management practices within business and government. Our mission is to conduct high quality, empirical studies on critical issues affecting the management and security of sensitive information about people and organizations.
We uphold strict data confidentiality, privacy and ethical research standards. We do not collect any personally identifiable information from individuals (or company identifiable information in our business research). Furthermore, we have strict quality standards to ensure that subjects are not asked extraneous, irrelevant or improper questions.
Follow us @AccentureSecure
Connect with us
The views and opinions expressed in this document are meant to stimulate thought and discussion. As each business has unique requirements and objectives, these ideas should not be viewed as professional advice with respect to your business.
This document makes descriptive reference to trademarks that may be owned by others. The use of such trademarks herein is not an assertion of ownership of such trademarks by Accenture and is not intended to represent or imply the existence of an association between Accenture and the lawful owners of such trademarks.
Copyright © 2017 Accenture. All rights reserved. Accenture, its logo, and High Performance Delivered are trademarks of Accenture.
Related Documents