AUGUST 31, 2017 2017 ANNUAL REPORT iShares Trust iShares MSCI All Peru Capped ETF | EPU | NYSE Arca iShares MSCI Argentina and Global Exposure ETF | AGT | BATS iShares MSCI Brazil Small-Cap ETF | EWZS | NASDAQ iShares MSCI China ETF | MCHI | NASDAQ iShares MSCI China Small-Cap ETF | ECNS | NYSE Arca iShares MSCI Indonesia ETF | EIDO | NYSE Arca iShares MSCI Philippines ETF | EPHE | NYSE Arca iShares MSCI Poland Capped ETF | EPOL | NYSE Arca iShares MSCI Qatar Capped ETF | QAT | NASDAQ iShares MSCI Saudi Arabia Capped ETF | KSA | NYSE Arca iShares MSCI UAE Capped ETF | UAE | NASDAQ

Welcome message from author
This document is posted to help you gain knowledge. Please leave a comment to let me know what you think about it! Share it to your friends and learn new things together.
Transcript
AUGUST 31, 2017
2017 ANNUAL REPORT
iShares Trust
� iShares MSCI All Peru Capped ETF | EPU | NYSE Arca
� iShares MSCI Argentina and Global Exposure ETF | AGT | BATS
� iShares MSCI Brazil Small-Cap ETF | EWZS | NASDAQ
� iShares MSCI China ETF | MCHI | NASDAQ
� iShares MSCI China Small-Cap ETF | ECNS | NYSE Arca
� iShares MSCI Indonesia ETF | EIDO | NYSE Arca
� iShares MSCI Philippines ETF | EPHE | NYSE Arca
� iShares MSCI Poland Capped ETF | EPOL | NYSE Arca
� iShares MSCI Qatar Capped ETF | QAT | NASDAQ
� iShares MSCI Saudi Arabia Capped ETF | KSA | NYSE Arca
� iShares MSCI UAE Capped ETF | UAE | NASDAQ


Table of Contents
Management’s Discussions of Fund Performance . . . . . . . . . . . . . . . . . . . . . . . . . . . . . . . . . . . . . . . . . . . . . . . . . . . . . . . . . . . . . . . . 5
About Fund Performance . . . . . . . . . . . . . . . . . . . . . . . . . . . . . . . . . . . . . . . . . . . . . . . . . . . . . . . . . . . . . . . . . . . . . . . . . . . . . . . . . . . 28
Shareholder Expenses . . . . . . . . . . . . . . . . . . . . . . . . . . . . . . . . . . . . . . . . . . . . . . . . . . . . . . . . . . . . . . . . . . . . . . . . . . . . . . . . . . . . . 28
Schedules of Investments . . . . . . . . . . . . . . . . . . . . . . . . . . . . . . . . . . . . . . . . . . . . . . . . . . . . . . . . . . . . . . . . . . . . . . . . . . . . . . . . . . . 29
iShares MSCI All Peru Capped ETF . . . . . . . . . . . . . . . . . . . . . . . . . . . . . . . . . . . . . . . . . . . . . . . . . . . . . . . . . . . . . . . . . . . . . . . . . 29
iShares MSCI Argentina and Global Exposure ETF . . . . . . . . . . . . . . . . . . . . . . . . . . . . . . . . . . . . . . . . . . . . . . . . . . . . . . . . . . . . 31
iShares MSCI Brazil Small-Cap ETF . . . . . . . . . . . . . . . . . . . . . . . . . . . . . . . . . . . . . . . . . . . . . . . . . . . . . . . . . . . . . . . . . . . . . . . . 33
iShares MSCI China ETF . . . . . . . . . . . . . . . . . . . . . . . . . . . . . . . . . . . . . . . . . . . . . . . . . . . . . . . . . . . . . . . . . . . . . . . . . . . . . . . . . 36
iShares MSCI China Small-Cap ETF . . . . . . . . . . . . . . . . . . . . . . . . . . . . . . . . . . . . . . . . . . . . . . . . . . . . . . . . . . . . . . . . . . . . . . . . 42
iShares MSCI Indonesia ETF . . . . . . . . . . . . . . . . . . . . . . . . . . . . . . . . . . . . . . . . . . . . . . . . . . . . . . . . . . . . . . . . . . . . . . . . . . . . . . 52
iShares MSCI Philippines ETF . . . . . . . . . . . . . . . . . . . . . . . . . . . . . . . . . . . . . . . . . . . . . . . . . . . . . . . . . . . . . . . . . . . . . . . . . . . . . 55
iShares MSCI Poland Capped ETF . . . . . . . . . . . . . . . . . . . . . . . . . . . . . . . . . . . . . . . . . . . . . . . . . . . . . . . . . . . . . . . . . . . . . . . . . 57
iShares MSCI Qatar Capped ETF . . . . . . . . . . . . . . . . . . . . . . . . . . . . . . . . . . . . . . . . . . . . . . . . . . . . . . . . . . . . . . . . . . . . . . . . . . 59
iShares MSCI Saudi Arabia Capped ETF . . . . . . . . . . . . . . . . . . . . . . . . . . . . . . . . . . . . . . . . . . . . . . . . . . . . . . . . . . . . . . . . . . . . . 61
iShares MSCI UAE Capped ETF . . . . . . . . . . . . . . . . . . . . . . . . . . . . . . . . . . . . . . . . . . . . . . . . . . . . . . . . . . . . . . . . . . . . . . . . . . . 64
Financial Statements . . . . . . . . . . . . . . . . . . . . . . . . . . . . . . . . . . . . . . . . . . . . . . . . . . . . . . . . . . . . . . . . . . . . . . . . . . . . . . . . . . . . . . . 66
Financial Highlights . . . . . . . . . . . . . . . . . . . . . . . . . . . . . . . . . . . . . . . . . . . . . . . . . . . . . . . . . . . . . . . . . . . . . . . . . . . . . . . . . . . . . . . . 80
Notes to Financial Statements . . . . . . . . . . . . . . . . . . . . . . . . . . . . . . . . . . . . . . . . . . . . . . . . . . . . . . . . . . . . . . . . . . . . . . . . . . . . . . . 91
Report of Independent Registered Public Accounting Firm . . . . . . . . . . . . . . . . . . . . . . . . . . . . . . . . . . . . . . . . . . . . . . . . . . . . . . . . . 105
Tax Information . . . . . . . . . . . . . . . . . . . . . . . . . . . . . . . . . . . . . . . . . . . . . . . . . . . . . . . . . . . . . . . . . . . . . . . . . . . . . . . . . . . . . . . . . . . 106
Board Review and Approval of Investment Advisory Contract . . . . . . . . . . . . . . . . . . . . . . . . . . . . . . . . . . . . . . . . . . . . . . . . . . . . . . 107
Supplemental Information . . . . . . . . . . . . . . . . . . . . . . . . . . . . . . . . . . . . . . . . . . . . . . . . . . . . . . . . . . . . . . . . . . . . . . . . . . . . . . . . . . . 120
Trustee and Officer Information . . . . . . . . . . . . . . . . . . . . . . . . . . . . . . . . . . . . . . . . . . . . . . . . . . . . . . . . . . . . . . . . . . . . . . . . . . . . . . 131

THIS PAGE INTENTIONALLY LEFT BLANK.

Management’s Discussion of Fund PerformanceiSHARES® TRUST
GLOBAL EQUITY MARKET OVERVIEW
Global equity markets posted strong returns for the 12 months ended August 31, 2017 (the “reporting period”). The MSCI ACWI,
a broad global equity index that includes both developed and emerging markets, returned 17.11% in U.S. dollar terms for the
reporting period.
The primary factor behind the robust performance of global equity markets was improving global economic growth, driven largely
by the continuation of accommodative monetary policies from many of the world’s central banks. Signs of stronger economic
activity in Europe emerged as the European Central Bank (“ECB”) maintained policies such as quantitative easing and negative
interest rates. Economic growth rates in China and Japan, the largest economies in Asia, also increased during the reporting
period, reflecting efforts by the People’s Bank of China (“PBOC”) and the Bank of Japan (“BOJ”) to stimulate economic activity.
Stronger economic growth led several central banks to consider reducing their economic stimulus measures. For example, late in
the reporting period, the ECB discussed the possibility of tapering its quantitative easing program, while the PBOC increased
short-term interest rates during the first half of 2017.
On a regional basis, European equity markets posted the best returns among developed markets, advancing by approximately
20% in U.S. dollar terms for the reporting period. European stocks benefited from improving economic conditions and stronger
corporate earnings. In addition, election outcomes in France and the Netherlands eased investor concerns about nationalist
presidential candidates and their opposition to the European Union (“E.U.”). Currency fluctuations also contributed meaningfully to
European equity performance in U.S. dollar terms as the euro appreciated by approximately 6% against the U.S. dollar during the
reporting period. The best-performing European stock markets included Austria, Italy, and Spain, while Ireland and Belgium
posted the weakest returns.
Equity markets in the Asia-Pacific region gained about 16% in U.S. dollar terms for the reporting period, led by Singapore and
Hong Kong. Japanese stocks also posted strong returns, benefiting from improving consumer spending and employment trends
that contributed to the ongoing recovery in the Japanese economy. However, equity market returns in Japan were hindered by a
decline in the Japanese yen, which depreciated by approximately 6% against the U.S. dollar.
The U.S. stock market returned approximately 15% for the reporting period. Despite mixed U.S. economic data, U.S. stocks
advanced initially in anticipation of pro-business fiscal policies from the new presidential administration. Although the
administration struggled to implement its fiscal agenda, stocks continued to move higher as better global economic conditions led
to a notable improvement in corporate earnings growth, particularly for multinational companies with significant operations outside
of the U.S. U.S. stocks advanced despite three short-term interest rate increases by the U.S. Federal Reserve Bank (the “Fed”)
during the reporting period, which increased the short-term interest rate target to its highest level since October 2008. The Fed
also unveiled a plan to start reducing the amount of U.S. Treasury bonds and mortgage-backed securities on its balance sheet
before the end of 2017.
Emerging markets stocks outperformed those in developed markets, returning more than 23% in U.S. dollar terms for the
reporting period. Emerging markets in Eastern Europe were the best performers, led by Poland, Greece, and Hungary. Equity
markets in the Middle East trailed for the reporting period amid continued geopolitical conflict in the region.
M A N A G E M E N T ’ S D I S C U S S I O N S O F F U N D P E R F O R M A N C E 5

Management’s Discussion of Fund PerformanceiSHARES® MSCI ALL PERU CAPPED ETFPerformance as of August 31, 2017
Average Annual Total Returns Cumulative Total Returns
NAV MARKET INDEX NAV MARKET INDEX
1 Year 16.89% 19.49% 17.93% 16.89% 19.49% 17.93%
5 Years (0.06)% 0.12% 0.64% (0.29)% 0.59% 3.23%
Since Inception 7.12% 7.08% 7.89% 75.74% 75.23% 86.38%
GROWTH OF $10 ,000 INVESTMENT
(S INCE INCEPTION AT NET ASSET VALUE)
$18,638$17,574
$8,000
$10,000
$12,000
$14,000
$16,000
$18,000
$20,000
$22,000
Aug 17Aug 12Aug 11
Fund Index
Aug 10Aug 09 Aug 14Aug 13 Aug 15 Aug 16
The inception date of the Fund was 6/19/09. The first day of secondary market trading was 6/22/09.
Past performance is no guarantee of future results. Performance results do not reflect the deduction of taxes that a shareholder would pay on fund distributions or on
the redemption or sale of fund shares. See “About Fund Performance” on page 28 for more information.
Shareholder Expenses
Actual Hypothetical 5% Return
BeginningAccount Value
(3/1/17)
EndingAccount Value
(8/31/17)Expenses Paid
During Period a
BeginningAccount Value
(3/1/17)
EndingAccount Value
(8/31/17)Expenses Paid
During Period aAnnualized
Expense Ratio
$ 1,000.00 $ 1,118.60 $ 3.26 $ 1,000.00 $ 1,022.10 $ 3.11 0.61%
a Expenses are calculated using the Fund’s annualized expense ratio (as disclosed in the table), multiplied by the average account value for the period, multipliedby the number of days in the period (184 days) and divided by the number of days in the year (365 days). See “Shareholder Expenses” on page 28 for moreinformation.
6 2 0 1 7 i S H A R E S A N N U A L R E P O R T T O S H A R E H O L D E R S

Management’s Discussion of Fund Performance (Continued)
iSHARES® MSCI ALL PERU CAPPED ETF
The iShares MSCI All Peru Capped ETF (the “Fund”) seeks to track the investment results of an index composed of Peruvian
equities, as represented by the MSCI All Peru Capped Index (the “Index”). The Fund invests in a representative sample of
securities included in the Index that collectively has an investment profile similar to the Index. Due to the use of representative
sampling, the Fund may or may not hold all of the securities that are included in the Index. For the 12-month reporting period
ended August 31, 2017, the total return for the Fund was 16.89%, net of fees, while the total return for the Index was 17.93%.
Peru’s stock market benefited from continuing economic growth during the reporting period. The country’s economy relies heavily
on exports, with ore and mineral exports representing more than half of Peru’s total exports. During the reporting period, Peru’s
economy benefited from significant increases in sales of some of its largest export products, including copper, gold, zinc, oil, and
gas. Benign inflationary conditions led to increased consumer spending, which reached a record high in the second quarter of
2017. In an effort to stimulate economic growth, Peru’s central bank reduced interest rates twice during the reporting period, to
the lowest level since December 2015.
The materials sector, the largest sector in the Index, representing approximately 47% of the Index on average for the reporting
period, was the largest contributor to the Index’s return. Metals and mining companies contributed the most in the materials
sector, benefiting from increased export demand for steel, particularly from China. The financials sector also contributed
significantly to the Index’s performance amid strength in Peruvian banks. Other contributors to the Index’s return included the
consumer staples and consumer discretionary sectors.
In contrast, the industrials sector detracted from the Index’s return for the reporting period as the construction and engineering
industry struggled. The utilities and energy sectors also detracted slightly from the Index’s performance amid a decline in energy
prices.
The Peruvian sol, which appreciated approximately 4% relative to the U.S. dollar during the reporting period, contributed to the
Index’s performance, as returns on Peruvian investments were higher when translated back into U.S. dollars.
ALLOCATION BY SECTOR
As of 8/31/17
Sector
Percentage of
Total Investments*
Materials 49.52%
Financials 29.77
Consumer Staples 8.40
Industrials 5.28
Utilities 3.09
Consumer Discretionary 3.04
Energy 0.90
TOTAL 100.00%
TEN LARGEST FUND HOLDINGS
As of 8/31/17
Security
Percentage of
Total Investments*
Credicorp Ltd. 22.65%
Southern Copper Corp. 12.86
Cia. de Minas Buenaventura SAA ADR 9.43
Alicorp SAA 4.63
Intercorp Financial Services Inc. 4.50
Hochschild Mining PLC 4.03
Volcan Cia. Minera SAA Class B 3.62
Ferreycorp SAA 3.23
Cementos Pacasmayo SAA 3.17
SACI Falabella 3.04
TOTAL 71.16%
* Excludes money market funds.
M A N A G E M E N T ’ S D I S C U S S I O N S O F F U N D P E R F O R M A N C E 7

Management’s Discussion of Fund PerformanceiSHARES® MSCI ARGENTINA AND GLOBAL EXPOSURE ETFPerformance as of August 31, 2017
Cumulative Total Returns
NAV MARKET INDEX
Since Inception 2.00% 2.15% 2.85%
The inception date of the Fund was 4/25/17. The first day of secondary market trading was 4/27/17.
For the fiscal period ended 8/31/17, the Fund did not have six months of performance and therefore line graphs are not presented.
Past performance is no guarantee of future results. Performance results do not reflect the deduction of taxes that a shareholder would pay on fund distributions or on
the redemption or sale of fund shares. See “About Fund Performance” on page 28 for more information.
Shareholder Expenses
Actual Hypothetical 5% Return
BeginningAccount Value
(4/25/17) a
EndingAccount Value
(8/31/17)Expenses Paid
During Period b
BeginningAccount Value
(3/1/17)
EndingAccount Value
(8/31/17)Expenses Paid
During Period bAnnualized
Expense Ratio
$ 1,000.00 $ 1,020.00 $ 2.09 $ 1,000.00 $ 1,022.20 $ 3.01 0.59%
a The beginning of the period (commencement of operations) is April 25, 2017.b Expenses are calculated using the Fund’s annualized expense ratio (as disclosed in the table), multiplied by the average account value for the period, multiplied
by the number of days in the period (128 days for actual and 184 days for hypothetical expenses) and divided by the number of days in the year (365 days). See“Shareholder Expenses” on page 28 for more information.
8 2 0 1 7 i S H A R E S A N N U A L R E P O R T T O S H A R E H O L D E R S
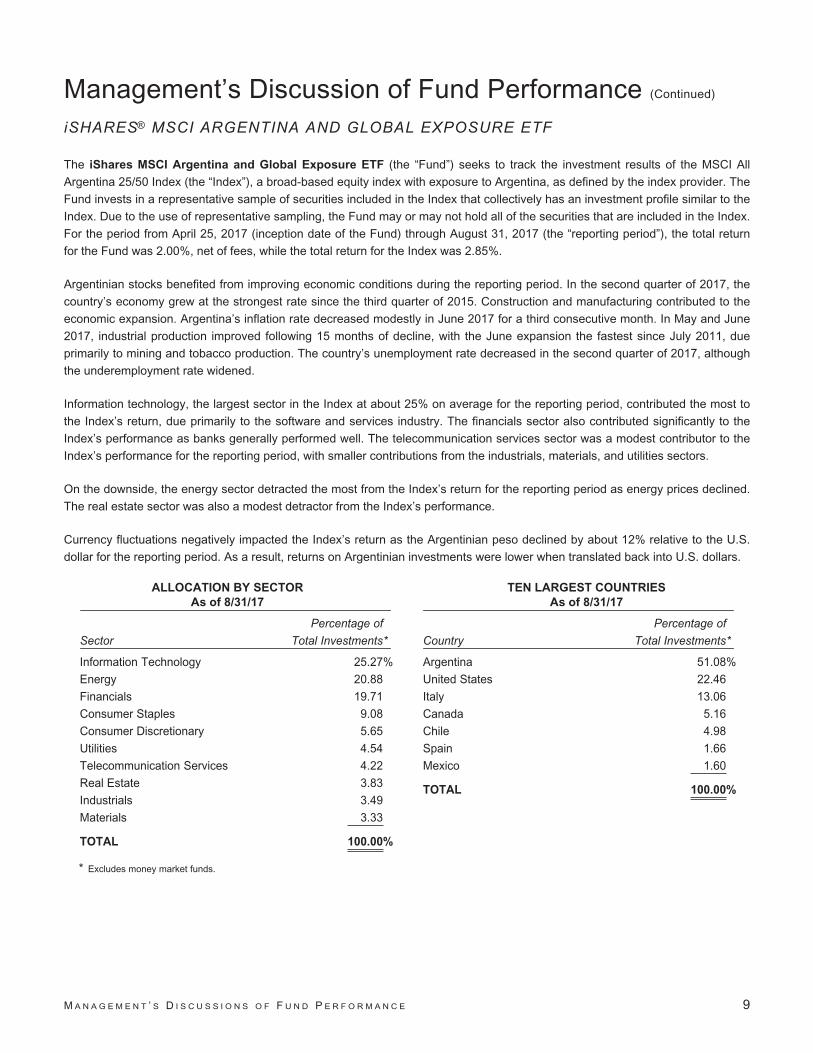
Management’s Discussion of Fund Performance (Continued)
iSHARES® MSCI ARGENTINA AND GLOBAL EXPOSURE ETF
The iShares MSCI Argentina and Global Exposure ETF (the “Fund”) seeks to track the investment results of the MSCI All
Argentina 25/50 Index (the “Index”), a broad-based equity index with exposure to Argentina, as defined by the index provider. The
Fund invests in a representative sample of securities included in the Index that collectively has an investment profile similar to the
Index. Due to the use of representative sampling, the Fund may or may not hold all of the securities that are included in the Index.
For the period from April 25, 2017 (inception date of the Fund) through August 31, 2017 (the “reporting period”), the total return
for the Fund was 2.00%, net of fees, while the total return for the Index was 2.85%.
Argentinian stocks benefited from improving economic conditions during the reporting period. In the second quarter of 2017, the
country’s economy grew at the strongest rate since the third quarter of 2015. Construction and manufacturing contributed to the
economic expansion. Argentina’s inflation rate decreased modestly in June 2017 for a third consecutive month. In May and June
2017, industrial production improved following 15 months of decline, with the June expansion the fastest since July 2011, due
primarily to mining and tobacco production. The country’s unemployment rate decreased in the second quarter of 2017, although
the underemployment rate widened.
Information technology, the largest sector in the Index at about 25% on average for the reporting period, contributed the most to
the Index’s return, due primarily to the software and services industry. The financials sector also contributed significantly to the
Index’s performance as banks generally performed well. The telecommunication services sector was a modest contributor to the
Index’s performance for the reporting period, with smaller contributions from the industrials, materials, and utilities sectors.
On the downside, the energy sector detracted the most from the Index’s return for the reporting period as energy prices declined.
The real estate sector was also a modest detractor from the Index’s performance.
Currency fluctuations negatively impacted the Index’s return as the Argentinian peso declined by about 12% relative to the U.S.
dollar for the reporting period. As a result, returns on Argentinian investments were lower when translated back into U.S. dollars.
ALLOCATION BY SECTOR
As of 8/31/17
Sector
Percentage of
Total Investments*
Information Technology 25.27%
Energy 20.88
Financials 19.71
Consumer Staples 9.08
Consumer Discretionary 5.65
Utilities 4.54
Telecommunication Services 4.22
Real Estate 3.83
Industrials 3.49
Materials 3.33
TOTAL 100.00%
TEN LARGEST COUNTRIES
As of 8/31/17
Country
Percentage of
Total Investments*
Argentina 51.08%
United States 22.46
Italy 13.06
Canada 5.16
Chile 4.98
Spain 1.66
Mexico 1.60
TOTAL 100.00%
* Excludes money market funds.
M A N A G E M E N T ’ S D I S C U S S I O N S O F F U N D P E R F O R M A N C E 9
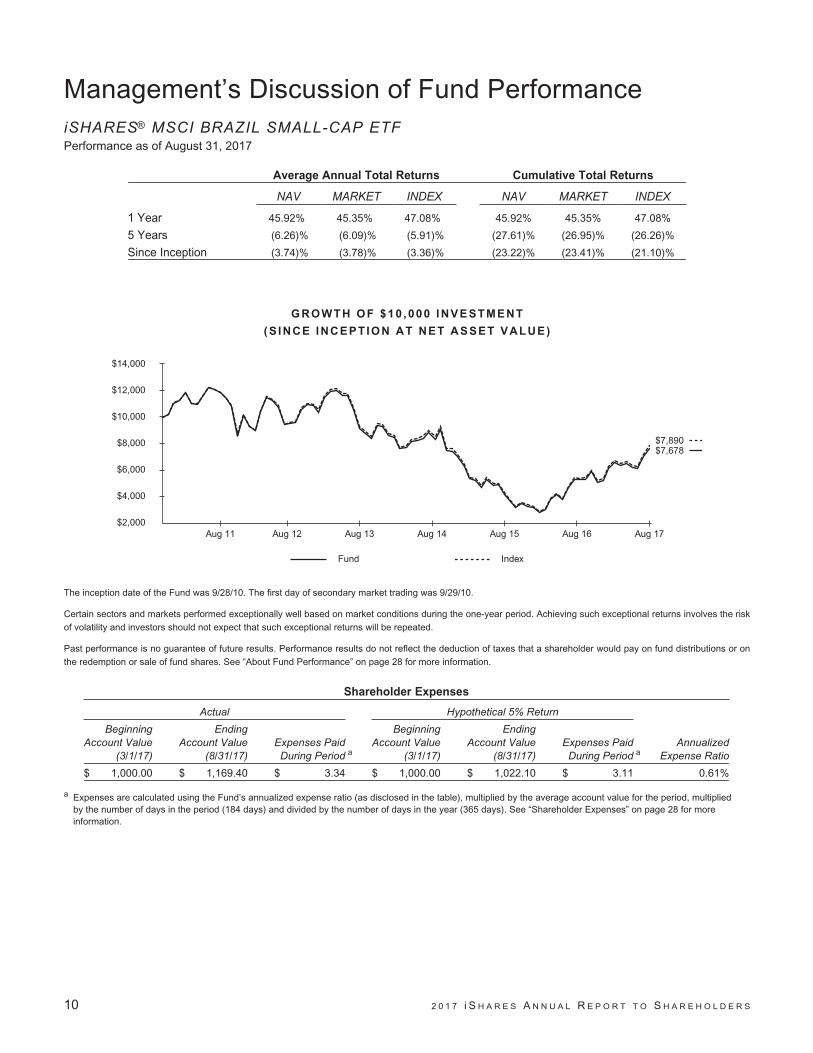
Management’s Discussion of Fund PerformanceiSHARES® MSCI BRAZIL SMALL-CAP ETFPerformance as of August 31, 2017
Average Annual Total Returns Cumulative Total Returns
NAV MARKET INDEX NAV MARKET INDEX
1 Year 45.92% 45.35% 47.08% 45.92% 45.35% 47.08%
5 Years (6.26)% (6.09)% (5.91)% (27.61)% (26.95)% (26.26)%
Since Inception (3.74)% (3.78)% (3.36)% (23.22)% (23.41)% (21.10)%
GROWTH OF $10 ,000 INVESTMENT
(S INCE INCEPTION AT NET ASSET VALUE)
$7,890$7,678
$2,000
$4,000
$6,000
$8,000
$10,000
$12,000
$14,000
Aug 17Aug 12Aug 11
Fund Index
Aug 14Aug 13 Aug 15 Aug 16
The inception date of the Fund was 9/28/10. The first day of secondary market trading was 9/29/10.
Certain sectors and markets performed exceptionally well based on market conditions during the one-year period. Achieving such exceptional returns involves the risk
of volatility and investors should not expect that such exceptional returns will be repeated.
Past performance is no guarantee of future results. Performance results do not reflect the deduction of taxes that a shareholder would pay on fund distributions or on
the redemption or sale of fund shares. See “About Fund Performance” on page 28 for more information.
Shareholder Expenses
Actual Hypothetical 5% Return
BeginningAccount Value
(3/1/17)
EndingAccount Value
(8/31/17)Expenses Paid
During Period a
BeginningAccount Value
(3/1/17)
EndingAccount Value
(8/31/17)Expenses Paid
During Period aAnnualized
Expense Ratio
$ 1,000.00 $ 1,169.40 $ 3.34 $ 1,000.00 $ 1,022.10 $ 3.11 0.61%
a Expenses are calculated using the Fund’s annualized expense ratio (as disclosed in the table), multiplied by the average account value for the period, multipliedby the number of days in the period (184 days) and divided by the number of days in the year (365 days). See “Shareholder Expenses” on page 28 for moreinformation.
10 2 0 1 7 i S H A R E S A N N U A L R E P O R T T O S H A R E H O L D E R S
Management’s Discussion of Fund Performance (Continued)
iSHARES® MSCI BRAZIL SMALL-CAP ETF
The iShares MSCI Brazil Small-Cap ETF (the “Fund”) seeks to track the investment results of an index composed of small-
capitalization Brazilian equities, as represented by the MSCI Brazil Small Cap Index (the “Index”). The Fund invests in a
representative sample of securities included in the Index that collectively has an investment profile similar to the Index. Due to the
use of representative sampling, the Fund may or may not hold all of the securities that are included in the Index. For the 12-month
reporting period ended August 31, 2017, the total return for the Fund was 45.92%, net of fees, while the total return for the Index
was 47.08%.
The sharp advance in Brazilian small-capitalization stocks was driven largely by a rebound in economic activity. The Brazilian
economy grew for the first time in more than three years in the second quarter of 2017. Consumer spending drove economic
growth, supported by falling inflation, which hit a record low in June 2017. Exports, an important component of Brazil’s economy,
increased significantly, particularly for some of the country’s main export products, including oil, iron ore, and soybeans. The
growth in exports was led by demand from Brazil’s largest trading partners, including China, the U.S., and Argentina. To stimulate
economic growth, the country’s central bank made its seventh consecutive interest rate reduction in July 2017, which brought
borrowing costs to their lowest level since September 2013.
Consumer discretionary, the largest sector in the Index on average during the reporting period, contributed the most to the Index’s
performance, led by the retail industry amid stronger consumer spending. The materials sector also contributed significantly to the
Index’s return as small-capitalization steel producers benefited from improved demand in China, which contributed to an increase
in steel prices.
The utilities sector also helped the Index’s performance for the reporting period, largely due to small-capitalization electric and
water utilities. Other contributors to the Index’s return included small-capitalization companies in the industrials, healthcare, and
financials sectors.
Currency fluctuations notably impacted the Index’s return as the Brazilian real appreciated by about 3% relative to the U.S. dollar
for the reporting period, making returns on Brazilian investments higher when translated back into U.S. dollars.
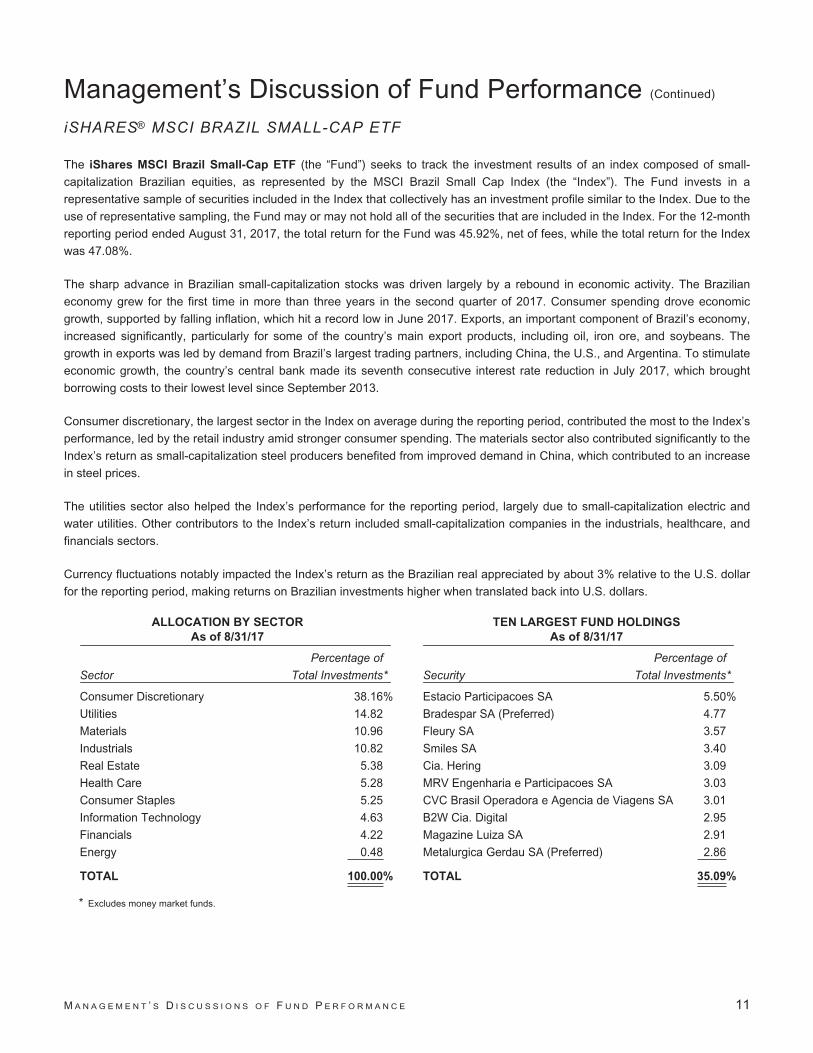
ALLOCATION BY SECTOR
As of 8/31/17
Sector
Percentage of
Total Investments*
Consumer Discretionary 38.16%
Utilities 14.82
Materials 10.96
Industrials 10.82
Real Estate 5.38
Health Care 5.28
Consumer Staples 5.25
Information Technology 4.63
Financials 4.22
Energy 0.48
TOTAL 100.00%
TEN LARGEST FUND HOLDINGS
As of 8/31/17
Security
Percentage of
Total Investments*
Estacio Participacoes SA 5.50%
Bradespar SA (Preferred) 4.77
Fleury SA 3.57
Smiles SA 3.40
Cia. Hering 3.09
MRV Engenharia e Participacoes SA 3.03
CVC Brasil Operadora e Agencia de Viagens SA 3.01
B2W Cia. Digital 2.95
Magazine Luiza SA 2.91
Metalurgica Gerdau SA (Preferred) 2.86
TOTAL 35.09%
* Excludes money market funds.
M A N A G E M E N T ’ S D I S C U S S I O N S O F F U N D P E R F O R M A N C E 11

Management’s Discussion of Fund PerformanceiSHARES® MSCI CHINA ETFPerformance as of August 31, 2017
Average Annual Total Returns Cumulative Total Returns
NAV MARKET INDEX NAV MARKET INDEX
1 Year 34.13% 34.39% 35.00% 34.13% 34.39% 35.00%
5 Years 11.55% 11.44% 12.14% 72.69% 71.90% 77.32%
Since Inception 5.62% 5.60% 6.19% 42.14% 41.98% 47.06%
GROWTH OF $10 ,000 INVESTMENT
(S INCE INCEPTION AT NET ASSET VALUE)
$14,706$14,214
$6,000
$8,000
$10,000
$12,000
$14,000
$16,000
Aug 17Aug 12Aug 11
Fund Index
Aug 14Aug 13 Aug 15 Aug 16
The inception date of the Fund was 3/29/11. The first day of secondary market trading was 3/31/11.
Past performance is no guarantee of future results. Performance results do not reflect the deduction of taxes that a shareholder would pay on fund distributions or on
the redemption or sale of fund shares. See “About Fund Performance” on page 28 for more information.
Shareholder Expenses
Actual Hypothetical 5% Return
BeginningAccount Value
(3/1/17)
EndingAccount Value
(8/31/17)Expenses Paid
During Period a
BeginningAccount Value
(3/1/17)
EndingAccount Value
(8/31/17)Expenses Paid
During Period aAnnualized
Expense Ratio
$ 1,000.00 $ 1,277.00 $ 3.50 $ 1,000.00 $ 1,022.10 $ 3.11 0.61%
a Expenses are calculated using the Fund’s annualized expense ratio (as disclosed in the table), multiplied by the average account value for the period, multipliedby the number of days in the period (184 days) and divided by the number of days in the year (365 days). See “Shareholder Expenses” on page 28 for moreinformation.
12 2 0 1 7 i S H A R E S A N N U A L R E P O R T T O S H A R E H O L D E R S

Management’s Discussion of Fund Performance (Continued)
iSHARES® MSCI CHINA ETF
The iShares MSCI China ETF (the “Fund”) seeks to track the investment results of an index composed of Chinese equities that
are available to international investors, as represented by the MSCI China Index (the “Index”). The Fund invests in a
representative sample of securities included in the Index that collectively has an investment profile similar to the Index. Due to the
use of representative sampling, the Fund may or may not hold all of the securities that are included in the Index. For the 12-month
reporting period ended August 31, 2017, the total return for the Fund was 34.13%, net of fees, while the total return for the Index
was 35.00%.
The strong performance of Chinese stocks for the reporting period was driven largely by a rebound in the Chinese economy. As a
major global exporter, China benefited from strengthening economic growth in many regions of the world. Government stimulus
efforts, focused primarily on infrastructure and real estate expansion, which drove property prices higher and led to a large
increase in industrial output, also contributed to the advance in Chinese stocks. As economic growth strengthened, China’s
central bank tightened monetary policy by increasing short-term interest rates in early 2017. The Chinese government also began
a regulatory effort to reduce leverage in the country’s financial system.
From a sector perspective, information technology, the largest sector in the Index on average during the reporting period,
contributed the most to the Index’s performance. Within the sector, the internet software and services industry was the leading
contributor, benefiting from increased domestic demand for online products and services including e-commerce, transportation,
and mobile payments.
The financials sector also contributed significantly to the Index’s performance for the reporting period, due primarily to improved
profitability for large Chinese banks. The consumer discretionary sector helped the Index’s return as automobile manufacturers
benefited from an improving outlook following a modest start to 2017. The real estate sector also contributed notably to the
Index’s performance, benefiting from government stimulus efforts and higher property prices.
The only sector to detract from the Index’s performance for the reporting period was telecommunication services, which declined
amid challenges facing the wireless telecommunication services industry.
ALLOCATION BY SECTOR
As of 8/31/17
Sector
Percentage of
Total Investments*
Information Technology 39.79%
Financials 23.75
Consumer Discretionary 9.68
Telecommunication Services 5.59
Energy 4.84
Industrials 4.59
Real Estate 4.52
Utilities 2.35
Health Care 1.87
Consumer Staples 1.76
Materials 1.26
TOTAL 100.00%
TEN LARGEST FUND HOLDINGS
As of 8/31/17
Security
Percentage of
Total Investments*
Tencent Holdings Ltd. 16.29%
Alibaba Group Holding Ltd. ADR 13.33
China Construction Bank Corp. Class H 5.03
China Mobile Ltd. 4.42
Baidu Inc. ADR 4.26
Industrial & Commercial Bank of China Ltd.
Class H 3.76
Bank of China Ltd. Class H 2.85
Ping An Insurance Group Co. of China Ltd.
Class H 2.83
JD.com Inc. ADR 1.88
China Life Insurance Co. Ltd. Class H 1.63
TOTAL 56.28%
* Excludes money market funds.
M A N A G E M E N T ’ S D I S C U S S I O N S O F F U N D P E R F O R M A N C E 13

Management’s Discussion of Fund PerformanceiSHARES® MSCI CHINA SMALL-CAP ETFPerformance as of August 31, 2017
Average Annual Total Returns Cumulative Total Returns
NAV MARKET INDEX NAV MARKET INDEX
1 Year 15.29% 16.35% 12.65% 15.29% 16.35% 12.65%
5 Years 12.03% 12.06% 10.99% 76.44% 76.71% 68.43%
Since Inception 2.20% 2.14% 1.39% 16.25% 15.83% 10.04%
GROWTH OF $10 ,000 INVESTMENT
(S INCE INCEPTION AT NET ASSET VALUE)
$11,625$11,004
$4,000
$6,000
$8,000
$10,000
$12,000
$14,000
$16,000
Aug 17Aug 12Aug 11
Fund Index
Aug 14Aug 13 Aug 15 Aug 16
The inception date of the Fund was 9/28/10. The first day of secondary market trading was 9/29/10.
Past performance is no guarantee of future results. Performance results do not reflect the deduction of taxes that a shareholder would pay on fund distributions or on
the redemption or sale of fund shares. See “About Fund Performance” on page 28 for more information.
Shareholder Expenses
Actual Hypothetical 5% Return
BeginningAccount Value
(3/1/17)
EndingAccount Value
(8/31/17)Expenses Paid
During Period a
BeginningAccount Value
(3/1/17)
EndingAccount Value
(8/31/17)Expenses Paid
During Period aAnnualized
Expense Ratio
$ 1,000.00 $ 1,108.30 $ 3.24 $ 1,000.00 $ 1,022.10 $ 3.11 0.61%
a Expenses are calculated using the Fund’s annualized expense ratio (as disclosed in the table), multiplied by the average account value for the period, multipliedby the number of days in the period (184 days) and divided by the number of days in the year (365 days). See “Shareholder Expenses” on page 28 for moreinformation.
14 2 0 1 7 i S H A R E S A N N U A L R E P O R T T O S H A R E H O L D E R S
Management’s Discussion of Fund Performance (Continued)
iSHARES® MSCI CHINA SMALL-CAP ETF
The iShares MSCI China Small-Cap ETF (the “Fund”) seeks to track the investment results of an index composed of small-
capitalization Chinese equities that are available to international investors, as represented by the MSCI China Small Cap Index
(the “Index”). The Fund invests in a representative sample of securities included in the Index that collectively has an investment
profile similar to the Index. Due to the use of representative sampling, the Fund may or may not hold all of the securities that are
included in the Index. For the 12-month reporting period ended August 31, 2017, the total return for the Fund was 15.29%, net of
fees, while the total return for the Index was 12.65%.
The positive performance of Chinese small-capitalization stocks for the reporting period was driven largely by a rebound in the
Chinese economy. As a major global exporter, China benefited from strengthening economic growth in many regions of the world.
Government stimulus efforts, focused primarily on infrastructure and real estate expansion, which drove property prices higher
and led to a large increase in industrial output, also contributed to the advance in Chinese small-capitalization stocks. As
economic growth strengthened, China’s central bank tightened monetary policy by increasing short-term interest rates in early
2017. The Chinese government also began a regulatory effort to reduce the amount of debt in the country’s financial system.
From a sector perspective, the real estate sector, which represented about 15% of the Index on average during the reporting
period, was the largest contributor to the Index’s return. Small-capitalization real estate development companies contributed the
most to the real estate sector amid strong home price appreciation.
The information technology sector also contributed significantly to the Index’s return for the reporting period, led by strength in
small-capitalization electronic component manufacturers and internet software and services companies. The materials sector was
another meaningful contributor to the Index’s performance, benefiting from small-capitalization paper producers.
On the downside, the utilities sector detracted from the Index’s performance for the reporting period, largely due to small-
capitalization water utilities. The telecommunication services sector, representing only a fractional weight in the Index on average,
also detracted slightly from the Index’s return.
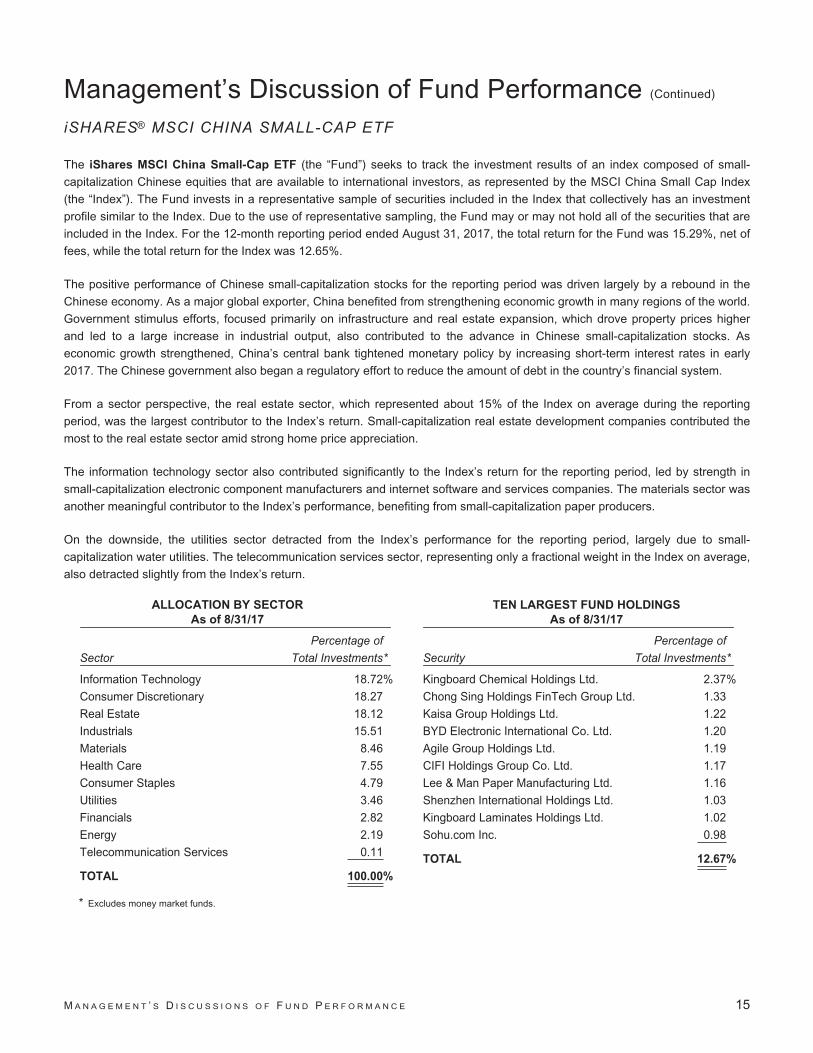
ALLOCATION BY SECTOR
As of 8/31/17
Sector
Percentage of
Total Investments*
Information Technology 18.72%
Consumer Discretionary 18.27
Real Estate 18.12
Industrials 15.51
Materials 8.46
Health Care 7.55
Consumer Staples 4.79
Utilities 3.46
Financials 2.82
Energy 2.19
Telecommunication Services 0.11
TOTAL 100.00%
TEN LARGEST FUND HOLDINGS
As of 8/31/17
Security
Percentage of
Total Investments*
Kingboard Chemical Holdings Ltd. 2.37%
Chong Sing Holdings FinTech Group Ltd. 1.33
Kaisa Group Holdings Ltd. 1.22
BYD Electronic International Co. Ltd. 1.20
Agile Group Holdings Ltd. 1.19
CIFI Holdings Group Co. Ltd. 1.17
Lee & Man Paper Manufacturing Ltd. 1.16
Shenzhen International Holdings Ltd. 1.03
Kingboard Laminates Holdings Ltd. 1.02
Sohu.com Inc. 0.98
TOTAL 12.67%
* Excludes money market funds.
M A N A G E M E N T ’ S D I S C U S S I O N S O F F U N D P E R F O R M A N C E 15

Management’s Discussion of Fund PerformanceiSHARES® MSCI INDONESIA ETFPerformance as of August 31, 2017
Average Annual Total Returns Cumulative Total Returns
NAV MARKET INDEX NAV MARKET INDEX
1 Year 5.53% 6.74% 6.07% 5.53% 6.74% 6.07%
5 Years 0.28% 0.34% 0.77% 1.40% 1.71% 3.91%
Since Inception 3.19% 3.18% 3.69% 25.87% 25.80% 30.38%
GROWTH OF $10 ,000 INVESTMENT
(S INCE INCEPTION AT NET ASSET VALUE)
$13,038$12,587
$7,000
$8,000
$9,000
$12,000
$13,000
$10,000
$11,000
$16,000
$15,000
Aug 17Aug 16Aug 15Aug 14Aug 13Aug 10 Aug 11 Aug 12
Fund Index
$14,000
The inception date of the Fund was 5/5/10. The first day of secondary market trading was 5/7/10.
Past performance is no guarantee of future results. Performance results do not reflect the deduction of taxes that a shareholder would pay on fund distributions or on
the redemption or sale of fund shares. See “About Fund Performance” on page 28 for more information.
Shareholder Expenses
Actual Hypothetical 5% Return
BeginningAccount Value
(3/1/17)
EndingAccount Value
(8/31/17)Expenses Paid
During Period a
BeginningAccount Value
(3/1/17)
EndingAccount Value
(8/31/17)Expenses Paid
During Period aAnnualized
Expense Ratio
$ 1,000.00 $ 1,100.60 $ 3.23 $ 1,000.00 $ 1,022.10 $ 3.11 0.61%
a Expenses are calculated using the Fund’s annualized expense ratio (as disclosed in the table), multiplied by the average account value for the period, multipliedby the number of days in the period (184 days) and divided by the number of days in the year (365 days). See “Shareholder Expenses” on page 28 for moreinformation.
16 2 0 1 7 i S H A R E S A N N U A L R E P O R T T O S H A R E H O L D E R S
Management’s Discussion of Fund Performance (Continued)
iSHARES® MSCI INDONESIA ETF
The iShares MSCI Indonesia ETF (the “Fund”) seeks to track the investment results of a broad-based index composed of
Indonesian equities, as represented by the MSCI Indonesia Investable Market Index (the “Index”). The Fund invests in a
representative sample of securities included in the Index that collectively has an investment profile similar to the Index. Due to the
use of representative sampling, the Fund may or may not hold all of the securities that are included in the Index. For the 12-month
reporting period ended August 31, 2017, the total return for the Fund was 5.53%, net of fees, while the total return for the Index
was 6.07%.
Indonesian stocks benefited from a continued expansion of Indonesia’s economy, the largest in Southeast Asia, during the
reporting period. Exports were a driver of economic growth as improving economic conditions for Indonesia’s key trading
partners, including China and the U.S., led to increased export demand. Recovering prices for key Indonesian exports, including
coal, palm oil, tea, and shrimp, also benefited the resource-rich country. Domestic demand, on the other hand, was low as
measured by weak growth for investment and private consumption, which constituted more than half of Indonesia’s economy.
From a sector perspective, the financials sector was the most significant contributor to the Index’s performance for the reporting
period. Banks were the largest contributors to the sector, benefiting from a series of interest rate reductions by the Bank of
Indonesia and a tax amnesty program aimed at repatriating offshore assets. State-owned banks served as gateways for
repatriation under the program, which resulted in declared assets equal to approximately 40% of Indonesia’s economy.
The telecommunications and energy sectors also contributed meaningfully to the Index’s return for the reporting period. A shift
toward offering data plans and improving network quality were factors benefiting companies in the telecommunications sector.
Rising prices for coal and other products benefited the energy sector.
The consumer discretionary and real estate sectors detracted the most from the Index’s performance for the reporting period.
Mixed performances in the consumer goods and retail companies detracted from the consumer discretionary sector. In the real
estate sector, weak consumer purchasing power reduced demand for residential housing, while oversupply in the office market
constrained prices.
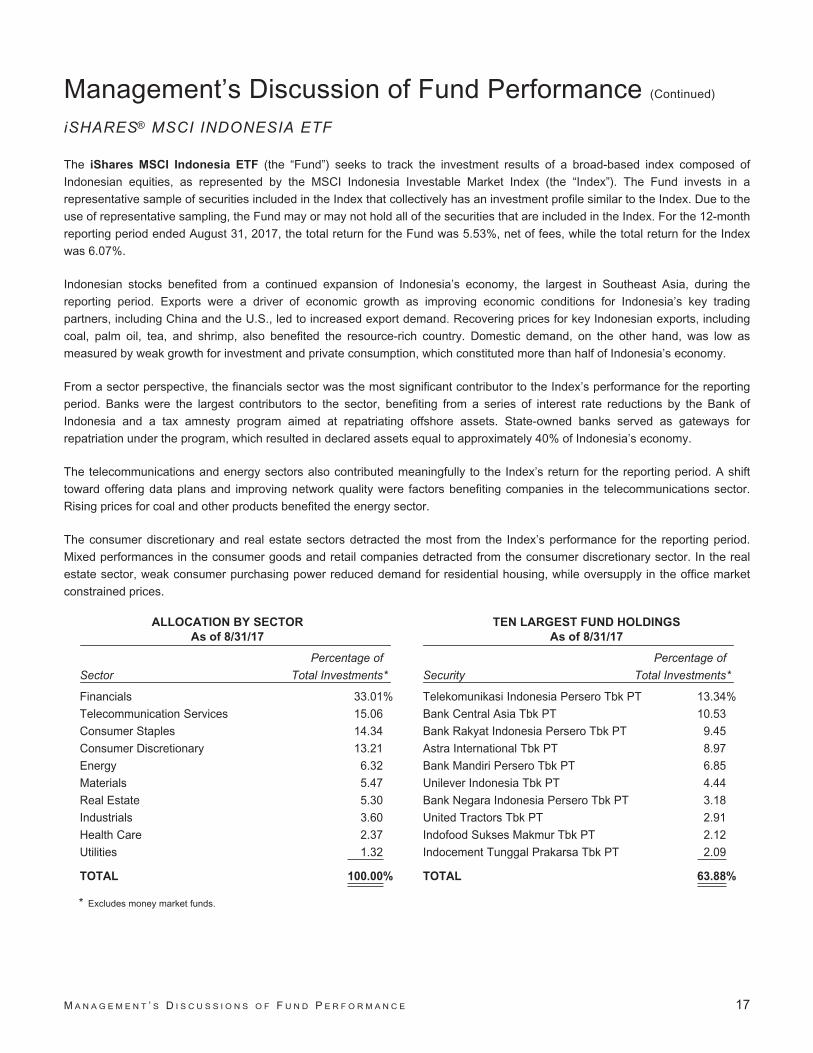
ALLOCATION BY SECTOR
As of 8/31/17
Sector
Percentage of
Total Investments*
Financials 33.01%
Telecommunication Services 15.06
Consumer Staples 14.34
Consumer Discretionary 13.21
Energy 6.32
Materials 5.47
Real Estate 5.30
Industrials 3.60
Health Care 2.37
Utilities 1.32
TOTAL 100.00%
TEN LARGEST FUND HOLDINGS
As of 8/31/17
Security
Percentage of
Total Investments*
Telekomunikasi Indonesia Persero Tbk PT 13.34%
Bank Central Asia Tbk PT 10.53
Bank Rakyat Indonesia Persero Tbk PT 9.45
Astra International Tbk PT 8.97
Bank Mandiri Persero Tbk PT 6.85
Unilever Indonesia Tbk PT 4.44
Bank Negara Indonesia Persero Tbk PT 3.18
United Tractors Tbk PT 2.91
Indofood Sukses Makmur Tbk PT 2.12
Indocement Tunggal Prakarsa Tbk PT 2.09
TOTAL 63.88%
* Excludes money market funds.
M A N A G E M E N T ’ S D I S C U S S I O N S O F F U N D P E R F O R M A N C E 17

Management’s Discussion of Fund PerformanceiSHARES® MSCI PHILIPPINES ETFPerformance as of August 31, 2017
Average Annual Total Returns Cumulative Total Returns
NAV MARKET INDEX NAV MARKET INDEX
1 Year (7.87)% (6.31)% (7.32)% (7.87)% (6.31)% (7.32)%
5 Years 4.92% 5.05% 5.67% 27.17% 27.94% 31.78%
Since Inception 6.35% 6.30% 6.91% 53.15% 52.64% 58.77%
GROWTH OF $10 ,000 INVESTMENT
(S INCE INCEPTION AT NET ASSET VALUE)
$15,877$15,315
$8,000
$10,000
$12,000
$14,000
$16,000
$18,000
$20,000
Aug 17Aug 12Aug 11
Fund Index
Aug 14Aug 13 Aug 15 Aug 16
The inception date of the Fund was 9/28/10. The first day of secondary market trading was 9/29/10.
Past performance is no guarantee of future results. Performance results do not reflect the deduction of taxes that a shareholder would pay on fund distributions or on
the redemption or sale of fund shares. See “About Fund Performance” on page 28 for more information.
Shareholder Expenses
Actual Hypothetical 5% Return
BeginningAccount Value
(3/1/17)
EndingAccount Value
(8/31/17)Expenses Paid
During Period a
BeginningAccount Value
(3/1/17)
EndingAccount Value
(8/31/17)Expenses Paid
During Period aAnnualized
Expense Ratio
$ 1,000.00 $ 1,067.10 $ 3.18 $ 1,000.00 $ 1,022.10 $ 3.11 0.61%
a Expenses are calculated using the Fund’s annualized expense ratio (as disclosed in the table), multiplied by the average account value for the period, multipliedby the number of days in the period (184 days) and divided by the number of days in the year (365 days). See “Shareholder Expenses” on page 28 for moreinformation.
18 2 0 1 7 i S H A R E S A N N U A L R E P O R T T O S H A R E H O L D E R S
Management’s Discussion of Fund Performance (Continued)
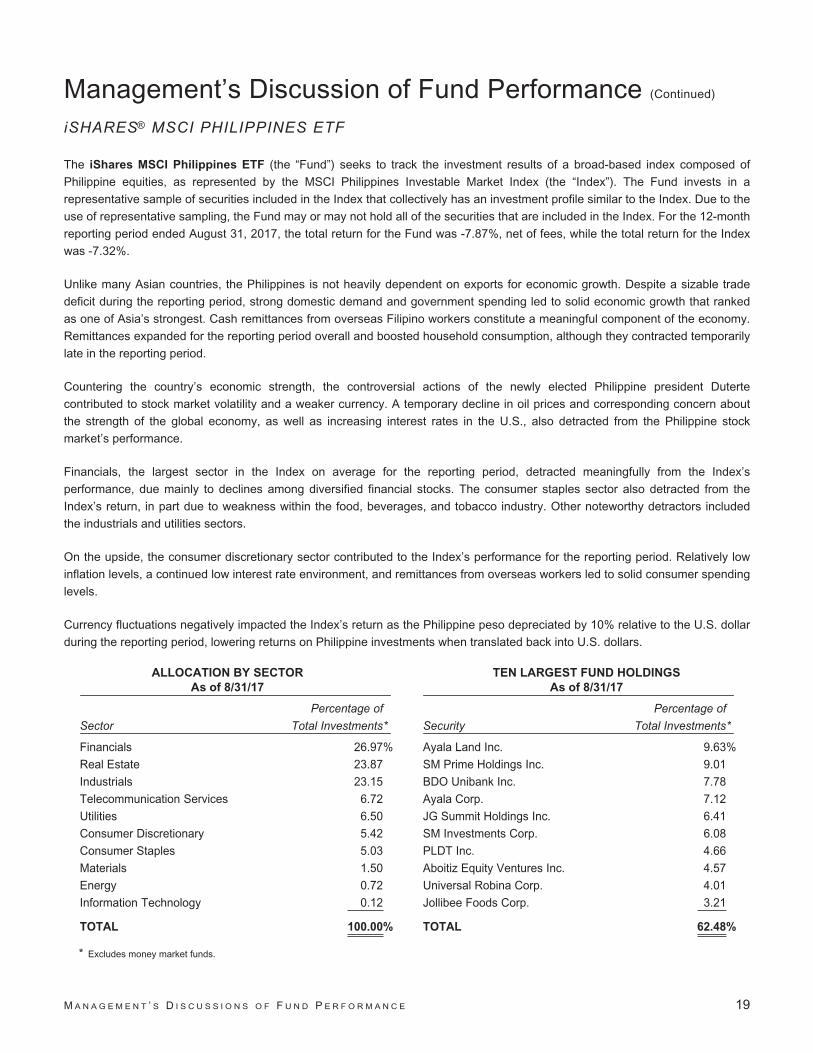
iSHARES® MSCI PHILIPPINES ETF
The iShares MSCI Philippines ETF (the “Fund”) seeks to track the investment results of a broad-based index composed of
Philippine equities, as represented by the MSCI Philippines Investable Market Index (the “Index”). The Fund invests in a
representative sample of securities included in the Index that collectively has an investment profile similar to the Index. Due to the
use of representative sampling, the Fund may or may not hold all of the securities that are included in the Index. For the 12-month
reporting period ended August 31, 2017, the total return for the Fund was -7.87%, net of fees, while the total return for the Index
was -7.32%.
Unlike many Asian countries, the Philippines is not heavily dependent on exports for economic growth. Despite a sizable trade
deficit during the reporting period, strong domestic demand and government spending led to solid economic growth that ranked
as one of Asia’s strongest. Cash remittances from overseas Filipino workers constitute a meaningful component of the economy.
Remittances expanded for the reporting period overall and boosted household consumption, although they contracted temporarily
late in the reporting period.
Countering the country’s economic strength, the controversial actions of the newly elected Philippine president Duterte
contributed to stock market volatility and a weaker currency. A temporary decline in oil prices and corresponding concern about
the strength of the global economy, as well as increasing interest rates in the U.S., also detracted from the Philippine stock
market’s performance.
Financials, the largest sector in the Index on average for the reporting period, detracted meaningfully from the Index’s
performance, due mainly to declines among diversified financial stocks. The consumer staples sector also detracted from the
Index’s return, in part due to weakness within the food, beverages, and tobacco industry. Other noteworthy detractors included
the industrials and utilities sectors.
On the upside, the consumer discretionary sector contributed to the Index’s performance for the reporting period. Relatively low
inflation levels, a continued low interest rate environment, and remittances from overseas workers led to solid consumer spending
levels.
Currency fluctuations negatively impacted the Index’s return as the Philippine peso depreciated by 10% relative to the U.S. dollar
during the reporting period, lowering returns on Philippine investments when translated back into U.S. dollars.
ALLOCATION BY SECTOR
As of 8/31/17
Sector
Percentage of
Total Investments*
Financials 26.97%
Real Estate 23.87
Industrials 23.15
Telecommunication Services 6.72
Utilities 6.50
Consumer Discretionary 5.42
Consumer Staples 5.03
Materials 1.50
Energy 0.72
Information Technology 0.12
TOTAL 100.00%
TEN LARGEST FUND HOLDINGS
As of 8/31/17
Security
Percentage of
Total Investments*
Ayala Land Inc. 9.63%
SM Prime Holdings Inc. 9.01
BDO Unibank Inc. 7.78
Ayala Corp. 7.12
JG Summit Holdings Inc. 6.41
SM Investments Corp. 6.08
PLDT Inc. 4.66
Aboitiz Equity Ventures Inc. 4.57
Universal Robina Corp. 4.01
Jollibee Foods Corp. 3.21
TOTAL 62.48%
* Excludes money market funds.
M A N A G E M E N T ’ S D I S C U S S I O N S O F F U N D P E R F O R M A N C E 19
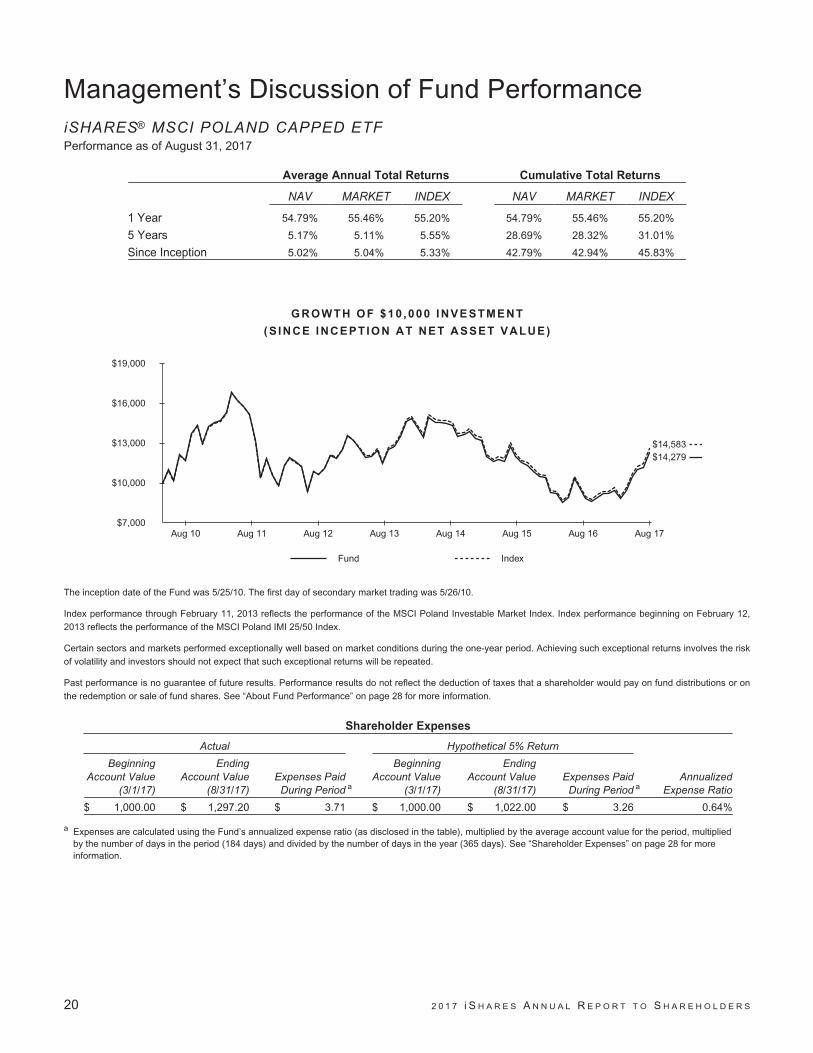
Management’s Discussion of Fund PerformanceiSHARES® MSCI POLAND CAPPED ETFPerformance as of August 31, 2017
Average Annual Total Returns Cumulative Total Returns
NAV MARKET INDEX NAV MARKET INDEX
1 Year 54.79% 55.46% 55.20% 54.79% 55.46% 55.20%
5 Years 5.17% 5.11% 5.55% 28.69% 28.32% 31.01%
Since Inception 5.02% 5.04% 5.33% 42.79% 42.94% 45.83%
GROWTH OF $10 ,000 INVESTMENT
(S INCE INCEPTION AT NET ASSET VALUE)
$14,583$14,279
$7,000
$10,000
$13,000
$16,000
$19,000
Aug 17Aug 12Aug 10
Fund Index
Aug 11 Aug 14Aug 13 Aug 15 Aug 16
The inception date of the Fund was 5/25/10. The first day of secondary market trading was 5/26/10.
Index performance through February 11, 2013 reflects the performance of the MSCI Poland Investable Market Index. Index performance beginning on February 12,
2013 reflects the performance of the MSCI Poland IMI 25/50 Index.
Certain sectors and markets performed exceptionally well based on market conditions during the one-year period. Achieving such exceptional returns involves the risk
of volatility and investors should not expect that such exceptional returns will be repeated.
Past performance is no guarantee of future results. Performance results do not reflect the deduction of taxes that a shareholder would pay on fund distributions or on
the redemption or sale of fund shares. See “About Fund Performance” on page 28 for more information.
Shareholder Expenses
Actual Hypothetical 5% Return
BeginningAccount Value
(3/1/17)
EndingAccount Value
(8/31/17)Expenses Paid
During Period a
BeginningAccount Value
(3/1/17)
EndingAccount Value
(8/31/17)Expenses Paid
During Period aAnnualized
Expense Ratio
$ 1,000.00 $ 1,297.20 $ 3.71 $ 1,000.00 $ 1,022.00 $ 3.26 0.64%
a Expenses are calculated using the Fund’s annualized expense ratio (as disclosed in the table), multiplied by the average account value for the period, multipliedby the number of days in the period (184 days) and divided by the number of days in the year (365 days). See “Shareholder Expenses” on page 28 for moreinformation.
20 2 0 1 7 i S H A R E S A N N U A L R E P O R T T O S H A R E H O L D E R S

Management’s Discussion of Fund Performance (Continued)
iSHARES® MSCI POLAND CAPPED ETF
The iShares MSCI Poland Capped ETF (the “Fund”) seeks to track the investment results of a broad-based index composed of
Polish equities, as represented by the MSCI Poland IMI 25/50 Index (the “Index”). The Fund invests in a representative sample of
securities included in the Index that collectively has an investment profile similar to the Index. Due to the use of representative
sampling, the Fund may or may not hold all of the securities that are included in the Index. For the 12-month reporting period
ended August 31, 2017, the total return for the Fund was 54.79%, net of fees, while the total return for the Index was 55.20%.
The Polish economy posted solid growth during the reporting period. At the corporate level, investment spending improved due to
increased business confidence, low inflation, and low interest rates. Demand was high for many Polish exports, including
furniture, lighting, and prefabricated buildings. Private consumption also rose, driven by increased incomes and social assistance
programs. Structural funds from the E.U., which try to reduce regional disparities in income, wealth, and opportunities, also
contributed to Poland’s economic momentum.
From a sector perspective, the financials sector, which represented approximately 43% of the Index on average, was the most
significant contributor to the Index’s return for the reporting period. Poland’s robust macroeconomic environment led to increased
credit ratings of its banks, attracting strong foreign capital inflows. Additionally, new employment opportunities in the nation’s
banks are being created as financial jobs depart London due to the U.K.’s impending exit from the E.U.
The energy sector also contributed meaningfully to the Index’s performance for the reporting period. Energy companies’ earnings
increased due to high oil refining profits, particularly compared to the previous year. The materials sector, especially the metals
and mining industry, also contributed to the Index’s return.
In contrast, the healthcare sector, which represented less than 1% of the Index on average, marginally detracted from the Index’s
return for the reporting period.
The Polish zloty, which appreciated about 9% relative to the U.S. dollar during the reporting period, was a large contributor to the
Index’s performance, as returns on Polish investments were higher when translated back into U.S. dollars.
ALLOCATION BY SECTOR
As of 8/31/17
Sector
Percentage of
Total Investments*
Financials 43.37%
Energy 19.55
Materials 9.97
Consumer Discretionary 8.94
Utilities 8.56
Information Technology 3.48
Telecommunication Services 1.92
Industrials 1.90
Consumer Staples 1.23
Real Estate 0.79
Health Care 0.29
TOTAL 100.00%
TEN LARGEST FUND HOLDINGS
As of 8/31/17
Security
Percentage of
Total Investments*
Polski Koncern Naftowy ORLEN SA 12.68%
Powszechna Kasa Oszczednosci Bank Polski SA 11.90
Powszechny Zaklad Ubezpieczen SA 10.08
Bank Pekao SA 6.79
KGHM Polska Miedz SA 4.43
PGE Polska Grupa Energetyczna SA 4.39
Polskie Gornictwo Naftowe i Gazownictwo SA 4.34
LPP SA 4.20
Bank Zachodni WBK SA 4.18
CCC SA 2.73
TOTAL 65.72%
* Excludes money market funds.
M A N A G E M E N T ’ S D I S C U S S I O N S O F F U N D P E R F O R M A N C E 21

Management’s Discussion of Fund PerformanceiSHARES® MSCI QATAR CAPPED ETFPerformance as of August 31, 2017
Average Annual Total Returns Cumulative Total Returns
NAV MARKET INDEX NAV MARKET INDEX
1 Year (16.52)% (15.79)% (16.00)% (16.52)% (15.79)% (16.00)%
Since Inception (8.34)% (8.04)% (7.84)% (25.25)% (24.42)% (23.83)%
GROWTH OF $10 ,000 INVESTMENT
(S INCE INCEPTION AT NET ASSET VALUE)
$7,617$7,475
$7,000
$8,000
$9,000
$10,000
$12,000
Aug 17Aug 14
Fund Index
$11,000
Aug 16Feb 16Aug 15Feb 15 Feb 17
The inception date of the Fund was 4/29/14. The first day of secondary market trading was 5/1/14.
Past performance is no guarantee of future results. Performance results do not reflect the deduction of taxes that a shareholder would pay on fund distributions or on
the redemption or sale of fund shares. See “About Fund Performance” on page 28 for more information.
Shareholder Expenses
Actual Hypothetical 5% Return
BeginningAccount Value
(3/1/17)
EndingAccount Value
(8/31/17)Expenses Paid
During Period a
BeginningAccount Value
(3/1/17)
EndingAccount Value
(8/31/17)Expenses Paid
During Period aAnnualized
Expense Ratio
$ 1,000.00 $ 849.20 $ 2.84 $ 1,000.00 $ 1,022.10 $ 3.11 0.61%
a Expenses are calculated using the Fund’s annualized expense ratio (as disclosed in the table), multiplied by the average account value for the period, multipliedby the number of days in the period (184 days) and divided by the number of days in the year (365 days). See “Shareholder Expenses” on page 28 for moreinformation.
22 2 0 1 7 i S H A R E S A N N U A L R E P O R T T O S H A R E H O L D E R S
Management’s Discussion of Fund Performance (Continued)
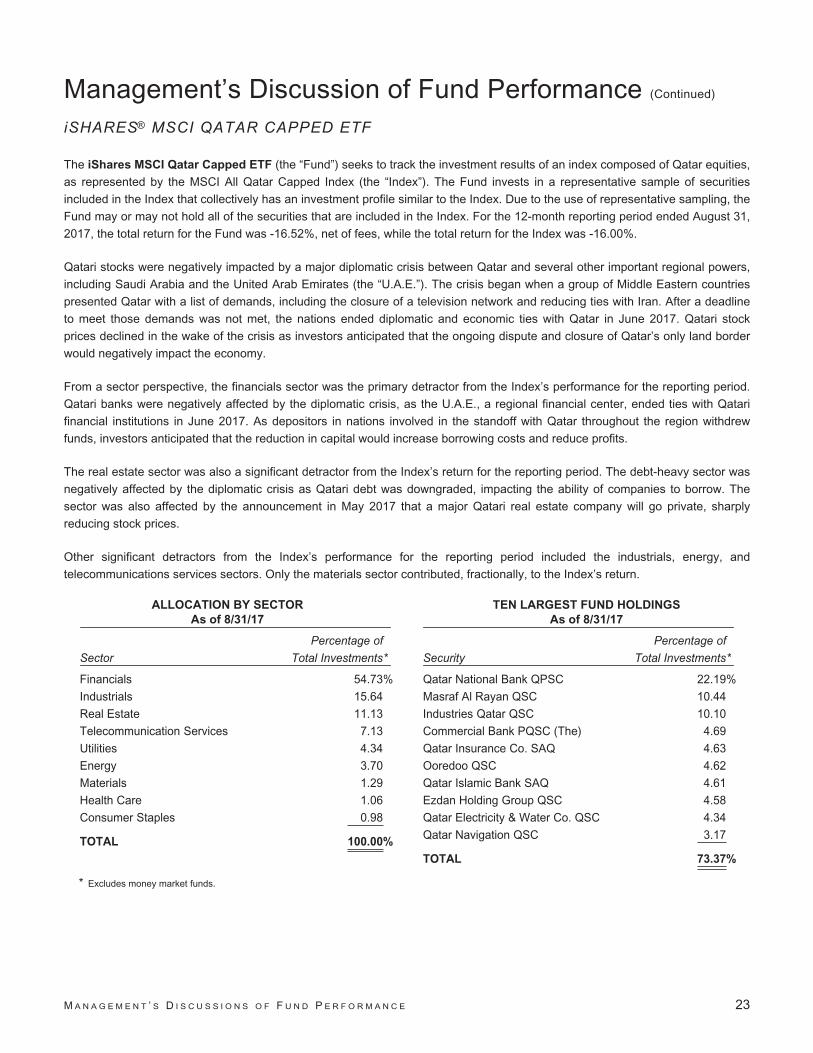
iSHARES® MSCI QATAR CAPPED ETF
The iShares MSCI Qatar Capped ETF (the “Fund”) seeks to track the investment results of an index composed of Qatar equities,
as represented by the MSCI All Qatar Capped Index (the “Index”). The Fund invests in a representative sample of securities
included in the Index that collectively has an investment profile similar to the Index. Due to the use of representative sampling, the
Fund may or may not hold all of the securities that are included in the Index. For the 12-month reporting period ended August 31,
2017, the total return for the Fund was -16.52%, net of fees, while the total return for the Index was -16.00%.
Qatari stocks were negatively impacted by a major diplomatic crisis between Qatar and several other important regional powers,
including Saudi Arabia and the United Arab Emirates (the “U.A.E.”). The crisis began when a group of Middle Eastern countries
presented Qatar with a list of demands, including the closure of a television network and reducing ties with Iran. After a deadline
to meet those demands was not met, the nations ended diplomatic and economic ties with Qatar in June 2017. Qatari stock
prices declined in the wake of the crisis as investors anticipated that the ongoing dispute and closure of Qatar’s only land border
would negatively impact the economy.
From a sector perspective, the financials sector was the primary detractor from the Index’s performance for the reporting period.
Qatari banks were negatively affected by the diplomatic crisis, as the U.A.E., a regional financial center, ended ties with Qatari
financial institutions in June 2017. As depositors in nations involved in the standoff with Qatar throughout the region withdrew
funds, investors anticipated that the reduction in capital would increase borrowing costs and reduce profits.
The real estate sector was also a significant detractor from the Index’s return for the reporting period. The debt-heavy sector was
negatively affected by the diplomatic crisis as Qatari debt was downgraded, impacting the ability of companies to borrow. The
sector was also affected by the announcement in May 2017 that a major Qatari real estate company will go private, sharply
reducing stock prices.
Other significant detractors from the Index’s performance for the reporting period included the industrials, energy, and
telecommunications services sectors. Only the materials sector contributed, fractionally, to the Index’s return.
ALLOCATION BY SECTOR
As of 8/31/17
Sector
Percentage of
Total Investments*
Financials 54.73%
Industrials 15.64
Real Estate 11.13
Telecommunication Services 7.13
Utilities 4.34
Energy 3.70
Materials 1.29
Health Care 1.06
Consumer Staples 0.98
TOTAL 100.00%
TEN LARGEST FUND HOLDINGS
As of 8/31/17
Security
Percentage of
Total Investments*
Qatar National Bank QPSC 22.19%
Masraf Al Rayan QSC 10.44
Industries Qatar QSC 10.10
Commercial Bank PQSC (The) 4.69
Qatar Insurance Co. SAQ 4.63
Ooredoo QSC 4.62
Qatar Islamic Bank SAQ 4.61
Ezdan Holding Group QSC 4.58
Qatar Electricity & Water Co. QSC 4.34
Qatar Navigation QSC 3.17
TOTAL 73.37%
* Excludes money market funds.
M A N A G E M E N T ’ S D I S C U S S I O N S O F F U N D P E R F O R M A N C E 23

Management’s Discussion of Fund PerformanceiSHARES® MSCI SAUDI ARABIA CAPPED ETFPerformance as of August 31, 2017
Average Annual Total Returns Cumulative Total Returns
NAV MARKET INDEX NAV MARKET INDEX
1 Year 24.06% 23.41% 25.38% 24.06% 23.41% 25.38%
Since Inception 4.79% 4.57% 5.82% 9.61% 9.16% 11.70%
GROWTH OF $10 ,000 INVESTMENT
(S INCE INCEPTION AT NET ASSET VALUE)
$7,000
$8,000
$9,000
$10,000
$12,000
Aug 17Nov 15
Fund Index
$11,000
Nov 16Aug 16May 16Feb 16 Feb 17 May 17
$11,170$10,961
The inception date of the Fund was 9/16/15. The first day of secondary market trading was 9/17/15.
Past performance is no guarantee of future results. Performance results do not reflect the deduction of taxes that a shareholder would pay on fund distributions or on
the redemption or sale of fund shares. See “About Fund Performance” on page 28 for more information.
Shareholder Expenses
Actual Hypothetical 5% Return
BeginningAccount Value
(3/1/17)
EndingAccount Value
(8/31/17)Expenses Paid
During Period a
BeginningAccount Value
(3/1/17)
EndingAccount Value
(8/31/17)Expenses Paid
During Period aAnnualized
Expense Ratio
$ 1,000.00 $ 1,084.30 $ 3.89 $ 1,000.00 $ 1,021.50 $ 3.77 0.74%
a Expenses are calculated using the Fund’s annualized expense ratio (as disclosed in the table), multiplied by the average account value for the period, multipliedby the number of days in the period (184 days) and divided by the number of days in the year (365 days). See “Shareholder Expenses” on page 28 for moreinformation.
24 2 0 1 7 i S H A R E S A N N U A L R E P O R T T O S H A R E H O L D E R S

Management’s Discussion of Fund Performance (Continued)
iSHARES® MSCI SAUDI ARABIA CAPPED ETF
The iShares MSCI Saudi Arabia Capped ETF (the “Fund”) seeks to track the investment results of a broad-based index
composed of Saudi Arabian equities, as represented by the MSCI Saudi Arabia IMI 25/50 Index (the “Index”). The Fund invests in
a representative sample of securities included in the Index that collectively has an investment profile similar to the Index. Due to
the use of representative sampling, the Fund may or may not hold all of the securities that are included in the Index. For the 12-
month reporting period ended August 31, 2017, the total return for the Fund was 24.06%, net of fees, while the total return for the
Index was 25.38%.
Despite slowing economic growth, Saudi Arabian stocks gained during the reporting period. Early in the reporting period, Saudi
stocks made broad-based gains as oil prices rebounded from a low in early 2016 and the country’s first international bond offering
increased investor confidence. More recently, Saudi stocks have benefited from the announcement that MSCI is considering
upgrading Saudi Arabia to emerging markets status and including Saudi stocks in the MSCI Emerging Markets Index. The
elevation of a reformist to crown prince of the country was also seen as encouraging by investors.
From a sector perspective, the largest contributor to the Index’s return was the financials sector, which represented approximately
36% of the Index on average for the reporting period. Within this sector, banks were the leading industry, benefiting from a
Moody’s upgraded outlook for the industry and improving profits. Saudi banks also benefited from interest rate increases in the
U.S., as the Saudi currency is pegged to the U.S. dollar at a fixed exchange rate. The fixed exchange rate means that interest
rates rise in Saudi Arabia when they rise in the U.S., which is generally beneficial for banks.
The materials sector was also a significant contributor to the Index’s performance for the reporting period, with the chemicals
industry making up the majority of the gains. This industry was helped by cost cutting measures taken in response to oil prices
which remain low by historical standards.
The consumer staples sector contributed to the Index’s return for the reporting period, as Saudi consumer spending remained
robust. The telecommunication services sector also contributed moderately to the Index’s return, while the real estate and
industrials sectors detracted fractionally from the Index’s performance.
ALLOCATION BY SECTOR
As of 8/31/17
Sector
Percentage of
Total Investments*
Financials 38.77%
Materials 32.30
Consumer Staples 7.76
Telecommunication Services 7.69
Utilities 4.13
Consumer Discretionary 3.23
Health Care 2.93
Real Estate 1.53
Industrials 1.10
Energy 0.56
TOTAL 100.00%
TEN LARGEST FUND HOLDINGS
As of 8/31/17
Security
Percentage of
Total Investments*
Saudi Basic Industries Corp. 14.60%
Al Rajhi Bank 10.44
National Commercial Bank 8.27
Saudi Telecom Co. 5.93
Almarai Co. 4.60
Samba Financial Group 4.42
Saudi Arabian Mining Co. 4.08
Saudi Electricity Co. 3.90
Riyad Bank 2.67
Yanbu National Petrochemical Co. 2.52
TOTAL 61.43%
* Excludes money market funds.
M A N A G E M E N T ’ S D I S C U S S I O N S O F F U N D P E R F O R M A N C E 25

Management’s Discussion of Fund PerformanceiSHARES® MSCI UAE CAPPED ETFPerformance as of August 31, 2017
Average Annual Total Returns Cumulative Total Returns
NAV MARKET INDEX NAV MARKET INDEX
1 Year 7.33% 8.66% 8.19% 7.33% 8.66% 8.19%
Since Inception (6.24)% (6.19)% (5.72)% (19.38)% (19.22)% (17.83)%
GROWTH OF $10 ,000 INVESTMENT
(S INCE INCEPTION AT NET ASSET VALUE)
$5,500
$7,000
$8,500
$10,000
$11,500
Aug 17Aug 14
Fund Index
Aug 16Feb 16Aug 15Feb 15 Feb 17
$8,217$8,062
The inception date of the Fund was 4/29/14. The first day of secondary market trading was 5/1/14.
Past performance is no guarantee of future results. Performance results do not reflect the deduction of taxes that a shareholder would pay on fund distributions or on
the redemption or sale of fund shares. See “About Fund Performance” on page 28 for more information.
Shareholder Expenses
Actual Hypothetical 5% Return
BeginningAccount Value
(3/1/17)
EndingAccount Value
(8/31/17)Expenses Paid
During Period a
BeginningAccount Value
(3/1/17)
EndingAccount Value
(8/31/17)Expenses Paid
During Period aAnnualized
Expense Ratio
$ 1,000.00 $ 1,070.30 $ 3.18 $ 1,000.00 $ 1,022.10 $ 3.11 0.61%
a Expenses are calculated using the Fund’s annualized expense ratio (as disclosed in the table), multiplied by the average account value for the period, multipliedby the number of days in the period (184 days) and divided by the number of days in the year (365 days). See “Shareholder Expenses” on page 28 for moreinformation.
26 2 0 1 7 i S H A R E S A N N U A L R E P O R T T O S H A R E H O L D E R S

Management’s Discussion of Fund Performance (Continued)
iSHARES® MSCI UAE CAPPED ETF
The iShares MSCI UAE Capped ETF (the “Fund”) seeks to track the investment results of an index composed of UAE equities,
as represented by the MSCI All UAE Capped Index (the “Index”). The Fund invests in a representative sample of securities
included in the Index that collectively has an investment profile similar to the Index. Due to the use of representative sampling, the
Fund may or may not hold all of the securities that are included in the Index. For the 12-month reporting period ended August 31,
2017, the total return for the Fund was 7.33%, net of fees, while the total return for the Index was 8.19%.
The reporting period for the United Arab Emirates (the “U.A.E.”) was characterized by steady but modest economic growth and
relatively low equity market volatility. Despite uncertainty created by a diplomatic and economic standoff between Qatar and a
group of Arab states including the U.A.E., stock prices rose steadily as foreign investment increased. The U.A.E. government
continued its effort to reduce reliance on oil markets and planned for future initial public offerings (“IPOs”) of several important
state-owned businesses.
From a sector perspective, the financials sector was the principal contributor to the Index’s return for the reporting period, with
banks making up a large portion of the gains. The banks industry, which benefited from increased merger activity, performed well
even as the ongoing diplomatic crisis prompted U.A.E. banks to withdraw funds from Qatar. The diversified financials industry
also contributed to the Index’s performance, benefiting from cost-saving actions and reductions in provisions for bad loans.
The real estate sector was another major contributor to the Index’s return for the reporting period. The sector was boosted by the
announcement that a major company would spin off one of its divisions into an IPO. Increased infrastructure spending related to
the upcoming Expo 2020 in Dubai also benefited the sector.
In contrast, the consumer discretionary sector detracted from the Index’s return for the reporting period as the theme park
industry struggled. Four major theme parks opened in the Dubai area during the reporting period, and expenses related to the
parks were higher than initially expected. The telecommunication services and consumer staples sectors were also modest
detractors from the Index’s return.
ALLOCATION BY SECTOR
As of 8/31/17
Sector
Percentage of
Total Investments*
Financials 30.46%
Real Estate 30.32
Telecommunication Services 17.59
Industrials 10.77
Health Care 5.04
Energy 2.92
Consumer Discretionary 1.93
Consumer Staples 0.97
TOTAL 100.00%
TEN LARGEST FUND HOLDINGS
As of 8/31/17
Security
Percentage of
Total Investments*
Emirates Telecommunications Group Co. PJSC 17.59%
Emaar Properties PJSC 16.72
First Abu Dhabi Bank PJSC 8.06
NMC Health PLC 5.05
DP World Ltd. 4.68
DAMAC Properties Dubai Co. PJSC 4.61
Abu Dhabi Commercial Bank PJSC 4.51
Aldar Properties PJSC 4.33
Dubai Islamic Bank PJSC 4.19
Union National Bank PJSC 3.15
TOTAL 72.89%
* Excludes money market funds.
M A N A G E M E N T ’ S D I S C U S S I O N S O F F U N D P E R F O R M A N C E 27

About Fund PerformancePast performance is no guarantee of future results. Current performance may be lower or higher than the performance data
quoted. Performance data current to the most recent month-end is available at www.ishares.com. Performance results assume
reinvestment of all dividends and capital gain distributions and do not reflect the deduction of taxes that a shareholder would pay
on fund distributions or on the redemption or sale of fund shares. The investment return and principal value of shares will vary
with changes in market conditions. Shares may be worth more or less than their original cost when they are redeemed or sold in
the market. Performance for certain funds may reflect a waiver of a portion of investment advisory fees. Without such a waiver,
performance would have been lower.
Net asset value or “NAV” is the value of one share of a fund as calculated in accordance with the standard formula for valuing
mutual fund shares. The price used to calculate market return (“Market Price”) is determined by using the midpoint between the
highest bid and the lowest offer on the primary stock exchange on which shares of a fund are listed for trading, as of the time that
such fund’s NAV is calculated. Certain funds may have a NAV which is determined prior to the opening of regular trading on its
listed exchange and their market returns are calculated using the midpoint of the bid/ask spread as of the opening of regular
trading on the exchange. Market and NAV returns assume that dividends and capital gain distributions have been reinvested at
Market Price and NAV, respectively.
An index is a statistical composite that tracks a specified financial market or sector. Unlike a fund, an index does not actually hold
a portfolio of securities and therefore does not incur the expenses incurred by a fund. These expenses negatively impact fund
performance. Also, market returns do not include brokerage commissions that may be payable on secondary market transactions.
If brokerage commissions were included, market returns would be lower.
Shareholder ExpensesAs a shareholder of a Fund, you incur two types of costs: (1) transaction costs, including brokerage commissions on purchases
and sales of fund shares and (2) ongoing costs, including management fees and other fund expenses. The expense example,
which is based on an investment of $1,000 invested on March 1, 2017 (or commencement of operations, as applicable) and held
through August 31, 2017, is intended to help you understand your ongoing costs (in dollars and cents) of investing in a Fund and
to compare these costs with the ongoing costs of investing in other funds.
Actual Expenses — The table provides information about actual account values and actual expenses. Annualized expense
ratios reflect contractual and voluntary fee waivers, if any. To estimate the expenses that you paid on your account over the
period, simply divide your account value by $1,000 (for example, an $8,600 account value divided by $1,000 = 8.6), then multiply
the result by the number corresponding to your Fund under the heading entitled “Expenses Paid During Period.”
Hypothetical Example for Comparison Purposes — The table also provides information about hypothetical account values and
hypothetical expenses based on each Fund’s actual expense ratio and an assumed rate of return of 5% per year before
expenses. You may use this information to compare the ongoing costs of investing in your Fund and other funds. To do so,
compare this 5% hypothetical example with the 5% hypothetical examples that appear in the shareholder reports of the other
funds.
Please note that the expenses shown in the table are meant to highlight your ongoing costs only and do not reflect any
transactional costs, such as brokerage commissions paid on purchases and sales of fund shares. Therefore, the hypothetical
examples are useful in comparing ongoing costs only and will not help you determine the relative total costs of owning different
funds. In addition, if these transactional costs were included, your costs would have been higher.
28 2 0 1 7 i S H A R E S A N N U A L R E P O R T T O S H A R E H O L D E R S

Schedule of InvestmentsiSHARES® MSCI ALL PERU CAPPED ETFAugust 31, 2017
Security Shares Value
COMMON STOCKS — 100.02%
BANKS — 29.78%
BBVA Banco Continental SA 3,560,102 $ 4,349,222
Credicorp Ltd. 190,777 38,697,207
Intercorp Financial Services Inc. 219,512 7,682,920
Scotiabank Peru SAA 12,105 125,102
50,854,451
CONSTRUCTION & ENGINEERING — 2.05%
Grana y Montero SAAa 4,988,192 3,508,585
3,508,585
CONSTRUCTION MATERIALS — 5.40%
Cementos Pacasmayo SAA 2,193,929 5,414,602
Union Andina de Cementos SAA 4,921,945 3,811,224
9,225,826
ELECTRIC UTILITIES — 3.09%
Enel Distribucion Peru SAA 1,088,354 1,846,660
Luz del Sur SAA 946,445 3,430,735
5,277,395
FOOD & STAPLES RETAILING — 2.90%
InRetail Peru Corp.b 270,712 4,954,030
4,954,030
FOOD PRODUCTS — 5.50%
Alicorp SAA 2,927,293 7,901,840
Casa Grande SAAa 760,074 1,493,651
9,395,491
METALS & MINING — 44.13%
Cia. de Minas Buenaventura
SAA ADR 1,199,541 16,109,836
Cia. Minera Milpo SAAa 4,444,837 5,128,394
Hochschild Mining PLC 1,883,531 6,890,322
Minsur SAa 8,036,756 3,297,512
Pan American Silver Corp. 187,756 3,486,309
Sociedad Minera Cerro
Verde SAAa 172,469 4,173,750
Southern Copper Corp. 539,915 21,974,540
Tahoe Resources Inc. 778,961 3,702,977
Trevali Mining Corp.a 3,846,889 4,418,361
Volcan Cia. Minera SAA Class B 21,558,862 6,185,328
75,367,329
MULTILINE RETAIL — 3.04%
SACI Falabella 516,920 5,197,084
5,197,084
Security Shares Value
OIL, GAS & CONSUMABLE FUELS — 0.90%
Refineria La Pampilla
SAA Relapasaa 21,578,849 $ 1,531,123
1,531,123
TRADING COMPANIES & DISTRIBUTORS — 3.23%
Ferreycorp SAA 9,306,863 5,512,626
5,512,626
TOTAL COMMON STOCKS
(Cost: $213,223,911) 170,823,940
SHORT-TERM INVESTMENTS — 0.05%
MONEY MARKET FUNDS — 0.05%
BlackRock Cash Funds: Treasury,
SL Agency Shares
0.96%c,d 92,100 92,100
92,100
TOTAL SHORT-TERM INVESTMENTS
(Cost: $92,100) 92,100
TOTAL INVESTMENTS
IN SECURITIES — 100.07%
(Cost: $213,316,011)e 170,916,040
Other Assets, Less Liabilities — (0.07)% (122,150)
NET ASSETS — 100.00% $170,793,890
ADR — American Depositary Receipts
a Non-income earning security.b This security may be resold to qualified institutional buyers under Rule 144A
of the Securities Act of 1933.c Affiliated issuer. See Schedule 1.d The rate quoted is the annualized seven-day yield of the fund at period end.e The cost of investments (including short positions and derivatives, if any) for
federal income tax purposes was $224,027,776. Net unrealized depreciationwas $53,111,736, of which $16,545,741 represented gross unrealizedappreciation on investments and $69,657,477 represented gross unrealizeddepreciation on investments.
S C H E D U L E S O F I N V E S T M E N T S 29
Schedule of Investments (Continued)
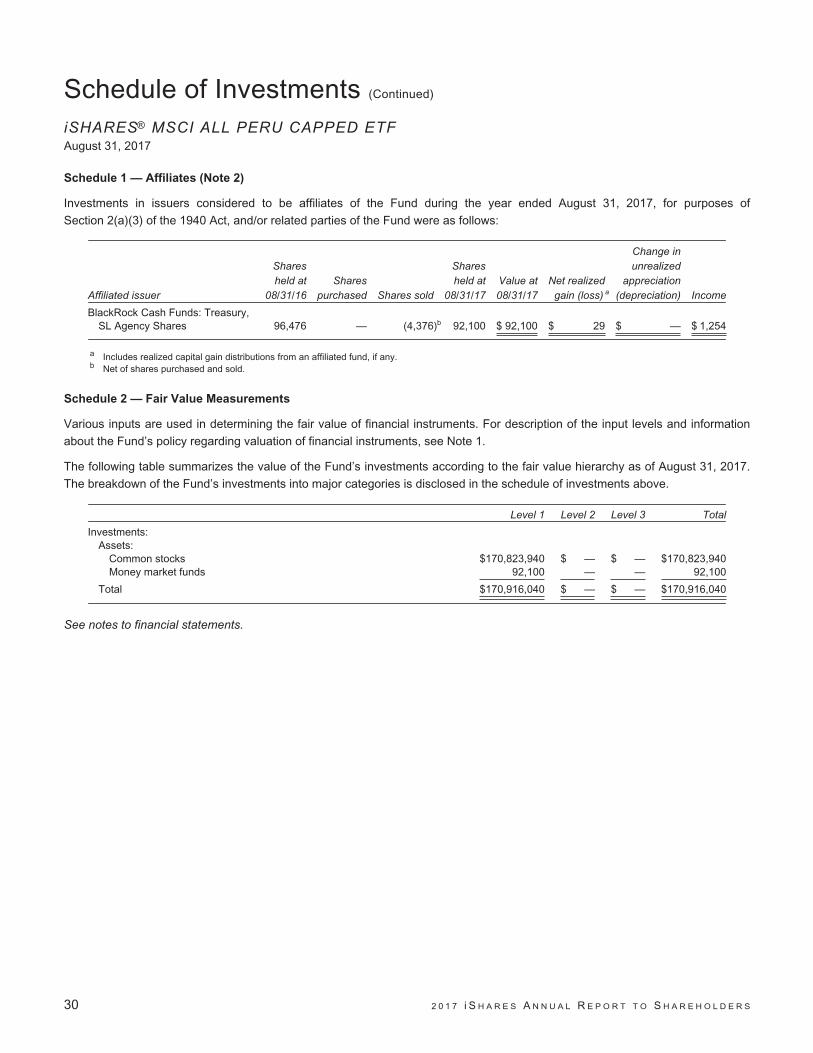
iSHARES® MSCI ALL PERU CAPPED ETFAugust 31, 2017
Schedule 1 — Affiliates (Note 2)
Investments in issuers considered to be affiliates of the Fund during the year ended August 31, 2017, for purposes of
Section 2(a)(3) of the 1940 Act, and/or related parties of the Fund were as follows:
Affiliated issuer
Sharesheld at
08/31/16Shares
purchased Shares sold
Sharesheld at
08/31/17Value at08/31/17
Net realizedgain (loss) a
Change inunrealized
appreciation(depreciation) Income
BlackRock Cash Funds: Treasury,SL Agency Shares 96,476 — (4,376)b 92,100 $ 92,100 $ 29 $ — $ 1,254
a Includes realized capital gain distributions from an affiliated fund, if any.b Net of shares purchased and sold.
Schedule 2 — Fair Value Measurements
Various inputs are used in determining the fair value of financial instruments. For description of the input levels and information
about the Fund’s policy regarding valuation of financial instruments, see Note 1.
The following table summarizes the value of the Fund’s investments according to the fair value hierarchy as of August 31, 2017.
The breakdown of the Fund’s investments into major categories is disclosed in the schedule of investments above.
Level 1 Level 2 Level 3 Total
Investments:Assets:
Common stocks $170,823,940 $ — $ — $170,823,940Money market funds 92,100 — — 92,100
Total $170,916,040 $ — $ — $170,916,040
See notes to financial statements.
30 2 0 1 7 i S H A R E S A N N U A L R E P O R T T O S H A R E H O L D E R S

Schedule of InvestmentsiSHARES® MSCI ARGENTINA AND GLOBAL EXPOSURE ETFAugust 31, 2017
Security Shares Value
COMMON STOCKS — 98.15%
ARGENTINA — 51.01%
Adecoagro SAa 39,780 $ 385,866
Arcos Dorados Holdings Inc. Class Aa 52,440 450,984
Banco Macro SA ADR 14,496 1,504,830
BBVA Banco Frances SA ADR 27,792 477,467
Cresud SACIF y A ADRa 16,308 314,744
Empresa Distribuidora y
Comercializadora Norte SA ADRa 4,320 152,064
Globant SAa 11,112 432,146
Grupo Clarin SA Class B GDRb,c 14,748 419,581
Grupo Financiero Galicia SA ADR 16,104 734,342
Grupo Supervielle SA ADR 15,720 321,160
IRSA Inversiones y Representaciones
SA ADRa 11,376 275,299
Pampa Energia SA ADRa 8,976 547,626
Telecom Argentina SA ADR 21,684 649,436
Transportadora de Gas del Sur
SA ADRa 30,996 539,021
YPF SA ADR 33,204 666,072
7,870,638
CANADA — 5.16%
Finning International Inc. 12,396 282,475
Pan American Silver Corp. 14,112 262,036
SSR Mining Inc.a 24,144 251,117
795,628
CHILE — 3.25%
Cencosud SA 84,144 252,952
Cia. Cervecerias Unidas SA 18,204 248,157
501,109
ITALY — 13.04%
Tenaris SA 150,660 2,011,513
2,011,513
MEXICO — 1.60%
Arca Continental SAB de CV 33,600 246,588
246,588
SPAIN — 1.66%
Prosegur Cia. de Seguridad SA 37,644 255,998
255,998
Security Shares Value
UNITED STATES — 22.43%
MercadoLibre Inc. 13,392 $ 3,461,430
3,461,430
TOTAL COMMON STOCKS
(Cost: $15,225,011) 15,142,904
PREFERRED STOCKS — 1.73%
CHILE — 1.73%
Embotelladora Andina SA Class B,
Preference Shares 56,460 266,047
266,047
TOTAL PREFERRED STOCKS
(Cost: $233,427) 266,047
SHORT-TERM INVESTMENTS — 0.28%
MONEY MARKET FUNDS — 0.28%
BlackRock Cash Funds: Treasury,
SL Agency Shares
0.96%d,e 43,863 43,863
43,863
TOTAL SHORT-TERM INVESTMENTS
(Cost: $43,863) 43,863
TOTAL INVESTMENTS
IN SECURITIES — 100.16%
(Cost: $15,502,301)f 15,452,814
Other Assets, Less Liabilities — (0.16)% (24,978)
NET ASSETS — 100.00% $15,427,836
ADR — American Depositary ReceiptsGDR — Global Depositary Receipts
a Non-income earning security.b This security may be resold to qualified foreign investors and foreign
institutional buyers under Regulation S of the Securities Act of 1933.c Grupo Clarin SA underwent a partial demerger to spin off its cable television,
internet and mobile businesses into a new corporation under the nameCablevision Holding SA, effective on August 31, 2017. For each GrupoClarin Class B GDR held, the Fund will receive 0.3715 of a new Grupo ClarinClass B GDR and 1.257 of a new Cablevision Holding Class B GDR. Theholdings of Grupo Clarin disclosed in the schedule of investments representsthe pre-spinoff Grupo Clarin Class B GDRs which is inclusive of its equityinterest in its cablevision subsidiary.
d Affiliated issuer. See Schedule 1.e The rate quoted is the annualized seven-day yield of the fund at period end.f The cost of investments (including short positions and derivatives, if any) for
federal income tax purposes was $15,977,105. Net unrealized depreciationwas $524,291, of which $619,312 represented gross unrealized appreciationon investments and $1,143,603 represented gross unrealized depreciationon investments.
S C H E D U L E S O F I N V E S T M E N T S 31
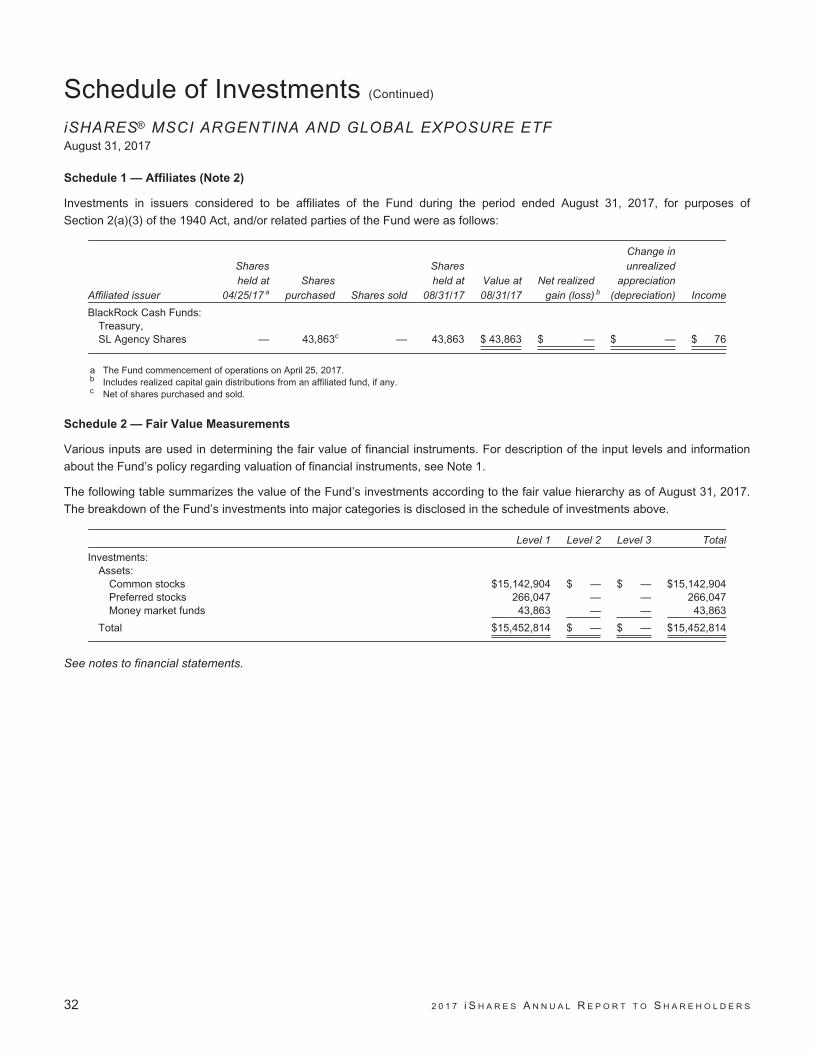
Schedule of Investments (Continued)
iSHARES® MSCI ARGENTINA AND GLOBAL EXPOSURE ETFAugust 31, 2017
Schedule 1 — Affiliates (Note 2)
Investments in issuers considered to be affiliates of the Fund during the period ended August 31, 2017, for purposes of
Section 2(a)(3) of the 1940 Act, and/or related parties of the Fund were as follows:
Affiliated issuer
Sharesheld at
04/25/17 aShares
purchased Shares sold
Sharesheld at
08/31/17Value at08/31/17
Net realizedgain (loss) b
Change inunrealized
appreciation(depreciation) Income
BlackRock Cash Funds:Treasury,SL Agency Shares — 43,863c — 43,863 $ 43,863 $ — $ — $ 76
a The Fund commencement of operations on April 25, 2017.b Includes realized capital gain distributions from an affiliated fund, if any.c Net of shares purchased and sold.
Schedule 2 — Fair Value Measurements
Various inputs are used in determining the fair value of financial instruments. For description of the input levels and information
about the Fund’s policy regarding valuation of financial instruments, see Note 1.
The following table summarizes the value of the Fund’s investments according to the fair value hierarchy as of August 31, 2017.
The breakdown of the Fund’s investments into major categories is disclosed in the schedule of investments above.
Level 1 Level 2 Level 3 Total
Investments:Assets:
Common stocks $15,142,904 $ — $ — $15,142,904Preferred stocks 266,047 — — 266,047Money market funds 43,863 — — 43,863
Total $15,452,814 $ — $ — $15,452,814
See notes to financial statements.
32 2 0 1 7 i S H A R E S A N N U A L R E P O R T T O S H A R E H O L D E R S
Schedule of InvestmentsiSHARES® MSCI BRAZIL SMALL-CAP ETFAugust 31, 2017
Security Shares Value
COMMON STOCKS — 74.05%
AUTO COMPONENTS — 1.23%
Mahle-Metal Leve SA 58,100 $ 353,610
Tupy SA 77,000 410,640
764,250
BANKS — 0.03%
Banco ABC Brasil SAa 3,991 21,068
21,068
COMMERCIAL SERVICES & SUPPLIES — 1.12%
Valid Solucoes e Servicos de
Seguranca em Meios de Pagamento
e Identificacao SA 109,961 698,603
698,603
CONSTRUCTION MATERIALS — 0.93%
Magnesita Refratarios SA 46,220 580,238
580,238
DIVERSIFIED CONSUMER SERVICES — 6.83%
Estacio Participacoes SA 415,800 3,410,764
GAEC Educacao SA 53,900 320,339
Ser Educacional SAb 56,800 526,940
4,258,043
ELECTRIC UTILITIES — 3.43%
Alupar Investimento SA Units 223,372 1,327,546
Light SAa 123,200 806,598
2,134,144
FOOD PRODUCTS — 5.22%
Marfrig Global Foods SAa 331,100 750,288
Minerva SA 161,700 595,110
Sao Martinho SA 246,400 1,366,518
SLC Agricola SA 77,000 543,279
3,255,195
HEALTH CARE PROVIDERS & SERVICES — 5.26%
Alliar Medicos A Frente SAa 61,600 321,073
Fleury SA 219,600 2,212,436
Instituto Hermes Pardini SA 77,000 743,950
3,277,459
HOTELS, RESTAURANTS & LEISURE — 3.00%
CVC Brasil Operadora e Agencia de
Viagens SA 154,000 1,869,663
1,869,663
HOUSEHOLD DURABLES — 7.14%
Cyrela Brazil Realty SA
Empreendimentos e Participacoes 400,400 1,677,214
Security Shares Value
Even Construtora e Incorporadora SAa 192,500 $ 291,829
EZ TEC Empreendimentos e
Participacoes SA 84,753 600,136
MRV Engenharia e Participacoes SA 438,900 1,881,727
4,450,906
INDEPENDENT POWER AND RENEWABLE
ELECTRICITY PRODUCERS — 1.83%
AES Tiete Energia SA 254,100 1,142,721
1,142,721
INSURANCE — 0.87%
Wiz Solucoes e Corretagem de
Seguros SA 100,100 541,786
541,786
INTERNET & DIRECT MARKETING RETAIL — 2.93%
B2W Cia. Digitala 310,827 1,826,564
1,826,564
MACHINERY — 1.67%
Iochpe Maxion SA 161,707 1,038,148
1,038,148
MEDIA — 4.85%
Multiplus SA 77,000 917,946
Smiles SA 95,300 2,105,326
3,023,272
MULTILINE RETAIL — 3.23%
Magazine Luiza SA 10,000 1,805,209
Marisa Lojas SAa 92,400 209,383
2,014,592
OIL, GAS & CONSUMABLE FUELS — 0.47%
QGEP Participacoes SA 123,200 295,230
295,230
REAL ESTATE MANAGEMENT &
DEVELOPMENT — 5.36%
Aliansce Shopping Centers SAa 138,600 766,464
BR Properties SA 184,800 645,474
Iguatemi Empresa de Shopping
Centers SA 136,600 1,623,684
Sonae Sierra Brasil SA 38,500 301,006
3,336,628
ROAD & RAIL — 1.61%
Cosan Logistica SAa 169,403 432,331
JSL SAa 69,300 173,996
Movida Participacoes SAa 130,900 394,807
1,001,134
S C H E D U L E S O F I N V E S T M E N T S 33
Schedule of Investments (Continued)
iSHARES® MSCI BRAZIL SMALL-CAP ETFAugust 31, 2017
Security Shares Value
SOFTWARE — 4.61%
Linx SA 192,500 $ 1,121,431
TOTVS SA 177,100 1,748,232
2,869,663
SPECIALTY RETAIL — 4.70%
Cia. Hering 223,300 1,916,159
Via Varejo SA 192,500 1,009,471
2,925,630
TEXTILES, APPAREL & LUXURY GOODS — 2.44%
Arezzo Industria e Comercio SA 69,300 1,008,296
Guararapes Confeccoes SA 12,800 514,124
1,522,420
TRANSPORTATION INFRASTRUCTURE — 3.09%
EcoRodovias Infraestrutura e
Logistica SA 346,500 1,178,328
Prumo Logistica SAa 115,500 414,801
Santos Brasil Participacoes SAa 361,900 333,553
1,926,682
WATER UTILITIES — 2.20%
Cia. de Saneamento de Minas
Gerais-COPASA 100,100 1,371,486
1,371,486
TOTAL COMMON STOCKS
(Cost: $26,602,416) 46,145,525
PREFERRED STOCKS — 25.48%
AIRLINES — 0.89%
GOL Linhas Aereas Inteligentes SA,
Preference Shares 154,000 554,536
554,536
BANKS — 3.30%
Banco ABC Brasil SA,
Preference Shares 104,265 563,666
Banco do Estado do Rio Grande do
Sul SA Class B, Preference Shares 277,200 1,490,640
2,054,306
ELECTRIC UTILITIES — 1.81%
Cia. Energetica do Ceara Class A,
Preference Shares 18,900 312,292
Eletropaulo Metropolitana Eletricidade
de Sao Paulo SA,
Preference Shares 161,700 818,149
1,130,441
Security Shares Value
GAS UTILITIES — 1.06%
Cia. de Gas de Sao Paulo –
COMGAS, Preference Shares 38,500 $ 660,745
660,745
INDEPENDENT POWER AND RENEWABLE
ELECTRICITY PRODUCERS — 2.20%
Cia. Energetica de Sao Paulo Class B,
Preference Shares 292,600 1,369,797
1,369,797
MACHINERY — 2.40%
Marcopolo SA, Preference Shares 754,600 932,922
Randon SA Implemetos e
Participacoes, Preference Shares 277,250 562,175
1,495,097
METALS & MINING — 9.98%
Bradespar SA, Preference Shares 346,500 2,960,136
Metalurgica Gerdau SA,
Preference Shares 985,600 1,772,949
Usinas Siderurgicas de Minas Gerais
SA Class A, Preference Shares 677,600 1,483,788
6,216,873
TEXTILES, APPAREL & LUXURY GOODS — 1.63%
Alpargatas SA, Preference Shares 231,000 1,013,142
1,013,142
WATER UTILITIES — 2.21%
Cia. de Saneamento do Parana,
Preference Shares 415,800 1,379,635
1,379,635
TOTAL PREFERRED STOCKS
(Cost: $7,976,496) 15,874,572
SHORT-TERM INVESTMENTS — 0.00%
MONEY MARKET FUNDS — 0.00%
BlackRock Cash Funds: Treasury,
SL Agency Shares
0.96%c,d 1,362 1,362
1,362
TOTAL SHORT-TERM INVESTMENTS
(Cost: $1,362) 1,362
34 2 0 1 7 i S H A R E S A N N U A L R E P O R T T O S H A R E H O L D E R S
Schedule of Investments (Continued)
iSHARES® MSCI BRAZIL SMALL-CAP ETFAugust 31, 2017
Value
TOTAL INVESTMENTS
IN SECURITIES — 99.53%
(Cost: $34,580,274)e $62,021,459
Other Assets, Less Liabilities — 0.47% 294,191
NET ASSETS — 100.00% $62,315,650
a Non-income earning security.b This security may be resold to qualified institutional buyers under Rule 144A
of the Securities Act of 1933.c Affiliated issuer. See Schedule 1.d The rate quoted is the annualized seven-day yield of the fund at period end.e The cost of investments (including short positions and derivatives, if any) for
federal income tax purposes was $43,620,505. Net unrealized appreciationwas $18,400,954, of which $27,667,605 represented gross unrealizedappreciation on investments and $9,266,651 represented gross unrealizeddepreciation on investments.
Schedule 1 — Affiliates (Note 2)
Investments in issuers considered to be affiliates of the Fund during the year ended August 31, 2017, for purposes of
Section 2(a)(3) of the 1940 Act, and/or related parties of the Fund were as follows:
Affiliated issuer
Sharesheld at
08/31/16Shares
purchased Shares sold
Sharesheld at
08/31/17Value at08/31/17
Net realizedgain (loss) a
Change inunrealized
appreciation(depreciation) Income
BlackRock Cash Funds: Treasury,SL Agency Shares 32,159 — (30,797)b 1,362 $ 1,362 $ — $ — $ 161
a Includes realized capital gain distributions from an affiliated fund, if any.b Net of shares purchased and sold.
Schedule 2 — Fair Value Measurements
Various inputs are used in determining the fair value of financial instruments. For description of the input levels and information
about the Fund’s policy regarding valuation of financial instruments, see Note 1.
The following table summarizes the value of the Fund’s investments according to the fair value hierarchy as of August 31, 2017.
The breakdown of the Fund’s investments into major categories is disclosed in the schedule of investments above.
Level 1 Level 2 Level 3 Total
Investments:Assets:
Common stocks $46,145,525 $ — $ — $46,145,525Preferred stocks 15,874,572 — — 15,874,572Money market funds 1,362 — — 1,362
Total $62,021,459 $ — $ — $62,021,459
See notes to financial statements.
S C H E D U L E S O F I N V E S T M E N T S 35

Schedule of InvestmentsiSHARES® MSCI CHINA ETFAugust 31, 2017
Security Shares Value
COMMON STOCKS — 99.57%
AEROSPACE & DEFENSE — 0.09%
AviChina Industry & Technology
Co. Ltd. Class Ha 3,765,000 $ 2,227,312
2,227,312
AIRLINES — 0.22%
Air China Ltd. Class H 3,344,000 2,973,793
China Southern Airlines Co. Ltd.
Class H 3,344,000 2,610,614
5,584,407
AUTO COMPONENTS — 0.33%
Fuyao Glass Industry Group Co.
Ltd. Class Hb 836,000 2,665,091
Minth Group Ltd. 1,254,000 5,776,144
8,441,235
AUTOMOBILES — 2.48%
Brilliance China Automotive
Holdings Ltd. 5,438,000 14,070,172
Byd Co. Ltd. Class H 1,152,500 6,862,179
Chongqing Changan
Automobile Co. Ltd. Class B 1,525,784 1,996,311
Dongfeng Motor Group Co. Ltd.
Class H 4,598,000 5,968,949
Geely Automobile Holdings Ltd. 8,569,000 21,065,433
Great Wall Motor Co. Ltd.
Class Ha 5,434,000 6,818,146
Guangzhou Automobile Group
Co. Ltd. Class H 3,782,000 7,461,120
64,242,310
BANKS — 14.86%
Agricultural Bank of China Ltd.
Class H 45,980,000 21,619,815
Bank of China Ltd. Class H 139,612,000 73,494,552
Bank of Communications Co.
Ltd. Class H 15,466,200 11,817,347
China CITIC Bank Corp. Ltd.
Class H 15,884,800 10,493,189
China Construction Bank Corp.
Class H 148,181,000 129,882,854
China Everbright Bank Co. Ltd.
Class H 4,807,000 2,309,389
China Merchants Bank Co. Ltd.
Class H 6,897,150 25,997,218
Security Shares Value
China Minsheng Banking Corp.
Ltd. Class H 9,718,800 $ 9,698,372
Chongqing Rural Commercial
Bank Co. Ltd. Class H 4,389,000 3,056,309
Industrial & Commercial Bank of
China Ltd. Class H 129,789,000 97,178,611
385,547,656
BEVERAGES — 0.35%
China Resources Beer Holdings
Co. Ltd. 2,926,000 7,342,619
Tsingtao Brewery Co. Ltd.
Class H 418,000 1,733,110
9,075,729
BIOTECHNOLOGY — 0.09%
3SBio Inc.a,b,c 1,777,000 2,443,064
2,443,064
CAPITAL MARKETS — 1.90%
China Cinda Asset
Management Co. Ltd.
Class H 15,466,000 5,750,508
China Everbright Ltd. 1,672,000 3,819,785
China Galaxy Securities Co.
Ltd. Class H 5,747,500 5,206,674
China Huarong Asset
Management Co. Ltd.
Class Hb 11,077,000 4,727,198
CITIC Securities Co. Ltd.
Class H 3,971,000 8,808,152
GF Securities Co. Ltd. Class H 2,382,600 5,083,968
Haitong Securities Co. Ltd.
Class H 5,684,800 9,529,809
Huatai Securities Co. Ltd.
Class Hb 2,884,200 6,419,611
49,345,705
CHEMICALS — 0.15%
Sinopec Shanghai
Petrochemical Co. Ltd.
Class H 6,270,000 3,909,512
3,909,512
COMMERCIAL SERVICES & SUPPLIES — 0.22%
China Everbright
International Ltd. 4,388,000 5,797,254
5,797,254
36 2 0 1 7 i S H A R E S A N N U A L R E P O R T T O S H A R E H O L D E R S

Schedule of Investments (Continued)
iSHARES® MSCI CHINA ETFAugust 31, 2017
Security Shares Value
COMMUNICATIONS EQUIPMENT — 0.13%
ZTE Corp. Class Hc 1,254,040 $ 3,420,932
3,420,932
CONSTRUCTION & ENGINEERING — 1.05%
China Communications
Construction Co. Ltd. Class H 7,733,000 10,295,582
China Railway Construction
Corp. Ltd. Class H 3,448,500 4,520,774
China Railway Group Ltd.
Class H 6,897,000 5,516,578
China State Construction
International Holdings Ltd. 3,344,000 4,845,231
Sinopec Engineering Group Co.
Ltd. Class H 2,194,500 1,979,591
27,157,756
CONSTRUCTION MATERIALS — 0.44%
Anhui Conch Cement Co. Ltd.
Class H 2,194,500 8,187,543
China National Building Material
Co. Ltd. Class H 5,024,000 3,158,275
11,345,818
DIVERSIFIED CONSUMER SERVICES — 1.32%
New Oriental Education &
Technology Group Inc. ADR 236,170 19,306,898
TAL Education Group
Class A ADR 492,822 14,996,573
34,303,471
DIVERSIFIED FINANCIAL SERVICES — 0.13%
Far East Horizon Ltd.a 3,554,000 3,246,823
3,246,823
DIVERSIFIED TELECOMMUNICATION
SERVICES — 1.16%
China Communications Services
Corp. Ltd. Class H 4,196,800 2,273,627
China Telecom Corp. Ltd.
Class H 24,662,000 12,667,460
China Unicom Hong Kong Ltd.c 10,450,000 15,221,461
30,162,548
ELECTRICAL EQUIPMENT — 0.28%
Shanghai Electric Group Co. Ltd.
Class Ha,c 5,024,000 2,278,837
Zhuzhou CRRC Times Electric
Co. Ltd. Class H 961,400 5,030,292
7,309,129
Security Shares Value
ELECTRONIC EQUIPMENT, INSTRUMENTS &
COMPONENTS — 1.57%
AAC Technologies Holdings Inc. 1,254,000 $ 22,864,236
Sunny Optical Technology Group
Co. Ltd. 1,254,000 17,977,346
40,841,582
ENERGY EQUIPMENT & SERVICES — 0.11%
China Oilfield Services Ltd.
Class H 3,344,000 2,743,067
2,743,067
FOOD & STAPLES RETAILING — 0.15%
Sun Art Retail Group Ltd. 4,180,000 3,850,762
3,850,762
FOOD PRODUCTS — 0.85%
China Huishan Dairy Holdings
Co. Ltd.a,d 7,446,000 9
China Mengniu Dairy Co. Ltd. 5,016,000 11,715,718
Tingyi Cayman Islands
Holding Corp.a 3,344,000 4,452,144
Want Want China Holdings Ltd.a 8,778,000 5,809,791
21,977,662
GAS UTILITIES — 0.82%
China Gas Holdings Ltd. 2,930,000 7,397,582
China Resources Gas Group Ltd.a 1,672,000 5,896,313
ENN Energy Holdings Ltd. 1,254,000 8,067,374
21,361,269
HEALTH CARE EQUIPMENT & SUPPLIES — 0.10%
Shandong Weigao Group Medical
Polymer Co. Ltd. Class H 3,344,000 2,670,432
2,670,432
HEALTH CARE PROVIDERS & SERVICES — 0.48%
Shanghai Pharmaceuticals
Holding Co. Ltd. Class H 1,212,200 2,983,086
Sinopharm Group Co. Ltd. Class H 2,090,000 9,439,976
12,423,062
HEALTH CARE TECHNOLOGY — 0.11%
Alibaba Health Information
Technology Ltd.a,c 5,852,000 2,729,181
2,729,181
HOTELS, RESTAURANTS & LEISURE — 0.93%
Yum China Holdings Inc.c 683,639 24,173,475
24,173,475
S C H E D U L E S O F I N V E S T M E N T S 37

Schedule of Investments (Continued)
iSHARES® MSCI CHINA ETFAugust 31, 2017
Security Shares Value
HOUSEHOLD DURABLES — 0.24%
Haier Electronics Group Co. Ltd. 2,305,000 $ 6,125,894
6,125,894
INDEPENDENT POWER AND RENEWABLE
ELECTRICITY PRODUCERS — 0.96%
CGN Power Co. Ltd. Class Hb 18,601,000 5,133,638
China Longyuan Power Group
Corp. Ltd. 5,643,000 4,225,157
China Power International
Development Ltd. 5,643,000 1,925,114
China Resources Power
Holdings Co. Ltd. 3,344,000 6,135,584
Huaneng Power International Inc.
Class H 7,524,000 4,922,140
Huaneng Renewables Corp. Ltd.
Class H 8,360,000 2,563,614
24,905,247
INDUSTRIAL CONGLOMERATES — 1.21%
Beijing Enterprises Holdings Ltd. 945,500 5,279,322
CITIC Ltd. 10,241,000 15,728,309
Fosun International Ltd.a 4,493,500 7,796,859
Shanghai Industrial Holdings Ltd. 836,000 2,542,251
31,346,741
INSURANCE — 6.76%
China Life Insurance Co. Ltd.
Class H 13,167,000 42,227,536
China Pacific Insurance Group
Co. Ltd. Class H 4,639,800 21,846,000
China Taiping Insurance
Holdings Co. Ltd. 2,842,524 8,625,870
New China Life Insurance Co.
Ltd. Class H 1,358,500 8,696,261
People’s Insurance Co. Group of
China Ltd. (The) Class H 12,540,000 5,912,336
PICC Property & Casualty Co.
Ltd. Class H 7,942,308 14,917,610
Ping An Insurance Group Co. of
China Ltd. Class H 9,196,000 73,025,625
175,251,238
INTERNET & DIRECT MARKETING RETAIL — 3.50%
Ctrip.com International Ltd. ADRc 694,298 35,721,632
JD.com Inc. ADRa,c 1,156,397 48,464,599
Vipshop Holdings Ltd. ADRc 711,436 6,623,469
90,809,700
Security Shares Value
INTERNET SOFTWARE & SERVICES — 37.05%
58.com Inc. ADRa,c 160,094 $ 10,026,687
Alibaba Group Holding
Ltd. ADRa,c 2,005,355 344,399,668
Autohome Inc. ADRa,c 92,169 5,923,702
Baidu Inc. ADRc 482,790 110,100,259
Momo Inc. ADRc 189,981 7,319,968
NetEase Inc. ADR 138,985 38,337,622
SINA Corp./Chinac 100,111 10,194,303
Tencent Holdings Ltd. 10,011,100 420,835,998
Weibo Corp. ADRa,c 81,928 8,282,921
YY Inc. ADRc 76,494 5,715,632
961,136,760
IT SERVICES — 0.18%
TravelSky Technology
Ltd. Class H 1,672,000 4,571,779
4,571,779
MACHINERY — 0.71%
China Conch Venture
Holdings Ltd.a 2,821,500 5,133,638
CRRC Corp. Ltd. Class H 7,315,650 6,599,223
Haitian International
Holdings Ltd. 1,045,000 3,137,757
Weichai Power Co. Ltd. Class H 3,553,000 3,659,026
18,529,644
MEDIA — 0.15%
Alibaba Pictures Group Ltd.a,c 22,990,000 4,024,341
4,024,341
METALS & MINING — 0.48%
Aluminum Corp. of China Ltd.
Class Ha,c 7,106,000 5,257,012
Jiangxi Copper Co. Ltd. Class H 2,090,000 3,626,446
Zijin Mining Group Co. Ltd.
Class H 10,032,000 3,678,787
12,562,245
OIL, GAS & CONSUMABLE FUELS — 4.71%
China Coal Energy Co. Ltd.
Class Ha 3,762,000 1,893,870
China Petroleum & Chemical
Corp. Class H 45,145,000 34,551,879
China Shenhua Energy Co. Ltd.
Class H 5,956,500 15,335,621
CNOOC Ltd. 31,559,000 37,742,813
Kunlun Energy Co. Ltd.a 5,852,000 5,667,724
38 2 0 1 7 i S H A R E S A N N U A L R E P O R T T O S H A R E H O L D E R S
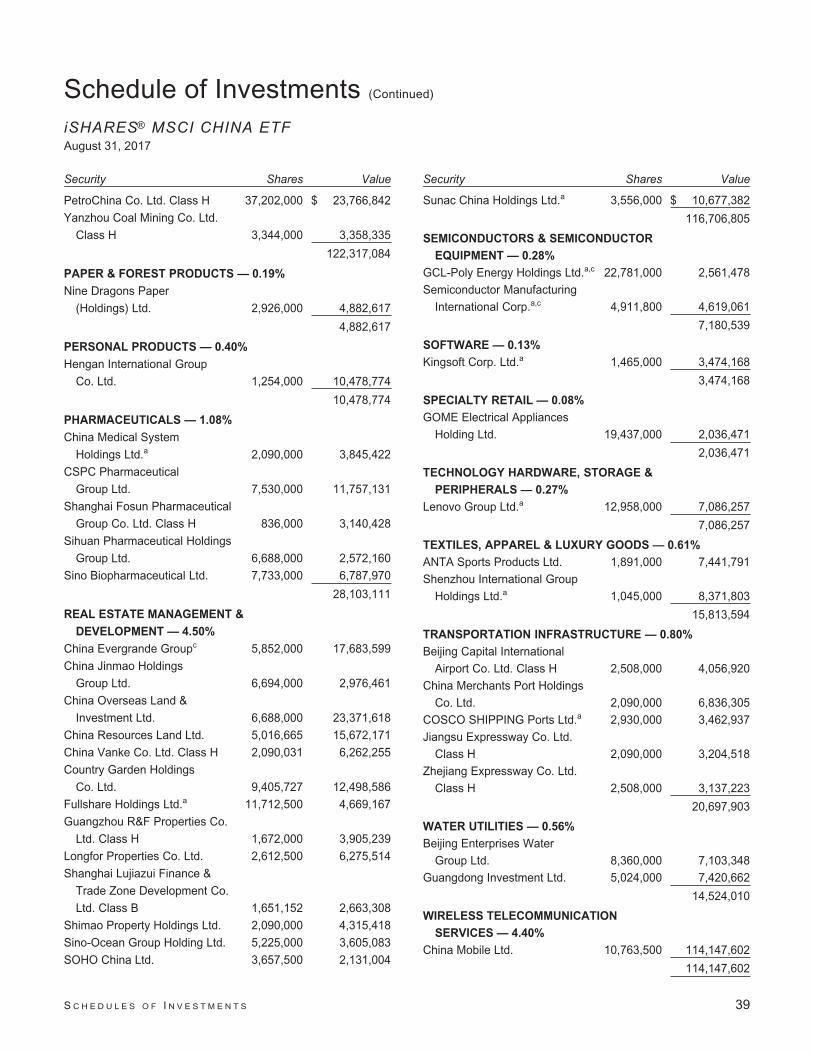
Schedule of Investments (Continued)
iSHARES® MSCI CHINA ETFAugust 31, 2017
Security Shares Value
PetroChina Co. Ltd. Class H 37,202,000 $ 23,766,842
Yanzhou Coal Mining Co. Ltd.
Class H 3,344,000 3,358,335
122,317,084
PAPER & FOREST PRODUCTS — 0.19%
Nine Dragons Paper
(Holdings) Ltd. 2,926,000 4,882,617
4,882,617
PERSONAL PRODUCTS — 0.40%
Hengan International Group
Co. Ltd. 1,254,000 10,478,774
10,478,774
PHARMACEUTICALS — 1.08%
China Medical System
Holdings Ltd.a 2,090,000 3,845,422
CSPC Pharmaceutical
Group Ltd. 7,530,000 11,757,131
Shanghai Fosun Pharmaceutical
Group Co. Ltd. Class H 836,000 3,140,428
Sihuan Pharmaceutical Holdings
Group Ltd. 6,688,000 2,572,160
Sino Biopharmaceutical Ltd. 7,733,000 6,787,970
28,103,111
REAL ESTATE MANAGEMENT &
DEVELOPMENT — 4.50%
China Evergrande Groupc 5,852,000 17,683,599
China Jinmao Holdings
Group Ltd. 6,694,000 2,976,461
China Overseas Land &
Investment Ltd. 6,688,000 23,371,618
China Resources Land Ltd. 5,016,665 15,672,171
China Vanke Co. Ltd. Class H 2,090,031 6,262,255
Country Garden Holdings
Co. Ltd. 9,405,727 12,498,586
Fullshare Holdings Ltd.a 11,712,500 4,669,167
Guangzhou R&F Properties Co.
Ltd. Class H 1,672,000 3,905,239
Longfor Properties Co. Ltd. 2,612,500 6,275,514
Shanghai Lujiazui Finance &
Trade Zone Development Co.
Ltd. Class B 1,651,152 2,663,308
Shimao Property Holdings Ltd. 2,090,000 4,315,418
Sino-Ocean Group Holding Ltd. 5,225,000 3,605,083
SOHO China Ltd. 3,657,500 2,131,004
Security Shares Value
Sunac China Holdings Ltd.a 3,556,000 $ 10,677,382
116,706,805
SEMICONDUCTORS & SEMICONDUCTOR
EQUIPMENT — 0.28%
GCL-Poly Energy Holdings Ltd.a,c 22,781,000 2,561,478
Semiconductor Manufacturing
International Corp.a,c 4,911,800 4,619,061
7,180,539
SOFTWARE — 0.13%
Kingsoft Corp. Ltd.a 1,465,000 3,474,168
3,474,168
SPECIALTY RETAIL — 0.08%
GOME Electrical Appliances
Holding Ltd. 19,437,000 2,036,471
2,036,471
TECHNOLOGY HARDWARE, STORAGE &
PERIPHERALS — 0.27%
Lenovo Group Ltd.a 12,958,000 7,086,257
7,086,257
TEXTILES, APPAREL & LUXURY GOODS — 0.61%
ANTA Sports Products Ltd. 1,891,000 7,441,791
Shenzhou International Group
Holdings Ltd.a 1,045,000 8,371,803
15,813,594
TRANSPORTATION INFRASTRUCTURE — 0.80%
Beijing Capital International
Airport Co. Ltd. Class H 2,508,000 4,056,920
China Merchants Port Holdings
Co. Ltd. 2,090,000 6,836,305
COSCO SHIPPING Ports Ltd.a 2,930,000 3,462,937
Jiangsu Expressway Co. Ltd.
Class H 2,090,000 3,204,518
Zhejiang Expressway Co. Ltd.
Class H 2,508,000 3,137,223
20,697,903
WATER UTILITIES — 0.56%
Beijing Enterprises Water
Group Ltd. 8,360,000 7,103,348
Guangdong Investment Ltd. 5,024,000 7,420,662
14,524,010
WIRELESS TELECOMMUNICATION
SERVICES — 4.40%
China Mobile Ltd. 10,763,500 114,147,602
114,147,602
S C H E D U L E S O F I N V E S T M E N T S 39
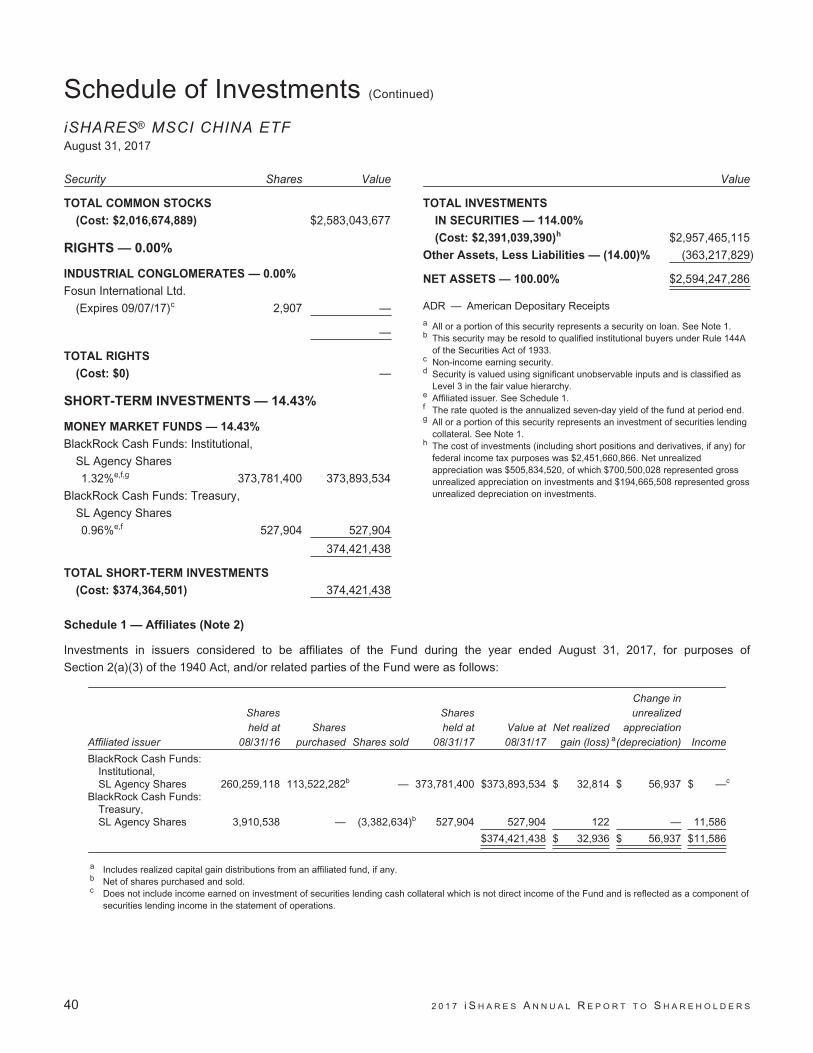
Schedule of Investments (Continued)
iSHARES® MSCI CHINA ETFAugust 31, 2017
Security Shares Value
TOTAL COMMON STOCKS
(Cost: $2,016,674,889) $2,583,043,677
RIGHTS — 0.00%
INDUSTRIAL CONGLOMERATES — 0.00%
Fosun International Ltd.
(Expires 09/07/17)c 2,907 —
—
TOTAL RIGHTS
(Cost: $0) —
SHORT-TERM INVESTMENTS — 14.43%
MONEY MARKET FUNDS — 14.43%
BlackRock Cash Funds: Institutional,
SL Agency Shares
1.32%e,f,g 373,781,400 373,893,534
BlackRock Cash Funds: Treasury,
SL Agency Shares
0.96%e,f 527,904 527,904
374,421,438
TOTAL SHORT-TERM INVESTMENTS
(Cost: $374,364,501) 374,421,438
Value
TOTAL INVESTMENTS
IN SECURITIES — 114.00%
(Cost: $2,391,039,390)h $2,957,465,115
Other Assets, Less Liabilities — (14.00)% (363,217,829)
NET ASSETS — 100.00% $2,594,247,286
ADR — American Depositary Receipts
a All or a portion of this security represents a security on loan. See Note 1.b This security may be resold to qualified institutional buyers under Rule 144A
of the Securities Act of 1933.c Non-income earning security.d Security is valued using significant unobservable inputs and is classified as
Level 3 in the fair value hierarchy.e Affiliated issuer. See Schedule 1.f The rate quoted is the annualized seven-day yield of the fund at period end.g All or a portion of this security represents an investment of securities lending
collateral. See Note 1.h The cost of investments (including short positions and derivatives, if any) for
federal income tax purposes was $2,451,660,866. Net unrealizedappreciation was $505,834,520, of which $700,500,028 represented grossunrealized appreciation on investments and $194,665,508 represented grossunrealized depreciation on investments.
Schedule 1 — Affiliates (Note 2)
Investments in issuers considered to be affiliates of the Fund during the year ended August 31, 2017, for purposes of
Section 2(a)(3) of the 1940 Act, and/or related parties of the Fund were as follows:
Affiliated issuer
Sharesheld at
08/31/16Shares
purchased Shares sold
Sharesheld at
08/31/17Value at08/31/17
Net realizedgain (loss) a
Change inunrealized
appreciation(depreciation) Income
BlackRock Cash Funds:Institutional,SL Agency Shares 260,259,118 113,522,282b — 373,781,400 $373,893,534 $ 32,814 $ 56,937 $ —c
BlackRock Cash Funds:Treasury,SL Agency Shares 3,910,538 — (3,382,634)b 527,904 527,904 122 — 11,586
$374,421,438 $ 32,936 $ 56,937 $11,586
a Includes realized capital gain distributions from an affiliated fund, if any.b Net of shares purchased and sold.c Does not include income earned on investment of securities lending cash collateral which is not direct income of the Fund and is reflected as a component of
securities lending income in the statement of operations.
40 2 0 1 7 i S H A R E S A N N U A L R E P O R T T O S H A R E H O L D E R S

Schedule of Investments (Continued)
iSHARES® MSCI CHINA ETFAugust 31, 2017
Schedule 2 — Futures Contracts (Note 5)
Futures contracts outstanding as of August 31, 2017 were as follows:
DescriptionNumber of
contractsExpiration
date
Notionalamount
(000)
Value/unrealized
appreciation(depreciation)
Long Contracts:
H-Shares Index 2,400 Sep 2017 $ 3,457 $ 30,271
Schedule 3 — Fair Value Measurements
Various inputs are used in determining the fair value of financial instruments. For description of the input levels and information
about the Fund’s policy regarding valuation of financial instruments, see Note 1.
The following table summarizes the value of the Fund’s investments according to the fair value hierarchy as of August 31, 2017.
The breakdown of the Fund’s investments into major categories is disclosed in the schedule of investments above.
Level 1 Level 2 Level 3 Total
Investments:Assets:
Common stocks $2,583,043,668 $ — $ 9 $2,583,043,677Rights — 0a — 0a
Money market funds 374,421,438 — — 374,421,438
Total $2,957,465,106 $ 0a $ 9 $2,957,465,115
Derivative financial instrumentsb:Assets:
Futures contracts $ 30,271 $ — $ — $ 30,271
Total $ 30,271 $ — $ — $ 30,271
a Rounds to less than $1.b Shown at the unrealized appreciation (depreciation) on the contracts.
See notes to financial statements.
S C H E D U L E S O F I N V E S T M E N T S 41

Schedule of InvestmentsiSHARES® MSCI CHINA SMALL-CAP ETFAugust 31, 2017
Security Shares Value
COMMON STOCKS — 99.43%
AEROSPACE & DEFENSE — 0.31%
KuangChi Science Ltd.a,b 198,000 $ 67,042
67,042
AIR FREIGHT & LOGISTICS — 0.80%
Guangdong Yueyen Transportation
Co. Ltd. Class H 27,000 17,525
Sinotrans Ltd. Class H 279,000 157,566
175,091
AIRLINES — 0.14%
Shandong Airlines Co. Ltd. Class B 18,000 30,704
30,704
AUTO COMPONENTS — 2.70%
Chaowei Power Holdings Ltd.b 99,000 51,230
China First Capital Group Ltd.a 396,000 158,371
Hunan Tyen Machinery Co.
Ltd. Class Ba 29,700 16,097
Launch Tech Co. Ltd. 22,500 26,391
Nexteer Automotive Group Ltd. 117,000 194,341
Tianneng Power International Ltd. 90,000 77,047
Xingda International Holdings Ltd. 126,000 48,298
Zhejiang Shibao Co. Ltd. Class H 45,000 17,019
588,794
AUTOMOBILES — 0.53%
Hybrid Kinetic Group Ltd.a,b,c 2,394,000 55,059
Qingling Motors Co. Ltd. Class H 90,000 28,979
Yadea Group Holdings Ltd.d 126,000 31,072
115,110
BANKS — 0.29%
Bank of Chongqing Co. Ltd. Class H 76,500 64,219
64,219
BEVERAGES — 0.86%
Anhui Gujing Distillery Co.
Ltd. Class B 16,200 69,466
Dynasty Fine Wines Group Ltd.a,b,c 128,000 1,145
Tibet Water Resources Ltd.a,b 297,000 116,501
187,112
BIOTECHNOLOGY — 0.28%
China Regenerative Medicine
International Ltd.a,b 1,395,000 35,292
Shanghai Haohai Biological
Technology Co. Ltd.d 5,400 26,598
61,890
Security Shares Value
BUILDING PRODUCTS — 0.79%
China Fangda Group Co.
Ltd. Class B 59,400 $ 38,935
China Lesso Group Holdings Ltd. 144,000 103,403
Far East Global Group Ltd. 72,000 9,200
Luoyang Glass Co. Ltd. Class Ha,b 36,000 21,435
172,973
CAPITAL MARKETS — 1.01%
China Minsheng Financial Holding
Corp. Ltd.a 1,350,000 87,971
Guolian Securities Co. Ltd. 62,000 31,450
Noah Holdings Ltd. ADRa,b 3,483 102,017
221,438
CHEMICALS — 1.91%
China BlueChemical Ltd. Class H 234,000 72,056
China Lumena New
Materials Corp.a,b,c 868,000 1
China XLX Fertiliser Ltd. 63,000 16,904
Fufeng Group Ltd. 207,600 131,831
Huabao International Holdings Ltd. 126,000 76,955
Hubei Sanonda Co. Ltd. Class Ba 23,400 23,022
Shanghai Chlor-Alkali Chemical Co.
Ltd. Class Ba 58,500 44,109
Sinofert Holdings Ltd.a,b 270,000 37,258
Yip’s Chemical Holdings Ltd.b 36,000 14,075
416,211
COMMERCIAL SERVICES & SUPPLIES — 1.08%
Beijing Enterprises Environment
Group Ltd.a 54,000 8,487
Capital Environment Holdings Ltd.a 612,000 22,677
China Greenland Broad Greenstate
Group Co Ltd.b 108,000 23,459
Dongjiang Environmental Co.
Ltd. Class H 28,900 39,880
Dynagreen Environmental Protection
Group Co. Ltd. Class H 54,000 28,289
Greentown Service Group Co. Ltd. 90,000 55,082
Shanghai Zhongyida Co. Ltd.a 51,300 22,829
Tianjin Capital Environmental
Protection Group Co. Ltd. Class H 54,000 34,222
234,925
COMMUNICATIONS EQUIPMENT — 2.26%
BYD Electronic International Co. Ltd.b 94,500 260,808
China All Access Holdings Ltd.b 162,000 45,952
42 2 0 1 7 i S H A R E S A N N U A L R E P O R T T O S H A R E H O L D E R S
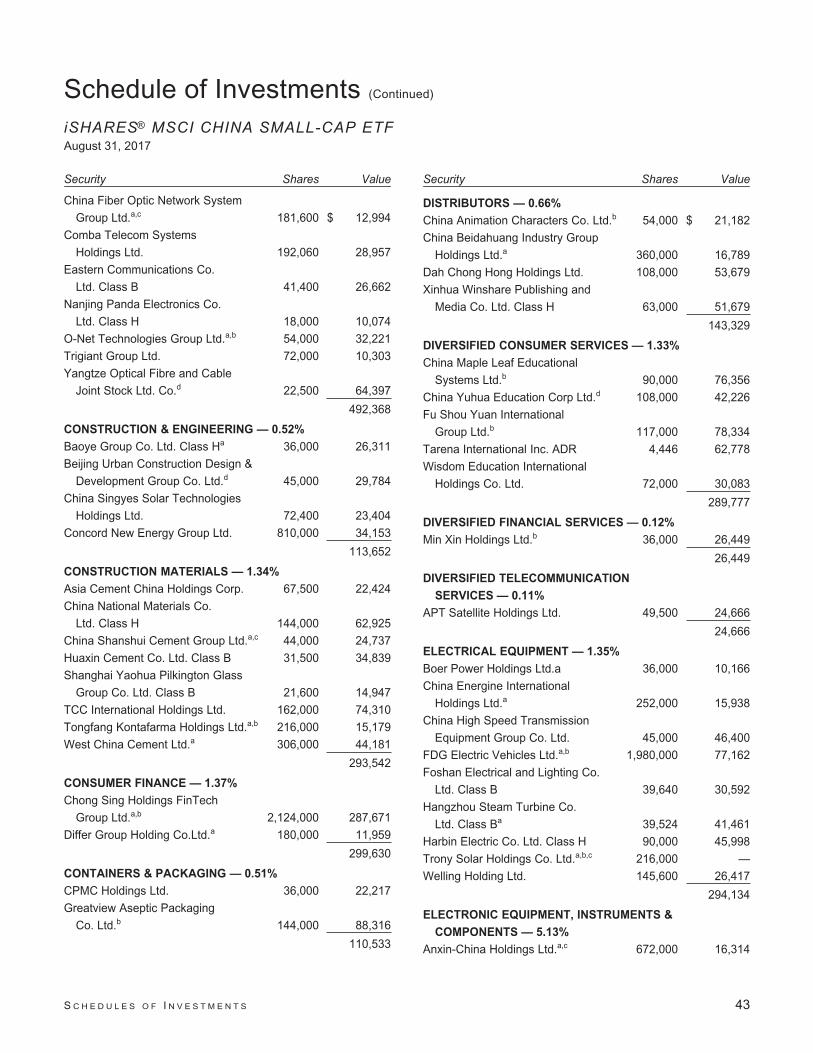
Schedule of Investments (Continued)
iSHARES® MSCI CHINA SMALL-CAP ETFAugust 31, 2017
Security Shares Value
China Fiber Optic Network System
Group Ltd.a,c 181,600 $ 12,994
Comba Telecom Systems
Holdings Ltd. 192,060 28,957
Eastern Communications Co.
Ltd. Class B 41,400 26,662
Nanjing Panda Electronics Co.
Ltd. Class H 18,000 10,074
O-Net Technologies Group Ltd.a,b 54,000 32,221
Trigiant Group Ltd. 72,000 10,303
Yangtze Optical Fibre and Cable
Joint Stock Ltd. Co.d 22,500 64,397
492,368
CONSTRUCTION & ENGINEERING — 0.52%
Baoye Group Co. Ltd. Class Ha 36,000 26,311
Beijing Urban Construction Design &
Development Group Co. Ltd.d 45,000 29,784
China Singyes Solar Technologies
Holdings Ltd. 72,400 23,404
Concord New Energy Group Ltd. 810,000 34,153
113,652
CONSTRUCTION MATERIALS — 1.34%
Asia Cement China Holdings Corp. 67,500 22,424
China National Materials Co.
Ltd. Class H 144,000 62,925
China Shanshui Cement Group Ltd.a,c 44,000 24,737
Huaxin Cement Co. Ltd. Class B 31,500 34,839
Shanghai Yaohua Pilkington Glass
Group Co. Ltd. Class B 21,600 14,947
TCC International Holdings Ltd. 162,000 74,310
Tongfang Kontafarma Holdings Ltd.a,b 216,000 15,179
West China Cement Ltd.a 306,000 44,181
293,542
CONSUMER FINANCE — 1.37%
Chong Sing Holdings FinTech
Group Ltd.a,b 2,124,000 287,671
Differ Group Holding Co.Ltd.a 180,000 11,959
299,630
CONTAINERS & PACKAGING — 0.51%
CPMC Holdings Ltd. 36,000 22,217
Greatview Aseptic Packaging
Co. Ltd.b 144,000 88,316
110,533
Security Shares Value
DISTRIBUTORS — 0.66%
China Animation Characters Co. Ltd.b 54,000 $ 21,182
China Beidahuang Industry Group
Holdings Ltd.a 360,000 16,789
Dah Chong Hong Holdings Ltd. 108,000 53,679
Xinhua Winshare Publishing and
Media Co. Ltd. Class H 63,000 51,679
143,329
DIVERSIFIED CONSUMER SERVICES — 1.33%
China Maple Leaf Educational
Systems Ltd.b 90,000 76,356
China Yuhua Education Corp Ltd.d 108,000 42,226
Fu Shou Yuan International
Group Ltd.b 117,000 78,334
Tarena International Inc. ADR 4,446 62,778
Wisdom Education International
Holdings Co. Ltd. 72,000 30,083
289,777
DIVERSIFIED FINANCIAL SERVICES — 0.12%
Min Xin Holdings Ltd.b 36,000 26,449
26,449
DIVERSIFIED TELECOMMUNICATION
SERVICES — 0.11%
APT Satellite Holdings Ltd. 49,500 24,666
24,666
ELECTRICAL EQUIPMENT — 1.35%
Boer Power Holdings Ltd.a 36,000 10,166
China Energine International
Holdings Ltd.a 252,000 15,938
China High Speed Transmission
Equipment Group Co. Ltd. 45,000 46,400
FDG Electric Vehicles Ltd.a,b 1,980,000 77,162
Foshan Electrical and Lighting Co.
Ltd. Class B 39,640 30,592
Hangzhou Steam Turbine Co.
Ltd. Class Ba 39,524 41,461
Harbin Electric Co. Ltd. Class H 90,000 45,998
Trony Solar Holdings Co. Ltd.a,b,c 216,000 —
Welling Holding Ltd. 145,600 26,417
294,134
ELECTRONIC EQUIPMENT, INSTRUMENTS &
COMPONENTS — 5.13%
Anxin-China Holdings Ltd.a,c 672,000 16,314
S C H E D U L E S O F I N V E S T M E N T S 43

Schedule of Investments (Continued)
iSHARES® MSCI CHINA SMALL-CAP ETFAugust 31, 2017
Security Shares Value
AVIC International Holdings
Ltd. Class H 37,184 $ 17,626
China Aerospace International
Holdings Ltd.b 252,000 31,554
China Innovationpay Group Ltd.a,b 720,000 36,798
Ju Teng International Holdings Ltd. 108,000 42,778
Kingboard Chemical Holdings Ltd. 94,500 515,579
Kingboard Laminates Holdings Ltd. 130,500 221,434
PAX Global Technology Ltd.b 108,000 59,751
Technovator International Ltd.a,b 72,000 21,803
Tongda Group Holdings Ltd.b 450,000 124,769
Wasion Group Holdings Ltd.b 72,000 30,727
1,119,133
ENERGY EQUIPMENT & SERVICES — 0.35%
Anton Oilfield Services Group/
Hong Konga,b 234,000 21,527
Hilong Holding Ltd. 108,000 13,937
Honghua Group Ltd.a 252,000 19,963
Wison Engineering Services Co. Ltd.a 153,000 21,504
76,931
EQUITY REAL ESTATE INVESTMENT TRUSTS
(REITS) — 0.72%
Spring REITb 99,000 44,779
Yuexiu REIT 171,000 112,522
157,301
FOOD & STAPLES RETAILING — 0.20%
Lianhua Supermarket Holdings Co.
Ltd. Class Ha 54,000 20,216
Springland International Holdings Ltd. 126,000 24,149
44,365
FOOD PRODUCTS — 3.35%
China Agri-Industries Holdings Ltd. 288,000 134,682
China Foods Ltd. 108,000 57,405
China Huiyuan Juice Group Ltd.a 67,500 20,872
China Modern Dairy Holdings Ltd.a 198,000 38,960
China Shengmu Organic Milk Ltd.a,b,d 486,000 80,726
China Yurun Food Group Ltd.a,b 180,000 22,999
COFCO Meat Holdings Ltd.a,b 261,000 52,357
Health and Happiness H&H
International Holdings Ltd.a,b 27,000 96,596
Honworld Group Ltd.d 27,000 12,868
Shanghai Greencourt Investment
Group Co. Ltd. Class Ba 49,500 28,066
Tenwow International Holdings Ltd. 90,000 18,054
Security Shares Value
Yashili International Holdings Ltd.a,b 117,000 $ 22,573
Yihai International Holding Ltd. 72,000 49,218
YuanShengTai Dairy Farm Ltd.a 486,000 22,355
Zhou Hei Ya International Holdings
Co. Ltd.d 81,000 73,378
731,109
GAS UTILITIES — 0.68%
China Oil and Gas Group Ltd.b 736,000 51,722
Towngas China Co. Ltd. 144,000 97,516
149,238
HEALTH CARE EQUIPMENT & SUPPLIES — 0.54%
Beijing Enterprises Medical & Health
Group Ltd.a 594,000 37,948
Lifetech Scientific Corp.a,b 288,000 63,661
PW Medtech Group Ltd.a 81,000 16,559
118,168
HEALTH CARE PROVIDERS & SERVICES — 1.75%
China NT Pharma Group Co.Ltd. 76,500 17,105
China Pioneer Pharma Holdings Ltd. 54,000 17,111
China Resources Phoenix Healthcare
Holdings Co. Ltd.b 81,000 102,357
Golden Meditech Holdings Ltd.a 144,000 20,607
Harmonicare Medical Holdings Ltd.d 63,017 23,753
iKang Healthcare Group Inc. ADRa 6,831 99,254
New Century Healthcare Holding
Co. Ltd.a,d 4,000 4,022
Rici Healthcare Holdings Ltd.a,d 63,000 14,409
Universal Medical Financial &
Technical Advisory Services
Co. Ltd.b,d 85,500 71,446
Wenzhou Kangning Hospital Co. Ltd.d 2,700 10,833
380,897
HOTELS, RESTAURANTS & LEISURE — 1.73%
500.com Ltd. ADRa,b 3,159 32,664
Ajisen (China) Holdings Ltd. 90,000 37,948
China LotSynergy Holdings Ltd.a 1,080,000 20,009
China Travel International Investment
Hong Kong Ltd.b 288,000 90,156
Haichang Ocean Park Holdings Ltd.a,d 162,000 36,638
Huangshan Tourism Development
Co. Ltd. Class B 33,300 51,748
Shanghai Jin Jiang International
Hotels Group Co. Ltd. Class H 162,000 46,159
44 2 0 1 7 i S H A R E S A N N U A L R E P O R T T O S H A R E H O L D E R S
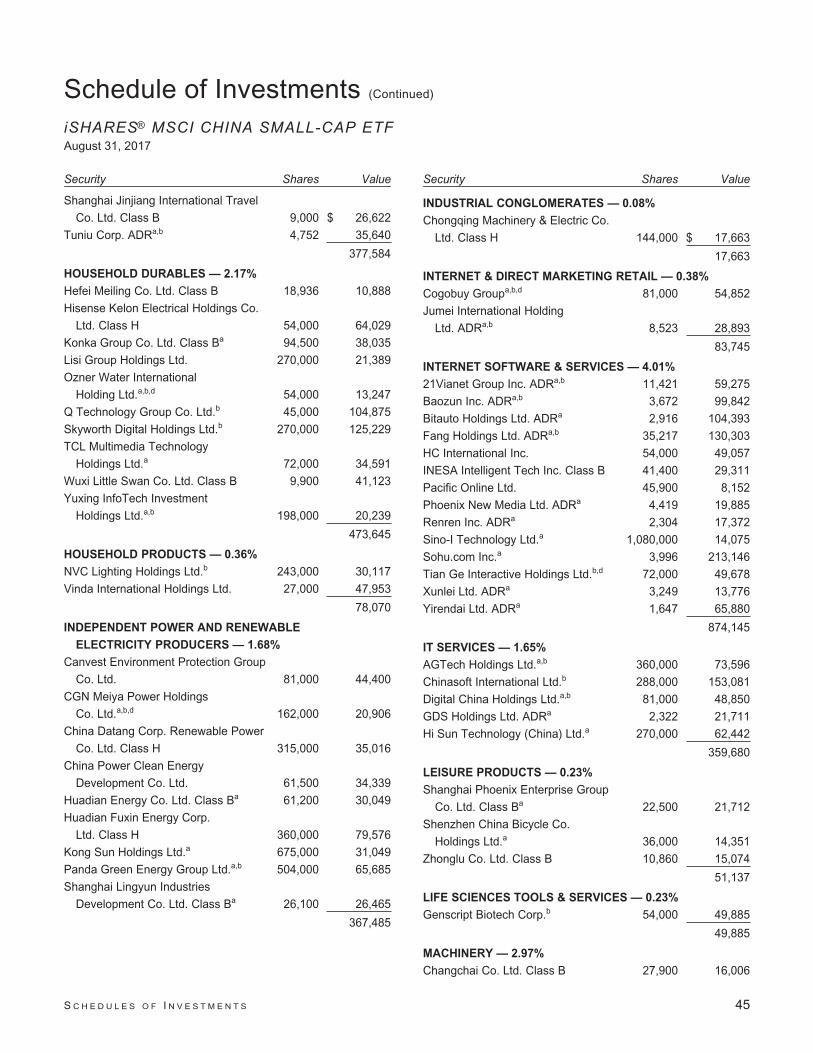
Schedule of Investments (Continued)
iSHARES® MSCI CHINA SMALL-CAP ETFAugust 31, 2017
Security Shares Value
Shanghai Jinjiang International Travel
Co. Ltd. Class B 9,000 $ 26,622
Tuniu Corp. ADRa,b 4,752 35,640
377,584
HOUSEHOLD DURABLES — 2.17%
Hefei Meiling Co. Ltd. Class B 18,936 10,888
Hisense Kelon Electrical Holdings Co.
Ltd. Class H 54,000 64,029
Konka Group Co. Ltd. Class Ba 94,500 38,035
Lisi Group Holdings Ltd. 270,000 21,389
Ozner Water International
Holding Ltd.a,b,d 54,000 13,247
Q Technology Group Co. Ltd.b 45,000 104,875
Skyworth Digital Holdings Ltd.b 270,000 125,229
TCL Multimedia Technology
Holdings Ltd.a 72,000 34,591
Wuxi Little Swan Co. Ltd. Class B 9,900 41,123
Yuxing InfoTech Investment
Holdings Ltd.a,b 198,000 20,239
473,645
HOUSEHOLD PRODUCTS — 0.36%
NVC Lighting Holdings Ltd.b 243,000 30,117
Vinda International Holdings Ltd. 27,000 47,953
78,070
INDEPENDENT POWER AND RENEWABLE
ELECTRICITY PRODUCERS — 1.68%
Canvest Environment Protection Group
Co. Ltd. 81,000 44,400
CGN Meiya Power Holdings
Co. Ltd.a,b,d 162,000 20,906
China Datang Corp. Renewable Power
Co. Ltd. Class H 315,000 35,016
China Power Clean Energy
Development Co. Ltd. 61,500 34,339
Huadian Energy Co. Ltd. Class Ba 61,200 30,049
Huadian Fuxin Energy Corp.
Ltd. Class H 360,000 79,576
Kong Sun Holdings Ltd.a 675,000 31,049
Panda Green Energy Group Ltd.a,b 504,000 65,685
Shanghai Lingyun Industries
Development Co. Ltd. Class Ba 26,100 26,465
367,485
Security Shares Value
INDUSTRIAL CONGLOMERATES — 0.08%
Chongqing Machinery & Electric Co.
Ltd. Class H 144,000 $ 17,663
17,663
INTERNET & DIRECT MARKETING RETAIL — 0.38%
Cogobuy Groupa,b,d 81,000 54,852
Jumei International Holding
Ltd. ADRa,b 8,523 28,893
83,745
INTERNET SOFTWARE & SERVICES — 4.01%
21Vianet Group Inc. ADRa,b 11,421 59,275
Baozun Inc. ADRa,b 3,672 99,842
Bitauto Holdings Ltd. ADRa 2,916 104,393
Fang Holdings Ltd. ADRa,b 35,217 130,303
HC International Inc. 54,000 49,057
INESA Intelligent Tech Inc. Class B 41,400 29,311
Pacific Online Ltd. 45,900 8,152
Phoenix New Media Ltd. ADRa 4,419 19,885
Renren Inc. ADRa 2,304 17,372
Sino-I Technology Ltd.a 1,080,000 14,075
Sohu.com Inc.a 3,996 213,146
Tian Ge Interactive Holdings Ltd.b,d 72,000 49,678
Xunlei Ltd. ADRa 3,249 13,776
Yirendai Ltd. ADRa 1,647 65,880
874,145
IT SERVICES — 1.65%
AGTech Holdings Ltd.a,b 360,000 73,596
Chinasoft International Ltd.b 288,000 153,081
Digital China Holdings Ltd.a,b 81,000 48,850
GDS Holdings Ltd. ADRa 2,322 21,711
Hi Sun Technology (China) Ltd.a 270,000 62,442
359,680
LEISURE PRODUCTS — 0.23%
Shanghai Phoenix Enterprise Group
Co. Ltd. Class Ba 22,500 21,712
Shenzhen China Bicycle Co.
Holdings Ltd.a 36,000 14,351
Zhonglu Co. Ltd. Class B 10,860 15,074
51,137
LIFE SCIENCES TOOLS & SERVICES — 0.23%
Genscript Biotech Corp.b 54,000 49,885
49,885
MACHINERY — 2.97%
Changchai Co. Ltd. Class B 27,900 16,006
S C H E D U L E S O F I N V E S T M E N T S 45

Schedule of Investments (Continued)
iSHARES® MSCI CHINA SMALL-CAP ETFAugust 31, 2017
Security Shares Value
China Ocean Industry Group Ltd.a,b 1,515,000 $ 12,389
China Yuchai International Ltd. 2,124 38,954
CIMC Enric Holdings Ltd.a 90,000 53,817
CRCC High-Tech Equipment
Corp. Ltd. 63,000 21,975
Dalian Refrigeration Co. Ltd. Class B 18,900 10,819
First Tractor Co. Ltd. Class H 54,000 25,184
Huangshi Dongbei Electrical
Appliance Co. Ltd. Class B 13,500 21,897
Kama Co. Ltd.a 29,715 30,636
Lonking Holdings Ltd. 270,000 107,290
Sany Heavy Equipment International
Holdings Co. Ltd.a,b 108,000 18,767
Shang Gong Group Co. Ltd. Class Ba 29,100 29,595
Shanghai Diesel Engine Co.
Ltd. Class B 44,145 34,654
Shanghai Highly Group Co.
Ltd. Class B 39,600 31,482
Shanghai Lingang Holdings Corp.
Ltd. Class Ba 14,400 23,962
Shanghai Prime Machinery Co.
Ltd. Class H 108,000 23,735
Sinotruk Hong Kong Ltd. 97,000 107,331
Sunpower Group Ltd. 36,000 16,966
Zhengzhou Coal Mining Machinery
Group Co. Ltd. Class H 34,200 21,893
647,352
MARINE — 0.55%
Chu Kong Shipping Enterprises
Group Co. Ltd. 54,000 13,938
Seaspan Corp. 6,723 48,002
Sinotrans Shipping Ltd. 189,000 58,923
120,863
MEDIA — 1.45%
Huanxi Media Group Ltd.a,b 90,000 22,769
Huayi Tencent Entertainment
Co. Ltd.a,b 720,000 26,219
IMAX China Holding Inc.a,b,d 14,400 33,192
Nan Hai Corp. Ltd. 1,800,000 58,647
Phoenix Satellite Television
Holdings Ltd. 180,000 26,219
Poly Culture Group Corp.
Ltd. Class H 11,700 26,610
SMI Holdings Group Ltd.b 151,200 75,151
Viva China Holdings Ltd.a 365,600 31,765
Security Shares Value
Wisdom Sports Groupa,b 117,000 $ 15,398
315,970
METALS & MINING — 2.76%
Bengang Steel Plates Co.
Ltd. Class Ba 56,700 24,125
Chiho Environmental Group Ltd.a,b 54,000 31,049
China Daye Non-Ferrous Metals
Mining Ltd.a 864,000 15,455
China Metal Recycling
Holdings Ltd.a,c 184,800 —
China Metal Resources
Utilization Ltd.a,b,d 72,000 27,507
China Silver Group Ltd.b 144,000 29,439
Da Ming International Holdings Ltd. 36,000 16,053
Inner Mongolia Eerduosi Resourses
Co. Ltd. Class B 43,200 48,082
MMG Ltd.a 288,000 140,569
North Mining Shares Co. Ltd.a 1,530,000 26,978
Real Gold Mining Ltd.a,c 126,000 64
Shougang Concord International
Enterprises Co. Ltd.a 684,000 25,345
Shougang Fushan Resources
Group Ltd. 342,000 77,345
Xinjiang Xinxin Mining Industry Co.
Ltd. Class Ha 108,000 15,179
Zhaojin Mining Industry Co.
Ltd. Class Hb 144,000 125,114
602,304
MULTI-UTILITIES — 0.13%
Tianjin Development Holdings Ltd. 54,000 29,048
29,048
MULTILINE RETAIL — 0.73%
Golden Eagle Retail Group Ltd. 63,000 80,496
Lifestyle China Group Ltd.a 112,500 41,973
Maoye International Holdings Ltd. 135,000 13,627
Parkson Retail Group Ltd.b 157,500 23,948
160,044
OIL, GAS & CONSUMABLE FUELS — 1.83%
China Suntien Green Energy Corp.
Ltd. Class H 216,000 46,918
Inner Mongolia Yitai Coal Co.
Ltd. Class B 153,900 200,378
MIE Holdings Corp.a 144,000 12,879
Shanxi Guoxin Energy Corp. Ltd.a 17,120 17,137
46 2 0 1 7 i S H A R E S A N N U A L R E P O R T T O S H A R E H O L D E R S

Schedule of Investments (Continued)
iSHARES® MSCI CHINA SMALL-CAP ETFAugust 31, 2017
Security Shares Value
Sino Oil And Gas Holdings Ltd.a 1,215,000 $ 24,839
Sinopec Kantons Holdings Ltd.b 144,000 89,236
Yanchang Petroleum
International Ltd.a 390,000 7,425
398,812
PAPER & FOREST PRODUCTS — 1.90%
China Forestry Holdings Co. Ltd.a,c 306,000 1
China Wood Optimization
Holding Ltd. 36,000 9,982
Foshan Huaxin Packaging Co. Ltd.c 39,100 22,581
Lee & Man Paper Manufacturing Ltd. 216,000 251,976
Qunxing Paper Holdings Co. Ltd.a,c 148,000 1,702
Shandong Chenming Paper Holdings
Ltd. Class B 55,823 81,454
Shandong Chenming Paper Holdings
Ltd. Class H 31,500 45,963
Superb Summit International
Group Ltd.a,c 59,500 456
414,115
PHARMACEUTICALS — 4.71%
Beijing Tong Ren Tang Chinese
Medicine Co. Ltd. 36,000 47,470
China Animal Healthcare Ltd.a,b,c 140,000 5,009
China Shineway Pharmaceutical
Group Ltd. 36,000 32,843
China Traditional Chinese Medicine
Holdings Co. Ltd.b 270,000 163,522
Consun Pharmaceutical Group Ltd.b 54,000 43,744
Dawnrays Pharmaceutical
Holdings Ltd. 72,000 42,870
Hua Han Health Industry Holdings
Ltd. Class Ha,b,c 651,960 34,987
Hutchison China Meditech Ltd.a 2,898 141,994
Lee’s Pharmaceutical Holdings Ltd.b 36,000 28,519
Livzon Pharmaceutical Group
Inc. Class H 14,066 76,562
Luye Pharma Group Ltd.b 157,500 79,691
Pengqi Technology Development Co.
Ltd. Class B 32,000 28,896
Shandong Xinhua Pharmaceutical
Co. Ltd. Class H 22,000 20,548
Shanghai Fudan-Zhangjiang Bio-
Pharmaceutical Co. Ltd. Class H 36,000 18,445
Shanghai Kai Kai Industrial Co. Ltd. 11,700 11,957
Security Shares Value
Shanghai Shenqi Pharmaceutical
Investment Management Co. Ltd. 5,400 $ 6,944
SSY Group Ltd. 216,255 100,025
Tianjin ZhongXin Pharmaceutical
Group Corp. Ltd. 26,100 29,493
Tong Ren Tang Technologies Co.
Ltd. Class H 81,000 113,845
1,027,364
PROFESSIONAL SERVICES — 1.03%
51job Inc. ADRa 3,294 195,664
Zhaopin Ltd. ADRa 1,647 30,140
225,804
REAL ESTATE MANAGEMENT &
DEVELOPMENT — 17.28%
Agile Group Holdings Ltd. 216,000 258,876
AVIC International Holding HK Ltd.a 468,000 22,424
Beijing Capital Land Ltd. Class H 144,000 72,861
Beijing North Star Co. Ltd. Class H 90,000 36,568
Beijing Properties Holdings Ltd.a,b 288,000 12,327
C C Land Holdings Ltd.a 216,500 47,580
Carnival Group International
Holdings Ltd.a,b 810,077 66,243
Central China Real Estate Ltd.a,b 99,038 38,216
China Aoyuan Property Group Ltd.b 153,000 64,708
China Electronics Optics Valley Union
Holding Co Ltd. 360,000 33,119
China Logistics Property Holdings
Co. Ltd.a,b 171,000 58,337
China Merchants Land Ltd.b 180,000 36,108
China Overseas Grand Oceans
Group Ltd. 126,000 68,583
China Overseas Property
Holdings Ltd.b 180,000 38,178
China SCE Property Holdings Ltd.b 162,800 83,205
China South City Holdings Ltd. 396,000 81,462
CIFI Holdings Group Co. Ltd. 450,000 252,988
Colour Life Services Group Co. Ltd.b 45,000 29,611
Crown International Corp Ltd.a,b 126,000 20,607
Fantasia Holdings Group Co. Ltd. 216,000 29,255
Future Land Development
Holdings Ltd. 234,000 95,975
Gemdale Properties & Investment
Corp. Ltd. 522,000 50,690
Glorious Property Holdings Ltd.a 387,000 43,020
Greenland Hong Kong Holdings Ltd. 108,000 37,948
S C H E D U L E S O F I N V E S T M E N T S 47
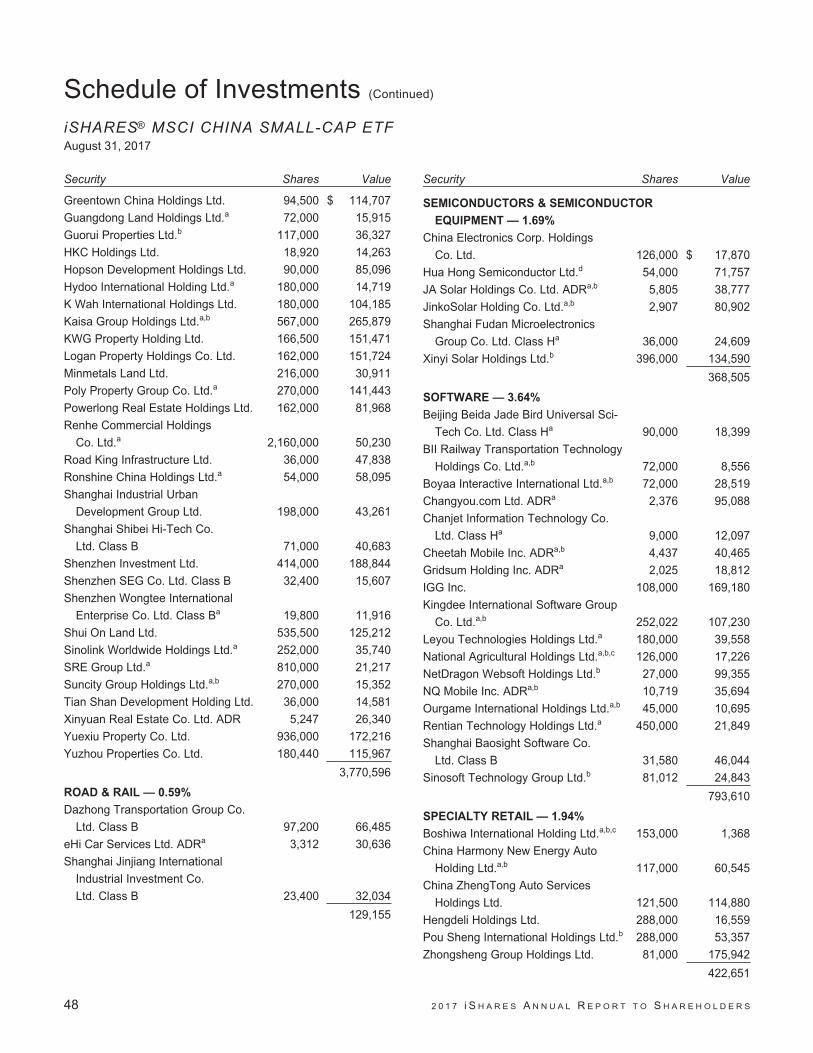
Schedule of Investments (Continued)
iSHARES® MSCI CHINA SMALL-CAP ETFAugust 31, 2017
Security Shares Value
Greentown China Holdings Ltd. 94,500 $ 114,707
Guangdong Land Holdings Ltd.a 72,000 15,915
Guorui Properties Ltd.b 117,000 36,327
HKC Holdings Ltd. 18,920 14,263
Hopson Development Holdings Ltd. 90,000 85,096
Hydoo International Holding Ltd.a 180,000 14,719
K Wah International Holdings Ltd. 180,000 104,185
Kaisa Group Holdings Ltd.a,b 567,000 265,879
KWG Property Holding Ltd. 166,500 151,471
Logan Property Holdings Co. Ltd. 162,000 151,724
Minmetals Land Ltd. 216,000 30,911
Poly Property Group Co. Ltd.a 270,000 141,443
Powerlong Real Estate Holdings Ltd. 162,000 81,968
Renhe Commercial Holdings
Co. Ltd.a 2,160,000 50,230
Road King Infrastructure Ltd. 36,000 47,838
Ronshine China Holdings Ltd.a 54,000 58,095
Shanghai Industrial Urban
Development Group Ltd. 198,000 43,261
Shanghai Shibei Hi-Tech Co.
Ltd. Class B 71,000 40,683
Shenzhen Investment Ltd. 414,000 188,844
Shenzhen SEG Co. Ltd. Class B 32,400 15,607
Shenzhen Wongtee International
Enterprise Co. Ltd. Class Ba 19,800 11,916
Shui On Land Ltd. 535,500 125,212
Sinolink Worldwide Holdings Ltd.a 252,000 35,740
SRE Group Ltd.a 810,000 21,217
Suncity Group Holdings Ltd.a,b 270,000 15,352
Tian Shan Development Holding Ltd. 36,000 14,581
Xinyuan Real Estate Co. Ltd. ADR 5,247 26,340
Yuexiu Property Co. Ltd. 936,000 172,216
Yuzhou Properties Co. Ltd. 180,440 115,967
3,770,596
ROAD & RAIL — 0.59%
Dazhong Transportation Group Co.
Ltd. Class B 97,200 66,485
eHi Car Services Ltd. ADRa 3,312 30,636
Shanghai Jinjiang International
Industrial Investment Co.
Ltd. Class B 23,400 32,034
129,155
Security Shares Value
SEMICONDUCTORS & SEMICONDUCTOR
EQUIPMENT — 1.69%
China Electronics Corp. Holdings
Co. Ltd. 126,000 $ 17,870
Hua Hong Semiconductor Ltd.d 54,000 71,757
JA Solar Holdings Co. Ltd. ADRa,b 5,805 38,777
JinkoSolar Holding Co. Ltd.a,b 2,907 80,902
Shanghai Fudan Microelectronics
Group Co. Ltd. Class Ha 36,000 24,609
Xinyi Solar Holdings Ltd.b 396,000 134,590
368,505
SOFTWARE — 3.64%
Beijing Beida Jade Bird Universal Sci-
Tech Co. Ltd. Class Ha 90,000 18,399
BII Railway Transportation Technology
Holdings Co. Ltd.a,b 72,000 8,556
Boyaa Interactive International Ltd.a,b 72,000 28,519
Changyou.com Ltd. ADRa 2,376 95,088
Chanjet Information Technology Co.
Ltd. Class Ha 9,000 12,097
Cheetah Mobile Inc. ADRa,b 4,437 40,465
Gridsum Holding Inc. ADRa 2,025 18,812
IGG Inc. 108,000 169,180
Kingdee International Software Group
Co. Ltd.a,b 252,022 107,230
Leyou Technologies Holdings Ltd.a 180,000 39,558
National Agricultural Holdings Ltd.a,b,c 126,000 17,226
NetDragon Websoft Holdings Ltd.b 27,000 99,355
NQ Mobile Inc. ADRa,b 10,719 35,694
Ourgame International Holdings Ltd.a,b 45,000 10,695
Rentian Technology Holdings Ltd.a 450,000 21,849
Shanghai Baosight Software Co.
Ltd. Class B 31,580 46,044
Sinosoft Technology Group Ltd.b 81,012 24,843
793,610
SPECIALTY RETAIL — 1.94%
Boshiwa International Holding Ltd.a,b,c 153,000 1,368
China Harmony New Energy Auto
Holding Ltd.a,b 117,000 60,545
China ZhengTong Auto Services
Holdings Ltd. 121,500 114,880
Hengdeli Holdings Ltd. 288,000 16,559
Pou Sheng International Holdings Ltd.b 288,000 53,357
Zhongsheng Group Holdings Ltd. 81,000 175,942
422,651
48 2 0 1 7 i S H A R E S A N N U A L R E P O R T T O S H A R E H O L D E R S

Schedule of Investments (Continued)
iSHARES® MSCI CHINA SMALL-CAP ETFAugust 31, 2017
Security Shares Value
TECHNOLOGY HARDWARE, STORAGE &
PERIPHERALS — 0.32%
Coolpad Group Ltd.a,c 432,000 $ 35,878
Goldpac Group Ltd. 45,000 13,340
TPV Technology Ltd. 126,000 21,734
70,952
TEXTILES, APPAREL & LUXURY GOODS — 4.32%
361 Degrees International Ltd. 81,000 34,878
Best Pacific International
Holdings Ltd.b 36,000 20,147
Bosideng International Holdings Ltd. 378,000 32,359
C.banner International
Holdings Ltd.a,b 135,000 49,678
China Dongxiang Group Co. Ltd. 459,000 82,106
China Lilang Ltd. 54,000 42,433
China Longevity Group Co. Ltd.a,c 96,000 859
Citychamp Watch & Jewellery
Group Ltd. 180,000 40,018
Cosmo Lady China Holdings
Co. Ltd.b,d 81,000 30,428
Fuguiniao Co. Ltd. Class Ha,c 43,200 16,062
HengTen Networks Group Ltd.a,b 3,096,000 98,104
HOSA International Ltd.b 90,000 27,254
Lao Feng Xiang Co. Ltd. Class B 27,980 107,947
Li Ning Co. Ltd.a 216,000 160,073
Luthai Textile Co. Ltd. Class B 33,300 37,315
Shanghai Haixin Group Co. Class B 57,600 39,398
Texhong Textile Group Ltd.b 40,500 46,055
Weiqiao Textile Co. Class Ha 54,000 28,703
XTEP International Holdings Ltd.b 139,500 49,551
943,368
TRADING COMPANIES & DISTRIBUTORS — 0.94%
BEP International Holdings Ltd.b 1,710,000 41,294
China Aircraft Leasing Group
Holdings Ltd.b 31,500 33,929
China Chengtong Development
Group Ltd.a,b 414,000 26,978
CITIC Resources Holdings Ltd.b 396,037 45,542
DongfengSci-Tech Group Co.
Ltd. Class Ba 92,100 28,831
Shanghai Dasheng Agricultural
Finance Technology Co. Ltd. 324,000 28,565
205,139
Security Shares Value
TRANSPORTATION INFRASTRUCTURE — 4.20%
Anhui Expressway Co. Ltd. Class H 54,000 $ 40,846
COSCO SHIPPING International
Hong Kong Co. Ltd. 72,000 30,450
Guangdong Provincial Expressway
Development Co. Ltd. Class B 49,500 43,767
HNA Infrastructure Co. Ltd. Class H 18,000 16,260
Hopewell Highway Infrastructure Ltd. 144,000 88,316
Jinzhou Port Co. Ltd. Class B 38,700 20,240
Qingdao Port International Co. Ltd.d 153,000 89,144
Qinhuangdao Port Co. Ltd.a 99,000 36,557
Shenzhen Chiwan Wharf Holdings
Ltd. Class B 17,100 30,217
Shenzhen Expressway Co.
Ltd. Class H 108,000 105,427
Shenzhen International Holdings Ltd. 121,500 223,239
Sichuan Expressway Co. Ltd. Class H 126,000 51,518
Tianjin Port Development Holdings Ltd. 252,000 41,536
Xiamen International Port Co.
Ltd. Class H 144,000 29,991
Yuexiu Transport Infrastructure Ltd. 90,000 68,997
916,505
WATER UTILITIES — 0.94%
China Everbright Water Ltd. 97,200 33,641
China Water Affairs Group Ltd. 108,000 62,373
China Water Industry Group Ltd.a 144,000 30,175
CT Environmental Group Ltd. 306,000 43,399
Kangda International Environmental
Co. Ltd.d 99,000 19,227
Yunnan Water Investment Co. Ltd. 45,000 16,444
205,259
TOTAL COMMON STOCKS
(Cost: $22,439,850) 21,701,186
RIGHTS — 0.04%
DISTRIBUTORS — 0.01%
Digital China Holdings Ltd.
(Expires 09/07/17)a 20,249 1,656
1,656
S C H E D U L E S O F I N V E S T M E N T S 49

Schedule of Investments (Continued)
iSHARES® MSCI CHINA SMALL-CAP ETFAugust 31, 2017
Security Shares Value
REAL ESTATE MANAGEMENT &
DEVELOPMENT — 0.03%
Carnival Group International Holdings
Ltd. (Expires 09/21/17)a 202,519 $ 6,210
6,210
TOTAL RIGHTS
(Cost: $0) 7,866
SHORT-TERM INVESTMENTS — 28.67%
MONEY MARKET FUNDS — 28.67%
BlackRock Cash Funds: Institutional,
SL Agency Shares
1.32%e,f,g 6,245,946 6,247,819
BlackRock Cash Funds: Treasury,
SL Agency Shares
0.96%e,f 8,446 8,446
6,256,265
TOTAL SHORT-TERM INVESTMENTS
(Cost: $6,254,767) 6,256,265
Value
TOTAL INVESTMENTS
IN SECURITIES — 128.14%
(Cost: $28,694,617)h $27,965,317
Other Assets, Less Liabilities — (28.14)% (6,140,481)
NET ASSETS — 100.00% $21,824,836
ADR — American Depositary Receipts
a Non-income earning security.b All or a portion of this security represents a security on loan. See Note 1.c Security is valued using significant unobservable inputs and is classified as
Level 3 in the fair value hierarchy.d This security may be resold to qualified institutional buyers under Rule 144A
of the Securities Act of 1933.e Affiliated issuer. See Schedule 1.f The rate quoted is the annualized seven-day yield of the fund at period end.g All or a portion of this security represents an investment of securities lending
collateral. See Note 1.h The cost of investments (including short positions and derivatives, if any) for
federal income tax purposes was $29,293,987. Net unrealized depreciationwas $1,328,670, of which $4,842,590 represented gross unrealizedappreciation on investments and $6,171,260 represented gross unrealizeddepreciation on investments.
Schedule 1 — Affiliates (Note 2)
Investments in issuers considered to be affiliates of the Fund during the year ended August 31, 2017, for purposes of
Section 2(a)(3) of the 1940 Act, and/or related parties of the Fund were as follows:
Affiliated issuer
Sharesheld at
08/31/16Shares
purchased Shares sold
Sharesheld at
08/31/17Value at08/31/17
Net realizedgain (loss) a
Change inunrealized
appreciation(depreciation) Income
BlackRock Cash Funds: Institutional,SL Agency Shares 6,103,400 142,546b — 6,245,946 $6,247,819 $ 98 $ 1,498 $ —c
BlackRock Cash Funds: Treasury,SL Agency Shares 17,981 — (9,535)b 8,446 8,446 2 — 154
$6,256,265 $ 100 $ 1,498 $ 154
a Includes realized capital gain distributions from an affiliated fund, if any.b Net of shares purchased and sold.c Does not include income earned on investment of securities lending cash collateral which is not direct income of the Fund and is reflected as a component of
securities lending income in the statement of operations.
50 2 0 1 7 i S H A R E S A N N U A L R E P O R T T O S H A R E H O L D E R S

Schedule of Investments (Continued)
iSHARES® MSCI CHINA SMALL-CAP ETFAugust 31, 2017
Schedule 2 — Fair Value Measurements
Various inputs are used in determining the fair value of financial instruments. For description of the input levels and information
about the Fund’s policy regarding valuation of financial instruments, see Note 1.
The following table summarizes the value of the Fund’s investments according to the fair value hierarchy as of August 31, 2017.
The breakdown of the Fund’s investments into major categories is disclosed in the schedule of investments above.
Level 1 Level 2 Level 3 Total
Investments:Assets:
Common stocks $21,477,324 $ — $223,862 $21,701,186Rights 1,656 6,210 — 7,866Money market funds 6,256,265 — — 6,256,265
Total $27,735,245 $ 6,210 $223,862 $27,965,317
The following table includes a rollfoward for the year ended August, 31, 2017 of investments whose values are classified as
Level 3 as of the beginning or end of the year.
Common Stocks
Balance at beginning of year $ 330,149Realized gain (loss) and change in unrealized appreciation/depreciation 150,172Purchases 62,505Sales (363,515)Transfers ina 186,956b
Transfers outa (142,405)c
Balance at end of year $ 223,862
Net change in unrealized appreciation/depreciation on investments still held at end of year $ (78,740)
a Represents the value as of the beginning of the reporting period.b Transfers in to Level 3 are due to the suspension of trading of equity securities.c Transfers out of Level 3 are due to resumption of trading of equity securities.
The following table summarizes the valuation techniques used and unobservable inputs developed by the Global Valuation
Committee to determine the fair value of certain of the Fund’s level 3 investments as of August 31, 2017:
ValueValuationApproach Valuation Technique Unobservable Inputs
Range ofUnobservable
Inputs a
WeightedAverage of
UnobservableInputs b
Common Stock $ 1,702 Market Market comparables Recovery rate n/a n/aCommon Stock 172,207 Market Last traded price — adjusted Liquidity discount -8% to -25% 14%Common Stockc 25,215 Market Grey market trade — adjusted Liquidity discount -40% to -95% 52%Common Stock 24,738 Market Grey market trade Trade details n/a n/a
a An increase in the unobservable input may result in a significant increase to value, while a decrease in the unobservable input may result in a significantdecrease to value.
b Unobservable inputs are weighted based on the fair value of the investments included in the range.c During the year ended August 31, 2017, the inputs used to value certain investments in common stocks in the amount of $31,364 were updated to
incorporate recent market transactions.
See notes to financial statements.
S C H E D U L E S O F I N V E S T M E N T S 51

Schedule of InvestmentsiSHARES® MSCI INDONESIA ETFAugust 31, 2017
Security Shares Value
COMMON STOCKS — 99.90%
AIRLINES — 0.07%
Garuda Indonesia Persero Tbk PTa 14,916,000 $ 364,459
364,459
AUTOMOBILES — 8.96%
Astra International Tbk PT 76,093,130 44,913,311
44,913,311
BANKS — 32.40%
Bank Bukopin Tbk 13,863,299 618,248
Bank Central Asia Tbk PT 37,134,758 52,743,492
Bank Danamon Indonesia Tbk PT 13,008,860 5,313,917
Bank Mandiri Persero Tbk PT 34,966,480 34,332,251
Bank Negara Indonesia Persero
Tbk PT 28,921,358 15,932,542
Bank Pembangunan Daerah Jawa
Barat Dan Banten Tbk PT 9,272,736 1,779,209
Bank Pembangunan Daerah Jawa
Timur Tbk PT 12,752,700 678,640
Bank Rakyat Indonesia Persero
Tbk PT 41,748,772 47,328,000
Bank Tabungan Negara Persero
Tbk PT 16,610,026 3,747,278
162,473,577
CAPITAL MARKETS — 0.34%
Kresna Graha Investama PT Tbka 50,589,800 1,691,130
1,691,130
CONSTRUCTION & ENGINEERING — 1.95%
Adhi Karya Persero Tbk PT 6,764,410 1,024,142
Pembangunan Perumahan
Persero Tbk PT 11,819,322 2,489,304
Sitara Propertindo Tbk PTa 15,832,200 872,183
Surya Semesta Internusa Tbk PT 11,620,074 579,175
Waskita Karya Persero Tbk PT 18,107,700 3,012,974
Wijaya Karya Persero Tbk PT 11,991,370 1,784,055
9,761,833
CONSTRUCTION MATERIALS — 4.73%
Holcim Indonesia Tbk PTa 5,904,500 351,827
Indocement Tunggal Prakarsa
Tbk PT 7,066,044 10,486,259
Semen Baturaja Persero TBK PT 9,384,700 2,124,254
Semen Indonesia Persero Tbk PT 11,404,155 8,953,569
Waskita Beton Precast Tbk PT 41,533,000 1,357,247
Security Shares Value
Wijaya Karya Beton Tbk PT 10,072,300 $ 426,537
23,699,693
DIVERSIFIED TELECOMMUNICATION
SERVICES — 14.39%
Inovisi Infracom Tbk PTa,b 9,476,400 —
Link Net Tbk PT 4,070,900 1,519,493
Telekomunikasi Indonesia
Persero Tbk PT 190,153,090 66,842,902
Tower Bersama Infrastructure
Tbk PT 7,885,200 3,797,213
72,159,608
FOOD & STAPLES RETAILING — 0.05%
Matahari Putra Prima Tbk PTa 5,107,900 254,591
254,591
FOOD PRODUCTS — 5.88%
Charoen Pokphand Indonesia
Tbk PT 28,086,625 5,831,206
Eagle High Plantations Tbk PTa 41,920,852 672,393
Indofood CBP Sukses Makmur
Tbk PT 9,037,454 5,910,042
Indofood Sukses Makmur Tbk PT 16,927,730 10,625,824
Japfa Comfeed Indonesia Tbk PT 17,432,800 1,567,933
Nippon Indosari Corpindo Tbk PT 5,834,100 533,473
Perusahaan Perkebunan London
Sumatra Indonesia Tbk PT 11,664,700 1,202,141
Salim Ivomas Pratama Tbk PT 12,054,500 449,943
Sawit Sumbermas Sarana Tbk PT 9,047,000 1,017,126
Tiga Pilar Sejahtera Food Tbka 7,948,700 616,617
Tunas Baru Lampung Tbk PT 10,148,200 1,064,869
29,491,567
GAS UTILITIES — 1.31%
Perusahaan Gas Negara Persero
Tbk PT 41,518,807 6,597,202
6,597,202
HEALTH CARE PROVIDERS & SERVICES — 0.21%
Siloam International Hospitals
Tbk PTa 1,280,212 1,053,090
1,053,090
HOUSEHOLD PRODUCTS — 4.45%
Sekawan Intipratama Tbk PTa,b 30,572,100 52,703
Unilever Indonesia Tbk PT 5,870,204 22,240,954
22,293,657
52 2 0 1 7 i S H A R E S A N N U A L R E P O R T T O S H A R E H O L D E R S
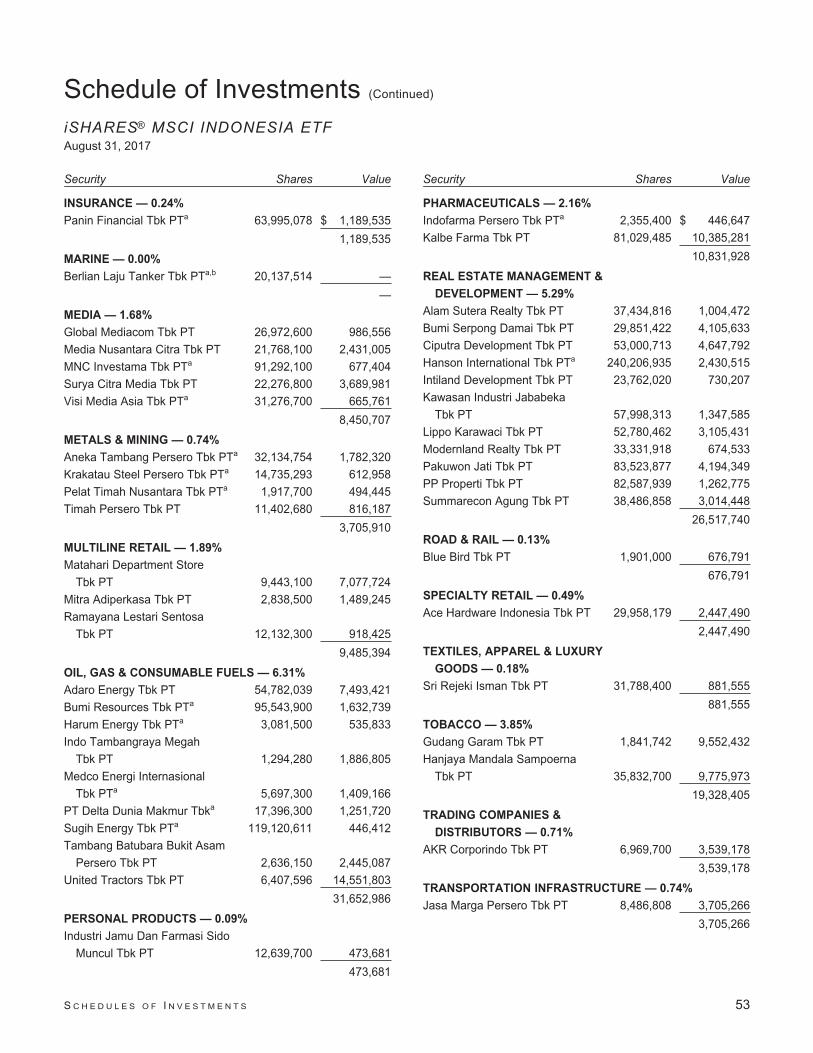
Schedule of Investments (Continued)
iSHARES® MSCI INDONESIA ETFAugust 31, 2017
Security Shares Value
INSURANCE — 0.24%
Panin Financial Tbk PTa 63,995,078 $ 1,189,535
1,189,535
MARINE — 0.00%
Berlian Laju Tanker Tbk PTa,b 20,137,514 —
—
MEDIA — 1.68%
Global Mediacom Tbk PT 26,972,600 986,556
Media Nusantara Citra Tbk PT 21,768,100 2,431,005
MNC Investama Tbk PTa 91,292,100 677,404
Surya Citra Media Tbk PT 22,276,800 3,689,981
Visi Media Asia Tbk PTa 31,276,700 665,761
8,450,707
METALS & MINING — 0.74%
Aneka Tambang Persero Tbk PTa 32,134,754 1,782,320
Krakatau Steel Persero Tbk PTa 14,735,293 612,958
Pelat Timah Nusantara Tbk PTa 1,917,700 494,445
Timah Persero Tbk PT 11,402,680 816,187
3,705,910
MULTILINE RETAIL — 1.89%
Matahari Department Store
Tbk PT 9,443,100 7,077,724
Mitra Adiperkasa Tbk PT 2,838,500 1,489,245
Ramayana Lestari Sentosa
Tbk PT 12,132,300 918,425
9,485,394
OIL, GAS & CONSUMABLE FUELS — 6.31%
Adaro Energy Tbk PT 54,782,039 7,493,421
Bumi Resources Tbk PTa 95,543,900 1,632,739
Harum Energy Tbk PTa 3,081,500 535,833
Indo Tambangraya Megah
Tbk PT 1,294,280 1,886,805
Medco Energi Internasional
Tbk PTa 5,697,300 1,409,166
PT Delta Dunia Makmur Tbka 17,396,300 1,251,720
Sugih Energy Tbk PTa 119,120,611 446,412
Tambang Batubara Bukit Asam
Persero Tbk PT 2,636,150 2,445,087
United Tractors Tbk PT 6,407,596 14,551,803
31,652,986
PERSONAL PRODUCTS — 0.09%
Industri Jamu Dan Farmasi Sido
Muncul Tbk PT 12,639,700 473,681
473,681
Security Shares Value
PHARMACEUTICALS — 2.16%
Indofarma Persero Tbk PTa 2,355,400 $ 446,647
Kalbe Farma Tbk PT 81,029,485 10,385,281
10,831,928
REAL ESTATE MANAGEMENT &
DEVELOPMENT — 5.29%
Alam Sutera Realty Tbk PT 37,434,816 1,004,472
Bumi Serpong Damai Tbk PT 29,851,422 4,105,633
Ciputra Development Tbk PT 53,000,713 4,647,792
Hanson International Tbk PTa 240,206,935 2,430,515
Intiland Development Tbk PT 23,762,020 730,207
Kawasan Industri Jababeka
Tbk PT 57,998,313 1,347,585
Lippo Karawaci Tbk PT 52,780,462 3,105,431
Modernland Realty Tbk PT 33,331,918 674,533
Pakuwon Jati Tbk PT 83,523,877 4,194,349
PP Properti Tbk PT 82,587,939 1,262,775
Summarecon Agung Tbk PT 38,486,858 3,014,448
26,517,740
ROAD & RAIL — 0.13%
Blue Bird Tbk PT 1,901,000 676,791
676,791
SPECIALTY RETAIL — 0.49%
Ace Hardware Indonesia Tbk PT 29,958,179 2,447,490
2,447,490
TEXTILES, APPAREL & LUXURY
GOODS — 0.18%
Sri Rejeki Isman Tbk PT 31,788,400 881,555
881,555
TOBACCO — 3.85%
Gudang Garam Tbk PT 1,841,742 9,552,432
Hanjaya Mandala Sampoerna
Tbk PT 35,832,700 9,775,973
19,328,405
TRADING COMPANIES &
DISTRIBUTORS — 0.71%
AKR Corporindo Tbk PT 6,969,700 3,539,178
3,539,178
TRANSPORTATION INFRASTRUCTURE — 0.74%
Jasa Marga Persero Tbk PT 8,486,808 3,705,266
3,705,266
S C H E D U L E S O F I N V E S T M E N T S 53

Schedule of Investments (Continued)
iSHARES® MSCI INDONESIA ETFAugust 31, 2017
Security Shares Value
WIRELESS TELECOMMUNICATION
SERVICES — 0.66%
XL Axiata Tbk PTa 12,221,800 $ 3,297,742
3,297,742
TOTAL COMMON STOCKS
(Cost: $548,795,871) 500,938,026
SHORT-TERM INVESTMENTS — 0.03%
MONEY MARKET FUNDS — 0.03%
BlackRock Cash Funds: Treasury,
SL Agency Shares
0.96%c,d 146,022 146,022
146,022
Value
TOTAL SHORT-TERM INVESTMENTS
(Cost: $146,022) $ 146,022
TOTAL INVESTMENTS
IN SECURITIES — 99.93% 501,084,048
(Cost: $548,941,893)e
Other Assets, Less Liabilities — 0.07% 327,039
NET ASSETS — 100.00% $501,411,087
a Non-income earning security.b Security is valued using significant unobservable inputs and is classified as
Level 3 in the fair value hierarchy.c Affiliated issuer. See Schedule 1.d The rate quoted is the annualized seven-day yield of the fund at period end.e The cost of investments (including short positions and derivatives, if any) for
federal income tax purposes was $555,301,837. Net unrealized depreciationwas $54,217,789, of which $40,015,266 represented gross unrealizedappreciation on investments and $94,233,055 represented gross unrealizeddepreciation on investments.
Schedule 1 — Affiliates (Note 2)
Investments in issuers considered to be affiliates of the Fund during the year ended August 31, 2017, for purposes of
Section 2(a)(3) of the 1940 Act, and/or related parties of the Fund were as follows:
Affiliated issuer
Sharesheld at
08/31/16Shares
purchased Shares sold
Sharesheld at
08/31/17Value at08/31/17
Net realizedgain (loss) a
Change inunrealized
appreciation(depreciation) Income
BlackRock Cash Funds: Treasury,SL Agency Shares 104,297 41,725b — 146,022 $146,022 $ 3 $ — $ 1,438
a Includes realized capital gain distributions from an affiliated fund, if any.b Net of shares purchased and sold.
Schedule 2 — Fair Value Measurements
Various inputs are used in determining the fair value of financial instruments. For description of the input levels and information
about the Fund’s policy regarding valuation of financial instruments, see Note 1.
The following table summarizes the value of the Fund’s investments according to the fair value hierarchy as of August 31, 2017.
The breakdown of the Fund’s investments into major categories is disclosed in the schedule of investments above.
Level 1 Level 2 Level 3 Total
Investments:Assets:
Common stocks $500,885,323 $ — $52,703 $500,938,026Money market funds 146,022 — — 146,022
Total $501,031,345 $ — $52,703 $501,084,048
See notes to financial statements.
54 2 0 1 7 i S H A R E S A N N U A L R E P O R T T O S H A R E H O L D E R S

Schedule of InvestmentsiSHARES® MSCI PHILIPPINES ETFAugust 31, 2017
Security Shares Value
COMMON STOCKS — 99.60%
AIRLINES — 0.71%
Cebu Air Inc. 579,880 $ 1,227,301
1,227,301
BANKS — 13.97%
Bank of the Philippine Islands 2,148,589 4,446,660
BDO Unibank Inc. 5,373,714 13,347,646
Metropolitan Bank & Trust Co. 1,739,046 2,977,143
Rizal Commercial Banking Corp. 270,418 271,105
Security Bank Corp. 618,100 3,019,836
24,062,390
CHEMICALS — 0.80%
D&L Industries Inc. 6,835,500 1,381,260
1,381,260
CONSTRUCTION MATERIALS — 0.44%
CEMEX Holdings Philippines Inc.a,b 6,392,400 749,549
749,549
DIVERSIFIED FINANCIAL SERVICES — 12.89%
Ayala Corp. 679,388 12,214,910
GT Capital Holdings Inc. 236,970 5,177,496
Metro Pacific Investments Corp. 38,762,500 4,810,277
22,202,683
ELECTRIC UTILITIES — 0.46%
First Philippine Holdings Corp. 606,129 793,642
793,642
FOOD & STAPLES RETAILING — 0.54%
Cosco Capital Inc. 6,049,800 926,919
926,919
FOOD PRODUCTS — 4.47%
Century Pacific Food Inc. 2,421,300 817,668
Universal Robina Corp. 2,410,650 6,882,860
7,700,528
HOTELS, RESTAURANTS & LEISURE — 5.40%
Bloomberry Resorts Corp.b 10,528,365 2,308,545
Jollibee Foods Corp. 1,182,533 5,504,776
Melco Resorts And Entertainment
(Philippines) Corp.b 4,647,100 807,362
Premium Leisure Corp. 21,619,000 684,440
9,305,123
Security Shares Value
INDEPENDENT POWER AND RENEWABLE
ELECTRICITY PRODUCERS — 4.83%
Aboitiz Power Corp. 4,024,015 $ 3,106,285
Energy Development Corp. 25,615,420 3,394,031
First Gen Corp. 3,503,437 1,151,608
Lopez Holdings Corp. 5,055,750 667,908
8,319,832
INDUSTRIAL CONGLOMERATES — 20.70%
Aboitiz Equity Ventures Inc. 5,391,390 7,844,225
Alliance Global Group Inc. 11,231,939 3,051,084
DMCI Holdings Inc. 10,891,000 3,341,581
JG Summit Holdings Inc. 7,833,882 10,992,236
SM Investments Corp. 658,721 10,433,718
35,662,844
METALS & MINING — 0.26%
Nickel Asia Corp. 3,118,200 439,973
439,973
OIL, GAS & CONSUMABLE FUELS — 0.71%
Petron Corp. 6,408,400 1,227,327
1,227,327
REAL ESTATE MANAGEMENT &
DEVELOPMENT — 23.78%
Ayala Land Inc. 20,116,240 16,511,278
DoubleDragon Properties Corp.b 1,828,990 1,558,412
Filinvest Land Inc. 26,521,590 989,960
Megaworld Corp. 30,852,700 2,978,549
Robinsons Land Corp. 4,477,400 2,030,011
SM Prime Holdings Inc. 23,688,535 15,462,128
Vista Land & Lifescapes Inc. 12,275,000 1,427,325
40,957,663
SOFTWARE — 0.12%
Xurpas Inc. 1,777,100 201,083
201,083
TRANSPORTATION INFRASTRUCTURE — 1.64%
International Container Terminal
Services Inc. 1,383,480 2,822,656
2,822,656
WATER UTILITIES — 1.18%
Manila Water Co. Inc. 3,369,529 2,038,048
2,038,048
S C H E D U L E S O F I N V E S T M E N T S 55
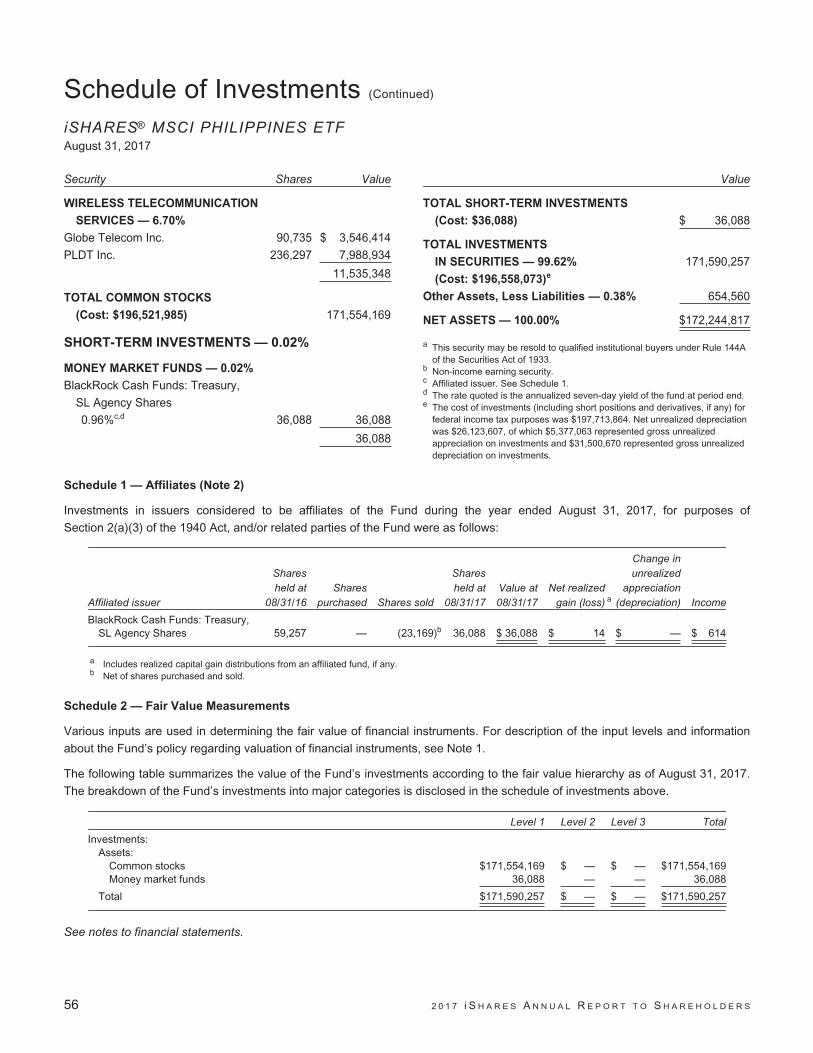
Schedule of Investments (Continued)
iSHARES® MSCI PHILIPPINES ETFAugust 31, 2017
Security Shares Value
WIRELESS TELECOMMUNICATION
SERVICES — 6.70%
Globe Telecom Inc. 90,735 $ 3,546,414
PLDT Inc. 236,297 7,988,934
11,535,348
TOTAL COMMON STOCKS
(Cost: $196,521,985) 171,554,169
SHORT-TERM INVESTMENTS — 0.02%
MONEY MARKET FUNDS — 0.02%
BlackRock Cash Funds: Treasury,
SL Agency Shares
0.96%c,d 36,088 36,088
36,088
Value
TOTAL SHORT-TERM INVESTMENTS
(Cost: $36,088) $ 36,088
TOTAL INVESTMENTS
IN SECURITIES — 99.62% 171,590,257
(Cost: $196,558,073)e
Other Assets, Less Liabilities — 0.38% 654,560
NET ASSETS — 100.00% $172,244,817
a This security may be resold to qualified institutional buyers under Rule 144Aof the Securities Act of 1933.
b Non-income earning security.c Affiliated issuer. See Schedule 1.d The rate quoted is the annualized seven-day yield of the fund at period end.e The cost of investments (including short positions and derivatives, if any) for
federal income tax purposes was $197,713,864. Net unrealized depreciationwas $26,123,607, of which $5,377,063 represented gross unrealizedappreciation on investments and $31,500,670 represented gross unrealizeddepreciation on investments.
Schedule 1 — Affiliates (Note 2)
Investments in issuers considered to be affiliates of the Fund during the year ended August 31, 2017, for purposes of
Section 2(a)(3) of the 1940 Act, and/or related parties of the Fund were as follows:
Affiliated issuer
Sharesheld at
08/31/16Shares
purchased Shares sold
Sharesheld at
08/31/17Value at08/31/17
Net realizedgain (loss) a
Change inunrealized
appreciation(depreciation) Income
BlackRock Cash Funds: Treasury,SL Agency Shares 59,257 — (23,169)b 36,088 $ 36,088 $ 14 $ — $ 614
a Includes realized capital gain distributions from an affiliated fund, if any.b Net of shares purchased and sold.
Schedule 2 — Fair Value Measurements
Various inputs are used in determining the fair value of financial instruments. For description of the input levels and information
about the Fund’s policy regarding valuation of financial instruments, see Note 1.
The following table summarizes the value of the Fund’s investments according to the fair value hierarchy as of August 31, 2017.
The breakdown of the Fund’s investments into major categories is disclosed in the schedule of investments above.
Level 1 Level 2 Level 3 Total
Investments:Assets:
Common stocks $171,554,169 $ — $ — $171,554,169Money market funds 36,088 — — 36,088
Total $171,590,257 $ — $ — $171,590,257
See notes to financial statements.
56 2 0 1 7 i S H A R E S A N N U A L R E P O R T T O S H A R E H O L D E R S
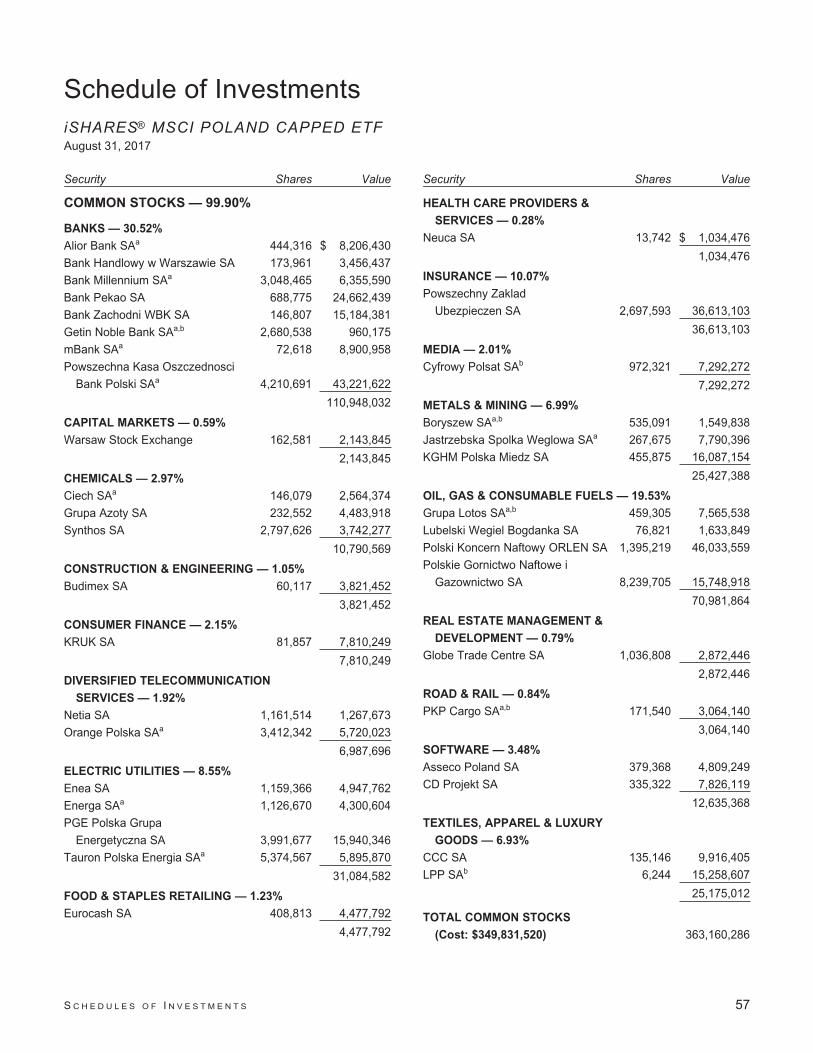
Schedule of InvestmentsiSHARES® MSCI POLAND CAPPED ETFAugust 31, 2017
Security Shares Value
COMMON STOCKS — 99.90%
BANKS — 30.52%
Alior Bank SAa 444,316 $ 8,206,430
Bank Handlowy w Warszawie SA 173,961 3,456,437
Bank Millennium SAa 3,048,465 6,355,590
Bank Pekao SA 688,775 24,662,439
Bank Zachodni WBK SA 146,807 15,184,381
Getin Noble Bank SAa,b 2,680,538 960,175
mBank SAa 72,618 8,900,958
Powszechna Kasa Oszczednosci
Bank Polski SAa 4,210,691 43,221,622
110,948,032
CAPITAL MARKETS — 0.59%
Warsaw Stock Exchange 162,581 2,143,845
2,143,845
CHEMICALS — 2.97%
Ciech SAa 146,079 2,564,374
Grupa Azoty SA 232,552 4,483,918
Synthos SA 2,797,626 3,742,277
10,790,569
CONSTRUCTION & ENGINEERING — 1.05%
Budimex SA 60,117 3,821,452
3,821,452
CONSUMER FINANCE — 2.15%
KRUK SA 81,857 7,810,249
7,810,249
DIVERSIFIED TELECOMMUNICATION
SERVICES — 1.92%
Netia SA 1,161,514 1,267,673
Orange Polska SAa 3,412,342 5,720,023
6,987,696
ELECTRIC UTILITIES — 8.55%
Enea SA 1,159,366 4,947,762
Energa SAa 1,126,670 4,300,604
PGE Polska Grupa
Energetyczna SA 3,991,677 15,940,346
Tauron Polska Energia SAa 5,374,567 5,895,870
31,084,582
FOOD & STAPLES RETAILING — 1.23%
Eurocash SA 408,813 4,477,792
4,477,792
Security Shares Value
HEALTH CARE PROVIDERS &
SERVICES — 0.28%
Neuca SA 13,742 $ 1,034,476
1,034,476
INSURANCE — 10.07%
Powszechny Zaklad
Ubezpieczen SA 2,697,593 36,613,103
36,613,103
MEDIA — 2.01%
Cyfrowy Polsat SAb 972,321 7,292,272
7,292,272
METALS & MINING — 6.99%
Boryszew SAa,b 535,091 1,549,838
Jastrzebska Spolka Weglowa SAa 267,675 7,790,396
KGHM Polska Miedz SA 455,875 16,087,154
25,427,388
OIL, GAS & CONSUMABLE FUELS — 19.53%
Grupa Lotos SAa,b 459,305 7,565,538
Lubelski Wegiel Bogdanka SA 76,821 1,633,849
Polski Koncern Naftowy ORLEN SA 1,395,219 46,033,559
Polskie Gornictwo Naftowe i
Gazownictwo SA 8,239,705 15,748,918
70,981,864
REAL ESTATE MANAGEMENT &
DEVELOPMENT — 0.79%
Globe Trade Centre SA 1,036,808 2,872,446
2,872,446
ROAD & RAIL — 0.84%
PKP Cargo SAa,b 171,540 3,064,140
3,064,140
SOFTWARE — 3.48%
Asseco Poland SA 379,368 4,809,249
CD Projekt SA 335,322 7,826,119
12,635,368
TEXTILES, APPAREL & LUXURY
GOODS — 6.93%
CCC SA 135,146 9,916,405
LPP SAb 6,244 15,258,607
25,175,012
TOTAL COMMON STOCKS
(Cost: $349,831,520) 363,160,286
S C H E D U L E S O F I N V E S T M E N T S 57

Schedule of Investments (Continued)
iSHARES® MSCI POLAND CAPPED ETFAugust 31, 2017
Security Shares Value
SHORT-TERM INVESTMENTS — 1.73%
MONEY MARKET FUNDS — 1.73%
BlackRock Cash Funds: Institutional,SL Agency Shares1.32%c,d,e 6,190,556 $ 6,192,414
BlackRock Cash Funds: Treasury,SL Agency Shares0.96%c,d 97,375 97,375
6,289,789
TOTAL SHORT-TERM INVESTMENTS
(Cost: $6,288,195) 6,289,789
Value
TOTAL INVESTMENTS
IN SECURITIES — 101.63% $369,450,075(Cost: $356,119,715)f
Other Assets, Less Liabilities — (1.63)% (5,913,395)
NET ASSETS — 100.00% $363,536,680
a Non-income earning security.b All or a portion of this security represents a security on loan. See Note 1.c Affiliated issuer. See Schedule 1.d The rate quoted is the annualized seven-day yield of the fund at period end.e All or a portion of this security represents an investment of securities lending
collateral. See Note 1.f The cost of investments (including short positions and derivatives, if any) for
federal income tax purposes was $373,381,999. Net unrealized depreciationwas $3,931,924, of which $42,709,121 represented gross unrealizedappreciation on investments and $46,641,045 represented gross unrealizeddepreciation on investments.
Schedule 1 — Affiliates (Note 2)
Investments in issuers considered to be affiliates of the Fund during the year ended August 31, 2017, for purposes of
Section 2(a)(3) of the 1940 Act, and/or related parties of the Fund were as follows:
Affiliated issuer
Sharesheld at
08/31/16Shares
purchased Shares sold
Sharesheld at
08/31/17Value at08/31/17
Net realizedgain (loss) a
Change inunrealized
appreciation(depreciation) Income
BlackRock Cash Funds:Institutional,SL Agency Shares 7,546,737 — (1,356,181)b 6,190,556 $6,192,414 $ 6,755 $ 1,594 $ —c
BlackRock Cash Funds: Treasury,SL Agency Shares 61,697 35,678b — 97,375 97,375 11 — 843
$6,289,789 $ 6,766 $ 1,594 $ 843
a Includes realized capital gain distributions from an affiliated fund, if any.b Net of shares purchased and sold.c Does not include income earned on investment of securities lending cash collateral which is not direct income of the Fund and is reflected as a component of
securities lending income in the statement of operations.
Schedule 2 — Fair Value Measurements
Various inputs are used in determining the fair value of financial instruments. For description of the input levels and information
about the Fund’s policy regarding valuation of financial instruments, see Note 1.
The following table summarizes the value of the Fund’s investments according to the fair value hierarchy as of August 31, 2017.
The breakdown of the Fund’s investments into major categories is disclosed in the schedule of investments above.
Level 1 Level 2 Level 3 Total
Investments:Assets:
Common stocks $363,160,286 $ — $ — $363,160,286Money market funds 6,289,789 — — 6,289,789
Total $369,450,075 $ — $ — $369,450,075
See notes to financial statements.
58 2 0 1 7 i S H A R E S A N N U A L R E P O R T T O S H A R E H O L D E R S
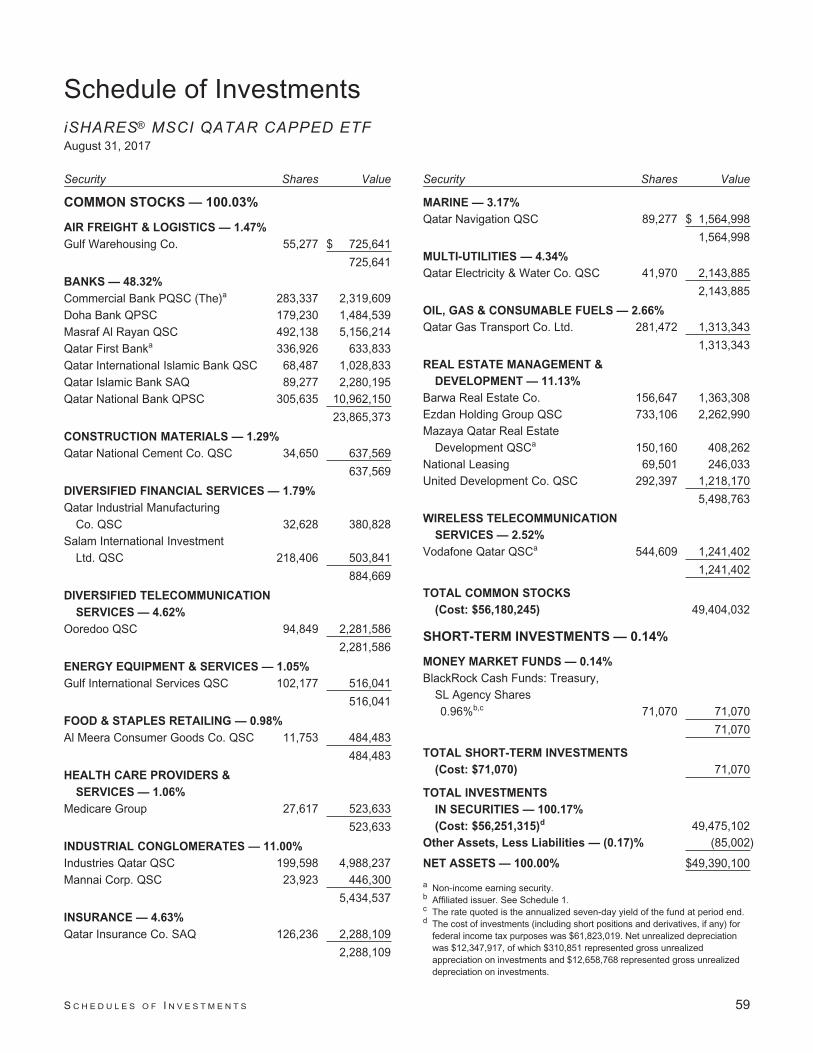
Schedule of InvestmentsiSHARES® MSCI QATAR CAPPED ETFAugust 31, 2017
Security Shares Value
COMMON STOCKS — 100.03%
AIR FREIGHT & LOGISTICS — 1.47%
Gulf Warehousing Co. 55,277 $ 725,641
725,641
BANKS — 48.32%
Commercial Bank PQSC (The)a 283,337 2,319,609Doha Bank QPSC 179,230 1,484,539Masraf Al Rayan QSC 492,138 5,156,214Qatar First Banka 336,926 633,833Qatar International Islamic Bank QSC 68,487 1,028,833Qatar Islamic Bank SAQ 89,277 2,280,195Qatar National Bank QPSC 305,635 10,962,150
23,865,373
CONSTRUCTION MATERIALS — 1.29%
Qatar National Cement Co. QSC 34,650 637,569
637,569
DIVERSIFIED FINANCIAL SERVICES — 1.79%
Qatar Industrial ManufacturingCo. QSC 32,628 380,828
Salam International InvestmentLtd. QSC 218,406 503,841
884,669
DIVERSIFIED TELECOMMUNICATION
SERVICES — 4.62%
Ooredoo QSC 94,849 2,281,586
2,281,586
ENERGY EQUIPMENT & SERVICES — 1.05%
Gulf International Services QSC 102,177 516,041
516,041
FOOD & STAPLES RETAILING — 0.98%
Al Meera Consumer Goods Co. QSC 11,753 484,483
484,483
HEALTH CARE PROVIDERS &
SERVICES — 1.06%
Medicare Group 27,617 523,633
523,633
INDUSTRIAL CONGLOMERATES — 11.00%
Industries Qatar QSC 199,598 4,988,237Mannai Corp. QSC 23,923 446,300
5,434,537
INSURANCE — 4.63%
Qatar Insurance Co. SAQ 126,236 2,288,109
2,288,109
Security Shares Value
MARINE — 3.17%
Qatar Navigation QSC 89,277 $ 1,564,998
1,564,998
MULTI-UTILITIES — 4.34%
Qatar Electricity & Water Co. QSC 41,970 2,143,885
2,143,885
OIL, GAS & CONSUMABLE FUELS — 2.66%
Qatar Gas Transport Co. Ltd. 281,472 1,313,343
1,313,343
REAL ESTATE MANAGEMENT &
DEVELOPMENT — 11.13%
Barwa Real Estate Co. 156,647 1,363,308Ezdan Holding Group QSC 733,106 2,262,990Mazaya Qatar Real Estate
Development QSCa 150,160 408,262National Leasing 69,501 246,033United Development Co. QSC 292,397 1,218,170
5,498,763
WIRELESS TELECOMMUNICATION
SERVICES — 2.52%
Vodafone Qatar QSCa 544,609 1,241,402
1,241,402
TOTAL COMMON STOCKS
(Cost: $56,180,245) 49,404,032
SHORT-TERM INVESTMENTS — 0.14%
MONEY MARKET FUNDS — 0.14%
BlackRock Cash Funds: Treasury,SL Agency Shares0.96%b,c 71,070 71,070
71,070
TOTAL SHORT-TERM INVESTMENTS
(Cost: $71,070) 71,070
TOTAL INVESTMENTS
IN SECURITIES — 100.17%
(Cost: $56,251,315)d 49,475,102Other Assets, Less Liabilities — (0.17)% (85,002)
NET ASSETS — 100.00% $49,390,100
a Non-income earning security.b Affiliated issuer. See Schedule 1.c The rate quoted is the annualized seven-day yield of the fund at period end.d The cost of investments (including short positions and derivatives, if any) for
federal income tax purposes was $61,823,019. Net unrealized depreciationwas $12,347,917, of which $310,851 represented gross unrealizedappreciation on investments and $12,658,768 represented gross unrealizeddepreciation on investments.
S C H E D U L E S O F I N V E S T M E N T S 59
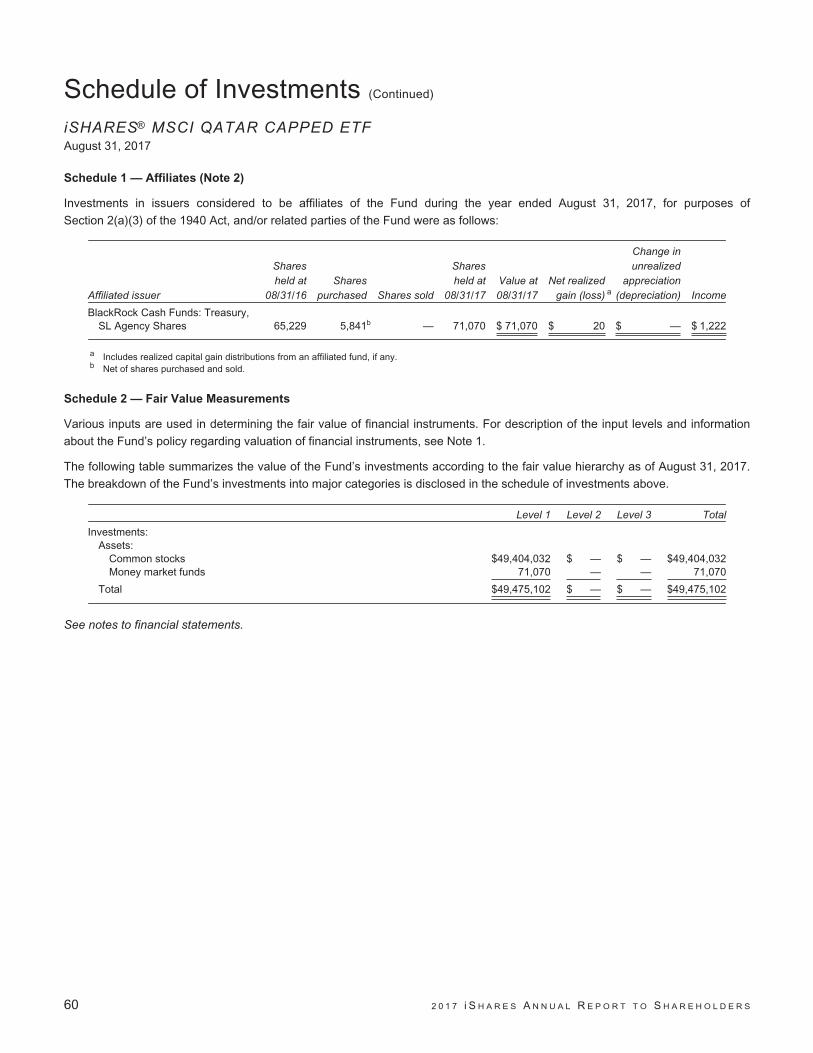
Schedule of Investments (Continued)
iSHARES® MSCI QATAR CAPPED ETFAugust 31, 2017
Schedule 1 — Affiliates (Note 2)
Investments in issuers considered to be affiliates of the Fund during the year ended August 31, 2017, for purposes of
Section 2(a)(3) of the 1940 Act, and/or related parties of the Fund were as follows:
Affiliated issuer
Sharesheld at
08/31/16Shares
purchased Shares sold
Sharesheld at
08/31/17Value at08/31/17
Net realizedgain (loss) a
Change inunrealized
appreciation(depreciation) Income
BlackRock Cash Funds: Treasury,SL Agency Shares 65,229 5,841b — 71,070 $ 71,070 $ 20 $ — $ 1,222
a Includes realized capital gain distributions from an affiliated fund, if any.b Net of shares purchased and sold.
Schedule 2 — Fair Value Measurements
Various inputs are used in determining the fair value of financial instruments. For description of the input levels and information
about the Fund’s policy regarding valuation of financial instruments, see Note 1.
The following table summarizes the value of the Fund’s investments according to the fair value hierarchy as of August 31, 2017.
The breakdown of the Fund’s investments into major categories is disclosed in the schedule of investments above.
Level 1 Level 2 Level 3 Total
Investments:Assets:
Common stocks $49,404,032 $ — $ — $49,404,032Money market funds 71,070 — — 71,070
Total $49,475,102 $ — $ — $49,475,102
See notes to financial statements.
60 2 0 1 7 i S H A R E S A N N U A L R E P O R T T O S H A R E H O L D E R S

Schedule of InvestmentsiSHARES® MSCI SAUDI ARABIA CAPPED ETFAugust 31, 2017
Security Shares Value
COMMON STOCKS — 99.93%
BANKS — 36.18%
Al Rajhi Bank 107,557 $ 1,910,111Alinma Bank 100,486 452,565Arab National Bank 47,948 311,709Bank Al-Jazira 34,991 116,910Bank AlBilad 40,145 206,602Banque Saudi Fransi 49,540 409,773National Commercial Bank 108,248 1,513,082Riyad Bank 163,716 488,939Samba Financial Group 125,117 808,046Saudi British Bank (The) 30,720 212,244Saudi Investment Bank (The) 48,465 193,591
6,623,572
BUILDING PRODUCTS — 0.13%
Saudi Ceramic Co. 3,405 24,560
24,560
CHEMICALS — 24.45%
Advanced Petrochemical Co. 13,205 158,311Alujain Corp. 2,542 14,946National Industrialization Co.a 44,861 166,994Sahara Petrochemical Co. 29,543 104,774Saudi Arabian Fertilizer Co. 25,582 413,997Saudi Basic Industries Corp. 101,242 2,670,486Saudi Industrial Investment Group 30,207 163,914Saudi International Petrochemical Co.a 24,697 93,514Saudi Kayan Petrochemical Co.a 100,728 228,036Yanbu National Petrochemical Co. 30,693 461,271
4,476,243
COMMERCIAL SERVICES &
SUPPLIES — 0.63%
Saudi Airlines Catering Co. 5,058 115,330
115,330
CONSTRUCTION MATERIALS — 3.51%
Arabian Cement Co./Saudi Arabia 6,709 57,247City Cement Co. 12,702 37,054Eastern Province Cement Co. 5,783 36,978Najran Cement Co.a 11,525 28,734Northern Region Cement Co. 12,170 30,829Qassim Cement Co. (The) 6,008 72,461Saudi Cement Co. 10,223 122,778Southern Province Cement Co. 8,630 115,797Yamama Cement Co. 13,594 60,028Yanbu Cement Co. 10,593 81,096
643,002
Security Shares Value
DIVERSIFIED FINANCIAL SERVICES — 0.20%
Aseer Trading Tourism &
Manufacturing Co. 8,498 $ 35,984
35,984
DIVERSIFIED TELECOMMUNICATION
SERVICES — 5.92%
Saudi Telecom Co. 54,173 1,084,269
1,084,269
ELECTRIC UTILITIES — 3.90%
Saudi Electricity Co. 113,142 714,114
714,114
FOOD PRODUCTS — 7.76%
Almarai Co. 38,670 840,796
Halwani Brothers Co. 1,605 20,543
National Agriculture Development
Co. (The)a 5,657 43,428
Saudia Dairy & Foodstuff Co. 2,184 68,486
Savola Group (The) 35,774 446,722
1,419,975
GAS UTILITIES — 0.23%
National Gas & Industrialization Co. 5,030 42,344
42,344
HEALTH CARE PROVIDERS &
SERVICES — 2.53%
Al Hammadi Development and
Investment Co.a 8,037 74,601
Dallah Healthcare Holding Co. 3,649 106,643
Middle East Healthcare Co. 3,755 64,462
Mouwasat Medical Services Co. 3,346 143,772
National Medical Care Co.a 3,000 33,062
Saudi Chemical Co. 4,232 39,869
462,409
HOTELS, RESTAURANTS & LEISURE — 1.25%
Abdul Mohsen Al-Hokair Tourism and
Development Co. 3,046 24,887
Al Tayyar Travel Group Holding Co. 14,072 133,358
Dur Hospitality Co. 4,855 26,280
Herfy Food Services Co. 3,118 44,315
228,840
INSURANCE — 2.37%
Al Rahjhi Co.a 2,095 30,317
Bupa Arabia for Cooperative
Insurance Co. 5,349 167,764
S C H E D U L E S O F I N V E S T M E N T S 61
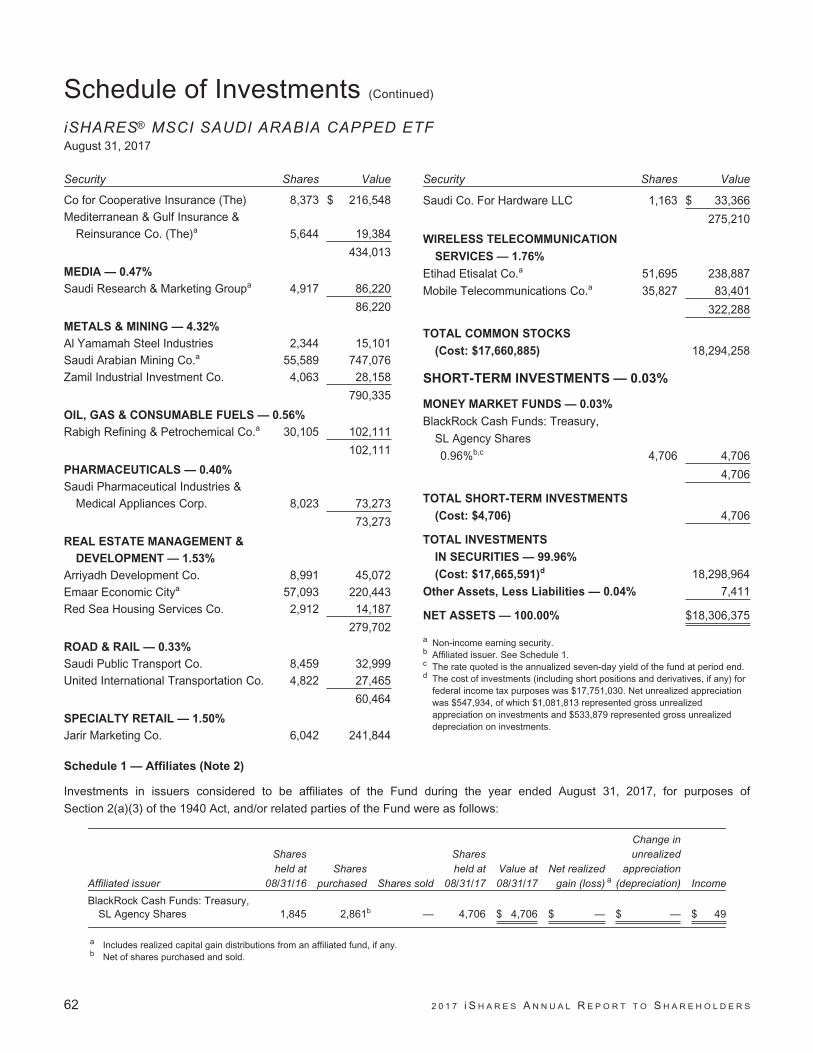
Schedule of Investments (Continued)
iSHARES® MSCI SAUDI ARABIA CAPPED ETFAugust 31, 2017
Security Shares Value
Co for Cooperative Insurance (The) 8,373 $ 216,548Mediterranean & Gulf Insurance &
Reinsurance Co. (The)a 5,644 19,384
434,013
MEDIA — 0.47%
Saudi Research & Marketing Groupa 4,917 86,220
86,220
METALS & MINING — 4.32%
Al Yamamah Steel Industries 2,344 15,101Saudi Arabian Mining Co.a 55,589 747,076Zamil Industrial Investment Co. 4,063 28,158
790,335
OIL, GAS & CONSUMABLE FUELS — 0.56%
Rabigh Refining & Petrochemical Co.a 30,105 102,111
102,111
PHARMACEUTICALS — 0.40%
Saudi Pharmaceutical Industries &Medical Appliances Corp. 8,023 73,273
73,273
REAL ESTATE MANAGEMENT &
DEVELOPMENT — 1.53%
Arriyadh Development Co. 8,991 45,072Emaar Economic Citya 57,093 220,443Red Sea Housing Services Co. 2,912 14,187
279,702
ROAD & RAIL — 0.33%
Saudi Public Transport Co. 8,459 32,999United International Transportation Co. 4,822 27,465
60,464
SPECIALTY RETAIL — 1.50%
Jarir Marketing Co. 6,042 241,844
Security Shares Value
Saudi Co. For Hardware LLC 1,163 $ 33,366
275,210
WIRELESS TELECOMMUNICATION
SERVICES — 1.76%
Etihad Etisalat Co.a 51,695 238,887
Mobile Telecommunications Co.a 35,827 83,401
322,288
TOTAL COMMON STOCKS
(Cost: $17,660,885) 18,294,258
SHORT-TERM INVESTMENTS — 0.03%
MONEY MARKET FUNDS — 0.03%
BlackRock Cash Funds: Treasury,
SL Agency Shares
0.96%b,c 4,706 4,706
4,706
TOTAL SHORT-TERM INVESTMENTS
(Cost: $4,706) 4,706
TOTAL INVESTMENTS
IN SECURITIES — 99.96%
(Cost: $17,665,591)d 18,298,964
Other Assets, Less Liabilities — 0.04% 7,411
NET ASSETS — 100.00% $18,306,375
a Non-income earning security.b Affiliated issuer. See Schedule 1.c The rate quoted is the annualized seven-day yield of the fund at period end.d The cost of investments (including short positions and derivatives, if any) for
federal income tax purposes was $17,751,030. Net unrealized appreciationwas $547,934, of which $1,081,813 represented gross unrealizedappreciation on investments and $533,879 represented gross unrealizeddepreciation on investments.
Schedule 1 — Affiliates (Note 2)
Investments in issuers considered to be affiliates of the Fund during the year ended August 31, 2017, for purposes of
Section 2(a)(3) of the 1940 Act, and/or related parties of the Fund were as follows:
Affiliated issuer
Sharesheld at
08/31/16Shares
purchased Shares sold
Sharesheld at
08/31/17Value at08/31/17
Net realizedgain (loss) a
Change inunrealized
appreciation(depreciation) Income
BlackRock Cash Funds: Treasury,SL Agency Shares 1,845 2,861b — 4,706 $ 4,706 $ — $ — $ 49
a Includes realized capital gain distributions from an affiliated fund, if any.b Net of shares purchased and sold.
62 2 0 1 7 i S H A R E S A N N U A L R E P O R T T O S H A R E H O L D E R S

Schedule of Investments (Continued)
iSHARES® MSCI SAUDI ARABIA CAPPED ETFAugust 31, 2017
Schedule 2 — Fair Value Measurements
Various inputs are used in determining the fair value of financial instruments. For description of the input levels and information
about the Fund’s policy regarding valuation of financial instruments, see Note 1.
The following table summarizes the value of the Fund’s investments according to the fair value hierarchy as of August 31, 2017.
The breakdown of the Fund’s investments into major categories is disclosed in the schedule of investments above.
Level 1 Level 2 Level 3 Total
Investments:Assets:
Common stocks $18,294,258 $ — $ — $18,294,258Money market funds 4,706 — — 4,706
Total $18,298,964 $ — $ — $18,298,964
See notes to financial statements.
S C H E D U L E S O F I N V E S T M E N T S 63
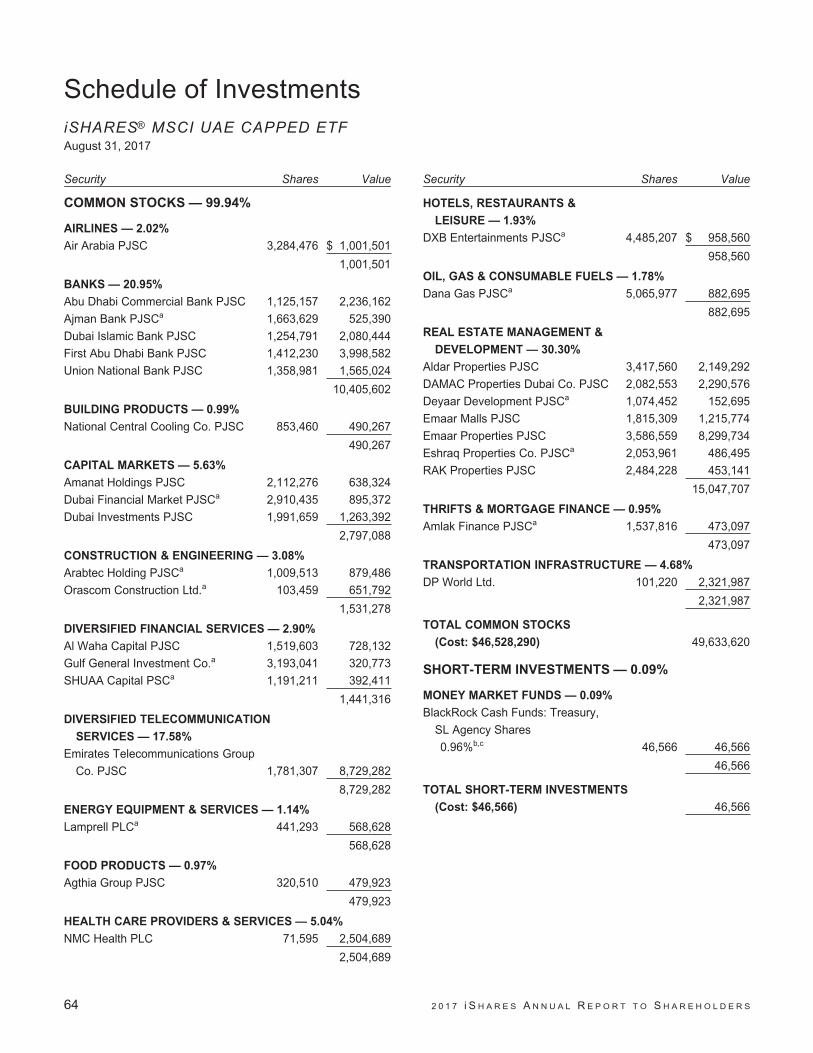
Schedule of InvestmentsiSHARES® MSCI UAE CAPPED ETFAugust 31, 2017
Security Shares Value
COMMON STOCKS — 99.94%
AIRLINES — 2.02%
Air Arabia PJSC 3,284,476 $ 1,001,501
1,001,501
BANKS — 20.95%
Abu Dhabi Commercial Bank PJSC 1,125,157 2,236,162
Ajman Bank PJSCa 1,663,629 525,390
Dubai Islamic Bank PJSC 1,254,791 2,080,444
First Abu Dhabi Bank PJSC 1,412,230 3,998,582
Union National Bank PJSC 1,358,981 1,565,024
10,405,602
BUILDING PRODUCTS — 0.99%
National Central Cooling Co. PJSC 853,460 490,267
490,267
CAPITAL MARKETS — 5.63%
Amanat Holdings PJSC 2,112,276 638,324
Dubai Financial Market PJSCa 2,910,435 895,372
Dubai Investments PJSC 1,991,659 1,263,392
2,797,088
CONSTRUCTION & ENGINEERING — 3.08%
Arabtec Holding PJSCa 1,009,513 879,486
Orascom Construction Ltd.a 103,459 651,792
1,531,278
DIVERSIFIED FINANCIAL SERVICES — 2.90%
Al Waha Capital PJSC 1,519,603 728,132
Gulf General Investment Co.a 3,193,041 320,773
SHUAA Capital PSCa 1,191,211 392,411
1,441,316
DIVERSIFIED TELECOMMUNICATION
SERVICES — 17.58%
Emirates Telecommunications Group
Co. PJSC 1,781,307 8,729,282
8,729,282
ENERGY EQUIPMENT & SERVICES — 1.14%
Lamprell PLCa 441,293 568,628
568,628
FOOD PRODUCTS — 0.97%
Agthia Group PJSC 320,510 479,923
479,923
HEALTH CARE PROVIDERS & SERVICES — 5.04%
NMC Health PLC 71,595 2,504,689
2,504,689
Security Shares Value
HOTELS, RESTAURANTS &
LEISURE — 1.93%
DXB Entertainments PJSCa 4,485,207 $ 958,560
958,560
OIL, GAS & CONSUMABLE FUELS — 1.78%
Dana Gas PJSCa 5,065,977 882,695
882,695
REAL ESTATE MANAGEMENT &
DEVELOPMENT — 30.30%
Aldar Properties PJSC 3,417,560 2,149,292
DAMAC Properties Dubai Co. PJSC 2,082,553 2,290,576
Deyaar Development PJSCa 1,074,452 152,695
Emaar Malls PJSC 1,815,309 1,215,774
Emaar Properties PJSC 3,586,559 8,299,734
Eshraq Properties Co. PJSCa 2,053,961 486,495
RAK Properties PJSC 2,484,228 453,141
15,047,707
THRIFTS & MORTGAGE FINANCE — 0.95%
Amlak Finance PJSCa 1,537,816 473,097
473,097
TRANSPORTATION INFRASTRUCTURE — 4.68%
DP World Ltd. 101,220 2,321,987
2,321,987
TOTAL COMMON STOCKS
(Cost: $46,528,290) 49,633,620
SHORT-TERM INVESTMENTS — 0.09%
MONEY MARKET FUNDS — 0.09%
BlackRock Cash Funds: Treasury,
SL Agency Shares
0.96%b,c 46,566 46,566
46,566
TOTAL SHORT-TERM INVESTMENTS
(Cost: $46,566) 46,566
64 2 0 1 7 i S H A R E S A N N U A L R E P O R T T O S H A R E H O L D E R S
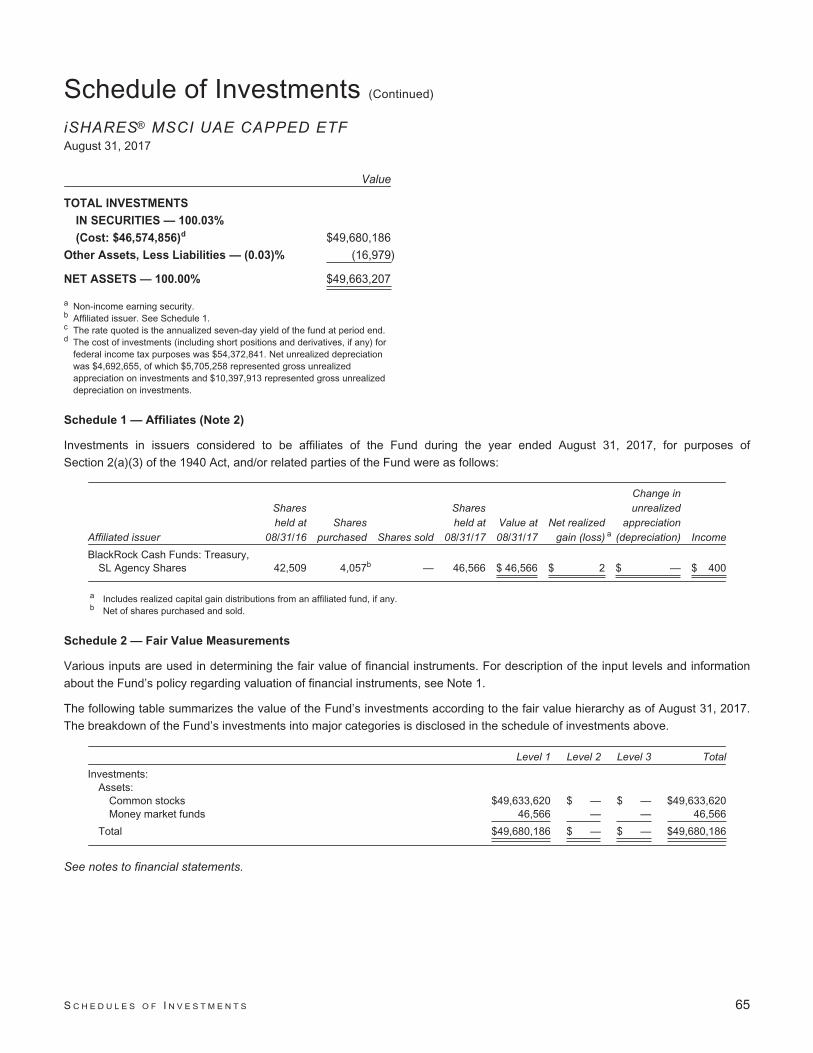
Schedule of Investments (Continued)
iSHARES® MSCI UAE CAPPED ETFAugust 31, 2017
Value
TOTAL INVESTMENTS
IN SECURITIES — 100.03%
(Cost: $46,574,856)d $49,680,186
Other Assets, Less Liabilities — (0.03)% (16,979)
NET ASSETS — 100.00% $49,663,207
a Non-income earning security.b Affiliated issuer. See Schedule 1.c The rate quoted is the annualized seven-day yield of the fund at period end.d The cost of investments (including short positions and derivatives, if any) for
federal income tax purposes was $54,372,841. Net unrealized depreciationwas $4,692,655, of which $5,705,258 represented gross unrealizedappreciation on investments and $10,397,913 represented gross unrealizeddepreciation on investments.
Schedule 1 — Affiliates (Note 2)
Investments in issuers considered to be affiliates of the Fund during the year ended August 31, 2017, for purposes of
Section 2(a)(3) of the 1940 Act, and/or related parties of the Fund were as follows:
Affiliated issuer
Sharesheld at
08/31/16Shares
purchased Shares sold
Sharesheld at
08/31/17Value at08/31/17
Net realizedgain (loss) a
Change inunrealized
appreciation(depreciation) Income
BlackRock Cash Funds: Treasury,SL Agency Shares 42,509 4,057b — 46,566 $ 46,566 $ 2 $ — $ 400
a Includes realized capital gain distributions from an affiliated fund, if any.b Net of shares purchased and sold.
Schedule 2 — Fair Value Measurements
Various inputs are used in determining the fair value of financial instruments. For description of the input levels and information
about the Fund’s policy regarding valuation of financial instruments, see Note 1.
The following table summarizes the value of the Fund’s investments according to the fair value hierarchy as of August 31, 2017.
The breakdown of the Fund’s investments into major categories is disclosed in the schedule of investments above.
Level 1 Level 2 Level 3 Total
Investments:Assets:
Common stocks $49,633,620 $ — $ — $49,633,620Money market funds 46,566 — — 46,566
Total $49,680,186 $ — $ — $49,680,186
See notes to financial statements.
S C H E D U L E S O F I N V E S T M E N T S 65
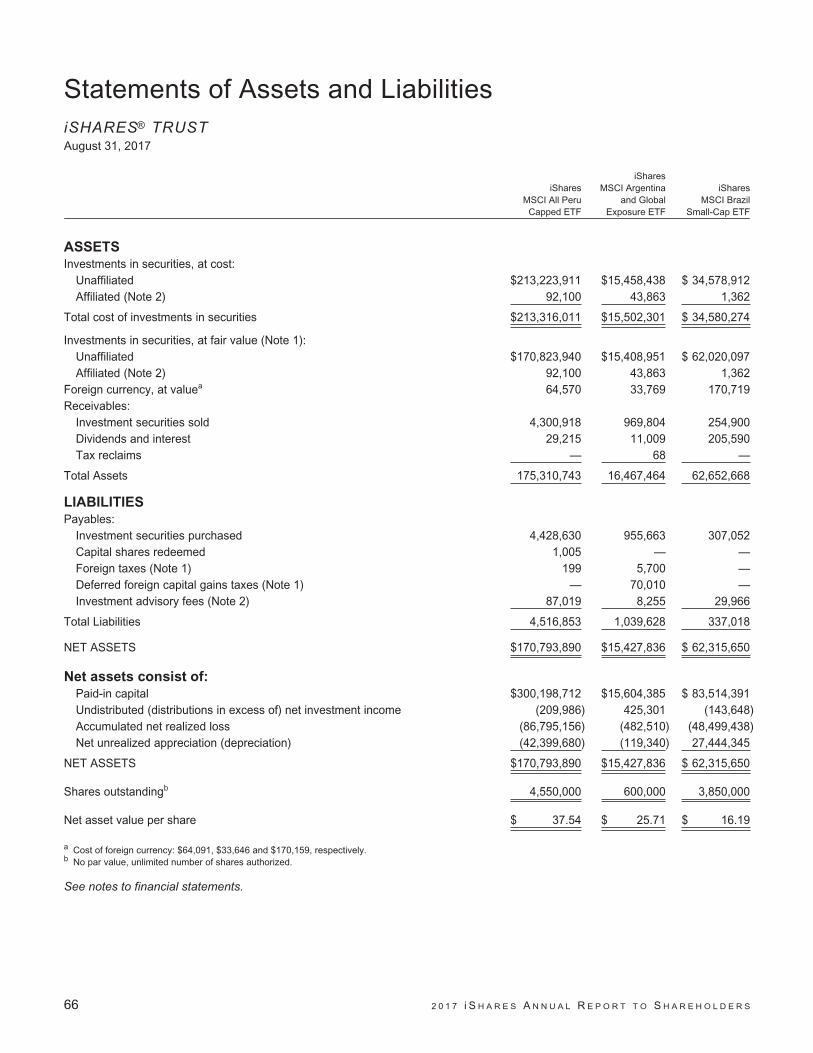
Statements of Assets and LiabilitiesiSHARES® TRUSTAugust 31, 2017
iSharesMSCI All Peru
Capped ETF
iSharesMSCI Argentina
and GlobalExposure ETF
iSharesMSCI Brazil
Small-Cap ETF
ASSETS
Investments in securities, at cost:Unaffiliated $213,223,911 $15,458,438 $ 34,578,912Affiliated (Note 2) 92,100 43,863 1,362
Total cost of investments in securities $213,316,011 $15,502,301 $ 34,580,274
Investments in securities, at fair value (Note 1):Unaffiliated $170,823,940 $15,408,951 $ 62,020,097Affiliated (Note 2) 92,100 43,863 1,362
Foreign currency, at valuea 64,570 33,769 170,719Receivables:
Investment securities sold 4,300,918 969,804 254,900Dividends and interest 29,215 11,009 205,590Tax reclaims — 68 —
Total Assets 175,310,743 16,467,464 62,652,668
LIABILITIES
Payables:Investment securities purchased 4,428,630 955,663 307,052Capital shares redeemed 1,005 — —Foreign taxes (Note 1) 199 5,700 —Deferred foreign capital gains taxes (Note 1) — 70,010 —Investment advisory fees (Note 2) 87,019 8,255 29,966
Total Liabilities 4,516,853 1,039,628 337,018
NET ASSETS $170,793,890 $15,427,836 $ 62,315,650
Net assets consist of:
Paid-in capital $300,198,712 $15,604,385 $ 83,514,391Undistributed (distributions in excess of) net investment income (209,986) 425,301 (143,648)Accumulated net realized loss (86,795,156) (482,510) (48,499,438)Net unrealized appreciation (depreciation) (42,399,680) (119,340) 27,444,345
NET ASSETS $170,793,890 $15,427,836 $ 62,315,650
Shares outstandingb 4,550,000 600,000 3,850,000
Net asset value per share $ 37.54 $ 25.71 $ 16.19
a Cost of foreign currency: $64,091, $33,646 and $170,159, respectively.b No par value, unlimited number of shares authorized.
See notes to financial statements.
66 2 0 1 7 i S H A R E S A N N U A L R E P O R T T O S H A R E H O L D E R S

Statements of Assets and Liabilities (Continued)
iSHARES® TRUSTAugust 31, 2017
iSharesMSCI China
ETF
iSharesMSCI China
Small-Cap ETF
iSharesMSCI Indonesia
ETF
ASSETS
Investments in securities, at cost:
Unaffiliated $2,016,674,889 $22,439,850 $548,795,871
Affiliated (Note 2) 374,364,501 6,254,767 146,022
Total cost of investments in securities $2,391,039,390 $28,694,617 $548,941,893
Investments in securities, at fair value (including securities on loana) (Note 1):
Unaffiliated $2,583,043,677 $21,709,052 $500,938,026
Affiliated (Note 2) 374,421,438 6,256,265 146,022
Foreign currency, at valueb 10,325,225 29,299 340,665
Foreign currency pledged to broker for futures contracts, at valueb 547,886 — —
Receivables:
Investment securities sold 6,753,237 36,192 2,502,266
Dividends and interest 6,562,012 71,409 47,082
Total Assets 2,981,653,475 28,102,217 503,974,061
LIABILITIES
Payables:
Investment securities purchased 12,029,882 20,287 2,303,744
Collateral for securities on loan (Note 1) 373,803,782 6,246,223 —
Capital shares redeemed 157,421 — —
Futures variation margin 64,945 — —
Investment advisory fees (Note 2) 1,350,159 10,871 259,230
Total Liabilities 387,406,189 6,277,381 2,562,974
NET ASSETS $2,594,247,286 $21,824,836 $501,411,087
Net assets consist of:
Paid-in capital $2,252,481,282 $27,428,857 $615,923,584
Undistributed (distributions in excess of) net investment income 28,186,450 (5,085) (46,890)
Accumulated net realized loss (252,872,001) (4,869,588) (66,607,242)
Net unrealized appreciation (depreciation) 566,451,555 (729,348) (47,858,365)
NET ASSETS $2,594,247,286 $21,824,836 $501,411,087
Shares outstandingc 41,800,000 450,000 18,650,000
Net asset value per share $ 62.06 $ 48.50 $ 26.89
a Securities on loan with values of $363,489,817, $5,411,010 and $ —, respectively. See Note 1.b Cost of foreign currency including currency pledged to broker for futures contracts, if any: $10,877,099, $29,303 and $341,148, respectively.c No par value, unlimited number of shares authorized.
See notes to financial statements.
F I N A N C I A L S T A T E M E N T S 67
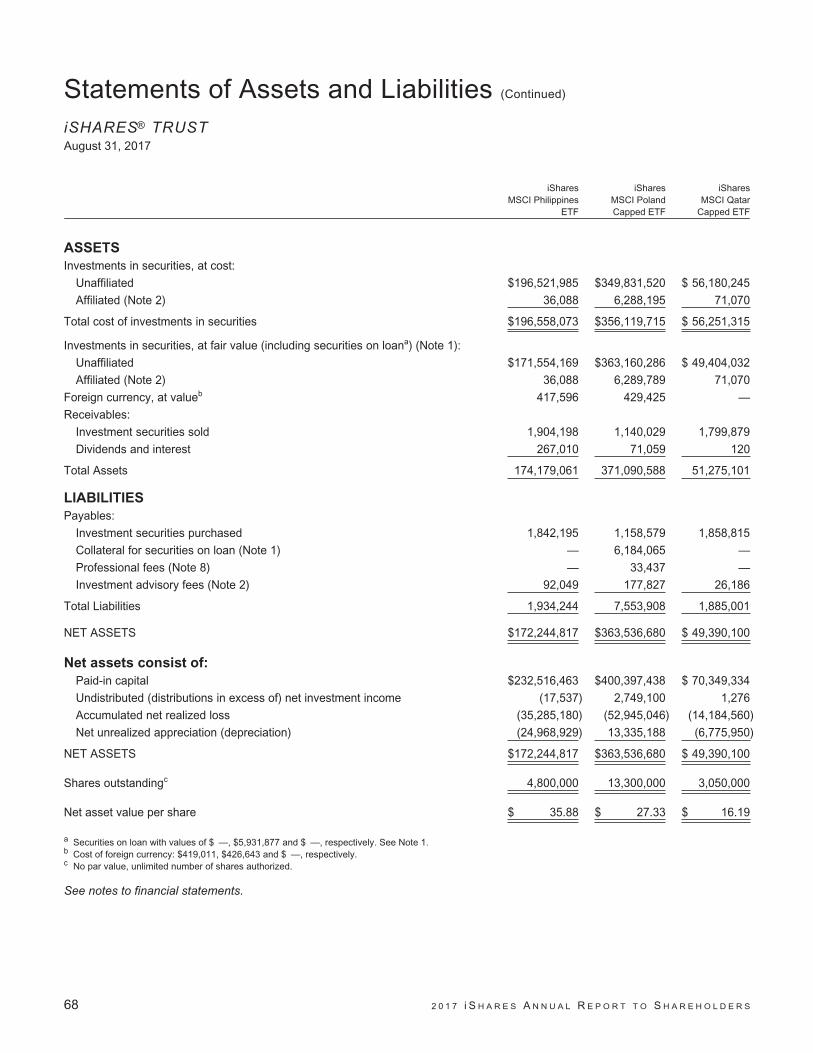
Statements of Assets and Liabilities (Continued)
iSHARES® TRUSTAugust 31, 2017
iSharesMSCI Philippines
ETF
iSharesMSCI PolandCapped ETF
iSharesMSCI Qatar
Capped ETF
ASSETS
Investments in securities, at cost:
Unaffiliated $196,521,985 $349,831,520 $ 56,180,245
Affiliated (Note 2) 36,088 6,288,195 71,070
Total cost of investments in securities $196,558,073 $356,119,715 $ 56,251,315
Investments in securities, at fair value (including securities on loana) (Note 1):
Unaffiliated $171,554,169 $363,160,286 $ 49,404,032
Affiliated (Note 2) 36,088 6,289,789 71,070
Foreign currency, at valueb 417,596 429,425 —
Receivables:
Investment securities sold 1,904,198 1,140,029 1,799,879
Dividends and interest 267,010 71,059 120
Total Assets 174,179,061 371,090,588 51,275,101
LIABILITIES
Payables:
Investment securities purchased 1,842,195 1,158,579 1,858,815
Collateral for securities on loan (Note 1) — 6,184,065 —
Professional fees (Note 8) — 33,437 —
Investment advisory fees (Note 2) 92,049 177,827 26,186
Total Liabilities 1,934,244 7,553,908 1,885,001
NET ASSETS $172,244,817 $363,536,680 $ 49,390,100
Net assets consist of:
Paid-in capital $232,516,463 $400,397,438 $ 70,349,334
Undistributed (distributions in excess of) net investment income (17,537) 2,749,100 1,276
Accumulated net realized loss (35,285,180) (52,945,046) (14,184,560)
Net unrealized appreciation (depreciation) (24,968,929) 13,335,188 (6,775,950)
NET ASSETS $172,244,817 $363,536,680 $ 49,390,100
Shares outstandingc 4,800,000 13,300,000 3,050,000
Net asset value per share $ 35.88 $ 27.33 $ 16.19
a Securities on loan with values of $ —, $5,931,877 and $ —, respectively. See Note 1.b Cost of foreign currency: $419,011, $426,643 and $ —, respectively.c No par value, unlimited number of shares authorized.
See notes to financial statements.
68 2 0 1 7 i S H A R E S A N N U A L R E P O R T T O S H A R E H O L D E R S

Statements of Assets and Liabilities (Continued)
iSHARES® TRUSTAugust 31, 2017
iSharesMSCI Saudi
Arabia CappedETF
iSharesMSCI UAE
Capped ETF
ASSETS
Investments in securities, at cost:
Unaffiliated $17,660,885 $ 46,528,290
Affiliated (Note 2) 4,706 46,566
Total cost of investments in securities $17,665,591 $ 46,574,856
Investments in securities, at fair value (Note 1):
Unaffiliated $18,294,258 $ 49,633,620
Affiliated (Note 2) 4,706 46,566
Foreign currency, at valuea 59,782 6,074
Receivables:
Investment securities sold 48,579 589,706
Dividends and interest 5,440 29
Total Assets 18,412,765 50,275,995
LIABILITIES
Payables:
Investment securities purchased 95,033 587,477
Investment advisory fees (Note 2) 11,357 25,311
Total Liabilities 106,390 612,788
NET ASSETS $18,306,375 $ 49,663,207
Net assets consist of:
Paid-in capital $17,756,677 $ 66,009,749
Undistributed (distributions in excess of) net investment income 188,633 (240,907)
Accumulated net realized loss (272,308) (19,210,954)
Net unrealized appreciation 633,373 3,105,319
NET ASSETS $18,306,375 $ 49,663,207
Shares outstandingb 700,000 2,800,000
Net asset value per share $ 26.15 $ 17.74
a Cost of foreign currency: $59,782 and $6,071, respectively.b No par value, unlimited number of shares authorized.
See notes to financial statements.
F I N A N C I A L S T A T E M E N T S 69

Statements of OperationsiSHARES® TRUSTYear ended August 31, 2017
iSharesMSCI All Peru
Capped ETF
iSharesMSCI Argentina
and GlobalExposure ETFa
iSharesMSCI Brazil
Small-Cap ETF
NET INVESTMENT INCOME
Dividends — unaffiliatedb $ 4,181,905 $ 38,766 $ 1,744,892
Dividends — affiliated (Note 2) 1,254 76 161
Total investment income 4,183,159 38,842 1,745,053
EXPENSESInvestment advisory fees (Note 2) 1,298,945 24,707 318,008
Proxy fees 4,643 55 1,314
Total expenses 1,303,588 24,762 319,322
Net investment income 2,879,571 14,080 1,425,731
NET REALIZED AND UNREALIZED GAIN (LOSS)
Net realized gain (loss) from:
Investments — unaffiliatedc (2,807,888) (64,797) (2,152,996)
In-kind redemptions — unaffiliated 15,379,815 189,110 —
Foreign currency transactions (13,626) 328 (19,831)
Realized gain distributions from affiliated funds 29 — —
Net realized gain (loss) 12,558,330 124,641 (2,172,827)
Net change in unrealized appreciation/depreciation on:
Investments — unaffiliatedd 12,192,175 (119,497) 18,266,472
Translation of assets and liabilities in foreign currencies 6,406 157 (2,410)
Net change in unrealized appreciation/depreciation 12,198,581 (119,340) 18,264,062
Net realized and unrealized gain 24,756,911 5,301 16,091,235
NET INCREASE IN NET ASSETS RESULTING FROM OPERATIONS $27,636,482 $ 19,381 $17,516,966
a For the period from April 25, 2017 (commencement of operations) to August 31, 2017.b Net of foreign withholding tax of $127,981, $1,578 and $83,636, respectively.c Net of foreign capital gains taxes of $ —, $5,700 and $ —, respectively.d Net of deferred foreign capital gains taxes of $ —, $70,010 and $ —, respectively.
See notes to financial statements.
70 2 0 1 7 i S H A R E S A N N U A L R E P O R T T O S H A R E H O L D E R S

Statements of Operations (Continued)
iSHARES® TRUSTYear ended August 31, 2017
iSharesMSCI China
ETF
iShares MSCIChina Small-
Cap ETF
iSharesMSCI Indonesia
ETF
NET INVESTMENT INCOME
Dividends — unaffiliateda $ 52,004,401 $ 451,755 $ 9,714,779
Dividends — affiliated (Note 2) 11,586 154 1,438
Securities lending income — affiliated — net (Note 2) 1,861,828 220,282 —
Total investment income 53,877,815 672,191 9,716,217
EXPENSESInvestment advisory fees (Note 2) 14,298,287 123,953 3,257,735
Proxy fees 49,853 440 11,400
Total expenses 14,348,140 124,393 3,269,135
Net investment income 39,529,675 547,798 6,447,082
NET REALIZED AND UNREALIZED GAIN (LOSS)
Net realized gain (loss) from:
Investments — unaffiliated (33,976,601) (8,384) (12,641,511)
Investments — affiliated (Note 2) 32,814 98 —
In-kind redemptions — unaffiliated 126,855,444 — 38,867,715
Futures contracts 2,543,059 — —
Foreign currency transactions (104,996) (409) 1,693
Realized gain distributions from affiliated funds 122 2 3
Net realized gain (loss) 95,349,842 (8,693) 26,227,900
Net change in unrealized appreciation/depreciation on:
Investments — unaffiliated 561,144,412 2,353,983 (15,952,498)
Investments — affiliated (Note 2) 56,937 1,498 —
Futures contracts 10,591 — —
Translation of assets and liabilities in foreign currencies (2,284) 40 4,109
Net change in unrealized appreciation/depreciation 561,209,656 2,355,521 (15,948,389)
Net realized and unrealized gain 656,559,498 2,346,828 10,279,511
NET INCREASE IN NET ASSETS RESULTING FROM OPERATIONS $696,089,173 $2,894,626 $ 16,726,593
a Net of foreign withholding tax of $4,557,984, $7,164 and $1,746,492, respectively.
See notes to financial statements.
F I N A N C I A L S T A T E M E N T S 71

Statements of Operations (Continued)
iSHARES® TRUSTYear ended August 31, 2017
iSharesMSCI Philippines
ETF
iSharesMSCI PolandCapped ETF
iSharesMSCI Qatar
Capped ETF
NET INVESTMENT INCOME
Dividends — unaffiliateda $ 1,899,035 $ 5,792,351 $ 1,679,983
Dividends — affiliated (Note 2) 614 843 1,222
Securities lending income — affiliated — net (Note 2) — 431,509 —
Foreign withholding tax claims (Note 8) — 377,598 —
Total investment income 1,899,649 6,602,301 1,681,205
EXPENSESInvestment advisory fees (Note 2) 1,131,578 1,498,182 281,769
Proxy fees 4,136 6,265 960
Professional fees (Note 8) — 37,954 —
Total expenses 1,135,714 1,542,401 282,729
Net investment income 763,935 5,059,900 1,398,476
NET REALIZED AND UNREALIZED GAIN (LOSS)
Net realized gain (loss) from:
Investments — unaffiliated (6,638,294) (10,848,308) (5,340,861)
Investments — affiliated (Note 2) — 6,755 —
In-kind redemptions — unaffiliated (3,668,515) 11,357,085 —
Foreign currency transactions (47,836) 43,185 127,984
Realized gain distributions from affiliated funds 14 11 20
Net realized gain (loss) (10,354,631) 558,728 (5,212,857)
Net change in unrealized appreciation/depreciation on:
Investments — unaffiliated (13,316,365) 107,278,210 (4,435,138)
Investments — affiliated (Note 2) — 1,594 —
Translation of assets and liabilities in foreign currencies (4,879) 34,058 263
Net change in unrealized appreciation/depreciation (13,321,244) 107,313,862 (4,434,875)
Net realized and unrealized gain (loss) (23,675,875) 107,872,590 (9,647,732)
NET INCREASE (DECREASE) IN NET ASSETS RESULTING FROM OPERATIONS $(22,911,940) $112,932,490 $(8,249,256)
a Net of foreign withholding tax of $813,872, $1,021,960 and $ —, respectively.
See notes to financial statements.
72 2 0 1 7 i S H A R E S A N N U A L R E P O R T T O S H A R E H O L D E R S

Statements of Operations (Continued)
iSHARES® TRUSTYear ended August 31, 2017
iSharesMSCI Saudi Arabia
Capped ETF
iSharesMSCI UAE
Capped ETF
NET INVESTMENT INCOME
Dividends — unaffiliateda $ 369,201 $ 1,547,782
Dividends — affiliated (Note 2) 49 400
Total investment income 369,250 1,548,182
EXPENSESInvestment advisory fees (Note 2) 61,727 267,537
Proxy fees 188 917
Total expenses 61,915 268,454
Net investment income 307,335 1,279,728
NET REALIZED AND UNREALIZED GAIN (LOSS)
Net realized gain (loss) from:
Investments — unaffiliated (104,574) (2,405,998)
In-kind redemptions — unaffiliated — 78,754
Foreign currency transactions (1,812) (7,743)
Realized gain distributions from affiliated funds — 2
Net realized loss (106,386) (2,334,985)
Net change in unrealized appreciation/depreciation on:
Investments — unaffiliated 1,176,934 4,117,351
Translation of assets and liabilities in foreign currencies — (17)
Net change in unrealized appreciation/depreciation 1,176,934 4,117,334
Net realized and unrealized gain 1,070,548 1,782,349
NET INCREASE IN NET ASSETS RESULTING FROM OPERATIONS $1,377,883 $ 3,062,077
a Net of foreign withholding tax of $14,745 and $ —, respectively.
See notes to financial statements.
F I N A N C I A L S T A T E M E N T S 73
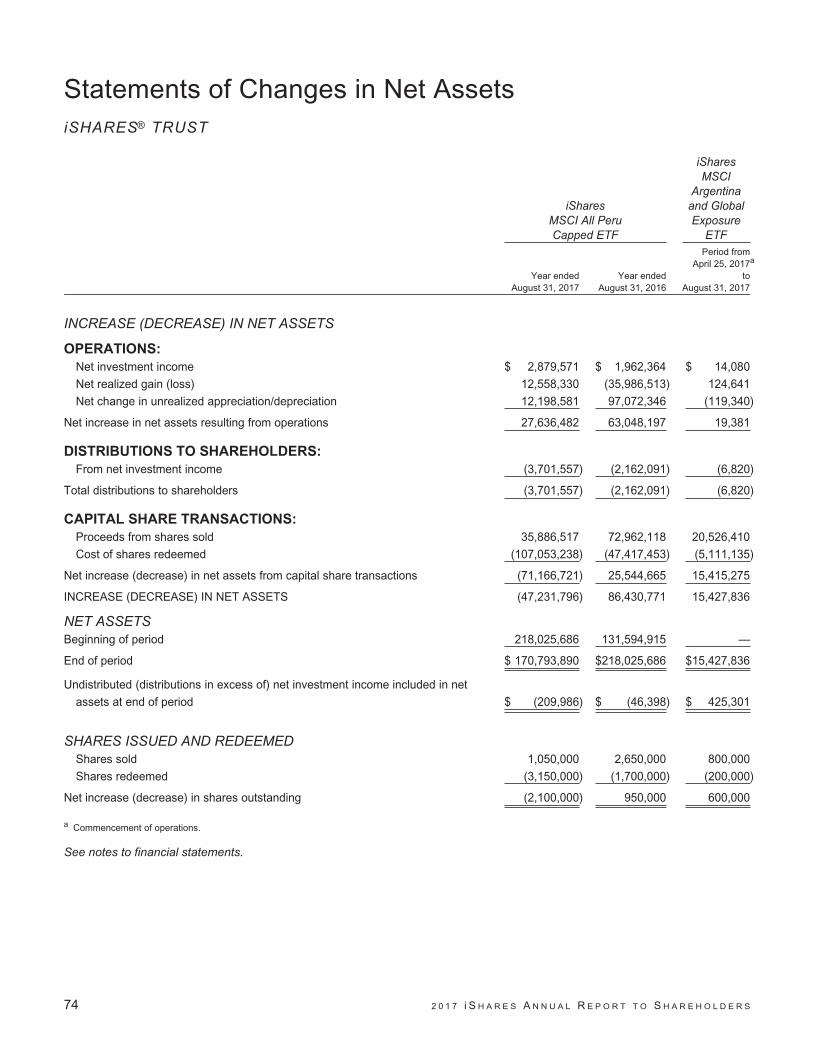
Statements of Changes in Net AssetsiSHARES® TRUST
iSharesMSCI All PeruCapped ETF
iSharesMSCI
Argentinaand GlobalExposure
ETF
Year endedAugust 31, 2017
Year endedAugust 31, 2016
Period fromApril 25, 2017a
toAugust 31, 2017
INCREASE (DECREASE) IN NET ASSETS
OPERATIONS:
Net investment income $ 2,879,571 $ 1,962,364 $ 14,080
Net realized gain (loss) 12,558,330 (35,986,513) 124,641
Net change in unrealized appreciation/depreciation 12,198,581 97,072,346 (119,340)
Net increase in net assets resulting from operations 27,636,482 63,048,197 19,381
DISTRIBUTIONS TO SHAREHOLDERS:
From net investment income (3,701,557) (2,162,091) (6,820)
Total distributions to shareholders (3,701,557) (2,162,091) (6,820)
CAPITAL SHARE TRANSACTIONS:
Proceeds from shares sold 35,886,517 72,962,118 20,526,410
Cost of shares redeemed (107,053,238) (47,417,453) (5,111,135)
Net increase (decrease) in net assets from capital share transactions (71,166,721) 25,544,665 15,415,275
INCREASE (DECREASE) IN NET ASSETS (47,231,796) 86,430,771 15,427,836
NET ASSETSBeginning of period 218,025,686 131,594,915 —
End of period $ 170,793,890 $218,025,686 $15,427,836
Undistributed (distributions in excess of) net investment income included in net
assets at end of period $ (209,986) $ (46,398) $ 425,301
SHARES ISSUED AND REDEEMEDShares sold 1,050,000 2,650,000 800,000
Shares redeemed (3,150,000) (1,700,000) (200,000)
Net increase (decrease) in shares outstanding (2,100,000) 950,000 600,000
a Commencement of operations.
See notes to financial statements.
74 2 0 1 7 i S H A R E S A N N U A L R E P O R T T O S H A R E H O L D E R S

Statements of Changes in Net Assets (Continued)
iSHARES® TRUST
iSharesMSCI Brazil Small-Cap ETF
iSharesMSCI China ETF
Year endedAugust 31, 2017
Year endedAugust 31, 2016
Year endedAugust 31, 2017
Year endedAugust 31, 2016
INCREASE (DECREASE) IN NET ASSETS
OPERATIONS:
Net investment income $ 1,425,731 $ 798,488 $ 39,529,675 $ 42,733,390
Net realized gain (loss) (2,172,827) (11,331,557) 95,349,842 (178,902,815)
Net change in unrealized appreciation/depreciation 18,264,062 22,414,456 561,209,656 267,731,484
Net increase in net assets resulting from operations 17,516,966 11,881,387 696,089,173 131,562,059
DISTRIBUTIONS TO SHAREHOLDERS:
From net investment income (1,601,858) (679,799) (29,342,450) (41,167,086)
Total distributions to shareholders (1,601,858) (679,799) (29,342,450) (41,167,086)
CAPITAL SHARE TRANSACTIONS:
Proceeds from shares sold 16,706,722 14,888,226 312,129,183 351,971,009
Cost of shares redeemed (20,393,245) (3,192,180) (484,619,997) (157,677,223)
Net increase (decrease) in net assets from capital
share transactions (3,686,523) 11,696,046 (172,490,814) 194,293,786
INCREASE IN NET ASSETS 12,228,585 22,897,634 494,255,909 284,688,759
NET ASSETSBeginning of year 50,087,065 27,189,431 2,099,991,377 1,815,302,618
End of year $ 62,315,650 $ 50,087,065 $2,594,247,286 $2,099,991,377
Undistributed (distributions in excess of) net investment
income included in net assets at end of year $ (143,648) $ (111,469) $ 28,186,450 $ 17,863,598
SHARES ISSUED AND REDEEMEDShares sold 1,200,000 1,450,000 6,400,000 7,800,000
Shares redeemed (1,700,000) (450,000) (9,400,000) (3,800,000)
Net increase (decrease) in shares outstanding (500,000) 1,000,000 (3,000,000) 4,000,000
See notes to financial statements.
F I N A N C I A L S T A T E M E N T S 75

Statements of Changes in Net Assets (Continued)
iSHARES® TRUST
iSharesMSCI China Small-Cap ETF
iSharesMSCI Indonesia ETF
Year endedAugust 31, 2017
Year endedAugust 31, 2016
Year endedAugust 31, 2017
Year endedAugust 31, 2016
INCREASE (DECREASE) IN NET ASSETS
OPERATIONS:
Net investment income $ 547,798 $ 648,162 $ 6,447,082 $ 6,068,963
Net realized gain (loss) (8,693) (2,613,330) 26,227,900 (36,634,508)
Net change in unrealized appreciation/depreciation 2,355,521 4,304,580 (15,948,389) 131,755,013
Net increase in net assets resulting from operations 2,894,626 2,339,412 16,726,593 101,189,468
DISTRIBUTIONS TO SHAREHOLDERS:
From net investment income (775,895) (768,088) (6,469,991) (5,726,092)
Return of capital — — — (324,115)
Total distributions to shareholders (775,895) (768,088) (6,469,991) (6,050,207)
CAPITAL SHARE TRANSACTIONS:
Proceeds from shares sold — 1,041 158,333,457 618,736,023
Cost of shares redeemed — (6,512,739) (369,376,936) (280,057,830)
Net increase (decrease) in net assets from capital
share transactions — (6,511,698) (211,043,479) 338,678,193
INCREASE (DECREASE) IN NET ASSETS 2,118,731 (4,940,374) (200,786,877) 433,817,454
NET ASSETSBeginning of year 19,706,105 24,646,479 702,197,964 268,380,510
End of year $21,824,836 $19,706,105 $ 501,411,087 $ 702,197,964
Distributions in excess of net investment income included in
net assets at end of year $ (5,085) $ (2,599) $ (46,890) $ (62,658)
SHARES ISSUED AND REDEEMEDShares sold — — 6,150,000 27,200,000
Shares redeemed — (150,000) (14,700,000) (13,300,000)
Net increase (decrease) in shares outstanding — (150,000) (8,550,000) 13,900,000
See notes to financial statements.
76 2 0 1 7 i S H A R E S A N N U A L R E P O R T T O S H A R E H O L D E R S

Statements of Changes in Net Assets (Continued)
iSHARES® TRUST
iSharesMSCI Philippines ETF
iSharesMSCI Poland Capped ETF
Year endedAugust 31, 2017
Year endedAugust 31, 2016
Year endedAugust 31, 2017
Year endedAugust 31, 2016
INCREASE (DECREASE) IN NET ASSETS
OPERATIONS:
Net investment income $ 763,935 $ 1,581,916 $ 5,059,900 $ 3,948,549
Net realized gain (loss) (10,354,631) 2,294,809 558,728 (24,759,076)
Net change in unrealized appreciation/depreciation (13,321,244) 20,746,387 107,313,862 (13,598,460)
Net increase (decrease) in net assets resulting
from operations (22,911,940) 24,623,112 112,932,490 (34,408,987)
DISTRIBUTIONS TO SHAREHOLDERS:
From net investment income (1,008,827) (2,096,978) (4,649,179) (2,589,910)
Total distributions to shareholders (1,008,827) (2,096,978) (4,649,179) (2,589,910)
CAPITAL SHARE TRANSACTIONS:
Proceeds from shares sold 60,308,205 217,152,095 170,932,433 108,806,967
Cost of shares redeemed (181,545,734) (188,547,640) (95,416,457) (85,638,124)
Net increase (decrease) in net assets from capital
share transactions (121,237,529) 28,604,455 75,515,976 23,168,843
INCREASE (DECREASE) IN NET ASSETS (145,158,296) 51,130,589 183,799,287 (13,830,054)
NET ASSETSBeginning of year 317,403,113 266,272,524 179,737,393 193,567,447
End of year $ 172,244,817 $ 317,403,113 $363,536,680 $179,737,393
Undistributed (distributions in excess of) net investment
income included in net assets at end of year $ (17,537) $ 19,665 $ 2,749,100 $ 1,994,555
SHARES ISSUED AND REDEEMEDShares sold 1,750,000 5,900,000 8,250,000 5,750,000
Shares redeemed (5,050,000) (5,300,000) (4,900,000) (4,750,000)
Net increase (decrease) in shares outstanding (3,300,000) 600,000 3,350,000 1,000,000
See notes to financial statements.
F I N A N C I A L S T A T E M E N T S 77

Statements of Changes in Net Assets (Continued)
iSHARES® TRUST
iSharesMSCI QatarCapped ETF
iSharesMSCI Saudi Arabia
Capped ETF
Year endedAugust 31, 2017
Year endedAugust 31, 2016
Year endedAugust 31, 2017
Period fromSeptember 16, 2015a
toAugust 31, 2016
INCREASE (DECREASE) IN NET ASSETS
OPERATIONS:
Net investment income $ 1,398,476 $ 1,549,144 $ 307,335 $ 156,479
Net realized loss (5,212,857) (4,086,778) (106,386) (168,175)
Net change in unrealized appreciation/depreciation (4,434,875) 1,313,485 1,176,934 (543,561)
Net increase (decrease) in net assets resulting
from operations (8,249,256) (1,224,149) 1,377,883 (555,257)
DISTRIBUTIONS TO SHAREHOLDERS:
From net investment income (1,458,378) (1,597,151) (169,819) (103,109)
Return of capital — (37,823) — —
Total distributions to shareholders (1,458,378) (1,634,974) (169,819) (103,109)
CAPITAL SHARE TRANSACTIONS:
Proceeds from shares sold 19,964,765 19,039,707 12,793,748 4,962,929
Cost of shares redeemed (14,353,080) (7,694,517) — —
Net increase in net assets from capital share transactions 5,611,685 11,345,190 12,793,748 4,962,929
INCREASE (DECREASE) IN NET ASSETS (4,095,949) 8,486,067 14,001,812 4,304,563
NET ASSETSBeginning of period 53,486,049 44,999,982 4,304,563 —
End of period $ 49,390,100 $53,486,049 $18,306,375 $4,304,563
Undistributed (distributions in excess of) net investment
income included in net assets at end of period $ 1,276 $ (66,825) $ 188,633 $ 52,929
SHARES ISSUED AND REDEEMEDShares sold 1,150,000 950,000 500,000 200,000
Shares redeemed (750,000) (400,000) — —
Net increase in shares outstanding 400,000 550,000 500,000 200,000
a Commencement of operations.
See notes to financial statements.
78 2 0 1 7 i S H A R E S A N N U A L R E P O R T T O S H A R E H O L D E R S
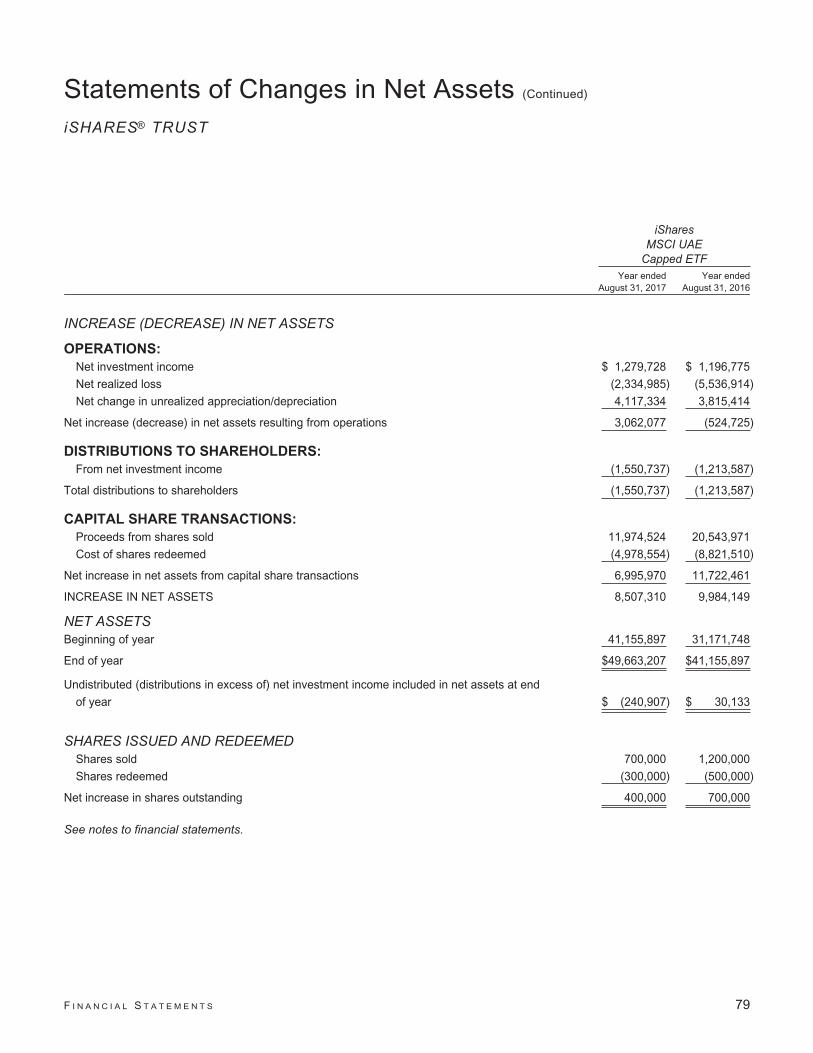
Statements of Changes in Net Assets (Continued)
iSHARES® TRUST
iSharesMSCI UAE
Capped ETFYear ended
August 31, 2017Year ended
August 31, 2016
INCREASE (DECREASE) IN NET ASSETS
OPERATIONS:
Net investment income $ 1,279,728 $ 1,196,775
Net realized loss (2,334,985) (5,536,914)
Net change in unrealized appreciation/depreciation 4,117,334 3,815,414
Net increase (decrease) in net assets resulting from operations 3,062,077 (524,725)
DISTRIBUTIONS TO SHAREHOLDERS:
From net investment income (1,550,737) (1,213,587)
Total distributions to shareholders (1,550,737) (1,213,587)
CAPITAL SHARE TRANSACTIONS:
Proceeds from shares sold 11,974,524 20,543,971
Cost of shares redeemed (4,978,554) (8,821,510)
Net increase in net assets from capital share transactions 6,995,970 11,722,461
INCREASE IN NET ASSETS 8,507,310 9,984,149
NET ASSETSBeginning of year 41,155,897 31,171,748
End of year $49,663,207 $41,155,897
Undistributed (distributions in excess of) net investment income included in net assets at end
of year $ (240,907) $ 30,133
SHARES ISSUED AND REDEEMEDShares sold 700,000 1,200,000
Shares redeemed (300,000) (500,000)
Net increase in shares outstanding 400,000 700,000
See notes to financial statements.
F I N A N C I A L S T A T E M E N T S 79

Financial HighlightsiSHARES® TRUST(For a share outstanding throughout each period)
iShares MSCI All Peru Capped ETFYear ended
Aug. 31, 2017Year ended
Aug. 31, 2016Year ended
Aug. 31, 2015Year ended
Aug. 31, 2014Year ended
Aug. 31, 2013
Net asset value, beginning of year $ 32.79 $ 23.09 $ 36.60 $ 33.90 $ 41.33
Income from investment operations:
Net investment incomea 0.46 0.33 0.36 0.45 0.94
Net realized and unrealized gain (loss)b 4.99 9.73 (13.48) 2.73 (7.07)
Total from investment operations 5.45 10.06 (13.12) 3.18 (6.13)
Less distributions from:
Net investment income (0.70) (0.36) (0.39) (0.48) (1.30)
Total distributions (0.70) (0.36) (0.39) (0.48) (1.30)
Net asset value, end of year $ 37.54 $ 32.79 $ 23.09 $ 36.60 $ 33.90
Total return 16.89% 44.13% (36.15)% 9.50% (15.36)%
Ratios/Supplemental data:
Net assets, end of year (000s) $170,794 $218,026 $131,595 $252,539 $313,565
Ratio of expenses to average net assets 0.62% 0.63% 0.61% 0.51% 0.51%
Ratio of expenses to average net assets prior to
waived fees n/a n/a 0.62% 0.62% 0.61%
Ratio of net investment income to average net assets 1.37% 1.23% 1.15% 1.33% 2.24%
Portfolio turnover ratec 13% 22% 21% 13% 11%
a Based on average shares outstanding throughout each period.b The amounts reported for a share outstanding may not accord with the change in aggregate gains and losses in securities for the fiscal period due to the timing of
capital share transactions in relation to the fluctuating market values of the Fund’s underlying securities.c Portfolio turnover rates exclude portfolio securities received or delivered in Creation Units but include portfolio transactions that are executed as a result of the Fund
processing capital share transactions in Creation Units partially for cash in U.S. dollars. Excluding such cash transactions, the portfolio turnover rates for the yearsended August 31, 2017 and August 31, 2016 were 12% and 22%, respectively. See Note 4.
See notes to financial statements.
80 2 0 1 7 i S H A R E S A N N U A L R E P O R T T O S H A R E H O L D E R S

Financial Highlights (Continued)
iSHARES® TRUST(For a share outstanding throughout the period)
iShares MSCI Argentina and Global Exposure ETFPeriod from
Apr. 25, 2017a
toAug. 31, 2017
Net asset value, beginning of period $ 25.23
Income from investment operations:
Net investment incomeb 0.03
Net realized and unrealized gainc 0.46
Total from investment operations 0.49
Less distributions from:
Net investment income (0.01)
Total distributions (0.01)
Net asset value, end of period $ 25.71
Total return 2.00%d
Ratios/Supplemental data:
Net assets, end of period (000s) $15,428
Ratio of expenses to average net assetse 0.59%
Ratio of net investment income to average net assetse 0.34%
Portfolio turnover ratef 17%d
a Commencement of operations.b Based on average shares outstanding throughout the period.c The amount reported for a share outstanding may not accord with the change in aggregate gains and losses in securities for the fiscal period due to the timing of
capital share transactions in relation to the fluctuating market values of the Fund’s underlying securities.d Not annualized.e Annualized for periods of less than one year.f Portfolio turnover rate excludes portfolio securities received or delivered as a result of processing capital share transactions in Creation Units.
See notes to financial statements.
F I N A N C I A L H I G H L I G H T S 81

Financial Highlights (Continued)
iSHARES® TRUST(For a share outstanding throughout each period)
iShares MSCI Brazil Small-Cap ETFYear ended
Aug. 31, 2017Year ended
Aug. 31, 2016Year ended
Aug. 31, 2015Year ended
Aug. 31, 2014Year ended
Aug. 31, 2013
Net asset value, beginning of year $ 11.51 $ 8.12 $ 21.00 $ 19.78 $ 25.65
Income from investment operations:
Net investment incomea 0.36 0.24 0.37 0.47 0.32
Net realized and unrealized gain (loss)b 4.74 3.35 (12.85) 1.13 (5.59)
Total from investment operations 5.10 3.59 (12.48) 1.60 (5.27)
Less distributions from:
Net investment income (0.42) (0.20) (0.40) (0.38) (0.43)
Return of capital — — (0.00)c — (0.17)
Total distributions (0.42) (0.20) (0.40) (0.38) (0.60)
Net asset value, end of year $ 16.19 $ 11.51 $ 8.12 $ 21.00 $ 19.78
Total return 45.92% 45.17% (60.01)% 8.18% (21.00)%
Ratios/Supplemental data:
Net assets, end of year (000s) $62,316 $50,087 $27,189 $40,951 $34,608
Ratio of expenses to average net assets 0.62% 0.63% 0.62% 0.62% 0.61%
Ratio of net investment income to average net assets 2.76% 2.77% 2.87% 2.36% 1.25%
Portfolio turnover rated 58% 38% 172% 40% 51%
a Based on average shares outstanding throughout each period.b The amounts reported for a share outstanding may not accord with the change in aggregate gains and losses in securities for the fiscal period due to the timing of
capital share transactions in relation to the fluctuating market values of the Fund’s underlying securities.c Rounds to less than $0.01.d Portfolio turnover rates include portfolio transactions that are executed as a result of the Fund processing capital share transactions in Creation Units solely for cash
in U.S. dollars. Excluding such transactions, the portfolio turnover rates for the years ended August 31, 2017, August 31, 2016, August 31, 2015, August 31, 2014and August 31, 2013 were 26%, 28%, 39%, 35% and 39%, respectively. See Note 4.
See notes to financial statements.
82 2 0 1 7 i S H A R E S A N N U A L R E P O R T T O S H A R E H O L D E R S

Financial Highlights (Continued)
iSHARES® TRUST(For a share outstanding throughout each period)
iShares MSCI China ETFYear ended
Aug. 31, 2017Year ended
Aug. 31, 2016Year ended
Aug. 31, 2015Year ended
Aug. 31, 2014Year ended
Aug. 31, 2013
Net asset value, beginning of year $ 46.87 $ 44.49 $ 50.34 $ 43.90 $ 39.68
Income from investment operations:
Net investment incomea 0.86 0.97 1.41 1.15 1.36
Net realized and unrealized gain (loss)b 14.94 2.34 (6.21) 6.24 3.88
Total from investment operations 15.80 3.31 (4.80) 7.39 5.24
Less distributions from:
Net investment income (0.61) (0.93) (1.05) (0.95) (1.02)
Total distributions (0.61) (0.93) (1.05) (0.95) (1.02)
Net asset value, end of year $ 62.06 $ 46.87 $ 44.49 $ 50.34 $ 43.90
Total return 34.13% 7.63% (9.86)% 17.03% 13.40%
Ratios/Supplemental data:
Net assets, end of year (000s) $2,594,247 $2,099,991 $1,815,303 $1,132,558 $856,075
Ratio of expenses to average net assets 0.62% 0.64% 0.62% 0.62% 0.61%
Ratio of net investment income to average net assets 1.70% 2.24% 2.65% 2.48% 3.02%
Portfolio turnover ratec 6% 27% 14% 7% 10%
a Based on average shares outstanding throughout each period.b The amounts reported for a share outstanding may not accord with the change in aggregate gains and losses in securities for the fiscal period due to the timing of
capital share transactions in relation to the fluctuating market values of the Fund’s underlying securities.c Portfolio turnover rates exclude portfolio securities received or delivered in Creation Units but include portfolio transactions that are executed as a result of the Fund
processing capital share transactions in Creation Units partially for cash in U.S. dollars. Excluding such cash transactions, the portfolio turnover rates for the yearsended August 31, 2017, August 31, 2016, August 31, 2015 and August 31, 2014 were 6%, 27%, 14% and 7%, respectively. See Note 4.
See notes to financial statements.
F I N A N C I A L H I G H L I G H T S 83

Financial Highlights (Continued)
iSHARES® TRUST(For a share outstanding throughout each period)
iShares MSCI China Small-Cap ETFYear ended
Aug. 31, 2017Year ended
Aug. 31, 2016Year ended
Aug. 31, 2015Year ended
Aug. 31, 2014Year ended
Aug. 31, 2013
Net asset value, beginning of year $ 43.79 $ 41.08 $ 48.30 $ 41.98 $ 32.15
Income from investment operations:
Net investment incomea 1.22 1.25 1.24 1.09 1.07
Net realized and unrealized gain (loss)b 5.21 2.99 (7.18) 6.55 9.87
Total from investment operations 6.43 4.24 (5.94) 7.64 10.94
Less distributions from:
Net investment income (1.72) (1.53) (1.28) (1.32) (1.11)
Total distributions (1.72) (1.53) (1.28) (1.32) (1.11)
Net asset value, end of year $ 48.50 $ 43.79 $ 41.08 $ 48.30 $ 41.98
Total return 15.29% 10.50% (12.94)% 18.46% 34.30%
Ratios/Supplemental data:
Net assets, end of year (000s) $21,825 $19,706 $24,646 $33,808 $31,487
Ratio of expenses to average net assets 0.62% 0.64% 0.62% 0.62% 0.61%
Ratio of net investment income to average net assets 2.72% 2.95% 2.44% 2.38% 2.60%
Portfolio turnover ratec 26% 31% 35% 33% 27%
a Based on average shares outstanding throughout each period.b The amounts reported for a share outstanding may not accord with the change in aggregate gains and losses in securities for the fiscal period due to the timing of
capital share transactions in relation to the fluctuating market values of the Fund’s underlying securities.c Portfolio turnover rates exclude portfolio securities received or delivered in Creation Units but include portfolio transactions that are executed as a result of the Fund
processing capital share transactions in Creation Units partially for cash in U.S. dollars. Excluding such cash transactions, the portfolio turnover rates for the yearsended August 31, 2017, August 31, 2016, August 31, 2015, August 31, 2014 and August 31, 2013 were 26%, 31%, 32%, 33% and 27%, respectively. See Note 4.
See notes to financial statements.
84 2 0 1 7 i S H A R E S A N N U A L R E P O R T T O S H A R E H O L D E R S

Financial Highlights (Continued)
iSHARES® TRUST(For a share outstanding throughout each period)
iShares MSCI Indonesia ETFYear ended
Aug. 31, 2017Year ended
Aug. 31, 2016Year ended
Aug. 31, 2015Year ended
Aug. 31, 2014Year ended
Aug. 31, 2013
Net asset value, beginning of year $ 25.82 $ 20.18 $ 28.54 $ 24.78 $ 28.49
Income from investment operations:
Net investment incomea 0.31 0.34 0.31 0.37 0.53
Net realized and unrealized gain (loss)b 1.11 5.59 (8.29) 3.75 (3.77)
Total from investment operations 1.42 5.93 (7.98) 4.12 (3.24)
Less distributions from:
Net investment income (0.35) (0.27) (0.38) (0.36) (0.47)
Return of capital — (0.02) — — —
Total distributions (0.35) (0.29) (0.38) (0.36) (0.47)
Net asset value, end of year $ 26.89 $ 25.82 $ 20.18 $ 28.54 $ 24.78
Total return 5.53% 29.59% (28.13)% 16.79% (11.67)%
Ratios/Supplemental data:
Net assets, end of year (000s) $501,411 $702,198 $268,381 $576,411 $392,769
Ratio of expenses to average net assets 0.62% 0.63% 0.62% 0.62% 0.61%
Ratio of net investment income to average net assets 1.22% 1.47% 1.16% 1.41% 1.67%
Portfolio turnover ratec 6% 5% 4% 8% 15%
a Based on average shares outstanding throughout each period.b The amounts reported for a share outstanding may not accord with the change in aggregate gains and losses in securities for the fiscal period due to the timing of
capital share transactions in relation to the fluctuating market values of the Fund’s underlying securities.c Portfolio turnover rates exclude portfolio securities received or delivered as a result of processing capital share transactions in Creation Units.
See notes to financial statements.
F I N A N C I A L H I G H L I G H T S 85

Financial Highlights (Continued)
iSHARES® TRUST(For a share outstanding throughout each period)
iShares MSCI Philippines ETFYear ended
Aug. 31, 2017Year ended
Aug. 31, 2016Year ended
Aug. 31, 2015Year ended
Aug. 31, 2014Year ended
Aug. 31, 2013
Net asset value, beginning of year $ 39.19 $ 35.50 $ 38.19 $ 31.93 $ 29.37
Income from investment operations:
Net investment incomea 0.15 0.21 0.34 0.35 0.42
Net realized and unrealized gain (loss)b (3.26) 3.74 (2.70) 6.22 2.47
Total from investment operations (3.11) 3.95 (2.36) 6.57 2.89
Less distributions from:
Net investment income (0.20) (0.26) (0.33) (0.31) (0.33)
Total distributions (0.20) (0.26) (0.33) (0.31) (0.33)
Net asset value, end of year $ 35.88 $ 39.19 $ 35.50 $ 38.19 $ 31.93
Total return (7.87)% 11.19% (6.21)% 20.53%c 9.81%
Ratios/Supplemental data:
Net assets, end of year (000s) $172,245 $317,403 $266,273 $351,313 $277,824
Ratio of expenses to average net assets 0.62% 0.64% 0.62% 0.62% 0.61%
Ratio of net investment income to average net assets 0.42% 0.58% 0.85% 1.02% 1.14%
Portfolio turnover rated 7% 10% 12% 24% 23%
a Based on average shares outstanding throughout each period.b The amounts reported for a share outstanding may not accord with the change in aggregate gains and losses in securities for the fiscal period due to the timing of
capital share transactions in relation to the fluctuating market values of the Fund’s underlying securities.c The total return disclosed is based on the net asset value (“NAV”) calculated daily for the creation and redemption of shares in the Fund, which may differ from the
NAV calculated for financial reporting purposes. Based on the NAV calculated for financial reporting purposes, the total return for the Fund was 20.63%.d Portfolio turnover rates exclude portfolio securities received or delivered as a result of processing capital share transactions in Creation Units.
See notes to financial statements.
86 2 0 1 7 i S H A R E S A N N U A L R E P O R T T O S H A R E H O L D E R S

Financial Highlights (Continued)
iSHARES® TRUST(For a share outstanding throughout each period)
iShares MSCI Poland Capped ETFYear ended
Aug. 31, 2017Year ended
Aug. 31, 2016Year ended
Aug. 31, 2015Year ended
Aug. 31, 2014Year ended
Aug. 31, 2013
Net asset value, beginning of year $ 18.06 $ 21.63 $ 28.02 $ 27.12 $ 24.31
Income from investment operations:
Net investment incomea 0.45b 0.42 0.65 0.84 0.74
Net realized and unrealized gain (loss)c 9.25 (3.70) (6.25) 1.04 2.94
Total from investment operations 9.70 (3.28) (5.60) 1.88 3.68
Less distributions from:
Net investment income (0.43) (0.29) (0.79) (0.98) (0.87)
Total distributions (0.43) (0.29) (0.79) (0.98) (0.87)
Net asset value, end of year $ 27.33 $ 18.06 $ 21.63 $ 28.02 $ 27.12
Total return 54.79%b (15.17)% (20.31)% 6.82% 15.13%
Ratios/Supplemental data:
Net assets, end of year (000s) $363,537 $179,737 $193,567 $297,056 $277,933
Ratio of expenses to average net assets 0.63% 0.64% 0.62% 0.62% 0.61%
Ratio of expenses to average net assets excluding
professional fees for foreign withholding tax
claims (Note 8) 0.62% n/a n/a n/a n/a
Ratio of net investment income to average net assets 2.07%b 2.24% 2.60% 2.83% 2.73%
Portfolio turnover rated 6% 10% 17% 10% 21%
a Based on average shares outstanding throughout each period.b Reflects the positive effect of foreign withholding tax claims, net of the associated professional fees (See Note 8), which resulted in the following increases for the
year ended August 31, 2017:• Net investment income per share by $0.03• Total return by 0.11%• Ratio of net investment income to average net assets by 0.14%
c The amounts reported for a share outstanding may not accord with the change in aggregate gains and losses in securities for the fiscal period due to the timing ofcapital share transactions in relation to the fluctuating market values of the Fund’s underlying securities.
d Portfolio turnover rates exclude portfolio securities received or delivered as a result of processing capital share transactions in Creation Units.
See notes to financial statements.
F I N A N C I A L H I G H L I G H T S 87
Financial Highlights (Continued)
iSHARES® TRUST(For a share outstanding throughout each period)
iShares MSCI Qatar Capped ETF
Year endedAug. 31, 2017
Year endedAug. 31, 2016
Period fromAug. 1, 2015
toAug. 31, 2015a
Year endedJul. 31, 2015
Period fromApr. 29, 2014b
toJul. 31, 2014
Net asset value, beginning of period $ 20.18 $ 21.43 $ 22.14 $ 24.73 $ 24.26
Income from investment operations:
Net investment income (loss)c 0.57 0.67 (0.01) 0.70 (0.02)
Net realized and unrealized gain (loss)d (3.90) (1.24) (0.70) (2.44) 0.49
Total from investment operations (3.33) (0.57) (0.71) (1.74) 0.47
Less distributions from:
Net investment income (0.66) (0.66) — (0.85) —
Return of capital — (0.02) — — —
Total distributions (0.66) (0.68) — (0.85) —
Net asset value, end of period $ 16.19 $ 20.18 $ 21.43 $ 22.14 $ 24.73
Total return (16.52)% (2.32)% (3.21)%e (7.10)% 1.94%e
Ratios/Supplemental data:
Net assets, end of period (000s) $49,390 $53,486 $45,000 $47,590 $35,853
Ratio of expenses to average net assetsf 0.62% 0.64% 0.63% 0.62% 0.61%
Ratio of net investment income (loss) to average
net assetsf 3.05% 3.44% (0.63)% 2.94% (0.34)%
Portfolio turnover rateg 47% 29% 5%e 85% 11%e
a The Fund’s fiscal year-end was changed from July 31 to August 31.b Commencement of operations.c Based on average shares outstanding throughout each period.d The amounts reported for a share outstanding may not accord with the change in aggregate gains and losses in securities for the fiscal period due to the timing of
capital share transactions in relation to the fluctuating market values of the Fund’s underlying securities.e Not annualized.f Annualized for periods of less than one year.g Portfolio turnover rates include portfolio transactions that are executed as a result of the Fund processing capital share transactions in Creation Units solely for cash
in U.S. dollars. Excluding such transactions, the portfolio turnover rates for the years ended August 31, 2017, August 31, 2016, the period ended August 31, 2015,the year ended July 31, 2015 and the period ended July 31, 2014 were 20%, 12%, 2%, 37% and 0%, respectively. See Note 4.
See notes to financial statements.
88 2 0 1 7 i S H A R E S A N N U A L R E P O R T T O S H A R E H O L D E R S
Financial Highlights (Continued)
iSHARES® TRUST(For a share outstanding throughout each period)
iShares MSCI Saudi Arabia Capped ETF
Year endedAug. 31, 2017
Period fromSep. 16, 2015a
toAug. 31, 2016
Net asset value, beginning of period $ 21.52 $ 24.92
Income from investment operations:
Net investment incomeb 0.91 0.81
Net realized and unrealized gain (loss)c 4.24 (3.69)
Total from investment operations 5.15 (2.88)
Less distributions from:
Net investment income (0.52) (0.52)
Total distributions (0.52) (0.52)
Net asset value, end of period $ 26.15 $ 21.52
Total return 24.06% (11.64)%d
Ratios/Supplemental data:
Net assets, end of period (000s) $18,306 $ 4,305
Ratio of expenses to average net assetse 0.74% 0.74%
Ratio of net investment income to average net assetse 3.68% 3.71%
Portfolio turnover ratef 21% 17%d
a Commencement of operations.b Based on average shares outstanding throughout each period.c The amounts reported for a share outstanding may not accord with the change in aggregate gains and losses in securities for the fiscal period due to the timing of
capital share transactions in relation to the fluctuating market values of the Fund’s underlying securities.d Not annualized.e Annualized for periods of less than one year.f Portfolio turnover rates include portfolio transactions that are executed as a result of the Fund processing capital share transactions in Creation Units solely for cash
in U.S. dollars. Excluding such cash transactions, the portfolio turnover rates for the year ended August 31, 2017 and the period ended August 31, 2016 were 21%and 17%, respectively. See Note 4.
See notes to financial statements.
F I N A N C I A L H I G H L I G H T S 89

Financial Highlights (Continued)
iSHARES® TRUST(For a share outstanding throughout each period)
iShares MSCI UAE Capped ETF
Year endedAug. 31, 2017
Year endedAug. 31, 2016
Period fromAug. 1, 2015
toYear ended
Aug. 31, 2015aYear ended
Jul. 31, 2015
Period fromApr. 29, 2014b
toYear ended
Jul. 31, 2014
Net asset value, beginning of period $ 17.15 $ 18.34 $ 20.46 $ 24.00 $ 25.04
Income from investment operations:
Net investment income (loss)c 0.50 0.68d (0.01) 1.01 0.01
Net realized and unrealized gain (loss)e 0.72 (1.19) (2.11) (3.56) (1.01)
Total from investment operations 1.22 (0.51) (2.12) (2.55) (1.00)
Less distributions from:
Net investment income (0.63) (0.68) — (0.99) (0.04)
Total distributions (0.63) (0.68) — (0.99) (0.04)
Net asset value, end of period $ 17.74 $ 17.15 $ 18.34 $ 20.46 $ 24.00
Total return 7.33% (2.66)% (10.36)%f (10.33)% (4.00)%f
Ratios/Supplemental data:
Net assets, end of period (000s) $49,663 $41,156 $31,172 $33,756 $51,610
Ratio of expenses to average net assetsg 0.62% 0.64% 0.63% 0.62% 0.62%
Ratio of net investment income (loss) to average
net assetsg 2.94% 4.09%d (0.76)% 4.81% 0.19%
Portfolio turnover rateh 33% 55% 1%f 72% 22%f
a The Fund’s fiscal year-end was changed from July 31 to August 31.b Commencement of operations.c Based on average shares outstanding throughout each period.d Includes a special distribution from Mediclinic International PLC. Excluding such special distribution, the net investment income would have been $0.52 per share
and 3.11% of average net assets.e The amount reported for a share outstanding may not accord with the change in aggregate gains and losses in securities for the fiscal period due to the timing of
capital share transactions in relation to the fluctuating market values of the Fund’s underlying securities.f Not annualized.g Annualized for periods of less than one year.h Portfolio turnover rates include portfolio transactions that are executed as a result of the Fund processing capital share transactions in Creation Units solely for cash
in U.S. dollars. Excluding such cash transactions, the portfolio turnover rates for the years ended August 31, 2017, August 31, 2016, the period ended August 31,2015, the year ended July 31, 2015 and the period ended July 31, 2014 were 23%, 29%, 1%, 38% and 1%, respectively. See Note 4.
See notes to financial statements.
90 2 0 1 7 i S H A R E S A N N U A L R E P O R T T O S H A R E H O L D E R S
Notes to Financial StatementsiSHARES® TRUST
iShares Trust (the “Trust”) is registered under the Investment Company Act of 1940, as amended (the “1940 Act”), as an open-
end management investment company. The Trust was established as a Delaware statutory trust pursuant to an Agreement and
Declaration of Trust dated December 16, 1999.
These financial statements relate only to the following funds (each, a “Fund,” and collectively, the “Funds”):
iShares ETF
Diversification
Classification
MSCI All Peru Capped Non-diversifiedMSCI Argentina and Global Exposurea Non-diversifiedMSCI Brazil Small-Cap DiversifiedMSCI China Non-diversifiedMSCI China Small-Cap DiversifiedMSCI Indonesia Non-diversified
iShares ETF
Diversification
Classification
MSCI Philippines Non-diversified
MSCI Poland Capped Non-diversified
MSCI Qatar Capped Non-diversified
MSCI Saudi Arabia Capped Non-diversified
MSCI UAE Capped Non-diversified
a The Fund commenced operations on April 25, 2017.
The investment objective of each Fund is to seek investment results that correspond generally to the price and yield performance,
before fees and expenses, of its underlying index. The investment adviser uses a “passive” or index approach to try to achieve
each Fund’s investment objective.
Pursuant to the Trust’s organizational documents, the Funds’ officers and trustees are indemnified against certain liabilities that
may arise out of the performance of their duties to the Funds. Additionally, in the normal course of business, the Funds enter into
contracts with service providers that contain general indemnification clauses. The Funds’ maximum exposure under these
arrangements is unknown as this would involve future claims that may be made against the Funds that have not yet occurred.
1. SIGNIFICANT ACCOUNTING POLICIES
The following significant accounting policies are consistently followed by each Fund in the preparation of its financial statements
in conformity with accounting principles generally accepted in the United States of America (“U.S. GAAP”). The preparation of
financial statements in conformity with U.S. GAAP requires management to make certain estimates and assumptions that affect
the reported amounts of assets and liabilities and disclosures of contingent assets and liabilities at the date of the financial
statements and the reported amounts of revenue and expenses during the reporting period. Actual results could differ from those
estimates. Each Fund is considered an investment company under U.S. GAAP and follows the accounting and reporting guidance
applicable to investment companies.
SECURITY VALUATION
Each Fund’s investments are valued at fair value each day that the Fund’s listing exchange is open and, for financial reporting
purposes, as of the report date should the reporting period end on a day that the Fund’s listing exchange is not open. U.S. GAAP
defines fair value as the price a fund would receive to sell an asset or pay to transfer a liability in an orderly transaction between
market participants at the measurement date. The BlackRock Global Valuation Methodologies Committee (the “Global Valuation
Committee”) provides oversight of the valuation of investments for the Funds. The investments of each Fund are valued pursuant
to policies and procedures developed by the Global Valuation Committee and approved by the Board of Trustees of the Trust (the
“Board”).
• Equity investments traded on a recognized securities exchange are valued at that day’s last reported trade price or the
official closing price, as applicable, on the exchange where the stock is primarily traded. Equity investments traded on a
recognized exchange for which there were no sales on that day are valued at the last traded price.
N O T E S T O F I N A N C I A L S T A T E M E N T S 91

Notes to Financial Statements (Continued)
iSHARES® TRUST
• Open-end U.S. mutual funds (including money market funds) are valued at that day’s published net asset value (“NAV”).
• Futures contract notional values are determined based on that day’s last reported settlement price on the exchange where
the contract is traded.
In the event that application of these methods of valuation results in a price for an investment which is deemed not to be
representative of the fair value of such investment or if a price is not available, the investment will be valued by the Global
Valuation Committee, in accordance with policies approved by the Board. The fair valuation approaches that may be utilized by
the Global Valuation Committee to determine fair value include market approach, income approach and the cost approach. The
valuation techniques used under these approaches take into consideration inputs that include but are not limited to (i) attributes
specific to the investment; (ii) the principal market for the investment; (iii) the customary participants in the principal market for the
investment; (iv) data assumptions by market participants for the investment, if reasonably available; (v) quoted prices for similar
investments in active markets; and (vi) other inputs, such as future cash flows, interest rates, yield curves, volatilities, prepayment
speeds, loss severities, credit risks and/or default rates. Valuations based on such inputs are reported to the Board on a quarterly
basis.
The Global Valuation Committee employs various methods for calibrating valuation approaches for investments where an active
market does not exist, including regular due diligence of the Trust’s pricing vendors, a regular review of key inputs and
assumptions, transactional back-testing or disposition analysis to compare unrealized gains and losses to realized gains and
losses, reviews of missing or stale prices, reviews of large movements in market values, and reviews of market related activity.
Fair value pricing could result in a difference between the prices used to calculate a Fund’s NAV and the prices used by the
Fund’s underlying index, which in turn could result in a difference between the Fund’s performance and the performance of the
Fund’s underlying index.
Various inputs are used in determining the fair value of financial instruments. Inputs may be based on independent market data
(“observable inputs”) or they may be internally developed (“unobservable inputs”). These inputs to valuation techniques are
categorized into a fair value hierarchy consisting of three broad levels for financial reporting purposes as follows:
• Level 1 — Unadjusted quoted prices in active markets for identical assets or liabilities;
• Level 2 — Inputs other than quoted prices included within Level 1 that are observable for the asset or liability either directly
or indirectly, including quoted prices for similar assets or liabilities in active markets, quoted prices for identical or similar
assets or liabilities in markets that are not considered to be active, inputs other than quoted prices that are observable for
the asset or liability (such as exchange rates, financing terms, interest rates, yield curves, volatilities, prepayment speeds,
loss severities, credit risks and default rates) or other market-corroborated inputs; and
• Level 3 — Unobservable inputs for the asset or liability based on the best information available in the circumstances, to the
extent observable inputs are not available, including the Global Valuation Committee’s assumptions used in determining the
fair value of investments.
The hierarchy gives the highest priority to unadjusted quoted prices in active markets for identical assets or liabilities (Level 1
measurements) and the lowest priority to unobservable inputs (Level 3 measurements). Accordingly, the degree of judgement
exercised in determining fair value is greatest for instruments categorized in Level 3. The inputs used to measure fair value may
fall into different levels of the fair value hierarchy. In such cases, for disclosure purposes, the fair value hierarchy classification is
determined based on the lowest level input that is significant to the fair value measurement in its entirety. The fair value hierarchy
for each Fund’s investments is included in its schedule of investments.
92 2 0 1 7 i S H A R E S A N N U A L R E P O R T T O S H A R E H O L D E R S
Notes to Financial Statements (Continued)
iSHARES® TRUST
Changes in valuation techniques may result in transfers in or out of an assigned level within the fair value hierarchy. In
accordance with the Trust’s policy, transfers between different levels of the fair value hierarchy are deemed to have occurred as
of the beginning of the reporting period. The categorization of values determined for financial instruments are based on the pricing
transparency of the financial instruments and are not necessarily an indication of the risks associated with investing in those
securities.
SECURITY TRANSACTIONS AND INCOME RECOGNITION
Security transactions are accounted for on trade date. Realized gains and losses on investment transactions are determined
using the specific identification method. Dividend income and capital gain distributions, if any, are recognized on the ex-dividend
date, net of any foreign taxes withheld at source. Any taxes withheld that are reclaimable from foreign tax authorities as of
August 31, 2017 are reflected in tax reclaims receivable. Upon notification from issuers, some of the dividend income received
from a real estate investment trust may be re-designated as a reduction of cost of the related investment and/or realized gain.
Non-cash dividends received, if any, are recognized on the ex-dividend date and recorded as non-cash dividend income at fair
value. Distributions received by the Funds may include a return of capital that is estimated by management. Such amounts are
recorded as a reduction of the cost of investments or reclassified to capital gains. Interest income is accrued daily.
FOREIGN CURRENCY TRANSLATION
The accounting records of the Funds are maintained in U.S. dollars. Foreign currencies, as well as investment securities and
other assets and liabilities denominated in foreign currencies, are translated into U.S. dollars using exchange rates deemed
appropriate by the investment adviser. Purchases and sales of securities, income receipts and expense payments are translated
into U.S. dollars on the respective dates of such transactions.
Each Fund does not isolate the effect of fluctuations in foreign exchange rates from the effect of fluctuations in the market prices
of securities. Such fluctuations are reflected by the Funds as a component of realized and unrealized gains and losses from
investments for financial reporting purposes. Each Fund reports realized currency gains (losses) on foreign currency related
transactions as components of net realized gain (loss) for financial reporting purposes, whereas such components are generally
treated as ordinary income for U.S. federal income tax purposes.
FOREIGN TAXES
The Funds may be subject to foreign taxes (a portion of which may be reclaimable) on income, stock dividends, capital gains on
investments, or certain foreign currency transactions. All foreign taxes are recorded in accordance with the applicable foreign tax
regulations and rates that exist in the foreign jurisdictions in which the Funds invest. These foreign taxes, if any, are paid by the
Funds and are reflected in their statements of operations as follows: foreign taxes withheld at source are presented as a reduction
of income, foreign taxes on securities lending income are presented as a reduction of securities lending income, foreign taxes on
stock dividends are presented as “other foreign taxes”, and foreign taxes on capital gains from sales of investments and foreign
taxes on foreign currency transactions are included in their respective net realized gain (loss) categories. Foreign taxes payable
or deferred as of August 31, 2017, if any, are disclosed in the Funds’ statements of assets and liabilities.
DISTRIBUTIONS TO SHAREHOLDERS
Dividends and distributions paid by each Fund are recorded on the ex-dividend dates. Distributions are determined on a tax basis
and may differ from net investment income and net realized capital gains for financial reporting purposes. Dividends and
distributions are paid in U.S. dollars and cannot be automatically reinvested in additional shares of the Funds.
N O T E S T O F I N A N C I A L S T A T E M E N T S 93

Notes to Financial Statements (Continued)
iSHARES® TRUST
LOANS OF PORTFOLIO SECURITIES
Each Fund may lend its investment securities to approved borrowers, such as brokers, dealers and other financial institutions.
The borrower pledges and maintains with the Fund collateral consisting of cash, an irrevocable letter of credit issued by an
approved bank, or securities issued or guaranteed by the U.S. government. The initial collateral received by each Fund is
required to have a value of at least 102% of the current value of the loaned securities for securities traded on U.S. exchanges and
a value of at least 105% for all other securities. The collateral is maintained thereafter at a value equal to at least 100% of the
current value of the securities on loan. The market value of the loaned securities is determined at the close of each business day
of the Funds. Any additional required collateral is delivered to the Funds and any excess collateral is returned by the Funds on
the next business day. During the term of the loan, each Fund is entitled to all distributions made on or in respect of the loaned
securities but does not receive interest income on securities received as collateral. Loans of securities are terminable at any time
and the borrower, after notice, is required to return borrowed securities within the standard time period for settlement of securities
transactions.
Cash received as collateral for securities on loan may be reinvested in certain short-term instruments either directly on behalf of a
fund or through one or more joint accounts or money market funds, including those managed by BlackRock Fund Advisors
(“BFA”), the Funds’ investment adviser, or its affiliates. As of August 31, 2017, any securities on loan were collateralized by cash
and/or U.S. government obligations. Cash collateral received was invested in money market funds managed by BFA and is
disclosed in the schedules of investments. Any non-cash collateral received cannot be sold, re-invested or pledged by the Fund,
except in the event of borrower default. The securities on loan for each Fund are also disclosed in its schedule of investments.
The total value of any securities on loan as of August 31, 2017 and the total value of the related cash collateral are disclosed in
the statements of assets and liabilities. Income earned by the Funds from securities lending is disclosed in the statements of
operations.
The risks of securities lending include the risk that the borrower may not provide additional collateral when required or may not
return the securities when due. To mitigate these risks, the Funds benefit from a borrower default indemnity provided by
BlackRock, Inc. (“BlackRock”). BlackRock’s indemnity allows for full replacement of securities loaned if the collateral received
does not cover the value of the securities loaned in the event of borrower default. Each Fund could incur a loss if the value of an
investment purchased with cash collateral falls below the value of the loaned securities or if the value of an investment purchased
with cash collateral falls below the value of the original cash collateral received.
Securities lending transactions are entered into by the Funds under Master Securities Lending Agreements (“MSLA”) which
provide the right, in the event of default (including bankruptcy or insolvency) for the non-defaulting party to liquidate the collateral
and calculate a net exposure to the defaulting party or request additional collateral. In the event that a borrower defaults, a Fund,
as lender, would offset the market value of the collateral received against the market value of the securities loaned. The value of
the collateral is typically greater than that of the market value of the securities loaned, leaving the lender with a net amount
payable to the defaulting party. However, bankruptcy or insolvency laws of a particular jurisdiction may impose restrictions on or
prohibitions against such a right of offset in the event of an MSLA counterparty’s bankruptcy or insolvency. Under the MSLA, the
borrower can resell or re-pledge the loaned securities, and a Fund can reinvest cash collateral, or, upon an event of default, resell
or re-pledge the collateral.
94 2 0 1 7 i S H A R E S A N N U A L R E P O R T T O S H A R E H O L D E R S

Notes to Financial Statements (Continued)
iSHARES® TRUST
The following table is a summary of securities lending agreements which are subject to offset under an MSLA as of August 31,
2017:
iShares ETF
and Counterparty
Market Value of
Securities on Loan
Cash Collateral
Received a
Net
Amount
MSCI ChinaBarclays Capital Inc. $ 627,310 $ 627,310 $ —BNP Paribas Prime Brokerage International Ltd. 57,118,835 57,118,835 —Citigroup Global Markets Inc. 43,808,046 43,808,046 —Credit Suisse Securities (USA) LLC 1,691,314 1,691,314 —Deutsche Bank Securities Inc. 10,670,010 10,670,010 —Goldman Sachs & Co. 7,667,562 7,667,562 —HSBC Bank PLC 68,763,470 68,763,470 —Jefferies LLC 591,476 591,476 —JPMorgan Securities LLC 6,820,576 6,820,576 —Merrill Lynch, Pierce, Fenner & Smith 140,815,057 140,815,057 —Morgan Stanley & Co. LLC 15,236,909 15,236,909 —Morgan Stanley & Co. LLC (U.S. Equity Securities Lending) 5,980,388 5,980,388 —Nomura Securities International Inc. 1,345,311 1,345,311 —Scotia Capital (USA) Inc. 248,952 248,952 —State Street Bank & Trust Company 2,104,601 2,104,601 —
$ 363,489,817 $ 363,489,817 $ —
MSCI China Small-CapBarclays Capital Inc. 134,252 134,252 —Citigroup Global Markets Inc. 145,394 145,394 —Credit Suisse Securities (USA) LLC 838,937 838,937 —Deutsche Bank Securities Inc. 608,994 608,994 —Goldman Sachs & Co. 496,069 496,069 —JPMorgan Securities LLC 653,541 653,541 —Merrill Lynch, Pierce, Fenner & Smith 827,773 827,773 —Morgan Stanley & Co. LLC 544,591 544,591 —Morgan Stanley & Co. LLC (U.S. Equity Securities Lending) 113,314 113,314 —Nomura Securities International Inc. 46,880 46,880 —Scotia Capital (USA) Inc. 6,337 6,337 —SG Americas Securities LLC 127,654 127,654 —State Street Bank & Trust Company 168,833 168,833 —UBS AG 495,262 495,262 —UBS Securities LLC 203,179 203,179 —
$ 5,411,010 $ 5,411,010 $ —
MSCI Poland CappedDeutsche Bank Securities Inc. 206,412 206,412 —Goldman Sachs & Co. 2,404,623 2,404,623 —JPMorgan Securities LLC 21,492 21,492 —Merrill Lynch, Pierce, Fenner & Smith 2,186,784 2,186,784 —Morgan Stanley & Co. LLC 589,313 589,313 —UBS AG 24,668 24,668 —UBS Securities LLC 498,585 498,585 —
$ 5,931,877 $ 5,931,877 $ —
a Collateral received in excess of the market value of securities on loan is not presented in this table. The total cash collateral received by each Fund isdisclosed in the Fund’s statement of assets and liabilities.
N O T E S T O F I N A N C I A L S T A T E M E N T S 95

Notes to Financial Statements (Continued)
iSHARES® TRUST
2. INVESTMENT ADVISORY AGREEMENT AND OTHER TRANSACTIONS WITH AFFILIATES
Pursuant to an Investment Advisory Agreement with the Trust, BFA manages the investment of each Fund’s assets. BFA is a
California corporation indirectly owned by BlackRock. Under the Investment Advisory Agreement, BFA is responsible for
substantially all expenses of the Funds, except (i) interest and taxes; (ii) brokerage commissions and other expenses connected
with the execution of portfolio transactions; (iii) distribution fees; (iv) the advisory fee payable to BFA; and (v) litigation expenses
and any extraordinary expenses (in each case as determined by a majority of the independent trustees).
For its investment advisory services to each of the iShares MSCI All Peru Capped, iShares MSCI Brazil Small-Cap, iShares MSCI
China, iShares MSCI China Small-Cap, iShares MSCI Indonesia, iShares MSCI Philippines, iShares MSCI Poland Capped,
iShares MSCI Qatar Capped and iShares MSCI UAE Capped ETFs, BFA is entitled to an annual investment advisory fee,
accrued daily and paid monthly by the Funds, based on each Fund’s allocable portion of the aggregate of the average daily net
assets of the Fund and certain other iShares funds, as follows:
Investment Advisory Fee Aggregate Average Daily Net Assets
0.74% First $2 billion
0.69 Over $2 billion, up to and including $4 billion
0.64 Over $4 billion, up to and including $8 billion
0.57 Over $8 billion, up to and including $16 billion
0.51 Over $16 billion, up to and including $24 billion
0.48 Over $24 billion, up to and including $32 billion
0.45 Over $32 billion
For its investment advisory services to each of the following Funds, BFA is entitled to an annual investment advisory fee, accrued
daily and paid monthly by the Funds, based on the average daily net assets of each Fund as follows:
iShares ETF
Investment
Advisory Fee
MSCI Argentina and Global Exposure 0.59%
MSCI Saudi Arabia Capped 0.74
The U.S. Securities and Exchange Commission has issued an exemptive order which permits BlackRock Institutional Trust
Company, N.A. (“BTC”), an affiliate of BFA, to serve as securities lending agent for the Funds, subject to applicable conditions. As
securities lending agent, BTC bears all operational costs directly related to securities lending. Each Fund is responsible for fees in
connection with the investment of cash collateral received for securities on loan in a money market fund managed by BFA,
however, BTC has agreed to reduce the amount of securities lending income it receives in order to effectively limit the collateral
investment fees each Fund bears to an annual rate of 0.04% (the “collateral investment fees”). Securities lending income is equal
to the total of income earned from the reinvestment of cash collateral, net of fees and other payments to and from borrowers of
securities, and less the collateral investment fees. The Funds retain a portion of securities lending income and remit the
remaining portion to BTC as compensation for its services as securities lending agent.
Pursuant to a securities lending agreement, each Fund retains 80% of securities lending income and the amount retained can
never be less than 70% of the total of securities lending income plus the collateral investment fees. In addition, commencing the
business day following the date that the aggregate securities lending income plus the collateral investment fees generated across
all 1940 Act iShares exchange-traded funds (the “iShares ETF Complex”) in a given calendar year exceeds the aggregate
securities lending income generated across the iShares ETF Complex in the calendar year 2013, each Fund, pursuant to a
96 2 0 1 7 i S H A R E S A N N U A L R E P O R T T O S H A R E H O L D E R S

Notes to Financial Statements (Continued)
iSHARES® TRUST
securities lending agreement, will retain for the remainder of that calendar year 85% of securities lending income and the amount
retained can never be less than 70% of the total of securities lending income plus the collateral investment fees.
For the year ended August 31, 2017, the total of securities lending agent services and collateral investment fees paid were as
follows:
iShares ETF
Fees Paid
to BTC
MSCI China $544,931
MSCI China Small-Cap 52,199
MSCI Poland Capped 100,450
BlackRock Investments, LLC, an affiliate of BFA, is the distributor for each Fund. Pursuant to the distribution agreement, BFA is
responsible for any fees or expenses for distribution services provided to the Funds.
Cross trading is the buying or selling of portfolio securities between funds to which BFA (or an affiliate) serves as investment
adviser. At its regularly scheduled quarterly meetings, the Board reviews such transactions as of the most recent calendar quarter
for compliance with the requirements and restrictions set forth by Rule 17a-7.
For the year ended August 31, 2017, transactions executed by the Funds pursuant to Rule 17a-7 under the 1940 Act were as
follows:
iShares ETF Purchases Sales
MSCI All Peru Capped $ 1,146,386 $ —
MSCI Argentina and Global Exposure 687,055 28,472
MSCI China 28,611,543 9,598,771
MSCI China Small-Cap 907,596 1,148,955
MSCI Poland Capped 3,038,338 1,600,585
MSCI UAE Capped — 540,897
Each Fund may invest its positive cash balances in certain money market funds managed by BFA or an affiliate. The income
earned on these temporary cash investments is included in “Dividends – affiliated” in the statements of operations.
The PNC Financial Services Group, Inc. is the largest stockholder of BlackRock and is considered to be an affiliate of the Funds
for 1940 Act purposes.
Certain trustees and officers of the Trust are also officers of BTC and/or BFA.
N O T E S T O F I N A N C I A L S T A T E M E N T S 97
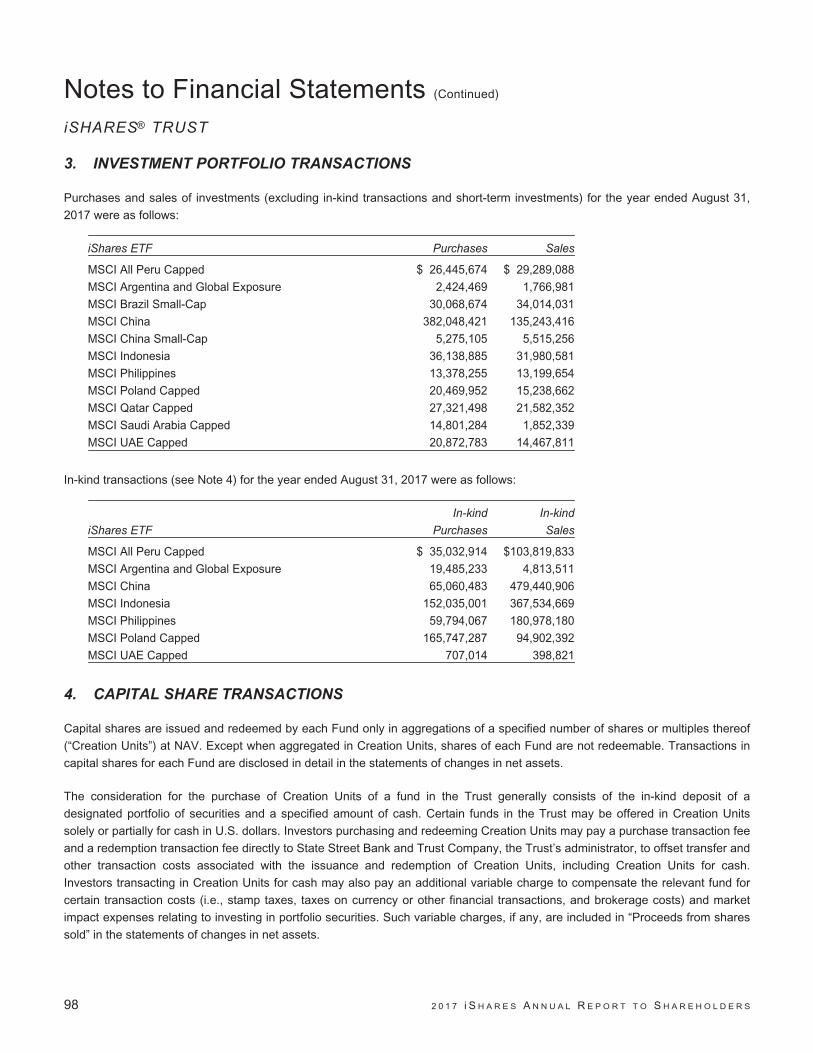
Notes to Financial Statements (Continued)
iSHARES® TRUST
3. INVESTMENT PORTFOLIO TRANSACTIONS
Purchases and sales of investments (excluding in-kind transactions and short-term investments) for the year ended August 31,
2017 were as follows:
iShares ETF Purchases Sales
MSCI All Peru Capped $ 26,445,674 $ 29,289,088
MSCI Argentina and Global Exposure 2,424,469 1,766,981
MSCI Brazil Small-Cap 30,068,674 34,014,031
MSCI China 382,048,421 135,243,416
MSCI China Small-Cap 5,275,105 5,515,256
MSCI Indonesia 36,138,885 31,980,581
MSCI Philippines 13,378,255 13,199,654
MSCI Poland Capped 20,469,952 15,238,662
MSCI Qatar Capped 27,321,498 21,582,352
MSCI Saudi Arabia Capped 14,801,284 1,852,339
MSCI UAE Capped 20,872,783 14,467,811
In-kind transactions (see Note 4) for the year ended August 31, 2017 were as follows:
iShares ETF
In-kind
Purchases
In-kind
Sales
MSCI All Peru Capped $ 35,032,914 $103,819,833
MSCI Argentina and Global Exposure 19,485,233 4,813,511
MSCI China 65,060,483 479,440,906
MSCI Indonesia 152,035,001 367,534,669
MSCI Philippines 59,794,067 180,978,180
MSCI Poland Capped 165,747,287 94,902,392
MSCI UAE Capped 707,014 398,821
4. CAPITAL SHARE TRANSACTIONS
Capital shares are issued and redeemed by each Fund only in aggregations of a specified number of shares or multiples thereof
(“Creation Units”) at NAV. Except when aggregated in Creation Units, shares of each Fund are not redeemable. Transactions in
capital shares for each Fund are disclosed in detail in the statements of changes in net assets.
The consideration for the purchase of Creation Units of a fund in the Trust generally consists of the in-kind deposit of a
designated portfolio of securities and a specified amount of cash. Certain funds in the Trust may be offered in Creation Units
solely or partially for cash in U.S. dollars. Investors purchasing and redeeming Creation Units may pay a purchase transaction fee
and a redemption transaction fee directly to State Street Bank and Trust Company, the Trust’s administrator, to offset transfer and
other transaction costs associated with the issuance and redemption of Creation Units, including Creation Units for cash.
Investors transacting in Creation Units for cash may also pay an additional variable charge to compensate the relevant fund for
certain transaction costs (i.e., stamp taxes, taxes on currency or other financial transactions, and brokerage costs) and market
impact expenses relating to investing in portfolio securities. Such variable charges, if any, are included in “Proceeds from shares
sold” in the statements of changes in net assets.
98 2 0 1 7 i S H A R E S A N N U A L R E P O R T T O S H A R E H O L D E R S

Notes to Financial Statements (Continued)
iSHARES® TRUST
5. FUTURES CONTRACTS
The Fund’s use of futures contracts is generally limited to cash equitization. This involves the use of available cash to invest in
index futures contracts in order to gain exposure to the equity markets represented in or by the Fund’s underlying index and is
intended to allow the Fund to better track its underlying index. Futures contracts are standardized, exchange-traded agreements
to buy or sell a financial instrument at a set price on a future date. Upon entering into a futures contract, a fund is required to
pledge to the executing broker which holds segregated from its own assets, an amount of cash, U.S. government securities or
other high-quality debt and equity securities equal to the minimum initial margin requirements of the exchange on which the
contract is traded.
Pursuant to the contract, the fund agrees to receive from or pay to the broker an amount of cash equal to the daily fluctuation in
notional value of the contract. Such receipts or payments are known as margin variation and are recorded by the fund as
unrealized appreciation or depreciation. When the contract is closed, the fund records a realized gain or loss equal to the
difference between the notional value of the contract at the time it was opened and the notional value at the time it was closed.
Losses may arise if the notional value of a futures contract decreases due to an unfavorable change in the market rates or values
of the underlying instrument during the term of the contract or if the counterparty does not perform under the contract. The use of
futures contracts also involves the risk of an imperfect correlation in the movements in the price of futures contracts and the
assets underlying such contracts.
The following table shows the value of futures contracts held by the iShares MSCI China ETF as of August 31, 2017 and the
related locations in the statements of assets and liabilities, presented by risk exposure category:
Assets
Equity contracts:
Variation margin / Net assets consist of – net unrealized
appreciation (depreciation)a $30,271
a Represents cumulative appreciation of futures contracts as reported in the schedule of investments. Only current day’s variation margin is reportedseparately within the statement of assets and liabilities.
The following table shows the realized and unrealized gains (losses) on futures contracts held by the iShares MSCI China ETF
during the year ended August 31, 2017 and the related locations in the statements of operations, presented by risk exposure
category:
Net Realized
Gain (Loss)
Net Change in
Unrealized
Appreciation/Depreciation
Equity contracts:
Futures contracts $ 2,543,059 $ 10,591
The following table shows the average quarter-end balances of open futures contracts for the iShares MSCI China ETF for the
year ended August 31, 2017:
Average value of contracts purchased $3,625,860
N O T E S T O F I N A N C I A L S T A T E M E N T S 99
Notes to Financial Statements (Continued)
iSHARES® TRUST
6. PRINCIPAL RISKS
In the normal course of business, each Fund invests in securities or other instruments and may enter into certain transactions,
and such activities subject the Fund to various risks, including, among others, fluctuations in the market (market risk) or failure of
an issuer to meet all of its obligations. The value of securities or other instruments may also be affected by various factors,
including, without limitation: (i) the general economy; (ii) the overall market as well as local, regional or global political and/or
social instability; (iii) regulation, taxation or international tax treaties between various countries; or (iv) currency, interest rate or
price fluctuations. Each Fund’s prospectus provides details of the risks to which the Fund is subject.
BFA uses a “passive” or index approach to try to achieve each Fund’s investment objective following the securities included in its
underlying index during upturns as well as downturns. BFA does not take steps to reduce market exposure or to lessen the
effects of a declining market. Divergence from the underlying index and the composition of the portfolio is monitored by BFA.
MARKET RISK
Market risk arises mainly from uncertainty about future values of financial instruments influenced by price, currency and interest
rate movements. It represents the potential loss a fund may suffer through holding market positions in the face of market
movements. A fund is exposed to market risk by its investment in equity, fixed income and/or financial derivative instruments or
by its investment in underlying funds. The fair value of securities held by a fund may decline due to general market conditions,
economic trends or events that are not specifically related to the issuers of the securities including local, regional or global
political, social or economic instability or to factors that affect a particular industry or group of industries. The extent of a fund’s
exposure to market risk is the market value of the investments held as shown in the fund’s schedule of investments.
A diversified portfolio, where this is appropriate and consistent with a fund’s objectives, minimizes the risk that a price change of a
particular investment will have a material impact on the NAV of a fund. The investment concentrations within each Fund’s portfolio
are disclosed in its schedule of investments.
Investing in the securities of non-U.S. issuers involves certain considerations and risks not typically associated with securities of
U.S. issuers. Such risks include, but are not limited to: differences in accounting, auditing and financial reporting standards; more
substantial governmental involvement in the economy; higher inflation rates, greater social, economic and political uncertainties;
possible nationalization or expropriation of assets; less availability of public information about issuers; imposition of withholding or
other taxes; higher transaction and custody costs and delays in settlement procedures; and lower level of regulation of the
securities markets and issuers. Non-U.S. securities may be less liquid, more difficult to value, and have greater price volatility due
to exchange rate fluctuations. These and other risks are heightened for investments in issuers from countries with less developed
capital markets.
When a fund concentrates its investments in issuers located in a single country, it assumes the risk that economic, political and
social conditions in that country may have a significant impact on its investment performance.
CREDIT RISK
Credit risk is the risk that an issuer or guarantor of debt instruments or the counterparty to a financial transaction, including
derivatives contracts, repurchase agreements or loans of portfolio securities, is unable or unwilling to make timely interest and/or
principal payments or to otherwise honor its obligations. BFA and its affiliates manage counterparty credit risk by entering into
transactions only with counterparties that they believe have the financial resources to honor their obligations and by monitoring
the financial stability of those counterparties. Financial assets, which potentially expose a fund to issuer and counterparty credit
100 2 0 1 7 i S H A R E S A N N U A L R E P O R T T O S H A R E H O L D E R S
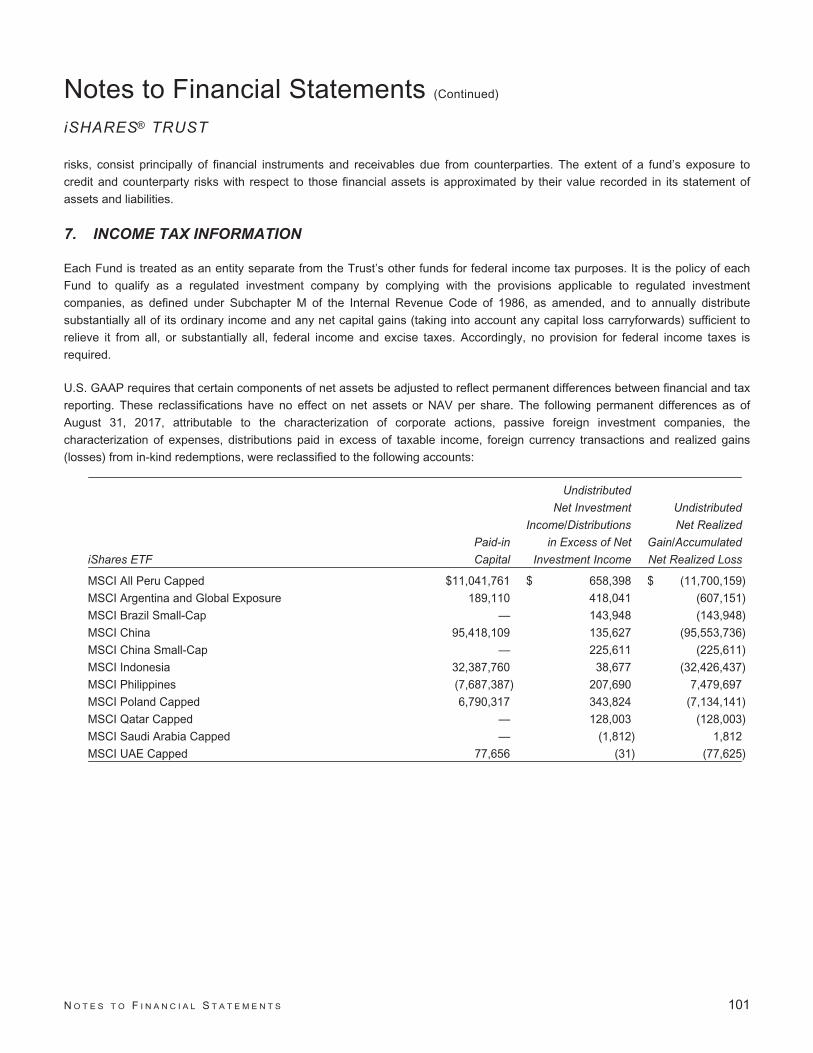
Notes to Financial Statements (Continued)
iSHARES® TRUST
risks, consist principally of financial instruments and receivables due from counterparties. The extent of a fund’s exposure to
credit and counterparty risks with respect to those financial assets is approximated by their value recorded in its statement of
assets and liabilities.
7. INCOME TAX INFORMATION
Each Fund is treated as an entity separate from the Trust’s other funds for federal income tax purposes. It is the policy of each
Fund to qualify as a regulated investment company by complying with the provisions applicable to regulated investment
companies, as defined under Subchapter M of the Internal Revenue Code of 1986, as amended, and to annually distribute
substantially all of its ordinary income and any net capital gains (taking into account any capital loss carryforwards) sufficient to
relieve it from all, or substantially all, federal income and excise taxes. Accordingly, no provision for federal income taxes is
required.
U.S. GAAP requires that certain components of net assets be adjusted to reflect permanent differences between financial and tax
reporting. These reclassifications have no effect on net assets or NAV per share. The following permanent differences as of
August 31, 2017, attributable to the characterization of corporate actions, passive foreign investment companies, the
characterization of expenses, distributions paid in excess of taxable income, foreign currency transactions and realized gains
(losses) from in-kind redemptions, were reclassified to the following accounts:
iShares ETF
Paid-in
Capital
Undistributed
Net Investment
Income/Distributions
in Excess of Net
Investment Income
Undistributed
Net Realized
Gain/Accumulated
Net Realized Loss
MSCI All Peru Capped $11,041,761 $ 658,398 $ (11,700,159)
MSCI Argentina and Global Exposure 189,110 418,041 (607,151)
MSCI Brazil Small-Cap — 143,948 (143,948)
MSCI China 95,418,109 135,627 (95,553,736)
MSCI China Small-Cap — 225,611 (225,611)
MSCI Indonesia 32,387,760 38,677 (32,426,437)
MSCI Philippines (7,687,387) 207,690 7,479,697
MSCI Poland Capped 6,790,317 343,824 (7,134,141)
MSCI Qatar Capped — 128,003 (128,003)
MSCI Saudi Arabia Capped — (1,812) 1,812
MSCI UAE Capped 77,656 (31) (77,625)
N O T E S T O F I N A N C I A L S T A T E M E N T S 101
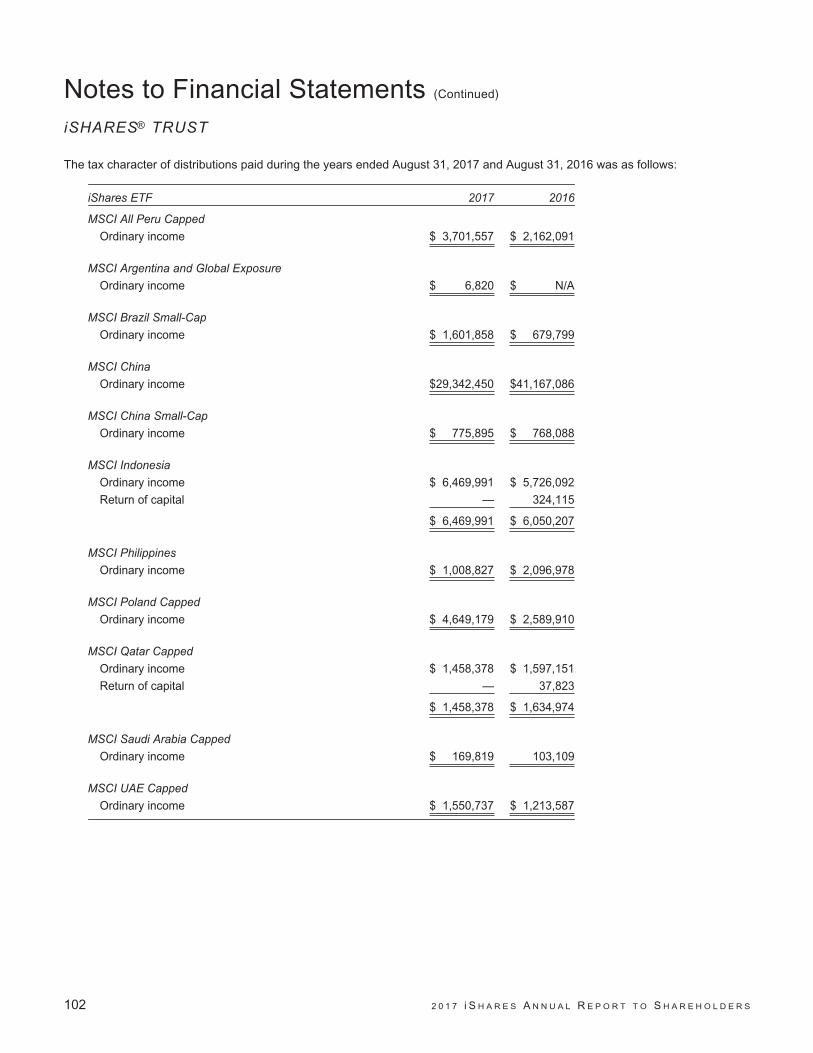
Notes to Financial Statements (Continued)
iSHARES® TRUST
The tax character of distributions paid during the years ended August 31, 2017 and August 31, 2016 was as follows:
iShares ETF 2017 2016
MSCI All Peru Capped
Ordinary income $ 3,701,557 $ 2,162,091
MSCI Argentina and Global Exposure
Ordinary income $ 6,820 $ N/A
MSCI Brazil Small-Cap
Ordinary income $ 1,601,858 $ 679,799
MSCI China
Ordinary income $29,342,450 $41,167,086
MSCI China Small-Cap
Ordinary income $ 775,895 $ 768,088
MSCI Indonesia
Ordinary income $ 6,469,991 $ 5,726,092
Return of capital — 324,115
$ 6,469,991 $ 6,050,207
MSCI Philippines
Ordinary income $ 1,008,827 $ 2,096,978
MSCI Poland Capped
Ordinary income $ 4,649,179 $ 2,589,910
MSCI Qatar Capped
Ordinary income $ 1,458,378 $ 1,597,151
Return of capital — 37,823
$ 1,458,378 $ 1,634,974
MSCI Saudi Arabia Capped
Ordinary income $ 169,819 103,109
MSCI UAE Capped
Ordinary income $ 1,550,737 $ 1,213,587
102 2 0 1 7 i S H A R E S A N N U A L R E P O R T T O S H A R E H O L D E R S

Notes to Financial Statements (Continued)
iSHARES® TRUST
As of August 31, 2017, the tax components of accumulated net earnings (losses) were as follows:
iShares ETF
Undistributed
Ordinary
Income
Capital
Loss
Carryforwards
Net
Unrealized
Gains (Losses) a
Qualified
Late-Year
Losses b Total
MSCI All Peru Capped $ 264,879 $(76,558,388) $ (53,111,313) $ — $(129,404,822)
MSCI Argentina and Global Exposure 425,301 (7,706) (594,144) — (176,549)
MSCI Brazil Small-Cap 1,936,896 (41,539,751) 18,404,114 — (21,198,741)
MSCI China 31,387,778 (195,451,853) 505,830,079 — 341,766,004
MSCI China Small-Cap 171,500 (4,446,803) (1,328,718) — (5,604,021)
MSCI Indonesia — (60,294,188) (54,218,309) — (114,512,497)
MSCI Philippines — (34,129,389) (26,124,720) (17,537) (60,271,646)
MSCI Poland Capped 5,709,508 (38,643,170) (3,927,096) — (36,860,758)
MSCI Qatar Capped 2,920 (8,614,500) (12,347,654) — (20,959,234)
MSCI Saudi Arabia Capped 188,633 (186,869) 547,934 — 549,698
MSCI UAE Capped 256,183 (11,910,059) (4,692,666) — (16,346,542)
a The difference between book-basis and tax-basis unrealized gains (losses) was attributable primarily to the tax deferral of losses on wash sales, thecharacterization of corporate actions, and the realization for tax purposes of unrealized gains on investments in passive foreign investment companies.
b The Funds have elected to defer certain qualified late-year losses and recognize such losses in the next taxable year.
As of August 31, 2017, the Funds had capital loss carryforwards available to offset future realized capital gains through the
indicated expiration dates as follows:
iShares ETF
Non-
Expiring a
Expiring
2019 Total
MSCI All Peru Capped $ 76,077,364 $481,024 $ 76,558,388
MSCI Argentina and Global Exposure 7,706 — 7,706
MSCI Brazil Small-Cap 41,539,751 — 41,539,751
MSCI China 195,451,853 — 195,451,853
MSCI China Small-Cap 4,446,803 — 4,446,803
MSCI Indonesia 60,273,859 20,329 60,294,188
MSCI Philippines 34,129,389 — 34,129,389
MSCI Poland Capped 38,643,165 5 38,643,170
MSCI Qatar Capped 8,614,500 — 8,614,500
MSCI Saudi Arabia Capped 186,869 — 186,869
MSCI UAE Capped 11,910,059 — 11,910,059
a Must be utilized prior to losses subject to expiration.
The Funds may own shares in certain foreign investment entities, referred to, under U.S. tax law, as “passive foreign investment
companies.” The Funds may elect to mark-to-market annually the shares of each passive foreign investment company and would
be required to distribute to shareholders any such marked-to-market gains.
Management has analyzed tax laws and regulations and their application to the Funds as of August 31, 2017, inclusive of the
open tax return years, and does not believe there are any uncertain tax positions that require recognition of a tax liability in the
Funds’ financial statements.
N O T E S T O F I N A N C I A L S T A T E M E N T S 103

Notes to Financial Statements (Continued)
iSHARES® TRUST
8. FOREIGN WITHHOLDING TAX CLAIMS
The iShares MSCI Poland Capped ETF has filed claims to recover taxes withheld by Poland on dividend income on the basis that
Poland had purportedly violated certain provisions in the Treaty on the Functioning of the European Union. The Fund has
received payments on certain of the claims resulting from a favorable court ruling that the imposition of a withholding tax by a
European Union member state on dividends paid to a nonresident company, including the Fund, while exempting domestic funds
from such taxes results in discriminatory tax withholding contrary to the free movement of capital. The Fund continues to evaluate
developments in Poland for potential impacts on recoverable withholding taxes. Polish withholding tax claims received are
disclosed in the statement of operations. Professional fees associated with the filing of tax claims in Poland that result in the
recovery of foreign withholding taxes have been approved by the Board as appropriate expenses of the Fund.
The Internal Revenue Service has issued guidance to address U.S. income tax liabilities attributable to fund shareholders
resulting from the recovery of foreign taxes withheld in prior years. These withheld foreign taxes were passed through to
shareholders in the form of foreign tax credits in the year the taxes were withheld. Assuming there are sufficient foreign taxes paid
which the Fund is able to pass through to its shareholders as a foreign tax credit in the current year, the Fund will be able to offset
the prior years’ withholding taxes recovered against the foreign taxes paid in the current year. Accordingly, no federal income tax
liability is recorded by the Fund.
9. LEGAL PROCEEDINGS
On June 16, 2016, investors (the “Plaintiffs”) in certain iShares funds (iShares Core S&P Small-Cap ETF, iShares Russell 1000
Growth ETF, iShares Core S&P 500 ETF, iShares Russell Mid-Cap Growth ETF, iShares Russell Mid-Cap ETF, iShares Russell
Mid-Cap Value ETF, iShares Select Dividend ETF, iShares Morningstar Mid-Cap ETF, iShares Morningstar Large-Cap ETF,
iShares U.S. Aerospace & Defense ETF and iShares U.S. Preferred Stock ETF) filed a putative class action lawsuit against
iShares Trust, BlackRock, Inc. and certain of its advisory affiliates, and certain directors/trustees and officers of the Funds
(collectively, “Defendants”). The lawsuit alleges the Defendants violated federal securities laws by failing to adequately disclose in
the prospectuses issued by the funds noted above the risks of using stop-loss orders in the event of a ‘flash crash’, such as the
one that occurred on May 6, 2010. On September 18, 2017, the Court issued a Statement of Decision holding that the Plaintiffs
lack standing to assert their claims. On October 11, 2017, the Court entered final judgment dismissing all of Plaintiffs’ claims with
prejudice.
10. SUBSEQUENT EVENTS
Management has evaluated the impact of all subsequent events on the Funds through the date the financial statements were
available to be issued and has determined that there were no subsequent events requiring adjustment or disclosure in the
financial statements.
104 2 0 1 7 i S H A R E S A N N U A L R E P O R T T O S H A R E H O L D E R S

Report of Independent Registered Public Accounting Firm
To the Board of Trustees of iShares Trust and
Shareholders of the iShares MSCI All Peru Capped ETF,
iShares MSCI Argentina and Global Exposure ETF, iShares MSCI Brazil Small-Cap ETF,
iShares MSCI China ETF, iShares MSCI China Small-Cap ETF, iShares MSCI Indonesia ETF,
iShares MSCI Philippines ETF, iShares MSCI Poland Capped ETF, iShares MSCI Qatar Capped ETF, iShares MSCI Saudi
Arabia Capped ETF and iShares MSCI UAE Capped ETF
In our opinion, the accompanying statements of assets and liabilities, including the schedules of investments, and the related
statements of operations and of changes in net assets and the financial highlights present fairly, in all material respects, the
financial position of iShares MSCI All Peru Capped ETF, iShares MSCI Argentina and Global Exposure ETF, iShares MSCI Brazil
Small-Cap ETF, iShares MSCI China ETF, iShares MSCI China Small-Cap ETF, iShares MSCI Indonesia ETF, iShares MSCI
Philippines ETF, iShares MSCI Poland Capped ETF, iShares MSCI Qatar Capped ETF, iShares MSCI Saudi Arabia Capped ETF
and iShares MSCI UAE Capped ETF (constituting funds of the iShares Trust, hereafter referred to as the “Funds”) as of
August 31, 2017, and the results of each of their operations, the changes in each of their net assets and the financial highlights
for each of the periods indicated, in conformity with accounting principles generally accepted in the United States of America.
These financial statements and financial highlights (hereafter referred to as “financial statements”) are the responsibility of the
Funds’ management. Our responsibility is to express an opinion on these financial statements based on our audits. We
conducted our audits of these financial statements in accordance with the standards of the Public Company Accounting Oversight
Board (United States). Those standards require that we plan and perform the audit to obtain reasonable assurance about whether
the financial statements are free of material misstatement. An audit includes examining, on a test basis, evidence supporting the
amounts and disclosures in the financial statements, assessing the accounting principles used and significant estimates made by
management, and evaluating the overall financial statement presentation. We believe that our audits, which included confirmation
of securities as of August 31, 2017 by correspondence with the custodian, transfer agent and brokers, or by other appropriate
auditing procedures where replies were not received, provide a reasonable basis for our opinion.
PricewaterhouseCoopers LLP
San Francisco, California
October 23, 2017
R E P O R T O F I N D E P E N D E N T R E G I S T E R E D P U B L I C A C C O U N T I N G F I R M 105

Tax Information (Unaudited)
iSHARES® TRUST
The following maximum amounts are hereby designated as qualified dividend income for individuals for the fiscal year ended
August 31, 2017:
iShares ETF
Qualified
Dividend
Income
MSCI All Peru Capped $ 1,905,342
MSCI Argentina and Global Exposure 33,778
MSCI China 34,820,373
MSCI China Small-Cap 107,401
iShares ETF
Qualified
Dividend
Income
MSCI Indonesia $11,396,136
MSCI Philippines 2,698,036
MSCI Poland Capped 6,704,788
MSCI UAE Capped 22,077
For corporate shareholders, the percentage of income dividends paid by the iShares MSCI All Peru Capped ETF during the fiscal
year ended August 31, 2017 that qualified for the dividends-received deduction was 6.44%.
For the fiscal year ended August 31, 2017, the following Funds earned foreign source income and paid foreign taxes which they
intend to pass through to their shareholders:
iShares ETF
Foreign Source
Income Earned
Foreign
Taxes Paid
MSCI All Peru Capped $ 4,718,171 $ 127,789
MSCI Argentina and Global Exposure 461,232 7,278
MSCI Brazil Small-Cap 1,828,528 83,636
MSCI China 56,562,508 4,557,984
MSCI China Small-Cap 494,692 7,164
MSCI Indonesia 11,461,271 1,745,714
MSCI Philippines 2,712,907 813,602
MSCI Poland Capped 6,814,311 501,534a
MSCI Qatar Capped 1,679,983 —
MSCI Saudi Arabia Capped 383,945 14,745
MSCI UAE Capped 1,547,782 —
a Amount has been reduced by the foreign withholding tax claims recovered from Poland in the current year. See Note 8.
106 2 0 1 7 i S H A R E S A N N U A L R E P O R T T O S H A R E H O L D E R S
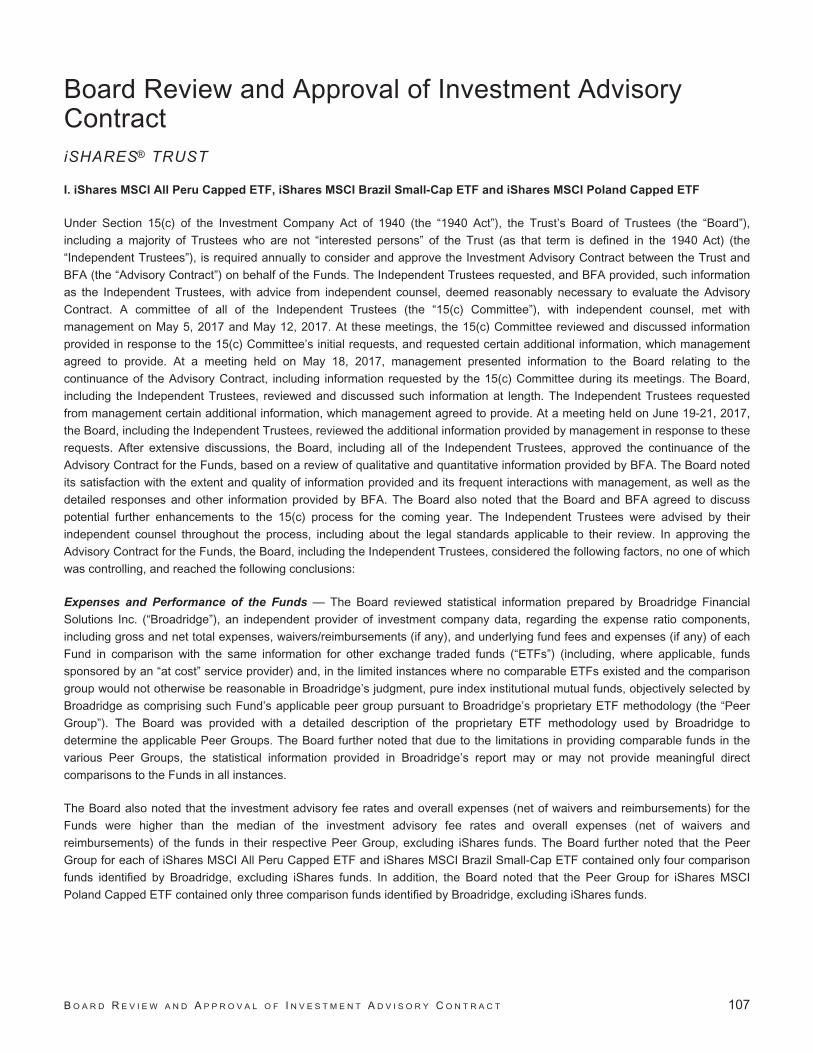
Board Review and Approval of Investment AdvisoryContractiSHARES® TRUST
I. iShares MSCI All Peru Capped ETF, iShares MSCI Brazil Small-Cap ETF and iShares MSCI Poland Capped ETF
Under Section 15(c) of the Investment Company Act of 1940 (the “1940 Act”), the Trust’s Board of Trustees (the “Board”),
including a majority of Trustees who are not “interested persons” of the Trust (as that term is defined in the 1940 Act) (the
“Independent Trustees”), is required annually to consider and approve the Investment Advisory Contract between the Trust and
BFA (the “Advisory Contract”) on behalf of the Funds. The Independent Trustees requested, and BFA provided, such information
as the Independent Trustees, with advice from independent counsel, deemed reasonably necessary to evaluate the Advisory
Contract. A committee of all of the Independent Trustees (the “15(c) Committee”), with independent counsel, met with
management on May 5, 2017 and May 12, 2017. At these meetings, the 15(c) Committee reviewed and discussed information
provided in response to the 15(c) Committee’s initial requests, and requested certain additional information, which management
agreed to provide. At a meeting held on May 18, 2017, management presented information to the Board relating to the
continuance of the Advisory Contract, including information requested by the 15(c) Committee during its meetings. The Board,
including the Independent Trustees, reviewed and discussed such information at length. The Independent Trustees requested
from management certain additional information, which management agreed to provide. At a meeting held on June 19-21, 2017,
the Board, including the Independent Trustees, reviewed the additional information provided by management in response to these
requests. After extensive discussions, the Board, including all of the Independent Trustees, approved the continuance of the
Advisory Contract for the Funds, based on a review of qualitative and quantitative information provided by BFA. The Board noted
its satisfaction with the extent and quality of information provided and its frequent interactions with management, as well as the
detailed responses and other information provided by BFA. The Board also noted that the Board and BFA agreed to discuss
potential further enhancements to the 15(c) process for the coming year. The Independent Trustees were advised by their
independent counsel throughout the process, including about the legal standards applicable to their review. In approving the
Advisory Contract for the Funds, the Board, including the Independent Trustees, considered the following factors, no one of which
was controlling, and reached the following conclusions:
Expenses and Performance of the Funds — The Board reviewed statistical information prepared by Broadridge Financial
Solutions Inc. (“Broadridge”), an independent provider of investment company data, regarding the expense ratio components,
including gross and net total expenses, waivers/reimbursements (if any), and underlying fund fees and expenses (if any) of each
Fund in comparison with the same information for other exchange traded funds (“ETFs”) (including, where applicable, funds
sponsored by an “at cost” service provider) and, in the limited instances where no comparable ETFs existed and the comparison
group would not otherwise be reasonable in Broadridge’s judgment, pure index institutional mutual funds, objectively selected by
Broadridge as comprising such Fund’s applicable peer group pursuant to Broadridge’s proprietary ETF methodology (the “Peer
Group”). The Board was provided with a detailed description of the proprietary ETF methodology used by Broadridge to
determine the applicable Peer Groups. The Board further noted that due to the limitations in providing comparable funds in the
various Peer Groups, the statistical information provided in Broadridge’s report may or may not provide meaningful direct
comparisons to the Funds in all instances.
The Board also noted that the investment advisory fee rates and overall expenses (net of waivers and reimbursements) for the
Funds were higher than the median of the investment advisory fee rates and overall expenses (net of waivers and
reimbursements) of the funds in their respective Peer Group, excluding iShares funds. The Board further noted that the Peer
Group for each of iShares MSCI All Peru Capped ETF and iShares MSCI Brazil Small-Cap ETF contained only four comparison
funds identified by Broadridge, excluding iShares funds. In addition, the Board noted that the Peer Group for iShares MSCI
Poland Capped ETF contained only three comparison funds identified by Broadridge, excluding iShares funds.
B O A R D R E V I E W A N D A P P R O V A L O F I N V E S T M E N T A D V I S O R Y C O N T R A C T 107

Board Review and Approval of Investment AdvisoryContract (Continued)
iSHARES® TRUST
In addition, to the extent that any of the comparison funds included in the Peer Group, excluding iShares funds, track the same
index as any particular Fund, Broadridge also provided, and the Board reviewed, a comparison of such Fund’s performance for
the one-, three-, five-, ten-year, and since inception periods, as applicable, and for the quarter ended December 31, 2016, to that
of relevant comparison funds for the same periods.
The Board noted that each Fund seeks to track its specified underlying index and that, during the year, the Board received
periodic reports on each Fund’s short- and longer-term performance in comparison with its underlying index. Such periodic
comparative performance information, including any additional detailed information requested by the Boards, was also
considered. The Board noted that each Fund generally performed in line with its underlying index over the relevant periods.
Based on this review, the other factors considered at the meeting, and their general knowledge of ETF pricing, the Board
concluded that the investment advisory fee rate and the historical performance of each Fund supported the Board’s approval of
the continuance of the Advisory Contract for the coming year.
Nature, Extent and Quality of Services Provided by BFA — Based on management’s representations, including information
about recent and proposed enhancements to the iShares business, including with respect to capital markets support and
analysis, technology, product design, compliance and risk management, and other services, the Board expected that there would
be no diminution in the scope of services required of or provided by BFA under the Advisory Contract for the coming year as
compared to the scope of services provided by BFA during prior years. In reviewing the scope of these services, the Board
considered BFA’s investment philosophy and experience, noting that BFA and its affiliates have committed significant resources
over time, including during the past year, to supporting the iShares funds and their shareholders. The Board also considered
BFA’s compliance program and its compliance record with respect to the Funds. In that regard, the Board noted that BFA reports
to the Board about portfolio management and compliance matters on a periodic basis in connection with regularly scheduled
meetings of the Board, and on other occasions as necessary and appropriate, and has provided information and made
appropriate officers available as needed to provide further assistance with these matters. The Board also reviewed the
background and experience of the persons responsible for the day-to-day management of the Funds, as well as the resources
available to them in managing the Funds. In addition to the above considerations, the Board reviewed and considered detailed
presentations regarding BFA’s investment performance, investment and risk management processes and strategies provided at
the June 19-21, 2017 meeting and throughout the previous year, and matters related to BFA’s portfolio compliance policies and
procedures. The Board noted that each Fund had met its investment objective consistently since its respective inception date.
Based on review of this information, and the performance information discussed above, the Board concluded that the nature,
extent and quality of services provided by BFA to the Funds under the Advisory Contract supported the Board’s approval of the
continuance of the Advisory Contract for the coming year.
Costs of Services Provided to Funds and Profits Realized by BFA and Affiliates — The Board reviewed information about
the profitability of the Funds to BlackRock, on a Fund-by-Fund basis and in the aggregate, based on the fees payable to BFA and
its affiliates (including fees under the Advisory Contract), and other sources of revenue and expense to BFA and its affiliates from
the Funds’ operations for the last calendar year. The Board reviewed BlackRock’s profitability methodology for the iShares funds,
including supplemental information that was responsive to requests of the 15(c) Committee. The Board noted that the 15(c)
Committee had focused on the methodology and profitability presentation during its meetings. The Board discussed the sources
of direct and ancillary revenue with management, including the revenues to BTC, a BFA affiliate, from securities lending by the
Funds. The Board also discussed BFA’s profit margin as reflected in the Funds’ profitability analyses and reviewed information
regarding potential economies of scale (as discussed below). Based on this review, the Board concluded that the profits realized
by BFA and its affiliates under the Advisory Contract and from other relationships between the Funds and BFA and/or its affiliates,
if any, were within a reasonable range in light of the factors considered.
108 2 0 1 7 i S H A R E S A N N U A L R E P O R T T O S H A R E H O L D E R S

Board Review and Approval of Investment AdvisoryContract (Continued)
iSHARES® TRUST
Economies of Scale — The Board reviewed information regarding potential economies of scale or other efficiencies that may
result from increases in the Funds’ assets, noting that the issue of economies of scale had been focused on by the 15(c)
Committee during its meetings and addressed by management, including through supplemental information. The Board and the
15(c) Committee reviewed information provided by BFA regarding scale benefits shared with the iShares funds through relatively
low fee rates established at inception, breakpoints and waivers or other fee reductions, as well as through additional investment in
the iShares business and the provision of improved or additional infrastructure and services to the iShares funds and their
shareholders. The Board and the 15(c) Committee received information regarding BlackRock’s historical profitability, including
BFA’s and its affiliates’ costs in providing services. The cost information distinguished, among other things, between fixed and
variable costs, and explained how the level of fixed and variable costs, as well as the nature of such costs, may impact the
existence or size of scale benefits. The Board noted that the Advisory Contract for the Funds already provided for breakpoints in
the Funds’ investment advisory fee rates as the assets of the Funds, on an aggregated basis with the assets of certain other
iShares funds, increase. The Board noted that it would continue to monitor the sharing of economies of scale to determine the
appropriateness of adding new or revised breakpoints in the future.
Based on this review, as well as the other factors considered at the meeting, the Board, recognizing its responsibility to consider
the Advisory Contract at least annually, determined to approve the continuance of the Advisory Contract for the coming year.
Fees and Services Provided for Other Comparable Funds/Accounts Managed by BFA and its Affiliates — The Board
received and considered information regarding the investment advisory/management fee rates for other funds/accounts in the
U.S. for which BFA (or its affiliates) provides investment advisory/management services, including open-end funds registered
under the 1940 Act (including sub-advised funds), collective trust funds, and institutional separate accounts (together, the “Other
Accounts”), and acknowledged BFA’s assertion that the iShares funds are fundamentally different investment vehicles from the
Other Accounts. The Board noted that BFA and its affiliates do not manage Other Accounts with substantially the same
investment objectives and strategies as the Funds and that track the same index as the Funds. The Board further noted that BFA
provided the Board with detailed information regarding how the Other Accounts (particularly institutional clients) generally differ
from the Funds, including in terms of the different and generally more extensive services provided to the Funds, as well as other
significant differences. In that regard, the Board considered that the pricing of services to institutional clients is typically based on
a number of factors beyond the nature and extent of the specific services to be provided and often depends on the overall
relationship between the client and its affiliates and the adviser and its affiliates. In addition, the Board considered the relative
complexity and inherent risks and challenges of managing and providing other services to the Funds, as publicly traded ETFs, as
compared to the Other Accounts that are institutional clients in light of differing regulatory requirements and client-imposed
mandates. The Board also acknowledged BFA’s expressed business purpose for launching a suite of iShares “Core” ETFs that
generally are subject to lower investment advisory fees than iShares non-Core ETFs that may provide a similar investment
exposure. The Board also considered the “all-inclusive” nature of the Funds’ advisory fee structure, and the Fund expenses borne
by BFA under this arrangement. The Board noted that the investment advisory fee rates under the Advisory Contract for the
Funds were generally higher than the investment advisory/management fee rates for certain of the Other Accounts (particularly
institutional clients) and concluded that the differences appeared to be consistent with the factors discussed.
Other Benefits to BFA and/or its Affiliates — The Board reviewed the “fallout” benefits or ancillary revenue received by BFA
and/or its affiliates in connection with the services provided to the Funds by BFA, such as payment of revenue to BTC, the Funds’
securities lending agent, for loaning portfolio securities (which was included in the profit margins reviewed by the Board pursuant
to BFA’s profitability methodology), and payment of advisory fees and/or administration fees to BFA and BTC (or their affiliates) in
connection with any investments by the Funds in other funds for which BFA (or its affiliates) provides investment advisory
services and/or administration services. The Board also noted the revenue received by BFA and/or its affiliates pursuant to an
agreement that permits a service provider to use certain portions of BlackRock’s technology platform to service accounts
managed by BFA and/or its affiliates, including the iShares funds. The Board noted that BFA generally does not use soft dollars
B O A R D R E V I E W A N D A P P R O V A L O F I N V E S T M E N T A D V I S O R Y C O N T R A C T 109
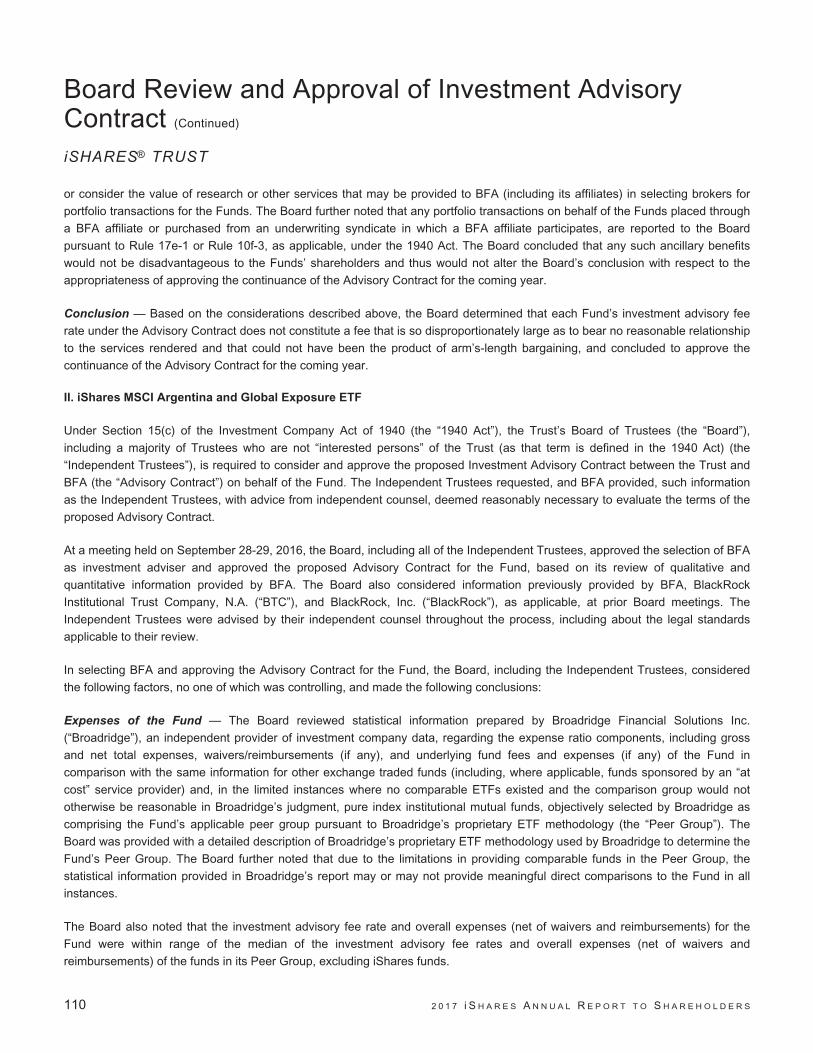
Board Review and Approval of Investment AdvisoryContract (Continued)
iSHARES® TRUST
or consider the value of research or other services that may be provided to BFA (including its affiliates) in selecting brokers for
portfolio transactions for the Funds. The Board further noted that any portfolio transactions on behalf of the Funds placed through
a BFA affiliate or purchased from an underwriting syndicate in which a BFA affiliate participates, are reported to the Board
pursuant to Rule 17e-1 or Rule 10f-3, as applicable, under the 1940 Act. The Board concluded that any such ancillary benefits
would not be disadvantageous to the Funds’ shareholders and thus would not alter the Board’s conclusion with respect to the
appropriateness of approving the continuance of the Advisory Contract for the coming year.
Conclusion — Based on the considerations described above, the Board determined that each Fund’s investment advisory fee
rate under the Advisory Contract does not constitute a fee that is so disproportionately large as to bear no reasonable relationship
to the services rendered and that could not have been the product of arm’s-length bargaining, and concluded to approve the
continuance of the Advisory Contract for the coming year.
II. iShares MSCI Argentina and Global Exposure ETF
Under Section 15(c) of the Investment Company Act of 1940 (the “1940 Act”), the Trust’s Board of Trustees (the “Board”),
including a majority of Trustees who are not “interested persons” of the Trust (as that term is defined in the 1940 Act) (the
“Independent Trustees”), is required to consider and approve the proposed Investment Advisory Contract between the Trust and
BFA (the “Advisory Contract”) on behalf of the Fund. The Independent Trustees requested, and BFA provided, such information
as the Independent Trustees, with advice from independent counsel, deemed reasonably necessary to evaluate the terms of the
proposed Advisory Contract.
At a meeting held on September 28-29, 2016, the Board, including all of the Independent Trustees, approved the selection of BFA
as investment adviser and approved the proposed Advisory Contract for the Fund, based on its review of qualitative and
quantitative information provided by BFA. The Board also considered information previously provided by BFA, BlackRock
Institutional Trust Company, N.A. (“BTC”), and BlackRock, Inc. (“BlackRock”), as applicable, at prior Board meetings. The
Independent Trustees were advised by their independent counsel throughout the process, including about the legal standards
applicable to their review.
In selecting BFA and approving the Advisory Contract for the Fund, the Board, including the Independent Trustees, considered
the following factors, no one of which was controlling, and made the following conclusions:
Expenses of the Fund — The Board reviewed statistical information prepared by Broadridge Financial Solutions Inc.
(“Broadridge”), an independent provider of investment company data, regarding the expense ratio components, including gross
and net total expenses, waivers/reimbursements (if any), and underlying fund fees and expenses (if any) of the Fund in
comparison with the same information for other exchange traded funds (including, where applicable, funds sponsored by an “at
cost” service provider) and, in the limited instances where no comparable ETFs existed and the comparison group would not
otherwise be reasonable in Broadridge’s judgment, pure index institutional mutual funds, objectively selected by Broadridge as
comprising the Fund’s applicable peer group pursuant to Broadridge’s proprietary ETF methodology (the “Peer Group”). The
Board was provided with a detailed description of Broadridge’s proprietary ETF methodology used by Broadridge to determine the
Fund’s Peer Group. The Board further noted that due to the limitations in providing comparable funds in the Peer Group, the
statistical information provided in Broadridge’s report may or may not provide meaningful direct comparisons to the Fund in all
instances.
The Board also noted that the investment advisory fee rate and overall expenses (net of waivers and reimbursements) for the
Fund were within range of the median of the investment advisory fee rates and overall expenses (net of waivers and
reimbursements) of the funds in its Peer Group, excluding iShares funds.
110 2 0 1 7 i S H A R E S A N N U A L R E P O R T T O S H A R E H O L D E R S

Board Review and Approval of Investment AdvisoryContract (Continued)
iSHARES® TRUST
Based on this review, the other factors considered at the meeting, and their general knowledge of ETF pricing, the Board
concluded that the proposed investment advisory fee and expense level of the Fund supported the Board’s approval of the
Advisory Contract.
Nature, Extent and Quality of Services to be Provided by BFA — The Board reviewed the scope of services to be provided by
BFA under the Advisory Contract. In reviewing the scope of these services, the Board considered BFA’s investment philosophy
and experience, noting that BFA and its affiliates have committed significant resources over time, including during the past year,
to supporting iShares funds and their shareholders. The Board considered representations by BFA, BTC, and BlackRock that the
scope and quality of services to be provided to the Fund would be similar to the scope and quality of services provided to other
iShares funds. The Board also considered BFA’s compliance program and its compliance record with respect to other iShares
funds. In that regard, the Board noted that BFA reports to the Board about portfolio management and compliance matters on a
periodic basis in connection with regularly scheduled meetings of the Board, and on other occasions as necessary and
appropriate, and has provided information and made appropriate officers available as needed to provide further assistance with
these matters. The Board also reviewed the background and experience of the persons who will be responsible for the day-to-day
management of the Fund, as well as the resources that will be available to them in managing the Fund. In addition to the above
considerations, the Board reviewed and considered detailed presentations regarding BFA’s investment performance, investment
and risk management processes and strategies provided throughout the previous year, and matters related to BFA’s portfolio
compliance policies and procedures.
Based on the review of this information, the Board concluded that the nature, extent and quality of services to be provided by BFA
to the Fund under the Advisory Contract supported the Board’s approval of the Advisory Contract.
Costs of Services to be Provided to the Fund and Profits to be Realized by BFA and Affiliates — The Board did not
consider the profitability of the Fund to BFA based on the fees payable under the Advisory Contract or revenue to be received by
BFA or its affiliates in connection with services to be provided to the Fund since the proposed relationship had not yet
commenced. The Board noted that it expects to receive profitability information from BFA periodically following the Fund’s launch
and will thus be in a position to evaluate whether any new or additional breakpoints or other adjustments in Fund fees would be
appropriate.
Economies of Scale — The Board reviewed information regarding potential economies of scale or other efficiencies that may
result from increases in the Fund’s assets. The Board noted that it had previously received and considered information regarding
scale benefits shared with the iShares funds through relatively low fee rates established at inception, breakpoints, waivers, or
other fee reductions, as well as through additional investment in the iShares business and the provision of improved or additional
infrastructure and services to the iShares funds and their shareholders. The Board noted that the Advisory Contract for the Fund
did not provide for any breakpoints in the Fund’s investment advisory fee rate as the assets of the Fund increase. However, the
Board noted that should material economies of scale exist in the future that are not otherwise shared, a breakpoint structure for
the Fund may be appropriate, and that it would continue to monitor the sharing of economies of scale to determine the
appropriateness of adding breakpoints in the future.
Based on this review, as well as the other factors considered at the meeting, the Board, recognizing its responsibility to consider
this issue periodically, determined to approve the Advisory Contract.
Fees and Services Provided for Other Comparable Funds/Accounts Managed by BFA and its Affiliates — The Board
received and considered information regarding the investment advisory/management fee rates for other funds/accounts in the
U.S. for which BFA (or its affiliates) provides investment advisory/management services, including open-end funds registered
under the 1940 Act (including sub-advised funds), collective trust funds, and institutional separate accounts (together, the
B O A R D R E V I E W A N D A P P R O V A L O F I N V E S T M E N T A D V I S O R Y C O N T R A C T 111
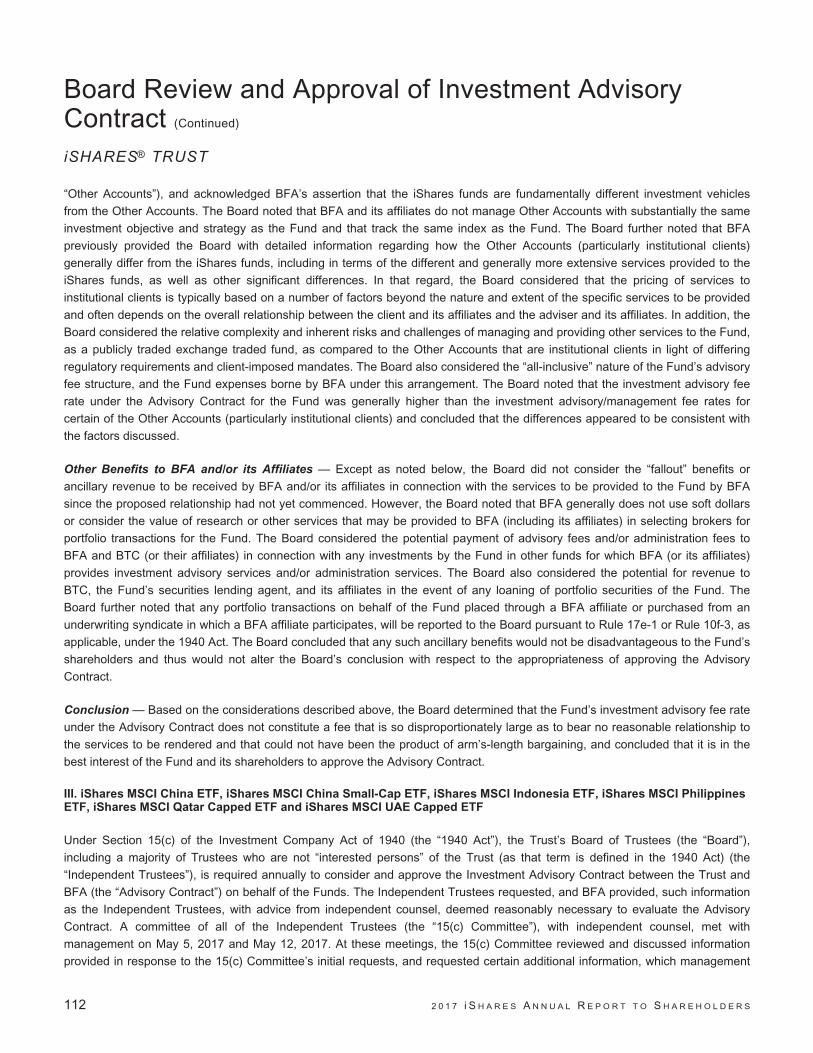
Board Review and Approval of Investment AdvisoryContract (Continued)
iSHARES® TRUST
“Other Accounts”), and acknowledged BFA’s assertion that the iShares funds are fundamentally different investment vehicles
from the Other Accounts. The Board noted that BFA and its affiliates do not manage Other Accounts with substantially the same
investment objective and strategy as the Fund and that track the same index as the Fund. The Board further noted that BFA
previously provided the Board with detailed information regarding how the Other Accounts (particularly institutional clients)
generally differ from the iShares funds, including in terms of the different and generally more extensive services provided to the
iShares funds, as well as other significant differences. In that regard, the Board considered that the pricing of services to
institutional clients is typically based on a number of factors beyond the nature and extent of the specific services to be provided
and often depends on the overall relationship between the client and its affiliates and the adviser and its affiliates. In addition, the
Board considered the relative complexity and inherent risks and challenges of managing and providing other services to the Fund,
as a publicly traded exchange traded fund, as compared to the Other Accounts that are institutional clients in light of differing
regulatory requirements and client-imposed mandates. The Board also considered the “all-inclusive” nature of the Fund’s advisory
fee structure, and the Fund expenses borne by BFA under this arrangement. The Board noted that the investment advisory fee
rate under the Advisory Contract for the Fund was generally higher than the investment advisory/management fee rates for
certain of the Other Accounts (particularly institutional clients) and concluded that the differences appeared to be consistent with
the factors discussed.
Other Benefits to BFA and/or its Affiliates — Except as noted below, the Board did not consider the “fallout” benefits or
ancillary revenue to be received by BFA and/or its affiliates in connection with the services to be provided to the Fund by BFA
since the proposed relationship had not yet commenced. However, the Board noted that BFA generally does not use soft dollars
or consider the value of research or other services that may be provided to BFA (including its affiliates) in selecting brokers for
portfolio transactions for the Fund. The Board considered the potential payment of advisory fees and/or administration fees to
BFA and BTC (or their affiliates) in connection with any investments by the Fund in other funds for which BFA (or its affiliates)
provides investment advisory services and/or administration services. The Board also considered the potential for revenue to
BTC, the Fund’s securities lending agent, and its affiliates in the event of any loaning of portfolio securities of the Fund. The
Board further noted that any portfolio transactions on behalf of the Fund placed through a BFA affiliate or purchased from an
underwriting syndicate in which a BFA affiliate participates, will be reported to the Board pursuant to Rule 17e-1 or Rule 10f-3, as
applicable, under the 1940 Act. The Board concluded that any such ancillary benefits would not be disadvantageous to the Fund’s
shareholders and thus would not alter the Board’s conclusion with respect to the appropriateness of approving the Advisory
Contract.
Conclusion — Based on the considerations described above, the Board determined that the Fund’s investment advisory fee rate
under the Advisory Contract does not constitute a fee that is so disproportionately large as to bear no reasonable relationship to
the services to be rendered and that could not have been the product of arm’s-length bargaining, and concluded that it is in the
best interest of the Fund and its shareholders to approve the Advisory Contract.
III. iShares MSCI China ETF, iShares MSCI China Small-Cap ETF, iShares MSCI Indonesia ETF, iShares MSCI PhilippinesETF, iShares MSCI Qatar Capped ETF and iShares MSCI UAE Capped ETF
Under Section 15(c) of the Investment Company Act of 1940 (the “1940 Act”), the Trust’s Board of Trustees (the “Board”),
including a majority of Trustees who are not “interested persons” of the Trust (as that term is defined in the 1940 Act) (the
“Independent Trustees”), is required annually to consider and approve the Investment Advisory Contract between the Trust and
BFA (the “Advisory Contract”) on behalf of the Funds. The Independent Trustees requested, and BFA provided, such information
as the Independent Trustees, with advice from independent counsel, deemed reasonably necessary to evaluate the Advisory
Contract. A committee of all of the Independent Trustees (the “15(c) Committee”), with independent counsel, met with
management on May 5, 2017 and May 12, 2017. At these meetings, the 15(c) Committee reviewed and discussed information
provided in response to the 15(c) Committee’s initial requests, and requested certain additional information, which management
112 2 0 1 7 i S H A R E S A N N U A L R E P O R T T O S H A R E H O L D E R S

Board Review and Approval of Investment AdvisoryContract (Continued)
iSHARES® TRUST
agreed to provide. At a meeting held on May 18, 2017, management presented information to the Board relating to the
continuance of the Advisory Contract, including information requested by the 15(c) Committee during its meetings. The Board,
including the Independent Trustees, reviewed and discussed such information at length. The Independent Trustees requested
from management certain additional information, which management agreed to provide. At a meeting held on June 19-21, 2017,
the Board, including the Independent Trustees, reviewed the additional information provided by management in response to these
requests. After extensive discussions, the Board, including all of the Independent Trustees, approved the continuance of the
Advisory Contract for the Funds, based on a review of qualitative and quantitative information provided by BFA. The Board noted
its satisfaction with the extent and quality of information provided and its frequent interactions with management, as well as the
detailed responses and other information provided by BFA. The Board also noted that the Board and BFA agreed to discuss
potential further enhancements to the 15(c) process for the coming year. The Independent Trustees were advised by their
independent counsel throughout the process, including about the legal standards applicable to their review. In approving the
Advisory Contract for the Funds, the Board, including the Independent Trustees, considered the following factors, no one of which
was controlling, and reached the following conclusions:
Expenses and Performance of the Funds — The Board reviewed statistical information prepared by Broadridge Financial
Solutions Inc. (“Broadridge”), an independent provider of investment company data, regarding the expense ratio components,
including gross and net total expenses, waivers/reimbursements (if any), and underlying fund fees and expenses (if any) of each
Fund in comparison with the same information for other exchange traded funds (“ETFs”) (including, where applicable, funds
sponsored by an “at cost” service provider) and, in the limited instances where no comparable ETFs existed and the comparison
group would not otherwise be reasonable in Broadridge’s judgment, pure index institutional mutual funds, objectively selected by
Broadridge as comprising such Fund’s applicable peer group pursuant to Broadridge’s proprietary ETF methodology (the “Peer
Group”). The Board was provided with a detailed description of the proprietary ETF methodology used by Broadridge to
determine the applicable Peer Groups. The Board further noted that due to the limitations in providing comparable funds in the
various Peer Groups, the statistical information provided in Broadridge’s report may or may not provide meaningful direct
comparisons to the Funds in all instances.
The Board also noted that the investment advisory fee rates and overall expenses (net of waivers and reimbursements) for the
Funds were lower than the median of the investment advisory fee rates and overall expenses (net of waivers and
reimbursements) of the funds in their respective Peer Group, excluding iShares funds.
In addition, to the extent that any of the comparison funds included in the Peer Group, excluding iShares funds, track the same
index as any particular Fund, Broadridge also provided, and the Board reviewed, a comparison of such Fund’s performance for
the one-, three-, five-, ten-year, and since inception periods, as applicable, and for the quarter ended December 31, 2016, to that
of relevant comparison funds for the same periods.
The Board noted that each Fund seeks to track its specified underlying index and that, during the year, the Board received
periodic reports on each Fund’s short- and longer-term performance in comparison with its underlying index. Such periodic
comparative performance information, including any additional detailed information requested by the Boards, was also
considered. The Board noted that each Fund generally performed in line with its underlying index over the relevant periods.
Based on this review, the other factors considered at the meeting, and their general knowledge of ETF pricing, the Board
concluded that the investment advisory fee rate and the historical performance of each Fund supported the Board’s approval of
the continuance of the Advisory Contract for the coming year.
Nature, Extent and Quality of Services Provided by BFA — Based on management’s representations, including information
about recent and proposed enhancements to the iShares business, including with respect to capital markets support and
B O A R D R E V I E W A N D A P P R O V A L O F I N V E S T M E N T A D V I S O R Y C O N T R A C T 113
Board Review and Approval of Investment AdvisoryContract (Continued)
iSHARES® TRUST
analysis, technology, product design, compliance and risk management, and other services, the Board expected that there would
be no diminution in the scope of services required of or provided by BFA under the Advisory Contract for the coming year as
compared to the scope of services provided by BFA during prior years. In reviewing the scope of these services, the Board
considered BFA’s investment philosophy and experience, noting that BFA and its affiliates have committed significant resources
over time, including during the past year, to supporting the iShares funds and their shareholders. The Board also considered
BFA’s compliance program and its compliance record with respect to the Funds. In that regard, the Board noted that BFA reports
to the Board about portfolio management and compliance matters on a periodic basis in connection with regularly scheduled
meetings of the Board, and on other occasions as necessary and appropriate, and has provided information and made
appropriate officers available as needed to provide further assistance with these matters. The Board also reviewed the
background and experience of the persons responsible for the day-to-day management of the Funds, as well as the resources
available to them in managing the Funds. In addition to the above considerations, the Board reviewed and considered detailed
presentations regarding BFA’s investment performance, investment and risk management processes and strategies provided at
the June 19-21, 2017 meeting and throughout the previous year, and matters related to BFA’s portfolio compliance policies and
procedures. The Board noted that each Fund had met its investment objective consistently since its respective inception date.
Based on review of this information, and the performance information discussed above, the Board concluded that the nature,
extent and quality of services provided by BFA to the Funds under the Advisory Contract supported the Board’s approval of the
continuance of the Advisory Contract for the coming year.
Costs of Services Provided to Funds and Profits Realized by BFA and Affiliates — The Board reviewed information about
the profitability of the Funds to BlackRock, on a Fund-by-Fund basis and in the aggregate, based on the fees payable to BFA and
its affiliates (including fees under the Advisory Contract), and other sources of revenue and expense to BFA and its affiliates from
the Funds’ operations for the last calendar year. The Board reviewed BlackRock’s profitability methodology for the iShares funds,
including supplemental information that was responsive to requests of the 15(c) Committee. The Board noted that the 15(c)
Committee had focused on the methodology and profitability presentation during its meetings. The Board discussed the sources
of direct and ancillary revenue with management, including the revenues to BTC, a BFA affiliate, from securities lending by the
Funds. The Board also discussed BFA’s profit margin as reflected in the Funds’ profitability analyses and reviewed information
regarding potential economies of scale (as discussed below). Based on this review, the Board concluded that the profits realized
by BFA and its affiliates under the Advisory Contract and from other relationships between the Funds and BFA and/or its affiliates,
if any, were within a reasonable range in light of the factors considered.
Economies of Scale — The Board reviewed information regarding potential economies of scale or other efficiencies that may
result from increases in the Funds’ assets, noting that the issue of economies of scale had been focused on by the 15(c)
Committee during its meetings and addressed by management, including through supplemental information. The Board and the
15(c) Committee reviewed information provided by BFA regarding scale benefits shared with the iShares funds through relatively
low fee rates established at inception, breakpoints and waivers or other fee reductions, as well as through additional investment in
the iShares business and the provision of improved or additional infrastructure and services to the iShares funds and their
shareholders. The Board and the 15(c) Committee received information regarding BlackRock’s historical profitability, including
BFA’s and its affiliates’ costs in providing services. The cost information distinguished, among other things, between fixed and
variable costs, and explained how the level of fixed and variable costs, as well as the nature of such costs, may impact the
existence or size of scale benefits. The Board noted that the Advisory Contract for the Funds already provided for breakpoints in
the Funds’ investment advisory fee rates as the assets of the Funds, on an aggregated basis with the assets of certain other
iShares funds, increase. The Board noted that it would continue to monitor the sharing of economies of scale to determine the
appropriateness of adding new or revised breakpoints in the future.
114 2 0 1 7 i S H A R E S A N N U A L R E P O R T T O S H A R E H O L D E R S

Board Review and Approval of Investment AdvisoryContract (Continued)
iSHARES® TRUST
Based on this review, as well as the other factors considered at the meeting, the Board, recognizing its responsibility to consider
the Advisory Contract at least annually, determined to approve the continuance of the Advisory Contract for the coming year.
Fees and Services Provided for Other Comparable Funds/Accounts Managed by BFA and its Affiliates — The Board
received and considered information regarding the investment advisory/management fee rates for other funds/accounts in the
U.S. for which BFA (or its affiliates) provides investment advisory/management services, including open-end funds registered
under the 1940 Act (including sub-advised funds), collective trust funds, and institutional separate accounts (together, the “Other
Accounts”), and acknowledged BFA’s assertion that the iShares funds are fundamentally different investment vehicles from the
Other Accounts. The Board noted that BFA and its affiliates do not manage Other Accounts with substantially the same
investment objectives and strategies as the Funds and that track the same index as the Funds. The Board further noted that BFA
provided the Board with detailed information regarding how the Other Accounts (particularly institutional clients) generally differ
from the Funds, including in terms of the different and generally more extensive services provided to the Funds, as well as other
significant differences. In that regard, the Board considered that the pricing of services to institutional clients is typically based on
a number of factors beyond the nature and extent of the specific services to be provided and often depends on the overall
relationship between the client and its affiliates and the adviser and its affiliates. In addition, the Board considered the relative
complexity and inherent risks and challenges of managing and providing other services to the Funds, as publicly traded ETFs, as
compared to the Other Accounts that are institutional clients in light of differing regulatory requirements and client-imposed
mandates. The Board also acknowledged BFA’s expressed business purpose for launching a suite of iShares “Core” ETFs that
generally are subject to lower investment advisory fees than iShares non-Core ETFs that may provide a similar investment
exposure. The Board also considered the “all-inclusive” nature of the Funds’ advisory fee structure, and the Fund expenses borne
by BFA under this arrangement. The Board noted that the investment advisory fee rates under the Advisory Contract for the
Funds were generally higher than the investment advisory/management fee rates for certain of the Other Accounts (particularly
institutional clients) and concluded that the differences appeared to be consistent with the factors discussed.
Other Benefits to BFA and/or its Affiliates — The Board reviewed the “fallout” benefits or ancillary revenue received by BFA
and/or its affiliates in connection with the services provided to the Funds by BFA, such as payment of revenue to BTC, the Funds’
securities lending agent, for loaning portfolio securities (which was included in the profit margins reviewed by the Board pursuant
to BFA’s profitability methodology), and payment of advisory fees and/or administration fees to BFA and BTC (or their affiliates) in
connection with any investments by the Funds in other funds for which BFA (or its affiliates) provides investment advisory
services and/or administration services. The Board also noted the revenue received by BFA and/or its affiliates pursuant to an
agreement that permits a service provider to use certain portions of BlackRock’s technology platform to service accounts
managed by BFA and/or its affiliates, including the iShares funds. The Board noted that BFA generally does not use soft dollars
or consider the value of research or other services that may be provided to BFA (including its affiliates) in selecting brokers for
portfolio transactions for the Funds. The Board further noted that any portfolio transactions on behalf of the Funds placed through
a BFA affiliate or purchased from an underwriting syndicate in which a BFA affiliate participates, are reported to the Board
pursuant to Rule 17e-1 or Rule 10f-3, as applicable, under the 1940 Act. The Board concluded that any such ancillary benefits
would not be disadvantageous to the Funds’ shareholders and thus would not alter the Board’s conclusion with respect to the
appropriateness of approving the continuance of the Advisory Contract for the coming year.
Conclusion — Based on the considerations described above, the Board determined that each Fund’s investment advisory fee
rate under the Advisory Contract does not constitute a fee that is so disproportionately large as to bear no reasonable relationship
to the services rendered and that could not have been the product of arm’s-length bargaining, and concluded to approve the
continuance of the Advisory Contract for the coming year.
B O A R D R E V I E W A N D A P P R O V A L O F I N V E S T M E N T A D V I S O R Y C O N T R A C T 115

Board Review and Approval of Investment AdvisoryContract (Continued)
iSHARES® TRUST
IV. iShares MSCI Saudi Arabia Capped ETF
Under Section 15(c) of the Investment Company Act of 1940 (the “1940 Act”), the Trust’s Board of Trustees (the “Board”),
including a majority of Trustees who are not “interested persons” of the Trust (as that term is defined in the 1940 Act) (the
“Independent Trustees”), is required annually to consider and approve the Investment Advisory Contract between the Trust and
BFA (the “Advisory Contract”) on behalf of the Fund. The Independent Trustees requested, and BFA provided, such information
as the Independent Trustees, with advice from independent counsel, deemed reasonably necessary to evaluate the Advisory
Contract. A committee of all of the Independent Trustees (the “15(c) Committee”), with independent counsel, met with
management on May 5, 2017 and May 12, 2017. At these meetings, the 15(c) Committee reviewed and discussed information
provided in response to the 15(c) Committee’s initial requests, and requested certain additional information, which management
agreed to provide. At a meeting held on May 18, 2017, management presented information to the Board relating to the
continuance of the Advisory Contract, including information requested by the 15(c) Committee during its meetings. The Board,
including the Independent Trustees, reviewed and discussed such information at length. The Independent Trustees requested
from management certain additional information, which management agreed to provide. At a meeting held on June 19-21, 2017,
the Board, including the Independent Trustees, reviewed the additional information provided by management in response to these
requests. After extensive discussions, the Board, including all of the Independent Trustees, approved the continuance of the
Advisory Contract for the Fund, based on a review of qualitative and quantitative information provided by BFA. The Board noted
its satisfaction with the extent and quality of information provided and its frequent interactions with management, as well as the
detailed responses and other information provided by BFA. The Board also noted that the Board and BFA agreed to discuss
potential further enhancements to the 15(c) process for the coming year. The Independent Trustees were advised by their
independent counsel throughout the process, including about the legal standards applicable to their review. In approving the
Advisory Contract for the Fund, the Board, including the Independent Trustees, considered the following factors, no one of which
was controlling, and reached the following conclusions:
Expenses and Performance of the Fund — The Board reviewed statistical information prepared by Broadridge Financial
Solutions Inc. (“Broadridge”), an independent provider of investment company data, regarding the expense ratio components,
including gross and net total expenses, waivers/reimbursements (if any), and underlying fund fees and expenses (if any) of the
Fund in comparison with the same information for other exchange traded funds (“ETFs”) (including, where applicable, funds
sponsored by an “at cost” service provider) and, in the limited instances where no comparable ETFs existed and the comparison
group would not otherwise be reasonable in Broadridge’s judgment, pure index institutional mutual funds, objectively selected by
Broadridge as comprising the Fund’s applicable peer group pursuant to Broadridge’s proprietary ETF methodology (the “Peer
Group”). The Board was provided with a detailed description of the proprietary ETF methodology used by Broadridge to
determine the Fund’s Peer Group. The Board further noted that due to the limitations in providing comparable funds in the Peer
Group, the statistical information provided in Broadridge’s report may or may not provide meaningful direct comparisons to the
Fund in all instances.
The Board also noted that the investment advisory fee rate and overall expenses (net of waivers and reimbursements) for the
Fund were lower than the median of the investment advisory fee rates and overall expenses (net of waivers and reimbursements)
of the funds in its Peer Group, excluding iShares funds.
In addition, to the extent that any of the comparison funds included in the Peer Group, excluding iShares funds, track the same
index as the Fund, Broadridge also provided, and the Board reviewed, a comparison of the Fund’s performance for the one-,
three-, five-, ten-year, and since inception periods, as applicable, and for the quarter ended December 31, 2016, to that of
relevant comparison funds for the same periods.
116 2 0 1 7 i S H A R E S A N N U A L R E P O R T T O S H A R E H O L D E R S

Board Review and Approval of Investment AdvisoryContract (Continued)
iSHARES® TRUST
The Board noted that the Fund seeks to track its specified underlying index and that, during the year, the Board received periodic
reports on the Fund’s short- and longer-term performance in comparison with its underlying index. Such periodic comparative
performance information, including any additional detailed information requested by the Boards, was also considered. The Board
noted that the Fund generally performed in line with its underlying index over the relevant periods.
Based on this review, the other factors considered at the meeting, and their general knowledge of ETF pricing, the Board
concluded that the investment advisory fee rate and the historical performance of the Fund supported the Board’s approval of the
continuance of the Advisory Contract for the coming year.
Nature, Extent and Quality of Services Provided by BFA — Based on management’s representations, including information
about recent and proposed enhancements to the iShares business, including with respect to capital markets support and
analysis, technology, product design, compliance and risk management, and other services, the Board expected that there would
be no diminution in the scope of services required of or provided by BFA under the Advisory Contract for the coming year as
compared to the scope of services provided by BFA during prior years. In reviewing the scope of these services, the Board
considered BFA’s investment philosophy and experience, noting that BFA and its affiliates have committed significant resources
over time, including during the past year, to supporting the iShares funds and their shareholders. The Board also considered
BFA’s compliance program and its compliance record with respect to the Fund. In that regard, the Board noted that BFA reports
to the Board about portfolio management and compliance matters on a periodic basis in connection with regularly scheduled
meetings of the Board, and on other occasions as necessary and appropriate, and has provided information and made
appropriate officers available as needed to provide further assistance with these matters. The Board also reviewed the
background and experience of the persons responsible for the day-to-day management of the Fund, as well as the resources
available to them in managing the Fund. In addition to the above considerations, the Board reviewed and considered detailed
presentations regarding BFA’s investment performance, investment and risk management processes and strategies provided at
the June 19-21, 2017 meeting and throughout the previous year, and matters related to BFA’s portfolio compliance policies and
procedures. The Board noted that the Fund had met its investment objective consistently since its inception date.
Based on review of this information, and the performance information discussed above, the Board concluded that the nature,
extent and quality of services provided by BFA to the Fund under the Advisory Contract supported the Board’s approval of the
continuance of the Advisory Contract for the coming year.
Costs of Services Provided to Fund and Profits Realized by BFA and Affiliates — The Board reviewed information about the
profitability of the Fund to BlackRock, based on the fees payable to BFA and its affiliates (including fees under the Advisory
Contract), and other sources of revenue and expense to BFA and its affiliates from the Fund’s operations for the last calendar
year. The Board reviewed BlackRock’s profitability methodology for the iShares funds, including supplemental information that
was responsive to requests of the 15(c) Committee. The Board noted that the 15(c) Committee had focused on the methodology
and profitability presentation during its meetings. The Board discussed the sources of direct and ancillary revenue with
management, including the revenues to BTC, a BFA affiliate, from securities lending by the Fund. The Board also discussed
BFA’s profit margin as reflected in the Fund’s profitability analysis and reviewed information regarding potential economies of
scale (as discussed below). Based on this review, the Board concluded that the profits realized by BFA and its affiliates under the
Advisory Contract and from other relationships between the Fund and BFA and/or its affiliates, if any, were within a reasonable
range in light of the factors considered.
Economies of Scale — The Board reviewed information regarding potential economies of scale or other efficiencies that may
result from increases in the Fund’s assets, noting that the issue of economies of scale had been focused on by the 15(c)
Committee during its meetings and addressed by management, including through supplemental information. The Board and the
15(c) Committee reviewed information provided by BFA regarding scale benefits shared with the iShares funds through relatively
B O A R D R E V I E W A N D A P P R O V A L O F I N V E S T M E N T A D V I S O R Y C O N T R A C T 117
Board Review and Approval of Investment AdvisoryContract (Continued)
iSHARES® TRUST
low fee rates established at inception, breakpoints and waivers or other fee reductions, as well as through additional investment in
the iShares business and the provision of improved or additional infrastructure and services to the iShares funds and their
shareholders. The Board and the 15(c) Committee received information regarding BlackRock’s historical profitability, including
BFA’s and its affiliates’ costs in providing services. The cost information distinguished, among other things, between fixed and
variable costs, and explained how the level of fixed and variable costs, as well as the nature of such costs, may impact the
existence or size of scale benefits. The Board noted that the Advisory Contract for the Fund did not provide for any breakpoints in
the Fund’s investment advisory fee rate as the assets of the Fund increase. However, the Board noted that should material
economies of scale be identified in the future that are not otherwise shared, a breakpoint structure for the Fund may be
appropriate, and that it would continue to monitor the sharing of economies of scale to determine the appropriateness of adding
breakpoints in the future.
Based on this review, as well as the other factors considered at the meeting, the Board, recognizing its responsibility to consider
the Advisory Contract at least annually, determined to approve the continuance of the Advisory Contract for the coming year.
Fees and Services Provided for Other Comparable Funds/Accounts Managed by BFA and its Affiliates — The Board
received and considered information regarding the investment advisory/management fee rates for other funds/accounts in the
U.S. for which BFA (or its affiliates) provides investment advisory/management services, including open-end funds registered
under the 1940 Act (including sub-advised funds), collective trust funds, and institutional separate accounts (together, the “Other
Accounts”), and acknowledged BFA’s assertion that the iShares funds are fundamentally different investment vehicles from the
Other Accounts. The Board noted that BFA and its affiliates do not manage Other Accounts with substantially the same
investment objective and strategy as the Fund and that track the same index as the Fund. The Board further noted that BFA
provided the Board with detailed information regarding how the Other Accounts (particularly institutional clients) generally differ
from the Fund, including in terms of the different and generally more extensive services provided to the Fund, as well as other
significant differences. In that regard, the Board considered that the pricing of services to institutional clients is typically based on
a number of factors beyond the nature and extent of the specific services to be provided and often depends on the overall
relationship between the client and its affiliates and the adviser and its affiliates. In addition, the Board considered the relative
complexity and inherent risks and challenges of managing and providing other services to the Fund, as a publicly traded ETF, as
compared to the Other Accounts that are institutional clients, in light of differing regulatory requirements and client-imposed
mandates. The Board also acknowledged BFA’s expressed business purpose for launching a suite of iShares “Core” ETFs that
generally are subject to lower investment advisory fees than iShares non-Core ETFs that may provide a similar investment
exposure. The Board also considered the “all-inclusive” nature of the Fund’s advisory fee structure, and the Fund expenses borne
by BFA under this arrangement. The Board noted that the investment advisory fee rate under the Advisory Contract for the Fund
was generally higher than the investment advisory/management fee rates for certain of the Other Accounts (particularly
institutional clients) and concluded that the differences appeared to be consistent with the factors discussed.
Other Benefits to BFA and/or its Affiliates — The Board reviewed the “fallout” benefits or ancillary revenue received by BFA
and/or its affiliates in connection with the services provided to the Fund by BFA, such as payment of revenue to BTC, the Fund’s
securities lending agent, for loaning portfolio securities (which was included in the profit margins reviewed by the Board pursuant
to BFA’s profitability methodology), and payment of advisory fees and/or administration fees to BFA and BTC (or their affiliates) in
connection with any investments by the Fund in other funds for which BFA (or its affiliates) provides investment advisory services
and/or administration services. The Board also noted the revenue received by BFA and/or its affiliates pursuant to an agreement
that permits a service provider to use certain portions of BlackRock’s technology platform to service accounts managed by BFA
and/or its affiliates, including the iShares funds. The Board noted that BFA generally does not use soft dollars or consider the
value of research or other services that may be provided to BFA (including its affiliates) in selecting brokers for portfolio
transactions for the Fund. The Board further noted that any portfolio transactions on behalf of the Fund placed through a BFA
affiliate or purchased from an underwriting syndicate in which a BFA affiliate participates, are reported to the Board pursuant to
118 2 0 1 7 i S H A R E S A N N U A L R E P O R T T O S H A R E H O L D E R S

Board Review and Approval of Investment AdvisoryContract (Continued)
iSHARES® TRUST
Rule 17e-1 or Rule 10f-3, as applicable, under the 1940 Act. The Board concluded that any such ancillary benefits would not be
disadvantageous to the Fund’s shareholders and thus would not alter the Board’s conclusion with respect to the appropriateness
of approving the continuance of the Advisory Contract for the coming year.
Conclusion — Based on the considerations described above, the Board determined that the Fund’s investment advisory fee rate
under the Advisory Contract does not constitute a fee that is so disproportionately large as to bear no reasonable relationship to
the services rendered and that could not have been the product of arm’s-length bargaining, and concluded to approve the
continuance of the Advisory Contract for the coming year.
B O A R D R E V I E W A N D A P P R O V A L O F I N V E S T M E N T A D V I S O R Y C O N T R A C T 119

Supplemental Information (Unaudited)
iSHARES® TRUST
Proxy Results
A special meeting of the shareholders of each series of iShares Trust (the “Trust”) was held on June 19, 2017, to elect five
Trustees to the Board of Trustees of the Trust. The five nominees were Jane D. Carlin, Richard L. Fagnani, Drew E. Lawton,
Madhav V. Rajan and Mark Wiedman, all of whom were elected as Trustees at the special meeting. The other Trustees whose
terms of office as Trustees continued after the special meeting are Cecilia H. Herbert, Charles A. Hurty, John E. Kerrigan, John E.
Martinez and Robert S. Kapito.
Trustee Votes For Votes Withheld
Jane D. Carlin 8,669,874,031 59,322,838
Richard L. Fagnani 8,672,718,914 56,477,955
Drew E. Lawton 8,670,713,236 58,483,633
Madhav V. Rajan 8,653,682,870 75,513,999
Mark Wiedman 8,664,674,816 64,522,053
Section 19(a) Notices
The amounts and sources of distributions reported are estimates and are provided pursuant to regulatory requirements and are
not being provided for tax reporting purposes. The actual amounts and sources for tax reporting purposes will depend upon each
Fund’s investment experience during the year and may be subject to changes based on the tax regulations. Shareholders will
receive a Form 1099-DIV each calendar year that will inform them how to report these distributions for federal income tax
purposes.
Total Cumulative Distributionsfor the Fiscal Year
% Breakdown of the Total CumulativeDistributions for the Fiscal Year
iShares ETF
Net
Investment
Income
Net
Realized
Capital
Gains
Return of
Capital
Total Per
Share
Net
Investment
Income
Net
Realized
Capital
Gains
Return
of
Capital
Total
Per
Share
MSCI All Peru Capped $ 0.679551 $ — $0.016342 $0.695893 98% — % 2% 100%
MSCI Brazil Small-Cap 0.357171 — 0.059611 0.416782 86 — 14 100
MSCI China Small-Cap 1.724212 — — 1.724212 100 — — 100
MSCI Indonesia 0.354848 — — 0.354848 100 — — 100
MSCI Philippines 0.126699 — 0.077861 0.204560 62 — 38 100
MSCI Poland Capped 0.425292 — — 0.425292 100 — — 100
MSCI Saudi Arabia Capped 0.524400 — — 0.524400 100 — — 100
MSCI UAE Capped 0.632954 — — 0.632954 100 — — 100
Premium/Discount Information
The Premium/Discount Information section is intended to present information about the differences between the daily market
price on secondary markets for shares of a fund and that fund’s NAV. NAV is the price at which a fund issues and redeems
shares. It is calculated in accordance with the standard formula for valuing mutual fund shares. The “Market Price” of a fund
generally is determined using the midpoint between the highest bid and the lowest ask on the primary securities exchange on
which shares of such fund are listed for trading, as of the time that the fund’s NAV is calculated. A fund’s Market Price may be at,
above or below its NAV. The NAV of a fund will fluctuate with changes in the value of its portfolio holdings. The Market Price of a
fund will fluctuate in accordance with changes in its NAV, as well as market supply and demand.
120 2 0 1 7 i S H A R E S A N N U A L R E P O R T T O S H A R E H O L D E R S

Supplemental Information (Unaudited) (Continued)
iSHARES® TRUST
Premiums or discounts are the differences (expressed as a percentage) between the NAV and Market Price of a fund on a given
day, generally at the time the NAV is calculated. A premium is the amount that a fund is trading above the reported NAV,
expressed as a percentage of the NAV. A discount is the amount that a fund is trading below the reported NAV, expressed as a
percentage of the NAV.
Premium/discount information for the Funds covering the most recently completed calendar year and the most recently completed
calendar quarters since that year (or the life of the Fund, if shorter) is publicly accessible, free of charge, at www.iShares.com.
The following information shows the frequency of distributions of premiums and discounts for the Funds for the immediately
preceding five calendar years (or from the inception date of the Fund, if less than five years) through the date of the most recent
calendar quarter-end. Each line in each table shows the number of trading days in which the Fund traded within the premium/
discount range indicated. The number of trading days in each premium/discount range is also shown as a percentage of the total
number of trading days in the period covered by each table. All data presented here represents past performance, which cannot
be used to predict future results.
iShares MSCI All Peru Capped ETFPeriod Covered: January 1, 2012 through June 30, 2017
Premium/Discount Range
Number
of Days
Percentage of
Total Days
Greater than 1.5% and Less than 2.0% . . . . . . . . . . . . . . . . . . . . . . . . . . . . . . . . . . . . . . . . . . . . . . . . . . . . . . 2 0.14%
Greater than 1.0% and Less than 1.5% . . . . . . . . . . . . . . . . . . . . . . . . . . . . . . . . . . . . . . . . . . . . . . . . . . . . . . 35 2.53
Greater than 0.5% and Less than 1.0% . . . . . . . . . . . . . . . . . . . . . . . . . . . . . . . . . . . . . . . . . . . . . . . . . . . . . . 136 9.83
Greater than 0.0% and Less than 0.5% . . . . . . . . . . . . . . . . . . . . . . . . . . . . . . . . . . . . . . . . . . . . . . . . . . . . . . 292 21.11
At NAV . . . . . . . . . . . . . . . . . . . . . . . . . . . . . . . . . . . . . . . . . . . . . . . . . . . . . . . . . . . . . . . . . . . . . . . . . . . . . . . . 8 0.58
Less than 0.0% and Greater than –0.5% . . . . . . . . . . . . . . . . . . . . . . . . . . . . . . . . . . . . . . . . . . . . . . . . . . . . . 425 30.74
Less than –0.5% and Greater than –1.0% . . . . . . . . . . . . . . . . . . . . . . . . . . . . . . . . . . . . . . . . . . . . . . . . . . . . 402 29.07
Less than –1.0% and Greater than –1.5% . . . . . . . . . . . . . . . . . . . . . . . . . . . . . . . . . . . . . . . . . . . . . . . . . . . . 67 4.84
Less than –1.5% and Greater than –2.0% . . . . . . . . . . . . . . . . . . . . . . . . . . . . . . . . . . . . . . . . . . . . . . . . . . . . 11 0.80
Less than –2.0% and Greater than –2.5% . . . . . . . . . . . . . . . . . . . . . . . . . . . . . . . . . . . . . . . . . . . . . . . . . . . . 4 0.29
Less than –2.5% . . . . . . . . . . . . . . . . . . . . . . . . . . . . . . . . . . . . . . . . . . . . . . . . . . . . . . . . . . . . . . . . . . . . . . . . 1 0.07
1,383 100.00%
S U P P L E M E N T A L I N F O R M A T I O N 121

Supplemental Information (Unaudited) (Continued)
iSHARES® TRUST
iShares MSCI Argentina and Global Exposure ETFPeriod Covered: April 25, 2017 through June 30, 2017
Premium/Discount Range
Number
of Days
Percentage
of Total
Days
Greater than 0.0% and Less than 0.5% . . . . . . . . . . . . . . . . . . . . . . . . . . . . . . . . . . . . . . . . . . . . . . . . . . . . . . . . 44 91.66%
At NAV . . . . . . . . . . . . . . . . . . . . . . . . . . . . . . . . . . . . . . . . . . . . . . . . . . . . . . . . . . . . . . . . . . . . . . . . . . . . . . . . . . 2 4.17
Less than 0.0% and Greater than –0.5% . . . . . . . . . . . . . . . . . . . . . . . . . . . . . . . . . . . . . . . . . . . . . . . . . . . . . . . 2 4.17
48 100.00%
iShares MSCI Brazil Small-Cap ETFPeriod Covered: January 1, 2012 through June 30, 2017
Premium/Discount Range
Number
of Days
Percentage of
Total Days
Greater than 3.0% and Less than 3.5% . . . . . . . . . . . . . . . . . . . . . . . . . . . . . . . . . . . . . . . . . . . . . . . . . . . . . . 2 0.14%
Greater than 2.5% and Less than 3.0% . . . . . . . . . . . . . . . . . . . . . . . . . . . . . . . . . . . . . . . . . . . . . . . . . . . . . . 8 0.58
Greater than 2.0% and Less than 2.5% . . . . . . . . . . . . . . . . . . . . . . . . . . . . . . . . . . . . . . . . . . . . . . . . . . . . . . 12 0.87
Greater than 1.5% and Less than 2.0% . . . . . . . . . . . . . . . . . . . . . . . . . . . . . . . . . . . . . . . . . . . . . . . . . . . . . . 39 2.82
Greater than 1.0% and Less than 1.5% . . . . . . . . . . . . . . . . . . . . . . . . . . . . . . . . . . . . . . . . . . . . . . . . . . . . . . 82 5.93
Greater than 0.5% and Less than 1.0% . . . . . . . . . . . . . . . . . . . . . . . . . . . . . . . . . . . . . . . . . . . . . . . . . . . . . . 197 14.24
Greater than 0.0% and Less than 0.5% . . . . . . . . . . . . . . . . . . . . . . . . . . . . . . . . . . . . . . . . . . . . . . . . . . . . . . 322 23.28
At NAV . . . . . . . . . . . . . . . . . . . . . . . . . . . . . . . . . . . . . . . . . . . . . . . . . . . . . . . . . . . . . . . . . . . . . . . . . . . . . . . . 12 0.87
Less than 0.0% and Greater than –0.5% . . . . . . . . . . . . . . . . . . . . . . . . . . . . . . . . . . . . . . . . . . . . . . . . . . . . . 385 27.85
Less than –0.5% and Greater than –1.0% . . . . . . . . . . . . . . . . . . . . . . . . . . . . . . . . . . . . . . . . . . . . . . . . . . . . 226 16.34
Less than –1.0% and Greater than –1.5% . . . . . . . . . . . . . . . . . . . . . . . . . . . . . . . . . . . . . . . . . . . . . . . . . . . . 70 5.06
Less than –1.5% and Greater than –2.0% . . . . . . . . . . . . . . . . . . . . . . . . . . . . . . . . . . . . . . . . . . . . . . . . . . . . 14 1.01
Less than –2.0% and Greater than –2.5% . . . . . . . . . . . . . . . . . . . . . . . . . . . . . . . . . . . . . . . . . . . . . . . . . . . . 8 0.58
Less than –2.5% and Greater than –3.0% . . . . . . . . . . . . . . . . . . . . . . . . . . . . . . . . . . . . . . . . . . . . . . . . . . . . 6 0.43
1,383 100.00%
122 2 0 1 7 i S H A R E S A N N U A L R E P O R T T O S H A R E H O L D E R S
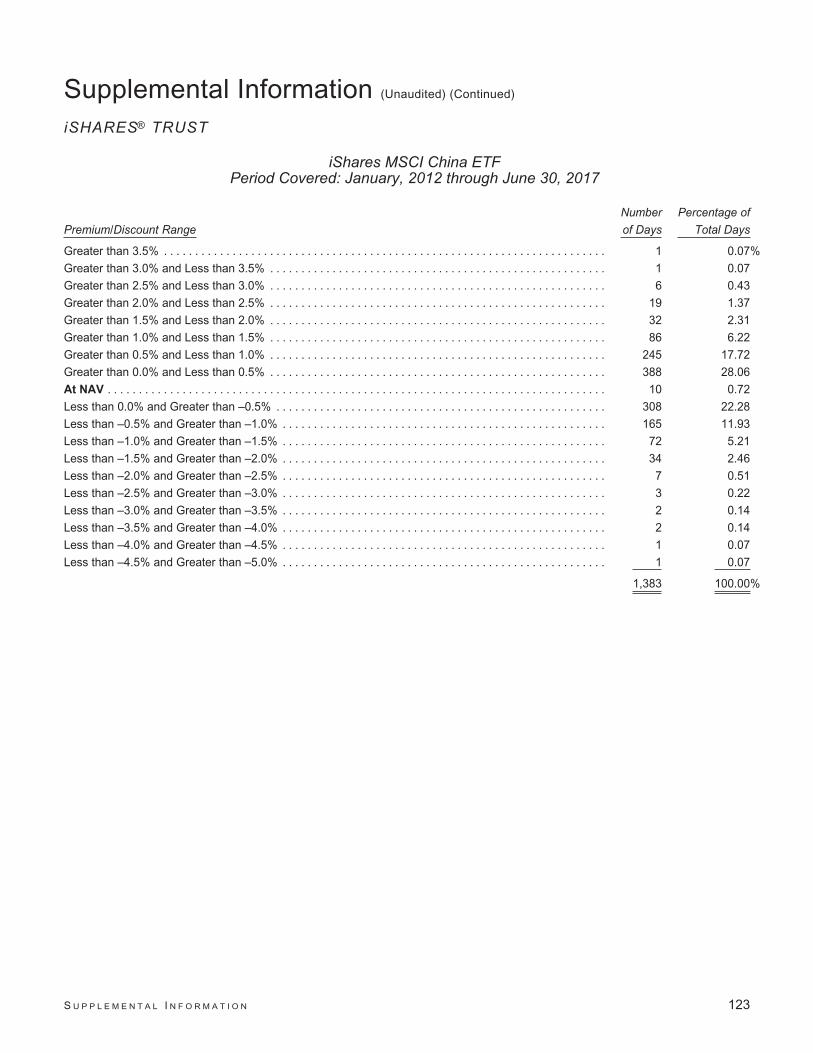
Supplemental Information (Unaudited) (Continued)
iSHARES® TRUST
iShares MSCI China ETFPeriod Covered: January, 2012 through June 30, 2017
Premium/Discount Range
Number
of Days
Percentage of
Total Days
Greater than 3.5% . . . . . . . . . . . . . . . . . . . . . . . . . . . . . . . . . . . . . . . . . . . . . . . . . . . . . . . . . . . . . . . . . . . . . . . 1 0.07%
Greater than 3.0% and Less than 3.5% . . . . . . . . . . . . . . . . . . . . . . . . . . . . . . . . . . . . . . . . . . . . . . . . . . . . . . 1 0.07
Greater than 2.5% and Less than 3.0% . . . . . . . . . . . . . . . . . . . . . . . . . . . . . . . . . . . . . . . . . . . . . . . . . . . . . . 6 0.43
Greater than 2.0% and Less than 2.5% . . . . . . . . . . . . . . . . . . . . . . . . . . . . . . . . . . . . . . . . . . . . . . . . . . . . . . 19 1.37
Greater than 1.5% and Less than 2.0% . . . . . . . . . . . . . . . . . . . . . . . . . . . . . . . . . . . . . . . . . . . . . . . . . . . . . . 32 2.31
Greater than 1.0% and Less than 1.5% . . . . . . . . . . . . . . . . . . . . . . . . . . . . . . . . . . . . . . . . . . . . . . . . . . . . . . 86 6.22
Greater than 0.5% and Less than 1.0% . . . . . . . . . . . . . . . . . . . . . . . . . . . . . . . . . . . . . . . . . . . . . . . . . . . . . . 245 17.72
Greater than 0.0% and Less than 0.5% . . . . . . . . . . . . . . . . . . . . . . . . . . . . . . . . . . . . . . . . . . . . . . . . . . . . . . 388 28.06
At NAV . . . . . . . . . . . . . . . . . . . . . . . . . . . . . . . . . . . . . . . . . . . . . . . . . . . . . . . . . . . . . . . . . . . . . . . . . . . . . . . . 10 0.72
Less than 0.0% and Greater than –0.5% . . . . . . . . . . . . . . . . . . . . . . . . . . . . . . . . . . . . . . . . . . . . . . . . . . . . . 308 22.28
Less than –0.5% and Greater than –1.0% . . . . . . . . . . . . . . . . . . . . . . . . . . . . . . . . . . . . . . . . . . . . . . . . . . . . 165 11.93
Less than –1.0% and Greater than –1.5% . . . . . . . . . . . . . . . . . . . . . . . . . . . . . . . . . . . . . . . . . . . . . . . . . . . . 72 5.21
Less than –1.5% and Greater than –2.0% . . . . . . . . . . . . . . . . . . . . . . . . . . . . . . . . . . . . . . . . . . . . . . . . . . . . 34 2.46
Less than –2.0% and Greater than –2.5% . . . . . . . . . . . . . . . . . . . . . . . . . . . . . . . . . . . . . . . . . . . . . . . . . . . . 7 0.51
Less than –2.5% and Greater than –3.0% . . . . . . . . . . . . . . . . . . . . . . . . . . . . . . . . . . . . . . . . . . . . . . . . . . . . 3 0.22
Less than –3.0% and Greater than –3.5% . . . . . . . . . . . . . . . . . . . . . . . . . . . . . . . . . . . . . . . . . . . . . . . . . . . . 2 0.14
Less than –3.5% and Greater than –4.0% . . . . . . . . . . . . . . . . . . . . . . . . . . . . . . . . . . . . . . . . . . . . . . . . . . . . 2 0.14
Less than –4.0% and Greater than –4.5% . . . . . . . . . . . . . . . . . . . . . . . . . . . . . . . . . . . . . . . . . . . . . . . . . . . . 1 0.07
Less than –4.5% and Greater than –5.0% . . . . . . . . . . . . . . . . . . . . . . . . . . . . . . . . . . . . . . . . . . . . . . . . . . . . 1 0.07
1,383 100.00%
S U P P L E M E N T A L I N F O R M A T I O N 123
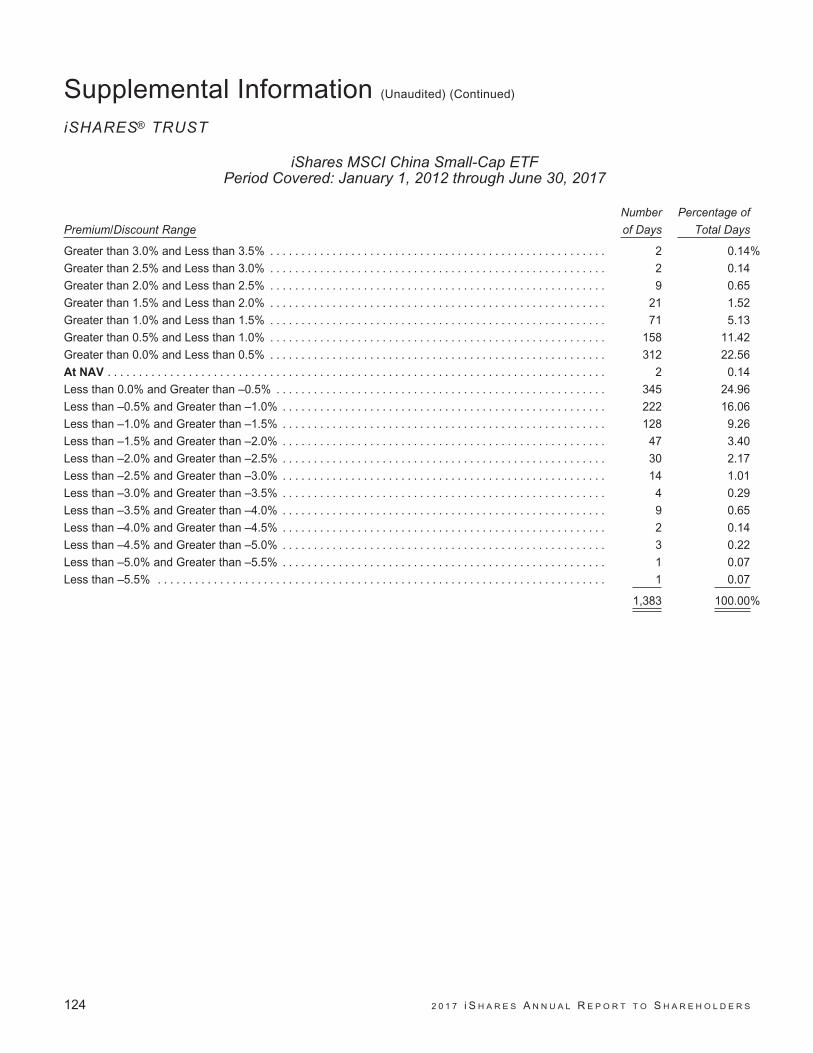
Supplemental Information (Unaudited) (Continued)
iSHARES® TRUST
iShares MSCI China Small-Cap ETFPeriod Covered: January 1, 2012 through June 30, 2017
Premium/Discount Range
Number
of Days
Percentage of
Total Days
Greater than 3.0% and Less than 3.5% . . . . . . . . . . . . . . . . . . . . . . . . . . . . . . . . . . . . . . . . . . . . . . . . . . . . . . 2 0.14%
Greater than 2.5% and Less than 3.0% . . . . . . . . . . . . . . . . . . . . . . . . . . . . . . . . . . . . . . . . . . . . . . . . . . . . . . 2 0.14
Greater than 2.0% and Less than 2.5% . . . . . . . . . . . . . . . . . . . . . . . . . . . . . . . . . . . . . . . . . . . . . . . . . . . . . . 9 0.65
Greater than 1.5% and Less than 2.0% . . . . . . . . . . . . . . . . . . . . . . . . . . . . . . . . . . . . . . . . . . . . . . . . . . . . . . 21 1.52
Greater than 1.0% and Less than 1.5% . . . . . . . . . . . . . . . . . . . . . . . . . . . . . . . . . . . . . . . . . . . . . . . . . . . . . . 71 5.13
Greater than 0.5% and Less than 1.0% . . . . . . . . . . . . . . . . . . . . . . . . . . . . . . . . . . . . . . . . . . . . . . . . . . . . . . 158 11.42
Greater than 0.0% and Less than 0.5% . . . . . . . . . . . . . . . . . . . . . . . . . . . . . . . . . . . . . . . . . . . . . . . . . . . . . . 312 22.56
At NAV . . . . . . . . . . . . . . . . . . . . . . . . . . . . . . . . . . . . . . . . . . . . . . . . . . . . . . . . . . . . . . . . . . . . . . . . . . . . . . . . 2 0.14
Less than 0.0% and Greater than –0.5% . . . . . . . . . . . . . . . . . . . . . . . . . . . . . . . . . . . . . . . . . . . . . . . . . . . . . 345 24.96
Less than –0.5% and Greater than –1.0% . . . . . . . . . . . . . . . . . . . . . . . . . . . . . . . . . . . . . . . . . . . . . . . . . . . . 222 16.06
Less than –1.0% and Greater than –1.5% . . . . . . . . . . . . . . . . . . . . . . . . . . . . . . . . . . . . . . . . . . . . . . . . . . . . 128 9.26
Less than –1.5% and Greater than –2.0% . . . . . . . . . . . . . . . . . . . . . . . . . . . . . . . . . . . . . . . . . . . . . . . . . . . . 47 3.40
Less than –2.0% and Greater than –2.5% . . . . . . . . . . . . . . . . . . . . . . . . . . . . . . . . . . . . . . . . . . . . . . . . . . . . 30 2.17
Less than –2.5% and Greater than –3.0% . . . . . . . . . . . . . . . . . . . . . . . . . . . . . . . . . . . . . . . . . . . . . . . . . . . . 14 1.01
Less than –3.0% and Greater than –3.5% . . . . . . . . . . . . . . . . . . . . . . . . . . . . . . . . . . . . . . . . . . . . . . . . . . . . 4 0.29
Less than –3.5% and Greater than –4.0% . . . . . . . . . . . . . . . . . . . . . . . . . . . . . . . . . . . . . . . . . . . . . . . . . . . . 9 0.65
Less than –4.0% and Greater than –4.5% . . . . . . . . . . . . . . . . . . . . . . . . . . . . . . . . . . . . . . . . . . . . . . . . . . . . 2 0.14
Less than –4.5% and Greater than –5.0% . . . . . . . . . . . . . . . . . . . . . . . . . . . . . . . . . . . . . . . . . . . . . . . . . . . . 3 0.22
Less than –5.0% and Greater than –5.5% . . . . . . . . . . . . . . . . . . . . . . . . . . . . . . . . . . . . . . . . . . . . . . . . . . . . 1 0.07
Less than –5.5% . . . . . . . . . . . . . . . . . . . . . . . . . . . . . . . . . . . . . . . . . . . . . . . . . . . . . . . . . . . . . . . . . . . . . . . . 1 0.07
1,383 100.00%
124 2 0 1 7 i S H A R E S A N N U A L R E P O R T T O S H A R E H O L D E R S
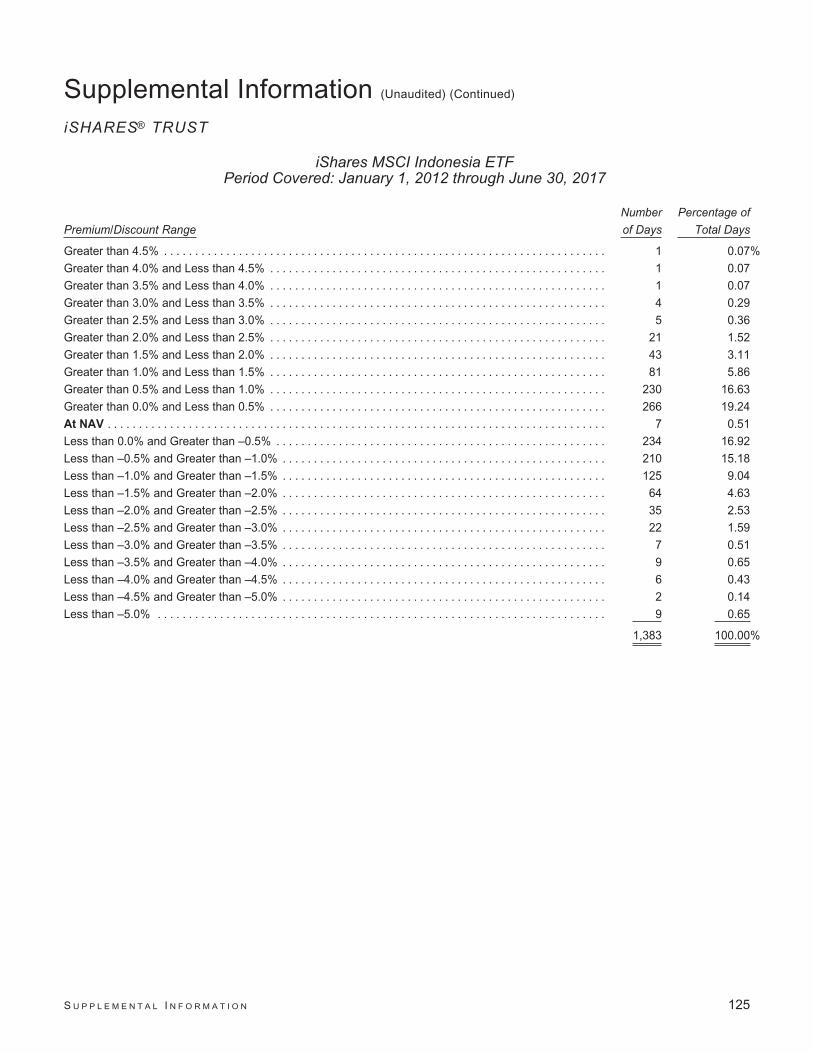
Supplemental Information (Unaudited) (Continued)
iSHARES® TRUST
iShares MSCI Indonesia ETFPeriod Covered: January 1, 2012 through June 30, 2017
Premium/Discount Range
Number
of Days
Percentage of
Total Days
Greater than 4.5% . . . . . . . . . . . . . . . . . . . . . . . . . . . . . . . . . . . . . . . . . . . . . . . . . . . . . . . . . . . . . . . . . . . . . . . 1 0.07%
Greater than 4.0% and Less than 4.5% . . . . . . . . . . . . . . . . . . . . . . . . . . . . . . . . . . . . . . . . . . . . . . . . . . . . . . 1 0.07
Greater than 3.5% and Less than 4.0% . . . . . . . . . . . . . . . . . . . . . . . . . . . . . . . . . . . . . . . . . . . . . . . . . . . . . . 1 0.07
Greater than 3.0% and Less than 3.5% . . . . . . . . . . . . . . . . . . . . . . . . . . . . . . . . . . . . . . . . . . . . . . . . . . . . . . 4 0.29
Greater than 2.5% and Less than 3.0% . . . . . . . . . . . . . . . . . . . . . . . . . . . . . . . . . . . . . . . . . . . . . . . . . . . . . . 5 0.36
Greater than 2.0% and Less than 2.5% . . . . . . . . . . . . . . . . . . . . . . . . . . . . . . . . . . . . . . . . . . . . . . . . . . . . . . 21 1.52
Greater than 1.5% and Less than 2.0% . . . . . . . . . . . . . . . . . . . . . . . . . . . . . . . . . . . . . . . . . . . . . . . . . . . . . . 43 3.11
Greater than 1.0% and Less than 1.5% . . . . . . . . . . . . . . . . . . . . . . . . . . . . . . . . . . . . . . . . . . . . . . . . . . . . . . 81 5.86
Greater than 0.5% and Less than 1.0% . . . . . . . . . . . . . . . . . . . . . . . . . . . . . . . . . . . . . . . . . . . . . . . . . . . . . . 230 16.63
Greater than 0.0% and Less than 0.5% . . . . . . . . . . . . . . . . . . . . . . . . . . . . . . . . . . . . . . . . . . . . . . . . . . . . . . 266 19.24
At NAV . . . . . . . . . . . . . . . . . . . . . . . . . . . . . . . . . . . . . . . . . . . . . . . . . . . . . . . . . . . . . . . . . . . . . . . . . . . . . . . . 7 0.51
Less than 0.0% and Greater than –0.5% . . . . . . . . . . . . . . . . . . . . . . . . . . . . . . . . . . . . . . . . . . . . . . . . . . . . . 234 16.92
Less than –0.5% and Greater than –1.0% . . . . . . . . . . . . . . . . . . . . . . . . . . . . . . . . . . . . . . . . . . . . . . . . . . . . 210 15.18
Less than –1.0% and Greater than –1.5% . . . . . . . . . . . . . . . . . . . . . . . . . . . . . . . . . . . . . . . . . . . . . . . . . . . . 125 9.04
Less than –1.5% and Greater than –2.0% . . . . . . . . . . . . . . . . . . . . . . . . . . . . . . . . . . . . . . . . . . . . . . . . . . . . 64 4.63
Less than –2.0% and Greater than –2.5% . . . . . . . . . . . . . . . . . . . . . . . . . . . . . . . . . . . . . . . . . . . . . . . . . . . . 35 2.53
Less than –2.5% and Greater than –3.0% . . . . . . . . . . . . . . . . . . . . . . . . . . . . . . . . . . . . . . . . . . . . . . . . . . . . 22 1.59
Less than –3.0% and Greater than –3.5% . . . . . . . . . . . . . . . . . . . . . . . . . . . . . . . . . . . . . . . . . . . . . . . . . . . . 7 0.51
Less than –3.5% and Greater than –4.0% . . . . . . . . . . . . . . . . . . . . . . . . . . . . . . . . . . . . . . . . . . . . . . . . . . . . 9 0.65
Less than –4.0% and Greater than –4.5% . . . . . . . . . . . . . . . . . . . . . . . . . . . . . . . . . . . . . . . . . . . . . . . . . . . . 6 0.43
Less than –4.5% and Greater than –5.0% . . . . . . . . . . . . . . . . . . . . . . . . . . . . . . . . . . . . . . . . . . . . . . . . . . . . 2 0.14
Less than –5.0% . . . . . . . . . . . . . . . . . . . . . . . . . . . . . . . . . . . . . . . . . . . . . . . . . . . . . . . . . . . . . . . . . . . . . . . . 9 0.65
1,383 100.00%
S U P P L E M E N T A L I N F O R M A T I O N 125

Supplemental Information (Unaudited) (Continued)
iSHARES® TRUST
iShares MSCI Philippines ETFPeriod Covered: January 1, 2012 through June 30, 2017
Premium/Discount Range
Number
of Days
Percentage of
Total Days
Greater than 3.5% . . . . . . . . . . . . . . . . . . . . . . . . . . . . . . . . . . . . . . . . . . . . . . . . . . . . . . . . . . . . . . . . . . . . . . . 3 0.22%
Greater than 3.0% and Less than 3.5% . . . . . . . . . . . . . . . . . . . . . . . . . . . . . . . . . . . . . . . . . . . . . . . . . . . . . . 1 0.07
Greater than 2.5% and Less than 3.0% . . . . . . . . . . . . . . . . . . . . . . . . . . . . . . . . . . . . . . . . . . . . . . . . . . . . . . 1 0.07
Greater than 2.0% and Less than 2.5% . . . . . . . . . . . . . . . . . . . . . . . . . . . . . . . . . . . . . . . . . . . . . . . . . . . . . . 14 1.01
Greater than 1.5% and Less than 2.0% . . . . . . . . . . . . . . . . . . . . . . . . . . . . . . . . . . . . . . . . . . . . . . . . . . . . . . 37 2.68
Greater than 1.0% and Less than 1.5% . . . . . . . . . . . . . . . . . . . . . . . . . . . . . . . . . . . . . . . . . . . . . . . . . . . . . . 88 6.36
Greater than 0.5% and Less than 1.0% . . . . . . . . . . . . . . . . . . . . . . . . . . . . . . . . . . . . . . . . . . . . . . . . . . . . . . 214 15.47
Greater than 0.0% and Less than 0.5% . . . . . . . . . . . . . . . . . . . . . . . . . . . . . . . . . . . . . . . . . . . . . . . . . . . . . . 282 20.40
At NAV . . . . . . . . . . . . . . . . . . . . . . . . . . . . . . . . . . . . . . . . . . . . . . . . . . . . . . . . . . . . . . . . . . . . . . . . . . . . . . . . 10 0.72
Less than 0.0% and Greater than –0.5% . . . . . . . . . . . . . . . . . . . . . . . . . . . . . . . . . . . . . . . . . . . . . . . . . . . . . 254 18.37
Less than –0.5% and Greater than –1.0% . . . . . . . . . . . . . . . . . . . . . . . . . . . . . . . . . . . . . . . . . . . . . . . . . . . . 224 16.20
Less than –1.0% and Greater than –1.5% . . . . . . . . . . . . . . . . . . . . . . . . . . . . . . . . . . . . . . . . . . . . . . . . . . . . 144 10.41
Less than –1.5% and Greater than –2.0% . . . . . . . . . . . . . . . . . . . . . . . . . . . . . . . . . . . . . . . . . . . . . . . . . . . . 58 4.19
Less than –2.0% and Greater than –2.5% . . . . . . . . . . . . . . . . . . . . . . . . . . . . . . . . . . . . . . . . . . . . . . . . . . . . 24 1.74
Less than –2.5% and Greater than –3.0% . . . . . . . . . . . . . . . . . . . . . . . . . . . . . . . . . . . . . . . . . . . . . . . . . . . . 16 1.16
Less than –3.0% and Greater than –3.5% . . . . . . . . . . . . . . . . . . . . . . . . . . . . . . . . . . . . . . . . . . . . . . . . . . . . 4 0.29
Less than –3.5% and Greater than –4.0% . . . . . . . . . . . . . . . . . . . . . . . . . . . . . . . . . . . . . . . . . . . . . . . . . . . . 2 0.14
Less than –4.0% and Greater than –4.5% . . . . . . . . . . . . . . . . . . . . . . . . . . . . . . . . . . . . . . . . . . . . . . . . . . . . 2 0.14
Less than –4.5% . . . . . . . . . . . . . . . . . . . . . . . . . . . . . . . . . . . . . . . . . . . . . . . . . . . . . . . . . . . . . . . . . . . . . . . . 5 0.36
1,383 100.00%
126 2 0 1 7 i S H A R E S A N N U A L R E P O R T T O S H A R E H O L D E R S

Supplemental Information (Unaudited) (Continued)
iSHARES® TRUST
iShares MSCI Poland Capped ETFPeriod Covered: January 1, 2012 through June 30, 2017
Premium/Discount Range
Number
of Days
Percentage of
Total Days
Greater than 3.5% . . . . . . . . . . . . . . . . . . . . . . . . . . . . . . . . . . . . . . . . . . . . . . . . . . . . . . . . . . . . . . . . . . . . . . . 3 0.22%
Greater than 3.0% and Less than 3.5% . . . . . . . . . . . . . . . . . . . . . . . . . . . . . . . . . . . . . . . . . . . . . . . . . . . . . . 2 0.14
Greater than 2.5% and Less than 3.0% . . . . . . . . . . . . . . . . . . . . . . . . . . . . . . . . . . . . . . . . . . . . . . . . . . . . . . 1 0.07
Greater than 2.0% and Less than 2.5% . . . . . . . . . . . . . . . . . . . . . . . . . . . . . . . . . . . . . . . . . . . . . . . . . . . . . . 9 0.65
Greater than 1.5% and Less than 2.0% . . . . . . . . . . . . . . . . . . . . . . . . . . . . . . . . . . . . . . . . . . . . . . . . . . . . . . 8 0.58
Greater than 1.0% and Less than 1.5% . . . . . . . . . . . . . . . . . . . . . . . . . . . . . . . . . . . . . . . . . . . . . . . . . . . . . . 64 4.63
Greater than 0.5% and Less than 1.0% . . . . . . . . . . . . . . . . . . . . . . . . . . . . . . . . . . . . . . . . . . . . . . . . . . . . . . 264 19.09
Greater than 0.0% and Less than 0.5% . . . . . . . . . . . . . . . . . . . . . . . . . . . . . . . . . . . . . . . . . . . . . . . . . . . . . . 442 31.97
At NAV . . . . . . . . . . . . . . . . . . . . . . . . . . . . . . . . . . . . . . . . . . . . . . . . . . . . . . . . . . . . . . . . . . . . . . . . . . . . . . . . 10 0.72
Less than 0.0% and Greater than –0.5% . . . . . . . . . . . . . . . . . . . . . . . . . . . . . . . . . . . . . . . . . . . . . . . . . . . . . 357 25.81
Less than –0.5% and Greater than –1.0% . . . . . . . . . . . . . . . . . . . . . . . . . . . . . . . . . . . . . . . . . . . . . . . . . . . . 159 11.50
Less than –1.0% and Greater than –1.5% . . . . . . . . . . . . . . . . . . . . . . . . . . . . . . . . . . . . . . . . . . . . . . . . . . . . 38 2.75
Less than –1.5% and Greater than –2.0% . . . . . . . . . . . . . . . . . . . . . . . . . . . . . . . . . . . . . . . . . . . . . . . . . . . . 17 1.23
Less than –2.0% and Greater than –2.5% . . . . . . . . . . . . . . . . . . . . . . . . . . . . . . . . . . . . . . . . . . . . . . . . . . . . 5 0.36
Less than –2.5% and Greater than –3.0% . . . . . . . . . . . . . . . . . . . . . . . . . . . . . . . . . . . . . . . . . . . . . . . . . . . . 2 0.14
Less than –3.0% and Greater than –3.5% . . . . . . . . . . . . . . . . . . . . . . . . . . . . . . . . . . . . . . . . . . . . . . . . . . . . 1 0.07
Less than –3.5% and Greater than –4.0% . . . . . . . . . . . . . . . . . . . . . . . . . . . . . . . . . . . . . . . . . . . . . . . . . . . . 1 0.07
1,383 100.00%
iShares MSCI Qatar Capped ETFPeriod Covered: April 29, 2014 through June 30, 2017
Premium/Discount Range
Number
of Days
Percentage of
Total Days
Greater than 3.0% . . . . . . . . . . . . . . . . . . . . . . . . . . . . . . . . . . . . . . . . . . . . . . . . . . . . . . . . . . . . . . . . . . . . . . . 2 0.25%
Greater than 2.5% and Less than 3.0% . . . . . . . . . . . . . . . . . . . . . . . . . . . . . . . . . . . . . . . . . . . . . . . . . . . . . . 2 0.25
Greater than 2.0% and Less than 2.5% . . . . . . . . . . . . . . . . . . . . . . . . . . . . . . . . . . . . . . . . . . . . . . . . . . . . . . 7 0.87
Greater than 1.5% and Less than 2.0% . . . . . . . . . . . . . . . . . . . . . . . . . . . . . . . . . . . . . . . . . . . . . . . . . . . . . . 19 2.37
Greater than 1.0% and Less than 1.5% . . . . . . . . . . . . . . . . . . . . . . . . . . . . . . . . . . . . . . . . . . . . . . . . . . . . . . 77 9.61
Greater than 0.5% and Less than 1.0% . . . . . . . . . . . . . . . . . . . . . . . . . . . . . . . . . . . . . . . . . . . . . . . . . . . . . . 128 15.98
Greater than 0.0% and Less than 0.5% . . . . . . . . . . . . . . . . . . . . . . . . . . . . . . . . . . . . . . . . . . . . . . . . . . . . . . 154 19.23
At NAV . . . . . . . . . . . . . . . . . . . . . . . . . . . . . . . . . . . . . . . . . . . . . . . . . . . . . . . . . . . . . . . . . . . . . . . . . . . . . . . . 9 1.12
Less than 0.0% and Greater than –0.5% . . . . . . . . . . . . . . . . . . . . . . . . . . . . . . . . . . . . . . . . . . . . . . . . . . . . . 174 21.73
Less than –0.5% and Greater than –1.0% . . . . . . . . . . . . . . . . . . . . . . . . . . . . . . . . . . . . . . . . . . . . . . . . . . . . 146 18.23
Less than –1.0% and Greater than –1.5% . . . . . . . . . . . . . . . . . . . . . . . . . . . . . . . . . . . . . . . . . . . . . . . . . . . . 61 7.62
Less than –1.5% and Greater than –2.0% . . . . . . . . . . . . . . . . . . . . . . . . . . . . . . . . . . . . . . . . . . . . . . . . . . . . 16 2.00
Less than –2.0% and Greater than –2.5% . . . . . . . . . . . . . . . . . . . . . . . . . . . . . . . . . . . . . . . . . . . . . . . . . . . . 1 0.12
Less than –2.5% and Greater than –3.0% . . . . . . . . . . . . . . . . . . . . . . . . . . . . . . . . . . . . . . . . . . . . . . . . . . . . 4 0.50
Less than –3.0% . . . . . . . . . . . . . . . . . . . . . . . . . . . . . . . . . . . . . . . . . . . . . . . . . . . . . . . . . . . . . . . . . . . . . . . . 1 0.12
801 100.00%
S U P P L E M E N T A L I N F O R M A T I O N 127

Supplemental Information (Unaudited) (Continued)
iSHARES® TRUST
iShares MSCI Saudi Arabia Capped ETFPeriod Covered: September 16, 2015 through June 30, 2017
Premium/Discount Range
Number
of Days
Percentage of
Total Days
Greater than 5.0% . . . . . . . . . . . . . . . . . . . . . . . . . . . . . . . . . . . . . . . . . . . . . . . . . . . . . . . . . . . . . . . . . . . . . . . 1 0.22%
Greater than 4.5% and Less than 5.0% . . . . . . . . . . . . . . . . . . . . . . . . . . . . . . . . . . . . . . . . . . . . . . . . . . . . . . 2 0.44
Greater than 4.0% and Less than 4.5% . . . . . . . . . . . . . . . . . . . . . . . . . . . . . . . . . . . . . . . . . . . . . . . . . . . . . . 2 0.44
Greater than 3.5% and Less than 4.0% . . . . . . . . . . . . . . . . . . . . . . . . . . . . . . . . . . . . . . . . . . . . . . . . . . . . . . 5 1.11
Greater than 3.0% and Less than 3.5% . . . . . . . . . . . . . . . . . . . . . . . . . . . . . . . . . . . . . . . . . . . . . . . . . . . . . . 24 5.31
Greater than 2.5% and Less than 3.0% . . . . . . . . . . . . . . . . . . . . . . . . . . . . . . . . . . . . . . . . . . . . . . . . . . . . . . 45 9.96
Greater than 2.0% and Less than 2.5% . . . . . . . . . . . . . . . . . . . . . . . . . . . . . . . . . . . . . . . . . . . . . . . . . . . . . . 95 21.02
Greater than 1.5% and Less than 2.0% . . . . . . . . . . . . . . . . . . . . . . . . . . . . . . . . . . . . . . . . . . . . . . . . . . . . . . 116 25.67
Greater than 1.0% and Less than 1.5% . . . . . . . . . . . . . . . . . . . . . . . . . . . . . . . . . . . . . . . . . . . . . . . . . . . . . . 88 19.47
Greater than 0.5% and Less than 1.0% . . . . . . . . . . . . . . . . . . . . . . . . . . . . . . . . . . . . . . . . . . . . . . . . . . . . . . 44 9.73
Greater than 0.0% and Less than 0.5% . . . . . . . . . . . . . . . . . . . . . . . . . . . . . . . . . . . . . . . . . . . . . . . . . . . . . . 15 3.32
At NAV . . . . . . . . . . . . . . . . . . . . . . . . . . . . . . . . . . . . . . . . . . . . . . . . . . . . . . . . . . . . . . . . . . . . . . . . . . . . . . . . 1 0.22
Less than 0.0% and Greater than –0.5% . . . . . . . . . . . . . . . . . . . . . . . . . . . . . . . . . . . . . . . . . . . . . . . . . . . . . 4 0.88
Less than –0.5% and Greater than –1.0% . . . . . . . . . . . . . . . . . . . . . . . . . . . . . . . . . . . . . . . . . . . . . . . . . . . . 5 1.11
Less than –1.0% and Greater than –1.5% . . . . . . . . . . . . . . . . . . . . . . . . . . . . . . . . . . . . . . . . . . . . . . . . . . . . 2 0.44
Less than –1.5% and Greater than –2.0% . . . . . . . . . . . . . . . . . . . . . . . . . . . . . . . . . . . . . . . . . . . . . . . . . . . . 2 0.44
Less than –2.0% . . . . . . . . . . . . . . . . . . . . . . . . . . . . . . . . . . . . . . . . . . . . . . . . . . . . . . . . . . . . . . . . . . . . . . . . 1 0.22
452 100.00%
128 2 0 1 7 i S H A R E S A N N U A L R E P O R T T O S H A R E H O L D E R S
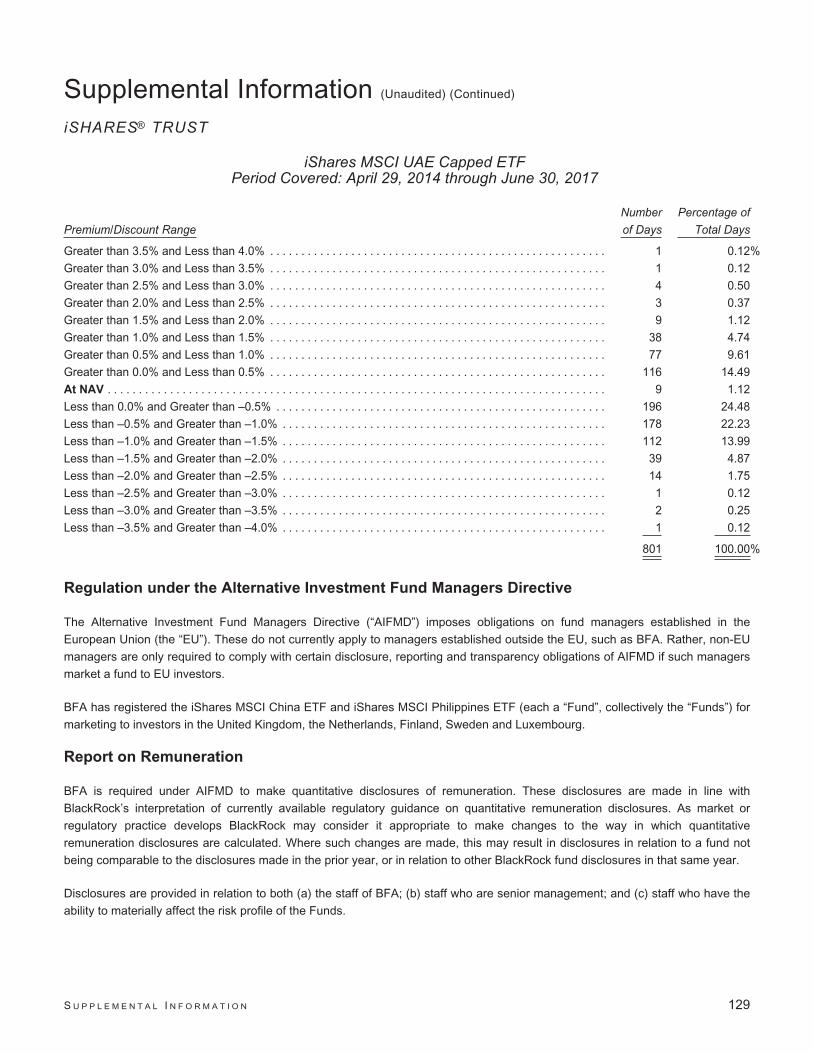
Supplemental Information (Unaudited) (Continued)
iSHARES® TRUST
iShares MSCI UAE Capped ETFPeriod Covered: April 29, 2014 through June 30, 2017
Premium/Discount Range
Number
of Days
Percentage of
Total Days
Greater than 3.5% and Less than 4.0% . . . . . . . . . . . . . . . . . . . . . . . . . . . . . . . . . . . . . . . . . . . . . . . . . . . . . . 1 0.12%
Greater than 3.0% and Less than 3.5% . . . . . . . . . . . . . . . . . . . . . . . . . . . . . . . . . . . . . . . . . . . . . . . . . . . . . . 1 0.12
Greater than 2.5% and Less than 3.0% . . . . . . . . . . . . . . . . . . . . . . . . . . . . . . . . . . . . . . . . . . . . . . . . . . . . . . 4 0.50
Greater than 2.0% and Less than 2.5% . . . . . . . . . . . . . . . . . . . . . . . . . . . . . . . . . . . . . . . . . . . . . . . . . . . . . . 3 0.37
Greater than 1.5% and Less than 2.0% . . . . . . . . . . . . . . . . . . . . . . . . . . . . . . . . . . . . . . . . . . . . . . . . . . . . . . 9 1.12
Greater than 1.0% and Less than 1.5% . . . . . . . . . . . . . . . . . . . . . . . . . . . . . . . . . . . . . . . . . . . . . . . . . . . . . . 38 4.74
Greater than 0.5% and Less than 1.0% . . . . . . . . . . . . . . . . . . . . . . . . . . . . . . . . . . . . . . . . . . . . . . . . . . . . . . 77 9.61
Greater than 0.0% and Less than 0.5% . . . . . . . . . . . . . . . . . . . . . . . . . . . . . . . . . . . . . . . . . . . . . . . . . . . . . . 116 14.49
At NAV . . . . . . . . . . . . . . . . . . . . . . . . . . . . . . . . . . . . . . . . . . . . . . . . . . . . . . . . . . . . . . . . . . . . . . . . . . . . . . . . 9 1.12
Less than 0.0% and Greater than –0.5% . . . . . . . . . . . . . . . . . . . . . . . . . . . . . . . . . . . . . . . . . . . . . . . . . . . . . 196 24.48
Less than –0.5% and Greater than –1.0% . . . . . . . . . . . . . . . . . . . . . . . . . . . . . . . . . . . . . . . . . . . . . . . . . . . . 178 22.23
Less than –1.0% and Greater than –1.5% . . . . . . . . . . . . . . . . . . . . . . . . . . . . . . . . . . . . . . . . . . . . . . . . . . . . 112 13.99
Less than –1.5% and Greater than –2.0% . . . . . . . . . . . . . . . . . . . . . . . . . . . . . . . . . . . . . . . . . . . . . . . . . . . . 39 4.87
Less than –2.0% and Greater than –2.5% . . . . . . . . . . . . . . . . . . . . . . . . . . . . . . . . . . . . . . . . . . . . . . . . . . . . 14 1.75
Less than –2.5% and Greater than –3.0% . . . . . . . . . . . . . . . . . . . . . . . . . . . . . . . . . . . . . . . . . . . . . . . . . . . . 1 0.12
Less than –3.0% and Greater than –3.5% . . . . . . . . . . . . . . . . . . . . . . . . . . . . . . . . . . . . . . . . . . . . . . . . . . . . 2 0.25
Less than –3.5% and Greater than –4.0% . . . . . . . . . . . . . . . . . . . . . . . . . . . . . . . . . . . . . . . . . . . . . . . . . . . . 1 0.12
801 100.00%
Regulation under the Alternative Investment Fund Managers Directive
The Alternative Investment Fund Managers Directive (“AIFMD”) imposes obligations on fund managers established in the
European Union (the “EU”). These do not currently apply to managers established outside the EU, such as BFA. Rather, non-EU
managers are only required to comply with certain disclosure, reporting and transparency obligations of AIFMD if such managers
market a fund to EU investors.
BFA has registered the iShares MSCI China ETF and iShares MSCI Philippines ETF (each a “Fund”, collectively the “Funds”) for
marketing to investors in the United Kingdom, the Netherlands, Finland, Sweden and Luxembourg.
Report on Remuneration
BFA is required under AIFMD to make quantitative disclosures of remuneration. These disclosures are made in line with
BlackRock’s interpretation of currently available regulatory guidance on quantitative remuneration disclosures. As market or
regulatory practice develops BlackRock may consider it appropriate to make changes to the way in which quantitative
remuneration disclosures are calculated. Where such changes are made, this may result in disclosures in relation to a fund not
being comparable to the disclosures made in the prior year, or in relation to other BlackRock fund disclosures in that same year.
Disclosures are provided in relation to both (a) the staff of BFA; (b) staff who are senior management; and (c) staff who have the
ability to materially affect the risk profile of the Funds.
S U P P L E M E N T A L I N F O R M A T I O N 129

Supplemental Information (Unaudited) (Continued)
iSHARES® TRUST
All individuals included in the aggregated figures disclosed are rewarded in line with BlackRock’s remuneration policy for their
responsibilities across the relevant BlackRock business area. As all individuals have a number of areas of responsibilities, only
the portion of remuneration for those individuals’ services attributable to each Fund is included in the aggregate figures disclosed.
BlackRock has a clear and well defined pay-for-performance philosophy, and compensation programs which support that
philosophy. For senior management, a significant percentage of variable remuneration is deferred over time. All employees are
subject to a claw-back policy.
Compensation decisions for employees are made based on BlackRock’s full-year financial results and other non-financial goals
and objectives. Alongside financial performance, individual compensation is also based on strategic and operating results and
other considerations such as management and leadership capabilities. No set formulas are established and no fixed benchmarks
are used in determining annual incentive awards.
Bonus pools are reviewed by BlackRock’s independent compensation committee, taking into account both actual and projected
financial information together with information provided by the Operational Risk and Regulatory Compliance departments in
relation to any activities, incidents or events that warrant consideration in making compensation decisions.
Functions such as Finance, Operational Risk, Legal & Compliance, and Human Resources each have their own organizational
structures which are independent of the business units. Functional bonus pools are determined with reference to the performance
of each individual function and the remuneration of the senior members of control functions is directly overseen by BlackRock’s
independent compensation committee. No individual is involved in setting his or her own remuneration.
Members of staff and senior management of BFA typically provide both AIFMD and non-AIFMD related services in respect of
multiple funds, clients and functions of BFA and across the broader BlackRock group. Therefore, the figures disclosed are a sum
of each individual’s portion of remuneration attributable to each Fund according to an objective apportionment methodology which
acknowledges the multiple-service nature of BFA. Accordingly the figures are not representative of any individual’s actual
remuneration or their remuneration structure.
The amount of the total remuneration awarded by BFA to its staff which has been attributed to the iShares MSCI China ETF in
respect of BFA’s financial year ending December 31, 2016 was USD 229.22 thousand. This figure is comprised of fixed
remuneration of USD 90.17 thousand and variable remuneration of USD 139.05 thousand. There were a total of 325 beneficiaries
of the remuneration described above.
The amount of the aggregate remuneration awarded by BFA, which has been attributed to the iShares MSCI China ETF in
respect of BFA’s financial year ending December 31, 2016, to its senior management was USD 31.70 thousand, and to members
of its staff whose actions have a material impact on the risk profile of the Fund was USD 7.64 thousand.
The amount of the total remuneration awarded by BFA to its staff which has been attributed to the iShares MSCI Philippines ETF
in respect of BFA’s financial year ending December 31, 2016 was USD 15.15 thousand. This figure is comprised of fixed
remuneration of USD 5.96 thousand and variable remuneration of USD 9.19 thousand. There were a total of 325 beneficiaries of
the remuneration described above.
The amount of the aggregate remuneration awarded by BFA, which has been attributed to the iShares MSCI Philippines ETF in
respect of the BFA’s financial year ending December 31, 2016, to its senior management was USD 2.10 thousand, and to
members of its staff whose actions have a material impact on the risk profile of the Fund was USD 0.50 thousand.
130 2 0 1 7 i S H A R E S A N N U A L R E P O R T T O S H A R E H O L D E R S

Trustee and Officer InformationiSHARES® TRUST
The Board of Trustees has responsibility for the overall management and operations of the Funds, including general supervision
of the duties performed by BFA and other service providers. Each Trustee serves until he or she resigns, is removed, dies, retires
or becomes incapacitated. Each officer shall hold office until his or her successor is elected and qualifies or until his or her death,
resignation or removal. Trustees who are not “interested persons” (as defined in the 1940 Act) of the Trust are referred to as
independent trustees (“Independent Trustees”).
The registered investment companies advised by BFA or its affiliates (the “BlackRock-advised Funds”) are organized into one
complex of closed-end funds, two complexes of open-end funds and one complex of exchange-traded funds (“Exchange-Traded
Fund Complex”) (each, a “BlackRock Fund Complex”). Each Fund is included in the BlackRock Fund Complex referred to as the
Exchange-Traded Fund Complex. Each Trustee also serves as a Director of iShares, Inc. and a Trustee of iShares U.S. ETF
Trust and, as a result, oversees a total of 344 funds (as of August 31, 2017) within the Exchange-Traded Fund Complex. Drew E.
Lawton, from October 2016 to June 2017, and Richard L. Fagnani, from April 2017 to June 2017, served as Advisory Board
Members for iShares Trust, iShares, Inc. and iShares U.S. ETF Trust with respect to all funds within the Exchange-Traded Fund
Complex. With the exception of Robert S. Kapito, Mark K. Wiedman, Charles Park, Martin Small and Benjamin Archibald, the
address of each Trustee, and officer is c/o BlackRock, Inc., 400 Howard Street, San Francisco, CA 94105. The address of
Mr. Kapito, Mr. Wiedman, Mr. Park, Mr. Small and Mr. Archibald is c/o BlackRock, Inc., Park Avenue Plaza, 55 East 52nd Street,
New York, NY 10055. The Board has designated Cecilia H. Herbert as its Independent Board Chair. Additional information about
the Funds’ Trustees and officers may be found in the Funds’ combined Statement of Additional Information, which is available
without charge, upon request, by calling toll-free 1-800-iShares (1-800-474-2737).
Interested Trustees
Name (Age) Position(s)
Principal Occupation(s)
During the Past 5 Years Other Directorships Held by Trustee
Robert S. Kapitoa (60) Trustee(since 2009).
President, BlackRock, Inc.(since 2006); Vice Chairman ofBlackRock, Inc. and Head ofBlackRock’s Portfolio ManagementGroup (since its formation in 1998) andBlackRock, Inc.’s predecessor entities(since 1988); Trustee, University ofPennsylvania (since 2009); Presidentof Board of Directors, Hope & HeroesChildren’s Cancer Fund (since 2002).
Director of BlackRock, Inc.(since 2006); Director of iShares, Inc.(since 2009); Trustee of iShares U.S.ETF Trust (since 2011).
Mark K. Wiedmanb (46) Trustee(since 2013).
Senior Managing Director, BlackRock,Inc. (since 2014); Managing Director,BlackRock, Inc. (2007-2014); GlobalHead of BlackRock’s ETF and IndexInvestments Business (since 2016);Global Head of iShares (2011-2016);Head of Corporate Strategy,BlackRock, Inc. (2009-2011).
Director of iShares, Inc. (since 2013);Trustee of iShares U.S. ETF Trust(since 2013); Director of PennyMacFinancial Services, Inc. (since 2008).
a Robert S. Kapito is deemed to be an “interested person” (as defined in the 1940 Act) of the Trust due to his affiliations with BlackRock, Inc. and its affiliates.b Mark K. Wiedman is deemed to be an “interested person” (as defined in the 1940 Act) of the Trust due to his affiliations with BlackRock, Inc. and its affiliates.
T R U S T E E A N D O F F I C E R I N F O R M A T I O N 131

Trustee and Officer Information (Continued)
iSHARES® TRUST
Independent Trustees
Name (Age) Position(s)
Principal Occupation(s)
During the Past 5 Years Other Directorships Held by Trustee
Cecilia H. Herbert (68) Trustee(since 2005);IndependentBoard Chair(since 2016).
Trustee and Member of the Finance,Technology and Quality Committee ofStanford Health Care (since 2016);Trustee and Member of the InvestmentCommittee, WNET, a New York publicmedia company (since 2011); Chair(1994-2005) and Member (since 1992)of the Investment Committee,Archdiocese of San Francisco;Director (1998-2013) and President(2007-2011) of the Board of Directors,Catholic Charities CYO; Trustee(2002-2011) and Chair of the Financeand Investment Committee(2006-2010) of the Thacher School.
Director of iShares, Inc. (since 2005);Trustee of iShares U.S. ETF Trust(since 2011); Independent Board Chairof iShares, Inc. and iShares U.S. ETFTrust (since 2016); Trustee of ForwardFunds (14 portfolios) (since 2009);Trustee of Salient MF Trust(4 portfolios) (since 2015).
Jane D. Carlin (61) Trustee(since 2015);Risk CommitteeChair(since 2016).
Consultant (since 2012); ManagingDirector and Global Head of FinancialHolding Company Governance &Assurance and the Global Head ofOperational Risk Management ofMorgan Stanley (2006-2012).
Director of iShares, Inc. (since 2015);Trustee of iShares U.S. ETF Trust(since 2015); Director of PHHCorporation (mortgage solutions)(since 2012); Director of The HanoverInsurance Group, Inc. (since 2016).
Richard L. Fagnani (62) Trustee(since 2017);Equity PlusCommittee Chair(since 2017).
Partner, KPMG LLP (2002-2016). Director of iShares, Inc. (since 2017);Trustee of iShares U.S. ETF Trust(since 2017).
Charles A. Hurty (73) Trustee(since 2005);Audit CommitteeChair(since 2006).
Retired; Partner, KPMG LLP(1968-2001).
Director of iShares, Inc. (since 2005);Trustee of iShares U.S. ETF Trust(since 2011); Director of SkyBridgeAlternative Investments Multi-AdviserHedge Fund Portfolios LLC (2portfolios) (since 2002).
John E. Kerrigan (62) Trustee(since 2005);SecuritiesLendingCommittee Chair(since 2016).
Chief Investment Officer, Santa ClaraUniversity (since 2002).
Director of iShares, Inc. (since 2005);Trustee of iShares U.S. ETF Trust(since 2011).
Drew E. Lawton (58) Trustee(since 2017);15(c) CommitteeChair(since 2017).
Senior Managing Director of New YorkLife Insurance Company (2010-2015).
Director of iShares, Inc. (since 2017);Trustee of iShares U.S. ETF Trust(since 2017).
132 2 0 1 7 i S H A R E S A N N U A L R E P O R T T O S H A R E H O L D E R S

Trustee and Officer Information (Continued)
iSHARES® TRUST
Independent Trustees (Continued)
Name (Age) Position(s)
Principal Occupation(s)
During the Past 5 Years Other Directorships Held by Trustee
John E. Martinez (56) Trustee(since 2003);Fixed IncomePlus CommitteeChair(since 2016).
Director of Real Estate EquityExchange, Inc. (since 2005).
Director of iShares, Inc. (since 2003);Trustee of iShares U.S. ETF Trust(since 2011).
Madhav V. Rajan (53) Trustee(since 2011);Nominating andGovernanceCommittee Chair(since 2017).
Dean, and George Pratt ShultzProfessor of Accounting, University ofChicago Booth School of Business(since 2017); Robert K. JaedickeProfessor of Accounting, StanfordUniversity Graduate School ofBusiness (2001-2017); Professor ofLaw (by courtesy), Stanford LawSchool (2005-2017); Senior AssociateDean for Academic Affairs and Headof MBA Program, Stanford UniversityGraduate School of Business(2010-2016).
Director of iShares, Inc. (since 2011);Trustee of iShares U.S. ETF Trust(since 2011); Director, Cavium, Inc.(since 2013).
T R U S T E E A N D O F F I C E R I N F O R M A T I O N 133

Trustee and Officer Information (Continued)
iSHARES® TRUST
Officersc
Name (Age) Position(s)
Principal Occupation(s)
During the Past 5 Years
Martin Small (42) President(since 2016).
Managing Director, BlackRock, Inc. (since 2010); Head of U.S. iShares(since 2015); Co-Head of the U.S. Financial Markets Advisory Group, BlackRock,Inc. (2008-2014).
Jack Gee (57) Treasurer andChief FinancialOfficer(since 2008).
Managing Director, BlackRock, Inc. (since 2009); Senior Director of FundAdministration of Intermediary Investor Business, BGI (2009).
Benjamin Archibald (42) Secretary(since 2015).
Managing Director, BlackRock, Inc. (since 2014); Director, BlackRock, Inc.(2010-2013): Secretary of the BlackRock-advised mutual funds (since 2012).
Alan Mason (56) Executive VicePresident(since 2016).
Managing Director, BlackRock, Inc. (since 2009).
Steve Messinger (55) Executive VicePresident(since 2016).
Managing Director, BlackRock, Inc. (2007-2014 and since 2016); ManagingDirector, Beacon Consulting Group (2014-2016).
Charles Park (49) Chief ComplianceOfficer(since 2006).
Chief Compliance Officer of BlackRock Advisors, LLC and the BlackRock-advisedFunds in the Equity-Bond Complex, the Equity-Liquidity Complex and the Closed-End Complex (since 2014); Chief Compliance Officer of BFA (since 2006).
Scott Radell (48) Executive VicePresident(since 2012).
Managing Director, BlackRock, Inc. (since 2009); Head of Portfolio Solutions,BlackRock, Inc. (since 2009).
c Manish Mehta served as President until October 15, 2016.
134 2 0 1 7 i S H A R E S A N N U A L R E P O R T T O S H A R E H O L D E R S


For more information visit www.iShares.com or call 1-800-474-2737
This report is intended for the Funds’ shareholders. It may not be distributed to prospective investors unless it is preceded or accompanied by
the current prospectus.
Investing involves risk, including possible loss of principal.
The iShares Funds are distributed by BlackRock Investments, LLC (together with its affiliates, “BlackRock”).
The iShares Funds are not sponsored, endorsed, issued, sold or promoted by MSCI Inc., nor does this company make any representation regarding theadvisability of investing in the iShares Funds. BlackRock is not affiliated with the company listed above.
A description of the policies that the Funds use to determine how to vote proxies relating to portfolio securities and information about how the Funds votedproxies relating to portfolio securities during the most recent twelve-month period ending June 30 is available without charge, upon request, by calling toll-free 1-800-474-2737; on the Funds’ website at www.iShares.com; and on the U.S. Securities and Exchange Commission (SEC) website at www.sec.gov.
The Funds file their complete schedules of portfolio holdings with the SEC for the first and third quarters of each fiscal year on Form N-Q. The Funds’ FormsN-Q are available on the SEC’s website or may be reviewed and copied at the SEC’s Public Reference Room in Washington, D.C. Information on theoperation of the Public Reference Room may be obtained by calling 1-800-SEC-0330. The Funds also disclose their complete schedules of portfolio holdingson a daily basis on the Funds’ website.
©2017 BlackRock, Inc. All rights reserved. iSHARES and BLACKROCK are registered trademarks of BlackRock, Inc. or its subsidiaries. All other marks arethe property of their respective owners.iS
-AR
-806
-081
7
Related Documents