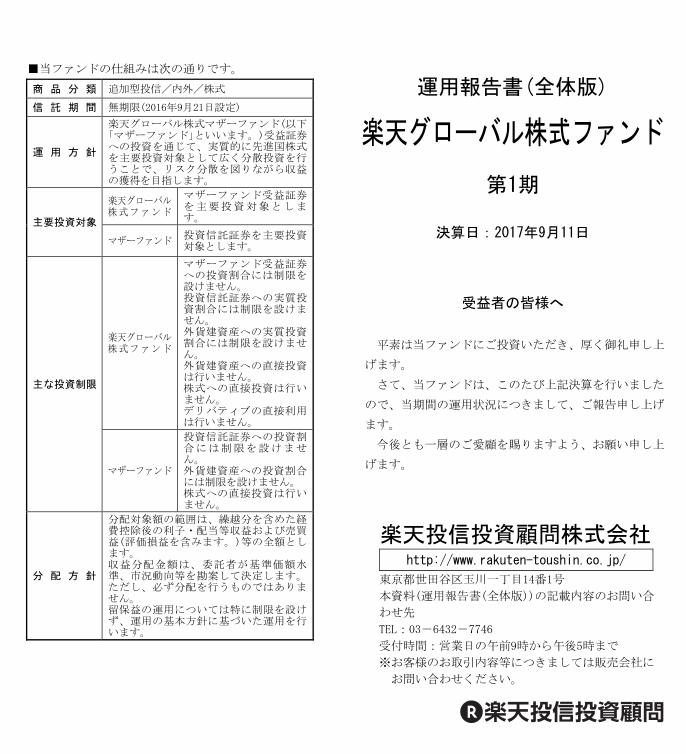
■当ファンドの仕組みは次の通りです。 商 品 分 類 追加型投信/内外/株式 信 託 期 間 無期限(2016年9月21日設定) 運 用 方 針 楽天グローバル株式マザーファンド(以下 「マザーファンド」といいます。)受益証券 への投資を通じて、実質的に先進国株式 を主要投資対象として広く分散投資を行 うことで、リスク分散を図りながら収益 の獲得を目指します。 主要投資対象 楽天グローバル 株式ファンド マザーファンド受益証券 を主要投資対象としま す。 マザーファンド 投資信託証券を主要投資 対象とします。 主な投資制限 楽天グローバル 株式ファンド マザーファンド受益証券 への投資割合には制限を 設けません。 投資信託証券への実質投 資割合には制限を設けま せん。 外貨建資産への実質投資 割合には制限を設けませ ん。 外貨建資産への直接投資 は行いません。 株式への直接投資は行い ません。 デリバティブの直接利用 は行いません。 マザーファンド 投資信託証券への投資割 合には制限を設けませ ん。 外貨建資産への投資割合 には制限を設けません。 株式への直接投資は行い ません。 分 配 方 針 分配対象額の範囲は、繰越分を含めた経 費控除後の利子・配当等収益および売買 益(評価損益を含みます。)等の全額とし ます。 収益分配金額は、委託者が基準価額水 準、市況動向等を勘案して決定します。 ただし、必ず分配を行うものではありま せん。 留保益の運用については特に制限を設け ず、運用の基本方針に基づいた運用を行 います。 運用報告書(全体版) 楽天グローバル株式ファンド 第1期 決算日:2017年9月11日 受益者の皆様へ 平素は当ファンドにご投資いただき、厚く御礼申し上 げます。 さて、当ファンドは、このたび上記決算を行いました ので、当期間の運用状況につきまして、ご報告申し上げ ます。 今後とも一層のご愛顧を賜りますよう、お願い申し上 げます。 楽天投信投資顧問株式会社 http://www.rakuten-toushin.co.jp/ 東京都世田谷区玉川一丁目14番1号 本資料(運用報告書(全体版))の記載内容のお問い合 わせ先 TEL:03-6432-7746 受付時間:営業日の午前9時から午後5時まで ※お客様のお取引内容等につきましては販売会社に お問い合わせください。

Welcome message from author
This document is posted to help you gain knowledge. Please leave a comment to let me know what you think about it! Share it to your friends and learn new things together.
Transcript
00_3771553712911.doc
■当ファンドの仕組みは次の通りです。 商 品 分 類 追加型投信/内外/株式
信 託 期 間 無期限(2016年9月21日設定)
運 用 方 針
楽天グローバル株式マザーファンド(以下「マザーファンド」といいます。)受益証券への投資を通じて、実質的に先進国株式を主要投資対象として広く分散投資を行うことで、リスク分散を図りながら収益の獲得を目指します。
主要投資対象
楽天グローバル 株式ファンド
マザーファンド受益証券を主要投資対象とします。
マザーファンド 投資信託証券を主要投資対象とします。
主な投資制限
楽天グローバル 株式ファンド
マザーファンド受益証券への投資割合には制限を設けません。 投資信託証券への実質投資割合には制限を設けません。 外貨建資産への実質投資割合には制限を設けません。 外貨建資産への直接投資は行いません。 株式への直接投資は行いません。 デリバティブの直接利用は行いません。
マザーファンド
投資信託証券への投資割合には制限を設けません。 外貨建資産への投資割合には制限を設けません。 株式への直接投資は行いません。
分 配 方 針
分配対象額の範囲は、繰越分を含めた経費控除後の利子・配当等収益および売買益(評価損益を含みます。)等の全額とします。 収益分配金額は、委託者が基準価額水準、市況動向等を勘案して決定します。ただし、必ず分配を行うものではありません。 留保益の運用については特に制限を設けず、運用の基本方針に基づいた運用を行います。
運用報告書(全体版)
楽天グローバル株式ファンド
第1期
決算日:2017年9月11日
受益者の皆様へ
平素は当ファンドにご投資いただき、厚く御礼申し上
げます。
さて、当ファンドは、このたび上記決算を行いました
ので、当期間の運用状況につきまして、ご報告申し上げ
ます。
今後とも一層のご愛顧を賜りますよう、お願い申し上
げます。
楽天投信投資顧問株式会社 http://www.rakuten-toushin.co.jp/
東京都世田谷区玉川一丁目14番1号
本資料(運用報告書(全体版))の記載内容のお問い合
わせ先
TEL:03-6432-7746
受付時間:営業日の午前9時から午後5時まで
※お客様のお取引内容等につきましては販売会社に
お問い合わせください。
01_3771553712911.doc
- 0 -
■本資料の表記に関する注記 ・金額等の数値は単位未満切捨または四捨五入により表示しております。このため、各項目の合計の値が合計
欄と一致しないことがあります。
・-印は、組入・売買が無いことを示します。
01_3771553712911.doc
- 1 -
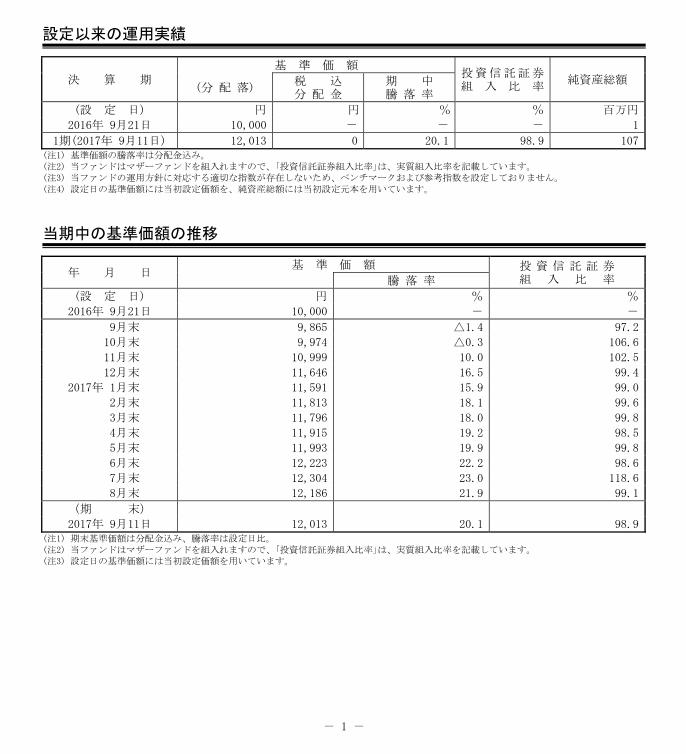
設定以来の運用実績
決 算 期 基 準 価 額
投資信託証券 組 入 比 率
純資産総額 (分 配 落)
税 込 分 配 金
期 中 騰 落 率
(設 定 日) 円 円 % % 百万円
2016年 9月21日 10,000 - - - 1
1期(2017年 9月11日) 12,013 0 20.1 98.9 107 (注1) 基準価額の騰落率は分配金込み。 (注2) 当ファンドはマザーファンドを組入れますので、「投資信託証券組入比率」は、実質組入比率を記載しています。 (注3) 当ファンドの運用方針に対応する適切な指数が存在しないため、ベンチマークおよび参考指数を設定しておりません。 (注4) 設定日の基準価額には当初設定価額を、純資産総額には当初設定元本を用いています。
当期中の基準価額の推移
年 月 日 基 準 価 額 投 資 信 託 証 券
組 入 比 率 騰 落 率
(設 定 日) 円 % %
2016年 9月21日 10,000 - -
9月末 9,865 △1.4 97.2
10月末 9,974 △0.3 106.6
11月末 10,999 10.0 102.5
12月末 11,646 16.5 99.4
2017年 1月末 11,591 15.9 99.0
2月末 11,813 18.1 99.6
3月末 11,796 18.0 99.8
4月末 11,915 19.2 98.5
5月末 11,993 19.9 99.8
6月末 12,223 22.2 98.6
7月末 12,304 23.0 118.6
8月末 12,186 21.9 99.1
(期 末)
2017年 9月11日 12,013 20.1 98.9 (注1) 期末基準価額は分配金込み、騰落率は設定日比。 (注2) 当ファンドはマザーファンドを組入れますので、「投資信託証券組入比率」は、実質組入比率を記載しています。 (注3) 設定日の基準価額には当初設定価額を用いています。
01_3771553712911.doc
- 2 -
当期中の運用経過と今後の運用方針
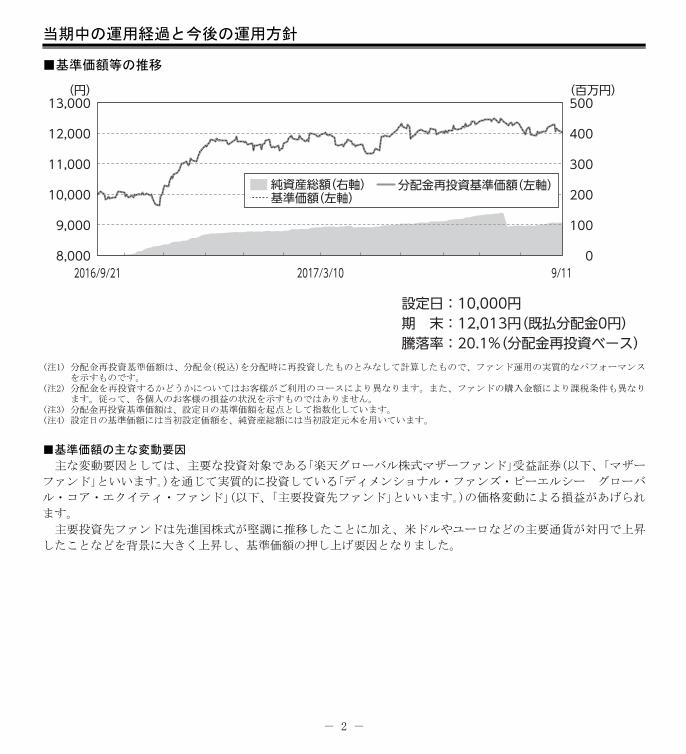
■基準価額等の推移
(注1) 分配金再投資基準価額は、分配金(税込)を分配時に再投資したものとみなして計算したもので、ファンド運用の実質的なパフォーマンス
を示すものです。 (注2) 分配金を再投資するかどうかについてはお客様がご利用のコースにより異なります。また、ファンドの購入金額により課税条件も異なり
ます。従って、各個人のお客様の損益の状況を示すものではありません。 (注3) 分配金再投資基準価額は、設定日の基準価額を起点として指数化しています。 (注4) 設定日の基準価額には当初設定価額を、純資産総額には当初設定元本を用いています。
■基準価額の主な変動要因
主な変動要因としては、主要な投資対象である「楽天グローバル株式マザーファンド」受益証券(以下、「マザー
ファンド」といいます。)を通じて実質的に投資している「ディメンショナル・ファンズ・ピーエルシー グローバ
ル・コア・エクイティ・ファンド」(以下、「主要投資先ファンド」といいます。)の価格変動による損益があげられ
ます。
主要投資先ファンドは先進国株式が堅調に推移したことに加え、米ドルやユーロなどの主要通貨が対円で上昇
したことなどを背景に大きく上昇し、基準価額の押し上げ要因となりました。
01_3771553712911.doc
- 3 -
■投資環境
先進国株式は米大統領選挙の不透明感等を背景に2016年11月上旬まで上値が重い展開が続きましたが、選挙後
はトランプ政権の掲げる政策への期待等から、年末にかけて一本調子で上昇する展開となりました。期後半には
トランプ政権の政策運営に対する警戒や不安が高まったものの、グローバル規模で景気の改善基調が強まってい
るとの認識の広がりや、堅調な企業業績等が政治の不透明感による下押し圧力を打ち消す格好となり、先進国株
式は上昇基調を維持しました。
米ドルやユーロなどの主要通貨も対円で上昇しました。米ドルは、米トランプ政権の掲げる政策への期待感や
米長期金利の上昇を背景に期前半を中心に上昇しました。ユーロも政治的不透明感の後退や域内の景況感の改善
など背景に堅調に推移しました。
■当ファンドのポートフォリオ
追加設定・解約による資金フローを鑑みながら、マザーファンドの投資を通じて、「ディメンショナル・
ファンズ・ピーエルシー グローバル・コア・エクイティ・ファンド」の組入比率を高位に維持し、一部ETFを投
資対象とする運用を行いました。
■当ファンドのベンチマークとの差異
当ファンドは運用の目標となるベンチマークおよび参考指数を設けておりません。
■分配金
運用の基本方針等を勘案し、収益分配は見送らせていただきました。なお、留保益の運用については、特に制
限を設けず、元本部分と同一の運用を行います。
●分配原資の内訳 (1万口当たり・税込)
項 目 第1期
2016年9月21日~2017年9月11日
当期分配金 (円) -
(対基準価額比率) (%) (-)
当期の収益 (円) -
当期の収益以外 (円) -
翌期繰越分配対象額 (円) 2,013 (注1) 「対基準価額比率」は「当期分配金」の期末基準価額(分配金込み)に対する比率であり、ファンドの収益率とは異なります。 (注2) 「当期の収益」は経費控除後の配当等収益および経費控除後の有価証券売買等損益、「当期の収益以外」は収益調整金および分配準備積立金
です。 (注3) 「当期の収益」および「当期の収益以外」は、円未満を切捨てて表示しているため、合計した額が「当期分配金」と一致しない場合があります。
■今後の運用方針
引き続きマザーファンドを通じて、主要投資先ファンドの組入比率を高位に維持し、一部ETFを投資対象とす
る運用を行います。
01_3771553712911.doc
- 4 -
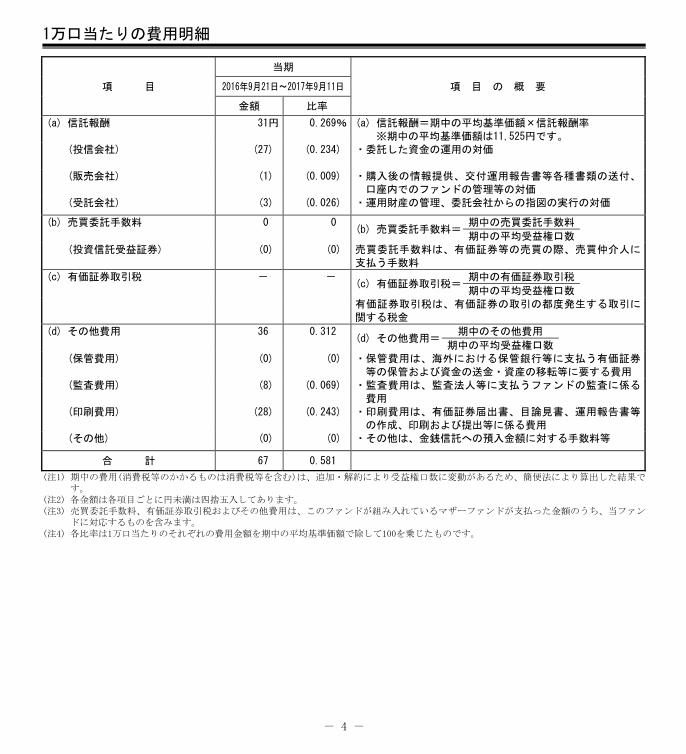
1万口当たりの費用明細
項 目
当期
項 目 の 概 要 2016年9月21日~2017年9月11日
金額 比率
(a) 信託報酬 31円 0.269% (a) 信託報酬=期中の平均基準価額×信託報酬率
※期中の平均基準価額は11,525円です。
(投信会社)
(27) (0.234) ・委託した資金の運用の対価
(販売会社) (1) (0.009) ・購入後の情報提供、交付運用報告書等各種書類の送付、
口座内でのファンドの管理等の対価
(受託会社) (3) (0.026) ・運用財産の管理、委託会社からの指図の実行の対価
(b) 売買委託手数料 0 0 (b) 売買委託手数料=
期中の売買委託手数料
期中の平均受益権口数
(投資信託受益証券) (0) (0) 売買委託手数料は、有価証券等の売買の際、売買仲介人に
支払う手数料
(c) 有価証券取引税 - - (c) 有価証券取引税=
期中の有価証券取引税
期中の平均受益権口数
有価証券取引税は、有価証券の取引の都度発生する取引に
関する税金
(d) その他費用 36 0.312 (d) その他費用=
期中のその他費用
期中の平均受益権口数
(保管費用) (0) (0) ・保管費用は、海外における保管銀行等に支払う有価証券
等の保管および資金の送金・資産の移転等に要する費用
(監査費用) (8) (0.069) ・監査費用は、監査法人等に支払うファンドの監査に係る
費用
(印刷費用) (28) (0.243) ・印刷費用は、有価証券届出書、目論見書、運用報告書等
の作成、印刷および提出等に係る費用
(その他) (0) (0) ・その他は、金銭信託への預入金額に対する手数料等
合 計 67 0.581
(注1) 期中の費用(消費税等のかかるものは消費税等を含む)は、追加・解約により受益権口数に変動があるため、簡便法により算出した結果です。
(注2) 各金額は各項目ごとに円未満は四捨五入してあります。 (注3) 売買委託手数料、有価証券取引税およびその他費用は、このファンドが組み入れているマザーファンドが支払った金額のうち、当ファン
ドに対応するものを含みます。 (注4) 各比率は1万口当たりのそれぞれの費用金額を期中の平均基準価額で除して100を乗じたものです。
01_3771553712911.doc
- 5 -
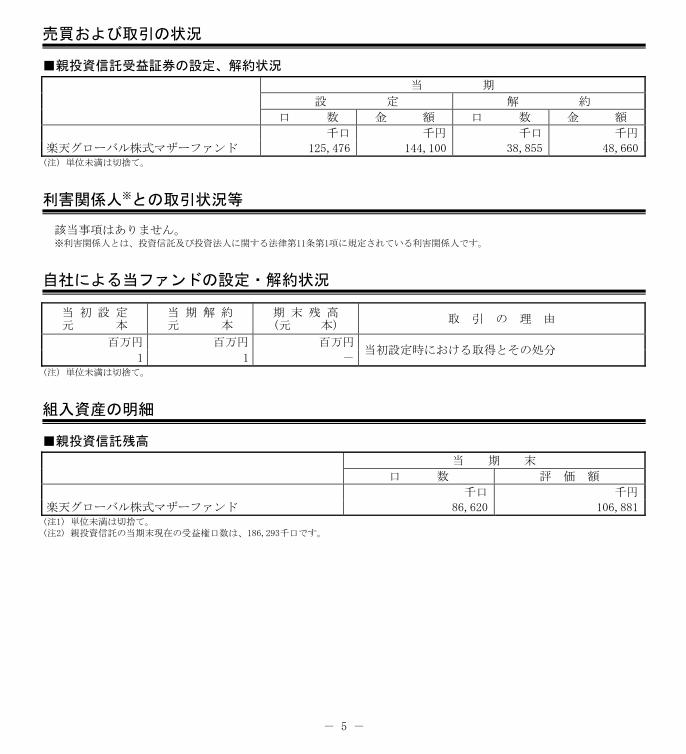
売買および取引の状況
■親投資信託受益証券の設定、解約状況
当 期
設 定 解 約
口 数 金 額 口 数 金 額
千口 千円 千口 千円
楽天グローバル株式マザーファンド 125,476 144,100 38,855 48,660 (注) 単位未満は切捨て。
利害関係人※との取引状況等
該当事項はありません。 ※利害関係人とは、投資信託及び投資法人に関する法律第11条第1項に規定されている利害関係人です。
自社による当ファンドの設定・解約状況
当 初 設 定 元 本
当 期 解 約 元 本
期 末 残 高 (元 本)
取 引 の 理 由
百万円 百万円 百万円 当初設定時における取得とその処分
1 1 - (注) 単位未満は切捨て。
組入資産の明細 ■親投資信託残高
当 期 末
口 数 評 価 額
千口 千円
楽天グローバル株式マザーファンド 86,620 106,881 (注1) 単位未満は切捨て。 (注2) 親投資信託の当期末現在の受益権口数は、186,293千口です。
01_3771553712911.doc
- 6 -
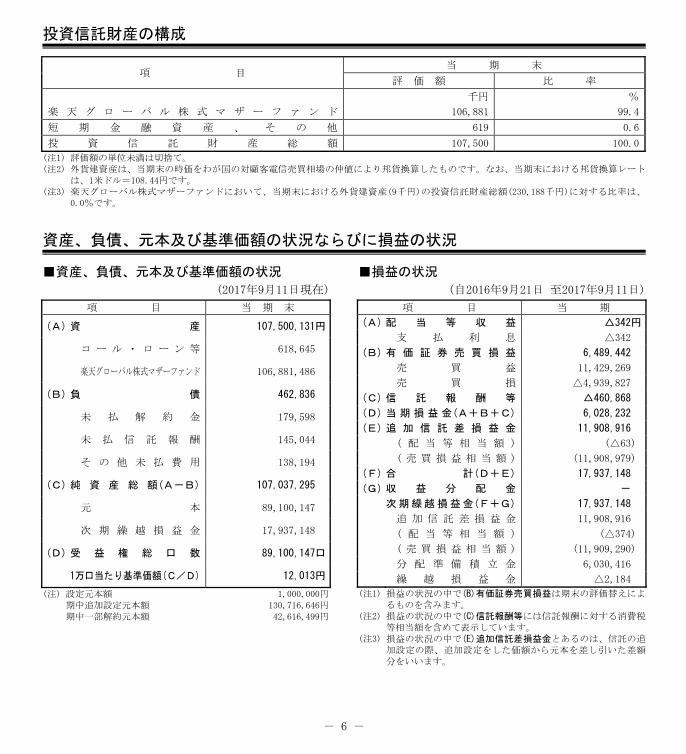
投資信託財産の構成
項 目 当 期 末
評 価 額 比 率
千円 %
楽 天 グ ロ ー バ ル 株 式 マ ザ ー フ ァ ン ド 106,881 99.4
短 期 金 融 資 産 、 そ の 他 619 0.6
投 資 信 託 財 産 総 額 107,500 100.0
(注1) 評価額の単位未満は切捨て。 (注2) 外貨建資産は、当期末の時価をわが国の対顧客電信売買相場の仲値により邦貨換算したものです。なお、当期末における邦貨換算レート
は、1米ドル=108.44円です。 (注3) 楽天グローバル株式マザーファンドにおいて、当期末における外貨建資産(9千円)の投資信託財産総額(230,188千円)に対する比率は、
0.0%です。
資産、負債、元本及び基準価額の状況ならびに損益の状況 ■資産、負債、元本及び基準価額の状況
(2017年9月11日現在)
項 目 当 期 末
(A) 資 産 107,500,131円
コ ー ル ・ ロ ー ン 等 618,645
楽天グローバル株式マザーファンド 106,881,486
(B) 負 債 462,836
未 払 解 約 金 179,598
未 払 信 託 報 酬 145,044
そ の 他 未 払 費 用 138,194
(C) 純 資 産 総 額(A-B) 107,037,295
元 本 89,100,147
次 期 繰 越 損 益 金 17,937,148
(D) 受 益 権 総 口 数 89,100,147口
1万口当たり基準価額(C/D) 12,013円
(注) 設定元本額 1,000,000円 期中追加設定元本額 130,716,646円 期中一部解約元本額 42,616,499円
■損益の状況
(自2016年9月21日 至2017年9月11日)
項 目 当 期
(A) 配 当 等 収 益 △342円
支 払 利 息 △342
(B) 有 価 証 券 売 買 損 益 6,489,442
売 買 益 11,429,269
売 買 損 △4,939,827
(C) 信 託 報 酬 等 △460,868
(D) 当 期 損 益 金(A+B+C) 6,028,232
(E) 追 加 信 託 差 損 益 金 11,908,916
( 配 当 等 相 当 額 ) (△63)
( 売 買 損 益 相 当 額 ) (11,908,979)
(F) 合 計(D+E) 17,937,148
(G) 収 益 分 配 金 -
次期繰越損益金(F+G) 17,937,148
追 加 信 託 差 損 益 金 11,908,916
( 配 当 等 相 当 額 ) (△374)
( 売 買 損 益 相 当 額 ) (11,909,290)
分 配 準 備 積 立 金 6,030,416
繰 越 損 益 金 △2,184
(注1) 損益の状況の中で(B)有価証券売買損益は期末の評価替えによるものを含みます。
(注2) 損益の状況の中で(C)信託報酬等には信託報酬に対する消費税等相当額を含めて表示しています。
(注3) 損益の状況の中で(E)追加信託差損益金とあるのは、信託の追加設定の際、追加設定をした価額から元本を差し引いた差額分をいいます。
01_3771553712911.doc
- 7 -
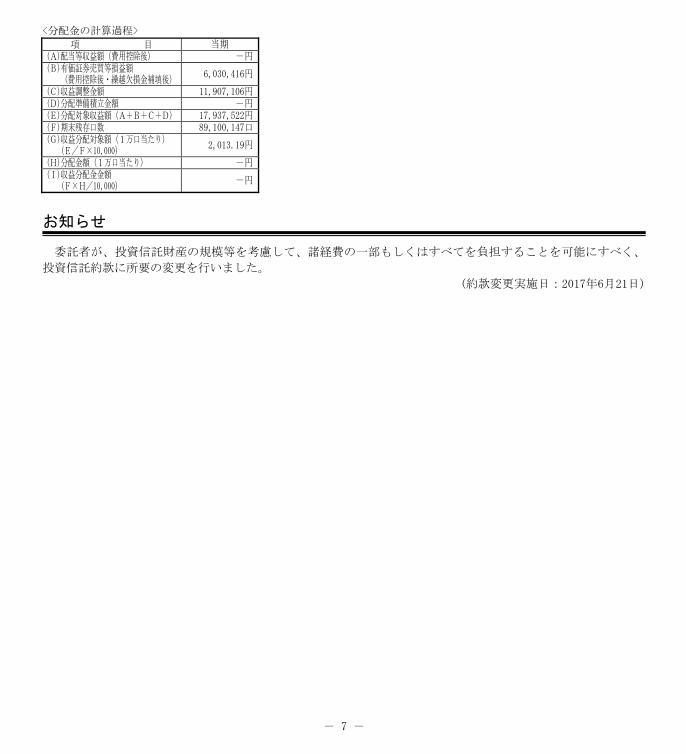
<分配金の計算過程>
項 目 当期 (A)配当等収益額(費用控除後) -円 (B)有価証券売買等損益額
(費用控除後・繰越欠損金補填後) 6,030,416円
(C)収益調整金額 11,907,106円 (D)分配準備積立金額 -円 (E)分配対象収益額(A+B+C+D) 17,937,522円 (F)期末残存口数 89,100,147口 (G)収益分配対象額(1万口当たり)
(E/F×10,000) 2,013.19円
(H)分配金額(1万口当たり) -円 (I)収益分配金金額
(F×H/10,000) -円
お知らせ
委託者が、投資信託財産の規模等を考慮して、諸経費の一部もしくはすべてを負担することを可能にすべく、
投資信託約款に所要の変更を行いました。
(約款変更実施日:2017年6月21日)
02_3771553712911.doc
- 8 -
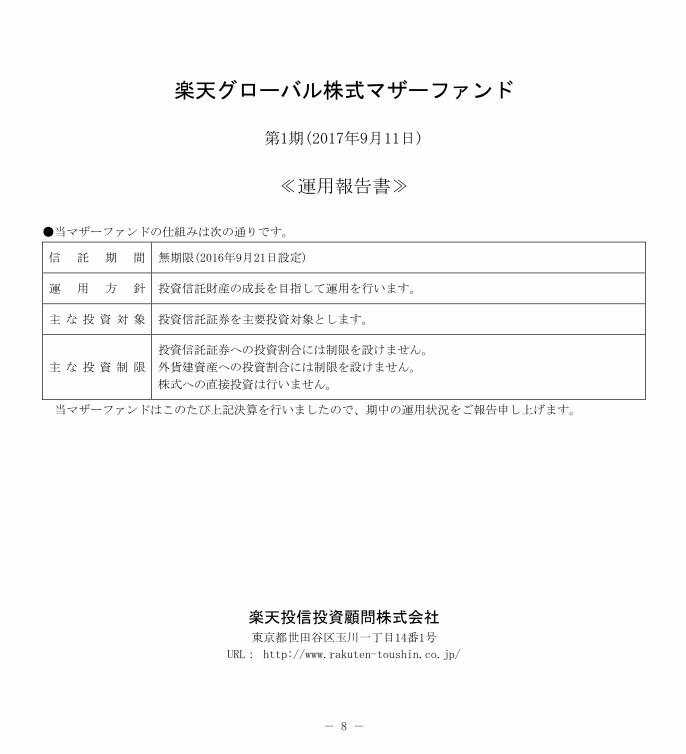
楽天グローバル株式マザーファンド
第1期(2017年9月11日)
≪運用報告書≫
●当マザーファンドの仕組みは次の通りです。
信 託 期 間 無期限(2016年9月21日設定)
運 用 方 針 投資信託財産の成長を目指して運用を行います。
主 な 投 資 対 象 投資信託証券を主要投資対象とします。
主 な 投 資 制 限
投資信託証券への投資割合には制限を設けません。
外貨建資産への投資割合には制限を設けません。
株式への直接投資は行いません。
当マザーファンドはこのたび上記決算を行いましたので、期中の運用状況をご報告申し上げます。
楽天投信投資顧問株式会社 東京都世田谷区玉川一丁目14番1号
URL: http://www.rakuten-toushin.co.jp/

03_3771553712911.doc
- 9 -
設定以来の運用実績
決 算 期 基 準 価 額
投 資 信 託 証 券 組 入 比 率
純資産総額
期 中 騰 落 率
(設 定 日) 円 % % 百万円
2016年 9月21日 10,000 - - 0
1期(2017年 9月11日) 12,339 23.4 99.1 229 (注1) 当ファンドの運用方針に対応する適切な指数が存在しないため、ベンチマークおよび参考指数を設定しておりません。 (注2) 設定日の基準価額には当初設定価額を、純資産総額には当初設定元本を用いています。
当期中の基準価額の推移
年 月 日 基 準 価 額 投 資 信 託 証 券
組 入 比 率 騰 落 率
(設 定 日) 円 % %
2016年 9月21日 10,000 - -
9月末 10,016 0.2 99.7
10月末 10,153 1.5 106.6
11月末 11,203 12.0 102.6
12月末 11,868 18.7 99.5
2017年 1月末 11,818 18.2 99.2
2月末 12,050 20.5 99.7
3月末 12,038 20.4 99.8
4月末 12,170 21.7 98.5
5月末 12,256 22.6 99.9
6月末 12,497 25.0 98.7
7月末 12,617 26.2 81.0
8月末 12,515 25.2 99.3
(期 末)
2017年 9月11日 12,339 23.4 99.1 (注1) 騰落率は設定日比。 (注2) 設定日の基準価額には当初設定価額を用いています。
03_3771553712911.doc
- 10 -
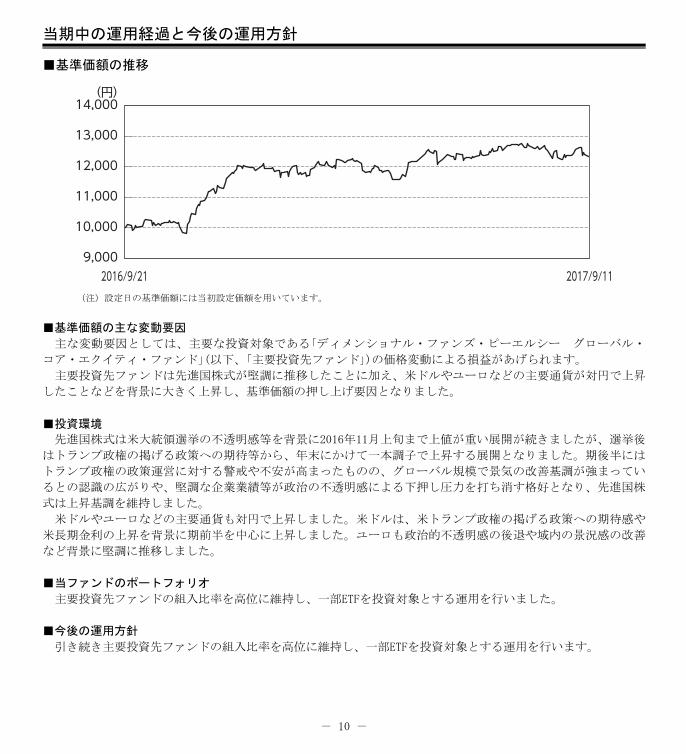
当期中の運用経過と今後の運用方針
■基準価額の推移
(注)設定日の基準価額には当初設定価額を用いています。
■基準価額の主な変動要因
主な変動要因としては、主要な投資対象である「ディメンショナル・ファンズ・ピーエルシー グローバル・
コア・エクイティ・ファンド」(以下、「主要投資先ファンド」)の価格変動による損益があげられます。
主要投資先ファンドは先進国株式が堅調に推移したことに加え、米ドルやユーロなどの主要通貨が対円で上昇
したことなどを背景に大きく上昇し、基準価額の押し上げ要因となりました。
■投資環境
先進国株式は米大統領選挙の不透明感等を背景に2016年11月上旬まで上値が重い展開が続きましたが、選挙後
はトランプ政権の掲げる政策への期待等から、年末にかけて一本調子で上昇する展開となりました。期後半には
トランプ政権の政策運営に対する警戒や不安が高まったものの、グローバル規模で景気の改善基調が強まってい
るとの認識の広がりや、堅調な企業業績等が政治の不透明感による下押し圧力を打ち消す格好となり、先進国株
式は上昇基調を維持しました。
米ドルやユーロなどの主要通貨も対円で上昇しました。米ドルは、米トランプ政権の掲げる政策への期待感や
米長期金利の上昇を背景に期前半を中心に上昇しました。ユーロも政治的不透明感の後退や域内の景況感の改善
など背景に堅調に推移しました。
■当ファンドのポートフォリオ
主要投資先ファンドの組入比率を高位に維持し、一部ETFを投資対象とする運用を行いました。
■今後の運用方針
引き続き主要投資先ファンドの組入比率を高位に維持し、一部ETFを投資対象とする運用を行います。
03_3771553712911.doc
- 11 -
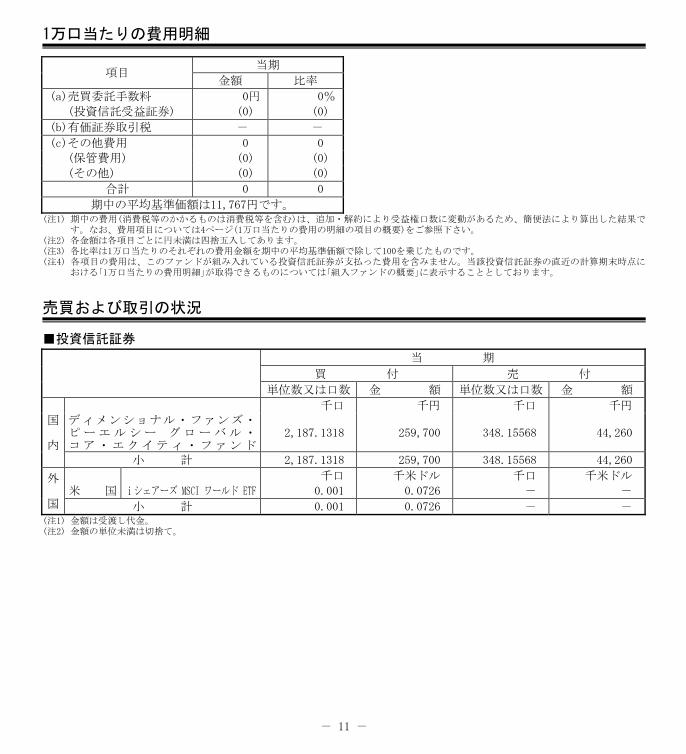
1万口当たりの費用明細
項目 当期
金額 比率
(a)売買委託手数料 0円 0%
(投資信託受益証券) (0) (0)
(b)有価証券取引税 - -
(c)その他費用 0 0
(保管費用) (0) (0)
(その他) (0) (0)
合計 0 0
期中の平均基準価額は11,767円です。 (注1) 期中の費用(消費税等のかかるものは消費税等を含む)は、追加・解約により受益権口数に変動があるため、簡便法により算出した結果で
す。なお、費用項目については4ページ(1万口当たりの費用の明細の項目の概要)をご参照下さい。 (注2) 各金額は各項目ごとに円未満は四捨五入してあります。 (注3) 各比率は1万口当たりのそれぞれの費用金額を期中の平均基準価額で除して100を乗じたものです。 (注4) 各項目の費用は、このファンドが組み入れている投資信託証券が支払った費用を含みません。当該投資信託証券の直近の計算期末時点に
おける「1万口当たりの費用明細」が取得できるものについては「組入ファンドの概要」に表示することとしております。
売買および取引の状況
■投資信託証券
当 期
買 付 売 付
単位数又は口数 金 額 単位数又は口数 金 額
国 内
千口 千円 千口 千円 ディメンショナル・ファンズ・ ピ ー エ ル シ ー グ ロ ー バ ル ・ コア・エクイティ・ファンド
2,187.1318 259,700 348.15568 44,260
小 計 2,187.1318 259,700 348.15568 44,260
外 国
千口 千米ドル 千口 千米ドル
米 国 iシェアーズ MSCI ワールド ETF 0.001 0.0726 - -
小 計 0.001 0.0726 - - (注1) 金額は受渡し代金。 (注2) 金額の単位未満は切捨て。
03_3771553712911.doc
- 12 -
利害関係人※との取引状況等
該当事項はありません。 ※利害関係人とは、投資信託及び投資法人に関する法律第11条第1項に規定されている利害関係人です。
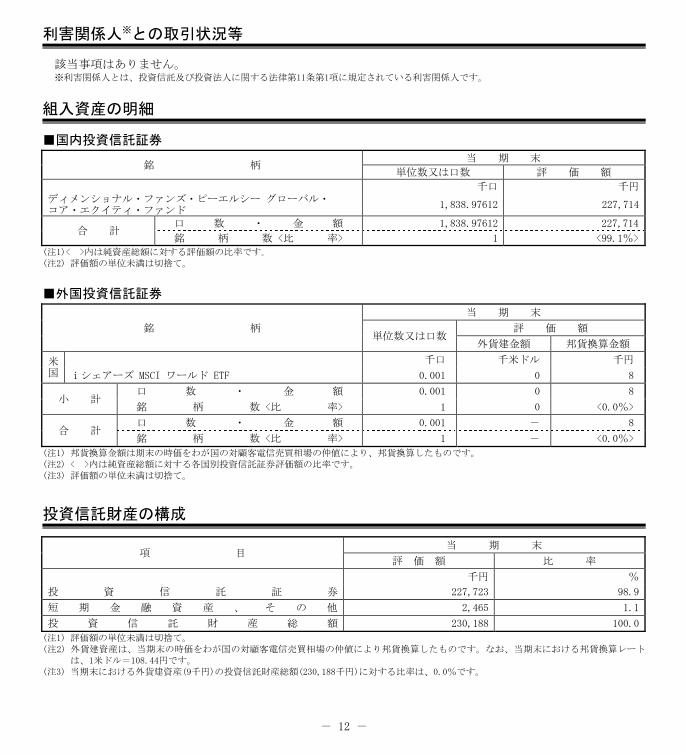
組入資産の明細
■国内投資信託証券
銘 柄 当 期 末
単位数又は口数 評 価 額
千口 千円 ディメンショナル・ファンズ・ピーエルシー グローバル・ コア・エクイティ・ファンド
1,838.97612 227,714
合 計 口 数 ・ 金 額 1,838.97612 227,714
銘 柄 数 <比 率> 1 <99.1%>
(注1)< >内は純資産総額に対する評価額の比率です。 (注2) 評価額の単位未満は切捨て。
■外国投資信託証券
銘 柄
当 期 末
単位数又は口数 評 価 額
外貨建金額 邦貨換算金額
米 国
千口 千米ドル 千円
iシェアーズ MSCI ワールド ETF 0.001 0 8
小 計 口 数 ・ 金 額 0.001 0 8
銘 柄 数 <比 率> 1 0 <0.0%>
合 計 口 数 ・ 金 額 0.001 - 8
銘 柄 数 <比 率> 1 - <0.0%>
(注1) 邦貨換算金額は期末の時価をわが国の対顧客電信売買相場 の仲値により、邦貨換算したものです。 (注2) < >内は純資産総額に対する各国別投資信託証券評価額の比率です。 (注3) 評価額の単位未満は切捨て。
投資信託財産の構成
項 目 当 期 末
評 価 額 比 率
千円 %
投 資 信 託 証 券 227,723 98.9
短 期 金 融 資 産 、 そ の 他 2,465 1.1
投 資 信 託 財 産 総 額 230,188 100.0
(注1) 評価額の単位未満は切捨て。 (注2) 外貨建資産は、当期末の時価をわが国の対顧客電信売買相場の仲値により邦貨換算したものです。なお、当期末における邦貨換算レート
は、1米ドル=108.44円です。 (注3) 当期末における外貨建資産(9千円)の投資信託財産総額(230,188千円)に対する比率は、0.0%です。
03_3771553712911.doc
- 13 -
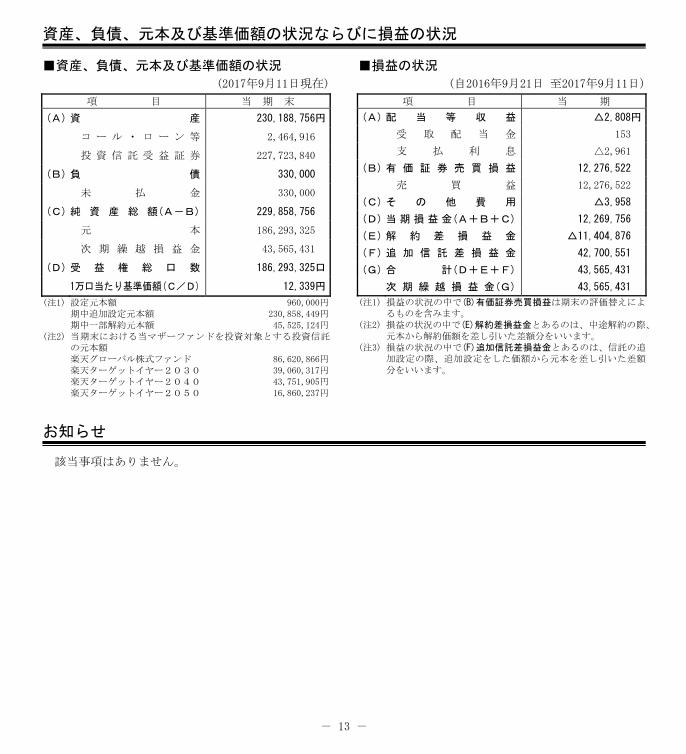
資産、負債、元本及び基準価額の状況ならびに損益の状況
■資産、負債、元本及び基準価額の状況
(2017年9月11日現在)
項 目 当 期 末
(A) 資 産 230,188,756円
コ ー ル ・ ロ ー ン 等 2,464,916
投 資 信 託 受 益 証 券 227,723,840
(B) 負 債 330,000
未 払 金 330,000
(C) 純 資 産 総 額(A-B) 229,858,756
元 本 186,293,325
次 期 繰 越 損 益 金 43,565,431
(D) 受 益 権 総 口 数 186,293,325口
1万口当たり基準価額(C/D) 12,339円
(注1) 設定元本額 960,000円 期中追加設定元本額 230,858,449円 期中一部解約元本額 45,525,124円
(注2) 当期末における当マザーファンドを投資対象とする投資信託の元本額 楽天グローバル株式ファンド 86,620,866円 楽天ターゲットイヤー2030 39,060,317円 楽天ターゲットイヤー2040 43,751,905円 楽天ターゲットイヤー2050 16,860,237円
■損益の状況
(自2016年9月21日 至2017年9月11日)
項 目 当 期
(A) 配 当 等 収 益 △2,808円 受 取 配 当 金 153
支 払 利 息 △2,961
(B) 有 価 証 券 売 買 損 益 12,276,522
売 買 益 12,276,522
(C) そ の 他 費 用 △3,958
(D) 当 期 損 益 金(A+B+C) 12,269,756
(E) 解 約 差 損 益 金 △11,404,876
(F) 追 加 信 託 差 損 益 金 42,700,551
(G) 合 計(D+E+F) 43,565,431
次 期 繰 越 損 益 金(G) 43,565,431
(注1) 損益の状況の中で(B)有価証券売買損益は期末の評価替えによるものを含みます。
(注2) 損益の状況の中で(E)解約差損益金とあるのは、中途解約の際、元本から解約価額を差し引いた差額分をいいます。
(注3) 損益の状況の中で(F)追加信託差損益金とあるのは、信託の追加設定の際、追加設定をした価額から元本を差し引いた差額分をいいます。
お知らせ
該当事項はありません。
03_3771553712911.doc
- 14 -
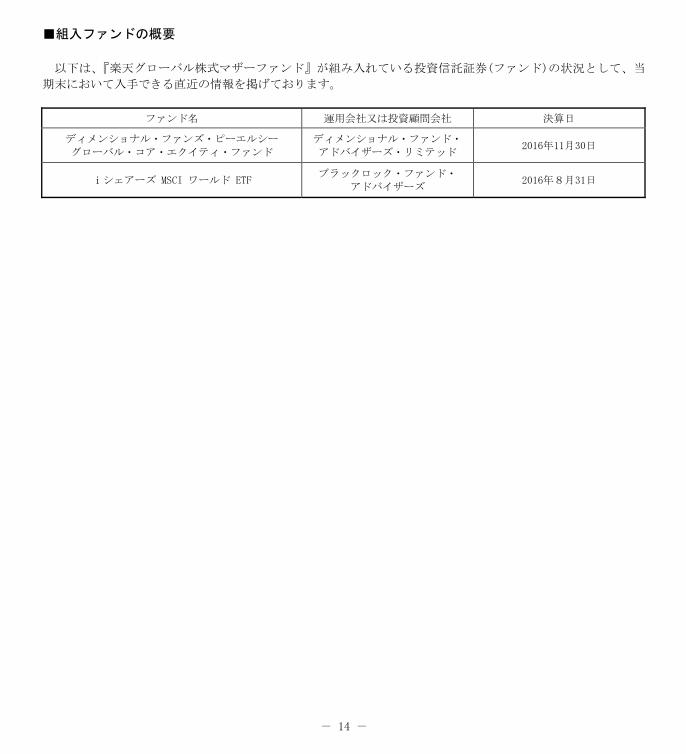
■組入ファンドの概要
以下は、『楽天グローバル株式マザーファンド』が組み入れている投資信託証券(ファンド)の状況として、当
期末において入手できる直近の情報を掲げております。
ファンド名 運用会社又は投資顧問会社 決算日
ディメンショナル・ファンズ・ピーエルシー
グローバル・コア・エクイティ・ファンド
ディメンショナル・ファンド・
アドバイザーズ・リミテッド 2016年11月30日
iシェアーズ MSCI ワールド ETF ブラックロック・ファンド・
アドバイザーズ 2016年8月31日
03_3771553712911.doc
- 15 -
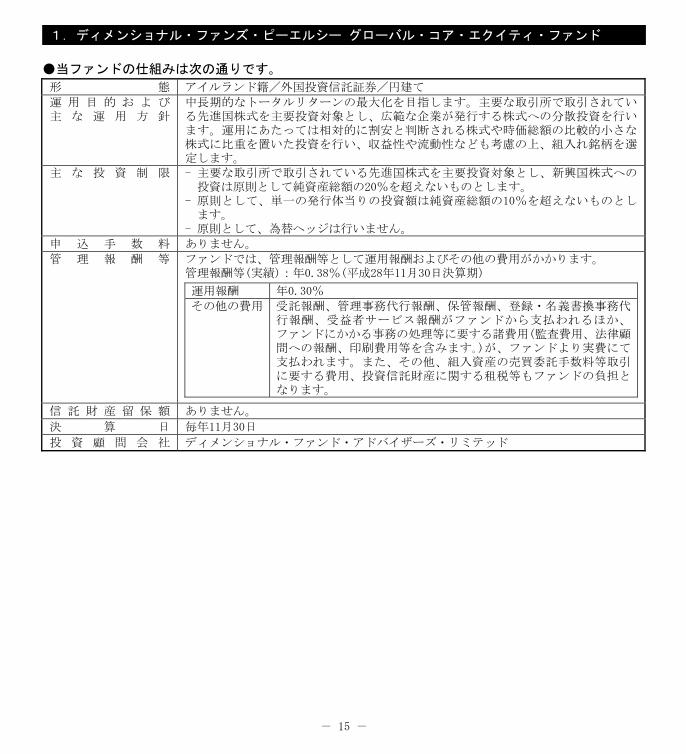
1.ディメンショナル・ファンズ・ピーエルシー グローバル・コア・エクイティ・ファンド
●当ファンドの仕組みは次の通りです。
形 態 アイルランド籍/外国投資信託証券/円建て
運 用 目 的 お よ び 主 な 運 用 方 針
中長期的なトータルリターンの 大化を目指します。主要な取引所で取引されている先進国株式を主要投資対象とし、広範な企業が発行する株式への分散投資を行います。運用にあたっては相対的に割安と判断される株式や時価総額の比較的小さな株式に比重を置いた投資を行い、収益性や流動性なども考慮の上、組入れ銘柄を選定します。
主 な 投 資 制 限 - 主要な取引所で取引されている先進国株式を主要投資対象とし、新興国株式への投資は原則として純資産総額の20%を超えないものとします。
- 原則として、単一の発行体当りの投資額は純資産総額の10%を超えないものとします。
- 原則として、為替ヘッジは行いません。
申 込 手 数 料 ありません。
管 理 報 酬 等 ファンドでは、管理報酬等として運用報酬およびその他の費用がかかります。 管理報酬等(実績):年0.38%(平成28年11月30日決算期) 運用報酬 年0.30%
その他の費用 受託報酬、管理事務代行報酬、保管報酬、登録・名義書換事務代行報酬、受益者サービス報酬がファンドから支払われるほか、ファンドにかかる事務の処理等に要する諸費用(監査費用、法律顧問への報酬、印刷費用等を含みます。)が、ファンドより実費にて支払われます。また、その他、組入資産の売買委託手数料等取引に要する費用、投資信託財産に関する租税等もファンドの負担となります。
信 託 財 産 留 保 額 ありません。
決 算 日 毎年11月30日
投 資 顧 問 会 社 ディメンショナル・ファンド・アドバイザーズ・リミテッド
- 16 -
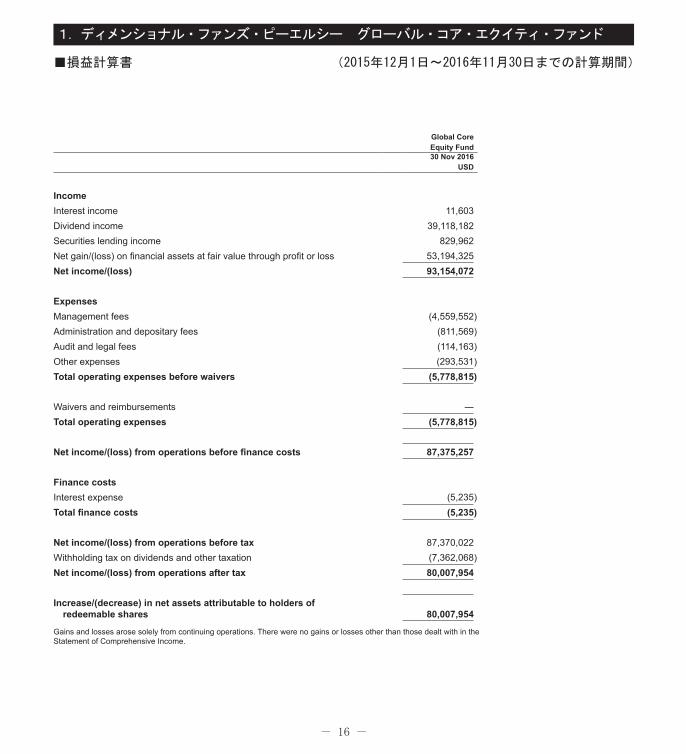
1.ディメンショナル・ファンズ・ピーエルシー グローバル・コア・エクイティ・ファンド
■損益計算書� (2015年12月1日~2016年11月30日までの計算期間)
Global Core Equity Fund30 Nov 2016
USD
IncomeInterest income 11,603Dividend income 39,118,182Securities lending income 829,962Net gain/(loss) on financial assets at fair value through profit or loss 53,194,325Net income/(loss) 93,154,072
ExpensesManagement fees (4,559,552)Administration and depositary fees (811,569)Audit and legal fees (114,163)Other expenses (293,531)Total operating expenses before waivers (5,778,815)
Waivers and reimbursements ―Total operating expenses (5,778,815)
Net income/(loss) from operations before finance costs 87,375,257
Finance costsInterest expense (5,235)Total finance costs (5,235)
Net income/(loss) from operations before tax 87,370,022Withholding tax on dividends and other taxation (7,362,068)Net income/(loss) from operations after tax 80,007,954
Increase/(decrease) in net assets attributable to holders of redeemable shares 80,007,954
Gains and losses arose solely from continuing operations. There were no gains or losses other than those dealt with in the Statement of Comprehensive Income.
010_3771524762911.indd���16 2017/10/11���13:01:23
- 17 -
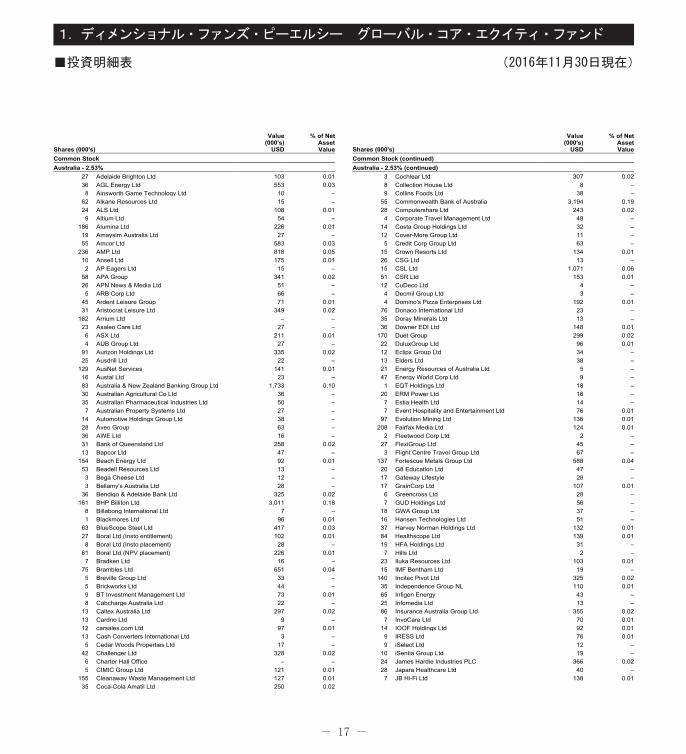
1.ディメンショナル・ファンズ・ピーエルシー グローバル・コア・エクイティ・ファンド
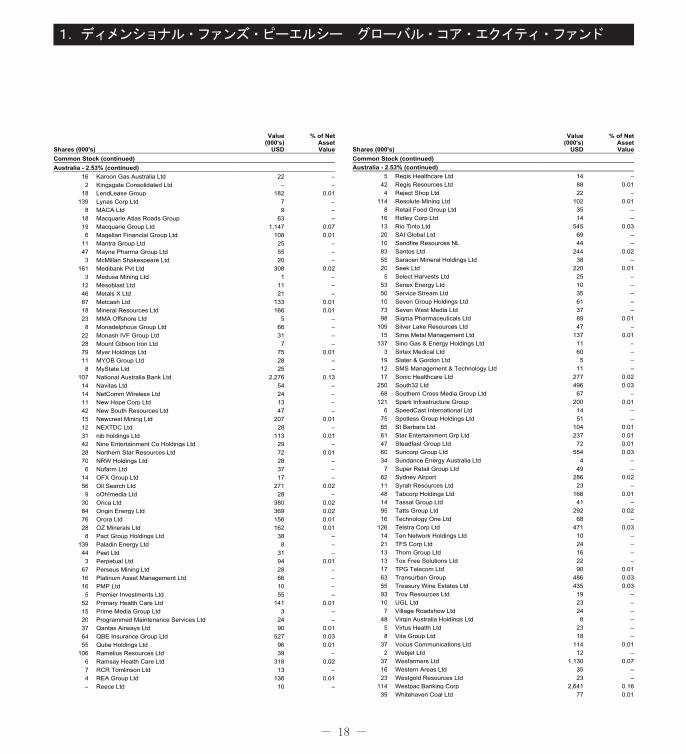
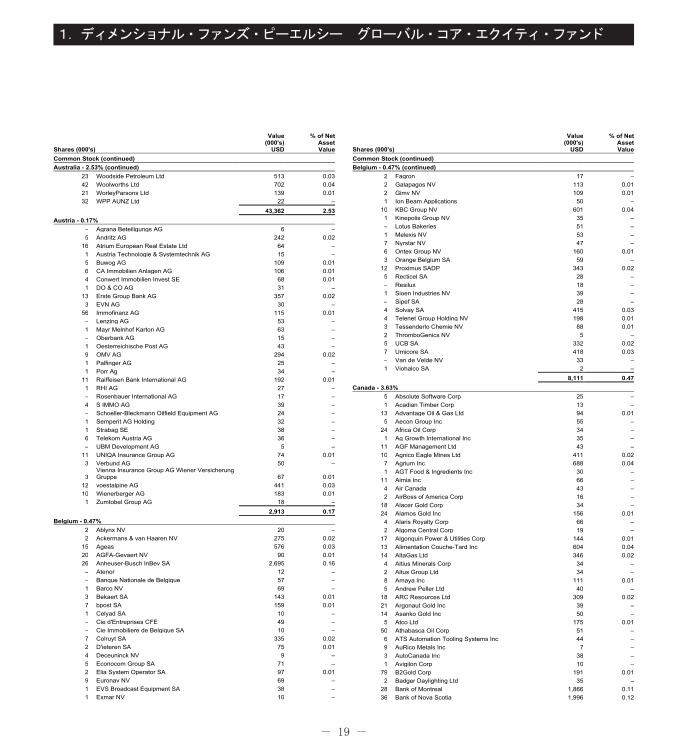
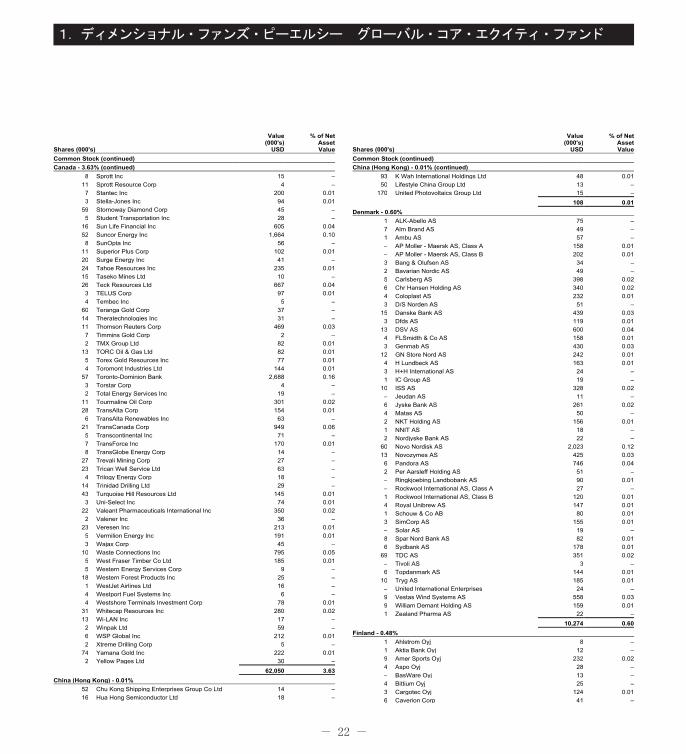
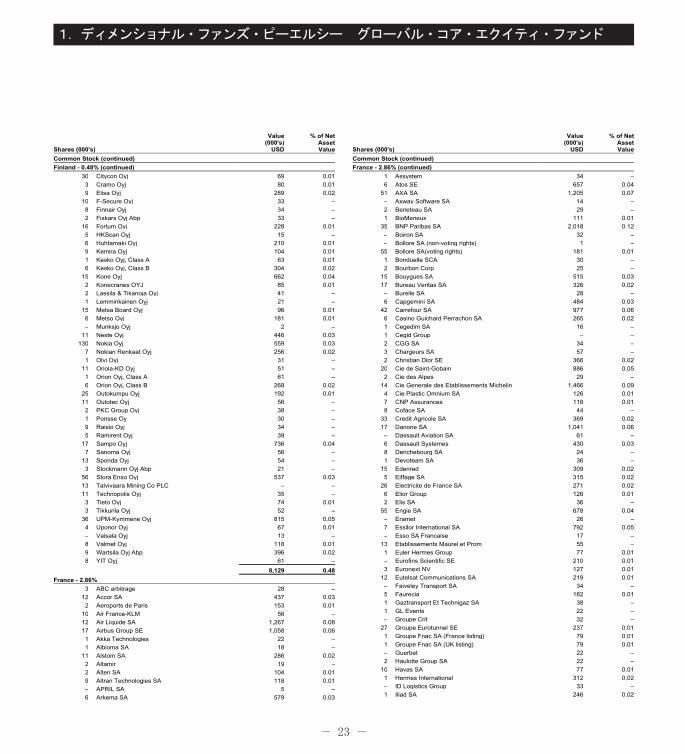
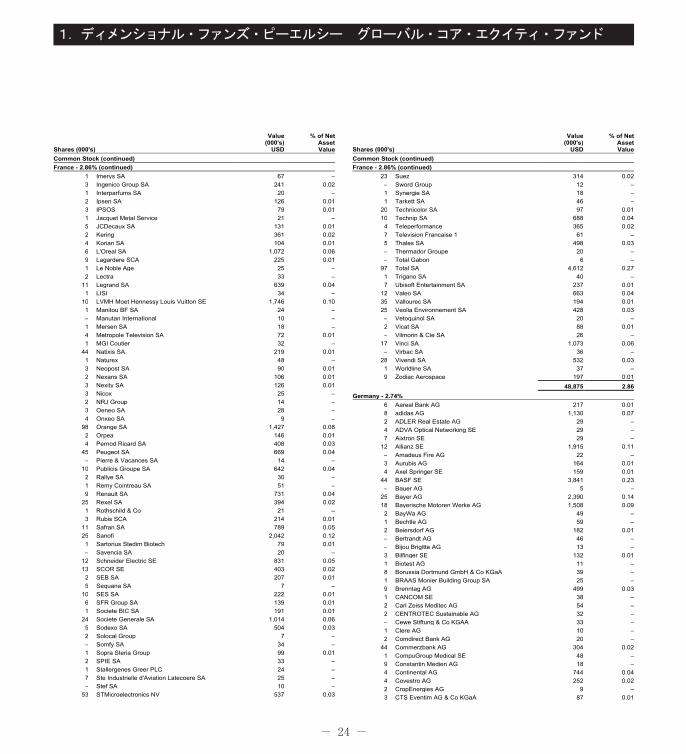
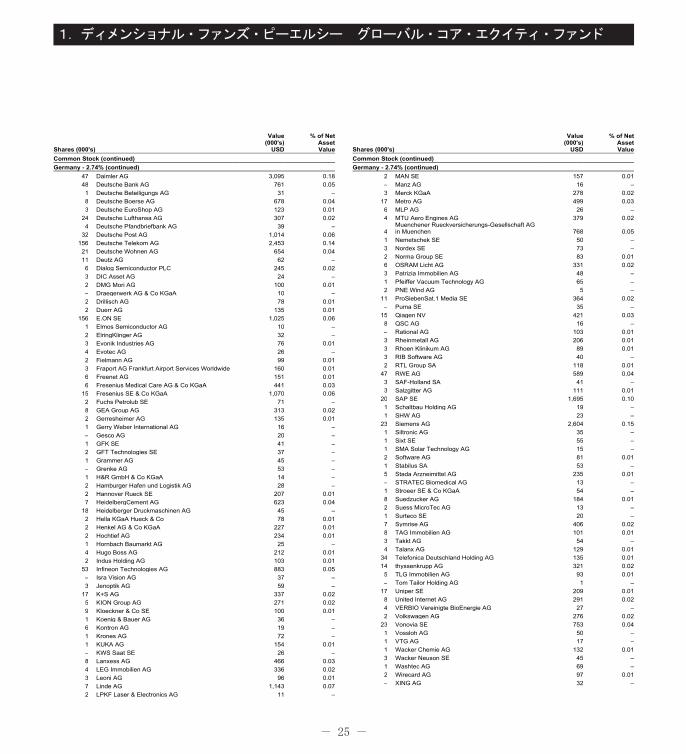
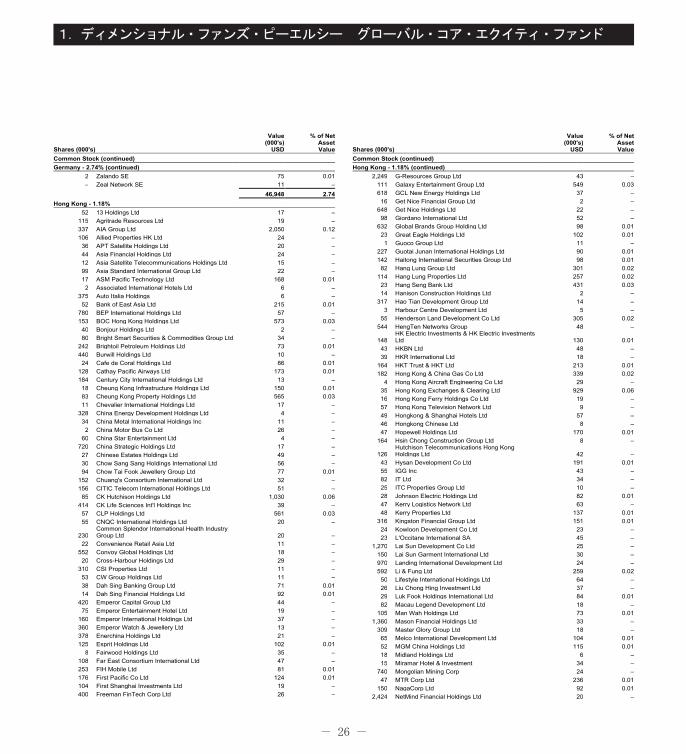
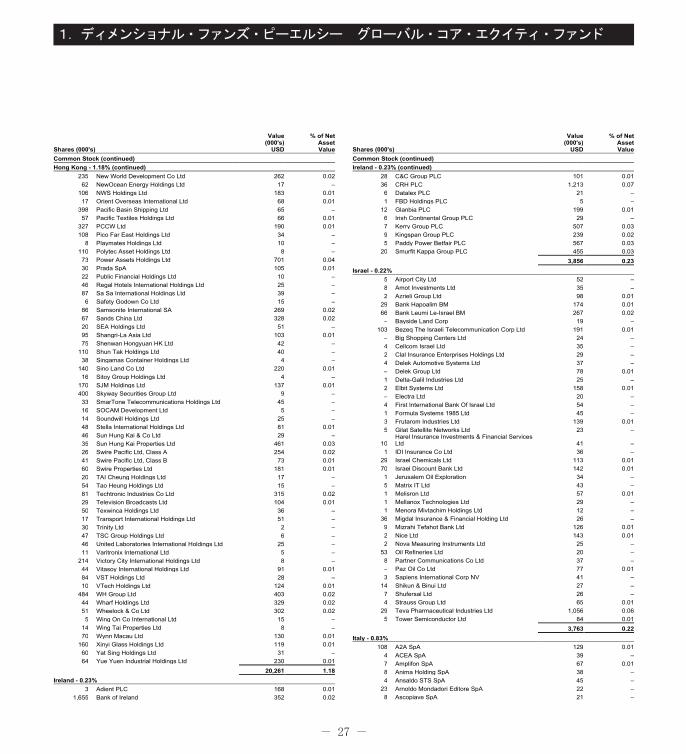
■投資明細表� (2016年11月30日現在)
Shares (000's)
Value(000's)
USD
% of NetAssetValue
Common StockAustralia - 2.53%
27 Adelaide Brighton Ltd 103 0.01 36 AGL Energy Ltd 553 0.03 8 Ainsworth Game Technology Ltd 10 –
62 Alkane Resources Ltd 15 – 24 ALS Ltd 108 0.01 9 Altium Ltd 54 –
186 Alumina Ltd 226 0.01 19 Amaysim Australia Ltd 27 – 55 Amcor Ltd 583 0.03
236 AMP Ltd 818 0.05 10 Ansell Ltd 175 0.01 2 AP Eagers Ltd 15 –
58 APA Group 341 0.02 26 APN News & Media Ltd 51 – 5 ARB Corp Ltd 66 –
45 Ardent Leisure Group 71 0.01 31 Aristocrat Leisure Ltd 349 0.02
162 Arrium Ltd – – 23 Asaleo Care Ltd 27 – 6 ASX Ltd 211 0.01 4 AUB Group Ltd 27 –
91 Aurizon Holdings Ltd 335 0.02 25 Ausdrill Ltd 22 –
129 AusNet Services 141 0.01 16 Austal Ltd 23 – 83 Australia & New Zealand Banking Group Ltd 1,733 0.10 30 Australian Agricultural Co Ltd 36 – 35 Australian Pharmaceutical Industries Ltd 50 – 7 Australian Property Systems Ltd 27 –
14 Automotive Holdings Group Ltd 38 – 28 Aveo Group 63 – 36 AWE Ltd 16 – 31 Bank of Queensland Ltd 258 0.02 13 Bapcor Ltd 47 –
154 Beach Energy Ltd 92 0.01 53 Beadell Resources Ltd 13 – 3 Bega Cheese Ltd 12 – 3 Bellamy's Australia Ltd 28 –
36 Bendigo & Adelaide Bank Ltd 325 0.02 161 BHP Billiton Ltd 3,011 0.18
8 Billabong International Ltd 7 – 1 Blackmores Ltd 96 0.01
63 BlueScope Steel Ltd 417 0.03 27 Boral Ltd (Insto entitlement) 102 0.01 8 Boral Ltd (Insto placement) 28 –
61 Boral Ltd (NPV placement) 226 0.01 7 Bradken Ltd 16 –
75 Brambles Ltd 651 0.04 5 Breville Group Ltd 33 – 5 Brickworks Ltd 44 – 9 BT Investment Management Ltd 73 0.01 8 Cabcharge Australia Ltd 22 –
13 Caltex Australia Ltd 297 0.02 13 Cardno Ltd 9 – 12 carsales.com Ltd 97 0.01 13 Cash Converters International Ltd 3 – 5 Cedar Woods Properties Ltd 17 –
42 Challenger Ltd 328 0.02 6 Charter Hall Office – – 5 CIMIC Group Ltd 121 0.01
155 Cleanaway Waste Management Ltd 127 0.01 35 Coca-Cola Amatil Ltd 250 0.02
Shares (000's)
Value(000's)
USD
% of NetAssetValue
Common Stock (continued)Australia - 2.53% (continued)
3 Cochlear Ltd 307 0.02 8 Collection House Ltd 8 – 9 Collins Foods Ltd 38 –
55 Commonwealth Bank of Australia 3,194 0.19 28 Computershare Ltd 243 0.02 4 Corporate Travel Management Ltd 48 –
14 Costa Group Holdings Ltd 32 – 12 Cover-More Group Ltd 11 – 5 Credit Corp Group Ltd 63 –
15 Crown Resorts Ltd 134 0.01 26 CSG Ltd 13 – 15 CSL Ltd 1,071 0.06 51 CSR Ltd 153 0.01 12 CuDeco Ltd 4 – 4 Decmil Group Ltd 3 – 4 Domino's Pizza Enterprises Ltd 192 0.01
76 Donaco International Ltd 23 – 35 Doray Minerals Ltd 13 – 36 Downer EDI Ltd 148 0.01
170 Duet Group 299 0.02 22 DuluxGroup Ltd 96 0.01 12 Eclipx Group Ltd 34 – 13 Elders Ltd 38 – 21 Energy Resources of Australia Ltd 5 – 47 Energy World Corp Ltd 9 – 1 EQT Holdings Ltd 18 –
20 ERM Power Ltd 16 – 7 Estia Health Ltd 14 – 7 Event Hospitality and Entertainment Ltd 76 0.01
97 Evolution Mining Ltd 136 0.01 208 Fairfax Media Ltd 124 0.01
2 Fleetwood Corp Ltd 2 – 27 FlexiGroup Ltd 45 – 3 Flight Centre Travel Group Ltd 67 –
137 Fortescue Metals Group Ltd 588 0.04 20 G8 Education Ltd 47 – 17 Gateway Lifestyle 28 – 17 GrainCorp Ltd 107 0.01 6 Greencross Ltd 28 – 7 GUD Holdings Ltd 56 –
18 GWA Group Ltd 37 – 16 Hansen Technologies Ltd 51 – 37 Harvey Norman Holdings Ltd 132 0.01 84 Healthscope Ltd 139 0.01 19 HFA Holdings Ltd 31 – 7 Hills Ltd 2 –
23 Iluka Resources Ltd 103 0.01 15 IMF Bentham Ltd 19 –
140 Incitec Pivot Ltd 325 0.02 35 Independence Group NL 110 0.01 65 Infigen Energy 43 – 25 Infomedia Ltd 13 – 86 Insurance Australia Group Ltd 355 0.02 7 InvoCare Ltd 70 0.01
14 IOOF Holdings Ltd 92 0.01 9 IRESS Ltd 76 0.01 9 iSelect Ltd 12 –
10 iSentia Group Ltd 19 – 24 James Hardie Industries PLC 366 0.02 28 Japara Healthcare Ltd 40 – 7 JB Hi-Fi Ltd 138 0.01
010_3771524762911.indd���17 2017/10/11���13:01:23
- 18 -
1.ディメンショナル・ファンズ・ピーエルシー グローバル・コア・エクイティ・ファンド
Shares (000's)
Value(000's)
USD
% of NetAssetValue
Common Stock (continued)Australia - 2.53% (continued)
16 Karoon Gas Australia Ltd 22 – 2 Kingsgate Consolidated Ltd – –
18 LendLease Group 182 0.01 139 Lynas Corp Ltd 7 –
8 MACA Ltd 9 – 18 Macquarie Atlas Roads Group 63 – 19 Macquarie Group Ltd 1,147 0.07 6 Magellan Financial Group Ltd 108 0.01
11 Mantra Group Ltd 25 – 47 Mayne Pharma Group Ltd 55 – 3 McMillan Shakespeare Ltd 20 –
161 Medibank Pvt Ltd 308 0.02 3 Medusa Mining Ltd 1 –
12 Mesoblast Ltd 11 – 46 Metals X Ltd 21 – 87 Metcash Ltd 133 0.01 18 Mineral Resources Ltd 166 0.01 23 MMA Offshore Ltd 5 – 8 Monadelphous Group Ltd 66 –
22 Monash IVF Group Ltd 31 – 28 Mount Gibson Iron Ltd 7 – 79 Myer Holdings Ltd 75 0.01 11 MYOB Group Ltd 28 – 8 MyState Ltd 25 –
107 National Australia Bank Ltd 2,276 0.13 14 Navitas Ltd 54 – 14 NetComm Wireless Ltd 24 – 11 New Hope Corp Ltd 13 – 42 New South Resources Ltd 47 – 15 Newcrest Mining Ltd 207 0.01 12 NEXTDC Ltd 28 – 31 nib holdings Ltd 113 0.01 42 Nine Entertainment Co Holdings Ltd 29 – 28 Northern Star Resources Ltd 72 0.01 70 NRW Holdings Ltd 28 – 6 Nufarm Ltd 37 –
14 OFX Group Ltd 17 – 56 Oil Search Ltd 271 0.02 9 oOh!media Ltd 28 –
30 Orica Ltd 380 0.02 84 Origin Energy Ltd 369 0.02 76 Orora Ltd 156 0.01 28 OZ Minerals Ltd 162 0.01 8 Pact Group Holdings Ltd 38 –
139 Paladin Energy Ltd 8 – 44 Peet Ltd 31 – 3 Perpetual Ltd 94 0.01
67 Perseus Mining Ltd 28 – 16 Platinum Asset Management Ltd 66 – 16 PMP Ltd 10 – 5 Premier Investments Ltd 55 –
52 Primary Health Care Ltd 141 0.01 15 Prime Media Group Ltd 3 – 20 Programmed Maintenance Services Ltd 24 – 37 Qantas Airways Ltd 90 0.01 64 QBE Insurance Group Ltd 527 0.03 55 Qube Holdings Ltd 96 0.01
106 Ramelius Resources Ltd 39 – 6 Ramsay Health Care Ltd 318 0.02 7 RCR Tomlinson Ltd 13 – 4 REA Group Ltd 136 0.01 – Reece Ltd 10 –
Shares (000's)
Value(000's)
USD
% of NetAssetValue
Common Stock (continued)Australia - 2.53% (continued)
5 Regis Healthcare Ltd 14 – 42 Regis Resources Ltd 88 0.01 4 Reject Shop Ltd 22 –
114 Resolute Mining Ltd 102 0.01 8 Retail Food Group Ltd 35 –
16 Ridley Corp Ltd 14 – 13 Rio Tinto Ltd 545 0.03 20 SAI Global Ltd 69 – 10 Sandfire Resources NL 44 – 83 Santos Ltd 244 0.02 55 Saracen Mineral Holdings Ltd 38 – 20 Seek Ltd 220 0.01 5 Select Harvests Ltd 25 –
53 Senex Energy Ltd 10 – 50 Service Stream Ltd 35 – 10 Seven Group Holdings Ltd 61 – 73 Seven West Media Ltd 37 – 98 Sigma Pharmaceuticals Ltd 89 0.01
109 Silver Lake Resources Ltd 47 – 15 Sims Metal Management Ltd 137 0.01
137 Sino Gas & Energy Holdings Ltd 11 – 3 Sirtex Medical Ltd 60 –
19 Slater & Gordon Ltd 5 – 12 SMS Management & Technology Ltd 11 – 17 Sonic Healthcare Ltd 277 0.02
250 South32 Ltd 496 0.03 68 Southern Cross Media Group Ltd 67 –
121 Spark Infrastructure Group 200 0.01 6 SpeedCast International Ltd 14 –
75 Spotless Group Holdings Ltd 51 – 65 St Barbara Ltd 104 0.01 61 Star Entertainment Grp Ltd 237 0.01 47 Steadfast Group Ltd 72 0.01 60 Suncorp Group Ltd 554 0.03 34 Sundance Energy Australia Ltd 4 – 7 Super Retail Group Ltd 49 –
62 Sydney Airport 286 0.02 11 Syrah Resources Ltd 23 – 48 Tabcorp Holdings Ltd 166 0.01 14 Tassal Group Ltd 41 – 95 Tatts Group Ltd 292 0.02 16 Technology One Ltd 68 –
126 Telstra Corp Ltd 471 0.03 14 Ten Network Holdings Ltd 10 – 21 TFS Corp Ltd 24 – 13 Thorn Group Ltd 16 – 13 Tox Free Solutions Ltd 22 – 17 TPG Telecom Ltd 90 0.01 63 Transurban Group 486 0.03 55 Treasury Wine Estates Ltd 435 0.03 93 Troy Resources Ltd 19 – 10 UGL Ltd 23 – 7 Village Roadshow Ltd 24 –
48 Virgin Australia Holdings Ltd 8 – 5 Virtus Health Ltd 23 – 8 Vita Group Ltd 18 –
37 Vocus Communications Ltd 114 0.01 2 Webjet Ltd 12 –
37 Wesfarmers Ltd 1,130 0.07 16 Western Areas Ltd 35 – 23 Westgold Resources Ltd 23 –
114 Westpac Banking Corp 2,641 0.16 39 Whitehaven Coal Ltd 77 0.01
010_3771524762911.indd���18 2017/10/11���13:01:23
- 19 -
1.ディメンショナル・ファンズ・ピーエルシー グローバル・コア・エクイティ・ファンド
Shares (000's)
Value(000's)
USD
% of NetAssetValue
Common Stock (continued)Australia - 2.53% (continued)
23 Woodside Petroleum Ltd 513 0.03 42 Woolworths Ltd 702 0.04 21 WorleyParsons Ltd 139 0.01 32 WPP AUNZ Ltd 22 –
43,362 2.53Austria - 0.17%
– Agrana Beteiligungs AG 6 – 5 Andritz AG 242 0.02
16 Atrium European Real Estate Ltd 64 – 1 Austria Technologie & Systemtechnik AG 15 – 5 Buwog AG 109 0.01 6 CA Immobilien Anlagen AG 106 0.01 4 Conwert Immobilien Invest SE 68 0.01 1 DO & CO AG 31 –
13 Erste Group Bank AG 357 0.02 3 EVN AG 30 –
56 Immofinanz AG 115 0.01 – Lenzing AG 53 – 1 Mayr Melnhof Karton AG 63 – – Oberbank AG 15 – 1 Oesterreichische Post AG 43 – 9 OMV AG 294 0.02 1 Palfinger AG 25 – 1 Porr Ag 34 –
11 Raiffeisen Bank International AG 192 0.01 1 RHI AG 27 – – Rosenbauer International AG 17 – 4 S IMMO AG 39 – – Schoeller-Bleckmann Oilfield Equipment AG 24 – 1 Semperit AG Holding 32 – 1 Strabag SE 38 – 6 Telekom Austria AG 36 – – UBM Development AG 5 –
11 UNIQA Insurance Group AG 74 0.01 3 Verbund AG 50 –
3 Vienna Insurance Group AG Wiener Versicherung Gruppe 67 0.01
12 voestalpine AG 441 0.03 10 Wienerberger AG 183 0.01 1 Zumtobel Group AG 18 –
2,913 0.17Belgium - 0.47%
2 Ablynx NV 20 – 2 Ackermans & van Haaren NV 275 0.02
15 Ageas 576 0.03 20 AGFA-Gevaert NV 90 0.01 26 Anheuser-Busch InBev SA 2,695 0.16 – Atenor 12 – – Banque Nationale de Belgique 57 – 1 Barco NV 69 – 3 Bekaert SA 143 0.01 7 bpost SA 159 0.01 1 Celyad SA 10 – – Cie d'Entreprises CFE 49 – – Cie Immobiliere de Belgique SA 10 – 7 Colruyt SA 335 0.02 2 D'ieteren SA 75 0.01 4 Deceuninck NV 9 – 5 Econocom Group SA 71 – 2 Elia System Operator SA 97 0.01 9 Euronav NV 69 – 1 EVS Broadcast Equipment SA 38 – 1 Exmar NV 10 –
Shares (000's)
Value(000's)
USD
% of NetAssetValue
Common Stock (continued)Belgium - 0.47% (continued)
2 Fagron 17 – 2 Galapagos NV 113 0.01 2 Gimv NV 109 0.01 1 Ion Beam Applications 50 –
10 KBC Group NV 601 0.04 1 Kinepolis Group NV 35 – – Lotus Bakeries 51 – 1 Melexis NV 53 – 7 Nyrstar NV 47 – 6 Ontex Group NV 160 0.01 3 Orange Belgium SA 59 –
12 Proximus SADP 343 0.02 5 Recticel SA 28 – – Resilux 18 – 1 Sioen Industries NV 39 – – Sipef SA 28 – 4 Solvay SA 415 0.03 4 Telenet Group Holding NV 198 0.01 3 Tessenderlo Chemie NV 88 0.01 2 ThromboGenics NV 5 – 5 UCB SA 332 0.02 7 Umicore SA 418 0.03 – Van de Velde NV 33 – 1 Viohalco SA 2 –
8,111 0.47Canada - 3.63%
5 Absolute Software Corp 25 – 1 Acadian Timber Corp 13 –
13 Advantage Oil & Gas Ltd 94 0.01 5 Aecon Group Inc 55 –
24 Africa Oil Corp 34 – 1 Ag Growth International Inc 35 –
11 AGF Management Ltd 43 – 10 Agnico Eagle Mines Ltd 411 0.02 7 Agrium Inc 688 0.04 1 AGT Food & Ingredients Inc 30 –
11 Aimia Inc 66 – 4 Air Canada 43 – 2 AirBoss of America Corp 16 –
18 Alacer Gold Corp 34 – 24 Alamos Gold Inc 156 0.01 4 Alaris Royalty Corp 66 – 2 Algoma Central Corp 19 –
17 Algonquin Power & Utilities Corp 144 0.01 13 Alimentation Couche-Tard Inc 604 0.04 14 AltaGas Ltd 346 0.02 4 Altius Minerals Corp 34 – 2 Altus Group Ltd 34 – 8 Amaya Inc 111 0.01 5 Andrew Peller Ltd 40 –
18 ARC Resources Ltd 309 0.02 21 Argonaut Gold Inc 39 – 14 Asanko Gold Inc 50 – 5 Atco Ltd 175 0.01
50 Athabasca Oil Corp 51 – 6 ATS Automation Tooling Systems Inc 44 – 9 AuRico Metals Inc 7 – 3 AutoCanada Inc 38 – 1 Avigilon Corp 10 –
79 B2Gold Corp 191 0.01 2 Badger Daylighting Ltd 35 –
28 Bank of Montreal 1,866 0.11 36 Bank of Nova Scotia 1,996 0.12
010_3771524762911.indd���19 2017/10/11���13:01:23

- 20 -
1.ディメンショナル・ファンズ・ピーエルシー グローバル・コア・エクイティ・ファンド
Shares (000's)
Value(000's)
USD
% of NetAssetValue
Common Stock (continued)Canada - 3.63% (continued)
5 Banro Corp 1 – 22 Barrick Gold Corp 328 0.02 18 Baytex Energy Corp 77 0.01 7 BCE Inc 310 0.02 9 Bellatrix Exploration Ltd 7 – 8 Birchcliff Energy Ltd 56 – 2 Bird Construction Inc 14 – 1 Black Diamond Group Ltd 4 –
34 BlackBerry Ltd 264 0.02 44 BlackPearl Resources Inc 58 –
111 Bombardier Inc 155 0.01 23 Bonavista Energy Corp 78 0.01 4 Bonterra Energy Corp 73 – 5 Boralex Inc 60 –
27 Brookfield Asset Management Inc 887 0.05 3 BRP Inc 57 –
20 CAE Inc 288 0.02 4 Calfrac Well Services Ltd 11 – 1 Calian Group Ltd 9 – 1 Callidus Capital Corp 15 –
25 Cameco Corp 227 0.01 13 Canaccord Genuity Group Inc 40 – 14 Canacol Energy Ltd 47 – 6 Canadian Energy Services & Technology Corp 33 –
16 Canadian Imperial Bank of Commerce 1,228 0.07 24 Canadian National Railway Co 1,578 0.09 47 Canadian Natural Resources Ltd 1,593 0.09 4 Canadian Pacific Railway Ltd 666 0.04 4 Canadian Tire Corp Ltd 454 0.03 7 Canadian Utilities Ltd 181 0.01 9 Canadian Western Bank 188 0.01 3 Canam Group Inc 21 –
11 Canexus Corp 12 – 7 Canfor Corp 72 – 3 Canfor Pulp Products Inc 22 – 6 CanWel Building Materials Group Ltd 25 – 5 Canyon Services Group Inc 21 – 7 Capital Power Corp 129 0.01
65 Capstone Mining Corp 50 – 8 Cascades Inc 71 – 2 CCL Industries Inc 271 0.02
11 Celestica Inc 134 0.01 39 Cenovus Energy Inc 596 0.04 18 Centerra Gold Inc 95 0.01 13 Cequence Energy Ltd 2 – 1 Cervus Equipment Corp 8 – 9 CGI Group Inc 435 0.03
12 Chartwell Retirement Residences 131 0.01 30 China Gold International Resources Corp Ltd 62 – 11 CI Financial Corp 225 0.01 4 Cineplex Inc 133 0.01 2 Clearwater Seafoods Inc 20 – 1 Cogeco Communications Inc 62 – 1 Cogeco Inc 46 – 2 Colliers International Group Inc 70 – 5 Computer Modelling Group Ltd 31 – 2 Concordia International Corp 6 – 1 Constellation Software Inc 424 0.03
11 Continental Gold Inc 28 – 10 Copper Mountain Mining Corp 6 – 13 Corus Entertainment Inc 116 0.01 11 Cott Corp 126 0.01 30 Crescent Point Energy Corp 376 0.02
Shares (000's)
Value(000's)
USD
% of NetAssetValue
Common Stock (continued)Canada - 3.63% (continued)
15 Crew Energy Inc 85 0.01 7 CRH Medical Corp 38 – 7 Delphi Energy Corp 7 –
82 Denison Mines Corp 35 – 3 Descartes Systems Group Inc 64 –
12 Detour Gold Corp 153 0.01 7 DH Corp 96 0.01
23 DHX Media Ltd 120 0.01 6 Dollarama Inc 410 0.02 6 Dominion Diamond Corp 56 – 3 Dorel Industries Inc 84 0.01
15 Dundee Precious Metals Inc 24 – 3 Eastern Platinum Ltd 1 –
18 ECN Capital Corp 41 – 55 Eldorado Gold Corp 152 0.01 30 Element Fleet Management Corp 247 0.02 3 Emera Inc 87 0.01
14 Empire Co Ltd 193 0.01 27 Enbridge Inc 1,146 0.07 9 Enbridge Income Fund Holdings Inc 237 0.01
38 Encana Corp 471 0.03 7 Endeavour Mining Corp 103 0.01 8 Enercare Inc 104 0.01 7 Enerflex Ltd 90 0.01 2 Enghouse Systems Ltd 64 –
11 Ensign Energy Services Inc 73 – 1 Equitable Group Inc 27 – 9 Essential Energy Services Ltd 4 – 1 Evertz Technologies Ltd 8 – 2 Exchange Income Corp 63 – 4 Exco Technologies Ltd 30 – 4 Extendicare Inc 27 – 1 Fairfax Financial Holdings Ltd 540 0.03 3 Fiera Capital Corp 28 –
14 Finning International Inc 275 0.02 2 Firm Capital Mortgage Investment Corp 20 –
10 First Capital Realty Inc 149 0.01 7 First Majestic Silver Corp 62 – 1 First National Financial Corp 24 –
52 First Quantum Minerals Ltd 589 0.04 2 FirstService Corp 86 0.01
15 Fortis Inc (Canada listing) 450 0.03 7 Fortis Inc (US listing) 209 0.01
13 Fortuna Silver Mines Inc 77 0.01 4 Franco-Nevada Corp 232 0.01 8 Freehold Royalties Ltd 80 0.01 4 Genworth MI Canada Inc 101 0.01 3 George Weston Ltd 256 0.02 5 Gibson Energy Inc 63 – 9 Gildan Activewear Inc 256 0.02 1 Gluskin Sheff + Associates Inc 13 – 2 GMP Capital Inc 7 –
34 Goldcorp Inc 452 0.03 49 Golden Star Resources Ltd 42 – 29 Gran Tierra Energy Inc 82 0.01 2 Granite Oil Corp 8 – 3 Great Canadian Gaming Corp 54 – 7 Great-West Lifeco Inc 185 0.01 2 Guardian Capital Group Ltd 34 – 3 Guyana Goldfields Inc 11 – 2 Heroux-Devtek Inc 28 – 1 High Liner Foods Inc 20 – 6 Home Capital Group Inc 136 0.01
010_3771524762911.indd���20 2017/10/11���13:01:24

- 21 -
1.ディメンショナル・ファンズ・ピーエルシー グローバル・コア・エクイティ・ファンド
Shares (000's)
Value(000's)
USD
% of NetAssetValue
Common Stock (continued)Canada - 3.63% (continued)
19 Horizon North Logistics Inc 26 – 18 HudBay Minerals Inc 123 0.01 6 Hudson's Bay Co 69 –
13 Husky Energy Inc 151 0.01 42 IAMGOLD Corp 152 0.01 6 IGM Financial Inc 161 0.01 3 IMAX Corp 83 0.01 2 Imperial Metals Corp 9 – 6 Imperial Oil Ltd 197 0.01 9
Industrial Alliance Insurance & Financial Services Inc 373 0.02
6 Innergex Renewable Energy Inc 63 – 5 Intact Financial Corp 353 0.02
16 Inter Pipeline Ltd 334 0.02 6 Interfor Corp 67 – 4 Intertain Group Ltd 28 – 5 Intertape Polymer Group Inc 85 0.01
40 Ithaca Energy Inc 45 – 63 Ivanhoe Mines Ltd 112 0.01 4 Jean Coutu Group PJC Inc 65 – 8 Just Energy Group Inc 41 – – K-Bro Linen Inc 11 – 1 Kelt Exploration Ltd 3 –
11 Keyera Corp 321 0.02 122 Kinross Gold Corp 402 0.02
7 Kirkland Lake Gold Inc 41 – 17 Klondex Mines Ltd 84 0.01 10 Knight Therapeutics Inc 81 0.01 7 Labrador Iron Ore Royalty Corp 89 0.01 3 Laurentian Bank of Canada 109 0.01 2 Leon's Furniture Ltd 31 – 5 Linamar Corp 196 0.01 1 Liquor Stores NA Ltd 11 – 5 Loblaw Cos Ltd 272 0.02
26 Lucara Diamond Corp 63 – 55 Lundin Mining Corp 270 0.02 2 MacDonald Dettwiler & Associates Ltd 109 0.01 2 Magellan Aerospace Corp 33 –
16 Magna International Inc 632 0.04 – Mainstreet Equity Corp 10 – 8 Major Drilling Group International Inc 36 –
24 Mandalay Resources Corp 12 – 3 Manitoba Telecom Services Inc 81 0.01
53 Manulife Financial Corp 917 0.05 7 Maple Leaf Foods Inc 159 0.01 7 Martinrea International Inc 37 – 3 Medical Facilities Corp 38 –
11 MEG Energy Corp 53 – 2 Melcor Developments Ltd 16 –
13 Merus Labs International Inc 13 – 7 Methanex Corp 294 0.02
13 Metro Inc 401 0.02 10 Mitel Networks Corp 70 – – Morguard Corp 52 – 3 Morneau Shepell Inc 42 – 1 MTY Food Group Inc 34 – 7 Mullen Group Ltd 94 0.01
25 National Bank of Canada 943 0.06 18 Nevsun Resources Ltd 59 – 3 New Flyer Industries Inc 90 0.01
48 New Gold Inc 172 0.01 3 Newalta Corp 4 – 3 Norbord Inc 73 – 3 North American Energy Partners Inc 12 –
Shares (000's)
Value(000's)
USD
% of NetAssetValue
Common Stock (continued)Canada - 3.63% (continued)
3 North West Co Inc 62 – 9 Northern Blizzard Resources Inc 24 –
24 Northern Dynasty Minerals Ltd 28 – 7 Northland Power Inc 118 0.01
11 NuVista Energy Ltd 58 – 49 OceanaGold Corp 136 0.01 5 Onex Corp 323 0.02 6 Open Text Corp 357 0.02 8 Osisko Gold Royalties Ltd 78 0.01
12 Painted Pony Petroleum Ltd 87 0.01 13 Pan American Silver Corp 212 0.01 2 Paramount Resources Ltd 21 –
10 Parex Resources Inc 127 0.01 5 Parkland Fuel Corp 106 0.01 5 Pason Systems Inc 54 –
11 Pembina Pipeline Corp 328 0.02 38 Pengrowth Energy Corp 57 – 41 Penn West Petroleum Ltd 71 – 10 Peyto Exploration & Development Corp 251 0.02 2 PHX Energy Services Corp 5 –
26 Pine Cliff Energy Ltd 22 – 2 Pizza Pizza Royalty Corp 19 – 6 Platinum Group Metals Ltd 10 –
61 Potash Corp of Saskatchewan Inc 1,107 0.07 1 PrairieSky Royalty Ltd 23 –
28 Precision Drilling Corp 150 0.01 1 Premium Brands Holdings Corp 53 – 9 Pretium Resources Inc 81 0.01 9 Primero Mining Corp 8 – 2 QLT Inc 4 – 5 Quebecor Inc 136 0.01
12 Raging River Exploration Inc 96 0.01 4 Reitmans Canada Ltd 22 – 7 Restaurant Brands International Inc 321 0.02 4 Richelieu Hardware Ltd 78 0.01 6 Richmont Mines Inc 40 – 7 Ritchie Bros Auctioneers Inc 262 0.02 7 RMP Energy Inc 4 –
10 Rogers Communications Inc 370 0.02 10 Rogers Sugar Inc 47 – 45 Royal Bank of Canada (Canada listing) 2,907 0.17 5 Royal Bank of Canada (US listing) 295 0.02 5 Russel Metals Inc 98 0.01
26 Sabina Gold & Silver Corp 18 – 16 Sandstorm Gold Ltd 58 – 9 Sandvine Corp 20 –
10 Saputo Inc 352 0.02 8 Savanna Energy Services Corp 10 – 3 Seabridge Gold Inc 25 – 1 Sears Canada Inc (Canada listing) 2 – 2 Sears Canada Inc (US listing) 3 –
11 Secure Energy Services Inc 79 0.01 23 SEMAFO Inc 70 – 9 Seven Generations Energy Ltd 212 0.01
26 Shaw Communications Inc 501 0.03 4 ShawCor Ltd 94 0.01
22 Sherritt International Corp 20 – 2 Sienna Senior Living Inc 18 – 3 Sierra Wireless Inc 50 –
10 Silver Standard Resources Inc 99 0.01 14 Silver Wheaton Corp 257 0.02 9 SNC-Lavalin Group Inc 396 0.02
30 Spartan Energy Corp 74 0.01
010_3771524762911.indd���21 2017/10/11���13:01:24
- 22 -
1.ディメンショナル・ファンズ・ピーエルシー グローバル・コア・エクイティ・ファンド
Shares (000's)
Value(000's)
USD
% of NetAssetValue
Common Stock (continued)Canada - 3.63% (continued)
8 Sprott Inc 15 – 11 Sprott Resource Corp 4 – 7 Stantec Inc 200 0.01 3 Stella-Jones Inc 94 0.01
59 Stornoway Diamond Corp 45 – 5 Student Transportation Inc 28 –
16 Sun Life Financial Inc 605 0.04 52 Suncor Energy Inc 1,664 0.10 8 SunOpta Inc 56 –
11 Superior Plus Corp 102 0.01 20 Surge Energy Inc 41 – 24 Tahoe Resources Inc 235 0.01 15 Taseko Mines Ltd 10 – 26 Teck Resources Ltd 667 0.04 3 TELUS Corp 97 0.01 4 Tembec Inc 5 –
60 Teranga Gold Corp 37 – 14 Theratechnologies Inc 31 – 11 Thomson Reuters Corp 469 0.03 7 Timmins Gold Corp 2 – 2 TMX Group Ltd 82 0.01
13 TORC Oil & Gas Ltd 82 0.01 5 Torex Gold Resources Inc 77 0.01 4 Toromont Industries Ltd 144 0.01
57 Toronto-Dominion Bank 2,688 0.16 3 Torstar Corp 4 – 2 Total Energy Services Inc 19 –
11 Tourmaline Oil Corp 301 0.02 28 TransAlta Corp 154 0.01 6 TransAlta Renewables Inc 63 –
21 TransCanada Corp 949 0.06 5 Transcontinental Inc 71 – 7 TransForce Inc 170 0.01 8 TransGlobe Energy Corp 14 –
27 Trevali Mining Corp 27 – 23 Trican Well Service Ltd 63 – 4 Trilogy Energy Corp 18 –
14 Trinidad Drilling Ltd 29 – 43 Turquoise Hill Resources Ltd 145 0.01 3 Uni-Select Inc 74 0.01
22 Valeant Pharmaceuticals International Inc 350 0.02 2 Valener Inc 36 –
23 Veresen Inc 213 0.01 5 Vermilion Energy Inc 191 0.01 3 Wajax Corp 45 –
10 Waste Connections Inc 795 0.05 5 West Fraser Timber Co Ltd 185 0.01 5 Western Energy Services Corp 9 –
18 Western Forest Products Inc 25 – 1 WestJet Airlines Ltd 16 – 4 Westport Fuel Systems Inc 6 – 4 Westshore Terminals Investment Corp 78 0.01
31 Whitecap Resources Inc 280 0.02 13 Wi-LAN Inc 17 – 2 Winpak Ltd 59 – 6 WSP Global Inc 212 0.01 2 Xtreme Drilling Corp 5 –
74 Yamana Gold Inc 222 0.01 2 Yellow Pages Ltd 30 –
62,050 3.63China (Hong Kong) - 0.01%
52 Chu Kong Shipping Enterprises Group Co Ltd 14 – 16 Hua Hong Semiconductor Ltd 18 –
Shares (000's)
Value(000's)
USD
% of NetAssetValue
Common Stock (continued)China (Hong Kong) - 0.01% (continued)
93 K Wah International Holdings Ltd 48 0.01 50 Lifestyle China Group Ltd 13 –
170 United Photovoltaics Group Ltd 15 – 108 0.01
Denmark - 0.60%1 ALK-Abello AS 75 – 7 Alm Brand AS 49 – 1 Ambu AS 57 – – AP Moller - Maersk AS, Class A 158 0.01 – AP Moller - Maersk AS, Class B 202 0.01 3 Bang & Olufsen AS 34 – 2 Bavarian Nordic AS 49 – 5 Carlsberg AS 398 0.02 6 Chr Hansen Holding AS 340 0.02 4 Coloplast AS 232 0.01 3 D/S Norden AS 51 –
15 Danske Bank AS 439 0.03 3 Dfds AS 119 0.01
13 DSV AS 600 0.04 4 FLSmidth & Co AS 158 0.01 3 Genmab AS 430 0.03
12 GN Store Nord AS 242 0.01 4 H Lundbeck AS 163 0.01 3 H+H International AS 24 – 1 IC Group AS 19 –
10 ISS AS 328 0.02 – Jeudan AS 11 – 6 Jyske Bank AS 261 0.02 4 Matas AS 50 – 2 NKT Holding AS 156 0.01 1 NNIT AS 18 – 2 Nordjyske Bank AS 22 –
60 Novo Nordisk AS 2,023 0.12 13 Novozymes AS 425 0.03 6 Pandora AS 746 0.04 2 Per Aarsleff Holding AS 51 – – Ringkjoebing Landbobank AS 90 0.01 – Rockwool International AS, Class A 27 – 1 Rockwool International AS, Class B 120 0.01 4 Royal Unibrew AS 147 0.01 1 Schouw & Co AB 80 0.01 3 SimCorp AS 155 0.01 – Solar AS 19 – 8 Spar Nord Bank AS 82 0.01 6 Sydbank AS 178 0.01
69 TDC AS 351 0.02 – Tivoli AS 3 – 6 Topdanmark AS 144 0.01
10 Tryg AS 185 0.01 – United International Enterprises 24 – 9 Vestas Wind Systems AS 558 0.03 9 William Demant Holding AS 159 0.01 1 Zealand Pharma AS 22 –
10,274 0.60Finland - 0.48%
1 Ahlstrom Oyj 8 – 1 Aktia Bank Oyj 12 – 9 Amer Sports Oyj 232 0.02 4 Aspo Oyj 28 – – BasWare Oyj 13 – 4 Bittium Oyj 25 – 3 Cargotec Oyj 124 0.01 6 Caverion Corp 41 –
010_3771524762911.indd���22 2017/10/11���13:01:24
- 23 -
1.ディメンショナル・ファンズ・ピーエルシー グローバル・コア・エクイティ・ファンド
Shares (000's)
Value(000's)
USD
% of NetAssetValue
Common Stock (continued)Finland - 0.48% (continued)
30 Citycon Oyj 69 0.01 3 Cramo Oyj 80 0.01 9 Elisa Oyj 289 0.02
10 F-Secure Oyj 33 – 8 Finnair Oyj 34 – 2 Fiskars Oyj Abp 33 –
16 Fortum Oyj 228 0.01 5 HKScan Oyj 15 – 6 Huhtamaki Oyj 210 0.01 9 Kemira Oyj 104 0.01 1 Kesko Oyj, Class A 63 0.01 6 Kesko Oyj, Class B 304 0.02
15 Kone Oyj 662 0.04 2 Konecranes OYJ 85 0.01 2 Lassila & Tikanoja Oyj 41 – 1 Lemminkainen Oyj 21 –
15 Metsa Board Oyj 96 0.01 6 Metso Oyj 181 0.01 – Munksjo Oyj 2 –
11 Neste Oyj 446 0.03 130 Nokia Oyj 559 0.03
7 Nokian Renkaat Oyj 256 0.02 1 Olvi Oyj 31 –
11 Oriola-KD Oyj 51 – 1 Orion Oyj, Class A 61 – 6 Orion Oyj, Class B 268 0.02
25 Outokumpu Oyj 192 0.01 11 Outotec Oyj 56 – 2 PKC Group Oyj 38 – 1 Ponsse Oy 30 – 9 Raisio Oyj 34 – 5 Ramirent Oyj 39 –
17 Sampo Oyj 736 0.04 7 Sanoma Oyj 56 –
13 Sponda Oyj 54 – 3 Stockmann Oyj Abp 21 –
56 Stora Enso Oyj 537 0.03 13 Talvivaara Mining Co PLC – – 11 Technopolis Oyj 35 – 3 Tieto Oyj 74 0.01 3 Tikkurila Oyj 52 –
36 UPM-Kymmene Oyj 815 0.05 4 Uponor Oyj 67 0.01 – Vaisala Oyj 13 – 8 Valmet Oyj 118 0.01 9 Wartsila Oyj Abp 396 0.02 8 YIT Oyj 61 –
8,129 0.48France - 2.86%
3 ABC arbitrage 28 – 12 Accor SA 437 0.03 2 Aeroports de Paris 153 0.01
10 Air France-KLM 56 – 12 Air Liquide SA 1,267 0.08 17 Airbus Group SE 1,058 0.06 1 Akka Technologies 22 – 1 Albioma SA 18 –
11 Alstom SA 286 0.02 2 Altamir 19 – 2 Alten SA 104 0.01 9 Altran Technologies SA 118 0.01 – APRIL SA 5 – 6 Arkema SA 579 0.03
Shares (000's)
Value(000's)
USD
% of NetAssetValue
Common Stock (continued)France - 2.86% (continued)
1 Assystem 34 – 6 Atos SE 657 0.04
51 AXA SA 1,205 0.07 – Axway Software SA 14 – 2 Beneteau SA 29 – 1 BioMerieux 111 0.01
35 BNP Paribas SA 2,018 0.12 – Boiron SA 32 – – Bollore SA (non-voting rights) 1 –
55 Bollore SA(voting rights) 181 0.01 1 Bonduelle SCA 30 – 2 Bourbon Corp 25 –
15 Bouygues SA 515 0.03 17 Bureau Veritas SA 326 0.02 – Burelle SA 28 – 6 Capgemini SA 484 0.03
42 Carrefour SA 977 0.06 6 Casino Guichard Perrachon SA 265 0.02 1 Cegedim SA 16 – 1 Cegid Group – – 2 CGG SA 34 – 3 Chargeurs SA 57 – 2 Christian Dior SE 366 0.02
20 Cie de Saint-Gobain 886 0.05 2 Cie des Alpes 29 –
14 Cie Generale des Etablissements Michelin 1,466 0.09 4 Cie Plastic Omnium SA 126 0.01 7 CNP Assurances 118 0.01 8 Coface SA 44 –
33 Credit Agricole SA 369 0.02 17 Danone SA 1,041 0.06 – Dassault Aviation SA 61 – 6 Dassault Systemes 430 0.03 8 Derichebourg SA 24 – 1 Devoteam SA 36 –
15 Edenred 309 0.02 5 Eiffage SA 315 0.02
26 Electricite de France SA 271 0.02 6 Elior Group 126 0.01 2 Elis SA 36 –
55 Engie SA 678 0.04 – Eramet 26 – 7 Essilor International SA 792 0.05 – Esso SA Francaise 17 –
13 Etablissements Maurel et Prom 55 – 1 Euler Hermes Group 77 0.01 – Eurofins Scientific SE 210 0.01 3 Euronext NV 127 0.01
12 Eutelsat Communications SA 219 0.01 – Faiveley Transport SA 34 – 5 Faurecia 182 0.01 1 Gaztransport Et Technigaz SA 38 – 1 GL Events 22 – – Groupe Crit 32 –
27 Groupe Eurotunnel SE 237 0.01 1 Groupe Fnac SA (France listing) 79 0.01 1 Groupe Fnac SA (UK listing) 79 0.01 – Guerbet 22 – 2 Haulotte Group SA 22 –
10 Havas SA 77 0.01 1 Hermes International 312 0.02 – ID Logistics Group 33 – 1 Iliad SA 246 0.02
010_3771524762911.indd���23 2017/10/11���13:01:24
- 24 -
1.ディメンショナル・ファンズ・ピーエルシー グローバル・コア・エクイティ・ファンド
Shares (000's)
Value(000's)
USD
% of NetAssetValue
Common Stock (continued)France - 2.86% (continued)
1 Imerys SA 67 – 3 Ingenico Group SA 241 0.02 1 Interparfums SA 20 – 2 Ipsen SA 126 0.01 3 IPSOS 79 0.01 1 Jacquet Metal Service 21 – 5 JCDecaux SA 131 0.01 2 Kering 361 0.02 4 Korian SA 104 0.01 6 L'Oreal SA 1,072 0.06 9 Lagardere SCA 225 0.01 1 Le Noble Age 25 – 2 Lectra 33 –
11 Legrand SA 639 0.04 1 LISI 34 –
10 LVMH Moet Hennessy Louis Vuitton SE 1,746 0.10 1 Manitou BF SA 24 – – Manutan International 10 – 1 Mersen SA 18 – 4 Metropole Television SA 72 0.01 1 MGI Coutier 32 –
44 Natixis SA 219 0.01 1 Naturex 48 – 3 Neopost SA 90 0.01 2 Nexans SA 106 0.01 3 Nexity SA 126 0.01 3 Nicox 25 – 2 NRJ Group 14 – 3 Oeneo SA 28 – 4 Onxeo SA 9 –
98 Orange SA 1,427 0.08 2 Orpea 146 0.01 4 Pernod Ricard SA 408 0.03
45 Peugeot SA 669 0.04 – Pierre & Vacances SA 14 –
10 Publicis Groupe SA 642 0.04 2 Rallye SA 30 – 1 Remy Cointreau SA 51 – 9 Renault SA 731 0.04
25 Rexel SA 394 0.02 1 Rothschild & Co 21 – 3 Rubis SCA 214 0.01
11 Safran SA 789 0.05 25 Sanofi 2,042 0.12 1 Sartorius Stedim Biotech 79 0.01 – Savencia SA 20 –
12 Schneider Electric SE 831 0.05 13 SCOR SE 403 0.02 2 SEB SA 207 0.01 5 Sequana SA 7 –
10 SES SA 222 0.01 6 SFR Group SA 139 0.01 1 Societe BIC SA 191 0.01
24 Societe Generale SA 1,014 0.06 5 Sodexo SA 504 0.03 2 Solocal Group 7 – – Somfy SA 34 – 1 Sopra Steria Group 99 0.01 2 SPIE SA 33 – 1 Stallergenes Greer PLC 24 – 7 Ste Industrielle d'Aviation Latecoere SA 25 – – Stef SA 10 –
53 STMicroelectronics NV 537 0.03
Shares (000's)
Value(000's)
USD
% of NetAssetValue
Common Stock (continued)France - 2.86% (continued)
23 Suez 314 0.02 – Sword Group 12 – 1 Synergie SA 18 – 1 Tarkett SA 46 –
20 Technicolor SA 97 0.01 10 Technip SA 688 0.04 4 Teleperformance 365 0.02 7 Television Francaise 1 61 – 5 Thales SA 498 0.03 – Thermador Groupe 20 – – Total Gabon 6 –
97 Total SA 4,612 0.27 1 Trigano SA 40 – 7 Ubisoft Entertainment SA 237 0.01
12 Valeo SA 663 0.04 35 Vallourec SA 194 0.01 25 Veolia Environnement SA 428 0.03 – Vetoquinol SA 20 – 2 Vicat SA 88 0.01 – Vilmorin & Cie SA 26 –
17 Vinci SA 1,073 0.06 – Virbac SA 36 –
28 Vivendi SA 532 0.03 1 Worldline SA 37 – 9 Zodiac Aerospace 197 0.01
48,875 2.86Germany - 2.74%
6 Aareal Bank AG 217 0.01 8 adidas AG 1,130 0.07 2 ADLER Real Estate AG 29 – 4 ADVA Optical Networking SE 29 – 7 Aixtron SE 29 –
12 Allianz SE 1,915 0.11 – Amadeus Fire AG 22 – 3 Aurubis AG 164 0.01 4 Axel Springer SE 159 0.01
44 BASF SE 3,841 0.23 – Bauer AG 5 –
25 Bayer AG 2,390 0.14 18 Bayerische Motoren Werke AG 1,508 0.09 2 BayWa AG 49 – 1 Bechtle AG 59 – 2 Beiersdorf AG 182 0.01 – Bertrandt AG 46 – – Bijou Brigitte AG 13 – 3 Bilfinger SE 132 0.01 1 Biotest AG 11 – 8 Borussia Dortmund GmbH & Co KGaA 39 – 1 BRAAS Monier Building Group SA 25 – 9 Brenntag AG 499 0.03 1 CANCOM SE 38 – 2 Carl Zeiss Meditec AG 54 – 2 CENTROTEC Sustainable AG 32 – – Cewe Stiftung & Co KGAA 33 – 1 Clere AG 10 – 2 Comdirect Bank AG 20 –
44 Commerzbank AG 304 0.02 1 CompuGroup Medical SE 48 – 9 Constantin Medien AG 18 – 4 Continental AG 744 0.04 4 Covestro AG 252 0.02 2 CropEnergies AG 9 – 3 CTS Eventim AG & Co KGaA 87 0.01
010_3771524762911.indd���24 2017/10/11���13:01:25
- 25 -
1.ディメンショナル・ファンズ・ピーエルシー グローバル・コア・エクイティ・ファンド
Shares (000's)
Value(000's)
USD
% of NetAssetValue
Common Stock (continued)Germany - 2.74% (continued)
47 Daimler AG 3,095 0.18 48 Deutsche Bank AG 761 0.05 1 Deutsche Beteiligungs AG 31 – 8 Deutsche Boerse AG 678 0.04 3 Deutsche EuroShop AG 123 0.01
24 Deutsche Lufthansa AG 307 0.02 4 Deutsche Pfandbriefbank AG 39 –
32 Deutsche Post AG 1,014 0.06 156 Deutsche Telekom AG 2,453 0.14
21 Deutsche Wohnen AG 654 0.04 11 Deutz AG 62 – 6 Dialog Semiconductor PLC 245 0.02 3 DIC Asset AG 24 – 2 DMG Mori AG 100 0.01 – Draegerwerk AG & Co KGaA 10 – 2 Drillisch AG 78 0.01 2 Duerr AG 135 0.01
156 E.ON SE 1,025 0.06 1 Elmos Semiconductor AG 10 – 2 ElringKlinger AG 32 – 3 Evonik Industries AG 76 0.01 4 Evotec AG 26 – 2 Fielmann AG 99 0.01 3 Fraport AG Frankfurt Airport Services Worldwide 160 0.01 6 Freenet AG 151 0.01 6 Fresenius Medical Care AG & Co KGaA 441 0.03
15 Fresenius SE & Co KGaA 1,070 0.06 2 Fuchs Petrolub SE 71 – 8 GEA Group AG 313 0.02 2 Gerresheimer AG 135 0.01 1 Gerry Weber International AG 16 – – Gesco AG 20 – 1 GFK SE 41 – 2 GFT Technologies SE 37 – 1 Grammer AG 45 – – Grenke AG 53 – 1 H&R GmbH & Co KGaA 14 – 2 Hamburger Hafen und Logistik AG 28 – 2 Hannover Rueck SE 207 0.01 7 HeidelbergCement AG 623 0.04
18 Heidelberger Druckmaschinen AG 45 – 2 Hella KGaA Hueck & Co 78 0.01 2 Henkel AG & Co KGaA 227 0.01 2 Hochtief AG 234 0.01 1 Hornbach Baumarkt AG 25 – 4 Hugo Boss AG 212 0.01 2 Indus Holding AG 103 0.01
53 Infineon Technologies AG 883 0.05 – Isra Vision AG 37 – 3 Jenoptik AG 59 –
17 K+S AG 337 0.02 5 KION Group AG 271 0.02 9 Kloeckner & Co SE 100 0.01 1 Koenig & Bauer AG 36 – 6 Kontron AG 19 – 1 Krones AG 72 – 1 KUKA AG 154 0.01 – KWS Saat SE 26 – 8 Lanxess AG 466 0.03 4 LEG Immobilien AG 336 0.02 3 Leoni AG 96 0.01 7 Linde AG 1,143 0.07 2 LPKF Laser & Electronics AG 11 –
Shares (000's)
Value(000's)
USD
% of NetAssetValue
Common Stock (continued)Germany - 2.74% (continued)
2 MAN SE 157 0.01 – Manz AG 16 – 3 Merck KGaA 278 0.02
17 Metro AG 499 0.03 6 MLP AG 26 – 4 MTU Aero Engines AG 379 0.02
4 Muenchener Rueckversicherungs-Gesellschaft AG in Muenchen 768 0.05
1 Nemetschek SE 50 – 3 Nordex SE 73 – 2 Norma Group SE 83 0.01 6 OSRAM Licht AG 331 0.02 3 Patrizia Immobilien AG 48 – 1 Pfeiffer Vacuum Technology AG 65 – 2 PNE Wind AG 5 –
11 ProSiebenSat.1 Media SE 364 0.02 – Puma SE 35 –
15 Qiagen NV 421 0.03 8 QSC AG 16 – – Rational AG 103 0.01 3 Rheinmetall AG 206 0.01 3 Rhoen Klinikum AG 89 0.01 3 RIB Software AG 40 – 2 RTL Group SA 118 0.01
47 RWE AG 589 0.04 3 SAF-Holland SA 41 – 3 Salzgitter AG 111 0.01
20 SAP SE 1,695 0.10 1 Schaltbau Holding AG 19 – 1 SHW AG 23 –
23 Siemens AG 2,604 0.15 1 Siltronic AG 35 – 1 Sixt SE 55 – 1 SMA Solar Technology AG 15 – 2 Software AG 81 0.01 1 Stabilus SA 53 – 5 Stada Arzneimittel AG 235 0.01 – STRATEC Biomedical AG 13 – 1 Stroeer SE & Co KGaA 54 – 8 Suedzucker AG 184 0.01 2 Suess MicroTec AG 13 – 1 Surteco SE 20 – 7 Symrise AG 406 0.02 8 TAG Immobilien AG 101 0.01 3 Takkt AG 54 – 4 Talanx AG 129 0.01
34 Telefonica Deutschland Holding AG 135 0.01 14 thyssenkrupp AG 321 0.02 5 TLG Immobilien AG 93 0.01 – Tom Tailor Holding AG 1 –
17 Uniper SE 209 0.01 8 United Internet AG 291 0.02 4 VERBIO Vereinigte BioEnergie AG 27 – 2 Volkswagen AG 276 0.02
23 Vonovia SE 753 0.04 1 Vossloh AG 50 – 1 VTG AG 17 – 1 Wacker Chemie AG 132 0.01 3 Wacker Neuson SE 45 – 1 Washtec AG 69 – 2 Wirecard AG 97 0.01 – XING AG 32 –
010_3771524762911.indd���25 2017/10/11���13:01:25
- 26 -
1.ディメンショナル・ファンズ・ピーエルシー グローバル・コア・エクイティ・ファンド
Shares (000's)
Value(000's)
USD
% of NetAssetValue
Common Stock (continued)Germany - 2.74% (continued)
2 Zalando SE 75 0.01 – Zeal Network SE 11 –
46,948 2.74Hong Kong - 1.18%
52 13 Holdings Ltd 17 – 115 Agritrade Resources Ltd 19 – 337 AIA Group Ltd 2,050 0.12 106 Allied Properties HK Ltd 24 –
36 APT Satellite Holdings Ltd 20 – 44 Asia Financial Holdings Ltd 24 – 12 Asia Satellite Telecommunications Holdings Ltd 15 – 99 Asia Standard International Group Ltd 22 – 17 ASM Pacific Technology Ltd 168 0.01 2 Associated International Hotels Ltd 6 –
375 Auto Italia Holdings 6 – 52 Bank of East Asia Ltd 215 0.01
780 BEP International Holdings Ltd 57 – 153 BOC Hong Kong Holdings Ltd 573 0.03
40 Bonjour Holdings Ltd 2 – 80 Bright Smart Securities & Commodities Group Ltd 34 –
242 Brightoil Petroleum Holdings Ltd 73 0.01 440 Burwill Holdings Ltd 10 –
24 Cafe de Coral Holdings Ltd 86 0.01 128 Cathay Pacific Airways Ltd 173 0.01 184 Century City International Holdings Ltd 13 –
18 Cheung Kong Infrastructure Holdings Ltd 150 0.01 83 Cheung Kong Property Holdings Ltd 565 0.03 11 Chevalier International Holdings Ltd 17 –
328 China Energy Development Holdings Ltd 4 – 34 China Metal International Holdings Inc 11 – 2 China Motor Bus Co Ltd 26 –
60 China Star Entertainment Ltd 4 – 720 China Strategic Holdings Ltd 17 –
27 Chinese Estates Holdings Ltd 49 – 30 Chow Sang Sang Holdings International Ltd 56 – 94 Chow Tai Fook Jewellery Group Ltd 77 0.01
152 Chuang's Consortium International Ltd 32 – 156 CITIC Telecom International Holdings Ltd 51 –
85 CK Hutchison Holdings Ltd 1,030 0.06 414 CK Life Sciences Int'l Holdings Inc 39 –
57 CLP Holdings Ltd 561 0.03 55 CNQC International Holdings Ltd 20 –
230 Common Splendor International Health Industry Group Ltd 20 –
22 Convenience Retail Asia Ltd 11 – 552 Convoy Global Holdings Ltd 18 –
20 Cross-Harbour Holdings Ltd 29 – 310 CSI Properties Ltd 11 –
53 CW Group Holdings Ltd 11 – 38 Dah Sing Banking Group Ltd 71 0.01 14 Dah Sing Financial Holdings Ltd 92 0.01
420 Emperor Capital Group Ltd 44 – 75 Emperor Entertainment Hotel Ltd 19 –
160 Emperor International Holdings Ltd 37 – 360 Emperor Watch & Jewellery Ltd 13 – 378 Enerchina Holdings Ltd 21 – 125 Esprit Holdings Ltd 102 0.01
8 Fairwood Holdings Ltd 35 – 108 Far East Consortium International Ltd 47 – 253 FIH Mobile Ltd 81 0.01 176 First Pacific Co Ltd 124 0.01 104 First Shanghai Investments Ltd 19 – 400 Freeman FinTech Corp Ltd 26 –
Shares (000's)
Value(000's)
USD
% of NetAssetValue
Common Stock (continued)Hong Kong - 1.18% (continued)
2,249 G-Resources Group Ltd 43 – 111 Galaxy Entertainment Group Ltd 549 0.03 618 GCL New Energy Holdings Ltd 37 –
16 Get Nice Financial Group Ltd 2 – 648 Get Nice Holdings Ltd 22 –
98 Giordano International Ltd 52 – 632 Global Brands Group Holding Ltd 98 0.01
23 Great Eagle Holdings Ltd 102 0.01 1 Guoco Group Ltd 11 –
227 Guotai Junan International Holdings Ltd 90 0.01 142 Haitong International Securities Group Ltd 98 0.01
82 Hang Lung Group Ltd 301 0.02 114 Hang Lung Properties Ltd 257 0.02
23 Hang Seng Bank Ltd 431 0.03 14 Hanison Construction Holdings Ltd 2 –
317 Hao Tian Development Group Ltd 14 – 3 Harbour Centre Development Ltd 5 –
55 Henderson Land Development Co Ltd 305 0.02 544 HengTen Networks Group 48 –
148 HK Electric Investments & HK Electric Investments Ltd 130 0.01
43 HKBN Ltd 48 – 39 HKR International Ltd 18 –
164 HKT Trust & HKT Ltd 213 0.01 182 Hong Kong & China Gas Co Ltd 339 0.02
4 Hong Kong Aircraft Engineering Co Ltd 29 – 35 Hong Kong Exchanges & Clearing Ltd 929 0.06 16 Hong Kong Ferry Holdings Co Ltd 19 – 57 Hong Kong Television Network Ltd 9 – 49 Hongkong & Shanghai Hotels Ltd 57 – 46 Hongkong Chinese Ltd 8 – 47 Hopewell Holdings Ltd 170 0.01
164 Hsin Chong Construction Group Ltd 8 –
126 Hutchison Telecommunications Hong Kong Holdings Ltd 42 –
43 Hysan Development Co Ltd 191 0.01 55 IGG Inc 43 – 82 IT Ltd 34 – 25 ITC Properties Group Ltd 10 – 28 Johnson Electric Holdings Ltd 82 0.01 47 Kerry Logistics Network Ltd 63 – 48 Kerry Properties Ltd 137 0.01
316 Kingston Financial Group Ltd 151 0.01 24 Kowloon Development Co Ltd 23 – 23 L'Occitane International SA 45 –
1,270 Lai Sun Development Co Ltd 25 – 150 Lai Sun Garment International Ltd 30 – 970 Landing International Development Ltd 24 – 592 Li & Fung Ltd 259 0.02
50 Lifestyle International Holdings Ltd 64 – 26 Liu Chong Hing Investment Ltd 37 – 29 Luk Fook Holdings International Ltd 84 0.01 82 Macau Legend Development Ltd 18 –
105 Man Wah Holdings Ltd 73 0.01 1,360 Mason Financial Holdings Ltd 33 –
309 Master Glory Group Ltd 18 – 65 Melco International Development Ltd 104 0.01 52 MGM China Holdings Ltd 115 0.01 18 Midland Holdings Ltd 6 – 15 Miramar Hotel & Investment 34 –
740 Mongolian Mining Corp 24 – 47 MTR Corp Ltd 236 0.01
150 NagaCorp Ltd 92 0.01 2,424 NetMind Financial Holdings Ltd 20 –
010_3771524762911.indd���26 2017/10/11���13:01:25
- 27 -
1.ディメンショナル・ファンズ・ピーエルシー グローバル・コア・エクイティ・ファンド
Shares (000's)
Value(000's)
USD
% of NetAssetValue
Common Stock (continued)Hong Kong - 1.18% (continued)
235 New World Development Co Ltd 262 0.02 62 NewOcean Energy Holdings Ltd 17 –
106 NWS Holdings Ltd 183 0.01 17 Orient Overseas International Ltd 68 0.01
398 Pacific Basin Shipping Ltd 65 – 57 Pacific Textiles Holdings Ltd 66 0.01
327 PCCW Ltd 190 0.01 108 Pico Far East Holdings Ltd 34 –
8 Playmates Holdings Ltd 10 – 110 Polytec Asset Holdings Ltd 8 –
73 Power Assets Holdings Ltd 701 0.04 30 Prada SpA 105 0.01 22 Public Financial Holdings Ltd 10 – 46 Regal Hotels International Holdings Ltd 25 – 87 Sa Sa International Holdings Ltd 39 – 6 Safety Godown Co Ltd 15 –
86 Samsonite International SA 269 0.02 67 Sands China Ltd 328 0.02 20 SEA Holdings Ltd 51 – 95 Shangri-La Asia Ltd 103 0.01 75 Shenwan Hongyuan HK Ltd 42 –
110 Shun Tak Holdings Ltd 40 – 38 Singamas Container Holdings Ltd 4 –
140 Sino Land Co Ltd 220 0.01 16 Sitoy Group Holdings Ltd 4 –
170 SJM Holdings Ltd 137 0.01 400 Skyway Securities Group Ltd 9 –
33 SmarTone Telecommunications Holdings Ltd 45 – 16 SOCAM Development Ltd 5 – 14 Soundwill Holdings Ltd 25 – 48 Stella International Holdings Ltd 81 0.01 46 Sun Hung Kai & Co Ltd 29 – 35 Sun Hung Kai Properties Ltd 461 0.03 26 Swire Pacific Ltd, Class A 254 0.02 41 Swire Pacific Ltd, Class B 73 0.01 60 Swire Properties Ltd 181 0.01 20 TAI Cheung Holdings Ltd 17 – 54 Tao Heung Holdings Ltd 15 – 81 Techtronic Industries Co Ltd 315 0.02 29 Television Broadcasts Ltd 104 0.01 50 Texwinca Holdings Ltd 36 – 17 Transport International Holdings Ltd 51 – 30 Trinity Ltd 2 – 47 TSC Group Holdings Ltd 6 – 46 United Laboratories International Holdings Ltd 25 – 11 Varitronix International Ltd 5 –
214 Victory City International Holdings Ltd 8 – 44 Vitasoy International Holdings Ltd 91 0.01 84 VST Holdings Ltd 28 – 10 VTech Holdings Ltd 124 0.01
484 WH Group Ltd 403 0.02 44 Wharf Holdings Ltd 329 0.02 51 Wheelock & Co Ltd 302 0.02 5 Wing On Co International Ltd 15 –
14 Wing Tai Properties Ltd 8 – 70 Wynn Macau Ltd 130 0.01
160 Xinyi Glass Holdings Ltd 119 0.01 60 Yat Sing Holdings Ltd 31 – 64 Yue Yuen Industrial Holdings Ltd 230 0.01
20,261 1.18Ireland - 0.23%
3 Adient PLC 168 0.01 1,655 Bank of Ireland 352 0.02
Shares (000's)
Value(000's)
USD
% of NetAssetValue
Common Stock (continued)Ireland - 0.23% (continued)
28 C&C Group PLC 101 0.01 36 CRH PLC 1,213 0.07 6 Datalex PLC 21 – 1 FBD Holdings PLC 5 –
12 Glanbia PLC 199 0.01 6 Irish Continental Group PLC 29 – 7 Kerry Group PLC 507 0.03 9 Kingspan Group PLC 239 0.02 5 Paddy Power Betfair PLC 567 0.03
20 Smurfit Kappa Group PLC 455 0.03 3,856 0.23
Israel - 0.22%5 Airport City Ltd 52 – 8 Amot Investments Ltd 35 – 2 Azrieli Group Ltd 98 0.01
29 Bank Hapoalim BM 174 0.01 66 Bank Leumi Le-Israel BM 267 0.02 – Bayside Land Corp 19 –
103 Bezeq The Israeli Telecommunication Corp Ltd 191 0.01 – Big Shopping Centers Ltd 24 – 4 Cellcom Israel Ltd 35 – 2 Clal Insurance Enterprises Holdings Ltd 29 – 4 Delek Automotive Systems Ltd 37 – – Delek Group Ltd 78 0.01 1 Delta-Galil Industries Ltd 25 – 2 Elbit Systems Ltd 158 0.01 – Electra Ltd 20 – 4 First International Bank Of Israel Ltd 54 – 1 Formula Systems 1985 Ltd 45 – 3 Frutarom Industries Ltd 139 0.01 5 Gilat Satellite Networks Ltd 23 –
10 Harel Insurance Investments & Financial Services Ltd 41 –
1 IDI Insurance Co Ltd 36 – 29 Israel Chemicals Ltd 113 0.01 70 Israel Discount Bank Ltd 142 0.01 1 Jerusalem Oil Exploration 34 – 5 Matrix IT Ltd 43 – 1 Melisron Ltd 57 0.01 1 Mellanox Technologies Ltd 29 – 1 Menora Mivtachim Holdings Ltd 12 –
36 Migdal Insurance & Financial Holding Ltd 26 – 9 Mizrahi Tefahot Bank Ltd 126 0.01 2 Nice Ltd 143 0.01 2 Nova Measuring Instruments Ltd 25 –
53 Oil Refineries Ltd 20 – 8 Partner Communications Co Ltd 37 – – Paz Oil Co Ltd 77 0.01 3 Sapiens International Corp NV 41 –
14 Shikun & Binui Ltd 27 – 7 Shufersal Ltd 26 – 4 Strauss Group Ltd 65 0.01
29 Teva Pharmaceutical Industries Ltd 1,056 0.06 5 Tower Semiconductor Ltd 84 0.01
3,763 0.22Italy - 0.83%
108 A2A SpA 129 0.01 4 ACEA SpA 39 – 7 Amplifon SpA 67 0.01 8 Anima Holding SpA 38 – 4 Ansaldo STS SpA 45 –
23 Arnoldo Mondadori Editore SpA 22 – 8 Ascopiave SpA 21 –
010_3771524762911.indd���27 2017/10/11���13:01:26
- 28 -
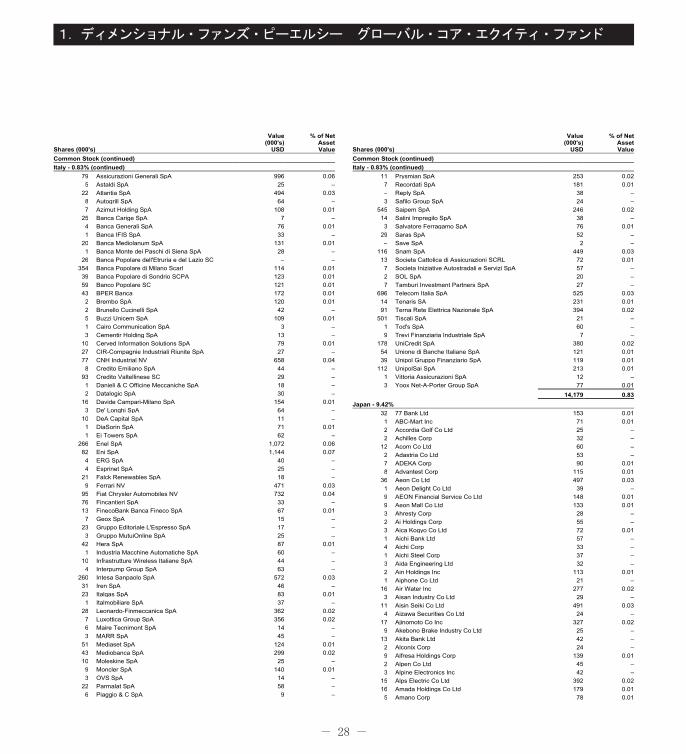
1.ディメンショナル・ファンズ・ピーエルシー グローバル・コア・エクイティ・ファンド
Shares (000's)
Value(000's)
USD
% of NetAssetValue
Common Stock (continued)Italy - 0.83% (continued)
79 Assicurazioni Generali SpA 996 0.06 5 Astaldi SpA 25 –
22 Atlantia SpA 494 0.03 8 Autogrill SpA 64 – 7 Azimut Holding SpA 108 0.01
25 Banca Carige SpA 7 – 4 Banca Generali SpA 76 0.01 1 Banca IFIS SpA 33 –
20 Banca Mediolanum SpA 131 0.01 1 Banca Monte dei Paschi di Siena SpA 28 –
26 Banca Popolare dell'Etruria e del Lazio SC – – 354 Banca Popolare di Milano Scarl 114 0.01
39 Banca Popolare di Sondrio SCPA 123 0.01 59 Banco Popolare SC 121 0.01 43 BPER Banca 172 0.01 2 Brembo SpA 120 0.01 2 Brunello Cucinelli SpA 42 – 5 Buzzi Unicem SpA 109 0.01 1 Cairo Communication SpA 3 – 3 Cementir Holding SpA 13 –
10 Cerved Information Solutions SpA 79 0.01 27 CIR-Compagnie Industriali Riunite SpA 27 – 77 CNH Industrial NV 658 0.04 8 Credito Emiliano SpA 44 –
93 Credito Valtellinese SC 29 – 1 Danieli & C Officine Meccaniche SpA 18 – 2 Datalogic SpA 30 –
16 Davide Campari-Milano SpA 154 0.01 3 De' Longhi SpA 64 –
10 DeA Capital SpA 11 – 1 DiaSorin SpA 71 0.01 1 Ei Towers SpA 62 –
266 Enel SpA 1,072 0.06 82 Eni SpA 1,144 0.07 4 ERG SpA 40 – 4 Esprinet SpA 25 –
21 Falck Renewables SpA 18 – 9 Ferrari NV 471 0.03
95 Fiat Chrysler Automobiles NV 732 0.04 76 Fincantieri SpA 33 – 13 FinecoBank Banca Fineco SpA 67 0.01 7 Geox SpA 15 –
23 Gruppo Editoriale L'Espresso SpA 17 – 3 Gruppo MutuiOnline SpA 25 –
42 Hera SpA 87 0.01 1 Industria Macchine Automatiche SpA 60 –
10 Infrastrutture Wireless Italiane SpA 44 – 4 Interpump Group SpA 63 –
260 Intesa Sanpaolo SpA 572 0.03 31 Iren SpA 46 – 23 Italgas SpA 83 0.01 1 Italmobiliare SpA 37 –
28 Leonardo-Finmeccanica SpA 362 0.02 7 Luxottica Group SpA 356 0.02 6 Maire Tecnimont SpA 14 – 3 MARR SpA 45 –
51 Mediaset SpA 124 0.01 43 Mediobanca SpA 299 0.02 10 Moleskine SpA 25 – 9 Moncler SpA 140 0.01 3 OVS SpA 14 –
22 Parmalat SpA 58 – 6 Piaggio & C SpA 9 –
Shares (000's)
Value(000's)
USD
% of NetAssetValue
Common Stock (continued)Italy - 0.83% (continued)
11 Prysmian SpA 253 0.02 7 Recordati SpA 181 0.01 – Reply SpA 38 – 3 Safilo Group SpA 24 –
545 Saipem SpA 246 0.02 14 Salini Impregilo SpA 38 – 3 Salvatore Ferragamo SpA 76 0.01
29 Saras SpA 52 – – Save SpA 2 –
116 Snam SpA 449 0.03 13 Societa Cattolica di Assicurazioni SCRL 72 0.01 7 Societa Iniziative Autostradali e Servizi SpA 57 – 2 SOL SpA 20 – 7 Tamburi Investment Partners SpA 27 –
696 Telecom Italia SpA 525 0.03 14 Tenaris SA 231 0.01 91 Terna Rete Elettrica Nazionale SpA 394 0.02
501 Tiscali SpA 21 – 1 Tod's SpA 60 – 9 Trevi Finanziaria Industriale SpA 7 –
178 UniCredit SpA 380 0.02 54 Unione di Banche Italiane SpA 121 0.01 39 Unipol Gruppo Finanziario SpA 119 0.01
112 UnipolSai SpA 213 0.01 1 Vittoria Assicurazioni SpA 12 – 3 Yoox Net-A-Porter Group SpA 77 0.01
14,179 0.83Japan - 9.42%
32 77 Bank Ltd 153 0.01 1 ABC-Mart Inc 71 0.01 2 Accordia Golf Co Ltd 25 – 2 Achilles Corp 32 –
12 Acom Co Ltd 60 – 2 Adastria Co Ltd 53 – 7 ADEKA Corp 90 0.01 8 Advantest Corp 115 0.01
36 Aeon Co Ltd 497 0.03 1 Aeon Delight Co Ltd 39 – 9 AEON Financial Service Co Ltd 148 0.01 9 Aeon Mall Co Ltd 133 0.01 3 Ahresty Corp 28 – 2 Ai Holdings Corp 55 – 3 Aica Kogyo Co Ltd 72 0.01 1 Aichi Bank Ltd 57 – 4 Aichi Corp 33 – 1 Aichi Steel Corp 37 – 3 Aida Engineering Ltd 32 – 2 Ain Holdings Inc 113 0.01 1 Aiphone Co Ltd 21 –
16 Air Water Inc 277 0.02 3 Aisan Industry Co Ltd 29 –
11 Aisin Seiki Co Ltd 491 0.03 4 Aizawa Securities Co Ltd 24 –
17 Ajinomoto Co Inc 327 0.02 9 Akebono Brake Industry Co Ltd 25 –
13 Akita Bank Ltd 42 – 2 Alconix Corp 24 – 9 Alfresa Holdings Corp 139 0.01 2 Alpen Co Ltd 45 – 3 Alpine Electronics Inc 42 –
15 Alps Electric Co Ltd 392 0.02 16 Amada Holdings Co Ltd 179 0.01 5 Amano Corp 78 0.01
010_3771524762911.indd���28 2017/10/11���13:01:26
- 29 -
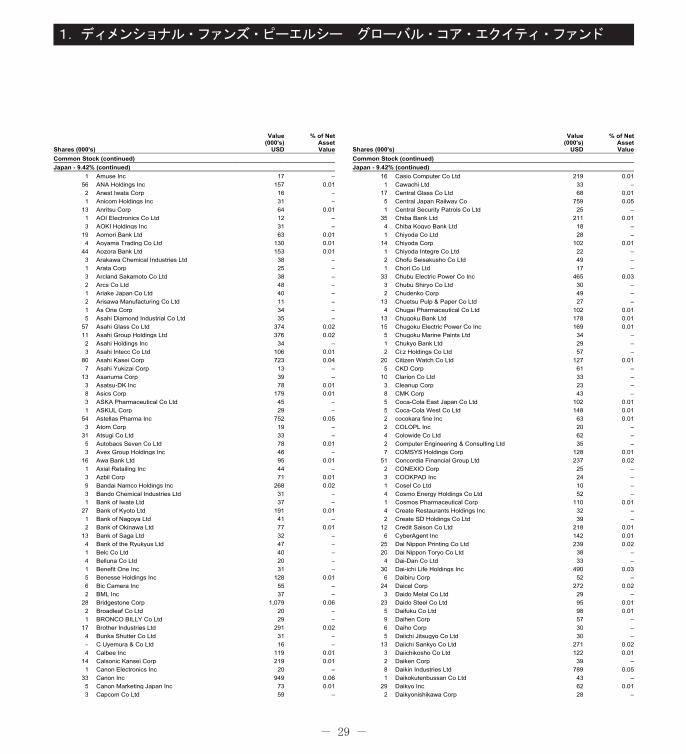
1.ディメンショナル・ファンズ・ピーエルシー グローバル・コア・エクイティ・ファンド
Shares (000's)
Value(000's)
USD
% of NetAssetValue
Common Stock (continued)Japan - 9.42% (continued)
1 Amuse Inc 17 – 56 ANA Holdings Inc 157 0.01 2 Anest Iwata Corp 16 – 1 Anicom Holdings Inc 31 –
13 Anritsu Corp 64 0.01 1 AOI Electronics Co Ltd 12 – 3 AOKI Holdings Inc 31 –
19 Aomori Bank Ltd 63 0.01 4 Aoyama Trading Co Ltd 130 0.01
44 Aozora Bank Ltd 153 0.01 3 Arakawa Chemical Industries Ltd 38 – 1 Arata Corp 25 – 3 Arcland Sakamoto Co Ltd 38 – 2 Arcs Co Ltd 48 – 1 Ariake Japan Co Ltd 40 – 2 Arisawa Manufacturing Co Ltd 11 – 1 As One Corp 34 – 5 Asahi Diamond Industrial Co Ltd 35 –
57 Asahi Glass Co Ltd 374 0.02 11 Asahi Group Holdings Ltd 376 0.02 2 Asahi Holdings Inc 34 – 3 Asahi Intecc Co Ltd 106 0.01
80 Asahi Kasei Corp 723 0.04 7 Asahi Yukizai Corp 13 –
13 Asanuma Corp 39 – 3 Asatsu-DK Inc 78 0.01 8 Asics Corp 179 0.01 3 ASKA Pharmaceutical Co Ltd 45 – 1 ASKUL Corp 29 –
54 Astellas Pharma Inc 752 0.05 3 Atom Corp 19 –
31 Atsugi Co Ltd 33 – 5 Autobacs Seven Co Ltd 78 0.01 3 Avex Group Holdings Inc 46 –
16 Awa Bank Ltd 95 0.01 1 Axial Retailing Inc 44 – 3 Azbil Corp 71 0.01 9 Bandai Namco Holdings Inc 268 0.02 3 Bando Chemical Industries Ltd 31 – 1 Bank of Iwate Ltd 37 –
27 Bank of Kyoto Ltd 191 0.01 1 Bank of Nagoya Ltd 41 – 2 Bank of Okinawa Ltd 77 0.01
13 Bank of Saga Ltd 32 – 4 Bank of the Ryukyus Ltd 47 – 1 Belc Co Ltd 40 – 4 Belluna Co Ltd 20 – 1 Benefit One Inc 31 – 5 Benesse Holdings Inc 128 0.01 6 Bic Camera Inc 55 – 2 BML Inc 37 –
28 Bridgestone Corp 1,079 0.06 2 Broadleaf Co Ltd 20 – 1 BRONCO BILLY Co Ltd 29 –
17 Brother Industries Ltd 291 0.02 4 Bunka Shutter Co Ltd 31 – – C Uyemura & Co Ltd 16 – 4 Calbee Inc 119 0.01
14 Calsonic Kansei Corp 219 0.01 1 Canon Electronics Inc 20 –
33 Canon Inc 949 0.06 5 Canon Marketing Japan Inc 73 0.01 3 Capcom Co Ltd 59 –
Shares (000's)
Value(000's)
USD
% of NetAssetValue
Common Stock (continued)Japan - 9.42% (continued)
16 Casio Computer Co Ltd 219 0.01 1 Cawachi Ltd 33 –
17 Central Glass Co Ltd 68 0.01 5 Central Japan Railway Co 759 0.05 1 Central Security Patrols Co Ltd 25 –
35 Chiba Bank Ltd 211 0.01 4 Chiba Kogyo Bank Ltd 18 – 1 Chiyoda Co Ltd 28 –
14 Chiyoda Corp 102 0.01 1 Chiyoda Integre Co Ltd 22 – 2 Chofu Seisakusho Co Ltd 49 – 1 Chori Co Ltd 17 –
33 Chubu Electric Power Co Inc 465 0.03 3 Chubu Shiryo Co Ltd 30 – 2 Chudenko Corp 49 –
13 Chuetsu Pulp & Paper Co Ltd 27 – 4 Chugai Pharmaceutical Co Ltd 102 0.01
13 Chugoku Bank Ltd 178 0.01 15 Chugoku Electric Power Co Inc 169 0.01 5 Chugoku Marine Paints Ltd 34 – 1 Chukyo Bank Ltd 29 – 2 Ci:z Holdings Co Ltd 57 –
20 Citizen Watch Co Ltd 127 0.01 5 CKD Corp 61 –
10 Clarion Co Ltd 33 – 3 Cleanup Corp 23 – 8 CMK Corp 43 – 5 Coca-Cola East Japan Co Ltd 102 0.01 5 Coca-Cola West Co Ltd 148 0.01 2 cocokara fine Inc 63 0.01 2 COLOPL Inc 20 – 4 Colowide Co Ltd 62 – 2 Computer Engineering & Consulting Ltd 35 – 7 COMSYS Holdings Corp 128 0.01
51 Concordia Financial Group Ltd 237 0.02 2 CONEXIO Corp 25 – 3 COOKPAD Inc 24 – 1 Cosel Co Ltd 10 – 4 Cosmo Energy Holdings Co Ltd 52 – 1 Cosmos Pharmaceutical Corp 110 0.01 4 Create Restaurants Holdings Inc 32 – 2 Create SD Holdings Co Ltd 39 –
12 Credit Saison Co Ltd 218 0.01 6 CyberAgent Inc 142 0.01
25 Dai Nippon Printing Co Ltd 239 0.02 20 Dai Nippon Toryo Co Ltd 38 – 4 Dai-Dan Co Ltd 33 –
30 Dai-ichi Life Holdings Inc 490 0.03 6 Daibiru Corp 52 –
24 Daicel Corp 272 0.02 3 Daido Metal Co Ltd 29 –
23 Daido Steel Co Ltd 95 0.01 5 Daifuku Co Ltd 98 0.01 9 Daihen Corp 57 – 6 Daiho Corp 30 – 5 Daiichi Jitsugyo Co Ltd 30 –
13 Daiichi Sankyo Co Ltd 271 0.02 3 Daiichikosho Co Ltd 122 0.01 2 Daiken Corp 39 – 8 Daikin Industries Ltd 789 0.05 1 Daikokutenbussan Co Ltd 43 –
29 Daikyo Inc 62 0.01 2 Daikyonishikawa Corp 28 –
010_3771524762911.indd���29 2017/10/11���13:01:26
- 30 -
1.ディメンショナル・ファンズ・ピーエルシー グローバル・コア・エクイティ・ファンド
Shares (000's)
Value(000's)
USD
% of NetAssetValue
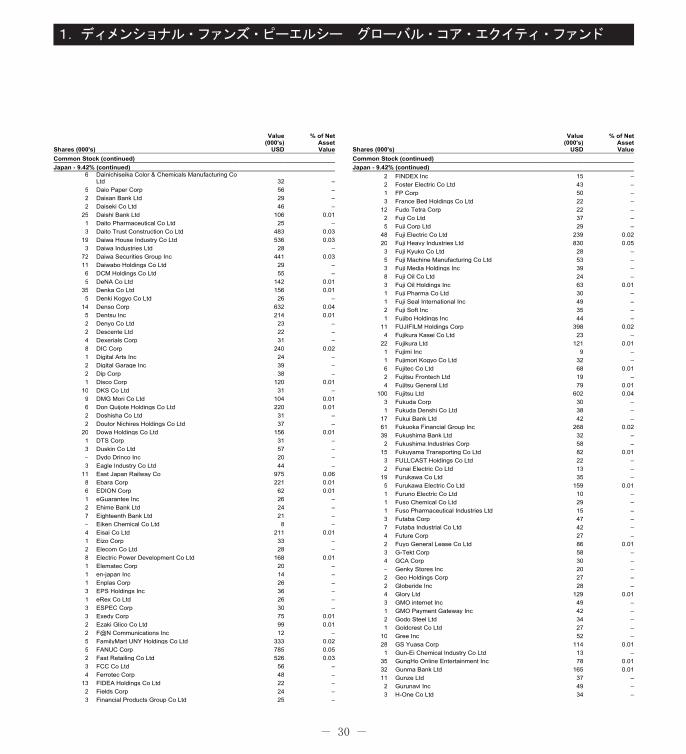
Common Stock (continued)Japan - 9.42% (continued)
6 Dainichiseika Color & Chemicals Manufacturing Co Ltd 32 –
5 Daio Paper Corp 56 – 2 Daisan Bank Ltd 29 – 2 Daiseki Co Ltd 46 –
25 Daishi Bank Ltd 106 0.01 1 Daito Pharmaceutical Co Ltd 25 – 3 Daito Trust Construction Co Ltd 483 0.03
19 Daiwa House Industry Co Ltd 536 0.03 3 Daiwa Industries Ltd 28 –
72 Daiwa Securities Group Inc 441 0.03 11 Daiwabo Holdings Co Ltd 29 – 6 DCM Holdings Co Ltd 55 – 5 DeNA Co Ltd 142 0.01
35 Denka Co Ltd 156 0.01 5 Denki Kogyo Co Ltd 26 –
14 Denso Corp 632 0.04 5 Dentsu Inc 214 0.01 2 Denyo Co Ltd 23 – 2 Descente Ltd 22 – 4 Dexerials Corp 31 – 8 DIC Corp 240 0.02 1 Digital Arts Inc 24 – 2 Digital Garage Inc 39 – 2 Dip Corp 38 – 1 Disco Corp 120 0.01
10 DKS Co Ltd 31 – 9 DMG Mori Co Ltd 104 0.01 6 Don Quijote Holdings Co Ltd 220 0.01 2 Doshisha Co Ltd 31 – 2 Doutor Nichires Holdings Co Ltd 37 –
20 Dowa Holdings Co Ltd 156 0.01 1 DTS Corp 31 – 3 Duskin Co Ltd 57 – – Dydo Drinco Inc 20 – 3 Eagle Industry Co Ltd 44 –
11 East Japan Railway Co 975 0.06 8 Ebara Corp 221 0.01 6 EDION Corp 62 0.01 1 eGuarantee Inc 26 – 2 Ehime Bank Ltd 24 – 7 Eighteenth Bank Ltd 21 – – Eiken Chemical Co Ltd 8 – 4 Eisai Co Ltd 211 0.01 1 Eizo Corp 33 – 2 Elecom Co Ltd 28 – 8 Electric Power Development Co Ltd 168 0.01 1 Elematec Corp 20 – 1 en-japan Inc 14 – 1 Enplas Corp 26 – 3 EPS Holdings Inc 36 – 1 eRex Co Ltd 26 – 3 ESPEC Corp 30 – 3 Exedy Corp 75 0.01 2 Ezaki Glico Co Ltd 99 0.01 2 F@N Communications Inc 12 – 5 FamilyMart UNY Holdings Co Ltd 333 0.02 5 FANUC Corp 785 0.05 2 Fast Retailing Co Ltd 526 0.03 3 FCC Co Ltd 56 – 4 Ferrotec Corp 48 –
13 FIDEA Holdings Co Ltd 22 – 2 Fields Corp 24 – 3 Financial Products Group Co Ltd 25 –
Shares (000's)
Value(000's)
USD
% of NetAssetValue
Common Stock (continued)Japan - 9.42% (continued)
2 FINDEX Inc 15 – 2 Foster Electric Co Ltd 43 – 1 FP Corp 50 – 3 France Bed Holdings Co Ltd 22 –
12 Fudo Tetra Corp 22 – 2 Fuji Co Ltd 37 – 5 Fuji Corp Ltd 29 –
48 Fuji Electric Co Ltd 239 0.02 20 Fuji Heavy Industries Ltd 830 0.05 3 Fuji Kyuko Co Ltd 28 – 5 Fuji Machine Manufacturing Co Ltd 53 – 3 Fuji Media Holdings Inc 39 – 8 Fuji Oil Co Ltd 24 – 3 Fuji Oil Holdings Inc 63 0.01 1 Fuji Pharma Co Ltd 30 – 1 Fuji Seal International Inc 49 – 2 Fuji Soft Inc 35 – 1 Fujibo Holdings Inc 44 –
11 FUJIFILM Holdings Corp 398 0.02 4 Fujikura Kasei Co Ltd 23 –
22 Fujikura Ltd 121 0.01 1 Fujimi Inc 9 – 1 Fujimori Kogyo Co Ltd 32 – 6 Fujitec Co Ltd 68 0.01 2 Fujitsu Frontech Ltd 19 – 4 Fujitsu General Ltd 79 0.01
100 Fujitsu Ltd 602 0.04 3 Fukuda Corp 30 – 1 Fukuda Denshi Co Ltd 38 –
17 Fukui Bank Ltd 42 – 61 Fukuoka Financial Group Inc 268 0.02 39 Fukushima Bank Ltd 32 – 2 Fukushima Industries Corp 58 –
15 Fukuyama Transporting Co Ltd 82 0.01 3 FULLCAST Holdings Co Ltd 22 – 2 Funai Electric Co Ltd 13 –
19 Furukawa Co Ltd 35 – 5 Furukawa Electric Co Ltd 159 0.01 1 Furuno Electric Co Ltd 10 – 1 Fuso Chemical Co Ltd 29 – 1 Fuso Pharmaceutical Industries Ltd 15 – 3 Futaba Corp 47 – 7 Futaba Industrial Co Ltd 42 – 4 Future Corp 27 – 2 Fuyo General Lease Co Ltd 86 0.01 3 G-Tekt Corp 58 – 4 GCA Corp 30 – – Genky Stores Inc 20 – 2 Geo Holdings Corp 27 – 2 Globeride Inc 28 – 4 Glory Ltd 129 0.01 3 GMO internet Inc 49 – 1 GMO Payment Gateway Inc 42 – 2 Godo Steel Ltd 34 – 1 Goldcrest Co Ltd 27 –
10 Gree Inc 52 – 28 GS Yuasa Corp 114 0.01 1 Gun-Ei Chemical Industry Co Ltd 13 –
35 GungHo Online Entertainment Inc 78 0.01 32 Gunma Bank Ltd 165 0.01 11 Gunze Ltd 37 – 2 Gurunavi Inc 49 – 3 H-One Co Ltd 34 –
010_3771524762911.indd���30 2017/10/11���13:01:26
- 31 -
1.ディメンショナル・ファンズ・ピーエルシー グローバル・コア・エクイティ・ファンド
Shares (000's)
Value(000's)
USD
% of NetAssetValue
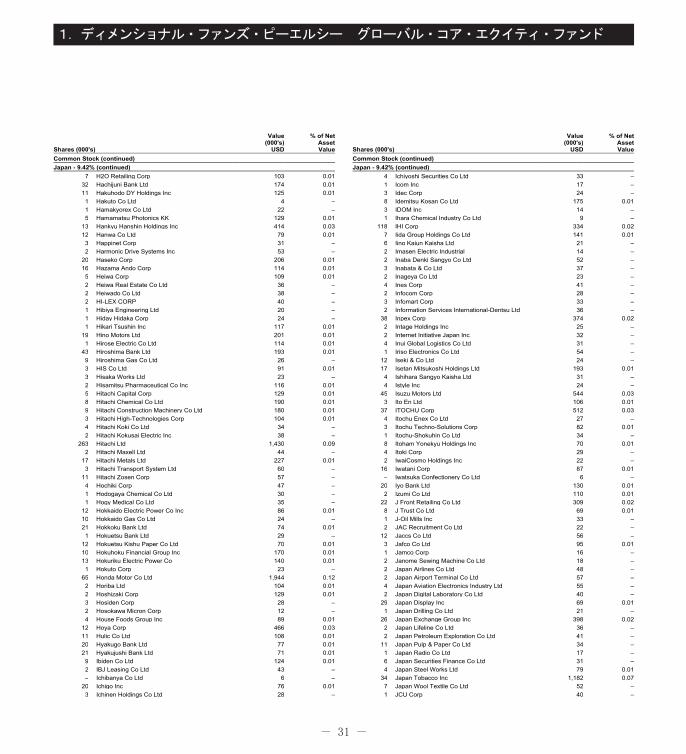
Common Stock (continued)Japan - 9.42% (continued)
7 H2O Retailing Corp 103 0.01 32 Hachijuni Bank Ltd 174 0.01 11 Hakuhodo DY Holdings Inc 125 0.01 1 Hakuto Co Ltd 4 – 1 Hamakyorex Co Ltd 22 – 5 Hamamatsu Photonics KK 129 0.01
13 Hankyu Hanshin Holdings Inc 414 0.03 12 Hanwa Co Ltd 79 0.01 3 Happinet Corp 31 – 2 Harmonic Drive Systems Inc 53 –
20 Haseko Corp 206 0.01 16 Hazama Ando Corp 114 0.01 5 Heiwa Corp 109 0.01 2 Heiwa Real Estate Co Ltd 36 – 2 Heiwado Co Ltd 38 – 2 HI-LEX CORP 40 – 1 Hibiya Engineering Ltd 20 – 1 Hiday Hidaka Corp 24 – 1 Hikari Tsushin Inc 117 0.01
19 Hino Motors Ltd 201 0.01 1 Hirose Electric Co Ltd 114 0.01
43 Hiroshima Bank Ltd 193 0.01 9 Hiroshima Gas Co Ltd 26 – 3 HIS Co Ltd 91 0.01 3 Hisaka Works Ltd 23 – 2 Hisamitsu Pharmaceutical Co Inc 116 0.01 5 Hitachi Capital Corp 129 0.01 8 Hitachi Chemical Co Ltd 190 0.01 9 Hitachi Construction Machinery Co Ltd 180 0.01 3 Hitachi High-Technologies Corp 104 0.01 4 Hitachi Koki Co Ltd 34 – 2 Hitachi Kokusai Electric Inc 38 –
263 Hitachi Ltd 1,430 0.09 2 Hitachi Maxell Ltd 44 –
17 Hitachi Metals Ltd 227 0.01 3 Hitachi Transport System Ltd 60 –
11 Hitachi Zosen Corp 57 – 4 Hochiki Corp 47 – 1 Hodogaya Chemical Co Ltd 30 – 1 Hogy Medical Co Ltd 35 –
12 Hokkaido Electric Power Co Inc 86 0.01 10 Hokkaido Gas Co Ltd 24 – 21 Hokkoku Bank Ltd 74 0.01 1 Hokuetsu Bank Ltd 29 –
12 Hokuetsu Kishu Paper Co Ltd 70 0.01 10 Hokuhoku Financial Group Inc 170 0.01 13 Hokuriku Electric Power Co 140 0.01 1 Hokuto Corp 23 –
65 Honda Motor Co Ltd 1,944 0.12 2 Horiba Ltd 104 0.01 2 Hoshizaki Corp 129 0.01 3 Hosiden Corp 28 – 2 Hosokawa Micron Corp 12 – 4 House Foods Group Inc 89 0.01
12 Hoya Corp 466 0.03 11 Hulic Co Ltd 108 0.01 20 Hyakugo Bank Ltd 77 0.01 21 Hyakujushi Bank Ltd 71 0.01 9 Ibiden Co Ltd 124 0.01 2 IBJ Leasing Co Ltd 43 – – Ichibanya Co Ltd 6 –
20 Ichigo Inc 76 0.01 3 Ichinen Holdings Co Ltd 28 –
Shares (000's)
Value(000's)
USD
% of NetAssetValue
Common Stock (continued)Japan - 9.42% (continued)
4 Ichiyoshi Securities Co Ltd 33 – 1 Icom Inc 17 – 3 Idec Corp 24 – 8 Idemitsu Kosan Co Ltd 175 0.01 3 IDOM Inc 14 – 1 Ihara Chemical Industry Co Ltd 9 –
118 IHI Corp 334 0.02 7 Iida Group Holdings Co Ltd 141 0.01 6 Iino Kaiun Kaisha Ltd 21 – 2 Imasen Electric Industrial 14 – 2 Inaba Denki Sangyo Co Ltd 52 – 3 Inabata & Co Ltd 37 – 2 Inageya Co Ltd 23 – 4 Ines Corp 41 – 2 Infocom Corp 28 – 3 Infomart Corp 33 – 2 Information Services International-Dentsu Ltd 36 –
38 Inpex Corp 374 0.02 2 Intage Holdings Inc 25 – 2 Internet Initiative Japan Inc 32 – 4 Inui Global Logistics Co Ltd 31 – 1 Iriso Electronics Co Ltd 54 –
12 Iseki & Co Ltd 24 – 17 Isetan Mitsukoshi Holdings Ltd 193 0.01 4 Ishihara Sangyo Kaisha Ltd 31 – 4 Istyle Inc 24 –
45 Isuzu Motors Ltd 544 0.03 3 Ito En Ltd 106 0.01
37 ITOCHU Corp 512 0.03 4 Itochu Enex Co Ltd 27 – 3 Itochu Techno-Solutions Corp 82 0.01 1 Itochu-Shokuhin Co Ltd 34 – 8 Itoham Yonekyu Holdings Inc 70 0.01 4 Itoki Corp 29 – 2 IwaiCosmo Holdings Inc 22 –
16 Iwatani Corp 87 0.01 – Iwatsuka Confectionery Co Ltd 6 –
20 Iyo Bank Ltd 130 0.01 2 Izumi Co Ltd 110 0.01
22 J Front Retailing Co Ltd 309 0.02 8 J Trust Co Ltd 69 0.01 1 J-Oil Mills Inc 33 – 2 JAC Recruitment Co Ltd 22 –
12 Jaccs Co Ltd 56 – 3 Jafco Co Ltd 95 0.01 1 Jamco Corp 16 – 2 Janome Sewing Machine Co Ltd 18 – 2 Japan Airlines Co Ltd 48 – 2 Japan Airport Terminal Co Ltd 57 – 4 Japan Aviation Electronics Industry Ltd 55 – 2 Japan Digital Laboratory Co Ltd 40 –
29 Japan Display Inc 69 0.01 1 Japan Drilling Co Ltd 21 –
26 Japan Exchange Group Inc 398 0.02 2 Japan Lifeline Co Ltd 36 – 2 Japan Petroleum Exploration Co Ltd 41 –
11 Japan Pulp & Paper Co Ltd 34 – 1 Japan Radio Co Ltd 17 – 6 Japan Securities Finance Co Ltd 31 – 4 Japan Steel Works Ltd 79 0.01
34 Japan Tobacco Inc 1,182 0.07 7 Japan Wool Textile Co Ltd 52 – 1 JCU Corp 40 –
010_3771524762911.indd���31 2017/10/11���13:01:27
- 32 -
1.ディメンショナル・ファンズ・ピーエルシー グローバル・コア・エクイティ・ファンド
Shares (000's)
Value(000's)
USD
% of NetAssetValue
Common Stock (continued)Japan - 9.42% (continued)
6 Jeol Ltd 24 – 23 JFE Holdings Inc 349 0.02 7 JGC Corp 110 0.01
23 Jimoto Holdings Inc 38 – 1 Jin Co Ltd 25 – 5 Joshin Denki Co Ltd 42 – 1 Joyful Honda Co Ltd 37 – 2 JSP Corp 53 –
15 JSR Corp 216 0.01 19 JTEKT Corp 307 0.02 2 Juki Corp 19 –
23 Juroku Bank Ltd 75 0.01 17 JVC Kenwood Corp 47 – 92 JX Holdings Inc 357 0.02 1 K&O Energy Group Inc 15 – 5 K's Holdings Corp 97 0.01
13 kabu.com Securities Co Ltd 43 – 4 Kadokawa Dwango 50 – 2 Kaga Electronics Co Ltd 33 – 2 Kagome Co Ltd 59 –
46 Kajima Corp 325 0.02 7 Kakaku.com Inc 112 0.01 2 Kaken Pharmaceutical Co Ltd 107 0.01 – Kameda Seika Co Ltd 14 – 2 Kamei Corp 23 –
20 Kamigumi Co Ltd 186 0.01 2 Kanaden Corp 21 – 2 Kanagawa Chuo Kotsu Co Ltd 13 – 2 Kanamoto Co Ltd 46 – 7 Kandenko Co Ltd 65 0.01
28 Kaneka Corp 227 0.01 42 Kanematsu Corp 70 0.01 2 Kanematsu Electronics Ltd 41 –
38 Kansai Electric Power Co Inc 374 0.02 10 Kansai Paint Co Ltd 180 0.01 3 Kansai Urban Banking Corp 34 – 3 Kanto Denka Kogyo Co Ltd 25 –
16 Kao Corp 723 0.04 3 Kappa Create Co Ltd 35 – 3 Kasai Kogyo Co Ltd 39 – 2 Katakura Industries Co Ltd 21 – 2 Kato Sangyo Co Ltd 45 – 1 Kato Works Co Ltd 21 – 1 Kawada Technologies Inc 41 –
113 Kawasaki Heavy Industries Ltd 364 0.02 77 Kawasaki Kisen Kaisha Ltd 171 0.01 58 KDDI Corp 1,521 0.09 35 Keihan Holdings Co Ltd 225 0.01 4 Keihanshin Building Co Ltd 21 – 3 Keihin Corp 43 –
26 Keikyu Corp 282 0.02 29 Keio Corp 233 0.02 8 Keisei Electric Railway Co Ltd 203 0.01
20 Keiyo Bank Ltd 86 0.01 6 Keiyo Co Ltd 27 –
12 Kenedix Inc 46 – 6 Kewpie Corp 150 0.01 2 Key Coffee Inc 29 – 1 Keyence Corp 581 0.04 1 KFC Holdings Japan Ltd 18 – 5 Kikkoman Corp 154 0.01
11 Kinden Corp 145 0.01 8 Kintetsu Department Store Co Ltd 25 –
Shares (000's)
Value(000's)
USD
% of NetAssetValue
Common Stock (continued)Japan - 9.42% (continued)
90 Kintetsu Group Holdings Co Ltd 350 0.02 3 Kintetsu World Express Inc 40 –
30 Kirin Holdings Co Ltd 485 0.03 2 Kissei Pharmaceutical Co Ltd 43 – 1 Kita-Nippon Bank Ltd 24 – 1 Kitagawa Iron Works Co Ltd 18 – 4 Kito Corp 39 – 8 Kitz Corp 48 – 5 Kiyo Bank Ltd 80 0.01 3 KLab Inc 15 – 9 KNT-CT Holdings Co Ltd 12 – 3 Koa Corp 32 – 2 Koatsu Gas Kogyo Co Ltd 13 – 3 Kobayashi Pharmaceutical Co Ltd 115 0.01 1 Kobe Bussan Co Ltd 21 – 1 Kobe Electric Railway Co Ltd 3 –
28 Kobe Steel Ltd 268 0.02 3 Kohnan Shoji Co Ltd 65 0.01 5 Koito Manufacturing Co Ltd 265 0.02 8 Kokuyo Co Ltd 98 0.01
26 Komatsu Ltd 623 0.04 4 Komatsu Seiren Co Ltd 27 – 2 Komeri Co Ltd 60 – 5 Komori Corp 61 – 1 Konaka Co Ltd 2 – 4 Konami Holdings Corp 137 0.01
35 Konica Minolta Inc 336 0.02 4 Konishi Co Ltd 40 – 2 Konoike Transport Co Ltd 34 – 2 Kose Corp 121 0.01 1 Kotobuki Spirits Co Ltd 21 –
10 Krosaki Harima Corp 28 – 33 Kubota Corp 506 0.03 30 Kumagai Gumi Co Ltd 78 0.01 5 Kumiai Chemical Industry Co Ltd 31 – 1 Kura Corp 43 –
15 Kurabo Industries Ltd 31 – 24 Kuraray Co Ltd 342 0.02 1 Kureha Corp 54 – 1 Kurimoto Ltd 17 – 8 Kurita Water Industries Ltd 174 0.01 3 Kuroda Electric Co Ltd 55 – 1 Kusuri no Aoki Holdings Co Ltd 51 –
18 KYB Corp 83 0.01 8 Kyocera Corp 366 0.02 6 Kyodo Printing Co Ltd 20 – 1 Kyoei Steel Ltd 26 – 3 Kyokuto Kaihatsu Kogyo Co Ltd 35 – 2 Kyokuto Securities Co Ltd 26 – 1 Kyokuyo Co Ltd 19 – 3 KYORIN Holdings Inc 70 0.01 1 Kyoritsu Maintenance Co Ltd 45 – 2 Kyosan Electric Manufacturing Co Ltd 7 – 7 Kyowa Exeo Corp 103 0.01
10 Kyowa Hakko Kirin Co Ltd 144 0.01 4 Kyudenko Corp 113 0.01
24 Kyushu Electric Power Co Inc 241 0.02 24 Kyushu Financial Group Inc 159 0.01 2 LAC Co Ltd 24 – 1 Laox Co Ltd 7 – 2 Lasertec Corp 31 – 3 Lawson Inc 209 0.01
18 Leopalace21 Corp 97 0.01
010_3771524762911.indd���32 2017/10/11���13:01:27
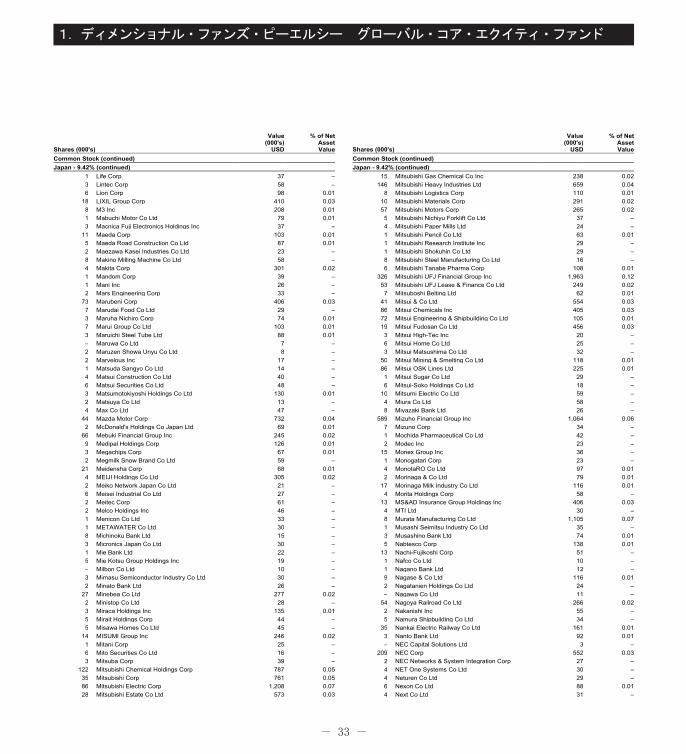
- 33 -
1.ディメンショナル・ファンズ・ピーエルシー グローバル・コア・エクイティ・ファンド
Shares (000's)
Value(000's)
USD
% of NetAssetValue
Common Stock (continued)Japan - 9.42% (continued)
1 Life Corp 37 – 3 Lintec Corp 58 – 6 Lion Corp 98 0.01
18 LIXIL Group Corp 410 0.03 8 M3 Inc 208 0.01 1 Mabuchi Motor Co Ltd 79 0.01 3 Macnica Fuji Electronics Holdings Inc 37 –
11 Maeda Corp 103 0.01 5 Maeda Road Construction Co Ltd 87 0.01 2 Maezawa Kasei Industries Co Ltd 23 – 8 Makino Milling Machine Co Ltd 58 – 4 Makita Corp 301 0.02 1 Mandom Corp 39 – 1 Mani Inc 26 – 2 Mars Engineering Corp 33 –
73 Marubeni Corp 406 0.03 7 Marudai Food Co Ltd 29 – 3 Maruha Nichiro Corp 74 0.01 7 Marui Group Co Ltd 103 0.01 3 Maruichi Steel Tube Ltd 88 0.01 – Maruwa Co Ltd 7 – 2 Maruzen Showa Unyu Co Ltd 8 – 2 Marvelous Inc 17 – 1 Matsuda Sangyo Co Ltd 14 – 4 Matsui Construction Co Ltd 40 – 6 Matsui Securities Co Ltd 48 – 3 Matsumotokiyoshi Holdings Co Ltd 130 0.01 2 Matsuya Co Ltd 13 – 4 Max Co Ltd 47 –
44 Mazda Motor Corp 732 0.04 2 McDonald's Holdings Co Japan Ltd 69 0.01
66 Mebuki Financial Group Inc 245 0.02 9 Medipal Holdings Corp 126 0.01 3 Megachips Corp 67 0.01 2 Megmilk Snow Brand Co Ltd 59 –
21 Meidensha Corp 68 0.01 4 MEIJI Holdings Co Ltd 305 0.02 2 Meiko Network Japan Co Ltd 21 – 6 Meisei Industrial Co Ltd 27 – 2 Meitec Corp 61 – 2 Melco Holdings Inc 46 – 1 Menicon Co Ltd 33 – 1 METAWATER Co Ltd 30 – 8 Michinoku Bank Ltd 15 – 3 Micronics Japan Co Ltd 30 – 1 Mie Bank Ltd 22 – 5 Mie Kotsu Group Holdings Inc 19 – – Milbon Co Ltd 10 – 3 Mimasu Semiconductor Industry Co Ltd 30 – 2 Minato Bank Ltd 26 –
27 Minebea Co Ltd 277 0.02 2 Ministop Co Ltd 28 – 3 Miraca Holdings Inc 135 0.01 5 Mirait Holdings Corp 44 – 5 Misawa Homes Co Ltd 45 –
14 MISUMI Group Inc 246 0.02 1 Mitani Corp 25 – 6 Mito Securities Co Ltd 16 – 3 Mitsuba Corp 39 –
122 Mitsubishi Chemical Holdings Corp 787 0.05 35 Mitsubishi Corp 761 0.05 86 Mitsubishi Electric Corp 1,208 0.07 28 Mitsubishi Estate Co Ltd 573 0.03
Shares (000's)
Value(000's)
USD
% of NetAssetValue
Common Stock (continued)Japan - 9.42% (continued)
15 Mitsubishi Gas Chemical Co Inc 238 0.02 146 Mitsubishi Heavy Industries Ltd 659 0.04
8 Mitsubishi Logistics Corp 110 0.01 10 Mitsubishi Materials Corp 291 0.02 57 Mitsubishi Motors Corp 265 0.02 5 Mitsubishi Nichiyu Forklift Co Ltd 37 – 4 Mitsubishi Paper Mills Ltd 24 – 1 Mitsubishi Pencil Co Ltd 63 0.01 1 Mitsubishi Research Institute Inc 29 – 1 Mitsubishi Shokuhin Co Ltd 29 – 8 Mitsubishi Steel Manufacturing Co Ltd 16 – 6 Mitsubishi Tanabe Pharma Corp 108 0.01
326 Mitsubishi UFJ Financial Group Inc 1,963 0.12 53 Mitsubishi UFJ Lease & Finance Co Ltd 249 0.02 7 Mitsuboshi Belting Ltd 62 0.01
41 Mitsui & Co Ltd 554 0.03 86 Mitsui Chemicals Inc 405 0.03 72 Mitsui Engineering & Shipbuilding Co Ltd 105 0.01 19 Mitsui Fudosan Co Ltd 456 0.03 3 Mitsui High-Tec Inc 20 – 6 Mitsui Home Co Ltd 25 – 3 Mitsui Matsushima Co Ltd 32 –
50 Mitsui Mining & Smelting Co Ltd 118 0.01 86 Mitsui OSK Lines Ltd 225 0.01 1 Mitsui Sugar Co Ltd 29 – 6 Mitsui-Soko Holdings Co Ltd 18 –
10 Mitsumi Electric Co Ltd 59 – 4 Miura Co Ltd 58 – 8 Miyazaki Bank Ltd 26 –
589 Mizuho Financial Group Inc 1,064 0.06 7 Mizuno Corp 34 – 1 Mochida Pharmaceutical Co Ltd 42 – 2 Modec Inc 23 –
15 Monex Group Inc 36 – 1 Monogatari Corp 23 – 4 MonotaRO Co Ltd 97 0.01 2 Morinaga & Co Ltd 79 0.01
17 Morinaga Milk Industry Co Ltd 116 0.01 4 Morita Holdings Corp 58 –
13 MS&AD Insurance Group Holdings Inc 406 0.03 4 MTI Ltd 30 – 8 Murata Manufacturing Co Ltd 1,105 0.07 1 Musashi Seimitsu Industry Co Ltd 35 – 3 Musashino Bank Ltd 74 0.01 5 Nabtesco Corp 138 0.01
13 Nachi-Fujikoshi Corp 51 – 1 Nafco Co Ltd 10 – 1 Nagano Bank Ltd 12 – 9 Nagase & Co Ltd 116 0.01 2 Nagatanien Holdings Co Ltd 24 – – Nagawa Co Ltd 11 –
54 Nagoya Railroad Co Ltd 266 0.02 2 Nakanishi Inc 55 – 5 Namura Shipbuilding Co Ltd 34 –
35 Nankai Electric Railway Co Ltd 161 0.01 3 Nanto Bank Ltd 92 0.01 – NEC Capital Solutions Ltd 3 –
209 NEC Corp 552 0.03 2 NEC Networks & System Integration Corp 27 – 4 NET One Systems Co Ltd 30 – 4 Neturen Co Ltd 29 – 6 Nexon Co Ltd 88 0.01 4 Next Co Ltd 31 –
010_3771524762911.indd���33 2017/10/11���13:01:27
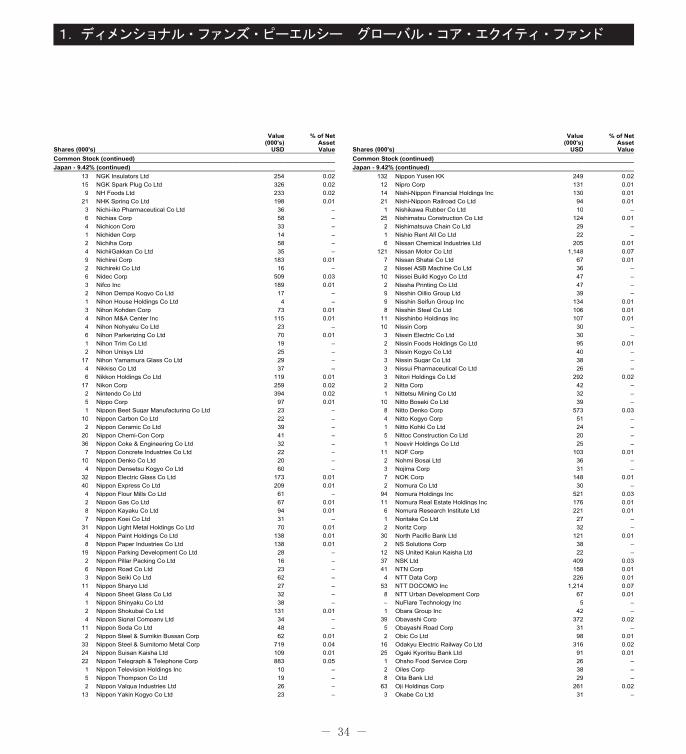
- 34 -
1.ディメンショナル・ファンズ・ピーエルシー グローバル・コア・エクイティ・ファンド
Shares (000's)
Value(000's)
USD
% of NetAssetValue
Common Stock (continued)Japan - 9.42% (continued)
13 NGK Insulators Ltd 254 0.02 15 NGK Spark Plug Co Ltd 326 0.02 9 NH Foods Ltd 233 0.02
21 NHK Spring Co Ltd 198 0.01 3 Nichi-iko Pharmaceutical Co Ltd 36 – 6 Nichias Corp 58 – 4 Nichicon Corp 33 – 1 Nichiden Corp 14 – 2 Nichiha Corp 58 – 4 NichiiGakkan Co Ltd 35 – 9 Nichirei Corp 183 0.01 2 Nichireki Co Ltd 16 – 6 Nidec Corp 509 0.03 3 Nifco Inc 189 0.01 2 Nihon Dempa Kogyo Co Ltd 17 – 1 Nihon House Holdings Co Ltd 4 – 3 Nihon Kohden Corp 73 0.01 4 Nihon M&A Center Inc 115 0.01 4 Nihon Nohyaku Co Ltd 23 – 6 Nihon Parkerizing Co Ltd 70 0.01 1 Nihon Trim Co Ltd 19 – 2 Nihon Unisys Ltd 25 –
17 Nihon Yamamura Glass Co Ltd 29 – 4 Nikkiso Co Ltd 37 – 6 Nikkon Holdings Co Ltd 119 0.01
17 Nikon Corp 259 0.02 2 Nintendo Co Ltd 394 0.02 5 Nippo Corp 97 0.01 1 Nippon Beet Sugar Manufacturing Co Ltd 23 –
10 Nippon Carbon Co Ltd 22 – 2 Nippon Ceramic Co Ltd 39 –
20 Nippon Chemi-Con Corp 41 – 36 Nippon Coke & Engineering Co Ltd 32 – 7 Nippon Concrete Industries Co Ltd 22 –
10 Nippon Denko Co Ltd 20 – 4 Nippon Densetsu Kogyo Co Ltd 60 –
32 Nippon Electric Glass Co Ltd 173 0.01 40 Nippon Express Co Ltd 209 0.01 4 Nippon Flour Mills Co Ltd 61 – 2 Nippon Gas Co Ltd 67 0.01 8 Nippon Kayaku Co Ltd 94 0.01 7 Nippon Koei Co Ltd 31 –
31 Nippon Light Metal Holdings Co Ltd 70 0.01 4 Nippon Paint Holdings Co Ltd 138 0.01 8 Nippon Paper Industries Co Ltd 138 0.01
19 Nippon Parking Development Co Ltd 28 – 2 Nippon Pillar Packing Co Ltd 16 – 6 Nippon Road Co Ltd 23 – 3 Nippon Seiki Co Ltd 62 –
11 Nippon Sharyo Ltd 27 – 4 Nippon Sheet Glass Co Ltd 32 – 1 Nippon Shinyaku Co Ltd 38 – 2 Nippon Shokubai Co Ltd 131 0.01 4 Nippon Signal Company Ltd 34 –
11 Nippon Soda Co Ltd 48 – 2 Nippon Steel & Sumikin Bussan Corp 62 0.01
33 Nippon Steel & Sumitomo Metal Corp 719 0.04 24 Nippon Suisan Kaisha Ltd 109 0.01 22 Nippon Telegraph & Telephone Corp 883 0.05 1 Nippon Television Holdings Inc 10 – 5 Nippon Thompson Co Ltd 19 – 2 Nippon Valqua Industries Ltd 26 –
13 Nippon Yakin Kogyo Co Ltd 23 –
Shares (000's)
Value(000's)
USD
% of NetAssetValue
Common Stock (continued)Japan - 9.42% (continued)
132 Nippon Yusen KK 249 0.02 12 Nipro Corp 131 0.01 14 Nishi-Nippon Financial Holdings Inc 130 0.01 21 Nishi-Nippon Railroad Co Ltd 94 0.01 1 Nishikawa Rubber Co Ltd 10 –
25 Nishimatsu Construction Co Ltd 124 0.01 2 Nishimatsuya Chain Co Ltd 29 – 1 Nishio Rent All Co Ltd 22 – 6 Nissan Chemical Industries Ltd 205 0.01
121 Nissan Motor Co Ltd 1,148 0.07 7 Nissan Shatai Co Ltd 67 0.01 2 Nissei ASB Machine Co Ltd 36 –
10 Nissei Build Kogyo Co Ltd 47 – 2 Nissha Printing Co Ltd 47 – 9 Nisshin Oillio Group Ltd 39 – 9 Nisshin Seifun Group Inc 134 0.01 8 Nisshin Steel Co Ltd 106 0.01
11 Nisshinbo Holdings Inc 107 0.01 10 Nissin Corp 30 – 3 Nissin Electric Co Ltd 30 – 2 Nissin Foods Holdings Co Ltd 95 0.01 3 Nissin Kogyo Co Ltd 40 – 3 Nissin Sugar Co Ltd 38 – 3 Nissui Pharmaceutical Co Ltd 26 – 3 Nitori Holdings Co Ltd 292 0.02 2 Nitta Corp 42 – 1 Nittetsu Mining Co Ltd 32 –
10 Nitto Boseki Co Ltd 39 – 8 Nitto Denko Corp 573 0.03 4 Nitto Kogyo Corp 51 – 1 Nitto Kohki Co Ltd 24 – 5 Nittoc Construction Co Ltd 20 – 1 Noevir Holdings Co Ltd 25 –
11 NOF Corp 103 0.01 2 Nohmi Bosai Ltd 36 – 3 Nojima Corp 31 – 7 NOK Corp 148 0.01 2 Nomura Co Ltd 30 –
94 Nomura Holdings Inc 521 0.03 11 Nomura Real Estate Holdings Inc 176 0.01 6 Nomura Research Institute Ltd 221 0.01 1 Noritake Co Ltd 27 – 2 Noritz Corp 32 –
30 North Pacific Bank Ltd 121 0.01 2 NS Solutions Corp 38 –
12 NS United Kaiun Kaisha Ltd 22 – 37 NSK Ltd 409 0.03 41 NTN Corp 158 0.01 4 NTT Data Corp 226 0.01
53 NTT DOCOMO Inc 1,214 0.07 8 NTT Urban Development Corp 67 0.01 – NuFlare Technology Inc 5 – 1 Obara Group Inc 42 –
39 Obayashi Corp 372 0.02 5 Obayashi Road Corp 31 – 2 Obic Co Ltd 98 0.01
16 Odakyu Electric Railway Co Ltd 316 0.02 25 Ogaki Kyoritsu Bank Ltd 91 0.01 1 Ohsho Food Service Corp 26 – 2 Oiles Corp 38 – 8 Oita Bank Ltd 29 –
63 Oji Holdings Corp 261 0.02 3 Okabe Co Ltd 31 –
010_3771524762911.indd���34 2017/10/11���13:01:27

- 35 -
1.ディメンショナル・ファンズ・ピーエルシー グローバル・コア・エクイティ・ファンド
Shares (000's)
Value(000's)
USD
% of NetAssetValue
Common Stock (continued)Japan - 9.42% (continued)
2 Okamoto Industries Inc 19 – 6 Okamura Corp 52 –
12 Okasan Securities Group Inc 70 0.01 8 Oki Electric Industry Co Ltd 104 0.01 1 Okinawa Cellular Telephone Co 40 – 2 Okinawa Electric Power Co Inc 38 – 8 OKUMA Corp 72 0.01
12 Okumura Corp 71 0.01 8 Okura Industrial Co Ltd 36 – 2 Okuwa Co Ltd 21 – 8 Olympus Corp 278 0.02 9 Omron Corp 333 0.02 6 Ono Pharmaceutical Co Ltd 134 0.01 2 Onoken Co Ltd 16 –
11 Onward Holdings Co Ltd 73 0.01 3 Open House Co Ltd 80 0.01 1 Optex Co Ltd 35 – 2 Oracle Corp Japan 95 0.01 5 Organo Corp 21 –
39 Orient Corp 69 0.01 5 Oriental Land Co Ltd 298 0.02
61 ORIX Corp 965 0.06 94 Osaka Gas Co Ltd 359 0.02 6 Osaka Soda Co Ltd 25 – 1 Osaka Steel Co Ltd 9 – 5 Osaki Electric Co Ltd 51 – 6 OSG Corp 128 0.01
17 OSJB Holdings Corp 35 – 3 Otsuka Corp 143 0.01 6 Otsuka Holdings Co Ltd 242 0.02 1 Outsourcing Inc 35 – 1 Oyo Corp 15 – 3 Pacific Industrial Co Ltd 41 – 9 Pacific Metals Co Ltd 30 – 1 Pack Corp 25 – 1 PAL GROUP Holdings Co Ltd 29 – 3 Paltac Corporation 61 – 6 PanaHome Corp 43 –
101 Panasonic Corp 1,043 0.06 2 Paramount Bed Holdings Co Ltd 55 – 2 Parco Co Ltd 18 – 5 Park24 Co Ltd 152 0.01 4 PC Depot Corp 20 –
15 Penta-Ocean Construction Co Ltd 75 0.01 2 PeptiDream Inc 105 0.01 6 Pigeon Corp 150 0.01 2 Pilot Corp 92 0.01 1 Piolax Inc 49 –
26 Pioneer Corp 55 – 2 Plenus Co Ltd 39 – 1 Pola Orbis Holdings Inc 70 0.01 6 Press Kogyo Co Ltd 27 – 4 Pressance Corp 45 – 4 Prestige International Inc 28 –
10 Prima Meat Packers Ltd 35 – 1 Proto Corp 16 – 4 Raito Kogyo Co Ltd 45 –
25 Rakuten Inc 252 0.02 1 Recruit Holdings Co Ltd 31 – 3 Relia Inc 33 – 1 Relo Group Inc 110 0.01
14 Rengo Co Ltd 83 0.01 118 Resona Holdings Inc 577 0.04
Shares (000's)
Value(000's)
USD
% of NetAssetValue
Common Stock (continued)Japan - 9.42% (continued)
5 Resorttrust Inc 102 0.01 2 Retail Partners Co Ltd 21 –
44 Ricoh Co Ltd 358 0.02 2 Ricoh Leasing Co Ltd 46 – 3 Right On Co Ltd 29 – 1 Riken Corp 33 – 2 Riken Keiki Co Ltd 29 – 7 Riken Technos Corp 36 – – Riken Vitamin Co Ltd 16 – 1 Ringer Hut Co Ltd 22 – 1 Rinnai Corp 103 0.01 2 Riso Kagaku Corp 35 – 2 Rock Field Co Ltd 29 – 4 Rohm Co Ltd 234 0.02 5 Rohto Pharmaceutical Co Ltd 71 0.01 1 Roland DG Corp 18 – 8 Round One Corp 55 – 2 Royal Holdings Co Ltd 34 –
10 Ryobi Ltd 41 – 5 Ryoden Corp 33 – 1 Ryohin Keikaku Co Ltd 257 0.02 3 Ryosan Co Ltd 79 0.01 2 Ryoyo Electro Corp 23 – 1 S Foods Inc 24 – 2 Sac's Bar Holdings Inc 21 –
28 Saibu Gas Co Ltd 60 – 2 Saizeriya Co Ltd 49 – 6 Sakai Chemical Industry Co Ltd 19 – 1 Sakai Moving Service Co Ltd 25 – 4 Sakata INX Corp 56 – 2 Sakata Seed Corp 53 – 5 Sala Corp 29 – 1 San-A Co Ltd 48 – 4 San-Ai Oil Co Ltd 28 – 9 San-In Godo Bank Ltd 70 0.01
14 Sanden Holdings Corp 45 – 3 Sangetsu Corp 50 – 7 Sanken Electric Co Ltd 30 – 4 Sanki Engineering Co Ltd 37 – 3 Sankyo Co Ltd 99 0.01 2 Sankyo Tateyama Inc 26 –
19 Sankyu Inc 112 0.01 4 Sanoh Industrial Co Ltd 27 – 3 Sanrio Co Ltd 45 – 2 Sanshin Electronics Co Ltd 20 –
22 Santen Pharmaceutical Co Ltd 276 0.02 15 Sanwa Holdings Corp 152 0.01 1 Sanyo Chemical Industries Ltd 43 – 4 Sanyo Denki Co Ltd 26 – 3 Sanyo Electric Railway Co Ltd 15 – 9 Sanyo Shokai Ltd 13 –
10 Sanyo Special Steel Co Ltd 51 – 2 Sanyo Trading Co Ltd 23 – 6 Sapporo Holdings Ltd 170 0.01 2 Sato Holdings Corp 38 – 1 Sawada Holdings Co Ltd 10 – 2 Sawai Pharmaceutical Co Ltd 113 0.01
20 SBI Holdings Inc 251 0.02 3 Screen Holdings Co Ltd 170 0.01 3 SCSK Corp 88 0.01 6 Secom Co Ltd 464 0.03
14 Sega Sammy Holdings Inc 209 0.01 9 Seibu Holdings Inc 160 0.01
010_3771524762911.indd���35 2017/10/11���13:01:28
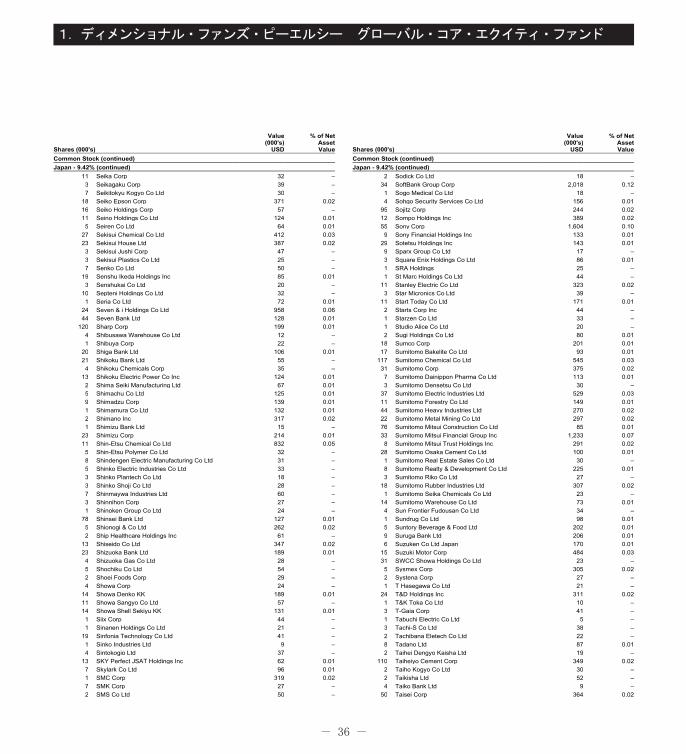
- 36 -
1.ディメンショナル・ファンズ・ピーエルシー グローバル・コア・エクイティ・ファンド
Shares (000's)
Value(000's)
USD
% of NetAssetValue
Common Stock (continued)Japan - 9.42% (continued)
11 Seika Corp 32 – 3 Seikagaku Corp 39 – 7 Seikitokyu Kogyo Co Ltd 30 –
18 Seiko Epson Corp 371 0.02 16 Seiko Holdings Corp 57 – 11 Seino Holdings Co Ltd 124 0.01 5 Seiren Co Ltd 64 0.01
27 Sekisui Chemical Co Ltd 412 0.03 23 Sekisui House Ltd 387 0.02 3 Sekisui Jushi Corp 47 – 3 Sekisui Plastics Co Ltd 25 – 7 Senko Co Ltd 50 –
19 Senshu Ikeda Holdings Inc 85 0.01 3 Senshukai Co Ltd 20 –
10 Septeni Holdings Co Ltd 32 – 1 Seria Co Ltd 72 0.01
24 Seven & i Holdings Co Ltd 958 0.06 44 Seven Bank Ltd 128 0.01
120 Sharp Corp 199 0.01 4 Shibusawa Warehouse Co Ltd 12 – 1 Shibuya Corp 22 –
20 Shiga Bank Ltd 106 0.01 21 Shikoku Bank Ltd 55 – 4 Shikoku Chemicals Corp 35 –
13 Shikoku Electric Power Co Inc 124 0.01 2 Shima Seiki Manufacturing Ltd 67 0.01 5 Shimachu Co Ltd 125 0.01 9 Shimadzu Corp 139 0.01 1 Shimamura Co Ltd 132 0.01 2 Shimano Inc 317 0.02 1 Shimizu Bank Ltd 15 –
23 Shimizu Corp 214 0.01 11 Shin-Etsu Chemical Co Ltd 832 0.05 5 Shin-Etsu Polymer Co Ltd 32 – 8 Shindengen Electric Manufacturing Co Ltd 31 – 5 Shinko Electric Industries Co Ltd 33 – 3 Shinko Plantech Co Ltd 18 – 3 Shinko Shoji Co Ltd 28 – 7 Shinmaywa Industries Ltd 60 – 3 Shinnihon Corp 27 – 1 Shinoken Group Co Ltd 24 –
78 Shinsei Bank Ltd 127 0.01 5 Shionogi & Co Ltd 262 0.02 2 Ship Healthcare Holdings Inc 61 –
13 Shiseido Co Ltd 347 0.02 23 Shizuoka Bank Ltd 189 0.01 4 Shizuoka Gas Co Ltd 28 – 5 Shochiku Co Ltd 54 – 2 Shoei Foods Corp 29 – 4 Showa Corp 24 –
14 Showa Denko KK 189 0.01 11 Showa Sangyo Co Ltd 57 – 14 Showa Shell Sekiyu KK 131 0.01 1 Siix Corp 44 – 1 Sinanen Holdings Co Ltd 21 –
19 Sinfonia Technology Co Ltd 41 – 1 Sinko Industries Ltd 9 – 4 Sintokogio Ltd 37 –
13 SKY Perfect JSAT Holdings Inc 62 0.01 7 Skylark Co Ltd 96 0.01 1 SMC Corp 319 0.02 7 SMK Corp 27 – 2 SMS Co Ltd 50 –
Shares (000's)
Value(000's)
USD
% of NetAssetValue
Common Stock (continued)Japan - 9.42% (continued)
2 Sodick Co Ltd 18 – 34 SoftBank Group Corp 2,018 0.12 1 Sogo Medical Co Ltd 18 – 4 Sohgo Security Services Co Ltd 156 0.01
95 Sojitz Corp 244 0.02 12 Sompo Holdings Inc 389 0.02 55 Sony Corp 1,604 0.10 9 Sony Financial Holdings Inc 133 0.01
29 Sotetsu Holdings Inc 143 0.01 9 Sparx Group Co Ltd 17 – 3 Square Enix Holdings Co Ltd 86 0.01 1 SRA Holdings 25 – 1 St Marc Holdings Co Ltd 44 –
11 Stanley Electric Co Ltd 323 0.02 3 Star Micronics Co Ltd 39 –
11 Start Today Co Ltd 171 0.01 2 Starts Corp Inc 44 – 1 Starzen Co Ltd 33 – 1 Studio Alice Co Ltd 20 – 2 Sugi Holdings Co Ltd 80 0.01
18 Sumco Corp 201 0.01 17 Sumitomo Bakelite Co Ltd 93 0.01
117 Sumitomo Chemical Co Ltd 545 0.03 31 Sumitomo Corp 375 0.02 7 Sumitomo Dainippon Pharma Co Ltd 113 0.01 3 Sumitomo Densetsu Co Ltd 30 –
37 Sumitomo Electric Industries Ltd 529 0.03 11 Sumitomo Forestry Co Ltd 149 0.01 44 Sumitomo Heavy Industries Ltd 270 0.02 22 Sumitomo Metal Mining Co Ltd 297 0.02 76 Sumitomo Mitsui Construction Co Ltd 85 0.01 33 Sumitomo Mitsui Financial Group Inc 1,233 0.07 8 Sumitomo Mitsui Trust Holdings Inc 291 0.02
28 Sumitomo Osaka Cement Co Ltd 100 0.01 1 Sumitomo Real Estate Sales Co Ltd 30 – 8 Sumitomo Realty & Development Co Ltd 225 0.01 3 Sumitomo Riko Co Ltd 27 –
18 Sumitomo Rubber Industries Ltd 307 0.02 1 Sumitomo Seika Chemicals Co Ltd 23 –
14 Sumitomo Warehouse Co Ltd 73 0.01 4 Sun Frontier Fudousan Co Ltd 34 – 1 Sundrug Co Ltd 98 0.01 5 Suntory Beverage & Food Ltd 202 0.01 9 Suruga Bank Ltd 206 0.01 6 Suzuken Co Ltd Japan 170 0.01
15 Suzuki Motor Corp 484 0.03 31 SWCC Showa Holdings Co Ltd 23 – 5 Sysmex Corp 305 0.02 2 Systena Corp 27 – 1 T Hasegawa Co Ltd 21 –
24 T&D Holdings Inc 311 0.02 1 T&K Toka Co Ltd 10 – 3 T-Gaia Corp 41 – 1 Tabuchi Electric Co Ltd 5 – 3 Tachi-S Co Ltd 38 – 2 Tachibana Eletech Co Ltd 22 – 8 Tadano Ltd 87 0.01 2 Taihei Dengyo Kaisha Ltd 19 –
110 Taiheiyo Cement Corp 349 0.02 2 Taiho Kogyo Co Ltd 30 – 2 Taikisha Ltd 52 – 4 Taiko Bank Ltd 9 –
50 Taisei Corp 364 0.02
010_3771524762911.indd���36 2017/10/11���13:01:28
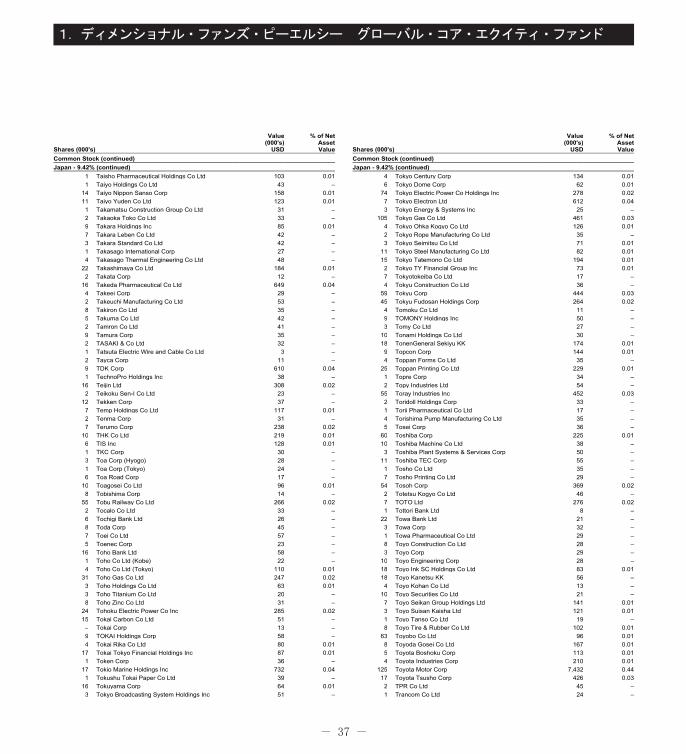
- 37 -
1.ディメンショナル・ファンズ・ピーエルシー グローバル・コア・エクイティ・ファンド
Shares (000's)
Value(000's)
USD
% of NetAssetValue
Common Stock (continued)Japan - 9.42% (continued)
1 Taisho Pharmaceutical Holdings Co Ltd 103 0.01 1 Taiyo Holdings Co Ltd 43 –
14 Taiyo Nippon Sanso Corp 158 0.01 11 Taiyo Yuden Co Ltd 123 0.01 1 Takamatsu Construction Group Co Ltd 31 – 2 Takaoka Toko Co Ltd 33 – 9 Takara Holdings Inc 85 0.01 7 Takara Leben Co Ltd 42 – 3 Takara Standard Co Ltd 42 – 1 Takasago International Corp 27 – 4 Takasago Thermal Engineering Co Ltd 48 –
22 Takashimaya Co Ltd 184 0.01 2 Takata Corp 12 –
16 Takeda Pharmaceutical Co Ltd 649 0.04 4 Takeei Corp 29 – 2 Takeuchi Manufacturing Co Ltd 53 – 8 Takiron Co Ltd 35 – 5 Takuma Co Ltd 42 – 2 Tamron Co Ltd 41 – 9 Tamura Corp 35 – 2 TASAKI & Co Ltd 32 – 1 Tatsuta Electric Wire and Cable Co Ltd 3 – 2 Tayca Corp 11 – 9 TDK Corp 610 0.04 1 TechnoPro Holdings Inc 38 –
16 Teijin Ltd 308 0.02 2 Teikoku Sen-I Co Ltd 23 –
12 Tekken Corp 37 – 7 Temp Holdings Co Ltd 117 0.01 2 Tenma Corp 31 – 7 Terumo Corp 238 0.02
10 THK Co Ltd 219 0.01 6 TIS Inc 128 0.01 1 TKC Corp 30 – 3 Toa Corp (Hyogo) 28 – 1 Toa Corp (Tokyo) 24 – 6 Toa Road Corp 17 –
10 Toagosei Co Ltd 96 0.01 8 Tobishima Corp 14 –
55 Tobu Railway Co Ltd 266 0.02 2 Tocalo Co Ltd 33 – 6 Tochigi Bank Ltd 26 – 8 Toda Corp 45 – 7 Toei Co Ltd 57 – 5 Toenec Corp 23 –
16 Toho Bank Ltd 58 – 1 Toho Co Ltd (Kobe) 22 – 4 Toho Co Ltd (Tokyo) 110 0.01
31 Toho Gas Co Ltd 247 0.02 3 Toho Holdings Co Ltd 63 0.01 3 Toho Titanium Co Ltd 20 – 8 Toho Zinc Co Ltd 31 –
24 Tohoku Electric Power Co Inc 285 0.02 15 Tokai Carbon Co Ltd 51 – – Tokai Corp 13 – 9 TOKAI Holdings Corp 58 – 4 Tokai Rika Co Ltd 80 0.01
17 Tokai Tokyo Financial Holdings Inc 87 0.01 1 Token Corp 36 –
17 Tokio Marine Holdings Inc 732 0.04 1 Tokushu Tokai Paper Co Ltd 39 –
16 Tokuyama Corp 64 0.01 3 Tokyo Broadcasting System Holdings Inc 51 –
Shares (000's)
Value(000's)
USD
% of NetAssetValue
Common Stock (continued)Japan - 9.42% (continued)
4 Tokyo Century Corp 134 0.01 6 Tokyo Dome Corp 62 0.01
74 Tokyo Electric Power Co Holdings Inc 278 0.02 7 Tokyo Electron Ltd 612 0.04 3 Tokyo Energy & Systems Inc 25 –
105 Tokyo Gas Co Ltd 461 0.03 4 Tokyo Ohka Kogyo Co Ltd 126 0.01 2 Tokyo Rope Manufacturing Co Ltd 35 – 3 Tokyo Seimitsu Co Ltd 71 0.01
11 Tokyo Steel Manufacturing Co Ltd 82 0.01 15 Tokyo Tatemono Co Ltd 194 0.01 2 Tokyo TY Financial Group Inc 73 0.01 7 Tokyotokeiba Co Ltd 17 – 4 Tokyu Construction Co Ltd 36 –
59 Tokyu Corp 444 0.03 45 Tokyu Fudosan Holdings Corp 264 0.02 4 Tomoku Co Ltd 11 – 9 TOMONY Holdings Inc 50 – 3 Tomy Co Ltd 27 –
10 Tonami Holdings Co Ltd 30 – 18 TonenGeneral Sekiyu KK 174 0.01 9 Topcon Corp 144 0.01 4 Toppan Forms Co Ltd 35 –
25 Toppan Printing Co Ltd 229 0.01 1 Topre Corp 34 – 2 Topy Industries Ltd 54 –
55 Toray Industries Inc 452 0.03 2 Toridoll Holdings Corp 33 – 1 Torii Pharmaceutical Co Ltd 17 – 4 Torishima Pump Manufacturing Co Ltd 35 – 5 Tosei Corp 36 –
60 Toshiba Corp 225 0.01 10 Toshiba Machine Co Ltd 38 – 3 Toshiba Plant Systems & Services Corp 50 –
11 Toshiba TEC Corp 55 – 1 Tosho Co Ltd 35 – 7 Tosho Printing Co Ltd 29 –
54 Tosoh Corp 369 0.02 2 Totetsu Kogyo Co Ltd 46 – 7 TOTO Ltd 276 0.02 1 Tottori Bank Ltd 8 –
22 Towa Bank Ltd 21 – 3 Towa Corp 32 – 1 Towa Pharmaceutical Co Ltd 29 – 8 Toyo Construction Co Ltd 28 – 3 Toyo Corp 29 –
10 Toyo Engineering Corp 28 – 18 Toyo Ink SC Holdings Co Ltd 83 0.01 18 Toyo Kanetsu KK 56 – 4 Toyo Kohan Co Ltd 13 –
10 Toyo Securities Co Ltd 21 – 7 Toyo Seikan Group Holdings Ltd 141 0.01 3 Toyo Suisan Kaisha Ltd 121 0.01 1 Toyo Tanso Co Ltd 19 – 8 Toyo Tire & Rubber Co Ltd 102 0.01
63 Toyobo Co Ltd 96 0.01 8 Toyoda Gosei Co Ltd 167 0.01 5 Toyota Boshoku Corp 113 0.01 4 Toyota Industries Corp 210 0.01
125 Toyota Motor Corp 7,432 0.44 17 Toyota Tsusho Corp 426 0.03 2 TPR Co Ltd 45 – 1 Trancom Co Ltd 24 –
010_3771524762911.indd���37 2017/10/11���13:01:28
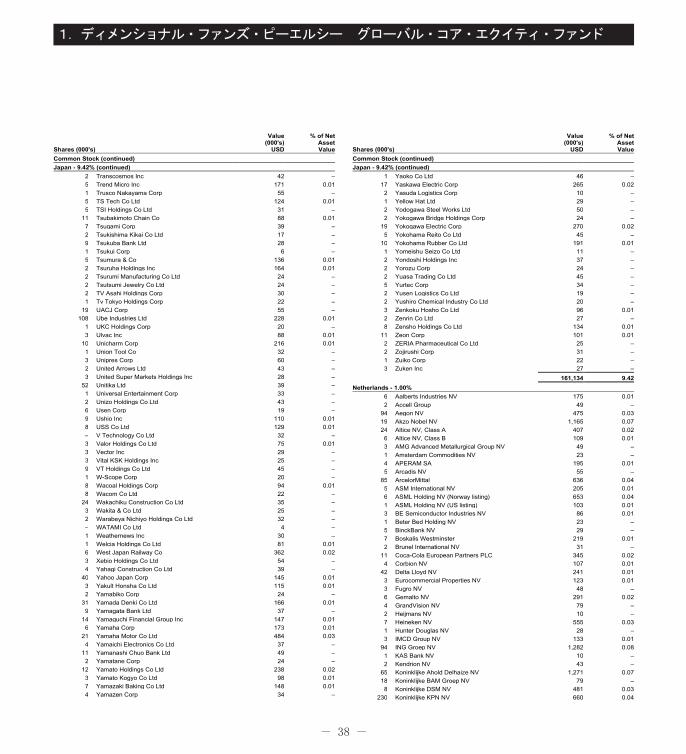
- 38 -
1.ディメンショナル・ファンズ・ピーエルシー グローバル・コア・エクイティ・ファンド
Shares (000's)
Value(000's)
USD
% of NetAssetValue
Common Stock (continued)Japan - 9.42% (continued)
2 Transcosmos Inc 42 – 5 Trend Micro Inc 171 0.01 1 Trusco Nakayama Corp 55 – 5 TS Tech Co Ltd 124 0.01 5 TSI Holdings Co Ltd 31 –
11 Tsubakimoto Chain Co 88 0.01 7 Tsugami Corp 39 – 2 Tsukishima Kikai Co Ltd 17 – 9 Tsukuba Bank Ltd 28 – 1 Tsukui Corp 6 – 5 Tsumura & Co 136 0.01 2 Tsuruha Holdings Inc 164 0.01 2 Tsurumi Manufacturing Co Ltd 24 – 2 Tsutsumi Jewelry Co Ltd 24 – 2 TV Asahi Holdings Corp 30 – 1 Tv Tokyo Holdings Corp 22 –
19 UACJ Corp 55 – 108 Ube Industries Ltd 228 0.01
1 UKC Holdings Corp 20 – 3 Ulvac Inc 88 0.01
10 Unicharm Corp 216 0.01 1 Union Tool Co 32 – 3 Unipres Corp 60 – 2 United Arrows Ltd 43 – 3 United Super Markets Holdings Inc 28 –
52 Unitika Ltd 39 – 1 Universal Entertainment Corp 33 – 2 Unizo Holdings Co Ltd 43 – 6 Usen Corp 19 – 9 Ushio Inc 110 0.01 8 USS Co Ltd 129 0.01 – V Technology Co Ltd 32 – 3 Valor Holdings Co Ltd 75 0.01 3 Vector Inc 29 – 3 Vital KSK Holdings Inc 25 – 9 VT Holdings Co Ltd 45 – 1 W-Scope Corp 20 – 8 Wacoal Holdings Corp 94 0.01 8 Wacom Co Ltd 22 –
24 Wakachiku Construction Co Ltd 35 – 3 Wakita & Co Ltd 25 – 2 Warabeya Nichiyo Holdings Co Ltd 32 – – WATAMI Co Ltd 4 – 1 Weathernews Inc 30 – 1 Welcia Holdings Co Ltd 81 0.01 6 West Japan Railway Co 362 0.02 3 Xebio Holdings Co Ltd 54 – 4 Yahagi Construction Co Ltd 39 –
40 Yahoo Japan Corp 145 0.01 3 Yakult Honsha Co Ltd 115 0.01 2 Yamabiko Corp 24 –
31 Yamada Denki Co Ltd 166 0.01 9 Yamagata Bank Ltd 37 –
14 Yamaguchi Financial Group Inc 147 0.01 6 Yamaha Corp 173 0.01
21 Yamaha Motor Co Ltd 484 0.03 4 Yamaichi Electronics Co Ltd 37 –
11 Yamanashi Chuo Bank Ltd 49 – 2 Yamatane Corp 24 –
12 Yamato Holdings Co Ltd 238 0.02 3 Yamato Kogyo Co Ltd 98 0.01 7 Yamazaki Baking Co Ltd 148 0.01 4 Yamazen Corp 34 –
Shares (000's)
Value(000's)
USD
% of NetAssetValue
Common Stock (continued)Japan - 9.42% (continued)
1 Yaoko Co Ltd 46 – 17 Yaskawa Electric Corp 265 0.02 2 Yasuda Logistics Corp 10 – 1 Yellow Hat Ltd 29 – 2 Yodogawa Steel Works Ltd 50 – 2 Yokogawa Bridge Holdings Corp 24 –
19 Yokogawa Electric Corp 270 0.02 5 Yokohama Reito Co Ltd 45 –
10 Yokohama Rubber Co Ltd 191 0.01 1 Yomeishu Seizo Co Ltd 11 – 2 Yondoshi Holdings Inc 37 – 2 Yorozu Corp 24 – 2 Yuasa Trading Co Ltd 45 – 5 Yurtec Corp 34 – 2 Yusen Logistics Co Ltd 19 – 2 Yushiro Chemical Industry Co Ltd 20 – 3 Zenkoku Hosho Co Ltd 96 0.01 2 Zenrin Co Ltd 27 – 8 Zensho Holdings Co Ltd 134 0.01
11 Zeon Corp 101 0.01 2 ZERIA Pharmaceutical Co Ltd 25 – 2 Zojirushi Corp 31 – 1 Zuiko Corp 22 – 3 Zuken Inc 27 –
161,134 9.42Netherlands - 1.00%
6 Aalberts Industries NV 175 0.01 2 Accell Group 49 –
94 Aegon NV 475 0.03 19 Akzo Nobel NV 1,165 0.07 24 Altice NV, Class A 407 0.02 6 Altice NV, Class B 109 0.01 3 AMG Advanced Metallurgical Group NV 49 – 1 Amsterdam Commodities NV 23 – 4 APERAM SA 195 0.01 5 Arcadis NV 55 –
85 ArcelorMittal 636 0.04 5 ASM International NV 205 0.01 6 ASML Holding NV (Norway listing) 653 0.04 1 ASML Holding NV (US listing) 103 0.01 3 BE Semiconductor Industries NV 86 0.01 1 Beter Bed Holding NV 23 – 5 BinckBank NV 29 – 7 Boskalis Westminster 219 0.01 2 Brunel International NV 31 –
11 Coca-Cola European Partners PLC 345 0.02 4 Corbion NV 107 0.01
42 Delta Lloyd NV 241 0.01 3 Eurocommercial Properties NV 123 0.01 3 Fugro NV 48 – 6 Gemalto NV 291 0.02 4 GrandVision NV 79 – 2 Heijmans NV 10 – 7 Heineken NV 555 0.03 1 Hunter Douglas NV 28 – 3 IMCD Group NV 133 0.01
94 ING Groep NV 1,282 0.08 1 KAS Bank NV 10 – 2 Kendrion NV 43 –
65 Koninklijke Ahold Delhaize NV 1,271 0.07 18 Koninklijke BAM Groep NV 79 – 8 Koninklijke DSM NV 481 0.03
230 Koninklijke KPN NV 660 0.04
010_3771524762911.indd���38 2017/10/11���13:01:29
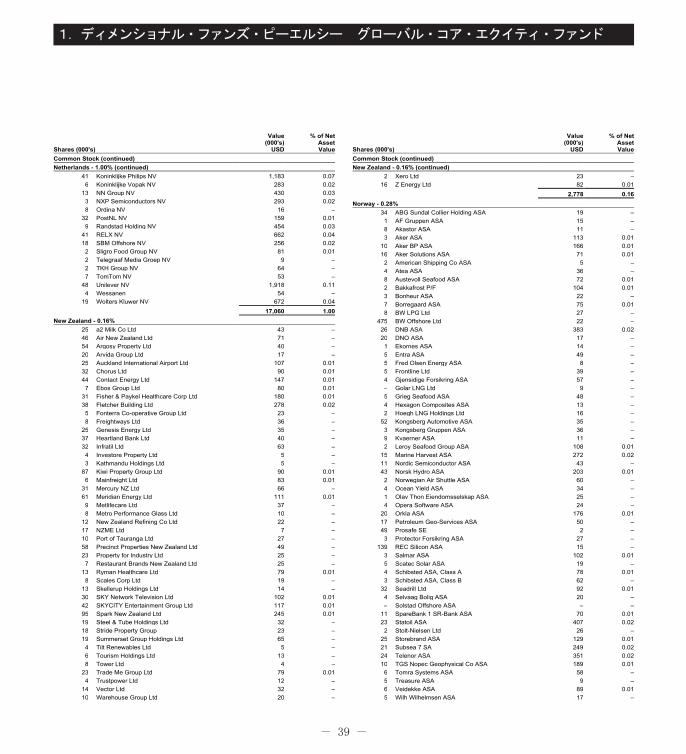
- 39 -
1.ディメンショナル・ファンズ・ピーエルシー グローバル・コア・エクイティ・ファンド
Shares (000's)
Value(000's)
USD
% of NetAssetValue
Common Stock (continued)Netherlands - 1.00% (continued)
41 Koninklijke Philips NV 1,183 0.07 6 Koninklijke Vopak NV 283 0.02
13 NN Group NV 430 0.03 3 NXP Semiconductors NV 293 0.02 8 Ordina NV 16 –
32 PostNL NV 159 0.01 9 Randstad Holding NV 454 0.03
41 RELX NV 662 0.04 18 SBM Offshore NV 256 0.02 2 Sligro Food Group NV 81 0.01 2 Telegraaf Media Groep NV 9 – 2 TKH Group NV 64 – 7 TomTom NV 53 –
48 Unilever NV 1,918 0.11 4 Wessanen 54 –
19 Wolters Kluwer NV 672 0.04 17,060 1.00
New Zealand - 0.16%25 a2 Milk Co Ltd 43 – 46 Air New Zealand Ltd 71 – 54 Argosy Property Ltd 40 – 20 Arvida Group Ltd 17 – 25 Auckland International Airport Ltd 107 0.01 32 Chorus Ltd 90 0.01 44 Contact Energy Ltd 147 0.01 7 Ebos Group Ltd 80 0.01
31 Fisher & Paykel Healthcare Corp Ltd 180 0.01 38 Fletcher Building Ltd 278 0.02 5 Fonterra Co-operative Group Ltd 23 – 8 Freightways Ltd 36 –
25 Genesis Energy Ltd 35 – 37 Heartland Bank Ltd 40 – 32 Infratil Ltd 63 – 4 Investore Property Ltd 5 – 3 Kathmandu Holdings Ltd 5 –
87 Kiwi Property Group Ltd 90 0.01 6 Mainfreight Ltd 83 0.01
31 Mercury NZ Ltd 66 – 61 Meridian Energy Ltd 111 0.01 9 Metlifecare Ltd 37 – 8 Metro Performance Glass Ltd 10 –
12 New Zealand Refining Co Ltd 22 – 17 NZME Ltd 7 – 10 Port of Tauranga Ltd 27 – 58 Precinct Properties New Zealand Ltd 49 – 23 Property for Industry Ltd 25 – 7 Restaurant Brands New Zealand Ltd 25 –
13 Ryman Healthcare Ltd 79 0.01 8 Scales Corp Ltd 19 –
13 Skellerup Holdings Ltd 14 – 30 SKY Network Television Ltd 102 0.01 42 SKYCITY Entertainment Group Ltd 117 0.01 95 Spark New Zealand Ltd 245 0.01 19 Steel & Tube Holdings Ltd 32 – 18 Stride Property Group 23 – 19 Summerset Group Holdings Ltd 65 – 4 Tilt Renewables Ltd 5 – 6 Tourism Holdings Ltd 13 – 8 Tower Ltd 4 –
23 Trade Me Group Ltd 79 0.01 4 Trustpower Ltd 12 –
14 Vector Ltd 32 – 10 Warehouse Group Ltd 20 –
Shares (000's)
Value(000's)
USD
% of NetAssetValue
Common Stock (continued)New Zealand - 0.16% (continued)
2 Xero Ltd 23 – 16 Z Energy Ltd 82 0.01
2,778 0.16Norway - 0.28%
34 ABG Sundal Collier Holding ASA 19 – 1 AF Gruppen ASA 15 – 8 Akastor ASA 11 – 3 Aker ASA 113 0.01
10 Aker BP ASA 166 0.01 16 Aker Solutions ASA 71 0.01 2 American Shipping Co ASA 5 – 4 Atea ASA 36 – 8 Austevoll Seafood ASA 72 0.01 2 Bakkafrost P/F 104 0.01 3 Bonheur ASA 22 – 7 Borregaard ASA 75 0.01 8 BW LPG Ltd 27 –
475 BW Offshore Ltd 22 – 26 DNB ASA 383 0.02 20 DNO ASA 17 – 1 Ekornes ASA 14 – 5 Entra ASA 49 – 5 Fred Olsen Energy ASA 8 – 5 Frontline Ltd 39 – 4 Gjensidige Forsikring ASA 57 – – Golar LNG Ltd 9 – 5 Grieg Seafood ASA 48 – 4 Hexagon Composites ASA 13 – 2 Hoegh LNG Holdings Ltd 16 –
52 Kongsberg Automotive ASA 35 – 3 Kongsberg Gruppen ASA 36 – 9 Kvaerner ASA 11 – 2 Leroy Seafood Group ASA 108 0.01
15 Marine Harvest ASA 272 0.02 11 Nordic Semiconductor ASA 43 – 43 Norsk Hydro ASA 203 0.01 2 Norwegian Air Shuttle ASA 60 – 4 Ocean Yield ASA 34 – 1 Olav Thon Eiendomsselskap ASA 25 – 4 Opera Software ASA 24 –
20 Orkla ASA 176 0.01 17 Petroleum Geo-Services ASA 50 – 49 Prosafe SE 2 – 3 Protector Forsikring ASA 27 –
139 REC Silicon ASA 15 – 3 Salmar ASA 102 0.01 5 Scatec Solar ASA 19 – 4 Schibsted ASA, Class A 78 0.01 3 Schibsted ASA, Class B 62 –
32 Seadrill Ltd 92 0.01 4 Selvaag Bolig ASA 20 – – Solstad Offshore ASA – –
11 SpareBank 1 SR-Bank ASA 70 0.01 23 Statoil ASA 407 0.02 2 Stolt-Nielsen Ltd 26 –
25 Storebrand ASA 129 0.01 21 Subsea 7 SA 249 0.02 24 Telenor ASA 351 0.02 10 TGS Nopec Geophysical Co ASA 189 0.01 6 Tomra Systems ASA 58 – 5 Treasure ASA 9 – 6 Veidekke ASA 89 0.01 5 Wilh Wilhelmsen ASA 17 –
010_3771524762911.indd���39 2017/10/11���13:01:29
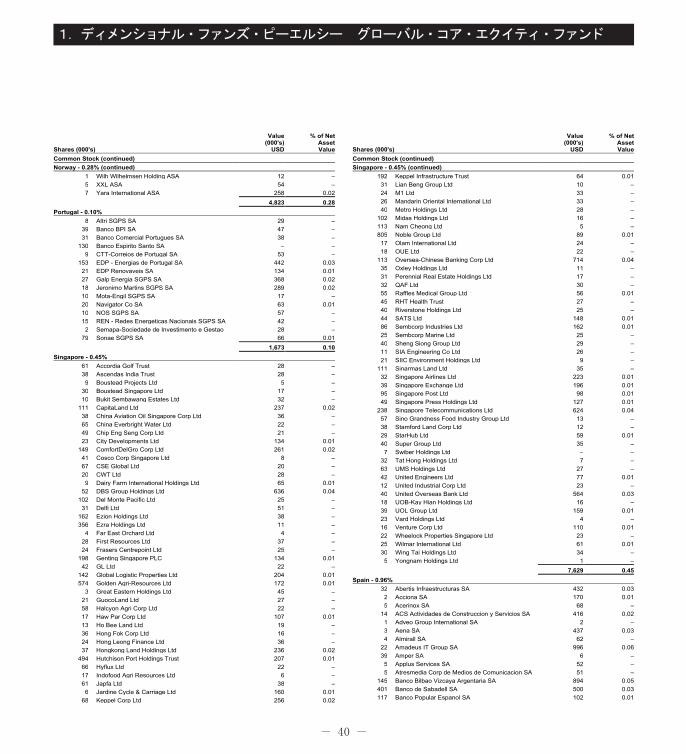
- 40 -
1.ディメンショナル・ファンズ・ピーエルシー グローバル・コア・エクイティ・ファンド
Shares (000's)
Value(000's)
USD
% of NetAssetValue
Common Stock (continued)Norway - 0.28% (continued)
1 Wilh Wilhelmsen Holding ASA 12 – 5 XXL ASA 54 – 7 Yara International ASA 258 0.02
4,823 0.28Portugal - 0.10%
8 Altri SGPS SA 29 – 39 Banco BPI SA 47 – 31 Banco Comercial Portugues SA 38 –
130 Banco Espirito Santo SA – – 9 CTT-Correios de Portugal SA 53 –
153 EDP - Energias de Portugal SA 442 0.03 21 EDP Renovaveis SA 134 0.01 27 Galp Energia SGPS SA 368 0.02 18 Jeronimo Martins SGPS SA 289 0.02 10 Mota-Engil SGPS SA 17 – 20 Navigator Co SA 63 0.01 10 NOS SGPS SA 57 – 15 REN - Redes Energeticas Nacionais SGPS SA 42 – 2 Semapa-Sociedade de Investimento e Gestao 28 –
79 Sonae SGPS SA 66 0.01 1,673 0.10
Singapore - 0.45%61 Accordia Golf Trust 28 – 38 Ascendas India Trust 28 – 9 Boustead Projects Ltd 5 –
30 Boustead Singapore Ltd 17 – 10 Bukit Sembawang Estates Ltd 32 –
111 CapitaLand Ltd 237 0.02 38 China Aviation Oil Singapore Corp Ltd 36 – 65 China Everbright Water Ltd 22 – 49 Chip Eng Seng Corp Ltd 21 – 23 City Developments Ltd 134 0.01
149 ComfortDelGro Corp Ltd 261 0.02 41 Cosco Corp Singapore Ltd 8 – 67 CSE Global Ltd 20 – 20 CWT Ltd 28 – 9 Dairy Farm International Holdings Ltd 65 0.01
52 DBS Group Holdings Ltd 636 0.04 102 Del Monte Pacific Ltd 25 –
31 Delfi Ltd 51 – 162 Ezion Holdings Ltd 38 – 356 Ezra Holdings Ltd 11 –
4 Far East Orchard Ltd 4 – 28 First Resources Ltd 37 – 24 Frasers Centrepoint Ltd 25 –
198 Genting Singapore PLC 134 0.01 42 GL Ltd 22 –
142 Global Logistic Properties Ltd 204 0.01 574 Golden Agri-Resources Ltd 172 0.01
3 Great Eastern Holdings Ltd 45 – 21 GuocoLand Ltd 27 – 58 Halcyon Agri Corp Ltd 22 – 17 Haw Par Corp Ltd 107 0.01 13 Ho Bee Land Ltd 19 – 36 Hong Fok Corp Ltd 16 – 24 Hong Leong Finance Ltd 36 – 37 Hongkong Land Holdings Ltd 236 0.02
494 Hutchison Port Holdings Trust 207 0.01 66 Hyflux Ltd 22 – 17 Indofood Agri Resources Ltd 6 – 61 Japfa Ltd 38 – 6 Jardine Cycle & Carriage Ltd 160 0.01
68 Keppel Corp Ltd 256 0.02
Shares (000's)
Value(000's)
USD
% of NetAssetValue
Common Stock (continued)Singapore - 0.45% (continued)
192 Keppel Infrastructure Trust 64 0.01 31 Lian Beng Group Ltd 10 – 24 M1 Ltd 33 – 26 Mandarin Oriental International Ltd 33 – 40 Metro Holdings Ltd 28 –
102 Midas Holdings Ltd 16 – 113 Nam Cheong Ltd 5 – 805 Noble Group Ltd 89 0.01
17 Olam International Ltd 24 – 18 OUE Ltd 22 –
113 Oversea-Chinese Banking Corp Ltd 714 0.04 35 Oxley Holdings Ltd 11 – 31 Perennial Real Estate Holdings Ltd 17 – 32 QAF Ltd 30 – 55 Raffles Medical Group Ltd 56 0.01 45 RHT Health Trust 27 – 40 Riverstone Holdings Ltd 25 – 44 SATS Ltd 148 0.01 86 Sembcorp Industries Ltd 162 0.01 25 Sembcorp Marine Ltd 25 – 40 Sheng Siong Group Ltd 29 – 11 SIA Engineering Co Ltd 26 – 21 SIIC Environment Holdings Ltd 9 –
111 Sinarmas Land Ltd 35 – 32 Singapore Airlines Ltd 223 0.01 39 Singapore Exchange Ltd 196 0.01 95 Singapore Post Ltd 98 0.01 49 Singapore Press Holdings Ltd 127 0.01
238 Singapore Telecommunications Ltd 624 0.04 57 Sino Grandness Food Industry Group Ltd 13 – 38 Stamford Land Corp Ltd 12 – 29 StarHub Ltd 59 0.01 40 Super Group Ltd 35 – 7 Swiber Holdings Ltd – –
32 Tat Hong Holdings Ltd 7 – 63 UMS Holdings Ltd 27 – 42 United Engineers Ltd 77 0.01 12 United Industrial Corp Ltd 23 – 40 United Overseas Bank Ltd 564 0.03 18 UOB-Kay Hian Holdings Ltd 16 – 39 UOL Group Ltd 159 0.01 23 Vard Holdings Ltd 4 – 16 Venture Corp Ltd 110 0.01 22 Wheelock Properties Singapore Ltd 23 – 25 Wilmar International Ltd 61 0.01 30 Wing Tai Holdings Ltd 34 – 5 Yongnam Holdings Ltd 1 –
7,629 0.45Spain - 0.96%
32 Abertis Infraestructuras SA 432 0.03 2 Acciona SA 170 0.01 5 Acerinox SA 68 –
14 ACS Actividades de Construccion y Servicios SA 416 0.02 1 Adveo Group International SA 2 – 3 Aena SA 437 0.03 4 Almirall SA 62 –
22 Amadeus IT Group SA 996 0.06 39 Amper SA 6 – 5 Applus Services SA 52 – 5 Atresmedia Corp de Medios de Comunicacion SA 51 –
145 Banco Bilbao Vizcaya Argentaria SA 894 0.05 401 Banco de Sabadell SA 500 0.03 117 Banco Popular Espanol SA 102 0.01
010_3771524762911.indd���40 2017/10/11���13:01:29
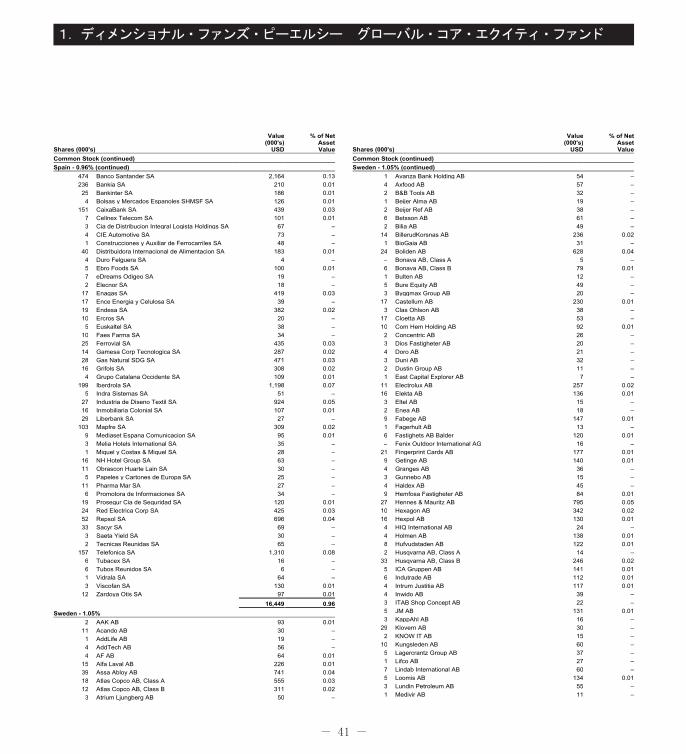
- 41 -
1.ディメンショナル・ファンズ・ピーエルシー グローバル・コア・エクイティ・ファンド
Shares (000's)
Value(000's)
USD
% of NetAssetValue
Common Stock (continued)Spain - 0.96% (continued)
474 Banco Santander SA 2,164 0.13 236 Bankia SA 210 0.01
25 Bankinter SA 186 0.01 4 Bolsas y Mercados Espanoles SHMSF SA 126 0.01
151 CaixaBank SA 439 0.03 7 Cellnex Telecom SA 101 0.01 3 Cia de Distribucion Integral Logista Holdings SA 67 – 4 CIE Automotive SA 73 – 1 Construcciones y Auxiliar de Ferrocarriles SA 48 –
40 Distribuidora Internacional de Alimentacion SA 183 0.01 4 Duro Felguera SA 4 – 5 Ebro Foods SA 100 0.01 7 eDreams Odigeo SA 19 – 2 Elecnor SA 18 –
17 Enagas SA 419 0.03 17 Ence Energia y Celulosa SA 39 – 19 Endesa SA 382 0.02 10 Ercros SA 20 – 5 Euskaltel SA 38 –
10 Faes Farma SA 34 – 25 Ferrovial SA 435 0.03 14 Gamesa Corp Tecnologica SA 287 0.02 28 Gas Natural SDG SA 471 0.03 16 Grifols SA 308 0.02 4 Grupo Catalana Occidente SA 109 0.01
199 Iberdrola SA 1,198 0.07 5 Indra Sistemas SA 51 –
27 Industria de Diseno Textil SA 924 0.05 16 Inmobiliaria Colonial SA 107 0.01 29 Liberbank SA 27 –
103 Mapfre SA 309 0.02 9 Mediaset Espana Comunicacion SA 95 0.01 3 Melia Hotels International SA 35 – 1 Miquel y Costas & Miquel SA 28 –
16 NH Hotel Group SA 63 – 11 Obrascon Huarte Lain SA 30 – 5 Papeles y Cartones de Europa SA 25 –
11 Pharma Mar SA 27 – 6 Promotora de Informaciones SA 34 –
19 Prosegur Cia de Seguridad SA 120 0.01 24 Red Electrica Corp SA 425 0.03 52 Repsol SA 696 0.04 33 Sacyr SA 69 – 3 Saeta Yield SA 30 – 2 Tecnicas Reunidas SA 65 –
157 Telefonica SA 1,310 0.08 6 Tubacex SA 16 – 6 Tubos Reunidos SA 6 – 1 Vidrala SA 64 – 3 Viscofan SA 130 0.01
12 Zardoya Otis SA 97 0.01 16,449 0.96
Sweden - 1.05%2 AAK AB 93 0.01
11 Acando AB 30 – 1 AddLife AB 19 – 4 AddTech AB 56 – 4 AF AB 64 0.01
15 Alfa Laval AB 226 0.01 39 Assa Abloy AB 741 0.04 18 Atlas Copco AB, Class A 555 0.03 12 Atlas Copco AB, Class B 311 0.02 3 Atrium Ljungberg AB 50 –
Shares (000's)
Value(000's)
USD
% of NetAssetValue
Common Stock (continued)Sweden - 1.05% (continued)
1 Avanza Bank Holding AB 54 – 4 Axfood AB 57 – 2 B&B Tools AB 32 – 1 Beijer Alma AB 19 – 2 Beijer Ref AB 38 – 6 Betsson AB 61 – 2 Bilia AB 49 –
14 BillerudKorsnas AB 236 0.02 1 BioGaia AB 31 –
24 Boliden AB 628 0.04 – Bonava AB, Class A 5 – 6 Bonava AB, Class B 79 0.01 1 Bulten AB 12 – 5 Bure Equity AB 49 – 3 Byggmax Group AB 20 –
17 Castellum AB 230 0.01 3 Clas Ohlson AB 38 –
17 Cloetta AB 53 – 10 Com Hem Holding AB 92 0.01 2 Concentric AB 26 – 3 Dios Fastigheter AB 20 – 4 Doro AB 21 – 3 Duni AB 32 – 2 Dustin Group AB 11 – 1 East Capital Explorer AB 7 –
11 Electrolux AB 257 0.02 16 Elekta AB 136 0.01 3 Eltel AB 15 – 2 Enea AB 18 – 9 Fabege AB 147 0.01 1 Fagerhult AB 13 – 6 Fastighets AB Balder 120 0.01 – Fenix Outdoor International AG 16 –
21 Fingerprint Cards AB 177 0.01 9 Getinge AB 140 0.01 4 Granges AB 36 – 3 Gunnebo AB 15 – 4 Haldex AB 45 – 9 Hemfosa Fastigheter AB 84 0.01
27 Hennes & Mauritz AB 795 0.05 10 Hexagon AB 342 0.02 16 Hexpol AB 130 0.01 4 HIQ International AB 24 – 4 Holmen AB 138 0.01 8 Hufvudstaden AB 122 0.01 2 Husqvarna AB, Class A 14 –
33 Husqvarna AB, Class B 246 0.02 5 ICA Gruppen AB 141 0.01 6 Indutrade AB 112 0.01 4 Intrum Justitia AB 117 0.01 4 Inwido AB 39 – 3 ITAB Shop Concept AB 22 – 5 JM AB 131 0.01 3 KappAhl AB 16 –
29 Klovern AB 30 – 2 KNOW IT AB 15 –
10 Kungsleden AB 60 – 5 Lagercrantz Group AB 37 – 1 Lifco AB 27 – 7 Lindab International AB 60 – 5 Loomis AB 134 0.01 3 Lundin Petroleum AB 55 – 1 Medivir AB 11 –
010_3771524762911.indd���41 2017/10/11���13:01:29
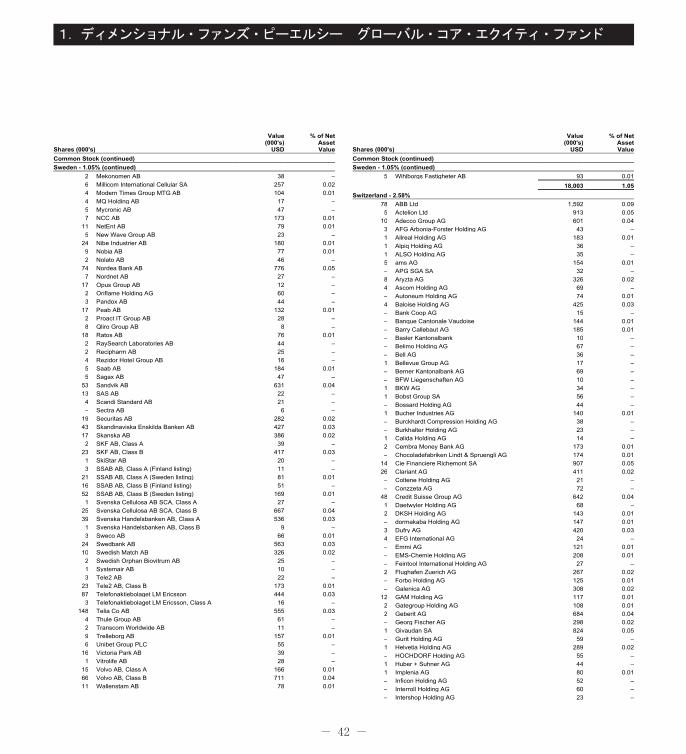
- 42 -
1.ディメンショナル・ファンズ・ピーエルシー グローバル・コア・エクイティ・ファンド
Shares (000's)
Value(000's)
USD
% of NetAssetValue
Common Stock (continued)Sweden - 1.05% (continued)
2 Mekonomen AB 38 – 6 Millicom International Cellular SA 257 0.02 4 Modern Times Group MTG AB 104 0.01 4 MQ Holding AB 17 – 5 Mycronic AB 47 – 7 NCC AB 173 0.01
11 NetEnt AB 79 0.01 5 New Wave Group AB 23 –
24 Nibe Industrier AB 180 0.01 9 Nobia AB 77 0.01 2 Nolato AB 46 –
74 Nordea Bank AB 776 0.05 7 Nordnet AB 27 –
17 Opus Group AB 12 – 2 Oriflame Holding AG 60 – 3 Pandox AB 44 –
17 Peab AB 132 0.01 2 Proact IT Group AB 28 – 8 Qliro Group AB 8 –
18 Ratos AB 76 0.01 2 RaySearch Laboratories AB 44 – 2 Recipharm AB 25 – 4 Rezidor Hotel Group AB 16 – 5 Saab AB 184 0.01 5 Sagax AB 47 –
53 Sandvik AB 631 0.04 13 SAS AB 22 – 4 Scandi Standard AB 21 – – Sectra AB 6 –
19 Securitas AB 282 0.02 43 Skandinaviska Enskilda Banken AB 427 0.03 17 Skanska AB 386 0.02 2 SKF AB, Class A 39 –
23 SKF AB, Class B 417 0.03 1 SkiStar AB 20 – 3 SSAB AB, Class A (Finland listing) 11 –
21 SSAB AB, Class A (Sweden listing) 81 0.01 16 SSAB AB, Class B (Finland listing) 51 – 52 SSAB AB, Class B (Sweden listing) 169 0.01 1 Svenska Cellulosa AB SCA, Class A 27 –
25 Svenska Cellulosa AB SCA, Class B 667 0.04 39 Svenska Handelsbanken AB, Class A 536 0.03 1 Svenska Handelsbanken AB, Class B 9 – 3 Sweco AB 66 0.01
24 Swedbank AB 563 0.03 10 Swedish Match AB 326 0.02 2 Swedish Orphan Biovitrum AB 25 – 1 Systemair AB 10 – 3 Tele2 AB 22 –
23 Tele2 AB, Class B 173 0.01 87 Telefonaktiebolaget LM Ericsson 444 0.03 3 Telefonaktiebolaget LM Ericsson, Class A 16 –
148 Telia Co AB 555 0.03 4 Thule Group AB 61 – 2 Transcom Worldwide AB 11 – 9 Trelleborg AB 157 0.01 6 Unibet Group PLC 55 –
16 Victoria Park AB 39 – 1 Vitrolife AB 28 –
15 Volvo AB, Class A 166 0.01 66 Volvo AB, Class B 711 0.04 11 Wallenstam AB 78 0.01
Shares (000's)
Value(000's)
USD
% of NetAssetValue
Common Stock (continued)Sweden - 1.05% (continued)
5 Wihlborgs Fastigheter AB 93 0.01 18,003 1.05
Switzerland - 2.58%78 ABB Ltd 1,592 0.09 5 Actelion Ltd 913 0.05
10 Adecco Group AG 601 0.04 3 AFG Arbonia-Forster Holding AG 43 – 1 Allreal Holding AG 183 0.01 1 Alpiq Holding AG 36 – 1 ALSO Holding AG 35 – 5 ams AG 154 0.01 – APG SGA SA 32 – 8 Aryzta AG 326 0.02 4 Ascom Holding AG 69 – – Autoneum Holding AG 74 0.01 4 Baloise Holding AG 425 0.03 – Bank Coop AG 15 – – Banque Cantonale Vaudoise 144 0.01 – Barry Callebaut AG 185 0.01 – Basler Kantonalbank 10 – – Belimo Holding AG 67 – – Bell AG 36 – 1 Bellevue Group AG 17 – – Berner Kantonalbank AG 69 – – BFW Liegenschaften AG 10 – 1 BKW AG 34 – 1 Bobst Group SA 56 – – Bossard Holding AG 44 – 1 Bucher Industries AG 140 0.01 – Burckhardt Compression Holding AG 38 – – Burkhalter Holding AG 23 – 1 Calida Holding AG 14 – 2 Cembra Money Bank AG 173 0.01 – Chocoladefabriken Lindt & Spruengli AG 174 0.01
14 Cie Financiere Richemont SA 907 0.05 26 Clariant AG 411 0.02 – Coltene Holding AG 21 – – Conzzeta AG 72 –
48 Credit Suisse Group AG 642 0.04 1 Daetwyler Holding AG 68 – 2 DKSH Holding AG 143 0.01 – dormakaba Holding AG 147 0.01 3 Dufry AG 420 0.03 4 EFG International AG 24 – – Emmi AG 121 0.01 – EMS-Chemie Holding AG 208 0.01 – Feintool International Holding AG 27 – 2 Flughafen Zuerich AG 267 0.02 – Forbo Holding AG 125 0.01 – Galenica AG 308 0.02
12 GAM Holding AG 117 0.01 2 Gategroup Holding AG 108 0.01 2 Geberit AG 684 0.04 – Georg Fischer AG 298 0.02 1 Givaudan SA 824 0.05 – Gurit Holding AG 59 – 1 Helvetia Holding AG 289 0.02 – HOCHDORF Holding AG 55 – 1 Huber + Suhner AG 44 – 1 Implenia AG 80 0.01 – Inficon Holding AG 52 – – Interroll Holding AG 60 – – Intershop Holding AG 23 –
010_3771524762911.indd���42 2017/10/11���13:01:30
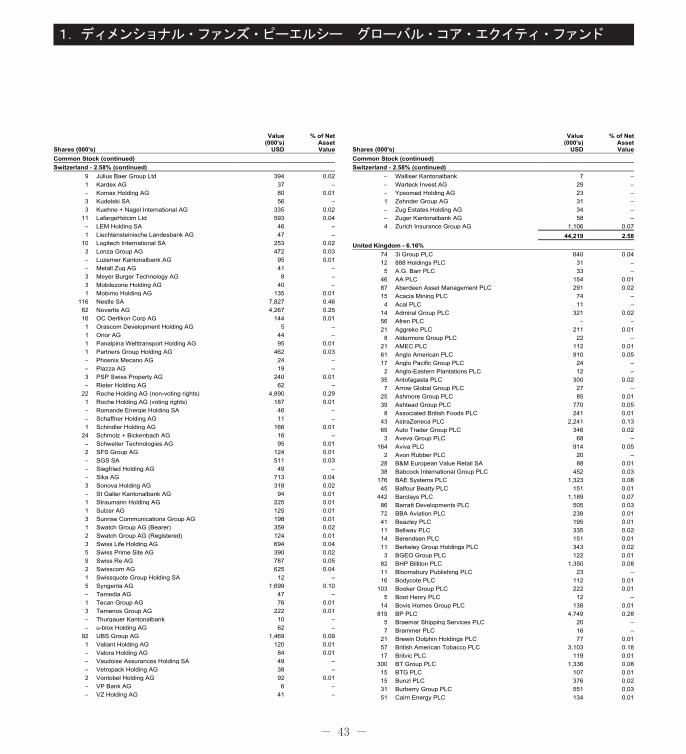
- 43 -
1.ディメンショナル・ファンズ・ピーエルシー グローバル・コア・エクイティ・ファンド
Shares (000's)
Value(000's)
USD
% of NetAssetValue
Common Stock (continued)Switzerland - 2.58% (continued)
9 Julius Baer Group Ltd 394 0.02 1 Kardex AG 37 – – Komax Holding AG 80 0.01 3 Kudelski SA 56 – 3 Kuehne + Nagel International AG 335 0.02
11 LafargeHolcim Ltd 593 0.04 – LEM Holding SA 46 – 1 Liechtensteinische Landesbank AG 47 –
10 Logitech International SA 253 0.02 3 Lonza Group AG 472 0.03 – Luzerner Kantonalbank AG 95 0.01 – Metall Zug AG 41 – 3 Meyer Burger Technology AG 8 – 3 Mobilezone Holding AG 40 – 1 Mobimo Holding AG 135 0.01
116 Nestle SA 7,827 0.46 62 Novartis AG 4,267 0.25 16 OC Oerlikon Corp AG 144 0.01 1 Orascom Development Holding AG 5 – 1 Orior AG 44 – 1 Panalpina Welttransport Holding AG 95 0.01 1 Partners Group Holding AG 462 0.03 – Phoenix Mecano AG 24 – – Plazza AG 19 – 3 PSP Swiss Property AG 240 0.01 – Rieter Holding AG 62 –
22 Roche Holding AG (non-voting rights) 4,890 0.29 1 Roche Holding AG (voting rights) 187 0.01 – Romande Energie Holding SA 46 – – Schaffner Holding AG 11 – 1 Schindler Holding AG 166 0.01
24 Schmolz + Bickenbach AG 16 – – Schweiter Technologies AG 95 0.01 2 SFS Group AG 124 0.01 – SGS SA 511 0.03 – Siegfried Holding AG 49 – – Sika AG 713 0.04 3 Sonova Holding AG 318 0.02 – St Galler Kantonalbank AG 94 0.01 1 Straumann Holding AG 225 0.01 1 Sulzer AG 125 0.01 3 Sunrise Communications Group AG 198 0.01 1 Swatch Group AG (Bearer) 359 0.02 2 Swatch Group AG (Registered) 124 0.01 3 Swiss Life Holding AG 694 0.04 5 Swiss Prime Site AG 390 0.02 9 Swiss Re AG 787 0.05 2 Swisscom AG 625 0.04 1 Swissquote Group Holding SA 12 – 5 Syngenta AG 1,699 0.10 – Tamedia AG 47 – 1 Tecan Group AG 76 0.01 3 Temenos Group AG 222 0.01 – Thurgauer Kantonalbank 10 – – u-blox Holding AG 62 –
92 UBS Group AG 1,469 0.09 1 Valiant Holding AG 120 0.01 – Valora Holding AG 84 0.01 – Vaudoise Assurances Holding SA 49 – – Vetropack Holding AG 38 – 2 Vontobel Holding AG 92 0.01 – VP Bank AG 6 – – VZ Holding AG 41 –
Shares (000's)
Value(000's)
USD
% of NetAssetValue
Common Stock (continued)Switzerland - 2.58% (continued)
– Walliser Kantonalbank 7 – – Warteck Invest AG 29 – – Ypsomed Holding AG 23 – 1 Zehnder Group AG 31 – – Zug Estates Holding AG 34 – – Zuger Kantonalbank AG 58 – 4 Zurich Insurance Group AG 1,106 0.07
44,219 2.58United Kingdom - 6.16%
74 3i Group PLC 640 0.04 12 888 Holdings PLC 31 – 5 A.G. Barr PLC 33 –
46 AA PLC 154 0.01 87 Aberdeen Asset Management PLC 291 0.02 15 Acacia Mining PLC 74 – 4 Acal PLC 11 –
14 Admiral Group PLC 321 0.02 56 Afren PLC – – 21 Aggreko PLC 211 0.01 8 Aldermore Group PLC 22 –
21 AMEC PLC 112 0.01 61 Anglo American PLC 910 0.05 17 Anglo Pacific Group PLC 24 – 2 Anglo-Eastern Plantations PLC 12 –
35 Antofagasta PLC 300 0.02 7 Arrow Global Group PLC 27 –
25 Ashmore Group PLC 85 0.01 39 Ashtead Group PLC 770 0.05 8 Associated British Foods PLC 241 0.01
43 AstraZeneca PLC 2,241 0.13 69 Auto Trader Group PLC 346 0.02 3 Aveva Group PLC 68 –
164 Aviva PLC 914 0.05 2 Avon Rubber PLC 20 –
28 B&M European Value Retail SA 88 0.01 38 Babcock International Group PLC 452 0.03
176 BAE Systems PLC 1,323 0.08 45 Balfour Beatty PLC 151 0.01
442 Barclays PLC 1,189 0.07 86 Barratt Developments PLC 505 0.03 72 BBA Aviation PLC 238 0.01 41 Beazley PLC 195 0.01 11 Bellway PLC 335 0.02 14 Berendsen PLC 151 0.01 11 Berkeley Group Holdings PLC 343 0.02 3 BGEO Group PLC 122 0.01
82 BHP Billiton PLC 1,350 0.08 11 Bloomsbury Publishing PLC 23 – 16 Bodycote PLC 112 0.01
103 Booker Group PLC 222 0.01 5 Boot Henry PLC 12 –
14 Bovis Homes Group PLC 138 0.01 819 BP PLC 4,749 0.28
5 Braemar Shipping Services PLC 20 – 7 Brammer PLC 16 –
21 Brewin Dolphin Holdings PLC 77 0.01 57 British American Tobacco PLC 3,103 0.18 17 Britvic PLC 119 0.01
300 BT Group PLC 1,336 0.08 15 BTG PLC 107 0.01 15 Bunzl PLC 376 0.02 31 Burberry Group PLC 551 0.03 51 Cairn Energy PLC 134 0.01
010_3771524762911.indd���43 2017/10/11���13:01:30

- 44 -
1.ディメンショナル・ファンズ・ピーエルシー グローバル・コア・エクイティ・ファンド
Shares (000's)
Value(000's)
USD
% of NetAssetValue
Common Stock (continued)United Kingdom - 6.16% (continued)
6 Cambian Group PLC 9 – 11 Cape PLC 19 – 33 Capita PLC 214 0.01 48 Capital & Counties Properties PLC 170 0.01 11 Card Factory PLC 35 – 43 Carillion PLC 132 0.01 4 Carnival PLC 228 0.01 2 Castings PLC 8 –
96 Centamin PLC 157 0.01 310 Centrica PLC 815 0.05
21 Chemring Group PLC 44 – 4 Chesnara PLC 15 –
14 Cineworld Group PLC 96 0.01 6 Circassia Pharmaceuticals Plc 7 – 2 Clarkson PLC 49 –
13 Close Brothers Group PLC 222 0.01 1 CLS Holdings PLC 23 –
123 Cobham PLC 252 0.02 15 Coca-Cola HBC AG 314 0.02 21 Communisis PLC 10 – 57 Compass Group PLC 968 0.06 8 Computacenter PLC 72 – 2 Consort Medical PLC 30 – 5 Costain Group PLC 21 – 9 Countrywide PLC 19 – 3 Cranswick PLC 72 –
19 Crest Nicholson Holdings plc 102 0.01 9 Croda International PLC 386 0.02
16 CYBG PLC 56 – 1 Daejan Holdings PLC 50 –
16 Daily Mail & General Trust PLC 149 0.01 9 Dairy Crest Group PLC 64 – 4 DCC PLC 335 0.02 9 De La Rue PLC 66 –
95 Debenhams PLC 65 – 4 Dechra Pharmaceuticals PLC 72 –
16 Devro PLC 28 – 80 Diageo PLC 2,013 0.12 3 Dialight PLC 22 – 3 Dignity PLC 94 0.01 9 Diploma PLC 106 0.01
110 Direct Line Insurance Group PLC 477 0.03 67 Dixons Carphone PLC 276 0.02 30 Domino's Pizza Group PLC 130 0.01 39 Drax Group PLC 139 0.01 66 DS Smith PLC 323 0.02 6 Dunelm Group PLC 60 – 9 e2v technologies PLC 20 – 9 easyJet PLC 113 0.01
29 Electrocomponents PLC 160 0.01 42 Elementis PLC 133 0.01
133 EnQuest PLC 50 – 41 Enterprise Inns PLC 56 – 2 Entertainment One Ltd 6 –
21 esure Group PLC 52 – 4 Euromoney Institutional Investor PLC 49 –
30 Evraz PLC 89 0.01 45 Experian PLC 855 0.05 2 FDM Group Holdings PLC 15 –
15 Fenner PLC 46 – 13 Ferrexpo PLC 21 – 3 Fidessa Group PLC 72 –
16 Filtrona PLC 81 0.01
Shares (000's)
Value(000's)
USD
% of NetAssetValue
Common Stock (continued)United Kingdom - 6.16% (continued)
111 Firstgroup PLC 142 0.01 12 Foxtons Group PLC 15 – 10 Fresnillo PLC 151 0.01 1 Fuller Smith & Turner PLC 8 –
97 G4S PLC 297 0.02 7 Galliford Try PLC 113 0.01 4 GAME Digital PLC 3 – – Games Workshop Group PLC 3 –
11 Gem Diamonds Ltd 14 – 5 Genus PLC 109 0.01
154 GKN PLC 596 0.04 147 GlaxoSmithKline PLC 2,744 0.16 323 Glencore PLC 1,130 0.07
3 Go-Ahead Group PLC 67 – 21 Gocompare.Com Group PLC 16 – 17 Grafton Group PLC 115 0.01 30 Grainger PLC 85 0.01 25 Greencore Group PLC 90 0.01 26 Greene King PLC 224 0.01 6 Greggs PLC 66 –
43 Gulf Keystone Petroleum Ltd 1 – 11 Gulf Marine Services PLC 7 – 16 GVC Holdings PLC 133 0.01 16 Halfords Group PLC 67 – 27 Halma PLC 315 0.02 17 Hargreaves Lansdown PLC 243 0.01 94 Hays PLC 164 0.01 7 Headlam Group PLC 42 – 9 Helical PLC 34 –
73 Henderson Group PLC 211 0.01 9 Hikma Pharmaceuticals PLC 194 0.01 6 Hill & Smith Holdings PLC 89 0.01 1 Hilton Food Group PLC 10 –
20 Hiscox Ltd 266 0.02 24 Hochschild Mining PLC 65 – 14 Hogg Robinson Group PLC 12 – 17 HomeServe PLC 133 0.01 40 Howden Joinery Group PLC 179 0.01
566 HSBC Holdings PLC 4,484 0.26 15 Hunting PLC 99 0.01 6 Huntsworth PLC 3 –
35 ICAP PLC 216 0.01 23 IG Group Holdings PLC 237 0.01 9 IHS Markit Ltd 338 0.02
22 Imagination Technologies Group PLC 61 – 17 IMI PLC 204 0.01 29 Imperial Tobacco Group PLC 1,225 0.07 34 Inchcape PLC 257 0.02 53 Indivior PLC 212 0.01 58 Informa PLC 469 0.03 35 Inmarsat PLC 315 0.02 13 InterContinental Hotels Group PLC 539 0.03 21 Intermediate Capital Group PLC 177 0.01 47 International Consolidated Airlines Group SA 255 0.02 13 International Personal Finance PLC 44 – 8 Interserve PLC 31 –
11 Intertek Group PLC 450 0.03 55 Investec PLC 359 0.02 20 IP Group PLC 34 – 19 ITE Group PLC 35 –
175 ITV PLC 368 0.02 145 J Sainsbury PLC 419 0.03
5 James Fisher & Sons PLC 92 0.01
010_3771524762911.indd���44 2017/10/11���13:01:30
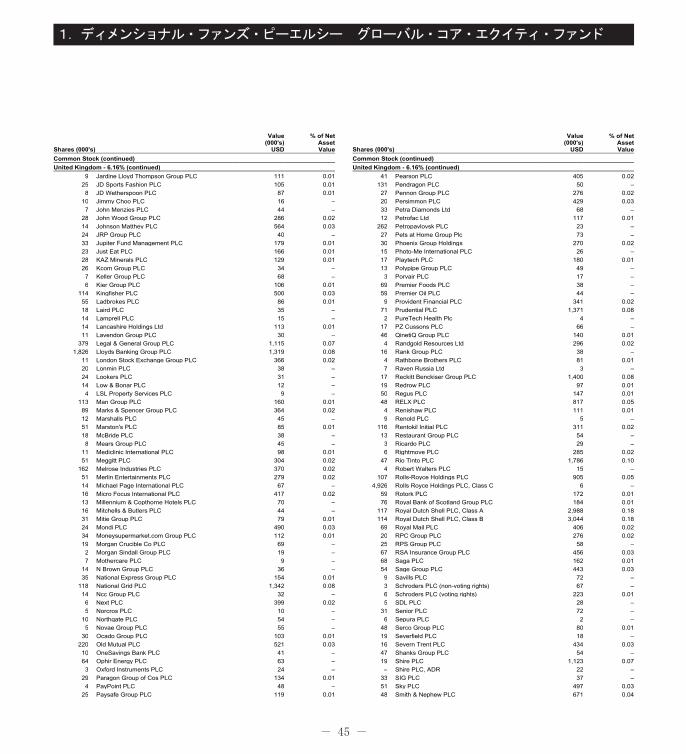
- 45 -
1.ディメンショナル・ファンズ・ピーエルシー グローバル・コア・エクイティ・ファンド
Shares (000's)
Value(000's)
USD
% of NetAssetValue
Common Stock (continued)United Kingdom - 6.16% (continued)
9 Jardine Lloyd Thompson Group PLC 111 0.01 25 JD Sports Fashion PLC 105 0.01 8 JD Wetherspoon PLC 87 0.01
10 Jimmy Choo PLC 16 – 7 John Menzies PLC 44 –
28 John Wood Group PLC 286 0.02 14 Johnson Matthey PLC 564 0.03 24 JRP Group PLC 40 – 33 Jupiter Fund Management PLC 179 0.01 23 Just Eat PLC 166 0.01 28 KAZ Minerals PLC 129 0.01 26 Kcom Group PLC 34 – 7 Keller Group PLC 68 – 6 Kier Group PLC 106 0.01
114 Kingfisher PLC 500 0.03 55 Ladbrokes PLC 86 0.01 18 Laird PLC 35 – 14 Lamprell PLC 15 – 14 Lancashire Holdings Ltd 113 0.01 11 Lavendon Group PLC 30 –
379 Legal & General Group PLC 1,115 0.07 1,826 Lloyds Banking Group PLC 1,319 0.08
11 London Stock Exchange Group PLC 366 0.02 20 Lonmin PLC 38 – 24 Lookers PLC 31 – 14 Low & Bonar PLC 12 – 4 LSL Property Services PLC 9 –
113 Man Group PLC 160 0.01 89 Marks & Spencer Group PLC 364 0.02 12 Marshalls PLC 45 – 51 Marston's PLC 85 0.01 18 McBride PLC 38 – 8 Mears Group PLC 45 –
11 Mediclinic International PLC 98 0.01 51 Meggitt PLC 304 0.02
162 Melrose Industries PLC 370 0.02 51 Merlin Entertainments PLC 279 0.02 14 Michael Page International PLC 67 – 16 Micro Focus International PLC 417 0.02 13 Millennium & Copthorne Hotels PLC 70 – 16 Mitchells & Butlers PLC 44 – 31 Mitie Group PLC 79 0.01 24 Mondi PLC 490 0.03 34 Moneysupermarket.com Group PLC 112 0.01 19 Morgan Crucible Co PLC 69 – 2 Morgan Sindall Group PLC 19 – 7 Mothercare PLC 9 –
14 N Brown Group PLC 36 – 35 National Express Group PLC 154 0.01
118 National Grid PLC 1,342 0.08 14 Ncc Group PLC 32 – 6 Next PLC 399 0.02 5 Norcros PLC 10 –
10 Northgate PLC 54 – 5 Novae Group PLC 55 –
30 Ocado Group PLC 103 0.01 220 Old Mutual PLC 521 0.03
10 OneSavings Bank PLC 41 – 64 Ophir Energy PLC 63 – 3 Oxford Instruments PLC 24 –
29 Paragon Group of Cos PLC 134 0.01 4 PayPoint PLC 48 –
25 Paysafe Group PLC 119 0.01
Shares (000's)
Value(000's)
USD
% of NetAssetValue
Common Stock (continued)United Kingdom - 6.16% (continued)
41 Pearson PLC 405 0.02 131 Pendragon PLC 50 –
27 Pennon Group PLC 276 0.02 20 Persimmon PLC 429 0.03 33 Petra Diamonds Ltd 68 – 12 Petrofac Ltd 117 0.01
262 Petropavlovsk PLC 23 – 27 Pets at Home Group Plc 73 – 30 Phoenix Group Holdings 270 0.02 15 Photo-Me International PLC 26 – 17 Playtech PLC 180 0.01 13 Polypipe Group PLC 49 – 3 Porvair PLC 17 –
69 Premier Foods PLC 38 – 59 Premier Oil PLC 44 – 9 Provident Financial PLC 341 0.02
71 Prudential PLC 1,371 0.08 2 PureTech Health Plc 4 –
17 PZ Cussons PLC 66 – 46 QinetiQ Group PLC 140 0.01 4 Randgold Resources Ltd 296 0.02
16 Rank Group PLC 38 – 4 Rathbone Brothers PLC 81 0.01 7 Raven Russia Ltd 3 –
17 Reckitt Benckiser Group PLC 1,400 0.08 19 Redrow PLC 97 0.01 50 Regus PLC 147 0.01 48 RELX PLC 817 0.05 4 Renishaw PLC 111 0.01 9 Renold PLC 5 –
116 Rentokil Initial PLC 311 0.02 13 Restaurant Group PLC 54 – 3 Ricardo PLC 29 – 6 Rightmove PLC 285 0.02
47 Rio Tinto PLC 1,786 0.10 4 Robert Walters PLC 15 –
107 Rolls-Royce Holdings PLC 905 0.05 4,926 Rolls Royce Holdings PLC, Class C 6 –
59 Rotork PLC 172 0.01 76 Royal Bank of Scotland Group PLC 184 0.01
117 Royal Dutch Shell PLC, Class A 2,988 0.18 114 Royal Dutch Shell PLC, Class B 3,044 0.18
69 Royal Mail PLC 406 0.02 20 RPC Group PLC 276 0.02 25 RPS Group PLC 58 – 67 RSA Insurance Group PLC 456 0.03 68 Saga PLC 162 0.01 54 Sage Group PLC 443 0.03 9 Savills PLC 72 – 3 Schroders PLC (non-voting rights) 67 – 6 Schroders PLC (voting rights) 223 0.01 5 SDL PLC 28 –
31 Senior PLC 72 – 6 Sepura PLC 2 –
48 Serco Group PLC 80 0.01 19 Severfield PLC 18 – 16 Severn Trent PLC 434 0.03 47 Shanks Group PLC 54 – 19 Shire PLC 1,123 0.07 – Shire PLC, ADR 22 –
33 SIG PLC 37 – 51 Sky PLC 497 0.03 48 Smith & Nephew PLC 671 0.04
010_3771524762911.indd���45 2017/10/11���13:01:31

- 46 -
1.ディメンショナル・ファンズ・ピーエルシー グローバル・コア・エクイティ・ファンド
Shares (000's)
Value(000's)
USD
% of NetAssetValue
Common Stock (continued)United Kingdom - 6.16% (continued)
35 Smiths Group PLC 625 0.04 12 Smiths News PLC 21 – 12 Soco International PLC 21 – 10 Spectris PLC 250 0.02 51 Speedy Hire PLC 28 – 5 Spirax-Sarco Engineering PLC 268 0.02
12 Spire Healthcare Group PLC 54 – 48 Spirent Communications PLC 48 – 12 Sportech PLC 11 – 14 Sports Direct International PLC 54 – 56 SSE PLC 1,034 0.06 24 SSP Group PLC 109 0.01 15 St Ives PLC 23 – 33 St James's Place PLC 386 0.02 21 St Modwen Properties PLC 75 – 23 Stagecoach Group PLC 58 – 93 Standard Chartered PLC 742 0.04 89 Standard Life PLC 385 0.02 6 SThree PLC 20 –
17 Stobart Group Ltd 34 – 2 SuperGroup PLC 45 –
22 Synthomer PLC 103 0.01 33 TalkTalk Telecom Group PLC 66 – 3 Tarsus Group PLC 11 –
20 Tate & Lyle PLC 172 0.01 222 Taylor Wimpey PLC 411 0.02
2 Ted Baker PLC 60 – 5 Telecom Plus PLC 73 –
434 Tesco PLC 1,133 0.07 99 Thomas Cook Group PLC 105 0.01 11 Topps Tiles PLC 12 – 17 Travis Perkins PLC 286 0.02 3 Trifast PLC 6 –
27 Trinity Mirror PLC 27 – 14 TT Electronics PLC 25 – 28 TUI AG 375 0.02 21 Tullett Prebon PLC 119 0.01 75 Tullow Oil PLC 281 0.02 6 Tyman PLC 18 –
13 U & I Group PLC 28 – 26 UBM PLC 235 0.01 18 UDG Healthcare PLC 148 0.01 4 Ultra Electronics Holdings PLC 112 0.01
38 Unilever PLC 1,524 0.09 16 UNITE Group PLC 109 0.01 39 United Utilities Group PLC 428 0.03 24 Vectura Group PLC 43 – 7 Vedanta Resources PLC 70 –
22 Vesuvius PLC 108 0.01 6 Victrex PLC 137 0.01
14 Virgin Money Holdings UK PLC 54 – 1 Vitec Group PLC 5 –
909 Vodafone Group PLC 2,196 0.13 1 Vp PLC 11 –
15 Weir Group PLC 348 0.02 7 WH Smith PLC 137 0.01 9 Whitbread PLC 397 0.02
67 William Hill PLC 253 0.02 8 Wincanton PLC 23 –
183 Wm Morrison Supermarkets PLC 497 0.03 13 Wolseley PLC 781 0.05 26 Worldpay Group PLC 88 0.01 37 WPP PLC 800 0.05
Shares (000's)
Value(000's)
USD
% of NetAssetValue
Common Stock (continued)United Kingdom - 6.16% (continued)
8 WS Atkins PLC 137 0.01 5 Xaar PLC 24 – 1 XP Power Ltd 14 –
13 Zoopla Property Group PLC 53 – 105,502 6.16
United States - 57.65%2 1-800-Flowers.com Inc 25 – 2 1st Source Corp 71 – 3 3D Systems Corp 39 –
19 3M Co 3,222 0.19 2 A H Belo Corp 13 – 3 A Schulman Inc 95 0.01 2 A-Mark Precious Metals Inc 25 – 4 AAON Inc 117 0.01 3 AAR Corp 123 0.01 6 Aaron's Inc 181 0.01 1 Abaxis Inc 40 –
46 Abbott Laboratories 1,759 0.10 50 AbbVie Inc 3,067 0.18 2 Abeona Therapeutics Inc 11 – 5 Abercrombie & Fitch Co 66 – 2 ABIOMED Inc 202 0.01 5 ABM Industries Inc 223 0.01 9 Abraxas Petroleum Corp 19 – 2 Acacia Research Corp 14 – 6 Acadia Healthcare Co Inc 244 0.01
19 Accenture PLC 2,243 0.13 2 Access National Corp 59 – 9 ACCO Brands Corp 117 0.01 3 Accretive Health Inc 8 – 5 Accuray Inc 28 – 2 Aceto Corp 44 –
11 ACI Worldwide Inc 196 0.01 1 ACNB Corp 20 – 3 Acorda Therapeutics Inc 52 –
29 Activision Blizzard Inc 1,053 0.06 3 Actua Corp 47 – 4 Actuant Corp 106 0.01 3 Acuity Brands Inc 730 0.04 6 Acxiom Corp 161 0.01 3 Adamas Pharmaceuticals Inc 51 – 1 Adams Resources & Energy Inc 20 – 1 Addus HomeCare Corp 42 – 1 Adeptus Health Inc 5 – 9 Adobe Systems Inc 891 0.05 4 ADTRAN Inc 86 0.01 4 Advance Auto Parts Inc 622 0.04 2 Advanced Drainage Systems Inc 51 – 2 Advanced Energy Industries Inc 138 0.01
64 Advanced Micro Devices Inc 571 0.03 1 AdvanSix Inc 18 – 3 Advisory Board Co 93 0.01
14 AECOM 497 0.03 2 Aegion Corp 58 – 1 AEP Industries Inc 97 0.01 4 Aerojet Rocketdyne Holdings Inc 89 0.01 3 Aerovironment Inc 81 0.01
46 AES Corp 530 0.03 14 Aetna Inc 1,893 0.11 4 Affiliated Managers Group Inc 543 0.03
21 Aflac Inc 1,510 0.09 7 AGCO Corp 393 0.02
16 Agilent Technologies Inc 712 0.04
010_3771524762911.indd���46 2017/10/11���13:01:31
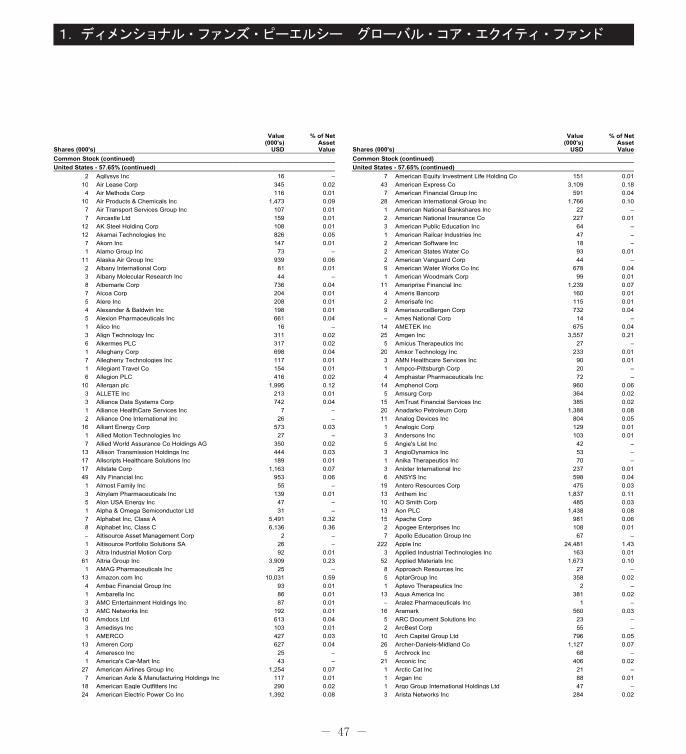
- 47 -
1.ディメンショナル・ファンズ・ピーエルシー グローバル・コア・エクイティ・ファンド
Shares (000's)
Value(000's)
USD
% of NetAssetValue
Common Stock (continued)United States - 57.65% (continued)
2 Agilysys Inc 16 – 10 Air Lease Corp 345 0.02 4 Air Methods Corp 116 0.01
10 Air Products & Chemicals Inc 1,473 0.09 7 Air Transport Services Group Inc 107 0.01 7 Aircastle Ltd 159 0.01
12 AK Steel Holding Corp 108 0.01 12 Akamai Technologies Inc 826 0.05 7 Akorn Inc 147 0.01 1 Alamo Group Inc 73 –
11 Alaska Air Group Inc 939 0.06 2 Albany International Corp 81 0.01 3 Albany Molecular Research Inc 44 – 8 Albemarle Corp 736 0.04 7 Alcoa Corp 204 0.01 5 Alere Inc 208 0.01 4 Alexander & Baldwin Inc 198 0.01 5 Alexion Pharmaceuticals Inc 661 0.04 1 Alico Inc 16 – 3 Align Technology Inc 311 0.02 6 Alkermes PLC 317 0.02 1 Alleghany Corp 698 0.04 7 Allegheny Technologies Inc 117 0.01 1 Allegiant Travel Co 154 0.01 6 Allegion PLC 416 0.02
10 Allergan plc 1,995 0.12 3 ALLETE Inc 213 0.01 3 Alliance Data Systems Corp 742 0.04 1 Alliance HealthCare Services Inc 7 – 2 Alliance One International Inc 26 –
16 Alliant Energy Corp 573 0.03 1 Allied Motion Technologies Inc 27 – 7 Allied World Assurance Co Holdings AG 350 0.02
13 Allison Transmission Holdings Inc 444 0.03 17 Allscripts Healthcare Solutions Inc 189 0.01 17 Allstate Corp 1,163 0.07 49 Ally Financial Inc 953 0.06 1 Almost Family Inc 55 – 3 Alnylam Pharmaceuticals Inc 139 0.01 5 Alon USA Energy Inc 47 – 1 Alpha & Omega Semiconductor Ltd 31 – 7 Alphabet Inc, Class A 5,491 0.32 8 Alphabet Inc, Class C 6,136 0.36 – Altisource Asset Management Corp 2 – 1 Altisource Portfolio Solutions SA 26 – 3 Altra Industrial Motion Corp 92 0.01
61 Altria Group Inc 3,909 0.23 1 AMAG Pharmaceuticals Inc 25 –
13 Amazon.com Inc 10,031 0.59 4 Ambac Financial Group Inc 93 0.01 1 Ambarella Inc 86 0.01 3 AMC Entertainment Holdings Inc 87 0.01 3 AMC Networks Inc 192 0.01
10 Amdocs Ltd 613 0.04 3 Amedisys Inc 103 0.01 1 AMERCO 427 0.03
13 Ameren Corp 627 0.04 4 Ameresco Inc 25 – 1 America's Car-Mart Inc 43 –
27 American Airlines Group Inc 1,254 0.07 7 American Axle & Manufacturing Holdings Inc 117 0.01
18 American Eagle Outfitters Inc 290 0.02 24 American Electric Power Co Inc 1,392 0.08
Shares (000's)
Value(000's)
USD
% of NetAssetValue
Common Stock (continued)United States - 57.65% (continued)
7 American Equity Investment Life Holding Co 151 0.01 43 American Express Co 3,109 0.18 7 American Financial Group Inc 591 0.04
28 American International Group Inc 1,766 0.10 1 American National Bankshares Inc 22 – 2 American National Insurance Co 227 0.01 3 American Public Education Inc 64 – 1 American Railcar Industries Inc 47 – 2 American Software Inc 18 – 2 American States Water Co 93 0.01 2 American Vanguard Corp 44 – 9 American Water Works Co Inc 678 0.04 1 American Woodmark Corp 99 0.01
11 Ameriprise Financial Inc 1,239 0.07 4 Ameris Bancorp 160 0.01 2 Amerisafe Inc 115 0.01 9 AmerisourceBergen Corp 732 0.04 – Ames National Corp 14 –
14 AMETEK Inc 675 0.04 25 Amgen Inc 3,557 0.21 5 Amicus Therapeutics Inc 27 –
20 Amkor Technology Inc 233 0.01 3 AMN Healthcare Services Inc 90 0.01 1 Ampco-Pittsburgh Corp 20 – 4 Amphastar Pharmaceuticals Inc 72 –
14 Amphenol Corp 960 0.06 5 Amsurg Corp 364 0.02
15 AmTrust Financial Services Inc 385 0.02 20 Anadarko Petroleum Corp 1,388 0.08 11 Analog Devices Inc 804 0.05 1 Analogic Corp 129 0.01 3 Andersons Inc 103 0.01 5 Angie's List Inc 42 – 3 AngioDynamics Inc 53 – 1 Anika Therapeutics Inc 70 – 3 Anixter International Inc 237 0.01 6 ANSYS Inc 598 0.04
19 Antero Resources Corp 475 0.03 13 Anthem Inc 1,837 0.11 10 AO Smith Corp 485 0.03 13 Aon PLC 1,438 0.08 15 Apache Corp 981 0.06 2 Apogee Enterprises Inc 108 0.01 7 Apollo Education Group Inc 67 –
222 Apple Inc 24,481 1.43 3 Applied Industrial Technologies Inc 163 0.01
52 Applied Materials Inc 1,673 0.10 8 Approach Resources Inc 27 – 5 AptarGroup Inc 358 0.02 1 Aptevo Therapeutics Inc 2 –
13 Aqua America Inc 381 0.02 – Aralez Pharmaceuticals Inc 1 –
16 Aramark 560 0.03 5 ARC Document Solutions Inc 23 – 2 ArcBest Corp 55 –
10 Arch Capital Group Ltd 796 0.05 26 Archer-Daniels-Midland Co 1,127 0.07 5 Archrock Inc 68 –
21 Arconic Inc 406 0.02 1 Arctic Cat Inc 21 – 1 Argan Inc 88 0.01 1 Argo Group International Holdings Ltd 47 – 3 Arista Networks Inc 284 0.02
010_3771524762911.indd���47 2017/10/11���13:01:31
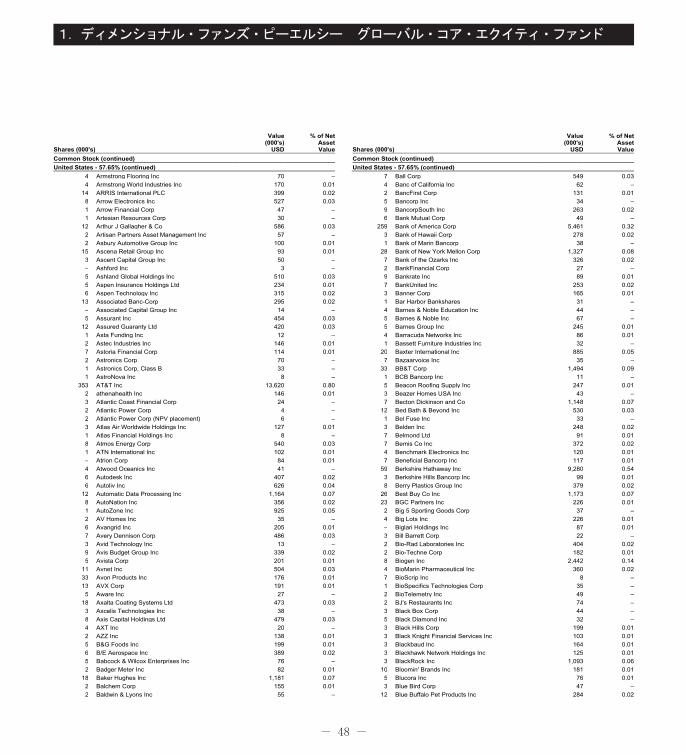
- 48 -
1.ディメンショナル・ファンズ・ピーエルシー グローバル・コア・エクイティ・ファンド
Shares (000's)
Value(000's)
USD
% of NetAssetValue
Common Stock (continued)United States - 57.65% (continued)
4 Armstrong Flooring Inc 70 – 4 Armstrong World Industries Inc 170 0.01
14 ARRIS International PLC 399 0.02 8 Arrow Electronics Inc 527 0.03 1 Arrow Financial Corp 47 – 1 Artesian Resources Corp 30 –
12 Arthur J Gallagher & Co 586 0.03 2 Artisan Partners Asset Management Inc 57 – 2 Asbury Automotive Group Inc 100 0.01
15 Ascena Retail Group Inc 93 0.01 3 Ascent Capital Group Inc 50 – – Ashford Inc 3 – 5 Ashland Global Holdings Inc 510 0.03 5 Aspen Insurance Holdings Ltd 234 0.01 6 Aspen Technology Inc 315 0.02
13 Associated Banc-Corp 295 0.02 – Associated Capital Group Inc 14 – 5 Assurant Inc 454 0.03
12 Assured Guaranty Ltd 420 0.03 1 Asta Funding Inc 12 – 2 Astec Industries Inc 146 0.01 7 Astoria Financial Corp 114 0.01 2 Astronics Corp 70 – 1 Astronics Corp, Class B 33 – 1 AstroNova Inc 8 –
353 AT&T Inc 13,620 0.80 2 athenahealth Inc 146 0.01 3 Atlantic Coast Financial Corp 24 – 2 Atlantic Power Corp 4 – 2 Atlantic Power Corp (NPV placement) 6 – 3 Atlas Air Worldwide Holdings Inc 127 0.01 1 Atlas Financial Holdings Inc 8 – 8 Atmos Energy Corp 540 0.03 1 ATN International Inc 102 0.01 – Atrion Corp 84 0.01 4 Atwood Oceanics Inc 41 – 6 Autodesk Inc 407 0.02 6 Autoliv Inc 626 0.04
12 Automatic Data Processing Inc 1,164 0.07 8 AutoNation Inc 356 0.02 1 AutoZone Inc 925 0.05 2 AV Homes Inc 35 – 6 Avangrid Inc 205 0.01 7 Avery Dennison Corp 486 0.03 3 Avid Technology Inc 13 – 9 Avis Budget Group Inc 339 0.02 5 Avista Corp 201 0.01
11 Avnet Inc 504 0.03 33 Avon Products Inc 176 0.01 13 AVX Corp 191 0.01 5 Aware Inc 27 –
18 Axalta Coating Systems Ltd 473 0.03 3 Axcelis Technologies Inc 38 – 8 Axis Capital Holdings Ltd 479 0.03 4 AXT Inc 20 – 2 AZZ Inc 138 0.01 5 B&G Foods Inc 199 0.01 6 B/E Aerospace Inc 389 0.02 5 Babcock & Wilcox Enterprises Inc 76 – 2 Badger Meter Inc 82 0.01
18 Baker Hughes Inc 1,181 0.07 2 Balchem Corp 155 0.01 2 Baldwin & Lyons Inc 55 –
Shares (000's)
Value(000's)
USD
% of NetAssetValue
Common Stock (continued)United States - 57.65% (continued)
7 Ball Corp 549 0.03 4 Banc of California Inc 62 – 2 BancFirst Corp 131 0.01 5 Bancorp Inc 34 – 9 BancorpSouth Inc 263 0.02 6 Bank Mutual Corp 49 –
259 Bank of America Corp 5,461 0.32 3 Bank of Hawaii Corp 278 0.02 1 Bank of Marin Bancorp 38 –
28 Bank of New York Mellon Corp 1,327 0.08 7 Bank of the Ozarks Inc 326 0.02 2 BankFinancial Corp 27 – 9 Bankrate Inc 89 0.01 7 BankUnited Inc 253 0.02 3 Banner Corp 165 0.01 1 Bar Harbor Bankshares 31 – 4 Barnes & Noble Education Inc 44 – 5 Barnes & Noble Inc 67 – 5 Barnes Group Inc 245 0.01 4 Barracuda Networks Inc 86 0.01 1 Bassett Furniture Industries Inc 32 –
20 Baxter International Inc 885 0.05 7 Bazaarvoice Inc 35 –
33 BB&T Corp 1,494 0.09 1 BCB Bancorp Inc 11 – 5 Beacon Roofing Supply Inc 247 0.01 3 Beazer Homes USA Inc 43 – 7 Becton Dickinson and Co 1,148 0.07
12 Bed Bath & Beyond Inc 530 0.03 1 Bel Fuse Inc 33 – 3 Belden Inc 248 0.02 7 Belmond Ltd 91 0.01 7 Bemis Co Inc 372 0.02 4 Benchmark Electronics Inc 120 0.01 7 Beneficial Bancorp Inc 117 0.01
59 Berkshire Hathaway Inc 9,280 0.54 3 Berkshire Hills Bancorp Inc 99 0.01 8 Berry Plastics Group Inc 379 0.02
26 Best Buy Co Inc 1,173 0.07 23 BGC Partners Inc 226 0.01 2 Big 5 Sporting Goods Corp 37 – 4 Big Lots Inc 226 0.01 – Biglari Holdings Inc 87 0.01 3 Bill Barrett Corp 22 – 2 Bio-Rad Laboratories Inc 404 0.02 2 Bio-Techne Corp 182 0.01 8 Biogen Inc 2,442 0.14 4 BioMarin Pharmaceutical Inc 360 0.02 7 BioScrip Inc 8 – 1 BioSpecifics Technologies Corp 35 – 2 BioTelemetry Inc 49 – 2 BJ's Restaurants Inc 74 – 3 Black Box Corp 44 – 5 Black Diamond Inc 32 – 3 Black Hills Corp 199 0.01 3 Black Knight Financial Services Inc 103 0.01 3 Blackbaud Inc 164 0.01 3 Blackhawk Network Holdings Inc 125 0.01 3 BlackRock Inc 1,093 0.06
10 Bloomin' Brands Inc 181 0.01 5 Blucora Inc 76 0.01 3 Blue Bird Corp 47 –
12 Blue Buffalo Pet Products Inc 284 0.02
010_3771524762911.indd���48 2017/10/11���13:01:32
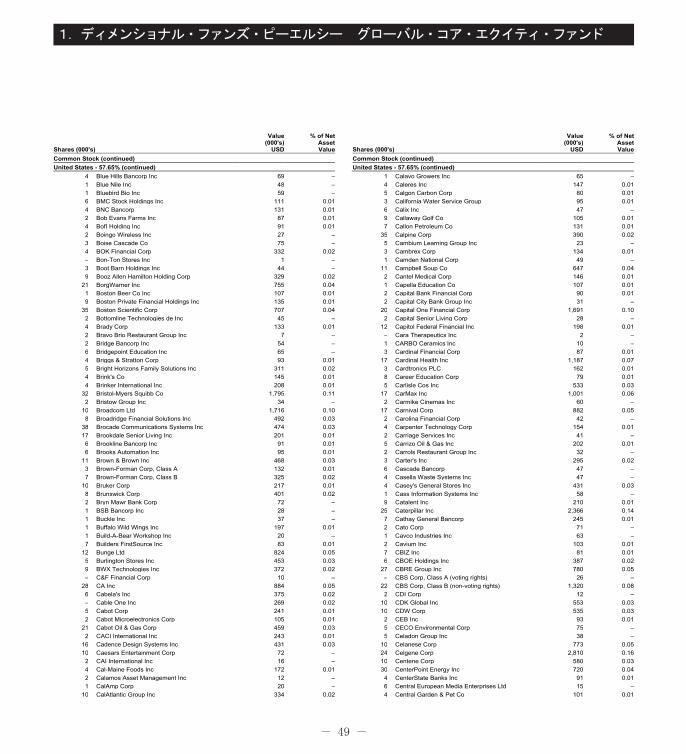
- 49 -
1.ディメンショナル・ファンズ・ピーエルシー グローバル・コア・エクイティ・ファンド
Shares (000's)
Value(000's)
USD
% of NetAssetValue
Common Stock (continued)United States - 57.65% (continued)
4 Blue Hills Bancorp Inc 69 – 1 Blue Nile Inc 48 – 1 Bluebird Bio Inc 59 – 6 BMC Stock Holdings Inc 111 0.01 4 BNC Bancorp 131 0.01 2 Bob Evans Farms Inc 87 0.01 4 BofI Holding Inc 91 0.01 2 Boingo Wireless Inc 27 – 3 Boise Cascade Co 75 – 4 BOK Financial Corp 332 0.02 – Bon-Ton Stores Inc 1 – 3 Boot Barn Holdings Inc 44 – 9 Booz Allen Hamilton Holding Corp 329 0.02
21 BorgWarner Inc 755 0.04 1 Boston Beer Co Inc 107 0.01 9 Boston Private Financial Holdings Inc 135 0.01
35 Boston Scientific Corp 707 0.04 2 Bottomline Technologies de Inc 45 – 4 Brady Corp 133 0.01 2 Bravo Brio Restaurant Group Inc 7 – 2 Bridge Bancorp Inc 54 – 6 Bridgepoint Education Inc 65 – 4 Briggs & Stratton Corp 93 0.01 5 Bright Horizons Family Solutions Inc 311 0.02 4 Brink's Co 145 0.01 4 Brinker International Inc 208 0.01
32 Bristol-Myers Squibb Co 1,795 0.11 2 Bristow Group Inc 34 –
10 Broadcom Ltd 1,716 0.10 8 Broadridge Financial Solutions Inc 492 0.03
38 Brocade Communications Systems Inc 474 0.03 17 Brookdale Senior Living Inc 201 0.01 6 Brookline Bancorp Inc 91 0.01 6 Brooks Automation Inc 95 0.01
11 Brown & Brown Inc 468 0.03 3 Brown-Forman Corp, Class A 132 0.01 7 Brown-Forman Corp, Class B 325 0.02
10 Bruker Corp 217 0.01 8 Brunswick Corp 401 0.02 2 Bryn Mawr Bank Corp 72 – 1 BSB Bancorp Inc 28 – 1 Buckle Inc 37 – 1 Buffalo Wild Wings Inc 197 0.01 1 Build-A-Bear Workshop Inc 20 – 7 Builders FirstSource Inc 83 0.01
12 Bunge Ltd 824 0.05 5 Burlington Stores Inc 453 0.03 9 BWX Technologies Inc 372 0.02 – C&F Financial Corp 10 –
28 CA Inc 884 0.05 6 Cabela's Inc 375 0.02 – Cable One Inc 269 0.02 5 Cabot Corp 241 0.01 2 Cabot Microelectronics Corp 105 0.01
21 Cabot Oil & Gas Corp 459 0.03 2 CACI International Inc 243 0.01
16 Cadence Design Systems Inc 431 0.03 10 Caesars Entertainment Corp 72 – 2 CAI International Inc 16 – 4 Cal-Maine Foods Inc 172 0.01 2 Calamos Asset Management Inc 12 – 1 CalAmp Corp 20 –
10 CalAtlantic Group Inc 334 0.02
Shares (000's)
Value(000's)
USD
% of NetAssetValue
Common Stock (continued)United States - 57.65% (continued)
1 Calavo Growers Inc 65 – 4 Caleres Inc 147 0.01 5 Calgon Carbon Corp 80 0.01 3 California Water Service Group 95 0.01 6 Calix Inc 47 – 9 Callaway Golf Co 105 0.01 7 Callon Petroleum Co 131 0.01
35 Calpine Corp 390 0.02 5 Cambium Learning Group Inc 23 – 3 Cambrex Corp 134 0.01 1 Camden National Corp 49 –
11 Campbell Soup Co 647 0.04 2 Cantel Medical Corp 146 0.01 1 Capella Education Co 107 0.01 2 Capital Bank Financial Corp 90 0.01 2 Capital City Bank Group Inc 31 –
20 Capital One Financial Corp 1,691 0.10 2 Capital Senior Living Corp 28 –
12 Capitol Federal Financial Inc 198 0.01 – Cara Therapeutics Inc 2 – 1 CARBO Ceramics Inc 10 – 3 Cardinal Financial Corp 87 0.01
17 Cardinal Health Inc 1,187 0.07 3 Cardtronics PLC 162 0.01 8 Career Education Corp 79 0.01 5 Carlisle Cos Inc 533 0.03
17 CarMax Inc 1,001 0.06 2 Carmike Cinemas Inc 60 –
17 Carnival Corp 882 0.05 2 Carolina Financial Corp 42 – 4 Carpenter Technology Corp 154 0.01 2 Carriage Services Inc 41 – 5 Carrizo Oil & Gas Inc 202 0.01 2 Carrols Restaurant Group Inc 32 – 3 Carter's Inc 295 0.02 6 Cascade Bancorp 47 – 4 Casella Waste Systems Inc 47 – 4 Casey's General Stores Inc 431 0.03 1 Cass Information Systems Inc 58 – 9 Catalent Inc 210 0.01
25 Caterpillar Inc 2,366 0.14 7 Cathay General Bancorp 245 0.01 2 Cato Corp 71 – 1 Cavco Industries Inc 63 – 2 Cavium Inc 103 0.01 7 CBIZ Inc 81 0.01 6 CBOE Holdings Inc 387 0.02
27 CBRE Group Inc 780 0.05 – CBS Corp, Class A (voting rights) 26 –
22 CBS Corp, Class B (non-voting rights) 1,320 0.08 2 CDI Corp 12 –
10 CDK Global Inc 553 0.03 10 CDW Corp 535 0.03 2 CEB Inc 93 0.01 5 CECO Environmental Corp 75 – 5 Celadon Group Inc 38 –
10 Celanese Corp 773 0.05 24 Celgene Corp 2,810 0.16 10 Centene Corp 580 0.03 30 CenterPoint Energy Inc 720 0.04 4 CenterState Banks Inc 91 0.01 6 Central European Media Enterprises Ltd 15 – 4 Central Garden & Pet Co 101 0.01
010_3771524762911.indd���49 2017/10/11���13:01:32
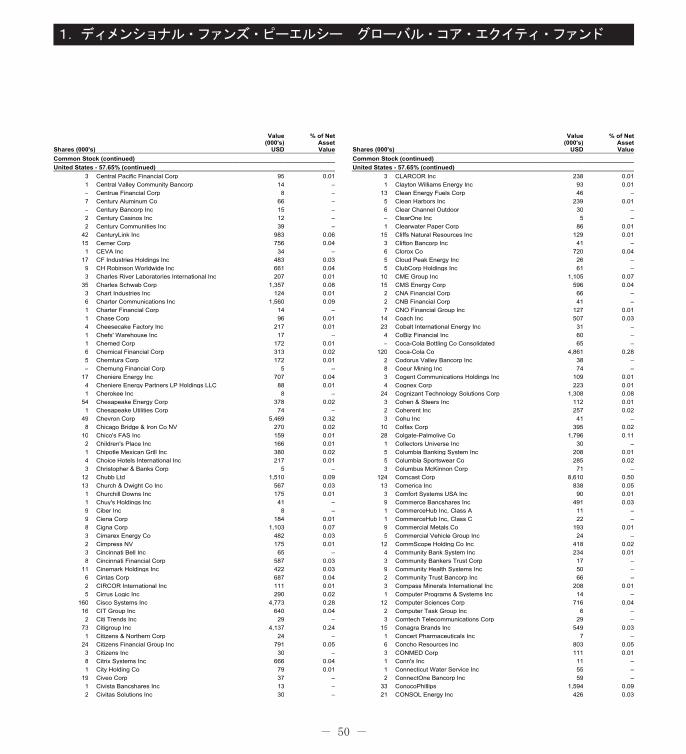
- 50 -
1.ディメンショナル・ファンズ・ピーエルシー グローバル・コア・エクイティ・ファンド
Shares (000's)
Value(000's)
USD
% of NetAssetValue
Common Stock (continued)United States - 57.65% (continued)
3 Central Pacific Financial Corp 95 0.01 1 Central Valley Community Bancorp 14 – – Centrue Financial Corp 8 – 7 Century Aluminum Co 66 – – Century Bancorp Inc 15 – 2 Century Casinos Inc 12 – 2 Century Communities Inc 39 –
42 CenturyLink Inc 983 0.06 15 Cerner Corp 756 0.04 1 CEVA Inc 34 –
17 CF Industries Holdings Inc 483 0.03 9 CH Robinson Worldwide Inc 661 0.04 3 Charles River Laboratories International Inc 207 0.01
35 Charles Schwab Corp 1,357 0.08 3 Chart Industries Inc 124 0.01 6 Charter Communications Inc 1,560 0.09 1 Charter Financial Corp 14 – 1 Chase Corp 96 0.01 4 Cheesecake Factory Inc 217 0.01 1 Chefs' Warehouse Inc 17 – 1 Chemed Corp 172 0.01 6 Chemical Financial Corp 313 0.02 5 Chemtura Corp 172 0.01 – Chemung Financial Corp 5 –
17 Cheniere Energy Inc 707 0.04 4 Cheniere Energy Partners LP Holdings LLC 88 0.01 1 Cherokee Inc 8 –
54 Chesapeake Energy Corp 378 0.02 1 Chesapeake Utilities Corp 74 –
49 Chevron Corp 5,469 0.32 8 Chicago Bridge & Iron Co NV 270 0.02
10 Chico's FAS Inc 159 0.01 2 Children's Place Inc 166 0.01 1 Chipotle Mexican Grill Inc 380 0.02 4 Choice Hotels International Inc 217 0.01 3 Christopher & Banks Corp 5 –
12 Chubb Ltd 1,510 0.09 13 Church & Dwight Co Inc 567 0.03 1 Churchill Downs Inc 175 0.01 1 Chuy's Holdings Inc 41 – 9 Ciber Inc 8 – 9 Ciena Corp 184 0.01 8 Cigna Corp 1,103 0.07 3 Cimarex Energy Co 482 0.03 2 Cimpress NV 175 0.01 3 Cincinnati Bell Inc 65 – 8 Cincinnati Financial Corp 587 0.03
11 Cinemark Holdings Inc 422 0.03 6 Cintas Corp 687 0.04 2 CIRCOR International Inc 111 0.01 5 Cirrus Logic Inc 290 0.02
160 Cisco Systems Inc 4,773 0.28 16 CIT Group Inc 640 0.04 2 Citi Trends Inc 29 –
73 Citigroup Inc 4,137 0.24 1 Citizens & Northern Corp 24 –
24 Citizens Financial Group Inc 791 0.05 3 Citizens Inc 30 – 8 Citrix Systems Inc 666 0.04 1 City Holding Co 79 0.01
19 Civeo Corp 37 – 1 Civista Bancshares Inc 13 – 2 Civitas Solutions Inc 30 –
Shares (000's)
Value(000's)
USD
% of NetAssetValue
Common Stock (continued)United States - 57.65% (continued)
3 CLARCOR Inc 238 0.01 1 Clayton Williams Energy Inc 93 0.01
13 Clean Energy Fuels Corp 46 – 5 Clean Harbors Inc 239 0.01 6 Clear Channel Outdoor 30 – – ClearOne Inc 5 – 1 Clearwater Paper Corp 86 0.01
15 Cliffs Natural Resources Inc 129 0.01 3 Clifton Bancorp Inc 41 – 6 Clorox Co 720 0.04 5 Cloud Peak Energy Inc 26 – 5 ClubCorp Holdings Inc 61 –
10 CME Group Inc 1,105 0.07 15 CMS Energy Corp 596 0.04 2 CNA Financial Corp 66 – 2 CNB Financial Corp 41 – 7 CNO Financial Group Inc 127 0.01
14 Coach Inc 507 0.03 23 Cobalt International Energy Inc 31 – 4 CoBiz Financial Inc 60 – – Coca-Cola Bottling Co Consolidated 65 –
120 Coca-Cola Co 4,861 0.28 2 Codorus Valley Bancorp Inc 38 – 8 Coeur Mining Inc 74 – 3 Cogent Communications Holdings Inc 109 0.01 4 Cognex Corp 223 0.01
24 Cognizant Technology Solutions Corp 1,308 0.08 3 Cohen & Steers Inc 112 0.01 2 Coherent Inc 257 0.02 3 Cohu Inc 41 –
10 Colfax Corp 395 0.02 28 Colgate-Palmolive Co 1,796 0.11 1 Collectors Universe Inc 30 – 5 Columbia Banking System Inc 208 0.01 5 Columbia Sportswear Co 285 0.02 3 Columbus McKinnon Corp 71 –
124 Comcast Corp 8,610 0.50 13 Comerica Inc 838 0.05 3 Comfort Systems USA Inc 90 0.01 9 Commerce Bancshares Inc 491 0.03 1 CommerceHub Inc, Class A 11 – 1 CommerceHub Inc, Class C 22 – 9 Commercial Metals Co 193 0.01 5 Commercial Vehicle Group Inc 24 –
12 CommScope Holding Co Inc 418 0.02 4 Community Bank System Inc 234 0.01 3 Community Bankers Trust Corp 17 – 9 Community Health Systems Inc 50 – 2 Community Trust Bancorp Inc 66 – 3 Compass Minerals International Inc 208 0.01 1 Computer Programs & Systems Inc 14 –
12 Computer Sciences Corp 716 0.04 2 Computer Task Group Inc 6 – 3 Comtech Telecommunications Corp 29 –
15 Conagra Brands Inc 549 0.03 1 Concert Pharmaceuticals Inc 7 – 6 Concho Resources Inc 803 0.05 3 CONMED Corp 111 0.01 1 Conn's Inc 11 – 1 Connecticut Water Service Inc 55 – 2 ConnectOne Bancorp Inc 59 –
33 ConocoPhillips 1,594 0.09 21 CONSOL Energy Inc 426 0.03
010_3771524762911.indd���50 2017/10/11���13:01:32
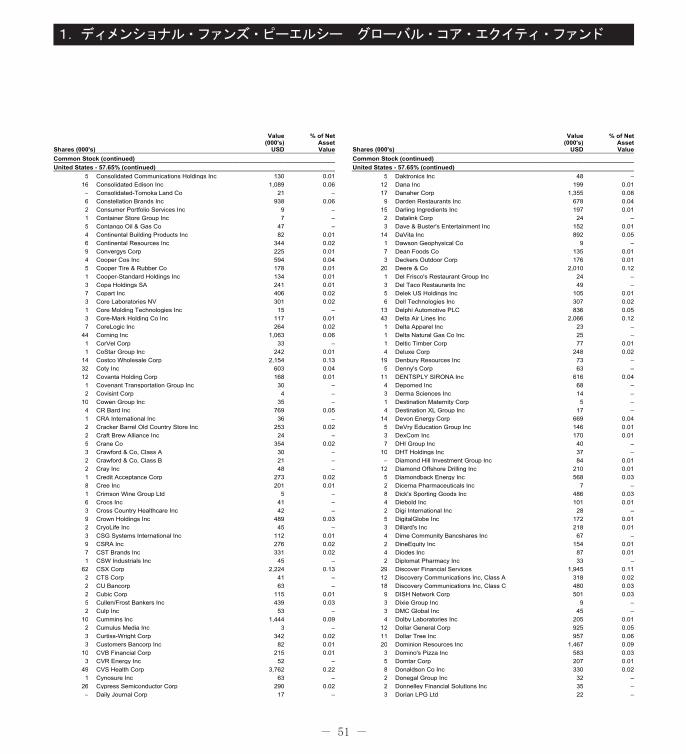
- 51 -
1.ディメンショナル・ファンズ・ピーエルシー グローバル・コア・エクイティ・ファンド
Shares (000's)
Value(000's)
USD
% of NetAssetValue
Common Stock (continued)United States - 57.65% (continued)
5 Consolidated Communications Holdings Inc 130 0.01 16 Consolidated Edison Inc 1,089 0.06 – Consolidated-Tomoka Land Co 21 – 6 Constellation Brands Inc 938 0.06 2 Consumer Portfolio Services Inc 9 – 1 Container Store Group Inc 7 – 5 Contango Oil & Gas Co 47 – 4 Continental Building Products Inc 82 0.01 6 Continental Resources Inc 344 0.02 9 Convergys Corp 225 0.01 4 Cooper Cos Inc 594 0.04 5 Cooper Tire & Rubber Co 178 0.01 1 Cooper-Standard Holdings Inc 134 0.01 3 Copa Holdings SA 241 0.01 7 Copart Inc 406 0.02 3 Core Laboratories NV 301 0.02 1 Core Molding Technologies Inc 15 – 3 Core-Mark Holding Co Inc 117 0.01 7 CoreLogic Inc 264 0.02
44 Corning Inc 1,063 0.06 1 CorVel Corp 33 – 1 CoStar Group Inc 242 0.01
14 Costco Wholesale Corp 2,154 0.13 32 Coty Inc 603 0.04 12 Covanta Holding Corp 168 0.01 1 Covenant Transportation Group Inc 30 – 2 Covisint Corp 4 –
10 Cowen Group Inc 35 – 4 CR Bard Inc 769 0.05 1 CRA International Inc 36 – 2 Cracker Barrel Old Country Store Inc 253 0.02 2 Craft Brew Alliance Inc 24 – 5 Crane Co 354 0.02 3 Crawford & Co, Class A 30 – 2 Crawford & Co, Class B 21 – 2 Cray Inc 48 – 1 Credit Acceptance Corp 273 0.02 8 Cree Inc 201 0.01 1 Crimson Wine Group Ltd 5 – 6 Crocs Inc 41 – 3 Cross Country Healthcare Inc 42 – 9 Crown Holdings Inc 489 0.03 2 CryoLife Inc 45 – 3 CSG Systems International Inc 112 0.01 9 CSRA Inc 276 0.02 7 CST Brands Inc 331 0.02 1 CSW Industrials Inc 45 –
62 CSX Corp 2,224 0.13 2 CTS Corp 41 – 2 CU Bancorp 63 – 2 Cubic Corp 115 0.01 5 Cullen/Frost Bankers Inc 439 0.03 2 Culp Inc 53 –
10 Cummins Inc 1,444 0.09 2 Cumulus Media Inc 3 – 3 Curtiss-Wright Corp 342 0.02 3 Customers Bancorp Inc 82 0.01
10 CVB Financial Corp 215 0.01 3 CVR Energy Inc 52 –
49 CVS Health Corp 3,762 0.22 1 Cynosure Inc 63 –
26 Cypress Semiconductor Corp 290 0.02 – Daily Journal Corp 17 –
Shares (000's)
Value(000's)
USD
% of NetAssetValue
Common Stock (continued)United States - 57.65% (continued)
5 Daktronics Inc 48 – 12 Dana Inc 199 0.01 17 Danaher Corp 1,355 0.08 9 Darden Restaurants Inc 678 0.04
15 Darling Ingredients Inc 197 0.01 2 Datalink Corp 24 – 3 Dave & Buster's Entertainment Inc 152 0.01
14 DaVita Inc 892 0.05 1 Dawson Geophysical Co 9 – 7 Dean Foods Co 135 0.01 3 Deckers Outdoor Corp 176 0.01
20 Deere & Co 2,010 0.12 1 Del Frisco's Restaurant Group Inc 24 – 3 Del Taco Restaurants Inc 49 – 5 Delek US Holdings Inc 105 0.01 6 Dell Technologies Inc 307 0.02
13 Delphi Automotive PLC 836 0.05 43 Delta Air Lines Inc 2,066 0.12 1 Delta Apparel Inc 23 – 1 Delta Natural Gas Co Inc 25 – 1 Deltic Timber Corp 77 0.01 4 Deluxe Corp 248 0.02
19 Denbury Resources Inc 73 – 5 Denny's Corp 63 –
11 DENTSPLY SIRONA Inc 616 0.04 4 Depomed Inc 68 – 3 Derma Sciences Inc 14 – 1 Destination Maternity Corp 5 – 4 Destination XL Group Inc 17 –
14 Devon Energy Corp 669 0.04 5 DeVry Education Group Inc 146 0.01 3 DexCom Inc 170 0.01 7 DHI Group Inc 40 –
10 DHT Holdings Inc 37 – – Diamond Hill Investment Group Inc 84 0.01
12 Diamond Offshore Drilling Inc 210 0.01 5 Diamondback Energy Inc 568 0.03 2 Dicerna Pharmaceuticals Inc 7 – 8 Dick's Sporting Goods Inc 486 0.03 4 Diebold Inc 101 0.01 2 Digi International Inc 28 – 5 DigitalGlobe Inc 172 0.01 3 Dillard's Inc 218 0.01 4 Dime Community Bancshares Inc 67 – 2 DineEquity Inc 154 0.01 4 Diodes Inc 87 0.01 2 Diplomat Pharmacy Inc 33 –
29 Discover Financial Services 1,945 0.11 12 Discovery Communications Inc, Class A 318 0.02 18 Discovery Communications Inc, Class C 480 0.03 9 DISH Network Corp 501 0.03 3 Dixie Group Inc 9 – 3 DMC Global Inc 45 – 4 Dolby Laboratories Inc 205 0.01
12 Dollar General Corp 925 0.05 11 Dollar Tree Inc 957 0.06 20 Dominion Resources Inc 1,467 0.09 3 Domino's Pizza Inc 583 0.03 5 Domtar Corp 207 0.01 8 Donaldson Co Inc 330 0.02 2 Donegal Group Inc 32 – 2 Donnelley Financial Solutions Inc 35 – 3 Dorian LPG Ltd 22 –
010_3771524762911.indd���51 2017/10/11���13:01:33
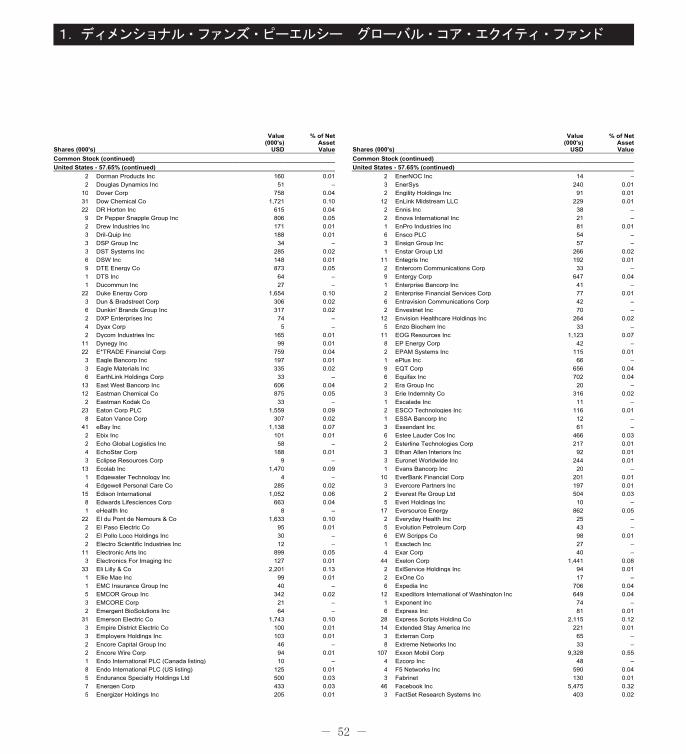
- 52 -
1.ディメンショナル・ファンズ・ピーエルシー グローバル・コア・エクイティ・ファンド
Shares (000's)
Value(000's)
USD
% of NetAssetValue
Common Stock (continued)United States - 57.65% (continued)
2 Dorman Products Inc 160 0.01 2 Douglas Dynamics Inc 51 –
10 Dover Corp 758 0.04 31 Dow Chemical Co 1,721 0.10 22 DR Horton Inc 615 0.04 9 Dr Pepper Snapple Group Inc 806 0.05 2 Drew Industries Inc 171 0.01 3 Dril-Quip Inc 188 0.01 3 DSP Group Inc 34 – 3 DST Systems Inc 285 0.02 6 DSW Inc 148 0.01 9 DTE Energy Co 873 0.05 1 DTS Inc 64 – 1 Ducommun Inc 27 –
22 Duke Energy Corp 1,654 0.10 3 Dun & Bradstreet Corp 306 0.02 6 Dunkin' Brands Group Inc 317 0.02 2 DXP Enterprises Inc 74 – 4 Dyax Corp 5 – 2 Dycom Industries Inc 165 0.01
11 Dynegy Inc 99 0.01 22 E*TRADE Financial Corp 759 0.04 3 Eagle Bancorp Inc 197 0.01 3 Eagle Materials Inc 335 0.02 6 EarthLink Holdings Corp 33 –
13 East West Bancorp Inc 606 0.04 12 Eastman Chemical Co 875 0.05 2 Eastman Kodak Co 33 –
23 Eaton Corp PLC 1,559 0.09 8 Eaton Vance Corp 307 0.02
41 eBay Inc 1,138 0.07 2 Ebix Inc 101 0.01 2 Echo Global Logistics Inc 58 – 4 EchoStar Corp 188 0.01 3 Eclipse Resources Corp 9 –
13 Ecolab Inc 1,470 0.09 1 Edgewater Technology Inc 4 – 4 Edgewell Personal Care Co 285 0.02
15 Edison International 1,052 0.06 8 Edwards Lifesciences Corp 663 0.04 1 eHealth Inc 8 –
22 EI du Pont de Nemours & Co 1,633 0.10 2 El Paso Electric Co 95 0.01 2 El Pollo Loco Holdings Inc 30 – 2 Electro Scientific Industries Inc 12 –
11 Electronic Arts Inc 899 0.05 3 Electronics For Imaging Inc 127 0.01
33 Eli Lilly & Co 2,201 0.13 1 Ellie Mae Inc 99 0.01 1 EMC Insurance Group Inc 40 – 5 EMCOR Group Inc 342 0.02 3 EMCORE Corp 21 – 2 Emergent BioSolutions Inc 64 –
31 Emerson Electric Co 1,743 0.10 3 Empire District Electric Co 100 0.01 3 Employers Holdings Inc 103 0.01 2 Encore Capital Group Inc 46 – 2 Encore Wire Corp 94 0.01 1 Endo International PLC (Canada listing) 10 – 8 Endo International PLC (US listing) 125 0.01 5 Endurance Specialty Holdings Ltd 500 0.03 7 Energen Corp 433 0.03 5 Energizer Holdings Inc 205 0.01
Shares (000's)
Value(000's)
USD
% of NetAssetValue
Common Stock (continued)United States - 57.65% (continued)
2 EnerNOC Inc 14 – 3 EnerSys 240 0.01 2 Engility Holdings Inc 91 0.01
12 EnLink Midstream LLC 229 0.01 2 Ennis Inc 38 – 2 Enova International Inc 21 – 1 EnPro Industries Inc 81 0.01 6 Ensco PLC 54 – 3 Ensign Group Inc 57 – 1 Enstar Group Ltd 266 0.02
11 Entegris Inc 192 0.01 2 Entercom Communications Corp 33 – 9 Entergy Corp 647 0.04 1 Enterprise Bancorp Inc 41 – 2 Enterprise Financial Services Corp 77 0.01 6 Entravision Communications Corp 42 – 2 Envestnet Inc 70 –
12 Envision Healthcare Holdings Inc 264 0.02 5 Enzo Biochem Inc 33 –
11 EOG Resources Inc 1,123 0.07 8 EP Energy Corp 42 – 2 EPAM Systems Inc 115 0.01 1 ePlus Inc 66 – 9 EQT Corp 656 0.04 6 Equifax Inc 702 0.04 2 Era Group Inc 20 – 3 Erie Indemnity Co 316 0.02 1 Escalade Inc 11 – 2 ESCO Technologies Inc 116 0.01 1 ESSA Bancorp Inc 12 – 3 Essendant Inc 61 – 6 Estee Lauder Cos Inc 466 0.03 2 Esterline Technologies Corp 217 0.01 3 Ethan Allen Interiors Inc 92 0.01 3 Euronet Worldwide Inc 244 0.01 1 Evans Bancorp Inc 20 –
10 EverBank Financial Corp 201 0.01 3 Evercore Partners Inc 197 0.01 2 Everest Re Group Ltd 504 0.03 5 Everi Holdings Inc 10 –
17 Eversource Energy 862 0.05 2 Everyday Health Inc 25 – 5 Evolution Petroleum Corp 43 – 6 EW Scripps Co 98 0.01 1 Exactech Inc 27 – 4 Exar Corp 40 –
44 Exelon Corp 1,441 0.08 2 ExlService Holdings Inc 94 0.01 2 ExOne Co 17 – 6 Expedia Inc 706 0.04
12 Expeditors International of Washington Inc 649 0.04 1 Exponent Inc 74 – 6 Express Inc 81 0.01
28 Express Scripts Holding Co 2,115 0.12 14 Extended Stay America Inc 221 0.01 3 Exterran Corp 65 – 8 Extreme Networks Inc 33 –
107 Exxon Mobil Corp 9,328 0.55 4 Ezcorp Inc 48 – 4 F5 Networks Inc 590 0.04 3 Fabrinet 130 0.01
46 Facebook Inc 5,475 0.32 3 FactSet Research Systems Inc 403 0.02
010_3771524762911.indd���52 2017/10/11���13:01:33
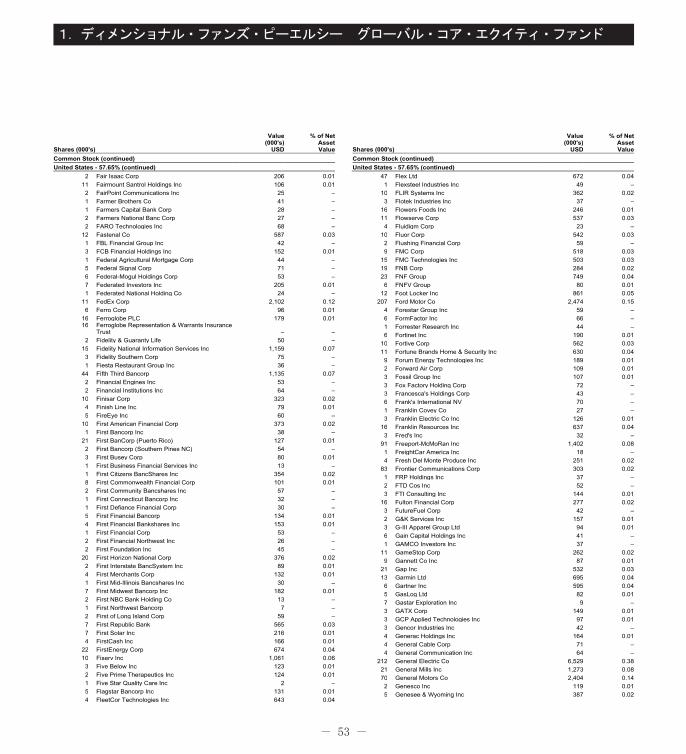
- 53 -
1.ディメンショナル・ファンズ・ピーエルシー グローバル・コア・エクイティ・ファンド
Shares (000's)
Value(000's)
USD
% of NetAssetValue
Common Stock (continued)United States - 57.65% (continued)
2 Fair Isaac Corp 206 0.01 11 Fairmount Santrol Holdings Inc 106 0.01 2 FairPoint Communications Inc 25 – 1 Farmer Brothers Co 41 – 1 Farmers Capital Bank Corp 28 – 2 Farmers National Banc Corp 27 – 2 FARO Technologies Inc 68 –
12 Fastenal Co 587 0.03 1 FBL Financial Group Inc 42 – 3 FCB Financial Holdings Inc 152 0.01 1 Federal Agricultural Mortgage Corp 44 – 5 Federal Signal Corp 71 – 6 Federal-Mogul Holdings Corp 53 – 7 Federated Investors Inc 205 0.01 1 Federated National Holding Co 24 –
11 FedEx Corp 2,102 0.12 6 Ferro Corp 96 0.01
16 Ferroglobe PLC 179 0.01 16
Ferroglobe Representation & Warrants Insurance Trust – –
2 Fidelity & Guaranty Life 50 – 15 Fidelity National Information Services Inc 1,159 0.07 3 Fidelity Southern Corp 75 – 1 Fiesta Restaurant Group Inc 36 –
44 Fifth Third Bancorp 1,135 0.07 2 Financial Engines Inc 53 – 2 Financial Institutions Inc 64 –
10 Finisar Corp 323 0.02 4 Finish Line Inc 79 0.01 5 FireEye Inc 60 –
10 First American Financial Corp 373 0.02 1 First Bancorp Inc 38 –
21 First BanCorp (Puerto Rico) 127 0.01 2 First Bancorp (Southern Pines NC) 54 – 3 First Busey Corp 80 0.01 1 First Business Financial Services Inc 13 – 1 First Citizens BancShares Inc 354 0.02 8 First Commonwealth Financial Corp 101 0.01 2 First Community Bancshares Inc 57 – 1 First Connecticut Bancorp Inc 32 – 1 First Defiance Financial Corp 30 – 5 First Financial Bancorp 134 0.01 4 First Financial Bankshares Inc 153 0.01 1 First Financial Corp 53 – 2 First Financial Northwest Inc 26 – 2 First Foundation Inc 45 –
20 First Horizon National Corp 376 0.02 2 First Interstate BancSystem Inc 89 0.01 4 First Merchants Corp 132 0.01 1 First Mid-Illinois Bancshares Inc 30 – 7 First Midwest Bancorp Inc 182 0.01 2 First NBC Bank Holding Co 13 – 1 First Northwest Bancorp 7 – 2 First of Long Island Corp 59 – 7 First Republic Bank 565 0.03 7 First Solar Inc 216 0.01 4 FirstCash Inc 166 0.01
22 FirstEnergy Corp 674 0.04 10 Fiserv Inc 1,061 0.06 3 Five Below Inc 123 0.01 2 Five Prime Therapeutics Inc 124 0.01 1 Five Star Quality Care Inc 2 – 5 Flagstar Bancorp Inc 131 0.01 4 FleetCor Technologies Inc 643 0.04
Shares (000's)
Value(000's)
USD
% of NetAssetValue
Common Stock (continued)United States - 57.65% (continued)
47 Flex Ltd 672 0.04 1 Flexsteel Industries Inc 49 –
10 FLIR Systems Inc 362 0.02 3 Flotek Industries Inc 37 –
16 Flowers Foods Inc 246 0.01 11 Flowserve Corp 537 0.03 4 Fluidigm Corp 23 –
10 Fluor Corp 542 0.03 2 Flushing Financial Corp 59 – 9 FMC Corp 518 0.03
15 FMC Technologies Inc 503 0.03 19 FNB Corp 284 0.02 23 FNF Group 749 0.04 6 FNFV Group 80 0.01
12 Foot Locker Inc 861 0.05 207 Ford Motor Co 2,474 0.15
4 Forestar Group Inc 59 – 6 FormFactor Inc 66 – 1 Forrester Research Inc 44 – 6 Fortinet Inc 190 0.01
10 Fortive Corp 562 0.03 11 Fortune Brands Home & Security Inc 630 0.04 9 Forum Energy Technologies Inc 189 0.01 2 Forward Air Corp 109 0.01 3 Fossil Group Inc 107 0.01 3 Fox Factory Holding Corp 72 – 3 Francesca's Holdings Corp 43 – 6 Frank's International NV 70 – 1 Franklin Covey Co 27 – 3 Franklin Electric Co Inc 126 0.01
16 Franklin Resources Inc 637 0.04 3 Fred's Inc 32 –
91 Freeport-McMoRan Inc 1,402 0.08 1 FreightCar America Inc 18 – 4 Fresh Del Monte Produce Inc 251 0.02
83 Frontier Communications Corp 303 0.02 1 FRP Holdings Inc 37 – 2 FTD Cos Inc 52 – 3 FTI Consulting Inc 144 0.01
16 Fulton Financial Corp 277 0.02 3 FutureFuel Corp 42 – 2 G&K Services Inc 157 0.01 3 G-III Apparel Group Ltd 94 0.01 6 Gain Capital Holdings Inc 41 – 1 GAMCO Investors Inc 37 –
11 GameStop Corp 262 0.02 9 Gannett Co Inc 87 0.01
21 Gap Inc 532 0.03 13 Garmin Ltd 695 0.04 6 Gartner Inc 595 0.04 5 GasLog Ltd 82 0.01 7 Gastar Exploration Inc 9 – 3 GATX Corp 149 0.01 3 GCP Applied Technologies Inc 97 0.01 3 Gencor Industries Inc 42 – 4 Generac Holdings Inc 164 0.01 4 General Cable Corp 71 – 4 General Communication Inc 64 –
212 General Electric Co 6,529 0.38 21 General Mills Inc 1,273 0.08 70 General Motors Co 2,404 0.14 2 Genesco Inc 119 0.01 5 Genesee & Wyoming Inc 387 0.02
010_3771524762911.indd���53 2017/10/11���13:01:33
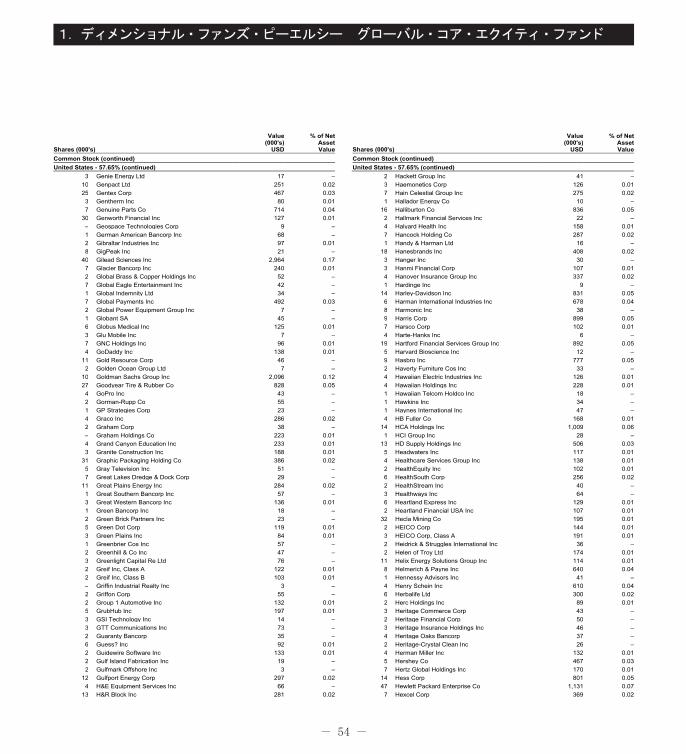
- 54 -
1.ディメンショナル・ファンズ・ピーエルシー グローバル・コア・エクイティ・ファンド
Shares (000's)
Value(000's)
USD
% of NetAssetValue
Common Stock (continued)United States - 57.65% (continued)
3 Genie Energy Ltd 17 – 10 Genpact Ltd 251 0.02 25 Gentex Corp 467 0.03 3 Gentherm Inc 80 0.01 7 Genuine Parts Co 714 0.04
30 Genworth Financial Inc 127 0.01 – Geospace Technologies Corp 9 – 1 German American Bancorp Inc 68 – 2 Gibraltar Industries Inc 97 0.01 8 GigPeak Inc 21 –
40 Gilead Sciences Inc 2,964 0.17 7 Glacier Bancorp Inc 240 0.01 2 Global Brass & Copper Holdings Inc 52 – 7 Global Eagle Entertainment Inc 42 – 1 Global Indemnity Ltd 34 – 7 Global Payments Inc 492 0.03 2 Global Power Equipment Group Inc 7 – 1 Globant SA 45 – 6 Globus Medical Inc 125 0.01 3 Glu Mobile Inc 7 – 7 GNC Holdings Inc 96 0.01 4 GoDaddy Inc 138 0.01
11 Gold Resource Corp 46 – 2 Golden Ocean Group Ltd 7 –
10 Goldman Sachs Group Inc 2,096 0.12 27 Goodyear Tire & Rubber Co 828 0.05 4 GoPro Inc 43 – 2 Gorman-Rupp Co 55 – 1 GP Strategies Corp 23 – 4 Graco Inc 286 0.02 2 Graham Corp 38 – – Graham Holdings Co 223 0.01 4 Grand Canyon Education Inc 233 0.01 3 Granite Construction Inc 188 0.01
31 Graphic Packaging Holding Co 386 0.02 5 Gray Television Inc 51 – 7 Great Lakes Dredge & Dock Corp 29 –
11 Great Plains Energy Inc 284 0.02 1 Great Southern Bancorp Inc 57 – 3 Great Western Bancorp Inc 136 0.01 1 Green Bancorp Inc 18 – 2 Green Brick Partners Inc 23 – 5 Green Dot Corp 119 0.01 3 Green Plains Inc 84 0.01 1 Greenbrier Cos Inc 57 – 2 Greenhill & Co Inc 47 – 3 Greenlight Capital Re Ltd 76 – 2 Greif Inc, Class A 122 0.01 2 Greif Inc, Class B 103 0.01 – Griffin Industrial Realty Inc 3 – 2 Griffon Corp 55 – 2 Group 1 Automotive Inc 132 0.01 5 GrubHub Inc 197 0.01 3 GSI Technology Inc 14 – 3 GTT Communications Inc 73 – 2 Guaranty Bancorp 35 – 6 Guess? Inc 92 0.01 2 Guidewire Software Inc 133 0.01 2 Gulf Island Fabrication Inc 19 – 2 Gulfmark Offshore Inc 3 –
12 Gulfport Energy Corp 297 0.02 4 H&E Equipment Services Inc 66 –
13 H&R Block Inc 281 0.02
Shares (000's)
Value(000's)
USD
% of NetAssetValue
Common Stock (continued)United States - 57.65% (continued)
2 Hackett Group Inc 41 – 3 Haemonetics Corp 126 0.01 7 Hain Celestial Group Inc 275 0.02 1 Hallador Energy Co 10 –
16 Halliburton Co 836 0.05 2 Hallmark Financial Services Inc 22 – 4 Halyard Health Inc 158 0.01 7 Hancock Holding Co 287 0.02 1 Handy & Harman Ltd 16 –
18 Hanesbrands Inc 408 0.02 3 Hanger Inc 30 – 3 Hanmi Financial Corp 107 0.01 4 Hanover Insurance Group Inc 337 0.02 1 Hardinge Inc 9 –
14 Harley-Davidson Inc 831 0.05 6 Harman International Industries Inc 678 0.04 8 Harmonic Inc 38 – 9 Harris Corp 899 0.05 7 Harsco Corp 102 0.01 4 Harte-Hanks Inc 6 –
19 Hartford Financial Services Group Inc 892 0.05 5 Harvard Bioscience Inc 12 – 9 Hasbro Inc 777 0.05 2 Haverty Furniture Cos Inc 33 – 4 Hawaiian Electric Industries Inc 126 0.01 4 Hawaiian Holdings Inc 228 0.01 1 Hawaiian Telcom Holdco Inc 18 – 1 Hawkins Inc 34 – 1 Haynes International Inc 47 – 4 HB Fuller Co 168 0.01
14 HCA Holdings Inc 1,009 0.06 1 HCI Group Inc 28 –
13 HD Supply Holdings Inc 506 0.03 5 Headwaters Inc 117 0.01 4 Healthcare Services Group Inc 138 0.01 2 HealthEquity Inc 102 0.01 6 HealthSouth Corp 256 0.02 2 HealthStream Inc 40 – 3 Healthways Inc 64 – 6 Heartland Express Inc 129 0.01 2 Heartland Financial USA Inc 107 0.01
32 Hecla Mining Co 195 0.01 2 HEICO Corp 144 0.01 3 HEICO Corp, Class A 191 0.01 2 Heidrick & Struggles International Inc 36 – 2 Helen of Troy Ltd 174 0.01
11 Helix Energy Solutions Group Inc 114 0.01 8 Helmerich & Payne Inc 640 0.04 1 Hennessy Advisors Inc 41 – 4 Henry Schein Inc 610 0.04 6 Herbalife Ltd 300 0.02 2 Herc Holdings Inc 89 0.01 3 Heritage Commerce Corp 43 – 2 Heritage Financial Corp 50 – 3 Heritage Insurance Holdings Inc 46 – 4 Heritage Oaks Bancorp 37 – 2 Heritage-Crystal Clean Inc 26 – 4 Herman Miller Inc 132 0.01 5 Hershey Co 467 0.03 7 Hertz Global Holdings Inc 170 0.01
14 Hess Corp 801 0.05 47 Hewlett Packard Enterprise Co 1,131 0.07 7 Hexcel Corp 369 0.02
010_3771524762911.indd���54 2017/10/11���13:01:33
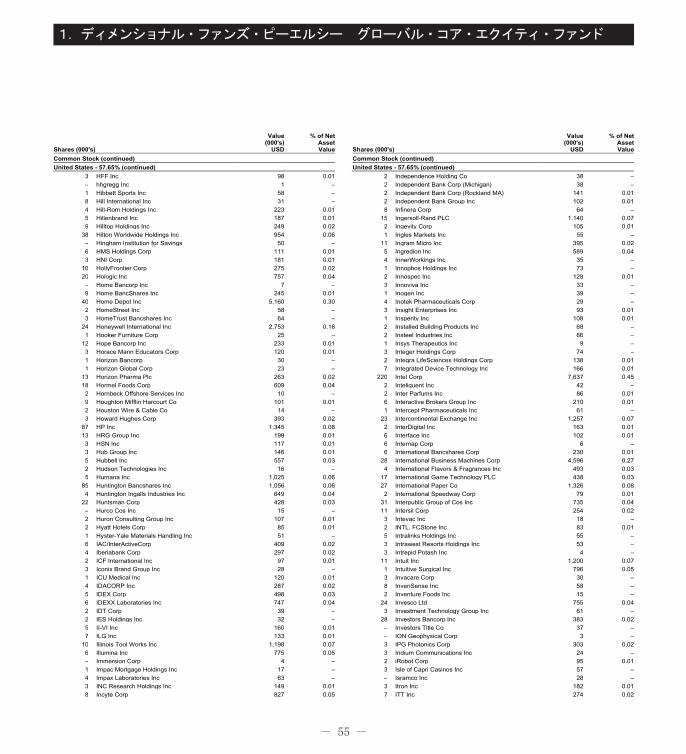
- 55 -
1.ディメンショナル・ファンズ・ピーエルシー グローバル・コア・エクイティ・ファンド
Shares (000's)
Value(000's)
USD
% of NetAssetValue
Common Stock (continued)United States - 57.65% (continued)
3 HFF Inc 98 0.01 – hhgregg Inc 1 – 1 Hibbett Sports Inc 58 – 8 Hill International Inc 31 – 4 Hill-Rom Holdings Inc 223 0.01 5 Hillenbrand Inc 187 0.01 9 Hilltop Holdings Inc 249 0.02
38 Hilton Worldwide Holdings Inc 954 0.06 – Hingham Institution for Savings 50 – 6 HMS Holdings Corp 111 0.01 3 HNI Corp 181 0.01
10 HollyFrontier Corp 275 0.02 20 Hologic Inc 757 0.04 – Home Bancorp Inc 7 – 9 Home BancShares Inc 245 0.01
40 Home Depot Inc 5,160 0.30 2 HomeStreet Inc 58 – 3 HomeTrust Bancshares Inc 64 –
24 Honeywell International Inc 2,753 0.16 1 Hooker Furniture Corp 25 –
12 Hope Bancorp Inc 233 0.01 3 Horace Mann Educators Corp 120 0.01 1 Horizon Bancorp 30 – 1 Horizon Global Corp 23 –
13 Horizon Pharma Plc 263 0.02 18 Hormel Foods Corp 609 0.04 2 Hornbeck Offshore Services Inc 10 – 9 Houghton Mifflin Harcourt Co 101 0.01 2 Houston Wire & Cable Co 14 – 3 Howard Hughes Corp 393 0.02
87 HP Inc 1,345 0.08 13 HRG Group Inc 199 0.01 3 HSN Inc 117 0.01 3 Hub Group Inc 146 0.01 5 Hubbell Inc 557 0.03 2 Hudson Technologies Inc 16 – 5 Humana Inc 1,025 0.06
85 Huntington Bancshares Inc 1,056 0.06 4 Huntington Ingalls Industries Inc 649 0.04
22 Huntsman Corp 428 0.03 – Hurco Cos Inc 15 – 2 Huron Consulting Group Inc 107 0.01 2 Hyatt Hotels Corp 85 0.01 1 Hyster-Yale Materials Handling Inc 51 – 6 IAC/InterActiveCorp 409 0.02 4 Iberiabank Corp 297 0.02 2 ICF International Inc 97 0.01 3 Iconix Brand Group Inc 28 – 1 ICU Medical Inc 120 0.01 4 IDACORP Inc 287 0.02 5 IDEX Corp 498 0.03 6 IDEXX Laboratories Inc 747 0.04 2 IDT Corp 39 – 2 IES Holdings Inc 32 – 5 II-VI Inc 160 0.01 7 ILG Inc 133 0.01
10 Illinois Tool Works Inc 1,198 0.07 6 Illumina Inc 775 0.05 – Immersion Corp 4 – 1 Impac Mortgage Holdings Inc 17 – 4 Impax Laboratories Inc 63 – 3 INC Research Holdings Inc 149 0.01 8 Incyte Corp 827 0.05
Shares (000's)
Value(000's)
USD
% of NetAssetValue
Common Stock (continued)United States - 57.65% (continued)
2 Independence Holding Co 38 – 2 Independent Bank Corp (Michigan) 38 – 2 Independent Bank Corp (Rockland MA) 141 0.01 2 Independent Bank Group Inc 102 0.01 8 Infinera Corp 64 –
15 Ingersoll-Rand PLC 1,140 0.07 2 Ingevity Corp 105 0.01 1 Ingles Markets Inc 55 –
11 Ingram Micro Inc 395 0.02 5 Ingredion Inc 589 0.04 4 InnerWorkings Inc 35 – 1 Innophos Holdings Inc 73 – 2 Innospec Inc 128 0.01 3 Innoviva Inc 33 – 1 Inogen Inc 39 – 4 Inotek Pharmaceuticals Corp 29 – 3 Insight Enterprises Inc 93 0.01 1 Insperity Inc 108 0.01 2 Installed Building Products Inc 68 – 2 Insteel Industries Inc 66 – 1 Insys Therapeutics Inc 9 – 3 Integer Holdings Corp 74 – 2 Integra LifeSciences Holdings Corp 138 0.01 7 Integrated Device Technology Inc 166 0.01
220 Intel Corp 7,637 0.45 2 Inteliquent Inc 42 – 2 Inter Parfums Inc 86 0.01 6 Interactive Brokers Group Inc 210 0.01 1 Intercept Pharmaceuticals Inc 61 –
23 Intercontinental Exchange Inc 1,257 0.07 2 InterDigital Inc 163 0.01 6 Interface Inc 102 0.01 6 Internap Corp 6 – 6 International Bancshares Corp 230 0.01
28 International Business Machines Corp 4,596 0.27 4 International Flavors & Fragrances Inc 493 0.03
17 International Game Technology PLC 438 0.03 27 International Paper Co 1,326 0.08 2 International Speedway Corp 79 0.01
31 Interpublic Group of Cos Inc 735 0.04 11 Intersil Corp 254 0.02 3 Intevac Inc 18 – 2 INTL. FCStone Inc 83 0.01 5 Intralinks Holdings Inc 55 – 3 Intrawest Resorts Holdings Inc 53 – 3 Intrepid Potash Inc 4 –
11 Intuit Inc 1,200 0.07 1 Intuitive Surgical Inc 796 0.05 3 Invacare Corp 30 – 8 InvenSense Inc 58 – 2 Inventure Foods Inc 15 –
24 Invesco Ltd 755 0.04 3 Investment Technology Group Inc 61 –
28 Investors Bancorp Inc 383 0.02 – Investors Title Co 37 – – ION Geophysical Corp 3 – 3 IPG Photonics Corp 303 0.02 3 Iridium Communications Inc 24 – 2 iRobot Corp 95 0.01 3 Isle of Capri Casinos Inc 57 – – Isramco Inc 28 – 3 Itron Inc 182 0.01 7 ITT Inc 274 0.02
010_3771524762911.indd���55 2017/10/11���13:01:34
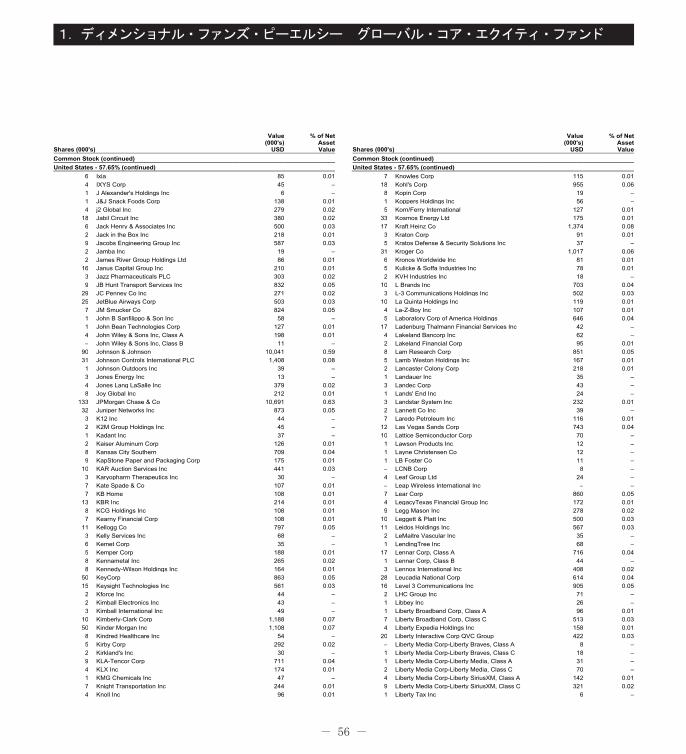
- 56 -
1.ディメンショナル・ファンズ・ピーエルシー グローバル・コア・エクイティ・ファンド
Shares (000's)
Value(000's)
USD
% of NetAssetValue
Common Stock (continued)United States - 57.65% (continued)
6 Ixia 85 0.01 4 IXYS Corp 45 – 1 J Alexander's Holdings Inc 6 – 1 J&J Snack Foods Corp 138 0.01 4 j2 Global Inc 279 0.02
18 Jabil Circuit Inc 380 0.02 6 Jack Henry & Associates Inc 500 0.03 2 Jack in the Box Inc 218 0.01 9 Jacobs Engineering Group Inc 587 0.03 2 Jamba Inc 19 – 2 James River Group Holdings Ltd 86 0.01
16 Janus Capital Group Inc 210 0.01 3 Jazz Pharmaceuticals PLC 303 0.02 9 JB Hunt Transport Services Inc 832 0.05
29 JC Penney Co Inc 271 0.02 25 JetBlue Airways Corp 503 0.03 7 JM Smucker Co 824 0.05 1 John B Sanfilippo & Son Inc 58 – 1 John Bean Technologies Corp 127 0.01 4 John Wiley & Sons Inc, Class A 198 0.01 – John Wiley & Sons Inc, Class B 11 –
90 Johnson & Johnson 10,041 0.59 31 Johnson Controls International PLC 1,408 0.08 1 Johnson Outdoors Inc 39 – 3 Jones Energy Inc 13 – 4 Jones Lang LaSalle Inc 379 0.02 8 Joy Global Inc 212 0.01
133 JPMorgan Chase & Co 10,691 0.63 32 Juniper Networks Inc 873 0.05 3 K12 Inc 44 – 2 K2M Group Holdings Inc 45 – 1 Kadant Inc 37 – 2 Kaiser Aluminum Corp 126 0.01 8 Kansas City Southern 709 0.04 9 KapStone Paper and Packaging Corp 175 0.01
10 KAR Auction Services Inc 441 0.03 3 Karyopharm Therapeutics Inc 30 – 7 Kate Spade & Co 107 0.01 7 KB Home 108 0.01
13 KBR Inc 214 0.01 8 KCG Holdings Inc 108 0.01 7 Kearny Financial Corp 108 0.01
11 Kellogg Co 797 0.05 3 Kelly Services Inc 68 – 6 Kemet Corp 35 – 5 Kemper Corp 188 0.01 8 Kennametal Inc 265 0.02 8 Kennedy-Wilson Holdings Inc 164 0.01
50 KeyCorp 863 0.05 15 Keysight Technologies Inc 561 0.03 2 Kforce Inc 44 – 2 Kimball Electronics Inc 43 – 3 Kimball International Inc 49 –
10 Kimberly-Clark Corp 1,188 0.07 50 Kinder Morgan Inc 1,108 0.07 8 Kindred Healthcare Inc 54 – 5 Kirby Corp 292 0.02 2 Kirkland's Inc 30 – 9 KLA-Tencor Corp 711 0.04 4 KLX Inc 174 0.01 1 KMG Chemicals Inc 47 – 7 Knight Transportation Inc 244 0.01 4 Knoll Inc 96 0.01
Shares (000's)
Value(000's)
USD
% of NetAssetValue
Common Stock (continued)United States - 57.65% (continued)
7 Knowles Corp 115 0.01 18 Kohl's Corp 955 0.06 8 Kopin Corp 19 – 1 Koppers Holdings Inc 56 – 5 Korn/Ferry International 127 0.01
33 Kosmos Energy Ltd 175 0.01 17 Kraft Heinz Co 1,374 0.08 3 Kraton Corp 91 0.01 5 Kratos Defense & Security Solutions Inc 37 –
31 Kroger Co 1,017 0.06 6 Kronos Worldwide Inc 81 0.01 5 Kulicke & Soffa Industries Inc 78 0.01 2 KVH Industries Inc 18 –
10 L Brands Inc 703 0.04 3 L-3 Communications Holdings Inc 502 0.03
10 La Quinta Holdings Inc 119 0.01 4 La-Z-Boy Inc 107 0.01 5 Laboratory Corp of America Holdings 646 0.04
17 Ladenburg Thalmann Financial Services Inc 42 – 4 Lakeland Bancorp Inc 62 – 2 Lakeland Financial Corp 95 0.01 8 Lam Research Corp 851 0.05 5 Lamb Weston Holdings Inc 167 0.01 2 Lancaster Colony Corp 218 0.01 1 Landauer Inc 35 – 3 Landec Corp 43 – 1 Lands' End Inc 24 – 3 Landstar System Inc 232 0.01 2 Lannett Co Inc 39 – 7 Laredo Petroleum Inc 116 0.01
12 Las Vegas Sands Corp 743 0.04 10 Lattice Semiconductor Corp 70 – 1 Lawson Products Inc 12 – 1 Layne Christensen Co 12 – 1 LB Foster Co 11 – – LCNB Corp 8 – 4 Leaf Group Ltd 24 – – Leap Wireless International Inc – – 7 Lear Corp 860 0.05 4 LegacyTexas Financial Group Inc 172 0.01 9 Legg Mason Inc 278 0.02
10 Leggett & Platt Inc 500 0.03 11 Leidos Holdings Inc 567 0.03 2 LeMaitre Vascular Inc 35 – 1 LendingTree Inc 68 –
17 Lennar Corp, Class A 716 0.04 1 Lennar Corp, Class B 44 – 3 Lennox International Inc 408 0.02
28 Leucadia National Corp 614 0.04 16 Level 3 Communications Inc 905 0.05 2 LHC Group Inc 71 – 1 Libbey Inc 26 – 1 Liberty Broadband Corp, Class A 96 0.01 7 Liberty Broadband Corp, Class C 513 0.03 4 Liberty Expedia Holdings Inc 158 0.01
20 Liberty Interactive Corp QVC Group 422 0.03 – Liberty Media Corp-Liberty Braves, Class A 8 – 1 Liberty Media Corp-Liberty Braves, Class C 18 – 1 Liberty Media Corp-Liberty Media, Class A 31 – 2 Liberty Media Corp-Liberty Media, Class C 70 – 4 Liberty Media Corp-Liberty SiriusXM, Class A 142 0.01 9 Liberty Media Corp-Liberty SiriusXM, Class C 321 0.02 1 Liberty Tax Inc 6 –
010_3771524762911.indd���56 2017/10/11���13:01:34
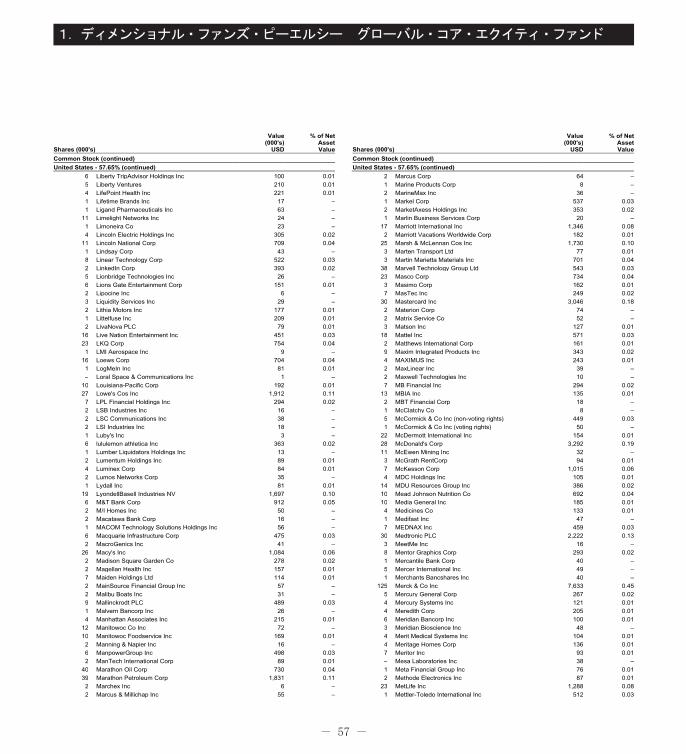
- 57 -
1.ディメンショナル・ファンズ・ピーエルシー グローバル・コア・エクイティ・ファンド
Shares (000's)
Value(000's)
USD
% of NetAssetValue
Common Stock (continued)United States - 57.65% (continued)
6 Liberty TripAdvisor Holdings Inc 100 0.01 5 Liberty Ventures 210 0.01 4 LifePoint Health Inc 221 0.01 1 Lifetime Brands Inc 17 – 1 Ligand Pharmaceuticals Inc 63 –
11 Limelight Networks Inc 24 – 1 Limoneira Co 23 – 4 Lincoln Electric Holdings Inc 305 0.02
11 Lincoln National Corp 709 0.04 1 Lindsay Corp 43 – 8 Linear Technology Corp 522 0.03 2 LinkedIn Corp 393 0.02 5 Lionbridge Technologies Inc 26 – 6 Lions Gate Entertainment Corp 151 0.01 2 Lipocine Inc 6 – 3 Liquidity Services Inc 29 – 2 Lithia Motors Inc 177 0.01 1 Littelfuse Inc 209 0.01 2 LivaNova PLC 79 0.01
16 Live Nation Entertainment Inc 451 0.03 23 LKQ Corp 754 0.04 1 LMI Aerospace Inc 9 –
16 Loews Corp 704 0.04 1 LogMeIn Inc 81 0.01 – Loral Space & Communications Inc 1 –
10 Louisiana-Pacific Corp 192 0.01 27 Lowe's Cos Inc 1,912 0.11 7 LPL Financial Holdings Inc 294 0.02 2 LSB Industries Inc 16 – 2 LSC Communications Inc 38 – 2 LSI Industries Inc 18 – 1 Luby's Inc 3 – 6 lululemon athletica Inc 363 0.02 1 Lumber Liquidators Holdings Inc 13 – 2 Lumentum Holdings Inc 89 0.01 4 Luminex Corp 84 0.01 2 Lumos Networks Corp 35 – 1 Lydall Inc 81 0.01
19 LyondellBasell Industries NV 1,697 0.10 6 M&T Bank Corp 912 0.05 2 M/I Homes Inc 50 – 2 Macatawa Bank Corp 16 – 1 MACOM Technology Solutions Holdings Inc 56 – 6 Macquarie Infrastructure Corp 475 0.03 2 MacroGenics Inc 41 –
26 Macy's Inc 1,084 0.06 2 Madison Square Garden Co 278 0.02 2 Magellan Health Inc 157 0.01 7 Maiden Holdings Ltd 114 0.01 2 MainSource Financial Group Inc 57 – 2 Malibu Boats Inc 31 – 9 Mallinckrodt PLC 489 0.03 1 Malvern Bancorp Inc 26 – 4 Manhattan Associates Inc 215 0.01
12 Manitowoc Co Inc 72 – 10 Manitowoc Foodservice Inc 169 0.01 2 Manning & Napier Inc 16 – 6 ManpowerGroup Inc 498 0.03 2 ManTech International Corp 89 0.01
40 Marathon Oil Corp 730 0.04 39 Marathon Petroleum Corp 1,831 0.11 2 Marchex Inc 6 – 2 Marcus & Millichap Inc 55 –
Shares (000's)
Value(000's)
USD
% of NetAssetValue
Common Stock (continued)United States - 57.65% (continued)
2 Marcus Corp 64 – 1 Marine Products Corp 8 – 2 MarineMax Inc 36 – 1 Markel Corp 537 0.03 2 MarketAxess Holdings Inc 353 0.02 1 Marlin Business Services Corp 20 –
17 Marriott International Inc 1,346 0.08 2 Marriott Vacations Worldwide Corp 182 0.01
25 Marsh & McLennan Cos Inc 1,730 0.10 3 Marten Transport Ltd 77 0.01 3 Martin Marietta Materials Inc 701 0.04
38 Marvell Technology Group Ltd 543 0.03 23 Masco Corp 734 0.04 3 Masimo Corp 162 0.01 7 MasTec Inc 249 0.02
30 Mastercard Inc 3,046 0.18 2 Materion Corp 74 – 2 Matrix Service Co 52 – 3 Matson Inc 127 0.01
18 Mattel Inc 571 0.03 2 Matthews International Corp 161 0.01 9 Maxim Integrated Products Inc 343 0.02 4 MAXIMUS Inc 243 0.01 2 MaxLinear Inc 39 – 2 Maxwell Technologies Inc 10 – 7 MB Financial Inc 294 0.02
13 MBIA Inc 135 0.01 2 MBT Financial Corp 18 – 1 McClatchy Co 8 – 5 McCormick & Co Inc (non-voting rights) 449 0.03 1 McCormick & Co Inc (voting rights) 50 –
22 McDermott International Inc 154 0.01 28 McDonald's Corp 3,292 0.19 11 McEwen Mining Inc 32 – 3 McGrath RentCorp 94 0.01 7 McKesson Corp 1,015 0.06 4 MDC Holdings Inc 105 0.01
14 MDU Resources Group Inc 386 0.02 10 Mead Johnson Nutrition Co 692 0.04 10 Media General Inc 185 0.01 4 Medicines Co 133 0.01 1 Medifast Inc 47 – 7 MEDNAX Inc 459 0.03
30 Medtronic PLC 2,222 0.13 3 MeetMe Inc 16 – 8 Mentor Graphics Corp 293 0.02 1 Mercantile Bank Corp 40 – 5 Mercer International Inc 49 – 1 Merchants Bancshares Inc 40 –
125 Merck & Co Inc 7,633 0.45 5 Mercury General Corp 267 0.02 4 Mercury Systems Inc 121 0.01 4 Meredith Corp 205 0.01 6 Meridian Bancorp Inc 100 0.01 3 Meridian Bioscience Inc 48 – 4 Merit Medical Systems Inc 104 0.01 4 Meritage Homes Corp 136 0.01 7 Meritor Inc 93 0.01 – Mesa Laboratories Inc 38 – 1 Meta Financial Group Inc 76 0.01 2 Methode Electronics Inc 87 0.01
23 MetLife Inc 1,288 0.08 1 Mettler-Toledo International Inc 512 0.03
010_3771524762911.indd���57 2017/10/11���13:01:34
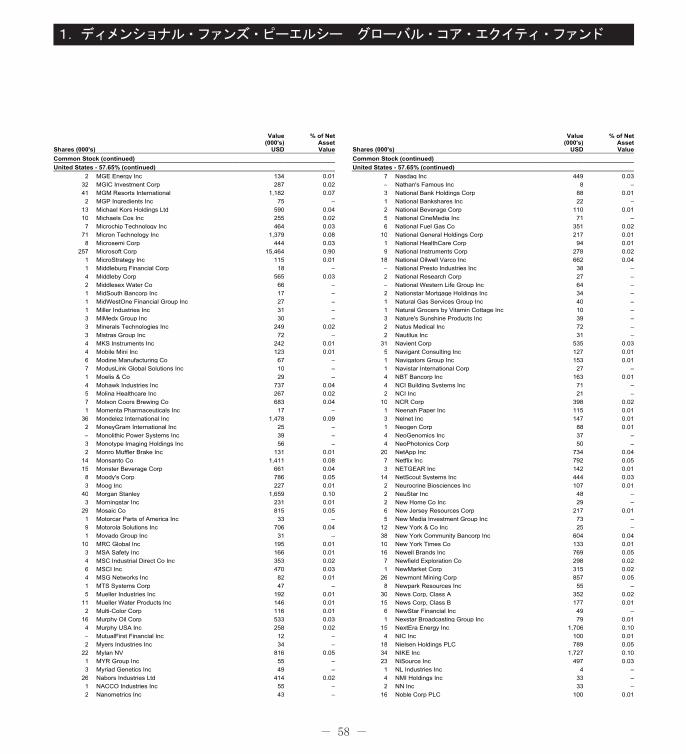
- 58 -
1.ディメンショナル・ファンズ・ピーエルシー グローバル・コア・エクイティ・ファンド
Shares (000's)
Value(000's)
USD
% of NetAssetValue
Common Stock (continued)United States - 57.65% (continued)
2 MGE Energy Inc 134 0.01 32 MGIC Investment Corp 287 0.02 41 MGM Resorts International 1,182 0.07 2 MGP Ingredients Inc 75 –
13 Michael Kors Holdings Ltd 590 0.04 10 Michaels Cos Inc 255 0.02 7 Microchip Technology Inc 464 0.03
71 Micron Technology Inc 1,379 0.08 8 Microsemi Corp 444 0.03
257 Microsoft Corp 15,464 0.90 1 MicroStrategy Inc 115 0.01 1 Middleburg Financial Corp 18 – 4 Middleby Corp 565 0.03 2 Middlesex Water Co 66 – 1 MidSouth Bancorp Inc 17 – 1 MidWestOne Financial Group Inc 27 – 1 Miller Industries Inc 31 – 3 MiMedx Group Inc 30 – 3 Minerals Technologies Inc 249 0.02 3 Mistras Group Inc 72 – 4 MKS Instruments Inc 242 0.01 4 Mobile Mini Inc 123 0.01 6 Modine Manufacturing Co 67 – 7 ModusLink Global Solutions Inc 10 – 1 Moelis & Co 29 – 4 Mohawk Industries Inc 737 0.04 5 Molina Healthcare Inc 267 0.02 7 Molson Coors Brewing Co 683 0.04 1 Momenta Pharmaceuticals Inc 17 –
36 Mondelez International Inc 1,478 0.09 2 MoneyGram International Inc 25 – – Monolithic Power Systems Inc 39 – 3 Monotype Imaging Holdings Inc 56 – 2 Monro Muffler Brake Inc 131 0.01
14 Monsanto Co 1,411 0.08 15 Monster Beverage Corp 661 0.04 8 Moody's Corp 786 0.05 3 Moog Inc 227 0.01
40 Morgan Stanley 1,659 0.10 3 Morningstar Inc 231 0.01
29 Mosaic Co 815 0.05 1 Motorcar Parts of America Inc 33 – 9 Motorola Solutions Inc 706 0.04 1 Movado Group Inc 31 –
10 MRC Global Inc 195 0.01 3 MSA Safety Inc 166 0.01 4 MSC Industrial Direct Co Inc 353 0.02 6 MSCI Inc 470 0.03 4 MSG Networks Inc 82 0.01 1 MTS Systems Corp 47 – 5 Mueller Industries Inc 192 0.01
11 Mueller Water Products Inc 146 0.01 2 Multi-Color Corp 116 0.01
16 Murphy Oil Corp 533 0.03 4 Murphy USA Inc 258 0.02 – MutualFirst Financial Inc 12 – 2 Myers Industries Inc 34 –
22 Mylan NV 816 0.05 1 MYR Group Inc 55 – 3 Myriad Genetics Inc 49 –
26 Nabors Industries Ltd 414 0.02 1 NACCO Industries Inc 55 – 2 Nanometrics Inc 43 –
Shares (000's)
Value(000's)
USD
% of NetAssetValue
Common Stock (continued)United States - 57.65% (continued)
7 Nasdaq Inc 449 0.03 – Nathan's Famous Inc 8 – 3 National Bank Holdings Corp 88 0.01 1 National Bankshares Inc 22 – 2 National Beverage Corp 110 0.01 5 National CineMedia Inc 71 – 6 National Fuel Gas Co 351 0.02
10 National General Holdings Corp 217 0.01 1 National HealthCare Corp 94 0.01 9 National Instruments Corp 278 0.02
18 National Oilwell Varco Inc 662 0.04 – National Presto Industries Inc 38 – 2 National Research Corp 27 – – National Western Life Group Inc 64 – 2 Nationstar Mortgage Holdings Inc 34 – 1 Natural Gas Services Group Inc 40 – 1 Natural Grocers by Vitamin Cottage Inc 10 – 3 Nature's Sunshine Products Inc 39 – 2 Natus Medical Inc 72 – 2 Nautilus Inc 31 –
31 Navient Corp 535 0.03 5 Navigant Consulting Inc 127 0.01 1 Navigators Group Inc 153 0.01 1 Navistar International Corp 27 – 4 NBT Bancorp Inc 163 0.01 4 NCI Building Systems Inc 71 – 2 NCI Inc 21 –
10 NCR Corp 398 0.02 1 Neenah Paper Inc 115 0.01 3 Nelnet Inc 147 0.01 1 Neogen Corp 88 0.01 4 NeoGenomics Inc 37 – 4 NeoPhotonics Corp 50 –
20 NetApp Inc 734 0.04 7 Netflix Inc 792 0.05 3 NETGEAR Inc 142 0.01
14 NetScout Systems Inc 444 0.03 2 Neurocrine Biosciences Inc 107 0.01 2 NeuStar Inc 48 – 2 New Home Co Inc 29 – 6 New Jersey Resources Corp 217 0.01 5 New Media Investment Group Inc 73 –
12 New York & Co Inc 25 – 38 New York Community Bancorp Inc 604 0.04 10 New York Times Co 133 0.01 16 Newell Brands Inc 769 0.05 7 Newfield Exploration Co 298 0.02 1 NewMarket Corp 315 0.02
26 Newmont Mining Corp 857 0.05 8 Newpark Resources Inc 55 –
30 News Corp, Class A 352 0.02 15 News Corp, Class B 177 0.01 6 NewStar Financial Inc 49 – 1 Nexstar Broadcasting Group Inc 79 0.01
15 NextEra Energy Inc 1,706 0.10 4 NIC Inc 100 0.01
18 Nielsen Holdings PLC 789 0.05 34 NIKE Inc 1,727 0.10 23 NiSource Inc 497 0.03 1 NL Industries Inc 4 – 4 NMI Holdings Inc 33 – 2 NN Inc 33 –
16 Noble Corp PLC 100 0.01
010_3771524762911.indd���58 2017/10/11���13:01:35
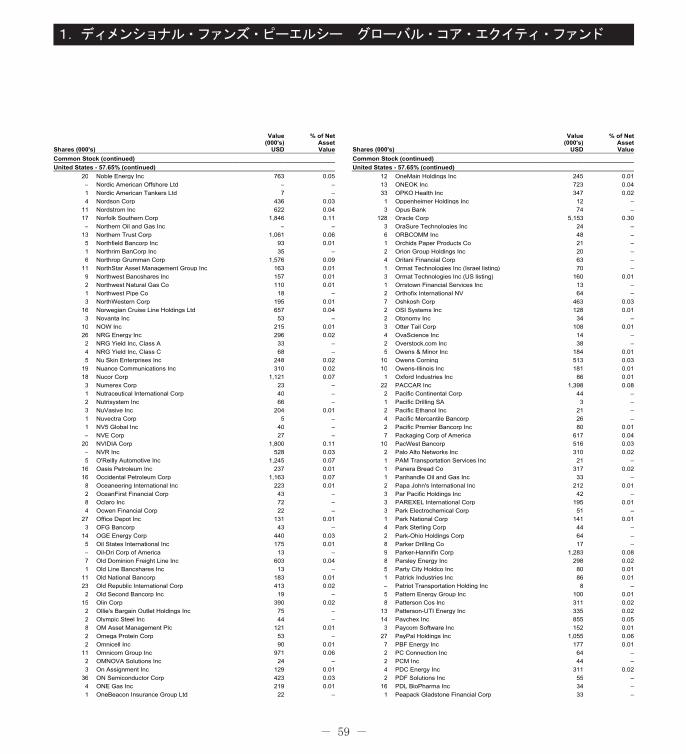
- 59 -
1.ディメンショナル・ファンズ・ピーエルシー グローバル・コア・エクイティ・ファンド
Shares (000's)
Value(000's)
USD
% of NetAssetValue
Common Stock (continued)United States - 57.65% (continued)
20 Noble Energy Inc 763 0.05 – Nordic American Offshore Ltd – – 1 Nordic American Tankers Ltd 7 – 4 Nordson Corp 436 0.03
11 Nordstrom Inc 622 0.04 17 Norfolk Southern Corp 1,846 0.11 – Northern Oil and Gas Inc – –
13 Northern Trust Corp 1,061 0.06 5 Northfield Bancorp Inc 93 0.01 1 Northrim BanCorp Inc 35 – 6 Northrop Grumman Corp 1,576 0.09
11 NorthStar Asset Management Group Inc 163 0.01 9 Northwest Bancshares Inc 157 0.01 2 Northwest Natural Gas Co 110 0.01 1 Northwest Pipe Co 18 – 3 NorthWestern Corp 195 0.01
16 Norwegian Cruise Line Holdings Ltd 657 0.04 3 Novanta Inc 53 –
10 NOW Inc 215 0.01 26 NRG Energy Inc 296 0.02 2 NRG Yield Inc, Class A 33 – 4 NRG Yield Inc, Class C 68 – 5 Nu Skin Enterprises Inc 248 0.02
19 Nuance Communications Inc 310 0.02 18 Nucor Corp 1,121 0.07 3 Numerex Corp 23 – 1 Nutraceutical International Corp 40 – 2 Nutrisystem Inc 66 – 3 NuVasive Inc 204 0.01 1 Nuvectra Corp 5 – 1 NV5 Global Inc 40 – – NVE Corp 27 –
20 NVIDIA Corp 1,800 0.11 – NVR Inc 528 0.03 5 O'Reilly Automotive Inc 1,245 0.07
16 Oasis Petroleum Inc 237 0.01 16 Occidental Petroleum Corp 1,163 0.07 8 Oceaneering International Inc 223 0.01 2 OceanFirst Financial Corp 43 – 8 Oclaro Inc 72 – 4 Ocwen Financial Corp 22 –
27 Office Depot Inc 131 0.01 3 OFG Bancorp 43 –
14 OGE Energy Corp 440 0.03 5 Oil States International Inc 175 0.01 – Oil-Dri Corp of America 13 – 7 Old Dominion Freight Line Inc 603 0.04 1 Old Line Bancshares Inc 13 –
11 Old National Bancorp 183 0.01 23 Old Republic International Corp 413 0.02 2 Old Second Bancorp Inc 19 –
15 Olin Corp 390 0.02 2 Ollie's Bargain Outlet Holdings Inc 75 – 2 Olympic Steel Inc 44 – 8 OM Asset Management Plc 121 0.01 2 Omega Protein Corp 53 – 2 Omnicell Inc 90 0.01
11 Omnicom Group Inc 971 0.06 2 OMNOVA Solutions Inc 24 – 3 On Assignment Inc 129 0.01
36 ON Semiconductor Corp 423 0.03 4 ONE Gas Inc 219 0.01 1 OneBeacon Insurance Group Ltd 22 –
Shares (000's)
Value(000's)
USD
% of NetAssetValue
Common Stock (continued)United States - 57.65% (continued)
12 OneMain Holdings Inc 245 0.01 13 ONEOK Inc 723 0.04 33 OPKO Health Inc 347 0.02 1 Oppenheimer Holdings Inc 12 – 3 Opus Bank 74 –
128 Oracle Corp 5,153 0.30 3 OraSure Technologies Inc 24 – 6 ORBCOMM Inc 48 – 1 Orchids Paper Products Co 21 – 2 Orion Group Holdings Inc 20 – 4 Oritani Financial Corp 63 – 1 Ormat Technologies Inc (Israel listing) 70 – 3 Ormat Technologies Inc (US listing) 160 0.01 1 Orrstown Financial Services Inc 13 – 2 Orthofix International NV 64 – 7 Oshkosh Corp 463 0.03 2 OSI Systems Inc 128 0.01 2 Otonomy Inc 34 – 3 Otter Tail Corp 108 0.01 4 OvaScience Inc 14 – 2 Overstock.com Inc 38 – 5 Owens & Minor Inc 184 0.01
10 Owens Corning 513 0.03 10 Owens-Illinois Inc 181 0.01 1 Oxford Industries Inc 86 0.01
22 PACCAR Inc 1,398 0.08 2 Pacific Continental Corp 44 – 1 Pacific Drilling SA 3 – 2 Pacific Ethanol Inc 21 – 4 Pacific Mercantile Bancorp 26 – 2 Pacific Premier Bancorp Inc 80 0.01 7 Packaging Corp of America 617 0.04
10 PacWest Bancorp 516 0.03 2 Palo Alto Networks Inc 310 0.02 1 PAM Transportation Services Inc 21 – 1 Panera Bread Co 317 0.02 1 Panhandle Oil and Gas Inc 33 – 2 Papa John's International Inc 212 0.01 3 Par Pacific Holdings Inc 42 – 3 PAREXEL International Corp 195 0.01 3 Park Electrochemical Corp 51 – 1 Park National Corp 141 0.01 4 Park Sterling Corp 44 – 2 Park-Ohio Holdings Corp 64 – 8 Parker Drilling Co 17 – 9 Parker-Hannifin Corp 1,283 0.08 8 Parsley Energy Inc 298 0.02 5 Party City Holdco Inc 80 0.01 1 Patrick Industries Inc 86 0.01 – Patriot Transportation Holding Inc 8 – 5 Pattern Energy Group Inc 100 0.01 8 Patterson Cos Inc 311 0.02
13 Patterson-UTI Energy Inc 335 0.02 14 Paychex Inc 855 0.05 3 Paycom Software Inc 152 0.01
27 PayPal Holdings Inc 1,055 0.06 7 PBF Energy Inc 177 0.01 2 PC Connection Inc 64 – 2 PCM Inc 44 – 4 PDC Energy Inc 311 0.02 2 PDF Solutions Inc 55 –
16 PDL BioPharma Inc 34 – 1 Peapack Gladstone Financial Corp 33 –
010_3771524762911.indd���59 2017/10/11���13:01:35
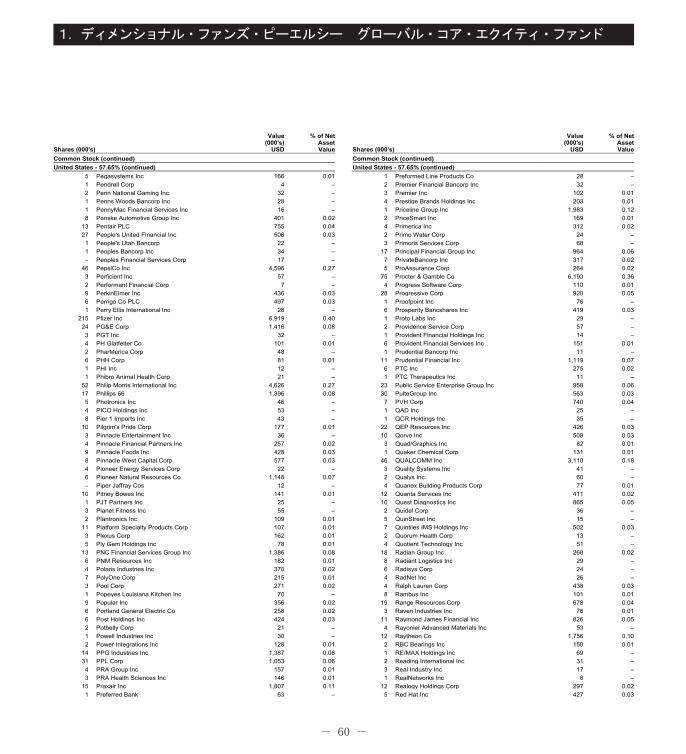
- 60 -
1.ディメンショナル・ファンズ・ピーエルシー グローバル・コア・エクイティ・ファンド
Shares (000's)
Value(000's)
USD
% of NetAssetValue
Common Stock (continued)United States - 57.65% (continued)
5 Pegasystems Inc 166 0.01 1 Pendrell Corp 4 – 2 Penn National Gaming Inc 32 – 1 Penns Woods Bancorp Inc 28 – 1 PennyMac Financial Services Inc 16 – 8 Penske Automotive Group Inc 401 0.02
13 Pentair PLC 755 0.04 27 People's United Financial Inc 506 0.03 1 People's Utah Bancorp 22 – 1 Peoples Bancorp Inc 34 – – Peoples Financial Services Corp 17 –
46 PepsiCo Inc 4,596 0.27 3 Perficient Inc 57 – 2 Performant Financial Corp 7 – 9 PerkinElmer Inc 436 0.03 6 Perrigo Co PLC 497 0.03 1 Perry Ellis International Inc 28 –
215 Pfizer Inc 6,919 0.40 24 PG&E Corp 1,416 0.08 3 PGT Inc 32 – 4 PH Glatfelter Co 101 0.01 2 PharMerica Corp 48 – 6 PHH Corp 81 0.01 1 PHI Inc 12 – 1 Phibro Animal Health Corp 21 –
52 Philip Morris International Inc 4,626 0.27 17 Phillips 66 1,396 0.08 5 Photronics Inc 46 – 4 PICO Holdings Inc 53 – 8 Pier 1 Imports Inc 43 –
10 Pilgrim's Pride Corp 177 0.01 3 Pinnacle Entertainment Inc 36 – 4 Pinnacle Financial Partners Inc 257 0.02 9 Pinnacle Foods Inc 428 0.03 8 Pinnacle West Capital Corp 577 0.03 4 Pioneer Energy Services Corp 22 – 6 Pioneer Natural Resources Co 1,148 0.07 – Piper Jaffray Cos 12 –
10 Pitney Bowes Inc 141 0.01 1 PJT Partners Inc 25 – 3 Planet Fitness Inc 55 – 2 Plantronics Inc 109 0.01
11 Platform Specialty Products Corp 107 0.01 3 Plexus Corp 162 0.01 5 Ply Gem Holdings Inc 78 0.01
13 PNC Financial Services Group Inc 1,386 0.08 6 PNM Resources Inc 182 0.01 4 Polaris Industries Inc 370 0.02 7 PolyOne Corp 215 0.01 3 Pool Corp 271 0.02 1 Popeyes Louisiana Kitchen Inc 70 – 9 Popular Inc 356 0.02 6 Portland General Electric Co 258 0.02 6 Post Holdings Inc 424 0.03 2 Potbelly Corp 21 – 1 Powell Industries Inc 30 – 2 Power Integrations Inc 128 0.01
14 PPG Industries Inc 1,387 0.08 31 PPL Corp 1,053 0.06 4 PRA Group Inc 157 0.01 3 PRA Health Sciences Inc 146 0.01
15 Praxair Inc 1,807 0.11 1 Preferred Bank 63 –
Shares (000's)
Value(000's)
USD
% of NetAssetValue
Common Stock (continued)United States - 57.65% (continued)
1 Preformed Line Products Co 28 – 2 Premier Financial Bancorp Inc 32 – 3 Premier Inc 102 0.01 4 Prestige Brands Holdings Inc 203 0.01 1 Priceline Group Inc 1,983 0.12 2 PriceSmart Inc 169 0.01 4 Primerica Inc 312 0.02 2 Primo Water Corp 24 – 3 Primoris Services Corp 68 –
17 Principal Financial Group Inc 964 0.06 7 PrivateBancorp Inc 317 0.02 5 ProAssurance Corp 264 0.02
75 Procter & Gamble Co 6,193 0.36 4 Progress Software Corp 110 0.01
28 Progressive Corp 920 0.05 1 Proofpoint Inc 76 – 6 Prosperity Bancshares Inc 419 0.03 1 Proto Labs Inc 29 – 2 Providence Service Corp 57 – 1 Provident Financial Holdings Inc 14 – 6 Provident Financial Services Inc 151 0.01 1 Prudential Bancorp Inc 11 –
11 Prudential Financial Inc 1,119 0.07 6 PTC Inc 275 0.02 1 PTC Therapeutics Inc 11 –
23 Public Service Enterprise Group Inc 958 0.06 30 PulteGroup Inc 563 0.03 7 PVH Corp 740 0.04 1 QAD Inc 25 – 1 QCR Holdings Inc 35 –
22 QEP Resources Inc 426 0.03 10 Qorvo Inc 508 0.03 3 Quad/Graphics Inc 82 0.01 1 Quaker Chemical Corp 131 0.01
46 QUALCOMM Inc 3,110 0.18 3 Quality Systems Inc 41 – 2 Qualys Inc 60 – 4 Quanex Building Products Corp 77 0.01
12 Quanta Services Inc 411 0.02 10 Quest Diagnostics Inc 865 0.05 2 Quidel Corp 36 – 5 QuinStreet Inc 15 – 7 Quintiles IMS Holdings Inc 502 0.03 2 Quorum Health Corp 13 – 4 Quotient Technology Inc 51 –
18 Radian Group Inc 268 0.02 8 Radiant Logistics Inc 29 – 6 Radisys Corp 24 – 4 RadNet Inc 26 – 4 Ralph Lauren Corp 438 0.03 8 Rambus Inc 101 0.01
19 Range Resources Corp 678 0.04 3 Raven Industries Inc 76 0.01
11 Raymond James Financial Inc 826 0.05 4 Rayonier Advanced Materials Inc 53 –
12 Raytheon Co 1,756 0.10 2 RBC Bearings Inc 150 0.01 1 RE/MAX Holdings Inc 69 – 2 Reading International Inc 31 – 3 Real Industry Inc 17 – 1 RealNetworks Inc 6 –
12 Realogy Holdings Corp 297 0.02 5 Red Hat Inc 427 0.03
010_3771524762911.indd���60 2017/10/11���13:01:35
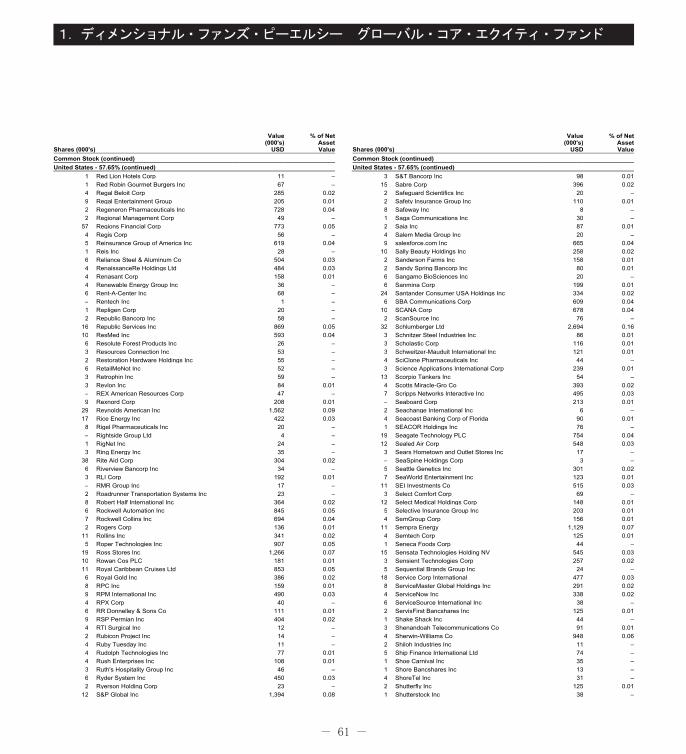
- 61 -
1.ディメンショナル・ファンズ・ピーエルシー グローバル・コア・エクイティ・ファンド
Shares (000's)
Value(000's)
USD
% of NetAssetValue
Common Stock (continued)United States - 57.65% (continued)
1 Red Lion Hotels Corp 11 – 1 Red Robin Gourmet Burgers Inc 67 – 4 Regal Beloit Corp 285 0.02 9 Regal Entertainment Group 205 0.01 2 Regeneron Pharmaceuticals Inc 728 0.04 2 Regional Management Corp 49 –
57 Regions Financial Corp 773 0.05 4 Regis Corp 56 – 5 Reinsurance Group of America Inc 619 0.04 1 Reis Inc 28 – 6 Reliance Steel & Aluminum Co 504 0.03 4 RenaissanceRe Holdings Ltd 484 0.03 4 Renasant Corp 158 0.01 4 Renewable Energy Group Inc 36 – 6 Rent-A-Center Inc 68 – – Rentech Inc 1 – 1 Repligen Corp 20 – 2 Republic Bancorp Inc 58 –
16 Republic Services Inc 869 0.05 10 ResMed Inc 593 0.04 6 Resolute Forest Products Inc 26 – 3 Resources Connection Inc 53 – 2 Restoration Hardware Holdings Inc 55 – 6 RetailMeNot Inc 52 – 3 Retrophin Inc 59 – 3 Revlon Inc 84 0.01 – REX American Resources Corp 47 – 9 Rexnord Corp 208 0.01
29 Reynolds American Inc 1,562 0.09 17 Rice Energy Inc 422 0.03 8 Rigel Pharmaceuticals Inc 20 – – Rightside Group Ltd 4 – 1 RigNet Inc 24 – 3 Ring Energy Inc 35 –
38 Rite Aid Corp 304 0.02 6 Riverview Bancorp Inc 34 – 3 RLI Corp 192 0.01 – RMR Group Inc 17 – 2 Roadrunner Transportation Systems Inc 23 – 8 Robert Half International Inc 364 0.02 6 Rockwell Automation Inc 845 0.05 7 Rockwell Collins Inc 694 0.04 2 Rogers Corp 136 0.01
11 Rollins Inc 341 0.02 5 Roper Technologies Inc 907 0.05
19 Ross Stores Inc 1,266 0.07 10 Rowan Cos PLC 181 0.01 11 Royal Caribbean Cruises Ltd 853 0.05 6 Royal Gold Inc 386 0.02 8 RPC Inc 159 0.01 9 RPM International Inc 490 0.03 4 RPX Corp 40 – 6 RR Donnelley & Sons Co 111 0.01 9 RSP Permian Inc 404 0.02 4 RTI Surgical Inc 12 – 2 Rubicon Project Inc 14 – 4 Ruby Tuesday Inc 11 – 4 Rudolph Technologies Inc 77 0.01 4 Rush Enterprises Inc 108 0.01 3 Ruth's Hospitality Group Inc 46 – 6 Ryder System Inc 450 0.03 2 Ryerson Holding Corp 23 –
12 S&P Global Inc 1,394 0.08
Shares (000's)
Value(000's)
USD
% of NetAssetValue
Common Stock (continued)United States - 57.65% (continued)
3 S&T Bancorp Inc 98 0.01 15 Sabre Corp 396 0.02 2 Safeguard Scientifics Inc 20 – 2 Safety Insurance Group Inc 110 0.01 8 Safeway Inc 8 – 1 Saga Communications Inc 30 – 2 Saia Inc 87 0.01 4 Salem Media Group Inc 20 – 9 salesforce.com Inc 665 0.04
10 Sally Beauty Holdings Inc 258 0.02 2 Sanderson Farms Inc 158 0.01 2 Sandy Spring Bancorp Inc 80 0.01 6 Sangamo BioSciences Inc 20 – 6 Sanmina Corp 199 0.01
24 Santander Consumer USA Holdings Inc 334 0.02 6 SBA Communications Corp 609 0.04
10 SCANA Corp 678 0.04 2 ScanSource Inc 76 –
32 Schlumberger Ltd 2,694 0.16 3 Schnitzer Steel Industries Inc 86 0.01 3 Scholastic Corp 116 0.01 3 Schweitzer-Mauduit International Inc 121 0.01 4 SciClone Pharmaceuticals Inc 44 – 3 Science Applications International Corp 239 0.01
13 Scorpio Tankers Inc 54 – 4 Scotts Miracle-Gro Co 393 0.02 7 Scripps Networks Interactive Inc 495 0.03 – Seaboard Corp 213 0.01 2 Seachange International Inc 6 – 4 Seacoast Banking Corp of Florida 90 0.01 1 SEACOR Holdings Inc 76 –
19 Seagate Technology PLC 754 0.04 12 Sealed Air Corp 548 0.03 3 Sears Hometown and Outlet Stores Inc 17 – – SeaSpine Holdings Corp 3 – 5 Seattle Genetics Inc 301 0.02 7 SeaWorld Entertainment Inc 123 0.01
11 SEI Investments Co 515 0.03 3 Select Comfort Corp 69 –
12 Select Medical Holdings Corp 148 0.01 5 Selective Insurance Group Inc 203 0.01 4 SemGroup Corp 156 0.01
11 Sempra Energy 1,129 0.07 4 Semtech Corp 125 0.01 1 Seneca Foods Corp 44 –
15 Sensata Technologies Holding NV 545 0.03 3 Sensient Technologies Corp 257 0.02 5 Sequential Brands Group Inc 24 –
18 Service Corp International 477 0.03 8 ServiceMaster Global Holdings Inc 291 0.02 4 ServiceNow Inc 338 0.02 6 ServiceSource International Inc 38 – 2 ServisFirst Bancshares Inc 125 0.01 1 Shake Shack Inc 44 – 3 Shenandoah Telecommunications Co 91 0.01 4 Sherwin-Williams Co 948 0.06 2 Shiloh Industries Inc 11 – 5 Ship Finance International Ltd 74 – 1 Shoe Carnival Inc 35 – 1 Shore Bancshares Inc 13 – 4 ShoreTel Inc 31 – 2 Shutterfly Inc 125 0.01 1 Shutterstock Inc 38 –
010_3771524762911.indd���61 2017/10/11���13:01:36

- 62 -
1.ディメンショナル・ファンズ・ピーエルシー グローバル・コア・エクイティ・ファンド
Shares (000's)
Value(000's)
USD
% of NetAssetValue
Common Stock (continued)United States - 57.65% (continued)
1 SI Financial Group Inc 12 – 2 Sierra Bancorp 41 – 4 Sigma Designs Inc 33 – 3 Signature Bank 510 0.03 5 Signet Jewelers Ltd 442 0.03 4 Silgan Holdings Inc 206 0.01 3 Silicon Laboratories Inc 190 0.01 4 Silver Spring Networks Inc 53 – 3 Simmons First National Corp 172 0.01 4 Simpson Manufacturing Co Inc 168 0.01 6 Sinclair Broadcast Group Inc 197 0.01
95 Sirius XM Holdings Inc 435 0.03 7 Six Flags Entertainment Corp 375 0.02 2 SJW Group 92 0.01
11 Skechers U.S.A. Inc 260 0.02 4 SkyWest Inc 145 0.01 9 Skyworks Solutions Inc 702 0.04
42 SLM Corp 424 0.03 8 SM Energy Co 304 0.02 4 Smart & Final Stores Inc 48 – 4 Smith & Wesson Holding Corp 83 0.01 5 Snap-on Inc 829 0.05 8 Snyder's-Lance Inc 316 0.02 3 Sonic Automotive Inc 68 – 2 Sonic Corp 62 – 8 Sonoco Products Co 434 0.03 6 Sonus Networks Inc 37 – 3 Sotheby's 135 0.01 6 South Jersey Industries Inc 198 0.01 2 South State Corp 175 0.01
31 Southern Co 1,469 0.09 5 Southern Copper Corp 154 0.01 – Southern First Bancshares Inc 14 – 1 Southern Missouri Bancorp Inc 30 – 1 Southern National Bancorp of Virginia Inc 18 – 2 Southside Bancshares Inc 76 –
36 Southwest Airlines Co 1,657 0.10 2 Southwest Bancorp Inc 33 – 3 Southwest Gas Corp 252 0.02
34 Southwestern Energy Co 387 0.02 1 SP Plus Corp 29 – 5 Spartan Motors Inc 48 – 3 SpartanNash Co 92 0.01
26 Spectra Energy Corp 1,062 0.06 3 Spectrum Brands Holdings Inc 402 0.02 6 Spectrum Pharmaceuticals Inc 25 – 4 Speedway Motorsports Inc 80 0.01 3 Spire Inc 195 0.01
12 Spirit AeroSystems Holdings Inc 670 0.04 6 Spirit Airlines Inc 331 0.02 5 Splunk Inc 260 0.02 2 Spok Holdings Inc 37 – 2 Sportsman's Warehouse Holdings Inc 16 –
51 Sprint Corp 397 0.02 9 Sprouts Farmers Market Inc 185 0.01 4 SPX Corp 109 0.01 3 SPX FLOW Inc 103 0.01
15 SS&C Technologies Holdings Inc 450 0.03 7 St Joe Co 144 0.01
12 St Jude Medical Inc 938 0.06 2 Stage Stores Inc 11 – 1 Stamps.com Inc 72 – 2 Standard Motor Products Inc 79 0.01
Shares (000's)
Value(000's)
USD
% of NetAssetValue
Common Stock (continued)United States - 57.65% (continued)
1 Standex International Corp 99 0.01 8 Stanley Black & Decker Inc 967 0.06
39 Staples Inc 380 0.02 44 Starbucks Corp 2,536 0.15 5 Starz 166 0.01 4 State Auto Financial Corp 103 0.01 3 State Bank Financial Corp 70 – 4 State National Cos Inc 54 –
16 State Street Corp 1,291 0.08 17 Steel Dynamics Inc 599 0.04 6 Steelcase Inc 87 0.01 4 Stein Mart Inc 18 – 3 Stemline Therapeutics Inc 46 – 2 Stepan Co 138 0.01 3 Stericycle Inc 249 0.02 7 Steris PLC 434 0.03
11 Sterling Bancorp 256 0.02 4 Sterling Construction Co Inc 36 – 5 Steven Madden Ltd 175 0.01 2 Stewart Information Services Corp 89 0.01 5 Stifel Financial Corp 265 0.02
10 Stillwater Mining Co 157 0.01 1 Stock Yards Bancorp Inc 62 – 1 Stonegate Bank 39 – 3 Stoneridge Inc 54 – – Straight Path Communications Inc 3 – 3 Stratasys Ltd 47 – 1 Strattec Security Corp 19 – 1 Stratus Properties Inc 40 – 1 Strayer Education Inc 45 – 7 Stryker Corp 807 0.05 1 Sturm Ruger & Co Inc 69 – 2 Sucampo Pharmaceuticals Inc 27 – 1 Suffolk Bancorp 54 – 1 Summit Financial Group Inc 24 – 5 Summit Materials Inc 126 0.01 2 Sun Bancorp Inc 48 – 2 Sun Hydraulics Corp 88 0.01 8 SunCoke Energy Inc 91 0.01 3 SunEdison Semiconductor Ltd 33 – 8 SunPower Corp 54 –
19 SunTrust Banks Inc 1,012 0.06 4 Super Micro Computer Inc 106 0.01
14 Superior Energy Services Inc 246 0.01 3 Superior Industries International Inc 68 – 1 Superior Uniform Group Inc 21 – 2 Supernus Pharmaceuticals Inc 43 –
19 Supervalu Inc 86 0.01 3 Supreme Industries Inc 41 – 2 Surgical Care Affiliates Inc 93 0.01 1 SurModics Inc 25 – 5 SVB Financial Group 733 0.04 8 Swift Transportation Co 191 0.01 4 Sykes Enterprises Inc 120 0.01
31 Symantec Corp 746 0.04 2 Synaptics Inc 126 0.01 3 Synchronoss Technologies Inc 133 0.01
50 Synchrony Financial 1,719 0.10 17 Synergy Resources Corp 157 0.01 3 SYNNEX Corp 376 0.02
11 Synopsys Inc 656 0.04 11 Synovus Financial Corp 419 0.03 5 Syntel Inc 102 0.01
010_3771524762911.indd���62 2017/10/11���13:01:36
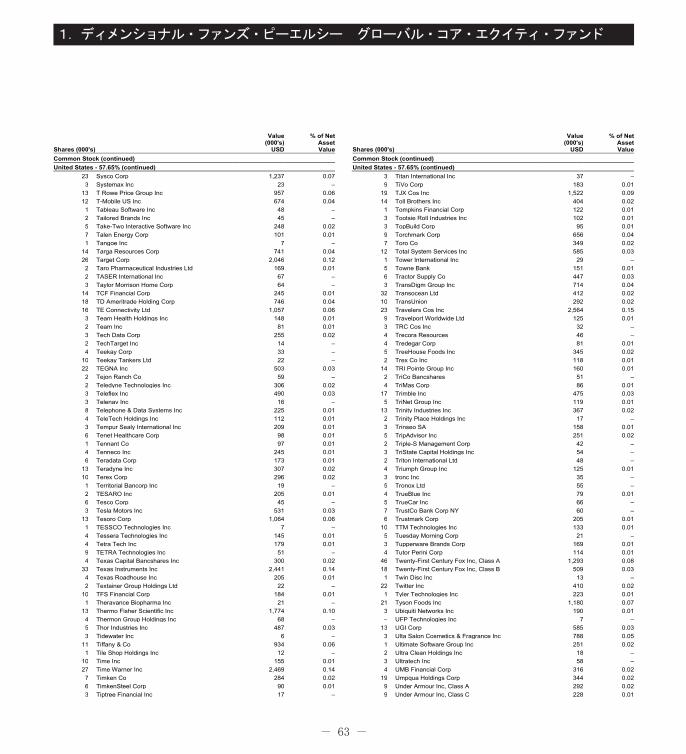
- 63 -
1.ディメンショナル・ファンズ・ピーエルシー グローバル・コア・エクイティ・ファンド
Shares (000's)
Value(000's)
USD
% of NetAssetValue
Common Stock (continued)United States - 57.65% (continued)
23 Sysco Corp 1,237 0.07 3 Systemax Inc 23 –
13 T Rowe Price Group Inc 957 0.06 12 T-Mobile US Inc 674 0.04 1 Tableau Software Inc 48 – 2 Tailored Brands Inc 45 – 5 Take-Two Interactive Software Inc 248 0.02 7 Talen Energy Corp 101 0.01 1 Tangoe Inc 7 –
14 Targa Resources Corp 741 0.04 26 Target Corp 2,046 0.12 2 Taro Pharmaceutical Industries Ltd 169 0.01 2 TASER International Inc 67 – 3 Taylor Morrison Home Corp 64 –
14 TCF Financial Corp 245 0.01 18 TD Ameritrade Holding Corp 746 0.04 16 TE Connectivity Ltd 1,057 0.06 3 Team Health Holdings Inc 148 0.01 2 Team Inc 81 0.01 3 Tech Data Corp 255 0.02 2 TechTarget Inc 14 – 4 Teekay Corp 33 –
10 Teekay Tankers Ltd 22 – 22 TEGNA Inc 503 0.03 2 Tejon Ranch Co 59 – 2 Teledyne Technologies Inc 306 0.02 3 Teleflex Inc 490 0.03 3 Telenav Inc 16 – 8 Telephone & Data Systems Inc 225 0.01 4 TeleTech Holdings Inc 112 0.01 3 Tempur Sealy International Inc 209 0.01 6 Tenet Healthcare Corp 98 0.01 1 Tennant Co 97 0.01 4 Tenneco Inc 245 0.01 6 Teradata Corp 173 0.01
13 Teradyne Inc 307 0.02 10 Terex Corp 296 0.02 1 Territorial Bancorp Inc 19 – 2 TESARO Inc 205 0.01 6 Tesco Corp 45 – 3 Tesla Motors Inc 531 0.03
13 Tesoro Corp 1,064 0.06 1 TESSCO Technologies Inc 7 – 4 Tessera Technologies Inc 145 0.01 4 Tetra Tech Inc 179 0.01 9 TETRA Technologies Inc 51 – 4 Texas Capital Bancshares Inc 300 0.02
33 Texas Instruments Inc 2,441 0.14 4 Texas Roadhouse Inc 205 0.01 2 Textainer Group Holdings Ltd 22 –
10 TFS Financial Corp 184 0.01 1 Theravance Biopharma Inc 21 –
13 Thermo Fisher Scientific Inc 1,774 0.10 4 Thermon Group Holdings Inc 68 – 5 Thor Industries Inc 487 0.03 3 Tidewater Inc 6 –
11 Tiffany & Co 934 0.06 1 Tile Shop Holdings Inc 12 –
10 Time Inc 155 0.01 27 Time Warner Inc 2,469 0.14 7 Timken Co 284 0.02 6 TimkenSteel Corp 90 0.01 3 Tiptree Financial Inc 17 –
Shares (000's)
Value(000's)
USD
% of NetAssetValue
Common Stock (continued)United States - 57.65% (continued)
3 Titan International Inc 37 – 9 TiVo Corp 183 0.01
19 TJX Cos Inc 1,522 0.09 14 Toll Brothers Inc 404 0.02 1 Tompkins Financial Corp 122 0.01 3 Tootsie Roll Industries Inc 102 0.01 3 TopBuild Corp 95 0.01 9 Torchmark Corp 656 0.04 7 Toro Co 349 0.02
12 Total System Services Inc 585 0.03 1 Tower International Inc 29 – 5 Towne Bank 151 0.01 6 Tractor Supply Co 447 0.03 3 TransDigm Group Inc 714 0.04
32 Transocean Ltd 412 0.02 10 TransUnion 292 0.02 23 Travelers Cos Inc 2,564 0.15 9 Travelport Worldwide Ltd 125 0.01 3 TRC Cos Inc 32 – 4 Trecora Resources 46 – 4 Tredegar Corp 81 0.01 5 TreeHouse Foods Inc 345 0.02 2 Trex Co Inc 118 0.01
14 TRI Pointe Group Inc 160 0.01 2 TriCo Bancshares 51 – 4 TriMas Corp 86 0.01
17 Trimble Inc 475 0.03 5 TriNet Group Inc 119 0.01
13 Trinity Industries Inc 367 0.02 2 Trinity Place Holdings Inc 17 – 3 Trinseo SA 158 0.01 5 TripAdvisor Inc 251 0.02 2 Triple-S Management Corp 42 – 3 TriState Capital Holdings Inc 54 – 2 Triton International Ltd 48 – 4 Triumph Group Inc 125 0.01 3 tronc Inc 35 – 5 Tronox Ltd 55 – 4 TrueBlue Inc 79 0.01 5 TrueCar Inc 66 – 7 TrustCo Bank Corp NY 60 – 6 Trustmark Corp 205 0.01
10 TTM Technologies Inc 133 0.01 5 Tuesday Morning Corp 21 – 3 Tupperware Brands Corp 169 0.01 4 Tutor Perini Corp 114 0.01
46 Twenty-First Century Fox Inc, Class A 1,293 0.08 18 Twenty-First Century Fox Inc, Class B 509 0.03 1 Twin Disc Inc 13 –
22 Twitter Inc 410 0.02 1 Tyler Technologies Inc 223 0.01
21 Tyson Foods Inc 1,180 0.07 3 Ubiquiti Networks Inc 190 0.01 – UFP Technologies Inc 7 –
13 UGI Corp 585 0.03 3 Ulta Salon Cosmetics & Fragrance Inc 788 0.05 1 Ultimate Software Group Inc 251 0.02 2 Ultra Clean Holdings Inc 18 – 3 Ultratech Inc 58 – 4 UMB Financial Corp 316 0.02
19 Umpqua Holdings Corp 344 0.02 9 Under Armour Inc, Class A 292 0.02 9 Under Armour Inc, Class C 228 0.01
010_3771524762911.indd���63 2017/10/11���13:01:36
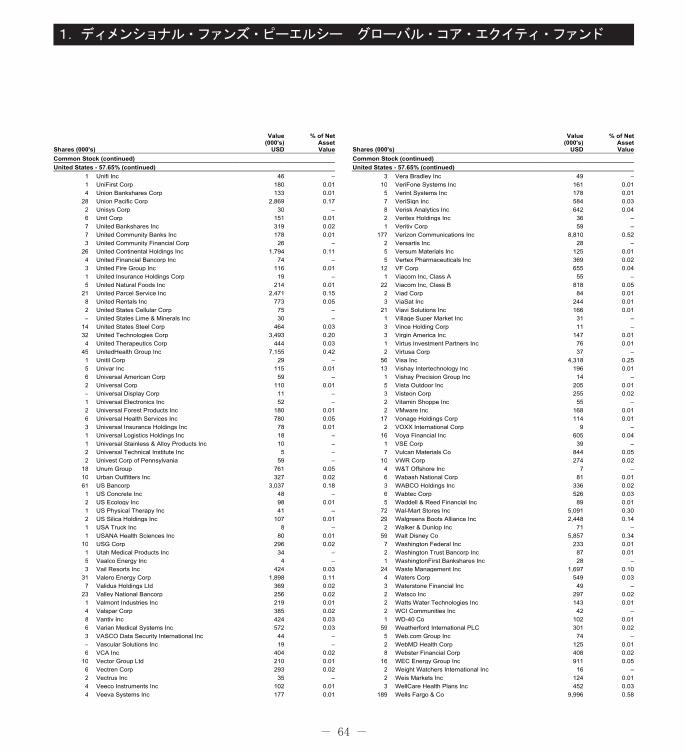
- 64 -
1.ディメンショナル・ファンズ・ピーエルシー グローバル・コア・エクイティ・ファンド
Shares (000's)
Value(000's)
USD
% of NetAssetValue
Common Stock (continued)United States - 57.65% (continued)
1 Unifi Inc 46 – 1 UniFirst Corp 180 0.01 4 Union Bankshares Corp 133 0.01
28 Union Pacific Corp 2,869 0.17 2 Unisys Corp 30 – 6 Unit Corp 151 0.01 7 United Bankshares Inc 319 0.02 7 United Community Banks Inc 178 0.01 3 United Community Financial Corp 26 –
26 United Continental Holdings Inc 1,794 0.11 4 United Financial Bancorp Inc 74 – 3 United Fire Group Inc 116 0.01 1 United Insurance Holdings Corp 19 – 5 United Natural Foods Inc 214 0.01
21 United Parcel Service Inc 2,471 0.15 8 United Rentals Inc 773 0.05 2 United States Cellular Corp 75 – – United States Lime & Minerals Inc 30 –
14 United States Steel Corp 464 0.03 32 United Technologies Corp 3,493 0.20 4 United Therapeutics Corp 444 0.03
45 UnitedHealth Group Inc 7,155 0.42 1 Unitil Corp 29 – 5 Univar Inc 115 0.01 6 Universal American Corp 59 – 2 Universal Corp 110 0.01 – Universal Display Corp 11 – 1 Universal Electronics Inc 52 – 2 Universal Forest Products Inc 180 0.01 6 Universal Health Services Inc 780 0.05 3 Universal Insurance Holdings Inc 78 0.01 1 Universal Logistics Holdings Inc 18 – 1 Universal Stainless & Alloy Products Inc 10 – 2 Universal Technical Institute Inc 5 – 2 Univest Corp of Pennsylvania 59 –
18 Unum Group 761 0.05 10 Urban Outfitters Inc 327 0.02 61 US Bancorp 3,037 0.18 1 US Concrete Inc 48 – 2 US Ecology Inc 98 0.01 1 US Physical Therapy Inc 41 – 2 US Silica Holdings Inc 107 0.01 1 USA Truck Inc 8 – 1 USANA Health Sciences Inc 80 0.01
10 USG Corp 296 0.02 1 Utah Medical Products Inc 34 – 5 Vaalco Energy Inc 4 – 3 Vail Resorts Inc 424 0.03
31 Valero Energy Corp 1,898 0.11 7 Validus Holdings Ltd 369 0.02
23 Valley National Bancorp 256 0.02 1 Valmont Industries Inc 219 0.01 4 Valspar Corp 385 0.02 8 Vantiv Inc 424 0.03 6 Varian Medical Systems Inc 572 0.03 3 VASCO Data Security International Inc 44 – – Vascular Solutions Inc 19 – 6 VCA Inc 404 0.02
10 Vector Group Ltd 210 0.01 6 Vectren Corp 293 0.02 2 Vectrus Inc 35 – 4 Veeco Instruments Inc 102 0.01 4 Veeva Systems Inc 177 0.01
Shares (000's)
Value(000's)
USD
% of NetAssetValue
Common Stock (continued)United States - 57.65% (continued)
3 Vera Bradley Inc 49 – 10 VeriFone Systems Inc 161 0.01 5 Verint Systems Inc 178 0.01 7 VeriSign Inc 584 0.03 8 Verisk Analytics Inc 642 0.04 2 Veritex Holdings Inc 36 – 1 Veritiv Corp 59 –
177 Verizon Communications Inc 8,810 0.52 2 Versartis Inc 28 – 5 Versum Materials Inc 125 0.01 5 Vertex Pharmaceuticals Inc 369 0.02
12 VF Corp 655 0.04 1 Viacom Inc, Class A 55 –
22 Viacom Inc, Class B 818 0.05 2 Viad Corp 84 0.01 3 ViaSat Inc 244 0.01
21 Viavi Solutions Inc 166 0.01 1 Village Super Market Inc 31 – 3 Vince Holding Corp 11 – 3 Virgin America Inc 147 0.01 1 Virtus Investment Partners Inc 76 0.01 2 Virtusa Corp 37 –
56 Visa Inc 4,318 0.25 13 Vishay Intertechnology Inc 196 0.01 1 Vishay Precision Group Inc 14 – 5 Vista Outdoor Inc 205 0.01 3 Visteon Corp 255 0.02 2 Vitamin Shoppe Inc 55 – 2 VMware Inc 168 0.01
17 Vonage Holdings Corp 114 0.01 2 VOXX International Corp 9 –
16 Voya Financial Inc 605 0.04 1 VSE Corp 39 – 7 Vulcan Materials Co 844 0.05
10 VWR Corp 274 0.02 4 W&T Offshore Inc 7 – 6 Wabash National Corp 81 0.01 3 WABCO Holdings Inc 336 0.02 6 Wabtec Corp 526 0.03 5 Waddell & Reed Financial Inc 89 0.01
72 Wal-Mart Stores Inc 5,091 0.30 29 Walgreens Boots Alliance Inc 2,448 0.14 2 Walker & Dunlop Inc 71 –
59 Walt Disney Co 5,857 0.34 7 Washington Federal Inc 233 0.01 2 Washington Trust Bancorp Inc 87 0.01 1 WashingtonFirst Bankshares Inc 28 –
24 Waste Management Inc 1,697 0.10 4 Waters Corp 549 0.03 3 Waterstone Financial Inc 49 – 2 Watsco Inc 297 0.02 2 Watts Water Technologies Inc 143 0.01 2 WCI Communities Inc 42 – 1 WD-40 Co 102 0.01
59 Weatherford International PLC 301 0.02 5 Web.com Group Inc 74 – 2 WebMD Health Corp 125 0.01 8 Webster Financial Corp 408 0.02
16 WEC Energy Group Inc 911 0.05 2 Weight Watchers International Inc 16 – 2 Weis Markets Inc 124 0.01 3 WellCare Health Plans Inc 452 0.03
189 Wells Fargo & Co 9,996 0.58
010_3771524762911.indd���64 2017/10/11���13:01:37
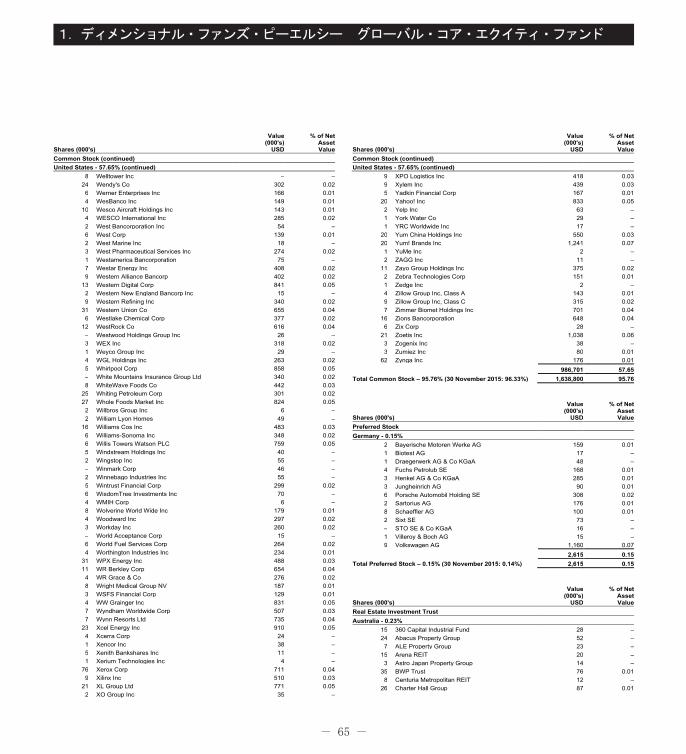
- 65 -
1.ディメンショナル・ファンズ・ピーエルシー グローバル・コア・エクイティ・ファンド
Shares (000's)
Value(000's)
USD
% of NetAssetValue
Common Stock (continued)United States - 57.65% (continued)
8 Welltower Inc – – 24 Wendy's Co 302 0.02 6 Werner Enterprises Inc 166 0.01 4 WesBanco Inc 149 0.01
10 Wesco Aircraft Holdings Inc 143 0.01 4 WESCO International Inc 285 0.02 2 West Bancorporation Inc 54 – 6 West Corp 139 0.01 2 West Marine Inc 18 – 3 West Pharmaceutical Services Inc 274 0.02 1 Westamerica Bancorporation 75 – 7 Westar Energy Inc 408 0.02 9 Western Alliance Bancorp 402 0.02
13 Western Digital Corp 841 0.05 2 Western New England Bancorp Inc 15 – 9 Western Refining Inc 340 0.02
31 Western Union Co 655 0.04 6 Westlake Chemical Corp 377 0.02
12 WestRock Co 616 0.04 – Westwood Holdings Group Inc 26 – 3 WEX Inc 318 0.02 1 Weyco Group Inc 29 – 4 WGL Holdings Inc 263 0.02 5 Whirlpool Corp 858 0.05 – White Mountains Insurance Group Ltd 340 0.02 8 WhiteWave Foods Co 442 0.03
25 Whiting Petroleum Corp 301 0.02 27 Whole Foods Market Inc 824 0.05 2 Willbros Group Inc 6 – 2 William Lyon Homes 49 –
16 Williams Cos Inc 483 0.03 6 Williams-Sonoma Inc 348 0.02 6 Willis Towers Watson PLC 759 0.05 5 Windstream Holdings Inc 40 – 2 Wingstop Inc 55 – – Winmark Corp 46 – 2 Winnebago Industries Inc 55 – 5 Wintrust Financial Corp 299 0.02 6 WisdomTree Investments Inc 70 – 4 WMIH Corp 6 – 8 Wolverine World Wide Inc 179 0.01 4 Woodward Inc 297 0.02 3 Workday Inc 260 0.02 – World Acceptance Corp 15 – 6 World Fuel Services Corp 264 0.02 4 Worthington Industries Inc 234 0.01
31 WPX Energy Inc 488 0.03 11 WR Berkley Corp 654 0.04 4 WR Grace & Co 276 0.02 8 Wright Medical Group NV 187 0.01 3 WSFS Financial Corp 129 0.01 4 WW Grainger Inc 831 0.05 7 Wyndham Worldwide Corp 507 0.03 7 Wynn Resorts Ltd 735 0.04
23 Xcel Energy Inc 910 0.05 4 Xcerra Corp 24 – 1 Xencor Inc 38 – 5 Xenith Bankshares Inc 11 – 1 Xerium Technologies Inc 4 –
76 Xerox Corp 711 0.04 9 Xilinx Inc 510 0.03
21 XL Group Ltd 771 0.05 2 XO Group Inc 35 –
Shares (000's)
Value(000's)
USD
% of NetAssetValue
Common Stock (continued)United States - 57.65% (continued)
9 XPO Logistics Inc 418 0.03 9 Xylem Inc 439 0.03 5 Yadkin Financial Corp 167 0.01
20 Yahoo! Inc 833 0.05 2 Yelp Inc 63 – 1 York Water Co 29 – 1 YRC Worldwide Inc 17 –
20 Yum China Holdings Inc 550 0.03 20 Yum! Brands Inc 1,241 0.07 1 YuMe Inc 2 – 2 ZAGG Inc 11 –
11 Zayo Group Holdings Inc 375 0.02 2 Zebra Technologies Corp 151 0.01 1 Zedge Inc 2 – 4 Zillow Group Inc, Class A 143 0.01 9 Zillow Group Inc, Class C 315 0.02 7 Zimmer Biomet Holdings Inc 701 0.04
16 Zions Bancorporation 648 0.04 6 Zix Corp 28 –
21 Zoetis Inc 1,038 0.06 3 Zogenix Inc 38 – 3 Zumiez Inc 80 0.01
62 Zynga Inc 176 0.01 986,701 57.65
Total Common Stock – 95.76% (30 November 2015: 96.33%) 1,638,800 95.76
Shares (000's)
Value(000's)
USD
% of NetAssetValue
Preferred StockGermany - 0.15%
2 Bayerische Motoren Werke AG 159 0.01 1 Biotest AG 17 – 1 Draegerwerk AG & Co KGaA 48 – 4 Fuchs Petrolub SE 168 0.01 3 Henkel AG & Co KGaA 285 0.01 3 Jungheinrich AG 90 0.01 6 Porsche Automobil Holding SE 308 0.02 2 Sartorius AG 176 0.01 8 Schaeffler AG 100 0.01 2 Sixt SE 73 – – STO SE & Co KGaA 16 – 1 Villeroy & Boch AG 15 – 9 Volkswagen AG 1,160 0.07
2,615 0.15Total Preferred Stock – 0.15% (30 November 2015: 0.14%) 2,615 0.15
Shares (000's)
Value(000's)
USD
% of NetAssetValue
Real Estate Investment TrustAustralia - 0.23%
15 360 Capital Industrial Fund 28 – 24 Abacus Property Group 52 – 7 ALE Property Group 23 –
15 Arena REIT 20 – 3 Astro Japan Property Group 14 –
35 BWP Trust 76 0.01 8 Centuria Metropolitan REIT 12 –
26 Charter Hall Group 87 0.01
010_3771524762911.indd���65 2017/10/11���13:01:37
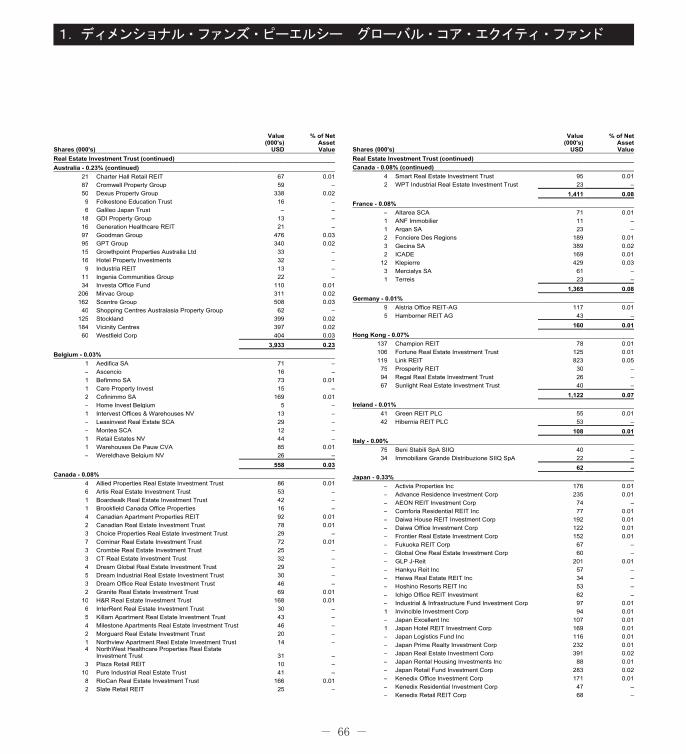
- 66 -
1.ディメンショナル・ファンズ・ピーエルシー グローバル・コア・エクイティ・ファンド
Shares (000's)
Value(000's)
USD
% of NetAssetValue
Real Estate Investment Trust (continued)Australia - 0.23% (continued)
21 Charter Hall Retail REIT 67 0.01 87 Cromwell Property Group 59 – 50 Dexus Property Group 338 0.02 9 Folkestone Education Trust 16 – 6 Galileo Japan Trust – –
18 GDI Property Group 13 – 16 Generation Healthcare REIT 21 – 97 Goodman Group 476 0.03 95 GPT Group 340 0.02 15 Growthpoint Properties Australia Ltd 33 – 16 Hotel Property Investments 32 – 9 Industria REIT 13 –
11 Ingenia Communities Group 22 – 34 Investa Office Fund 110 0.01
206 Mirvac Group 311 0.02 162 Scentre Group 508 0.03
40 Shopping Centres Australasia Property Group 62 – 125 Stockland 399 0.02 184 Vicinity Centres 397 0.02
60 Westfield Corp 404 0.03 3,933 0.23
Belgium - 0.03%1 Aedifica SA 71 – – Ascencio 16 – 1 Befimmo SA 73 0.01 1 Care Property Invest 15 – 2 Cofinimmo SA 169 0.01 – Home Invest Belgium 5 – 1 Intervest Offices & Warehouses NV 13 – – Leasinvest Real Estate SCA 29 – – Montea SCA 12 – 1 Retail Estates NV 44 – 1 Warehouses De Pauw CVA 85 0.01 – Wereldhave Belgium NV 26 –
558 0.03Canada - 0.08%
4 Allied Properties Real Estate Investment Trust 86 0.01 6 Artis Real Estate Investment Trust 53 – 1 Boardwalk Real Estate Investment Trust 42 – 1 Brookfield Canada Office Properties 16 – 4 Canadian Apartment Properties REIT 92 0.01 2 Canadian Real Estate Investment Trust 78 0.01 3 Choice Properties Real Estate Investment Trust 29 – 7 Cominar Real Estate Investment Trust 72 0.01 3 Crombie Real Estate Investment Trust 25 – 3 CT Real Estate Investment Trust 32 – 4 Dream Global Real Estate Investment Trust 29 – 5 Dream Industrial Real Estate Investment Trust 30 – 3 Dream Office Real Estate Investment Trust 46 – 2 Granite Real Estate Investment Trust 69 0.01
10 H&R Real Estate Investment Trust 168 0.01 6 InterRent Real Estate Investment Trust 30 – 5 Killam Apartment Real Estate Investment Trust 43 – 4 Milestone Apartments Real Estate Investment Trust 46 – 2 Morguard Real Estate Investment Trust 20 – 1 Northview Apartment Real Estate Investment Trust 14 – 4
NorthWest Healthcare Properties Real Estate Investment Trust 31 –
3 Plaza Retail REIT 10 – 10 Pure Industrial Real Estate Trust 41 – 8 RioCan Real Estate Investment Trust 166 0.01 2 Slate Retail REIT 25 –
Shares (000's)
Value(000's)
USD
% of NetAssetValue
Real Estate Investment Trust (continued)Canada - 0.08% (continued)
4 Smart Real Estate Investment Trust 95 0.01 2 WPT Industrial Real Estate Investment Trust 23 –
1,411 0.08France - 0.08%
– Altarea SCA 71 0.01 1 ANF Immobilier 11 – 1 Argan SA 23 – 2 Fonciere Des Regions 189 0.01 3 Gecina SA 389 0.02 2 ICADE 169 0.01
12 Klepierre 429 0.03 3 Mercialys SA 61 – 1 Terreis 23 –
1,365 0.08Germany - 0.01%
9 Alstria Office REIT-AG 117 0.01 5 Hamborner REIT AG 43 –
160 0.01Hong Kong - 0.07%
137 Champion REIT 78 0.01 106 Fortune Real Estate Investment Trust 125 0.01 119 Link REIT 823 0.05
75 Prosperity REIT 30 – 94 Regal Real Estate Investment Trust 26 – 67 Sunlight Real Estate Investment Trust 40 –
1,122 0.07Ireland - 0.01%
41 Green REIT PLC 55 0.01 42 Hibernia REIT PLC 53 –
108 0.01Italy - 0.00%
75 Beni Stabili SpA SIIQ 40 – 34 Immobiliare Grande Distribuzione SIIQ SpA 22 –
62 –Japan - 0.33%
– Activia Properties Inc 176 0.01 – Advance Residence Investment Corp 235 0.01 – AEON REIT Investment Corp 74 – – Comforia Residential REIT Inc 77 0.01 – Daiwa House REIT Investment Corp 192 0.01 – Daiwa Office Investment Corp 122 0.01 – Frontier Real Estate Investment Corp 152 0.01 – Fukuoka REIT Corp 67 – – Global One Real Estate Investment Corp 60 – – GLP J-Reit 201 0.01 – Hankyu Reit Inc 57 – – Heiwa Real Estate REIT Inc 34 – – Hoshino Resorts REIT Inc 53 – – Ichigo Office REIT Investment 62 – – Industrial & Infrastructure Fund Investment Corp 97 0.01 1 Invincible Investment Corp 94 0.01 – Japan Excellent Inc 107 0.01 1 Japan Hotel REIT Investment Corp 169 0.01 – Japan Logistics Fund Inc 116 0.01 – Japan Prime Realty Investment Corp 232 0.01 – Japan Real Estate Investment Corp 391 0.02 – Japan Rental Housing Investments Inc 88 0.01 – Japan Retail Fund Investment Corp 283 0.02 – Kenedix Office Investment Corp 171 0.01 – Kenedix Residential Investment Corp 47 – – Kenedix Retail REIT Corp 68 –
010_3771524762911.indd���66 2017/10/11���13:01:37
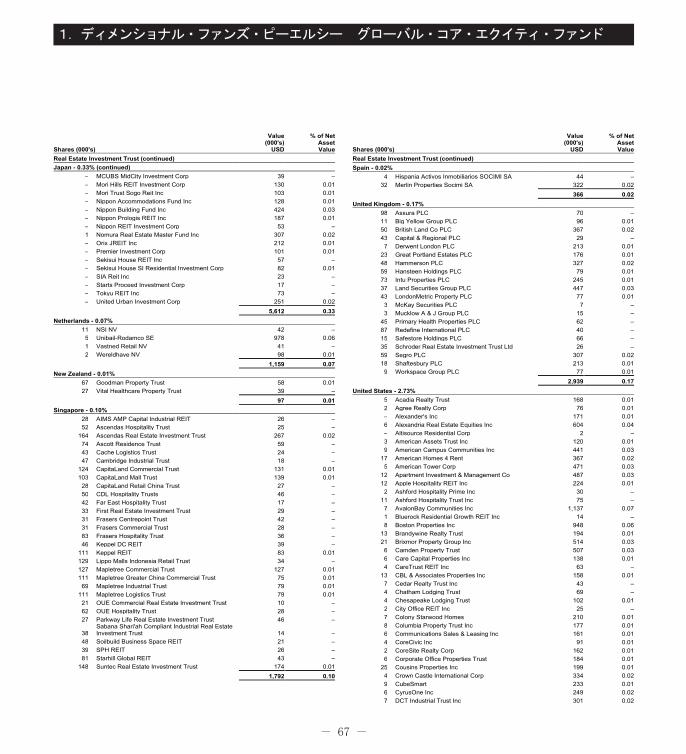
- 67 -
1.ディメンショナル・ファンズ・ピーエルシー グローバル・コア・エクイティ・ファンド
Shares (000's)
Value(000's)
USD
% of NetAssetValue
Real Estate Investment Trust (continued)Japan - 0.33% (continued)
– MCUBS MidCity Investment Corp 39 – – Mori Hills REIT Investment Corp 130 0.01 – Mori Trust Sogo Reit Inc 103 0.01 – Nippon Accommodations Fund Inc 128 0.01 – Nippon Building Fund Inc 424 0.03 – Nippon Prologis REIT Inc 187 0.01 – Nippon REIT Investment Corp 53 – 1 Nomura Real Estate Master Fund Inc 307 0.02 – Orix JREIT Inc 212 0.01 – Premier Investment Corp 101 0.01 – Sekisui House REIT Inc 57 – – Sekisui House SI Residential Investment Corp 82 0.01 – SIA Reit Inc 23 – – Starts Proceed Investment Corp 17 – – Tokyu REIT Inc 73 – – United Urban Investment Corp 251 0.02
5,612 0.33Netherlands - 0.07%
11 NSI NV 42 – 5 Unibail-Rodamco SE 978 0.06 1 Vastned Retail NV 41 – 2 Wereldhave NV 98 0.01
1,159 0.07New Zealand - 0.01%
67 Goodman Property Trust 58 0.01 27 Vital Healthcare Property Trust 39 –
97 0.01Singapore - 0.10%
28 AIMS AMP Capital Industrial REIT 26 – 52 Ascendas Hospitality Trust 25 –
164 Ascendas Real Estate Investment Trust 267 0.02 74 Ascott Residence Trust 59 – 43 Cache Logistics Trust 24 – 47 Cambridge Industrial Trust 18 –
124 CapitaLand Commercial Trust 131 0.01 103 CapitaLand Mall Trust 139 0.01
28 CapitaLand Retail China Trust 27 – 50 CDL Hospitality Trusts 46 – 42 Far East Hospitality Trust 17 – 33 First Real Estate Investment Trust 29 – 31 Frasers Centrepoint Trust 42 – 31 Frasers Commercial Trust 28 – 83 Frasers Hospitality Trust 36 – 46 Keppel DC REIT 39 –
111 Keppel REIT 83 0.01 129 Lippo Malls Indonesia Retail Trust 34 – 127 Mapletree Commercial Trust 127 0.01 111 Mapletree Greater China Commercial Trust 75 0.01
69 Mapletree Industrial Trust 79 0.01 111 Mapletree Logistics Trust 79 0.01
21 OUE Commercial Real Estate Investment Trust 10 – 62 OUE Hospitality Trust 28 – 27 Parkway Life Real Estate Investment Trust 46 –
38 Sabana Shari'ah Compliant Industrial Real Estate Investment Trust 14 –
48 Soilbuild Business Space REIT 21 – 39 SPH REIT 26 – 81 Starhill Global REIT 43 –
148 Suntec Real Estate Investment Trust 174 0.01 1,792 0.10
Shares (000's)
Value(000's)
USD
% of NetAssetValue
Real Estate Investment Trust (continued)Spain - 0.02%
4 Hispania Activos Inmobiliarios SOCIMI SA 44 – 32 Merlin Properties Socimi SA 322 0.02
366 0.02United Kingdom - 0.17%
98 Assura PLC 70 – 11 Big Yellow Group PLC 96 0.01 50 British Land Co PLC 367 0.02 43 Capital & Regional PLC 29 – 7 Derwent London PLC 213 0.01
23 Great Portland Estates PLC 176 0.01 48 Hammerson PLC 327 0.02 59 Hansteen Holdings PLC 79 0.01 73 Intu Properties PLC 245 0.01 37 Land Securities Group PLC 447 0.03 43 LondonMetric Property PLC 77 0.01 3 McKay Securities PLC 7 – 3 Mucklow A & J Group PLC 15 –
45 Primary Health Properties PLC 62 – 87 Redefine International PLC 40 – 15 Safestore Holdings PLC 66 – 35 Schroder Real Estate Investment Trust Ltd 26 – 59 Segro PLC 307 0.02 18 Shaftesbury PLC 213 0.01 9 Workspace Group PLC 77 0.01
2,939 0.17United States - 2.73%
5 Acadia Realty Trust 168 0.01 2 Agree Realty Corp 76 0.01 – Alexander's Inc 171 0.01 6 Alexandria Real Estate Equities Inc 604 0.04 – Altisource Residential Corp 2 – 3 American Assets Trust Inc 120 0.01 9 American Campus Communities Inc 441 0.03
17 American Homes 4 Rent 367 0.02 5 American Tower Corp 471 0.03
12 Apartment Investment & Management Co 487 0.03 12 Apple Hospitality REIT Inc 224 0.01 2 Ashford Hospitality Prime Inc 30 –
11 Ashford Hospitality Trust Inc 75 – 7 AvalonBay Communities Inc 1,137 0.07 1 Bluerock Residential Growth REIT Inc 14 – 8 Boston Properties Inc 948 0.06
13 Brandywine Realty Trust 194 0.01 21 Brixmor Property Group Inc 514 0.03 6 Camden Property Trust 507 0.03 6 Care Capital Properties Inc 138 0.01 4 CareTrust REIT Inc 63 –
13 CBL & Associates Properties Inc 158 0.01 7 Cedar Realty Trust Inc 43 – 4 Chatham Lodging Trust 69 – 4 Chesapeake Lodging Trust 102 0.01 2 City Office REIT Inc 25 – 7 Colony Starwood Homes 210 0.01 8 Columbia Property Trust Inc 177 0.01 6 Communications Sales & Leasing Inc 161 0.01 4 CoreCivic Inc 91 0.01 2 CoreSite Realty Corp 162 0.01 6 Corporate Office Properties Trust 184 0.01
25 Cousins Properties Inc 199 0.01 4 Crown Castle International Corp 334 0.02 9 CubeSmart 233 0.01 6 CyrusOne Inc 249 0.02 7 DCT Industrial Trust Inc 301 0.02
010_3771524762911.indd���67 2017/10/11���13:01:38
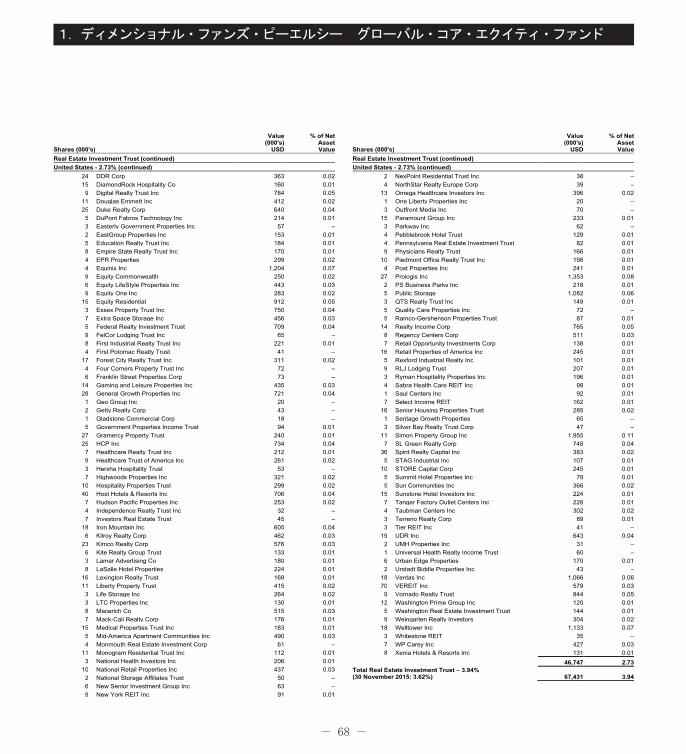
- 68 -
1.ディメンショナル・ファンズ・ピーエルシー グローバル・コア・エクイティ・ファンド
Shares (000's)
Value(000's)
USD
% of NetAssetValue
Real Estate Investment Trust (continued)United States - 2.73% (continued)
24 DDR Corp 363 0.02 15 DiamondRock Hospitality Co 160 0.01 9 Digital Realty Trust Inc 784 0.05
11 Douglas Emmett Inc 412 0.02 25 Duke Realty Corp 640 0.04 5 DuPont Fabros Technology Inc 214 0.01 3 Easterly Government Properties Inc 57 – 2 EastGroup Properties Inc 153 0.01 5 Education Realty Trust Inc 184 0.01 8 Empire State Realty Trust Inc 170 0.01 4 EPR Properties 299 0.02 4 Equinix Inc 1,204 0.07 9 Equity Commonwealth 250 0.02 6 Equity LifeStyle Properties Inc 443 0.03 9 Equity One Inc 283 0.02
15 Equity Residential 912 0.05 3 Essex Property Trust Inc 750 0.04 7 Extra Space Storage Inc 456 0.03 5 Federal Realty Investment Trust 709 0.04 9 FelCor Lodging Trust Inc 65 – 8 First Industrial Realty Trust Inc 221 0.01 4 First Potomac Realty Trust 41 –
17 Forest City Realty Trust Inc 311 0.02 4 Four Corners Property Trust Inc 72 – 6 Franklin Street Properties Corp 73 –
14 Gaming and Leisure Properties Inc 435 0.03 28 General Growth Properties Inc 721 0.04 1 Geo Group Inc 20 – 2 Getty Realty Corp 43 – 1 Gladstone Commercial Corp 18 – 5 Government Properties Income Trust 94 0.01
27 Gramercy Property Trust 240 0.01 25 HCP Inc 734 0.04 7 Healthcare Realty Trust Inc 212 0.01 9 Healthcare Trust of America Inc 261 0.02 3 Hersha Hospitality Trust 53 – 7 Highwoods Properties Inc 321 0.02
10 Hospitality Properties Trust 299 0.02 40 Host Hotels & Resorts Inc 706 0.04 7 Hudson Pacific Properties Inc 253 0.02 4 Independence Realty Trust Inc 32 – 7 Investors Real Estate Trust 45 –
18 Iron Mountain Inc 605 0.04 6 Kilroy Realty Corp 462 0.03
23 Kimco Realty Corp 576 0.03 6 Kite Realty Group Trust 133 0.01 3 Lamar Advertising Co 180 0.01 8 LaSalle Hotel Properties 224 0.01
16 Lexington Realty Trust 169 0.01 11 Liberty Property Trust 415 0.02 3 Life Storage Inc 264 0.02 3 LTC Properties Inc 130 0.01 8 Macerich Co 515 0.03 7 Mack-Cali Realty Corp 176 0.01
15 Medical Properties Trust Inc 183 0.01 5 Mid-America Apartment Communities Inc 490 0.03 4 Monmouth Real Estate Investment Corp 61 –
11 Monogram Residential Trust Inc 112 0.01 3 National Health Investors Inc 206 0.01
10 National Retail Properties Inc 437 0.03 2 National Storage Affiliates Trust 50 – 6 New Senior Investment Group Inc 63 – 9 New York REIT Inc 91 0.01
Shares (000's)
Value(000's)
USD
% of NetAssetValue
Real Estate Investment Trust (continued)United States - 2.73% (continued)
2 NexPoint Residential Trust Inc 38 – 4 NorthStar Realty Europe Corp 39 –
13 Omega Healthcare Investors Inc 396 0.02 1 One Liberty Properties Inc 20 – 3 Outfront Media Inc 70 –
15 Paramount Group Inc 233 0.01 3 Parkway Inc 62 – 4 Pebblebrook Hotel Trust 129 0.01 4 Pennsylvania Real Estate Investment Trust 82 0.01 9 Physicians Realty Trust 166 0.01
10 Piedmont Office Realty Trust Inc 198 0.01 4 Post Properties Inc 241 0.01
27 Prologis Inc 1,353 0.08 2 PS Business Parks Inc 218 0.01 5 Public Storage 1,082 0.06 3 QTS Realty Trust Inc 149 0.01 5 Quality Care Properties Inc 72 – 5 Ramco-Gershenson Properties Trust 87 0.01
14 Realty Income Corp 765 0.05 8 Regency Centers Corp 511 0.03 7 Retail Opportunity Investments Corp 138 0.01
16 Retail Properties of America Inc 245 0.01 5 Rexford Industrial Realty Inc 101 0.01 9 RLJ Lodging Trust 207 0.01 3 Ryman Hospitality Properties Inc 196 0.01 4 Sabra Health Care REIT Inc 98 0.01 1 Saul Centers Inc 92 0.01 7 Select Income REIT 162 0.01
16 Senior Housing Properties Trust 285 0.02 1 Seritage Growth Properties 65 – 3 Silver Bay Realty Trust Corp 47 –
11 Simon Property Group Inc 1,955 0.11 7 SL Green Realty Corp 748 0.04
36 Spirit Realty Capital Inc 383 0.02 5 STAG Industrial Inc 107 0.01
10 STORE Capital Corp 245 0.01 5 Summit Hotel Properties Inc 78 0.01 5 Sun Communities Inc 366 0.02
15 Sunstone Hotel Investors Inc 224 0.01 7 Tanger Factory Outlet Centers Inc 228 0.01 4 Taubman Centers Inc 302 0.02 3 Terreno Realty Corp 89 0.01 3 Tier REIT Inc 41 –
19 UDR Inc 643 0.04 2 UMH Properties Inc 31 – 1 Universal Health Realty Income Trust 60 – 6 Urban Edge Properties 170 0.01 2 Urstadt Biddle Properties Inc 43 –
18 Ventas Inc 1,066 0.06 70 VEREIT Inc 579 0.03 9 Vornado Realty Trust 844 0.05
12 Washington Prime Group Inc 120 0.01 5 Washington Real Estate Investment Trust 144 0.01 9 Weingarten Realty Investors 304 0.02
18 Welltower Inc 1,133 0.07 3 Whitestone REIT 35 – 7 WP Carey Inc 427 0.03 8 Xenia Hotels & Resorts Inc 131 0.01
46,747 2.73Total Real Estate Investment Trust – 3.94% (30 November 2015: 3.62%) 67,431 3.94
010_3771524762911.indd���68 2017/10/11���13:01:38
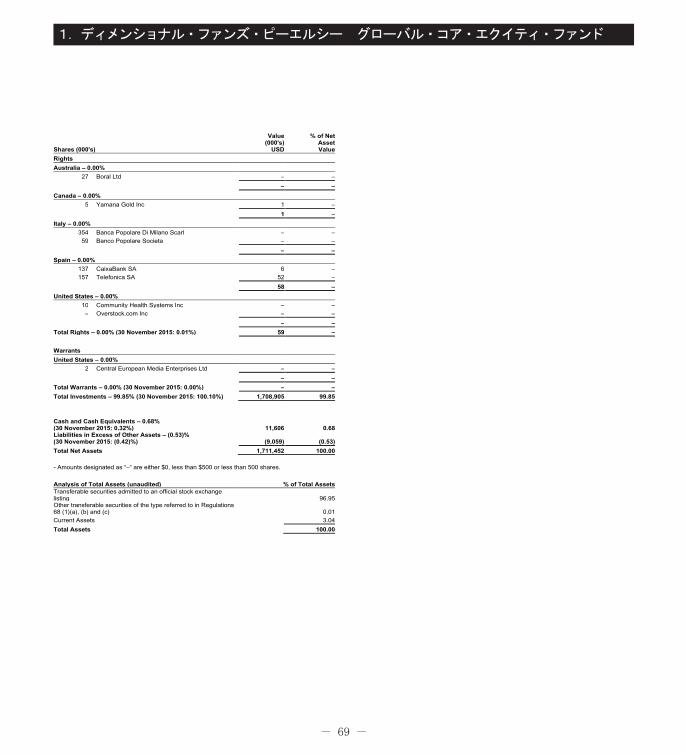
- 69 -
1.ディメンショナル・ファンズ・ピーエルシー グローバル・コア・エクイティ・ファンド
Shares (000's)
Value(000's)
USD
% of NetAssetValue
RightsAustralia – 0.00%
27 Boral Ltd – – – –
Canada – 0.00%5 Yamana Gold Inc 1 –
1 –Italy – 0.00%
354 Banca Popolare Di Milano Scarl – – 59 Banco Popolare Societa – –
– –Spain – 0.00%
137 CaixaBank SA 6 – 157 Telefonica SA 52 –
58 –United States – 0.00%
10 Community Health Systems Inc – – – Overstock.com Inc – –
– –Total Rights – 0.00% (30 November 2015: 0.01%) 59 – WarrantsUnited States – 0.00%
2 Central European Media Enterprises Ltd – – – –
Total Warrants – 0.00% (30 November 2015: 0.00%) – –Total Investments – 99.85% (30 November 2015: 100.10%) 1,708,905 99.85
Cash and Cash Equivalents – 0.68% (30 November 2015: 0.32%) 11,606 0.68 Liabilities in Excess of Other Assets – (0.53)% (30 November 2015: (0.42)%) (9,059) (0.53) Total Net Assets 1,711,452 100.00
- Amounts designated as “–“ are either $0, less than $500 or less than 500 shares.
Analysis of Total Assets (unaudited) % of Total Assets Transferable securities admitted to an official stock exchange listing 96.95 Other transferable securities of the type referred to in Regulations 68 (1)(a), (b) and (c) 0.01 Current Assets 3.04 Total Assets 100.00
010_3771524762911.indd���69 2017/10/11���13:01:38
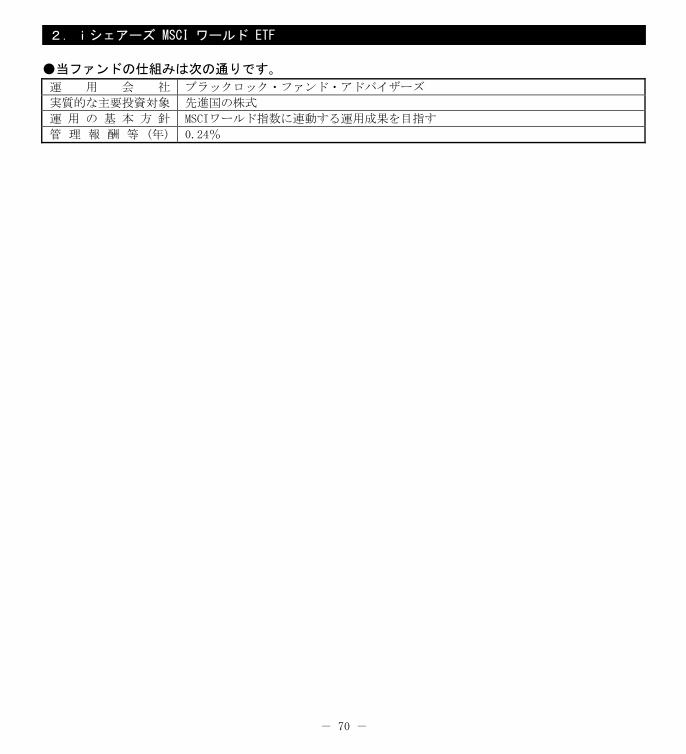
05_3771553712911.doc
- 70 -
2.iシェアーズ MSCI ワールド ETF
●当ファンドの仕組みは次の通りです。
運 用 会 社 ブラックロック・ファンド・アドバイザーズ
実質的な主要投資対象 先進国の株式
運 用 の 基 本 方 針 MSCIワールド指数に連動する運用成果を目指す
管 理 報 酬 等 (年) 0.24%
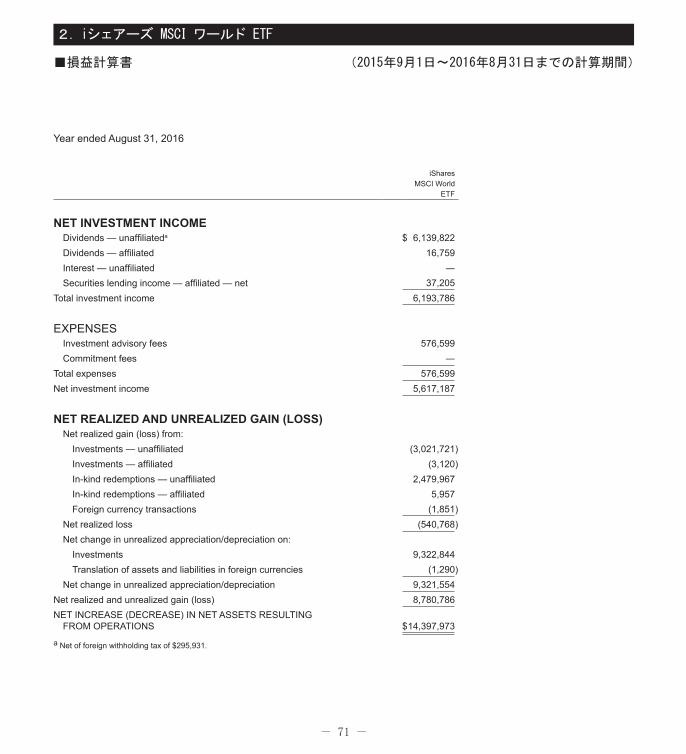
- 71 -
2.iシェアーズ MSCI ワールド ETF
Year ended August 31, 2016
iShares MSCI World
ETF
NET INVESTMENT INCOMEDividends — unaffiliateda $ 6,139,822Dividends — affiliated 16,759Interest — unaffiliated ―Securities lending income — affiliated — net 37,205
Total investment income 6,193,786
EXPENSESInvestment advisory fees 576,599Commitment fees ―
Total expenses 576,599Net investment income 5,617,187
NET REALIZED AND UNREALIZED GAIN (LOSS)Net realized gain (loss) from:
Investments — unaffiliated (3,021,721)Investments — affiliated (3,120)In-kind redemptions — unaffiliated 2,479,967In-kind redemptions — affiliated 5,957Foreign currency transactions (1,851)
Net realized loss (540,768)Net change in unrealized appreciation/depreciation on:
Investments 9,322,844Translation of assets and liabilities in foreign currencies (1,290)
Net change in unrealized appreciation/depreciation 9,321,554Net realized and unrealized gain (loss) 8,780,786NET INCREASE (DECREASE) IN NET ASSETS RESULTING
FROM OPERATIONS $ 14,397,973
a Net of foreign withholding tax of $295,931.
■損益計算書� (2015年9月1日~2016年8月31日までの計算期間)
011_3771524762911.indd���71 2017/10/11���13:10:31
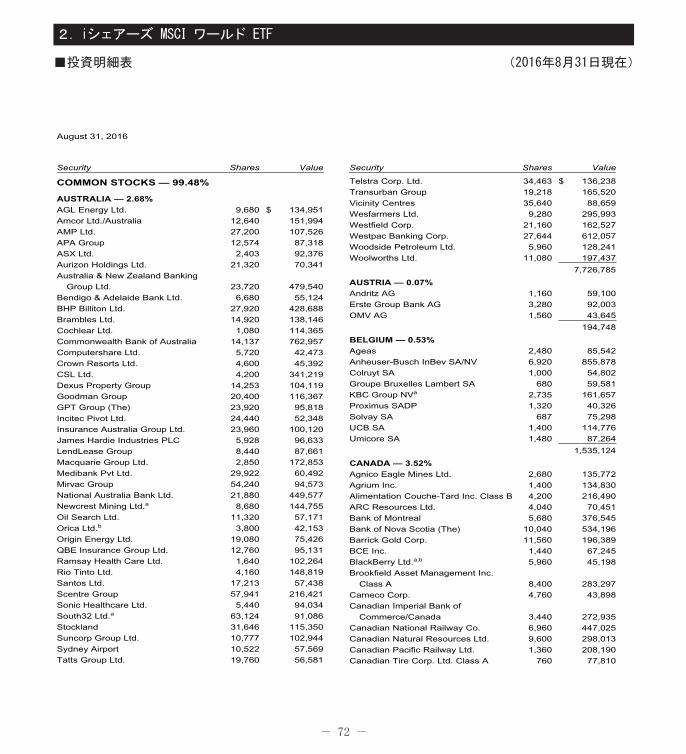
- 72 -
2.iシェアーズ MSCI ワールド ETF
■投資明細表� (2016年8月31日現在)
August 31, 2016
Security Shares Value
COMMON STOCKS — 99.48%
AUSTRALIA — 2.68%
AGL Energy Ltd. 9,680 $ 134,951
Amcor Ltd./Australia 12,640 151,994
AMP Ltd. 27,200 107,526
APA Group 12,574 87,318
ASX Ltd. 2,403 92,376
Aurizon Holdings Ltd. 21,320 70,341
Australia & New Zealand Banking
Group Ltd. 23,720 479,540
Bendigo & Adelaide Bank Ltd. 6,680 55,124
BHP Billiton Ltd. 27,920 428,688
Brambles Ltd. 14,920 138,146
Cochlear Ltd. 1,080 114,365
Commonwealth Bank of Australia 14,137 762,957
Computershare Ltd. 5,720 42,473
Crown Resorts Ltd. 4,600 45,392
CSL Ltd. 4,200 341,219
Dexus Property Group 14,253 104,119
Goodman Group 20,400 116,367
GPT Group (The) 23,920 95,818
Incitec Pivot Ltd. 24,440 52,348
Insurance Australia Group Ltd. 23,960 100,120
James Hardie Industries PLC 5,928 96,633
LendLease Group 8,440 87,661
Macquarie Group Ltd. 2,850 172,853
Medibank Pvt Ltd. 29,922 60,492
Mirvac Group 54,240 94,573
National Australia Bank Ltd. 21,880 449,577
Newcrest Mining Ltd.a 8,680 144,755
Oil Search Ltd. 11,320 57,171
Orica Ltd.b 3,800 42,153
Origin Energy Ltd. 19,080 75,426
QBE Insurance Group Ltd. 12,760 95,131
Ramsay Health Care Ltd. 1,640 102,264
Rio Tinto Ltd. 4,160 148,819
Santos Ltd. 17,213 57,438
Scentre Group 57,941 216,421
Sonic Healthcare Ltd. 5,440 94,034
South32 Ltd.a 63,124 91,086
Stockland 31,646 115,350
Suncorp Group Ltd. 10,777 102,944
Sydney Airport 10,522 57,569
Tatts Group Ltd. 19,760 56,581
Security Shares Value
Telstra Corp. Ltd. 34,463 $ 136,238
Transurban Group 19,218 165,520
Vicinity Centres 35,640 88,659
Wesfarmers Ltd. 9,280 295,993
Westfield Corp. 21,160 162,527
Westpac Banking Corp. 27,644 612,057
Woodside Petroleum Ltd. 5,960 128,241
Woolworths Ltd. 11,080 197,437
7,726,785
AUSTRIA — 0.07%
Andritz AG 1,160 59,100
Erste Group Bank AG 3,280 92,003
OMV AG 1,560 43,645
194,748
BELGIUM — 0.53%
Ageas 2,480 85,542
Anheuser-Busch InBev SA/NV 6,920 855,878
Colruyt SA 1,000 54,802
Groupe Bruxelles Lambert SA 680 59,581
KBC Group NVa 2,735 161,657
Proximus SADP 1,320 40,326
Solvay SA 687 75,298
UCB SA 1,400 114,776
Umicore SA 1,480 87,264
1,535,124
CANADA — 3.52%
Agnico Eagle Mines Ltd. 2,680 135,772
Agrium Inc. 1,400 134,830
Alimentation Couche-Tard Inc. Class B 4,200 216,490
ARC Resources Ltd. 4,040 70,451
Bank of Montreal 5,680 376,545
Bank of Nova Scotia (The) 10,040 534,196
Barrick Gold Corp. 11,560 196,389
BCE Inc. 1,440 67,245
BlackBerry Ltd.a,b 5,960 45,198
Brookfield Asset Management Inc.
Class A 8,400 283,297
Cameco Corp. 4,760 43,898
Canadian Imperial Bank of
Commerce/Canada 3,440 272,935
Canadian National Railway Co. 6,960 447,025
Canadian Natural Resources Ltd. 9,600 298,013
Canadian Pacific Railway Ltd. 1,360 208,190
Canadian Tire Corp. Ltd. Class A 760 77,810
011_3771524762911.indd���72 2017/10/11���13:10:31
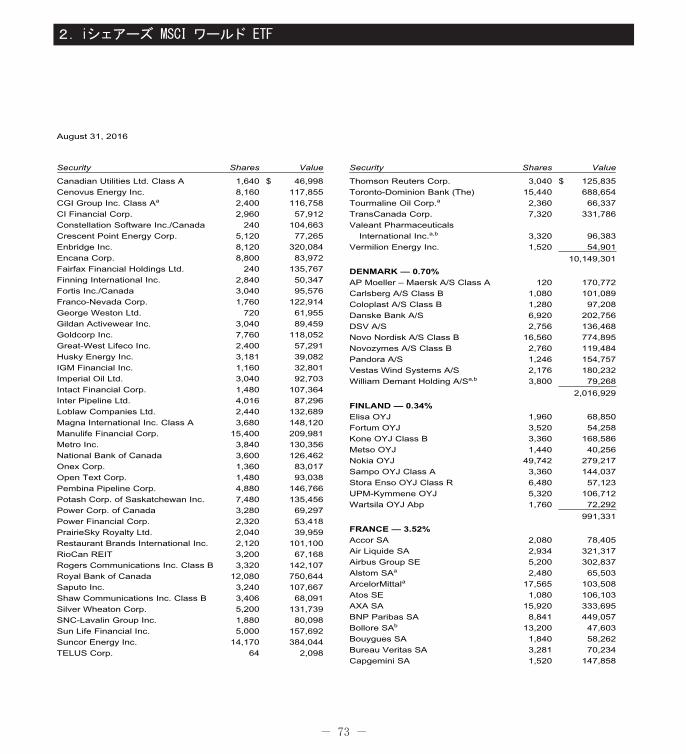
- 73 -
2.iシェアーズ MSCI ワールド ETF
August 31, 2016
Security Shares Value
Canadian Utilities Ltd. Class A 1,640 $ 46,998
Cenovus Energy Inc. 8,160 117,855
CGI Group Inc. Class Aa 2,400 116,758
CI Financial Corp. 2,960 57,912
Constellation Software Inc./Canada 240 104,663
Crescent Point Energy Corp. 5,120 77,265
Enbridge Inc. 8,120 320,084
Encana Corp. 8,800 83,972
Fairfax Financial Holdings Ltd. 240 135,767
Finning International Inc. 2,840 50,347
Fortis Inc./Canada 3,040 95,576
Franco-Nevada Corp. 1,760 122,914
George Weston Ltd. 720 61,955
Gildan Activewear Inc. 3,040 89,459
Goldcorp Inc. 7,760 118,052
Great-West Lifeco Inc. 2,400 57,291
Husky Energy Inc. 3,181 39,082
IGM Financial Inc. 1,160 32,801
Imperial Oil Ltd. 3,040 92,703
Intact Financial Corp. 1,480 107,364
Inter Pipeline Ltd. 4,016 87,296
Loblaw Companies Ltd. 2,440 132,689
Magna International Inc. Class A 3,680 148,120
Manulife Financial Corp. 15,400 209,981
Metro Inc. 3,840 130,356
National Bank of Canada 3,600 126,462
Onex Corp. 1,360 83,017
Open Text Corp. 1,480 93,038
Pembina Pipeline Corp. 4,880 146,766
Potash Corp. of Saskatchewan Inc. 7,480 135,456
Power Corp. of Canada 3,280 69,297
Power Financial Corp. 2,320 53,418
PrairieSky Royalty Ltd. 2,040 39,959
Restaurant Brands International Inc. 2,120 101,100
RioCan REIT 3,200 67,168
Rogers Communications Inc. Class B 3,320 142,107
Royal Bank of Canada 12,080 750,644
Saputo Inc. 3,240 107,667
Shaw Communications Inc. Class B 3,406 68,091
Silver Wheaton Corp. 5,200 131,739
SNC-Lavalin Group Inc. 1,880 80,098
Sun Life Financial Inc. 5,000 157,692
Suncor Energy Inc. 14,170 384,044
TELUS Corp. 64 2,098
Security Shares Value
Thomson Reuters Corp. 3,040 $ 125,835
Toronto-Dominion Bank (The) 15,440 688,654
Tourmaline Oil Corp.a 2,360 66,337
TransCanada Corp. 7,320 331,786
Valeant Pharmaceuticals
International Inc.a,b 3,320 96,383
Vermilion Energy Inc. 1,520 54,901
10,149,301
DENMARK — 0.70%
AP Moeller – Maersk A/S Class A 120 170,772
Carlsberg A/S Class B 1,080 101,089
Coloplast A/S Class B 1,280 97,208
Danske Bank A/S 6,920 202,756
DSV A/S 2,756 136,468
Novo Nordisk A/S Class B 16,560 774,895
Novozymes A/S Class B 2,760 119,484
Pandora A/S 1,246 154,757
Vestas Wind Systems A/S 2,176 180,232
William Demant Holding A/Sa,b 3,800 79,268
2,016,929
FINLAND — 0.34%
Elisa OYJ 1,960 68,850
Fortum OYJ 3,520 54,258
Kone OYJ Class B 3,360 168,586
Metso OYJ 1,440 40,256
Nokia OYJ 49,742 279,217
Sampo OYJ Class A 3,360 144,037
Stora Enso OYJ Class R 6,480 57,123
UPM-Kymmene OYJ 5,320 106,712
Wartsila OYJ Abp 1,760 72,292
991,331
FRANCE — 3.52%
Accor SA 2,080 78,405
Air Liquide SA 2,934 321,317
Airbus Group SE 5,200 302,837
Alstom SAa 2,480 65,503
ArcelorMittala 17,565 103,508
Atos SE 1,080 106,103
AXA SA 15,920 333,695
BNP Paribas SA 8,841 449,057
Bollore SAb 13,200 47,603
Bouygues SA 1,840 58,262
Bureau Veritas SA 3,281 70,234
Capgemini SA 1,520 147,858
011_3771524762911.indd���73 2017/10/11���13:10:32
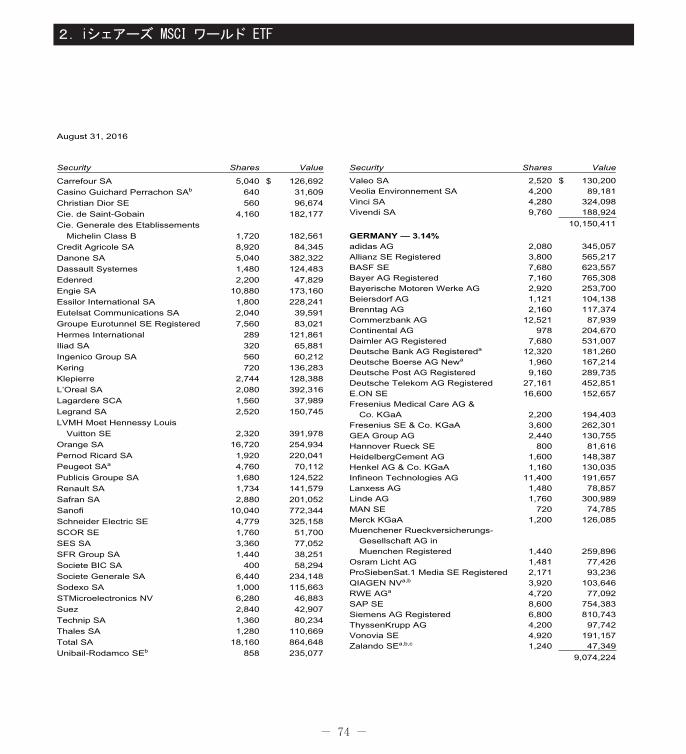
- 74 -
2.iシェアーズ MSCI ワールド ETF
August 31, 2016
Security Shares Value
Carrefour SA 5,040 $ 126,692
Casino Guichard Perrachon SAb 640 31,609
Christian Dior SE 560 96,674
Cie. de Saint-Gobain 4,160 182,177
Cie. Generale des Etablissements
Michelin Class B 1,720 182,561
Credit Agricole SA 8,920 84,345
Danone SA 5,040 382,322
Dassault Systemes 1,480 124,483
Edenred 2,200 47,829
Engie SA 10,880 173,160
Essilor International SA 1,800 228,241
Eutelsat Communications SA 2,040 39,591
Groupe Eurotunnel SE Registered 7,560 83,021
Hermes International 289 121,861
Iliad SA 320 65,881
Ingenico Group SA 560 60,212
Kering 720 136,283
Klepierre 2,744 128,388
L’Oreal SA 2,080 392,316
Lagardere SCA 1,560 37,989
Legrand SA 2,520 150,745
LVMH Moet Hennessy Louis
Vuitton SE 2,320 391,978
Orange SA 16,720 254,934
Pernod Ricard SA 1,920 220,041
Peugeot SAa 4,760 70,112
Publicis Groupe SA 1,680 124,522
Renault SA 1,734 141,579
Safran SA 2,880 201,052
Sanofi 10,040 772,344
Schneider Electric SE 4,779 325,158
SCOR SE 1,760 51,700
SES SA 3,360 77,052
SFR Group SA 1,440 38,251
Societe BIC SA 400 58,294
Societe Generale SA 6,440 234,148
Sodexo SA 1,000 115,663
STMicroelectronics NV 6,280 46,883
Suez 2,840 42,907
Technip SA 1,360 80,234
Thales SA 1,280 110,669
Total SA 18,160 864,648
Unibail-Rodamco SEb 858 235,077
Security Shares Value
Valeo SA 2,520 $ 130,200Veolia Environnement SA 4,200 89,181Vinci SA 4,280 324,098Vivendi SA 9,760 188,924
10,150,411
GERMANY — 3.14%adidas AG 2,080 345,057Allianz SE Registered 3,800 565,217BASF SE 7,680 623,557Bayer AG Registered 7,160 765,308Bayerische Motoren Werke AG 2,920 253,700Beiersdorf AG 1,121 104,138Brenntag AG 2,160 117,374Commerzbank AG 12,521 87,939Continental AG 978 204,670Daimler AG Registered 7,680 531,007Deutsche Bank AG Registereda 12,320 181,260Deutsche Boerse AG Newa 1,960 167,214Deutsche Post AG Registered 9,160 289,735Deutsche Telekom AG Registered 27,161 452,851E.ON SE 16,600 152,657Fresenius Medical Care AG &
Co. KGaA 2,200 194,403Fresenius SE & Co. KGaA 3,600 262,301GEA Group AG 2,440 130,755Hannover Rueck SE 800 81,616HeidelbergCement AG 1,600 148,387Henkel AG & Co. KGaA 1,160 130,035Infineon Technologies AG 11,400 191,657Lanxess AG 1,480 78,857Linde AG 1,760 300,989MAN SE 720 74,785Merck KGaA 1,200 126,085Muenchener Rueckversicherungs-
Gesellschaft AG inMuenchen Registered 1,440 259,896
Osram Licht AG 1,481 77,426ProSiebenSat.1 Media SE Registered 2,171 93,236QIAGEN NVa,b 3,920 103,646RWE AGa 4,720 77,092SAP SE 8,600 754,383Siemens AG Registered 6,800 810,743ThyssenKrupp AG 4,200 97,742Vonovia SE 4,920 191,157Zalando SEa,b,c 1,240 47,349
9,074,224
011_3771524762911.indd���74 2017/10/11���13:10:32
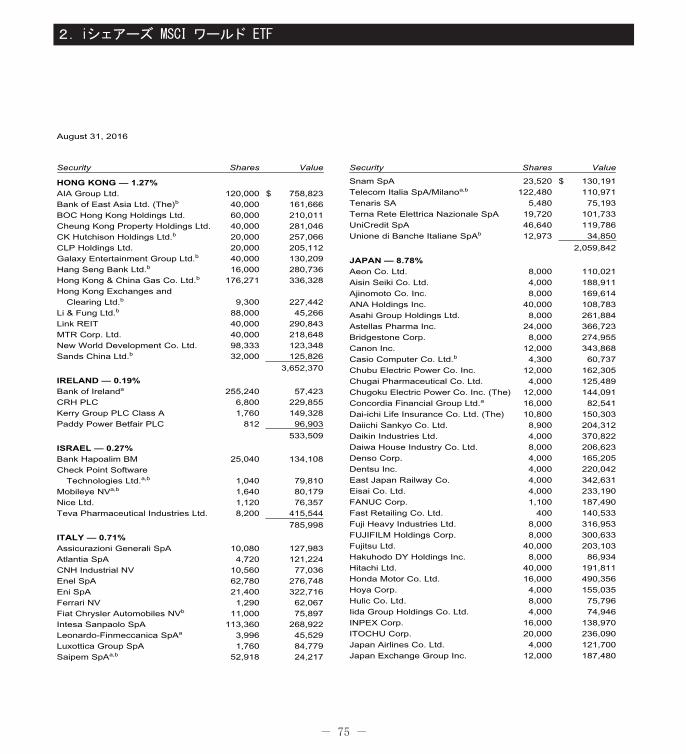
- 75 -
2.iシェアーズ MSCI ワールド ETF
August 31, 2016
Security Shares Value
HONG KONG — 1.27%AIA Group Ltd. 120,000 $ 758,823
Bank of East Asia Ltd. (The)b 40,000 161,666
BOC Hong Kong Holdings Ltd. 60,000 210,011
Cheung Kong Property Holdings Ltd. 40,000 281,046
CK Hutchison Holdings Ltd.b 20,000 257,066
CLP Holdings Ltd. 20,000 205,112
Galaxy Entertainment Group Ltd.b 40,000 130,209
Hang Seng Bank Ltd.b 16,000 280,736
Hong Kong & China Gas Co. Ltd.b 176,271 336,328
Hong Kong Exchanges and
Clearing Ltd.b 9,300 227,442
Li & Fung Ltd.b 88,000 45,266
Link REIT 40,000 290,843
MTR Corp. Ltd. 40,000 218,648
New World Development Co. Ltd. 98,333 123,348
Sands China Ltd.b 32,000 125,826
3,652,370
IRELAND — 0.19%Bank of Irelanda 255,240 57,423
CRH PLC 6,800 229,855
Kerry Group PLC Class A 1,760 149,328
Paddy Power Betfair PLC 812 96,903
533,509
ISRAEL — 0.27%Bank Hapoalim BM 25,040 134,108
Check Point Software
Technologies Ltd.a,b 1,040 79,810
Mobileye NVa,b 1,640 80,179
Nice Ltd. 1,120 76,357
Teva Pharmaceutical Industries Ltd. 8,200 415,544
785,998
ITALY — 0.71%Assicurazioni Generali SpA 10,080 127,983
Atlantia SpA 4,720 121,224
CNH Industrial NV 10,560 77,036
Enel SpA 62,780 276,748
Eni SpA 21,400 322,716
Ferrari NV 1,290 62,067
Fiat Chrysler Automobiles NVb 11,000 75,897
Intesa Sanpaolo SpA 113,360 268,922
Leonardo-Finmeccanica SpAa 3,996 45,529
Luxottica Group SpA 1,760 84,779
Saipem SpAa,b 52,918 24,217
Security Shares Value
Snam SpA 23,520 $ 130,191
Telecom Italia SpA/Milanoa,b 122,480 110,971
Tenaris SA 5,480 75,193
Terna Rete Elettrica Nazionale SpA 19,720 101,733
UniCredit SpA 46,640 119,786
Unione di Banche Italiane SpAb 12,973 34,850
2,059,842
JAPAN — 8.78%
Aeon Co. Ltd. 8,000 110,021
Aisin Seiki Co. Ltd. 4,000 188,911
Ajinomoto Co. Inc. 8,000 169,614
ANA Holdings Inc. 40,000 108,783
Asahi Group Holdings Ltd. 8,000 261,884
Astellas Pharma Inc. 24,000 366,723
Bridgestone Corp. 8,000 274,955
Canon Inc. 12,000 343,868
Casio Computer Co. Ltd.b 4,300 60,737
Chubu Electric Power Co. Inc. 12,000 162,305
Chugai Pharmaceutical Co. Ltd. 4,000 125,489
Chugoku Electric Power Co. Inc. (The) 12,000 144,091
Concordia Financial Group Ltd.a 16,000 82,541
Dai-ichi Life Insurance Co. Ltd. (The) 10,800 150,303
Daiichi Sankyo Co. Ltd. 8,900 204,312
Daikin Industries Ltd. 4,000 370,822
Daiwa House Industry Co. Ltd. 8,000 206,623
Denso Corp. 4,000 165,205
Dentsu Inc. 4,000 220,042
East Japan Railway Co. 4,000 342,631
Eisai Co. Ltd. 4,000 233,190
FANUC Corp. 1,100 187,490
Fast Retailing Co. Ltd. 400 140,533
Fuji Heavy Industries Ltd. 8,000 316,953
FUJIFILM Holdings Corp. 8,000 300,633
Fujitsu Ltd. 40,000 203,103
Hakuhodo DY Holdings Inc. 8,000 86,934
Hitachi Ltd. 40,000 191,811
Honda Motor Co. Ltd. 16,000 490,356
Hoya Corp. 4,000 155,035
Hulic Co. Ltd. 8,000 75,796
Iida Group Holdings Co. Ltd. 4,000 74,946
INPEX Corp. 16,000 138,970
ITOCHU Corp. 20,000 236,090
Japan Airlines Co. Ltd. 4,000 121,700
Japan Exchange Group Inc. 12,000 187,480
011_3771524762911.indd���75 2017/10/11���13:10:32
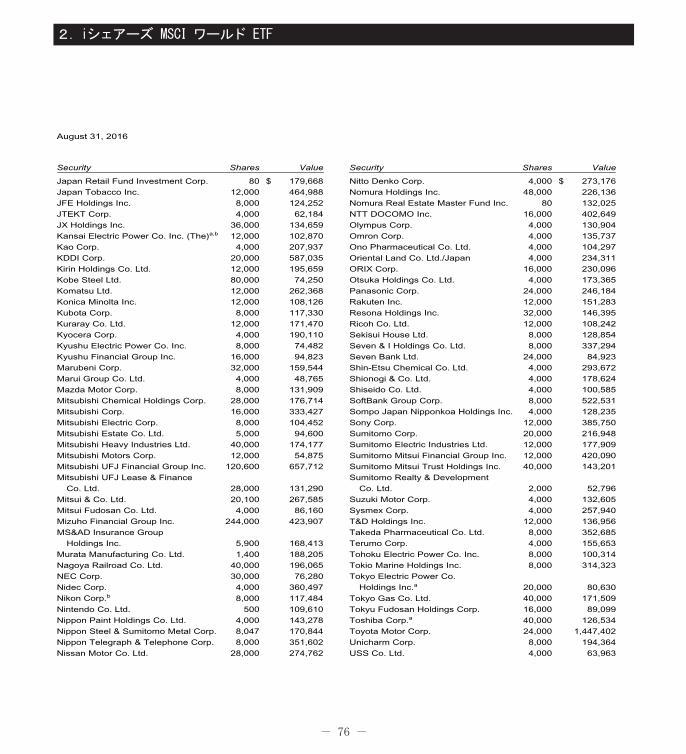
- 76 -
2.iシェアーズ MSCI ワールド ETF
August 31, 2016
Security Shares Value
Japan Retail Fund Investment Corp. 80 $ 179,668
Japan Tobacco Inc. 12,000 464,988
JFE Holdings Inc. 8,000 124,252
JTEKT Corp. 4,000 62,184
JX Holdings Inc. 36,000 134,659
Kansai Electric Power Co. Inc. (The)a,b 12,000 102,870
Kao Corp. 4,000 207,937
KDDI Corp. 20,000 587,035
Kirin Holdings Co. Ltd. 12,000 195,659
Kobe Steel Ltd. 80,000 74,250
Komatsu Ltd. 12,000 262,368
Konica Minolta Inc. 12,000 108,126
Kubota Corp. 8,000 117,330
Kuraray Co. Ltd. 12,000 171,470
Kyocera Corp. 4,000 190,110
Kyushu Electric Power Co. Inc. 8,000 74,482
Kyushu Financial Group Inc. 16,000 94,823
Marubeni Corp. 32,000 159,544
Marui Group Co. Ltd. 4,000 48,765
Mazda Motor Corp. 8,000 131,909
Mitsubishi Chemical Holdings Corp. 28,000 176,714
Mitsubishi Corp. 16,000 333,427
Mitsubishi Electric Corp. 8,000 104,452
Mitsubishi Estate Co. Ltd. 5,000 94,600
Mitsubishi Heavy Industries Ltd. 40,000 174,177
Mitsubishi Motors Corp. 12,000 54,875
Mitsubishi UFJ Financial Group Inc. 120,600 657,712
Mitsubishi UFJ Lease & Finance
Co. Ltd. 28,000 131,290
Mitsui & Co. Ltd. 20,100 267,585
Mitsui Fudosan Co. Ltd. 4,000 86,160
Mizuho Financial Group Inc. 244,000 423,907
MS&AD Insurance Group
Holdings Inc. 5,900 168,413
Murata Manufacturing Co. Ltd. 1,400 188,205
Nagoya Railroad Co. Ltd. 40,000 196,065
NEC Corp. 30,000 76,280
Nidec Corp. 4,000 360,497
Nikon Corp.b 8,000 117,484
Nintendo Co. Ltd. 500 109,610
Nippon Paint Holdings Co. Ltd. 4,000 143,278
Nippon Steel & Sumitomo Metal Corp. 8,047 170,844
Nippon Telegraph & Telephone Corp. 8,000 351,602
Nissan Motor Co. Ltd. 28,000 274,762
Security Shares Value
Nitto Denko Corp. 4,000 $ 273,176
Nomura Holdings Inc. 48,000 226,136
Nomura Real Estate Master Fund Inc. 80 132,025
NTT DOCOMO Inc. 16,000 402,649
Olympus Corp. 4,000 130,904
Omron Corp. 4,000 135,737
Ono Pharmaceutical Co. Ltd. 4,000 104,297
Oriental Land Co. Ltd./Japan 4,000 234,311
ORIX Corp. 16,000 230,096
Otsuka Holdings Co. Ltd. 4,000 173,365
Panasonic Corp. 24,000 246,184
Rakuten Inc. 12,000 151,283
Resona Holdings Inc. 32,000 146,395
Ricoh Co. Ltd. 12,000 108,242
Sekisui House Ltd. 8,000 128,854
Seven & I Holdings Co. Ltd. 8,000 337,294
Seven Bank Ltd. 24,000 84,923
Shin-Etsu Chemical Co. Ltd. 4,000 293,672
Shionogi & Co. Ltd. 4,000 178,624
Shiseido Co. Ltd. 4,000 100,585
SoftBank Group Corp. 8,000 522,531
Sompo Japan Nipponkoa Holdings Inc. 4,000 128,235
Sony Corp. 12,000 385,750
Sumitomo Corp. 20,000 216,948
Sumitomo Electric Industries Ltd. 12,000 177,909
Sumitomo Mitsui Financial Group Inc. 12,000 420,090
Sumitomo Mitsui Trust Holdings Inc. 40,000 143,201
Sumitomo Realty & Development
Co. Ltd. 2,000 52,796
Suzuki Motor Corp. 4,000 132,605
Sysmex Corp. 4,000 257,940
T&D Holdings Inc. 12,000 136,956
Takeda Pharmaceutical Co. Ltd. 8,000 352,685
Terumo Corp. 4,000 155,653
Tohoku Electric Power Co. Inc. 8,000 100,314
Tokio Marine Holdings Inc. 8,000 314,323
Tokyo Electric Power Co.
Holdings Inc.a 20,000 80,630
Tokyo Gas Co. Ltd. 40,000 171,509
Tokyu Fudosan Holdings Corp. 16,000 89,099
Toshiba Corp.a 40,000 126,534
Toyota Motor Corp. 24,000 1,447,402
Unicharm Corp. 8,000 194,364
USS Co. Ltd. 4,000 63,963
011_3771524762911.indd���76 2017/10/11���13:10:32
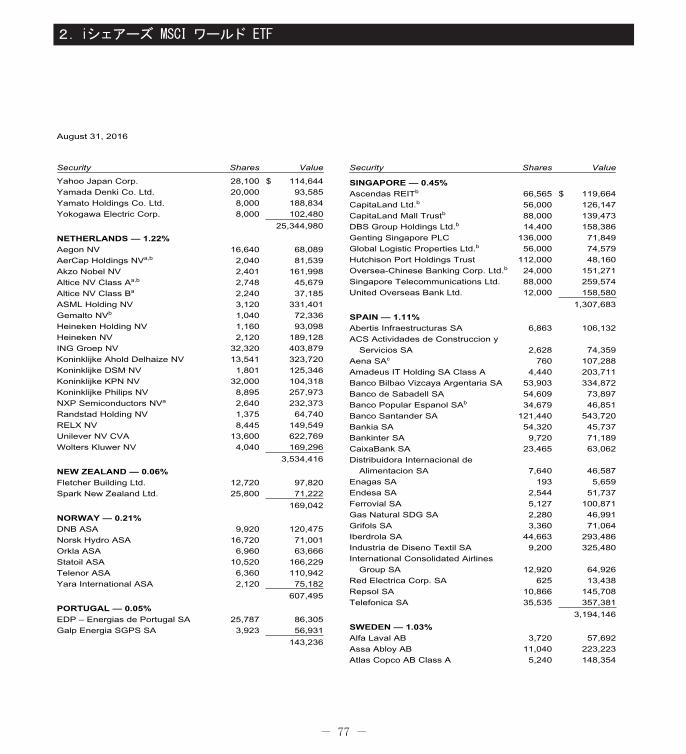
- 77 -
2.iシェアーズ MSCI ワールド ETF
August 31, 2016
Security Shares Value
Yahoo Japan Corp. 28,100 $ 114,644
Yamada Denki Co. Ltd. 20,000 93,585
Yamato Holdings Co. Ltd. 8,000 188,834
Yokogawa Electric Corp. 8,000 102,480
25,344,980
NETHERLANDS — 1.22%
Aegon NV 16,640 68,089
AerCap Holdings NVa,b 2,040 81,539
Akzo Nobel NV 2,401 161,998
Altice NV Class Aa,b 2,748 45,679
Altice NV Class Ba 2,240 37,185
ASML Holding NV 3,120 331,401
Gemalto NVb 1,040 72,336
Heineken Holding NV 1,160 93,098
Heineken NV 2,120 189,128
ING Groep NV 32,320 403,879
Koninklijke Ahold Delhaize NV 13,541 323,720
Koninklijke DSM NV 1,801 125,346
Koninklijke KPN NV 32,000 104,318
Koninklijke Philips NV 8,895 257,973
NXP Semiconductors NVa 2,640 232,373
Randstad Holding NV 1,375 64,740
RELX NV 8,445 149,549
Unilever NV CVA 13,600 622,769
Wolters Kluwer NV 4,040 169,296
3,534,416
NEW ZEALAND — 0.06%
Fletcher Building Ltd. 12,720 97,820
Spark New Zealand Ltd. 25,800 71,222
169,042
NORWAY — 0.21%
DNB ASA 9,920 120,475
Norsk Hydro ASA 16,720 71,001
Orkla ASA 6,960 63,666
Statoil ASA 10,520 166,229
Telenor ASA 6,360 110,942
Yara International ASA 2,120 75,182
607,495
PORTUGAL — 0.05%
EDP – Energias de Portugal SA 25,787 86,305
Galp Energia SGPS SA 3,923 56,931
143,236
Security Shares Value
SINGAPORE — 0.45%
Ascendas REITb 66,565 $ 119,664
CapitaLand Ltd.b 56,000 126,147
CapitaLand Mall Trustb 88,000 139,473
DBS Group Holdings Ltd.b 14,400 158,386
Genting Singapore PLC 136,000 71,849
Global Logistic Properties Ltd.b 56,000 74,579
Hutchison Port Holdings Trust 112,000 48,160
Oversea-Chinese Banking Corp. Ltd.b 24,000 151,271
Singapore Telecommunications Ltd. 88,000 259,574
United Overseas Bank Ltd. 12,000 158,580
1,307,683
SPAIN — 1.11%
Abertis Infraestructuras SA 6,863 106,132
ACS Actividades de Construccion y
Servicios SA 2,628 74,359
Aena SAc 760 107,288
Amadeus IT Holding SA Class A 4,440 203,711
Banco Bilbao Vizcaya Argentaria SA 53,903 334,872
Banco de Sabadell SA 54,609 73,897
Banco Popular Espanol SAb 34,679 46,851
Banco Santander SA 121,440 543,720
Bankia SA 54,320 45,737
Bankinter SA 9,720 71,189
CaixaBank SA 23,465 63,062
Distribuidora Internacional de
Alimentacion SA 7,640 46,587
Enagas SA 193 5,659
Endesa SA 2,544 51,737
Ferrovial SA 5,127 100,871
Gas Natural SDG SA 2,280 46,991
Grifols SA 3,360 71,064
Iberdrola SA 44,663 293,486
Industria de Diseno Textil SA 9,200 325,480
International Consolidated Airlines
Group SA 12,920 64,926
Red Electrica Corp. SA 625 13,438
Repsol SA 10,866 145,708
Telefonica SA 35,535 357,381
3,194,146
SWEDEN — 1.03%
Alfa Laval AB 3,720 57,692
Assa Abloy AB 11,040 223,223
Atlas Copco AB Class A 5,240 148,354
011_3771524762911.indd���77 2017/10/11���13:10:32
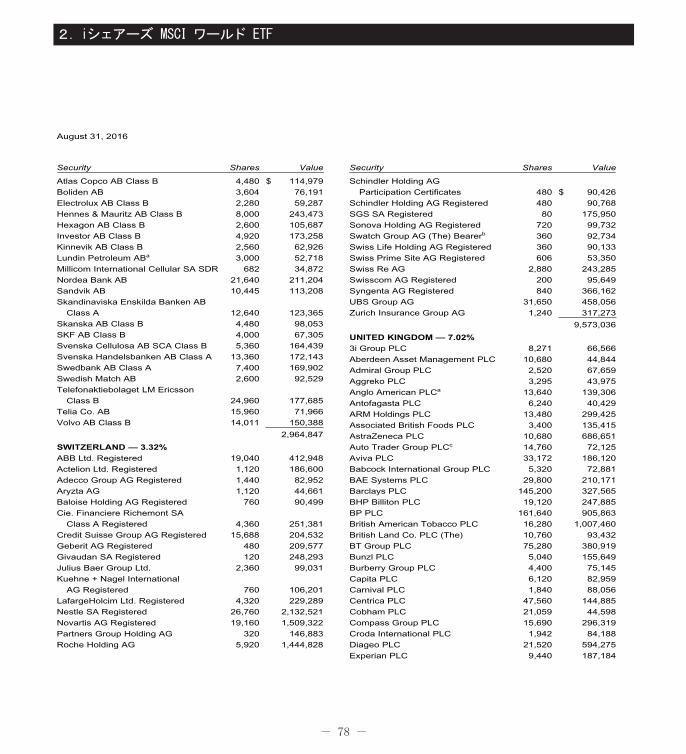
- 78 -
2.iシェアーズ MSCI ワールド ETF
August 31, 2016
Security Shares Value
Atlas Copco AB Class B 4,480 $ 114,979
Boliden AB 3,604 76,191
Electrolux AB Class B 2,280 59,287
Hennes & Mauritz AB Class B 8,000 243,473
Hexagon AB Class B 2,600 105,687
Investor AB Class B 4,920 173,258
Kinnevik AB Class B 2,560 62,926
Lundin Petroleum ABa 3,000 52,718
Millicom International Cellular SA SDR 682 34,872
Nordea Bank AB 21,640 211,204
Sandvik AB 10,445 113,208
Skandinaviska Enskilda Banken AB
Class A 12,640 123,365
Skanska AB Class B 4,480 98,053
SKF AB Class B 4,000 67,305
Svenska Cellulosa AB SCA Class B 5,360 164,439
Svenska Handelsbanken AB Class A 13,360 172,143
Swedbank AB Class A 7,400 169,902
Swedish Match AB 2,600 92,529
Telefonaktiebolaget LM Ericsson
Class B 24,960 177,685
Telia Co. AB 15,960 71,966
Volvo AB Class B 14,011 150,388
2,964,847
SWITZERLAND — 3.32%
ABB Ltd. Registered 19,040 412,948
Actelion Ltd. Registered 1,120 186,600
Adecco Group AG Registered 1,440 82,952
Aryzta AG 1,120 44,661
Baloise Holding AG Registered 760 90,499
Cie. Financiere Richemont SA
Class A Registered 4,360 251,381
Credit Suisse Group AG Registered 15,688 204,532
Geberit AG Registered 480 209,577
Givaudan SA Registered 120 248,293
Julius Baer Group Ltd. 2,360 99,031
Kuehne + Nagel International
AG Registered 760 106,201
LafargeHolcim Ltd. Registered 4,320 229,289
Nestle SA Registered 26,760 2,132,521
Novartis AG Registered 19,160 1,509,322
Partners Group Holding AG 320 146,883
Roche Holding AG 5,920 1,444,828
Security Shares Value
Schindler Holding AG
Participation Certificates 480 $ 90,426
Schindler Holding AG Registered 480 90,768
SGS SA Registered 80 175,950
Sonova Holding AG Registered 720 99,732
Swatch Group AG (The) Bearerb 360 92,734
Swiss Life Holding AG Registered 360 90,133
Swiss Prime Site AG Registered 606 53,350
Swiss Re AG 2,880 243,285
Swisscom AG Registered 200 95,649
Syngenta AG Registered 840 366,162
UBS Group AG 31,650 458,056
Zurich Insurance Group AG 1,240 317,273
9,573,036
UNITED KINGDOM — 7.02%
3i Group PLC 8,271 66,566
Aberdeen Asset Management PLC 10,680 44,844
Admiral Group PLC 2,520 67,659
Aggreko PLC 3,295 43,975
Anglo American PLCa 13,640 139,306
Antofagasta PLC 6,240 40,429
ARM Holdings PLC 13,480 299,425
Associated British Foods PLC 3,400 135,415
AstraZeneca PLC 10,680 686,651
Auto Trader Group PLCc 14,760 72,125
Aviva PLC 33,172 186,120
Babcock International Group PLC 5,320 72,881
BAE Systems PLC 29,800 210,171
Barclays PLC 145,200 327,565
BHP Billiton PLC 19,120 247,885
BP PLC 161,640 905,863
British American Tobacco PLC 16,280 1,007,460
British Land Co. PLC (The) 10,760 93,432
BT Group PLC 75,280 380,919
Bunzl PLC 5,040 155,649
Burberry Group PLC 4,400 75,145
Capita PLC 6,120 82,959
Carnival PLC 1,840 88,056
Centrica PLC 47,560 144,885
Cobham PLC 21,059 44,598
Compass Group PLC 15,690 296,319
Croda International PLC 1,942 84,188
Diageo PLC 21,520 594,275
Experian PLC 9,440 187,184
011_3771524762911.indd���78 2017/10/11���13:10:32
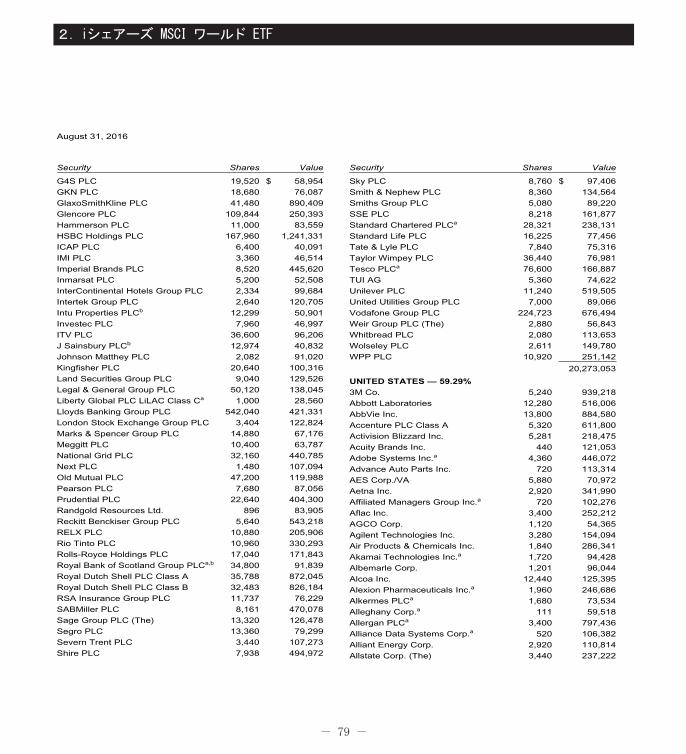
- 79 -
2.iシェアーズ MSCI ワールド ETF
August 31, 2016
Security Shares Value
G4S PLC 19,520 $ 58,954
GKN PLC 18,680 76,087
GlaxoSmithKline PLC 41,480 890,409
Glencore PLC 109,844 250,393
Hammerson PLC 11,000 83,559
HSBC Holdings PLC 167,960 1,241,331
ICAP PLC 6,400 40,091
IMI PLC 3,360 46,514
Imperial Brands PLC 8,520 445,620
Inmarsat PLC 5,200 52,508
InterContinental Hotels Group PLC 2,334 99,684
Intertek Group PLC 2,640 120,705
Intu Properties PLCb 12,299 50,901
Investec PLC 7,960 46,997
ITV PLC 36,600 96,206
J Sainsbury PLCb 12,974 40,832
Johnson Matthey PLC 2,082 91,020
Kingfisher PLC 20,640 100,316
Land Securities Group PLC 9,040 129,526
Legal & General Group PLC 50,120 138,045
Liberty Global PLC LiLAC Class Ca 1,000 28,560
Lloyds Banking Group PLC 542,040 421,331
London Stock Exchange Group PLC 3,404 122,824
Marks & Spencer Group PLC 14,880 67,176
Meggitt PLC 10,400 63,787
National Grid PLC 32,160 440,785
Next PLC 1,480 107,094
Old Mutual PLC 47,200 119,988
Pearson PLC 7,680 87,056
Prudential PLC 22,640 404,300
Randgold Resources Ltd. 896 83,905
Reckitt Benckiser Group PLC 5,640 543,218
RELX PLC 10,880 205,906
Rio Tinto PLC 10,960 330,293
Rolls-Royce Holdings PLC 17,040 171,843
Royal Bank of Scotland Group PLCa,b 34,800 91,839
Royal Dutch Shell PLC Class A 35,788 872,045
Royal Dutch Shell PLC Class B 32,483 826,184
RSA Insurance Group PLC 11,737 76,229
SABMiller PLC 8,161 470,078
Sage Group PLC (The) 13,320 126,478
Segro PLC 13,360 79,299
Severn Trent PLC 3,440 107,273
Shire PLC 7,938 494,972
Security Shares Value
Sky PLC 8,760 $ 97,406
Smith & Nephew PLC 8,360 134,564
Smiths Group PLC 5,080 89,220
SSE PLC 8,218 161,877
Standard Chartered PLCa 28,321 238,131
Standard Life PLC 16,225 77,456
Tate & Lyle PLC 7,840 75,316
Taylor Wimpey PLC 36,440 76,981
Tesco PLCa 76,600 166,887
TUI AG 5,360 74,622
Unilever PLC 11,240 519,505
United Utilities Group PLC 7,000 89,066
Vodafone Group PLC 224,723 676,494
Weir Group PLC (The) 2,880 56,843
Whitbread PLC 2,080 113,653
Wolseley PLC 2,611 149,780
WPP PLC 10,920 251,142
20,273,053
UNITED STATES — 59.29%
3M Co. 5,240 939,218
Abbott Laboratories 12,280 516,006
AbbVie Inc. 13,800 884,580
Accenture PLC Class A 5,320 611,800
Activision Blizzard Inc. 5,281 218,475
Acuity Brands Inc. 440 121,053
Adobe Systems Inc.a 4,360 446,072
Advance Auto Parts Inc. 720 113,314
AES Corp./VA 5,880 70,972
Aetna Inc. 2,920 341,990
Affiliated Managers Group Inc.a 720 102,276
Aflac Inc. 3,400 252,212
AGCO Corp. 1,120 54,365
Agilent Technologies Inc. 3,280 154,094
Air Products & Chemicals Inc. 1,840 286,341
Akamai Technologies Inc.a 1,720 94,428
Albemarle Corp. 1,201 96,044
Alcoa Inc. 12,440 125,395
Alexion Pharmaceuticals Inc.a 1,960 246,686
Alkermes PLCa 1,680 73,534
Alleghany Corp.a 111 59,518
Allergan PLCa 3,400 797,436
Alliance Data Systems Corp.a 520 106,382
Alliant Energy Corp. 2,920 110,814
Allstate Corp. (The) 3,440 237,222
011_3771524762911.indd���79 2017/10/11���13:10:32
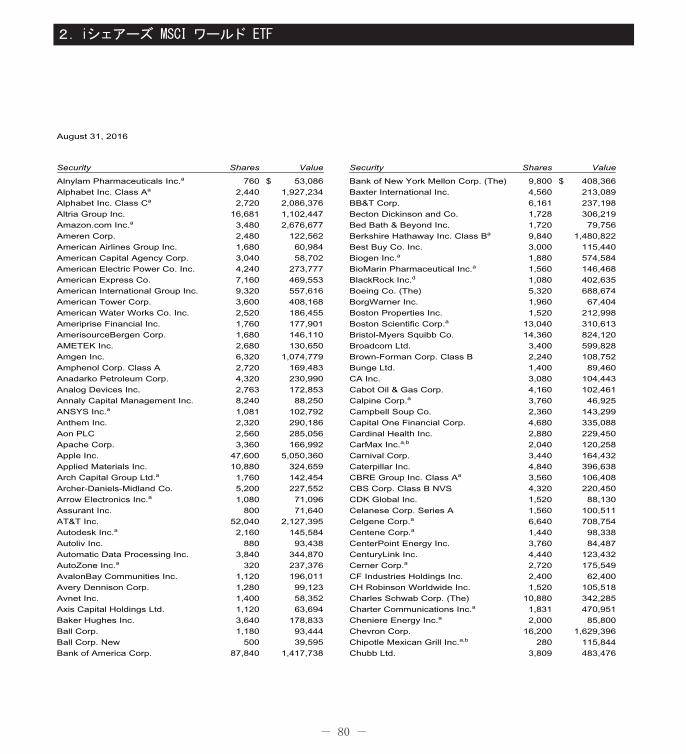
- 80 -
2.iシェアーズ MSCI ワールド ETF
August 31, 2016
Security Shares Value
Alnylam Pharmaceuticals Inc.a 760 $ 53,086
Alphabet Inc. Class Aa 2,440 1,927,234
Alphabet Inc. Class Ca 2,720 2,086,376
Altria Group Inc. 16,681 1,102,447
Amazon.com Inc.a 3,480 2,676,677
Ameren Corp. 2,480 122,562
American Airlines Group Inc. 1,680 60,984
American Capital Agency Corp. 3,040 58,702
American Electric Power Co. Inc. 4,240 273,777
American Express Co. 7,160 469,553
American International Group Inc. 9,320 557,616
American Tower Corp. 3,600 408,168
American Water Works Co. Inc. 2,520 186,455
Ameriprise Financial Inc. 1,760 177,901
AmerisourceBergen Corp. 1,680 146,110
AMETEK Inc. 2,680 130,650
Amgen Inc. 6,320 1,074,779
Amphenol Corp. Class A 2,720 169,483
Anadarko Petroleum Corp. 4,320 230,990
Analog Devices Inc. 2,763 172,853
Annaly Capital Management Inc. 8,240 88,250
ANSYS Inc.a 1,081 102,792
Anthem Inc. 2,320 290,186
Aon PLC 2,560 285,056
Apache Corp. 3,360 166,992
Apple Inc. 47,600 5,050,360
Applied Materials Inc. 10,880 324,659
Arch Capital Group Ltd.a 1,760 142,454
Archer-Daniels-Midland Co. 5,200 227,552
Arrow Electronics Inc.a 1,080 71,096
Assurant Inc. 800 71,640
AT&T Inc. 52,040 2,127,395
Autodesk Inc.a 2,160 145,584
Autoliv Inc. 880 93,438
Automatic Data Processing Inc. 3,840 344,870
AutoZone Inc.a 320 237,376
AvalonBay Communities Inc. 1,120 196,011
Avery Dennison Corp. 1,280 99,123
Avnet Inc. 1,400 58,352
Axis Capital Holdings Ltd. 1,120 63,694
Baker Hughes Inc. 3,640 178,833
Ball Corp. 1,180 93,444
Ball Corp. New 500 39,595
Bank of America Corp. 87,840 1,417,738
Security Shares Value
Bank of New York Mellon Corp. (The) 9,800 $ 408,366
Baxter International Inc. 4,560 213,089
BB&T Corp. 6,161 237,198
Becton Dickinson and Co. 1,728 306,219
Bed Bath & Beyond Inc. 1,720 79,756
Berkshire Hathaway Inc. Class Ba 9,840 1,480,822
Best Buy Co. Inc. 3,000 115,440
Biogen Inc.a 1,880 574,584
BioMarin Pharmaceutical Inc.a 1,560 146,468
BlackRock Inc.d 1,080 402,635
Boeing Co. (The) 5,320 688,674
BorgWarner Inc. 1,960 67,404
Boston Properties Inc. 1,520 212,998
Boston Scientific Corp.a 13,040 310,613
Bristol-Myers Squibb Co. 14,360 824,120
Broadcom Ltd. 3,400 599,828
Brown-Forman Corp. Class B 2,240 108,752
Bunge Ltd. 1,400 89,460
CA Inc. 3,080 104,443
Cabot Oil & Gas Corp. 4,160 102,461
Calpine Corp.a 3,760 46,925
Campbell Soup Co. 2,360 143,299
Capital One Financial Corp. 4,680 335,088
Cardinal Health Inc. 2,880 229,450
CarMax Inc.a,b 2,040 120,258
Carnival Corp. 3,440 164,432
Caterpillar Inc. 4,840 396,638
CBRE Group Inc. Class Aa 3,560 106,408
CBS Corp. Class B NVS 4,320 220,450
CDK Global Inc. 1,520 88,130
Celanese Corp. Series A 1,560 100,511
Celgene Corp.a 6,640 708,754
Centene Corp.a 1,440 98,338
CenterPoint Energy Inc. 3,760 84,487
CenturyLink Inc. 4,440 123,432
Cerner Corp.a 2,720 175,549
CF Industries Holdings Inc. 2,400 62,400
CH Robinson Worldwide Inc. 1,520 105,518
Charles Schwab Corp. (The) 10,880 342,285
Charter Communications Inc.a 1,831 470,951
Cheniere Energy Inc.a 2,000 85,800
Chevron Corp. 16,200 1,629,396
Chipotle Mexican Grill Inc.a,b 280 115,844
Chubb Ltd. 3,809 483,476
011_3771524762911.indd���80 2017/10/11���13:10:32
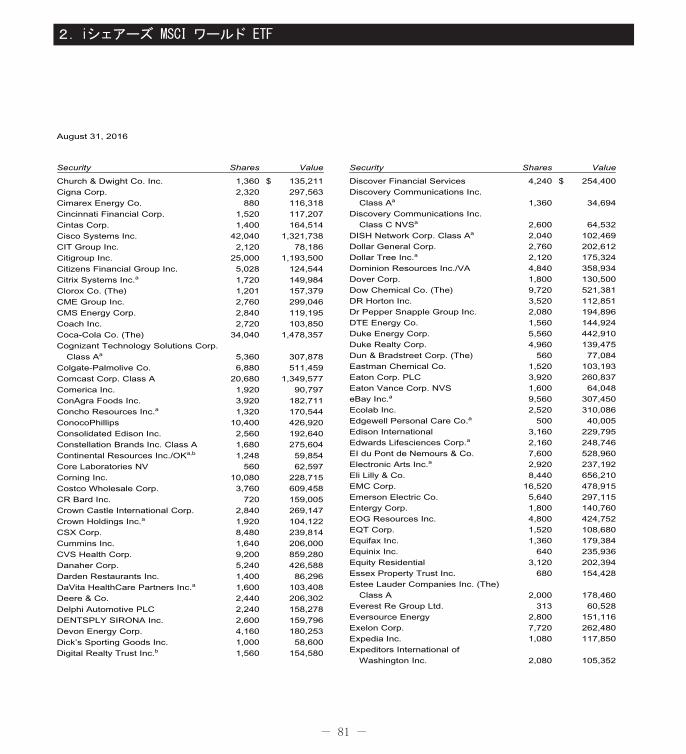
- 81 -
2.iシェアーズ MSCI ワールド ETF
August 31, 2016
Security Shares Value
Church & Dwight Co. Inc. 1,360 $ 135,211
Cigna Corp. 2,320 297,563
Cimarex Energy Co. 880 116,318
Cincinnati Financial Corp. 1,520 117,207
Cintas Corp. 1,400 164,514
Cisco Systems Inc. 42,040 1,321,738
CIT Group Inc. 2,120 78,186
Citigroup Inc. 25,000 1,193,500
Citizens Financial Group Inc. 5,028 124,544
Citrix Systems Inc.a 1,720 149,984
Clorox Co. (The) 1,201 157,379
CME Group Inc. 2,760 299,046
CMS Energy Corp. 2,840 119,195
Coach Inc. 2,720 103,850
Coca-Cola Co. (The) 34,040 1,478,357
Cognizant Technology Solutions Corp.
Class Aa 5,360 307,878
Colgate-Palmolive Co. 6,880 511,459
Comcast Corp. Class A 20,680 1,349,577
Comerica Inc. 1,920 90,797
ConAgra Foods Inc. 3,920 182,711
Concho Resources Inc.a 1,320 170,544
ConocoPhillips 10,400 426,920
Consolidated Edison Inc. 2,560 192,640
Constellation Brands Inc. Class A 1,680 275,604
Continental Resources Inc./OKa,b 1,248 59,854
Core Laboratories NV 560 62,597
Corning Inc. 10,080 228,715
Costco Wholesale Corp. 3,760 609,458
CR Bard Inc. 720 159,005
Crown Castle International Corp. 2,840 269,147
Crown Holdings Inc.a 1,920 104,122
CSX Corp. 8,480 239,814
Cummins Inc. 1,640 206,000
CVS Health Corp. 9,200 859,280
Danaher Corp. 5,240 426,588
Darden Restaurants Inc. 1,400 86,296
DaVita HealthCare Partners Inc.a 1,600 103,408
Deere & Co. 2,440 206,302
Delphi Automotive PLC 2,240 158,278
DENTSPLY SIRONA Inc. 2,600 159,796
Devon Energy Corp. 4,160 180,253
Dick’s Sporting Goods Inc. 1,000 58,600
Digital Realty Trust Inc.b 1,560 154,580
Security Shares Value
Discover Financial Services 4,240 $ 254,400
Discovery Communications Inc.
Class Aa 1,360 34,694
Discovery Communications Inc.
Class C NVSa 2,600 64,532
DISH Network Corp. Class Aa 2,040 102,469
Dollar General Corp. 2,760 202,612
Dollar Tree Inc.a 2,120 175,324
Dominion Resources Inc./VA 4,840 358,934
Dover Corp. 1,800 130,500
Dow Chemical Co. (The) 9,720 521,381
DR Horton Inc. 3,520 112,851
Dr Pepper Snapple Group Inc. 2,080 194,896
DTE Energy Co. 1,560 144,924
Duke Energy Corp. 5,560 442,910
Duke Realty Corp. 4,960 139,475
Dun & Bradstreet Corp. (The) 560 77,084
Eastman Chemical Co. 1,520 103,193
Eaton Corp. PLC 3,920 260,837
Eaton Vance Corp. NVS 1,600 64,048
eBay Inc.a 9,560 307,450
Ecolab Inc. 2,520 310,086
Edgewell Personal Care Co.a 500 40,005
Edison International 3,160 229,795
Edwards Lifesciences Corp.a 2,160 248,746
EI du Pont de Nemours & Co. 7,600 528,960
Electronic Arts Inc.a 2,920 237,192
Eli Lilly & Co. 8,440 656,210
EMC Corp. 16,520 478,915
Emerson Electric Co. 5,640 297,115
Entergy Corp. 1,800 140,760
EOG Resources Inc. 4,800 424,752
EQT Corp. 1,520 108,680
Equifax Inc. 1,360 179,384
Equinix Inc. 640 235,936
Equity Residential 3,120 202,394
Essex Property Trust Inc. 680 154,428
Estee Lauder Companies Inc. (The)
Class A 2,000 178,460
Everest Re Group Ltd. 313 60,528
Eversource Energy 2,800 151,116
Exelon Corp. 7,720 262,480
Expedia Inc. 1,080 117,850
Expeditors International of
Washington Inc. 2,080 105,352
011_3771524762911.indd���81 2017/10/11���13:10:32
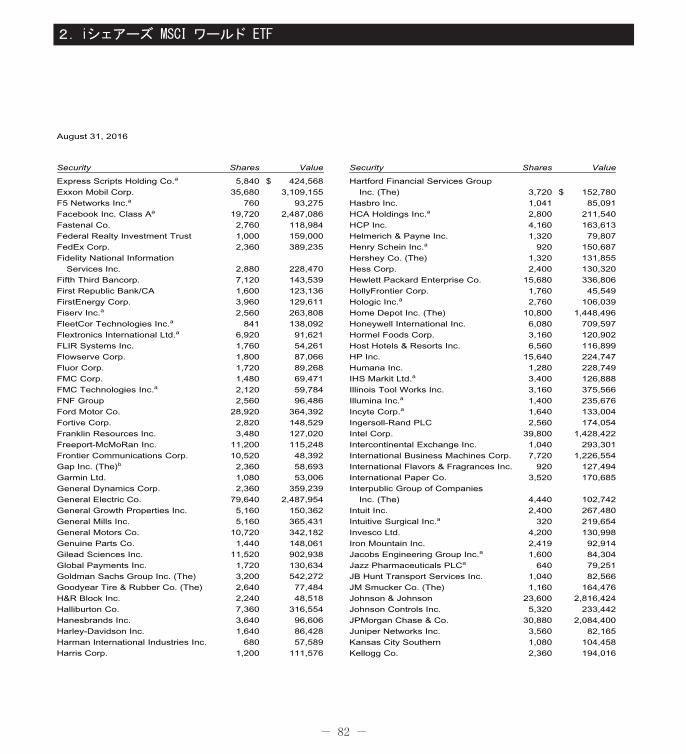
- 82 -
2.iシェアーズ MSCI ワールド ETF
August 31, 2016
Security Shares Value
Express Scripts Holding Co.a 5,840 $ 424,568
Exxon Mobil Corp. 35,680 3,109,155
F5 Networks Inc.a 760 93,275
Facebook Inc. Class Aa 19,720 2,487,086
Fastenal Co. 2,760 118,984
Federal Realty Investment Trust 1,000 159,000
FedEx Corp. 2,360 389,235
Fidelity National Information
Services Inc. 2,880 228,470
Fifth Third Bancorp. 7,120 143,539
First Republic Bank/CA 1,600 123,136
FirstEnergy Corp. 3,960 129,611
Fiserv Inc.a 2,560 263,808
FleetCor Technologies Inc.a 841 138,092
Flextronics International Ltd.a 6,920 91,621
FLIR Systems Inc. 1,760 54,261
Flowserve Corp. 1,800 87,066
Fluor Corp. 1,720 89,268
FMC Corp. 1,480 69,471
FMC Technologies Inc.a 2,120 59,784
FNF Group 2,560 96,486
Ford Motor Co. 28,920 364,392
Fortive Corp. 2,820 148,529
Franklin Resources Inc. 3,480 127,020
Freeport-McMoRan Inc. 11,200 115,248
Frontier Communications Corp. 10,520 48,392
Gap Inc. (The)b 2,360 58,693
Garmin Ltd. 1,080 53,006
General Dynamics Corp. 2,360 359,239
General Electric Co. 79,640 2,487,954
General Growth Properties Inc. 5,160 150,362
General Mills Inc. 5,160 365,431
General Motors Co. 10,720 342,182
Genuine Parts Co. 1,440 148,061
Gilead Sciences Inc. 11,520 902,938
Global Payments Inc. 1,720 130,634
Goldman Sachs Group Inc. (The) 3,200 542,272
Goodyear Tire & Rubber Co. (The) 2,640 77,484
H&R Block Inc. 2,240 48,518
Halliburton Co. 7,360 316,554
Hanesbrands Inc. 3,640 96,606
Harley-Davidson Inc. 1,640 86,428
Harman International Industries Inc. 680 57,589
Harris Corp. 1,200 111,576
Security Shares Value
Hartford Financial Services Group
Inc. (The) 3,720 $ 152,780
Hasbro Inc. 1,041 85,091
HCA Holdings Inc.a 2,800 211,540
HCP Inc. 4,160 163,613
Helmerich & Payne Inc. 1,320 79,807
Henry Schein Inc.a 920 150,687
Hershey Co. (The) 1,320 131,855
Hess Corp. 2,400 130,320
Hewlett Packard Enterprise Co. 15,680 336,806
HollyFrontier Corp. 1,760 45,549
Hologic Inc.a 2,760 106,039
Home Depot Inc. (The) 10,800 1,448,496
Honeywell International Inc. 6,080 709,597
Hormel Foods Corp. 3,160 120,902
Host Hotels & Resorts Inc. 6,560 116,899
HP Inc. 15,640 224,747
Humana Inc. 1,280 228,749
IHS Markit Ltd.a 3,400 126,888
Illinois Tool Works Inc. 3,160 375,566
Illumina Inc.a 1,400 235,676
Incyte Corp.a 1,640 133,004
Ingersoll-Rand PLC 2,560 174,054
Intel Corp. 39,800 1,428,422
Intercontinental Exchange Inc. 1,040 293,301
International Business Machines Corp. 7,720 1,226,554
International Flavors & Fragrances Inc. 920 127,494
International Paper Co. 3,520 170,685
Interpublic Group of Companies
Inc. (The) 4,440 102,742
Intuit Inc. 2,400 267,480
Intuitive Surgical Inc.a 320 219,654
Invesco Ltd. 4,200 130,998
Iron Mountain Inc. 2,419 92,914
Jacobs Engineering Group Inc.a 1,600 84,304
Jazz Pharmaceuticals PLCa 640 79,251
JB Hunt Transport Services Inc. 1,040 82,566
JM Smucker Co. (The) 1,160 164,476
Johnson & Johnson 23,600 2,816,424
Johnson Controls Inc. 5,320 233,442
JPMorgan Chase & Co. 30,880 2,084,400
Juniper Networks Inc. 3,560 82,165
Kansas City Southern 1,080 104,458
Kellogg Co. 2,360 194,016
011_3771524762911.indd���82 2017/10/11���13:10:32
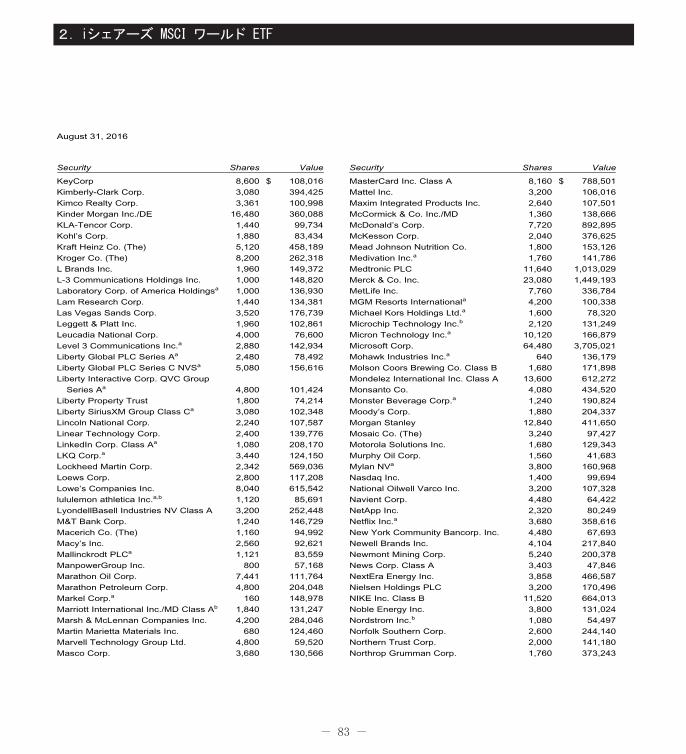
- 83 -
2.iシェアーズ MSCI ワールド ETF
August 31, 2016
Security Shares Value
KeyCorp 8,600 $ 108,016
Kimberly-Clark Corp. 3,080 394,425
Kimco Realty Corp. 3,361 100,998
Kinder Morgan Inc./DE 16,480 360,088
KLA-Tencor Corp. 1,440 99,734
Kohl’s Corp. 1,880 83,434
Kraft Heinz Co. (The) 5,120 458,189
Kroger Co. (The) 8,200 262,318
L Brands Inc. 1,960 149,372
L-3 Communications Holdings Inc. 1,000 148,820
Laboratory Corp. of America Holdingsa 1,000 136,930
Lam Research Corp. 1,440 134,381
Las Vegas Sands Corp. 3,520 176,739
Leggett & Platt Inc. 1,960 102,861
Leucadia National Corp. 4,000 76,600
Level 3 Communications Inc.a 2,880 142,934
Liberty Global PLC Series Aa 2,480 78,492
Liberty Global PLC Series C NVSa 5,080 156,616
Liberty Interactive Corp. QVC Group
Series Aa 4,800 101,424
Liberty Property Trust 1,800 74,214
Liberty SiriusXM Group Class Ca 3,080 102,348
Lincoln National Corp. 2,240 107,587
Linear Technology Corp. 2,400 139,776
LinkedIn Corp. Class Aa 1,080 208,170
LKQ Corp.a 3,440 124,150
Lockheed Martin Corp. 2,342 569,036
Loews Corp. 2,800 117,208
Lowe’s Companies Inc. 8,040 615,542
lululemon athletica Inc.a,b 1,120 85,691
LyondellBasell Industries NV Class A 3,200 252,448
M&T Bank Corp. 1,240 146,729
Macerich Co. (The) 1,160 94,992
Macy’s Inc. 2,560 92,621
Mallinckrodt PLCa 1,121 83,559
ManpowerGroup Inc. 800 57,168
Marathon Oil Corp. 7,441 111,764
Marathon Petroleum Corp. 4,800 204,048
Markel Corp.a 160 148,978
Marriott International Inc./MD Class Ab 1,840 131,247
Marsh & McLennan Companies Inc. 4,200 284,046
Martin Marietta Materials Inc. 680 124,460
Marvell Technology Group Ltd. 4,800 59,520
Masco Corp. 3,680 130,566
Security Shares Value
MasterCard Inc. Class A 8,160 $ 788,501
Mattel Inc. 3,200 106,016
Maxim Integrated Products Inc. 2,640 107,501
McCormick & Co. Inc./MD 1,360 138,666
McDonald’s Corp. 7,720 892,895
McKesson Corp. 2,040 376,625
Mead Johnson Nutrition Co. 1,800 153,126
Medivation Inc.a 1,760 141,786
Medtronic PLC 11,640 1,013,029
Merck & Co. Inc. 23,080 1,449,193
MetLife Inc. 7,760 336,784
MGM Resorts Internationala 4,200 100,338
Michael Kors Holdings Ltd.a 1,600 78,320
Microchip Technology Inc.b 2,120 131,249
Micron Technology Inc.a 10,120 166,879
Microsoft Corp. 64,480 3,705,021
Mohawk Industries Inc.a 640 136,179
Molson Coors Brewing Co. Class B 1,680 171,898
Mondelez International Inc. Class A 13,600 612,272
Monsanto Co. 4,080 434,520
Monster Beverage Corp.a 1,240 190,824
Moody’s Corp. 1,880 204,337
Morgan Stanley 12,840 411,650
Mosaic Co. (The) 3,240 97,427
Motorola Solutions Inc. 1,680 129,343
Murphy Oil Corp. 1,560 41,683
Mylan NVa 3,800 160,968
Nasdaq Inc. 1,400 99,694
National Oilwell Varco Inc. 3,200 107,328
Navient Corp. 4,480 64,422
NetApp Inc. 2,320 80,249
Netflix Inc.a 3,680 358,616
New York Community Bancorp. Inc. 4,480 67,693
Newell Brands Inc. 4,104 217,840
Newmont Mining Corp. 5,240 200,378
News Corp. Class A 3,403 47,846
NextEra Energy Inc. 3,858 466,587
Nielsen Holdings PLC 3,200 170,496
NIKE Inc. Class B 11,520 664,013
Noble Energy Inc. 3,800 131,024
Nordstrom Inc.b 1,080 54,497
Norfolk Southern Corp. 2,600 244,140
Northern Trust Corp. 2,000 141,180
Northrop Grumman Corp. 1,760 373,243
011_3771524762911.indd���83 2017/10/11���13:10:32
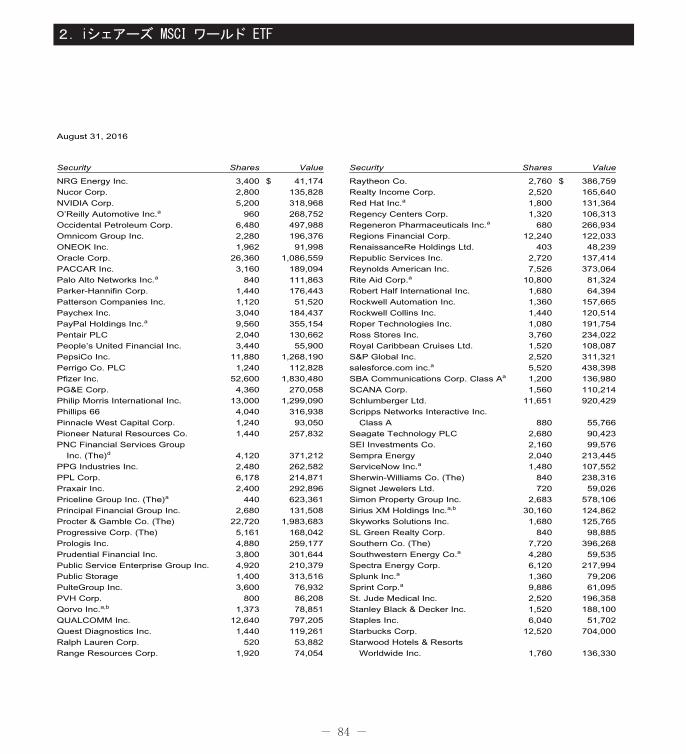
- 84 -
2.iシェアーズ MSCI ワールド ETF
August 31, 2016
Security Shares Value
NRG Energy Inc. 3,400 $ 41,174
Nucor Corp. 2,800 135,828
NVIDIA Corp. 5,200 318,968
O’Reilly Automotive Inc.a 960 268,752
Occidental Petroleum Corp. 6,480 497,988
Omnicom Group Inc. 2,280 196,376
ONEOK Inc. 1,962 91,998
Oracle Corp. 26,360 1,086,559
PACCAR Inc. 3,160 189,094
Palo Alto Networks Inc.a 840 111,863
Parker-Hannifin Corp. 1,440 176,443
Patterson Companies Inc. 1,120 51,520
Paychex Inc. 3,040 184,437
PayPal Holdings Inc.a 9,560 355,154
Pentair PLC 2,040 130,662
People’s United Financial Inc. 3,440 55,900
PepsiCo Inc. 11,880 1,268,190
Perrigo Co. PLC 1,240 112,828
Pfizer Inc. 52,600 1,830,480
PG&E Corp. 4,360 270,058
Philip Morris International Inc. 13,000 1,299,090
Phillips 66 4,040 316,938
Pinnacle West Capital Corp. 1,240 93,050
Pioneer Natural Resources Co. 1,440 257,832
PNC Financial Services Group
Inc. (The)d 4,120 371,212
PPG Industries Inc. 2,480 262,582
PPL Corp. 6,178 214,871
Praxair Inc. 2,400 292,896
Priceline Group Inc. (The)a 440 623,361
Principal Financial Group Inc. 2,680 131,508
Procter & Gamble Co. (The) 22,720 1,983,683
Progressive Corp. (The) 5,161 168,042
Prologis Inc. 4,880 259,177
Prudential Financial Inc. 3,800 301,644
Public Service Enterprise Group Inc. 4,920 210,379
Public Storage 1,400 313,516
PulteGroup Inc. 3,600 76,932
PVH Corp. 800 86,208
Qorvo Inc.a,b 1,373 78,851
QUALCOMM Inc. 12,640 797,205
Quest Diagnostics Inc. 1,440 119,261
Ralph Lauren Corp. 520 53,882
Range Resources Corp. 1,920 74,054
Security Shares Value
Raytheon Co. 2,760 $ 386,759
Realty Income Corp. 2,520 165,640
Red Hat Inc.a 1,800 131,364
Regency Centers Corp. 1,320 106,313
Regeneron Pharmaceuticals Inc.a 680 266,934
Regions Financial Corp. 12,240 122,033
RenaissanceRe Holdings Ltd. 403 48,239
Republic Services Inc. 2,720 137,414
Reynolds American Inc. 7,526 373,064
Rite Aid Corp.a 10,800 81,324
Robert Half International Inc. 1,680 64,394
Rockwell Automation Inc. 1,360 157,665
Rockwell Collins Inc. 1,440 120,514
Roper Technologies Inc. 1,080 191,754
Ross Stores Inc. 3,760 234,022
Royal Caribbean Cruises Ltd. 1,520 108,087
S&P Global Inc. 2,520 311,321
salesforce.com inc.a 5,520 438,398
SBA Communications Corp. Class Aa 1,200 136,980
SCANA Corp. 1,560 110,214
Schlumberger Ltd. 11,651 920,429
Scripps Networks Interactive Inc.
Class A 880 55,766
Seagate Technology PLC 2,680 90,423
SEI Investments Co. 2,160 99,576
Sempra Energy 2,040 213,445
ServiceNow Inc.a 1,480 107,552
Sherwin-Williams Co. (The) 840 238,316
Signet Jewelers Ltd. 720 59,026
Simon Property Group Inc. 2,683 578,106
Sirius XM Holdings Inc.a,b 30,160 124,862
Skyworks Solutions Inc. 1,680 125,765
SL Green Realty Corp. 840 98,885
Southern Co. (The) 7,720 396,268
Southwestern Energy Co.a 4,280 59,535
Spectra Energy Corp. 6,120 217,994
Splunk Inc.a 1,360 79,206
Sprint Corp.a 9,886 61,095
St. Jude Medical Inc. 2,520 196,358
Stanley Black & Decker Inc. 1,520 188,100
Staples Inc. 6,040 51,702
Starbucks Corp. 12,520 704,000
Starwood Hotels & Resorts
Worldwide Inc. 1,760 136,330
011_3771524762911.indd���84 2017/10/11���13:10:32
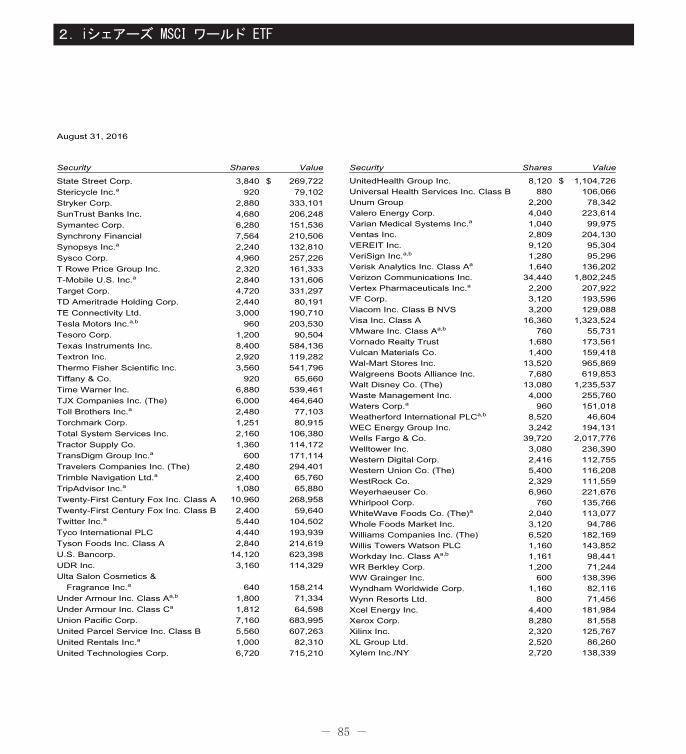
- 85 -
2.iシェアーズ MSCI ワールド ETF
August 31, 2016
Security Shares Value
State Street Corp. 3,840 $ 269,722
Stericycle Inc.a 920 79,102
Stryker Corp. 2,880 333,101
SunTrust Banks Inc. 4,680 206,248
Symantec Corp. 6,280 151,536
Synchrony Financial 7,564 210,506
Synopsys Inc.a 2,240 132,810
Sysco Corp. 4,960 257,226
T Rowe Price Group Inc. 2,320 161,333
T-Mobile U.S. Inc.a 2,840 131,606
Target Corp. 4,720 331,297
TD Ameritrade Holding Corp. 2,440 80,191
TE Connectivity Ltd. 3,000 190,710
Tesla Motors Inc.a,b 960 203,530
Tesoro Corp. 1,200 90,504
Texas Instruments Inc. 8,400 584,136
Textron Inc. 2,920 119,282
Thermo Fisher Scientific Inc. 3,560 541,796
Tiffany & Co. 920 65,660
Time Warner Inc. 6,880 539,461
TJX Companies Inc. (The) 6,000 464,640
Toll Brothers Inc.a 2,480 77,103
Torchmark Corp. 1,251 80,915
Total System Services Inc. 2,160 106,380
Tractor Supply Co. 1,360 114,172
TransDigm Group Inc.a 600 171,114
Travelers Companies Inc. (The) 2,480 294,401
Trimble Navigation Ltd.a 2,400 65,760
TripAdvisor Inc.a 1,080 65,880
Twenty-First Century Fox Inc. Class A 10,960 268,958
Twenty-First Century Fox Inc. Class B 2,400 59,640
Twitter Inc.a 5,440 104,502
Tyco International PLC 4,440 193,939
Tyson Foods Inc. Class A 2,840 214,619
U.S. Bancorp. 14,120 623,398
UDR Inc. 3,160 114,329
Ulta Salon Cosmetics &
Fragrance Inc.a 640 158,214
Under Armour Inc. Class Aa,b 1,800 71,334
Under Armour Inc. Class Ca 1,812 64,598
Union Pacific Corp. 7,160 683,995
United Parcel Service Inc. Class B 5,560 607,263
United Rentals Inc.a 1,000 82,310
United Technologies Corp. 6,720 715,210
Security Shares Value
UnitedHealth Group Inc. 8,120 $ 1,104,726Universal Health Services Inc. Class B 880 106,066Unum Group 2,200 78,342Valero Energy Corp. 4,040 223,614Varian Medical Systems Inc.a 1,040 99,975Ventas Inc. 2,809 204,130VEREIT Inc. 9,120 95,304VeriSign Inc.a,b 1,280 95,296Verisk Analytics Inc. Class Aa 1,640 136,202Verizon Communications Inc. 34,440 1,802,245Vertex Pharmaceuticals Inc.a 2,200 207,922VF Corp. 3,120 193,596Viacom Inc. Class B NVS 3,200 129,088Visa Inc. Class A 16,360 1,323,524VMware Inc. Class Aa,b 760 55,731Vornado Realty Trust 1,680 173,561Vulcan Materials Co. 1,400 159,418Wal-Mart Stores Inc. 13,520 965,869Walgreens Boots Alliance Inc. 7,680 619,853Walt Disney Co. (The) 13,080 1,235,537Waste Management Inc. 4,000 255,760Waters Corp.a 960 151,018Weatherford International PLCa,b 8,520 46,604WEC Energy Group Inc. 3,242 194,131Wells Fargo & Co. 39,720 2,017,776Welltower Inc. 3,080 236,390Western Digital Corp. 2,416 112,755Western Union Co. (The) 5,400 116,208WestRock Co. 2,329 111,559Weyerhaeuser Co. 6,960 221,676Whirlpool Corp. 760 135,766WhiteWave Foods Co. (The)a 2,040 113,077Whole Foods Market Inc. 3,120 94,786Williams Companies Inc. (The) 6,520 182,169Willis Towers Watson PLC 1,160 143,852Workday Inc. Class Aa,b 1,161 98,441WR Berkley Corp. 1,200 71,244WW Grainger Inc. 600 138,396Wyndham Worldwide Corp. 1,160 82,116Wynn Resorts Ltd. 800 71,456Xcel Energy Inc. 4,400 181,984Xerox Corp. 8,280 81,558Xilinx Inc. 2,320 125,767XL Group Ltd. 2,520 86,260Xylem Inc./NY 2,720 138,339
011_3771524762911.indd���85 2017/10/11���13:10:32
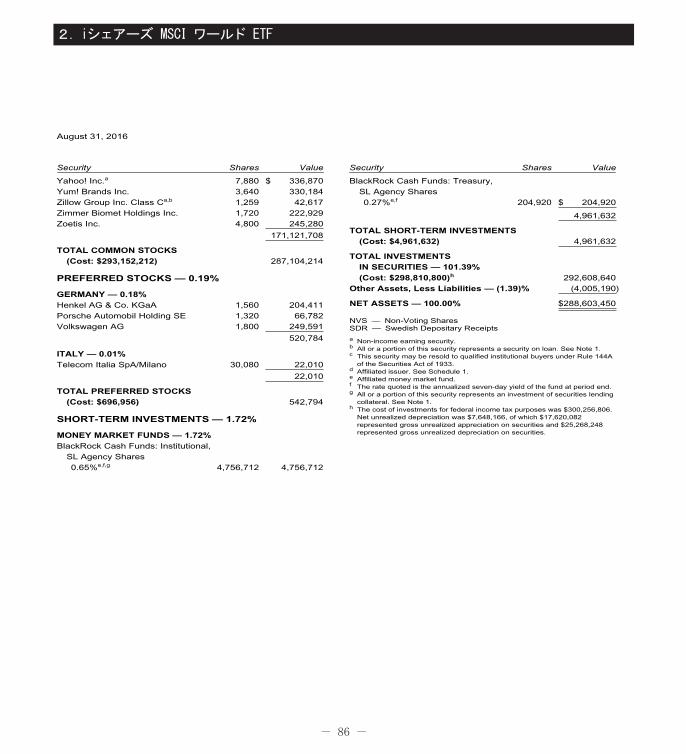
- 86 -
2.iシェアーズ MSCI ワールド ETF
August 31, 2016
Security Shares Value
Yahoo! Inc.a 7,880 $ 336,870Yum! Brands Inc. 3,640 330,184Zillow Group Inc. Class Ca,b 1,259 42,617Zimmer Biomet Holdings Inc. 1,720 222,929Zoetis Inc. 4,800 245,280
171,121,708
TOTAL COMMON STOCKS(Cost: $293,152,212) 287,104,214
PREFERRED STOCKS — 0.19%
GERMANY — 0.18%Henkel AG & Co. KGaA 1,560 204,411Porsche Automobil Holding SE 1,320 66,782Volkswagen AG 1,800 249,591
520,784
ITALY — 0.01%Telecom Italia SpA/Milano 30,080 22,010
22,010
TOTAL PREFERRED STOCKS(Cost: $696,956) 542,794
SHORT-TERM INVESTMENTS — 1.72%
MONEY MARKET FUNDS — 1.72%BlackRock Cash Funds: Institutional,
SL Agency Shares
0.65%e,f,g 4,756,712 4,756,712
Security Shares Value
BlackRock Cash Funds: Treasury,SL Agency Shares
0.27%e,f 204,920 $ 204,920
4,961,632
TOTAL SHORT-TERM INVESTMENTS(Cost: $4,961,632) 4,961,632
TOTAL INVESTMENTSIN SECURITIES — 101.39%(Cost: $298,810,800)h 292,608,640
Other Assets, Less Liabilities — (1.39)% (4,005,190)
NET ASSETS — 100.00% $288,603,450
NVS — Non-Voting SharesSDR — Swedish Depositary Receipts
a Non-income earning security.b All or a portion of this security represents a security on loan. See Note 1.c This security may be resold to qualified institutional buyers under Rule 144A
of the Securities Act of 1933.d Affiliated issuer. See Schedule 1.e Affiliated money market fund.f The rate quoted is the annualized seven-day yield of the fund at period end.g All or a portion of this security represents an investment of securities lending
collateral. See Note 1.h The cost of investments for federal income tax purposes was $300,256,806.
Net unrealized depreciation was $7,648,166, of which $17,620,082represented gross unrealized appreciation on securities and $25,268,248represented gross unrealized depreciation on securities.
011_3771524762911.indd���86 2017/10/11���13:10:32
Related Documents