2017 2018 Q1 Q2 Q3 Q4 Total Q1 Q2 Q3 Q4 Total Caribbean 67% 43% 33% 53% 49% Caribbean 69% 44% 37% 55% 51% Europe 20% 32% 10% 16% Europe 23% 32% 12% 17% Asia Pacific 27% 17% 15% 23% 21% Asia Pacific 27% 13% 10% 18% 17% Alaska 6% 10% 4% Alaska 6% 9% 4% Bermuda 3% 4% 0% 2% Bermuda 3% 4% 2% 2% Other 6% 11% 6% 13% 9% Other 5% 11% 8% 13% 9% Total 100% 100% 100% 100% 100% Total 100% 100% 100% 100% 100% YoY 1% -4% -6% -1% -2% YoY -4% 3% 8% 10% 4% YoY Excl. SSC -4% 3% 8% 8% 4% 2019 2020 Q1 Q2 Q3 Q4 Total Q1 Q2 Q3 Q4 Total Caribbean 72% 45% 37% 56% 52% Caribbean 69% 43% 34% 52% 49% Europe 20% 32% 10% 16% Europe 23% 36% 13% 18% Asia Pacific 21% 12% 10% 18% 15% Asia Pacific 21% 14% 10% 21% 16% Alaska 7% 11% 5% Alaska 6% 11% 5% Bermuda 4% 3% 1% 2% Bermuda 1% 2% 1% 1% Other 7% 12% 7% 15% 10% Other 9% 12% 6% 13% 10% Total 100% 100% 100% 100% 100% Total 100% 100% 100% 100% 100% YoY 11% 11% 9% 2% 8% YoY 5% 1% 4% 7% 4% YoY Excl. SSC 8% 8% 6% 1% 6% Assumptions for Mix 2016: Pullmantur only included for January through July 2017: Pullmantur excluded 2018 - 2020: Silversea shown on Quarter Lag YoY Change For all years - what we reported / expect to report with no adjustments 1Q19 Public Schedules

Welcome message from author
This document is posted to help you gain knowledge. Please leave a comment to let me know what you think about it! Share it to your friends and learn new things together.
Transcript
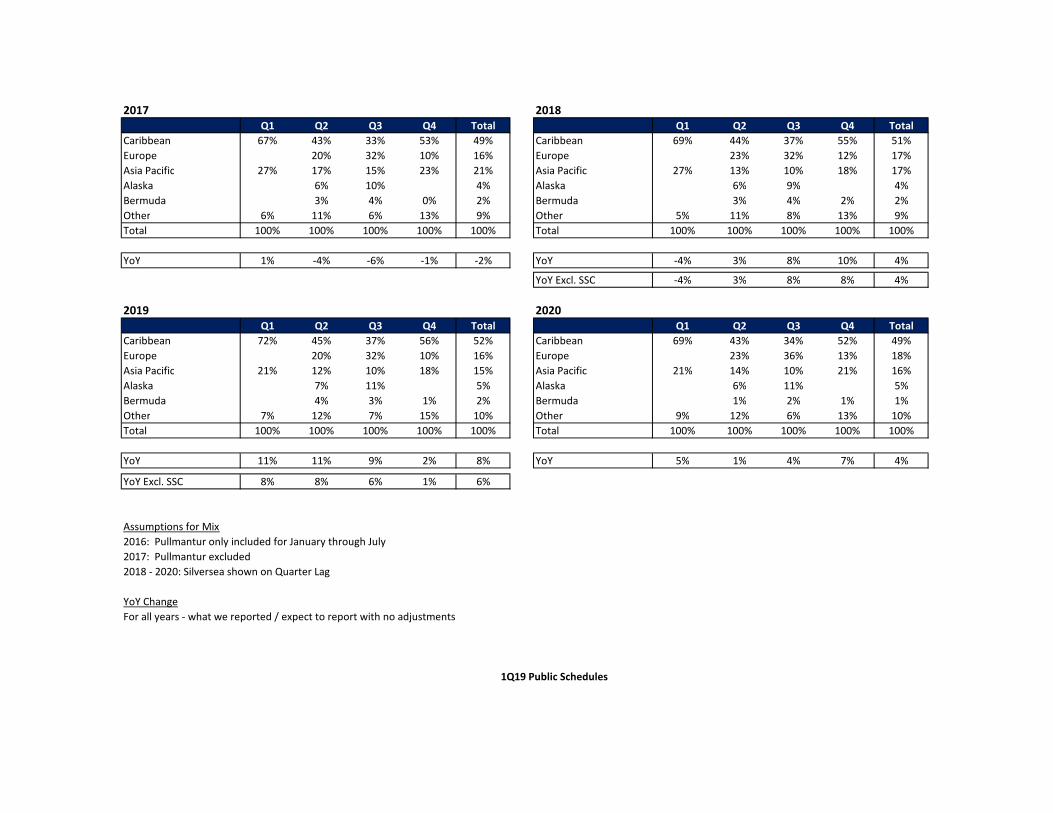
2017 2018
Q1 Q2 Q3 Q4 Total Q1 Q2 Q3 Q4 Total
Caribbean 67% 43% 33% 53% 49% Caribbean 69% 44% 37% 55% 51%
Europe 20% 32% 10% 16% Europe 23% 32% 12% 17%
Asia Pacific 27% 17% 15% 23% 21% Asia Pacific 27% 13% 10% 18% 17%
Alaska 6% 10% 4% Alaska 6% 9% 4%
Bermuda 3% 4% 0% 2% Bermuda 3% 4% 2% 2%
Other 6% 11% 6% 13% 9% Other 5% 11% 8% 13% 9%
Total 100% 100% 100% 100% 100% Total 100% 100% 100% 100% 100%
YoY 1% -4% -6% -1% -2% YoY -4% 3% 8% 10% 4%
YoY Excl. SSC -4% 3% 8% 8% 4%
2019 2020
Q1 Q2 Q3 Q4 Total Q1 Q2 Q3 Q4 Total
Caribbean 72% 45% 37% 56% 52% Caribbean 69% 43% 34% 52% 49%
Europe 20% 32% 10% 16% Europe 23% 36% 13% 18%
Asia Pacific 21% 12% 10% 18% 15% Asia Pacific 21% 14% 10% 21% 16%
Alaska 7% 11% 5% Alaska 6% 11% 5%
Bermuda 4% 3% 1% 2% Bermuda 1% 2% 1% 1%
Other 7% 12% 7% 15% 10% Other 9% 12% 6% 13% 10%
Total 100% 100% 100% 100% 100% Total 100% 100% 100% 100% 100%
YoY 11% 11% 9% 2% 8% YoY 5% 1% 4% 7% 4%
YoY Excl. SSC 8% 8% 6% 1% 6%
Assumptions for Mix
2016: Pullmantur only included for January through July
2017: Pullmantur excluded
2018 - 2020: Silversea shown on Quarter Lag
YoY Change
For all years - what we reported / expect to report with no adjustments
1Q19 Public Schedules
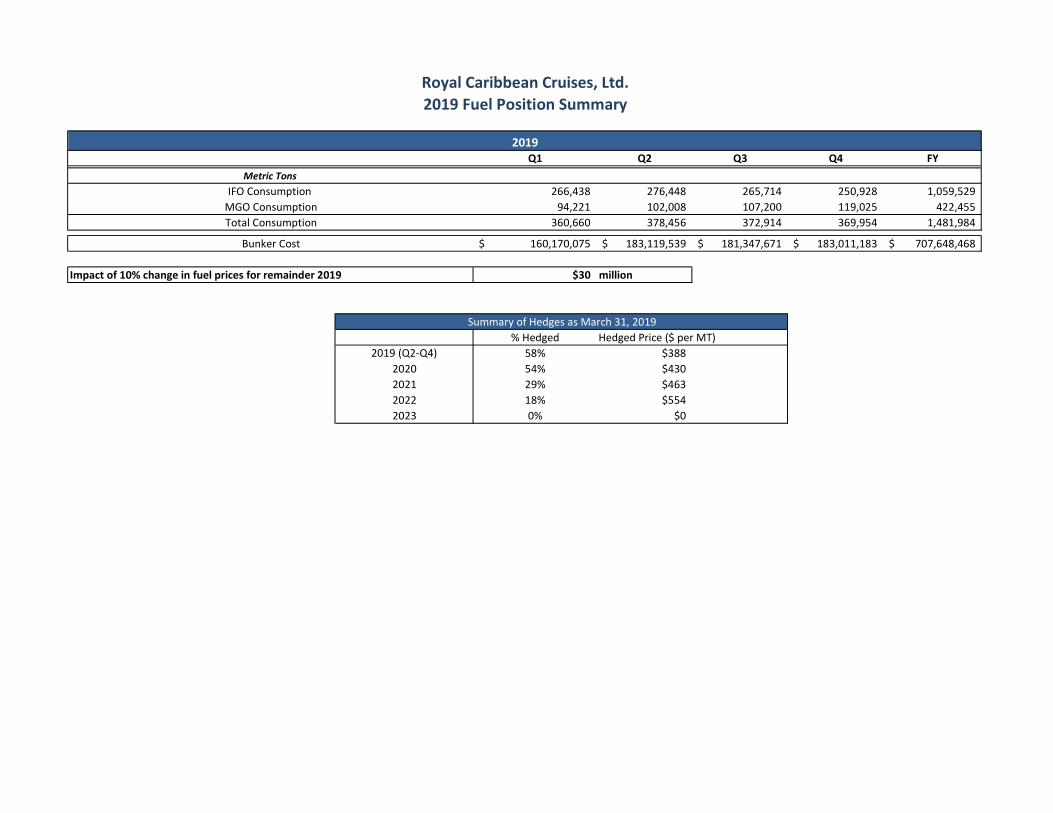
Q1 Q2 Q3 Q4 FY
266,438 276,448 265,714 250,928 1,059,529 94,221 102,008 107,200 119,025 422,455
360,660 378,456 372,914 369,954 1,481,984
160,170,075$ 183,119,539$ 181,347,671$ 183,011,183$ 707,648,468$
Impact of 10% change in fuel prices for remainder 2019 $30 million
% Hedged2019 (Q2-Q4) 58% $388
2020 54% $4302021 29% $4632022 18% $5542023 0% $0
Metric Tons
2019
IFO Consumption
Summary of Hedges as March 31, 2019
Royal Caribbean Cruises, Ltd.2019 Fuel Position Summary
Total Consumption
Bunker Cost
Hedged Price ($ per MT)
MGO Consumption
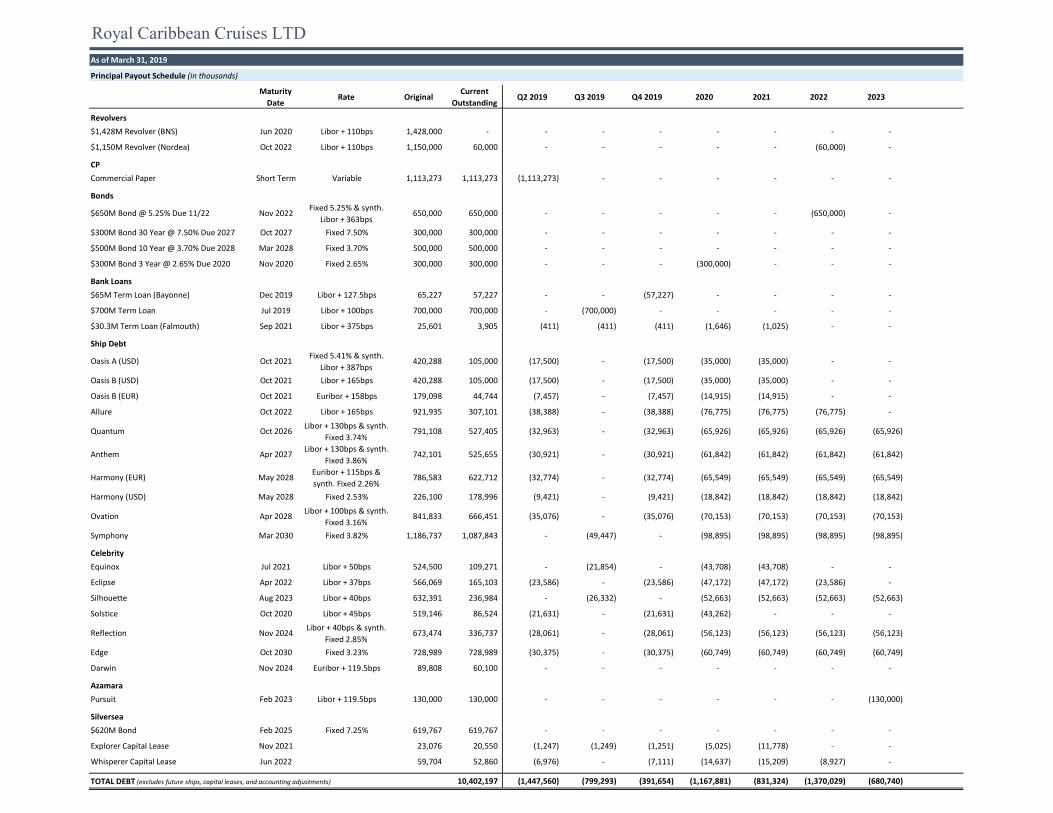
Royal Caribbean Cruises LTDAs of March 31, 2019
Principal Payout Schedule (in thousands)
Maturity Date
Rate OriginalCurrent
OutstandingQ2 2019 Q3 2019 Q4 2019 2020 2021 2022 2023
Revolvers
$1,428M Revolver (BNS) Jun 2020 Libor + 110bps 1,428,000 - - - - - - - -
$1,150M Revolver (Nordea) Oct 2022 Libor + 110bps 1,150,000 60,000 - - - - - (60,000) -
CP
Commercial Paper Short Term Variable 1,113,273 1,113,273 (1,113,273) - - - - - -
Bonds
$650M Bond @ 5.25% Due 11/22 Nov 2022Fixed 5.25% & synth.
Libor + 363bps650,000 650,000 - - - - - (650,000) -
$300M Bond 30 Year @ 7.50% Due 2027 Oct 2027 Fixed 7.50% 300,000 300,000 - - - - - - -
$500M Bond 10 Year @ 3.70% Due 2028 Mar 2028 Fixed 3.70% 500,000 500,000 - - - - - - -
$300M Bond 3 Year @ 2.65% Due 2020 Nov 2020 Fixed 2.65% 300,000 300,000 - - - (300,000) - - -
Bank Loans
$65M Term Loan (Bayonne) Dec 2019 Libor + 127.5bps 65,227 57,227 - - (57,227) - - - -
$700M Term Loan Jul 2019 Libor + 100bps 700,000 700,000 - (700,000) - - - - -
$30.3M Term Loan (Falmouth) Sep 2021 Libor + 375bps 25,601 3,905 (411) (411) (411) (1,646) (1,025) - -
Ship Debt
Oasis A (USD) Oct 2021Fixed 5.41% & synth.
Libor + 387bps420,288 105,000 (17,500) - (17,500) (35,000) (35,000) - -
Oasis B (USD) Oct 2021 Libor + 165bps 420,288 105,000 (17,500) - (17,500) (35,000) (35,000) - -
Oasis B (EUR) Oct 2021 Euribor + 158bps 179,098 44,744 (7,457) - (7,457) (14,915) (14,915) - -
Allure Oct 2022 Libor + 165bps 921,935 307,101 (38,388) - (38,388) (76,775) (76,775) (76,775) -
Quantum Oct 2026Libor + 130bps & synth.
Fixed 3.74%791,108 527,405 (32,963) - (32,963) (65,926) (65,926) (65,926) (65,926)
Anthem Apr 2027Libor + 130bps & synth.
Fixed 3.86%742,101 525,655 (30,921) - (30,921) (61,842) (61,842) (61,842) (61,842)
Harmony (EUR) May 2028Euribor + 115bps & synth. Fixed 2.26%
786,583 622,712 (32,774) - (32,774) (65,549) (65,549) (65,549) (65,549)
Harmony (USD) May 2028 Fixed 2.53% 226,100 178,996 (9,421) - (9,421) (18,842) (18,842) (18,842) (18,842)
Ovation Apr 2028Libor + 100bps & synth.
Fixed 3.16%841,833 666,451 (35,076) - (35,076) (70,153) (70,153) (70,153) (70,153)
Symphony Mar 2030 Fixed 3.82% 1,186,737 1,087,843 - (49,447) - (98,895) (98,895) (98,895) (98,895)
Celebrity
Equinox Jul 2021 Libor + 50bps 524,500 109,271 - (21,854) - (43,708) (43,708) - -
Eclipse Apr 2022 Libor + 37bps 566,069 165,103 (23,586) - (23,586) (47,172) (47,172) (23,586) -
Silhouette Aug 2023 Libor + 40bps 632,391 236,984 - (26,332) - (52,663) (52,663) (52,663) (52,663)
Solstice Oct 2020 Libor + 45bps 519,146 86,524 (21,631) - (21,631) (43,262) - - -
Reflection Nov 2024Libor + 40bps & synth.
Fixed 2.85%673,474 336,737 (28,061) - (28,061) (56,123) (56,123) (56,123) (56,123)
Edge Oct 2030 Fixed 3.23% 728,989 728,989 (30,375) - (30,375) (60,749) (60,749) (60,749) (60,749)
Darwin Nov 2024 Euribor + 119.5bps 89,808 60,100 - - - - - - -
Azamara
Pursuit Feb 2023 Libor + 119.5bps 130,000 130,000 - - - - - - (130,000)
Silversea
$620M Bond Feb 2025 Fixed 7.25% 619,767 619,767 - - - - - - -
Explorer Capital Lease Nov 2021 23,076 20,550 (1,247) (1,249) (1,251) (5,025) (11,778) - -
Whisperer Capital Lease Jun 2022 59,704 52,860 (6,976) - (7,111) (14,637) (15,209) (8,927) -
TOTAL DEBT (excludes future ships, capital leases, and accounting adjustments) 10,402,197 (1,447,560) (799,293) (391,654) (1,167,881) (831,324) (1,370,029) (680,740)
Related Documents