2017-2018 Annual School Forest Survey Results Response Rate: Sixty-nine individual schools or districts provided responses to the survey out of 241 individual schools or districts that received the survey. Sixty-nine (69) district responses were received from 67 public school districts, 2 private schools, and 0 higher education institutions. This is a 29% response rate. The survey was sent to 234 public schools, 6 private schools, and 1 higher education institution with registered school forests. Overall, it was distributed to over 390 contacts within the school forest database. Interestingly 62% of the districts that participated in the survey this year also did so last year. That means that 38% of the school districts that responded were different from last year’s participants and 47 of the districts that did complete the survey last year did not fill it out this year. As a result, this survey serves as a “snapshot” of school forest activity in Wisconsin, not as a comprehensive report. Ironically, even as the district participation changes each year, the survey completion rate and responses seem to stay consistent. That consistency is seen in a few of the charts that show comparative data. However, due to the fact that not all school forests submit data and that not all of the same school forests submit data every year, we can observe general trends throughout certain questions that were asked in the survey, but do not assume that these are precise and final numbers. This report is merely a representation of Wisconsin’s School Forest Program over the past year. The schools/districts who responded include: Alma, Antigo, Athens, Baldwin-Woodville, Beecher-Dunbar-Pembine, Black Hawk, Black River Falls, Bonduel, Bowler, Burlington, Butternut, Cambria-Friesland, Cambridge, Cedarburg, Chequamegon, D. C. Everest, De Soto, Elcho, Gilman, Goodman-Armstrong Creek, Granton, Green Lake, Greendale, Hartland Lakeside, Highland, Iola-Scandinavia, Ithaca, Kenosha, La Crosse, Lac du Flambeau, Lake Country, Laona, Lodi, Marathon, Marshfield, Merrill, Mishicot, Montello, Necedah, Newman Catholic Schools, Nicolet High School, Oconto Falls, Osseo-Fairchild, Owen- Withee, Pardeeville, Pittsville, Prentice, Princeton, Reedsburg, Rhinelander, Rib Lake, South Shore, Southern Door County, Stevens Point, Tigerton, Tomahawk, Tomorrow River, Trinity Lutheran School, Unity, Valders, Verona, West Salem, Weston, Whitnall, Wild Rose, and Wisconsin Rapids. Survey Respondents: EE/SF Coordinator = 21 Building & Grounds Coordinator = 1 Community Volunteer = 4 Pupil Services/Guidance Dept. = 2 Curriculum Secretary = 1 Administrator = 14 Principal: 9 Superintendent: 6 Curriculum Director: 0 Director of Special Education: 1 Teacher = 41 GRADE LEVELS TAUGHT: Early Childhood: 1 Elementary: 12 Middle School/Jr High: 19 High School: 31 Post-Secondary: 0 SUBJECTS/CLASSES TAUGHT: All subjects (elem. teachers): 6 Art: 0 Agriculture Education: 11 English: 0 Math: 3 Physical Education: 2 Science: 22 Social Studies: 2 Special Education: 2 Technology Education: 3 Other: 3 (PBL, AP Psychology, field day studies) Survey Respondents within Institution Administrator Env.Ed Coordinator/SF Coordinator Teacher Community Volunteer Buildings and Grounds Coord. Other n=69

Welcome message from author
This document is posted to help you gain knowledge. Please leave a comment to let me know what you think about it! Share it to your friends and learn new things together.
Transcript

2017-2018 Annual School Forest Survey Results
Response Rate: Sixty-nine individual schools or districts provided responses to the survey out of 241 individual schools or districts that received the survey. Sixty-nine (69) district responses were received from 67 public school districts, 2 private schools, and 0 higher education institutions. This is a 29% response rate. The survey was sent to 234 public schools, 6 private schools, and 1 higher education institution with registered school forests. Overall, it was distributed to over 390 contacts within the school forest database. Interestingly 62% of the districts that participated in the survey this year also did so last year. That means that 38% of the school districts that responded were different from last year’s participants and 47 of the districts that did complete the survey last year did not fill it out this year. As a result, this survey serves as a “snapshot” of school forest activity in Wisconsin, not as a comprehensive report. Ironically, even as the district participation changes each year, the survey completion rate and responses seem to stay consistent. That consistency is seen in a few of the charts that show comparative data. However, due to the fact that not all school forests submit data and that not all of the same school forests submit data every year, we can observe general trends throughout certain questions that were asked in the survey, but do not assume that these are precise and final numbers. This report is merely a representation of Wisconsin’s School Forest Program over the past year. The schools/districts who responded include: Alma, Antigo, Athens, Baldwin-Woodville, Beecher-Dunbar-Pembine, Black Hawk, Black River Falls, Bonduel, Bowler, Burlington, Butternut, Cambria-Friesland, Cambridge, Cedarburg, Chequamegon, D. C. Everest, De Soto, Elcho, Gilman, Goodman-Armstrong Creek, Granton, Green Lake, Greendale, Hartland Lakeside, Highland, Iola-Scandinavia, Ithaca, Kenosha, La Crosse, Lac du Flambeau, Lake Country, Laona, Lodi, Marathon, Marshfield, Merrill, Mishicot, Montello, Necedah, Newman Catholic Schools, Nicolet High School, Oconto Falls, Osseo-Fairchild, Owen-Withee, Pardeeville, Pittsville, Prentice, Princeton, Reedsburg, Rhinelander, Rib Lake, South Shore, Southern Door County, Stevens Point, Tigerton, Tomahawk, Tomorrow River, Trinity Lutheran School, Unity, Valders, Verona, West Salem, Weston, Whitnall, Wild Rose, and Wisconsin Rapids.
Survey Respondents: EE/SF Coordinator = 21 Building & Grounds Coordinator = 1 Community Volunteer = 4 Pupil Services/Guidance Dept. = 2 Curriculum Secretary = 1 Administrator = 14
Principal: 9 Superintendent: 6 Curriculum Director: 0 Director of Special Education: 1
Teacher = 41 GRADE LEVELS TAUGHT:
Early Childhood: 1 Elementary: 12 Middle School/Jr High: 19 High School: 31 Post-Secondary: 0
SUBJECTS/CLASSES TAUGHT:
All subjects (elem. teachers): 6 Art: 0 Agriculture Education: 11 English: 0 Math: 3 Physical Education: 2
Science: 22 Social Studies: 2 Special Education: 2 Technology Education: 3 Other: 3 (PBL, AP Psychology, field day studies)
Survey Respondents within Institution
Administrator
Env.Ed Coordinator/SF Coordinator
Teacher
Community Volunteer
Buildings and Grounds Coord.
Other
n=69

School Forest Success: Greatest School Forest Accomplishments Responses indicating the district’s greatest school forest accomplishments in the 2017-2018 school year:
Administrator interest-22%, Community involvement-30%, Facility development/improvement-38%, Completed a grant-13%, Implement new curriculum-27%, Increased use of the school forest-52%, School Forest educational development planning-3%, Forest management plan completed-3%, Staff development opportunities-3%, manage natural resources-11%, register as a school forest-3%, and a few others seen below.
The comparative data shows which school forest accomplishments were identified over the past 9 years. Certain trends have begun to emerge with the challenge of increasing or maintaining the use of the school forest as the top accomplishment recognized by school forest programs across the state. Other top accomplishments include implementing new curriculum or lessons at the forest and improving or developing facilities at the school forest.
22
30
38
13
27
52
3
3
3
11
3
3
3
0 10 20 30 40 50 60
Administrator Interest
Community Involvement
Facility Develop/Improvement
Completed a grant/raised or accepted funding
Implement New Curriculum/lessons
Increase/Maintain Use of School Forest
SF Educational Development Planning
Forest Mgmt Plan completed
Staff Development at the forest
Harvested timber/managed the resource
Registered as a school forest
Planted trees
Increased Communication/Awareness of the forest
Percent
Greatest Accomplishments in the 2017-2018 School Year
n=63
0
10
20
30
40
50
60
70
Per
cen
t o
f R
esp
on
ses
Comparative Data: School Forest Accomplishments
2009 2010-11 2011-12 2012-13 2013-14 2014-15 2015-16 2016-17 2017-18

Goals for the next 1-3 years The main school forest goals cited by the schools for the next three years are to develop or improve the facilities and trails, to maintain or increase the use of the school forest, to develop or implement curriculum at the school forest, and manage the forest’s natural resources. The chart below shows school forest goals listed in each category by the sixty (60) schools that responded.
Indicators of school forest success for 2017-2018 Sixty (60) schools responded. Results are listed as percentages.
n=84
40
30
13
4
19
3
1
3
6
0
3
1
0 5 10 15 20 25 30 35 40 45
Develop/Improve Facilities & Trails
Maintian/Increase SF Use
Develop/Implement Curriculum
Develop SF Education Plan
Manage Natural Resources
Staff Development
Increase Funding/Write grants
Increase Community Use
Harvest Timber
Create/Grow a SF Committee
Create/Hire Ecologist/Coordinator Position
Aquire additional forest property
Number of Responses
School Forest Goals for the next 1-3 years n=60
0 10 20 30 40 50 60 70 80 90 100
The school forest increased students’ connection to community resources.
The school forest increased attendance in school
The school forest increased student learning
The school forest involved students in community action projects
Teachers recognized the school forest as a valuable learning environment
Students indicated the school forest is a place where they enjoy learning
The lessons presented at the school forest increased students’ knowledge of natural resource management issues
The school forest was used by more people in 2017-2018 compared to theprevious school year
Indicators of School Forest Success
Strongly Agree Agree Neutral Disagree Strongly Disagree

School Forest Utilization during the 2017-2018 School Year:
Student Visits The following data has been calculated based off of the number of school districts that responded for each grade level. More comprehensive data is available upon request.
• School Forest Use. Respondents indicated that 69% of the forests had visits from PreK-5th grade students, 73% had visits from 6th-8th grade students, 74% had students in 9th-12th grade that visited, and 8% had post-secondary students.
• Number of Students. A total of 32,533 students visited their school forests during the last school year. In reality, this total number is much higher. Many school forests that have daily field trips to the forest did not respond to the survey. The average number of students from each grade level that visited their school forest can be seen in the chart below. * The number of students per grade level reported is as follows: 1449 Pre-Kindergarten, 2591 Kindergarten, 2980 1st grade, 3123 - 2nd grade, 3005 - 3rd grade, 3144 - 4th grade, 2935 - 5th grade, 2834 - 6th grade, 2390 - 7th grade, 2030 - 8th grade, 2210 - 9th grade, 1216 - 10th grade, 1263 - 11th grade, 1208 - 12th grade, and 155 Post Secondary students.
• Number of Trips. Respondents reported a total of 2,056 field trips to school forests in Wisconsin. The average number of times (trips) each grade level visited the school forest can be seen in the chart below.
6973 74
8
0
10
20
30
40
50
60
70
80
90
100
PreK-5thGrade
6th-8thGrade
9th-12thGrade
PostSecondary
Percent of School Forests that had Student Visits from the following Grades
n=49,48,47,48

Comparative data regarding the total number of students who visited school forests each year is a minimum estimate of the actual number of students who visited. This figure is calculated from the survey results submitted by school forest educators, however it is known that not all schools who had students at the forest completed the survey. Comparative data shows a trend in the decrease in the number of students that visit the forest as they increase in age. There has been a consistent drop in the middle school and even more so in the high school years. Middle and high school class schedules limit the amount of time a teacher is able to spend with each student and many teachers are not able to make it to the forest and back during the bell schedule with their class. Another difference is high school students are visiting the school forest with a specific course and not necessarily as an entire grade-level as is common in the elementary grades.
32533
46081
41766
33329
3681736875
48828
13312
0
10000
20000
30000
40000
50000
60000
2017-182016-172015-162014-152013-142012-132011-122010-11
Nu
mb
er o
f St
ud
ents
Comparative Data: Reported Number of Students that Visited the School Forest Each Year
0
20
40
60
80
100
120
140
160
180
Pre-K Kinder 1st 2nd 3rd 4th 5th 6th 7th 8th 9th 10th 11th 12th
Avg
Nu
mb
er o
f St
ud
ents
Grade Level
Comparative Data: Average Number of Students per Grade Level that visit the School Forest each year
2007 2008 2009 2010-11 2012-13
2013-14 2014-15 2015-16 2016-17 2017-18

What are students learning at the school forest? Evidence of Student Learning as a Result of School Forest Experiences The following examples were recorded by respondents as both formal and informal evidence of student learning that has taken place because of student field trips at the school forest.
Timber Cruising, Species Identification, Survival Skills practice Students learned how to tap trees for maple syrup production. Learned to identify signs of wildlife using the Snapshot
of WI program and trips to the school forest. Students learned to identify trees and plants within the school forest. Students learned how to trim trees.
Forestry students won the 2018 FFA regional and state Forestry Career Development Event. Students learned about habitat/grouse relationships (cause & effect) HS students learned tree identification, understanding of board ft, and use of Biltmore sticks. Students in
environmental science describe leaf and plant structures more accurately. Appreciation of forest resources in general is increased.
Implementation of state-of-the-art maple sap production facility with student input and help. Student-led tours of forest. Student assistance in harvesting and maintenance of forest.
Each of our 7th-10th graders have learning targets and corresponding worksheet/project that receives a summative grade. The programs that we deliver at the school forest augments what is learning in the classroom.
My students can identify various tree species and diseases that they learned about in the classroom. They also can do many forestry measurements as a direct result of having the school forest here.
Ecology classes learned how to use dibble bars and helped the elementary plant over 300 seedlings on Earth Day. Student wellness improved (goal of district) Students have learned a lot about camping and spending time outside. Students have also learned about the removal
of invasive species that is taking place at the school forest. Students love the hands-on learning connecting real life environment to curriculum. Students submitted data collected to worm watch. Students learned and were tested on frog i.d. and calls. Students
were tested on tree i.d., both leaf and winter stem. Students who are taking a forestry virtual class completed activities for their class at the school forest this past
semester. Students are also working on putting up signs to identify species of trees and plants in the school forest. Teachers who took classes to the forest for full day instruction saw increased focus on activities due to lack of
distractions and increased access to the outdoor spaces. Students in science classes demonstrated an ability to improve their application of forestry and biology principals as measured by reflections and formative and summative assessments.
Sustainability through School Forests The school forest was used to help students understand the forest’s economic, social, or environmental importance in the community in 45 (or 74%) of the schools that responded. The following examples are a shortened list that indicate how the school forest was used to help students understand the economic, social, or environmental impact it has in the local community.
Students have participated in a local ski race that takes place mostly on the school forest trails in conjunction with Forest Springs. Students have learned the importance of tourism to the community and help maintain trails and infrastructure for walking, snowmobiling, ATV use, and cross-country skiing.
Students learn the value of proper forest management both economically and environmentally. Students measure standing timber to estimate amounts and board feet. The value of this lumber is then calculated. Students discuss the conflicts between competing groups of society who use the forest resources.
Contribute to citizen science research such as Worm Watch and Snapshot Wisconsin Constructing a single-track mountain bike trail. Approximately 7 miles were built in the last 3 years. Managing the forest for grouse habitat and it’s hunting relationship to economics and culture of our community High school students commented on pursuing careers in forestry. Industry experts presented lessons to 5th graders
and high school students at a logging day demonstration Students worked to trim trees to help with growth of new plants as well as improve health of trees. Students also
tapped trees to learn how maple syrup is made. New emphasis in district on social and emotional learning. The school forest was a site used to showcase the impact
of nature on well-being. Hosted community events such as a moonlight snowshoe activity, Trail of Terror fundraiser, a 'storybook school
forest' event Fall Forest Festival, clean-up day, and tree planting

Products created from school forests… Thirteen (13) of the school forests (or 21%) had students involved in making value added forest products from the school forest that are sold or donated to the community. They indicated those products included firewood, maple syrup, benches, lumber, woodchips, plaques, and bird houses.
Concepts Students Learned about while at the School Forest
Respondents were asked to identify which ecology and non-ecology concepts students were learning about while visiting the forest. The following chart displays the concepts learned by early elementary, middle, high school and post-secondary students at the school forest. The following concepts were grouped in these topic areas: General Ecology (adaptations, biodiversity, living/nonliving, ecosystems, habitat, energy transfer, food webs/chains, succession, etc), Forestry (trees, management, tree ID, measurement, forest history, chainsaw safety, etc), Soils (also rocks and minerals), Water Ecology (ponds, lakes, streams, etc), Wildlife (animals, species ID, management, etc), Outdoor Recreation (hike, snowshoe, ski, bike, etc), Orienteering/Mapping (compass, GPS, etc), Team Building (includes ropes/challenge course). Other concepts taught at the forest included hunter education, service learning, and world languages.
0 10 20 30 40 50 60 70 80 90 100
General Ecology
Forestry
Soils
Water Ecology
Wildlife
Invasive Species
Careers
Outdoor Recreation
Orienteering/Mapping
Citizen Science /Env. Research
Nature Literature
Nature Writing
Nature Art
Nature Observation
Team Building
Leadership Skills
Restoration Projects
Astronomy
Archaeology/Fossils
Environmental Educ. Methods
Maple Syrup Production
Measurement/Graphing
Phenology/Seasonal Changes
Geology
Weather
Other
Percent
Co
nce
pt
Concepts Students Learned while at the School Forest
PreK-5th Grade 6-8th Grade 9-12th Grade Post Secondaryn=35,38,38,5
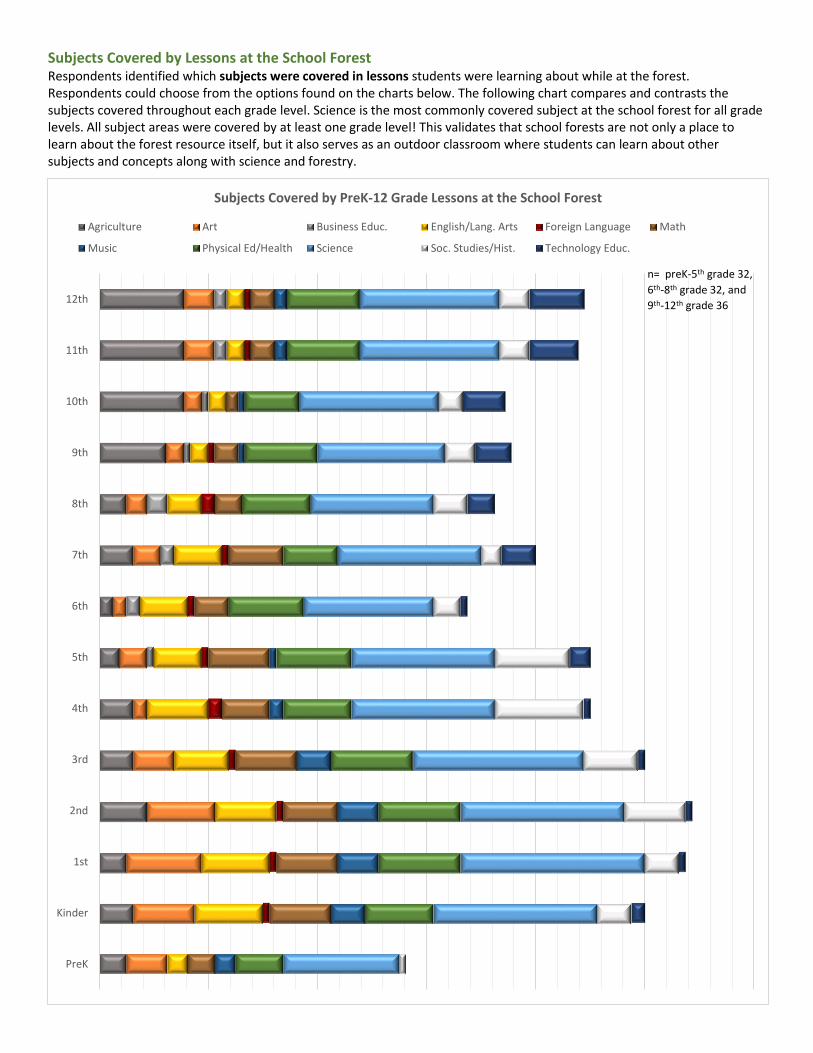
Subjects Covered by Lessons at the School Forest Respondents identified which subjects were covered in lessons students were learning about while at the forest. Respondents could choose from the options found on the charts below. The following chart compares and contrasts the subjects covered throughout each grade level. Science is the most commonly covered subject at the school forest for all grade levels. All subject areas were covered by at least one grade level! This validates that school forests are not only a place to learn about the forest resource itself, but it also serves as an outdoor classroom where students can learn about other subjects and concepts along with science and forestry.
PreK
Kinder
1st
2nd
3rd
4th
5th
6th
7th
8th
9th
10th
11th
12th
Subjects Covered by PreK-12 Grade Lessons at the School Forest
Agriculture Art Business Educ. English/Lang. Arts Foreign Language Math
Music Physical Ed/Health Science Soc. Studies/Hist. Technology Educ.
n= preK-5th grade 32,
6th-8th grade 32, and
9th-12th grade 36

Community Use of the School Forest
• Community members used 47 (or 77%) of the school forests in the school districts that responded.
• Collectively, 10,877 community members utilized the 47 school forests that responded to an inquiry asking how many community members used their school forest.
• The number of community members that used the school forests ranged from 1 to 2,500 people.
• Utilization of the school forest was highest from the general public, including recreationalists but not hunters. The districts indicated boy scouts, girl scouts, church youth groups, hunters, school clubs, local organizations, parent volunteers, government agencies, and school athletic teams also used the school forest.
• Community members or local community organizations were involved in helping manage the forest’s natural resources on 31 school forests, or 54% of the school forests that responded.
• Community events were hosted or provided by 28 (or 46%) of the school forests that responded. The type of community event is seen in the chart below. Other various special topic events listed: maple sugaring days, moon walk, a wedding, toddler hikes, Men’s Club dinner, listening session, book walk, yoga retreat, and training for sheriff canine dogs.
0
20
40
60
80
100
Comparative Data: Percent of School Forests Used by the Community
40
28
21
74
13
34
28
62
38
55
11
0 20 40 60 80 100
Boy Scouts
Girl Scouts
Church Youth Groups
General Public
Hunters
School Clubs
School Athletic Teams
Parent Volunteers
Government Agencies
Community Organizations
Other
Percent
Community Members who use School Forests n=47
26
43
21
4
19
19
11
40
32
4
2
27
0 10 20 30 40 50 60 70 80 90 100
Fun run/cross country/track sporting events
Snowshoeing or skiing
Bird identification
Invasive plant workshop
Forest festival
Earth Day event
Parent’s night
Arbor Day tree planting event
Trail/Site maintenance
Haunted Forest
(Boy/Girl)Scouting Events
Other various events
Percent
Community Events at School Forestsn=47

School Forest Management • Sustainable forest management activities, lessons, events, or
programs have occurred on 49 school forests or 80% of the districts that responded.
• Sixty-one people responded to the type of sustainable forest management that occurred on their school forest. Invasive species control and trail additions or improvements were the most common management activities sited. Other management included forest restoration, timber harvest, tree planting, a timber cruise, prairie restoration, and wildlife habitat projects.
• 73% of the respondents indicated the next management activity would take place within the next year, 11% indicated 1-5 years, and 0% indicated more than 5 years. 16% of the respondents indicated a management activity, but did not list a date for it to be completed.
Comparative data shows that the most common management activities implemented at school forests are invasive species control and trail additions or improvements. Harvesting timber or preparing for a future harvest is a critical part of sustainable management at school forests and occur at approximately 20% of the responding forests each year.
51
20
26
11
52
36
33
20
0 10 20 30 40 50 60 70 80 90 100
Invasive Species Control
Timber Cruise
Forest Restoration
Timber Harvest
Trail Addition/Improvement
Tree Planting
Wildlife Projects
Prairie Restoration
Percent
Forest Management Activities in the 2017-2018 School Yearn=61
0
20
40
60
80
100
Comparative Data: Percent of School Forests that Implemented Sustainable
Management Activities
0
10
20
30
40
50
60
70
80
90
100
Invasive Species Control Prairie Restoration Timber Harvest TrailAddition/Improvement
Tree Planting Wildlife Habitat Projects Preparing Site forHarvest
Per
cen
t
Comparative Data: Sustainable Management Activities on School Forests each year
2007 2008 2009 2010-11 2011-12 2012-13 2013-14 2014-15 2015-16 2016-17 2017-18
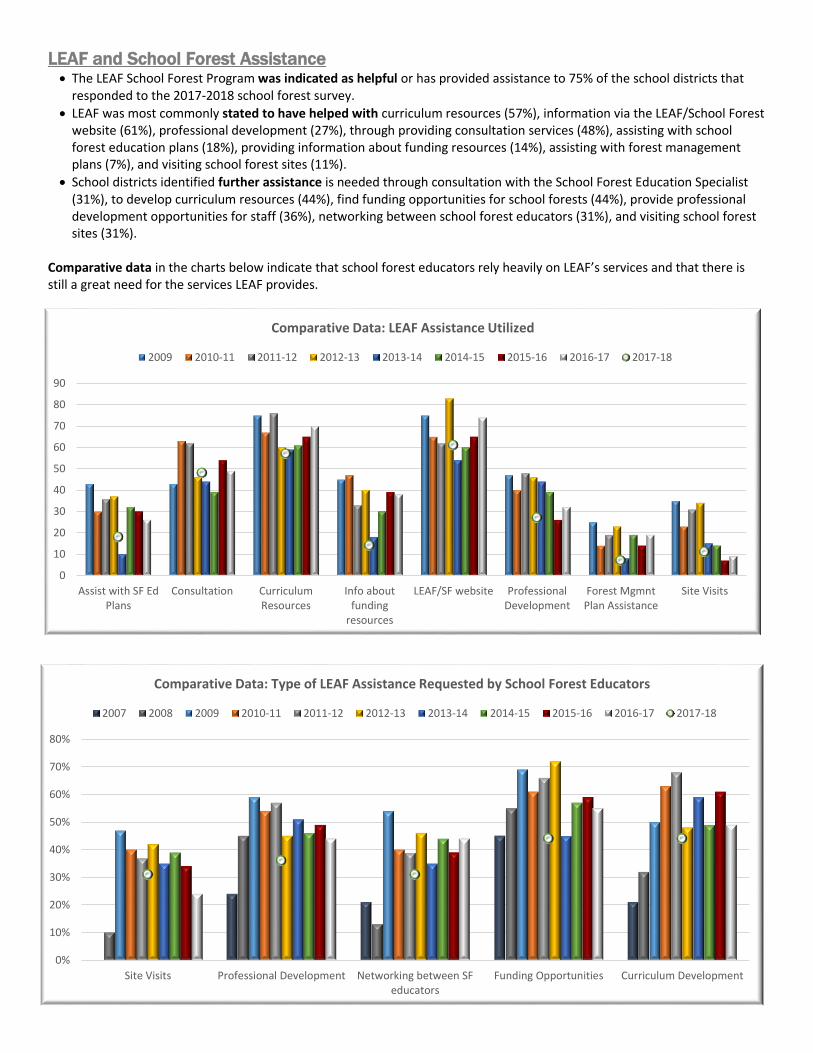
LEAF and School Forest Assistance • The LEAF School Forest Program was indicated as helpful or has provided assistance to 75% of the school districts that
responded to the 2017-2018 school forest survey.
• LEAF was most commonly stated to have helped with curriculum resources (57%), information via the LEAF/School Forest website (61%), professional development (27%), through providing consultation services (48%), assisting with school forest education plans (18%), providing information about funding resources (14%), assisting with forest management plans (7%), and visiting school forest sites (11%).
• School districts identified further assistance is needed through consultation with the School Forest Education Specialist (31%), to develop curriculum resources (44%), find funding opportunities for school forests (44%), provide professional development opportunities for staff (36%), networking between school forest educators (31%), and visiting school forest sites (31%).
Comparative data in the charts below indicate that school forest educators rely heavily on LEAF’s services and that there is still a great need for the services LEAF provides.
0%
10%
20%
30%
40%
50%
60%
70%
80%
Site Visits Professional Development Networking between SFeducators
Funding Opportunities Curriculum Development
Comparative Data: Type of LEAF Assistance Requested by School Forest Educators
2007 2008 2009 2010-11 2011-12 2012-13 2013-14 2014-15 2015-16 2016-17 2017-18
0
10
20
30
40
50
60
70
80
90
Assist with SF EdPlans
Consultation CurriculumResources
Info aboutfunding
resources
LEAF/SF website ProfessionalDevelopment
Forest MgmntPlan Assistance
Site Visits
Comparative Data: LEAF Assistance Utilized
2009 2010-11 2011-12 2012-13 2013-14 2014-15 2015-16 2016-17 2017-18

School Forest Personnel: School Forest Committees:
• Found in 52% of the responding districts while 48% of the respondents did not have a committee
Does the district have an official School Forest Coordinator or person in charge of school forest programming?
• 48% do have a school forest coordinator while 52% do not • Position is a full-time paid position in 6% of the school forests that responded,
part-time positions in 20%, and volunteer position in 30% of the school forests.
School Forest Budgets 2017-2018 School Forest Expenditures The following school forest expenditures were reported on the survey:
• School districts spent a total of $46,155 on education materials for their school forest programs. This calculates to an average of $1,282 per school district who responded. School districts indicated a range of $0 to $20,000 was spent on education materials for the school forest. 39% of the school districts reported that no money ($0) is spent on school forest education materials.
• School districts spent a total of $409,817 on education personnel for their school forest programs. This calculates to an average of $11,709 per school district who responded. School districts indicated a range of $0 to $150,000 was spent on education personnel for the school forest. 51% of the school districts reported that no money ($0) is spent on school forest education personnel.
• School districts spent a total of $121,900 on facility construction for their school forest programs. This calculates to an average of $4,203 per school district who responded. School districts indicated a range of $0 to $40,000 was spent on facility construction at the school forest. 79% of the school districts reported that no money ($0) is spent on school forest facility construction.
• School districts spent a total of $75,020 on maintenance for their school forest programs. This calculates to an average of $2,143 per school district who responded. School districts indicated a range of $0 to $40,000 was spent on maintenance at the school forest. 34% of the school districts reported that no money ($0) is spent on school forest maintenance.
• School districts spent a total of $84,445 on transportation for their school forest programs. This calculates to an average of $2,559 per school district who responded. School districts indicated a range of $0 to $25,000 was spent on transportation to and from the school forest. 48% of the school districts reported that no money ($0) is spent on school forest transportation.
No48
Yes
52
School Forests with an Advisory Committee in 2017-2018
$-
$100,000
$200,000
$300,000
$400,000
$500,000
$600,000
Education Materials Education Personnel Facility Construction Maintenance Tranportation
Comparative Data: School Forest Expenses Reported Each Year
2007 2008 2009 2010-11 2011-12 2012-13 2013-14 2014-15 2015-16 2016-17 2017-18
n=43

2017-2018 School Forest Income Twenty-three percent (23%) of the school districts in the survey reported their school forest had generated income in the 2017-2018 school year. A combined total of $97,665 was generated from school forest land or programming. Income from the school forest was generated from the following categories: timber sales occurred at 45% of those forests and generated a minimum of $36,300; eighteen percent (18%) of the school districts generated money for their school forests through fundraisers and raised a total of $29,770, thirty six percent (36%) of the districts generated $26,275 through donations, zero (0%) of the districts raised money through facility rental, and 27% of the these districts reported gaining $5,320 through grants.
Yes23%
No77%
School Forests that Generated Income in
2017-2018n=47
3
$36,300
$26,275
$5,320
$29,770
$0 $0
$5,000
$10,000
$15,000
$20,000
$25,000
$30,000
$35,000
$40,000
Timber Harvest Donations Grants Fundraiser Facility Rental
Income Reported by School Forests during the 2017-2018 School Year
$0
$100,000
$200,000
$300,000
$400,000
$500,000
$600,000
$700,000
$800,000
$900,000
$1,000,000
Amount
Comparative Data: Total Timber Sale Revenue
Reported
2007 2008 2009
2010-11 2011-12 2012-13
2013-14 2014-15 2015-16
2016-17 2017-18
$0
$20,000
$40,000
$60,000
$80,000
$100,000
$120,000
$140,000
$160,000
$180,000
Comparative Data: Timber Harvest Revenue Reported
n=11

Desired Annual School Forest Budgets The following information is what school districts indicated would be their desired annual budget for school forest programming:
• School districts would like a range of $0 to $50,000 to spend on education materials for their school forest programs. The grand total desired for school forest education materials from all of the districts that responded is $119,159. This calculates to an average of $3,310 per school district that responded.
• School districts would like a range of $0 to $200,000 to spend on education personnel for their school forest programs. The grand total desired for school forest education personnel from all of the districts that responded is $830,700. This calculates to an average of $25,959 per school district that responded.
• School districts would like a range of $0 to $500,000 to spend on facility construction for their school forest programs. The grand total desired for school forest facility construction from all of the districts that responded is $970,300. This calculates to an average of $28,538 per school district that responded.
• School districts would like a range of $0 to $75,000 to spend on maintenance for their school forest programs. The grand total desired for school forest maintenance from all of the districts that responded is $187,350. This calculates to an average of $5,677 per school district that responded.
• School districts would like a range of $0 to $25,000 to spend on transportation to and from their school forest programs. The grand total desired for school forest transportation from all of the districts that responded is $100,950. This calculates to an average of $3,155 per school district that responded.
$3,310
$25,959
$28,538
$5,677
$3,155
$1,282
$11,709
$4,203
$2,143 $2,559
$-
$5,000
$10,000
$15,000
$20,000
$25,000
$30,000
Education Materials Education Personnel Facility Construction Maintenance Transportation
School Forest Budget: 2017-2018 Average Spent vs Desired Budget
Average Desired Average Spent n=43, 40

Portable Sawmill and Kiln Inquiry The following set of questions were included on this year’s survey for the first time to attempt to gather information and inform stakeholders regarding the availability and use of portable sawmills and kilns at school forests and their inclusion in school forest programming. This information will not be gathered on a yearly basis.
Portable Sawmills at School Forests School forest educators were asked about the availability of portable sawmill use and ownership by districts with school forests. School forest educators responded that none of their districts owned portable sawmills. Respondents indicated that they have community members or guests bring a portable sawmill for the district to borrow at 10% of the forests. Interestingly, 24% of the respondents indicated they would be interested in owning a portable sawmill for use at the school forest.
Kilns at School Forests
School forest educators were also asked about whether their school or school forest had a kiln for drying lumber harvested from the forest. There were 2 (3%) school forest educators that responded that their school owns a kiln. A majority (76%) of the schools/forests do not own a kiln. However, 23% of the schools/forests who don’t own a kiln would be interested in building one.
Report Prepared by: Gretchen Marshall - Forestry & Outdoor Education Specialist - LEAF Program: 2018
Related Documents