2016 WISCONSIN BIG GAME HARVEST SUMMARY DEER | BEAR | TURKEY WISCONSIN DEPARTMENT OF NATURAL RESOURCES MAY 2017 Young turkey hunters and mentors celebrate a successful Learn to Hunt at Governor Dodge State Park. Learn to Hunt events, available for deer, bear, turkey and other species, are a great way for beginning hunters of all ages to put their knowledge to the test in the field and learn from an experienced mentor. Photo by Jerry Davis. PUB-WM-284-2017

Welcome message from author
This document is posted to help you gain knowledge. Please leave a comment to let me know what you think about it! Share it to your friends and learn new things together.
Transcript

2016
WISCONSIN BIG GAME
HARVEST SUMMARY
DEER | BEAR | TURKEY
WISCONSIN DEPARTMENT OF
NATURAL RESOURCES
MAY 2017
Young turkey hunters and mentors celebrate a successful Learn to Hunt at Governor Dodge State Park. Learn to Hunt events, available for deer, bear, turkey and other species, are a great way for beginning hunters of all ages to put their knowledge to the test in the field and learn from an experienced mentor. Photo by Jerry Davis.
PUB-WM-284-2017

Dear Wisconsin Big Game Enthusiast:
Wisconsin hunters experienced another excellent year afield in the pursuit of big game. In 2016, hunters participated in the launch of
the new licensing system, Go Wild. Overall, hunters appreciated the convenience of being able to print tags from home and utilize
alternative forms of proof of licensing. Thank you to all of the hunters that have provided feedback on the new licensing system.
Gun deer hunters enjoyed an October youth hunt, the traditional November 9-day gun season, December muzzleloader, a statewide
December antlerless-only hunt, and a Holiday Hunt in select counties. The archery season ran from Sept. 17, 2016 – Jan. 8, 2017. The
crossbow season ran concurrently with the archery season. The overall deer harvest was up slightly in 2016 compared to 2015, with
316,774 deer registered by archery (48,272), crossbow (39,776) and gun (228,726) hunters. The 2016 combined archery/crossbow
buck kill (51,734) was similar to the record-setting 2015 levels (51,891). The youth deer hunt continues to increasingly provide
positive experiences and expose new hunters to the outdoor world.
The 2016 Wisconsin bear harvest increased 11.5% compared to 2015 harvest levels, with 4,682 bears harvested by 11,520 hunters
who successfully drew a kill tag. The 2016 bear harvest approached the established harvest goal of 4,750 bears, with the harvest being
slightly lower than anticipated in Bear Management Zone C. A record 109,221 people applied for either a preference point or kill tag
for the 2016 bear season. Although the state black bear population continues to spread southward with bear harvested as far south as
Vernon and Dodge Counties, the highest bear kill occurred in the Northern Region (3,643). More bears were harvested over bait alone
(3,464) than were shot over dogs and bait (1,060). A total of 12,850 permits will be available for the 2017 season, with a harvest goal
of 5,000 bears.
Turkey hunters registered a total of 45,501 turkeys during the 2016 spring hunting season, an 11% increase from the 2015 spring
season and the highest spring turkey harvest since 2010. The statewide success rate for the spring turkey season was 21.4%, up
slightly from 19.7% in 2015. Turkey hunters registered a total of 4,992 birds during the 2016 fall season, with a success rate of 7.4%.
Turkey production in 2016 was down an estimated 27% due to significant rainfall during the brood-rearing period, which could have
impacted fall harvest and success rates.
Thank you for your interest in Wisconsin’s big game species. Enjoy your time in the field, and have a safe and enjoyable hunting
experience in 2017.
Mark Witecha, DNR Upland Wildlife Ecologist
2017 Deer Hunting Season Dates
Bow & Crossbow: Sept. 16 – Jan. 7, 2018
Bow & Crossbow (metro): Sept. 16 – Jan. 31, 2018
Youth Deer Hunt: Oct. 7 & 8
Disabled Hunt: Oct. 7 – 15
9-day Gun Hunt: Nov. 18 – 26
Gun Hunt (metro): Nov. 18 – Dec. 6
Muzzleloader: Nov. 27 – Dec. 6
December antlerless-only: Dec. 7 – 10
December Holiday Hunt: Dec. 24 – Jan. 1, 2018
2017 Bear Hunting Season Dates
Zone C:
With aid of bait and other legal Sept. 6 – Oct. 10
methods not utilizing dogs
Zones A, B and D:
With aid of dogs only Sept. 6 – 12
With aid of dogs, bait or other Sept. 13 – Oct. 3
legal methods
With aid of bait and other legal Oct. 4 - 10
methods not utilizing dogs
2017 Turkey Hunting Season Dates
Youth Turkey Hunt: April 15 & 16 Fall Season: Zones 1 – 5 = Sept. 16 – Dec. 31
Spring Season: A = April 19 – 25 Zone 6 & 7 = Sept. 16 – Nov. 17
B = April 26 – May 2
C = May 3 – 9
D = May 10 – 16
E = May 17 – 23
F = May 24 - 30
The 2016 Big Game Harvest Summary
Volume 27 – Issue 1 Deer, Bear and Turkey Compiled by Brian Dhuey
Wisconsin Department of Natural Resources, Bureau of Wildlife Management 2801 Progress Ave., Madison, WI 53716

Table of Contents Gun Deer Harvest Report Narrative ................................................................................................................................................... 2 Hunting Permit Distribution ...................................................................................................................... 8 Antlerless Quota .................................................................................................................................... 12 Opening Day Pressure ........................................................................................................................... 14
Gun Deer Statistics Deer Management Zone ........................................................................................................................ 16 Deer Management Unit 9-Day Season ........................................................................................................................... 20 Muzzleloader Season................................................................................................................ 21 Youth/December Antlerless/Holiday Hunt................................................................................. 22 Total Gun Deer Harvest ............................................................................................................ 23
Hot-Spot Damage Deer Management Zone ........................................................................................................................ 24
Deer Management Unit .......................................................................................................................... 25
Chippewa Harvest Summary .................................................................................................................................. 26 Deer Management Unit .......................................................................................................................... 27
Bow Statistics Deer Management Zone ........................................................................................................................ 28 Deer Management Unit .......................................................................................................................... 30
Crossbow Statistics Deer Management Zone ........................................................................................................................ 31 Deer Management Unit .......................................................................................................................... 33 Wisconsin Deer Harvest Summary 1966-2016 ................................................................................................... 34 Hunting Accident Summary................................................................................................................................. 38
Deer Ages and Condition .......................................................................................................................................... 41
Black Bear Harvest Report Narrative .............................................................................................................................................................. 45 Harvest Permit Distribution ................................................................................................................................. 47 Harvest by: Bear Zone .............................................................................................................................................. 48 County .................................................................................................................................................... 49 Game Management Unit ........................................................................................................................ 50 Historical Harvest ................................................................................................................................... 53 Tribal ...................................................................................................................................................... 54
Wolf Harvest Report NO WOLF SEASON IN 2016
Spring Turkey Harvest Report Narrative .............................................................................................................................................................. 56 Hunting Permit Distribution ................................................................................................................................. 59 Harvest by Zone .................................................................................................................................................. 60 Historical Harvest ................................................................................................................................................ 62
Fall Turkey Harvest Report Narrative .............................................................................................................................................................. 64 Hunting Permit Distribution and Harvest ............................................................................................................. 66 Historical Harvest ................................................................................................................................................ 67

The 2016 Wisconsin Deer Hunting Summary By Brian Dhuey and Kevin Wallenfang
2016 Season Highlights
Bow Totals
Deer Management Zone Antlered Antlerless Unknown Total
Central Farmland 15,254 13,393 0 28,647 Central Forest 1,325 461 0 1,786 Northern Forest 4,509 1,300 0 5,809 Southern Farmland 7,083 4,946 0 12,029 Unknown 1 0 0 1 Total 28,172 20,100 0 48,272
Crossbow Totals
Deer Management Zone Antlered Antlerless Unknown Total
Central Farmland 12,426 11,224 0 23,650 Central Forest 1,277 504 0 1,781 Northern Forest 5,823 1,697 0 7,520 Southern Farmland 4,033 2,788 0 6,821 Unknown 3 1 0 4 Total 23,562 16,214 0 39,776
Gun Totals
Deer Management Zone Antlered Antlerless Unknown Totala
Central Farmland 52,977 77,816 0 130,793 Central Forest 5,350 3,539 0 8,889 Northern Forest 24,997 11,104 0 36,101 Southern Farmland 21,862 31,033 0 52,895 Unknown 0 18 30 48 Total 105,186 123,510 30 228,726 a Includes damage deer
Tribal Totals
Antlered Antlerless Unknown Total
582 886 1 1,469
2
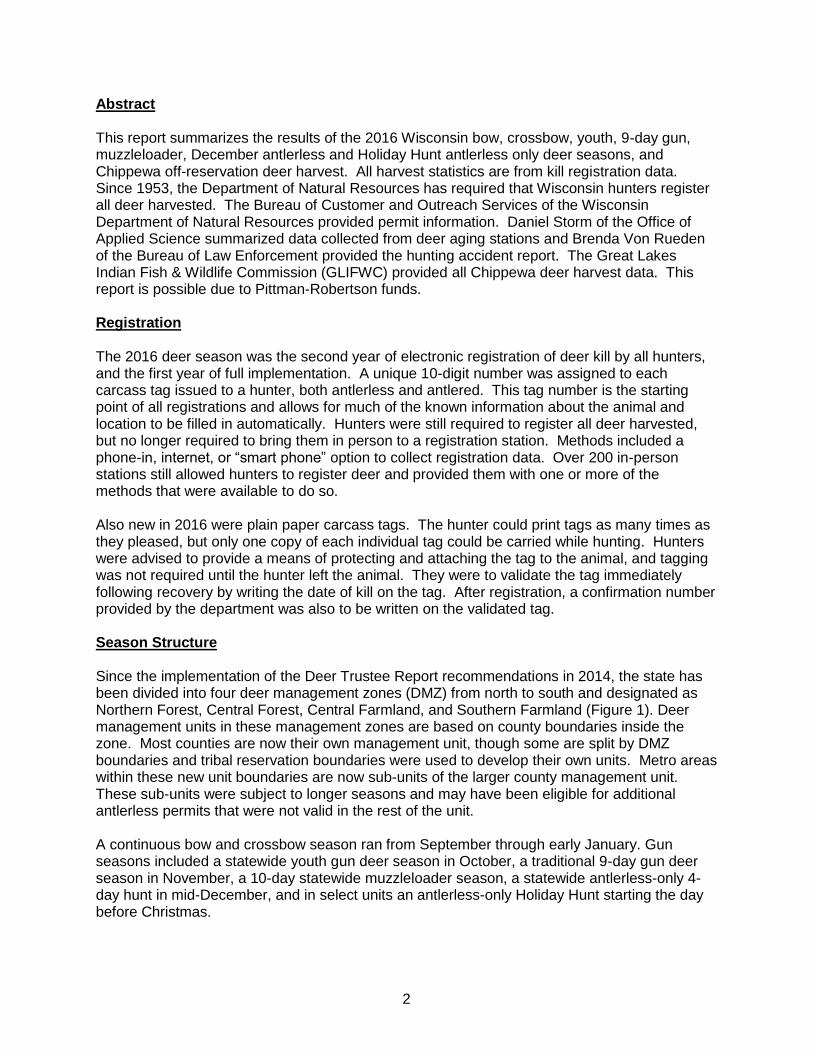
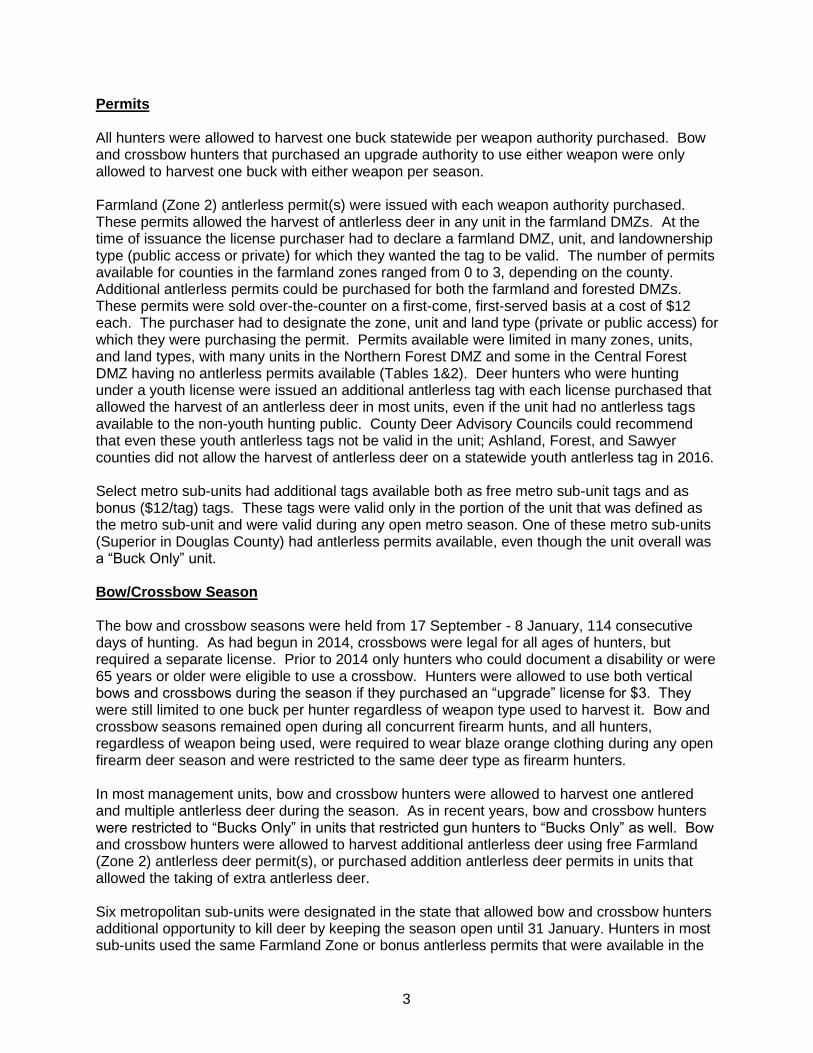
Abstract This report summarizes the results of the 2016 Wisconsin bow, crossbow, youth, 9-day gun, muzzleloader, December antlerless and Holiday Hunt antlerless only deer seasons, and Chippewa off-reservation deer harvest. All harvest statistics are from kill registration data. Since 1953, the Department of Natural Resources has required that Wisconsin hunters register all deer harvested. The Bureau of Customer and Outreach Services of the Wisconsin Department of Natural Resources provided permit information. Daniel Storm of the Office of Applied Science summarized data collected from deer aging stations and Brenda Von Rueden of the Bureau of Law Enforcement provided the hunting accident report. The Great Lakes Indian Fish & Wildlife Commission (GLIFWC) provided all Chippewa deer harvest data. This report is possible due to Pittman-Robertson funds. Registration The 2016 deer season was the second year of electronic registration of deer kill by all hunters, and the first year of full implementation. A unique 10-digit number was assigned to each carcass tag issued to a hunter, both antlerless and antlered. This tag number is the starting point of all registrations and allows for much of the known information about the animal and location to be filled in automatically. Hunters were still required to register all deer harvested, but no longer required to bring them in person to a registration station. Methods included a phone-in, internet, or “smart phone” option to collect registration data. Over 200 in-person stations still allowed hunters to register deer and provided them with one or more of the methods that were available to do so. Also new in 2016 were plain paper carcass tags. The hunter could print tags as many times as they pleased, but only one copy of each individual tag could be carried while hunting. Hunters were advised to provide a means of protecting and attaching the tag to the animal, and tagging was not required until the hunter left the animal. They were to validate the tag immediately following recovery by writing the date of kill on the tag. After registration, a confirmation number provided by the department was also to be written on the validated tag. Season Structure Since the implementation of the Deer Trustee Report recommendations in 2014, the state has been divided into four deer management zones (DMZ) from north to south and designated as Northern Forest, Central Forest, Central Farmland, and Southern Farmland (Figure 1). Deer management units in these management zones are based on county boundaries inside the zone. Most counties are now their own management unit, though some are split by DMZ boundaries and tribal reservation boundaries were used to develop their own units. Metro areas within these new unit boundaries are now sub-units of the larger county management unit. These sub-units were subject to longer seasons and may have been eligible for additional antlerless permits that were not valid in the rest of the unit. A continuous bow and crossbow season ran from September through early January. Gun seasons included a statewide youth gun deer season in October, a traditional 9-day gun deer season in November, a 10-day statewide muzzleloader season, a statewide antlerless-only 4-day hunt in mid-December, and in select units an antlerless-only Holiday Hunt starting the day before Christmas.
3
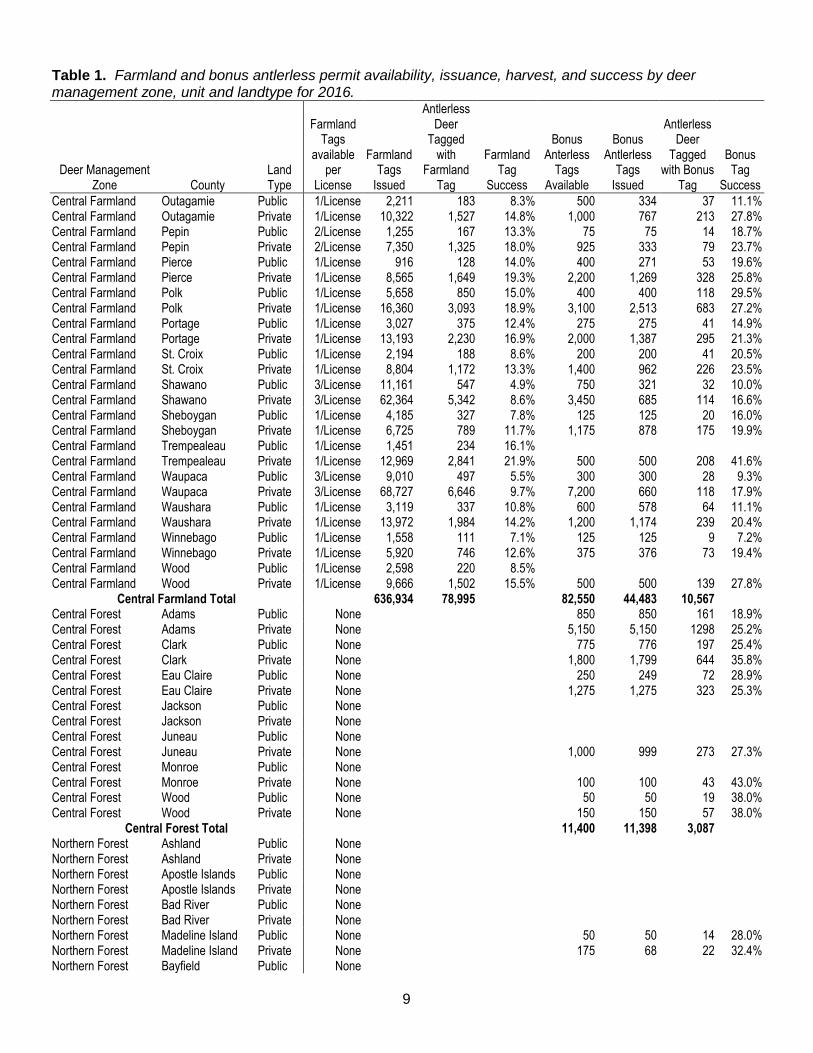
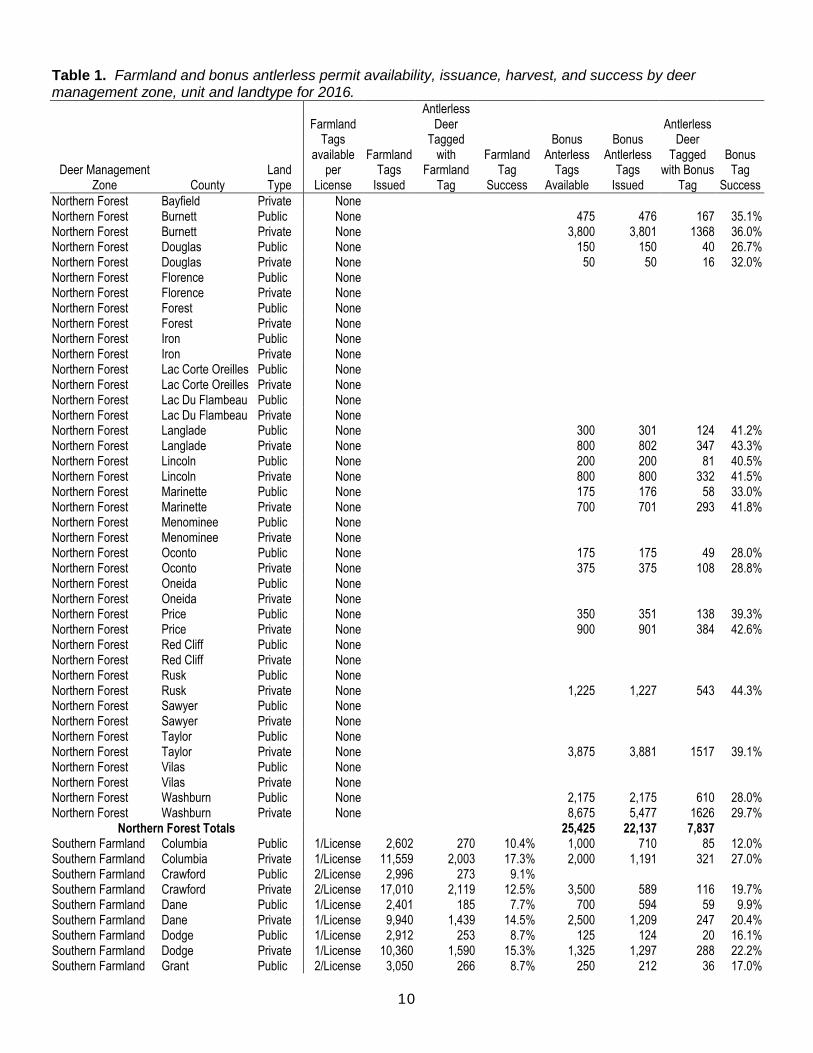
Permits All hunters were allowed to harvest one buck statewide per weapon authority purchased. Bow and crossbow hunters that purchased an upgrade authority to use either weapon were only allowed to harvest one buck with either weapon per season. Farmland (Zone 2) antlerless permit(s) were issued with each weapon authority purchased. These permits allowed the harvest of antlerless deer in any unit in the farmland DMZs. At the time of issuance the license purchaser had to declare a farmland DMZ, unit, and landownership type (public access or private) for which they wanted the tag to be valid. The number of permits available for counties in the farmland zones ranged from 0 to 3, depending on the county. Additional antlerless permits could be purchased for both the farmland and forested DMZs. These permits were sold over-the-counter on a first-come, first-served basis at a cost of $12 each. The purchaser had to designate the zone, unit and land type (private or public access) for which they were purchasing the permit. Permits available were limited in many zones, units, and land types, with many units in the Northern Forest DMZ and some in the Central Forest DMZ having no antlerless permits available (Tables 1&2). Deer hunters who were hunting under a youth license were issued an additional antlerless tag with each license purchased that allowed the harvest of an antlerless deer in most units, even if the unit had no antlerless tags available to the non-youth hunting public. County Deer Advisory Councils could recommend that even these youth antlerless tags not be valid in the unit; Ashland, Forest, and Sawyer counties did not allow the harvest of antlerless deer on a statewide youth antlerless tag in 2016. Select metro sub-units had additional tags available both as free metro sub-unit tags and as bonus ($12/tag) tags. These tags were valid only in the portion of the unit that was defined as the metro sub-unit and were valid during any open metro season. One of these metro sub-units (Superior in Douglas County) had antlerless permits available, even though the unit overall was a “Buck Only” unit. Bow/Crossbow Season The bow and crossbow seasons were held from 17 September - 8 January, 114 consecutive days of hunting. As had begun in 2014, crossbows were legal for all ages of hunters, but required a separate license. Prior to 2014 only hunters who could document a disability or were 65 years or older were eligible to use a crossbow. Hunters were allowed to use both vertical bows and crossbows during the season if they purchased an “upgrade” license for $3. They were still limited to one buck per hunter regardless of weapon type used to harvest it. Bow and crossbow seasons remained open during all concurrent firearm hunts, and all hunters, regardless of weapon being used, were required to wear blaze orange clothing during any open firearm deer season and were restricted to the same deer type as firearm hunters. In most management units, bow and crossbow hunters were allowed to harvest one antlered and multiple antlerless deer during the season. As in recent years, bow and crossbow hunters were restricted to “Bucks Only” in units that restricted gun hunters to “Bucks Only” as well. Bow and crossbow hunters were allowed to harvest additional antlerless deer using free Farmland (Zone 2) antlerless deer permit(s), or purchased addition antlerless deer permits in units that allowed the taking of extra antlerless deer. Six metropolitan sub-units were designated in the state that allowed bow and crossbow hunters additional opportunity to kill deer by keeping the season open until 31 January. Hunters in most sub-units used the same Farmland Zone or bonus antlerless permits that were available in the

4
larger deer management unit. Like gun hunters, bow and crossbow hunters could purchase additional antlerless permits throughout the season or until all were sold. Wisconsin bowhunters killed 48,272 deer in 2016. Crossbow hunters killed 39,776 deer. The combined harvest was 88,048; this is up from the combined harvest of 87,098 killed in 2015. Above normal amounts of precipitation and temperatures greeted hunters during the first month of the season. October and November brought more above average temperatures but drier than normal precipitation. December returned to normal for temperatures and precipitation. Weather events during the rut were fairly limited, but temperatures during late October and first week of November were above average, and may have affected rutting activity leading to reduced deer movement. Bow and crossbow hunter pressure is at its highest during the rut and many successful hunts occurred during this period. Overall, weather conditions for hunting were quite good throughout most of the season for bow and crossbow hunters and should have not adversely affected success. A summary of the bow and crossbow deer harvest by deer management unit is contained in Figures 6-9 and Tables 13-16. Firearm Seasons October A statewide youth deer hunt was held on the 8-9th of October. All persons from 10-15 years of age were eligible to hunt. Mentored hunting was introduced to the state in 2009; this allowed anyone age 10 or older to hunt without a Hunter’s Education certification as long as they hunted with an 18-year-old or older mentor. All youth who were mentored or possessed a Hunter’s Education certification card and a gun deer license were eligible to hunt. The bag limit was one buck and additional antlerless deer with the appropriate carcass tag(s). All youth deer license holders were issued a free antlerless permit, which were valid in most units, even in “Buck Only” units. Three units restricted the use of youth antlerless tags, Ashland, Forest, and Sawyer, and youth were only allowed to harvest an antlered deer. A total of 8,826 deer were killed by youth during these two days (Table 7 and Figure 4). A special gun hunt for disabled hunters was held on sponsor landowners’ properties; a deer of either sex was legal from 1-9 October.
November Wisconsin held the 2016 regular 9-day firearm deer season during 19-27 November. Rifles were allowed in most of the state, but local governments could restrict their discharge in their jurisdictions. Firearm license holders were issued one antlered deer tag valid statewide and 0-3 antlerless deer tag(s) that was restricted for use in the Farmland DMZ deer unit and land type of their choice (public and private). Many units in all DMZs offered additional antlerless tags that were specific to land type and were sold for $12 on a first-come, first-served basis. Gun hunters in all of the state were greeted with normal temperatures and very high winds—gusts in excess of 40mph—for all of opening day. Only the northern tier of counties had snow on the ground for opening day, as much of the rest of the state was snowless, with only a few pockets of snowcover in other locations. High winds made for difficult conditions for hunters to hear and see deer. Many hunters reported not hunting from elevated stands for fear of falling or falling trees. Sunday morning’s weather saw normal temperatures and much reduced wind gusts which made for more huntable conditions. Temperatures stayed about average during much of the remaining part of the week with snow arriving in the northern third of the state during mid-week. Generally, temperatures were average to above average with no major precipitation events occurring during the 9-day hunting season. The statewide corn harvest was much above average in most of the state with all parts of the state having little standing corn during the season. Frozen ground with snow cover for much of the gun season in the north,

5
and may have helped hunters in accessing remote hunting areas and wetlands. Sales of gun deer licenses in 2016 were down from the previous year. Overall hunting conditions ranked a qualitative 6 on a scale of 1 to 10. This is in comparison to a 7 in 2015. Starting in 2009, deer hunters were asked at the time of registration to rate the weather conditions, deer seen, and hours hunted on the day they killed their deer. Hunters rated the weather on a scale of 1 to 10 with 1 being the worst. Mean weather ranking for the opening day of the 9-day gun season was 4.4, lower than last year’s 4.7, only slightly higher than the worst ranking of 4.2 of 2013. Prior years have varied from 4 to 7 with 6.5 in 2014, 4.2 in 2013, 7.1 in 2012, 6.0 in 2011, 6.6 in 2010, and 6.1 in 2009; all years were different at the p < 0.05 level. The weather ranking for the rest of the season was 7.1, higher than the 5.1 in 2015, the 6.0 in 2014, 6.2 in 2013, 6.7 in 2012, 6.6 in 2011, 5.6 in 2010 and 6.2 in 2009; all years were different at the p ≤ 0.05 level. The number of deer seen per hour hunted for opening day was 1.16. This was similar to last year’s 1.18, but significantly (p ≤ .05) higher than the 1.10 in 2014, 1.09 in 2013, 1.02 in 2012, 0.96 in 2011, 1.08 in 2010, and 0.79 in 2009. Deer seen per hour for the rest of the 9-day season was 1.15 in 2016, less than the 1.18 in 2015. This is in comparison to the 1.20 in 2014, 1.08 in 2013, 1.02 in 2012, 0.96 in 2011, 1.03 in 2010 and 0.80 in 2009; all years were different (p ≤ .05). Please note that these rankings are for successful hunters only, and are probably biased by that fact. Metro deer sub-units’ gun deer season opened on 19 November and was open for 21 days (running through 7 December). The bag limit was one antlered deer for the length of the season. Additional antlerless deer tags were available for purchase that allowed hunters to bag additional antlerless deer. December All DMZs in the state were open for muzzleloader-only hunting from 28 November - 7 December. Any unused carcass tag, both antlered and antlerless, could be used during this time. Only hunters possessing or accompanying someone with an unused carcass tag could take part in the muzzleloader season. Muzzleloaders were allowed to have scopes with a magnification of greater than 1X, which became legal prior to the 2010 muzzleloader season. Wisconsin held a statewide antlerless-only gun season from 8-11 December. All hunters with an unfilled antlerless deer tag could take part in the season. This season allowed hunters who were unable to fill their antlerless tags during the 9-day and muzzleloader seasons another chance to kill an antlerless deer. County Deer Advisory Councils had the ability to recommend a Holiday Hunt on a unit-by-unit basis in 2016. Thirteen councils recommended a Holiday Hunt. These units were in the Central and Southern Farmland DMZs. The season was for antlerless deer only and was held from 24 December through 1 January. Hunting conditions for the December seasons were mostly favorable. Most of December had average to above temperatures with most of the state receiving some snowfall during the first week of December. This should have made for good hunting conditions with normal temperatures for comfortable sitting and snow depths not hindering hunter access but making deer more visible.

6
Hunters killed the 25th highest kill total in the last 83 years (316,744; 1st 2000 = 615,293, 2nd 2007 = 518,573) during the bow, crossbow, youth, 9-day, muzzleloader, and December and Holiday Hunt antlerless seasons combined. Only once in the past 25 years has the total deer harvest for Wisconsin fallen below 300,000 (1993). A summary of youth, 9-day, muzzleloader, December antlerless, and holiday deer harvest by deer management unit is contained in Table 5-7, and Figures 2-4, respectively. Agricultural Damage Shooting Program Wisconsin's agricultural damage deer shooting program was in effect for 2016. In 2016, the department issued 506 agriculture damage deer shooting permits in 64 counties. The number of deer shooting permits issued in 2016 decreased from 2015 when 542 permits were issued in 64 counties. There are two types of deer shooting permits agriculture producers can choose from: permits that require the producer to allow public hunting access during the state deer hunting season, under this option producers are eligible for deer damage compensations; and permits that do not require the producer to allow public hunting access but producers are not eligible for deer damage compensation. Of the two permits types, 226 deer shooting permits were issued where public deer hunting access was required on property the producer owns or leases and 280 deer shooting permits were issued where public hunting access was not required on the property the producer owns or leases. The number of shooting permits issued each year for the last 10 years are as follows:
2007 - 698 permits in 62 counties 2012 - 521 permits in 67 counties 2008 - 713 permits in 66 counties 2013 - 618 permits in 65 counties 2009 - 611 permits in 66 counties 2014 - 617 Permits in 67 counties
2010 - 501 permits in 62 counties 2015 - 542 Permits in 64 counties 2011 - 484 permits in 64 counties 2016 – 506 Permits in 64 counties
Damage permits were primarily valid for harvesting antlerless deer using a gun (occasional exceptions are made to harvest antlered deer or to use archery equipment for harvest). A total of 4,134 deer were harvested under authority of this program; nearly all (3,959) were antlerless. Data from past years has shown that less than 5% of the damage deer are killed with archery tackle. Because of this, all damage deer are assumed to be killed by gun hunters and are in the 9-day harvest totals. Tables 9 & 10 summarize deer harvest in the agricultural damage shooting program. Chippewa Deer Harvest Deer hunting in the off-reservation portions of the ceded territory by the tribes of the Lake Superior Chippewa took place from 1 September to 31 December. The Tribes harvested 1,469 deer in 2016. Tribal totals are not included in the statewide gun harvest totals in this report, but used in calculating population estimates for each of the units that have tribal harvest. The total Tribal deer harvest by year is in Table 11. A summary of the 2016 Tribal deer harvest by management unit is contained in Table 12. Other off-reservation treaty harvest information can be obtained by contacting the Great Lakes Indian Fish & Wildlife Commission, P.O. Box 9, Odanah, WI 54861.
7
CWD Harvest With the Deer Trustee Report implementation, the Chronic Wasting Disease (CWD) management zone has been eliminated and is now referred to as CWD-affected areas. These boundaries match the counties that prohibit baiting and feeding (43 counties in 2016). A county is included if a wild or captive animal has been tested and confirmed to be positive for CWD in the county or if a portion of the county that is within a 10-mile radius of where the animal that had been tested and confirmed to be positive for CWD. Special seasons or extensions of seasons no longer exist as had in the past. Season length and bagging rates were similar to the rest of the state. The “bonus buck” provision that had allowed the taking of additional antlered deer if an antlerless deer was killed first was discontinued in 2015, with all prior issued bonus buck stickers expiring on 31 March 2015.

8
Table 1. Farmland and bonus antlerless permit availability, issuance, harvest, and success by deer management zone, unit and landtype for 2016.
Deer Management Zone County
Land Type
Farmland Tags
available per
License
Farmland Tags
Issued
Antlerless Deer
Tagged with
Farmland Tag
Farmland Tag
Success
Bonus Anterless
Tags Available
Bonus Antlerless
Tags Issued
Antlerless Deer
Tagged with Bonus
Tag
Bonus Tag
Success
Central Farmland Adams Public 1/License 2,000 149 7.5% 50 50 4 8.0%
Central Farmland Adams Private 1/License 6,249 691 11.1% 1,800 659 120 18.2%
Central Farmland Barron Public None 550 551 159 28.9%
Central Farmland Barron Private None 4,950 4,952 1509 30.5%
Central Farmland Brown Public 1/License 1,695 129 7.6% 225 225 34 15.1%
Central Farmland Brown Private 1/License 7,720 987 12.8% 875 521 99 19.0%
Central Farmland Buffalo Public 2/License 1,803 156 8.7% 500 212 19 9.0%
Central Farmland Buffalo Private 2/License 23,985 3,572 14.9% 3,000 955 248 26.0%
Central Farmland Calumet Public 1/License 1,085 120 11.1% 100 100 18 18.0%
Central Farmland Calumet Private 1/License 3,549 480 13.5% 400 352 73 20.7%
Central Farmland Chippewa Public None
Central Farmland Chippewa Private None 2,500 2,500 874 35.0%
Central Farmland Clark Public 1/License 3,246 297 9.1% 25 25 8 32.0%
Central Farmland Clark Private 1/License 12,898 2,153 16.7% 825 825 212 25.7%
Central Farmland Door Public 3/License 4,483 313 7.0% 500 124 10 8.1%
Central Farmland Door Private 3/License 22,450 1,884 8.4% 1,500 310 46 14.8%
Central Farmland Dunn Public 1/License 3,509 498 14.2% 400 402 93 23.1%
Central Farmland Dunn Private 1/License 14,517 2,784 19.2% 2,100 1,980 567 28.6%
Central Farmland Eau Claire Public 1/License 3,360 287 8.5% 50 50 5 10.0%
Central Farmland Eau Claire Private 1/License 8,695 1,224 14.1% 800 801 171 21.3%
Central Farmland Fond Du Lac Public 1/License 4,240 381 9.0% 450 452 55 12.2%
Central Farmland Fond Du Lac Private 1/License 9,652 1,395 14.5% 2,800 947 197 20.8%
Central Farmland Green Lake Public 2/License 2,831 191 6.7% 750 300 43 14.3%
Central Farmland Green Lake Private 2/License 13,498 2,062 15.3% 2,000 447 130 29.1%
Central Farmland Jackson Public 1/License 2,558 181 7.1%
Central Farmland Jackson Private 1/License 10,235 1,595 15.6% 1,100 1,101 250 22.7%
Central Farmland Juneau Public 1/License 1,595 104 6.5% 25 24 7 29.2%
Central Farmland Juneau Private 1/License 7,909 1,063 13.4% 1,050 888 156 17.6%
Central Farmland Kewaunee Public 3/License 2,755 148 5.4% 300 62 8 12.9%
Central Farmland Kewaunee Private 3/License 19,554 1,760 9.0% 1,100 156 21 13.5%
Central Farmland La Crosse Public 1/License 1,062 91 8.6% 150 150 20 13.3%
Central Farmland La Crosse Private 1/License 7,974 1,294 16.2% 850 746 176 23.6%
Central Farmland Manitowoc Public 2/License 4,339 273 6.3% 300 186 32 17.2%
Central Farmland Manitowoc Private 2/License 19,857 1,966 9.9% 2,000 377 64 17.0%
Central Farmland Marathon Public 1/License 7,619 846 11.1%
Central Farmland Marathon Private 1/License 27,645 4,486 16.2% 3,500 2,420 594 24.5%
Central Farmland Marinette Public 1/License 4,353 345 7.9% 175 174 41 23.6%
Central Farmland Marinette Private 1/License 12,077 1,574 13.0% 2,050 1,196 253 21.2%
Central Farmland Marquette Public 2/License 4,500 369 8.2% 2,000 425 44 10.4%
Central Farmland Marquette Private 2/License 22,989 3,025 13.2% 8,000 703 163 23.2%
Central Farmland Mccoy Public 1/License
Central Farmland Mccoy Private 1/License
Central Farmland Monroe Public 1/License 3,008 341 11.3% 400 399 54 13.5%
Central Farmland Monroe Private 1/License 12,842 2,417 18.8% 1,350 1,325 363 27.4%
Central Farmland Oconto Public 1/License 5,321 419 7.9% 200 200 36 18.0%
Central Farmland Oconto Private 1/License 13,996 1,934 13.8% 2,075 1,203 244 20.3%
9
Table 1. Farmland and bonus antlerless permit availability, issuance, harvest, and success by deer management zone, unit and landtype for 2016.
Deer Management Zone County
Land Type
Farmland Tags
available per
License
Farmland Tags
Issued
Antlerless Deer
Tagged with
Farmland Tag
Farmland Tag
Success
Bonus Anterless
Tags Available
Bonus Antlerless
Tags Issued
Antlerless Deer
Tagged with Bonus
Tag
Bonus Tag
Success
Central Farmland Outagamie Public 1/License 2,211 183 8.3% 500 334 37 11.1% Central Farmland Outagamie Private 1/License 10,322 1,527 14.8% 1,000 767 213 27.8% Central Farmland Pepin Public 2/License 1,255 167 13.3% 75 75 14 18.7% Central Farmland Pepin Private 2/License 7,350 1,325 18.0% 925 333 79 23.7% Central Farmland Pierce Public 1/License 916 128 14.0% 400 271 53 19.6% Central Farmland Pierce Private 1/License 8,565 1,649 19.3% 2,200 1,269 328 25.8% Central Farmland Polk Public 1/License 5,658 850 15.0% 400 400 118 29.5% Central Farmland Polk Private 1/License 16,360 3,093 18.9% 3,100 2,513 683 27.2% Central Farmland Portage Public 1/License 3,027 375 12.4% 275 275 41 14.9% Central Farmland Portage Private 1/License 13,193 2,230 16.9% 2,000 1,387 295 21.3% Central Farmland St. Croix Public 1/License 2,194 188 8.6% 200 200 41 20.5% Central Farmland St. Croix Private 1/License 8,804 1,172 13.3% 1,400 962 226 23.5% Central Farmland Shawano Public 3/License 11,161 547 4.9% 750 321 32 10.0% Central Farmland Shawano Private 3/License 62,364 5,342 8.6% 3,450 685 114 16.6% Central Farmland Sheboygan Public 1/License 4,185 327 7.8% 125 125 20 16.0% Central Farmland Sheboygan Private 1/License 6,725 789 11.7% 1,175 878 175 19.9% Central Farmland Trempealeau Public 1/License 1,451 234 16.1%
Central Farmland Trempealeau Private 1/License 12,969 2,841 21.9% 500 500 208 41.6% Central Farmland Waupaca Public 3/License 9,010 497 5.5% 300 300 28 9.3% Central Farmland Waupaca Private 3/License 68,727 6,646 9.7% 7,200 660 118 17.9% Central Farmland Waushara Public 1/License 3,119 337 10.8% 600 578 64 11.1% Central Farmland Waushara Private 1/License 13,972 1,984 14.2% 1,200 1,174 239 20.4% Central Farmland Winnebago Public 1/License 1,558 111 7.1% 125 125 9 7.2% Central Farmland Winnebago Private 1/License 5,920 746 12.6% 375 376 73 19.4% Central Farmland Wood Public 1/License 2,598 220 8.5%
Central Farmland Wood Private 1/License 9,666 1,502 15.5% 500 500 139 27.8%
Central Farmland Total 636,934 78,995 82,550 44,483 10,567 Central Forest Adams Public None 850 850 161 18.9% Central Forest Adams Private None 5,150 5,150 1298 25.2% Central Forest Clark Public None 775 776 197 25.4% Central Forest Clark Private None 1,800 1,799 644 35.8% Central Forest Eau Claire Public None 250 249 72 28.9% Central Forest Eau Claire Private None 1,275 1,275 323 25.3% Central Forest Jackson Public None
Central Forest Jackson Private None
Central Forest Juneau Public None
Central Forest Juneau Private None 1,000 999 273 27.3% Central Forest Monroe Public None
Central Forest Monroe Private None 100 100 43 43.0% Central Forest Wood Public None 50 50 19 38.0% Central Forest Wood Private None 150 150 57 38.0%
Central Forest Total 11,400 11,398 3,087 Northern Forest Ashland Public None
Northern Forest Ashland Private None
Northern Forest Apostle Islands Public None
Northern Forest Apostle Islands Private None
Northern Forest Bad River Public None
Northern Forest Bad River Private None
Northern Forest Madeline Island Public None 50 50 14 28.0% Northern Forest Madeline Island Private None 175 68 22 32.4% Northern Forest Bayfield Public None
10
Table 1. Farmland and bonus antlerless permit availability, issuance, harvest, and success by deer management zone, unit and landtype for 2016.
Deer Management Zone County
Land Type
Farmland Tags
available per
License
Farmland Tags
Issued
Antlerless Deer
Tagged with
Farmland Tag
Farmland Tag
Success
Bonus Anterless
Tags Available
Bonus Antlerless
Tags Issued
Antlerless Deer
Tagged with Bonus
Tag
Bonus Tag
Success
Northern Forest Bayfield Private None
Northern Forest Burnett Public None 475 476 167 35.1% Northern Forest Burnett Private None 3,800 3,801 1368 36.0% Northern Forest Douglas Public None 150 150 40 26.7% Northern Forest Douglas Private None 50 50 16 32.0% Northern Forest Florence Public None
Northern Forest Florence Private None
Northern Forest Forest Public None
Northern Forest Forest Private None
Northern Forest Iron Public None
Northern Forest Iron Private None
Northern Forest Lac Corte Oreilles Public None
Northern Forest Lac Corte Oreilles Private None
Northern Forest Lac Du Flambeau Public None
Northern Forest Lac Du Flambeau Private None
Northern Forest Langlade Public None 300 301 124 41.2% Northern Forest Langlade Private None 800 802 347 43.3% Northern Forest Lincoln Public None 200 200 81 40.5% Northern Forest Lincoln Private None 800 800 332 41.5% Northern Forest Marinette Public None 175 176 58 33.0% Northern Forest Marinette Private None 700 701 293 41.8% Northern Forest Menominee Public None
Northern Forest Menominee Private None
Northern Forest Oconto Public None 175 175 49 28.0% Northern Forest Oconto Private None 375 375 108 28.8% Northern Forest Oneida Public None
Northern Forest Oneida Private None
Northern Forest Price Public None 350 351 138 39.3% Northern Forest Price Private None 900 901 384 42.6% Northern Forest Red Cliff Public None
Northern Forest Red Cliff Private None
Northern Forest Rusk Public None
Northern Forest Rusk Private None 1,225 1,227 543 44.3% Northern Forest Sawyer Public None
Northern Forest Sawyer Private None
Northern Forest Taylor Public None
Northern Forest Taylor Private None 3,875 3,881 1517 39.1% Northern Forest Vilas Public None
Northern Forest Vilas Private None
Northern Forest Washburn Public None 2,175 2,175 610 28.0% Northern Forest Washburn Private None 8,675 5,477 1626 29.7%
Northern Forest Totals 25,425 22,137 7,837 Southern Farmland Columbia Public 1/License 2,602 270 10.4% 1,000 710 85 12.0% Southern Farmland Columbia Private 1/License 11,559 2,003 17.3% 2,000 1,191 321 27.0% Southern Farmland Crawford Public 2/License 2,996 273 9.1%
Southern Farmland Crawford Private 2/License 17,010 2,119 12.5% 3,500 589 116 19.7% Southern Farmland Dane Public 1/License 2,401 185 7.7% 700 594 59 9.9% Southern Farmland Dane Private 1/License 9,940 1,439 14.5% 2,500 1,209 247 20.4% Southern Farmland Dodge Public 1/License 2,912 253 8.7% 125 124 20 16.1% Southern Farmland Dodge Private 1/License 10,360 1,590 15.3% 1,325 1,297 288 22.2% Southern Farmland Grant Public 2/License 3,050 266 8.7% 250 212 36 17.0%

11
Table 1. Farmland and bonus antlerless permit availability, issuance, harvest, and success by deer management zone, unit and landtype for 2016.
Deer Management Zone County
Land Type
Farmland Tags
available per
License
Farmland Tags
Issued
Antlerless Deer
Tagged with
Farmland Tag
Farmland Tag
Success
Bonus Anterless
Tags Available
Bonus Antlerless
Tags Issued
Antlerless Deer
Tagged with Bonus
Tag
Bonus Tag
Success
Southern Farmland Grant Private 2/License 23,748 3,002 12.6% 3,000 762 156 20.5% Southern Farmland Green Public 1/License 753 67 8.9% 250 226 27 11.9% Southern Farmland Green Private 1/License 5,105 875 17.1% 1,750 715 181 25.3% Southern Farmland Iowa Public 1/License 1,384 186 13.4% 450 451 57 12.6% Southern Farmland Iowa Private 1/License 9,218 1,576 17.1% 3,000 1,196 357 29.8% Southern Farmland Jefferson Public 1/License 2,492 192 7.7% 75 76 12 15.8% Southern Farmland Jefferson Private 1/License 6,839 987 14.4% 950 950 164 17.3% Southern Farmland Kenosha Public 1/License 997 30 3.0%
Southern Farmland Kenosha Private 1/License 1,825 131 7.2%
Southern Farmland Lafayette Public 1/License 668 76 11.4% 75 75 16 21.3% Southern Farmland Lafayette Private 1/License 4,757 935 19.7% 1,125 736 207 28.1% Southern Farmland Milwaukee Public 2/License 154 5 3.2% 75 35 0 0.0% Southern Farmland Milwaukee Private 2/License 892 70 7.8% 600 98 16 16.3% Southern Farmland Ozaukee Public 1/License 685 52 7.6% 250 231 12 5.2% Southern Farmland Ozaukee Private 1/License 3,159 409 12.9% 750 468 98 20.9% Southern Farmland Racine Public 1/License 961 32 3.3%
Southern Farmland Racine Private 1/License 2,587 178 6.9%
Southern Farmland Richland Public 2/License 1,872 162 8.7% 500 188 17 9.0% Southern Farmland Richland Private 2/License 20,640 2,563 12.4% 5,000 673 161 23.9% Southern Farmland Rock Public 1/License 1,656 109 6.6% 400 400 29 7.3% Southern Farmland Rock Private 1/License 5,722 661 11.6% 1,500 768 128 16.7% Southern Farmland Sauk Public 2/License 5,436 404 7.4% 750 468 47 10.0% Southern Farmland Sauk Private 2/License 25,866 3,304 12.8% 3,200 795 201 25.3% Southern Farmland Vernon Public 2/License 3,960 389 9.8% 100 101 16 15.8% Southern Farmland Vernon Private 2/License 25,788 3,427 13.3% 1,000 835 156 18.7% Southern Farmland Walworth Public 1/License 2,123 108 5.1% 150 150 16 10.7% Southern Farmland Walworth Private 1/License 3,753 340 9.1% 375 375 55 14.7% Southern Farmland Washington Public 1/License 2,981 193 6.5% 400 399 37 9.3% Southern Farmland Washington Private 1/License 7,770 983 12.7% 1,350 980 181 18.5% Southern Farmland Waukesha Public 1/License 3,219 137 4.3% 500 499 37 7.4% Southern Farmland Waukesha Private 1/License 5,695 623 10.9% 1,500 970 170 17.5%
Southern Farmland Total 245,535 30,605 40,475 19,546 3,726

12
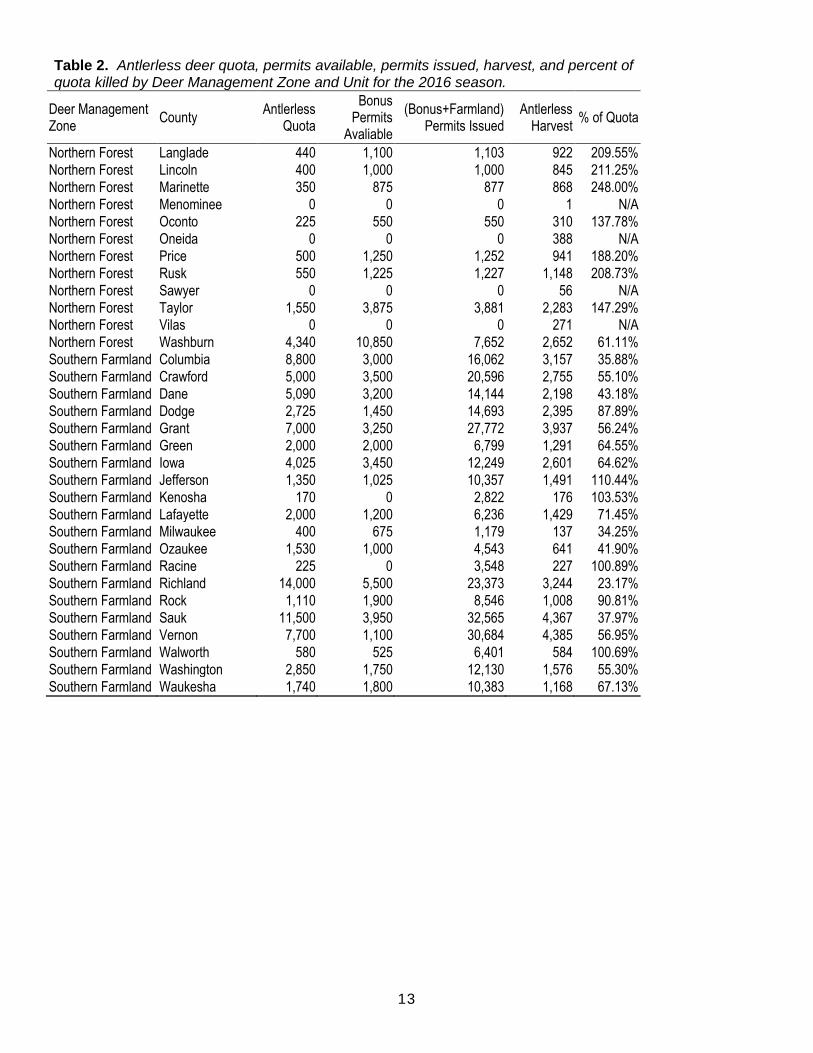
Table 2. Antlerless deer quota, permits available, permits issued, harvest, and percent of quota killed by Deer Management Zone and Unit for the 2016 season.
Deer Management Zone
County Antlerless
Quota
Bonus Permits
Avaliable
(Bonus+Farmland) Permits Issued
Antlerless Harvest
% of Quota
Central Farmland Adams 1,525 1,850 8,958 1,056 69.25% Central Farmland Barron 2,190 5,500 5,503 2,171 99.13%
Central Farmland Brown 3,000 1,100 10,162 1,558 51.93%
Central Farmland Buffalo 9,000 3,500 26,955 4,352 48.36%
Central Farmland Calumet 1,480 500 5,086 778 52.57%
Central Farmland Chippewa 1,000 2,500 2,500 1,412 141.20%
Central Farmland Clark 1,800 2,575 16,994 2,982 165.67%
Central Farmland Door 6,250 2,000 27,367 2,428 38.85% Central Farmland Dunn 7,200 2,500 20,408 4,362 60.58%
Central Farmland Eau Claire 1,300 850 12,906 1,834 141.08%
Central Farmland Fond Du Lac 2,500 3,250 15,291 2,275 91.00%
Central Farmland Green Lake 4,800 2,750 17,076 2,839 59.15%
Central Farmland Jackson 2,550 1,100 13,894 2,325 91.18%
Central Farmland Juneau 1,800 1,075 10,416 1,457 80.94%
Central Farmland Kewaunee 4,750 1,400 22,527 2,081 43.81%
Central Farmland La Crosse 3,120 1,000 9,933 2,169 69.52%
Central Farmland Manitowoc 5,000 2,300 24,759 2,524 50.48%
Central Farmland Marathon 6,500 3,500 37,685 6,699 103.06%
Central Farmland Marinette 2,000 2,225 17,800 2,612 130.60%
Central Farmland Marquette 11,000 10,000 28,617 3,926 35.69% Central Farmland Monroe 5,000 1,750 17,574 3,558 71.16%
Central Farmland Oconto 5,500 2,275 20,720 2,963 53.87%
Central Farmland Outagamie 5,810 1,500 13,634 2,367 40.74%
Central Farmland Pepin 2,500 1,000 9,013 1,698 67.92%
Central Farmland Pierce 4,400 2,600 11,021 2,578 58.59%
Central Farmland Polk 7,000 3,500 24,931 5,322 76.03%
Central Farmland Portage 4,890 2,275 17,882 3,378 69.08%
Central Farmland Shawano 17,000 4,200 12,160 2,231 13.12%
Central Farmland Sheboygan 2,205 1,300 74,531 6,560 297.51%
Central Farmland St Croix 3,000 1,600 11,913 1,737 57.90%
Central Farmland Trempealeau 4,000 500 14,920 3,792 94.80%
Central Farmland Waupaca 14,200 7,500 78,697 7,892 55.58% Central Farmland Waushara 4,400 1,800 18,843 2,959 67.25%
Central Farmland Winnebago 1,300 500 7,979 1,086 83.54%
Central Farmland Wood 1,200 500 12,764 2,209 184.08%
Central Forest Adams 3,000 6,000 6,000 1,818 60.60%
Central Forest Clark 1,000 2,575 2,575 1,234 123.40%
Central Forest Eau Claire 625 1,525 1,524 476 76.16%
Central Forest Jackson 0 0 0 124 N/A
Central Forest Juneau 510 1,000 999 486 95.29%
Central Forest Monroe 150 100 100 118 78.67%
Central Forest Wood 100 200 200 248 248.00%
Northern Forest Ashland 0 0 0 17 N/A
Northern Forest Bayfield 0 0 0 356 N/A Northern Forest Burnett 2,000 4,275 4,277 1,995 99.75%
Northern Forest Douglas (Superior)
0 200 200 550 N/A
Northern Forest Florence 0 0 0 353 N/A
Northern Forest Forest 0 0 0 43 N/A
Northern Forest Iron 0 0 0 61 N/A
13
Table 2. Antlerless deer quota, permits available, permits issued, harvest, and percent of quota killed by Deer Management Zone and Unit for the 2016 season.
Deer Management Zone
County Antlerless
Quota
Bonus Permits
Avaliable
(Bonus+Farmland) Permits Issued
Antlerless Harvest
% of Quota
Northern Forest Langlade 440 1,100 1,103 922 209.55%
Northern Forest Lincoln 400 1,000 1,000 845 211.25%
Northern Forest Marinette 350 875 877 868 248.00%
Northern Forest Menominee 0 0 0 1 N/A
Northern Forest Oconto 225 550 550 310 137.78%
Northern Forest Oneida 0 0 0 388 N/A
Northern Forest Price 500 1,250 1,252 941 188.20%
Northern Forest Rusk 550 1,225 1,227 1,148 208.73%
Northern Forest Sawyer 0 0 0 56 N/A
Northern Forest Taylor 1,550 3,875 3,881 2,283 147.29% Northern Forest Vilas 0 0 0 271 N/A
Northern Forest Washburn 4,340 10,850 7,652 2,652 61.11%
Southern Farmland Columbia 8,800 3,000 16,062 3,157 35.88%
Southern Farmland Crawford 5,000 3,500 20,596 2,755 55.10%
Southern Farmland Dane 5,090 3,200 14,144 2,198 43.18%
Southern Farmland Dodge 2,725 1,450 14,693 2,395 87.89%
Southern Farmland Grant 7,000 3,250 27,772 3,937 56.24%
Southern Farmland Green 2,000 2,000 6,799 1,291 64.55%
Southern Farmland Iowa 4,025 3,450 12,249 2,601 64.62%
Southern Farmland Jefferson 1,350 1,025 10,357 1,491 110.44%
Southern Farmland Kenosha 170 0 2,822 176 103.53%
Southern Farmland Lafayette 2,000 1,200 6,236 1,429 71.45% Southern Farmland Milwaukee 400 675 1,179 137 34.25%
Southern Farmland Ozaukee 1,530 1,000 4,543 641 41.90%
Southern Farmland Racine 225 0 3,548 227 100.89%
Southern Farmland Richland 14,000 5,500 23,373 3,244 23.17%
Southern Farmland Rock 1,110 1,900 8,546 1,008 90.81%
Southern Farmland Sauk 11,500 3,950 32,565 4,367 37.97%
Southern Farmland Vernon 7,700 1,100 30,684 4,385 56.95%
Southern Farmland Walworth 580 525 6,401 584 100.69%
Southern Farmland Washington 2,850 1,750 12,130 1,576 55.30%
Southern Farmland Waukesha 1,740 1,800 10,383 1,168 67.13%

14
Table 3. Nine-day gun season opening day deer hunting pressure expressed as hunters per square mile of deer range, with current deer range densities 2014-16.
Deer Management Zone
County Deer Range 2014a 2015
a 2016
a
Central Farmland Adams 72.07 31.4 25.1 19.0
Central Farmland Barron 530.99 14.2 18 12.3
Central Farmland Brown 113.47 37.3 34.1 23.2
Central Farmland Buffalo 559.95 15.4 18.2 11.6
Central Farmland Calumet 68.6 33 58.3 33.7
Central Farmland Chippewa 665.88 10 15.1 11.7
Central Farmland Clark 273.17 13.3 18.4 27.3
Central Farmland Door 272.16 20 20.9 22.8
Central Farmland Dunn 585.77 12.9 13.4 13.1
Central Farmland Eau Claire 287.72 13.1 12.1 11.3
Central Farmland Fond Du Lac 214.43 32.4 34.3 34.8
Central Farmland Green Lake 179.13 26.1 26.7 35.8
Central Farmland Jackson 374.28 21 15.9 18.0
Central Farmland Juneau 231.29 18.9 15.6 12.3
Central Farmland Kewaunee 97.56 52.6 43.6 55.0
Central Farmland La Crosse 320.14 20.3 17.7 20.4
Central Farmland Manitowoc 174.95 30.2 53.1 30.0
Central Farmland Marathon 1000.16 18 23.2 19.3
Central Farmland Marinette 345.96 13.5 16 16.1
Central Farmland Marquette 342.73 20.3 31.2 27.3
Central Farmland Monroe 539.21 17.9 15.6 16.6
Central Farmland Oconto 413.03 25.2 30.9 23.2
Central Farmland Outagamie 192.9 27.4 32.8 26.2
Central Farmland Pepin 165.04 20.1 17.2 15.3
Central Farmland Pierce 266.77 20.4 24.2 21.7
Central Farmland Polk 623.37 17.9 21.3 18.7
Central Farmland Portage 502.89 23.4 18.2 24.3
Central Farmland St. Croix 239.24 23.3 18.9 18.0
Central Farmland Shawano 579.7 24 27.4 27.6
Central Farmland Sheboygan 190.74 27.7 30.4 22.6
Central Farmland Trempealeau 541.65 17.8 17.6 16.7
Central Farmland Waupaca 480.64 33.3 41.3 27.8
Central Farmland Waushara 383.45 28.3 27.3 28.8
Central Farmland Winnebago 112.94 26.7 35.4 27.0
Central Farmland Wood 263.13 18.4 25 16.4
Central Forest Adams 430.39 23.2 24.9 21.3
Central Forest Clark 474.71 22.6 18.2 20.2
Central Forest Eau Claire 173.23 14.8 10.4 15.8
Central Forest Jackson 452.88 9 7.7 10.0
Central Forest Juneau 380.52 13.9 12.9 12.7
Central Forest Monroe 108.57 12.5 7.1 7.7
Central Forest Wood 294.58 13.8 9.6 8.9
Northern Forest Ashland 821.69 5.3 5.3 5.9
Northern Forest Bayfield 1409.69 7.8 8.9 7.6
Northern Forest Burnett 762.68 12.5 13.2 10.1

15
Table 3. Nine-day gun season opening day deer hunting pressure expressed as hunters per square mile of deer range, with current deer range densities 2014-16.
Deer Management Zone
County Deer Range 2014a 2015
a 2016
a
Northern Forest Douglas 1238.2 6.1 7.9 6.3
Northern Forest Florence 477.22 18 17.6 13.9
Northern Forest Forest 996.54 9.2 9.7 7.5
Northern Forest Iron 711.55 4.7 5.6 4.6
Northern Forest Langlade 748.59 11.7 13.8 11.1
Northern Forest Lincoln 797.12 14.2 13.3 14.6
Northern Forest Marinette 920.62 16.7 20.3 13.9
Northern Forest Menominee 182.0
Northern Forest Oconto 336.93 21.1 14.2 14.7
Northern Forest Oneida 1072.2 10 11.9 9.0
Northern Forest Price 1199.87 10.3 11.5 8.9
Northern Forest Rusk 818.11 11.1 11.2 12.0
Northern Forest Sawyer 1113.47 9.2 7.5 7.2
Northern Forest Taylor 814.2 16.5 14.7 10.1
Northern Forest Vilas 769.09 12.4 12.1 12.9
Northern Forest Washburn 745.84 11.9 14.4 11.3
Southern Farmland Columbia 370.92 33 29.9 24.9
Southern Farmland Crawford 455.33 12.9 15 15.7
Southern Farmland Dane 428.74 14.4 13.8 13.7
Southern Farmland Dodge 272.75 22.7 26 22.0
Southern Farmland Grant 547.09 16 16.7 17.7
Southern Farmland Green 179.79 12.6 20.1 15.2
Southern Farmland Iowa 417.64 21.3 17.3 15.1
Southern Farmland Jefferson 196.83 29.9 17.7 18.2
Southern Farmland Kenosha 92.74 6.5 7 9.1
Southern Farmland Lafayette 146.29 26.8 23.8 20.8
Southern Farmland Milwaukee 46.42 . . .
Southern Farmland Ozaukee 78.21 13.5 21.4 13.4
Southern Farmland Racine 100.29 12 5.1 7.3
Southern Farmland Richland 415.11 20 19.9 20.8
Southern Farmland Rock 138.42 15.3 19.6 26.6
Southern Farmland Sauk 525.39 15.8 20.6 22.4
Southern Farmland Vernon 525.85 16.1 22.3 20.8
Southern Farmland Walworth 177.47 10.2 13.8 11.8
Southern Farmland Washington 187.83 17.7 17.9 11.8
Southern Farmland Waukesha 245.97 9.2 7.9 9.4
a Opening day pressure is obtained from a survey sent to 10,000 Gun Deer and Sports license holders every year. The survey asks
hunters to list the unit they hunted in each day of the season. Results from this survey are expanded to estimate the total hunters in each unit. Sampling problems can affect the estimates. Quota permit allocation and season structure may also shift hunting pressure. Questions or comments should be directed to Brian Dhuey.
16
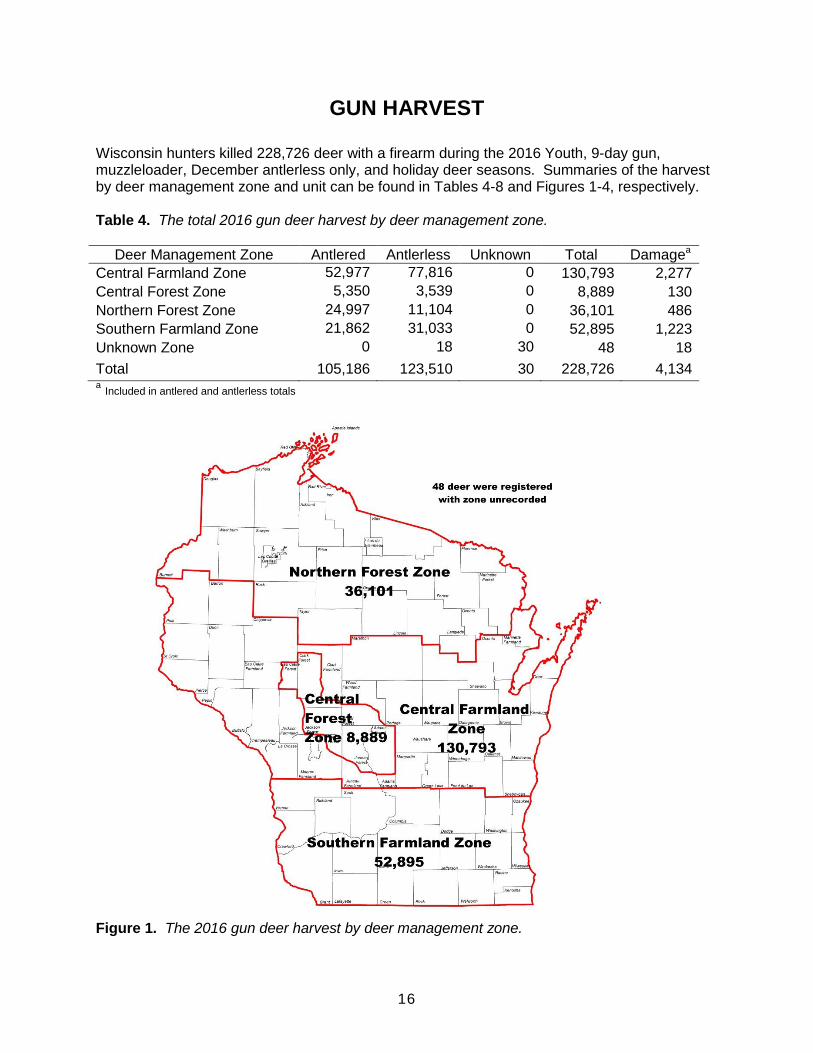
GUN HARVEST
Wisconsin hunters killed 228,726 deer with a firearm during the 2016 Youth, 9-day gun, muzzleloader, December antlerless only, and holiday deer seasons. Summaries of the harvest by deer management zone and unit can be found in Tables 4-8 and Figures 1-4, respectively. Table 4. The total 2016 gun deer harvest by deer management zone.
Deer Management Zone Antlered Antlerless Unknown Total Damagea
Central Farmland Zone 52,977 77,816 0 130,793 2,277
Central Forest Zone 5,350 3,539 0 8,889 130
Northern Forest Zone 24,997 11,104 0 36,101 486
Southern Farmland Zone 21,862 31,033 0 52,895 1,223
Unknown Zone 0 18 30 48 18
Total 105,186 123,510 30 228,726 4,134 a Included in antlered and antlerless totals
Figure 1. The 2016 gun deer harvest by deer management zone.

17
Total Gun Deer Harvest = 228,726 Figure 2. The 2016 gun harvest by deer management unit, youth, 9-day, muzzleloader, December, and Holiday antlerless seasons.

18
Total Muzzleloader Harvest = 6,400
Figure 3. The 2016 muzzleloader harvest by deer management unit.
19
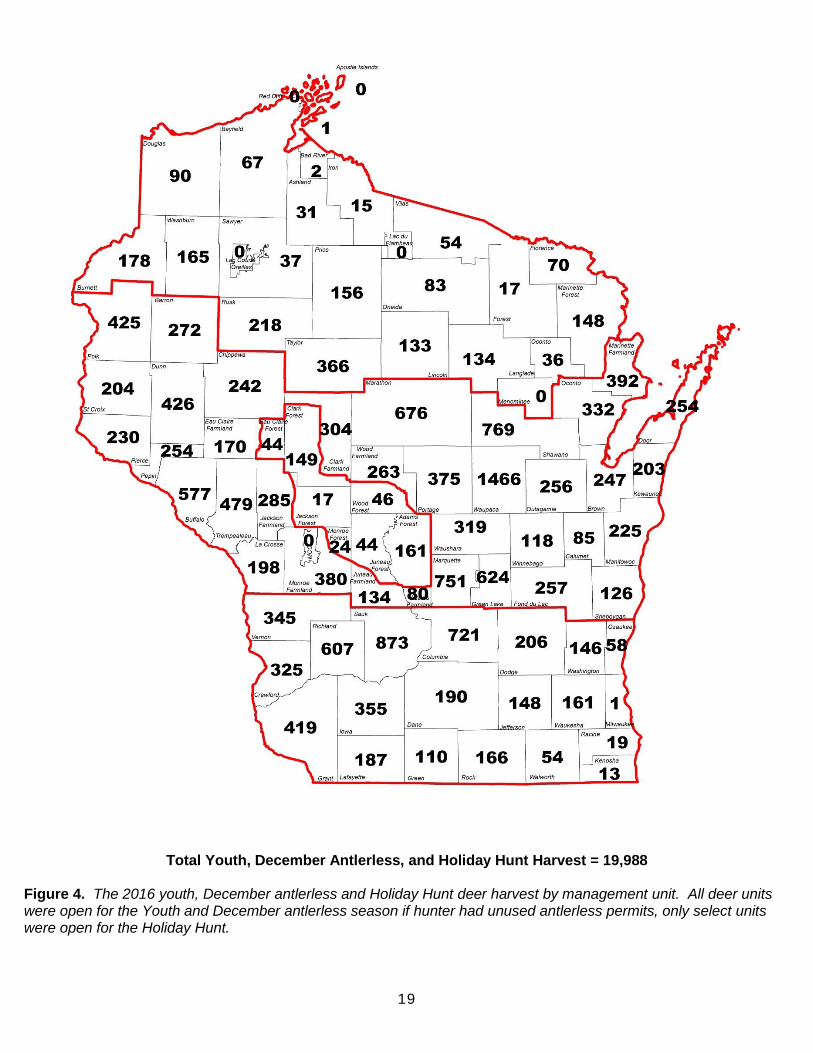
Total Youth, December Antlerless, and Holiday Hunt Harvest = 19,988 Figure 4. The 2016 youth, December antlerless and Holiday Hunt deer harvest by management unit. All deer units were open for the Youth and December antlerless season if hunter had unused antlerless permits, only select units were open for the Holiday Hunt.

20
Table 5. Summary of the 2016 9-day gun deer harvest by zone and county.
County
Deer Management
Zone 9-Day
Antlered 9-Day
Antlerless 9-Day Unks
9-Day Total County
Deer Management Zone
9-Day Antlered
9-Day Antlerless
9-Day Unks
9-Day Total
Adams Central Farmland 394 742 0 1,136 Ashland Northern Forest 675 10 0 685
Barron Central Farmland 1,759 1,476 0 3,235 Apostle Islands Northern Forest 0 0 0
Brown Central Farmland 711 775 0 1,486 Bad River Northern Forest 58 0 58
Buffalo Central Farmland 1,630 2,765 0 4,395 Madeline Island Northern Forest 44 23 0 67
Calumet Central Farmland 359 500 0 859 Bayfield Northern Forest 2,021 276 0 2,297
Chippewa Central Farmland 1,529 849 0 2,378 Burnett Northern Forest 1,743 1,387 0 3,130
Clark Central Farmland 1,376 2,065 0 3,441 Douglas Northern Forest 1,942 369 0 2,311
Door Central Farmland 1,240 1,543 0 2,783 Florence Northern Forest 824 276 0 1,100
Dunn Central Farmland 2,008 3,091 0 5,099 Forest Northern Forest 844 34 0 878
Eau Claire Central Farmland 779 1,115 0 1,894 Iron Northern Forest 300 38 0 338
Fond du Lac Central Farmland 1,102 1,375 0 2,477 Lac Corte Oreilles Northern Forest 15 0 15
Green Lake Central Farmland 1,140 1,678 0 2,818 Lac du Flambeau Northern Forest 9 3 0 12
Jackson Central Farmland 1,311 1,508 0 2,819 Langlade Northern Forest 1,334 594 0 1,928
Juneau Central Farmland 788 1,056 0 1,844 Lincoln Northern Forest 1,314 531 0 1,845
Kewaunee Central Farmland 888 1,346 0 2,234 Marinette Northern Forest 1,942 519 0 2,461
La Crosse Central Farmland 1,028 1,396 0 2,424 Menominee Northern Forest 1 0 1
Manitowoc Central Farmland 1,077 1,622 0 2,699 Oconto Northern Forest 538 198 0 736
Marathon Central Farmland 3,373 4,449 0 7,822 Oneida Northern Forest 1,337 277 0 1,614
Marinette Central Farmland 1,242 1,390 0 2,632 Price Northern Forest 1,420 586 0 2,006
Marquette Central Farmland 1,680 2,333 0 4,013 Red Cliff Northern Forest 0 0
MCCoy Central Farmland 223 200 0 423 Rusk Northern Forest 1,705 775 0 2,480
Monroe Central Farmland 1,789 2,457 0 4,246 Sawyer Northern Forest 1,360 49 0 1,409
Oconto Central Farmland 1,738 1,749 0 3,487 Taylor Northern Forest 1,701 1,368 0 3,069
Outagamie Central Farmland 1,060 1,320 0 2,380 Vilas Northern Forest 859 191 0 1,050
Pepin Central Farmland 624 1,114 0 1,738 Washburn Northern Forest 1,544 1,981 0 3,525
Pierce Central Farmland 1,144 1,764 0 2,908 Northern Forest Total 23,529 9,486 0 33,015
Polk Central Farmland 2,512 3,916 0 6,428 Columbia Southern Farmland 1,953 1,875 0 3,828
Portage Central Farmland 1,862 2,325 0 4,187 Crawford Southern Farmland 1,385 2,091 0 3,476
St Croix Central Farmland 989 1,417 0 2,406 Dane Southern Farmland 1,161 1,449 0 2,610
Shawano Central Farmland 2,867 4,010 0 6,877 Dodge Southern Farmland 1,267 1,669 0 2,936
Sheboygan Central Farmland 809 1,096 0 1,905 Grant Southern Farmland 2,309 2,971 0 5,280
Trempealeau Central Farmland 1,840 2,570 0 4,410 Green Southern Farmland 785 965 0 1,750
Waupaca Central Farmland 3,107 4,402 0 7,509 Iowa Southern Farmland 1,694 1,764 0 3,458
Waushara Central Farmland 1,571 1,895 0 3,466 Jefferson Southern Farmland 683 983 0 1,666
Winnebago Central Farmland 573 589 0 1,162 Kenosha Southern Farmland 90 82 0 172
Wood Central Farmland 1,058 1,383 0 2,441 Lafayette Southern Farmland 788 1,025 0 1,813
Central Farmland Total 49,180 65,281 0 114,461 Milwaukee Southern Farmland 34 46 0 80
Adams Central Forest 1,275 1,211 0 2,486 Ozaukee Southern Farmland 230 290 0 520
Clark Central Forest 1,351 860 0 2,211 Racine Southern Farmland 126 129 0 255
Eau Claire Central Forest 357 341 0 698 Richland Southern Farmland 1,916 2,138 0 4,054
Jackson Central Forest 600 101 0 701 Rock Southern Farmland 459 592 0 1,051
Juneau Central Forest 698 354 0 1,052 Sauk Southern Farmland 2,235 2,711 0 4,946
Monroe Central Forest 235 76 0 311 Vernon Southern Farmland 2,301 3,397 0 5,698
Wood Central Forest 580 176 0 756 Walworth Southern Farmland 333 331 0 664
Central Forest Total 5,096 3,119 0 8,215 Washington Southern Farmland 617 851 0 1,468
Waukesha Southern Farmland 367 507 0 874
Southern Farmland Total 20,733 25,866 0 46,599
Unknown Unknown 0 18 30 48
Unknown Total 0 18 30 48
Grand Total 98,538 103,770 30 202,338

21
Table 6. Summary of the 2016 muzzleloader deer harvest by zone and unit.
County
Deer Management Zone
Muzzle loader Antlered
Muzzle loader Antlerless
Muzzle loader Unks
Muzzle loader Total County
Deer Management Zone
Muzzle loader Antlered
Muzzle loader Antlerless
Muzzle loader Unks
Muzzle loader Total
Adams Central Farmland 10 27 0 37 Ashland Northern Forest 32 0 32
Barron Central Farmland 37 42 0 79 Apostle Islands Northern Forest 0
Brown Central Farmland 54 61 0 115 Bad River Northern Forest 3 1 4
Buffalo Central Farmland 67 137 0 204 Madeline Island Northern Forest 1 0 1
Calumet Central Farmland 12 16 0 28 Bayfield Northern Forest 79 7 0 86
Chippewa Central Farmland 37 38 0 75 Burnett Northern Forest 36 40 0 76
Clark Central Farmland 25 53 0 78 Douglas Northern Forest 62 15 0 77
Door Central Farmland 28 61 0 89 Florence Northern Forest 22 5 0 27
Dunn Central Farmland 44 68 0 112 Forest Northern Forest 14 1 0 15
Eau Claire Central Farmland 25 42 0 67 Iron Northern Forest 11 4 0 15
Fond du Lac Central Farmland 34 58 0 92 Lac Corte Oreilles Northern Forest 0
Green Lake Central Farmland 32 89 0 121 Lac du Flambeau Northern Forest 1 1
Jackson Central Farmland 38 86 0 124 Langlade Northern Forest 44 26 0 70
Juneau Central Farmland 10 21 0 31 Lincoln Northern Forest 45 17 0 62
Kewaunee Central Farmland 22 48 0 70 Marinette Northern Forest 54 25 0 79
La Crosse Central Farmland 53 95 0 148 Menominee Northern Forest 0
Manitowoc Central Farmland 36 71 0 107 Oconto Northern Forest 10 5 0 15
Marathon Central Farmland 73 156 0 229 Oneida Northern Forest 39 15 0 54
Marinette Central Farmland 30 87 0 117 Price Northern Forest 74 32 0 106
Marquette Central Farmland 48 79 0 127 Red Cliff Northern Forest 0
MCCoy Central Farmland 1 1 Rusk Northern Forest 52 19 0 71
Monroe Central Farmland 38 59 0 97 Sawyer Northern Forest 56 1 0 57
Oconto Central Farmland 41 70 0 111 Taylor Northern Forest 76 56 0 132
Outagamie Central Farmland 39 61 0 100 Vilas Northern Forest 28 3 0 31
Pepin Central Farmland 17 48 0 65 Washburn Northern Forest 23 51 0 74
Pierce Central Farmland 48 83 0 131 Northern Forest Total 761 324 0 1,085
Polk Central Farmland 39 98 0 137 Columbia Southern Farmland 45 55 0 100
Portage Central Farmland 40 64 0 104 Crawford Southern Farmland 23 52 0 75
St Croix Central Farmland 27 60 0 87 Dane Southern Farmland 28 46 0 74
Shawano Central Farmland 67 184 0 251 Dodge Southern Farmland 33 52 0 85
Sheboygan Central Farmland 30 56 0 86 Grant Southern Farmland 51 82 0 133
Trempealeau Central Farmland 52 127 0 179 Green Southern Farmland 12 12 0 24
Waupaca Central Farmland 87 210 0 297 Iowa Southern Farmland 26 28 0 54
Waushara Central Farmland 39 58 0 97 Jefferson Southern Farmland 14 17 0 31
Winnebago Central Farmland 23 39 0 62 Kenosha Southern Farmland 10 6 0 16
Wood Central Farmland 28 51 0 79 Lafayette Southern Farmland 6 25 0 31
Central Farmland Total 1,331 2,603 0 3,934 Milwaukee Southern Farmland 0 0
Adams Central Forest 32 36 0 68 Ozaukee Southern Farmland 22 38 0 60
Clark Central Forest 25 18 0 43 Racine Southern Farmland 9 4 0 13
Eau Claire Central Forest 12 5 0 17 Richland Southern Farmland 25 34 0 59
Jackson Central Forest 11 1 0 12 Rock Southern Farmland 14 14 0 28
Juneau Central Forest 15 6 0 21 Sauk Southern Farmland 29 69 0 98
Monroe Central Forest 9 3 0 12 Vernon Southern Farmland 47 108 0 155
Wood Central Forest 12 4 0 16 Walworth Southern Farmland 9 14 0 23
Central Forest Total 116 73 0 189 Washington Southern Farmland 29 50 0 79
Waukesha Southern Farmland 30 24 0 54
Southern Farmland Total 462 730 0 1,192
Unknown Unknown 0
Unknown Total 0 0 0 0
Grand Total 2,670 3,730 0 6,400

22
Table 7. Summary of the 2016 Youth, December antlerless, and Holiday Hunt season deer harvest by zone and unit.
County
Deer Management Zone Antlered Antlerless Unks Total Kill County
Deer Management Zone Antlered Antlerless Unks Total Kill
Adams Central Farmland 15 65 0 80 Ashland Northern Forest 29 2 0 31
Barron Central Farmland 99 173 0 272 Apostle Islands Northern Forest 0 0 0 0
Brown Central Farmland 51 196 0 247 Bad River Northern Forest 2 0 0 2
Buffalo Central Farmland 118 459 0 577 Madeline Island Northern Forest 0 1 0 1
Calumet Central Farmland 18 67 0 85 Bayfield Northern Forest 34 33 0 67
Chippewa Central Farmland 95 147 0 242 Burnett Northern Forest 37 141 0 178
Clark Central Farmland 80 224 0 304 Douglas Northern Forest 29 61 0 90
Door Central Farmland 67 187 0 254 Florence Northern Forest 26 44 0 70
Dunn Central Farmland 102 324 0 426 Forest Northern Forest 17 0 0 17
Eau Claire Central Farmland 34 136 0 170 Iron Northern Forest 7 8 0 15
Fond du Lac Central Farmland 56 201 0 257 Lac Corte Oreilles Northern Forest 0 0 0 0
Green Lake Central Farmland 54 570 0 624 Lac du Flambeau Northern Forest 0 0 0 0
Jackson Central Farmland 71 214 0 285 Langlade Northern Forest 37 97 0 134
Juneau Central Farmland 30 104 0 134 Lincoln Northern Forest 50 83 0 133
Kewaunee Central Farmland 47 156 0 203 Marinette Northern Forest 51 97 0 148
La Crosse Central Farmland 39 159 0 198 Menominee Northern Forest 0 0 0 0
Manitowoc Central Farmland 48 177 0 225 Oconto Northern Forest 10 26 0 36
Marathon Central Farmland 168 508 0 676 Oneida Northern Forest 37 46 0 83
Marinette Central Farmland 50 342 0 392 Price Northern Forest 61 95 0 156
Marquette Central Farmland 68 683 0 751 Red Cliff Northern Forest 0 0 0 0
MCCoy Central Farmland 0 0 0 0 Rusk Northern Forest 80 138 0 218
Monroe Central Farmland 64 316 0 380 Sawyer Northern Forest 36 1 0 37
Oconto Central Farmland 82 250 0 332 Taylor Northern Forest 122 244 0 366
Outagamie Central Farmland 66 190 0 256 Vilas Northern Forest 16 38 0 54
Pepin Central Farmland 26 228 0 254 Washburn Northern Forest 26 139 0 165
Pierce Central Farmland 43 187 0 230 Northern Forest Total 707 1,294 0 2,001
Polk Central Farmland 101 324 0 425 Columbia Southern Farmland 73 648 0 721
Portage Central Farmland 86 289 0 375 Crawford Southern Farmland 27 298 0 325
St Croix Central Farmland 59 145 0 204 Dane Southern Farmland 31 159 0 190
Shawano Central Farmland 161 608 0 769 Dodge Southern Farmland 51 155 0 206
Sheboygan Central Farmland 30 96 0 126 Grant Southern Farmland 66 353 0 419
Trempealeau Central Farmland 105 374 0 479 Green Southern Farmland 13 97 0 110
Waupaca Central Farmland 170 1,296 0 1,466 Iowa Southern Farmland 58 297 0 355
Waushara Central Farmland 71 248 0 319 Jefferson Southern Farmland 22 126 0 148
Winnebago Central Farmland 32 86 0 118 Kenosha Southern Farmland 2 11 0 13
Wood Central Farmland 60 203 0 263 Lafayette Southern Farmland 27 160 0 187
Central Farmland Total 2,466 9,932 0 12,398 Milwaukee Southern Farmland 0 1 0 1
Adams Central Forest 26 135 0 161 Ozaukee Southern Farmland 12 46 0 58
Clark Central Forest 53 96 0 149 Racine Southern Farmland 2 17 0 19
Eau Claire Central Forest 8 36 0 44 Richland Southern Farmland 68 539 0 607
Jackson Central Forest 11 6 0 17 Rock Southern Farmland 19 147 0 166
Juneau Central Forest 12 32 0 44 Sauk Southern Farmland 81 792 0 873
Monroe Central Forest 13 11 0 24 Vernon Southern Farmland 62 283 0 345
Wood Central Forest 15 31 0 46 Walworth Southern Farmland 10 44 0 54
Central Forest Total 138 347 0 485 Washington Southern Farmland 29 117 0 146
Waukesha Southern Farmland 14 147 0 161
Southern Farmland Total 667 4,437 0 5,104
Unknown Unknown
Unknown Total
Grand Total 3,978 16,010 0 19,988
23
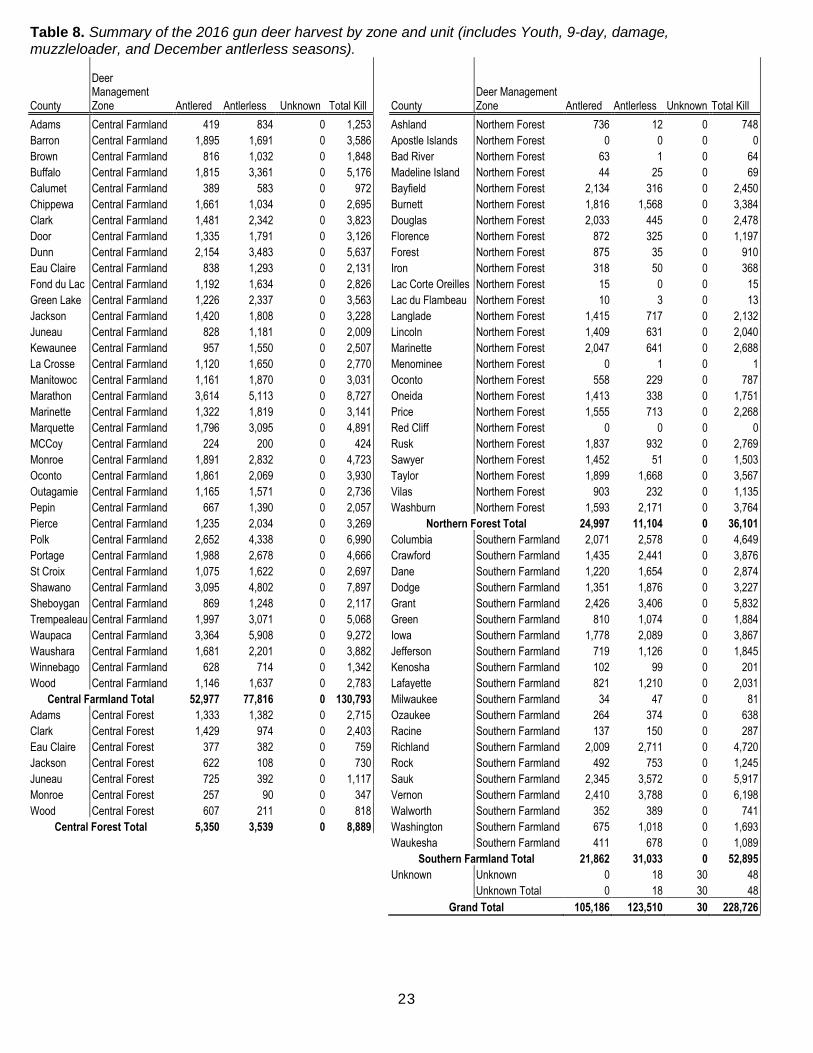
Table 8. Summary of the 2016 gun deer harvest by zone and unit (includes Youth, 9-day, damage, muzzleloader, and December antlerless seasons).
County
Deer Management Zone Antlered Antlerless Unknown Total Kill County
Deer Management Zone Antlered Antlerless Unknown Total Kill
Adams Central Farmland 419 834 0 1,253 Ashland Northern Forest 736 12 0 748
Barron Central Farmland 1,895 1,691 0 3,586 Apostle Islands Northern Forest 0 0 0 0
Brown Central Farmland 816 1,032 0 1,848 Bad River Northern Forest 63 1 0 64
Buffalo Central Farmland 1,815 3,361 0 5,176 Madeline Island Northern Forest 44 25 0 69
Calumet Central Farmland 389 583 0 972 Bayfield Northern Forest 2,134 316 0 2,450
Chippewa Central Farmland 1,661 1,034 0 2,695 Burnett Northern Forest 1,816 1,568 0 3,384
Clark Central Farmland 1,481 2,342 0 3,823 Douglas Northern Forest 2,033 445 0 2,478
Door Central Farmland 1,335 1,791 0 3,126 Florence Northern Forest 872 325 0 1,197
Dunn Central Farmland 2,154 3,483 0 5,637 Forest Northern Forest 875 35 0 910
Eau Claire Central Farmland 838 1,293 0 2,131 Iron Northern Forest 318 50 0 368
Fond du Lac Central Farmland 1,192 1,634 0 2,826 Lac Corte Oreilles Northern Forest 15 0 0 15
Green Lake Central Farmland 1,226 2,337 0 3,563 Lac du Flambeau Northern Forest 10 3 0 13
Jackson Central Farmland 1,420 1,808 0 3,228 Langlade Northern Forest 1,415 717 0 2,132
Juneau Central Farmland 828 1,181 0 2,009 Lincoln Northern Forest 1,409 631 0 2,040
Kewaunee Central Farmland 957 1,550 0 2,507 Marinette Northern Forest 2,047 641 0 2,688
La Crosse Central Farmland 1,120 1,650 0 2,770 Menominee Northern Forest 0 1 0 1
Manitowoc Central Farmland 1,161 1,870 0 3,031 Oconto Northern Forest 558 229 0 787
Marathon Central Farmland 3,614 5,113 0 8,727 Oneida Northern Forest 1,413 338 0 1,751
Marinette Central Farmland 1,322 1,819 0 3,141 Price Northern Forest 1,555 713 0 2,268
Marquette Central Farmland 1,796 3,095 0 4,891 Red Cliff Northern Forest 0 0 0 0
MCCoy Central Farmland 224 200 0 424 Rusk Northern Forest 1,837 932 0 2,769
Monroe Central Farmland 1,891 2,832 0 4,723 Sawyer Northern Forest 1,452 51 0 1,503
Oconto Central Farmland 1,861 2,069 0 3,930 Taylor Northern Forest 1,899 1,668 0 3,567
Outagamie Central Farmland 1,165 1,571 0 2,736 Vilas Northern Forest 903 232 0 1,135
Pepin Central Farmland 667 1,390 0 2,057 Washburn Northern Forest 1,593 2,171 0 3,764
Pierce Central Farmland 1,235 2,034 0 3,269 Northern Forest Total 24,997 11,104 0 36,101
Polk Central Farmland 2,652 4,338 0 6,990 Columbia Southern Farmland 2,071 2,578 0 4,649
Portage Central Farmland 1,988 2,678 0 4,666 Crawford Southern Farmland 1,435 2,441 0 3,876
St Croix Central Farmland 1,075 1,622 0 2,697 Dane Southern Farmland 1,220 1,654 0 2,874
Shawano Central Farmland 3,095 4,802 0 7,897 Dodge Southern Farmland 1,351 1,876 0 3,227
Sheboygan Central Farmland 869 1,248 0 2,117 Grant Southern Farmland 2,426 3,406 0 5,832
Trempealeau Central Farmland 1,997 3,071 0 5,068 Green Southern Farmland 810 1,074 0 1,884
Waupaca Central Farmland 3,364 5,908 0 9,272 Iowa Southern Farmland 1,778 2,089 0 3,867
Waushara Central Farmland 1,681 2,201 0 3,882 Jefferson Southern Farmland 719 1,126 0 1,845
Winnebago Central Farmland 628 714 0 1,342 Kenosha Southern Farmland 102 99 0 201
Wood Central Farmland 1,146 1,637 0 2,783 Lafayette Southern Farmland 821 1,210 0 2,031
Central Farmland Total 52,977 77,816 0 130,793 Milwaukee Southern Farmland 34 47 0 81
Adams Central Forest 1,333 1,382 0 2,715 Ozaukee Southern Farmland 264 374 0 638
Clark Central Forest 1,429 974 0 2,403 Racine Southern Farmland 137 150 0 287
Eau Claire Central Forest 377 382 0 759 Richland Southern Farmland 2,009 2,711 0 4,720
Jackson Central Forest 622 108 0 730 Rock Southern Farmland 492 753 0 1,245
Juneau Central Forest 725 392 0 1,117 Sauk Southern Farmland 2,345 3,572 0 5,917
Monroe Central Forest 257 90 0 347 Vernon Southern Farmland 2,410 3,788 0 6,198
Wood Central Forest 607 211 0 818 Walworth Southern Farmland 352 389 0 741
Central Forest Total 5,350 3,539 0 8,889 Washington Southern Farmland 675 1,018 0 1,693
Waukesha Southern Farmland 411 678 0 1,089
Southern Farmland Total 21,862 31,033 0 52,895
Unknown Unknown 0 18 30 48
Unknown Total 0 18 30 48
Grand Total 105,186 123,510 30 228,726

24
Hot-Spot Damage Summaries of Wisconsin’s hot-spot damage deer harvest by deer management zone, and deer management unit in Tables 9 & 10. Table 9. The 2016 damage deer harvest summary by deer management zone.
Deer management zone Antlered Antlerless Unknown Total
Central Farmland 89 2,188 0 2,277
Central Forest 4 126 0 130
Northern Forest 11 475 0 486
Southern Farmland 71 1,152 0 1,223
Unknown 0 18 0 18
Total 175 3,959 0 4,134
Figure 5. The 2016 damage deer harvest by deer management zone.

25
Table 10. Summary of the 2016 damage/nuisance deer harvest by zone and unit.
County
Deer Management Zone Antlered Antlerless Unknown Total Kill County
Deer Management Zone Antlered Antlerless Unknown Total Kill
Adams Central Farmland 0 19 0 19 Bayfield Northern Forest 3 7 0 10
Barron Central Farmland 3 23 0 26 Burnett Northern Forest 0 30 0 30
Brown Central Farmland 19 103 0 122 Douglas Northern Forest 7 31 0 38
Buffalo Central Farmland 0 57 0 57 Florence Northern Forest 0 109 0 109
Calumet Central Farmland 0 5 0 5 Forest Northern Forest 0 15 0 15
Chippewa Central Farmland 1 25 0 26 Iron Northern Forest 0 2 0 2
Clark Central Farmland 0 9 0 9 Langlade Northern Forest 0 26 0 26
Door Central Farmland 6 28 0 34 Lincoln Northern Forest 0 48 0 48
Dunn Central Farmland 1 35 0 36 Oneida Northern Forest 0 20 0 20
Eau Claire Central Farmland 2 9 0 11 Price Northern Forest 0 32 0 32
Fond du Lac Central Farmland 0 21 0 21 Rusk Northern Forest 0 46 0 46
Green Lake Central Farmland 6 221 0 227 Sawyer Northern Forest 0 30 0 30
Jackson Central Farmland 2 62 0 64 Taylor Northern Forest 1 21 0 22
Juneau Central Farmland 0 1 0 1 Vilas Northern Forest 0 25 0 25
Kewaunee Central Farmland 1 12 0 13 Washburn Northern Forest 0 33 0 33
La Crosse Central Farmland 7 69 0 76 Northern Forest Total 11 475 0 486
Manitowoc Central Farmland 0 16 0 16 Columbia Southern Farmland 3 164 0 167
Marathon Central Farmland 0 125 0 125 Crawford Southern Farmland 3 43 0 46
Marinette Central Farmland 0 198 0 198 Dane Southern Farmland 11 55 0 66
Marquette Central Farmland 0 84 0 84 Dodge Southern Farmland 2 14 0 16
MCCoy Central Farmland Grant Southern Farmland 0 140 0 140
Monroe Central Farmland 0 34 0 34 Green Southern Farmland 0 12 0 12
Oconto Central Farmland 1 28 0 29 Iowa Southern Farmland 0 135 0 135
Outagamie Central Farmland 4 180 0 184 Jefferson Southern Farmland 1 14 0 15
Pepin Central Farmland 0 6 0 6 Kenosha Southern Farmland
Pierce Central Farmland 4 5 0 9 Lafayette Southern Farmland 0 20 0 20
Polk Central Farmland 3 100 0 103 Milwaukee Southern Farmland 34 44 0 78
Portage Central Farmland 4 147 0 151 Ozaukee Southern Farmland 0 3 0 3
St Croix Central Farmland 1 13 0 14 Racine Southern Farmland 1 4 0 5
Shawano Central Farmland 6 129 0 135 Richland Southern Farmland 1 117 0 118
Sheboygan Central Farmland 14 12 0 26 Rock Southern Farmland 0 3 0 3
Trempealeau Central Farmland 0 76 0 76 Sauk Southern Farmland 1 88 0 89
Waupaca Central Farmland 4 139 0 143 Vernon Southern Farmland 0 103 0 103
Waushara Central Farmland 0 80 0 80 Walworth Southern Farmland 0 8 0 8
Winnebago Central Farmland 0 33 0 33 Washington Southern Farmland 5 56 0 61
Wood Central Farmland 0 84 0 84 Waukesha Southern Farmland 9 129 0 138
Central Farmland Total 89 2,188 0 2,277 Southern Farmland Total 71 1,152 0 1,223
Adams Central Forest 0 65 0 65 Jackson Unknown 0 5 0 5
Clark Central Forest 0 13 0 13 LaCrosse Unknown 0 7 0 7
Eau Claire Central Forest Monroe Unknown 0 2 0 2
Jackson Central Forest 2 8 0 10 St Croix Unknown 0 2 0 2
Juneau Central Forest 2 9 0 11 Wood Unknown 0 1 0 1
Monroe Central Forest 0 8 0 8 Unknown Unknown 0 1 0 1
Wood Central Forest 0 23 0 23 Unknown Total 0 18 0 18
Central Forest Total 4 126 0 130
Grand Total 175 3,959 0 4,134
26
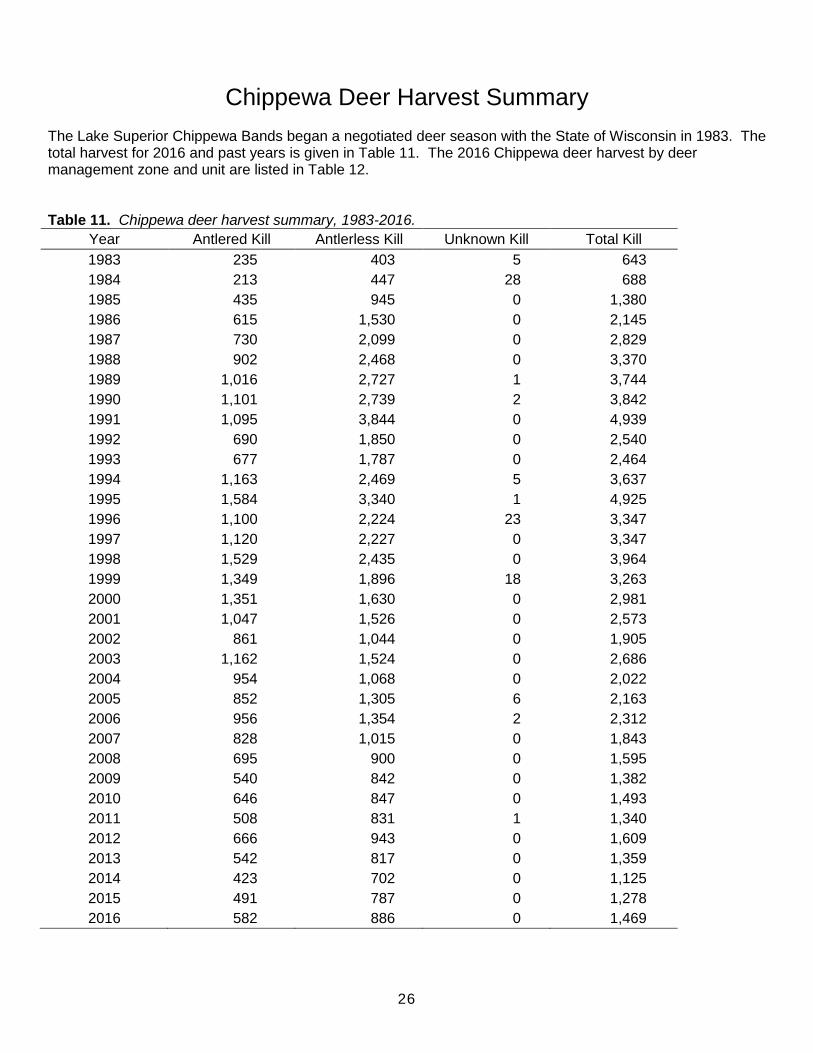
Chippewa Deer Harvest Summary The Lake Superior Chippewa Bands began a negotiated deer season with the State of Wisconsin in 1983. The total harvest for 2016 and past years is given in Table 11. The 2016 Chippewa deer harvest by deer management zone and unit are listed in Table 12. Table 11. Chippewa deer harvest summary, 1983-2016.
Year Antlered Kill Antlerless Kill Unknown Kill Total Kill
1983 235 403 5 643
1984 213 447 28 688
1985 435 945 0 1,380
1986 615 1,530 0 2,145
1987 730 2,099 0 2,829
1988 902 2,468 0 3,370
1989 1,016 2,727 1 3,744
1990 1,101 2,739 2 3,842
1991 1,095 3,844 0 4,939
1992 690 1,850 0 2,540
1993 677 1,787 0 2,464
1994 1,163 2,469 5 3,637
1995 1,584 3,340 1 4,925
1996 1,100 2,224 23 3,347
1997 1,120 2,227 0 3,347
1998 1,529 2,435 0 3,964
1999 1,349 1,896 18 3,263
2000 1,351 1,630 0 2,981
2001 1,047 1,526 0 2,573
2002 861 1,044 0 1,905
2003 1,162 1,524 0 2,686
2004 954 1,068 0 2,022
2005 852 1,305 6 2,163
2006 956 1,354 2 2,312
2007 828 1,015 0 1,843
2008 695 900 0 1,595
2009 540 842 0 1,382
2010 646 847 0 1,493
2011 508 831 1 1,340
2012 666 943 0 1,609
2013 542 817 0 1,359
2014 423 702 0 1,125
2015 491 787 0 1,278
2016 582 886 0 1,469

27
Table 12. Summary of the 2016 Chippewa harvest by deer management zone and unit.
Deer Management Zone County Antlered Antlerless Unknown Total
Northern Forest Ashland 1 0 0 1
Northern Forest Barron 1 1 0 2
Northern Forest Bayfield 139 129 1 269
Northern Forest Burnett 165 204 0 369
Central Farmland Chippewa 2 1 0 3
Northern Forest Douglas 60 85 0 145
Central Forest Eau Claire 1 0 0 1
Northern Forest Florence 2 21 0 23
Northern Forest Forest 22 84 0 106
Northern Forest Iron 4 11 0 15
Northern Forest Langlade 9 11 0 20
Northern Forest Lincoln 0 2 0 2
Northern Forest Marinette 1 13 0 14
Northern Forest Oconto 1 0 0 1
Northern Forest Oneida 21 54 0 75
Central Farmland Polk 10 3 0 13
Northern Forest Price 10 28 0 38
Northern Forest Rusk 5 10 0 15
Northern Forest Sawyer 49 72 0 121
Central Farmland St. Croix 0 1 0 1
Northern Forest Taylor 1 0 0 1
Northern Forest Vilas 51 136 0 187
Northern Forest Washburn 27 19 0 46
Unknown 0 1 0 1
Total
582 886 1 1,469
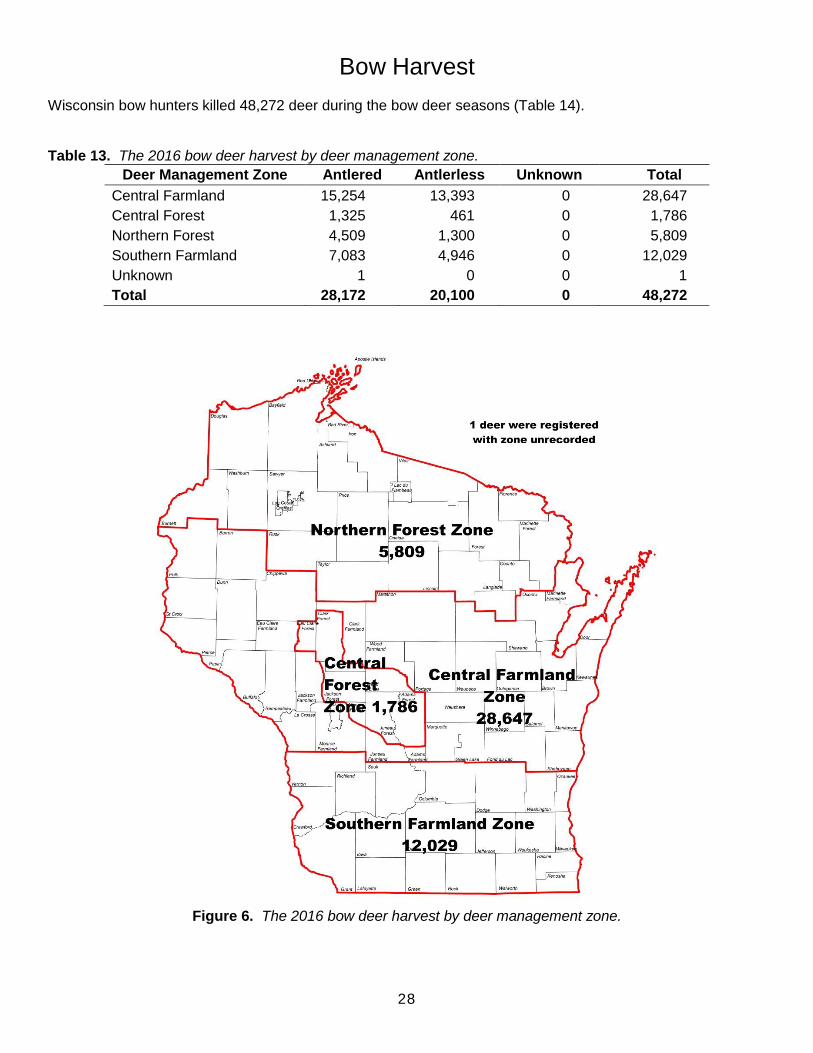
28
Bow Harvest Wisconsin bow hunters killed 48,272 deer during the bow deer seasons (Table 14). Table 13. The 2016 bow deer harvest by deer management zone.
Deer Management Zone Antlered Antlerless Unknown Total
Central Farmland 15,254 13,393 0 28,647
Central Forest 1,325 461 0 1,786
Northern Forest 4,509 1,300 0 5,809
Southern Farmland 7,083 4,946 0 12,029
Unknown 1 0 0 1
Total 28,172 20,100 0 48,272
Figure 6. The 2016 bow deer harvest by deer management zone.

29
Total Bow Harvest = 48,272
Figure 7. The 2016 bow deer harvest by deer management zone and unit.

30
Table 14. Summary of the 2016 bow deer harvest by zone and unit (vertical bow).
County
Deer Management Zone
Bow Antlered
Bow Antlerless
Bow Unknown
Bow Total Kill County
Deer Management Zone
Bow Antlered
Bow Antlerless
Bow Unknown
Bow Total Kill
Adams Central Farmland 110 115 0 225 Ashland Northern Forest 124 0 0 124
Barron Central Farmland 476 267 0 743 Apostle Islands Northern Forest 0 0 0 0
Brown Central Farmland 304 260 0 564 Bad River Northern Forest 4 0 0 4
Buffalo Central Farmland 817 633 0 1,450 Madeline Island Northern Forest 5 7 0 12
Calumet Central Farmland 133 108 0 241 Bayfield Northern Forest 263 11 0 274
Chippewa Central Farmland 545 199 0 744 Burnett Northern Forest 325 258 0 583
Clark Central Farmland 303 329 0 632 Douglas Northern Forest 334 38 0 372
Door Central Farmland 261 277 0 538 Florence Northern Forest 120 16 0 136
Dunn Central Farmland 544 502 0 1,046 Forest Northern Forest 100 2 0 102
Eau Claire Central Farmland 250 284 0 534 Iron Northern Forest 45 2 0 47
Fond du Lac Central Farmland 423 379 0 802 Lac Corte Oreilles Northern Forest 0 0 0 0
Green Lake Central Farmland 365 284 0 649 Lac du Flambeau Northern Forest 0 0 0 0
Jackson Central Farmland 408 312 0 720 Langlade Northern Forest 287 91 0 378
Juneau Central Farmland 224 154 0 378 Lincoln Northern Forest 334 92 0 426
Kewaunee Central Farmland 225 237 0 462 Marinette Northern Forest 363 76 0 439
La Crosse Central Farmland 381 322 0 703 Menominee Northern Forest 1 0 0 1
Manitowoc Central Farmland 392 313 0 705 Oconto Northern Forest 139 30 0 169
Marathon Central Farmland 895 765 0 1,660 Oneida Northern Forest 187 21 0 208
Marinette Central Farmland 228 345 0 573 Price Northern Forest 317 94 0 411
Marquette Central Farmland 499 479 0 978 Red Cliff Northern Forest 0 0 0 0
MCCoy Central Farmland 41 55 0 96 Rusk Northern Forest 415 101 0 516
Monroe Central Farmland 462 446 0 908 Sawyer Northern Forest 317 2 0 319
Oconto Central Farmland 471 377 0 848 Taylor Northern Forest 471 227 0 698
Outagamie Central Farmland 457 431 0 888 Vilas Northern Forest 107 14 0 121
Pepin Central Farmland 180 174 0 354 Washburn Northern Forest 251 218 0 469
Pierce Central Farmland 368 324 0 692 Northern Forest Total 4,509 1,300 0 5,809
Polk Central Farmland 638 565 0 1,203 Columbia Southern Farmland 597 350 0 947
Portage Central Farmland 478 361 0 839 Crawford Southern Farmland 370 187 0 557
St Croix Central Farmland 401 411 0 812 Dane Southern Farmland 507 364 0 871
Shawano Central Farmland 899 975 0 1,874 Dodge Southern Farmland 465 325 0 790
Sheboygan Central Farmland 308 268 0 576 Grant Southern Farmland 565 364 0 929
Trempealeau Central Farmland 679 466 0 1,145 Green Southern Farmland 239 139 0 378
Waupaca Central Farmland 1,018 1,117 0 2,135 Iowa Southern Farmland 486 355 0 841
Waushara Central Farmland 510 379 0 889 Jefferson Southern Farmland 284 218 0 502
Winnebago Central Farmland 275 208 0 483 Kenosha Southern Farmland 60 49 0 109
Wood Central Farmland 286 272 0 558 Lafayette Southern Farmland 200 145 0 345
Central Farmland Total 15,254 13,393 0 28,647 Milwaukee Southern Farmland 31 41 0 72
Adams Central Forest 328 201 0 529 Ozaukee Southern Farmland 164 147 0 311
Clark Central Forest 324 117 0 441 Racine Southern Farmland 81 45 0 126
Eau Claire Central Forest 91 49 0 140 Richland Southern Farmland 545 345 0 890
Jackson Central Forest 165 8 0 173 Rock Southern Farmland 253 171 0 424
Juneau Central Forest 170 54 0 224 Sauk Southern Farmland 666 543 0 1,209
Monroe Central Forest 75 17 0 92 Vernon Southern Farmland 639 374 0 1,013
Wood Central Forest 172 15 0 187 Walworth Southern Farmland 166 118 0 284
Central Forest Total 1,325 461 0 1,786 Washington Southern Farmland 380 344 0 724
Waukesha Southern Farmland 385 322 0 707
Southern Farmland Total 7,083 4,946 0 12,029
Unknown Unknown 1 0 0 1
Unknown Total 1 0 0 1
Grand Total 28,172 20,100 0 48,272

31
Crossbow Harvest Wisconsin crossbow hunters killed 39,776 deer during the crossbow deer seasons (Table 16). Table 15. The 2016 crossbow deer harvest by deer management zone.
Deer Management Zone Antlered Antlerless Unknown Total
Central Farmland 12,426 11,224 0 23,650
Central Forest 1,277 504 0 1,781
Northern Forest 5,823 1,697 0 7,520
Southern Farmland 4,033 2,788 0 6,821
Unknown 3 1 0 4
Total 23,562 16,214 0 39,776
Figure 8. The 2016 crossbow deer harvest by deer management zone.
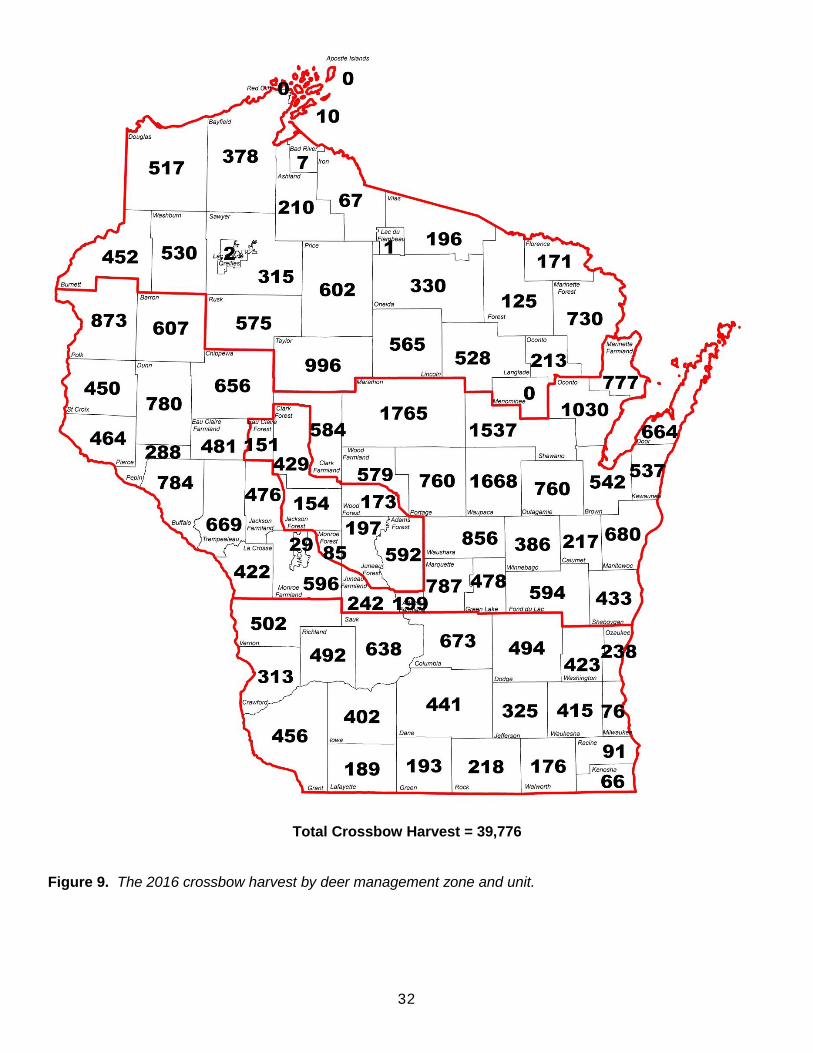
32
Total Crossbow Harvest = 39,776
Figure 9. The 2016 crossbow harvest by deer management zone and unit.

33
Table 16. Summary of the 2016 crossbow deer harvest by zone and unit.
County
Deer Management Zone
XBow Antlered
XBow Antlerless
XBow Unknown
XBow Total Kill County
Deer Management Zone
XBow Antlered
XBow Antlerless
XBow Unknown
XBow Total Kill
Adams Central Farmland 92 107 0 199 Ashland Northern Forest 205 5 0 210
Barron Central Farmland 394 213 0 607 Apostle Islands Northern Forest 0 0 0 0
Brown Central Farmland 276 266 0 542 Bad River Northern Forest 7 0 0 7
Buffalo Central Farmland 426 358 0 784 Madeline Island Northern Forest 6 4 0 10
Calumet Central Farmland 130 87 0 217 Bayfield Northern Forest 349 29 0 378
Chippewa Central Farmland 477 179 0 656 Burnett Northern Forest 283 169 0 452
Clark Central Farmland 273 311 0 584 Douglas Northern Forest 450 67 0 517
Door Central Farmland 304 360 0 664 Florence Northern Forest 159 12 0 171
Dunn Central Farmland 403 377 0 780 Forest Northern Forest 119 6 0 125
Eau Claire Central Farmland 224 257 0 481 Iron Northern Forest 58 9 0 67
Fond du Lac Central Farmland 332 262 0 594 Lac Corte Oreilles Northern Forest 1 1 0 2
Green Lake Central Farmland 260 218 0 478 Lac du Flambeau Northern Forest 1 0 0 1
Jackson Central Farmland 271 205 0 476 Langlade Northern Forest 414 114 0 528
Juneau Central Farmland 120 122 0 242 Lincoln Northern Forest 443 122 0 565
Kewaunee Central Farmland 243 294 0 537 Marinette Northern Forest 579 151 0 730
La Crosse Central Farmland 225 197 0 422 Menominee Northern Forest 0 0 0 0
Manitowoc Central Farmland 339 341 0 680 Oconto Northern Forest 162 51 0 213
Marathon Central Farmland 944 821 0 1,765 Oneida Northern Forest 301 29 0 330
Marinette Central Farmland 329 448 0 777 Price Northern Forest 468 134 0 602
Marquette Central Farmland 435 352 0 787 Red Cliff Northern Forest 0 0 0 0
MCCoy Central Farmland 21 8 0 29 Rusk Northern Forest 460 115 0 575
Monroe Central Farmland 316 280 0 596 Sawyer Northern Forest 312 3 0 315
Oconto Central Farmland 513 517 0 1,030 Taylor Northern Forest 608 388 0 996
Outagamie Central Farmland 395 365 0 760 Vilas Northern Forest 171 25 0 196
Pepin Central Farmland 154 134 0 288 Washburn Northern Forest 267 263 0 530
Pierce Central Farmland 244 220 0 464 Northern Forest Total 5,823 1,697 0 7,520
Polk Central Farmland 454 419 0 873 Columbia Southern Farmland 444 229 0 673
Portage Central Farmland 421 339 0 760 Crawford Southern Farmland 186 127 0 313
St Croix Central Farmland 252 198 0 450 Dane Southern Farmland 261 180 0 441
Shawano Central Farmland 754 783 0 1,537 Dodge Southern Farmland 300 194 0 494
Sheboygan Central Farmland 212 221 0 433 Grant Southern Farmland 289 167 0 456
Trempealeau Central Farmland 414 255 0 669 Green Southern Farmland 115 78 0 193
Waupaca Central Farmland 801 867 0 1,668 Iowa Southern Farmland 245 157 0 402
Waushara Central Farmland 477 379 0 856 Jefferson Southern Farmland 178 147 0 325
Winnebago Central Farmland 222 164 0 386 Kenosha Southern Farmland 38 28 0 66
Wood Central Farmland 279 300 0 579 Lafayette Southern Farmland 115 74 0 189
Central Farmland Total 12,426 11,224 0 23,650 Milwaukee Southern Farmland 27 49 0 76
Adams Central Forest 357 235 0 592 Ozaukee Southern Farmland 118 120 0 238
Clark Central Forest 286 143 0 429 Racine Southern Farmland 59 32 0 91
Eau Claire Central Forest 106 45 0 151 Richland Southern Farmland 304 188 0 492
Jackson Central Forest 146 8 0 154 Rock Southern Farmland 134 84 0 218
Juneau Central Forest 157 40 0 197 Sauk Southern Farmland 386 252 0 638
Monroe Central Forest 74 11 0 85 Vernon Southern Farmland 279 223 0 502
Wood Central Forest 151 22 0 173 Walworth Southern Farmland 99 77 0 176
Central Forest Total 1,277 504 0 1,781 Washington Southern Farmland 209 214 0 423
Waukesha Southern Farmland 247 168 0 415
Southern Farmland Total 4,033 2,788 0 6,821
Unknown Unknown 3 1 0 4
Unknown Total 3 1 0 4
Grand Total 23,562 16,214 0 39,776

34
Table 17. Wisconsin deer harvest and hunters 1966-2016.
Gun Season Bow Season Crossbow Season
Year Antlered Antlerless Total Licensed Hunters Antlered Antlerless Total
Licensed Hunters1 Antlered Antlerless Total
Licensed Hunters2
1966 67,362 42,700 110,062 432,111 1,357 4,629 5,986 85,114 1967 71,032 57,295 128,527 470,782 1,714 5,878 7,592 101,573
1968 62,521 57,465 119,986 503,190 1,924 5,010 6,934 114,975 1969 52,655 45,353 98,008 506,526 1,576 4,411 5,987 106,669 1970 50,308 22,536 72,844 501,799 1,775 4,745 6,520 101,573 1971 48,994 21,841 70,835 509,447 1,696 4,826 6,522 100,206 1972 49,416 25,411 74,827 517,724 1,956 5,131 7,087 98,720 1973 57,364 24,741 82,105 514,626 2,594 5,862 8,456 105,875 1974 67,313 33,092 100,405 556,815 3,390 9,124 12,514 119,960 1975 73,373 44,005 117,378 582,113 4,439 9,149 13,588 133,775 1976 69,510 52,999 122,509 589,590 4,775 8,861 13,636 133,318 1977 82,762 49,148 131,910 617,823 5,993 10,797 16,790 146,760 1978 87,397 63,448 150,845 644,594 6,472 11,641 18,113 157,838 1979 76,550 49,020 125,570 617,109 6,203 9,815 16,018 144,511 1980 81,041 58,583 139,624 618,333 8,950 12,004 20,954 155,386 1981 99,034 67,639 166,673 629,034 11,867 17,216 29,083 173,874 1982 97,534 85,181 182,715 637,320 12,854 17,996 30,850 189,524 1983 96,628 100,672 197,600 649,972 14,208 18,668 32,876 194,367 1984 117,197 138,726 255,726 657,969 17,049 21,842 38,891 205,132 1985 112,701 161,601 274,302 670,329 19,396 21,348 40,744 215,900 1986 117,886 140,882 259,240 662,771 19,126 21,256 40,490 216,472 1987 116,881 133,393 250,530 660,400 21,278 21,253 42,651 208,675 1988 121,536 141,888 263,424 653,790 22,213 20,180 42,393 210,518 1989 139,651 170,282 310,192 661,713 25,249 20,994 46,394 210,912 1990 140,726 209,005 350,040 699,275 26,263 22,860 49,291 216,981 1991 120,009 232,330 352,520 674,422 29,739 37,110 67,097 216,559 1992 111,476 177,245 288,820 666,570 29,992 30,324 60,478 220,872 1993 116,507 100,977 217,584 652,491 30,661 22,274 53,008 224,008 1994 135,574 171,945 307,629 670,776 36,772 29,419 66,254 234,077 1995 171,891 225,846 398,002 684,944 39,379 29,790 69,269 244,262 1996 138,622 250,011 388,791 677,072 33,625 39,224 72,941 235,780 1997 121,050 171,296 292,513 671,706 36,812 30,264 67,115 237,991 1998 151,575 180,601 332,254 668,958 42,010 33,251 75,301 241,391 1999 159,296 242,908 402,204 690,194 45,562 46,641 92,203 252,322 2000 171,753 356,741 528,494 694,712 40,579 46,220 86,799 258,002 2001 141,942 219,322 361,264 688,540 40,867 42,217 83,120 260,239 2002 126,470 191,418 317,888 618,945 29,322 24,831 54,133 227,124 2003 147,436 240,908 388,344 644,818 45,498 50,109 95,607 247,211 2004 133,223 280,571 413,794 649,955 33,635 69,937 103,572 252,602 2005 147,622 239,688 387,310 641,771 35,935 42,515 78,450 247,309 2006 137,278 256,028 393,306 644,906 40,081 73,837 113,918 258,394 2007 133,131 269,432 402,563 641,432 38,011 77,999 116,010 258,854 2008 103,845 248,756 352,601 643,266 34,662 64,622 99,284 266,435 2009 92,754 149,108 241,862 638,842 41,402 45,839 87,241 261,964 2010 106,263 146,775 253,038 622,542 42,115 41,718 83,833 254,014 2011 106,396 151,115 257,511 622,860 44,443 45,757 90,200 255,426 2012 119,469 154,578 274,047 634,821 45,988 48,279 94,267 263,860 2013 102,221 152,782 255,003 634,655 41,517 46,111 87,628 266,380 2014 97,196 125,392 222,588 609,816 30,433 24,377 54,810 232,718 15,768 11,123 26,891 113,506
2015 99,757 122,974 222,731 613,165 31,229 21,775 53,004 227,700 20,594 13,500 34,094 131,293 2016 105,186 123,540 228,726 599,862a 28,172 20,100 48,272 229,880a 23,562 16,214 39,776 149,348a
a Numbers are preliminary 1 Includes bow, conservation patron, and crossbow authorities that purchased bow upgrade 2 Includes crossbow, conservation patron, and bow authorities that purchased crossbow upgrade

35
Figure 10. Total deer harvest by weapon type, 1966-2016.
0
100,000
200,000
300,000
400,000
500,000
600,000
700,000
19
66
19
67
19
68
19
69
19
70
19
71
19
72
19
73
19
74
19
75
19
76
19
77
19
78
19
79
19
80
19
81
19
82
19
83
19
84
19
85
19
86
19
87
19
88
19
89
19
90
19
91
19
92
19
93
19
94
19
95
19
96
19
97
19
98
19
99
20
00
20
01
20
02
20
03
20
04
20
05
20
06
20
07
20
08
20
09
20
10
20
11
20
12
20
13
20
14
20
15
20
16
Kill
Year
Total Kill by Weapon Type 1966-2016
Crossbow Total
Bow Total
Gun Total
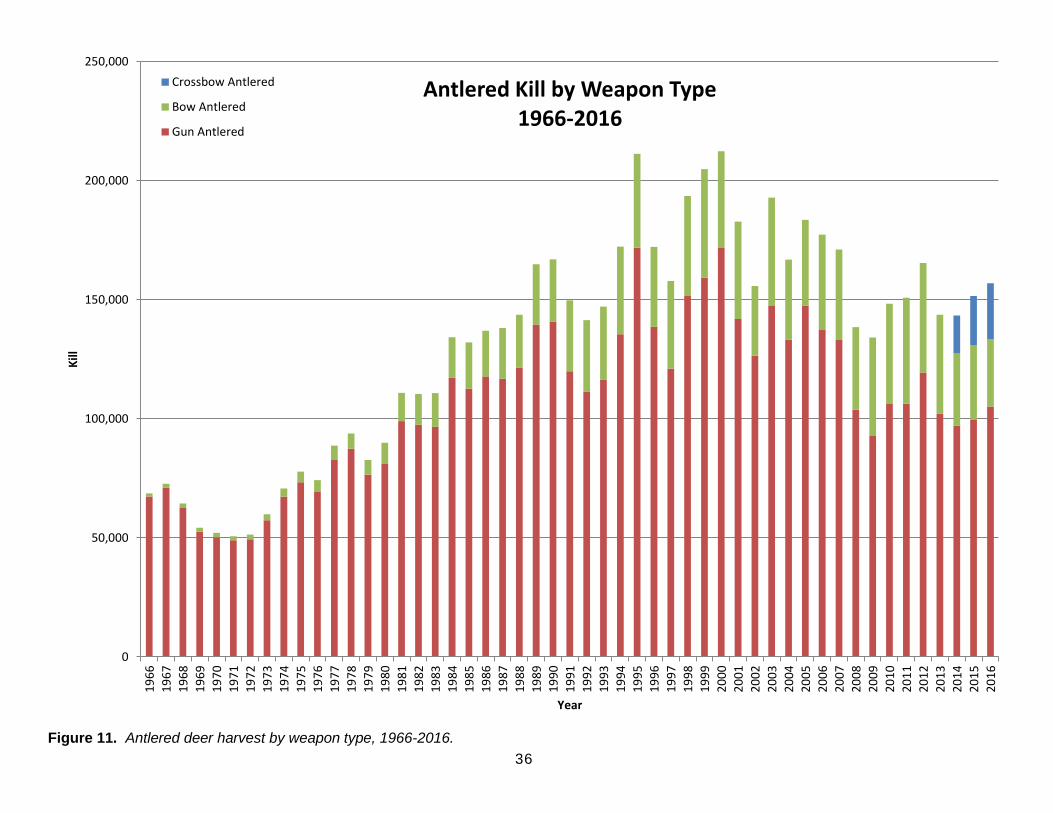
36
Figure 11. Antlered deer harvest by weapon type, 1966-2016.
0
50,000
100,000
150,000
200,000
250,000
19
66
19
67
19
68
19
69
19
70
19
71
19
72
19
73
19
74
19
75
19
76
19
77
19
78
19
79
19
80
19
81
19
82
19
83
19
84
19
85
19
86
19
87
19
88
19
89
19
90
19
91
19
92
19
93
19
94
19
95
19
96
19
97
19
98
19
99
20
00
20
01
20
02
20
03
20
04
20
05
20
06
20
07
20
08
20
09
20
10
20
11
20
12
20
13
20
14
20
15
20
16
Kill
Year
Antlered Kill by Weapon Type 1966-2016
Crossbow Antlered
Bow Antlered
Gun Antlered
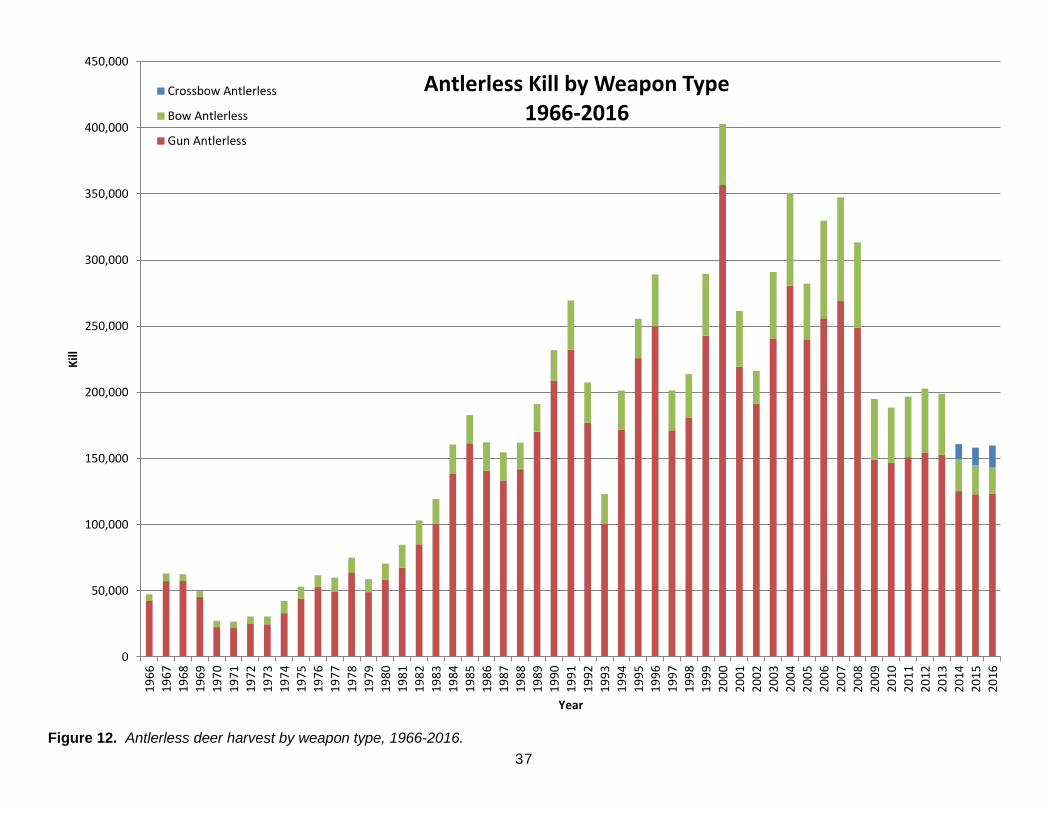
37
Figure 12. Antlerless deer harvest by weapon type, 1966-2016.
0
50,000
100,000
150,000
200,000
250,000
300,000
350,000
400,000
450,000
19
66
19
67
19
68
19
69
19
70
19
71
19
72
19
73
19
74
19
75
19
76
19
77
19
78
19
79
19
80
19
81
19
82
19
83
19
84
19
85
19
86
19
87
19
88
19
89
19
90
19
91
19
92
19
93
19
94
19
95
19
96
19
97
19
98
19
99
20
00
20
01
20
02
20
03
20
04
20
05
20
06
20
07
20
08
20
09
20
10
20
11
20
12
20
13
20
14
20
15
20
16
Kill
Year
Antlerless Kill by Weapon Type 1966-2016
Crossbow Antlerless
Bow Antlerless
Gun Antlerless

38
Hunting Accident Report
By Brenda Von Rueden
Bureau of Law Enforcement
2016 Bow Season, 17 September - 8 January 2016 Crossbow Season, 17 September - 8 January 2016 Youth Deer Season, 8 - 9 October 2016 9-Day Gun Deer Season, 19 - 27 November 2016 Muzzleloader Deer Season, 28 November - 7 December 2016 December Antlerless Only Gun Deer Season, 8 - 11 December 2016 Holiday Hunt Antlerless Only Gun Deer Season, 24 December – 1 January Table 18. The 9-day gun deer season accident summary by DNR region.
DNR Region Fatal Non-Fatal Total
Central Farmland 0 0 0
Central Forest 0 0 0
Northern Forest 0 3 3
Southern Farmland 0 2 2
Total 0 5 5
Table 19. The bow, crossbow, muzzleloader, December antlerless only, and holiday hunt deer seasons accident summary by DNR region.
DNR Region Fatal Non-Fatal Total
Central Farmland 0 0 0
Central Forest 0 0 0
Northern Forest 0 0 0
Southern Farmland 0 0 0
Total 0 0 0
2 accidents (40%) were a result of hunters shooting themselves.
2 accidents (40%) involved victim and shooter being members of the same hunting party.
No accidents occurred outside the 9-day gun deer season.
No fatal accidents occurred in 2016.
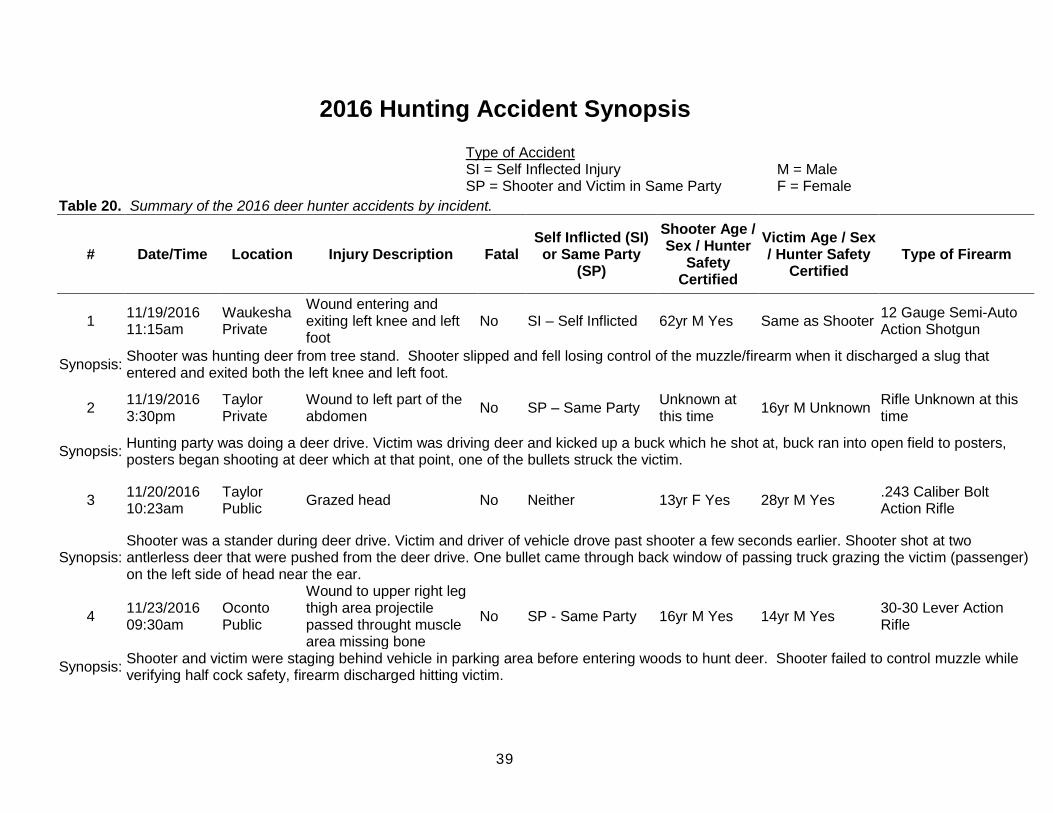
39
2016 Hunting Accident Synopsis Type of Accident SI = Self Inflected Injury M = Male SP = Shooter and Victim in Same Party F = Female
Table 20. Summary of the 2016 deer hunter accidents by incident.
# Date/Time Location Injury Description Fatal Self Inflicted (SI) or Same Party
(SP)
Shooter Age / Sex / Hunter
Safety Certified
Victim Age / Sex / Hunter Safety
Certified Type of Firearm
1 11/19/2016 11:15am
Waukesha Private
Wound entering and exiting left knee and left foot
No SI – Self Inflicted 62yr M Yes Same as Shooter 12 Gauge Semi-Auto Action Shotgun
Synopsis: Shooter was hunting deer from tree stand. Shooter slipped and fell losing control of the muzzle/firearm when it discharged a slug that entered and exited both the left knee and left foot.
2 11/19/2016 3:30pm
Taylor Private
Wound to left part of the abdomen
No SP – Same Party Unknown at this time
16yr M Unknown Rifle Unknown at this time
Synopsis: Hunting party was doing a deer drive. Victim was driving deer and kicked up a buck which he shot at, buck ran into open field to posters, posters began shooting at deer which at that point, one of the bullets struck the victim.
3 11/20/2016 10:23am
Taylor Public
Grazed head No Neither 13yr F Yes 28yr M Yes .243 Caliber Bolt Action Rifle
Synopsis: Shooter was a stander during deer drive. Victim and driver of vehicle drove past shooter a few seconds earlier. Shooter shot at two antlerless deer that were pushed from the deer drive. One bullet came through back window of passing truck grazing the victim (passenger) on the left side of head near the ear.
4 11/23/2016 09:30am
Oconto Public
Wound to upper right leg thigh area projectile passed throught muscle area missing bone
No SP - Same Party 16yr M Yes 14yr M Yes 30-30 Lever Action Rifle
Synopsis: Shooter and victim were staging behind vehicle in parking area before entering woods to hunt deer. Shooter failed to control muzzle while verifying half cock safety, firearm discharged hitting victim.

40
Table 20. Summary of the 2016 deer hunter accidents by incident.
# Date/Time Location Injury Description Fatal Self Inflicted (SI) or Same Party
(SP)
Shooter Age / Sex / Hunter
Safety Certified
Victim Age / Sex / Hunter Safety
Certified Type of Firearm
5 11/24/2016 02:30pm
Ozaukee Private
Slug entered through the inside of left foot and exited through the back of heel
No SI – Self Inflicted 15yr M Yes Same as Shooter 12 gauge semi-auto action shotgun
Synopsis: Victim was hunting deer in tower stand. Victim wanted to reposition and while moving the firearm it discharged hitting victim in foot.
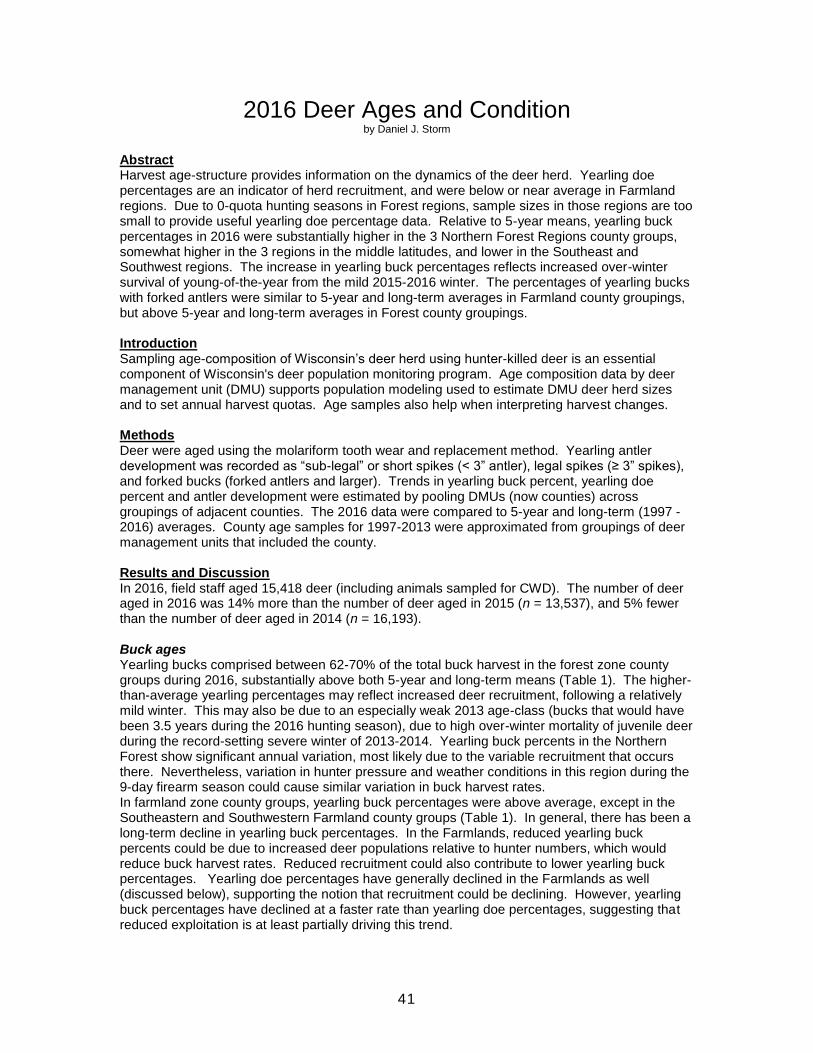
41
2016 Deer Ages and Condition
by Daniel J. Storm
Abstract Harvest age-structure provides information on the dynamics of the deer herd. Yearling doe percentages are an indicator of herd recruitment, and were below or near average in Farmland regions. Due to 0-quota hunting seasons in Forest regions, sample sizes in those regions are too small to provide useful yearling doe percentage data. Relative to 5-year means, yearling buck percentages in 2016 were substantially higher in the 3 Northern Forest Regions county groups, somewhat higher in the 3 regions in the middle latitudes, and lower in the Southeast and Southwest regions. The increase in yearling buck percentages reflects increased over-winter survival of young-of-the-year from the mild 2015-2016 winter. The percentages of yearling bucks with forked antlers were similar to 5-year and long-term averages in Farmland county groupings, but above 5-year and long-term averages in Forest county groupings. Introduction Sampling age-composition of Wisconsin’s deer herd using hunter-killed deer is an essential component of Wisconsin's deer population monitoring program. Age composition data by deer management unit (DMU) supports population modeling used to estimate DMU deer herd sizes and to set annual harvest quotas. Age samples also help when interpreting harvest changes. Methods Deer were aged using the molariform tooth wear and replacement method. Yearling antler development was recorded as “sub-legal” or short spikes (< 3” antler), legal spikes (≥ 3” spikes), and forked bucks (forked antlers and larger). Trends in yearling buck percent, yearling doe percent and antler development were estimated by pooling DMUs (now counties) across groupings of adjacent counties. The 2016 data were compared to 5-year and long-term (1997 -2016) averages. County age samples for 1997-2013 were approximated from groupings of deer management units that included the county. Results and Discussion In 2016, field staff aged 15,418 deer (including animals sampled for CWD). The number of deer aged in 2016 was 14% more than the number of deer aged in 2015 (n = 13,537), and 5% fewer than the number of deer aged in 2014 (n = 16,193). Buck ages Yearling bucks comprised between 62-70% of the total buck harvest in the forest zone county groups during 2016, substantially above both 5-year and long-term means (Table 1). The higher-than-average yearling percentages may reflect increased deer recruitment, following a relatively mild winter. This may also be due to an especially weak 2013 age-class (bucks that would have been 3.5 years during the 2016 hunting season), due to high over-winter mortality of juvenile deer during the record-setting severe winter of 2013-2014. Yearling buck percents in the Northern Forest show significant annual variation, most likely due to the variable recruitment that occurs there. Nevertheless, variation in hunter pressure and weather conditions in this region during the 9-day firearm season could cause similar variation in buck harvest rates. In farmland zone county groups, yearling buck percentages were above average, except in the Southeastern and Southwestern Farmland county groups (Table 1). In general, there has been a long-term decline in yearling buck percentages. In the Farmlands, reduced yearling buck percents could be due to increased deer populations relative to hunter numbers, which would reduce buck harvest rates. Reduced recruitment could also contribute to lower yearling buck percentages. Yearling doe percentages have generally declined in the Farmlands as well (discussed below), supporting the notion that recruitment could be declining. However, yearling buck percentages have declined at a faster rate than yearling doe percentages, suggesting that reduced exploitation is at least partially driving this trend.

42
Table 1. Regional trends in percent yearling bucks in the buck harvest, 2012-2016.
Yearling Buck Percentages Percent
2016 is off 5-yr. Mean
Region 5 Year Mean (%)
Long-term Mean (%)
2012 2013 2014 2015 2016
Northwest Forest 51 53 50 55 45 53 60 18
Northcentral Forest 53 53 56 53 49 55 65 22
Northeast Forest 56 62 64 51 48 63 70 24
Central Forest 57 56 60 58 49 59 62 10
Central Farmland 54 59 56 56 47 58 61 12
Lake Michigan Farmland 56 62 56 60 54 56 62 10
Western Farmland 54 57 56 53 48 59 58 8
Southeastern Farmland 53 54 50 55 56 53 48 -10
Southwestern Farmland 41 47 42 42 38 43 39 -5
*1997-2016 Doe ages Yearling doe percentage data was inadequate to make inferences in the forest zones and the Lake Michigan Farmland zone, due to low numbers of antlerless deer aged there. Yearling doe percentages in farmland zone county groups have declined over time (Table 2). Long-term decreases in yearling doe percentages across the farmland regions may be attributed to decreased reproduction and survival to 1 year of age resulting from a legacy of past high deer populations and over-browsed woodlands and reduced nutrition. Predator populations may play a role in these changes; however, our research using collared deer shows that predation increases when deer are in poor nutritional condition. Table 2. Regional trends in percent yearling does in the doe harvest, 2010-2016.
Yearling Doe Percentages Percent
2016 is off 5-yr. Mean
Region 5 Year Mean (%)
Long-term Mean (%)
2012 2013 2014 2015 2016
Northwest Forest† 30 28 27 24 40 28 30 1
Northcentral Forest† 22 27 27 25 13 23 27 22
Northeast Forest† 25 27 32 19 21 27 31 25
Central Forest† 30 29 29 29 25 36 35 18
Central Farmland 31 34 33 32 30 30 29 -7
Lake Michigan Farmland† 35 38 37 38 35 30 29 -17
Western Farmland 33 35 32 30 33 36 32 -2
Southeastern Farmland 35 36 34 39 34 35 31 -13
Southwestern Farmland 28 32 30 27 28 29 29 2
*1997-2016 †Sample size inadequate to interpret
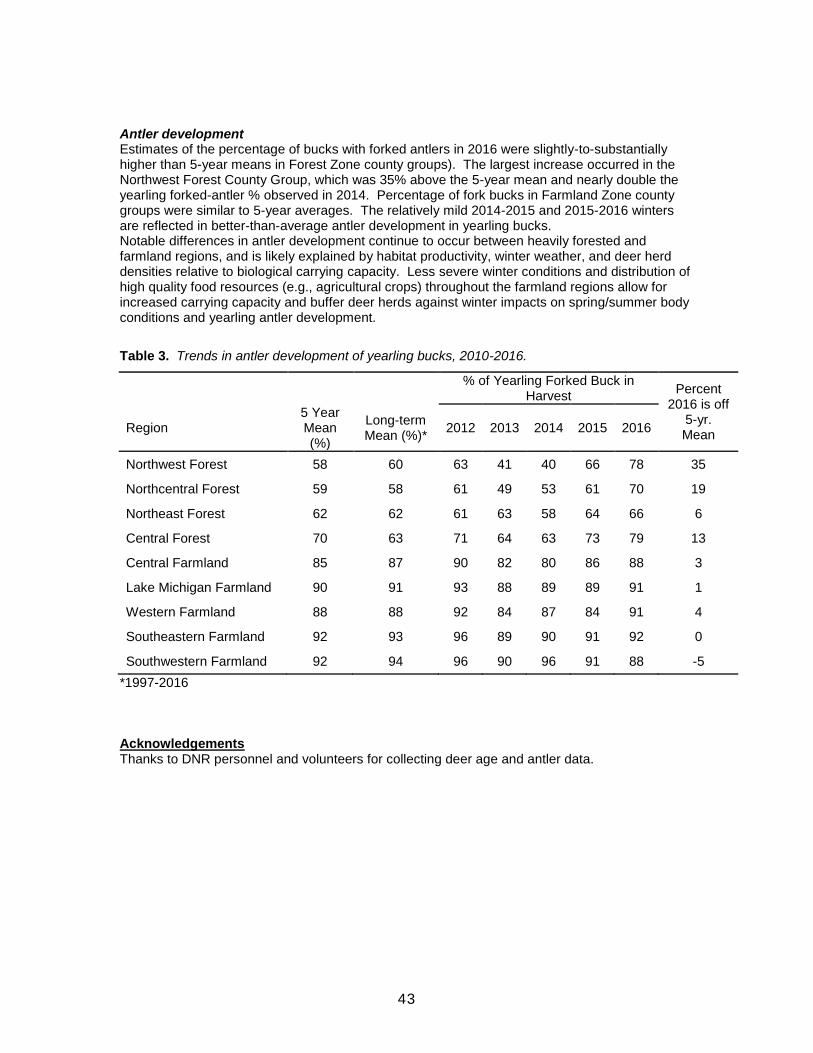
43
Antler development Estimates of the percentage of bucks with forked antlers in 2016 were slightly-to-substantially higher than 5-year means in Forest Zone county groups). The largest increase occurred in the Northwest Forest County Group, which was 35% above the 5-year mean and nearly double the yearling forked-antler % observed in 2014. Percentage of fork bucks in Farmland Zone county groups were similar to 5-year averages. The relatively mild 2014-2015 and 2015-2016 winters are reflected in better-than-average antler development in yearling bucks. Notable differences in antler development continue to occur between heavily forested and farmland regions, and is likely explained by habitat productivity, winter weather, and deer herd densities relative to biological carrying capacity. Less severe winter conditions and distribution of high quality food resources (e.g., agricultural crops) throughout the farmland regions allow for increased carrying capacity and buffer deer herds against winter impacts on spring/summer body conditions and yearling antler development.
Table 3. Trends in antler development of yearling bucks, 2010-2016.
% of Yearling Forked Buck in
Harvest Percent
2016 is off 5-yr. Mean
Region 5 Year Mean (%)
Long-term Mean (%)*
2012 2013 2014 2015 2016
Northwest Forest 58 60 63 41 40 66 78 35
Northcentral Forest 59 58 61 49 53 61 70 19
Northeast Forest 62 62 61 63 58 64 66 6
Central Forest 70 63 71 64 63 73 79 13
Central Farmland 85 87 90 82 80 86 88 3
Lake Michigan Farmland 90 91 93 88 89 89 91 1
Western Farmland 88 88 92 84 87 84 91 4
Southeastern Farmland 92 93 96 89 90 91 92 0
Southwestern Farmland 92 94 96 90 96 91 88 -5
*1997-2016 Acknowledgements Thanks to DNR personnel and volunteers for collecting deer age and antler data.

44
Figure 1. The number of adult bucks aged, 1959–2016.
Figure 2. The number of adult does aged, 1960–2016.

45
Wisconsin Black Bear Harvest Report 2016
By Brian Dhuey, Dave MacFarland and Brad Koele
Abstract Wisconsin bear hunters killed 4,682 black bears during the 2016 season. This was 11.5% higher than the 2015 kill of 4,198 bears. The 2016 kill was comprised of 49% males and 51% females. The three leading counties of kill were Bayfield, Washburn, and Douglas. Background Wisconsin requires non-Chippewa hunters to obtain a bear harvest permit to kill a bear. The state is divided into four Bear Management Zones (BMZ, Figure 1), and hunters are required to apply for a permit within one of those zones. Kill permits are distributed through a preference point system giving unsuccessful applicants who applied, but did not receive a permit in previous years, the first chance to receive a kill permit the following year. Each kill permit allows the taking of one adult bear not accompanied by a cub or cubs in the specified zone. Wisconsin’s bear season has opened on the first Wednesday after Labor Day since the 2000 season. The 2016 bear season ran from 7 September through 11 October (35 days). In the northern 1/3rd of the state (BMZ A, B and D), hunting with the use of bait was allowed 7 September- 4 October while the use of dogs was allowed during 14 September – 11 October. Hunters in the southern 2/3rds of the state (BMZ C) could hunt the entire 35-day season with the use of bait and all methods not utilizing dogs. Methods Wisconsin requires non-Chippewa bear hunters to register all bear. Historically, bear were registered at designated DNR registration stations. Electronic registration of bear began in 2015 and continued again this year; all bear were registered through an automated telephone system or through the DNR registrations website. To complete legal registration, all hunters were required to submit via mail an upper first premolar for age analysis. Data on bear harvested by Chippewa tribal members on ceded lands were obtained from the Great Lakes Indian Fish and Wildlife Commission (GLIFWC). All kill data is summarized using the Statistical Analysis System (SAS). Results A total of 109,221 people applied for a record 11,520 black bear harvest permits in 2016. The number of applicants increased by 0.1% and the number of permits increased 7.8% between 2015 and 2016 (Tables 1 and 10). A total of 11,520 permits were offered to hunters prior to the season. A statewide tetracycline mark-recapture study in 2006 and 2011 resulted in an increased population estimate from previous population estimates for the state. While bear numbers have dropped in parts of the state, the bear population has not declined in response to management actions taken in the Northwest area of the state (Zone D). Quota and permits have remained high in these areas.

46
During the 2016 season, 11,520 hunters killed 4,682 black bears (40.6% success rate), compared to 4,198 taken in 2015. Males comprised 49.3% (2,310), females 50.6% (2,371) of the harvest (Table 2, Figure 2). The Northern Region had the highest bear kill (3,643) followed by Northeast (532), and West Central (507, Table 2). The most bears were shot in Zone D (1,624) followed by Zones A (1,141), C (1,067), and B (850) (Table 3 and Figure 1). The five leading counties of kill were Bayfield (488), Washburn (291), Douglas (285), Price (283), and Rusk (279) (Table 4, Fig. 3). Black bear kill by game management unit can be found in Table 5 and Figure 4. This was the second year that bear hunters could register their kills without having to visit an in-person registration station. Many hunters still left the game management unit of harvest blank. This year’s harvest was the second highest in the history of the state. The number of bear taken over bait alone (3,464; Table 6) was greater than the number shot over dogs (1,060; includes bear shot over dogs and bait). One hundred twelve bear were taken without the use of dogs or bait. Gun hunters took a total of 3,874 bear, while archers killed 594; 169 bear were killed with a crossbow (Table 6). Table 7 and Figure 5 summarize the historical Wisconsin black bear kill from 1957 through 2016. Chippewa hunters killed 45 bear in 2016 (Tables 8 and 9); this was five more than the 40 killed in 2015. More information on the Chippewa bear kill can be obtained by contacting the Great Lakes Indian Fish and Wildlife Commission (GLIFWC), P.O. Box 9, Odanah, WI 54861. A total of 790 black bear complaints were filed from January-December 2016. This was slightly less than the number of complaints (825) filed in 2015. As a result, 585 bear were captured and relocated from problem areas. This was more than the 519 that were moved in 2015. Five nuisance bear shooting permits and forty-seven agricultural damage bear shooting permits were issued in twelve different counties during the spring, summer, and fall of 2016. Three hundred twenty eight kill tags were issued to these permit holders, tag numbers ranged from 1 to 11 for each permit. One hundred eighteen bear were killed under the agriculture damage shooting permits. No bear were killed on nuisance permits in 2016. In addition to agriculture damage and nuisance permits issued in 2016, seventy-five tags were issued with fourteen bear harvested under a 2-year pilot project focused on reducing bear conflicts around the Village of Grantsburg in Burnett County. The pilot project will be conducted in 2016 and 2017. In 2015, thirty agriculture damage bear shooting permits were issued with at least sixty-five bear being killed. One nuisance bear shooting permit was issued in 2015 with no bear being killed under that permit. The Wisconsin corn crop was at or ahead of normal crop development in 2016. This meant that most areas had corn that was past the milk stage prior to the bear season opening. As is usual, a predominance of natural foods during the first part of the bear hunting season may have caused bears to visit bait sites with less regularity and/or reduced bear movements. Despite the abundance of natural foods, bait stations continued to be visited by bears with at least some degree of activity throughout much of the hunting season. Much of September saw above average temperatures and precipitation through much of the season. Warm and wet conditions may have limited

47
hunter efforts and bear movements, especially early in the season. Later in the season temperatures and precipitation events were more conducive to hunters pursuing bears. The 2016 bear kill of 4,682 was the second highest on record but below the DNR harvest goal of 4,750 bears. Hunter success in 2016 was 41%, below the long-term average of 54%. The DNR Black Bear Advisory Committee, with support from GLIFWC, USFS, Wisconsin Bear Hunters Association, Wisconsin Wildlife Federation, and the Wisconsin Conservation Congress established a harvest goal of 5,000 bears for the 2017 season. A total of 12,850 Black Bear harvest permits will be available to hunters to achieve this goal. Table 1. Harvest goal, number of permits issued, bear kill and percent success, by zone for the 2016 black bear season.
Zone
Harvest Goal
Permits Issued
Black Bear Kill
% of Quota
A 1,000 1,655 1,141 114.1%
B 850 1,195 850 100.0%
C 1,300 6,190 1,067 82.1%
D 1,600 2,480 1,624 101.5%
Unknown
Total 4,750 11,520 4,682 98.6%
Table 2. Black bear kill by DNR region, 2016.
Region Males Females Unreported Total
Northeastern 272 260 0 532
Northern 1,776 1,866 1 3,643
West Central 262 245 0 507
Unknown 0 0 0 0
Total 2,310 2,371 1 4,682
Table 3. Black bear kill by zone, 2016.
Zone Males Females Unreported Total
A 592 549 0 1,141
B 364 485 1 850
C 565 502 0 1,067
D 789 835 0 1,642
Unknown 0 0 0 0
Total 2,310 2,371 1 4,682
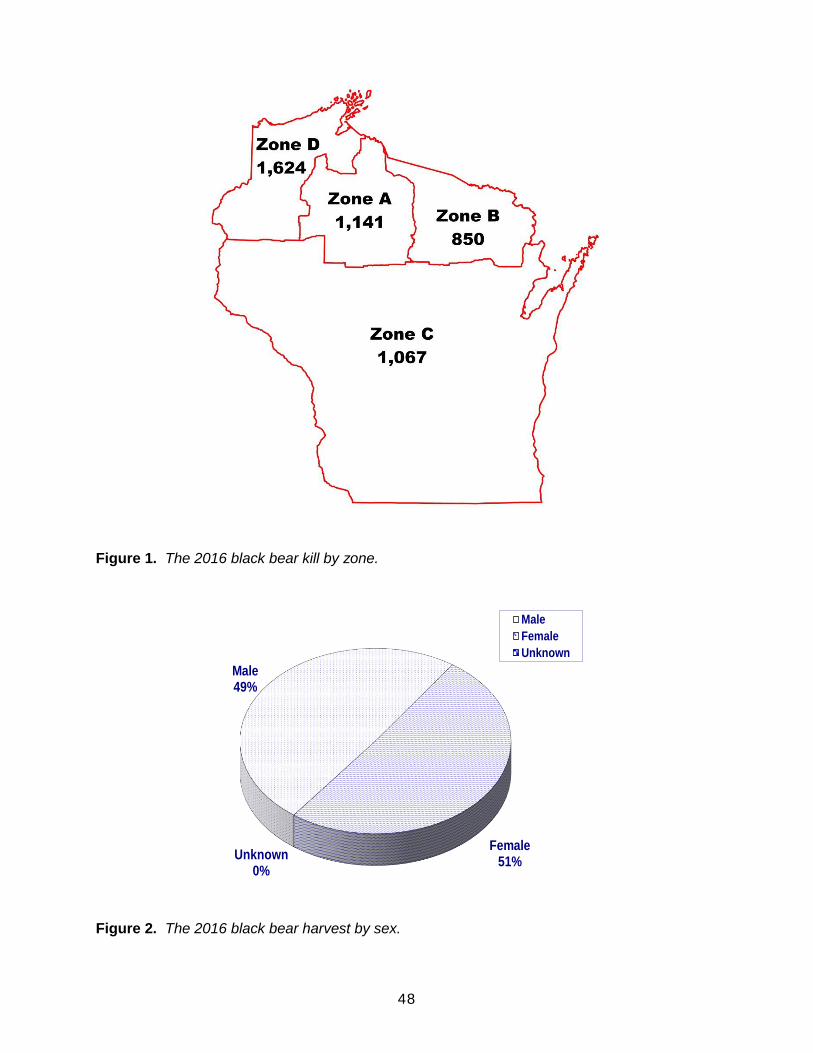
48
Figure 1. The 2016 black bear kill by zone. Figure 2. The 2016 black bear harvest by sex.
Male49%
Female51%
Unknown0%
Male
Female
Unknown

49
Figure 3. The 2016 black bear kill by county. Table 4. The 2016 black bear kill by county and sex.
County Males Females Un-
reported Total
Adams 1 0 0 1 Ashland 135 107 0 242 Barron 76 62 0 138 Bayfield 236 252 0 488 Brown 1 0 0 1 Buffalo 2 0 0 2 Burnett 91 108 0 199 Chippewa 60 64 0 124 Clark 26 46 0 72 Douglas 136 149 0 285 Dunn 21 18 0 39 Eau Claire 10 25 0 35 Florence 41 67 0 108 Forest 69 74 0 143 Iron 50 38 0 88 Jackson 38 24 0 62 Juneau 7 3 0 10 Langlade 89 119 0 208 Lincoln 70 66 0 136 Marathon 57 47 0 104 Marinette 126 115 0 241 Monroe 2 2 0 4
County Males Females Un-
reported Total
Oconto 98 107 0 205 Oneida 54 74 0 128 Outagamie 1 0 0 1 Pepin 3 2 0 5 Pierce 0 1 0 1 Polk 60 66 0 126 Portage 6 1 0 7 Price 138 145 0 283 Rusk 141 138 0 279 St. Croix 15 1 0 16 Sawyer 123 134 0 257 Shawano 41 36 0 77 Taylor 82 57 0 139 Trempealeau 4 1 0 5 Vilas 51 52 1 104 Washburn 134 157 0 291 Waupaca 5 2 0 7 Waushara 0 1 0 1 Wood 10 10 0 20 Total 2,310 2,371 1 4,682

50
Figure 4. The 2016 black bear kill by game management unit.

51
Table 5. The 2016 black bear harvest by game management unit and sex.
Unit Males Females Unks Total
Unit Males Females Unks Total
1 22 12 0 34
40 25 45 0 70 01M 3 2 0 5 41 11 14 0 25
2 90 89 0 179
42 27 33 0 60
3 85 116 0 201
43 50 54 0 104
4 32 30 0 62
44 53 50 0 103
5 1 0 0 1 45 37 55 0 92
6 83 71 0 154
46 27 24 0 51
7 49 26 0 75
47 35 36 0 71 8 55 56 0 111
48 0 1 0 1
9 49 67 0 116
49A 19 40 0 59
10 24 36 0 60
49B 29 21 0 50
11 42 43 0 85
50 28 29 0 57
12 49 74 0 123
51A 28 14 0 42
13 75 85 0 160
51B 53 43 0 96
14 27 17 0 44
52 14 26 0 40
15 41 47 0 88
52A 0 1 0 1
16 45 45 0 90
53 5 6 0 11
17 25 35 0 60
54A 2 1 0 3
18 68 52 0 120
55 27 29 0 56
19 45 45 0 90
56 5 4 0 9 20 49 36 0 85
57 7 5 0 12
21 18 11 0 29
57A 6 5 0 11
22 41 43 0 84
57B 7 1 0 8
22A 30 21 0 51
57C 1 1 0 2
23 61 66 0 127
57D 0 1 0 1
23A 3 0 0 3
58 13 37 0 50
24 25 25 0 50
59A 33 31 0 64
25 51 77 0 128
59B 7 12 0 19
26 39 29 0 68
59C 22 12 0 34
27 23 26 0 49
60B 6 0 0 6
28 56 52 0 108
60M 2 0 0 2
29A 21 13 0 34
61 4 0 0 4 29B 12 11 0 23
61C 1 0 0 1
30 29 27 0 56
62A 6 6 0 12
31 34 31 0 65
62B 10 7 0 17
32 45 25 0 70
63A 2 1 0 3
33 33 23 0 56
63B 9 8 0 17
34 10 7 0 17
65A 1 2 0 3
35 22 25 0 47
72 0 2 0 2
36 15 19 0 34
78 3 3 0 6
37 10 23 0 33
79 2 1 0 3
38 19 24 0 43
Unknown 97 108 1 206
39 40 40 0 80 Total 2,310 2,371 1 4,682

52
Table 6. The 2016 black bear kill by hunting method and weapon type (does not include Chippewa harvest of 45 bear).
Weapon Method Bow Crossbow Gun Total
Dogs 10 2 663 675
Bait 569 162 2,733 3,464
Dogs and Bait 10 5 370 385
None 5 0 107 112
Unknown 0 0 1 1
Total 594 169 3,874 4,637
Figure 5. Black bear kill, 1957-2016.

53
Table 7. Black bear kill by sex, 1957-2016.Year Male Female Unk Total
1957 --- --- 460 1958 --- --- 811
1959 --- --- 665
1960 --- --- 675
1961 --- --- 337
1962 ---- --- 617
1963 --- --- 579
1964 --- --- 511
1965 --- --- 308
1966 --- --- 475
1967 --- --- 541
1968 --- --- 613
1969 --- --- 752
1970 331 341 672
1971 444 347 791
1972 --- --- 878
1973 376 230 606
1974 224 166 390
1975 344 195 539
1976 373 206 579
1977 375 256 631
1978 426 436 10 872
1979 449 288 737
1980 469 386 855
1981 624 610 1,234
1982 797 636 1,433
1983 539 395 934
1984 617 480 1,097
1985 No Season
1986 308 195 503
1987 533 304 837
1988 601 494 30 1,125
1989 584 375 19 978
1990 705 501 41 1,247
1991 715 480 24 1,219
1992 789 631 54 1,474
1993 715 494 49 1,258
1994 781 513 34 1,328
1995 953 735 49 1,737
1996 1,288 955 82 2,325
1997 1,165 950 63 2,178
1998 1,727 1,378 79 3,184
1999 1,456 1,301 124 2,881
2000 1,543 1,376 156 3,075
2001 1,632 1,336 18 2,986
2002 1,290 1,143 38 2,471
2003 1,613 1,288 4 2,905
2004 1,618 1,433 12 3,063
2005 1,537 1,107 1 2,645
2006 1,615 1,448 5 3,068
2007 1,528 1,261 8 2,797
Year Male Female Unk Total
2008 1,616 1,324 15 2,955
2009 2,135 1,828 46 4,009
2010 2,519 2,602 12 5,133
2011 2,171 2,047 39 4,257
2012 2,287 2,275 84 4,646
2013 2,005 1,888 59 3,952
2014 2,255 2,210 61 4,526
2015 2,198 2,000 0 4,198
2016 2,310 2,371 1 4,682

54
Table 8. The 2016 Tribal black bear kill by game management unit and sex1.
Unit Male Female Unknowns Total
01 1 0 0 1
02 2 1 0 3
03 5 2 0 7
04 1 0 0 1
05 1 0 0 1
06 2 0 0 2
08 0 1 0 1
10 0 1 0 1
11 1 2 0 3
12 1 0 0 1
14 0 1 0 1
15 0 1 0 1
26 2 0 0 2
29B 1 0 0 1
30 1 0 0 1
36 1 1 0 2
37 1 2 0 3
38 1 1 0 2
40 1 0 0 1
43 1 1 0 2
44 1 3 0 4
45 1 2 0 3
Unknown 0 0 1 1
Total 25 19 1 45 1 These data are included in the statewide totals.

55
Table 9. The number of black bear harvest permits issued and the number of applicants, 1974-2017.
Year
Residents
Non-residents
No. Permits Issued
No. of Applicants
1974 3,459 3,459 3,459 1975 4,116 4,116 4,116
1976 4,899 4,899 4,899
1977 5,025 5,025 5,025
1978 6,283 6,283 6,283
1979 5,612 179 5,791 5,791
1980 6,352 171 6,523 6,523
1981 7,247 241 7,488 7,488 1982 8,142 224 8,366 8,366
1983 7,077 218 7,295 7,295
1984 6,439 320 6,759 6,759
1985 Season Closed
1986 840 8,289
1987 1,730 10,203
1988 1,663 10,208
1989 2,020 13,734
1990 2,825 15,988
1991 2,560 17,668
1992 2,620 19,415
1993 2,110 22,555 1994 2,175 25,799
1995 2,710 30,086
1996 4,570 35,356
1997 4,700 41,969
1998 5,860 44,928
1999 6,014 50,938
2000 6,598 50,601
2001 5,681 53,508
2002 4,985 54,879
2003 4,710 56,944
2004 4,741 61,726
2005 4,549 66,777 2006 4,277 68,821
2007 4,405 80,213
2008 4,660 86,138
2009 7,310 95,384
2010 8,910 97,467
2011 9,005 103,854
2012 9,015 104,391
2013 8,560 106,573
2014 10,340 108,271
2015 10,690 109,088
2016 11,520 109,221
2017 12,850 112,9931
1 Preliminary data
56
Spring Turkey Harvest Report
2016 By Brian Dhuey and Mark Witecha
Abstract A total of 45,501 turkeys were harvested during the 2016 spring turkey hunt. The spring season was comprised of 6 hunting periods in 7 turkey management zones, and Fort McCoy. The uncorrected success rate for permit holders was 21%, based on a total of 212,772 permits issued. Hunter success rates of 20% or above occurred in 4 of the 7 major hunting zones. Highest success rates per hunting period occurred in the first period of the season. Eighty-three percent of the harvested males were adults, up from 80% in the 2015 harvest. Two hunting incidents occurred during the spring season; in both incidents the shooter and victim were in the same hunting party, and one of the incidents was fatal. Methods Harvest information was obtained through mandatory registration of harvested turkeys. All turkey hunters are required to register their bird by 5:00pm the day after harvest via phone-in registration or via the DNR website. All registered birds are given a confirmation number which the hunter must retain until the bird is consumed. Registration records were then compiled and summarized using the Statistical Analysis System (SAS). Results Hunting Zones Wisconsin is divided into 7 Turkey Management Zones (TMZ) with similar timber, agriculture, ownership, and hunter and turkey densities (Figure 1). State parks were no longer separate management zones within the larger turkey management zone. Starting in 2015 all state parks in a turkey zone were open to all hunters who possessed a valid turkey tag for that zone and time period. Fort McCoy still allowed limited access for turkey hunting on the military base. Permit Levels Permit levels in each zone are recommended by the DNR Turkey Committee and decided upon by the Wildlife Policy Team. Consideration is given to the following when permits levels are set: previous hunter success rates, turkey population and distribution within a zone, square miles of turkey range (i.e., square miles of timber), recruitment, winter severity, and hunter interference rates (Table 1). A total of 212,772 permits were issued in 2016 compared to 208,250 in 2015 and 210,496 in 2014. A total of 134,903 applications were received for the spring hunt. There were 131,732 permits issued via a drawing/preference process to these applicants by mail. A total of 3,171 applicants did not get a permit through the drawing process. These applicants either applied for oversubscribed zones or restricted their choices to the first 3 hunt periods where there were more applicants than permits. One zone was oversubscribed in 2016. This was the tenth year that leftover permits were sold ($10 for resident, $15 for non-residents) over the counter (OTC) at DNR license sales locations on a first-come, first-served basis at a

57
rate of one permit per customer per day. This continued until all permits available for a zone were issued or the season closed. A total of 81,040 permits were issued this way. Permit Selection All applicants were required to pay a $3 spring turkey permit application fee to enter the preference drawing. Preference for permits was given first to landowners (up to 30% of permits available per zone/time period combination), followed by residents who applied for but did not receive a permit in the spring of 2015, other residents, and finally non-residents. Applications were randomly selected, but applicants within each preference category were issued available permits for their first choice zone and time period second, third, fourth, etc. choices were filled. Age Ratio Adult gobblers comprised 83% of the 2016 spring turkey harvest (Table 2). This proportion is higher than the 2015 level of 80% and is more typical after a year of “normal” recruitment. Turkey recruitment has been fairly steady with few events that may have caused declines in the past few years. Hunters being more selective in harvesting turkeys in the spring and selecting adult Toms may have affected this ratio as well. Harvest and Success Rates The 2016 spring turkey harvest was 45,501 birds taken (Figure 1, Table 3). This was 11% more than the 40,975 killed in 2015 and short of the record harvest total for the state of 52,880 take in 2008. The hunter success rate of 21% was similar to last year’s 20% and close to the long-term average. Good hunter success rates (defined as above 20%) occurred in 4 of the 7 main turkey zones open to spring hunting (Table 4). TMZ 1 - 4 were above 20% and had the hunter success rates of 22%, 23%, 20% and 21% respectively, while all other TMZ’s were between 14-18%. The highest success rates per period occurred in the first period of the season, at 28% and 23%. The winter of 2016 was mild and ended fairly early with spring’s arrival being normal with slightly above average temps and average rainfall. A normal weather pattern occurred for much of the spring season hunting periods. Spring phenology may have been slightly advanced, and there may have been increased breeding behavior during the early periods. Recruitment was normal in 2015 in much of the state and may have led to stable or increased turkey numbers. A statewide youth turkey hunt was held for the tenth time in the spring of 2016. A youth mentored hunting law was instituted in 2009 which allows youth ages 10 and older to hunt without a Hunter’s Education card as long as they were accompanied by an adult at least 18 years of age. All youth ages 10-15 that had obtained a Hunter’s Ed card or were mentored hunters and held a valid turkey permit and license were eligible to hunt. Youth were restricted to the zone of their valid turkey permit but the permit could be from any time period. The hunt occurred on the 9-10th of April, with 2,791 turkeys being harvested (Table 3). All unused permits were still valid for the zone and time period of issuance. Accidents There were two hunting accidents during the 2016 spring turkey hunt; 1 in 2015, 1 in 2014, 2 in 2013 and 3 in 2012. Both incidents were accidents where the shooter and the victim were in the same hunting party, including one fatality. One incident involved one hunter mistakenly shooting someone when they thought they were shooting at a turkey. One was for not safely handling a firearm. Turkey hunting continues to be a very safe sport with less than 3 accidents per 100,000 permits.
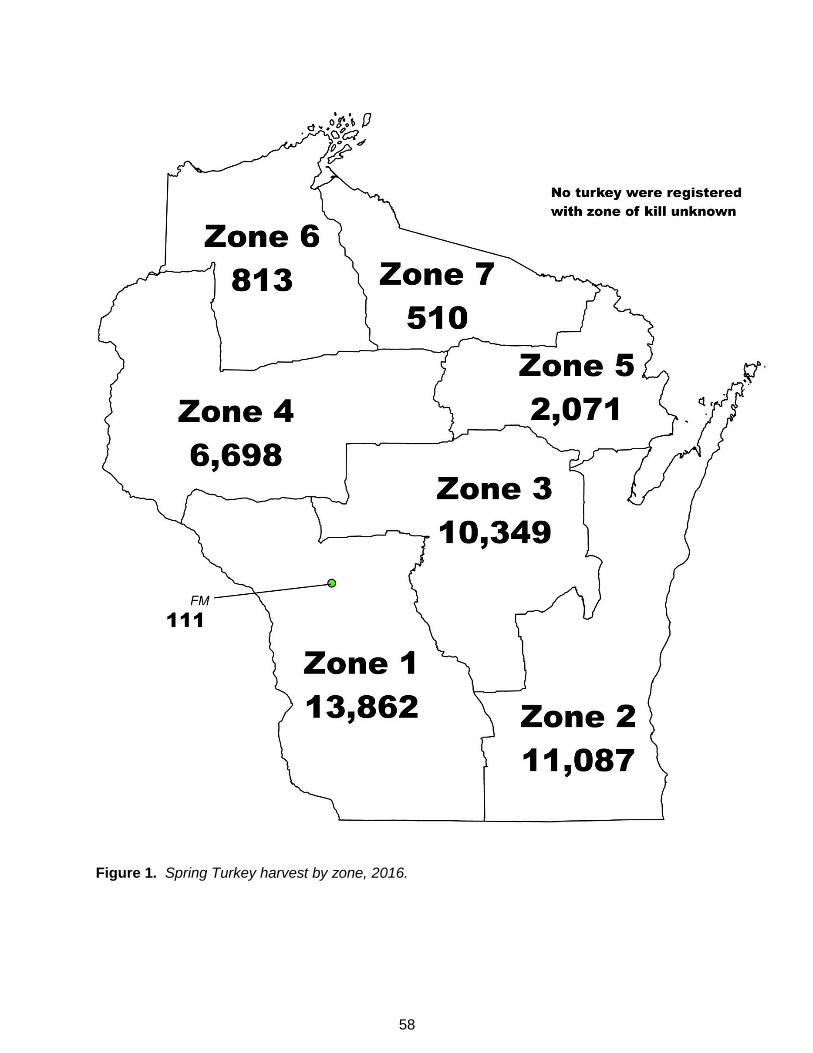
58
Figure 1. Spring Turkey harvest by zone, 2016.

59
Table 1. Total number of spring turkey permits issued, 1995-2016.
Zone 1995a 1996a 1997a 1998a 1999a 2000a 2001a 2002a 2003a 2004a 2005a 2006a 2007a 2008a 2009 2010 2011 2012 2013 2014 2015 2016
1 44,661 48,117 54,265 56,983 59,534 67,476 68,990 68,434 68,820 71,764 72,303 71,806 70,893 70,167 70,068 68,806 67,152 59,875 66,061 62,903 61,030 61,960
2 5,497 7,005 8,562 10,057 11,017 13,496 15,496 16,656 18,600 22,616 23,850 27,022 28,857 29,729 34,196 34,344 34,198 40,797 41,999 45,000 45,055 47,942
3 10,630 12,558 19,460 22,193 27,007 32,859 44,858 50,102 52,800 56,896 59,100 59,215 59,876 60,390 59,694 56,273 54,611 48,898 54,430 51,826 50,063 50,570
4 4,603 5,309 7,106 8,384 10,901 14,031 16,558 18,701 21,890 26,143 28,524 30,076 31,632 33,032 34,909 35,295 34,908 31,974 34,914 31,287 31,727 31,860
5 2,803 2,504 2,806 2,845 3,094 3,564 4,688 5,408 6,300 8,510 9,303 9,463 10,055 10,722 11,989 12,087 11,994 11,654 11,998 11,132 12,001 12,016
6 0 0 0 0 0 0 0 0 0 0 0 1,350 2,011 2,763 4,200 4,510 4,495 4,499 4,500 4,327 4,501 4,502
7 0 0 0 0 0 0 0 0 0 0 0 1,203 1,200 1,500 2,400 2,400 2,400 3,602 3,600 3,348 3,583 3,602
FM 235 0 449 463 463 610 555 555 0 482 510 510 510 384 398 351 325 392 296 324 290 320
Total 68,429 75,493 92,648 100,925 112,016 132,036 151,145 159,856 168,410 186,411 193,590 200,645 205,034 208,687 217,854 214,066 210,083 201,691 217,798 210,496 208,250 212,772 a Data was compiled from “old” turkey zone information Table 2. Percent of the harvest composed of adult gobblers, 1995-2016.
Zone 1995a
1996a
1997a
1998a
1999a
2000a
2001a
2002a
2003a
2004a
2005a
2006a
2007a
2008a
2009 2010 2011 2012 2013 2014 2015 2016
1 59 72 72 67 63 75 79 72 75 78 86 71 73 78 84 80 77 82 73 90 76 84
2 62 64 72 66 63 68 77 69 73 79 86 75 78 80 87 81 78 84 76 89 80 84
3 55 70 71 70 68 76 80 73 76 76 87 68 75 81 84 77 76 81 72 91 80 83
4 61 67 63 61 55 71 75 72 77 76 86 71 73 81 88 83 79 81 69 93 80 79
5 48 45 61 53 56 66 70 68 83 75 82 71 76 83 86 81 75 82 76 91 86 83
6 75 69 79 87 80 75 78 76 90 82 82
7 76 75 77 83 83 77 81 75 86 83 79
FM 89 90 85 88 79 87 90 90 79
Statewide 59 70 71 68 65 74 79 72 76 78 87 72 75 81 86 80 77 82 73 91 80 83 a Data was compiled from “old” turkey zone information
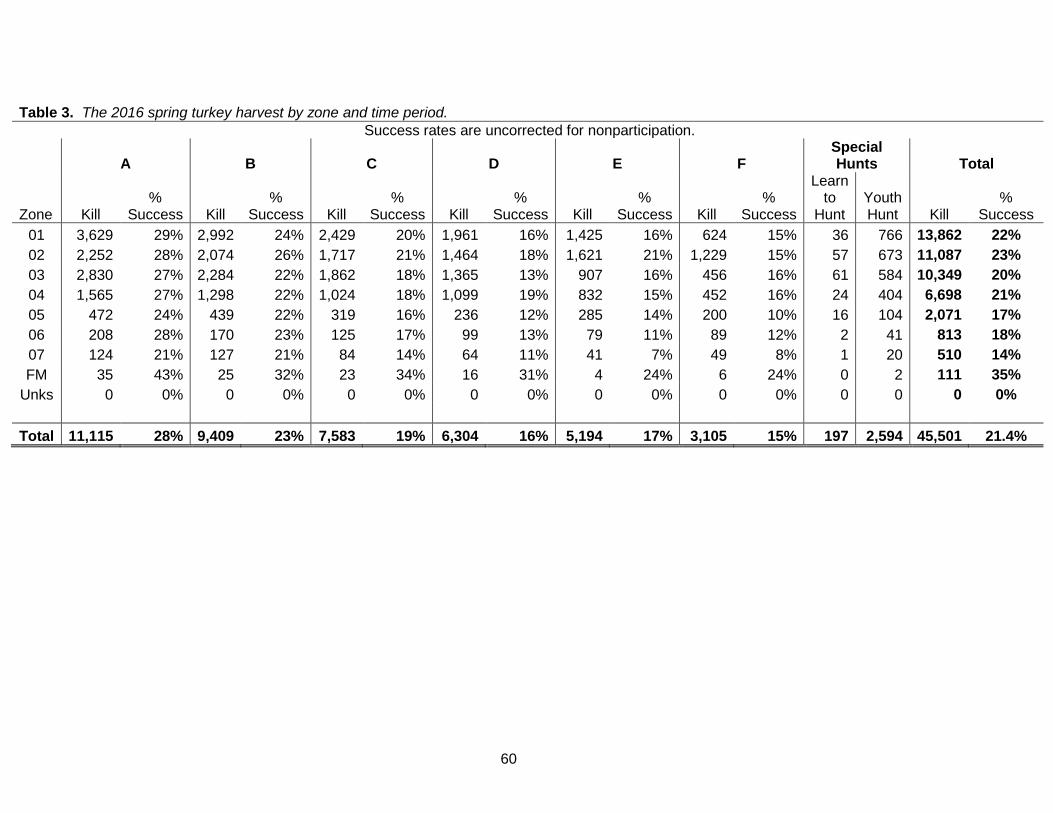
60
Table 3. The 2016 spring turkey harvest by zone and time period.
Success rates are uncorrected for nonparticipation.
A B C D E F
Special Hunts Total
Zone Kill %
Success Kill %
Success Kill %
Success Kill %
Success Kill %
Success Kill %
Success
Learn to
Hunt Youth Hunt Kill
% Success
01 3,629 29% 2,992 24% 2,429 20% 1,961 16% 1,425 16% 624 15% 36 766 13,862 22%
02 2,252 28% 2,074 26% 1,717 21% 1,464 18% 1,621 21% 1,229 15% 57 673 11,087 23%
03 2,830 27% 2,284 22% 1,862 18% 1,365 13% 907 16% 456 16% 61 584 10,349 20%
04 1,565 27% 1,298 22% 1,024 18% 1,099 19% 832 15% 452 16% 24 404 6,698 21%
05 472 24% 439 22% 319 16% 236 12% 285 14% 200 10% 16 104 2,071 17%
06 208 28% 170 23% 125 17% 99 13% 79 11% 89 12% 2 41 813 18%
07 124 21% 127 21% 84 14% 64 11% 41 7% 49 8% 1 20 510 14%
FM 35 43% 25 32% 23 34% 16 31% 4 24% 6 24% 0 2 111 35%
Unks 0 0% 0 0% 0 0% 0 0% 0 0% 0 0% 0 0 0 0%
Total 11,115 28% 9,409 23% 7,583 19% 6,304 16% 5,194 17% 3,105 15% 197 2,594 45,501 21.4%

61
Table 4. Hunter success rates (percent successful) for 1994-2016.
Zone 1995a 1996
a 1997
a 1998
a 1999
a 2000
a 2001
a 2002
a 2003
a 2004
a 2005
a 2006
a 2007
a 2008
a 2009 2010 2011 2012 2013 2014 2015 2016
1 23% 24% 22% 27% 29% 28% 25% 24% 24% 24% 22% 21% 22% 23% 22% 22% 18% 20% 17% 19% 19% 22%
2 21% 22% 22% 25% 29% 29% 28% 27% 32% 32% 31% 29% 28% 30% 30% 28% 25% 26% 21% 23% 23% 23%
3 23% 27% 26% 31% 32% 31% 26% 24% 24% 24% 22% 22% 25% 24% 22% 19% 18% 21% 17% 20% 20% 20%
4 20% 21% 22% 31% 31% 29% 28% 27% 26% 27% 26% 27% 30% 28% 28% 23% 18% 19% 15% 18% 18% 21%
5 14% 14% 16% 18% 23% 26% 24% 24% 20% 22% 21% 21% 24% 25% 22% 20% 18% 19% 17% 18% 17% 17%
6 28% 25% 26% 21% 19% 18% 17% 14% 13% 16% 18%
7 19% 20% 22% 15% 17% 16% 16% 12% 11% 14% 14%
FM Total 41% 25% 32% 32% 29% 28% 25% 0% 25% 28% 22% 24% 33% 27% 26% 20% 28% 33% 22% 24% 35%
Statewide 22% 24% 23% 28% 30% 29% 26% 25% 25% 25% 24% 23% 25% 25% 24% 22% 19% 21% 17% 20% 20% 21% a Data was compiled from “old” turkey zone information
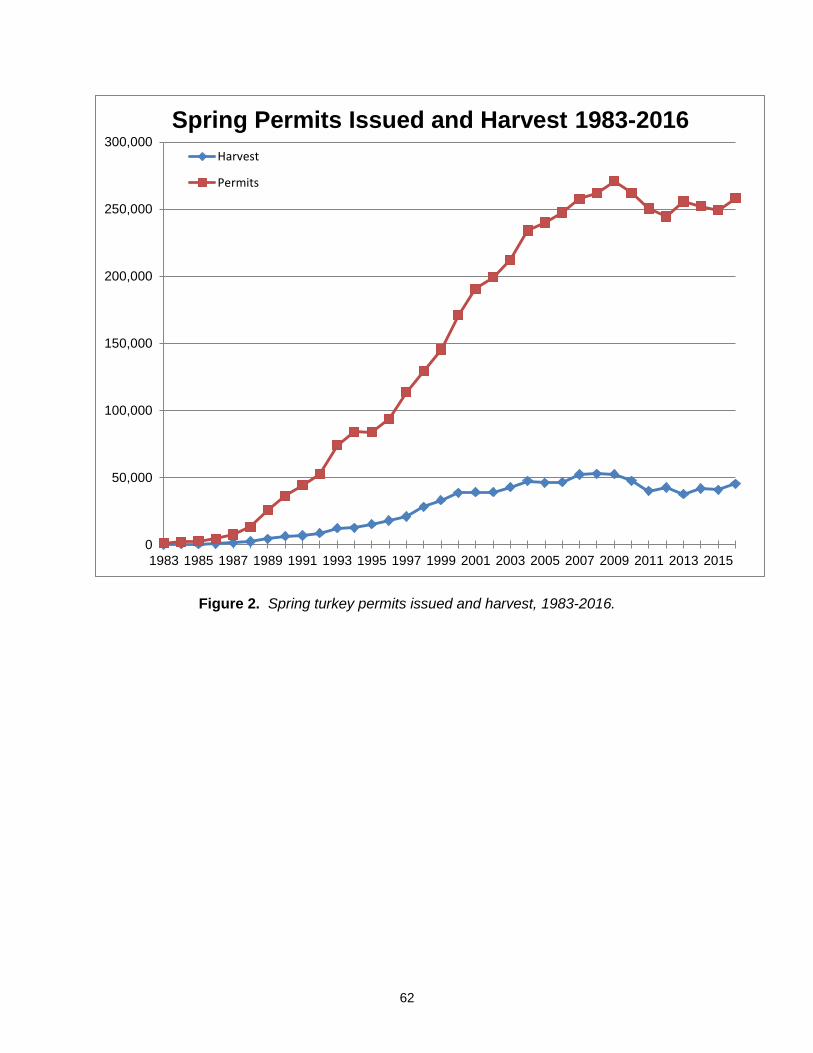
62
Figure 2. Spring turkey permits issued and harvest, 1983-2016.
0
50,000
100,000
150,000
200,000
250,000
300,000
1983 1985 1987 1989 1991 1993 1995 1997 1999 2001 2003 2005 2007 2009 2011 2013 2015
Spring Permits Issued and Harvest 1983-2016
Harvest
Permits

63
Table 5. Historical number of permits issued, harvest, and permit success for spring turkey hunting, 1983-2016.
Year Permits Harvest Permit Success
1983 1,200 182 15.2% 1984 1,950 303 15.5% 1985 2,025 496 24.5% 1986 3,675 793 21.6% 1987 6,040 1,478 24.5% 1988 11,070 2,486 22.5% 1989 21,280 4,400 20.7% 1990 29,877 6,465 21.6% 1991 37,414 6,846 18.3% 1992 43,925 8,798 20.0% 1993 61,767 12,316 19.9% 1994 71,420 12,637 17.7% 1995 68,588 15,323 22.3% 1996 75,812 18,000 23.7% 1997 92,734 20,992 22.6% 1998 101,141 28,338 28.0% 1999 112,256 33,168 29.5% 2000 132,318 38,686 29.2% 2001 151,522 39,211 25.9% 2002 160,101 39,336 24.6% 2003 169,277 42,970 25.4% 2004 186,608 47,477 25.4% 2005 193,826 46,183 23.8% 2006 200,869 46,662 23.2% 2007 205,306 52,428 25.5% 2008 208,972 52,880 25.3% 2009 218,133 52,581 24.1% 2010 214,356 47,722 22.3% 2011 210,384 40,133 19.1% 2012 201,984 42.612 21.1% 2013 217,798 37,804 17.4% 2014 210,496 41,815 19.9% 2015 208,250 40,975 19.7% 2016 212,772 45,501 21.4%
64
Fall Turkey Harvest Report 2016
by Brian Dhuey and Mark Witecha Abstract The 2016 fall turkey season was open from 17 September through 31 December, 106 consecutive days, with no closure during the gun deer season in Turkey Management Zones (TMZ) 1-5. Turkey Management Zones 6 and 7 had a 63 day season running from 17 September through 18 November. Statewide, the number of permits available (101,800) was up from the 100,700 available in 2015. Total permits issued through a random drawing process and over-the-counter sales were 68,055. Permitted hunters harvested 4,992 turkeys for a success rate uncorrected for nonparticipation of 7.3%. This success rate almost the same as 7.4% recorded last year. Turkey brood production can affect the number of birds available to harvest in fall; brood production varied across the state with more areas that saw declines than increases. While turkey numbers vary among regions, turkeys are doing well statewide with strong numbers going into the fall hunting season. Methods Harvest information was obtained through mandatory registration of harvested turkeys. Starting in the fall of 2011, hunters were no longer required to take a harvested bird to a registration station, but instead registered their birds over the phone or on the DNR website. Information collected at the time of registration was the same as in the past with hunters required to inform the DNR of the zone, county, date of kill, sex and age of each turkey killed. Registration records were summarized using the Statistical Analysis System (SAS). Results The whole state was open to fall turkey hunting from 17 September – 18 November in 2016 (Figure 1). The fall hunting season structure was changed in 2016, with a continuous season through the 9-day gun deer season till the 31st of December in TMZ’s 1-5 (in previous years the turkey season was closed during the gun deer season, but reopened on the Monday following through the 31 December). This allowed most fall turkey hunters 106 days afield to pursue turkeys. This was done to allow hunters to enjoy an extended season and increase their chances of bagging a bird. Past modern fall hunts have ranged from 7-106 days. Permit Levels Permit levels vary depending on the spring hunting success, amount of timber, hunter interference, hunter demand, and turkey population densities and distributions within zones. With spring success increasing, turkey numbers remaining strong in most of the state, and a high demand for permits in TMZ’s 5, 6, and 7, the DNR Wild Turkey Committee did increase the permit level for the 2016 fall season by 200 permits in each of these zones (Table 1). Permit Selection All applicants were required to pay a $3 fee for an application to enter the preference drawing. Preference for permits was given first to landowners (up to 30% of permits available in each zone), followed by residents who applied for but did not receive a permit in the fall of 2015, other residents, and finally non-residents. Applications were randomly selected, but first choice zones of all applicants within each preference category were issued available permits before second,

65
third, fourth, etc. choices were filled. Like in the spring, leftover permits were sold ($10 for resident, $15 for non-residents) over-the-counter at DNR license sales locations on a first-come, first-served basis at a rate of one permit per day. This continued until all permits available for a zone were issued or the season closed. A total of 55,867 permits were issued through the drawing process and another 12,188 over-the-counter for a total of 68,055. This was more than the 66,332 issued in the fall of 2015. Harvest and Success Rates Fall turkey hunters registered 4,992 turkeys in the fall of 2016. This is an increase from the 4,864 registered in the fall of 2015. Data on the historical fall turkey harvests are summarized in Table 2 and Figure 2. Beginning in 2007, the start of the fall turkey season was moved up from the 1st of October to open concurrent with the archery season in mid-September. This was done to give hunters more opportunity to hunt fall turkeys. The fall turkey season overlapped several statewide deer hunts; all hunters are required to wear blaze orange during these deer seasons. This blaze orange requirement probably had the effect of eliminating days of fall turkey hunting. After a successful three year trial period, the use of dogs for fall turkey hunting was allowed statewide. It was legal to fall turkey hunt with the aid of dogs for the entire fall season in any open zone. The fall hunter’s success rate (percent of permits that harvested a turkey) was 7.3%, almost the same as the 7.4% in 2015, and close to the previous 3 years. Fall success rates varied by zone from 5.5% to 10.0%, with the highest success rate occurring in Zone 6 (Figure 1, Table1). There are a number of factors that affect turkey success rates: turkey abundance, weather, other concurrent hunting seasons, permit levels and hunting techniques. As permits become more common, they may fall into the hands of the less devoted turkey hunter, primarily bow hunters who may apply for a turkey permit on the off chance that one might walk under their tree stand while bow hunting, for example. These less dedicated hunters may never go out with the sole purpose of hunting turkeys. Data from the Fall Turkey Hunter Survey indicates that approximately 30% of hunters purchasing a fall turkey permit only hunt turkeys “opportunistically” when hunting other game. Lastly, the sale of second tags to hunters could have an effect on success rates, as they may feel more “invested” in harvesting a turkey as they had to pay some amount for the permit as opposed to getting it free through the drawing process from the DNR. Fall Turkey Hunter surveys show that hunter participation in 2016 was 66%, 2015 was 64%, but lower than the average between 1989 and 2015 of 72%. Hunter success rates are uncorrected for non-active hunters and noncompliance, actual success rates are higher. Age and Sex Ratios The percentage of the harvest composed of adult turkeys (70%) was very similar to 2015 (69%). Females comprised 53.3% of the harvest while males accounted for 46.7%. Adult females comprised 35.3% of the fall harvest, juvenile hens 18.0%, gobblers 34.6%, jakes 12.1%. The percentage of adult males in the harvest was lower than in 2015 (37% gobblers). Adults are generally believed to be less vulnerable to fall hunting than juveniles, particularly for hens. There are probable prestige biases at work also, where hunters are reluctant to admit to killing a juvenile bird. Hunters could also be confusing jakes and juvenile hens as adult hens, or using

66
hunting methods and selectivity toward adults. These all could be factors affecting adult to juvenile ratios. Accidents There were no fall accidents during the 2016 hunting season. There have been no accidents in fall turkey hunting for eight of the last ten years. Since fall hunting of turkeys began in 1989, there have been one fatal, and 27 non-fatal hunting accidents with an average of one per year. Table 1. Turkey kill by zone, age and sex, permits issued, and permit success rate for 2016.
Zone Hens Juv. Hens Toms Jakes Unks
Total Harvest
Permits Issued
% Success
1 280 181 272 99 0 832
15,115 5.5%
2 638 308 667 211 0 1,824 21,998 8.3%
3 432 200 348 123 0 1,103
14,939 7.4%
4 210 129 233 98 0 670 9,055 7.4%
5 102 33 108 34 0 277
3,999 6.9%
6 49 25 62 24 0 160 1,600 10.0%
7 42 21 32 15 0 110
1,200 9.2%
FM 9 1 4 2 0 16 149 10.7%
UNK
0 Totals 1,762 898 1,726 606 0 4,992 68,055 7.3%
Figure 1. Fall turkey harvest by zone, 2016.

Table 2. Historical number of permits issued, harvest, and permit success for fall turkey hunting, 1989-2016.
Year Permits Issued Harvest Permit Success
1989 7,260 1,570 21.6% 1990 12,465 3,433 27.5% 1991 16,668 2,904 17.4% 1992 24,997 5,024 20.1% 1993 31,449 5,625 17.9% 1994 17,889 3,896 21.8% 1995 28,555 6,241 21.9% 1996 30,779 6,305 20.5% 1997 32,569 6,004 18.4% 1998 41,131 8,845 21.5% 1999 55,479 10,825 19.5% 2000 69,566 11,263 16.2% 2001 71,601 11,029 15.4% 2002 75,040 10,860 14.5% 2003 78,831 12,554 15.9% 2004 79,178 10,362 13.1% 2005 85,678 10,650 12.4% 2006 78,782 12,108 15.4% 2007 80,382 12,010 14.9% 2008 76,448 10,698 14.0% 2009 68,796 8,281 12.0% 2010 61,567 7,394 12.0% 2011 54,949 5,433 9.9% 2012 55,099 7,054 12.8% 2013 65,101 4,631 7.1% 2014 62,708 4,228 6.7% 2015 65,705 4,864 7.4% 2016 68,055 4,992 7.3%
Figure 2. Fall turkey permits issued and harvest, 1989-2016.
0
10,000
20,000
30,000
40,000
50,000
60,000
70,000
80,000
90,000
19
89
19
90
19
91
19
92
19
93
19
94
19
95
19
96
19
97
19
98
19
99
20
00
20
01
20
02
20
03
20
04
20
05
20
06
20
07
20
08
20
09
20
10
20
11
20
12
20
13
20
14
20
15
20
16
Fall Turkey Permits Issued and Harvest, 1989-2016
Harvest
Permits

Do you have questions on a regulation?
Need assistance finding a license or registration agent?
Are you looking for some additional information on Wisconsin’s
natural resources?
Visit our website: dnr.wi.gov
Or
Contact the DNR’s Call Center
1-888-DNRINFo
(1-888-936-7463)
Answered 7 days per week
7 a.m. to 10 p.m.
The Wisconsin Department of Natural Resources provides equal opportunity in its employment, programs, services and
functions under an Affirmative Action Plan. If you have any questions, please write to Equal Opportunity Office,
Department of Interior, Washington, D.C. 20240.
This publication is available in alternative format (large print, Braille, audio tape, etc.) upon request.
Please call 608-266-8204 for more information.
Related Documents