2016 Transfer Station Customer Survey January 19, 2017 FINAL King County Waste Monitoring Program

Welcome message from author
This document is posted to help you gain knowledge. Please leave a comment to let me know what you think about it! Share it to your friends and learn new things together.
Transcript

2016 Transfer Station Customer Survey
January 19, 2017 FINAL
King County Waste Monitoring Program

EXECUTIVE SUMMARY 2016 Transfer Station Customer Survey
King County Department of Natural Resources and Parks | 2
Executive Summary The goal of this work was to gather data on how self-haul customers obtain information about recycling services offered at King County Solid Waste Division (SWD) facilities, the clarity of recycling signs and directions at these facilities, and the level of satisfaction with customer service at the scale house and on the tipping floor pertaining to recycling services.
The project team surveyed self-haul customers at seven transfer stations. Each transfer station was surveyed over two weekdays and two weekend days by a team of two surveyors—one surveyed randomly selected customers as they entered the facility and the second surveyed those same customers as they exited the facility. The teams surveyed 1,169 customers as they entered the facilities and 995 of those customers as they exited the facilities. Forty-three customers were surveyed only as they exited.
Key Findings · Eighty-seven percent of surveyed customers were bringing materials from a residence. · Seventy-four percent of surveyed customers reported that the materials they brought
were from a location that currently has garbage service; 68 percent reported the location had recycling services; and 58 percent reported the location had organics service.
· “It’s the closest facility” is the most commonly reported reason surveyed customers chose a particular facility.
· Fifteen percent of respondents reported researching the recycling services at the facility prior to coming, primarily via an internet search engine.
· Nearly 90 percent of respondents brought only garbage or only separated recyclable/compostable materials to the facility.
· Cardboard is the most commonly reported material separated for recycling. · Seventy-three percent of respondents reported that it was “very easy” to drop off their
recyclable materials. · Fifty-two percent of respondents rated the signs regarding what materials are accepted
as “very good.” “Make the signs larger” was the most commonly proposed method for improving the signs.
· Seventy-six percent of respondents reported that the overall customer service they received was “very good.”

OVERVIEW AND OBJECTIVE 2016 Transfer Station Customer Survey
King County Department of Natural Resources and Parks | 3
Overview and Objective The goal of this work was to gather data on how self-haul customers obtain information about recycling services offered at King County Solid Waste Division (SWD) facilities, the clarity of recycling signs and directions at these facilities, and the level of satisfaction with customer service at the scale house and on the tipping floor pertaining to recycling services. To gather this data, Cascadia Consulting Group designed and implemented a survey of self-haul customers as they entered and exited seven SWD transfer station or drop box facilities that offer recycling services. In addition to focusing on the objectives above, the survey was designed to gather data on the number and percentage of customers at each transfer station or drop box facility that use the recycling services (i.e., sort recyclable/compostable materials from their garbage before they arrive or at the station) and the number and percentage of customers at each transfer station that would prefer printed materials and signs to be in a language other than English, as well as which languages they preferred.

SUMMARY OF METHODS 2016 Transfer Station Customer Survey
King County Department of Natural Resources and Parks | 4
Summary of Methods At the outset of this task, Cascadia conducted a training for Cascadia staff and SWD interns who comprised the survey crew. This training included an office component that covered survey procedures and introduced the script to be used when speaking with customers, and an in-field survey pilot at the Shoreline Recycling and Transfer Station that allowed survey staff to practice conducting the entry and exit surveys under supervision by experienced project staff.
The project team surveyed self-haul customers at the Bow Lake, Enumclaw, Houghton, Renton, Shoreline, and Vashon recycling and transfer facilities and at the Cedar Falls drop box facility. Survey staff visited each facility four times: one weekday and one weekend day in August, and again on one weekday and one weekend day in October/November. To prevent conflicts with facility staff, SWD notified the facility managers of the survey schedule one week in advance and provided a reminder the day before.
Cascadia conducted four survey sessions—two summer and two fall—at each of the seven facilities, for a total of 28 survey shifts. Each survey shift lasted 7.5 hours. The number of completed surveys by facility and season are given in Table 1 below.
Table 1. Number of Entry/Exit Surveys by Facility and Season
The surveys were conducted as follows.
1. Two surveyors worked together at each facility: the entry surveyor was positioned beside the scale house entry lane, and the exit surveyor was positioned at a location where customers could be surveyed safely without obstructing exiting traffic.
2. The entry surveyor selected vehicles to participate in the survey based on the customers’ availability (i.e., immediately after completing a survey, the entry surveyor selected the next self-haul vehicle that approached the scale house to be surveyed).
3. When a selected vehicle approached the scale house, the entry surveyor asked the driver to pull out of the scale house line and complete the survey. The surveyor handed each surveyed customer a card printed with a unique ID number. Once the customer
Entry Exit Pair Entry Exit Pair Entry Exit PairBow Lake 79 70 69 103 77 63 182 147 132Cedar Falls (drop box) 68 66 65 63 59 55 131 125 120Enumclaw 84 82 81 84 75 71 168 157 152Houghton 105 90 88 81 72 72 186 162 160Renton 83 68 64 57 55 53 140 123 117Shoreline 97 78 75 80 73 71 177 151 146Vashon 103 95 92 82 78 76 185 173 168Total 619 549 534 550 489 461 1,169 1,038 995
Total Completed SurveysFall Completed SurveysSummer Completed Surveys

SUMMARY OF METHODS 2016 Transfer Station Customer Survey
King County Department of Natural Resources and Parks | 5
completed the entry survey they were allowed to re-enter the scale house line from the location where they were parked.
4. After completing an entry survey, the entry surveyor selected the next available self-haul vehicle and began another survey.
5. The exit surveyor completed exit surveys with as many of the customers selected by the entry surveyor as possible, retrieving the ID cards given by the entry surveyor and logging the ID number to correlate each participant’s entry and exit survey results. At the conclusion of the exit survey, each participant received a short handout that provided information about the survey, helpful online resources, and SWD contact information. Participants were also offered a free recycling tote bag. Note: Due to variable customer participation and customers exiting the tip building at variable rates, the survey team was not able to conduct exit surveys with all customers who participated in the entry survey.
6. At the end of a survey shift, the entry and exit surveyors reviewed and cross-checked their forms for completeness and consistency.
Certain types of customers may be under represented in survey responses. Participation in the two-part survey was voluntary, so commercial customers may have been less likely to agree to participate (though in this survey, 12 percent of respondents reported bringing materials from a business compared to 13 percent in other self-haul customer surveys conducted at King County scale houses). In addition, most surveyors spoke only English, so customers with limited or no English proficiency were not able to complete the survey.

SURVEY RESPONSES 2016 Transfer Station Customer Survey
King County Department of Natural Resources and Parks | 6
Survey Responses
Entry Survey Questions and Responses This section details the 27 questions asked as part of the entry survey and summarizes customers’ responses.
Question 1: Record the survey number.
This question is only a log of the numbered cards used to link entry and exit surveys. There are no findings to report for this question.
Question 2: Estimate the length of time the customer has been waiting (in minutes). n=1,169
The large majority (91%) of respondents to the entry survey did not need to wait in line before taking the survey. Another 7 percent of respondents waited for five minutes or less. The surveying locations were typically a distance before customers reached the scale house, so survey wait time does not necessarily represent scale house wait time.
Figure 1. Q2: Wait Time
1,061
1117 17 15
26
4 2 310
1 20
1,200
0 1 2 3 4 5 6 8 9 10 15 20
# of
Res
pons
es
Wait Time (in Minutes)

SURVEY RESPONSES 2016 Transfer Station Customer Survey
King County Department of Natural Resources and Parks | 7
Question 3: Note the gender of the customer. n=1,169
More than four-fifths (82%) of respondents were male, based on visual observation by the surveyor. Customers were not directly asked to identify their gender.
Figure 2. Q3: Gender
Male82%
Female18%
Indeterminate0%
Gender of Respondent

SURVEY RESPONSES 2016 Transfer Station Customer Survey
King County Department of Natural Resources and Parks | 8
Question 4: Record the acceptance or refusal of the survey.
More than three-fourths (78%) of customers approached participated in the survey. Not all customers were approached due to the amount of time needed to complete the survey and the logistics of surveying at the scale house. In addition, some customers drove past the entry surveyor, refusing to stop to be invited to take the survey.
Figure 3. Q4: Survey Acceptance
Accepted78%
Refused21%
Unable to Complete
1%
Survey Acceptance

SURVEY RESPONSES 2016 Transfer Station Customer Survey
King County Department of Natural Resources and Parks | 9
Question 5: In what language was the survey completed? n=1,169
Nearly all (99%) of surveys were completed in English. Approximately 1 percent were completed in Spanish, and a minimal number were completed in Russian. These percentages do not necessarily represent languages preferred by transfer station customers in general because most surveyors were not able to administer the survey in a language other than English.
Figure 4. Q5: Survey Language
English99%
Spanish1%
Russian0%
Language Used for Survey

SURVEY RESPONSES 2016 Transfer Station Customer Survey
King County Department of Natural Resources and Parks | 10
Question 6: Are the materials you are bringing here today from your home, work, or somewhere else? n=1,169
The large majority of respondents (87%) reported bringing materials from home. Another 12 percent reported that the materials came from work.
Figure 5. Q6: Origin of Materials
Home87%
Work12%
Public Space0%
Somewhere else1% No Response
0%
Origin of Materials

SURVEY RESPONSES 2016 Transfer Station Customer Survey
King County Department of Natural Resources and Parks | 11
Question 7: If the materials are from your home, do you own or rent your residence? n=1,012
Among respondents bringing materials from home, the large majority (87%) reported owning their home. Another 12 percent reported renting. One person reported that it was from the location where they are squatting.
Figure 6. Q7: Own or Rent Residence
Own87%
Rent12%
Other0%
Refused to Answer
1%
Own or Rent Residence

SURVEY RESPONSES 2016 Transfer Station Customer Survey
King County Department of Natural Resources and Parks | 12
Question 8: What is the ZIP code at the location where the materials originated?
Customers provided 100 unique ZIP codes as a response to this question from 98001 to 98918. Thirty-seven customers responded “don’t know,” eight customers refused to answer, and 18 customers provided no response.
Question 9: Are the materials you are bringing here today from a location that currently has curbside collection service for garbage? n=1,169
Among all respondents, nearly three-quarters (74%) said the original location of the materials had curbside collection service for garbage while 21 percent said it did not.
Figure 7. Q9: Does Origin Have Curbside Garbage Service
Yes74%
No21%
Don't Know3%
Refused to answer
0% No Response2%
Have Garbage Service

SURVEY RESPONSES 2016 Transfer Station Customer Survey
King County Department of Natural Resources and Parks | 13
Question 10: Are the materials you are bringing here today from a location that currently has curbside collection service for recycling? n=1,169
Slightly fewer respondents (68%) said the original location of the materials had curbside collection service for recycling while more than one-quarter of respondents (26%) said it did not.
Figure 8. Q10: Does Origin Have Curbside Recycling Service
Yes68%
No26%
Don't Know4%
Refused to answer
0% No Response2%
Have Recycling Service

SURVEY RESPONSES 2016 Transfer Station Customer Survey
King County Department of Natural Resources and Parks | 14
Question 11: Are the materials you are bringing here today from a location that currently has curbside collection service for organics? n=1,169
Even fewer respondents (57%) said the original location of the materials had curbside collection service for organics while more than one-third of respondents (34%) said it did not.
Figure 9. Q11: Does Origin Have Curbside Organics Service
Yes57%
No34%
Don't Know7%
Refused to answer
0%No Response
2%
Have Organics Service

SURVEY RESPONSES 2016 Transfer Station Customer Survey
King County Department of Natural Resources and Parks | 15
Question 12: How many times per year do you visit this or any other transfer station? n=1,169
Approximately one-third of respondents (35%) reported visiting transfer stations four times a year or fewer, with 15 percent visiting one to two times per year and another 15 percent visiting three to four times per year. Another 30 percent reported visiting between five and twelve times per year. The remainder reported visiting more frequently: 13 to 24 times per year (14%), 25 to 52 times per year (14%), 53 to 156 times per year (6%), and more than 156 times per year (1%).
Figure 10. Q12: Visits per Year
59
175
166
348
156
159
63
17
26
0 100 200 300 400
7 times ever or fewer
Up to twice a year
Up to four times per year
Up to once a month
Up to twice a month
Up to once a week
Up to three times per week
More than 3 times per week
No Response
Number of Responses
Num
ber o
f Visi
ts A
nnua
lly

SURVEY RESPONSES 2016 Transfer Station Customer Survey
King County Department of Natural Resources and Parks | 16
Question 13: Which transfer stations do you usually use? (Select all that apply.) n=1,152
When asked which transfer stations they usually use, the most common responses were Shoreline and Houghton. Approximately 12 percent of respondents reported using non-SWD facilities, primarily North Seattle (5%) and South Seattle (5%).
Figure 11. Q13: Transfer Station Usually Used
119
5964
2054
232204
21880
204160
19739
0 50 100 150 200 250
Refused to answerOther non-Division transfer station
South SeattleNorth Seattle
VashonSkykomish (drop box)
ShorelineRenton
HoughtonFactoria
EnumclawCedar Falls (drop box)
Bow LakeAlgona
# of Responses
Transfer Stations Usually Used

SURVEY RESPONSES 2016 Transfer Station Customer Survey
King County Department of Natural Resources and Parks | 17
Question 14: Why did you choose this station today? (Select all that apply.) n=1,152
The majority of respondents reported choosing the transfer station they visited because it was the closest station (69%) and/or it was convenient (33%).
Figure 12. Q14: Why This Facility Today
391
808
35
10
37
0
0
53
0 100 200 300 400 500 600 700 800 900
It's convenient
It's the closest station
It's on my way to my destination
It always has the shortest line
It has a particular service I want
I have a friend who works here
It's my favorite (I like the art/view/staff)
Other
# of Responses
Why this faciilty

SURVEY RESPONSES 2016 Transfer Station Customer Survey
King County Department of Natural Resources and Parks | 18
Question 15: Before you drove to this facility, did you look for information about recycling services offered at King County facilities? n=1,169
The large majority (83%) of respondents did not look for information about recycling services offered at King County facilities while 15 percent said they did look for this information.
Figure 13. Q15: Looked for Information
Yes15%
No83%
Refused to answer
0%
No Response2%
Did You Look for Information

SURVEY RESPONSES 2016 Transfer Station Customer Survey
King County Department of Natural Resources and Parks | 19
Question 15a: Where did you look for information? (Select all that apply.) n=179
Among respondents who looked for information on recycling at King County facilities, they most commonly reported doing an internet search (59%), searching for information the King County Solid Waste Division website (39%), and/or searching for information on their city’s website (15%).
Figure 14. Q15a: Where Looked for Information
4
1
0
105
69
27
2
11
1
0
1
0 20 40 60 80 100 120
Called the King County SWD customer service…
Called my City
Called my waste hauler
Searched for information on the Internet (e.g.,…
Searched for information on the KC SWD website
Searched for information on my City’s website
Searched for information on my waste hauler’s …
Looked at King County printed materials…
Asked a friend or neighbor
Refused to answer
Other (please specify)
# of Responses
Where did you look

SURVEY RESPONSES 2016 Transfer Station Customer Survey
King County Department of Natural Resources and Parks | 20
Question 15b: Were you able to obtain all of the information you were seeking? n=179
The vast majority (90%) of respondents who searched for information on recycling at King County facilities said they were able to obtain all the information they were seeking.
Figure 15. Q15b: Whether Found Information
Yes90%
No10%
Did You Find the Information you Needed

SURVEY RESPONSES 2016 Transfer Station Customer Survey
King County Department of Natural Resources and Parks | 21
Question 15c: If you didn’t find what you were looking for, what additional information were you looking for? n=18
Of the eighteen respondents who were not able to find all the information they were seeking about recycling at King County facilities, nine people mentioned seeking information on where or how to recycle specific items including televisions, tires, rechargeable batteries, Christmas trees, metal, toilets, concrete, Styrofoam, medical hazardous materials, and appliances. Another five respondents mentioned general information problems such as “vague information” and “not accurate.”
These are the unedited responses from customers.
· Rechargeable batteries. They have a lot of other places but they wouldn't tell me if this place would take it or not.
· Do they take TVs? I thought they said yes. At least this station does not take TVs! · I had to look through too much ad stuff. · Couldn't find how to get rid of Christmas tree. · Not specific if it's service for commercial only. · Sometimes the site sends you off but it's a good start. · Vague information. · Not accurate. · How many tires they would accept. · How to recycle metal. · Where to recycle a TV. · Would like a video showing the separation process of commingled recyclables that are
compacted to show that materials are actually getting recycled. · Disappointed because I have a toilet, could put in garbage can. It could be recycled, but
they charge in Renton. Disappointed that there isn't a way to recycle. · What to do with concrete. · Hard to tell what to accepts what. · Styrofoam - where to take. Recycling of medical hazardous materials. · Was looking for a place to take appliances. · Correct info about where to bring tires.

SURVEY RESPONSES 2016 Transfer Station Customer Survey
King County Department of Natural Resources and Parks | 22
Question 16: Would it be useful to you to have information, materials, and signs in a language other than English? n=1,169
Approximately 5 percent of respondents said that it would be useful to have information, materials, and signs in languages other than English. The large majority (93%) of respondents said that this would not be useful. These percentages do not necessarily represent languages preferred by transfer station customers in general because 99 percent of surveys were conducted in English and most surveyors were not able to administer the survey in a language other than English.
Figure 16. Q16: Signs in Other Languages
Yes5%
No93%
Refused to answer
0%
No Response2%
Would Signs in Other Languages be Useful

SURVEY RESPONSES 2016 Transfer Station Customer Survey
King County Department of Natural Resources and Parks | 23
Question 16a: What languages would be useful? (Select all that apply.) n=48
Respondents who wanted information in languages other than English most commonly mentioned Spanish (75%). Other languages mentioned were Vietnamese (5 people), Mandarin (3 people), Ukrainian (2 people). One person each mentioned Cambodian, Cantonese, Portuguese, Somali, and Russian. The other four languages suggested were French, German, Japanese, and Hungarian.
Figure 17. Q16a: Which Languages
365
111
31
02
000
14
0 5 10 15 20 25 30 35 40
SpanishVietnamese
RussianSomali
PortugueseMandarin
CantoneseKorean
UkrainianAmharicPunjabiTagolog
CambodianOther (please specify)
# of Responses
Languages

SURVEY RESPONSES 2016 Transfer Station Customer Survey
King County Department of Natural Resources and Parks | 24
The order of the following two questions (Question 17 and Question 18) was alternated for each survey to reduce biases in customers’ responses.
Question 17: There are many materials you can recycle at this transfer station if you separate them from garbage. Please rate how much saving money would motivate you to recycle using a scale from 1 to 5 with 1 being not at all motivating and 5 being very motivating? n=1,169
When asked to rate on a scale from 1 (not at all) to 5 (very) how much saving money would motivate them to recycle, more than half of respondents (59%) gave a rating of 4 or 5. In contrast, 24 percent of respondents rated saving money as not motivating (a rating of 1 or 2).
Figure 18. Q17: Monetary Motivation for Recycling Behavior
1 (not at all motivating)
16%
28%
313%
412%
5 (very motivating)
47%
Refused to Answer
2%
No Response2%
Money Motivation

SURVEY RESPONSES 2016 Transfer Station Customer Survey
King County Department of Natural Resources and Parks | 25
Question 18: There are many materials you can recycle at this transfer station if you separate them from garbage. Please rate how much conserving resources and protecting the environment would motivate you to recycle using a scale from 1 to 5 with 1 being not at all motivating and 5 being very motivating? n=1,169
When asked how much conserving resources and protecting the environment would motivate them to recycle (using the same scale), more respondents gave environmental protection a high rating of 4 (16%) or 5 (67%) than gave monetary savings a high rating. In contrast, far fewer respondents (6%) rated protecting the environment as not motivating (a rating of 1 or 2).
Figure 19. Q18: Environmental Motivation for Recycling Behavior
1 (not at all motivating)
4% 22% 3
8%
416%
5 (very motivating)
67%
Refused to Answer
1%
No Response2%
Environmental Motivation

SURVEY RESPONSES 2016 Transfer Station Customer Survey
King County Department of Natural Resources and Parks | 26
Question 19: How important are the types of recyclable and compostable materials accepted at this facility? (Please use a scale of 1 to 5 with one being not at all important and 5 being very important.) n=1,169
Respondents were asked to rate on a scale from 1 (not at all) to 5 (very) the importance of various facility characteristics. Nearly three-quarters of respondents rated the types of recyclable and compostable materials accepted as being highly important with a rating of 4 (22%) or 5 (50%).
Figure 20. Q19: Importance of Types of Materials Accepted
1 (Not important at all)
9%2
5%
311%
422%
5 (Very important)
50%
Refused to Answer
2%
No Response1%
Types of Materials Accepted

SURVEY RESPONSES 2016 Transfer Station Customer Survey
King County Department of Natural Resources and Parks | 27
Question 20: How important is having staff in the recycling area available to answer questions at this facility? (Please use a scale of 1 to 5 with one being not at all important and 5 being very important.) n=1,169
Using the same scale, fewer than one-third of respondents rated having staff to answer questions in the recycling area as being highly important with a rating of 4 (14%) or 5 (17%). In contrast, more than half of respondents rated having staff available as less important, with a rating of 1 (33%) or 2 (18%).
Figure 21. Q20: Importance of Staff in Recycling Area
1 (Not important at all)33%
218%
315%
414%
5 (Very important)
17%
Refused to Answer
1%
No Response2%
Staff in Recycling Area

SURVEY RESPONSES 2016 Transfer Station Customer Survey
King County Department of Natural Resources and Parks | 28
Question 21: How important is the amount of time it takes to complete your visit to this facility? (Please use a scale of 1 to 5 with one being not at all important and 5 being very important.) n=1,169
Using the same scale, two-thirds of respondents rated the amount of time to complete their visit as being highly important with a rating of 4 (24%) or 5 (42%).
Figure 22. Q21: Importance of Time Needed to Complete Visit
1 (Not important at all)
9%2
5%
317%
424%
5 (Very important)
42%
Refused to Answer
1%
No Response2%
Time to Complete Visit

SURVEY RESPONSES 2016 Transfer Station Customer Survey
King County Department of Natural Resources and Parks | 29
Question 22: How important is the cost of the services you receive at this facility? (Please use a scale of 1 to 5 with one being not at all important and 5 being very important.) n=1,169
Using the same scale, more than half of respondents rated the cost of services as being highly important with a rating of 4 (20%) or 5 (36%). Just over one-fifth of respondents rate it less important with a rating of 1 (14%) or 2 (8%).
Figure 23. Q22: Importance of Cost of Services
1 (Not important at all)14%
28%
319%
420%
5 (Very important)
36%
Refused to Answer
1%
No Response2%
Cost of Service

SURVEY RESPONSES 2016 Transfer Station Customer Survey
King County Department of Natural Resources and Parks | 30
Question 23: This last question is optional, but for demographic purposes, I’d like to ask your age range. Are you...? n=1,169
Nearly three quarters of respondents reported their age as between 52 and 70 (42%) or between 37 and 51 (31%). Another 16 percent of respondents said their age was between 18 and 36.
Figure 24. Q23: Age of Respondent
Younger than 180%
18-3616%
37-5131%
52-7042%
71 and older8%
No Answer1%
No Response2%
Age of Respondents
SURVEY RESPONSES 2016 Transfer Station Customer Survey
King County Department of Natural Resources and Parks | 31
Exit Survey Questions and Responses This section details the 20 questions asked as part of the exit survey and summarizes customers’ responses.
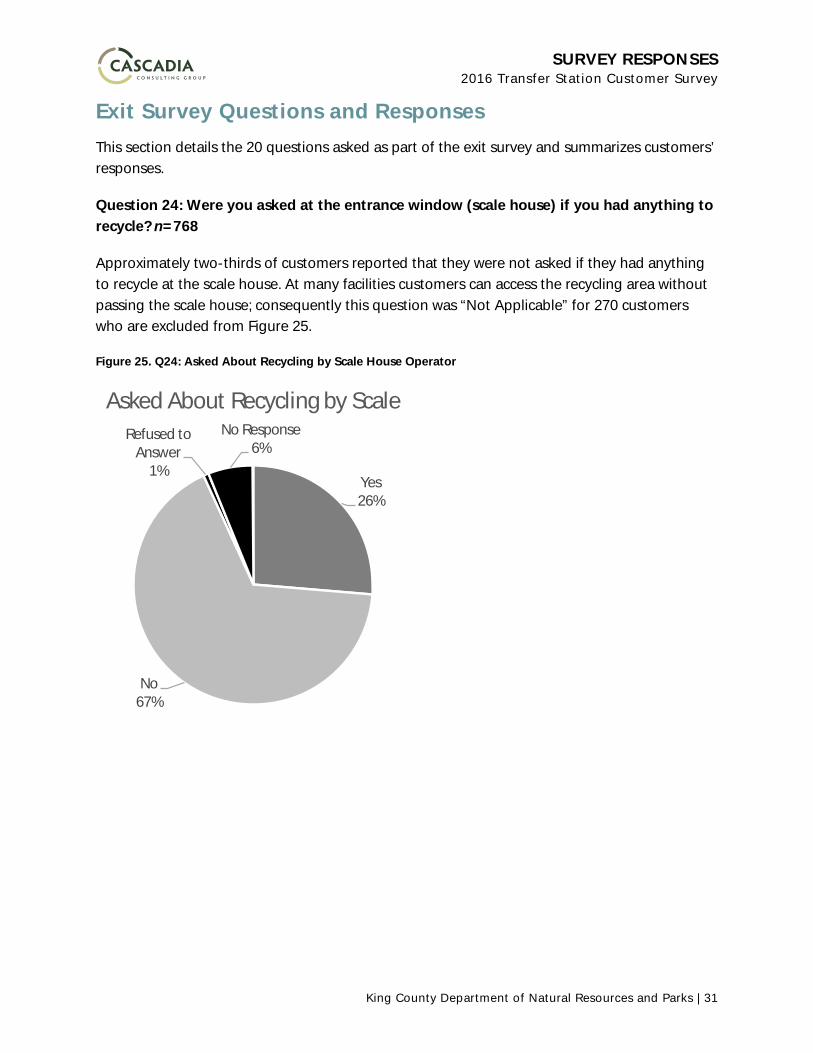
Question 24: Were you asked at the entrance window (scale house) if you had anything to recycle? n=768
Approximately two-thirds of customers reported that they were not asked if they had anything to recycle at the scale house. At many facilities customers can access the recycling area without passing the scale house; consequently this question was “Not Applicable” for 270 customers who are excluded from Figure 25.
Figure 25. Q24: Asked About Recycling by Scale House Operator
Yes26%
No67%
Refused to Answer
1%
No Response6%
Asked About Recycling by Scale

SURVEY RESPONSES 2016 Transfer Station Customer Survey
King County Department of Natural Resources and Parks | 32
Question 25: Did you ask any questions at the entrance window about recycling? n=808
The majority of customers (87%) reported that they did not ask the scale house any questions about recycling. At many facilities customers can access the recycling area without passing the scale house, for this reason this question was “Not Applicable” for 230 customers who are excluded from Figure 26.
Figure 26. Q25: Asked Scale about Recycling
Yes8%
No87%
Refused to Answer
0%
No Response5%
Asked Scale About Recycling

SURVEY RESPONSES 2016 Transfer Station Customer Survey
King County Department of Natural Resources and Parks | 33
Question 25a: Were your questions answered to your satisfaction? n=67
Among the customers who did ask recycling questions at the scale house, almost all (97%) had their questions answered to their satisfaction.
Figure 27. Q25a: Recycling Questions Answered by Scale House
Yes97%
No3%
Recycling Questions Answered by Scale

SURVEY RESPONSES 2016 Transfer Station Customer Survey
King County Department of Natural Resources and Parks | 34
Question 26: Did you bring any garbage to this facility today? Did you bring any materials separated for recycling or composting? n=1,038
Nearly an equal share of customers reported bringing only garbage (44%) or only separated recyclable or compostable materials (42%) to the facility. Customers bringing both garbage and separated recyclable/compostable were less prevalent (14%).
Figure 28. Q26: Materials Delivered
452
144
440
2
0
0 100 200 300 400 500
Garbage only
Garbage and separatedrecyclable/compostable materials
Separated recyclable orcompostable materials only
Refused to Answer
No Response
#of Responses
Mat
eria
ls De
liver
ed

SURVEY RESPONSES 2016 Transfer Station Customer Survey
King County Department of Natural Resources and Parks | 35
Question 26a: 95 percent of disposed loads contain materials that could be recycled such as clean wood, yard waste, paper, plastic, glass, and metals. In your opinion, what are the main obstacles that prevent people from recycling more at transfer stations? n=320
Customers who brought only garbage to the facility were asked about obstacles that prevent recycling at transfer stations. The most frequently cited obstacles were the length of time necessary to separate recyclable materials from garbage, that it was too inconvenient, and lack of information about the availability of recycling service or about what materials are accepted for recycling.
Table 2. Q26a: Obstacles to Recycling
The unedited “other” responses are presented below.
· The transfer station should provide taking apart and sorting the loads · Not enough facility to recycle · Lack of caring · Not adequate parking in the recycling section here at Vashon TS, need HHW here · No obstacle but stubbornness · Should have MRF systems to separate things · Assume the garbage is sorted for recycling · Should have a place where it's all for recycling · Don't have proper vehicle · Not enough stuff
Obstacles# of
Responses
Too inconvenient 92Have to weigh in and out twice 8Takes too long to separate/prepare materials 116Doesn't save money 9Recycle and disposal areas too separated 14Lack of information-don't know what is accepted or that it was available 58Need more material type options 13Other 10
Total Responses 320

SURVEY RESPONSES 2016 Transfer Station Customer Survey
King County Department of Natural Resources and Parks | 36
Question 26b: Which materials did you bring for recycling or composting? n=584
Cardboard and general commingled recyclables were the most frequently reported materials delivered for recycling. Yard waste and scrap metals were also commonly reported.
Figure 29. Q26b: Recyclable Materials Delivered
7514
72314
3312
11042
81210
1
0 50 100 150 200 250 300 350
Yard wasteClean wood waste
Scrap metalsCardboard
Bikes/bike partsGeneral commingled recyclables
Major appliancesMercury-containing items
TextilesFood waste
Polystyrene blocks and coolersPlastic bags and wrapOther (please specify)
Refused to answer
# of Responses
Recc
ycla
ble
Deliv
ered

SURVEY RESPONSES 2016 Transfer Station Customer Survey
King County Department of Natural Resources and Parks | 37
Question 27: In the recycling area, did one of our staff members offer to answer questions? n=363
Over four-fifths of customers who brought recyclable materials reported that SWD staff did not offer to answer questions in the recycling area. At many facilities the recycling area is unstaffed; consequently, 221 customers reported that this question was “Not Applicable.” They are excluded from Figure 30.
Customers who responded “Yes” to this question were directed to Question 27a; customers who responded “No” were directed to Question 27b. Customers for whom the question was not applicable or who did not respond were directed to Question 28.
Figure 30. Q27: Offer of Help at Recycle Area
Yes19%
No81%
No Response0%
Staff Offered Help at Recycle

SURVEY RESPONSES 2016 Transfer Station Customer Survey
King County Department of Natural Resources and Parks | 38
Question 27a: If a staff member did offer to answer questions, did you have questions for the staff member in the recycling area? n=69
Approximately 28 percent of the 69 customers who reported that SWD staff did offer to answer questions actually had a question about recycling. The majority (72%) did not have any questions about recycling.
Customers who responded “Yes” to this question were directed to Question 27d. All other customers were directed to Question 28.
Figure 31. Q27a: Need for Offered Help at Recycle Area
Yes28%
No72%
No Response0%
Staff Offered Help=Yes, Needed Help?

SURVEY RESPONSES 2016 Transfer Station Customer Survey
King County Department of Natural Resources and Parks | 39
Question 27b: If a staff member did not offer to answer questions, did you have questions for the staff member in the recycling area? n=293
Approximately 7 percent of the 293 customers who reported that SWD staff did not offer to answer questions actually had a question about recycling. The majority (93%) did not have any questions about recycling. This means that approximately 6 percent of customers had a recycling question in the recycling area and either the SWD staff did not approach the customer or there were no SWD staff in the recycling area.
Customers who responded yes to this question were directed to Question 27c. All other customers were directed to Question 28.
Figure 32. Q27b: Need for Help (Not Offered) at Recycle Area
Yes7%
No93%
No Response0%
Staff Offered Help=No, Needed Help?

SURVEY RESPONSES 2016 Transfer Station Customer Survey
King County Department of Natural Resources and Parks | 40
Question 27c: If a staff member did not offer to answer questions, and you had questions for the staff member in the recycling area, did you ask a staff member your questions? n=20
There were 20 customers who reported having a question in the recycling area and not being approached by SWD staff to answer questions. Of those 20 customers, four people found a SWD staff person to ask their question. The remaining 16 customers had questions that went unanswered.
Customers that responded yes to this question were directed to Question 27d. All other customers were directed to Question 28.
Figure 33. Q27c: Sought Unoffered Help at Recycle Area
Yes20%
No80%
No Response0%
Staff Offered Help=No, Needed Help=Yes, Received?
SURVEY RESPONSES 2016 Transfer Station Customer Survey
King County Department of Natural Resources and Parks | 41
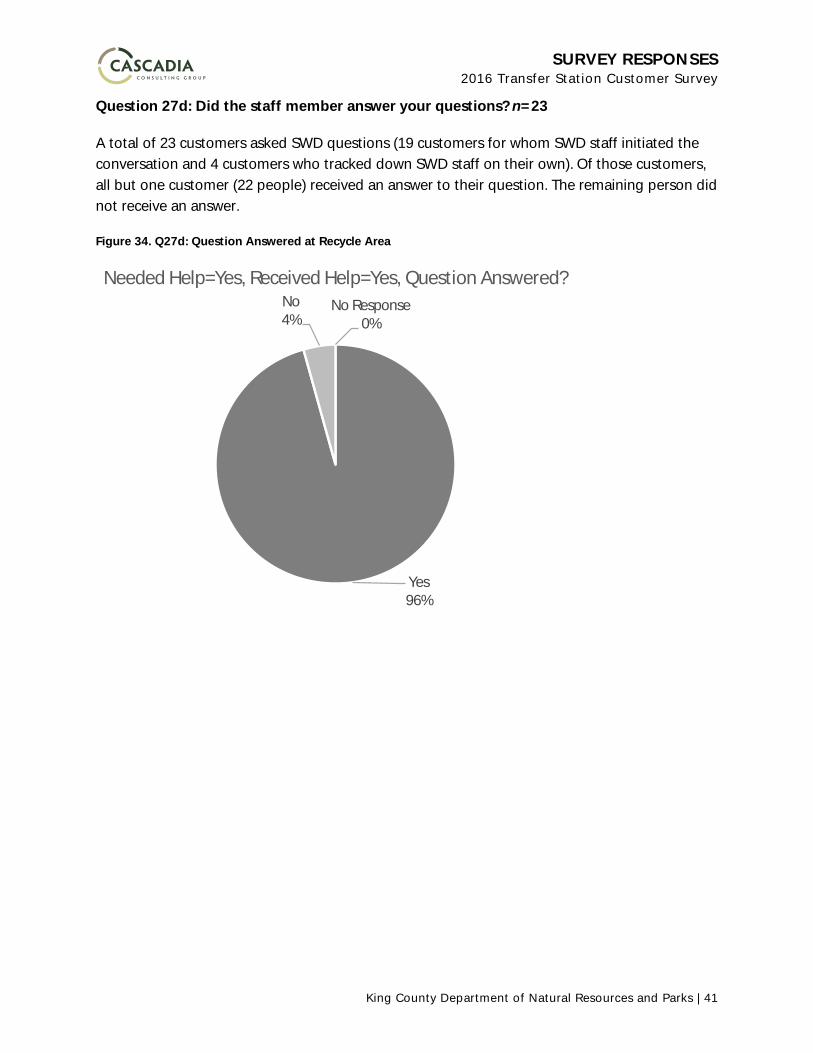
Question 27d: Did the staff member answer your questions? n=23
A total of 23 customers asked SWD questions (19 customers for whom SWD staff initiated the conversation and 4 customers who tracked down SWD staff on their own). Of those customers, all but one customer (22 people) received an answer to their question. The remaining person did not receive an answer.
Figure 34. Q27d: Question Answered at Recycle Area
Yes96%
No4%
No Response0%
Needed Help=Yes, Received Help=Yes, Question Answered?
SURVEY RESPONSES 2016 Transfer Station Customer Survey
King County Department of Natural Resources and Parks | 42
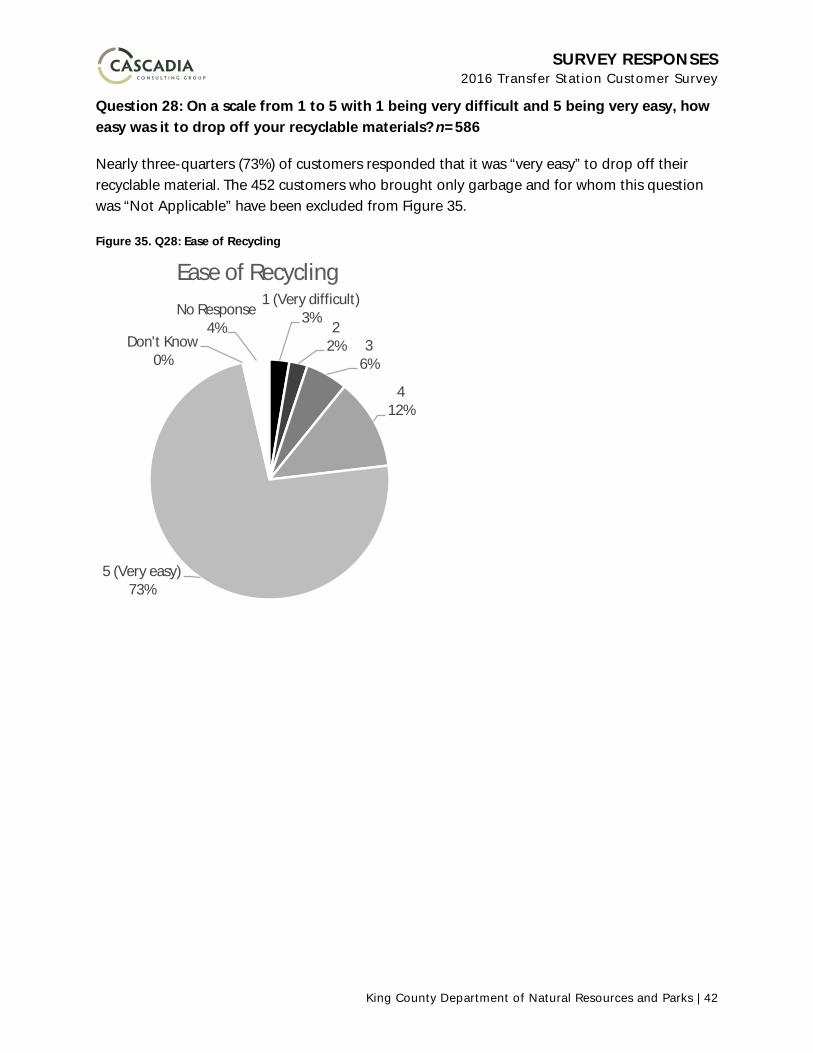
Question 28: On a scale from 1 to 5 with 1 being very difficult and 5 being very easy, how easy was it to drop off your recyclable materials? n=586
Nearly three-quarters (73%) of customers responded that it was “very easy” to drop off their recyclable material. The 452 customers who brought only garbage and for whom this question was “Not Applicable” have been excluded from Figure 35.
Figure 35. Q28: Ease of Recycling
1 (Very difficult)3%
22% 3
6%
412%
5 (Very easy)73%
Don't Know0%
No Response4%
Ease of Recycling

SURVEY RESPONSES 2016 Transfer Station Customer Survey
King County Department of Natural Resources and Parks | 43
Question 28a: How can we make it easier for you to drop off your recyclable materials? n=187
The two most common responses suggested improving access to the recycling area and making the space bigger (primarily so that wait times are shorter or it’s easier to back up). Many customers also suggested making the holes on the recycling containers larger.
Table 3. Q28a: Make Recycling Easier
The unedited “other” responses are included below.
· I think it should be open 24/7. Shut compacted down at night and just. Leave it open. Better/easier to drive into out of recycling area.
· On rainy days have a cover · Lattes · Eliminate trash compactors. Eliminate waiting line. Compactors have created difficulties. · Open up the north Seattle transfer station · Full bins · The two days that the transfer station are closed out of the week are inconvenient · No issues here. Closed days are a problem. · It's good. Except for days it's closed. · Maybe a Porta-Potty · Push broom would be really handy at the recycling area · It went great. A cover. · Difficult to load car in a way that makes it easy to unload at the station, tempting to
dump everything into garbage for easier time. Too many kinds of recyclables to separate. · Staff aggressive that customer didn't park straight · Area in different place than previously · Have a deposit on bottles, plastic and cans. Make area cleaner. · Says wait times have gotten longer
# of Responses
Make Cheaper 2Don't require weighing in and out twice 3Remove chains/lower wall/lower physical effort 18Makes holes in bins bigger 32Make recycling area bigger 36Provide easier/better/clearer access to recycling area 47Provide more staff assistance 5Accept more material types 16
Other 28
Total Responses 187

SURVEY RESPONSES 2016 Transfer Station Customer Survey
King County Department of Natural Resources and Parks | 44
· Extend hours for people who work during day · Install scoop on face of recyclable bins, a shoot of sorts · Have two little houses at every recycle place, one for building supplies. Offer to sell to
the public. Second house would be for furniture and household things that people dump here. Offload their stuff there for a smaller price, organize items. Sometimes people need just small amounts of things. Charge a small fee to offload things, would pay for full time staff by itself.
· Less smell · Sometimes it's a full bin, and stuff goes in trash instead · Have recycling facility in the Snoqualmie Valley · Have a station at Snoqualmie but not Snoqualmie ridge · Eliminate surveys · Provide things to smash boxes · Closer location

SURVEY RESPONSES 2016 Transfer Station Customer Survey
King County Department of Natural Resources and Parks | 45
Question 29: On a scale from 1 to 5 with 1 being very poor and 5 being very good, how would you rate the signs about what materials are accepted for recycling? n=921
More than three-quarters of customers rated the signs about the materials accepted for recycling highly with a score of 5 (52%) or 4 (25%). The 117 customers who delivered only garbage and responded that the question was not applicable to them have been excluded from Figure 36.
Figure 36. Q29: Signs about Accepted Materials
1 (Very poor)2% 2
5%3
11%
425%5 (Very good)
52%
Don't Know2%
No Response3%
Accepted Materials Signs

SURVEY RESPONSES 2016 Transfer Station Customer Survey
King County Department of Natural Resources and Parks | 46
Question 29a: How can the signs about what materials are accepted be more helpful? n=185
Making the signs and/or font larger was the most prevalent suggestion for making the signs more helpful. Making them more comprehensive with more examples was also frequently cited.
Table 4. Q29a: Make Material Acceptance Signs Better
The unedited “other” responses are included below.
· Textile is not marked for recycling · The current flow of the transfer station doesn't allow for easy unloading of recyclables. It
would be great if customers could unload recyclables first and then continue on to the transfer station. The current set up could work if there were better signs indicating the preferred flow of traffic if you would recycle first before dumping your waste as trash. A flow map would be helpful on the website.
· A sign saying that the recycling area is free to use. It would be helpful to have a larger recycling area.
· Signs about how to dispose of latex paint · Put signs earlier near the entrance so people can see them while they are waiting · Scale house should remind them that they offer recycling services · There are just too many different recyclable materials, all very confusing · Confusing at first, staff help made up for poor signage. Website didn't mention that
cardboard and metal recycling is free; he accidentally paid for it once because of incomplete website info
· Scrap metal location not clear, staff had to point it out · The green line was super helpful · Batteries
# of Responses
Larger 57More pictures 7More comprehensive/more examples 42Plastic triangle/resin codes 5Less detailed 10More signs 21Add fliers 2Additional languages 3
Didn't see signs 8
Mark bins better 7Other 23
Total Responses 185

SURVEY RESPONSES 2016 Transfer Station Customer Survey
King County Department of Natural Resources and Parks | 47
· Use arrows about where to put things · "With cardboard" confusing · Clothing needs to indicate that all fabrics are accepted, not just good quality ones · They shouldn't blow over · List for cardboard is confusing, font hierarchy confusing, misleading · Some signs say plastic bags are accepted if they contain shredded paper, some do not
(signs contradict each other), make signs about no plastic bags more prominent · It has changed over time what's acceptable, there often isn't anyone in there to clarify · Color lane lines could be clearer · Color coding · If they put anything new, put a flag on it. Would be good if they accepted more things
like electronics. · No one stops to read · Signs are wrong. It says paper only but it is actually mixed.

SURVEY RESPONSES 2016 Transfer Station Customer Survey
King County Department of Natural Resources and Parks | 48
Question 30: On a scale from 1 to 5 with 1 being very poor and 5 being very good, how would you rate all other signage at this facility (about directions, for example)? n=1,038
More than four-fifths of customers rated the other signs (about directions, hours, etc.) highly with a score of 5 (58%) or 4 (24%).
Figure 37. Q30: Other Signs
1 (Very poor)0% 2
3% 39%
424%
5 (Very good)58%
Don't Know2%
No Response0%
Not Applicable4%
Other Signs

SURVEY RESPONSES 2016 Transfer Station Customer Survey
King County Department of Natural Resources and Parks | 49
Question 30a: How can the other signage at this facility be more helpful? n=129
The most common comment from customers was that the signs about where to go once inside the facility were confusing.
Table 5. Q30a: Make Other Signs Better
The unedited “other” responses are included below.
· Make them nicer updated · Not clear · If you're colorblind it's difficult to see the red and green lines · No button to press on exit gate for free recycling · More pictures · Love the Spanish version · Put a sign about the costs to give people a better idea of what to expect. Add directions
about what to expect when going through. · Old signage still up · More organized. More uniform. · Blinking lights · Better spacing · Unclear how much it will cost · Can the sign that says authorized vehicles sign only be pushed back to allow people to
have turnaround room · Pay after signs at scales for unfamiliar people · Signs about where to go and untie loads are contradictory and too small
# of Responses
Better/more directions sign to the transfer station 19Better/more directions signs once inside the facility 46More/brighter colored lines 6Better/more signs about which scales/dumping bays are available 4More signs/larger font on signs 28Repaint signs/Remove foliage blocking signs 5Fewer signs 4Fewer painted lines 2
Other 15
Total Responses 129

SURVEY RESPONSES 2016 Transfer Station Customer Survey
King County Department of Natural Resources and Parks | 50
Question 31: On a scale from 1 to 5 with 1 being very poor and 5 being very good, how would you rate the staff’s helpfulness in answering questions? n=714
Nearly three-quarters (72%) of customers rated the staff helpfulness as “very good.” 324 customers responded that this question was “Not Applicable” as they were visiting a facility where they can access the recycling area without passing the scale house and the recycling area is unstaffed. These responses have been excluded from Figure 38.
Figure 38. Q31: Staff Helpfulness
1 (Very poor)2% 2
1%3
7%
415%
5 (Very good)72%
Don't Know3%
No Response0%
Staff Helpfulness

SURVEY RESPONSES 2016 Transfer Station Customer Survey
King County Department of Natural Resources and Parks | 51
Question 32: On a scale from 1 to 5 with 1 being very poor and 5 being very good, how would you rate the overall customer service you've received from staff so far today? n=807
More than three-quarters (76%) of customers rated the customer service as “very good.” 231 customers responded that this question was “Not Applicable” as they were visiting a facility where they can access the recycling area without passing the scale house and the recycling area is unstaffed. These responses have been excluded from Figure 39.
Figure 39. Q32: Overall Customer Service
1 (Very poor)2% 2
0% 36%
414%
5 (Very good)76%
Don't Know2%
No Response0%
Overall Customer Service

SURVEY RESPONSES 2016 Transfer Station Customer Survey
King County Department of Natural Resources and Parks | 52
Question 33: Finally, would you say that the customer service you experienced at this facility today is better, worse, or similar to customer service you’ve received in the past at this facility? Or is this the first time you visited this facility? n=881
Approximately 14 percent said the customer service they received the day they were surveyed was better than in the past. The majority of customers (78%) reported that the customer service they received was similar to customer service they had received in the past. 157 customers responded that this question was “Not Applicable” as they were visiting a facility where they can access the recycling area without passing the scale house and the recycling area is unstaffed. These responses have been excluded from Figure 40.
Figure 40. Q33: Historical Customer Service Comparison
Better14%
Similar78%
Worse3%
First Time/Don't Remember
5%
No Response0%
Customer Service Historical Comparison

CROSSTABS 2016 Transfer Station Customer Survey
King County Department of Natural Resources and Parks | 53
Crosstabs Cross-tabulation (crosstab) tables illustrate the relationship between two or more survey questions, allowing for the analysis of how respondents who provided a specific answer on one survey question answered other questions in the survey. Crosstabs can be useful for segmenting answers by audience type (e.g., gender, ZIP code, or primary language spoken) and identifying other patterns among respondents. For example, a crosstab table could identify the correlation—or lack thereof—between respondents who rent or own their homes and how many transfer center visits they make annually.
Entry Survey Crosstabs Table 5 presents the results of comparing Question 13: Which transfer station(s) do you usually use? with Question 14: Why did you choose this station today?
“It’s the closest station” is the most frequently reported reason for choosing a transfer station. “It’s convenient” was also reported frequently.
Table 6. Question 13 crossed with Question 14
n % n % n % n % n % n % n %
Algona, n=39 12 31% 15 38% 4 10% 2 5% 4 10% 0 0% 2 5%Bow Lake, n=197 65 33% 100 51% 7 4% 3 2% 9 5% 0 0% 13 7%Cedar Falls (drop box), n=160 50 31% 106 66% 2 1% 0 0% 2 1% 0 0% 0 0%Enumclaw, n=204 95 47% 89 44% 5 2% 2 1% 8 4% 0 0% 5 2%Factoria, n=80 17 21% 44 55% 10 13% 0 0% 5 6% 0 0% 4 5%Houghton, n=218 36 17% 157 72% 9 4% 1 0% 5 2% 0 0% 10 5%Renton, n=204 50 25% 130 64% 7 3% 1 0% 6 3% 0 0% 10 5%Shoreline, n=232 63 27% 139 60% 14 6% 3 1% 2 1% 0 0% 11 5%Skykomish (drop box), n=4 2 50% 2 50% 0 0% 0 0% 0 0% 0 0% 0 0%Vashon, n=205 53 26% 143 70% 3 1% 1 0% 3 1% 0 0% 2 1%North Seattle, n=64 16 25% 38 59% 2 3% 2 3% 0 0% 0 0% 6 9%South Seattle, n=59 20 34% 28 47% 6 10% 0 0% 2 3% 0 0% 3 5%
It's my favorite (I like the
art/view/staff) OtherIt's convenientIt's the closest
station
It's on my way to my
destination
It always has the shortest
line
It has a particular
service I want

CROSSTABS 2016 Transfer Station Customer Survey
King County Department of Natural Resources and Parks | 54
Table 6 and Figure 41 present the results of comparing Question 13: Which transfer station(s) do you usually use? with Question 19: How important are the types of recyclable or compostable materials accepted at this facility when considering which transfer station to use?
Between 60 percent and 86 percent of customers ranked the importance of types of materials accepted as either a 4 or a 5. Of the facilities operated by the SWD, the importance of the types of materials accepted was highest at Enumclaw (86%) and lowest at the Skykomish drop box (67%). The number of respondents who usually use Skykomish is very small (n=3) so findings for that facility are anecdotal at best.
Table 7. Question 13 crossed with Question 19
n % n % n % n % n % n % n %
Algona, n=33 3 9% 1 3% 3 9% 9 27% 16 48% 1 3% 0 0%Bow Lake, n=176 11 6% 8 5% 26 15% 47 27% 75 43% 9 5% 0 0%Cedar Falls (drop box), n=135 6 4% 11 8% 19 14% 28 21% 70 52% 1 1% 0 0%Enumclaw, n=177 6 3% 5 3% 12 7% 60 34% 92 52% 2 1% 0 0%Factoria, n=62 6 10% 1 2% 10 16% 11 18% 34 55% 0 0% 0 0%Houghton, n=196 14 7% 16 8% 31 16% 38 19% 94 48% 2 1% 1 1%Renton, n=164 22 13% 5 3% 15 9% 25 15% 94 57% 2 1% 1 1%Shoreline, n=190 25 13% 12 6% 21 11% 34 18% 96 51% 2 1% 0 0%Skykomish (drop box), n=3 0 0% 0 0% 1 33% 0 0% 2 67% 0 0% 0 0%Vashon, n=188 27 14% 3 2% 15 8% 38 20% 103 55% 2 1% 0 0%North Seattle, n=49 4 8% 2 4% 10 20% 7 14% 26 53% 0 0% 0 0%South Seattle, n=48 4 8% 5 10% 10 21% 11 23% 18 38% 0 0% 0 0%
No Response
1 (Not important
at all) 2 3 45 (Very
important)Refused to
Answer

CROSSTABS 2016 Transfer Station Customer Survey
King County Department of Natural Resources and Parks | 55
Figure 41. Question 13 crossed with Question 19
0%10%20%30%40%50%60%70%80%90%
100%
Prop
ortio
n of
Res
pons
es
Facility Usually Visited
Importance of Materials Accepted for Diversion
5 (Very important)4321 (Not important at all)

CROSSTABS 2016 Transfer Station Customer Survey
King County Department of Natural Resources and Parks | 56
Table 7 and Figure 42 present the results of comparing Question 13: Which transfer station(s) do you usually use? with Question 20: How important is having staff available in the recycling area to answer questions when considering which transfer station to use?
There are few clear findings from this crosstab: the availability of staff seems to be neither particularly important nor particularly unimportant. Two findings stand out in Table 7, nearly half of customers (48%) who report usually using either Cedar Falls or Vashon say that the availability of staff to answer questions in the recycling area is not important at all. The number of respondents who usually use Skykomish is very small (n=3) so findings for that facility are anecdotal at best.
Table 8. Question 13 crossed with Question 20
n % n % n % n % n % n % n %
Algona, n=33 7 21% 7 21% 8 24% 7 21% 4 12% 0 0% 0 0%Bow Lake, n=176 35 20% 20 11% 33 19% 35 20% 50 28% 2 1% 1 1%Cedar Falls (drop box), n=135 65 48% 23 17% 21 16% 14 10% 11 8% 1 1% 0 0%Enumclaw, n=177 35 20% 47 27% 31 18% 37 21% 26 15% 1 1% 0 0%Factoria, n=62 18 29% 12 19% 7 11% 9 15% 15 24% 1 2% 0 0%Houghton, n=196 60 31% 30 15% 29 15% 29 15% 46 23% 1 1% 1 1%Renton, n=164 60 37% 20 12% 16 10% 25 15% 37 23% 6 4% 0 0%Shoreline, n=190 58 31% 44 23% 29 15% 22 12% 32 17% 3 2% 2 1%Skykomish (drop box), n=3 1 33% 0 0% 1 33% 0 0% 1 33% 0 0% 0 0%Vashon, n=188 90 48% 38 20% 33 18% 13 7% 11 6% 2 1% 1 1%North Seattle, n=49 8 16% 12 24% 7 14% 7 14% 15 31% 0 0% 0 0%South Seattle, n=48 18 38% 8 17% 5 10% 6 13% 11 23% 0 0% 0 0%
1 (Not important
at all) 2 3 45 (Very
important)Refused to
AnswerNo
Response

CROSSTABS 2016 Transfer Station Customer Survey
King County Department of Natural Resources and Parks | 57
Figure 42. Question 13 crossed with Question 20
0%10%20%30%40%50%60%70%80%90%
100%
Prop
ortio
n of
Res
pons
es
Facility Usually Visited
Importance of Staff in Recycling Area
5 (Very important)4321 (Not important at all)

CROSSTABS 2016 Transfer Station Customer Survey
King County Department of Natural Resources and Parks | 58
Table 8 and Figure 43 present the results of comparing Question 13: Which transfer station(s) do you usually use? with Question 21: How important is the length of time it takes to complete your visit to this facility when considering which transfer station to use?
At 10 of the 12 transfer stations, more than 65 percent of customers ranked the importance of the length of time needed to complete their visit as either a 4 or a 5. Of the facilities operated by the SWD, the importance of the length of time needed to complete their visit was highest at Bow Lake (76%). Importance ratings were lower for customers at Vashon (55%) and Skykomish (33%); however, customers at these remote facilities do not have easy access to alternative facilities even if wait times are long. The number of respondents who usually use Skykomish is very small (n=3) so findings for that facility are anecdotal at best.
Table 9. Question 13 crossed with Question 21
n % n % n % n % n % n % n %
Algona, n=33 5 15% 1 3% 4 12% 10 30% 12 36% 1 3% 0 0%Bow Lake, n=176 11 6% 5 3% 23 13% 54 31% 80 45% 2 1% 1 1%Cedar Falls (drop box), n=135 9 7% 6 4% 23 17% 41 30% 55 41% 1 1% 0 0%Enumclaw, n=177 4 2% 17 10% 39 22% 45 25% 71 40% 1 1% 0 0%Factoria, n=62 8 13% 3 5% 8 13% 16 26% 25 40% 1 2% 1 2%Houghton, n=196 8 4% 10 5% 34 17% 43 22% 97 49% 2 1% 2 1%Renton, n=164 26 16% 6 4% 24 15% 26 16% 80 49% 2 1% 0 0%Shoreline, n=190 22 12% 8 4% 25 13% 42 22% 92 48% 1 1% 0 0%Skykomish (drop box), n=3 0 0% 0 0% 2 67% 0 0% 1 33% 0 0% 0 0%Vashon, n=188 35 19% 12 6% 36 19% 46 24% 57 30% 2 1% 0 0%North Seattle, n=49 5 10% 4 8% 6 12% 13 27% 21 43% 0 0% 0 0%South Seattle, n=48 7 15% 1 2% 3 6% 10 21% 26 54% 1 2% 0 0%
No Response
1 (Not important
at all) 2 3 45 (Very
important)Refused to
Answer

CROSSTABS 2016 Transfer Station Customer Survey
King County Department of Natural Resources and Parks | 59
Figure 43. Question 13 crossed with Question 21
0%10%20%30%40%50%60%70%80%90%
100%
Prop
ortio
n of
Res
pons
es
Facility Usually Visited
Importance of Time to Complete Visit
5 (Very important)4321 (Not important at all)

CROSSTABS 2016 Transfer Station Customer Survey
King County Department of Natural Resources and Parks | 60
Table 9 and Figure 44 present the results of comparing Question 13: Which transfer station(s) do you usually use? with Question 22: How important are the cost of the services you receive at this facility when considering which transfer station to use?
Most customers at most stations considered cost to be a very important factor (more than 55% at 9 of the 12 stations). This result is interesting because all of the SWD facilities charge the same rate for disposal, so the cost shouldn’t be an issue when considering which facility to use (assuming the decision has already been made to visit one of the facilities). The number of respondents who usually use Skykomish is very small (n=3) so findings for that facility are anecdotal at best.
Table 10. Question 13 crossed with Question 22
n % n % n % n % n % n % n %
Algona, n=33 3 9% 3 9% 6 18% 7 21% 14 42% 0 0% 0 0%Bow Lake, n=176 20 11% 8 5% 34 19% 42 24% 67 38% 5 3% 0 0%Cedar Falls (drop box), n=135 9 7% 15 11% 29 21% 31 23% 49 36% 1 1% 1 1%Enumclaw, n=177 15 8% 12 7% 29 16% 51 29% 70 40% 0 0% 0 0%Factoria, n=62 11 18% 5 8% 12 19% 12 19% 21 34% 1 2% 0 0%Houghton, n=196 26 13% 19 10% 52 27% 40 20% 57 29% 1 1% 1 1%Renton, n=164 31 19% 14 9% 26 16% 19 12% 72 44% 2 1% 0 0%Shoreline, n=190 44 23% 21 11% 27 14% 37 19% 60 32% 1 1% 0 0%Skykomish (drop box), n=3 0 0% 0 0% 0 0% 1 33% 2 67% 0 0% 0 0%Vashon, n=188 36 19% 10 5% 27 14% 26 14% 86 46% 3 2% 0 0%North Seattle, n=49 5 10% 5 10% 7 14% 10 20% 22 45% 0 0% 0 0%South Seattle, n=48 7 15% 6 13% 8 17% 8 17% 19 40% 0 0% 0 0%
1 (Not important
at all) 2 3 45 (Very
important)Refused to
AnswerNo
Response

CROSSTABS 2016 Transfer Station Customer Survey
King County Department of Natural Resources and Parks | 61
Figure 44. Question 13 crossed with Question 22
0%10%20%30%40%50%60%70%80%90%
100%
Prop
ortio
n of
Res
pons
es
Facility Usually Visited
Importance of Cost When Choosing Facility
5 (Very important)4321 (Not important at all)

CROSSTABS 2016 Transfer Station Customer Survey
King County Department of Natural Resources and Parks | 62
Table 10 and Figure 45 present the results of comparing Question 6: Are the materials you are bringing here today from your home, work, or somewhere else? with Question 17: There are many materials you can recycle at this transfer station if you separate them from garbage. Please rate how much saving money would motivate you to recycle using a scale from 1 to 5 with 1 being not at all motivating and 5 being very motivating?
Nearly half of customers bringing materials from home or work considered saving money to be very motivating (a rating of 4 or 5) when recycling. Saving money is similarly motivating whether customers bring materials from home (58%) or work (59%).
Table 11. Question 6 crossed with Question 17
Figure 45. Question 6 crossed with Question 17
n % n % n % n % n % n % n %
Home,n=1012 164 16% 91 9% 134 13% 124 12% 470 46% 17 2% 12 1%Work (either a fixed work space or a job site),n=138 25 18% 6 4% 22 16% 14 10% 68 49% 3 2% 0 0%Public Space (park, church, festival, etc.),n=5 2 40% 1 20% 0 0% 1 20% 1 20% 0 0% 0 0%Somewhere else,n=8 1 13% 1 13% 1 13% 0 0% 5 63% 0 0% 0 0%Refused to answer,n=0 0 0% 0 0% 0 0% 0 0% 0 0% 0 0% 0 0%No Response,n=6 0 0% 0 0% 0 0% 0 0% 0 0% 0 0% 6 100%
1No
ResponseRefused to
answer5432
0%
10%
20%
30%
40%
50%
60%
70%
80%
90%
100%
Home Work (either a fixedwork space or a job
site)
Public Space (park,church, festival,
etc.)
Somewhere else
Prop
ortio
n of
Res
pons
es
Origin of Materials
Saving Money
5 (very motivating)4321 (not at all motivating)

CROSSTABS 2016 Transfer Station Customer Survey
King County Department of Natural Resources and Parks | 63
Table 11 and Figure 46 present the results of comparing Question 6: Are the materials you are bringing here today from your home, work, or somewhere else? with Question 18: There are many materials you can recycle at this transfer station if you separate them from garbage. Please rate how much conserving resources and protecting the environment would motivate you to recycle using a scale from 1 to 5 with 1 being not at all motivating and 5 being very motivating?
Nearly two-thirds of customers overall considered conserving resources and protecting the environment to be very motivating when recycling. The percentage of respondents rating environmental motivation with a 4 or 5 is similar for all four material origins (between 79% and 100%).
Table 12. Question 6 crossed with Question 18
Figure 46. Question 6 crossed with Question 18
n % n % n % n % n % n % n %
Home,n=1012 34 3% 17 2% 81 8% 161 16% 696 69% 11 1% 12 1%Work (either a fixed work space or a job site),n=138 8 6% 4 3% 15 11% 27 20% 82 59% 2 1% 0 0%Public Space (park, church, festival, etc.),n=5 0 0% 0 0% 1 20% 0 0% 4 80% 0 0% 0 0%Somewhere else,n=8 0 0% 0 0% 0 0% 1 13% 7 88% 0 0% 0 0%Refused to answer,n=0 0 0% 0 0% 0 0% 0 0% 0 0% 0 0% 0 0%No Response,n=6 0 0% 0 0% 0 0% 0 0% 0 0% 0 0% 6 100%
Refused to answer
No Response1 2 3 4 5
0%
10%
20%
30%
40%
50%
60%
70%
80%
90%
100%
Home Work (either a fixedwork space or a job
site)
Public Space (park,church, festival,
etc.)
Somewhere else
Prop
ortio
n of
Res
pons
es
Origin of Materials
Conserve Resources and Protect Environment
5 (very motivating)4321 (not at all motivating)

CROSSTABS 2016 Transfer Station Customer Survey
King County Department of Natural Resources and Parks | 64
Table 12 and Figure 47 present the results of comparing Question 9: Are the materials you are bringing here today from a location that currently has curbside collection service for garbage? with Question 17: There are many materials you can recycle at this transfer station if you separate them from garbage. Please rate how much saving money would motivate you to recycle using a scale from 1 to 5 with 1 being not at all motivating and 5 being very motivating?
Regardless of whether the generating location has curbside garbage service, most customers said that saving money was a “very motivating” reason to recycle. The percent of customers giving a rating of 4 or 5 was slightly lower for customers with (57%) versus without (67%) curbside garbage service at their material’s point of generation.
Table 13. Question 9 crossed with Question 17
Figure 47. Question 9 crossed with Question 17
n % n % n % n % n % n % n %
Yes, n=867 164 19% 73 8% 116 13% 106 12% 392 45% 14 2% 2 0%No, n=241 18 7% 22 9% 35 15% 27 11% 136 56% 3 1% 0 0%Don't Know, n=38 8 21% 3 8% 6 16% 5 13% 13 34% 3 8% 0 0%Refused to answer, n=2 0 0% 0 0% 0 0% 0 0% 2 100% 0 0% 0 0%No Response, n=21 2 10% 1 5% 0 0% 1 5% 1 5% 0 0% 16 76%
No Response
Refused to answer54321
0%
10%
20%
30%
40%
50%
60%
70%
80%
90%
100%
Yes No Don't Know
Prop
ortio
n of
Res
pons
es
Has Curbside Garbage Service
Saving Money
5 (very motivating)4321 (not at all motivating)

CROSSTABS 2016 Transfer Station Customer Survey
King County Department of Natural Resources and Parks | 65
Table 13 and Figure 48 present the results of comparing Question 10: Are the materials you are bringing here today from a location that currently has curbside collection service for recycling? with Question 17: There are many materials you can recycle at this transfer station if you separate them from garbage. Please rate how much saving money would motivate you to recycle using a scale from 1 to 5 with 1 being not at all motivating and 5 being very motivating?
Regardless of whether the generating location has curbside recycling service, most customers said that saving money was a “very motivating” reason to recycle. The percent of customers giving a rating of 4 or 5 was slightly lower for customers with (58%) versus without (66%) curbside recycling service at their material’s point of generation.
Table 14. Question 10 crossed with Question 17
Figure 48. Question 10 crossed with Question 17
n % n % n % n % n % n % n %
Yes, n=795 147 18% 71 9% 105 13% 101 13% 357 45% 12 2% 2 0%No, n=300 28 9% 22 7% 47 16% 31 10% 167 56% 5 2% 0 0%Don't Know, n=51 15 29% 5 10% 5 10% 6 12% 17 33% 3 6% 0 0%Refused to answer, n=2 0 0% 0 0% 0 0% 0 0% 2 100% 0 0% 0 0%No Response, n=21 2 10% 1 5% 0 0% 1 5% 1 5% 0 0% 16 76%
1 2 3 4 5Refused to
answerNo
Response
0%
10%
20%
30%
40%
50%
60%
70%
80%
90%
100%
Yes No Don't Know
Prop
ortio
n of
Res
pons
es
Has Curbside Recycling Service
Saving Money
5 (very motivating)4321 (not at all motivating)

CROSSTABS 2016 Transfer Station Customer Survey
King County Department of Natural Resources and Parks | 66
Table 14 and Figure 49 present the results of comparing Question 11: Are the materials you are bringing here today from a location that currently has curbside collection service for organics? with Question 17: There are many materials you can recycle at this transfer station if you separate them from garbage. Please rate how much saving money would motivate you to recycle using a scale from 1 to 5 with 1 being not at all motivating and 5 being very motivating?
Regardless of whether the generating location has curbside organics service, most customers said that saving money was a “very motivating” reason to recycle. The percent of customers giving a rating of 4 or 5 was slightly lower for customers with (57%) versus without (66%) curbside organics service at their material’s point of generation.
Table 15. Question 11 crossed with Question 17
Figure 49. Question 11 crossed with Question 17
n % n % n % n % n % n % n %
Yes, n=664 130 20% 53 8% 90 14% 86 13% 294 44% 10 2% 1 0%No, n=395 36 9% 36 9% 56 14% 45 11% 216 55% 5 1% 1 0%Don't Know, n=87 24 28% 9 10% 11 13% 7 8% 31 36% 5 6% 0 0%Refused to answer, n=2 0 0% 0 0% 0 0% 0 0% 2 100% 0 0% 0 0%No Response, n=21 2 10% 1 5% 0 0% 1 5% 1 5% 0 0% 16 76%
1 2 3 4 5Refused to
answerNo
Response
0%
10%
20%
30%
40%
50%
60%
70%
80%
90%
100%
Yes No Don't Know
Prop
ortio
n of
Res
pons
es
Has Curbside Organics Service
Saving Money
5 (very motivating)4321 (not at all motivating)

CROSSTABS 2016 Transfer Station Customer Survey
King County Department of Natural Resources and Parks | 67
Table 15 and Figure 50 present the results of comparing Question 9: Are the materials you are bringing here today from a location that currently has curbside collection service for garbage? with Question 18: There are many materials you can recycle at this transfer station if you separate them from garbage. Please rate how much conserving resources and protecting the environment would motivate you to recycle using a scale from 1 to 5 with 1 being not at all motivating and 5 being very motivating?
Regardless of whether the generating location has curbside garbage service, most customers said that conserving resources and protecting the environment was a “very motivating” reason to recycle. The percentage of customers giving a rating of 4 or 5 was similar between customers with and without curbside garbage service at their material’s point of generation. On average, regardless of whether the generating location has garbage service, more customers considered conserving resources and protecting the environment as motivating (rating of 4 or 5) than saving money (85% vs. 57% for customers with curbside garbage and 86% vs. 67% for customers without curbside garbage).
Table 16. Question 9 crossed with Question 18
n % n % n % n % n % n % n %
Yes, n=867 33 4% 17 2% 70 8% 150 17% 587 68% 8 1% 2 0%No, n=241 3 1% 3 1% 23 10% 32 13% 177 73% 3 1% 0 0%Don't Know, n=38 5 13% 1 3% 3 8% 7 18% 20 53% 2 5% 0 0%Refused to answer, n=2 1 50% 0 0% 0 0% 0 0% 1 50% 0 0% 0 0%No Response, n=21 0 0% 0 0% 1 5% 0 0% 4 19% 0 0% 16 76%
Refused to answer
No Response1 2 3 4 5

CROSSTABS 2016 Transfer Station Customer Survey
King County Department of Natural Resources and Parks | 68
Figure 50. Question 9 crossed with Question 18
0%
10%
20%
30%
40%
50%
60%
70%
80%
90%
100%
Yes No Don't Know
Prop
ortio
n of
Res
pons
es
Has Curbside Garbage Service
Conserve Resources and Protect Environment
5 (very motivating)4321 (not at all motivating)

CROSSTABS 2016 Transfer Station Customer Survey
King County Department of Natural Resources and Parks | 69
Table 16 and Figure 51 present the results of comparing Question 10: Are the materials you are bringing here today from a location that currently has curbside collection service for recycling? with Question 18: There are many materials you can recycle at this transfer station if you separate them from garbage. Please rate how much conserving resources and protecting the environment would motivate you to recycle using a scale from 1 to 5 with 1 being not at all motivating and 5 being very motivating?
Regardless of whether the generating location has curbside recycling service, most customers said that conserving resources and protecting the environment was a “very motivating” reason to recycle. The percentage of customers giving a rating of 4 or 5 was similar between customers with and without curbside recycling service at their material’s point of generation. On average, regardless of whether the generating location has curbside recycling service, more customers considered conserving resources and protecting the environment as motivating (rating of 4 or 5) than saving money (84% vs 58% for customers with curbside recycling and 89% vs 66% for customers without curbside recycling).
Table 17. Question 10 crossed with Question 18
n % n % n % n % n % n % n %
Yes, n=795 32 4% 17 2% 68 9% 143 18% 525 66% 8 1% 2 0%No, n=300 3 1% 3 1% 24 8% 40 13% 227 76% 3 1% 0 0%Don't Know, n=51 6 12% 1 2% 4 8% 6 12% 32 63% 2 4% 0 0%Refused to answer, n=2 1 50% 0 0% 0 0% 0 0% 1 50% 0 0% 0 0%No Response, n=21 0 0% 0 0% 1 5% 0 0% 4 19% 0 0% 16 76%
3 4 5Refused to
answerNo
Response1 2

CROSSTABS 2016 Transfer Station Customer Survey
King County Department of Natural Resources and Parks | 70
Figure 51. Question 10 crossed with Question 18
0%
10%
20%
30%
40%
50%
60%
70%
80%
90%
100%
Yes No Don't Know
Prop
ortio
n of
Res
pons
es
Has Curbside Recycling Service
Conserve Resources and Protect Environment
5 (very motivating)4321 (not at all motivating)

CROSSTABS 2016 Transfer Station Customer Survey
King County Department of Natural Resources and Parks | 71
Table 17 and Figure 52 present the results of comparing Question 11: Are the materials you are bringing here today from a location that currently has curbside collection service for organics? with Question 18: There are many materials you can recycle at this transfer station if you separate them from garbage. Please rate how much conserving resources and protecting the environment would motivate you to recycle using a scale from 1 to 5 with 1 being not at all motivating and 5 being very motivating?
Regardless of whether the generating location has curbside organics service, most customers said that conserving resources and protecting the environment was a “very motivating” reason to recycle. The percentage of customers giving a rating of 4 or 5 was similar between customers with and without curbside organics service at their material’s point of generation. On average, regardless of whether the generating location has curbside organics service, more customers considered conserving resources and protecting the environment as motivating (rating of 4 or 5) than saving money (84% vs 57% for customers with curbside organics and 88% vs 66% for customers without curbside organics).
Table 18. Question 11 crossed with Question 18
n % n % n % n % n % n % n %
Yes, n=664 28 4% 16 2% 57 9% 119 18% 436 66% 7 1% 1 0%No, n=395 8 2% 3 1% 33 8% 58 15% 289 73% 3 1% 1 0%Don't Know, n=87 5 6% 2 2% 6 7% 12 14% 59 68% 3 3% 0 0%Refused to answer, n=2 1 50% 0 0% 0 0% 0 0% 1 50% 0 0% 0 0%No Response, n=21 0 0% 0 0% 1 5% 0 0% 4 19% 0 0% 16 76%
1 2 3 4 5Refused to
answerNo
Response

CROSSTABS 2016 Transfer Station Customer Survey
King County Department of Natural Resources and Parks | 72
Figure 52. Question 11 crossed with Question 18
0%
10%
20%
30%
40%
50%
60%
70%
80%
90%
100%
Yes No Don't Know
Prop
ortio
n of
Res
pons
es
Has Curbside Organics Service
Conserve Resources and Protect Environment
5 (very motivating)4321 (not at all motivating)

CROSSTABS 2016 Transfer Station Customer Survey
King County Department of Natural Resources and Parks | 73
Exit Survey Crosstabs Table 18 and Figure 53 present the results by surveyed facility for Question 24: Were you asked at the entrance window (scale house) if you had anything to recycle?
At many of the facilities, this question is not applicable because customers can access the recycling area without passing by the scale house. Among customers who must pass the scale house, fewer than half were asked if they had anything to recycle at all facilities except Shoreline. At Shoreline approximately every other customer was asked if they had anything to recycle. Most customers who pass through the scale house at most facilities were not asked if they have recyclable items in their vehicles.
Table 19. Surveyed Facility crossed with Question 24
Figure 53. Surveyed Facility crossed with Question 24
n % n % n % n % n %Bow Lake, n=147 58 39% 83 56% 0 0% 3 2% 3 2%Cedar Falls, n=125 15 12% 68 54% 38 30% 0 0% 4 3%Enumclaw, n=157 26 17% 73 46% 47 30% 0 0% 11 7%Houghton, n=162 20 12% 129 80% 9 6% 1 1% 3 2%Renton, n=123 5 4% 66 54% 43 35% 0 0% 9 7%Shoreline, n=151 77 51% 66 44% 0 0% 1 1% 7 5%Vashon, n=173 1 1% 29 17% 133 77% 0 0% 10 6%
No Response
Refused to Answer
Not ApplicableNoYes
0%10%20%30%40%50%60%70%80%90%
Bow Lake Cedar Falls Enumclaw Houghton Renton Shoreline Vashon
Surveyed Facility
Asked to Recycle at the Scale
Yes No Not Applicable

CROSSTABS 2016 Transfer Station Customer Survey
King County Department of Natural Resources and Parks | 74
Table 19 and Figure 54 present the results of comparing Question 26: Did you bring any materials separated for recycling or composting? Did you bring any garbage to this facility today? with Question 24: Were you asked at the entrance window (scale house) if you had anything to recycle?
In general, most customers were not asked if they have anything to recycle, regardless of what materials they were bringing to the facility. At many of the facilities, this question was not applicable because customers can access the recycling area without passing by the scale house.
Table 20. Question 26 crossed with Question 24
Figure 54. Question 26 crossed with Question 24
n % n % n % n % n %Garbage only, n=452 101 22% 330 73% 0 0% 2 0% 19 4%Separated recyclable or compostable materials only, n=440 58 13% 103 23% 270 61% 2 0% 7 2%Garbage and separated recyclable/compostable materials, n=144 43 30% 80 56% 0 0% 0 0% 21 15%Refused to answer, n=2 0 0% 1 50% 0 0% 1 50% 0 0%No Response, n=0 0 0% 0 0% 0 0% 0 0% 0 0%
Yes NoNot
ApplicableRefused to
AnswerNo
Response
0%10%20%30%40%50%60%70%80%
Garbage only Separated recyclable orcompostable materials only
Garbage and separatedrecyclable/compostable
materialsMaterials Brought to the Facility
Asked to Recycle at the Scale
Yes No Not Applicable

CROSSTABS 2016 Transfer Station Customer Survey
King County Department of Natural Resources and Parks | 75
Table 20 and Figure 55 present the results of comparing Question 24: Were you asked at the entrance window (scale house) if you had anything to recycle? with Question 28: On a scale from 1 to 5 with 1 being very difficult and 5 being very easy, how easy was it to drop off your recyclable materials?
Regardless of whether the scale house asked the customer if they had anything to recycle, the majority of customers reported that recycling was very easy. Overall 89 percent to 93 percent of customers gave ease of recycling a score of 4 or 5 whether or not they were asked if they had anything to recycle.
Table 21. Question 24 crossed with Question 28
Figure 55. Question 24 crossed with Question 28
n % n % n % n % n % n n nYes, n=101 3 3% 2 2% 2 2% 15 15% 79 78% 0 101 0No, n=169 3 2% 4 2% 12 7% 25 15% 125 74% 0 330 15Not Applicable, n=266 9 3% 8 3% 15 6% 26 10% 208 78% 0 0 4Refused to Answer, n=2 0 0% 0 0% 1 50% 0 0% 1 50% 0 2 1No Response, n=27 1 4% 0 0% 3 11% 6 22% 17 63% 1 19 0
Not ApplicableDon't Know
5 (very easy)432
1 (very difficult)
No Response
0%10%20%30%40%50%60%70%80%90%
100%
Yes No
Prop
ortio
n of
Res
pons
es
Asked to Recycle at Scalehouse
Ease of Recycling
5 (very easy)4321 (very difficult)

CROSSTABS 2016 Transfer Station Customer Survey
King County Department of Natural Resources and Parks | 76
Table 21 and Figure 56 present the results of comparing Question 24: Were you asked at the entrance window (scale house) if you had anything to recycle? with Question 31: On a scale from 1 to 5 with 1 being very poor and 5 being very good, How would you rate the staff’s helpfulness in answering questions?
Regardless of whether the scale house asked the customer if they had anything to recycle, the majority of customers reported that the staff helpfulness was very good. The percentage of customers giving a rating of 4 or 5 was 96 percent for customers who reported being asked if they had anything to recycle versus 88 percent for those not asked if they had anything to recycle.
Table 22. Question 24 crossed with Question 31
Figure 56. Question 24 crossed with Question 31
n % n % n % n % n % n n nYes, n=170 0 0% 0 0% 6 4% 16 9% 148 87% 1 31 0No, n=383 11 3% 4 1% 32 8% 71 19% 265 69% 11 119 1Not Applicable, n=134 1 1% 1 1% 12 9% 22 16% 98 73% 9 172 2Refused to Answer, n=2 0 0% 0 0% 0 0% 1 50% 1 50% 1 2 0No Response, n=0 0 0% 0 0% 0 0% 0 0% 0 0% 0 0 0
1 (very poor) 2 3 4
5 (very good) Don't Know
Not Applicable
No Response
0%10%20%30%40%50%60%70%80%90%
100%
Yes No
Prop
ortio
n of
Res
pons
es
Asked to Recycle at Scalehouse
Staff Helpfulness
5 (very good)4321 (very poor)

CROSSTABS 2016 Transfer Station Customer Survey
King County Department of Natural Resources and Parks | 77
Table 22 presents the results by surveyed facility for Question 28a: How can we make it easier for you to drop off your recyclable materials?
Customers at the Vashon facility provided the most responses to this question; their most common responses were:
· Make the recycling area bigger · Provide easier/better/clearer access to the recycling area
Table 23. Surveyed Facility crossed with Question 28a
Table 23 presents the results by surveyed facility for Question 29a: How can the signs about what materials are accepted be more helpful?
Customers at the Shoreline facility provided the most responses to this question; their most common responses were:
· Make the signs larger · Make the signs more comprehensive/have more examples
Table 24. Surveyed Facility crossed with Question 29a
n % n % n % n % n % n % n % n %
Make Cheaper 0 0% 0 0% 1 7% 0 0% 0 0% 1 4% 0 0% 2 1%Don't require weighing in and out twice 1 8% 0 0% 0 0% 0 0% 0 0% 2 7% 0 0% 3 2%Remove chains/lower wall/lower physical effort 1 8% 0 0% 1 7% 0 0% 1 3% 5 18% 10 15% 18 10%Makes holes in bins bigger 1 8% 6 32% 1 7% 3 20% 6 19% 3 11% 12 18% 32 17%Make recycling area bigger 0 0% 4 21% 1 7% 3 20% 6 19% 4 14% 18 27% 36 19%Provide easier/better/clearer access to recycling area 4 33% 1 5% 4 29% 4 27% 9 28% 7 25% 18 27% 47 25%Provide more staff assistance 1 8% 1 5% 0 0% 0 0% 1 3% 1 4% 1 1% 5 3%Accept more material types 2 17% 3 16% 2 14% 2 13% 2 6% 2 7% 3 4% 16 9%Other 2 17% 4 21% 4 29% 3 20% 7 22% 3 11% 5 7% 28 15%
Total Responses 12 100% 19 100% 14 100% 15 100% 32 100% 28 100% 67 100% 187 100%
Cedar Falls (drop box)Bow Lake
Total ResponsesVashonShorelineRentonHoughtonEnumclaw
n % n % n % n % n % n % n % n %
Larger 6 33% 13 50% 3 21% 12 36% 10 42% 11 29% 2 6% 57 31%More pictures 0 0% 0 0% 0 0% 2 6% 1 4% 3 8% 1 3% 7 4%More comprehensive/more examples 6 33% 4 15% 6 43% 5 15% 3 13% 10 26% 8 25% 42 23%Plastic triangle/resin codes 0 0% 0 0% 1 7% 0 0% 1 4% 0 0% 3 9% 5 3%Less detailed 1 6% 0 0% 1 7% 0 0% 2 8% 2 5% 4 13% 10 5%More signs 2 11% 3 12% 2 14% 5 15% 3 13% 4 11% 2 6% 21 11%Add fliers 0 0% 0 0% 0 0% 0 0% 0 0% 0 0% 2 6% 2 1%Additional languages 0 0% 0 0% 0 0% 0 0% 2 8% 0 0% 1 3% 3 2%Didn't see signs 0 0% 1 4% 0 0% 3 9% 0 0% 2 5% 2 6% 8 4%
Mark bins better 0 0% 1 4% 1 7% 4 12% 1 4% 0 0% 0 0% 7 4%Other 3 17% 4 15% 0 0% 2 6% 1 4% 6 16% 7 22% 23 12%
Total Responses 18 100% 26 100% 14 100% 33 100% 24 100% 38 100% 32 100% 185 100%
Renton Shoreline VashonTotal
ResponsesBow LakeCedar Falls (drop box) Enumclaw Houghton
Related Documents


