NREL is a national laboratory of the U.S. Department of Energy Office of Energy Efficiency & Renewable Energy Operated by the Alliance for Sustainable Energy, LLC This report is available at no cost from the National Renewable Energy Laboratory (NREL) at www.nrel.gov/publications. Contract No. DE-AC36-08GO28308 National Renewable Energy Laboratory 15013 Denver West Parkway Golden, CO 80401 303-275-3000 • www.nrel.gov Technical Report NREL/TP-5000-66599 September 2016 2016 Offshore Wind Energy Resource Assessment for the United States Walt Musial, Donna Heimiller, Philipp Beiter, George Scott, and Caroline Draxl National Renewable Energy Laboratory

Welcome message from author
This document is posted to help you gain knowledge. Please leave a comment to let me know what you think about it! Share it to your friends and learn new things together.
Transcript
NREL is a national laboratory of the U.S. Department of Energy Office of Energy Efficiency & Renewable Energy Operated by the Alliance for Sustainable Energy, LLC
This report is available at no cost from the National Renewable Energy Laboratory (NREL) at www.nrel.gov/publications.
Contract No. DE-AC36-08GO28308
National Renewable Energy Laboratory 15013 Denver West Parkway Golden, CO 80401 303-275-3000 • www.nrel.gov
Technical Report NREL/TP-5000-66599 September 2016
2016 Offshore Wind Energy Resource Assessment for the United States Walt Musial, Donna Heimiller, Philipp Beiter, George Scott, and Caroline Draxl National Renewable Energy Laboratory

NREL is a national laboratory of the U.S. Department of Energy Office of Energy Efficiency & Renewable Energy Operated by the Alliance for Sustainable Energy, LLC
This report is available at no cost from the National Renewable Energy Laboratory (NREL) at www.nrel.gov/publications.
Contract No. DE-AC36-08GO28308
National Renewable Energy Laboratory 15013 Denver West Parkway Golden, CO 80401 303-275-3000 • www.nrel.gov
2016 Offshore Wind Energy Resource Assessment for the United States Walt Musial, Donna Heimiller, Philipp Beiter, George Scott, and Caroline Draxl National Renewable Energy Laboratory
Prepared under Task No. WE15.5C01
Technical Report NREL/TP-5000-66599 September 2016

NOTICE
This report was prepared as an account of work sponsored by an agency of the United States government. Neither the United States government nor any agency thereof, nor any of their employees, makes any warranty, express or implied, or assumes any legal liability or responsibility for the accuracy, completeness, or usefulness of any information, apparatus, product, or process disclosed, or represents that its use would not infringe privately owned rights. Reference herein to any specific commercial product, process, or service by trade name, trademark, manufacturer, or otherwise does not necessarily constitute or imply its endorsement, recommendation, or favoring by the United States government or any agency thereof. The views and opinions of authors expressed herein do not necessarily state or reflect those of the United States government or any agency thereof.
This report is available at no cost from the National Renewable Energy Laboratory (NREL) at www.nrel.gov/publications.
Available electronically at SciTech Connect http:/www.osti.gov/scitech
Available for a processing fee to U.S. Department of Energy and its contractors, in paper, from:
U.S. Department of Energy Office of Scientific and Technical Information P.O. Box 62 Oak Ridge, TN 37831-0062 OSTI http://www.osti.gov Phone: 865.576.8401 Fax: 865.576.5728 Email: [email protected]
Available for sale to the public, in paper, from: U.S. Department of Commerce National Technical Information Service 5301 Shawnee Road Alexandria, VA 22312 NTIS http://www.ntis.gov Phone: 800.553.6847 or 703.605.6000 Fax: 703.605.6900 Email: [email protected]
Cover Photos by Dennis Schroeder: (left to right) NREL 26173, NREL 18302, NREL 19758, NREL 29642, NREL 19795.
NREL prints on paper that contains recycled content.

iii This report is available at no cost from the National Renewable Energy Laboratory (NREL) at www.nrel.gov/publications.
Acknowledgments This work was supported by the U.S. Department of Energy (DOE) under Contract No. DE-AC36-08GO28308 with the National Renewable Energy Laboratory (NREL). Funding for the work was provided by the DOE Office of Energy Efficiency and Renewable Energy, Wind and Water Power Technologies Office. The authors would like to extend thanks to NREL technical staff who contributed to this study including Dylan Hettinger as well as Aaron Smith (now with Principle Power Inc.). We would like to thank the DOE Wind and Water Power Technologies Office staff and contractors including Alana Duerr, Patrick Gilman, Ben Maurer, and Jose Zayas for supporting this research and providing feedback throughout the process. Thanks also to Greg Matzat (New York State Energy Research and Development Agency) for his guidance at the early stages of this study. NREL would also like to thank the following peer reviewers and other contributors: Bruce Bailey (AWS Truepower, LLC), Chris Ziesler (AWS Truepower, LLC), Matt Filippelli (AWS Truepower, LLC), Darryl Francois (Bureau of Ocean Energy Management), and Bill White (Massachusetts Clean Energy Center). Technical editing was provided by Sheri Anstedt, Corrie Christol, and Tiffany Byrne.

iv This report is available at no cost from the National Renewable Energy Laboratory (NREL) at www.nrel.gov/publications.
Nomenclature or List of Acronyms
AEP annual energy production AWST AWS Truepower BOEM Bureau of Ocean Energy Management DOE U.S. Department of Energy DOI U.S. Department of the Interior EEZ Exclusive Economic Zone EIA Energy Information Administration GCF gross capacity factor GIS geographic information system GW gigawatt GWh/yr gigawatt-hour per year LCOE levelized cost of energy m meter MERRA Modern-Era Retrospective Analysis m/s meters per second MW megawatt MW/km2 megawatt per square kilometer nm nautical mile NOAA National Oceanic and Atmospheric Administration NREL National Renewable Energy Laboratory OCS Outer Continental Shelf ReEDS Regional Energy Deployment System SLA Submerged Lands Act TW terawatt TWh/yr terawatt-hours per year WIND Toolkit Wind Integration National Dataset Toolkit WRF Weather Research and Forecasting

v This report is available at no cost from the National Renewable Energy Laboratory (NREL) at www.nrel.gov/publications.
Executive Summary This report, the 2016 Offshore Wind Energy Resource Assessment for the United States, was developed by the National Renewable Energy Laboratory (NREL), and updates a previous national resource assessment study (Schwartz et al. 2010), and refines and reaffirms that the available wind resource is sufficient for offshore wind to be a large-scale contributor to the nation’s electric energy supply. Experience from other renewable technologies, such as land-based wind and solar energy, indicates that offshore wind site development will likely be highly selective. Therefore, the resource potential needs to significantly exceed the anticipated deployment to allow for siting flexibility. When developers and regulators have more siting options, projects can be built in the most economical and least conflicted areas. Therefore, an abundant wind resource is one of the essential building blocks that compose the value proposition for offshore wind. As such, the study shows that to implement the U.S. Department of Energy’s (DOE’s) Wind Vision 86-gigawatt (GW) offshore wind deployment scenario for 2050 (DOE 2015a), it would require the United States to use about 0.8% of the gross resource area or about 4.2% of the total technical resource area. Some of the significant highlights and updates featured in this report include:
• Expansion of the gross resource area. The previous resource assessment had a domain boundary of 50 nautical miles (nm) from shore because of limits on wind data availability. However, global industry data show that offshore wind projects are being developed at distances from shore that exceed 50 nm (Smith, Stehly, and Musial 2015). For this report, the domain boundaries were extended from 50 nm to 200 nm, the outer edge of the U.S. Exclusive Economic Zone (EEZ) [Musial and Ram 2010, page 135], utilizing wind speed data from NREL’s Wind Integration National Dataset (WIND) Toolkit (Draxl 2015).
• Turbine hub height. The gross and technical potential resource was calculated using wind speed at a turbine hub height of 100 meters (m) (previously 90 m) to reflect market trends for the likely height of new offshore turbine installations in the United States over the next 5 years (Smith, Stehly, and Musial 2015).
• Capacity array power density. For calculating the gross and technical resource potential, the array power density of offshore wind installations was lowered from 5 megawatts per square kilometer (MW/km2) to 3 MW/km2 based on developer input for likely array spacing in U.S. projects (Musial 2013; Musial et al. 2013) and to provide consistency with the DOE Wind Vision.
• Energy production potential. The energy production potential was assessed using a representative 6-MW turbine power curve, including geospatial estimates of gross and net capacity factor for the entire resource area. Net capacity factor estimates considered wake losses, electrical losses, turbine availability, and other system losses.1
• Technology exclusions. For estimating the technical potential, technology exclusions based on maximum water depth for deployment, minimum wind speed, and limits to floating technology in freshwater surface ice were applied. In consultation with industry technology developers, excluded areas include water depths greater than 1,000 m (Arent
1 Note that loss calculations in this resource assessment are not sufficient for site-specific annual energy production estimates.

vi This report is available at no cost from the National Renewable Energy Laboratory (NREL) at www.nrel.gov/publications.
et al. 2012), wind speeds lower than 7 m/s (Schwartz et al. 2010), and water deeper than 60 m in the Great Lakes.2 These exclusions are intended to reflect the current state of offshore wind technology. However, with appropriate investments in the development of new technology, certain resource areas could be expanded to increase the resource estimates found in this report. For example, the development of ice-resistant floating foundations for water deeper than 60 m in the Great Lakes would extend the technical resource potential in this region. As an example of how the technical exclusions are applied, the dark blue shaded area in the map in Figure ES-1 shows the area that was excluded with water deeper than 1,000 m.
Figure ES-1. Gross potential resource area showing excluded water depths of more than 1,000 m in dark blue
• Land Use and Environmental Exclusions. Land-use and environmental exclusion areas, such as shipping lanes and marine protected areas, were deducted from the total technical potential resource area using a database developed by Black & Veatch (Black & Veatch 2010). These same exclusions were used to compute the energy supply curves in the Wind Vision study (DOE 2015a).
The analysis progression followed for this report is shown in Figure ES-2, which aligns with a new framework described by Beiter et al. (2016a). Figure ES-2 also shows the resource totals at each analysis step. The raw data for this study are tabulated in Appendix A through Appendix I.
2 Water depths more than 60 m are assumed to require floating platform technology. As of this writing, there are no examples of floating systems of any kind that could be installed permanently in the Great Lakes during the winter season. New technology could be developed to overcome this barrier to add resource area to this region.

vii This report is available at no cost from the National Renewable Energy Laboratory (NREL) at www.nrel.gov/publications.
Figure ES-2. Progression of analysis for the 2016 Offshore Wind Energy Resource Assessment for
the United States
Through application of the analysis steps described in Figure ES-2, the gross resource potential area is reduced by approximately 75% to arrive at the technical resource potential area. The area is further reduced to include land-use and environmental exclusions. The final technical potential eliminates approximately 84% of the original gross energy supply but still has an energy potential that is twice as large as the electric energy demand for the United States (Energy Information Administration [EIA] 2015).
Regional assessments were carried out for the five U.S. regions defined in the Wind Vision study scenario. The gross resource potential was compared to the final net technical potential for both capacity potential in gigawatts and net energy potential in terawatt-hours per year (TWh/year) (Figure ES-3).
Figure ES-3. Capacity (left) and net energy (right) offshore gross resource (dark blue) and final net
technical (light blue) potential estimates for five U.S. offshore wind resource regions

viii This report is available at no cost from the National Renewable Energy Laboratory (NREL) at www.nrel.gov/publications.
To reach the Wind Vision 2050 deployment scenario of 86 GW, approximately 4% of the technical resource area (about 0.8% of the gross resource area) would need to be developed. If developed, the energy produced would be approximately 7% of the U.S. electric consumption. Figure ES-3 shows the U.S. offshore wind technical resource potential and how it is distributed among all five U.S. regions. Each region is capable of contributing to a viable offshore wind industry by supporting significant deployment and participating in a robust offshore wind industrial supply chain and its supporting infrastructure.
Finally, state-by-state comparisons were made to determine geographically how the resource is distributed among the 29 offshore states examined (note that Alaska was not part of the study). Figure ES-4 shows this state-by-state comparison for two water depth classes: shallower than 60 m, and deeper than 60 m.
Figure ES-4. Offshore wind net technical energy potential (7,203 TWh/year) by state for depths of
more than and less than 60 m
State-by-state comparisons indicate an abundance of resource potential in all U.S. regions relative to their electricity consumption. The best resource, based on quality and quantity, was found to be in northeast states such as Maine, Massachusetts, Rhode Island, New York, and New Jersey. Massachusetts has the highest technical offshore resource potential. Southern states such as Florida, Texas, and Louisiana all had large resource areas because of long coastlines and wider continental shelves, but the quality of their resource was lower due to lower wind speeds.
Using the most current industry knowledge, this updated U.S. offshore wind resource assessment has refined and reaffirmed the abundance of the available offshore wind resource. Moreover, it conforms to a new framework for resource classification that describes the offshore wind resources in terms that help promote consistency with broader renewable resource potential classification schemes (Beiter et al. 2016a; Lopez 2012) and other energy sources. This report does not cover the cost of offshore wind or the relative economic differences between sites. The analysis used to quantify the cost and economic potential is covered in a companion NREL report (Beiter et al. 2016b).

ix This report is available at no cost from the National Renewable Energy Laboratory (NREL) at www.nrel.gov/publications.
Table of Contents Acknowledgments ..................................................................................................................................... iii Nomenclature or List of Acronyms .......................................................................................................... iv Executive Summary .................................................................................................................................... v Table of Contents ....................................................................................................................................... ix List of Figures ............................................................................................................................................. x List of Tables .............................................................................................................................................. xi 1 Introduction and Background ............................................................................................................. 1 2 Previous Resource Assessments, Changes, and Limitations ......................................................... 2 3 Applicable Uses and Limits ................................................................................................................. 3 4 Offshore Wind Energy Terminology Framework ............................................................................... 4 5 Progression of Analysis ...................................................................................................................... 7
5.1 Gross Potential Resource .............................................................................................................. 7 The gross potential resource analysis method followed these steps: ...................................................... 7 5.2 Technical Potential Resource ........................................................................................................ 8
6 Data Sources ......................................................................................................................................... 9 6.1 Wind Speed Data ........................................................................................................................... 9 6.2 Bathymetry Data ......................................................................................................................... 11 6.3 State Boundaries .......................................................................................................................... 12
7 Gross Offshore Wind Resource ........................................................................................................ 14 7.1 Gross Resource Area ................................................................................................................... 14 7.2 Gross Resource Capacity ............................................................................................................ 16 7.3 Gross Resource Energy ............................................................................................................... 17 7.4 Gross Offshore Energy Potential with Losses Included .............................................................. 22
8 Technical Resource ............................................................................................................................ 26 8.1 Technology Exclusions ............................................................................................................... 26 8.2 Technical Offshore Resource Area ............................................................................................. 27 8.3 Technical Offshore Resource Capacity ....................................................................................... 28 8.4 Technical Offshore Resource Energy Potential with Losses ...................................................... 28 8.5 Technical Offshore Resource Energy Potential with Land-Use and Environmental Exclusions 29
9 State and Regional Data Comparisons ............................................................................................ 33 9.1 Comparison of Gross Resource to Net Technical Potential ........................................................ 33 9.2 State-by-State Comparisons ........................................................................................................ 34 9.3 Resource in State Versus Federal Waters .................................................................................... 37
10 Summary and Key Findings .............................................................................................................. 39 11 Recommendations for Future Analyses .......................................................................................... 40 References ................................................................................................................................................. 41 Appendices ................................................................................................................................................ 45
Appendix A. Gross Offshore Resource Area Tables ............................................................................ 45 Appendix B. Gross Offshore Resource Capacity Tables ..................................................................... 49 Appendix C. Gross Offshore Resource Energy Tables ........................................................................ 52 Appendix D. Gross Resource Energy Tables (With Losses) ................................................................ 55 Appendix E. Technical Offshore Resource Area Tables ...................................................................... 58 Appendix F. Technical Offshore Resource Capacity Tables................................................................ 61 Appendix G. Technical Offshore Resource Energy Potential (With Losses; No Conflicting
Exclusions) .................................................................................................................................. 64 Appendix H. Net Technical Resource Capacity ................................................................................... 67 Appendix I. Net Technical Energy Potential ........................................................................................ 70 Appendix J. Comparison to Wind Vision ............................................................................................. 73 Wind Vision 2015 Assumptions ........................................................................................................... 73 2016 Offshore Wind Resource Assessment Assumptions ................................................................... 73

x This report is available at no cost from the National Renewable Energy Laboratory (NREL) at www.nrel.gov/publications.
List of Figures Figure ES-1. Gross potential resource area showing excluded water depths of more than 1,000 m
in dark blue ........................................................................................................................................... vi Figure ES-2. Progression of analysis for the 2016 Offshore Wind Energy Resource Assessment for
the United States ............................................................................................................................. vii Figure ES-3. Capacity (left) and net energy (right) offshore gross resource (blue) and final net
technical (red) potential estimates for five U.S. offshore wind resource regions ....................... vii Figure ES-4. Offshore wind net technical energy potential (7,203 TWh/year) by state for depths of
more than and less than 60 m .......................................................................................................... viii Figure 1. Offshore wind energy resource classification framework. Illustration from Beiter et al.
2016a ...................................................................................................................................................... 4 Figure 2. Progression of analysis for the 2016 Offshore Wind Energy Resource Assessment for
the United States .................................................................................................................................. 7 Figure 3. Offshore wind resource data (100 m) used for the 2016 offshore Wind resource
assessment. Map provided by NREL, AWS Truepower, and Vaisala/3TIER .................................. 9 Figure 4. Weather Research and Forecasting modeling domains for the WIND Toolkit ................... 10 Figure 5. Bathymetry map of contiguous United States and Hawaii showing areas with depths out
to the U.S. EEZ .................................................................................................................................... 12 Figure 6. State administrative areas at distances out to 50 nm. Figure provided by Schwartz et al.
2010 ...................................................................................................................................................... 13 Figure 8. Offshore wind projects installed and under development as a function of depth and
distance to shore. Figure from Smith, Stehly, and Musial (2015) .................................................. 16 Figure 9. Generic 6-MW power curve for representative wind turbine technology available for
commercial deployment in 2015 (assumed operation date of 2017) ............................................. 18 Figure 10. Unit 600-MW wind plant for Openwind energy and wake loss calculations using 7-by-7
rotor diameter (D) spacing and a generic 155-m turbine ............................................................... 19 Figure 11. Turbine density for 18 large (> 200-MW capacity) offshore wind power projects showing
turbine spacing scenarios for three reference configurations. Figure from Musial 2013 .......... 20 Figure 12. Using Openwind, 7,159-unit wind plants were represented over the resource area of the
continental United States from 0 to 50 nm ...................................................................................... 20 Figure 13. Gross capacity factor correlation with wind speed as derived regionally from Openwind
data ...................................................................................................................................................... 21 Figure 14. Array efficiency as a function of wind speed for four continental U.S. regions .............. 23 Figure 15. Electrical system losses from the offshore to the land-based substation ....................... 24 Figure 16. Net capacity factor for gross offshore wind resource area with losses ........................... 25 Figure 17. Wind speed map for the technical resource area ................................................................ 28 Figure 19. Excluded area percentages. Figure provided by NREL, DOE (2015), and Black & Veatch
(2010) ................................................................................................................................................... 30 Figure 20. Net capacity factor for technical potential energy resource with technical exclusions for
five U.S. offshore wind resource regions. ....................................................................................... 33 Note: The states included in each region are shaded to show which states are in each region. .... 33 Figure 21. Offshore wind resource capacity (left) and net energy (right) gross resource (blue) and
final net technical (light blue) potential estimates for five U.S. offshore wind resource regions33 Figure 22. Offshore wind net technical energy potential (7,203 TWh/year) divided by state for water
depths of less than 60 m (blue) and greater than 60 m (red) ......................................................... 34 Figure 23. Offshore wind net technical energy potential with an 8-m/s wind speed exclusion by
state ..................................................................................................................................................... 35 Figure 24. Offshore wind net technical energy potential (7,203 TWh/year) divided by state. The
dashed red line indicates the level at which the state's electric load is equal to the its resource. Figure provided by NREL (year) and EIA (2015c) .......................................................... 36
Figure 25. Percent of electricity imported from outside the state to meet demand. Figure provided by NREL (year), EIA (2015b, 2015c) .................................................................................................. 37

xi This report is available at no cost from the National Renewable Energy Laboratory (NREL) at www.nrel.gov/publications.
List of Tables Table 1. Wind Turbine Power Curve Inputs ............................................................................................ 17 Table 2. Offshore Wind Resource Reductions by Exclusion Category ............................................... 31 Table 3. Technical Resource in State and Federal Waters ................................................................... 38 Table A-1. Gross Offshore Wind Potential by Water Depth: Area (km2) .............................................. 46 Table A-2. Gross Offshore Wind Potential by Distance from Shore: Area (km2) ............................... 47 Table A-3. Gross Offshore Wind Potential by Wind Speed: Area (km2) .............................................. 48 Table B-1. Gross Offshore Wind Potential by Water Depth: Capacity (MW) ....................................... 49 Table B-2. Gross Offshore Wind Potential by Distance from Shore: Capacity (MW) ........................ 50 Table B-3. Gross Offshore Wind Potential by Wind Speed: Capacity (MW) ....................................... 51 Table C-1. Gross Offshore Wind Potential by Water Depth: Generation (GWh/yr) ............................ 52 Table C-2. Gross Offshore Wind Potential by Distance from Shore: Generation (GWh/yr) .............. 53 Table C-3. Gross Offshore Wind Potential by Wind Speed: Generation (GWh/yr) ............................. 54 Table D-1. Net Offshore Wind Potential by Water Depth: Generation (GWh/yr) ................................. 55 Table D-2. Net Offshore Wind Potential by Distance from Shore: Generation (GWh/yr) ................... 56 Table D-3. Net Offshore Wind Potential by Wind Speed: Generation (GWh/yr) ................................. 57 Table E-1. Technical Offshore Wind Potential by Water Depth: Area (km2) ....................................... 58 Table E-2. Technical Offshore Wind Potential by Distance from Shore: Area (km2) ......................... 59 Table E-3. Technical Offshore Wind Potential by Wind Speed: Area (km2) ........................................ 60 Table F-1. Technical Offshore Wind Potential by Water Depth: Area (km2) ........................................ 61 Table F-2. Technical Offshore Wind Potential by Distance from Shore: Area (km2) .......................... 62 Table F-3. Technical Offshore Wind Potential by Wind Speed: Area (km2) ........................................ 63 Table G-1. Technical Offshore Wind Potential by Water Depth: Generation (GWh/yr) ...................... 64 Table G-2. Techical Offshore Wind Potential by Distance from Shore: Generation (GWh/yr) .......... 65 Table G-3. Technical Offshore Wind Potential by Wind Speed: Generation (GWh/yr) ...................... 66 Table H-1. Technical Offshore Wind Potential by Water Depth: Capacity (MW) ................................ 67 Table H-2. Technical Offshore Wind Potential by Distance from Shore: Capacity (MW) .................. 68 Table H-3. Technical Offshore Wind Potential by Wind Speed: Capacity (MW) ................................. 69 Table I-1. Technical Offshore Wind Potential by Water Depth: Generation (GWh/yr)........................ 70 Table I-2. Technical Offshore Wind Potential by Distance from Shore: Generation (GWh/yr) ......... 71 Table I-3. Technical Offshore Wind Potential by Wind Speed: Generation (GWh/yr) ........................ 72 Table K-1. State-to-State Boundary Data ................................................................................................ 75 Table L-1. Gross Theoretical Recoverable Resource Energy with Losses (Wakes, Electrical,
Availability, and Other) in TWh/year ................................................................................................. 76

1 This report is available at no cost from the National Renewable Energy Laboratory (NREL) at www.nrel.gov/publications.
1 Introduction and Background This report updates and quantifies the U.S. offshore wind resource capacity and energy yield potential which is the foundation of the offshore wind value proposition. The U.S. offshore wind resource is robust, abundant, and regionally diverse, allowing for offshore wind development that can be located near congested load centers with some of the highest electric rates in the United States (Musial and Ram 2010). These coastal wind resources can provide local power generation, relief from transmission congestion, positive externalities including zero carbon emissions, energy diversity, and economic development, particularly in regions that depend on imports of traditional fossil-based fuels.
In March 2015, the U.S. Department of Energy (DOE) published Wind Vision: A New Era for Wind Power in the United States (DOE 2015a). The report examines a detailed, long-term, broad-reaching scenario for the United States to generate 35% of its electricity from wind energy by 2050, using both land-based and offshore wind. The Wind Vision scenario estimates that 86 gigawatts (GW) of offshore wind power capacity could be deployed in the nation by 2050 and provides a high-level road map of the actions necessary to realize this scenario. The Wind Vision highlights an offshore wind resource potential that can contribute to all regions of the United States, including the North and South Atlantic Ocean, the Gulf of Mexico, the Great Lakes, and the Pacific Ocean (including California, Oregon, Washington, and Hawaii).
This report updates the previous national resource assessment studies (Schwartz et al. 2010), and refines and reaffirms the adequacy of the available offshore wind resource to be a viable large-scale contributor to the electric energy supply. Experience from other renewable technologies, such as land-based wind and solar energy, indicates that site development will likely be highly selective. Therefore, the resource potential should ideally exceed the expected long-term deployment by a significant amount to allow for siting flexibility. When developers and regulators have more siting options, projects can be built in the most economical and least-conflicted areas.
The motivation for conducting this new offshore wind resource assessment was motivated by several factors including the:
• Availability of expanded, higher-quality wind resource data • Need to keep pace with advances in offshore wind technology • Need for improved consistency to allow comparison with other renewable and
nonrenewable resources • Anticipated release of an updated offshore wind strategy by DOE and the U.S.
Department of the Interior in 2016.
This updated 2016 Offshore Wind Energy Resource Assessment for the United States conforms to a new framework for resource classification described in Section 4 and documented more fully by Beiter et al. 2016a, which describes the offshore wind resources in terms that help promote consistency with broader renewable resource potential classification schemes (Beiter et al. 2016a; Lopez 2012) and other energy sources.
2 This report is available at no cost from the National Renewable Energy Laboratory (NREL) at www.nrel.gov/publications.
2 Previous Resource Assessments, Changes, and Limitations
In 2010, the first comprehensive U.S. offshore wind energy resource assessment was documented by the National Renewable Energy Laboratory (NREL) (Schwartz et al. 2010). The Schwartz wind resource study quantified the gross offshore wind energy resource capacity for the contiguous United States and Hawaii3 at about 4,150 GW. This gross resource potential (for the geographic domain extending from 0 to 50 nautical miles [nm] from the shoreline) provided a coarse evaluation of the quantity of ocean and Great Lake areas that would support offshore wind commercial development by state, sorted into discrete bands of water depth (0–30 meters [m]; 30–60 m; and more than 60 m), wind speed, and distance from shore (0–3 nm, 3–12 nm, and 12–50 nm). The 2010 study was effective in showing that the gross offshore resource potential was large relative to the U.S. energy consumption.4 However, it did not quantify the gross or net energy production potential or losses; nor did it address the technically developable resource potential by excluding areas with apparent technology, environmental, and land-use conflicts.
Using Schwartz et al. (2010) as a point of comparison, several assumptions have changed in this report:
• Distance from shore is now extended from a 50-nm boundary to the edge of the U.S. Exclusive Economic Zone (EEZ), up to 200 nm
• Turbine hub height was changed from 90 to 100 m to reflect current technology trends
• Array power density was changed from 5 megawatts per square kilometer (MW/km2) to 3 MW/km2 to account for growth in rotor diameters and likely requirements for inter-array buffers
• Energy production is estimated over the entire domain and losses were calculated based on current wind turbine assumptions
• Technology exclusions were imposed to compute technical potential, acknowledging limitations in the current technology based on water depth, ice climate survival, and annual average wind speed
• Land-use and environmental exclusions were included based on data available from the Wind Vision.
3 Alaska’s vast offshore wind resource is not yet counted. However, because of its extensive coastline and enormous wind-driven wave climate, it will likely have the largest gross resource capacity of any state (National Oceanic and Atmospheric Administration [NOAA] 2016; Previsic 2012; http://www.infoplease.com/ipa/A0001801.html) 4 As evidence, in subsequent studies (e.g., Wind Vision), none of the offshore wind deployment scenarios in the Regional Energy Deployment System capacity expansion model were constrained by resource availability.

3 This report is available at no cost from the National Renewable Energy Laboratory (NREL) at www.nrel.gov/publications.
3 Applicable Uses and Limits Although this report makes a significant stride forward in quality, consistency, detail, and applicability to the recent Wind Vision offshore resource data, it is important to note that this new database and resource classification are limited in their use applications.
Appropriately, these data are generally intended for quantifying offshore wind gross and technical resource potential at a state, regional, and national level for the purposes of:
• Identifying potential wind energy areas and evaluating the efficacy of one area relative to another on a global scale
• Establishing energy production estimates in the 14.6 GW of auctioned lease areas and other lease areas for early planning and energy policy decision-making
• Site prospecting analysis for developers seeking inputs for initial economic and energy estimation tools
• Alternative site analysis by regulators
• Local and regional policy decision-making for long-range energy planning.
The data in this assessment are not intended to support site-specific design and the due diligence efforts that are necessary to safely deploy an offshore wind facility. More rigorous analysis of wind characteristics and data validations will be necessary to complete a wind facility design and install and operate such a facility.
Although these data show resource areas that have been reduced to account for technology limits, these reductions were applied with broad criteria to allow for multiple solutions. These limits will vary widely depending on the technology and this study should not be used as a substitute for more rigorous engineering analysis.
Similarly, environmental and land-use exclusions were assumed to reduce the area of developable sea surface. However, this analysis makes no attempt to identify actual site locations. Moreover, it is certain that several land-use and environmental conflicts have not been fully identified or considered. As such, this study should not be used as a substitute for a rigorous marine spatial planning process.

4 This report is available at no cost from the National Renewable Energy Laboratory (NREL) at www.nrel.gov/publications.
4 Offshore Wind Energy Terminology Framework The new offshore wind energy resource classification framework developed by NREL is shown in Figure 1. Generally, this terminology framework conforms to methods of renewable energy resource classification that have been developed by Lopez (2012) and which provide accepted conventions based on their regular appearance in congressional briefings on renewable energy resources (DOE 2013; Beiter et al. 2016a).
Figure 1. Offshore wind energy resource classification framework. Illustration from Beiter et al.
2016a
In Figure 1, all of the global resources are contained in the outer ellipse. As refinements and exclusion criteria are applied to the total resource, the potential resource supply is diminished, moving toward the inside. Each successive ellipse is a subset of the larger one it is part of. For instance, offshore wind “technical resource potential” is a subset of “gross resource potential,” which in turn is a subset of “total offshore wind resource potential.”
The total offshore wind resource potential includes the entire set of offshore wind resources (recoverable and nonrecoverable), regardless of whether the resource can be developed under presently available technological or commercial paradigms. In addition, all recoverable resource classes inside the total offshore wind resource potential in Figure 1 are also included in this resource class as well as unquantified and nonrecoverable offshore wind resources. For example, upper-air wind and high-seas wind (> 200 nm from shore) are considered unrecoverable using current technology. Similarly, the offshore wind resource potential inside the Alaskan EEZ (< 200 nm) is considered unquantified at this time. However, because of its remoteness from load

5 This report is available at no cost from the National Renewable Energy Laboratory (NREL) at www.nrel.gov/publications.
centers, much of this vast energetic offshore wind may also be unrecoverable. Competing-use and environmental exclusions are not considered at all in this category. Generally, this study is only concerned with the gross recoverable resource potential and technical resource potential that is represented by the ellipses inside the total offshore wind resource potential.
The gross resource potential is limited to the boundaries of the U.S. EEZ (up to 200 nm from shore), assessed at 100 m above the sea surface, which is the average height of offshore turbine hubs expected to be deployed in the next 5 years. Because large arrays depend on the continuous replenishment of the kinetic energy in the free stream wind, gross resource potential must include some assumptions about how turbines are spaced within the array. Conflicting use and environmental exclusions are not considered.
The technical resource potential captures the subset of gross resource potential that may be commercially viable within a reasonable timeframe. It takes into account technical limits of offshore wind, including water depth, freshwater ice, and areas where winds are too low for consideration of large utility-scale projects. Generally, water depths less than 1,000 m and wind speeds greater than 7 meters per second (m/s) are included in the technical resource potential. In addition, technical resource potential excludes ice regions in the Great Lakes where depths are greater than 60 m—the depths at which floating technology is assumed to become the most viable option. To date, floating wind technology has not yet been developed that can survive in freshwater ice floes.
The economic resource potential is the available supply of offshore wind energy at a given site where a project’s levelized cost of energy is equal to or below the expected levelized avoided cost of energy (Brown et al. 2015; Namovicz 2013; Beiter et al. 2016b). Economic potential can vary significantly depending on specific economic and market conditions including local incentive schemes, market barriers, competition among different technologies, electricity exports and imports, elasticity of demand, market failure, and the social cost of carbon, and forms of strategic market behavior and monopoly power. Market, policy, and economic factors that can change the economic resource potential of offshore wind vary considerably, and often within a shorter timeframe. By comparison, options to increase the technical potential of offshore wind are typically conducted over a longer timeframe.5
Deployment is simply the nameplate gigawatt capacity of the commissioned offshore wind installations or the quantity of electric energy delivered by those turbines (Smith, Stehly, and Musial 2015). The first offshore installation in U.S. waters is a 30-MW project that is scheduled to be commissioned in 2016 off Block Island (Rhode Island).
Note that the scope of this report is limited to the gross resource potential and the technical resource potential as shown in Figure 1. Further information about the economic potential of offshore wind is described in Beiter et al. 2016b.
The 2010 analysis performed by Schwartz et al. considered only the gross resource potential based on nameplate capacity. However, the nameplate power capacity is not the best indicator of potential from an energy production or economic perspective. Therefore, this analysis looks at resource potential based on energy production and nameplate capacity. The energy-based
5 In a long-term perspective, research and development activities can be expected to increase offshore technical potential.

6 This report is available at no cost from the National Renewable Energy Laboratory (NREL) at www.nrel.gov/publications.
resource potential is derived from capacity factors associated with annual average wind speeds. Gross capacity factors (GCFs) are derived from defined power curves representative of 2015 technology. Losses and exclusions are applied to the gross potential to obtain the subset of gross resource potential that may be considered viable without considering technical, conflicting use, or environmental limits. This process is described in Section 5.
7 This report is available at no cost from the National Renewable Energy Laboratory (NREL) at www.nrel.gov/publications.
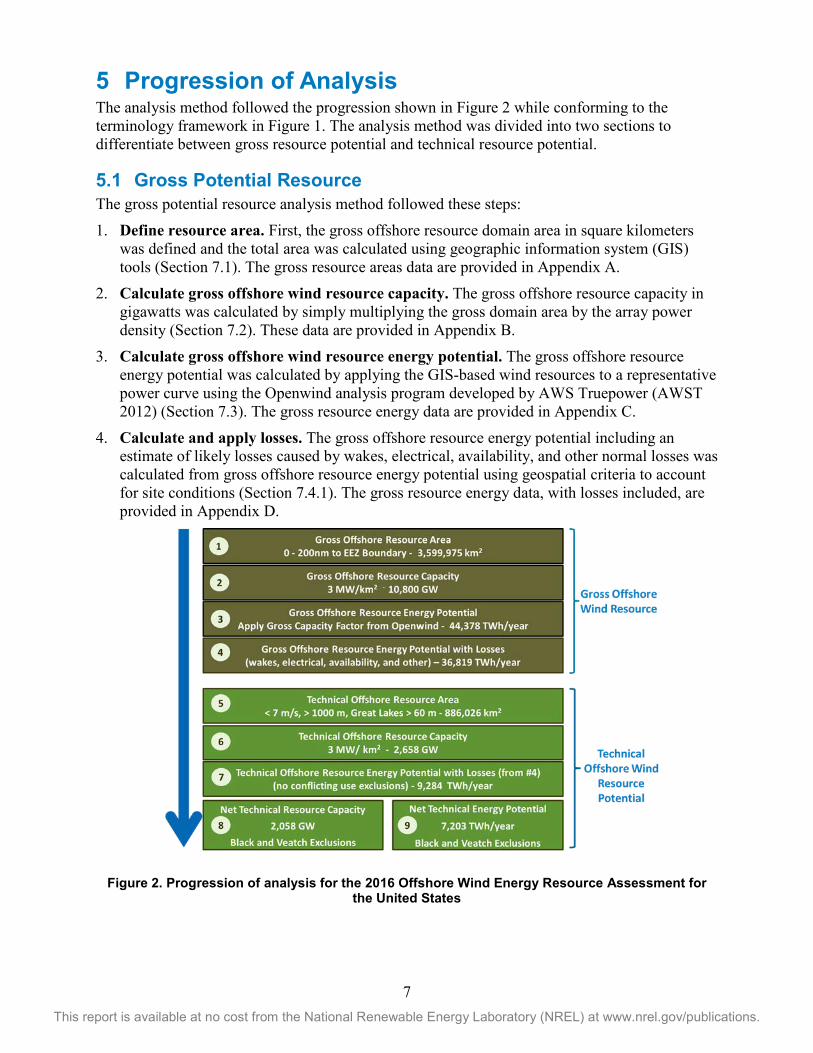
5 Progression of Analysis The analysis method followed the progression shown in Figure 2 while conforming to the terminology framework in Figure 1. The analysis method was divided into two sections to differentiate between gross resource potential and technical resource potential.
5.1 Gross Potential Resource The gross potential resource analysis method followed these steps:
1. Define resource area. First, the gross offshore resource domain area in square kilometers was defined and the total area was calculated using geographic information system (GIS) tools (Section 7.1). The gross resource areas data are provided in Appendix A.
2. Calculate gross offshore wind resource capacity. The gross offshore resource capacity in gigawatts was calculated by simply multiplying the gross domain area by the array power density (Section 7.2). These data are provided in Appendix B.
3. Calculate gross offshore wind resource energy potential. The gross offshore resource energy potential was calculated by applying the GIS-based wind resources to a representative power curve using the Openwind analysis program developed by AWS Truepower (AWST 2012) (Section 7.3). The gross resource energy data are provided in Appendix C.
4. Calculate and apply losses. The gross offshore resource energy potential including an estimate of likely losses caused by wakes, electrical, availability, and other normal losses was calculated from gross offshore resource energy potential using geospatial criteria to account for site conditions (Section 7.4.1). The gross resource energy data, with losses included, are provided in Appendix D.
Figure 2. Progression of analysis for the 2016 Offshore Wind Energy Resource Assessment for
the United States

8 This report is available at no cost from the National Renewable Energy Laboratory (NREL) at www.nrel.gov/publications.
5.2 Technical Potential Resource The technical potential resource analysis method followed these steps:
1. Define technical resource area utilizing exclusion factors. The technical potential area in square kilometers was calculated by reducing the gross potential area using the technology exclusion filters. These exclusions include area of wind speeds less than 7 m/s, water depths greater than 1,000 m, and water depths (in the Great Lakes only) greater than 60 m (Section 8.2). Note this technical potential area does not yet account for exclusions that are a result of conflicting industry use and environmental conflicts, which are applied later. The data for technical potential area are provided in Appendix E.
2. Calculate technical offshore capacity. The technical offshore capacity potential was calculated by multiplying the technical offshore resource area by the array power density (Section 8.3). Note the array power density is 3 MW/km2 for all resource categories. The data for technical offshore capacity potential are provided in Appendix F.
3. Calculate technical energy potential with losses. The technical offshore energy potential (with losses considered) was calculated by using the gross offshore resource energy potential (step 4 in Section 5.1) and applying the same technology exclusions used to obtain the technical resource area in step 5 (Section 8.4). The data for technical offshore energy potential are provided in Appendix G.
4. Apply industry use and environmental conflicts. In the final step, the exclusions for industry use and environmental conflicts were applied. These exclusions assume that a percentage of the technical resource area will not be available for development. However, because of rigorous marine spatial planning activities underway, the study does not specify the exact location of the excluded areas (Section 8.5). These percentages are applied to the technical offshore capacity potential and the technical offshore energy potential (with losses), respectively, to obtain the final technical resource estimates. The data for technical offshore capacity potential and net technical energy potential are provided in Appendix H and Appendix I, respectively.

9 This report is available at no cost from the National Renewable Energy Laboratory (NREL) at www.nrel.gov/publications.
6 Data Sources In developing this report, multiple data sources were required to conduct a thorough assessment of potential resource area, capacity, and energy production. The following sections identify the data sources utilized during the wind resource assessment and describe how they were used to shape the results of this assessment.
6.1 Wind Speed Data Three primary sources contributed wind speed data for the wind resource analysis: AWS Truepower, the Wind Integration National Dataset (WIND) Toolkit, and Vaisala/3Tier. For the contiguous United States, the annual average wind speed data was adjusted to 100 m above the surface (data produced by AWS Truepower), at a distance of 0 to 50 nm from shore. WIND Toolkit data were utilized to extend the domain from 50 to 200 nm. For Hawaii, AWS Truepower 100-m wind speed data were used in the area of 0 to 12 nm from shore. To extend the domain to the 200-nm EEZ, 100-m data from Vaisala/3Tier6 (extrapolated from 90-m data) were used in the area of 12 to 200 nm from shore. The composite map combining these data is shown in Figure 3.
Figure 3. Offshore wind resource data (100 m) used for the 2016 offshore wind resource assessment. Map provided by NREL, AWS Truepower, and Vaisala/3TIER
6 The Hawaii monthly offshore wind speed data set is available on Wind Prospector (https://maps.nrel.gov/wind-prospector). The resulting data set is intended to provide broad estimates of wind speed variation for the purposes of identifying possible wind energy sites. It is not intended to provide estimates of possible energy production for the purpose of investing in offshore wind projects or making financing decisions in specific locations.

10 This report is available at no cost from the National Renewable Energy Laboratory (NREL) at www.nrel.gov/publications.
6.1.1 AWS Truepower Data The primary wind speed data for the regions between 0 and 50 nm from shore was licensed from AWS Truepower by NREL. AWS Truepower data were available for the contiguous United States and for Hawaii out to 12 nm. These data provided long-term annual average wind speeds (m/s) at a 100-m height above the surface. The data are output from a mesoscale model with nominal a 2-km spatial resolution, downscaled to a 200-m resolution (AWS Truepower 2012).
6.1.2 WIND Toolkit Data To date, the WIND Toolkit contains the largest, publicly available grid integration wind dataset, with both meteorological and power values (Draxl 2015). DOE Wind and Solar Programs funded the WIND Toolkit data creation. The WIND Toolkit consists of a wind resource and forecast dataset with a 2-by-2-km grid and 20-m vertical resolution from the surface to a 200-m elevation. It includes meteorological and power data every 5 minutes. The data are based on the Weather Research and Forecasting (WRF) model, which incorporates 7 complete years of data from 2007 through 2013. Figure 4 shows the WRF modeling domains (gridded data is available for the innermost domain and metadata is available on Wind Prospector at https://maps.nrel.gov/wind-prospector).
Using the WIND Toolkit, the area of offshore resource domain was extended from 50 nm to 200 nm for this study.
Figure 4. Weather Research and Forecasting modeling domains for the WIND Toolkit
6.1.3 Vaisala/3Tier Wind Data Vaisala/3Tier data, at a 90-m height above the surface were extrapolated to 100 m assuming a power law wind shear of 1/7, and were used to characterize the domain in Hawaii from 12 nm
11 This report is available at no cost from the National Renewable Energy Laboratory (NREL) at www.nrel.gov/publications.
out to 200 nm. These data were joined with the AWS Truepower data that covered the region inside the 12 nm territorial sea boundary. Modeled mean wind speed data from Vaisala/3TIER were provided to NREL on a 2-km grid and were mapped onto the 1.2-by-1.2 km Bureau of Ocean Energy Management (BOEM) aliquot grid cells by assigning mean wind speeds corresponding to the nearest 2-km Vaisala grid cell. This process created a long-term, 17-year wind speed record for each aliquot.
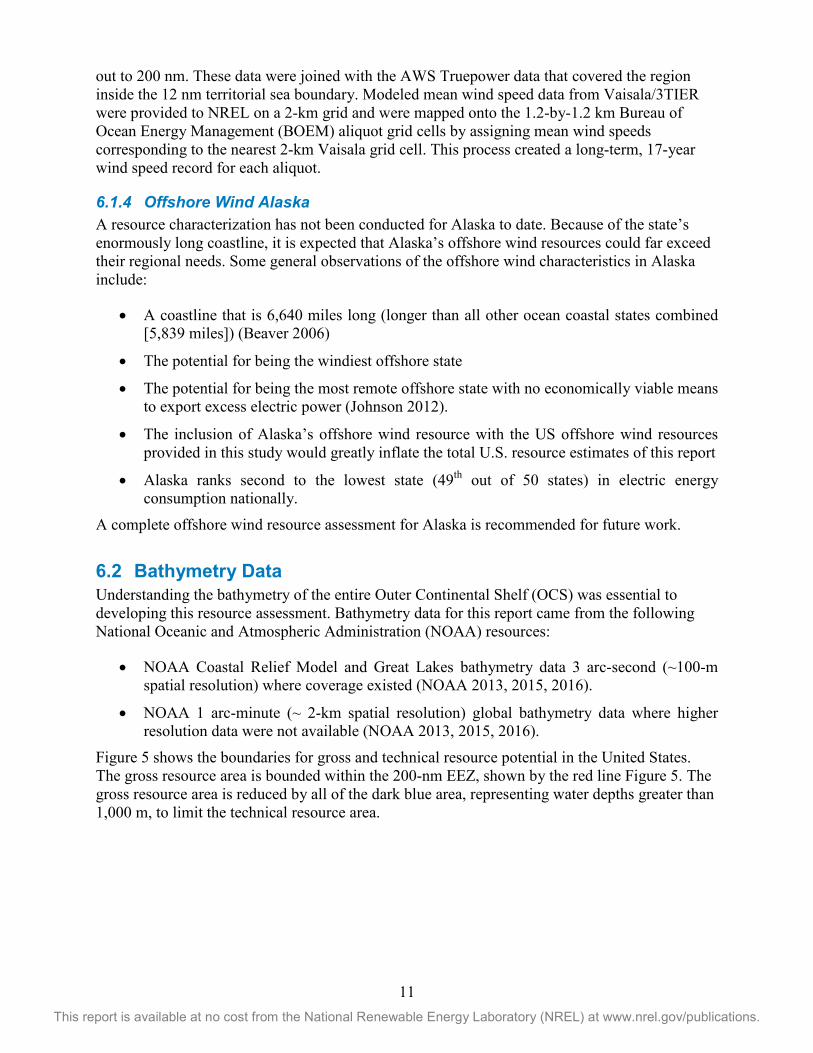
6.1.4 Offshore Wind Alaska A resource characterization has not been conducted for Alaska to date. Because of the state’s enormously long coastline, it is expected that Alaska’s offshore wind resources could far exceed their regional needs. Some general observations of the offshore wind characteristics in Alaska include:
• A coastline that is 6,640 miles long (longer than all other ocean coastal states combined [5,839 miles]) (Beaver 2006)
• The potential for being the windiest offshore state
• The potential for being the most remote offshore state with no economically viable means to export excess electric power (Johnson 2012).
• The inclusion of Alaska’s offshore wind resource with the US offshore wind resources provided in this study would greatly inflate the total U.S. resource estimates of this report
• Alaska ranks second to the lowest state (49th out of 50 states) in electric energy consumption nationally.
A complete offshore wind resource assessment for Alaska is recommended for future work.
6.2 Bathymetry Data Understanding the bathymetry of the entire Outer Continental Shelf (OCS) was essential to developing this resource assessment. Bathymetry data for this report came from the following National Oceanic and Atmospheric Administration (NOAA) resources:
• NOAA Coastal Relief Model and Great Lakes bathymetry data 3 arc-second (~100-m spatial resolution) where coverage existed (NOAA 2013, 2015, 2016).
• NOAA 1 arc-minute (~ 2-km spatial resolution) global bathymetry data where higher resolution data were not available (NOAA 2013, 2015, 2016).
Figure 5 shows the boundaries for gross and technical resource potential in the United States. The gross resource area is bounded within the 200-nm EEZ, shown by the red line Figure 5. The gross resource area is reduced by all of the dark blue area, representing water depths greater than 1,000 m, to limit the technical resource area.

12 This report is available at no cost from the National Renewable Energy Laboratory (NREL) at www.nrel.gov/publications.
Figure 5. Bathymetry map of contiguous United States and Hawaii showing areas with depths out
to the U.S. EEZ
6.3 State Boundaries The determination of offshore jurisdiction encompasses complex legal agreements between individual states, between the individual states and the federal government, and treaties between the United States and adjacent countries. Some of these boundaries are currently unresolved (e.g., New Jersey versus Delaware, Supreme Court Decision No. 134 Original, October Term 2007, and Thormahlen [1999]). The state/federal offshore boundary is determined by the Submerged Land Act (SLA) and individual Supreme Court decisions for Texas and Florida (Thormahlen 1999). Seaward of the SLA, BOEM for administrative purposes, has drawn border lines based on standard principles of boundary measurement (i.e. the use of equidistance) relative to the shorelines of two adjoining coastal states. These border lines extend from the SLA line to the limit of the United States’ OCS based on the United Nations Convention on the Law of the Sea (Federal Register).
Landward of the SLA line, state boundaries are based on legal agreements dating back to the Colonial period. A national dataset of state boundaries is still under development by BOEM and NOAA. For this report, NREL constructed an offshore administrative boundaries dataset from BOEM, SLA, OCS, and OCS administrative boundaries, and individual state and local government administrative boundary datasets. Where there was no available state data landward of the SLA, NREL constructed lines from the SLA to the shoreline. The summary list of data sources used and a more detailed listing is provided in Appendix K. Figure 6 illustrates the offshore area for each state out to the 50-nm delineation that was used in Schwartz et al. (2010). Note, the colors are provided to differentiate between adjacent states and do not have any other significance. This analysis used a simple extrapolation to extend the Schwartz boundaries out to the 200-nm EEZ. However, it should be noted that the United States does not recognize a state offshore domain on the OCS outside of state territorial waters (0‒12 nm). Therefore, state boundaries from 3 nm (9 nm offshore Texas and the west coast of Florida) to 200 nm used in this analysis are approximations and should only be used for illustrative and planning purposes.

13 This report is available at no cost from the National Renewable Energy Laboratory (NREL) at www.nrel.gov/publications.
Figure 6. State resource areas at distances out to 50 nm. Figure provided by Schwartz et al. 2010

14 This report is available at no cost from the National Renewable Energy Laboratory (NREL) at www.nrel.gov/publications.
7 Gross Offshore Wind Resource The gross resource was calculated for this study considering all coastal waters in the United States that have federal and state jurisdiction. The calculation of gross resource does not discriminate on the basis of possible technology, use conflicts, or environmental impacts. Therefore, it intentionally includes areas that might not be economical to develop or could be unsuitable for various reasons that normal site screening might eliminate using today’s knowledge base. However, the assessment does take into consideration the experience and trends of the offshore wind industry over the past few decades to establish physical parameters for array power density and turbine height that are needed to limit power capacity and energy production. As such, the gross potential resource provides an upper bound on the maximum offshore wind potential but should not be used as a proxy for long-term deployment estimates.
7.1 Gross Resource Area The gross resource area outlined in this report includes all offshore water area from the shoreline to the 200-nm EEZ using a 200-m-by-200-m grid cell. In the Great Lakes, the domain extends to the middle of the lakes where the U.S. and Canadian borders intersect. The U.S. gross resource area (excluding Alaska) was calculated for this study to be 3,599,975 km2. Globally, offshore wind projects are now being installed more frequently at sites that are farther from shore than the 50-nm limit used by the Schwartz 2010 study, which limited the offshore wind resource to sites inside 50 nm. Projects have been proposed in Germany, for example, that are over 54 nm (100 km) from shore (Smith, Stehly, and Musial 2015). With high-voltage direct-current electric transmission technology maturing, and the desire for projects to be out of sight, project distances-to-shore may continue to increase even further (Figure 8).
7.1.1 Distance Zones Within the total gross resource area domain, data were further classified into the following four distance zones.
• The 0-to-3-nm zone. This zone is generally the area that contains state waters, but is outside BOEM’s jurisdiction (Musial and Ram 2010).7
• The 3-to-12-nm zone. This zone extends to the territorial waters boundary at 12 nm. In this zone, conflicting-use impacts may be higher than in areas farther out. Some studies have found that opposition to offshore wind projects on the basis of view shed or aesthetics begin to decline rapidly beyond 12 nm (Lilley, Firestone, and Kempton 2010).
• The 12-to-50-nm zone. The 50-nm boundary was original selected to focus the effort of offshore wind resource evaluation on the near-shore area where access to grid and shore-based support services was more feasible (Schwartz et al. 2010). Subsequent assessments show that project feasibility is not necessarily limited to 50 nm. For this study, the 50-nm delineation was retained as a reference to help describe the differences between far-shore and near-shore impacts out to the 200-nm EEZ limit. For example, the Wind Vision study exclusions provided by Black & Veatch show a significant drop in use and environmental conflicts from the 12-to-50-nm zone to the 50-to-200-nm zone (from 21% to 8%, respectively).
7 For Texas and the western coast of Florida, state waters extend to 9 nm (see Section 9.3). For the Great Lakes, all of the resource is in state waters (see Table 3).

15 This report is available at no cost from the National Renewable Energy Laboratory (NREL) at www.nrel.gov/publications.
• The 50-to-200-nm zone. This additional distance from shore was added to the gross resource area to provide the possibility of development beyond 50 nm where conflicts are lower and some regions have large areas of developable water with depths less than 1,000 m.
Figure 7 shows a map defining these distance zones.
Figure 7. Gross offshore area map highlighting distance-to-shore zones
7.1.2 Depth Zones The domain area was also classified separately in five water depth bands: 0–30 m, 30–60 m, 60–700 m, 700‒1,000 m, and greater than 1,000 m. These depth-band classifications were approximately the same as the 2010 study except with additional break points added at 700 m and 1,000 m to allow for more realistic assessments of technology limits. Figure 8 shows the range of depth and distance from shore that offshore wind installations have been deployed and are being planned, but does not include any floating projects.
It is widely known that floating offshore wind technology cannot extend beyond some practical depth limit. However, there is no industry-wide consensus on the precise depth limit of floating wind plants. Researchers and developers interviewed for this study agree that the limit today should be between 700 m and 1,300 m, which is not a hard physical limit and is based mostly on economic criteria; however, there is some concern that electrical subsea cables may not be suitable below a 1,300-m depth. The Wind Vision study used a depth of 700 m to define the maximum deployment depth, but industry elicitation suggests that 1,000 m may be more appropriate. Both 700 m and 1,000 m were used as depth delineators for this study; however, 1,000 m was chosen as the maximum cut-off for U.S. technical resource potential to remain consistent with past work and to acknowledge industry trends that are indicating a deeper limit (Arent et al. 2012; Weinstein 2016; Campbell 2016).
Previous depth delineators for fixed-bottom technology of 30 m and 60 m appear to still be appropriate based on progress shown in European wind installations, and these delineators were retained for this study. The shallower 30-m depth cutoff is relevant as a shallower economic

16 This report is available at no cost from the National Renewable Energy Laboratory (NREL) at www.nrel.gov/publications.
break point for earlier monopile and gravity-based foundation technology, whereas the 60-m depth seems to be a reasonable upper economic limit for fixed-bottom systems.
Furthermore, the resource area was geographically subdivided along the state boundaries assigned by NREL (see Section 6.3) to allow individual state resources to be approximated. The tabulated data for gross resource area by state, water depth, and distance to shore are shown in Appendix A.
Figure 8. Offshore wind projects installed and under development as a function of depth and distance to shore. Figure from Smith, Stehly, and Musial (2015)
7.2 Gross Resource Capacity The gross resource capacity was calculated in gigawatts by multiplying the gross resource area by the assumed nominal array power density of 3 MW/km2, which results in a gross capacity of 10,800 GW for the entire United States, excluding Alaska. This is the theoretical recoverable resource based on turbine nameplate capacity that would be possible if wind turbines were installed everywhere on the OCS and Great Lakes without regard to technology and use limits (see Appendix B). In the previous study conducted by Schwartz et al. (2010), a higher array power density of 5 MW/km2 was used. However, the lower density used for this analysis accounts for wider spacing to ensure reasonable wake replenishment with current turbine technology in large arrays. Note that today’s turbines have lower specific power (larger rotors) than turbines 10 years ago, which naturally dictates wider turbine tower spacing. Optimum spacing will vary with atmospheric conditions, but an array power density of 3 MW/km2 is more able to account for normal turbine spacing with internal wind plant buffers included, and is consistent with the density used in the Wind Vision (DOE 2015a).

17 This report is available at no cost from the National Renewable Energy Laboratory (NREL) at www.nrel.gov/publications.
7.3 Gross Resource Energy The gross resource energy potential was calculated over the entire gross resource area of 3,599,975 km2 described in Section 7.1. Gross resource energy potential is reported in terawatt hours per year (TWh/year). This metric was not part of previous resource assessments (e.g., Schwartz et al. 2010). With no assumed technology, conflicting use, or environmental exclusions, and no performance losses (i.e., wakes, electrical), the gross U.S. offshore resource area can theoretically produce 44,378 TWh of energy each year (see Appendix C).
The gross offshore energy potential for a unit area was calculated using the following equation:
Gross Offshore Energy = Array Power Density x Gross Capacity Factor x 8760 hours per year (1)
The array power density was set to 3 MW/km2 as described earlier. The GCF was calculated for each grid cell on the gross offshore resource area using Openwind. That analysis is described in the following sections.
7.3.1 Power Curve To calculate the GCF, it was necessary to assume a wind turbine power curve that is representative of current technology in 2015. NREL created a generic 6-MW power curve that is based on typical commercial offshore wind turbines that were on the market in 2015. The wind turbine power curve used for this report was based on the inputs listed in Table 1 and is shown in Figure 9.
Table 1. Wind Turbine Power Curve Inputs
Turbine Characteristic 2015 Technology Value
Turbine Rated Power (MW) 6 Turbine Rotor Diameter (m) 155 Turbine Hub Height (m) 100 Turbine Specific Power (W/m2) 318
Note that Figure 9 shows the power curve with Region 2 and Region 3 labeled. Region 2 is where the turbine is operating below rated power, in lower winds, and operation is controlled to maximize power production. Region 3 is the part of the power curve where power is regulated by the pitch actuators to maintain rated power (6 MW). These regions are referred to later in describing the relationship of wake losses to average annual wind speed.

18 This report is available at no cost from the National Renewable Energy Laboratory (NREL) at www.nrel.gov/publications.
Figure 9. Generic 6-MW power curve for representative wind turbine technology available for commercial deployment in 2015 (assumed operation date of 2017)
Using this power curve, the gross energy production and GCF were calculated from Openwind analysis for distances from shore between 0 and 50 nm.
7.3.2 Evaluating Gross Capacity Factor The Openwind Enterprise tool is a commercial wind energy facility design tool created by AWS Truepower and licensed to NREL. It has the capability to perform layout design, flow modeling, wake modeling, and energy assessment. Openwind Enterprise was selected for its interoperability with GIS data as well as its capability to model deep array wake effects.
One component of Openwind is the WindMap flow model, which is based on the NOABL code (Phillips 1979) and solves the conservation of mass equation to generate a three-dimensional wind flow map. The model accounts for moderate changes in terrain (for land-based applications) and surface roughness when used in conjunction with measured time series meteorological data.
The Openwind Deep Array Fast Eddy-Viscosity Wake Model was used to perform the wake loss analysis for this report. It enhances the open-source version of Openwind and provides additional accuracy in the modeling of the downwind effects of free-stream- and turbine-generated turbulence and predicts the recovery of the free-stream wind flow field in the array. The Deep Array Fast Eddy-Viscosity Wake Model (AWS Truepower 2010) is a combination of the open-source standard Eddy-Viscosity (EV) model and a roughness effect associated with each turbine.
The gridded turbine layer function within Openwind was used to create a standard 10-by-10 turbine array layout for 100 6-MW turbines. Wind turbine spacing was chosen to be 7 rotor

19 This report is available at no cost from the National Renewable Energy Laboratory (NREL) at www.nrel.gov/publications.
diameters (D), corresponding to a turbine array density of 5.1 MW/km2. This turbine density is about 70% greater than the array power density of 3 MW/km2 used to calculate the resource for this report; however, the Openwind capacity factor analysis does not include array buffers and setbacks which would be needed under most development scenarios. Therefore, for the purposes of resource assessment, the resource capacity is represented more accurately by 3 MW/km2. This standard layout is shown in Figure 10 which occupies a nominal area of 117 km2. Note that this standard array configuration would be considered inefficient relative to today’s optimized commercial array layouts, so wake losses calculations in this report would be expected to be higher than actual projects. This is offset to some degree by lower accounting for availability losses described in Section 7.4.1.
Figure 10. Unit 600-MW wind plant for Openwind energy and wake loss calculations using 7-by-7
rotor diameter (D) spacing and a generic 155-m rotor
The 5.1 MW/km2 turbine array density of this 10-by-10 array is slightly lower than typical European offshore wind projects that have a mean turbine array density of 6.1 MW/km2 as shown in Figure 11 (Musial et al 2013). These data were collected in 2013 for 18 European arrays, each of which have at least 200 MW of nameplate capacity.

20 This report is available at no cost from the National Renewable Energy Laboratory (NREL) at www.nrel.gov/publications.
Figure 11. Turbine density for 18 large (> 200-MW capacity) offshore wind power projects showing
turbine spacing scenarios for three reference configurations. Figure from Musial et al2013
The 600-MW 10-by-10 array shown in Figure 10 was replicated 7,159 times to cover the resource area from 0 to 50 nm without overlapping. Each 600-MW wind plant was modeled in Openwind individually on the GIS grid. No spaces were allowed between adjacent layouts. Although wake interactions were modeled inside each array, no wake interactions between layouts occurred because each wind plant was modeled independently without the presence of other arrays. The geographic area covered by this analysis is shown in Figure 12. Note that Hawaii and Alaska were not modeled in this analysis. For each location, Openwind calculated the energy yield and GCF, with and without wake losses.
Figure 12. Using Openwind, 7,159-unit wind plants were modeled over the resource area of the
continental United States from 0 to 50 nm

21 This report is available at no cost from the National Renewable Energy Laboratory (NREL) at www.nrel.gov/publications.
7.3.3 Calculating Gross Resource Energy Potential Modeled hourly wind speed data from AWS Truepower was used with Openwind to estimate the GCF and wake losses using the NREL generic 6-MW wind turbine power curve for sites between 0 and 50 nm in the continental United States as described earlier.
This analysis was conducted before the decision to expand the gross resource area beyond the 50-nm boundary, established by Schwartz et al. (2010), was made. As shown in Figure 12, the analysis domain does not cover the entire gross resource potential area, which now extends to 200 nm and also includes Hawaii. Therefore, it was necessary to extrapolate the Openwind analysis data to generate the GCF for the regions between 50 and 200 nm and Hawaii. This was done by correlating the wind speed at each grid point with the GCF that was calculated in Openwind for that region. Areas beyond 50 nm were assigned a GCF and wake loss value based on the regional linear wind speed correlation. These linear correlations with Openwind data are shown in Figure 13 for the Atlantic, Gulf of Mexico, Great Lakes, and Pacific regions. Note that the Pacific region exhibited more scatter in the correlation and some nonlinear characteristics, especially at higher wind speeds. This unusual behavior is attributed to variability in Weibull k factors that tended to lower the energy production for the generic turbine at many West Coast sites.
Figure 13. Gross capacity factor correlation with wind speed as derived regionally from Openwind
data
This study found that when developing the GCF values for Hawaii that the Hawaiian Weibull characteristics do not correlate with the Pacific Weibull characteristics even though they are both in the Pacific region. When compared with other regions, the Hawaiian Weibull k values actually matched best with the Gulf of Mexico. Therefore, Hawaiian GCF values were assigned using correlations for the Gulf of Mexico Openwind data.
Relating the final GCF values at each grid point back to Eq. 1, the energy production potential was calculated at each grid point. As mentioned, the sum of all these energy values is 44,378 TWh/year, the theoretical gross energy resource potential for the United States, assuming no

22 This report is available at no cost from the National Renewable Energy Laboratory (NREL) at www.nrel.gov/publications.
technology or use exclusions, and no losses. In the next section, losses will be applied to the gross energy resource without reducing the resource area.
7.4 Gross Offshore Energy Potential with Losses Included To assess the realistic net energy available, losses must be considered to reduce the energy resource available by considering real-world operational effects. The losses considered in this study are only intended to reduce the GCF to nominal net energy levels and to approximate geographic biases as a result of wind speed and electrical transmission losses. This study does not provide a comprehensive assessment of losses on a site-specific basis and should not be used as a siting tool to determine net annual energy production (AEP). To perform these more rigorous analyses, refer to DNV KEMA (2013) and AWS Truepower (2014).
7.4.1 Losses During modeling and analysis, the following resource assessment losses were deducted from the gross capacity factor values:
• Wake losses ranging from 4% to 12% were applied to the arrays via the Openwind analysis and regional correlations, using methodology similar to the methods described above for the GCF
• Electrical losses ranging from 1% to 5% were applied using a geospatial relationship that accounts for export cable length based on distance to shore and depth (Beiter et al 2016b)
• Availability losses were applied using a constant availability of 96% based on the 2014 Cost of Energy Review (Mone et al. 2015)
• Other losses were assigned an additional constant 2%, based on internal NREL fixed/floating analyses (Beiter et al 2016b).
The AEP system losses were calculated using Eq. 2:
1 – (1 * (1 – Electrical Losses) * (1 – Wake Losses) * (1 – Other Losses) * Availability) (2)
The total losses assessed in this study over the entire resource area ranged from 12% to 23% depending on the site depth, distance from shore, and wind speed characteristics. However, the method of determining these losses would likely underestimate the total losses for a calculation of AEP when a full accounting of availability is conducted.
7.4.1.1 Wake Losses The Openwind analysis described in Section 7.3.2 used to compute the GCF also computed the wake losses resulting from each of the 10-by-10 600-MW arrays. The Openwind data showed a strong correlation of wake losses with wind speed, where lower wind speeds generated higher wake losses. This outcome was expected because turbines sited in regions with low annual average wind speeds tend to run more often in Region 2 of the power curve (see Figure 9), where pitch systems cannot adjust for reduced wind speed. Figure 14 shows the regional correlations for the Atlantic, Gulf of Mexico, Great Lakes, and Pacific. In the chart, array efficiency is plotted against wind speed, where array efficiency is defined as the actual energy produced by the array, with wake losses present, divided by the energy production if each turbine were operating in unobstructed flow.

23 This report is available at no cost from the National Renewable Energy Laboratory (NREL) at www.nrel.gov/publications.
Figure 14. Array efficiency as a function of wind speed for four continental U.S. regions
Because no other losses are considered in the Openwind analysis, the computed array efficiency is directly related to wake losses. Within the relevant range of wind speeds, between 7.0 m/s and 11.5 m/s for the continental United States, Figure 14 shows that array efficiency varies from 0.88 at a 7.0-m/s wind speed to 0.96 for the highest wind speeds. This range corresponds to wake losses of 4% to 12%, respectively. Note that significant scatter is present in the Pacific region, but for the other regions the array efficiency shows stronger linear correlation, with regional differences attributed to variations in Weibull k and c parameters.
As with the GCF analysis, the Openwind wake loss analysis, represented in Figure 14, does not cover the expanded gross resource area out to 200 nm, or the Hawaiian Islands. As with the GCF, regional correlations with wind speed were conducted to assign wake losses to these areas. As with the gross capacity factor analysis, the Weibull k factors for the Gulf of Mexico were applied to Hawaii as they fit to the Hawaiian wind characteristics the best.
Losses other than those caused by the wake effects were accounted for more directly through generalized constants or by deriving values from other GIS layers.
7.4.1.2 Electrical Losses The electrical system loss analysis used in the resource assessment was based on NREL offshore wind cost studies, which take into account how electrical system losses change with respect to the projects’ distance from the point of cable landfall (Beiter et al. 2016b). Electrical system losses were calculated to account for the increased cable lengths as sites become deeper and more remote. Electrical losses are assumed to be primarily a function of distance from the point of interconnection (DStoL) and water depth (WD), and are represented by Eq. 3:

24 This report is available at no cost from the National Renewable Energy Laboratory (NREL) at www.nrel.gov/publications.
Figure 15 is a graphical representation of this equation, showing the lowest losses nearshore and in shallow water as predicted from these assumptions and this equation.
Figure 15. Electrical system losses from the offshore to the land-based substation
These system losses are based on the assumption that the least cost technology will be selected to transmit the power and are described more fully by Beiter et al. (2016b). The data represented in Figure 15 illustrate that these system electrical losses range between 1% and 5%.
7.4.1.3 Availability and Other Losses The assessment of availability for offshore sites is highly dependent on meteorological ocean conditions, availability of service equipment, and the maturity of the land-based infrastructure. In this study, no attempt was made to disaggregate these variables. Instead, a nominal availability of 96% was chosen for all sites in the resource area. This value is based on the 2014 Cost of Energy Review (Mone et al. 2015). Further analysis on availability would be necessary on a site-specific basis, but for the purpose of conducting this resource assessment, the constant value is considered sufficient.
A wide range of other additional losses are normally considered as well. These losses relate to turbine underperformance, curtailments, and environmental factors. A detailed assessment of these losses is not part of the scope of this study, however, they were addressed by assuming an additional 2% energy reduction for all grid points within the gross resource area. This value is also consistent with other recent NREL cost analysis (Beiter et al. 2016b).
(3)

25 This report is available at no cost from the National Renewable Energy Laboratory (NREL) at www.nrel.gov/publications.
7.4.2 Gross Offshore Resource Energy Potential with Losses Gross offshore resource energy potential was calculated within the domain boundaries of 0-200 nm, which do not change when the losses are applied. With losses from wakes, electrical, availability, and other loss types, the gross offshore wind energy resource is reduced to 36,819 TWh/year (see Appendix D). When losses are included, the net capacity factor is calculated. These net capacity factors are mapped in Figure 16 for the entire gross offshore resource domain. This map is considered a relevant intermediate step toward calculating the technical energy potential, but the net capacity factor values in regions where the technology is not suitable have little value. The next section describes the technical resource potential for the United States.
Figure 16. Net capacity factor for gross offshore wind resource area with losses

26 This report is available at no cost from the National Renewable Energy Laboratory (NREL) at www.nrel.gov/publications.
8 Technical Resource The technical resource potential of offshore wind captures the subset of gross offshore wind resource potential that can be considered recoverable using available technology within reasonable limits. It also considers nominal land-use and environmental siting constraints without specifying specific site locations, which are defined as a percentage of the available area. It takes into account technical limits of offshore wind, including system performance and loss criteria, conflicting use and environmental constraints, and technology limits. The technology filters are generally applied as a function of precise geographical location and are considered in Section 8.1 through Section 8.4, whereas conflicting land-use and siting constraints are considered as a percentage of the remaining area (Section 8.5).
8.1 Technology Exclusions Technology exclusions were applied to the gross resource potential to effectively restrict the resource area to geographic locations that are suitable for the technology based on industry experience to date. These technology exclusions are not intended to limit development or restrict innovation. In fact, it is expected that the boundaries used for technical potential in this report will change as new technology is developed and more experience is gained. Three technology filters were used to reduce the gross resource area for offshore wind to new boundaries defined for technical offshore wind resource potential. The technical resource area limits water depth to less than 1,000 m and wind speeds to areas with an annual average that is greater than 7 m/s, and excludes ice regions in the Great Lakes where depths are greater than 60 m, because floating wind technology has not yet been developed for platforms to survive in freshwater ice floes.
8.1.1 Water Depth Greater Than 1,000 m Areas with a water depth greater than 1,000 m were excluded from the technical potential assessment. In consultation with global floating offshore wind technology developers, the 1,000-m depth was a reasonable cutoff for the resource assessment using current technology and industry experience, although no hard limits to deploying the technology in deeper waters were identified. This depth limit increases the cutoff that was used in the Wind Vision study scenario from 700 m to 1,000 m, but for this report, the 700-m delineation was retained so resources could be quantified at different depths. NREL cost models indicate that there will be some economic penalty in going to deeper water with floating wind technology but the cost relative to depth is mostly caused by increased mooring line and electric cable length, and greater distances for service crews to travel because deeper waters tend to be farther from shore. It has been noted in Japan that electric cables may be limited to depths less than 1,300 m (A. Bossler, personal communication based on direct translation, 2016). In California, Trident Winds has proposed a project at the 1,000-m depth near Morro Bay, so it would seem the depth limit of 1,000 m is set low enough to avoid eliminating critical resource area while remaining consistent with past studies (Arent 2012; Weinstein 2016).
Referring to the bathymetry map in Figure 5, the area shaded in dark blue was excluded because the water depth is above 1,000 m. Note that in most cases, the depth limit is reached before the 200-nm EEZ limit, which makes the 1,000-m isobath the exterior boundary of the technical resource area for most locations, and effectively reduces the average distance to shore.
Also note that the previous exterior boundary used by Schwartz et al. (2010) was defined as the 50-nm distance to shore. Using depth criteria rather than the previous distance-to-shore criteria for the technical resource area boundary adds resource area to many locations on the East Coast
27 This report is available at no cost from the National Renewable Energy Laboratory (NREL) at www.nrel.gov/publications.
while reducing resource area on the West Coast, where a narrow continental shelf results in very deep water near shore.
8.1.2 Wind Speed Less Than 7 m/s Areas with wind speeds less than 7 m/s at a 100-m elevation were also eliminated from the technical potential assessment, which corresponds approximately to areas below 30% net capacity factor.8 The 7-m/s cutoff is consistent with exclusions that were used by Schwartz et al. (2010). This exclusion sets a lower bound for average wind speed where studies do not show any economic potential for large, utility-scale offshore wind development in the United States (Beiter et al. 2016b). This low-wind technical resource exclusion does not preclude development in areas with low winds, where high energy prices may warrant consideration of less energetic sites (e.g., island communities).
8.1.3 Water Depth Greater Than 60 m in the Great Lakes Technical resource potential also excludes the Great Lakes ice regions with depths greater than 60 m, which eliminates approximately 771 TWh/year of gross resource potential. The previous resource assessment performed by Schwartz et al. (2010) set no technology limits to account for ice in the Great Lakes. To date, there are no floating structures of any kind that are deployed year-round in the Great Lakes. Even navigation buoys are retrieved during the winter. Worldwide, deployment of wind turbines in freshwater ice conditions is rare and limited to fixed-bottom technology. Floating wind turbines could conceivably be designed to survive these conditions, however, there is no industry experience with this type of technology to date.
8.2 Technical Offshore Resource Area Technical offshore resource area is determined by applying the technical exclusions described in Section 8.1 to the gross offshore resource area. When these exclusions are applied, the area is reduced from 3,599,975 km2 to 886,026 km2, a reduction of over 75% (Appendix E). Figure 17 shows the wind speed map for the continental United States and Hawaii for the total technical offshore resource area, which eliminates regions where depth is above 1,000 m and wind speed is below 7 /m/s, and in the Great Lakes region where depths are above 60 m.
8 Note 30% net capacity factor was used as the cutoff for the Wind Vision study (DOE 2015). This analysis verified that 7 m/s and 30% net capacity factor yield nearly identical resource estimates.

28 This report is available at no cost from the National Renewable Energy Laboratory (NREL) at www.nrel.gov/publications.
Figure 17. Wind speed map for the U.S. offshore wind energy technical resource area
The technical offshore resource area was calculated by applying technical exclusions to the gross offshore resource area discussed in Section 7.1.
8.3 Technical Offshore Resource Capacity The technical resource capacity was calculated in gigawatts by multiplying the technical resource area by the assumed nominal array power density of 3 MW/km2, which results in a technical resource capacity of 2,658 GW for the entire United States excluding Alaska. This amount is the technically recoverable resource based on turbine nameplate capacity that is possible with today’s technology if wind turbines were installed everywhere inside the boundaries of the technical offshore resource area and without regard for conflicting use or environmental restrictions (see Appendix E).
8.4 Technical Offshore Resource Energy Potential with Losses Technical offshore resource energy potential with losses was calculated by applying the technology exclusion area reductions to the gross offshore resource energy potential with losses. This assessment was done without applying conflicting use exclusions, resulting in a technical resource energy potential of 9,284 TWh/year (see Appendix F). The technical energy potential was calculated using the same loss assumptions described in Section 7.4.1. The resulting energy values are the net energy resource that wind turbines would be able to produce within the technical offshore resource area if turbines were installed at 3 MW/km2 everywhere inside the boundaries but without regard for conflicting use or environmental restrictions. These conflicting use and environmental reductions are discussed in Section 8.5.

29 This report is available at no cost from the National Renewable Energy Laboratory (NREL) at www.nrel.gov/publications.
8.5 Technical Offshore Resource Energy Potential with Land-Use and Environmental Exclusions
In this section, the technical offshore resource potential is further reduced both in the capacity of the total resource and in the net energy that can be produced.
8.5.1 Competing Use and Environmental Exclusions Data In the 2015 Wind Vision, a Black & Veatch study was used to identify areas of competing-use and environmental exclusions (shown on the map in Figure 18 in red [Black & Veatch 2010]). These areas include national marine sanctuaries, marine protected areas, wildlife refuges, shipping and towing lanes, and offshore platforms and pipelines.
Figure 18. Estimated excluded areas due to competing use and environmental exclusions. Figure
from NREL; Black & Veatch (2010)
For this study, additional analysis was performed to calculate the percentage of excluded areas that can be deducted from the technical potential resource totals as a function of distance to shore, and is shown in Figure 19.
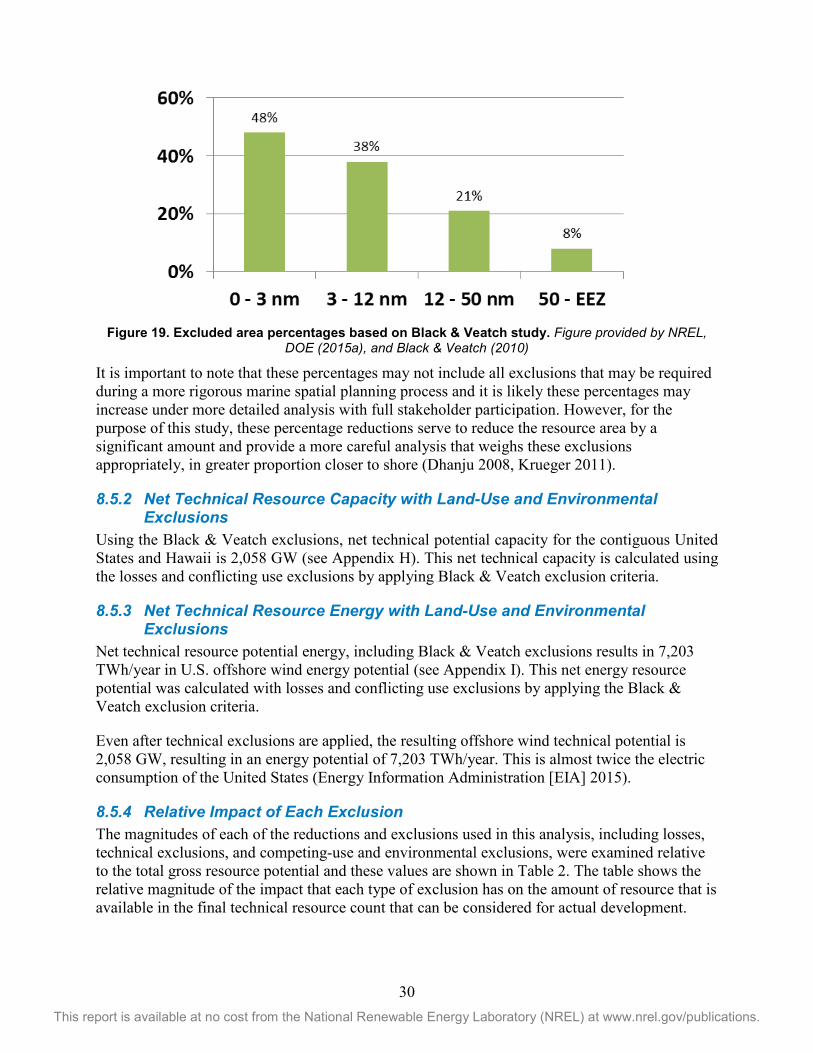
30 This report is available at no cost from the National Renewable Energy Laboratory (NREL) at www.nrel.gov/publications.
Figure 19. Excluded area percentages based on Black & Veatch study. Figure provided by NREL, DOE (2015a), and Black & Veatch (2010)
It is important to note that these percentages may not include all exclusions that may be required during a more rigorous marine spatial planning process and it is likely these percentages may increase under more detailed analysis with full stakeholder participation. However, for the purpose of this study, these percentage reductions serve to reduce the resource area by a significant amount and provide a more careful analysis that weighs these exclusions appropriately, in greater proportion closer to shore (Dhanju 2008, Krueger 2011).
8.5.2 Net Technical Resource Capacity with Land-Use and Environmental Exclusions
Using the Black & Veatch exclusions, net technical potential capacity for the contiguous United States and Hawaii is 2,058 GW (see Appendix H). This net technical capacity is calculated using the losses and conflicting use exclusions by applying Black & Veatch exclusion criteria.
8.5.3 Net Technical Resource Energy with Land-Use and Environmental Exclusions
Net technical resource potential energy, including Black & Veatch exclusions results in 7,203 TWh/year in U.S. offshore wind energy potential (see Appendix I). This net energy resource potential was calculated with losses and conflicting use exclusions by applying the Black & Veatch exclusion criteria.
Even after technical exclusions are applied, the resulting offshore wind technical potential is 2,058 GW, resulting in an energy potential of 7,203 TWh/year. This is almost twice the electric consumption of the United States (Energy Information Administration [EIA] 2015).
8.5.4 Relative Impact of Each Exclusion The magnitudes of each of the reductions and exclusions used in this analysis, including losses, technical exclusions, and competing-use and environmental exclusions, were examined relative to the total gross resource potential and these values are shown in Table 2. The table shows the relative magnitude of the impact that each type of exclusion has on the amount of resource that is available in the final technical resource count that can be considered for actual development.
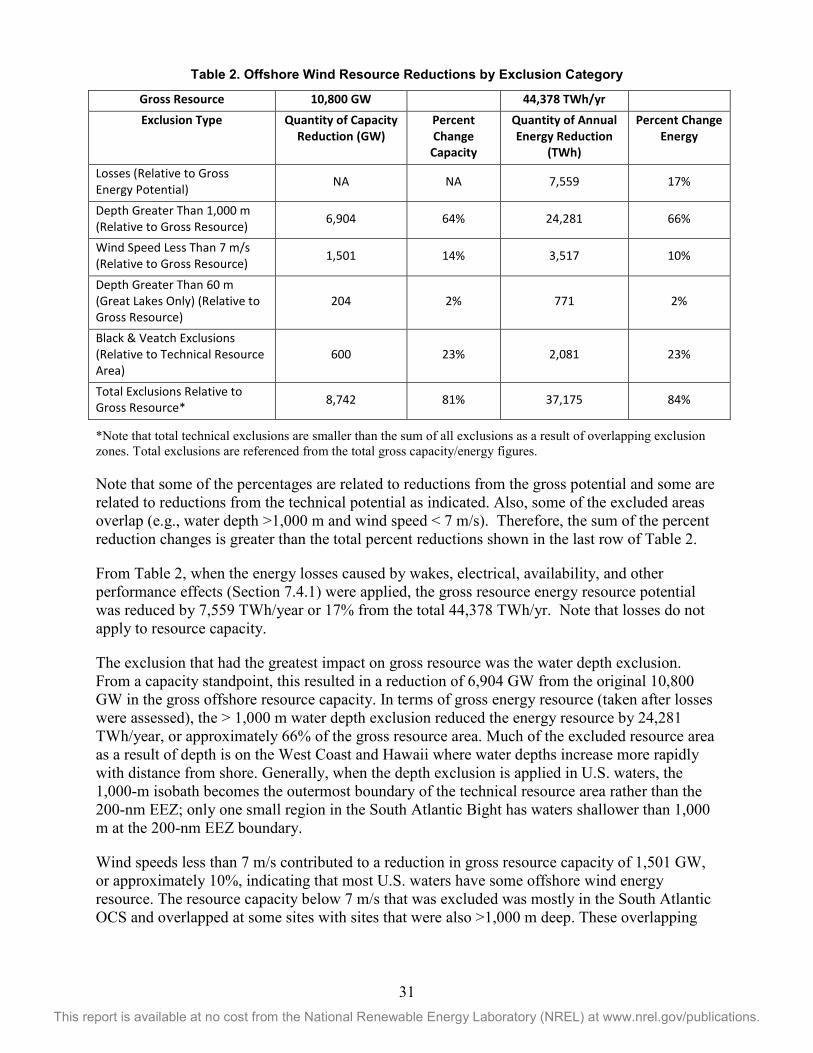
31 This report is available at no cost from the National Renewable Energy Laboratory (NREL) at www.nrel.gov/publications.
Table 2. Offshore Wind Resource Reductions by Exclusion Category
Gross Resource 10,800 GW 44,378 TWh/yr Exclusion Type Quantity of Capacity
Reduction (GW) Percent Change
Capacity
Quantity of Annual Energy Reduction
(TWh)
Percent Change Energy
Losses (Relative to Gross Energy Potential) NA NA 7,559 17%
Depth Greater Than 1,000 m (Relative to Gross Resource) 6,904 64% 24,281 66%
Wind Speed Less Than 7 m/s (Relative to Gross Resource) 1,501 14% 3,517 10%
Depth Greater Than 60 m (Great Lakes Only) (Relative to Gross Resource)
204 2% 771 2%
Black & Veatch Exclusions (Relative to Technical Resource Area)
600 23% 2,081 23%
Total Exclusions Relative to Gross Resource* 8,742 81% 37,175 84%
*Note that total technical exclusions are smaller than the sum of all exclusions as a result of overlapping exclusion zones. Total exclusions are referenced from the total gross capacity/energy figures.
Note that some of the percentages are related to reductions from the gross potential and some are related to reductions from the technical potential as indicated. Also, some of the excluded areas overlap (e.g., water depth >1,000 m and wind speed < 7 m/s). Therefore, the sum of the percent reduction changes is greater than the total percent reductions shown in the last row of Table 2.
From Table 2, when the energy losses caused by wakes, electrical, availability, and other performance effects (Section 7.4.1) were applied, the gross resource energy resource potential was reduced by 7,559 TWh/year or 17% from the total 44,378 TWh/yr. Note that losses do not apply to resource capacity.
The exclusion that had the greatest impact on gross resource was the water depth exclusion. From a capacity standpoint, this resulted in a reduction of 6,904 GW from the original 10,800 GW in the gross offshore resource capacity. In terms of gross energy resource (taken after losses were assessed), the > 1,000 m water depth exclusion reduced the energy resource by 24,281 TWh/year, or approximately 66% of the gross resource area. Much of the excluded resource area as a result of depth is on the West Coast and Hawaii where water depths increase more rapidly with distance from shore. Generally, when the depth exclusion is applied in U.S. waters, the 1,000-m isobath becomes the outermost boundary of the technical resource area rather than the 200-nm EEZ; only one small region in the South Atlantic Bight has waters shallower than 1,000 m at the 200-nm EEZ boundary.
Wind speeds less than 7 m/s contributed to a reduction in gross resource capacity of 1,501 GW, or approximately 10%, indicating that most U.S. waters have some offshore wind energy resource. The resource capacity below 7 m/s that was excluded was mostly in the South Atlantic OCS and overlapped at some sites with sites that were also >1,000 m deep. These overlapping

32 This report is available at no cost from the National Renewable Energy Laboratory (NREL) at www.nrel.gov/publications.
areas resulted in the sum of each technical exclusion category being larger than the total exclusions shown in the last row of Table 2.
For the Great Lakes only, approximately 204 GW of capacity was excluded where water depths exceeded 60 m. This technology limit was set to restrict floating wind systems from being deployed in freshwater ice environments in which the current floating technology may not be able to survive. This reduction accounted for only a 2% reduction in the gross resource capacity and energy potential, respectively.
The competing-use and environmental exclusions developed by Black & Veatch were applied after all other exclusions were assessed. Therefore, they were applied only to the technical offshore resource area, already reduced to 886,026 km2 by including the technical exclusions. On average, these exclusions reduced the technical resource area to 686,541 km2, or about 23% of the total remaining area. Note that these competing industry-use and possible environmental conflicts were applied as a function of distance from shore (as shown in Figure 19).
Overall, the total technical resource capacity was reduced by 81% from the original gross capacity of 10,800 GW to 2,058 GW. The total offshore resource energy potential of 44,378 TWh/year was reduced by about 84%, to 7,203 TWh/year. In spite of these reductions, the remaining technical resource potential is still abundant enough in most regions to allow for a relatively high degree of flexibility in site selection and settlement of competing-use conflicts. When compared to the total annual U.S. electricity consumption reported by E IA for 2014, the technical resource energy potential is almost double the 3,863 TWh used (EIA 2015).

33 This report is available at no cost from the National Renewable Energy Laboratory (NREL) at www.nrel.gov/publications.
9 State and Regional Data Comparisons In the United States, there are 30 states that have a boundary on an ocean or a Great Lake. In these coastal states, about 78% of the electricity of the United States is used (Musial and Ram 2010). As the nation advances its clean energy policies, offshore wind is poised to play a key role in many of these states, and individual state policies are driving the pace of offshore wind development as much as key federal initiatives (Smith, Stehly, and Musial 2015).
The U.S. resource totals were counted by region and individual state. Figure 20 shows the net capacity factor plotted inside the technical resource area (described earlier) with the five U.S. regions defined under the Wind Vision study scenario (DOE 2015a).
Figure 20. Net capacity factor for technical potential energy resource with technical exclusions for
five U.S. offshore wind resource regions
Note: The states included in each region are shaded to show which states are in each region.
9.1 Comparison of Gross Resource to Net Technical Potential Figure 21 shows the U.S. offshore wind technical resource potential relative to the gross resource potential and how it is distributed among the five U.S. regions shown in Figure 20.
Figure 21. Offshore wind resource capacity (left) and net energy (right) gross resource (dark blue) and final net technical (light blue) potential estimates for five U.S. offshore wind resource regions

34 This report is available at no cost from the National Renewable Energy Laboratory (NREL) at www.nrel.gov/publications.
To reach the Wind Vision Study Scenario deployment of 86 GW, approximately 29,000 km2 would be required for offshore wind development, which equates to approximately 4% of the nation’s technical resource area (about 0.8% of the gross resource area). As estimated by the Wind Vision study, this amount would equate to approximately 7% of the U.S. electric consumption (DOE 2015a), with some coastal utilities potentially having much higher offshore wind electric generation penetrations on the grid. Each region shown in Figure 20 has the resource supply to contribute substantially to a viable offshore wind industry through deployment to serve its local and regional energy needs, as well the potential to participate in a robust manufacturing supply chain with supporting coastal infrastructure for marine construction and service operations.
9.2 State-by-State Comparisons The net technical energy resource potential of 7,203 TWh/year for the United States was broken down for each state in this analysis. Figure 22 shows how the net energy potential is portioned for each state, divided into water depths of less than 60 m and greater than 60 m.
Figure 22. Offshore wind net technical energy potential (7,203 TWh/year) divided by state for water depths of less than 60 m (blue) and greater than 60 m (red)
The depth delineation at 60 m was used to distinguish the possible floating technology resource from the likely fixed-bottom resource. Figure 22 shows that after all the technology, conflicting-use, and environmental resource exclusions are deducted, Massachusetts has the largest fraction of total resource, followed by Florida, Texas, and Louisiana. The large energy resource in these southern states is attributed to a large quantity of ocean area that encompass relatively long coastlines and wide continential shelves. However, the quantity of the resource is not a good indication of resource quality. These southern states tend to have a high quantity of resource at low wind speeds between 7 m/s and 8 m/s, and net capacity factors are less than 35%.
To test the sensitivity of the net resource quantity to the wind speed technology exclusion criterion of 7 m/s, Figure 23 shows the distribution of net technical energy resource for the offshore states if the wind speed cutoff for the low wind speed technical exclusion were set to 8 m/s. In Figure 23, for winds above 8 m/s, Massachusetts’ resource remains the highest with a net

35 This report is available at no cost from the National Renewable Energy Laboratory (NREL) at www.nrel.gov/publications.
technical resource of over 1,000 TWh/year, whereas several states with lower wind speeds show virtually no net technical resource potential above 8 m/s. For this greater-than-8- m/s scenario, Massachusetts is now followed by North Carolina, Maine, South Carolina, and California.
Figure 23. Offshore wind net technical energy potential with an 8-m/s wind speed exclusion by
state
Figure 24 shows the ratio of each state’s net technical resource potential compared to the state’s total electric demand. The dashed red line indicates the level at which the state’s electric load is equal to the state’s resource. The figure shows that 19 states have resources that exceed their electric demand, and many states have resources many times greater.
In Figure 24, Maine, which has a relatively low electric demand (12.6 TWh/year according to the EIA [2014] figures), shows the greatest resource relative to its own electricity use, followed by Massachusetts, Hawaii, Rhode Island, South Carolina, and Louisiana.

36 This report is available at no cost from the National Renewable Energy Laboratory (NREL) at www.nrel.gov/publications.
Figure 24. Ratio of net offshore wind technical energy resource potential to electric load by state.
The dashed red line indicates the level at which the state's electric load is equal to its offshore wind technical resource potential. Figure provided by NREL (2016) and EIA (2015c)
Offshore wind has the advantage of providing significant economic benefits to states with copious resources through job growth, energy diversity, reduced pollution, electric system operational flexibility, and transmission congestion relief. However, in many offshore states, the current electric energy supply is imported from outside the state as shown in Figure 25.

37 This report is available at no cost from the National Renewable Energy Laboratory (NREL) at www.nrel.gov/publications.
Figure 25. Percent of state electricity demand imported or exported Figure provided by NREL
(2016), EIA (2015b, 2015c)
One of the reasons electricity is often imported is because of the lack of cost-effective indigenous resources. In planning future energy requirements in many states, offshore wind could provide a hedge to limit the required imports and help increase economic activity inside state borders (DOE 2015a; Beiter et al. 2016b). 9.3 Resource in State Versus Federal Waters Out of more than 685,000 km2 of technical potential resource area, 11.7%, or just over 80,000 km2, lies in state waters. The remaining 606,000 km2 is in federal waters. Table 3 details these results by distance from shore for the technical resource area with all exclusions applied.

38 This report is available at no cost from the National Renewable Energy Laboratory (NREL) at www.nrel.gov/publications.
Table 3. Technical Resource in State and Federal Waters
From the technical resource capacity in Appendix E, the area in state waters is 102,141 km2 but was reduced by 48% to 53,113 km2 to account for competing industry use and environmental exclusions (see Figure 19). In addition, the area in the Great Lakes, from 3 nm to the midlake Canadian border (or midlake between states), is also considered state waters. This area adds an additional 34,194 km2 to the state water area, and can be broken down with 27,550 km2 between 3 and 12 nm, and 6,644 km2 between 12 and 50 nm. Also, in Texas, and on the gulf side of Florida, state waters extend to 9 nm. This area from 3 nm to 9 nm adds an additional 7,566 km2 to the U.S. state waters. When the exclusions to account for competing industry use and environmental exclusions are applied (38% between 3 and 12 nm and 21% between 12 and 50 nm [from Figure 19]), the total state water technical potential area is 80,134 km2.
Although there has been activity in state and federal waters, this study calculated that about 88.3% of the technical offshore wind resource potential area (605,858 km2) in the United States is in federal waters and approximately 11.7% of the total technical resource area is in state waters. Because the majority of the resource is in federal waters, to build 86 GW of offshore wind by 2050 as prescribed by the Wind Vision Study Scenario, it is likely that most of the development would take place on the OCS under federal jurisdiction. Therefore, an efficient, clearly defined federal regulatory process that works closely with stakeholders to identify wind energy areas and facilitate the safe development of offshore wind projects is essential for the growth of offshore wind in the United States.
Distance to Shore (nm) < 3 3 - 12 12 - 50 50 - 200 TotalsPercent of Technical
Area
State Waters, only 0-3 nm (no exclusions) (km2)
102,141 0 0 0 102,141
Additional State Waters in Great Lakes (no exclusions) (km2)
0 27,550 6,644 0 34,194
Additional State Waters in TX and FL (no exclusions) (km2)
0 7,566 0 0 7,566
Total State Waters (no exclusions) (km2) 102,141 35,116 6,644 0 143,901
Total State Waters (with Exclusions) (km2) TECHNICAL POTENTIAL
53,113 21,772 5,249 0 80,134 11.68%
Federal Waters Area (with Exclusions)(km2)
0 66,789 270,908 268,161 605,858 88.32%
Total Area Technical Potential (with exclusions)(km2)
53,113 88,561 276,156 268,161 685,992 100.00%

39 This report is available at no cost from the National Renewable Energy Laboratory (NREL) at www.nrel.gov/publications.
10 Summary and Key Findings This report was sponsored by DOE to inform a new DOE/U.S. Department of the Interior offshore wind strategy scheduled to be released in 2016. This new resource assessment is the most comprehensive and up-to-date analysis of the offshore wind resource in the United States.
The report replaces the previous analysis done by NREL (Schwartz et al. 2010), which only considered gross resource capacity. By comparison, the gross resource capacity in this report increased from the 4,150 GW reported by Schwartz to 10,800 GW. This increase was because of the expansion of the resource domain that was extended from an arbitrary 50-nm outer boundary to the edge of the 200-nm EEZ defined by international law.
Gross resource capacity estimates are insufficient, however, for defining or estimating the developable resource area or actual deployment potential. Many offshore areas are unsuitable for offshore wind deployment on the basis of competing uses, or technical and environmental incompatibilities. As a result, exclusion criteria were developed and applied to the offshore resource area to filter out sites that are unlikely to be developable. Technical exclusions included all areas with water depth greater than 1,000 m, with wind speeds less than 7 m/s, and with water depths greater than 60 m (in the Great Lakes). The competing-use and environmental exclusions were applied by eliminating a percentage of the remaining area based on analysis performed by Black & Veatch and NREL as a function of distance to shore. The resource remaining after subtracting for these exclusions was the final technical resource potential. This technical resource potential with all exclusions applied is the best estimate of developable offshore resource area and is the primary metric for quantifying U.S. offshore wind potential in both installed capacity and energy production units.
Energy production estimates included with this analysis are based on 2015 turbine technology assumptions and include basic criteria for losses including wakes, electrical, and availability. Energy estimates enable better site-to-site comparisons especially on a regional level, but should not be used for site-specific engineering design.
Technical resource potential was found to be 2,058 GW of capacity at 3 MW/km2 and 7,203 TWh/year of net energy production for the United States. This technical energy potential of 7,203 TWh/year is approximately twice the electricity used in the United States in 2014. On a capacity basis, the revised technical capacity potential is approximately half of the capacity estimated by Schwartz et al. (2010) but is a much better metric for estimating the developable resource.
The U.S. offshore wind resource compares favorably with the DOE Wind Vision scenario, which prescribes that 86 GW of offshore wind will be deployed by 2050. This scenario would require the United States to use only 0.8% of the gross resource area, or about 4.2% of the total technical resource potential area.
State-by-state comparisons indicate an abundance of resource potential in all U.S. regions relative to their electricity consumption. The best resource, based on quality and quantity, was found to be in northeast states such as Maine, Massachusetts, Rhode Island, New York, and New Jersey. Massachusetts has the highest technical offshore resource potential. Southern states such as Florida, Texas, and Louisiana all had large resource areas because of large coast lines and wider continental shelves, but the quality of their resource was lower due to lower wind speeds.

40 This report is available at no cost from the National Renewable Energy Laboratory (NREL) at www.nrel.gov/publications.
11 Recommendations for Future Analyses The analyses presented in this report are based on modeled data by state and region. However, these data are not fully validated with measurements, especially hub-height wind speeds. More effort should be placed into reducing uncertainty of the data sets (Bailey et al. 2015).
Alaska’s offshore resource has not yet been quantified. The state’s resource should be quantitatively assessed and added to the WIND Toolkit database.
To integrate offshore wind into the grid at various regional locations, the time-varying component must be characterized better on a daily, seasonal, and yearly basis to allow for more robust modeling of electric systems and more precise estimates of the operational costs and capacity value benefits.
Future resource assessments should be conducted periodically on approximately a 5-year basis for the entire United States. The modeling capabilities are continuously improving and state-of-the-art mesoscale analysis tools are needed to aid regulators, policymakers, energy planners, and developers in determining capacity factors and seasonal capacity value, and to conduct comparative site selection and trade-offs.
41 This report is available at no cost from the National Renewable Energy Laboratory (NREL) at www.nrel.gov/publications.
References Arent, D., P. Sullivan, D. Heimiller, A. Lopez, K. Eurek, J. Badger, H. E. Jørgensen, M. Kelly, L. Clarke, and P. Luckow. 2012. Improved Offshore Wind Resource Assessment in Global Climate Stabilization Scenarios (Technical Report). NREL/TP-6A20-55049. National Renewable Energy Laboratory (NREL), Golden, CO (US). http://www.nrel.gov/docs/fy13osti/55049.pdf.
AWS Truepower, LLC. 2010. OpenWind Theoretical Basis and Validation. http://www.awsopenwind.org/downloads/documentation/OpenWindTheoryAndValidation.pdf Accessed April 6, 2013.
AWS Truepower, LLC. 2012. Wind Resource Maps and Data: Methods and Validation. https://www.awstruepower.com/products/maps-and-resource-data Accessed July 2016.
AWS Truepower, LLC. 2014. “AWS Truepower Loss and Uncertainty Methods,” Memorandum. June 5, 2014, https://www.awstruepower.com/assets/AWS-Truepower-Loss-and-Uncertainty-Memorandum-5-Jun-2014.pdf.
Bailey, B., Filippelli, M., and Baker, M. 2015. “Metocean Data Needs Assessment for US Offshore Wind Energy,” Prepared for the U.S. Department of Energy under Contract DE-EE0005372: National Offshore Wind Energy Resource and Design Data Campaign—Analysis and Collaboration. usmodcore.com/.../AWST_MetoceanDataNeedsAssessment_DOE_FinalReport_14Jan2015.pdf
Beaver, J. 2006. U.S. International Borders: Brief Facts, Knowledge Services Group, Updated November 9, 2006, Order Code RS21729, https://fas.org/sgp/crs/misc/RS21729.pdf.
Beiter, P., W. Musial, and A. Smith. 2016a. Terminology Guideline for Classifying Offshore Wind Energy Resources (Technical Report), NREL/TP-6A20-65431. National Renewable Energy Laboratory (NREL), Golden, CO (US). www.nrel.gov/docs/fy16/65431.pdf.
Beiter, P., W. Musial, A. Smith, L. Kilcher, R. Damiani, M. Maness, S. Sirnivas, T. Stehly, V. Gevorgian, M. Mooney, and G. Scott. 2016b. A Spatial-Economic Cost Reduction Pathway Analysis for U.S. Offshore Wind Energy Development from 2015–2030 (Technical Report), NREL/TP-6A20-66579. National Renewable Energy Laboratory (NREL), Golden, CO (US). www.nrel.gov/docs/fy16/66579.pdf.
Black & Veatch. 2010. Technology Characterization for Renewable Energy Electricity Futures Study: GIS Database of Offshore Wind Resource Competing Uses and Environmentally Sensitive Areas. Overland Park, KS: Black & Veatch. Unpublished report contracted by NREL.
Brown, A., P. Beiter, D. Heimiller, C. Davidson, P. Denholm, J. Melius, A. Lopez, D. Hettinger, D. Mulcahy, and G. Porro. 2015. Estimating Renewable Energy Economic Potential in the United States: Methodology and Initial Results (Technical Report.) NREL/TP-6A20-64503. National Renewable Energy Laboratory (NREL), Golden, CO (US). http://www.nrel.gov/docs/fy15osti/64503.pdf.

42 This report is available at no cost from the National Renewable Energy Laboratory (NREL) at www.nrel.gov/publications.
Campbell, S. 2016. “Growing interest in Hawaiian offshore potential” May 17, 2016 Windpower Monthly. Accessed July 2016. http://www.windpoweroffshore.com/article/1395274/growing-interest-hawaiian-offshore-potential.
Dhanju A., P. Whitaker, and W. Kempton. 2008. “Assessing offshore wind resources: An accessible methodology.” Renewable Energy 35: 1244‒1254. http://www.sciencedirect.com/science/article/pii/S096014810700078X.
DOE (U.S. Department of Energy). 2013. “Report to Congress on Renewable Energy Resource Assessment Information for the United States.” DOE Office of Energy Efficiency and Renewable Energy (EERE). (EPACT) Prepared by the National Renewable Energy Laboratory.
DOE. 2015a. Wind Vision: A New Era for Wind Power in the United States. U.S. Department of Energy Office of Energy Efficiency and Renewable Energy. DOE/GO-102015-4557. Washington, D.C. Accessed May 2015. http://www.energy.gov/sites/prod/files/WindVision_Report_final.pdf.
DOE. 2015b. Revolution…Now. The Future Arrives for Five Clean Energy Technologies – 2015 Update. U.S. Department of Energy (DOE), Washington, D.C. (US). http://www.energy.gov/sites/prod/files/2015/11/f27/Revolution-Now-11132015.pdf.
Draxl. 2015. Draxl, C, Clifton, A. Hodge, B., McCaa, J. The Wind Integration National Dataset (WIND) Toolkit, Applied Energy, Volume 151, 1 August 2015, Pages 355-366, ISSN 0306-2619, http://dx.doi.org/10.1016/j.apenergy.2015.03.121.
DNV KEMA. Framework for the Categorisation of Losses and Uncertainty for Wind Energy Assessments, Sustainable Energy. energize - March 2013. Accessed July 2016. http://www.ee.co.za/wp-content/uploads/legacy/Energize_2013/08_ST_01_DNV_Categorisation-.pdf.
EIA. 2015a. “Summary Statistics for the United States, 2004 - 2014” Accessed July 2016. http://www.eia.gov/electricity/annual/
EIA. 2015b. “Net Generation by State by Type of Producer by Energy Source (EIA forms 906, 920, and 923).” Accessed June 2016. https://www.eia.gov/electricity/data/state/.
EIA. 2015c. “Retail Sales of Electricity by State by Sector by Provider (EIA form 861).” Accessed June 2016. https://www.eia.gov/electricity/data/state/.
Johnson, E. J. Meyer, M. Mager, A. Horel, and G. Holdmann. 2012. Stranded Renewable Energy Resources of Alaska: A Preliminary Overview of Opportunities and Challenges to Development. Prepared for: The National Renewable Energy Laboratory, The Alaska Center for Energy and Power, University of Alaska Fairbanks. http://www.uaf.edu/files/acep/Standed-Renewables-Report-Final.pdf.
Krueger, A. D., G. R. Parsons, and J. Firestone. 2011. Valuing the Visual Disamenity of Offshore Wind Power Projects at Varying Distances from the Shore. University of Delaware, Land Economics. 87 (2): 268–283, ISSN 0023-7639; E-ISSN 1543-8325. https://works.bepress.com/george_parsons/7/.

43 This report is available at no cost from the National Renewable Energy Laboratory (NREL) at www.nrel.gov/publications.
Lopez A., B. Roberts, D. Heimiller, N. Blair, and G. Porro. 2012. U.S. Renewable Energy Technical Potentials: A GIS-Based Analysis (Technical Report). NREL/TP-6A20-51946. National Renewable Energy Laboratory (NREL), Golden, CO (US). http://www.nrel.gov/docs/fy12osti/51946.pdf.
Lilley M., Firestone J., and Kempton . 2010. “The Effect of Wind Power Installations on Coastal Tourism,” Energies 2010, 3: 1‒22; doi:10.3390/en3010001 energies ISSN 1996-1073. http://www.mdpi.com/1996-1073/3/1/1.
Moné, C., T. Stehly, B. Maples, E. Settle. 2015. 2014 Cost of Wind Energy Review (Technical Report). NREL/TP-6A20-64281. National Renewable Energy Laboratory (NREL), Golden, CO (US). http://www.nrel.gov/docs/fy16osti/64281.pdf.
Musial, W. and B. Ram. 2010. Large-Scale Offshore Wind Power in the United States: Assessment of Opportunities and Barriers (Technical Report). NREL/TP-500-40745. National Renewable Energy Laboratory, Golden, CO (US). http://www.nrel.gov/docs/fy10osti/40745.pdf.
Musial, W. D. 2013. “Proposed Methodology for Massachusetts Wind Energy Area Delineation,” Webinar presentation at BOEM Massachusetts Task Force meeting, May 15, 2013. Accessed July 2016. http://www.nrel.gov/docs/fy14osti/60942.pdf.
Musial, W., D. Elliott, J. Fields, Z. Parker, G. Scott, C. Draxl. 2013. Assessment of Offshore Wind Energy Leasing Areas for the BOEM New Jersey Wind Energy Area (Technical Report). NREL/TP-5000-60403. National Renewable Energy Laboratory (NREL), Golden, CO (US). http://www.nrel.gov/docs/fy13osti/60403.pdf.
Namovicz, C. 2013. “Assessing the Economic Value of New Utility-Scale Renewable Generation Projects.” Presented at the EIA Energy Conference, June 17, 2013. Washington, DC: U.S. Energy Information Administration. Accessed May 2015. http://www.eia.gov/conference/2013/pdf/presentations/namovicz.pdf.
NOAA. 2013 National Oceanic and Atmospheric Administration (NOAA). 2013. “U.S. Coastal Relief Model Volume,” (New England). Accessed November 25, 2013. http://www.ngdc.noaa.gov/mgg/coastal/crm.html.
NOAA. 2015. “Great Lakes Bathymetry.” Accessed July 2016. https://www.ngdc.noaa.gov/mgg/greatlakes/greatlakes.html
NOAA. 2016. “ETOPO1.” Accessed July 2016. https://www.ngdc.noaa.gov/mgg/global/global.html
Phillips 1979. Phillips, G.T. “A Preliminary Users Guide for the NOABL Objectives Analysis Code”, DOE/ET/20280-T1, July 1979. http://www.osti.gov/scitech/servlets/purl/7080538 Accessed 7-12-16.
Previsic, M., J. Epler, M. Hand, D. Heimiller, W. Short, K. Eurek. 2012. The Future Potential of Wave Power in the United States. RE-Vision, Sacramento, CA. http://www.re-vision.net/documents/The%20Future%20of%20Wave%20Power%20MP%209-20-12%20V2.pdf.
44 This report is available at no cost from the National Renewable Energy Laboratory (NREL) at www.nrel.gov/publications.
Schwartz, M., D. Heimiller, S. Haymes, W. Musial, W. 2010. Assessment of Offshore Wind Energy Resources for the United States (Technical Report). NREL/TP-500-45889. National Renewable Energy Laboratory (NREL), Golden, CO (US).http://www.nrel.gov/docs/fy10osti/45889.pdf.
Smith, Aaron, Tyler Stehly, Walter Musial. 2015. 2014-2015 Offshore Wind Technologies Market Report (Technical Report). NREL/TP-5000-64283. National Renewable Energy Laboratory (NREL), Golden, CO (US). http://www.nrel.gov/docs/fy15osti/64283.pdf.
Thormahlen, L. 1999. Boundary Development on the Outer Continental Shelf. OCS Report MMS 99-006.: Department of the Interior Minerals Management Service. Lakewood, CO. http://www.worldcat.org/title/boundary-development-on-the-outer-continental-shelf/oclc/263996802.
Weinstein, A. 2016. “Morro Bay Offshore: a 1,000 MW floating offshore wind farm.” Presentation given at the Integrated Energy Policy Report Workshop on Offshore Renewable Energy, Sacramento, CA, May 25, 2016.

45 This report is available at no cost from the National Renewable Energy Laboratory (NREL) at www.nrel.gov/publications.
Appendices Appendices A through I provide the raw data from the current resource assessment. Each appendix provides a breakdown of the resource by water depth, distance from shore, and wind speed. These data are broken down by state in alphabetical order. The appendices are presented in the same order described in Section 5 and outlined in Figure 2. Most of the analysis in Section 9 comes directly from the data provided in Appendix I.
Appendix A. Gross Offshore Resource Area Tables The Tables in Appendix A display the data for Gross Offshore Resource Area by water depth, distance from shore and wind speed as discussed in Section 7.

46 This report is available at no cost from the National Renewable Energy Laboratory (NREL) at www.nrel.gov/publications.
Table A-1. Gross Offshore Wind Potential by Water Depth: Area (km2)
State < 30 m 30–60 m 60–700 m 700–1000 m < 1000 m Grand TotalAlabama 4,854 2,900 2,340 1,204 1,585 12,883California 3,468 3,222 48,518 30,862 479,988 566,058Connecticut 1,224 263 40 0 0 1,527Delaware 2,351 655 38 0 0 3,044Florida 102,000 55,117 118,478 72,269 86,386 434,248Georgia 10,817 4,948 3,383 1,914 0 21,063Hawaii 1,105 1,354 14,666 5,105 979,257 1,001,486Illinois 1,396 994 1,800 0 0 4,190Indiana 591 0 0 0 0 591Louisiana 43,113 16,716 34,147 14,418 151,369 259,763Maine 4,797 2,773 34,939 0 0 42,509Maryland 7,931 3,441 3,520 536 28,175 43,603Massachusetts 10,828 25,182 57,507 2,014 86,411 181,943Michigan 18,956 14,284 65,525 0 0 98,766Minnesota 277 274 6,079 0 0 6,631Mississippi 2,980 279 0 0 0 3,258New Hampshire 146 143 416 0 0 706New Jersey 8,841 12,402 8,150 711 25,060 55,164New York 8,009 11,304 19,068 909 15,899 55,188North Carolina 30,371 16,242 21,718 7,443 193,375 269,149Ohio 9,145 0 0 0 0 9,145Oregon 693 786 23,440 4,468 139,882 169,270Pennsylvania 1,480 432 0 0 0 1,912Rhode Island 1,078 2,480 2,916 139 470 7,083South Carolina 17,860 8,320 26,176 19,338 7,563 79,258Texas 35,525 20,430 26,878 10,308 37,872 131,013Virginia 14,411 5,065 2,494 349 8,790 31,110Washington 5,031 3,034 14,197 4,139 58,850 85,250Wisconsin 5,209 3,671 15,283 0 0 24,163Total 354,488 216,712 551,717 176,126 2,300,932 3,599,975
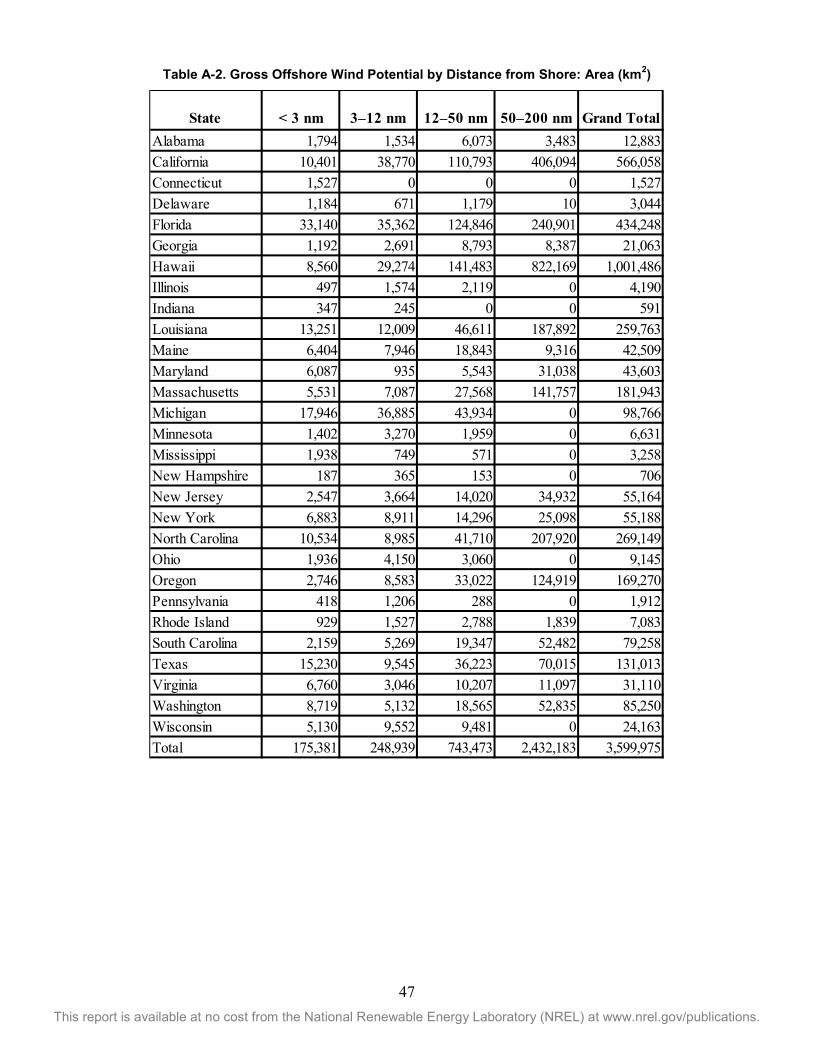
47 This report is available at no cost from the National Renewable Energy Laboratory (NREL) at www.nrel.gov/publications.
Table A-2. Gross Offshore Wind Potential by Distance from Shore: Area (km2)
State < 3 nm 3–12 nm 12–50 nm 50–200 nm Grand TotalAlabama 1,794 1,534 6,073 3,483 12,883California 10,401 38,770 110,793 406,094 566,058Connecticut 1,527 0 0 0 1,527Delaware 1,184 671 1,179 10 3,044Florida 33,140 35,362 124,846 240,901 434,248Georgia 1,192 2,691 8,793 8,387 21,063Hawaii 8,560 29,274 141,483 822,169 1,001,486Illinois 497 1,574 2,119 0 4,190Indiana 347 245 0 0 591Louisiana 13,251 12,009 46,611 187,892 259,763Maine 6,404 7,946 18,843 9,316 42,509Maryland 6,087 935 5,543 31,038 43,603Massachusetts 5,531 7,087 27,568 141,757 181,943Michigan 17,946 36,885 43,934 0 98,766Minnesota 1,402 3,270 1,959 0 6,631Mississippi 1,938 749 571 0 3,258New Hampshire 187 365 153 0 706New Jersey 2,547 3,664 14,020 34,932 55,164New York 6,883 8,911 14,296 25,098 55,188North Carolina 10,534 8,985 41,710 207,920 269,149Ohio 1,936 4,150 3,060 0 9,145Oregon 2,746 8,583 33,022 124,919 169,270Pennsylvania 418 1,206 288 0 1,912Rhode Island 929 1,527 2,788 1,839 7,083South Carolina 2,159 5,269 19,347 52,482 79,258Texas 15,230 9,545 36,223 70,015 131,013Virginia 6,760 3,046 10,207 11,097 31,110Washington 8,719 5,132 18,565 52,835 85,250Wisconsin 5,130 9,552 9,481 0 24,163Total 175,381 248,939 743,473 2,432,183 3,599,975

48 This report is available at no cost from the National Renewable Energy Laboratory (NREL) at www.nrel.gov/publications.
Table A-3. Gross Offshore Wind Potential by Wind Speed: Area (km2)
State < 7 m/s7–7.25
m/s7.25–7.5
m/s7.5–7.75
m/s7.75–8
m/s8–8.25
m/s8.25–8.5
m/s8.5–8.75
m/s8.75–9
m/s9–9.25
m/s9.25–9.5
m/s9.5–9.75
m/s9.75–10
m/s10–10.25
m/s10.25–10.5
m/s10.5–10.75
m/s10.75–11
m/s11–11.25
m/s11.25–11.5
m/s Grand TotalAlabama 4,347 5,426 3,111 0 0 0 0 0 0 0 0 0 0 0 0 0 0 0 0 12,883California 58,758 11,380 17,188 20,821 26,638 46,300 87,822 36,051 36,808 71,147 51,419 39,537 30,216 17,367 8,741 4,865 1,001 0 0 566,058Connecticut 154 156 217 458 373 170 0 0 0 0 0 0 0 0 0 0 0 0 0 1,527Delaware 26 112 131 221 344 680 1,014 511 5 0 0 0 0 0 0 0 0 0 0 3,044Florida 289,178 87,808 45,988 11,138 137 0 0 0 0 0 0 0 0 0 0 0 0 0 0 434,248Georgia 475 391 3,955 9,675 4,827 1,740 0 0 0 0 0 0 0 0 0 0 0 0 0 21,063Hawaii 23,704 4,826 7,743 20,647 16,282 139,192 185,565 124,674 212,008 86,764 19,351 18,924 42,427 53,659 38,690 3,596 897 667 1,871 1,001,486Illinois 0 3 25 61 83 149 1,771 2,085 13 0 0 0 0 0 0 0 0 0 0 4,190Indiana 0 5 29 56 75 171 255 1 0 0 0 0 0 0 0 0 0 0 0 591Louisiana 104,709 89,186 28,111 35,986 1,770 0 0 0 0 0 0 0 0 0 0 0 0 0 0 259,763Maine 411 417 502 589 585 758 1,080 1,237 1,647 2,385 5,731 13,918 8,749 4,499 0 0 0 0 0 42,509Maryland 3,683 1,184 665 400 129 424 3,766 2,491 4,842 13,434 6,645 5,939 0 0 0 0 0 0 0 43,603Massachusetts 29 76 116 211 331 517 1,082 1,777 2,316 3,112 28,179 92,826 51,370 0 0 0 0 0 0 181,943Michigan 812 1,137 1,866 3,440 7,033 13,470 13,827 17,348 24,405 7,797 4,963 2,668 0 0 0 0 0 0 0 98,766Minnesota 1,815 1,545 1,550 1,163 556 2 0 0 0 0 0 0 0 0 0 0 0 0 0 6,631Mississippi 1,461 1,316 482 0 0 0 0 0 0 0 0 0 0 0 0 0 0 0 0 3,258New Hampshire 25 8 8 22 25 31 88 142 202 129 25 0 0 0 0 0 0 0 0 706New Jersey 55 114 282 427 638 793 2,437 5,850 5,515 26,109 9,778 3,166 0 0 0 0 0 0 0 55,164New York 221 231 437 713 1,840 4,789 5,888 851 1,445 11,992 25,133 1,649 0 0 0 0 0 0 0 55,188North Carolina 978 681 1,147 3,761 14,180 23,780 49,636 56,573 52,500 36,779 24,099 5,038 0 0 0 0 0 0 0 269,149Ohio 0 5 45 225 877 2,610 4,067 1,318 0 0 0 0 0 0 0 0 0 0 0 9,145Oregon 737 265 323 379 457 2,978 21,409 52,491 50,937 14,977 8,515 4,554 4,037 1,976 1,881 2,241 1,114 0 0 169,270Pennsylvania 0 0 2 16 42 376 1,092 384 0 0 0 0 0 0 0 0 0 0 0 1,912Rhode Island 63 96 171 59 74 147 170 259 563 533 4,917 32 0 0 0 0 0 0 0 7,083South Carolina 234 296 399 12,558 26,159 25,417 11,036 3,160 0 0 0 0 0 0 0 0 0 0 0 79,258Texas 63 197 41,006 29,943 24,605 9,329 9,126 9,845 6,834 66 0 0 0 0 0 0 0 0 0 131,013Virginia 1,029 440 782 1,635 2,900 2,117 3,880 7,093 7,996 2,540 698 0 0 0 0 0 0 0 0 31,110Washington 6,973 744 642 978 1,223 9,360 18,924 27,346 18,320 741 0 0 0 0 0 0 0 0 0 85,250Wisconsin 557 779 2,051 1,532 1,907 1,390 2,548 6,039 7,353 7 0 0 0 0 0 0 0 0 0 24,163Total 500,497 208,823 158,969 157,112 134,090 286,688 426,484 357,526 433,709 278,512 189,451 188,252 136,799 77,500 49,312 10,702 3,011 667 1,871 3,599,975
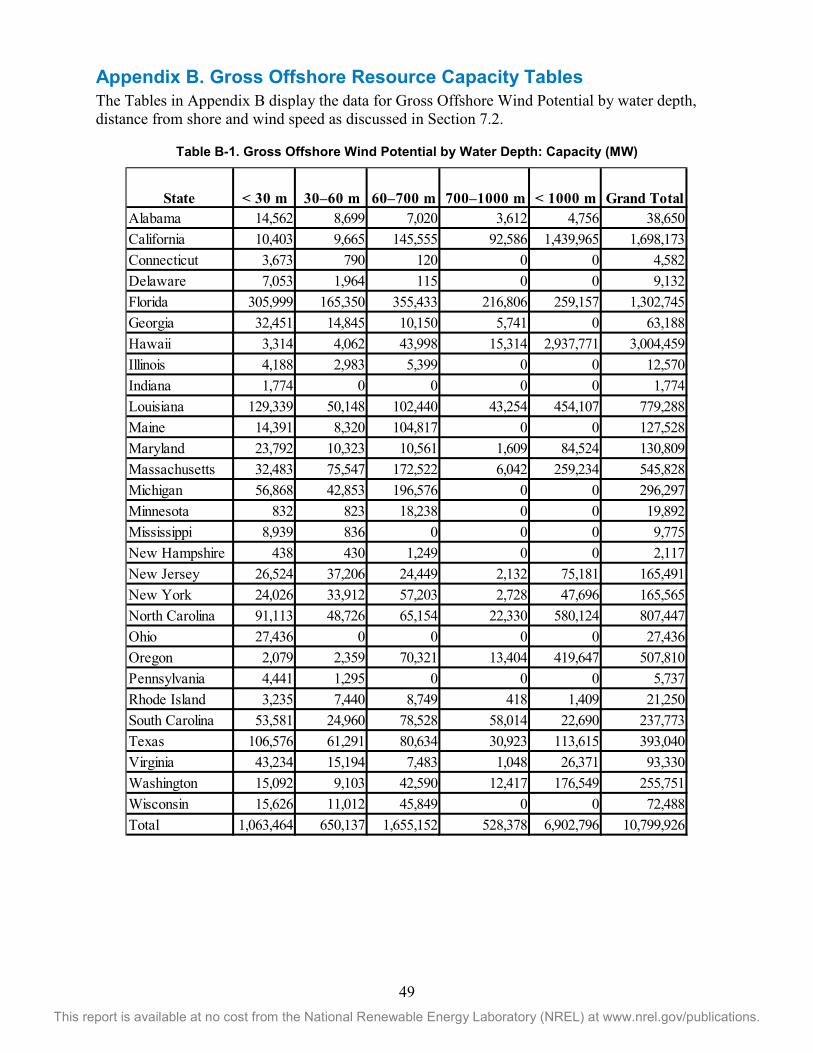
49 This report is available at no cost from the National Renewable Energy Laboratory (NREL) at www.nrel.gov/publications.
Appendix B. Gross Offshore Resource Capacity Tables The Tables in Appendix B display the data for Gross Offshore Wind Potential by water depth, distance from shore and wind speed as discussed in Section 7.2.
Table B-1. Gross Offshore Wind Potential by Water Depth: Capacity (MW)
State < 30 m 30–60 m 60–700 m 700–1000 m < 1000 m Grand TotalAlabama 14,562 8,699 7,020 3,612 4,756 38,650California 10,403 9,665 145,555 92,586 1,439,965 1,698,173Connecticut 3,673 790 120 0 0 4,582Delaware 7,053 1,964 115 0 0 9,132Florida 305,999 165,350 355,433 216,806 259,157 1,302,745Georgia 32,451 14,845 10,150 5,741 0 63,188Hawaii 3,314 4,062 43,998 15,314 2,937,771 3,004,459Illinois 4,188 2,983 5,399 0 0 12,570Indiana 1,774 0 0 0 0 1,774Louisiana 129,339 50,148 102,440 43,254 454,107 779,288Maine 14,391 8,320 104,817 0 0 127,528Maryland 23,792 10,323 10,561 1,609 84,524 130,809Massachusetts 32,483 75,547 172,522 6,042 259,234 545,828Michigan 56,868 42,853 196,576 0 0 296,297Minnesota 832 823 18,238 0 0 19,892Mississippi 8,939 836 0 0 0 9,775New Hampshire 438 430 1,249 0 0 2,117New Jersey 26,524 37,206 24,449 2,132 75,181 165,491New York 24,026 33,912 57,203 2,728 47,696 165,565North Carolina 91,113 48,726 65,154 22,330 580,124 807,447Ohio 27,436 0 0 0 0 27,436Oregon 2,079 2,359 70,321 13,404 419,647 507,810Pennsylvania 4,441 1,295 0 0 0 5,737Rhode Island 3,235 7,440 8,749 418 1,409 21,250South Carolina 53,581 24,960 78,528 58,014 22,690 237,773Texas 106,576 61,291 80,634 30,923 113,615 393,040Virginia 43,234 15,194 7,483 1,048 26,371 93,330Washington 15,092 9,103 42,590 12,417 176,549 255,751Wisconsin 15,626 11,012 45,849 0 0 72,488Total 1,063,464 650,137 1,655,152 528,378 6,902,796 10,799,926

50 This report is available at no cost from the National Renewable Energy Laboratory (NREL) at www.nrel.gov/publications.
Table B-2. Gross Offshore Wind Potential by Distance from Shore: Capacity (MW)
State < 3 nm 3–12 nm 12–50 nm 50–200 nm Grand TotalAlabama 5,382 4,601 18,218 10,449 38,650California 31,203 116,310 332,379 1,218,281 1,698,173Connecticut 4,582 0 0 0 4,582Delaware 3,552 2,014 3,537 29 9,132Florida 99,419 106,086 374,537 722,703 1,302,745Georgia 3,577 8,072 26,379 25,160 63,188Hawaii 25,680 87,823 424,448 2,466,508 3,004,459Illinois 1,491 4,723 6,357 0 12,570Indiana 1,041 734 0 0 1,774Louisiana 39,754 36,027 139,832 563,675 779,288Maine 19,211 23,838 56,530 27,948 127,528Maryland 18,262 2,804 16,628 93,115 130,809Massachusetts 16,592 21,262 82,704 425,270 545,828Michigan 53,839 110,656 131,801 0 296,297Minnesota 4,205 9,810 5,877 0 19,892Mississippi 5,814 2,248 1,713 0 9,775New Hampshire 562 1,095 460 0 2,117New Jersey 7,642 10,992 42,061 104,796 165,491New York 20,650 26,732 42,888 75,295 165,565North Carolina 31,603 26,956 125,129 623,759 807,447Ohio 5,807 12,449 9,180 0 27,436Oregon 8,237 25,750 99,066 374,757 507,810Pennsylvania 1,253 3,619 864 0 5,737Rhode Island 2,787 4,581 8,364 5,518 21,250South Carolina 6,478 15,807 58,042 157,446 237,773Texas 45,691 28,636 108,669 210,044 393,040Virginia 20,281 9,137 30,620 33,291 93,330Washington 26,156 15,395 55,694 158,506 255,751Wisconsin 15,389 28,656 28,443 0 72,488Total 526,143 746,816 2,230,418 7,296,549 10,799,926

51 This report is available at no cost from the National Renewable Energy Laboratory (NREL) at www.nrel.gov/publications.
Table B-3. Gross Offshore Wind Potential by Wind Speed: Capacity (MW)
State < 7 m/s7–7.25
m/s7.25–7.5
m/s7.5–7.75
m/s7.75–8
m/s8–8.25
m/s8.25–8.5
m/s8.5–8.75
m/s8.75–9
m/s9–9.25
m/s9.25–9.5
m/s9.5–9.75
m/s9.75–10
m/s10–10.25
m/s10.25–10.5
m/s10.5–10.75
m/s10.75–11
m/s11–11.25
m/s11.25–11.5
m/s Grand TotalAlabama 13,041 16,277 9,332 0 0 0 0 0 0 0 0 0 0 0 0 0 0 0 0 38,650California 176,275 34,141 51,565 62,463 79,914 138,899 263,466 108,153 110,424 213,440 154,256 118,611 90,647 52,100 26,223 14,595 3,002 0 0 1,698,173Connecticut 461 467 650 1,374 1,120 511 0 0 0 0 0 0 0 0 0 0 0 0 0 4,582Delaware 78 337 392 662 1,033 2,039 3,041 1,534 16 0 0 0 0 0 0 0 0 0 0 9,132Florida 867,533 263,424 137,964 33,414 411 0 0 0 0 0 0 0 0 0 0 0 0 0 0 1,302,745Georgia 1,425 1,173 11,865 29,026 14,480 5,219 0 0 0 0 0 0 0 0 0 0 0 0 0 63,188Hawaii 71,112 14,477 23,230 61,940 48,846 417,575 556,696 374,023 636,024 260,292 58,052 56,773 127,281 160,976 116,070 10,788 2,691 2,002 5,612 3,004,459Illinois 0 9 75 182 249 448 5,313 6,254 40 0 0 0 0 0 0 0 0 0 0 12,570Indiana 1 15 86 168 226 512 764 3 0 0 0 0 0 0 0 0 0 0 0 1,774Louisiana 314,127 267,559 84,334 107,957 5,310 0 0 0 0 0 0 0 0 0 0 0 0 0 0 779,288Maine 1,234 1,252 1,505 1,767 1,756 2,273 3,241 3,711 4,940 7,154 17,194 41,755 26,248 13,498 0 0 0 0 0 127,528Maryland 11,049 3,551 1,996 1,201 387 1,271 11,299 7,474 14,527 40,302 19,935 17,817 0 0 0 0 0 0 0 130,809Massachusetts 87 228 347 632 994 1,552 3,245 5,331 6,949 9,337 84,536 278,479 154,111 0 0 0 0 0 0 545,828Michigan 2,435 3,410 5,599 10,321 21,098 40,410 41,480 52,043 73,216 23,391 14,890 8,003 0 0 0 0 0 0 0 296,297Minnesota 5,446 4,636 4,650 3,490 1,667 5 0 0 0 0 0 0 0 0 0 0 0 0 0 19,892Mississippi 4,383 3,947 1,445 0 0 0 0 0 0 0 0 0 0 0 0 0 0 0 0 9,775New Hampshire 76 24 23 66 75 93 265 425 607 388 75 0 0 0 0 0 0 0 0 2,117New Jersey 165 342 845 1,282 1,913 2,379 7,312 17,550 16,544 78,328 29,333 9,499 0 0 0 0 0 0 0 165,491New York 664 694 1,310 2,138 5,519 14,367 17,665 2,553 4,334 35,975 75,398 4,948 0 0 0 0 0 0 0 165,565North Carolina 2,934 2,042 3,440 11,282 42,540 71,339 148,907 169,718 157,500 110,338 72,296 15,113 0 0 0 0 0 0 0 807,447Ohio 0 14 134 674 2,631 7,829 12,200 3,955 0 0 0 0 0 0 0 0 0 0 0 27,436Oregon 2,210 795 970 1,138 1,371 8,933 64,228 157,472 152,811 44,932 25,544 13,661 12,112 5,928 5,643 6,723 3,341 0 0 507,810Pennsylvania 0 0 5 49 126 1,129 3,276 1,151 0 0 0 0 0 0 0 0 0 0 0 5,737Rhode Island 190 287 512 177 221 442 510 778 1,688 1,598 14,751 95 0 0 0 0 0 0 0 21,250South Carolina 701 889 1,196 37,673 78,478 76,251 33,107 9,479 0 0 0 0 0 0 0 0 0 0 0 237,773Texas 188 591 123,017 89,829 73,815 27,988 27,379 29,536 20,501 197 0 0 0 0 0 0 0 0 0 393,040Virginia 3,087 1,320 2,345 4,904 8,701 6,350 11,641 21,280 23,989 7,621 2,093 0 0 0 0 0 0 0 0 93,330Washington 20,920 2,232 1,925 2,934 3,668 28,080 56,772 82,038 54,959 2,223 0 0 0 0 0 0 0 0 0 255,751Wisconsin 1,671 2,337 6,152 4,595 5,722 4,171 7,645 18,116 22,058 22 0 0 0 0 0 0 0 0 0 72,488Total 1,501,491 626,469 476,906 471,336 402,270 860,063 1,279,453 1,072,578 1,301,126 835,536 568,354 564,755 410,398 232,501 147,935 32,106 9,034 2,002 5,612 10,799,926
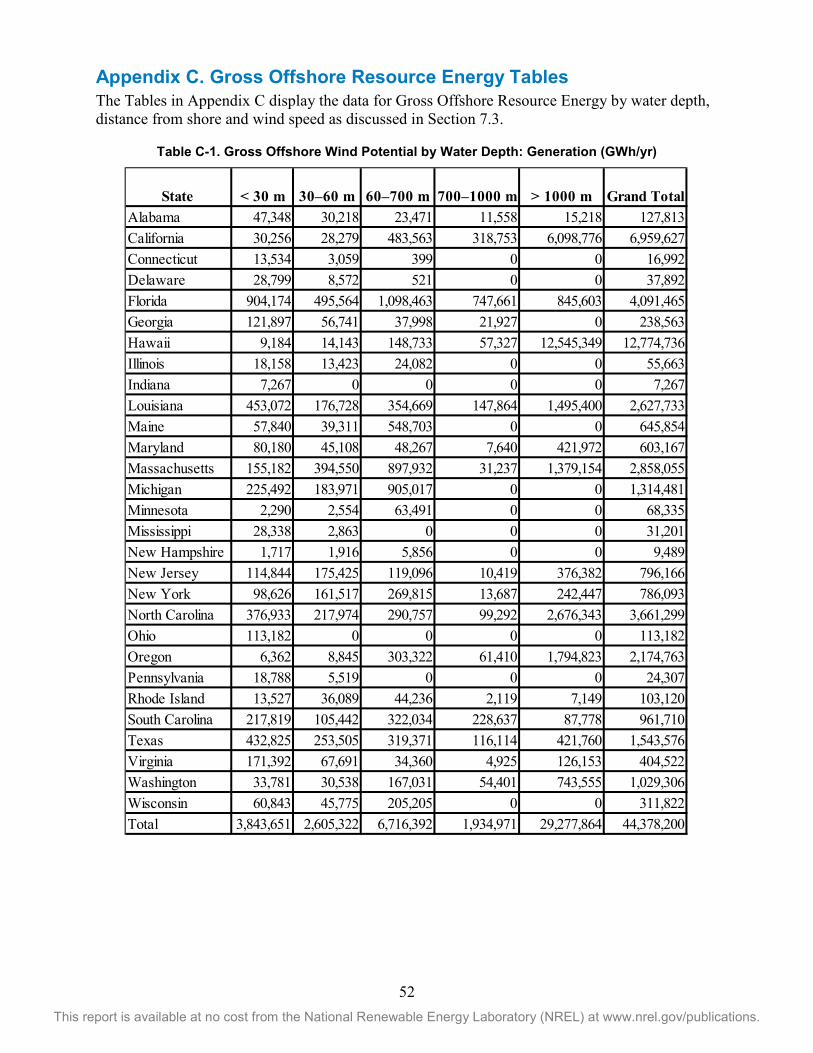
52 This report is available at no cost from the National Renewable Energy Laboratory (NREL) at www.nrel.gov/publications.
Appendix C. Gross Offshore Resource Energy Tables The Tables in Appendix C display the data for Gross Offshore Resource Energy by water depth, distance from shore and wind speed as discussed in Section 7.3.
Table C-1. Gross Offshore Wind Potential by Water Depth: Generation (GWh/yr)
State < 30 m 30–60 m 60–700 m 700–1000 m > 1000 m Grand TotalAlabama 47,348 30,218 23,471 11,558 15,218 127,813California 30,256 28,279 483,563 318,753 6,098,776 6,959,627Connecticut 13,534 3,059 399 0 0 16,992Delaware 28,799 8,572 521 0 0 37,892Florida 904,174 495,564 1,098,463 747,661 845,603 4,091,465Georgia 121,897 56,741 37,998 21,927 0 238,563Hawaii 9,184 14,143 148,733 57,327 12,545,349 12,774,736Illinois 18,158 13,423 24,082 0 0 55,663Indiana 7,267 0 0 0 0 7,267Louisiana 453,072 176,728 354,669 147,864 1,495,400 2,627,733Maine 57,840 39,311 548,703 0 0 645,854Maryland 80,180 45,108 48,267 7,640 421,972 603,167Massachusetts 155,182 394,550 897,932 31,237 1,379,154 2,858,055Michigan 225,492 183,971 905,017 0 0 1,314,481Minnesota 2,290 2,554 63,491 0 0 68,335Mississippi 28,338 2,863 0 0 0 31,201New Hampshire 1,717 1,916 5,856 0 0 9,489New Jersey 114,844 175,425 119,096 10,419 376,382 796,166New York 98,626 161,517 269,815 13,687 242,447 786,093North Carolina 376,933 217,974 290,757 99,292 2,676,343 3,661,299Ohio 113,182 0 0 0 0 113,182Oregon 6,362 8,845 303,322 61,410 1,794,823 2,174,763Pennsylvania 18,788 5,519 0 0 0 24,307Rhode Island 13,527 36,089 44,236 2,119 7,149 103,120South Carolina 217,819 105,442 322,034 228,637 87,778 961,710Texas 432,825 253,505 319,371 116,114 421,760 1,543,576Virginia 171,392 67,691 34,360 4,925 126,153 404,522Washington 33,781 30,538 167,031 54,401 743,555 1,029,306Wisconsin 60,843 45,775 205,205 0 0 311,822Total 3,843,651 2,605,322 6,716,392 1,934,971 29,277,864 44,378,200

53 This report is available at no cost from the National Renewable Energy Laboratory (NREL) at www.nrel.gov/publications.
Table C-2. Gross Offshore Wind Potential by Distance from Shore: Generation (GWh/yr)
State < 3 nm 3–12 nm 12–50 nm 50–200 nm Grand TotalAlabama 15,630 15,695 63,005 33,483 127,813California 79,681 371,992 1,365,870 5,142,084 6,959,627Connecticut 16,992 0 0 0 16,992Delaware 13,805 8,486 15,468 134 37,892Florida 272,610 320,194 1,178,204 2,320,456 4,091,465Georgia 11,831 29,397 103,142 94,194 238,563Hawaii 76,688 297,850 1,792,327 10,607,871 12,774,736Illinois 6,188 21,230 28,245 0 55,663Indiana 4,209 3,058 0 0 7,267Louisiana 122,855 128,980 514,575 1,861,322 2,627,733Maine 80,600 118,310 300,336 146,609 645,854Maryland 55,920 11,912 72,846 462,489 603,167Massachusetts 73,438 104,049 426,552 2,254,016 2,858,055Michigan 212,294 482,689 619,498 0 1,314,481Minnesota 13,170 33,078 22,087 0 68,335Mississippi 17,596 7,654 5,951 0 31,201New Hampshire 2,231 5,010 2,249 0 9,489New Jersey 29,879 48,656 197,044 520,587 796,166New York 82,240 116,521 207,963 379,369 786,093North Carolina 120,596 113,567 563,558 2,863,579 3,661,299Ohio 22,603 51,575 39,003 0 113,182Oregon 29,246 110,931 451,984 1,582,603 2,174,763Pennsylvania 5,299 15,288 3,719 0 24,307Rhode Island 11,201 21,816 42,110 27,993 103,120South Carolina 23,639 63,186 245,497 629,388 961,710Texas 184,391 122,503 458,676 778,005 1,543,576Virginia 73,051 37,712 135,207 158,553 404,522Washington 64,830 59,166 241,643 663,666 1,029,306Wisconsin 59,208 121,439 131,176 0 311,822Total 1,781,920 2,841,944 9,227,935 30,526,401 44,378,200

54 This report is available at no cost from the National Renewable Energy Laboratory (NREL) at www.nrel.gov/publications.
Table C-3. Gross Offshore Wind Potential by Wind Speed: Generation (GWh/yr) State < 7 m/s
7–7.25 m/s
7.25–7.5 m/s
7.5–7.75 m/s
7.75–8 m/s
8–8.25 m/s
8.25–8.5 m/s
8.5–8.75 m/s
8.75–9 m/s
9–9.25 m/s
9.25–9.5 m/s
9.5–9.75 m/s
9.75–10 m/s
10–10.25 m/s
10.25–10.5 m/s
10.5–10.75 m/s
10.75–11 m/s
11–11.25 m/s
11.25–11.5 m/s Grand Total
Alabama 40,525 54,396 32,892 0 0 0 0 0 0 0 0 0 0 0 0 0 0 0 0 127,813California 425,464 113,960 180,705 228,600 304,425 549,742 1,081,388 459,212 482,387 948,941 720,407 556,639 434,501 255,785 129,931 72,496 15,046 0 0 6,959,627Connecticut 1,436 1,586 2,326 5,114 4,405 2,125 0 0 0 0 0 0 0 0 0 0 0 0 0 16,992Delaware 250 1,143 1,402 2,495 4,140 8,473 13,104 6,809 76 0 0 0 0 0 0 0 0 0 0 37,892Florida 2,579,349 893,313 491,370 125,823 1,609 0 0 0 0 0 0 0 0 0 0 0 0 0 0 4,091,465Georgia 4,350 3,861 42,551 109,296 57,334 21,172 0 0 0 0 0 0 0 0 0 0 0 0 0 238,563Hawaii 151,720 48,662 81,775 227,542 186,656 1,655,063 2,282,517 1,582,545 2,770,896 1,165,192 266,503 266,807 611,289 788,822 579,451 54,791 13,884 10,479 30,142 12,774,736Illinois 0 32 268 687 987 1,872 23,294 28,332 191 0 0 0 0 0 0 0 0 0 0 55,663Indiana 3 50 308 633 898 2,129 3,231 14 0 0 0 0 0 0 0 0 0 0 0 7,267Louisiana 997,041 907,223 301,859 400,901 20,709 0 0 0 0 0 0 0 0 0 0 0 0 0 0 2,627,733Maine 3,852 4,248 5,381 6,634 6,818 9,397 13,893 16,686 23,113 34,784 86,729 218,799 141,395 74,127 0 0 0 0 0 645,854Maryland 30,924 11,763 6,927 4,447 1,531 5,344 48,977 33,172 68,281 196,945 101,139 93,718 0 0 0 0 0 0 0 603,167Massachusetts 275 774 1,244 2,380 3,929 6,346 14,122 24,076 32,447 45,371 428,107 1,460,874 838,111 0 0 0 0 0 0 2,858,055Michigan 7,604 11,602 19,924 38,628 82,862 166,799 178,594 234,381 342,867 114,429 75,303 41,487 0 0 0 0 0 0 0 1,314,481Minnesota 16,476 15,578 16,592 13,109 6,562 19 0 0 0 0 0 0 0 0 0 0 0 0 0 68,335Mississippi 13,013 13,108 5,080 0 0 0 0 0 0 0 0 0 0 0 0 0 0 0 0 31,201New Hampshire 229 83 84 251 297 384 1,145 1,902 2,849 1,888 378 0 0 0 0 0 0 0 0 9,489New Jersey 481 1,160 3,026 4,831 7,565 9,706 31,567 79,026 77,763 382,259 148,817 49,964 0 0 0 0 0 0 0 796,166New York 2,036 2,355 4,694 8,067 21,773 58,520 74,809 11,191 20,233 175,706 380,868 25,840 0 0 0 0 0 0 0 786,093North Carolina 8,892 6,929 11,930 41,926 167,624 294,234 643,965 763,832 736,906 538,783 366,785 79,494 0 0 0 0 0 0 0 3,661,299Ohio 0 48 482 2,547 10,413 31,397 51,426 16,869 0 0 0 0 0 0 0 0 0 0 0 113,182Oregon 6,016 2,673 3,413 4,100 5,239 35,177 262,889 666,176 643,081 200,753 115,646 63,235 58,065 29,201 28,219 33,886 16,995 0 0 2,174,763Pennsylvania 0 0 18 185 502 4,661 13,826 5,115 0 0 0 0 0 0 0 0 0 0 0 24,307Rhode Island 585 975 1,832 667 875 1,831 2,231 3,516 7,970 7,709 74,429 501 0 0 0 0 0 0 0 103,120South Carolina 2,164 3,016 4,282 141,865 310,462 315,330 142,652 41,940 0 0 0 0 0 0 0 0 0 0 0 961,710Texas 599 2,007 441,872 341,114 293,542 114,722 118,842 133,345 96,581 952 0 0 0 0 0 0 0 0 0 1,543,576Virginia 9,140 4,481 8,398 17,915 33,395 25,864 50,051 94,831 112,585 37,243 10,620 0 0 0 0 0 0 0 0 404,522Washington 45,648 7,496 6,748 10,652 13,655 110,963 232,994 349,876 241,372 9,902 0 0 0 0 0 0 0 0 0 1,029,306Wisconsin 5,086 7,989 21,832 17,263 22,426 17,301 33,570 82,623 103,622 110 0 0 0 0 0 0 0 0 0 311,822Total 4,353,158 2,120,511 1,699,215 1,757,670 1,570,631 3,448,568 5,319,089 4,635,469 5,763,219 3,860,966 2,775,732 2,857,357 2,083,361 1,147,935 737,601 161,172 45,925 10,479 30,142 44,378,200

55 This report is available at no cost from the National Renewable Energy Laboratory (NREL) at www.nrel.gov/publications.
Appendix D. Gross Resource Energy Tables (With Losses) The Tables in Appendix D display the data for Gross Resource Energy (with losses) by water depth, distance from shore and wind speed as discussed in Section 7.4.2.
Table D-1. Net Offshore Wind Potential by Water Depth: Generation (GWh/yr)
State < 30 m 30–60 m 60–700 m 700–1000 m > 1000 m Grand TotalAlabama 38,976 24,843 19,156 9,333 12,295 104,604California 25,334 23,642 407,147 267,535 5,110,089 5,833,748Connecticut 11,238 2,550 328 0 0 14,117Delaware 24,058 7,166 435 0 0 31,659Florida 735,527 401,391 887,337 603,550 677,096 3,304,901Georgia 100,654 46,690 31,080 17,847 0 196,271Hawaii 7,692 11,905 125,057 48,185 10,372,700 10,565,540Illinois 15,249 11,248 20,060 0 0 46,558Indiana 6,092 0 0 0 0 6,092Louisiana 374,011 145,203 289,983 120,006 1,206,238 2,135,442Maine 48,459 33,322 465,138 0 0 546,920Maryland 66,293 37,734 40,368 6,373 352,875 503,643Massachusetts 131,543 334,629 759,244 26,241 1,160,709 2,412,366Michigan 188,561 154,186 759,036 0 0 1,101,783Minnesota 1,873 2,102 52,322 0 0 56,298Mississippi 23,287 2,355 0 0 0 25,642New Hampshire 1,435 1,613 4,938 0 0 7,986New Jersey 96,303 147,290 100,024 8,706 314,719 667,042New York 82,773 136,334 226,909 11,471 202,956 660,443North Carolina 315,669 182,802 242,359 82,133 2,220,945 3,043,907Ohio 95,121 0 0 0 0 95,121Oregon 5,318 7,478 258,742 52,042 1,503,538 1,827,117Pennsylvania 15,842 4,651 0 0 0 20,492Rhode Island 11,363 30,550 37,323 1,778 5,995 87,009South Carolina 181,718 87,823 265,623 186,432 71,518 793,114Texas 360,115 210,373 263,109 94,655 342,997 1,271,248Virginia 143,220 56,757 28,748 4,105 105,147 337,976Washington 27,908 25,655 140,568 45,561 621,620 861,312Wisconsin 50,785 38,299 171,531 0 0 260,615Total 3,186,418 2,168,590 5,596,565 1,585,952 24,281,439 36,818,964

56 This report is available at no cost from the National Renewable Energy Laboratory (NREL) at www.nrel.gov/publications.
Table D-2. Net Offshore Wind Potential by Distance from Shore: Generation (GWh/yr)
State < 3 nm 3–12 nm 12–50 nm 50–200 nm Grand TotalAlabama 12,842 12,958 51,729 27,075 104,604California 66,283 313,097 1,152,211 4,302,157 5,833,748Connecticut 14,117 0 0 0 14,117Delaware 11,505 7,103 12,939 112 31,659Florida 221,998 260,883 956,520 1,865,501 3,304,901Georgia 9,746 24,260 85,266 76,999 196,271Hawaii 64,572 250,158 1,509,574 8,741,236 10,565,540Illinois 5,196 17,824 23,538 0 46,558Indiana 3,527 2,565 0 0 6,092Louisiana 101,147 106,769 424,595 1,502,931 2,135,442Maine 67,797 100,374 254,667 124,082 546,920Maryland 45,928 9,990 60,953 386,772 503,643Massachusetts 61,995 88,300 361,179 1,900,892 2,412,366Michigan 177,596 404,781 519,406 0 1,101,783Minnesota 10,845 27,210 18,243 0 56,298Mississippi 14,433 6,313 4,896 0 25,642New Hampshire 1,866 4,219 1,901 0 7,986New Jersey 24,933 40,861 165,449 435,799 667,042New York 68,841 98,222 175,262 318,118 660,443North Carolina 100,670 95,354 472,257 2,375,625 3,043,907Ohio 18,947 43,366 32,807 0 95,121Oregon 24,684 95,183 384,171 1,323,079 1,827,117Pennsylvania 4,455 12,904 3,133 0 20,492Rhode Island 9,383 18,475 35,580 23,572 87,009South Carolina 19,626 52,766 204,824 515,897 793,114Texas 153,886 102,326 380,879 634,157 1,271,248Virginia 60,692 31,631 113,408 132,244 337,976Washington 53,791 49,933 202,845 554,743 861,312Wisconsin 49,424 101,422 109,769 0 260,615Total 1,480,724 2,379,246 7,718,003 25,240,991 36,818,964

57 This report is available at no cost from the National Renewable Energy Laboratory (NREL) at www.nrel.gov/publications.
Table D-3. Net Offshore Wind Potential by Wind Speed: Generation (GWh/yr)
State < 7 m/s7–7.25
m/s7.25–7.5
m/s7.5–7.75
m/s7.75–8
m/s8–8.25
m/s8.25–8.5
m/s8.5–8.75
m/s8.75–9
m/s9–9.25
m/s9.25–9.5
m/s9.5–9.75
m/s9.75–10
m/s10–10.25
m/s10.25–10.5
m/s10.5–10.75
m/s10.75–11
m/s11–11.25
m/s11.25–11.5
m/s Grand TotalAlabama 32,857 44,681 27,066 0 0 0 0 0 0 0 0 0 0 0 0 0 0 0 0 104,604California 346,785 93,852 149,054 189,113 252,597 457,346 902,057 384,175 405,123 797,597 606,109 472,559 370,620 219,104 111,865 62,721 13,070 0 0 5,833,748Connecticut 1,176 1,308 1,927 4,249 3,674 1,782 0 0 0 0 0 0 0 0 0 0 0 0 0 14,117Delaware 205 942 1,161 2,076 3,459 7,088 10,969 5,694 64 0 0 0 0 0 0 0 0 0 0 31,659Florida 2,080,106 722,676 398,551 102,241 1,327 0 0 0 0 0 0 0 0 0 0 0 0 0 0 3,304,901Georgia 3,561 3,179 34,925 89,692 47,362 17,552 0 0 0 0 0 0 0 0 0 0 0 0 0 196,271Hawaii 123,172 40,007 67,105 185,848 153,689 1,355,396 1,872,831 1,303,546 2,290,707 968,948 223,901 223,436 511,652 662,074 488,460 47,285 12,045 9,107 26,330 10,565,540Illinois 0 27 223 573 826 1,568 19,451 23,730 161 0 0 0 0 0 0 0 0 0 0 46,558Indiana 3 41 256 528 752 1,786 2,715 12 0 0 0 0 0 0 0 0 0 0 0 6,092Louisiana 803,606 735,417 248,196 331,090 17,133 0 0 0 0 0 0 0 0 0 0 0 0 0 0 2,135,442Maine 3,157 3,503 4,456 5,518 5,686 7,880 11,676 14,071 19,541 29,481 73,482 185,387 120,042 63,039 0 0 0 0 0 546,920Maryland 25,238 9,703 5,733 3,699 1,279 4,480 40,998 27,747 56,992 164,344 84,609 78,820 0 0 0 0 0 0 0 503,643Massachusetts 226 638 1,031 1,979 3,282 5,316 11,873 20,316 27,454 38,498 360,987 1,232,230 708,535 0 0 0 0 0 0 2,412,366Michigan 6,269 9,610 16,554 32,118 69,030 139,212 149,554 196,794 288,023 96,158 63,449 35,013 0 0 0 0 0 0 0 1,101,783Minnesota 13,503 12,817 13,697 10,833 5,433 16 0 0 0 0 0 0 0 0 0 0 0 0 0 56,298Mississippi 10,662 10,792 4,188 0 0 0 0 0 0 0 0 0 0 0 0 0 0 0 0 25,642New Hampshire 187 68 70 208 248 322 964 1,602 2,401 1,595 321 0 0 0 0 0 0 0 0 7,986New Jersey 392 957 2,507 4,019 6,318 8,123 26,483 66,181 65,329 320,218 124,494 42,020 0 0 0 0 0 0 0 667,042New York 1,667 1,944 3,892 6,718 18,184 49,166 62,753 9,423 17,110 147,984 319,839 21,763 0 0 0 0 0 0 0 660,443North Carolina 7,274 5,715 9,863 34,406 137,458 242,296 533,468 635,335 614,143 450,070 307,067 66,812 0 0 0 0 0 0 0 3,043,907Ohio 0 40 400 2,124 8,708 26,342 43,296 14,211 0 0 0 0 0 0 0 0 0 0 0 95,121Oregon 4,984 2,238 2,867 3,454 4,428 29,472 219,936 556,823 537,336 169,429 98,429 54,046 49,844 25,162 24,398 29,494 14,775 0 0 1,827,117Pennsylvania 0 0 15 154 420 3,926 11,670 4,307 0 0 0 0 0 0 0 0 0 0 0 20,492Rhode Island 479 804 1,518 555 731 1,534 1,876 2,971 6,753 6,536 62,827 426 0 0 0 0 0 0 0 87,009South Carolina 1,772 2,487 3,547 115,747 254,759 260,703 118,952 35,147 0 0 0 0 0 0 0 0 0 0 0 793,114Texas 493 1,654 359,410 279,294 242,403 95,260 99,065 111,579 81,284 807 0 0 0 0 0 0 0 0 0 1,271,248Virginia 7,465 3,695 6,956 14,886 27,904 21,686 42,013 79,518 93,909 31,059 8,883 0 0 0 0 0 0 0 0 337,976Washington 37,630 6,277 5,669 8,983 11,561 92,729 194,984 292,693 202,458 8,326 0 0 0 0 0 0 0 0 0 861,312Wisconsin 4,187 6,612 18,081 14,339 18,644 14,487 28,125 69,160 86,886 92 0 0 0 0 0 0 0 0 0 260,615Total 3,517,056 1,721,684 1,388,918 1,444,448 1,297,295 2,845,470 4,405,707 3,855,036 4,795,676 3,231,141 2,334,399 2,412,511 1,760,694 969,379 624,723 139,500 39,889 9,107 26,330 36,818,964

58 This report is available at no cost from the National Renewable Energy Laboratory (NREL) at www.nrel.gov/publications.
Appendix E. Technical Offshore Resource Area Tables The Tables in Appendix E display the data for Technical Offshore Resource Area by water depth, distance from shore and wind speed as discussed in Section 8.2.
Table E-1. Technical Offshore Wind Potential by Water Depth: Area (km2)
State < 30 m 30–60 m 60–700 m 700–1000 m Grand TotalAlabama 4,029 2,854 1,653 0 8,536California 1,556 1,380 30,987 18,946 52,869Connecticut 1,088 262 24 0 1,374Delaware 2,325 655 38 0 3,018Florida 13,522 10,755 26,621 55,974 106,871Georgia 10,342 4,948 3,383 1,914 20,588Hawaii 395 916 9,978 3,935 15,225Illinois 1,396 994 0 0 2,390Indiana 591 0 0 0 591Louisiana 37,626 16,440 28,381 10,290 92,737Maine 4,390 2,769 34,939 0 42,098Maryland 4,347 3,417 3,446 536 11,745Massachusetts 10,799 25,182 57,507 2,014 95,503Michigan 18,244 14,222 0 0 32,466Minnesota 5 80 0 0 85Mississippi 1,552 246 0 0 1,797New Hampshire 121 143 416 0 680New Jersey 8,786 12,402 8,150 711 30,048New York 7,790 11,304 12,755 909 32,758North Carolina 29,405 16,239 21,709 7,443 74,796Ohio 9,145 0 0 0 9,145Oregon 288 705 23,190 4,468 28,651Pennsylvania 1,480 432 0 0 1,912Rhode Island 1,015 2,480 2,916 139 6,550South Carolina 17,627 8,320 26,175 19,338 71,461Texas 35,463 20,430 26,878 10,308 93,079Virginia 13,415 5,054 2,473 349 21,291Washington 644 2,032 12,612 4,139 19,427Wisconsin 4,757 3,575 0 0 8,332Total 242,144 168,237 334,231 141,414 886,026

59 This report is available at no cost from the National Renewable Energy Laboratory (NREL) at www.nrel.gov/publications.
Table E-2. Technical Offshore Wind Potential by Distance from Shore: Area (km2)
State < 3 nm 3–12 nm 12–50 nm 50–200 nm Grand TotalAlabama 877 1,534 6,073 53 8,536California 2,611 21,223 28,796 240 52,869Connecticut 1,374 0 0 0 1,374Delaware 1,158 671 1,179 10 3,018Florida 1,184 2,877 40,482 62,328 106,871Georgia 717 2,691 8,793 8,387 20,588Hawaii 3,679 8,365 2,941 240 15,225Illinois 497 1,439 454 0 2,390Indiana 347 245 0 0 591Louisiana 7,441 12,009 42,255 31,032 92,737Maine 5,997 7,942 18,843 9,316 42,098Maryland 2,405 935 5,543 2,863 11,745Massachusetts 5,502 7,087 27,568 55,346 95,503Michigan 14,766 15,005 2,695 0 32,466Minnesota 23 62 0 0 85Mississippi 477 749 571 0 1,797New Hampshire 162 365 153 0 680New Jersey 2,492 3,664 14,020 9,872 30,048New York 6,489 4,927 12,142 9,200 32,758North Carolina 9,557 8,985 34,430 21,824 74,796Ohio 1,936 4,150 3,060 0 9,145Oregon 2,012 8,581 18,027 31 28,651Pennsylvania 418 1,206 288 0 1,912Rhode Island 866 1,527 2,788 1,370 6,550South Carolina 1,926 5,269 19,347 44,919 71,461Texas 15,168 9,545 36,223 32,143 93,079Virginia 5,732 3,046 10,207 2,307 21,291Washington 1,971 4,906 12,550 0 19,427Wisconsin 4,361 3,834 138 0 8,332Total 102,141 142,841 349,565 291,479 886,026

60 This report is available at no cost from the National Renewable Energy Laboratory (NREL) at www.nrel.gov/publications.
Table E-3. Technical Offshore Wind Potential by Wind Speed: Area (km2)
State7–7.25
m/s7.25–7.5
m/s7.5–7.75
m/s7.75–8
m/s8–8.25
m/s8.25–8.5
m/s8.5–8.75
m/s8.75–9
m/s9–9.25
m/s9.25–9.5
m/s9.5–9.75
m/s9.75–10
m/s10–10.25
m/s10.25–10.5
m/s10.5–10.75
m/s10.75–11
m/s11–11.25
m/s11.25–11.5
m/s Grand TotalAlabama 5,426 3,111 0 0 0 0 0 0 0 0 0 0 0 0 0 0 0 0 8,536California 3,503 3,727 4,361 4,604 5,622 6,536 4,931 3,900 4,421 3,744 2,077 1,044 1,438 952 1,173 835 0 0 52,869Connecticut 156 217 458 373 170 0 0 0 0 0 0 0 0 0 0 0 0 0 1,374Delaware 112 131 221 344 680 1,014 511 5 0 0 0 0 0 0 0 0 0 0 3,018Florida 55,647 39,949 11,138 137 0 0 0 0 0 0 0 0 0 0 0 0 0 0 106,871Georgia 391 3,955 9,675 4,827 1,740 0 0 0 0 0 0 0 0 0 0 0 0 0 20,588Hawaii 1,060 1,219 1,472 1,953 2,088 1,947 1,446 882 569 785 453 307 283 215 288 156 88 13 15,225Illinois 3 25 61 83 149 859 1,197 13 0 0 0 0 0 0 0 0 0 0 2,390Indiana 5 29 56 75 171 255 1 0 0 0 0 0 0 0 0 0 0 0 591Louisiana 34,321 24,028 32,619 1,770 0 0 0 0 0 0 0 0 0 0 0 0 0 0 92,737Maine 417 502 589 585 758 1,080 1,237 1,647 2,385 5,731 13,918 8,749 4,499 0 0 0 0 0 42,098Maryland 1,184 665 400 129 424 3,766 2,491 2,262 424 0 0 0 0 0 0 0 0 0 11,745Massachusetts 76 116 211 331 517 1,082 1,777 2,316 3,112 20,543 49,558 15,863 0 0 0 0 0 0 95,503Michigan 1,077 1,711 2,537 4,723 8,310 7,318 4,830 1,786 40 120 14 0 0 0 0 0 0 0 32,466Minnesota 83 2 0 0 0 0 0 0 0 0 0 0 0 0 0 0 0 0 85Mississippi 1,316 482 0 0 0 0 0 0 0 0 0 0 0 0 0 0 0 0 1,797New Hampshire 8 8 22 25 31 88 142 202 129 25 0 0 0 0 0 0 0 0 680New Jersey 114 282 427 638 793 2,437 5,850 5,515 13,946 48 0 0 0 0 0 0 0 0 30,048New York 231 437 713 1,835 3,023 1,525 674 1,445 11,603 10,850 422 0 0 0 0 0 0 0 32,758North Carolina 681 1,147 1,665 2,818 5,672 25,282 27,667 9,866 0 0 0 0 0 0 0 0 0 0 74,796Ohio 5 45 225 877 2,610 4,067 1,318 0 0 0 0 0 0 0 0 0 0 0 9,145Oregon 265 323 379 457 1,048 2,872 4,684 4,870 4,817 3,320 1,389 1,212 553 631 1,205 626 0 0 28,651Pennsylvania 0 2 16 42 376 1,092 384 0 0 0 0 0 0 0 0 0 0 0 1,912Rhode Island 96 171 59 74 147 170 259 563 533 4,447 32 0 0 0 0 0 0 0 6,550South Carolina 296 399 8,496 23,267 24,808 11,036 3,160 0 0 0 0 0 0 0 0 0 0 0 71,461Texas 197 22,174 13,746 21,762 9,329 9,126 9,845 6,834 66 0 0 0 0 0 0 0 0 0 93,079Virginia 440 782 1,635 2,900 2,117 3,880 7,093 2,444 0 0 0 0 0 0 0 0 0 0 21,291Washington 744 642 978 1,223 1,667 4,247 7,500 2,151 276 0 0 0 0 0 0 0 0 0 19,427Wisconsin 620 1,023 1,015 1,041 1,252 1,679 1,352 350 0 0 0 0 0 0 0 0 0 0 8,332Total 108,473 107,299 93,172 76,893 73,501 91,358 88,350 47,051 42,320 49,615 67,864 27,175 6,773 1,799 2,666 1,617 88 13 886,026

61 This report is available at no cost from the National Renewable Energy Laboratory (NREL) at www.nrel.gov/publications.
Appendix F. Technical Offshore Resource Capacity Tables The Tables in Appendix F display the data for Technical Offshore Resource Capacity by water depth, distance from shore and wind speed as discussed in Section 8.3.
Table F-1. Technical Offshore Wind Potential by Water Depth: Area (km2)
State < 30 m 30–60 m 60–700 m 700–1000 m Grand TotalAlabama 12,088 8,562 4,960 0 25,609California 4,667 4,140 92,962 56,838 158,607Connecticut 3,265 785 71 0 4,121Delaware 6,975 1,964 115 0 9,054Florida 40,565 32,266 79,862 167,921 320,613Georgia 31,027 14,845 10,150 5,741 61,763Hawaii 1,186 2,748 29,935 11,805 45,674Illinois 4,188 2,983 0 0 7,171Indiana 1,773 0 0 0 1,773Louisiana 112,877 49,321 85,143 30,871 278,212Maine 13,171 8,306 104,816 0 126,294Maryland 13,040 10,251 10,337 1,609 35,236Massachusetts 32,397 75,547 172,522 6,042 286,508Michigan 54,732 42,666 0 0 97,398Minnesota 15 240 0 0 255Mississippi 4,655 737 0 0 5,392New Hampshire 362 430 1,249 0 2,041New Jersey 26,359 37,206 24,449 2,132 90,145New York 23,369 33,911 38,265 2,728 98,273North Carolina 88,214 48,718 65,126 22,330 224,389Ohio 27,436 0 0 0 27,436Oregon 865 2,115 69,569 13,404 85,954Pennsylvania 4,441 1,295 0 0 5,737Rhode Island 3,044 7,440 8,749 418 19,650South Carolina 52,882 24,960 78,526 58,014 214,382Texas 106,390 61,290 80,634 30,923 279,237Virginia 40,246 15,161 7,418 1,048 63,872Washington 1,933 6,096 37,835 12,417 58,281Wisconsin 14,271 10,726 0 0 24,997Total 726,433 504,711 1,002,692 424,242 2,658,078

62 This report is available at no cost from the National Renewable Energy Laboratory (NREL) at www.nrel.gov/publications.
Table F-2. Technical Offshore Wind Potential by Distance from Shore: Area (km2)
State < 3 nm 3–12 nm 12–50 nm 50–200 nm Grand TotalAlabama 2,630 4,601 18,218 160 25,609California 7,833 63,668 86,387 720 158,607Connecticut 4,121 0 0 0 4,121Delaware 3,474 2,014 3,537 29 9,054Florida 3,553 8,632 121,445 186,984 320,613Georgia 2,152 8,072 26,379 25,160 61,763Hawaii 11,036 25,095 8,823 720 45,674Illinois 1,491 4,318 1,362 0 7,171Indiana 1,040 734 0 0 1,773Louisiana 22,322 36,027 126,765 93,097 278,212Maine 17,990 23,825 56,530 27,948 126,294Maryland 7,214 2,804 16,628 8,590 35,236Massachusetts 16,506 21,262 82,704 166,037 286,508Michigan 44,297 45,016 8,085 0 97,398Minnesota 68 187 0 0 255Mississippi 1,432 2,248 1,713 0 5,392New Hampshire 486 1,095 460 0 2,041New Jersey 7,477 10,992 42,061 29,615 90,145New York 19,468 14,781 36,425 27,599 98,273North Carolina 28,670 26,956 103,291 65,472 224,389Ohio 5,807 12,449 9,180 0 27,436Oregon 6,036 25,742 54,082 94 85,954Pennsylvania 1,253 3,619 864 0 5,737Rhode Island 2,597 4,581 8,364 4,109 19,650South Carolina 5,777 15,807 58,042 134,756 214,382Texas 45,504 28,636 108,669 96,429 279,237Virginia 17,195 9,137 30,620 6,920 63,872Washington 5,913 14,719 37,649 0 58,281Wisconsin 13,082 11,502 413 0 24,997Total 306,422 428,523 1,048,695 874,438 2,658,078

63 This report is available at no cost from the National Renewable Energy Laboratory (NREL) at www.nrel.gov/publications.
Table F-3. Technical Offshore Wind Potential by Wind Speed: Area (km2)
State7–7.25
m/s7.25–7.5
m/s7.5–7.75
m/s7.75–8
m/s8–8.25
m/s8.25–8.5
m/s8.5–8.75
m/s8.75–9
m/s9–9.25
m/s9.25–9.5
m/s9.5–9.75
m/s9.75–10
m/s10–10.25
m/s10.25–10.5
m/s10.5–10.75
m/s10.75–11
m/s11–11.25
m/s11.25–11.5
m/s Grand TotalAlabama 16,277 9,332 0 0 0 0 0 0 0 0 0 0 0 0 0 0 0 0 25,609California 10,508 11,182 13,083 13,811 16,867 19,608 14,794 11,699 13,264 11,233 6,232 3,132 4,314 2,856 3,518 2,506 0 0 158,607Connecticut 467 650 1,374 1,120 511 0 0 0 0 0 0 0 0 0 0 0 0 0 4,121Delaware 337 392 662 1,033 2,039 3,041 1,534 16 0 0 0 0 0 0 0 0 0 0 9,054Florida 166,942 119,847 33,414 411 0 0 0 0 0 0 0 0 0 0 0 0 0 0 320,613Georgia 1,173 11,865 29,026 14,480 5,219 0 0 0 0 0 0 0 0 0 0 0 0 0 61,763Hawaii 3,179 3,658 4,415 5,859 6,265 5,842 4,339 2,646 1,706 2,356 1,360 921 850 646 864 467 264 38 45,674Illinois 9 75 182 249 448 2,576 3,592 40 0 0 0 0 0 0 0 0 0 0 7,171Indiana 15 86 168 226 512 764 3 0 0 0 0 0 0 0 0 0 0 0 1,773Louisiana 102,963 72,083 97,856 5,310 0 0 0 0 0 0 0 0 0 0 0 0 0 0 278,212Maine 1,252 1,505 1,767 1,756 2,273 3,241 3,711 4,940 7,154 17,194 41,755 26,248 13,498 0 0 0 0 0 126,294Maryland 3,551 1,996 1,201 387 1,271 11,299 7,474 6,785 1,272 0 0 0 0 0 0 0 0 0 35,236Massachusetts 228 347 632 994 1,552 3,245 5,331 6,949 9,337 61,628 148,674 47,590 0 0 0 0 0 0 286,508Michigan 3,231 5,132 7,610 14,169 24,929 21,953 14,490 5,359 119 361 43 0 0 0 0 0 0 0 97,398Minnesota 250 5 0 0 0 0 0 0 0 0 0 0 0 0 0 0 0 0 255Mississippi 3,947 1,445 0 0 0 0 0 0 0 0 0 0 0 0 0 0 0 0 5,392New Hampshire 24 23 66 75 93 265 425 607 388 75 0 0 0 0 0 0 0 0 2,041New Jersey 342 845 1,282 1,913 2,379 7,312 17,550 16,544 41,837 143 0 0 0 0 0 0 0 0 90,145New York 694 1,310 2,138 5,506 9,068 4,576 2,023 4,334 34,809 32,551 1,265 0 0 0 0 0 0 0 98,273North Carolina 2,042 3,440 4,995 8,453 17,017 75,845 83,000 29,598 0 0 0 0 0 0 0 0 0 0 224,389Ohio 14 134 674 2,631 7,829 12,200 3,955 0 0 0 0 0 0 0 0 0 0 0 27,436Oregon 795 970 1,138 1,371 3,144 8,615 14,051 14,611 14,450 9,961 4,167 3,635 1,659 1,893 3,616 1,877 0 0 85,954Pennsylvania 0 5 49 126 1,129 3,276 1,151 0 0 0 0 0 0 0 0 0 0 0 5,737Rhode Island 287 512 177 221 442 510 778 1,688 1,598 13,342 95 0 0 0 0 0 0 0 19,650South Carolina 889 1,196 25,487 69,802 74,424 33,107 9,479 0 0 0 0 0 0 0 0 0 0 0 214,382Texas 591 66,521 41,239 65,286 27,988 27,379 29,536 20,501 197 0 0 0 0 0 0 0 0 0 279,237Virginia 1,320 2,345 4,904 8,701 6,350 11,641 21,280 7,332 0 0 0 0 0 0 0 0 0 0 63,872Washington 2,232 1,925 2,934 3,668 5,000 12,740 22,499 6,454 829 0 0 0 0 0 0 0 0 0 58,281Wisconsin 1,861 3,070 3,046 3,122 3,755 5,038 4,055 1,049 0 0 0 0 0 0 0 0 0 0 24,997Total 325,420 321,896 279,517 230,679 220,502 274,074 265,049 141,154 126,960 148,845 203,591 81,526 20,320 5,396 7,999 4,850 264 38 2,658,078
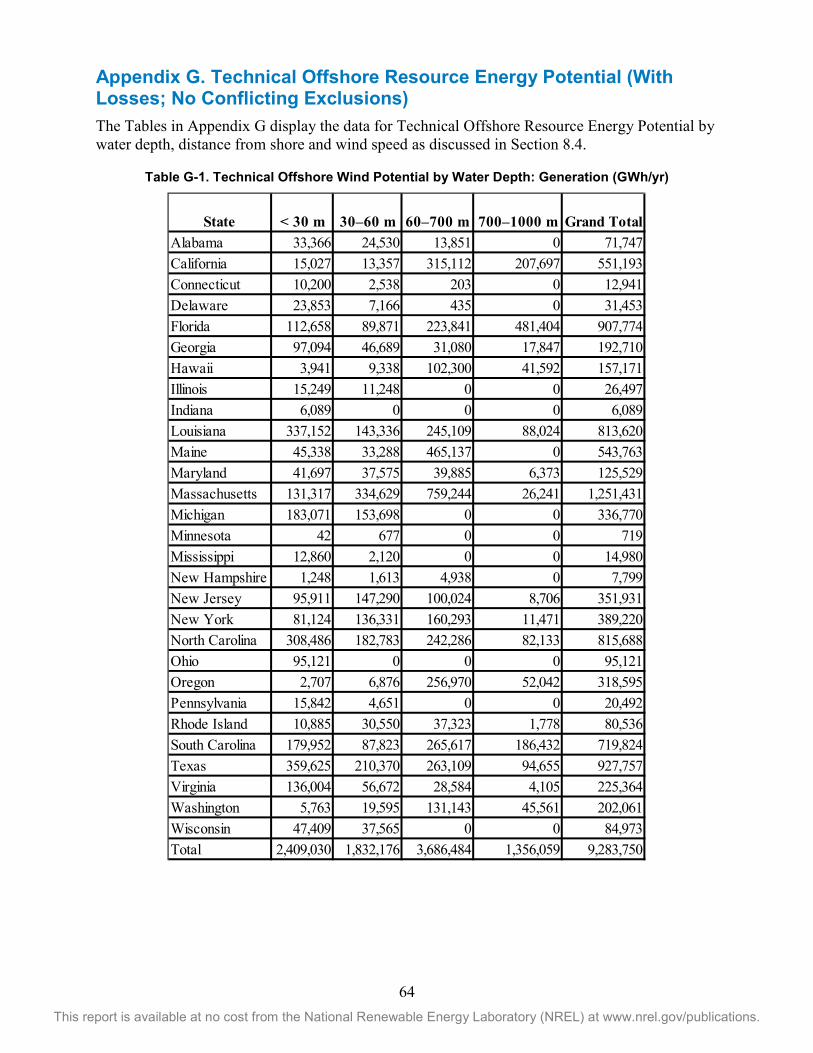
64 This report is available at no cost from the National Renewable Energy Laboratory (NREL) at www.nrel.gov/publications.
Appendix G. Technical Offshore Resource Energy Potential (With Losses; No Conflicting Exclusions) The Tables in Appendix G display the data for Technical Offshore Resource Energy Potential by water depth, distance from shore and wind speed as discussed in Section 8.4.
Table G-1. Technical Offshore Wind Potential by Water Depth: Generation (GWh/yr)
State < 30 m 30–60 m 60–700 m 700–1000 m Grand TotalAlabama 33,366 24,530 13,851 0 71,747California 15,027 13,357 315,112 207,697 551,193Connecticut 10,200 2,538 203 0 12,941Delaware 23,853 7,166 435 0 31,453Florida 112,658 89,871 223,841 481,404 907,774Georgia 97,094 46,689 31,080 17,847 192,710Hawaii 3,941 9,338 102,300 41,592 157,171Illinois 15,249 11,248 0 0 26,497Indiana 6,089 0 0 0 6,089Louisiana 337,152 143,336 245,109 88,024 813,620Maine 45,338 33,288 465,137 0 543,763Maryland 41,697 37,575 39,885 6,373 125,529Massachusetts 131,317 334,629 759,244 26,241 1,251,431Michigan 183,071 153,698 0 0 336,770Minnesota 42 677 0 0 719Mississippi 12,860 2,120 0 0 14,980New Hampshire 1,248 1,613 4,938 0 7,799New Jersey 95,911 147,290 100,024 8,706 351,931New York 81,124 136,331 160,293 11,471 389,220North Carolina 308,486 182,783 242,286 82,133 815,688Ohio 95,121 0 0 0 95,121Oregon 2,707 6,876 256,970 52,042 318,595Pennsylvania 15,842 4,651 0 0 20,492Rhode Island 10,885 30,550 37,323 1,778 80,536South Carolina 179,952 87,823 265,617 186,432 719,824Texas 359,625 210,370 263,109 94,655 927,757Virginia 136,004 56,672 28,584 4,105 225,364Washington 5,763 19,595 131,143 45,561 202,061Wisconsin 47,409 37,565 0 0 84,973Total 2,409,030 1,832,176 3,686,484 1,356,059 9,283,750

65 This report is available at no cost from the National Renewable Energy Laboratory (NREL) at www.nrel.gov/publications.
Table G-2. Techical Offshore Wind Potential by Distance from Shore: Generation (GWh/yr)
State < 3 nm 3–12 nm 12–50 nm 50–200 nm Grand TotalAlabama 6,601 12,958 51,729 459 71,747California 25,840 216,662 306,525 2,166 551,193Connecticut 12,941 0 0 0 12,941Delaware 11,300 7,103 12,939 112 31,453Florida 9,798 24,007 336,699 537,271 907,774Georgia 6,186 24,260 85,266 76,998 192,710Hawaii 37,713 84,867 32,052 2,539 157,171Illinois 5,196 16,284 5,018 0 26,497Indiana 3,525 2,565 0 0 6,089Louisiana 62,076 106,769 385,364 259,412 813,620Maine 64,673 100,341 254,667 124,082 543,763Maryland 20,692 9,990 60,953 33,895 125,529Massachusetts 61,769 88,300 361,179 740,183 1,251,431Michigan 146,207 159,601 30,962 0 336,770Minnesota 193 526 0 0 719Mississippi 3,771 6,313 4,896 0 14,980New Hampshire 1,679 4,219 1,901 0 7,799New Jersey 24,541 40,861 165,449 121,080 351,931New York 65,311 56,437 152,309 115,162 389,220North Carolina 93,397 95,354 387,038 239,898 815,688Ohio 18,947 43,366 32,807 0 95,121Oregon 19,722 95,162 203,389 322 318,595Pennsylvania 4,455 12,904 3,133 0 20,492Rhode Island 8,904 18,475 35,580 17,577 80,536South Carolina 17,854 52,766 204,824 444,378 719,824Texas 153,392 102,326 380,879 291,160 927,757Virginia 53,228 31,631 113,408 27,097 225,364Washington 17,567 48,528 135,966 0 202,061Wisconsin 43,310 40,156 1,507 0 84,973Total 1,000,787 1,502,731 3,746,441 3,033,790 9,283,750

66 This report is available at no cost from the National Renewable Energy Laboratory (NREL) at www.nrel.gov/publications.
Table G-3. Technical Offshore Wind Potential by Wind Speed: Generation (GWh/yr)
State7–7.25
m/s7.25–7.5
m/s7.5–7.75
m/s7.75–8
m/s8–8.25
m/s8.25–8.5
m/s8.5–8.75
m/s8.75–9
m/s9–9.25
m/s9.25–9.5
m/s9.5–9.75
m/s9.75–10
m/s10–10.25
m/s10.25–10.5
m/s10.5–10.75
m/s10.75–11
m/s11–11.25
m/s11.25–11.5
m/s Grand TotalAlabama 44,681 27,066 0 0 0 0 0 0 0 0 0 0 0 0 0 0 0 0 71,747California 28,897 32,360 39,569 43,773 55,750 67,368 52,887 43,184 50,570 43,747 24,430 12,633 18,092 12,101 14,983 10,849 0 0 551,193Connecticut 1,308 1,927 4,249 3,674 1,782 0 0 0 0 0 0 0 0 0 0 0 0 0 12,941Delaware 942 1,161 2,076 3,459 7,088 10,969 5,694 64 0 0 0 0 0 0 0 0 0 0 31,453Florida 457,320 346,887 102,241 1,327 0 0 0 0 0 0 0 0 0 0 0 0 0 0 907,774Georgia 3,179 34,925 89,692 47,362 17,552 0 0 0 0 0 0 0 0 0 0 0 0 0 192,710Hawaii 8,902 10,759 13,581 18,807 20,919 20,196 15,544 9,735 6,496 9,223 5,480 3,815 3,601 2,802 3,822 2,105 1,211 174 157,171Illinois 27 223 573 826 1,568 9,413 13,707 161 0 0 0 0 0 0 0 0 0 0 26,497Indiana 41 256 528 752 1,786 2,715 12 0 0 0 0 0 0 0 0 0 0 0 6,089Louisiana 283,635 212,329 300,523 17,133 0 0 0 0 0 0 0 0 0 0 0 0 0 0 813,620Maine 3,503 4,456 5,518 5,686 7,880 11,676 14,071 19,541 29,481 73,482 185,387 120,042 63,039 0 0 0 0 0 543,763Maryland 9,703 5,733 3,699 1,279 4,480 40,998 27,747 26,675 5,215 0 0 0 0 0 0 0 0 0 125,529Massachusetts 638 1,031 1,979 3,282 5,316 11,873 20,316 27,454 38,498 263,639 658,676 218,728 0 0 0 0 0 0 1,251,431Michigan 9,108 15,164 23,620 46,194 85,868 78,806 54,741 21,021 498 1,559 191 0 0 0 0 0 0 0 336,770Minnesota 703 15 1 0 0 0 0 0 0 0 0 0 0 0 0 0 0 0 719Mississippi 10,792 4,188 0 0 0 0 0 0 0 0 0 0 0 0 0 0 0 0 14,980New Hampshire 68 70 208 248 322 964 1,602 2,401 1,595 321 0 0 0 0 0 0 0 0 7,799New Jersey 957 2,507 4,019 6,318 8,123 26,483 66,181 65,329 171,402 612 0 0 0 0 0 0 0 0 351,931New York 1,944 3,892 6,718 18,140 30,937 16,437 7,412 17,110 143,227 137,932 5,472 0 0 0 0 0 0 0 389,220North Carolina 5,715 9,863 15,156 27,418 57,943 273,281 311,750 114,559 0 2 0 0 0 0 0 0 0 0 815,688Ohio 40 400 2,124 8,708 26,342 43,296 14,211 0 0 0 0 0 0 0 0 0 0 0 95,121Oregon 2,238 2,867 3,454 4,428 10,339 29,461 49,908 53,652 54,413 37,986 16,136 14,649 6,913 8,069 15,794 8,285 0 0 318,595Pennsylvania 0 15 154 420 3,926 11,670 4,307 0 0 0 0 0 0 0 0 0 0 0 20,492Rhode Island 804 1,518 555 731 1,534 1,876 2,971 6,753 6,536 56,832 426 0 0 0 0 0 0 0 80,536South Carolina 2,487 3,547 78,416 226,768 254,507 118,952 35,147 0 0 0 0 0 0 0 0 0 0 0 719,824Texas 1,654 194,714 128,939 214,456 95,260 99,065 111,579 81,284 807 0 0 0 0 0 0 0 0 0 927,757Virginia 3,695 6,956 14,886 27,904 21,686 42,013 79,518 28,705 0 0 0 0 0 0 0 0 0 0 225,364Washington 6,277 5,669 8,983 11,561 16,462 44,222 81,485 24,193 3,208 0 0 0 0 0 0 0 0 0 202,061Wisconsin 5,256 9,037 9,492 10,121 13,029 18,502 15,424 4,113 0 0 0 0 0 0 0 0 0 0 84,973Total 894,513 939,536 860,955 750,778 750,401 980,234 986,214 545,935 511,945 625,335 896,197 369,867 91,644 22,972 34,599 21,239 1,211 174 9,283,750

67 This report is available at no cost from the National Renewable Energy Laboratory (NREL) at www.nrel.gov/publications.
Appendix H. Net Technical Resource Capacity The Tables in Appendix H display the data for Net Technical Resource Capacity by water depth, distance from shore and wind speed as discussed in Section 8.5.2.
Table H-1. Technical Offshore Wind Potential by Water Depth: Capacity (MW)
State < 30 m 30–60 m 60–700 m 700–1000 m Grand TotalAlabama 8,166 6,656 3,939 0 18,760California 2,769 2,498 63,881 43,307 112,455Connecticut 1,698 408 37 0 2,143Delaware 4,272 1,510 94 0 5,876Florida 30,284 25,628 66,052 153,203 275,166Georgia 22,630 12,909 9,290 5,282 50,110Hawaii 617 1,801 18,711 7,802 28,930Illinois 2,458 2,070 0 0 4,528Indiana 995 0 0 0 995Louisiana 79,667 40,249 72,713 27,109 219,739Maine 6,935 4,972 82,591 0 94,498Maryland 7,905 8,087 9,057 1,480 26,529Massachusetts 20,521 62,874 150,900 5,559 239,855Michigan 30,505 26,827 0 0 57,331Minnesota 8 144 0 0 151Mississippi 2,974 517 0 0 3,491New Hampshire 201 259 836 0 1,295New Jersey 17,039 29,800 22,377 1,961 71,177New York 13,029 24,543 33,373 2,510 73,454North Carolina 57,837 38,366 57,037 20,215 173,455Ohio 17,990 0 0 0 17,990Oregon 478 1,187 49,706 10,538 61,910Pennsylvania 2,744 834 0 0 3,578Rhode Island 1,695 5,108 7,391 384 14,578South Carolina 37,578 20,039 71,643 53,373 182,633Texas 68,136 49,324 70,070 28,449 215,979Virginia 25,670 12,062 6,466 964 45,163Washington 1,030 3,624 27,483 9,806 41,944Wisconsin 7,781 6,479 0 0 14,260Total 473,612 388,774 823,646 371,944 2,057,976

68 This report is available at no cost from the National Renewable Energy Laboratory (NREL) at www.nrel.gov/publications.
Table H-2. Technical Offshore Wind Potential by Distance from Shore: Capacity (MW)
State < 3 nm 3–12 nm 12–50 nm 50–200 nm Grand TotalAlabama 1,368 2,852 14,392 148 18,760California 4,073 39,474 68,246 662 112,455Connecticut 2,143 0 0 0 2,143Delaware 1,806 1,249 2,794 27 5,876Florida 1,847 5,352 95,941 172,025 275,166Georgia 1,119 5,005 20,839 23,147 50,110Hawaii 5,738 15,559 6,970 662 28,930Illinois 775 2,677 1,076 0 4,528Indiana 541 455 0 0 995Louisiana 11,608 22,337 100,145 85,649 219,739Maine 9,355 14,772 44,659 25,712 94,498Maryland 3,751 1,738 13,136 7,903 26,529Massachusetts 8,583 13,182 65,336 152,754 239,855Michigan 23,034 27,910 6,387 0 57,331Minnesota 35 116 0 0 151Mississippi 744 1,394 1,353 0 3,491New Hampshire 253 679 363 0 1,295New Jersey 3,888 6,815 33,228 27,246 71,177New York 10,123 9,164 28,776 25,391 73,454North Carolina 14,908 16,713 81,600 60,234 173,455Ohio 3,020 7,718 7,252 0 17,990Oregon 3,139 15,960 42,725 86 61,910Pennsylvania 652 2,244 682 0 3,578Rhode Island 1,350 2,840 6,608 3,780 14,578South Carolina 3,004 9,800 45,853 123,975 182,633Texas 23,662 17,755 85,848 88,715 215,979Virginia 8,941 5,665 24,190 6,366 45,163Washington 3,075 9,126 29,743 0 41,944Wisconsin 6,803 7,131 326 0 14,260Total 159,340 265,684 828,469 804,483 2,057,976

69 This report is available at no cost from the National Renewable Energy Laboratory (NREL) at www.nrel.gov/publications.
Table H-3. Technical Offshore Wind Potential by Wind Speed: Capacity (MW)
State7–7.25
m/s7.25–7.5
m/s7.5–7.75
m/s7.75–8
m/s8–8.25
m/s8.25–8.5
m/s8.5–8.75
m/s8.75–9
m/s9–9.25
m/s9.25–9.5
m/s9.5–9.75
m/s9.75–10
m/s10–10.25
m/s10.25–10.5
m/s10.5–10.75
m/s10.75–11
m/s11–11.25
m/s11.25–11.5
m/s Grand TotalAlabama 11,507 7,253 0 0 0 0 0 0 0 0 0 0 0 0 0 0 0 0 18,760California 7,069 7,516 9,003 9,763 12,138 14,265 10,442 8,159 9,157 8,001 4,708 2,285 3,222 2,059 2,692 1,980 0 0 112,455Connecticut 243 338 714 582 265 0 0 0 0 0 0 0 0 0 0 0 0 0 2,143Delaware 175 204 344 541 1,168 2,215 1,214 15 0 0 0 0 0 0 0 0 0 0 5,876Florida 137,997 106,293 30,551 325 0 0 0 0 0 0 0 0 0 0 0 0 0 0 275,166Georgia 635 9,006 24,712 11,610 4,147 0 0 0 0 0 0 0 0 0 0 0 0 0 50,110Hawaii 1,838 2,143 2,618 3,554 3,903 3,914 2,870 1,925 1,169 1,679 888 555 517 380 518 277 155 27 28,930Illinois 5 39 95 129 260 1,686 2,290 25 0 0 0 0 0 0 0 0 0 0 4,528Indiana 8 45 87 118 289 448 2 0 0 0 0 0 0 0 0 0 0 0 995Louisiana 86,720 54,040 75,048 3,931 0 0 0 0 0 0 0 0 0 0 0 0 0 0 219,739Maine 657 785 920 917 1,220 1,803 2,103 2,925 4,680 12,696 34,429 20,782 10,580 0 0 0 0 0 94,498Maryland 1,846 1,038 624 203 778 8,652 5,973 6,243 1,171 0 0 0 0 0 0 0 0 0 26,529Massachusetts 119 181 328 517 808 1,737 2,986 3,967 5,861 51,242 129,180 42,930 0 0 0 0 0 0 239,855Michigan 1,680 2,677 4,013 7,863 14,693 13,205 8,910 3,896 76 286 34 0 0 0 0 0 0 0 57,331Minnesota 149 3 0 0 0 0 0 0 0 0 0 0 0 0 0 0 0 0 151Mississippi 2,448 1,044 0 0 0 0 0 0 0 0 0 0 0 0 0 0 0 0 3,491New Hampshire 13 12 35 39 48 155 252 380 303 59 0 0 0 0 0 0 0 0 1,295New Jersey 178 440 667 995 1,272 4,618 13,209 13,142 36,534 124 0 0 0 0 0 0 0 0 71,177New York 361 681 1,112 2,884 5,056 2,566 1,161 2,805 28,816 27,014 999 0 0 0 0 0 0 0 73,454North Carolina 1,062 1,789 2,684 4,723 10,891 61,198 67,312 23,795 0 0 0 0 0 0 0 0 0 0 173,455Ohio 7 70 350 1,488 4,653 8,385 3,037 0 0 0 0 0 0 0 0 0 0 0 17,990Oregon 415 505 598 747 1,972 6,039 10,065 10,973 11,089 7,631 3,021 2,544 1,058 1,251 2,521 1,481 0 0 61,910Pennsylvania 0 3 25 66 663 2,013 808 0 0 0 0 0 0 0 0 0 0 0 3,578Rhode Island 149 266 92 115 247 293 439 1,005 1,026 10,870 75 0 0 0 0 0 0 0 14,578South Carolina 462 624 21,836 60,871 64,322 27,014 7,504 0 0 0 0 0 0 0 0 0 0 0 182,633Texas 371 60,428 31,561 49,743 19,129 19,375 21,144 14,107 122 0 0 0 0 0 0 0 0 0 215,979Virginia 687 1,220 2,554 4,635 3,894 8,670 16,898 6,605 0 0 0 0 0 0 0 0 0 0 45,163Washington 1,191 1,039 1,639 2,219 3,217 9,224 17,661 5,099 655 0 0 0 0 0 0 0 0 0 41,944Wisconsin 1,033 1,745 1,736 1,684 2,050 2,903 2,426 683 0 0 0 0 0 0 0 0 0 0 14,260Total 259,024 261,423 213,949 170,260 157,082 200,378 198,707 105,747 100,658 119,602 173,333 69,096 15,377 3,689 5,731 3,738 155 27 2,057,976

70 This report is available at no cost from the National Renewable Energy Laboratory (NREL) at www.nrel.gov/publications.
Appendix I. Net Technical Energy Potential The Tables in Appendix I display the data for Technical Offshore Wind Potential by water depth, distance from shore and wind speed as discussed in Section 8.5.3.
Table I-1. Technical Offshore Wind Potential by Water Depth: Generation (GWh/yr)
State < 30 m 30–60 m 60–700 m 700–1000 m Grand TotalAlabama 22,684 19,070 11,002 0 52,755California 8,920 8,068 216,579 158,348 391,915Connecticut 5,304 1,320 106 0 6,729Delaware 14,719 5,528 358 0 20,604Florida 84,141 71,412 185,315 439,393 780,260Georgia 71,120 40,466 28,452 16,419 156,456Hawaii 2,049 6,127 64,100 27,608 99,885Illinois 8,974 7,788 0 0 16,762Indiana 3,423 0 0 0 3,423Louisiana 239,034 116,697 208,772 77,069 641,572Maine 23,902 20,120 367,162 0 411,184Maryland 25,735 29,656 35,036 5,863 96,289Massachusetts 84,384 279,883 664,758 24,142 1,053,166Michigan 102,386 97,054 0 0 199,440Minnesota 22 405 0 0 426Mississippi 8,259 1,484 0 0 9,743New Hampshire 693 976 3,322 0 4,991New Jersey 62,564 118,033 91,587 8,010 280,193New York 45,542 99,377 139,754 10,553 295,226North Carolina 203,990 143,936 211,934 74,292 634,153Ohio 62,657 0 0 0 62,657Oregon 1,504 3,877 183,961 40,888 230,230Pennsylvania 9,793 2,999 0 0 12,792Rhode Island 6,107 21,081 31,539 1,636 60,363South Carolina 128,518 70,389 242,215 171,517 612,639Texas 229,811 168,020 227,055 87,082 711,968Virginia 87,924 45,128 24,983 3,776 161,812Washington 3,079 11,684 95,889 35,984 146,636Wisconsin 25,874 22,735 0 0 48,609Total 1,573,108 1,413,312 3,033,877 1,182,581 7,202,878

71 This report is available at no cost from the National Renewable Energy Laboratory (NREL) at www.nrel.gov/publications.
Table I-2. Technical Offshore Wind Potential by Distance from Shore: Generation (GWh/yr)
State < 3 nm 3–12 nm 12–50 nm 50–200 nm Grand TotalAlabama 3,432 8,034 40,866 423 52,755California 13,437 134,331 242,155 1,992 391,915Connecticut 6,729 0 0 0 6,729Delaware 5,876 4,404 10,222 103 20,604Florida 5,095 14,884 265,992 494,289 780,260Georgia 3,217 15,041 67,360 70,838 156,456Hawaii 19,611 52,618 25,321 2,336 99,885Illinois 2,702 10,096 3,964 0 16,762Indiana 1,833 1,590 0 0 3,423Louisiana 32,279 66,197 304,438 238,659 641,572Maine 33,630 62,211 201,187 114,155 411,184Maryland 10,760 6,194 48,153 31,183 96,289Massachusetts 32,120 54,746 285,332 680,968 1,053,166Michigan 76,027 98,953 24,460 0 199,440Minnesota 100 326 0 0 426Mississippi 1,961 3,914 3,868 0 9,743New Hampshire 873 2,616 1,502 0 4,991New Jersey 12,761 25,334 130,704 111,394 280,193New York 33,962 34,991 120,324 105,949 295,226North Carolina 48,567 59,120 305,760 220,706 634,153Ohio 9,852 26,887 25,918 0 62,657Oregon 10,255 59,000 160,677 297 230,230Pennsylvania 2,316 8,001 2,475 0 12,792Rhode Island 4,630 11,454 28,108 16,170 60,363South Carolina 9,284 32,715 161,811 408,828 612,639Texas 79,764 63,442 300,894 267,867 711,968Virginia 27,679 19,611 89,593 24,929 161,812Washington 9,135 30,087 107,413 0 146,636Wisconsin 22,521 24,897 1,190 0 48,609Total 520,409 931,694 2,959,688 2,791,087 7,202,878

72 This report is available at no cost from the National Renewable Energy Laboratory (NREL) at www.nrel.gov/publications.
Table I-3. Technical Offshore Wind Potential by Wind Speed: Generation (GWh/yr)
State7–7.25
m/s7.25–7.5
m/s7.5–7.75
m/s7.75–8
m/s8–8.25
m/s8.25–8.5
m/s8.5–8.75
m/s8.75–9
m/s9–9.25
m/s9.25–9.5
m/s9.5–9.75
m/s9.75–10
m/s10–10.25
m/s10.25–10.5
m/s10.5–10.75
m/s10.75–11
m/s11–11.25
m/s11.25–11.5
m/s Grand TotalAlabama 31,718 21,037 0 0 0 0 0 0 0 0 0 0 0 0 0 0 0 0 52,755California 19,421 21,760 27,223 30,929 40,106 49,012 37,346 30,144 34,927 31,118 18,457 9,215 13,517 8,717 11,452 8,570 0 0 391,915Connecticut 680 1,002 2,210 1,911 927 0 0 0 0 0 0 0 0 0 0 0 0 0 6,729Delaware 490 604 1,079 1,812 4,062 7,994 4,504 59 0 0 0 0 0 0 0 0 0 0 20,604Florida 378,019 307,711 93,482 1,048 0 0 0 0 0 0 0 0 0 0 0 0 0 0 780,260Georgia 1,724 26,489 76,332 37,963 13,948 0 0 0 0 0 0 0 0 0 0 0 0 0 156,456Hawaii 5,146 6,300 8,051 11,405 13,027 13,518 10,274 7,069 4,447 6,567 3,572 2,299 2,188 1,646 2,291 1,250 711 123 99,885Illinois 14 116 298 429 910 6,155 8,739 100 0 0 0 0 0 0 0 0 0 0 16,762Indiana 22 133 275 391 1,007 1,589 7 0 0 0 0 0 0 0 0 0 0 0 3,423Louisiana 239,170 159,284 230,434 12,684 0 0 0 0 0 0 0 0 0 0 0 0 0 0 641,572Maine 1,838 2,323 2,874 2,970 4,228 6,496 7,981 11,579 19,267 54,251 152,901 95,062 49,412 0 0 0 0 0 411,184Maryland 5,046 2,981 1,924 672 2,743 31,405 22,181 24,541 4,798 0 0 0 0 0 0 0 0 0 96,289Massachusetts 332 536 1,029 1,707 2,766 6,354 11,383 15,682 24,188 219,198 572,555 197,435 0 0 0 0 0 0 1,053,166Michigan 4,736 7,909 12,454 25,650 50,607 47,443 33,669 15,274 315 1,232 151 0 0 0 0 0 0 0 199,440Minnesota 418 8 1 0 0 0 0 0 0 0 0 0 0 0 0 0 0 0 426Mississippi 6,720 3,023 0 0 0 0 0 0 0 0 0 0 0 0 0 0 0 0 9,743New Hampshire 36 36 108 129 167 564 950 1,501 1,245 253 0 0 0 0 0 0 0 0 4,991New Jersey 498 1,304 2,090 3,285 4,345 16,736 49,812 51,889 149,703 531 0 0 0 0 0 0 0 0 280,193New York 1,011 2,024 3,494 9,503 17,247 9,204 4,270 11,077 118,546 114,529 4,323 0 0 0 0 0 0 0 295,226North Carolina 2,972 5,130 8,153 15,313 37,167 220,396 252,900 92,120 0 1 0 0 0 0 0 0 0 0 634,153Ohio 21 208 1,104 4,923 15,702 29,785 10,914 0 0 0 0 0 0 0 0 0 0 0 62,657Oregon 1,167 1,495 1,816 2,413 6,485 20,664 35,783 40,290 41,765 29,104 11,707 10,253 4,412 5,335 11,005 6,536 0 0 230,230Pennsylvania 0 8 80 218 2,304 7,165 3,016 0 0 0 0 0 0 0 0 0 0 0 12,792Rhode Island 418 789 289 381 856 1,079 1,678 4,021 4,201 46,315 336 0 0 0 0 0 0 0 60,363South Carolina 1,294 1,850 67,113 197,594 219,915 97,047 27,827 0 0 0 0 0 0 0 0 0 0 0 612,639Texas 1,037 177,067 98,618 163,453 65,284 70,191 79,931 55,885 500 0 0 0 0 0 0 0 0 0 711,968Virginia 1,922 3,617 7,754 14,874 13,314 31,313 63,146 25,872 0 0 0 0 0 0 0 0 0 0 161,812Washington 3,349 3,061 5,012 6,995 10,598 32,011 63,963 19,113 2,535 0 0 0 0 0 0 0 0 0 146,636Wisconsin 2,919 5,141 5,407 5,460 7,107 10,674 9,223 2,677 0 0 0 0 0 0 0 0 0 0 48,609Total 712,135 762,946 658,704 554,112 534,824 716,796 739,499 408,895 406,436 503,099 764,002 314,264 69,530 15,698 24,749 16,357 711 123 7,202,878

73 This report is available at no cost from the National Renewable Energy Laboratory (NREL) at www.nrel.gov/publications.
Appendix J. Comparison to Wind Vision This study was intended to build on the discussions and analysis performed in the U.S. Department of Energy Wind Vision study published in March 2015. However, the tools and procedures used are continuously evolving. Therefore, many assumptions used in this report changed since the Wind Vision analysis was conducted. Wind Vision 2015 Assumptions The key assumptions are provided here to allow the reader to compare the Wind Vision to this report. The bullets below pertain to the Wind Vision scenario (DOE 20150.
• Gross area not calculated • Hub height is 90 m • Domain boundary calculated by depth and wind speed bands of:
o 0–30 m o 30‒60 m o 60‒700 m (shallower cutoff than this report)
• Distance-from-shore bands of: o None
• Array power density is 3 MW/km2 • Turbine specific power is 318 W/m2 • Gross energy is based on supply curves only • Losses fixed at 15% (same as land-based) • Technology exclusions:
o Below 30% net capacity factor excluded o Greater than 700-m depth excluded o Great Lakes ice exclusion: none
• Conflicting-use Exclusions: Black & Veatch 36% offshore (no distance-to- shore gradient).
2016 Offshore Wind Resource Assessment Assumptions The key assumptions for this report are provided again to allow the reader to compare the Wind Vision to this report. The bullets below pertain to this report.
• Gross area defined by 200-nm EEZ • Hub height raised to 100 m • Resource classification depth bands of:
o 0‒30 m o 30‒60 m o 60–1,000 m
• Distance-from-shore bands: o 0‒3 nm o 3‒12 nm o 12 nm–50 nm o 50 nm–200 nm
• Gross capacity power density is 3 MW/km2 • Turbine specific power is 318 W/m2

74 This report is available at no cost from the National Renewable Energy Laboratory (NREL) at www.nrel.gov/publications.
• Variable losses 12% to 23% based on actual wind plant performance (17% on average) o 6% fixed (4% availability, 2% other based on Beiter 2016) o Electrical losses (1%‒5%) o Wake losses (4% to 12%) from Openwind
• Technology exclusions: o Less than 7 m/s excluded (same as 2010 assessment) o Greater than 1,000 m excluded (updated based on developer feedback) o Greater than 60 m in Great Lakes excluded
• Conflicting-use exclusions: Black & Veatch 36% offshore.
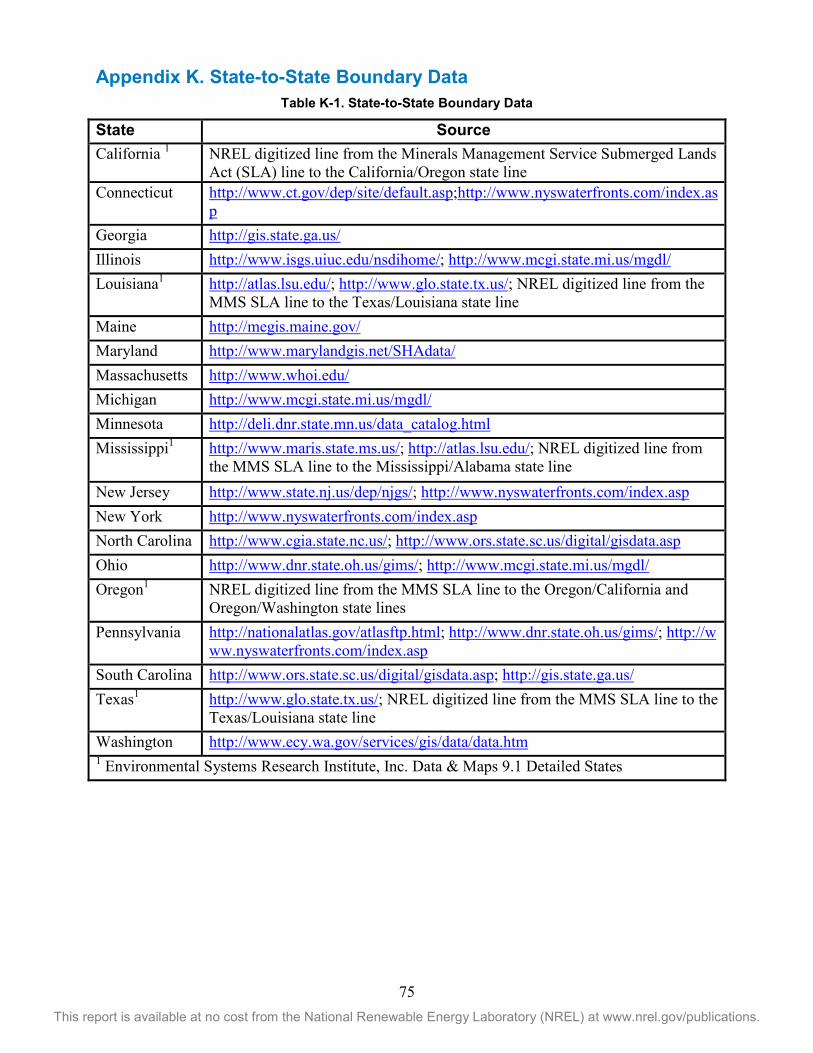
75 This report is available at no cost from the National Renewable Energy Laboratory (NREL) at www.nrel.gov/publications.
Appendix K. State-to-State Boundary Data Table K-1. State-to-State Boundary Data
State Source California 1 NREL digitized line from the Minerals Management Service Submerged Lands
Act (SLA) line to the California/Oregon state line Connecticut http://www.ct.gov/dep/site/default.asp;http://www.nyswaterfronts.com/index.as
p Georgia http://gis.state.ga.us/
Illinois http://www.isgs.uiuc.edu/nsdihome/; http://www.mcgi.state.mi.us/mgdl/ Louisiana1 http://atlas.lsu.edu/; http://www.glo.state.tx.us/; NREL digitized line from the
MMS SLA line to the Texas/Louisiana state line Maine http://megis.maine.gov/
Maryland http://www.marylandgis.net/SHAdata/
Massachusetts http://www.whoi.edu/
Michigan http://www.mcgi.state.mi.us/mgdl/
Minnesota http://deli.dnr.state.mn.us/data_catalog.html
Mississippi1 http://www.maris.state.ms.us/; http://atlas.lsu.edu/; NREL digitized line from the MMS SLA line to the Mississippi/Alabama state line
New Jersey http://www.state.nj.us/dep/njgs/; http://www.nyswaterfronts.com/index.asp New York http://www.nyswaterfronts.com/index.asp
North Carolina http://www.cgia.state.nc.us/; http://www.ors.state.sc.us/digital/gisdata.asp Ohio http://www.dnr.state.oh.us/gims/; http://www.mcgi.state.mi.us/mgdl/ Oregon1 NREL digitized line from the MMS SLA line to the Oregon/California and
Oregon/Washington state lines Pennsylvania http://nationalatlas.gov/atlasftp.html; http://www.dnr.state.oh.us/gims/; http://w
ww.nyswaterfronts.com/index.asp South Carolina http://www.ors.state.sc.us/digital/gisdata.asp; http://gis.state.ga.us/ Texas1 http://www.glo.state.tx.us/; NREL digitized line from the MMS SLA line to the
Texas/Louisiana state line Washington http://www.ecy.wa.gov/services/gis/data/data.htm
1 Environmental Systems Research Institute, Inc. Data & Maps 9.1 Detailed States

76 This report is available at no cost from the National Renewable Energy Laboratory (NREL) at www.nrel.gov/publications.
Appendix L. Annual Energy Production Loss Assumption Table Table L-1. Gross Theoretical Recoverable Resource Energy with Losses (Wakes, Electrical,
Availability, and Other) in TWh/year
Variable Assumption Source
AEP net AEPnet = GCF * 8760 * 600 * (1-AEPSysLosses) Smith, Stehly, and Musial 2015, pg. 74
AEP System Losses AEP System Losses = 1 - (1 * (1 – Electrical Losses) * (1 – Wake Losses) * (1 – Other Losses) * Availability)
Smith, Stehly, and Musial 2015, pg. 74
Gross Capacity Factor
Atlantic: GCF = -0.2196 + 0.0852 x windspeed (R2=0.998) Gulf of Mexico: GCF = -0.2590 + 0.0908 x windspeed (R2= 0.999) Great Lakes: GCF = -0.2265 + 0.0863 x R2 (R2= 0.988) Pacific: GCF = -0.4007 + 0.14636 x windspeed -0.00508793 x (windspeed2) (R2 = 0.985)
Linear relationship developed by George Scott, NREL for Openwind analysis
Electrical Losses Equation Based on Depth and Distance to Shore
Electrical losses = (2.07+(0.073 x Dist) + (-0.0016 x Dist2)+(0.000017 x Dist 3) + (-0.000000086 x Dist4) + (0.000000000157 x Dist5) + 0.0015 x Depth + (-0.0000047 x Depth2) + (0.0000000082 x Depth3) + (-0.0000000000041 x Depth4))/100 Dist: Distance from site to cable landfall (km) Depth: Water depth (m)
Smith, Stehly, and Musial 2015, pg. 100‒101
Wake Losses from Openwind
Linear relationship (Openwind 600-MW wind farm with 10-by-10 wind turbine grid (6 MW each); whole ocean tiled with these cells; and then … within 0‒50 nm; for each location, for more ~7,000 spots (not Hawaii) calculated wake losses). Plotted against wind speed.
Linear relationship developed by George Scott, NREL from Openwind analysis
Other Losses 2% (performance, environmental, curtailment) Smith, Stehly, and Musial 2015, pg. 22
Availability 96% Mone et al. 2015, p. 42
Related Documents