2016 Federal Reserve Payments Study Detailed Data Tables Each sheet contains two tables: 1) 2015 data and 2) 2012 and 2015 comparison data. The balances, values and averages are in U.S. dollars. Totals for general-purpose credit, non-prepaid debit, and general-purpose prepaid were estimated from both DFIPS and NPIPS and were approximately the same. For convenience, DFIPS total estimates were adjusted to be equal to NPIPS total estimates and all the subcategories were adjusted proportionately. Definitions Business For-profit and not-for-profit enterprises and federal, state, and local government agencies CAGR Compound annual growth rate CSS Check Sample Survey DFIPS Depository and Financial Institutions Payments Survey EBT Electronic benefits transfers NAST Net, authorized and settled transactions NPIPS Networks, Processors, and Issuers Payments Surveys GP General-Purpose Item Share of Total The sub-item's proportion of the corresponding top-tier total item (e.g., total transactions, NAST, or cards in force) PL Private-Label P2P Person-to-person Unit The actual units the amount is reported with the following key: TH = thousands, MM = millions, BN = billions, TR = trillions Contents Accounts and Cards Transaction deposit accounts, debit cards, GP credit card accounts and cards, GP prepaid card program accounts and cards (DFIPS) Checks Checks paid, checks deposited, and checks written by counterparty and purpose (DFIPS & CSS) ACH ACH credit transfers originated and ACH debit transfers received (DFIPS & NPIPS) Non-Prepaid Debit Non-prepaid debit card transactions (DFIPS & NPIPS) GP Prepaid General-purpose prepaid card transactions from networks and processors (DFIPS & NPIPS) PL Prepaid Issuers & Processors Private-label prepaid card transactions from issuers and processors, including EBT card transactions (NPIPS) GP Credit General-purpose credit card network and non-network transactions (DFIPS & NPIPS) PL Credit Merchant Issuers Private-label credit card transactions from merchant issuers (NPIPS) PL Credit Processors Private-label credit card transactions from processors (NPIPS) P2P and Money Transfer Person-to-person and money transfer transactions from processors (NPIPS) Online Bill Pay Online bill payment transactions from processors (NPIPS) Walk-In Bill Pay Walk-in bill payment transactions from processors (NPIPS) PL ACH Debit Private-label ACH debit card transactions from processors (NPIPS) Online Payment Authentication Payments initiated using online payment authentication methods from processors (NPIPS) Mobile Wallet Transactions using mobile wallets from processors (NPIPS)

Welcome message from author
This document is posted to help you gain knowledge. Please leave a comment to let me know what you think about it! Share it to your friends and learn new things together.
Transcript

2016 Federal Reserve Payments Study Detailed Data Tables
Each sheet contains two tables: 1) 2015 data and 2) 2012 and 2015 comparison data. The balances, values and averages are in U.S. dollars.Totals for general-purpose credit, non-prepaid debit, and general-purpose prepaid were estimated from both DFIPS and NPIPS and were approximately the same. For convenience, DFIPS total estimates were adjusted to be equal to NPIPS total estimates and all the subcategories were adjusted proportionately.
DefinitionsBusiness For-profit and not-for-profit enterprises and federal, state, and local government agencies CAGR Compound annual growth rateCSS Check Sample SurveyDFIPS Depository and Financial Institutions Payments SurveyEBT Electronic benefits transfersNAST Net, authorized and settled transactionsNPIPS Networks, Processors, and Issuers Payments SurveysGP General-PurposeItem Share of Total The sub-item's proportion of the corresponding top-tier total item (e.g., total transactions, NAST, or cards in force)PL Private-LabelP2P Person-to-personUnit The actual units the amount is reported with the following key: TH = thousands, MM = millions, BN = billions, TR = trillions
ContentsAccounts and Cards Transaction deposit accounts, debit cards, GP credit card accounts and cards, GP prepaid card program accounts and cards (DFIPS)Checks Checks paid, checks deposited, and checks written by counterparty and purpose (DFIPS & CSS)ACH ACH credit transfers originated and ACH debit transfers received (DFIPS & NPIPS)Non-Prepaid Debit Non-prepaid debit card transactions (DFIPS & NPIPS)GP Prepaid General-purpose prepaid card transactions from networks and processors (DFIPS & NPIPS)PL Prepaid Issuers & Processors Private-label prepaid card transactions from issuers and processors, including EBT card transactions (NPIPS)GP Credit General-purpose credit card network and non-network transactions (DFIPS & NPIPS)PL Credit Merchant Issuers Private-label credit card transactions from merchant issuers (NPIPS)PL Credit Processors Private-label credit card transactions from processors (NPIPS)P2P and Money Transfer Person-to-person and money transfer transactions from processors (NPIPS)Online Bill Pay Online bill payment transactions from processors (NPIPS)Walk-In Bill Pay Walk-in bill payment transactions from processors (NPIPS)PL ACH Debit Private-label ACH debit card transactions from processors (NPIPS)Online Payment Authentication Payments initiated using online payment authentication methods from processors (NPIPS)Mobile Wallet Transactions using mobile wallets from processors (NPIPS)

Accounts and Cards, 2015 (DFIPS),Average of Monthly Totals
Number Units
Value Units
2015 Number
2015 Value
2015 Average Value
Number Item Amount of Total
Value Item Amount of Total
All transaction deposit accounts MM BN 316.0 3,814.20 12,071 100.0 100.0Consumer transaction deposit accounts MM BN 279.3 1,498.57 5,365 88.4 39.3Business transaction deposit accounts MM BN 36.7 2,315.62 63,145 11.6 60.7
Retail sweep program accounts MM BN 98.8 1,407.74 14,244 100.0 100.0Consumer retail sweep program accounts MM BN 88.4 864.85 9,786 89.4 61.4Business retail sweep program accounts MM BN 10.5 542.89 51,909 10.6 38.6
Wholesale sweep program accounts MM BN 0.1 350.05 2,782,729 100.0 100.0
Prepaid card program accounts MM BN 258.3 32.30 125 100.0 100.0Reloadable prepaid card program accounts MM BN 96.7 30.22 312 37.4 93.6Non-reloadable prepaid card program accounts MM BN 161.6 2.08 13 62.6 6.4
All credit card accounts MM BN 319.3 709.75 2,223 100.0 100.0Consumer credit card accounts MM BN 286.4 630.54 2,202 89.7 88.8
Consumer credit card accounts with current balances only MM BN 113.5 150.65 1,327 35.6 21.2Consumer credit card accounts with revolving balances MM BN 172.9 479.89 2,776 54.1 67.6
Business credit card accounts MM BN 32.9 79.22 2,405 10.3 11.2
All non-prepaid debit cards in force MM 384.1 100.0Consumer non-prepaid debit cards in force MM 358.0 93.2Business non-prepaid debit cards in force MM 26.1 6.8
All non-prepaid debit cards with purchase activity MM 221.6 57.7Consumer non-prepaid debit cards with purchase activity MM 209.6 54.6Business non-prepaid debit cards with purchase activity MM 11.9 3.1
All non-prepaid debit cards that are chip enabled MM 57.6 15.0Consumer non-prepaid debit cards that are chip enabled MM 52.5 13.7Business non-prepaid debit cards that are chip enabled MM 5.1 1.3
All GP prepaid cards in force MM 290.1 100.0Reloadable prepaid cards in force MM 130.1 44.8Non-reloadable prepaid cards in force MM 160.0 55.2
All GP prepaid cards with purchase activity MM 59.2 20.4Reloadable prepaid cards with purchase activity MM 48.4 16.7Non-reloadable prepaid cards with purchase activity MM 10.9 3.8
All GP prepaid cards that are chip enabled MM 0.3 0.1Reloadable prepaid cards that are chip enabled MM 0.3 0.1Non-reloadable prepaid cards that are chip enabled MM 0.0 0.0
Note:Figures may not sum because of rounding.Average of monthly totals means the average of end-of-month totals for 2015.

Accounts and Cards, 2015 (DFIPS),Average of Monthly Totals
Number Units
Value Units
2015 Number
2015 Value
2015 Average Value
Number Item Amount of Total
Value Item Amount of Total
All GP credit cards in force MM 511.5 100.0Consumer GP credit cards in force MM 452.4 88.5Business GP credit cards in force MM 59.0 11.5
All GP credit cards with purchase activity MM 284.1 55.5Consumer GP credit cards with purchase activity MM 260.9 51.0Business GP credit cards with purchase activity MM 23.2 4.5
All GP credit cards that are chip enabled MM 190.3 37.2Consumer GP credit cards that are chip enabled MM 171.6 33.6Business GP credit cards that are chip enabled MM 18.7 3.7
Note:Figures may not sum because of rounding.Average of monthly totals means the average of end-of-month totals for 2015.
Accounts and Cards, 2012 & 2015 (DFIPS),Average of Monthly Totals
Number Units
Value Units
2012 Number
2012 Value
2012 Average
Value
2015 Number
2015 Value
2015Average
Value
2012 to 2015 Number Change
2012 to 2015 Value Change
2012 to 2015 Number (CAGR)
as a Percent
2012 to 2015 Value (CAGR) as a Percent
All transaction deposit accounts MM BN 320.0 4,313.58 13,480 316.0 3,814.20 12,071 -4.0 -499.39 -0.4 -4.0Consumer transaction deposit accounts MM BN 287.4 2,299.04 8,001 279.3 1,498.57 5,365 -8.1 -800.47 -0.9 -13.3Business transaction deposit accounts MM BN 32.6 2,014.54 61,706 36.7 2,315.62 63,145 4.0 301.08 4.0 4.8
Retail sweep program accounts MM BN 98.8 1,407.74 14,244Consumer retail sweep program accounts MM BN 88.4 864.85 9,786Business retail sweep program accounts MM BN 10.5 542.89 51,909
Wholesale sweep program accounts MM BN 0.1 350.05 2,782,729
Prepaid card program accounts MM BN 236.3 8.34 35 258.3 32.30 125 22.0 23.97 3.0 57.1Reloadable prepaid card program accounts MM BN 96.7 30.22 312Non-reloadable prepaid card program accounts MM BN 161.6 2.08 13
All credit card accounts MM BN 309.1 587.37 1,900 319.3 709.75 2,223 10.2 122.39 1.1 6.5Consumer credit card accounts MM BN 279.7 531.44 1,900 286.4 630.54 2,202 6.7 99.10 0.8 5.9
Consumer credit card accounts with current balances only MM BN 113.5 150.65 1,327Consumer credit card accounts with revolving balances MM BN 172.9 479.89 2,776
Business credit card accounts MM BN 29.5 55.93 1,899 32.9 79.22 2,405 3.5 23.29 3.8 12.3
All non-prepaid debit cards in force MM 282.8 384.1 101.3 10.7Consumer non-prepaid debit cards in force MM 265.4 358.0 92.6 10.5Business non-prepaid debit cards in force MM 17.4 26.1 8.7 14.5
All non-prepaid debit cards with purchase activity MM 182.5 221.6 39.1 6.7Consumer non-prepaid debit cards with purchase activity MM 173.9 209.6 35.7 6.4Business non-prepaid debit cards with purchase activity MM 8.6 11.9 3.4 11.6
All non-prepaid debit cards that are chip enabled MM 23.5 57.6 34.1 34.8Consumer non-prepaid debit cards that are chip enabled MM 22.1 52.5 30.5 33.5Business non-prepaid debit cards that are chip enabled MM 1.4 5.1 3.6 52.0
All GP prepaid cards in force MM 159.1 290.1 131.0 22.2Reloadable prepaid cards in force MM 130.1Non-reloadable prepaid cards in force MM 160.0
All GP prepaid cards with purchase activity MM 29.4 59.2 29.8 26.3Reloadable prepaid cards with purchase activity MM 48.4Non-reloadable prepaid cards with purchase activity MM 10.9
All GP prepaid cards that are chip enabled MM 0.0 0.3 0.3 922.3Reloadable prepaid cards that are chip enabled MM 0.3Non-reloadable prepaid cards that are chip enabled MM 0.0
Note:Figures may not sum because of rounding.CAGR is compound annual growth rate.Average of monthly totals means the average of end-of-month totals for 2015.
Accounts and Cards, 2012 & 2015 (DFIPS),Average of Monthly Totals
Number Units
Value Units
2012 Number
2012 Value
2012 Average
Value
2015 Number
2015 Value
2015Average
Value
2012 to 2015 Number Change
2012 to 2015 Value Change
2012 to 2015 Number (CAGR)
as a Percent
2012 to 2015 Value (CAGR) as a Percent
All GP credit cards in force MM 333.6 511.5 177.9 15.3Consumer GP credit cards in force MM 305.3 452.4 147.1 14.0Business GP credit cards in force MM 28.3 59.0 30.8 27.8
All GP credit cards with purchase activity MM 187.8 284.1 96.3 14.8Consumer GP credit cards with purchase activity MM 172.1 260.9 88.8 14.9Business GP credit cards with purchase activity MM 15.7 23.2 7.5 13.9
All GP credit cards that are chip enabled MM 23.6 190.3 166.8 100.7Consumer GP credit cards that are chip enabled MM 23.4 171.6 148.2 94.3Business GP credit cards that are chip enabled MM 0.1 18.7 18.6 404.4
Note:Figures may not sum because of rounding.CAGR is compound annual growth rate.Average of monthly totals means the average of end-of-month totals for 2015.

Checks, 2015 (DFIPS and CSS) Number Units
Value Units
2015 Number
2015 Value
2015 Average Value
Number Item Amount of Total
Value Item Amount of Total
Checks paid total transactions by transaction type (DFIPS) BN TR 17.3 26.83 1,554 100.0 100.0U.S. treasury checks paid (DFIPS) BN TR 0.1 0.14 2,400 0.3 0.5Postal money order checks paid (DFIPS) BN TR 0.1 0.02 225 0.5 0.1Commercial checks paid (DFIPS) BN TR 17.1 26.67 1,558 99.1 99.4
Commercial interbank checks paid (DFIPS) BN TR 12.6 17.9 1,420 72.8 66.6Commercial interbank inclearings (DFIPS) BN TR 11.9 17.09 1,438 68.8 63.7Commercial interbank on-us correspondent checks paid (DFIPS) BN TR 0.7 0.77 1,112 4.0 2.9
Commercial on-us checks paid (DFIPS) BN TR 4.5 8.81 1,941 26.3 32.8
Commercial checks paid by counterparty (DFIPS) BN TR 17.1 26.67 1,558 99.1 99.4Commercial consumer checks paid (DFIPS) BN TR 9.2 6.60 713 54.0 24.7Commercial business checks paid (DFIPS) BN TR 7.9 20.07 2,551 46.0 75.3
Checks written (DFIPS) BN TR 19.4 27.34 1,410 100.0 100.0Checks written converted to ACH payments (DFIPS) BN TR 2.1 0.50 238 10.9 1.8
Checks written by counterparty (CSS) BN TR 19.4 27.34 1,410 100.0 100.0Checks written by consumers (CSS) BN TR 10.7 5.29 497 55.0 19.4
Checks written by consumers to consumers (CSS) BN TR 1.8 1.02 557 9.4 3.7Checks written by consumers to businesses (CSS) BN TR 8.8 4.27 484 45.5 15.6
Checks written by businesses (CSS) BN TR 8.7 22.04 2,526 45.0 80.6Checks written by businesses to consumers (CSS) BN TR 3.4 3.64 1,058 17.8 13.3Checks written by businesses to businesses (CSS) BN TR 5.3 18.40 3,481 27.3 67.3
Checks written by purpose (CSS) BN TR 19.4 27.34 1,410 100.0 100.0Income checks written (CSS) BN TR 3.4 3.64 1,058 17.8 13.3Casual checks written (CSS) BN TR 1.8 1.02 557 9.4 3.7Bill Pay checks written (CSS) BN TR 12.6 22.07 1,747 65.2 80.8
Bill pay checks written from consumers to businesses (CSS) BN TR 7.6 3.93 518 39.1 14.4Bill pay checks written from businesses to businesses (CSS) BN TR 5.1 18.15 3,586 26.1 66.4
Point of Sale checks written (CSS) BN TR 1.1 0.16 146 5.6 0.6Point of Sale checks written from consumers to businesses (CSS) BN TR 0.9 0.11 114 4.8 0.4Point of Sale checks written from businesses to businesses (CSS) BN TR 0.1 0.05 351 0.8 0.2
Bill pay/point of sale checks written (CSS) BN TR 0.4 0.44 1,131 2.0 1.6Bill pay/point of sale checks written from consumers to businesses (CSS) BN TR 0.3 0.24 769 1.6 0.9Bill pay/point of sale checks written from businesses to businesses (CSS) BN TR 0.1 0.20 2,545 0.4 0.7
Checks written by transaction value range (CSS) BN 19.4 100.0Checks written transactions with $50.00 or less in total value (CSS) BN 4.9 25.5Checks written transactions with $50.01 to $100.00 in total value (CSS) BN 2.9 15.2Checks written transactions with $100.01 to $500.00 in total value (CSS) BN 6.5 33.6Checks written transactions with $500.01 to $1000.00 in total value (CSS) BN 2.1 10.7Checks written transactions with $1,000.01 to $2,500.00 in total value (CSS) BN 1.5 7.8Checks written transactions with $2,500.01 to $5,000.00 in total value (CSS) BN 0.6 3.2Checks written transactions with greater than $5,000.00 in total value (CSS) BN 0.8 4.0
Note:Figures may not sum because of rounding.Checks written is the sum of "checks paid" and "checks converted to ACH payments," which uses the check as a source document to initiate the ACH payment.Checks written by businesses to consumers (B2C) were defined as income payments, including payroll, dividends, and refunds.Checks written by consumers to consumers (C2C) were defined as casual payments. These are also called person-to-person (P2P) payments.Checks written to businesses were categorized as either bill pay, point-of-sale (POS) or, in cases where the purpose of a check written to a business could not be determined, bill pay/point-of-sa C2B refers to consumer-to-business. B2B refers to business-to-business.
Checks, 2015 (DFIPS and CSS) Number Units
Value Units
2015 Number
2015 Value
2015 Average Value
Number Item Amount of Total
Value Item Amount of Total
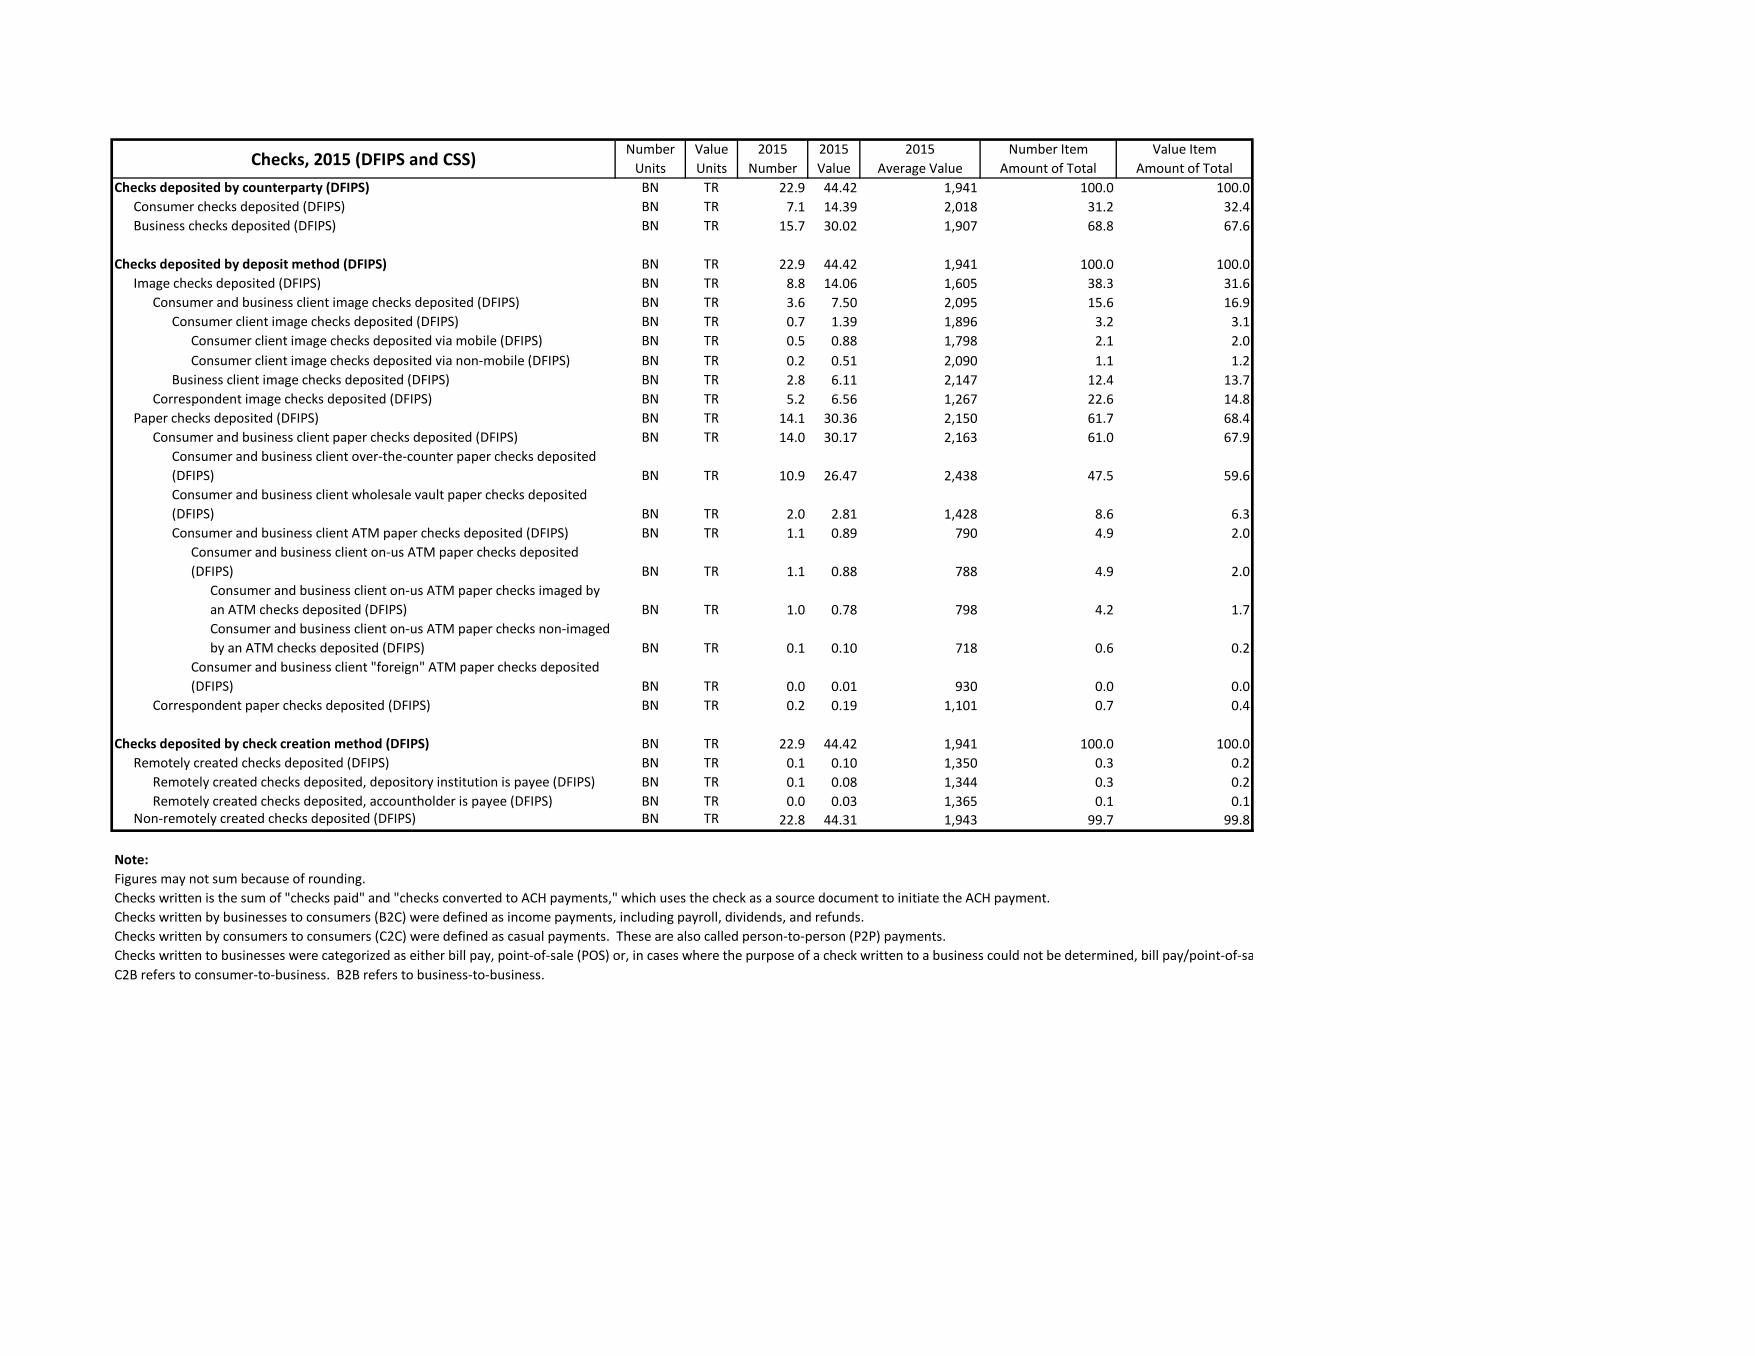
Checks deposited by counterparty (DFIPS) BN TR 22.9 44.42 1,941 100.0 100.0Consumer checks deposited (DFIPS) BN TR 7.1 14.39 2,018 31.2 32.4Business checks deposited (DFIPS) BN TR 15.7 30.02 1,907 68.8 67.6
Checks deposited by deposit method (DFIPS) BN TR 22.9 44.42 1,941 100.0 100.0Image checks deposited (DFIPS) BN TR 8.8 14.06 1,605 38.3 31.6
Consumer and business client image checks deposited (DFIPS) BN TR 3.6 7.50 2,095 15.6 16.9Consumer client image checks deposited (DFIPS) BN TR 0.7 1.39 1,896 3.2 3.1
Consumer client image checks deposited via mobile (DFIPS) BN TR 0.5 0.88 1,798 2.1 2.0Consumer client image checks deposited via non-mobile (DFIPS) BN TR 0.2 0.51 2,090 1.1 1.2
Business client image checks deposited (DFIPS) BN TR 2.8 6.11 2,147 12.4 13.7Correspondent image checks deposited (DFIPS) BN TR 5.2 6.56 1,267 22.6 14.8
Paper checks deposited (DFIPS) BN TR 14.1 30.36 2,150 61.7 68.4Consumer and business client paper checks deposited (DFIPS) BN TR 14.0 30.17 2,163 61.0 67.9
Consumer and business client over-the-counter paper checks deposited (DFIPS) BN TR 10.9 26.47 2,438 47.5 59.6Consumer and business client wholesale vault paper checks deposited (DFIPS) BN TR 2.0 2.81 1,428 8.6 6.3Consumer and business client ATM paper checks deposited (DFIPS) BN TR 1.1 0.89 790 4.9 2.0
Consumer and business client on-us ATM paper checks deposited (DFIPS) BN TR 1.1 0.88 788 4.9 2.0
Consumer and business client on-us ATM paper checks imaged by an ATM checks deposited (DFIPS) BN TR 1.0 0.78 798 4.2 1.7Consumer and business client on-us ATM paper checks non-imaged by an ATM checks deposited (DFIPS) BN TR 0.1 0.10 718 0.6 0.2
Consumer and business client "foreign" ATM paper checks deposited (DFIPS) BN TR 0.0 0.01 930 0.0 0.0
Correspondent paper checks deposited (DFIPS) BN TR 0.2 0.19 1,101 0.7 0.4
Checks deposited by check creation method (DFIPS) BN TR 22.9 44.42 1,941 100.0 100.0Remotely created checks deposited (DFIPS) BN TR 0.1 0.10 1,350 0.3 0.2
Remotely created checks deposited, depository institution is payee (DFIPS) BN TR 0.1 0.08 1,344 0.3 0.2Remotely created checks deposited, accountholder is payee (DFIPS) BN TR 0.0 0.03 1,365 0.1 0.1
Non-remotely created checks deposited (DFIPS) BN TR 22.8 44.31 1,943 99.7 99.8
Note:Figures may not sum because of rounding.Checks written is the sum of "checks paid" and "checks converted to ACH payments," which uses the check as a source document to initiate the ACH payment.Checks written by businesses to consumers (B2C) were defined as income payments, including payroll, dividends, and refunds.Checks written by consumers to consumers (C2C) were defined as casual payments. These are also called person-to-person (P2P) payments.Checks written to businesses were categorized as either bill pay, point-of-sale (POS) or, in cases where the purpose of a check written to a business could not be determined, bill pay/point-of-sa C2B refers to consumer-to-business. B2B refers to business-to-business.
Checks, 2012 & 2015 (DFIPS and CSS) Number Units
Value Units
2012 Number
2012 Value
2012 Average
Value
2015 Number
2015 Value
2015Average
Value
2012 to 2015 Number Change
2012 to 2015 Value Change
2012 to 2015 Number (CAGR)
as a Percent
2012 to 2015 Value (CAGR) as a Percent
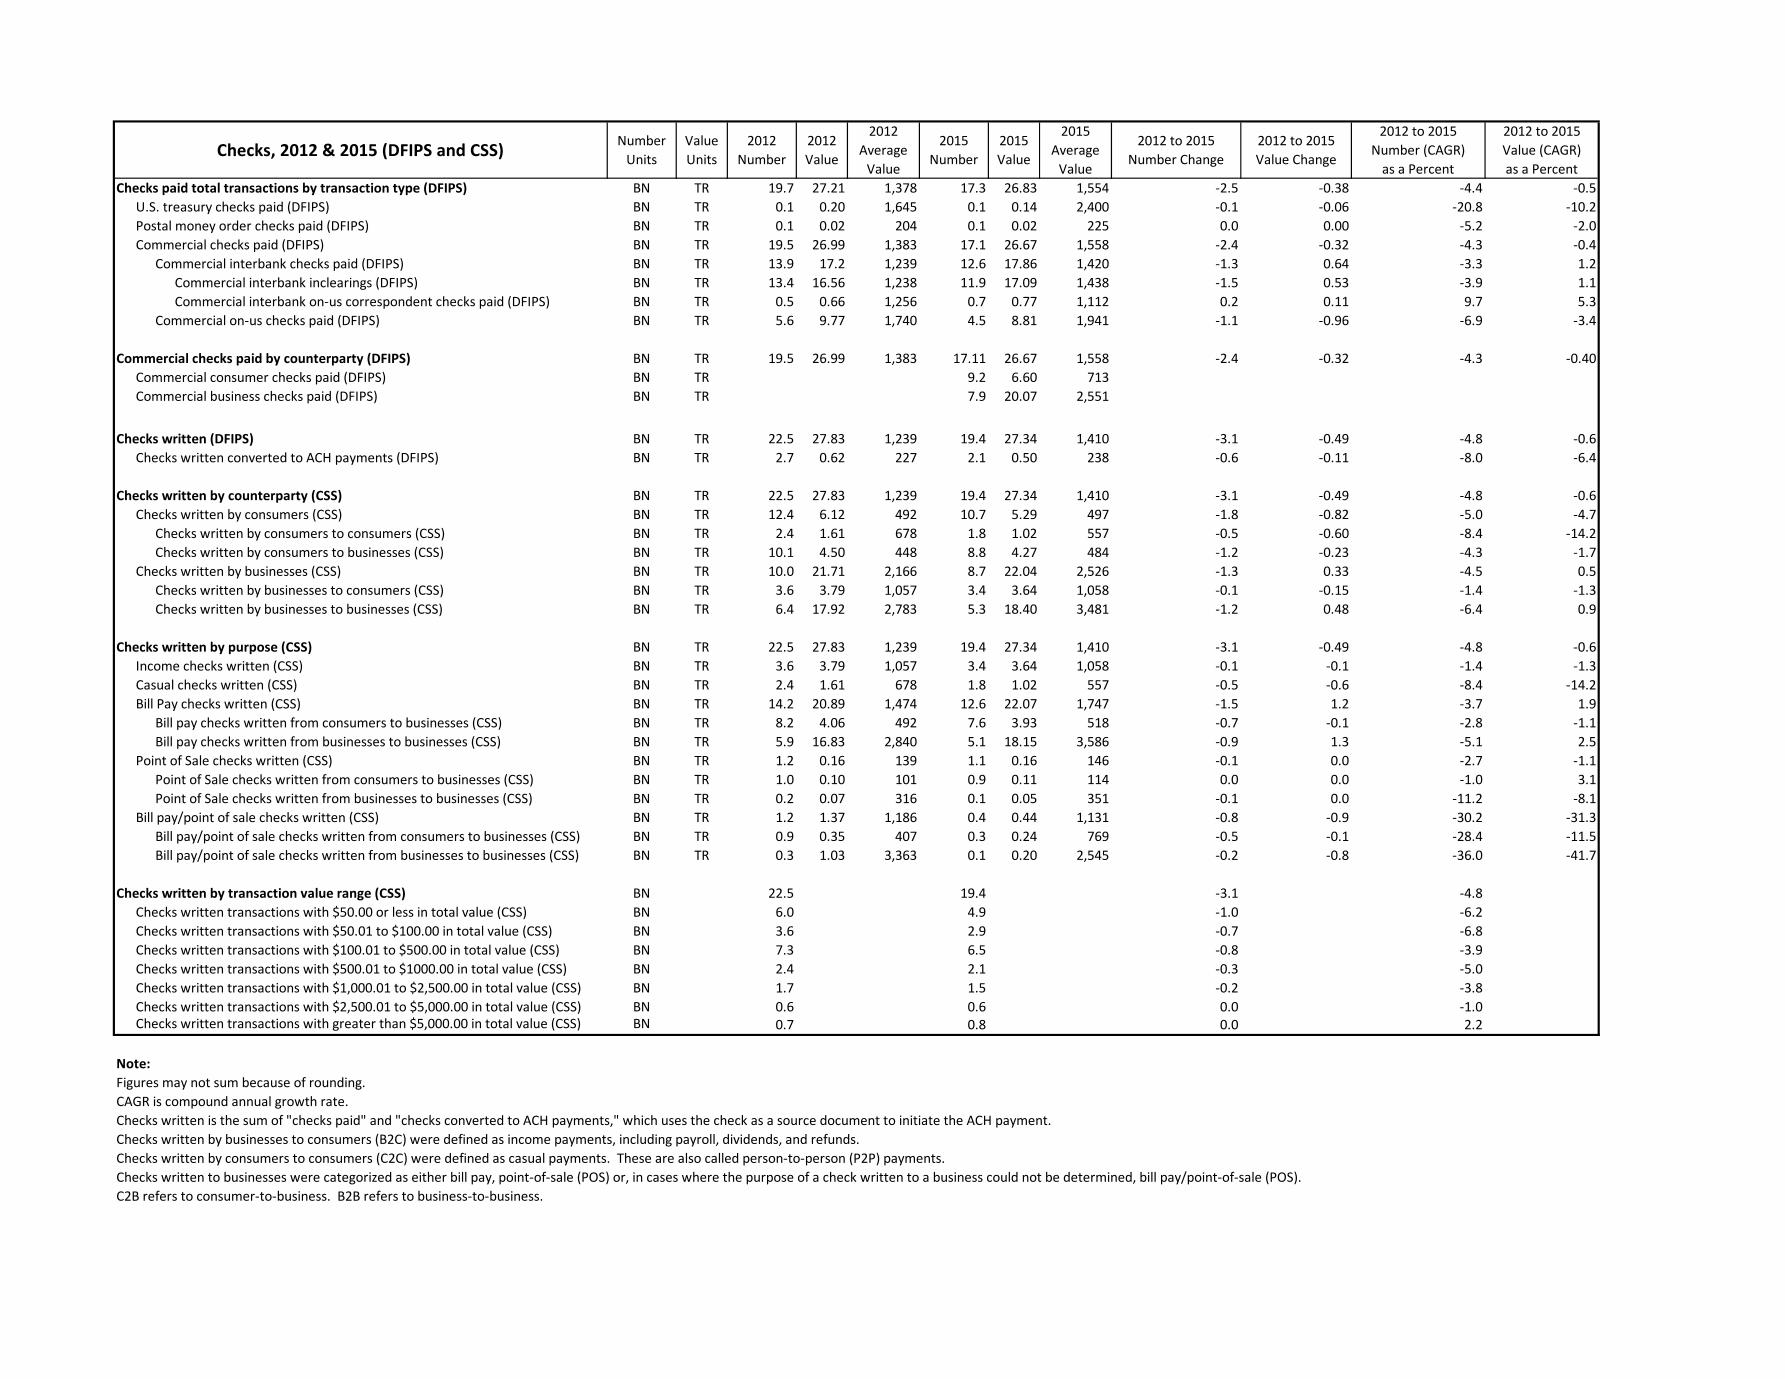
Checks paid total transactions by transaction type (DFIPS) BN TR 19.7 27.21 1,378 17.3 26.83 1,554 -2.5 -0.38 -4.4 -0.5U.S. treasury checks paid (DFIPS) BN TR 0.1 0.20 1,645 0.1 0.14 2,400 -0.1 -0.06 -20.8 -10.2Postal money order checks paid (DFIPS) BN TR 0.1 0.02 204 0.1 0.02 225 0.0 0.00 -5.2 -2.0Commercial checks paid (DFIPS) BN TR 19.5 26.99 1,383 17.1 26.67 1,558 -2.4 -0.32 -4.3 -0.4
Commercial interbank checks paid (DFIPS) BN TR 13.9 17.2 1,239 12.6 17.86 1,420 -1.3 0.64 -3.3 1.2Commercial interbank inclearings (DFIPS) BN TR 13.4 16.56 1,238 11.9 17.09 1,438 -1.5 0.53 -3.9 1.1Commercial interbank on-us correspondent checks paid (DFIPS) BN TR 0.5 0.66 1,256 0.7 0.77 1,112 0.2 0.11 9.7 5.3
Commercial on-us checks paid (DFIPS) BN TR 5.6 9.77 1,740 4.5 8.81 1,941 -1.1 -0.96 -6.9 -3.4
Commercial checks paid by counterparty (DFIPS) BN TR 19.5 26.99 1,383 17.11 26.67 1,558 -2.4 -0.32 -4.3 -0.40Commercial consumer checks paid (DFIPS) BN TR 9.2 6.60 713Commercial business checks paid (DFIPS) BN TR 7.9 20.07 2,551
Checks written (DFIPS) BN TR 22.5 27.83 1,239 19.4 27.34 1,410 -3.1 -0.49 -4.8 -0.6Checks written converted to ACH payments (DFIPS) BN TR 2.7 0.62 227 2.1 0.50 238 -0.6 -0.11 -8.0 -6.4
Checks written by counterparty (CSS) BN TR 22.5 27.83 1,239 19.4 27.34 1,410 -3.1 -0.49 -4.8 -0.6Checks written by consumers (CSS) BN TR 12.4 6.12 492 10.7 5.29 497 -1.8 -0.82 -5.0 -4.7
Checks written by consumers to consumers (CSS) BN TR 2.4 1.61 678 1.8 1.02 557 -0.5 -0.60 -8.4 -14.2Checks written by consumers to businesses (CSS) BN TR 10.1 4.50 448 8.8 4.27 484 -1.2 -0.23 -4.3 -1.7
Checks written by businesses (CSS) BN TR 10.0 21.71 2,166 8.7 22.04 2,526 -1.3 0.33 -4.5 0.5Checks written by businesses to consumers (CSS) BN TR 3.6 3.79 1,057 3.4 3.64 1,058 -0.1 -0.15 -1.4 -1.3Checks written by businesses to businesses (CSS) BN TR 6.4 17.92 2,783 5.3 18.40 3,481 -1.2 0.48 -6.4 0.9
Checks written by purpose (CSS) BN TR 22.5 27.83 1,239 19.4 27.34 1,410 -3.1 -0.49 -4.8 -0.6Income checks written (CSS) BN TR 3.6 3.79 1,057 3.4 3.64 1,058 -0.1 -0.1 -1.4 -1.3Casual checks written (CSS) BN TR 2.4 1.61 678 1.8 1.02 557 -0.5 -0.6 -8.4 -14.2Bill Pay checks written (CSS) BN TR 14.2 20.89 1,474 12.6 22.07 1,747 -1.5 1.2 -3.7 1.9
Bill pay checks written from consumers to businesses (CSS) BN TR 8.2 4.06 492 7.6 3.93 518 -0.7 -0.1 -2.8 -1.1Bill pay checks written from businesses to businesses (CSS) BN TR 5.9 16.83 2,840 5.1 18.15 3,586 -0.9 1.3 -5.1 2.5
Point of Sale checks written (CSS) BN TR 1.2 0.16 139 1.1 0.16 146 -0.1 0.0 -2.7 -1.1Point of Sale checks written from consumers to businesses (CSS) BN TR 1.0 0.10 101 0.9 0.11 114 0.0 0.0 -1.0 3.1Point of Sale checks written from businesses to businesses (CSS) BN TR 0.2 0.07 316 0.1 0.05 351 -0.1 0.0 -11.2 -8.1
Bill pay/point of sale checks written (CSS) BN TR 1.2 1.37 1,186 0.4 0.44 1,131 -0.8 -0.9 -30.2 -31.3Bill pay/point of sale checks written from consumers to businesses (CSS) BN TR 0.9 0.35 407 0.3 0.24 769 -0.5 -0.1 -28.4 -11.5Bill pay/point of sale checks written from businesses to businesses (CSS) BN TR 0.3 1.03 3,363 0.1 0.20 2,545 -0.2 -0.8 -36.0 -41.7
Checks written by transaction value range (CSS) BN 22.5 19.4 -3.1 -4.8Checks written transactions with $50.00 or less in total value (CSS) BN 6.0 4.9 -1.0 -6.2Checks written transactions with $50.01 to $100.00 in total value (CSS) BN 3.6 2.9 -0.7 -6.8Checks written transactions with $100.01 to $500.00 in total value (CSS) BN 7.3 6.5 -0.8 -3.9Checks written transactions with $500.01 to $1000.00 in total value (CSS) BN 2.4 2.1 -0.3 -5.0Checks written transactions with $1,000.01 to $2,500.00 in total value (CSS) BN 1.7 1.5 -0.2 -3.8Checks written transactions with $2,500.01 to $5,000.00 in total value (CSS) BN 0.6 0.6 0.0 -1.0Checks written transactions with greater than $5,000.00 in total value (CSS) BN 0.7 0.8 0.0 2.2
Note:Figures may not sum because of rounding.CAGR is compound annual growth rate.Checks written is the sum of "checks paid" and "checks converted to ACH payments," which uses the check as a source document to initiate the ACH payment.Checks written by businesses to consumers (B2C) were defined as income payments, including payroll, dividends, and refunds.Checks written by consumers to consumers (C2C) were defined as casual payments. These are also called person-to-person (P2P) payments.Checks written to businesses were categorized as either bill pay, point-of-sale (POS) or, in cases where the purpose of a check written to a business could not be determined, bill pay/point-of-sale (POS). C2B refers to consumer-to-business. B2B refers to business-to-business.

Checks, 2012 & 2015 (DFIPS and CSS) Number Units
Value Units
2012 Number
2012 Value
2012 Average
Value
2015 Number
2015 Value
2015Average
Value
2012 to 2015 Number Change
2012 to 2015 Value Change
2012 to 2015 Number (CAGR)
as a Percent
2012 to 2015 Value (CAGR) as a Percent
Checks deposited by counterparty (DFIPS) BN TR 24.7 32.42 1,312 22.9 44.42 1,941 -1.8 12.00 -2.5 11.1Consumer checks deposited (DFIPS) BN TR 7.1 14.39 2,018Business checks deposited (DFIPS) BN TR 15.7 30.02 1,907
Checks deposited by deposit method (DFIPS) BN TR 24.7 32.42 1,312 22.9 44.42 1,941 -1.8 12.00 -2.5 11.1Image checks deposited (DFIPS) BN TR 8.8 10.69 1,221 8.8 14.06 1,605 0.0 3.37 0.0 9.6
Consumer and business client image checks deposited (DFIPS) BN TR 3.4 5.44 1,595 3.6 7.50 2,095 0.2 2.06 1.6 11.3Consumer client image checks deposited (DFIPS) BN TR 0.2 0.33 1,489 0.7 1.39 1,896 0.5 1.06 49.0 61.6
Consumer client image checks deposited via mobile (DFIPS) BN TR 0.1 0.13 1,000 0.5 0.88 1,798 0.4 0.75 56.1 89.7Consumer client image checks deposited via non-mobile (DFIPS) BN TR 0.1 0.20 2,161 0.2 0.51 2,090 0.2 0.31 38.1 36.6
Business client image checks deposited (DFIPS) BN TR 3.2 5.11 1,602 2.8 6.11 2,147 -0.3 1.00 -3.7 6.1Correspondent image checks deposited (DFIPS) BN TR 5.3 5.25 982 5.2 6.56 1,267 -0.2 1.31 -1.0 7.7
Paper checks deposited (DFIPS) BN TR 15.9 21.73 1,363 14.1 30.36 2,150 -1.8 8.63 -4.0 11.8Consumer and business client paper checks deposited (DFIPS) BN TR 15.9 21.64 1,360 14.0 30.17 2,163 -2.0 8.53 -4.3 11.7
Consumer and business client over-the-counter paper checks deposited (DFIPS) BN TR 10.9 26.47 2,438Consumer and business client wholesale vault paper checks deposited (DFIPS) BN TR 2.0 2.81 1,428Consumer and business client ATM paper checks deposited (DFIPS) BN TR 1.1 0.89 790
Consumer and business client on-us ATM paper checks deposited (DFIPS) BN TR 1.1 0.88 788
Consumer and business client on-us ATM paper checks imaged by an ATM checks deposited (DFIPS) BN TR 1.0 0.78 798Consumer and business client on-us ATM paper checks non-imaged by an ATM checks deposited (DFIPS) BN TR 0.1 0.10 718
Consumer and business client "foreign" ATM paper checks deposited (DFIPS) BN TR 0.0 0.01 930
Correspondent paper checks deposited (DFIPS) BN TR 0.0 0.09 2,283 0.2 0.19 1,101 0.1 0.10 65.9 30.1
Checks deposited by check creation method (DFIPS) BN TR 24.7 32.42 1,312 22.9 44.42 1,941 -1.8 12.00 -2.5 11.1Remotely created checks deposited (DFIPS) BN TR 0.1 0.10 1,350
Remotely created checks deposited, depository institution is payee (DFIPS) BN TR 0.1 0.08 1,344Remotely created checks deposited, accountholder is payee (DFIPS) BN TR 0.0 0.03 1,365
Non-remotely created checks deposited (DFIPS) BN TR 22.8 44.31 1,943
Note:Figures may not sum because of rounding.CAGR is compound annual growth rate.Checks written is the sum of "checks paid" and "checks converted to ACH payments," which uses the check as a source document to initiate the ACH payment.Checks written by businesses to consumers (B2C) were defined as income payments, including payroll, dividends, and refunds.Checks written by consumers to consumers (C2C) were defined as casual payments. These are also called person-to-person (P2P) payments.Checks written to businesses were categorized as either bill pay, point-of-sale (POS) or, in cases where the purpose of a check written to a business could not be determined, bill pay/point-of-sale (POS). C2B refers to consumer-to-business. B2B refers to business-to-business.
ACH, 2015 (DFIPS and NPIPS) Number Units
Value Units
2015 Number
2015 Value
2015 Average Value
Number Item Amount of Total
Value Item Amount of Total
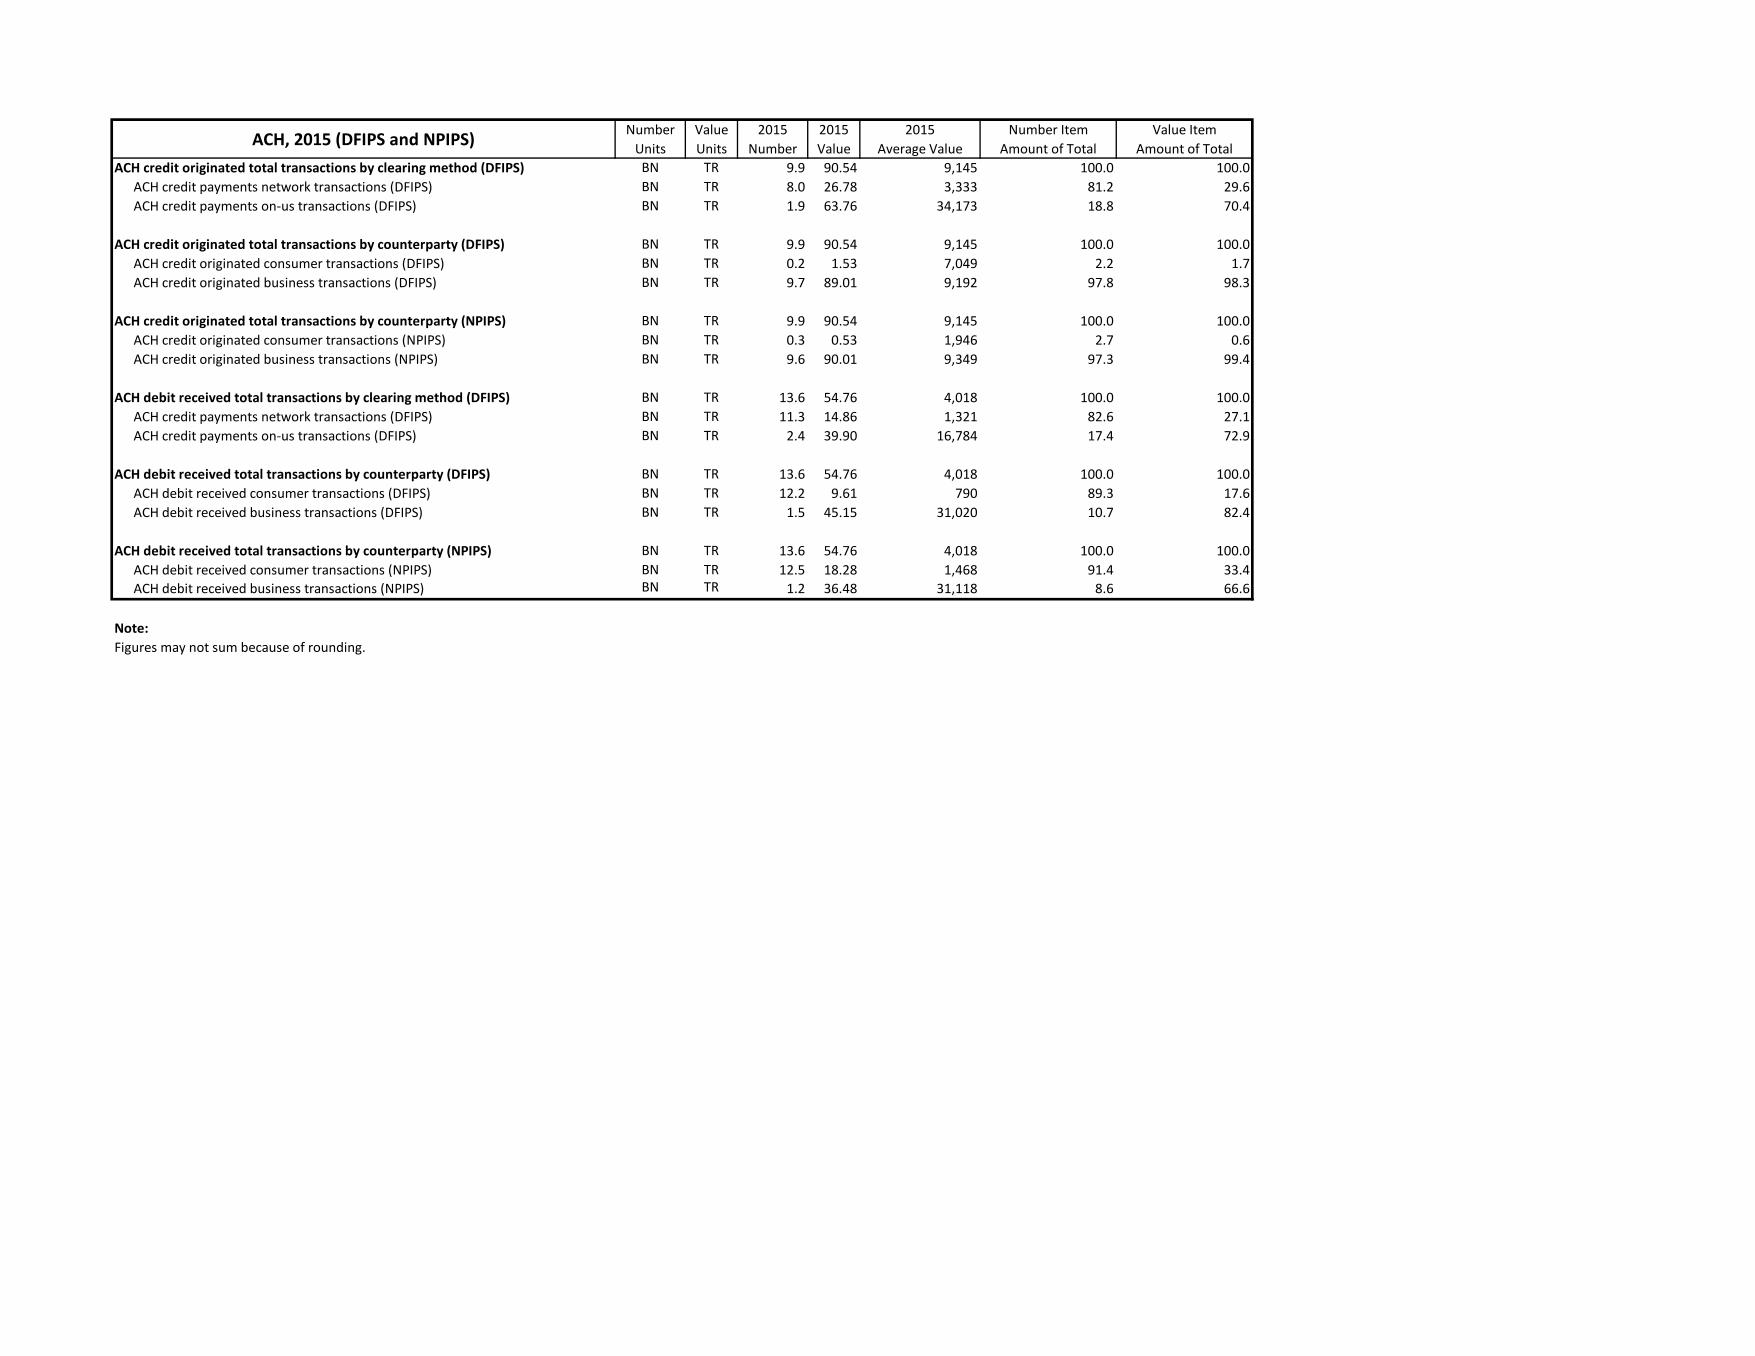
ACH credit originated total transactions by clearing method (DFIPS) BN TR 9.9 90.54 9,145 100.0 100.0ACH credit payments network transactions (DFIPS) BN TR 8.0 26.78 3,333 81.2 29.6ACH credit payments on-us transactions (DFIPS) BN TR 1.9 63.76 34,173 18.8 70.4
ACH credit originated total transactions by counterparty (DFIPS) BN TR 9.9 90.54 9,145 100.0 100.0ACH credit originated consumer transactions (DFIPS) BN TR 0.2 1.53 7,049 2.2 1.7ACH credit originated business transactions (DFIPS) BN TR 9.7 89.01 9,192 97.8 98.3
ACH credit originated total transactions by counterparty (NPIPS) BN TR 9.9 90.54 9,145 100.0 100.0ACH credit originated consumer transactions (NPIPS) BN TR 0.3 0.53 1,946 2.7 0.6ACH credit originated business transactions (NPIPS) BN TR 9.6 90.01 9,349 97.3 99.4
ACH debit received total transactions by clearing method (DFIPS) BN TR 13.6 54.76 4,018 100.0 100.0ACH credit payments network transactions (DFIPS) BN TR 11.3 14.86 1,321 82.6 27.1ACH credit payments on-us transactions (DFIPS) BN TR 2.4 39.90 16,784 17.4 72.9
ACH debit received total transactions by counterparty (DFIPS) BN TR 13.6 54.76 4,018 100.0 100.0ACH debit received consumer transactions (DFIPS) BN TR 12.2 9.61 790 89.3 17.6ACH debit received business transactions (DFIPS) BN TR 1.5 45.15 31,020 10.7 82.4
ACH debit received total transactions by counterparty (NPIPS) BN TR 13.6 54.76 4,018 100.0 100.0ACH debit received consumer transactions (NPIPS) BN TR 12.5 18.28 1,468 91.4 33.4ACH debit received business transactions (NPIPS) BN TR 1.2 36.48 31,118 8.6 66.6
Note:Figures may not sum because of rounding.

ACH, 2012 & 2015 (DFIPS and NPIPS) Number Units
Value Units
2012 Number
2012 Value
2012 Average
Value
2015 Number
2015 Value
2015Average
Value
2012 to 2015 Number Change
2012 to 2015 Value Change
2012 to 2015 Number (CAGR)
as a Percent
2012 to 2015 Value (CAGR) as a Percent
ACH credit originated total transactions by clearing method (DFIPS) BN TR 8.6 76.56 8,944 9.9 90.54 9,145 1.3 13.98 5.0 5.7ACH credit payments network transactions (DFIPS) BN TR 6.9 22.64 3,259 8.0 26.78 3,333 1.1 4.13 5.0 5.7ACH credit payments on-us transactions (DFIPS) BN TR 1.6 53.92 33,421 1.9 63.76 34,173 0.3 9.84 5.0 5.7
ACH credit originated total transactions by counterparty (DFIPS) BN TR 8.6 76.56 8,944 9.9 90.54 9,145 1.3 13.98 5.0 5.7ACH credit originated consumer transactions (DFIPS) BN TR 0.2 1.53 7,049ACH credit originated business transactions (DFIPS) BN TR 9.7 89.01 9,192
ACH credit originated total transactions by counterparty (NPIPS) BN TR 8.6 76.56 8,944 9.9 90.54 9,145 1.3 13.98 5.0 5.7ACH credit originated consumer transactions (NPIPS) BN TR 0.2 0.37 1,799 0.3 0.53 1,946 0.1 0.15 9.3 12.2ACH credit originated business transactions (NPIPS) BN TR 8.4 76.19 9,122 9.6 90.01 9,349 1.3 13.82 4.9 5.7
ACH debit received total transactions by clearing method (DFIPS) BN TR 11.8 52.45 4,427 13.6 54.76 4,018 1.8 2.31 4.8 1.4ACH credit payments network transactions (DFIPS) BN TR 9.8 14.24 1,456 11.3 14.86 1,321 1.5 0.63 4.8 1.4ACH credit payments on-us transactions (DFIPS) BN TR 2.1 38.22 18,493 2.4 39.90 16,784 0.3 1.68 4.8 1.4
ACH debit received total transactions by counterparty (DFIPS) BN TR 11.8 52.45 4,427 13.6 54.76 4,018 1.8 2.31 4.8 1.4ACH debit received consumer transactions (DFIPS) BN TR 12.2 9.61 790ACH debit received business transactions (DFIPS) BN TR 1.5 45.15 31,020
ACH debit received total transactions by counterparty (NPIPS) BN TR 11.8 52.45 4,427 13.6 54.76 4,018 1.8 2.31 4.8 1.4ACH debit received consumer transactions (NPIPS) BN TR 10.9 17.55 1,604 12.5 18.28 1,468 1.5 0.72 4.4 1.4ACH debit received business transactions (NPIPS) BN TR 0.9 34.90 38,575 1.2 36.48 31,118 0.3 1.59 9.0 1.5
Note:Figures may not sum because of rounding.CAGR is compound annual growth rate.

Non-Prepaid Debit Card, 2015 (DFIPS and NPIPS)
Number Units
Value Units
2015 Number
2015 Value
2015 Average Value
Number Item Amount of Total
Value Item Amount of Total
GP non-prepaid debit card network net, authorized & settled transactions (NAST) (DFIPS & NPIPS) BN TR 59.6 2.29 38 100.0 100.0
GP non-prepaid debit card network NAST by transaction type (DFIPS) BN TR 59.6 2.29 38 100.0 100.0GP non-prepaid debit card network card-present transactions (DFIPS) BN TR 52.4 1.83 35 88.0 79.7
GP non-prepaid debit card network signature-authenticated card-present transactions (DFIPS) BN TR 31.2 0.98 31 52.4 42.8GP non-prepaid debit card network PIN-authenticated card-present transactions (DFIPS) BN TR 20.7 0.82 40 34.7 35.9GP non-prepaid debit card network non-signature-authenticated and non-PIN-authenticated card-present transactions (DFIPS) BN TR 0.5 0.02 42 0.8 0.9
GP non-prepaid debit card network card-not-present transactions (DFIPS) BN TR 7.2 0.47 65 12.0 20.3
GP non-prepaid debit card network NAST by transaction type (NPIPS) BN TR 59.6 2.29 38 100.0 100.0GP non-prepaid debit card network in-person transactions (NPIPS) BN TR 50.9 1.66 33 85.4 72.3
GP non-prepaid debit card network in-person chip transactions (NPIPS) BN TR 0.4 0.02 49 0.7 1.0GP non-prepaid debit card network in-person no chip transactions (NPIPS) BN TR 50.5 1.64 32 84.6 71.3
GP non-prepaid debit card network remote transactions (NPIPS) BN TR 8.7 0.63 73 14.6 27.7GP non-prepaid debit card network remote mail-order/telephone-order transactions (NPIPS) BN TR 1.3 0.15 113 2.2 6.4 (NPIPS) BN TR 5.2 0.35 67 8.8 15.3GP non-prepaid debit card network remote recurring transactions (NPIPS) BN TR 1.4 0.08 59 2.3 3.6GP non-prepaid debit card network remote installment transactions (NPIPS) BN TR 0.0 0.00 38 0.0 0.0GP non-prepaid debit card network remote non-mail-order/telephone-order, non-internet, non-recurring, and non-installment transactions (NPIPS) BN TR 0.8 0.05 70 1.3 2.4
GP non-prepaid debit card network NAST by counterparty (DFIPS) BN TR 59.6 2.29 38 100.0 100.0GP non-prepaid debit card network consumer transactions (DFIPS) BN TR 57.5 2.10 36 96.4 91.5GP non-prepaid debit card network business transactions (DFIPS) BN TR 2.1 0.19 91 3.6 8.5
GP non-prepaid debit card network NAST by counterparty (NPIPS) BN TR 59.6 2.29 38 100.0 100.0GP non-prepaid debit card network consumer transactions (NPIPS) BN TR 57.4 2.09 36 96.4 91.1GP non-prepaid debit card network business transactions (NPIPS) BN TR 2.2 0.20 94 3.6 8.9
Note:Figures may not sum because of rounding.

Non-Prepaid Debit Card, 2015 (DFIPS and NPIPS)
Number Units
Value Units
2015 Number
2015 Value
2015 Average Value
Number Item Amount of Total
Value Item Amount of Total
GP non-prepaid debit card network NAST by transaction value range (NPIPS) BN TR 59.6 2.29 38 100.0 100.0GP non-prepaid debit card network transactions with less than $5.00 in total value (NPIPS) BN TR 8.3 0.02 3 14.0 0.9GP non-prepaid debit card network transactions with $5.00 to 9.99 in total value (NPIPS) BN TR 11.1 0.08 7 18.6 3.6GP non-prepaid debit card network transactions with $10.00 to 14.99 in total value (NPIPS) BN TR 7.6 0.09 12 12.7 4.0GP non-prepaid debit card network transactions with $15.00 to 24.99 in total value (NPIPS) BN TR 9.8 0.19 19 16.5 8.3GP non-prepaid debit card network transactions with $25.00 to 49.99 in total value (NPIPS) BN TR 11.7 0.41 35 19.6 17.7GP non-prepaid debit card network transactions with $50.00 or greater in total value (NPIPS) BN TR 11.1 1.50 135 18.7 65.5
GP non-prepaid debit card network transactions with $50.00 to 99.99 in total value (NPIPS) BN TR 6.4 0.44 68 10.8 19.1GP non-prepaid debit card network transactions with $100.00 to 499.99 in total value (NPIPS) BN TR 4.4 0.78 177 7.4 34.1GP non-prepaid debit card network transactions with $500.00 to 999.99 in total value (NPIPS) BN TR 0.2 0.13 655 0.3 5.8GP non-prepaid debit card network transactions with $1,000.00 or greater in total value (NPIPS) BN TR 0.1 0.15 1,841 0.1 6.4
GP non-prepaid debit card network NAST by payee location (NPIPS) BN TR 59.6 2.29 38 100.0 100.0GP non-prepaid debit card network domestic transactions with U.S. cards (NPIPS) BN TR 59.3 2.27 38 99.5 99.2GP non-prepaid debit card network cross-border transactions with U.S. cards (NPIPS) BN TR 0.3 0.02 63 0.5 0.8
GP non-prepaid debit card network cross-border transactions with non-U.S. cards (NPIPS) BN TR 0.3 0.02 70 100.0 100.0
Note:Figures may not sum because of rounding.

Non-Prepaid Debit Card, 2012 & 2015 (DFIPS and NPIPS)
Number Units
Value Units
2012 Number
2012 Value
2012 Average
Value
2015 Number
2015 Value
2015Average
Value
2012 to 2015 Number Change
2012 to 2015 Value Change
2012 to 2015 Number (CAGR)
as a Percent
2012 to 2015 Value (CAGR) as a Percent
GP non-prepaid debit card network net, authorized & settled transactions (NAST) (DFIPS & NPIPS) BN TR 47.3 1.87 40 59.6 2.29 38 12.3 0.42 8.0 7.0
GP non-prepaid debit card network NAST by transaction type (DFIPS) BN TR 47.3 1.87 40 59.6 2.29 38 12.3 0.42 8.0 7.0GP non-prepaid debit card network card-present transactions (DFIPS) BN TR 52.4 1.83 35
GP non-prepaid debit card network signature-authenticated card-present transactions (DFIPS) BN TR 31.2 0.98 31GP non-prepaid debit card network PIN-authenticated card-present transactions (DFIPS) BN TR 20.7 0.82 40GP non-prepaid debit card network non-signature-authenticated and non-PIN-authenticated card-present transactions (DFIPS) BN TR 0.5 0.02 42
GP non-prepaid debit card network card-not-present transactions (DFIPS) BN TR 7.2 0.47 65
GP non-prepaid debit card network NAST by transaction type (NPIPS) BN TR 47.3 1.87 40 59.6 2.29 38 12.3 0.42 8.0 7.0GP non-prepaid debit card network in-person transactions (NPIPS) BN TR 41.7 1.47 35 50.9 1.66 33 9.2 0.19 6.9 4.2
GP non-prepaid debit card network in-person chip transactions (NPIPS) BN TR 0.0 0.00 14 0.4 0.02 49 0.4 0.02 153.8 282.9GP non-prepaid debit card network in-person no chip transactions (NPIPS) BN TR 41.7 1.47 35 50.5 1.64 32 8.8 0.17 6.6 3.7
GP non-prepaid debit card network remote transactions (NPIPS) BN TR 5.6 0.41 73 8.7 0.63 73 3.1 0.23 16.1 16.1GP non-prepaid debit card network remote mail-order/telephone-order transactions (NPIPS) BN TR 1.3 0.15 113 (NPIPS) BN TR 5.2 0.35 67GP non-prepaid debit card network remote recurring transactions (NPIPS) BN TR 1.4 0.08 59GP non-prepaid debit card network remote installment transactions (NPIPS) BN TR 0.0 0.00 38GP non-prepaid debit card network remote non-mail-order/telephone-order, non-internet, non-recurring, and non-installment transactions (NPIPS) BN TR 0.8 0.05 70
GP non-prepaid debit card network NAST by counterparty (DFIPS) BN TR 47.3 1.87 40 59.6 2.29 38 12.3 0.42 8.0 7.0GP non-prepaid debit card network consumer transactions (DFIPS) BN TR 45.7 1.73 38 57.5 2.10 36 11.8 0.37 8.0 6.6GP non-prepaid debit card network business transactions (DFIPS) BN TR 1.6 0.14 88 2.1 0.19 91 0.5 0.05 10.1 11.4
GP non-prepaid debit card network NAST by counterparty (NPIPS) BN TR 47.3 1.87 40 59.6 2.29 38 12.3 0.42 8.0 7.0GP non-prepaid debit card network consumer transactions (NPIPS) BN TR 45.8 1.73 38 57.4 2.09 36 11.7 0.36 7.9 6.5GP non-prepaid debit card network business transactions (NPIPS) BN TR 1.5 0.14 93 2.2 0.20 94 0.7 0.06 12.8 13.1
Note:Figures may not sum because of rounding.CAGR is compound annual growth rate.2012 figures are restated as net, authorized and settled transactions (NAST). Figures reported in 2013 were adjusted to net, purchase transactions (NPT).

Non-Prepaid Debit Card, 2012 & 2015 (DFIPS and NPIPS)
Number Units
Value Units
2012 Number
2012 Value
2012 Average
Value
2015 Number
2015 Value
2015Average
Value
2012 to 2015 Number Change
2012 to 2015 Value Change
2012 to 2015 Number (CAGR)
as a Percent
2012 to 2015 Value (CAGR) as a Percent
GP non-prepaid debit card network NAST by transaction value range (NPIPS) BN TR 47.3 1.87 40 59.6 2.29 38 12.3 0.42 8.0 7.0GP non-prepaid debit card network transactions with less than $5.00 in total value (NPIPS) BN TR 6.1 0.02 3 8.3 0.02 3 2.3 0.00 11.2 4.4GP non-prepaid debit card network transactions with $5.00 to 9.99 in total value (NPIPS) BN TR 8.5 0.06 7 11.1 0.08 7 2.6 0.02 9.5 9.2GP non-prepaid debit card network transactions with $10.00 to 14.99 in total value (NPIPS) BN TR 5.7 0.07 12 7.6 0.09 12 1.8 0.02 9.8 9.3GP non-prepaid debit card network transactions with $15.00 to 24.99 in total value (NPIPS) BN TR 7.7 0.15 20 9.8 0.19 19 2.1 0.04 8.5 8.1GP non-prepaid debit card network transactions with $25.00 to 49.99 in total value (NPIPS) BN TR 9.9 0.35 36 11.7 0.41 35 1.8 0.05 5.7 4.7GP non-prepaid debit card network transactions with $50.00 or greater in total value (NPIPS) BN TR 9.5 1.22 129 11.1 1.50 135 1.7 0.29 5.6 7.3
GP non-prepaid debit card network transactions with $50.00 to 99.99 in total value (NPIPS) BN TR 6.4 0.44 68GP non-prepaid debit card network transactions with $100.00 to 499.99 in total value (NPIPS) BN TR 4.4 0.78 177GP non-prepaid debit card network transactions with $500.00 to 999.99 in total value (NPIPS) BN TR 0.2 0.13 655GP non-prepaid debit card network transactions with $1,000.00 or greater in total value (NPIPS) BN TR 0.1 0.15 1,841
GP non-prepaid debit card network NAST by payee location (NPIPS) BN TR 47.3 1.87 40 59.6 2.29 38 12.3 0.42 8.0 7.0GP non-prepaid debit card network domestic transactions with U.S. cards (NPIPS) BN TR 47.1 1.86 39 59.3 2.27 38 12.3 0.42 8.0 7.0GP non-prepaid debit card network cross-border transactions with U.S. cards (NPIPS) BN TR 0.2 0.01 72 0.3 0.02 63 0.1 0.00 10.5 5.7
GP non-prepaid debit card network cross-border transactions with non-U.S. cards (NPIPS) BN TR 0.3 0.02 70
Note:Figures may not sum because of rounding.CAGR is compound annual growth rate.2012 figures are restated as net, authorized and settled transactions (NAST). Figures reported in 2013 were adjusted to net, purchase transactions (NPT).

General-Purpose Prepaid Debit Card, 2015 (DFIPS and NPIPS)
Number Units
Value Units
2015 Number
2015 Value
2015 Average Value
Number Item Amount of Total
Value Item Amount of Total
GP prepaid debit card network net, authorized & settled transactions (NAST) (DFIPS & NPIPS) BN TR 3.7 0.12 34 100.0 100.0
GP prepaid debit card network NAST by transaction type (DFIPS) BN TR 3.7 0.12 34 100.0 100.0GP prepaid debit card network card-present transactions (DFIPS) BN TR 3.0 0.11 37 80.4 86.8
GP prepaid debit card network signature-authenticated card-present transactions (DFIPS) BN TR 1.6 0.08 48 43.9 61.9GP prepaid debit card network PIN-authenticated card-present transactions (DFIPS) BN TR 1.3 0.03 23 35.3 23.9GP prepaid debit card network non-signature-authenticated and non-PIN-authenticated card-present transactions (DFIPS) BN TR 0.0 0.00 30 1.2 1.1
GP prepaid debit card network card-not-present transactions (DFIPS) BN TR 0.7 0.02 23 19.6 13.2
GP prepaid debit card network NAST by transaction type (NPIPS GP prepaid networks) BN TR 3.7 0.12 34 100.0 100.0
GP prepaid debit card network in-person transactions (NPIPS GP prepaid networks) BN TR 3.0 0.08 28 81.5 67.8
GP prepaid debit card network in-person chip transactions (NPIPS GP prepaid networks) BN TR 0.0 0.00 35 0.1 0.1
GP prepaid debit card network in-person chip PIN-authenticated transactions (NPIPS GP prepaid networks) BN TR 0.0 0.00 34 0.1 0.1GP prepaid debit card network in-person chip non-PIN-authenticated transactions (NPIPS GP prepaid networks) BN TR 0.0 0.00 37 0.0 0.0
GP prepaid debit card network in-person no chip transactions (NPIPS GP prepaid networks) BN TR 3.0 0.08 28 81.4 67.7
GP prepaid debit card network in-person no chip PIN-authenticated transactions (NPIPS GP prepaid networks) BN TR 1.1 0.03 30 29.8 26.6GP prepaid debit card network in-person no chip non-PIN-authenticated transactions (NPIPS GP prepaid networks) BN TR 1.9 0.05 27 51.6 41.1
GP prepaid debit card network remote transactions (NPIPS GP prepaid networks) BN TR 0.7 0.04 59 18.5 32.2
GP prepaid debit card network remote mail-order/telephone-order transactions (NPIPS GP prepaid networks) BN TR 0.1 0.01 87 3.2 8.3GP prepaid debit card network remote internet purchase transactions (NPIPS GP prepaid networks) BN TR 0.5 0.02 50 12.6 18.4GP prepaid debit card network remote recurring transactions (NPIPS GP prepaid networks) BN TR 0.1 0.00 53 1.7 2.7GP prepaid debit card network remote installment transactions (NPIPS GP prepaid networks) BN TR 0.0 0.00 52 0.0 0.0GP prepaid debit card network remote non-mail-order/telephone-order, non-internet, non-recurring, and non-installment transactions (NPIPS GP prepaid networks) BN TR 0.0 0.00 94 1.0 2.7
GP prepaid debit card network NAST by card type (DFIPS) BN TR 3.7 0.12 34 100.0 100.0GP prepaid debit card network reloadable card transactions (DFIPS) BN TR 3.3 0.12 35 90.3 93.1GP prepaid debit card network non-reloadable card transactions (DFIPS) BN TR 0.4 0.01 24 9.7 7.0
Note:Figures may not sum because of rounding.

General-Purpose Prepaid Debit Card, 2015 (DFIPS and NPIPS)
Number Units
Value Units
2015 Number
2015 Value
2015 Average Value
Number Item Amount of Total
Value Item Amount of Total
GP prepaid debit card network NAST by counterparty (NPIPS GP prepaid networks) BN TR 3.7 0.12 34 100.0 100.0
GP prepaid debit card network consumer transactions (NPIPS GP prepaid networks) BN TR 3.6 0.12 33 98.9 97.3
GP prepaid debit card network consumer government-administered transactions (NPIPS GP prepaid networks) BN TR 0.4 0.01 26 12.2 9.4GP prepaid debit card network consumer non-government-administered transactions (NPIPS GP prepaid networks) BN TR 3.2 0.11 34 86.7 87.9
GP prepaid debit card network business transactions (NPIPS GP prepaid networks) BN TR 0.0 0.00 82 1.1 2.7
GP prepaid debit card network NAST by counterparty (NPIPS GP prepaid processors) BN TR 3.7 0.12 34 100.0 100.0
GP prepaid debit card network consumer transactions (NPIPS GP prepaid processors) BN TR 3.7 0.12 34 99.3 99.5
GP prepaid debit card network consumer government-administered general-use prepaid card transactions (NPIPS GP prepaid processors) BN TR 0.3 0.01 27 8.8 7.0GP prepaid debit card network consumer non-government-administered card transactions (NPIPS GP prepaid processors) BN TR 3.3 0.12 35 90.5 92.5
GP prepaid debit card network consumer non-government-administered gift card transactions (NPIPS GP prepaid processors) BN TR 0.3 0.01 24 8.2 5.8GP prepaid debit card network consumer non-government-administered FSA/HSA medical transactions (NPIPS GP prepaid processors) BN TR 0.3 0.02 76 8.4 19.0GP prepaid debit card network consumer non-government-administered customer refund and incentive transactions (NPIPS GP prepaid processors) BN TR 0.1 0.00 34 3.4 3.5GP prepaid debit card network consumer non-government-administered payroll transactions (NPIPS GP prepaid processors) BN TR 0.4 0.01 15 9.6 4.2GP prepaid debit card network consumer non-government-administered non-gift, non-FSA/HSA medical, non-customer refund and incentive, and non-payroll card transactions (NPIPS GP prepaid processors) BN TR 2.2 0.07 33 60.8 60.0
GP prepaid debit card network business transactions (NPIPS GP prepaid processors) BN TR 0.0 0.00 23 0.7 0.5
GP prepaid debit card network NAST by payee location (NPIPS GP prepaid networks) BN TR 3.7 0.12 34 100.0 100.0
GP prepaid debit card network domestic transactions with U.S. cards (NPIPS GP prepaid networks) BN TR 3.6 0.12 34 99.1 99.3GP prepaid debit card network cross-border transactions with U.S. cards (NPIPS GP prepaid networks) BN TR 0.0 0.00 27 0.9 0.7
Note:Figures may not sum because of rounding.

General-Purpose Prepaid Debit Card, 2015 (DFIPS and NPIPS)
Number Units
Value Units
2015 Number
2015 Value
2015 Average Value
Number Item Amount of Total
Value Item Amount of Total
GP prepaid debit card network NAST by payee location (NPIPS GP prepaid processors) BN TR 3.7 0.12 34 100.0 100.0
GP prepaid debit card network domestic transactions with U.S. cards (NPIPS GP prepaid processors) BN TR 2.8 0.09 34 75.8 76.1GP prepaid debit card network cross-border transactions with U.S. cards (NPIPS GP prepaid processors) BN TR 0.9 0.03 33 24.2 23.9
GP prepaid debit card network cross-border transactions with non-U.S. cards (NPIPS GP prepaid networks) BN TR 0.1 0.00 66 100.0 100.0
Note:Figures may not sum because of rounding.

General-Purpose Prepaid Debit Card, 2012 & 2015 (DFIPS and NPIPS)
Number Units
Value Units
2012 Number
2012 Value
2012 Average
Value
2015 Number
2015 Value
2015Average
Value
2012 to 2015 Number Change
2012 to 2015 Value Change
2012 to 2015 Number (CAGR)
as a Percent
2012 to 2015 Value (CAGR) as a Percent
GP prepaid debit card network net, authorized & settled transactions (NAST) (DFIPS & NPIPS) BN TR 3.1 0.11 35 3.7 0.12 34 0.6 0.02 5.6 4.4
GP prepaid debit card network NAST by transaction type (DFIPS) BN TR 3.1 0.11 35 3.7 0.12 34 0.6 0.02 5.6 4.4GP prepaid debit card network card-present transactions (DFIPS) BN TR 3.0 0.11 37
GP prepaid debit card network signature-authenticated card-present transactions (DFIPS) BN TR 1.6 0.08 48GP prepaid debit card network PIN-authenticated card-present transactions (DFIPS) BN TR 1.3 0.03 23GP prepaid debit card network non-signature-authenticated and non-PIN-authenticated card-present transactions (DFIPS) BN TR 0.0 0.00 30
GP prepaid debit card network card-not-present transactions (DFIPS) BN TR 0.7 0.02 23
GP prepaid debit card network NAST by transaction type (NPIPS GP prepaid networks) BN TR 3.1 0.11 35 3.7 0.12 34 0.6 0.02 5.6 4.4
GP prepaid debit card network in-person transactions (NPIPS GP prepaid networks) BN TR 2.7 0.09 31 3.0 0.08 28 0.2 0.00 2.9 -0.7
GP prepaid debit card network in-person chip transactions (NPIPS GP prepaid networks) BN TR 0.0 0.00 9 0.0 0.00 35 0.0 0.00 316.7 550.4
GP prepaid debit card network in-person chip PIN-authenticated transactions (NPIPS GP prepaid networks) BN TR 0.0 0.00 35 0.0 0.00 34 0.0 0.00 1174.6 1163.9GP prepaid debit card network in-person chip non-PIN-authenticated transactions (NPIPS GP prepaid networks) BN TR 0.0 0.00 9 0.0 0.00 37 0.0 0.00 220.1 415.8
GP prepaid debit card network in-person no chip transactions (NPIPS GP prepaid networks) BN TR 2.7 0.09 31 3.0 0.08 28 0.2 0.00 2.9 -0.7
GP prepaid debit card network in-person no chip PIN-authenticated transactions (NPIPS GP prepaid networks) BN TR 1.2 0.05 38 1.1 0.03 30 -0.1 -0.01 -2.9 -10.1GP prepaid debit card network in-person no chip non-PIN-authenticated transactions (NPIPS GP prepaid networks) BN TR 1.5 0.04 26 1.9 0.05 27 0.3 0.01 7.0 8.1
GP prepaid debit card network remote transactions (NPIPS GP prepaid networks) BN TR 0.4 0.02 61 0.7 0.04 59 0.3 0.02 21.5 19.8
GP prepaid debit card network remote mail-order/telephone-order transactions (NPIPS GP prepaid networks) BN TR 0.1 0.01 87GP prepaid debit card network remote internet purchase transactions (NPIPS GP prepaid networks) BN TR 0.5 0.02 50GP prepaid debit card network remote recurring transactions (NPIPS GP prepaid networks) BN TR 0.1 0.00 53GP prepaid debit card network remote installment transactions (NPIPS GP prepaid networks) BN TR 0.0 0.00 52GP prepaid debit card network remote non-mail-order/telephone-order, non-internet, non-recurring, and non-installment transactions (NPIPS GP prepaid networks) BN TR 0.0 0.00 94
GP prepaid debit card network NAST by card type (DFIPS) BN TR 3.1 0.11 35 3.7 0.12 34 0.6 0.02 5.6 4.4GP prepaid debit card network reloadable card transactions (DFIPS) BN TR 3.3 0.12 35GP prepaid debit card network non-reloadable card transactions (DFIPS) BN TR 0.4 0.01 24
Note:Figures may not sum because of rounding.CAGR is compound annual growth rate.2012 figures are restated as net, authorized and settled transactions (NAST). Figures reported in 2013 were adjusted to net, purchase transactions (NPT).

General-Purpose Prepaid Debit Card, 2012 & 2015 (DFIPS and NPIPS)
Number Units
Value Units
2012 Number
2012 Value
2012 Average
Value
2015 Number
2015 Value
2015Average
Value
2012 to 2015 Number Change
2012 to 2015 Value Change
2012 to 2015 Number (CAGR)
As a percent
2012 to 2015 Value (CAGR) As a percent
GP prepaid debit card network NAST by counterparty (NPIPS GP prepaid networks) BN TR 3.1 0.11 35 3.7 0.12 34 0.6 0.02 5.6 4.4
GP prepaid debit card network consumer transactions (NPIPS GP prepaid networks) BN TR 3.6 0.12 33
GP prepaid debit card network consumer government-administered transactions (NPIPS GP prepaid networks) BN TR 0.4 0.01 26GP prepaid debit card network consumer non-government-administered transactions (NPIPS GP prepaid networks) BN TR 3.2 0.11 34
GP prepaid debit card network business transactions (NPIPS GP prepaid networks) BN TR 0.0 0.00 82
GP prepaid debit card network NAST by counterparty (NPIPS GP prepaid processors) BN TR 3.1 0.11 35 3.7 0.12 34 0.6 0.02 5.6 4.4
GP prepaid debit card network consumer transactions (NPIPS GP prepaid processors) BN TR 3.1 0.11 35 3.7 0.12 34 0.5 0.01 5.3 4.2
GP prepaid debit card network consumer government-administered general-use prepaid card transactions (NPIPS GP prepaid processors) BN TR 0.5 0.02 40 0.3 0.01 27 -0.2 -0.01 -14.6 -25.5GP prepaid debit card network consumer non-government-administered card transactions (NPIPS GP prepaid processors) BN TR 2.6 0.09 34 3.3 0.12 35 0.7 0.03 8.5 9.2
GP prepaid debit card network consumer non-government-administered gift card transactions (NPIPS GP prepaid processors) BN TR 0.3 0.01 21 0.3 0.01 24 0.0 0.00 -3.4 1.4GP prepaid debit card network consumer non-government-administered FSA/HSA medical transactions (NPIPS GP prepaid processors) BN TR 0.2 0.01 52 0.3 0.02 76 0.1 0.01 11.6 27.0GP prepaid debit card network consumer non-government-administered customer refund and incentive transactions (NPIPS GP prepaid processors) BN TR 0.2 0.00 26 0.1 0.00 34 0.0 0.00 -6.8 2.4GP prepaid debit card network consumer non-government-administered payroll transactions (NPIPS GP prepaid processors) BN TR 0.5 0.01 24 0.4 0.01 15 -0.1 -0.01 -9.3 -23.1GP prepaid debit card network consumer non-government-administered non-gift, non-FSA/HSA medical, non-customer refund and incentive, and non-payroll card transactions (NPIPS GP prepaid processors) BN TR 1.4 0.05 38 2.2 0.07 33 0.8 0.02 16.4 11.2
GP prepaid debit card network business transactions (NPIPS GP prepaid processors) BN TR 0.0 0.00 0 0.0 0.00 23 0.0 0.00
GP prepaid debit card network NAST by payee location (NPIPS GP prepaid networks) BN TR 3.1 0.11 35 3.7 0.12 34 0.6 0.02 5.6 4.4
GP prepaid debit card network domestic transactions with U.S. cards (NPIPS GP prepaid networks) BN TR 3.1 0.11 35 3.6 0.12 34 0.5 0.01 5.5 4.4GP prepaid debit card network cross-border transactions with U.S. cards (NPIPS GP prepaid networks) BN TR 0.0 0.00 38 0.0 0.00 27 0.0 0.00 20.3 7.2
Note:Figures may not sum because of rounding.CAGR is compound annual growth rate.2012 figures are restated as net, authorized and settled transactions (NAST). Figures reported in 2013 were adjusted to net, purchase transactions (NPT).
General-Purpose Prepaid Debit Card, 2012 & 2015 (DFIPS and NPIPS)
Number Units
Value Units
2012 Number
2012 Value
2012 Average
Value
2015 Number
2015 Value
2015Average
Value
2012 to 2015 Number Change
2012 to 2015 Value Change
2012 to 2015 Number (CAGR)
as a Percent
2012 to 2015 Value (CAGR) as a Percent
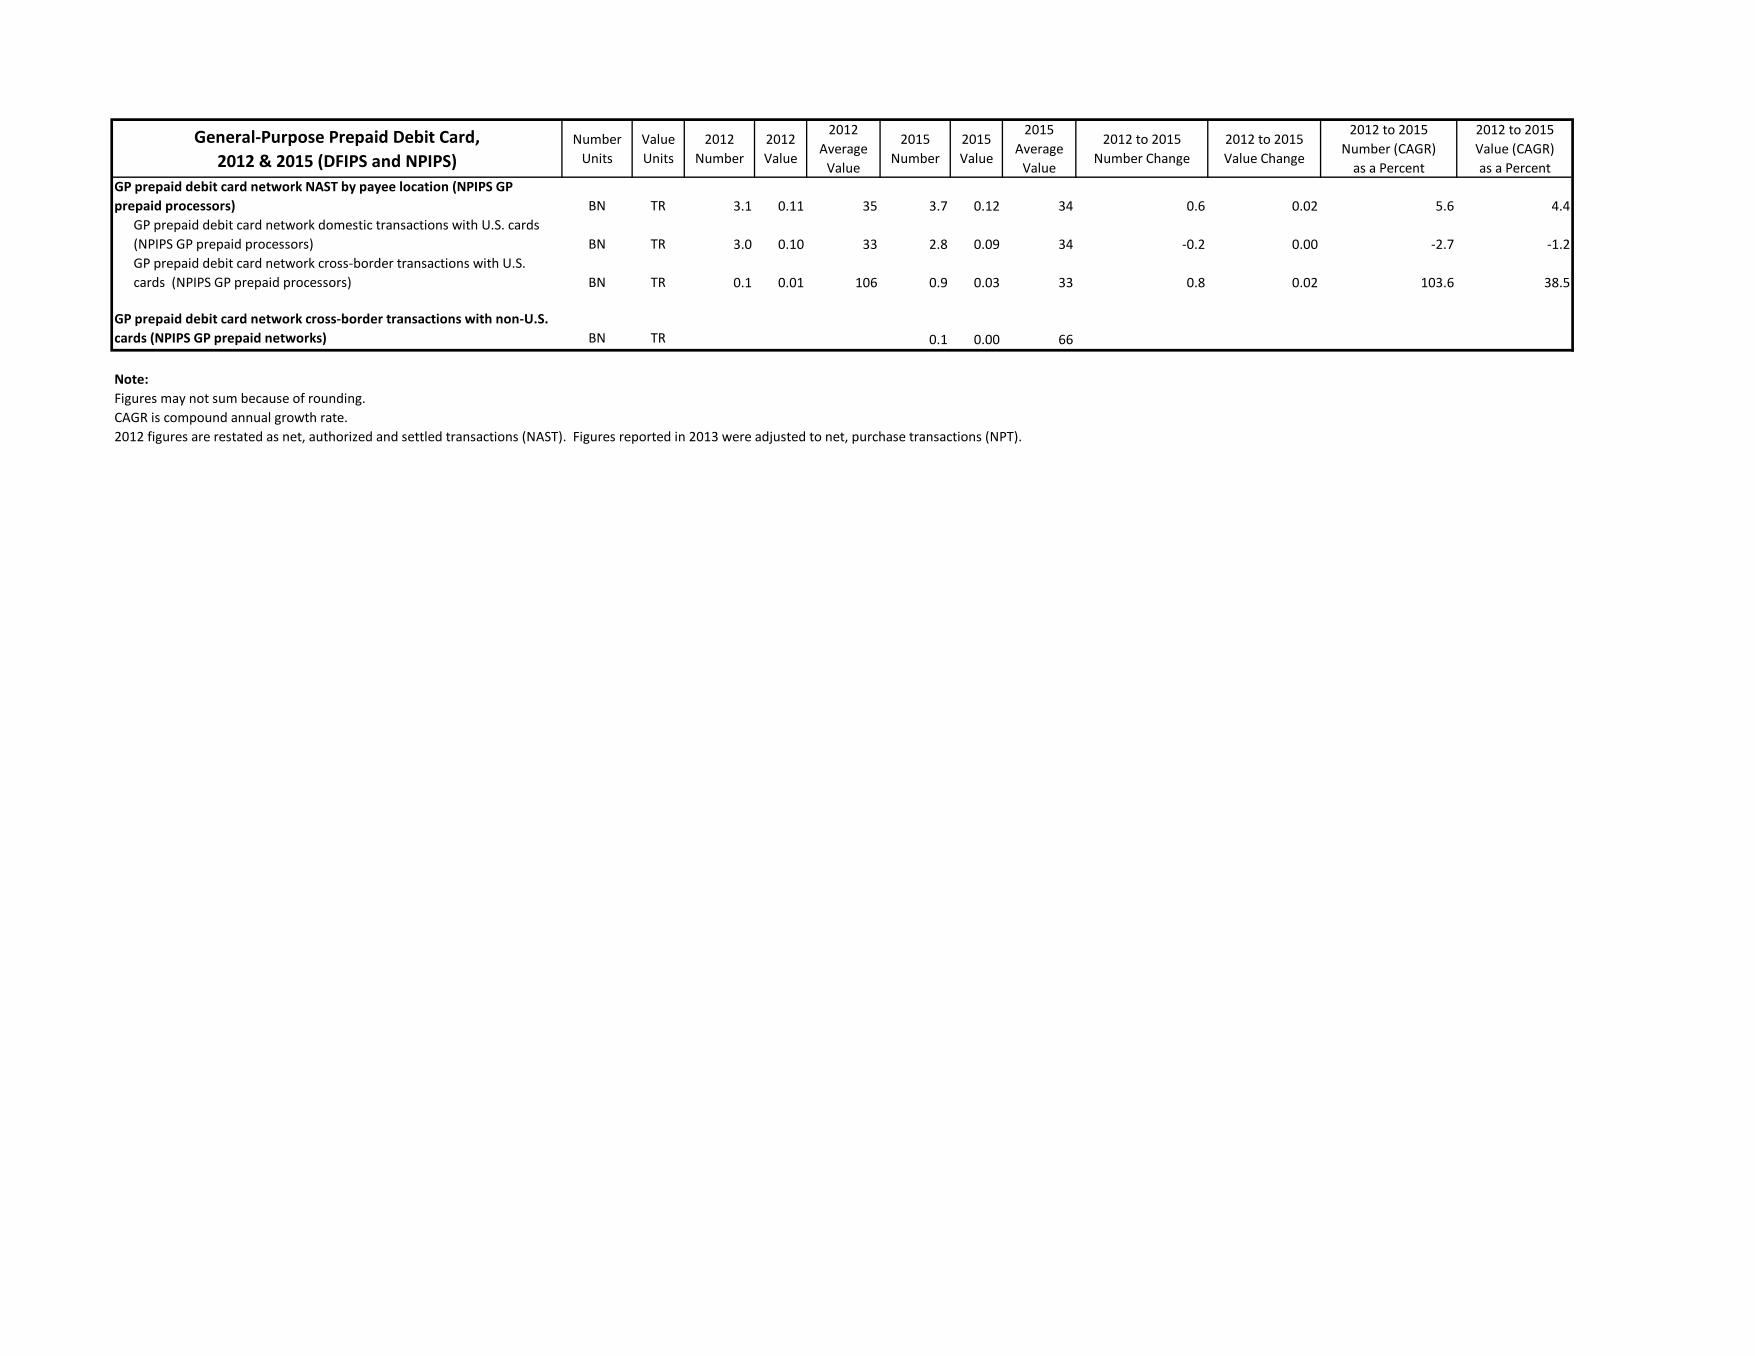
GP prepaid debit card network NAST by payee location (NPIPS GP prepaid processors) BN TR 3.1 0.11 35 3.7 0.12 34 0.6 0.02 5.6 4.4
GP prepaid debit card network domestic transactions with U.S. cards (NPIPS GP prepaid processors) BN TR 3.0 0.10 33 2.8 0.09 34 -0.2 0.00 -2.7 -1.2GP prepaid debit card network cross-border transactions with U.S. cards (NPIPS GP prepaid processors) BN TR 0.1 0.01 106 0.9 0.03 33 0.8 0.02 103.6 38.5
GP prepaid debit card network cross-border transactions with non-U.S. cards (NPIPS GP prepaid networks) BN TR 0.1 0.00 66
Note:Figures may not sum because of rounding.CAGR is compound annual growth rate.2012 figures are restated as net, authorized and settled transactions (NAST). Figures reported in 2013 were adjusted to net, purchase transactions (NPT).
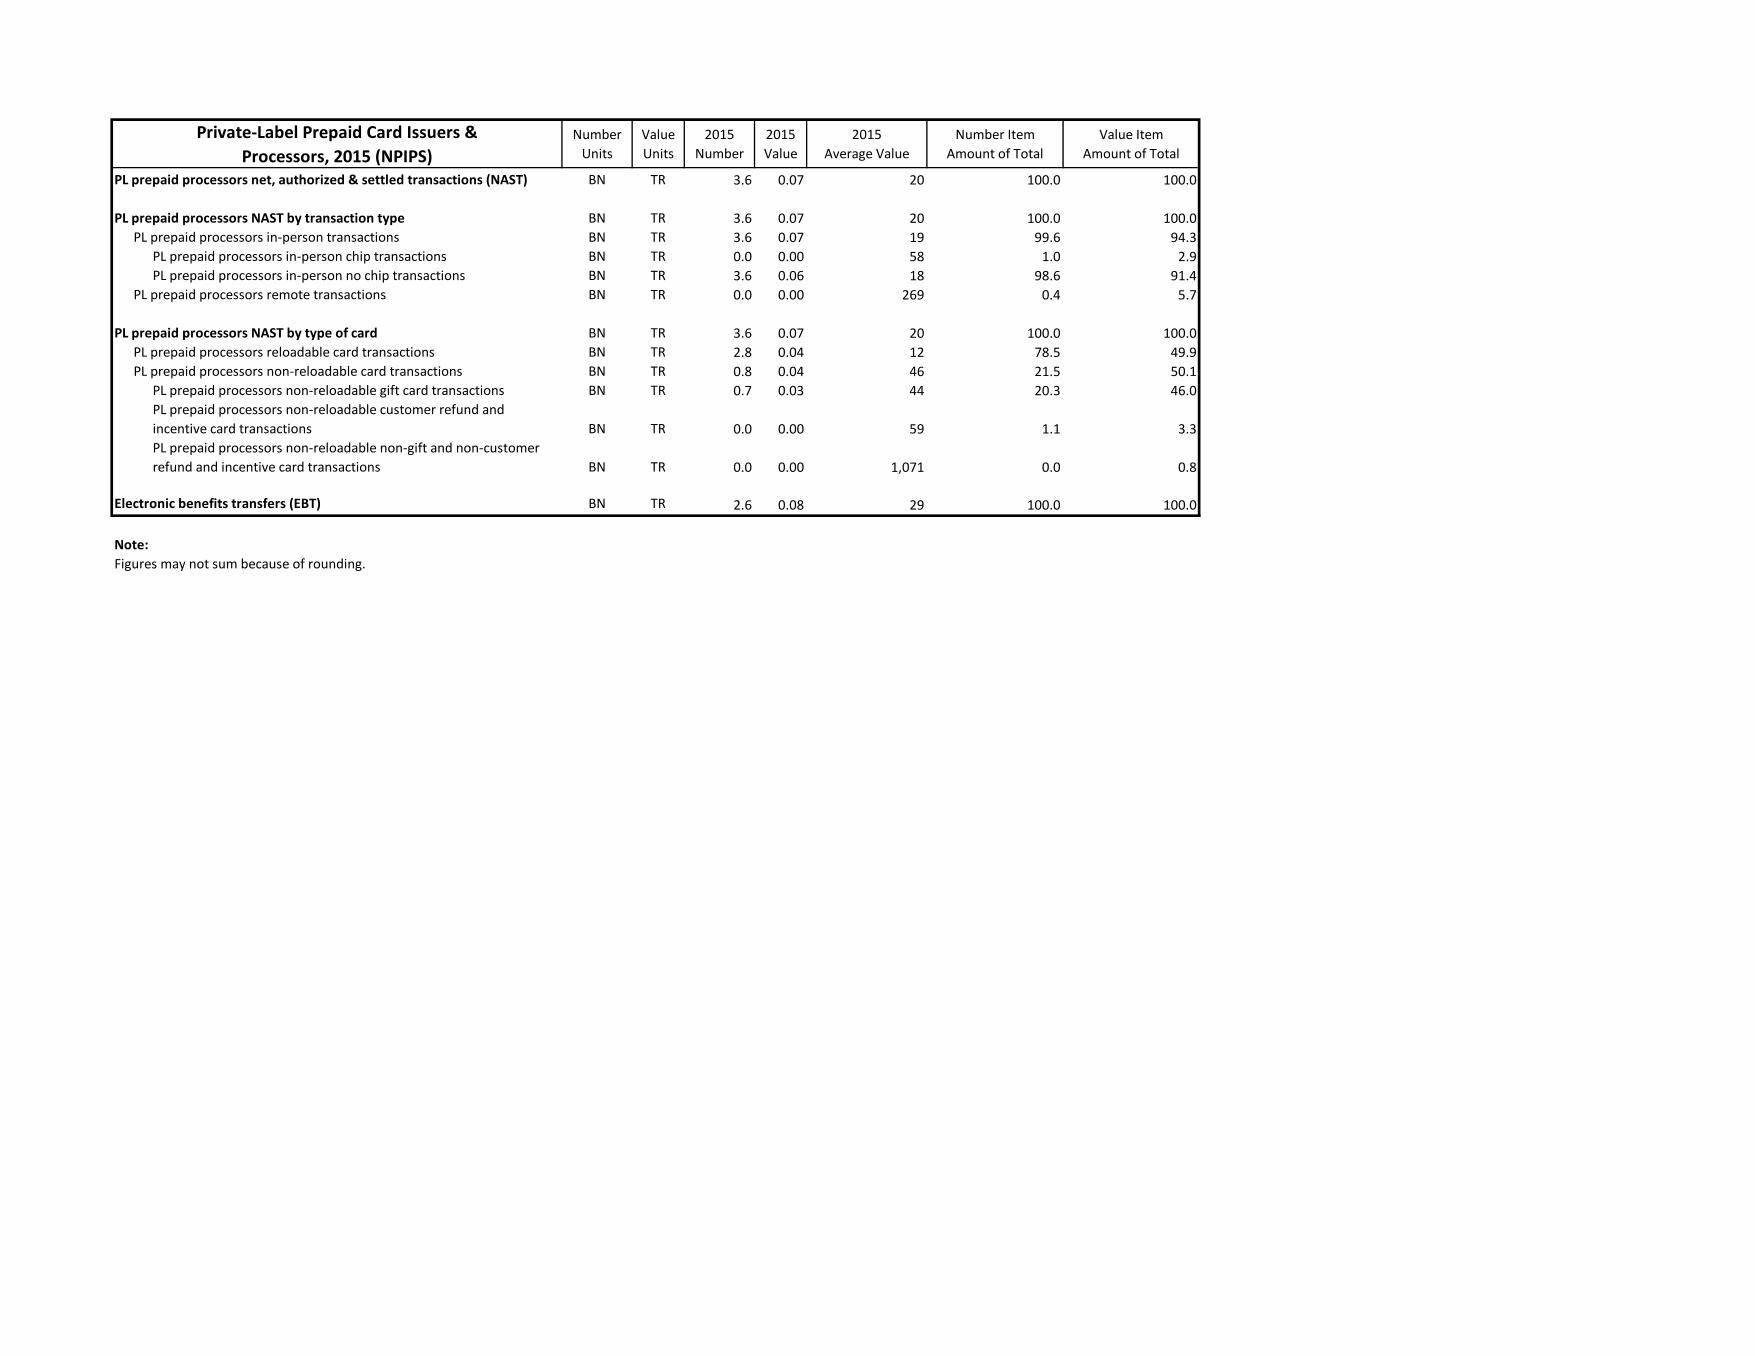
Private-Label Prepaid Card Issuers &Processors, 2015 (NPIPS)
Number Units
Value Units
2015 Number
2015 Value
2015 Average Value
Number Item Amount of Total
Value Item Amount of Total
PL prepaid processors net, authorized & settled transactions (NAST) BN TR 3.6 0.07 20 100.0 100.0
PL prepaid processors NAST by transaction type BN TR 3.6 0.07 20 100.0 100.0PL prepaid processors in-person transactions BN TR 3.6 0.07 19 99.6 94.3
PL prepaid processors in-person chip transactions BN TR 0.0 0.00 58 1.0 2.9PL prepaid processors in-person no chip transactions BN TR 3.6 0.06 18 98.6 91.4
PL prepaid processors remote transactions BN TR 0.0 0.00 269 0.4 5.7
PL prepaid processors NAST by type of card BN TR 3.6 0.07 20 100.0 100.0PL prepaid processors reloadable card transactions BN TR 2.8 0.04 12 78.5 49.9PL prepaid processors non-reloadable card transactions BN TR 0.8 0.04 46 21.5 50.1
PL prepaid processors non-reloadable gift card transactions BN TR 0.7 0.03 44 20.3 46.0PL prepaid processors non-reloadable customer refund and incentive card transactions BN TR 0.0 0.00 59 1.1 3.3PL prepaid processors non-reloadable non-gift and non-customer refund and incentive card transactions BN TR 0.0 0.00 1,071 0.0 0.8
Electronic benefits transfers (EBT) BN TR 2.6 0.08 29 100.0 100.0
Note:Figures may not sum because of rounding.

Private-Label Prepaid Card Issuers &Processors, 2012 & 2015 (NPIPS)
Number Units
Value Units
2012 Number
2012 Value
2012 Average
Value
2015 Number
2015 Value
2015Average
Value
2012 to 2015 Number Change
2012 to 2015 Value Change
2012 to 2015 Number (CAGR)
as a Percent
2012 to 2015 Value (CAGR) as a Percent
PL prepaid processors net, authorized & settled transactions (NAST) BN TR 3.7 0.05 13 3.6 0.07 20 0.0 0.02 -0.3 15.0
PL prepaid processors NAST by transaction type BN TR 3.7 0.05 13 3.6 0.07 20 0.0 0.02 -0.3 15.0PL prepaid processors in-person transactions BN TR 3.6 0.05 13 3.6 0.07 19 0.0 0.02 -0.2 13.3
PL prepaid processors in-person chip transactions BN TR 0.0 0.00 38 0.0 0.00 58 0.0 0.00 147.6 183.4PL prepaid processors in-person no chip transactions BN TR 3.6 0.05 13 3.6 0.06 18 -0.1 0.02 -0.5 12.2
PL prepaid processors remote transactions BN TR 0.0 0.00 24 0.0 0.00 269 0.0 0.00 -15.6 90.0
PL prepaid processors NAST by type of card BN TR 3.7 0.05 13 3.6 0.07 20 0.0 0.02 -0.3 15.0PL prepaid processors reloadable card transactions BN TR 2.8 0.04 12PL prepaid processors non-reloadable card transactions BN TR 0.8 0.04 46
PL prepaid processors non-reloadable gift card transactions BN TR 0.7 0.03 44PL prepaid processors non-reloadable customer refund and incentive card transactions BN TR 0.0 0.00 59PL prepaid processors non-reloadable non-gift and non-customer refund and incentive card transactions BN TR 0.0 0.00 1,071
Electronic benefits transfers (EBT) BN TR 2.5 0.07 30 2.6 0.08 29 0.1 0.00 1.7 0.2
Note:Figures may not sum because of rounding.CAGR is compound annual growth rate.2012 figures are restated as net, authorized and settled transactions (NAST). Figures reported in 2013 were adjusted to net, purchase transactions (NPT).

General-Purpose Credit Card, 2015 (DFIPS and NPIPS)
Number Units
Value Units
2015 Number
2015 Value
2015 Average Value
Number Item Amount of Total
Value Item Amount of Total
GP credit card network net, authorized & settled transactions (NAST) BN TR 31.0 2.80 90 100.0 100.0
GP credit card network NAST by transaction type (DFIPS) BN TR 31.0 2.80 90 100.0 100.0GP credit card network card-present transactions (DFIPS) BN TR 22.2 1.49 67 71.7 53.0
GP credit card network signature-authenticated card-present transactions (DFIPS) BN TR 18.6 1.23 66 60.1 43.8GP credit card network PIN-authenticated card-present transactions (DFIPS) BN TR 0.1 0.01 132 0.3 0.4GP credit card network non-signature-authenticated and non-PIN-authenticated card-present transactions (DFIPS) BN TR 3.5 0.25 71 11.3 8.9
GP credit card network card-not-present transactions (DFIPS) BN TR 8.8 1.32 150 28.3 47.0
GP credit card network NAST by transaction type (NPIPS) BN TR 31.0 2.80 90 100.0 100.0GP credit card network in-person transactions (NPIPS) BN TR 22.2 1.42 64 71.7 50.7
GP credit card network in-person chip transactions (NPIPS) BN TR 1.1 0.09 83 3.4 3.1GP credit card network in-person chip PIN-authenticated transactions (NPIPS) BN TR 0.0 0.00 96 0.0 0.0GP credit card network in-person chip non-PIN-authenticated transactions (NPIPS) BN TR 1.0 0.09 82 3.4 3.1
GP credit card network in-person no chip transactions (NPIPS) BN TR 21.2 1.33 63 68.3 47.5GP credit card network in-person no chip PIN-authenticated transactions (NPIPS) BN TR 0.0 0.00 131 0.1 0.1GP credit card network in-person no chip non-PIN-authenticated transactions (NPIPS) BN TR 21.2 1.33 63 68.2 47.4
GP credit card network remote transactions (NPIPS) BN TR 8.8 1.38 158 28.3 49.3GP credit card network remote mail-order/telephone-order transactions (NPIPS) BN TR 1.1 0.39 362 3.5 13.9GP credit card network remote internet purchase transactions (NPIPS) BN TR 5.5 0.74 135 17.7 26.5GP credit card network remote recurring transactions (NPIPS) BN TR 1.7 0.14 78 5.6 4.9GP credit card network remote installment transactions (NPIPS) BN TR 0.0 0.00 44 0.0 0.0GP credit card network remote non-mail-order/telephone-order, non-internet, non-recurring, and non-installment transactions (NPIPS) BN TR 0.5 0.11 248 1.5 4.0
GP credit card network NAST by payment transaction type (NPIPS) BN TR 31.0 2.80 90 100.0 100.0GP credit card network cash advances, adjustments and returns transactions BN TR 1.1 0.12 113 3.4 4.3GP credit card network net purchase transactions (NPT) BN TR 30.0 2.68 90 96.6 95.7
GP credit card network NAST by counterparty (NPIPS) BN TR 31.0 2.80 90 100.0 100.0GP credit card network consumer transactions (NPIPS) BN TR 26.9 1.95 72 86.7 69.4GP credit card network business transactions (NPIPS) BN TR 4.1 0.86 207 13.3 30.6
Note:Figures may not sum because of rounding.

General-Purpose Credit Card, 2015 (DFIPS and NPIPS)
Number Units
Value Units
2015 Number
2015 Value
2015 Average Value
Number Item Amount of Total
Value Item Amount of Total
GP credit card network NAST by transaction value range (NPIPS) BN TR 31.0 2.80 90 100.0 100.0GP credit card network transactions with less than $5.00 in total value (NPIPS) BN TR 3.3 0.01 2 10.5 0.3GP credit card network transactions with $5.00 to 9.99 in total value (NPIPS) BN TR 3.9 0.03 7 12.4 1.0GP credit card network transactions with $10.00 to 14.99 in total value (NPIPS) BN TR 3.0 0.04 12 9.7 1.3GP credit card network transactions with $15.00 to 24.99 in total value (NPIPS) BN TR 4.5 0.09 20 14.4 3.1GP credit card network transactions with $25.00 to 49.99 in total value (NPIPS) BN TR 6.5 0.23 35 21.0 8.2GP credit card network transactions with $50.00 or greater in total value (NPIPS) BN TR 9.9 2.41 243 32.0 86.1
GP credit card network transactions with $50.00 to 99.99 in total value (NPIPS) BN TR 4.6 0.32 69 14.8 11.4GP credit card network transactions with $100.00 to 499.99 in total value (NPIPS) BN TR 4.6 0.86 189 14.7 30.7GP credit card network transactions with $500.00 to 999.99 in total value (NPIPS) BN TR 0.5 0.31 668 1.5 10.9GP credit card network transactions with $1,000.00 or greater in total value (NPIPS) BN TR 0.3 0.93 2,935 1.0 33.2
GP credit card network NAST by payee location (NPIPS) BN TR 31.0 2.80 90 100.0 100.0GP credit card network domestic transactions with U.S. cards (NPIPS) BN TR 30.5 2.73 89 98.5 97.5GP credit card network cross-border transactions with U.S. cards (NPIPS) BN TR 0.5 0.07 148 1.5 2.5
GP credit card network cross-border transactions with non-U.S. cards (NPIPS) BN TR 2.2 0.27 126 7.1 9.8
GP credit card non-network transactions (DFIPS) MM BN 83.3 76.67 920 100.0 100.0GP credit card non-network balance transfer transactions (DFIPS) MM BN 38.9 50.30 1,292 46.8 65.6GP credit card non-network convenience check transactions (DFIPS) MM BN 22.5 19.57 871 27.0 25.5GP credit card non-network non-balance transfer and non-convenience check transactions (DFIPS) MM BN 21.9 6.80 311 26.3 8.9
Note:Figures may not sum because of rounding.
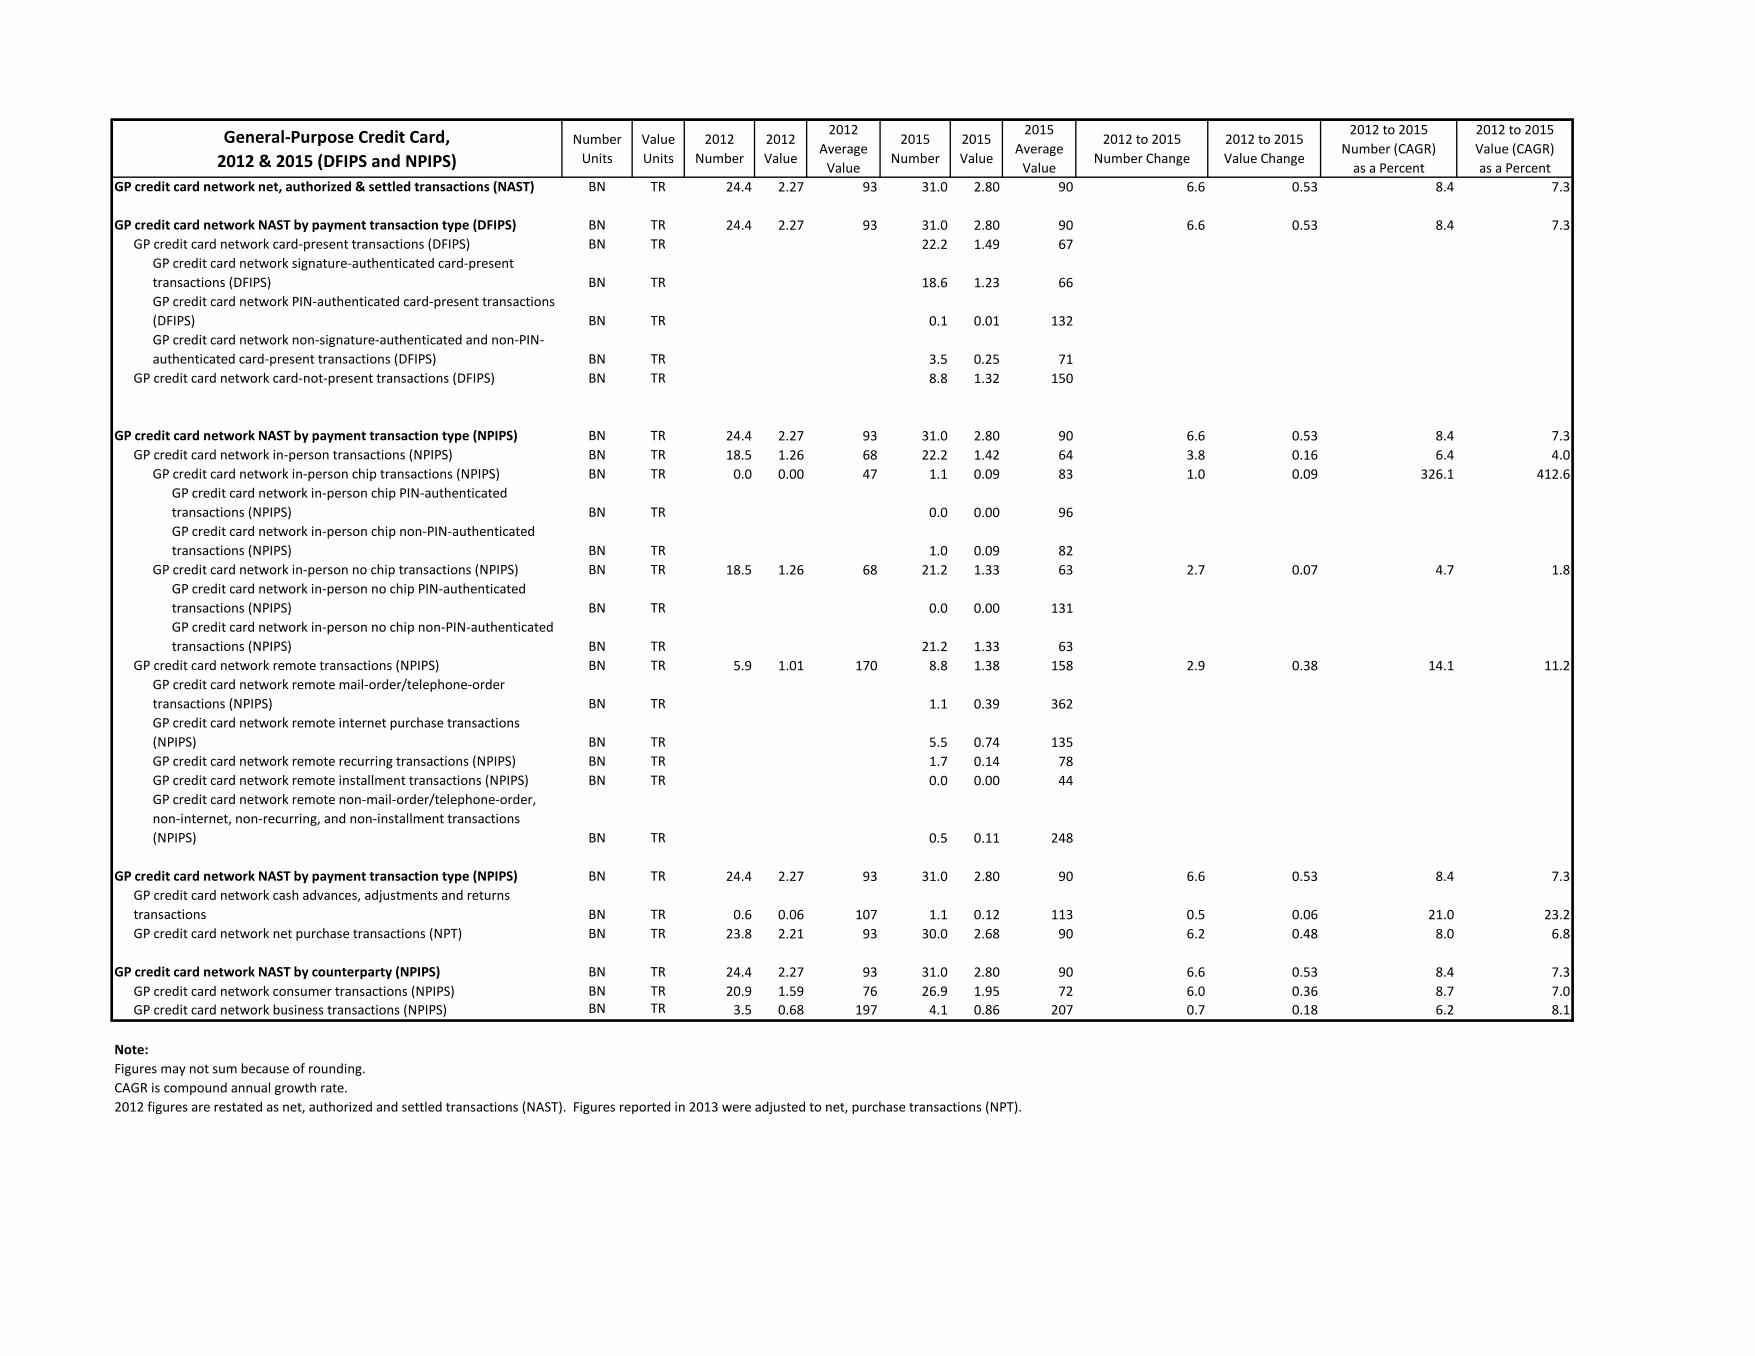
General-Purpose Credit Card, 2012 & 2015 (DFIPS and NPIPS)
Number Units
Value Units
2012 Number
2012 Value
2012 Average
Value
2015 Number
2015 Value
2015Average
Value
2012 to 2015 Number Change
2012 to 2015 Value Change
2012 to 2015 Number (CAGR)
as a Percent
2012 to 2015 Value (CAGR) as a Percent
GP credit card network net, authorized & settled transactions (NAST) BN TR 24.4 2.27 93 31.0 2.80 90 6.6 0.53 8.4 7.3
GP credit card network NAST by payment transaction type (DFIPS) BN TR 24.4 2.27 93 31.0 2.80 90 6.6 0.53 8.4 7.3GP credit card network card-present transactions (DFIPS) BN TR 22.2 1.49 67
GP credit card network signature-authenticated card-present transactions (DFIPS) BN TR 18.6 1.23 66GP credit card network PIN-authenticated card-present transactions (DFIPS) BN TR 0.1 0.01 132GP credit card network non-signature-authenticated and non-PIN-authenticated card-present transactions (DFIPS) BN TR 3.5 0.25 71
GP credit card network card-not-present transactions (DFIPS) BN TR 8.8 1.32 150
GP credit card network NAST by payment transaction type (NPIPS) BN TR 24.4 2.27 93 31.0 2.80 90 6.6 0.53 8.4 7.3GP credit card network in-person transactions (NPIPS) BN TR 18.5 1.26 68 22.2 1.42 64 3.8 0.16 6.4 4.0
GP credit card network in-person chip transactions (NPIPS) BN TR 0.0 0.00 47 1.1 0.09 83 1.0 0.09 326.1 412.6GP credit card network in-person chip PIN-authenticated transactions (NPIPS) BN TR 0.0 0.00 96GP credit card network in-person chip non-PIN-authenticated transactions (NPIPS) BN TR 1.0 0.09 82
GP credit card network in-person no chip transactions (NPIPS) BN TR 18.5 1.26 68 21.2 1.33 63 2.7 0.07 4.7 1.8GP credit card network in-person no chip PIN-authenticated transactions (NPIPS) BN TR 0.0 0.00 131GP credit card network in-person no chip non-PIN-authenticated transactions (NPIPS) BN TR 21.2 1.33 63
GP credit card network remote transactions (NPIPS) BN TR 5.9 1.01 170 8.8 1.38 158 2.9 0.38 14.1 11.2GP credit card network remote mail-order/telephone-order transactions (NPIPS) BN TR 1.1 0.39 362GP credit card network remote internet purchase transactions (NPIPS) BN TR 5.5 0.74 135GP credit card network remote recurring transactions (NPIPS) BN TR 1.7 0.14 78GP credit card network remote installment transactions (NPIPS) BN TR 0.0 0.00 44GP credit card network remote non-mail-order/telephone-order, non-internet, non-recurring, and non-installment transactions (NPIPS) BN TR 0.5 0.11 248
GP credit card network NAST by payment transaction type (NPIPS) BN TR 24.4 2.27 93 31.0 2.80 90 6.6 0.53 8.4 7.3GP credit card network cash advances, adjustments and returns transactions BN TR 0.6 0.06 107 1.1 0.12 113 0.5 0.06 21.0 23.2GP credit card network net purchase transactions (NPT) BN TR 23.8 2.21 93 30.0 2.68 90 6.2 0.48 8.0 6.8
GP credit card network NAST by counterparty (NPIPS) BN TR 24.4 2.27 93 31.0 2.80 90 6.6 0.53 8.4 7.3GP credit card network consumer transactions (NPIPS) BN TR 20.9 1.59 76 26.9 1.95 72 6.0 0.36 8.7 7.0GP credit card network business transactions (NPIPS) BN TR 3.5 0.68 197 4.1 0.86 207 0.7 0.18 6.2 8.1
Note:Figures may not sum because of rounding.CAGR is compound annual growth rate.2012 figures are restated as net, authorized and settled transactions (NAST). Figures reported in 2013 were adjusted to net, purchase transactions (NPT).

General-Purpose Credit Card, 2012 & 2015 (DFIPS and NPIPS)
Number Units
Value Units
2012 Number
2012 Value
2012 Average
Value
2015 Number
2015 Value
2015Average
Value
2012 to 2015 Number Change
2012 to 2015 Value Change
2012 to 2015 Number (CAGR)
as a Percent
2012 to 2015 Value (CAGR) as a Percent
GP credit card network NAST by transaction value range (NPIPS) BN TR 24.4 2.27 93 31.0 2.80 90 6.6 0.53 8.4 7.3GP credit card network transactions with less than $5.00 in total value (NPIPS) BN TR 2.1 0.01 3 3.3 0.01 2 1.1 0.00 15.4 12.1GP credit card network transactions with $5.00 to 9.99 in total value (NPIPS) BN TR 2.7 0.02 8 3.9 0.03 7 1.1 0.01 12.2 11.2GP credit card network transactions with $10.00 to 14.99 in total value (NPIPS) BN TR 2.2 0.03 13 3.0 0.04 12 0.8 0.01 10.6 9.4GP credit card network transactions with $15.00 to 24.99 in total value (NPIPS) BN TR 3.4 0.07 20 4.5 0.09 20 1.1 0.02 9.6 8.6GP credit card network transactions with $25.00 to 49.99 in total value (NPIPS) BN TR 5.4 0.20 37 6.5 0.23 35 1.1 0.03 6.4 4.9GP credit card network transactions with $50.00 or greater in total value (NPIPS) BN TR 8.5 1.95 229 9.9 2.41 243 1.4 0.47 5.3 7.4
GP credit card network transactions with $50.00 to 99.99 in total value (NPIPS) BN TR 4.6 0.32 69GP credit card network transactions with $100.00 to 499.99 in total value (NPIPS) BN TR 4.6 0.86 189GP credit card network transactions with $500.00 to 999.99 in total value (NPIPS) BN TR 0.5 0.31 668GP credit card network transactions with $1,000.00 or greater in total value (NPIPS) BN TR 0.3 0.93 2,935
GP credit card network NAST by payee location (NPIPS) BN TR 24.4 2.27 93 31.0 2.80 90 6.6 0.53 8.4 7.3GP credit card network domestic transactions with U.S. cards (NPIPS) BN TR 24.1 2.21 92 30.5 2.73 89 6.5 0.52 8.2 7.3GP credit card network cross-border transactions with U.S. cards (NPIPS) BN TR 0.3 0.06 188 0.5 0.07 148 0.2 0.01 16.8 7.9
GP credit card network cross-border transactions with non-U.S. cards (NPIPS) BN TR 2.2 0.27 126
GP credit card non-network transactions (DFIPS) MM BN 83.3 76.67 920GP credit card non-network balance transfer transactions (DFIPS) MM BN 38.9 50.30 1,292GP credit card non-network convenience check transactions (DFIPS) MM BN 22.5 19.57 871GP credit card non-network non-balance transfer and non-convenience check transactions (DFIPS) MM BN 21.9 6.80 311
Note:Figures may not sum because of rounding.CAGR is compound annual growth rate.2012 figures are restated as net, authorized and settled transactions (NAST). Figures reported in 2013 were adjusted to net, purchase transactions (NPT).

Private-Label Credit Card Merchant Issuers, 2015 (NPIPS)
Number Units
Value Units
2015 Number
2015 Value
2015 Average Value
Number Item Amount of Total
Value Item Amount of Total
PL credit card issuers net, authorized & settled transactions (NAST) BN TR 0.1 0.01 85 100.0 100.0
PL credit card issuers NAST by counterparty BN TR 0.1 0.01 85 100.0 100.0PL credit card issuers consumer transactions BN TR 0.0 0.00 100 71.4 83.8PL credit card issuers business transactions BN TR 0.0 0.00 48 28.6 16.2
PL credit card issuers NAST by transaction type BN TR 0.1 0.01 85 100.0 100.0PL credit card issuers in-person transactions BN TR 0.1 0.01 81 98.8 94.2
PL credit card issuers in-person chip transactions BN TR 0.0 0.00 0 0.0 0.0PL credit card issuers in-person no chip transactions BN TR 0.1 0.01 81 98.8 94.2
PL credit card issuers in-person mobile transactions BN TR 0.0 0.00 0 0.0 0.0PL credit card issuers in-person non-mobile transactions BN TR 0.1 0.01 81 98.8 94.2
PL credit card issuers remote transactions BN TR 0.0 0.00 409 1.2 5.8
Note:Figures may not sum because of rounding.

Private-Label Credit Card Merchant Issuers, 2012 & 2015 (NPIPS)
Number Units
Value Units
2012 Number
2012 Value
2012 Average
Value
2015 Number
2015 Value
2015Average
Value
2012 to 2015 Number Change
2012 to 2015 Value Change
2012 to 2015 Number (CAGR)
as a Percent
2012 to 2015 Value (CAGR) as a Percent
PL credit card issuers net, authorized & settled transactions (NAST) BN TR 0.3 0.03 98 0.1 0.01 85 -0.2 -0.02 -36.6 -39.5
PL credit card issuers NAST by counterparty BN TR 0.3 0.03 98 0.1 0.01 85 -0.2 -0.02 -36.6 -39.5PL credit card issuers consumer transactions BN TR 0.2 0.02 100 0.0 0.00 100 -0.2 -0.02 -41.8 -41.8PL credit card issuers business transactions BN TR 0.0 0.00 76 0.0 0.00 48 0.0 0.00 -2.7 -16.6
PL credit card issuers NAST by transaction type BN TR 0.3 0.03 98 0.1 0.01 85 -0.2 -0.02 -36.6 -39.5PL credit card issuers in-person transactions BN TR 0.3 0.02 96 0.1 0.01 81 -0.2 -0.02 -36.3 -39.9
PL credit card issuers in-person chip transactions BN TR 0.0 0.00 0 0.0 0.00 0 0.0 0.00PL credit card issuers in-person no chip transactions BN TR 0.3 0.02 96 0.1 0.01 81 -0.2 -0.02 -36.3 -39.9
PL credit card issuers in-person mobile transactions BN TR 0.0 0.00 0 0.0 0.00 0 0.0 0.00 0.0 0.0PL credit card issuers in-person non-mobile transactions BN TR 0.3 0.02 96 0.1 0.01 81 -0.2 -0.02 -36.3 -39.9
PL credit card issuers remote transactions BN TR 0.0 0.00 150 0.0 0.00 409 0.0 0.00 -50.0 -30.1
Note:Figures may not sum because of rounding.CAGR is compound annual growth rate.2012 figures are restated as net, authorized and settled transactions (NAST). Figures reported in 2013 were adjusted to net, purchase transactions (NPT).

Private-Label Credit Card Processors, 2015 (NPIPS)
Number Units
Value Units
2015 Number
2015 Value
2015 Average Value
Number Item Amount of Total
Value Item Amount of Total
PL credit card processors net, authorized & settled transactions (NAST) BN TR 2.7 0.35 129 100.0 100.0
PL credit card processors NAST by counterparty BN TR 2.7 0.35 129 100.0 100.0PL credit card processors consumer transactions BN TR 1.9 0.28 145 72.1 81.0PL credit card processors business transactions BN TR 0.7 0.07 88 27.9 19.0
PL credit card processors NAST by transaction type BN TR 2.7 0.35 129 100.0 100.0PL credit card processors in-person transactions BN TR 2.2 0.31 141 81.9 89.6
PL credit card processors in-person chip transactions BN TR 0.0 0.00 97 0.2 0.1PL credit card processors in-person no chip transactions BN TR 2.2 0.31 141 81.8 89.5
PL credit card processors remote transactions BN TR 0.5 0.04 74 18.1 10.4
PL credit card processors NAST by transaction value range BN TR 2.7 0.35 129 100.0 100.0PL credit card processors transactions with less than $5.00 in total value BN TR 0.2 0.00 2 8.1 0.1PL credit card processors transactions with $5.00 to 9.99 in total value BN TR 0.1 0.00 9 5.4 0.4PL credit card processors transactions with $10.00 to 14.99 in total value BN TR 0.2 0.00 15 6.3 0.7PL credit card processors transactions with $15.00 to 24.99 in total value BN TR 0.4 0.01 24 15.5 2.9PL credit card processors transactions with $25.00 to 49.99 in total value BN TR 0.6 0.03 42 23.9 7.9PL credit card processors transactions with $50.00 or greater in total value BN TR 1.1 0.31 279 40.8 88.1
PL credit card processors transactions with $50.00 to 99.99 in total value BN TR 0.5 0.04 82 19.7 12.4PL credit card processors transactions with $100.00 to 499.99 in total value BN TR 0.5 0.11 221 18.0 30.8PL credit card processors transactions with $500.00 to 999.99 in total value BN TR 0.0 0.03 742 1.6 9.0PL credit card processors transactions with $1,000.00 or greater in total value BN TR 0.0 0.12 2,902 1.6 35.8
Note:Figures may not sum because of rounding.
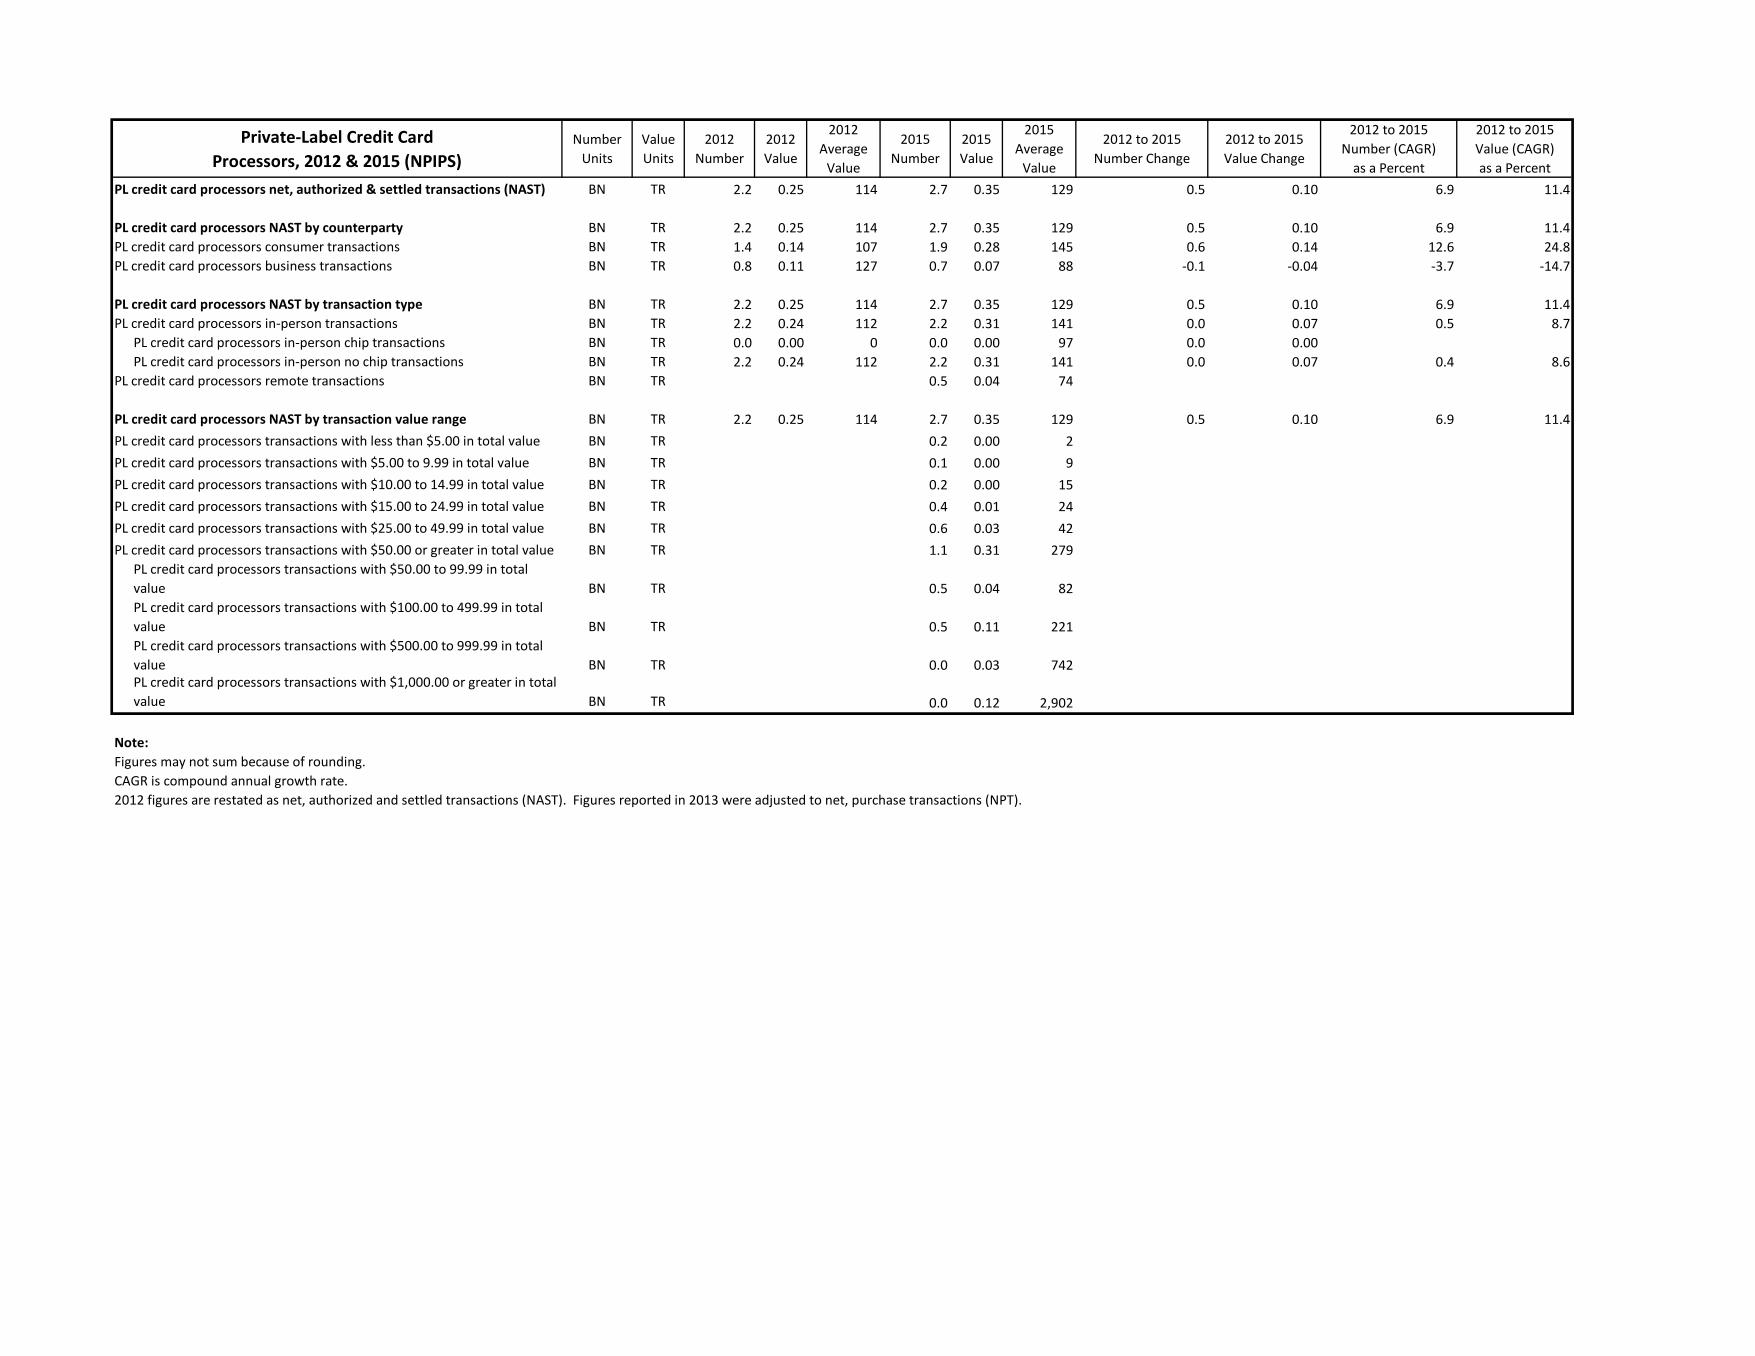
Private-Label Credit Card Processors, 2012 & 2015 (NPIPS)
Number Units
Value Units
2012 Number
2012 Value
2012 Average
Value
2015 Number
2015 Value
2015Average
Value
2012 to 2015 Number Change
2012 to 2015 Value Change
2012 to 2015 Number (CAGR)
as a Percent
2012 to 2015 Value (CAGR) as a Percent
PL credit card processors net, authorized & settled transactions (NAST) BN TR 2.2 0.25 114 2.7 0.35 129 0.5 0.10 6.9 11.4
PL credit card processors NAST by counterparty BN TR 2.2 0.25 114 2.7 0.35 129 0.5 0.10 6.9 11.4PL credit card processors consumer transactions BN TR 1.4 0.14 107 1.9 0.28 145 0.6 0.14 12.6 24.8PL credit card processors business transactions BN TR 0.8 0.11 127 0.7 0.07 88 -0.1 -0.04 -3.7 -14.7
PL credit card processors NAST by transaction type BN TR 2.2 0.25 114 2.7 0.35 129 0.5 0.10 6.9 11.4PL credit card processors in-person transactions BN TR 2.2 0.24 112 2.2 0.31 141 0.0 0.07 0.5 8.7
PL credit card processors in-person chip transactions BN TR 0.0 0.00 0 0.0 0.00 97 0.0 0.00PL credit card processors in-person no chip transactions BN TR 2.2 0.24 112 2.2 0.31 141 0.0 0.07 0.4 8.6
PL credit card processors remote transactions BN TR 0.5 0.04 74
PL credit card processors NAST by transaction value range BN TR 2.2 0.25 114 2.7 0.35 129 0.5 0.10 6.9 11.4PL credit card processors transactions with less than $5.00 in total value BN TR 0.2 0.00 2PL credit card processors transactions with $5.00 to 9.99 in total value BN TR 0.1 0.00 9PL credit card processors transactions with $10.00 to 14.99 in total value BN TR 0.2 0.00 15PL credit card processors transactions with $15.00 to 24.99 in total value BN TR 0.4 0.01 24PL credit card processors transactions with $25.00 to 49.99 in total value BN TR 0.6 0.03 42PL credit card processors transactions with $50.00 or greater in total value BN TR 1.1 0.31 279
PL credit card processors transactions with $50.00 to 99.99 in total value BN TR 0.5 0.04 82PL credit card processors transactions with $100.00 to 499.99 in total value BN TR 0.5 0.11 221PL credit card processors transactions with $500.00 to 999.99 in total value BN TR 0.0 0.03 742PL credit card processors transactions with $1,000.00 or greater in total value BN TR 0.0 0.12 2,902
Note:Figures may not sum because of rounding.CAGR is compound annual growth rate.2012 figures are restated as net, authorized and settled transactions (NAST). Figures reported in 2013 were adjusted to net, purchase transactions (NPT).

Person-to-Person (P2P) and Money TransferProcessors, 2015 (NPIPS)
Number Units
Value Units
2015 Number
2015 Value
2015 Average Value
Number Item Amount of Total
Value Item Amount of Total
Person-to-person & money transfer processors total transactions MM BN 396.9 138.35 349 100.0 100.0
Person-to-person and money transfer processors total transactions by payee location MM BN 396.9 138.35 349 100.0 100.0
Person-to-person and money transfer processors domestic transactions from U.S. domiciled accounts MM BN 317.0 110.28 348 79.9 79.7Person-to-person and money transfer processors cross-border transactions from U.S. domiciled accounts MM BN 79.9 28.08 351 20.1 20.3
Person-to-person and money transfer processors total transactions by clearing system MM BN 396.9 138.35 349 100.0 100.0
Person-to-person and money transfer processors credit card/signature debit networks transactions MM BN 20.3 2.69 133 5.1 1.9Person-to-person and money transfer processor EFT/PIN debit networks transactions MM BN 30.1 3.21 107 7.6 2.3Person-to-person and money transfer processor ACH transactions MM BN 88.0 23.25 264 22.2 16.8Person-to-person and money transfer processor book transfer transactions MM BN 167.0 48.11 288 42.1 34.8Person-to-person and money transfer processor non-credit card/signature debit network, non-EFT/PIN debit network, non-ACH, and non-book transfer transactions MM BN 91.6 61.10 667 23.1 44.2
Person-to-person and money transfer processors total transactions by origination channel MM BN 396.9 138.35 349 100.0 100.0
Person-to-person and money transfer processors website transactions MM BN 155.7 78.08 502 39.2 56.4Person-to-person and money transfer processors mobile phone transactions MM BN 113.8 17.98 158 28.7 13.0Person-to-person and money transfer processor in-person transactions MM BN 102.2 39.91 391 25.7 28.8Person-to-person and money transfer processor non-website, non-mobile phone, and non-in-person transactions MM BN 25.3 2.38 94 6.4 1.7
Note:Figures may not sum because of rounding.
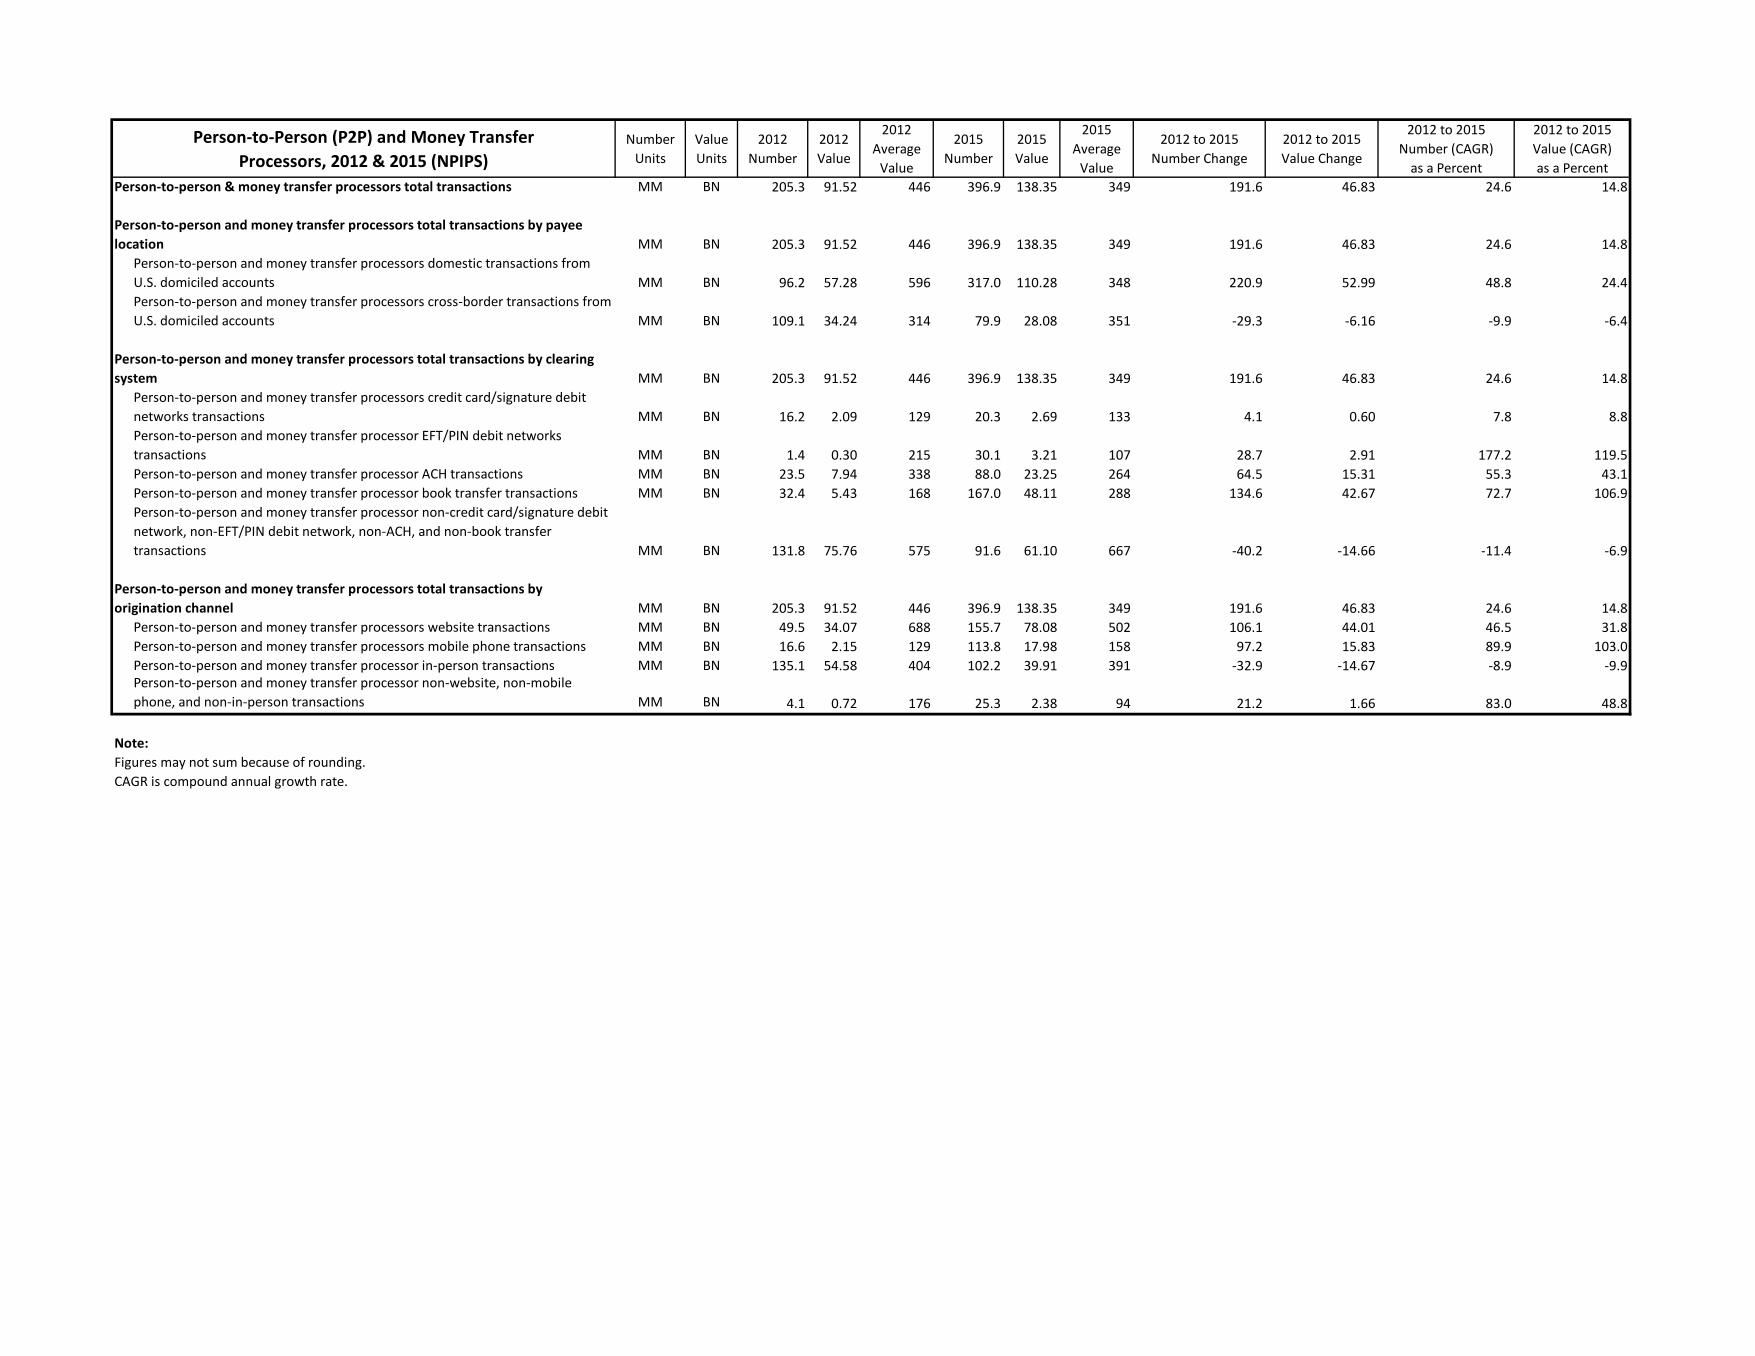
Person-to-Person (P2P) and Money TransferProcessors, 2012 & 2015 (NPIPS)
Number Units
Value Units
2012 Number
2012 Value
2012 Average
Value
2015 Number
2015 Value
2015Average
Value
2012 to 2015 Number Change
2012 to 2015 Value Change
2012 to 2015 Number (CAGR)
as a Percent
2012 to 2015 Value (CAGR) as a Percent
Person-to-person & money transfer processors total transactions MM BN 205.3 91.52 446 396.9 138.35 349 191.6 46.83 24.6 14.8
Person-to-person and money transfer processors total transactions by payee location MM BN 205.3 91.52 446 396.9 138.35 349 191.6 46.83 24.6 14.8
Person-to-person and money transfer processors domestic transactions from U.S. domiciled accounts MM BN 96.2 57.28 596 317.0 110.28 348 220.9 52.99 48.8 24.4Person-to-person and money transfer processors cross-border transactions from U.S. domiciled accounts MM BN 109.1 34.24 314 79.9 28.08 351 -29.3 -6.16 -9.9 -6.4
Person-to-person and money transfer processors total transactions by clearing system MM BN 205.3 91.52 446 396.9 138.35 349 191.6 46.83 24.6 14.8
Person-to-person and money transfer processors credit card/signature debit networks transactions MM BN 16.2 2.09 129 20.3 2.69 133 4.1 0.60 7.8 8.8Person-to-person and money transfer processor EFT/PIN debit networks transactions MM BN 1.4 0.30 215 30.1 3.21 107 28.7 2.91 177.2 119.5Person-to-person and money transfer processor ACH transactions MM BN 23.5 7.94 338 88.0 23.25 264 64.5 15.31 55.3 43.1Person-to-person and money transfer processor book transfer transactions MM BN 32.4 5.43 168 167.0 48.11 288 134.6 42.67 72.7 106.9Person-to-person and money transfer processor non-credit card/signature debit network, non-EFT/PIN debit network, non-ACH, and non-book transfer transactions MM BN 131.8 75.76 575 91.6 61.10 667 -40.2 -14.66 -11.4 -6.9
Person-to-person and money transfer processors total transactions by origination channel MM BN 205.3 91.52 446 396.9 138.35 349 191.6 46.83 24.6 14.8
Person-to-person and money transfer processors website transactions MM BN 49.5 34.07 688 155.7 78.08 502 106.1 44.01 46.5 31.8Person-to-person and money transfer processors mobile phone transactions MM BN 16.6 2.15 129 113.8 17.98 158 97.2 15.83 89.9 103.0Person-to-person and money transfer processor in-person transactions MM BN 135.1 54.58 404 102.2 39.91 391 -32.9 -14.67 -8.9 -9.9Person-to-person and money transfer processor non-website, non-mobile phone, and non-in-person transactions MM BN 4.1 0.72 176 25.3 2.38 94 21.2 1.66 83.0 48.8
Note:Figures may not sum because of rounding.CAGR is compound annual growth rate.

Online Bill Payment Processors,2015 (NPIPS)
Number Units
Value Units
2015 Number
2015 Value
2015 Average Value
Number Item Amount of Total
Value Item Amount of Total
Online bill payment processors total transactions MM BN 3,233.1 1,571.66 486 100.0 100.0Online bill payment processors bank/intermediary payment transactions MM BN 2,718.6 1,308.92 481 84.1 83.3
Online bill payment processors bank/intermediary payment transactions initiated with mobile device MM BN 217.5 66.95 308 6.7 4.3Online bill payment processors bank/intermediary payment transactions not initiated with mobile device MM BN 2,501.1 1,241.98 497 77.4 79.0
Online bill payment processors biller-direct transactions MM BN 514.6 262.73 511 15.9 16.7
Online bill payment processors total transactions by disbursement method MM BN 3,233.1 1,571.66 486 100.0 100.0
Online bill payment processors ACH disbursement MM BN 1,897.3 944.14 498 58.7 60.1Online bill payment processors check disbursement MM BN 453.4 266.46 588 14.0 17.0Online bill payment processors wire disbursement MM BN 578.9 227.89 394 17.9 14.5Online bill payment processors non-ACH, non-check, and non-wire disbursement MM BN 303.5 133.16 439 9.4 8.5
Online bill payment processor total transactions by funding method MM BN 3,233.1 1,571.66 486 100.0 100.0Online bill payment processors cash funding MM BN 0.1 0.01 150 0.0 0.0Online bill payment processors check funding MM BN 254.8 177.05 695 7.9 11.3Online bill payment processors GP Card funding MM BN 275.5 54.45 198 8.5 3.5Online bill payment processors ACH funding MM BN 2,460.4 1,235.47 502 76.1 78.6Online bill payment processors non-cash, non-check, non-GP card, and non-ACH funding MM BN 242.4 104.69 432 7.5 6.7
Note:Figures may not sum because of rounding.

Online Bill Payment Processors,2012 & 2015 (NPIPS)
Number Units
Value Units
2012 Number
2012 Value
2012 Average
Value
2015 Number
2015 Value
2015Average
Value
2012 to 2015 Number Change
2012 to 2015 Value Change
2012 to 2015 Number (CAGR)
as a Percent
2012 to 2015 Value (CAGR) as a Percent
Online bill payment processors total transactions MM BN 3,097.4 1,180.39 381 3,233.1 1,571.66 486 135.7 391.27 1.4 10.0Online bill payment processors bank/intermediary payment transactions MM BN 2,836.1 1,050.17 370 2,718.6 1,308.92 481 -117.5 258.75 -1.4 7.6
Online bill payment processors bank/intermediary payment transactions initiated with mobile device MM BN 217.5 66.95 308Online bill payment processors bank/intermediary payment transactions not initiated with mobile device MM BN 2,501.1 1,241.98 497
Online bill payment processors biller-direct transactions MM BN 261.3 130.22 498 514.6 262.73 511 253.3 132.52 25.3 26.4
Online bill payment processors total transactions by disbursement method MM BN 3,097.4 1,180.39 381 3,233.1 1,571.66 486 135.7 391.27 1.4 10.0
Online bill payment processors ACH disbursement MM BN 1,897.3 944.14 498Online bill payment processors check disbursement MM BN 453.4 266.46 588Online bill payment processors wire disbursement MM BN 578.9 227.89 394Online bill payment processors non-ACH, non-check, and non-wire disbursement MM BN 303.5 133.16 439
Online bill payment processor total transactions by funding method MM BN 3,097.4 1,180.39 381 3,233.1 1,571.66 486 135.7 391.27 1.4 10.0Online bill payment processors cash funding MM BN 0.1 0.01 150Online bill payment processors check funding MM BN 254.8 177.05 695Online bill payment processors GP Card funding MM BN 275.5 54.45 198Online bill payment processors ACH funding MM BN 2,460.4 1,235.47 502Online bill payment processors non-cash, non-check, non-GP card, and non-ACH funding MM BN 242.4 104.69 432
Note:Figures may not sum because of rounding.CAGR is compound annual growth rate.
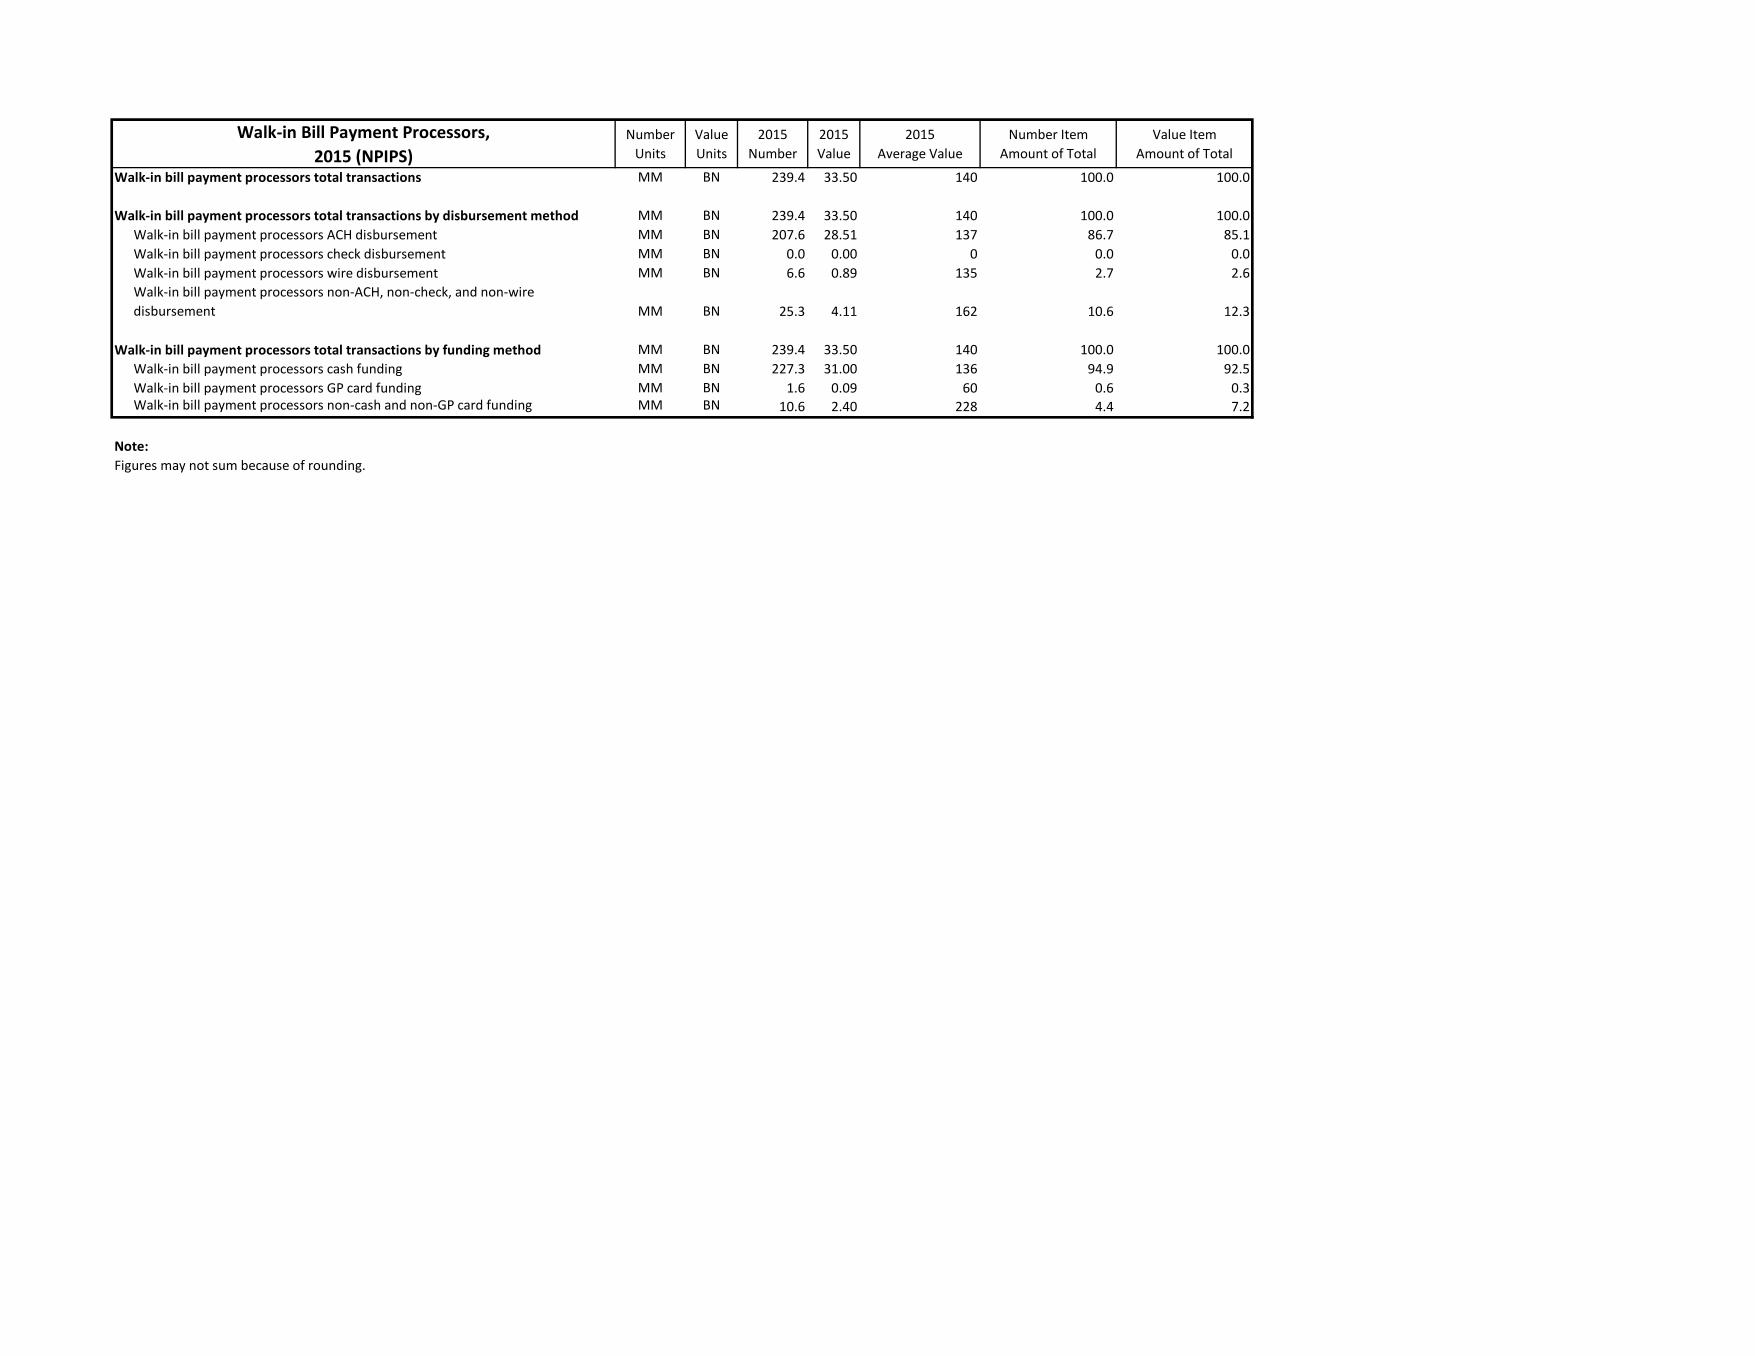
Walk-in Bill Payment Processors,2015 (NPIPS)
Number Units
Value Units
2015 Number
2015 Value
2015 Average Value
Number Item Amount of Total
Value Item Amount of Total
Walk-in bill payment processors total transactions MM BN 239.4 33.50 140 100.0 100.0
Walk-in bill payment processors total transactions by disbursement method MM BN 239.4 33.50 140 100.0 100.0Walk-in bill payment processors ACH disbursement MM BN 207.6 28.51 137 86.7 85.1Walk-in bill payment processors check disbursement MM BN 0.0 0.00 0 0.0 0.0Walk-in bill payment processors wire disbursement MM BN 6.6 0.89 135 2.7 2.6Walk-in bill payment processors non-ACH, non-check, and non-wire disbursement MM BN 25.3 4.11 162 10.6 12.3
Walk-in bill payment processors total transactions by funding method MM BN 239.4 33.50 140 100.0 100.0Walk-in bill payment processors cash funding MM BN 227.3 31.00 136 94.9 92.5Walk-in bill payment processors GP card funding MM BN 1.6 0.09 60 0.6 0.3Walk-in bill payment processors non-cash and non-GP card funding MM BN 10.6 2.40 228 4.4 7.2
Note:Figures may not sum because of rounding.

Walk-in Bill Payment Processors,2012 & 2015 (NPIPS)
Number Units
Value Units
2012 Number
2012 Value
2012 Average
Value
2015 Number
2015 Value
2015Average
Value
2012 to 2015 Number Change
2012 to 2015 Value Change
2012 to 2015 Number (CAGR)
as a Percent
2012 to 2015 Value (CAGR) as a Percent
Walk-in bill payment processors total transactions MM BN 285.6 43.81 153 239.4 33.50 140 -46.2 -10.31 -5.7 -8.6
Walk-in bill payment processors total transactions by disbursement method MM BN 285.6 43.81 153 239.4 33.50 140 -46.2 -10.31 -5.7 -8.6Walk-in bill payment processors ACH disbursement MM BN 276.9 41.39 149 207.6 28.51 137 -69.3 -12.89 -9.2 -11.7Walk-in bill payment processors check disbursement MM BN 0.0 0.00 122 0.0 0.00 0 0.0 0.00 -100.0 -100.0Walk-in bill payment processors wire disbursement MM BN 0.0 0.00 0 6.6 0.89 135 6.6 0.89Walk-in bill payment processors non-ACH, non-check, and non-wire disbursement MM BN 8.7 2.42 277 25.3 4.11 162 16.6 1.69 42.7 19.3
Walk-in bill payment processors total transactions by funding method MM BN 285.6 43.81 153 239.4 33.50 140 -46.2 -10.31 -5.7 -8.6Walk-in bill payment processors cash funding MM BN 261.8 37.81 144 227.3 31.00 136 -34.5 -6.80 -4.6 -6.4Walk-in bill payment processors GP card funding MM BN 0.0 0.00 0 1.6 0.09 60 1.6 0.09Walk-in bill payment processors non-cash and non-GP card funding MM BN 23.8 6.00 252 10.6 2.40 228 -13.2 -3.60 -23.7 -26.3
Note:Figures may not sum because of rounding.CAGR is compound annual growth rate.

Private-Label ACH Debit Card Processors, 2015 (NPIPS)
Number Units
Value Units
2015 Number
2015 Value
2015 Average Value
Number Item Amount of Total
Value Item Amount of Total
PL ACH debit card net, authorized & settled transactions (NAST) MM BN 233.5 11.77 50 100.0 100.0
PL ACH debit card payment processor NAST by transaction value range MM BN 233.5 11.77 50 100.0 100.0PL ACH debit card transactions with less than $5.00 in total value MM BN 24.4 0.07 3 10.4 0.6PL ACH debit card transactions with $5.00 to $9.99 in total value MM BN 19.6 0.14 7 8.4 1.2PL ACH debit card transactions with $10.00 to 14.99 in total value MM BN 17.2 0.21 12 7.4 1.8PL ACH debit card transactions with $15.00 to 24.99 in total value MM BN 34.9 0.69 20 15.0 5.9PL ACH debit card transactions with $25.00 to 49.99 in total value MM BN 60.0 2.14 36 25.7 18.2PL ACH debit card transactions with $50.00 or greater in total value MM BN 77.4 8.51 110 33.1 72.3
PL ACH debit card transactions with $50.00 to 99.99 in total value MM BN 45.8 3.23 70 19.6 27.4PL ACH debit card transactions with $100.00 or greater in total value MM BN 31.5 5.29 168 13.5 44.9
Note:Figures may not sum because of rounding.

Private-Label ACH Debit Card Processors, 2012 & 2015 (NPIPS)
Number Units
Value Units
2012 Number
2012 Value
2012 Average
Value
2015 Number
2015 Value
2015Average
Value
2012 to 2015 Number Change
2012 to 2015 Value Change
2012 to 2015 Number (CAGR)
as a Percent
2012 to 2015 Value (CAGR) as a Percent
PL ACH debit card net, authorized & settled transactions (NAST) MM BN 117.7 7.74 66 233.5 11.77 50 115.8 4.03 25.6 15.0
PL ACH debit card payment processor NAST by transaction value range MM BN 117.7 7.74 66 233.5 11.77 50 115.8 4.03 25.6 15.0PL ACH debit card transactions with less than $5.00 in total value MM BN 17.4 0.06 4 24.4 0.07 3 7.0 0.01 12.0 3.3PL ACH debit card transactions with $5.00 to $9.99 in total value MM BN 10.6 0.10 9 19.6 0.14 7 9.0 0.04 22.7 13.1PL ACH debit card transactions with $10.00 to 14.99 in total value MM BN 8.3 0.13 16 17.2 0.21 12 9.0 0.08 27.8 17.5PL ACH debit card transactions with $15.00 to 24.99 in total value MM BN 14.2 0.36 25 34.9 0.69 20 20.8 0.33 35.1 24.4PL ACH debit card transactions with $25.00 to 49.99 in total value MM BN 25.9 1.21 47 60.0 2.14 36 34.1 0.93 32.3 20.8PL ACH debit card transactions with $50.00 or greater in total value MM BN 41.5 5.87 142 77.4 8.51 110 35.9 2.64 23.1 13.2
PL ACH debit card transactions with $50.00 to 99.99 in total value MM BN 45.8 3.23 70PL ACH debit card transactions with $100.00 or greater in total value MM BN 31.5 5.29 168
Note:Figures may not sum because of rounding.CAGR is compound annual growth rate.2012 figures are restated as net, authorized and settled transactions (NAST). Figures reported in 2013 were adjusted to net, purchase transactions (NPT).

Online Payment Authentication Methods Processors, 2015 (NPIPS)
Number Units
Value Units
2015 Number
2015 Value
2015 Average Value
Number Item Amount of Total
Value Item Amount of Total
Online payment authentication methods processors total transactions MM BN 3,362.1 159.47 47 100.0 100.0Online payment authentication methods processors transactions redirected from merchant or biller site MM BN 2,976.7 129.07 43 88.5 80.9
Online payment authentication methods processors credit card transactions redirected from merchant or biller site MM BN 2,703.9 118.67 44 80.4 74.4Online payment authentication methods processors PIN debit transactions redirected from merchant or biller site MM BN 272.8 10.40 38 8.1 6.5
Online payment authentication methods processors prepaid/escrow transactions MM BN 56.8 1.44 25 1.7 0.9Online payment authentication methods processors cash at token vault transactions MM BN 0.0 0.00 0 0.0 0.0Online payment authentication methods processors non-redirected from merchant or biller site, non-prepaid/escrow-account, and non-cash at token vault transactions MM BN 328.5 28.95 88 9.8 18.2
Note:Figures may not sum because of rounding.
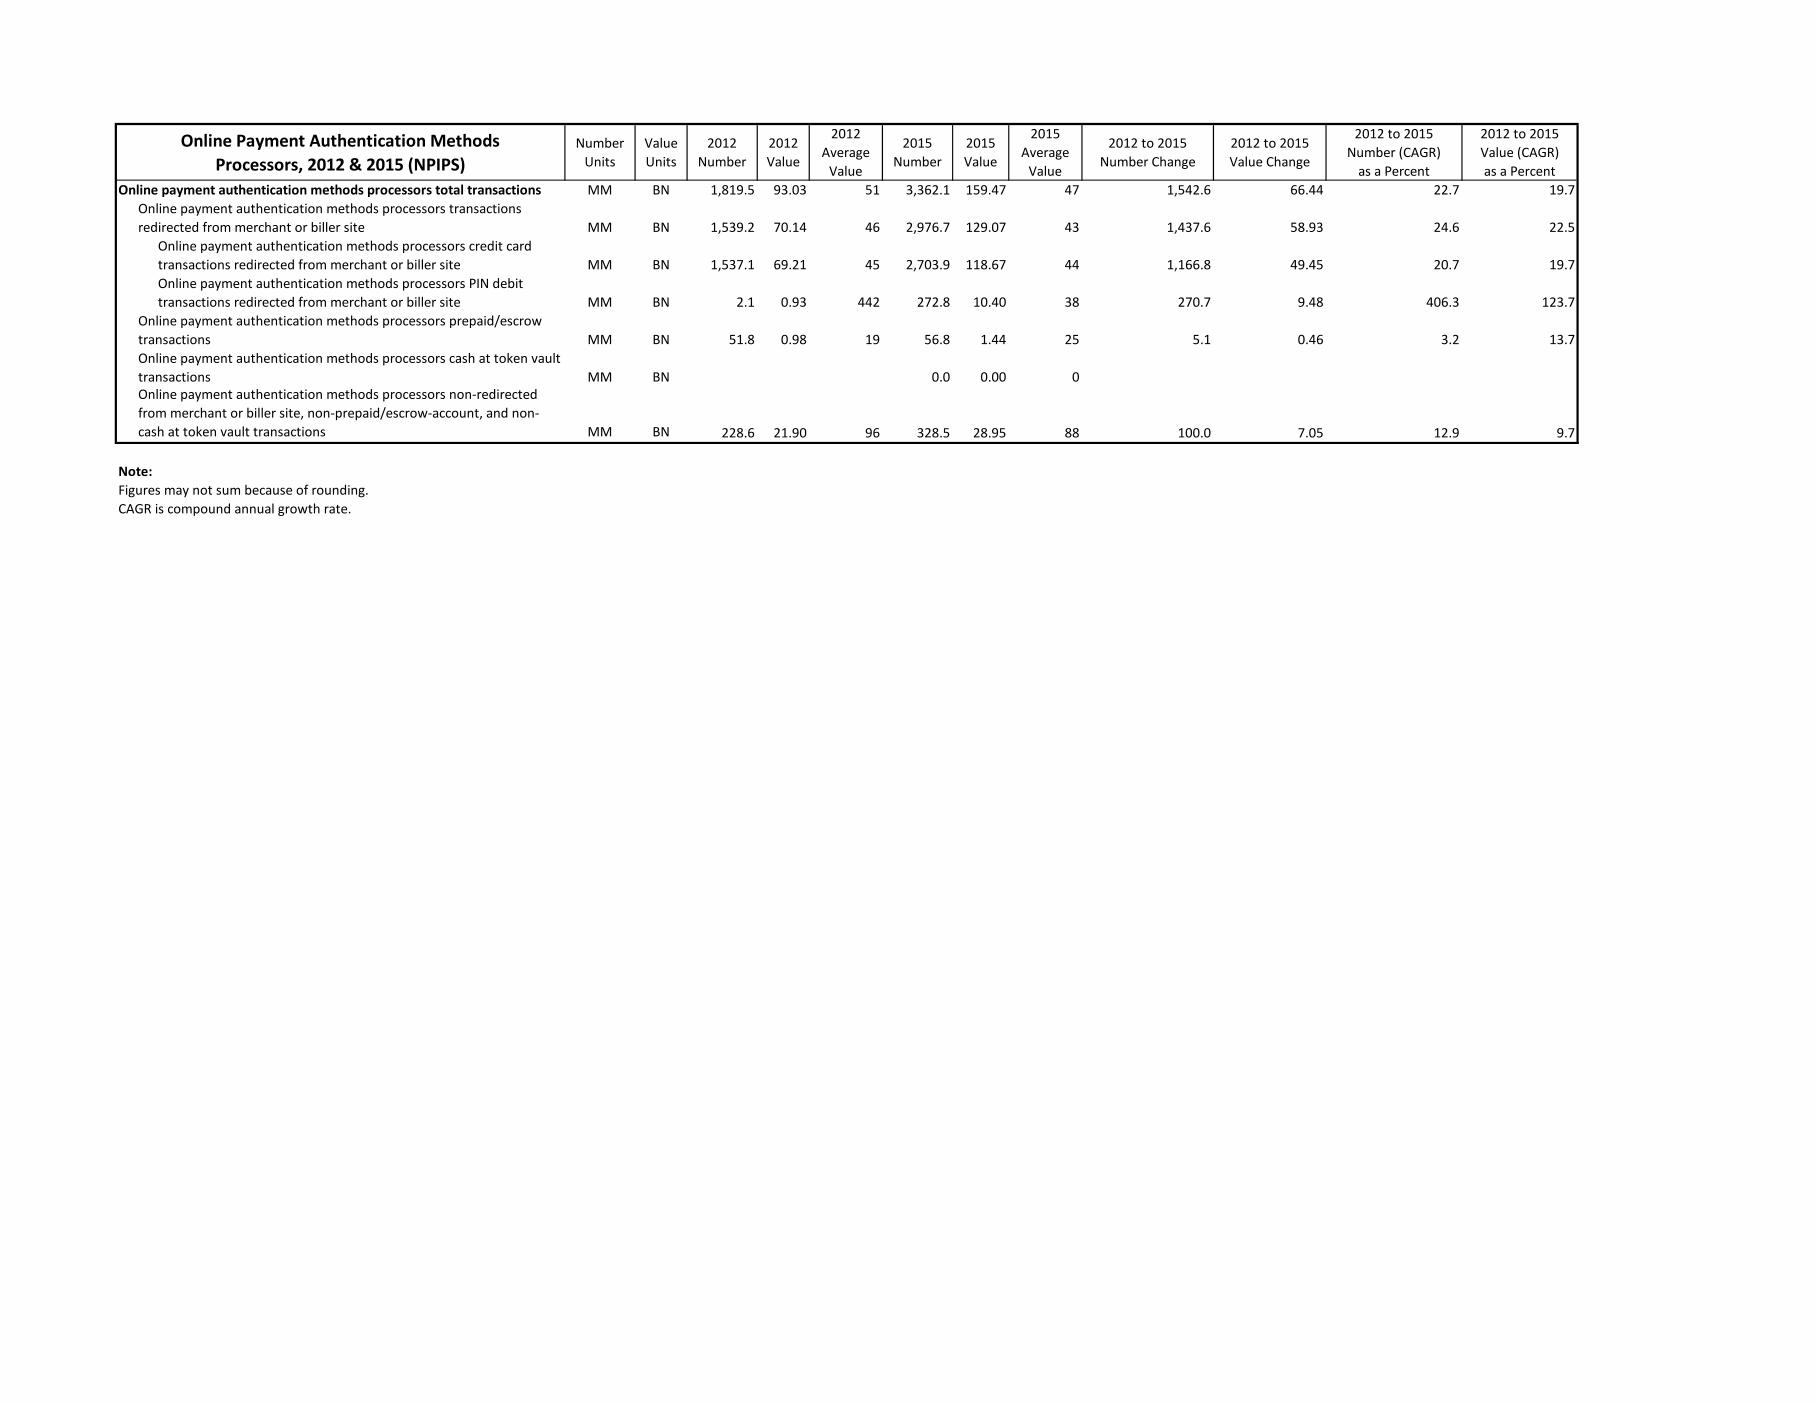
Online Payment Authentication Methods Processors, 2012 & 2015 (NPIPS)
Number Units
Value Units
2012 Number
2012 Value
2012 Average
Value
2015 Number
2015 Value
2015Average
Value
2012 to 2015 Number Change
2012 to 2015 Value Change
2012 to 2015 Number (CAGR)
as a Percent
2012 to 2015 Value (CAGR) as a Percent
Online payment authentication methods processors total transactions MM BN 1,819.5 93.03 51 3,362.1 159.47 47 1,542.6 66.44 22.7 19.7Online payment authentication methods processors transactions redirected from merchant or biller site MM BN 1,539.2 70.14 46 2,976.7 129.07 43 1,437.6 58.93 24.6 22.5
Online payment authentication methods processors credit card transactions redirected from merchant or biller site MM BN 1,537.1 69.21 45 2,703.9 118.67 44 1,166.8 49.45 20.7 19.7Online payment authentication methods processors PIN debit transactions redirected from merchant or biller site MM BN 2.1 0.93 442 272.8 10.40 38 270.7 9.48 406.3 123.7
Online payment authentication methods processors prepaid/escrow transactions MM BN 51.8 0.98 19 56.8 1.44 25 5.1 0.46 3.2 13.7Online payment authentication methods processors cash at token vault transactions MM BN 0.0 0.00 0Online payment authentication methods processors non-redirected from merchant or biller site, non-prepaid/escrow-account, and non-cash at token vault transactions MM BN 228.6 21.90 96 328.5 28.95 88 100.0 7.05 12.9 9.7
Note:Figures may not sum because of rounding.CAGR is compound annual growth rate.

Mobile Wallet Processors,2015 (NPIPS)
Number Units
Value Units
2015 Number
2015 Value
2015 Average Value
Number Item Amount of Total
Value Item Amount of Total
Mobile wallet processors total transactions MM BN 1,273.5 47.97 38 100.0 100.0Mobile wallet processors purchase transactions MM BN 1,250.1 44.99 36 98.2 93.8
Mobile wallet processors in-person purchase transactions MM BN 635.1 16.69 26 49.9 34.8Mobile wallet processors remote purchase transactions MM BN 615.0 28.30 46 48.3 59.0
Mobile wallet processors person-to-person transactions MM BN 23.5 2.98 127 1.8 6.2Mobile wallet processors non-purchase and non-person-to-person transactions MM BN 0.0 0.00 0 0.0 0.0
Note:Figures may not sum because of rounding.

Mobile Wallet Processors,2012 & 2015 (NPIPS)
Number Units
Value Units
2012 Number
2012 Value
2012 Average
Value
2015 Number
2015 Value
2015Average
Value
2012 to 2015 Number Change
2012 to 2015 Value Change
2012 to 2015 Number (CAGR)
as a Percent
2012 to 2015 Value (CAGR) as a Percent
Mobile wallet processors total transactions MM BN 250.6 9.48 38 1,273.5 47.97 38 1,023.0 38.49 71.9 71.7Mobile wallet processors purchase transactions MM BN 1,250.1 44.99 36
Mobile wallet processors in-person purchase transactions MM BN 635.1 16.69 26Mobile wallet processors remote purchase transactions MM BN 615.0 28.30 46
Mobile wallet processors person-to-person transactions MM BN 23.5 2.98 127Mobile wallet processors non-purchase and non-person-to-person transactions MM BN 0.0 0.00 0
Note:Figures may not sum because of rounding.CAGR is compound annual growth rate.
Related Documents