ound_3 5 TRA Bank Name Banco Bilbao Vizcaya Argentaria, SA LEI Code K8MS7FD7N5Z2WQ51AZ71 Country Code ES Ba 2016 EU-wide Transparency Exercise

Welcome message from author
This document is posted to help you gain knowledge. Please leave a comment to let me know what you think about it! Share it to your friends and learn new things together.
Transcript

Round_3
Master_version_2015 TRA Templates 26102015Bank Name Banco Bilbao Vizcaya Argentaria, SA
LEI Code K8MS7FD7N5Z2WQ51AZ71
Country Code ES
Ba
2016 EU-wide Transparency Exercise

201512 201606
(mln EUR, %)As of 31/12/2015 As of 30/06/2016 COREP CODE REGULATION
A OWN FUNDS 60,200 62,107 C 01.00 (r010,c010) Articles 4(118) and 72 of CRR
A.1COMMON EQUITY TIER 1 CAPITAL (net of deductions and after applying
transitional adjustments)48,554 47,559 C 01.00 (r020,c010) Article 50 of CRR
A.1.1Capital instruments eligible as CET1 Capital (including share premium and net own capital
instruments)26,377 26,741 C 01.00 (r030,c010) Articles 26(1) points (a) and (b), 27 to 29, 36(1) point (f) and 42 of CRR
A.1.2 Retained earnings 22,478 20,471 C 01.00 (r130,c010) Articles 26(1) point (c), 26(2) and 36 (1) points (a) and (l) of CRR
A.1.3 Accumulated other comprehensive income -1,904 0 C 01.00 (r180,c010) Articles 4(100), 26(1) point (d) and 36 (1) point (l) of CRR
A.1.4 Other Reserves 0 0 C 01.00 (r200,c010) Articles 4(117) and 26(1) point (e) of CRR
A.1.5 Funds for general banking risk 0 0 C 01.00 (r210,c010) Articles 4(112), 26(1) point (f) and 36 (1) point (l) of CRR
A.1.6 Minority interest given recognition in CET1 capital 5,835 6,484 C 01.00 (r230,c010) Article 84 of CRR
A.1.7 Adjustments to CET1 due to prudential filters -331 -480 C 01.00 (r250,c010) Articles 32 to 35 of and 36 (1) point (l) of CRR
A.1.8 (-) Intangible assets (including Goodwill) -9,752 -9,464 C 01.00 (r300,c010) + C 01.00 (r340,c010) Articles 4(113), 36(1) point (b) and 37 of CRR. Articles 4(115), 36(1) point (b) and 37 point (a) of
CCR
A.1.9(-) DTAs that rely on future profitability and do not arise from temporary differences net of
associated DTLs -949 -1,035 C 01.00 (r370,c010) Articles 36(1) point (c) and 38 of CRR
A.1.10 (-) IRB shortfall of credit risk adjustments to expected losses 0 0 C 01.00 (r380,c010) Articles 36(1) point (d), 40 and 159 of CRR
A.1.11 (-) Defined benefit pension fund assets 0 0 C 01.00 (r390,c010) Articles 4(109), 36(1) point (e) and 41 of CRR
A.1.12 (-) Reciprocal cross holdings in CET1 Capital 0 0 C 01.00 (r430,c010) Articles 4(122), 36(1) point (g) and 44 of CRR
A.1.13 (-) Excess deduction from AT1 items over AT1 Capital -549 0 C 01.00 (r440,c010) Article 36(1) point (j) of CRR
A.1.14 (-) Deductions related to assets which can alternatively be subject to a 1.250% risk weight -119 -82C 01.00 (r450,c010) + C 01.00 (r460,c010) +
C 01.00 (r470,c010) + C 01.00 (r471,c010)+
C 01.00 (r472,c010)
Articles 4(36), 36(1) point (k) (i) and 89 to 91 of CRR; Articles 36(1) point (k) (ii), 243(1) point (b),
244(1) point (b) and 258 of CRR; Articles 36(1) point k) (iii) and 379(3) of CRR; Articles 36(1)
point k) (iv) and 153(8) of CRR and Articles 36(1) point k) (v) and 155(4) of CRR.
A.1.14.1 Of which: from securitisation positions (-) -89 -65 C 01.00 (r460,c010) Articles 36(1) point (k) (ii), 243(1) point (b), 244(1) point (b) and 258 of CRR
A.1.15(-) Holdings of CET1 capital instruments of financial sector entities where the institiution does
not have a significant investment0 0 C 01.00 (r480,c010) Articles 4(27), 36(1) point (h); 43 to 46, 49 (2) and (3) and 79 of CRR
A.1.16 (-) Deductible DTAs that rely on future profitability and arise from temporary differences 0 0 C 01.00 (r490,c010) Articles 36(1) point (c) and 38; Articles 48(1) point (a) and 48(2) of CRR
A.1.17(-) Holdings of CET1 capital instruments of financial sector entities where the institiution has a
significant investment0 0 C 01.00 (r500,c010) Articles 4(27); 36(1) point (i); 43, 45; 47; 48(1) point (b); 49(1) to (3) and 79 of CRR
A.1.18 (-) Amount exceding the 17.65% threshold -278 -409 C 01.00 (r510,c010) Article 48 of CRR
A.1.19 (-) Additional deductions of CET1 Capital due to Article 3 CRR 0 0 C 01.00 (r524,c010) Article 3 CRR
A.1.20 CET1 capital elements or deductions - other 0 0 C 01.00 (r529,c010) -
A.1.21 Transitional adjustments 7,747 5,332 CA1 {1.1.1.6 + 1.1.1.8 + 1.1.1.26} -
A.1.21.1 Transitional adjustments due to grandfathered CET1 Capital instruments (+/-) 0 0 C 01.00 (r220,c010) Articles 483(1) to (3), and 484 to 487 of CRR
A.1.21.2 Transitional adjustments due to additional minority interests (+/-) 1,308 735 C 01.00 (r240,c010) Articles 479 and 480 of CRR
A.1.21.3 Other transitional adjustments to CET1 Capital (+/-) 6,439 4,597 C 01.00 (r520,c010) Articles 469 to 472, 478 and 481 of CRR
A.2 ADDITIONAL TIER 1 CAPITAL (net of deductions and after transitional adjustments) 0 2,805 C 01.00 (r530,c010) Article 61 of CRR
A.2.1 Additional Tier 1 Capital instruments 5,101 6,037 C 01.00 (r540,c010) + C 01.00 (r670,c010)
A.2.2 (-) Excess deduction from T2 items over T2 capital 0 0 C 01.00 (r720,c010)
A.2.3 Other Additional Tier 1 Capital components and deductions 549 0C 01.00 (r690,c010) + C 01.00 (r700,c010) +
C 01.00 (r710,c010) + C 01.00 (r740,c010) +
C 01.00 (r744,c010) + C 01.00 (r748,c010)
A.2.4 Additional Tier 1 transitional adjustments -5,651 -3,232C 01.00 (r660,c010) + C 01.00 (r680,c010) +
C 01.00 (r730,c010)
A.3 TIER 1 CAPITAL (net of deductions and after transitional adjustments) 48,554 50,364 C 01.00 (r015,c010) Article 25 of CRR
A.4 TIER 2 CAPITAL (net of deductions and after transitional adjustments) 11,646 11,742 C 01.00 (r750,c010) Article 71 of CRR
A.4.1 Tier 2 Capital instruments 7,623 8,439 C 01.00 (r760,c010) + C 01.00 (r890,c010)
A.4.2 Other Tier 2 Capital components and deductions 3,496 3,482
C 01.00 (r910,c010) + C 01.00 (r920,c010) +
C 01.00 (r930,c010) + C 01.00 (r940,c010) +
C 01.00 (r950,c010) + C 01.00 (r970,c010) +
C 01.00 (r974,c010) + C 01.00 (r978,c010)
A.4.3 Tier 2 transitional adjustments 528 -180C 01.00 (r880,c010) + C 01.00 (r900,c010) +
C 01.00 (r960,c010)
B TOTAL RISK EXPOSURE AMOUNT 401,277 395,085 C 02.00 (r010,c010) Articles 92(3), 95, 96 and 98 of CRR
B.1 Of which: Transitional adjustments included 695 1,022 C 05.01 (r010;c040)
C.1 COMMON EQUITY TIER 1 CAPITAL RATIO (transitional period) 12.10% 12.04% CA3 {1} -
C.2 TIER 1 CAPITAL RATIO (transitional period) 12.10% 12.75% CA3 {3} -
C.3 TOTAL CAPITAL RATIO (transitional period) 15.00% 15.72% CA3 {5} -
CET1 Capital
Fully loadedD COMMON EQUITY TIER 1 CAPITAL (fully loaded) 41,356 42,227
[A.1-A.1.13-A.1.21+MIN(A.2+A.1.13-
A.2.2-A.2.4+MIN(A.4+A.2.2-A.4.3,0),0)]-
CET1 RATIO (%)
Fully loaded1 E COMMON EQUITY TIER 1 CAPITAL RATIO (fully loaded) 10.32% 10.72% [D.1]/[B-B.1] -
(1) Fully loaded CET1 capital ratio estimation based on the formulae stated in column “COREP CODE”
CAPITAL RATIOS (%)
Transitional period
2016 EU-wide Transparency Exercise
Capital
Banco Bilbao Vizcaya Argentaria, SA
OWN FUNDS
Transitional period
OWN FUNDS
REQUIREMENTS

201512 201606
(mln EUR)
as of 31/12/2015 as of 30/06/2016
Risk exposure amounts for credit risk 348,002 342,129
Risk exposure amount for securitisation and re-securitisations in the banking book 1,395 1,466
Risk exposure amount for contributions to the default fund of a CCP 511 245
Risk exposure amount Other credit risk 346,096 340,418
Risk exposure amount for position, foreign exchange and commodities (Market risk) 16,151 18,230
of which: Risk exposure amount for securitisation and re-securitisations in the trading book1 102 93
Risk exposure amount for Credit Valuation Adjustment 3,833 2,687
Risk exposure amount for operational risk 33,291 32,040
Other risk exposure amounts 0 0
Total Risk Exposure Amount 401,277 395,085
(1)
May include hedges, which are not securitisation positions, as per Article 338.3 of CRR
2016 EU-wide Transparency Exercise
Risk exposure amounts
Banco Bilbao Vizcaya Argentaria, SA
201512 201606
(mln EUR)
Interest income 27,927 13,684
Of which debt securities income 4,858 2,365
Of which loans and advances income 21,996 10,874
Interest expenses 10,653 5,494
(Of which deposits expenses) 6,983 3,732
(Of which debt securities issued expenses) 2,778 1,210
(Expenses on share capital repayable on demand) 0 0
Dividend income 412 299
Net Fee and commission income 5,260 2,495
Gains or (-) losses on derecognition of financial assets and liabilities not measured at fair value through profit or loss, and of non financial
assets, net1,170 667
Gains or (-) losses on financial assets and liabilities held for trading, net -387 -16
Gains or (-) losses on financial assets and liabilities designated at fair value through profit or loss, net 141 14
Gains or (-) losses from hedge accounting, net -18 -62
Exchange differences [gain or (-) loss], net 1,012 524
Net other operating income /(expenses) -990 -476
TOTAL OPERATING INCOME, NET 23,875 11,635
(Administrative expenses) 11,384 5,549
(Depreciation) 1,311 673
(Provisions or (-) reversal of provisions) 720 278
(Commitments and guarantees given) 2 20
(Other provisions) 718 257
Of which pending legal issues and tax litigation1 -12
Of which restructuring1 36
(Impairment or (-) reversal of impairment on financial assets not measured at fair value through profit or loss) 4,542 2,111
(Loans and receivables) 4,517 1,977
(Held to maturity investments, AFS assets and financial assets measured at cost) 25 135
(Impairment or (-) reversal of impairment of investments in subsidaries, joint ventures and associates and on non-financial assets) 258 81
(of which Goodwill) 0 0
Negative goodwill recognised in profit or loss 26 0
Share of the profit or (-) loss of investments in subsidaries, joint ventures and associates -1,212 481
Profit or (-) loss from non-current assets and disposal groups classified as held for sale not qualifying as discontinued operations 740 -77
PROFIT OR (-) LOSS BEFORE TAX FROM CONTINUING OPERATIONS 5,213 3,346
PROFIT OR (-) LOSS AFTER TAX FROM CONTINUING OPERATIONS 3,779 2,453
Profit or (-) loss after tax from discontinued operations 0 0
PROFIT OR (-) LOSS FOR THE YEAR 3,779 2,453
Of which attributable to owners of the parent 2,597 1,818 (1)
Information available only as of end of the year
2016 EU-wide Transparency ExerciseP&L
Banco Bilbao Vizcaya Argentaria, SA
As of 31/12/2015As of
30/06/2016

201512 201606 201512 201512 201512 201512 201512 201512 201512 201512 201512 201512 201606 201606 201606 201606 201606 201606 201606 201606 201606 201606
As of
31/12/2015
As of
30/06/2016
(mln EUR)
MULTIPLICATION
FACTOR (mc) x
AVERAGE OF
PREVIOUS 60
WORKING DAYS
(VaRavg)
PREVIOUS
DAY (VaRt-1)
MULTIPLICATION
FACTOR (ms) x
AVERAGE OF
PREVIOUS 60
WORKING DAYS
(SVaRavg)
LATEST
AVAILABLE
(SVaRt-1)
12 WEEKS
AVERAGE
MEASURE
LAST
MEASUREFLOOR
12 WEEKS
AVERAGE
MEASURE
LAST
MEASURE
MULTIPLICATION
FACTOR (mc) x
AVERAGE OF
PREVIOUS 60
WORKING DAYS
(VaRavg)
PREVIOUS
DAY (VaRt-1)
MULTIPLICATION
FACTOR (ms) x
AVERAGE OF
PREVIOUS 60
WORKING DAYS
(SVaRavg)
LATEST
AVAILABLE
(SVaRt-1)
12 WEEKS
AVERAGE
MEASURE
LAST
MEASUREFLOOR
12 WEEKS
AVERAGE
MEASURE
LAST
MEASURE
Traded Debt Instruments 2,470 2,466 188 55 509 130 225 95 586 195
Of which: General risk 2,135 2,122 155 46 428 109 173 78 472 165
Of which: Specific risk 335 344 33 9 81 21 52 17 114 30
Equities 271 215 104 40 140 47 104 41 203 69
Of which: General risk 88 98 104 40 140 47 104 41 203 69
Of which: Specific risk 110 80 0 0 0 0 0 0 0 0
Foreign exchange risk 4,003 5,321 46 23 119 54 66 21 92 25
Commodities risk 59 19 0 0 0 0 0 0 0 0
Total 6,804 8,021 190 61 450 126 107 108 0 0 0 9,347 214 73 489 150 110 113 0 0 0 10,208
2016 EU-wide Transparency ExerciseMarket Risk
Banco Bilbao Vizcaya Argentaria, SA
SA IM IM
TOTAL RISK
EXPOSURE
AMOUNT
TOTAL RISK
EXPOSURE
AMOUNT
VaR (Memorandum item)STRESSED VaR (Memorandum
item)
INCREMENTAL
DEFAULT AND
MIGRATION RISK
CAPITAL CHARGE
STRESSED VaR (Memorandum
item)
INCREMENTAL
DEFAULT AND
MIGRATION RISK
CAPITAL CHARGE
ALL PRICE RISKS CAPITAL
CHARGE FOR CTP
TOTAL RISK
EXPOSURE
AMOUNT
As of 31/12/2015 As of 30/06/2016
ALL PRICE RISKS CAPITAL
CHARGE FOR CTP
TOTAL RISK
EXPOSURE
AMOUNT
VaR (Memorandum item)

201512 201512 201512 201512 201606 201606 201606 201606
(mln EUR, %)
Central governments or central banks 139,910 138,669 35,174 115,988 133,557 32,709
Regional governments or local authorities 7,050 6,807 2,996 5,708 5,665 2,939
Public sector entities 5,211 2,616 1,349 4,185 1,813 701
Multilateral Development Banks 39 38 25 58 58 36
International Organisations 9 9 0 6 6 0
Institutions 33,594 19,555 5,730 43,595 23,278 6,240
Corporates 155,351 105,263 101,195 145,878 106,629 100,254
of which: SME 15,778 11,985 10,331 20,958 16,884 15,251
Retail 76,212 52,632 36,929 79,582 53,333 37,438
of which: SME 24,263 15,987 9,540 24,695 16,716 9,960
Secured by mortgages on immovable property 54,979 53,158 20,497 55,251 54,077 21,298
of which: SME 6,490 6,394 2,782 7,016 6,927 3,807
Exposures in default 9,745 4,371 4,706 4,960 9,625 4,653 5,013 4,625
Items associated with particularly high risk 258 154 143 1,436 1,359 1,970
Covered bonds 846 839 393 0 0 0
Claims on institutions and corporates with a ST credit assessment 2,364 2,364 727 1,734 1,734 370
Collective investments undertakings (CIU) 605 293 67 437 239 51
Equity 0 0 0 0 0 0
Securitisation 3,370 3,358 1,049 4,552 4,543 1,217
Other exposures 27,690 34,081 18,806 26,472 44,522 18,811
Standardised Total 517,235 424,207 229,787 8,104 494,506 435,467 229,047 7,776(1)
Original exposure, unlike Exposure value, is reported before taking into account any effect due to credit conversion factors or credit risk mitigation techniques (e.g. substitution effects).
1 (mln EUR, %)
Central governments or central banks 69,189 63,211 9,652 59,666 75,247 12,012
Regional governments or local authorities 1,755 1,554 74 441 439 7
Public sector entities 395 349 142 136 131 105
Multilateral Development Banks 0 0 0 0 0 0
International Organisations 0 0 0 0 0 0
Institutions 12,586 638 100 13,168 1,374 260
Corporates 6,149 5,147 3,763 4,773 4,032 4,058
of which: SME 1,843 1,403 1,121 1,893 1,379 532
Retail 11,878 6,029 3,859 13,145 6,273 4,227
of which: SME 6,454 4,955 2,816 6,371 4,889 2,801
Secured by mortgages on immovable property 5,528 5,280 2,100 5,208 5,005 2,007
of which: SME 2,191 2,113 838 2,043 1,982 851
Exposures in default 4,816 2,025 2,229 0 3,854 1,505 1,787 0
Items associated with particularly high risk 254 150 142 181 105 90
Covered bonds 0 0 0 0 0 0
Claims on institutions and corporates with a ST credit assessment 174 174 39 172 172 38
Collective investments undertakings (CIU) 197 53 16 207 113 24
Equity 0 0 0 0 0 0
Securitisation
Other exposures 13,243 14,012 11,452 13,670 14,595 11,917
Standardised Total2 3,516 3,299
(1) Original exposure, unlike Exposure value, is reported before taking into account any effect due to credit conversion factors or credit risk mitigation techniques (e.g. substitution effects).
(2) Total value adjustments and provisions per country of counterparty does not include Securistisation exposures
2 (mln EUR, %)
Central governments or central banks 10,821 10,977 201 7,289 7,327 715
Regional governments or local authorities 4,945 4,945 2,873 4,992 4,992 2,843
Public sector entities 310 764 42 295 755 40
Multilateral Development Banks 0 0 0 2 2 0
International Organisations 0 0 0 0 0 0
Institutions 2,495 2,857 897 3,670 3,452 1,339
Corporates 55,470 36,268 34,962 53,841 39,002 35,566
of which: SME 152 133 133 280 275 275
Retail 8,428 6,674 4,679 10,726 6,648 4,662
of which: SME 3,575 1,831 1,046 3,420 1,815 1,037
Secured by mortgages on immovable property 15,747 15,273 5,675 14,926 14,488 5,371
of which: SME 2 2 1 2 2 1
Exposures in default 643 458 461 0 1,094 836 839 0
Items associated with particularly high risk 0 0 0 1 1 0
Covered bonds 0 0 0 0 0 0
Claims on institutions and corporates with a ST credit assessment 1,684 1,684 344 1,363 1,363 288
Collective investments undertakings (CIU) 187 92 18 138 33 7
Equity 0 0 0 0 0 0
Securitisation
Other exposures 1,381 2,814 973 1,354 2,696 1,004
Standardised Total2 304 332
(1) Original exposure, unlike Exposure value, is reported before taking into account any effect due to credit conversion factors or credit risk mitigation techniques (e.g. substitution effects).
(2) Total value adjustments and provisions per country of counterparty does not include Securistisation exposures
3 (mln EUR, %)
Central governments or central banks 19,837 19,862 9,063 19,542 19,545 10,932
Regional governments or local authorities 11 2 2 10 3 2
Public sector entities 2 3 0 1 2 0
Multilateral Development Banks 0 0 0 0 0 0
International Organisations 0 0 0 0 0 0
Institutions 2,847 3,454 1,516 3,539 3,634 1,778
Corporates 40,627 32,852 32,781 41,573 33,988 33,282
of which: SME 5,162 3,920 3,727 10,413 8,975 8,919
Retail 27,892 17,384 11,503 28,684 17,814 12,050
of which: SME 10,251 6,456 3,689 11,308 7,336 4,192
Secured by mortgages on immovable property 8,493 8,493 3,350 9,478 9,471 4,240
of which: SME 3,484 3,484 1,579 4,242 4,237 2,621
Exposures in default 1,588 320 378 0 1,715 398 463 0
Items associated with particularly high risk 0 0 0 208 208 312
Covered bonds 0 0 0 0 0 0
Claims on institutions and corporates with a ST credit assessment 0 0 0 0 0 0
Collective investments undertakings (CIU) 0 0 0 0 0 0
Equity 0 0 0 0 0 0
Securitisation
Other exposures 2,162 2,712 1,394 2,292 3,054 1,396
Standardised Total2 1,751 1,736
(1) Original exposure, unlike Exposure value, is reported before taking into account any effect due to credit conversion factors or credit risk mitigation techniques (e.g. substitution effects).
(2) Total value adjustments and provisions per country of counterparty does not include Securistisation exposures
2016 EU-wide Transparency Exercise
Credit Risk - Standardised Approach
Banco Bilbao Vizcaya Argentaria, SA
Standardised Approach
As of 31/12/2015 As of 30/06/2016
Risk exposure
amount
Value
adjustments and
provisions
Consolidated data
Standardised Approach
As of 31/12/2015 As of 30/06/2016
Original
Exposure1
Exposure
Value1
Risk exposure
amount
Value
adjustments and
provisions
Original
Exposure1
Exposure
Value1
Risk exposure
amount
Value
adjustments and
provisions2
SPAIN
Standardised Approach
As of 31/12/2015 As of 30/06/2016
Original
Exposure1
Exposure
Value1
Risk exposure
amount
Value
adjustments and
provisions2
Original
Exposure1
Exposure
Value1
Risk exposure
amount
Value
adjustments and
provisions2
UNITED STATES
Standardised Approach
As of 31/12/2015 As of 30/06/2016
Original
Exposure1
Exposure
Value1
Risk exposure
amount
Value
adjustments and
provisions2
Original
Exposure1
Exposure
Value1
Risk exposure
amount
Value
adjustments and
provisions2
TURKEY
Original
Exposure1
Exposure
Value1
Risk exposure
amount
Value
adjustments and
provisions2
Original
Exposure1
Exposure
Value1

2016 EU-wide Transparency Exercise
Credit Risk - Standardised Approach
Banco Bilbao Vizcaya Argentaria, SA
4 (mln EUR, %)
Central governments or central banks 16,441 20,501 48 8,868 12,273 1,897
Regional governments or local authorities 0 0 0 0 0 1
Public sector entities 2,911 171 35 2,777 104 22
Multilateral Development Banks 0 0 0 0 0 0
International Organisations 0 0 0 0 0 0
Institutions 3,112 2,938 775 7,781 2,718 777
Corporates 18,955 5,870 4,915 13,875 6,430 4,982
of which: SME 4,257 3,259 2,477 4,189 3,129 2,406
Retail 6,920 6,602 4,953 7,175 6,853 5,139
of which: SME 109 109 62 155 154 88
Secured by mortgages on immovable property 9,845 8,938 3,245 9,235 8,900 3,234
of which: SME 0 0 0 0 0 0
Exposures in default 434 380 380 0 501 477 477 0
Items associated with particularly high risk 0 0 0 444 444 666
Covered bonds 846 839 393 0 0 0
Claims on institutions and corporates with a ST credit assessment 288 288 288 0 0 0
Collective investments undertakings (CIU) 0 0 0 0 0 0
Equity 0 0 0 0 0 0
Securitisation
Other exposures 6,242 6,772 3,274 5,211 16,369 3,118
Standardised Total2 769 688
(1) Original exposure, unlike Exposure value, is reported before taking into account any effect due to credit conversion factors or credit risk mitigation techniques (e.g. substitution effects).
(2) Total value adjustments and provisions per country of counterparty does not include Securistisation exposures
5 (mln EUR, %)
Central governments or central banks 6,808 6,808 3,162 5,912 3,891 1,956
Regional governments or local authorities 47 47 23 41 40 20
Public sector entities 333 282 145 344 271 85
Multilateral Development Banks 19 19 10 19 19 22
International Organisations 0 0 0 0 0 0
Institutions 556 536 179 584 574 181
Corporates 9,327 7,324 7,318 8,438 7,159 7,042
of which: SME 1,956 1,628 1,237 1,978 1,745 1,745
Retail 5,469 3,268 2,451 3,815 3,205 2,165
of which: SME 2,253 1,410 1,058 1,815 1,333 1,000
Secured by mortgages on immovable property 3,839 3,737 1,589 3,915 3,817 1,595
of which: SME 0 22 9 0 17 9
Exposures in default 509 211 216 0 582 284 328 0
Items associated with particularly high risk 0 0 0 182 182 273
Covered bonds 0 0 0 0 0 0
Claims on institutions and corporates with a ST credit assessment 1 1 1 0 0 0
Collective investments undertakings (CIU) 0 0 0 0 0 0
Equity 0 0 0 0 0 0
Securitisation
Other exposures 982 1,221 284 994 1,265 336
Standardised Total2 518 501
(1) Original exposure, unlike Exposure value, is reported before taking into account any effect due to credit conversion factors or credit risk mitigation techniques (e.g. substitution effects).
(2) Total value adjustments and provisions per country of counterparty does not include Securistisation exposures
6 (mln EUR, %)
Central governments or central banks 112 106 29 126 123 34
Regional governments or local authorities 19 19 4 32 32 21
Public sector entities 0 5 0 0 5 0
Multilateral Development Banks 0 0 0 0 0 0
International Organisations 0 0 0 0 0 0
Institutions 1,774 1,810 85 3,392 2,225 21
Corporates 955 851 826 466 453 331
of which: SME 26 20 20 4 4 4
Retail 85 64 54 45 33 25
of which: SME 1 0 0 0 0 0
Secured by mortgages on immovable property 7 7 2 23 23 8
of which: SME 0 0 0 0 0 0
Exposures in default 48 48 48 0 0 0 0 0
Items associated with particularly high risk 0 0 0 0 0 0
Covered bonds 0 0 0 0 0 0
Claims on institutions and corporates with a ST credit assessment 0 0 0 0 0 0
Collective investments undertakings (CIU) 145 73 15 0 0 0
Equity 0 0 0 0 0 0
Securitisation
Other exposures 772 765 134 314 938 139
Standardised Total2 162 78
(1) Original exposure, unlike Exposure value, is reported before taking into account any effect due to credit conversion factors or credit risk mitigation techniques (e.g. substitution effects).
(2) Total value adjustments and provisions per country of counterparty does not include Securistisation exposures
7 (mln EUR, %)
Central governments or central banks 0 0 0 0 0 0
Regional governments or local authorities 0 0 0 0 0 0
Public sector entities 0 3 0 3 4 2
Multilateral Development Banks 0 0 0 0 0 0
International Organisations 0 0 0 0 0 0
Institutions 3,447 1,073 660 3,823 2,258 597
Corporates 909 473 463 644 473 465
of which: SME 37 32 32 30 23 23
Retail 252 236 199 225 216 180
of which: SME 3 1 1 1 0 0
Secured by mortgages on immovable property 115 115 53 120 120 57
of which: SME 0 0 0 0 0 0
Exposures in default 36 28 38 0 35 27 34 0
Items associated with particularly high risk 4 4 1 0 0 0
Covered bonds 0 0 0 0 0 0
Claims on institutions and corporates with a ST credit assessment 0 0 0 0 0 0
Collective investments undertakings (CIU) 0 0 0 0 0 0
Equity 0 0 0 0 0 0
Securitisation
Other exposures 0 1,349 0 0 1,451 0
Standardised Total2 13 16
(1) Original exposure, unlike Exposure value, is reported before taking into account any effect due to credit conversion factors or credit risk mitigation techniques (e.g. substitution effects).
(2) Total value adjustments and provisions per country of counterparty does not include Securistisation exposures
Standardised Approach
As of 31/12/2015 As of 30/06/2016
Risk exposure
amount
Value
adjustments and
provisions2
MEXICO
Standardised Approach
As of 31/12/2015 As of 30/06/2016
Original
Exposure1
Exposure
Value1
Risk exposure
amount
Value
adjustments and
provisions2
Original
Exposure1
Exposure
Value1
Risk exposure
amount
Value
adjustments and
provisions2
PERU
Standardised Approach
As of 31/12/2015 As of 30/06/2016
Original
Exposure1
Exposure
Value1
Risk exposure
amount
Value
adjustments and
provisions2
Original
Exposure1
Exposure
Value1
Risk exposure
amount
Value
adjustments and
provisions2
FRANCE
Standardised Approach
As of 31/12/2015 As of 30/06/2016
Original
Exposure1
Exposure
Value1
Risk exposure
amount
Value
adjustments and
provisions2
Original
Exposure1
Exposure
Value1
Risk exposure
amount
Value
adjustments and
provisions2
UNITED KINGDOM
Original
Exposure1
Exposure
Value1
Risk exposure
amount
Value
adjustments and
provisions2
Original
Exposure1
Exposure
Value1

2016 EU-wide Transparency Exercise
Credit Risk - Standardised Approach
Banco Bilbao Vizcaya Argentaria, SA
8 (mln EUR, %)
Central governments or central banks 763 774 0 828 840 418
Regional governments or local authorities 7 7 1 7 7 1
Public sector entities 82 87 12 108 101 20
Multilateral Development Banks 0 0 0 0 0 0
International Organisations 0 0 0 0 0 0
Institutions 1,237 1,225 259 1,596 1,580 303
Corporates 7,453 6,186 6,132 7,055 5,759 5,694
of which: SME 1,303 961 961 1,323 996 996
Retail 3,845 2,566 1,925 4,103 2,734 2,005
of which: SME 346 254 190 348 257 193
Secured by mortgages on immovable property 4,717 4,717 1,857 5,263 5,263 2,055
of which: SME 49 49 19 53 53 27
Exposures in default 312 214 260 0 355 266 320 0
Items associated with particularly high risk 0 0 0 175 175 263
Covered bonds 0 0 0 0 0 0
Claims on institutions and corporates with a ST credit assessment 197 197 50 177 177 38
Collective investments undertakings (CIU) 0 0 0 0 0 0
Equity 0 0 0 0 0 0
Securitisation
Other exposures 610 619 319 639 656 336
Standardised Total2 118 130
(1) Original exposure, unlike Exposure value, is reported before taking into account any effect due to credit conversion factors or credit risk mitigation techniques (e.g. substitution effects).
(2) Total value adjustments and provisions per country of counterparty does not include Securistisation exposures
9 (mln EUR, %)
Central governments or central banks 7,539 7,539 28 7,154 7,152 32
Regional governments or local authorities 80 80 16 0 0 0
Public sector entities 0 1 0 0 1 0
Multilateral Development Banks 0 0 0 0 0 0
International Organisations 0 0 0 0 0 0
Institutions 492 174 65 400 195 59
Corporates 330 258 257 88 81 80
of which: SME 81 75 75 60 54 54
Retail 169 139 104 69 68 51
of which: SME 0 0 0 0 0 0
Secured by mortgages on immovable property 8 8 3 7 7 3
of which: SME 0 0 0 0 0 0
Exposures in default 8 3 3 0 9 2 2 0
Items associated with particularly high risk 0 0 0 0 0 0
Covered bonds 0 0 0 0 0 0
Claims on institutions and corporates with a ST credit assessment 0 0 0 0 0 0
Collective investments undertakings (CIU) 0 0 0 0 0 0
Equity 0 0 0 0 0 0
Securitisation
Other exposures 4 126 4 74 147 7
Standardised Total2 7 10
(1) Original exposure, unlike Exposure value, is reported before taking into account any effect due to credit conversion factors or credit risk mitigation techniques (e.g. substitution effects).
(2) Total value adjustments and provisions per country of counterparty does not include Securistisation exposures
10 (mln EUR, %)
Central governments or central banks 1,589 1,918 689 1,320 1,682 831
Regional governments or local authorities 0 0 0 0 0 0
Public sector entities 311 282 282 342 312 278
Multilateral Development Banks 0 0 0 0 0 0
International Organisations 0 0 0 0 0 0
Institutions 447 445 128 494 490 0
Corporates 4,139 3,290 3,283 3,600 3,169 3,142
of which: SME 64 16 16 60 20 20
Retail 5,087 4,064 3,048 5,849 4,351 3,208
of which: SME 278 193 145 333 237 177
Secured by mortgages on immovable property 2,735 2,698 1,033 3,301 3,257 1,222
of which: SME 0 3 1 0 3 1
Exposures in default 259 172 175 0 378 239 245 0
Items associated with particularly high risk 0 0 0 245 245 368
Covered bonds 0 0 0 0 0 0
Claims on institutions and corporates with a ST credit assessment 0 0 0 0 0 0
Collective investments undertakings (CIU) 0 0 0 0 0 0
Equity 0 0 0 0 0 0
Securitisation
Other exposures 723 836 209 736 833 109
Standardised Total2 252 314
(1) Original exposure, unlike Exposure value, is reported before taking into account any effect due to credit conversion factors or credit risk mitigation techniques (e.g. substitution effects).
(2) Total value adjustments and provisions per country of counterparty does not include Securistisation exposures
Standardised Approach
As of 31/12/2015 As of 30/06/2016
Risk exposure
amount
Value
adjustments and
provisions2
CHILE
Standardised Approach
As of 31/12/2015 As of 30/06/2016
Original
Exposure1
Exposure
Value1
Risk exposure
amount
Value
adjustments and
provisions2
Original
Exposure1
Exposure
Value1
Risk exposure
amount
Value
adjustments and
provisions2
ITALY
Standardised Approach
As of 31/12/2015 As of 30/06/2016
Original
Exposure1
Exposure
Value1
Risk exposure
amount
Value
adjustments and
provisions2
Original
Exposure1
Exposure
Value1
Risk exposure
amount
Value
adjustments and
provisions2
COLOMBIA
Original
Exposure1
Exposure
Value1
Risk exposure
amount
Value
adjustments and
provisions2
Original
Exposure1
Exposure
Value1
201512 201512 201512 201512 201512 201512 201606 201606 201606 201606 201606 201606
(mln EUR, %)
Of which:
defaulted
Of which:
defaulted
Of which:
defaulted
Of which:
defaulted
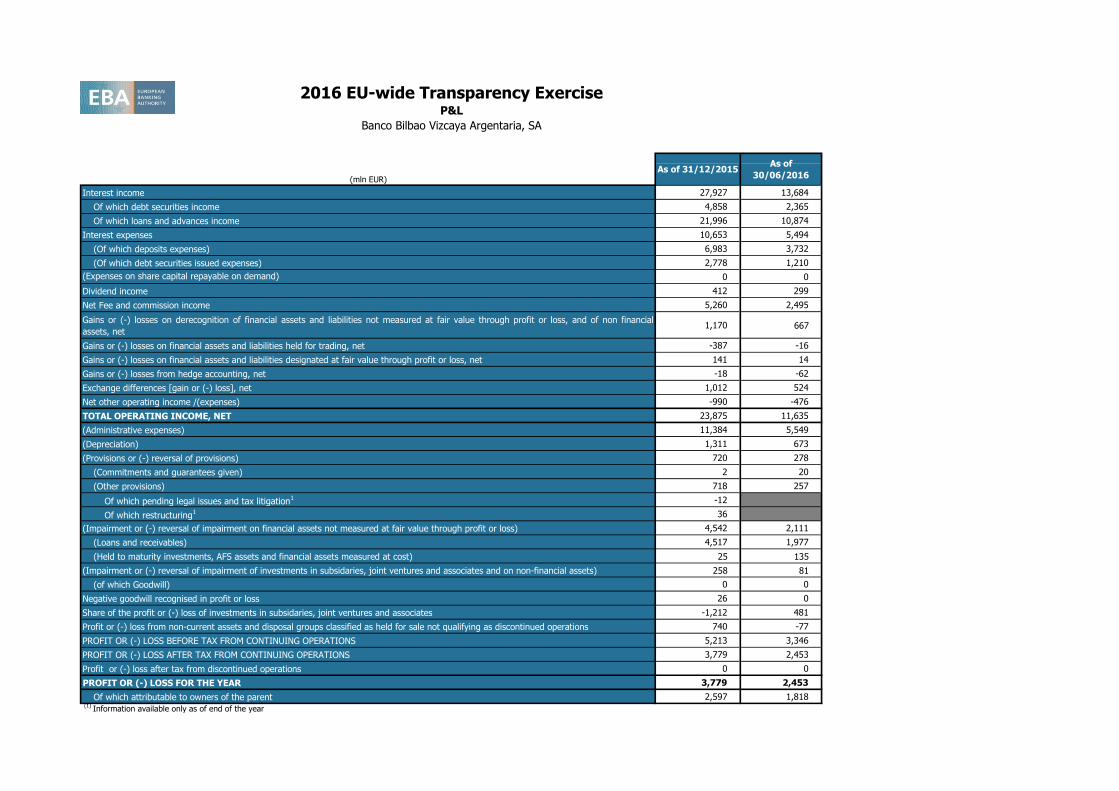
Central banks and central governments 4,475 419 5,730 224 12 19 4,995 274 5,995 647 1 25
Institutions 90,651 237 87,798 10,826 45 106 93,295 274 74,485 6,935 43 99
Corporates 140,200 15,835 111,061 63,607 4,667 5,976 141,754 14,546 112,134 63,779 4,160 5,603
Corporates - Of Which: Specialised Lending 12,480 460 11,748 10,165 0 259 11,858 353 11,258 10,495 0 264
Corporates - Of Which: SME 21,135 5,429 19,059 12,487 1,846 3,112 21,187 5,095 18,834 12,444 1,685 2,883
Retail 125,898 6,142 108,669 23,180 1,167 2,510 124,681 5,903 107,282 22,578 1,064 2,206
Retail - Secured on real estate property 97,099 5,291 90,441 12,411 1,107 1,533 95,319 5,123 88,623 11,415 1,009 1,270
Retail - Secured on real estate property - Of Which: SME 1,061 480 1,031 441 200 266 940 331 920 409 135 135
Retail - Secured on real estate property - Of Which: non-
SME
96,038 4,811 89,410 11,970 907 1,267 94,378 4,793 87,703 11,005 874 1,135
Retail - Qualifying Revolving 19,507 151 9,433 7,420 6 462 19,272 130 9,011 7,410 5 463
Retail - Other Retail 9,291 700 8,795 3,349 54 515 10,090 650 9,647 3,754 50 473
Retail - Other Retail - Of Which: SME 3,503 308 3,058 1,475 39 196 3,470 242 3,054 1,450 34 139
Retail - Other Retail - Of Which: non-SME 5,788 392 5,737 1,874 16 319 6,620 408 6,593 2,304 16 334
Equity 9,418 0 9,418 19,778 0 9,172 0 9,172 15,265 0
Securitisation 982 982 345 3 864 864 249 2
Other non credit-obligation assets 0 0
IRB Total 117,960 109,452(1)
Original exposure, unlike Exposure value, is reported before taking into account any effect due to credit conversion factors or credit risk mitigation techniques (e.g. substitution effects).
1 (mln EUR, %)
Of which:
defaulted
Of which:
defaulted
Of which:
defaulted
Of which:
defaulted
Central banks and central governments 57 8 243 16 1 3 891 7 1,044 236 0 3
Institutions 43,646 229 42,081 7,552 45 115 45,234 274 27,480 3,579 43 108
Corporates 65,425 15,410 52,748 31,723 4,622 5,479 64,458 14,204 52,228 30,807 4,087 5,138
Corporates - Of Which: Specialised Lending 4,263 243 4,138 3,755 0 150 3,933 233 3,825 3,838 0 145
Corporates - Of Which: SME 18,272 5,427 16,500 10,848 1,845 3,032 18,252 5,093 16,225 10,820 1,684 2,809
Retail 110,287 5,991 100,890 15,766 1,142 1,867 109,386 5,778 99,928 15,152 1,040 1,626
Retail - Secured on real estate property 96,594 5,277 89,938 12,231 1,087 1,530 94,820 5,110 88,128 11,237 989 1,268
Retail - Secured on real estate property - Of Which: SME 1,061 480 1,031 441 200 267 940 331 920 409 135 136
Retail - Secured on real estate property - Of Which: non-
SME
95,532 4,797 88,908 11,790 887 1,263 93,880 4,779 87,208 10,828 855 1,132
Retail - Qualifying Revolving 4,421 15 2,176 193 1 13 4,503 19 2,179 170 1 17
Retail - Other Retail 9,272 700 8,775 3,342 54 323 10,064 650 9,621 3,745 50 342
Retail - Other Retail - Of Which: SME 3,496 308 3,051 1,471 39 5 3,459 242 3,043 1,444 34 7
Retail - Other Retail - Of Which: non-SME 5,775 392 5,724 1,871 15 319 6,605 407 6,578 2,301 16 334
Equity 6,173 0 6,173 12,051 0 0 6,029 0 6,029 7,874 0 0
Securitisation
Other non credit-obligation assets
IRB Total(1)
Original exposure, unlike Exposure value, is reported before taking into account any effect due to credit conversion factors or credit risk mitigation techniques (e.g. substitution effects).
2 (mln EUR, %)
Of which:
defaulted
Of which:
defaulted
Of which:
defaulted
Of which:
defaulted
Central banks and central governments 3,008 0 3,034 7 0 0 1,498 0 1,523 22 0 0
Institutions 1,910 0 1,684 491 0 5 2,777 0 2,517 459 0 5
Corporates 12,766 56 8,690 3,533 0 10 13,520 0 9,556 4,123 0 18
Corporates - Of Which: Specialised Lending 572 56 473 439 0 1 424 0 371 402 0 1
Corporates - Of Which: SME 9 0 7 4 0 0 8 0 4 3 0 0
Retail 33 0 31 7 0 0 31 0 29 7 0 0
Retail - Secured on real estate property 29 0 29 7 0 0 27 0 27 6 0 0
Retail - Secured on real estate property - Of Which: SME 0 0 0 0 0 0 0 0 0 0 0 0
Retail - Secured on real estate property - Of Which: non-
SME
29 0 29 7 0 0 27 0 27 6 0 0
Retail - Qualifying Revolving 3 0 1 0 0 0 3 0 1 0 0 0
Retail - Other Retail 1 0 1 0 0 0 1 0 1 0 0 0
Retail - Other Retail - Of Which: SME 0 0 0 0 0 0 0 0 0 0 0 0
Retail - Other Retail - Of Which: non-SME 1 0 1 0 0 0 1 0 1 0 0 0
Equity 148 0 148 423 0 0 119 0 119 301 0 0
Securitisation
Other non credit-obligation assets
IRB Total(1)
Original exposure, unlike Exposure value, is reported before taking into account any effect due to credit conversion factors or credit risk mitigation techniques (e.g. substitution effects).
3 (mln EUR, %)
Of which:
defaulted
Of which:
defaulted
Of which:
defaulted
Of which:
defaulted
Central banks and central governments 1 0 146 3 0 0 1 0 214 3 0 0
Institutions 5 0 3 1 0 0 5 0 2 1 0 0
Corporates 568 0 333 235 0 0 591 0 321 232 0 0
Corporates - Of Which: Specialised Lending 286 0 197 155 0 0 271 0 214 165 0 0
Corporates - Of Which: SME 16 0 1 0 0 0 25 0 1 0 0 0
Retail 0 0 0 0 0 0 0 0 0 0 0 0
Retail - Secured on real estate property 0 0 0 0 0 0 0 0 0 0 0 0
Retail - Secured on real estate property - Of Which: SME 0 0 0 0 0 0 0 0 0 0 0 0
Retail - Secured on real estate property - Of Which: non-
SME
0 0 0 0 0 0 0 0 0 0 0 0
Retail - Qualifying Revolving 0 0 0 0 0 0 0 0 0 0 0 0
Retail - Other Retail 0 0 0 0 0 0 0 0 0 0 0 0
Retail - Other Retail - Of Which: SME 0 0 0 0 0 0 0 0 0 0 0 0
Retail - Other Retail - Of Which: non-SME 0 0 0 0 0 0 0 0 0 0 0 0
Equity 170 0 170 401 0 0 183 0 183 433 0 0
Securitisation
Other non credit-obligation assets
IRB Total(1)
Original exposure, unlike Exposure value, is reported before taking into account any effect due to credit conversion factors or credit risk mitigation techniques (e.g. substitution effects).
2016 EU-wide Transparency Exercise
Credit Risk - IRB Approach
Banco Bilbao Vizcaya Argentaria, SA
IRB Approach
As of 31/12/2015 As of 30/06/2016
Risk exposure amount Value
adjustments
and
provisions
Consolidated data
IRB Approach
As of 31/12/2015 As of 30/06/2016
Original Exposure1
Exposure
Value1
Risk exposure amount Value
adjustments
and
provisions
Original Exposure1
Exposure
Value1
Risk exposure amount Value
adjustments
and
provisions
SPAIN
IRB Approach
As of 31/12/2015 As of 30/06/2016
Original Exposure1
Exposure
Value1
Risk exposure amount Value
adjustments
and
provisions
Original Exposure1
Exposure
Value1
Risk exposure amount Value
adjustments
and
provisions
UNITED STATES
IRB Approach
As of 31/12/2015 As of 30/06/2016
Original Exposure1
Exposure
Value1
Risk exposure amount Value
adjustments
and
provisions
Original Exposure1
Exposure
Value1
Risk exposure amount Value
adjustments
and
provisions
TURKEY
Original Exposure1
Exposure
Value1
Risk exposure amount Value
adjustments
and
provisions
Original Exposure1
Exposure
Value1

2016 EU-wide Transparency Exercise
Credit Risk - IRB Approach
Banco Bilbao Vizcaya Argentaria, SA
4 (mln EUR, %)
Of which:
defaulted
Of which:
defaulted
Of which:
defaulted
Of which:
defaulted
Central banks and central governments 132 0 468 62 0 0 767 0 793 172 0 1
Institutions 577 0 298 8 0 1 13 0 35 6 0 0
Corporates 17,561 131 16,456 10,641 37 143 18,424 131 16,832 10,196 66 146
Corporates - Of Which: Specialised Lending 47 0 35 32 0 0 3 0 3 3 0 0
Corporates - Of Which: SME 2,644 0 2,383 1,460 0 16 2,665 0 2,404 1,410 1 17
Retail 15,061 137 7,255 7,228 5 449 14,744 111 6,830 7,241 4 296
Retail - Secured on real estate property 10 0 10 2 0 0 11 0 11 2 0 0
Retail - Secured on real estate property - Of Which: SME 0 0 0 0 0 0 0 0 0 0 0 0
Retail - Secured on real estate property - Of Which: non-
SME
10 0 10 2 0 0 11 0 11 2 0 0
Retail - Qualifying Revolving 15,050 137 7,244 7,226 5 449 14,732 111 6,818 7,239 4 296
Retail - Other Retail 1 0 1 0 0 0 2 0 2 0 0 0
Retail - Other Retail - Of Which: SME 0 0 0 0 0 0 0 0 0 0 0 0
Retail - Other Retail - Of Which: non-SME 1 0 1 0 0 0 2 0 2 0 0 0
Equity 1,171 0 1,171 2,764 0 0 1,160 0 1,160 2,765 0 0
Securitisation
Other non credit-obligation assets
IRB Total(1)
Original exposure, unlike Exposure value, is reported before taking into account any effect due to credit conversion factors or credit risk mitigation techniques (e.g. substitution effects).
5 (mln EUR, %)
Of which:
defaulted
Of which:
defaulted
Of which:
defaulted
Of which:
defaulted
Central banks and central governments 1 0 93 11 0 0 1 0 95 10 0 0
Institutions 6 0 3 1 0 0 12 0 6 2 0 0
Corporates 596 0 452 312 0 1 783 0 573 676 0 1
Corporates - Of Which: Specialised Lending 284 0 265 197 0 0 293 0 274 545 0 0
Corporates - Of Which: SME 2 0 2 2 0 0 6 0 2 2 0 0
Retail 2 0 2 0 0 0 2 0 2 0 0 0
Retail - Secured on real estate property 2 0 2 0 0 0 2 0 2 0 0 0
Retail - Secured on real estate property - Of Which: SME 0 0 0 0 0 0 0 0 0 0 0 0
Retail - Secured on real estate property - Of Which: non-
SME
2 0 2 0 0 0 2 0 2 0 0 0
Retail - Qualifying Revolving 0 0 0 0 0 0 0 0 0 0 0 0
Retail - Other Retail 0 0 0 0 0 0 0 0 0 0 0 0
Retail - Other Retail - Of Which: SME 0 0 0 0 0 0 0 0 0 0 0 0
Retail - Other Retail - Of Which: non-SME 0 0 0 0 0 0 0 0 0 0 0 0
Equity 14 0 14 38 0 0 14 0 14 39 0 0
Securitisation
Other non credit-obligation assets
IRB Total(1)
Original exposure, unlike Exposure value, is reported before taking into account any effect due to credit conversion factors or credit risk mitigation techniques (e.g. substitution effects).
6 (mln EUR, %)
Of which:
defaulted
Of which:
defaulted
Of which:
defaulted
Of which:
defaulted
Central banks and central governments 0 0 3 0 0 0 33 0 37 9 0 0
Institutions 16,939 0 16,724 430 0 0 15,930 0 15,643 421 0 0
Corporates 7,340 12 5,213 2,896 2 10 7,460 11 5,353 2,941 2 9
Corporates - Of Which: Specialised Lending 1,851 0 1,666 1,297 0 2 1,928 0 1,765 1,334 0 2
Corporates - Of Which: SME 110 2 104 114 1 1 130 1 125 132 1 1
Retail 36 2 33 14 3 1 35 2 33 16 2 1
Retail - Secured on real estate property 30 2 30 13 3 1 29 1 29 16 2 1
Retail - Secured on real estate property - Of Which: SME 0 0 0 0 0 0 0 0 0 0 0 0
Retail - Secured on real estate property - Of Which: non-
SME
30 2 30 13 3 1 29 1 29 16 2 1
Retail - Qualifying Revolving 4 0 1 0 0 0 4 0 1 0 0 0
Retail - Other Retail 2 0 2 1 0 0 2 0 2 0 0 0
Retail - Other Retail - Of Which: SME 1 0 1 0 0 0 0 0 0 0 0 0
Retail - Other Retail - Of Which: non-SME 1 0 1 0 0 0 2 0 2 0 0 0
Equity 33 0 33 107 0 0 48 0 48 133 0 0
Securitisation
Other non credit-obligation assets
IRB Total(1)
Original exposure, unlike Exposure value, is reported before taking into account any effect due to credit conversion factors or credit risk mitigation techniques (e.g. substitution effects).
7 (mln EUR, %)
Of which:
defaulted
Of which:
defaulted
Of which:
defaulted
Of which:
defaulted
Central banks and central governments 0 0 32 1 0 0 0 0 30 1 0 0
Institutions 10,309 0 10,287 749 0 0 11,091 0 11,071 814 0 0
Corporates 5,334 4 4,130 2,397 1 9 5,376 4 4,188 2,399 1 11
Corporates - Of Which: Specialised Lending 1,025 0 983 713 0 1 1,035 0 976 697 0 1
Corporates - Of Which: SME 0 0 0 0 0 0 3 0 2 1 0 0
Retail 173 5 170 57 7 2 164 5 160 51 7 1
Retail - Secured on real estate property 167 5 166 56 7 2 158 5 157 50 7 1
Retail - Secured on real estate property - Of Which: SME 0 0 0 0 0 0 0 0 0 0 0 0
Retail - Secured on real estate property - Of Which: non-
SME
167 5 166 56 7 2 158 5 157 50 7 1
Retail - Qualifying Revolving 4 0 1 0 0 0 4 0 2 0 0 0
Retail - Other Retail 2 0 2 1 0 0 2 0 2 1 0 0
Retail - Other Retail - Of Which: SME 1 0 1 0 0 0 0 0 0 0 0 0
Retail - Other Retail - Of Which: non-SME 2 0 2 1 0 0 2 0 2 1 0 0
Equity 137 0 137 424 0 0 68 0 68 157 0 0
Securitisation
Other non credit-obligation assets
IRB Total(1)
Original exposure, unlike Exposure value, is reported before taking into account any effect due to credit conversion factors or credit risk mitigation techniques (e.g. substitution effects).
IRB Approach
As of 31/12/2015 As of 30/06/2016
Risk exposure amount Value
adjustments
and
provisions
MEXICO
IRB Approach
As of 31/12/2015 As of 30/06/2016
Original Exposure1
Exposure
Value1
Risk exposure amount Value
adjustments
and
provisions
Original Exposure1
Exposure
Value1
Risk exposure amount Value
adjustments
and
provisions
PERU
IRB Approach
As of 31/12/2015 As of 30/06/2016
Original Exposure1
Exposure
Value1
Risk exposure amount Value
adjustments
and
provisions
Original Exposure1
Exposure
Value1
Risk exposure amount Value
adjustments
and
provisions
FRANCE
IRB Approach
As of 31/12/2015 As of 30/06/2016
Original Exposure1
Exposure
Value1
Risk exposure amount Value
adjustments
and
provisions
Original Exposure1
Exposure
Value1
Risk exposure amount Value
adjustments
and
provisions
UNITED KINGDOM
Original Exposure1
Exposure
Value1
Risk exposure amount Value
adjustments
and
provisions
Original Exposure1
Exposure
Value1

2016 EU-wide Transparency Exercise
Credit Risk - IRB Approach
Banco Bilbao Vizcaya Argentaria, SA
8 (mln EUR, %)
Of which:
defaulted
Of which:
defaulted
Of which:
defaulted
Of which:
defaulted
Central banks and central governments 0 0 3 0 0 0 37 0 40 23 0 0
Institutions 50 0 48 3 0 0 14 0 11 3 0 0
Corporates 660 0 480 231 0 1 716 0 539 260 0 1
Corporates - Of Which: Specialised Lending 0 0 0 0 0 0 0 0 0 0 0 0
Corporates - Of Which: SME 7 0 3 3 0 0 5 0 2 1 0 0
Retail 4 0 3 2 0 0 3 0 3 0 0 0
Retail - Secured on real estate property 2 0 2 2 0 0 2 0 1 0 0 0
Retail - Secured on real estate property - Of Which: SME 0 0 0 0 0 0 0 0 0 0 0 0
Retail - Secured on real estate property - Of Which: non-
SME
2 0 2 2 0 0 2 0 1 0 0 0
Retail - Qualifying Revolving 0 0 0 0 0 0 1 0 0 0 0 0
Retail - Other Retail 1 0 1 0 0 0 1 0 1 0 0 0
Retail - Other Retail - Of Which: SME 0 0 0 0 0 0 0 0 0 0 0 0
Retail - Other Retail - Of Which: non-SME 1 0 1 0 0 0 1 0 1 0 0 0
Equity 87 0 87 215 0 0 90 0 90 224 0 0
Securitisation
Other non credit-obligation assets
IRB Total(1)
Original exposure, unlike Exposure value, is reported before taking into account any effect due to credit conversion factors or credit risk mitigation techniques (e.g. substitution effects).
9 (mln EUR, %)
Of which:
defaulted
Of which:
defaulted
Of which:
defaulted
Of which:
defaulted
Central banks and central governments 0 0 57 0 0 0 62 8 94 47 0 8
Institutions 1,924 8 1,879 170 0 8 1,528 0 1,486 141 0 0
Corporates 6,007 62 4,042 2,018 3 34 6,749 44 4,473 2,166 3 27
Corporates - Of Which: Specialised Lending 411 18 401 333 0 15 386 7 381 345 0 15
Corporates - Of Which: SME 0 0 0 0 0 0 0 0 0 0 0 0
Retail 11 0 10 4 0 0 11 0 11 3 0 0
Retail - Secured on real estate property 10 0 10 3 0 0 10 0 10 3 0 0
Retail - Secured on real estate property - Of Which: SME 0 0 0 0 0 0 0 0 0 0 0 0
Retail - Secured on real estate property - Of Which: non-
SME
10 0 10 3 0 0 10 0 10 3 0 0
Retail - Qualifying Revolving 1 0 0 0 0 0 1 0 0 0 0 0
Retail - Other Retail 0 0 0 0 0 0 0 0 0 0 0 0
Retail - Other Retail - Of Which: SME 0 0 0 0 0 0 0 0 0 0 0 0
Retail - Other Retail - Of Which: non-SME 0 0 0 0 0 0 0 0 0 0 0 0
Equity 9 0 9 29 0 0 6 0 6 15 0 0
Securitisation
Other non credit-obligation assets
IRB Total(1)
Original exposure, unlike Exposure value, is reported before taking into account any effect due to credit conversion factors or credit risk mitigation techniques (e.g. substitution effects).
10 (mln EUR, %)
Of which:
defaulted
Of which:
defaulted
Of which:
defaulted
Of which:
defaulted
Central banks and central governments 0 0 0 0 0 0 0 0 3 1 0 0
Institutions 155 0 154 70 0 0 148 0 147 66 0 0
Corporates 787 0 733 404 0 1 779 0 721 394 0 1
Corporates - Of Which: Specialised Lending 157 0 153 107 0 0 151 0 145 102 0 0
Corporates - Of Which: SME 0 0 0 0 0 0 2 0 2 1 0 0
Retail 4 0 4 1 0 0 4 0 4 1 0 0
Retail - Secured on real estate property 3 0 3 0 0 0 3 0 3 1 0 0
Retail - Secured on real estate property - Of Which: SME 0 0 0 0 0 0 0 0 0 0 0 0
Retail - Secured on real estate property - Of Which: non-
SME
3 0 3 0 0 0 3 0 3 1 0 0
Retail - Qualifying Revolving 1 0 0 0 0 0 1 0 0 0 0 0
Retail - Other Retail 0 0 0 0 0 0 0 0 0 0 0 0
Retail - Other Retail - Of Which: SME 0 0 0 0 0 0 0 0 0 0 0 0
Retail - Other Retail - Of Which: non-SME 0 0 0 0 0 0 0 0 0 0 0 0
Equity 158 0 158 378 0 0 180 0 180 422 0 0
Securitisation
Other non credit-obligation assets
IRB Total(1)
Original exposure, unlike Exposure value, is reported before taking into account any effect due to credit conversion factors or credit risk mitigation techniques (e.g. substitution effects).
IRB Approach
As of 31/12/2015 As of 30/06/2016
Risk exposure amount Value
adjustments
and
provisions
CHILE
IRB Approach
As of 31/12/2015 As of 30/06/2016
Original Exposure1
Exposure
Value1
Risk exposure amount Value
adjustments
and
provisions
Original Exposure1
Exposure
Value1
Risk exposure amount Value
adjustments
and
provisions
ITALY
IRB Approach
As of 31/12/2015 As of 30/06/2016
Original Exposure1
Exposure
Value1
Risk exposure amount Value
adjustments
and
provisions
Original Exposure1
Exposure
Value1
Risk exposure amount Value
adjustments
and
provisions
COLOMBIA
Original Exposure1
Exposure
Value1
Risk exposure amount Value
adjustments
and
provisions
Original Exposure1
Exposure
Value1
201512 201512 201512 201512 201512 201512 201512 201512 201512 201512 201512 201512 201512 201512 201512 201512 201512 201512
2016 EU-wide Transparency Exercise
Sovereign Exposure
Banco Bilbao Vizcaya Argentaria, SA
(mln EUR)
of which:
loans and
advances
of which:
debt
securities
of which:
Loans and
advances
of which:
Debt
securities
of which:
Loans and
advances
of which:
Debt
securities
of which:
Loans and
advances
of which:
Debt
securities
of which:
Loans and
advances
of which:
Debt
securities
of which:
Loans and
advances
of which:
Debt
securities
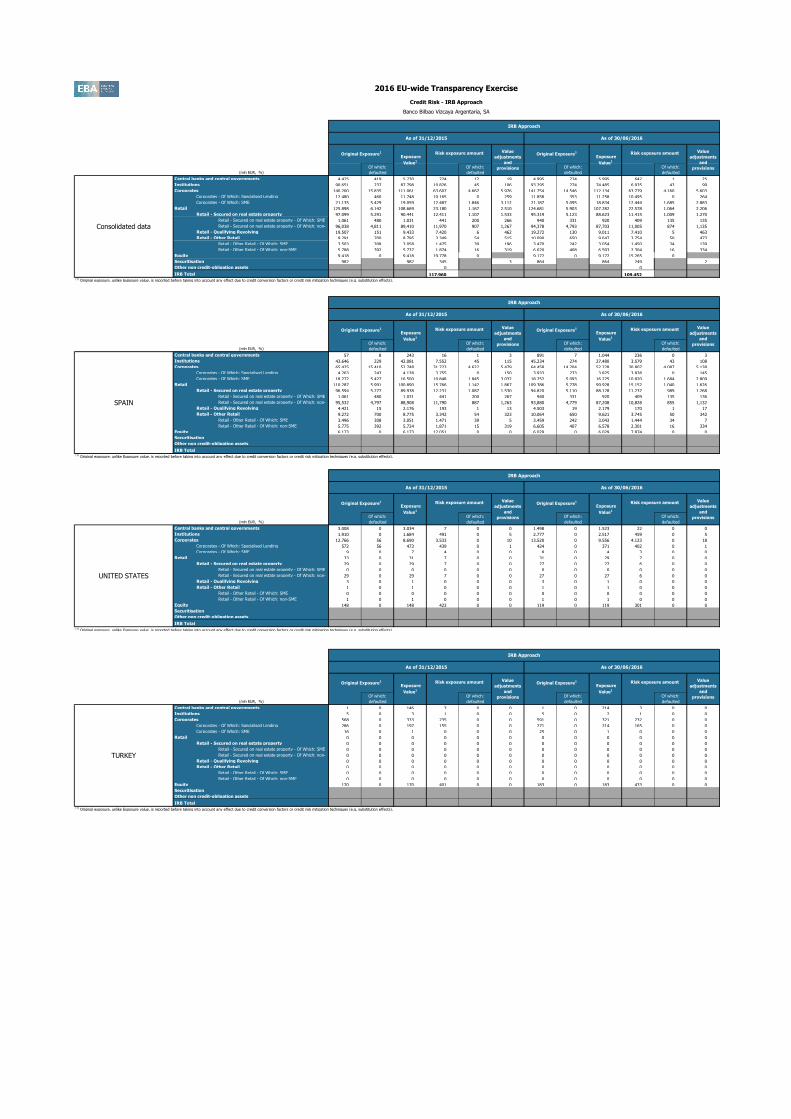
TOTAL - ALL COUNTRIES 136,266.3 38,544.2 97,722.1 28,446.1 0.0 28,446.1 0.0 0.0 0.0 66,048.5 0.0 66,048.5 41,785.7 38,544.2 3,241.5 0.0 0.0 0.0
Austria 24.2 0.0 24.2
Belgium 349.0 32.4 316.6
Bulgaria 20.3 0.0 20.3
Croatia 0.0 0.0 0.0
Cyprus 0.0 0.0 0.0
Czech Republic 0.0 0.0 0.0
Denmark 0.0 0.0 0.0
Estonia 0.0 0.0 0.0
Finland 13.9 0.0 13.9
France 960.7 34.3 926.4
Germany 533.6 0.0 533.6
Greece 0.0 0.0 0.0
Hungary 0.0 0.0 0.0
Ireland 0.6 0.0 0.6
Italy 9,831.8 79.8 9,752.0
Latvia 0.0 0.0 0.0
Lithuania 10.2 0.0 10.2
Luxembourg -0.6 0.0 -0.6
Malta 0.0 0.0 0.0
Netherlands 250.8 0.0 250.8
Poland 22.2 0.0 22.2
Portugal 701.9 427.6 274.3
Romania 299.2 5.3 293.9
Slovakia 0.0 0.0 0.0
Slovenia 0.0 0.0 0.0
Spain 65,497.2 23,500.0 41,997.1
Sweden 0.0 0.0 0.0
United Kingdom 0.0 0.0 0.0
Iceland 0.0 0.0 0.0
Liechtenstein 0.0 0.0 0.0
Norway 0.0 0.0 0.0
Switzerland 0.0 0.0 0.0
Australia 0.0 0.0 0.0
Canada 0.0 0.0 0.0
China 0.0 0.0 0.0
Hong Kong 64.0 0.0 64.0
Japan 9.0 0.1 8.9
U.S. 15,809.4 4,443.0 11,366.4
Other advanced economies non EEA 14.5 0.0 14.5
Other Central and eastern Europe countries non EEA 12,024.7 271.0 11,753.7
Middle East 0.0 0.0 0.0
Latin America and the Caribbean 29,418.1 9,544.4 19,873.7
Africa 17.0 17.0 0.0
Others 394.7 189.4 205.3
Note:
The information reported covers all exposures to “General governments” as defined in paragraph 41 (b) of Annex V of ITS on Supervisory reporting: “central governments, state or regional governments, and local governments, including administrative bodies and non-commercial undertakings, but excluding public companies and private companies held by
these administrations that have a commercial activity (which shall be reported under “non-financial corporations”); social security funds; and international organisations, such as the European Community, the International Monetary Fund and the Bank for International Settlements.
Regions:
Other advanced non EEA: Israel, Korea, New Zealand, Russia, San Marino, Singapore and Taiwan.
Other CEE non EEA: Albania, Bosnia and Herzegovina, FYR Macedonia, Montenegro, Serbia and Turkey.
Middle East: Bahrain, Djibouti, Iran, Iraq, Jordan, Kuwait, Lebanon, Libya, Mauritania, Oman, Qatar, Saudi Arabia, Sudan, Syria, United Arab Emirates and Yemen.
Latin America: Argentina, Belize, Bolivia, Brazil, Chile, Colombia, Costa Rica, Dominica, Dominican Republic, Ecuador, El Salvador, Grenada, Guatemala, Guyana, Haiti, Honduras, Jamaica, Mexico, Nicaragua, Panama, Paraguay, Peru, St. Kitts and Nevis, St. Lucia, St. Vincent and the Grenadines, Suriname, Trinidad and Tobago, Uruguay, Venezuela.
Africa: Algeria, Egypt, Morocco, South Africa and Tunisia.
(1) Includes "Trading financial assets" portfolio for banks reporting under GAAP(2) Includes "Non-trading non-derivative financial assets measured at fair value through profit or loss" portfolio for banks reporting under GAAP(3) Includes "Non-trading non-derivative financial assets measured at fair value to equity" portfolio for banks reporting under GAAP(4) Includes "Non-trading debt instruments measured at a cost-based method" and "Other non-trading non-derivative financial assets" portfolio for banks reporting under GAAP
As of 31/12/2015
Country / Region
Financial assets: Carrying Amount
Memo: breakdown by accounting portfolio
Held for
trading1
Designated at
fair value
through profit
or loss2
Available-for-
sale3
Loans and
Receivables4
Held-to-
maturity
investments

2016 EU-wide Transparency Exercise
Sovereign Exposure
Banco Bilbao Vizcaya Argentaria, SA
(mln EUR)
TOTAL - ALL COUNTRIES
Austria
Belgium
Bulgaria
Croatia
Cyprus
Czech Republic
Denmark
Estonia
Finland
France
Germany
Greece
Hungary
Ireland
Italy
Latvia
Lithuania
Luxembourg
Malta
Netherlands
Poland
Portugal
Romania
Slovakia
Slovenia
Spain
Sweden
United Kingdom
Iceland
Liechtenstein
Norway
Switzerland
Australia
Canada
China
Hong Kong
Japan
U.S.
Other advanced economies non EEA
Other Central and eastern Europe countries non EEA
Middle East
Latin America and the Caribbean
Africa
Others
Country / Region
201606 201606 201606 201606 201606 201606 201606 201606 201606 201606 201606 201606 201606 201606 201606 201606 201606 201606
of which:
loans and
advances
of which:
debt
securities
of which:
Loans and
advances
of which:
Debt
securities
of which:
Loans and
advances
of which:
Debt
securities
of which:
Loans and
advances
of which:
Debt
securities
of which:
Loans and
advances
of which:
Debt
securities
of which:
Loans and
advances
of which:
Debt
securities
135,384.9 38,175.6 97,209.3 29,247.4 0.0 29,247.4 0.0 0.0 0.0 46,236.0 0.0 46,236.0 42,302.5 38,175.6 4,127.0 17,585.4 0.0 17,585.4
48.1 0.0 48.1
283.3 33.3 250.0
8.1 0.0 8.1
0.0 0.0 0.0
0.0 0.0 0.0
0.0 0.0 0.0
0.0 0.0 0.0
0.0 0.0 0.0
13.6 0.0 13.6
434.0 33.3 400.7
500.0 0.0 500.0
0.0 0.0 0.0
0.0 0.0 0.0
0.0 0.0 0.0
11,144.2 69.7 11,074.5
0.0 0.0 0.0
0.0 0.0 0.0
-0.6 0.0 -0.6
0.0 0.0 0.0
290.6 0.0 290.6
44.5 0.0 44.5
599.8 259.4 340.4
322.5 3.9 318.5
0.0 0.0 0.0
0.0 0.0 0.0
65,123.8 23,708.6 41,415.2
0.0 0.0 0.0
10.4 10.4 0.0
0.0 0.0 0.0
0.0 0.0 0.0
0.0 0.0 0.0
0.0 0.0 0.0
0.0 0.0 0.0
0.0 0.0 0.0
0.0 0.0 0.0
62.6 0.0 62.6
8.7 0.1 8.6
16,222.0 4,503.5 11,718.4
26.2 0.0 26.2
11,661.6 242.6 11,419.0
0.0 0.0 0.0
28,239.8 9,082.1 19,157.7
16.3 16.3 0.0
325.4 212.4 113.0
Note:
The information reported covers all exposures to “General governments” as defined in paragraph 41 (b) of Annex V of ITS on Supervisory reporting: “central governments, state or regional governments, and local governments, including administrative bodies and non-commercial undertakings, but excluding public companies and private companies held by
these administrations that have a commercial activity (which shall be reported under “non-financial corporations”); social security funds; and international organisations, such as the European Community, the International Monetary Fund and the Bank for International Settlements.
Regions:
Other advanced non EEA: Israel, Korea, New Zealand, Russia, San Marino, Singapore and Taiwan.
Other CEE non EEA: Albania, Bosnia and Herzegovina, FYR Macedonia, Montenegro, Serbia and Turkey.
Middle East: Bahrain, Djibouti, Iran, Iraq, Jordan, Kuwait, Lebanon, Libya, Mauritania, Oman, Qatar, Saudi Arabia, Sudan, Syria, United Arab Emirates and Yemen.
Latin America: Argentina, Belize, Bolivia, Brazil, Chile, Colombia, Costa Rica, Dominica, Dominican Republic, Ecuador, El Salvador, Grenada, Guatemala, Guyana, Haiti, Honduras, Jamaica, Mexico, Nicaragua, Panama, Paraguay, Peru, St. Kitts and Nevis, St. Lucia, St. Vincent and the Grenadines, Suriname, Trinidad and Tobago, Uruguay, Venezuela.
Africa: Algeria, Egypt, Morocco, South Africa and Tunisia.
(1) Includes "Trading financial assets" portfolio for banks reporting under GAAP(2) Includes "Non-trading non-derivative financial assets measured at fair value through profit or loss" portfolio for banks reporting under GAAP(3) Includes "Non-trading non-derivative financial assets measured at fair value to equity" portfolio for banks reporting under GAAP(4) Includes "Non-trading debt instruments measured at a cost-based method" and "Other non-trading non-derivative financial assets" portfolio for banks reporting under GAAP
As of 30/06/2016
Financial assets: Carrying Amount
Memo: breakdown by accounting portfolio
Held-to-
maturity
investments
Held for
trading1
Designated at
fair value
through profit
or loss2
Available-for-
sale3
Loans and
Receivables4
201512 201512 201512 201512 201512 201512 201512 201606 201606 201606 201606 201606 201606 201606
(mln EUR, %)
Of which:
defaulted
Of which:
defaulted
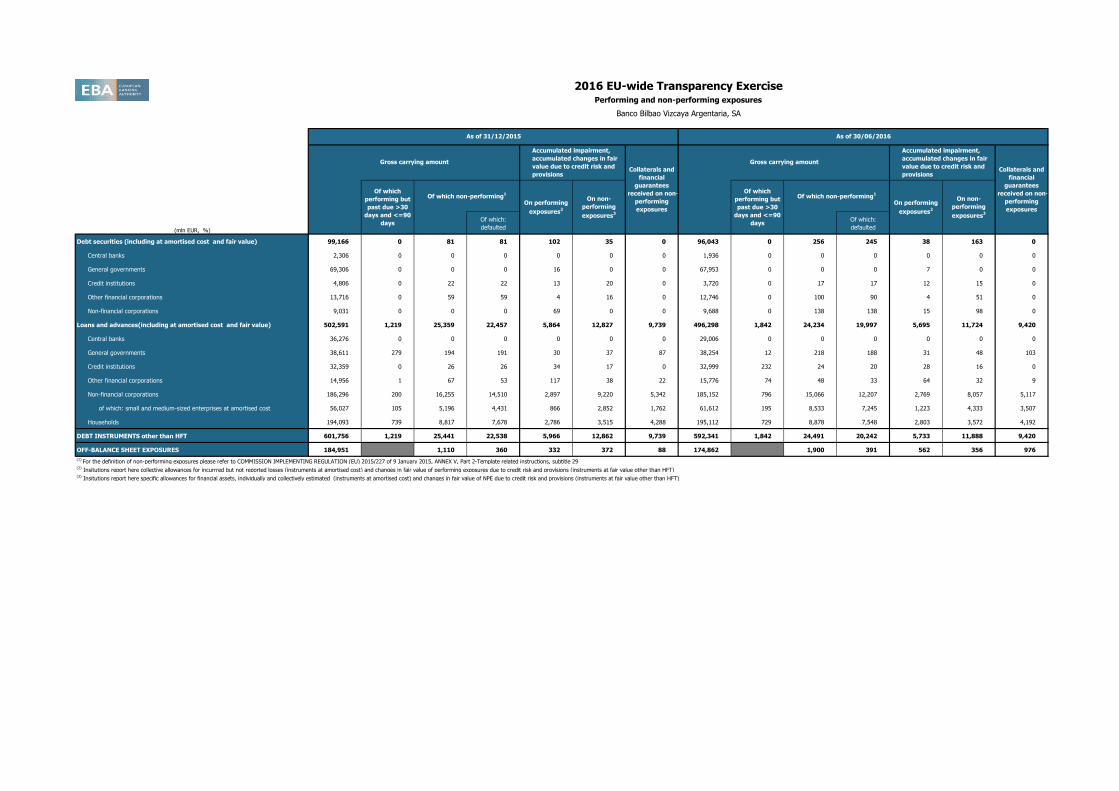
Debt securities (including at amortised cost and fair value) 99,166 0 81 81 102 35 0 96,043 0 256 245 38 163 0
Central banks 2,306 0 0 0 0 0 0 1,936 0 0 0 0 0 0
General governments 69,306 0 0 0 16 0 0 67,953 0 0 0 7 0 0
Credit institutions 4,806 0 22 22 13 20 0 3,720 0 17 17 12 15 0
Other financial corporations 13,716 0 59 59 4 16 0 12,746 0 100 90 4 51 0
Non-financial corporations 9,031 0 0 0 69 0 0 9,688 0 138 138 15 98 0
Loans and advances(including at amortised cost and fair value) 502,591 1,219 25,359 22,457 5,864 12,827 9,739 496,298 1,842 24,234 19,997 5,695 11,724 9,420
Central banks 36,276 0 0 0 0 0 0 29,006 0 0 0 0 0 0
General governments 38,611 279 194 191 30 37 87 38,254 12 218 188 31 48 103
Credit institutions 32,359 0 26 26 34 17 0 32,999 232 24 20 28 16 0
Other financial corporations 14,956 1 67 53 117 38 22 15,776 74 48 33 64 32 9
Non-financial corporations 186,296 200 16,255 14,510 2,897 9,220 5,342 185,152 796 15,066 12,207 2,769 8,057 5,117
of which: small and medium-sized enterprises at amortised cost 56,027 105 5,196 4,431 866 2,852 1,762 61,612 195 8,533 7,245 1,223 4,333 3,507
Households 194,093 739 8,817 7,678 2,786 3,515 4,288 195,112 729 8,878 7,548 2,803 3,572 4,192
DEBT INSTRUMENTS other than HFT 601,756 1,219 25,441 22,538 5,966 12,862 9,739 592,341 1,842 24,491 20,242 5,733 11,888 9,420
OFF-BALANCE SHEET EXPOSURES 184,951 1,110 360 332 372 88 174,862 1,900 391 562 356 976
(1) For the definition of non-performing exposures please refer to COMMISSION IMPLEMENTING REGULATION (EU) 2015/227 of 9 January 2015, ANNEX V, Part 2-Template related instructions, subtitle 29(2) Insitutions report here collective allowances for incurrred but not reported losses (instruments at amortised cost) and changes in fair value of performing exposures due to credit risk and provisions (instruments at fair value other than HFT)(3) Insitutions report here specific allowances for financial assets, individually and collectively estimated (instruments at amortised cost) and changes in fair value of NPE due to credit risk and provisions (instruments at fair value other than HFT)
2016 EU-wide Transparency ExercisePerforming and non-performing exposures
Banco Bilbao Vizcaya Argentaria, SA
As of 31/12/2015 As of 30/06/2016
On non-
performing
exposures3
Collaterals and
financial
guarantees
received on non-
performing
exposures
Of which
performing but
past due >30
days and <=90
days
Of which non-performing1
On performing
exposures2
On non-
performing
exposures3
Of which
performing but
past due >30
days and <=90
days
Of which non-performing1
On performing
exposures2
Gross carrying amount
Accumulated impairment,
accumulated changes in fair
value due to credit risk and
provisionsCollaterals and
financial
guarantees
received on non-
performing
exposures
Gross carrying amount
Accumulated impairment,
accumulated changes in fair
value due to credit risk and
provisions

201512 201512 201512 201512 201512 201606 201606 201606 201606 201606
(mln EUR, %)
Debt securities (including at amortised cost and fair value) 0 0 0 0 0 0 0 0 0 0
Central banks 0 0 0 0 0 0 0 0 0 0
General governments 0 0 0 0 0 0 0 0 0 0
Credit institutions 0 0 0 0 0 0 0 0 0 0
Other financial corporations 0 0 0 0 0 0 0 0 0 0
Non-financial corporations 0 0 0 0 0 0 0 0 0 0
Loans and advances (including at amortised cost and fair value) 34,092 16,079 7,993 7,132 18,669 31,581 15,398 7,477 6,739 16,876
Central banks 0 0 0 0 0 0 0 0 0 0
General governments 827 18 9 6 784 695 41 16 14 84
Credit institutions 0 0 0 0 0 0 0 0 0 0
Other financial corporations 62 13 8 2 28 70 13 17 11 38
Non-financial corporations 19,281 10,797 6,104 5,533 8,497 17,544 10,076 5,538 5,083 8,036
of which: small and medium-sized enterprises at amortised cost 5,790 2,830 1,594 1,428 3,346 9,448 6,143 3,215 2,998 5,218
Households 13,923 5,252 1,871 1,591 9,360 13,272 5,267 1,905 1,632 8,718
DEBT INSTRUMENTS other than HFT 34,092 16,079 7,993 7,132 18,669 31,581 15,398 7,477 6,739 16,876
Loan commitments given 662 37 9 9 10 586 28 8 8 68
(1) For the definition of forborne exposures please refer to COMMISSION IMPLEMENTING REGULATION (EU) 2015/227 of 9 January 2015, ANNEX V, Part 2-Template related instructions, subtitle 30
2016 EU-wide Transparency ExerciseForborne exposures
Banco Bilbao Vizcaya Argentaria, SA
As of 31/12/2015 As of 30/06/2016
Collateral and
financial
guarantees
received on
exposures with
forbearance
measures
Of which non-
performing
exposures with
forbearance
measures
Of which on non-
performing
exposures with
forbearance
measures
Of which non-
performing
exposures with
forbearance
measures
Of which on non-
performing
exposures with
forbearance
measures
Gross carrying amount of
exposures with forbearance
measures
Accumulated impairment,
accumulated changes in fair value
due to credit risk and provisions
for exposures with forbearance
measures
Collateral and
financial
guarantees
received on
exposures with
forbearance
measures
Gross carrying amount of
exposures with forbearance
measures
Accumulated impairment,
accumulated changes in fair value
due to credit risk and provisions
for exposures with forbearance
measures
Related Documents