Welcome message from author
This document is posted to help you gain knowledge. Please leave a comment to let me know what you think about it! Share it to your friends and learn new things together.
Transcript

䔀氀攀挀琀爀椀挀 倀漀眀攀爀 伀甀琀氀漀漀欀昀漀爀 倀攀渀渀猀礀氀瘀愀渀椀愀
㔀ⴀ
䄀甀最甀猀琀 㘀
倀攀渀渀猀礀氀瘀愀渀椀愀 倀甀戀氀椀挀 唀琀椀氀椀琀礀 䌀漀洀洀椀猀猀椀漀渀
Electric Power Outlook for Pennsylvania 2015-2020
ELECTRIC POWER OUTLOOK
FOR PENNSYLVANIA
2015ndash2020
August 2016
Published by
Pennsylvania Public Utility Commission
PO Box 3265
Harrisburg PA 17105-3265
wwwpucpagov
Technical Utility Services
Paul T Diskin Director
Prepared by
David M Washko - Reliability Engineer
Electric Power Outlook for Pennsylvania 2015-2020
Executive Summary
Introduction
Section 524(a) of the Public Utility Code (Code) requires jurisdictional electric distribution
companies (EDCs) to submit to the Pennsylvania Public Utility Commission (PUC or
Commission) information concerning plans and projections for meeting future customer demand1
The PUCrsquos regulations set forth the form and content of such information which is to be filed on
or before May 1 of each year2 Section 524(b) of the Code requires the Commission to prepare an
annual report summarizing and discussing the data provided on or before Sept 1 This report is to
be submitted to the General Assembly the Governor the Office of Consumer Advocate and each
affected public utility3
Since the enactment of the Electricity Generation Customer Choice and Competition Act4 the
Commissionrsquos regulations have been modified to reflect the competitive market Thus projections
of generating capability and overall system reliability have been obtained from regional
assessments
Any comments or conclusions contained in this report do not necessarily reflect the views or
opinions of the Commission or individual Commissioners Although issued by the Commission
this report is not to be considered or construed as approval or acceptance by the Commission of
any of the plans assumptions or calculations made by the EDCs or regional reliability entities
and reflected in the information submitted
Overview
This report concludes that sufficient generation transmission and distribution capacity exists to
reasonably meet the needs of Pennsylvaniarsquos electricity consumers for the foreseeable future
Regional generation adequacy and reserve margins of the mid-Atlantic will be satisfied through
2025 provided that planned generation and transmission projects will be forthcoming in a timely
manner The North American Electric Reliability Corporation (NERC) provided a reliability
assessment of the Regional Transmission Organization (RTO) which is PJM Interconnection
LLC (PJM) and concludes PJM will meet its reserve margin requirements in 2016 of 157
percent NERC also projects that PJM will meet its reserve margin requirements through 2025
Pennsylvaniarsquos aggregate electrical energy usage (residential commercial industrial sales for
resale and other) in 2015 was 146229 gigawatt hours (GWh) versus 146516 GWh for 2014
which is a 02 percent decrease in electrical usage Over the next five years total Pennsylvania
electric energy usage is projected to decrease at an average annual rate of 009 percent This
includes a decrease in average annual residential usage of 069 percent an increase in average
annual commercial usage of 003 percent and an increase in average annual industrial usage of
041 percent
1 See 66 Pa CS sect 524(a)
2 See 52 Pa Code sectsect 57141mdash57154
3 See 66 PaCS sect 524(b)
4 66 PaCS sectsect 2801mdash2812
Electric Power Outlook for Pennsylvania 2015-2020
Section 1 ndash Regional Electric Outlook
Purpose 1
Regional Reliability Organizations 2
North American Electric Reliability Corporation (NERC) 2
NERC Reliability Assessment 3
ReliabilityFirst Corporation (RFC) 4
Regional Transmission Organizations (RTO) 4
PJM Interconnection 4
PJM Peak Demand Performance and Generation Testing 5
PJM Bulk Electric System Status- Transmission 6
PJM Pennsylvania Regional Transmission Line Expansion Plan Overview 7
Status of PJM Backbone Transmission Lines 9
Section 2 ndash Pennsylvania Electric Outlook
Electric Distribution Companies (EDC) 11
Alternative Energy Portfolio Standards 13
Energy Efficiency and Conservation Program (Act 129) 15
Statewide Review of Electrical Energy Usage 19
Summary of Data for the Seven Largest EDCs 24
Duquesne Light Company 24
Metropolitan Edison Company 26
Pennsylvania Electric Company 28
Pennsylvania Power Company 30
West Penn Power Company 32
PECO Energy Company 34
PPL Electric Utilities Corporation 36
Summary of Data for the Four Smallest EDCs 38
Citizensrsquo Electric Company 38
Pike County Light amp Power Company 40
UGI Utilities IncmdashElectric Division 41
Wellsboro Electric Company 42
Appendix A ndash Data Tables Actual and Forecast Data Tables 43
Appendix B ndash Plant Additions and Upgrades Status of Pennsylvaniarsquos Plant Additions and Upgrades 51
Appendix C ndash Existing Generating Facilities Pennsylvaniarsquos Existing Electric Generating Facilities 54
Electric Power Outlook for Pennsylvania 2015-2020 1
Section 1 ndash Regional Electric Outlook
Purpose
The Electric Power Outlook for Pennsylvania 2015-2020 discusses the current and future electric
power supply and demand situation for the 11 investor-owned jurisdictional electric distribution
companies (EDCs) operating in the state and the entities responsible for maintaining the reliability
of the bulk electric supply system within the region that encompasses the state
Pursuant to Title 66 Pennsylvania Consolidated Statutes Section 524(b) the PUC annually
submits this report to the General Assembly the Governor the Office of Consumer Advocate and
affected public utilities It also is posted on the Commissionrsquos website5
The information contained in this report includes highlights of the past year as well as EDCs
projections of energy demand and peak load for 2016-20 The statersquos seven largest EDCs6
represent over 95 percent of jurisdictional electricity usage in Pennsylvania Accordingly
information regarding the four smallest EDCs contained in this report is limited7 The report also
provides a regional perspective with statistical information on the projected resources and
aggregate peak loads for the region that impacts Pennsylvania
As permitted under the Section 2809(e) of the Public Utility Code the Commission has adopted
revised regulations reducing from 20 years to five years the reporting requirements and the
reporting horizon for energy demand connected peak load and number of customers Because
Pennsylvania has a competitive retail electric market certain information is no longer required to
be reported This includes information regarding generation facilities such as capital investments
energy costs new facilities and expansion of existing facilities
The Commission relies on reports and analyses of regional entities including the ReliabilityFirst
Corporation (RFC) and PJM to obtain a more complete assessment of the current and future status
of the electric power supply within the region Also data for the report is submitted annually by
EDCs pursuant to the Commissions regulations Sources also include data submitted by regional
reliability councils to the North American Electric Reliability Corporation (NERC) and the US
Energy Information Administration (EIA)
5 This report is available at httpwwwpucpagovutility_industryelectricityelectric_reportsaspx
6 Those EDCs with at least 100000 customers
7 See 52 Pa Code sectsect 57141mdash57154
Electric Power Outlook for Pennsylvania 2015-2020 2
Regional Reliability Organizations
In Pennsylvania all major EDCs are interconnected with neighboring systems extending beyond
state boundaries These systems are organized into regional reliability councils responsible for
ensuring the reliability of the bulk electric system
North American Electric Reliability Corporation
The North American Electric Reliability Corporation
(NERC) has been granted legal authority by the
Federal Energy Regulatory Commission (FERC) to
enforce reliability standards and to mandate
compliance with those standards NERC oversees the
reliability of the bulk power system that provides
electricity to 334 million people has a total demand of
over 830 gigawatts (GW) has approximately 211000
miles of high-voltage transmission lines (230000 volts
and greater) and represents more than $1 trillion worth
of assets
NERCrsquos members operate in eight regional reliability entities Members include investor-owned
utilities federal and provincial entities rural electric cooperatives statemunicipal and provincial
utilities independent power producers independent system operators merchant electricity
generators power marketers and end-use electricity customers The membership accounts for
virtually all the electricity supplied in the United States Canada and a portion of Baja California
Norte Mexico The regional entity operating in Pennsylvania is ReliabilityFirst Corporation
(RFC)
NERC establishes criteria standards and requirements for its members and all control areas All
control areas must operate in a seamless and stable condition to prevent uncontrolled system
separations and cascading outages caused by any single transient event
Electric Power Outlook for Pennsylvania 2015-2020 3
NERC Reliability Assessment
The 2015 Long-Term Reliability Assessment8 is NERCrsquos independent review of the 10-year
reliability outlook for the North American bulk power system (BPS) while identifying trends
emerging issues and potential risk Also reported is insight on resource adequacy and operating
reliability as well as an overview of projected electricity demand growth for individual
assessments areas NERC also provides specific review of the PJM Regional Transmission
Organization (RTO)
In the 2015 assessment NERC identifies the following key issues for the North American BPS
Resources are sufficient to meet reliability targets in most areas in the 10-year review
period
Reserve Margins in several Assessment Areas are trending downward despite low load
growth but remain well above required reserve margin requirements of 157 percent
The projected PJM region reserve margins are 252 percent in 2016 289 percent in 2020
and 245 percent in 2025
Natural-gas-fired generation surpassed coal this year as the predominant fuel source for
electric generation and is the leading fuel type for capacity additions A growing reliance
on natural gas continues to raise reliability concerns regarding the ability of both gas and
electric infrastructures to maintain the BPS reliability despite substantial progress made
in addressing the interdependencies between these two industries There is a need to
enhance planning approaches to consider fuel deliverability availability and responses to
pipeline contingencies that are unique to each area
A changing resource mix requires additional measures and approaches for assessing
future reliability The North American electric power system is undergoing a significant
transformation with ongoing retirements of fossil-fired and nuclear capacity as well as
growth in natural gas wind and solar resources This shift is caused by several drivers
such as existing and proposed federal state and provincial environmental regulations as
well as low natural gas prices in addition to the ongoing integration of both distributed
and utility-scale renewable resources The resource mix changes are directly impacting
the behavior of the North American BPS These developments will have important
implications on system planning and operations as well as how NERC and the industry
assess reliability In order to maintain an adequate level of reliability through this
transition generation resources need to provide sufficient voltage control frequency
support and ramping capability as essential components to the reliable operations and
planning of the BPS
8 See NERC 2015 Long-Term Reliability Assessment Dec 2015 available at
nerccompaRAPAraReliability20Assessments20DL2015LTRA20-20Final20Reportpdf
Electric Power Outlook for Pennsylvania 2015-2020 4
ReliabilityFirst Corporation
ReliabilityFirst Corporation (RFC) headquartered in Fairlawn Ohio is one of eight NERC
regional entities serving North America and is the regional reliability entity for Pennsylvania Its
service territory consists of more than 72 million people in a 238000 square-mile area covering all
of New Jersey Delaware Pennsylvania Maryland District of Columbia West Virginia Ohio
Indiana and parts of Michigan Wisconsin Illinois Kentucky Tennessee and Virginia Its
membership includes load-serving entities (LSEs) RTOs suppliers and transmission companies
The RFC controls reliability standards and enforcement by entering into delegation agreements
with regional entities to ensure adequate generating capacity and transmission Some performance
factors considered in establishing acceptable reliability levels include load characteristics load
forecast error scheduled maintenance requirements and the forced outage rates of generating
units The RFC reliability standards require sufficient generating capacity to be installed to ensure
the probability of the system load exceeding available capacity is no greater than one day in 10
years LSEs that are members of RFC have a capacity obligation determined by evaluating
individual system load characteristics unit size and operating characteristics
Regional Transmission Organizations
The two RTOs within the RFC footprint are PJM Interconnection LLC (PJM) and Midcontinent
Independent System Operator Inc (MISO)
PJM Interconnection
PJM is a regional transmission organization that ensures the
reliability of the largest centrally dispatched control area in
North America covering 234417 square miles PJM
coordinates the operation of 183600 megawatts (MW) of
generating capacity with 165492 MW peak demand and
more than 62556 miles of transmission lines The PJM
RTO coordinates the movement of electricity for over 61
million people through all or parts of Delaware Illinois
Indiana Kentucky Maryland Michigan New Jersey North
Carolina Ohio Pennsylvania Tennessee Virginia West
Virginia and the District of Columbia9 PJM manages a
sophisticated regional planning process for generation and transmission expansion to ensure the
continued reliability of the electric system PJM is responsible for maintaining the integrity of the
regional power grid and for managing changes and additions to the grid to accommodate new
generating plants substations and transmission lines In addition PJM analyzes and forecasts
future electricity needs of the region Its planning process ensures that the electric system growth is
efficient and takes place in an orderly fashion PJM supports market innovation through its active
support for demand response markets for energy capacity and ancillary services and helps ensure
9 See PJM 2015 Annual Report available at httpwwwpjmcom~mediaabout-pjmnewsroomannual-reports2015-
annual-reportashx
Electric Power Outlook for Pennsylvania 2015-2020 5
that appropriate infrastructure and operational capabilities are in place to support newly installed
renewable energy facilities PJMrsquos mission can be described as below
Acting as a neutral independent party PJM operates a competitive wholesale electricity
market and manages the high-voltage electricity grid to ensure reliability for more than 61
million people
PJMrsquos long-term regional planning process provides a broad interstate perspective that
identifies the most effective and cost-efficient improvements to the grid to ensure reliability
and economic benefits on a system wide basis
An independent Board oversees PJMrsquos activities Effective governance and a collaborative
stakeholder process help PJM achieve its vision ldquoTo be the electric industry leader ndash today
and tomorrow ndash in reliable operations efficient wholesale markets and infrastructure
developmentrdquo
PJM coordinates the continuous buying selling and delivery of wholesale electricity through open
and competitive spot markets PJM balances the needs of suppliers wholesale customers and other
market participants and continuously monitors market behavior In 2015 the PJM market
decreased by 148 percent from $50 billion in 2014 to $426 billion in 2015 Membership
increased 16 percent from 945 members in 2014 to 960 members in 201510
PJMrsquos 2015
transmission volumes were 793 terawatt hours (TWhs) compared with 838 TWhs for 2014
The PJM annual 15 year growth rate (2016-2031) forecast was 13 percent and remained the
same as last yearrsquos11
In 2015 there were 104 generators that were deactivated totaling 10060
MW of generation12
To replace retiring generators there are over 25000 MW of new
generating resources under construction as of Dec 31 2015 and an additional 42000 MW
actively under study
Also of note in 2015 Terry Boston retired as PJMrsquos CEO and was replaced by Andy Ott Andy
Ott was the former PJM executive vice president responsible for executive oversight of the PJM
Market Operations and Market Strategy
PJM Peak Demand Performance and Generator Testing
On the morning of Feb 20 2015 PJM set a new wintertime peak demand record of 143086 MW
which surpassed the previous all-time winter peak of 142863 MW set on Jan 7 201413
There
was significant improvement in the generator forced outage rate during the Feb 20 2015 peak
demand event The forced outage rate was only 134 versus 22 on Jan 7 2014 The
10
httpwwwpjmcom~mediaabout-pjmnewsroomannual-reports2015-annual-reportashx 11
httpwwwpjmcom~mediacommittees-groupssubcommitteeslas2015113020151130-item-07-preliminary-load-
reportashx 12
httpwwwpjmcom~mediaabout-pjmnewsroomannual-reports2015-annual-reportashx 13
httpwwwpjmcom~mediadocumentsreports20150513-2015-winter-reportashx
Electric Power Outlook for Pennsylvania 2015-2020 6
improvement was primarily the result of PJM putting in place pre-winter operational testing for
dual-fuel and infrequently run units and an upgraded winter-preparation checklist program PJM
also required better communications of fuel status and increased generator coordination with
natural gas pipelines
A total of 168 units (9919 MW) participated in the pre-winter operational testing Units that
participated in the pre-winter operational testing had a lower rate of forced outages compared to
those that did not test During the testing 26 units out of 168 units experienced initial failures or
failed to complete the exercise Of those 26 units 16 were able to correct the issue and
subsequently successfully completed the exercise The total unit success rate of 94 percent includes
these corrected failures Chart 1 below details the causes of failures during the exercise
Chart 1 Cold Weather Operational Exercise ndash Causes of Failures
PJM Bulk Electric System Status- Transmission
PJM prepared for 2015 winter peak operations by analyzing winter transmission outage requests to
understand impacts to reliability and congestion The PJM Peak Period Outage Scheduling
Guidelines indicate transmission owners should avoid scheduling transmission outages that may
result in increased risk to system reliability during the winter peak periods14
PJM performed a detailed analysis on each outage request under winter peak system conditions
for outages that transmission owners needed to schedule over the 2015 winter peak This was to
ensure system reliability could be maintained before approving the outage The detailed analysis
also included an assessment of congestion impacts If there was a significant congestion impact for
14
httpwwwpjmcom~mediadocumentsreports20150513-2015-winter-reportashx
Electric Power Outlook for Pennsylvania 2015-2020 7
the outage PJM suggested that the outage be rescheduled PJM also communicated long-duration
scheduled transmission line outages of 500 kV or above (eg those scheduled for the entire season)
and projected impacts to PJM members through the PJM committee process
Prior to the 2015 winter season PJM performed a winter operations study with the transmission
owners as part of the Operations Assessment Task Force The study results indicated the PJM RTO
bulk power transmission system could be operated reliably during the 2015 winter peak load
period in accordance with the operating principles and guidelines contained in the PJM manuals
The task force also performed sensitivity studies to simulate extreme system conditions that PJM
might encounter during the winter season The 2015 winter sensitivity studies included the
following scenarios gas pipeline restrictions high winter loads close to the peak experienced in
2014 and high generation outages The study results showed all contingencies identified in the
sensitivity studies were controllable
PJM Pennsylvania Regional Transmission Expansion Plan Overview
The Pennsylvania electric power outlook generally reflects the projections of RFC which are
based on forecasts of PJM and MISO PJM evaluates regional data concerning the current and
future condition of the bulk electric system because it is planned on a regional rather than state
basis While the aggregate load for the statersquos consumers can be determined the availability and
mix of electrical generation units cannot be predicted since the complexities of a changing free
market will be the primary driving force
An RTO such as PJM has the primary responsibility to coordinate and plan future upgrades and
expansion of the regional transmission system A key part of the planning process is to evaluate
both generation interconnection and merchant transmission interconnection requests Although
transmission planning is performed on a regional basis most upgrades and expansion in
Pennsylvania are planned to support the local delivery system and new generating facilities
Load-serving entities (LSE) acquire capacity resources by entering bilateral agreements
participating in the PJM-operated capacity market owning generation andor pursuing load
management options15
The PJM generator interconnection process ensures new capacity
resources satisfy LSE requirements to reliably meet their obligations
All new generation that anticipates interconnecting and operating in parallel with the PJM
transmission grid and participating in the PJM capacity andor energy markets must submit an
interconnection request to PJM for technical evaluation and approval
Proposed new generating plants and increased capacity of existing plants in Pennsylvania total
23772 MW versus 14015 MW last year These facilities are under active study by PJM
Natural gas projects make up more than 21906 MW versus 10307 MW last year of this queued
15
A Load Serving Entity (LSE) is any entity (or the duly designated agent of such an entity) including a load
aggregator or power marketer that (a) serves end-users within the PJM Control Area and (b) is granted the authority
or has an obligation pursuant to state or local law regulation or franchise to sell electric energy to end-users located
within the PJM Control Area (definition from PJMcom glossary)
Electric Power Outlook for Pennsylvania 2015-2020 8
capacity This additional capacity may be used to serve Pennsylvania or out-of-state
customers16
Appendix B lists the current PJM interconnection requests for new generating
resources in Pennsylvania The existing generating capacity in Pennsylvania totals 42628
MW17
Appendix C lists existing generation facilities in Pennsylvania
Peak summer load growth rates for the Transmission Owner zones within Pennsylvania are
expected to range from 01 percent to 08 percent through 2025 Peak winter load-growth rates
are expected to range between 01 and 11 percent on average over the same time period
Forecasted summer peak loads are modeled in power flow studies used in PJMrsquos 2014 Regional
Transmission Expansion Plan (RTEP) studies PJMrsquos RTEP includes baseline transmission
upgrades in Pennsylvania to meet expected near-term 2020 peak load conditions RTEP studies
also assess anticipated needs for additional transmission expansion plans to meet long-term load
growth requirements through 203018
PJM conducts reliability studies to identify RTEP baseline upgrades needed to resolve all
identified reliability criteria violations PJM cannot compel a generator to operate but can make
financial arrangements with a generator to continue operating for reliability
In 2015 the PJM Board approved 214 new baseline and 207 new network transmission projects
totaling $19 billion and $13 billion respectively These approvals in 2015 however were
offset by existing project cost changes and by the removal of 202 network projects totaling $677
million and 42 existing RTEP baseline projects totaling $300 million19
In 2015 the PJM market was reconfigured as a result of the failure of a large number of reserve
generating resources to operate when called upon during the Jan 2014 Polar Vortex PJM added
a new capacity performance (CP) product Under the CP provisions for the 20182019 Delivery
Year PJM procured two capacity product types through RPM auctions Capacity Performance
and Base Capacity CP Resources must be capable of sustained predictable operation and are
expected to be available and capable of providing energy and reserves when needed throughout
the entire Delivery Year whereas Base Capacity Resources may not be capable of sustained
predictable operation andor may not be expected to provide energy and reserves outside of the
summer period Base Capacity Resources include Base Capacity Demand Resources (DR)
which are expected to be available only during the summer months and Base Capacity Energy
Efficiency (EE) Resources which are expected to provide permanent continuous load reduction
only during the summer months Base Capacity Resources also include Base Capacity
Generation Resources which are expected to be available throughout the Delivery Year like all
Capacity Performance Resources But unlike Capacity Performance Resources Base Capacity
Generation Resources will be subject to non-performance charges only when they fail to perform
when needed during the summer months (June through September)
16
See PJM 2015 RTEP available at httpwwwpjmcomdocumentsreportsrtep-documents2015-rtepaspx 17
Data reported to SNL and received by PUC staff 18
See PJM 2015 RTEP available at httpwwwpjmcomdocumentsreportsrtep-documents2015-rtepaspx 19
See PJM RTEP executive summary at httppjmcom~mediadocumentsreports2015-rtep2015-rtep-book-1ashx
Electric Power Outlook for Pennsylvania 2015-2020 9
The results of the 20182019 Reliability Pricing Model (RPM) BRA (Base Residual Auction)
held in 2015 produced an adequate amount of resources to serve the PJM region for the June 1
2018 to May 31 2019 delivery year The total capacity procured in the auction was 166837
MW which represents a 198 percent reserve margin or 41 higher than the target reserve
margin of 157 Demand Response (DR) Resources cleared 11084 MW versus 10975 MW
last year which is an increase of about 109 MW from last yearrsquos auction Energy Efficiency
Resources cleared 1247 MW versus a record 1339 MW last year which is a decrease of 92
MW from last yearrsquos auction Of the 11084 MW of DR 9600 was base capacity product and
1484 was capacity performance product and of the 1247 MW of EE resources 359 MW was
base capacity product and 887 MW was capacity performance product 20
Status of PJM Backbone Transmission Lines21
The specific status of approved backbone transmission lines is summarized below
Susquehanna-Roseland 500 kV Line
Approved by the PJM Board in June 2007 the Susquehanna-Roseland 500 kV line (Susquehanna-
Lackawanna-Hopatcong-Roseland) had a required in-service date of June 1 2012 Regulatory
process delays pushed the expected in-service out to June 1 2015 The line was approved by the
Pennsylvania Public Utility Commission in February 2010 and by the New Jersey Board of Public
Utilities in April 2010 The line received final approval from the National Park Service (NPS) who
issued a Record of Decision on October 2 2012 affirming the route chosen by PPampL and PSEampG
the NPS issued a special use (Construction) permit on Dec12 2012 The Hopatcong-Roseland
portion of the line was energized on March 31 2014 The Susquehanna-Lackawanna portion of the
line was energized on Sept 23 2014 The remainder of the line was placed in service in May 2015
Cloverdale-Lexington 500 kV Line
In October 2013 the PJM Board approved PJMrsquos recommendation to re-conductor the AEP
portion of the Cloverdale-Lexington 500 kV line including replacement of eleven tower structures
This follows December 2011 PJM Board approval to re-conductor the Dominion portion of the
Cloverdale-Lexington 500 kV circuit to resolve NERC criteria Category C N-1-1 violations AEP
and Dominion have coordinated plans underway to rebuild their respective portions of the 44 mile
line in order to increase its operational limit The Virginia State Corporate Commission released its
final order approving Dominionrsquos 74 mile portion of the line on September 7 2012 Dominion
began construction in late spring of 2013 with completion in December 2013 AEP filed its
application to re-conductor their 371 mile portion of the line in late 2013 AEP is expected to
complete line re-conductoring by June 1 2016
Dooms-Lexington 500 kV Line
Dominion filed an application with the Virginia State Corporate Commission on Nov 19 2012
On May 16 2013 the SCC granted a Certificate of Public Convenience and Necessity (CPCN)
authorizing the rebuild project The project is expected to be completed by Oct 1 2016
20
See PJM news release httpinsidelinespjmcompjm-announces-capacity-auction-results 21
See PJM 2015 RTEP Book 3 Section 12 httpwwwpjmcom~mediadocumentsreports2015-rtep2015-rtep-
book-3ashx
Electric Power Outlook for Pennsylvania 2015-2020 10
Mount Storm-Doubs 500 kV Line
The PJM Board approved the rebuild of the Mount Storm-Doubs line in October 2010 with a
required in-service date of June 2020 The Virginia State Corporation Commission issued a CPCN
for the line on Sept 1 2011 The West Virginia PSC issued a ruling on Dec 16 2010 that the
project is an ordinary extension of an existing system in the usual course of business and does
require a CPCN The Maryland PSC issued a CPCN on July 7 2013 The rebuild was completed
June 1 2015
Surry-Skiffes Creek 500 kV Line
The PJM Board approved plans to build a new 77 mile Surry to Skiffes Creek 500 kV line and a
2025 mile Skiffes Creek to Whealton 230 kV line in April 2012 June 1 2015 was identified as the
required in-service date for the 500 kV portion of the project and June 1 2016 as the required in-
service date for the 230 kV portion of the project The Virginia State Corporation Commission
approved Dominionrsquos request to build the project on Nov26 2013 Construction activities have
been delayed due to transmission permitting issues The expected in-service date has been revised
to June 30 2017 based on these permitting issues PJM will work with Dominion to ensure that
necessary operational guidelines are in place until the line is in service
Loudoun-Brambleton Area
PJMrsquos RTEP includes two 500 kV projects in this area First a project that encompasses a rebuild
of the Mosby-Brambleton-Pleasant View-Goose Creek portion of the Loudoun-Doubs 500 kV line
was approved by the PJM Board in October 2011 The project is expected to be completed by
Dominion by June 1 2016 PJMrsquos RTEP also includes a new second 500 kV line from Loudoun
to Brambleton as approved by the PJM Board in December 2013 This new line is expected to be
in service by June 1 2018
Northern New Jersey 345 kV Upgrades (Bergen to Linden Corridor Upgrade Project)
The Bergen to Linden Corridor project was approved by the PJM Board in December 2013 with a
required in-service date of June 2015 The project is comprised of a series of transmission facility
line upgrades from 138 kV to 345 kV in northern New Jersey Phase 1 of the project will focus on
work to be performed within the Hudson-BergenMarion-Bergen 230 kV and 138 kV overhead
transmission corridor and at the Bergen North Bergen Homestead Penhorn and Marion stations
Construction of Phase 1 began during the third quarter of 2015 with an anticipated in-service date
in June 2016 Phase 2 will focus upon work to be performed within the PSEampG Linden-Bayway
138 kV overhead transmission corridor and the Linden and Bayway stations with an anticipated
in-service date of June 2017 Phase 3 will focus on work to be performed on facilities
interconnected by underground cable looping together the Marion stations with an anticipated in-
service date of June 2018 The underground system will serve to loop together the facilities
upgraded in Phase 1 and Phase 2 of the project
Byron-Wayne 345 kV Line (Grand Prairie Gateway)
The Byron-Wayne 345 kV line was approved by the PJM Board in October 2012 with a requested
June 1 2017 in-service date Construction began in the second quarter of 2015 and is expected to
be completed during 2017
Electric Power Outlook for Pennsylvania 2015-2020 11
Mansfield-Northfield (Glen Willow) 345 kV Line
The Mansfield-Northfield 345 kV line was approved by the PJM Board in April 2012 with a
requested June 1 2015 in-service date FirstEnergy received approval for the Glenwillow-
Mansfield project from the Ohio Power Siting Board in February 2013 Construction began in Fall
2013
Section 2 ndash Pennsylvania Electric Outlook
Electric Distribution Companies
Eleven EDCs currently serve the electricity needs of the majority of Pennsylvanias homes
businesses and industries Cooperatives and municipal systems provide service to several rural and
urban areas The 11 jurisdictional EDCs are
Citizens Electric Company
Duquesne Light Company
Metropolitan Edison Company (FirstEnergy)
Pennsylvania Electric Company (FirstEnergy)
Pennsylvania Power Company (FirstEnergy)
PPL Electric Utilities Corporation
PECO Energy Company (Exelon)
Pike County Light amp Power Company (Orange amp Rockland Utilities Inc)
UGI Utilities Inc ndash Electric Division
Wellsboro Electric Company
West Penn Power Company (FirstEnergy)
Electric Power Outlook for Pennsylvania 2015-2020 12
Figure 2 Map of EDC Service Territories
Each LSE is responsible to make provisions for adequate generating resources to serve its
customers The local EDC or Commission-approved alternative default-service provider (DSP)
must acquire electricity pursuant to a Commission-approved competitive procurement process for
customers who (1) contract with an alternative electric generation supplier (EGS) and the chosen
EGS does not supply the service (2) do not choose an alternative supplier22
Under current law the
default electric generation prices are required to be based upon a ldquoprudent mixrdquo procurement
strategy that will produce the least cost to customers over time23
22
66 Pa CS sect 2803 23
See id sect 2807(e)(3)
Electric Power Outlook for Pennsylvania 2015-2020 13
Alternative Energy Portfolio Standards
The PUC continues to implement procedures and guidelines necessary to carry out the
requirements of the Alternative Energy Portfolio Standards Act (AEPS) of 2004 (Act 213)24
Act
213 requires that an annually increasing percentage of electricity sold to Pennsylvania retail
customers be derived from alternative energy resources The amount of electricity to be supplied
by alternative resources increases to a total of 18 percent by 2021 On July 19 2007 Act 35 of
2007 was signed into law amending Act 213 by changing the compliance schedule related to solar
photovoltaic (PV) energy Act 35 also amended other provisions of the law including definitions
for customer-generator and net metering On December 20 2008 a PUC rulemaking based on the
Act 35 changes became effective AEPS resources must be located in PJM
Alternative energy resources are categorized as Tier I and Tier II resources Tier I resources
include solar wind low-impact hydropower geothermal biologically derived methane gas fuel
cells biomass (including electricity generated in Pennsylvania utilizing by-products of the pulping
process and wood manufacturing process including bark wood chips sawdust and lignins in spent
pulping liquors)25
and coal mine methane Tier II resources include waste coal demand side
management distributed generation large-scale hydropower by-products of wood pulping and
wood manufacturing municipal solid waste and integrated combined coal gasification technology
Act 213 requires that by 2021 8 percent of the electricity sold in each EDC service territory will be
derived from Tier I resources including solar Energy derived from Tier II resources is to increase
to 10 percent Act 213 as amended by Act 35 of 2007 sets forth a 15-year schedule for complying
with its mandates as shown in Table 1 Since Jan 1 2011 all EDCs and EGSs have been required
to comply
24
Alternative Energy Portfolio Standards Act effective Feb 28 2005 73 PS sectsect 16481mdash16488 25
See 66 PaCS sect 2814(b)
Electric Power Outlook for Pennsylvania 2015-2020 14
Table 1 Alternative Energy Portfolio Standards
To meet the requirements of Act 213 EDCs and EGSs acquire alternative energy credits (AECs) in
quantities commensurate with the required tier percentage and the electricity sold to retail
customers AECs are separate from the electricity that is sold to customers An AEC represents
one megawatt hour (MWh) of qualified alternative electric generation or conservation whether
self-generated purchased along with the electric commodity or purchased separately through a
tradable instrument26
AECs are earned when a qualified facility generates 1000 kilowatt-hours (kWh) of electricity
through either estimated or actual metered production An AEC is a tradable certificate that
represents all the renewable energy benefits of electricity generated from a facility An AEC can
be sold or traded separately from the power AECs are generally purchased by EDCs and EGSs in
order to meet the percentages required under AEPS for any given year AECs can be traded
multiple times until they are retired for compliance purposes An AEC can only be retired once
and may not be used to satisfy any other obligations whether voluntarily or mandated by a
renewable energy portfolio standard in another state
In May 2015 the Commission issued a request for proposals for the Pennsylvania AEC program
administrator contract InClime won the contract assumed administrative duties as the
Pennsylvania AEC program administrator on January 1 2016 and is under contract through Dec
31 2018 with two options for one year extensions The AEC program administrator verifies that
EGSs and EDCs are complying with the minimum requirements of Act 213 PJM EISrsquo Generation
Attribute Tracking System (GATS) is the alternative energy credit registry used to track alternative
26
See 52 Pa Code sectsect 7561mdash7570
Total Solar PV Non-Solar
1 June 1 2006 ndash May 31 2007 15 00013 14987 42
2 June 1 2006 ndash May 31 2008 25 10013 24987 52
3 June 1 2006 ndash May 31 2009 35 20013 34987 62
4 June 1 2006 ndash May 31 2010 45 30013 44987 72
5 June 1 2006 ndash May 31 2011 55 40013 54987 82
6 June 1 2006 ndash May 31 2012 65 50013 64987 92
7 June 1 2006 ndash May 31 2013 75 60013 74987 102
8 June 1 2006 ndash May 31 2014 85 70013 84987 112
9 June 1 2006 ndash May 31 2015 95 80013 94987 122
10 June 1 2006 ndash May 31 2016 105 90013 104987 132
11 June 1 2006 ndash May 31 2017 115 100013 114987 142
12 June 1 2006 ndash May 31 2018 125 110013 124987 152
13 June 1 2006 ndash May 31 2019 135 120013 134987 162
14 June 1 2006 ndash May 31 2020 145 130013 144987 172
15 June 1 2006 ndash May 31 2021 155 140013 154987 182
Year PeriodTier I ( )
Tier II ( )
Electric Power Outlook for Pennsylvania 2015-2020 15
energy credit creation and transfer among qualified alternative energy systems GATS is used by
EDCs and EGSs to verify compliance with the requirements of Act 213
Under Act 213 the Commission adopted regulations promoting onsite generation by customer-
generators using renewable resources and eliminated previously existing barriers to net metering27
The regulations also provide for required metering capabilities and a compensation mechanism that
reimburses customer-generators for surplus energy supplied to the electric grid28
Act 35 of 2007
amended Act 213 One aspect of Act 35 altered the reconciliation mechanism used to compensate
customer-generators for surplus energy supplied through net metering29
The Commission also adopted regulations that govern interconnection for customer-generators
The regulations strive to eliminate barriers which may have previously existed with regard to
interconnection while ensuring that interconnection by customer-generators will not pose
unnecessary risks to the Commonwealthrsquos electric distribution systems30
As of May 31 2016 Pennsylvania had certified 12638 alternate energy facilities of which 8897
are located within the state31
The statewide cost for AEPS compliance for all LSEs in
Pennsylvania is estimated to be $1646 million for the reporting year 202132
Compliance costs for
2015 are not published or available at this time
For additional information on Alternative Energy in Pennsylvania please visit the Commissionrsquos
website (httpwwwpucpagovconsumer_infoelectricityalternative_energyaspx)
Energy Efficiency and Conservation Program (Act 129)
Act 129 of 2008
33 required the seven Pennsylvania EDCs
34 with at least 100000 customers
35 to
establish an energy efficiency and conservation (EEampC) plan The Commission-approved plans
were to reduce energy demand and consumption by 1 percent by May 31 2011 and 3 percent by
May 31 2013 Peak demand was to be reduced by 45 percent by May 31 2013 These
collectively were the Phase 1 targets Based on forecast growth data consumption reduction goals
totaled 1467 GWh in 2011 and 4400 GWh in 2013 Peak demand reduction goals were projected
to total 1193 MW for 201336
The Commission determined that with the exception of West Penn
27
Net metering measures the difference between the electricity supplied by an electric utility or EGS and the electricity
generated by a customer-generator when any portion of the electricity generated by the alternative energy generating
system is used to offset part or all of the customer-generatorrsquos requirements for electricity See 52 Pa Code sect 7512 28
See Docket No L-00050174 52 Pa Code sectsect 7511-7515 29
Id 30
See Docket No L-00050175 52 Pa Code sectsect 7521-7540 31
See httppennaepscomapppubliccontroller 32
See httpwwwpucstatepausElectricpdfAEPSAEPS_Ann_Rpt_2014pdf 33
Act 129 of 2008 effective November 14 2008 66 Pa CS sectsect28061-28062 34
The seven EDCs with Act 129 Energy Efficiency and Conservation obligations are Duquesne Light Company
Metropolitan Edison Company PECO Energy Company Pennsylvania Electric Company Pennsylvania Power
Company PPL Electric Utilities Corporation and West Penn Power Company 35
See 66 PaCS sect 28061 36
See Energy Consumption and Peak Demand Reduction Targets Order Docket No M-2008-2069887 entered Mar
30 2009
Electric Power Outlook for Pennsylvania 2015-2020 16
Power the EDCs achieved the 1 percent energy consumption reduction Phase 1 target by May 31
2011 The Commission also determined that all seven EDCs achieved both the 3 percent by May
31 2013 consumption reduction and the 45 percent by May 31 2013 peak demand reduction
Phase 1 targets37
Under Act 129 the Commission was also required to evaluate the costs and benefits of the EEampC
programs by Nov 31 2013 and every five years thereafter38
The Commission determined the
benefits of consumption reduction requirements outweighed the costs Based on the Act 129
Statewide Evaluatorrsquos (SWE)39
Electric Energy Efficiency Potential for Pennsylvania Final
Report40
the Commission set new consumption reduction targets to be attained in the three-year
period from Jun 1 2013 to May 31 2016 (Phase II) for the EDCs subject to the Act 129 EEampC
requirements41
These targets are outlined in Table 2 below
Table 2 Phase II Consumption Reduction Targets
Act 129 Phase II Three-Year Consumption Reduction Targets
EDC
Three-Year of
200910
Forecast Reductions
()
Three-Year MWh Value of 200910
Forecast Reductions
Duquesne 20 276722
Met-Ed 23 337753
PECO 29 1125851
Penelec 22 318813
Penn Power 20 95502
PPL 21 821072
West Penn 16 337533
Phase II of the EEampC Program ended on May 31 2016 The Commission is currently awaiting the
EDCsrsquo filing of final reports and the SWErsquos final review and audit of the Phase II Program in order
to determine each EDCrsquos compliance with the Phase II Implementation Order and attainment of its
Phase II consumption reduction target
While the Commission determined that energy efficiency (EE) programs were cost-effective it did
not have enough information regarding the cost-effectiveness of Act 129 demand response
37
See Energy Efficiency and Conservation Program Order Docket No M-2008-2069887 entered Mar 20 2014 38
See 66 PaCS sectsect 28061(c) and (d) 39
Public Meeting of Jun 25 2009 the Commission selected GDS Associates Inc Engineers and Consultants as the
statewide evaluator for Phase I 40
See the Electric Energy Efficiency Potential for Pennsylvania Final Report available at
httpwwwpucpagovfiling_resourcesissues_laws_regulationsact_129_informationact_129_statewide_evaluator_
swe_aspx 41
See Energy Efficiency and Conservation Program Implementation Order Docket No M-2012-2289411 entered
Aug 3 2012
Electric Power Outlook for Pennsylvania 2015-2020 17
programs in order to set additional peak demand reduction targets for Phase II of Act 12942
However assuming an EDC would be able to meet its Phase II consumption reduction target under
its Act 129 budget the Commission provided the opportunity for EDCs to propose either in the
EEampC plans or otherwise voluntary residential demand response programs43 Additionally the
Commission directed the SWE to perform a Demand Response Potential Study using residential
direct load control and commercial and industrial load curtailment models provided by the
Commission44 This study was to provide the Commission with the information necessary to
determine whether Act 129 Phase III peak demand reduction programs would be cost-effective
The SWE submitted its final version of the Demand Response Potential Study to the Commission
on February 25 201545 The SWE also performed an EE Potential Study to determine the cost
effective consumption reduction potential in Pennsylvania46 The SWE submitted its final Energy
Efficiency Potential Study to the Commission on Feb 25 201547
Following a review of the SWErsquos EE and Demand Response Potential Studies the Commission
found that additional consumption and peak demand reduction targets were cost-effective48 On
June 11 2015 the Commission adopted a Final Implementation Order prescribing targets for a
Phase III of the Act 129 EEampC Program to operate June 1 2016 through May 31 202149 The
EDCsrsquo consumption50 and peak demand reduction51 requirements are provided below in Tables 3
and 4 respectively While the EDCs must implement energy efficiency programs all five years of
the Phase III the Commission required demand response programs only during the last four years
of the Phase recognizing the time necessary to develop and implement such programs52
Additionally using the design and budgetary allocation information provided by the Commission
the SWE found no cost-effective demand response potential in the Penelec service territory and
therefore the Commission did not prescribe a peak demand reduction requirement for Penelec
42
Id at 38-42 43
Id at 42 and 43 To date PECO has an approved voluntary residential DR program in Phase II of Act 129 44
See Energy Efficiency and Conservation Program Final Order Docket No M-2012-2289411 entered Feb 20 2014 45
See Demand Response Potential for Pennsylvania ndash Final Report submitted by GDS Associates Inc et al
February 25 2015 (hereinafter DR Potential Study) 46
See Proposal to Pennsylvania Public Utility Commission ndash Statewide Evaluator RFP submitted by GDS
Associates Inc et al January 11 2013 47
See Energy Efficiency Potential for Pennsylvania ndash Final Report submitted by GDS Associates Inc et
al February 2015 (hereinafter EE Potential Study) 48
See Energy Efficiency and Conservation Program Final Implementation Order Docket No M-2014-2424864
entered June 19 2015 at 10-12 49
Id at 14-15 50
Id at 57 51
Id at 35 52
Id at 35
Electric Power Outlook for Pennsylvania 2015-2020 18
Table 3 Phase III Consumption Reduction Targets
Act 129 Phase III Five-Year Consumption Reduction Targets
EDC
Five-Year of
200910
Forecast Reductions
()
Five-Year MWh Value of 200910 Forecast
Reductions
Duquesne 31 440916
Met-Ed 40 599352
PECO 50 1962659
Penelec 39 566168
Penn Power 33 157371
PPL 38 1443035
West Penn 26 540986
Table 4 Phase III Peak Demand Reduction Targets
Act 129 Phase III Four-Year Peak Demand Reduction Targets
EDC
Four-Year
Reduction (Relative to
2007-2008 Peak
Demand)
Average Annual Potential Savings (MW)
Duquesne 17 42
Met-Ed 18 49
PECO 20 161
Penelec 00 0
Penn Power 17 17
PPL 14 92
West Penn 18 64
Electric Power Outlook for Pennsylvania 2015-2020 19
Statewide Review of Electrical Energy Usage
Pennsylvaniarsquos aggregate electrical energy usage (residential commercial industrial sales for
resale and other) in 2015 was 146229 GWh versus 146516 GWh for 2014 which is a 02 percent
decrease The number of electrical energy customers increased by 12855 or 023 percent
Residential usage represented 353 percent of the total usage followed by industrial (32 percent)
and commercial (29 percent) Aggregate non-coincident peak load53
decreased to 29351 MW in
2015 from 29952 MW in 2014 which is a 02 percent decrease from the previous year
As shown on Table 5 the total average annual aggregate five-year energy usage growth projection
for the residential commercial and industrial classes is projected to decrease 009 percent per year
This includes an average residential growth rate decrease of 069 percent a commercial growth
rate increase of 003 percent and an industrial growth rate increase of 041 percent for the entire
five-year period
Table 5 Average Aggregate five-year Electrical Energy Projection
53
Non-coincident peak load is the sum of EDCsrsquo annual peak loads regardless of their date or time of occurrence
Year Residential Commercial Industrial Total
2016 49422 41625 47826 138873
2017 48957 41630 48285 138872
2018 48734 41709 48608 139051
2019 48484 41712 48667 138863
2020 48079 41667 48624 138370
average annual growth () -069 003 041 -009
Energy Usage Projection (GWh)
Electric Power Outlook for Pennsylvania 2015-2020 20
Individual EDC forecasts are more specific to customers and geographical areas Each EDC bases
its forecasts on financial forecasts of its choosing The EDCrsquos forecasts are more specific for each
territory than the PJM forecast which is a broader forecast that includes Pennsylvania EDC
territories Tables 6 and 7 below provide metrics for 2015 and 2014 respectively
Table 6 PA EDC customers served energy usage and peak load (2015)
Table 7 PA EDC customers served energy usage and peak load (2014)
Total Sales For Total System Company Net Energy Peak
Customers Resale Consumption Losses Use For Load Load
Served (MWh) (MWh) (MWh) (MWh) (MWh) (MWh) (MWh) (MWh) (MWh) (MW)
Duquesne 586149 4108765 6398676 2897651 78017 20755 13503864 828571 36528 12638765 2804
Met-Ed 561426 5514991 2994882 5308797 28518 540883 14388070 1216111 0 13171959 2791
Penelec 587832 4350462 3557621 5646723 37557 2524195 16116558 1534460 0 14582098 2819
Penn Power 163807 1703245 1320785 1495920 6210 229663 4755822 223077 0 4532745 910
PPL 1422730 14461533 14335845 8268558 156524 0 37222460 2684616 63875 34473969 7842
PECO 1601219 13629811 8118412 15365066 888775 122781 38124845 2268368 36996 35819481 8094
West Penn 722615 7254613 5112059 7634863 47610 749243 20755967 1349408 0 19406559 3814
UGI 61931 554166 324382 106076 5629 132 990384 76153 2039 912192 193
Citizens 6945 8688 30019 57224 593 0 174724 8642 180 165902 43
Pike County 4694 29614 45998 0 391 0 76003 0 94 75909 19
Wellsboro 6300 43905 32636 43734 218 115 120608 9649 220 110739 22
Total 5725648 51659793 42271315 46824612 1250042 4187767 146229305 10199055 139932 135890318 29351
of Total 3533 2891 3202 085 286 10000
2015 VS 2014 023 030 097 -162 -249 -189 -020 080 2188 -029 -201
CompanyResidential Commercial Industrial Other
Total Sales For Total System Company Net Energy Peak
Customers Resale Consumption Losses Use For Load Load
Served (MWh) (MWh) (MWh) (MWh) (MWh) (MWh) (MWh) (MWh) (MWh) (MW)
Duquesne 591750 4068016 6431805 3164231 58452 24835 13747339 667123 36528 13043688 2693
Met-Ed 557803 5477233 2944043 5382193 28858 539278 14371606 1097404 0 13274202 2817
Penelec 588274 4461845 3591256 5646861 38641 2548112 16286715 1584888 0 14701827 3024
Penn Power 162577 1728349 1381442 1598555 6142 221039 4935527 241333 0 4694194 1018
PPL 1416655 14562909 14111306 8312629 157433 0 37144277 2679357 69018 34395902 7816
PECO 1594763 13222177 8025119 15309577 937404 180462 37674739 2265504 6746 35402489 8258
West Penn 721158 7281289 4955687 7972140 48081 754700 21011897 1473035 0 19538862 4019
UGI 62003 543149 316181 110622 5688 131 975771 92165 1988 881618 211
Citizens 6889 88335 29440 53974 600 0 172349 4287 195 167867 52
Pike County 4673 30433 44583 0 395 0 75411 0 116 75295 19
Wellsboro 6248 44002 32482 43595 220 97 120396 13216 220 106960 26
Total 5712793 51507737 41863344 47594377 1281914 4268654 146516027 10118312 114811 136282904 29952
of Total 3516 2857 3248 087 291 10000
OtherCompany
Residential Commercial Industrial
Electric Power Outlook for Pennsylvania 2015-2020 21
Figure 3 shows Pennsylvania historic and forecast energy usage for residential commercial and
industrial retail from 1972 to 2015 and forecasted usage from 2016 to 2020
Figure 3 Pennsylvania retail energy usage and 5 year forecast (GWh)
10000
14000
18000
22000
26000
30000
34000
38000
42000
46000
50000
54000
58000
Gig
aw
att
ho
urs
Residential Commercial Industrial
Electric Power Outlook for Pennsylvania 2015-2020 22
Figure 4 shows average residential cost and average usage from 1940 to 2015 Between 1970 and
2010 average residential usage in Pennsylvania increased 14 percent each year while average
cost increased 41 percent each year During the last 10 years average residential usage decreased
020 percent each year while average cost increased 25 percent a year
Figure 4 Average residential cost (centskWh) and usage (MWhyear)
0
1
2
3
4
5
6
7
8
9
10
11
12
13
Cost per kWh
kWh per year
Utility Restructuring
Electric Power Outlook for Pennsylvania 2015-2020 23
Figure 5 shows Pennsylvaniarsquos aggregate non-coincidental peak load demand from 2005 to 2015
and the associated 5 year projections estimated during the last 3 years
Figure 5 Pennsylvania aggregate non-coincidental peak load (MW)
26000
26500
27000
27500
28000
28500
29000
29500
30000
30500
31000
31500
32000
2006 2007 2008 2009 2010 2011 2012 2013 2014 2015 2016 2017 2018 2019 2020
Historic ______ Forecasts _ _ _ _
2014
2015
2016
Electric Power Outlook for Pennsylvania 2015-2020 24
Summary of Data for the Seven Large EDCs
The following section provides historic and projected energy usage and peak load demand statistics
for Pennsylvaniarsquos seven large EDCs
Duquesne Light Company (Duquesne)
Duquesne provides electric service to 586149
customers in the City of Pittsburgh and portions of
Allegheny and Beaver counties in Southwestern
Pennsylvania Duquesnersquos 2015 energy usage total
was 13504 GWh while in 2014 it was 13722 GWh
(a decrease of 16 percent from the previous year)
Duquesnersquos total usage mix consisted of commercial
(47 percent) residential (30 percent) industrial (21
percent) and sales for resale (less than 1 percent)
Over the next five years total energy usage is projected to decrease at an average annual rate of 06
percent This includes an average annual decrease in residential usage of 05 percent annual
commercial usage decrease of 06 percent and a decrease in average annual of industrial usage by
07 percent See Figure 6
Duquesnersquos highest peak load of 2804 MW occurred on July 29 2015 This represents an
increase of 4 percent from the previous yearrsquos peak of 2693 MW Summer peak load is projected
to increase from 2804 MW in summer 2015 to 2942 MW by summer 2020 or by an average
annual growth rate increase of 03 percent See Figure 7
Refer to Appendix A Tables A01-A04 for Duquesnersquos forecasts of peak load and residential
commercial and industrial energy demand filed with the Commission in years 2006 through 2016
Electric Power Outlook for Pennsylvania 2015-2020 25
Figure 6 Duquesne energy usage (GWh)
Figure 7 Duquesne peak load (MW)
2000
2500
3000
3500
4000
4500
5000
5500
6000
6500
7000
7500
2006 2007 2008 2009 2010 2011 2012 2013 2014 2015 2016 2017 2018 2019 2020
Commercial
Residential
Industrial
Historic Forecasts
2600
2700
2800
2900
3000
3100
3200
2006 2007 2008 2009 2010 2011 2012 2013 2014 2015 2016 2017 2018 2019 2020
Historic _______ Forecasts _ _ _ _ _
2016
20142015
Electric Power Outlook for Pennsylvania 2015-2020 26
Metropolitan Edison Company (Met-Ed)
Met-Ed provides service to 561426 customers in
all or portions of 14 counties in Eastern and
Southcentral Pennsylvania Met-Edrsquos 2015 energy
usage total was 14388 GWh while in 2014 it was
14372 GWh (an increase of 01 percent from the
previous year) Met-Edrsquos total sales mix consisted
of residential (38 percent) industrial (37 percent)
commercial (21 percent) and sales for resale (38
percent)
Over the next five years total energy usage is projected to decrease at an average annual rate of 10
percent This includes a decrease in average annual residential usage of 29 percent a decrease in
average annual commercial usage by 05 percent and an increase in average annual industrial
usage by 06 percent See Figure 8
Met-Edrsquos highest peak load of 2791 MW occurred on Aug 17 2015 This represents a decrease
of 09 percent from previous yearrsquos peak of 2817 MW Summer peak load is projected to increase
from 2791 MW in summer 2015 to 2995 MW by summer 2020 or by an average annual growth
rate increase of 14 percent See Figure 9
Refer to Appendix A Tables A05-A08 for Met-Edrsquos forecasts of peak load and residential
commercial and industrial energy demand filed with the Commission in years 2006 through 2016
Electric Power Outlook for Pennsylvania 2015-2020 27
Figure 8 Met-Ed energy usage (GWh)
Figure 9 Met-Ed peak load (MW)
2000
2500
3000
3500
4000
4500
5000
5500
6000
2006 2007 2008 2009 2010 2011 2012 2013 2014 2015 2016 2017 2018 2019 2020
Residential
Commercial
Industrial
Historic Forecasts
2600
2700
2800
2900
3000
3100
3200
3300
2006 2007 2008 2009 2010 2011 2012 2013 2014 2015 2016 2017 2018 2019 2020
20162015
2014
Historic ______ Forecasts _ _ _ _ _
Electric Power Outlook for Pennsylvania 2015-2020 28
Pennsylvania Electric Company (Penelec)
Penelec provides service to 587832 customers in
all or portions of 29 counties in Western and
Northern Pennsylvania Penelecrsquos 2015 energy
usage total was 16117 GWh while in 2014 it was
16287 GWh (a decrease of 10 percent from the
previous year) Penelecrsquos total sales mix consisted
of residential (27 percent) commercial (22
percent) industrial (35 percent) and sales for resale
(157 percent)
Over the next five years total energy usage is projected to decrease at an average annual rate of 09
percent This includes a decrease in average annual in residential usage of 27 percent flat
commercial usage and a decrease in average annual industrial usage by 01 percent See Figure
10
Penelecrsquos highest peak load of 2819 MW occurred on Aug 17 2015 This represents a decrease
of 68 percent from previous yearrsquos peak of 3024 MW Summer peak load is projected to increase
from 2819 MW in summer 2015 to 2907 MW by summer 2020 or by an average annual growth
rate decrease of 06 percent See Figure 11
Refer to Appendix A Tables A09-A12 for Penelecrsquos forecasts of peak load and residential
commercial and industrial energy demand filed with the Commission in years 2006 through 2016
Electric Power Outlook for Pennsylvania 2015-2020 29
Figure 10 Penelec energy usage (GWh)
Figure 11 Penelec peak load (MW)
3000
3500
4000
4500
5000
5500
6000
6500
2006 2007 2008 2009 2010 2011 2012 2013 2014 2015 2016 2017 2018 2019 2020
Historic Forecasts
Commercial
Residential
Industrial
2200
2400
2600
2800
3000
3200
3400
2006 2007 2008 2009 2010 2011 2012 2013 2014 2015 2016 2017 2018 2019 2020
Historic ______ Forecasts _ _ _ _
2014
2015 2016
Electric Power Outlook for Pennsylvania 2015-2020 30
Pennsylvania Power Company (Penn Power)
Penn Power provides service to 163807 customers in
all or portions of six counties in Western
Pennsylvania Penn Powerrsquos 2015 energy usage total
was 4756 GWh while in 2014 it was 4936 GWh (a
decrease of 37 percent from the previous year) Penn
Powerrsquos total usage mix consisted of residential (36
percent) commercial (28 percent) industrial (32
percent) and sales for resale (5 percent)
Over the next five years total energy usage is projected to increase at an average annual rate of 05
percent This includes a decrease in average annual residential usage of 22 percent flat
commercial usage and an increase in average annual industrial usage of 37 percent See Figure
12
Penn Powers highest peak load of 910 MW occurred on Aug 10 2015 This represents a decrease
of 11 percent from the previous yearrsquos peak of 1018 MW Summer peak load is projected to
increase from 910 MW in summer 2015 to 1006 MW by summer 2020 or by an average annual
growth rate increase of 20 percent See Figure 13
Refer to Appendix A Tables A13-A16 for Penn Powerrsquos forecasts of peak load and residential
commercial and industrial energy demand filed with the Commission in years 2006 through 2016
Electric Power Outlook for Pennsylvania 2015-2020 31
Figure 12 Penn Power energy usage (GWh)
Figure 13 Penn Power peak load (MW)
1000
1200
1400
1600
1800
2000
2006 2007 2008 2009 2010 2011 2012 2013 2014 2015 2016 2017 2018 2019 2020
Historic Forecasts
Residential
Commercial
Industrial
1000
1200
1400
1600
1800
2000
2006 2007 2008 2009 2010 2011 2012 2013 2014 2015 2016 2017 2018 2019 2020
Historic Forecasts
Residential
Commercial
Industrial
Electric Power Outlook for Pennsylvania 2015-2020 32
West Penn Power Company (West Penn)
West Penn provides service to 722615 customers in
all or portions of 24 counties in Western North and
South Central Pennsylvania West Pennrsquos 2015
energy usage total was 20798 GWh while in 2014 it
was 21012 GWh (a decrease of 10 percent from the
previous year) West Pennrsquos total usage mix consisted
of residential (35 percent) commercial (25 percent)
industrial (37 percent) and sales for resale (less than 4
percent)
Over the next five years total energy usage is projected to increase at an average annual rate of 02
percent This includes a decrease in average annual residential usage of 25 percent a decrease in
average annual commercial usage of 06 percent and an increase in average annual industrial usage
of 30 percent See Figure 14
West Pennrsquos highest peak load of 3814 MW occurred on July 29 2015 This represents a
decrease of 51 percent from the previous yearrsquos peak of 4019 MW Summer peak load is
projected to increase from 3814 MW in 2015 to 3917 MW by the year 2020 or by an average
annual growth rate increase of 5 percent See Figure 15
Refer to Appendix A Tables A25-A28 for West Pennrsquos forecasts of peak load and residential
commercial and industrial energy demand filed with the Commission in years 2006 through 2016
Electric Power Outlook for Pennsylvania 2015-2020 33
Figure 14 West Penn energy usage (GWh)
Figure 15 West Penn peak load (MW)
4000
4500
5000
5500
6000
6500
7000
7500
8000
8500
9000
9500
2006 2007 2008 2009 2010 2011 2012 2013 2014 2015 2016 2017 2018 2019 2020
Historic Forecasts
Industrial
Residential
Commercial
3500
3600
3700
3800
3900
4000
4100
4200
4300
2006 2007 2008 2009 2010 2011 2012 2013 2014 2015 2016 2017 2018 2019 2020
Historic ______ Forecasts _ _ _ _
2014
2015 2016
Electric Power Outlook for Pennsylvania 2015-2020 34
PECO Energy Company (PECO)
PECO is the largest electric utility in Pennsylvania
providing service to 1601219 customers in the City
of Philadelphia and all or portions of six counties in
Southeastern Pennsylvania PECOrsquos 2015 energy
usage total was 38125 GWh while in 2014 it was
37675 GWh (an increase of 11 percent from the
previous year) PECOrsquos total usage mix consisted of
residential (36 percent) commercial (21 percent)
industrial (40 percent) other54
(23 percent) and sales
for resale (03 percent)
Over the next five years total energy usage is projected to decrease at an average annual rate of 01
percent This includes a decrease in average annual residential usage of 04 percent a decrease in
average annual commercial growth usage by 02 and an increase in average annual industrial
usage by 02 percent See Figure 16
PECOrsquos highest peak load of 8094 MW occurred on July 20 2015 This represents a decrease of
2 percent from the previous yearrsquos peak of 8258 MW Summer peak load is projected to increase
from 8094 MW in summer 2015 to 8135 MW by summer 2020 or by an average annual growth
rate increase of 01 percent See Figure 17
Refer to Appendix A Tables A21-A24 for PECOrsquos forecasts of peak load and residential
commercial and industrial energy demand filed with the Commission in years 2006 through 2016
54
Sales in the ldquootherrdquo category include public streetlights highway lighting other public authorities railroads
railways and interdepartmental
Electric Power Outlook for Pennsylvania 2015-2020 35
Figure 16 PECO energy usage (GWh)
Figure 17 PECO Energy Company peak load (MW)
6000
7000
8000
9000
10000
11000
12000
13000
14000
15000
16000
17000
18000
2006 2007 2008 2009 2010 2011 2012 2013 2014 2015 2016 2017 2018 2019 2020
Historic Forecasts
Residential
Industrial
Commercial
7700
7900
8100
8300
8500
8700
8900
9100
9300
2006 2007 2008 2009 2010 2011 2012 2013 2014 2015 2016 2017 2018 2019 2020
Historic ______ Forecasts _ _ _ _ _
2014
2015
2016
Electric Power Outlook for Pennsylvania 2015-2020 36
PPL Electric Utilities Corporation (PPL)
PPL provides service to 1422730 customers over
a 10000-square-mile area in all or portions of 29
counties in Central Eastern Pennsylvania PPLrsquos
2015 energy usage total was 37222 GWh while
in 2014 it was 37144 GWh (an increase of 02
percent from the previous year) PPLrsquos total usage
mix consisted of residential (39 percent)
commercial (39 percent) industrial (22 percent)
and other (04 percent)
Over the next five years total energy usage is projected to decrease at an average annual rate of 03
percent This includes a decrease in average annual residential usage of 11 percent flat average
annual commercial usage and an increase in average annual industrial usage of 04 percent See
Figure 18
PPLrsquos highest peak load of 7842 MW occurred on February 20 2015 This represents an increase
of 03 percent from the previous yearrsquos peak of 7816 MW Winter peak load is projected to
decrease from 7842 MW in 2015 to 7427 MW by the year 2020 or by an average annual growth
rate decrease of 11 percent PPL expects the lower peak load due to Act 129 reductions See
Figure 19
Refer to Appendix A Tables A17-A20 for PPLrsquos forecasts of peak load and residential
commercial and industrial energy demand filed with the Commission in years 2006 through 2016
Electric Power Outlook for Pennsylvania 2015-2020 37
Figure 18 PPL Electric Utilities Corporation energy usage (GWh)
Figure 19 PPL Electric Utilities Corporation peak load (MW)
7000
8000
9000
10000
11000
12000
13000
14000
15000
16000
2006 2007 2008 2009 2010 2011 2012 2013 2014 2015 2016 2017 2018 2019 2020
Historic Forecast
Residential
Commercial
Industrial
6500
6700
6900
7100
7300
7500
7700
7900
8100
2006 2007 2008 2009 2010 2011 2012 2013 2014 2015 2016 2017 2018 2019 2020
Historic ______ Forecasts _ _ _ _ _
2015
2014
2016
Electric Power Outlook for Pennsylvania 2015-2020 38
Summary of Data for the Four Small EDCs
The following section provides historic and projected energy usage and peak load demand statistics
for Pennsylvaniarsquos four small EDCs
Citizensrsquo Electric Company (Citizensrsquo)
Citizensrsquo provides service to 6945 customers in
Union County Pennsylvania Citizensrsquo 2015 energy
usage total was 175 GWh while in 2014 it was 172
GWh (an increase of 17 percent from previous
year) Citizensrsquo total usage mix consisted of
residential (50 percent) commercial (17 percent)
industrial (33 percent) and other (less than 1
percent)
Over the next five years total energy usage is projected to increase at an average annual rate of 04
percent This includes an increase in average annual residential usage of 04 percent an increase in
average annual commercial usage of 04 percent and an increase in average annual industrial usage
of 04 percent See Figure 20 below
Citizensrsquo highest peak load of 432 MW occurred on Jan 19 2016 This represents a decrease of
20 percent from the previous yearrsquos peak of 519 MW Winter peak load is projected to grow from
432 MW in 2015 to 503 MW by the year 2020 or by an average annual growth rate increase of 3
percent
Electric Power Outlook for Pennsylvania 2015-2020 39
Figure 20 Citizens energy usage (GWh)
2000
3000
4000
5000
6000
7000
8000
9000
10000
2006 2007 2008 2009 2010 2011 2012 2013 2014 2015 2016 2017 2018 2019 2020
Historic ______ Forecasts _ _ _ _
Residential
Industrial
Commercial
Electric Power Outlook for Pennsylvania 2015-2020 40
Pike County Light amp Power Company (Pike)
Pike provides service to 4694 customers in
Eastern Pike County Northeastern
Pennsylvania Pikersquos 2015 energy usage total
was 76 GWh while in 2014 it was 75 GWh
(an increase of 13 percent from the previous
year) Pikersquos total usage mix consisted of
residential (39 percent) commercial (60
percent) and other (05 percent) Pike has no
industrial customers or sales for resale
Over the next five years total energy usage is projected to increase at an average annual rate of 07
percent which includes an increase in average annual residential growth rate of 18 percent and
near zero commercial growth See Figure 21
Pikersquos highest peak load of 185 MW occurred on July 20 2015 This represents a decrease of 27
percent from the previous yearrsquos peak of 19 MW Summer peak load is projected to remain the
same from 185 MW in summer 2015 to 188 MW by summer 2019 with a near zero average
annual growth
Figure 21 Pike County Light amp Power energy usage (GWh)
25
30
35
40
45
50
2006 2007 2008 2009 2010 2011 2012 2013 2014 2015 2016 2017 2018 2019 2020
Historic ______ Forecasts _ _ _ _
Residential
Commercial
Electric Power Outlook for Pennsylvania 2015-2020 41
UGI Utilities IncmdashElectric Division (UGI)
UGI provides electric service to 61931
customers in Northwestern Luzerne and
Southern Wyoming counties in Pennsylvania
UGIrsquos 2015 energy usage total was 990 GWh
while in 2014 it was 976 GWh (an increase of
14 percent from the previous year) UGIrsquos total
usage mix consisted of residential (56 percent)
commercial (33 percent) industrial (11 percent)
and sales for resale (001 percent)
Over the next five years total energy usage is projected to increase at an average annual rate of 02
percent which includes a decrease in average annual residential usage of 01 percent an increase
in average annual commercial usage of 06 and an increase in industrial annual usage of 07
percent See Figure 22
UGIrsquos highest peak load of 193 MW occurred on Jan 18 2016 This represents a decrease of 93
percent from the previous yearrsquos peak of 211 MW Winter peak load is projected to increase from
193 MW in winter 2015 to 194 MW by the year 2020 or by an average annual growth rate
increase of 01 percent
Figure 22 UGI Utilities Inc energy usage (GWh)
50
100
150
200
250
300
350
400
450
500
550
600
650
2006 2007 2008 2009 2010 2011 2012 2013 2014 2015 2016 2017 2018 2019 2020
Historic Forecasts
Residential
Commercial
Industrial
Electric Power Outlook for Pennsylvania 2015-2020 42
Wellsboro Electric Company (Wellsboro)
Wellsboro provides electric service to 6300
customers in Tioga County North Central
Pennsylvania Wellsbororsquos 2015 energy usage
total was 1206 GWh while in 2014 it was
1204 GWh (an increase of 02 percent from the
previous year) Wellsbororsquos total usage mix
consisted of residential (36 percent)
commercial (27 percent) and industrial (36
percent
Over the next five years total energy usage is projected to decrease at an average annual rate of 12
percent This includes an increase in average annual residential usage of 10 percent an increase in
average annual commercial usage of 10 percent and a decrease in average annual industrial usage
of 58 percent See Figure 23 The dramatic drop in Industrial usage is due to two large industrial
customers that are expected to leave the area in 2016 and 2017
Wellsbororsquos highest peak load of 22 MW occurred on Jan 7 2015 This represents a decrease of
18 percent from the previous yearrsquos peak of 26 MW Winter peak load growth is projected to
decrease from 22 MW in 2015 to 20 MW by the year 2020 or by an average annual growth rate
decrease of 19 percent
Figure 23 Wellsboro Electric Company energy usage (GWh)
2500
3000
3500
4000
4500
5000
2006 2007 2008 2009 2010 2011 2012 2013 2014 2015 2016 2017 2018 2019 2020
Historic ______ Forecasts _ _ _ _
Residential
Industrial
Commercial
Electric Power Outlook for Pennsylvania 2015-2020 43
Appendix A ndash Data Tables
The following tables provide actual and projected peak load as well as residential commercial and
industrial energy demand by EDC Actual data covers years 2006 through 2015 Five-year
projections are those filed with the Commission in years 2006 through 2016
Electric Power Outlook for Pennsylvania 2015-2020 44
Table A01 Duquesne Light Company Table A03 Duquesne Light CompanyActual and Projected Peak Load (MW) Actual and Projected Commercial Energy Demand (GWh)
Projected Peak Load Requirments Projected Commercial Energy Demand(Year Forecast Was Filed) (Year Forecast Was Filed)
Year Actual 2006 2007 2008 2009 2010 2011 2012 2013 2014 2015 2016 Year Actual 2006 2007 2008 2009 2010 2011 2012 2013 2014 2015 2016
2006 3053 2765 2006 6474 6693
2007 2890 2805 3039 2007 6715 6847 6784
2008 2822 2835 3086 2948 2008 6631 6991 6942 6731
2009 2732 2873 3141 3007 2862 2009 6537 7129 7127 6768 6648
2010 2889 2910 3194 3067 2836 2854 2010 6712 7259 7302 6815 6627 6428
2011 3012 3242 3128 2857 2863 2944 2011 6612 7457 6878 6583 6501 6681
2012 3054 3191 2850 2860 3000 2935 2012 6539 6952 6533 6585 6782 6682
2013 2951 2890 2917 3053 2980 2966 2013 6494 6527 6666 6854 6749 6642
2014 2693 2960 3088 3045 3021 2997 2014 6432 6742 6957 6842 6640 6600
2015 2804 3125 3102 3083 3056 2969 2015 6399 7056 6929 6640 6621 6494
2016 3132 3135 3094 3005 2893 2016 7017 6645 6648 6503 6371
2017 3167 3118 3026 2918 2017 6641 6643 6472 6327
2018 3143 3042 2938 2018 6654 6455 6299
2019 3056 2950 2019 6430 6254
2020 2942 2020 6210
Table A02 Duquesne Light Company Table A04 Duquesne Light CompanyActual and Projected Residential Energy Demand (GWh) Actual and Projected Industrial Energy Demand (GWh)
Projected Residential Energy Demand Projected Industrial Energy Demand(Year Forecast Was Filed) (Year Forecast Was Filed)
Year Actual 2006 2007 2008 2009 2010 2011 2012 2013 2014 2015 2016 Year Actual 2006 2007 2008 2009 2010 2011 2012 2013 2014 2015 2016
2006 3991 3984 2006 3182 3229
2007 4211 4054 4141 2007 3145 3299 3271
2008 4060 4118 4214 4216 2008 3079 3359 3315 3098
2009 3946 4181 4293 4293 4177 2009 2616 3411 3369 3102 3002
2010 4327 4243 4372 4371 4188 4117 2010 2987 3464 3420 3084 2933 2440
2011 4232 4453 4444 4181 4184 4213 2011 3120 3467 3140 2851 2407 2865
2012 4169 4527 4171 4267 4275 4350 2012 3406 3141 2777 2395 2846 3185
2013 4091 4197 4352 4332 4436 4246 2013 3337 2726 2385 2815 3226 3501
2014 4068 4448 4402 4509 4260 4217 2014 3164 2359 2770 3252 3035 2787
2015 4109 4474 4579 4265 4230 4176 2015 2898 2724 3272 3032 2778 2909
2016 4676 4284 4266 4202 4081 2016 3289 3031 2762 2896 2890
2017 4306 4266 4184 4068 2017 3031 2734 2873 2852
2018 4272 4172 4067 2018 2711 2851 2837
2019 4164 4053 2019 2826 2819
2020 4012 2020 2803
Electric Power Outlook for Pennsylvania 2015-2020 45
Table A05 Metropolitan Edison Company Table A07 Metropolitan Edison CompanyActual and Projected Peak Load (MW) Actual and Projected Commercial Energy Demand (GWh) Energy Sales (GWH)
Projected Peak Load Requirements Projected Commercial Energy Demand(Year Forecast Was Filed) (Year Forecast Was Filed)
Year Actual 2006 2007 2008 2009 2010 2011 2012 2013 2014 2015 2016 Year Actual 2006 2007 2008 2009 2010 2011 2012 2013 2014 2015 2016
2006 2884 2689 2006 4509 4462
2007 2825 2740 2740 2007 4715 4547 4664
2008 3045 2801 2801 2801 2008 4777 4668 4818 4818
2009 2739 2856 2857 2857 2829 2009 4568 4788 4969 4969 4853
2010 2715 2915 2915 2915 2932 2687 2010 3006 4908 5108 5108 5020 4671
2011 3125 2972 2972 3017 2640 2869 2011 2947 5244 5244 5152 4706 2955
2012 3036 3032 3085 2630 2775 2911 2012 2907 5375 5291 4783 2959 2871
2013 3012 3158 2668 2815 2928 2881 2013 2933 5421 4887 3019 2909 2900
2014 2817 2731 2872 2962 2887 2958 2014 2944 4963 3090 2948 2930 2914
2015 2791 2952 2995 2898 2965 2975 2015 2995 3158 2997 2937 2931 2983
2016 3028 2910 2974 2979 2987 2016 2995 2940 2964 2929 2919
2017 2932 2996 2985 2995 2017 2956 2984 2938 2923
2018 3017 2987 2997 2018 2989 2938 2927
2019 2986 2996 2019 2923 2925
2020 2995 2020 2921
The 2010 actual and 2011 forecast are based on a reclassification of the commercial and industrial classes
Table A06 Metropolitan Edison Company Table A08 Metropolitan Edison CompanyActual and Projected Residential Energy Demand (GWh) Actual and Projected Industrial Energy Demand (GWh)
Projected Residential Energy Demand Projected Industrial Energy Demand(Year Forecast Was Filed) (Year Forecast Was Filed)
Year Actual 2006 2007 2008 2009 2010 2011 2012 2013 2014 2015 2016 Year Actual 2006 2007 2008 2009 2010 2011 2012 2013 2014 2015 2016
2006 5287 5325 2006 4008 4176
2007 5595 5390 5516 2007 3992 4155 4123
2008 5598 5515 5699 5699 2008 3831 4177 4156 4156
2009 5448 5640 5872 5872 5771 2009 3439 4200 4181 4181 3620
2010 5666 5764 6037 6037 5836 5587 2010 5288 4221 4193 4193 3842 3538
2011 5588 6187 6187 5969 5552 5424 2011 5404 4201 4201 4035 3497 5443
2012 5363 6341 6109 5577 5226 5201 2012 5261 4209 4047 3528 5545 5434
2013 5553 6232 5682 5386 5184 5297 2013 5328 4048 3731 5589 5652 5411
2014 5477 5799 5547 5183 5159 5354 2014 5382 4021 5610 5765 5521 5322
2015 5515 5650 5212 5042 5421 5533 2015 5309 5625 5851 5561 5381 5413
2016 5210 4979 5438 5378 5190 2016 5847 5587 5456 5472 5350
2017 4993 5457 5392 5042 2017 5612 5508 5507 5372
2018 5476 5382 4925 2018 5524 5523 5467
2019 5351 4840 2019 5532 5474
2020 4760 2020 5467
The 2010 actual and 2011 forecast are based on a reclassification of the commercial and industrial classes
Electric Power Outlook for Pennsylvania 2015-2020 46
Table A09 Pennsylvania Electric Company Table A11 Pennsylvania Electric CompanyActual and Projected Peak Load (MW) Actual and Projected Commercial Energy Demand (GWh) Energy Sales
Projected Peak Load Requirements Projected Commercial Energy Demand(Year Forecast Was Filed) (Year Forecast Was Filed)
Year Actual 2006 2007 2008 2009 2010 2011 2012 2013 2014 2015 2016 Year Actual 2006 2007 2008 2009 2010 2011 2012 2013 2014 2015 2016
2006 2531 2511 2006 5010 4928
2007 2696 2554 2554 2007 4961 4990 5049
2008 2524 2598 2598 2598 2008 5139 5064 5099 5045
2009 2880 2637 2637 2637 2637 2009 5186 5140 5188 5122 5122
2010 2451 2674 2674 2674 2674 2603 2010 5019 5213 5277 5199 5199 5159
2011 2659 2711 2711 2711 2630 2465 2011 3671 5367 5277 5277 5213 5196
2012 3128 2750 2750 2661 2452 2515 2012 3534 5356 5356 5265 5215 3562
2013 3087 2789 2688 2458 2544 2938 2013 3531 5436 5320 5257 3526 3512
2014 3024 2715 2496 2579 2942 2927 2014 3591 5364 5343 3593 3535 3553
2015 2819 2531 2625 2987 2935 2888 2015 3558 5424 3650 3510 3552 3649
2016 2662 3039 2946 2896 2890 2016 3698 3503 3582 3582 3539
2017 3081 2962 2904 2898 2017 3503 3604 3614 3545
2018 2968 2904 2906 2018 3608 3619 3551
2019 2902 2907 2019 3607 3553
2020 2907 2020 3552
The 2010 actual and 2011 forecast are based on a reclassification of the commercial and industrial classes
Table A10 Pennsylvania Electric Company Table A12 Pennsylvania Electric CompanyActual and Projected Residential Energy Demand (GWh) Actual and Projected Industrial Energy Demand (GWh)
Projected Residential Energy Demand Projected Industrial Energy Demand(Year Forecast Was Filed) (Year Forecast Was Filed)
Year Actual 2006 2007 2008 2009 2010 2011 2012 2013 2014 2015 2016 Year Actual 2006 2007 2008 2009 2010 2011 2012 2013 2014 2015 2016
2006 4457 4295 2006 4729 4527
2007 4381 4333 4420 2007 4678 4612 4807
2008 4497 4385 4438 4469 2008 4610 4679 4828 4809
2009 4558 4438 4496 4533 4533 2009 4594 4708 4881 4881 4881
2010 4471 4524 4554 4598 4598 4611 2010 4044 4725 4905 4954 4954 4203
2011 4656 4614 4662 4662 4614 4569 2011 5748 4930 4983 4983 4538 4126
2012 4554 4727 4727 4662 4489 4460 2012 6005 5013 5013 4859 4222 6026
2013 4491 4793 4721 4443 4304 4257 2013 5731 5043 4889 4370 6175 5883
2014 4462 4776 4442 4387 4164 4469 2014 5647 4922 4607 6266 5993 5696
2015 4350 4486 4539 4145 4513 4491 2015 5647 4674 6304 6062 5808 5747
2016 4653 4157 4525 4373 4145 2016 6325 6133 5867 5822 5723
2017 4156 4554 4393 4011 2017 6130 5894 5931 5746
2018 4583 4394 3923 2018 5896 6017 5721
2019 4377 3856 2019 5998 5675
2020 3791 2020 5623
The 2010 actual and 2011 forecast are based on a reclassification of the commercial and industrial classes
Electric Power Outlook for Pennsylvania 2015-2020 47
Table A13 Pennsylvania Power Company Table A15 Pennsylvania Power CompanyActual and Projected Peak Load (MW) Actual and Projected Commercial Energy Demand (GWh) Energy Sales
Projected Peak Load Requirements Projected Commercial Energy Demand(Year Forecast Was Filed) (Year Forecast Was Filed)
Year Actual 2006 2007 2008 2009 2010 2011 2012 2013 2014 2015 2016 Year Actual 2006 2007 2008 2009 2010 2011 2012 2013 2014 2015 2016
2006 984 904 2006 1359 1384
2007 1042 930 921 2007 1414 1422 1394
2008 1063 938 936 936 2008 1404 1460 1427 1427
2009 901 951 951 951 984 2009 1367 1498 1461 1461 1401
2010 903 965 965 965 941 896 2010 1311 1535 1496 1496 1394 1428
2011 1102 980 980 963 890 944 2011 1327 1532 1532 1424 1408 1300
2012 963 994 981 899 947 1010 2012 1334 1569 1491 1449 1267 1291
2013 1054 995 930 983 1001 929 2013 1349 1535 1500 1272 1297 1337
2014 1018 977 1002 1003 930 867 2014 1381 1535 1277 1314 1347 1345
2015 910 1010 1006 953 873 931 2015 1321 1278 1335 1358 1322 1180
2016 1010 969 880 940 992 2016 1334 1365 1326 1048 1311
2017 980 885 947 999 2017 1374 1332 1049 1315
2018 889 949 1003 2018 1332 1047 1319
2019 949 1004 2019 1040 1321
2020 1006 2020 1321
Table A14 Pennsylvania Power Company Table A16 Pennsylvania Power CompanyActual and Projected Residential Energy Demand (GWh) Actual and Projected Industrial Energy Demand (GWh)
Projected Residential Energy Demand Projected Industrial Energy Demand(Year Forecast Was Filed) (Year Forecast Was Filed)
Year Actual 2006 2007 2008 2009 2010 2011 2012 2013 2014 2015 2016 Year Actual 2006 2007 2008 2009 2010 2011 2012 2013 2014 2015 2016
2006 1611 1659 2006 1708 1565
2007 1690 1699 1659 2007 1627 1578 1720
2008 1667 1744 1693 1693 2008 1614 1594 1727 1727
2009 1634 1789 1724 1724 1780 2009 1229 1610 1734 1734 1347
2010 1696 1835 1758 1758 1761 1701 2010 1488 1626 1741 1741 1517 1226
2011 1711 1789 1789 1806 1708 1664 2011 1542 1748 1748 1687 1214 1527
2012 1668 1821 1860 1721 1624 1590 2012 1456 1755 1694 1238 1652 1513
2013 1704 1904 1714 1638 1588 1645 2013 1509 1700 1370 1705 1483 1473
2014 1728 1739 1664 1582 1627 1677 2014 1599 1596 1725 1486 1518 1596
2015 1703 1684 1589 1619 1685 1752 2015 1496 1738 1490 1519 1743 1847
2016 1588 1625 1691 1689 1597 2016 1490 1488 1739 2079 1637
2017 1649 1699 1703 1563 2017 1485 1729 2202 1696
2018 1705 1713 1545 2018 1731 2256 1742
2019 1714 1532 2019 2278 1775
2020 1520 2020 1790
Electric Power Outlook for Pennsylvania 2015-2020 48
Table A17 PPL Electric Utilities Corporation Table A19 PPL Electric Utilities CorporationActual and Projected Peak Load (MW) Actual and Projected Commercial Energy Demand (GWh) Energy Sales (GWH)
Projected Peak Load Requirements Projected Commercial Energy Demand(Year Forecast Was Filed) (Year Forecast Was Filed)
Year Actual 2006 2007 2008 2009 2010 2011 2012 2013 2014 2015 2016 Year Actual 2006 2007 2008 2009 2010 2011 2012 2013 2014 2015 2016
2006 7577 7310 2006 13140 13188
2007 7163 7410 7200 2007 13756 13562 13184
2008 7414 7510 7270 7410 2008 13913 13836 13476 13676
2009 6845 7610 7340 7450 7180 2009 13818 14166 13777 14028 14258
2010 7365 7710 7400 7500 7250 7207 2010 10667 14492 14045 14253 14486 14098
2011 6776 7480 7580 7320 7227 7101 2011 14179 14290 14596 14631 14642 10756
2012 7182 7680 7360 7283 7138 7331 2012 14027 14907 14926 14907 10860 14217
2013 7190 7450 7366 7142 7400 7271 2013 14140 15228 15295 11022 14270 14354
2014 7816 7487 7216 7484 7403 7334 2014 14111 15827 11251 14411 14524 14414
2015 7842 7282 7622 7556 7477 7220 2015 14336 11499 14580 14740 14570 14235
2016 7731 7691 7568 7314 7209 2016 14754 14998 14741 14234 14214
2017 7785 7635 7408 7298 2017 15137 14859 14376 14257
2018 7686 7467 7385 2018 14985 14440 14326
2019 7511 7435 2019 14484 14357
2020 7427 2020 14357
Table A18 PPL Electric Utilities Corporation Table A20 PPL Electric Utilities CorporationActual and Projected Residential Energy Demand (GWh) Actual and Projected Industrial Energy Demand (GWh)
Projected Residential Energy Demand Projected Industrial Energy Demand(Year Forecast Was Filed) (Year Forecast Was Filed)
Year Actual 2006 2007 2008 2009 2010 2011 2012 2013 2014 2015 2016 Year Actual 2006 2007 2008 2009 2010 2011 2012 2013 2014 2015 2016
2006 13714 14099 2006 9704 9968
2007 14411 14392 14180 2007 9482 10048 9965
2008 14419 14555 14422 14469 2008 9551 10084 9999 9625
2009 14218 14794 14565 14584 14341 2009 8418 10150 10032 9570 9401
2010 14206 15036 14702 14562 14340 14384 2010 12045 10214 10059 9228 9141 8506
2011 14356 14828 14608 14246 14390 14142 2011 8467 10084 9005 8879 8365 12151
2012 13616 14770 14350 14226 14120 13848 2012 8173 9009 8866 8211 12116 8475
2013 14295 14443 14164 14005 13658 13607 2013 8052 8864 8110 12269 8468 8133
2014 14563 14325 14161 13667 13575 13588 2014 8313 8054 12450 8501 8182 8092
2015 14462 14335 13738 13602 13644 13647 2015 8269 12686 8550 8281 8171 7966
2016 13896 13695 13769 13720 13721 2016 8603 8407 8260 8066 8283
2017 13678 13814 13732 13750 2017 8459 8324 8129 8354
2018 13908 13781 13825 2018 8365 8168 8420
2019 13790 13826 2019 8189 8450
2020 13679 2020 8450
Electric Power Outlook for Pennsylvania 2015-2020 49
Table A21 PECO Energy Company Table A23 PECO Energy CompanyActual and Projected Peak Load (MW) Actual and Projected Commercial Energy Demand (GWh) Energy Sales (GWH)
Projected Peak Load Requirements Projected Commercial Energy Demand(Year Forecast Was Filed) (Year Forecast Was Filed)
Year Actual 2006 2007 2008 2009 2010 2011 2012 2013 2014 2015 2016 Year Actual 2006 2007 2008 2009 2010 2011 2012 2013 2014 2015 2016
2006 8932 8755 2006 8857 8691
2007 8549 8887 9066 2007 8892 8864 9034
2008 8824 9020 9202 8677 2008 8700 9042 9215 9069
2009 7994 9155 9340 8807 8956 2009 8404 9223 9399 9251 8874
2010 8864 9293 9480 8940 9091 8114 2010 8472 9407 9587 9436 9052 8572
2011 8984 9622 9074 9227 8236 8786 2011 8332 9779 9625 9233 8744 8589
2012 8549 9210 9365 8359 8770 8926 2012 8063 9817 9417 8918 8705 8360
2013 8618 9506 8485 8842 8956 8529 2013 8101 9606 9097 8879 8443 7821
2014 8258 8612 8916 8987 8580 8627 2014 8025 9279 9057 8528 7790 7858
2015 8094 8991 9018 8631 8635 8259 2015 8118 9238 8613 7868 7936 8021
2016 9049 8683 8644 8267 8102 2016 8699 7947 8015 8017 8044
2017 8735 8653 8275 8110 2017 8026 8096 8013 8020
2018 8661 8284 8118 2018 8177 8009 8016
2019 8292 8126 2019 8005 8018
2020 8135 2020 8019
Table A22 PECO Energy Company Table A24 PECO Energy CompanyActual and Projected Residential Energy Demand (GWh) Actual and Projected Industrial Energy Demand (GWh)
Projected Residential Energy Demand Projected Industrial Energy Demand(Year Forecast Was Filed) (Year Forecast Was Filed)
Year Actual 2006 2007 2008 2009 2010 2011 2012 2013 2014 2015 2016 Year Actual 2006 2007 2008 2009 2010 2011 2012 2013 2014 2015 2016
2006 12797 13738 2006 15821 16089
2007 13487 14013 13053 2007 16582 16411 16137
2008 13317 14293 13314 13757 2008 16534 16739 16460 16914
2009 12893 14579 13580 14032 13583 2009 15889 17074 16789 17252 16864
2010 13896 14870 13852 14313 13855 13151 2010 15824 17415 17125 17597 17202 16207
2011 13686 14129 14599 14132 13414 13912 2011 15755 17467 17949 17546 16531 15991
2012 13233 14891 14415 13683 14037 13669 2012 15253 18308 17897 16861 16153 15755
2013 13241 14703 13956 14317 13806 13392 2013 15379 18254 17199 16476 15912 15481
2014 13222 14235 14604 13944 14463 13343 2014 15310 17543 16806 16071 15714 15609
2015 13630 14896 14083 14608 13346 13288 2015 15365 17142 16232 15949 15844 15302
2016 14224 14754 13349 13355 13366 2016 16394 16188 16081 15294 15547
2017 14902 13351 13422 13341 2017 16431 16322 15287 15515
2018 13354 13489 13352 2018 16567 15279 15513
2019 13556 13354 2019 15271 15517
2020 13360 2020 15529
Pennsylvania Public Utility Commission 50
Table A25 West Penn Power Company Table A27 West Penn Power CompanyActual and Projected Peak Load (MW) Actual and Projected Commercial Energy Demand (GWh) Energy Sales (GWH)
Projected Peak Load Requirements Projected Commercial Energy Demand(Year Forecast Was Filed) (Year Forecast Was Filed)
Year Actual 2006 2007 2008 2009 2010 2011 2012 2013 2014 2015 2016 Year Actual 2006 2007 2008 2009 2010 2011 2012 2013 2014 2015 2016
2006 3926 3723 2006 4959 4996
2007 3838 3782 3813 2007 4998 5092 5083
2008 3826 3824 3882 3871 2008 4925 5179 5179 5115
2009 3667 3864 3965 3958 3910 2009 4880 5249 5279 5235 5048
2010 3988 3895 4028 4036 3990 3788 2010 4983 5318 5365 5327 5160 4966
2011 4017 4078 4083 4032 3755 3757 2011 4889 5452 5387 5275 4987 4909
2012 3808 4123 4084 3771 3754 3758 2012 4849 5462 5353 5059 4931 4819
2013 3914 4120 3809 3786 3771 3784 2013 4878 5450 5169 4979 4930 4845
2014 4019 3951 3879 3840 3846 4075 2014 4956 5307 5091 5083 4909 4860
2015 3814 3928 3903 3908 3945 3793 2015 5112 5229 5229 4946 4897 4996
2016 3964 3980 4012 3842 3793 2016 5343 4979 4932 4957 4900
2017 4015 4065 3927 3840 2017 5047 4962 5015 4915
2018 4077 4020 3886 2018 4962 5029 4941
2019 4031 3916 2019 5006 4952
2020 3917 2020 4954
Table A26 West Penn Power Company Table A28 West Penn Power CompanyActual and Projected Residential Energy Demand (GWh) Actual and Projected Industrial Energy Demand (GWh)
Projected Residential Energy Demand Projected Industrial Energy Demand(Year Forecast Was Filed) (Year Forecast Was Filed)
Year Actual 2006 2007 2008 2009 2010 2011 2012 2013 2014 2015 2016 Year Actual 2006 2007 2008 2009 2010 2011 2012 2013 2014 2015 2016
2006 7133 7164 2006 8144 8283
2007 7266 7289 7319 2007 8160 8429 8282
2008 7172 7387 7484 7481 2008 8135 8543 8411 8311
2009 7101 7417 7639 7654 7206 2009 7286 8615 8584 8476 8440
2010 7401 7447 7761 7774 7264 7147 2010 7617 8634 8728 8699 8711 7612
2011 7349 7869 7892 7233 7104 7139 2011 7818 8766 8799 8906 7740 7833
2012 7092 7965 7248 7085 7122 7121 2012 7685 8844 9093 7936 8025 8029
2013 7318 7102 6952 7047 7149 7146 2013 7777 9246 8105 8146 8172 8087
2014 7281 7008 7073 7188 7282 7311 2014 7972 8214 8264 8334 8303 7947
2015 7255 7148 7231 7369 7302 7383 2015 7635 8346 8487 8542 8161 8053
2016 7281 7431 7303 7157 6775 2016 8608 8786 8331 8492 8287
2017 7493 7319 7244 6634 2017 8878 8466 8903 8641
2018 7335 7298 6548 2018 8495 9321 8798
2019 7303 6473 2019 9700 8847
2020 6407 2020 8852
Electric Power Outlook for Pennsylvania 2015-20 51
Appendix B ndash Plant Additions and Upgrades
Table B-1 below represents PJM interconnection requests from 1997 to Dec 31 2015 for generation
resources located in Pennsylvania55
As shown in table below Pennsylvania has 8202 MW under
construction Under construction for the prior two years was 4629 MW in 2014 and 2134 MW in
2013
Table B-1 PJM New Generation Queue for Pennsylvania ndash Interconnection Requests (1997 to
December 31 2015)
The Active column represents the PJM study phase of a project before it can possibly be moved
forward to Under Construction classification The In-Service Nuclear MW value of 26218 MW
includes 1630 MW from Beaver Valley Nuclear Generating Station that was integrated into PJM in
2004 Under Construction Coal MW represents the Hatfields Ferry Power Plant in Monongahela that
was retired in Oct 2013 and has since executed a construction service agreement with PJM even
though FirstEnergy is conducting a long-term study to determine whether it is feasible to reopen
Withdrawn Nuclear MW represents PPL Plus Corporationrsquos Bell Bend project which was suspended
since Areva Corp stopped in Feb 2008 the NRC design approval process for their Evolutionary
Power Reactor
55
See PJM Pennsylvania State Report at httpwwwpjmcom
Pennsylvania Public Utility Commission 52
Tables B-2 and B-3 below show generation deactivations and activations in Pennsylvania for 2015
Table B-2 2015 Generation Deactivations in Pennsylvania
Unit MW Capacity
TO Zone Age ActualProjected Deactivation Date
Fuel Type
AES Beaver Valley 125 DLCO 26 612015 Coal
Arnold (Green Mountain) Wind Farm 07 Penelec 15 872015 Wind
Pottstown LF (Moser) 2 PECO 26 10152015 Landfill Gas
MH50 Marcus Hook Co-Gen 50 PECO 27 582015 Gas
In 2015 177 MW of capacity retired in Pennsylvania compared to 10800 MW in the entire PJM
territory This represents only 15 percent of the 10800 MW that retired in the PJM territory
Table B-3 2015 Generation Activations in Pennsylvania
Project Names In-service MW Date Fuel Type
Fayette II 5 2015 Q4 NG
TMI 230kV 168 2015 Q4 NUKE
North Meshoppen 345kV 154 2015 Q4 NG
North Meshoppen 345kv II 35 2015 Q4 NG
Printz 19 2015 Q4 NG
Arnold 345kV 8 2015 Q4 STORAGE
Meyersdale North 115kV 18 2015 Q4 NG
Piney Hydro 345kV 526 2015 Q2 HYDRO
Springdale 3 4 5 26 2015 Q1 NG
Allegheny Dam 5 5 2015 Q1 HYDRO
Allegheny Dam 6 138kV 5 2015 Q1 HYDRO
St Benedict-Patton 0 2015 Q1 WIND
The PJM Queue process does not use commercial names rather project names are used to track new
generation supply by interconnection points at the bus of the transmission system
Electric Power Outlook for Pennsylvania 2015-20 53
Graphs B-1 and B-2 below show fuel type percent of Projects in Queue (as of December 31 2015)
and other graph shows total MW Capacity by fuel type (as of December 31 2015)
Graph B-1 New Generation for Pennsylvania ndash Fuel Type Percent of Projects in Queue (December
31 2015)
Graph B-2 New Generation Queue for Pennsylvania ndash Total MW Capacity by Fuel Type
(December 31 2015)
Pennsylvania Public Utility Commission 54
Appendix C ndash Existing Generating Facilities
Table C-1 shows the PJM regional electricity supply mix summary of generating capacity and actual
generation by fuel type for 201556
Note the significant reduction in coal generation and
corresponding increase in natural gas generation Graph C-1 shows the Pennsylvania specific
generation capacity for 201557
Table C-2 shows the most recently available data on existing generating facilities located in
Pennsylvania58
Table C-1 Electrical Power Supply Mix
Electricity Supply Mix
PJM Region Capacity amp Generation Mix for 2015 amp 2014
(percent)
Energy Source 2015
Capacity
2014
Capacity
2015
Generation
2014
Generation
Coal 375 397 366 435
Nuclear 186 179 355 343
Natural Gas 34 307 234 173
Hydro Wind Solar amp Other 59 57 44 44
Oil 39 6 01 04
56
See State of the Market Report Monitoring Analytics available at
httpwwwmonitoringanalyticscomreportsPJM_State_of_the_Market2015shtml 57
Data reported directly from PJM to PUC staff in July 2016 58
Data reported to SNL and received by PUC staff in July 2016
Electric Power Outlook for Pennsylvania 2015-20 55
Graph C-1 Electrical Power Capacity Mix
2015 Pennsylvania Installed Capacity
Pennsylvania Public Utility Commission 56
Electric Power Outlook for Pennsylvania 2015-20 57
Table C-2 Electric Generating Facilities in Pennsylvania
County Plant Owner Ultimate ParentOwnership
()
Operating
Capacity
(MW)
Year First
Unit in
Service
Age Fuel Type
Adams Gettysburg Energy amp Nutrient Recovery Facility (GENRF) EnergyWorks BioPower Inc EnergyWorks BioPower Inc 100 27 2013 3 Biomass
Hamilton NRG REMA LLC NRG Energy Inc 100 24 1971 45 Oil
Hunterstown NRG REMA LLC NRG Energy Inc 100 75 1971 45 Oil
Hunterstown CC NRG Energy Inc NRG Energy Inc 100 810 2003 13 Gas
Orrtanna NRG REMA LLC NRG Energy Inc 100 26 1971 45 Oil
Allegheny Allegheny Energy 3 4 and 5 Allegheny Energy Supply Company LLC FirstEnergy Corp 100 550 2003 13 Gas
Allegheny Energy Units 1 and 2 Allegheny Energy Supply Company LLC FirstEnergy Corp 100 88 1999 17 Gas
Brunot Island Orion Power Holdings Inc NRG Energy Inc 100 15 1972 44 Oil
Brunot Island CC NRG Power Midwest LP NRG Energy Inc 100 2694 1973 43 Gas
Cheswick NRG Power Midwest LP NRG Energy Inc 100 563 1970 46 Coal
Clairton Works United States Steel Corporation United States Steel Corporation 100 274 1955 61 Nonrenewable
Mon Valley Works United States Steel Corporation United States Steel Corporation 100 319 1943 73 Nonrenewable
PPG Monroeville Chemicals Center PPG Monroeville Chemicals Center PPG Industries Incorporated 100 11 1998 18 Oil
PPG Place PPG Industries Incorporated PPG Industries Incorporated 100 23 1990 26 Oil
Armstrong Allegheny 5 Enduring Hydro LLC Enduring Hydro LLC 1 1988 28 Water
I Squared Capital I Squared Capital 99 1988 28 Water
Allegheny 6 Enduring Hydro LLC Enduring Hydro LLC 1 1988 28 Water
I Squared Capital I Squared Capital 99 1988 28 Water
Allegheny 8 (Torrent Hydro) BluEarth Renewables Inc BluEarth Renewables Inc 49 1990 26 Water
PSP Investments PSP Investments 51 1990 26 Water
Allegheny 9 (Torrent Hydro) BluEarth Renewables Inc BluEarth Renewables Inc 49 1990 26 Water
PSP Investments PSP Investments 51 1990 26 Water
Armstrong County International Power America Inc Engie SA 100 676 2002 14 Gas
Keystone ArcLight Capital Partners LLC ArcLight Capital Holdings LLC 4445 1967 49 Coal
NRG REMA LLC NRG Energy Inc 2037 1967 49 Coal
PSEG Fossil LLC Public Service Enterprise Group Incorporated 2284 1967 49 Coal
Talen Energy Corporation Talen Energy Corporation 617 1967 49 Coal
Talen Generation LLC Talen Energy Corporation 617 1967 49 Coal
Keystone IC Constellation Power Source Generation LLC Exelon Corporation 4198 1968 48 Oil
Duquesne Light Holdings Inc Duquesne Light Holdings Inc 247 1968 48 Oil
NRG REMA LLC NRG Energy Inc 2037 1968 48 Oil
PSEG Fossil LLC Public Service Enterprise Group Incorporated 2284 1968 48 Oil
Talen Energy Corporation Talen Energy Corporation 309 1968 48 Oil
Talen Generation LLC Talen Energy Corporation 925 1968 48 Oil
Mahoning Creek Enduring Hydro LLC Enduring Hydro LLC 51 2013 3 Water
I Squared Capital I Squared Capital 49 2013 3 Water
Beaver Beaver Solar Eaton Corporation Eaton Corporation 100 13 2012 4 Solar
Beaver Valley FirstEnergy Nuclear Generation Corp FirstEnergy Corp 8006 1976 40 Nuclear
Ohio Edison Company FirstEnergy Corp 1082 1976 40 Nuclear
Toledo Edison Company FirstEnergy Corp 912 1976 40 Nuclear
Beaver Valley Patterson Dam Enel Green Power North America Inc Enel Green Power SpA 317 1982 34 Water
Enel SpA 683 1982 34 Water
Townsend Hydro Beaver Falls Municipal Authority Beaver Falls Municipal Authority 100 42 1987 29 Water
Berks Altairnano PJM Li-ion Battery Storage Project AES Energy Storage LLC AES Corporation 100 1 2009 7 Nonrenewable
Evergreen Community Power Plant Evergreen Community Power LLC Interstate Resources Inc 100 25 2009 7 Biomass
Morgantown Solar Park Hankin Group Hankin Group 100 16 2011 5 Solar
Ontelaunee Energy Center Dynegy Power LLC Dynegy Inc 100 599 2002 14 Gas
Pioneer Crossing Landfill Fortistar LLC Fortistar LLC 100 2008 8 Biomass
Green Gas Americas Inc Green Gas International BV 0 2008 8 Biomass
Titus CT NRG REMA LLC NRG Energy Inc 100 35 1967 49 Oil
Blair Allegheny Ridge Wind Farm ArcLight Capital Partners LLC ArcLight Capital Holdings LLC 100 80 2007 9 Wind
American Eagle Paper Mills Team Ten LLC Team Ten LLC 100 171 1929 87 Coal
Chestnut Flats Windfarm EDF Renewable Energy Inc EDF Group 100 38 2011 5 Wind
Juniata Locomotive Shop Norfolk Southern Corporation Norfolk Southern Corporation 100 4 1955 61 Coal
North Allegheny Wind Duke Energy Renewables Inc Duke Energy Corporation 100 70 2009 7 Wind
Sandy Ridge Wind Farm Algonquin Power Fund (America) Inc Algonquin Power amp Utilities Corp 100 482 2012 4 Wind
1872
12
8
10
12
136
178
1700
112
67
Pennsylvania Public Utility Commission 58
Table C-2 Electric Generating Facilities in Pennsylvania (contrsquod)
County Plant Owner Ultimate ParentOwnership
()
Operating
Capacity
(MW)
Year First
Unit in
Service
Age Fuel Type
Bradford Beaver Dam Gas Project IMG Midstream LLC Bregal Investments Inc 100 199 2016 0 Gas
Northern Tier Landfill Talen Renewable Energy Energy Power Partners 100 16 2009 7 Biomass
Bucks Croydon Exelon Generation Company LLC Exelon Corporation 100 512 1974 42 Oil
Exelon-Conergy Solar Energy Center Conergy AG Kawa Capital Management Inc 100 15 2008 8 Solar
Fairless Hills Steam Generating Station Exelon Generation Company LLC Exelon Corporation 100 60 1996 20 Biomass
Fairless Works Energy Center Dominion Energy Inc Dominion Resources Inc 100 12984 2004 12 Gas
Falls Exelon Generation Company LLC Exelon Corporation 100 60 1970 46 Oil
Pennsbury Generating Station Exelon Generation Company LLC Exelon Corporation 100 54 1996 20 Biomass
Tullytown Landfill Gas Facility WM Renewable Energy LLC Waste Management Inc 100 16 2013 3 Biomass
Wheelabrator Falls Inc Wheelabrator Technologies Inc Energy Capital Partners LLC 100 46 1994 22 Biomass
Cambria Cambria Cogeneration Gulf Pacific Power LLC Harbert Management Corporation 375 1991 25 Coal
Harbert Power Fund V LLC Harbert Management Corporation 125 1991 25 Coal
UBS Global Asset Management UBS Group AG 50 1991 25 Coal
Colver Power Project Constellation Power Inc Exelon Corporation 25 1995 21 Coal
Gulf Pacific Power LLC Harbert Management Corporation 2812 1995 21 Coal
Harbert Power Fund V LLC Harbert Management Corporation 938 1995 21 Coal
UBS Global Asset Management UBS Group AG 375 1995 21 Coal
Ebensburg Power Company Babcock amp Wilcox Enterprises Inc Babcock amp Wilcox Enterprises Inc 100 50 1991 25 Coal
Highland North Wind Farm Everpower Wind Holdings Inc Terra Firma Capital Partners Ltd 100 75 2012 4 Wind
Highland Wind Project Everpower Wind Holdings Inc Terra Firma Capital Partners Ltd 100 625 2009 7 Wind
Patton Wind Farm Everpower Wind Holdings Inc Terra Firma Capital Partners Ltd 100 30 2012 4 Wind
Carbon PA Solar Park Project Consolidated Edison Development Inc Consolidated Edison Inc 100 10 2012 4 Solar
Panther Creek ArcLight Energy Partners Fund IV L P ArcLight Capital Holdings LLC 75 1992 24 Coal
Olympus Power LLC Olympus Holdings LLC 25 1992 24 Coal
Centre East Campus Plant Pennsylvania State University Pennsylvania State University 100 84 2011 5 Gas
Chester Andromeda One A Biomass Plant Behrens Energy Agriculture amp Robotics Behrens Energy Agriculture amp Robotics 100 4 2016 0 Biomass
Aqua Ingrams Mill Solar Aqua Pennsylvania Inc Aqua America Inc 100 04 2009 7 Solar
Longwood Gardens Solar Plant Ecogy Pennsylvania Systems LLC Ecogy Pennsylvania Systems LLC 100 13 2010 6 Solar
Marlboro Mushrooms Solar Field Marlborough Mushrooms Marlborough Mushrooms 100 1 2011 5 Solar
Pickering Solar Aqua America Inc Aqua America Inc 100 14 2012 4 Solar
SECCRA Community Landfill Southeastern Chester County Refuse Authority Southeastern Chester County Refuse Authority 100 25 2007 9 Biomass
Clarion Piney Brookfield Renewable Partners LP Brookfield Asset Management Inc 62 1924 92 Water
Brookfield Renewable Partners LP 38 1924 92 Water
Clearfield Shawville IC NRG REMA LLC NRG Energy Inc 100 6 1960 56 Oil
Clinton Lock Haven Talen Energy Supply LLC Talen Energy Corporation 100 14 1969 47 Oil
Cumberland Carlisle Area School District Carlisle Area School District Carlisle Area School District 100 13 2010 6 Solar
Knouse Foods Solar Plant Knouse Foods Cooperative Inc Knouse Foods Cooperative Inc 100 3 2010 6 Solar
Mountain NRG REMA LLC NRG Energy Inc 100 50 1972 44 Oil
PPG Industries Works 6 IC Facility PPG Industries Incorporated PPG Industries Incorporated 100 5 1972 44 Oil
Shippensburg (Cumberland County) Landfill Talen Renewable Energy Energy Power Partners 100 64 2009 7 Biomass
West Shore Talen Energy Supply LLC Talen Energy Corporation 100 28 1969 47 Oil
Dauphin Harrisburg Talen Energy Supply LLC Talen Energy Corporation 100 56 1967 49 Oil
Paxton Creek Cogeneration NRG Yield Inc NRG Energy Inc 551 1986 30 Gas
NRG Yield Inc 449 1986 30 Gas
Susquehanna Resource Management Complex (Harrisburg Facility Cogen) Lancaster County Solid Waste Management Authority Lancaster County Solid Waste Management Authority 100 218 1986 30 Biomass
Three Mile Island Exelon Generation Company LLC Exelon Corporation 100 829 1974 42 Nuclear
875
110
83
28
12
Electric Power Outlook for Pennsylvania 2015-20 59
Table C-2 Electric Generating Facilities in Pennsylvania (contrsquod)
County Plant Owner Ultimate ParentOwnership
()
Operating
Capacity
(MW)
Year First
Unit in
Service
Age Fuel Type
Delaware Chester Exelon Generation Company LLC Exelon Corporation 100 54 1969 47 Oil
Chester Operations Kimberly-Clark Corporation Kimberly-Clark Corporation 100 67 1986 30 Coal
Delaware County Resource Recovery Facility Covanta Energy Corporation Covanta Holding Corporation 100 80 1991 25 Biomass
Eddystone 3-4 Exelon Generation Company LLC Exelon Corporation 100 760 1974 42 Oil
Eddystone CT Exelon Generation Company LLC Exelon Corporation 100 76 1967 49 Oil
Liberty Electric Power Equipower Resources Corp Dynegy Inc 100 541 2002 14 Gas
Marcus Hook NextEra Energy Resources LLC NextEra Energy Inc 100 847 2004 12 Gas
Marcus Hook Cogeneration NextEra Energy Resources LLC NextEra Energy Inc 100 50 1987 29 Gas
Elk Johnsonburg Mill Domtar Paper Company LLC Domtar Corp 100 49 1993 23 Biomass
Erie Erie Coke Corporation Erie Coke Corporation Erie Coke Corporation 100 13 1953 63 Nonrenewable
Lakeview Gas Recovery WM Renewable Energy LLC Waste Management Inc 100 6 1997 19 Biomass
Fayette Allegheny Energy Units 8 and 9 Allegheny Energy Supply Company LLC FirstEnergy Corp 100 88 2000 16 Gas
Fayette Energy Facility Dynegy Inc Dynegy Inc 100 649 2003 13 Gas
Mill Run Wind Farm NextEra Energy Resources LLC NextEra Energy Inc 100 15 2001 15 Wind
South Chestnut Wind Project Avangrid Renewables LLC Avangrid Inc 185 2012 4 Wind
Iberdrola SA 815 2012 4 Wind
Franklin Allegheny Energy Units 12 amp 13 Allegheny Energy Supply Company LLC FirstEnergy Corp 100 88 2001 15 Gas
Falling Spring Chambersburg Borough of Chambersburg Borough of 100 5 1967 49 Gas
IESI Blue Ridge Landfill Talen Renewable Energy Energy Power Partners 100 64 2013 3 Biomass
Mountain View Landfill CCI Power Holdings LLC Castleton Commodities International LLC 1231 2003 13 Biomass
Energy Trading Innovations LLC 8769 2003 13 Biomass
Orchard Park Chambersburg Borough of Chambersburg Borough of 100 232 2003 13 Gas
Huntingdon Warrior Ridge Hydroelectric American Hydro Power Co American Hydro Power Co 100 28 1985 31 Water
Wm F Matson Generating Station Allegheny Electric Cooperative Inc Allegheny Electric Cooperative Inc 100 217 1988 28 Water
Indiana Conemaugh ArcLight Capital Partners LLC ArcLight Capital Holdings LLC 3511 1970 46 Coal
NRG Northeast Generating LLC NRG Energy Inc 372 1970 46 Coal
NRG REMA LLC NRG Energy Inc 1645 1970 46 Coal
PSEG Fossil LLC Public Service Enterprise Group Incorporated 225 1970 46 Coal
Talen Generation LLC Talen Energy Corporation 1625 1970 46 Coal
UGI Development Company UGI Corporation 597 1970 46 Coal
Conemaugh IC Constellation Power Source Generation LLC Exelon Corporation 3128 1970 46 Oil
Duquesne Light Holdings Inc Duquesne Light Holdings Inc 383 1970 46 Oil
NRG Northeast Generating LLC NRG Energy Inc 372 1970 46 Oil
NRG REMA LLC NRG Energy Inc 1645 1970 46 Oil
PSEG Fossil LLC Public Service Enterprise Group Incorporated 225 1970 46 Oil
Talen Generation LLC Talen Energy Corporation 1625 1970 46 Oil
UGI Development Company UGI Corporation 597 1970 46 Oil
Homer City GE Capital US Holdings Inc General Electric Company 90 1969 47 Coal
Metropolitan Life Insurance Company MetLife Inc 10 1969 47 Coal
Indiana University of Pennsylvania Indiana University of Pennsylvania Indiana University of Pennsylvania 100 24 1988 28 Gas
Seward Waste Coal Seward Generation LLC Robindale Energy Services Inc 100 521 2004 12 Coal
Lackawanna Archbald Cogeneration PEI Power Corporation Energy Transfer Partners LP 100 20 1988 28 Biomass
Archbald Power Station PEI Power Corporation Energy Transfer Partners LP 100 592 2001 15 Gas
Keystone Landfill Keystone Recovery Inc Keystone Recovery Inc 100 49 1995 21 Biomass
504
144
1700
112
19067
Pennsylvania Public Utility Commission 60
Table C-2 Electric Generating Facilities in Pennsylvania (contrsquod)
County Plant Owner Ultimate ParentOwnership
()
Operating
Capacity
(MW)
Year First
Unit in
Service
Age Fuel Type
Lancaster Dart Container Corp Cogen Dart Container Corp Dart Container Corp 100 104 2012 4 Biomass
Frey Farm Landfill Talen Renewable Energy Energy Power Partners 100 32 2006 10 Biomass
Holtwood Hydroelectric Plant Brookfield Renewable Partners LP Brookfield Asset Management Inc 62 1910 106 Water
Brookfield Renewable Partners LP 38 1910 106 Water
Talen Generation LLC Talen Energy Corporation 0 1910 106 Water
Honey Brook Generating Station (Granger) Granger Energy of Honey Brook LLC Granger Electric Co 100 32 2006 10 Biomass
Keystone Solar Project Bright Plain Renewable Energy LLC Bright Plain Renewable Energy LLC 50 2012 4 Solar
D E Shaw Renewable Investments LLC D E Shaw amp Co LP 50 2012 4 Solar
Lancaster County Resource Recovery Lancaster County Solid Waste Management Authority Lancaster County Solid Waste Management Authority 100 324 1991 25 Biomass
Martin Limestone Solar Array Plant Sunstream Energy LLC Sunstream Energy LLC 100 1 2012 4 Solar
Muddy Run Pumped Storage Facility Exelon Generation Company LLC Exelon Corporation 100 1070 1967 49 Water
Safe Harbor Brookfield Renewable Partners LP Brookfield Asset Management Inc 62 1931 85 Water
Brookfield Renewable Partners LP 38 1931 85 Water
Turkey Point Wind Project (Frey Farm Wind) Talen Renewable Energy Energy Power Partners 100 32 2011 5 Wind
Zook Generating Station (LampS Sweetners) Granger Electric Co Granger Electric Co 100 32 2013 3 Biomass
Lawrence New Castle NRG Power Midwest LP NRG Energy Inc 100 320 1939 77 Coal
New Castle IC Orion Power Holdings Inc NRG Energy Inc 100 25 1968 48 Oil
Lebanon Greater Lebanon Refuse Authority Landfill Talen Renewable Energy Energy Power Partners 100 32 2007 9 Biomass
PPL Ironwood TransCanada PipeLines Limited TransCanada Corporation 100 6601 2001 15 Gas
Lehigh Air Products Solar (Trexlertown Solar) Air Products Energy Enterprises LP Air Products and Chemicals Inc 100 19 2011 5 Solar
Allentown Talen Energy Supply LLC Talen Energy Corporation 100 56 1967 49 Oil
Luzerne AE Hunlock 4 Allegheny Energy Supply Company LLC FirstEnergy Corp 100 45 2000 16 Gas
Bear Creek Wind Project ArcLight Capital Partners LLC ArcLight Capital Holdings LLC 263 2006 10 Wind
Central Hudson Enterprises Corporation Fortis Inc 885 2006 10 Wind
Community Energy Inc Community Energy Inc 885 2006 10 Wind
JPMorgan Chase amp Co JPMorgan Chase amp Co 56 2006 10 Wind
Harwood Talen Energy Supply LLC Talen Energy Corporation 100 264 1967 49 Oil
Hazle Township Flywheel Energy Storage Beacon Power LLC Rockland Capital LLC 100 20 2013 3 Nonrenewable
Hazleton Cogeneration Starwood Energy Group Global LLC Starwood Energy Group Global LLC 100 1522 1989 27 Gas
Hunlock Repowering UGI Development Company UGI Corporation 100 1281 2011 5 Gas
Jenkins Talen Energy Supply LLC Talen Energy Corporation 100 276 1969 47 Oil
MATS Wind Electric City Wind Power Corporation Electric City Wind Power Corporation 100 055 2008 8 Wind
Romark PA Solar Romark Logistics of PA Inc Romark Logistics of PA Inc 100 18 2011 5 Solar
Susquehanna Nuclear Allegheny Electric Cooperative Inc Allegheny Electric Cooperative Inc 10 1983 33 Nuclear
Talen Generation LLC Talen Energy Corporation 90 1983 33 Nuclear
Lycoming Allenwood (PPLRE Lycoming County Landfill Project) Talen Renewable Energy Energy Power Partners 100 32 2012 4 Biomass
Laurel Hill Duke Energy Renewables Inc Duke Energy Corporation 100 69 2012 4 Wind
Lycoming County Landfill Project (PPL Renewable) Talen Renewable Energy Energy Power Partners 100 3 2012 4 Biomass
Williamsport Talen Energy Supply LLC Talen Energy Corporation 100 268 1967 49 Oil
Mercer General Electric Company General Electric Company General Electric Company 100 43 1984 32 Oil
Monroe Pocono Raceway Solar Project Pocono International Raceway Inc Pocono International Raceway Inc 100 3 2010 6 Solar
Shawnee CT NRG REMA LLC NRG Energy Inc 100 24 1972 44 Oil
249
5
4175
24
2620
Electric Power Outlook for Pennsylvania 2015-20 61
Table C-2 Electric Generating Facilities in Pennsylvania (contrsquod)
County Plant Owner Ultimate ParentOwnership
()
Operating
Capacity
(MW)
Year First
Unit in
Service
Age Fuel Type
Montgomery 500 Virginia Solar 500 Virginia Solar LP 500 Virginia Solar LP 100 1 2011 5 Solar
Conshohocken -Solar Sun Power Electric Conservation Services Group 100 006 1999 17 Solar
Covanta Plymouth (Montenay Montgomery) Covanta Plymouth Renewable Energy LP Covanta Holding Corporation 100 28 1991 25 Biomass
Hill at Whitemarsh Talen Renewable Energy Energy Power Partners 100 16 2007 9 Gas
Limerick Exelon Generation Company LLC Exelon Corporation 100 2386 1986 30 Nuclear
Moser Exelon Generation Company LLC Exelon Corporation 100 60 1970 46 Oil
Spring House IC Plant Janssen Pharmaceuticals Inc Johnson amp Johnson 100 38 2013 3 Gas
Stowe Waste Management Inc Waste Management Inc 100 3 1989 27 Biomass
West Point Facility Merck amp Company Inc Merck amp Company Inc 100 66 1989 27 Gas
West Point Facility IC Merck amp Company Inc Merck amp Company Inc 100 66 1972 44 Oil
Montour Montour Talen Generation LLC Talen Energy Corporation 100 1515 1971 45 Coal
Northampton Bethlehem CC Conectiv Bethlehem LLC Calpine Corporation 100 1134 2003 13 Gas
Bethlehem Landfill Commonwealth Landfill Gas Commonwealth Landfill Gas 20 2008 8 Biomass
Pepco Energy Services Inc Exelon Corporation 80 2008 8 Biomass
Crayola Solar Park Talen Renewable Energy Energy Power Partners 50 2010 6 Solar
UGI Development Company UGI Corporation 50 2010 6 Solar
Glendon Plant Talen Renewable Energy Energy Power Partners 100 32 2011 5 Biomass
Green Knight Energy Center Waste Management Inc Waste Management Inc 100 87 2001 15 Biomass
Lower Mount Bethel Talen Energy Corporation Talen Energy Corporation 100 5375 2004 12 Gas
Martins Creek 3 and 4 Talen Generation LLC Talen Energy Corporation 100 1700 1975 41 Gas
Martins Creek CT Talen Generation LLC Talen Energy Corporation 100 72 1971 45 Gas
Northampton EIF Northampton LLC Ares Owners Holdings LP 9118 1995 21 Coal
EIF Northampton LLC 882 1995 21 Coal
Portland CT NRG REMA LLC NRG Energy Inc 100 191 1967 49 Oil
Northumberland Mount Carmel Cogeneration Mt Carmel Co-Gen Inc Private investors-Kenneth M Pollock amp Connie J Pollock Rado 100 43 1990 26 Coal
Philadelphia Delaware CT Exelon Generation Company LLC Exelon Corporation 100 74 1969 47 Oil
Grays Ferry Cogeneration Grays Ferry Cogeneration Partners Veolia Environnement SA 100 177 1997 19 Gas
Lincoln Financial Field Solar Plant NRG Renew LLC NRG Energy Inc 100 29 2013 3 Solar
Newman amp Company Inc Newman amp Co Inc Newman amp Co Inc 100 18 1964 52 Gas
Philadelphia Refinery Carlyle Group LP Carlyle Group LP 67 1952 64 Nonrenewable
Sunoco Inc Energy Transfer Partners LP 33 1952 64 Nonrenewable
PWD Northeast WPCP Biogas Cogen Philadelphia Water Department Philadelphia Water Department 100 56 2013 3 Biomass
Richmond CT Exelon Generation Company LLC Exelon Corporation 100 132 1973 43 Oil
Schuylkill CT Exelon Generation Company LLC Exelon Corporation 100 38 1969 47 Oil
Southwark Exelon Generation Company LLC Exelon Corporation 100 72 1967 49 Oil
Temple SEGF Cogen Plant Temple University Temple University 100 16 1993 23 Gas
Pike Wallenpaupack Brookfield Renewable Partners LP Brookfield Asset Management Inc 62 1926 90 Water
Brookfield Renewable Partners LP 38 1926 90 Water
28
112
206
44
54
Pennsylvania Public Utility Commission 62
Table C-2 Electric Generating Facilities in Pennsylvania (contrsquod)
County Plant Owner Ultimate ParentOwnership
()
Operating
Capacity
(MW)
Year First
Unit in
Service
Age Fuel Type
Schuylkill Broad Mountain Landfill Facility UGI Development Company UGI Corporation 100 11 2009 7 Biomass
Fishbach Talen Energy Supply LLC Talen Energy Corporation 100 28 1969 47 Oil
John B Rich Memorial Power Station Cogentrix Energy Power Management LLC Carlyle Group LP 1955 1988 28 Coal
NextEra Energy Resources LLC NextEra Energy Inc 545 1988 28 Coal
Ontario Teachers Pension Plan Board Ontario Teachers Pension Plan Board 125 1988 28 Coal
RI-CORP Development Inc RI-CORP Development Inc 50 1988 28 Coal
UBS Global Asset Management UBS Group AG 125 1988 28 Coal
Locust Ridge II Avangrid Renewables LLC Avangrid Inc 185 2009 7 Wind
Iberdrola SA 815 2009 7 Wind
Locust Ridge Wind Farm Avangrid Renewables LLC Avangrid Inc 185 2007 9 Wind
Iberdrola SA 815 2007 9 Wind
Masser Farms Realty Solar Masser Farms Realty Ltd Masser Farms Realty Ltd 100 1 2011 5 Solar
Northeastern Power Cogeneration Facility Northeastern Power Company Engie SA 100 52 1989 27 Coal
Pine Grove Landfill CCI Power Holdings LLC Castleton Commodities International LLC 1231 2008 8 Biomass
Energy Trading Innovations LLC 8769 2008 8 Biomass
St Nicholas Cogeneration Schuylkill Energy Resource Inc Schuylkill Energy Resource Inc 100 86 1990 26 Coal
Westwood Generating Station Olympus Westwood Funding LLC Olympus Holdings LLC 75 1987 29 Coal
Treemont Funding LLC ArcLight Capital Holdings LLC 25 1987 29 Coal
Wheelabrator Frackville Energy Company Wheelabrator Technologies Inc Energy Capital Partners LLC 100 425 1988 28 Coal
Snyder Sunbury CT Corona Power LLC Corona Power LLC 100 472 1971 45 Oil
Sunbury IC Corona Power LLC Corona Power LLC 100 5 1967 49 Oil
Somerset Casselman Wind Avangrid Renewables LLC Avangrid Inc 185 2007 9 Wind
Iberdrola SA 815 2007 9 Wind
Forward WindPower LLC NRG Energy Inc NRG Energy Inc 25 2008 8 Wind
NRG Yield Inc NRG Energy Inc 4133 2008 8 Wind
NRG Yield Inc 3367 2008 8 Wind
Glades Pike Cogeneration Plant (CT) State Correctional Institution ndash Laurel Highlands State Correctional Institution ndash Laurel Highlands 100 25 2011 5 Biomass
Glades Pike Cogeneration Plant IC State Correctional Institution ndash Laurel Highlands State Correctional Institution ndash Laurel Highlands 100 28 2011 5 Biomass
Lookout WindPower LLC NRG Energy Inc NRG Energy Inc 25 2008 8 Wind
NRG Yield Inc NRG Energy Inc 4133 2008 8 Wind
NRG Yield Inc 3367 2008 8 Wind
Meyersdale Wind Project NextEra Energy Resources LLC NextEra Energy Inc 100 30 2003 13 Wind
Somerset Wind Project NextEra Energy Resources LLC NextEra Energy Inc 100 9 2001 15 Wind
Stony Creek Wind Farm ECampR Investco Mgmt LLC EON SE 50 2009 7 Wind
PD Alternative Investments US Inc PensionDanmark Holding AS 50 2009 7 Wind
Twin Ridges Wind Farm Everpower Wind Holdings Inc Terra Firma Capital Partners Ltd 100 1394 2012 4 Wind
Yough Hydro Power DR Hydro Co DR Hydro Co 100 122 1989 27 Water
Susquehanna Roundtop IMG Midstream LLC Bregal Investments Inc 100 22 2015 1 Gas
294
378
525
80
102
26
54
30
345
Electric Power Outlook for Pennsylvania 2015-20 63
Table C-2 Electric Generating Facilities in Pennsylvania (contrsquod)
County Plant Owner Ultimate ParentOwnership
()
Operating
Capacity
(MW)
Year First
Unit in
Service
Age Fuel Type
Tioga Armenia Mountain Wind ALLETE Clean Energy ALLETE Inc 100 1005 2009 7 Wind
Blossburg NRG REMA LLC NRG Energy Inc 100 24 1971 45 Gas
Union Bucknell University Bucknell University Bucknell University 100 67 1991 25 Gas
Venango Handsome Lake Energy Constellation Power Inc Exelon Corporation 100 2675 2001 15 Gas
Scrubgrass EIF United States Power Fund IV LP Ares Owners Holdings LP 20 1993 23 Coal
Olympus Power LLC Olympus Holdings LLC 30 1993 23 Coal
United States Power Fund III LP Ares Owners Holdings LP 50 1993 23 Coal
Warren Kinzua Pumped Storage Project (Seneca) Harbor Hydro Holdings LLC LS Power Group 100 513 1970 46 Water
Warren CT NRG REMA LLC NRG Energy Inc 100 57 1972 44 Oil
Washington Arden Landfill WM Renewable Energy LLC Waste Management Inc 100 48 2009 7 Biomass
Wayne Waymart Wind Farm NextEra Energy Resources LLC NextEra Energy Inc 100 645 2003 13 Wind
Westmoreland Conemaugh Hydroelectric Pennsylvania Renewable Resources Pennsylvania Renewable Resources 50 1989 27 Water
PSEG Global LLC Public Service Enterprise Group Incorporated 50 1989 27 Water
Wyoming Mehoopany Procter amp Gamble Co Procter amp Gamble Co 100 16 1984 32 Gas
Mehoopany CT Procter amp Gamble Co Procter amp Gamble Co 100 123 1985 31 Gas
Mehoopany Wind BP Wind Energy North America Inc BP plc 50 2012 4 Wind
Sempra US Gas amp Power LLC Sempra Energy 50 2012 4 Wind
York Brunner Island Talen Generation LLC Talen Energy Corporation 100 1411 1961 55 Coal
Brunner Island IC Talen Generation LLC Talen Energy Corporation 100 74 1967 49 Oil
PH Glatfelter Company - Pennsylvania P H Glatfelter Co P H Glatfelter Co 100 893 1948 68 Coal
Peach Bottom Exelon Generation Company LLC Exelon Corporation 50 1974 42 Nuclear
PSEG Nuclear LLC Public Service Enterprise Group Incorporated 50 1974 42 Nuclear
Tolna NRG REMA LLC NRG Energy Inc 100 50 1972 44 Oil
Turnkey Project - GlaxoSmith GlaxoSmithKline GlaxoSmithKline 100 15 2010 6 Solar
York Cogeneration Sapphire Power Generation Holdings LLC Talen Energy Corporation 100 566 1989 27 Gas
York County Resource Recovery Center York County Solid W amp R Authority York County Solid W amp R Authority 100 295 1989 27 Biomass
York Energy Center (Delta Power Project) Conectiv Mid Merit LLC Calpine Corporation 100 545 2011 5 Gas
York Haven Enduring Hydro LLC Enduring Hydro LLC 1 1905 111 Water
I Squared Capital I Squared Capital 99 1905 111 Water
861
15
1426
2576
19
- EPO-16 front cover
- 2016 Electric Power Outlook-body
- EPO-16 back cover lo-rez
-
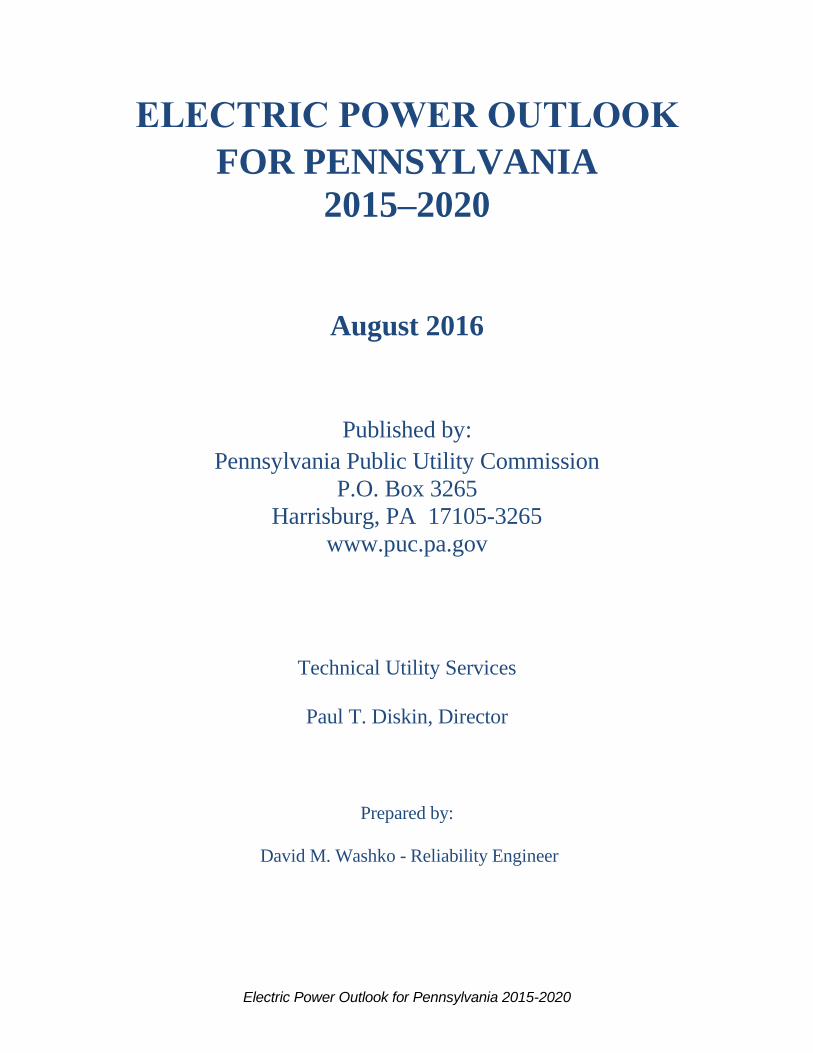
Electric Power Outlook for Pennsylvania 2015-2020
Section 1 ndash Regional Electric Outlook
Purpose 1
Regional Reliability Organizations 2
North American Electric Reliability Corporation (NERC) 2
NERC Reliability Assessment 3
ReliabilityFirst Corporation (RFC) 4
Regional Transmission Organizations (RTO) 4
PJM Interconnection 4
PJM Peak Demand Performance and Generation Testing 5
PJM Bulk Electric System Status- Transmission 6
PJM Pennsylvania Regional Transmission Line Expansion Plan Overview 7
Status of PJM Backbone Transmission Lines 9
Section 2 ndash Pennsylvania Electric Outlook
Electric Distribution Companies (EDC) 11
Alternative Energy Portfolio Standards 13
Energy Efficiency and Conservation Program (Act 129) 15
Statewide Review of Electrical Energy Usage 19
Summary of Data for the Seven Largest EDCs 24
Duquesne Light Company 24
Metropolitan Edison Company 26
Pennsylvania Electric Company 28
Pennsylvania Power Company 30
West Penn Power Company 32
PECO Energy Company 34
PPL Electric Utilities Corporation 36
Summary of Data for the Four Smallest EDCs 38
Citizensrsquo Electric Company 38
Pike County Light amp Power Company 40
UGI Utilities IncmdashElectric Division 41
Wellsboro Electric Company 42
Appendix A ndash Data Tables Actual and Forecast Data Tables 43
Appendix B ndash Plant Additions and Upgrades Status of Pennsylvaniarsquos Plant Additions and Upgrades 51
Appendix C ndash Existing Generating Facilities Pennsylvaniarsquos Existing Electric Generating Facilities 54
Electric Power Outlook for Pennsylvania 2015-2020 1
Section 1 ndash Regional Electric Outlook
Purpose
The Electric Power Outlook for Pennsylvania 2015-2020 discusses the current and future electric
power supply and demand situation for the 11 investor-owned jurisdictional electric distribution
companies (EDCs) operating in the state and the entities responsible for maintaining the reliability
of the bulk electric supply system within the region that encompasses the state
Pursuant to Title 66 Pennsylvania Consolidated Statutes Section 524(b) the PUC annually
submits this report to the General Assembly the Governor the Office of Consumer Advocate and
affected public utilities It also is posted on the Commissionrsquos website5
The information contained in this report includes highlights of the past year as well as EDCs
projections of energy demand and peak load for 2016-20 The statersquos seven largest EDCs6
represent over 95 percent of jurisdictional electricity usage in Pennsylvania Accordingly
information regarding the four smallest EDCs contained in this report is limited7 The report also
provides a regional perspective with statistical information on the projected resources and
aggregate peak loads for the region that impacts Pennsylvania
As permitted under the Section 2809(e) of the Public Utility Code the Commission has adopted
revised regulations reducing from 20 years to five years the reporting requirements and the
reporting horizon for energy demand connected peak load and number of customers Because
Pennsylvania has a competitive retail electric market certain information is no longer required to
be reported This includes information regarding generation facilities such as capital investments
energy costs new facilities and expansion of existing facilities
The Commission relies on reports and analyses of regional entities including the ReliabilityFirst
Corporation (RFC) and PJM to obtain a more complete assessment of the current and future status
of the electric power supply within the region Also data for the report is submitted annually by
EDCs pursuant to the Commissions regulations Sources also include data submitted by regional
reliability councils to the North American Electric Reliability Corporation (NERC) and the US
Energy Information Administration (EIA)
5 This report is available at httpwwwpucpagovutility_industryelectricityelectric_reportsaspx
6 Those EDCs with at least 100000 customers
7 See 52 Pa Code sectsect 57141mdash57154
Electric Power Outlook for Pennsylvania 2015-2020 2
Regional Reliability Organizations
In Pennsylvania all major EDCs are interconnected with neighboring systems extending beyond
state boundaries These systems are organized into regional reliability councils responsible for
ensuring the reliability of the bulk electric system
North American Electric Reliability Corporation
The North American Electric Reliability Corporation
(NERC) has been granted legal authority by the
Federal Energy Regulatory Commission (FERC) to
enforce reliability standards and to mandate
compliance with those standards NERC oversees the
reliability of the bulk power system that provides
electricity to 334 million people has a total demand of
over 830 gigawatts (GW) has approximately 211000
miles of high-voltage transmission lines (230000 volts
and greater) and represents more than $1 trillion worth
of assets
NERCrsquos members operate in eight regional reliability entities Members include investor-owned
utilities federal and provincial entities rural electric cooperatives statemunicipal and provincial
utilities independent power producers independent system operators merchant electricity
generators power marketers and end-use electricity customers The membership accounts for
virtually all the electricity supplied in the United States Canada and a portion of Baja California
Norte Mexico The regional entity operating in Pennsylvania is ReliabilityFirst Corporation
(RFC)
NERC establishes criteria standards and requirements for its members and all control areas All
control areas must operate in a seamless and stable condition to prevent uncontrolled system
separations and cascading outages caused by any single transient event
Electric Power Outlook for Pennsylvania 2015-2020 3
NERC Reliability Assessment
The 2015 Long-Term Reliability Assessment8 is NERCrsquos independent review of the 10-year
reliability outlook for the North American bulk power system (BPS) while identifying trends
emerging issues and potential risk Also reported is insight on resource adequacy and operating
reliability as well as an overview of projected electricity demand growth for individual
assessments areas NERC also provides specific review of the PJM Regional Transmission
Organization (RTO)
In the 2015 assessment NERC identifies the following key issues for the North American BPS
Resources are sufficient to meet reliability targets in most areas in the 10-year review
period
Reserve Margins in several Assessment Areas are trending downward despite low load
growth but remain well above required reserve margin requirements of 157 percent
The projected PJM region reserve margins are 252 percent in 2016 289 percent in 2020
and 245 percent in 2025
Natural-gas-fired generation surpassed coal this year as the predominant fuel source for
electric generation and is the leading fuel type for capacity additions A growing reliance
on natural gas continues to raise reliability concerns regarding the ability of both gas and
electric infrastructures to maintain the BPS reliability despite substantial progress made
in addressing the interdependencies between these two industries There is a need to
enhance planning approaches to consider fuel deliverability availability and responses to
pipeline contingencies that are unique to each area
A changing resource mix requires additional measures and approaches for assessing
future reliability The North American electric power system is undergoing a significant
transformation with ongoing retirements of fossil-fired and nuclear capacity as well as
growth in natural gas wind and solar resources This shift is caused by several drivers
such as existing and proposed federal state and provincial environmental regulations as
well as low natural gas prices in addition to the ongoing integration of both distributed
and utility-scale renewable resources The resource mix changes are directly impacting
the behavior of the North American BPS These developments will have important
implications on system planning and operations as well as how NERC and the industry
assess reliability In order to maintain an adequate level of reliability through this
transition generation resources need to provide sufficient voltage control frequency
support and ramping capability as essential components to the reliable operations and
planning of the BPS
8 See NERC 2015 Long-Term Reliability Assessment Dec 2015 available at
nerccompaRAPAraReliability20Assessments20DL2015LTRA20-20Final20Reportpdf
Electric Power Outlook for Pennsylvania 2015-2020 4
ReliabilityFirst Corporation
ReliabilityFirst Corporation (RFC) headquartered in Fairlawn Ohio is one of eight NERC
regional entities serving North America and is the regional reliability entity for Pennsylvania Its
service territory consists of more than 72 million people in a 238000 square-mile area covering all
of New Jersey Delaware Pennsylvania Maryland District of Columbia West Virginia Ohio
Indiana and parts of Michigan Wisconsin Illinois Kentucky Tennessee and Virginia Its
membership includes load-serving entities (LSEs) RTOs suppliers and transmission companies
The RFC controls reliability standards and enforcement by entering into delegation agreements
with regional entities to ensure adequate generating capacity and transmission Some performance
factors considered in establishing acceptable reliability levels include load characteristics load
forecast error scheduled maintenance requirements and the forced outage rates of generating
units The RFC reliability standards require sufficient generating capacity to be installed to ensure
the probability of the system load exceeding available capacity is no greater than one day in 10
years LSEs that are members of RFC have a capacity obligation determined by evaluating
individual system load characteristics unit size and operating characteristics
Regional Transmission Organizations
The two RTOs within the RFC footprint are PJM Interconnection LLC (PJM) and Midcontinent
Independent System Operator Inc (MISO)
PJM Interconnection
PJM is a regional transmission organization that ensures the
reliability of the largest centrally dispatched control area in
North America covering 234417 square miles PJM
coordinates the operation of 183600 megawatts (MW) of
generating capacity with 165492 MW peak demand and
more than 62556 miles of transmission lines The PJM
RTO coordinates the movement of electricity for over 61
million people through all or parts of Delaware Illinois
Indiana Kentucky Maryland Michigan New Jersey North
Carolina Ohio Pennsylvania Tennessee Virginia West
Virginia and the District of Columbia9 PJM manages a
sophisticated regional planning process for generation and transmission expansion to ensure the
continued reliability of the electric system PJM is responsible for maintaining the integrity of the
regional power grid and for managing changes and additions to the grid to accommodate new
generating plants substations and transmission lines In addition PJM analyzes and forecasts
future electricity needs of the region Its planning process ensures that the electric system growth is
efficient and takes place in an orderly fashion PJM supports market innovation through its active
support for demand response markets for energy capacity and ancillary services and helps ensure
9 See PJM 2015 Annual Report available at httpwwwpjmcom~mediaabout-pjmnewsroomannual-reports2015-
annual-reportashx
Electric Power Outlook for Pennsylvania 2015-2020 5
that appropriate infrastructure and operational capabilities are in place to support newly installed
renewable energy facilities PJMrsquos mission can be described as below
Acting as a neutral independent party PJM operates a competitive wholesale electricity
market and manages the high-voltage electricity grid to ensure reliability for more than 61
million people
PJMrsquos long-term regional planning process provides a broad interstate perspective that
identifies the most effective and cost-efficient improvements to the grid to ensure reliability
and economic benefits on a system wide basis
An independent Board oversees PJMrsquos activities Effective governance and a collaborative
stakeholder process help PJM achieve its vision ldquoTo be the electric industry leader ndash today
and tomorrow ndash in reliable operations efficient wholesale markets and infrastructure
developmentrdquo
PJM coordinates the continuous buying selling and delivery of wholesale electricity through open
and competitive spot markets PJM balances the needs of suppliers wholesale customers and other
market participants and continuously monitors market behavior In 2015 the PJM market
decreased by 148 percent from $50 billion in 2014 to $426 billion in 2015 Membership
increased 16 percent from 945 members in 2014 to 960 members in 201510
PJMrsquos 2015
transmission volumes were 793 terawatt hours (TWhs) compared with 838 TWhs for 2014
The PJM annual 15 year growth rate (2016-2031) forecast was 13 percent and remained the
same as last yearrsquos11
In 2015 there were 104 generators that were deactivated totaling 10060
MW of generation12
To replace retiring generators there are over 25000 MW of new
generating resources under construction as of Dec 31 2015 and an additional 42000 MW
actively under study
Also of note in 2015 Terry Boston retired as PJMrsquos CEO and was replaced by Andy Ott Andy
Ott was the former PJM executive vice president responsible for executive oversight of the PJM
Market Operations and Market Strategy
PJM Peak Demand Performance and Generator Testing
On the morning of Feb 20 2015 PJM set a new wintertime peak demand record of 143086 MW
which surpassed the previous all-time winter peak of 142863 MW set on Jan 7 201413
There
was significant improvement in the generator forced outage rate during the Feb 20 2015 peak
demand event The forced outage rate was only 134 versus 22 on Jan 7 2014 The
10
httpwwwpjmcom~mediaabout-pjmnewsroomannual-reports2015-annual-reportashx 11
httpwwwpjmcom~mediacommittees-groupssubcommitteeslas2015113020151130-item-07-preliminary-load-
reportashx 12
httpwwwpjmcom~mediaabout-pjmnewsroomannual-reports2015-annual-reportashx 13
httpwwwpjmcom~mediadocumentsreports20150513-2015-winter-reportashx
Electric Power Outlook for Pennsylvania 2015-2020 6
improvement was primarily the result of PJM putting in place pre-winter operational testing for
dual-fuel and infrequently run units and an upgraded winter-preparation checklist program PJM
also required better communications of fuel status and increased generator coordination with
natural gas pipelines
A total of 168 units (9919 MW) participated in the pre-winter operational testing Units that
participated in the pre-winter operational testing had a lower rate of forced outages compared to
those that did not test During the testing 26 units out of 168 units experienced initial failures or
failed to complete the exercise Of those 26 units 16 were able to correct the issue and
subsequently successfully completed the exercise The total unit success rate of 94 percent includes
these corrected failures Chart 1 below details the causes of failures during the exercise
Chart 1 Cold Weather Operational Exercise ndash Causes of Failures
PJM Bulk Electric System Status- Transmission
PJM prepared for 2015 winter peak operations by analyzing winter transmission outage requests to
understand impacts to reliability and congestion The PJM Peak Period Outage Scheduling
Guidelines indicate transmission owners should avoid scheduling transmission outages that may
result in increased risk to system reliability during the winter peak periods14
PJM performed a detailed analysis on each outage request under winter peak system conditions
for outages that transmission owners needed to schedule over the 2015 winter peak This was to
ensure system reliability could be maintained before approving the outage The detailed analysis
also included an assessment of congestion impacts If there was a significant congestion impact for
14
httpwwwpjmcom~mediadocumentsreports20150513-2015-winter-reportashx
Electric Power Outlook for Pennsylvania 2015-2020 7
the outage PJM suggested that the outage be rescheduled PJM also communicated long-duration
scheduled transmission line outages of 500 kV or above (eg those scheduled for the entire season)
and projected impacts to PJM members through the PJM committee process
Prior to the 2015 winter season PJM performed a winter operations study with the transmission
owners as part of the Operations Assessment Task Force The study results indicated the PJM RTO
bulk power transmission system could be operated reliably during the 2015 winter peak load
period in accordance with the operating principles and guidelines contained in the PJM manuals
The task force also performed sensitivity studies to simulate extreme system conditions that PJM
might encounter during the winter season The 2015 winter sensitivity studies included the
following scenarios gas pipeline restrictions high winter loads close to the peak experienced in
2014 and high generation outages The study results showed all contingencies identified in the
sensitivity studies were controllable
PJM Pennsylvania Regional Transmission Expansion Plan Overview
The Pennsylvania electric power outlook generally reflects the projections of RFC which are
based on forecasts of PJM and MISO PJM evaluates regional data concerning the current and
future condition of the bulk electric system because it is planned on a regional rather than state
basis While the aggregate load for the statersquos consumers can be determined the availability and
mix of electrical generation units cannot be predicted since the complexities of a changing free
market will be the primary driving force
An RTO such as PJM has the primary responsibility to coordinate and plan future upgrades and
expansion of the regional transmission system A key part of the planning process is to evaluate
both generation interconnection and merchant transmission interconnection requests Although
transmission planning is performed on a regional basis most upgrades and expansion in
Pennsylvania are planned to support the local delivery system and new generating facilities
Load-serving entities (LSE) acquire capacity resources by entering bilateral agreements
participating in the PJM-operated capacity market owning generation andor pursuing load
management options15
The PJM generator interconnection process ensures new capacity
resources satisfy LSE requirements to reliably meet their obligations
All new generation that anticipates interconnecting and operating in parallel with the PJM
transmission grid and participating in the PJM capacity andor energy markets must submit an
interconnection request to PJM for technical evaluation and approval
Proposed new generating plants and increased capacity of existing plants in Pennsylvania total
23772 MW versus 14015 MW last year These facilities are under active study by PJM
Natural gas projects make up more than 21906 MW versus 10307 MW last year of this queued
15
A Load Serving Entity (LSE) is any entity (or the duly designated agent of such an entity) including a load
aggregator or power marketer that (a) serves end-users within the PJM Control Area and (b) is granted the authority
or has an obligation pursuant to state or local law regulation or franchise to sell electric energy to end-users located
within the PJM Control Area (definition from PJMcom glossary)
Electric Power Outlook for Pennsylvania 2015-2020 8
capacity This additional capacity may be used to serve Pennsylvania or out-of-state
customers16
Appendix B lists the current PJM interconnection requests for new generating
resources in Pennsylvania The existing generating capacity in Pennsylvania totals 42628
MW17
Appendix C lists existing generation facilities in Pennsylvania
Peak summer load growth rates for the Transmission Owner zones within Pennsylvania are
expected to range from 01 percent to 08 percent through 2025 Peak winter load-growth rates
are expected to range between 01 and 11 percent on average over the same time period
Forecasted summer peak loads are modeled in power flow studies used in PJMrsquos 2014 Regional
Transmission Expansion Plan (RTEP) studies PJMrsquos RTEP includes baseline transmission
upgrades in Pennsylvania to meet expected near-term 2020 peak load conditions RTEP studies
also assess anticipated needs for additional transmission expansion plans to meet long-term load
growth requirements through 203018
PJM conducts reliability studies to identify RTEP baseline upgrades needed to resolve all
identified reliability criteria violations PJM cannot compel a generator to operate but can make
financial arrangements with a generator to continue operating for reliability
In 2015 the PJM Board approved 214 new baseline and 207 new network transmission projects
totaling $19 billion and $13 billion respectively These approvals in 2015 however were
offset by existing project cost changes and by the removal of 202 network projects totaling $677
million and 42 existing RTEP baseline projects totaling $300 million19
In 2015 the PJM market was reconfigured as a result of the failure of a large number of reserve
generating resources to operate when called upon during the Jan 2014 Polar Vortex PJM added
a new capacity performance (CP) product Under the CP provisions for the 20182019 Delivery
Year PJM procured two capacity product types through RPM auctions Capacity Performance
and Base Capacity CP Resources must be capable of sustained predictable operation and are
expected to be available and capable of providing energy and reserves when needed throughout
the entire Delivery Year whereas Base Capacity Resources may not be capable of sustained
predictable operation andor may not be expected to provide energy and reserves outside of the
summer period Base Capacity Resources include Base Capacity Demand Resources (DR)
which are expected to be available only during the summer months and Base Capacity Energy
Efficiency (EE) Resources which are expected to provide permanent continuous load reduction
only during the summer months Base Capacity Resources also include Base Capacity
Generation Resources which are expected to be available throughout the Delivery Year like all
Capacity Performance Resources But unlike Capacity Performance Resources Base Capacity
Generation Resources will be subject to non-performance charges only when they fail to perform
when needed during the summer months (June through September)
16
See PJM 2015 RTEP available at httpwwwpjmcomdocumentsreportsrtep-documents2015-rtepaspx 17
Data reported to SNL and received by PUC staff 18
See PJM 2015 RTEP available at httpwwwpjmcomdocumentsreportsrtep-documents2015-rtepaspx 19
See PJM RTEP executive summary at httppjmcom~mediadocumentsreports2015-rtep2015-rtep-book-1ashx
Electric Power Outlook for Pennsylvania 2015-2020 9
The results of the 20182019 Reliability Pricing Model (RPM) BRA (Base Residual Auction)
held in 2015 produced an adequate amount of resources to serve the PJM region for the June 1
2018 to May 31 2019 delivery year The total capacity procured in the auction was 166837
MW which represents a 198 percent reserve margin or 41 higher than the target reserve
margin of 157 Demand Response (DR) Resources cleared 11084 MW versus 10975 MW
last year which is an increase of about 109 MW from last yearrsquos auction Energy Efficiency
Resources cleared 1247 MW versus a record 1339 MW last year which is a decrease of 92
MW from last yearrsquos auction Of the 11084 MW of DR 9600 was base capacity product and
1484 was capacity performance product and of the 1247 MW of EE resources 359 MW was
base capacity product and 887 MW was capacity performance product 20
Status of PJM Backbone Transmission Lines21
The specific status of approved backbone transmission lines is summarized below
Susquehanna-Roseland 500 kV Line
Approved by the PJM Board in June 2007 the Susquehanna-Roseland 500 kV line (Susquehanna-
Lackawanna-Hopatcong-Roseland) had a required in-service date of June 1 2012 Regulatory
process delays pushed the expected in-service out to June 1 2015 The line was approved by the
Pennsylvania Public Utility Commission in February 2010 and by the New Jersey Board of Public
Utilities in April 2010 The line received final approval from the National Park Service (NPS) who
issued a Record of Decision on October 2 2012 affirming the route chosen by PPampL and PSEampG
the NPS issued a special use (Construction) permit on Dec12 2012 The Hopatcong-Roseland
portion of the line was energized on March 31 2014 The Susquehanna-Lackawanna portion of the
line was energized on Sept 23 2014 The remainder of the line was placed in service in May 2015
Cloverdale-Lexington 500 kV Line
In October 2013 the PJM Board approved PJMrsquos recommendation to re-conductor the AEP
portion of the Cloverdale-Lexington 500 kV line including replacement of eleven tower structures
This follows December 2011 PJM Board approval to re-conductor the Dominion portion of the
Cloverdale-Lexington 500 kV circuit to resolve NERC criteria Category C N-1-1 violations AEP
and Dominion have coordinated plans underway to rebuild their respective portions of the 44 mile
line in order to increase its operational limit The Virginia State Corporate Commission released its
final order approving Dominionrsquos 74 mile portion of the line on September 7 2012 Dominion
began construction in late spring of 2013 with completion in December 2013 AEP filed its
application to re-conductor their 371 mile portion of the line in late 2013 AEP is expected to
complete line re-conductoring by June 1 2016
Dooms-Lexington 500 kV Line
Dominion filed an application with the Virginia State Corporate Commission on Nov 19 2012
On May 16 2013 the SCC granted a Certificate of Public Convenience and Necessity (CPCN)
authorizing the rebuild project The project is expected to be completed by Oct 1 2016
20
See PJM news release httpinsidelinespjmcompjm-announces-capacity-auction-results 21
See PJM 2015 RTEP Book 3 Section 12 httpwwwpjmcom~mediadocumentsreports2015-rtep2015-rtep-
book-3ashx
Electric Power Outlook for Pennsylvania 2015-2020 10
Mount Storm-Doubs 500 kV Line
The PJM Board approved the rebuild of the Mount Storm-Doubs line in October 2010 with a
required in-service date of June 2020 The Virginia State Corporation Commission issued a CPCN
for the line on Sept 1 2011 The West Virginia PSC issued a ruling on Dec 16 2010 that the
project is an ordinary extension of an existing system in the usual course of business and does
require a CPCN The Maryland PSC issued a CPCN on July 7 2013 The rebuild was completed
June 1 2015
Surry-Skiffes Creek 500 kV Line
The PJM Board approved plans to build a new 77 mile Surry to Skiffes Creek 500 kV line and a
2025 mile Skiffes Creek to Whealton 230 kV line in April 2012 June 1 2015 was identified as the
required in-service date for the 500 kV portion of the project and June 1 2016 as the required in-
service date for the 230 kV portion of the project The Virginia State Corporation Commission
approved Dominionrsquos request to build the project on Nov26 2013 Construction activities have
been delayed due to transmission permitting issues The expected in-service date has been revised
to June 30 2017 based on these permitting issues PJM will work with Dominion to ensure that
necessary operational guidelines are in place until the line is in service
Loudoun-Brambleton Area
PJMrsquos RTEP includes two 500 kV projects in this area First a project that encompasses a rebuild
of the Mosby-Brambleton-Pleasant View-Goose Creek portion of the Loudoun-Doubs 500 kV line
was approved by the PJM Board in October 2011 The project is expected to be completed by
Dominion by June 1 2016 PJMrsquos RTEP also includes a new second 500 kV line from Loudoun
to Brambleton as approved by the PJM Board in December 2013 This new line is expected to be
in service by June 1 2018
Northern New Jersey 345 kV Upgrades (Bergen to Linden Corridor Upgrade Project)
The Bergen to Linden Corridor project was approved by the PJM Board in December 2013 with a
required in-service date of June 2015 The project is comprised of a series of transmission facility
line upgrades from 138 kV to 345 kV in northern New Jersey Phase 1 of the project will focus on
work to be performed within the Hudson-BergenMarion-Bergen 230 kV and 138 kV overhead
transmission corridor and at the Bergen North Bergen Homestead Penhorn and Marion stations
Construction of Phase 1 began during the third quarter of 2015 with an anticipated in-service date
in June 2016 Phase 2 will focus upon work to be performed within the PSEampG Linden-Bayway
138 kV overhead transmission corridor and the Linden and Bayway stations with an anticipated
in-service date of June 2017 Phase 3 will focus on work to be performed on facilities
interconnected by underground cable looping together the Marion stations with an anticipated in-
service date of June 2018 The underground system will serve to loop together the facilities
upgraded in Phase 1 and Phase 2 of the project
Byron-Wayne 345 kV Line (Grand Prairie Gateway)
The Byron-Wayne 345 kV line was approved by the PJM Board in October 2012 with a requested
June 1 2017 in-service date Construction began in the second quarter of 2015 and is expected to
be completed during 2017
Electric Power Outlook for Pennsylvania 2015-2020 11
Mansfield-Northfield (Glen Willow) 345 kV Line
The Mansfield-Northfield 345 kV line was approved by the PJM Board in April 2012 with a
requested June 1 2015 in-service date FirstEnergy received approval for the Glenwillow-
Mansfield project from the Ohio Power Siting Board in February 2013 Construction began in Fall
2013
Section 2 ndash Pennsylvania Electric Outlook
Electric Distribution Companies
Eleven EDCs currently serve the electricity needs of the majority of Pennsylvanias homes
businesses and industries Cooperatives and municipal systems provide service to several rural and
urban areas The 11 jurisdictional EDCs are
Citizens Electric Company
Duquesne Light Company
Metropolitan Edison Company (FirstEnergy)
Pennsylvania Electric Company (FirstEnergy)
Pennsylvania Power Company (FirstEnergy)
PPL Electric Utilities Corporation
PECO Energy Company (Exelon)
Pike County Light amp Power Company (Orange amp Rockland Utilities Inc)
UGI Utilities Inc ndash Electric Division
Wellsboro Electric Company
West Penn Power Company (FirstEnergy)
Electric Power Outlook for Pennsylvania 2015-2020 12
Figure 2 Map of EDC Service Territories
Each LSE is responsible to make provisions for adequate generating resources to serve its
customers The local EDC or Commission-approved alternative default-service provider (DSP)
must acquire electricity pursuant to a Commission-approved competitive procurement process for
customers who (1) contract with an alternative electric generation supplier (EGS) and the chosen
EGS does not supply the service (2) do not choose an alternative supplier22
Under current law the
default electric generation prices are required to be based upon a ldquoprudent mixrdquo procurement
strategy that will produce the least cost to customers over time23
22
66 Pa CS sect 2803 23
See id sect 2807(e)(3)
Electric Power Outlook for Pennsylvania 2015-2020 13
Alternative Energy Portfolio Standards
The PUC continues to implement procedures and guidelines necessary to carry out the
requirements of the Alternative Energy Portfolio Standards Act (AEPS) of 2004 (Act 213)24
Act
213 requires that an annually increasing percentage of electricity sold to Pennsylvania retail
customers be derived from alternative energy resources The amount of electricity to be supplied
by alternative resources increases to a total of 18 percent by 2021 On July 19 2007 Act 35 of
2007 was signed into law amending Act 213 by changing the compliance schedule related to solar
photovoltaic (PV) energy Act 35 also amended other provisions of the law including definitions
for customer-generator and net metering On December 20 2008 a PUC rulemaking based on the
Act 35 changes became effective AEPS resources must be located in PJM
Alternative energy resources are categorized as Tier I and Tier II resources Tier I resources
include solar wind low-impact hydropower geothermal biologically derived methane gas fuel
cells biomass (including electricity generated in Pennsylvania utilizing by-products of the pulping
process and wood manufacturing process including bark wood chips sawdust and lignins in spent
pulping liquors)25
and coal mine methane Tier II resources include waste coal demand side
management distributed generation large-scale hydropower by-products of wood pulping and
wood manufacturing municipal solid waste and integrated combined coal gasification technology
Act 213 requires that by 2021 8 percent of the electricity sold in each EDC service territory will be
derived from Tier I resources including solar Energy derived from Tier II resources is to increase
to 10 percent Act 213 as amended by Act 35 of 2007 sets forth a 15-year schedule for complying
with its mandates as shown in Table 1 Since Jan 1 2011 all EDCs and EGSs have been required
to comply
24
Alternative Energy Portfolio Standards Act effective Feb 28 2005 73 PS sectsect 16481mdash16488 25
See 66 PaCS sect 2814(b)
Electric Power Outlook for Pennsylvania 2015-2020 14
Table 1 Alternative Energy Portfolio Standards
To meet the requirements of Act 213 EDCs and EGSs acquire alternative energy credits (AECs) in
quantities commensurate with the required tier percentage and the electricity sold to retail
customers AECs are separate from the electricity that is sold to customers An AEC represents
one megawatt hour (MWh) of qualified alternative electric generation or conservation whether
self-generated purchased along with the electric commodity or purchased separately through a
tradable instrument26
AECs are earned when a qualified facility generates 1000 kilowatt-hours (kWh) of electricity
through either estimated or actual metered production An AEC is a tradable certificate that
represents all the renewable energy benefits of electricity generated from a facility An AEC can
be sold or traded separately from the power AECs are generally purchased by EDCs and EGSs in
order to meet the percentages required under AEPS for any given year AECs can be traded
multiple times until they are retired for compliance purposes An AEC can only be retired once
and may not be used to satisfy any other obligations whether voluntarily or mandated by a
renewable energy portfolio standard in another state
In May 2015 the Commission issued a request for proposals for the Pennsylvania AEC program
administrator contract InClime won the contract assumed administrative duties as the
Pennsylvania AEC program administrator on January 1 2016 and is under contract through Dec
31 2018 with two options for one year extensions The AEC program administrator verifies that
EGSs and EDCs are complying with the minimum requirements of Act 213 PJM EISrsquo Generation
Attribute Tracking System (GATS) is the alternative energy credit registry used to track alternative
26
See 52 Pa Code sectsect 7561mdash7570
Total Solar PV Non-Solar
1 June 1 2006 ndash May 31 2007 15 00013 14987 42
2 June 1 2006 ndash May 31 2008 25 10013 24987 52
3 June 1 2006 ndash May 31 2009 35 20013 34987 62
4 June 1 2006 ndash May 31 2010 45 30013 44987 72
5 June 1 2006 ndash May 31 2011 55 40013 54987 82
6 June 1 2006 ndash May 31 2012 65 50013 64987 92
7 June 1 2006 ndash May 31 2013 75 60013 74987 102
8 June 1 2006 ndash May 31 2014 85 70013 84987 112
9 June 1 2006 ndash May 31 2015 95 80013 94987 122
10 June 1 2006 ndash May 31 2016 105 90013 104987 132
11 June 1 2006 ndash May 31 2017 115 100013 114987 142
12 June 1 2006 ndash May 31 2018 125 110013 124987 152
13 June 1 2006 ndash May 31 2019 135 120013 134987 162
14 June 1 2006 ndash May 31 2020 145 130013 144987 172
15 June 1 2006 ndash May 31 2021 155 140013 154987 182
Year PeriodTier I ( )
Tier II ( )
Electric Power Outlook for Pennsylvania 2015-2020 15
energy credit creation and transfer among qualified alternative energy systems GATS is used by
EDCs and EGSs to verify compliance with the requirements of Act 213
Under Act 213 the Commission adopted regulations promoting onsite generation by customer-
generators using renewable resources and eliminated previously existing barriers to net metering27
The regulations also provide for required metering capabilities and a compensation mechanism that
reimburses customer-generators for surplus energy supplied to the electric grid28
Act 35 of 2007
amended Act 213 One aspect of Act 35 altered the reconciliation mechanism used to compensate
customer-generators for surplus energy supplied through net metering29
The Commission also adopted regulations that govern interconnection for customer-generators
The regulations strive to eliminate barriers which may have previously existed with regard to
interconnection while ensuring that interconnection by customer-generators will not pose
unnecessary risks to the Commonwealthrsquos electric distribution systems30
As of May 31 2016 Pennsylvania had certified 12638 alternate energy facilities of which 8897
are located within the state31
The statewide cost for AEPS compliance for all LSEs in
Pennsylvania is estimated to be $1646 million for the reporting year 202132
Compliance costs for
2015 are not published or available at this time
For additional information on Alternative Energy in Pennsylvania please visit the Commissionrsquos
website (httpwwwpucpagovconsumer_infoelectricityalternative_energyaspx)
Energy Efficiency and Conservation Program (Act 129)
Act 129 of 2008
33 required the seven Pennsylvania EDCs
34 with at least 100000 customers
35 to
establish an energy efficiency and conservation (EEampC) plan The Commission-approved plans
were to reduce energy demand and consumption by 1 percent by May 31 2011 and 3 percent by
May 31 2013 Peak demand was to be reduced by 45 percent by May 31 2013 These
collectively were the Phase 1 targets Based on forecast growth data consumption reduction goals
totaled 1467 GWh in 2011 and 4400 GWh in 2013 Peak demand reduction goals were projected
to total 1193 MW for 201336
The Commission determined that with the exception of West Penn
27
Net metering measures the difference between the electricity supplied by an electric utility or EGS and the electricity
generated by a customer-generator when any portion of the electricity generated by the alternative energy generating
system is used to offset part or all of the customer-generatorrsquos requirements for electricity See 52 Pa Code sect 7512 28
See Docket No L-00050174 52 Pa Code sectsect 7511-7515 29
Id 30
See Docket No L-00050175 52 Pa Code sectsect 7521-7540 31
See httppennaepscomapppubliccontroller 32
See httpwwwpucstatepausElectricpdfAEPSAEPS_Ann_Rpt_2014pdf 33
Act 129 of 2008 effective November 14 2008 66 Pa CS sectsect28061-28062 34
The seven EDCs with Act 129 Energy Efficiency and Conservation obligations are Duquesne Light Company
Metropolitan Edison Company PECO Energy Company Pennsylvania Electric Company Pennsylvania Power
Company PPL Electric Utilities Corporation and West Penn Power Company 35
See 66 PaCS sect 28061 36
See Energy Consumption and Peak Demand Reduction Targets Order Docket No M-2008-2069887 entered Mar
30 2009
Electric Power Outlook for Pennsylvania 2015-2020 16
Power the EDCs achieved the 1 percent energy consumption reduction Phase 1 target by May 31
2011 The Commission also determined that all seven EDCs achieved both the 3 percent by May
31 2013 consumption reduction and the 45 percent by May 31 2013 peak demand reduction
Phase 1 targets37
Under Act 129 the Commission was also required to evaluate the costs and benefits of the EEampC
programs by Nov 31 2013 and every five years thereafter38
The Commission determined the
benefits of consumption reduction requirements outweighed the costs Based on the Act 129
Statewide Evaluatorrsquos (SWE)39
Electric Energy Efficiency Potential for Pennsylvania Final
Report40
the Commission set new consumption reduction targets to be attained in the three-year
period from Jun 1 2013 to May 31 2016 (Phase II) for the EDCs subject to the Act 129 EEampC
requirements41
These targets are outlined in Table 2 below
Table 2 Phase II Consumption Reduction Targets
Act 129 Phase II Three-Year Consumption Reduction Targets
EDC
Three-Year of
200910
Forecast Reductions
()
Three-Year MWh Value of 200910
Forecast Reductions
Duquesne 20 276722
Met-Ed 23 337753
PECO 29 1125851
Penelec 22 318813
Penn Power 20 95502
PPL 21 821072
West Penn 16 337533
Phase II of the EEampC Program ended on May 31 2016 The Commission is currently awaiting the
EDCsrsquo filing of final reports and the SWErsquos final review and audit of the Phase II Program in order
to determine each EDCrsquos compliance with the Phase II Implementation Order and attainment of its
Phase II consumption reduction target
While the Commission determined that energy efficiency (EE) programs were cost-effective it did
not have enough information regarding the cost-effectiveness of Act 129 demand response
37
See Energy Efficiency and Conservation Program Order Docket No M-2008-2069887 entered Mar 20 2014 38
See 66 PaCS sectsect 28061(c) and (d) 39
Public Meeting of Jun 25 2009 the Commission selected GDS Associates Inc Engineers and Consultants as the
statewide evaluator for Phase I 40
See the Electric Energy Efficiency Potential for Pennsylvania Final Report available at
httpwwwpucpagovfiling_resourcesissues_laws_regulationsact_129_informationact_129_statewide_evaluator_
swe_aspx 41
See Energy Efficiency and Conservation Program Implementation Order Docket No M-2012-2289411 entered
Aug 3 2012
Electric Power Outlook for Pennsylvania 2015-2020 17
programs in order to set additional peak demand reduction targets for Phase II of Act 12942
However assuming an EDC would be able to meet its Phase II consumption reduction target under
its Act 129 budget the Commission provided the opportunity for EDCs to propose either in the
EEampC plans or otherwise voluntary residential demand response programs43 Additionally the
Commission directed the SWE to perform a Demand Response Potential Study using residential
direct load control and commercial and industrial load curtailment models provided by the
Commission44 This study was to provide the Commission with the information necessary to
determine whether Act 129 Phase III peak demand reduction programs would be cost-effective
The SWE submitted its final version of the Demand Response Potential Study to the Commission
on February 25 201545 The SWE also performed an EE Potential Study to determine the cost
effective consumption reduction potential in Pennsylvania46 The SWE submitted its final Energy
Efficiency Potential Study to the Commission on Feb 25 201547
Following a review of the SWErsquos EE and Demand Response Potential Studies the Commission
found that additional consumption and peak demand reduction targets were cost-effective48 On
June 11 2015 the Commission adopted a Final Implementation Order prescribing targets for a
Phase III of the Act 129 EEampC Program to operate June 1 2016 through May 31 202149 The
EDCsrsquo consumption50 and peak demand reduction51 requirements are provided below in Tables 3
and 4 respectively While the EDCs must implement energy efficiency programs all five years of
the Phase III the Commission required demand response programs only during the last four years
of the Phase recognizing the time necessary to develop and implement such programs52
Additionally using the design and budgetary allocation information provided by the Commission
the SWE found no cost-effective demand response potential in the Penelec service territory and
therefore the Commission did not prescribe a peak demand reduction requirement for Penelec
42
Id at 38-42 43
Id at 42 and 43 To date PECO has an approved voluntary residential DR program in Phase II of Act 129 44
See Energy Efficiency and Conservation Program Final Order Docket No M-2012-2289411 entered Feb 20 2014 45
See Demand Response Potential for Pennsylvania ndash Final Report submitted by GDS Associates Inc et al
February 25 2015 (hereinafter DR Potential Study) 46
See Proposal to Pennsylvania Public Utility Commission ndash Statewide Evaluator RFP submitted by GDS
Associates Inc et al January 11 2013 47
See Energy Efficiency Potential for Pennsylvania ndash Final Report submitted by GDS Associates Inc et
al February 2015 (hereinafter EE Potential Study) 48
See Energy Efficiency and Conservation Program Final Implementation Order Docket No M-2014-2424864
entered June 19 2015 at 10-12 49
Id at 14-15 50
Id at 57 51
Id at 35 52
Id at 35
Electric Power Outlook for Pennsylvania 2015-2020 18
Table 3 Phase III Consumption Reduction Targets
Act 129 Phase III Five-Year Consumption Reduction Targets
EDC
Five-Year of
200910
Forecast Reductions
()
Five-Year MWh Value of 200910 Forecast
Reductions
Duquesne 31 440916
Met-Ed 40 599352
PECO 50 1962659
Penelec 39 566168
Penn Power 33 157371
PPL 38 1443035
West Penn 26 540986
Table 4 Phase III Peak Demand Reduction Targets
Act 129 Phase III Four-Year Peak Demand Reduction Targets
EDC
Four-Year
Reduction (Relative to
2007-2008 Peak
Demand)
Average Annual Potential Savings (MW)
Duquesne 17 42
Met-Ed 18 49
PECO 20 161
Penelec 00 0
Penn Power 17 17
PPL 14 92
West Penn 18 64
Electric Power Outlook for Pennsylvania 2015-2020 19
Statewide Review of Electrical Energy Usage
Pennsylvaniarsquos aggregate electrical energy usage (residential commercial industrial sales for
resale and other) in 2015 was 146229 GWh versus 146516 GWh for 2014 which is a 02 percent
decrease The number of electrical energy customers increased by 12855 or 023 percent
Residential usage represented 353 percent of the total usage followed by industrial (32 percent)
and commercial (29 percent) Aggregate non-coincident peak load53
decreased to 29351 MW in
2015 from 29952 MW in 2014 which is a 02 percent decrease from the previous year
As shown on Table 5 the total average annual aggregate five-year energy usage growth projection
for the residential commercial and industrial classes is projected to decrease 009 percent per year
This includes an average residential growth rate decrease of 069 percent a commercial growth
rate increase of 003 percent and an industrial growth rate increase of 041 percent for the entire
five-year period
Table 5 Average Aggregate five-year Electrical Energy Projection
53
Non-coincident peak load is the sum of EDCsrsquo annual peak loads regardless of their date or time of occurrence
Year Residential Commercial Industrial Total
2016 49422 41625 47826 138873
2017 48957 41630 48285 138872
2018 48734 41709 48608 139051
2019 48484 41712 48667 138863
2020 48079 41667 48624 138370
average annual growth () -069 003 041 -009
Energy Usage Projection (GWh)
Electric Power Outlook for Pennsylvania 2015-2020 20
Individual EDC forecasts are more specific to customers and geographical areas Each EDC bases
its forecasts on financial forecasts of its choosing The EDCrsquos forecasts are more specific for each
territory than the PJM forecast which is a broader forecast that includes Pennsylvania EDC
territories Tables 6 and 7 below provide metrics for 2015 and 2014 respectively
Table 6 PA EDC customers served energy usage and peak load (2015)
Table 7 PA EDC customers served energy usage and peak load (2014)
Total Sales For Total System Company Net Energy Peak
Customers Resale Consumption Losses Use For Load Load
Served (MWh) (MWh) (MWh) (MWh) (MWh) (MWh) (MWh) (MWh) (MWh) (MW)
Duquesne 586149 4108765 6398676 2897651 78017 20755 13503864 828571 36528 12638765 2804
Met-Ed 561426 5514991 2994882 5308797 28518 540883 14388070 1216111 0 13171959 2791
Penelec 587832 4350462 3557621 5646723 37557 2524195 16116558 1534460 0 14582098 2819
Penn Power 163807 1703245 1320785 1495920 6210 229663 4755822 223077 0 4532745 910
PPL 1422730 14461533 14335845 8268558 156524 0 37222460 2684616 63875 34473969 7842
PECO 1601219 13629811 8118412 15365066 888775 122781 38124845 2268368 36996 35819481 8094
West Penn 722615 7254613 5112059 7634863 47610 749243 20755967 1349408 0 19406559 3814
UGI 61931 554166 324382 106076 5629 132 990384 76153 2039 912192 193
Citizens 6945 8688 30019 57224 593 0 174724 8642 180 165902 43
Pike County 4694 29614 45998 0 391 0 76003 0 94 75909 19
Wellsboro 6300 43905 32636 43734 218 115 120608 9649 220 110739 22
Total 5725648 51659793 42271315 46824612 1250042 4187767 146229305 10199055 139932 135890318 29351
of Total 3533 2891 3202 085 286 10000
2015 VS 2014 023 030 097 -162 -249 -189 -020 080 2188 -029 -201
CompanyResidential Commercial Industrial Other
Total Sales For Total System Company Net Energy Peak
Customers Resale Consumption Losses Use For Load Load
Served (MWh) (MWh) (MWh) (MWh) (MWh) (MWh) (MWh) (MWh) (MWh) (MW)
Duquesne 591750 4068016 6431805 3164231 58452 24835 13747339 667123 36528 13043688 2693
Met-Ed 557803 5477233 2944043 5382193 28858 539278 14371606 1097404 0 13274202 2817
Penelec 588274 4461845 3591256 5646861 38641 2548112 16286715 1584888 0 14701827 3024
Penn Power 162577 1728349 1381442 1598555 6142 221039 4935527 241333 0 4694194 1018
PPL 1416655 14562909 14111306 8312629 157433 0 37144277 2679357 69018 34395902 7816
PECO 1594763 13222177 8025119 15309577 937404 180462 37674739 2265504 6746 35402489 8258
West Penn 721158 7281289 4955687 7972140 48081 754700 21011897 1473035 0 19538862 4019
UGI 62003 543149 316181 110622 5688 131 975771 92165 1988 881618 211
Citizens 6889 88335 29440 53974 600 0 172349 4287 195 167867 52
Pike County 4673 30433 44583 0 395 0 75411 0 116 75295 19
Wellsboro 6248 44002 32482 43595 220 97 120396 13216 220 106960 26
Total 5712793 51507737 41863344 47594377 1281914 4268654 146516027 10118312 114811 136282904 29952
of Total 3516 2857 3248 087 291 10000
OtherCompany
Residential Commercial Industrial
Electric Power Outlook for Pennsylvania 2015-2020 21
Figure 3 shows Pennsylvania historic and forecast energy usage for residential commercial and
industrial retail from 1972 to 2015 and forecasted usage from 2016 to 2020
Figure 3 Pennsylvania retail energy usage and 5 year forecast (GWh)
10000
14000
18000
22000
26000
30000
34000
38000
42000
46000
50000
54000
58000
Gig
aw
att
ho
urs
Residential Commercial Industrial
Electric Power Outlook for Pennsylvania 2015-2020 22
Figure 4 shows average residential cost and average usage from 1940 to 2015 Between 1970 and
2010 average residential usage in Pennsylvania increased 14 percent each year while average
cost increased 41 percent each year During the last 10 years average residential usage decreased
020 percent each year while average cost increased 25 percent a year
Figure 4 Average residential cost (centskWh) and usage (MWhyear)
0
1
2
3
4
5
6
7
8
9
10
11
12
13
Cost per kWh
kWh per year
Utility Restructuring
Electric Power Outlook for Pennsylvania 2015-2020 23
Figure 5 shows Pennsylvaniarsquos aggregate non-coincidental peak load demand from 2005 to 2015
and the associated 5 year projections estimated during the last 3 years
Figure 5 Pennsylvania aggregate non-coincidental peak load (MW)
26000
26500
27000
27500
28000
28500
29000
29500
30000
30500
31000
31500
32000
2006 2007 2008 2009 2010 2011 2012 2013 2014 2015 2016 2017 2018 2019 2020
Historic ______ Forecasts _ _ _ _
2014
2015
2016
Electric Power Outlook for Pennsylvania 2015-2020 24
Summary of Data for the Seven Large EDCs
The following section provides historic and projected energy usage and peak load demand statistics
for Pennsylvaniarsquos seven large EDCs
Duquesne Light Company (Duquesne)
Duquesne provides electric service to 586149
customers in the City of Pittsburgh and portions of
Allegheny and Beaver counties in Southwestern
Pennsylvania Duquesnersquos 2015 energy usage total
was 13504 GWh while in 2014 it was 13722 GWh
(a decrease of 16 percent from the previous year)
Duquesnersquos total usage mix consisted of commercial
(47 percent) residential (30 percent) industrial (21
percent) and sales for resale (less than 1 percent)
Over the next five years total energy usage is projected to decrease at an average annual rate of 06
percent This includes an average annual decrease in residential usage of 05 percent annual
commercial usage decrease of 06 percent and a decrease in average annual of industrial usage by
07 percent See Figure 6
Duquesnersquos highest peak load of 2804 MW occurred on July 29 2015 This represents an
increase of 4 percent from the previous yearrsquos peak of 2693 MW Summer peak load is projected
to increase from 2804 MW in summer 2015 to 2942 MW by summer 2020 or by an average
annual growth rate increase of 03 percent See Figure 7
Refer to Appendix A Tables A01-A04 for Duquesnersquos forecasts of peak load and residential
commercial and industrial energy demand filed with the Commission in years 2006 through 2016
Electric Power Outlook for Pennsylvania 2015-2020 25
Figure 6 Duquesne energy usage (GWh)
Figure 7 Duquesne peak load (MW)
2000
2500
3000
3500
4000
4500
5000
5500
6000
6500
7000
7500
2006 2007 2008 2009 2010 2011 2012 2013 2014 2015 2016 2017 2018 2019 2020
Commercial
Residential
Industrial
Historic Forecasts
2600
2700
2800
2900
3000
3100
3200
2006 2007 2008 2009 2010 2011 2012 2013 2014 2015 2016 2017 2018 2019 2020
Historic _______ Forecasts _ _ _ _ _
2016
20142015
Electric Power Outlook for Pennsylvania 2015-2020 26
Metropolitan Edison Company (Met-Ed)
Met-Ed provides service to 561426 customers in
all or portions of 14 counties in Eastern and
Southcentral Pennsylvania Met-Edrsquos 2015 energy
usage total was 14388 GWh while in 2014 it was
14372 GWh (an increase of 01 percent from the
previous year) Met-Edrsquos total sales mix consisted
of residential (38 percent) industrial (37 percent)
commercial (21 percent) and sales for resale (38
percent)
Over the next five years total energy usage is projected to decrease at an average annual rate of 10
percent This includes a decrease in average annual residential usage of 29 percent a decrease in
average annual commercial usage by 05 percent and an increase in average annual industrial
usage by 06 percent See Figure 8
Met-Edrsquos highest peak load of 2791 MW occurred on Aug 17 2015 This represents a decrease
of 09 percent from previous yearrsquos peak of 2817 MW Summer peak load is projected to increase
from 2791 MW in summer 2015 to 2995 MW by summer 2020 or by an average annual growth
rate increase of 14 percent See Figure 9
Refer to Appendix A Tables A05-A08 for Met-Edrsquos forecasts of peak load and residential
commercial and industrial energy demand filed with the Commission in years 2006 through 2016
Electric Power Outlook for Pennsylvania 2015-2020 27
Figure 8 Met-Ed energy usage (GWh)
Figure 9 Met-Ed peak load (MW)
2000
2500
3000
3500
4000
4500
5000
5500
6000
2006 2007 2008 2009 2010 2011 2012 2013 2014 2015 2016 2017 2018 2019 2020
Residential
Commercial
Industrial
Historic Forecasts
2600
2700
2800
2900
3000
3100
3200
3300
2006 2007 2008 2009 2010 2011 2012 2013 2014 2015 2016 2017 2018 2019 2020
20162015
2014
Historic ______ Forecasts _ _ _ _ _
Electric Power Outlook for Pennsylvania 2015-2020 28
Pennsylvania Electric Company (Penelec)
Penelec provides service to 587832 customers in
all or portions of 29 counties in Western and
Northern Pennsylvania Penelecrsquos 2015 energy
usage total was 16117 GWh while in 2014 it was
16287 GWh (a decrease of 10 percent from the
previous year) Penelecrsquos total sales mix consisted
of residential (27 percent) commercial (22
percent) industrial (35 percent) and sales for resale
(157 percent)
Over the next five years total energy usage is projected to decrease at an average annual rate of 09
percent This includes a decrease in average annual in residential usage of 27 percent flat
commercial usage and a decrease in average annual industrial usage by 01 percent See Figure
10
Penelecrsquos highest peak load of 2819 MW occurred on Aug 17 2015 This represents a decrease
of 68 percent from previous yearrsquos peak of 3024 MW Summer peak load is projected to increase
from 2819 MW in summer 2015 to 2907 MW by summer 2020 or by an average annual growth
rate decrease of 06 percent See Figure 11
Refer to Appendix A Tables A09-A12 for Penelecrsquos forecasts of peak load and residential
commercial and industrial energy demand filed with the Commission in years 2006 through 2016
Electric Power Outlook for Pennsylvania 2015-2020 29
Figure 10 Penelec energy usage (GWh)
Figure 11 Penelec peak load (MW)
3000
3500
4000
4500
5000
5500
6000
6500
2006 2007 2008 2009 2010 2011 2012 2013 2014 2015 2016 2017 2018 2019 2020
Historic Forecasts
Commercial
Residential
Industrial
2200
2400
2600
2800
3000
3200
3400
2006 2007 2008 2009 2010 2011 2012 2013 2014 2015 2016 2017 2018 2019 2020
Historic ______ Forecasts _ _ _ _
2014
2015 2016
Electric Power Outlook for Pennsylvania 2015-2020 30
Pennsylvania Power Company (Penn Power)
Penn Power provides service to 163807 customers in
all or portions of six counties in Western
Pennsylvania Penn Powerrsquos 2015 energy usage total
was 4756 GWh while in 2014 it was 4936 GWh (a
decrease of 37 percent from the previous year) Penn
Powerrsquos total usage mix consisted of residential (36
percent) commercial (28 percent) industrial (32
percent) and sales for resale (5 percent)
Over the next five years total energy usage is projected to increase at an average annual rate of 05
percent This includes a decrease in average annual residential usage of 22 percent flat
commercial usage and an increase in average annual industrial usage of 37 percent See Figure
12
Penn Powers highest peak load of 910 MW occurred on Aug 10 2015 This represents a decrease
of 11 percent from the previous yearrsquos peak of 1018 MW Summer peak load is projected to
increase from 910 MW in summer 2015 to 1006 MW by summer 2020 or by an average annual
growth rate increase of 20 percent See Figure 13
Refer to Appendix A Tables A13-A16 for Penn Powerrsquos forecasts of peak load and residential
commercial and industrial energy demand filed with the Commission in years 2006 through 2016
Electric Power Outlook for Pennsylvania 2015-2020 31
Figure 12 Penn Power energy usage (GWh)
Figure 13 Penn Power peak load (MW)
1000
1200
1400
1600
1800
2000
2006 2007 2008 2009 2010 2011 2012 2013 2014 2015 2016 2017 2018 2019 2020
Historic Forecasts
Residential
Commercial
Industrial
1000
1200
1400
1600
1800
2000
2006 2007 2008 2009 2010 2011 2012 2013 2014 2015 2016 2017 2018 2019 2020
Historic Forecasts
Residential
Commercial
Industrial
Electric Power Outlook for Pennsylvania 2015-2020 32
West Penn Power Company (West Penn)
West Penn provides service to 722615 customers in
all or portions of 24 counties in Western North and
South Central Pennsylvania West Pennrsquos 2015
energy usage total was 20798 GWh while in 2014 it
was 21012 GWh (a decrease of 10 percent from the
previous year) West Pennrsquos total usage mix consisted
of residential (35 percent) commercial (25 percent)
industrial (37 percent) and sales for resale (less than 4
percent)
Over the next five years total energy usage is projected to increase at an average annual rate of 02
percent This includes a decrease in average annual residential usage of 25 percent a decrease in
average annual commercial usage of 06 percent and an increase in average annual industrial usage
of 30 percent See Figure 14
West Pennrsquos highest peak load of 3814 MW occurred on July 29 2015 This represents a
decrease of 51 percent from the previous yearrsquos peak of 4019 MW Summer peak load is
projected to increase from 3814 MW in 2015 to 3917 MW by the year 2020 or by an average
annual growth rate increase of 5 percent See Figure 15
Refer to Appendix A Tables A25-A28 for West Pennrsquos forecasts of peak load and residential
commercial and industrial energy demand filed with the Commission in years 2006 through 2016
Electric Power Outlook for Pennsylvania 2015-2020 33
Figure 14 West Penn energy usage (GWh)
Figure 15 West Penn peak load (MW)
4000
4500
5000
5500
6000
6500
7000
7500
8000
8500
9000
9500
2006 2007 2008 2009 2010 2011 2012 2013 2014 2015 2016 2017 2018 2019 2020
Historic Forecasts
Industrial
Residential
Commercial
3500
3600
3700
3800
3900
4000
4100
4200
4300
2006 2007 2008 2009 2010 2011 2012 2013 2014 2015 2016 2017 2018 2019 2020
Historic ______ Forecasts _ _ _ _
2014
2015 2016
Electric Power Outlook for Pennsylvania 2015-2020 34
PECO Energy Company (PECO)
PECO is the largest electric utility in Pennsylvania
providing service to 1601219 customers in the City
of Philadelphia and all or portions of six counties in
Southeastern Pennsylvania PECOrsquos 2015 energy
usage total was 38125 GWh while in 2014 it was
37675 GWh (an increase of 11 percent from the
previous year) PECOrsquos total usage mix consisted of
residential (36 percent) commercial (21 percent)
industrial (40 percent) other54
(23 percent) and sales
for resale (03 percent)
Over the next five years total energy usage is projected to decrease at an average annual rate of 01
percent This includes a decrease in average annual residential usage of 04 percent a decrease in
average annual commercial growth usage by 02 and an increase in average annual industrial
usage by 02 percent See Figure 16
PECOrsquos highest peak load of 8094 MW occurred on July 20 2015 This represents a decrease of
2 percent from the previous yearrsquos peak of 8258 MW Summer peak load is projected to increase
from 8094 MW in summer 2015 to 8135 MW by summer 2020 or by an average annual growth
rate increase of 01 percent See Figure 17
Refer to Appendix A Tables A21-A24 for PECOrsquos forecasts of peak load and residential
commercial and industrial energy demand filed with the Commission in years 2006 through 2016
54
Sales in the ldquootherrdquo category include public streetlights highway lighting other public authorities railroads
railways and interdepartmental
Electric Power Outlook for Pennsylvania 2015-2020 35
Figure 16 PECO energy usage (GWh)
Figure 17 PECO Energy Company peak load (MW)
6000
7000
8000
9000
10000
11000
12000
13000
14000
15000
16000
17000
18000
2006 2007 2008 2009 2010 2011 2012 2013 2014 2015 2016 2017 2018 2019 2020
Historic Forecasts
Residential
Industrial
Commercial
7700
7900
8100
8300
8500
8700
8900
9100
9300
2006 2007 2008 2009 2010 2011 2012 2013 2014 2015 2016 2017 2018 2019 2020
Historic ______ Forecasts _ _ _ _ _
2014
2015
2016
Electric Power Outlook for Pennsylvania 2015-2020 36
PPL Electric Utilities Corporation (PPL)
PPL provides service to 1422730 customers over
a 10000-square-mile area in all or portions of 29
counties in Central Eastern Pennsylvania PPLrsquos
2015 energy usage total was 37222 GWh while
in 2014 it was 37144 GWh (an increase of 02
percent from the previous year) PPLrsquos total usage
mix consisted of residential (39 percent)
commercial (39 percent) industrial (22 percent)
and other (04 percent)
Over the next five years total energy usage is projected to decrease at an average annual rate of 03
percent This includes a decrease in average annual residential usage of 11 percent flat average
annual commercial usage and an increase in average annual industrial usage of 04 percent See
Figure 18
PPLrsquos highest peak load of 7842 MW occurred on February 20 2015 This represents an increase
of 03 percent from the previous yearrsquos peak of 7816 MW Winter peak load is projected to
decrease from 7842 MW in 2015 to 7427 MW by the year 2020 or by an average annual growth
rate decrease of 11 percent PPL expects the lower peak load due to Act 129 reductions See
Figure 19
Refer to Appendix A Tables A17-A20 for PPLrsquos forecasts of peak load and residential
commercial and industrial energy demand filed with the Commission in years 2006 through 2016
Electric Power Outlook for Pennsylvania 2015-2020 37
Figure 18 PPL Electric Utilities Corporation energy usage (GWh)
Figure 19 PPL Electric Utilities Corporation peak load (MW)
7000
8000
9000
10000
11000
12000
13000
14000
15000
16000
2006 2007 2008 2009 2010 2011 2012 2013 2014 2015 2016 2017 2018 2019 2020
Historic Forecast
Residential
Commercial
Industrial
6500
6700
6900
7100
7300
7500
7700
7900
8100
2006 2007 2008 2009 2010 2011 2012 2013 2014 2015 2016 2017 2018 2019 2020
Historic ______ Forecasts _ _ _ _ _
2015
2014
2016
Electric Power Outlook for Pennsylvania 2015-2020 38
Summary of Data for the Four Small EDCs
The following section provides historic and projected energy usage and peak load demand statistics
for Pennsylvaniarsquos four small EDCs
Citizensrsquo Electric Company (Citizensrsquo)
Citizensrsquo provides service to 6945 customers in
Union County Pennsylvania Citizensrsquo 2015 energy
usage total was 175 GWh while in 2014 it was 172
GWh (an increase of 17 percent from previous
year) Citizensrsquo total usage mix consisted of
residential (50 percent) commercial (17 percent)
industrial (33 percent) and other (less than 1
percent)
Over the next five years total energy usage is projected to increase at an average annual rate of 04
percent This includes an increase in average annual residential usage of 04 percent an increase in
average annual commercial usage of 04 percent and an increase in average annual industrial usage
of 04 percent See Figure 20 below
Citizensrsquo highest peak load of 432 MW occurred on Jan 19 2016 This represents a decrease of
20 percent from the previous yearrsquos peak of 519 MW Winter peak load is projected to grow from
432 MW in 2015 to 503 MW by the year 2020 or by an average annual growth rate increase of 3
percent
Electric Power Outlook for Pennsylvania 2015-2020 39
Figure 20 Citizens energy usage (GWh)
2000
3000
4000
5000
6000
7000
8000
9000
10000
2006 2007 2008 2009 2010 2011 2012 2013 2014 2015 2016 2017 2018 2019 2020
Historic ______ Forecasts _ _ _ _
Residential
Industrial
Commercial
Electric Power Outlook for Pennsylvania 2015-2020 40
Pike County Light amp Power Company (Pike)
Pike provides service to 4694 customers in
Eastern Pike County Northeastern
Pennsylvania Pikersquos 2015 energy usage total
was 76 GWh while in 2014 it was 75 GWh
(an increase of 13 percent from the previous
year) Pikersquos total usage mix consisted of
residential (39 percent) commercial (60
percent) and other (05 percent) Pike has no
industrial customers or sales for resale
Over the next five years total energy usage is projected to increase at an average annual rate of 07
percent which includes an increase in average annual residential growth rate of 18 percent and
near zero commercial growth See Figure 21
Pikersquos highest peak load of 185 MW occurred on July 20 2015 This represents a decrease of 27
percent from the previous yearrsquos peak of 19 MW Summer peak load is projected to remain the
same from 185 MW in summer 2015 to 188 MW by summer 2019 with a near zero average
annual growth
Figure 21 Pike County Light amp Power energy usage (GWh)
25
30
35
40
45
50
2006 2007 2008 2009 2010 2011 2012 2013 2014 2015 2016 2017 2018 2019 2020
Historic ______ Forecasts _ _ _ _
Residential
Commercial
Electric Power Outlook for Pennsylvania 2015-2020 41
UGI Utilities IncmdashElectric Division (UGI)
UGI provides electric service to 61931
customers in Northwestern Luzerne and
Southern Wyoming counties in Pennsylvania
UGIrsquos 2015 energy usage total was 990 GWh
while in 2014 it was 976 GWh (an increase of
14 percent from the previous year) UGIrsquos total
usage mix consisted of residential (56 percent)
commercial (33 percent) industrial (11 percent)
and sales for resale (001 percent)
Over the next five years total energy usage is projected to increase at an average annual rate of 02
percent which includes a decrease in average annual residential usage of 01 percent an increase
in average annual commercial usage of 06 and an increase in industrial annual usage of 07
percent See Figure 22
UGIrsquos highest peak load of 193 MW occurred on Jan 18 2016 This represents a decrease of 93
percent from the previous yearrsquos peak of 211 MW Winter peak load is projected to increase from
193 MW in winter 2015 to 194 MW by the year 2020 or by an average annual growth rate
increase of 01 percent
Figure 22 UGI Utilities Inc energy usage (GWh)
50
100
150
200
250
300
350
400
450
500
550
600
650
2006 2007 2008 2009 2010 2011 2012 2013 2014 2015 2016 2017 2018 2019 2020
Historic Forecasts
Residential
Commercial
Industrial
Electric Power Outlook for Pennsylvania 2015-2020 42
Wellsboro Electric Company (Wellsboro)
Wellsboro provides electric service to 6300
customers in Tioga County North Central
Pennsylvania Wellsbororsquos 2015 energy usage
total was 1206 GWh while in 2014 it was
1204 GWh (an increase of 02 percent from the
previous year) Wellsbororsquos total usage mix
consisted of residential (36 percent)
commercial (27 percent) and industrial (36
percent
Over the next five years total energy usage is projected to decrease at an average annual rate of 12
percent This includes an increase in average annual residential usage of 10 percent an increase in
average annual commercial usage of 10 percent and a decrease in average annual industrial usage
of 58 percent See Figure 23 The dramatic drop in Industrial usage is due to two large industrial
customers that are expected to leave the area in 2016 and 2017
Wellsbororsquos highest peak load of 22 MW occurred on Jan 7 2015 This represents a decrease of
18 percent from the previous yearrsquos peak of 26 MW Winter peak load growth is projected to
decrease from 22 MW in 2015 to 20 MW by the year 2020 or by an average annual growth rate
decrease of 19 percent
Figure 23 Wellsboro Electric Company energy usage (GWh)
2500
3000
3500
4000
4500
5000
2006 2007 2008 2009 2010 2011 2012 2013 2014 2015 2016 2017 2018 2019 2020
Historic ______ Forecasts _ _ _ _
Residential
Industrial
Commercial
Electric Power Outlook for Pennsylvania 2015-2020 43
Appendix A ndash Data Tables
The following tables provide actual and projected peak load as well as residential commercial and
industrial energy demand by EDC Actual data covers years 2006 through 2015 Five-year
projections are those filed with the Commission in years 2006 through 2016
Electric Power Outlook for Pennsylvania 2015-2020 44
Table A01 Duquesne Light Company Table A03 Duquesne Light CompanyActual and Projected Peak Load (MW) Actual and Projected Commercial Energy Demand (GWh)
Projected Peak Load Requirments Projected Commercial Energy Demand(Year Forecast Was Filed) (Year Forecast Was Filed)
Year Actual 2006 2007 2008 2009 2010 2011 2012 2013 2014 2015 2016 Year Actual 2006 2007 2008 2009 2010 2011 2012 2013 2014 2015 2016
2006 3053 2765 2006 6474 6693
2007 2890 2805 3039 2007 6715 6847 6784
2008 2822 2835 3086 2948 2008 6631 6991 6942 6731
2009 2732 2873 3141 3007 2862 2009 6537 7129 7127 6768 6648
2010 2889 2910 3194 3067 2836 2854 2010 6712 7259 7302 6815 6627 6428
2011 3012 3242 3128 2857 2863 2944 2011 6612 7457 6878 6583 6501 6681
2012 3054 3191 2850 2860 3000 2935 2012 6539 6952 6533 6585 6782 6682
2013 2951 2890 2917 3053 2980 2966 2013 6494 6527 6666 6854 6749 6642
2014 2693 2960 3088 3045 3021 2997 2014 6432 6742 6957 6842 6640 6600
2015 2804 3125 3102 3083 3056 2969 2015 6399 7056 6929 6640 6621 6494
2016 3132 3135 3094 3005 2893 2016 7017 6645 6648 6503 6371
2017 3167 3118 3026 2918 2017 6641 6643 6472 6327
2018 3143 3042 2938 2018 6654 6455 6299
2019 3056 2950 2019 6430 6254
2020 2942 2020 6210
Table A02 Duquesne Light Company Table A04 Duquesne Light CompanyActual and Projected Residential Energy Demand (GWh) Actual and Projected Industrial Energy Demand (GWh)
Projected Residential Energy Demand Projected Industrial Energy Demand(Year Forecast Was Filed) (Year Forecast Was Filed)
Year Actual 2006 2007 2008 2009 2010 2011 2012 2013 2014 2015 2016 Year Actual 2006 2007 2008 2009 2010 2011 2012 2013 2014 2015 2016
2006 3991 3984 2006 3182 3229
2007 4211 4054 4141 2007 3145 3299 3271
2008 4060 4118 4214 4216 2008 3079 3359 3315 3098
2009 3946 4181 4293 4293 4177 2009 2616 3411 3369 3102 3002
2010 4327 4243 4372 4371 4188 4117 2010 2987 3464 3420 3084 2933 2440
2011 4232 4453 4444 4181 4184 4213 2011 3120 3467 3140 2851 2407 2865
2012 4169 4527 4171 4267 4275 4350 2012 3406 3141 2777 2395 2846 3185
2013 4091 4197 4352 4332 4436 4246 2013 3337 2726 2385 2815 3226 3501
2014 4068 4448 4402 4509 4260 4217 2014 3164 2359 2770 3252 3035 2787
2015 4109 4474 4579 4265 4230 4176 2015 2898 2724 3272 3032 2778 2909
2016 4676 4284 4266 4202 4081 2016 3289 3031 2762 2896 2890
2017 4306 4266 4184 4068 2017 3031 2734 2873 2852
2018 4272 4172 4067 2018 2711 2851 2837
2019 4164 4053 2019 2826 2819
2020 4012 2020 2803
Electric Power Outlook for Pennsylvania 2015-2020 45
Table A05 Metropolitan Edison Company Table A07 Metropolitan Edison CompanyActual and Projected Peak Load (MW) Actual and Projected Commercial Energy Demand (GWh) Energy Sales (GWH)
Projected Peak Load Requirements Projected Commercial Energy Demand(Year Forecast Was Filed) (Year Forecast Was Filed)
Year Actual 2006 2007 2008 2009 2010 2011 2012 2013 2014 2015 2016 Year Actual 2006 2007 2008 2009 2010 2011 2012 2013 2014 2015 2016
2006 2884 2689 2006 4509 4462
2007 2825 2740 2740 2007 4715 4547 4664
2008 3045 2801 2801 2801 2008 4777 4668 4818 4818
2009 2739 2856 2857 2857 2829 2009 4568 4788 4969 4969 4853
2010 2715 2915 2915 2915 2932 2687 2010 3006 4908 5108 5108 5020 4671
2011 3125 2972 2972 3017 2640 2869 2011 2947 5244 5244 5152 4706 2955
2012 3036 3032 3085 2630 2775 2911 2012 2907 5375 5291 4783 2959 2871
2013 3012 3158 2668 2815 2928 2881 2013 2933 5421 4887 3019 2909 2900
2014 2817 2731 2872 2962 2887 2958 2014 2944 4963 3090 2948 2930 2914
2015 2791 2952 2995 2898 2965 2975 2015 2995 3158 2997 2937 2931 2983
2016 3028 2910 2974 2979 2987 2016 2995 2940 2964 2929 2919
2017 2932 2996 2985 2995 2017 2956 2984 2938 2923
2018 3017 2987 2997 2018 2989 2938 2927
2019 2986 2996 2019 2923 2925
2020 2995 2020 2921
The 2010 actual and 2011 forecast are based on a reclassification of the commercial and industrial classes
Table A06 Metropolitan Edison Company Table A08 Metropolitan Edison CompanyActual and Projected Residential Energy Demand (GWh) Actual and Projected Industrial Energy Demand (GWh)
Projected Residential Energy Demand Projected Industrial Energy Demand(Year Forecast Was Filed) (Year Forecast Was Filed)
Year Actual 2006 2007 2008 2009 2010 2011 2012 2013 2014 2015 2016 Year Actual 2006 2007 2008 2009 2010 2011 2012 2013 2014 2015 2016
2006 5287 5325 2006 4008 4176
2007 5595 5390 5516 2007 3992 4155 4123
2008 5598 5515 5699 5699 2008 3831 4177 4156 4156
2009 5448 5640 5872 5872 5771 2009 3439 4200 4181 4181 3620
2010 5666 5764 6037 6037 5836 5587 2010 5288 4221 4193 4193 3842 3538
2011 5588 6187 6187 5969 5552 5424 2011 5404 4201 4201 4035 3497 5443
2012 5363 6341 6109 5577 5226 5201 2012 5261 4209 4047 3528 5545 5434
2013 5553 6232 5682 5386 5184 5297 2013 5328 4048 3731 5589 5652 5411
2014 5477 5799 5547 5183 5159 5354 2014 5382 4021 5610 5765 5521 5322
2015 5515 5650 5212 5042 5421 5533 2015 5309 5625 5851 5561 5381 5413
2016 5210 4979 5438 5378 5190 2016 5847 5587 5456 5472 5350
2017 4993 5457 5392 5042 2017 5612 5508 5507 5372
2018 5476 5382 4925 2018 5524 5523 5467
2019 5351 4840 2019 5532 5474
2020 4760 2020 5467
The 2010 actual and 2011 forecast are based on a reclassification of the commercial and industrial classes
Electric Power Outlook for Pennsylvania 2015-2020 46
Table A09 Pennsylvania Electric Company Table A11 Pennsylvania Electric CompanyActual and Projected Peak Load (MW) Actual and Projected Commercial Energy Demand (GWh) Energy Sales
Projected Peak Load Requirements Projected Commercial Energy Demand(Year Forecast Was Filed) (Year Forecast Was Filed)
Year Actual 2006 2007 2008 2009 2010 2011 2012 2013 2014 2015 2016 Year Actual 2006 2007 2008 2009 2010 2011 2012 2013 2014 2015 2016
2006 2531 2511 2006 5010 4928
2007 2696 2554 2554 2007 4961 4990 5049
2008 2524 2598 2598 2598 2008 5139 5064 5099 5045
2009 2880 2637 2637 2637 2637 2009 5186 5140 5188 5122 5122
2010 2451 2674 2674 2674 2674 2603 2010 5019 5213 5277 5199 5199 5159
2011 2659 2711 2711 2711 2630 2465 2011 3671 5367 5277 5277 5213 5196
2012 3128 2750 2750 2661 2452 2515 2012 3534 5356 5356 5265 5215 3562
2013 3087 2789 2688 2458 2544 2938 2013 3531 5436 5320 5257 3526 3512
2014 3024 2715 2496 2579 2942 2927 2014 3591 5364 5343 3593 3535 3553
2015 2819 2531 2625 2987 2935 2888 2015 3558 5424 3650 3510 3552 3649
2016 2662 3039 2946 2896 2890 2016 3698 3503 3582 3582 3539
2017 3081 2962 2904 2898 2017 3503 3604 3614 3545
2018 2968 2904 2906 2018 3608 3619 3551
2019 2902 2907 2019 3607 3553
2020 2907 2020 3552
The 2010 actual and 2011 forecast are based on a reclassification of the commercial and industrial classes
Table A10 Pennsylvania Electric Company Table A12 Pennsylvania Electric CompanyActual and Projected Residential Energy Demand (GWh) Actual and Projected Industrial Energy Demand (GWh)
Projected Residential Energy Demand Projected Industrial Energy Demand(Year Forecast Was Filed) (Year Forecast Was Filed)
Year Actual 2006 2007 2008 2009 2010 2011 2012 2013 2014 2015 2016 Year Actual 2006 2007 2008 2009 2010 2011 2012 2013 2014 2015 2016
2006 4457 4295 2006 4729 4527
2007 4381 4333 4420 2007 4678 4612 4807
2008 4497 4385 4438 4469 2008 4610 4679 4828 4809
2009 4558 4438 4496 4533 4533 2009 4594 4708 4881 4881 4881
2010 4471 4524 4554 4598 4598 4611 2010 4044 4725 4905 4954 4954 4203
2011 4656 4614 4662 4662 4614 4569 2011 5748 4930 4983 4983 4538 4126
2012 4554 4727 4727 4662 4489 4460 2012 6005 5013 5013 4859 4222 6026
2013 4491 4793 4721 4443 4304 4257 2013 5731 5043 4889 4370 6175 5883
2014 4462 4776 4442 4387 4164 4469 2014 5647 4922 4607 6266 5993 5696
2015 4350 4486 4539 4145 4513 4491 2015 5647 4674 6304 6062 5808 5747
2016 4653 4157 4525 4373 4145 2016 6325 6133 5867 5822 5723
2017 4156 4554 4393 4011 2017 6130 5894 5931 5746
2018 4583 4394 3923 2018 5896 6017 5721
2019 4377 3856 2019 5998 5675
2020 3791 2020 5623
The 2010 actual and 2011 forecast are based on a reclassification of the commercial and industrial classes
Electric Power Outlook for Pennsylvania 2015-2020 47
Table A13 Pennsylvania Power Company Table A15 Pennsylvania Power CompanyActual and Projected Peak Load (MW) Actual and Projected Commercial Energy Demand (GWh) Energy Sales
Projected Peak Load Requirements Projected Commercial Energy Demand(Year Forecast Was Filed) (Year Forecast Was Filed)
Year Actual 2006 2007 2008 2009 2010 2011 2012 2013 2014 2015 2016 Year Actual 2006 2007 2008 2009 2010 2011 2012 2013 2014 2015 2016
2006 984 904 2006 1359 1384
2007 1042 930 921 2007 1414 1422 1394
2008 1063 938 936 936 2008 1404 1460 1427 1427
2009 901 951 951 951 984 2009 1367 1498 1461 1461 1401
2010 903 965 965 965 941 896 2010 1311 1535 1496 1496 1394 1428
2011 1102 980 980 963 890 944 2011 1327 1532 1532 1424 1408 1300
2012 963 994 981 899 947 1010 2012 1334 1569 1491 1449 1267 1291
2013 1054 995 930 983 1001 929 2013 1349 1535 1500 1272 1297 1337
2014 1018 977 1002 1003 930 867 2014 1381 1535 1277 1314 1347 1345
2015 910 1010 1006 953 873 931 2015 1321 1278 1335 1358 1322 1180
2016 1010 969 880 940 992 2016 1334 1365 1326 1048 1311
2017 980 885 947 999 2017 1374 1332 1049 1315
2018 889 949 1003 2018 1332 1047 1319
2019 949 1004 2019 1040 1321
2020 1006 2020 1321
Table A14 Pennsylvania Power Company Table A16 Pennsylvania Power CompanyActual and Projected Residential Energy Demand (GWh) Actual and Projected Industrial Energy Demand (GWh)
Projected Residential Energy Demand Projected Industrial Energy Demand(Year Forecast Was Filed) (Year Forecast Was Filed)
Year Actual 2006 2007 2008 2009 2010 2011 2012 2013 2014 2015 2016 Year Actual 2006 2007 2008 2009 2010 2011 2012 2013 2014 2015 2016
2006 1611 1659 2006 1708 1565
2007 1690 1699 1659 2007 1627 1578 1720
2008 1667 1744 1693 1693 2008 1614 1594 1727 1727
2009 1634 1789 1724 1724 1780 2009 1229 1610 1734 1734 1347
2010 1696 1835 1758 1758 1761 1701 2010 1488 1626 1741 1741 1517 1226
2011 1711 1789 1789 1806 1708 1664 2011 1542 1748 1748 1687 1214 1527
2012 1668 1821 1860 1721 1624 1590 2012 1456 1755 1694 1238 1652 1513
2013 1704 1904 1714 1638 1588 1645 2013 1509 1700 1370 1705 1483 1473
2014 1728 1739 1664 1582 1627 1677 2014 1599 1596 1725 1486 1518 1596
2015 1703 1684 1589 1619 1685 1752 2015 1496 1738 1490 1519 1743 1847
2016 1588 1625 1691 1689 1597 2016 1490 1488 1739 2079 1637
2017 1649 1699 1703 1563 2017 1485 1729 2202 1696
2018 1705 1713 1545 2018 1731 2256 1742
2019 1714 1532 2019 2278 1775
2020 1520 2020 1790
Electric Power Outlook for Pennsylvania 2015-2020 48
Table A17 PPL Electric Utilities Corporation Table A19 PPL Electric Utilities CorporationActual and Projected Peak Load (MW) Actual and Projected Commercial Energy Demand (GWh) Energy Sales (GWH)
Projected Peak Load Requirements Projected Commercial Energy Demand(Year Forecast Was Filed) (Year Forecast Was Filed)
Year Actual 2006 2007 2008 2009 2010 2011 2012 2013 2014 2015 2016 Year Actual 2006 2007 2008 2009 2010 2011 2012 2013 2014 2015 2016
2006 7577 7310 2006 13140 13188
2007 7163 7410 7200 2007 13756 13562 13184
2008 7414 7510 7270 7410 2008 13913 13836 13476 13676
2009 6845 7610 7340 7450 7180 2009 13818 14166 13777 14028 14258
2010 7365 7710 7400 7500 7250 7207 2010 10667 14492 14045 14253 14486 14098
2011 6776 7480 7580 7320 7227 7101 2011 14179 14290 14596 14631 14642 10756
2012 7182 7680 7360 7283 7138 7331 2012 14027 14907 14926 14907 10860 14217
2013 7190 7450 7366 7142 7400 7271 2013 14140 15228 15295 11022 14270 14354
2014 7816 7487 7216 7484 7403 7334 2014 14111 15827 11251 14411 14524 14414
2015 7842 7282 7622 7556 7477 7220 2015 14336 11499 14580 14740 14570 14235
2016 7731 7691 7568 7314 7209 2016 14754 14998 14741 14234 14214
2017 7785 7635 7408 7298 2017 15137 14859 14376 14257
2018 7686 7467 7385 2018 14985 14440 14326
2019 7511 7435 2019 14484 14357
2020 7427 2020 14357
Table A18 PPL Electric Utilities Corporation Table A20 PPL Electric Utilities CorporationActual and Projected Residential Energy Demand (GWh) Actual and Projected Industrial Energy Demand (GWh)
Projected Residential Energy Demand Projected Industrial Energy Demand(Year Forecast Was Filed) (Year Forecast Was Filed)
Year Actual 2006 2007 2008 2009 2010 2011 2012 2013 2014 2015 2016 Year Actual 2006 2007 2008 2009 2010 2011 2012 2013 2014 2015 2016
2006 13714 14099 2006 9704 9968
2007 14411 14392 14180 2007 9482 10048 9965
2008 14419 14555 14422 14469 2008 9551 10084 9999 9625
2009 14218 14794 14565 14584 14341 2009 8418 10150 10032 9570 9401
2010 14206 15036 14702 14562 14340 14384 2010 12045 10214 10059 9228 9141 8506
2011 14356 14828 14608 14246 14390 14142 2011 8467 10084 9005 8879 8365 12151
2012 13616 14770 14350 14226 14120 13848 2012 8173 9009 8866 8211 12116 8475
2013 14295 14443 14164 14005 13658 13607 2013 8052 8864 8110 12269 8468 8133
2014 14563 14325 14161 13667 13575 13588 2014 8313 8054 12450 8501 8182 8092
2015 14462 14335 13738 13602 13644 13647 2015 8269 12686 8550 8281 8171 7966
2016 13896 13695 13769 13720 13721 2016 8603 8407 8260 8066 8283
2017 13678 13814 13732 13750 2017 8459 8324 8129 8354
2018 13908 13781 13825 2018 8365 8168 8420
2019 13790 13826 2019 8189 8450
2020 13679 2020 8450
Electric Power Outlook for Pennsylvania 2015-2020 49
Table A21 PECO Energy Company Table A23 PECO Energy CompanyActual and Projected Peak Load (MW) Actual and Projected Commercial Energy Demand (GWh) Energy Sales (GWH)
Projected Peak Load Requirements Projected Commercial Energy Demand(Year Forecast Was Filed) (Year Forecast Was Filed)
Year Actual 2006 2007 2008 2009 2010 2011 2012 2013 2014 2015 2016 Year Actual 2006 2007 2008 2009 2010 2011 2012 2013 2014 2015 2016
2006 8932 8755 2006 8857 8691
2007 8549 8887 9066 2007 8892 8864 9034
2008 8824 9020 9202 8677 2008 8700 9042 9215 9069
2009 7994 9155 9340 8807 8956 2009 8404 9223 9399 9251 8874
2010 8864 9293 9480 8940 9091 8114 2010 8472 9407 9587 9436 9052 8572
2011 8984 9622 9074 9227 8236 8786 2011 8332 9779 9625 9233 8744 8589
2012 8549 9210 9365 8359 8770 8926 2012 8063 9817 9417 8918 8705 8360
2013 8618 9506 8485 8842 8956 8529 2013 8101 9606 9097 8879 8443 7821
2014 8258 8612 8916 8987 8580 8627 2014 8025 9279 9057 8528 7790 7858
2015 8094 8991 9018 8631 8635 8259 2015 8118 9238 8613 7868 7936 8021
2016 9049 8683 8644 8267 8102 2016 8699 7947 8015 8017 8044
2017 8735 8653 8275 8110 2017 8026 8096 8013 8020
2018 8661 8284 8118 2018 8177 8009 8016
2019 8292 8126 2019 8005 8018
2020 8135 2020 8019
Table A22 PECO Energy Company Table A24 PECO Energy CompanyActual and Projected Residential Energy Demand (GWh) Actual and Projected Industrial Energy Demand (GWh)
Projected Residential Energy Demand Projected Industrial Energy Demand(Year Forecast Was Filed) (Year Forecast Was Filed)
Year Actual 2006 2007 2008 2009 2010 2011 2012 2013 2014 2015 2016 Year Actual 2006 2007 2008 2009 2010 2011 2012 2013 2014 2015 2016
2006 12797 13738 2006 15821 16089
2007 13487 14013 13053 2007 16582 16411 16137
2008 13317 14293 13314 13757 2008 16534 16739 16460 16914
2009 12893 14579 13580 14032 13583 2009 15889 17074 16789 17252 16864
2010 13896 14870 13852 14313 13855 13151 2010 15824 17415 17125 17597 17202 16207
2011 13686 14129 14599 14132 13414 13912 2011 15755 17467 17949 17546 16531 15991
2012 13233 14891 14415 13683 14037 13669 2012 15253 18308 17897 16861 16153 15755
2013 13241 14703 13956 14317 13806 13392 2013 15379 18254 17199 16476 15912 15481
2014 13222 14235 14604 13944 14463 13343 2014 15310 17543 16806 16071 15714 15609
2015 13630 14896 14083 14608 13346 13288 2015 15365 17142 16232 15949 15844 15302
2016 14224 14754 13349 13355 13366 2016 16394 16188 16081 15294 15547
2017 14902 13351 13422 13341 2017 16431 16322 15287 15515
2018 13354 13489 13352 2018 16567 15279 15513
2019 13556 13354 2019 15271 15517
2020 13360 2020 15529
Pennsylvania Public Utility Commission 50
Table A25 West Penn Power Company Table A27 West Penn Power CompanyActual and Projected Peak Load (MW) Actual and Projected Commercial Energy Demand (GWh) Energy Sales (GWH)
Projected Peak Load Requirements Projected Commercial Energy Demand(Year Forecast Was Filed) (Year Forecast Was Filed)
Year Actual 2006 2007 2008 2009 2010 2011 2012 2013 2014 2015 2016 Year Actual 2006 2007 2008 2009 2010 2011 2012 2013 2014 2015 2016
2006 3926 3723 2006 4959 4996
2007 3838 3782 3813 2007 4998 5092 5083
2008 3826 3824 3882 3871 2008 4925 5179 5179 5115
2009 3667 3864 3965 3958 3910 2009 4880 5249 5279 5235 5048
2010 3988 3895 4028 4036 3990 3788 2010 4983 5318 5365 5327 5160 4966
2011 4017 4078 4083 4032 3755 3757 2011 4889 5452 5387 5275 4987 4909
2012 3808 4123 4084 3771 3754 3758 2012 4849 5462 5353 5059 4931 4819
2013 3914 4120 3809 3786 3771 3784 2013 4878 5450 5169 4979 4930 4845
2014 4019 3951 3879 3840 3846 4075 2014 4956 5307 5091 5083 4909 4860
2015 3814 3928 3903 3908 3945 3793 2015 5112 5229 5229 4946 4897 4996
2016 3964 3980 4012 3842 3793 2016 5343 4979 4932 4957 4900
2017 4015 4065 3927 3840 2017 5047 4962 5015 4915
2018 4077 4020 3886 2018 4962 5029 4941
2019 4031 3916 2019 5006 4952
2020 3917 2020 4954
Table A26 West Penn Power Company Table A28 West Penn Power CompanyActual and Projected Residential Energy Demand (GWh) Actual and Projected Industrial Energy Demand (GWh)
Projected Residential Energy Demand Projected Industrial Energy Demand(Year Forecast Was Filed) (Year Forecast Was Filed)
Year Actual 2006 2007 2008 2009 2010 2011 2012 2013 2014 2015 2016 Year Actual 2006 2007 2008 2009 2010 2011 2012 2013 2014 2015 2016
2006 7133 7164 2006 8144 8283
2007 7266 7289 7319 2007 8160 8429 8282
2008 7172 7387 7484 7481 2008 8135 8543 8411 8311
2009 7101 7417 7639 7654 7206 2009 7286 8615 8584 8476 8440
2010 7401 7447 7761 7774 7264 7147 2010 7617 8634 8728 8699 8711 7612
2011 7349 7869 7892 7233 7104 7139 2011 7818 8766 8799 8906 7740 7833
2012 7092 7965 7248 7085 7122 7121 2012 7685 8844 9093 7936 8025 8029
2013 7318 7102 6952 7047 7149 7146 2013 7777 9246 8105 8146 8172 8087
2014 7281 7008 7073 7188 7282 7311 2014 7972 8214 8264 8334 8303 7947
2015 7255 7148 7231 7369 7302 7383 2015 7635 8346 8487 8542 8161 8053
2016 7281 7431 7303 7157 6775 2016 8608 8786 8331 8492 8287
2017 7493 7319 7244 6634 2017 8878 8466 8903 8641
2018 7335 7298 6548 2018 8495 9321 8798
2019 7303 6473 2019 9700 8847
2020 6407 2020 8852
Electric Power Outlook for Pennsylvania 2015-20 51
Appendix B ndash Plant Additions and Upgrades
Table B-1 below represents PJM interconnection requests from 1997 to Dec 31 2015 for generation
resources located in Pennsylvania55
As shown in table below Pennsylvania has 8202 MW under
construction Under construction for the prior two years was 4629 MW in 2014 and 2134 MW in
2013
Table B-1 PJM New Generation Queue for Pennsylvania ndash Interconnection Requests (1997 to
December 31 2015)
The Active column represents the PJM study phase of a project before it can possibly be moved
forward to Under Construction classification The In-Service Nuclear MW value of 26218 MW
includes 1630 MW from Beaver Valley Nuclear Generating Station that was integrated into PJM in
2004 Under Construction Coal MW represents the Hatfields Ferry Power Plant in Monongahela that
was retired in Oct 2013 and has since executed a construction service agreement with PJM even
though FirstEnergy is conducting a long-term study to determine whether it is feasible to reopen
Withdrawn Nuclear MW represents PPL Plus Corporationrsquos Bell Bend project which was suspended
since Areva Corp stopped in Feb 2008 the NRC design approval process for their Evolutionary
Power Reactor
55
See PJM Pennsylvania State Report at httpwwwpjmcom
Pennsylvania Public Utility Commission 52
Tables B-2 and B-3 below show generation deactivations and activations in Pennsylvania for 2015
Table B-2 2015 Generation Deactivations in Pennsylvania
Unit MW Capacity
TO Zone Age ActualProjected Deactivation Date
Fuel Type
AES Beaver Valley 125 DLCO 26 612015 Coal
Arnold (Green Mountain) Wind Farm 07 Penelec 15 872015 Wind
Pottstown LF (Moser) 2 PECO 26 10152015 Landfill Gas
MH50 Marcus Hook Co-Gen 50 PECO 27 582015 Gas
In 2015 177 MW of capacity retired in Pennsylvania compared to 10800 MW in the entire PJM
territory This represents only 15 percent of the 10800 MW that retired in the PJM territory
Table B-3 2015 Generation Activations in Pennsylvania
Project Names In-service MW Date Fuel Type
Fayette II 5 2015 Q4 NG
TMI 230kV 168 2015 Q4 NUKE
North Meshoppen 345kV 154 2015 Q4 NG
North Meshoppen 345kv II 35 2015 Q4 NG
Printz 19 2015 Q4 NG
Arnold 345kV 8 2015 Q4 STORAGE
Meyersdale North 115kV 18 2015 Q4 NG
Piney Hydro 345kV 526 2015 Q2 HYDRO
Springdale 3 4 5 26 2015 Q1 NG
Allegheny Dam 5 5 2015 Q1 HYDRO
Allegheny Dam 6 138kV 5 2015 Q1 HYDRO
St Benedict-Patton 0 2015 Q1 WIND
The PJM Queue process does not use commercial names rather project names are used to track new
generation supply by interconnection points at the bus of the transmission system
Electric Power Outlook for Pennsylvania 2015-20 53
Graphs B-1 and B-2 below show fuel type percent of Projects in Queue (as of December 31 2015)
and other graph shows total MW Capacity by fuel type (as of December 31 2015)
Graph B-1 New Generation for Pennsylvania ndash Fuel Type Percent of Projects in Queue (December
31 2015)
Graph B-2 New Generation Queue for Pennsylvania ndash Total MW Capacity by Fuel Type
(December 31 2015)
Pennsylvania Public Utility Commission 54
Appendix C ndash Existing Generating Facilities
Table C-1 shows the PJM regional electricity supply mix summary of generating capacity and actual
generation by fuel type for 201556
Note the significant reduction in coal generation and
corresponding increase in natural gas generation Graph C-1 shows the Pennsylvania specific
generation capacity for 201557
Table C-2 shows the most recently available data on existing generating facilities located in
Pennsylvania58
Table C-1 Electrical Power Supply Mix
Electricity Supply Mix
PJM Region Capacity amp Generation Mix for 2015 amp 2014
(percent)
Energy Source 2015
Capacity
2014
Capacity
2015
Generation
2014
Generation
Coal 375 397 366 435
Nuclear 186 179 355 343
Natural Gas 34 307 234 173
Hydro Wind Solar amp Other 59 57 44 44
Oil 39 6 01 04
56
See State of the Market Report Monitoring Analytics available at
httpwwwmonitoringanalyticscomreportsPJM_State_of_the_Market2015shtml 57
Data reported directly from PJM to PUC staff in July 2016 58
Data reported to SNL and received by PUC staff in July 2016
Electric Power Outlook for Pennsylvania 2015-20 55
Graph C-1 Electrical Power Capacity Mix
2015 Pennsylvania Installed Capacity
Pennsylvania Public Utility Commission 56
Electric Power Outlook for Pennsylvania 2015-20 57
Table C-2 Electric Generating Facilities in Pennsylvania
County Plant Owner Ultimate ParentOwnership
()
Operating
Capacity
(MW)
Year First
Unit in
Service
Age Fuel Type
Adams Gettysburg Energy amp Nutrient Recovery Facility (GENRF) EnergyWorks BioPower Inc EnergyWorks BioPower Inc 100 27 2013 3 Biomass
Hamilton NRG REMA LLC NRG Energy Inc 100 24 1971 45 Oil
Hunterstown NRG REMA LLC NRG Energy Inc 100 75 1971 45 Oil
Hunterstown CC NRG Energy Inc NRG Energy Inc 100 810 2003 13 Gas
Orrtanna NRG REMA LLC NRG Energy Inc 100 26 1971 45 Oil
Allegheny Allegheny Energy 3 4 and 5 Allegheny Energy Supply Company LLC FirstEnergy Corp 100 550 2003 13 Gas
Allegheny Energy Units 1 and 2 Allegheny Energy Supply Company LLC FirstEnergy Corp 100 88 1999 17 Gas
Brunot Island Orion Power Holdings Inc NRG Energy Inc 100 15 1972 44 Oil
Brunot Island CC NRG Power Midwest LP NRG Energy Inc 100 2694 1973 43 Gas
Cheswick NRG Power Midwest LP NRG Energy Inc 100 563 1970 46 Coal
Clairton Works United States Steel Corporation United States Steel Corporation 100 274 1955 61 Nonrenewable
Mon Valley Works United States Steel Corporation United States Steel Corporation 100 319 1943 73 Nonrenewable
PPG Monroeville Chemicals Center PPG Monroeville Chemicals Center PPG Industries Incorporated 100 11 1998 18 Oil
PPG Place PPG Industries Incorporated PPG Industries Incorporated 100 23 1990 26 Oil
Armstrong Allegheny 5 Enduring Hydro LLC Enduring Hydro LLC 1 1988 28 Water
I Squared Capital I Squared Capital 99 1988 28 Water
Allegheny 6 Enduring Hydro LLC Enduring Hydro LLC 1 1988 28 Water
I Squared Capital I Squared Capital 99 1988 28 Water
Allegheny 8 (Torrent Hydro) BluEarth Renewables Inc BluEarth Renewables Inc 49 1990 26 Water
PSP Investments PSP Investments 51 1990 26 Water
Allegheny 9 (Torrent Hydro) BluEarth Renewables Inc BluEarth Renewables Inc 49 1990 26 Water
PSP Investments PSP Investments 51 1990 26 Water
Armstrong County International Power America Inc Engie SA 100 676 2002 14 Gas
Keystone ArcLight Capital Partners LLC ArcLight Capital Holdings LLC 4445 1967 49 Coal
NRG REMA LLC NRG Energy Inc 2037 1967 49 Coal
PSEG Fossil LLC Public Service Enterprise Group Incorporated 2284 1967 49 Coal
Talen Energy Corporation Talen Energy Corporation 617 1967 49 Coal
Talen Generation LLC Talen Energy Corporation 617 1967 49 Coal
Keystone IC Constellation Power Source Generation LLC Exelon Corporation 4198 1968 48 Oil
Duquesne Light Holdings Inc Duquesne Light Holdings Inc 247 1968 48 Oil
NRG REMA LLC NRG Energy Inc 2037 1968 48 Oil
PSEG Fossil LLC Public Service Enterprise Group Incorporated 2284 1968 48 Oil
Talen Energy Corporation Talen Energy Corporation 309 1968 48 Oil
Talen Generation LLC Talen Energy Corporation 925 1968 48 Oil
Mahoning Creek Enduring Hydro LLC Enduring Hydro LLC 51 2013 3 Water
I Squared Capital I Squared Capital 49 2013 3 Water
Beaver Beaver Solar Eaton Corporation Eaton Corporation 100 13 2012 4 Solar
Beaver Valley FirstEnergy Nuclear Generation Corp FirstEnergy Corp 8006 1976 40 Nuclear
Ohio Edison Company FirstEnergy Corp 1082 1976 40 Nuclear
Toledo Edison Company FirstEnergy Corp 912 1976 40 Nuclear
Beaver Valley Patterson Dam Enel Green Power North America Inc Enel Green Power SpA 317 1982 34 Water
Enel SpA 683 1982 34 Water
Townsend Hydro Beaver Falls Municipal Authority Beaver Falls Municipal Authority 100 42 1987 29 Water
Berks Altairnano PJM Li-ion Battery Storage Project AES Energy Storage LLC AES Corporation 100 1 2009 7 Nonrenewable
Evergreen Community Power Plant Evergreen Community Power LLC Interstate Resources Inc 100 25 2009 7 Biomass
Morgantown Solar Park Hankin Group Hankin Group 100 16 2011 5 Solar
Ontelaunee Energy Center Dynegy Power LLC Dynegy Inc 100 599 2002 14 Gas
Pioneer Crossing Landfill Fortistar LLC Fortistar LLC 100 2008 8 Biomass
Green Gas Americas Inc Green Gas International BV 0 2008 8 Biomass
Titus CT NRG REMA LLC NRG Energy Inc 100 35 1967 49 Oil
Blair Allegheny Ridge Wind Farm ArcLight Capital Partners LLC ArcLight Capital Holdings LLC 100 80 2007 9 Wind
American Eagle Paper Mills Team Ten LLC Team Ten LLC 100 171 1929 87 Coal
Chestnut Flats Windfarm EDF Renewable Energy Inc EDF Group 100 38 2011 5 Wind
Juniata Locomotive Shop Norfolk Southern Corporation Norfolk Southern Corporation 100 4 1955 61 Coal
North Allegheny Wind Duke Energy Renewables Inc Duke Energy Corporation 100 70 2009 7 Wind
Sandy Ridge Wind Farm Algonquin Power Fund (America) Inc Algonquin Power amp Utilities Corp 100 482 2012 4 Wind
1872
12
8
10
12
136
178
1700
112
67
Pennsylvania Public Utility Commission 58
Table C-2 Electric Generating Facilities in Pennsylvania (contrsquod)
County Plant Owner Ultimate ParentOwnership
()
Operating
Capacity
(MW)
Year First
Unit in
Service
Age Fuel Type
Bradford Beaver Dam Gas Project IMG Midstream LLC Bregal Investments Inc 100 199 2016 0 Gas
Northern Tier Landfill Talen Renewable Energy Energy Power Partners 100 16 2009 7 Biomass
Bucks Croydon Exelon Generation Company LLC Exelon Corporation 100 512 1974 42 Oil
Exelon-Conergy Solar Energy Center Conergy AG Kawa Capital Management Inc 100 15 2008 8 Solar
Fairless Hills Steam Generating Station Exelon Generation Company LLC Exelon Corporation 100 60 1996 20 Biomass
Fairless Works Energy Center Dominion Energy Inc Dominion Resources Inc 100 12984 2004 12 Gas
Falls Exelon Generation Company LLC Exelon Corporation 100 60 1970 46 Oil
Pennsbury Generating Station Exelon Generation Company LLC Exelon Corporation 100 54 1996 20 Biomass
Tullytown Landfill Gas Facility WM Renewable Energy LLC Waste Management Inc 100 16 2013 3 Biomass
Wheelabrator Falls Inc Wheelabrator Technologies Inc Energy Capital Partners LLC 100 46 1994 22 Biomass
Cambria Cambria Cogeneration Gulf Pacific Power LLC Harbert Management Corporation 375 1991 25 Coal
Harbert Power Fund V LLC Harbert Management Corporation 125 1991 25 Coal
UBS Global Asset Management UBS Group AG 50 1991 25 Coal
Colver Power Project Constellation Power Inc Exelon Corporation 25 1995 21 Coal
Gulf Pacific Power LLC Harbert Management Corporation 2812 1995 21 Coal
Harbert Power Fund V LLC Harbert Management Corporation 938 1995 21 Coal
UBS Global Asset Management UBS Group AG 375 1995 21 Coal
Ebensburg Power Company Babcock amp Wilcox Enterprises Inc Babcock amp Wilcox Enterprises Inc 100 50 1991 25 Coal
Highland North Wind Farm Everpower Wind Holdings Inc Terra Firma Capital Partners Ltd 100 75 2012 4 Wind
Highland Wind Project Everpower Wind Holdings Inc Terra Firma Capital Partners Ltd 100 625 2009 7 Wind
Patton Wind Farm Everpower Wind Holdings Inc Terra Firma Capital Partners Ltd 100 30 2012 4 Wind
Carbon PA Solar Park Project Consolidated Edison Development Inc Consolidated Edison Inc 100 10 2012 4 Solar
Panther Creek ArcLight Energy Partners Fund IV L P ArcLight Capital Holdings LLC 75 1992 24 Coal
Olympus Power LLC Olympus Holdings LLC 25 1992 24 Coal
Centre East Campus Plant Pennsylvania State University Pennsylvania State University 100 84 2011 5 Gas
Chester Andromeda One A Biomass Plant Behrens Energy Agriculture amp Robotics Behrens Energy Agriculture amp Robotics 100 4 2016 0 Biomass
Aqua Ingrams Mill Solar Aqua Pennsylvania Inc Aqua America Inc 100 04 2009 7 Solar
Longwood Gardens Solar Plant Ecogy Pennsylvania Systems LLC Ecogy Pennsylvania Systems LLC 100 13 2010 6 Solar
Marlboro Mushrooms Solar Field Marlborough Mushrooms Marlborough Mushrooms 100 1 2011 5 Solar
Pickering Solar Aqua America Inc Aqua America Inc 100 14 2012 4 Solar
SECCRA Community Landfill Southeastern Chester County Refuse Authority Southeastern Chester County Refuse Authority 100 25 2007 9 Biomass
Clarion Piney Brookfield Renewable Partners LP Brookfield Asset Management Inc 62 1924 92 Water
Brookfield Renewable Partners LP 38 1924 92 Water
Clearfield Shawville IC NRG REMA LLC NRG Energy Inc 100 6 1960 56 Oil
Clinton Lock Haven Talen Energy Supply LLC Talen Energy Corporation 100 14 1969 47 Oil
Cumberland Carlisle Area School District Carlisle Area School District Carlisle Area School District 100 13 2010 6 Solar
Knouse Foods Solar Plant Knouse Foods Cooperative Inc Knouse Foods Cooperative Inc 100 3 2010 6 Solar
Mountain NRG REMA LLC NRG Energy Inc 100 50 1972 44 Oil
PPG Industries Works 6 IC Facility PPG Industries Incorporated PPG Industries Incorporated 100 5 1972 44 Oil
Shippensburg (Cumberland County) Landfill Talen Renewable Energy Energy Power Partners 100 64 2009 7 Biomass
West Shore Talen Energy Supply LLC Talen Energy Corporation 100 28 1969 47 Oil
Dauphin Harrisburg Talen Energy Supply LLC Talen Energy Corporation 100 56 1967 49 Oil
Paxton Creek Cogeneration NRG Yield Inc NRG Energy Inc 551 1986 30 Gas
NRG Yield Inc 449 1986 30 Gas
Susquehanna Resource Management Complex (Harrisburg Facility Cogen) Lancaster County Solid Waste Management Authority Lancaster County Solid Waste Management Authority 100 218 1986 30 Biomass
Three Mile Island Exelon Generation Company LLC Exelon Corporation 100 829 1974 42 Nuclear
875
110
83
28
12
Electric Power Outlook for Pennsylvania 2015-20 59
Table C-2 Electric Generating Facilities in Pennsylvania (contrsquod)
County Plant Owner Ultimate ParentOwnership
()
Operating
Capacity
(MW)
Year First
Unit in
Service
Age Fuel Type
Delaware Chester Exelon Generation Company LLC Exelon Corporation 100 54 1969 47 Oil
Chester Operations Kimberly-Clark Corporation Kimberly-Clark Corporation 100 67 1986 30 Coal
Delaware County Resource Recovery Facility Covanta Energy Corporation Covanta Holding Corporation 100 80 1991 25 Biomass
Eddystone 3-4 Exelon Generation Company LLC Exelon Corporation 100 760 1974 42 Oil
Eddystone CT Exelon Generation Company LLC Exelon Corporation 100 76 1967 49 Oil
Liberty Electric Power Equipower Resources Corp Dynegy Inc 100 541 2002 14 Gas
Marcus Hook NextEra Energy Resources LLC NextEra Energy Inc 100 847 2004 12 Gas
Marcus Hook Cogeneration NextEra Energy Resources LLC NextEra Energy Inc 100 50 1987 29 Gas
Elk Johnsonburg Mill Domtar Paper Company LLC Domtar Corp 100 49 1993 23 Biomass
Erie Erie Coke Corporation Erie Coke Corporation Erie Coke Corporation 100 13 1953 63 Nonrenewable
Lakeview Gas Recovery WM Renewable Energy LLC Waste Management Inc 100 6 1997 19 Biomass
Fayette Allegheny Energy Units 8 and 9 Allegheny Energy Supply Company LLC FirstEnergy Corp 100 88 2000 16 Gas
Fayette Energy Facility Dynegy Inc Dynegy Inc 100 649 2003 13 Gas
Mill Run Wind Farm NextEra Energy Resources LLC NextEra Energy Inc 100 15 2001 15 Wind
South Chestnut Wind Project Avangrid Renewables LLC Avangrid Inc 185 2012 4 Wind
Iberdrola SA 815 2012 4 Wind
Franklin Allegheny Energy Units 12 amp 13 Allegheny Energy Supply Company LLC FirstEnergy Corp 100 88 2001 15 Gas
Falling Spring Chambersburg Borough of Chambersburg Borough of 100 5 1967 49 Gas
IESI Blue Ridge Landfill Talen Renewable Energy Energy Power Partners 100 64 2013 3 Biomass
Mountain View Landfill CCI Power Holdings LLC Castleton Commodities International LLC 1231 2003 13 Biomass
Energy Trading Innovations LLC 8769 2003 13 Biomass
Orchard Park Chambersburg Borough of Chambersburg Borough of 100 232 2003 13 Gas
Huntingdon Warrior Ridge Hydroelectric American Hydro Power Co American Hydro Power Co 100 28 1985 31 Water
Wm F Matson Generating Station Allegheny Electric Cooperative Inc Allegheny Electric Cooperative Inc 100 217 1988 28 Water
Indiana Conemaugh ArcLight Capital Partners LLC ArcLight Capital Holdings LLC 3511 1970 46 Coal
NRG Northeast Generating LLC NRG Energy Inc 372 1970 46 Coal
NRG REMA LLC NRG Energy Inc 1645 1970 46 Coal
PSEG Fossil LLC Public Service Enterprise Group Incorporated 225 1970 46 Coal
Talen Generation LLC Talen Energy Corporation 1625 1970 46 Coal
UGI Development Company UGI Corporation 597 1970 46 Coal
Conemaugh IC Constellation Power Source Generation LLC Exelon Corporation 3128 1970 46 Oil
Duquesne Light Holdings Inc Duquesne Light Holdings Inc 383 1970 46 Oil
NRG Northeast Generating LLC NRG Energy Inc 372 1970 46 Oil
NRG REMA LLC NRG Energy Inc 1645 1970 46 Oil
PSEG Fossil LLC Public Service Enterprise Group Incorporated 225 1970 46 Oil
Talen Generation LLC Talen Energy Corporation 1625 1970 46 Oil
UGI Development Company UGI Corporation 597 1970 46 Oil
Homer City GE Capital US Holdings Inc General Electric Company 90 1969 47 Coal
Metropolitan Life Insurance Company MetLife Inc 10 1969 47 Coal
Indiana University of Pennsylvania Indiana University of Pennsylvania Indiana University of Pennsylvania 100 24 1988 28 Gas
Seward Waste Coal Seward Generation LLC Robindale Energy Services Inc 100 521 2004 12 Coal
Lackawanna Archbald Cogeneration PEI Power Corporation Energy Transfer Partners LP 100 20 1988 28 Biomass
Archbald Power Station PEI Power Corporation Energy Transfer Partners LP 100 592 2001 15 Gas
Keystone Landfill Keystone Recovery Inc Keystone Recovery Inc 100 49 1995 21 Biomass
504
144
1700
112
19067
Pennsylvania Public Utility Commission 60
Table C-2 Electric Generating Facilities in Pennsylvania (contrsquod)
County Plant Owner Ultimate ParentOwnership
()
Operating
Capacity
(MW)
Year First
Unit in
Service
Age Fuel Type
Lancaster Dart Container Corp Cogen Dart Container Corp Dart Container Corp 100 104 2012 4 Biomass
Frey Farm Landfill Talen Renewable Energy Energy Power Partners 100 32 2006 10 Biomass
Holtwood Hydroelectric Plant Brookfield Renewable Partners LP Brookfield Asset Management Inc 62 1910 106 Water
Brookfield Renewable Partners LP 38 1910 106 Water
Talen Generation LLC Talen Energy Corporation 0 1910 106 Water
Honey Brook Generating Station (Granger) Granger Energy of Honey Brook LLC Granger Electric Co 100 32 2006 10 Biomass
Keystone Solar Project Bright Plain Renewable Energy LLC Bright Plain Renewable Energy LLC 50 2012 4 Solar
D E Shaw Renewable Investments LLC D E Shaw amp Co LP 50 2012 4 Solar
Lancaster County Resource Recovery Lancaster County Solid Waste Management Authority Lancaster County Solid Waste Management Authority 100 324 1991 25 Biomass
Martin Limestone Solar Array Plant Sunstream Energy LLC Sunstream Energy LLC 100 1 2012 4 Solar
Muddy Run Pumped Storage Facility Exelon Generation Company LLC Exelon Corporation 100 1070 1967 49 Water
Safe Harbor Brookfield Renewable Partners LP Brookfield Asset Management Inc 62 1931 85 Water
Brookfield Renewable Partners LP 38 1931 85 Water
Turkey Point Wind Project (Frey Farm Wind) Talen Renewable Energy Energy Power Partners 100 32 2011 5 Wind
Zook Generating Station (LampS Sweetners) Granger Electric Co Granger Electric Co 100 32 2013 3 Biomass
Lawrence New Castle NRG Power Midwest LP NRG Energy Inc 100 320 1939 77 Coal
New Castle IC Orion Power Holdings Inc NRG Energy Inc 100 25 1968 48 Oil
Lebanon Greater Lebanon Refuse Authority Landfill Talen Renewable Energy Energy Power Partners 100 32 2007 9 Biomass
PPL Ironwood TransCanada PipeLines Limited TransCanada Corporation 100 6601 2001 15 Gas
Lehigh Air Products Solar (Trexlertown Solar) Air Products Energy Enterprises LP Air Products and Chemicals Inc 100 19 2011 5 Solar
Allentown Talen Energy Supply LLC Talen Energy Corporation 100 56 1967 49 Oil
Luzerne AE Hunlock 4 Allegheny Energy Supply Company LLC FirstEnergy Corp 100 45 2000 16 Gas
Bear Creek Wind Project ArcLight Capital Partners LLC ArcLight Capital Holdings LLC 263 2006 10 Wind
Central Hudson Enterprises Corporation Fortis Inc 885 2006 10 Wind
Community Energy Inc Community Energy Inc 885 2006 10 Wind
JPMorgan Chase amp Co JPMorgan Chase amp Co 56 2006 10 Wind
Harwood Talen Energy Supply LLC Talen Energy Corporation 100 264 1967 49 Oil
Hazle Township Flywheel Energy Storage Beacon Power LLC Rockland Capital LLC 100 20 2013 3 Nonrenewable
Hazleton Cogeneration Starwood Energy Group Global LLC Starwood Energy Group Global LLC 100 1522 1989 27 Gas
Hunlock Repowering UGI Development Company UGI Corporation 100 1281 2011 5 Gas
Jenkins Talen Energy Supply LLC Talen Energy Corporation 100 276 1969 47 Oil
MATS Wind Electric City Wind Power Corporation Electric City Wind Power Corporation 100 055 2008 8 Wind
Romark PA Solar Romark Logistics of PA Inc Romark Logistics of PA Inc 100 18 2011 5 Solar
Susquehanna Nuclear Allegheny Electric Cooperative Inc Allegheny Electric Cooperative Inc 10 1983 33 Nuclear
Talen Generation LLC Talen Energy Corporation 90 1983 33 Nuclear
Lycoming Allenwood (PPLRE Lycoming County Landfill Project) Talen Renewable Energy Energy Power Partners 100 32 2012 4 Biomass
Laurel Hill Duke Energy Renewables Inc Duke Energy Corporation 100 69 2012 4 Wind
Lycoming County Landfill Project (PPL Renewable) Talen Renewable Energy Energy Power Partners 100 3 2012 4 Biomass
Williamsport Talen Energy Supply LLC Talen Energy Corporation 100 268 1967 49 Oil
Mercer General Electric Company General Electric Company General Electric Company 100 43 1984 32 Oil
Monroe Pocono Raceway Solar Project Pocono International Raceway Inc Pocono International Raceway Inc 100 3 2010 6 Solar
Shawnee CT NRG REMA LLC NRG Energy Inc 100 24 1972 44 Oil
249
5
4175
24
2620
Electric Power Outlook for Pennsylvania 2015-20 61
Table C-2 Electric Generating Facilities in Pennsylvania (contrsquod)
County Plant Owner Ultimate ParentOwnership
()
Operating
Capacity
(MW)
Year First
Unit in
Service
Age Fuel Type
Montgomery 500 Virginia Solar 500 Virginia Solar LP 500 Virginia Solar LP 100 1 2011 5 Solar
Conshohocken -Solar Sun Power Electric Conservation Services Group 100 006 1999 17 Solar
Covanta Plymouth (Montenay Montgomery) Covanta Plymouth Renewable Energy LP Covanta Holding Corporation 100 28 1991 25 Biomass
Hill at Whitemarsh Talen Renewable Energy Energy Power Partners 100 16 2007 9 Gas
Limerick Exelon Generation Company LLC Exelon Corporation 100 2386 1986 30 Nuclear
Moser Exelon Generation Company LLC Exelon Corporation 100 60 1970 46 Oil
Spring House IC Plant Janssen Pharmaceuticals Inc Johnson amp Johnson 100 38 2013 3 Gas
Stowe Waste Management Inc Waste Management Inc 100 3 1989 27 Biomass
West Point Facility Merck amp Company Inc Merck amp Company Inc 100 66 1989 27 Gas
West Point Facility IC Merck amp Company Inc Merck amp Company Inc 100 66 1972 44 Oil
Montour Montour Talen Generation LLC Talen Energy Corporation 100 1515 1971 45 Coal
Northampton Bethlehem CC Conectiv Bethlehem LLC Calpine Corporation 100 1134 2003 13 Gas
Bethlehem Landfill Commonwealth Landfill Gas Commonwealth Landfill Gas 20 2008 8 Biomass
Pepco Energy Services Inc Exelon Corporation 80 2008 8 Biomass
Crayola Solar Park Talen Renewable Energy Energy Power Partners 50 2010 6 Solar
UGI Development Company UGI Corporation 50 2010 6 Solar
Glendon Plant Talen Renewable Energy Energy Power Partners 100 32 2011 5 Biomass
Green Knight Energy Center Waste Management Inc Waste Management Inc 100 87 2001 15 Biomass
Lower Mount Bethel Talen Energy Corporation Talen Energy Corporation 100 5375 2004 12 Gas
Martins Creek 3 and 4 Talen Generation LLC Talen Energy Corporation 100 1700 1975 41 Gas
Martins Creek CT Talen Generation LLC Talen Energy Corporation 100 72 1971 45 Gas
Northampton EIF Northampton LLC Ares Owners Holdings LP 9118 1995 21 Coal
EIF Northampton LLC 882 1995 21 Coal
Portland CT NRG REMA LLC NRG Energy Inc 100 191 1967 49 Oil
Northumberland Mount Carmel Cogeneration Mt Carmel Co-Gen Inc Private investors-Kenneth M Pollock amp Connie J Pollock Rado 100 43 1990 26 Coal
Philadelphia Delaware CT Exelon Generation Company LLC Exelon Corporation 100 74 1969 47 Oil
Grays Ferry Cogeneration Grays Ferry Cogeneration Partners Veolia Environnement SA 100 177 1997 19 Gas
Lincoln Financial Field Solar Plant NRG Renew LLC NRG Energy Inc 100 29 2013 3 Solar
Newman amp Company Inc Newman amp Co Inc Newman amp Co Inc 100 18 1964 52 Gas
Philadelphia Refinery Carlyle Group LP Carlyle Group LP 67 1952 64 Nonrenewable
Sunoco Inc Energy Transfer Partners LP 33 1952 64 Nonrenewable
PWD Northeast WPCP Biogas Cogen Philadelphia Water Department Philadelphia Water Department 100 56 2013 3 Biomass
Richmond CT Exelon Generation Company LLC Exelon Corporation 100 132 1973 43 Oil
Schuylkill CT Exelon Generation Company LLC Exelon Corporation 100 38 1969 47 Oil
Southwark Exelon Generation Company LLC Exelon Corporation 100 72 1967 49 Oil
Temple SEGF Cogen Plant Temple University Temple University 100 16 1993 23 Gas
Pike Wallenpaupack Brookfield Renewable Partners LP Brookfield Asset Management Inc 62 1926 90 Water
Brookfield Renewable Partners LP 38 1926 90 Water
28
112
206
44
54
Pennsylvania Public Utility Commission 62
Table C-2 Electric Generating Facilities in Pennsylvania (contrsquod)
County Plant Owner Ultimate ParentOwnership
()
Operating
Capacity
(MW)
Year First
Unit in
Service
Age Fuel Type
Schuylkill Broad Mountain Landfill Facility UGI Development Company UGI Corporation 100 11 2009 7 Biomass
Fishbach Talen Energy Supply LLC Talen Energy Corporation 100 28 1969 47 Oil
John B Rich Memorial Power Station Cogentrix Energy Power Management LLC Carlyle Group LP 1955 1988 28 Coal
NextEra Energy Resources LLC NextEra Energy Inc 545 1988 28 Coal
Ontario Teachers Pension Plan Board Ontario Teachers Pension Plan Board 125 1988 28 Coal
RI-CORP Development Inc RI-CORP Development Inc 50 1988 28 Coal
UBS Global Asset Management UBS Group AG 125 1988 28 Coal
Locust Ridge II Avangrid Renewables LLC Avangrid Inc 185 2009 7 Wind
Iberdrola SA 815 2009 7 Wind
Locust Ridge Wind Farm Avangrid Renewables LLC Avangrid Inc 185 2007 9 Wind
Iberdrola SA 815 2007 9 Wind
Masser Farms Realty Solar Masser Farms Realty Ltd Masser Farms Realty Ltd 100 1 2011 5 Solar
Northeastern Power Cogeneration Facility Northeastern Power Company Engie SA 100 52 1989 27 Coal
Pine Grove Landfill CCI Power Holdings LLC Castleton Commodities International LLC 1231 2008 8 Biomass
Energy Trading Innovations LLC 8769 2008 8 Biomass
St Nicholas Cogeneration Schuylkill Energy Resource Inc Schuylkill Energy Resource Inc 100 86 1990 26 Coal
Westwood Generating Station Olympus Westwood Funding LLC Olympus Holdings LLC 75 1987 29 Coal
Treemont Funding LLC ArcLight Capital Holdings LLC 25 1987 29 Coal
Wheelabrator Frackville Energy Company Wheelabrator Technologies Inc Energy Capital Partners LLC 100 425 1988 28 Coal
Snyder Sunbury CT Corona Power LLC Corona Power LLC 100 472 1971 45 Oil
Sunbury IC Corona Power LLC Corona Power LLC 100 5 1967 49 Oil
Somerset Casselman Wind Avangrid Renewables LLC Avangrid Inc 185 2007 9 Wind
Iberdrola SA 815 2007 9 Wind
Forward WindPower LLC NRG Energy Inc NRG Energy Inc 25 2008 8 Wind
NRG Yield Inc NRG Energy Inc 4133 2008 8 Wind
NRG Yield Inc 3367 2008 8 Wind
Glades Pike Cogeneration Plant (CT) State Correctional Institution ndash Laurel Highlands State Correctional Institution ndash Laurel Highlands 100 25 2011 5 Biomass
Glades Pike Cogeneration Plant IC State Correctional Institution ndash Laurel Highlands State Correctional Institution ndash Laurel Highlands 100 28 2011 5 Biomass
Lookout WindPower LLC NRG Energy Inc NRG Energy Inc 25 2008 8 Wind
NRG Yield Inc NRG Energy Inc 4133 2008 8 Wind
NRG Yield Inc 3367 2008 8 Wind
Meyersdale Wind Project NextEra Energy Resources LLC NextEra Energy Inc 100 30 2003 13 Wind
Somerset Wind Project NextEra Energy Resources LLC NextEra Energy Inc 100 9 2001 15 Wind
Stony Creek Wind Farm ECampR Investco Mgmt LLC EON SE 50 2009 7 Wind
PD Alternative Investments US Inc PensionDanmark Holding AS 50 2009 7 Wind
Twin Ridges Wind Farm Everpower Wind Holdings Inc Terra Firma Capital Partners Ltd 100 1394 2012 4 Wind
Yough Hydro Power DR Hydro Co DR Hydro Co 100 122 1989 27 Water
Susquehanna Roundtop IMG Midstream LLC Bregal Investments Inc 100 22 2015 1 Gas
294
378
525
80
102
26
54
30
345
Electric Power Outlook for Pennsylvania 2015-20 63
Table C-2 Electric Generating Facilities in Pennsylvania (contrsquod)
County Plant Owner Ultimate ParentOwnership
()
Operating
Capacity
(MW)
Year First
Unit in
Service
Age Fuel Type
Tioga Armenia Mountain Wind ALLETE Clean Energy ALLETE Inc 100 1005 2009 7 Wind
Blossburg NRG REMA LLC NRG Energy Inc 100 24 1971 45 Gas
Union Bucknell University Bucknell University Bucknell University 100 67 1991 25 Gas
Venango Handsome Lake Energy Constellation Power Inc Exelon Corporation 100 2675 2001 15 Gas
Scrubgrass EIF United States Power Fund IV LP Ares Owners Holdings LP 20 1993 23 Coal
Olympus Power LLC Olympus Holdings LLC 30 1993 23 Coal
United States Power Fund III LP Ares Owners Holdings LP 50 1993 23 Coal
Warren Kinzua Pumped Storage Project (Seneca) Harbor Hydro Holdings LLC LS Power Group 100 513 1970 46 Water
Warren CT NRG REMA LLC NRG Energy Inc 100 57 1972 44 Oil
Washington Arden Landfill WM Renewable Energy LLC Waste Management Inc 100 48 2009 7 Biomass
Wayne Waymart Wind Farm NextEra Energy Resources LLC NextEra Energy Inc 100 645 2003 13 Wind
Westmoreland Conemaugh Hydroelectric Pennsylvania Renewable Resources Pennsylvania Renewable Resources 50 1989 27 Water
PSEG Global LLC Public Service Enterprise Group Incorporated 50 1989 27 Water
Wyoming Mehoopany Procter amp Gamble Co Procter amp Gamble Co 100 16 1984 32 Gas
Mehoopany CT Procter amp Gamble Co Procter amp Gamble Co 100 123 1985 31 Gas
Mehoopany Wind BP Wind Energy North America Inc BP plc 50 2012 4 Wind
Sempra US Gas amp Power LLC Sempra Energy 50 2012 4 Wind
York Brunner Island Talen Generation LLC Talen Energy Corporation 100 1411 1961 55 Coal
Brunner Island IC Talen Generation LLC Talen Energy Corporation 100 74 1967 49 Oil
PH Glatfelter Company - Pennsylvania P H Glatfelter Co P H Glatfelter Co 100 893 1948 68 Coal
Peach Bottom Exelon Generation Company LLC Exelon Corporation 50 1974 42 Nuclear
PSEG Nuclear LLC Public Service Enterprise Group Incorporated 50 1974 42 Nuclear
Tolna NRG REMA LLC NRG Energy Inc 100 50 1972 44 Oil
Turnkey Project - GlaxoSmith GlaxoSmithKline GlaxoSmithKline 100 15 2010 6 Solar
York Cogeneration Sapphire Power Generation Holdings LLC Talen Energy Corporation 100 566 1989 27 Gas
York County Resource Recovery Center York County Solid W amp R Authority York County Solid W amp R Authority 100 295 1989 27 Biomass
York Energy Center (Delta Power Project) Conectiv Mid Merit LLC Calpine Corporation 100 545 2011 5 Gas
York Haven Enduring Hydro LLC Enduring Hydro LLC 1 1905 111 Water
I Squared Capital I Squared Capital 99 1905 111 Water
861
15
1426
2576
19
- EPO-16 front cover
- 2016 Electric Power Outlook-body
- EPO-16 back cover lo-rez
-
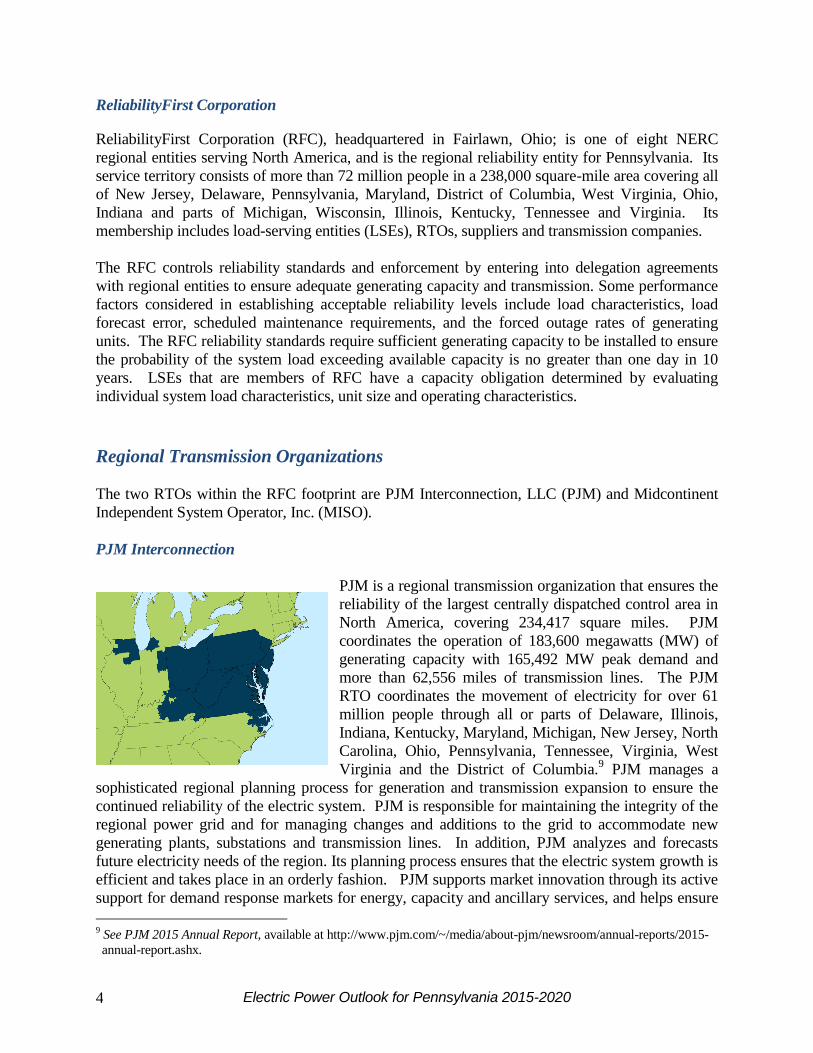
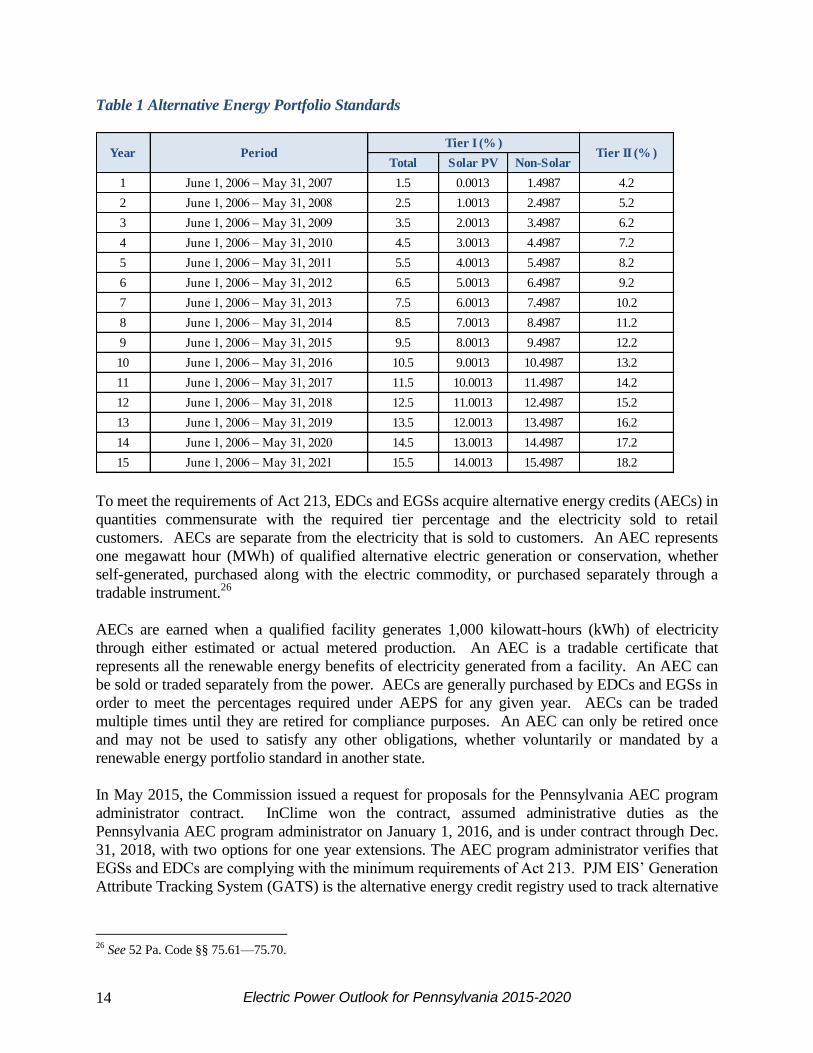
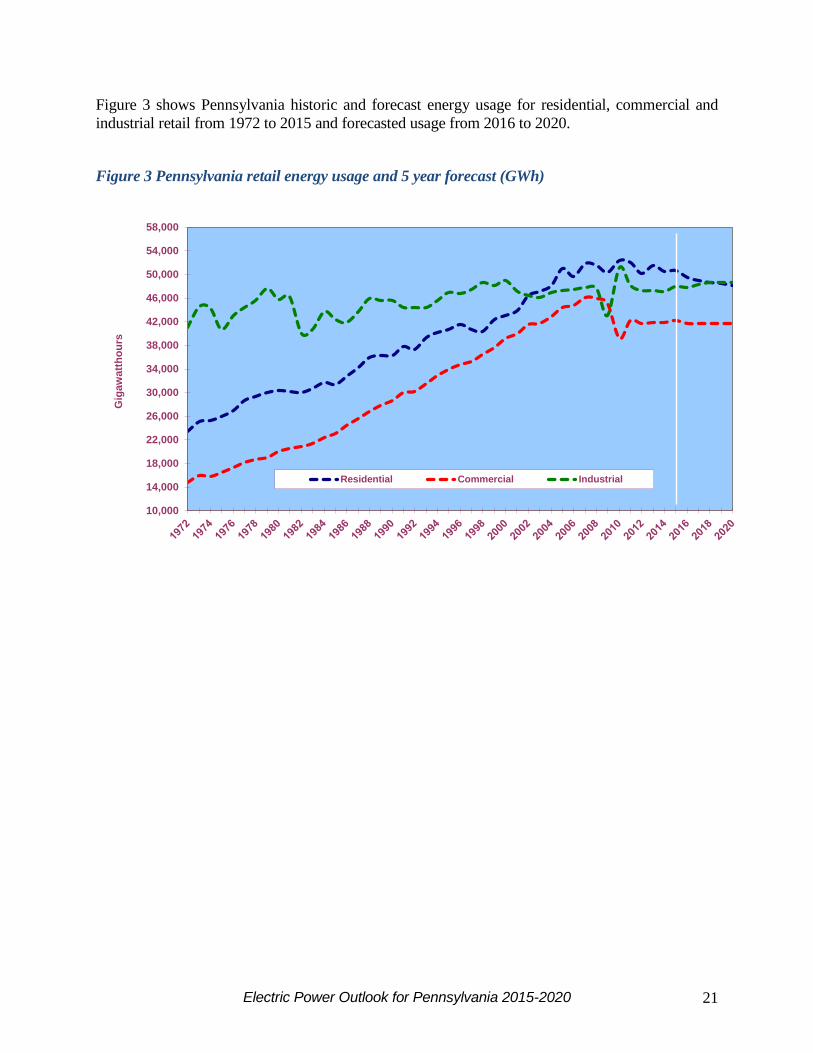
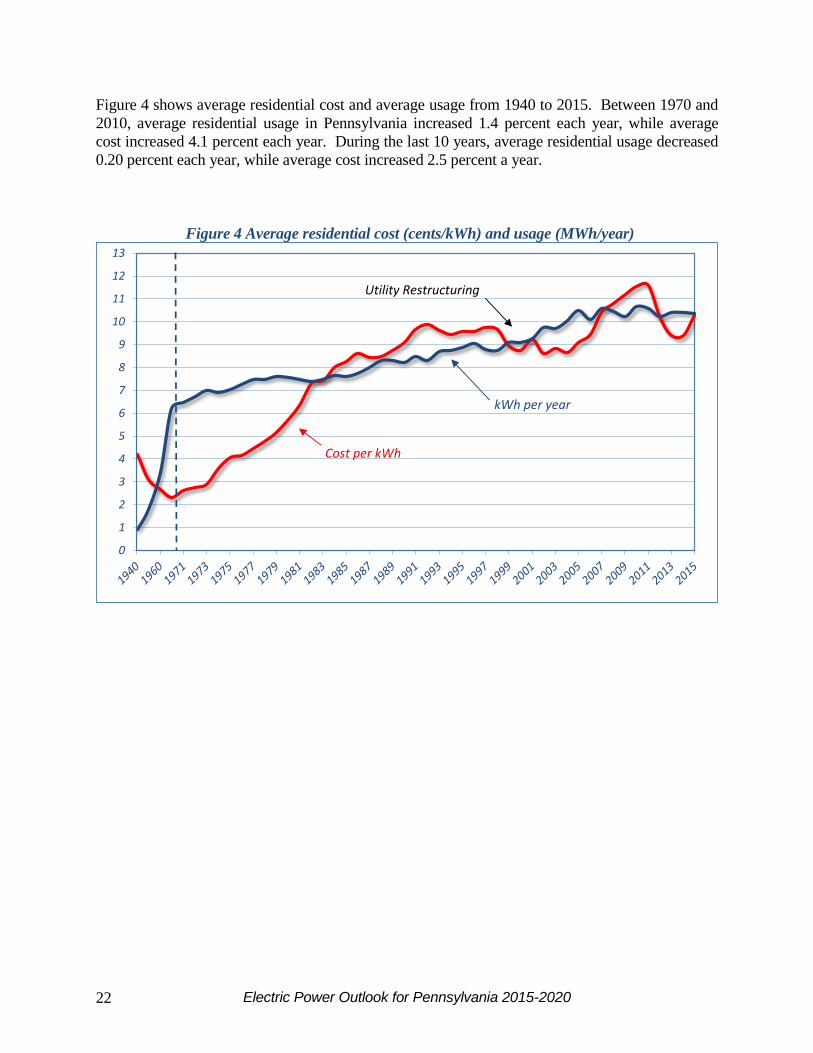
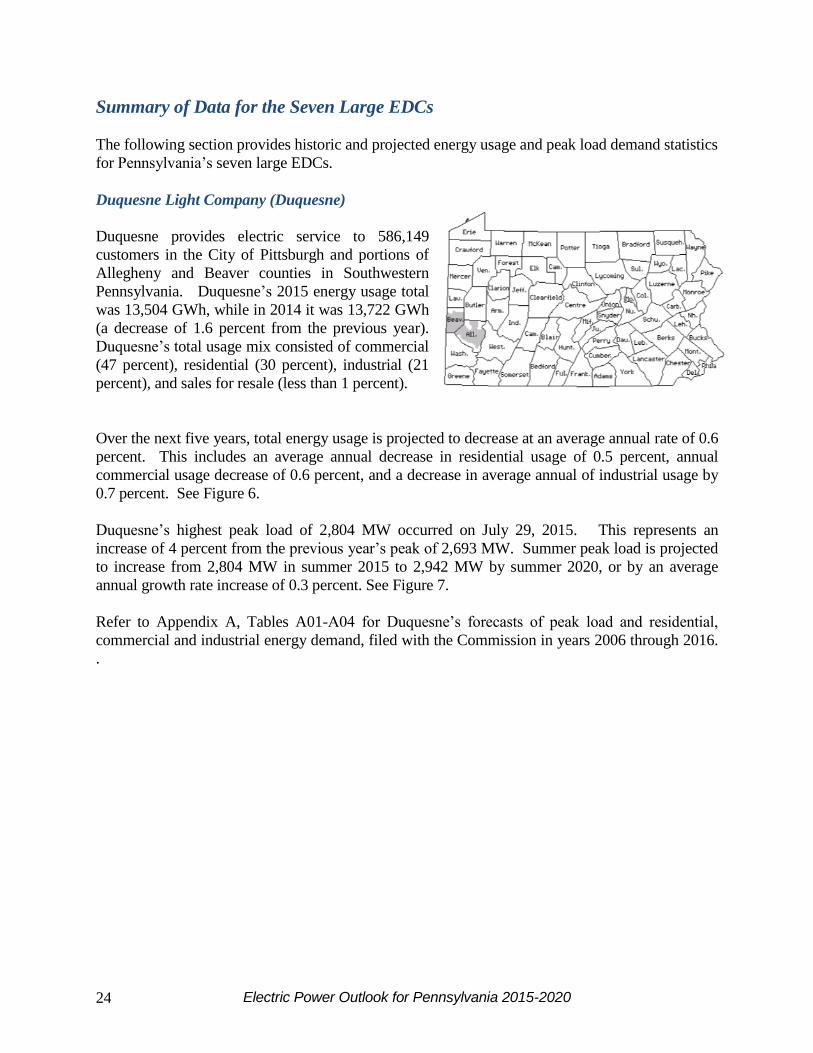
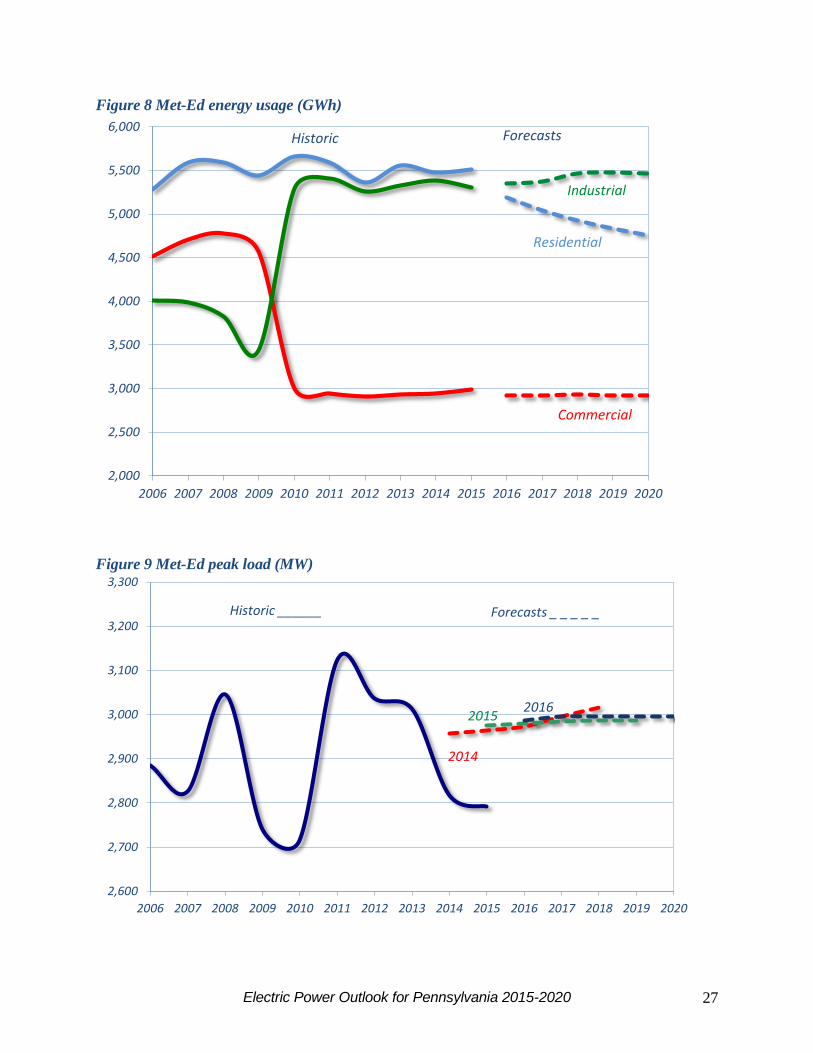
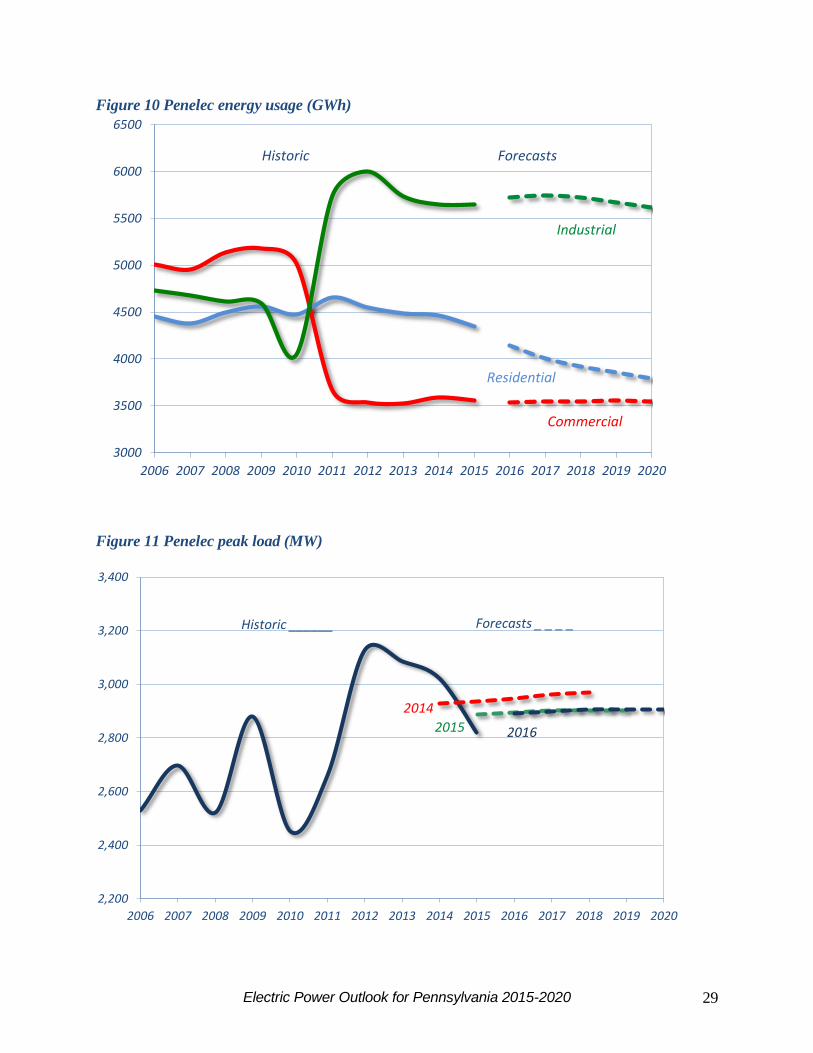
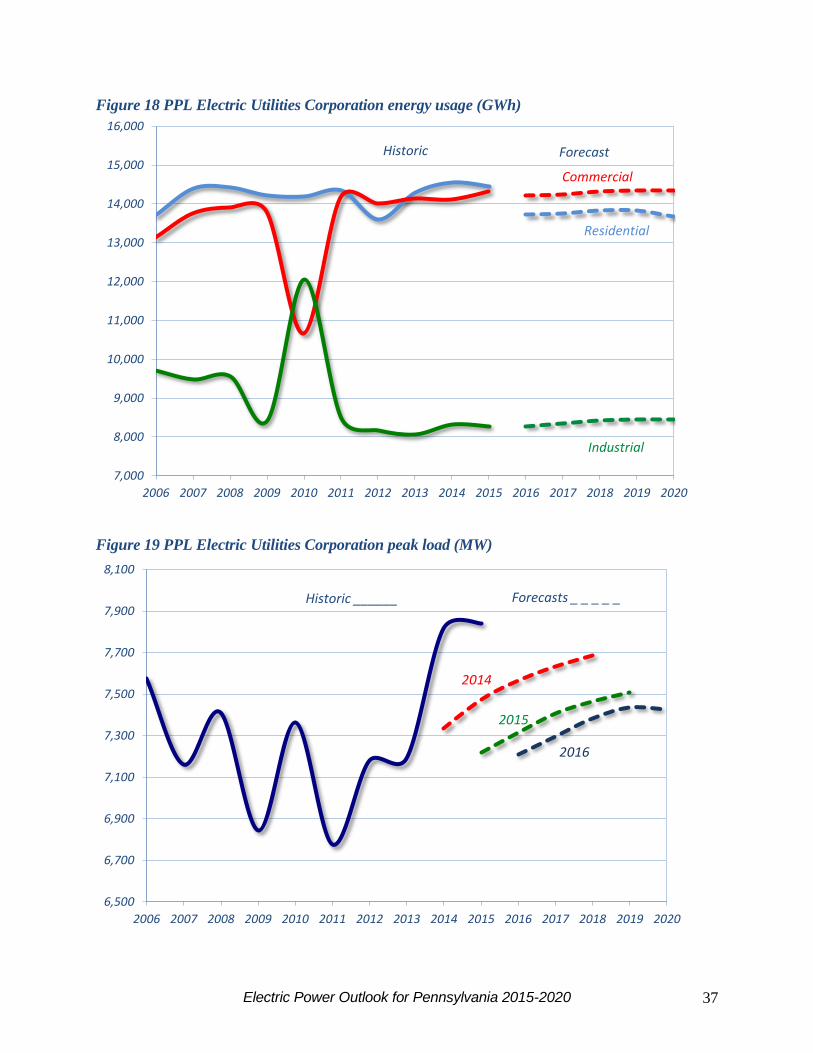
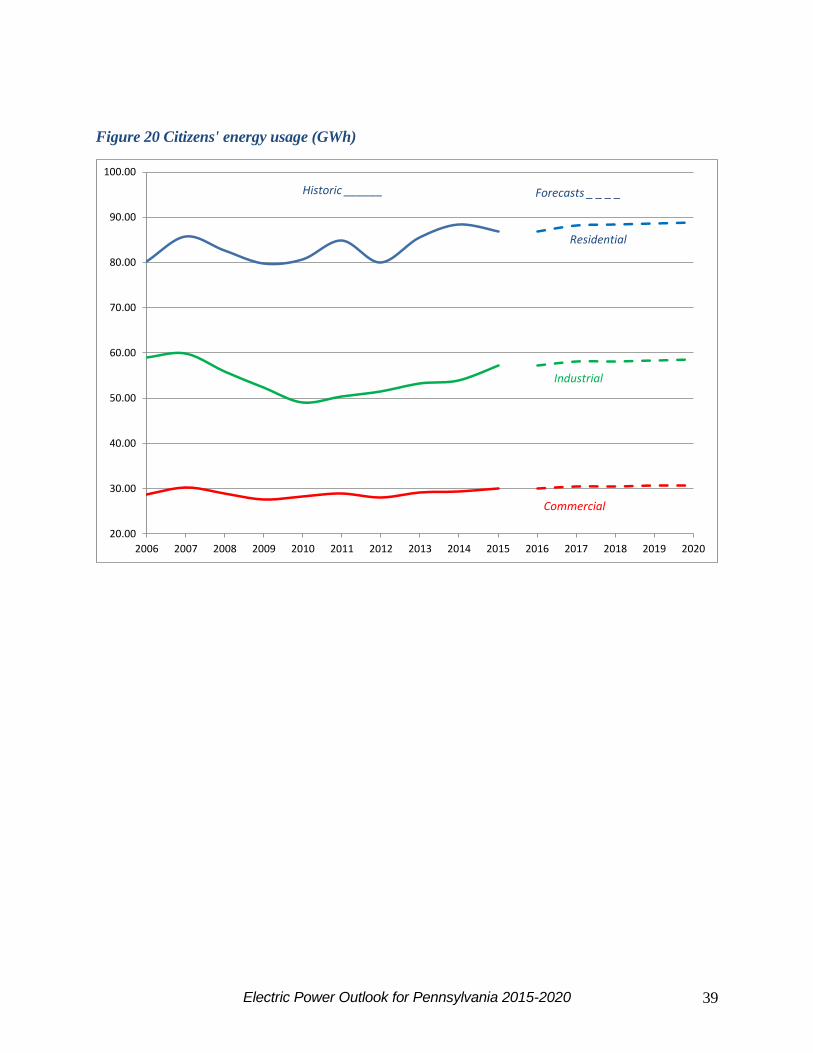
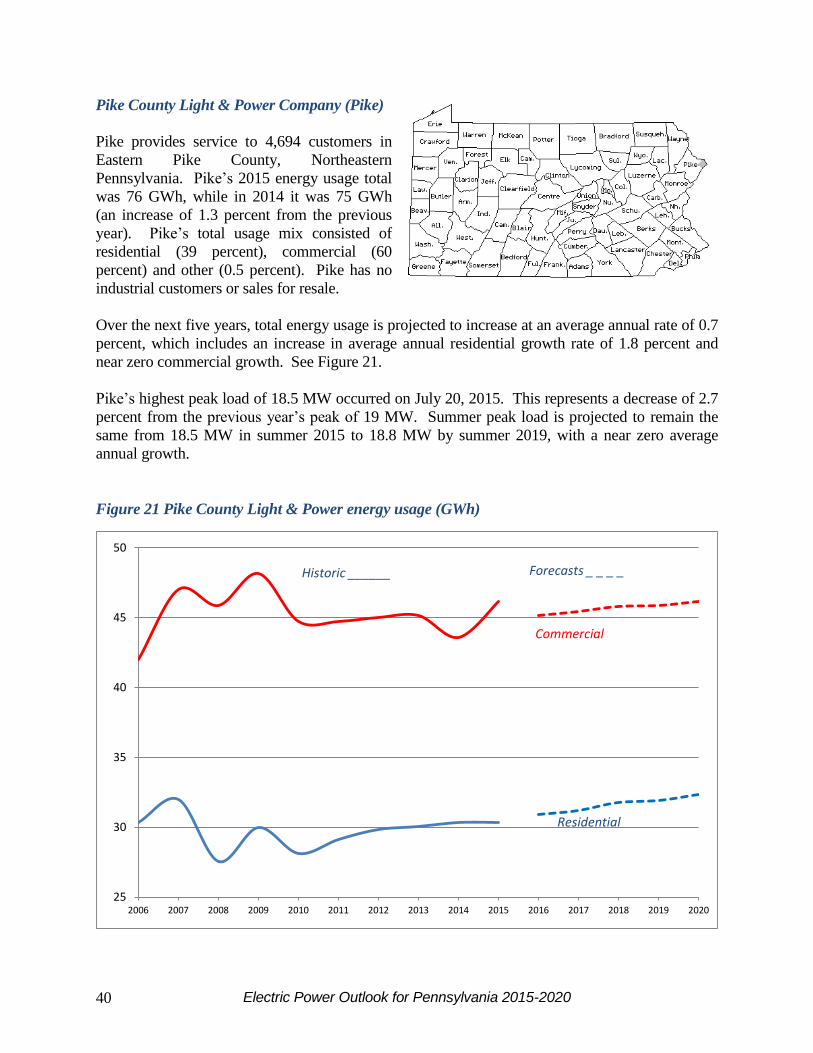
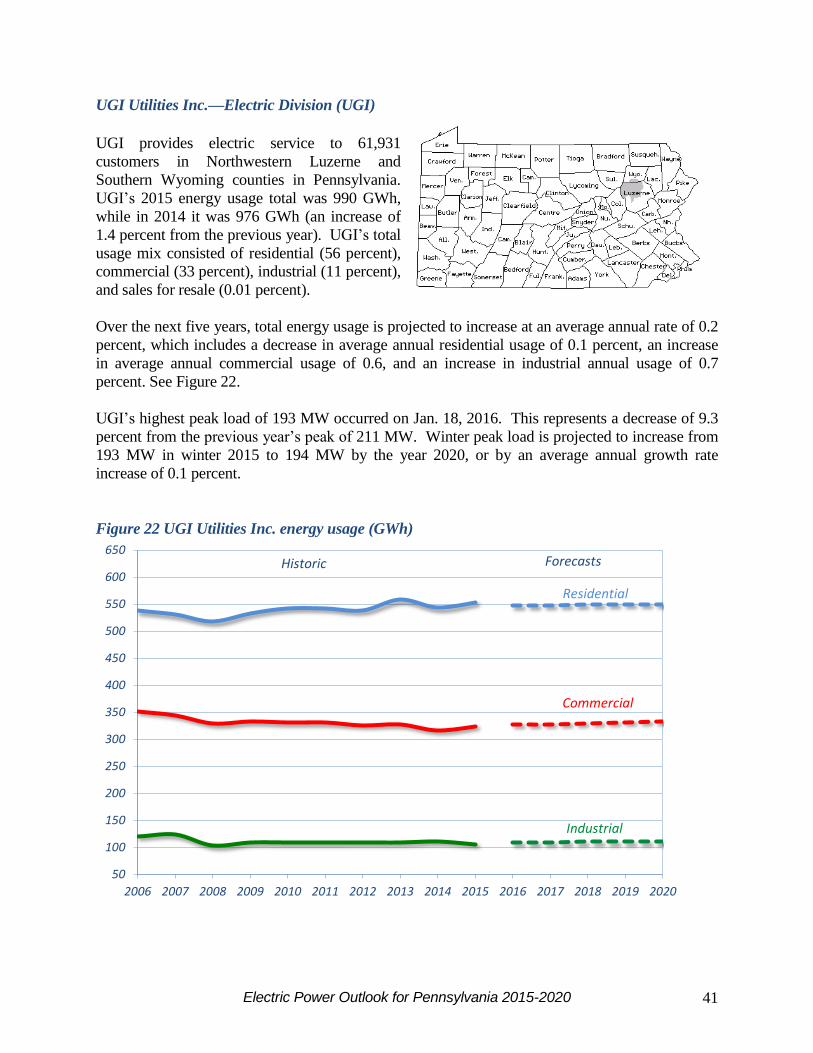
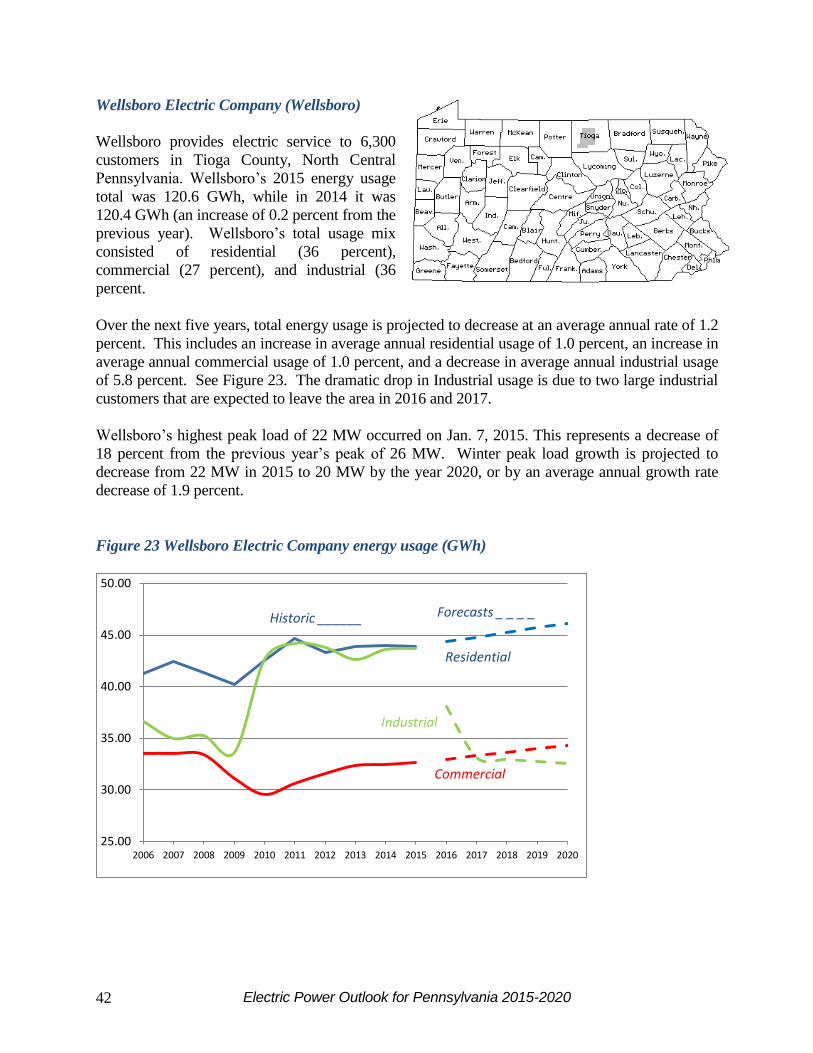
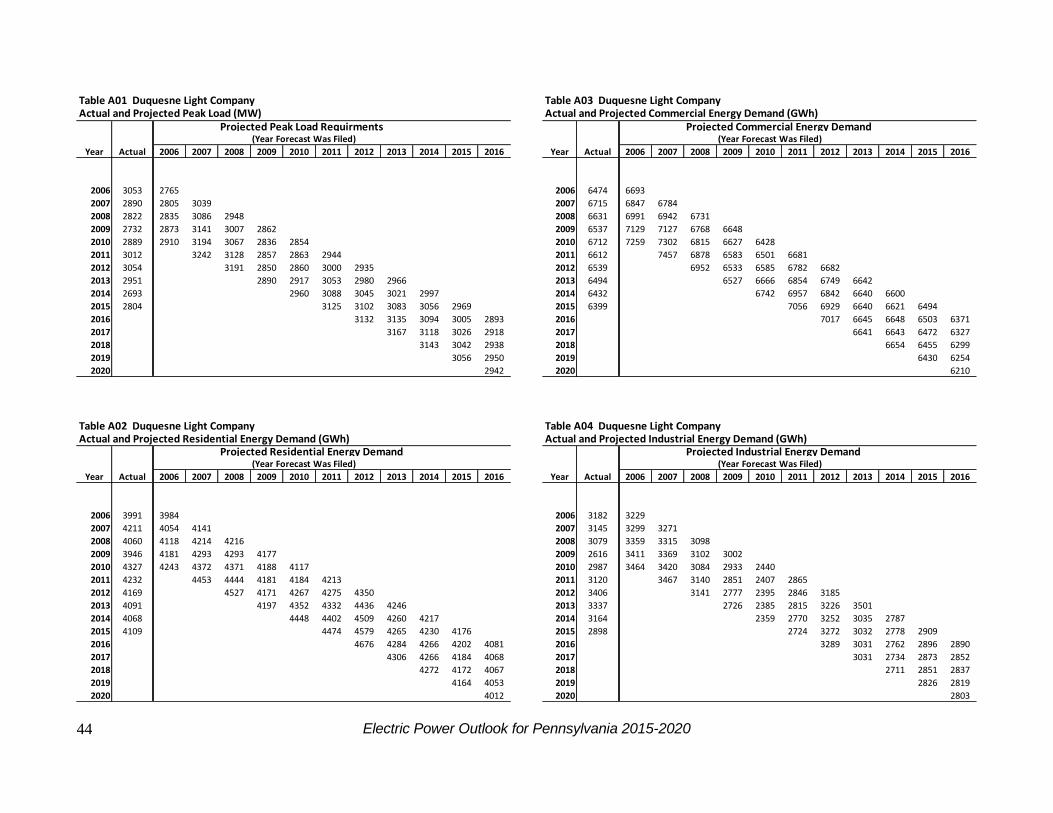
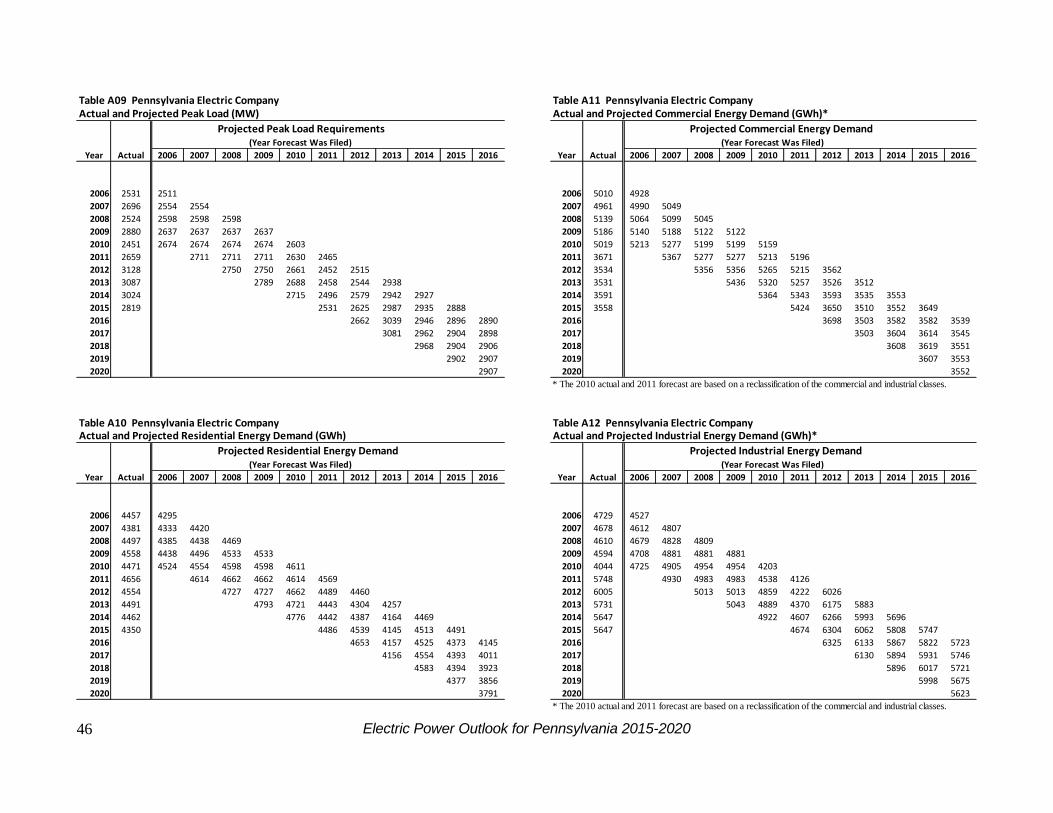
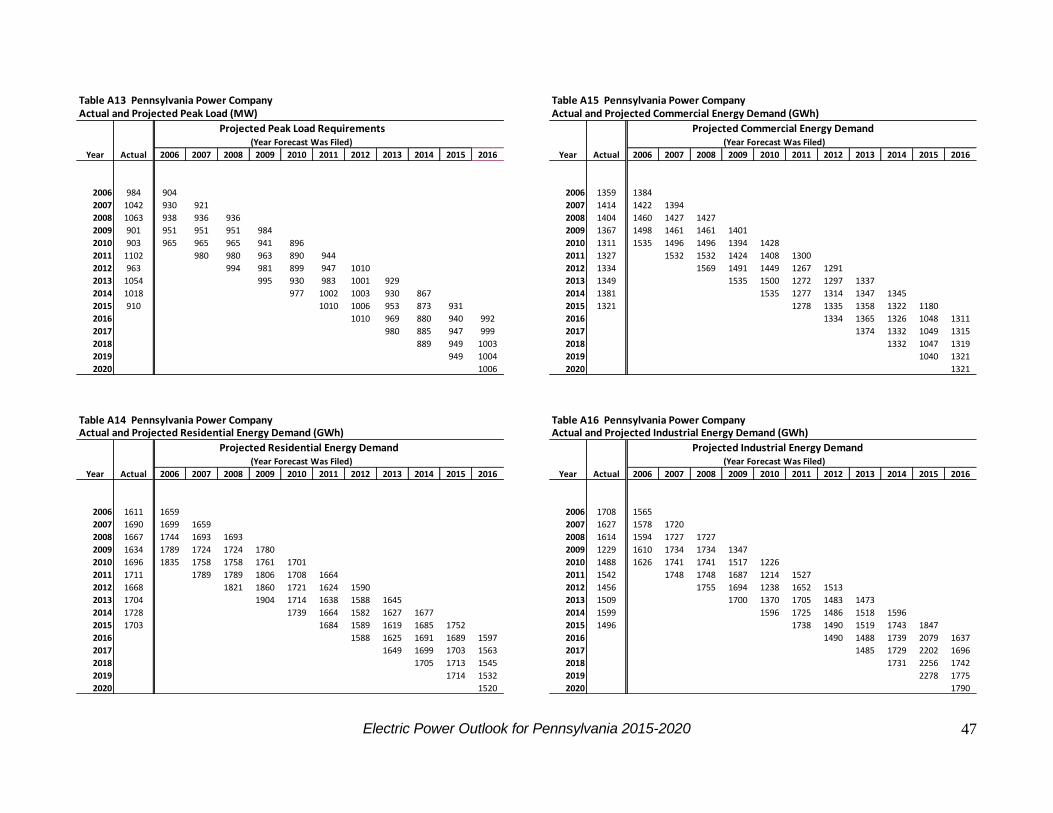
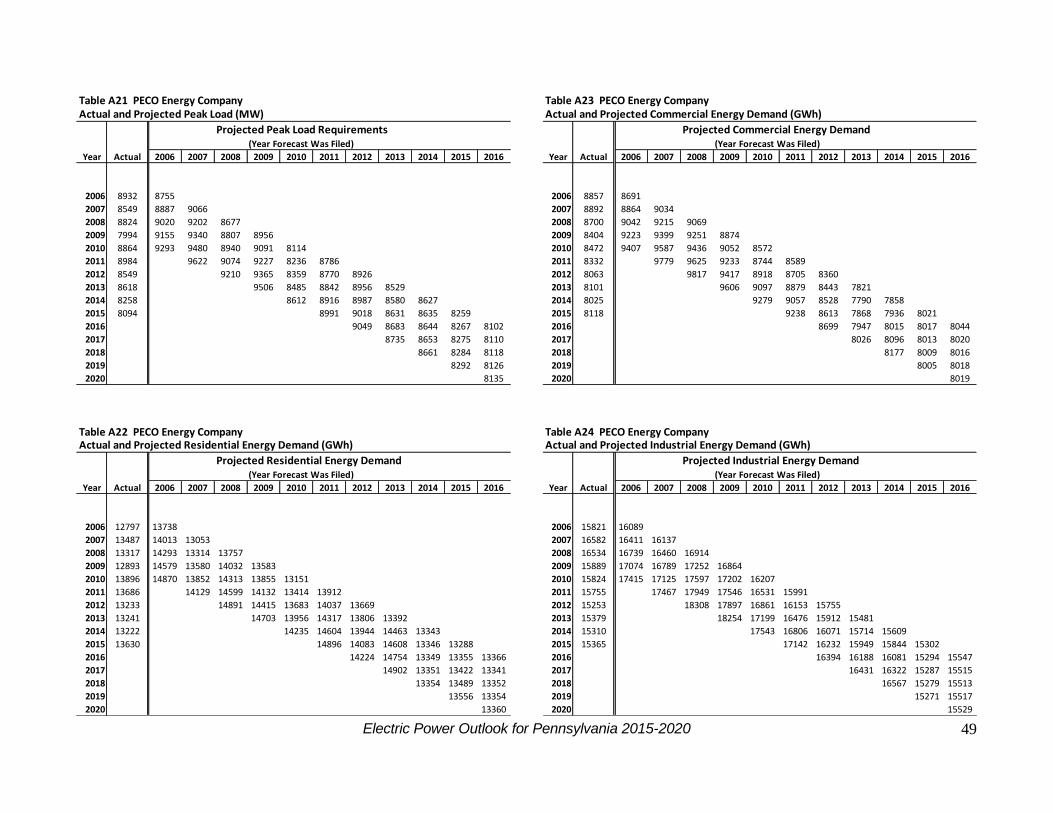
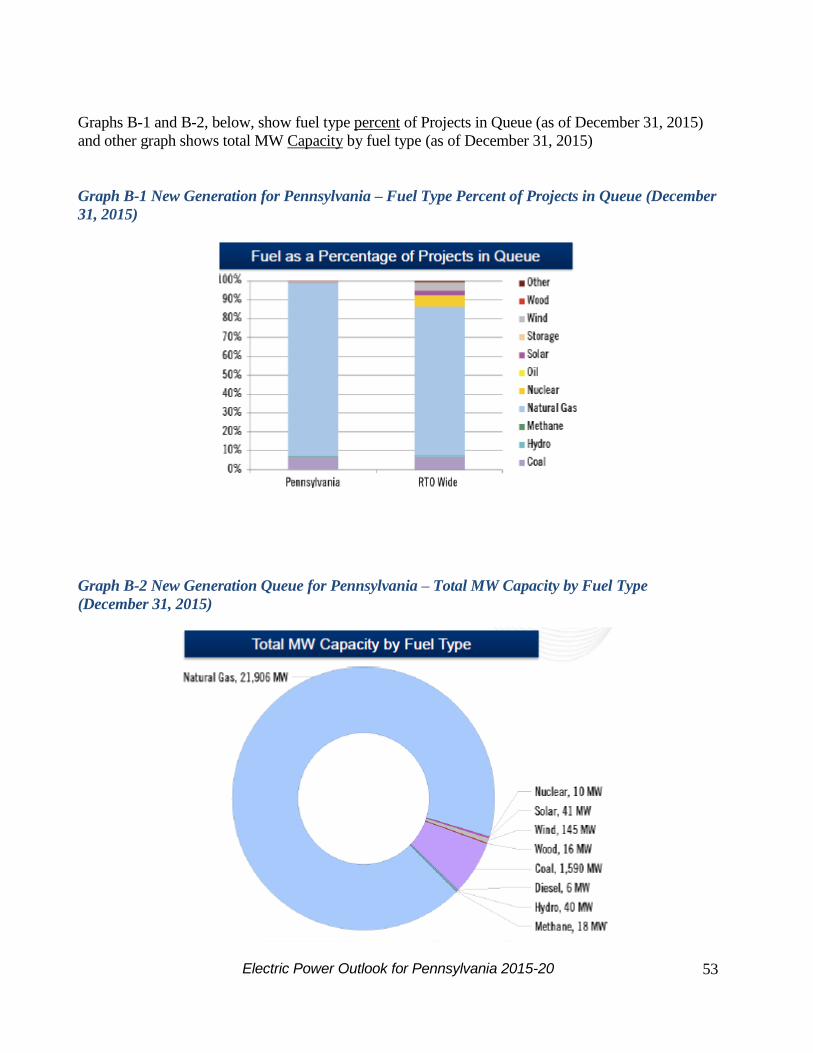
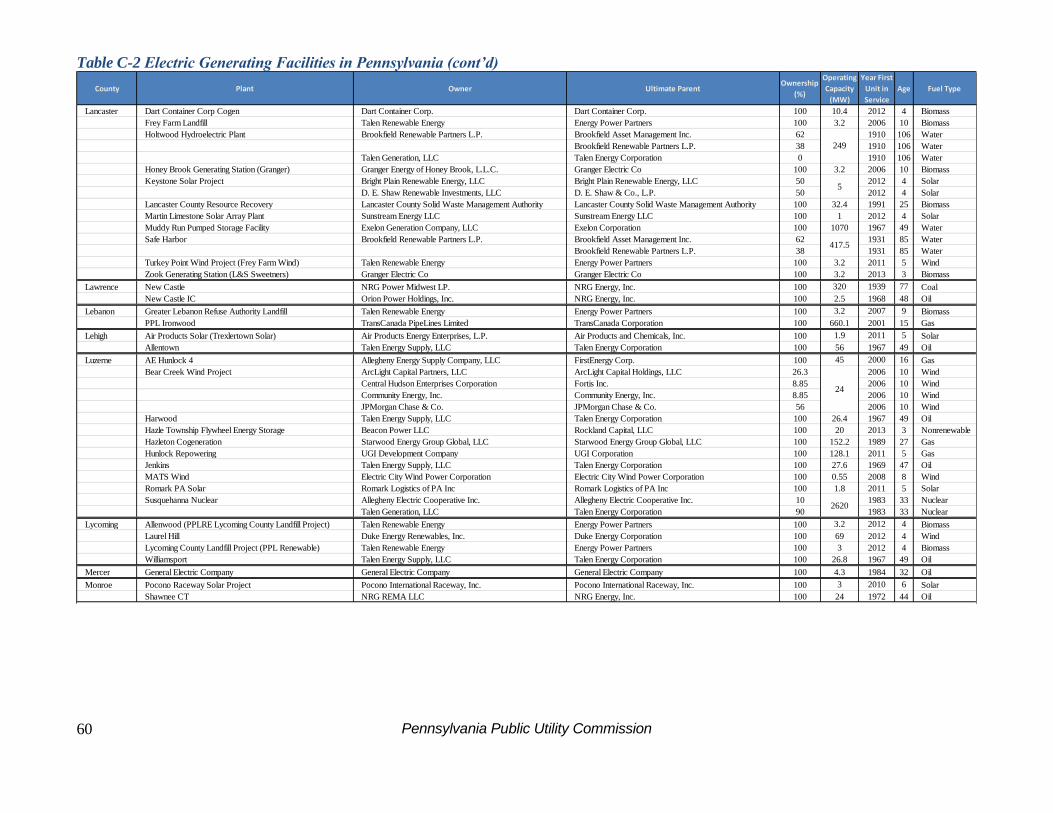
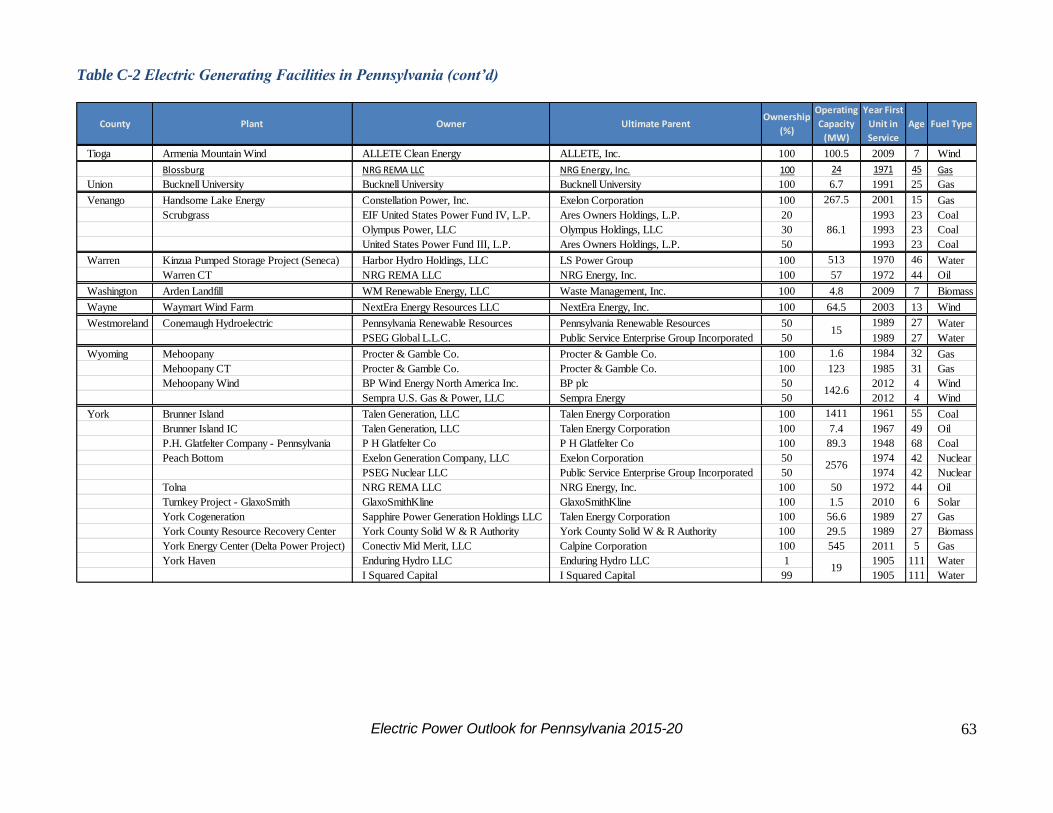

- EPO-16 front cover
- 2016 Electric Power Outlook-body
- EPO-16 back cover lo-rez
-
Related Documents