2016 Construction and Demolition Debris Market Study Final Report to MassDEP May 2017 Prepared By: Administered by:

Welcome message from author
This document is posted to help you gain knowledge. Please leave a comment to let me know what you think about it! Share it to your friends and learn new things together.
Transcript

2016 Construction and Demolition Debris Market Study Final Report to MassDEP May 2017
Prepared By:
Administered by:

Page | i 2016 CONSTRUCTION AND DEMOLITION DEBRIS MARKET STUDY
2016 CONSTRUCTION AND DEMOLITION DEBRIS
MARKET STUDY FINAL REPORT, APRIL 2017
Introduction ....................................................................................................................... 1
Tasks ................................................................................................................................... 2
Task 1A – Characterize the Quantities and Composition of C&D Materials ....................... 2
Task 1B – Characterization of Incoming and Outgoing Materials: ...................................... 2
Task 2 – Assess Current and Future Capacity of Recycling End Markets ............................ 3
Task 3 – Processing Advancements .................................................................................... 3
Task 4 – Barriers .................................................................................................................. 3
Analysis ............................................................................................................................... 4
Task 1A – Quantities and composition of C&D waste processed in Massachusetts........... 4
Task 1B – Composition of incoming C&D materials and out-going residues ...................... 6
Applying the Visual Survey Data to Annual Facility Reported Data .................................... 7
Results................................................................................................................................. 8
Task 2 – Current and Future Capacity of Recycling End Markets ..................................... 13
Introduction ...................................................................................................................... 13
Waste Wood ..................................................................................................................... 14
Fines .................................................................................................................................. 16
Other Materials................................................................................................................. 16
Task 3 -Processing Advancements .................................................................................... 19
Potential Processing Improvements ................................................................................. 20
Task 4 – Barriers ................................................................................................................ 23
Conclusions and Recommendations ................................................................................ 24

Page 1 | 2016 CONSTRUCTION AND DEMOLITION DEBRIS MARKET STUDY
INTRODUCTION
The Massachusetts Department of Environmental Protection (MassDEP) contracted with
the Northeast Recycling Council (NERC) and DSM Environmental Services (DSM) to
evaluate the current and future status of construction and demolition (C&D) debris
management in Massachusetts, and identify and recommend potential opportunities for
the diversion of a greater proportion of recyclable materials to recycling markets.
NERC provided administrative functions for the project and DSM carried out the field
work, analysis and report writing tasks.
MassDEP has established a goal of diverting 50 percent of C&D materials from disposal,
but in recent years the actual diversion rate has plateaued at around 30 percent. The
primary objective of the analysis undertaken by DSM was to first assess incoming and
outgoing materials at Massachusetts C&D processors and handling facilities, and to
determine what the opportunities and constraints are to increase materials diversion
beyond 30 percent.
The project commenced in July 2016 with the field work undertaken between
September and December, 2016.

Page | 2 2016 CONSTRUCTION AND DEMOLITION DEBRIS MARKET STUDY
TASKS
The analysis consisted of the following tasks summarized below.
TASK 1A – CHARACTERIZE THE QUANTITIES AND COMPOSITION
OF C&D MATERIALS MassDEP provided DSM with 2015 Solid Waste Facility Reports for each facility. These
reports are required to be completed annually by C&D processors and transfer stations
and are due February 15 of the following year.
These facility reports were used by DSM to quantify total C&D processing and disposal
activity in Massachusetts in 2015 (the most recent reporting year from which MassDEP
had compiled the data) as well as the recycling and disposition of the processed material
by material type.
DSM also used the reports to track incoming and outgoing quantities by material type to
better map material flow in the state, and more accurately represent materials recovery
rates through processing mixed C&D wastes.
TASK 1B – CHARACTERIZATION OF INCOMING AND OUTGOING
MATERIALS : MassDEP arranged for DSM to visit five C&D processors and two C&D transfer stations
to both interview owners/operators and to collect data on incoming and outgoing
material/waste streams. These seven facilities handled roughly 40 percent of the total
material sent to the 25 facilities operating in the Commonwealth in 2015.
At each facility, DSM conducted visual analyses of incoming loads of C&D (and other
materials), and outgoing loads of residues (from the five processors only) with the goal
of characterizing the incoming material and outgoing residue.
The visual samples for each facility were compiled by DSM and converted to weight
based estimates of the composition of incoming C&D materials and out-going residues
for each facility.
In addition to characterizing incoming and out-going loads, DSM also spent time with
the facility owner/operator to tour the facility, observe the processing equipment in
operation and to discuss processing and marketing issues that the owner/operator felt
were important to gaining a more complete understanding of C&D processing in
Massachusetts.

Page | 3 2016 CONSTRUCTION AND DEMOLITION DEBRIS MARKET STUDY
TASK 2 – ASSESS CURRENT AND FUTURE CAPACITY OF RECYCLING
END MARKETS DSM discussed with the seven participating processing/transfer facility owner/operators
where they believe the markets are today, and what they believe future markets will be.
DSM then contacted identified markets directly to discuss current specifications and
demand for materials that could be diverted from the incoming C&D materials.
TASK 3 – PROCESSING ADVANCEMENTS DSM discussed with facility owners/manager, industry professionals and end user
markets potential new technologies that might be available to increase recovery of C&D
materials from processing facilities. This included conducting a literature review of
certain technologies identified as potentially improving diversion of C&D materials.
TASK 4 – BARRIERS In addition to identifying potential opportunities for increased diversion at
Massachusetts C&D facilities, DSM also attempted to identify specific barriers to
increased diversion.

Page | 4 2016 CONSTRUCTION AND DEMOLITION DEBRIS MARKET STUDY
ANALYSIS
TASK 1A – QUANTITIES AND COMPOSITION OF C&D WASTE
PROCESSED IN MASSACHUSETTS DSM used the individual 2015 facility reports submitted to MassDEP as the basis for our
analysis of C&D processing and materials recovery in Massachusetts. While these
reports are comprehensive, they do require some degree of manipulation to clearly map
the flow of materials in Massachusetts.
Specifically, C&D processors (and transfer stations) receive several different streams of
material, some of which they process directly, some which they transfer, either directly
to disposal, or indirectly through another C&D transfer station for ultimate disposal, and
some of which they process as mixed C&D to recover material for recycling. In addition,
some transfer (of materials) is to another in-state C&D processing facility.
DSM tracked material flow between in-state facilities to eliminate double counting by
removing material (from the totals) that is originally delivered to one facility – typically a
processor - and then transferred either before processing or after processing to a
second in-state facility – either a C&D transfer station for disposal (and therefore
reported as incoming at that facility) or to a C&D processor (also reported as incoming
at that facility). Material reported as bulky waste was also compiled and disaggregated
to calculate processing of C&D materials only.
The revised material flow data were then used to calculate a state-wide recycling rate.
The manipulated generation and recovery data are presented in Table 1, below. Table 1
illustrates the different recycling rates calculated depending on what is included in the
denominator.
For example, Table 1 illustrates that roughly 25 percent of mixed C&D that was
processed in-state (or roughly 219,000 of 865,000 tons processed in-state) was
recovered for recycling in Massachusetts. Adding in source separated materials
delivered to C&D processors (roughly 86,000 tons), the recycling rate is 27 percent for
all C&D (in-state and out-of- state) or 32 percent if only C&D material that is processed
in-state is included.1
1 If bulky waste that is accepted by these facilities is included in the calculation of a C&D
recycling rate, the rate would fall to 22%. And if materials recovered from mixed C&D
sent out-of-state for processing were known and included, the rate would rise.

Page 5 | 2016 CONSTRUCTION AND DEMOLITION DEBRIS MARKET STUDY
TABLE 1 - Calculation of C&D Recycling Rates for Massachusetts Using 2015 Facility Reports (1)
(1) This Table excludes any C&D that is generated in Massachusetts but sent directly out of state for processing and/or disposal or
that is mixed with bulky waste and delivered directly to a MSW transfer station or disposal facility.
Table 1 also illustrates that diversion of material to landfill dependent uses totals roughly another 324,000 tons, which is 31 percent
of C&D waste processed in-state, or 23 percent of all C&D waste.
Generation & Recovery
Reported
2015 Tons Description
From Total
Generation
From
Net C&D
From Net
Instate C&D
Generation 1,379,994 Throughput to in-state facilities includes double-counting 100%
Less Bulky Waste 250,133 Coded as incoming bulky waste 18%
Net C&D: 1,129,861 Generation minus bulky 82%
Source Separated Materials 85,997 Incoming separated recyclable materials 6%
Mixed C&D 1,043,864 Net Mixed C&D 76% 100%
Transferred OOS 178,955 Coded as transferred out of state for processing 13% 17%
Net In-State C&D: 864,909 Net Mixed In-State C&D to process 63% 83% 100%
Recovered 219,009 Recovered from mixed in-state C&D 16% 21% 25%
Landfill Dependent Uses 323,687 Total landfill dependent uses from Instate C&D 23% 31% 37%
Disposed 322,213 Net disposed from Instate Mixed C&D 23% 31% 37%
Recycling Rate
Net C&D (from above) 1,129,861 Generation minus bulky 100%
Transferred OOS 178,955 Coded as transferred out of state for processing 16%
Net In-State Managed: 950,906 Includes source separated materials 84% 100%
Recycling Rate 305,006 Recovered from processing, plus source separate material 27% 32%
Landfill Dependent Uses 323,687 Total landfill dependent uses reported from instate C&D 29% 34%
Disposed 322,213 Net disposed from Instate Mixed C&D Only 29% 34%

Page 6 | 2016 CONSTRUCTION AND DEMOLITION DEBRIS MARKET STUDY
TASK 1B – COMPOSITION OF INCOMING C&D MATERIALS AND
OUT-GOING RESIDUES The data compiled in Task 1A above can then be disaggregated to investigate how well
C&D processors are doing at recovering specific materials from the mixed loads which
they process.
DSM devoted between 4 and 8 person-hours at seven C&D facilities (5 processing
facilities and 2 transfer stations) conducting visuals of incoming mixed C&D loads and,
for the five processing facilities, out-going residues. In all cases DSM conducted the
visual analysis as described below.
The enumerator starts with a data-sheet listing eight primary material categories and
roughly 44 secondary material categories
Primary categories are:
• Paper;
• Plastic;
• Glass;
• Organic;
• C&D;
• Metal;
• Special;
• Mixed MSW
Within each primary category there is a list of more detailed secondary categories.
Examples include:
• Paper – OCC, Other
• Plastic – Buckets, Film, Foamed Insulation, Other
• Organic – Yard Waste, Carpet
• C&D – ABC, Asphalt Roofing, Clean Lumber, Plywood, Treated Wood, Etc.
• Special – Appliances, Electronics, Bulky Items, Etc.
The enumerator first observes the incoming truck and briefly interviews the driver in
order to record the hauler name, vehicle number, and volume of material delivered on
the data form.
After the load is tipped, the enumerator walks around pile and writes down the percent
of each of the primary categories by volume, with the sum of the primary categories
equal to 100%.
The enumerator then walks back around the pile estimating the percent by volume of all
secondary categories within each primary category – with the percent equal to 100% for
each category.

Page | 7 2016 CONSTRUCTION AND DEMOLITION DEBRIS MARKET STUDY
Each visual survey is then entered into an excel spreadsheet with volumes converted to
pounds/tons based on the density for each material. The total pounds are compared
with the weight slip for that load and adjustments made as necessary so that the sum of
pounds from the visual estimate is roughly equivalent to the net weight of the load.2
Because of the limited number of hours of observations at each facility the visuals are
summed for each facility, and a single average percent composition calculated for that
day of observations for the incoming loads, and separately for the out-going residue.
APPLYING TH E V IS UAL SURVE Y DA TA TO ANNUAL FACIL ITY REPO RTED
DATA
The annual facility reports, when coupled with the visual survey data can be used to
estimate the following:
• The average composition of incoming C&D materials, by volume and by weight;
• Materials potentially available for recovery;
• Current recovery rates at the participating facilities;
• Maximum, potentially achievable recovery rates; and,
• Recovery rates necessary to achieve 50 percent recycling rate.
It is important to note here that the visual data were obtained on a single day that may,
or may not be representative of facility deliveries over time. However, the analysis
provides a snapshot of the composition of incoming material at each of the facilities
participating in the survey, and the relative effectiveness of these facilities at recovering
materials from the incoming C&D waste.
DSM analysis of field survey data and reported data was as follows:
• Mixed C&D material accepted (C&D Waste) were separated from total reported
deliveries for 2015 to help assure that the visual characterization data were
applied only to the percent of total deliveries that were mixed C&D materials
(see Task 1A above for a more complete description of the issue).
2 There are several reasons why the total pounds estimated from the visuals and the net weight of the load can vary. First, the visuals are estimates only based on volume and then adjusted by standard densities and the actual density may differ. Second, C&D loads are typically not very heavy which means that in cases where the net weight is based on a pre-recorded tare weight of the truck, factors such as the amount of fuel in the tank, mud on the truck, and in some cases the empty weight of the roll-off container, can have a significant impact. Third, most C&D loads are left un-covered until they are transported so rain and snow can and do impact the weights. In general DSM strives to be within plus or minus 20 percent of the reported net weight, and we have adjusted density data accordingly.

Page | 8 2016 CONSTRUCTION AND DEMOLITION DEBRIS MARKET STUDY
• The material composition percent by weight based on the visual data were
applied to reported C&D waste (Section 1, C&D Materials Accepted) at each
participating facility for 2015 to estimate incoming tons by material type at
each facility. This represents the theoretical maximum (tons) available by
material type for recovery.
• The reported annual facility materials recycled or used (Section 2, C&D
Materials Recycled or Used) data for each participating facility were divided
into the total (theoretically available) C&D Waste received to estimate what
percentage of incoming material (by material type) was actually recovered and
sold. This represents the recovery rate by material type.
• Recoverable materials in most cases include the following;
o Corrugated containers (OCC);
o Rigid plastic and plastic film;
o Asphalt (paving), brick and concrete (ABC);
o Asphalt roofing;
o Wood – clean wood, painted and stained wood, plywood, particle
board and other engineered woods;
o Clean Gypsum; and,
o Metals – ferrous and non-ferrous.
RESULTS
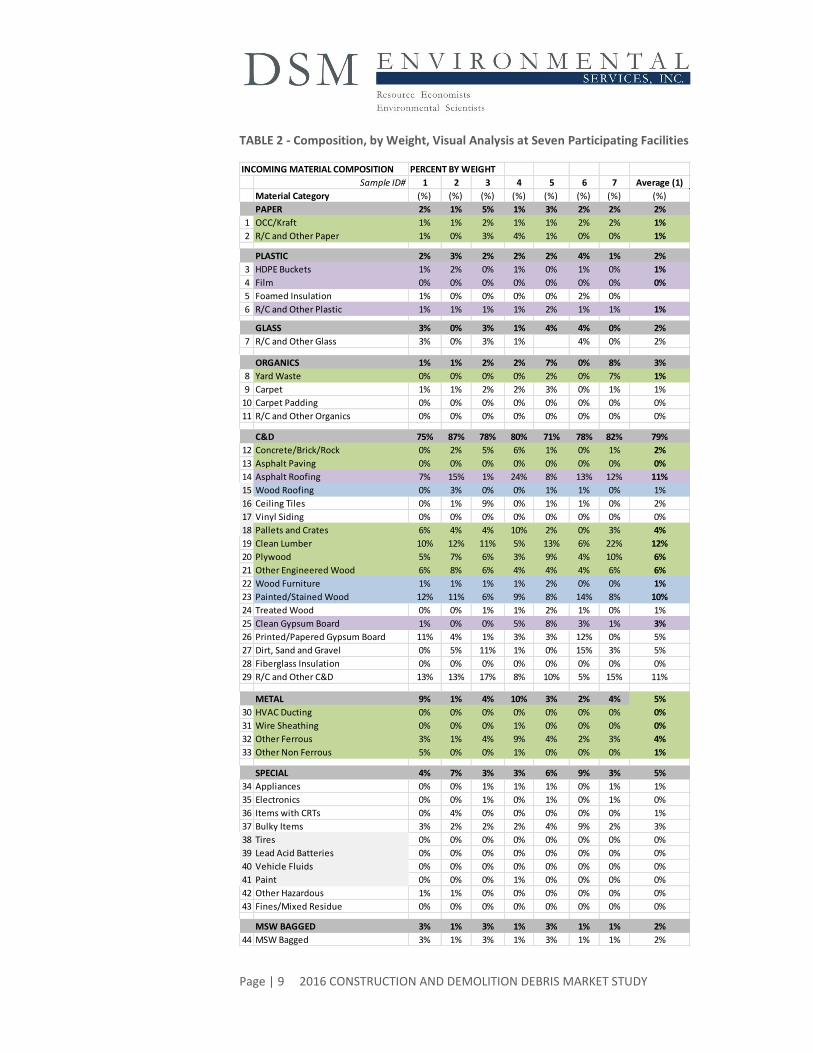
Table 2 (on the next page) presents the average composition (percent by weight) of
incoming C&D waste based on the visual surveys of incoming C&D waste at all seven
participating facilities.
Note that materials categories have been shaded to reflect targeted materials. Green is
used for materials with good market potential (e.g., “A” wood, OCC and paper, and
metals) and purple for materials that are either difficult to market, or for which there
are no markets. Finally, light blue is used for materials that can be targeted for “B”
wood, but are unlikely to end up as “A” wood. In most cases this means more highly
contaminated wood that might be suitable for a bio-mass combustion facility but is not
suitable for particle board production.
One further note concerning the material compositions reported in Table 2 is that
carpet and padding is included in the “organic” category because that is the way DSM’s
data collection forms have been organized for other C&D waste characterization
studies, not because carpet is somehow bio-degradable.
Page | 9 2016 CONSTRUCTION AND DEMOLITION DEBRIS MARKET STUDY
TABLE 2 - Composition, by Weight, Visual Analysis at Seven Participating Facilities
INCOMING MATERIAL COMPOSITION PERCENT BY WEIGHT
Sample ID# 1 2 3 4 5 6 7 Average (1)
Material Category (%) (%) (%) (%) (%) (%) (%) (%)
PAPER 2% 1% 5% 1% 3% 2% 2% 2%
1 OCC/Kraft 1% 1% 2% 1% 1% 2% 2% 1%
2 R/C and Other Paper 1% 0% 3% 4% 1% 0% 0% 1%
PLASTIC 2% 3% 2% 2% 2% 4% 1% 2%
3 HDPE Buckets 1% 2% 0% 1% 0% 1% 0% 1%
4 Film 0% 0% 0% 0% 0% 0% 0% 0%
5 Foamed Insulation 1% 0% 0% 0% 0% 2% 0%
6 R/C and Other Plastic 1% 1% 1% 1% 2% 1% 1% 1%
GLASS 3% 0% 3% 1% 4% 4% 0% 2%
7 R/C and Other Glass 3% 0% 3% 1% 4% 0% 2%
ORGANICS 1% 1% 2% 2% 7% 0% 8% 3%
8 Yard Waste 0% 0% 0% 0% 2% 0% 7% 1%
9 Carpet 1% 1% 2% 2% 3% 0% 1% 1%
10 Carpet Padding 0% 0% 0% 0% 0% 0% 0% 0%
11 R/C and Other Organics 0% 0% 0% 0% 0% 0% 0% 0%
C&D 75% 87% 78% 80% 71% 78% 82% 79%
12 Concrete/Brick/Rock 0% 2% 5% 6% 1% 0% 1% 2%
13 Asphalt Paving 0% 0% 0% 0% 0% 0% 0% 0%
14 Asphalt Roofing 7% 15% 1% 24% 8% 13% 12% 11%
15 Wood Roofing 0% 3% 0% 0% 1% 1% 0% 1%
16 Ceiling Tiles 0% 1% 9% 0% 1% 1% 0% 2%
17 Vinyl Siding 0% 0% 0% 0% 0% 0% 0% 0%
18 Pallets and Crates 6% 4% 4% 10% 2% 0% 3% 4%
19 Clean Lumber 10% 12% 11% 5% 13% 6% 22% 12%
20 Plywood 5% 7% 6% 3% 9% 4% 10% 6%
21 Other Engineered Wood 6% 8% 6% 4% 4% 4% 6% 6%
22 Wood Furniture 1% 1% 1% 1% 2% 0% 0% 1%
23 Painted/Stained Wood 12% 11% 6% 9% 8% 14% 8% 10%
24 Treated Wood 0% 0% 1% 1% 2% 1% 0% 1%
25 Clean Gypsum Board 1% 0% 0% 5% 8% 3% 1% 3%
26 Printed/Papered Gypsum Board 11% 4% 1% 3% 3% 12% 0% 5%
27 Dirt, Sand and Gravel 0% 5% 11% 1% 0% 15% 3% 5%
28 Fiberglass Insulation 0% 0% 0% 0% 0% 0% 0% 0%
29 R/C and Other C&D 13% 13% 17% 8% 10% 5% 15% 11%
METAL 9% 1% 4% 10% 3% 2% 4% 5%
30 HVAC Ducting 0% 0% 0% 0% 0% 0% 0% 0%
31 Wire Sheathing 0% 0% 0% 1% 0% 0% 0% 0%
32 Other Ferrous 3% 1% 4% 9% 4% 2% 3% 4%
33 Other Non Ferrous 5% 0% 0% 1% 0% 0% 0% 1%
SPECIAL 4% 7% 3% 3% 6% 9% 3% 5%
34 Appliances 0% 0% 1% 1% 1% 0% 1% 1%
35 Electronics 0% 0% 1% 0% 1% 0% 1% 0%
36 Items with CRTs 0% 4% 0% 0% 0% 0% 0% 1%
37 Bulky Items 3% 2% 2% 2% 4% 9% 2% 3%
38 Tires 0% 0% 0% 0% 0% 0% 0% 0%
39 Lead Acid Batteries 0% 0% 0% 0% 0% 0% 0% 0%
40 Vehicle Fluids 0% 0% 0% 0% 0% 0% 0% 0%
41 Paint 0% 0% 0% 1% 0% 0% 0% 0%
42 Other Hazardous 1% 1% 0% 0% 0% 0% 0% 0%
43 Fines/Mixed Residue 0% 0% 0% 0% 0% 0% 0% 0%
MSW BAGGED 3% 1% 3% 1% 3% 1% 1% 2%
44 MSW Bagged 3% 1% 3% 1% 3% 1% 1% 2%

Page | 10 2016 CONSTRUCTION AND DEMOLITION DEBRIS MARKET STUDY
Table 3 then presents the estimated average recovery rate for materials reported to be
recycled from the surveyed facilities. Recovery rates have been averaged by type, first
for the five processing facilities and then for the two transfer stations.
The recovery rates reported in Table 3 are calculated by multiplying the material
composition percentages for each facility presented in Table 2 times the total C&D
waste reported by that facility, and then compared against the same materials reported
to be recycled for that facility. For example, if Facility 1 reported incoming C&D waste of
50,000 tons (hypothetical), then 27 percent of that incoming C&D waste (or 13,500
tons) was assumed to be recoverable “A” wood (6% pallets and crates; 10% clean
lumber; 5% plywood; and, 6% other engineered wood – the green highlighted
categories for Facility 1 in Table 2). The wood fuel reported to be sold from that facility
is then divided into the 13,500 tons to calculate the recovery rate for these “A” wood
materials.3
The recovery rates reported in Table 3 attempt to exclude source separated materials
that were identified (on the annual reports) as delivered to each facility (e.g., C&D
Wood, Metals, Asphalt/Brick/Concrete). These incoming material deliveries are
subtracted from the total material recycled to represent a more accurate recovery rate
from processing mixed C&D waste; or, in the case of transfer stations without
processing lines, kick sorting.
However, there are still several estimated recovery rates of 100 percent in Table 3. This
is the case because some relatively homogeneous loads of Asphalt/Brick/Concrete (ABC)
and metals that arrive at the facility are not identified as incoming by material type on
the annual reports. DSM did not conduct visuals of these types of loads, but they are
included in the total material recycled in the annual reports to MassDEP, resulting in
calculated recovery rates that may not reflect just the mixed C&D waste loads coming
into the facility despite DSM’s best efforts to represent the data in this way.
Note that DSM has been able to deduct incoming loads of wood in most cases so the
recovery rates for wood – the most critical C&D material – fairly closely reflect actual
recovery rates of wood from mixed C&D loads.
3 The percent composition reported in Table 2 are not shown converted to actual tons for each facility because showing those conversions would make it possible for the reader to identify the specific facility based on the Solid Waste Facility Reports.

Page | 11 2016 CONSTRUCTION AND DEMOLITION DEBRIS MARKET STUDY
TABLE 3 - Estimated Recovery Rates, By Material Type, for Mixed C&D Loads
(1) Overall rate is for all materials listed in Table 3 and does not include electronics,
glass, mattresses, tires and other miscellaneous materials recovered in small quantities
at some facilities.
Two important points are clear from Table 3. First, the recovery rates for transfer
stations are much lower than they are for the processing facilities. This is the result of
both a different mix of incoming materials, and less or no manual and mechanical
sorting equipment.
Second, recovery rates for wood, which is the largest single component of C&D waste,
average 32 percent for the five processors that DSM visited; ranging from a low of 15 to
a high of 43 percent. These recovery rates would indicate that more wood could be
recovered from these facilities depending on sorting technologies and market demand
(see below).
Table 4, below compares the estimated average composition of residues for the five
processing facilities with the estimated average composition of the incoming material
from the same five processors. Table 4 confirms that significant amounts of potentially
recoverable materials remain after processing. However, several cautions are necessary
when reviewing Table 4.
First, observed residue piles do not coincide with incoming loads, they simply represent
grab samples of residues taken off the end of the processing line.
Second, it is important to recognize that visual sampling of a limited number of
incoming loads and residue grab samples necessarily results in relatively wide
“confidence intervals” for the reported data.
Third, because a significant amount of asphalt/brick/concrete, as well as wood (which
are heavy materials) are removed during processing, it changes the relative volume (and
weight) of the remaining material. For this reason, while OCC/Kraft may be a higher
percentage of the outgoing residue that does not mean that the facility is not capturing
marketable OCC/Kraft, only that some portion of the OCC/Kraft remains in the residue.
Processors Transfer Stations Overall(%) (%) (%)
OCC 31% 9% 22%
Plastic 6% 0% 3%
Metal 100% 49% 90%
Asphalt/Brick/Concrete 100% 100% 100%
Asphalt Roofing 12% 2% 7%
Clean Gypsum Board 9% 0% 4%
Wood 32% 4% 22%
Overall Materials Recovery Rate (1): 48% 6% 33%
Sorted Material

Page | 12 2016 CONSTRUCTION AND DEMOLITION DEBRIS MARKET STUDY
In many cases (and confirmed by our observations) this is because the remaining
OCC/Kraft is too contaminated to be recycled.
Finally, visual sampling of residue may not be as accurate as visual sampling of incoming
loads due to the difficulty of identifying processed materials which have been sized for
sorting. Plastics (especially) which are not as easily broken by the excavators, and large
pieces of corrugated are likely to be over represented in samples because they are
easier to see and identify in the pile than small pieces of wood, as illustrated by the
pictures of two residue samples that were visually characterized.
Given these qualifications, as illustrated by Table 4, it does appear possible to remove
greater quantities of wood and metals, especially during sorting if the markets are
capable of taking this material at a price that justifies increased sorting effort. And, as
discussed below, increased recovery of plastics might also be possible.

Page | 13 2016 CONSTRUCTION AND DEMOLITION DEBRIS MARKET STUDY
TABLE 4 - Comparison, By Weight, of Incoming and Residual Composition for
Marketable Materials (Potentially Marketable Materials Only) (1)
(1) Does not include all material categories and subcategories, and therefore does not
add to 100%.
TASK 2 – CURRENT AND FUTURE CAPACITY OF RECYCLING END
MARKETS
INTROD UCTIO N
Figure 1 below presents the composition (by weight) of the total material recycled from
Massachusetts processors and transfer stations in CY 2015. This does not include
material that may be recycled from construction or demolition sites and delivered
directly to a buyer or end user (e.g. metal scrap yard, asphalt shingle or ABC waste
recycling facility).
As illustrated by Figure 1, wood, metals and ABC were the primary materials diverted
and sold from Massachusetts C&D processors and transfer stations.
Material CategoryINCOMING
(%, By Weight) Marketability
RESIDUALS
(%, By Weight)
PAPER 2.3% 6.3%
OCC/Kraft 1.4% H 3.3%
PLASTIC 2.5% 8.6%
Rigids 0.9% M 4.5%
Film 0.1% L 1.2%
ORGANICS 3.1% 3.9%
Yard Waste 1.3% H 0.2%
Carpet/Padding 1.5% L 3.7%
C&D 78.6% 74.5%
Concrete/Brick/Rock 2.1% H 0.4%
Asphalt Roofing 11.3% M 8.5%
"A Wood" 27.5% H 22.3%
"B Wood" 10.6% M 6.3%
Clean Gypsum Board 2.6% L 3.0%
METAL 4.6% 2.5%
Ferrous 3.7% H 1.2%
Non-Ferrous 1.2% M 1.3%

Page | 14 2016 CONSTRUCTION AND DEMOLITION DEBRIS MARKET STUDY
Figure 1 - Composition of the Recycled Materials Sold from C&D Facilities in CY 2015
(Tons by Material Type)
The markets for each material illustrated in Figure 1 are reviewed below.
WASTE WOO D
At the time of DSM’s 2007 C&D analysis for MassDEP, there was a robust market for
waste wood – the most prevalent material available in mixed C&D waste. Below is a
quote from the 2008 report by DSM to MassDEP:
“The Sappi/Westbrook, Maine paper mill should significantly increase demand for waste
wood during 2008. Boralex is also expected to ramp up demand, although probably not
to levels achieved a few years ago. In addition, the new partnership between Tafisa and
Kruger in Quebec should significantly increase demand for waste wood, both as boiler
fuel and, hopefully, as particle board”.
As is often the case with future predictions, the situation eight years later is significantly
different.
• Sappi/Westbrook, Maine purchases very little waste wood from Massachusetts
processors.
• The Boralex (now ReEnergy) bio-fuels combustion facilities in Maine have all
stopped accepting waste wood (except some from their own processing
facilities) as a result of an unfavorable Connecticut ruling concerning
Renewable Energy Credits.
• According to the buyer for Tafisa, the Tafisa/Kruger partnership has been
terminated, which has meant the following for wood markets:
Page | 15 2016 CONSTRUCTION AND DEMOLITION DEBRIS MARKET STUDY
o First, the Quebec Ministry of Environment has tightened the
combustion specifications for the Tafisa boiler and the Kruger paper
mill boiler resulting in tighter specifications for waste wood;
o Second, because Tafisa no longer has a business relationship with
Kruger, Tafisa has tightened its specification for the amount of fines it
will accept because the fines can no longer be transferred to Kruger
for combustion; and,
o Third, the specification for allowable levels of trace metals has been
reduced at the Tafisa plant, also reducing the amount of fines Tafisa
can accept in the “A” wood.
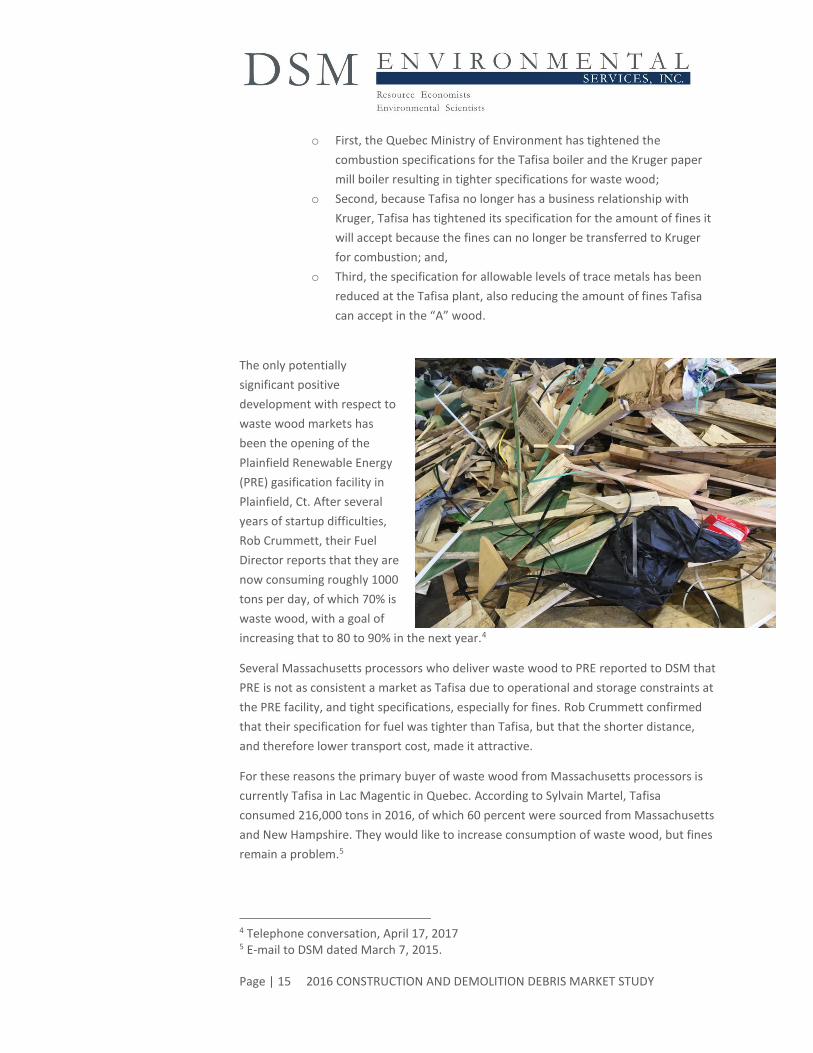
The only potentially
significant positive
development with respect to
waste wood markets has
been the opening of the
Plainfield Renewable Energy
(PRE) gasification facility in
Plainfield, Ct. After several
years of startup difficulties,
Rob Crummett, their Fuel
Director reports that they are
now consuming roughly 1000
tons per day, of which 70% is
waste wood, with a goal of
increasing that to 80 to 90% in the next year.4
Several Massachusetts processors who deliver waste wood to PRE reported to DSM that
PRE is not as consistent a market as Tafisa due to operational and storage constraints at
the PRE facility, and tight specifications, especially for fines. Rob Crummett confirmed
that their specification for fuel was tighter than Tafisa, but that the shorter distance,
and therefore lower transport cost, made it attractive.
For these reasons the primary buyer of waste wood from Massachusetts processors is
currently Tafisa in Lac Magentic in Quebec. According to Sylvain Martel, Tafisa
consumed 216,000 tons in 2016, of which 60 percent were sourced from Massachusetts
and New Hampshire. They would like to increase consumption of waste wood, but fines
remain a problem.5
4 Telephone conversation, April 17, 2017 5 E-mail to DSM dated March 7, 2015.

Page | 16 2016 CONSTRUCTION AND DEMOLITION DEBRIS MARKET STUDY
Finally, in 2007, there was some hope that the cleaner waste wood could be used in
other products such as animal bedding, mulch and commercial fuel pellets. While
animal bedding and mulch are markets for green wood, essentially these markets do not
exist for C&D wood except for source separate clean (unpainted, untreated)
dimensional lumber cut offs and in some cases, pallets. However, most mulchers and
end users of animal bedding do not want pallet wood as a source of their material due
to the possibility it has come into contact with chemicals, bacteria or other agents.
F INES
As was the case in 2007 fines continue to be a significant issue for C&D processors. The
outlet for fines as alternative daily cover (ADC) essentially disappeared because of
concerns associated with gypsum and hydrogen sulfide emissions at landfills. The
obvious alternative was to mix fines in with separated and ground wood waste for
delivery to bio-mass combustion facilities. Unfortunately, the fines tend to have higher
concentrations of trace metals and other contaminants and therefore the bio-mass
combustion facilities that still accept wood waste have reduced the quantity of fines
allowable in the wood waste.
Similarly, Tafisa has also reduced the amount of allowable fines in their material, in part
because the fines also contain higher concentrations of lead which Tafisa needs to limit
in its products.
The end result is that there are really no markets for fines, and fines are an inevitable
by-product of processing mixed C&D waste; which involves dumping on a tipping floor,
breakage of the incoming material by excavators,6 in most cases, prior to introduction to
the sort line, and then grinding of the resultant recovered wood, with screening to
reduce fines, to meet end user specifications.
OTHER MA TERIALS
COR RUGATED CONTAIN ERS (OCC)
The market for OCC remains relatively stable. The most significant issue for C&D
processors is that much of the OCC delivered in mixed C&D loads is contaminated by
other C&D materials, and because many C&D containers are open top containers, the
OCC can also be very wet. As a consequence, while OCC is often picked for recycling, the
recovery rate is much lower than in a single stream MRF, and the value of the OCC is
also lower. In addition, most C&D processing facilities do not have balers (due to the
6 Most processors no longer use grinders at the front of the processing line, which reduces the amount of fines, instead preferring to break the incoming material into pieces that can be manually pulled off of the sorting line.

Page | 17 2016 CONSTRUCTION AND DEMOLITION DEBRIS MARKET STUDY
high capital cost and low usage time for this piece of equipment), making marketing
OCC limited to selling to other processors who have balers.
Figure 2 below shows the typical quality of OCC sorted off of a processing line.
Figure 2 – OCC Chute off Mixed C&D
Processing Line
METAL S
There remain robust markets for both ferrous and non-ferrous metals, although there
can be relatively large swings in the value of these metals. Much of the metal observed
in the residue is either attached to wood (such as roofing) or is wire and wire sheathing
which can be difficult to manually remove, and may not be captured by magnets.
PL AST ICS
Markets for plastics are relatively stable, although Chinese restrictions on the import of
recycled plastic have reduced the value of lower value plastics – which are the primary
plastics available in mixed C&D. Bulky rigid plastics especially, including clean five gallon
pails or other containers, have some value, although contaminants in the buckets
significantly reduce their value.

Page | 18 2016 CONSTRUCTION AND DEMOLITION DEBRIS MARKET STUDY
And, like OCC, plastic film, while prevalent in the mixed C&D, is often relatively highly
contaminated reducing its value. In addition, it can be difficult to pull film off the picking
line because it tends to be tangled with all of the other mixed C&D.
Rigid plastics are often found in the bulky waste deliveries where large plastic toys,
outdoor play equipment and furniture and broken laundry, waste and recycling
containers are often found. These materials are more likely to be recovered at facilities
that are also marketing other commercial (and residential) recyclables and have easier
access to plastic recycling markets and can mix and bale rigid C&D plastics with other
residential/commercial plastics.
GYP SUM
At the time of preparation of this report DSM has learned that a gypsum recycling
facility is supposed to open shortly in Raynham, MA. To date DSM has not been able to
confirm the capacity and specifications for this facility. Gypsum that is recycled from
Massachusetts facilities typically goes to Pennsylvania where it is made into an
agricultural product.
The primary way to recycle gypsum, however, is not as a component of mixed C&D
because it tends to break into small particles during collection, transport and mixing on
the tipping floor.
Instead, it is typically necessary to manage it separately at the job site where it can be
kept separate in large pieces, and remain relatively clean. In addition, most gypsum
recycling facilities require new gypsum, not painted or wallpapered gypsum, which is
typical of demolition debris.
ASP HAL T ROOF ING SHINGL ES
While most asphalt roofing that is recycled is delivered directly to a facility designed to
specifically handle this material, a fair amount of mixed C&D from roofing jobs or repairs
contain asphalt shingles. The main market for facilities in Massachusetts is Carneys,

Page | 19 2016 CONSTRUCTION AND DEMOLITION DEBRIS MARKET STUDY
located in Raynham. Other potential markets, although not as commonly reported to
be used, are Rooftop Recycling in Boxborough, MA and RAS-Tech located in Brentwood,
NH.
TASK 3 -PROCESSING ADVANCEMENTS As presented in Table 1, the current recycling rate for Massachusetts C&D ranges from
27 to 32 percent, depending on how it is calculated. MassDEP has established a goal of
recycling 50 percent of C&D, and therefore one of the tasks associated with this analysis
was to investigate how/whether that goal could be met.
Table 5, below presents estimates of current recovery rates by recyclable material type,
as well potentially high achievable rates (and tonnages) for the same materials.
• Column 1 is derived from multiplying the average percent composition (by
material type) in Table 2 by the total reported mixed C&D waste (in tons)
processed in Massachusetts.
• Column 2 represents the sum of reported incoming source separated material.
• Column 3 is the sum of Columns 1 and 2.
• Column 4 represents the total reported material recycled.
• Column 5 divides Column 4 (Recycled) by Column 3 (Total Available) to
calculate the current recovery rate by material.
• Column 7 is multiplication of the Total Available (Column 3) by the Potentially
Achievable Recovery Rate shown in Column 6.
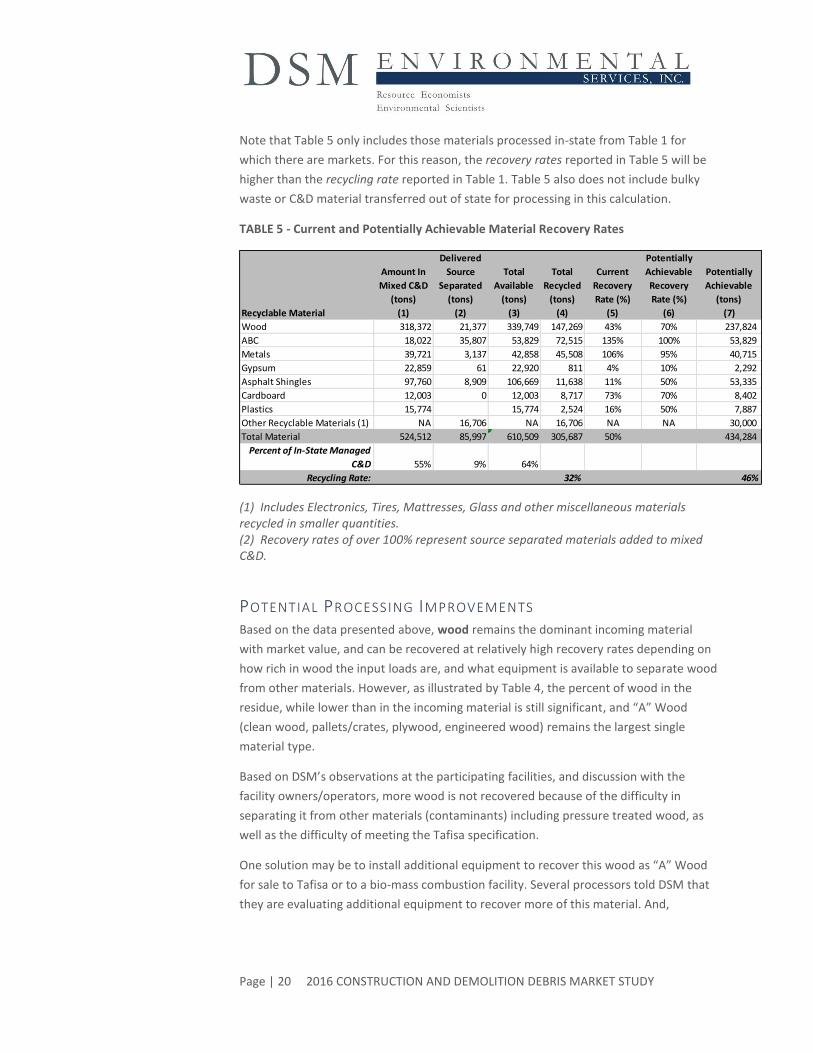
As illustrated by Table 5, based on DSM’s visual analysis of mixed C&D loads, coupled
with incoming source separated materials, roughly 55 percent of all of the C&D
generated and processed in Massachusetts consists of materials that are currently
recyclable (Column 1).
Massachusetts processors are currently recovering roughly 50 percent of these
materials based on DSM’s visual analysis (Column 5).7 Column 6 presents what DSM
would consider to be the high end of potentially achievable recovery rates for these
same materials.
As illustrated in Column 7, applying these theoretical recovery rates would result in
roughly 435,000 tons recovered (compared with roughly 306,000 tons currently) which
would result in a maximum achievable recycling rate for in-state processed/transferred
material of 46 percent.
7 Some materials such as electronics, tires, mattresses and glass are not shown in column 3 because it would be difficult to estimate the total amount of these materials (as a group) found in mixed C&D, however DSM expects that the recovery rate is relatively low for these materials since not all facilities recover these materials.
Page | 20 2016 CONSTRUCTION AND DEMOLITION DEBRIS MARKET STUDY
Note that Table 5 only includes those materials processed in-state from Table 1 for
which there are markets. For this reason, the recovery rates reported in Table 5 will be
higher than the recycling rate reported in Table 1. Table 5 also does not include bulky
waste or C&D material transferred out of state for processing in this calculation.
TABLE 5 - Current and Potentially Achievable Material Recovery Rates
(1) Includes Electronics, Tires, Mattresses, Glass and other miscellaneous materials recycled in smaller quantities. (2) Recovery rates of over 100% represent source separated materials added to mixed C&D.
POTENTIAL PROCESSING IMPROVEMENTS Based on the data presented above, wood remains the dominant incoming material
with market value, and can be recovered at relatively high recovery rates depending on
how rich in wood the input loads are, and what equipment is available to separate wood
from other materials. However, as illustrated by Table 4, the percent of wood in the
residue, while lower than in the incoming material is still significant, and “A” Wood
(clean wood, pallets/crates, plywood, engineered wood) remains the largest single
material type.
Based on DSM’s observations at the participating facilities, and discussion with the
facility owners/operators, more wood is not recovered because of the difficulty in
separating it from other materials (contaminants) including pressure treated wood, as
well as the difficulty of meeting the Tafisa specification.
One solution may be to install additional equipment to recover this wood as “A” Wood
for sale to Tafisa or to a bio-mass combustion facility. Several processors told DSM that
they are evaluating additional equipment to recover more of this material. And,
Amount In
Mixed C&D
(tons)
Delivered
Source
Separated
(tons)
Total
Available
(tons)
Total
Recycled
(tons)
Current
Recovery
Rate (%)
Potentially
Achievable
Recovery
Rate (%)
Potentially
Achievable
(tons)
(1) (2) (3) (4) (5) (6) (7)
Wood 318,372 21,377 339,749 147,269 43% 70% 237,824
ABC 18,022 35,807 53,829 72,515 135% 100% 53,829
Metals 39,721 3,137 42,858 45,508 106% 95% 40,715
Gypsum 22,859 61 22,920 811 4% 10% 2,292
Asphalt Shingles 97,760 8,909 106,669 11,638 11% 50% 53,335
Cardboard 12,003 0 12,003 8,717 73% 70% 8,402
Plastics 15,774 15,774 2,524 16% 50% 7,887
Other Recyclable Materials (1) NA 16,706 NA 16,706 NA NA 30,000
Total Material 524,512 85,997 610,509 305,687 50% 434,284
Percent of In-State Managed
C&D 55% 9% 64%
Recycling Rate: 32% 46%
Recyclable Material

Page | 21 2016 CONSTRUCTION AND DEMOLITION DEBRIS MARKET STUDY
according to Lou Martin, Sales Manager for Van Dyke Recycling Solutions8, at least one
Massachusetts processor requested a preliminary design and cost estimate to install
optical sorting equipment and the associated up-front equipment, but ultimately made
a decision not to move forward.
Therefore, it is DSM’s opinion that one possible way to increase C&D material diversion
might be for MassDEP to assist with the capital cost of up-front conveyors, air
separators, disc screens and optical sorters to recover more wood. One benefit of
optical sorting is that the material does not touch the optical sorters which reduces
wear on the equipment. But the optical sorters need a relatively clean material so there
is a need to remove plastics and other non-wood materials before the wood is
presented to the optical sorters.
In addition, according to Lou Martin, optical identification of pressure treated wood is
really still in the development stage, with full scale application occurring over the next
several years, so these facilities will still need to pull questionable pressure treated
wood out manually, which will reduce the overall recovery rate for not pressure treated
wood.
This is potentially another area where assistance from MassDEP in advancing the
technology for optically identifying pressure treated wood might prove important in
increasing recovery. DSM spoke with representatives from several companies who
design and manufacture optical sorting equipment who said that they could conceive of
ways to optically identify pressure treated wood if the demand for the equipment was
there.
Another, lower cost approach to increase the recovery of wood might be to install more
air separators and disc screens to remove contaminants from “B” wood lines.
Another option that MA DEP requested DSM investigate was the potential to install
small scale gasification units at one or more of the processors to convert the “B” Wood
into energy. Unfortunately, after conducting research on this issue, it is DSM’s opinion
that this option is not feasible for facilities in Massachusetts.9 This is primarily the case
because MA C&D processors do not need building heat, but primarily need electric
power to run their sorting equipment. This requires that any bio-gas produced be run
through an internal combustion engine to produce power for a generator set.
According to Ted Pytlar (see reference below) the resulting bio-gas contains tars and
other impurities that make it very difficult to fuel an internal combustion engine without
extensive gas clean-up, which puts the cost of the fuel significantly higher than for
8 Telephone conversation, January 20, 2017 9 See for example, Status of Existing Biomass Gasification and Pyrolysis Facilities in North America, Theodore S Pytlar, Divirka and Bartilucci Consulting Engineers, from the Proceedings of the 18th Annual North American Waste-to-Energy Conference, May 11 – 13, 2010. Also follow-up telephone conversation with Ted Pytlar, January 20, 2017.

Page | 22 2016 CONSTRUCTION AND DEMOLITION DEBRIS MARKET STUDY
conventional gasoline or diesel fuel. This was confirmed by a second source which
compiled a list of small scale facilities around the world which were operating, but, in
most cases have stopped operating.10 Therefore it is DSM’s opinion that it is unlikely
that small scale gasification equipment designed to consume “B” wood generated at
existing processor will be cost effective or feasible as a way to increase materials
recovery.
It is important to note here that the Plainfield Energy Recovery Facility in Plainfield, CT is
a large-scale bio-mass gasification facility. Many of the issues cited above with respect
to small scale gasification appear to also be a problem with large scale gasification of
waste wood. For this reason, if Massachusetts wants to encourage more recovery of
waste wood in Massachusetts, outlets other than gasification should be considered –
such as source separated clean wood applications and combustion.
The second material to target with potential market value is metal. While the C&D
processors that DSM evaluated are using magnets to remove ferrous metals, there
remain non-ferrous metals in the residue that might be valuable. When compared to
wood, additional recovery of metal will probably not have much of an impact on the
overall recycling/recovery rate, but could potentially improve the economics of
processing though greater recovery of higher value materials.
Recovery of non-ferrous metals in most cases would involve the addition of eddy
current separators. As with optical sorting, it is likely that some additional clean-up of
the material would be necessary in front of the eddy current separator, but the cost and
complexity is probably significantly less than for clean-up prior to an optical sorter.
The third material that might be targeted is bulky, rigid plastic. As illustrated by Table 4,
plastic is estimated to represent roughly 9 percent of the weight of outgoing residue at
the five processing facilities where DSM has observational data. And, based on DSM’s
observations, roughly 80 percent of this plastic might be bulky rigid plastic (bulky rigids
plus an estimated 50 percent of the “other plastics” category). In most cases this
represents a mix of resins, and would be of low value. However, if the processing facility
has room to create a separate bunker to collect this material it might make sense to
recover it. This is especially the case if the facility is accepting a significant amount of
bulky waste, which also contains bulky rigid plastics. But without a baler, the net value
to the processor is relatively low and therefore without significant extra space, it may
continue to not be economical to recycle this material.
Another significant material is carpet. While in the past this material might also have
had value, the move away from nylon based carpet to PET based carpets has
significantly reduced the value of dirty carpet. As such, DSM is not convinced that
investing in recovery of carpet will make financial sense.
10 https://energypedia.info/wiki/Electricity_Generation_from_Biogas
Page | 23 2016 CONSTRUCTION AND DEMOLITION DEBRIS MARKET STUDY
Two other materials for which limited markets exist in Massachusetts are asphalt
shingles and gypsum. There are currently several markets for asphalt shingles in
Massachusetts and New Hampshire; and efforts are being made to revive gypsum
recycling. To the extent possible, MassDEP should work with these markets to help
ensure their success.
TASK 4 – BARRIERS Barriers to increasing the recycling rate for C&D materials in Massachusetts fall into five
categories:
• Market specifications for waste wood;
• Relatively low cost landfill and rail transfer and disposal of waste wood;
• Lack of a uniform definition of “processing” for C&D waste leading to low
recovery rates at facilities without mechanized processing equipment;
• Distance between where the majority of C&D is generated and availability of
processing capacity; and,
• Low value for commodities such as mixed plastics, dirty OCC, vinyl siding and
other materials where the additional processing and transport costs far
outweigh the value even when a market can be found
As discussed above, the market for waste wood has shrunk since DSM last conducted
this study in 2007. In addition, specifications have been tightened. This makes it difficult
for processors to invest in more labor or technology to recover more “A” Wood,
primarily for the single particle board market in Quebec.
The economics also are difficult because it is so inexpensive to load C&D onto a rail car
and ship it to low cost landfills – especially in Ohio. As such, the incentive will always be
there to process the recyclable rich loads and to transfer for disposal loads that contain
smaller quantities of recyclables, or that are more heavily contaminated.
While DSM cannot quantify how much C&D waste is actually run through a processing
line; based on our observations, a greater percentage of C&D appears to be processed
now than in 2007/08. However, a significant amount of material arriving at transfer
stations or at crowded processing facilities may not be processed at all because it is low
in recyclables of any value and the cost to transfer to process the material outweighs
any benefit.
Finally, C&D waste generation is cyclical with the economy and the majority is generated
in locations where the economy is doing well. This means that C&D waste generation
may be the largest in the greater Boston area where facilities are harder to get to, or
where trucks may experience longer wait times. In some cases, this C&D waste may
make its way to other transfer stations and bypass processing facilities or be direct
hauled out of state where processing may or may not occur.

Page | 24 2016 CONSTRUCTION AND DEMOLITION DEBRIS MARKET STUDY
CONCLUSIONS AND RECOMMENDATIONS
It is DSM’s opinion that processors in Massachusetts are doing a relatively good job of
recovering materials from mixed C&D waste – currently recovering roughly 50 percent
of marketable materials, resulting in a 32 percent recycling rate for C&D waste managed
in Massachusetts (As shown in Table 1 and 5). This is despite the fact that the market for
wood waste - the most prevalent material in mixed C&D is more limited now, in terms
of both capacity and tighter specifications – than it was in 2007.
Recovering greater amounts of material will require continued investment in new
processing equipment at existing processing facilities. These investments will be
constrained by the relatively low tipping fee to dispose of mixed C&D waste at
Massachusetts landfills, and of rail shipment of mixed C&D waste to out-of-state
landfills. This low cost alternative makes it difficult for processors to justify running low
value C&D through their processing facilities, and constrains investment in new, capital
intensive processing technologies.
Based on DSM’s analysis of incoming and outgoing materials, MassDEP should consider
providing assistance to C&D processors to invest in additional processing equipment
targeting the following materials:
• Recovery of additional “A” wood through additional investments in new
processing equipment, and investments in research necessary to prove the
potential to optically sort pressure treated wood from non-pressure treated
wood;
• Recovery of additional metals through investments in eddy current separators
and other equipment necessary to recover non-ferrous metals;
• Conversion of more “B” wood to “A” wood through systems designed to sort
smaller pieces of wood, and to remove contaminants and fines form this wood;
and,
• Potential investments in recovery of bulky plastics through dedication of
sorting space for bulky plastics and, potentially, film, with baling of the
resulting separated materials at high throughput facilities.
Related Documents


![WASTE REDUCTION, CONSTRUCTION AND DEMOLITION DEBRISpublications.iowa.gov/7270/1/bestmgmtpractices[2].pdf · WASTE REDUCTION, CONSTRUCTION AND DEMOLITION DEBRIS A Guide for Building,](https://static.cupdf.com/doc/110x72/602bfc2e9bf0cd6e6a610a9a/waste-reduction-construction-and-demolition-2pdf-waste-reduction-construction.jpg)