2016 CASA update 2017 scallop survey summary ABC and OFL estimates for 2018-2019 Dvora Hart Northeast Fisheries Science Center Woods Hole MA

Welcome message from author
This document is posted to help you gain knowledge. Please leave a comment to let me know what you think about it! Share it to your friends and learn new things together.
Transcript
2016 CASA update 2017 scallop survey summary
ABC and OFL estimates for 2018-2019
Dvora Hart
Northeast Fisheries Science Center
Woods Hole MA
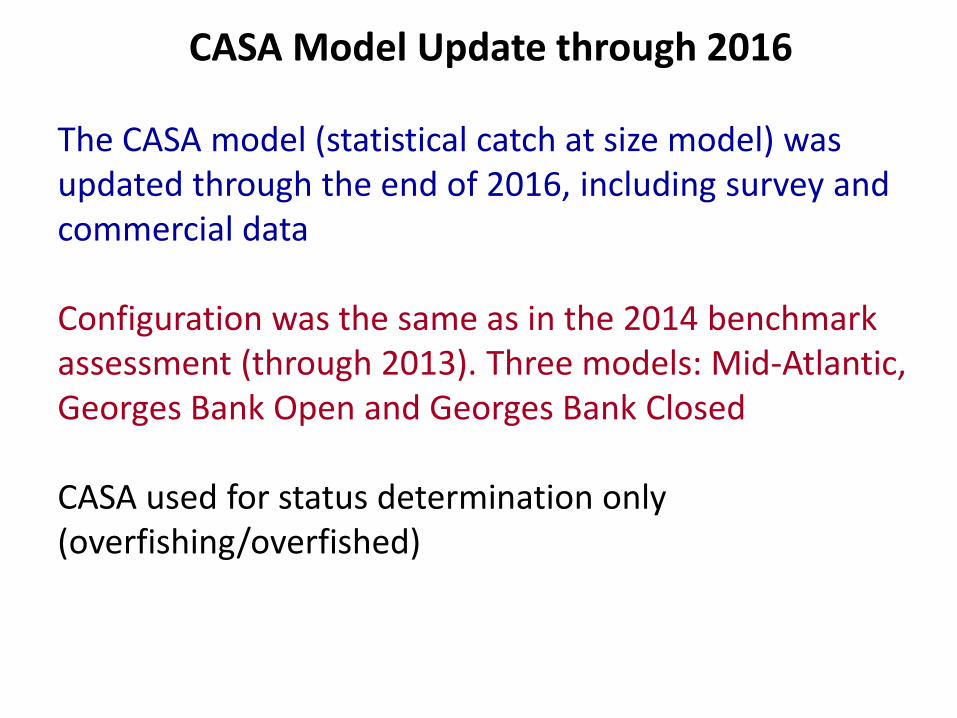
CASA Model Update through 2016
The CASA model (statistical catch at size model) was updated through the end of 2016, including survey andcommercial data
Configuration was the same as in the 2014 benchmark assessment (through 2013). Three models: Mid-Atlantic, Georges Bank Open and Georges Bank Closed
CASA used for status determination only (overfishing/overfished)

Biomass and fishing mortality by region and overall
Overall F16 = 0.12 No overfishing
Overall Bms16 = 381,957 mtAbove target, not overfished
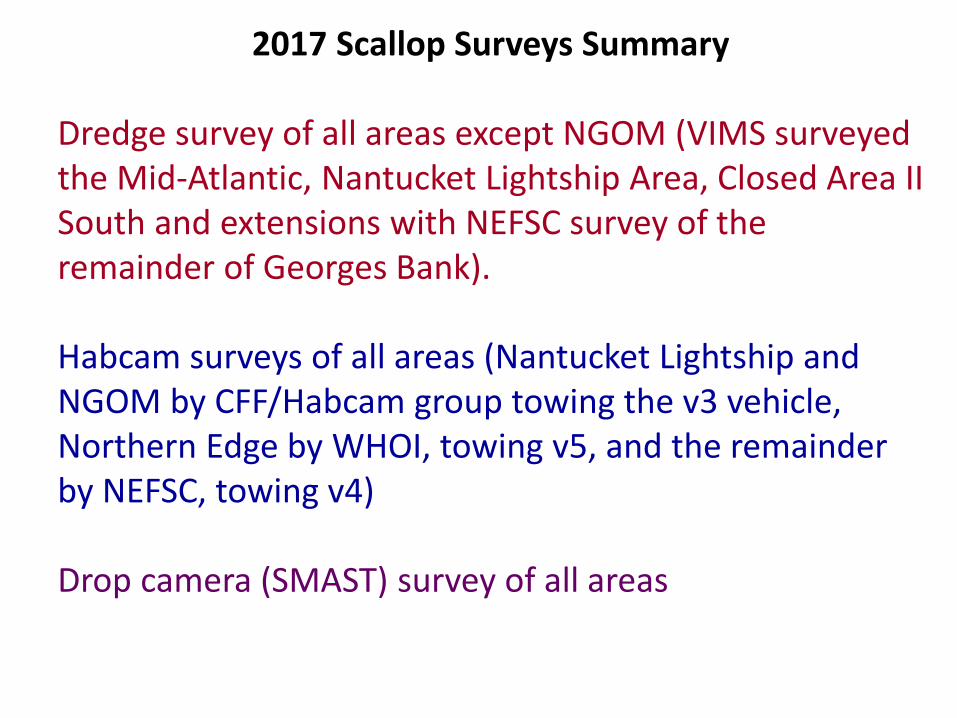
2017 Scallop Surveys Summary
Dredge survey of all areas except NGOM (VIMS surveyed the Mid-Atlantic, Nantucket Lightship Area, Closed Area II South and extensions with NEFSC survey of the remainder of Georges Bank).
Habcam surveys of all areas (Nantucket Lightship and NGOM by CFF/Habcam group towing the v3 vehicle, Northern Edge by WHOI, towing v5, and the remainder by NEFSC, towing v4)
Drop camera (SMAST) survey of all areas
2017 Scallop Surveys Summary
Consistent with previous surveys, very high densities of scallops were observed in portions of the Nantucket Lightship and Elephant Trunk areas. These densities were 1-2 orders of magnitude higher than that typically observed
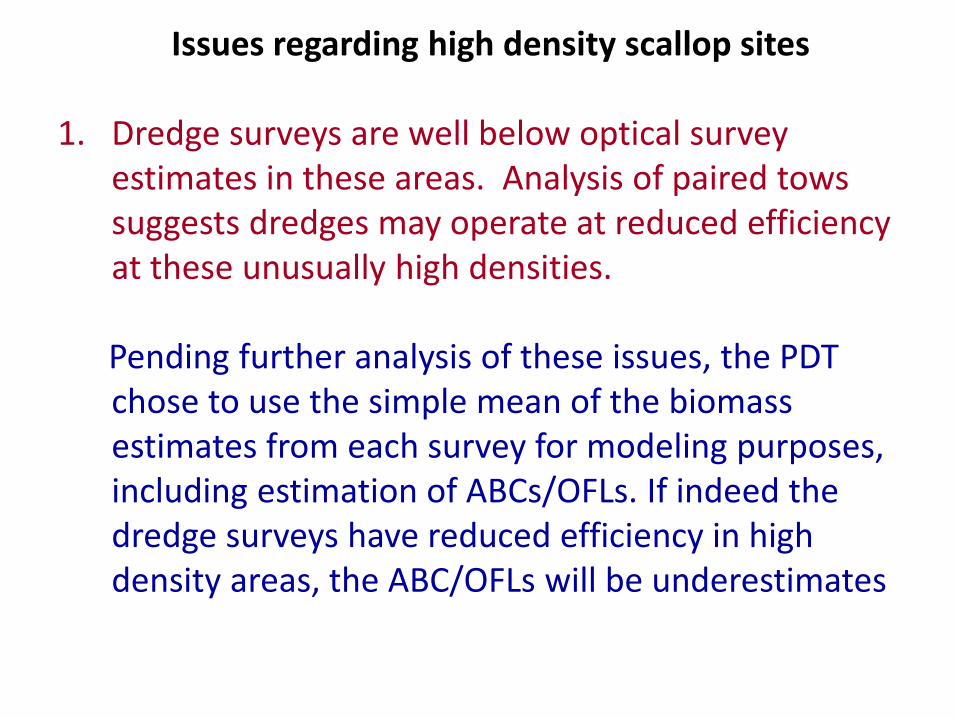
Issues regarding high density scallop sites
1. Dredge surveys are well below optical survey estimates in these areas. Analysis of paired towssuggests dredges may operate at reduced efficiency at these unusually high densities.
Pending further analysis of these issues, the PDT chose to use the simple mean of the biomass estimates from each survey for modeling purposes, including estimation of ABCs/OFLs. If indeed the dredge surveys have reduced efficiency in high density areas, the ABC/OFLs will be underestimates
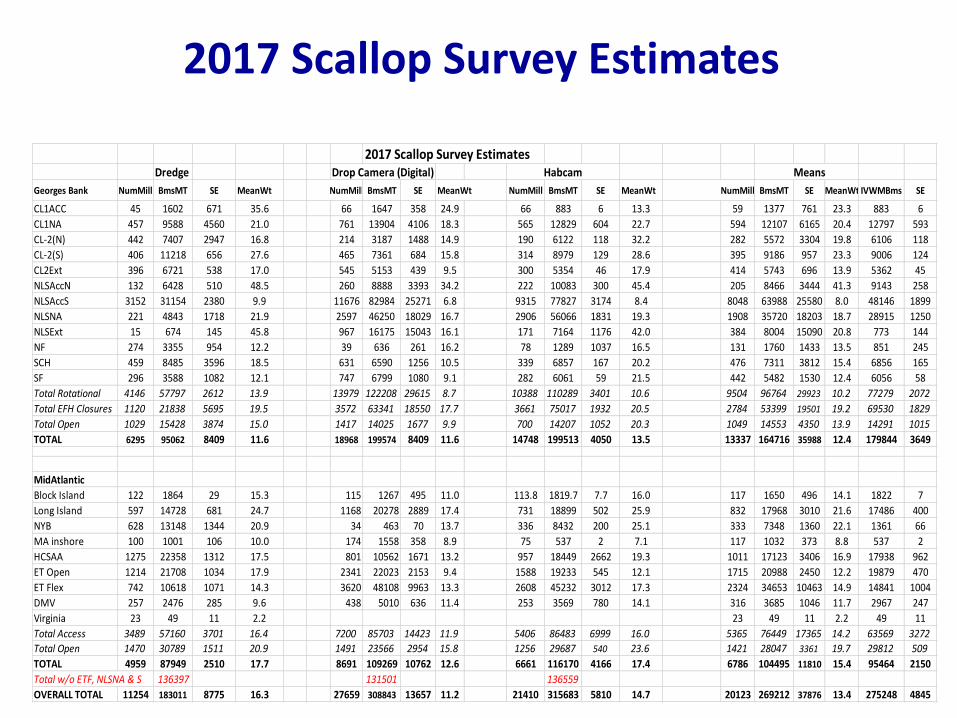
2017 Scallop Survey EstimatesDredge Drop Camera (Digital) Habcam Means
Georges Bank NumMill BmsMT SE MeanWt NumMill BmsMT SE MeanWt NumMill BmsMT SE MeanWt NumMill BmsMT SE MeanWt IVWMBms SE
CL1ACC 45 1602 671 35.6 66 1647 358 24.9 66 883 6 13.3 59 1377 761 23.3 883 6
CL1NA 457 9588 4560 21.0 761 13904 4106 18.3 565 12829 604 22.7 594 12107 6165 20.4 12797 593
CL-2(N) 442 7407 2947 16.8 214 3187 1488 14.9 190 6122 118 32.2 282 5572 3304 19.8 6106 118
CL-2(S) 406 11218 656 27.6 465 7361 684 15.8 314 8979 129 28.6 395 9186 957 23.3 9006 124
CL2Ext 396 6721 538 17.0 545 5153 439 9.5 300 5354 46 17.9 414 5743 696 13.9 5362 45
NLSAccN 132 6428 510 48.5 260 8888 3393 34.2 222 10083 300 45.4 205 8466 3444 41.3 9143 258
NLSAccS 3152 31154 2380 9.9 11676 82984 25271 6.8 9315 77827 3174 8.4 8048 63988 25580 8.0 48146 1899
NLSNA 221 4843 1718 21.9 2597 46250 18029 16.7 2906 56066 1831 19.3 1908 35720 18203 18.7 28915 1250
NLSExt 15 674 145 45.8 967 16175 15043 16.1 171 7164 1176 42.0 384 8004 15090 20.8 773 144
NF 274 3355 954 12.2 39 636 261 16.2 78 1289 1037 16.5 131 1760 1433 13.5 851 245
SCH 459 8485 3596 18.5 631 6590 1256 10.5 339 6857 167 20.2 476 7311 3812 15.4 6856 165
SF 296 3588 1082 12.1 747 6799 1080 9.1 282 6061 59 21.5 442 5482 1530 12.4 6056 58
Total Rotational 4146 57797 2612 13.9 13979 122208 29615 8.7 10388 110289 3401 10.6 9504 96764 29923 10.2 77279 2072
Total EFH Closures 1120 21838 5695 19.5 3572 63341 18550 17.7 3661 75017 1932 20.5 2784 53399 19501 19.2 69530 1829
Total Open 1029 15428 3874 15.0 1417 14025 1677 9.9 700 14207 1052 20.3 1049 14553 4350 13.9 14291 1015
TOTAL 6295 95062 8409 11.6 18968 199574 8409 11.6 14748 199513 4050 13.5 13337 164716 35988 12.4 179844 3649
MidAtlantic
Block Island 122 1864 29 15.3 115 1267 495 11.0 113.8 1819.7 7.7 16.0 117 1650 496 14.1 1822 7
Long Island 597 14728 681 24.7 1168 20278 2889 17.4 731 18899 502 25.9 832 17968 3010 21.6 17486 400
NYB 628 13148 1344 20.9 34 463 70 13.7 336 8432 200 25.1 333 7348 1360 22.1 1361 66
MA inshore 100 1001 106 10.0 174 1558 358 8.9 75 537 2 7.1 117 1032 373 8.8 537 2
HCSAA 1275 22358 1312 17.5 801 10562 1671 13.2 957 18449 2662 19.3 1011 17123 3406 16.9 17938 962
ET Open 1214 21708 1034 17.9 2341 22023 2153 9.4 1588 19233 545 12.1 1715 20988 2450 12.2 19879 470
ET Flex 742 10618 1071 14.3 3620 48108 9963 13.3 2608 45232 3012 17.3 2324 34653 10463 14.9 14841 1004
DMV 257 2476 285 9.6 438 5010 636 11.4 253 3569 780 14.1 316 3685 1046 11.7 2967 247
Virginia 23 49 11 2.2 23 49 11 2.2 49 11
Total Access 3489 57160 3701 16.4 7200 85703 14423 11.9 5406 86483 6999 16.0 5365 76449 17365 14.2 63569 3272
Total Open 1470 30789 1511 20.9 1491 23566 2954 15.8 1256 29687 540 23.6 1421 28047 3361 19.7 29812 509
TOTAL 4959 87949 2510 17.7 8691 109269 10762 12.6 6661 116170 4166 17.4 6786 104495 11810 15.4 95464 2150
Total w/o ETF, NLSNA & S 136397 131501 136559
OVERALL TOTAL 11254 183011 8775 16.3 27659 308843 13657 11.2 21410 315683 5810 14.7 20123 269212 37876 13.4 275248 4845
2017 Scallop Survey Estimates
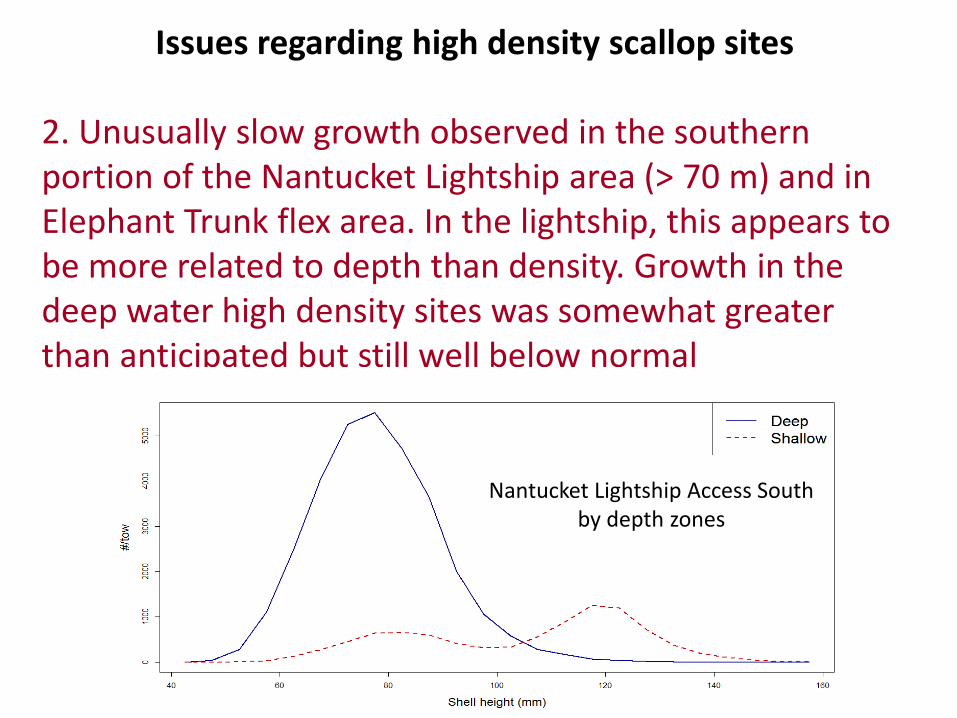
Issues regarding high density scallop sites
2. Unusually slow growth observed in the southern portion of the Nantucket Lightship area (> 70 m) and in Elephant Trunk flex area. In the lightship, this appears to be more related to depth than density. Growth in thedeep water high density sites was somewhat greaterthan anticipated but still well below normal
Nantucket Lightship Access Southby depth zones

In 2016, L∞ was estimated as 90 mm in the deepportion of Nantucket Lightship Access Area. Actual growth was somewhat faster, corresponding to an L∞
of about 110 mm. This estimate was used in theACL/OFL calculations and in Framework projections

Very slow growth was observed in the Elephant Trunk Flex area, especially in the high density areas

A similar phenomenon was observed in the Elephant Trunk between 2005 and 2006, where little growth was observed. However, normal growth resumed between 2006 and 2007

Growth in ET Flex in the coming year could be similar to 2016-2017 (nearly no growth), or nearly normal growth could resume. Giventhese uncertainties, L∞ was set at 110 mm for this area. This is less than normal growth, but faster than the observed growth during 2016-2017.
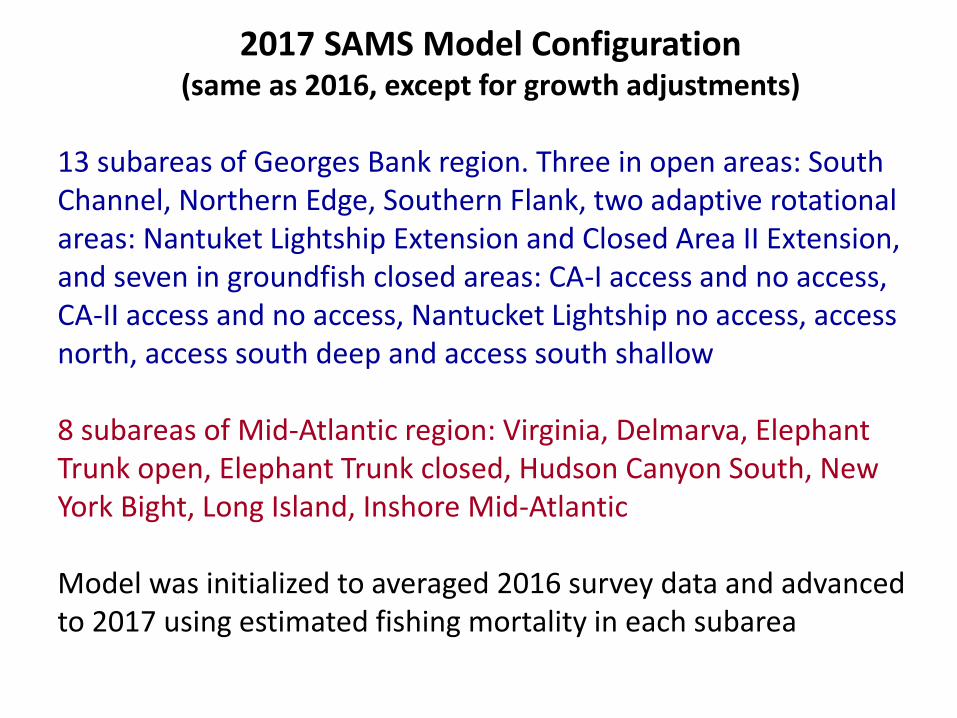
2017 SAMS Model Configuration(same as 2016, except for growth adjustments)
13 subareas of Georges Bank region. Three in open areas: South Channel, Northern Edge, Southern Flank, two adaptive rotational areas: Nantuket Lightship Extension and Closed Area II Extension, and seven in groundfish closed areas: CA-I access and no access, CA-II access and no access, Nantucket Lightship no access, access north, access south deep and access south shallow
8 subareas of Mid-Atlantic region: Virginia, Delmarva, Elephant Trunk open, Elephant Trunk closed, Hudson Canyon South, New York Bight, Long Island, Inshore Mid-Atlantic
Model was initialized to averaged 2016 survey data and advanced to 2017 using estimated fishing mortality in each subarea

ACL/OFL calculations with 2018 exploitable biomass.
ACL/OFL correspond to F = 0.38 and 0.48, respectively
Year ACL-Land ACL-Disc ACL-Tot Biomass OFL-Land OFL-Disc OFL-Total
2018 45950 14018 59968 288993 55573 16482 72055
2019 45805 12321 58126 266885 55336 14297 69633

Thank you!
Related Documents


