TABLE OF CONTENTS Litigation Activity Overview The Maturing PTAB Alice and § 101 Challenges January-December YEAR IN REVIEW 2015 Shifting Case Outcomes The Role of EDTX PATENT LITIGATION

Welcome message from author
This document is posted to help you gain knowledge. Please leave a comment to let me know what you think about it! Share it to your friends and learn new things together.
Transcript

TABLE OF CONTENTS
Litigation Activity Overview
The Maturing PTAB
Alice and § 101 Challenges
Januar y-December
YEAR IN REVIEW 2015
Shifting Case Outcomes
The Role of EDTX
PATENT LITIGATION

TABLE OF CONTENTS
A LETTER FROM OUR CEO _________________ 3
LITIGATION ACTIVITY OVERVIEW
New Patent Litigation Proceedings ________________ 6
Litigants in New Patent Cases ___________________ 7
Patent Accusations in New Patent Cases ___________ 8
New Docket Entries in Patent Litigation Proceedings __ 9
Claim Constructions __________________________ 10
District Court Patent Determinations _____________ 11
KEY PLAYERS IN DISTRICT COURT CASES
Top Patentees _______________________________ 12
Top Accused Infringers ________________________ 13
Top Patentee Firms ___________________________ 14
Top Patentee Lawyers ________________________ 15
Top Accused Infringers Firms ___________________ 16
Top Accused Infringers Lawyers _________________ 17
Top Patent Classifications ______________________ 18
COMPARISON OF COURTS AND JUDGES
Top Courts by Number of New Cases, Litigants, and Accusations ________________________________ 19
Average Time to Claim Construction by Court ______ 20
Average Time to Summary Judgment by Court _____ 21
Average Time to Trial by Court __________________ 22
Top Judges by Number of New Cases, Litigants, and Accusations ________________________________ 23
Average Time to Claim Construction by Judge ______ 24
Average Time to Motion for Summary Judgment by Judge ______________________________________ 25
Average Time to Trial by Judge __________________ 26
Comparison of Jury Trial, Bench Trial and Dispositive Motion Outcomes ____________________________ 27
IMPACT OF ALICE AND OTHER DECISIONS
Outcomes of 35 U.S.C. § 101 Challenges __________ 29
Motion Success Rates _________________________ 30
District Court Patent Determinations ______________ 32
THE MATURING PTAB
New PTAB Petitions __________________________ 33
New PTAB Petitions By Tech Code _______________ 34
PTAB Institution Decision Outcomes ______________ 35
PTAB Institution Outcomes by Asserted Unpatentability Ground ____________________________________ 38
PTAB Patent Determinations ____________________ 42
KEY PLAYERS IN THE PTAB
Top PTAB Petitioners __________________________ 44
Top Patent Owners in PTAB Proceedings __________ 45
Top Firms in the PTAB _________________________ 46
Top Attorneys in the PTAB ______________________ 48
OUR YEAR IN REVIEW ____________________ 50
ABOUT OUR METHODOLOGY _____________ 52

YEAR IN REVIEW | 2015
Page 3 ©2016 Docket Navigator. All Rights Reserved.
2015 YEAR IN REVIEW A LETTER FROM OUR CEO
DEAR FRIENDS:
As the past few years have shown, there is no “normal” year for U.S. patent litigation. 2015 was another active year, and another year of surprises. After falling slightly in 2014, the number of new patent litigation proceedings rebounded in 2015, increasing 13% overall. While the number of new U.S. district court cases increased 15% over 2014, the number of Patent Trial and Appeal Board (PTAB) proceedings increased only 7%. Yet beyond those macro level statistics, the patent landscape continues to shift, prompting all members of the patent community to reevaluate business and legal strategies. In this report, we analyze patent litigation data from the U.S. district courts, the International Trade Commission (ITC), and AIA proceedings in the PTAB to help you better understand those changes. Key findings include:
OVERALL LITIGATION ACTIVITY
The number of new patent litigation proceedings increased by 13% in 2015 and the number of litigants in those new cases increased at a similar rate, 12.6%. While these numbers suggest a growing volume of patent litigation activity, a look at a different metric – the number of infringement accusations asserted in those new cases – increased by a modest 1.3% overall and actually declined by 5.5% in the U.S. district courts. These numbers suggest that, while the number of patent cases is increasing, the complexity (and perhaps the stakes) of individual cases is decreasing. (See pages 6-11.)
THE MATURING PTAB
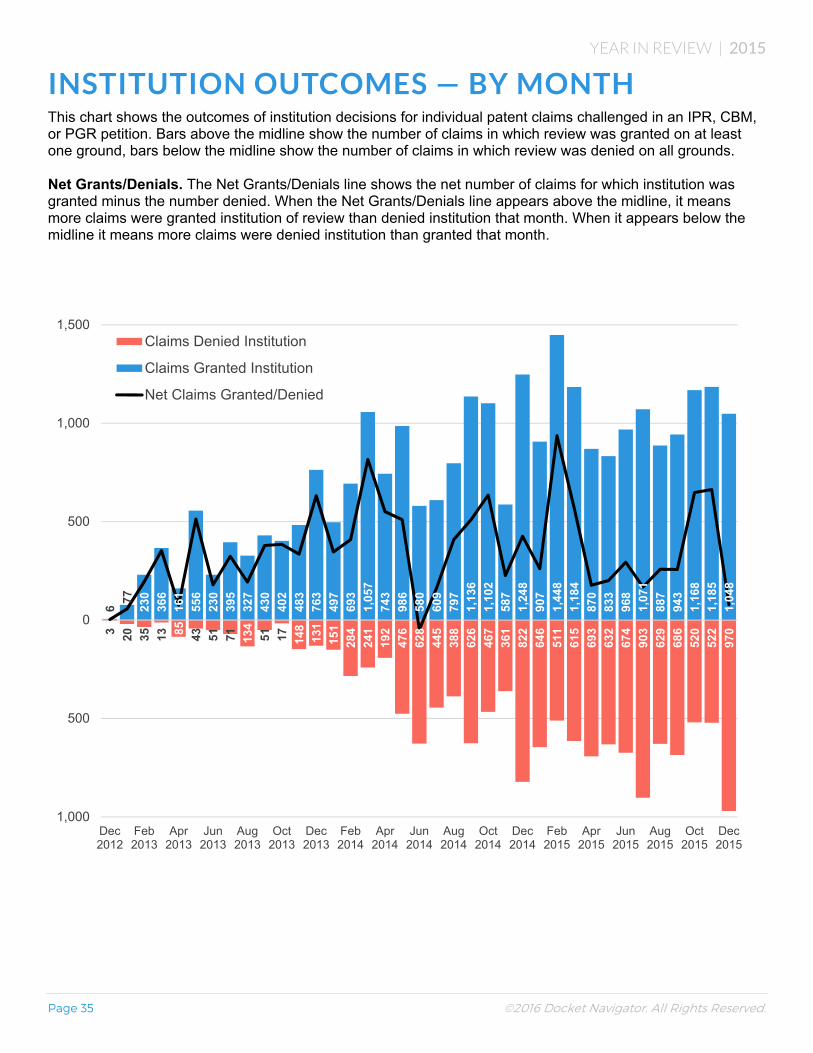
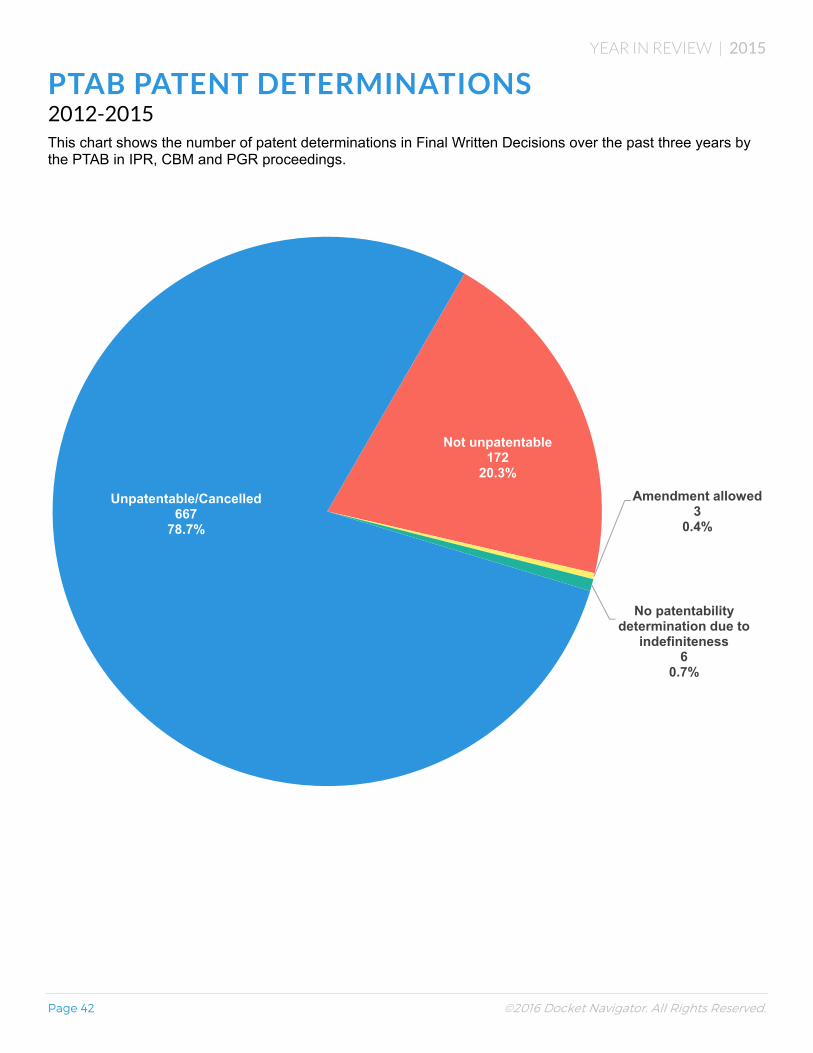
As the PTAB matures, outcomes have become slightly more balanced. At the institution phase, the number of net institutions (the difference between the number of claims instituted and not instituted) has dropped. However, that drop is highly dependent on the unpatentability ground asserted. Net institutions for claims challenged on anticipation grounds (35 U.S.C. § 102) dropped sharply throughout 2015, as did claims challenged under 35 U.S.C. § 112. But net institutions for claims challenged on obviousness grounds (35 U.S.C. § 103) remained relatively flat during the first half of 2015, then spiked sharply during the last half of the year. Net institutions for claims challenged on unpatentable subject matter grounds (35 U.S.C. § 101) rose sharply throughout 2014, but began dropping in April 2015 and continue to decline. (See pages 33-41.) Once instituted, claims are overwhelmingly found unpatentable. To date, 78.8% of PTAB proceedings to reach a final written decision resulted in one or more claims being deemed unpatentable. (See page 42.)
ALICE AND SECTION 101 CHALLENGES
Alice and the new test for patentable subject matter under 35 U.S.C. § 101 are playing an increasingly important role in patent litigation. From the date Alice was decided through the end of 2015, U.S. district courts addressed 191 Section 101 patent challenges, 67% of which were granted in whole or part. But, importantly, results vary significantly by district. In EDTX, the success rate was only 35%. Also interesting, the timing of the motion in relation to the stage of litigation does not appear to affect the outcomes. In other words, within a specific court, the grant rate for challenges brought in the early stages of litigation is very close to the grant rate for challenges brought in a mature stage. (See page 29.)
NEW PATENT LITIGATION PROCEEDINGS 13%
COMPLEXITY OF INDIVIDUAL CASES
SECTION 101 CHALLENGES GRANTED OR PARTIALLY GRANTED 67%
§ 101 INSTITUTIONS
§ 102 INSTITUTIONS
§ 112 INSTITUTIONS
§ 103 INSTITUTIONS

YEAR IN REVIEW | 2015
Page 4 ©2016 Docket Navigator. All Rights Reserved.
SHIFTING CASE OUTCOMES
Case outcomes in U.S. district courts continue to shift against patentees. As a proportion of all determinations, 2015 saw the highest percentage of invalidity determinations and the lowest percentage of infringement determinations since 2008, both by a wide margin. (See pages 10 and 27.)
THE ROLE OF EDTX
The Eastern District of Texas remains the most popular forum for patent disputes when considering the number of new cases (44.2% of all new cases), or the number of litigants in those cases (27.9% of all litigants in new cases). But when considering the number of infringement accusations, Delaware holds the top spot (22.5% versus 19.4% for EDTX). (See page 19.)
As lawmakers, courts, and administrative agencies continue to shift the patent landscape, navigating the path to optimal legal outcomes grows more complex. We hope you find this report to be a valuable tool. If you are a Docket Navigator subscriber, we appreciate your business. We are honored and grateful for your support. If you are not a Docket Navigator subscriber and would like to learn more about our service, please visit our website or contact us anytime. Very best wishes for 2016, Darryl E. Towell CEO/Co-founder
DETERMINATIONS FAVORING PATENTEES
DETERMINATIONS FAVORING PATENT CHALLENGERS
WE WELCOME YOUR FEEDBACK
Our work helping you navigate the complexities of patent litigation is just beginning. As we continue to enhance Docket Navigator services, we welcome and encourage your input. If you have any questions about this report or suggestions for making it better, please contact us at 866-352-2749 or send an email to [email protected]. Additional contact information can be found on our contact page.
44.2% OF ALL NEW CASES

YEAR IN REVIEW | 2015
Page 5 ©2016 Docket Navigator. All Rights Reserved.
NEW IN 2016 EXCITING NEW FEATURES IN OUR PIPELINE
NEW MOBILE APP (Coming in February) More than twenty percent of our 13,000+ subscribers now view Docket Navigator content on a mobile device. In early 2016 we will release the Docket Navigator mobile app which will allow you to receive this content on a mobile device. The app will cover:
o The Docket Report
o Docket Alerts
o New Case Alerts
o Special Reports
Available for iOS and Android, subscribers will be able to select the type of content to receive and whether to receive push notifications.
ENHANCED USER INTERFACE (Coming Spring 2016) Navigating Docket Navigator is about to get much easier! Our new user interface features:
o A sleek new look that integrates traditional search results and new analytics tools
o Touch-friendly design that looks and works better in a mobile environment
o Virtual “binders” to help save, organize, and share research
o Pre-configured searches for answer frequently-asked questions
o Structured search assistant to simplify complex queries
EXPANDED COVERAGE (Coming Fall 2016) Every year, we expand the scope of Docket Navigator coverage. Here is a preview of some upgrades in progress for 2016.
o Expanded Federal Circuit coverage. Track U.S. district court, ITC and PTAB decisions during appeal.
o Additional Practice Areas. We’re working to expand Docket Navigator services to cover Trademark, Copyright, and other federal practice areas.

YEAR IN REVIEW | 2015
Page 6 ©2016 Docket Navigator. All Rights Reserved.
NEW PATENT LITIGATION PROCEEDINGS 2008-2015 Since 2008, the number of patent litigation proceedings has grown by 187%. After a small decline in 2014, the number of new patent litigation proceedings in 2015 increased by 13% to a record 7,597. In the district courts, the number of new patent infringement cases increased by 15%, and in the PTAB the number of AIA proceedings (IPR, CBM and PGR reviews) increased by a smaller 7%.
111792
1,677 1,797
2,612 2,570
3,3533,905
5,459
6,0945,006
5,762
36 29
56
69
43
4737
38
0
1000
2000
3000
4000
5000
6000
7000
8000
2008 2009 2010 2011 2012 2013 2014 2015
Patent Trial and Appeal Board (PTAB)U.S. District CourtsInternational Trade Commission (ITC)
13% 15% 7% ALL PROCEEDINGS DISTRICT COURTS PTAB
Want to be notified when a new case is filed?
It’s easy to get New Case Alerts. Go to your “MY ACCOUNT” page in Docket Navigator and click “activate new case alerts”. You’ll be notified throughout the day as new patent cases are added to the database.

YEAR IN REVIEW | 2015
Page 7 ©2016 Docket Navigator. All Rights Reserved.
LITIGANTS IN NEW PATENT CASES 2008-2015 The number of litigants of all types in new patent proceedings increased by 13% overall, making 2015 a record year. However, while the number of litigants in new U.S. district court cases increased 7% over 2014, 2015 still ranked below 2013, 2012, and 2011. Conversely, the number of litigants in new PTAB proceedings grew more than 30% over 2014, more than tripling the number of litigants involved in proceedings initiated in 2013.
334 2,424
5,9207,727
11,954 12,617
17,569
20,653 20,023
21,163
16,969
18,205
348 266
527
739 566
368409
304
0
5,000
10,000
15,000
20,000
25,000
30,000
2008 2009 2010 2011 2012 2013 2014 2015
Patent Trial and Appeal Board (PTAB)U.S. District CourtsInternational Trade Commission (ITC)
13% 30% 7% ALL PROCEEDINGS PTAB DISTRICT COURTS
Want to be notified when a company is named in a patent suit?
It’s easy with a Docket Alert. When performing a cases search, just enter the company’s name and click “CREATE ALERT” at the bottom of the page. We’ll run that same search for you each weekday morning, and if there are any “hits” we will send you an email.

YEAR IN REVIEW | 2015
Page 8 ©2016 Docket Navigator. All Rights Reserved.
PATENT ACCUSATIONS IN NEW PATENT CASES 2008-2015 With the exception of 2011, the number of accusations asserted in new patent cases has increased at a very modest rate since 2010. For 2015, the total number of accusations asserted in all new cases grew by only 1.3% over 2014 and only 10% over 2010. But the number of accusations asserted in new U.S. district court cases dropped to the lowest level since 2009. In contrast, the number of accusations in the PTAB grew by 64% in 2015, more than four and a half times the number asserted in 2013.
244 1,6524,702
7,713
17,84719,418
29,565
40,073
30,61730,651
27,131
25,6461,005
860
2,355
4,301
2,1352,138 2,730
1,660
0
5,000
10,000
15,000
20,000
25,000
30,000
35,000
40,000
45,000
2008 2009 2010 2011 2012 2013 2014 2015
Patent Trial and Appeal Board (PTAB)US District CourtsInternational Trade Commission (ITC)
1.3% 5.5% 64% ALL PROCEEDINGS DISTRICT COURTS PTAB

YEAR IN REVIEW | 2015
Page 9 ©2016 Docket Navigator. All Rights Reserved.
NEW DOCKET ENTRIES 2008-2015 2015 was the first year since 2008 in which the total number of docket entries in patent proceedings dropped. While the total number of docket entries in U.S. district court cases dropped by about 10%, the number of docket entries in PTAB proceedings grew by 23%.
4,68144,117
110,624135,996
241,417 241,510259,791
300,690
356,009
370,921
358,046 322,963
13,615 10,53812,015
14,971
19,345
12,433
10,9739,181
0
50,000
100,000
150,000
200,000
250,000
300,000
350,000
400,000
450,000
500,000
2008 2009 2010 2011 2012 2013 2014 2015
Patent Trial and Appeal Board (PTAB)U.S. District CourtsInternational Trade Commission (ITC)
2.4% 10% 23% ALL PROCEEDINGS DISTRICT COURTS PTAB
Would you like to be notified of any new filings on a patent case?
Go to the CASE SUMMARY PAGE and click on the Filings tab. Then click “Create Alert” at the bottom of that tab. We’ll check that tab for you every weekday and notify you of any new docket entries that we find.

YEAR IN REVIEW | 2015
Page 10 ©2016 Docket Navigator. All Rights Reserved.
CLAIM CONSTRUCTIONS 2008-2015 2015 was a record year for claim constructions, increasing 18% over 2014 which was also a record year. In the U.S. district courts, the number of claims construed increased by 10%, but the PTAB recorded the largest increase of 34%. For comparison, the PTAB construed about as many terms in 2015 as all U.S. district courts combined in 2009 or 2010.
111,321
4,401
5,908
7,471
5,862 5,922 6,4127,185
8,025
8,226
9,084
40
702
206
376
397
0
2,000
4,000
6,000
8,000
10,000
12,000
14,000
16,000
2008 2009 2010 2011 2012 2013 2014 2015
Patent Trial and Appeal Board (PTAB)U.S. District CourtsInternational Trade Commission (ITC)
18% 10% 34% ALL PROCEEDINGS DISTRICT COURTS PTAB
You can search the Docket Navigator dictionary of more than 92,000 construed claim terms by performing a TERMS SEARCH. You can even set up a Docket Alert to be notified the next time a court construes a claim by clicking “Create Alert” at the bottom of the page.

YEAR IN REVIEW | 2015
Page 11 ©2016 Docket Navigator. All Rights Reserved.
DISTRICT COURT PATENT DETERMINATIONS 2008-2015 In 2015, the total number of patent determinations of all types fell by almost 16% from 2014’s record level. Yet 2015 still recorded the second highest number of patent determinations since 2008. In addition, the distribution of determinations continued to shift. The number of invalidity determinations increased by more than 53%. Conversely, the number of infringement determinations declined by almost 47%. The chart in page 32 shows the distribution of determinations each year as a percentage of total determinations within a year.
232 249 283 299422
263
547
292
218 195264
325
447
429
693
61296 95
91134
193
79
254
94
252 273
378319
509
615
540
468
149 205
226 173
303
278
359
551
0
500
1000
1500
2000
2500
2008 2009 2010 2011 2012 2013 2014 2015
InfringedNot invalidNot unenforceableNot infringedUnenforceableInvalid
15.8% 53.5% 46.6% ALL DETERMINATIONS INVALIDITY INFRINGEMENT
Did you know that you can use a patent determination as a search filter?
For example, you can GENERATE A LIST of all cases in which a patent claim has been found invalid.

YEAR IN REVIEW | 2015
Page 12 ©2016 Docket Navigator. All Rights Reserved.
TOP PATENTEES In District Court Cases in 2015
102
85
69
66
62
60
57
56
51
50
50
50
49
42
40
38
36
33
33
32
31
31
30
28
27
27
26
26
25
25
eDekka LLC
Data Carriers, LLC
Shipping and Transit, LLC
CryptoPeak Solutions, LLC
Hawk Tech. Systems, LLC
Rothschild Connected DevicesInnovations, LLC
Sockeye Licensing TX LLC
Wetro Lan, LLC
Eclipse IP LLC
Oberalis LLC
Genaville LLC
Loramax LLC
ChriMar Systems, Inc.
Olivistar LLC
Motile Optics, LLC
Graham Springs LLC
Astrazeneca Pharma. LP
UrgenSync, LLC
Symbology Innovations, LLC
High Quality Printing Inventions,LLC
Encoditech LLC
Avioniqs, LLC
Trover Group, Inc.
Qommerce Systems, LLC
Verified Hiring, LLC
Unibeam Photonics, LLC
Nonend Inventions, NV
Frequency Systems, LLC
Icon Laser Solutions LLC
Ectolink, LLC
NUMBER OF NEW PATENT CASES
56
56
58
60
60
61
61
62
62
63
65
66
66
67
72
75
75
79
80
85
85
90
99
102
114
122
146
180
217
246
Wetro Lan, LLC
Nonend Inventions, NV
HZNP Limited
Roche Palo Alto LLC
Helsinn Healthcare SA
Forest Laboratories Holdings, Ltd.
Rothschild Connected DevicesInnovations, LLC
Ericsson, Inc.
Avioniqs, LLC
Hawk Technology Systems, LLC
Olivistar LLC
Reflection Code LLC
CryptoPeak Solutions, LLC
Purdue Pharma LP
St. Luke Technologies, LLC
Phoenix Licensing, LLC
LPL Licensing, LLC
Location Services IP, LLC
Oakley, Inc.
Data Carriers, LLC
TQ Delta LLC
Koninklijke Philips NV
Symbology Innovations, LLC
eDekka LLC
Sockeye Licensing TX LLC
Astrazeneca Pharmaceuticals LP
Shipping and Transit, LLC
ChriMar Systems, Inc.
Azure Networks, LLC
Eclipse IP LLC
NUMBER OF PATENT ACCUSATIONS

YEAR IN REVIEW | 2015
Page 13 ©2016 Docket Navigator. All Rights Reserved.
TOP ACCUSED INFRINGERS In District Court Cases in 2015
14
14
14
15
16
16
16
16
16
17
18
18
18
18
20
21
25
26
26
30
31
31
32
32
32
34
36
40
45
50
55
61
BlackBerry Corporation
Panasonic Corp. of North…
Sony Mobile Comm. (USA) Inc.
Cisco Systems, Inc.
Huawei Technologies USA, Inc.
Target Corporation
Motorola Mobility, LLC
Alcatel-Lucent USA Inc.
ASUS Computer International
Google Inc.
Cellco Partnership d/b/a…
Lenovo (United States) Inc.
Wal-Mart Stores, Inc.
Acer America Corp.
Teva Pharmaceuticals USA, Inc.
Dr. Reddy's Laboratories, Inc.
Par Pharmaceutical, Inc.
AT&T Mobility LLC
Microsoft Corporation
Lupin Pharmaceuticals, Inc.
Dell, Inc.
ZTE (USA) Inc.
HTC America, Inc.
Apotex Inc.
Amneal Pharmaceuticals LLC
Actavis, Inc.
LG Electronics USA, Inc.
Hewlett-Packard Company
Amazon.com, Inc.
Mylan Pharmaceuticals Inc.
Apple Inc.
Samsung Electronics America,…
NUMBER OF NEW PATENT CASES
53
53
54
56
56
58
60
61
66
67
68
70
75
76
76
76
85
94
97
105
105
106
110
132
149
162
189
192
222
229
240
247
424
Hetero USA Inc.
Sigmapharm Laboratories, LLC
Prinston Pharmaceutical Inc.
Collegium Pharmaceutical, Inc.
Taro Pharmaceuticals USA,…
Alvogen Pine Brook, Inc.
Paddock Laboratories, LLC
Aurobindo Pharma Limited
Acer America Corp.
Fresenius Kabi USA, LLC
Sandoz Inc.
Accord Healthcare, Inc.
HEC Pharm Co., Ltd.
ASUS Computer International
Ford Motor Company
Microsoft Corporation
Amazon.com, Inc.
Teva Pharmaceuticals USA,…
InvaGen Pharmaceuticals Inc.
Dell, Inc.
HTC America, Inc.
LG Electronics USA, Inc.
ZTE (USA) Inc.
Dr. Reddy's Laboratories, Inc.
Hewlett-Packard Company
Apotex Inc.
Samsung Electronics…
Par Pharmaceutical, Inc.
Actavis Laboratories FL, Inc.
Lupin Limited
Amneal Pharmaceuticals LLC
Apple Inc.
Mylan Pharmaceuticals Inc.
NUMBER OF PATENT ACCUSATIONS

YEAR IN REVIEW | 2015
Page 14 ©2016 Docket Navigator. All Rights Reserved.
TOP PATENTEE FIRMS In District Court Cases in 2015
56
59
59
60
62
64
74
79
87
88
91
98
99
101
103
120
136
137
139
143
145
157
175
273
425
Collins Edmonds…
Paul Hastings
Devlin Law Firm
Russ August & Kabat
Parker Bunt & Ainsworth
Bayard
Cotman IP Law Group
Finnegan Henderson…
Direction IP Law
Ferraiuoli LLC
DiNovo Price Ellwanger &…
Farnan
Corcoran IP Law
Scheef & Stone
Olavi & Dunne
McCarter & English
Brandt Law Firm
Capshaw DeRieux
Morris Nichols Arsht &…
Ni Wang & Massand
Kizzia & Johnson
Stamoulis & Weinblatt
Spangler Law
Tadlock Law Firm
Austin Hansley PLLC
NUMBER OF NEW PATENT CASES
46
46
47
47
48
50
50
53
54
55
55
58
58
63
66
67
71
72
73
78
78
96
106
123
159
Ashby & Geddes
Wilmer Cutler Pickering…
Nelson Bumgardner
McCarter & English
Hayes Messina Gilman &…
Foley & Lardner
McDermott Will & Emery
Paul Hastings
Albritton Law Firm
Niro Haller & Niro
Dechert
Latham & Watkins
Susman Godfrey
Morris Nichols Arsht &…
Bayard
Cooley
Russ August & Kabat
Quinn Emanuel Urquhart &…
Finnegan Henderson…
McKool Smith
Capshaw DeRieux
Fish & Richardson
Farnan
Perkins Coie
Ward Smith & Hill
NUMBER OF LITIGATION MILESTONES
YEAR IN REVIEW | 2015
Page 15 ©2016 Docket Navigator. All Rights Reserved.
TOP PATENTEE LAWYERS In District Court Cases in 2015
66
67
68
70
72
72
74
74
75
87
87
88
95
96
98
99
100
101
102
117
119
119
119
127
128
135
136
137
137
145
158
158
175
223
242
273
423
423
Krystal L. Gibbens
Maryellen Noreika
Dorian S. Berger
Daniel L. Schmid
Daniel C. Cotman
Daniel P. Hipskind
Rasheed M. McWilliams
Michael J. Farnan
Andrew G. DiNovo
David B. Dyer
David R. Bennett
Eugenio J. Torres-Oyola
D. Jeffrey Rambin
Brian J. Dunne
Brian E. Farnan
Peter J. Corcoran, III
Jaspal S. Hare
Bryan R. Haynes
Matt Olavi
Timothy Wang
Stevenson Moore V
Anthony Ricciardelli
D. Bradley Kizzia
Neal G. Massand
Jack B. Blumenfeld
Elizabeth L. DeRieux
Benton Patterson
Hao Ni
Todd Y. Brandt
Jay B. Johnson
Richard C. Weinblatt
Stamatios Stamoulis
Andrew W. Spangler
John J. Harvey, Jr.
Keith Smiley
Craig Tadlock
Brandon M. LaPray
Austin Hansley
NUMBER OF NEW PATENT CASES
37
37
37
37
37
37
38
38
38
38
39
39
39
39
40
40
43
44
44
44
45
45
47
48
52
53
56
59
66
68
69
72
76
78
90
106
120
142
Bindu A. Palapura
Blake B. Greene
Courtland Reichman
Richard C. Weinblatt
Terrence P. McMahon
Timothy J. Devlin
Dean G. Bostock
Matthew D. Powers
Paul J. Cronin
Stephen E. Edwards
Christopher D. Banys
Jennifer Lu Gilbert
Kevin Gannon
Richard C. Lin
Andrew C. Mayo
Stamatios Stamoulis
Michael James Ercolini
James C. Hall
Samiyah Diaz
Thomas R. Fulford
James J. Foster
Steven E. Lipman
Paul J. Hayes
Martin J. Black
Eric M. Albritton
Jack B. Blumenfeld
Vanessa R. Tiradentes
Richard D. Kirk
Stephen B. Brauerman
S. Calvin Capshaw
Marc A. Fenster
D. Jeffrey Rambin
Michael J. Farnan
Elizabeth L. DeRieux
Claire Abernathy Henry
Brian E. Farnan
J. Wesley Hill
T. John Ward, Jr.
NUMBER OF LITIGATION MILESTONES

YEAR IN REVIEW | 2015
Page 16 ©2016 Docket Navigator. All Rights Reserved.
TOP ACCUSED INFRINGERS FIRMS In District Court Cases in 2015
37
37
37
38
40
40
41
42
45
46
47
48
48
49
49
50
50
52
62
65
72
75
97
136
172
278
Yarbrough Wilcox
Kilpatrick Townsend &…
Pillsbury Winthrop Shaw…
Young Conaway Stargatt…
Finnegan Henderson…
Greenberg Traurig
Quinn Emanuel Urquhart &…
Siebman Burg Phillips &…
Morgan Lewis & Bockius
Wilson Robertson &…
Duane Morris
The Dacus Firm
Wilson Sonsini Goodrich &…
Haltom and Doan
Alston & Bird
Baker Botts
Potter Anderson & Corroon
Cooley
Perkins Coie
Winston & Strawn
Findlay & Craft
DLA Piper
Morris Nichols Arsht &…
Potter Minton
Gillam & Smith
Fish & Richardson
NUMBER OF NEW PATENT CASES
76
76
79
86
88
89
92
93
94
96
97
97
97
98
99
105
107
114
124
131
144
146
148
161
167
180
185
Morrison & Foerster
K&L Gates
Wilson Sonsini Goodrich…
Weil Gotshal & Manges
Gibson Dunn & Crutcher
Findlay & Craft
Foley & Lardner
Paul Hastings
Kilpatrick Townsend &…
Sidley Austin
Cooley
Orrick Herrington & Sutcliffe
Kirkland & Ellis
Jones Day
McDermott Will & Emery
Potter Anderson & Corroon
DLA Piper
Latham & Watkins
Wilmer Cutler Pickering…
Winston & Strawn
Perkins Coie
Baker Botts
Potter Minton
Quinn Emanuel Urquhart…
Gillam & Smith
Morris Nichols Arsht &…
Fish & Richardson
NUMBER OF LITIGATION MILESTONES
To view average times to milestones like claim construction or trial for specific courts or judges, click the “TIME TO MILESTONES” tab on the main Docket Navigator search page.

YEAR IN REVIEW | 2015
Page 17 ©2016 Docket Navigator. All Rights Reserved.
TOP ACCUSED INFRINGERS LAWYERS In District Court Cases in 2015
19
19
19
20
22
23
24
24
26
27
27
28
31
33
33
33
33
36
36
37
41
42
44
44
48
65
67
70
101
105
146
202
Stephen J Kraftschik
Liza M Walsh
William J O'Brien
Karen A Confoy
Anthony V Nguyen
Jennifer Ying
Brent Douglas McCabe
Elizabeth L DeRieux
Bindu A Palapura
Dallas William Tharpe
John C Phillips, Jr.
Kent E. Baldauf, Jr.
Michael C. Smith
John M. Guaragna
Harry L. Gillam, Jr.
J. Thad Heartfield
Michael A. Bittner
David E. Moore
Trey Yarbrough
Jennifer H. Doan
R. Brian Craft
David B. Conrad
Jennifer P Ainsworth
Jack B. Blumenfeld
Deron R. Dacus
Wasif H. Qureshi
Allen F. Gardner
Eric H. Findlay
Ricardo J. Bonilla
Michael Edwin Jones
Melissa Richards Smith
Neil J McNabnay
NUMBER OF NEW PATENT CASES
38
38
38
38
39
39
39
39
39
39
40
40
41
41
42
43
44
44
45
46
49
49
53
56
56
61
63
71
81
109
123
135
144
Terrence P. McMahon
John W. Shaw
Jennifer J. Rho
J. Mark Mann
David A. Nelson
Dabney J. Carr, IV
William F. Lee
R. Brian Craft
J. Thad Heartfield
Edward R. Reines
I. Neel Chatterjee
Charles K. Verhoeven
Patrick Colbert Clutter, IV
Eric M. Albritton
Yar R. Chaikovsky
Jennifer H. Doan
Shawn A Latchford
Harry L. Gillam, Jr.
Debby E. Gunter
Jeffrey G. Homrig
Ramsey M. Al-Salam
Deron R. Dacus
Eric H. Findlay
Jennifer P. Ainsworth
John F. Bufe
Bindu A. Palapura
Trey Yarbrough
Richard L. Horwitz
David E. Moore
Allen F. Gardner
Jack B. Blumenfeld
Michael Edwin Jones
Melissa Richards Smith
NUMBER OF LITIGATION MILESTONES

YEAR IN REVIEW | 2015
Page 18 ©2016 Docket Navigator. All Rights Reserved.
TOP PATENT CLASSIFICATIONS By Number of Determinations 2008-2015
0 500 1000 1500 2000 2500 3000 3500 4000 4500 5000 5500
Plants
Agriculture, Food, Textiles
Nuclear & X-rays
Heating
Pipes & Joints
Metal Working
Semiconductor Devices
Gas Chemical
Motors & Engines & Parts
Amusement Devices
Earth Working & Wells
Resins
Coating Chemical
Electrical Lighting
Biotechnology
Agriculture, Husbandry, Food
Apparel & Textile
Electrical Devices
Measuring & Testing
Information Storage
Transportation
Power Systems
Furniture, House Fixtures
Receptacles
Materials Processing & Handling
Surgery & Medical Instruments
Organic Compounds
Design
Computer Peripherials
Drugs
Communications
Computer Hardware & Software
Optics
InfringedNot invalidNot unenforceableNot infringedUnenforceableInvalid
You can find a list of cases involving a specific class of patents with a CASES SEARCH, FILTERED BY PATENT CLASSIFICATION.

YEAR IN REVIEW | 2015
Page 19 ©2016 Docket Navigator. All Rights Reserved.
TOP COURTS By New Cases, New Litigants, and New Accusations The volume of litigation activity is often expressed in terms of number of cases. But cases are not equal in size or complexity. This is particularly true since the enactment of the AIA joinder rules, which prompted many plaintiffs to file multiple cases where they previously would have filed one. In addition, failure to account for case relationships (transfers of venue, consolidations, etc.) can further skew the results. (See “Related Cases” on page 54.)
In addition to the number of cases, we measure the number of litigants involved in those new cases. In this way, cases involving multiple defendants are given greater weight that cases involving a single defendant. We also measure the number of accusations asserted in those cases, so cases involving multiple patents are given more weight than cases involving a single patent. (See “Patent Accusations” on page 53.) The result is a more granular measure of litigation activity.
Looking at 2015, 44.2% of all new patent cases were filed in the EDTX. But those cases involved only 27.9% of the litigants in new cases. Further, the new EDTX cases involved only 19.4% of all new accusations, whereas new DED cases involved of 22.5%.
TXED 44.2%
TXED 27.9%
TXED 19.4%
DED 9.4%
DED 17.7%
DED 22.5%
CACD 4.8%
CACD 7.1%CACD 8.8%
NJD 4.7%
NJD 6.6% NJD 9.6%
CAND 3.9%CAND 5.3% CAND 4.8%
ILND 2.8%ILND 2.5% ILND 2.5%
NYSD 2.6%NYSD 2.4% NYSD 3.3%
FLSD 2.2%FLSD 2.2% FLSD 1.8%
Others 25.4% Others 28.4% Others 27.4%
0%
10%
20%
30%
40%
50%
60%
70%
80%
90%
100%
5,762 CASES 17,099 PARTIES 27,908 ACCUSATIONS

YEAR IN REVIEW | 2015
Page 20 ©2016 Docket Navigator. All Rights Reserved.
AVERAGE TIME TO CLAIM CONSTRUCTION By Court 2008-2015 This chart shows the average number of days from case filing to claim construction by US district courts with at least 15 claim construction orders filed between 2008 and 2015. The national average for all patent litigation cases over the same period was just under two years, 720 days. Eighteen courts beat the national average, with Virginia Eastern and Wisconsin Western Districts occupying the top two positions.
1,246
1,219
1,021
982
950
915
892
891
874
864
839
830
828
822
817
812
807
790
785
784
783
775
734
709
707
694
692
689
668
668
664
658
650
635
626
624
606
572
518
440
391
Connecticut District
Pennsylvania Middle District
Court of Federal Claims
Ohio Southern District
New York Eastern District
Utah District
Nevada District
Illinois Northern District
Michigan Eastern District
New Jersey District
Indiana Southern District
Ohio Northern District
Colorado District
Wisconsin Eastern District
Nebraska District
Georgia Northern District
New York Northern District
Texas Southern District
Michigan Western District
Delaware District
Maryland District
Minnesota District
New York Southern District
North Carolina Western District
Texas Western District
Pennsylvania Eastern District
Florida Middle District
Massachusetts District
Arizona District
Pennsylvania Western District
Texas Eastern District
California Northern District
Oregon District
Texas Northern District
California Southern District
California Central District
Washington Western District
Missouri Eastern District
Florida Southern District
Wisconsin Western District
Virginia Eastern District
YEAR IN REVIEW | 2015
Page 21 ©2016 Docket Navigator. All Rights Reserved.
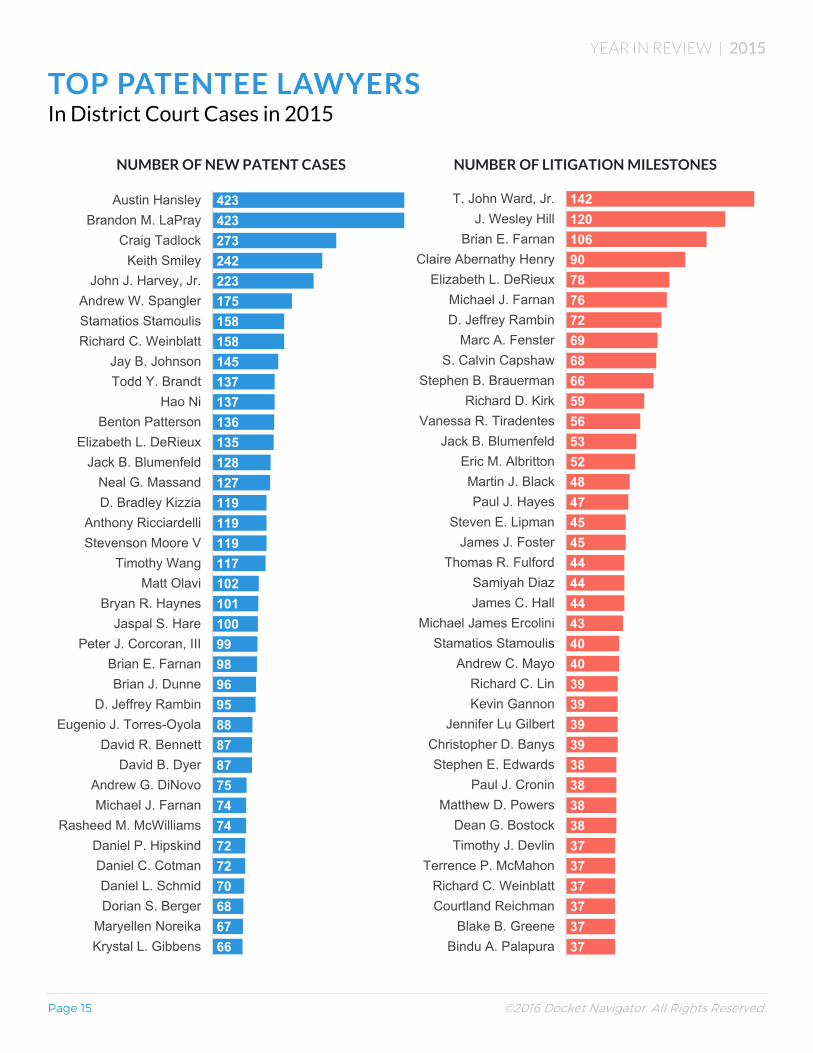
AVERAGE TIME TO SUMMARY JUDGMENT By Court 2008-2015 This chart shows the average number of days from case filing to a motion for summary judgment (MSJ) in US District Courts for orders which occurred between 2008 and 2015. The chart labeled “MSJ in favor of patentee” shows times for motions, which if granted, would favor the patentee. Conversely, the chart labeled “MSJ against patentee” shows times for motions, which if granted, would favor an accused infringer or patent challenger. Only districts with at least 15 orders between 2008 and 2015 are shown.
1,897
1,535
1,409
1,340
1,336
1,316
1,310
1,254
1,247
1,196
1,160
1,143
1,083
1,057
1,036
1,027
1,007
995
988
948
926
912
908
888
857
808
802
800
483
483
453
New York Eastern
Michigan Eastern
Oregon
New York Northern
Utah
Washington Western
Georgia Northern
Ohio Northern
Illinois Northern
Illinois Central
Nevada
New Jersey
Massachusetts
Delaware
Nebraska
Minnesota
Pennsylvania Western
Wisconsin Eastern
New York Southern
Texas Southern
California Northern
Colorado
California Southern
Maryland
Texas Eastern
California Central
Missouri Eastern
Florida Middle
Wisconsin Western
Virginia Eastern
Florida Southern
MSJ IN FAVOR OF PATENTEE
1,5511,4821,4181,3811,3501,3471,3131,3041,2831,2711,2611,2461,2311,2061,1751,1371,1231,1081,0901,0821,0521,0271,0231,0131,002986980967965916915904903899889859839831807804758683650490397
ConnecticutNew York Eastern
DCCt. Federal Claims
NY NorthernOregon
Ohio NorthernMichigan Eastern
Ohio SouthernIndiana Southern
NevadaUtah
Georgia NorthernPenn. Middle
ArizonaDelaware
Illinois CentralMissouri Eastern
New York SouthernNew Jersey
Oklahoma WesternCalifornia Eastern
Illinois NorthernMaryland
MassachusettsPenn. Eastern
Wisconsin EasternMichigan Western
Penn. WesternMinnesota
N.C. WesternNebraska
Texas SouthernTexas WesternTexas Northern
ColoradoCalifornia Northern
California CentralCalifornia Southern
Texas EasternFlorida Middle
Wash. WesternFlorida Southern
Wisconsin WesternVirginia Eastern
MSJ AGAINST PATENTEE

YEAR IN REVIEW | 2015
Page 22 ©2016 Docket Navigator. All Rights Reserved.
AVERAGE TIME TO TRIAL By Court 2008-2015 This chart shows the average number of days from case filing to a trial event in US District Courts with at least 10 occurrences between 2008 and 2015. The national average for all patent litigation cases over the same period was 1,203 days.
1,973
1,828
1,614
1,426
1,290
1,277
1,238
1,200
1,178
1,166
1,124
1,095
998
977
954
917
889
719
514
Illinois Northern District
Colorado District
Nevada District
Massachusetts District
New York Southern District
California Northern District
Arizona District
California Southern District
New Jersey District
Delaware District
Pennsylvania Western District
California Central District
Washington Western District
Texas Eastern District
Texas Northern District
Florida Southern District
Florida Middle District
Wisconsin Western District
Virginia Eastern District
You can find all Verdicts issued since 2008 with a DOCUMENTS SEARCH. Want to add bench rulings? Click the pencil icon next to the “type of court document” in the Search Criteria, then click “FINDINGS OF FACT AND CONCLUSIONS OF LAW”.

YEAR IN REVIEW | 2015
Page 23 ©2016 Docket Navigator. All Rights Reserved.
TOP JUDGES By New Cases, New Litigants, and New Accusations This chart shows a comparison of the top judges by number of new patent litigation cases filed in 2015, the number of litigants in those new cases, and the number of accusations in those cases. The total number of new district court cases increased, as did the number of cases assigned to the top eight judges. The top eight judges presided over 63.9% of all new cases in 2015; almost the same group of eight presided over 52% in 2014. Judge Rodney Gilstrap continues to carry the lion’s share (24.6%) of patent litigation with a total of 1,686 cases filed in 2015. Although the top eight judges were assigned 63.9% of all new cases in 2015, those cases involved only 42.1% of the litigants in all new district court cases and only 36.3% of the accusations in those cases. (See page 53 for information on how accusations are calculated.)
Rodney Gilstrap 24.6%Rodney Gilstrap 16.6%
Rodney Gilstrap 11.8%
Roy S. Payne 15.6%
Roy S. Payne 10.4%
Roy S. Payne 7.1%
Robert W. Schroeder, III 12.2%
Robert W. Schroeder, III 7.1%
Robert W. Schroeder, III 5.4%
John D. Love 3.5%
John D. Love 2.2%
John D. Love 2.4%
Richard G. Andrews 2.7%
Richard G. Andrews 1.9%
Richard G. Andrews 3.3%
Gregory M. Sleet 1.9%
Gregory M. Sleet 1.5%
Gregory M. Sleet 2.4%
Leonard P. Stark 1.8%
Leonard P. Stark 1.3%
Leonard P. Stark 2.0%
Sue L. Robinson 1.6%
Sue L. Robinson 1.2%
Sue L. Robinson 1.8%
Others 36.1%
Others 57.9%
Others 63.7%
0%
10%
20%
30%
40%
50%
60%
70%
80%
90%
100%
6,846 CASES 33,027 LITIGANTS 46,541 ACCUSATIONS

YEAR IN REVIEW | 2015
Page 24 ©2016 Docket Navigator. All Rights Reserved.
AVERAGE TIME TO CLAIM CONSTRUCTION By Judge The chart below shows the average number of days from case filing to claim construction for judges with at least 20 claim construction orders filed between 2008 and 2015. The national average for all patent litigation cases over the same period was just under two years, 720 days.
1,021984
896884
853791767
765754
738728720
706701
691688686
680678
664661659
654612
606606605
589578
571554541
521517
505491479
437434
412405
Peter G. SheridanMary L. CooperJeffrey S. White
Sue L. RobinsonMary Pat ThyngeRonald M. WhyteLeonard P. Stark
Lee YeakelF. Dennis Saylor, IVRichard G. Andrews
Gregory M. SleetPaul S. Grewal
Ann D. MontgomeryJoel A. PisanoLeonard Davis
Caroline CravenMichael H. Schneider
Cathy Ann BencivengoRodney Gilstrap
Keith F. GiblinSam Sparks
Susan IllstonColleen McMahon
Barbara M. G. LynnDean D. Pregerson
James V. SelnaRoy S. PayneJohn D. LoveJon S. Tigar
R. Gary KlausnerMarilyn L. Huff
Andrew J. GuilfordMariana R. Pfaelzer
Lucy H. KohRon Clark
John A. KronstadtWilliam M. ConleyDana M. SabrawOtis D. Wright, IIWilliam H. Alsup
Barbara B. Crabb

YEAR IN REVIEW | 2015
Page 25 ©2016 Docket Navigator. All Rights Reserved.
AVERAGE TIME TO MOTION For Summary Judgment by Judge The charts below show the average number of days from case filing to a Motion for Summary Judgment (MSJ) ruling by district court judges which occurred between 2008 and 2015. The chart labeled “MSJ in favor of patentee” shows times for motions, which if granted, would favor the patentee. Conversely, the chart labeled “MSJ against patentee” shows times for motions, which if granted, would favor an accused infringer or patent challenger.
For MSJ against patentee, only judges with at least 20 total MSJ orders between 2008 and 2015 were considered. Since there were far fewer MSJ orders in favor overall, for those orders the minimum threshold was lowered to 10 total MSJ orders.
The national average for all patent litigation cases over the same period was roughly comparable, at 1,013 and 945 days respectively.
1,648
1,549
1,472
1,182
1,158
1,139
1,115
1,086
1,065
1,062
1,057
979
970
930
924
835
823
814
784
736
677
631
596
535
524
487
450
345
Benjamin H. Settle
F. Dennis Saylor, IV
Mary L. Cooper
James F. Holderman
Leonard P. Stark
Mary S. Scriven
Susan Illston
Joan N. Ericksen
Stanley R. Chesler
Richard G. Andrews
Robert W. Schroeder, III
Rodney Gilstrap
William C. Griesbach
Leonard Davis
Sue L. Robinson
Dana M. Sabraw
Marilyn L. Huff
R. Gary Klausner
Cormac J. Carney
James V. Selna
Mariana R. Pfaelzer
John D. Love
Andrew J. Guilford
William M. Conley
Philip S. Gutierrez
Leonie M. Brinkema
Barbara B. Crabb
William G. Young
MSJ IN FAVOR OF PATENTEE
1,5671,3191,2661,2381,0801,0421,006975956895864864840825824808762751744703698674673666653631624600545514511506469464339314289
Mary Pat Thynge
Richard G. Stearns
Virginia M. Kendall
Leonard P. Stark
R. Gary Klausner
Richard G. Andrews
Rodney Gilstrap
Ronald M. Whyte
Sue L. Robinson
Andrew J. Guilford
Claudia Wilken
George H. Wu
Susan Illston
Roy S. Payne
Richard Seeborg
Paul S. Grewal
Leonard Davis
William C. Griesbach
Dana M. Sabraw
Cormac J. Carney
Michael H. Schneider
Mariana R. Pfaelzer
William H. Alsup
John D. Love
Lucy H. Koh
Ron Clark
Marilyn L. Huff
William G. Young
James V. Selna
William M. Conley
Otis D. Wright, II
Katherine B. Forrest
Leonie M. Brinkema
Barbara B. Crabb
Jed S. Rakoff
Richard A. Posner
Gerald Bruce Lee
MSJ AGAINST PATENTEE

YEAR IN REVIEW | 2015
Page 26 ©2016 Docket Navigator. All Rights Reserved.
AVERAGE TIME TO TRIAL By Judge The chart below shows the average number of days from case filing to a trial event before District Court judges with at least six occurrences between 2008 and 2015. The national average for all patent litigation cases over the same period was 1,203 days.
2,368
1,837
1,537
1,433
1,270
1,154
1,126
1,055
1,055
1,033
1,031
999
999
992
965
954
922
920
781
777
729
709
693
673
505
382
Ronald M. Whyte
John A. Houston
Leonard P. Stark
Jose L. Linares
Roy S. Payne
Sue L. Robinson
Dana M. Sabraw
Marilyn L. Huff
William H. Alsup
Ricardo S. Martinez
Richard G. Andrews
Paul S. Grewal
Joel A. Pisano
Rodney Gilstrap
Gregory M. Sleet
Peter G. Sheridan
Leonard Davis
James V. Selna
Barbara B. Crabb
Lucy H. Koh
John D. Love
Ron Clark
William M. Conley
Michael H. Schneider
Jed S. Rakoff
Manuel L. Real
You can view a JUDGE’S LITIGATION HISTORY in patent cases with a Judges search. Just click Judges on our SEARCH PAGE, type in the last name and click the judge’s full name in the drop-down suggestions. Be sure to click the tabs across the top of the page to reveal more information.

YEAR IN REVIEW | 2015
Page 27 ©2016 Docket Navigator. All Rights Reserved.
COMPARISON OF JURY TRIAL, BENCH TRIAL AND DISPOSITIVE MOTION OUTCOMES 2008-2015 These charts show how patent determinations differ based on the jurisdiction and type of proceeding. It is designed to help answer questions like: “Am I more likely to succeed with a jury or in a bench trial?” or “Are juries in Delaware more likely to favor patent owners than juries in New Jersey?”
The line labeled “verdict” represents determinations rendered in jury verdicts. The line labeled “FFCL” represents determinations rendered in FRCP 52 Findings of Fact and Conclusions of Law following bench trials. The line labeled “MSJ” represents determinations rendered in orders on summary judgment motions. The line labeled “Other” represents determinations rendered in all other types of court documents.
ALL US DISTRICT COURTS
Across all US district courts, over 70% of all bench trial determinations favored patentees. Jury trial determinations also favored patentees, but to a lesser degree. On the other hand, 67.5% of summary judgment determinations favor accused patent infringers or patent challengers.
Infringed Not Invalid Not Unenforceable Not Infringed Unenforceable Invalid However, a closer look at the top courts shows even more variation. (next page)
1,330
364
166
519
1,470
640
236
602
607
228
168
35
1,052
1,666
90
398
81
42
52
9
1,021
854
93
183
0% 10% 20% 30% 40% 50% 60% 70% 80% 90% 100%
Other
MSJ
FFCL
Verdict
Each colored line represents the determinations rendered in a specific type of proceeding: jury trial, bench trial, summary judgment, or other. Colors correspond to the type of determination. Blue shades represent determinations that favor patentees.
HOW TO READ THESE CHARTS
DETERMINATIONS THAT FAVOR ACCUSED INFRINGERS
DETERMINATIONS THAT FAVOR PATENTEES

YEAR IN REVIEW | 2015
Page 28 ©2016 Docket Navigator. All Rights Reserved.
COMPARISON OF JURY TRIAL, BENCH TRIAL AND DISPOSITIVE MOTION OUTCOMES Continued
Infringed Not Invalid Not Unenforceable Not Infringed Unenforceable Invalid
144
19
49
78
189
63
77
99
47
16
38
4
193
169
33
72
15
13
174
94
30
36
0% 20% 40% 60% 80% 100%
Other
MSJ
FFCL
Verdict
DELAWARE DISTRICT
110
43
3
12
106
91
2
17
36
43
5
4
105
246
11
11
7
10
2
122
153
7
6
0% 20% 40% 60% 80% 100%
Other
MSJ
FFCL
Verdict
CALIFORNIA CENTRAL DISTRICT
169
21
15
141
277
120
16
154
63
7
37
1
153
105
5
98
3
4
134
69
50
0% 20% 40% 60% 80% 100%
Other
MSJ
FFCL
Verdict
TEXAS EASTERN DISTRICT
32
6
22
6
31
25
20
6
16
6
10
1
54
70
5
2
8
3
5
69
55
8
0% 20% 40% 60% 80% 100%
Other
MSJ
FFCL
Verdict
NEW YORK SOUTHERN DISTRICT
74
38
29
2
67
19
35
4
22
3
11
1
29
27
10
4
5
1
2
2
38
14
17
3
0% 20% 40% 60% 80% 100%
Other
MSJ
FFCL
Verdict
NEW JERSEY DISTRICT
34
27
51
65
26
10
69
13
9
2
1
104
191
69
1
2
3
2
100
100
25
0% 20% 40% 60% 80% 100%
Other
MSJ
FFCL
Verdict
CALIFORNIA NORTHERN DISTRICT
32
11
1
22
54
20
2
19
14
18
3
1
56
60
1
15
13
2
6
31
19
5
0% 20% 40% 60% 80% 100%
Other
MSJ
FFCL
Verdict
CALIFORNIA SOUTHERN DISTRICT
23
11
4
27
14
4
6
16
4
24
64
6
11
4
24
34
0% 20% 40% 60% 80% 100%
Other
MSJ
FFCL
ILLINOIS NORTHERN DISTRICT
YEAR IN REVIEW | 2015
Page 29 ©2016 Docket Navigator. All Rights Reserved.
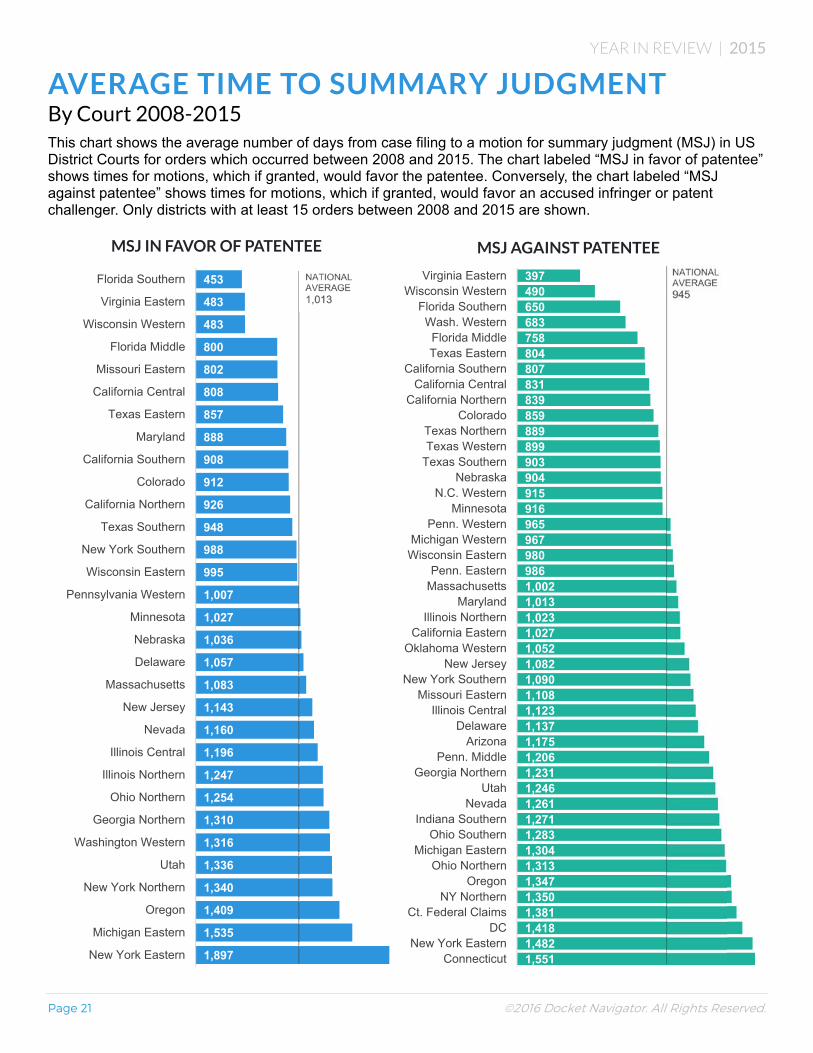
OUTCOMES OF 35 U.S.C. § 101 CHALLENGES These charts show the outcomes of judicial decisions on challenges to patent validity under 35 U.S.C. § 101 after Alice Corporation Pty. Ltd. v. CLS Bank International, et al., 573 U.S. ___, 134 S.Ct. 2347 (2014), through the end of 2015. During that time, U.S. district courts addressed 191 Section 101 patent challenges, 67% of which were resolved favorable or partially favorable to the patent challengers. But, importantly, the results vary significantly by district. In EDTX, only 35% of challenges were resolved favorable or partially favorable to the patent challengers. Conversely, DED resolved 88% of § 101 challenges in favor or partially in favor of the patent challenger.
Also interesting, the timing of the motion in relation to the stage of litigation does not appear to affect the outcomes. Within a specific court, the grant rate for challenges brought in the early stages of litigation is very close to the grant rate for challenges brought at a mature stage.
8
13
13
23
109
1
1
3
7
20
17
6
6
4
64
0% 10% 20% 30% 40% 50% 60% 70% 80% 90% 100%
TXED
CACD
CAND
DED
National
All § 101 Challenges
3
1
3
8
28
1
1
5
11
6
2
1
18
0% 10% 20% 30% 40% 50% 60% 70% 80% 90% 100%
TXED
CACD
CAND
DED
National
§ 101 Challenges Asserted in Early Stage
5
12
10
15
81
1
2
2
9
11
4
6
3
46
0% 10% 20% 30% 40% 50% 60% 70% 80% 90% 100%
TXED
CACD
CAND
DED
National
§ 101 Challenges Asserted in Mature Stage
Favorable to Patent Challenger Partially Favorable to Patent Challenger Favorable to Patentee

YEAR IN REVIEW | 2015
Page 30 ©2016 Docket Navigator. All Rights Reserved.
MOTION SUCCESS RATES 2012-2015 This chart shows the success rates of more than 40 types of motions from 2012 to 2015. Excluding single-year variances, the national success rate for most types of motions remained relatively stable over the four-year period. This might suggest that, despite significant changes in the legal landscape, the daily administration of patent disputes in US district courts remains relatively unchanged. A few notable exceptions include:
o Motions for summary judgment of patent invalidity: In 2012 and 2013, the success rate of summary judgment motions challenging the validity was around 30% each year. But in 2014 and 2015, the success rate jumped to more than 40%, likely reflecting the impact of challenges under 35 U.S.C. § 101 after Alice Corporation Pty. Ltd. v. CLS Bank International, et al., 573 U.S. ___, 134 S.Ct. 2347 (2014).
o Motions for summary judgment of no willful infringement: Success rates skyrocketed from less than 10% in 2011 to more than 70% in 2014, likely due to the heightened standard under Bard Peripheral Vascular, Inc. v. W.L. Gore and Assocs., Inc., 682 F.3d 1003 (Fed. Cir. 2012) (en banc) and 35 U.S.C. § 298. In 2015, however, the success rate fell to just over 51%.
o Motions to limit the number of claims or prior art: Success rates increased from about 50% in 2011 to more than 80% in 2015.
44.4%
100.0%
72.4%
68.0%
69.5%
54.5%
43.3%
34.7%
55.6%
46.7%
52.8%
57.7%
29.4%
33.3%
76.4%
0% 20% 40% 60% 80% 100%
Motion to Bifurcate
Motion to Stay Pending Investigation by ITC
Motion to Stay Pending Inter Partes Review
Motion to Stay Pending CBM Review
Motion to Stay Pending Reexamination
Motion for Judgment on the Pleadings
Motion to Dismiss -- Failure to State a Claim
Motion to Dismiss -- Lack of Personal Jurisdiction
Motion to Dismiss -- Lack of Subject Matter
Motion to Dismiss -- Lack of Standing
Motion to Transfer Venue -- Convenience
Motion re First-to-File Rule
Motion for Preliminary Injunction
Motion to Disqualify Counsel
Motion to Amend or Supplement Pleading
2015201420132012

YEAR IN REVIEW | 2015
Page 31 ©2016 Docket Navigator. All Rights Reserved.
MOTION SUCCESS RATES Continued
56.3%
58.3%
31.6%
50.0%
92.9%
17.9%
34.4%
20.7%
13.9%
11.8%
25.7%
50.0%
38.6%
40.0%
51.6%
51.3%
48.9%
31.3%
56.4%
40.9%
56.9%
35.6%
80.7%
52.9%
46.7%
51.1%
22.0%
37.0%
64.6%
0% 20% 40% 60% 80% 100%
Motion for Contempt (Permanent Injunction)
Motion for Enhanced Damages
Motion for Attorney Fees
Motion for Ongoing Royalty
Motion for Permanent Injunction
Motion for New Trial
Motion for Sanctions -- Court's Inherent Power
Motion for Sanctions (28 USC § 1927)
Motion for Sanctions (FRCP 11)
Motion for Interlocutory Appeal
Motion for Judgment as a Matter of Law
MSJ -- Claim Not Barred by SOL, Laches, Estoppel
MSJ -- Claim Barred by SOL, Laches, Estoppel
MSJ -- Claim Barred by Prior Agreement
MSJ -- Damages
MSJ -- No Willful Infringement
MSJ -- Not Unenforceable
MSJ -- Unenforceability
MSJ -- No Invalidity
MSJ -- Invalidity
MSJ -- Noninfringement
MSJ -- Infringement
Motion to Limit Number of Claims/Prior Art
Motion in Limine -- Fact Witness/Evidence/Exhibit
Motion in Limine -- Expert Testimony
Motion to Strike Expert Reports
Motion for Discovery Sanctions -- Issue/Evidence
Motion for Discovery Sanctions -- Monetary
Motion to Compel Discovery
2015
2014
2013
2012

YEAR IN REVIEW | 2015
Page 32 ©2016 Docket Navigator. All Rights Reserved.
DISTRICT COURT PATENT DETERMINATIONS 2008-2015 (Percentage) This chart shows the percentage of each type of patent determination based on the total number of determinations of all types for that year. 2015 saw a significant increase in the percentage of determinations of invalidity, nearly doubling the previous year’s number. In contrast, the percentage of infringement determinations in 2015 fell to 14.4%, the lowest level in at least eight years.
23.7% 23.8% 22.4% 23.8% 22.1%15.6%
22.6%
14.4%
22.3%18.6% 20.9%
25.9%23.4%
25.4%
28.7%
30.1%
9.8%
9.1% 7.2%
10.67%
10.1%
4.7%
10.5%
4.6%
25.7%
26.1% 30.0%
25.4%
26.7%
36.4%
22.4%
23.0%
3.3%
2.9%1.6%
0.5%
1.8% 1.5% 1.0%
0.8%
15.2%19.6% 17.9%
13.8% 15.9% 16.5% 14.9%
27.1%
0%
10%
20%
30%
40%
50%
60%
70%
80%
90%
100%
2008 2009 2010 2011 2012 2013 2014 2015
Infringed Not invalid Not unenforceable Not infringed Unenforceable Invalid
2014 14.9% 2015 27.1%
2014 22.6% 2015 14.4%
2014 11.5% 2015 5.4%
INVALID INFRINGED ENFORCEABILITY (COMBINED)

YEAR IN REVIEW | 2015
Page 33 ©2016 Docket Navigator. All Rights Reserved.
NEW PTAB PETITIONS 2012-2015 The chart below shows the number of new IPR, CBM, and PGR petitions filed in the Patent & Trademark Appeals Board (PTAB) by month.
0
25
50
75
100
125
150
175
200
Sep2012
Nov2012
Jan2013
Mar2013
May2013
Jul2013
Sep2013
Nov2013
Jan2014
Mar2014
May2014
Jul2014
Sep2014
Nov2014
Jan2015
Mar2015
May2015
Jul2015
Sep2015
Nov2015
Inter Partes Review
Post Grant Review
Covered Business Method
Want to be notified whenever a new PTAB petition is filed?
Just click “Create Alert” at the bottom of this LIST OF PTAB CASES.

YEAR IN REVIEW | 2015
Page 34 ©2016 Docket Navigator. All Rights Reserved.
NEW PTAB PETITIONS BY TECH CODE 2012-2015 This chart shows the number of IPR, CBM and PGR petitions by Tech Code that were filed in the PTAB each month. Each Tech Code is represented by a different colored band.
*Tech Code 2700 (Communications and information systems) has been split into Tech Codes: 2100 (Computer Architecture and Software) and 2600 (Communications). For purposes of this chart, Tech Code 2700 includes all three.
0
25
50
75
100
125
150
175
200
Sep2012
Nov2012
Jan2013
Mar2013
May2013
Jul2013
Sep2013
Nov2013
Jan2014
Mar2014
May2014
Jul2014
Sep2014
Nov2014
Jan2015
Mar2015
May2015
Jul2015
Sep2015
Nov2015
2700 Communications & Software*
2800 Semiconductors et al
3600 Transportation et al
3700 Mechanical et al
2400 Networking et al
1600 Biotech et al
1700 Chemical et al
other
YEAR IN REVIEW | 2015
Page 35 ©2016 Docket Navigator. All Rights Reserved.
INSTITUTION OUTCOMES — BY MONTH This chart shows the outcomes of institution decisions for individual patent claims challenged in an IPR, CBM, or PGR petition. Bars above the midline show the number of claims in which review was granted on at least one ground, bars below the midline show the number of claims in which review was denied on all grounds. Net Grants/Denials. The Net Grants/Denials line shows the net number of claims for which institution was granted minus the number denied. When the Net Grants/Denials line appears above the midline, it means more claims were granted institution of review than denied institution that month. When it appears below the midline it means more claims were denied institution than granted that month.
3 20 35 13 85 43 51 71 134
51 17 148
131
151
284
241
192
476
628
445
388
626
467
361
822
646
511
615
693
632
674
903
629
686
520
522
970
6
77
230
366
161
556
230
395
327
430
402
483
763
497
693
1,05
7
743
986
580
609
797
1,13
6
1,10
2
587
1,24
8
907
1,44
8
1,18
4
870
833
968
1,07
1
887
943
1,16
8
1,18
5
1,04
8
1,000
500
0
500
1,000
1,500
Dec2012
Feb2013
Apr2013
Jun2013
Aug2013
Oct2013
Dec2013
Feb2014
Apr2014
Jun2014
Aug2014
Oct2014
Dec2014
Feb2015
Apr2015
Jun2015
Aug2015
Oct2015
Dec2015
Claims Denied Institution
Claims Granted Institution
Net Claims Granted/Denied

YEAR IN REVIEW | 2015
Page 36 ©2016 Docket Navigator. All Rights Reserved.
INSTITUTION OUTCOMES — CUMULATIVE This chart is the same as the chart on the previous page, but adds a new line. Cumulative Claims Granted/Denied. The Cumulative Claims Granted/Denied line shows the cumulative number of net claims granted or denied institution each month. If the same number of claims were granted and denied institution over time, the Cumulative Claims Granted/Denied line would be horizontal. When the line rises, it indicates a trend toward granting institution. When the line falls, it indicates a trend toward denying institution.
SUCCESS RATES OF ALL PTAB CLAIMS SINCE THE AIA WAS ENACTED
1,000
1,000
3,000
5,000
7,000
9,000
11,000
13,000
Dec2012
Feb2013
Apr2013
Jun2013
Aug2013
Oct2013
Dec2013
Feb2014
Apr2014
Jun2014
Aug2014
Oct2014
Dec2014
Feb2015
Apr2015
Jun2015
Aug2015
Oct2015
Dec2015
Claims Granted Institution
Claims Denied Institution
Net Claims Granted/Denied
Cumulative Net Claims Granted/Denied
66%
YEAR IN REVIEW | 2015
Page 37 ©2016 Docket Navigator. All Rights Reserved.
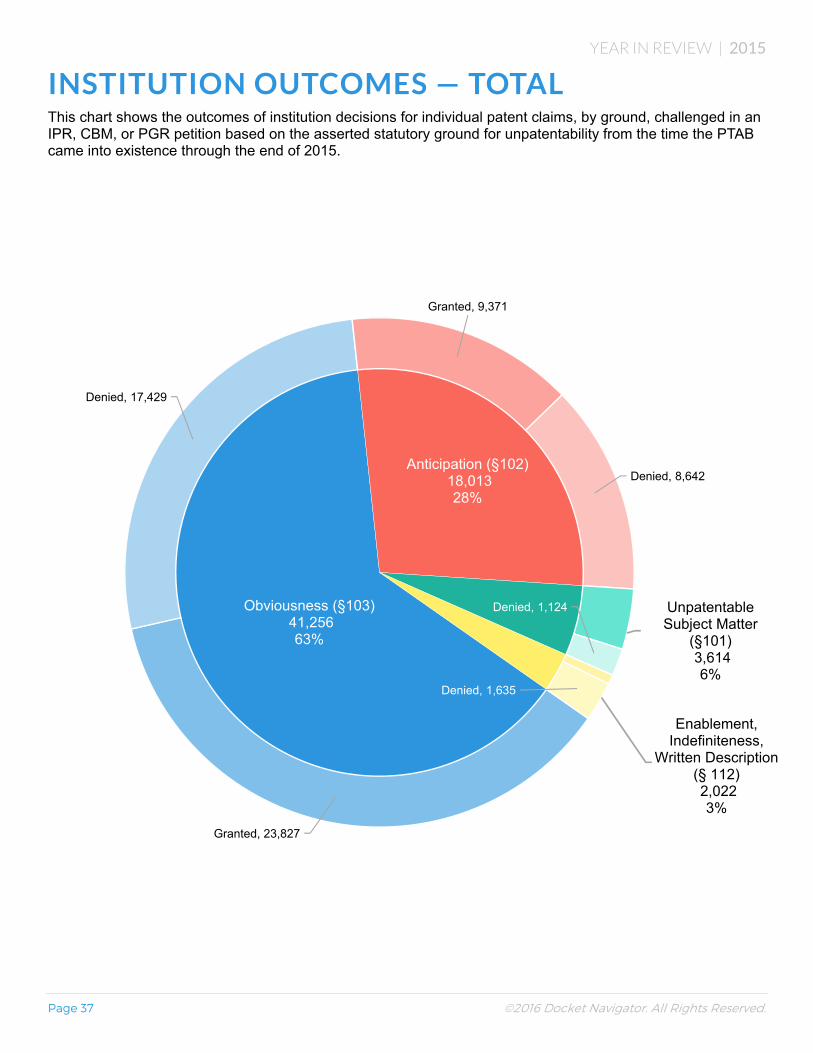
INSTITUTION OUTCOMES — TOTAL This chart shows the outcomes of institution decisions for individual patent claims, by ground, challenged in an IPR, CBM, or PGR petition based on the asserted statutory ground for unpatentability from the time the PTAB came into existence through the end of 2015.
Obviousness (§103)41,256 63%
Anticipation (§102)18,013 28%
Unpatentable Subject Matter
(§101)3,614 6%
Enablement, Indefiniteness,
Written Description (§ 112)2,022 3%
Granted, 23,827
Denied, 17,429
Granted, 9,371
Denied, 8,642
Denied, 1,124
Denied, 1,635

YEAR IN REVIEW | 2015
Page 38 ©2016 Docket Navigator. All Rights Reserved.
INSTITUTION OUTCOMES — § 101 For Claims Challenged on Unpatentable Subject Matter Grounds (35 U.S.C. § 101) This chart shows the outcomes of institution decisions for individual patent claims challenged in a PTAB petition on the ground of lack of patentable subject matter (35 U.S.C. § 101). Bars above the midline show the number of claims in which review was granted, bars below the midline show the number of claims in which review was denied. Net Grants/Denials. The Net Grants/Denials line shows the net number of claims for which institution was granted minus the number of claims denied. When the Net Grants/Denials line appears above the midline, it means more claims were granted institution of review than denied that month. When the Net Grants/Denials line appears below the midline, it means more claims were denied institution than granted that month. Cumulative Net Claims Granted/Denied. The Cumulative Net Claims Granted/Denied line shows the cumulative number of Net Grants/Denials. When the line rises, it indicates a trend toward granting institution; when the line falls, it indicates a trend toward denying institution. When the line is flat, it indicates the same number of claims are granted and denied institution of review.
SUCCESS RATE OF CLAIMS CHALLENGED UNDER 35 U.S.C. § 101 SINCE THE AIA WAS ENACTED
250
50
150
350
550
750
950
1150
1350
1550
1750
Jan2013
Mar2013
May2013
Jul2013
Sep2013
Nov2013
Jan2014
Mar2014
May2014
Jul2014
Sep2014
Nov2014
Jan2015
Mar2015
May2015
Jul2015
Sep2015
Nov2015
Claims Granted InstitutionClaims Denied InstitutionNet Claims Granted/DeniedCumulative Net Claims Granted/Denied
68.9%

YEAR IN REVIEW | 2015
Page 39 ©2016 Docket Navigator. All Rights Reserved.
INSTITUTION OUTCOMES — § 102 For Claims Challenged on Anticipation Grounds (35 U.S.C. § 102) This chart shows the outcomes of institution decisions for individual patent claims challenged in a PTAB petition on anticipation (35 U.S.C. § 102) grounds. Bars above the midline show the number of claims in which review was granted, bars below the midline show the number of claims in which review was denied. Net Grants/Denials. The Net Grants/Denials line shows the net number of claims for which institution was granted minus the number of claims denied. When the Net Grants/Denials line appears above the midline, it means more claims were granted institution of review than denied that month. When the Net Grants/Denials line appears below the midline, it means more claims were denied institution than granted that month. Cumulative Net Claims Granted/Denied. The Cumulative Net Claims Granted/Denied line shows the cumulative number of Net Grants/Denials. When the line rises, it indicates a trend toward granting institution; when the line falls, it indicates a trend toward denying institution. When the line is flat, it indicates the same number of claims are granted and denied institution of review.
SUCCESS RATE OF CLAIMS CHALLENGED UNDER 35 U.S.C. § 102 SINCE THE AIA WAS ENACTED
600
400
200
0
200
400
600
800
1000
1200
1400
Dec2012
Feb2013
Apr2013
Jun2013
Aug2013
Oct2013
Dec2013
Feb2014
Apr2014
Jun2014
Aug2014
Oct2014
Dec2014
Feb2015
Apr2015
Jun2015
Aug2015
Oct2015
Dec2015
Claims Granted Institution
Claims Denied Institution
Net Claims Granted/Denied
Cumulative Net Claims Granted/Denied
52%

YEAR IN REVIEW | 2015
Page 40 ©2016 Docket Navigator. All Rights Reserved.
INSTITUTION OUTCOMES — § 103 For Claims Asserts on Obviousness Grounds (35 U.S.C. § 103) This chart shows the outcomes of institution decisions for individual patent claims challenged in a PTAB petition on obviousness (35 U.S.C. § 103) grounds. Bars above the midline show the number of claims in which review was granted, bars below the midline show the number of claims in which review was denied. Net Grants/Denials. The Net Grants/Denials line shows the net number of claims for which institution was granted minus the number of claims denied. When the Net Grants/Denials line appears above the midline, it means more claims were granted institution of review than denied that month. When the Net Grants/Denials line appears below the midline, it means more claims were denied institution than granted that month. Cumulative Net Claims Granted/Denied. The Cumulative Net Claims Granted/Denied line shows the cumulative number of Net Grants/Denials. When the line rises, it indicates a trend toward granting institution; when the line falls, it indicates a trend toward denying institution. When the line is flat, it indicates the same number of claims are granted and denied institution of review.
SUCCESS RATE OF CLAIMS CHALLENGED UNDER 35 U.S.C. § 103 SINCE THE AIA WAS ENACTED
1,500
500
500
1,500
2,500
3,500
4,500
5,500
6,500
Dec2012
Feb2013
Apr2013
Jun2013
Aug2013
Oct2013
Dec2013
Feb2014
Apr2014
Jun2014
Aug2014
Oct2014
Dec2014
Feb2015
Apr2015
Jun2015
Aug2015
Oct2015
Dec2015
Claims Granted InstitutionClaims Denied InstitutionNet Claims Granted/DeniedCumulative Net Claims Granted/Denied
57.8%

YEAR IN REVIEW | 2015
Page 41 ©2016 Docket Navigator. All Rights Reserved.
INSTITUTION OUTCOMES — § 112 For Claims Challenged on 35 U.S.C. § 112 Grounds This chart shows the outcomes of institution decisions for individual patent claims challenged in a PTAB petition on 35 U.S.C. § 112 grounds. Bars above the midline show the number of claims in which review was granted, bars below the midline show the number of claims in which review was denied. Net Grants/Denials. The Net Grants/Denials line shows the net number of claims for which institution was granted minus the number of claims denied. When the Net Grants/Denials line appears above the midline, it means more claims were granted institution of review than denied that month. When the Net Grants/Denials line appears below the midline, it means more claims were denied institution than granted that month. Cumulative Net Claims Granted/Denied. The Cumulative Net Claims Granted/Denied line shows the cumulative number of Net Grants/Denials. When the line rises, it indicates a trend toward granting institution; when the line falls, it indicates a trend toward denying institution. When the line is flat, it indicates the same number of claims are granted and denied institution of review.
SUCCESS RATE OF CLAIMS CHALLENGED UNDER 35 U.S.C. § 112 SINCE THE AIA WAS ENACTED
1,400
1,200
1,000
800
600
400
200
0
200
Jan2013
Mar2013
May2013
Jul2013
Sep2013
Nov2013
Jan2014
Mar2014
May2014
Jul2014
Sep2014
Nov2014
Jan2015
Mar2015
May2015
Jul2015
Sep2015
Nov2015
Claims Granted Institution
Claims Denied Institution
Net Claims Granted/Denied
Cumulative Net Claims Instituted
19.1%
YEAR IN REVIEW | 2015
Page 42 ©2016 Docket Navigator. All Rights Reserved.
PTAB PATENT DETERMINATIONS 2012-2015 This chart shows the number of patent determinations in Final Written Decisions over the past three years by the PTAB in IPR, CBM and PGR proceedings.
Not unpatentable172
20.3%
Amendment allowed3
0.4%
No patentability determination due to
indefiniteness6
0.7%
Unpatentable/Cancelled667
78.7%

YEAR IN REVIEW | 2015
Page 43 ©2016 Docket Navigator. All Rights Reserved.
PTAB PATENT DETERMINATIONS 2012-2015 by Month This chart shows the number of patent determinations by month over the past three years by the PTAB in IPR, CBM, and PGR proceedings. Each color represents a different type of determination.
0
10
20
30
40
50
60
70
80
Jun2013
Aug2013
Oct2013
Dec2013
Feb2014
Apr2014
Jun2014
Aug2014
Oct2014
Dec2014
Feb2015
Apr2015
Jun2015
Aug2015
Oct2015
Dec2015
Unpatentable/Cancelled
Not unpatentable
No patentability determination due to indefiniteness
Amendment allowed
You can view all patent determinations in IPR, CBM, and PGR proceedings with a DETERMINATIONS SEARCH.

YEAR IN REVIEW | 2015
Page 44 ©2016 Docket Navigator. All Rights Reserved.
TOP PTAB PETITIONERS The following is a list of petitioners that filed petitions for IPR, CBM or PGR Review in 2015. For the purpose of this chart, affiliates have been removed. (For example, Lupin Pharmaceuticals, Inc. is on the list, but Lupin, Inc. is not.) This helps make the list a more accurate representation of PTAB proceedings, where there may be many parties-in-interest appearing on the same cases.
15
15
15
16
16
16
16
17
17
17
17
17
17
18
18
18
18
19
20
22
23
23
25
30
33
35
38
42
58
120
Ericsson, Inc.
Intel Corporation
Lupin Pharmaceuticals, Inc.
American Megatrends, Inc.
Giga-Byte Technology Co., Ltd.
MSI Computer Corp.
T-Mobile USA, Inc.
Arista Networks, Inc.
Qualcomm Incorporated
TCL Corporation
TCT Mobile (US), Inc.
Unified Patents Inc.
Volkswagen Group of America, Inc.
Daimler North America Corporation
Mercedes-Benz USA, LLC
ServiceNow, Inc.
Toshiba Corporation
Ford Motor Company
Microsoft Corporation
TRW Automotive US LLC
Micron Technology, Inc.
Toyota Motor Corporation
Sony Corporation
IP Navigation Group, LLC
Hayman Capital Master Fund, LP
nXn Partners, LLC
LG Electronics, Inc.
Google Inc.
Samsung Electronics Co., Ltd.
Apple Inc.
You can set up an alert on all new PTAB IPRs, CBMs, or PGRs by clicking “Create Alert” at the bottom of a CASES SEARCH RESULTS PAGE, filtered by PTAB as the court/agency.

YEAR IN REVIEW | 2015
Page 45 ©2016 Docket Navigator. All Rights Reserved.
TOP PATENT OWNERS IN PTAB PROCEEDINGS The following is a list of patent owners that had their patents challenged in petitions for IPR, CBM or PGR Review in 2015. For the purpose of this chart, affiliates have been removed. (For example, Intellectual Ventures II LLC is on the chart, and Intellectual Ventures I LLC is not.) This helps make the list a more accurate representation of PTAB proceedings, where there may be many parties-in-interest appearing on the same cases.
12
12
12
12
12
12
13
13
13
14
15
15
16
17
17
18
18
18
19
19
19
21
22
22
26
26
27
28
35
ZiiLABS Inc., Ltd.
Straight Path IP Group, Inc.
Milwaukee Electric Tool Corporation
Intellectual Ventures II LLC
Horizon Pharma, Inc.
Bonutti Skeletal Innovations LLC
Vivint, Inc.
Core Wireless Licensing SARL
Cellular Communications Equipment LLC
BASF Corporation
Samsung Electronics Co., Ltd.
Longitude Licensing Ltd.
Kinglite Holdings Inc.
Smartflash LLC
Cisco Systems, Inc.
TracBeam, LLC
Joao Control & Monitoring Systems, LLC
Global Touch Solutions, LLC
VirnetX Inc.
Jazz Pharmaceuticals, Inc.
Golden Wave Partners Co., Ltd.
Signal IP, Inc.
Paice LLC
The Abell Foundation, Inc.
Magna Electronics, Inc.
Finjan, Inc.
Ericsson, Inc.
Acacia Research Group LLC
Innovative Display Technologies LLC
You can set up an alert on all new PTAB IPRs, CBMs, or PGRs by clicking “Create Alert” at the bottom of a CASES SEARCH RESULTS PAGE, filtered by PTAB as the court/agency.
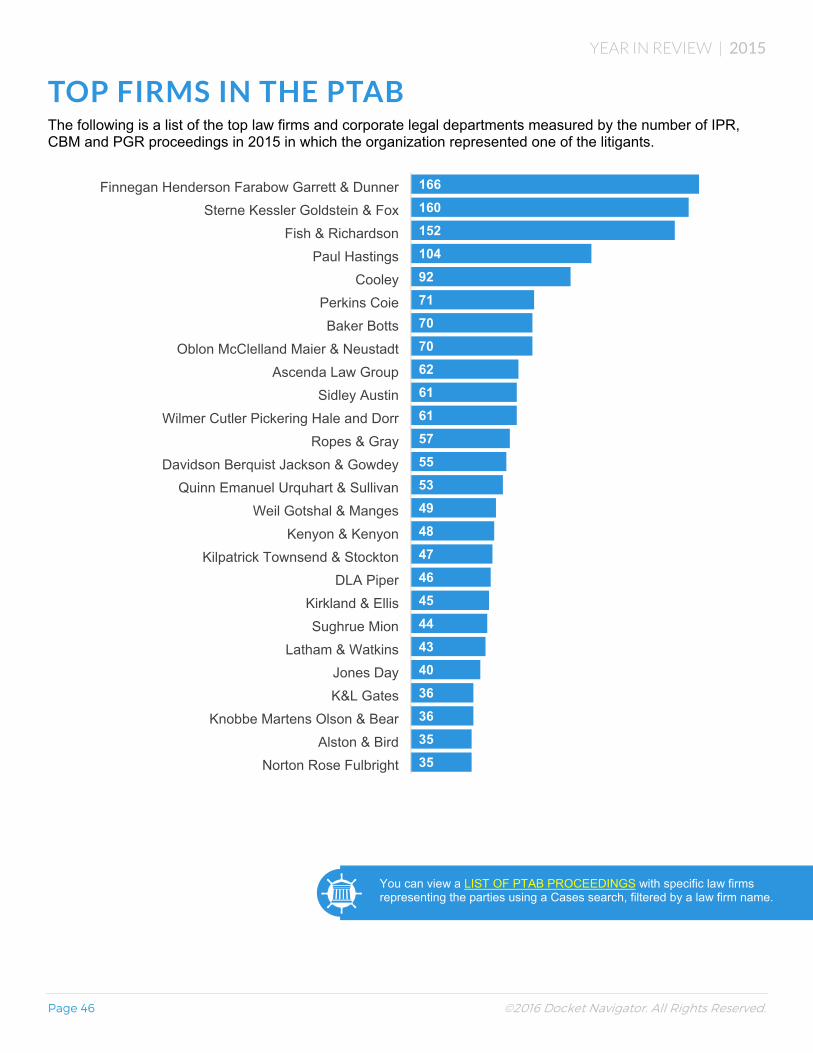
YEAR IN REVIEW | 2015
Page 46 ©2016 Docket Navigator. All Rights Reserved.
TOP FIRMS IN THE PTAB The following is a list of the top law firms and corporate legal departments measured by the number of IPR, CBM and PGR proceedings in 2015 in which the organization represented one of the litigants.
35
35
36
36
40
43
44
45
46
47
48
49
53
55
57
61
61
62
70
70
71
92
104
152
160
166
Norton Rose Fulbright
Alston & Bird
Knobbe Martens Olson & Bear
K&L Gates
Jones Day
Latham & Watkins
Sughrue Mion
Kirkland & Ellis
DLA Piper
Kilpatrick Townsend & Stockton
Kenyon & Kenyon
Weil Gotshal & Manges
Quinn Emanuel Urquhart & Sullivan
Davidson Berquist Jackson & Gowdey
Ropes & Gray
Wilmer Cutler Pickering Hale and Dorr
Sidley Austin
Ascenda Law Group
Oblon McClelland Maier & Neustadt
Baker Botts
Perkins Coie
Cooley
Paul Hastings
Fish & Richardson
Sterne Kessler Goldstein & Fox
Finnegan Henderson Farabow Garrett & Dunner
You can view a LIST OF PTAB PROCEEDINGS with specific law firms representing the parties using a Cases search, filtered by a law firm name.

YEAR IN REVIEW | 2015
Page 47 ©2016 Docket Navigator. All Rights Reserved.
TOP FIRMS IN THE PTAB Continued Haynes & Boone 34
Kramer Levin Naftalis & Frankel 33
Covington & Burling 32
Mayer Brown 31
Morrison & Foerster 30
Goodwin Procter 29
Pepper Hamilton 29
Mintz Levin Cohn Ferris Glovsky & Popeo 28
Proskauer Rose 27
Gardner Linn Burkhart & Flory 26
Bragalone Conroy 25
Lathrop & Gage 25
Brooks Kushman 24
Finjan Inc. 24
Venable 24
Duane Morris 23
Lerner David Littenberg Krumholz & Mentlik 23
Intellectual Ventures 23
Sheppard Mullin Richter & Hampton 23
Wilson Sonsini Goodrich & Rosati 23
Orrick Herrington & Sutcliffe 22
Bryan Cave 21
Dentons 21
Foley & Lardner 21
McAndrews Held & Malloy 21
SoCal IP Law Group 21
Heninger Garrison Davis 20
Stadheim & Grear 20
Wolf Greenfield & Sacks 20
Baker & Hostetler 19
Desmarais 19
Dovel & Luner 19
Fitzpatrick Cella Harper & Scinto 19
Greenberg Traurig 19
Hill Kertscher & Wharton 19
McDermott Will & Emery 19
Novak Druce Connolly Bove + Quigg 19
UNH School of Law 19
AZA Law Firm 18
Joao Control & Monitoring Systems 18
Law Offices of Gregory J. Gonsalves 18
Morgan Lewis & Bockius 18
O'Melveny & Myers 18
Buchanan Ingersoll & Rooney 17
Irell & Manella 17
Nelson Bumgardner 17
Quarles & Brady 17
Williams & Connolly 17
DiNovo Price Ellwanger & Hardy 16
Harness Dickey & Pierce 16
Pillsbury Winthrop Shaw Pittman 16
Martin & Ferraro 15
Neifeld IP Law 15
Robins Kaplan 15
Akin Gump Strauss Hauer & Feld 14
Banner & Witcoff 14
Blank Rome 14
Crowell & Moring 14
Fenwick & West 14
McKool Smith 14
Unified Patents, Inc. 14
Arnold & Porter 13
Baker & McKenzie 13
Cravath Swaine & Moore 13
Dorsey & Whitney 13
Erise IP 13
Lee & Hayes 13
Skiermont Derby 13
Renaissance IP Law Group 13
Faegre Baker & Daniels 12
Locke Lord 12
Law Offices of Marc R. Labgold, PC 12
Panitch Schwarze Belisario & Nadel 12
Steptoe & Johnson 12
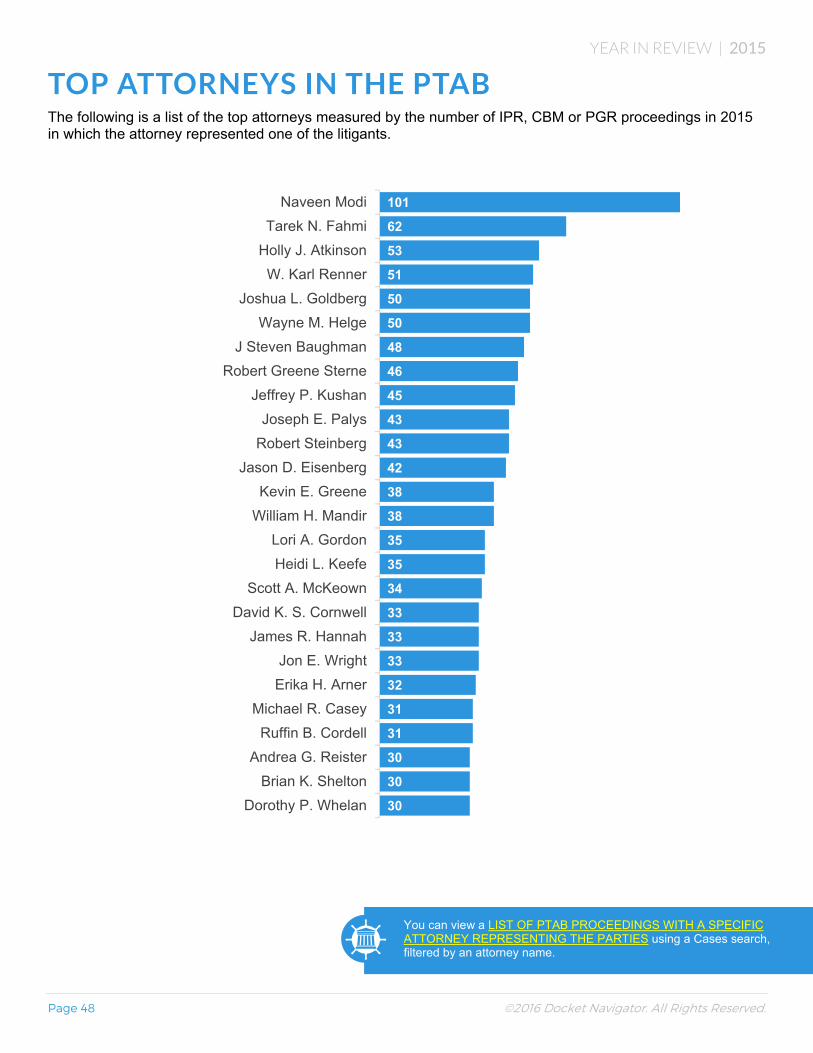
YEAR IN REVIEW | 2015
Page 48 ©2016 Docket Navigator. All Rights Reserved.
TOP ATTORNEYS IN THE PTAB The following is a list of the top attorneys measured by the number of IPR, CBM or PGR proceedings in 2015 in which the attorney represented one of the litigants.
30
30
30
31
31
32
33
33
33
34
35
35
38
38
42
43
43
45
46
48
50
50
51
53
62
101
Dorothy P. Whelan
Brian K. Shelton
Andrea G. Reister
Ruffin B. Cordell
Michael R. Casey
Erika H. Arner
Jon E. Wright
James R. Hannah
David K. S. Cornwell
Scott A. McKeown
Heidi L. Keefe
Lori A. Gordon
William H. Mandir
Kevin E. Greene
Jason D. Eisenberg
Robert Steinberg
Joseph E. Palys
Jeffrey P. Kushan
Robert Greene Sterne
J Steven Baughman
Wayne M. Helge
Joshua L. Goldberg
W. Karl Renner
Holly J. Atkinson
Tarek N. Fahmi
Naveen Modi
You can view a LIST OF PTAB PROCEEDINGS WITH A SPECIFIC ATTORNEY REPRESENTING THE PARTIES using a Cases search, filtered by an attorney name.

YEAR IN REVIEW | 2015
Page 49 ©2016 Docket Navigator. All Rights Reserved.
TOP ATTORNEYS IN THE PTAB Continued
Bing Ai 29
Timothy W. Riffe 29
Jason E. Stach 28
David L. Cavanaugh 27
Brian J. Livedalen 26
W. Todd Baker 26
Jonathan R. K. Stroud 26
Timothy A. Flory 26
Terence J. Linn 26
Terry A. Saad 25
Michael Kim 24
T. William Kennedy 24
F. Dominic Cerrito 24
Jeffrey R. Bragalone 24
Jeffrey H. Price 24
Jay I. Alexander 24
Nicholas C. Kliewer 24
Justin B. Kimble 24
Lisa M. Mandrusiak 24
Eugene Goryunov 23
Alex Kuo 23
Tim R. Seeley 23
Brian W. Oaks 23
Allan J. Sternstein 22
Megan Freeland Raymond 22
Andrew W. Schultz 22
Andrew C. Mace 22
Frank C. Calvosa 22
Christopher T. L. Douglas 22
Timothy K. Sendek 22
Linda L. Kordziel 22
Rene A. Vazquez 22
Joseph A Micallef 21
A. Justin Poplin 21
Steven C. Sereboff 21
James R. Hietala 20
Fadi N. Kiblawi 20
George C. Summerfield 20
Darren M. Jiron 20
Michelle K. Holoubek 20
John V. Biernacki 19
Christopher Frerking 19
Brian E. Ferguson 19
James M. Heintz 19
Vivek A. Ganti 19
Brent K. Yamashita 19
Lionel M. Lavenue 19
Orion Armon 19
P. Andrew Riley 19
Kevin K. McNish 19
Evangeline Shih 18
Joseph J. Richetti 18
Kevin R. Greenleaf 18
Walter D. Davis, Jr. 18
James T. Wilson 18
Andrew G. Heinz 18
Dion M. Bregman 18
Brent R. Babcock 18
Lissi Mojica 18
Chad C. Walters 18
Raymond A. Joao 18
Gregory J. Gonsalves 18
Mitchell G. Stockwell 18
Sean Luner 18
Edward H. Sikorski 18
Michael J. Lennon 17
Martin R. Bader 17
Stephen S. Korniczky 17
Steven M. Bauer 17
Don Daybell 17
Eliot D. Williams 17
David A. Randall 17
Frank A. Angileri 17
Nam H. Kim 17

YEAR IN REVIEW | 2015
Page 50 ©2016 Docket Navigator. All Rights Reserved.
OUR YEAR IN REVIEW WE’VE MADE A FEW IMPROVEMENTS!
Each year, the patent landscape shifts and grows more complex. And each year we work to improve Docket Navigator to help you better navigate that changing environment. Here is a short list of enhancements we’ve completed or are nearing completion.
NEW ANALYTICS TOOLS
CASES BY YEAR
Displays the number of patent cases per year in the U.S. district courts, the PTAB, and the ITC. The chart may be filtered by court, judge, company, law firm, or many other filters. Like all of our analytics tools, you can now create great looking PDF charts for clients and colleagues with the click of a button.
See a sample search here: Cases by Year
MOTION SUCCESS RATES
Do you ever need to know a judge’s track record for granting a particular type of motion? Or how a change in the patent laws or a Supreme Court decision is being interpreted by district courts? The Motion Success Report can provide answers. For example, you can view the success rates of motions for summary judgment of noninfringement in the Northern District of California or the trend for motions to dismiss on the basis of 35 USC § 101 and how decisions like Alice Corp. v. CLS Bank International have impacted that trend. Like all of our analytics tools, you can now create great looking PDF charts for clients and colleagues with the click of a button.
LAW FIRM PROFILES
Many of our customers have asked how to view a law firm’s experience in patent litigation. Our new law firm profiles show the cases a law firm has been involved with, the firm’s clients, remedies for and against those clients, patent determinations for patents that their clients asserted, as well as patents they defended their clients against.
TIME TO MILESTONES REPORT NOW LINKS TO UNDERLYING DATA
The Time to Milestones Report is a powerful tool that lets you answer timing questions like “Will I get to a jury trial quicker in in the Eastern District of Texas or the District of Delaware?” (hint: EDTX is faster by about 8 months). Now when you click on one of the “milestones” in our Time to Milestones reports, you can see all the court documents used to calculate the reported times.
PATENT STATISTICS PAGE
You can view a variety of patent litigation statistics 24/7 at https://www.docketnavigator.com/stats.
MORE THAN
500,000 SEARCHES PERFORMED
EVERY MONTH
MORE THAN
64,000 ACTIVE ALERTS
MORE THAN
10,000,000 DOCKET REPORTS
DELIVERED
MORE THAN
13,000 SUBSCRIBERS
YEAR IN REVIEW | 2015
Page 51 ©2016 Docket Navigator. All Rights Reserved.
NEW SEARCHES
DETERMINATIONS
The Docket Navigator search page now supports a new search type called Determinations. This search returns a list of determinations for each patent, linked to the document that contained the court’s ruling. A determination is a judicial or administrative decision about the infringement, validity, or enforceability of a patent.
PTAB INSTITUTION DECISIONS
The Docket Navigator search page now supports a new search type called PTAB Institutions. With this new search, you can now create a list of every ground that was granted or denied in an institution decision complete with the challenged claim numbers. This is a great tool for answering questions like “How many times has the PTAB granted or denied a request for review based on the ground of Indefiniteness?”
CUSTOMIZED CASE ALERTS NOW SENT MULTIPLE TIMES PER DAY Our New Case Alerts, which report all new cases, are generated continuously throughout the day (and evenings, weekends, and holidays). Several subscribers asked for the ability to focus these alerts to cases involving particular parties. We support that functionality with customized Docket Alerts, but until recently, Docket Alerts were generated only once per day. We enhanced our system for generating customized Docket Alerts to address this need. Now, if you create a Docket Alert on Cases using a party name as a filter, you’ll be notified throughout the day if that party shows up on a case.
You can learn more about alerts, including the difference between New Case Alerts and customized Docket Alerts, in our new Learning Center here.
NEW LEARNING CENTER We now have a great page full of helpful tips and tricks on how to use Docket Navigator. You can access the Learning Center anytime by clicking HELP at the top of our webpages. The new Learning Center includes:
o A helpful list of FAQ’s, in most instances complete with live links to the search results for a variety of questions.
o Tips on how to manage your alerts, including how to edit your list of recipients.
o Some great new videos that explain Time to Milestones and Motion Success Analytics charts and how to create or edit them.
o Our complete Scope of Data.
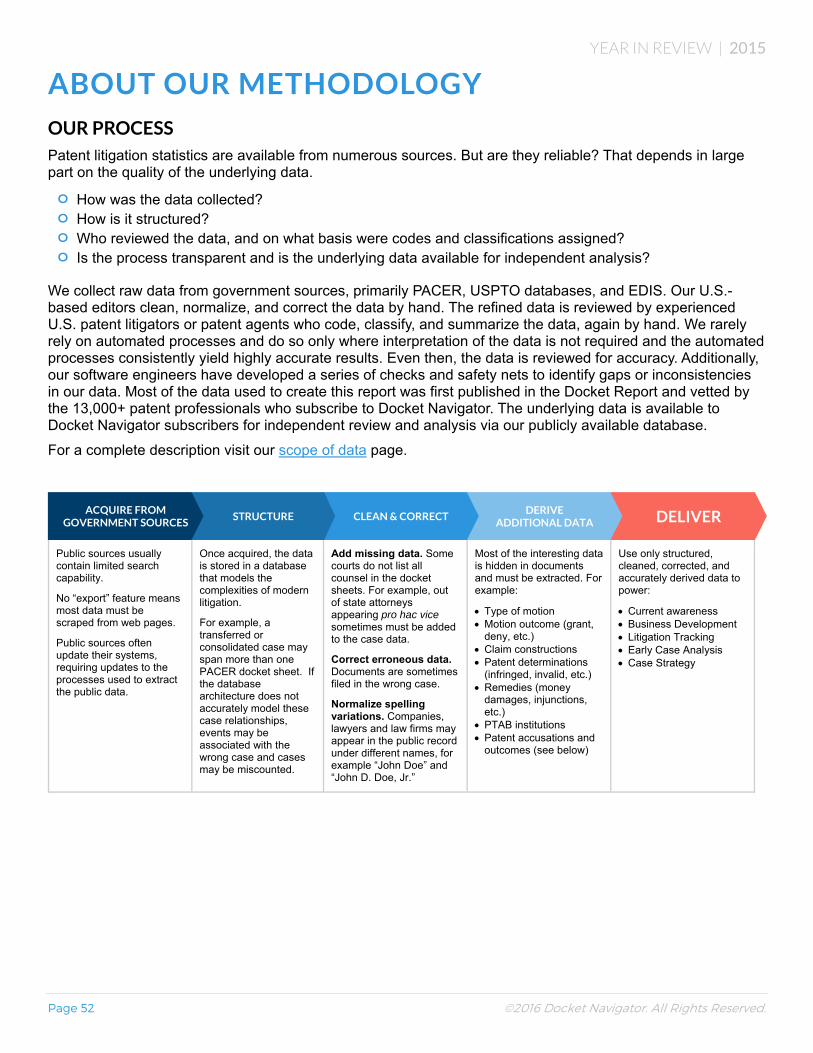
YEAR IN REVIEW | 2015
Page 52 ©2016 Docket Navigator. All Rights Reserved.
ABOUT OUR METHODOLOGY OUR PROCESS Patent litigation statistics are available from numerous sources. But are they reliable? That depends in large part on the quality of the underlying data.
o How was the data collected? o How is it structured? o Who reviewed the data, and on what basis were codes and classifications assigned? o Is the process transparent and is the underlying data available for independent analysis?
We collect raw data from government sources, primarily PACER, USPTO databases, and EDIS. Our U.S.-based editors clean, normalize, and correct the data by hand. The refined data is reviewed by experienced U.S. patent litigators or patent agents who code, classify, and summarize the data, again by hand. We rarely rely on automated processes and do so only where interpretation of the data is not required and the automated processes consistently yield highly accurate results. Even then, the data is reviewed for accuracy. Additionally, our software engineers have developed a series of checks and safety nets to identify gaps or inconsistencies in our data. Most of the data used to create this report was first published in the Docket Report and vetted by the 13,000+ patent professionals who subscribe to Docket Navigator. The underlying data is available to Docket Navigator subscribers for independent review and analysis via our publicly available database.
For a complete description visit our scope of data page.
Public sources usually contain limited search capability.
No “export” feature means most data must be scraped from web pages.
Public sources often update their systems, requiring updates to the processes used to extract the public data.
Once acquired, the data is stored in a database that models the complexities of modern litigation.
For example, a transferred or consolidated case may span more than one PACER docket sheet. If the database architecture does not accurately model these case relationships, events may be associated with the wrong case and cases may be miscounted.
Add missing data. Some courts do not list all counsel in the docket sheets. For example, out of state attorneys appearing pro hac vice sometimes must be added to the case data.
Correct erroneous data. Documents are sometimes filed in the wrong case.
Normalize spelling variations. Companies, lawyers and law firms may appear in the public record under different names, for example “John Doe” and “John D. Doe, Jr.”
Most of the interesting data is hidden in documents and must be extracted. For example:
Type of motion Motion outcome (grant,
deny, etc.) Claim constructions Patent determinations
(infringed, invalid, etc.) Remedies (money
damages, injunctions, etc.)
PTAB institutions Patent accusations and
outcomes (see below)
Use only structured, cleaned, corrected, and accurately derived data to power:
Current awareness Business Development Litigation Tracking Early Case Analysis Case Strategy
DELIVER DERIVE ADDITIONAL DATA
CLEAN & CORRECT STRUCTURE ACQUIRE FROM
GOVERNMENT SOURCES

YEAR IN REVIEW | 2015
Page 53 ©2016 Docket Navigator. All Rights Reserved.
PATENT ACCUSATIONS A Patent Accusation is a more granular way to measure the volume of litigation activity than counting the number of cases or litigants. As used in this report, the term means a request for relief in a U.S. district court, the ITC or the PTAB (AIA proceedings), the resolution of which could determine if a patent has been infringed or the patent’s validity or enforceability.
For example, a civil case with one plaintiff asserting one patent against one defendant would involve one patent accusation, whereas a case with one plaintiff asserting 5 patents against 10 defendants would result in 50 infringement accusation. Multiple claims involving the same parties and patents (e.g., a claim of infringement and a declaratory judgment counterclaim of invalidity or unenforceability) are counted as a single accusation. In a PTAB proceeding, each challenge to the patentability of a patent would create one patent accusation.
ACCUSATION OUTCOMES (coming soon) Many types of sporting events have exactly one winner and exactly one loser. But modern litigation is far more nuanced. Judges, juries, and litigants often find middle ground that falls short of complete victory for either side. Cases against multiple defendants will have multiple outcomes. Yet even between a single plaintiff and defendant, multiple patents may be asserted, creating the possibility of multiple outcomes – one for each patent. Docket Navigator tracks this information at a granular level, recording a separate outcome for every Patent Accusation. (See Patent Accusation, above, for more information.) For example, in a case in which a single plaintiff (Company A) asserts two patents (Patents X & Y) against two defendants (Companies B & C), the following information can be derived from the court record and recorded in the Docket Navigator database:
PATENT ACCUSATIONS OUTCOMES
Patentee Asserted Patent Accused Infringer/Patent Challenger Result
Company A Patent X Company B Patentee Win
Company A Patent X Company C Accused Infringer Win
Company A Patent Y Company B Patentee Win
Company A Patent Y Company C Patentee Win
Accusation and outcome data is not available from any public source of litigation data. It must be derived, by hand, from court documents. (See “Our Process,” above, for more information.) Through the end of 2015, Docket Navigator has coded accusations for 52,757 cases, creating more than 361,628 new accusation records.
MEASURING LITIGATION ACTIVITY

YEAR IN REVIEW | 2015
Page 54 ©2016 Docket Navigator. All Rights Reserved.
WHY SHOULD I CARE ABOUT ACCUSATIONS AND OUTCOMES? The addition of accusations and outcomes data greatly enhances the power of the Docket Navigator database and its ability to provide you with helpful information. For example, the data can be used to:
o More accurately measure litigation activity. Cases come in all sizes. Some are simple, some are complex. Systems that analyze cases as the most granular level gloss over this important distinction. With the addition of accusation data, we can now analyze the accusations asserted in those cases and readily distinguish between simple and complex cases. Among other things, this mitigates the artificial increase in new case filings following enactment of the AIA joinder rules. The charts on pages 19 and 23 provide examples of how this data can be used in the context of overall litigation activity. But the data can be used on more focused inquiries as well. For example, we can now measure and report the experience of lawyers, law firms, judges, and companies in terms of accusations instead of cases.
o More accurate track records. One of the most frequent questions we receive from subscribers is the ability to track outcomes by court, judge, law firm, company, patent, etc. Tracking outcomes on a case-by-case basis cannot provide an adequate answer. Consider the example of a defendant who prevails on liability for 9 out of 10 asserted patents, protects its most valuable product or service, but loses on the 1 remaining patent. Should that case be counted as a “win” for plaintiff and plaintiff’s counsel or a “loss” for defendant and defense counsel? Accusation and outcome data allow us to answer that question with a level of precision never before possible. The same is true of questions about the track record of a court or judge, or the litigation history of a patent.
PATENT DETERMINATIONS
A patent determination occurs when a court or administrative agency issues a decision that determines the infringement, validity, or enforceability of one or more claims of a patent. There may be more than one determination per patent and determinations may be overturned or reversed in later proceedings. For purposes of this report, determinations based on stipulated requests have been excluded.
RELATED CASES
The concept of a “case” is relatively well understood by those involved in litigation. But cases are often related to other cases in ways that blur the distinction between the two. For example, if a case is transferred to another court, how many cases exist? Is it accurate to say the plaintiff filed two cases or that the patent was asserted in two cases? No; there is a single case that existed in two different courts at two different times. As a result, there are two different case numbers and two dockets. How those two dockets are publicly recorded is determined by local judges and clerks, and varies substantially. For example, when receiving a transferred case, some courts duplicate all the documents that were previously filed in the earlier case, but other courts do not. Similarly, when entering orders in consolidated actions, some courts record a single document that applies to all constituent cases, while other courts enter duplicate documents in each individual case. Correctly associating events (pleadings, motions, orders, etc.) with the correct proceeding is crucial for accurate legal research and analysis. Litigation data services that follow a simplistic approach treat each docket as a separate case and are at the whim of local policies when determining which documents and events should be associated with a particular case. This can lead to both double counting and missing key litigation events.
Docket Navigator takes a different approach. We manually associate documents, and all of the data associated with those documents, with each case in which it forms a part of the proceedings. This association allows us to accurately identify all cases in which an instance of a particular action, event or sequence of events occurred. It also allows us to correctly identify unique instances of particular events and disregard any duplicate recording due to local recording policies.

YEAR IN REVIEW | 2015
Page 55 ©2016 Docket Navigator. All Rights Reserved.
LITIGATION MILESTONES
A litigation milestone is an event that marks meaningful progress in a patent litigation proceeding such as claim construction, summary judgment, entry of a damage award or injunction, trial, etc. Milestones are determined based on Docket Navigator’s classification of pleadings, orders, and other litigation documents.
TRIAL EVENTS
A trial event is an event in a patent litigation proceeding that indicates a trial occurred in a district court proceeding. Jury trials are indicated by a verdict and bench trials are indicated by the filing of a FRCP 52 Findings of Fact and Conclusions of Law.
EARLY STAGE AND MATURE STAGE
The chart on page 29 compares decision outcomes for patent validity challenges under 35 U.S.C. § 101 in early stages of litigation with outcomes in mature stages. For purposes of that chart, “early stage” means a § 101 challenge that was asserted in a motion to dismiss for failure to state a claim under FRCP 12(b)(6). “Mature stage” means a § 101 challenge that was addressed in any other type of court document, including, for example, motions for summary judgment, motions for judgment as a matter of law, motions for judgment on the pleadings, findings of fact and conclusions of law, motions for leave to file any of the above, motions for judgment on partial findings, and the like.
CHALLENGED CLAIM – PTAB INSTITUTIONS
As used in the charts on pages 35 – 41, a challenged claim means a patent claim that is challenged in a PTAB proceeding as being unpatentable based on a specified statutory ground (e.g., 35 U.S.C. § 102). All arguments and evidence supporting the ground are considered together. For example, if a petitioner argues that Claim 1 is unpatentable under 35 U.S.C. § 102 in light of two different prior art references, both arguments will be considered a single challenge. Thus, if the PTAB accepts either argument or both, the claim will be regarded as instituted on 35 U.S.C. § 102 grounds. If both arguments are rejected, the claim will be regarded as denied institution on 35 U.S.C. § 102 grounds.

YEAR IN REVIEW | 2015
Page 56 ©2016 Docket Navigator. All Rights Reserved.
THE FINE PRINT Download or use of this report is subject to our TERMS OF USE.
You are free to share this report with others. You may also utilize the data or charts in your own publications, but in all cases you must clearly attribute the source by including the following citation: “Source: Docket Navigator”. You are prohibited from storing, publishing, selling, licensing or otherwise making available the information as part of any database or service.
Every effort is made to ensure that all information published is correct. However, we disclaim any liability for errors or omissions. All of the information contained in this report is provided “as is”, “with all faults” and “as available.” We make no express or implied warranties or guarantees about this report or any of its content.
TO THE EXTENT PERMITTED BY LAW, WE DISCLAIM IMPLIED WARRANTIES THAT THE REPORT AND ITS CONTENT ARE MERCHANTABLE, OF SATISFACTORY QUALITY, ACCURATE, FIT FOR A PARTICULAR PURPOSE OR NEED, TIMELY, RELIABLE, OR NONINFRINGING.
No legal advice is intended or offered by Docket Navigator in making any of the content available, and Docket Navigator disclaims any and all liability related to any decision taken by a party in reliance upon the content. See our Terms of Use available at (http://home.docketnavigator.com/terms-of-use/) for a full description of the conditions on which this information is provided.
CONTACT INFORMATION
If this report is your first introduction to Docket Navigator, we invite you to subscribe to our service. Docket Navigator is unlike any other legal research database. The daily curation, categorization, and annotation of every significant event in every patent case in the United States is the cornerstone of our product.
Docket Navigator is an essential tool for 100+ federal judges and clerks, 300+ PTAB judges and paralegals, 500+ in-house attorneys and researchers, and more than 12,000 outside attorneys, including 88 of the top 100 law firms. Contact us today to see why.
Related Documents