Machine Learning and Statistics for the Quantified Self: Movement & Fitness Data Analysis Machine Learning Meet-up August 3, 2015 Dr. Jennifer Davis Data Scientist, Accenture Digital

2015_8_3_MLFitnessData
Aug 17, 2015
Welcome message from author
This document is posted to help you gain knowledge. Please leave a comment to let me know what you think about it! Share it to your friends and learn new things together.
Transcript
Machine Learning and Statistics for the Quantified Self: Movement & Fitness Data
Analysis
Machine Learning Meet-upAugust 3, 2015
Dr. Jennifer DavisData Scientist, Accenture Digital

‘The Internet of Things’ first referred to RFIDs

History of Internet of ‘Fitness’ Things
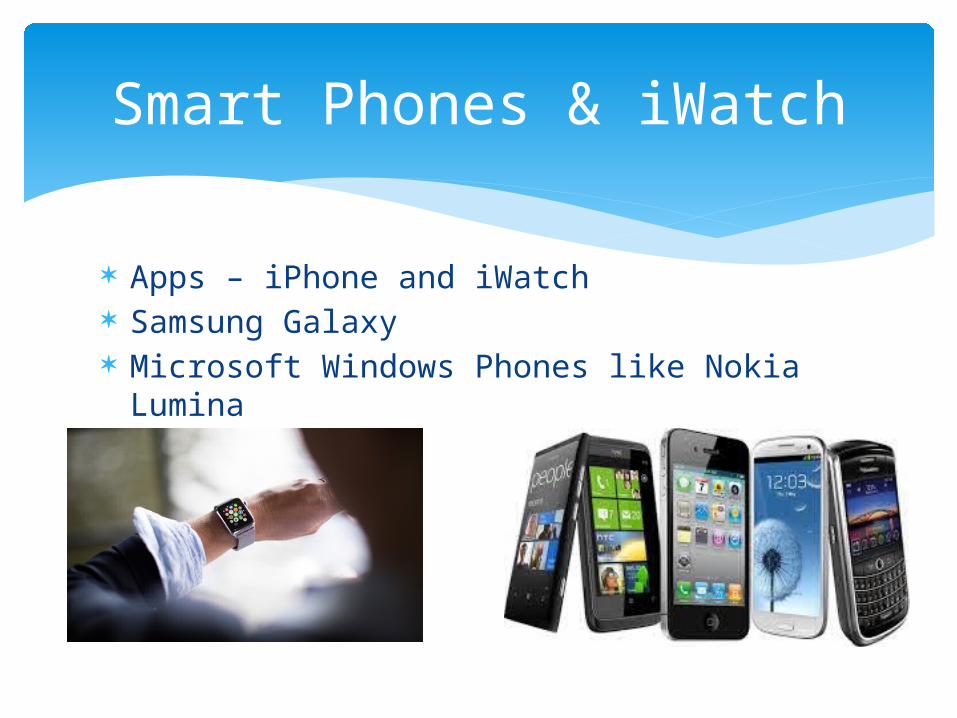
Apps – iPhone and iWatch Samsung Galaxy Microsoft Windows Phones like Nokia Lumina
Smart Phones & iWatch

Very Popular Quantifer: FitBit
FitBit recently hired designer Tory Burch to make their product ‘fancier’ – you can wear your FitBit to that meeting or to ‘date night’…likely an attempt to compete with ‘Leaf’

Measures specific types of Movement, and strength training exercises in different directions, i.e. x, y and z vectors of data and rotational measurements
Creating the movement ‘genome’ – you can sign up to have your exercise movement quantified in 3D!
Movement Genome: Atlas Wearables

Fashionably Fit: Mind, Body Connections: BellaBeat ‘Leaf’ Jewelry
Bella’sBeat ‘Leaf’ has the ability to measure how rapidly and deeply you are breathing. A cell-phone app can then ‘coach’ you into more steady, calm-producing breathing
Longitudinal Data Counts Number of steps taken in a day Distance run over the period of a week Quality of sleep – length of wake vs. sleep
Quantitative Measurements Calories burned Breathing rate Blood glucose Skin temperature & moisture UV exposure (microsoft band)
3-Dimensional movement – correct or not for weightlifting movements Others will come to market soon!
Fitness & Movement Data Types

Sleep patterns – amount of time spent in deep sleep vs. wake?
Total Activity – ‘sitting is the new smoking’ Distance/GPS – how far did we run or walk? Calories Burned – will we lose or maintain
weight? Heart Rate – are we aerobic conditioning? Breathing Rate – can we control breathing to
‘de-stress’?
What we want to learn from our quantified fitness & movement data
What ‘good’ sleep patterns look like is unknown, and yet we still quantify this variable! Freakanomics Radio: Economics of Sleep Part I & 2, Air
Dates July 8 & 15 Lots of data is available but not yet analyzed Sleep researchers could crowd-source data analysis
Missing data points Lots of data, e.g. 160 features and 20,000
observations ~ 3.2 million data points for a small study
Which algorithms to choose? Scalable Analyses
The Promise & Problem with Movement & Quantified Health Data

Basic data cleaning scripts do the following: Merge the training and test sets to create one
data set Extracts the measurements on the mean & std
dev for each measurement & adds as a new column
Uses descriptive activity names to name activities within the data set
Appropriately labels the data to indicate its type
Creates a second, independent and ‘tidy’ dataset
Problem #1: The data is a mess
Most data will have the problems above , i.e. the labels to the data will make no sense, there will be missing data in some categories, some of the data needs to be reformated (i.e. different structure)

Centering data is useful pre-processing step for most types of machine learning. This is accomplished in part by taking the means of each data type and adjusting observations in relation to the group mean or medians. Optionally using z-scores or median absolute deviation to center the data can improve results.
Problem #1 Continued: The data is still a mess
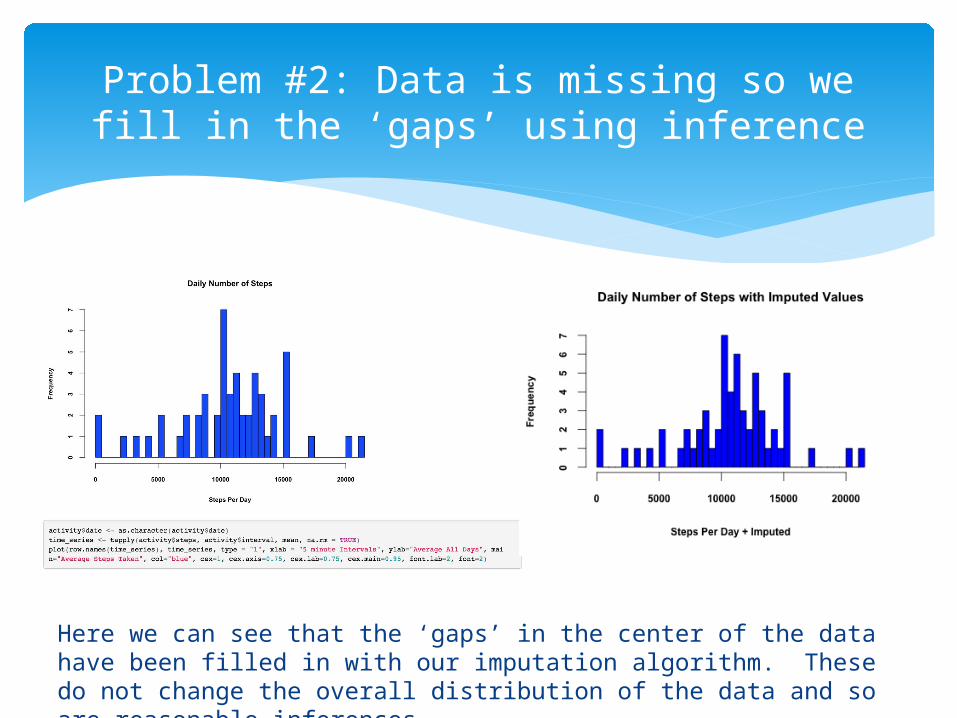
Problem #2: Data is missing so we fill in the ‘gaps’ using inference
Here we can see that the ‘gaps’ in the center of the data have been filled in with our imputation algorithm. These do not change the overall distribution of the data and so are reasonable inferences.

Problem #2 continued: Imputing the Missing Values
Imputing based on a general machine learning pre-processing concept – taking the averages of the observations along a distribution and randomly inferring values within 2 standard deviations

Imputing Missing Values with Scikit Learn (Python Library)

Example #1: Was I active this week?
Here we used our imputed and real data to perform a time-series analysis. A visual assessment suggests that weekends are more active overall but that activity increases during the waking hour. The data represent ~ 4 hour time-frame.

About the dataset: Full training data set contains 19,622 observations and 160
features, creating ~ 3.1 million data points!
First we reduce the dimensionality and examine the factors involved in correctly performing a dumbbell-based bicep curl
There are 5 classes of exercise performance (a, b, c, d, e)
Data comes from: Velloso, E; Bulling, A; Gellersen, H; Ugulino, W; Fuks, H.
Qualitative activity recognition of weight lifting exercises. Proceedings of 4th International Conference in Cooperation with SIGCHI (Augmented Human, 2013), Stuttgart, Germany: ACM SIGCHI, 2013
Example #2: Did I do the exercise correctly?

Experiment set-up
Velluso et. al. used machine learning methods to determine Classes A-E, with A being the correct performance of the exercise.

My first pass to reduce dimensions: Remove features with large amounts of missing data if
not necessary for prediction Remove features with variance between groups of less
than 25% FUN FACT: Atlas Wearables uses a similar rejection if the
variance is <% technique as a way to detect faulty sensors
Center and scale data prior to building & applying a prediction algorithm
If necessary use PCA or other methods
Reducing dimensions in Movement Data: Practical Considerations

Visualizing the Movement Data
Here exercise movement and performance was categorized into 5 classes. In each instance the participants in the study were instructed to perform an exercise in a specific manner which was correct or incorrect. Class A is correct, the other classes are incorrect.
Use data centering and scaling (important many ML algorithms)
Try a few different classifiers Regression Classification Tree Random Forest
Random Forest tends to be generically a good ensemble classifier, but not always the best
You will need to examine your confusion matrix to determine the accuracy & precision of your classifier
Using a ROC curve can give a quick visual on AUC, Sensitivity & Specificity
Choosing a Classifier for Degree of Skill in Movement

Confusion Matrix for RF
In this instance a Random Forest classifier did okay (70% accuracy overall) for the test data, but a different method might have given better accuracy (>80%*). There are also other tricks for pre-processing if a regression is used. Examples include using z-score or median absolute deviation to center or scale the data.
*See Velluso manuscript for an alternate approach.
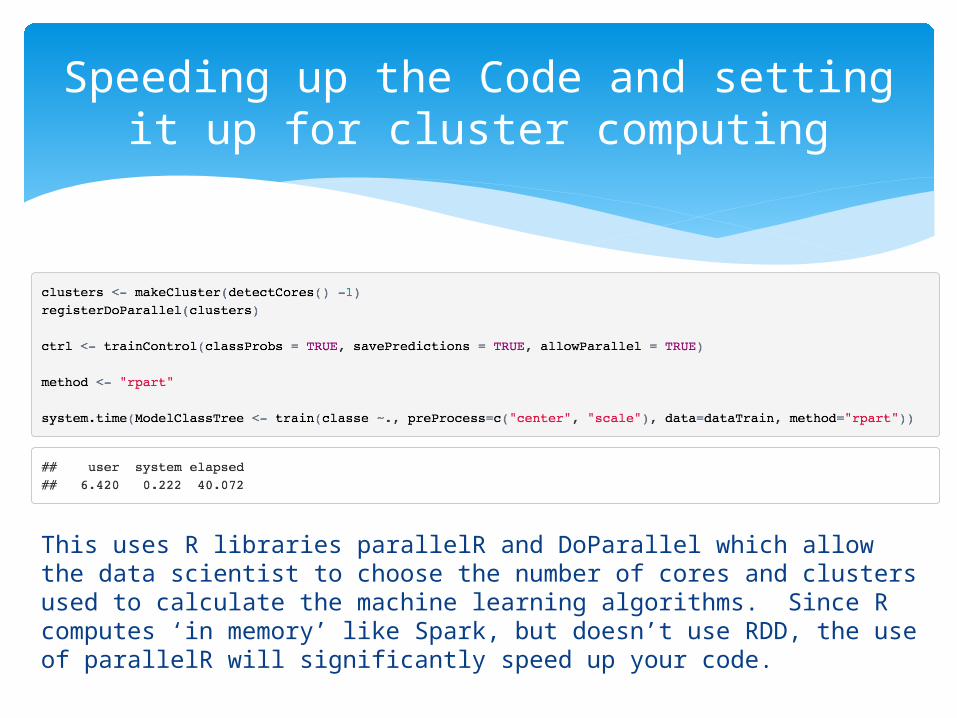
Speeding up the Code and setting it up for cluster computing
This uses R libraries parallelR and DoParallel which allow the data scientist to choose the number of cores and clusters used to calculate the machine learning algorithms. Since R computes ‘in memory’ like Spark, but doesn’t use RDD, the use of parallelR will significantly speed up your code.

Tips & Tricks in R Programming Language
Tips & Tricks in Python Programming Language
Try Spark for its resilient distributed data forms as an efficient way to perform iterative calculations on larger datasets
R or Python will work just fine for analyzing fitness data and both are available on most Hadoop or ‘big data’ platforms
Go Forth Quantify and Analyze!
Austin Machine Learning Meet-up for an invitation to speak
BlackLocus for their widespread support of the data science community in Austin and this Meeting
Thom Lake, Chief Data Scientist, Atlas Wearables for helpful comments on machine learning & movement data
Bill Kleinebecker, Health Symmetric for helpful suggestions on technologies
Megan Galloway, BlackLocus for helpful comments You for coming to the talk!
Acknowledgements

You can reach me via LinkedIn at: https://www.linkedin.com/in/drjenniferdavis
You can find more examples of analyses in my github repo or rpubs: https://github.com/jddavis-100/Statistics-and-Machine-Learning/
wiki/Welcome-&-Table-of-Contents rpubs.com/Jdavis -- all the analyses we discussed this evening:
Machine learning/Dumbbell exercise: http://rpubs.com/JDavis/82742
Imputing data: http://rpubs.com/JDavis/97608 Tidying data: http://rpubs.com/JDavis/97612
Centering data using R functions: http://gastonsanchez.com/blog/how-to/2014/01/15/Center-data-in-R.html
Preprocessing data with scikit learn (python library for doing the same analyses):
http://scikit-learn.org/stable/modules/preprocessing.html
Some useful Links

Fitness trackers are popular among insurance & employers – but is your data safe? The Guardian, April 17, 2015
Health and data: can digital fitness monitors revolutionise our lives? The Guardian, May 19, 2015
Just How Big Can Wearable Tech Get? Forbes, March 31, 2015
The revolution will be digitized. The Washington Post, May 9, 2015
Further Reading
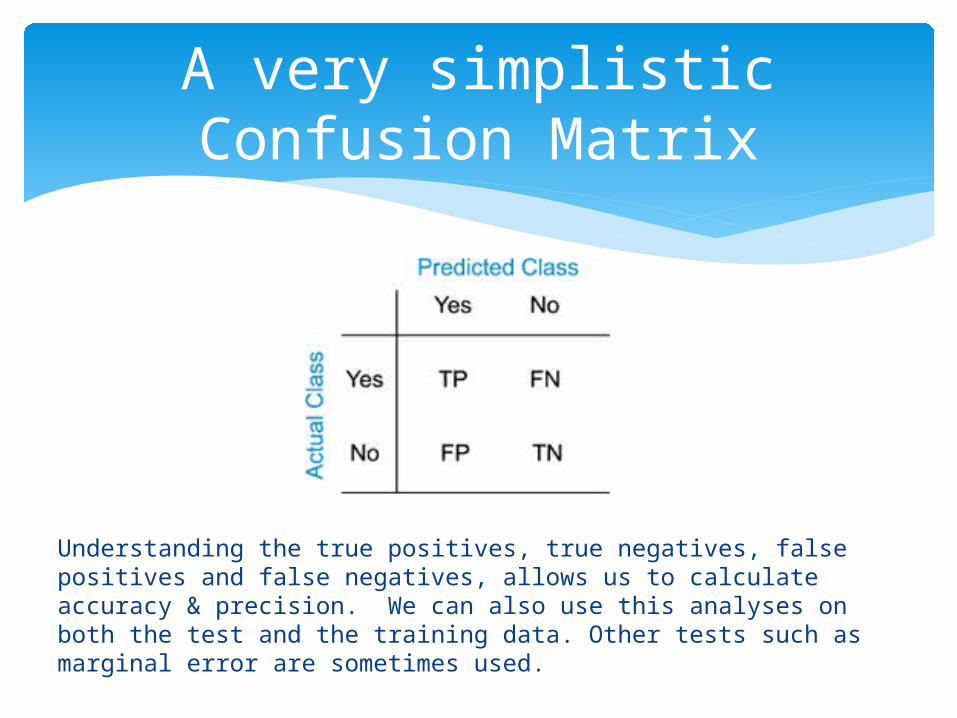
A very simplistic Confusion Matrix
Understanding the true positives, true negatives, false positives and false negatives, allows us to calculate accuracy & precision. We can also use this analyses on both the test and the training data. Other tests such as marginal error are sometimes used.