Welcome message from author
This document is posted to help you gain knowledge. Please leave a comment to let me know what you think about it! Share it to your friends and learn new things together.
Transcript


INDEX
ITEM DESCRIPTION PAGE
INTRODUCTION ................................................................................................................. 1
TIMETABLE AND SUBMISSIONS ......................................................................................... 2
MAYOR’S FOREWORD ....................................................................................................... 3
2014/2015 IN REVIEW........................................................................................................ 4
2015/2016 PREVIEWED .................................................................................................... 16
STATEMENT OF REVENUE POLICY ................................................................................... 20
WARREN SHIRE COUNCIL SUMMARY BY FUND 2015/2016 ........................................... 26
CAPITAL WORKS PROJECTS ............................................................................................ 27
GOODS AND SERVICES TAX ............................................................................................ 30
PROPOSED LOAN BORROWINGS FOR 2015/2016 ......................................................... 30 ESTIMATES OF INCOME & EXPENDITURE – 2015/2016 TO 2018/2019..……………….32 FEES & CHARGES – 2015/2016

Operational Plan Financial Information - Estimates 2015/16 Page 1
INTRODUCTION
The Integrated Planning and Reporting Framework requires NSW Local Government to prepare a
four (4) year Delivery Program that spans the term of the Council and a one (1) year Operational
Plan. The Operational Plan establishes the budget and priorities emanating from the adopted
Community Strategic Plan - ‘Warren Shire 2022’.
This Document is an appendix to the 2015/16 Operational Plan.
The financial information has been colour coded and indexed where possible with CSP x.x.x in line
with the five (5) key issues identified the Community Strategic Plan - ‘Warren Shire 2022’ and
2013/14 to 2016/17 Delivery Program for easy reference. The five (5) key issues are;
Social (coloured yellow)
Economic (coloured grey)
Infrastructure (coloured red)
Environmental (coloured green)
Governance (coloured blue)
The Operational Plan figures are displayed in bold font in the column labelled “2015/16 Estimate”
with the other three columns on the right representing the four year cycle in line with Council’s
Long Term Financial Plan.
Commentary on various items is provided as notes to that particular revenue or expense.

Operational Plan Financial Information - Estimates 2015/16 Page 2
TIMETABLE AND SUBMISSIONS
The following is the proposed timetable for consideration, exhibition and adoption of the document:
Thursday 21st May 2015 - Present the Draft 2015/16 Operational Plan to Council
Wednesday 27th May 2015 - Advertise the Draft 2015/16 Operational Plan for
public comment.
Wednesday 24th June 2015 - Final day for public comment.
Thursday 25th June 2015 - Adoption of 2015/16 Operational Plan by Council.
Written submissions can be lodged with Council on or before 3.00 pm on Wednesday 24th June
2015 and should be addressed to:
The General Manager Warren Shire Council
PO Box 6 WARREN NSW 2824
Should any information or assistance be required in relation to this matter, please do not hesitate to
contact the General Manager or Manager, Finance and Administration at this office on (02) 6847
6600.

Operational Plan Financial Information - Estimates 2015/16 Page 3
MAYOR’S FOREWORD
In line with the Integrated Planning and Reporting framework Council presents the following
information which outlines financial revenues and expenditures for our Operational Plan and is set
out in accordance with legislative requirements.
A balanced budget has been prepared taking account of the following:
Community aspirations as per the Community Strategic Plan adopted in April 2013 and re-
endorsed in January 2014.
Maintenance of the integrity of productive works programs where funds permit; and
Maintenance and, where possible, improvement of existing levels of service right across the
full range of our responsibilities.
Council was also required to submit a “Fit for the Future” Proposal utilising Template 3 – Rural
Council for assessment. All Councils must lodge their proposals by 30th June 2015.
IPART will be undertaking the assessments of these proposals and advice has been received that
they will be completed by October 2015. Council will be advised of the outcome hopefully well
before the end of the year.
Given the overwhelming support for Council from the community organised petition in June 2013
to remain a standalone body, Council has prepared its “Fit for the Future” proposal based on the
Rural Council Template as a standalone Council. It is hoped that IPART will assess Warren as a
“Fit for the Future” Council, therefore removing uncertainly about our ability to continue as a
service provider to the community.
Once again appreciation is expressed to our management team who have worked well together
presenting these documents.
NRF (Rex) Wilson OAM
Mayor

Operational Plan Financial Information - Estimates 2015/16 Page 4
2014/2015 IN REVIEW
The 2014/15 year has by no means been an easy year for Council to manage the provision of services
to our community. The ever increasing demand outside of Council’s core activities for our scarce
resources, coupled with the uncertainly of Council’s future, does not sit well with trying to develop
future Works Programs and Management Plans.
The recognition of Warren Shire Council in the Local Government Independent Review Panel’s
Final Report, as a Group C Rural Council where there would be no benefit in a merger with an
adjoining Council has to a degree eased some pressure. Not with standing this, there has been an
enormous amount of time consumed in preparing Council’s “Fit for the Future” proposal that will
be used in the future to improve Council’s performance.
The decision of the Rural and Remote Medical Services (RaRMS) to Practice Manage the Warren
Family Health Centre, sees the future of the delivery of health services in our community very
positive.
Council’s decision to upgrade the gym equipment at the Warren Sporting and Cultural Centre and
the increased patronage will reflect a healthier community in the long term.
Council has continued on with the high value it places on its employees with training playing a lead
role in the workforce and this informs Council’s Salary System. The actions enable us to provide a
better skilled employee to provide a better service to our community.
Council is also continually reviewing and upgrading its plant and work practices.
Council’s philosophy has not changed which sees Warren Local Government Area as an agricultural
based economy with the town of Warren being the main service centre and it is important that it
remains an attractive functional rural centre. During the year a number of worthwhile programs and
enhancements have been undertaken to improve the quality of life for our community and improve
operational efficiency.
These include:
Completion of Financial Reports 30.6.2014
Fit for the Future Workshops attended
Fit for the Future Workshop Improvement Proposal
New pool cleaner
Swimming pool amenities improvements
Participation in NSW Grain Harvest Management Scheme 2014-2016
Stafford Street Reservoir inspection
Lifeguard shields
XC5 Footpath replacement – 510 metres
Kerb and gutter replacement – 260 metres
Gunningba stormwater drains – installed 200 metres of 600mm pipe
Clean Up Australia Day participation
ANZAC Day co-ordination
Fish restocking (15,000 Golden Perch)
RFS hazard reduction

Operational Plan Financial Information - Estimates 2015/16 Page 5
Implementing risk management
Nevertire bus shelter
Spar carpark garden re-development
Private Pool Inspection Program
Extension Tiger Bay walkway approval
Participation in the Small Business Friendly Council Program
Road Stabilising Contract acceptance
4 x 2 cab chassis truck – Workshop
4 x 2 cab chassis truck – Sewer Crew
Warren Sporting & Cultural Centre – two (2) new stages
Warren Sporting & Cultural Centre – 250 new chairs
Warren Sporting & Cultural Centre – upgrade security
Warren Sporting & Cultural Centre – new microphones
Showground/Racecourse retaining wall and stairs
Pedestrian Access Management Plan
Pedestrian access ramps – Dubbo Street
Depot land additional 1.4 Ha secured
Records compactus
RaRMS Agreement to Practice Manage Warren Family Health Centre
Spray Sealing Contract re-negotiated
Waste Less Recycle More Initiative Grant
Consumer Behaviour and Economic Leakage Project
Reviewed 15 Year Plant Replacement Program
Finalise Lawn Cemetery extension including ashes columbarium

Operational Plan Financial Information - Estimates 2015/16 Page 6
In the attempt to maximise the benefit of scarce resources, keep abreast with the latest information
and benefits from economies of scale Council has continued to participate in a number of regional
initiatives and groups. This participation is undertaken without impacting on Council’s autonomy.
This participation involves: -
Orana Regional Organisation of Councils
Procurement, lobbying, resource/knowledge sharing -
12 councils
Castlereagh Macquarie County Council Noxious weed control 5 councils
North Western Library Co-operative Library services 4 councils
Lower Macquarie Water Utilities Alliance Water & Sewerage 12 councils
Central West Catchment Management Environment 16 councils
Roads Maintenance Council contracts cluster State Highway works 2 councils
Rural Fire Service Zoning Rural Fire Protection 3 councils
NetWaste Waste Management initiatives 26 councils
Local Government Procurement Procurement Statewide
Regional Procurement Individual procurement contracts 11 councils
Outback Arts Arts & Cultural 6 councils
Northwest Regional Food Surveillance group
Food inspections 12 councils
Warren Interagency Service agencies All agencies
Audit & Risk Management Committee
Internal auditing 6 councils
Local Government Rangers Association – Western Region
Animal control and regulatory services 26 councils
OROC – Finance Group Local Government Finance 12 councils
OROC – Human Resource Group Industrial Relations 12 councils
OROC – Economic Development Officer Group
Economic Development & Promotions 12 councils

Operational Plan Financial Information - Estimates 2015/16 Page 7
ROADS
A reliable road network is essential for our food and fibre producers to get produce to market and
Council places a high priority on ensuring adequate resources are directed to its road network. The
2014/15 year has seen the continuation of the unsealed network being maintained to a higher
engineering standard (reformed and crowned) with the aim of extending maintenance intervals.
Seasonal conditions, namely the lack of water in some areas, has meant the rescheduling of some
works to areas where water can be sourced. Lack of funding has not permitted the fifth (5th) crew
to be engaged during the year and a review of these arrangements will be required in the future.
The renewal of the lesser travelled rural sealed roads have been treated as what Warren Shire terms
“Recycling” (road ripped, pulvi mixer, reshaped and a 5 metre seal). This process versus
reconstruction can be undertaken at 25% of the cost of reconstruction, thus enabling four (4) times
the length of the road to be achieved. In addition to the general maintenance the following works
were undertaken on Council’s road network: -
STATE HIGHWAY
Shoulder widening – 6.2 kms
Heavy patching
Reseals
Shoulder grading works
REGIONAL ROADS
Shoulder grading
Reseals
Carinda Road recycling – 3.5 kms
LOCAL ROADS
Reseals – rural
Reseals – town streets
Shoulder grading
Urban heavy patching
Cook/Banks Streets reconstruction
Bullagreen Road recycling – 3.5 kms
Old Warren Road recycling – 0.9 km
Ellengerah Road reconstruction – 4.5 kms
ROAD PLANT
John Deere 770G
Caterpillar Backhoe 432F

Operational Plan Financial Information - Estimates 2015/16 Page 8
The following quantifies works on Council’s road network were undertaken:
LOCAL ROADS
RURAL UNSEALED ROADS MAINTENANCE - GRADING
Road No
Road Name
Road Length
2009/ 2010 Km
2010/ 2011 Km
2011/ 2012 Km
2012/ 2013 Km
2013/ 2014 Km
2014/ 2015 Km
1 Oxley 5 5 5 - - 5 -
2 Sanctuary 3 - - 3 - - -
3 Canonba 15 15 15 - - 3 25
4 Sullivans 5 5 - 5 - 1 5
6 Retreat 11 - 11 11 11 - -
8 Ben Avon - 1.5 - - - 1.5 1.5
9 Booka 51 51 - 51 5 51 51
10 Killaloo Lane 7 7 7 - - 7 -
11 Catons 16 16 - - - - 16
14 Griffiths Lane 2 2 - - - - -
15 Johnsons 17 - - 17 17 - 17
16 Notts Lane 8 - - 8 8 - 8
17 Lamphs 4 4 4 - - 4 -
18 Mannix 5 5 - - - - -
19 Macks 6 - 12 - - - 6
20 Nellievale 5 - - - - - -
21 Duffity 7 7 7 7 7 - -
22 Gillendoon 3 3 - 3 - - 3
23 Gradgery 22 22 33 22 22 3 22
24 Hatton Lane 8 8 - 8 - 8 -
25 Cullemburrawang 7 7 - 7 - - 7
26 Drungalear 13 26 - 13 13 - 13
28 Rothsay 6 - - 6 - 6 -
30 Wonbobbie 11 11 11 11 11 4 11
31 Pigeonbah 15 15 15 15 - 15 -
32 Gunnegaldra 3 2 4 - Sealed
33 Castlebar Lane 10 10 10 - 10 - 10
34 Pleasant View 12 12 12 12 12 12 -

Operational Plan Financial Information - Estimates 2015/16 Page 9
Road No
Road Name
Road Length
2009/ 2010 Km
2010/ 2011 Km
2011/ 2012 Km
2012/ 2013 Km
2013/ 2014 Km
2014/ 2015 Km
36 Gibson Way 24 - 24 - 24 - 24
38 Yungundi - - 10 10 10 - -
40 Merrigal 19 19 19 19 - 19 -
41 Dicks Camp 5 5 - 5 - - -
42 Boss's Lane 3 - 3 - - - -
43 Armatree 6 - 6 - - 6 -
44 Charlieville 2 - - 2 - - -
45 Emby West 7 7 - 7 - - -
48 Ringorah 12 - 6 12 12 12 -
50 Christies Lane 14 14 14 14 2 14 -
51 Oakley 7 7 7 7 - - -
52 Wyndabyne 1 - - - - - -
53 Thornton 7 7 7 27 7 7 7
54 Cathundral-Bogan 27 27 - 18 11 11 -
56 Tabratong Lane 18 18 18 - 18 9 18
60 Dandaloo 26 26 - - 26 - 4
61 Elsinore 14 14 - 14 14 14 -
62 Buddabadah 17 17 - 17 17 - 6
63 Heatherbrae 4 4 4 4 - - 4
64 Ellengerah 13 13 - 13 - 13 -
65 Old Warren 19 38 19 10 19 19 19
68 Bundemar 11 - - 11 11 - 11
69 Mullengudgery 8 8 - 16 - - 8
70 Warren St (Hilton
Lane) 1 1 1 -
Sealed
72 Snakes Lane 2 - - 2 2 2 -
75 Pineclump 11 11 11 - - 11 -
76 Brangus Park 1 1 - - - -
77 Wambianna Soldier 5 - - - - - -
79 Greentree 3 - 3 3 3 - -
81 Kiameron 10 10 10 - - 10 -
83 Rifle Range 5 5 - 5 Sealed
86 Ellerslie 2 - 2 - 2 - 2
87 Cremorne 6 6 6 6 6 6 6
88 Quigley/ Carroll
3 3 - 3 3 3 -

Operational Plan Financial Information - Estimates 2015/16 Page 10
Road No
Road Name
Road Length
2009/ 2010 Km
2010/ 2011 Km
2011/ 2012 Km
2012/ 2013 Km
2013/ 2014 Km
2014/ 2015 Km
89 Leeches Creek 1 - 1 1 1 - -
90 Inglewood 1 - - 1 - - -
95 Gunningba 13 13 13 15 13 13 -
98 Colane 14 - - 14 - - 14
93 Yarrendale 5 - 5 5 - 5 -
97 Kianga-Marebone 10 10 - 10 10 - -
Total kms
maintained 507 332 477 327 295 318
Total Length
Unsealed Roads 647 647 647 638 638 638
% maintained 78% 51% 73% 51% 46% 50%
SHOULDER GRADING (BOTH SIDES)
Road No
Road Name
Road Length
2009/ 2010 Km
2010/ 2011 Km
2011/ 2012 Km
2012/ 2013 Km
2013/ 2014 Km
2014/ 2015 Km
5 Buckiinguy 23 - - - - - -
12 Lemongrove 30 - 18 - - - -
27 Bullagreen 32 - 4 - - - 23
46 Widgeree 3 7 2 - - 6 -
53 Thornton 2 2 - - - -
58 Bogan 26 15 17 12 12 - -
59 Tottenham 48 - 2 - 15 4 13
65 Old Warren 23 5 14 6 2 2 -
66 Wambianna 31 - - - - - -
37 Collie 6 - - - - - -
35 Collie/Bourbah 10 16 - 6 - 10 -
64 Ellengerah 12 - - - - - -
68 Bundemar 34 - - 34 4 - -
73 Udora 1 - - - - - -
75 Pineclump Soldier
6 - - - - 12 -
83 Rifle Range 8 - -
Total kms Shoulder Grading
43 57 58 33 34 36
Total kms Road 286 286 286 291 291 291
% Road Shoulder Grading
15% 20% 20% 11% 12% 12%

Operational Plan Financial Information - Estimates 2015/16 Page 11
GRAVEL/LOAM RESHEETING (RURAL)
Road
No Road Name
2009/10 km
2010/11 km
2011/12 km
2012/13 km
2013/14 km
2014/15 km
9 Booka - - - - - 3
22 Gillendoon - - - 3 - -
23 Gradgery - - - - - 6
26 Drungalear - - - 3 - -
28 Rothsay - - - - - -
30 Wonbobbie - - - - - -
31 Pigeonbah 3 - - 3 6 -
32 Gunnegaldra - - - - - -
33 Castlebar - - - 3 - -
34 Pleasant View - - - 3 - -
36 Gibsons Way - - - - 4 -
38 Yungundi - - - - - -
40 Merrigal - - 5 - - -
41 Dicks Camp - - - - - -
43 Armatree - - - - - -
45 Emby West - - - - - -
48 Ringorah - - - - - 4
50 Christies - - 3 - - -
51 Oakley - - - - - 3
53 Thornton 4 - - - 3 -
54 Cathundral-
Bogan 5 - - - - 4
56 Tabratong - - - - - 3
60 Dandaloo 2 - - - - -
61 Elsinore - - - - - 4
62 Buddabadah 3 - - 4 - 3
63 Heatherbrae - - - - - 4
64 Ellengerah 4 - - - - -
65 Old Warren - 5 - - - 5
68 Bundemar - - - 3 - -
69 Mullengudgery 3 - - - - -
73 Udora - - - - - -
75 Pineclump - - - - -
76 Brangus Park 1 - - - -
77 Wambianna
Soldiers - - - - - -
83 Rifle Range - - - - - -
86 Ellerslie - - - 2 - -
87 Cremorne - - - - - -
89 Leeches Ck - - - - - -
93 Yarrendale - - - - - -
95 Gunningba 3 - - 3 - 4
97 Kianga-
Marebone - - 5 - - -
98 Colane - - - - 5 -
Total Length Resheeted
27 6 13 27 18 43
Total Length
Proposed 58 51 69 42 49 59
% Resheeted 47% 12% 19% 64% 37% 73%
Operational Plan Financial Information - Estimates 2015/16 Page 12
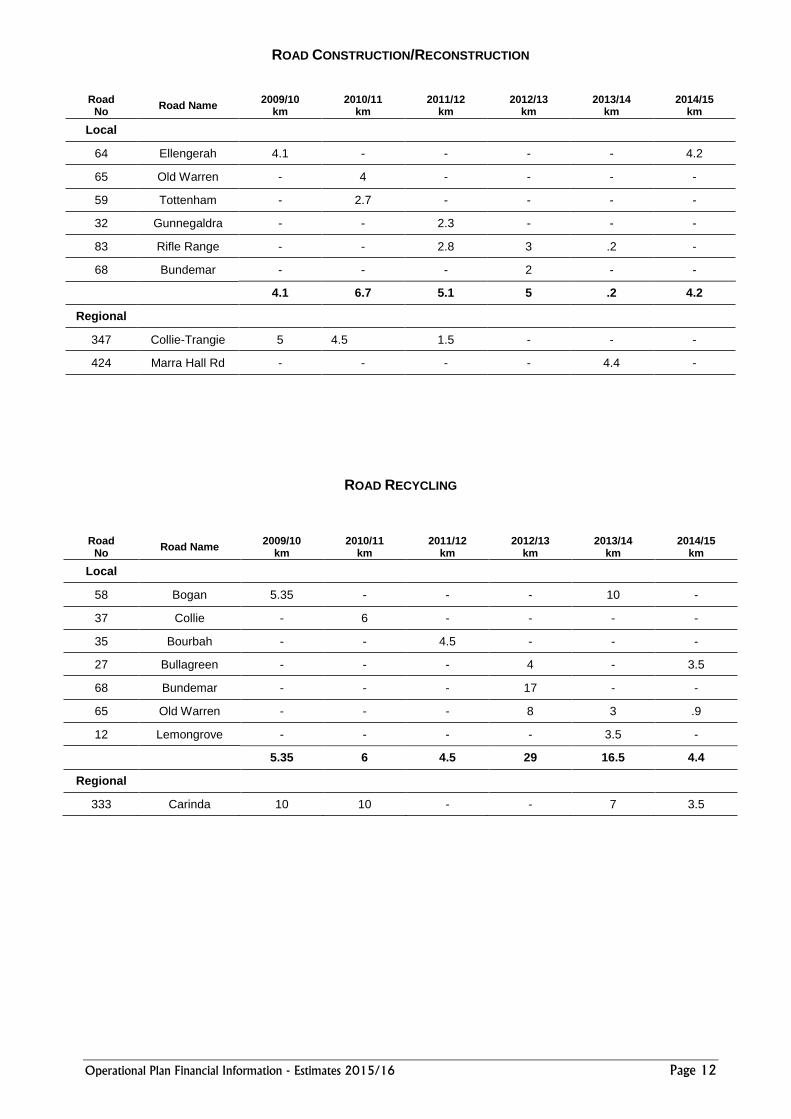
ROAD CONSTRUCTION/RECONSTRUCTION
Road
No Road Name
2009/10 km
2010/11 km
2011/12 km
2012/13 km
2013/14 km
2014/15 km
Local
64 Ellengerah 4.1 - - - - 4.2
65 Old Warren - 4 - - - -
59 Tottenham - 2.7 - - - -
32 Gunnegaldra - - 2.3 - - -
83 Rifle Range - - 2.8 3 .2 -
68 Bundemar - - - 2 - -
4.1 6.7 5.1 5 .2 4.2
Regional
347 Collie-Trangie 5 4.5 1.5 - - -
424 Marra Hall Rd - - - - 4.4 -
ROAD RECYCLING
Road
No Road Name
2009/10 km
2010/11 km
2011/12 km
2012/13 km
2013/14 km
2014/15 km
Local
58 Bogan 5.35 - - - 10 -
37 Collie - 6 - - - -
35 Bourbah - - 4.5 - - -
27 Bullagreen - - - 4 - 3.5
68 Bundemar - - - 17 - -
65 Old Warren - - - 8 3 .9
12 Lemongrove - - - - 3.5 -
5.35 6 4.5 29 16.5 4.4
Regional
333 Carinda 10 10 - - 7 3.5

Operational Plan Financial Information - Estimates 2015/16 Page 13
REGIONAL ROADS
UNSEALED MAINTENANCE – GRADING
Road No
Road Name
Road Length
2009/ 2010 km
2010/ 2011 km
2011/ 2012 km
2012/ 2013 Km
2013/ 2014 Km
2014/ 2015 Km
MR 424
Coolabah-Quambone
18 18 8 18 18 2 12
MR 7516
Carinda-Brewarrina
19 25 - 19 - 19 -
MR 347
Collie-Trangie 12 24 12 Sealed
Total kms Unsealed Maintenance
67 20 37 18 21 12
Total kms Unsealed Regional Roads
49 49 37 37 37 37
104% 137% 41% 100% 49% 57% 32%
SHOULDER GRADING
Road No
Road Name
Road Length
2009/10 km
2010/11 km
2012/13 km
2012/13 km
2013/14 Km
2014/15 Km
MR 424
Marra 13 - - - - - -
MR 7515
Warren 41 15 20 14 - 10 15
MR 202
Marthaguy 78 5 - - 27 - 5
MR 333
Carinda 165 121 25 - 25 75 40
MR 347
Collie-Trangie 21 - 9 - - - -
Total kms Shoulder Grading
318 141 54 14 52 85 60
% Shoulders Graded 46% 18% 5% 16% 25% 19%
STATE HIGHWAY 11
SHOULDER GRADING
Road No
Road Name
Road Length
2009/ 2010 km
2010/ 2011 km
2011/ 2012 km
2012/ 2013 km
2013/ 2014 km
2014/ 2015 km
SH 11 Oxley Highway 70 21 8 10 25 5 15
Total kms 70 70 70 70 70 70
% Graded 30% 11% 14% 35% 7% 21%

Operational Plan Financial Information - Estimates 2015/16 Page 14
The above breakdown of individual roads is summarised as follows: -
Description
Total Length for which Council is
Responsible For
2009/10 2010/11 2011/12 2012/13 2013/14 2014/15
kms % kms % kms % kms % kms % kms %
LOCAL ROADS
Unsealed Maintenance
638
647 to 2012 507 78 332 51 477 73 327 51 295 46 318 50
Shoulder Grading 291
286 to 2012 43 15 57 20 58 20 33 11 34 12 36 12
Gravel Loam Resheeting
- 27 47 6 12 13 19 27 64 18 37 43 73
Construction/ Reconstruction
4.1 - 6.7 - 5.1 - 5 - .2 - 4.2 -
Recycling 5.35 - 6 - 4.5 - 29 - 16.5 - 4.4 -
REGIONAL ROADS
Unsealed Maintenance
37 49 to 2012
67 137 20 41 37 100 18 49 21 57 12 32
Shoulder Grading 318
309 to 2012 141 46 54 18 14 5 52 16 85 25 60 19
Construction/ Reconstruction
5 - 4.5 - 1.5 - - - 4.4 - - -
Recycling 10 - 10 - - - - - 7 - 3.5 -
STATE HIGHWAY
Shoulder Grading 70 21 30 8 11 70 14 25 35 5 7 15 21

Operational Plan Financial Information - Estimates 2015/16 Page 15
WATER AND SEWER FUNDS
The 2014/15 year has seen the continuation rebuilding of Council’s Water & Sewer team. The
opportunity has arisen and been tailored to fully review Council’s operation of these areas and as a
result a review in the organisational structure. This review will see two (2) teams (a reactive &
proactive). One (1) team will undertake repairs and the other enhancements and preventative
maintenance. This system will require further review, especially in light of the changing of Water
& Sewer Managers.
Although the Water & Sewer Crew are stepping through a learning phase, they have still been able
to undertake some worthwhile projects: -
Sewer main relining – 676 metres
Sewer main jump-up replacements – 35
Water supply valve replacement – 18 bore, 4 river
Warren Shire Council is an active member of the Lower Macquarie Water Utilities Alliance. This
group sees those councils on the regulated Macquarie working together to ensure each member
council complies with “Best Practice Guidelines” and meets the statutory reporting requirements.
It is also using peer exchange network with the long term goal of each council retaining its autonomy
and as a group, reviewing Strategic Business Plans and synchronising capital improvements to take
advantage of economies of scale.
The Alliance has demonstrated both innovation and best practice principles and has:
Achievement of 100% overall compliance with Best Practice requirements
Review of water licences
Telemetry System review
Completion of the following Regional Strategic Plans:
IWCM (Evaluation Study)
Demand Management Plan for each Council and a Regional Demand Management Plan
Drought Management Plan for each Council and a Regional Drought Management Plan.
Drinking Water Quality Management Plan for each Council
Storm Water Harvesting Strategy
Regional IWCM
Collaborative completion of Annual Performance Reports
Alliance Long Term Plan

Operational Plan Financial Information - Estimates 2015/16 Page 16
2015/2016 PREVIEWED
When looking to the 2015/16 year, one must take into account the proposal that has been submitted
to the Office of Local Government under “Fit for the Future.
This proposal outlines a number of areas for improvement and it is intended to concentrate on two
(2) main areas during the 2015/16 year. Firstly, a review of assets and the development of more
formal Asset Management Plans (AMP’s), which will include updated condition assessments.
Secondly, to link with these AMP’s is a full review of each activity of Council, looking at the service
provided and service levels. From this, new service levels will be developed and these will integrate
with the AMP’s. It is proposed to present an area of Council’s activity to each Council meeting in
2015/16 for review.
The process of producing the budget involves each Department submitting their costs for the
operations of the various functions and services Council provides. These costings involve recurrent
costs, improvement works and capital expenditure along with revenues to be received. Actual
revenue and expenditure, where known have been included and where not, anticipated revenue and
expenditure.
The initial Estimates were considered by Council management on Tuesday 12th May 2015 from
which a balanced bottom line (less depreciation) is presented. It should be noted that Council’s
management staff are acutely aware of the current economic climate and the need to maintain the
integrity of works programs for all functions of Council.
Council’s rating structure remains the same as per the previous years. The Estimates for 2015/16
have been prepared on the following basis:-
General fund rates have been increased by 2.4%, this equates to an approximate increase of
$110,681 on 2014/15,
Salaries and Wages have been increased by 2.8% with 53 pay periods,
Recurrent costs have been increased by 2%,
Fees and Charges have been increased by 3%,
Interest on investments have been calculated at 2.25%,
If known actual revenue and expenses have been used, and
Some carryover amounts have been included in this document but the majority will not be
known until the 2014/15 financial statements have been completed, additional carryover items
will be included in the September 2015/16 Quarterly Budget Review document.
GENERAL FUND
Warren Shire Council, being a multi-functional organisation, has the responsibility to provide
services to the community, which include many varied activities. When developing a budget it is
extremely important that all areas are considered to ensure they each have the ability to deliver the
level of service expected by our community.
Specific and capital works programs have been closely monitored to ensure any works carried out
link closely to Council’s ability to provide services. The intent of improvement works is to allow
more efficient service delivery and improve quality of life for the Warren Local Government Area.

Operational Plan Financial Information - Estimates 2015/16 Page 17
2015/2016 PREVIEWED CONTINUED
This document includes a number of improvement works and other projects which are additional to
recurrent operations and are included to achieve the following:
Infrastructure improvement
Preventative maintenance
Statutory requirement
Limit Council exposure to risk
Public liability issues
Allow more efficient use of resources
Council has been fortunate to be able to fund a number of projects as a result of its past decisions in
creating the infrastructure improvement reserve. The specific programs and capital works to be
undertaken in 2015/16 are outlined as follows: -
Specific/Renewal/Capital Works $
Staff training 100,000
RFS hazard reduction 40,000
EM Plan 17,563
Dog / Cat De-sexing Program 5,000
EIPP Program (Youth) 18,369
Youth Programs 4,230
Community Builders program 40,350
Water Quality and Salinity Alliance 3,200
Sewer lines infiltration M & M 20,000
Computer system 359,552
MP Printers 30,000
Depot land extension 74,000
Dwellings refurbishment 34,870
Waste Less Recycle More Initiative 85,957
Stormwater drainage 101,902
Water mains replacement 46,000
Warren – new 3A Bore 340,000
Warren – new 6A Bore 243,000
Warren – new water mains 152,500
Nevertire – new Bore 215,000
Collie – new Bore 365,000
Sewer pump stations 4,000
Sewer Treatment works 500,000
Sewer mains 20,000
Library – drainage / water proofing 45,000

Operational Plan Financial Information - Estimates 2015/16 Page 18
Specific/Renewal/Capital Works $
Library – photocopier 6,400
Kerbing / layback Macquarie Park 12,000
Playground equipment 20,400
Urban Road Reseals 30,000
Urban Road Heavy Patching 50,000
XC5 footpaths 25,000
Kerbing & guttering 25,000
Hale Street footpath 12,000
Bundemar Street reconstruction 114,737
Rural local roads reseals 230,000
Buckiinguy Road recycling 700,000
Bullagreen Road Recycling 142,786
R2R to be determined 459,887
Gravel / loam resheeting 604,047
Airport fence 4,000
Runway markings 18,000
Marra Road Construction Stage 2 660,000
Regional road recycling 100,000
Regional reseals 200,000
Regional resheeting 100,000
Information signage Collie 2,500
Information signage Nevertire 35,500
Visitors Information Centre painting 10,000
Heavy plant acquisitions 659,435

Operational Plan Financial Information - Estimates 2015/16 Page 19
The Warren Water Fund operates a user pay system, which means in simple terms that water users
will pay an annual fixed availability charge. This will cover the costs to Council for constructing
and maintaining water mains and reservoirs for the water supply system. A user charge will be
levied for every kilolitre of water used. This will cover the costs to Council for the purchasing of
water from State Water, pumping the water and chlorination.
The Warren Sewer Fund residential users are based on a per connection fee with non-residential
users on an availability charge plus a potential usage charge. This will cover the cost of operations,
capital improvements and future works.
Warren Shire Council’s Strategic Business Plan for Water Supply, Sewerage Services and
Integrated Water Cycle Management Strategy sets the operational and improvement direction for
the ensuing year.
The receipt of funding under the Restart NSW – Water Security Program that will see two (2) new
bores at Warren, one (1) each at Collie and Nevertire, along with Wilson to Burton Streets water
main upgrade. This will not only provide security, but will make the fund more sustainable.
SUMMATION
I wish to formally compliment all staff who were involved in its preparation. Hopefully this
document, as presented, is informative and will enable Council to thoroughly assess its financial
position and planned works for 2015/16. I wish Council well in its deliberations.
Ashley Wielinga
General Manager

Operational Plan Financial Information - Estimates 2015/16 Page 20
STATEMENT OF REVENUE POLICY
STATEMENT OF RATES
Council’s proposed revenue policy as applied to rating is summarised as follows:
Rate Type Category Sub
Category Ad Valorem Cents in $
Minimum Rate
Min Rate % of Total Rate
Rate Yield $
No. of Assess.
Ordinary Residential Warren 4.315687 471.00 35.69 446,005.19 748
Ordinary Residential Nevertire 0.923890 195.00 93.13 15,074.75 76
Ordinary Residential Collie 1.982700 195.00 94.61 13,603.59 68
Ordinary Residential Rural 1.018973 254.00 8.00 139,671.57 205
Ordinary Farmland 0.577929 254.00 0.32 3,689,734.15 683
Ordinary Business 10.58433 471.00 0.49 190,765.62 91
Ordinary Business Other 0.746415 254.00 56.48 10,343.63 32
Total 4,505,198.50 1,903
The above calculations have been based on a 2.4% increase in the general rate yield, which is the
maximum permissible rate increase as set by the Independent Pricing and Regulatory Tribunal
(IPART), this equates to an approximate increase of $110,681 on the 2014/2015 rate levy. This
policy may be subject to change depending on finalisation of land value changes and objections
received from the Valuer General.
Proposed ordinary rates to be levied by Council are as follows:
RESIDENTIAL
Council proposes to levy a main residential category rate, together with three sub-categories, as
summarised hereunder.
* SUB-CATEGORY RESIDENTIAL – WARREN CENTRE OF POPULATION
Properties placed in this category include all properties meeting the residential definition, being
those properties within the Warren Centre of Population. It is proposed to levy an ad/valorem
amount (amount in the dollar) of 4.315687 cents on a rateable value of $6,645,700 with an estimated
yield of $286,807.19. A minimum rate of $471.00 will apply with an estimated yield of
$159,198.00.
* SUB-CATEGORY RESIDENTIAL - NEVERTIRE CENTRE OF POPULATION
All residential properties within the Nevertire Centre of Population will be subject to this rate. It is
proposed to levy an ad-valorem amount (amount in the dollar) of 0.92389 cents on a rateable value
of $112,000 with an estimated yield of $1,034.75. A minimum rate of $195.00 will apply with an
estimated yield of $14,040.00.
* SUB-CATEGORY RESIDENTIAL - COLLIE CENTRE OF POPULATION
All residential properties within the Collie Centre of Population will be subject to this rate. It is
proposed to levy an ad-valorem amount (amount in the dollar) of 1.9827 cents on a rateable value
of $37,000 with an estimated yield of $733.59. A minimum rate of $195.00 will apply with an
estimated yield of $12,870.00.

Operational Plan Financial Information - Estimates 2015/16 Page 21
* SUB-CATEGORY RESIDENTIAL - RURAL RESIDENTIAL
All properties satisfying the rural residential definition will be subject to this rate. The majority of
such properties are situated on the fringe of Warren. It is proposed to levy an ad-valorem amount
(amount in the dollar) of 1.018973 cents on a rateable value of $12,610,300 with an estimated yield
of $128,495.57. A minimum rate of $254.00 will apply with an estimated yield of $11,176.00.
FARMLAND
Council proposes to levy a farmland rate on all properties satisfying the farmland definition. The
rate will apply to all genuine farming properties, and will be the lowest tier of the rating structure.
It is proposed to levy an ad-valorem amount (rate in the dollar) of 0.577929 cents on a rateable value
of $636,375,072 with an estimated yield of $3,677,796.15. A minimum rate of $254.00 will apply
with an estimated yield of $11,938.00.
BUSINESS
Council proposes to levy a main business category rate, together with one sub-category, as
summarised.
* BUSINESS - GENERAL
Properties placed in this category include lands within the Warren Centre of Population that satisfy
the business criteria pursuant to Section 518 of the Local Government Act, 1993. It is proposed to
levy an ad-valorem amount (amount in the dollar) of 10.58433 cents on a rateable value of
$1,793,440 with an estimated yield of $189,823.62. A minimum of $471.00 will apply with an
estimated yield of $942.00.
* SUB-CATEGORY BUSINESS - OTHER
All business properties meeting the business definition that are situated on the fringe of Warren and
at the Warren Aerodrome will be subject to this rate. It is proposed to levy an ad-valorem amount
(amount in the dollar) of 0.746415 cents on a rateable value of $603,100 with an estimated yield of
$4,501.63. A minimum rate of $254.00 will apply with an estimated yield of $5,842.00.
MINING
Council does not propose to levy a mining rate as no properties satisfy the mining definition.
INTEREST ON RATES
Interest to be charged on overdue rates is regulated by the Office of Local Government. It is
proposed to apply the maximum rate determined under this regulation. Interest will be calculated
on a simple daily basis at the rate of 8.5%. (Unless advised otherwise by the Minister for Local
Government)
FEES AND CHARGES STATEMENT
Council provides a range of services for which it charges an amount or fee authorised under various
sections of the Local Government Act, 1993, and are summarised as follows:
WARREN WATER AVAILABILITY CHARGE
Council proposes to levy a water supply charge under Section 501 of the Local Government Act,
1993 on each parcel of land within the Warren Water Supply Area for which the services are

Operational Plan Financial Information - Estimates 2015/16 Page 22
available. The purpose of the charge is to finance the provision and maintenance of an effective
water supply scheme for all properties within the Warren water supply area. It is proposed to levy
an availability charge of $330.00 with an estimated yield of $295,680.00.
WARREN RESIDENTIAL SEWERAGE CHARGE
Council proposes to levy a sewerage charge under Section 501 of the Local Government Act, 1993,
on each parcel of land within the Warren Local Sewerage Area for which the services are available.
The purpose of the charge is to finance the provision and maintenance of an effective sewerage
scheme for all properties within the Warren sewerage area. It is proposed to levy a charge of
$500.00 with an estimated yield of $370,500.00.
NEVERTIRE WATER AVAILABILITY CHARGE
Council proposes to levy a water supply charge under Section 501 of the Local Government Act,
1993, on each parcel of land within the Nevertire Local Water Supply Area for which the services
are available. The purpose of the charge is to finance the provision and maintenance of an effective
water supply to all properties within the Nevertire water supply area. It is proposed to levy an
availability charge of $450.00 per assessment with an estimated yield of $26,550.00. Any
assessment in respect of land not built upon and not supplied with water, the charge shall be $170.00
with an estimated yield of $3,570.00.
NEVERTIRE SEWERAGE CHARGE
Council proposes to levy a sewerage charge under Section 501 of the Local Government Act, 1993
on each parcel of land within the Nevertire Local Sewerage Area for which the service is available.
The purpose of the rate is to finance the provision and maintenance of an effective sewerage scheme
for all rateable properties within the Nevertire sewerage area. It is proposed to levy a charge of
$525.00 per assessment with an estimated yield of $18,870.00. Any assessment in respect of land
not built upon and not connected to Council's sewerage will be charged the amount of $200.00 with
an estimated yield of $3,315.00.
COLLIE WATER AVAILABILITY CHARGE
Council proposes to levy a water supply charge under Section 501 of the Local Government Act,
1993, on each parcel of land within the Collie Local Water Supply Area for which the services are
available. The purpose of the charge is to finance the provision and maintenance of an effective
water supply to all properties within the Collie water supply area. It is proposed to levy an
availability charge of $335.00 per assessment with an estimated yield of $8,040.00. Any assessment
in respect of land not built upon and not supplied with water the charge shall be $170.00 with an
estimated yield of $7,310.00.
DOMESTIC WASTE MANAGEMENT SERVICES
In accordance with Section 504 of the Local Government Act, 1993, Council proposes to levy an
annual charge for the provision of Domestic Waste Management (DWM) services on each parcel of
rateable land in Warren, Nevertire and occupied parcels in Collie for which services are available.
Charges will be made on the following basis:
* Vacant Land Charge $ 38.00 pa * Domestic Waste Charge $240.00 pa
It is estimated the total number of properties to be serviced during 2015/2016 will be 779 together
with approximately 68 parcels of vacant land with service availability.

Operational Plan Financial Information - Estimates 2015/16 Page 23
The service availability charge is a minimal amount, and has been established in respect to
legislative requirements. The charge has been fixed at a level that will recoup the perceived costs
of making the Domestic Waste Management service available.
WASTE MANAGEMENT SERVICES
In accordance with Section 501 of the Local Government Act, 1993, Council proposes to levy an
annual charge for the provision of Waste Management Services on each parcel of rateable land in
Warren, Nevertire and occupied parcels in Collie for which services are available. Charges will be
made on the following basis: * Waste Management Charge $240.00 pa
It is estimated the total number of properties to be serviced during 2015/2016 will be 82.
The charge has been fixed at a level that will recoup the perceived costs of making the Waste
Management service available.
USAGE WATER CHARGES
Council proposes to levy usage water charges in accordance with Section 502 of the Local
Government Act, 1993, on all properties. The purpose of this charge is two-fold:
(1) to assist in the financing of water supplies;
(2) to encourage conservative use of water.
The usage water charge for 2015/2016 will be:
Warren Bore Water Supply - 0 – 450 kl - $1.03/kilolitre
- over 450 kl - $1.55/kilolitre
Warren River Water Supply - 0 – 450 kl - $0.38/kilolitre
- over 450 kl - $0.66/kilolitre
Nevertire Bore Water Supply- 0 – 450 kl - $0.59/kilolitre
- over 450 kl - $0.86/kilolitre
Collie Bore Water Supply - 0 - 400 kl - $1.28/kilolitre
- over 400 kl - $1.93/kilolitre
AVAILABILITY CHARGES FOR WATER SUPPLIED TO NON RATEABLE PROPERTIES
Council proposes to make a charge in accordance with Section 501 of the Local Government Act,
1993, being the availability charge for any water supplied to non-rateable properties. The charge
applicable will be dependent upon the supply from which the water is drawn, as indicated below:
Warren - $330.00 Nevertire - $450.00 Collie - $335.00

Operational Plan Financial Information - Estimates 2015/16 Page 24
RESIDENTIAL SEWERAGE CHARGES FOR MULTIPLE USER PROPERTIES
Residential properties in Warren with more than two (2) WC’s, are charged half the minimum
sewerage charge multiplied by the number of additional WC's in addition to the annual sewerage
charge.
Charge for WC/Urinal - $250.00
NON-RESIDENTIAL SEWERAGE ACCESS CHARGE
Council proposes to make a charge in accordance with Section 501 of the Local Government Act,
1993, being a sewerage charge to non-residential properties. The charge applicable will be
dependent upon the sewerage scheme, as indicated below:
Warren - $460.00 Nevertire - $460.00
NON-RESIDENTIAL SEWERAGE USAGE CHARGE
Council proposes to levy a usage charge in accordance with Section 502 of the Local Government
Act, 1993, on all non-residential properties.
Best practice guidelines for non-residential customers involves charging an appropriate sewer usage
charge for the estimated volume discharged to the sewerage system based on the capacity
requirement that their loads place on the system relative to residential customers. Grant funding for
sewerage augmentation is conditional on council adopting these pricing guidelines.
The sewer usage charge will be calculated quarterly by multiplying the bore (potable) water usage
by the relevant sewer discharge factor (SDF) multiplied by the sewer usage charge per kilolitre
The sewerage usage charge for 2015/2016 will be $1.80/kilolitre.
i.e. if a property uses 20 kls of bore (potable) water in the first quarter with a SDF of
90% at a usage charge of $1.80 per kilolitre their account would be:
20 kls X 90% (SDF) = 18 kls X $1.80 = $32.40 usage charge for the quarter
TRADE WASTE CHARGES - NON RESIDENTIAL PROPERTIES
Council is responsible for the approval and monitoring of liquid trade waste discharges in
accordance with the Office of Water ―Water Supply, Sewerage & Trade Waste Pricing Guidelines.
A liquid trade waste discharger is a property that discharges waste into the sewerage system other
than domestic sewerage or unpolluted water. The fee structure for each category is based on the load
each places on the treatment process and consists of an access fee and scheduled inspection fee.
Where a scheduled inspection detects non-compliant issues any additional inspections undertaken
to correct the issues will attract a re-inspection fee.
All charges are listed in the 2015/16 Fees and Charges section at the back of this document.
Operational Plan Financial Information - Estimates 2015/16 Page 25
VARIOUS FEES AND CHARGES
In accordance with Section 608 of the Local Government Act, 1993, Council proposes a range of
fees and charges as contained in the "2015/2016 Fees and Charges Schedule" to be included in the
estimates document.
Council is required to charge GST on certain goods and services provided. The above document
lists fees and charges as either inclusive of GST or GST not applicable As the determination of
exempt charges made by the government may change from time to time Council may adjust fees
and charges by the GST effect of any changes notified
Generally, these fees are intended to cover the following contingencies:
supply of a service, product or commodity
giving information
providing a service in connection with the Council's regulatory functions, including receiving an application for approval, granting an approval, making an inspection and issuing a certificate
allowing admission to any building or enclosure
The following factors have been taken into account in determining the fees proposed:
The cost of providing the service
The importance of the service to the community
The price fixed by the relevant industry body
Any factors specified in the Local Government Regulations
The fees set for a wide range for goods and services are based on recovery of operating costs,
contribution to the cost of replacement of the assets utilised. Examples are:
Reinstatement of roads and footpaths
Plant hire
Plan printing
Section 603 certificates
Sporting & Cultural Complex hire
Racecourse/restaurant hire
Provision of a range of goods and services where statutory charges are set by regulation. Examples are:
Section 149 certificates
Development applications
Information supplied under Government Information (Public Access) Act 2009
Impounding fees
Dog registrations
Building application fees

Operational Plan Financial Information - Estimates 2015/16 Page 26
WARREN SHIRE COUNCIL SUMMARY BY FUND 2015/2016
Result Add Result Before
Surplus/ Depreciation Depreciation
Fund Revenue Capital Total Expenses Capital Total (Deficit) Surplus/
(Deficit)
General Fund 12,935,466 0 12,935,466 11,243,580 5,297,618 16,541,198 (3,605,732) 3,605,732 0
Water Supply Fund 633,742 1,315,500 1,949,242 754,563 1,361,500 2,116,063 (166,821) 191,000 24,179
Sewerage Fund 555,880 250,000 805,880 735,432 524,000 1,259,432 (453,552) 235,000 (218,552)
TOTAL 14,125,088 1,565,500 15,690,588 12,733,575 7,183,118 19,916,693 (4,226,105) 4,031,732 (194,373)
Estimated Income Estimated Expenditure
34.05%
7.15%
1.50%
35.02%
9.96%
1.72%
9.02%
1.58%
Estimated Sources of Revenue 2015/16
Rates & Annual Charges
User Charges & Fees
Interest on Investments
Grants & Contributions - Operating
Grants & Contributions - Capital
Other Revenues
Transfers from Reserves
Sale of Assets
26.24%0.13%
11.10%
20.42%
5.58%0.24%
35.91%
0.38%
Estimated Expenditure 2015/16
Employee Costs
Borrowing Costs
Materials & Contracts
Depreciation
Other Expenses
Transfers to Reserves
Capital Works
Repayment of Loans

Operational Plan Financial Information - Estimates 2015/16 Page 27
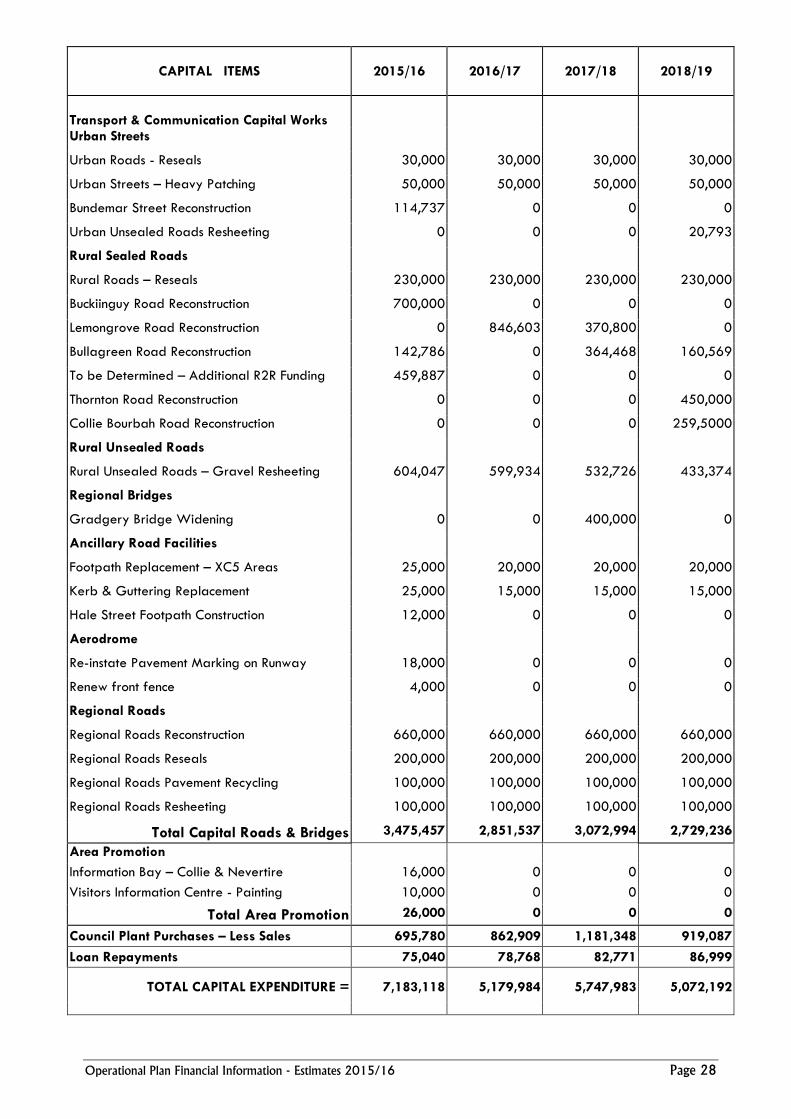
CAPITAL WORKS PROJECTS
CAPITAL ITEMS
2015/16 2016/17 2017/18 2018/19
$ $ $ $
Administration Capital Purchases
Computer Hardware/Software 359,552 8,000 8,000 8,000
MFD Printer/Copier Replacement X 2 30,000 0 0 0
Council Building – Specific Works 6,500 6,500 6,500 6,500
Depot Land Extension 74,000 0 0 0
Council Chambers Improvements 0 400,000 400,000 400,000
Total Capital Administration 470,052 414,500 414,500 414,500
Housing & Community Amenities
Transfer Sale of Land to Restricted Funds 16,500 16,500 16,500 16,500
Dwellings Refurbishment/Specific Maintenance 34,870 14,870 14,870 14,870
Ewenmar Waste Depot Improvements 85,957 0 0 0
Gunningba Estate Drainage 101,902 66,900 0 0
Total Housing & Community Amenities 239,229 98,270 31,370 31,370
Water Supplies Capital Works
Bores 1,163000 0 0 0
Water Valve Replacement 5,000 0 0 0
Mains Renewal/Upgrade 193,500 54,000 45,000 55,000
Purchase of Plant & Equipment 0 0 0 0
Total Capital Water Supplies 1,361,500 54,000 45,000 55,000
Sewerage Services Capital Works
Sewer Pump Stations 4,000 0 0 6,000
Treatment Works 500,000 800,000 900,000 800,000
Mains Upgrade 20,000 20,000 20,000 30,000
Purchase of Plant & Equipment 0 0 0 0
Total Capital Services Supplies
524,000
820,000
920,000
836,000
Recreation & Culture Capital Works
Library – MFD Printer/Copier Replacement 6,400 0 0 0
Library Stormwater & Leak Proofing 45,000 0 0 0
Parks & Reserves – Playground Equipment 20,400 0 0 0
Layback & Path to Cenotaph – Macquarie Park 12,000 0 0 0
Total Recreation & Culture 83,800 0 0 0
Operational Plan Financial Information - Estimates 2015/16 Page 28
CAPITAL ITEMS
2015/16 2016/17 2017/18 2018/19
Transport & Communication Capital Works
Urban Streets
Urban Roads - Reseals 30,000 30,000 30,000 30,000
Urban Streets – Heavy Patching 50,000 50,000 50,000 50,000
Bundemar Street Reconstruction 114,737 0 0 0
Urban Unsealed Roads Resheeting 0 0 0 20,793
Rural Sealed Roads
Rural Roads – Reseals 230,000 230,000 230,000 230,000
Buckiinguy Road Reconstruction 700,000 0 0 0
Lemongrove Road Reconstruction 0 846,603 370,800 0
Bullagreen Road Reconstruction 142,786 0 364,468 160,569
To be Determined – Additional R2R Funding 459,887 0 0 0
Thornton Road Reconstruction 0 0 0 450,000
Collie Bourbah Road Reconstruction 0 0 0 259,5000
Rural Unsealed Roads
Rural Unsealed Roads – Gravel Resheeting 604,047 599,934 532,726 433,374
Regional Bridges
Gradgery Bridge Widening 0 0 400,000 0
Ancillary Road Facilities
Footpath Replacement – XC5 Areas 25,000 20,000 20,000 20,000
Kerb & Guttering Replacement 25,000 15,000 15,000 15,000
Hale Street Footpath Construction 12,000 0 0 0
Aerodrome
Re-instate Pavement Marking on Runway 18,000 0 0 0
Renew front fence 4,000 0 0 0
Regional Roads
Regional Roads Reconstruction 660,000 660,000 660,000 660,000
Regional Roads Reseals 200,000 200,000 200,000 200,000
Regional Roads Pavement Recycling 100,000 100,000 100,000 100,000
Regional Roads Resheeting 100,000 100,000 100,000 100,000
Total Capital Roads & Bridges 3,475,457 2,851,537 3,072,994 2,729,236
Area Promotion
Information Bay – Collie & Nevertire 16,000 0 0 0
Visitors Information Centre - Painting 10,000 0 0 0
Total Area Promotion 26,000 0 0 0
Council Plant Purchases – Less Sales 695,780 862,909 1,181,348 919,087
Loan Repayments 75,040 78,768 82,771 86,999
TOTAL CAPITAL EXPENDITURE = 7,183,118 5,179,984 5,747,983 5,072,192

Operational Plan Financial Information - Estimates 2015/16 Page 29
PRICING POLICY FOR GOODS AND SERVICES
Council is committed to providing a variety of goods and services, which reflect not only the needs
of individual customers, but also the wider community. Council strives to attain the highest possible
standards by making maximum use of all resources, working in a spirit of teamwork and harmony
amongst its Councillors, staff and the community.
Council will ensure that fees and charges are raised as equitably as possible, but at all times, those
groups and individuals in the community who are unable to meet such commitments because of
financial hardship will always receive due consideration.
Council supports the user pays principle in the assessment and calculation of fees and charges, whilst
recognising the need for supplementing income in particular circumstances.
Council recognises the need to provide services for groups and members of the community that may
not be able to afford a commercial rate for the provision of such services.
Council will ensure that all rates, charges and fees are set so as to provide adequate cash flows to
meet operating costs and to assist in the provision of funding capital works. Council will pursue all
cost effective opportunities in order to maximise its revenue base and to seek an acceptable
commercial rate of return on investments, subject of course to community service obligations.
Council recognises the need to set prices for goods and services to provide the most effective level
of service possible to our community.
Council recognises the need to set prices for goods and services in order to ensure resources are not
wasted or underutilised and wherever possible can promote more efficient and effective investment
in the provision of infrastructure and essential services.
Council's policy in relation to charges for works on private land is:
"Where work is carried out on private property by labour and plant, utilising materials purchased by Council, the work is charged at actual cost together with appropriate loadings to cover overheads."

Operational Plan Financial Information - Estimates 2015/16 Page 30
GOODS AND SERVICES TAX
Council is required to charge GST on the provision of goods and services unless specifically exempt
under section 81-5 of A New Tax System (Goods and Services Tax) Act 1999.
In many instances charges imposed by authority of an act of parliament have been declared exempt
of GST. Council where required to charge GST on other goods and services has incorporated this
tax into its Fees and Charges for the future year.
It is expected that the Federal Government will make changes to this section 81 list over time.
Accordingly Council will adjust its fees and charges from time to time by the GST effect of any
future determinations made by the government.
PROPOSED LOAN BORROWINGS FOR 2015/2016
Council's purpose in borrowing is to distribute the initial capital cost of assets and major capital
improvements to those members of the community who benefit from the assets in the future, rather
than imposing the total initial capital cost on current ratepayers.
Council does not propose to borrow loan funds during 2015/2016.
SUMMARY OF LOAN BORROWINGS
1996/97 Levee Upgrade – Stage I
300,000
1997/98 Levee Upgrade – Stage II(a)
495,000
1998/99 Levee Upgrade – Stage II(b) 255,000
Sewerage Works 150,000
1999/00 Levee Upgrade – Stage III 300,000
Water Supply Works 100,000
2000/01 Levee Upgrade 175,000
2001/02 to 2009/10 Nil Nil
2010/11 Construction of Warren Family Health
Centre 500,000
2012/13 Nil Nil
2013/14 Nil Nil
2014/15 Nil Nil
2015/16 Nil Nil

Operational Plan Financial Information - Estimates 2015/16 Page 31
WARREN SHIRE COUNCIL - LOAN REPAYMENTS & BALANCES TO 30/6/2016
LOAN INT TERM ORIGINAL INSTITUTE PRINCIPAL PRINCIPAL YEAR
NO LOAN PURPOSE RATE AMOUNT 30-Jun-15 PRINCIPAL INTEREST 30-Jun-16 FINALISED
===== ======================== ====== ===== ======== ======== ========== ======== ======== ========== ========
GENERAL FUND
217 Refinancing of Silo Loans 0.00 30 840,888 TREASURY 168,177.60 28,029.60 0.00 140,148.00 2020
250 Medical Centre Construction 7.64 10 500,000 NAB 343,407.02 47,010.81 25,414.89 296,396.21 2021
---------------- ------------- ------------- ----------------
TOTAL GENERAL FUND = 511,584.62 75,040.41 25,414.89 436,544.21
========== ======== ======== ==========
2015/2016
Revenue & Expenditure on Warren Shire Council Roads & Bridges
Year Regional Roads Local Road Total Road R.M.S. S. Total
& Bridges Exp. & Bridges Exp. & Bridges Exp. Grant Revenue Revenue
2005/06 2,381,702 1,656,241 4,037,943 2,395,260 1,642,683 4,037,943
2006/07 2,290,750 2,121,496 4,412,246 2,349,498 2,062,748 4,412,246
2007/08 3,197,539 2,481,049 5,678,588 3,399,136 2,279,452 5,678,588
2008/09 2,485,232 2,234,454 4,719,686 2,539,232 2,180,454 4,719,686
2009/10 1,883,923 2,868,494 4,752,417 2,076,301 2,676,116 4,752,417
2010/11 2,451,113 1,720,185 4,171,298 3,138,604 1,032,694 4,171,298
2011/12 1,961,945 3,024,013 4,985,958 2,889,165 2,096,793 4,985,958
2012/13 1,272,514 3,611,199 4,883,713 1,339,459 3,544,254 4,883,713
2013/14 1,936,925 2,994,150 4,931,075 1,955,138 2,975,937 4,931,075
Original Est. 2014/15 1,800,000 2,515,398 4,315,398 1,800,000 2,515,398 4,315,398
Revised Est. 2014/15 1,471,000 2,923,407 4,394,407 1,471,000 2,923,407 4,394,407
Estimate 2015/16 1,742,000 3,207,400 4,949,400 1,742,000 3,207,400 4,949,400
1,656,241
2,121,496
2,481,049
2,234,454
2,868,494
1,720,185
3,024,013
3,611,199
2,994,150
2,515,398
2,923,407
3,207,400
0
500,000
1,000,000
1,500,000
2,000,000
2,500,000
3,000,000
3,500,000
4,000,000
2005/06 2006/07 2007/08 2008/09 2009/10 2010/11 2011/12 2012/13 2013/14 Original Est.
2014/15
Revised Est.
2014/15
Estimate
2015/16
Year
Council, FAGS & R2R Revenue spent on Roads & Bridges2005/06 to Est. 2015/16

Page 3
2
WARREN SHIRE COUNCIL
2015/2016 Estimates

Page 3
3
2013/14 2014/15 2014/15 2015/16 2016/17 2017/18 2018/19
Actual Original Anticipated Estimate Estimate Estimate Estimate
Income from Continuing Operations
Rates & Annual Charges 5,067,696 5,199,554 5,197,207 5,350,503 5,350,503 5,350,503 5,350,503
User Charges & Fees 1,153,806 1,172,300 1,542,666 1,123,863 1,123,863 1,123,863 1,123,863
Interest & Investment Revenue 408,948 319,900 327,033 236,300 236,300 236,300 236,300
Other Revenues 510,605 262,517 281,172 270,075 270,075 270,075 270,075
Grants & Contributions provided for Operating Purposes 3,796,661 4,922,206 4,671,213 5,502,947 4,981,008 4,983,508 4,981,008
Grants & Contributions provided for Capital Purposes 0 0 1,353,000 1,565,500 450,000 500,000 450,000
Nett Gain on Disopsal of Assets 83,303 0 0 0 0 0 0
Nett Share in Joint Ventures 0 0 0 0 0 0 0
Total Income from Continuing Operations 11,021,019 11,876,477 13,372,291 14,049,188 12,411,749 12,464,249 12,411,749
Expenses from Continuing Operations
Employee Benefits & On-Costs 4,669,945 4,446,780 4,446,780 5,181,365 5,165,365 5,165,365 5,165,365
Borrowing Costs 50,459 28,812 28,812 25,415 21,697 17,693 13,454
Materials & Contracts 2,313,878 2,777,970 3,353,844 2,192,090 2,186,976 2,191,976 2,206,976
Depreciation & Amortisation 3,612,568 3,969,032 3,969,032 4,031,732 4,036,457 4,044,457 4,049,457
Other Expenses 1,039,815 1,111,923 1,093,709 1,102,503 1,127,059 1,103,059 1,103,059
Nett Loss on Disposal of Assets 0 0 0 0 0 0 0
Nett Share in Joint Ventures 3,569 0 0 0 0 0 0
Total Expenses from Continuing Operations 11,690,234 12,334,517 12,892,177 12,533,105 12,537,554 12,522,550 12,538,311
Net Operating Result for the Year (669,215) (458,040) 480,114 1,516,083 (125,805) (58,301) (126,562)
Net Operating Result for the year before Grants and
Contributions provided for Capital Purposes (669,215) (458,040) (872,886) (49,417) (575,805) (558,301) (576,562)
Warren Shire Council
Estimated Income Statement
for the Financial Year Ended 30th June 2016

Page 3
4
-------------------------------------------------- ------------------------------------------------------------------------------------------------------------------------------------------ ---- ---------------------------------------------- ------------------------------------- ------------------ ------------------- ------------------ ------------------------------------
2013/14 2014/15 2014/15 2015/16 2016/17 2017/18 2018/19 2013/14 2014/15 2014/15 2015/16 2016/17 2017/18 2018/19
EXPENDITURE Actual Original Anticipated Estimate Estimate Estimate Estimate INCOME Actual Original Anticipated Estimate Estimate Estimate Estimate
Estimate Expenditure Estimate Income
-------------------------------------------------- ------------------------------------------------------------------------------------------------------------------------------------------ ---- ---------------------------------------------- ------------------------------------- ------------------ ------------------- ------------------ ------------------------------------
Administration 3,417,437 3,504,766 3,517,199 3,597,406 3,640,256 3,612,252 3,608,013 Administration 7,152,516 7,316,109 7,392,281 7,413,777 7,349,927 7,325,927 7,325,927
Public Order & Safety 283,766 316,715 312,529 322,107 299,544 304,544 299,544 Public Order & Safety 76,588 88,958 88,958 85,646 65,583 68,083 65,583
Health 344,160 316,672 316,672 326,634 326,634 326,634 326,634 Health 15,226 3,000 4,480 3,000 3,000 3,000 3,000
Community Services & Education 51,598 75,773 76,773 70,473 70,473 70,473 70,473 Community Services & Education 46,694 68,473 69,473 67,473 67,473 67,473 67,473
Housing & Comm. Amenities 720,761 758,399 776,003 769,412 761,412 761,412 761,412 Housing & Comm. Amenities 437,149 374,409 391,496 413,208 405,208 405,208 405,208
Recreation & Culture 1,267,640 1,281,074 1,295,872 1,315,787 1,315,787 1,315,787 1,315,787 Recreation & Culture 228,869 206,188 222,685 218,214 218,214 218,214 218,214
Mining, Manufacturing & Const. 31,799 28,500 28,500 18,500 18,500 18,500 18,500 Mining, Manufacturing & Const. 45,851 27,000 27,050 16,125 16,125 16,125 16,125
Transport & Communication 4,436,345 4,471,130 4,977,524 4,514,827 4,525,489 4,525,489 4,525,489 Transport & Communication 1,250,695 1,286,149 1,762,977 1,291,493 1,285,662 1,285,662 1,285,662
Economic Services 298,854 383,233 392,084 308,434 305,934 305,934 305,934 Economic Services 118,526 164,936 166,253 100,310 100,310 100,310 100,310
------------------- ---------------------------------------------------------------------------------------------------------------------- ------------------- ------------------------------------- ------------------- --------------- ------------------ ------------------
General Fund Operating Expenditure 10,852,360 11,136,262 11,693,156 11,243,580 11,264,029 11,241,025 11,231,786 General Fund Operating Income 9,372,114 9,535,222 10,125,653 9,609,246 9,511,502 9,490,002 9,487,502
Water Supplies 804,314 728,447 728,447 778,742 772,742 786,742 779,937 Water Supplies 669,591 660,671 660,671 633,742 633,742 633,742 634,937
Sewerage Services 675,522 674,388 674,389 735,432 717,432 720,432 743,432 Sewerage Services 651,783 710,263 717,078 774,432 900,432 950,432 936,432
------------------- ---------------------------------------------------------------------------------------------------------------------- ------------------- ------------------------------------- ------------------- --------------- ------------------ ------------------
Total Operating Expenditure 12,332,196 12,539,097 13,095,992 12,757,754 12,754,203 12,748,199 12,755,155 Total Operating Income 10,693,488 10,906,156 11,503,402 11,017,420 11,045,676 11,074,176 11,058,871
Capital Expenditure Capital Income
General Fund 5,102,065 3,969,682 4,590,440 5,274,013 4,565,984 5,193,483 4,538,192 General Fund 3,234,349 2,010,690 2,597,911 3,302,615 2,712,054 3,338,049 2,676,019
Water Supply Fund 53,228 113,224 1,466,224 1,361,500 54,000 45,000 55,000 Water Supply Fund 0 0 1,353,000 1,315,500 0 0 0
Sewerage Services Fund 205,561 263,875 270,689 524,000 820,000 920,000 836,000 Sewerage Services Fund 0 0 0 250,000 400,000 450,000 400,000
------------------------------------------------------------------------------------------------------------------------------------------ ------------------------------------- ------------------ ---------------- ------------------ ------------------------------------
Total Capital Expenditure 5,360,854 4,346,781 6,327,353 7,159,513 5,439,984 6,158,483 5,429,192 Total Capital Income 3,234,349 2,010,690 3,950,911 4,868,115 3,112,054 3,788,049 3,076,019
------------------------------------------------------------------------------------------------------------------------------------------ ------------------------------------------------------------------------------------------------------------------------------------
Total Operating & Capital Expenditure 17,693,050 16,885,878 19,423,345 19,917,267 18,194,187 18,906,682 18,184,347 Total Operating & Capital Income 13,927,837 12,916,846 15,454,313 15,885,535 14,157,730 14,862,225 14,134,890
================================================================================ =============================================================================
Estimated Budget Results
Surplus/(Deficit) (3,765,213) (3,969,032) (3,969,032) (4,031,732) (4,036,457) (4,044,457) (4,049,457)
Add Depreciation Included in Above 4,021,927 3,969,032 3,969,032 4,031,732 4,036,457 4,044,457 4,049,457
Est. Surplus/(Deficit) before Dep'n 256,714 0 0 0 0 0 0
Functions/Activities
WARREN SHIRE COUNCIL
ESTIMATES - 2015/2016

Page 3
5
1. GENERAL RATES AND EXTRA CHARGES
General Rate income has been increased by IPART’s determination being 2.4%. The increase for the year 2015/16 is estimated to
be approximately $110,681.00.
2. FINANCIAL ASSISTANCE GRANT
YEAR EQUALISATION ROADS TOTAL
2011/2012 $1,232,361 $915,166 $2,147,527
2012/2013 $1,244,099 $905,187 $2,149,286
2013/2014 $1,386,680 $960,740 $2,347,420
2014/2015 $1,460,298 $975,011 $2,435,309
2015/2016 $1,460,298 $975,011 $2,435,309
The FAG's Grant has not been increased due to the Commonwealth Government’s decision to freeze any indexation on payments
over 3 years from 2014/2015 to 2016/2017. There may be a slight increase in these funds through the Grants Commissions
distribution of the equalisation component.
3. SALARIES AND ALLOWANCES - have been increased by 2.8% to compensate for all performance revues and the award
increase of 2.7% from 1st July 2015, there will be 53 pay periods in 2015/16.
DEPARTMENT SALARIES &
ALLOWANCES
ACCRUED
LEAVE
TOTAL
Administration $ 618,124 $ 80,416 $ 698,540
Engineering $ 621,783 $ 74,125 $ 695,908
Health & Building $ 177,294 $ 21,618 $ 198,913
Library $ 122,598 $ 11,205 $ 133,803
Economic Development $ 62,442 $ 7,050 $ 69,492
Other N.E.I. $ 2,054,049 $223,401 $ 2,277,810

Page 3
6
---------------------------------------------- --------------------------------------------------------------------------------------------------------------------- ---- ---------------------------------------- --------------------------------- ---------------- ------------------ --------------- --------------- ---------------
2013/14 2014/15 2014/15 2015/16 2016/17 2017/18 2018/19 2013/14 2014/15 2014/15 2015/16 2016/17 2017/18 2018/19
EXPENDITURE Actual Original Anticipated Estimate Estimate Estimate Estimate INCOME Actual Original Anticipated Estimate Estimate Estimate Estimate
Estimate Expenditure Estimate Income
---------------------------------------------- --------------------------------------------------------------------------------------------------------------------- ---- ---------------------------------------- --------------------------------- ---------------- ------------------ --------------- --------------- ---------------
RATES
General Rates 4,290,026 4,290,034 4,394,517 4,394,517 4,505,198 4,505,198 4,505,198
1 General Rate Increase Differential 0 104,520 0 110,681 0 0 0
Extra Charges 8,387 7,000 7,000 7,000 7,000 7,000 7,000
Pensioner Write Off (35,702) (34,500) (35,928) (35,738) (35,738) (35,738) (35,738)
---------------- ---------------- ---------------- --------------- --------------- --------------- ---------------
Net General Purpose Rates = 4,262,711 4,367,054 4,365,589 4,476,460 4,476,460 4,476,460 4,476,460
CORPORATE SUPPORT SERVICES CORPORATE SUPPORT SERVICES
Administration Expenses Administration
3 Salaries & Allowances 619,637 618,124 618,124 668,500 668,500 668,500 668,500
Staff Housing Subsidy 13,400 11,960 11,960 13,250 13,250 13,250 13,250 Sec. 603 Certificates 5,420 5,300 5,300 5,300 5,300 5,300 5,300
Staff Uniforms 1,552 1,400 1,400 1,400 1,400 1,400 1,400 Gen. Admin. Sundry Income 804 750 750 750 750 750 750
Travelling 5,146 5,297 5,297 15,000 15,000 15,000 15,000
Accrued Leave Entitlements 81,908 80,416 80,416 83,600 83,600 83,600 83,600
Administration Buildings - Operating Expenses
Office Equipment - M & R 1,485 4,452 3,452 4,452 4,452 4,452 4,452 Sundry Sales & Services 2,695 1,500 1,500 1,500 1,500 1,500 1,500
Computer - M'tce & Consumables 47,073 48,983 48,983 49,963 49,963 49,963 49,963
Lighting & Power 17,964 16,000 16,000 18,000 18,000 18,000 18,000 RMS Agency 74,583 70,412 70,412 76,000 76,000 76,000 76,000
Council Rates & Charges 4,952 5,451 5,451 5,560 5,560 5,560 5,560
Administration Buildings - Maintenance & Repairs
Building M & R - General 2,607 8,500 12,141 8,500 8,500 8,500 8,500
Wages of Cleaner 22,265 23,770 23,770 24,245 24,245 24,245 24,245
Furniture & Fittings M & R 5,154 3,500 4,500 3,570 3,570 3,570 3,570 Grants & Subsidies
Sundry Expenses 4,693 4,815 4,174 4,911 4,911 4,911 4,911 2 Financial Assist Grant 1,210,158 2,394,368 2,435,309 2,435,309 2,435,309 2,435,309 2,435,309
Prepaid Financial Assist Grant 1,137,262 0 0 0 0 0 0
Administration Expenses - Other Pensioners Rate Subsidy 19,616 18,975 17,921 19,656 19,656 19,656 19,656
Advertising 10,027 25,000 16,000 16,000 16,000 16,000 16,000
Printing & Stationery 22,924 25,000 23,000 25,000 25,000 25,000 25,000
Postage 7,900 8,000 8,000 8,000 8,000 8,000 8,000
Telephone 25,385 28,000 24,000 26,000 26,000 26,000 26,000
Security Services 518 750 750 550 550 550 550
Valuation Fees 16,779 17,271 17,117 17,616 17,616 17,616 17,616
Audit Fees 28,000 28,840 28,840 29,417 29,417 29,417 29,417
Internal Audit 25,764 31,929 31,929 0 32,568 32,568 32,568
Bank Charges 5,015 5,938 4,938 6,057 6,057 6,057 6,057
Legal Expenses 512 5,000 11,000 5,000 5,000 5,000 5,000
Subscriptions & Sundry Office Expenses 8,795 9,000 7,409 9,000 9,000 9,000 9,000
Celebrations - Australia Day - CSP 1.1.6 1,177 1,400 945 1,428 1,428 1,428 1,428
Internet Access & Website 3,175 2,000 2,000 2,000 2,000 2,000 2,000
OROC Executive Officer 10,337 10,640 9,250 9,435 9,435 9,435 9,435
OROC Procurement 2,457 2,529 1,965 0 0 0 0
OROC - Infrastructure Masterplan 0 0 2,500 0 0 0 0
ADMINISTRATION

Page 3
7
4. INSURANCES
06/07 07/08 08/09 09/10 10/11 11/12 12/13 13/14 14/15
Est.
15/16
Members Accident 2,500 2,500 2,625 2,625 2,750 2,881 2,881 2,881 2,881 2,939
Fidelity Guarantee 1,332 1,180 1,229 1,556 1,250 1,242 1,465 1,364 1,364 1,405
Public Liability 88,000 90,900 94,100 89,395 89,395 89,395 92,523 95,670 97,870 99,827
Miscellaneous ISR 44,050 46,899 61,639 62,673 63,868 69,527 94,015 97,212 94,530 96,421
Workers
Compensation 228,414 133,676 121,994 204,821 225,596 230,771 213,110 204,219 220,000 215,000
TOTALS 364,296 275,155 281,587 361,070 382,859 393,816 403,994 401,346 416,645 415,592
5. INTEREST ON INVESTMENTS
Interest on investments has been calculated at 2.25% which is based on the predicted interest rates as advised by the National
Australia Bank’s Australian Weekly Market Report and the Reserve Bank’s decision to drop the interest rates to 2% on 5th May
2015.

Page 3
8
---------------------------------------------- --------------------------------------------------------------------------------------------------------------------- ---- ---------------------------------------- --------------------------------- ---------------- ------------------ --------------- --------------- ---------------
2013/14 2014/15 2014/15 2015/16 2016/17 2017/18 2018/19 2013/14 2014/15 2014/15 2015/16 2016/17 2017/18 2018/19
EXPENDITURE Actual Original Anticipated Estimate Estimate Estimate Estimate INCOME Actual Original Anticipated Estimate Estimate Estimate Estimate
Estimate Expenditure Estimate Income ---------------------------------------------- --------------------------------------------------------------------------------------------------------------------- ---- ---------------------------------------- --------------------------------- ---------------- ------------------ --------------- --------------- ---------------
4 Administration Expenses - Insurances
- Fidelity Guarantee 1,364 1,405 1,364 1,405 1,405 1,405 1,405
- Public Liability & Professional Indemnity 95,670 98,473 97,870 99,827 99,827 99,827 99,827
- P.I. Excess 0 25,000 25,000 25,000 25,000 25,000 25,000 From Restricted Funds 0 25,000 25,000 25,000 25,000 25,000 25,000
- Industrial Special Risk 90,725 100,060 94,530 96,421 96,421 96,421 96,421 Property Scheme Rebate 6,479 6,000 12,143 6,000 6,000 6,000 6,000
- Sick Leave 3,865 3,980 1,951 3,990 3,990 3,990 3,990 OHS Incentive Payment 18,680 4,000 4,000 4,000 4,000 4,000 4,000
- Risk Management 0 15,000 15,000 15,000 15,000 15,000 15,000 From Restricted Funds 0 15,000 15,000 15,000 15,000 15,000 15,000
Interest Interest
On Loans 32,076 28,758 28,758 25,415 21,697 17,693 13,454 5 Interest on Investment 288,956 225,000 230,155 158,400 158,400 158,400 158,400
Elected Members Activities
Election Expenses 0 4,000 4,000 4,000 28,000 4,000 4,000 From Restricted Funds 0 0 0 0 24,000 0 0
Mayoral Allowance 20,000 20,586 23,440 24,030 24,030 24,030 24,030
Members Fees 100,834 103,788 103,153 105,732 105,732 105,732 105,732
Travelling & Subsistence 7,998 7,945 7,945 8,104 8,104 8,104 8,104
Delegates Expenses 15,526 18,870 18,870 19,247 19,247 19,247 19,247 From Restricted Funds 5,000 0 0 0 0 0 0
4 Insurance - Members Accident 2,881 2,965 2,881 2,939 2,939 2,939 2,939
LGNSW Subscription 12,305 12,666 15,677 15,991 15,991 15,991 15,991
Section 356 (Donation) - CSP 1.1.6 8,907 9,733 9,733 9,928 9,928 9,928 9,928
Depreciation - Corporate Support 48,660 48,000 48,000 48,000 48,000 48,000 48,000
--------------------------------------------------------------------------------------------------------------------- --------------------------------- ---------------- ------------------ --------------- --------------- ---------------
Corporate Support Total = 1,437,412 1,535,194 1,523,483 1,561,483 1,614,333 1,586,329 1,582,090 Corporate Support Total = 2,769,653 2,766,305 2,817,490 2,746,915 2,770,915 2,746,915 2,746,915
==================================================================== =================== ========= ========== ========= ========= =========
ENGINEERING & WORKS SUPPORT SERVICES
Engineering & Supervision
3 Engineering Salaries & Allowances 543,284 621,780 621,780 635,200 635,200 635,200 635,200
Staff Housing Subsidy 18,205 17,160 17,160 12,720 12,720 12,720 12,720
Travelling 54,594 56,195 56,195 75,000 75,000 75,000 75,000
Accrual of Leave Entitlements 59,259 74,125 74,125 73,350 73,350 73,350 73,350
Engineering Office Expenses 17,162 20,000 20,000 20,000 20,000 20,000 20,000
Depot Expenses 45,151 41,000 41,000 40,000 40,000 40,000 40,000
Depot Electricity 13,720 13,500 19,500 18,000 18,000 18,000 18,000
Council Rates & Charges 7,056 6,875 8,067 8,228 8,228 8,228 8,228
Stores Unaccounted For (10,393) 1,000 1,000 1,000 1,000 1,000 1,000
Safety Clothing/Boots 18,440 17,000 17,000 17,000 17,000 17,000 17,000
Training & Development - CSP 5.2.3 145,683 115,000 115,000 100,000 100,000 100,000 100,000
Work Health & Safety - CSP 5.2.3 14,083 0 0 0 0 0 0 From Restricted Funds 30,000 0 0 0 0 0 0
Consultative Committee - CSP 5.2.3 105 5,177 5,177 5,281 5,281 5,281 5,281 Existing Worker Traineeship 6,500 6,000 6,000 6,000 6,000 6,000 6,000
Consultative Committee 0 1,984 1,984 2,024 2,024 2,024 2,024
Mobile Phone Replacements 1,164 3,500 8,000 3,500 3,500 3,500 3,500 From Restricted Funds 0 0 4,500 0 0 0 0
Tools in Use Purchase 5,221 12,000 12,000 8,000 8,000 8,000 8,000 Sale of Old Materials 9 2,000 2,000 2,000 2,000 2,000 2,000
Depreciation - Engineering & Works 25,783 32,000 32,000 32,000 32,000 32,000 32,000
--------------------------------------------------------------------------------------------------------------------- --------------------------------- ---------------- --------------- --------------- --------------- ---------------
Engineering & Works Total = 958,517 1,038,296 1,049,988 1,051,303 1,051,303 1,051,303 1,051,303 Engineering & Works Total = 36,509 8,000 12,500 8,000 8,000 8,000 8,000
==================================================================== =================== ========= ========== ========= ========= =========
ADMINISTRATION

Page 3
9
6. SUPERANNUATION
Reflects the actual cost to Council in line with the Superannuation Guarantee Levy of 9.50%, it also includes an additional
$107,121 in contributions due to the global financial crisis. The increase has been offset by restricted employee overheads to
an amount of $87,850.00.
7. PLANT HIRE INCOME
Increases in expenditure will be offset by increased plant hire income throughout the year. The level of activity is expected
to be similar to the previous year.
8. DIESEL FUEL REBATE
A Diesel Fuel Rebate of $77,000 is expected this year.

Page 4
0
---------------------------------------------- --------------------------------------------------------------------------------------------------------------------- ---- ---------------------------------------- --------------------------------- ---------------- ------------------ --------------- --------------- ---------------
2013/14 2014/15 2014/15 2015/16 2016/17 2017/18 2018/19 2013/14 2014/15 2014/15 2015/16 2016/17 2017/18 2018/19
EXPENDITURE Actual Original Anticipated Estimate Estimate Estimate Estimate INCOME Actual Original Anticipated Estimate Estimate Estimate Estimate
Estimate Expenditure Estimate Income
---------------------------------------------- --------------------------------------------------------------------------------------------------------------------- ---- ---------------------------------------- --------------------------------- ---------------- ------------------ --------------- --------------- ---------------
CLEARING ACCOUNTS
3 Employees' Leave Entitlements
- Provision for ELE - NEI 213,337 222,849 222,849 211,250 211,250 211,250 211,250
- Sick NEI 80,489 72,108 72,108 73,550 73,550 73,550 73,550
- Public Holidays - NEI 73,785 78,516 78,516 83,900 83,900 83,900 83,900
6 - Superannuation 456,947 500,000 500,000 510,700 510,700 510,700 510,700 From Restricted Funds 0 87,850 87,850 87,850 0 0 0
4 - Workers Comp. Insurance 236,295 220,000 220,000 215,000 205,000 205,000 205,000
- Fringe Benefit Tax 33,209 42,000 42,000 42,000 42,000 42,000 42,000
- H R Advance 1,682 1,730 1,682 1,716 1,716 1,716 1,716 From Restricted Funds 1,682 1,730 1,682 1,716 1,716 1,716 1,716
- Medical Reports & Tests all Staff 0 0 10,500 0 0 0 0 From Restricted Funds 0 0 10,000 0 0 0 0
On-Cost Contribution - R.M.S. (176,504) (180,000) (180,000) (180,000) (180,000) (180,000) (180,000)
--------------------------------------------------------------------------------------------------------------------- --------------------------------- ---------------- --------------- --------------- --------------- ---------------
Employment Overheads Total = 919,240 957,203 967,655 958,116 948,116 948,116 948,116 Employment Overheads Total = 1,682 89,580 99,532 89,566 1,716 1,716 1,716
==================================================================== =================== ========= ========== ========= ========= =========
Less - Contributions from Works
Administration (114,309) (117,657) (117,657) (120,010) (120,010) (120,010) (120,010)
Engineering (103,220) (106,244) (106,244) (108,369) (108,369) (108,369) (108,369)
Health (4,446) (6,524) (6,524) (6,524) (6,524) (6,524) (6,524)
Risk/Administration (93,575) (43,679) (43,679) (44,553) (44,553) (44,553) (44,553)
RMCC Management 35,400 28,392 28,392 37,000 37,000 37,000 37,000
--------------------------------------------------------------------------------------------------------------------- --------------------------------- ---------------- ------------------ --------------- --------------- ---------------
Contributions from Works Total = (280,150) (245,712) (245,712) (242,456) (242,456) (242,456) (242,456) Contributions from Works Total = 0 0 0 0 0 0 0
==================================================================== =================== ========= ========== ========= ========= =========
7 Plant Running Expenses
Plant Running Expenses 1,601,939 1,720,000 1,720,000 1,720,000 1,720,000 1,720,000 1,720,000
Workshop Expenses 71,967 48,000 50,000 48,960 48,960 48,960 48,960 8 Diesel Fuel Rebate 74,461 69,795 81,795 77,000 77,000 77,000 77,000
Communication M&R 0 4,991 4,991 4,000 4,000 4,000 4,000
Electrical Testing Plant 5,103 6,794 6,794 6,000 6,000 6,000 6,000 RMS - HVIS Rental Income 7,500 15,375 15,375 15,836 15,836 15,836 15,836
Plant Hire Income (2,146,631) (2,410,000) (2,410,000) (2,410,000) (2,410,000) (2,410,000) (2,410,000)
Depreciation - Plant 850,040 850,000 850,000 900,000 900,000 900,000 900,000
--------------------------------------------------------------------------------------------------------------------- --------------------------------- ---------------- ------------------ --------------- --------------- ---------------
Plant Running Expenses Total = 382,418 219,785 221,785 268,960 268,960 268,960 268,960 Plant Running Expenses Total 81,961 85,170 97,170 92,836 92,836 92,836 92,836
==================================================================== =================== ========= ========== ========= ========= =========
--------------------------------------------------------------------------------------------------------------------- --------------------------------- ---------------- ------------------ --------------- --------------- ---------------
ADMINISTRATION TOTAL = 3,417,437 3,504,766 3,517,199 3,597,406 3,640,256 3,612,252 3,608,013 ADMINISTRATION TOTAL = 7,152,516 7,316,109 7,392,281 7,413,777 7,349,927 7,325,927 7,325,927
==================================================================== =================== ========= ========== ========= ========= =========
ADMINISTRATION

Page 4
1
9. FIRE PROTECTION & EMERGENCY SERVICES CONTRIBUTIONS
The amounts provided are based on estimated contributions to the NSW RFS, NSW Fire & Rescue and SES in line with the
current legislative requirements.
10. ANIMAL CONTROL EXPENSES
Ongoing expenditure in relation to animal control within the Warren shire under the current regime.
11. EM PLAN PREPARATION
Council is required to have a new Emergency Management Plan prepared this year this plan has been funded from prior
year’s restrictions.

Page 4
2
------------------------------------------------- --------------------------------------------------------------------------------------------------------------------- ---- ------------------------------------------- -------------------------------- --------------- --------------- --------------- --------------- ---------------
2013/14 2014/15 2014/15 2015/16 2016/17 2017/18 2018/19 2013/14 2014/15 2014/15 2015/16 2016/17 2017/18 2018/19
EXPENDITURE Actual Original Anticipated Estimate Estimate Estimate Estimate INCOME Actual Original Anticipated Estimate Estimate Estimate Estimate
Estimate Expenditure Estimate Income
------------------------------------------------- --------------------------------------------------------------------------------------------------------------------- ---- ------------------------------------------- -------------------------------- --------------- --------------- --------------- --------------- ---------------
Fire Protection - CSP 1.4.3 Fire Protection
9 NSW Fire & Rescue Contribution 18,989 19,545 18,989 19,369 19,369 19,369 19,369
9 NSW RFS Contribution 82,855 85,500 84,137 87,750 87,750 87,750 87,750
Bush Fire Expenses 4,804 20,223 20,223 2,000 2,000 2,000 2,000 Bushfire Claimable Expenses 29,586 39,308 39,308 20,000 20,000 20,000 20,000
Bushfire Plant M & R 23,125 19,085 19,085 18,000 18,000 18,000 18,000
Hazard Reduction 35,000 40,000 40,000 40,000 40,000 40,000 40,000 Hazard Reduction 35,000 40,000 40,000 40,000 40,000 40,000 40,000
Depreciation - Fire Protection 31,757 31,800 31,800 31,800 31,800 31,800 31,800
--------------------------------------------------------------------------------------------------------------------- -------------------------------- --------------- --------------- --------------- --------------- ---------------
Fire Protection Total = 196,530 216,153 214,234 198,919 198,919 198,919 198,919 Fire Protection Total = 64,586 79,308 79,308 60,000 60,000 60,000 60,000
==================================================================== =================== ======== ======== ======== ======== =========
10 Animal Control - CSP 1.4.1 Animal Control
Impounding Expenses 439 1,108 1,108 1,130 1,130 1,130 1,130 Dog Registrations 1,830 3,000 3,000 1,000 1,000 1,000 1,000
Dog Control - Ranger 54,249 60,616 60,616 60,800 60,800 60,800 60,800 Pound Fees - Dogs 240 250 250 250 250 250 250
Pound M & R 290 3,781 3,781 3,857 3,857 3,857 3,857 Fines & Costs 3,368 2,000 2,000 2,000 2,000 2,000 2,000
Dog Control - Sundry Exp. 2,805 3,013 3,013 3,073 3,073 3,073 3,073 Sale of Accessories 0 150 150 0 0 0 0
Ranger Uniform/Equipment 478 864 864 500 500 500 500
Ranger Vehicle M&R 5,893 5,664 5,664 10,000 10,000 10,000 10,000
Ranger Development Program 1,296 1,703 1,703 1,737 1,737 1,737 1,737
Desexing Subsidy Program 2,297 0 0 5,000 0 5,000 0 From Restricted Funds 2,500 0 0 0 0 0 0
Other Animals Control 508 880 880 898 898 898 898 Grant Funds 0 0 0 2,500 0 2,500 0
Council Rates & Charges 242 249 248 253 253 253 253
Depreciation - Animal Control 592 592 592 592 592 592 592
--------------------------------------------------------------------------------------------------------------------- -------------------------------- --------------- --------------- --------------- --------------- ---------------
Animal Control Total = 69,089 78,470 78,469 87,840 82,840 87,840 82,840 Animal Control Total = 7,938 5,400 5,400 5,750 3,250 5,750 3,250
==================================================================== =================== ======== ======== ======== ======== =========
Emergency Services - CSP 1.4.3 Emergency Services
9 SES Contribution 6,190 6,371 4,105 4,187 4,187 4,187 4,187
S.E.S. - Warren Unit Operations 1,071 3,777 3,777 1,500 1,500 1,500 1,500 S.E.S. - Expenses Claim 4,064 4,250 4,250 2,333 2,333 2,333 2,333
Emergency Centre - General M & R 1,256 3,012 3,012 3,072 3,072 3,072 3,072
Emergency Centre - Electricity 3,944 3,104 3,104 3,166 3,166 3,166 3,166
Council Rates & Charges 1,465 1,607 1,607 1,639 1,639 1,639 1,639
11 EM Plan Preparation 0 0 0 17,563 0 0 0 From Restricted Funds 0 0 0 17,563 0 0 0
Depreciation - Emergency Services 4,221 4,221 4,221 4,221 4,221 4,221 4,221
--------------------------------------------------------------------------------------------------------------------- -------------------------------- --------------- --------------- --------------- --------------- ---------------
Emergency Services Total = 18,147 22,092 19,826 35,348 17,785 17,785 17,785 Emergency Services Total = 4,064 4,250 4,250 19,896 2,333 2,333 2,333
==================================================================== =================== ======== ======== ======== ======== =========
Other Total = 0 0 0 0 0 0 0 Other Total = 0 0 0 0 0 0 0
TOTAL PUBLIC ORDER --------------------------------------------------------------------------------------------------------------------- TOTAL PUBLIC ORDER -------------------------------- --------------- --------------- --------------- --------------- ---------------
& SAFETY 283,766 316,715 312,529 322,107 299,544 304,544 299,544 & SAFETY 76,588 88,958 88,958 85,646 65,583 68,083 65,583
==================================================================== =================== ======== ======== ======== ======== =========
PUBLIC ORDER & SAFETY

Page 4
3
12. NOXIOUS PLANTS - $99,517
Council's contribution to the Castlereagh Macquarie County Council for control and destruction of noxious plants within
the Shire has been increased by 2.4% the same as rate pegging as determined by IPART.

Page 4
4
---------------------------------------------- ----------------------------------------------------------------------------------------------------------------- ---- ----------------------------------------- -------------------------------- ---------------- ---------------- ---------------- ---------------- ----------------
2013/14 2014/15 2014/15 2015/16 2016/17 2017/18 2018/19 2013/14 2014/15 2014/15 2015/16 2016/17 2017/18 2018/19
EXPENDITURE Actual Original Anticipated Estimate Estimate Estimate Estimate INCOME Actual Original Anticipated Estimate Estimate Estimate Estimate
Estimate Expenditure Estimate Income
---------------------------------------------- ----------------------------------------------------------------------------------------------------------------- ---- ----------------------------------------- -------------------------------- ---------------- ---------------- ---------------- ---------------- ----------------
ADMINISTRATION & INSPECTION - CSP 1.4.4 ADMINISTRATION & INSPECTION
3 Salaries 184,400 177,295 177,295 184,400 184,400 184,400 184,400 Licences & Fees 4,028 3,000 4,480 3,000 3,000 3,000 3,000
Staff Housing Subsidy 8,510 1,295 1,295 0 0 0 0 Parental Leave Subsidy 11,198 0 0 0 0 0 0
Travelling 5,274 5,429 5,429 10,000 10,000 10,000 10,000
Provision for ELE 41,762 21,618 21,618 20,867 20,867 20,867 20,867
Sundry Office Expenses 948 1,500 1,500 1,500 1,500 1,500 1,500
Environmental Health Plan Costs 0 2,000 2,000 0 0 0 0
State of Environment Costs 3,000 4,250 4,250 4,250 4,250 4,250 4,250
Admin. Other Acts 5,266 6,100 6,100 6,100 6,100 6,100 6,100
----------------------------------------------------------------------------------------------------------------- -------------------------------- ---------------- ---------------- ---------------- ---------------- ----------------
Admin. & Inspection Total 249,160 219,487 219,487 227,117 227,117 227,117 227,117 Admin. & Inspection Total 15,226 3,000 4,480 3,000 3,000 3,000 3,000
================================================================== =================== ========= ========= ========= ========= =========
NOXIOUS PLANTS - CSP 4.1.3
12 Contribution to C.M.C.C. 95,000 97,185 97,185 99,517 99,517 99,517 99,517
----------------------------------------------------------------------------------------------------------------- -------------------------------- ---------------- ---------------- ---------------- ---------------- ----------------
Admin. & Inspection Total 95,000 97,185 97,185 99,517 99,517 99,517 99,517 Admin. & Inspection Total 0 0 0 0 0 0 0
================================================================== =================== ========= ========= ========= ========= =========
----------------------------------------------------------------------------------------------------------------- -------------------------------------------------------------------------------------------------------------------
TOTAL HEALTH = 344,160 316,672 316,672 326,634 326,634 326,634 326,634 TOTAL HEALTH = 15,226 3,000 4,480 3,000 3,000 3,000 3,000
================================================================== ===================================================================
HEALTH SERVICES

Page 4
5
13. YOUTH SERVICES
Council held meetings with Department of Family and Community Services regarding funding in Youth Services as a
result Council will receive Grant Funding for youth programs that can be sourced by community organisations to run
programs to benefit the youth of Warren Shire.
There are two (2) types of funding available:
EIPP (Early Intervention and Placement Prevention) - $20,410.00
Community Builders Program - $44,833.00

Page 4
6
------------------------------------------------ ----------------------------------------------------------------------------------------------------------------------- ---- ----------------------------------------- -------------------------------- --------------- --------------- --------------- --------------- ---------------
2013/14 2014/15 2014/15 2015/16 2016/17 2017/18 2018/19 2013/14 2014/15 2014/15 2015/16 2016/17 2017/18 2018/19
EXPENDITURE Actual Original Anticipated Estimate Estimate Estimate Estimate INCOME Actual Original Anticipated Estimate Estimate Estimate Estimate
Estimate Expenditure Estimate Income
------------------------------------------------ ----------------------------------------------------------------------------------------------------------------------- ---- ----------------------------------------- -------------------------------- --------------- --------------- --------------- --------------- ---------------
13 YOUTH SERVICES - CSP 1.2.1 YOUTH SERVICES
EIPP Program Costs 9,360 18,369 18,369 18,369 18,369 18,369 18,369 12 EIPP Grant 10,400 20,410 20,410 20,410 20,410 20,410 20,410
Cont. To Administration 1,040 2,041 2,041 2,041 2,041 2,041 2,041
Youth Week Expenses 1,834 1,230 1,230 1,230 1,230 1,230 1,230 Youth Week Grant 1,230 1,230 1,230 1,230 1,230 1,230 1,230
Youth Programs 0 3,000 3,000 3,000 3,000 3,000 3,000
----------------------------------------------------------------------------------------------------------------------- -------------------------------- --------------- --------------- --------------- --------------- ---------------
Youth Services Total = 16,534 28,940 28,940 24,640 24,640 24,640 24,640 Youth Centre Total = 11,630 21,640 21,640 21,640 21,640 21,640 21,640
===================================================================== =================== ======== ======== ======== ======== =========
EDUCATION - CSP 1.1.4 EDUCATION
Warren Scholarship 1,000 1,000 2,000 1,000 1,000 1,000 1,000 From Scholarship Funds 1,000 1,000 2,000 1,000 1,000 1,000 1,000
----------------------------------------------------------------------------------------------------------------------- -------------------------------- --------------- --------------- --------------- --------------- ---------------
Education Total = 1,000 1,000 2,000 1,000 1,000 1,000 1,000 Education Total = 1,000 1,000 2,000 1,000 1,000 1,000 1,000
===================================================================== =================== ======== ======== ======== ======== =========
OTHER COMMUNITY - CSP 1.2.1 OTHER COMMUNITY
13 Community Building Program 30,658 40,350 40,350 40,350 40,350 40,350 40,350 13 CBP Grant 34,064 44,833 44,833 44,833 44,833 44,833 44,833
Cont. To Administration 3,406 4,483 4,483 4,483 4,483 4,483 4,483
International Women's Day 0 1,000 1,000 0 0 0 0 International Women's Day 0 1,000 1,000 0 0 0 0
----------------------------------------------------------------------------------------------------------------------- -------------------------------- --------------- --------------- --------------- --------------- ---------------
Other Community Total = 34,064 45,833 45,833 44,833 44,833 44,833 44,833 Other Community Total = 34,064 45,833 45,833 44,833 44,833 44,833 44,833
===================================================================== =================== ======== ======== ======== ======== =========
TOTAL COMMUNITY & ----------------------------------------------------------------------------------------------------------------------- TOTAL COMMUNITY & -------------------------------- --------------- --------------- --------------- --------------- ---------------
EDUCATION SERVICES = 51,598 75,773 76,773 70,473 70,473 70,473 70,473 EDUCATION SERVICES = 46,694 68,473 69,473 67,473 67,473 67,473 67,473
===================================================================== ========= ========= ======== ======== ======== ======== =========
COMMUNITY SERVICES & EDUCATION

Page 4
7
14. GARBAGE COLLECTION & DISPOSAL
The Domestic Waste Management Charge (DWM) for Warren, Nevertire & Collie will increase by $10.00 to $240.00 for
2015/16.
The Garbage Collection costs reflect the contractor’s rates which will increase in July 2015.
Garbage Disposal reflects Councils anticipated costs in relation to the disposal of waste.

Page 4
8
---------------------------------------------- ------------------------------------------------------------------------------------------------------------------- ---- ----------------------------------------- ---------------------------------- ---------------- --------------- -------------- -------------- ---------------
2013/14 2014/15 2014/15 2015/16 2016/17 2017/18 2018/19 2013/14 2014/15 2014/15 2015/16 2016/17 2017/18 2018/19
EXPENDITURE Actual Original Anticipated Estimate Estimate Estimate Estimate INCOME Actual Original Anticipated Estimate Estimate Estimate Estimate
Estimate Expenditure Estimate Income
---------------------------------------------- ------------------------------------------------------------------------------------------------------------------- ---- ----------------------------------------- ---------------------------------- ---------------- --------------- -------------- -------------- ---------------
HOUSING - CSP 1.1.5 HOUSING
Dwellings - General M & R 22,839 20,648 20,648 21,061 21,061 21,061 21,061 Dwellings Rents 68,626 66,000 66,000 83,000 83,000 83,000 83,000
Council Rates & Charges 15,927 17,163 17,163 17,506 17,506 17,506 17,506
Depreciation - Housing 22,863 22,900 22,900 22,900 22,900 22,900 22,900
------------------------------------------------------------------------------------------------------------------- ---------------------------------- ---------------- --------------- -------------- -------------- ---------------
Housing Total = 61,629 60,711 60,711 61,467 61,467 61,467 61,467 Housing Total = 68,626 66,000 66,000 83,000 83,000 83,000 83,000
=================================================================== ==================== ========= ======== ======== ======== =========
TOWN PLANNING TOWN PLANNING
Sundry Town Planning Expenses 176 2,500 1,500 2,500 2,500 2,500 2,500 Develop. Application Fees 19,519 16,200 16,200 16,200 16,200 16,200 16,200
Sec. 149 Certificates 11,133 8,000 8,000 8,200 8,200 8,200 8,200
Sundry Town Planning Income 0 300 300 300 300 300 300
------------------------------------------------------------------------------------------------------------------- ---------------------------------- ---------------- --------------- -------------- -------------- ---------------
Town Planning Total = 176 2,500 1,500 2,500 2,500 2,500 2,500 Town Planning Total = 30,652 24,500 24,500 24,700 24,700 24,700 24,700
=================================================================== ==================== ========= ======== ======== ======== =========
14 14 GARBAGE COLLECTION
Contractor Charge - Warren 83,584 91,229 91,229 93,054 93,054 93,054 93,054 Charges - Warren 181,796 185,516 185,516 195,554 195,554 195,554 195,554
- Nevertire 6,293 7,261 7,261 7,406 7,406 7,406 7,406 - Nevertire 10,193 10,754 10,984 11,712 11,712 11,712 11,712
- Collie 12,775 12,761 12,761 13,016 13,016 13,016 13,016 - Collie 5,060 5,290 5,290 5,520 5,520 5,520 5,520
Parks & Street 20,437 22,656 22,656 23,109 23,109 23,109 23,109 - Parks & Street 27,004 26,682 27,810 28,664 28,664 28,664 28,664
- Waste Management 26,044 27,140 26,220 27,360 27,360 27,360 27,360
Less: Pensioner Write Off (14,311) (13,940) (14,491) (14,672) (14,672) (14,672) (14,672)
Pensioner Rate Subsidy 7,866 7,667 7,967 8,070 8,070 8,070 8,070
------------------------------------------------------------------------------------------------------------------- ---------------------------------- ---------------- --------------- -------------- -------------- ---------------
Garbage Collection Total = 123,089 133,907 133,907 136,585 136,585 136,585 136,585 Garbage Collection Total = 243,652 249,109 249,296 262,208 262,208 262,208 262,208
=================================================================== ==================== ========= ======== ======== ======== =========
14 GARBAGE DISPOSAL - CSP 4.2.1 GARBAGE DISPOSAL
Depot Expenses - Warren 6,500 11,392 6,392 11,392 11,392 11,392 11,392
Council Rates & Charges 1,044 1,602 1,602 1,634 1,634 1,634 1,634 Sundry Income 923 600 600 600 600 600 600
Future Pits 30,273 24,078 24,078 24,560 24,560 24,560 24,560
Demolition/Building Waste Pit 9,937 10,228 10,228 10,433 10,433 10,433 10,433 Depot Waste Fees 515 0 0 0 0 0 0
Pit Fire Expenses 0 18,137 18,137 18,500 18,500 18,500 18,500
Tip Opening & Closing Expenses 21,120 23,032 23,032 23,493 23,493 23,493 23,493
Green waste separation/waste reduction 19,202 15,401 20,401 10,809 10,809 10,809 10,809
Carcass Pit Expenses 4,515 7,773 7,773 7,928 7,928 7,928 7,928
Steel Pallet & Rubble Heap Expenses 18,597 25,303 25,303 25,809 25,809 25,809 25,809 Sale Scrap Metal 19,260 7,500 7,500 7,500 7,500 7,500 7,500
Contractor Charges - Warren 51,147 48,262 48,262 49,227 49,227 49,227 49,227
Specific Works 481 2,000 2,000 0 0 0 0
Depreciation - Garbage Disposal 976 976 976 976 976 976 976
------------------------------------------------------------------------------------------------------------------- ---------------------------------- ---------------- --------------- -------------- -------------- ---------------
Garbage Disposal Total = 163,792 188,184 188,184 184,761 184,761 184,761 184,761 Garbage Disposal Total = 20,698 8,100 8,100 8,100 8,100 8,100 8,100
=================================================================== ==================== ========= ======== ======== ======== =========
HOUSING & COMMUNITY SERVICES
GARBAGE COLLECTION - CSP 4.2.1

Page 4
9
15. STREET CLEANING
Reflects the costs associated with street cleaning in Warren & Nevertire to maintain an attractive town.

Page 5
0
---------------------------------------------- ------------------------------------------------------------------------------------------------------------------- ---- ----------------------------------------- ---------------------------------- ---------------- --------------- -------------- -------------- ---------------
2013/14 2014/15 2014/15 2015/16 2016/17 2017/18 2018/19 2013/14 2014/15 2014/15 2015/16 2016/17 2017/18 2018/19
EXPENDITURE Actual Original Anticipated Estimate Estimate Estimate Estimate INCOME Actual Original Anticipated Estimate Estimate Estimate Estimate
Estimate Expenditure Estimate Income
---------------------------------------------- ------------------------------------------------------------------------------------------------------------------- ---- ----------------------------------------- ---------------------------------- ---------------- --------------- -------------- -------------- ---------------
15 STREET CLEANING - CSP 1.4.5 STREET CLEANING
Street Cleaning - Warren 84,563 83,700 83,700 85,374 85,374 85,374 85,374
- Nevertire 3,524 6,669 6,669 6,802 6,802 6,802 6,802
Street Cleaning CBD 22,096 24,132 24,132 24,615 24,615 24,615 24,615
Litter Control - Warren 757 1,100 1,100 1,100 1,100 1,100 1,100
- Nevertire 269 275 575 275 275 275 275
Street Bin Collection 17,534 18,048 19,302 19,756 19,756 19,756 19,756
Repairs to street bins 113 4,433 4,433 2,022 2,022 2,022 2,022
------------------------------------------------------------------------------------------------------------------- ---------------------------------- ---------------- --------------- -------------- -------------- ---------------
Street Cleaning Total = 128,856 138,357 139,911 139,944 139,944 139,944 139,944 Street Cleaning Total = 0 0 0 0 0 0 0
=================================================================== ==================== ========= ======== ======== ======== =========
OTHER SANITATION & GARBAGE OTHER SANITATION & GARBAGE
Disposal of Dead Animals 0 500 500 500 500 500 500 Septic Tank Applications 100 200 200 200 200 200 200
Disposal of Abandoned Vehicles 0 250 250 250 250 250 250
------------------------------------------------------------------------------------------------------------------- ---------------------------------- ---------------- --------------- -------------- -------------- ---------------
Other Garbage Total = 0 750 750 750 750 750 750 Other Garbage Total = 100 200 200 200 200 200 200
=================================================================== ==================== ========= ======== ======== ======== =========
URBAN DRAINAGE - CSP 4.3.1 URBAN DRAINAGE
Stormwater Drainage - General 9,620 9,500 14,400 9,690 9,690 9,690 9,690 From Restricted Funds 0 0 4,900 0 0 0 0
Mains flushing 235 2,849 699 2,900 2,900 2,900 2,900
Gross Pollutant Trap M&R 213 699 2,849 2,000 2,000 2,000 2,000
Depreciation - Urban Drainage 37,456 37,445 37,445 37,445 37,445 37,445 37,445
------------------------------------------------------------------------------------------------------------------- ---------------------------------- ---------------- --------------- -------------- -------------- ---------------
Urban Drainage Total = 47,524 50,493 55,393 52,035 52,035 52,035 52,035 Urban Drainage Total = 0 0 4,900 0 0 0 0
=================================================================== ==================== ========= ======== ======== ======== =========
FLOOD MITIGATION FLOOD MITIGATION
Levee M & R 6,543 12,068 18,068 12,300 12,300 12,300 12,300 From Restricted Funds 0 0 6,000 0 0 0 0
Depreciation - Levee Bank 107,017 107,000 107,000 107,000 107,000 107,000 107,000
------------------------------------------------------------------------------------------------------------------- ---------------------------------- ---------------- --------------- -------------- -------------- ---------------
Flood Mitigation Total = 113,560 119,068 125,068 119,300 119,300 119,300 119,300 Flood Mitigation Total = 0 0 6,000 0 0 0 0
=================================================================== ==================== ========= ======== ======== ======== =========
HOUSING & COMMUNITY SERVICES

Page 5
1

Page 5
2
---------------------------------------------- ------------------------------------------------------------------------------------------------------------------- ---- ----------------------------------------- ---------------------------------- ---------------- --------------- -------------- -------------- ---------------
2013/14 2014/15 2014/15 2015/16 2016/17 2017/18 2013/14 2014/15 2014/15 2015/16 2016/17 2017/18 2018/19
EXPENDITURE Actual Original Anticipated Estimate Estimate Estimate INCOME Actual Original Anticipated Estimate Estimate Estimate Estimate
Estimate Expenditure Estimate Income
---------------------------------------------- ------------------------------------------------------------------------------------------------------------------- ---- ----------------------------------------- ---------------------------------- ---------------- --------------- -------------- -------------- ---------------
ENVIRONMENTAL PROTECTION ENVIRONMENTAL PROTECTION
LLS Water Quality & Salinity Alliance 3,000 3,000 3,150 3,200 3,200 3,200 3,200 From Restricted Funds 1,750 0 6,000 0 0 0 0
Tiger Bay Wetlands Boundary Adjustment 1,750 0 6,000 8,000 0 0 0 From Restricted Funds 7,546 0 0 8,000 0 0 0
Green Team Works 7,546 0 0 0 0 0 0
Keep Australia Beautiful Expenses 5,224 0 0 0 0 0 0 Keep Australia Beautiful Grant 4,545 0 0 0 0 0 0
------------------------------------------------------------------------------------------------------------------- ---------------------------------- ---------------- --------------- -------------- -------------- ---------------
Environmental Protection Total = 17,520 3,000 9,150 11,200 3,200 3,200 3,200 Environmental Protection Total = 13,841 0 6,000 8,000 0 0 0
=================================================================== ==================== ========= ======== ======== ======== =========
PUBLIC CEMETERIES - CSP 4.1.2 PUBLIC CEMETERIES
Cemetery - Warren Lawn 48,691 43,026 43,026 43,887 43,887 43,887 43,887 Cemetery Fees 58,708 25,000 25,000 27,000 27,000 27,000 27,000
- Other Cemeteries 5,923 6,194 6,194 6,318 6,318 6,318 6,318
Dicks Camp (Trust Account) 872 1,500 1,500 0 0 0 0 From Restricted Funds 872 1,500 1,500 0 0 0 0
Council Rates & Charges 4,868 5,228 5,228 5,184 5,184 5,184 5,184
Depreciation - Public Cemeteries 673 673 673 673 673 673 673
------------------------------------------------------------------------------------------------------------------- ---------------------------------- ---------------- --------------- -------------- -------------- ---------------
Public Cemeteries Total = 61,027 56,621 56,621 56,062 56,062 56,062 56,062 Public Cemeteries Total = 59,580 26,500 26,500 27,000 27,000 27,000 27,000
=================================================================== ==================== ========= ======== ======== ======== =========
OTHER COMMUNITY AMENITIES
Village Amenities - Nevertire 1,489 2,500 2,500 2,500 2,500 2,500 2,500
Village Amenities - Collie 2,099 1,500 1,500 1,500 1,500 1,500 1,500
Village Amenities - Marra 0 500 500 500 500 500 500
Depreciation - Village Amenities 0 308 308 308 308 308 308
------------------------------------------------------------------------------------------------------------------- ---------------------------------- ---------------- --------------- -------------- -------------- ---------------
Other Community Amen. Total = 3,588 4,808 4,808 4,808 4,808 4,808 4,808 Other Community Amen. Total = 0 0 0 0 0 0 0
=================================================================== ==================== ========= ======== ======== ======== =========
TOTAL HOUSING & ------------------------------------------------------------------------------------------------------------------- TOTAL HOUSING & ---------------------------------- ---------------- --------------- -------------- -------------- ---------------
COMMUNITY AMENITIES = 720,761 758,399 776,003 769,412 761,412 761,412 761,412 COMMUNITY AMENITIES = 437,149 374,409 391,496 413,208 405,208 405,208 405,208
=================================================================== ==================== ========= ======== ======== ======== =========
HOUSING & COMMUNITY SERVICES
OTHER COMMUNITY AMENITIES - CSP 3.2.5

Page 5
3
WATER SUPPLIES
16. Water Availability Charges
The Warren Water Availability Charge has been increased by $10.00 to $330.00 for 2015/16,
The Nevertire Water Availability Charge has been increased by $15.00 to $450.00 for 2015/16, and
The Collie Water Availability Charge has been increased by $10.00 to $325.00 for 2015/16.
17. Water Usage Charges
Warren Bore Water Usage Charge - (Up to 450kl) increased $0.03 to $1.03/kl
- (Over 450kl) increased $0.04 to $1.55/kl
Warren River Water Usage Charge - (Up to 450kl) increased $0.01 to $0.38/kl
- (Over 450kl) increased $0.02 to $0.66/kl
Nevertire Bore Water Usage Charge - (Up to 450kl) increased $0.02 to $0.59/kl
- (Over 450kl) increased $0.02 to $0.86/kl
Collie Bore Water Usage Charge - (Up to 400kl) increased $0.04 to $1.28/kl
- (Over 400kl) increased $0.05 to $1.92/kl

Page 5
4
2013/14 2014/15 2014/15 2015/16 2016/17 2017/18 2018/19 2013/14 2014/15 2014/15 2015/16 2016/17 2017/18 2018/19
EXPENDITURE Actual Original Anticipated Estimate Estimate Estimate Estimate INCOME Actual Original Anticipated Estimate Estimate Estimate Estimate
Estimate Expenditure Estimate Income
--------------------------------------------- ------------------------------------------------------------------------------------------------------------------------------ ----- -------------------------------------------------- --------------------------------- --------------- --------------- --------------- --------------- ---------------
Management - CSP 4.3.2 16 Annual Charges
Administration Costs 56,382 58,034 58,034 59,195 59,195 59,195 59,195 Warren 277,140 286,080 285,760 295,680 295,680 295,680 295,680
Overhead Contribution 49,666 19,477 19,477 30,000 30,000 30,000 30,000 Nevertire 27,425 28,095 28,965 30,120 30,120 30,120 30,120
Engineering Supervision 50,920 52,412 52,412 53,460 53,460 53,460 53,460 Collie 14,440 15,060 14,895 15,350 15,350 15,350 15,350
Building Contributions 7,500 0 0 0 0 0 0
ELE Accruals 5,606 0 0 11,343 11,343 11,343 11,343 Extra Charges 1,267 1,400 1,400 1,400 1,400 1,400 1,400
Management Sundries 748 4,205 4,205 4,289 4,289 4,289 4,289 Less: Pension Rebate (17,041) (16,400) (16,975) (16,931) (16,931) (16,931) (16,931)
Training Expenses 7,090 3,000 3,000 3,000 3,000 3,000 3,000
Operations - CSP 4.3.2 17 User Charges
Mains - Operations 41,220 29,128 29,128 29,711 29,711 29,711 29,711 Water Usage Charges 283,937 240,000 240,000 247,200 247,200 247,200 247,200
Mains - Maintenance 144,216 125,934 125,934 128,453 128,453 128,453 128,453 Non-Rateable Water & Other Charges 36,248 37,263 37,343 38,731 38,731 38,731 38,731
Reservoirs - Operations 8,143 8,295 8,295 8,461 8,461 8,461 8,461 - Aerodrome Water Charges 720 850 765 880 880 880 880
Reservoirs - Maintenance 10,451 11,286 11,286 11,512 11,512 11,512 11,512
Pump Stns - Operations 3,006 15,770 5,770 16,085 16,085 16,085 16,085 Tapping Fees 6,386 2,000 2,462 2,000 2,000 2,000 2,000
Pump Stns - Maintenance 60,350 37,579 37,579 38,331 38,331 38,331 38,331
Pump Stns - Electricity 19,821 79,604 79,604 65,000 65,000 65,000 65,000 Interest on Investment 17,927 13,000 13,707 10,000 10,000 10,000 10,000
Water Treatment - Operations 10,481 15,790 15,790 16,106 16,106 16,106 16,106
Water Treatment - Chemical Costs 18,155 18,412 18,412 18,780 18,780 18,780 18,780 Reimburse Collie Chemical Dosing 4,330 0 0 0 0 0 0
Other Operations Costs 10,456 11,030 21,030 11,251 11,251 11,251 11,251
Other Maintenance Costs 1,274 4,813 4,813 4,909 4,909 4,909 4,909 Ellengerah Road Capital Contribution 7,449 0 0 0 0 0 0
Water Purchases 23,523 24,537 24,537 25,028 25,028 25,028 25,028
Telemetry Costs 8,720 5,259 5,259 5,364 5,364 5,364 5,364 Grants
Meter Reading 19,463 18,395 18,395 18,763 18,763 18,763 18,763 Pensioner Rebates DLG 9,363 9,020 9,333 9,312 9,312 9,312 9,312
Miscellaneous - Rates etc. 4,336 4,433 4,433 4,522 4,522 4,522 4,522
Carp Muster Donation 500 0 0 0 0 0 0
Interest on Loans 169 54 54 0 0 0 0
Depreciation - Water Supply Services 187,951 181,000 181,000 191,000 193,000 198,000 200,000
Transfer to Restricted Funds 54,167 0 0 24,179 16,179 25,179 16,374 Transfer From Restricted Funds 0 44,303 43,016 0 0 0 1,195
------------------------------------------------------------------------------------------------------------------------------ --------------------------------- --------------- --------------- --------------- --------------- ---------------
TOTAL WATER SUPPLIES 804,314 728,447 728,447 778,742 772,742 786,742 779,937 TOTAL WATER SUPPLIES 669,591 660,671 660,671 633,742 633,742 633,742 634,937
========================================================================= =================== ======== ======== ======== ======== =========
Breakdown of Operating and Capital Income/Expenditure
Operating Income = 669,591 660,671 660,671 633,742 633,742 633,742 634,937
Capital Income = 0 0 1,353,000 1,315,500 0 0 0
Total Income = 669,591 660,671 2,013,671 1,949,242 633,742 633,742 634,937
Operating Expenditure = 804,314 728,447 728,447 778,742 772,742 786,742 779,937
Capital Expenditure = 53,228 113,224 1,466,224 1,361,500 54,000 45,000 55,000
Total Expenditure = 857,542 841,671 2,194,671 2,140,242 826,742 831,742 834,937
Result Including Depreciation = (187,951) (181,000) (181,000) (191,000) (193,000) (198,000) (200,000)
Depreciation = 187,951 181,000 181,000 191,000 193,000 198,000 200,000
Result Before Depreciation = 0 0 0 0 0 0 0
WATER SUPPLIES

Page 5
5
SEWERAGE SERVICES
18. Residential Sewerage Access Charge
The Warren Residential Access Charge has been increased by $10.00 to $495.00 for 2015/16, and
The Nevertire Residential Access Charge has been increased by $10.00 to $520.00 for 2015/16.
19. Non-residential Sewerage Access and Usage Charges
This will be the second year of the introduction of the Non-residential Sewerage Access and Usage Charges.
There will be no increase in the charges from 2014/15, details of the two-part tariff structure are:
a) The non-residential sewer access will be levied on the rate notice the 2015/16 access charge will be $460.00,
b) The non-residential sewer usage charge will be levied each quarter when the water meters a read by multiplying the total
bore (potable) water consumed multiplied by a sewer discharge factor, this usage charge will be included on the quarterly
water usage notices, the usage charge for 2015/16 will be $1.80 per kilolitre.
i.e. if a non-residential property uses 20 kls of bore (potable) water in the first quarter with a SDF of 90% at a usage charge
of $1.80 per kilolitre their account would be:
20 kls X 90% (SDF) = 18 kls X $1.80 = $32.40 usage charge for the quarter.

Page 5
6
------------------------------------------- ----------------------------------------------------------------------------------------------------------------------------------- ----- ----------------------------------------------- -------------------------------- --------------- --------------- --------------- --------------- ---------------
2013/14 2014/15 2014/15 2015/16 2016/17 2017/18 2018/19 INCOME 2013/14 2014/15 2014/15 2015/16 2016/17 2017/18 2018/19
EXPENDITURE Actual Original Anticipated Estimate Estimate Estimate Estimate Actual Original Anticipated Estimate Estimate Estimate Estimate
Estimate Expenditure Estimate Income
------------------------------------------- ----------------------------------------------------------------------------------------------------------------------------------- ----- ----------------------------------------------- -------------------------------- --------------- --------------- --------------- --------------- ---------------
Management - CSP 4.3.3 18 Annual Charges
Administration Expenses 57,927 59,624 59,624 60,816 60,816 60,816 60,816 Warren Residential Access Charge 401,095 356,960 357,445 370,500 370,500 370,500 370,500
Overheads Costs 40,564 24,076 24,076 35,000 35,000 35,000 35,000 Nevertire Residential Access Charge 22,055 21,675 22,185 23,025 23,025 23,025 23,025
Engineering Supervision 52,300 53,832 53,832 54,909 54,909 54,909 54,909
LMWUA Costs 24,744 0 0 10,000 10,000 10,000 10,000 Extra Charges 1,681 2,500 2,500 2,500 2,500 2,500 2,500
Engineering Building Contribution 7,500 0 0 0 0 0 0 Less: Pension Rebate (15,466) (15,553) (15,400) (15,356) (15,356) (15,356) (15,356)
ELE Accruals 2,136 9,197 9,197 14,085 14,085 14,085 14,085
Training Expenses 0 2,000 2,000 2,000 2,000 2,000 2,000 19 Non Residential Access Charge 0 47,840 46,000 45,540 45,540 45,540 45,540
Operations - CSP 4.3.3 User Charges
Charges for Water 855 880 881 907 907 907 907 Other Sewer Charges 64,034 14,433 23,305 23,525 23,525 23,525 23,525
Sewer Mains - Operations 898 8,409 8,409 8,577 8,577 8,577 8,577 19 Non Residential Sewer Usage 0 34,000 34,000 40,000 40,000 40,000 40,000
Sewer Mains - Maintenance 61,485 50,418 50,418 51,426 51,426 51,426 51,426
Pump Stations - Operations 290 8,107 8,107 8,269 8,269 8,269 8,269 Interest on Investments 90,696 71,000 72,271 57,000 57,000 57,000 57,000
Pump Stations - Maintenance 50,838 81,780 81,780 83,416 83,416 83,416 83,416
Pump Stations - Energy Costs 26,565 29,945 29,945 30,544 30,544 30,544 30,544 Sewer Plan Fees 1,105 700 700 700 700 700 700
Treatment Works - Operations 51,304 68,905 68,905 70,283 70,283 70,283 70,283
Treatment Works - Maintenance 21,097 30,982 30,982 31,602 31,602 31,602 31,602 Grants
Treatment Works - Energy Costs 2,909 3,932 3,932 4,011 4,011 4,011 4,011 Pension Rebate DLG 8,502 8,745 8,467 8,446 8,446 8,446 8,446
Other Operations - Costs 1,817 5,658 5,658 5,771 5,771 5,771 5,771
Telemetry Expenses 4,343 4,752 4,752 4,847 4,847 4,847 4,847
Miscellaneous(Rates etc.) 3,392 3,891 3,891 3,969 3,969 3,969 3,969
Root Cutting & Cleaning 24,636 0 0 0 0 0 0
Infiltration Reduction M & M 0 0 0 20,000 0 0 20,000
Supply Grease traps - Businesses 7,240 0 0 0 0 0 0 Trade Waste Advance - Grease Trap 7,240 0 0 0 0 0 0
Loss on Sale of Assets 3,380 0 0 0 0 0 0
Depreciation - Sewerage Services 229,302 228,000 228,000 235,000 237,000 240,000 243,000
Transfer to Restricted Funds 0 0 0 0 0 0 0 Transfer From Restricted Funds 70,841 167,963 165,605 218,552 344,552 394,552 380,552
----------------------------------------------------------------------------------------------------------------------------------- -------------------------------- --------------- --------------- --------------- --------------- ---------------
TOTAL SEWERAGE SERVICES 675,522 674,388 674,389 735,432 717,432 720,432 743,432 TOTAL SEWERAGE SERVICES 651,783 710,263 717,078 774,432 900,432 950,432 936,432
============================================================================ =================== ======== ======== ======== ======== =========
Breakdown of Operating and Capital Income/Expenditure
Operating Income = 651,783 710,263 717,078 774,432 900,432 950,432 936,432
Capital Income = 0 0 0 250,000 400,000 450,000 400,000
Total Income = 651,783 710,263 717,078 1,024,432 1,300,432 1,400,432 1,336,432
Operating Expenditure = 675,522 674,388 674,389 735,432 717,432 720,432 743,432
Capital Expenditure = 205,561 263,875 270,689 524,000 820,000 920,000 836,000
Total Expenditure = 881,083 938,263 945,078 1,259,432 1,537,432 1,640,432 1,579,432
Result Including Depreciation = (229,300) (228,000) (228,000) (235,000) (237,000) (240,000) (243,000)
Depreciation = 229,302 228,000 228,000 235,000 237,000 240,000 243,000
Result Before Depreciation = 0 0 0 0 0 0 0
SEWERAGE SERVICES

Page 5
7
20. LIBRARY
Reflects contributions to the North Western Library Co-Operative.
To defray the costs incurred by Council in the provision of a regional librarian, a contribution of $42,680.00 is to be received
from the member councils comprising the North Western Library service. A contribution of $24,800.00 will also be received
for the provision of the Casual Technical Services Officer.
21. LOCAL HISTORY PROJECT - $3,162
Funds allocated for the continuation of the Local History Project, which involves the scanning of old memorabilia such as
photos and papers into the Spydus Library Management System
22. ARTS COUNCIL - $9,093
Reflects Council's continued contribution to the Outback Arts Council.

Page 5
8
-------------------------------------------------- ------------------------------------------------------------------------------------------------------------------ ----- ----------------------------------------- -------------------------------- --------------- --------------- --------------- --------------- ---------------
2013/14 2014/15 2014/15 2015/16 2016/17 2017/18 2018/19 2013/14 2014/15 2014/15 2015/16 2016/17 2017/18 2018/19
EXPENDITURE Actual Original Anticipated Estimate Estimate Estimate Estimate INCOME Actual Original Anticipated Estimate Estimate Estimate Estimate
Estimate Expenditure Estimate Income
-------------------------------------------------- ------------------------------------------------------------------------------------------------------------------ ----- ----------------------------------------- -------------------------------- --------------- --------------- --------------- --------------- ---------------
PUBLIC LIBRARIES - CSP 3.2.3 PUBLIC LIBRARIES
Administration Administration
Admin. Expenses 17,519 16,146 16,146 16,469 16,469 16,469 16,469 Per Capita Grant 13,635 13,635 13,634 13,635 13,635 13,635 13,635
Public Internet Access & Wi-Fi Expenses 1,165 1,168 1,168 4,405 4,405 4,405 4,405 Photocopying Charges 1,792 2,000 2,000 2,000 2,000 2,000 2,000
20 Cont. to NW Library 22,400 22,915 22,915 23,465 23,465 23,465 23,465 Charges & Fees 1,048 1,000 1,000 1,000 1,000 1,000 1,000
20 Cont. to NW Library -M'tce - Computer 9,980 11,210 11,210 11,480 11,480 11,480 11,480
20 Cont. to NW Library - Salary 13,720 14,035 14,035 16,870 16,870 16,870 16,870
Library Staff & Overheads Library Staff & Overheads
3 Salaries & Allowances 129,402 122,598 122,598 136,800 136,800 136,800 136,800 20 Cont. From N.W. Library 40,742 41,680 41,680 42,680 42,680 42,680 42,680
Travel Expenses 2,830 2,913 2,913 5,000 5,000 5,000 5,000 20 Cont. to Technical Services 14,624 14,460 14,460 24,800 24,800 24,800 24,800
Entitlements ELE 12,423 11,205 11,205 11,550 11,550 11,550 11,550
General Library Services Expenditure General Library Services Income
Periodicals & Magazines 3,678 3,923 3,923 4,001 4,001 4,001 4,001
Toys 1,573 1,939 1,939 1,978 1,978 1,978 1,978
Freight & Cartage 97 115 115 117 117 117 117
Books M & R 7,461 7,018 7,331 7,478 7,478 7,478 7,478
State Library Reference Grant 6,836 6,500 6,813 6,949 6,949 6,949 6,949 State Library Reference Grant 6,841 6,500 6,813 6,949 6,949 6,949 6,949
21 Local History Project 2,559 3,100 3,100 3,162 3,162 3,162 3,162
Revitalising Libraries 9,587 0 0 0 0 0 0 Revitalising Libraries 9,587 0 0 0 0 0 0
CBP Expenses 14,519 2,800 18,000 0 0 0 0 Community Builders Program 14,519 2,800 18,000 0 0 0 0
Expenses of Providing Assets
Furniture M & R 1,548 1,645 1,645 1,678 1,678 1,678 1,678
Building M & R - General 12,002 7,300 7,300 7,300 7,300 7,300 7,300
Lighting/Heat/Cooling 13,966 16,500 16,500 16,500 16,500 16,500 16,500
Cleaning 7,281 7,843 7,843 8,200 8,200 8,200 8,200
Specific Works - Drainage 2,878 0 0 0 0 0 0 From Restricted Funds 2,878 0 0 0 0 0 0
Council Rates & Charges 1,175 1,494 1,494 1,524 1,524 1,524 1,524
Depreciation - Public Libraries 15,455 15,455 15,455 15,455 15,455 15,455 15,455
------------------------------------------------------------------------------------------------------------------ -------------------------------- --------------- --------------- --------------- --------------- ---------------
Public Libraries Total = 310,054 277,822 293,648 300,381 300,381 300,381 300,381 Public Libraries Total = 105,666 82,075 97,587 91,064 91,064 91,064 91,064
================================================================== ================== ========= ========= ========= ========= =========
OTHER CULTURAL SERVICES OTHER CULTURAL SERVICES
22 Arts Council 8,664 8,918 8,915 9,093 9,093 9,093 9,093
------------------------------------------------------------------------------------------------------------------ -------------------------------- --------------- --------------- --------------- --------------- ---------------
Other Cultural Services Total = 8,664 8,918 8,915 9,093 9,093 9,093 9,093 Other Cultural Services Total = 0 0 0 0 0 0 0
================================================================== ================== ========= ========= ========= ========= =========
RECREATION & CULTURE

Page 5
9

Page 6
0
-------------------------------------------------- ------------------------------------------------------------------------------------------------------------------ ----- ----------------------------------------- -------------------------------- --------------- --------------- --------------- --------------- ---------------
2013/14 2014/15 2014/15 2015/16 2016/17 2017/18 2018/19 2013/14 2014/15 2014/15 2015/16 2016/17 2017/18 2018/19
EXPENDITURE Actual Original Anticipated Estimate Estimate Estimate Estimate INCOME Actual Original Anticipated Estimate Estimate Estimate Estimate
Estimate Expenditure Estimate Income
-------------------------------------------------- ------------------------------------------------------------------------------------------------------------------ ----- ----------------------------------------- -------------------------------- --------------- --------------- --------------- --------------- ---------------
SWIMMING POOLS - CSP 3.2.2 SWIMMING POOLS
Swimming Pool - M & R 123,688 154,821 154,821 157,917 157,917 157,917 157,917 Entry Charges 27,016 27,621 27,621 28,450 28,450 28,450 28,450
- Electricity 15,282 15,730 15,730 16,045 16,045 16,045 16,045 Other Revenue 19,909 20,492 20,492 21,107 21,107 21,107 21,107
Council Rates & Charges 7,080 10,928 10,928 7,447 7,447 7,447 7,447
Depreciation - Swimming Pool 16,642 17,700 17,700 17,700 17,700 17,700 17,700
------------------------------------------------------------------------------------------------------------------ -------------------------------- --------------- --------------- --------------- --------------- ---------------
Swimming Pools Total = 162,692 199,179 199,179 199,109 199,109 199,109 199,109 Swimming Pools Total = 46,925 48,113 48,113 49,557 49,557 49,557 49,557
================================================================== ================== ========= ========= ========= ========= =========
SPORTING GROUNDS - CSP 3.2.4
Sporting Complex - Operations 85,658 76,663 76,663 78,196 78,196 78,196 78,196 Sporting Complex - Operations 23,514 24,073 24,073 24,795 24,795 24,795 24,795
Sporting Complex - Electricity 17,521 18,002 18,002 18,002 18,002 18,002 18,002 Be Active Community Walking Progam 0 0 985 0 0 0 0
Council Rates & Charges 4,418 5,232 5,232 5,586 5,586 5,586 5,586 Sporting Complex - Sundry Income 5 150 150 50 50 50 50
Sporting Ovals - M & R 64,264 74,325 74,325 75,812 75,812 75,812 75,812
Victoria Oval - Turf Wicket M & R 5,095 8,066 8,066 8,227 8,227 8,227 8,227 Rents & Fees - Ovals 7,068 7,167 7,167 6,800 6,800 6,800 6,800
Council Rates & Charges 10,165 10,906 9,563 10,701 10,701 10,701 10,701
Depreciation - Sporting Grounds 40,804 40,800 40,800 40,800 40,800 40,800 40,800
------------------------------------------------------------------------------------------------------------------ -------------------------------- --------------- --------------- --------------- --------------- ---------------
Sporting Grounds Total = 227,925 233,994 232,651 237,324 237,324 237,324 237,324 Sporting Grounds Total = 30,587 31,390 32,375 31,645 31,645 31,645 31,645
================================================================== ================== ========= ========= ========= ========= =========
PARKS & GARDENS - CSP 3.2.1 PARKS & GARDENS
Parks & Gardens M & R 194,337 207,572 207,572 211,723 211,723 211,723 211,723
Park Toilets Operation/Cleaning 6,892 8,760 8,760 8,935 8,935 8,935 8,935
Council Rates & Charges 18,331 18,871 19,189 19,064 19,064 19,064 19,064
Depreciation - Parks & Gardens 8,312 8,310 8,310 8,310 8,310 8,310 8,310
------------------------------------------------------------------------------------------------------------------ -------------------------------- --------------- --------------- --------------- --------------- ---------------
Parks & Gardens Total = 227,872 243,513 243,831 248,032 248,032 248,032 248,032 Parks & Gardens Total = 0 0 0 0 0 0 0
================================================================== ================== ========= ========= ========= ========= =========
RECREATION & CULTURE

Page 6
1

Page 6
2
-------------------------------------------------- ------------------------------------------------------------------------------------------------------------------ ----- ----------------------------------------- -------------------------------- --------------- --------------- --------------- --------------- ---------------
2013/14 2014/15 2014/15 2015/16 2016/17 2017/18 2018/19 2013/14 2014/15 2014/15 2015/16 2016/17 2017/18 2018/19
EXPENDITURE Actual Original Anticipated Estimate Estimate Estimate Estimate INCOME Actual Original Anticipated Estimate Estimate Estimate Estimate
Estimate Expenditure Estimate Income
-------------------------------------------------- ------------------------------------------------------------------------------------------------------------------ ----- ----------------------------------------- -------------------------------- --------------- --------------- --------------- --------------- ---------------
OTHER SPORT & RECREATION OTHER SPORT & RECREATION
Showground/Racecourse - CSP 3.2.4 Showground/Racecourse -
General M & R 201,565 184,104 184,104 187,786 187,786 187,786 187,786 Rents & Fees 35,182 33,802 33,802 34,816 34,816 34,816 34,816
Electricity 15,313 18,829 18,829 19,000 19,000 19,000 19,000
Council Rates & Charges 3,348 3,594 3,594 3,559 3,559 3,559 3,559
Depreciation - Other Sport & Rec. 91,695 92,000 92,000 92,000 92,000 92,000 92,000
------------------------------------------------------------------------------------------------------------------ -------------------------------- --------------- --------------- --------------- --------------- ---------------
Showground/Racecourse Total = 311,921 298,527 298,527 302,345 302,345 302,345 302,345 Showground/Racecourse Total = 35,182 33,802 33,802 34,816 34,816 34,816 34,816
================================================================== ================== ========= ========= ========= ========= =========
OTHER SPORT & RECREATION OTHER SPORT & RECREATION
Vacation Play Centres - CSP 1.2.2 18,512 19,121 19,121 19,503 19,503 19,503 19,503 Vacation Play Centre Grant 6,194 6,593 6,593 6,791 6,791 6,791 6,791
Vacation Play User Charges 4,315 4,215 4,215 4,341 4,341 4,341 4,341
------------------------------------------------------------------------------------------------------------------ -------------------------------- --------------- --------------- --------------- --------------- ---------------
Other Sport & Rec. Total = 18,512 19,121 19,121 19,503 19,503 19,503 19,503 Other Sport & Rec. Total = 10,509 10,808 10,808 11,132 11,132 11,132 11,132
================================================================== ================== ========= ========= ========= ========= =========
TOTAL RECREATION & ------------------------------------------------------------------------------------------------------------------ TOTAL RECREATION & -------------------------------- --------------- --------------- --------------- --------------- ---------------
CULTURE = 1,267,640 1,281,074 1,295,872 1,315,787 1,315,787 1,315,787 1,315,787 CULTURE = 228,869 206,188 222,685 218,214 218,214 218,214 218,214
================================================================== ================== ========= ========= ========= ========= =========
RECREATION & CULTURE

Page 6
3

Page 6
4
------------------------------------------- -------------------------------------------------------------------------------------------------------------------- ---- ----------------------------------------- -------------------------------- ---------------- ---------------- ---------------- ---------------- ----------------
2013/14 2014/15 2014/15 2015/16 2016/17 2017/18 2018/19 2013/14 2014/15 2014/15 2015/16 2016/17 2017/18 2018/19
EXPENDITURE Actual Original Anticipated Estimate Estimate Estimate Estimate INCOME Actual Original Anticipated Estimate Estimate Estimate Estimate
Estimate Expenditure Estimate Income
------------------------------------------- -------------------------------------------------------------------------------------------------------------------- ---- ----------------------------------------- -------------------------------- ---------------- ---------------- ---------------- ---------------- ----------------
BUILDING CONTROL BUILDING CONTROL
Sundry Expenses 0 500 500 500 500 500 500 Section 317AE Certificates 250 1,000 1,000 500 500 500 500
Commission B.S.C. 327 250 300 125 125 125 125
Sundry Building Income 400 750 750 500 500 500 500
-------------------------------------------------------------------------------------------------------------------- -------------------------------- ---------------- ---------------- ---------------- ---------------- ----------------
Building Control Total = 0 500 500 500 500 500 500 Building Control Total = 977 2,000 2,050 1,125 1,125 1,125 1,125
==================================================================== =================== ========= ========= ========= ========= =========
QUARRIES & PITS - CSP 4.2.2 QUARRIES & PITS
Mt Foster - Council 30,901 20,000 20,000 10,000 10,000 10,000 10,000 Mt Foster - Sales 38,506 10,000 10,000 10,000 10,000 10,000 10,000
Mt Foster - Charged to Works 0 10,000 10,000 0 0 0 0
Gravel Pits - M & R 878 5,000 5,000 5,000 5,000 5,000 5,000 Gravel Pits - Income from Sales 6,368 5,000 5,000 5,000 5,000 5,000 5,000
Depreciation - Quarry 20 3,000 3,000 3,000 3,000 3,000 3,000
-------------------------------------------------------------------------------------------------------------------- -------------------------------- ---------------- ---------------- ---------------- ---------------- ----------------
Quarries & Pits Total = 31,799 28,000 28,000 18,000 18,000 18,000 18,000 Quarries & Pits Total = 44,874 25,000 25,000 15,000 15,000 15,000 15,000
==================================================================== =================== ========= ========= ========= ========= =========
TOTAL MINING, TOTAL MINING,
MANUFACTURING -------------------------------------------------------------------------------------------------------------------- MANUFACTURING -------------------------------- ---------------- ---------------- ---------------- ---------------- ----------------
& CONSTRUCTION 31,799 28,500 28,500 18,500 18,500 18,500 18,500 & CONSTRUCTION 45,851 27,000 27,050 16,125 16,125 16,125 16,125
==================================================================== =================== ========= ========= ========= ========= =========
MINING, MANUFACTURING & CONSTRUCTION

Page 6
5

Page 6
6
---------------------------------------------------- ------------------------------------------------------------------------------------------------------------------- -- ----------------------------------------- -------------------------------- ---------------- ---------------- ---------------- ---------------- ----------------
2013/14 2014/15 2014/15 2015/16 2016/17 2017/18 2018/19 2013/14 2014/15 2014/15 2015/16 2016/17 2017/18 2018/19
EXPENDITURE Actual Original Anticipated Estimate Estimate Estimate Estimate INCOME Actual Original Anticipated Estimate Estimate Estimate Estimate
Estimate Expenditure Estimate Income
---------------------------------------------------- ------------------------------------------------------------------------------------------------------------------- -- ----------------------------------------- -------------------------------- ---------------- ---------------- ---------------- ---------------- ----------------
URBAN ROADS - CSP 3.1.1 URBAN ROADS MAINTENANCE
Urban Roads - Sealed 36,825 32,582 42,582 33,234 33,234 33,234 33,234
Urban Roads - Unsealed 9,901 17,031 7,031 17,372 17,372 17,372 17,372
Depreciation - Urban Sealed Roads 131,605 162,000 162,000 162,000 162,000 162,000 162,000
------------------------------------------------------------------------------------------------------------------- -------------------------------- ---------------- ---------------- ---------------- ---------------- ----------------
Urban Roads M'tce Total = 178,331 211,613 211,613 212,606 212,606 212,606 212,606 Urban Roads M'tce Total = 0 0 0 0 0 0 0
=================================================================== =================== ========= ========= ========= ========= =========
RURAL ROADS - SEALED - CSP 3.1.1 RURAL ROADS - SEALED
Rural Roads - General M'tce 229,020 273,177 223,177 227,641 227,641 227,641 227,641
Depreciation - Rural Sealed Roads 705,158 661,000 661,000 661,000 661,000 661,000 661,000
------------------------------------------------------------------------------------------------------------------- -------------------------------- ---------------- ---------------- ---------------- ---------------- ----------------
Rural Roads - Sealed Total = 934,178 934,177 884,177 888,641 888,641 888,641 888,641 Rural Roads - Sealed Total = 0 0 0 0 0 0 0
=================================================================== =================== ========= ========= ========= ========= =========
RURAL ROADS - UNSEALED - CSP 3.1.1 RURAL ROADS - UNSEALED
Rural Roads - General M'tce 510,717 476,173 576,173 587,696 587,696 587,696 587,696
Depreciation - Rural Unsealed Roads 395,915 389,500 389,500 389,500 389,500 389,500 389,500
------------------------------------------------------------------------------------------------------------------- -------------------------------- ---------------- ---------------- ---------------- ---------------- ----------------
Rural Roads - Unsealed Total = 906,632 865,673 965,673 977,196 977,196 977,196 977,196 Rural Roads - Unsealed Total = 0 0 0 0 0 0 0
=================================================================== =================== ========= ========= ========= ========= =========
BRIDGES - RURAL ROADS - CSP 3.1.1 BRIDGES - RURAL UNSEALED ROADS
Shire - Bridges General 3,307 18,626 12,524 10,000 18,626 18,626 18,626 From Restricted Funds 4,681 0 13,898 0 0 0 0
Depreciation - Rural Bridges 108,335 108,335 108,335 108,335 108,500 108,500 108,500
------------------------------------------------------------------------------------------------------------------- -------------------------------- ---------------- ---------------- ---------------- ---------------- ----------------
Bridges - Rural Roads Total = 111,642 126,961 120,859 118,335 127,126 127,126 127,126 Bridges - Rural Roads Total = 4,681 0 13,898 0 0 0 0
=================================================================== =================== ========= ========= ========= ========= =========
TRANSPORT & COMMUNICATION

Page 6
7
23. AERODROME RESEALING RESERVE - $6,924
Funds to be set aside for future resealing of airport runway

Page 6
8
---------------------------------------------------- ------------------------------------------------------------------------------------------------------------------- -- ----------------------------------------- -------------------------------- ---------------- ---------------- ---------------- ---------------- ----------------
2013/14 2014/15 2014/15 2015/16 2016/17 2017/18 2018/19 2013/14 2014/15 2014/15 2015/16 2016/17 2017/18 2018/19
EXPENDITURE Actual Original Anticipated Estimate Estimate Estimate Estimate INCOME Actual Original Anticipated Estimate Estimate Estimate Estimate
Estimate Expenditure Estimate Income
---------------------------------------------------- ------------------------------------------------------------------------------------------------------------------- -- ----------------------------------------- -------------------------------- ---------------- ---------------- ---------------- ---------------- ----------------
ANCILLARY SERVICES - CSP 1.4.6 ANCILLARY SERVICES
Paved & Unpaved Footpaths 3,287 15,811 15,811 16,127 15,361 15,361 15,361
Kerb & Guttering - General 13,318 20,000 20,000 16,127 19,775 19,775 19,775
PAMP Management Plan 0 0 11,500 0 0 0 0 RMS - PAMP Funding 2,800 0 9,700 0 0 0 0
Tree Maintenance 41,202 42,000 42,000 35,000 33,664 33,664 33,664
Cycleway Maintenance 3,541 6,012 6,012 6,132 5,841 5,841 5,841
Commercial Area - Supply Paint 354 2,000 2,000 2,500 2,000 2,000 2,000
Street Lighting 92,765 91,000 91,000 81,000 81,000 81,000 81,000 Street Lighting Subsidy 26,000 26,000 26,000 26,000 26,000 26,000 26,000
Lighting - additional poles & lights 0 5,831 5,831 5,831 5,831 5,831 5,831 From Restricted Funds 0 5,831 5,831 5,831 0 0 0
Depreciation - Ancillary Services 29,929 4,314 4,314 4,314 4,314 4,314 4,314
------------------------------------------------------------------------------------------------------------------- -------------------------------- ---------------- ---------------- ---------------- ---------------- ----------------
Ancillary Services Total = 184,396 186,968 198,468 167,031 167,786 167,786 167,786 Ancillary Services Total = 28,800 31,831 41,531 31,831 26,000 26,000 26,000
=================================================================== =================== ========= ========= ========= ========= =========
AERODROMES - CSP 3.1.3 AERODROMES
Maint & Working Expenses 27,936 30,100 30,100 30,100 30,100 30,100 30,100 Landing Fees 7,561 7,783 9,788 8,016 8,016 8,016 8,016
Electricity 4,122 4,200 4,200 4,200 4,756 4,756 4,756
Council Rates & Charges 1,475 1,662 1,662 1,695 1,695 1,695 1,695
23 Aerodrome Resealing Reserve 0 6,788 6,788 6,924 6,924 6,924 6,924
Depreciation - Aerodromes 17,905 17,750 17,750 17,750 17,750 17,750 17,750
------------------------------------------------------------------------------------------------------------------- -------------------------------- ---------------- ---------------- ---------------- ---------------- ----------------
Aerodromes Total = 51,438 60,500 60,500 60,669 61,225 61,225 61,225 Aerodromes Total = 7,561 7,783 9,788 8,016 8,016 8,016 8,016
=================================================================== =================== ========= ========= ========= ========= =========
BUS SHELTERS & SERVICE BUS SHELTERS & SERVICE
Shelters & Streets Seats 0 500 500 500 500 500 500
Information Bay Expenses 0 500 500 500 500 500 500
Depreciation - Parking Areas 656 700 700 700 1,260 1,260 1,260
------------------------------------------------------------------------------------------------------------------- -------------------------------- ---------------- ---------------- ---------------- ---------------- ----------------
Bus Shelters & Service Total = 656 1,700 1,700 1,700 2,260 2,260 2,260 Bus Shelters & Service Total = 0 0 0 0 0 0 0
=================================================================== =================== ========= ========= ========= ========= =========
TRANSPORT & COMMUNICATION

Page 6
9
24. STATE ROADS M & R
Reflects Council's contractual arrangement as maintaining authority for the Roads & Maritime Services (RMS) on State
Highway11 – (Nevertire to Collie).
25. REGIONAL ROADS M & R
This estimate has a contra income entry and reflects the RMS Contribution for maintenance of the Regional Roads & Bridges
network.

Page 7
0
---------------------------------------------------- ------------------------------------------------------------------------------------------------------------------- -- ----------------------------------------- -------------------------------- ---------------- ---------------- ---------------- ---------------- ----------------
2013/14 2014/15 2014/15 2015/16 2016/17 2017/18 2018/19 2013/14 2014/15 2014/15 2015/16 2016/17 2017/18 2018/19
EXPENDITURE Actual Original Anticipated Estimate Estimate Estimate Estimate INCOME Actual Original Anticipated Estimate Estimate Estimate Estimate
Estimate Expenditure Estimate Income
---------------------------------------------------- ------------------------------------------------------------------------------------------------------------------- -- ----------------------------------------- -------------------------------- ---------------- ---------------- ---------------- ---------------- ----------------
R.M.S. Works R.M.S. Works
State Highway 11 - CSP 3.1.2 State Roads - M & R
24 State Highway 11 - RMCC 199,908 206,535 200,634 204,646 204,646 204,646 204,646 RMS Contribution 199,908 206,535 200,634 204,646 204,646 204,646 204,646
State Highway 11 - Work Orders 355,745 300,000 673,453 300,000 300,000 300,000 300,000 State Highway 11 - Work Orders 355,745 300,000 673,453 300,000 300,000 300,000 300,000
------------------------------------------------------------------------------------------------------------------- -------------------------------------------------------------------------------------------------------------------
State Roads Total = 555,653 506,535 874,087 504,646 504,646 504,646 504,646 State Roads Total = 555,653 506,535 874,087 504,646 504,646 504,646 504,646
=================================================================== =================== ========= ========= ========= ========= =========
25 Regional Roads - CSP 3.1.2 Regional Roads - CSP 3.1.2
Block Grant Program 616,214 661,000 734,232 667,000 667,000 667,000 667,000 Block Grant Program - Current Year 591,000 676,000 741,461 682,000 682,000 682,000 682,000
Traffic Grant Program - Traffic Signs 44,788 64,000 82,212 65,000 65,000 65,000 65,000 Traffic Signs - Current Years 63,000 64,000 64,000 65,000 65,000 65,000 65,000
Traffic Signs - Previous C/fwd 0 0 18,212 0 0 0 0
Regional Road Bridges - CSP 3.1.2 Regional Road Bridges - CSP 3.1.2
Block Grant Program - Bridges 5,277 15,000 7,000 15,000 15,000 15,000 15,000
Depreciation - Regional Roads 798,137 788,000 788,000 788,000 788,000 788,000 788,000
Depreciation - Regional Bridges 49,003 49,003 49,003 49,003 49,003 49,003 49,003
------------------------------------------------------------------------------------------------------------------- -------------------------------- ---------------- ---------------- ---------------- ---------------- ----------------
Regional Roads Total = 1,513,419 1,577,003 1,660,447 1,584,003 1,584,003 1,584,003 1,584,003 Regional Roads Total = 654,000 740,000 823,673 747,000 747,000 747,000 747,000
=================================================================== =================== ========= ========= ========= ========= =========
TOTAL TRANSPORT & ------------------------------------------------------------------------------------------------------------------- TOTAL TRANSPORT & -------------------------------- ---------------- ---------------- ---------------- ---------------- ----------------
COMMUNICATION = 4,436,345 4,471,130 4,977,524 4,514,827 4,525,489 4,525,489 4,525,489 COMMUNICATION = 1,250,695 1,286,149 1,762,977 1,291,493 1,285,662 1,285,662 1,285,662
=================================================================== =================== ========= ========= ========= ========= =========
TRANSPORT & COMMUNICATION

Page 7
1

Page 7
2
-------------------------------------------------- ----------------------------------------------------------------------------------------------------------------- ---- ----------------------------------------------- -------------------------------- ----------------- --------------- --------------- --------------- ---------------
2013/14 2014/15 2014/15 2015/16 2016/17 2017/18 2018/19 2013/14 2014/15 2014/15 2015/16 2016/17 2017/18 2018/19
EXPENDITURE Actual Original Anticipated Estimate Estimate Estimate Estimate INCOME Actual Original Anticipated Estimate Estimate Estimate Estimate
Estimate Expenditure Estimate Income
-------------------------------------------------- ----------------------------------------------------------------------------------------------------------------- ---- ----------------------------------------------- -------------------------------- ----------------- --------------- --------------- --------------- ---------------
CARAVAN PARKS CARAVAN PARKS
Caravan Park - M & R 3,002 4,955 2,955 3,014 3,014 3,014 3,014 Rents 3,971 0 0 0 0 0 0
- Electricity 586 915 915 650 650 650 650
Council Rates & Charges 10,790 8,039 8,039 8,200 8,200 8,200 8,200
Depreciation - Caravan Park 6,950 6,950 6,950 6,950 6,950 6,950 6,950
----------------------------------------------------------------------------------------------------------------- -------------------------------- ----------------- --------------- --------------- --------------- ---------------
Caravan Parks Total = 21,328 20,859 18,859 18,814 18,814 18,814 18,814 Caravan Parks Total = 3,971 0 0 0 0 0 0
================================================================== ================== ========== ========= ========= ========= =========
AREA PROMOTION AREA PROMOTION
Advertising Area - CSP 2.2.2 3,644 6,100 5,100 5,202 5,202 5,202 5,202
Area Promotion - CSP 2.2.2 1,379 5,500 5,500 5,500 5,500 5,500 5,500
Printing of Information Booklets 5,175 4,016 4,016 4,016 4,016 4,016 4,016
Information Centre M & R 5,676 5,349 5,349 5,456 5,456 5,456 5,456
Electricity 1,988 3,237 3,237 2,200 2,200 2,200 2,200
Council Rates & Charges 1,744 1,892 1,892 1,930 1,930 1,930 1,930
Sundry Expenses/Sale Goods 2,498 3,815 4,815 4,000 4,000 4,000 4,000 Sundry Income/Sale of Goods 2,128 2,000 2,000 2,000 2,000 2,000 2,000
150 Year Pavers 380 0 0 0 0 0 0 From Restricted Funds 600 0 0 0 0 0 0
Tourism - Specific Works 5,138 13,500 13,500 0 0 0 0 Donation - C of C Signage Warren 4,400 0 0 0 0 0 0
Depreciation - Area Promotion 6,234 5,700 5,700 5,700 5,700 5,700 5,700
----------------------------------------------------------------------------------------------------------------- -------------------------------- ----------------- --------------- --------------- --------------- ---------------
Tourism & Area Total = 33,856 49,109 49,109 34,004 34,004 34,004 34,004 Tourism & Area Total = 7,128 2,000 2,000 2,000 2,000 2,000 2,000
================================================================== ================== ========== ========= ========= ========= =========
ECOMICE DEVELOPMENT
3 Economic Development Salary 61,687 62,500 67,628 55,000 55,000 55,000 55,000 Parental Leave Subsidy 10,026 0 5,128 0 0 0 0
Economic Development Travelling 1,551 1,600 1,600 2,500 2,500 2,500 2,500 Grant Funds 7,000 0 0 0 0 0 0
Economic Development ELE 12,614 7,000 7,000 6,000 6,000 6,000 6,000
Economic Development Office Expenses 618 1,000 1,000 1,020 1,020 1,020 1,020
Economic Development Programs 5,006 10,000 10,000 0 0 0 0 From Restricted Funds 0 0 2,864 0 0 0 0
Economic Leakage Research Study 0 0 5,727 0 0 0 0 Con't Warren Chamber of Commerce 0 0 2,863 0 0 0 0
Orana Regional Relocation Project 0 0 0 2,500 0 0 0
----------------------------------------------------------------------------------------------------------------- -------------------------------- ----------------- --------------- --------------- --------------- ---------------
Economic Development Total = 81,476 82,100 92,955 67,020 64,520 64,520 64,520 Economic Development Total = 17,026 0 10,855 0 0 0 0
================================================================== ================== ========== ========= ========= ========= =========
SALEYARDS SALEYARDS
Saleyards Rates 242 249 248 253 253 253 253
Wash Down Bay 1,576 500 500 500 500 500 500
----------------------------------------------------------------------------------------------------------------- -------------------------------- ----------------- --------------- --------------- --------------- ---------------
Saleyards Total = 1,818 749 748 753 753 753 753 Saleyards Total = 0 0 0 0 0 0 0
================================================================== ================== ========== ========= ========= ========= =========
ECONOMIC AFFAIRS
ECONOMIC DEVELOPMENT - CSP 2.1.2

Page 7
3

Page 7
4
-------------------------------------------------- ----------------------------------------------------------------------------------------------------------------- ---- ----------------------------------------------- -------------------------------- ----------------- --------------- --------------- --------------- ---------------
2013/14 2014/15 2014/15 2015/16 2016/17 2017/18 2018/19 2013/14 2014/15 2014/15 2015/16 2016/17 2017/18 2018/19
EXPENDITURE Actual Original Anticipated Estimate Estimate Estimate Estimate INCOME Actual Original Anticipated Estimate Estimate Estimate Estimate
Estimate Expenditure Estimate Income
-------------------------------------------------- ----------------------------------------------------------------------------------------------------------------- ---- ----------------------------------------------- -------------------------------- ----------------- --------------- --------------- --------------- ---------------
OTHER BUSINESS UNDERTAKINGS OTHER BUSINESS UNDERTAKINGS
Private Works 28,067 100,000 100,000 60,000 60,000 60,000 60,000 Private Works 47,309 120,000 120,000 72,000 72,000 72,000 72,000
----------------------------------------------------------------------------------------------------------------- -------------------------------- ----------------- --------------- --------------- --------------- ---------------
Private Works Total = 28,067 100,000 100,000 60,000 60,000 60,000 60,000 Private Works Total = 47,309 120,000 120,000 72,000 72,000 72,000 72,000
================================================================== ================== ========== ========= ========= ========= =========
Council Property NEI - Council Property NEI -
Endeavour Hall M'tce Works 3,479 3,500 3,500 3,570 3,570 3,570 3,570
Council Rates & Charges 2,446 2,668 2,668 2,748 2,748 2,748 2,748
Medical Centre - M & R - CSP 1.3.1 12,576 3,500 6,500 3,570 3,570 3,570 3,570 Medical Centre Rents 23,959 24,436 16,358 10,600 10,600 10,600 10,600
Council Rates & Charges 2,729 3,085 3,205 3,301 3,301 3,301 3,301
Family Health Centre - M&R - CSP 1.3.1 2,895 3,500 6,500 3,570 3,570 3,570 3,570 Family Health Centre Rent 11,706 12,000 12,000 12,000 12,000 12,000 12,000
Council Rates & Charges 2,371 2,573 2,573 2,650 2,650 2,650 2,650
113 Dubbo Street Building - M & R 2,295 3,500 1,500 3,570 3,570 3,570 3,570
113 Dubbo Street Building - Electricity 2,868 3,100 3,100 2,900 2,900 2,900 2,900
Council Rates & Charges 3,049 3,329 3,329 3,429 3,429 3,429 3,429
Riversmart Building M & R 2,038 2,915 1,915 1,953 1,953 1,953 1,953
Electricity 1,167 1,200 381 0 0 0 0
Council Rates & Charges 260 1,801 270 275 275 275 275
Other Land & Buildings M & R 5,302 3,500 3,500 3,570 3,570 3,570 3,570
Council Rates - Other Property NEI 16,167 16,600 16,600 17,098 17,098 17,098 17,098 Burton Street - Rent 3,640 3,640 3,640 3,710 3,710 3,710 3,710
Council Rates - Gunningba Est 25,086 26,345 25,572 26,339 26,339 26,339 26,339 Rent -NEI 3,787 2,860 1,400 0 0 0 0
Depreciation - Council Properties NEI 47,581 49,300 49,300 49,300 49,300 49,300 49,300
----------------------------------------------------------------------------------------------------------------- -------------------------------- ----------------- --------------- --------------- --------------- ---------------
Council Properties N.E.I. Total = 132,309 130,416 130,413 127,843 127,843 127,843 127,843 Council Properties N.E.I. Total = 43,092 42,936 33,398 26,310 26,310 26,310 26,310
================================================================== ================== ========== ========= ========= ========= =========
----------------------------------------------------------------------------------------------------------------- -------------------------------- ----------------- --------------- --------------- --------------- ---------------
TOTAL ECONOMIC AFFAIRS 298,854 383,233 392,084 308,434 305,934 305,934 305,934 TOTAL ECONOMIC AFFAIRS 118,526 164,936 166,253 100,310 100,310 100,310 100,310
================================================================== ================== ========== ========= ========= ========= =========
ECONOMIC AFFAIRS

Page 7
5
12. COMPUTER HARDWARE & SOFTWARE UPGRADE - $359,552
Council has been advised by its financial software provider Civica P/L that support for the Fujitsu 2000Plus package will be
ceasing and it needs replacing, Council has been using this software since 1988. Tenders will be called for a new financial &
asset management system that will suit Council’s requirements. This will be funded from an internal restriction that has been
built up over many years.
13. MFD PRINTER/COPIER REPLACEMENT X 2 - $30,000
The 2 Toshiba Multi Function Devices (MFD) Printer & Photocopiers are 5 ½ years old both machines have done over 800,000
copies and require replacement. The new machines are expected to pay for themselves in the next 5 years by way of reduced
copying costs, i.e. 1 back & white copy currently costs 1 cent per copy under the new Government rate this will reduce to 0.585
cents. This is also funded from Computer Hardware & Software reserve
14. DEPOT LAND EXTENSION - $74,000
These funds will allow for the fencing and setup of the newly acquired land at the rear of Workshop/Depot to finalise this
project, funding for this project comes from the Depot Reserve - $24,000 and the Infrastructure Improvement/Replacement
Reserve - $50,000.
15. DWELLINGS – SPECIFIC WORKS - $34,870
These funds are allocated for continued renewal works on Council owned residences as per the Health & Development’s priority
list, this has been funded from the Council Dwellings Reserve.
16. EWENMAR WASTE DEPOT IMPROVEMENTS - $85,957
Council was successful in the grant application from the EPA – “Waste Less Recycle More” in the amount of $59,552 to
undertake improvements at the Ewenmar Waste Depot, the balance of funds $26,405 will be funded from the Domestic Waste
Management reserve.
17. GUNNINGBA ESTATE DRAINAGE (STAGE 2) - $101,902
These funds as identified in the Stormwater Asset Management Plan are to enclose the open drain in Gunningba Estate
Residential Subdivision, it is anticipated it will allow for approximately 100 metres. This is to be funded from savings in
2014/15 - $33,664 and the Infrastructure Improvement/Replacement Reserve - $68,238.

Page 7
6
--------------------------------------------------- ------------------------------------------------------------------------------------------------------------------------------- ----- ----------------------------------------------- ------------------------------------ ------------------ ---------------- ----------------- ----------------- -----------------
2013/14 2014/15 2014/15 2015/16 2016/17 2017/18 2018/19 2013/14 2014/15 2014/15 2015/16 2016/17 2017/18 2018/19
EXPENDITURE Actual Original Anticipated Estimate Estimate Estimate Estimate INCOME Actual Original Anticipated Estimate Estimate Estimate Estimate
Estimate Expenditure Estimate Income
--------------------------------------------------- ------------------------------------------------------------------------------------------------------------------------------- ----- ----------------------------------------------- ------------------------------------------------------- ---------------- ----------------- ----------------- -----------------
26 Computer Hardware/Software 6,044 8,000 11,520 359,552 8,000 8,000 8,000 From Restricted Funds 0 0 3,520 351,552 0 0 0
27 MFD Printer/Copier Replacement X 2 3,522 0 6,500 30,000 0 0 0 From Restricted Funds 0 0 0 30,000 0 0 0
Specific Works - Air conditioning 5,600 6,500 0 6,500 6,500 6,500 6,500 From Restricted Funds 5,600 0 0 6,500 0 0 0
Building Improvements 0 0 0 0 400,000 400,000 400,000 From Restricted Funds 0 0 0 0 350,000 350,000 350,000
Capital Contributions - Water & Sewer 0 0 0 0 50,000 50,000 50,000
Engineering Temporary Office 100,553 0 0 0 0 0 0 From Restricted Funds 92,766 0 0 0 0 0 0
Capital Contributions - Water & Sewer 15,000 0 0 0 0 0 0
Depot Improvements 183,452 0 0 0 0 0 0 From Infrastructure Reserve 183,452 0 0 0 0 0 0
From Infrastructure Reserve 0 0 0 50,000 0 0 0
28 Depot Land Extension 3,386 0 50,910 74,000 0 0 0 From Depot Improvements Reserve 0 0 50,910 24,000 0 0 0
------------------------------------------------------------------------------------------------------------------------------- ------------------------------------------------------- ---------------- ----------------- ----------------- -----------------
Total Capital Administration 302,557 14,500 68,930 470,052 414,500 414,500 414,500 Total Capital Administration 296,818 0 54,430 462,052 400,000 400,000 400,000
========================================================================== ===================== ========== ========= ========== ========== ==========
Animal Control Animal Control
Dog Pound Security Fencing 0 5,000 5,000 0 0 0 0
------------------------------------------------------------------------------------------------------------------------------- ------------------------------------ ------------------ ---------------- ----------------- ----------------- -----------------
Total Capital Public Order & Safety 0 5,000 5,000 0 0 0 0 Total Capital Public Order & Safety 0 0 0 0 0 0 0
========================================================================== ===================== ========== ========= ========== ========== ==========
Housing Housing
29 Dwellings - Specific Works - CSP 1.1.5 16,000 14,578 19,578 34,870 14,870 14,870 14,870 From Dwellings Restricted Funds 16,000 0 5,000 34,870 0 0 0
Transfer to Land Reserve 95,976 16,500 16,500 16,500 16,500 16,500 16,500 Sale Of Land 0 16,500 16,500 16,500 16,500 16,500 16,500
Garbage Depot Garbage Depot
30 Ewenmar Waste Depot Improvements 0 0 0 85,957 0 0 0 Waste Less Recycle More Grant 0 0 0 59,552 0 0 0
From DWM Restricted Funds 0 0 0 26,405 0 0 0
Part Ewenmar Waste Depot Sale 95,976 0 0 0 0 0 0
Urban Drainage Urban Drainage
31 Gunningbar Estate Drainage - CSP 4.3.1 15,346 66,900 116,600 101,902 66,900 0 0 From Restricted Funds 0 66,900 116,600 33,664 0 0 0
From Infrastructure Reserve 0 0 0 68,238 66,900 0 0
Public Cemeteries Public Cemeteries
Cemetery - Specific Works 21,694 0 68,180 0 0 0 0 From Restricted Funds 21,694 0 68,180 0 0 0 0
------------------------------------------------------------------------------------------------------------------------------- ------------------------------------ ------------------ ---------------- ----------------- ----------------- -----------------
Total Capital Housing & Comm. 149,016 97,978 220,858 239,229 98,270 31,370 31,370 Total Capital Housing & Comm. 133,670 83,400 206,280 239,229 83,400 16,500 16,500
========================================================================== ===================== ========== ========= ========== ========== ==========
CAPITAL ITEMS
Administration Administration
Public Order & Safety Public Order & Safety
Housing & Community Amenities Housing & Community Amenities

Page 7
7
12. WATER SUPPLY CAPITAL WORKS - $1,315,500
Water Main & Valve Replacement Program - $46,000
Restart NSW Grant – Water Security Program
Warren Water - Upgrade Main - Wilson St. to Burton St. - $152,500
Warren Water- New Bore No. 3 - $340,000
Warren Water- New Bore No. 6 - $243,000
Nevertire Water- New Bore - $215,000
Collie Water- New Bore - $365,000
13. SEWERAGE SERVICE CAPITAL WORKS - $524,000
Pump Station – Pump Replacements/Backups - $4,000
Sewer Rising Main – Upgrade - $20,000
Treatment Works – Upgrade (dependant on 50% grant funding from the
Country Towns Water & Sewerage program. - $500,000
14. LIBRARY - $51,400
Purchase of new MFD Photocopier/Printer (current one over 10 years old) - $6,400
Stormwater, Drainage & Leak Proofing Works - $45,000
15. PARKS, GARDENS & RESERVES - $32,400
Purchase of playground equipment - $20,400
Construction of kerb layback and path to the Cenotaph in Macquarie Park - $12,000
These will be funded from the Infrastructure Improvement/Replacement Reserve.

Page 7
8
--------------------------------------------------- ------------------------------------------------------------------------------------------------------------------------------- ----- ----------------------------------------------- ------------------------------------ ------------------ ---------------- ----------------- ----------------- -----------------
2013/14 2014/15 2014/15 2015/16 2016/17 2017/18 2018/19 2013/14 2014/15 2014/15 2015/16 2016/17 2017/18 2018/19
EXPENDITURE Actual Original Anticipated Estimate Estimate Estimate Estimate INCOME Actual Original Anticipated Estimate Estimate Estimate Estimate
Estimate Expenditure Estimate Income
--------------------------------------------------- ------------------------------------------------------------------------------------------------------------------------------- ----- ----------------------------------------------- ------------------------------------ ------------------ ---------------- ----------------- ----------------- -----------------
Loan Repayments 3,541 1,849 1,849 0 0 0 0
Capital Works
Bores 0 10,000 10,000 0 0 0 0
Water Mains 35,654 75,000 75,000 46,000 54,000 45,000 55,000
Reservoirs 0 20,000 20,000 0 0 0 0
32 Restart NSW Capital Works 14,033 0 1,353,000 1,315,500 0 0 0 Restart NSW Grant 0 0 1,353,000 1,315,500 0 0 0
Plant & Equipment 0 6,375 6,375 0 0 0 0
------------------------------------------------------------------------------------------------------------------------------- ------------------------------------ ------------------ ---------------- ----------------- ----------------- -----------------
Total Capital Water Supplies 53,228 113,224 1,466,224 1,361,500 54,000 45,000 55,000 Total Capital Water Supplies 0 0 1,353,000 1,315,500 0 0 0
========================================================================== ===================== ========== ========= ========== ========== ==========
Capital Works
Sewer Pump Stations 0 10,000 10,000 4,000 0 0 6,000
33 Treatment Works 39,303 50,000 50,000 500,000 800,000 900,000 800,000 Loan funds 0 0 0 0 0 0 0
Sewer Mains 100,353 166,000 167,863 20,000 20,000 20,000 30,000 CTWS Grant 0 0 0 250,000 400,000 450,000 400,000
Plant & Equipment 65,905 37,875 42,826 0 0 0 0
------------------------------------------------------------------------------------------------------------------------------- ------------------------------------ ------------------ ---------------- ----------------- ----------------- -----------------
Total Capital Sewerage Services 205,561 263,875 270,689 524,000 820,000 920,000 836,000 Total Capital Sewerage Services 0 0 0 250,000 400,000 450,000 400,000
========================================================================== ===================== ========== ========= ========== ========== ==========
Library Services Library Services
34 Library - Specific Works & MDF Printer 12,217 0 0 51,400 0 0 0 From Restricted Funds 0 0 0 51,400 0 0 0
Swimming Pool Swimming Pool
Pool Improvements 49,589 15,000 175,690 0 0 0 0 CBP Grant 40,000 0 0 0 0 0 0
From Infrastructure Reserve 0 0 121,120 0 0 0 0
Sporting Complex Sporting Complex
Capital Works 0 15,000 64,272 0 0 0 0 From Infrastructure Reserve 0 15,000 64,460 0 0 0 0
Parks Gardens & Reserves Parks Gardens & Reserves
35 Parks & Gardens Improvements 52,852 20,000 77,000 32,400 0 0 0 Parks Gardens & Reserves Improvements 42,000 20,000 77,000 32,400 0 0 0
Showground/Racecourse Showground/Racecourse 0 0 0 0 0 0 0
Specific M & R 0 0 31,884 0 0 0 0 From Restricted Funds 0 0 9,755 0 0 0 0
------------------------------------------------------------------------------------------------------------------------------- ------------------------------------ ------------------ ---------------- ----------------- ----------------- -----------------
Total Capital Recreation & Culture 114,658 50,000 348,846 83,800 0 0 0 Total Capital Recreation & Culture 82,000 35,000 272,335 83,800 0 0 0
========================================================================== ===================== ========== ========= ========== ========== ==========
CAPITAL ITEMS
Recreation & Culture Recreation & Culture
Water Supplies Water Supplies
Sewerage Services Sewerage Services

Page 7
9
12. ROADS, BRIDGES & ACILLARY – CAPITAL WORKS - $3,475,457
Urban Roads - Reseals - $30,000
Urban Roads Heavy Patching - $50,000
Bundemar Street Reconstruction - $114,737
Rural Roads – Reseals - $230,000
Buckiinguy Road - Recycling - $700,000
Bullagreen Road - Recycling - $142,786
Extra R2R Funding – to be determined - $459,887
Gravel/Loam Resheeting - $604,047
Total Local Roads Capital Works $2,331,457
Footpath Renewal – XC5 Rated Areas - $25,000
New Footpath Hale Street - $12,000
Kerb & Guttering Renewals - $25,000
Total Ancillary Capital Works $62,000
Re-instate Aerodrome Runway Pavement Marking - $18,000
New fencing front of Aerodrome - $4,000
Total Aerodrome Capital Works $22,000
Regional Roads Reconstruction - $660,000
Regional Roads Resheeting - $100,000
Regional Roads Reseals - $200,000
Regional Roads Resheeting - $100,000
Total Regional Roads Capital Works $1,060,000
13. NETT PLANT REPLACEMENT - $695,780
A nett purchase amount of $644,435 has been allocated for heavy plant replacement
Purchases - $774,435 – Sales/Trade-ins - $130,000
A nett purchase amount of $51,345 has been allocated for light vehicle replacement
Purchases - $130,000 – Sales/Trade-ins - $78,655

Page 8
0
--------------------------------------------------- ------------------------------------------------------------------------------------------------------------------------------- ----- ----------------------------------------------- ------------------------------------ ------------------ ---------------- ----------------- ----------------- -----------------
2013/14 2014/15 2014/15 2015/16 2016/17 2017/18 2018/19 2013/14 2014/15 2014/15 2015/16 2016/17 2017/18 2018/19
EXPENDITURE Actual Original Anticipated Estimate Estimate Estimate Estimate INCOME Actual Original Anticipated Estimate Estimate Estimate Estimate
Estimate Expenditure Estimate Income
--------------------------------------------------- ------------------------------------------------------------------------------------------------------------------------------- ----- ----------------------------------------------- ------------------------------------ ------------------ ---------------- ----------------- ----------------- -----------------
36
Urban Roads - Reseals 39,309 30,000 30,000 30,000 30,000 30,000 30,000
Urban Roads - Resheeting 0 0 0 0 0 0 20,793
Urban Streets Reconstruction 121,029 150,000 318,672 164,737 50,000 50,000 50,000 From Restricted Funds 61,915 100,000 298,672 114,737 50,000 50,000 50,000
Rural Roads Reseals 201,955 230,000 230,000 230,000 230,000 230,000 230,000
Rural Roads Construction/Recycling 1,419,989 809,907 812,504 1,302,673 846,603 735,268 870,069 Grant Funds Roads to Recovery 662,545 457,290 459,887 919,774 459,887 459,887 459,887From Restricted Funds 134,838 0 0 0 0 0 97,632
Gravel/Loam Resheeting 422,098 477,902 670,744 604,047 599,934 532,726 433,374 From Restricted Funds 0 0 192,842 0 123,767 26,162 0
Rural Roads Bridge Replacement 0 0 0 0 0 400,000 0 From Restricted Funds 0 0 0 0 0 400,000 0
Ancillary Road Services Renewals 82,648 65,000 143,461 62,000 35,000 35,000 35,000 From Restricted Funds 0 0 78,061 62,000 35,000 35,000 35,000
Aerodrome Renewals 0 0 0 22,000 0 0 0 From Infrastructure Reserve 0 0 0 22,000 0 0 0
Regional Roads Reconstruction 641,290 660,000 267,494 660,000 660,000 660,000 660,000 Repair Program Grant 330,000 330,000 0 330,000 330,000 330,000 330,000
3 X 3 (GST Replacement) 76,000 76,000 76,000 76,000 76,000 76,000 76,000
Regional Roads - Block Grant 454,000 254,000 190,973 254,000 254,000 254,000 254,000
Regional Roads Pavement Recycling 348,579 100,000 300,551 100,000 100,000 100,000 100,000 Regional Roads - Block Grant 181,138 100,000 300,000 100,000 100,000 100,000 100,000
Regional Roads Reseals 244,140 200,000 38,575 200,000 200,000 200,000 200,000 Regional Roads - Block Grant 200,000 200,000 38,566 200,000 200,000 200,000 200,000
Regional Roads Resheeting 36,637 100,000 59,148 100,000 100,000 100,000 100,000 Regional Roads - Block Grant 60,000 100,000 60,000 100,000 100,000 100,000 100,000
------------------------------------------------------------------------------------------------------------------------------- ------------------------------------ ------------------ ---------------- ----------------- ----------------- -----------------
Total Capital Transport & Comm. 3,557,674 2,822,809 2,871,149 3,475,457 2,851,537 3,072,994 2,729,236 Total Capital Transport & Comm. 2,160,436 1,617,290 1,695,001 2,178,511 1,728,654 2,031,049 1,702,519
========================================================================== ===================== ========== ========= ========== ========== ==========
Area Promotion Area Promotion
Area Promotion - Specific Works 25,012 0 0 16,000 0 0 0 From Restricted Funds 22,400 0 0 15,368 0 0 0
Information Centre - Painting 0 0 0 10,000 0 0 0
Council Property NEI Council Property NEI
Medical Centre - air conditioning 10,174 0 16,397 0 0 0 0 From Infrastructure Reserve 0 0 15,000 0 0 0 0
------------------------------------------------------------------------------------------------------------------------------- ------------------------------------ ------------------ ---------------- ----------------- ----------------- -----------------
Total Capital Economic Affairs 35,186 0 16,397 26,000 0 0 0 Total Capital Economic Affairs 22,400 0 15,000 15,368 0 0 0
========================================================================== ===================== ========== ========= ========== ========== ==========
37 Heavy Plant Purchases 714,914 778,063 778,063 774,435 913,336 1,298,983 1,069,760 Heavy Plant Sales 112,195 205,000 205,000 130,000 154,000 270,000 257,000
From Heavy Plant Reserve 353,066 0 0 115,000 200,000 400,000 170,000
37 Light Plant Purchases 159,681 129,625 209,490 130,000 209,573 292,865 206,327 Light Plant Sales 73,764 70,000 117,649 78,655 106,000 140,500 100,000
From Light Plant Reserve 0 0 32,216 0 40,000 80,000 30,000
Loan Repayments
Principal on Loans 68,379 71,707 71,707 75,040 78,768 82,771 86,999
------------------------------------------------------------------------------------------------------------------------------- ------------------------------------ ------------------ ---------------- ----------------- ----------------- -----------------
Total Capital Other 942,974 979,395 1,059,260 979,475 1,201,677 1,674,619 1,363,086 Total Capital Other 539,025 275,000 354,865 323,655 500,000 890,500 557,000
========================================================================== ===================== ========== ========= ========== ========== ==========------------------------------------------------------------------------------------------------------------------------------- ------------------------------------ ------------------ ---------------- ----------------- ----------------- -----------------
TOTAL ALL CAPITAL EXPENDITURE 5,360,854 4,346,781 6,327,353 7,159,513 5,439,984 6,158,483 5,429,192 TOTAL ALL CAPITAL INCOME 3,234,349 2,010,690 3,950,911 4,868,115 3,112,054 3,788,049 3,076,019
========================================================================== ===================== ========== ========= ========== ========== ==========
CAPITAL ITEMS
Plant Purchases Plant Purchases
Transport & Communications Transport & Communications
Economic Affairs Economic Affairs

Page 8
1


WARREN SHIRE COUNCIL 2015/2016 FEES AND CHARGES
Fees & Charges
2015/2016Charging Authority
Inc GST (Y or N)
DEVELOPMENT AND ASSOCIATED FEES
DEVELOPMENT, CONSTRUCTION CERTIFICATE AND COMPLYING DEVELOPMENT CERTIFICATE APPLICATION* Where a Construction Certificate Application is lodged with the Development Application only the Construction Certificate Fee will apply.* Where the Construction Certificate Application is lodged after determination of the Development Application an additional charge amounting to 70% of the DA fee will be charged* Fees not noted in this schedule will apply in accordance with Environmental Planning and Assessment Regulation 2000 (as amended)
up to $5000 110.00EP&A Regulation
Pt 15 N
$5,001 - $50,000 170.00EP&A Regulation
Pt 15 N$170 plus an additional $3.00 for each $1,000 (or part of $1,000)by which the estimated cost exceeds $5,000
$50,001 to $250,000 352.00EP&A Regulation
Pt 15 N$352.00 plus an additional $3.64 for each $1,000 (or part of $1,000) by which the estimated cost exceeds $50,000
$250,001 - $500,000 1,160.00EP&A Regulation
Pt 15 N $1,160.00 plus an additional $2.34 for each $1,000 (or part of $1,000) by which the estimated cost exceeds $250,000
$500,001 - $1,000,000 1,745.00EP&A Regulation
Pt 15 N $1,745.00 plus an additional $1.64 for each $1,000 (or part of $1,000) by which the estimated cost exceeds $500,000
$1,000,001 - $10,000,000 2,615.00EP&A Regulation
Pt 15 N $2,615.00 plus an additional $1.44 for each $1,000 (or part of $1,000) by which the estimated cost exceeds $1,000,000
More than $10,000,000 15,875.00EP&A Regulation
Pt 15 N $15,875.00 plus an additional $1.19 for each $1,000 (or part of $1,000) by which the estimated cost exceeds $10,000,000 * NOTE - REFER TO EXEMPTIONS FOR SOME PUBLIC AUTHORITIES
OTHER DEVELOPMENT
Development for the purpose of one or more advertisements 285.00EP&A Regulation
Pt 15 N
plus for each advertisement in excess of one 93.00EP&A Regulation Pt 15 C 246(2)(A) N
Development involving the erection of a dwelling-house with an estimated construction cost of $100,000 or less 455.00
EP&A Regulation Pt 15 CL 250 N
Development that does not involve the erection of a building, the carrying out of a work, the subdivision of land or the demolition of a building or work 285.00
EP&A Regulation Pt 15 CL 250 N
ADDITIONAL FEES
Residential Flat Development referred to design panel under SEPP65 760.00EP&A Regulation
Pt 15 CL 248 N
Advertising of Development - Designated development 2,220.00EP&A Regulation
Pt 15 CL 252 N
- Advertised development 1,105.00EP&A Regulation
Pt 15 CL 252 N
- Prohibited development 1,105.00EP&A Regulation
Pt 15 CL 252 N
- Development required to be advertised under a DCP or EPI 1,105.00EP&A Regulation
Pt 15 CL 252 N
Note: The Council must refund so much of this fee paid not spent in giving the notice.
Integrated Development 140.00EP&A Regulation
Pt 15 CL 253 N
plus for each approval body 320.00EP&A Regulation Pt 15 CL 253(4) N
Development involving the erection of a building, the carrying out of work or the demolition of a work or a building, and having an estimated cost within the range specified below.
Please Note: The Plan First Fee for all Development Application Fees over $50,000.00 is incorporated in the total fee payable.
Page 1

WARREN SHIRE COUNCIL 2015/2016 FEES AND CHARGES
Fees & Charges
2015/2016Charging Authority
Inc GST (Y or N)
OTHER FEES
Review of a Determination (s.82A(3)) - does not involve the erection of building, the carrying out of works or demolition
50% of original fee
EP&A Regulation Pt 15 N
estimated cost of construction of $100,000 or less- in any other case as set out below 190.00EP&A Regulation
Pt 15 N
up to $5000 55.00EP&A Regulation
Pt 15 N
$5,001 - $250,000 85.00EP&A Regulation
Pt 15 N$85 plus an additional $1.50 for each $1,000 (or part of $1,000) of the estimated cost
$250,001 to $500,000 500.00EP&A Regulation
Pt 15 N$500.00 plus an additional $0.85 for each $1,000 (or part of $1,000) by which the estimated cost exceeds $250,000
$500,001 - $1,000,000 712.00EP&A Regulation
Pt 15 N $712.00 plus an additional $0.50 for each $1,000 (or part of $1,000) by which the estimated cost exceeds $500,000
$1,000,001 - $10,000,000 987.00EP&A Regulation
Pt 15 N $987.00 plus an additional $0.40 for each $1,000 (or part of $1,000) by which the estimated cost exceeds $1,000,000
More than $10,000,000 4,737.00EP&A Regulation
Pt 15 N $4,737.00 plus an additional $0.27 for each $1,000 (or part of $1,000) by which the estimated cost exceeds $10,000,000
Modification of a consent (s.96(1)) 71.00EP&A Regulation
Pt 15 CL 258 N
Modification of a consent (s.96(1A) or s.96(1AA) minimal environmental impact)
645.00 or 50% of original fee
whichever lesser
EP&A Regulation Pt 15 N
Modification of a consent (s.96(2)or s.96(1AA) not minimal environmental impact)
- original fee less than $100.0050% of original
feeEP&A Regulation
Pt 15 N - original fee $100.00 or more
- does not involve the erection of building, the carrying out of works or demolition50% of original
feeEP&A Regulation
Pt 15 N
estimated cost of construction of $100,000 or less- in any other case as set out below 190.00EP&A Regulation
Pt 15 N
up to $5000 55.00EP&A Regulation
Pt 15 N
$5,001 - $250,000 85.00EP&A Regulation
Pt 15 N$85 plus an additional $1.50 for each $1,000 (or part of $1,000) of the estimated cost
$250,001 to $500,000 500.00EP&A Regulation
Pt 15 N$500.00 plus an additional $0.85 for each $1,000 (or part of $1,000) by which the estimated cost exceeds $250,000
$500,001 - $1,000,000 712.00EP&A Regulation
Pt 15 N $712.00 plus an additional $0.50 for each $1,000 (or part of $1,000) by which the estimated cost exceeds $500,000
$1,000,001 - $10,000,000 987.00EP&A Regulation
Pt 15 N $987.00 plus an additional $0.40 for each $1,000 (or part of $1,000) by which the estimated cost exceeds $1,000,000
More than $10,000,000 4,737.00EP&A Regulation
Pt 15 N $4,737.00 plus an additional $0.27 for each $1,000 (or part of $1,000) by which the estimated cost exceeds $10,000,000
Additional fee where notice of application required (unspent amount to be refunded) 665.00EP&A Regulation
Pt 15 N
Additional fee where clause 115(1A) applies 760.00
EP&A Regulation Pt 15 CL 258
(2)(A) N
Registration Fee for submission of privately certified certificate 30.00EP&A Regulation
Pt 15 N
Page 2

WARREN SHIRE COUNCIL 2015/2016 FEES AND CHARGES
Fees & Charges
2015/2016Charging Authority
Inc GST (Y or N)
SUBDIVISION FEES
Subdivision not involving the opening of Public Road 330.00EP&A Regulation
Pt 15 N
plus for each new lot created 53.00EP&A Regulation
Pt 15 N
Subdivision involving the opening of Public Road 665.00EP&A Regulation
Pt 15 N
plus for each new lot created 65.00EP&A Regulation
Pt 15 N
Strata Subdivision 330.00EP&A Regulation
Pt 15 N
plus for each addition lot created 65.00EP&A Regulation
Pt 15 N
ASSOCIATED DEVELOPMENT FEESAdditional Stamping 23.00 Council YCertificate of Classification 76.00 Council YRequest for Information in Writing 68.00 Council YLiquor Licensing Board Inspection (initial inspection and report) 213.00 Council YAdditional Inspection 96.00 Council YAnnual Charge of Supply of Approvals 203.00 Council YSearch of Records 53.00 Council Y plus per hour or part thereof where in excess of one 39.00 Council Y
TOWN PLANNING CERTIFICATE
Section 149 (2) Certificate 53.00EP&A Regulation
Pt 15 CL 259 N
Section 149 (2) & (5) Certificate 133.00EP&A Regulation
Pt 15 NSewer Drainage Diagram - search & copy fee (non-refundable) 23.00 Council NUrgent Certificates (Under 48 hours notice) - additional fee 69.00 Council Y
BUILDING CERTIFICATE
Building Certificate under section 149D Building Certificate Class 1a or Class 10 250.00EP&A Regulation
Pt 15 N
Other Classes - not exceeding 200m2 floor area 250.00EP&A Regulation
Pt 15 CL 260 N
Other Classes - 201m2 - 2000 m2 floor area 250.00EP&A Regulation
Pt 15 N plus $0.50 per square metre over 200
Other Classes - exceeding 2000m2 floor area 1,165.00EP&A Regulation
Pt 15 CL 260 N plus $0.075 per square metre over 2000
Other Classes - where no floor area applies 250.00EP&A Regulation
Pt 15 CL 260 1 (C) N
Copy of a Building Certificate 13.00EP&A Regulation
Pt 15 CL 261 NSwimming Pool S.24 Compliance Certificate 50.00 S Pool Act NSwimming Pool - First inspection 150.00 S Pool Reg NSwimming Pool - Second inspection 100.00 S Pool Reg NSwimming Pool - inspections for pensioners (half cost) 50.00 S Pool Reg N
ADVERTISING SIGNSPool Signs 21.00 Council YTourist Signs - small 75.00 Council Y - large 152.00 Council Y
SWIMMING POOL (COMMENCING OCTOBER 2015)Family Full Season 177.00 Council YFamily - Half Season to 31/12/2015 96.00 Council YFamily - Half Season from 1/1/2016 104.00 Council YSingle - Full Season 88.00 Council YSingle - Half Season to 31/12/2015 55.00 Council YSingle - Half Season from 1/1/2016 62.00 Council YSingle Entry 3.20 Council YUnder 1 Year of Age Free Council YSchool PE & Sports (Child) 2.10 Council YSchool Carnivals (Normal Admission) 3.20 Council YLifeguards per hour 63.00 Council Y
Page 3

WARREN SHIRE COUNCIL 2015/2016 FEES AND CHARGES
Fees & Charges
2015/2016Charging Authority
Inc GST (Y or N)
CEMETERY FEESOld Warren Cemetery and NevertireRight of Burial (Reservation) - Nevertire Only 287.00 Council YInterment 418.00 Council YInterment - Weekend/Public Holidays 534.00 Council Y
Interment (Dug By Hand) ~ Price on Application On Application Council Y (at no risk to Council)
Lawn Cemetery* Grave site/reservation 1,335.00 Council YCombined Ashes & Grave Site 1,724.00 Council YFamily plot 10,683.00 Council YInterment 418.00 Council YInterment - weekend/public holidays 534.00 Council Y** Ashes 389.00 Council YInterment - ashes 287.00 Council Y
Exhumation (on application) On Application Council Y
* All site/reservation includes land, perpetual maintenance, headstone configuration and installation of plaques. Does not include purchase of plaque.** Includes perpetual maintenance, receptacle for ash urn, headstone configuration and installation of 'Plaques. Does not include purchase of plaque.
Collie, Marra, Dicks Camp (on application)
CLERK'S CERTIFICATESSection 603 Certificates 75.00 LG Act NUrgent Certificates (Under 48 hours notice) - additional fee 52.00 Council YOutstanding Notices - s.735A LGA 77.00 Council NOutstanding Notices - s.121ZP EP&AA 77.00 Council NOutstanding Notices - s.735A LGA & s.121ZP EP&AA 103.00 Council N
POUND FEES (IMPOUNDING ACT)Minimum fee per animal/article impounded 44.00 Council YAnimals - Horse, Ass, Mule, Cow, Goat or Pig 44.00 Council Y - Sustenance per head/day 16.00 Council Y
Impounded horses, cattle, other animals or articles including transport, feeding, advertising and any other associated cost.
Ranger Call-out Fee (remove roaming stock from roads and reserves) - per hour 69.00 Council Y
DOG REGISTRATION/IMPOUNDING
Lifetime registration - Cats and Dogs - Desexed - Clause 17 (1) (a) 52.00Companion Animal
RegulationN
- Pensioner rate Desexed - Clause 17 (1) (b) 21.00Companion Animal
RegulationN
- Entire (Non desexed) - Clause 17 (1) (c) 192.00Companion Animal
RegulationN
- Registered Breeder - Clause 17 (1) (d) 52.00Companion Animal
RegulationN
Microchipping of impounded animals ONLY - (to paid with the release fee). 33.00 Council YImpounding - Release 44.00 Council Y - Sustenance - Per Day 12.00 Council YCat Traps Deposit - (refunded when trap returned) 42.00 Council Y
Compliance Certificate - Dangerous Dogs/Restricted Breeds - S.28(A) 100.00Companion Animal
Regulation N
ENVIRONMENTAL HEALTH INSPECTIONSAnnual Administration Fee - All Premises - Single Program 30.00 Council YAnnual Administration Fee - All Premises - Multiple Programs 50.00 Council YInspection Fee - Class A - (see Environmental Health Plan for definitions) 80.00 Council YInspection Fee - Class B - (see Environmental Health Plan for definitions) 50.00 Council YInspection Fee - Class C - (see Environmental Health Plan for definitions) 30.00 Council YSampling Fee - Any 50.00 Council Y
LGA APPLICATIONS & APPROVALSInstallation of Manufactured Home - S.68A(1) 250.00 Council YInstall temporary structure on land - S.68A(2) 100.00 Council YUse Building as Place of Public Entertainment (New Application) - S.68A(3) 200.00 Council YUse Building as Place of Public Entertainment (Renew/Extend Approval) - S.68A(3) 100.00 Council YOther Minor Approvals - Section 68 LGA 1993 60.00 Council YInstall & Operate Septic Tank - S68C(5) (Application & Licence) 100.00 Council YRenew Approval to Operate Septic Tank - S68C(6) (Inspections) 50.00 Council Y
Page 4

WARREN SHIRE COUNCIL 2015/2016 FEES AND CHARGES
Fees & Charges
2015/2016Charging Authority
Inc GST (Y or N)
LIBRARY CHARGESFaxes - First page 3.30 Council Y - Subsequent Pages 1.20 Council YPhotocopying - Black A4 sheet 0.40 Council Y - Black A3 sheet 0.50 Council Y - Bulk Black A4 sheet 0.30 Council Y - Double sided A4 sheet 0.50 Council YPhotocopying - Colour A4 sheet 3.00 Council Y - Colour A3 sheet 6.00 Council Y - Bulk Colour A4 sheet 1.00 Council Y - Double sided A4 sheet 1.00 Council YLibrary - Students and Reference Material 0.20 Council YScanning to Email 1.10 Council YOverdue FeesLost Item Processing Charge 5.50 Council YDVD's (Overdue fee) per day 1.50 Council YEarphones 2.00 Council YUSB 10.00 Council YReplacement Card 2.00 Council YNational Library - Inter Library Loans 16.50 Council YInter-Library Loans (Charging Libraries Only) 6.00 Council YUnreturned items (A tax invoice for full cost of item less depreciation)Laminating - A4 sheet 3.30 Council Y - A3 sheet 5.10 Council Y - Business Cards 1.60 Council YPhotographs 10.00 Council YDigital Photographs 10.00 Council YPhotographs CD 2.00 Council YPostage & Handling 10.00 Council Y
OFFICE CHARGESPhotocopying 0.60 Council YBinding per document (includes front & back covers) - narrow 1.50 Council Y - medium 1.75 Council Y - large 2.00 Council YPlan Printing - A1 8.80 Council YPlan Printing - A2 4.60 Council YBulk Plan Printing - negotiable Negotiable Council YColour Printing per page - A4 1.10 Council YColour Printing per page - A3 2.20 Council YColour Printing over 100 pages -negotiable Negotiable Council YSecretarial Services per hour 76.00 Council YFinancial Services per hour 143.00 Council YSurveying Services per hour 108.00 Council YReplacement of lost/damaged key to Council property 29.00 Council YDishonoured Cheque Fee 29.00 Council YFee copy of Rate Notice 3.00 Council YFee for copy of Management Plan & Estimates 39.00 Council YSecurity Deposit on Projector with or without Laptop Computer - (Refundable) 260.00 Council YHire of data projector only - per day 38.00 Council YHire of data projector with laptop computer- per day 66.00 Council Y
EXTRA CHARGES ON RATESInterest on overdue rates (Set by the Division of Local Government) 8.50% LG Act N
GARBAGE CHARGESDomestic Waste - Extra Service 5.07 Council NCommercial Waste - Extra Charges 5.07 Council YSale of 240 litre bins (includes delivery to within Warren) 115.00 Council YReplacement lids and bolts for bins 15.00 Council YReplacement wheels 15.00 Council YDisposal of Demolished building & other materials per cubic metre 29.00 Council Y
GOVERNMENT INFORMATION (PUBLIC ACCESS) ACT 2009Personal Requests
Application Fee - (by a natural person about their personal affairs) 30.00 GIPA Act 2009 NResearch in excess of 20 hours for personal records (per hour) 30.00 GIPA Act 2009 NInternal Review of determination - (no hourly rate payable) 40.00 GIPA Act 2009 N
All Other Requests
Application Fee (ie: for matters not relating to personal affairs of the applicant) 30.00 GIPA Act 2009 NResearch of Records (per hour after application) 30.00 GIPA Act 2009 NInternal Review of determination - (no hourly rate payable) 40.00 GIPA Act 2009 N
Page 5

WARREN SHIRE COUNCIL 2015/2016 FEES AND CHARGES
Fees & Charges
2015/2016Charging Authority
Inc GST (Y or N)
SALE OF MAPSTown Map 3.20 Council YShire Maps 6.00 Council YMaps Topographical (LIC) 13.50 Council YTourist Maps (LIC) 3.20 Council Y
SALE OF LOCAL PUBLICATIONSAcross the Black Soil Plains 10.00 Council YKeep the Billy Boiling 10.00 Council YReed Bed Country (Macquarie Marshes) 70.00 Council Y
OVALSPlaying fields will be marked as per Council Policy (P5, P1-1)
Victoria Oval - (including hire of toilets)
Warren Cricket Association - per season 888.00 Council Y
Rugby Union/League - per day 213.00 Council Y
Junior League - per season 213.00 Council Y
Other Sporting - no admission charge - per season 213.00 Council Y
Other Sporting - with admission charge - per day 213.00 Council Y
Other - no admission charge - per day 107.00 Council Y
**Wet Weather - in case of wet weather it is possible to use the Sporting Complex on application with the Centre Manager. The hire fee will be as per the Fees and Charges schedule for a training session.
Use of Training Facilities, without lights - per session 10.00 Council Y
Use of Lights - for Cricket Match per hour (plus hire fee of Oval) 35.00 Council Y
Use of Lights - for Football Competition per hour (plus hire fee of Oval) 28.00 Council Y
Use of Lights - for Training per hour (plus hire fee of Oval) 10.00 Council Y
*'Cleaning Charge (applies if ground/change rooms/toilets not left in a satisfactory condition, to be paid before next usage and be based on actual cost of cleaning). 213.00 Council Y
EM Carter Oval
Warren Cricket Association (Per season) 213.00 Council Y
Other Sporting - no admission charge (Per season) 213.00 Council Y
Other Sporting - with admission charge (Per day) 213.00 Council Y
Other Users - no admission charge (Per day) 107.00 Council Y
Use of Training Facilities With Lights (Per night) 32.00 Council Y
Use of Training Facilities without Lights (Per session) 10.00 Council Y*'Cleaning Charge (applies if ground/change rooms/toilets not left in a satisfactory condition, to be paid before next usage and be based on actual cost of cleaning). 213.00 Council Y
Noel Waters Oval
Warren Cricket Association (per season) 92.00 Council Y
Nevertire Tennis Club (pa) 276.00 Council Y
Nevertire Campdraft (Per event Per day) 276.00 Council Y
Rodeo (Per event Per day) 276.00 Council Y
Nevertire Soccer Club (pa) 92.00 Council Y
Nevertire Cricket Club (pa) 92.00 Council Y
Other Users (per day) 52.00 Council Y*'Cleaning Charge (applies if ground/change rooms/toilets not left in a satisfactory condition, to be paid before next usage and be based on actual cost of cleaning). 213.00 Council Y
PARKS
Victoria Park
Small Field Day (per event per day) 88.00 Council Y
Small Circus (per day) plus electricity 264.00 Council Y
Large Circus (per day) plus electricity 541.00 Council Y
Security Deposit 443.00 Council N
Bore Flat
Small Side-show (per day) 88.00 Council Y
Security Deposit 443.00 Council N
Page 6

WARREN SHIRE COUNCIL 2015/2016 FEES AND CHARGES
Fees & Charges
2015/2016Charging Authority
Inc GST (Y or N)
WARREN SPORTING & CULTURAL CENTREEntire Complex (Exclusive Use)Private UseFunction (plus deposit) 587.00 Council YMeeting/Group Activity (plus deposit): Full day 457.00 Council Y½ Day 324.00 Council YSecurity deposit (refundable) 377.00 Council NLocal Sporting /Health/Cultural GroupMeeting/Group Activity (plus deposit): Full day 324.00 Council Y½ Day 194.00 Council YSecurity deposit (refundable) 377.00 Council N
Far West Academy of Sport - Annual Charge (Use of Oval and Courts for Camps) 250.00 Council YFar West Academy of Sport - Weekend Camps (Kitchen & Cleaning per event) 157.00 Council YFar West Academy of Sport - Weekend Camps (per person per event sleeping) 5.00 Council Y
Part Complex (Shared Use) Entire Complex except Community Room or KitchenPrivate UseFunction (plus deposit) 457.00 Council YMeeting/Group Activity (plus deposit): Full day 324.00 Council Y½ Day 226.00 Council YSecurity deposit (refundable) 377.00 Council N
Local Sporting /Health/Cultural GroupMeeting/Group Activity (plus deposit): Full day 263.00 Council Y½ Day 163.00 Council YSecurity deposit (refundable) 377.00 Council N
Community Room and Kitchen onlyPrivate UseFunction (plus deposit) 357.00 Council YMeeting/Group Activity (plus deposit): Full day 324.00 Council Y½ Day 194.00 Council YSecurity deposit (refundable) 377.00 Council N
Local Sporting /Health/Cultural GroupMeeting/Group Activity (plus deposit): Full day 130.00 Council Y½ Day 97.00 Council YSecurity deposit (refundable) 377.00 Council N
Community Room Only (Whiteboard & projection screen provided)Private Use YFunction (plus deposit) 195.00 Council YMeeting/Group Activity (plus deposit): Full day 76.00 Council Y½ Day 53.00 Council NSecurity deposit (refundable) 324.00 Council
Local Sporting /Health/Cultural GroupFunction (plus deposit) 130.00 Council YMeeting/Group Activity: Full day 76.00 Council Y½ Day 53.00 Council YUp to 2 hrs 23.00 Council Y
Kitchen/Coolroom/Canteen OnlyPrivate UseFull kitchen facilities with coolroom (per event) 195.00 Council YWithout cooking facilities with coolroom (per event) 92.00 Council YCoolroom only: Full day 43.00 Council Y½ Day 28.00 Council YLocal Sporting Carnival/EventFull Kitchen with coolroom (per event) 104.00 Council YWithout cooking facilities with coolroom (per event) 43.00 Council Y
Use of Court for Sporting Event (Netball, Basketball & Indoor Cricket) per game 57.00 Council YUse of Court for Sporting Event (Netball, Basketball & Indoor Cricket) per day 226.00 Council Y
Page 7

WARREN SHIRE COUNCIL 2015/2016 FEES AND CHARGES
Fees & Charges
2015/2016Charging Authority
Inc GST (Y or N)
WARREN SPORTING & CULTURAL CENTRE
Other Area eg Ground floor carpeted or Upstairs Carpeted areaPrivate UseMeeting/Group Activity – up to 2 hrs 38.00 Council Y½ Day 66.00 Council YFull day 92.00 Council Y
Local Sporting /Health/Cultural GroupMeeting/Group Activity – up to 2 hrs (Playgroups, Bushmobile Rugrats, fitness classes etc.) 10.00 Council Y½ Day 28.00 Council YFull day 53.00 Council Y
Private UseFunction 234.00 Council YMeeting/Group Activity – up to 2 hrs 66.00 Council Y½ Day 104.00 Council YFull day 184.00 Council Y
Local Sporting /Health/Cultural GroupFunction 157.00 Council YMeeting/Group Activity – up to 2 hrs 53.00 Council Y½ Day 76.00 Council YFull day 130.00 Council Y
BBQ Area Only - (includes cost of gas) 34.00 Council Y
Storage Cage Hire (per year)Private UseLarge 76.00 Council YMedium 53.00 Council YSmall 28.00 Council YLocker 11.00 Council Y
Local Sporting /Health/Cultural GroupLarge 38.00 Council YMedium 28.00 Council YSmall 11.00 Council YLocker 6.00 Council Y
Gymnasium - per year 150.00 Council Yper ½ year 90.00 Council YVisitors temporary members up to 6 months 90.00 Council YShort term use weekly basis 15.00 Council YKey Deposit (refundable) 62.00 Council N
General CommentsOther uses by negotiationNo bookings confirmed until deposit is paidCancellation fee of 25% of hire fee if cancelled less than two weeks prior to the event
If area is not cleaned to the satisfaction of the Manager, actual costs of cleaning will be charged
Arrangements must be made 7 days in advance of the day required.
Hire charges (for use of equipment outside centre)Deposit (refundable) 39.00 Council NTables 10.00 Council YChairs 1.00 Council YUrn 19.00 Council YBainmarie per hire (25% discount for multi hire) 53.00 Council YCROCKERY & CUTLERY IS NOT FOR HIREVacation CarePer Child per Day 6.00 Council YReplacement of broken table 124.00 Council YReplacement of broken chairs 36.00 Council Y
Other Area (eg: Ground floor carpeted area, 1st floor open area) plus Community Room or Kitchen
An additional charge applies where Council's resources are required for setting up or taking down and/or removing and/or delivery of goods.
Page 8

WARREN SHIRE COUNCIL 2015/2016 FEES AND CHARGES
Fees & Charges
2015/2016Charging Authority
Inc GST (Y or N)
PLANT HIRE RATES FOR PRIVATE WORKSAll per hour and with operatorExcavator (1) 215.00 Council YExcavator with Hammer (1 and 4) 230.00 Council YExcavator - Mini Victory ( P. 168) 120.00 Council YMotor Grader (24,25) 162.00 Council YMotor Grader with rear mounted rubber tyred roller (22, 23, 28) 164.00 Council YFront End Loader (Large) (Plant 11 & 12) 177.00 Council YBackhoe/Loader (8 and 14) 117.00 Council YTractor (Small) (15 and 21) 97.00 Council YTractor (Large) (Plant 13) 116.00 Council YDrawn Rollers (6, 83 & 84) 30.00 Council YOther Tractor Attachments (105, 75, 76, 20, 88, 78, 87, 53, 52, 97) 30.00 Council YSelf Propelled Roller - Pneumatic tyred (92 & 95) 132.00 Council YSelf Propelled Roller - Vibratory Flatdrum (5) 130.00 Council YSelf Propelled Roller - Vibratory Sheepfoot (10) 130.00 Council YForklift (Plant 102 & 104) 76.00 Council YMobile Street Sweeper (47) 128.00 Council YRide-on Mower (89,70) 107.00 Council YTender Truck (63,64,58,49,61,46,59,57) 77.00 Council YTruck and Hiab (Bridge Truck) (43) 152.00 Council YTruck and Hiab (Bridge Truck) with step-deck trailer (43 &48) 177.00 Council YBitumen Patching Truck (plus material) (41,50) 160.00 Council YRoad Train Dolley (60) 68.00 Council YPrime Mover and Low Loader Combination (minimum $200) (30 or 33 & 38) 228.00 Council YPrime Mover and Road Train Combination (30 or 33, 150 &152) 260.00 Council YPrime Mover and Trailer Combination (30 or 33 & 150 or 152) 207.00 Council YGravel Truck and Dog Combination (31 & 151 ) 186.00 Council YGravel Truck (6x4 - Large) (31, 32) 158.00 Council YGravel Truck (4x2 - Small) (Plant 36) 126.00 Council YWatercart (Large - 40,000 litres) (34 & 154, 27 & 153) 166.00 Council YWatercart (Small - 13,500 litres) (106, 42, 107) 126.00 Council YTrailer - Jetting & Camera unit (P167) 157.00 Council YTrailer - Jetting unit only (P 167) 104.00 Council YTrailer - Camera unit only (P 167) 92.00 Council Y
LABOUR RATESApprentice 44.00 Council YLabourer 57.00 Council YPlant Operator 71.00 Council YTruck Driver 71.00 Council YTradesman - Plumber, Mechanic, Carpenter (Including Plant & Tools) 91.00 Council YOverseer (Including Plant) 97.00 Council Y
Rules of Plant Hire
The following Ancillary Plant are NOT available for private hire. Edge Trimmer, Lawn Mower, Ladders, Whipper Snipper, Boom Chainsaw, Generator, Caravan, Concrete Mixer, Sludge pumps, Chainsaw
Minimum Charge on all Plant charged per day - 1/2 day Minimum Charge for Labour - 1/2 hour
QUARRY PRODUCTS - PER TONNEDust 13.00 Council Y5mm 38.00 Council Y7mm 38.00 Council Y10mm 38.00 Council Y14mm 38.00 Council Y20mm 38.00 Council YConcrete Mix 38.00 Council YRoad Base 21.00 Council YJaw Run 21.00 Council YSpalls 21.00 Council YSpalls (Selected) 27.00 Council Y
*Quantities over 500 tonne - negotiable
Dust - Per Bucket (1m3) - from Warren Shire Depot 42.00 Council YLoam/Gravel - per tonne - from actual pit 4.10 Council YSand - per tonne - from actual pit 1.30 Council Y
Minimum Charge on all Plant charged per hour except Prime Mover and Low Loader - 1/2 hour
Employees Hiring - Comprehensive plant rate less normal operators hourly wage at Grade 5 of Salary System
Page 9

WARREN SHIRE COUNCIL 2015/2016 FEES AND CHARGES
Fees & Charges
2015/2016Charging Authority
Inc GST (Y or N)
ROAD AND FOOTPATH RESTORATIONS
For areas up to 10 square metresActual Cost + 10% GST Council Y
Bitumen RoadsActual Cost + 10% GST Council Y
Concrete FootpathsActual Cost + 10% GST Council Y
For areas over 10 square metresActual Cost + 10% GST Council Y
Kerb & Gutter FootpathActual Cost + 10% GST Council Y
WARREN SHOWGROUND/RACECOURSE** No bookings confirmed until deposit is paid** Cancellation fee of $65 is charged if cancelled less that two (2) weeks prior to the event** Variations by negotiation onlyKey to Facilities UsageA - ArenaB - Lower bar and Cool RoomG - GrandstandGA - Grassed AreaHS - Horse StallsHY - Holding YardsK - KitchenL - GBS Falkiner LoungeM - McCalman PavilionP - Bird/Wool PavilionR - RestaurantS - Sand RollT- Car ParkX - Cattle YardsZ - Rodeo Yards- P & A Association - Show (Full Facilities) Includes cleaning up to 4 hours 3,716.00 Council Y- Rodeo Committee - 2 day Rodeo (G, T, HY, A, Z, L, HS, X, B) * (inc. cleaning 4 hours) 5,627.00 Council Y- Rodeo Committee - 1 Day Campdraft (A,HS, S, T, Z) (cleaning not included) 464.00 Council Y- Rodeo Committee - 2 day Campdraft (G,T, HY, A, Z, L, HS, X, B) * (inc. cleaning 4 hours) 2,784.00 Council Y- Warren Jockey Club - per year (R, L, G, HS, B, T, K, S, GA) (inc. cleaning 4 hours) 27,309.00 Council Y- Polocrosse Carnival - 2 days (G, T, HS, A, K, L, X, B, HY, S) #* (plus $150 deposit) inc 4 hrs 2,277.00 Council Y- Polocrosse smaller carnival - 1 day. (HS, K, X, L, A) (inc. cleaning 4 hrs) 1,298.00 Council Y- Pony Club - Ten Meetings(T, A, HS, )* Cleaning not included 304.00 Council Y- Pony Club - District/State Meeting (T, A, K, L, HS, S)* Cleaning not included 921.00 Council Y- Pony Club Camp - kids sleepover in Rest & Upstairs (L, K, R) per day (cleaning not included) 88.00 Council Y- Western Equestrian (T, A, K, L, HS, S)* Cleaning not included 921.00 Council Y- Circus (T, X) (cleaning not included) 552.00 Council Y
Use of FacilitiesTraining Charges - Per horse Per week 4.00 Council YHorse Stalls - minimum (Per week Per stall) 8.00 Council YHolding Paddocks (Per week Per animal) 5.00 Council YHolding Paddocks (Per annum Per animal) 221.00 Council YCattle Yards (Per pen Per week) 8.00 Council YRodeo Yards (Per pen Per week) - minimum charge 8.00 Council YUse of lights, arena area - per hour 18.00 Council Y
0.00GBS Falkiner Memorial LoungeDay rate (up to 5.00 pm) 215.00 Council YNight rate (after 5.00 pm) 304.00 Council YSecurity Deposit 480.00 Council NMinimum Usage Charge 215.00 Council YIncludes Cleaning of 4 hours only - Actual cost after 4 hours + 9.5% superannuation
Restaurant and Kitchen CombinedDay rate with full kitchen (up to 5.00 pm) 388.00 Council YDay rate without kitchen (up to 5.00 pm) 284.00 Council YNight rate with full kitchen (after 5.00 pm) 480.00 Council YNight rate without kitchen (after 5.00 pm) 388.00 Council YSecurity Deposit 480.00 Council NMinimum usage charge 307.00 Council YIncludes Cleaning of 4 hours only - Actual cost after 4 hours + 9.5% superannuation
Restaurant OnlyDay rate with cleaning (15 persons or less) 150.00 Council YDay rate (up to 5.00 pm) 285.00 Council YNight rate (after 5.00 pm) 388.00 Council YMinimum usage 150.00 Council YSecurity Deposit 388.00 Council NIncludes Cleaning of 4 hours only - Actual cost after 4 hours + 9.5% superannuation
# Stables to be mucked out by user - * Includes camping one day before and after event up to midday
Page 10

WARREN SHIRE COUNCIL 2015/2016 FEES AND CHARGES
Fees & Charges
2015/2016Charging Authority
Inc GST (Y or N)
WARREN SHOWGROUND/RACECOURSEKitchen OnlyWithout cooking facilities 100.00 Council YFull kitchen 215.00 Council YSecurity Deposit 388.00 Council NMinimum usage chargeIncludes Cleaning of 4 hours only - Actual cost after 4 hours + 9.5% superannuation
Cool Rooms (per day - Minimum charge) 57.00 Council Y
Garden - Bar AreaPer day (with cool room) 304.00 Council YPer day (without cool room) 249.00 Council YMinimum Usage Charge 249.00 Council YSecurity Deposit 279.00 Council NIncludes Cleaning of 4 hours only - Actual cost after 4 hours + 9.5% superannuation
McCalman PavilionDay rate with cleaning (up to 5.00 pm) 215.00 Council YNight rate (after 5.00 pm) 285.00 Council YSecurity Deposit 215.00 Council NMinimum Usage Charge 215.00 Council YIncludes Cleaning of 4 hours only - Actual cost after 4 hours + 9.5% superannuation
MiscellaneousUse of showers Jockey's room (per head) 2.00 Council YCamping/showers and toilets (overnight only) (per head) 5.50 Council YToilet Cleaning/Servicing (by quotation)Hire of Misc Equipment (by negotiation)
TRAFFIC FACILITIES HIRESigns (per sign, per day) 9.00 Council YBarricades (per barricade, per day) 9.00 Council YCones (per cone, per day) 9.00 Council YFlashing Lights (per light, per day) 23.00 Council YSecurity Deposit (per lights each plus batteries) 55.00 Council NSecurity Deposit (per sign & cones each) 159.00 Council N
LIQUID TRADE WASTE FEES
Annual FeesCategory 1 87.00 Council NCategory 2 175.00 Council NLarge Discharger 585.00 Council N
Industrial Discharger169.00 to
585.00 Council N
Reinspection Fee 78.98 Council N
Trade Waste Usage ChargesCategory 1 with appropriate pre-treatment Nil Council NCategory 1 without appropriate pre-treatment 1.78/kL Council NCategory 2 with appropriate pre-treatment 1.78/kL Council NCategory 2 without appropriate pre-treatment 14.55/kL Council NFood Waste Disposal Charge 26.40/bed Council N
Substance Price/ Per KgAluminium 0.73 Council NAmmonia* (as N) 2.15 Council NArsenic 71.30 Council NBarium 35.65 Council NBiochemical oxygen demand* (BOD) 0.73 Council NBoron 0.73 Council NBromine 14.30 Council NCadmium 330.00 Council NChloride No charge Council NChlorinated hydrocarbons 35.65 Council NChlorinated phenolics 1,468.00 Council NChlorine 1.50 Council NChromium 24.00 Council NCobalt 15.00 Council NCopper 15.00 Council NCyanide 73.00 Council NFluoride 4.00 Council N
Page 11

WARREN SHIRE COUNCIL 2015/2016 FEES AND CHARGES
Fees & Charges
2015/2016Charging Authority
Inc GST (Y or N)
Formaldehyde 1.50 Council NOil and Grease* (Total O&G) 1.30 Council NHerbicides/defoliants 735.00 Council NIron 1.50 Council NLead 37.00 Council NLithium 7.15 Council NManganese 7.15 Council NMercaptans 73.00 Council NMercury 2,446.00 Council NMethylene blue active substances (MBAS) 0.75 Council NMolybdenum 0.75 Council NNickel 24.00 Council NNitrogen* (Total Kjeldahl Nitrogen – Ammonia) as N 0.20 Council NOrganoarsenic compounds 719.00 Council NPesticides general (excludes organochlorins and organophosphates) 735.00 Council NPetroleum hydrocarbons (non-flammable) 2.50 Council NPhenolic compounds (non-chlorinated) 7.15 Council NPhosphorus* (Total P) 1.50 Council NPolynuclear aromatic hydrocarbons 15.00 Council NSelenium 52.00 Council NSilver 1.40 Council NSulphate* (SO4) 0.20 Council NSulphide 1.50 Council NSulphite 2.00 Council NSuspended Solids* (SS) 1.00 Council NThiosulphate 0.30 Council NTin 7.15 Council NTotal dissolved solids* (TDS) 0.08 Council NUranium 7.15 Council NZinc 15.00 Council N
WATERTapping Fees 20 mm Bore Water Service - Warren 449.00 Council N20 mm River Water Service - Warren 449.00 Council NDual Service - Warren 681.00 Council NTapping Fee - Collie 564.00 Council NTapping Fee - Nevertire 480.00 Council NFire Service 1,082.00 Council NDisconnection/Reconnection Fee 80.00 Council NMeter Readings 35.00 Council NMeter Testing Fee 88.00 Council N
Bore Water StandpipeWarren (per KL. Minimum $30) 6.10 Council NNevertire (per KL Minimum $30) 6.10 Council NCollie (per KL Minimum $30) 6.10 Council NDrought Circumstances - EC Declared (per Kl Minimum $30) 3.10 Council NWater Sampling (per site) - Microbiological Analysis 118.00 Council NWater Sampling (per site) - Chemical Analysis 310.00 Council N
River Water StandpipeWarren (per KL. Minimum $20) 3.10 Council NDrought Circumstances - EC Declared (per Kl Minimum $20) 1.33 Council N
Sewer Connection - BY QUOTATION ONLY
Page 12
Related Documents