© VCAA 2015 VCE Further Mathematics 2 examination report General comments The selection of modules by students in 2015 is shown in the table below. The 2015 examination presented opportunities for all students to start well with the Core section and each module. Questions then became more challenging as students progressed through each module. Students are urged to use reading time to identify and comprehend all the questions they are to answer. It was clear that many students did not read some questions carefully and misread or misunderstood what was required. Most students managed their time well and were able to keep the context of questions in mind when responding. Many students did not follow the instructions given on the examination paper. For example: • answers given as a number instead of a percentage (Core, Question 1c.) • choosing the incorrect variable as the dependent variable (Core, Question 4a.) • not completing the question by finding the difference between two numbers (Core, Question 5bi.) • failure to use the cosine rule (Module 2: Geometry and trigonometry, Question 2bii.) • referring to the vertical axis rather than the horizontal axis (Module 3: Graphs and relations, Question 3bii.) • shading outside the required region instead of inside (Module 3: Graphs and relations, Question 5b.) • using the compound formula for a flat rate question (Module 4: Business-related mathematics, Question 2a.) • not attempting part of a question (Module 4: Business-related mathematics, Question 5c.) • writing a Hamiltonian circuit when the question asks for a non-Hamiltonian circuit (Module 5: Networks and decision mathematics 2ai.) Module % 2015 1: Number patterns 27 2: Geometry and trigonometry 65 3: Graphs and relations 46 4: Business-related mathematics 31 5: Networks and decision mathematics 49 6: Matrices 83

Welcome message from author
This document is posted to help you gain knowledge. Please leave a comment to let me know what you think about it! Share it to your friends and learn new things together.
Transcript

© VCAA
2015 VCE Further Mathematics 2 examination report
General comments The selection of modules by students in 2015 is shown in the table below.
The 2015 examination presented opportunities for all students to start well with the Core section and each module. Questions then became more challenging as students progressed through each module.
Students are urged to use reading time to identify and comprehend all the questions they are to answer. It was clear that many students did not read some questions carefully and misread or misunderstood what was required.
Most students managed their time well and were able to keep the context of questions in mind when responding.
Many students did not follow the instructions given on the examination paper. For example:
• answers given as a number instead of a percentage (Core, Question 1c.) • choosing the incorrect variable as the dependent variable (Core, Question 4a.) • not completing the question by finding the difference between two numbers (Core, Question
5bi.) • failure to use the cosine rule (Module 2: Geometry and trigonometry, Question 2bii.) • referring to the vertical axis rather than the horizontal axis (Module 3: Graphs and relations,
Question 3bii.) • shading outside the required region instead of inside (Module 3: Graphs and relations,
Question 5b.) • using the compound formula for a flat rate question (Module 4: Business-related
mathematics, Question 2a.) • not attempting part of a question (Module 4: Business-related mathematics, Question 5c.) • writing a Hamiltonian circuit when the question asks for a non-Hamiltonian circuit (Module
5: Networks and decision mathematics 2ai.)
Module
% 2015
1: Number patterns 27
2: Geometry and trigonometry 65
3: Graphs and relations 46
4: Business-related mathematics 31
5: Networks and decision mathematics 49
6: Matrices 83
2015 VCE Further Mathematics 2 examination report
© VCAA Page 2
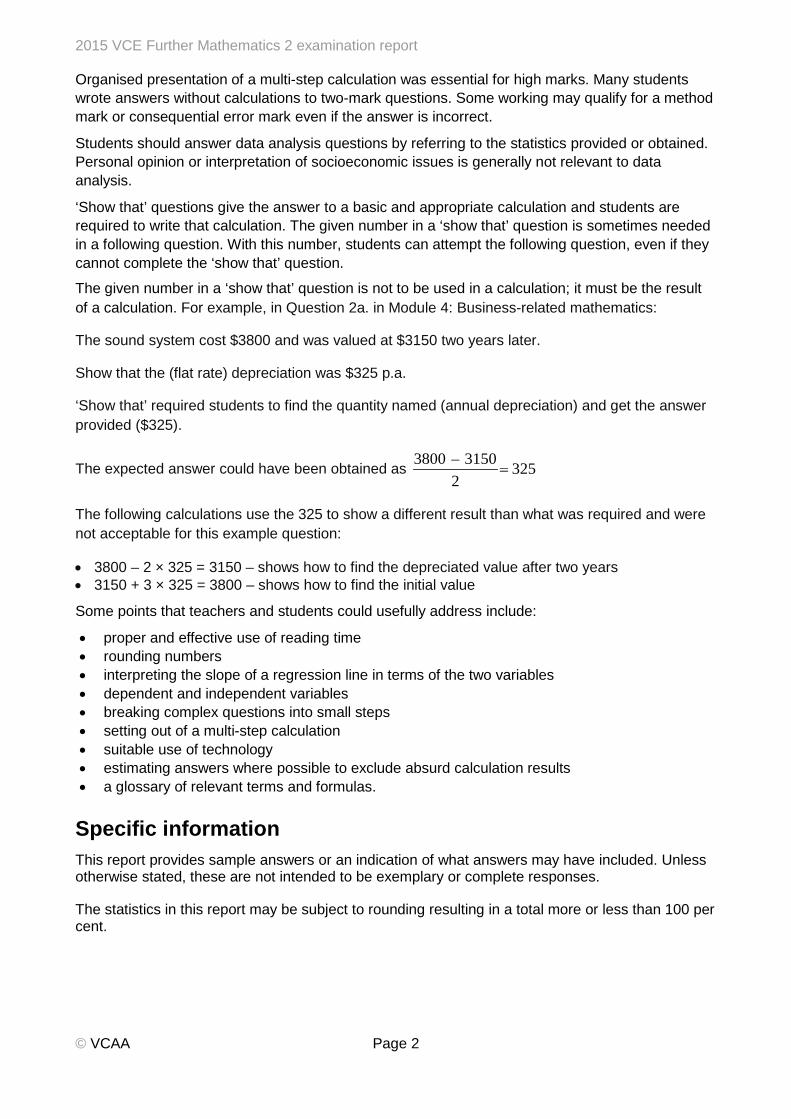
Organised presentation of a multi-step calculation was essential for high marks. Many students wrote answers without calculations to two-mark questions. Some working may qualify for a method mark or consequential error mark even if the answer is incorrect.
Students should answer data analysis questions by referring to the statistics provided or obtained. Personal opinion or interpretation of socioeconomic issues is generally not relevant to data analysis.
‘Show that’ questions give the answer to a basic and appropriate calculation and students are required to write that calculation. The given number in a ‘show that’ question is sometimes needed in a following question. With this number, students can attempt the following question, even if they cannot complete the ‘show that’ question.
The given number in a ‘show that’ question is not to be used in a calculation; it must be the result of a calculation. For example, in Question 2a. in Module 4: Business-related mathematics:
The sound system cost $3800 and was valued at $3150 two years later.
Show that the (flat rate) depreciation was $325 p.a.
‘Show that’ required students to find the quantity named (annual depreciation) and get the answer provided ($325).
The expected answer could have been obtained as 3800 – 3150 3252
=
The following calculations use the 325 to show a different result than what was required and were not acceptable for this example question:
• 3800 – 2 × 325 = 3150 – shows how to find the depreciated value after two years • 3150 + 3 × 325 = 3800 – shows how to find the initial value
Some points that teachers and students could usefully address include:
• proper and effective use of reading time • rounding numbers • interpreting the slope of a regression line in terms of the two variables • dependent and independent variables • breaking complex questions into small steps • setting out of a multi-step calculation • suitable use of technology • estimating answers where possible to exclude absurd calculation results • a glossary of relevant terms and formulas.
Specific information This report provides sample answers or an indication of what answers may have included. Unless otherwise stated, these are not intended to be exemplary or complete responses.
The statistics in this report may be subject to rounding resulting in a total more or less than 100 per cent.
2015 VCE Further Mathematics 2 examination report
© VCAA Page 3
Core Question 1a.
Marks 0 1 Average
% 44 56 0.6
70–75 years
This question was not well answered. Many students simply wrote ‘5’, while others wrote ‘negatively skewed’.
Question 1b.
Marks 0 1 Average
% 23 77 0.8
14 countries
A common incorrect answer was 9.
Question 1c.
Marks 0 1 Average
% 32 68 0.7
16.4%
30 0.1639... 16.4%183
= ≈
An answer rounded to one decimal place was expected. A number of students simply wrote 16% or an unrounded figure. This answer was not accepted. It could not be considered as a rounding error as there was no evidence that rounding had occurred.
Question 2a.
Marks 0 1 Average
% 17 83 0.9
Negatively skewed (with no outliers)
Question 2b.
Marks 0 1 2 Average
% 48 15 37 0.9
Median life expectancy changes with year. For example, in 1953 the median was 52, in 1973 the median was 63 and in 1993 the median was 69.
Observing the change in IQR values between 1953, 1973 and 1993, with appropriate values quoted, was also acceptable.
Some students referred to mean values, which are not discernible from a box plot unless it is perfectly symmetrical.

2015 VCE Further Mathematics 2 examination report
© VCAA Page 4
Question 3a.
Marks 0 1 Average
% 60 40 0.4
On average, male life expectancy increased by 0.88 years for each one-year increase in female life expectancy.
This question was not well answered, with many students describing the scatterplot instead of interpreting the slope of the line as asked.
The increase in male life expectancy needed to be related to one unit (year) increase in female life expectancy. Answers such as ‘On average, male life expectancy increased by 0.88 years for every increase in female life expectancy’ were not accepted.
Some students incorrectly interpreted slope = 0.88 as r = 0.88
Question 3b.
Marks 0 1 Average
% 22 78 0.8
34.4 years
Question 3c.
Marks 0 1 Average
% 48 52 0.5
95% of the variation in male life expectancy can be explained by the variation in female life expectancy.
A common error was to interpret ‘The coefficient of determination is 0.95’ as meaning r = 0.95 and then using r2 = 0.9025 = 90.25% for the interpretation.
Question 4a.
Marks 0 1 Average
% 37 63 0.7
Strong, positive, linear
Many students did not state the form as linear.
Question 4b.
Marks 0 1 Average
% 51 49 0.5
male = 9.69 + 0.81 × female
Students needed to correctly enter the data from the table to determine the coefficients for this equation. Some inappropriately used the data from the first column as the independent variable in technology calculation.
Many students did not follow rounding instructions and wrote 9.7, instead of 9.69, in the first box.

2015 VCE Further Mathematics 2 examination report
© VCAA Page 5
Question 5a.
Marks 0 1 Average
% 23 77 0.8
22 years
Question 5bi.
Marks 0 1 2 Average
% 15 27 58 1.5
3 years
Australia life expectancy = –451.7 + 0.2657 × 2030 = 87.67… years UK life expectancy = –350.4 + 0.2143 × 2030 = 84.62… years Difference = 87.67…– 84.62… = 3.04…
Some students correctly calculated the numbers for Australia and the United Kingdom but then did not find the required difference.
Some students found negative values for life expectancies. Negative values are non-consistent with the context.
Question 5bii.
Marks 0 1 Average
% 55 45 0.5
The regression equation was used to make predictions outside the available range of data.
This question required a response related to the given statistical data rather than any sociological possibilities. Many students wrote about the likely impact of future technological advances, wars, famines, viruses or advances in medicine, or simply stated ‘You don’t know what’s going to happen in the future’. Such responses were not accepted.
Module 1: Number patterns Questions 1a.–2c.
Marks 0 1 2 3 4 5 6 7 8 Average
% 1 4 5 7 9 12 16 22 25 5.8
1a.
2150 – 2000 = 150

2015 VCE Further Mathematics 2 examination report
© VCAA Page 6
1b. 2600 kg
1c. 20 200 kg
1d. Week 6
1e. Cn + 150
2a.
2b.
Week 6
2c.
60%
A common incorrect answer was 160%.
Questions 2di.–3b.
Marks 0 1 2 3 4 5 6 7 Average
% 42 19 12 7 6 5 4 4 1.7
2di.
76.8
2dii. 154.8
W4 = 1.6 × 128 – 50 = 154.8

2015 VCE Further Mathematics 2 examination report
© VCAA Page 7
2diii. 88.3
W3 = 128
W4 = 1.6 × W3 – k
W4 = 1.6 × 128 – k
W5 = 1.6 × W4 – k
98 = 1.6 × (1.6 × 128 – k) – k
Solve: 327.68 – 2.6k = 98
3a.
Number of ladybirds taken from the greenhouse and also the number of ladybirds released into the field
3b. 857
Constant G means Gn+1 = Gn = 1200
1200 = 1.25 × 1200 – m
m = 300
Constant F means Fn+1 = Fn = f with m = 300
f = 0.65 × f + 300
0.35f = 300
f = 857.142…
This question was not answered well. Most students were unable to see the link between Gn, Gn+1
and 1200 to find the value of m that was needed to then find f.
Module 2: Geometry and trigonometry Questions 1a.–1d.
Marks 0 1 2 3 4 Average
% 6 22 27 25 21 2.3
1a.
400 m

2015 VCE Further Mathematics 2 examination report
© VCAA Page 8
1b.
0.6
300 0.6500
=
1c. 0.008 metres
4001 50 000x =
Many students either misread the question or did not check if their answer was reasonable for a distance on a map. Any answer greater than a metre would not be reasonable in this context. Some students gave answers up to 20 000 kilometres.
1d.
16°
Questions 1e.–2a.
Marks 0 1 2 3 Average
% 17 13 23 47 2
1e.
2a. 475 m
sin30950
475
x
x
=
=
Students may need to draw triangles as applicable to answer questions. For this question, lines could be drawn east and north from C to T.

2015 VCE Further Mathematics 2 examination report
© VCAA Page 9
Questions 2bi.–3a.
Marks 0 1 2 3 4 Average
% 21 19 20 17 23 2
2bi. 908 m
( )( )2 2950 1400 2 950 1400 cos 40
908.196
+ − × × ×
=
2bii.
142° (after a demonstrated substitution into the cosine rule to find ∠CET or ∠CTE)
2 2 2
2 2 2
1400 950 908 2 950 908 cos( )97.76...
or950 1400 908 2 1400 908 cos( )
42.24...
CTECTE
CETCET
= + − × × × ∠∠ =
= + − × × × ∠∠ =
Hence bearing of E from T = 360 – 120 – 97.76 = 142.24º
or
360 – 120 – 140 + 42.24 = 142.24º
To qualify for full marks, responses required evidence of use of the cosine rule.
A method mark was available in this two-mark question if the final answer was incorrect. However, some calculations were poorly set out and this method mark could not always be allocated.
3a. 2 22.4 2.4 2
2.4 1.326...3.73 m
h = + −= +≈
Questions 3b.–4
Marks 0 1 2 3 4 Average
% 35 19 19 13 14 1.5 Question 3b.
76 m2
Front and back: 12 2.4 4 4 1.33 24.522
× × + × × ≈
Walls and roof: 4 2.4 5.4 51.84× × ≈

2015 VCE Further Mathematics 2 examination report
© VCAA Page 10
Total = 24.52 51.84 76.36+ =
Few students answered this question correctly. Many did not make use of the answer to Question 3a.
Students often used the rule for total surface area of a rectangular prism, not recognising that there was no floor or single rectangular roof section.
Many calculations were poorly set out and a method mark could not be awarded. Students are encouraged to clearly label each step, such as ‘Wall:’ or ‘Front:’ in an extended calculation and to draw supporting diagrams where applicable.
Question 4
7.3 m
Obtuse angle in the thin triangle at the top is: 180 – 38 = 142°
Let required height = x
Solve (372 = 312 + x2 – 2×31 × x × cos(142°))
∴x = 7.269… ≈ 7.3
Other valid methods used the sine rule or applications of Pythagoras’ theorem.
The most common error was to consider the two right triangles as being similar; however, they were not. Many students used cos(38°) to find 24.42 m as the low height but then inappropriately applied a scale factor 37:31 to find the incorrect high height.
A number of other students incorrectly assumed that 38° also applied to the top angle of the larger right triangle.
Module 3: Graphs and relations Questions 1a.–2b.
Marks 0 1 2 3 4 Average
% 0 1 7 26 65 3.6
1a.
$1200
1b.
8 days
2a.
18 000 yen
2b.
90 yen
The slope of the line will provide the answer. The two points to help determine this should be read off the graph and as far apart as possible, such as (0, 0) and (200, 18 000).

2015 VCE Further Mathematics 2 examination report
© VCAA Page 11
Questions 3a.–4d.
Marks 0 1 2 3 4 5 6 7 8 Average
% 4 8 18 15 12 12 12 12 8 4.1
3a.
Algebraic solution of equations is a required skill. A transposition step in this ‘show that’ question was expected, and k = 1425 needed to be the result of an appropriate calculation.
3bi.
$15
0 95 1425
1425 95
1425 1595
dollars
dollars
dollars
= × −
= ×
= =
3bii.
There is a $15 commission or fixed charge for any conversion into yen.
Other acceptable answers included ‘$15 base fee is charged before the agency will convert dollars to yen’ or ‘You need more than $15 to buy any yen’.
4a.
$250
4b.
$300
4c.
Many students found this question challenging. Many were able to correctly locate the horizontal line, but often without the open circle required at (0, 75). A much smaller number of students were

2015 VCE Further Mathematics 2 examination report
© VCAA Page 12
able to correctly draw in the inclined line but most of these did not include the filled dot at weight = 40.
The connection between the horizontal and inclined lines at weight = 20 was sometimes marked with a dot inside an open circle. As the graph does not ‘break’ at this point, there was no need for either of these.
4d. 27.8 kg
22.5 375 25022.5 625
27.77...
weightweight
weight
× − =× =
=
The most common incorrect answer was 30 kg. However, the open circle at this point, for luggage paid at the airport, means there cannot be a point of intersection here.
The inclined line cuts through the step graph at around weight = 28 where cost = $250 and a calculation is needed to find the answer correct to one decimal place as required. Questions 5a.–5c.
Marks 0 1 2 3 Average
% 23 29 19 30 1.6
5a.
Ben must attend at least 10 lessons in Japanese.
5b.
The question required the feasible region to be shaded. Some students used shading to highlight excluded sections, leaving their feasible region as unshaded. These students could still qualify for marks as long as they clearly labelled or identified their (unshaded) answer with a legend.
5c.
23 English lessons

2015 VCE Further Mathematics 2 examination report
© VCAA Page 13
Module 4: Business-related mathematics Question 1a.–1c.
Marks 0 1 2 3 Average
% 18 16 24 42 1.9
1a.
$8.00
Let x = the amount before 10% GST is added
GST 8810% of 880.1 88
1.1 8888 1.180
xx xx x
xxx
+ =+ =+ =
== ÷=
Then
80 + GST = 88
GST = 88 – 80 = 8
A common incorrect answer was 10% of 88 = $8.80
1b.
$352
1c.
$99
Questions 2a.–3b.
Marks 0 1 2 3 4 5 Average
% 13 17 18 18 19 16 2.6
2a.
3800 – 3150 3252
=
The 325 should not have been substituted into a calculation. It needed to be the result of a calculation.
2b. 10 years
Let t = number of years
Solve: 3800 – 325t = 550
t = 10

2015 VCE Further Mathematics 2 examination report
© VCAA Page 14
2c. 13.11%
Solve: ( )51040 2100 1 r= −
r = 0.13114…
3a. $12 500
460 100 12 5003.68
P ×= =
3b. It will last forever.
Many students did not know that perpetuities pay out only the interest earned, while the principal remains unchanged.
The most common incorrect answer was 12500 27 years
460≈
Questions 4a.–5b.
Marks 0 1 2 3 4 5 Average
% 41 14 12 12 13 7 1.7
4a. $4072.54
63.64000 1 4072.542...1200
A = + =
Answers rounded to $4072.55 or $4072.50 were not accepted.
4b. 4 × 0.8% = 3.2%
4c. $6664.63
N = 20 I = 3.2 PV = –2000 PMT = –200 FV = 6664.629… P/Y = 4 C/Y = 4 Answers of $6664.60 or $6664.65 were not accepted.

2015 VCE Further Mathematics 2 examination report
© VCAA Page 15
5a.
5.91%
N = 144 I = 5.9100… PV = 50 000 PMT = –485.60 FV = 0 P/Y = 12 C/Y = 12
5b. $2951
N = 12
I = 5.91
PV = 50 000
PMT = –485.60
FV = –47 048.7077…
P/Y = 12
C/Y = 12 Paid off = 50 000 – 47 048.71 = 2951.29
Students who gave an incorrect answer to Question 5a. may have qualified for a consequential error mark for this question if they included their technology finance solver input.
A number of students found the future value after one year but did not go on to find the amount paid off.
Question 5c.
Marks 0 1 2 Average
% 76 7 17 0.4
10 months
After six years:
N = 72 I = 5.91 PV = 50 000 PMT = –485.60 FV = –29 376.045… P/Y = 12 C/Y = 12 Deduct $3500 payment from FV and use result as new PV.
New PV = 29 376.05 – 3500.00 = 25 876.05
Next find N needed to get FV = 0
N = 61.960…

2015 VCE Further Mathematics 2 examination report
© VCAA Page 16
I = 5.91 PV = 25 876.05 PMT = –485.60 FV = 0 P/Y = 12 C/Y = 12 Few students attempted this question. Students who partially completed this question may have qualified for a method mark if they had included their technology finance solver input.
Module 5: Networks and decision mathematics Questions 1a.–1c.
Marks 0 1 2 3 Average
% 0 2 23 74 2.7
1a. $300
1b. $920
1c. N and P (or P and N)
Questions 1di.–2b.
Marks 0 1 2 3 4 5 Average
% 10 15 17 20 18 19 2.8
1di.
Many students were unable to find this minimum spanning tree.
Common incorrect trees excluded PO or KL instead of MN.
Some students drew complete circuits.

2015 VCE Further Mathematics 2 examination report
© VCAA Page 17
1dii. $120
Disconnecting J-P and O-P will reduce cost by $600 but must then add in N-M to add $480 back in.
480 – 600 = –120
2ai.
S - Q - R - S - U
2aii. Town S is passed through twice.
2b. 162 km
Sum all the distances for the Hamiltonian circuit: Factory – T – S – R – Q – U – Factory
Question 3a.–3fii.
Marks 0 1 2 3 4 5 6 7 Average
% 10 15 12 12 18 14 13 6 3.3 3a. 3 minutes
3b. 4 minutes
Common incorrect answers were 12 and 13 minutes.
3c. 3 minutes
3d. A - C - F - H - I
3e. The critical path is increased by 7 minutes to become 33 minutes.
It was insufficient to simply write an answer of ‘7 minutes’ or ‘33 minutes’. Reference to an ‘increase’ or ‘new critical path’ was expected.

2015 VCE Further Mathematics 2 examination report
© VCAA Page 18
3fi.
The dummy activity needed to indicate that F has become a prerequisite for G. This required an arrow on the line. Then, this connection needed to be identified as having a duration of zero or be labelled as dummy.
3fii. The critical path is increased by 2 minutes to become 28 minutes.
A number of students incorrectly stated that ‘there is no effect since a dummy takes zero time’, while others stated that ‘there is no effect since G is not on the critical path’.
Module 6: Matrices Questions 1a.–1cii.
Marks 0 1 2 3 4 5 Average
% 0 4 4 9 19 63 4.3
1a. 120 students
1bi.
0
5 10 3 215 30 9 610 20 6 4
Q S P = =
1bii. 30 intermediate-level students
A common incorrect answer was 60 students.
1ci.
C × Q
Also accepted was the matrix calculation written as:
dummy
2015 VCE Further Mathematics 2 examination report
© VCAA Page 19
[ ]5 10 3 2
15 25 40 15 30 9 610 20 6 4
×
Some students incorrectly gave Q × C.
1cii. $340
Questions 2a.–3a.
Marks 0 1 2 3 4 5 Average
% 9 7 10 16 25 33 3.4
2a. All of the advanced-level students stay as advanced-level students.
2bi.
1
105852
S =
2bii. 12 intermediate-level students
0.20 × 60 = 12
A common incorrect answer was 2.
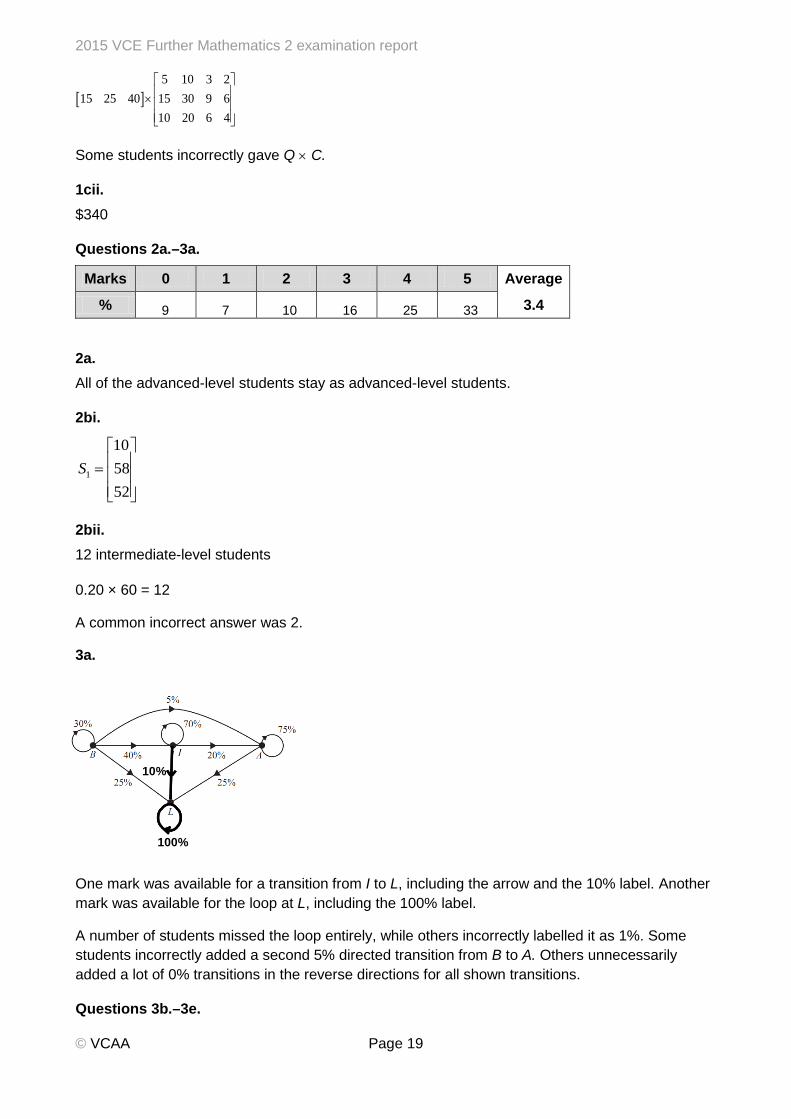
3a.
One mark was available for a transition from I to L, including the arrow and the 10% label. Another mark was available for the loop at L, including the 100% label.
A number of students missed the loop entirely, while others incorrectly labelled it as 1%. Some students incorrectly added a second 5% directed transition from B to A. Others unnecessarily added a lot of 0% transitions in the reverse directions for all shown transitions.
Questions 3b.–3e.
10%
100%

2015 VCE Further Mathematics 2 examination report
© VCAA Page 20
Marks 0 1 2 3 4 5 Average
% 36 17 18 14 7 8 1.6
3b. 17.5%
0.25 × 20 + 0.1 × 60+ 0.25 × 40 = 21 students left 21 0.175 17.5%
120= =
Many students did not convert 21 students into the required percentage.
3c. 43 advanced-level students
2
2
0.30 0 0 0 20 1.80.40 0.70 0 0 60 37.40.05 0.20 0.75 0 40 42.550.25 0.10 0.25 1 0 38.25
S
= =
Some students rounded 42.55 to 42 despite the question instruction, ‘Write your answer correct to the nearest whole number’.
3d. 5 assessments
( )( )
44 2 0
55 2 0
54 40
43 40
S T R
S T R
= × ≈ >
= × ≈ <
3e. 7 intermediate-level students
1
0.30 0 0 0 20 4 100.40 0.70 0 0 60 2 520.05 0.20 0.75 0 40 3 460.25 0.10 0.25 1 0 0 21
R
= × + =
2
0.30 0 0 0 10 4 70.40 0.70 0 0 52 2 42.40.05 0.20 0.75 0 46 3 48.40.25 0.10 0.25 1 21 0 40.2
R
= × + =
3
0.30 0 0 0 7 4 6.10.40 0.70 0 0 42.4 2 34.480.05 0.20 0.75 0 48.4 3 48.130.25 0.10 0.25 1 40.2 0 58.29
R
= × + =

2015 VCE Further Mathematics 2 examination report
© VCAA Page 21
20% of 34.48 intermediate students = 6.896
Students were not expected to write out all of these matrix calculations to qualify for a method mark if their final answer was incorrect. The progression in these state matrices could be shown by using the correct equation to write the matrices R1, R2 and R3.
Of those who attempted this question, many inappropriately used ( )33 2 0R T R V= + , whereas
3 2R TR V= + needed to be used instead.
Some students found and interpreted R4 instead of R3.
Related Documents