Welcome message from author
This document is posted to help you gain knowledge. Please leave a comment to let me know what you think about it! Share it to your friends and learn new things together.
Transcript


CHINA ECONOMIC OVERVIEW

CHINA GDP AND GDP PER CAPITA
3
Source: National Bureau of Statistics – Jun 2015
-
1,000
2,000
3,000
4,000
5,000
6,000
7,000
8,000
2006 2007 2008 2009 2010 2011 2012 2013 2014
0%
5%
10%
15%
20%
25%GDP PER CAPITA (USD)
Source: National Bureau of Statistics, IMF
RMB 45,385 (USD $7,262)2014 GDP Per Capita - China
USD$10,9232014 GDP Per Capita – Global Average
+4%YOY
VS.
CHINA'S GDP GROWTH YEAR-ON-YEAR
8.1%
7.6%7.4%
7.9%7.7%
7.5%
7.8%7.7%
7.4%7.5% 7.4%7.3%
5.8%
6.5%
5.00%
5.50%
6.00%
6.50%
7.00%
7.50%
8.00%
8.50%
Q12012
Q2 Q3 Q4 Q12013
Q2 Q3 Q4 Q12014
Q2 Q3 Q4 Q12015
Q2
7.2%
Chinese economy slows down in 2015 with growth dropping to 6.5%. GDP per Capita-China inches closer to the global average.

CONSUMER CONFIDENCE
4
Source: National Bureau of Statistics – Jul 2015
CONTRIBUTION FACTORS
• GDP distribution structure adjustment (shift from heavy industrial production based economy towards services focused enrironment)
• Central bank further lower rates and loosened loan restrictions
• Consistent low unemployment rate
• Steady development of disposable household income
• Government’s policy to encourage consumption, especially for lower tiers
CHINA CONSUMER CONFIDENCE
85
90
95
100
105
110
115
Even with a slowdown in the Economy China’s consumer confidence remains well above 100 and well above the 2008 crisis levels.

CHINA ADVERTISING OVERVIEW

Media: Exclude all no-cost items & Hong Kong Media
Source: CTR AdEx Power 2014-2015; iResearch 2014-2015
TOTAL MONITORED AD INVESTMENT
6
17.0%
-1.3%0.2%
-3.0%
-18.8%
-12.6% -13.2% -14.6%
4.1%
-4.8%-1.9%
-4.3%
-25%
-20%
-15%
-10%
-5%
0%
5%
10%
15%
20%
0
20,000
40,000
60,000
80,000
100,000
120,000
140,000
Jul2014
Aug Sep Oct Nov Dec Jan2015
Feb Mar Apr May Jun
Ad Investment YOY Growth
TOTAL MONITORED AD INVESTMENT (Jul 2014 - Jun 2015): RMB 1,243,336 MILLION
RMB: Million
H1 2015-7% YOY Growth
Advertising investment declines by 7% in 2015.
MONITORED SPENDING BY INDUSTRY
7
2%18%
-21%-1% 3%
-10%4%
-25%
25%
-18%-1%
-24%1% 11%
-12%
157%
-50%
0%
50%
100%
150%
200%
-
20,000
40,000
60,000
80,000
100,000
120,000
140,000
160,000
Jan-Jun 2014 Jan-Jun 2015 YOYRMB: Million
TOTAL MONITORED AD INVESTMENT BY SECTORS (Jan-Jun 2014 & 2015)
Food and drink still dominates among all categories; Pharmaceuticals keeps stable growing pace and move its place to No.2 while toiletries drops in the opposite.
Media: Exclude all no-cost items & Hong Kong Media
Source: CTR AdEx Power 2014-2015; iResearch 2014-2015

OVERALL MEDIA LANDSCAPE

39%digital
61%traditional
34%digital
66%traditional
31%digital
69%traditional
0%
10%
20%
30%
40%
50%
60%
70%
80%
90%
100%
2012 2013 2014 2015
SHARE OF TIME SPENT 2012-2015
Internet via mobile phone
Internet via others
TV
Magazine
Newspaper
Radio
29%digital
33%digital 39%
digital 42%digital67%
traditional
71%traditional
61%traditional
58%traditional
MEDIA COVERAGE BY CHANNELS
10
18% 19%
74%
59%
33%
28%
96% 95%
62%
71%
23%
58%
0%
10%
20%
30%
40%
50%
60%
70%
80%
90%
100%
2012 2013 2014 2015 Q1
MEDIA PENETRATION 2012-2015
TV
Internet via others
Newspaper
Internet via mobile phone
Magazine
Radio
+9%
+35%
Source: CMMS Summer 2013-2015Note: Internet in Share of time spent including PC and mobile internet.
Digital media continues to grow penetration at a steady pace of 9% while Mobile internet consumption sees a massive jump in penetration of 58%.

CROSS TIERS MEDIA CONSUMPTION
11
Source: CMMS Summer 2013-2015
0.2 0.2 0.2 0.2 0.1 0.2 0.2 0.2 0.2
0.5 0.5 0.4 0.4 0.4 0.3 0.4 0.4 0.3
0.1 0.1 0.1 0.0 0.0 0.0 0.1 0.1 0.1
3.0 3.0 2.82.6
2.4 2.4 2.3 2.2 2.1
1.8 2.02.0
1.11.3 1.2 1.1
1.11.0
0.30.6 0.8
0.3 0.5 0.80.4 0.6 0.8
0.0
1.0
2.0
3.0
4.0
5.0
6.0
7.0
2013 2014Tier 1
2015 2013 2014Tier 2
2015 2013 2014Tier 3
2015
TIME SPENT ON MEDIA PER DAY, BY CITY TIER 2013-2015
Internet via mobile phones
Internet via others
TV
Magazine
Newspaper
Radio
36%digital
41%digital
45%digital
30%digital
37%digital
41%digital 34%
digital37%
digital
41%digital
Tier 1 continues to consume more media while increase in Digital consumption across tiers.

2.4
1.8 1.92.0
2.1 2.3
3.0
1.4
1.4
1.82.0
1.9 1.70.7
0.8
1.0
1.3
1.3 1.1 0.9
0.3
0.0
1.0
2.0
3.0
4.0
5.0
6.0
7.0
Total population 15-19 20-24 25-29 30-34 35-39 40+
TIME SPENT ON MEDIA PER DAY, BY AGE GROUP 2015
Mobile Internet via mobile phone
Internet via others
TV
Magazine
Newspaper
Radio
MEDIA CONSUMPTION BY AGE
12
Young people continue to drive heavy digital consumption, in contrast to the 40+ age group.
Source: CMMS Summer 2015
52%digital
57%digital
56%digital
52%digital
48%digital
22%digital
42%digital

CHINA DIGITAL LANDSCAPE

TOTAL POPULATION
27.8%72.2% OF NETIZENS
URBAN RURAL
INTERNET PENETRATION6% YOY
49% OF TOTAL POPULATION668,000,000NETIZENS
594,000,000 89% OF NETIZENS
MOBILE WEBMOBILE NETIZENS 13% YOY
Nearly half the population has internet access with higher growth in mobile netizensof 13%.
Sources: National Bureau of Statistics of China Dec 2014; CNNIC July 2015
DIGITAL LANDSCAPE
1,367,820,000
14

NETIZENS GROWTH RATE
Growth rate of netizens and mobile netizens is slowing down.
Sources: CNNIC July 2011-2015
485
538
591632
668
318
388
464
527
594
15%
11%10%
7%6%
15%
22%
20%
14%13%
0%
5%
10%
15%
20%
25%
0
100
200
300
400
500
600
700
800
2011 2012 2013 2014 2015
TOTAL NETIZEN & MOBILE NETIZEN GROWTH(2011-2015)
Netizens Mobile Netizens Netizen Growth Mobile Netizen Growth
Units: Million
15

31% 32%
20% 19%
13% 12%
2% 7%8% 6%5% 5%5% 4%
11% 9%
0%
10%
20%
30%
40%
50%
60%
70%
80%
90%
100%
14-Jun 15-Jun
SHARE OF TIME SPENT
Video IM Game
Finance Social Search
E-comment Entertainment News
Others
MEDIA CONSUMPTION ON PC
-20%
-15%
-10%
-5%
0%
5%
10%
15%
0
100,000
200,000
300,000
400,000
500,000
600,000
Sear
ch IM
Vid
eo
New
s
Soci
al
E-co
mm
erce
Ente
rtai
nm
ent IT
Fin
ance
Emai
l
Life
Edu
cati
on
Gam
e
Au
to
Mar
keti
ng
Rea
lEst
ate
On
line
Rec
ruit
men
t
Trav
elin
g
BB
S
MONTHLY COVERAGE BY CATEGORY
Jun-14 Jun-15 YoY Growth
-1%
1%
Source: iUserTracker Jun 2014 & 2015, including key categories (IM) of PC software.
(‘000)
5%
16
On PC, user behavior across categories remained relatively unchanged for most categories however categories like IT and finance witness big spikes in growth.

MEDIA CONSUMPTION ON MOBILE
-20%
0%
20%
40%
60%
80%
100%
0
100,000
200,000
300,000
400,000
500,000
600,000
MONTHLY COVERAGE BY CATEGORY
Jan-15* Jun-15 Growth(Jun/Jan)
22% 24%
17% 18%
12% 8%
7% 7%5% 6%4% 5%4% 4%3% 2%
21% 20%
0%
10%
20%
30%
40%
50%
60%
70%
80%
90%
100%
Jan-15* Jun-15
SHARE OF TIME SPEND
IM Online VideoTheme Plug-in GameSearch BrowserSocial E-readingNews&Information Online ShoppingOthers
2%
Source: mUserTracker Jan & Jun 2015 (*not compare with Jun 2014 due to huge gap after panel change), search combine both APP and site.
(‘000)
1%
-4%
17
IM is the most used on Mobile and still growing. Travel witnesses massive growth in 2015
DIGITAL AD SPENDING BY FORMAT
18
27.7% 26.5% 28.5% 29.4% 30.8% 31.0% 31.1%
23.3% 27.1% 26.0% 27.9% 29.2% 29.7% 30.5%
29.4% 24.0% 21.2% 18.2% 16.2% 15.4% 14.3%
6.2% 7.2% 8.0% 8.6% 9.2% 9.7% 10.2%
13.4% 15.2% 16.3% 15.9% 14.6% 14.2% 13.9%
0%
10%
20%
30%
40%
50%
60%
70%
80%
90%
100%
2012 2013 2014 2015e 2016e 2017e 2018e
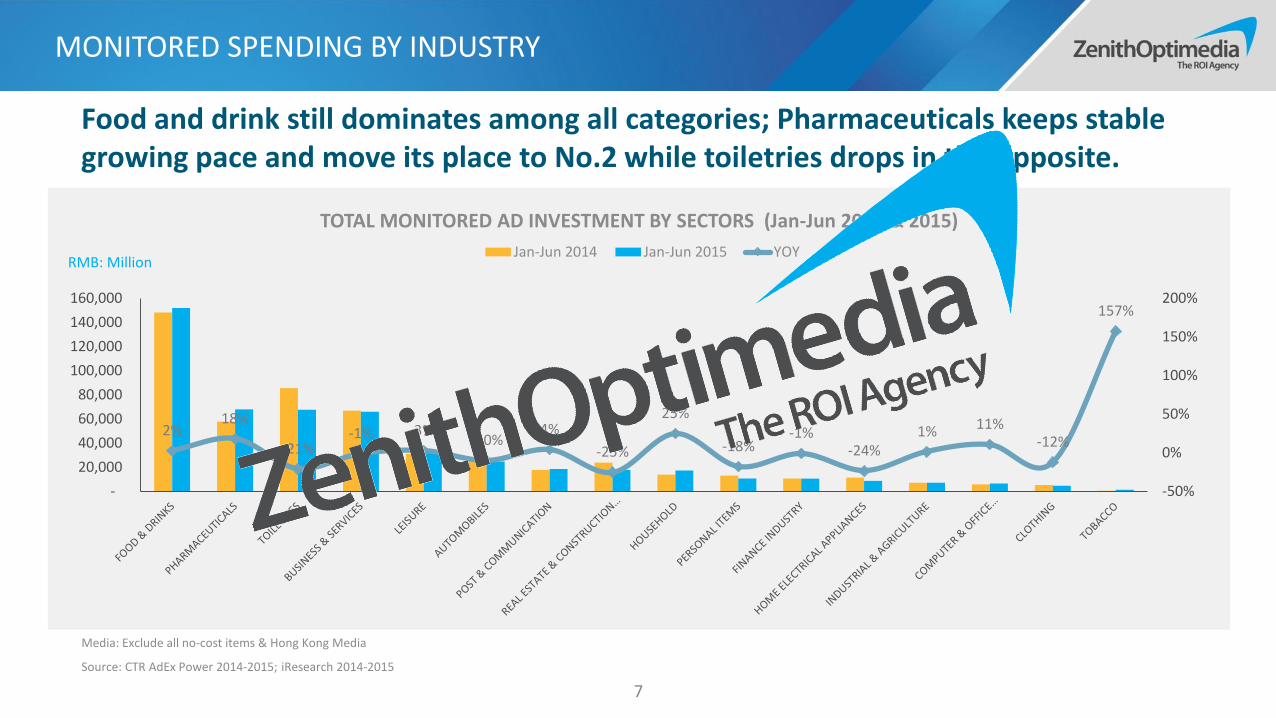
SHARE OF DIGITAL AD SPENDING IN CHINA BY FORMAT
Keyword Search EC Search & Display Display/Banner Pre-roll Others
Source: 2014 China Online Advertising Report - iResearch - May 2015 Notes: “Others” include rich media, text link, classifieds, email etc.
-3 pts.
+2 pts.
+1 pts.
Ad investments witness a slight shift from display/banner towards pre-roll and search.

INTERNET+ BOOST FASTER TRANSFORMATION
19
KEY FEATURES OF INTERNET+
Traditional companies are expected to achieve rapid transformation under the Internet+ policy, as well as internet giants struggle for further growth.
• Internet+ is a new generation of ICT (Information Communication Technology), which connect any traditional industry with internet.• It was proposed by Pony Ma (Chairman of Tencent) in NPC&CPPCC early 2015, further supported by government with action plan, and become a hot topic in China Internet Conference.
CROSS BOUNDARY跨界融合
INNOVATIVE DRIVEN创新驱动
STRUCTURAL REMODELLING重塑结构
RESPECT HUMANITY尊重人性
OPEN ENVIRONMENT开放生态
CONNECT EVERYTHING连接一切
-
1,000
2,000
3,000
4,000
5,000
6,000
INDUSTRY INVESTMENT OF KEY DIGITAL COMPANIES IN 2014
Baidu
Alibaba
Tencent
Qihoo360
Xiaomi
Source: ITJUZI.COM
WECHAT OPEN CONNECTION TO ALL
20
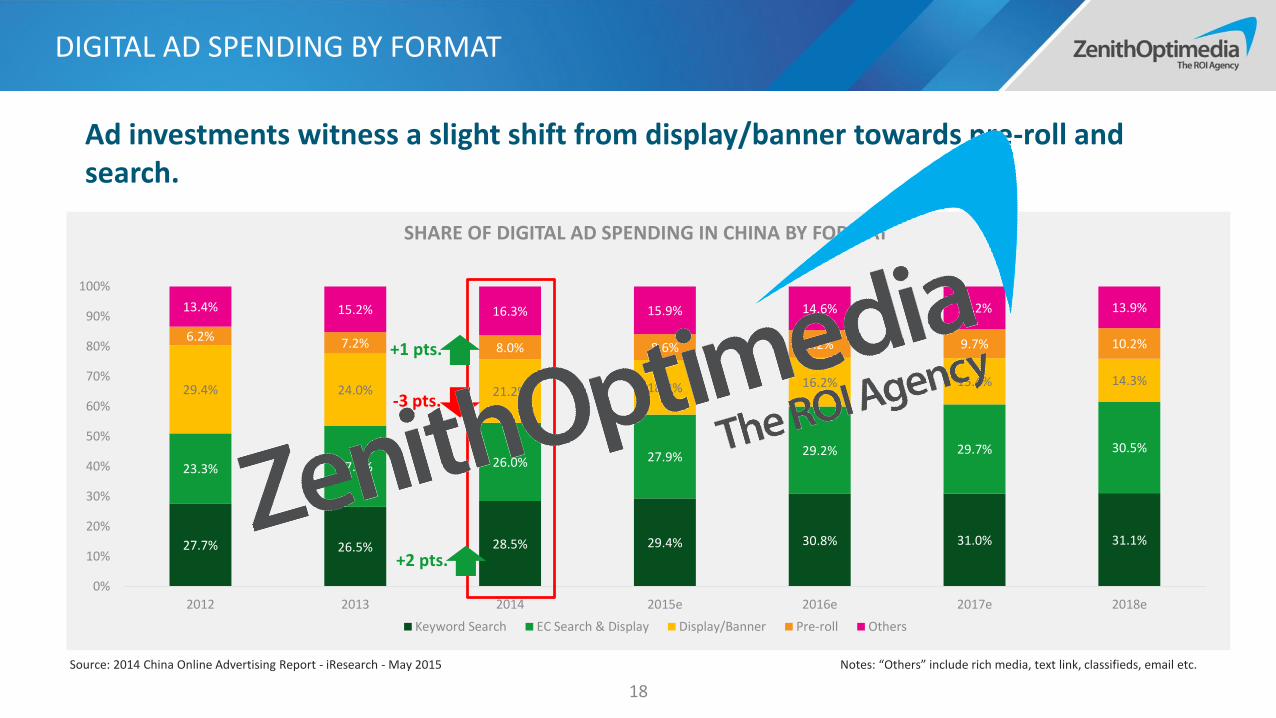
O2O CONNECTION THROUGH IBEACON ENABLED SHAKE FUNCTION
HARDWARE CONNECTION THROUGHOPEN API
PHOTO SHARING DEVICE
SPORTS TRACKING DEVICE
HEALTH TRACKING DEVICE
TOY INTERACTIVE FUNCTION
TV INTERACTIVE FUNCTION
AIR CONDITONER CONTROL

THE INTERPRETATION OF NEW ADVERTISING LAW
21
New Advertising Law
Approved on:2015.04.24Force on:2015.09.01Detailed Rules:41Added Rules:33All Rules:75
Introducing a More Detailed Regulatory FrameworkThe existing law is very short and has been widely criticized for being too vague. The amended law is almost double in length and is muchmore prescriptive. The key elements of the rules cover alcohol, health food, medicine, medical device advertising etc. For example,Drinking gestures are banned in alcohol advertising; no one is allowed to promote products of medicine and health food advertising.
Focus on Children and CelebritiesUnder the new law, children under age 10 cannot endorse products at all and celebrity endorsers can be held responsible for false claims inads. If someone makes misleading claims about the product,they will be prohibited endorsement for 3 years.
Tightening Oversight of Mass Media Advertising Release BehaviorAny advertisement published via mass media shall be marked conspicuously as "advertisement" so as to distinguish it from otherinformation and avoid misleading consumers. Radio stations and TV stations shall, when publishing advertisements, comply with theprovisions of the relevant authorities under the State Council on the length of time and means of publishing, and provide clear indicationson the length of time of advertisements.
Added a Slew of Rules Targeting Internet UsersInternet users must be able to close a pop-up ad with a single click, an EDM must contain the users real identity, including their contactdetails, and any other form of electronic direct marketing is prohibited unless the recipient has consented.
"False Advertising" DefinedThe new law clarifies the scope of "false advertising". This would include, for example, fabrication of product efficacy, or claims about aproduct/service which do not match the actual conditions and which have a substantive effect on the decision to purchase.
1
2
3
4
5

MOBILE

REACH BY DEVICE
24
Source: CNNIC Jan 2010 – Jul 2015
Units: Million
Source: MIIT Communication Operation Report, May 2015
83%80% 82%
79% 78%
71%71% 70% 70% 70% 71%
68%
35%40%
50% 49% 49%45% 46% 47%
44% 44% 43% 43%
69%72% 72% 70% 73%
72%74%
79% 81% 83%86%
89%
35% 34%
16% 16%
0%
10%
20%
30%
40%
50%
60%
70%
80%
90%
100%
INTERNET PENETRATION BY DEVICE
Desktop Laptop Mobile Phone Tablet TV
401.6
485.3466
97.3
178
0
100
200
300
400
500
600
2013 2014 2015
TOTAL 3G & 4G USERS IN CHINA
3G Users 4G Users
Mobile reach now overtakes desktop and laptop which have remained flat for sometime. Meanwhile more mobile users upgrade to high-speed 3G and 4G connections.

TIME SPENT ON MOBILE PHONE VS. OTHER DIGITAL
25
Sources: CMMS Summer 2015
1.4 1.41.8 2 1.9 1.7
0.7
0.8 1
1.31.3
1.1
0.9
0.3
0.0
0.5
1.0
1.5
2.0
2.5
3.0
3.5
Total population 15-19 20-24 25-29 30-34 35-39 40+
TIME SPENT ON MOBILE INTERNET VS. DESKTOP INTERNET
Internet via others Internet via mobile phone
36% on mobile phone
42% on
mobile phone
42% on
mobile phone
39% on
mobile phone 37% on
mobile phone35% on
mobile phone
30% on
mobile phone
Teens and college-age users are the heaviest mobile consumers, with mobile phones taking up 42% of digital consumption.

SMARTPHONE OS
26
20.1%
79.0%
0.5% 0.1% 0.3%
2015 JUNE SMARTPHONE SALES
iPhone Android Windows Blackberry Others
Source: Kantar Worldpanel Jun 2015
MEDIAN HOUSEHOLD INCOME BY OPERATING SYSTEM
Source: CMMS Summer 2015
Unit:RMB
9,060
11,081 9,807
8,331 7,992
0
2000
4000
6000
8000
10000
12000
Android iOS WindowsPhone
Blackberry Other OS
IOS continues to expand share with increasing ads investment, driven by need oftarget higher income mobile users.
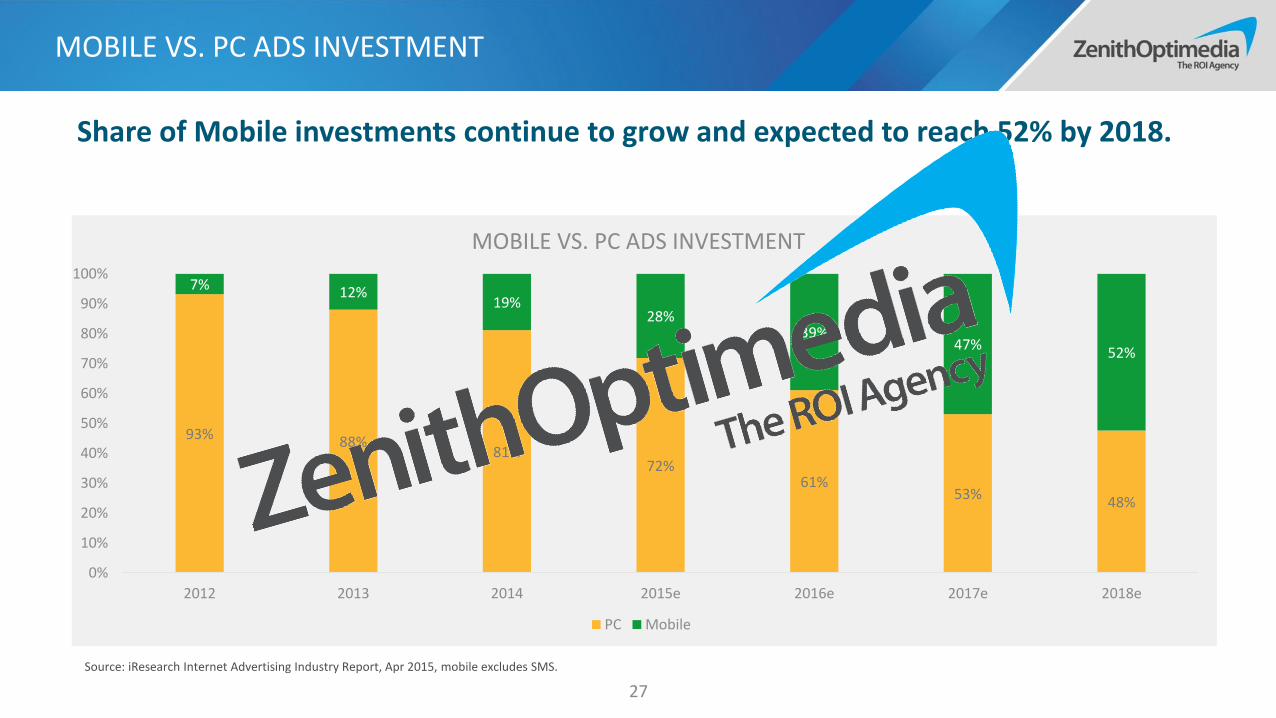
MOBILE VS. PC ADS INVESTMENT
27
93% 88%81%
72%61%
53%48%
7% 12%19%
28%39%
47%52%
0%
10%
20%
30%
40%
50%
60%
70%
80%
90%
100%
2012 2013 2014 2015e 2016e 2017e 2018e
MOBILE VS. PC ADS INVESTMENT
PC Mobile
Share of Mobile investments continue to grow and expected to reach 52% by 2018.
Source: iResearch Internet Advertising Industry Report, Apr 2015, mobile excludes SMS.
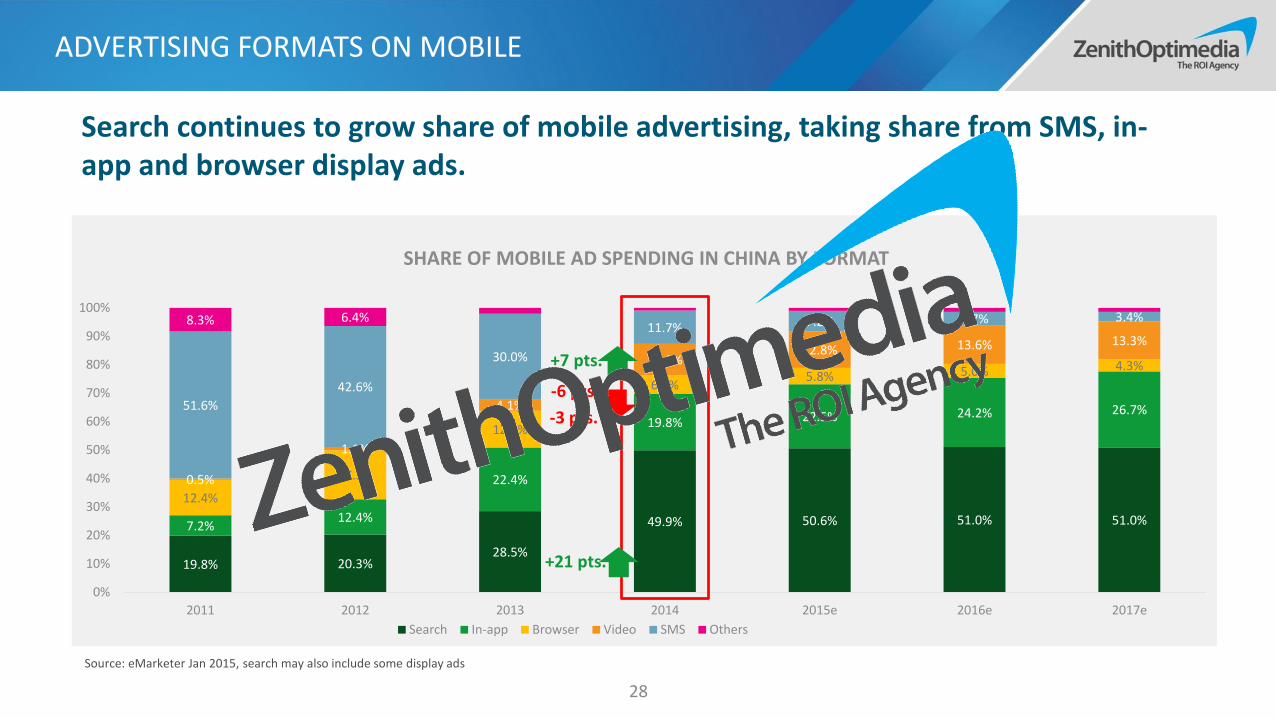
ADVERTISING FORMATS ON MOBILE
28
19.8% 20.3%28.5%
49.9% 50.6% 51.0% 51.0%7.2%12.4%
22.4%
19.8% 22.5% 24.2% 26.7%
12.4%
17.3%
12.9%
6.6%5.8% 5.0% 4.3%
0.5%
1.1%
4.1%
11.0%12.8% 13.6% 13.3%
51.6%
42.6%
30.0%
11.7% 7.2% 4.7% 3.4%8.3% 6.4%
0%
10%
20%
30%
40%
50%
60%
70%
80%
90%
100%
2011 2012 2013 2014 2015e 2016e 2017e
SHARE OF MOBILE AD SPENDING IN CHINA BY FORMAT
Search In-app Browser Video SMS Others
-3 pts.
+21 pts.
+7 pts.
-6 pts.
Source: eMarketer Jan 2015, search may also include some display ads
Search continues to grow share of mobile advertising, taking share from SMS, in-app and browser display ads.

FORMATS & CASES

DISPLAY GAMIFICATION FUNCTIONFOCUS ON STORYTELLING. USE SLIDESHOW OR
ANIMATION TO TELL THE BRAND/PRODUCT STORY OR THE MECHANISM OF A CAMPAIGN
INTEGRATE BRAND/PRODUCT INTO A MINI GAME TO BOOST ENGAGEMENT AND
SHARING
SERVE AS A LONG TERM FUNCTIONAL MOBILE PAGE, WHERE CONSUMER CAN FIND SERVICES SUCH AS E-COMMERCE.
KEY WAYS OF H5 USAGE
30

NATIVE EXPERIENCE
31
《这个陌生来电你敢接吗?》Incoming Call from Avengers
Dianping played a virtual call game from character of The Avenger 2 to promote its discounted movie tickets, which is the first widely distributed campaign using the “incoming call” interactive.
《吴亦凡即将入伍》The Unexpected Entrance of Kris Wu
Tencent game WeFire attracted consumers’ eyeball with a news-like H5 page, to broadcast rumor of celebrity Chris Wu joining army, ended with Chris jump into screen to clarify it himself.
《滴滴打车再见》The Goodbye of Didi Taxi
Didi leveraged the mobile phone interface by testing consumers to keep only one APP, and make it a teaser for its new branding campaign, claiming even the last one will be beaten by Didi.
Imitative H5 interactives tailor-made for the native environment and occasions are able to generate surprises and further drive to viral.

CONNECTED EXPERIENCE
32
Fall in Love with SummerSix God
Love MoreMercedes-Benz
Connecting two mobile phone through QR code becomes a new trend on Valentine’s Day. Utilizing the appeal of love couple, Mercedes-Benz and Six God both launched a mobile campaign by this mechanism on Chinese Valentine’s Day (Qixi). One user scan the QR code on another’s phone, then the animations in both phones will go synchronous.
Multi-screen interactives now able to transform and cater to varied viewer type with experiences that connect them to real people offline.
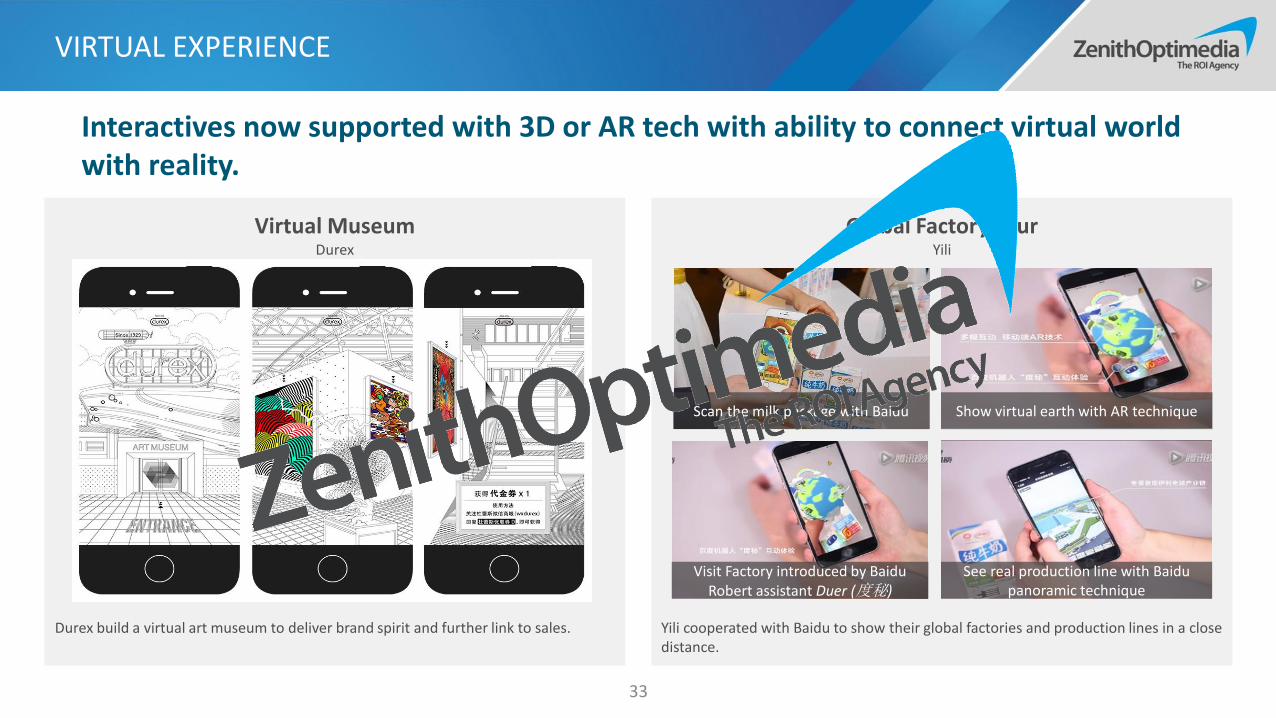
VIRTUAL EXPERIENCE
33
Yili cooperated with Baidu to show their global factories and production lines in a close distance.
Scan the milk package with Baidu Show virtual earth with AR technique
Visit Factory introduced by Baidu Robert assistant Duer (度秘)
See real production line with Baidu panoramic technique
Durex build a virtual art museum to deliver brand spirit and further link to sales.
Interactives now supported with 3D or AR tech with ability to connect virtual world with reality.
Global Factory TourYili
Virtual MuseumDurex

34
Mobile is quickly becoming the devise for convergence between online and offline. The growth of mobile will be further boosted by the government's new Internet + Policy.1.
When creating H5 interactives, keep in consideration the environment and the purchase journey stage the consumers might be in. Native format help build up relevance and enhance creative effectiveness.
2.
Make good use of technology to deliver greater brand experience however make sure it is aimed at achieving business objective.3.
VIEWPOINT ON MOBILE
Use mobile to deliver greater brand experience however do not compromise on reach.4.

TV & OTV
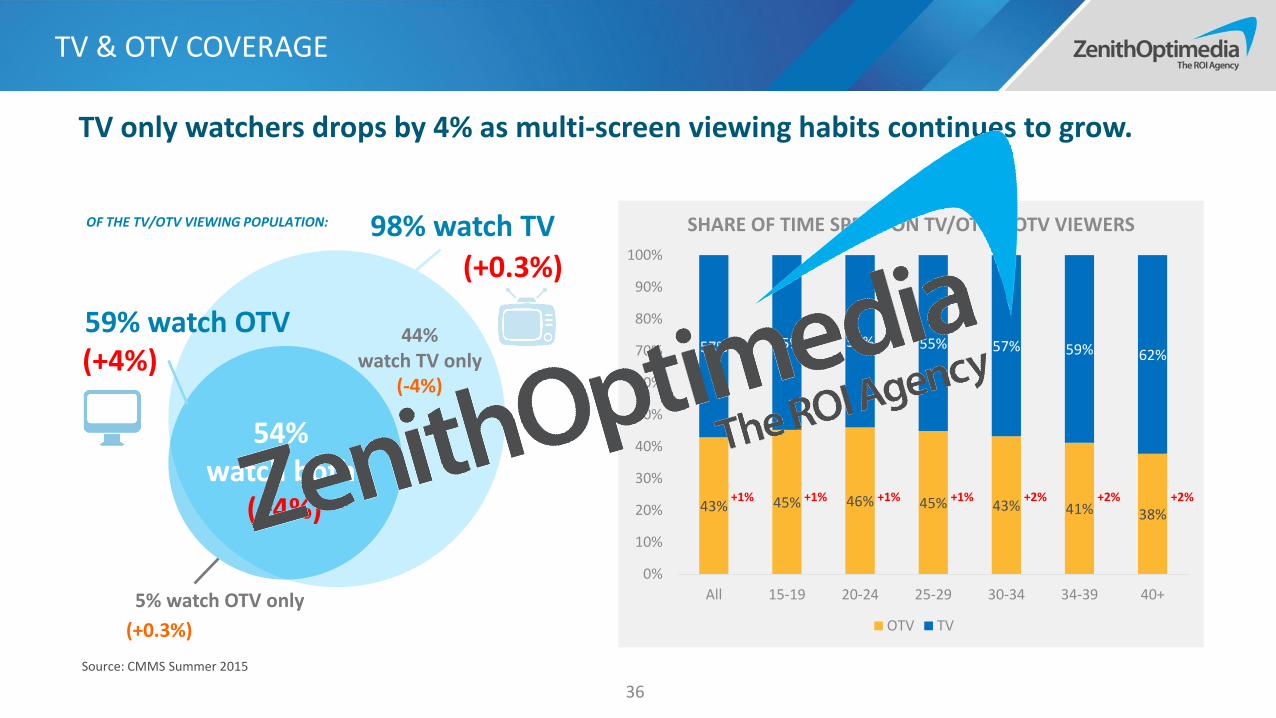
Source: CMMS Summer 2015
59% watch OTV
98% watch TV
54% watch both
5% watch OTV only
OF THE TV/OTV VIEWING POPULATION:
44% watch TV only
(+4%)
(-4%)
(+0.3%)
(+0.3%)
(+4%)
43% 45% 46% 45% 43% 41% 38%
57% 55% 54% 55% 57% 59% 62%
0%
10%
20%
30%
40%
50%
60%
70%
80%
90%
100%
All 15-19 20-24 25-29 30-34 34-39 40+
SHARE OF TIME SPENT ON TV/OTV – OTV VIEWERS
OTV TV
+1% +1% +1% +1% +2% +2% +2%
TV & OTV COVERAGE
36
TV only watchers drops by 4% as multi-screen viewing habits continues to grow.
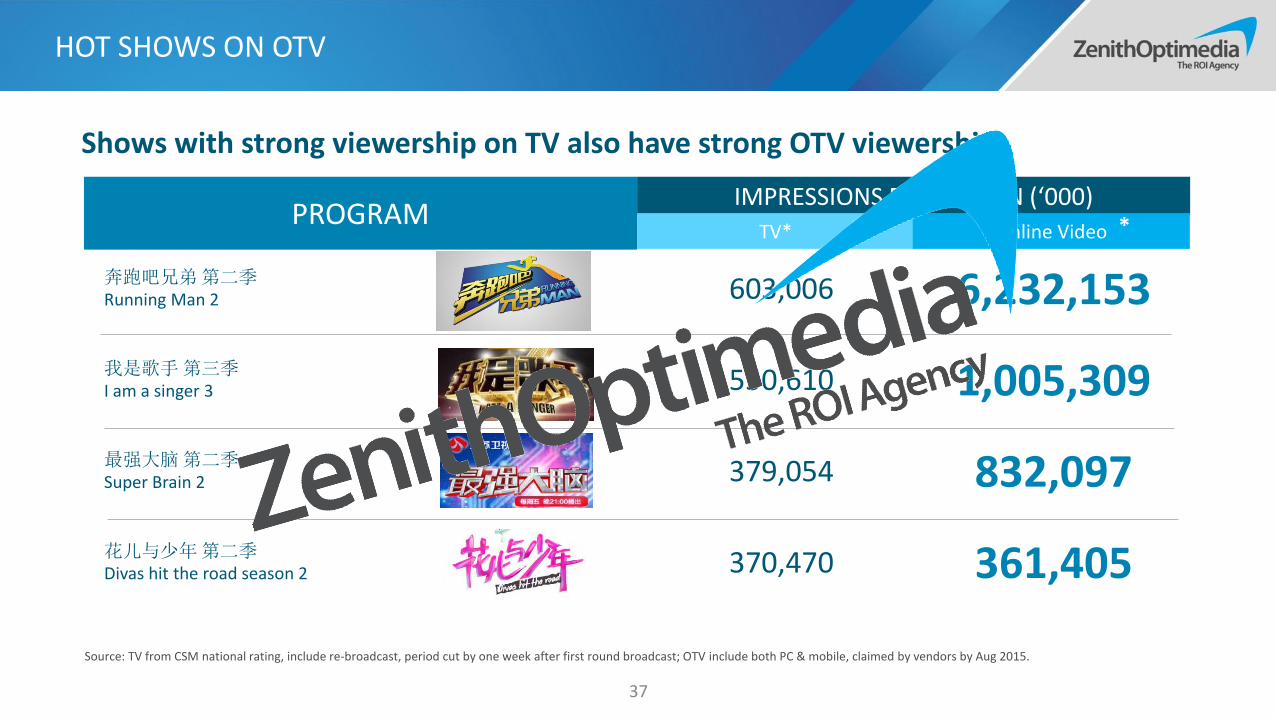
HOT SHOWS ON OTV
37
Source: TV from CSM national rating, include re-broadcast, period cut by one week after first round broadcast; OTV include both PC & mobile, claimed by vendors by Aug 2015.
Impression per episode('000)
TV* OTV
奔跑吧兄弟第二季Running Man 2 603,006 6,232,153
我是歌手第三季I am a singer 3 550,610 1,005,309
最强大脑第二季Super Brain 2 379,054 832,097
花儿与少年第二季Divas hit the road season 2 370,470 361,405
PROGRAMIMPRESSIONS PER SEASON (‘000)
TV* Online Video *
Shows with strong viewership on TV also have strong OTV viewership.

MORE TV STATION JOIN OTV BATTLE
38
Following Hunan PSTV, Zhejiang PSTV also officially launched their own online broadcast platform “China Blue TV” (CZTV.com).
Highly associated with The Voice of China
“China Blue TV” search index:Peak always happen on VOC S4 broadcast day
Same trend for website traffic even from S3 before the official launchPV UV

TV & OTV INTEGRATION
39
HALF HOUR DAILY CLIPS ON TV
24H/7D LIVE BROADCAST
BULLETS SCREEN
REAL TIME CHATTING
360 DEGREE PANORAMA VIEW
Tencent launched a long term survival challenge reality show, which was promoted across multi-platform.
ALWAYS ON ONLINE
FOLLOW & DISCUSS
CUSTORMIZED APP
VOTE & CHEER

TV
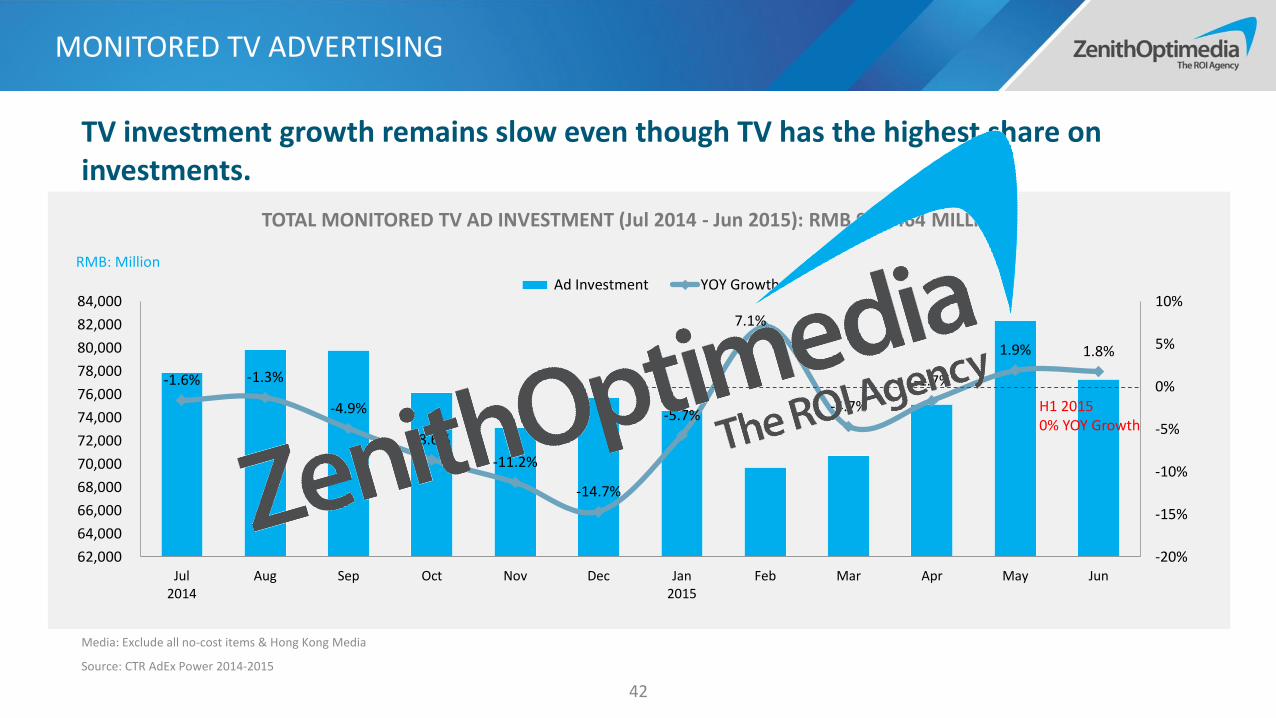
MONITORED TV ADVERTISING
42
RMB: Million
TOTAL MONITORED TV AD INVESTMENT (Jul 2014 - Jun 2015): RMB 912,464 MILLION
-1.6% -1.3%
-4.9%
-8.6%
-11.2%
-14.7%
-5.7%
7.1%
-4.7%
-1.7%
1.9% 1.8%
-20%
-15%
-10%
-5%
0%
5%
10%
62,000
64,000
66,000
68,000
70,000
72,000
74,000
76,000
78,000
80,000
82,000
84,000
Jul2014
Aug Sep Oct Nov Dec Jan2015
Feb Mar Apr May Jun
Ad Investment YOY Growth
H1 20150% YOY Growth
Media: Exclude all no-cost items & Hong Kong Media
Source: CTR AdEx Power 2014-2015
TV investment growth remains slow even though TV has the highest share on investments.

PRIME TIME TV AD INVESTMENT
43
RMB: Million
TOTAL MONITORED TV IN PRIME TIME (17:00-24:00)AD INVESTMENT (Jul.2014-Jun.2015): RMB 597,775 MILLION
3.1%3.9%
0.7%
-2.9%
-6.8%
-9.0%
-5.0%
7.8%
-8.4%
-5.4%
-1.7%-2.9%
-10%
-8%
-6%
-4%
-2%
0%
2%
4%
6%
8%
10%
0
10,000
20,000
30,000
40,000
50,000
60,000
Jul2014
Aug Sep Oct Nov Dec Jan2015
Feb Mar Apr May Jun
Ad Investment YOY Growth
H1 2015-3% YOY Growth
Media: Exclude all no-cost items & Hong Kong Media
Source: CTR AdEx Power 2014-2015
Prime time investments are similar across months. H1 2015 sees a slight decrease in the average investment.

TV AD INVESTMENT BY CATEGORY
44
RMB: Million
TV MONITORED AD INVESTMENT BY SECTORS (Jan-Jun 2014 & 2015)
19%0%
13%
-23%
1% 4%-10% -13%
29%10%
-15%
29%
-22% -26% -25%
-4%13% 14%
-12% -11%
179%
-50%
0%
50%
100%
150%
200%
0
10,000
20,000
30,000
40,000
50,000
60,000
70,000
80,000
Jan-Jun 2014 Jan-Jun 2015 YOY Growth
Media: Exclude all no-cost items & Hong Kong Media
Source: CTR AdEx Power 2014-2015
Pharmaceuticals continue to strengthen investments on TV, while massive -23% drop for toiletries.

AHTV CONDUCTED THE LARGEST REVISION IN 18 YEARS ON JULY 2015
45
Data Source:Infosys 2013/1/1-2015/6/6;1800-2330; Target:P20-45 ;cities group
1.41.5
1.81.7 1.6
1.5
1.41.2
1.31.2
1
1.2
1.4
1.6
1.8
2
2.2
2013Q1
2013Q2
2014Q1
2014Q2
2014Q1
2014Q2
2015Q1
2015Q2
2015Q1
2015Q2
2013-2015 part of STV’s market share
AHTV Shandong STV Dragon STV Beijing STV
Market share%
Mon Tue Wed Thu Fri Sat Sun
19:30 The first dolphin theatre (1)
20:30 The first dolphin theatre (2)
21:20Ten years younger
Super Clinic supernannyThe end of the world into boys and girls
Super idol /Law of the
jungle
Good luck belongs to
you
How the Super
scholar Was Tempered
22:00Good luck Best choice BABY GO I love the peach garden
22:30Chinese farmers song
Super idol replay23:00
Beautiful reinforcem
ent
The masters of cooking
Distance-close
Distance-close
Mon Tue Wed Thu Fri Sat Sun
19:33 The first dolphin theatre (1)
20:30 The first dolphin theatre (2)
21:20Ten years younger
BABY GOMythBuster
s
The SurvivalDistance-
close
Super Speaker
To find you
22:00 Starlight dolphin theatre (1) Starlight dolphin theatre (1)
22:55
Starlight dolphin theatre (2)Starlight dolphin theatre
(2)23:05Starlight dolphin theatre
(1)
AHTV shifted focus from dramas and introduced 15 big ticket programs.
Original arrangement New arrangement
剧集时长 综艺时长 其他 剧集时长 综艺时长 其他 剧集时长 综艺时长 其他
Different type of programs of AHTV broadcast time percentage during 1930-2345
Before: the drama broadcast time percentage is about 70%
After: the variety broadcast time percentage is about 50%
Before “One Drama, Two Satellites” issued
After “One Drama, Two Satellites” issued
After revision
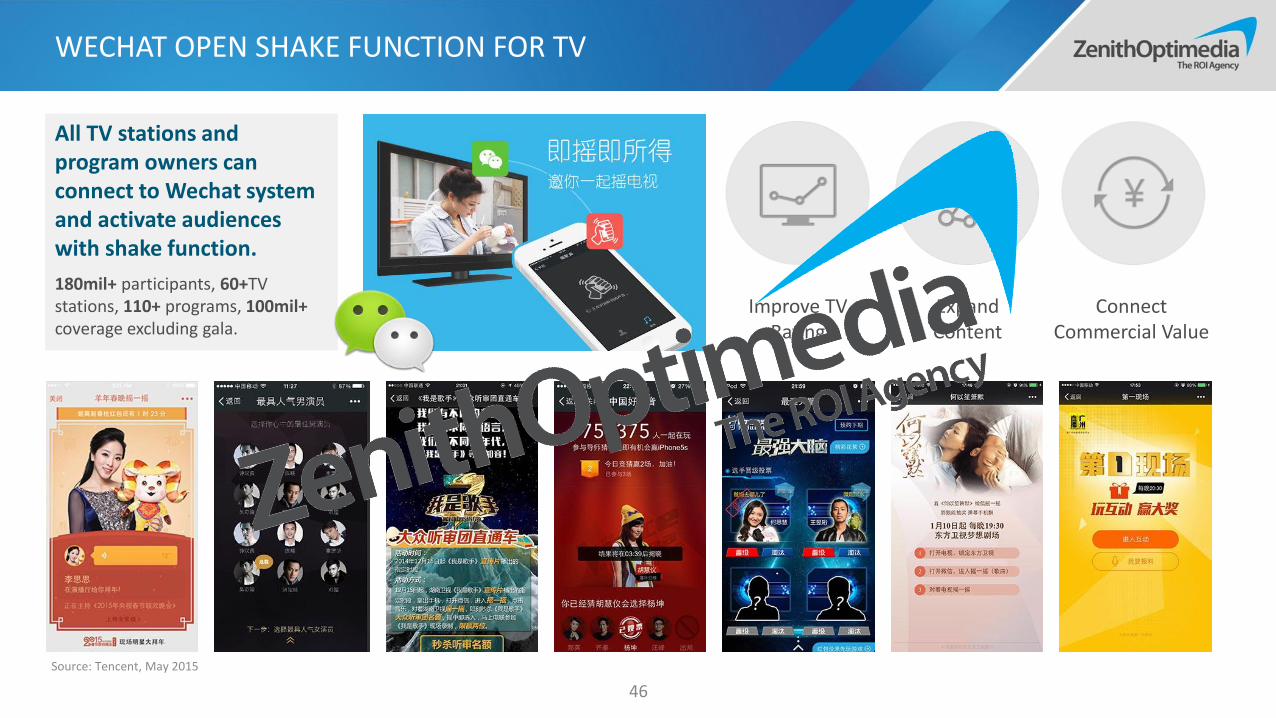
All TV stations and program owners can connect to Wechat system and activate audiences with shake function.
WECHAT OPEN SHAKE FUNCTION FOR TV
46
Improve TV Rating
Expand Content
Connect Commercial Value
180mil+ participants, 60+TV stations, 110+ programs, 100mil+ coverage excluding gala.
Source: Tencent, May 2015

3RD PARTY PROVIDERS HELP TO BUILD BETTER CONNECTION
47
TV LINK: TV CONTENT MOBILIZATION TV WATCH: LIVE TV INTERACTIVE
3rd party platform (e.g. TVM) also provide interactive service to connect mobile consumers with TV stations/programs through or throughout Wechat.
TV Studio
TVM system
Connect through mobile
Mobile Users

OTV

461MILLION USERS
69%* REACHAMONG ALL NETIZENS
8 DAYS PER MONTH
52 MINUTESPER USAGE DAY
PC MOBILE
63% REACH AMONG ALL NETIZENS
13 DAYS PER MONTH
43 MINUTESPER USAGE DAY
ONLINE VIDEO OVERVIEW
50
Source: Total netizen number from CNNIC, PC & Mobile reach number (based on CNNIC netizen), days and time spent from iUserTracker & mUserTracker Jun 2015;* PC reach has been adjusted to align with CNNIC penetration limit.

MEDIA SHARE OF TIME SPENT ON PC AND MOBILE
TIME SPENT BY VIDEO PLATFORM
51
PC
2%
+2%
-5%-2%
Source: iUserTracker & mUserTracker Jun 2014 & 2015, PC exclude software
+1%
4%
20%
19%
11%11%
8%
6%
4%
4%
3%2%
12%
iQiyi
Youku
LeTV
Sohu
PPTV
Tudou
iMangoTV
Tencent
Xunlei
CNTV
Others
PC viewership remained comparatively more stable than mobile, Youku’s leads however share slight decline with the growth of IQIYI.
Mobile Jun-2015Desk Jun-2015
30%
27%
16%
8%
6%
5%
5% 2%Youku
iQiyi
Tencent
PPS
Sohu
PPTV
Tudou
LeTV
Funshion
Others
-2%
+7%
MOBILE

Source: Claimed Publisher Data
VIDEO VIEWS BY DEVICE
52
Viewer prefer tablets and phone for online video especially when logged on to Tencent, Youku&Tudou video platforms.
20%30%
45% 46% 51% 54% 54% 55%67%
73% 55%
46% 48% 38%39% 36%
27%
26%
7%16%
9% 7% 12% 7% 10%18%
7%
0%
10%
20%
30%
40%
50%
60%
70%
80%
90%
100%
Tencent Youku&Tudou PPTV MangoTV iQiyi&PPS LeTV Sohu Video Baofeng Funshion
VIDEO VIEW % BY DEVICE
PC PHONE TABLET

ONLINE VIDEO ADVERTISING REVENUE
53
Source: iResearch Yearly Data Release 2014 – Online Video
0.2 0.5 3.27.3
13.5
21.9
31.8
6.59.3
12.0
15.6
18.8
20.8
22.3
3%
5%
21%
32%
42%
51%
59%
0%
10%
20%
30%
40%
50%
60%
70%
0
10
20
30
40
50
60
2012 2013 2014 2015e 2016e 2017e 2018e
2012-2017 ADVERTISING REVENUE FOR ONLINE VIDEO (MOBILE & PC)
Mobile Advertising Non-Mobile Advertising % of All OTV Advertising
RMB: Billion
Mobile video share of revenue grows massively from 21% to 32% in 2015.

YOUKU & TUDOU’S CHANGE OF STRATEGY FOCUS
PGC + UGC MORE THAN 10 MIL CHANNELS
MORE THAN 10 BIL INVESTMENT
“The end of pure video media,
evolution from a video platform,
to an entertainment eco-system”
Fan & Fun Integrated Content Marketing
IP focused
Innovative
Interactive
Integrated
I4 1. SHOW 2. FAN 3. CULTURE 4. JOURNEY
1. Eyeballs眼球经济
2. Fan Economy粉丝经济
3. Vertical Marketing 垂直人群
4. SocialHot Topics 社会话题
54

LETV: MULTIPLE SPORTS PPTV: LFP TENCENT: NBA IQIYI: CHINA OPEN
THE CONTENT COMPETITION EXPAND TO SPORTS PROGRAM
55
With the content competition turning red-hot, and release of sports strategy from government, video platforms are expanding their battlefield to sports area.
500 mil: exclusive online broadcast
right for NBA in next 5 years
250 mil EURO: exclusive online
broadcast right for LFP in next 5 years
Exclusive online broadcast right for China Open from Oct 2015-2018
Get broadcast right for 120+ sports
competitions in past 2 years.

FORMATS & CASES

PRODUCT PLACEMENT THROUGH
HOLOGRAPHIC PROJECTION
POST-PRODUCTION CONTENT PLACEMENT
57
PRODUCT PLACEMENT THROUGH
MAGIC POST
New technology allows brands to do product placement in online programs after production.
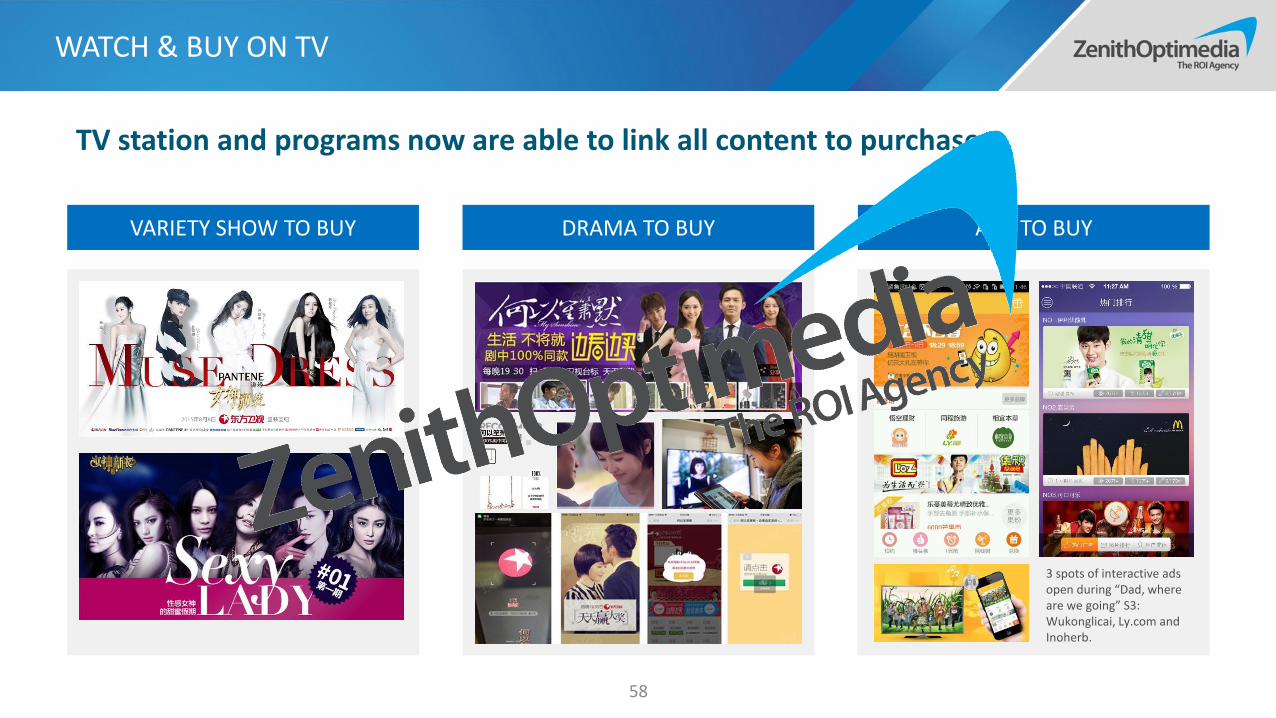
WATCH & BUY ON TV
58
VARIETY SHOW TO BUY DRAMA TO BUY ADS TO BUY
TV station and programs now are able to link all content to purchase.
3 spots of interactive ads open during “Dad, where are we going” S3: Wukonglicai, Ly.com and Inoherb.

59
Purchase function are placed on relevant video content, for higher noticeability and conversion.
ORIGINAL COOPERATION CELEBRITY COOPERATION CATEGORY PRODUCT CO-OP
Note: coming soon in iQiyi
WATCH & BUY IN OTV
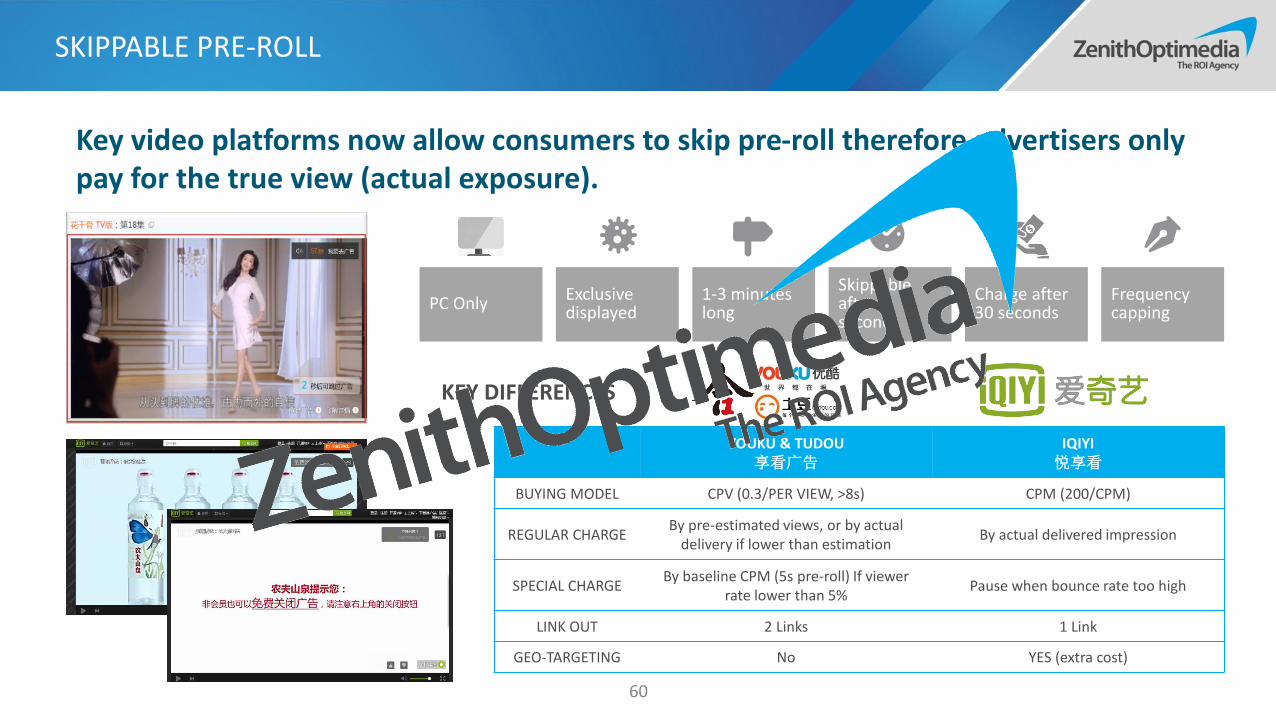
SKIPPABLE PRE-ROLL
60
Key video platforms now allow consumers to skip pre-roll therefore advertisers only pay for the true view (actual exposure).
YOUKU & TUDOU享看广告
IQIYI悦享看
BUYING MODEL CPV (0.3/PER VIEW, >8s) CPM (200/CPM)
REGULAR CHARGEBy pre-estimated views, or by actual
delivery if lower than estimationBy actual delivered impression
SPECIAL CHARGEBy baseline CPM (5s pre-roll) If viewer
rate lower than 5%Pause when bounce rate too high
LINK OUT 2 Links 1 Link
GEO-TARGETING No YES (extra cost)
Exclusive displayed
1-3 minutes long
Skippable after 5 seconds
Charge after 30 seconds
Frequency cappingPC Only
KEY DIFFERENCES
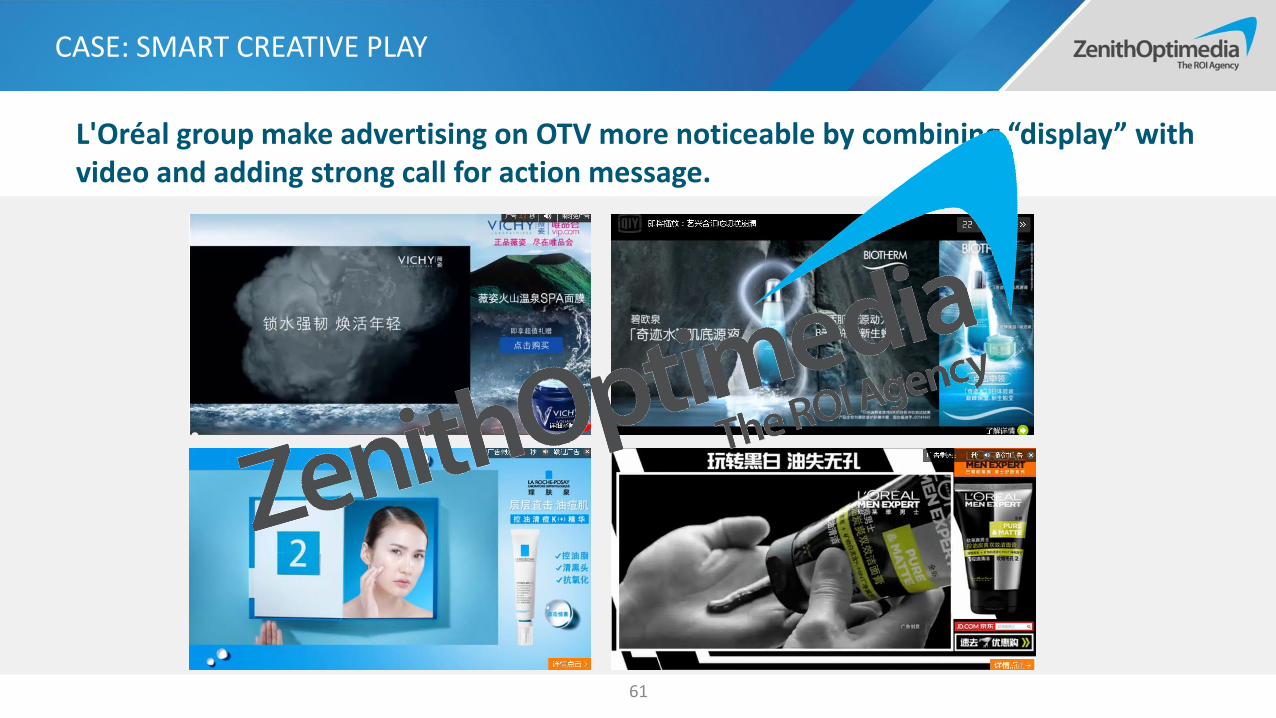
CASE: SMART CREATIVE PLAY
61
L'Oréal group make advertising on OTV more noticeable by combining “display” with video and adding strong call for action message.

DRAMA VARIETY SHOW
CASE: RIO’S OCCASION CONTENT PLACEMENT
62
From popular drama My Sunshine to hot variety show Running Man, RIO invests on a series of content placement as the look to build strong association with friends gathering.
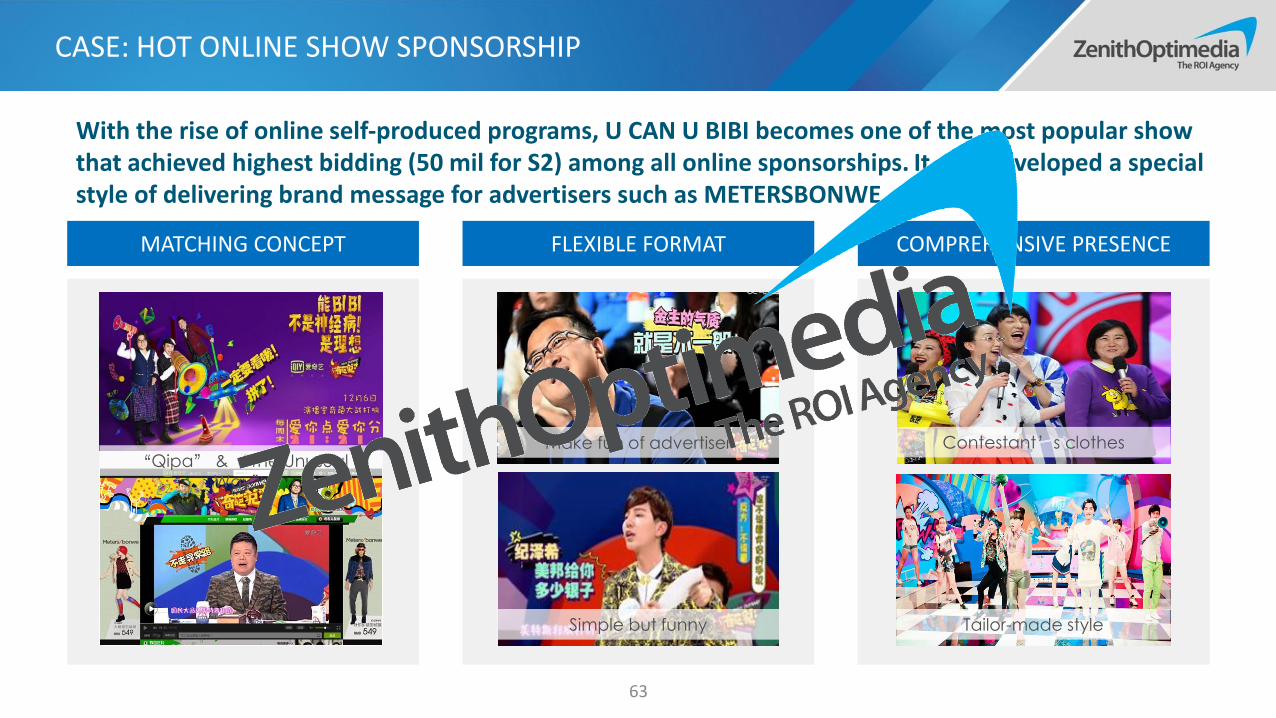
CASE: HOT ONLINE SHOW SPONSORSHIP
63
i
MATCHING CONCEPT FLEXIBLE FORMAT COMPREHENSIVE PRESENCE
Make fun of advertiser
Simple but funny Tailor-made style
Contestant’s clothes“Qipa” & “The Unusual
Way”
With the rise of online self-produced programs, U CAN U BIBI becomes one of the most popular show that achieved highest bidding (50 mil for S2) among all online sponsorships. It also developed a special style of delivering brand message for advertisers such as METERSBONWE.

CASE: MENGNIU FIRST AD FOR FIRST DAY
64
Teaser - Raise Curiosity5 Weibo posted by Deluxe during 5 days before new year to warm up for the new release, get 64k forwards, 12.7k comments
Warm up - Create Hot Topic Media and KOL joined the discussion, achieved 90 mil coverage, 61.6k forwards and 15.4k comments
Tipping Point - Interactive Live Topic + First Ad ReleaseHost invited audience to guess and count down for the new year, together with first 90s TVC release, which delivered the brand value of “better 2015” at the most relevant moment.
Mengniu associated with Hunan PSTV for their New Year celebration live broadcast. The brand welcomed the first day of 2015 with their new ad which gained massive attention. At the same time it created interactive on social supported by impact display cross big digital platforms

65
To build brand association with content look to go beyond single devise consider TV and OTV ( PC +Mobile). Try to leverage all elements of the content such as celebrity, fans, events etc.
1.
Consider post-production opportunities if budget doesn’t allow for in program integration, however all initiatives should always connect and drive to brand platforms.2.
Test True View pre-roll, compare visits and actual conversion per reach point for regular vs True View pre-roll.3.
Look to collaborate with online PGC & UGC program opportunities to increase interaction and deliver brand experience in a native environment.4.
VIEWPOINT ON VIDEO & OTV

SOCIAL
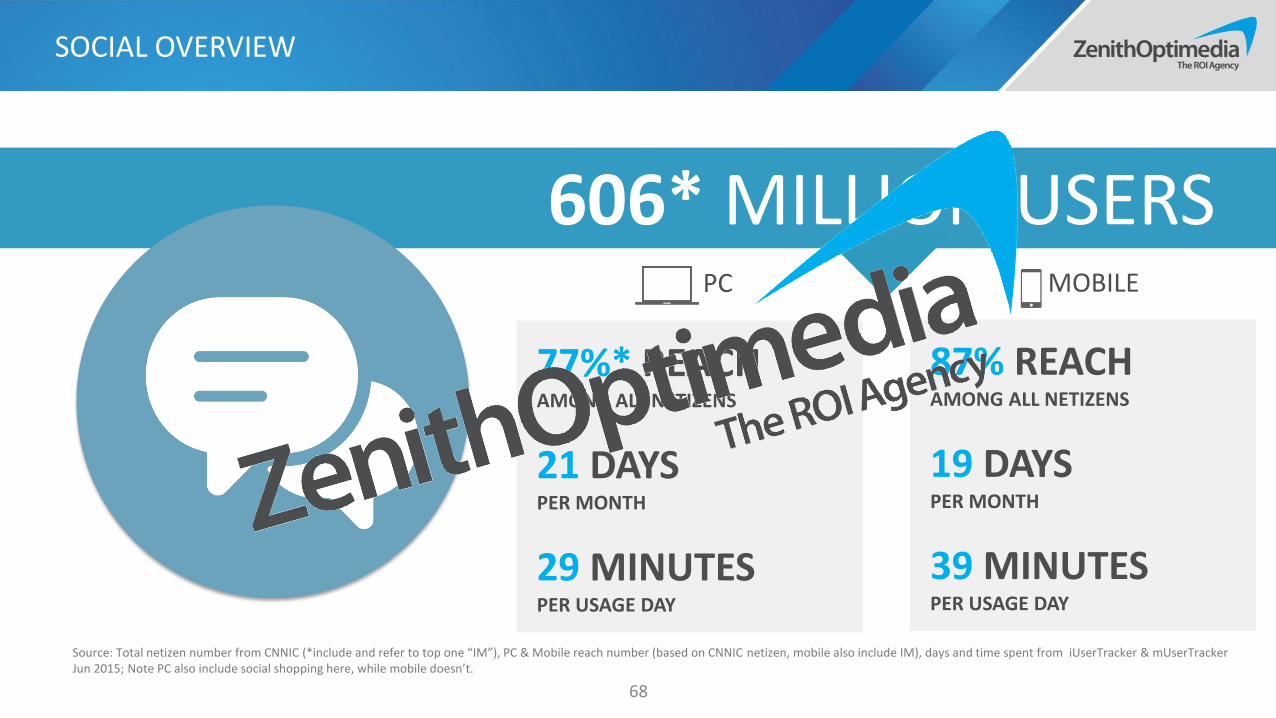
606* MILLION USERS
77%* REACHAMONG ALL NETIZENS
21 DAYS PER MONTH
29 MINUTESPER USAGE DAY
PC MOBILE
87% REACHAMONG ALL NETIZENS
19 DAYS PER MONTH
39 MINUTESPER USAGE DAY
SOCIAL OVERVIEW
68
Source: Total netizen number from CNNIC (*include and refer to top one “IM”), PC & Mobile reach number (based on CNNIC netizen, mobile also include IM), days and time spent from iUserTracker & mUserTrackerJun 2015; Note PC also include social shopping here, while mobile doesn’t.
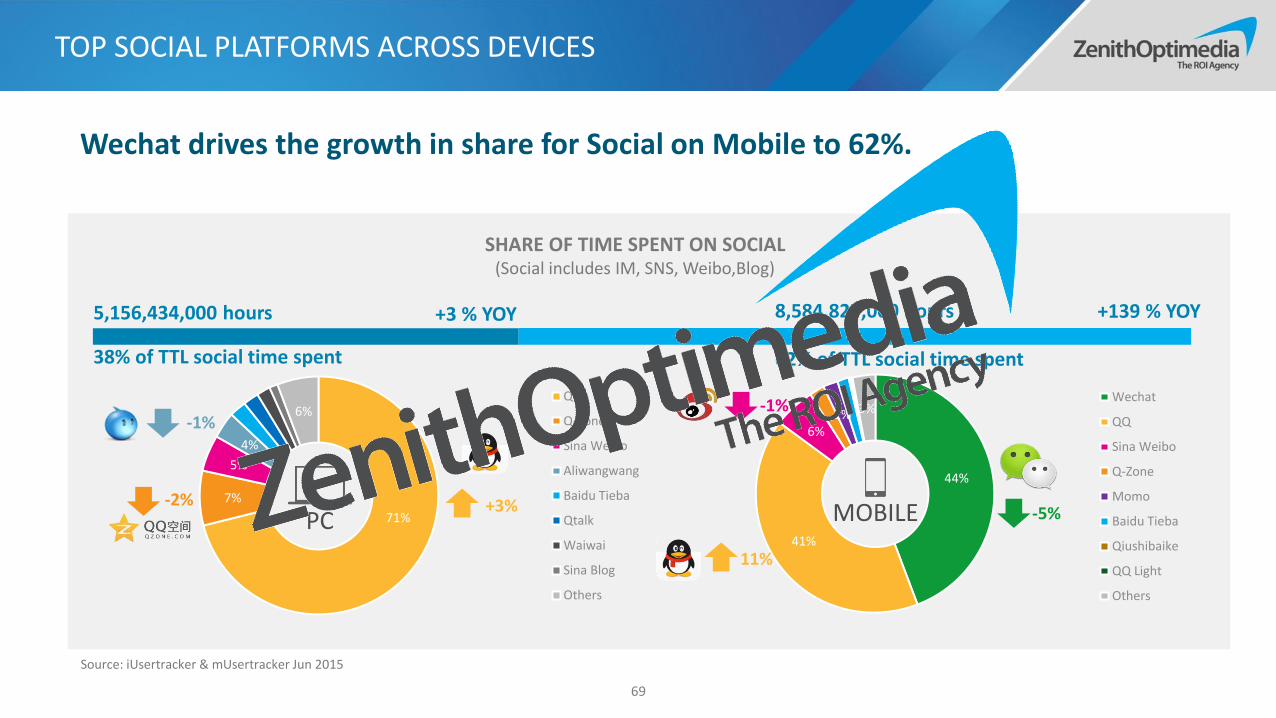
71%
7%
5%
4%
6%QQ
Q-Zone
Sina Weibo
Aliwangwang
Baidu Tieba
Qtalk
Waiwai
Sina Blog
Others
44%
41%
6%2% 3%
Sina Weibo
Q-Zone
Momo
Baidu Tieba
Qiushibaike
QQ Light
Others
11%
-5%
-1%
5,156,434,000 hours
38% of TTL social time spent
+3 % YOY 8,584,827,000 hours
62% of TTL social time spent
+139 % YOY
+3%-2%
-1%
TOP SOCIAL PLATFORMS ACROSS DEVICES
69
Source: iUsertracker & mUsertracker Jun 2015
SHARE OF TIME SPENT ON SOCIAL(Social includes IM, SNS, Weibo,Blog)
PC MOBILE
Wechat drives the growth in share for Social on Mobile to 62%.
MONTHLY REACH OF TOP PROGRAMS
70
0%
10%
20%
30%
40%
50%
60%
70%
80%
90%
100%
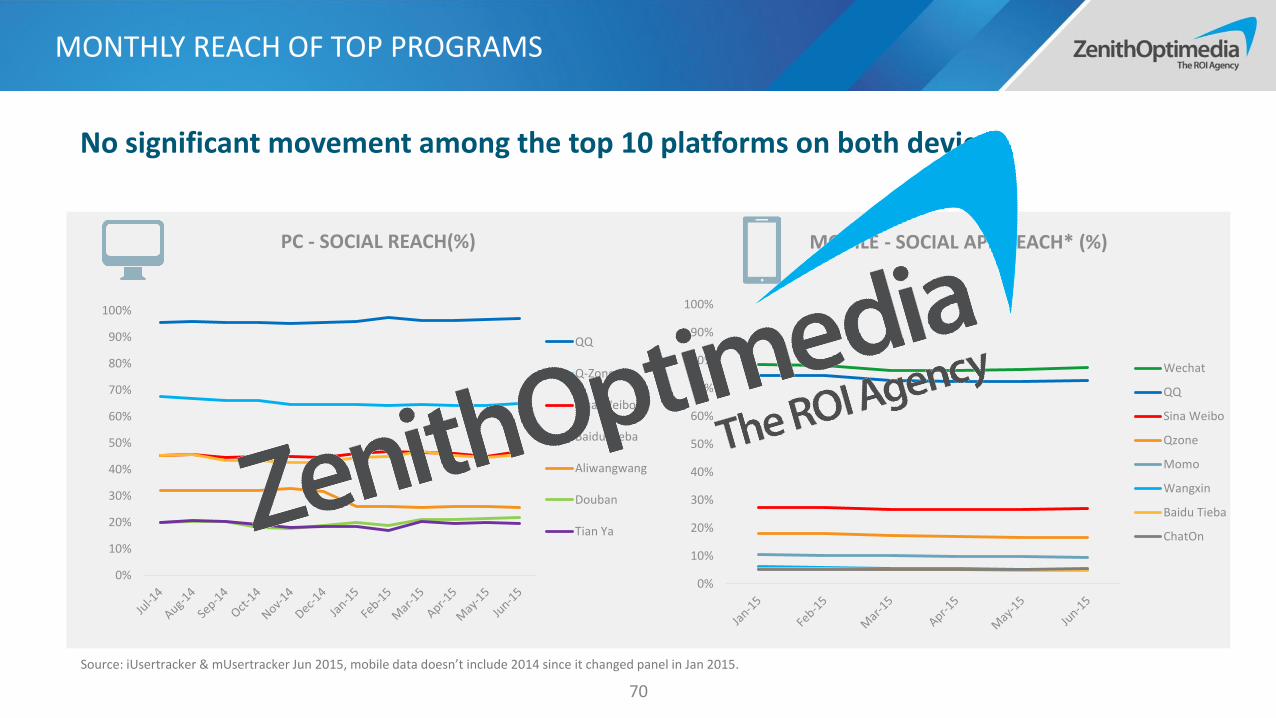
PC - SOCIAL REACH(%)
Q-Zone
Sina Weibo
Baidu Tieba
Aliwangwang
Douban
Tian Ya
Source: iUsertracker & mUsertracker Jun 2015, mobile data doesn’t include 2014 since it changed panel in Jan 2015.
0%
10%
20%
30%
40%
50%
60%
70%
80%
90%
100%
MOBILE - SOCIAL APP REACH* (%)
Sina Weibo
Qzone
Momo
Wangxin
Baidu Tieba
ChatOn
No significant movement among the top 10 platforms on both devices.

VERTICAL SOCIAL APPS
71
Q&A SOCIAL PICTURE SOCIAL SPORTS SOCIAL MOM SOCIAL CAREER SOCIAL
Vertical platforms driven by diverse consumer needs and interests.
-
1,000
2,000
3,000
Jan
-15
Feb
-15
Mar
-15
Ap
r-1
5
May
-15
Jun
-15
Jul-
15
Monthly Coverage (K'000)
3,000
3,500
4,000
4,500
Jan
-15
Feb
-15
Mar
-15
Ap
r-1
5
May
-15
Jun
-15
Jul-
15
Monthly Coverage (K'000)
2,600 2,800 3,000 3,200 3,400
Jan
-15
Feb
-15
Mar
-15
Ap
r-1
5
May
-15
Jun
-15
Jul-
15
Monthly Coverage (K'000)
- 500
1,000 1,500 2,000
Jan
-15
Feb
-15
Mar
-15
Ap
r-1
5
May
-15
Jun
-15
Jul-
15
Monthly Coverage (K'000)
-
200
400
600
Monthly Coverage (K'000)

FORMATS & CASES

WECHAT OPEN MOMENT ADS SYSTEM TO ALL
73
1 2
3
4
5
AVATAR + NAME PROMOTION TAG
LINK TO DETAILS
PICTURES (9 MAX)
LIKE / COMMENT
EXPOSE TO HIGH ACTIVE USERS
EXPOSE TO MORE OF THEIR FRIENDS IF THEY INTERACTIVE WITH THE ADS
DATA ANALYSIS FROM WECHAT
ADS ENGINE FEEDS
4+
FOR ADS TO BE DELIVERED
POSITION
5th
AFTER THE 4+ FEEDS
TIME SPAN
6H
WITHOUT INTERACTIVE
RESERVED
7D
& ONE AD TO ONE PERSON IN 48H
VIEWABLE
100%
ADS SHOWN IN THE SCREEN
EXPOSURE
3WAYS
FEEDS, DETAILED PAGE, SHARE OUT
PROTECT
10MINS
CHARGE ONCE FOR FEED ADS*
PROTECT
4MAX
CHARGE TIMES WITHIN 7 DAYS
FORMAT MECHANICS EXPOSURE
COST
40 CPM WITHOUT GEO-TARGETING140 CPM FOR BJ&SH TARGETING90 CPM FOR OTHER KEY CITY TARGETING1.1X FOR GENDER TARGETING1.2X FOR LINK TO DETAILS

NATIVE WECHAT EXPERIENCE
74
The movie “Tiny Time” are promoted through series of fake Wechat dialogues posted by actors and actress. Users are also invited to check more details after sending out a default message.
L’Oreal Paris promote Cannes campaign by creating a fake moment page, in which celebrities are posting latest content in Cannes Film Festival, and consumers can also like or type in comment, exactly like how they do in the real moment.
《时代姐妹花,邀你来撕逼》The Invitation of Tiny Time
《戛纳明星朋友圈》The Moment of Celebrities in Cannes
Brand look to deliver stronger brand experience with native advertising on Wechat.

CASE: CHANDO DELIVERS DIFFERENT MESSAGES TO DIFFERENT GROUPS
75
Moments Ads Three different versions of landing pageVivian Xu’s “private”
moment page
To leverage the current hot topic ‘sleepless new moms’, Chando utilized its spokesperson Vivian Xu and launched a Wechat campaign to promote anti-aging product “Sleep” cream. Different from other H5 interactive, Chando gave out 3 different versions of communication and was able to become a part of the conversation.
Share to separate groups in real moment in Vivian’s tone

China World Trade Corporation - Milan Expo campaign
Wanda Half-year Celebration HONDA MODE Launch
QUICK FLASHING IN WECHAT MOMENTS
76
To achieve this effect, participants need to spontaneously change their avatar and post similar information required by organizer/brand in their personal moments.
Flash mob activity could be a way to activate fans and drive public attention in short time without paid ads, but it requires loyalty or attractive incentive.

77
Use Wechat Moment Ads to reach out to a large audience base. Include call to action mechanism which drives consumers to sign up for the brands’ Wechat accounts for always on interaction.
1.
Use Wechat to deliver richer brand experience while Weibo to create hot topics to keep brand fresh in the category. Brand needs to find the right balance depending on the objective.
2.
Use other social platforms to strengthen brand specific association and incremental reach. Also can be used to reach the core target.3.
VIEWPOINT ON SOCIAL

MAGAZINE AND NEWSPAPER

31%
68%63%
31%
16%
95%
30%
64%67%
46%
16%
96%
28%
59%
71%
58%
19%
95%
0%
10%
20%
30%
40%
50%
60%
70%
80%
90%
100%
Magazine Reach NewspaperReach
Internet Reach Mobile InternetReach
Radio Reach TV Reach
2013-2015 REACH OF PRINT MEDIA
2013 2014 2015
PRINT MEDIA OVERVIEW
80
Source: CMMS Summer 2013-2015
14.6 minutes on magazine
35.4 minutes on newspaper
DAILY TIME SPENT ON PRINT
Print readership continues to decline as viewer shift online.
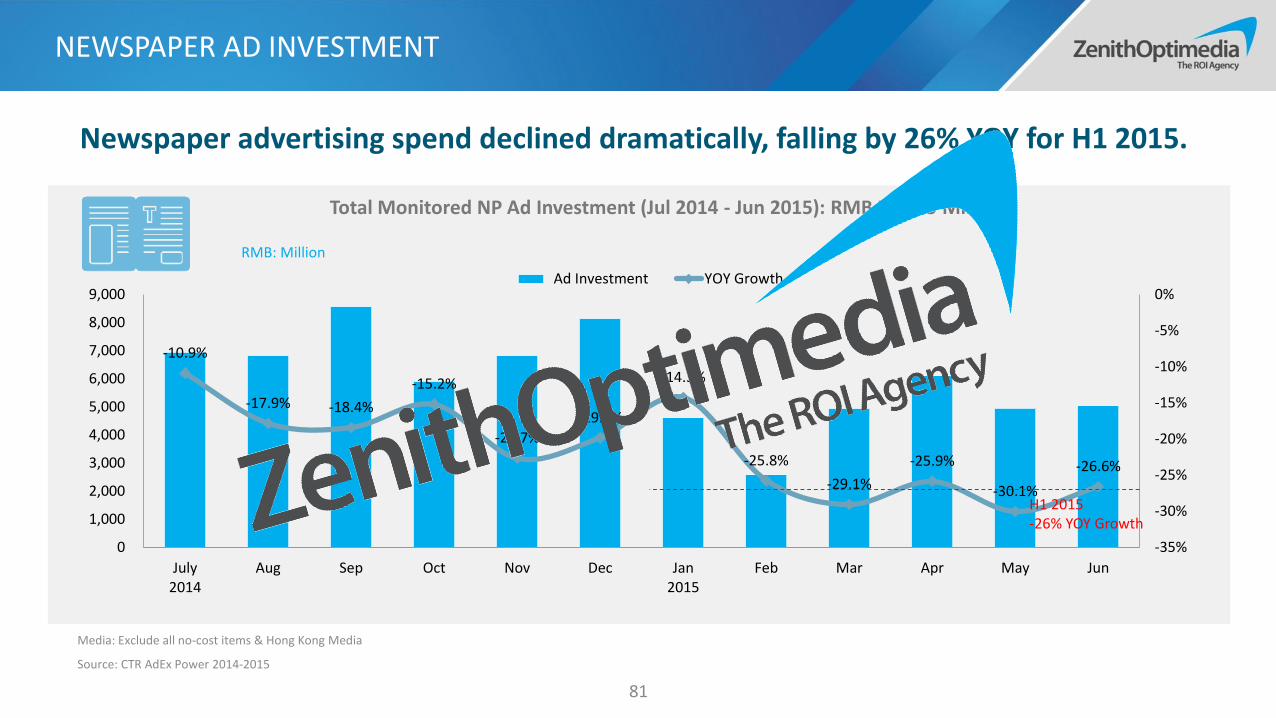
-10.9%
-17.9% -18.4%
-15.2%
-22.7%
-19.9%
-14.3%
-25.8%
-29.1%
-25.9%
-30.1%
-26.6%
-35%
-30%
-25%
-20%
-15%
-10%
-5%
0%
0
1,000
2,000
3,000
4,000
5,000
6,000
7,000
8,000
9,000
July2014
Aug Sep Oct Nov Dec Jan2015
Feb Mar Apr May Jun
Ad Investment YOY Growth
Total Monitored NP Ad Investment (Jul 2014 - Jun 2015): RMB 71,455 Million
RMB: Million
NEWSPAPER AD INVESTMENT
81
H1 2015-26% YOY Growth
Media: Exclude all no-cost items & Hong Kong Media
Source: CTR AdEx Power 2014-2015
Newspaper advertising spend declined dramatically, falling by 26% YOY for H1 2015.

NP Monitored Ad Investment By Sectors (Jan-Jun 2014 & 2015)
The Ad spend in Newspaper decreases among all categories.
NEWSPAPER AD INVESTMENT BY INDUSTRY
82
RMB: Million
-27%-44%
-17% -7%-28%
-45%
-2%-23% -28%
-40%-21% -29% -30%
-2%
-56% -47%
2%-15%
71%
148%
-56%
-100%
-50%
0%
50%
100%
150%
200%
0
1,000
2,000
3,000
4,000
5,000
6,000
7,000
8,000
9,000
10,000Jan-Jun 2014 Jan-Jun 2015 YOY Growth
Media: Exclude all no-cost items & Hong Kong Media
Source: CTR AdEx Power 2014-2015

MAGAZINE AD INVESTMENT
83
Total Monitored MG Ad Investment (Jul2014 - Jun2015): RMB 16,902 Million
-13.5%
-11.2%-9.6%
-11.1%
-13.4%-12.3%
-10.8%
-3.8%
-14.1%
-18.7%
-20.8%
-16.4%
-25%
-20%
-15%
-10%
-5%
0%
0
500
1,000
1,500
2,000
2,500
Jul2014
Aug Sep Oct Nov Dec Jan2015
Feb Mar Apr May Jun
Ad Investment YOY GrowthRMB: Million
H1 2015-15% YOY Growth
Media: Exclude all no-cost items & Hong Kong Media
Source: CTR AdEx Power 2014-2015
Declining investment on magazine slipped for 15% YOY for the first half of 2015.

MAGAZINE AD INVESTMENT BY INDUSTRY
84
MG Monitored Ad Investment By Sectors (Jan-Jun 2014 & 2015)
-14% -8%-19%
-26%-15%
-25% -30%-17% -22%
2%
-32%-19% -18% -19%
-35% -36%
-5%
41%
94%80%
-62%
-80%
-60%
-40%
-20%
0%
20%
40%
60%
80%
100%
120%
0
500
1,000
1,500
2,000
2,500Jan-Jun 2014 Jan-Jun 2015 YOY Growth
RMB: Million
Media: Exclude all no-cost items & Hong Kong Media
Source: CTR AdEx Power 2014-2015
Ad spend on magazine drop in all the key categories.

FORMATS & CASES

CASE: VIVO CREATE HOT TOPIC WITH SPECIAL EXECUTION IN NEWSPAPER
86
D1: Scan QR code to Wechat page, with teaser message “See you at Wechat on May 14 th D2: Wechat ads on May 14th
As a teaser of new product launch, Vivo bought 4 full pages in People’s Daily with most of the space in blank except for eye-catching copy and QR code, which were also handed to attendees during the launch event hosted on the same day generating curiosity and talk ability.
87
When investing in magazine & newspaper, think in a long term view, be more focused in title selections to leverage key assets of major publication.1.
Use print to further widen reach however need to link or drive traffic to other media especially brand owned platforms. This will help maximize the impact of print.2.
VIEWPOINT ON PRINT

RADIO

90
Source: CMMS Summer 2013-2015
1 hour 5 minutes on radio
-3.5% YOY
Car Owners Non Car-Owners58 minutes on radio 1 hour 11 minutes on radio
DAILY TIME SPENT ON RADIO (YESTERDAY)
-1.7% YOY
16%
48%
13%16%
49%
10%
19%
53%
13%
0%
10%
20%
30%
40%
50%
60%
Total Population Car Owners Car Non-Owners
MONTHLY REACH OF RADIO 2013-2015 BY CAR OWNERSHIP
2013 2014 2015
-6.8% YOY
Total Population
RADIO OVERVIEW
Radio continues to increase reach among car owners, however time spent per person declines with increase in light listeners.

45%
8%
3% 3% 2% 2% 2% 1.3% 0.7% 0.6% 0.3%2%
7%
2% 2%1% 1% 1% 0.4% 0.3% 0.3% 0.4%
57.6
63.6
57.6 58.8
70.8
52.8
45.6
62.4
73.8
79.8 88.8
57.6
79.2
57.6 58.8
77.4
66
76.2
57
67.2
73.2
54.6
0
10
20
30
40
50
60
70
80
90
100
0%
5%
10%
15%
20%
25%
30%
35%
40%
45%
50%
Private Car Home Taxi Bus Company Public Area Park/Green Belt School Metro Cycling/Walking Company Car
LOCATION & TIME SPENT - CAR OWNERS VS. NON CAR OWNERS
Petration - Car Owners Petration - Non Car-owners Time Spent - Car Owners Time Spent - Non Car-owners
RADIO CONSUMPTION
91
MinutesPenetration
Car owners spend averagely more time in radio when travelling in other transportations, however non car-drivers spend more when staying at fixed places.

RADIO AD INVESTMENT
92
TOTAL MONITORED RD AD INVESTMENT (Jul 2014 - Jun 2015): RMB 36,356 MILLION
23.0% 23.1%
17.2%19.6%
28.3%
19.6%
-2.4%
17.2%
-3.6%
7.6% 6.7%
10.5%
-10%
-5%
0%
5%
10%
15%
20%
25%
30%
0
500
1,000
1,500
2,000
2,500
3,000
3,500
4,000
Jul2014
Aug Sep Oct Nov Dec Jan2015
Feb Mar Apr May Jun
Ad Investment YOY GrowthRMB: Million
H1 20156% YOY Growth
Media: Exclude all no-cost items & Hong Kong Media
Source: CTR AdEx Power 2014-2015
Radio investments grow at a steady pace of 6%.
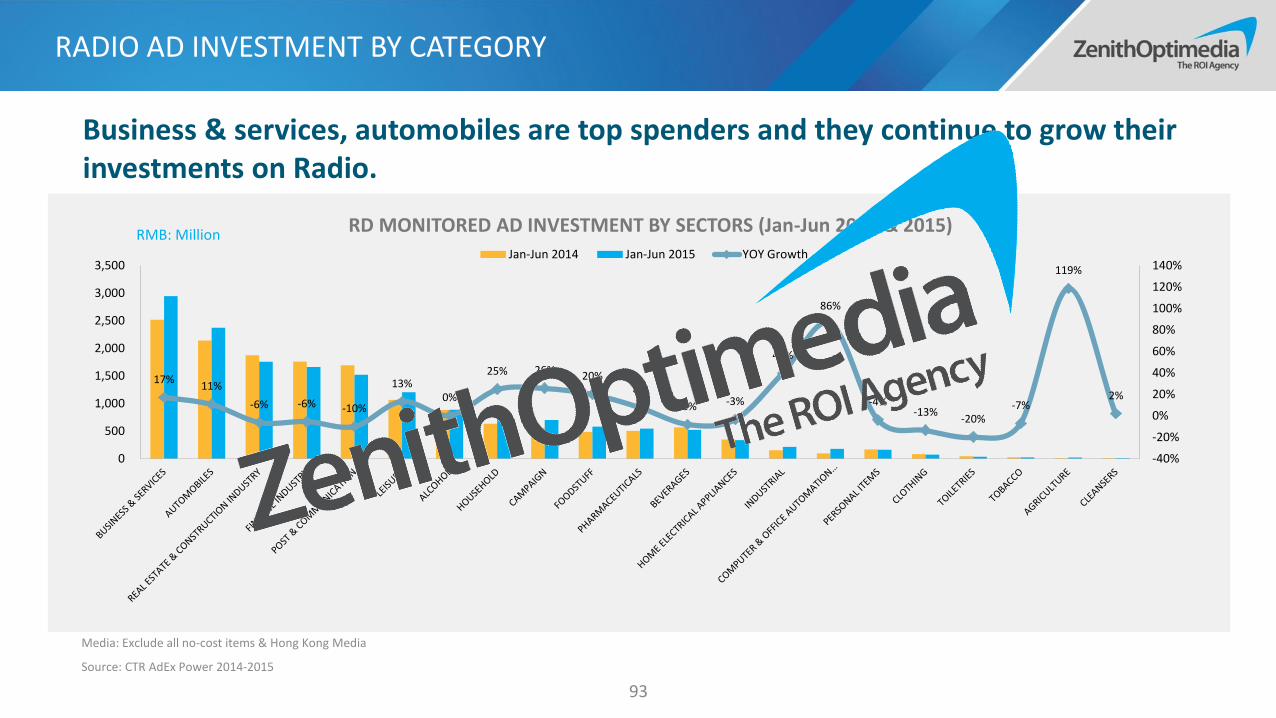
RD MONITORED AD INVESTMENT BY SECTORS (Jan-Jun 2014 & 2015)
17%11%
-6% -6% -10%
13%0%
25% 26% 20%8%
-8% -3%
40%
86%
-4%-13%
-20%-7%
119%
2%
-40%
-20%
0%
20%
40%
60%
80%
100%
120%
140%
0
500
1,000
1,500
2,000
2,500
3,000
3,500Jan-Jun 2014 Jan-Jun 2015 YOY Growth
RMB: Million
RADIO AD INVESTMENT BY CATEGORY
93
Media: Exclude all no-cost items & Hong Kong Media
Source: CTR AdEx Power 2014-2015
Business & services, automobiles are top spenders and they continue to grow their investments on Radio.

FORMATS & CASES

CASE: LIVE BROADCASTING IN CADILLAC
95
• Monday - Tuesday: free oral broadcast + ads clip, as preview for Friday• Friday: freestyle oral broadcast, with car features introduced also through HIT
FM Weibo during 16:00 - 19:00
CADILLAC cooperated with HIT FM, and delivered special features of ATS-L through interactive broadcasting experience, with one DJ seat in the room and another in the moving car, a first for the radio station.
96
Radio works well to reach middle and upper classes, especially car owners however due to the high clutter need to create stand out communication.1.
Leverage RJs and in program integration to stand out and also drive local area activations at relatively lower costs.2.
VIEWPOINT ON RADIO

OOH

OOH AD INVESTMENT
98
Media: Exclude all no-cost items & Hong Kong Media
Source: CTR AdEx Power 2014-2015
TOTAL MONITORED OOH AD INVESTMENT (Jul 2014 - Jun 2015): RMB 40,640 MILLION
14.6%
11.2%
14.8% 14.5%
8.7% 7.7%
0.9%
5.7%4.0%
-3.7% -3.3%
-9.2%
-15%
-10%
-5%
0%
5%
10%
15%
20%
2,800
2,900
3,000
3,100
3,200
3,300
3,400
3,500
3,600
Jul2014
Aug Sep Oct Nov Dec Jan2015
Feb Mar Apr May Jun
Ad Investment YOY Growth
RMB: Million
OOH investments remain stable, with only 1% decline in H1 2015.
H1 2015-1% YOY Growth

OOH AD INVESTMENT BY INDUSTRY
99
Media: Exclude all no-cost items & Hong Kong Media
Source: CTR AdEx Power 2014-2015
OOH Monitored Ad Investment By Sectors (Jan-Jun 2014 & 2015)
2.3% 4.5% 10.8% 15.3% 2.7% -0.2%21.5%
-5.2%13.9%
-39.3% -26.3%7.6%
-15.3%15.6%
-27.8% -19.3%-3.7% -5.7% -10.5%
200.1%
-32.1%-1.3%
-100%
-50%
0%
50%
100%
150%
200%
250%
0
500
1,000
1,500
2,000
2,500
3,000
3,500
Jan-Jun 2014 Jan-Jun 2015 YOY GrowthRMB: Million
Beverages & Food reduce investment by 26% while Business & Services, Real Estate and Post & Communication continue to increase investments.

TOP 10 OOH ADVERTISER IN 2015 H1
100
Online brands join in the competition, with 4 out of 5 new entries coming from digital roots - 58.com, Tu’niu, Liepin and Tmall; Mengniu also show strong presence in H1 2015; KFC and Nongfu Spring still secure their top 2 position.
Source:CODC Jan-Jun 2015
482
505
598
604
614
619
621
634
794
1,176
- 200 400 600 800 1,000 1,200 1,400
Tmall
Liepin.com
Suning Appliance
Mengniu
Gold Jiangnan
Tuniu.com
Suning Commerce
58.com
Nongfu Spring
KFC
Growth(vs Jan-Jun,2014)
27%
-29%
109%
124%
70%
61%
146%
-4%
96%
21486%
RMB: Million

DIFFERENT MEDIA WITH DIFFERENT DEVELOPMENT
101
Screen, Metro and Airport show stable growth with development of tier 2&3 cities.
Source: CODC Jan-Jun 2014 & 2015Description: Metro, bus and taxi screens are included in screen media; Railway expand tracking coverage into more stations in 2015.
31,157
12,336
4,627 4,237 3,086 2,436
749 443
35,107
13,466
4,717 4,921 3,029 2,440
730 2,440
13% 9% 2% 16% -2% 0% -2%
451%*
-300%
-200%
-100%
0%
100%
200%
300%
400%
500%
0
5,000
10,000
15,000
20,000
25,000
30,000
35,000
40,000
Screen Metro Single Airport Bus Body Bus Shelter Network Railway*
OOH SPENDING BY FORMAT
2014 Jan-Jun 2015 Jan-Jun YTD Growth
RMB: Million
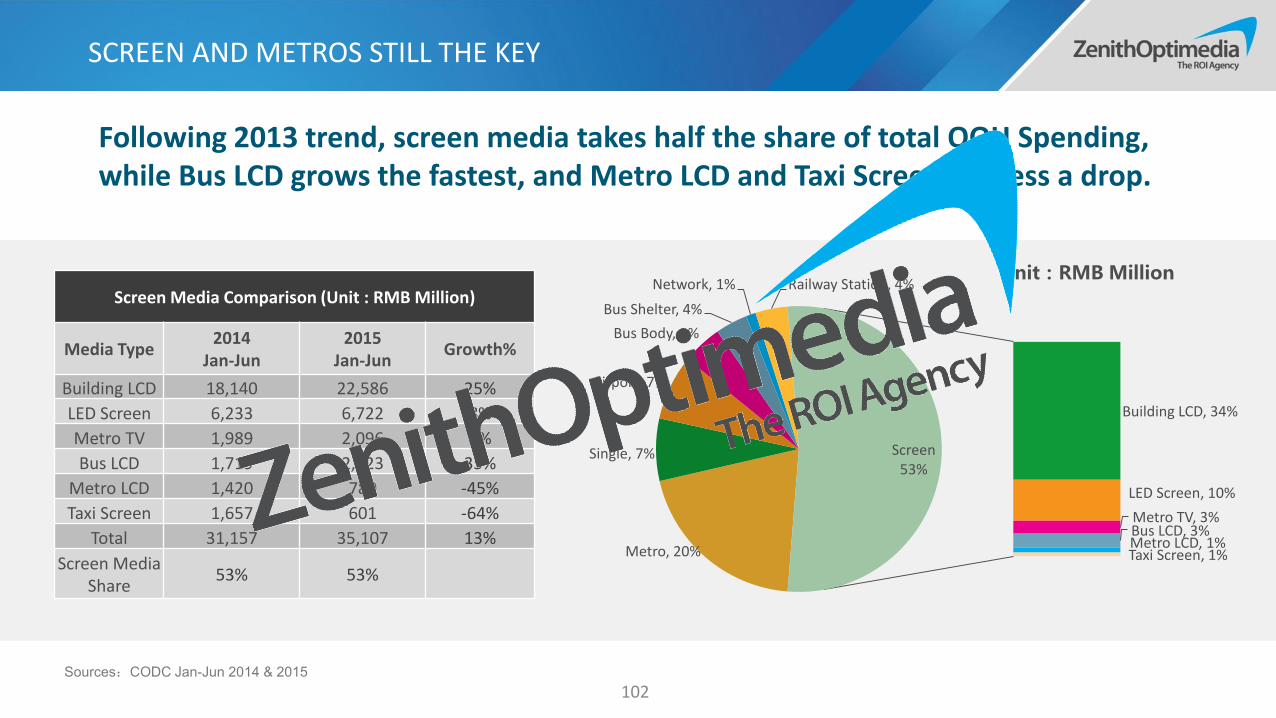
SCREEN AND METROS STILL THE KEY
102Sources:CODC Jan-Jun 2014 & 2015
Unit:RMB Million
Metro, 20%
Single, 7%
Airport, 7%
Bus Body, 5%
Bus Shelter, 4%
Network, 1% Railway Station, 4%
Building LCD, 34%
LED Screen, 10%
Metro TV, 3%Bus LCD, 3%Metro LCD, 1%Taxi Screen, 1%
Screen53%
Screen Media Comparison (Unit : RMB Million)
Media Type2014
Jan-Jun2015
Jan-JunGrowth%
Building LCD 18,140 22,586 25%
LED Screen 6,233 6,722 8%
Metro TV 1,989 2,096 5%
Bus LCD 1,719 2,323 35%
Metro LCD 1,420 780 -45%
Taxi Screen 1,657 601 -64%
Total 31,157 35,107 13%
Screen Media Share
53% 53%
Following 2013 trend, screen media takes half the share of total OOH Spending, while Bus LCD grows the fastest, and Metro LCD and Taxi Screen witness a drop.

OOH TREND ACROSS TIERS
103
Source: CODC Jan-Jun 2015
Units:Million RMB
50%, Screen 24%, Metro
6%, Single
8%, Airport4%, Bus Body
3%, Bus Shelter
1%, Network
4%, Railway
Screen
Metro
Single
Airport
Bus Body
Bus Shelter
Network
Railway
54%, Screen
19%, Metro
7%, Single
7%, Airport5%, Bus Body
4%, Bus Shelter
3%, Railway
Screen
Metro
Single
Airport
Bus Body
Bus Shelter
Network
Railway
58%, Screen4%, Metro
13%, Single
5%, Airport
6%, Bus Body
8%, Bus Shelter
3%, Network
4%, Railway
Screen
Metro
Single
Airport
Bus Body
Bus Shelter
Network
Railway
SHARE OF OOH FORMAT INVESTMENT CROSS TIERS
Metro in T1&2 are slowing down while screen media, airport develop faster in Tier 3 due to improvement in infrastructure. Bus body and shelter still maintain their importance however decline in T1&2.

FORMATS & CASES

OOH GOING MORE “REAL”
105
REAL PRODUCT DISPLAY REAL 3D EFFECT AUGMENTED REALITY
More real products are displayed extra to the regular format or original placement
More vivid animation are created in LED screen
through upgraded tech
More engaged experience are activated through new
technology
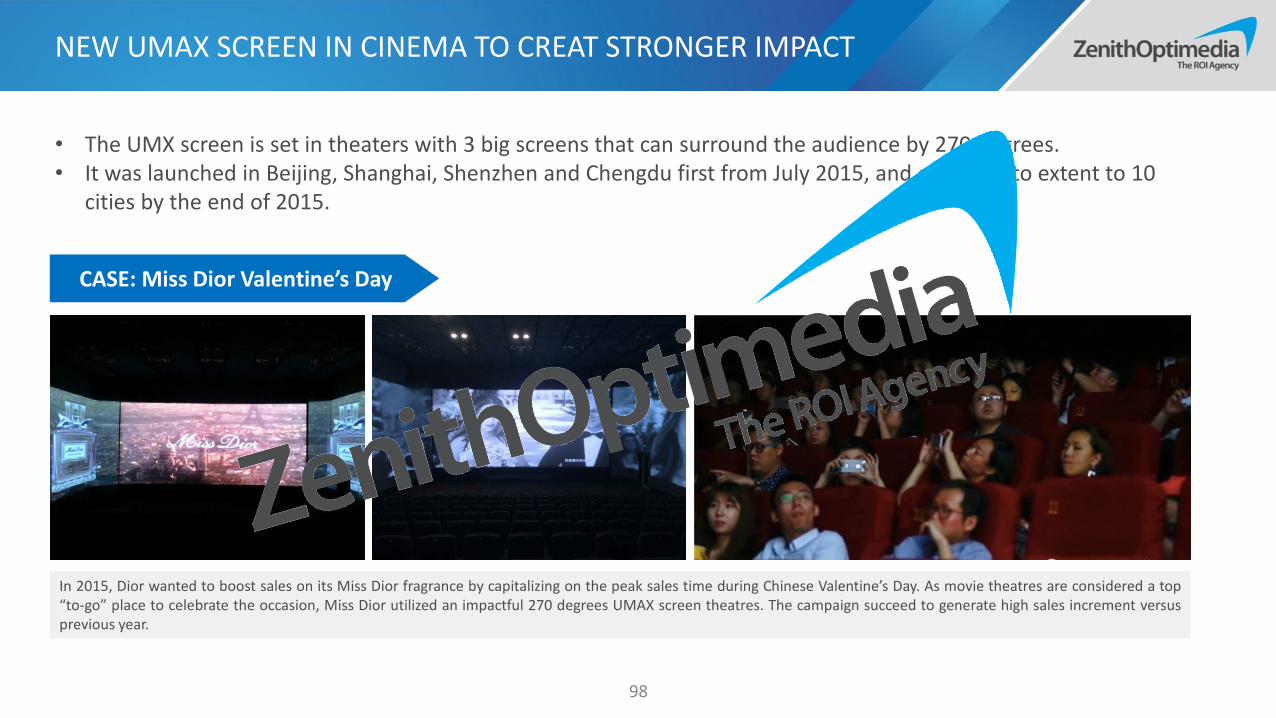
NEW UMAX SCREEN IN CINEMA TO CREAT STRONGER IMPACT
• The UMX screen is set in theaters with 3 big screens that can surround the audience by 270 degrees. • It was launched in Beijing, Shanghai, Shenzhen and Chengdu first from July 2015, and expected to extent to 10
cities by the end of 2015.
In 2015, Dior wanted to boost sales on its Miss Dior fragrance by capitalizing on the peak sales time during Chinese Valentine’s Day. As movie theatres are considered a top“to-go” place to celebrate the occasion, Miss Dior utilized an impactful 270 degrees UMAX screen theatres. The campaign succeed to generate high sales increment versusprevious year.
CASE: Miss Dior Valentine’s Day
98

PRECISE TARGETING THROUGH CHINA POST SCREENS
107
AUDIENCE RECOGNITON‘biometric feature signature’
Individuals Directional movement Number of glances Dwell time of each glance
IMON TargetEngage™ launched new OOH targeting format with real-time programmatic buy by upgrading traditional street kiosk space into mobile connected screens.
WIFI HOTSPOT

VARIOUS INTERACTIVE THROUGH IWON
108
Banners served after Wi-Fi connecting
Customized individual e-coupons
Brand/product placement in
interactive game
Brand Involvement
with educational cartoon
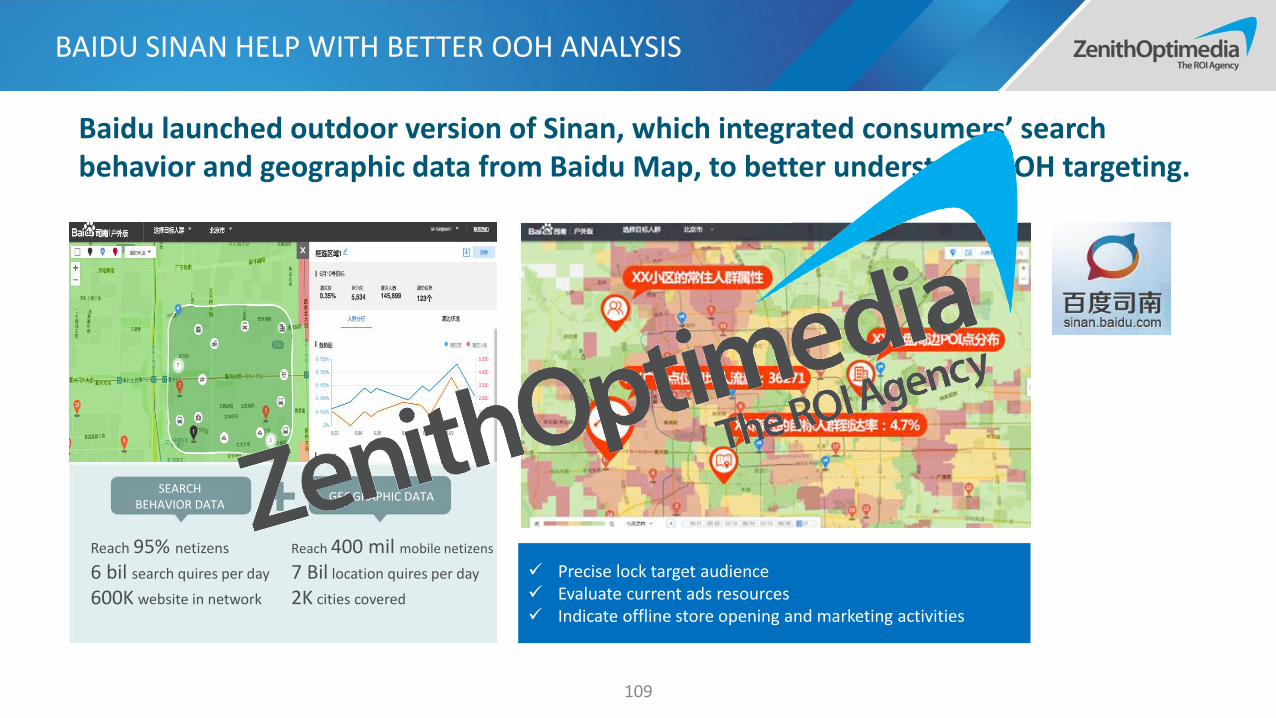
BAIDU SINAN HELP WITH BETTER OOH ANALYSIS
109
Baidu launched outdoor version of Sinan, which integrated consumers’ search behavior and geographic data from Baidu Map, to better understand OOH targeting.
Precise lock target audience Evaluate current ads resources Indicate offline store opening and marketing activities
SEARCH BEHAVIOR DATA
GEOGRAPHIC DATA
Reach 95% netizens
6 bil search quires per day
600K website in network
Reach 400 mil mobile netizens
7 Bil location quires per day
2K cities covered

110
With the improvement in OOH and Mobile technology, OOH can enable integration of offline and online activities to deliver stronger brand experience. Mechanics need to be simple and user friendly.
1.
Combination of AOD technology with OOH can help turn OOH into a more targeted medium.2.
Using new data system to improve pre-campaign evaluation and post-campaign measurement to evaluate the true value of the investment.3.
VIEWPOINT ON OOH

E-COMMERCE

374 MILLION USERS
56%* REACH AMONG ALL NETIZENS
7 DAYS PER MONTH
15 MINUTESPER USAGE DAY
PC MOBILE
46% REACH AMONG ALL NETIZENS
9 DAYS PER MONTH
11 MINUTESPER USAGE DAY
E-COMMERCE OVERVIEW
112
Source: Total netizen number from CNNIC, PC & Mobile reach number (based on CNNIC netizen), days and time spent from iUserTracker & mUserTracker Jun 2015;* PC reach has been adjusted to align with CNNIC penetration limit,, both PC and mobile here don’t include social shopping.

56%
19%
11%
2%Taobao
Tmall
JD.com
VIP.com
Suning
Meituan (GB)
Dangdang
Yhd.com
Amazon
Others
-1%
+3%
Source: iUserTracker & mUserTracker Jun 2014-2015
64%7%
6%
4%
3%
2%2%
Taobao
Meituan (GB)
Jindong
Tmall
VIP
Mogujie
Meilishuo
Jumei
Juhuasuan (GB)
Nuomi (GB)
Others
PC MOBILE
-3%
TOP EC PLATFORMS ACROSS DEVICES
113
SHARE OF TIME SPENT ON EC
+3%
-2%
+9%
Alibaba drives growth with increased share on mobile.
* Dianping ranks after JD if added.

B2C vs. C2C
114
Source: iResearch Yearly Data Release 2014 – E-commerce
B2C is expected to take more than half share of all transactions, dominated by TMALL and JD.
25.3%34.6%
40.4% 45.3%51.0% 56.0% 60.6% 63.5%
74.7%65.4%
59.6% 54.7%49.0% 44.0% 39.4% 36.5%
0%
10%
20%
30%
40%
50%
60%
70%
80%
90%
100%
2011 2012 2013 2014 2015e 2016e 2017e 2018e
ONLINE SHOPPING MARKET - B2C VS. C2C BY TOTAL TRANSACTIONS
B2C C2C
60.4%19.5%
3.0%
2.9%1.7%
1.5%1.4%
1.3% 1.1%
MARKET SHARE OF TOP B2C PALYERS BY TOTAL TRANSACTIONS (2014)
TMALL
JD.com
VIP.com
Suning.com
Gome.com.cn
yhd.com
Dangdang
Amazon.cn
Yixun.com
Jumei.com
Other

SHOWROOMING AMONG SEARCH SAVVY MOBILE USERS
While in brick and mortar stores many actually search on their mobile devices and make online purchase.
Source: McKinsey iConsumer China 2015
74% of shoppers who use mobile search are showrooming – checking out products in store but
buying online or from other competitor’s retail channels
115

E-COMMERCE CATEGORIES
Most frequent online purchases are packaged and fresh food – though the most popular category overall is still apparel at 66% penetration and 2,700RMB spent per year.
Source: McKinsey iConsumer China 2015
Consumer usage of online food shopping is very high in China at 40+% versus under 10% in the US.
Buying food online is becoming more feasible due to quicker delivery time, with roughly 40% using same or next day delivery.
116

M-COMMERCE
117
98.5% 94.2%85.5%
66.3%
49.4%38.9%
32.4% 28.8%
1.5% 5.8%14.5%
33.7%
50.6%61.1%
67.6% 71.2%
0%
10%
20%
30%
40%
50%
60%
70%
80%
90%
100%
2011 2012 2013 2014 2015e 2016e 2017e 2018e
SHOPPING TRANSACTIONS - MOBILE VS. PC
PC Mobile
Source: iResearch Yearly Data Release Jun 2015 – E-commerce
Mobile will account for more than half of all transactions, growing speed slows down but still higher than 100%.
69%45% 45%
14% 7% 5% 4%4%
426%
490%
298%
243%
115%
61%38% 23%
0%
100%
200%
300%
400%
500%
600%
0
10,000
20,000
30,000
40,000
50,000
60,000
2011 2012 2013 2014 2015e 2016e 2017e 2018e
SHOPPING TRANSACTION – MOBILE vs PC
PC Mobile PC growth Mobile growth
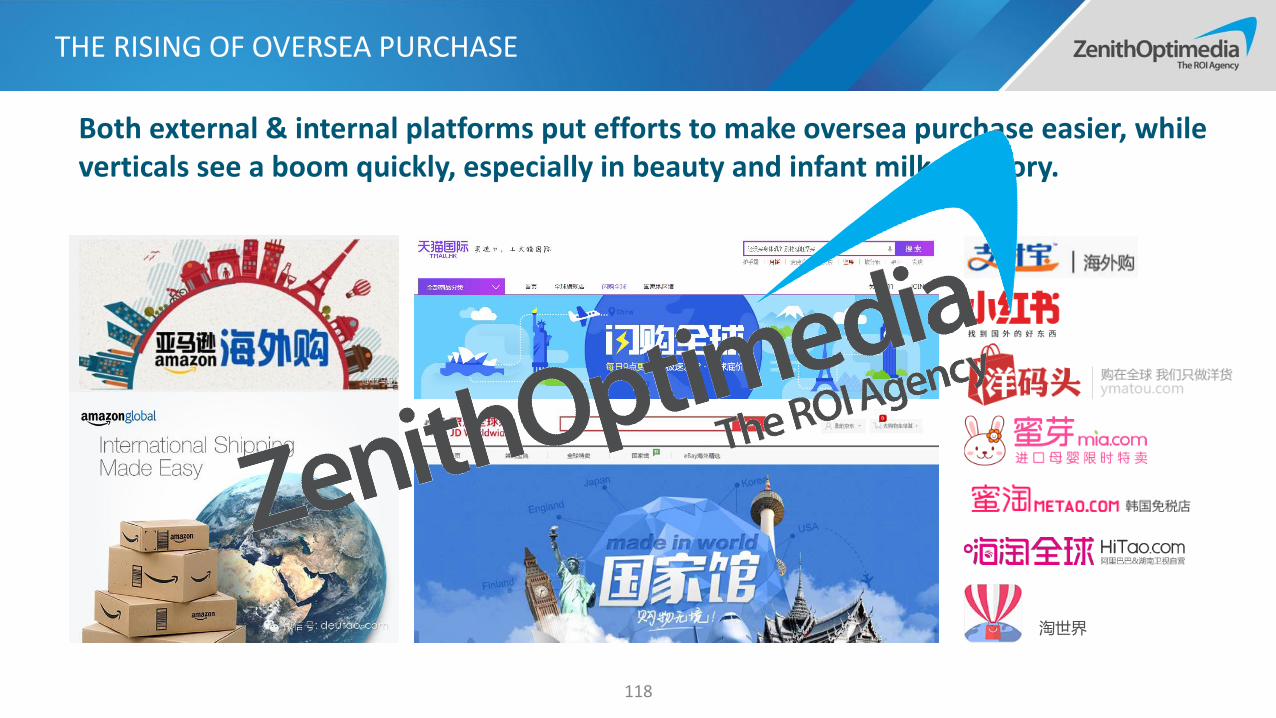
THE RISING OF OVERSEA PURCHASE
Both external & internal platforms put efforts to make oversea purchase easier, while verticals see a boom quickly, especially in beauty and infant milk category.
淘世界
118

MORE FUSION FOR ONLINE AND OFFLINE
Both traditional and digital giants are building their O2O ecosystem with a focus on data integration and varied services .
ALIBABA EXPAND TO OFFLINE WANDA EXPAND TO ONLINE DASHANG EXPAND TO ONLINE
Wanda announced the cooperation with Tencentand Baidu for e-commerce business in 2014, and officially launched its first physical platform Feifanby end of July, 2015.
Dashang Group, one of the biggest retailers in China, launched its own e-commerce platform Tiangou in Nov 2014.
Alibaba invested in Intime in March 2014, and further became its No.1 shareholder in July 2015, meanwhile launched APP “Miaojie” to serve for offline shopping.
119

GROUP-BUY UPGRADE USER FLOW WITH MOBILE PAYMENT
120
Group-buy service are upgraded, from “pay and consume” to “consume and pay”, with simplified flow facilitated by mobile and flexible discount operation.
“SHANHUI”/”FLASH DISCOUNT” FROM DIANPING“DISCOUNT PAYMENT”
FROM MEITUANDIANPING IS THE PLATFORM TO INITIATE THIS SERVICE,
FOLLOWED BY MEITUAN

FORMATS & CASES

USER GENERATED CONTENT BRIDGE FOR SALES
122
Taobao opened its mobile platform to public to encourage high quality user generated content while also sharing revenue with generators.
One of the most valuable writers earned 136K within 7 days by producing hundreds of qualified content.
123
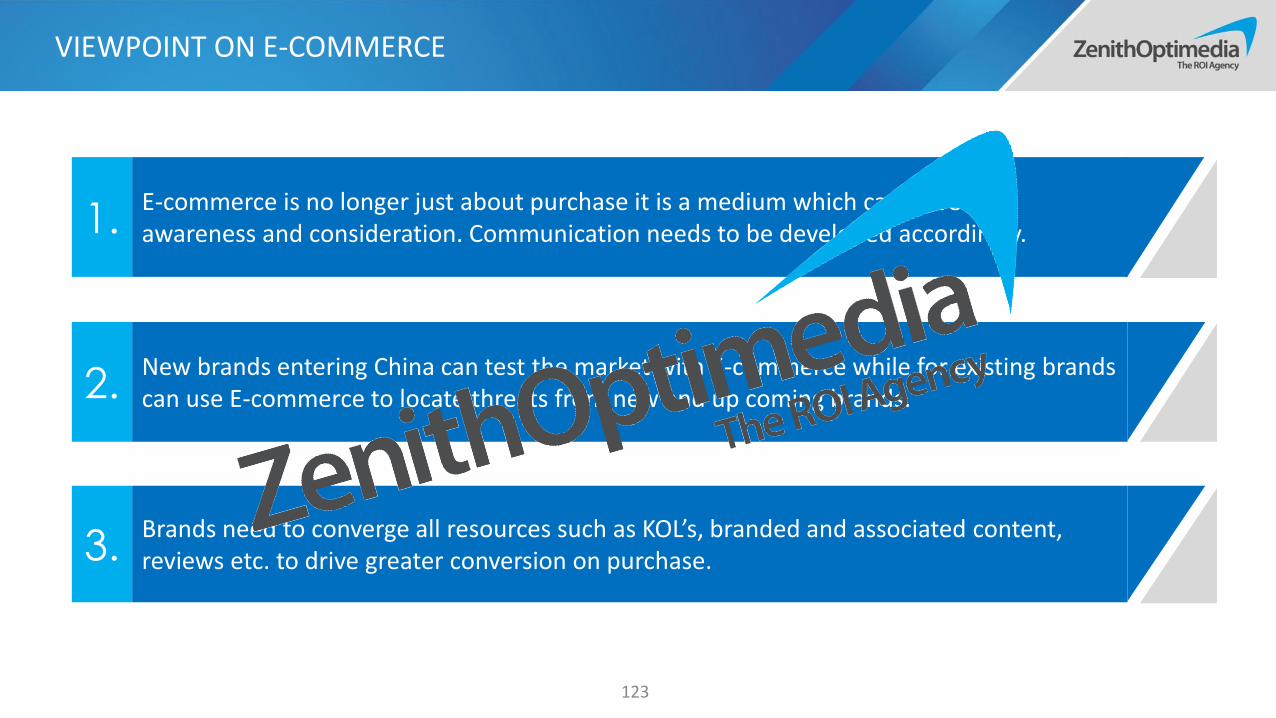
E-commerce is no longer just about purchase it is a medium which can drive also awareness and consideration. Communication needs to be developed accordingly.1.
New brands entering China can test the market with E-commerce while for existing brands can use E-commerce to locate threats from new and up coming brands. 2.
Brands need to converge all resources such as KOL’s, branded and associated content, reviews etc. to drive greater conversion on purchase.3.
VIEWPOINT ON E-COMMERCE

SEARCH
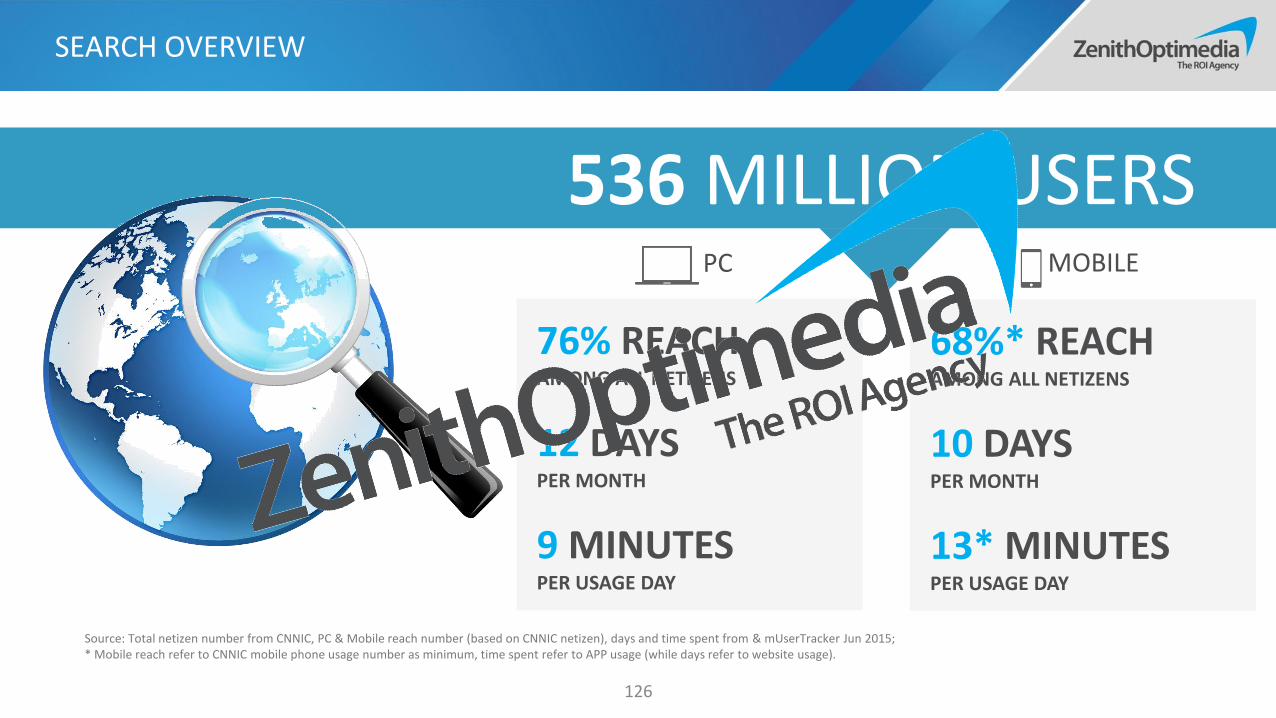
536 MILLION USERS
76% REACH AMONG ALL NETIZENS
12 DAYS PER MONTH
9 MINUTESPER USAGE DAY
PC MOBILE
68%* REACH AMONG ALL NETIZENS
10 DAYSPER MONTH
13* MINUTESPER USAGE DAY
Source: Total netizen number from CNNIC, PC & Mobile reach number (based on CNNIC netizen), days and time spent from & mUserTracker Jun 2015;* Mobile reach refer to CNNIC mobile phone usage number as minimum, time spent refer to APP usage (while days refer to website usage).
SEARCH OVERVIEW
126

SEARCH RANKING BY PAGE VIEWS
127
Change in Reach
-1%
+4%
+2%
Change in Reach
+9%
-19%
Source: iUsertracker & mUsertracker Jun 2014-2015, use site data for mobile, but Shenma is not well tracked according to the market share published by CNZZ, Mar 2015Note: PVs are within iResearch panel geography, scale may not be representative of the total online population
-
50,000
100,000
150,000
200,000
250,000
Jul-
14
Au
g-14
Sep
-14
Oct
-14
No
v-14
Dec
-14
Jan
-15
Feb
-15
Mar
-15
Ap
r-1
5
May
-15
Jun
-15
PV OF SEARCH ENGINE ON PC (Mil)
Baidu Haosou Sogou Etao
Google Soku Bing
-
10,000
20,000
30,000
40,000
50,000
60,000
Jan-15 Feb-15 Mar-15 Apr-15 May-15 Jun-15
PV OF SEARCH ENGINE ON MOBILE (Mil)
Baidu Easou Sogou Etao Bing
+9%
Baidu, 80%
Shenma*, 13%
Sogou, 6%
MARKET SHARE OF MOBILE SEARCH
Usage of 360 search continues to grow, though still dwarfed by Baidu’s dominant share of search. Sogou surpassed Easou in mobile, also Shenma gains share rapidly with the support of UC browser.

PC & MOBILE DIFFERENCES CROSS TIME
128
0 1 2 3 4 5 6 7 8 9 1 0 1 1 1 2 1 3 1 4 1 5 1 6 1 7 1 8 1 9 2 0 2 1 2 2 2 3
Monday
Tuesday
Wednesday
ThursdayFriday
Saturday
Sunday
PC MOBILE
Source: Baidu Tanxing Jul 2015
PC dominates working time (day and week days) while mobile spikes up during me time (night and weekends).
PC VS. MOBILE SEARCH CROSS THE DAY
PC MOBILE
PC VS. MOBILE SEARCH CROSS THE WEEK

THE RISING OF VOICE & PICTURE SEARCH
129
Voice and picture search is predicted to grow by 50%.
Source: Baidu Mobile Website Trend Report, Jan 2015
VOICE & PICTURE SEARCH INDEX
GENERAL SEARCH INDEX
J a n F e b M a r A p r M a y J u n J u l A u g S e p O c t N o v D e c
VOICE SEARCH VOICE INPUT VOICE TRANSFORMING VOICE HELPER

FORMATS & CASES
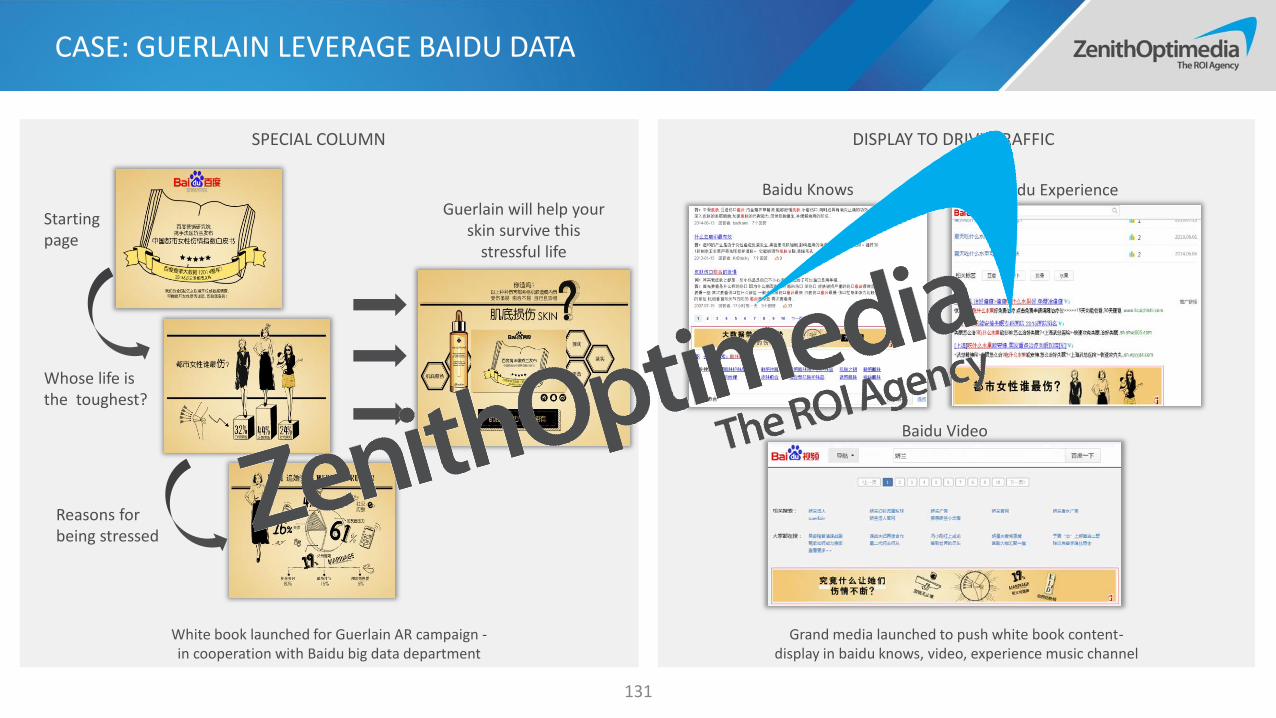
White book launched for Guerlain AR campaign -in cooperation with Baidu big data department
Grand media launched to push white book content-display in baidu knows, video, experience music channel
CASE: GUERLAIN LEVERAGE BAIDU DATA
131
Starting page
Whose life is the toughest?
Reasons for being stressed
Guerlain will help your skin survive this
stressful life
Baidu Knows Baidu Experience
Baidu Video
SPECIAL COLUMN DISPLAY TO DRIVE TRAFFIC
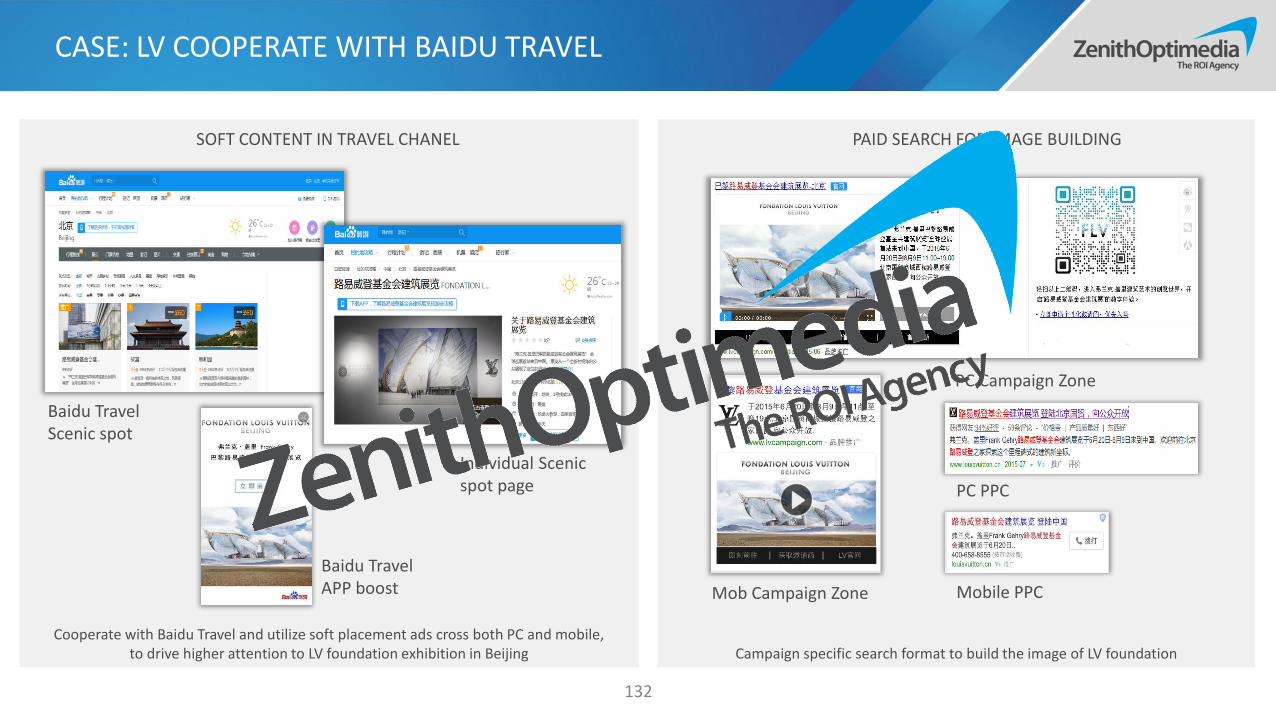
Cooperate with Baidu Travel and utilize soft placement ads cross both PC and mobile, to drive higher attention to LV foundation exhibition in Beijing Campaign specific search format to build the image of LV foundation
SOFT CONTENT IN TRAVEL CHANEL PAID SEARCH FOR IMAGE BUILDING
CASE: LV COOPERATE WITH BAIDU TRAVEL
132
PC Campaign Zone
Mob Campaign Zone
PC PPC
Baidu Travel APP boost
Baidu Travel Scenic spot
Individual Scenic spot page
Mobile PPC

Keep a close watch of 2nd, 3rd players in both PC and mobile beyond Baidu (e.g. 360, Shenma), as they also have strong background, and are trying hard to grab share.1.
Optimize delivery across time bands and devices when doing search campaigns.2.
Pay attention to the rise of picture and voice search, start to integrate this new tech in campaign where necessary. 3.
When investing in search platforms, especially Baidu, look to leverage key assets of the ecosystem beyond paid search.4.
133
VIEWPOINT ON SEARCH

PROGRAMMATIC BUYING

PROGRAMMATIC INVESTMENT USA VS. CHINA
136
4%9%
15%
21%
0%
10%
20%
30%
40%
50%
60%
70%
0
5
10
15
20
25
2013 2014e 2015e 2016e
INVESTMENT OF PROGRAMMATIC DISPLAY IN CHINA
Programmatic digital display ad spending
Programmatic mobile ad spending
% of total digital display ad spending
24%
45%
55%
63%
0%
10%
20%
30%
40%
50%
60%
70%
0
5
10
15
20
25
2013 2014e 2015e 2016e
INVESTMENT OF PROGRAMMATIC DISPLAY IN USA
Programmatic digital display ad spending
% of total digital display ad spending
BILLION (USD) BILLION (RMB)
China witnesses a rapid growth in programmatic investments however way behind USA.
Source: USA data from eMarketer Oct 2014, China data from iResearch programmatic report 2014

DATA TECHNOLOGY EMPOWERING PROGRAMMATIC EFFICIENCY
137
1st party data
1st Party DataVisitors’ cookiesMobile Phone No.QQ numberPayment CardContacts…
3rd Party Data Provider• Online Behavior
• Purchasing Behavior
programmed buy Inventory Bidding Performance Optimization…
3rd party data
2nd party data
2nd Party DataAd PlacementIPISPURL
…
• Cookies Cleaning• Audience Verification• Data Segments• Data Safety• …
Audience Insight
Inventory Estimation
• Comprehensive data processing for client’s first party data to command programmatic targeting
• Integrate offline database, CRM for data cleansing, mining, analytics and look-alike modeling
• Consumer insight research to facilitate decision making of planning and strategy

EXTENDED TARGETING BEYOND AUDIENCE SEGMENT
138
• Targeting based on public interests, completed integration with Baidu Search Index & Taobao Purchasing Index
• Targeting based on environmental factors, weather, temperature, air quality, and other event based signals
• Extension of TV ad to cover incremental reach on PC and mobile, full media channel coverage for audience interaction with brand
Search Index
Purchase Index
Sync with Localized Online IndexTrigger Ads Based on Real-time Data Across Platforms
WeatherIndex
SportsIndex
PurchasingIndex
SearchIndex More..
TV
Trigger Ads on 2nd And 3rd Screens Based on TV Ads

SOCIALLY INTELLIGENT MEDIA VIA PROGRAMMATIC
139
• Integrated with leading social platforms, taking advantage of effective and timely reach audience
• Harness valuable social data, listen and respond to social trend promptly depending on different attitude
• Tailor campaign objectives flexibly according to negative, neutral or positive attitude
Listen What Your Customers Are SayingInfluence TA with 1:1 Creative Based on Individuals’ Attitude
Listen Analysis Response
Listen social feedbacks on brands by contextual targeting in UGC on mainstream social media via API
Analysis whether audiences’ attitude based on AOD are negative/neutral/positive about the brand according to UGC, Key Word and Tags.
Response promptly by displaying the 1:1 dynamic creative ads on vertical media platform accordingly in real time
Negative
Branding Ads
From 0 to 1
AOD social serves as instant online
crisis PR specialist, bridges consumers
with brand in a positive way
Build consumers’ confidence to brand
and brand recognition
Positive/Neutral
Promotion Ads
1+1>2
AOD social is complementary to
traditional advertising and offline PR
Enhance brand preference and brand
loyalty

BE WHERE YOUR USERS ARE
140
• Focus on mobile data analytics of location and purchasing transactions, target audience from different view
• Consolidated footprint and location technologies, reverse predict audience offline behavior
• Integrated offline transaction platform, closing the loop of offline sales attribution to online promotion
Offline
Capture
Online
Profiling
Offline
Transaction
Online
Tracking
Consumers’
Purchasing Behavior
Data in Circle
Capture consumers’ purchasing behavior from their offline purchase history data
Launch Ad campaigns for selected TA on multiple online platforms
Profiling data is done by matching raw data with AOD demo database to lock in TAs
Drive TAs to purchase at offline stores and feedback the purchasing data to AOD at the same time
Feedback the tracking data to database and refine the profiling process
21
3
4
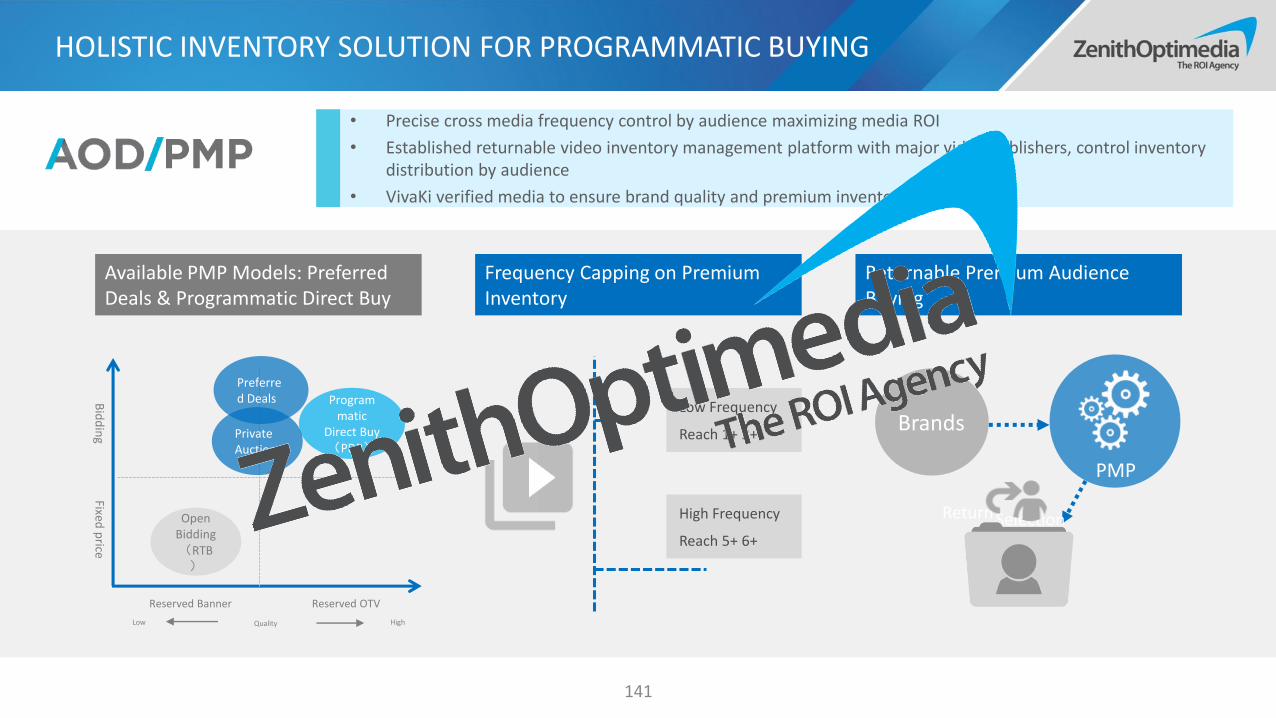
HOLISTIC INVENTORY SOLUTION FOR PROGRAMMATIC BUYING
141
• Precise cross media frequency control by audience maximizing media ROI
• Established returnable video inventory management platform with major video publishers, control inventory distribution by audience
• VivaKi verified media to ensure brand quality and premium inventory supply
Available PMP Models: Preferred Deals & Programmatic Direct Buy
Frequency Capping on Premium Inventory
Returnable Premium Audience Buying
Preferred Deals Program
matic Direct Buy(PDB)
Bid
din
gFixed
price
Reserved Banner Reserved OTV
Quality Low High
Private Auction
Open Bidding(RTB)
Low Frequency
Reach 1+ 2+
High Frequency
Reach 5+ 6+
Brands
PMP
SelectionReturn

FORMATS & CASES

TRAVEL
BEAUTY
BEAUTY CAMERA
LIFE
LAUNCH CAMPAIGN AT RIGHT TIME AND RIGHT MESSAGE IN RIGHT PLACE
143
Ads triggered only when
temperature > 25°C
Deliver relevant message in relevant environment with different mindset
Campaign Goal
Educate consumers for hair removalEnhance brand preference with limited budget
Where & Who
Target young female in selected key cities through mobile programmatic buy
Result
200% higher CTR and time spent than expected70% search query increase in mobile
Unaided awareness raise 25%
25°C
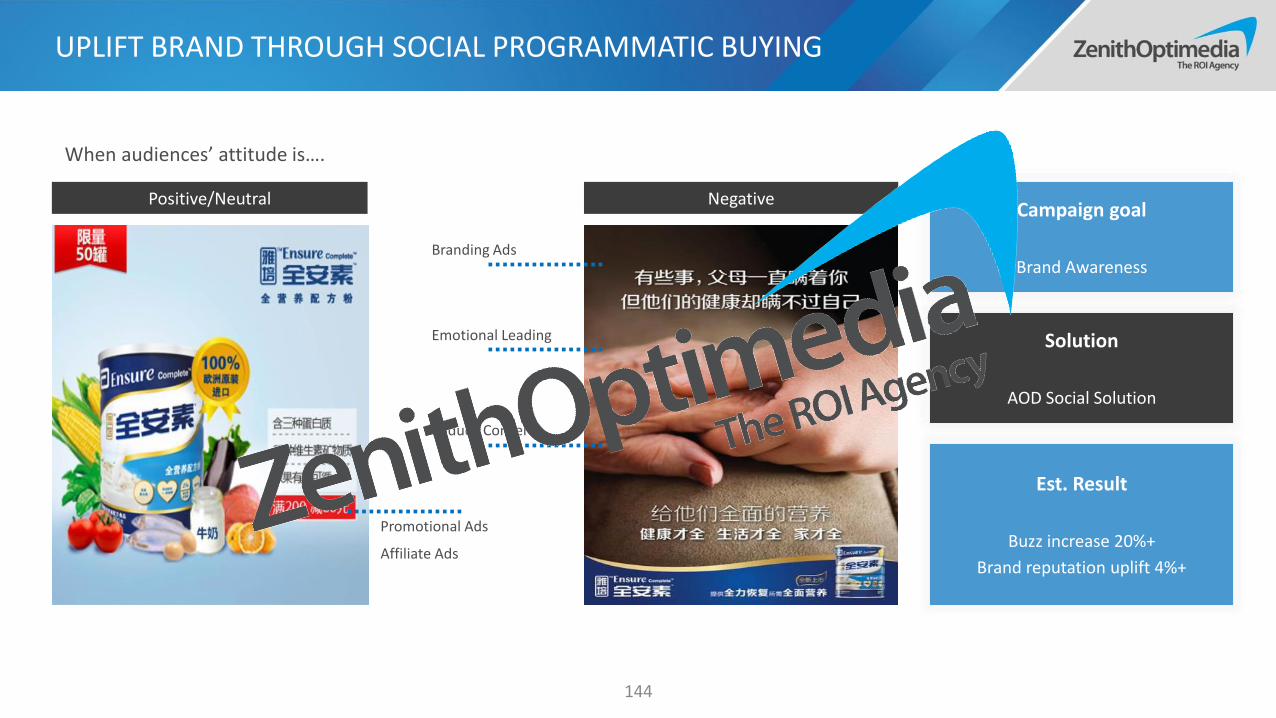
UPLIFT BRAND THROUGH SOCIAL PROGRAMMATIC BUYING
144
Campaign goal
Brand Awareness
Solution
AOD Social Solution
Est. Result
Buzz increase 20%+
Brand reputation uplift 4%+
When audiences’ attitude is….
Positive/Neutral Negative
Promotional Ads
Affiliate Ads
Emotional Leading
Branding Ads
Reduce Concerns

IMPROVE TA% INTELLIGENTLY WITH PMP
145
Campaign goal
Frequency Capping
Improve the ratio of TA
(4 times reach)
Launch Model
PDB (Private Direct Buy)
Result
4 times UV is 23.4%
Only 2% reach over frequented

146
Continue increasing investment in programmatic buys for greater efficiency and precision targeting.1.
Leverage the power of data from both partnership, and real time connection or tracking, to generate stronger consumer understanding and insights.2.
Upgrade from standard version to customized version which is built to target the potential consumers of the specific brand with the right communication.3.
Optimize current investment through PMP, to control frequency cross platforms, as well as secure premium inventories among qualified target audience. 4.
VIEWPOINT ON PROGRAMMATIC BUYING

MYKIM CHIKLI CEO ZENITHOPTIMEDIA GROUP CHINASHANN BIGLIONE HEAD OF STRATEGY ZENITHOPTIMEDIA GROUP CHINASAMEER SINGH HEAD OF CHANNEL PLANNING ZENITHOPTIMEDIA GROUP CHINAOLIVIA ZHANG ASSOCIATE DIRECTOR STRATEGY ZENITHOPTIMEDIA GROUP CHINAMOLLIE CHEN SUPERVISOR STRATEGY ZENITHOPTIMEDIA GROUP CHINAVIVI WAN DESIGNER BUSINESS DEVELOPMENT ZENITHOPTIMEDIA GROUP CHINA
Related Documents