2015 Greenhouse Gas Reporting Prepared For: Worcester Polytechnic Institute Worcester, Massachusetts April 2016

Welcome message from author
This document is posted to help you gain knowledge. Please leave a comment to let me know what you think about it! Share it to your friends and learn new things together.
Transcript

2015 Greenhouse Gas Reporting Prepared For: Worcester Polytechnic Institute Worcester, Massachusetts April 2016

Table of Contents Tighe&Bond
i
Section 1 Introduction
1.1 Applicability ................................................................................. 1-1 1.2 Emissions Reporting ..................................................................... 1-1 1.3 Grouping Emission Sources ............................................................ 1-2 1.4 Methodology ................................................................................ 1-2
1.4.1 Calculation-Based Methodologies .......................................... 1-2 1.4.2 Measurement-Based Methodologies ....................................... 1-3 1.4.3 Mandatory Methodologies ...................................................... 1-3 1.4.4 Simplified Emissions ........................................................... 1-3
1.5 Carbon Dioxide Equivalents ............................................................ 1-3
Section 2 Project Scope
2.1 Inventory .................................................................................... 2-1 2.2 Methodology ................................................................................ 2-2 2.3 Combined Reporting Units ............................................................. 2-3 2.4 Data Collection ............................................................................ 2-3
Section 3 Report Summary
3.1 Reporting Year 2015 ..................................................................... 3-1 3.2 Data Retention ............................................................................. 3-2
Appendix A Climate Registry Submittal
Appendix B Supporting Documentation
Tables
3-1 Emissions Report Summary
J:\W\W1489 WPI\GHG\2015\GHG_TextFinal.doc

Tighe&Bond
Greenhouse Gas Emissions Report – WPI, Worcester, MA 1-1
Section 1 Introduction In August 2008, Massachusetts enacted into law the Global Warming Solutions Act (GWSA). The Act requires an 80 percent reduction of greenhouse gas (GHG) emissions economy-wide by 2050, with a 2020 target to be set between 10 and 25 percent below 1990 levels. As part of the GWSA, Massachusetts promulgated greenhouse gas reporting regulations in July 2009 that affect approximately 300 facilities in the state.
1.1 Applicability In July of 2009, the Massachusetts Department of Environmental Protection (MADEP) promulgated greenhouse gas emissions reporting (310 CMR 7.71). In accordance with 310 CMR 7.71, the following facilities are subject to the reporting requirements:
All facilities that are regulated under Title V of the U.S. Clean Air Act and 310 CMR 7.0, Appendix C
Facilities that emit more than 5,000 tons per year of carbon dioxide equivalent emissions
Retail sellers of electricity
GHG Emissions Reporting for facilities subject to the requirements of 310 CMR 7.71 commenced in 2010 for calendar year 2009. Reporting of 2009 emissions was due by June 15, 2010 and only included carbon dioxide emissions from stationary and mobile fuel combustion sources. Beginning in 2011, for emissions that occur in 2010, and each year thereafter, facilities are required to report emissions of all greenhouse gases by April 15 in carbon dioxide equivalent. The additional gasses include methane, nitrous oxide, sulfur hexafluoride, hydroflourocarbons and perflourocarbons.
Worcester Polytechnic Institute (WPI) is applicable to the GHG reporting requirements of 310 CMR 7.71 because the carbon dioxide equivalent emission from the site in 2015 exceeded the 5,000 tons threshold. Therefore, this facility is required to report GHG emissions to the MADEP.
1.2 Emissions Reporting The MADEP has adopted the General Reporting Protocol (GRP) established by The Climate Registry, a nonprofit collaboration, to record and track the greenhouse gas emissions of businesses, municipalities and other organizations. Reporters are required to refer to 310 CMR 7.71 to determine which emissions sources should be reported and then use methodologies included in the GRP to quantify emissions from those sources. The relevant sections of the GRP are the methodologies that explain how to quantify emissions from particular source categories (e.g., boilers, refrigeration units, vehicle fleets, etc.), and facilities are required to use these methodologies to quantify emissions for reporting to MADEP.
As described in the GRP, the reporting of the six greenhouse gases from applicable sources at a facility is required. Facilities emitting greater than 5,000 tons of carbon dioxide equivalent (CO2e) are required to include carbon dioxide emissions from on-road vehicles. Title V facilities emitting less than 5,000 tons of carbon dioxide equivalent

Section 1 Introduction Tighe&Bond
Greenhouse Gas Emissions Report – WPI, Worcester, MA 1-2
emissions are not required to report emissions from motor vehicles, while all facilities emitting greater than 5,000 tons of carbon dioxide are required to report emissions from all vehicles operated by the facility.
Facilities subject to the Massachusetts GHG Reporting Program are required to electronically report their greenhouse gas emissions using a regional electronic reporting system. The MADEP contracted with The Climate Registry to develop the Massachusetts Greenhouse Gas Registry which is built off of The Climate Registry’s Climate Registry Information System (CRIS) software platform. The MA GHG Registry allows subject facilities to calculate and report GHG emissions per the requirements of the MA GHG Reporting Regulation and the quantification methodologies of The Climate Registry’s General Reporting Protocol. This comprehensive reporting tool is used by Massachusetts facility reporters, the MADEP, and the general public.
A total facility emissions report for WPI using the MA GHG Reporting Program is included in Appendix A of this report.
1.3 Grouping Emission Sources In accordance with Chapter 11 of The Climate Registry General Reporting Protocol, facilities with a large number of small emissions sources are required to report GHG emissions from these units, regardless of unit size. However, small emission units such as space heaters and welding tools can be accounted for by using simplified estimation methods to quantify emissions, as long as the total amount of emissions quantified in accordance with simplified emissions methods does not exceed 1,000 short tons. Simplified estimation methods allow for the aggregation of smaller emission units and provide a credible estimate of emissions while minimizing the reporting burden on a facility.
1.4 Methodology The MADEP requires emission quantification based upon The Climate Registry General Reporting Protocol. The following subsections identify the prescribed methodologies.
1.4.1 Calculation-Based Methodologies Calculation-based methodologies involve the calculation of emissions based on activity data and emission factors. Activity data can include data on fuel consumption, input material flow, or product output. Emission factors are determined by means of direct measurement and laboratory analyses or by using generalized default factors. Default emission factors sometimes change over time as the components of energy (electricity, fuel, etc.) change and as emission factor quantification methods are refined. The Registry updates emission factors on an annual basis in January to reflect the most up-to-date knowledge. In most cases, facilities reporting emissions data from previous years can use the most up to date emission factors available when the inventory is being reported. In the case of default emission factors for electricity use, facilities must use the emission factor closest to the emissions year reported that do not post-date the emissions year. Facilities with access to high-quality site specific emission factors are encouraged to use those factors. Activity data and calculations should be reported in appropriately accurate detail.

Section 1 Introduction Tighe&Bond
Greenhouse Gas Emissions Report – WPI, Worcester, MA 1-3
1.4.2 Measurement-Based Methodologies Measurement-based methodologies determine emissions by means of continuous measurement of the exhaust stream and the concentration of the relevant GHG(s) in the flue gas. Direct measurement will only be relevant to entities with facilities using existing continuous emission monitoring systems (CEMS), such as power plants or industrial facilities with large stationary combustion units. Facilities without existing monitoring systems will not need to install new monitoring equipment to comply with The Registry’s quantification requirements.
1.4.3 Mandatory Methodologies The Registry accepts all GHG emission calculation methodologies mandated by a state, provincial, or federal GHG Regulatory reporting program. Like all information publically reported through The Registry, data calculated using mandatory methodologies must be included in the Verification Body’s risk assessment in accordance with the guidelines of the General Verification Protocol. Although it is encouraged, Facilities are not required to use mandatory calculation methods. Facilities may also elect to use some mandatory calculation methods for select sources or gasses and other Registry-approved methods for others. Please note, where mandatory requirements exclude certain emission sources, Facilities are still required to quantify emissions from those sources in accordance with The Registry’s reporting requirements.
1.4.4 Simplified Emissions Facilities are encouraged to use the Climate Registry’s approved methodologies described in the paragraph above. However, the Registry understands that in some cases these methodologies are not feasible for a facility within their organizational boundaries. In these cases, facilities are allowed to use alternative, simplified estimation methods for any combination of emission sources or gases, provided that the emissions from these sources and/or gases are less than 5% of the facility’s total emissions.
Methodologies used for specific emission sources and gases are detailed in Section 2.2.
1.5 Carbon Dioxide Equivalents Beginning in RY 2010, facilities are required to report emissions from additional GHGs, as described in Section 1.1. In order to report emissions of non CO2 gases, facilities must convert the emissions to CO2 equivalents, calculated on the basis of each GHGs Global Warming Potential (GWP). GWPs represent the ratio of the heat trapping ability of each green-house gas relative to that of CO2. For this report, the emissions of non-CO2 gases are converted to units of CO2 equivalent by using the following GWPs:
TABLE 1-1 Global Warming Potentials
Common Name Formula GWP Carbon Dioxide CO2 1
Methane CH4 21 Nitrous Oxide N2O 310
Sulfur Hexafluoride SF6 23,900 HFCs/PFCs Varies Varies (150-11,700)

Tighe&Bond
Greenhouse Gas Emissions Report – WPI, Worcester, MA 2-1
Section 2 Project Scope WPI is located at 100 Institute Road in Worcester, Massachusetts and is a technological university. WPI Campus comprises 35 major buildings. The off-campus buildings including Lee Street and Gateway Park are also included in this report.
WPI is applicable to the Greenhouse Gas reporting requirements of 310 CMR 7.71 as an emitter of greater than 5,000 tons/year CO2e during the calendar year 2013 as stated in 310 CMR 7.71(2).
This report includes all applicable GHG emissions, including carbon dioxide, methane, nitrous oxide, hydrofluorocarbons, perflouorocarbons and sulfur hexafluoride in tons of CO2e.
2.1 Inventory WPI has the following emission sources subject to GHG emissions inventory:
Founders Equip. Boiler # 4
Generator # 1 Daniels Hall, Kohler
Generator # 2 Founders Hall, CPI
Generator # 3 Harrington, Onan
Generator # 4 Salisbury, Olympian
Generator # 5 Fuller #1 Roof, Superior
Generator # 6 Fuller #2 Caterpillar
Generator # 9 Power Plant, SR-4 Caterpillar
Generator #7 Gateway, Kohler
Generator #10 East Hall, Kohler
Generator # 11 Goddard, Olympian
Generator #8 Gateway Garage, Caterpillar
Generator #13 Gateway 2 Generator
Generator #12 Rec Center Generator
Generator #14 Faraday Generator
Generator #15 Drury Lane
Power House New Boiler #1
Power House New Boiler #2
Power House New Boiler #3
Off Campus Residences (group)
On-Campus Miscell. 1st set (group)
On-Campus Miscell. 2nd set (group)

Section 2 Introduction Tighe&Bond
Greenhouse Gas Emissions Report – WPI, Worcester, MA 2-2
On-Campus Miscell. 3rd set (group)
Gateway Cleaver Brooks Boilers (2)
Gateway Lattern Boilers (2)
Salisbury Estates Heating
HVAC units
Vehicle Air Conditioning units
Refrigeration units
Non-highway Motor units
Tier 1 1998-2003 Light Trucks
Tier 2 2004-2009 Light Trucks
Tier 2 Passenger Cars
WPI uses ABC, K, K-CL, Halon, CL-D and CO2 type fire extinguishers. WPI contracts the services of Bob O’Connell Fire Protection from Worcester, MA to maintain the fire extinguishers. Therefore, WPI is not including the emission from fire extinguishers that were used in 2015 in its GHG report.
WPI uses and maintains multiple refrigeration units that mainly include R404A, R410A and R134A as a heat transfer medium. The emissions reported were calculated based on available purchase records, maintenance inventory records and available capacity data provided by WPI personnel.
WPI uses AC window units that contain only R-22. WPI uses a variety of refrigerators that contain R134A. It was estimated that WPI used 250 G.E. units model GTH21KBAWN that contained 4.23 ounces of R134A each. WPI uses a number of vehicles that are equipped with air conditioning. The refrigerator and mobile air conditioning emissions were calculated using the operation emission factor from GRP Table 16.3.
2.2 Methodology For 2015, WPI has chosen to utilize Calculation-based methodologies. Default emission factors are found in the GRP’s 2013 update to Table 12.1 – Default Factors for Calculating CO2 Emissions from Fossil Fuel Combustion.
The selection of the calculation-based methodology is due to the technical constraints and excessive costs of data collection per unit of emission. As shown in the CRIS emission report included in Appendix A of this report, fuel combustion at the WPI facility resulted in the generation of approximately 9,613 metric tons. Informal research identified the costs associated with the purchase of a Continuous Emissions Monitoring (CEM) system at approximately $30,000. The additional costs of installing, operating and maintain such a system would be in excess of this amount. It should be noted that a CEM would be needed it for each emission source. A CEM system quote is included in Appendix B
The specific heat and carbon contents of the fuels combusted at the facility are unknown. Therefore, WPI has utilized the emission factors in Tables 12.1 and 12.2 of the Climate Registry General Reporting Protocol. These tables are included in Appendix B of this report.

Section 2 Introduction Tighe&Bond
Greenhouse Gas Emissions Report – WPI, Worcester, MA 2-3
In addition, WPI has chosen to utilize the Simplified Method for the calculation of HFC emissions utilizing default emission factors found in the GRP’s update to Table 16.3 – Default Emission Factors for Refrigeration/Air Conditioning Equipment. Equation 16e was used to estimate emissions from each type of refrigerant. This methodology was chosen because it is not feasible for WPI to determine a base inventory for each refrigerant used at the facility, which is required for use of Tier A. However, WPI was able to conduct an inventory, identifying the refrigeration unit and the capacity and type of refrigerant for the larger units, allowing them to use a more accurate version of the Screening Method. Additionally, records of maintenance to refrigeration units, which is required for use of Tier B were used. Where specific capacity was not available, the most conservative value from Table 13.6 was used. It should be noted that the refrigerant’s emissions calculated using the Screening Method is less than 1,000 short tons.
2.3 Combined Reporting Units Stationary emission units are grouped in the same manner as reported in the Source Registration Emission Statement. Mobile sources are grouped by type of fuel and EPA EPA Tier classification as follows: Tier 1 for years 1998-2003; and Tier 2 for vehicles years 2004-2012. A summary of the vehicles grouped under each Tier is included in Appendix B. Also, refrigerant units were grouped by type of refrigerant as indicated in Section 2.2.
2.4 Data Collection The data used to calculate emissions at WPI was provided by WPI personnel and was taken directly from fuel consumption, operating, maintenance and purchase records.

Tighe&Bond
Greenhouse Gas Emissions Report – WPI, Worcester, MA 3-1
Section 3 Report Summary
3.1 Reporting Year 2015 In calendar year 2015, WPI generated 10,787 short tons (9,786 metric tons) of CO2e. Table 3-1 below provides source specific emissions data. Additionally, Appendix A of this report includes the Climate Registry Information System (CRIS) Report submitted to the Climate Registry and MADEP.
TABLE 3-1 Emissions Report Summary
Emission Source Methodology Fuel
Carbon Dioxide
Equivalent Emissions
(metric tons)
Founders Equip. Boiler # 4 Calculations-Based
N.G. 209.5413
Generator # 1 Daniels Hall, Kohler Calculations-Based
N.G. 2.3570
Generator # 2 Founders Hall, CPI Calculations-Based
N.G. 2.0431
Generator # 3 Harrington, Onan Calculations-Based
N.G. 0.3632
Generator # 4 Salisbury, Olympian Calculations-Based
N.G. 2.2579
Generator # 5 Fuller #1 Roof, Superior Calculations-Based
diesel 1.1946
Generator # 6 Fuller #2 Caterpillar Calculations-Based
diesel 4.2475
Generator # 9 Power Plant, Caterpillar Calculations-Based
Diesel 13.2328
Generator #7 Gateway, Kohler Calculations-Based
diesel 19.6960
Generator #10 East Hall, Kohler Calculations-Based
diesel 3.4307
Generator # 11 Goddard, Olympian Calculations-Based
N.G. 0.0820
Generator #8 Gateway Garage, Caterpillar Calculations-Based
diesel 1.3110
Generator #13 Gateway 2 Generator Calculations-Based
diesel 5.8628
Generator #12 Rec Center Generator Calculations-Based
diesel 0.7392
Generator #14 Faraday Olympian Calculations-Based
N.G. 39.4884
Generator #15 Drury Lane Calculations-Based N.G. 0.4184

Section 3 Report Summary Tighe&Bond
Greenhouse Gas Emissions Report – WPI, Worcester, MA 3-2
TABLE 3-1 Emissions Report Summary
Emission Source Methodology Fuel
Carbon Dioxide
Equivalent Emissions
(metric tons)
Power House New Boiler #1 Calculations-Based
N.G./diesel 1,594.0416
Power House New Boiler #2 Calculations-Based
N.G. 1,831.8328
Power House New Boiler #3 Calculations-Based
N.G./diesel 1,848.3834
Off Campus Residences Calculations-Based
N.G. 1,189.5314
On-Campus Miscell. 1st set Calculations-Based
N.G. 393.0077
On-Campus Miscell. 2nd set Calculations-Based
N.G. 317.5819
On-Campus Miscell. 3rd set Calculations-Based
N.G. 305.5233
Gateway Cleaver Brooks Boilers (2) Calculations-Based
N.G. 748.5961
Gateway Lattern Boilers (2) Calculations-Based
N.G. 208.9857
Salisbury Estates Heating Calculations-Based N.G. 683.0109
Refrigeration units Calculations-Based /Simplified
R134A/R404A/R410A 0.102
Non-highway Motor units Calculations-Based
diesel 11.4230
Tier 1 1998-2003 Light Trucks Calculations-Based
gasoline 11.7607
Tier 2 2004-2009 Light Trucks Calculations-Based
gasoline 92.3527
Tier 2 Passenger Cars Calculations-Based
gasoline 9.2218
Vehicle Refrigeration Calculations-Based
R134A 0.0076
TOTAL 9,786
3.2 Data Retention WPI will maintain GHG emission documentation on site for at least 5 years from the date of submittal to the climate registry as required by 310 CMR 7.71.

Tighe&Bond
Greenhouse Gas Emissions Report – WPI, Worcester, MA
Appendix A Climate Registry Submittal

Massachusetts Greenhouse Gas Emissions Reporting ProgramTotal Facility Emissions Report
4/15/2016 8:38:55
WORCESTER POLYTECHNICAL INSTITUTE [Facility AQ ID: 1180127]
1180127MA Facility AQ IdWORCESTER, United States
Facility InformationFacility Name WORCESTER POLYTECHNICAL INSTITUTE [Facility AQ ....
Facility Address
Facility ContactContact EmailContact PhoneNAIC Code 611310 - Colleges, Universities, and Professional SchoolsFacility Description
GRUDZINSKI, [email protected]
Facility Category Stationary source(e.g. power plants etc)Facility Location Massachusetts
2015 Emissions Information
The Climate Registry's General Reporting Protocol and associated updates and clarificationsReporting Protocol
100 INSTITUTE RD,WORCESTER, Massachusetts,016090000, United States
ASSOCIATED ENTITIES
Report Status Certified_Submitted
Consolidation Methodology Financial ControlOperational ControlEntity Name Equity Share
Operational Control OnlyWORCESTERPOLYTECHNIC INSTITUTE
Not Applicable Yes Not Applicable
Page 1 of 10

Massachusetts Greenhouse Gas Emissions Reporting ProgramTotal Facility Emissions Report
4/15/2016 8:38:55
WORCESTER POLYTECHNICAL INSTITUTE [Facility AQ ID: 1180127]
1180127MA Facility AQ IdWORCESTER, United States
TOTAL EMISSIONS: WORCESTER POLYTECHNICAL INSTITUTE [Facility AQ ID: 1180127]
CO2e PFCsHFCs SF6DIRECT EMISSIONS (Scope 1)Metric Tons N2OCH4CO2
000.1096000172.375Fugitive - Scope 1
0000.004320.0065124.74738126.22296Mobile Combustion - Scope 1
0000000Process - Scope 1
0000.159140.750719422.028639487.13166Stationary Combustion - Scope 1
9785.72962TOTAL DIRECT EMISSIONS 9546.77601 0.75721 0.16346 0.1096 0 0
CO2BIOGENIC EMISSIONS Metric Tons
Mobile Biomass Combustion - Biomass 0
Stationary Biomass Combustion - Biomass 0
0TOTAL BIOGENIC EMISSIONS
CO2e in metric ton (t)
10786.92044CO2e in short ton (ton)
Total Facility Emissions
9785.72962
Page 2 of 10

Massachusetts Greenhouse Gas Emissions Reporting ProgramTotal Facility Emissions Report
4/15/2016 8:38:55
WORCESTER POLYTECHNICAL INSTITUTE [Facility AQ ID: 1180127]
1180127MA Facility AQ IdWORCESTER, United States
Emissions Category CalculationMethodology
Total CO2e(metrictons)
Factor SourceEmittingActivityName
Amount(metrictons)
GreenHouseGas
EmittingActivity
Fuel Amount EmissionFactor
HeatContent
OxidationFactor
CommentDETAILED EMISSIONS
CoefficientPerform
EfficiencyFactor
BOILER #4FOUNDERS -2HB SMITH+2 PVINATURAL GAS
Stationary Combustion - Scope 1 Boilers CO2 209.53418 209.53418 Emission Factor 2014 Default EmissionFactors - Table #12.1
1,000 -1,025 Btu/ SCF
3960.2MMBtu
52.91kg/MMBtu
1025Btu/scf
BOILER #4FOUNDERS -2HB SMITH+2 PVINATURAL GAS
Stationary Combustion - Scope 1 Boilers CH4 0.00356 0.07485 Emission Factor 2014 Default EmissionFactors - Table #12.7
1,000 -1,025 Btu/ SCF
3960.2MMBtu
0.9 g/MMBtu 1025Btu/scf
BOILER #4FOUNDERS -2HB SMITH+2 PVINATURAL GAS
Stationary Combustion - Scope 1 Boilers N2O 0.00356 1.1049 Emission Factor 2014 Default EmissionFactors - Table #12.7
1,000 -1,025 Btu/ SCF
3960.2MMBtu
0.9 g/MMBtu 1025Btu/scf
BOILERS (2)GATEWAY -CLEAVERBROOKS - NATGAS
Stationary Combustion - Scope 1 Boilers CO2 748.57068 748.57068 Emission Factor 2014 Default EmissionFactors - Table #12.1
1,000 -1,025 Btu/ SCF
14148 MMBtu 52.91kg/MMBtu
1025Btu/scf
BOILERS (2)GATEWAY -CLEAVERBROOKS - NATGAS
Stationary Combustion - Scope 1 Boilers CH4 0.01273 0.2674 Emission Factor 2014 Default EmissionFactors - Table #12.7
1,000 -1,025 Btu/ SCF
14148 MMBtu 0.9 g/MMBtu 1025Btu/scf
BOILERS (2)GATEWAY -CLEAVERBROOKS - NATGAS
Stationary Combustion - Scope 1 Boilers N2O 0.01273 3.94729 Emission Factor 2014 Default EmissionFactors - Table #12.7
1,000 -1,025 Btu/ SCF
14148 MMBtu 0.9 g/MMBtu 1025Btu/scf
BOILERS (2)GATEWAY -LATTNER - NATGAS
Stationary Combustion - Scope 1 Boilers CO2 208.97863 208.97863 Emission Factor 2014 Default EmissionFactors - Table #12.1
1,000 -1,025 Btu/ SCF
3949.7MMBtu
52.91kg/MMBtu
1025Btu/scf
BOILERS (2)GATEWAY -LATTNER - NATGAS
Stationary Combustion - Scope 1 Boilers CH4 0.00355 0.07465 Emission Factor 2014 Default EmissionFactors - Table #12.7
1,000 -1,025 Btu/ SCF
3949.7MMBtu
0.9 g/MMBtu 1025Btu/scf
BOILERS (2)GATEWAY -LATTNER - NATGAS
Stationary Combustion - Scope 1 Boilers N2O 0.00355 1.10197 Emission Factor 2014 Default EmissionFactors - Table #12.7
1,000 -1,025 Btu/ SCF
3949.7MMBtu
0.9 g/MMBtu 1025Btu/scf
EMER GEN #1 -DANIELS HALL -KOHLER80-R2-82 - NATGAS - PWR HSE
Stationary Combustion - Scope 1 ReciprocatingEngines (2-StrokeLean Burn)
CO2 2.32804 2.32804 Emission Factor 2014 Default EmissionFactors - Table #12.1
1,000 -1,025 Btu/ SCF
44 MMBtu 52.91kg/MMBtu
1025Btu/scf
EMER GEN #1 -DANIELS HALL -KOHLER80-R2-82 - NATGAS - PWR HSE
Stationary Combustion - Scope 1 ReciprocatingEngines (2-StrokeLean Burn)
CH4 0.02895 0.60799 Emission Factor 2014 Default EmissionFactors - Table #12.7
1,000 -1,025 Btu/ SCF
44 MMBtu 658 g/MMBtu 1025Btu/scf
EMER GEN #1 -DANIELS HALL -KOHLER80-R2-82 - NATGAS - PWR HSE
Stationary Combustion - Scope 1 ReciprocatingEngines (2-StrokeLean Burn)
N2O 0 0 PreCalculated 1,000 -1,025 Btu/ SCF
44 MMBtu 44 MMBTU x0.0001Kg/MMBTU/10 ..
EMER GEN #10- EAST HALL -KOHLER 150
Stationary Combustion - Scope 1 UnspecifiedTechnology
CO2 3.43056 3.43056 Emission Factor 2014 Default EmissionFactors - Table #12.1
DistillateFuel OilNo. 2
336 gal 10.21 kg/gal 0.138MMBtu/gal
Page 3 of 10

Massachusetts Greenhouse Gas Emissions Reporting ProgramTotal Facility Emissions Report
4/15/2016 8:38:55
WORCESTER POLYTECHNICAL INSTITUTE [Facility AQ ID: 1180127]
1180127MA Facility AQ IdWORCESTER, United States
EMER GEN #10- EAST HALL -KOHLER 150
Stationary Combustion - Scope 1 UnspecifiedTechnology
CH4 0.00014 0.00292 Emission Factor 2014 Default EmissionFactors - Table #12.9
DistillateFuel OilNo. 2
336 gal 0.003kg/MMBtu
0.138MMBtu/gal
EMER GEN #10- EAST HALL -KOHLER 150
Stationary Combustion - Scope 1 UnspecifiedTechnology
N2O 3e-005 0.00862 Emission Factor 2014 Default EmissionFactors - Table #12.9
DistillateFuel OilNo. 2
336 gal 0.0006kg/MMBtu
0.138MMBtu/gal
EMER GEN #11- GODDARDHALLOLYMPIANG60F3 NAT GAS
Stationary Combustion - Scope 1 ReciprocatingEngines (2-StrokeLean Burn)
CO2 0.7291 0.7291 Emission Factor 2014 Default EmissionFactors - Table #12.1
1,000 -1,025 Btu/ SCF
13.78 MMBtu 52.91kg/MMBtu
1025Btu/scf
EMER GEN #11- GODDARDHALLOLYMPIANG60F3 NAT GAS
Stationary Combustion - Scope 1 ReciprocatingEngines (2-StrokeLean Burn)
CH4 0.00907 0.19041 Emission Factor 2014 Default EmissionFactors - Table #12.7
1,000 -1,025 Btu/ SCF
13.78 MMBtu 658 g/MMBtu 1025Btu/scf
EMER GEN #11- GODDARDHALLOLYMPIANG60F3 NAT GAS
Stationary Combustion - Scope 1 ReciprocatingEngines (2-StrokeLean Burn)
N2O 0 0 PreCalculated 1,000 -1,025 Btu/ SCF
13.78 MMBtu 13.78 MMBTU x0.0001Kg/MMBTU/10 ..
EMER GEN #12- REC CENTERGENERATOR
Stationary Combustion - Scope 1 UnspecifiedTechnology
CO2 0.7392 0.7392 Emission Factor 2014 Default EmissionFactors - Table #12.1
DistillateFuel OilNo. 2
72.4 gal 10.21 kg/gal 0.138MMBtu/gal
EMER GEN #12- REC CENTERGENERATOR
Stationary Combustion - Scope 1 UnspecifiedTechnology
CH4 3e-005 0.00063 Emission Factor 2014 Default EmissionFactors - Table #12.9
DistillateFuel OilNo. 2
72.4 gal 0.003kg/MMBtu
0.138MMBtu/gal
EMER GEN #12- REC CENTERGENERATOR
Stationary Combustion - Scope 1 UnspecifiedTechnology
N2O 1e-005 0.00186 Emission Factor 2014 Default EmissionFactors - Table #12.9
DistillateFuel OilNo. 2
72.4 gal 0.0006kg/MMBtu
0.138MMBtu/gal
EMER GEN #13- GATEWAY 2GENERATOR -CUMMINS
Stationary Combustion - Scope 1 UnspecifiedTechnology
CO2 5.86258 5.86258 Emission Factor 2014 Default EmissionFactors - Table #12.1
DistillateFuel OilNo. 2
574.2 gal 10.21 kg/gal 0.138MMBtu/gal
EMER GEN #13- GATEWAY 2GENERATOR -CUMMINS
Stationary Combustion - Scope 1 UnspecifiedTechnology
CH4 0.00024 0.00499 Emission Factor 2014 Default EmissionFactors - Table #12.9
DistillateFuel OilNo. 2
574.2 gal 0.003kg/MMBtu
0.138MMBtu/gal
EMER GEN #13- GATEWAY 2GENERATOR -CUMMINS
Stationary Combustion - Scope 1 UnspecifiedTechnology
N2O 5e-005 0.01474 Emission Factor 2014 Default EmissionFactors - Table #12.9
DistillateFuel OilNo. 2
574.2 gal 0.0006kg/MMBtu
0.138MMBtu/gal
EMER GEN #14- FARADAYOLYMPIAN
Stationary Combustion - Scope 1 ReciprocatingEngines (2-StrokeLean Burn)
CO2 39.37933 39.37933 Emission Factor 2014 Default EmissionFactors - Table #12.1
1,000 -1,025 Btu/ SCF
744.27MMBtu
52.91kg/MMBtu
1025Btu/scf
EMER GEN #14- FARADAYOLYMPIAN
Stationary Combustion - Scope 1 ReciprocatingEngines (2-StrokeLean Burn)
CH4 0.48973 10.28432 Emission Factor 2014 Default EmissionFactors - Table #12.7
1,000 -1,025 Btu/ SCF
744.27MMBtu
658 g/MMBtu 1025Btu/scf
EMER GEN #14- FARADAYOLYMPIAN
Stationary Combustion - Scope 1 ReciprocatingEngines (2-StrokeLean Burn)
N2O 0.0001 0.031 PreCalculated 1,000 -1,025 Btu/ SCF
744.27MMBtu
744.27 MMBTUx 0.0001Kg/MMBTU/10 ..
EMER GEN #15- DRURY LANEGENERAC
Stationary Combustion - Scope 1 ReciprocatingEngines (2-StrokeLean Burn)
CO2 0.41323 0.41323 Emission Factor 2014 Default EmissionFactors - Table #12.1
1,000 -1,025 Btu/ SCF
7.81 MMBtu 52.91kg/MMBtu
1025Btu/scf
EMER GEN #15- DRURY LANE
Stationary Combustion - Scope 1 ReciprocatingEngines (2-Stroke
CH4 0.00514 0.10792 Emission Factor 2014 Default EmissionFactors - Table #12.7
1,000 -1,025 Btu
7.81 MMBtu 658 g/MMBtu 1025Btu/scf
Page 4 of 10

Massachusetts Greenhouse Gas Emissions Reporting ProgramTotal Facility Emissions Report
4/15/2016 8:38:55
WORCESTER POLYTECHNICAL INSTITUTE [Facility AQ ID: 1180127]
1180127MA Facility AQ IdWORCESTER, United States
GENERAC Lean Burn) / SCFEMER GEN #15- DRURY LANEGENERAC
Stationary Combustion - Scope 1 ReciprocatingEngines (2-StrokeLean Burn)
N2O 0 0 PreCalculated 1,000 -1,025 Btu/ SCF
7.81 MMBtu 7.81 MMBTU x0.0001Kg/MMBTU/10 ..
EMER GEN #2 -CPI 115G0 - NATGAS -FOUNDERSHALL
Stationary Combustion - Scope 1 ReciprocatingEngines (2-StrokeLean Burn)
CO2 2.01799 2.01799 Emission Factor 2014 Default EmissionFactors - Table #12.1
1,000 -1,025 Btu/ SCF
38.14 MMBtu 52.91kg/MMBtu
1025Btu/scf
EMER GEN #2 -CPI 115G0 - NATGAS -FOUNDERSHALL
Stationary Combustion - Scope 1 ReciprocatingEngines (2-StrokeLean Burn)
CH4 0.0251 0.52702 Emission Factor 2014 Default EmissionFactors - Table #12.7
1,000 -1,025 Btu/ SCF
38.14 MMBtu 658 g/MMBtu 1025Btu/scf
EMER GEN #2 -CPI 115G0 - NATGAS -FOUNDERSHALL
Stationary Combustion - Scope 1 ReciprocatingEngines (2-StrokeLean Burn)
N2O 0 0 PreCalculated 1,000 -1,025 Btu/ SCF
38.14 MMBtu 38.14 MMBTU x0.0001Kg/MMBTU/10 ..
EMER GEN #3 -ONAN 15JC4R -NAT GAS -HARRINGTON
Stationary Combustion - Scope 1 ReciprocatingEngines (2-StrokeLean Burn)
CO2 0.35873 0.35873 Emission Factor 2014 Default EmissionFactors - Table #12.1
1,000 -1,025 Btu/ SCF
6.78 MMBtu 52.91kg/MMBtu
1025Btu/scf
EMER GEN #3 -ONAN 15JC4R -NAT GAS -HARRINGTON
Stationary Combustion - Scope 1 ReciprocatingEngines (2-StrokeLean Burn)
CH4 0.00446 0.09369 Emission Factor 2014 Default EmissionFactors - Table #12.7
1,000 -1,025 Btu/ SCF
6.78 MMBtu 658 g/MMBtu 1025Btu/scf
EMER GEN #3 -ONAN 15JC4R -NAT GAS -HARRINGTON
Stationary Combustion - Scope 1 ReciprocatingEngines (2-StrokeLean Burn)
N2O 0 0 PreCalculated 1,000 -1,025 Btu/ SCF
6.78 MMBtu 6.78 MMBTU x0.0001Kg/MMBTU/10 ..
EMER GEN #4 -OLYMPIAN 96A -NAT GAS-SALISBURY
Stationary Combustion - Scope 1 ReciprocatingEngines (2-StrokeLean Burn)
CO2 2.23016 2.23016 Emission Factor 2014 Default EmissionFactors - Table #12.1
1,000 -1,025 Btu/ SCF
42.15 MMBtu 52.91kg/MMBtu
1025Btu/scf
EMER GEN #4 -OLYMPIAN 96A -NAT GAS-SALISBURY
Stationary Combustion - Scope 1 ReciprocatingEngines (2-StrokeLean Burn)
CH4 0.02773 0.58243 Emission Factor 2014 Default EmissionFactors - Table #12.7
1,000 -1,025 Btu/ SCF
42.15 MMBtu 658 g/MMBtu 1025Btu/scf
EMER GEN #4 -OLYMPIAN 96A -NAT GAS-SALISBURY
Stationary Combustion - Scope 1 ReciprocatingEngines (2-StrokeLean Burn)
N2O 0 0 PreCalculated 1,000 -1,025 Btu/ SCF
42.15 MMBtu 42.15 MMBTU x0.0001Kg/MMBTU/10 ..
EMER GEN #5 -FULLER #1ROOF,SUPERIOR
Stationary Combustion - Scope 1 UnspecifiedTechnology
CO2 1.19457 1.19457 Emission Factor 2014 Default EmissionFactors - Table #12.1
DistillateFuel OilNo. 2
117 gal 10.21 kg/gal 0.138MMBtu/gal
EMER GEN #5 -FULLER #1ROOF,SUPERIOR
Stationary Combustion - Scope 1 UnspecifiedTechnology
CH4 5e-005 0.00102 Emission Factor 2014 Default EmissionFactors - Table #12.9
DistillateFuel OilNo. 2
117 gal 0.003kg/MMBtu
0.138MMBtu/gal
EMER GEN #5 -FULLER #1ROOF,SUPERIOR
Stationary Combustion - Scope 1 UnspecifiedTechnology
N2O 1e-005 0.003 Emission Factor 2014 Default EmissionFactors - Table #12.9
DistillateFuel OilNo. 2
117 gal 0.0006kg/MMBtu
0.138MMBtu/gal
EMER GEN #6 -FULLER #2CATERPILLAR#D200P4DIESEL
Stationary Combustion - Scope 1 UnspecifiedTechnology
CO2 4.24736 4.24736 Emission Factor 2014 Default EmissionFactors - Table #12.1
DistillateFuel OilNo. 2
416 gal 10.21 kg/gal 0.138MMBtu/gal
EMER GEN #6 -FULLER #2CATERPILLAR#D200P4
Stationary Combustion - Scope 1 UnspecifiedTechnology
CH4 0.00017 0.00362 Emission Factor 2014 Default EmissionFactors - Table #12.9
DistillateFuel OilNo. 2
416 gal 0.003kg/MMBtu
0.138MMBtu/gal
Page 5 of 10

Massachusetts Greenhouse Gas Emissions Reporting ProgramTotal Facility Emissions Report
4/15/2016 8:38:55
WORCESTER POLYTECHNICAL INSTITUTE [Facility AQ ID: 1180127]
1180127MA Facility AQ IdWORCESTER, United States
DIESELEMER GEN #6 -FULLER #2CATERPILLAR#D200P4DIESEL
Stationary Combustion - Scope 1 UnspecifiedTechnology
N2O 3e-005 0.01068 Emission Factor 2014 Default EmissionFactors - Table #12.9
DistillateFuel OilNo. 2
416 gal 0.0006kg/MMBtu
0.138MMBtu/gal
EMER GEN #7 -GATEWAYKOHLER 500
Stationary Combustion - Scope 1 UnspecifiedTechnology
CO2 15.39668 15.39668 Emission Factor 2014 Default EmissionFactors - Table #12.1
DistillateFuel OilNo. 2
1508 gal 10.21 kg/gal 0.138MMBtu/gal
EMER GEN #7 -GATEWAYKOHLER 500
Stationary Combustion - Scope 1 UnspecifiedTechnology
CH4 0.00062 0.01311 Emission Factor 2014 Default EmissionFactors - Table #12.9
DistillateFuel OilNo. 2
1508 gal 0.003kg/MMBtu
0.138MMBtu/gal
EMER GEN #7 -GATEWAYKOHLER 500
Stationary Combustion - Scope 1 UnspecifiedTechnology
N2O 0.00012 0.03871 Emission Factor 2014 Default EmissionFactors - Table #12.9
DistillateFuel OilNo. 2
1508 gal 0.0006kg/MMBtu
0.138MMBtu/gal
EMER GEN #8GATEWAYGARAGE CATD125-6 DIESEL
Stationary Combustion - Scope 1 UnspecifiedTechnology
CO2 1.31096 1.31096 Emission Factor 2014 Default EmissionFactors - Table #12.1
DistillateFuel OilNo. 2
128.4 gal 10.21 kg/gal 0.138MMBtu/gal
EMER GEN #8GATEWAYGARAGE CATD125-6 DIESEL
Stationary Combustion - Scope 1 UnspecifiedTechnology
CH4 5e-005 0.00112 Emission Factor 2014 Default EmissionFactors - Table #12.9
DistillateFuel OilNo. 2
128.4 gal 0.003kg/MMBtu
0.138MMBtu/gal
EMER GEN #8GATEWAYGARAGE CATD125-6 DIESEL
Stationary Combustion - Scope 1 UnspecifiedTechnology
N2O 1e-005 0.0033 Emission Factor 2014 Default EmissionFactors - Table #12.9
DistillateFuel OilNo. 2
128.4 gal 0.0006kg/MMBtu
0.138MMBtu/gal
EMER GEN #9 -POWER PLANTCATERPILLAR #SR-4 DIESEL
Stationary Combustion - Scope 1 UnspecifiedTechnology
CO2 13.23216 13.23216 Emission Factor 2014 Default EmissionFactors - Table #12.1
DistillateFuel OilNo. 2
1296 gal 10.21 kg/gal 0.138MMBtu/gal
EMER GEN #9 -POWER PLANTCATERPILLAR #SR-4 DIESEL
Stationary Combustion - Scope 1 UnspecifiedTechnology
CH4 0.00054 0.01127 Emission Factor 2014 Default EmissionFactors - Table #12.9
DistillateFuel OilNo. 2
1296 gal 0.003kg/MMBtu
0.138MMBtu/gal
EMER GEN #9 -POWER PLANTCATERPILLAR #SR-4 DIESEL
Stationary Combustion - Scope 1 UnspecifiedTechnology
N2O 0.00011 0.03327 Emission Factor 2014 Default EmissionFactors - Table #12.9
DistillateFuel OilNo. 2
1296 gal 0.0006kg/MMBtu
0.138MMBtu/gal
HVAC Units Fugitive - Scope 1 UnspecifiedTechnology
HFC-13 .. 0.075 97.5 PreCalculated N/A 56 L
Light truckVehicles Tier 0
Mobile Combustion - Scope 1 EPA Tier 0 CO2 0 0 Emission Factor 2014 Default EmissionFactors - Table #13.1
All 0 gal 8.78 kg/gal 5.25MMBtu/bbl
Light truckVehicles Tier 0
Mobile Combustion - Scope 1 EPA Tier 0 CH4 0 0 Emission Factor 2014 Default EmissionFactors - Table #13.4
All 0 mi 0.0776 g/mi
Light truckVehicles Tier 0
Mobile Combustion - Scope 1 EPA Tier 0 N2O 0 0 Emission Factor 2014 Default EmissionFactors - Table #13.4
All 0 mi 0.1056 g/mi
Light truckvehicles Tier 1
Mobile Combustion - Scope 1 EPA Tier 1 CO2 11.75818 11.75818 Emission Factor 2014 Default EmissionFactors - Table #13.1
All 1339.2 gal 8.78 kg/gal 5.25MMBtu/bbl
Light truckvehicles Tier 1
Mobile Combustion - Scope 1 EPA Tier 1 CH4 0.00085 0.01776 Emission Factor 2014 Default EmissionFactors - Table #13.4
All 18708 mi 0.0452 g/mi
Page 6 of 10

Massachusetts Greenhouse Gas Emissions Reporting ProgramTotal Facility Emissions Report
4/15/2016 8:38:55
WORCESTER POLYTECHNICAL INSTITUTE [Facility AQ ID: 1180127]
1180127MA Facility AQ IdWORCESTER, United States
Light truckvehicles Tier 1
Mobile Combustion - Scope 1 EPA Tier 1 N2O 0.00163 0.50513 Emission Factor 2014 Default EmissionFactors - Table #13.4
All 18708 mi 0.0871 g/mi
Light truckvehicles Tier 2
Mobile Combustion - Scope 1 EPA Tier 2 CO2 92.34909 92.34909 Emission Factor 2014 Default EmissionFactors - Table #13.1
All 10518.12 gal 8.78 kg/gal 5.25MMBtu/bbl
Light truckvehicles Tier 2
Mobile Combustion - Scope 1 EPA Tier 2 CH4 0.00256 0.05373 Emission Factor 2014 Default EmissionFactors - Table #13.4
All 156954 mi 0.0163 g/mi
Light truckvehicles Tier 2
Mobile Combustion - Scope 1 EPA Tier 2 N2O 0.00104 0.32113 Emission Factor 2014 Default EmissionFactors - Table #13.4
All 156954 mi 0.0066 g/mi
Mobile AirConditioning
Fugitive - Scope 1 UnspecifiedTechnology
HFC-13 .. 0.0076 9.88 PreCalculated N/A 6 L
Motor Equipment Mobile Combustion - Scope 1 AgriculturalEquipment
CO2 11.42111 11.42111 Emission Factor 2014 Default EmissionFactors - Table #13.1
All 1118.62 gal 10.21 kg/gal 5.8MMBtu/bbl
Motor Equipment Mobile Combustion - Scope 1 AgriculturalEquipment
CH4 0.00161 0.03383 Emission Factor 2014 Default EmissionFactors - Table #13.7
All 1118.62 gal 1.44 g/gal 5.8MMBtu/bbl
Motor Equipment Mobile Combustion - Scope 1 AgriculturalEquipment
N2O 0.00029 0.09016 Emission Factor 2014 Default EmissionFactors - Table #13.7
All 1118.62 gal 0.26 g/gal 5.8MMBtu/bbl
NEW BOILER#1-VICTORYENERGY - NATGAS / #2 OIL
Stationary Combustion - Scope 1 Boilers CO2 1593.82909 1593.82909 Emission Factor 2014 Default EmissionFactors - Table #12.1
1,000 -1,025 Btu/ SCF
30123.4MMBtu
52.91kg/MMBtu
1025Btu/scf
NEW BOILER#1-VICTORYENERGY - NATGAS / #2 OIL
Stationary Combustion - Scope 1 Boilers CH4 0.02711 0.56933 Emission Factor 2014 Default EmissionFactors - Table #12.7
1,000 -1,025 Btu/ SCF
30123.4MMBtu
0.9 g/MMBtu 1025Btu/scf
NEW BOILER#1-VICTORYENERGY - NATGAS / #2 OIL
Stationary Combustion - Scope 1 Boilers N2O 0.02711 8.40443 Emission Factor 2014 Default EmissionFactors - Table #12.7
1,000 -1,025 Btu/ SCF
30123.4MMBtu
0.9 g/MMBtu 1025Btu/scf
NEW BOILER#1-VICTORYENERGY - NATGAS / #2 OIL
Stationary Combustion - Scope 1 UnspecifiedTechnology
CO2 0.15826 0.15826 Emission Factor 2014 Default EmissionFactors - Table #12.1
DistillateFuel OilNo. 2
15.5 gal 10.21 kg/gal 0.138MMBtu/gal
NEW BOILER#1-VICTORYENERGY - NATGAS / #2 OIL
Stationary Combustion - Scope 1 UnspecifiedTechnology
CH4 1e-005 0.00013 Emission Factor 2014 Default EmissionFactors - Table #12.9
DistillateFuel OilNo. 2
15.5 gal 0.003kg/MMBtu
0.138MMBtu/gal
NEW BOILER#1-VICTORYENERGY - NATGAS / #2 OIL
Stationary Combustion - Scope 1 UnspecifiedTechnology
N2O 0 0.0004 Emission Factor 2014 Default EmissionFactors - Table #12.9
DistillateFuel OilNo. 2
15.5 gal 0.0006kg/MMBtu
0.138MMBtu/gal
NEW BOILER#2-VICTORYENERGY - NATGAS
Stationary Combustion - Scope 1 Boilers CO2 1831.20981 1831.20981 Emission Factor 2014 Default EmissionFactors - Table #12.1
1,000 -1,025 Btu/ SCF
34609.9MMBtu
52.91kg/MMBtu
1025Btu/scf
NEW BOILER Stationary Combustion - Scope 1 Boilers CH4 0.03115 0.65413 Emission Factor 2014 Default Emission 1,000 - 34609.9 0.9 g/MMBtu 1025
Page 7 of 10

Massachusetts Greenhouse Gas Emissions Reporting ProgramTotal Facility Emissions Report
4/15/2016 8:38:55
WORCESTER POLYTECHNICAL INSTITUTE [Facility AQ ID: 1180127]
1180127MA Facility AQ IdWORCESTER, United States
#2-VICTORYENERGY - NATGAS
Factors - Table #12.7 1,025 Btu/ SCF
MMBtu Btu/scf
NEW BOILER#2-VICTORYENERGY - NATGAS
Stationary Combustion - Scope 1 Boilers N2O 0.03115 9.65616 Emission Factor 2014 Default EmissionFactors - Table #12.7
1,000 -1,025 Btu/ SCF
34609.9MMBtu
0.9 g/MMBtu 1025Btu/scf
NEW BOILER#3-VICTORYENERGY - NATGAS / #2 OIL
Stationary Combustion - Scope 1 Boilers CO2 1848.16217 1848.16217 Emission Factor 2014 Default EmissionFactors - Table #12.1
1,000 -1,025 Btu/ SCF
34930.3MMBtu
52.91kg/MMBtu
1025Btu/scf
NEW BOILER#3-VICTORYENERGY - NATGAS / #2 OIL
Stationary Combustion - Scope 1 Boilers CH4 0.03144 0.66018 Emission Factor 2014 Default EmissionFactors - Table #12.7
1,000 -1,025 Btu/ SCF
34930.3MMBtu
0.9 g/MMBtu 1025Btu/scf
NEW BOILER#3-VICTORYENERGY - NATGAS / #2 OIL
Stationary Combustion - Scope 1 Boilers N2O 0.03144 9.74555 Emission Factor 2014 Default EmissionFactors - Table #12.7
1,000 -1,025 Btu/ SCF
34930.3MMBtu
0.9 g/MMBtu 1025Btu/scf
NEW BOILER#3-VICTORYENERGY - NATGAS / #2 OIL
Stationary Combustion - Scope 1 UnspecifiedTechnology
CO2 0.15826 0.15826 Emission Factor 2014 Default EmissionFactors - Table #12.1
DistillateFuel OilNo. 2
15.5 gal 10.21 kg/gal 0.138MMBtu/gal
NEW BOILER#3-VICTORYENERGY - NATGAS / #2 OIL
Stationary Combustion - Scope 1 UnspecifiedTechnology
CH4 1e-005 0.00013 Emission Factor 2014 Default EmissionFactors - Table #12.9
DistillateFuel OilNo. 2
15.5 gal 0.003kg/MMBtu
0.138MMBtu/gal
NEW BOILER#3-VICTORYENERGY - NATGAS / #2 OIL
Stationary Combustion - Scope 1 UnspecifiedTechnology
N2O 0 0.0004 Emission Factor 2014 Default EmissionFactors - Table #12.9
DistillateFuel OilNo. 2
15.5 gal 0.0006kg/MMBtu
0.138MMBtu/gal
OFF-CAMPUSRESIDENCES -NAT. GAS
Stationary Combustion - Scope 1 Boilers CO2 1189.49087 1189.49087 Emission Factor 2014 Default EmissionFactors - Table #12.1
1,000 -1,025 Btu/ SCF
22481.4MMBtu
52.91kg/MMBtu
1025Btu/scf
OFF-CAMPUSRESIDENCES -NAT. GAS
Stationary Combustion - Scope 1 Boilers CH4 0.02023 0.4249 Emission Factor 2014 Default EmissionFactors - Table #12.7
1,000 -1,025 Btu/ SCF
22481.4MMBtu
0.9 g/MMBtu 1025Btu/scf
OFF-CAMPUSRESIDENCES -NAT. GAS
Stationary Combustion - Scope 1 Boilers N2O 0.02023 6.27231 Emission Factor 2014 Default EmissionFactors - Table #12.7
1,000 -1,025 Btu/ SCF
22481.4MMBtu
0.9 g/MMBtu 1025Btu/scf
ON-CAMPUSMISCELLANEOUSSOURCES 1STSET - NAT. GAS
Stationary Combustion - Scope 1 Boilers CO2 392.99432 392.99432 Emission Factor 2014 Default EmissionFactors - Table #12.1
1,000 -1,025 Btu/ SCF
7427.6MMBtu
52.91kg/MMBtu
1025Btu/scf
ON-CAMPUSMISCELLANEOUSSOURCES 1STSET - NAT. GAS
Stationary Combustion - Scope 1 Boilers CH4 0.00668 0.14038 Emission Factor 2014 Default EmissionFactors - Table #12.7
1,000 -1,025 Btu/ SCF
7427.6MMBtu
0.9 g/MMBtu 1025Btu/scf
ON-CAMPUSMISCELLANEOUSSOURCES 1STSET - NAT. GAS
Stationary Combustion - Scope 1 Boilers N2O 0.00668 2.0723 Emission Factor 2014 Default EmissionFactors - Table #12.7
1,000 -1,025 Btu/ SCF
7427.6MMBtu
0.9 g/MMBtu 1025Btu/scf
ON-CAMPUSMISCELLANEOUSSOURCES 2NDSET - NAT. GAS
Stationary Combustion - Scope 1 Boilers CO2 317.57111 317.57111 Emission Factor 2014 Default EmissionFactors - Table #12.1
1,000 -1,025 Btu/ SCF
6002.1MMBtu
52.91kg/MMBtu
1025Btu/scf
ON-CAMPUSMISCELLANEOUSSOURCES 2NDSET - NAT. GAS
Stationary Combustion - Scope 1 Boilers CH4 0.0054 0.11344 Emission Factor 2014 Default EmissionFactors - Table #12.7
1,000 -1,025 Btu/ SCF
6002.1MMBtu
0.9 g/MMBtu 1025Btu/scf
ON-CAMPUS Stationary Combustion - Scope 1 Boilers N2O 0.0054 1.67459 Emission Factor 2014 Default Emission 1,000 - 6002.1 0.9 g/MMBtu 1025
Page 8 of 10

Massachusetts Greenhouse Gas Emissions Reporting ProgramTotal Facility Emissions Report
4/15/2016 8:38:55
WORCESTER POLYTECHNICAL INSTITUTE [Facility AQ ID: 1180127]
1180127MA Facility AQ IdWORCESTER, United States
MISCELLANEOUSSOURCES 2NDSET - NAT. GAS
Factors - Table #12.7 1,025 Btu/ SCF
MMBtu Btu/scf
ON-CAMPUSMISCELLANEOUSSOURCES 3RDSET - NAT. GAS
Stationary Combustion - Scope 1 Boilers CO2 305.51292 305.51292 Emission Factor 2014 Default EmissionFactors - Table #12.1
1,000 -1,025 Btu/ SCF
5774.2MMBtu
52.91kg/MMBtu
1025Btu/scf
ON-CAMPUSMISCELLANEOUSSOURCES 3RDSET - NAT. GAS
Stationary Combustion - Scope 1 Boilers CH4 0.0052 0.10913 Emission Factor 2014 Default EmissionFactors - Table #12.7
1,000 -1,025 Btu/ SCF
5774.2MMBtu
0.9 g/MMBtu 1025Btu/scf
ON-CAMPUSMISCELLANEOUSSOURCES 3RDSET - NAT. GAS
Stationary Combustion - Scope 1 Boilers N2O 0.0052 1.611 Emission Factor 2014 Default EmissionFactors - Table #12.7
1,000 -1,025 Btu/ SCF
5774.2MMBtu
0.9 g/MMBtu 1025Btu/scf
PassengerVehicles Tier 2
Mobile Combustion - Scope 1 EPA Tier 0 CO2 9.219 9.219 Emission Factor 2014 Default EmissionFactors - Table #13.1
All 1050 gal 8.78 kg/gal 5.25MMBtu/bbl
PassengerVehicles Tier 2
Mobile Combustion - Scope 1 EPA Tier 0 CH4 0.00148 0.03116 Emission Factor 2014 Default EmissionFactors - Table #13.4
All 21074 mi 0.0704 g/mi
PassengerVehicles Tier 2
Mobile Combustion - Scope 1 EPA Tier 0 N2O 0.00136 0.42268 Emission Factor 2014 Default EmissionFactors - Table #13.4
All 21074 mi 0.0647 g/mi
RefrigerationR404A
Fugitive - Scope 1 UnspecifiedTechnology
R-404A 0.012 39.12 PreCalculated N/A 9 L
RefrigerationR410A
Fugitive - Scope 1 UnspecifiedTechnology
R-410A 0.015 25.875 PreCalculated N/A 11 L
SALISBURYESTATESHEATING
Stationary Combustion - Scope 1 Boilers CO2 682.98768 682.98768 Emission Factor 2014 Default EmissionFactors - Table #12.1
1,000 -1,025 Btu/ SCF
12908.48MMBtu
52.91kg/MMBtu
1025Btu/scf
SALISBURYESTATESHEATING
Stationary Combustion - Scope 1 Boilers CH4 0.01162 0.24397 Emission Factor 2014 Default EmissionFactors - Table #12.7
1,000 -1,025 Btu/ SCF
12908.48MMBtu
0.9 g/MMBtu 1025Btu/scf
SALISBURYESTATESHEATING
Stationary Combustion - Scope 1 Boilers N2O 0.01162 3.60147 Emission Factor 2014 Default EmissionFactors - Table #12.7
1,000 -1,025 Btu/ SCF
12908.48MMBtu
0.9 g/MMBtu 1025Btu/scf
Page 9 of 10

Massachusetts Greenhouse Gas Emissions Reporting ProgramTotal Facility Emissions Report
4/15/2016 8:38:55
WORCESTER POLYTECHNICAL INSTITUTE [Facility AQ ID: 1180127]
1180127MA Facility AQ IdWORCESTER, United States
Page 10 of 10

Tighe&Bond
Greenhouse Gas Emissions Report – WPI, Worcester, MA
Appendix B Supporting Documentation

Worcester Polytechnic InstituteWorcester, MA
Greenhouse Gas Emissions Report
Summary of Sources of GHG Emissions Operating in 2015
EU# Emission Unit Fuel Quantity Used Unit of MeasureQuantity
UsedUnit of
MeasureEmission
Factor (EF)(1) Unit of Measure EF SourceMetric-Tons of CO2
Emitted(2)Short-Tons of CO2
Emitted(3)
DIRECT EMISSIONS SCOPE 1Carbon Dioxide CO2 - GWP 1Stationary Fuel CombustionEU # 4 Founders Equip. Boiler # 4 N. G. 39,602 Therms 3,960.20 MMBTU 52.91 Kg CO2/MMBTU GRP Table 12.1 209.53 230.970EU # 7 Generator # 1 Daniels Hall, Kohler N.G. 0.0428 MMCF 44.00 MMBTU 52.91 Kg CO2/MMBTU GRP Table 12.1 2.3280 2.566EU # 8 Generator # 2 Founders Hall, CPI N.G. 0.0371 MMCF 38.14 MMBTU 52.91 Kg CO2/MMBTU GRP Table 12.1 2.0179 2.224EU # 9 Generator # 3 Harrington, Onan N.G. 0.0066 MMCF 6.78 MMBTU 52.91 Kg CO2/MMBTU GRP Table 12.1 0.3590 0.396EU # 10 Generator # 4 Salisbury, Olympian N.G. 0.0410 MMCF 42.15 MMBTU 52.91 Kg CO2/MMBTU GRP Table 12.1 2.2301 2.458EU # 11 Generator Security, Honda N.G. - MMCF 0.00 MMBTU 52.91 Kg CO2/MMBTU GRP Table 12.1 0.0000 0.000EU # 12 Generator #5 Fuller #1 Roof, Superior diesel 0.1170 1000 gallons 117.00 gallons 10.21 kg/gallon GRP Table 12.1 1.1946 1.317EU # 13 Generator #6 Fuller #2 Caterpillar diesel 0.4160 1000 gallons 416.00 gallons 10.21 kg/gallon GRP Table 12.1 4.2474 4.682EU # 14 Generator #9, Power Plant,SR-4 Caterpillar diesel 1.2960 1000 gallons 1,296.00 gallons 10.21 kg/gallon GRP Table 12.1 13.2322 14.586EU # 28 Generator #7 Gateway, Kohler diesel 1.5088 1000 gallons 1,508.80 gallons 10.21 kg/gallon GRP Table 12.1 15.4048 16.981EU # 29 Generator #10 East Hall, Kohler diesel 0.3360 1000 gallons 336.00 gallons 10.21 kg/gallon GRP Table 12.1 3.4306 3.782EU # 30 Generator # 11 Goddard, Olympian N.G. 0.0134 MMCF 13.78 MMBTU 52.91 Kg CO2/MMBTU GRP Table 12.1 0.7288 0.803EU # 31 Generator #8 Gateway Garage, Caterpiller diesel 0.1284 1000 gallons 128.40 gallons 10.21 kg/gallon GRP Table 12.1 1.3110 1.445
33 Generator #13 Gateway 2 Generator diesel 0.5742 1000 gallons 574.20 gallons 10.21 kg/gallon GRP Table 12.1 5.8626 6.46232 Generator #12 Rec Center Generator diesel 0.0724 1000 gallons 72.40 gallons 10.21 kg/gallon GRP Table 12.1 0.7392 0.81534 Generator #14 Faraday Generator N.G. 0.7240 MMCF 744.27 MMBTU 52.91 Kg CO2/MMBTU GRP Table 12.1 39.3794 43.40835 Generator #15 Drury Lane N.G. 0.0076 MMCF 7.81 MMBTU 52.91 Kg CO2/MMBTU GRP Table 12.1 0.4134 0.456
EU # 15 Power House New Boiler #1 N. G. 301,234 Therms 30,123.40 MMBTU 52.91 Kg CO2/MMBTU GRP Table 12.1 1,593.83 1,757#2 Oil 0.0155 1000 gallons 15.5000 gallons 10.21 kg/gallon GRP Table 12.1 0.1583 0.1744
EU # 16 Power House New Boiler #2 N.G. 346,099 Therms 34,609.90 MMBTU 52.91 Kg CO2/MMBTU GRP Table 12.1 1,831.21 2,019EU # 17 Power House New Boiler #3 N.G. 349,303 Therms 34,930.30 MMBTU 52.91 Kg CO2/MMBTU GRP Table 12.1 1,848.16 2,037
#2 Oil 0.0155 1000 gallons 15.5000 gallons 10.21 kg/gallon GRP Table 12.1 0.1583 0.1744EU # 20 Off Campus Residences (group) N.G. 224,814 Therms 22,481.40 MMBTU 52.91 Kg CO2/MMBTU GRP Table 12.1 1,189.49 1,311EU # 21 On-Campus Miscell. 1st set N.G. 74,276 Therms 7,427.60 MMBTU 52.91 Kg CO2/MMBTU GRP Table 12.1 392.99 433EU # 22 On-Campus Miscell. 2nd set N.G. 60,021 Therms 6,002.10 MMBTU 52.91 Kg CO2/MMBTU GRP Table 12.1 317.57 350EU # 23 On-Campus Miscell. 3rd set N.G. 57,742 Therms 5,774.20 MMBTU 52.91 Kg CO2/MMBTU GRP Table 12.1 305.51 337EU # 24 Off-Campus Residences Oil #2 Oil - 1000 gallons 0.00 gallons 10.21 kg/gallon GRP Table 12.1 0.00 0EU # 27 Gateway Cleaver Brooks Boilers (2) N.G. 141,480 Therms 14,148.00 MMBTU 52.91 Kg CO2/MMBTU GRP Table 12.1 748.57 825EU # 26 Gateway Lattern Boilers (2) N.G. 39,497 Therms 3,949.70 MMBTU 52.91 Kg CO2/MMBTU GRP Table 12.1 208.98 230
Salisbury Estates Heating N.G. 129,085 Therms 12,908.48 MMBTU 52.91 Kg CO2/MMBTU GRP Table 12.1 682.99 753
Mobile Fuel CombustionNon-Highway Motor Vehicles diesel 1,118.62 gallons 10.21 Kg CO2/gallon GRP Table 12.1 11.42 13Tier 1 - Light Trucks gasoline 1,339.20 gallons 8.78 Kg CO2/gallon GRP Table 12.1 11.76 13Tier 2 - Light Trucks gasoline 10,518.12 gallons 8.78 Kg CO2/gallon GRP Table 12.1 92.35 102Tier 2 - Passenger Cars gasoline 1,050.00 gallons 8.78 Kg CO2/gallon GRP Table 12.1 9.22 10
J:\W\W1489 WPI\GHG\2015\2015GHG_Emissions_Calc (add).xlsx 1 of 3

Worcester Polytechnic InstituteWorcester, MA
Greenhouse Gas Emissions Report
Summary of Sources of GHG Emissions Operating in 2015
EU# Emission Unit Fuel Quantity Used Unit of MeasureQuantity
UsedUnit of
MeasureEmission
Factor (EF)(1) Unit of Measure EF SourceMetric-Tons of CO2
Emitted(2)Short-Tons of CO2
Emitted(3)
Methane CH4 - GWP 21Stationary Fuel CombustionEU # 4 Founders Equip. Boiler # 4 N. G. 39,602 Therms 3,960.20 MMBTU 0.9 g/MMBTU GRP Table 12.7 0.0036 0.0039EU # 7 Generator # 1 Daniels Hall, Kohler N.G. 0.0428 MMCF 44.00 MMBTU 658 g/MMBTU GRP Table 12.7 0.0290 0.0319EU # 8 Generator # 2 Founders Hall, CPI N.G. 0.0371 MMCF 38.14 MMBTU 658 g/MMBTU GRP Table 12.7 0.0251 0.0277EU # 9 Generator # 3 Harrington, Onan N.G. 0.0066 MMCF 6.78 MMBTU 658 g/MMBTU GRP Table 12.7 0.0045 0.0049EU # 10 Generator # 4 Salisbury, Olympian N.G. 0.0410 MMCF 42.15 MMBTU 658 g/MMBTU GRP Table 12.7 0.0277 0.0306EU # 11 Generator Security, Honda N.G. - MMCF 0.00 MMBTU 658 g/MMBTU GRP Table 12.7 0.0000 0.0000EU # 12 Generator #5 Fuller #1 Roof, Superior diesel 0.1170 1000 gallons 117.00 gallons 0.003 Kg/MMBTU GRP Table 12.9 0.0000 0.0001EU # 13 Generator #6 Fuller #2 Caterpillar diesel 0.4160 1000 gallons 416.00 gallons 0.003 Kg/MMBTU GRP Table 12.9 0.0002 0.0002EU # 14 Generator #9, Power Plant,SR-4 Caterpillar diesel 1.2960 1000 gallons 1,296.00 gallons 0.003 Kg/MMBTU GRP Table 12.9 0.0005 0.0006EU # 28 Generator #7 Gateway, Kohler diesel 1.5088 1000 gallons 1,508.80 gallons 0.003 Kg/MMBTU GRP Table 12.9 0.0006 0.0007EU # 29 Generator #10 East Hall, Kohler diesel 0.3360 1000 gallons 336.00 gallons 0.003 Kg/MMBTU GRP Table 12.9 0.0001 0.0002EU # 30 Generator # 11 Goddard, Olympian N.G. 0.0134 MMCF 13.78 MMBTU 658 g/MMBTU GRP Table 12.7 0.0091 0.0100EU # 31 Generator #8 Gateway Garage, Caterpiller diesel 0.1284 1000 gallons 128.40 gallons 0.003 Kg/MMBTU GRP Table 12.9 0.0001 0.0001
Generator #13 Gateway 2 Generator diesel 0.5742 1000 gallons 574.20 gallons 0.003 Kg/MMBTU GRP Table 12.9 0.0002 0.0003Generator #12 Rec Center Generator diesel 0.0724 1000 gallons 72.40 gallons 0.003 Kg/MMBTU GRP Table 12.9 0.0000 0.0000Generator #14 Faraday Generator N.G. 0.7240 MMCF 744.27 MMBTU 658 g/MMBTU GRP Table 12.7 0.4897 0.5398Generator #15 Drury Lane N.G. 0.0076 MMCF 7.81 MMBTU 658 g/MMBTU GRP Table 12.7 0.0051 0.0057
EU # 15 Power House New Boiler #1 N. G. 301,234 Therms 30,123.40 MMBTU 0.9 g/MMBTU GRP Table 12.7 0.0271 0.0299#2 Oil 0.0155 1000 gallons 15.5000 gallons 0.2 g/MMBTU GRP Table 12.9 0.0000 0.0000
EU # 16 Power House New Boiler #2 N.G. 346,099 Therms 34,609.90 MMBTU 0.9 g/MMBTU GRP Table 12.7 0.0311 0.0343EU # 17 Power House New Boiler #3 N.G. 349,303 Therms 34,930.30 MMBTU 0.9 g/MMBTU GRP Table 12.7 0.0314 0.0347
#2 Oil 0.0155 1000 gallons 15.5000 gallons 0.2 g/MMBTU GRP Table 12.9 0.0000 0.0000EU # 20 Off Campus Residences (group) N.G. 224,814 Therms 22,481.40 MMBTU 0.9 g/MMBTU GRP Table 12.7 0.0202 0.0223EU # 21 On-Campus Miscell. 1st set N.G. 74,276 Therms 7,427.60 MMBTU 0.9 g/MMBTU GRP Table 12.7 0.0067 0.0074EU # 22 On-Campus Miscell. 2nd set N.G. 60,021 Therms 6,002.10 MMBTU 0.9 g/MMBTU GRP Table 12.7 0.0054 0.0060EU # 23 On-Campus Miscell. 3rd set N.G. 57,742 Therms 5,774.20 MMBTU 0.9 g/MMBTU GRP Table 12.7 0.0052 0.0057EU # 24 Off-Campus Residences Oil #2 Oil - 1000 gallons 0.00 gallons 0.0030 Kg/MMBTU GRP Table 12.9 0.0000 0.0000EU # 27 Gateway Cleaver Brooks Boilers (2) N.G. 141,480 Therms 14,148.00 MMBTU 0.9 g/MMBTU GRP Table 12.7 0.0127 0.0140EU # 26 Gateway Lattern Boilers (2) N.G. 39,497 Therms 3,949.70 MMBTU 0.9 g/MMBTU GRP Table 12.7 0.0036 0.0039
Salisbury Estates Heating N.G. 129,085 Therms 12,908.48 MMBTU 0.9 g/MMBTU GRP Table 12.7 0.0120 0.0132Mobile Fuel Combustion
Non-Highway Motor Vehicles diesel 1,118.62 gallons 1.44 g/gal GRP Table 13.7 0.0016 0.0018Tier 1 - Light Trucks gasoline 1,339.20 gallons 0.0452 g/mi GRP Table 13.4 0.0008 0.0009Tier 2 - Light Trucks gasoline 10,518.12 gallons 0.0163 g/mi GRP Table 13.4 0.0026 0.0028Tier 2 - Passenger Cars gasoline 1,050.00 gallons 0.0704 g/mi GRP Table 13.4 0.0015 0.0016
J:\W\W1489 WPI\GHG\2015\2015GHG_Emissions_Calc (add).xlsx 2 of 3

Worcester Polytechnic InstituteWorcester, MA
Greenhouse Gas Emissions Report
Summary of Sources of GHG Emissions Operating in 2015
EU# Emission Unit Fuel Quantity Used Unit of MeasureQuantity
UsedUnit of
MeasureEmission
Factor (EF)(1) Unit of Measure EF SourceMetric-Tons of CO2
Emitted(2)Short-Tons of CO2
Emitted(3)
Nitrous Oxide N2O - GWP 310Stationary Fuel CombustionEU # 4 Founders Equip. Boiler # 4 N. G. 39,602 Therms 3,960.20 MMBTU 0.9 g/MMBTU GRP Table 12.7 0.0036 0.0039EU # 7 Generator # 1 Daniels Hall, Kohler N.G. 0.0428 MMCF 44.00 MMBTU 0.0001 Kg/MMBTU GRP Table 12.7 0.0000 0.0000EU # 8 Generator # 2 Founders Hall, CPI N.G. 0.0371 MMCF 38.14 MMBTU 0.0001 Kg/MMBTU GRP Table 12.7 0.0000 0.0000EU # 9 Generator # 3 Harrington, Onan N.G. 0.0066 MMCF 6.78 MMBTU 0.0001 Kg/MMBTU GRP Table 12.7 0.0000 0.0000EU # 10 Generator # 4 Salisbury, Olympian N.G. 0.0410 MMCF 42.15 MMBTU 0.0001 Kg/MMBTU GRP Table 12.7 0.0000 0.0000EU # 11 Generator Security, Honda N.G. - MMCF 0.00 MMBTU 0.0001 Kg/MMBTU GRP Table 12.7 0.0000 0.0000EU # 12 Generator #5 Fuller #1 Roof, Superior diesel 0.1170 1000 gallons 117.00 gallons 0.0006 Kg/MMBTU GRP Table 12.9 0.0000 0.0000EU # 13 Generator #6 Fuller #2 Caterpillar diesel 0.4160 1000 gallons 416.00 gallons 0.0006 Kg/MMBTU GRP Table 12.9 0.0000 0.0000EU # 14 Generator #9, Power Plant,SR-4 Caterpillar diesel 1.2960 1000 gallons 1,296.00 gallons 0.0006 Kg/MMBTU GRP Table 12.9 0.0001 0.0001EU # 28 Generator #7 Gateway, Kohler diesel 1.5088 1000 gallons 1,508.80 gallons 0.0006 Kg/MMBTU GRP Table 12.9 0.0001 0.0001EU # 29 Generator #10 East Hall, Kohler diesel 0.3360 1000 gallons 336.00 gallons 0.0006 Kg/MMBTU GRP Table 12.9 0.0000 0.0000EU # 30 Generator # 11 Goddard, Olympian N.G. 0.0134 MMCF 13.78 MMBTU 0.0001 Kg/MMBTU GRP Table 12.7 0.0000 0.0000EU # 31 Generator #8 Gateway Garage, Caterpiller diesel 0.1284 1000 gallons 128.40 gallons 0.0006 Kg/MMBTU GRP Table 12.9 0.0000 0.0000
Generator #13 Gateway 2 Generator diesel 0.5742 1000 gallons 574.20 gallons 0.0006 Kg/MMBTU GRP Table 12.9 0.0000 0.0000Generator #12 Rec Center Generator diesel 0.0724 1000 gallons 72.40 gallons 0.0006 Kg/MMBTU GRP Table 12.9 0.0000 0.0000Generator #14 Faraday Generator N.G. 0.7240 MMCF 744.27 MMBTU 0.0001 Kg/MMBTU GRP Table 12.7 0.0001 0.0001Generator #15 Drury Lane N.G. 0.0076 MMCF 7.81 MMBTU 0.0001 Kg/MMBTU GRP Table 12.7 0.0000 0.0000
EU # 15 Power House New Boiler #1 N. G. 301,234 Therms 30,123.40 MMBTU 0.9 g/MMBTU GRP Table 12.7 0.0271 0.0299#2 Oil 0.0155 1000 gallons 15.5000 gallons 0.4 g/MMBTU GRP Table 12.9 0.0000 0.0000
EU # 16 Power House New Boiler #2 N.G. 346,099 Therms 34,609.90 MMBTU 0.9 g/MMBTU GRP Table 12.7 0.0311 0.0343EU # 17 Power House New Boiler #3 N.G. 349,303 Therms 34,930.30 MMBTU 0.9 g/MMBTU GRP Table 12.7 0.0314 0.0347
#2 Oil 0.0155 1000 gallons 15.5000 gallons 0.4 g/MMBTU GRP Table 12.9 0.0000 0.0000EU # 20 Off Campus Residences (group) N.G. 224,814 Therms 22,481.40 MMBTU 0.9 g/MMBTU GRP Table 12.7 0.0202 0.0223EU # 21 On-Campus Miscell. 1st set N.G. 74,276 Therms 7,427.60 MMBTU 0.9 g/MMBTU GRP Table 12.7 0.0067 0.0074EU # 22 On-Campus Miscell. 2nd set N.G. 60,021 Therms 6,002.10 MMBTU 0.9 g/MMBTU GRP Table 12.7 0.0054 0.0060EU # 23 On-Campus Miscell. 3rd set N.G. 57,742 Therms 5,774.20 MMBTU 0.9 g/MMBTU GRP Table 12.7 0.0052 0.0057EU # 24 Off-Campus Residences Oil #2 Oil - 1000 gallons 0.00 gallons 0.0 kg/MMBTU GRP Table 12.9 0.0000 0.0000EU # 27 Gateway Cleaver Brooks Boilers (2) N.G. 141,480 Therms 14,148.00 MMBTU 0.9 g/MMBTU GRP Table 12.7 0.0127 0.0140EU # 26 Gateway Lattern Boilers (2) N.G. 39,497 Therms 3,949.70 MMBTU 0.9 g/MMBTU GRP Table 12.7 0.0036 0.0039
Salisbury Estates Heating N.G. 129,085 Therms 12,908.48 MMBTU 0.9 g/MMBTU GRP Table 12.7 0.0116 0.0128Mobile Fuel Combustion
Non-Highway Motor Vehicles diesel 1,118.62 gallons 0.26 g/gal GRP Table 13.7 0.0003 0.0003Tier 1 - Light Trucks gasoline 1,339.20 gallons 0.0871 g/mi GRP Table 13.4 0.0016 0.0018Tier 2 - Light Trucks gasoline 10,518.12 gallons 0.0066 g/mi GRP Table 13.4 0.0010 0.0011Tier 2 - Passenger Cars gasoline 1,050.00 gallons 0.0647 g/mi GRP Table 13.4 0.0014 0.0015
REFRIGERATION R134A(5) - GWP 1300HVAC Units - Facility Wide R134A 150.0000 pounds 0.0750 tons 1,300 GWP 98 107
REFRIGERATION Acetylene - GWP 1300Acetylene 20 cubic feet 0.1043 kg CO2 / CF GRP Chapter 12.4 P72 0.002086 0.00230
REFRIGERATION R410A(5) - GWP 1725R410A 30.0000 pounds 0.0150 tons 23 26
REFRIGERATION R404A(5) - GWP 3260R404A 24.0000 pounds 0.0120 tons 35 39
VEHICLE REFRIGERATION R134A(6) - GWP 1300R134A 15.1333 0.0076 tons 9 10
TOTAL 9,713 10,707
(1) Based on General Reporting Protocol 1.1 last updated on 1/14/2011. Nat Gas heat content used is 1028 MMBTU/MMCFper 40 CFR 98 Subpart C Table C-1(2) Threshold for reporting GHGs all facilities exceeding 5,000 short-tons of CO2 emissions.(3) Threshold for reporting GHGs to USEPA: all facilities exceeding 25,000 metric-tons of CO2 emissions.(4) Fuel usage was provided by WPI Chief Engineer(5) Reporting of refrigerant was based on purchasing records for 2012(6) Reporting of refrigerant was based on vehicle refrigerant capacity and operating emission factor of 20%
J:\W\W1489 WPI\GHG\2015\2015GHG_Emissions_Calc (add).xlsx 3 of 3

SCOPING AUDITWorcester Polytechnic InstituteJanuary 3, 2017
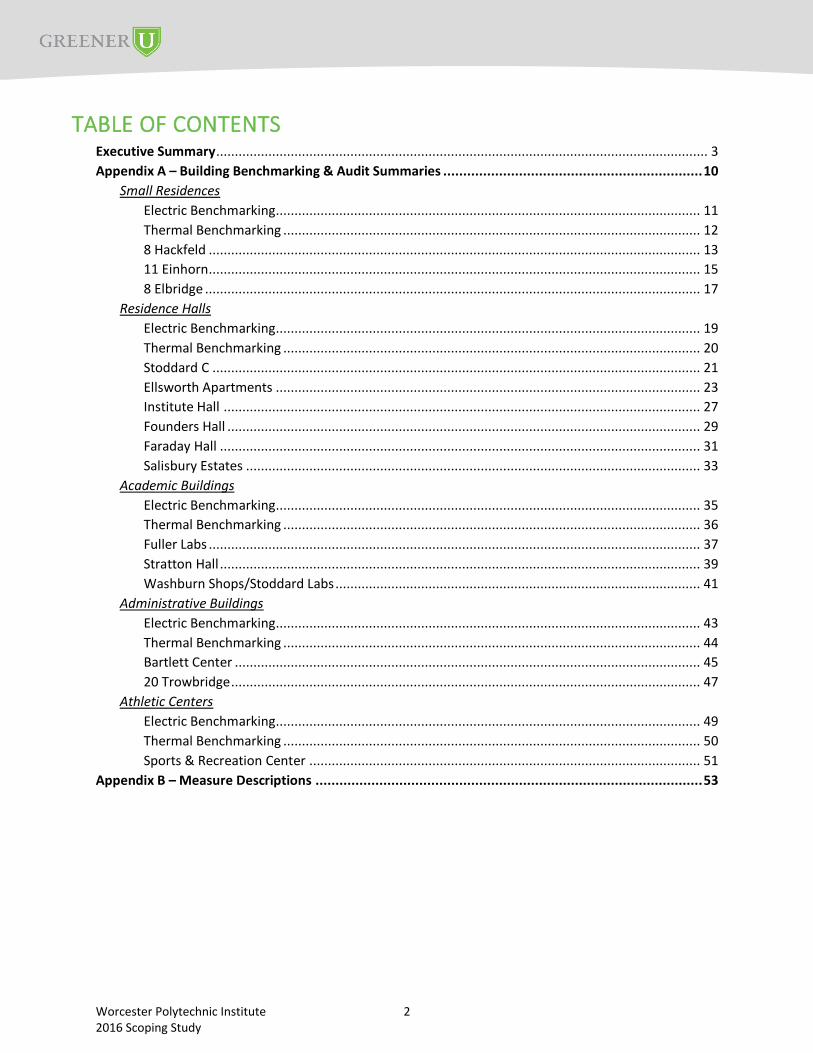
TABLE OF CONTENTS Executive Summary .................................................................................................................................... 3
Appendix A – Building Benchmarking & Audit Summaries ................................................................. 10
Small Residences
Electric Benchmarking.................................................................................................................. 11
Thermal Benchmarking ................................................................................................................ 12
8 Hackfeld .................................................................................................................................... 13
11 Einhorn .................................................................................................................................... 15
8 Elbridge ..................................................................................................................................... 17
Residence Halls
Electric Benchmarking.................................................................................................................. 19
Thermal Benchmarking ................................................................................................................ 20
Stoddard C ................................................................................................................................... 21
Ellsworth Apartments .................................................................................................................. 23
Institute Hall ................................................................................................................................ 27
Founders Hall ............................................................................................................................... 29
Faraday Hall ................................................................................................................................. 31
Salisbury Estates .......................................................................................................................... 33
Academic Buildings
Electric Benchmarking.................................................................................................................. 35
Thermal Benchmarking ................................................................................................................ 36
Fuller Labs .................................................................................................................................... 37
Stratton Hall ................................................................................................................................. 39
Washburn Shops/Stoddard Labs .................................................................................................. 41
Administrative Buildings
Electric Benchmarking.................................................................................................................. 43
Thermal Benchmarking ................................................................................................................ 44
Bartlett Center ............................................................................................................................. 45
20 Trowbridge .............................................................................................................................. 47
Athletic Centers
Electric Benchmarking.................................................................................................................. 49
Thermal Benchmarking ................................................................................................................ 50
Sports & Recreation Center ......................................................................................................... 51
Appendix B – Measure Descriptions ................................................................................................. 53
Worcester Polytechnic Institute2016 Scoping Study
2

EXECUTIVE SUMMARY Worcester Polytechnic Institute has retained GreenerU to provide a high-level
assessment of the energy efficiency opportunities on campus. This effort is
intended to identify opportunities to invest in campus energy efficiency and to
support work toward WPI’s greenhouse gas reduction goals. This study presents
GreenerU’s findings which include identification of $4.2M in potential Energy
Efficiency Opportunities. Combined with previously identified, but not yet
implemented opportunities on campus, WPI has a total of $6M of potential Energy
Efficiency work.
Implementation of all identified Energy Efficiency work would reduce campus
energy use by 20,300 MMBTU or an additional 8% of the 2016 campus energy
consumption, and campus greenhouse gas (GHG) emissions by 1,600 metric tons
of CO2 equivalents (MTCDE) or 8% of the 2016 greenhouse gas emissions. These
projects would generate almost $534,000 in annual energy cost savings.
As part of our study, GreenerU looked at 17 buildings on WPI’s campus. Energy
efficiency reduction opportunities were identified through our walkthroughs,
energy use data provided by WPI and benchmarking these buildings against similar
buildings in the GreenerU database. The energy efficiency opportunities identified
in these buildings include the following:
» LED Lighting
» Intelligent Lighting Controls
» Recommissioning & Optimization of Equipment
» Building Envelope Upgrades
» HVAC Equipment & Control Upgrades
» Cogeneration the Sports & Rec Center
HISTORY – 2011 – 2015 Since 2011, Worcester Polytechnic Institute has implemented nearly $4 million in energy projects – both on
their own and with GreenerU. Measures completed include:
» Energy Efficiency work at the Rubin Campus Center including:
– Major upgrades to HVAC controls, including use of VAV occupancy based controls
– Melink Kitchen Hood Controls
– Replacement of VAV reheat valve actuators & MAU steam valve actuator
– Lighting improvements and lighting controls
» Gateway LSBE Building including:
– Upgrades to HVAC controls, fume hood controls, and ventilation optimization
– Dynamic static pressure reset and discharge air temperature reset on MAUs and RTUs
– Optimization of glycol heat recovery pump hours of operation
– Installation of Tecogen cogeneration modules
– Lighting improvements and lighting controls
AT A GLANCE
Energy Efficiency
Opportunities on the
WPI Campus:
GHG emissions reductions – 1,600 MTCDE
Energy savings – 20,300 MMBTU
Cost savings - $534,000
8% campus Energy & Carbon Reduction
Worcester Polytechnic Institute2016 Scoping Study
3

» Extensive energy upgrades at Higgins Labs and Goddard Hall including:
– Upgrades to building controls, and air handling equipment, including fume hood controls
– Optimization of glycol system
– Weatherization
– Lighting improvements and lighting controls
» Extensive energy upgrades at Alden Memorial Hall, Atwater Kent Laboratory, & Morgan Hall,
including:
– Major upgrades to HVAC controls, including occupancy base controls and scheduling
– Expansion of the DDC system at Atwater Kent
– Installation of VFDs on fans and pumps
– Kitchen Hood Controls
» Several Lighting retrofit projects around campus
The chart below illustrates the effects on energy consumption this work has had. Through the success of this
work, WPI has held energy consumption close to 2006 levels, while adding 15% to its building stock over that
period during construction of the Sports & Recreation Center and Faraday Hall dormitory.
Normalizing this data by square footage of campus building stock over the same period, as is done in the chart
below, better illustrates the accomplishments of WPI’s program. If WPI was to have done no energy efficiency
work over the same period of time.
Worcester Polytechnic Institute2016 Scoping Study
4

FINDINGS The buildings audited under this scope of work were developed in collaboration with WPI Facilities staff, and
represent about a third of WPI’s total built square footage. Buildings on campus not included in this study
either have been recently renovated, will soon be renovated, or are not energy priorities for the staff. The
buildings in this study are:
The buildings included in this study comprise 33% of the campus total gross square footage. The estimated
annual electrical usage of these buildings is about 22% of the campus total. This proportion is significant to
the square footage in part because the selected buildings are among the most energy intensive on campus.
For thermal usage, the annual usage of these buildings is about 13%.
Areas of focus during the walk-throughs included: HVAC systems and controls, lighting and controls, and
building envelope. Measures to improve building systems were evaluated on a building-by-building and
measure-by-measure basis.
Campus TotalBuildings in Scoping
Audit
Square Feet (SF) 2,030,000 670,000 33%
Annual Electric Usage (kWh) 29,310,000 8,660,000 30%
Annual Thermal Usage (MMBTU) 150,000 30,000 20%
2016 Scoping Audit Building
11 Einhorn Founders Hall
20 Trowbridge Fuller Labs
8 Elbridge Institute Hall
8 Hackfeld Salisbury Estates
Bartlett Center Sports & Recreation Center
Ellsworth Apartments 1 Stoddard C
Ellsworth Apartments 2 Stratton Hall
Ellsworth Apartments 3 Washburn Shops – Stoddard Labs
Faraday Hall
Worcester Polytechnic Institute2016 Scoping Study
5

Results from this study identified some great energy efficiency reduction opportunities. GreenerU
recommends continuing a path towards their greenhouse gas goals by devising a multi-year plan that will help
Worcester Polytechnic Institute achieve their energy efficiency goals, as well as address deferred maintenance
through energy project funding. GreenerU estimates that if WPI implements all opportunities identified, there
is opportunity to reduce campus energy by nearly 20,300 MMBTU. GreenerU estimates that WPI can achieve
1,600 MTCDE reduction from these projects. Based on our experience working on 24 campuses, we estimate
an investment of $5M to $6M achieving a simple ROI of 8% to 10%.
This strategy, focusing on technologies like LED lighting and intelligent lighting controls, as well as existing
technologies that are not fully taken advantage of like DDC controls and building envelope improvements
helps WPI continue towards their energy efficiency improvement goals.
NEXT STEPS We recommend the following process to continue on the path towards implementation:
Worcester Polytechnic Institute2016 Scoping Study
6

This path forward starts with identification of year 1 buildings and commencement of engineering studies for
this first group of buildings which represent the best opportunity for carbon reduction and energy savings. The
initial findings and savings estimates in this report require additional engineering work to gain a more accurate
view of actual savings. A project development team would conduct more in-depth audits of the buildings,
including operational controls reviews, utility analysis, condition and function assessments, and facilities
personnel interviews.
Results from this investigation will then propel the next phase, which is the Formulation & Design phase to
finalize ECMs to be implemented in year 1. A detailed audit report would be prepared, including contractor
pricing, estimated incentive amounts and calculated savings and paybacks.
Following approval of the phase 1 ECMs, implementation of the year 1 ECMs would take place while year 2
ECMs are investigated and developed. Planning of the implementation phase should take into consideration
the busy schedule of university buildings, and work around these unique challenges.
At the end of implementation, a program should be developed to monitor the ECMs implemented to maintain
savings long term. This optimization program would prevent energy creep and deterioration of savings over
time. This program can be tailored for multiple layers of complexity, depending on the needs and capabilities
of the facilities staff.
GreenerU’s business is built around implementing energy efficiency and deferred maintenance programs like
this for our customers. We would welcome the opportunity to continue working with Worcester Polytechnic
Institute on implementing this program.
Worcester Polytechnic Institute2016 Scoping Study
7

Worcester Polytechnic Institute2016 Scoping Study
8

Program Summary by Building
Building GSF Space Use Electric
kWh
Thermal
kBtu
Electric
kWh
Thermal
kBtu
Electric
kWh
Thermal
kBtu
Total
MMBtu
Total Cost
Savings Installed Cost
Deferred
Maintenance
Cost
Simple
Payback
GHG Emissions
Reduction
MTCO2 Fuller Labs 73,250 Academic 1,212,141 4,155,912 699,741 3,010,561 512,400 1,145,351 2,894 73,300$ 695,100$ 183,100$ 9.5 225
Stratton Hall 24,380 Academic 290,879 1,656,962 199,479 1,342,262 91,400 314,700 627 14,200$ 140,500$ -$ 9.9 50
Washburn ShopsStoddard Labs 42,606 Academic 151,913 4,028,823 102,413 2,925,823 49,500 1,103,000 1,272 17,200$ 470,800$ -$ 27.4 79
Bartlett Center 16,200 Administration 268,078 893,592 130,151 670,192 137,926 223,400 694 18,819$ 348,300$ 311,000$ 18.5 55
20 Trowbridge 4,536 Administration 9,668 205,200 6,368 112,900 3,300 92,300 104 1,300$ 23,800$ -$ 18.3 11
Sports & Recreation Center 145,000 Athletic Facilities 2,931,400 7,887,900 1,958,560 6,507,500 972,840 1,380,400 4,700 130,777$ 1,261,600$ 565,500$ 9.6 380
11 Einhorn 3,600 Grad Housing, faculty/ staff 10,357 212,200 7,157 122,200 3,200 90,000 101 1,200$ 20,700$ -$ 17.3 11
Salisbury Estates 130,000 Grad Housing, faculty/ staff 1,537,120 6,042,990 1,212,820 5,005,990 324,300 1,037,000 2,144 49,400$ 263,300$ -$ 5.3 161
8 Elbridge 6,200 Grad Housing, faculty/ staff 21,386 427,500 17,086 246,200 4,300 181,300 196 2,400$ 28,900$ -$ 12.0 16
8 Hackfeld 3,900 Grad Housing, faculty/ staff 20,586 365,700 13,086 254,600 7,500 111,100 137 2,000$ 34,600$ -$ 17.3 13
Faraday Hall 88,000 Residence Halls 926,800 4,541,300 691,400 4,264,800 235,400 276,500 1,080 31,000$ 308,000$ -$ 9.9 93
Institute Hall 15,300 Residence Halls 117,360 834,300 73,360 623,800 44,000 210,500 361 7,400$ 91,900$ -$ 12.4 30
Founders Hall 96,994 Residence Halls 707,200 908,700 424,000 770,600 283,200 138,100 1,104 35,500$ 412,200$ -$ 11.6 100
Stoddard C 12,326 Residence Halls 203,200 161,400 142,900 116,300 60,300 45,100 251 7,700$ 62,900$ -$ 8.2 26
Ellsworth Apartments 3 5,488 Residence Halls 109,130 195,000 81,830 195,000 27,300 - 93 3,300$ 33,000$ -$ 10.0 13
Ellsworth Apartments 2 3,136 Residence Halls 62,360 199,200 46,760 199,200 15,600 - 53 1,900$ 17,300$ -$ 9.1 10
Ellsworth Apartments 1 3,920 Residence Halls 77,950 249,000 58,550 249,000 19,400 - 66 2,300$ 23,500$ -$ 10.2 11
2016 Scoping Study TOTAL 674,836 8,657,528 32,965,680 5,865,661 26,616,928 2,791,866 6,348,751 15,875 399,696$ 4,236,400$ 1,059,600$ 10.60 1,284
Salisbury Labs 69,830 Laboratory 966,955 5,613,000 667,128 4,791,000 299,827 822,000 1,845 44,323$ 442,300$ 137
Exterior Lighting (Non-Athletics) Exterior 744,120 - 172,000 - 572,120 - 1,952 68,654$ 900,000$ 177
Exterior Lighting (Athletics) Exterior 218,750 - 43,750 - 175,000 - 597 21,000$ 450,000$ 54
Previously Studied TOTAL 69,830 1,929,825 5,613,000 882,878 4,791,000 1,046,947 822,000 4,394 133,977$ 1,792,300$ - 368
TOTAL Campus Opportunity 744,666 10,587,353 38,578,680 6,748,539 31,407,928 3,838,813 7,170,751 20,269 533,673$ 6,028,700$ 1,059,600$ 10.60 1,652
Savings Existing Proposed
2016 Scop
ing Stu
dy
Previously
Studied, Not
Implementd
Worcester Polytechnic Institute2016 Scoping Study
9

APPENDIX ABUILDING BENCHMARKING & AUDIT
SUMMARIES
Worcester Polytechnic Institute2016 Scoping Study
10

0
10
20
30
kWh/
GS
F
Building
11 Einhorn
20 Trowbridge
8 Elbridge
8 Hackfeld
Ellsworth Apartments 1
Ellsworth Apartments 2
Ellsworth Apartments 3
Stoddard C
Benchmark
Small ResidencesElectric Benchmarking
Worcester Polytechnic Institute2016 Scoping Study
11

0
100
200
300
400
kBT
U/G
SF
Building
11 Einhorn
20 Trowbridge
8 Elbridge
8 Hackfeld
Ellsworth Apartments 1
Ellsworth Apartments 2
Ellsworth Apartments 3
Stoddard C
Benchmark
Small ResidencesThermal Benchmarking
Worcester Polytechnic Institute2016 Scoping Study
12

Worcester Polytechnic InstituteEnergy Efficiency Scoping Audit
Building Existing Conditions
Building Name/Photo
Description
Building square footage
Type of facility
Ask Facilities StaffMajor problemsRecent renovationsPlanned renovationsIdeas for energy conservationRecent efficiency projectsOccupied Spaces
EMS \ Controlso Manufacturer and vintageo Local Control or on EMS?o End device control (pneumatic, electric, DDC)
HVAC Systems (Airside)o Type of systemso AHUs, RTUs, FCUs, Unit Ventilators, H&Vo Cooling/heating coils?
Space heating systemso Steam versus hot watero Any year round heating?o Any process steam? (i.e. kitchen, autoclaves, other)
Lightingo Type of lighting (T8, T12, CF, LED)o Occupancy sensors? Where?
Plumbingo City water or well water?o Showers: low flow?o Sinks – aerators?
Envelopeo No. of storieso Façade typeo Type of windows (double hung, fixed, 1x/2x pane)
Mechanical Rooms Primary Heating Systems
o Boiler Typeo Boiler and/or distribution pressure?o HW Pumps
CV or VFDs? Primary Cooling Systems
o Chiller? DX? Other?o Any year round cooling? (i.e. IT/data)o CHW Pumps
CV or VFDs? Domestic hot water
o Type: elec, gas, instantaneous Domestic hot water is provided by an A.O. Smith gas-fired heater.
8 Hackfeld
8 Hackfeld is a 3,900 square foot, off-campus residence for graduate students and faculty / staff. The building hasthree apartments and was built in 1905.
Occupants leave windows open during the heating season due to overheating and lack of control between the threeapartments. The chimney is detoriating and needs masonry work. The building is due for a controls upgrade. LEDlighting conversion and occupant engagement could be the main measures in this building.
There is one zone between the three apartments which is controlled via an electric thermostat on the second floor.
There is no airside equipment for the building.
Space heating is provided by one-pipe steam cast iron radiators. A Weil-McLain gas-fired steam boiler is located in thebasement which serves the building.
Lighting is comprised of a combination of incandescent and fluorescent. Occupants also have plug-in lighting asneeded. Upgrading to LED system is recommended.
Each apartment has their own kitchen and bathroom. Although GreenerU was unable to access the individualapartment, it can be assumed that the shower heads, faucets and toilets are all low flow.
The building is a three-story house composed a stone foundation, wood beam framing, and vinyl siding. The operablewindows are a mix of single and double pane.
Heating is provided via a Weil-McLain gas-fired steam boiler. There is uninsulated steam piping found throughout thebasement and remainder of the building.
There is no cooling systems in this building. Occupants may use window air conditioning units.
Worcester Polytechnic Institute2016 Scoping Study
13

Worcester Polytechnic InstituteEnergy Efficiency Scoping Audit
Building Existing Conditions
General Information
Building 8 Hackfeld
GSF 3,900Space Use Grad Housing, faculty/ staff
Utility UsageProposed
Total Usage EUI Total Usage EUIElectric Usage (kWh) 20,586 5.3 13,086 3.4Thermal Usage (kBtu) 365,700 93.8 254,600 65.3TOTAL (kBtu) 435,939 111.8 299,249 76.7
**Thermal Usage is quantified by Gas DataEnd Use Breakdown
ElectrickWh
ThermalkBtu
Lighting 8,234 -Fans - -Pumps - -Cooling 6,382 -Heating - 292,560DHW - 73,140Process Loads - -Plug Loads 5,970 -TOTAL 20,586 365,700
MeasuresTarget Reduction Lifetime Reduction
Costlevel Measure Electric
kWhThermal
kBtuCost Savings Installed Cost Simple Payback Equivalent CO2
(MTeCO2)1 Retrocommissioning - - -$ -$ - -1 Control Sequence Optimization - - -$ -$ - -1 Occupancy Based Controls - - -$ -$ - -1 Demand Controlled Ventilation - - -$ -$ - -1 VFD Installation on Fans - - -$ -$ - -1 VFD Instllation on Pumps - - -$ -$ - -3 TRV Installation - 14,600 100$ 11,700$ 117.0 13 Building Envelope Improvements 300 14,600 200$ 7,800$ 39.0 11 Pneumatic to DDC Conversion - - -$ -$ - -1 HVAC Controls Upgrade 100 58,500 600$ 2,000$ 3.3 31 LED Lighting Conversion 7,100 - 900$ 11,700$ 13.0 21 Pipe Insulation - 23,400 200$ 1,400$ 7.0 11 Thermal Jackets Installation - - -$ -$ - -1 Window Replacement - - -$ -$ - -1 AHU Replacement - - -$ -$ - -1 Electric to HW Conversion - - -$ -$ - -1 OA AHU for data center - - -$ -$ - -1 Heat Recovery Installation - - -$ -$ - -1 Fume Hood Improvements - - -$ -$ - -1 Electric to VRF Conversion - - -$ -$ - -1 DX to Chilled Water Cooling - - -$ -$ - -1 Cogen - - -$ -$ - -
TOTAL 7,500 111,100 2,000 34,600 17.3 13
Existing End Use Breakdown
Lighting, 6%
Fans, 0%
Pumps, 0%
Cooling, 5%
Heating, 67%
Domestic HW, 17%
Process Loads, 0%
Plug Loads, 5%
End Use Breakdown
Lighting, 6%
Fans, 0%
Pumps, 0%
Cooling, 5%
Heating, 67%
Domestic HW, 17%
Process Loads, 0%
Plug Loads, 5%
Worcester Polytechnic Institute2016 Scoping Study
14

Worcester Polytechnic InstituteEnergy Efficiency Scoping Audit
Building Existing Conditions
Building Name/Photo
Description
Building square footage
Type of facility
Ask Facilities StaffMajor problemsRecent renovationsPlanned renovationsIdeas for energy conservationRecent efficiency projectsOccupied Spaces
EMS \ Controlso Manufacturer and vintageo Local Control or on EMS?o End device control (pneumatic, electric, DDC)
HVAC Systems (Airside)o Type of systemso AHUs, RTUs, FCUs, Unit Ventilators, H&Vo Cooling/heating coils?
Space heating systemso Steam versus hot watero Any year round heating?o Any process steam? (i.e. kitchen, autoclaves, other)
Lightingo Type of lighting (T8, T12, CF, LED)o Occupancy sensors? Where?
Plumbingo City water or well water?o Showers: low flow?o Sinks – aerators?
Envelopeo No. of storieso Façade typeo Type of windows (double hung, fixed, 1x/2x pane)
Mechanical Rooms Primary Heating Systems
o Boiler Typeo Boiler and/or distribution pressure?o HW Pumps
CV or VFDs? Primary Cooling Systems
o Chiller? DX? Other?o Any year round cooling? (i.e. IT/data)o CHW Pumps
CV or VFDs? Domestic hot water
o Type: elec, gas, instantaneous Domestic hot water is provided by an A.O. Smith ProMax +Plus gas-fired heater.
11 Einhorn
11 Einhorn is a 3,600 square foot, off-campus residence for graduate students and faculty / staff. The building is athree story building and was built in 1905.
Occupants leave windows open during the heating season due to overheating. LED lighting conversion and occupantengagement could be the main measures in this building.
The majority of thebuilding is served via a furnace with one thermostatic controller. A supplemental furnace servingthe second floor is controlled via a separate thermostatic controller.
There is no airside equipment in the building.
Space heating is provided to the majority of the buidling by a Rudd furnace. Supplemental heat for the second floor isprovided by a wall mounted furnace.
Lighting is comprised of a combination of incandescent and fluorescent. Occupants also have plug-in lighting asneeded. Upgrading to LED system is recommended.
Each apartment has their own kitchen and bathroom. Although GreenerU was unable to access the individualapartment, it can be assumed that the shower heads, faucets and toilets are all low flow.
The building is two-story house composed a brick and stone foundation, wood beam framing, and a combinationshingle siding and stucco. The operable windows are a mix of single and double pane.
Heating is provided via an outdated Rudd furnace. A smaller, wall mounted furnace provides additional heat asneeded to the second floor.
There is no central cooling system in this building. Occupants may use window air conditioning units.
Worcester Polytechnic Institute2016 Scoping Study
15
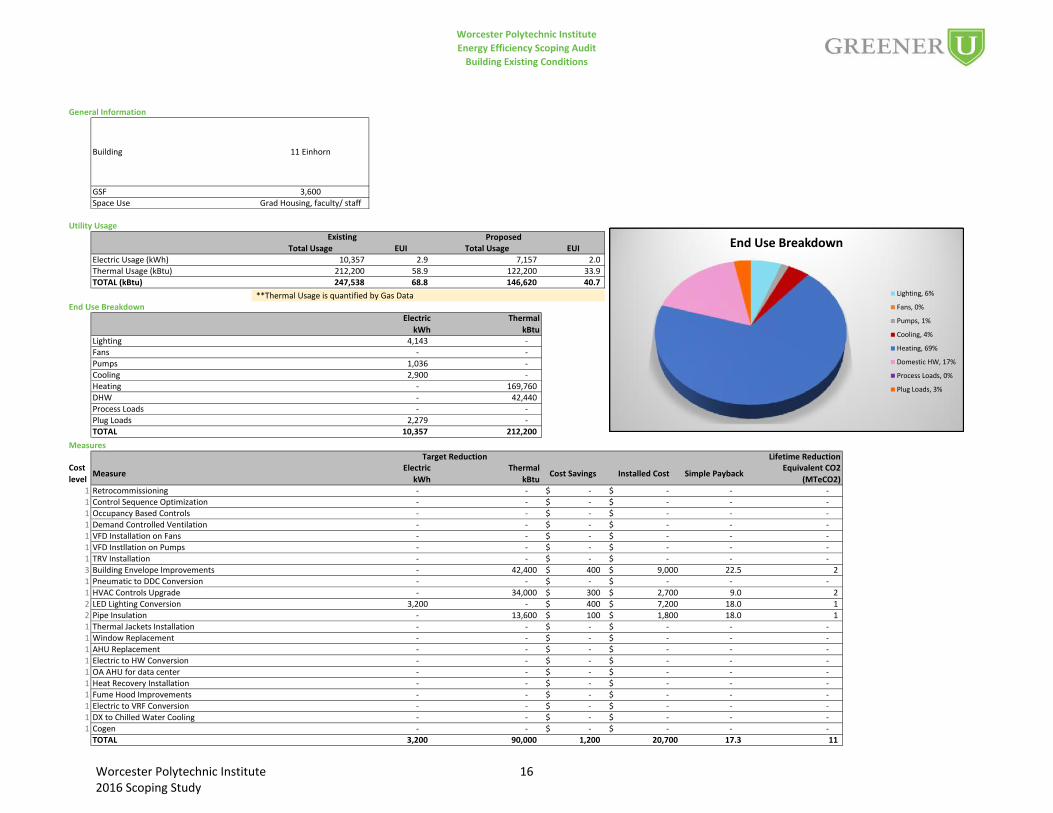
Worcester Polytechnic InstituteEnergy Efficiency Scoping Audit
Building Existing Conditions
General Information
Building 11 Einhorn
GSF 3,600Space Use Grad Housing, faculty/ staff
Utility UsageProposed
Total Usage EUI Total Usage EUIElectric Usage (kWh) 10,357 2.9 7,157 2.0Thermal Usage (kBtu) 212,200 58.9 122,200 33.9TOTAL (kBtu) 247,538 68.8 146,620 40.7
**Thermal Usage is quantified by Gas DataEnd Use Breakdown
ElectrickWh
ThermalkBtu
Lighting 4,143 -Fans - -Pumps 1,036 -Cooling 2,900 -Heating - 169,760DHW - 42,440Process Loads - -Plug Loads 2,279 -TOTAL 10,357 212,200
MeasuresTarget Reduction Lifetime Reduction
Costlevel Measure Electric
kWhThermal
kBtuCost Savings Installed Cost Simple Payback Equivalent CO2
(MTeCO2)1 Retrocommissioning - - -$ -$ - -1 Control Sequence Optimization - - -$ -$ - -1 Occupancy Based Controls - - -$ -$ - -1 Demand Controlled Ventilation - - -$ -$ - -1 VFD Installation on Fans - - -$ -$ - -1 VFD Instllation on Pumps - - -$ -$ - -1 TRV Installation - - -$ -$ - -3 Building Envelope Improvements - 42,400 400$ 9,000$ 22.5 21 Pneumatic to DDC Conversion - - -$ -$ - -1 HVAC Controls Upgrade - 34,000 300$ 2,700$ 9.0 22 LED Lighting Conversion 3,200 - 400$ 7,200$ 18.0 12 Pipe Insulation - 13,600 100$ 1,800$ 18.0 11 Thermal Jackets Installation - - -$ -$ - -1 Window Replacement - - -$ -$ - -1 AHU Replacement - - -$ -$ - -1 Electric to HW Conversion - - -$ -$ - -1 OA AHU for data center - - -$ -$ - -1 Heat Recovery Installation - - -$ -$ - -1 Fume Hood Improvements - - -$ -$ - -1 Electric to VRF Conversion - - -$ -$ - -1 DX to Chilled Water Cooling - - -$ -$ - -1 Cogen - - -$ -$ - -
TOTAL 3,200 90,000 1,200 20,700 17.3 11
Existing End Use Breakdown
Lighting, 6%
Fans, 0%
Pumps, 1%
Cooling, 4%
Heating, 69%
Domestic HW, 17%
Process Loads, 0%
Plug Loads, 3%
End Use Breakdown
Lighting, 20%
Fans, 9%
Pumps, 4%
Cooling, 8%
Heating, 48%
Domestic HW, 7%
Process Loads, 0%
Plug Loads, 5%
End Use Breakdown
Lighting, 13%
Fans, 3%
Pumps, 7%
Cooling, 8%
Heating, 63%
Domestic HW, 2%
Process Loads, 0%
Plug Loads, 4%
End Use Breakdown
Lighting, 20%
Fans, 9%
Pumps, 4%
Cooling, 8%
Heating, 48%
Domestic HW, 7%
Process Loads, 0%
Plug Loads, 5%
End Use Breakdown
Lighting, 6%
Fans, 0%
Pumps, 1%
Cooling, 4%
Heating, 69%
Domestic HW, 17%
Process Loads, 0%
Plug Loads, 3%
Worcester Polytechnic Institute2016 Scoping Study
16

Worcester Polytechnic InstituteEnergy Efficiency Scoping Audit
Building Existing Conditions
Building Name/Photo
Description
Building square footage
Type of facility
Ask Facilities StaffMajor problemsRecent renovationsPlanned renovationsIdeas for energy conservationRecent efficiency projectsOccupied Spaces
EMS \ Controlso Manufacturer and vintageo Local Control or on EMS?o End device control (pneumatic, electric, DDC)
HVAC Systems (Airside)o Type of systemso AHUs, RTUs, FCUs, Unit Ventilators, H&Vo Cooling/heating coils?
Space heating systemso Steam versus hot watero Any year round heating?o Any process steam? (i.e. kitchen, autoclaves, other)
Lightingo Type of lighting (T8, T12, CF, LED)o Occupancy sensors? Where?
Plumbingo City water or well water?o Showers: low flow?o Sinks – aerators?
Envelopeo No. of storieso Façade typeo Type of windows (double hung, fixed, 1x/2x pane)
Mechanical Rooms Primary Heating Systems
o Boiler Typeo Boiler and/or distribution pressure?o HW Pumps
CV or VFDs? Primary Cooling Systems
o Chiller? DX? Other?o Any year round cooling? (i.e. IT/data)o CHW Pumps
CV or VFDs? Domestic hot water
o Type: elec, gas, instantaneous Each apartment is served by an individual electric domestic hot water heater.
8 Elbridge
8 Elbridge is a 6,200 square foot, off-campus residence for graduate students and faculty / staff. The building hasthree apartments and was built in 1905.
During the site visit, all first floor windows were open due to overheating and lack of control between the threeapartments. The building is due for a controls upgrade. LED lighting conversion, control upgrade, and occupantengagement could be the main measures in this building.
Two steam boilers separate the three apartments into two zones. One zone controls the first floor apartment and theother zone controls the second and third floor apartments.
There is no airside equipment in the building.
Space heating is provided by one-pipe steam cast iron radiators. Two Weil-McLain gas-fired steam boilers are locatedin the basement which serve the building.
Lighting is comprised of a combination of incandescent and fluorescent. Occupants also have plug-in lighting asneeded. Upgrading to LED system is recommended.
Each apartment has their own kitchen and bathroom. Although GreenerU was unable to access the individualapartment, it can be assumed that the shower heads, faucets and toilets are all low flow.
The building is a three-story house composed a stone foundation, wood beam framing, and vinyl siding. The operablewindows are a mix of single and double pane and should be replaced.
Heating is provided by two Weil-McLain gas-fired steam boilers. One boiler serves the first floor apartment and theother serves the second and third floor apartments. There is uninsulated steam piping found throughout thebasement and remainder of the building.
There is no central cooling system in this building. Occupants may use window air conditioning units.
Worcester Polytechnic Institute2016 Scoping Study
17

Worcester Polytechnic InstituteEnergy Efficiency Scoping Audit
Building Existing Conditions
General Information
Building 8 Elbridge
GSF 6,200Space Use Grad Housing, faculty/ staff
Utility UsageProposed
Total Usage EUI Total Usage EUIElectric Usage (kWh) 21,386 3.4 17,086 2.8Thermal Usage (kBtu) 427,500 69.0 246,200 39.7TOTAL (kBtu) 500,469 80.7 304,497 49.1
**Thermal Usage is quantified by Gas DataEnd Use Breakdown
ElectrickWh
ThermalkBtu
Lighting 9,624 -Fans - -Pumps - -Cooling 7,485 -Heating - 342,000DHW - 85,500Process Loads - -Plug Loads 4,277 -TOTAL 21,386 427,500
MeasuresTarget Reduction Lifetime Reduction
Costlevel Measure Electric
kWhThermal
kBtuCost Savings Installed Cost Simple Payback Equivalent CO2
(MTeCO2)1 Retrocommissioning - - -$ -$ - -1 Control Sequence Optimization - - -$ -$ - -1 Occupancy Based Controls - - -$ -$ - -1 Demand Controlled Ventilation - - -$ -$ - -1 VFD Installation on Fans - - -$ -$ - -1 VFD Instllation on Pumps - - -$ -$ - -1 TRV Installation - 68,400 700$ 6,200$ 8.9 41 Building Envelope Improvements - 17,100 200$ 1,900$ 9.5 11 Pneumatic to DDC Conversion - - -$ -$ - -1 HVAC Controls Upgrade - 68,400 700$ 3,100$ 4.4 43 LED Lighting Conversion 4,300 - 500$ 15,500$ 31.0 11 Pipe Insulation - 27,400 300$ 2,200$ 7.3 11 Thermal Jackets Installation - - -$ -$ - -1 Window Replacement - - -$ -$ - -1 AHU Replacement - - -$ -$ - -1 Electric to HW Conversion - - -$ -$ - -1 OA AHU for data center - - -$ -$ - -1 Heat Recovery Installation - - -$ -$ - -1 Fume Hood Improvements - - -$ -$ - -1 Electric to VRF Conversion - - -$ -$ - -1 DX to Chilled Water Cooling - - -$ -$ - -1 Cogen - - -$ -$ - -
TOTAL 4,300 181,300 2,400 28,900 12.0 16
Existing End Use Breakdown
Lighting, 7%
Fans, 0%
Pumps, 0%
Cooling, 5%
Heating, 68%
Domestic HW, 17%
Process Loads, 0%
Plug Loads, 3%
End Use Breakdown
Lighting, 7%
Fans, 0%
Pumps, 0%
Cooling, 5%
Heating, 68%
Domestic HW, 17%
Process Loads, 0%
Plug Loads, 3%
Worcester Polytechnic Institute2016 Scoping Study
18

0
5
10
15
20
kWh/
GS
F
Building
Faraday Hall
Founders Hall
Institute Hall
Salisbury Estates
Benchmark
Residence HallsElectric Benchmarking
Worcester Polytechnic Institute2016 Scoping Study
19

0
100
200
kBT
U/G
SF
Building
Faraday Hall
Founders Hall
Institute Hall
Salisbury Estates
Benchmark
Residence HallsThermal Benchmarking
Worcester Polytechnic Institute2016 Scoping Study
20

Worcester Polytechnic InstituteEnergy Efficiency Scoping Audit
Building Existing Conditions
Building Name/Photo
Description
Building square footage
Type of facility
Ask Facilities StaffMajor problemsRecent renovationsPlanned renovationsIdeas for energy conservationRecent efficiency projectsOccupied Spaces
EMS \ Controlso Manufacturer and vintageo Local Control or on EMS?o End device control (pneumatic, electric, DDC)
HVAC Systems (Airside)o Type of systemso AHUs, RTUs, FCUs, Unit Ventilators, H&Vo Cooling/heating coils?
Space heating systemso Steam versus hot watero Any year round heating?o Any process steam? (i.e. kitchen, autoclaves, other)
Lightingo Type of lighting (T8, T12, CF, LED)o Occupancy sensors? Where?
Plumbingo City water or well water?o Showers: low flow?o Sinks – aerators?
Envelopeo No. of storieso Façade typeo Type of windows (double hung, fixed, 1x/2x pane)
Mechanical Rooms Primary Heating Systems
o Boiler Typeo Boiler and/or distribution pressure?o HW Pumps
CV or VFDs? Primary Cooling Systems
o Chiller? DX? Other?o Any year round cooling? (i.e. IT/data)o CHW Pumps
CV or VFDs? Domestic hot water
o Type: elec, gas, instantaneous
The building has a gas fired makeup air unit for heating purposes. Split AC units provide cooling to the common areasof the complex as well as the infirmary. Fan coil units provide heat to common areas.
Building heating is provided by electric heat baeboard radiation which are located in all areas.
Almost all lights are fluorescents except in the common areas which have recessed LED screw-in lamps. Upgrading toLED system is recommended
The Health Center in Stoddard C is the only portion of the complex on the Schneider control system. The AC units andeight sections of electric fin tube radiation are monitored via the Schneider control system. The remainder of thecomplex is not on a central management system and is only locally controlled. Each single or triple room has anelectric thermostat to control electric baseboard radiation. Local Mitsubishi thermostats serve the split units in thecommon areas.
Stoddard A-C
The Stoddard Complex consists of three buildings (A-C), for a total of approximately 12,326 square feet. It primarilyserves as a student dorm building with the Health Center located in Stoddard C. The complex was built in 1970. Eachbuilding has three floors made up of single and triples rooms and accomodates approximately 84 students.
The building is due for controls upgrade. LED lighting upgrade and and building envelope improvements could havesignificant opportunity
Split AC units provide cooling to the common areas and Health Center during the summer months.
Domestic hot water is made with an electric water heater.
The shower heads, faucets and toilets are all low flow.
The building is of block construction with brick and metal façade. The windows in common areas are inoperable,double pane windows. Windows in single and triple rooms are operable double pane windows.
Heating is provided via electric baseboard radiation. An electric DHW serves the buildings during the summer months.
Worcester Polytechnic Institute2016 Scoping Study
21

Worcester Polytechnic Institute
Energy Efficiency Scoping Audit
Building Existing Conditions
General Information
Building Stoddard C
GSF 12,326
Space Use Residence Halls
Utility Usage
ProposedTotal Usage EUI Total Usage EUI
Electric Usage (kWh) 203,200 16.5 142,900 11.6 Thermal Usage (kBtu) 161,400 13.1 116,300 9.4 TOTAL (kBtu) 854,718 69.3 603,875 49.0
**Thermal Usage is quantified by Gas Data
End Use Breakdown
Electric
kWh
Thermal
kBtuLighting 30,480 -
Fans - -
Pumps - - Cooling 30,480 - Heating 125,984 161,400 DHW - -
Process Loads - -
Plug Loads 16,256 -
TOTAL 203,200 161,400
MeasuresTarget Reduction Lifetime Reduction
Cost
levelMeasure
Electric
kWh
Thermal
kBtuCost Savings Installed Cost Simple Payback
Equivalent CO2
(MTeCO2)1 Retrocommissioning 6,300 8,100 800$ 3,700$ 4.6 2
1 Control Sequence Optimization 12,500 16,100 1,700$ 6,200$ 3.6 5
1 Occupancy Based Controls - - -$ -$ - -
1 Demand Controlled Ventilation - - -$ -$ - -
1 VFD Installation on Fans 7,600 4,800 1,000$ 8,600$ 8.6 3
1 VFD Instllation on Pumps - - -$ -$ - -
1 TRV Installation - - -$ -$ - -
1 Building Envelope Improvements 15,600 16,100 2,000$ 19,700$ 9.9 6
1 Pneumatic to DDC Conversion - - -$ -$ - -
1 HVAC Controls Upgrade - - -$ -$ - -
1 LED Lighting Conversion 18,300 - 2,200$ 24,700$ 11.2 6
1 Pipe Insulation - - -$ -$ - -
1 Thermal Jackets Installation - - -$ -$ - -
1 Window Replacement - - -$ -$ - -
1 AHU Replacement - - -$ -$ - -
1 Electric to HW Conversion - -$ -$ - -
1 OA AHU for data center - - -$ -$ - -
1 Heat Recovery Installation - - -$ -$ - -
1 Fume Hood Improvements - - -$ -$ - -
1 Electric to VRF Conversion - - -$ -$ - -
1 DX to Chilled Water Cooling - - -$ -$ - -
1 Cogen - - -$ -$ - - TOTAL 60,300 45,100 7,700 62,900 8.2 26
Existing End Use Breakdown
Lighting, 12%
Fans, 0%
Pumps, 0%
Cooling, 12%
Heating, 69%
Domestic HW, 0%
Process Loads, 0%
Plug Loads, 6%
End Use Breakdown
Lighting, 12%
Fans, 0%
Pumps, 0%
Cooling, 12%
Heating, 69%
Domestic HW, 0%
Process Loads, 0%
Plug Loads, 6%
Worcester Polytechnic Institute2016 Scoping Study
22

Worcester Polytechnic InstituteEnergy Efficiency Scoping Audit
Building Existing Conditions
Building Name/Photo
Description
Building square footage
Type of facility
Ask Facilities StaffMajor problemsRecent renovationsPlanned renovationsIdeas for energy conservationRecent efficiency projectsOccupied Spaces
EMS \ Controlso Manufacturer and vintageo Local Control or on EMS?o End device control (pneumatic, electric, DDC)
HVAC Systems (Airside)o Type of systemso AHUs, RTUs, FCUs, Unit Ventilators, H&Vo Cooling/heating coils?
Space heating systemso Steam versus hot watero Any year round heating?o Any process steam? (i.e. kitchen, autoclaves, other)
Lightingo Type of lighting (T8, T12, CF, LED)o Occupancy sensors? Where?
Plumbingo City water or well water?o Showers: low flow?o Sinks – aerators?
Envelopeo No. of storieso Façade typeo Type of windows (double hung, fixed, 1x/2x pane)
Mechanical Rooms Primary Heating Systems
o Boiler Typeo Boiler and/or distribution pressure?o HW Pumps
CV or VFDs? Primary Cooling Systems
o Chiller? DX? Other?o Any year round cooling? (i.e. IT/data)o CHW Pumps
CV or VFDs? Domestic hot water
o Type: elec, gas, instantaneous Domestic hot water is provided by a gas-fired water heater.
Ellsworth Apartments 1-3
Ellsworth Apartments are a series of three upper class apartment residences that were built in 1973. Each apartmenthas approximately 5 to 7 students. The buildings are a combination of brick and vinyl siding with double panewindows. The total square footage of the three apartment buildings is 12,544 square feet.
The building is due for a controls upgrade. LED lighting conversion and HW conversion could be the main measures inthis building.
There is no energy management system in this building. Each apartment has individual control over the electricbaseboard radiation via a wall mounted thermostat. All apartments have electric submeters.
Apartments have portable window air conditioning units to provide cooling as needed.
Building heating is provided by electric heat baseboard radiation which is located throughout the building.
Almost all lights are fluorescents and no lighting controls. Upgrading to LED system is recommended.
Each apartment has their own kitchen and bathroom. Although GreenerU was unable to access the individualapartment, it can be assumed that the shower heads, faucets and toilets are all low flow.
Ellsworth Apartments consist of two story apartments with basements. The building is of block construction with brickand vinyl siding. The double-pane windows with metal frames allow infiltration and weather stripping isrecommended.
There is no boiler system in this building. Heating is supplied via electric baseboard radiation.
There is no mechanical cooling in the building. Apartments are cooled via window air conditioning units.
Worcester Polytechnic Institute2016 Scoping Study
23

Worcester Polytechnic InstituteEnergy Efficiency Scoping Audit
Building Existing Conditions
General Information
Building Ellsworth Apartments 3
GSF 5,488Space Use Residence Halls
Utility UsageProposed
Total Usage EUI Total Usage EUIElectric Usage (kWh) 109,130 19.9 81,830 14.9Thermal Usage (kBtu) 195,000 35.5 195,000 35.5TOTAL (kBtu) 567,352 103.4 474,204 86.4
**Thermal Usage is quantified by Gas DataEnd Use Breakdown
ElectrickWh
ThermalkBtu
Lighting 21,826 -Fans - -Pumps - -Cooling 10,913 -Heating 70,935 -DHW - 195,000Process Loads - -Plug Loads 5,457 -TOTAL 109,130 195,000
MeasuresTarget Reduction Lifetime Reduction
Costlevel Measure Electric
kWhThermal
kBtuCost Savings Installed Cost Simple Payback Equivalent CO2
(MTeCO2)1 Retrocommissioning - - -$ -$ - -1 Control Sequence Optimization - - -$ -$ - -1 Occupancy Based Controls - - -$ -$ - -1 Demand Controlled Ventilation - - -$ -$ - -1 VFD Installation on Fans - - -$ -$ - -1 VFD Instllation on Pumps - - -$ -$ - -1 TRV Installation - - -$ -$ - -1 Building Envelope Improvements 8,200 - 1,000$ 11,000$ 11.0 31 Pneumatic to DDC Conversion - - -$ -$ - -1 HVAC Controls Upgrade 8,200 - 1,000$ 5,500$ 5.5 31 LED Lighting Conversion 10,900 - 1,300$ 16,500$ 12.7 31 Pipe Insulation - - -$ -$ - -1 Thermal Jackets Installation - - -$ -$ - -1 Window Replacement - - -$ -$ - -1 AHU Replacement - - -$ -$ - -1 Electric to HW Conversion - - -$ -$ - -1 OA AHU for data center - - -$ -$ - -1 Heat Recovery Installation - - -$ -$ - -1 Fume Hood Improvements - - -$ -$ - -1 Electric to VRF Conversion - - -$ -$ - -1 DX to Chilled Water Cooling - - -$ -$ - -1 Cogen - - -$ -$ - -
TOTAL 27,300 - 3,300 33,000 10.0 13
Existing End Use Breakdown
Lighting, 13%
Fans, 0%
Pumps, 0%
Cooling, 7%
Heating, 43%
Domestic HW, 34%
Process Loads, 0%
Plug Loads, 3%
End Use Breakdown
Lighting, 13%
Fans, 0%
Pumps, 0%
Cooling, 7%
Heating, 43%
Domestic HW, 34%
Process Loads, 0%
Plug Loads, 3%
Worcester Polytechnic Institute2016 Scoping Study
24

Worcester Polytechnic InstituteEnergy Efficiency Scoping Audit
Building Existing Conditions
General Information
Building Ellsworth Apartments 2
GSF 3,136Space Use Residence Halls
Utility UsageProposed
Total Usage EUI Total Usage EUIElectric Usage (kWh) 62,360 19.9 46,760 14.9Thermal Usage (kBtu) 199,200 63.5 199,200 63.5TOTAL (kBtu) 411,972 131.4 358,745 114.4
**Thermal Usage is quantified by Gas DataEnd Use Breakdown
ElectrickWh
ThermalkBtu
Lighting 12,472 -Fans - -Pumps - -Cooling 6,236 -Heating 40,534 -DHW - 199,200Process Loads - -Plug Loads 3,118 -TOTAL 62,360 199,200
MeasuresTarget Reduction Lifetime Reduction
Costlevel Measure Electric
kWhThermal
kBtuCost Savings Installed Cost Simple Payback Equivalent CO2
(MTeCO2)1 Retrocommissioning - - -$ -$ - -1 Control Sequence Optimization - - -$ -$ - -1 Occupancy Based Controls - - -$ -$ - -1 Demand Controlled Ventilation - - -$ -$ - -1 VFD Installation on Fans - - -$ -$ - -1 VFD Instllation on Pumps - - -$ -$ - -1 TRV Installation - - -$ -$ - -1 Building Envelope Improvements 4,700 - 600$ 6,300$ 10.5 11 Pneumatic to DDC Conversion - - -$ -$ - -1 HVAC Controls Upgrade 4,700 - 600$ 1,600$ 2.7 11 LED Lighting Conversion 6,200 - 700$ 9,400$ 13.4 21 Pipe Insulation - - -$ -$ - -1 Thermal Jackets Installation - - -$ -$ - -1 Window Replacement - - -$ -$ - -1 AHU Replacement - - -$ -$ - -1 Electric to HW Conversion - - -$ -$ - -1 OA AHU for data center - - -$ -$ - -1 Heat Recovery Installation - - -$ -$ - -1 Fume Hood Improvements - - -$ -$ - -1 Electric to VRF Conversion - - -$ -$ - -1 DX to Chilled Water Cooling - - -$ -$ - -1 Cogen - - -$ -$ - -
TOTAL 15,600 - 1,900 17,300 9.1 10
Existing End Use Breakdown
Lighting, 10%
Fans, 0%
Pumps, 0%
Cooling, 5%
Heating, 34%
Domestic HW, 48%
Process Loads, 0%
Plug Loads, 3%
End Use Breakdown
Lighting, 10%
Fans, 0%
Pumps, 0%
Cooling, 5%
Heating, 34%
Domestic HW, 48%
Process Loads, 0%
Plug Loads, 3%
Worcester Polytechnic Institute2016 Scoping Study
25
Worcester Polytechnic InstituteEnergy Efficiency Scoping Audit
Building Existing Conditions
General Information
Building Ellsworth Apartments 1
GSF 3,920Space Use Residence Halls
Utility UsageProposed
Total Usage EUI Total Usage EUIElectric Usage (kWh) 77,950 19.9 58,550 14.9Thermal Usage (kBtu) 249,000 63.5 249,000 63.5TOTAL (kBtu) 514,965 131.4 448,773 114.5
**Thermal Usage is quantified by Gas DataEnd Use Breakdown
ElectrickWh
ThermalkBtu
Lighting 15,590 -Fans - -Pumps - -Cooling 7,795 -Heating 50,668 -DHW - 249,000Process Loads - -Plug Loads 3,898 -TOTAL 77,950 249,000
MeasuresTarget Reduction Lifetime Reduction
Costlevel Measure Electric
kWhThermal
kBtuCost Savings Installed Cost Simple Payback Equivalent CO2
(MTeCO2)1 Retrocommissioning - - -$ -$ - -1 Control Sequence Optimization - - -$ -$ - -1 Occupancy Based Controls - - -$ -$ - -1 Demand Controlled Ventilation - - -$ -$ - -1 VFD Installation on Fans - - -$ -$ - -1 VFD Instllation on Pumps - - -$ -$ - -1 TRV Installation - - -$ -$ - -1 Building Envelope Improvements 5,800 - 700$ 7,800$ 11.1 21 Pneumatic to DDC Conversion - - -$ -$ - -1 HVAC Controls Upgrade 5,800 - 700$ 3,900$ 5.6 21 LED Lighting Conversion 7,800 - 900$ 11,800$ 13.1 21 Pipe Insulation - - -$ -$ - -1 Thermal Jackets Installation - - -$ -$ - -1 Window Replacement - - -$ -$ - -1 AHU Replacement - - -$ -$ - -1 Electric to HW Conversion - - -$ -$ - -1 OA AHU for data center - - -$ -$ - -1 Heat Recovery Installation - - -$ -$ - -1 Fume Hood Improvements - - -$ -$ - -1 Electric to VRF Conversion - - -$ -$ - -1 DX to Chilled Water Cooling - - -$ -$ - -1 Cogen - - -$ -$ - -
TOTAL 19,400 - 2,300 23,500 10.2 11
Existing End Use Breakdown
Lighting, 10%
Fans, 0%
Pumps, 0%
Cooling, 5%
Heating, 34%
Domestic HW, 48%
Process Loads, 0%
Plug Loads, 3%
End Use Breakdown
Lighting, 10%
Fans, 0%
Pumps, 0%
Cooling, 5%
Heating, 34%
Domestic HW, 48%
Process Loads, 0%
Plug Loads, 3%
Worcester Polytechnic Institute2016 Scoping Study
26

Worcester Polytechnic InstituteEnergy Efficiency Scoping Audit
Building Existing Conditions
Building Name/Photo
Description
Building square footage
Type of facility
Ask Facilities StaffMajor problemsRecent renovationsPlanned renovationsIdeas for energy conservationRecent efficiency projectsOccupied Spaces
EMS \ Controlso Manufacturer and vintageo Local Control or on EMS?o End device control (pneumatic, electric, DDC)
HVAC Systems (Airside)o Type of systemso AHUs, RTUs, FCUs, Unit Ventilators, H&Vo Cooling/heating coils?
Space heating systemso Steam versus hot watero Any year round heating?o Any process steam? (i.e. kitchen, autoclaves, other)
Lightingo Type of lighting (T8, T12, CF, LED)o Occupancy sensors? Where?
Plumbingo City water or well water?o Showers: low flow?o Sinks – aerators?
Envelopeo No. of storieso Façade typeo Type of windows (double hung, fixed, 1x/2x pane)
Mechanical Rooms Primary Heating Systems
o Boiler Typeo Boiler and/or distribution pressure?o HW Pumps
CV or VFDs? Primary Cooling Systems
o Chiller? DX? Other?o Any year round cooling? (i.e. IT/data)o CHW Pumps
CV or VFDs? Domestic hot water
o Type: elec, gas, instantaneous Domestic hot water is provided by two gas-fired Rheem heaters.
Institute Hall
Institute Hall is a 15,300 square foot, four story residence hall and was built in 1989. There are singles, doubles,triples, and quads which in total houses approximately 90 students. A study lounge is located on the first floor and thebuilding also has a laundry room.
A new rooftop unit was recently installed to provide ventilation to the building. All valves on hot water convectorswere recently replaced as well.
The main building level controls are on ALC system. Temperature sensors are located throughout the building formonitoring purposes. Each room has an individual zone valve on the hot water convectors to regulate temperature.
A new rooftop unit provides ventilation to the building.
Space heating is a combination of hot water convectors in the rooms with zone valve temperatures controls via localthermostatic controls. Three older McQuay fan coil units are located in the entryways and have ALC temperaturecontrols.
The lighting is a combination of compact fluorescent lamps and fluorescent T8 lamps. Upgrading to LED system isrecommended.
The shower heads, faucets and toilets are all low flow.
The building is of block construction with brick. The old single-pane operable windows need to be replaced.
Heating is provided by three Buderus gas-fired condensing boilers; two of the three have been taken from the RecCenter and reused in the building. Two hot water pumps are equipped with VFDs and circulate hot water to the zonesin the building.
There is no mechanical cooling in the building.
Worcester Polytechnic Institute2016 Scoping Study
27

Worcester Polytechnic InstituteEnergy Efficiency Scoping Audit
Building Existing Conditions
General Information
Building Institute Hall
GSF 15,300Space Use Residence Halls
Utility UsageProposed
Total Usage EUI Total Usage EUIElectric Usage (kWh) 117,360 7.7 73,360 4.8Thermal Usage (kBtu) 834,300 54.5 623,800 40.8TOTAL (kBtu) 1,234,732 80.7 874,104 57.1
**Gas Data is quantified by Gas DataEnd Use Breakdown
ElectrickWh
ThermalkBtu
Lighting 46,944 -Fans 11,736 -Pumps 8,215 -Cooling 41,076 -Heating - 725,841DHW - 108,459Process Loads - -Plug Loads 9,389 -TOTAL 117,360 834,300
MeasuresTarget Reduction Lifetime Reduction
Costlevel Measure Electric
kWhThermal
kBtuCost Savings Installed Cost Simple Payback Equivalent CO2
(MTeCO2)1 Retrocommissioning 3,100 36,300 700$ 6,100$ 8.7 31 Control Sequence Optimization 4,900 29,000 900$ 9,200$ 10.2 31 Occupancy Based Controls - - -$ -$ - -1 Demand Controlled Ventilation - - -$ -$ - -1 VFD Installation on Fans 4,700 - 600$ 7,700$ 12.8 11 VFD Instllation on Pumps - - -$ -$ - -1 TRV Installation - - -$ -$ - -1 Building Envelope Improvements 3,100 72,600 1,100$ 15,300$ 13.9 51 Pneumatic to DDC Conversion - - -$ -$ - -1 HVAC Controls Upgrade - - -$ -$ - -1 LED Lighting Conversion 28,200 - 3,400$ 45,900$ 13.5 91 Pipe Insulation - 72,600 700$ 7,700$ 11.0 41 Thermal Jackets Installation - - -$ -$ - -1 Window Replacement - - -$ -$ - -1 AHU Replacement - - -$ -$ - -1 Electric to HW Conversion - - -$ -$ - -1 OA AHU for data center - - -$ -$ - -1 Heat Recovery Installation - - -$ -$ - -1 Fume Hood Improvements - - -$ -$ - -1 Electric to VRF Conversion - - -$ -$ - -1 DX to Chilled Water Cooling - - -$ -$ - -1 Cogen - - -$ -$ - -
TOTAL 44,000 210,500 7,400 91,900 12.4 30
Existing End Use Breakdown
Lighting, 13%
Fans, 3%
Pumps, 2%
Cooling, 11%
Heating, 59%
Domestic HW, 9%
Process Loads, 0%
Plug Loads, 3%
End Use Breakdown
Lighting, 13%
Fans, 3%
Pumps, 2%
Cooling, 11%
Heating, 59%
Domestic HW, 9%
Process Loads, 0%
Plug Loads, 3%
Worcester Polytechnic Institute2016 Scoping Study
28

Worcester Polytechnic InstituteEnergy Efficiency Scoping Audit
Building Existing Conditions
Building Name/Photo
Description
Building square footage
Type of facility
Ask Facilities StaffMajor problemsRecent renovationsPlanned renovationsIdeas for energy conservationRecent efficiency projectsOccupied Spaces
EMS \ Controlso Manufacturer and vintageo Local Control or on EMS?o End device control (pneumatic, electric, DDC)
HVAC Systems (Airside)o Type of systemso AHUs, RTUs, FCUs, Unit Ventilators, H&Vo Cooling/heating coils?
Space heating systemso Steam versus hot watero Any year round heating?o Any process steam? (i.e. kitchen, autoclaves, other)
Lightingo Type of lighting (T8, T12, CF, LED)o Occupancy sensors? Where?
Plumbingo City water or well water?o Showers: low flow?o Sinks – aerators?
Envelopeo No. of storieso Façade typeo Type of windows (double hung, fixed, 1x/2x pane)
Mechanical Rooms Primary Heating Systems
o Boiler Typeo Boiler and/or distribution pressure?o HW Pumps
CV or VFDs? Primary Cooling Systems
o Chiller? DX? Other?o Any year round cooling? (i.e. IT/data)o CHW Pumps
CV or VFDs? Domestic hot water
o Type: elec, gas, instantaneous Domestic hot water is provided by the gas-fired boilers.
Founders Hall
Founders Hall is a 96,994 square foot residence hall built in 1985. The four story building has double to eight personsuites, where each is equipped with a kitchen. The first floor houses the WPI Police Station and the Goat's HeadRestaurant.
The two Bosch hot water boilers that serve the building were recently installed in 2013. The outdate Trane fan coilunits in the Police Station are planned to be replaced with new Friedrichs units. The Goat's Head Restaurant has andolder Trane makeup air unit that should be replaced with a more efficient unit. LED lighting conversion andretrocommissioning of the existing fan coil units in the suites could be the main measures in this building.
The building controls is on the Schneider Electric system. The ductless splits that serve the Police Station arecontrolled via local Mitsubishi thermostats. The Trane fan coil units are controlled via local thermostatic and fancontrols. Hot water radiation in dorm suites is controlled by Honeywell T87 thermostats.
Note: GreenerU could not access the Goat's Head Restaurant during the site visit. An outdated Trane Climate Changermakeup air unit serves the kitchen of the Goat's Restaurant. The unit provides heating only via hot water coils. Thereis no VFD on the supply fan. An exhaust fan located on the roof is linked to the makeup air unit controls. Twocondensing units located on the second floor also serve the kitchen with two stages of cooling capabilities. Two airhandling units provide the dining area with hot water heat and DX cooling.
Space heating consists of hot water baseboard radiation in the dorm suites and hallways. The Police Station is heatedby six ductless split units and eight Trane fan coil units.
Almost all lights are fluorescents. Upgrading to LED system is recommended.
The shower heads, faucets and toilets are all low flow.
The building is of block construction with brick facade. The windows are operable double-pane.
Two Bosch hot water boilers were recently installed in 2013 to provide heat to Founders Hall. Two Armstrong hotwater pumps operate in lead / lag to circulate hot water to the building and both are equipped with VFDs.
The air handling units in the Goat's Restaurant provide DX cooling to the space. There are also two units that serve thekitchen area via two stages of cooling. Trane fan coil units and Mitsubishi ductless split units in the Police Stationprovide cooling year round as needed.
Worcester Polytechnic Institute2016 Scoping Study
29

Worcester Polytechnic InstituteEnergy Efficiency Scoping Audit
Building Existing Conditions
General Information
Building Founders Hall
GSF 96,994Space Use Residence Halls
Utility UsageProposed
Total Usage EUI Total Usage EUIElectric Usage (kWh) 707,200 7.3 424,000 4.4Thermal Usage (kBtu) 908,700 9.4 770,600 7.9TOTAL (kBtu) 3,321,666 34.2 2,217,288 22.9
**Thermal Usage is quantified by Gas DataEnd Use Breakdown
ElectrickWh
ThermalkBtu
Lighting 282,880 -Fans 106,080 -Pumps 84,864 -Cooling 141,440 -Heating - 726,960DHW - 181,740Process Loads - -Plug Loads 91,936 -TOTAL 707,200 908,700
MeasuresTarget Reduction Lifetime Reduction
Costlevel Measure Electric
kWhThermal
kBtuCost Savings Installed Cost Simple Payback Equivalent CO2
(MTeCO2)1 Retrocommissioning 16,600 36,300 2,400$ 29,100$ 12.1 71 Control Sequence Optimization 26,600 29,100 3,500$ 48,500$ 13.9 101 Occupancy Based Controls - - -$ -$ - -1 Demand Controlled Ventilation - - -$ -$ - -1 VFD Installation on Fans 37,100 - 4,500$ 48,500$ 10.8 121 VFD Instllation on Pumps - - -$ -$ - -1 TRV Installation - - -$ -$ - -1 Building Envelope Improvements 33,200 72,700 4,700$ 19,400$ 4.1 141 Pneumatic to DDC Conversion - - -$ -$ - -1 HVAC Controls Upgrade - - -$ -$ - -1 LED Lighting Conversion 169,700 - 20,400$ 266,700$ 13.1 531 Pipe Insulation - - -$ -$ - -1 Thermal Jackets Installation - - -$ -$ - -1 Window Replacement - - -$ -$ - -1 AHU Replacement - - -$ -$ - -1 Electric to HW Conversion - - -$ -$ - -1 OA AHU for data center - - -$ -$ - -1 Heat Recovery Installation - - -$ -$ - -1 Fume Hood Improvements - - -$ -$ - -1 Electric to VRF Conversion - - -$ -$ - -1 DX to Chilled Water Cooling - - -$ -$ - -1 Cogen - - -$ -$ - -
TOTAL 283,200 138,100 35,500 412,200 11.6 100
Existing End Use Breakdown
Lighting, 29%
Fans, 11%
Pumps, 9%
Cooling, 15%
Heating, 22%
Domestic HW, 5%
Process Loads, 0%
Plug Loads, 9%
End Use Breakdown
Lighting, 29%
Fans, 11%
Pumps, 9%
Cooling, 15%
Heating, 22%
Domestic HW, 5%
Process Loads, 0%
Plug Loads, 9%
Worcester Polytechnic Institute2016 Scoping Study
30

Worcester Polytechnic InstituteEnergy Efficiency Scoping Audit
Building Existing Conditions
Building Name/Photo
Description
Building square footage
Type of facility
Ask Facilities StaffMajor problemsRecent renovationsPlanned renovationsIdeas for energy conservationRecent efficiency projectsOccupied Spaces
EMS \ Controlso Manufacturer and vintageo Local Control or on EMS?o End device control (pneumatic, electric, DDC)
HVAC Systems (Airside)o Type of systemso AHUs, RTUs, FCUs, Unit Ventilators, H&Vo Cooling/heating coils?
Space heating systemso Steam versus hot watero Any year round heating?o Any process steam? (i.e. kitchen, autoclaves, other)
Lightingo Type of lighting (T8, T12, CF, LED)o Occupancy sensors? Where?
Plumbingo City water or well water?o Showers: low flow?o Sinks – aerators?
Envelopeo No. of storieso Façade typeo Type of windows (double hung, fixed, 1x/2x pane)
Mechanical Rooms Primary Heating Systems
o Boiler Typeo Boiler and/or distribution pressure?o HW Pumps
CV or VFDs? Primary Cooling Systems
o Chiller? DX? Other?o Any year round cooling? (i.e. IT/data)o CHW Pumps
CV or VFDs? Domestic hot water
o Type: elec, gas, instantaneous Domestic hot water is provided via the two Lochinvar gas-fired hot water boilers. Two Aqua Plex domestic hot watertanks store water which is then circulated to the building via two pumps that are equipped with VFDs.
Faraday Hall
Faraday Hall is a 88,000 square foot residence hall that was recently built in 2013. It houses approximately 260students in studios, or four person suites with kitchens and common areas. There is a laundry room, lounge spaces,and game room.
The building was built 3 years ago. LED lighting conversion and retrocommissioning could be the main measures inthis building.
The building controls is on the Schneider Electric system. Each suite has two temperature sensors which is relayedback to the Schneider system. The hallway fan coil units are controlled by wall thermostats with heat / cool and fancontrols.
Each wing (three total) at Faraday Hall is ventilated by a York energy recovery unit located on the roof. The supply andreturn/exhaust fans on each unit are equipped with VFDs. Each wing also has two exhaust fans, one for the kitchenareas and the other for the bathrooms. The laundry room has it own respective exhaust fan.
Space heating is provided to suites by two-pipe valence units. Common areas and hallways are heated via hot waterbaseboard radiation.
Almost all lights are fluorescents. Upgrading to LED system is recommended. Occupancy sensors are located in thehallways.
The shower heads, faucets and toilets are all low flow.
Faraday Hall is a five story building with an exterior façade made of glass and brick. The windows are double pane andinoperable.
Heating is provided to the building by two gas-fired Lochinvar hot water boilers. Two hot water pumps circulate to thebuilding and are equipped with VFDs.
Cooling is provided to the building via a Flex Sys Multi-stack air cooled chiller and an Evapco cooling tower located onthe roof. The three chilled water pumps and three condenser water pumps are equipped with VFDs. Mitsusbishi Mr.Slim split air condtioning units provide cooling to data closets in each wing (6 total). Valence units in the suites aretwo-pipe systems which have the capability of heating hot water or chilled water cooling. Fan coil units in hallwaysprovide cooling.
Worcester Polytechnic Institute2016 Scoping Study
31

Worcester Polytechnic InstituteEnergy Efficiency Scoping Audit
Building Existing Conditions
General Information
Building Faraday Hall
GSF 88,000Space Use Residence Halls
Utility UsageProposed
Total Usage EUI Total Usage EUIElectric Usage (kWh) 926,800 10.5 691,400 7.9Thermal Usage (kBtu) 4,541,300 51.6 4,264,800 48.5TOTAL (kBtu) 7,703,542 87.5 6,623,857 75.3
**Thermal Usage is quantified by Gas DataEnd Use Breakdown
ElectrickWh
ThermalkBtu
Lighting 370,720 -Fans 111,216 -Pumps 74,144 -Cooling 315,112 -Heating - 3,950,931DHW - 590,369Process Loads - -Plug Loads 55,608 -TOTAL 926,800 4,541,300
MeasuresTarget Reduction Lifetime Reduction
Costlevel Measure Electric
kWhThermal
kBtuCost Savings Installed Cost Simple Payback Equivalent CO2
(MTeCO2)1 Retrocommissioning 10,000 79,000 2,000$ 17,600$ 8.8 71 Control Sequence Optimization 40,000 197,500 6,800$ 26,400$ 3.9 231 Occupancy Based Controls - - -$ -$ - -1 Demand Controlled Ventilation - - -$ -$ - -1 VFD Installation on Fans - - -$ -$ - -1 VFD Instllation on Pumps - - -$ -$ - -1 TRV Installation - - -$ -$ - -1 Building Envelope Improvements - - -$ -$ - -1 Pneumatic to DDC Conversion - - -$ -$ - -1 HVAC Controls Upgrade - - -$ -$ - -1 LED Lighting Conversion 185,400 - 22,200$ 264,000$ 11.9 571 Pipe Insulation - - -$ -$ - -1 Thermal Jackets Installation - - -$ -$ - -1 Window Replacement - - -$ -$ - -1 AHU Replacement - - -$ -$ - -1 Electric to HW Conversion - - -$ -$ - -1 OA AHU for data center - - -$ -$ - -1 Heat Recovery Installation - - -$ -$ - -1 Fume Hood Improvements - - -$ -$ - -1 Electric to VRF Conversion - - -$ -$ - -1 DX to Chilled Water Cooling - - -$ -$ - -1 Cogen - - -$ -$ - -
TOTAL 235,400 276,500 31,000 308,000 9.9 93
Existing End Use Breakdown
Lighting, 16%
Fans, 5%
Pumps, 3%
Cooling, 14%
Heating, 51%
Domestic HW, 8%
Process Loads, 0%
Plug Loads, 2%
End Use Breakdown
Lighting, 16%
Fans, 5%
Pumps, 3%
Cooling, 14%
Heating, 51%
Domestic HW, 8%
Process Loads, 0%
Plug Loads, 2%
Worcester Polytechnic Institute2016 Scoping Study
32

Worcester Polytechnic InstituteEnergy Efficiency Scoping Audit
Building Existing Conditions
Building Name/Photo
Description
Building square footage
Type of facility
Ask Facilities StaffMajor problemsRecent renovationsPlanned renovationsIdeas for energy conservationRecent efficiency projectsOccupied Spaces
EMS \ Controlso Manufacturer and vintageo Local Control or on EMS?o End device control (pneumatic, electric, DDC)
HVAC Systems (Airside)o Type of systemso AHUs, RTUs, FCUs, Unit Ventilators, H&Vo Cooling/heating coils?
Space heating systemso Steam versus hot watero Any year round heating?o Any process steam? (i.e. kitchen, autoclaves, other)
Lightingo Type of lighting (T8, T12, CF, LED)o Occupancy sensors? Where?
Plumbingo City water or well water?o Showers: low flow?o Sinks – aerators?
Envelopeo No. of storieso Façade typeo Type of windows (double hung, fixed, 1x/2x pane)
Mechanical Rooms Primary Heating Systems
o Boiler Typeo Boiler and/or distribution pressure?o HW Pumps
CV or VFDs? Primary Cooling Systems
o Chiller? DX? Other?o Any year round cooling? (i.e. IT/data)o CHW Pumps
CV or VFDs? Domestic hot water
o Type: elec, gas, instantaneous Domestic hot water is provided by a gas-fired A.O. Smith DuraMax hot water heater in one mechanical room and aTekmar hot water heater in the other. Each hot water heater is piped to two domestic hot water storage tanks.
Salisbury Estates
Salisbury Estates is a 130,000 square foot complex that serves as residences for graduate students and faculty / staffand was built in 1955. WPI utilizes approximately 50 units as housing.
The staff mentioned that WPI does not own this complex of apartments. LED lighting conversion andretrocommissioning could be the main measures for the units that WPI leases.
There is no energy management system in this complex. Each apartment is controlled by a Honeywell T87 thermostat.
There is no airside equipment in the building.
Space heating system is provided by hot water cast iron radiatiors.
Lighting is comprised of a combination of incandescent and fluorescent. Occupants also have plug-in lighting asneeded. Upgrading to LED system is recommended.
Each apartment has their own kitchen and bathroom. The shower heads, faucets and toilets are all low flow.
The building is of block construction with brick with a full basement. Windows are double pane and operable, but mayneed weather stripping in areas.
Heating is provide by Hydrotherm MultiTemp modular hot water boilers which are located in two separate mechanicalrooms. Each mechanical room houses two boilers with five modular units per boiler. Hot water is provided to thespaces by two, constant volume circulation pumps.
There is no mechanical cooling in the building.
Worcester Polytechnic Institute2016 Scoping Study
33

Worcester Polytechnic InstituteEnergy Efficiency Scoping Audit
Building Existing Conditions
General Information
Building Salisbury Estates** Only
ApartmentsLeased by WPI
GSF 130,000Space Use Grad Housing, faculty/ staff
Utility UsageProposed
Total Usage EUI Total Usage EUIElectric Usage (kWh) 1,537,120 11.8 1,212,820 9.3Thermal Usage (kBtu) 6,042,990 46.5 5,005,990 38.5TOTAL (kBtu) 11,287,643 86.8 9,144,132 70.3
**Thermal Usage is quantified by gas dataEnd Use Breakdown
ElectrickWh
ThermalkBtu
Lighting 768,560 -Fans - -Pumps 276,682 -Cooling 322,795 -Heating - 4,713,532DHW - 1,329,458Process Loads - -Plug Loads 169,083 -TOTAL 1,537,120 6,042,990
MeasuresTarget Reduction Lifetime Reduction
Costlevel Measure Electric
kWhThermal
kBtuCost Savings Installed Cost Simple Payback Equivalent CO2
(MTeCO2)1 Retrocommissioning - - -$ -$ - -1 Control Sequence Optimization - - -$ -$ - -1 Occupancy Based Controls - - -$ -$ - -1 Demand Controlled Ventilation - - -$ -$ - -1 VFD Installation on Fans - - -$ -$ - -1 VFD Instllation on Pumps 110,700 235,700 15,700$ 19,500$ 1.2 471 TRV Installation - - -$ -$ - -1 Building Envelope Improvements - 377,100 3,800$ 26,000$ 6.8 201 Pneumatic to DDC Conversion - - -$ -$ - -1 HVAC Controls Upgrade 59,900 424,200 11,500$ 22,800$ 2.0 411 LED Lighting Conversion 153,700 - 18,400$ 195,000$ 10.6 481 Pipe Insulation - - -$ -$ - -1 Thermal Jackets Installation - - -$ -$ - -1 Window Replacement - - -$ -$ - -1 AHU Replacement - - -$ -$ - -1 Electric to HW Conversion - - -$ -$ - -1 OA AHU for data center - - -$ -$ - -1 Heat Recovery Installation - - -$ -$ - -1 Fume Hood Improvements - - -$ -$ - -1 Electric to VRF Conversion - - -$ -$ - -1 DX to Chilled Water Cooling - - -$ -$ - -1 Cogen - - -$ -$ - -
TOTAL 324,300 1,037,000 49,400 263,300 5.3 161
Existing End Use Breakdown
Lighting, 23%
Fans, 0%
Pumps, 8%
Cooling, 10%
Heating, 42%
Domestic HW, 12%
Process Loads, 0%
Plug Loads, 5%
End Use Breakdown
Lighting, 20%
Fans, 9%
Pumps, 4%
Cooling, 8%
Heating, 48%
Domestic HW, 7%
Process Loads, 0%
Plug Loads, 5%
End Use Breakdown
Lighting, 17%
Fans, 14%
Pumps, 6%
Cooling, 16%
Heating, 22%
Domestic HW, 13%
Process Loads, 9%
Plug Loads, 4%
End Use Breakdown
Lighting, 20%
Fans, 9%
Pumps, 4%
Cooling, 8%
Heating, 48%
Domestic HW, 7%
Process Loads, 0%
Plug Loads, 5%
End Use Breakdown
Lighting, 8%
Fans, 0%
Pumps, 1%
Cooling, 2%
Heating, 86%
Domestic HW, 0%
Process Loads, 0%
Plug Loads, 2%
End Use Breakdown
Lighting, 20%
Fans, 9%
Pumps, 4%
Cooling, 8%
Heating, 48%
Domestic HW, 7%
Process Loads, 0%
Plug Loads, 5%
End Use Breakdown
Lighting, 20%
Fans, 5%
Pumps, 4%
Cooling, 12%
Heating, 49%
Domestic HW, 5%
Process Loads, 0%
Plug Loads, 5%
End Use Breakdown
Lighting, 20%
Fans, 9%
Pumps, 4%
Cooling, 8%
Heating, 48%
Domestic HW, 7%
Process Loads, 0%
Plug Loads, 5%
End Use Breakdown
Lighting, 23%
Fans, 0%
Pumps, 8%
Cooling, 10%
Heating, 42%
Domestic HW, 12%
Process Loads, 0%
Plug Loads, 5%
Worcester Polytechnic Institute2016 Scoping Study
34

0
10
20
30
kWh/
GS
F
Building
Fuller Labs
Stratton Hall
Washburn ShopsStoddard Labs
Benchmark
Academic BuildingsElectric Benchmarking
Worcester Polytechnic Institute2016 Scoping Study
35

0
50
100
150
200
250
kBT
U/G
SF
Building
Fuller Labs
Stratton Hall
Washburn ShopsStoddard Labs
Benchmark
Academic BuildingsThermal Benchmarking
Worcester Polytechnic Institute2016 Scoping Study
36

Worcester Polytechnic InstituteEnergy Efficiency Scoping Audit
Building Existing Conditions
Building Name/Photo
Description
Building square footage
Type of facility
Ask Facilities StaffMajor problemsRecent renovationsPlanned renovationsIdeas for energy conservationRecent efficiency projectsOccupied Spaces
EMS \ Controlso Manufacturer and vintageo Local Control or on EMS?o End device control (pneumatic, electric, DDC)
HVAC Systems (Airside)o Type of systemso AHUs, RTUs, FCUs, Unit Ventilators, H&Vo Cooling/heating coils?
Space heating systemso Steam versus hot watero Any year round heating?o Any process steam? (i.e. kitchen, autoclaves, other)
Lightingo Type of lighting (T8, T12, CF, LED)o Occupancy sensors? Where?
Plumbingo City water or well water?o Showers: low flow?o Sinks – aerators?
Envelopeo No. of storieso Façade typeo Type of windows (double hung, fixed, 1x/2x pane)
Mechanical Rooms Primary Heating Systems
o Boiler Typeo Boiler and/or distribution pressure?o HW Pumps
CV or VFDs? Primary Cooling Systems
o Chiller? DX? Other?o Any year round cooling? (i.e. IT/data)o CHW Pumps
CV or VFDs? Domestic hot water
o Type: elec, gas, instantaneous Domestic hot water is made with gas-fired hot water heater.
Fuller Labs
Fuller Labs is a 73,250 square foot academic building that was built in 1990. The building houses the ComputerScience department, Computing and Communications Center, and Academic Technology Center.
WPI is in the process of converting the energy management system at Fuller Labs from the Schneider to AutomatedLogic (ALC) controls system. LED lighting conversion could be the main measures in this building.
The controls for the building is on Schneider Electric and ALC system. WPI is in the process of converting the buildingfrom Schneider to ALC. The chiller, air handling units, variable air volume (VAV) boxes, fan coil units, and pumps areall controlled and monitored using the EMS.
AHU -1 serves the computer labs, AHU- 2 serves the administrative area, and AHU-3 serves the lecture halls. AHU-1and AHU-2 have steam heating coils and chilled water coils. A steam to hot water heat exchanger provides hot waterto the heating coils in AHU-3. AHU-3 also has chilled water coils. VAV boxes are located throughout the building andhave electric reheat. A couple fan coil units serve a room in the basement and one on the second floor.
Space heating is provided by a combination of steam and hot water heating coils in the AHUs and electric reheat in theVAV boxes. The lobby area has electric baseboard heat.
Lighting is predominantly fluorescent. Occupants also have task lighting as needed. Upgrading to LED system isrecommended.
The faucets and toilets are all low flow.
The building is of block construction with brick and metal framing. The windows are double-pane with adequateweather stripping around the perimeter.
Heating is provide by campus steam loop in winter. There is a HW converter that produces HW for AHU-3 heating.Remaining heat is provided by electric reheat. Pumps do not have VFDs.
Cooling is provided by two Carrier chillers that were installed approximately 6 years ago. Chilled water is circulated bythree pumps. The pumps do not have VFDs. Free cooling is provided via a heat exchanger in the winter. The chillersystem serves the IT/data room year round.
Worcester Polytechnic Institute2016 Scoping Study
37

Worcester Polytechnic InstituteEnergy Efficiency Scoping Audit
Building Existing Conditions
General Information
Building Fuller Labs
GSF 73,250Space Use Academic
Utility UsageProposed
Total Usage EUI Total Usage EUIElectric Usage (kWh) 1,212,141 16.5 699,741 9.6Thermal Usage (kBtu) 4,155,912 56.7 3,010,561 41.1TOTAL (kBtu) 8,291,737 113.2 5,398,077 73.7
**Thermal Usage allocated based on Square Footage and Usage TypeEnd Use Breakdown ** Electric Usage is allocated on square footage and use type
ElectrickWh
ThermalkBtu
Lighting 484,856 -Fans 218,185 -Pumps 96,971 -Cooling 193,943 -Heating 96,971 3,615,643DHW - 540,269Process Loads - -Plug Loads 121,214 -TOTAL 1,212,141 4,155,912
MeasuresTarget Reduction Lifetime Reduction
Costlevel Measure Electric
kWhThermal
kBtuCost Savings Installed Cost Simple Payback Equivalent CO2
(MTeCO2)1 Retrocommissioning 18,200 361,600 5,900$ 29,300$ 5.0 251 Control Sequence Optimization 36,400 325,400 7,700$ 36,600$ 4.8 291 Occupancy Based Controls 18,200 253,100 4,800$ 25,000$ 5.2 191 Demand Controlled Ventilation 15,800 180,800 3,700$ 18,300$ 4.9 151 VFD Installation on Fans 37,100 - 4,500$ 47,600$ 10.6 121 VFD Instllation on Pumps 29,100 - 3,500$ 36,600$ 10.5 91 TRV Installation - - -$ -$ - -1 Building Envelope Improvements 18,200 289,300 5,100$ 25,600$ 5.0 211 Pneumatic to DDC Conversion - - -$ -$ - -1 HVAC Controls Upgrade - - -$ -$ - -1 LED Lighting Conversion 242,400 - 29,100$ 293,000$ 10.1 751 Pipe Insulation - - -$ -$ - -1 Thermal Jackets Installation - - -$ -$ - -1 Window Replacement - - -$ -$ - -1 AHU Replacement - - -$ -$ - -2 Electric to HW Conversion 97,000 (264,849) 9,000$ 183,100$ 20.3 161 OA AHU for data center - - -$ -$ - -1 Heat Recovery Installation - - -$ -$ - -1 Fume Hood Improvements - - -$ -$ - -1 Electric to VRF Conversion - - -$ -$ - -1 DX to Chilled Water Cooling - - -$ -$ - -1 Cogen - - -$ -$ - -
TOTAL 512,400 1,145,351 73,300 695,100 9.5 225
Existing End Use Breakdown
Lighting, 20%
Fans, 9%
Pumps, 4%
Cooling, 8%
Heating, 48%
Domestic HW, 7%
Process Loads, 0%
Plug Loads, 5%
Worcester Polytechnic Institute2016 Scoping Study
38

Worcester Polytechnic InstituteEnergy Efficiency Scoping Audit
Building Existing Conditions
Building Name/Photo
Description
Building square footage
Type of facility
Ask Facilities StaffMajor problemsRecent renovationsPlanned renovationsIdeas for energy conservationRecent efficiency projectsOccupied Spaces
EMS \ Controlso Manufacturer and vintageo Local Control or on EMS?o End device control (pneumatic, electric, DDC)
HVAC Systems (Airside)o Type of systemso AHUs, RTUs, FCUs, Unit Ventilators, H&Vo Cooling/heating coils?
Space heating systemso Steam versus hot watero Any year round heating?o Any process steam? (i.e. kitchen, autoclaves, other)
Lightingo Type of lighting (T8, T12, CF, LED)o Occupancy sensors? Where?
Plumbingo City water or well water?o Showers: low flow?o Sinks – aerators?
Envelopeo No. of storieso Façade typeo Type of windows (double hung, fixed, 1x/2x pane)
Mechanical Rooms Primary Heating Systems
o Boiler Typeo Boiler and/or distribution pressure?o HW Pumps
CV or VFDs? Primary Cooling Systems
o Chiller? DX? Other?o Any year round cooling? (i.e. IT/data)o CHW Pumps
CV or VFDs? Domestic hot water
o Type: elec, gas, instantaneous Domestic hot water is provided by an electric hot water heater.
Stratton Hall
Stratton Hall is a 24,380 square foot academic building and was built in 1894. It originally housed the MechanicalEngineering department. The building now houses the Mathematical Sciences department and Center for IndustrialMathematics and Statistics. There are approximately seven classrooms in the buildings and the remainder are offices.
WPI is in the process of converting all energy management systems on campus from Schneider to Automated Logic(ALC) controls system. LED lighting conversion and converting to the ALC system could be the main measures in thisbuilding.
The building is controlled by the Schneider Electric controls system. The EMS monitors the chilled water pumps and airhandling unit. Thermostatic radiators valves allow occupants control of heat in the building.
One AHU provides ventilation and temperature controls for the building. A general exhaust serves the building as well.
Space heating is provided by hot water radiators which are equipped with thermostatic radiator valves.
Lighting in Stratton Hall is predominantly fluorescent. Upgrading to LED system is recommended.
The faucets and toilets are all low flow.
The building is of block construction with brick. The windows have been upgraded to double-pane with metal framing.Occupants use window AC units
Heating is provided from the campus steam plant which is converted to hot water and supplies the building via hotwater radiators equipped with TRVs.
Thereare no cooling systems in this building. Occupants use window air conditioning units for individual spaces.
Worcester Polytechnic Institute2016 Scoping Study
39

Worcester Polytechnic InstituteEnergy Efficiency Scoping Audit
Building Existing Conditions
General Information
Building Stratton Hall
GSF 24,380Space Use Academic
Utility UsageProposed
Total Usage EUI Total Usage EUIElectric Usage (kWh) 290,879 11.9 199,479 8.2Thermal Usage (kBtu) 1,656,962 68.0 1,342,262 55.1TOTAL (kBtu) 2,649,441 108.7 2,022,885 83.0
**Thermal Usage allocated based on Square Footage and Usage TypeEnd Use Breakdown
ElectrickWh
ThermalkBtu
Lighting 101,808 -Fans 26,179 -Pumps 55,267 -Cooling 61,085 -Heating - 1,656,962DHW 17,453 -Process Loads - -Plug Loads 29,088 -TOTAL 290,879 1,656,962
MeasuresTarget Reduction Lifetime Reduction
Costlevel Measure Electric
kWhThermal
kBtuCost Savings Installed Cost Simple Payback Equivalent CO2
(MTeCO2)1 Retrocommissioning 7,100 82,800 1,700$ 9,800$ 5.8 71 Control Sequence Optimization 11,400 66,300 2,000$ 12,200$ 6.1 71 Occupancy Based Controls 4,300 33,100 900$ 10,000$ 11.1 31 Demand Controlled Ventilation 1,000 49,700 600$ 4,900$ 8.2 33 VFD Installation on Fans 9,600 - 1,200$ 9,800$ 8.2 31 VFD Instllation on Pumps - - -$ -$ - -1 TRV Installation - - -$ -$ - -1 Building Envelope Improvements 7,100 82,800 1,700$ 14,600$ 8.6 71 Pneumatic to DDC Conversion - - -$ -$ - -1 HVAC Controls Upgrade - - -$ -$ - -1 LED Lighting Conversion 50,900 - 6,100$ 79,200$ 13.0 161 Pipe Insulation - - -$ -$ - -1 Thermal Jackets Installation - - -$ -$ - -1 Window Replacement - - -$ -$ - -1 AHU Replacement - - -$ -$ - -1 Electric to HW Conversion - - -$ -$ - -1 OA AHU for data center - - -$ -$ - -1 Heat Recovery Installation - - -$ -$ - -1 Fume Hood Improvements - - -$ -$ - -1 Electric to VRF Conversion - - -$ -$ - -1 DX to Chilled Water Cooling - - -$ -$ - -1 Cogen - - -$ -$ - -
TOTAL 91,400 314,700 14,200 140,500 9.9 50
Existing End Use Breakdown
Lighting, 13%
Fans, 3%
Pumps, 7%
Cooling, 8%
Heating, 63%
Domestic HW, 2%
Process Loads, 0%
Plug Loads, 4%
End Use Breakdown
Lighting, 20%
Fans, 9%
Pumps, 4%
Cooling, 8%
Heating, 48%
Domestic HW, 7%
Process Loads, 0%
Plug Loads, 5%
End Use Breakdown
Lighting, 13%
Fans, 3%
Pumps, 7%
Cooling, 8%
Heating, 63%
Domestic HW, 2%
Process Loads, 0%
Plug Loads, 4%
Worcester Polytechnic Institute2016 Scoping Study
40

Worcester Polytechnic InstituteEnergy Efficiency Scoping Audit
Building Existing Conditions
Building Name/Photo
Description
Building square footage
Type of facility
Ask Facilities StaffMajor problemsRecent renovationsPlanned renovationsIdeas for energy conservationRecent efficiency projectsOccupied Spaces
EMS \ Controlso Manufacturer and vintageo Local Control or on EMS?o End device control (pneumatic, electric, DDC)
HVAC Systems (Airside)o Type of systemso AHUs, RTUs, FCUs, Unit Ventilators, H&Vo Cooling/heating coils?
Space heating systemso Steam versus hot watero Any year round heating?o Any process steam? (i.e. kitchen, autoclaves, other)
Lightingo Type of lighting (T8, T12, CF, LED)o Occupancy sensors? Where?
Plumbingo City water or well water?o Showers: low flow?o Sinks – aerators?
Envelopeo No. of storieso Façade typeo Type of windows (double hung, fixed, 1x/2x pane)
Mechanical Rooms Primary Heating Systems
o Boiler Typeo Boiler and/or distribution pressure?o HW Pumps
CV or VFDs? Primary Cooling Systems
o Chiller? DX? Other?o Any year round cooling? (i.e. IT/data)o CHW Pumps
CV or VFDs? Domestic hot water
o Type: elec, gas, instantaneous Domestic hot water is provided by a gas-fired hot water heater.
Washburn Shops / Stoddard Labs
Washburn Shops / Stoddard Labs is a 42,606 square foot academic building that was built in 1868. Washburn housesoffices, departments for manufacturing engineering and materials science as well as the Materials CharacterizationLaboratory and the Metal Processing Institute.
A water sourced heat pump system was installed in the building approximately 25 years ago which serveapproximately 20 to 25 Trane heat pump units. LED lighting conversion and retrocommissioning could be the mainmeasures in this building.
The building is not on the energy management system. The fin tube radiation is locally controlled via pneumaticthermostatic controls.
Part of the third floor is ventilated by three Carrier rooftop units which provide DX cooling only. Three exhaust fansserve fume hoods located in the lab spaces on the third floor. Other exhaust fans serve the first floor machine shop.
Space heating consists of hot water fin tube radiation throughout the building which are split into zones and controlledvia pneumatically controlled thermostats. There is no year round heating or process steam in the building.
Almost all lights are fluorescents with no occupancy or vacancy sensors. Upgrading to LED system with lighitngcontrols is recommended.
The faucets and toilets are all low flow.
Washburn Shops / Stoddard Labs is a three story building constructed of brick with double pane windows.
Heating is provide by the campus steam loop in winter. There is a steam to hot water converter in the Powerhousethat provides hot water to Washburn. The hot water pumps are equipped with VFDs.
DX cooling for third floor offices, labs, and classrooms. A water source heat pump system for cooling only was installedapproximately 25 years ago. The system serves approximately 20 to 25 Trane heat pumps in the building.
Worcester Polytechnic Institute2016 Scoping Study
41

Worcester Polytechnic InstituteEnergy Efficiency Scoping Audit
Building Existing Conditions
General Information
Building Washburn ShopsStoddardLabs
GSF 42,606Space Use Academic
Utility UsageProposed
Total Usage EUI Total Usage EUIElectric Usage (kWh) 151,913 3.6 102,413 2.4Thermal Usage (kBtu) 4,028,823 94.6 2,925,823 68.7TOTAL (kBtu) 4,547,151 106.7 3,275,257 76.9
**Thermal Usage allocated based on Square Footage and Usage TypeEnd Use Breakdown
ElectrickWh
ThermalkBtu
Lighting 56,208 -Fans 16,710 -Pumps 13,672 -Cooling 36,459 -Heating - 3,021,618DHW - 1,007,206Process Loads - -Plug Loads 28,863 -TOTAL 151,913 4,028,823
MeasuresTarget Reduction Lifetime Reduction
Costlevel Measure Electric
kWhThermal
kBtuCost Savings Installed Cost Simple Payback Equivalent CO2
(MTeCO2)1 Retrocommissioning - - -$ -$ - -1 Control Sequence Optimization - - -$ -$ - -1 Occupancy Based Controls - - -$ -$ - -1 Demand Controlled Ventilation - - -$ -$ - -1 VFD Installation on Fans - - -$ -$ - -1 VFD Instllation on Pumps - - -$ -$ - -1 TRV Installation - - -$ -$ - -3 Building Envelope Improvements 3,300 105,800 1,500$ 32,000$ 21.3 72 Pneumatic to DDC Conversion 11,400 695,000 8,400$ 140,600$ 16.7 411 HVAC Controls Upgrade - - -$ -$ - -3 LED Lighting Conversion 28,100 - 3,400$ 127,800$ 37.6 91 Pipe Insulation - - -$ -$ - -1 Thermal Jackets Installation - - -$ -$ - -1 Window Replacement - - -$ -$ - -3 AHU Replacement 6,700 302,200 3,900$ 170,400$ 43.7 181 Electric to HW Conversion - - -$ -$ - -1 OA AHU for data center - - -$ -$ - -1 Heat Recovery Installation - - -$ -$ - -1 Fume Hood Improvements - - -$ -$ - -1 Electric to VRF Conversion - - -$ -$ - -1 DX to Chilled Water Cooling - - -$ -$ - -1 Cogen - - -$ -$ - -
TOTAL 49,500 1,103,000 17,200 470,800 27.4 79
Existing End Use Breakdown
Lighting, 4%
Fans, 1%
Pumps, 1%
Cooling, 3%
Heating, 66%
Domestic HW, 22%
Process Loads, 0%
Plug Loads, 2%
End Use Breakdown
Lighting, 20%
Fans, 9%
Pumps, 4%
Cooling, 8%
Heating, 48%
Domestic HW, 7%
Process Loads, 0%
Plug Loads, 5%
End Use Breakdown
Lighting, 4%
Fans, 1%
Pumps, 1%
Cooling, 3%
Heating, 66%
Domestic HW, 22%
Process Loads, 0%
Plug Loads, 2%
Worcester Polytechnic Institute2016 Scoping Study
42

0
20
40
60
kWh/
GS
F
Building
20 Trowbridge
Bartlett Center
Benchmark
Administrative BuildingsElectric Benchmarking
Worcester Polytechnic Institute2016 Scoping Study
43

0
50
100
kBT
U/G
SF Building
20 Trowbridge
Bartlett Center
Benchmark
Administrative BuildingsThermal Benchmarking
Worcester Polytechnic Institute2016 Scoping Study
44

Worcester Polytechnic InstituteEnergy Efficiency Scoping Audit
Building Existing Conditions
Building Name/Photo
Description
Building square footage
Type of facility
Ask Facilities StaffMajor problemsRecent renovationsPlanned renovationsIdeas for energy conservationRecent efficiency projectsOccupied Spaces
EMS \ Controlso Manufacturer and vintageo Local Control or on EMS?o End device control (pneumatic, electric, DDC)
HVAC Systems (Airside)o Type of systemso AHUs, RTUs, FCUs, Unit Ventilators, H&Vo Cooling/heating coils?
Space heating systemso Steam versus hot watero Any year round heating?o Any process steam? (i.e. kitchen, autoclaves, other)
Lightingo Type of lighting (T8, T12, CF, LED)o Occupancy sensors? Where?
Plumbingo City water or well water?o Showers: low flow?o Sinks – aerators?
Envelopeo No. of storieso Façade typeo Type of windows (double hung, fixed, 1x/2x pane)
Mechanical Rooms Primary Heating Systems
o Boiler Typeo Boiler and/or distribution pressure?o HW Pumps
CV or VFDs? Primary Cooling Systems
o Chiller? DX? Other?o Any year round cooling? (i.e. IT/data)o CHW Pumps
CV or VFDs? Domestic hot water
o Type: elec, gas, instantaneous Domestic hot water is provided by an electric hot water heater.
Bartlett Center
Bartlett Center is a 16,200 square foot administrative building and was built in 2006. The building is LEED ceritifiedand is home to the Office of Admissions and Financial Aid.
Staff were not aware of any major issues in the building. WPI is in the process of converting all buildings fromSchneider to ALC. LED lighting conversion and a building controls upgrade ould be the main measures in this building.
The controls for the building is on Schneider Electric controls system. WPI is in the process of converting the buildingfrom Schneider to ALC. The air handling unit and hot water system are all monitored using the EMS. The fan coil unit/ fan power boxes are also monitored on the EMS via wall temperature sensors.
One York air handling unit serves the building. The unit is equipped with a VFD for the supply and return fan andprovides DX cooling. Fan power boxes located throughout the building have hot water coils for reheat. A generalexhaust fan is located on the roof. Two return fans are equipped with VFDs. The condensing unit is located on theroof.
Space heating is provided by the fan power boxes / fan coil units which are equipped with hot water coils.
Almost all lights are fluorescents. Upgrading to LED system is recommended.
The faucets and toilets are all low flow.
The building is of block construction with brick with double pane windows.
Heating is provide by campus steam loop in winter. There is a steam to hot water converter which provides the AHUand fan coil units / fan power boxes with hot water.
AHU-1 provides DX cooling to the building. A Mitsubishi Mr. Slim split air conditioning unit provides cooling to the IT /data room year round.
Worcester Polytechnic Institute2016 Scoping Study
45

Worcester Polytechnic InstituteEnergy Efficiency Scoping Audit
Building Existing Conditions
General Information
Building Bartlett Center
GSF 16,200Space Use Administration
Utility UsageProposed
Total Usage EUI Total Usage EUIElectric Usage (kWh) 268,078 16.5 130,151 8.0Thermal Usage (kBtu) 893,592 55.2 670,192 41.4TOTAL (kBtu) 1,808,273 111.6 1,114,268 68.8
**Thermal Usage allocated based on Square Footage and Usage TypeEnd Use Breakdown ** Electric Usage is allocated on square footage and use type
ElectrickWh
ThermalkBtu
Lighting 104,550 -Fans 26,808 -Pumps 21,446 -Cooling 61,658 -Heating - 893,592DHW 26,808 -Process Loads - -Plug Loads 26,808 -TOTAL 268,078 893,592
MeasuresTarget Reduction Lifetime Reduction
Costlevel Measure Electric
kWhThermal
kBtuCost Savings Installed Cost Simple Payback Equivalent CO2
(MTeCO2)1 Retrocommissioning - - -$ -$ - -1 Control Sequence Optimization - - -$ -$ - -1 Occupancy Based Controls 5,500 44,700 1,100$ 8,100$ 7.4 41 Demand Controlled Ventilation - - -$ -$ - -1 VFD Installation on Fans - - -$ -$ - -1 VFD Instllation on Pumps - - -$ -$ - -1 TRV Installation - - -$ -$ - -1 Building Envelope Improvements 8,800 44,700 1,500$ 16,200$ 10.8 51 Pneumatic to DDC Conversion - - -$ -$ - -2 HVAC Controls Upgrade 22,000 134,000 4,000$ 56,700$ 14.2 141 LED Lighting Conversion 52,300 - 6,300$ 64,800$ 10.3 161 Pipe Insulation - - -$ -$ - -1 Thermal Jackets Installation - - -$ -$ - -1 Window Replacement - - -$ -$ - -1 AHU Replacement - - -$ -$ - -1 Electric to HW Conversion - - -$ -$ - -1 OA AHU for data center - - -$ -$ - -1 Heat Recovery Installation - - -$ -$ - -1 Fume Hood Improvements - - -$ -$ - -1 Electric to VRF Conversion - - -$ -$ - -3 DX to Chilled Water Cooling 49,326 - 5,919$ 202,500$ 34.2 151 Cogen - - -$ -$ - -
TOTAL 137,926 223,400 18,819 348,300 18.5 55
Existing End Use Breakdown
Lighting, 20%
Fans, 5%
Pumps, 4%
Cooling, 12%
Heating, 49%
Domestic HW, 5%
Process Loads, 0%
Plug Loads, 5%
End Use Breakdown
Lighting, 20%
Fans, 9%
Pumps, 4%
Cooling, 8%
Heating, 48%
Domestic HW, 7%
Process Loads, 0%
Plug Loads, 5%
End Use Breakdown
Lighting, 20%
Fans, 5%
Pumps, 4%
Cooling, 12%
Heating, 49%
Domestic HW, 5%
Process Loads, 0%
Plug Loads, 5%
Worcester Polytechnic Institute2016 Scoping Study
46

Worcester Polytechnic InstituteEnergy Efficiency Scoping Audit
Building Existing Conditions
Building Name/Photo
Description
Building square footage
Type of facility
Ask Facilities StaffMajor problemsRecent renovationsPlanned renovationsIdeas for energy conservationRecent efficiency projectsOccupied Spaces
EMS \ Controlso Manufacturer and vintageo Local Control or on EMS?o End device control (pneumatic, electric, DDC)
HVAC Systems (Airside)o Type of systemso AHUs, RTUs, FCUs, Unit Ventilators, H&Vo Cooling/heating coils?
Space heating systemso Steam versus hot watero Any year round heating?o Any process steam? (i.e. kitchen, autoclaves, other)
Lightingo Type of lighting (T8, T12, CF, LED)o Occupancy sensors? Where?
Plumbingo City water or well water?o Showers: low flow?o Sinks – aerators?
Envelopeo No. of storieso Façade typeo Type of windows (double hung, fixed, 1x/2x pane)
Mechanical Rooms Primary Heating Systems
o Boiler Typeo Boiler and/or distribution pressure?o HW Pumps
CV or VFDs? Primary Cooling Systems
o Chiller? DX? Other?o Any year round cooling? (i.e. IT/data)o CHW Pumps
CV or VFDs? Domestic hot water
o Type: elec, gas, instantaneous Domestic hot water is provided to the building via an electric A.O. Smith Energy Saver heater.
20 Trowbridge
20 Trowbridge is a two story, 4,536 square foot administrive building that was constructed in 1905. It houses theOffice of Pre-Collegiate Outreach Programs. Typical operating hours are from 8am to 5pm.
The heating system in the building was recently renovated with a new boiler, pumps, and piping. LED lightingconversion and occupant engagement could be the main measures in this building. Also, retrocommissioning isrecommended for the heating system which could include scheduling and an outside air reset strategy.
There is no energy management system in this building. There are three zones on each floor which are locallycontrolled via Honeywell T87 thermostats. The Lochinvar boiler has capabilities to control pump speed, night setback,and zone temperature setpoints. The system should be verified to ensure that the system is working properly.
There is no airside equipment in this building.
Space heating is provided via hot water from a Lochinvar hot water boiler to newer baseboard radiation locatedthroughout the building.
Almost all lights are fluorescents. Occupants use task lighting at their desks. Upgrading to LED system isrecommended.
The faucets and toilets are all low flow.
20 Trowbridge is a three story building with a basement. The exterior is wood siding with operable, double panewindows.
Heating is provided by a recently installed gas-fired Lochinvar condensing hot water boiler. There are three Grundfoszone pumps which are variable speed.
There is no central cooling system in this building. Occupants may use window air conditioning units.
Worcester Polytechnic Institute2016 Scoping Study
47

Worcester Polytechnic InstituteEnergy Efficiency Scoping Audit
Building Existing Conditions
General Information
Building 20 Trowbridge
GSF 4,536Space Use Administration
Utility UsageProposed
Total Usage EUI Total Usage EUIElectric Usage (kWh) 9,668 2.1 6,368 1.4Thermal Usage (kBtu) 205,200 45.2 112,900 24.9TOTAL (kBtu) 238,187 52.5 134,628 29.7
**Thermal Usage is quantified by Gas DataEnd Use Breakdown
ElectrickWh
ThermalkBtu
Lighting 5,801 -Fans - -Pumps 773 -Cooling 1,644 -Heating - 205,200DHW - -Process Loads - -Plug Loads 1,450 -TOTAL 9,668 205,200
MeasuresTarget Reduction Lifetime Reduction
Costlevel Measure Electric
kWhThermal
kBtuCost Savings Installed Cost Simple Payback Equivalent CO2
(MTeCO2)1 Retrocommissioning - - -$ -$ - -1 Control Sequence Optimization - - -$ -$ - -1 Occupancy Based Controls - - -$ -$ - -1 Demand Controlled Ventilation - - -$ -$ - -1 VFD Installation on Fans - - -$ -$ - -1 VFD Instllation on Pumps - - -$ -$ - -1 TRV Installation - - -$ -$ - -2 Building Envelope Improvements 400 30,800 400$ 6,800$ 17.0 21 Pneumatic to DDC Conversion - - -$ -$ - -1 HVAC Controls Upgrade - 41,000 400$ 4,500$ 11.3 23 LED Lighting Conversion 2,900 - 300$ 9,100$ 30.3 12 Pipe Insulation - 20,500 200$ 3,400$ 17.0 11 Thermal Jackets Installation - - -$ -$ - -1 Window Replacement - - -$ -$ - -1 AHU Replacement - - -$ -$ - -1 Electric to HW Conversion - - -$ -$ - -1 OA AHU for data center - - -$ -$ - -1 Heat Recovery Installation - - -$ -$ - -1 Fume Hood Improvements - - -$ -$ - -1 Electric to VRF Conversion - - -$ -$ - -1 DX to Chilled Water Cooling - - -$ -$ - -1 Cogen - - -$ -$ - -
TOTAL 3,300 92,300 1,300 23,800 18.3 11
Existing End Use Breakdown
Lighting, 8%
Fans, 0%
Pumps, 1%
Cooling, 2%
Heating, 86%
Domestic HW, 0%
Process Loads, 0%
Plug Loads, 2%
End Use Breakdown
Lighting, 20%
Fans, 9%
Pumps, 4%
Cooling, 8%
Heating, 48%
Domestic HW, 7%
Process Loads, 0%
Plug Loads, 5%
End Use Breakdown
Lighting, 20%
Fans, 5%
Pumps, 4%
Cooling, 12%
Heating, 49%
Domestic HW, 5%
Process Loads, 0%
Plug Loads, 5%
End Use Breakdown
Lighting, 20%
Fans, 9%
Pumps, 4%
Cooling, 8%
Heating, 48%
Domestic HW, 7%
Process Loads, 0%
Plug Loads, 5%
End Use Breakdown
Lighting, 8%
Fans, 0%
Pumps, 1%
Cooling, 2%
Heating, 86%
Domestic HW, 0%
Process Loads, 0%
Plug Loads, 2%
Worcester Polytechnic Institute2016 Scoping Study
48

0
10
20
30
kWh/
GS
F Building
Sports & Recreation Center
Benchmark
Athletic CentersElectric Benchmarking
Worcester Polytechnic Institute2016 Scoping Study
49

0
50
100
150
200
kBT
U/G
SF Building
Sports & Recreation Center
Benchmark
Athletic CentersThermal Benchmarking
Worcester Polytechnic Institute2016 Scoping Study
50

Worcester Polytechnic InstituteEnergy Efficiency Scoping Audit
Building Existing Conditions
Building Name/Photo
Description
Building square footage
Type of facility
Ask Facilities StaffMajor problemsRecent renovationsPlanned renovationsIdeas for energy conservationRecent efficiency projectsOccupied Spaces
EMS \ Controlso Manufacturer and vintageo Local Control or on EMS?o End device control (pneumatic, electric, DDC)
HVAC Systems (Airside)o Type of systemso AHUs, RTUs, FCUs, Unit Ventilators, H&Vo Cooling/heating coils?
Space heating systemso Steam versus hot watero Any year round heating?o Any process steam? (i.e. kitchen, autoclaves, other)
Lightingo Type of lighting (T8, T12, CF, LED)o Occupancy sensors? Where?
Plumbingo City water or well water?o Showers: low flow?o Sinks – aerators?
Envelopeo No. of storieso Façade typeo Type of windows (double hung, fixed, 1x/2x pane)
Mechanical Rooms Primary Heating Systems
o Boiler Typeo Boiler and/or distribution pressure?o HW Pumps
CV or VFDs? Primary Cooling Systems
o Chiller? DX? Other?o Any year round cooling? (i.e. IT/data)o CHW Pumps
CV or VFDs? Domestic hot water
o Type: elec, gas, instantaneous Domestic hot water is provided by a gas-fired hot water heater.
Sports & Recreation Center
The Sports & Recreation Center is a 154,000 square foot athletics building and was built in 2012. The building housesa fitness center, gymnasium, competition swimming pool, rowing room, squash and tennis courts, and an aerobicsarea. The typical hours of operation are from 6am to 12am daily.
The Sports & Recreation Center was recently built in 2012. The summer boilers which are used for the swimming poolare approximately two years old yet there has been issues with the boilers; the pool temperature setpoint isapproximately 82oF, but the pool usual has an actual temperature of 78oF. LED lighting conversion andretrocommissioning could be the main measures in this building.
The building controls is on the ALC system. The EMS controls and monitors the hot water system, chillers, hot waterradiation, VAV reheat boxes, cabinet unit heaters, fan coil units, air handling units, and energy recovery units.
Four Trane air handling units, AHU-1 through AHU-4, are located on the roof of the building and serve the maingymnasium year round. Two units typically operate at one time, in lead / lag and are equipped with hot water andchilled water coils. AHU-5 serves the raquetball and squash courts and AHU-6 serves the track / aerobics area. Eachunit is equipped with hot water and chilled water coils. Three energy recovery units serve the dance studios, weightroom areas, stairwells, and offices. Five exhaust fans are located on the roof and provide ventilation for various areasin the building.
Space heating is provided by hot water VAV duct reheat coils, fan coil units, and cabinet unit heaters for the majorityof areas. Two heat exchangers are located in the swimming pool mechanical room and provide hot water to thebuilding.
Almost all lights are fluorescents. Upgrading to LED system is recommended. Occupancy sensors for some commonareas
The shower heads, faucets and toilets are all low flow.
The building has four stories and is of block construction with brick. The windows are double pane and original to thebuilding when it was constructed in 2012.
Heating is provide by campus steam loop in winter. There are two hot water converters that produces hot water forthe air handling units, VAV duct reheat coils, fan coil units and cabinet unit heaters. The pumps are equipped withVFDs. The swimming pool is heated by two Lochinvar hot water boiler during the summer.
Cooling is provided by the two chillers located in the mechanical room. Chilled water is circulated by three pumpswhich are equipped with VFDs.
Worcester Polytechnic Institute2016 Scoping Study
51
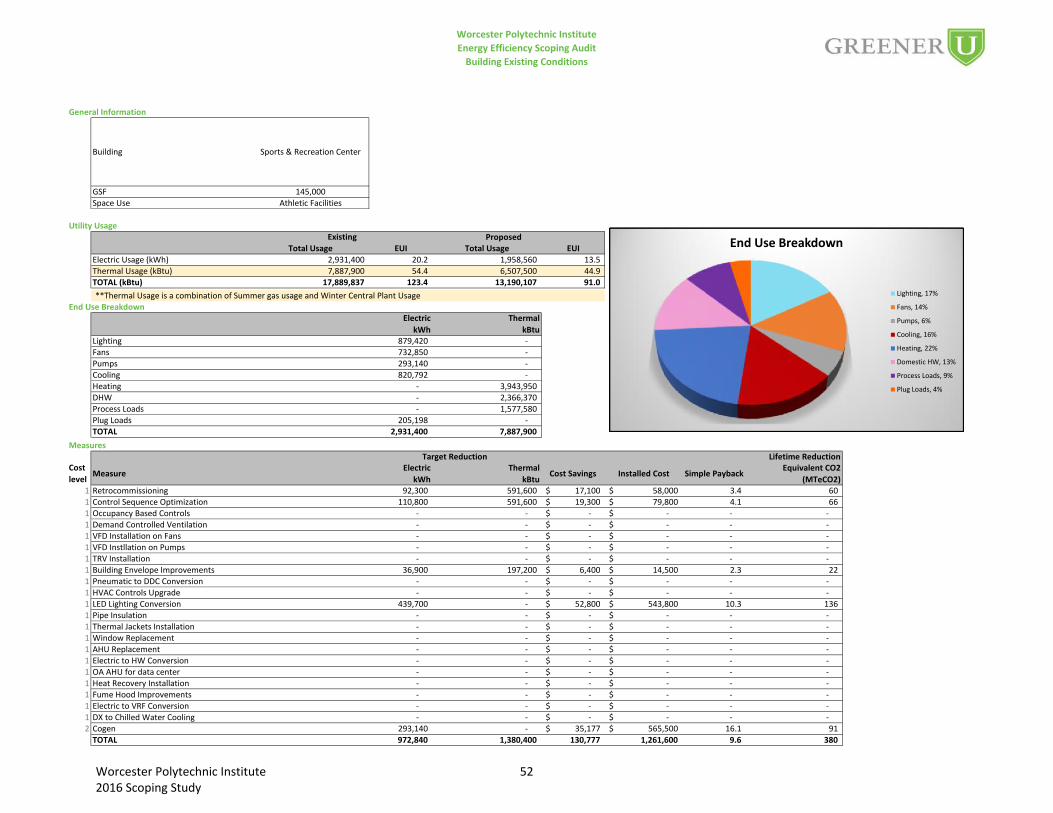
Worcester Polytechnic InstituteEnergy Efficiency Scoping Audit
Building Existing Conditions
General Information
Building Sports & Recreation Center
GSF 145,000Space Use Athletic Facilities
Utility UsageProposed
Total Usage EUI Total Usage EUIElectric Usage (kWh) 2,931,400 20.2 1,958,560 13.5Thermal Usage (kBtu) 7,887,900 54.4 6,507,500 44.9TOTAL (kBtu) 17,889,837 123.4 13,190,107 91.0**Thermal Usage is a combination of Summer gas usage and Winter Central Plant Usage
End Use BreakdownElectric
kWhThermal
kBtuLighting 879,420 -Fans 732,850 -Pumps 293,140 -Cooling 820,792 -Heating - 3,943,950DHW - 2,366,370Process Loads - 1,577,580Plug Loads 205,198 -TOTAL 2,931,400 7,887,900
MeasuresTarget Reduction Lifetime Reduction
Costlevel Measure Electric
kWhThermal
kBtuCost Savings Installed Cost Simple Payback Equivalent CO2
(MTeCO2)1 Retrocommissioning 92,300 591,600 17,100$ 58,000$ 3.4 601 Control Sequence Optimization 110,800 591,600 19,300$ 79,800$ 4.1 661 Occupancy Based Controls - - -$ -$ - -1 Demand Controlled Ventilation - - -$ -$ - -1 VFD Installation on Fans - - -$ -$ - -1 VFD Instllation on Pumps - - -$ -$ - -1 TRV Installation - - -$ -$ - -1 Building Envelope Improvements 36,900 197,200 6,400$ 14,500$ 2.3 221 Pneumatic to DDC Conversion - - -$ -$ - -1 HVAC Controls Upgrade - - -$ -$ - -1 LED Lighting Conversion 439,700 - 52,800$ 543,800$ 10.3 1361 Pipe Insulation - - -$ -$ - -1 Thermal Jackets Installation - - -$ -$ - -1 Window Replacement - - -$ -$ - -1 AHU Replacement - - -$ -$ - -1 Electric to HW Conversion - - -$ -$ - -1 OA AHU for data center - - -$ -$ - -1 Heat Recovery Installation - - -$ -$ - -1 Fume Hood Improvements - - -$ -$ - -1 Electric to VRF Conversion - - -$ -$ - -1 DX to Chilled Water Cooling - - -$ -$ - -2 Cogen 293,140 - 35,177$ 565,500$ 16.1 91
TOTAL 972,840 1,380,400 130,777 1,261,600 9.6 380
Existing End Use Breakdown
Lighting, 17%
Fans, 14%
Pumps, 6%
Cooling, 16%
Heating, 22%
Domestic HW, 13%
Process Loads, 9%
Plug Loads, 4%
End Use Breakdown
Lighting, 20%
Fans, 9%
Pumps, 4%
Cooling, 8%
Heating, 48%
Domestic HW, 7%
Process Loads, 0%
Plug Loads, 5%
End Use Breakdown
Lighting, 8%
Fans, 0%
Pumps, 1%
Cooling, 2%
Heating, 86%
Domestic HW, 0%
Process Loads, 0%
Plug Loads, 2%
End Use Breakdown
Lighting, 20%
Fans, 9%
Pumps, 4%
Cooling, 8%
Heating, 48%
Domestic HW, 7%
Process Loads, 0%
Plug Loads, 5%
End Use Breakdown
Lighting, 20%
Fans, 5%
Pumps, 4%
Cooling, 12%
Heating, 49%
Domestic HW, 5%
Process Loads, 0%
Plug Loads, 5%
End Use Breakdown
Lighting, 20%
Fans, 9%
Pumps, 4%
Cooling, 8%
Heating, 48%
Domestic HW, 7%
Process Loads, 0%
Plug Loads, 5%
End Use Breakdown
Lighting, 17%
Fans, 14%
Pumps, 6%
Cooling, 16%
Heating, 22%
Domestic HW, 13%
Process Loads, 9%
Plug Loads, 4%
Worcester Polytechnic Institute2016 Scoping Study
52

APPENDIX B
ENERGY EFFICIENCY OPPORTUNITIES
Worcester Polytechnic Institute2016 Scoping Study
53

Below is a summary of the energy conservation and deferred maintenance measures proposed in this
analysis report:
RETRO-COMMISSIONING Proper functionality of HVAC systems and associated controls is critical for energy efficient building
operations. Recommissioning of controls systems is recommended for several buildings included in the
study. GreenerU recommends an approach to existing building commissioning (EBCx) that includes the
use of both on site field testing and diagnostic analytics. This approach allows for the initial
identification of controls issues.
CONTROL SEQUENCE OPTIMIZATION Based on our site visits and EMS (Energy Management System) observation, we identified several
opportunities to optimize existing control sequences which would yield significant energy savings.
Typical control sequence optimization strategies include, but not limited to, discharge air temperature
setpoint reset, duct static pressure setpoint reset, optimize HVAC equipment time schedules, optimize
air flow setpoints, economizer operation optimization, and differential pressure reset.
OCCUPANCY BASED CONTROLS There are many areas in the campus (classrooms, offices, conference rooms, etc.,) where implementing
occupancy based temperature and ventilation controls is a good strategy. In this measure, occupancy
sensors would be installed, wired to the EMS, and be used to setback temperatures and flows during
unoccupied periods. In locations where a lighting upgrade project is implemented and lighting
occupancy controls are added, these sensors can be utilized for integration with the EMS.
DEMAND CONTROLLED VENTILATION CO2 levels in spaces can be used as an indicator of air quality. We have identified large spaces with
highly variable occupancy that would benefit from reducing the amount of outside ventilation being
provided during periods of low or no occupancy. CO2 sensor(s) would be installed either in the space or
in the return air duct to monitor the air quality in the space. The outside air intake would be modulated
to maintain the space CO2 level below acceptable level.
VFD INSTALLATION ON FANS AND PUMPS Many fans and pumps in the buildings we surveyed operate at full capacity all the time, and do not have
VFDs installed on the motors. In this measure, VFDs would be installed on these fan and pump motors,
so that they can be operated at lower speeds when the demand is low. This measure will reduce
fan/pump energy consumption, and could potentially reduce heating/cooling energy in areas that have
simultaneous heating and cooling issues.
TRV INSTALLATION ON RADIATORS Two of the buildings that we surveyed have one-pipe steam radiators systems to provide space heating.
Although there are zone level controls on these radiators, significant energy savings could be generated
with the installation of TRVs (Thermostatic Radiator Valves) on each radiator. By providing occupants
Worcester Polytechnic Institute2016 Scoping Study
54

with temperature control at the radiator level, control occupant comfort is improved and less heating
energy is wasted as compared to radiators that run as a zone, controlled by single centralized
thermostat. Additionally, rooms with better thermal control tend to have fewer open windows during
the winter months, reducing the risk for pipe-freeze conditions.
BUILDING ENVELOPE IMPROVEMENTS GreenerU identified several building envelope improvement opportunities in all the buildings in this
study because many exterior doors and windows had gaps. Infiltration of unconditioned air increases
the heating load in the winter and the cooling load in the summer. GreenerU recommends door and
window weather stripping, and window sash sealing.
PNEUMATIC TO DDC CONVERSION Some of the valve and damper actuators have pneumatic actuators, controlled by the EMS via E-to-P
transducers. Old pneumatic actuators tend to fail or operate inaccurately leading to higher energy
consumption in some scenarios. We recommend converting these actuators to DDC. This will also
reduce the load on air compressors. This measure is applicable to the thermostats located in Washburn
Shops / Stoddard Labs.
HVAC CONTROLS UPGRADE Residential buildings recommended for a HVAC Controls Upgrade include installing smart thermostats
such as Nest thermostats or equal manufacturer. Smart thermostats allow individual control of the
system, ability to schedule for days of the week with temperature setbacks, and external
communication via internet / WIFI.
LED LIGHTING CONVERSION GreenerU identified opportunities in almost all buildings to continue retrofitting or replacing existing
lighting systems throughout Babson College with LED and additional lighting controls. Lighting controls
will include day lighting and occupancy controls – both local and networked lighting control systems – as
appropriate.
PIPE INSULATION There are multiple mechanical rooms in the buildings surveyed that have exposed steam or hot water
piping. This measure will insulate piping and fittings to reduce heating and cooling energy. Insulating
steam piping and fittings is a low payback measure that can generate significant savings
AHU REPLACEMENT This measure would replace the three rooftop units at Washburn Shops / Stoddard Labs which have
rusted out and frequently require maintenance. GreenerU recommends replacing the unit with an
efficient model that would be sized to provide the necessary ventilation rates according to ASHRAE’s
requirements.
Worcester Polytechnic Institute2016 Scoping Study
55
Related Documents